CITY OF EL PASO - Fiscal Year 2021-2022 Budget Cover Page
511
-
Upload
khangminh22 -
Category
Documents
-
view
1 -
download
0
Transcript of CITY OF EL PASO - Fiscal Year 2021-2022 Budget Cover Page

recoverya return to a normal state of health, mind, or strength.
RECOVERY

1006.1.3
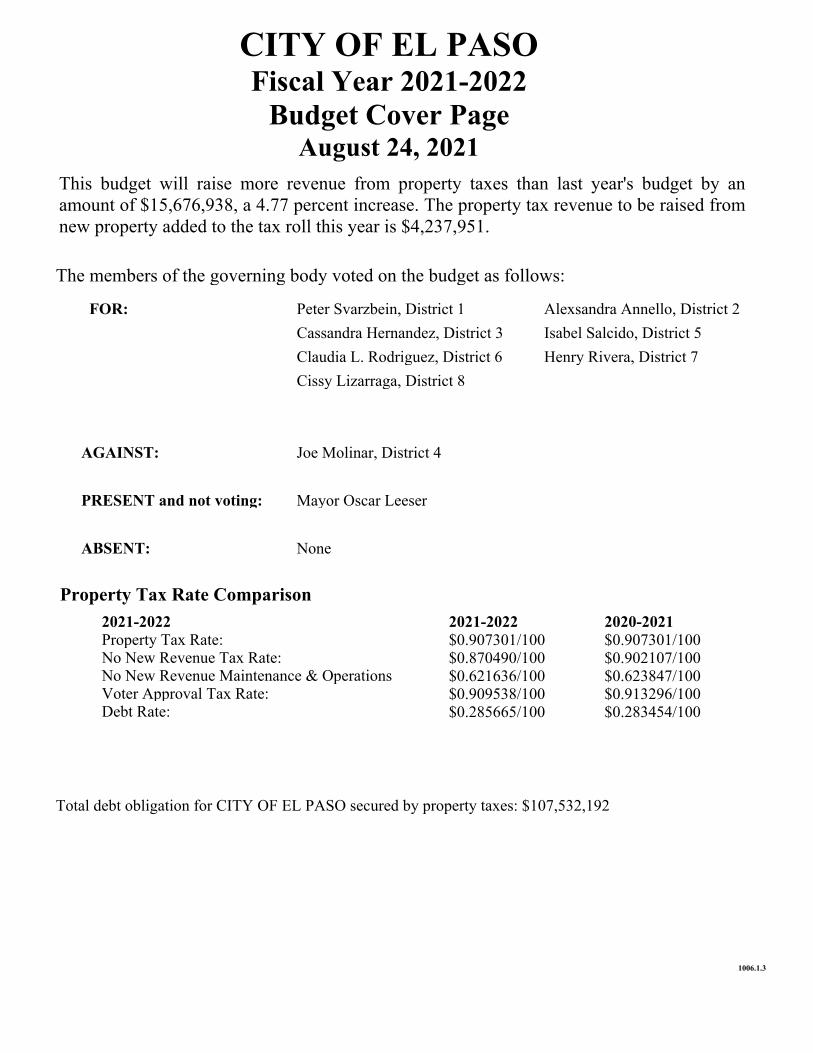
CITY OF EL PASO Fiscal Year 2021-2022
Budget Cover Page August 24, 2021
2021-2022 Property Tax Rate: No New Revenue Tax Rate: No New Revenue Maintenance & Operations Voter Approval Tax Rate: Debt Rate:
2021-2022 $0.907301/100 $0.870490/100 $0.621636/100 $0.909538/100 $0.285665/100
2020-2021 $0.907301/100 $0.902107/100 $0.623847/100 $0.913296/100 $0.283454/100
FOR: Peter Svarzbein, District 1
Cassandra Hernandez, District 3
Claudia L. Rodriguez, District 6
Cissy Lizarraga, District 8
Alexsandra Annello, District 2
Isabel Salcido, District 5
Henry Rivera, District 7
AGAINST: Joe Molinar, District 4
PRESENT and not voting: Mayor Oscar Leeser
ABSENT: None
This budget will raise more revenue from property taxes than last year's budget by anamount of $15,676,938, a 4.77 percent increase. The property tax revenue to be raised fromnew property added to the tax roll this year is $4,237,951.
The members of the governing body voted on the budget as follows:
Property Tax Rate Comparison
Total debt obligation for CITY OF EL PASO secured by property taxes: $107,532,192
Fiscal Year 2022 BudgetAdopted by City Council August 24, 2021
Prepared by:
Office of Management & Budget300 N. Campbell
El Paso Texas 79901915-212-0000
WWW.ELPASOTEXAS.GOV

CITY OF EL PASO Table of Contents
FY 2022 BUDGET
Introduction
DEPARTMENT DIRECTORS BY GOAL ........................................................................................................................ 6
HELPFUL CONTACT INFORMATION ......................................................................................................................... 7
ACCOLADES AND RECOGNITIONS………………………………………………………………………………………………………………….… 8
HELPFUL MOBILE APPS ...................................................................................................................................... 10
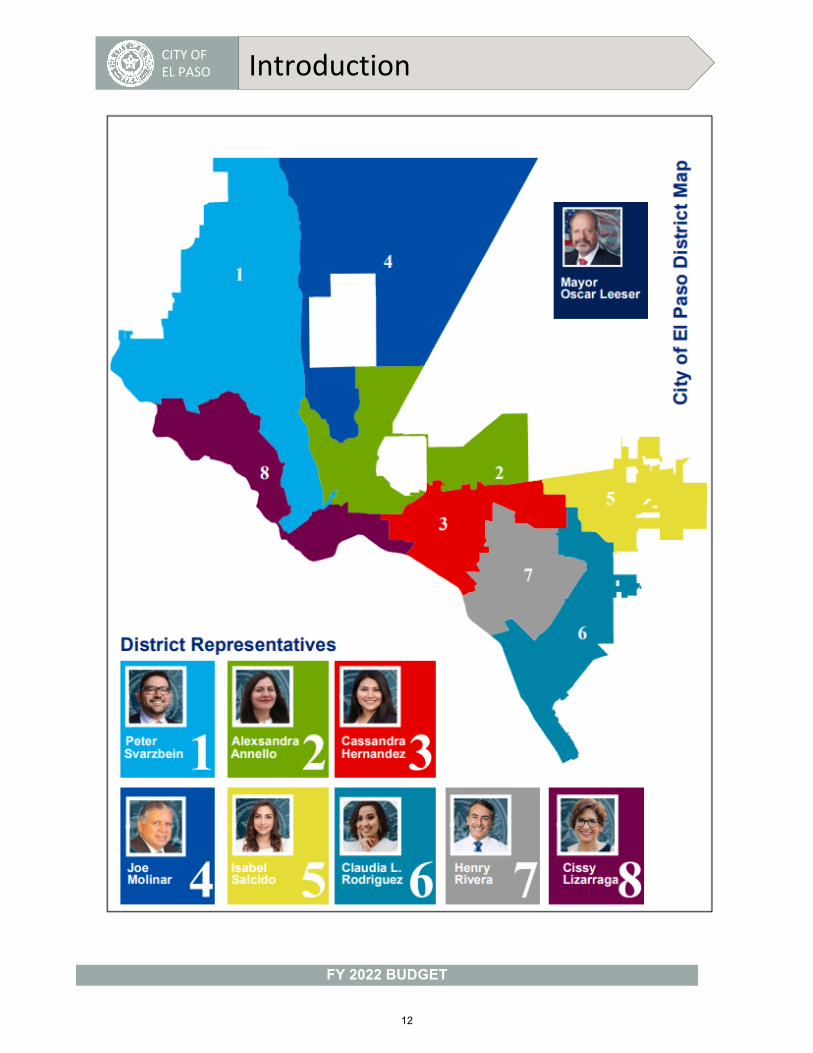
MAYOR AND CITY COUNCIL WITH DISTRICT MAP ..................................................................................................... 12
OFFICE OF MANAGEMENT AND BUDGET STAFF AND SPECIAL ACKNOWLEDGEMENTS ..................................................... 13
BUDGET MESSAGE ............................................................................................................................................ 15
DOCUMENT GUIDE ........................................................................................................................................... 20
VISION AND MISSION STATEMENT ....................................................................................................................... 26
STRATEGIC PLAN .............................................................................................................................................. 27
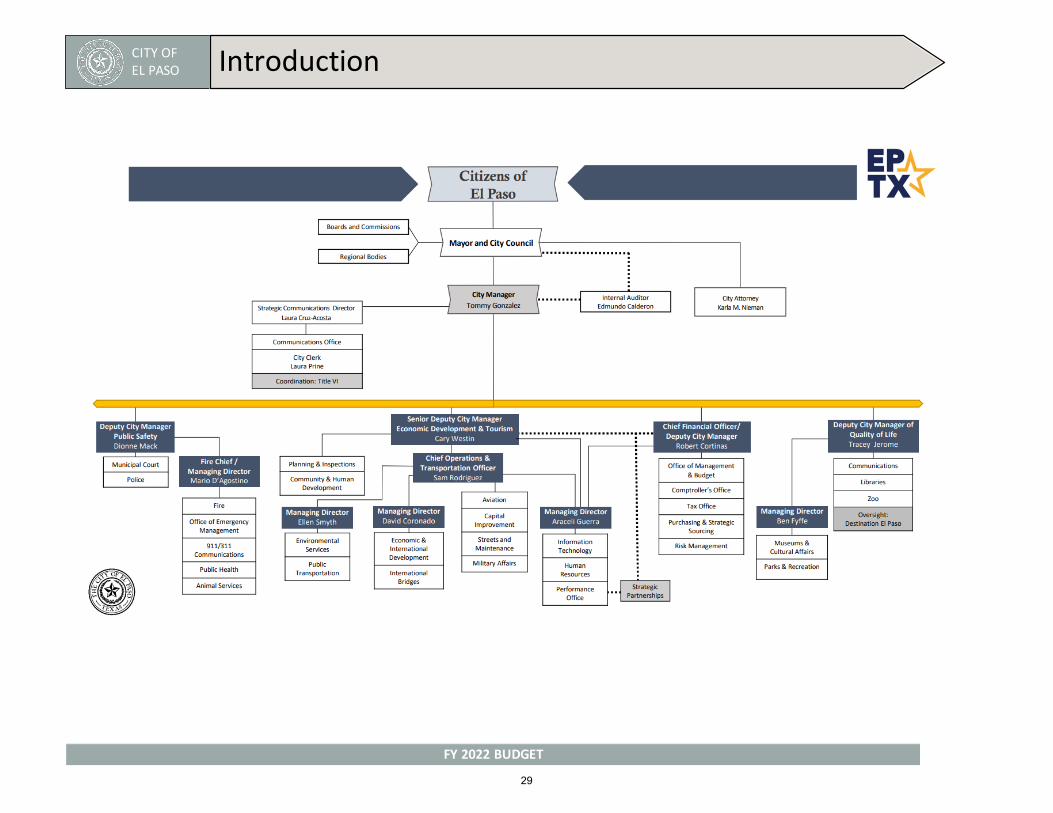
CITY ORGANIZATIONAL CHART ............................................................................................................................ 29
BOARDS AND COMMITTEES AND COMMISSIONS .................................................................................................... 30
Community Profile
LOCATION AND HISTORY .................................................................................................................................... 32
FORT BLISS ...................................................................................................................................................... 33
DEMOGRAPHICS .............................................................................................................................................. 34
INCOME ......................................................................................................................................................... 35
ECONOMIC INITIATIVES ..................................................................................................................................... 36
EDUCATION .................................................................................................................................................... 38
MEDICAL SCHOOLS ........................................................................................................................................... 39
TRANSPORTATION ............................................................................................................................................ 40
ATTRACTIONS AND POINTS OF INTEREST ............................................................................................................... 42
SPORTS .......................................................................................................................................................... 43
GENERAL TAX INFORMATION .............................................................................................................................. 44
Fiscal Overview
BUDGET POLICIES ............................................................................................................................................ 46
FINANCIAL POLICIES .......................................................................................................................................... 53
BUDGET PROCESS ............................................................................................................................................. 58
FUND STRUCTURE ............................................................................................................................................ 63
FIVE‐YEAR ADOPTED GENERAL FUND AND NON‐GENERAL FUND BUDGET COMPARISON ................................................ 67
TWO‐YEAR ADOPTED GENERAL FUND AND NON‐GENERAL FUND BUDGET TO ACTUAL COMPARISON ................................ 68
FTE (FULL‐TIME EQUIVALENT) POSITION SUMMARIES ............................................................................................. 69
PROPERTY TAX ................................................................................................................................................. 72
DEBT ADMINISTRATION ..................................................................................................................................... 77
1

CITY OF EL PASO Table of Contents
FY 2022 BUDGET
Financial Summaries
REVENUES ...................................................................................................................................................... 80
ALL SOURCES REVENUE DETAIL ........................................................................................................................... 98
EXPENDITURES .............................................................................................................................................. 105
ALL EXPENDITURES DETAIL ............................................................................................................................... 110
GENERAL FUND VARIANCE IN ACTUAL FY 2018‐2022 ............................................................................................ 119
NON‐GENERAL FUND VARIANCE IN ACTUAL FY 2018‐2022 .................................................................................... 122
CONSOLIDATED YEAR END STATEMENTS ............................................................................................................. 125
FUND SUMMARIES ......................................................................................................................................... 129
Budget Detail
GOAL 1: ECONOMIC DEVELOPMENT .................................................................................................................. 139
AVIATION ........................................................................................................................................ 140
DESTINATION EL PASO ........................................................................................................................ 148
ECONOMIC DEVELOPMENT ................................................................................................................. 152
INTERNATIONAL BRIDGES ................................................................................................................... 158
GOAL 2: PUBLIC SAFETY ................................................................................................................................... 165
FIRE ................................................................................................................................................ 166
MUNICIPAL COURT…………………………………………………………………………………………………….…………………173
POLICE ............................................................................................................................................ 179
GOAL 3: VISUAL IMAGE ................................................................................................................................... 187
PLANNING AND INSPECTIONS .............................................................................................................. 188
GOAL 4: QUALITY OF LIFE................................................................................................................................. 196
LIBRARY .......................................................................................................................................... 197
MUSEUMS AND CULTURAL AFFAIRS ...................................................................................................... 203
PARKS AND RECREATION .................................................................................................................... 210
ZOO ................................................................................................................................................ 217
GOAL 5: TRANSPARENT AND CONSISTENT COMMUNICATION.................................................................................. 225
INFORMATION TECHNOLOGY ............................................................................................................... 226
GOAL 6: SOUND GOVERNANCE AND FISCAL MANAGEMENT .................................................................................... 234
CITY ATTORNEY ................................................................................................................................. 235
CITY CLERK ....................................................................................................................................... 241
CITY MANAGER ................................................................................................................................. 247
HUMAN RESOURCES .......................................................................................................................... 253
MAYOR AND COUNCIL ........................................................................................................................ 259
NON‐DEPARTMENTAL ........................................................................................................................ 264
OFFICE OF THE COMPTROLLER ............................................................................................................. 268
PURCHASING AND STRATEGIC SOURCING ............................................................................................... 274
2

CITY OF EL PASO Table of Contents
FY 2022 BUDGET
TAX OFFICE ...................................................................................................................................... 280
GOAL 7: ENHANCE AND SUSTAIN INFRASTRUCTURE .............................................................................................. 287
CAPITAL IMPROVEMENT DEPARTMENT .................................................................................................. 288
STREETS AND MAINTENANCE ............................................................................................................... 295
SUN METRO ..................................................................................................................................... 303
GOAL 8: HEALTHY AND SUSTAINABLE COMMUNITY .............................................................................................. 312
ANIMAL SERVICES ............................................................................................................................. 313
COMMUNITY AND HUMAN DEVELOPMENT ............................................................................................ 320
ENVIRONMENTAL SERVICES ................................................................................................................. 326
PUBLIC HEALTH DEPARTMENT ............................................................................................................. 333
Long Range Planning LONG RANGE PLANNING .................................................................................................................................. 342
MULTI‐YEAR FINANCIAL OUTLOOK ..................................................................................................................... 346
VISION BLOCK: VIBRANT REGIONAL ECONOMY ..................................................................................................... 352
VISION BLOCK: SAFE AND BEAUTIFUL NEIGHBORHOODS ........................................................................................ 354
VISION BLOCK: RECREATIONAL, CULTURAL AND EDUCATIONAL OPPORTUNITIES......................................................... 356
VISION BLOCK: HIGH PERFORMING GOVERNMENT ................................................................................................ 357
PERFORMANCE EXCELLENCE RESULTS ................................................................................................................ 359
Capital Improvements CAPITAL IMPROVEMENT PROGRAM ................................................................................................................... 364
IMPACT ON THE OPERATING BUDGET ................................................................................................................. 368
CAPITAL IMPROVEMENT PROGRAM SUMMARY BY YEAR ........................................................................................ 369
CAPITAL PROJECT DESCRIPTIONS…………………………………………………………………………………………………………………. 376
Appendix
BUDGET RESOLUTION ..................................................................................................................................... 417
SCHEDULE A ‐ REVENUES AND EXPENDITURES CHANGES TO PROPOSED BUDGET ........................................................ 430
SCHEDULE B ‐ STAFFING CHANGES TO PROPOSED BUDGET ..................................................................................... 431
SCHEDULE B1 - CERTIFICATION PAY .................................................................................................................... 432
SCHEDULE C ‐ DEPARTMENTAL FEE LIST .............................................................................................................. 433
SCHEDULE D ‐ JOB CODES/GRADES .................................................................................................................... 477
SCHEDULE E ‐ INFORMATION TECHNOLOGY CONTRACTUAL SERVICES ...................................................................... 489
ORDINANCE LEVYING FY2022 TAXES ................................................................................................................... 494
GLOSSARY OF ACRONYMS ................................................................................................................................ 496
GLOSSARY OF TERMS ...................................................................................................................................... 498
3
4
CITY OF EL PASO BUDGET BOOK 2022
GROWTH
INTRODUCTION
INTR
ODUCTIO
N
CITY OF EL PASO Introduction
FY 2022 BUDGET
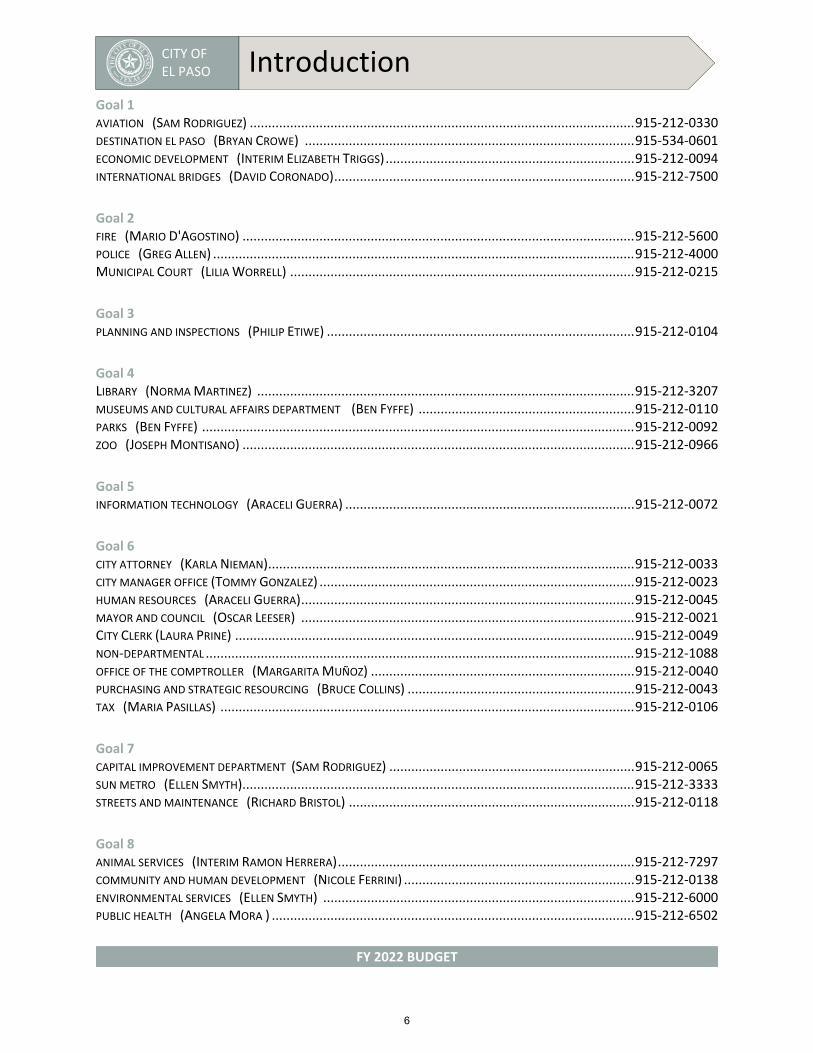
Goal 1 AVIATION (SAM RODRIGUEZ) ......................................................................................................... 915‐212‐0330 DESTINATION EL PASO (BRYAN CROWE) .......................................................................................... 915‐534‐0601 ECONOMIC DEVELOPMENT (INTERIM ELIZABETH TRIGGS) .................................................................... 915‐212‐0094 INTERNATIONAL BRIDGES (DAVID CORONADO) .................................................................................. 915‐212‐7500
Goal 2 FIRE (MARIO D'AGOSTINO) ........................................................................................................... 915‐212‐5600 POLICE (GREG ALLEN) ................................................................................................................... 915‐212‐4000 MUNICIPAL COURT (LILIA WORRELL) .............................................................................................. 915‐212‐0215
Goal 3 PLANNING AND INSPECTIONS (PHILIP ETIWE) .................................................................................... 915‐212‐0104
Goal 4 LIBRARY (NORMA MARTINEZ) ....................................................................................................... 915‐212‐3207 MUSEUMS AND CULTURAL AFFAIRS DEPARTMENT (BEN FYFFE) ........................................................... 915‐212‐0110 PARKS (BEN FYFFE) ...................................................................................................................... 915‐212‐0092 ZOO (JOSEPH MONTISANO) ........................................................................................................... 915‐212‐0966
Goal 5 INFORMATION TECHNOLOGY (ARACELI GUERRA) ............................................................................... 915‐212‐0072
Goal 6 CITY ATTORNEY (KARLA NIEMAN) .................................................................................................... 915‐212‐0033 CITY MANAGER OFFICE (TOMMY GONZALEZ) ...................................................................................... 915‐212‐0023 HUMAN RESOURCES (ARACELI GUERRA) ........................................................................................... 915‐212‐0045 MAYOR AND COUNCIL (OSCAR LEESER) ........................................................................................... 915‐212‐0021 CITY CLERK (LAURA PRINE) ............................................................................................................. 915‐212‐0049 NON‐DEPARTMENTAL ..................................................................................................................... 915‐212‐1088 OFFICE OF THE COMPTROLLER (MARGARITA MUÑOZ) ........................................................................ 915‐212‐0040 PURCHASING AND STRATEGIC RESOURCING (BRUCE COLLINS) .............................................................. 915‐212‐0043 TAX (MARIA PASILLAS) ................................................................................................................. 915‐212‐0106
Goal 7 CAPITAL IMPROVEMENT DEPARTMENT (SAM RODRIGUEZ) ................................................................... 915‐212‐0065 SUN METRO (ELLEN SMYTH)........................................................................................................... 915‐212‐3333 STREETS AND MAINTENANCE (RICHARD BRISTOL) .............................................................................. 915‐212‐0118
Goal 8 ANIMAL SERVICES (INTERIM RAMON HERRERA) ................................................................................. 915‐212‐7297 COMMUNITY AND HUMAN DEVELOPMENT (NICOLE FERRINI) ............................................................... 915‐212‐0138 ENVIRONMENTAL SERVICES (ELLEN SMYTH) ..................................................................................... 915‐212‐6000 PUBLIC HEALTH (ANGELA MORA ) ................................................................................................... 915‐212‐6502
6
CITY OF EL PASO Introduction
FY 2022 BUDGET FY 2022 BUDGET
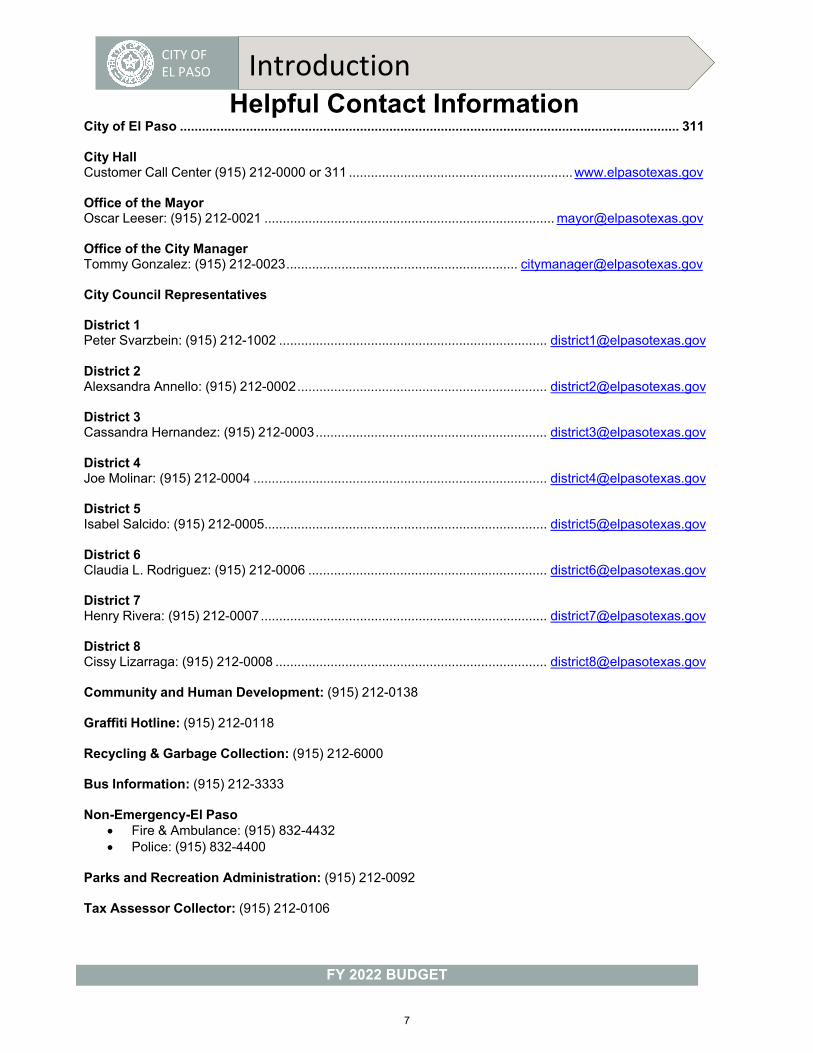
Helpful Contact Information City of El Paso ........................................................................................................................................ 311
City Hall Customer Call Center (915) 212-0000 or 311 ............................................................. www.elpasotexas.gov
Office of the Mayor Oscar Leeser: (915) 212-0021 ............................................................................... [email protected]
Office of the City Manager Tommy Gonzalez: (915) 212-0023 ............................................................... [email protected]
City Council Representatives
District 1 Peter Svarzbein: (915) 212-1002 ......................................................................... [email protected]
District 2 Alexsandra Annello: (915) 212-0002 .................................................................... [email protected]
District 3 Cassandra Hernandez: (915) 212-0003 ............................................................... [email protected]
District 4 Joe Molinar: (915) 212-0004 ................................................................................ [email protected]
District 5 Isabel Salcido: (915) 212-0005............................................................................. [email protected]
District 6 Claudia L. Rodriguez: (915) 212-0006 ................................................................. [email protected]
District 7 Henry Rivera: (915) 212-0007 .............................................................................. [email protected]
District 8 Cissy Lizarraga: (915) 212-0008 .......................................................................... [email protected]
Community and Human Development: (915) 212-0138
Graffiti Hotline: (915) 212-0118
Recycling & Garbage Collection: (915) 212-6000
Bus Information: (915) 212-3333
Non-Emergency-El Paso Fire & Ambulance: (915) 832-4432 Police: (915) 832-4400
Parks and Recreation Administration: (915) 212-0092
Tax Assessor Collector: (915) 212-0106
7
CITY OF EL PASO Introduction
FY 2022 BUDGET FY 2022 BUDGET
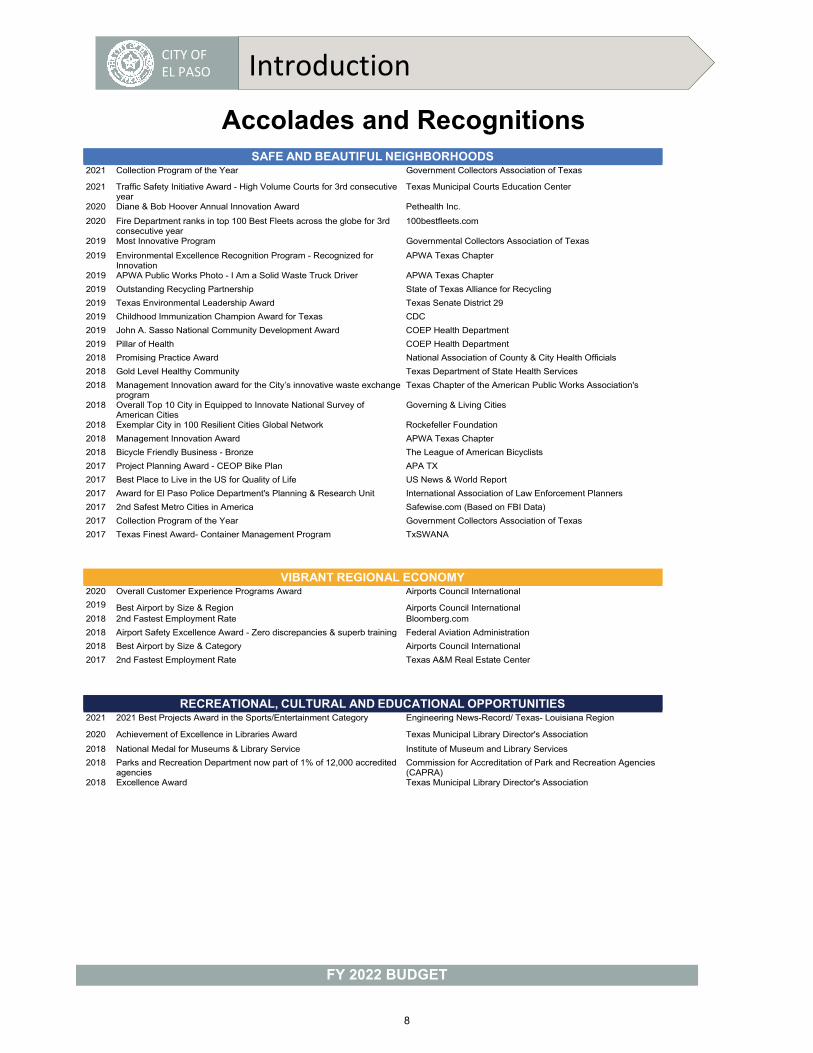
Accolades and RecognitionsSAFE AND BEAUTIFUL NEIGHBORHOODS
2021 Collection Program of the Year Government Collectors Association of Texas
2021 Traffic Safety Initiative Award - High Volume Courts for 3rd consecutive year
Texas Municipal Courts Education Center
2020 Diane & Bob Hoover Annual Innovation Award Pethealth Inc.
2020 Fire Department ranks in top 100 Best Fleets across the globe for 3rd consecutive year
100bestfleets.com
2019 Most Innovative Program Governmental Collectors Association of Texas
2019 Environmental Excellence Recognition Program - Recognized for Innovation
APWA Texas Chapter
2019 APWA Public Works Photo - I Am a Solid Waste Truck Driver APWA Texas Chapter
2019 Outstanding Recycling Partnership State of Texas Alliance for Recycling
2019 Texas Environmental Leadership Award Texas Senate District 29
2019 Childhood Immunization Champion Award for Texas CDC
2019 John A. Sasso National Community Development Award COEP Health Department
2019 Pillar of Health COEP Health Department
2018 Promising Practice Award National Association of County & City Health Officials
2018 Gold Level Healthy Community Texas Department of State Health Services
2018 Management Innovation award for the City’s innovative waste exchange program
Texas Chapter of the American Public Works Association's
2018 Overall Top 10 City in Equipped to Innovate National Survey of American Cities
Governing & Living Cities
2018 Exemplar City in 100 Resilient Cities Global Network Rockefeller Foundation
2018 Management Innovation Award APWA Texas Chapter
2018 Bicycle Friendly Business - Bronze The League of American Bicyclists
2017 Project Planning Award - CEOP Bike Plan APA TX
2017 Best Place to Live in the US for Quality of Life US News & World Report
2017 Award for El Paso Police Department's Planning & Research Unit International Association of Law Enforcement Planners
2017 2nd Safest Metro Cities in America Safewise.com (Based on FBI Data)
2017 Collection Program of the Year Government Collectors Association of Texas
2017 Texas Finest Award- Container Management Program TxSWANA
VIBRANT REGIONAL ECONOMY 2020 Overall Customer Experience Programs Award Airports Council International
2019 Best Airport by Size & Region Airports Council International 2018 2nd Fastest Employment Rate Bloomberg.com
2018 Airport Safety Excellence Award - Zero discrepancies & superb training Federal Aviation Administration
2018 Best Airport by Size & Category Airports Council International
2017 2nd Fastest Employment Rate Texas A&M Real Estate Center
RECREATIONAL, CULTURAL AND EDUCATIONAL OPPORTUNITIES 2021 2021 Best Projects Award in the Sports/Entertainment Category Engineering News-Record/ Texas- Louisiana Region
2020 Achievement of Excellence in Libraries Award Texas Municipal Library Director's Association
2018 National Medal for Museums & Library Service Institute of Museum and Library Services
2018 Parks and Recreation Department now part of 1% of 12,000 accredited agencies
Commission for Accreditation of Park and Recreation Agencies (CAPRA)
2018 Excellence Award Texas Municipal Library Director's Association
8

CITY OF EL PASO Introduction
FY 2022 BUDGET FY 2022 BUDGET
HIGH PERFORMING GOVERNMENT 2021 Aetna 2021 Making a Difference Workplace Wellbeing GOLD Award Aetna
2020 Achievement of Excellence in Procurement for 7th consecutive years Texas Public Purchasing Association
2020 Top Ten 2020 Digital Cities Survey Winner for Cities (pop > 500,000) for 3rd year in a row
Center for Digital Government
2020 Diane & Bob Hoover Annual Innovation Award Pethealth Inc.
2020 2nd Place Overall City Government Experience Government Technology
2020 Future Ready Award Government Technology
2020 Texas Award for Performance Excellence Quality Texas Foundation
2019 Top Performer in Employee- Engaged Category Equipt to Innovate Survey of American Cities
2019 Texas Award for Performance Excellence Quality Texas Foundation
2019 Best of Texas Winner - Prisoner Log Web Application Center for Digital Government
2018 IDC Smart City North America Awards Winner Emergency Management
2018 Best of Texas Awards (Ask Laura) Govtech.com
2018 Innovation Award Texas Chapter of the American Public Works Association's Management
2018 El Paso is an All-American City (focus on Civic Engagement) National League of Cities
2018 Promising Practice for Paso del Norte Electronic Network for Linkage to Preventative Health Services
National Association of County & City Health Officials
2017 Innovator of the Year for EP Marketplace ProcureCon EPIC Award 2017 Municipal Excellence Award in the Communications Programs Category
for "Your City in 5" Texas Municipal League
2017 Best of Texas Winner - Zoo Web Cam Project Center for Digital Government
2017 Top Ten 2017 Digital Cities Survey Winner for Cities (pop > 500,000) Center for Digital Government
9

CITY OF EL PASO Introduction
FY 2022 BUDGET FY 2022 BUDGET
Helpful Mobile AppsEP311 EP311 Connects you directly with City of El Paso staff to more efficiently resolve issues in our community.
Build El Paso Inspection Build El Paso inspection APP allows users to view and request inspections on issued permits.
El Paso Daycation El Paso has awesome projects ready for you and your family to enjoy. It has neighborhood spray parks, new zoo exhibits, hike and bike paths and lots more. There’s so much to do, it’s like the entire city is your very own playground
El Paso PD The El Paso PD app provides the community the ability to submit anonymous tips to the El Paso, TX Police Department. The app also displays agency crime alerts, online crime map, and other organization web and social media content.
Park 915 The Park 915 app, powered by ParkMobile, gives you a smarter way to park in El Paso. Easily pay for on-street and off-street parking right from your mobile device. You can also reserve parking ahead of time in lots, garages, venues, airports, and universities across the country.
Android
Android
Android
Android
Android
iOS
iOS
iOS
iOS
iOS
10
CITY OF EL PASO Introduction
FY 2022 BUDGET FY 2022 BUDGET
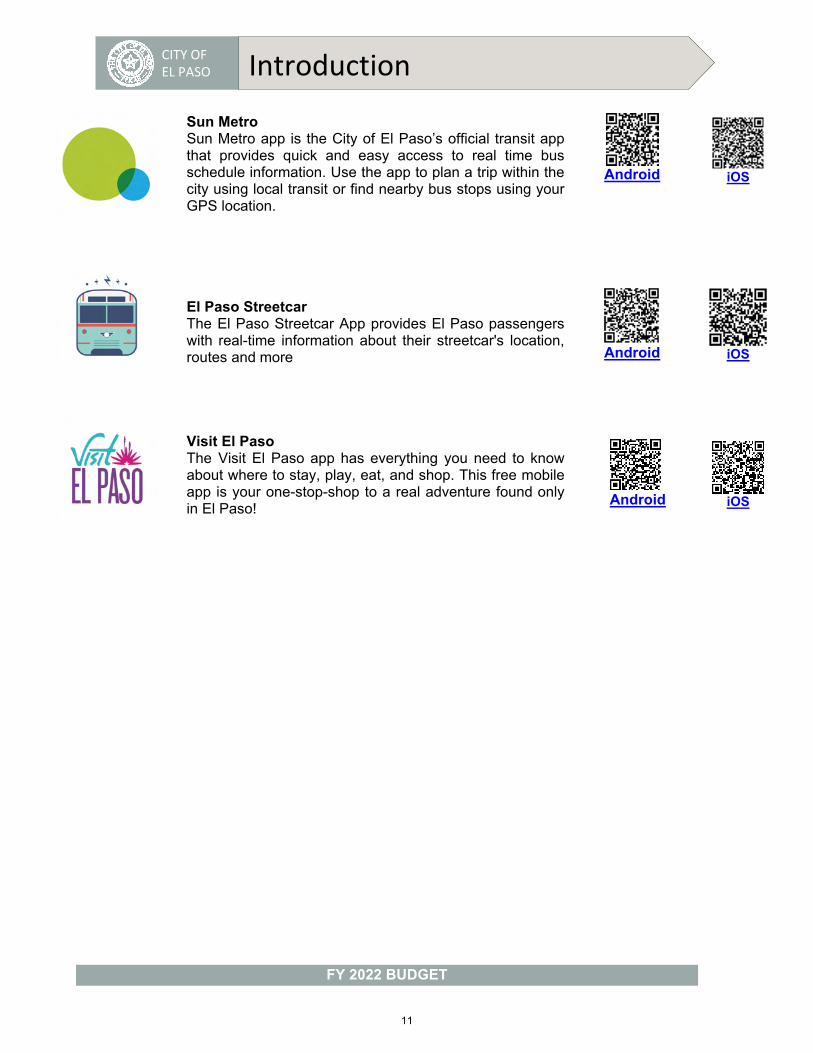
Sun Metro Sun Metro app is the City of El Paso’s official transit app that provides quick and easy access to real time bus schedule information. Use the app to plan a trip within the city using local transit or find nearby bus stops using your GPS location.
El Paso Streetcar The El Paso Streetcar App provides El Paso passengers with real-time information about their streetcar's location, routes and more
Visit El Paso The Visit El Paso app has everything you need to know about where to stay, play, eat, and shop. This free mobile app is your one-stop-shop to a real adventure found only in El Paso!
Android
Android
Android
iOS
iOS
iOS
11
CITY OF EL PASO Introduction
FY 2022 BUDGET FY 2022 BUDGET
12

CITY OF EL PASO Introduction
FY 2022 BUDGET FY 2022 BUDGET
Office of Management & Budget Staff & Special Acknowledgements
K. Nicole CoteDirector of Management and Budget
Sasho Andonoski Executive Budget Advisor
Bonnie Cordova Lead Budget Analyst
Ramon Lopez Sr. Budget Analyst
Alejandra Monge Budget Analyst
David Torres Sr. Executive Budget Advisor
Domingo Cordero Data Scientist
Daniel Hanson Sr. Budget Analyst
Monica Lundgren Financial & Benefits System Admin.
Ana Rico Budget Analyst
Former Staff: Ana Arzola
Denice Sepulveda
Special Acknowledgements: Performance Office
Tax Office Economic Development
Capital Improvement Department Streets and Maintenance Department of Aviation
Destination El Paso El Paso Community College
University of Texas at El Paso New Mexico State University
Texas Tech University Health Sciences Center Fort Bliss
13

CITY OF EL PASO Introduction
FY 2022 BUDGET FY 2022 BUDGET
14
City Manager’s Office
TO: Honorable Mayor and City Council FROM: Tomás González, City Manager DATE: August 24, 2021 SUBJECT: Fiscal Year 2021 - 2022 Adopted Budget
In the past two years, the El Paso community has faced unprecedented events
that have required immediate action, resolve, and resilience. The
humanitarian crisis created by the surge of immigrants crossing the border
from Mexico into the US; the aftermath of the August 3, 2019, mass shooting
tragedy; and the continual response and recovery of a worldwide COVID-19
pandemic have been difficult for our community. During these challenging
times, we remain focused on our Vision, Mission, and Values. The FY 2021 –
2022 Adopted Budget demonstrates our commitment to delivering exceptional services to support a high quality of life and place for our community and continues the progress the City of El Paso has made toward
achieving our vision of developing a vibrant regional economy, safe and beautiful neighborhoods, and exceptional recreational, cultural and educational opportunities powered by a high performing government.
The City’s organizational culture embodies the relentless spirit of the ‘El Paso
Strong’ mantra through a proactive commitment to our people by empowering
the organization. Together we serve our community, build the technology,
make strategic decisions, manage the risks, determine our investments and
drive innovation. Ultimately, the basis of our success is our people. Over the
past 7 years, our City has experienced a financial transformation both in
terms of our financial performance and our steadfast dedication to the services
we deliver to our community. It is because of this transformation, that in FY
2021, we were able to open four Water Parks and restore services, with
steadfast revenue projections and potentially ending on a better financial
15
City Manager’s Office
footing then when the pandemic started. It is together with a great team of
people - who can navigate these challenging circumstances while dedicating
themselves to the community – is what ensures our prosperity now and in the
future.
In putting together the FY 2021 – 2022 Adopted Budget, we focused on
meeting these new challenges while keeping our commitments to our
community and developing a vibrant regional economy. We are listening to
our community, as this budget focuses on restoring core and essential services
that were reduced or deferred during the onset of the pandemic, innovate in
how we deliver services, be resilient in dealing with health, financial and
operational impacts, and minimize the health and economic impacts on our
community.
The FY 2021 – 2022 Adopted All Funds budget of $1.1 billion, an increase of
$82.8 million from the prior year. The increase in the budget is due to funding
Public Safety departments, streets investment and a phased-in recovery plan.
A net increase of 259.02 FTE’s are included in next year’s budget, primarily in
the Public Safety and Health departments, to address the COVID-19
pandemic.
The budget focuses on the core services identified as priorities by the
community through the annual Chime In! survey, such as streets, public safety
and community health. Key costs drivers in the FY 2021 – 2022 Adopted
General Fund Budget include investment in Safe and Beautiful Neighborhoods and Exceptional Recreational, Cultural, and Education Opportunities. Identified as the number one priority through the Chime In!
survey, the FY 2021 – 2022 Adopted Budget includes investment in streets of
16

City Manager’s Office
– $20 million for street resurfacing projects and updating the pavement
condition index study, $1.8 million in Vision Zero plan to enhance intersection
safety, $500K to complete ADA on-demand requests, and $250K for
Neighborhood Traffic Management Plan projects.
Along with the significant increase on street expenditures, investment in Public
Safety includes; an increase in the number of public safety academies (two
Police and three Fire), almost $7.8 million set aside funds for police cars, fire
trucks, ambulances and radio system, increase staffing in 911 communications
(seven new positions), and $1.2 million to maintain the Crisis Intervention
Team.
To support a high quality of life and place for our community increases for
Exceptional Recreational, Cultural, and Education Opportunities includes; $10.7 million increase for all recreation & senior centers, libraries,
museums, aquatics (except those scheduled to remain closed due to
construction or being utilized for other operations), $1.5 million for enhanced
maintenance at City sport complexes, $500K to implement a pilot project for
automated irrigation at eight City parks, and restoration of funding for the
downtown holiday celebration, Winterfest. Additionally, increase for quality of
life services to includes the maintenance and operations costs of projects to
be completed in FY 2022.
17
City Manager’s Office
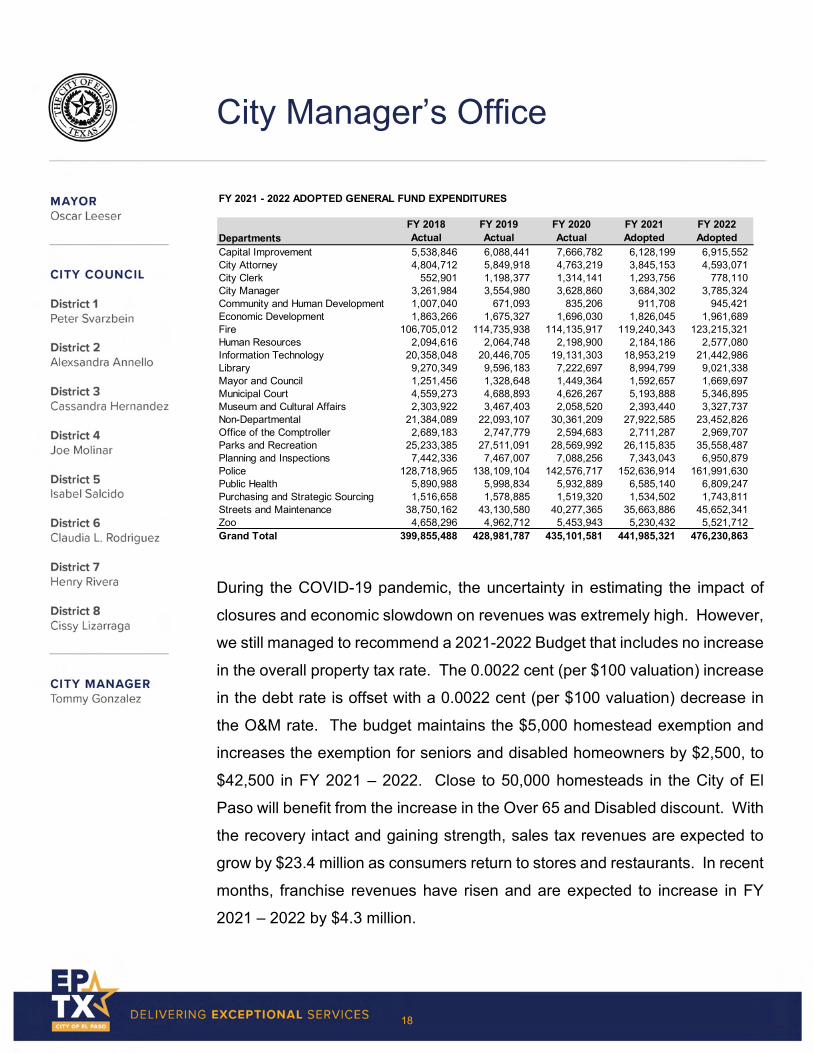
During the COVID-19 pandemic, the uncertainty in estimating the impact of
closures and economic slowdown on revenues was extremely high. However,
we still managed to recommend a 2021-2022 Budget that includes no increase
in the overall property tax rate. The 0.0022 cent (per $100 valuation) increase
in the debt rate is offset with a 0.0022 cent (per $100 valuation) decrease in
the O&M rate. The budget maintains the $5,000 homestead exemption and
increases the exemption for seniors and disabled homeowners by $2,500, to
$42,500 in FY 2021 – 2022. Close to 50,000 homesteads in the City of El
Paso will benefit from the increase in the Over 65 and Disabled discount. With
the recovery intact and gaining strength, sales tax revenues are expected to
grow by $23.4 million as consumers return to stores and restaurants. In recent
months, franchise revenues have risen and are expected to increase in FY
2021 – 2022 by $4.3 million.
FY 2021 - 2022 ADOPTED GENERAL FUND EXPENDITURES
DepartmentsFY 2018 Actual
FY 2019 Actual
FY 2020 Actual
FY 2021 Adopted
FY 2022 Adopted
Capital Improvement 5,538,846 6,088,441 7,666,782 6,128,199 6,915,552 City Attorney 4,804,712 5,849,918 4,763,219 3,845,153 4,593,071 City Clerk 552,901 1,198,377 1,314,141 1,293,756 778,110 City Manager 3,261,984 3,554,980 3,628,860 3,684,302 3,785,324 Community and Human Development 1,007,040 671,093 835,206 911,708 945,421 Economic Development 1,863,266 1,675,327 1,696,030 1,826,045 1,961,689 Fire 106,705,012 114,735,938 114,135,917 119,240,343 123,215,321 Human Resources 2,094,616 2,064,748 2,198,900 2,184,186 2,577,080 Information Technology 20,358,048 20,446,705 19,131,303 18,953,219 21,442,986 Library 9,270,349 9,596,183 7,222,697 8,994,799 9,021,338 Mayor and Council 1,251,456 1,328,648 1,449,364 1,592,657 1,669,697 Municipal Court 4,559,273 4,688,893 4,626,267 5,193,888 5,346,895 Museum and Cultural Affairs 2,303,922 3,467,403 2,058,520 2,393,440 3,327,737 Non-Departmental 21,384,089 22,093,107 30,361,209 27,922,585 23,452,826 Office of the Comptroller 2,689,183 2,747,779 2,594,683 2,711,287 2,969,707 Parks and Recreation 25,233,385 27,511,091 28,569,992 26,115,835 35,558,487 Planning and Inspections 7,442,336 7,467,007 7,088,256 7,343,043 6,950,879 Police 128,718,965 138,109,104 142,576,717 152,636,914 161,991,630 Public Health 5,890,988 5,998,834 5,932,889 6,585,140 6,809,247 Purchasing and Strategic Sourcing 1,516,658 1,578,885 1,519,320 1,534,502 1,743,811 Streets and Maintenance 38,750,162 43,130,580 40,277,365 35,663,886 45,652,341 Zoo 4,658,296 4,962,712 5,453,943 5,230,432 5,521,712 Grand Total 399,855,488 428,981,787 435,101,581 441,985,321 476,230,863
18

City Manager’s Office
Our ability to remain strong and focused is embedded in our FY 2021 - 2022
Adopted Budget by supporting our mission of delivering exceptional service to support a high quality of life and place for our community. This budget
continues the progress the City of El Paso has made toward achieving our
vision of developing a vibrant regional economy, safe and beautiful neighborhoods, and exceptional recreational, cultural and educational opportunities powered by a high performing government.
Thank you for continuing to make the tough and necessary decisions for our
community. That type of decision making is why We Are El Paso Strong!
Tomás González
City Manager
FY 2021 - 2022 ADOPTED GENERAL FUND REVENUES
FY 2018 FY 2019 FY 2020 FY 2021 FY 2022REVENUE BY SOURCE ACTUAL ACTUAL ACTUAL ADOPTED ADOPTEDProperty Taxes 170,814,897 192,095,217 213,422,017 226,894,834 235,929,354 Penalties and Interest-Delinquent Taxes 1,316,914 1,581,339 1,458,170 - - Sales Taxes 92,109,776 96,649,172 99,591,904 82,572,139 105,957,017 Franchise Fees 53,828,945 50,463,842 50,281,692 45,465,495 49,750,000 Charges for Services 32,042,279 31,562,902 27,114,822 31,413,624 28,636,083 Fines and Forfeitures 8,143,341 9,081,658 6,770,925 4,950,740 5,653,301 Licenses and Permits 14,352,347 14,809,826 13,564,189 10,640,778 12,743,122 Intergovernmental Revenues 1,013,206 1,002,594 1,149,614 984,329 1,168,809 Interest 738,134 1,330,102 861,504 100,000 125,000 Rents and Other 3,618,374 5,047,012 1,160,226 2,793,181 2,236,970 Other Sources (Uses) 5,476,738 5,974,830 5,874,651 4,998,408 5,336,175 Operating Transfers In 17,959,697 24,614,114 34,476,062 31,171,793 28,695,033 TOTAL REVENUES 401,414,649 434,212,608 455,725,776 441,985,321 476,230,863
19

CITY OF EL PASO Introduction
FY 2022 BUDGET
Document Guide The intended use of this document is four-fold, as recommended by the Government Finance Officers Association (GFOA): a Policy Document, Financial Plan, Operations Guide, and Communications Device.
City Council adopted the FY 2022 budget on August 24, 2021 as part of the vision for El Paso’s future while considering the availability of resources and continuation of services. The eight sections of the book were developed with respect to City Council’s key areas of focus as defined by their Strategic Policy statements, which are:
Economic Development Public Safety Visual Image Quality of Life
Communication Sound Governance Infrastructure Healthy, Sustainable Community
Segments of the Budget Book:
Introduction: This section provides an overview of the entity’s structure:
Document Guide Vision and Mission
Statement Strategic Plan
City Organizational Chart Boards and Committees
Community Profile: This section gives an understanding of the City’s past, present, and future:
Living in El Paso Location and History Economic Initiatives Tourism Fort Bliss Medical Transportation
Demographics Cost of Living and Wage Rates Major Employers General Tax Information
Fiscal Overview: This section presents policy and process along with financial and personnel comparisons across fiscal years:
Budget Policies Financial Policies Budget Process Five-Year Adopted General
Fund Comparison
Two-Year Adopted General FundBudget to Actual Comparison
FTE (Full-Time Equivalent)Position Summaries
Property Tax Debt Administration
20

CITY OF EL PASO Introduction
FY 2022 BUDGET
Financial Summaries: This section addresses projected revenue and expenditures, previous, and current:
Revenues Reveues by Source Expenditures
Financial Statements Consolidated Summaries Fund Summaries
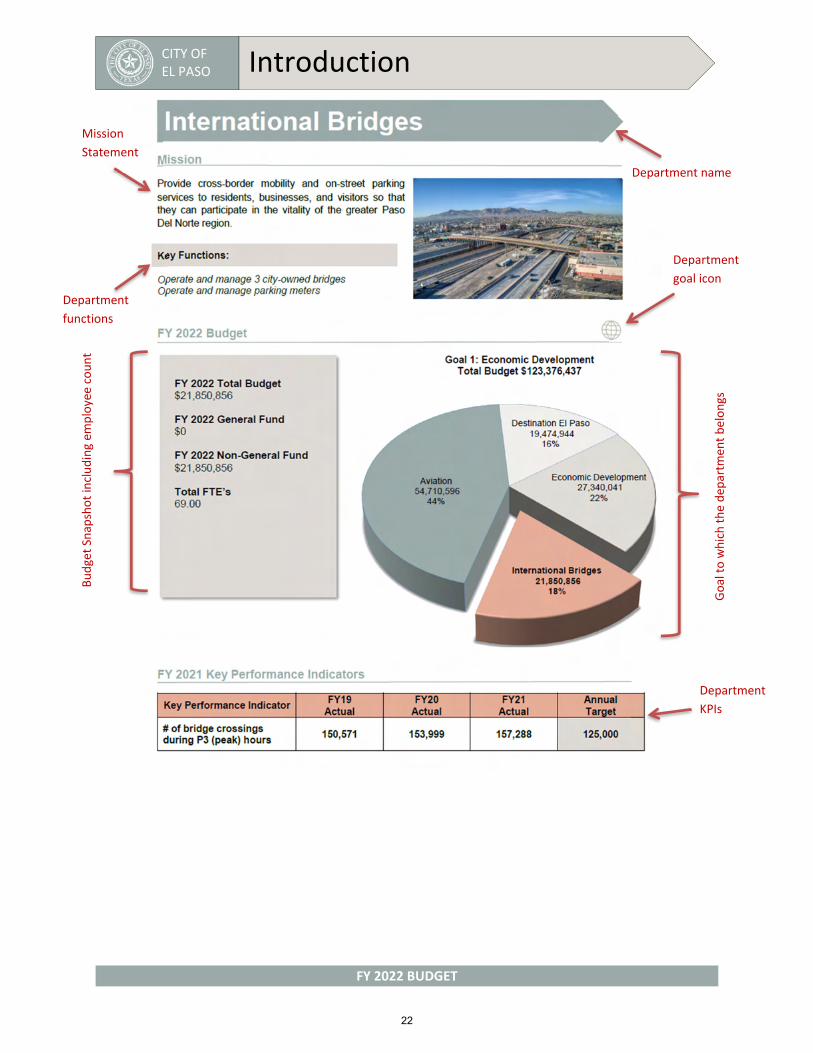
Budget Detail: This section provides department-specific information covering budget, staffing, fund sources, divisions, and performance data. The example below shows how a department’s mission, budget summary, fund sources, and staffing are displayed on one page.
GOAL 1 - Economic Development Create an environment conducive to strong sustainable economic development
GOAL 2 - Public Safety Set the standard for a safe and secure city
GOAL 3 - Visual Image Promote the visual image of El Paso
GOAL 4 - Quality of Life Enhance El Paso’s quality of life through recreational, cultural and educational environments
GOAL 5 - Communication Promote transparent and consistent communication amongst all members of the community
GOAL 6 - Sound Governance Set the standard for sound governance and fiscal management
GOAL 7 - Infrastructure Enhance and sustain El Paso’s infrastructure network
GOAL 8 - Healthy Community Nurture and promote a healthy, sustainable community
21
CITY OF EL PASO Introduction
FY 2022 BUDGET
Mission
Statement
Goal to which the dep
artm
ent belongs
Budget Snapshot including em
ployee count
Department name
Department
KPIs
Department
functions
Department
goal icon
22
CITY OF EL PASO Introduction
FY 2022 BUDGET
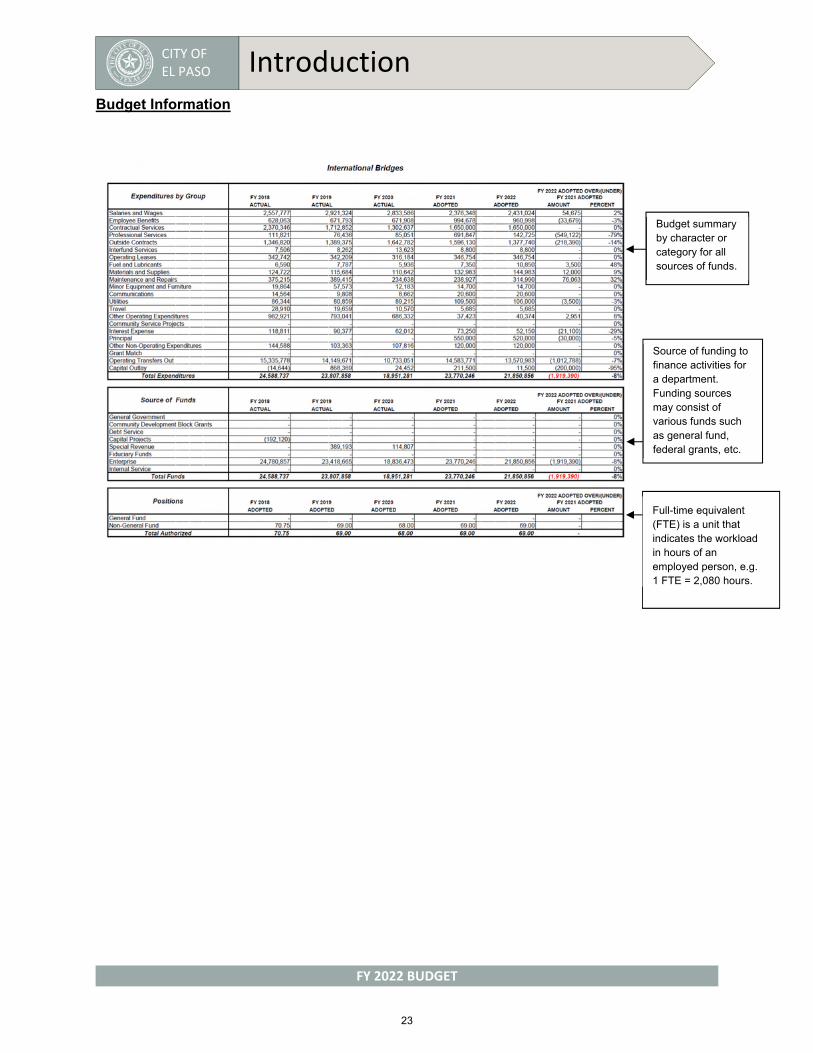
Budget Information
Budget summary by character or category for all sources of funds.
Source of funding to finance activities for a department. Funding sources may consist of various funds such as general fund, federal grants, etc.
Full-time equivalent (FTE) is a unit that indicates the workload in hours of an employed person, e.g. 1 FTE = 2,080 hours.
23

CITY OF EL PASO Introduction
FY 2022 BUDGET
Strategic Plan
On December 16, 2014, City Council approved and adopted the 2015 Strategic Plan. The plan is aligned with the City of El Paso’s Mission, Vision, and Values. Each department is assigned to one of the eight goals and staff is provided with a clear direction of strategies, actions, and required tasks to achieve the City’s goals. Key Performance Indicators are a gauge utilized to measure the current performance against historical data and targeted achievements. On February 16, 2017, the Mayor and City Council gathered for a strategic planning session where they reviewed the accomplishments for the 2015 Strategic Plan and approved the addition of the “20 in 2020” visionary incentives and adjustments to specific strategies implemented on November 20, 2014. City Council reviews the Strategic Plan and makes necessary updates annually.
As a key element of the City’s Strategic Planning Process, the Mayor, City Council and Senior Leaders convened a session on May 16, 2019. City leaders reviewed work accomplished and traction made in the eight adopted strategic goals activated in 2015 and the “20 in 2020” visionary initiatives geared toward vision attainment.
During this Strategic Planning Session, Mayor and Council adopted a refreshed Mission and Vision and approved the new “25 by 2025” visionary initiatives setting the tone and direction of the City’s service delivery.
Strategic Vision Blocks and Goals
Safe + Beautiful Neighborhoods
Safe and Secure City
Infrastructure Network
Healthy, Sustainable Community
Vibrant Regional Economy Strong Sustainable Economic Development
Promote the Visual Image
Recreational, Cultural + Educational Opportunities
Enhance Quality of Life
High Performing Government
Transparent and Consistent Communication
Sound Governance and Fiscal Management
24
CITY OF EL PASO Introduction
FY 2022 BUDGET
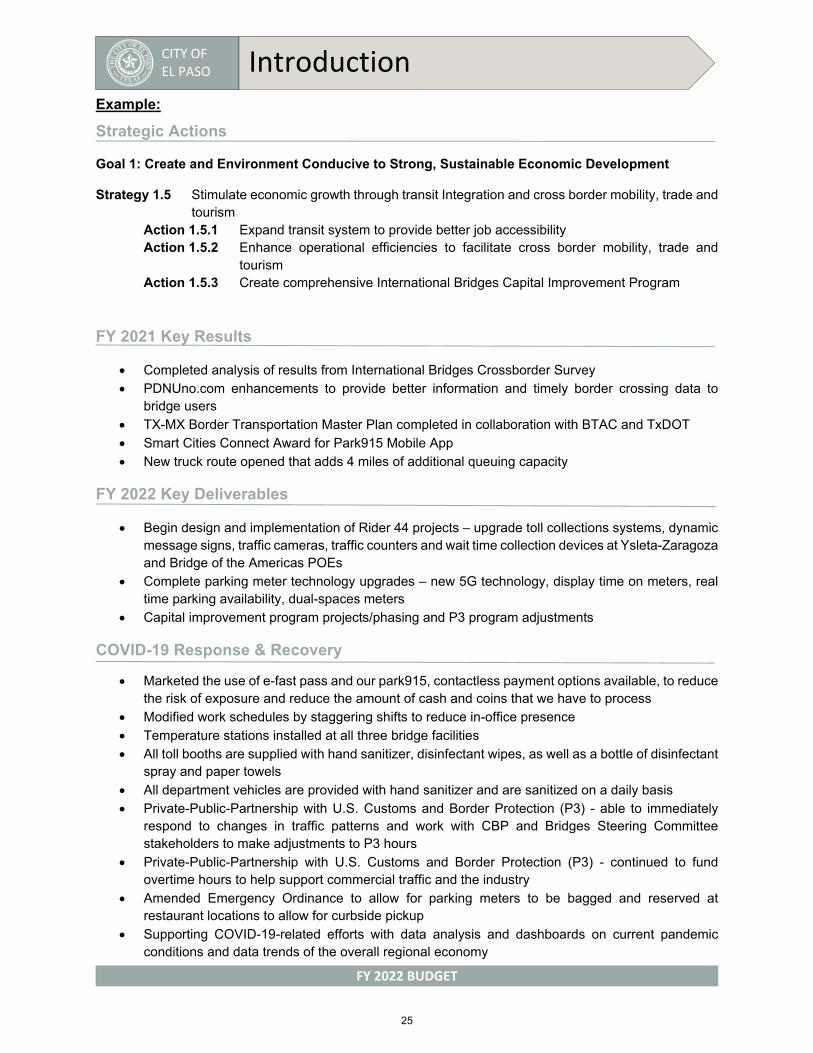
Example:
Strategic Actions
Goal 1: Create and Environment Conducive to Strong, Sustainable Economic Development
Strategy 1.5 Stimulate economic growth through transit Integration and cross border mobility, trade and tourism
Action 1.5.1 Expand transit system to provide better job accessibility Action 1.5.2 Enhance operational efficiencies to facilitate cross border mobility, trade and
tourism Action 1.5.3 Create comprehensive International Bridges Capital Improvement Program
FY 2021 Key Results
Completed analysis of results from International Bridges Crossborder Survey PDNUno.com enhancements to provide better information and timely border crossing data to
bridge users TX-MX Border Transportation Master Plan completed in collaboration with BTAC and TxDOT Smart Cities Connect Award for Park915 Mobile App New truck route opened that adds 4 miles of additional queuing capacity
FY 2022 Key Deliverables
Begin design and implementation of Rider 44 projects – upgrade toll collections systems, dynamicmessage signs, traffic cameras, traffic counters and wait time collection devices at Ysleta-Zaragozaand Bridge of the Americas POEs
Complete parking meter technology upgrades – new 5G technology, display time on meters, realtime parking availability, dual-spaces meters
Capital improvement program projects/phasing and P3 program adjustments
COVID-19 Response & Recovery
Marketed the use of e-fast pass and our park915, contactless payment options available, to reducethe risk of exposure and reduce the amount of cash and coins that we have to process
Modified work schedules by staggering shifts to reduce in-office presence Temperature stations installed at all three bridge facilities All toll booths are supplied with hand sanitizer, disinfectant wipes, as well as a bottle of disinfectant
spray and paper towels All department vehicles are provided with hand sanitizer and are sanitized on a daily basis Private-Public-Partnership with U.S. Customs and Border Protection (P3) - able to immediately
respond to changes in traffic patterns and work with CBP and Bridges Steering Committeestakeholders to make adjustments to P3 hours
Private-Public-Partnership with U.S. Customs and Border Protection (P3) - continued to fundovertime hours to help support commercial traffic and the industry
Amended Emergency Ordinance to allow for parking meters to be bagged and reserved atrestaurant locations to allow for curbside pickup
Supporting COVID-19-related efforts with data analysis and dashboards on current pandemicconditions and data trends of the overall regional economy
25
CITY OF EL PASO Introduction
FY 2022 BUDGET
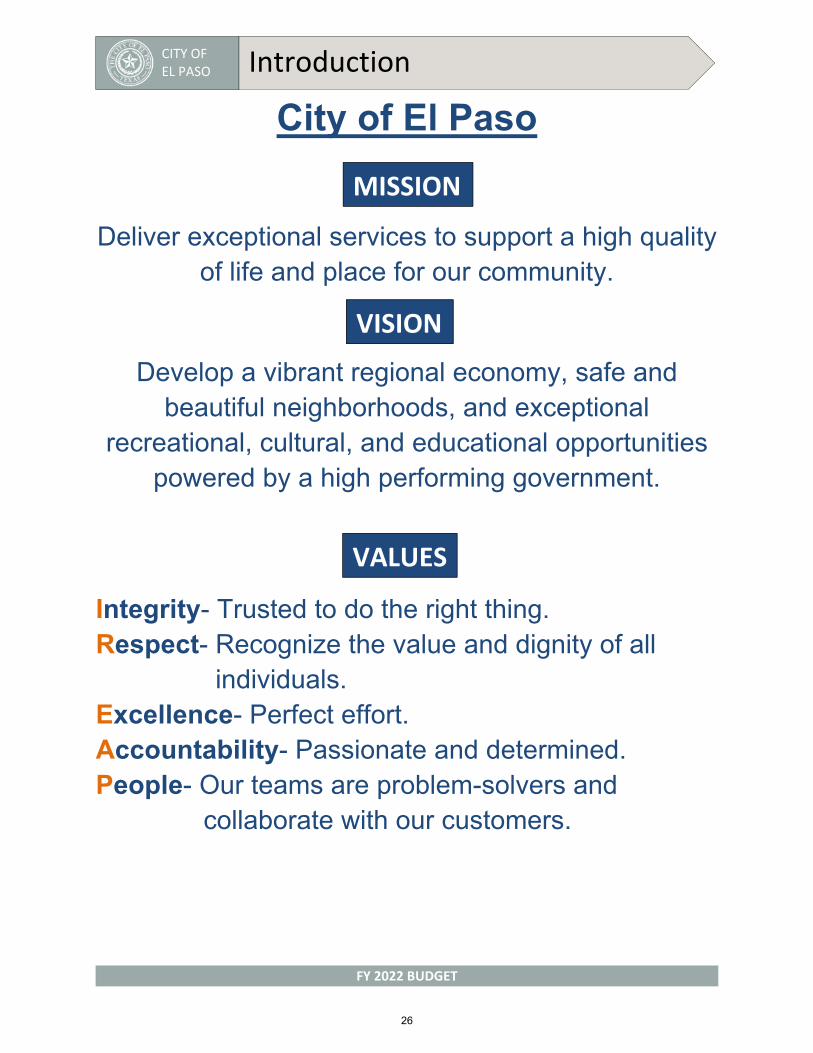
City of El Paso
Deliver exceptional services to support a high quality of life and place for our community.
Develop a vibrant regional economy, safe and beautiful neighborhoods, and exceptional
recreational, cultural, and educational opportunities powered by a high performing government.
Integrity- Trusted to do the right thing. Respect- Recognize the value and dignity of all
individuals. Excellence- Perfect effort. Accountability- Passionate and determined. People- Our teams are problem-solvers and
collaborate with our customers.
VALUES
VISION
MISSION
26

CITY OF EL PASO Introduction
FY 2022 BUDGET
Strategic Plan 2021 Strategic Goals and Strategies
1) Create an Environment Conducive to Strong, Sustainable Economic Development1.1 Stabilize and expand El Paso’s tax base 1.2 Enhance visitor revenue opportunities 1.3 Maximize venue efficiencies through revenue growth and control 1.4 Grow the core business of air transportation 1.5 Stimulate economic growth through transit integration 1.6 Provide business friendly permitting and inspection processes 1.7 Identify and develop plans for areas of reinvestment and local partnership
2) Set the Standard for a Safe and Secure City2.1 Maintain standing as one of the Nation’s top safest cities 2.2 Strengthen community involvement in resident safety 2.3 Increase public safety operational efficiency 2.4 Improve motorist safety and traffic management solutions 2.5 Take proactive approaches to prevent fire/medical incidents and lower regional risk 2.6 Enforce Municipal Court orders 2.7 Maximize Municipal Court efficiency and enhance customer experience 2.8 Implement effective code enforcement strategies to reduce nuisances, enhance visual appearance and improve overall health and safety 2.9 Promote building safety
3) Promote the Visual Image of El Paso3.1 Improve the visual impression of the community (gateways, corridors, intersections, and parkland) 3.2 Set one standard for infrastructure across the city 3.3 Establish a brand that celebrates and promotes El Paso’s unique identity and offerings
4) Enhance El Paso’s Quality of Life through Recreational, Cultural and EducationalEnvironments
4.1 Deliver bond projects impacting quality of life across the city in a timely, efficient manner 4.2 Create innovative recreational, educational and cultural programs 4.3 Establish technical criteria for improved Quality of Life facilities
5) Promote Transparent and Consistent Communication Amongst All Members of theCommunity
5.1 Set a climate of respect, collaboration, and team spirit among Council, city staff, and the community 5.2 Leverage and expand the use of current and new technology to reduce inefficiencies and improve communications 5.3 Promote a well-balanced customer service philosophy throughout the organization 5.4 Enhance internal communication and employee engagement
27

CITY OF EL PASO Introduction
FY 2022 BUDGET
5.5 Strengthen messaging opportunities through media outlets and proactive community outreach
6) Set the Standard for Sound Governance and Fiscal Management6.1 Recruit and retain a skilled and diverse workforce 6.2 Implement employee benefits and services that promote financial security 6.3 Implement programs to reduce organizational risks 6.4 Implement leading-edge practices for achieving quality and performance excellence 6.5 Deliver services timely and effectively with focus on continual improvement 6.6 Ensure continued financial stability and accountability through sound financial management, budgeting, and reporting 6.7 Deliver effective and efficient processes to maximize value in obtaining goods and services 6.8 Support transparent and inclusive government 6.9 Maximize Municipal Court efficiency and enhance customer service through technology 6.10 Enhance the quality of decision making with legal representation and support 6.11 Provide efficient and effective services to taxpayers 6.12 Maintain systems integrity, compliance and business continuity
7) Enhance and Sustain El Paso’s Infrastructure Network7.1 Provide reliable and sustainable water supply and distribution systems 7.2 Improve competitiveness through infrastructure improvements impacting the quality of life 7.3 Enhance a regional comprehensive transportation system 7.4 Continue the strategic investment in city facilities and technology 7.5 Set one standard for infrastructure across the city
8) Nurture and Promote a Healthy, Sustainable Community8.1 Deliver prevention, intervention and mobilization services to promote a healthy, productive and safe community 8.2 Stabilize neighborhoods through community, housing and ADA improvements 8.3 Enhance animal services to ensure El Paso’s pets are provided a safe and healthy environment 8.4 Reduce operational energy consumption 8.5 Improve air quality throughout El Paso 8.6 Provide long-term, cost effective, sustainable regional solid waste solutions 8.7 Ensure community compliance with environmental regulatory requirements 8.8 Improve community resilience through education, outreach, and the develop the resilience strategy 8.9 Enhance vector control and environmental education to provide a safe and healthy environment
28
CITY OF EL PASO Introduction
FY 2022 BUDGET
29

CITY OF EL PASO Introduction
FY 2022 BUDGET
Boards and Committees
Animal Shelter Advisory Committee Bond Overview Advisory Committee Bicycle Advisory Committee Capital Improvements Advisory Committee Central Appraisal District Board of Directors Citizens' Advisory Committee for the Board of the Mass Transit Department City Accessibility Advisory Committee City of El Paso Employees' Retirement Trust Board of Trustees City Review Committee Committee on Border Relations Community Development Steering Committee El Paso Bond Overview Advisory Committee (BOAC) El Paso County 911 District Board of Managers El Paso Housing Finance Corporation Fair Housing Task Force Financial Oversight and Audit Committee (FOAC) Fire and Police Pension Fund Board of Trustees Foster Grandparent Program Advisory Council Greater El Paso Civic, Convention and Tourism Advisory Board Housing Authority Board of Commissioners Joint Housing Task Force Mass Transit Department Board
Museums & Cultural Affairs Advisory Board Open Space Advisory Board Parks and Recreation Advisory Board Public Art Committee Public Service Board Public Service Board Selection Committee Regional Renewable Energy Advisory Council Retired and Senior Volunteer Program Advisory Council Tax Advisory Committee Tax Increment Reinvestment Zone #5 (TIRZ) Tax Increment Reinvestment Zone #6 (TIRZ) Tax Increment Reinvestment Zone #7 (TIRZ) Tax Increment Reinvestment Zone #8 (TIRZ) Tax Increment Reinvestment Zone #9 (TIRZ) Tax Increment Reinvestment Zone #10 (TIRZ) Tax Increment Reinvestment Zone #11 (TIRZ) Tax Increment Reinvestment Zone #13 (TIRZ) Transportation Policy Board for the El Paso Urban Transportation Study Uptown Parking Benefit District Advisory Committee Veterans Affairs Advisory Committee Youth Advisory Board Zoning Board of Adjustment (ZBA)
Commissions Building & Standards Commission
City Plan Commission (CPC) Civil Service Commission Districting Commission
Ethics Review Commission Historic Landmark Commission
30

CITY OF EL PASO BUDGET BOOK 2022
GROWTH
COMMUNITY PROFILE
COMMUNITY
PROFILE
CITY OF EL PASO Community Profile
FY 2022 BUDGET
Source: Business Report SR18-1: Borderplex Economic Outlook to 2021 "Highlights from the Borderplex Economic Outlook to 2021" by Thomas M. Fullerton Jr. and Steven L. Fullerton (utep.edu)
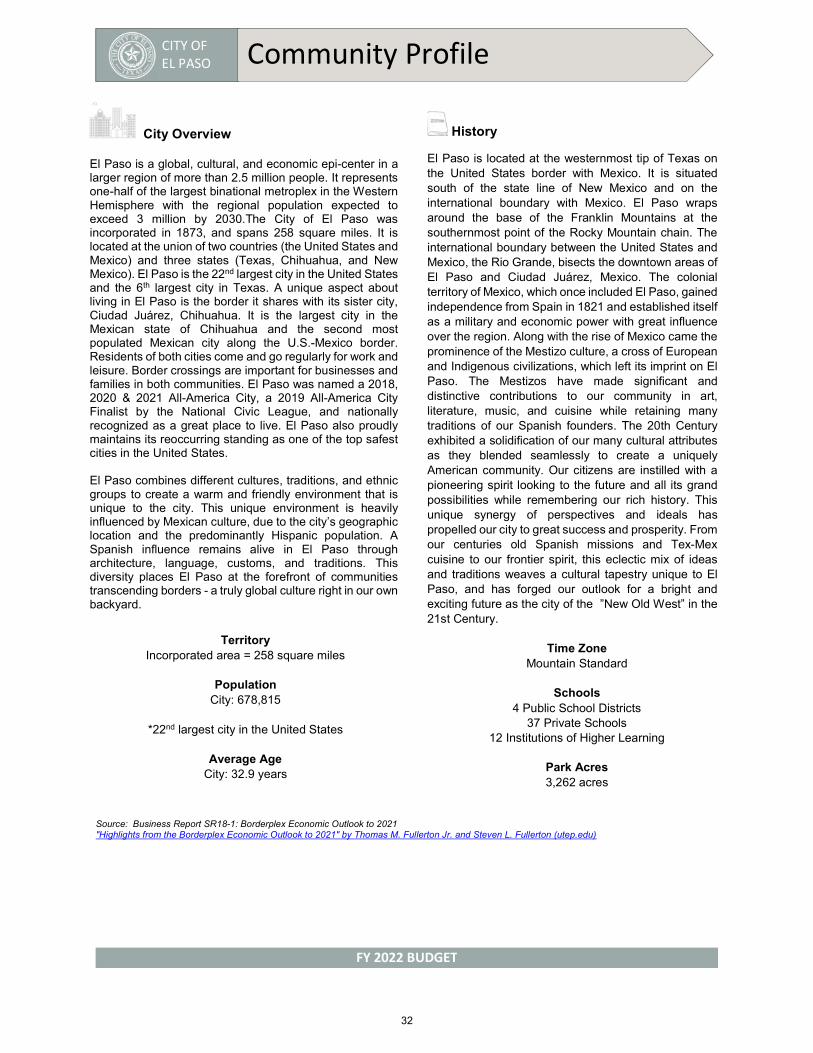
City Overview
El Paso is a global, cultural, and economic epi-center in a larger region of more than 2.5 million people. It represents one-half of the largest binational metroplex in the Western Hemisphere with the regional population expected to exceed 3 million by 2030.The City of El Paso was incorporated in 1873, and spans 258 square miles. It is located at the union of two countries (the United States and Mexico) and three states (Texas, Chihuahua, and New Mexico). El Paso is the 22nd largest city in the United States and the 6th largest city in Texas. A unique aspect about living in El Paso is the border it shares with its sister city, Ciudad Juárez, Chihuahua. It is the largest city in the Mexican state of Chihuahua and the second most populated Mexican city along the U.S.-Mexico border. Residents of both cities come and go regularly for work and leisure. Border crossings are important for businesses and families in both communities. El Paso was named a 2018, 2020 & 2021 All-America City, a 2019 All-America City Finalist by the National Civic League, and nationally recognized as a great place to live. El Paso also proudly maintains its reoccurring standing as one of the top safest cities in the United States.
El Paso combines different cultures, traditions, and ethnic groups to create a warm and friendly environment that is unique to the city. This unique environment is heavily influenced by Mexican culture, due to the city’s geographic location and the predominantly Hispanic population. A Spanish influence remains alive in El Paso through architecture, language, customs, and traditions. This diversity places El Paso at the forefront of communities transcending borders - a truly global culture right in our own backyard.
History
El Paso is located at the westernmost tip of Texas on the United States border with Mexico. It is situated south of the state line of New Mexico and on the international boundary with Mexico. El Paso wraps around the base of the Franklin Mountains at the southernmost point of the Rocky Mountain chain. The international boundary between the United States and Mexico, the Rio Grande, bisects the downtown areas of El Paso and Ciudad Juárez, Mexico. The colonial territory of Mexico, which once included El Paso, gained independence from Spain in 1821 and established itself as a military and economic power with great influence over the region. Along with the rise of Mexico came the prominence of the Mestizo culture, a cross of European and Indigenous civilizations, which left its imprint on El Paso. The Mestizos have made significant and distinctive contributions to our community in art, literature, music, and cuisine while retaining many traditions of our Spanish founders. The 20th Century exhibited a solidification of our many cultural attributes as they blended seamlessly to create a uniquely American community. Our citizens are instilled with a pioneering spirit looking to the future and all its grand possibilities while remembering our rich history. This unique synergy of perspectives and ideals has propelled our city to great success and prosperity. From our centuries old Spanish missions and Tex-Mex cuisine to our frontier spirit, this eclectic mix of ideas and traditions weaves a cultural tapestry unique to El Paso, and has forged our outlook for a bright and exciting future as the city of the ”New Old West” in the 21st Century.
Territory Incorporated area = 258 square miles
Population City: 678,815
*22nd largest city in the United States
Average Age City: 32.9 years
Time Zone Mountain Standard
Schools 4 Public School Districts
37 Private Schools 12 Institutions of Higher Learning
Park Acres 3,262 acres
32
CITY OF EL PASO Community Profile
FY 2022 BUDGET
Fort Bliss
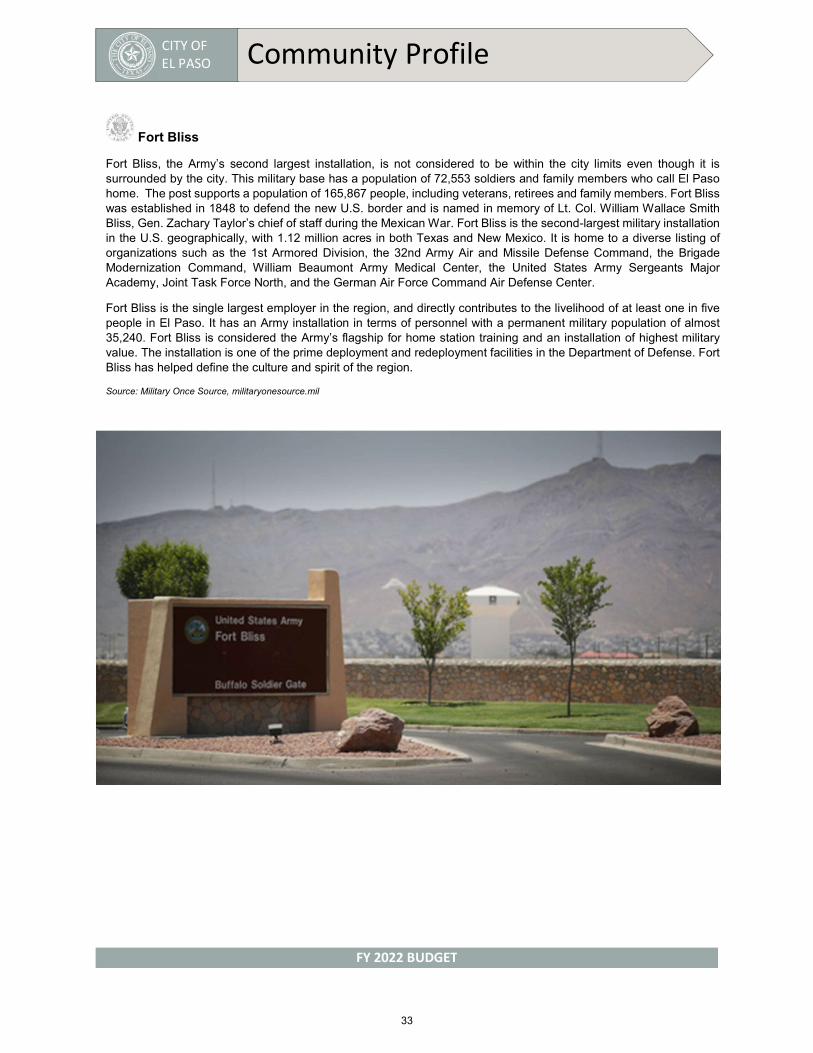
Fort Bliss, the Army’s second largest installation, is not considered to be within the city limits even though it is surrounded by the city. This military base has a population of 72,553 soldiers and family members who call El Paso home. The post supports a population of 165,867 people, including veterans, retirees and family members. Fort Bliss was established in 1848 to defend the new U.S. border and is named in memory of Lt. Col. William Wallace Smith Bliss, Gen. Zachary Taylor’s chief of staff during the Mexican War. Fort Bliss is the second-largest military installation in the U.S. geographically, with 1.12 million acres in both Texas and New Mexico. It is home to a diverse listing of organizations such as the 1st Armored Division, the 32nd Army Air and Missile Defense Command, the Brigade Modernization Command, William Beaumont Army Medical Center, the United States Army Sergeants Major Academy, Joint Task Force North, and the German Air Force Command Air Defense Center.
Fort Bliss is the single largest employer in the region, and directly contributes to the livelihood of at least one in five people in El Paso. It has an Army installation in terms of personnel with a permanent military population of almost 35,240. Fort Bliss is considered the Army’s flagship for home station training and an installation of highest military value. The installation is one of the prime deployment and redeployment facilities in the Department of Defense. Fort Bliss has helped define the culture and spirit of the region.
Source: Military Once Source, militaryonesource.mil
33

CITY OF EL PASO Community Profile
FY 2022 BUDGET
El Paso City & County Population Figures FY2017 FY2018 FY2019 FY2020
City Population
683.577 682,669 685,575 678,815
County Population
840,410 840,758 840,971 865,657
Source U.S. Census Bureau QuickFacts: El Paso County, Texas; El Paso city, Texas
Demographics
The El Paso Metropolitan Statistical Area (MSA) shares the border region with Ciudad Juarez, Mexico, the largest city in the state of Chihuahua and the fifth largest in Mexico. Combined, the bi-national metropolitan region of El Paso and Ciudad Juarez would exceed three million residents.
It is anticipated that the region will experience significant population growth in the coming years, largely driven by the expansion of Fort Bliss as well as improved job market conditions.
Highway Miles to Major Cities
International Border Crossings
The City of El Paso International Bridges Department manages three of the region's international ports of entry: the Paso Del Norte, Stanton, and Zaragoza bridges. The border crossings connect El Paso, Texas and Ciudad Juarez, Chihuahua - the world's largest international border metroplex. The U.S. side of these ports of entry are owned and operated by the City of El Paso. The City’s partnership with Customs and Border Protection keep northbound lanes open during peak hours to improve cross-border mobility. The International Bridges Department will continue the collaboration between various U.S. and Mexican governmental agencies, private entities to implement and support the continuous improvement of services provided to the users of our international ports of entry, facilitating trade, tourism and economic growth for the Paso Del Norte Region. To support COVID-19-related efforts, the department provides dataanalysis and dashboards on current pandemicconditions and data trends of the overall regionaleconomy.
Hispanic 81%
White 13%
Black 4%
Asian 1%
Other 1%
City of El Paso Population by Race and Ethnicity
34
CITY OF EL PASO Community Profile
FY 2022 BUDGET
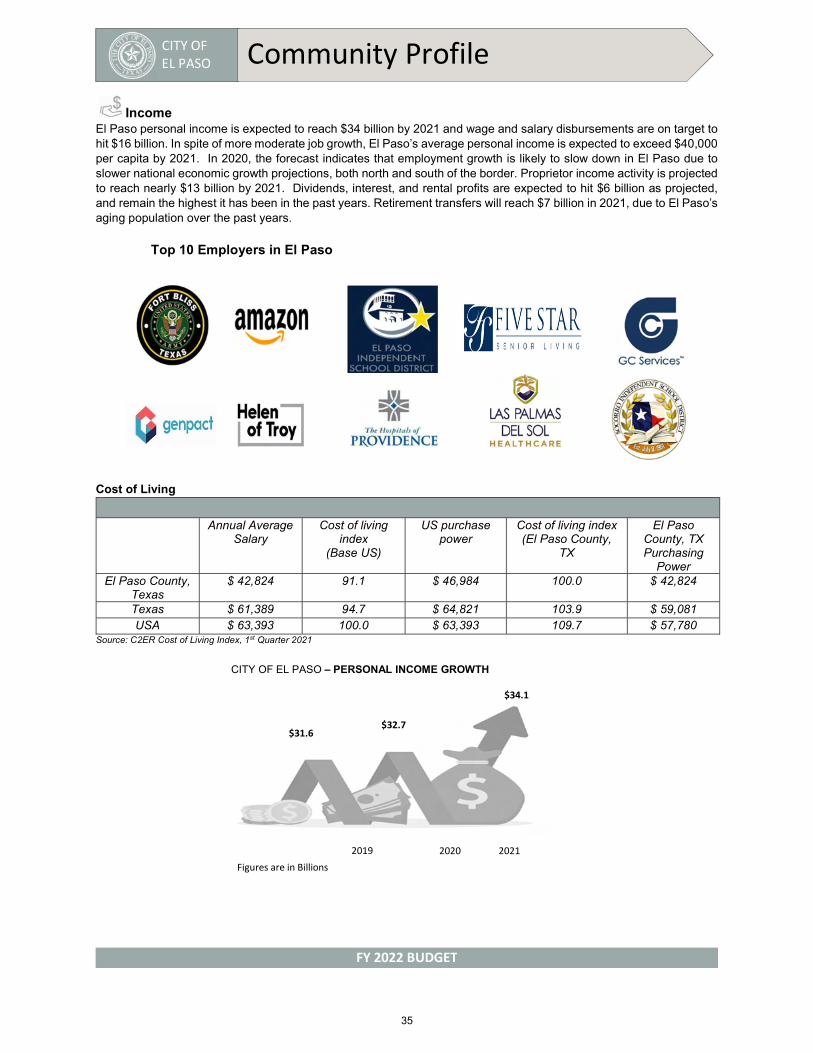
Income El Paso personal income is expected to reach $34 billion by 2021 and wage and salary disbursements are on target to hit $16 billion. In spite of more moderate job growth, El Paso’s average personal income is expected to exceed $40,000 per capita by 2021. In 2020, the forecast indicates that employment growth is likely to slow down in El Paso due to slower national economic growth projections, both north and south of the border. Proprietor income activity is projected to reach nearly $13 billion by 2021. Dividends, interest, and rental profits are expected to hit $6 billion as projected, and remain the highest it has been in the past years. Retirement transfers will reach $7 billion in 2021, due to El Paso’s aging population over the past years.
Top 10 Employers in El Paso
Cost of Living
Source: C2ER Cost of Living Index, 1st Quarter 2021
Annual Average Salary
Cost of living index
(Base US)
US purchase power
Cost of living index (El Paso County,
TX
El Paso County, TX Purchasing
Power El Paso County,
Texas $ 42,824 91.1 $ 46,984 100.0 $ 42,824
Texas $ 61,389 94.7 $ 64,821 103.9 $ 59,081 USA $ 63,393 100.0 $ 63,393 109.7 $ 57,780
2019 2020 2021
$31.6 $32.7
$34.1
Figures are in Billions
CITY OF EL PASO – PERSONAL INCOME GROWTH
35

CITY OF EL PASO Community Profile
FY 2022 BUDGET
Economic Initiatives
El Paso is the largest metro area along the Texas-Mexico border which boasts a best-in-class, business friendly, operating environment while also offering a great living experience. Our region represents one of the largest manufacturing centers in North America and is recognized as globally competitive. This is largely due to El Paso's unique quality of possessing the largest bilingual and bi-cultural workforce in the Western Hemisphere.
El Paso continues to work toward the strategic policies established by the Mayor and City Council. The strategic policies set the direction for the City and have led to the following economic initiatives through public/private partnerships. In FY2022, the City will continue expanding downtown revitalization efforts, implementing incentive policies to attract and retain investment opportunities, as well as the enhancement of small business recovery plan.
Quality of Life Bond
In November 2012, voters in El Paso approved all three propositions included in the 2012 Quality of Life Bond, making it the largest bond passed in the City’s history at $473,250,000. The propositions – which included improvements for parks and recreation facilities, open space and trails, libraries, museums, the zoo, neighborhoods, and culture and performing arts facilities – passed with one of the largest voting margins for similar bonds across the nation. Additionally, the bond also included plans for the construction of four Neighborhood Water Parks, a children’s museum, and several recreation centers.
A multitude of projects have been completed with proceeds from the bond, such as upgrades and enhancements to parks and parks facilities throughout the city, the purchase of two bookmobiles, enhancements to pedestrian pathways downtown, the Northeast Regional Skate Park, the Eastside Regional Park, the Westside Natatorium, and the Wildlife Theater. So far, 156 projects have been completed. In 2021, we completed 35 projects and only one is deferred. This past summer we opened four water parks, Camp Cohen, Lost Kingdom, Oasis and Chapoteo; as well as four recreational centers, The Beast Urban Park, Chamizal, Sylvia Carreon, and Valle Bajo. In 2022, there’s 50 anticipated projects.
36

CITY OF EL PASO Community Profile
FY 2022 BUDGET
Public Safety Bond On November 5, 2019, voters in El Paso Texas approved a $ 413,122,650 million in public safety bonds. The issuance of these bonds are for the construction of new facilities along with renovations, as well as for vehicle and equipment replacement. Police Department will invest $221.9M in the construction of two regional command center, a new training academy, the renovation of headquarters, four regional commands centers, and fleet replacement. Fire Department will invest $191.2M in the construction of three fire stations, public safety training facilities, and logistics, as well as the renovations of thirty-four fire stations and vehicle replacement.
Beautification and Revitalization The Paseo de las Luces project revitalized South El Paso Street, which connects San Jacinto Plaza to the International Bridge. The estimated cost for the project is $7.9 million, which includes placing string lights along the street, pedestrian walkways restoration, tree replacements, as well as an archway. This project was completed on November 7th of 2018. As part of the Public Art Master Plan adopted on October 28, 2014 the following projects have been completed, Chamizal Recreational Center Mural, Clardy Fox Library Renovations, Far East Transfer Center Art Piece. Country Club Roundabout Art Piece, Alabama Street Mural Replacement are schedule to be completed by the end of 2021. The goal for this coming 2022, are the following projects, Children’s Museum Umbrella Canopy, August 3rd Memorial, Fire Station 36 Art, and The Pavo Real Recreational Center Improvements.
37
CITY OF EL PASO Community Profile
FY 2022 BUDGET
Education
El Paso has four school districts, El Paso Independent School District, Ysleta Independent School District, Socorro Independent School District, and Canutillo Independent School District. The four districts have a combined of 108 Elementary Schools, 35 Middle Schools, and 34 High Schools; additionally, El Paso has eight charter schools throughout the city and 37 private schools.
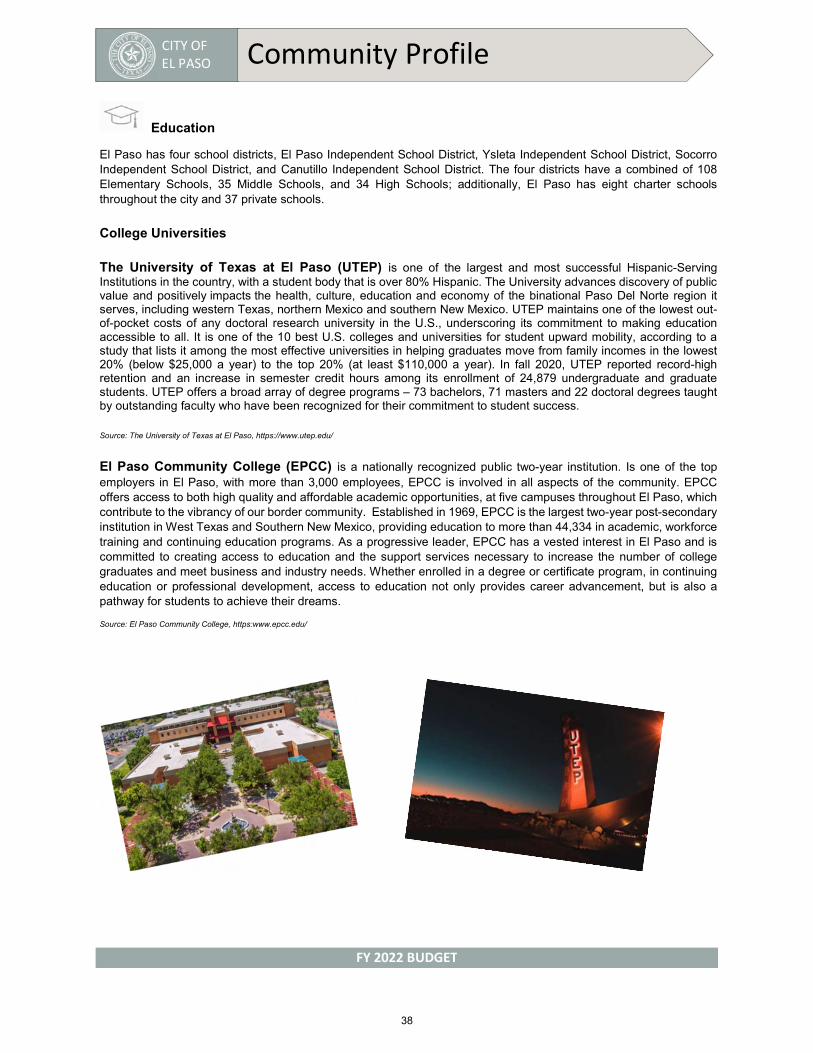
College Universities
The University of Texas at El Paso (UTEP) is one of the largest and most successful Hispanic-Serving Institutions in the country, with a student body that is over 80% Hispanic. The University advances discovery of public value and positively impacts the health, culture, education and economy of the binational Paso Del Norte region it serves, including western Texas, northern Mexico and southern New Mexico. UTEP maintains one of the lowest out-of-pocket costs of any doctoral research university in the U.S., underscoring its commitment to making education accessible to all. It is one of the 10 best U.S. colleges and universities for student upward mobility, according to a study that lists it among the most effective universities in helping graduates move from family incomes in the lowest 20% (below $25,000 a year) to the top 20% (at least $110,000 a year). In fall 2020, UTEP reported record-high retention and an increase in semester credit hours among its enrollment of 24,879 undergraduate and graduate students. UTEP offers a broad array of degree programs – 73 bachelors, 71 masters and 22 doctoral degrees taught by outstanding faculty who have been recognized for their commitment to student success.
Source: The University of Texas at El Paso, https://www.utep.edu/
El Paso Community College (EPCC) is a nationally recognized public two-year institution. Is one of the top employers in El Paso, with more than 3,000 employees, EPCC is involved in all aspects of the community. EPCC offers access to both high quality and affordable academic opportunities, at five campuses throughout El Paso, which contribute to the vibrancy of our border community. Established in 1969, EPCC is the largest two-year post-secondary institution in West Texas and Southern New Mexico, providing education to more than 44,334 in academic, workforce training and continuing education programs. As a progressive leader, EPCC has a vested interest in El Paso and is committed to creating access to education and the support services necessary to increase the number of college graduates and meet business and industry needs. Whether enrolled in a degree or certificate program, in continuing education or professional development, access to education not only provides career advancement, but is also a pathway for students to achieve their dreams.
Source: El Paso Community College, https:www.epcc.edu/
38

CITY OF EL PASO Community Profile
FY 2022 BUDGET
Medical Schools
The Paul L. Foster School of Medicine is the first four-year medical school on the U.S./Mexico border. This unique setting provides exposure not only to traditional medicine but also to international, bicultural and border health care issues. The medical school is the cornerstone of the proposed Medical Center of the Americas, the first planned medical facilities campus for health delivery, research, education and economic development in El Paso.
In 2011, the Texas Higher Education Coordinating Board approved the establishment of the Gayle Greve Hunt School of Nursing (GGHSON) which began on the El Paso campus with a $10 million dollar gift to the Texas Tech University System from the Hunt Family Foundation. The school was established to address a long-term shortage of nurses who provide care to this medically underserved area. The GGHSON also has a Second Degree BSN program.
In 2012, the TTUHSC Graduate School of Biomedical Sciences opened a branch in El Paso with an educational program structured around a core curriculum in biomedical sciences. The program offers a Master of Science degree in biomedical sciences with opportunities for elective courses and research experiences in a broad range of laboratories.
In 2017, TTUHSC announced the upcoming construction of an $83 million research lab and classroom building on the Texas Tech University Health Sciences Center El Paso campus. Construction of the five-story, 219,000-square-foot Medical Sciences Building II, began in May 2017. The 84th Texas Legislature approved funding for the MSB II in 2015 under House Bill 100, which appropriated $75 million for the building’s construction. TTUHSC El Paso will contribute an additional $8 million, bringing the total construction cost to $83 million.
In 2021, the Woody L Hunt School of Dental Medicine opened its doors to the first 40 students, it’s a great opportunity to students to become tomorrow’s leading health care providers. These opportunities will include providing oral health care to numerous populations, investigations in biomedical research, leadership, ethics, behavioral sciences and professionalism, along with community engagement. Their formula for success includes comprehensive interactive coursework, sustained evidence-based learning and clinical experiences, and preparation through scholarship and interprofessional teamwork while in school, so that students are prepared for their professional futures.
Source: Texas Tech University Health Sciences Center El Paso
Paul L Foster School of Medicine
Gayle Greve Hunt School of Nursing
Graduate School if Biomedical Sciences
Woody L Hunt School of Dentistry
39
CITY OF EL PASO Community Profile
FY 2022 BUDGET
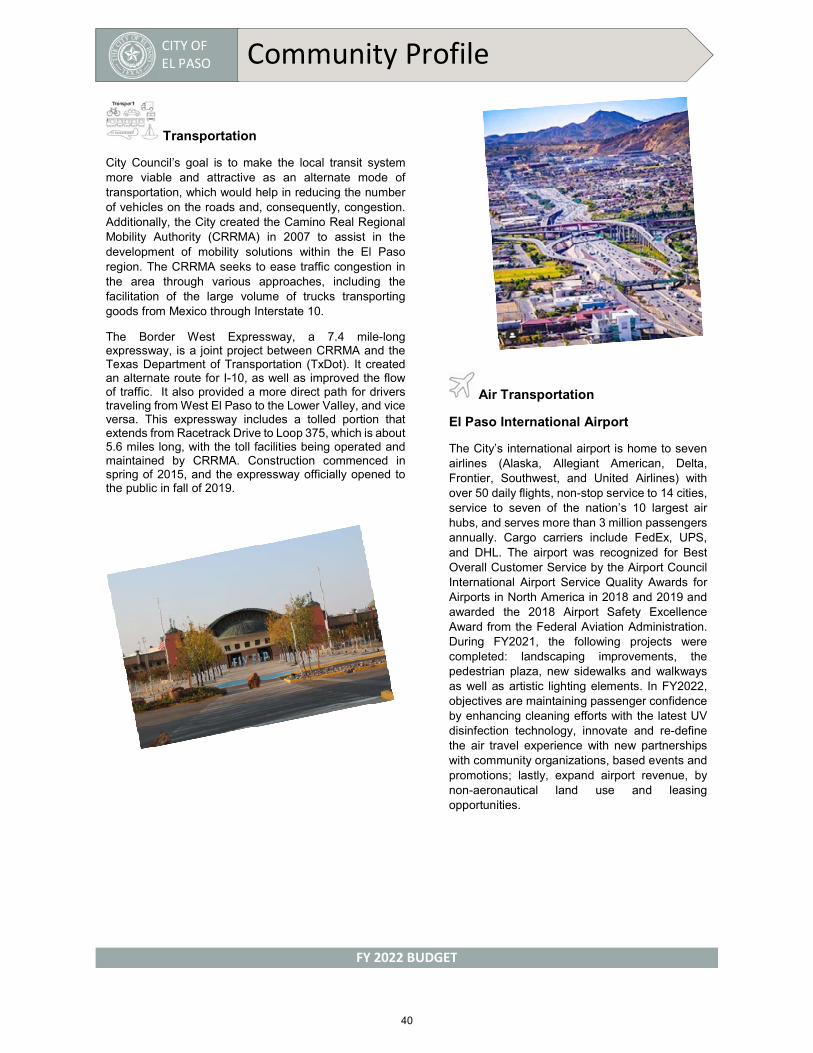
Transportation
City Council’s goal is to make the local transit system more viable and attractive as an alternate mode of transportation, which would help in reducing the number of vehicles on the roads and, consequently, congestion. Additionally, the City created the Camino Real Regional Mobility Authority (CRRMA) in 2007 to assist in the development of mobility solutions within the El Paso region. The CRRMA seeks to ease traffic congestion in the area through various approaches, including the facilitation of the large volume of trucks transporting goods from Mexico through Interstate 10.
The Border West Expressway, a 7.4 mile-long expressway, is a joint project between CRRMA and the Texas Department of Transportation (TxDot). It created an alternate route for I-10, as well as improved the flow of traffic. It also provided a more direct path for drivers traveling from West El Paso to the Lower Valley, and vice versa. This expressway includes a tolled portion that extends from Racetrack Drive to Loop 375, which is about 5.6 miles long, with the toll facilities being operated and maintained by CRRMA. Construction commenced in spring of 2015, and the expressway officially opened to the public in fall of 2019.
Air Transportation
El Paso International Airport
The City’s international airport is home to seven airlines (Alaska, Allegiant American, Delta, Frontier, Southwest, and United Airlines) with over 50 daily flights, non-stop service to 14 cities, service to seven of the nation’s 10 largest air hubs, and serves more than 3 million passengers annually. Cargo carriers include FedEx, UPS, and DHL. The airport was recognized for Best Overall Customer Service by the Airport Council International Airport Service Quality Awards for Airports in North America in 2018 and 2019 and awarded the 2018 Airport Safety Excellence Award from the Federal Aviation Administration. During FY2021, the following projects were completed: landscaping improvements, the pedestrian plaza, new sidewalks and walkways as well as artistic lighting elements. In FY2022, objectives are maintaining passenger confidence by enhancing cleaning efforts with the latest UV disinfection technology, innovate and re-define the air travel experience with new partnerships with community organizations, based events and promotions; lastly, expand airport revenue, by non-aeronautical land use and leasing opportunities.
40
CITY OF EL PASO Community Profile
FY 2022 BUDGET
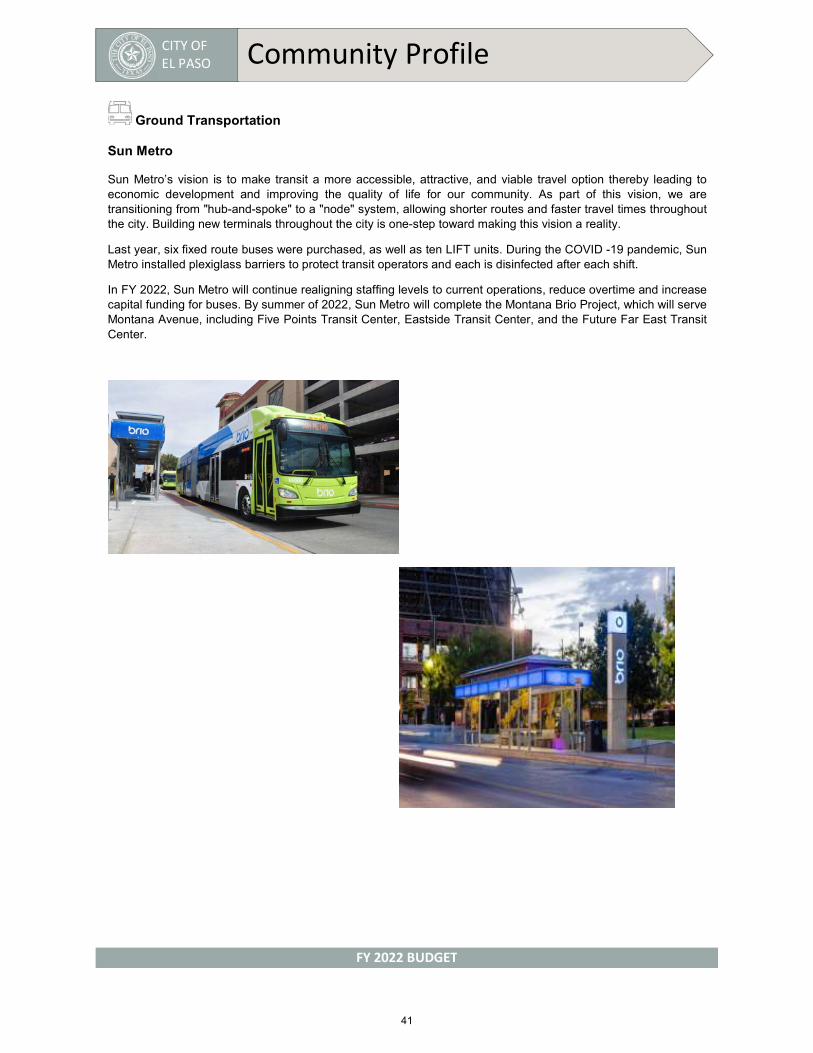
Ground Transportation
Sun Metro
Sun Metro’s vision is to make transit a more accessible, attractive, and viable travel option thereby leading to economic development and improving the quality of life for our community. As part of this vision, we are transitioning from "hub-and-spoke" to a "node" system, allowing shorter routes and faster travel times throughout the city. Building new terminals throughout the city is one-step toward making this vision a reality.
Last year, six fixed route buses were purchased, as well as ten LIFT units. During the COVID -19 pandemic, Sun Metro installed plexiglass barriers to protect transit operators and each is disinfected after each shift.
In FY 2022, Sun Metro will continue realigning staffing levels to current operations, reduce overtime and increase capital funding for buses. By summer of 2022, Sun Metro will complete the Montana Brio Project, which will serve Montana Avenue, including Five Points Transit Center, Eastside Transit Center, and the Future Far East Transit Center.
41
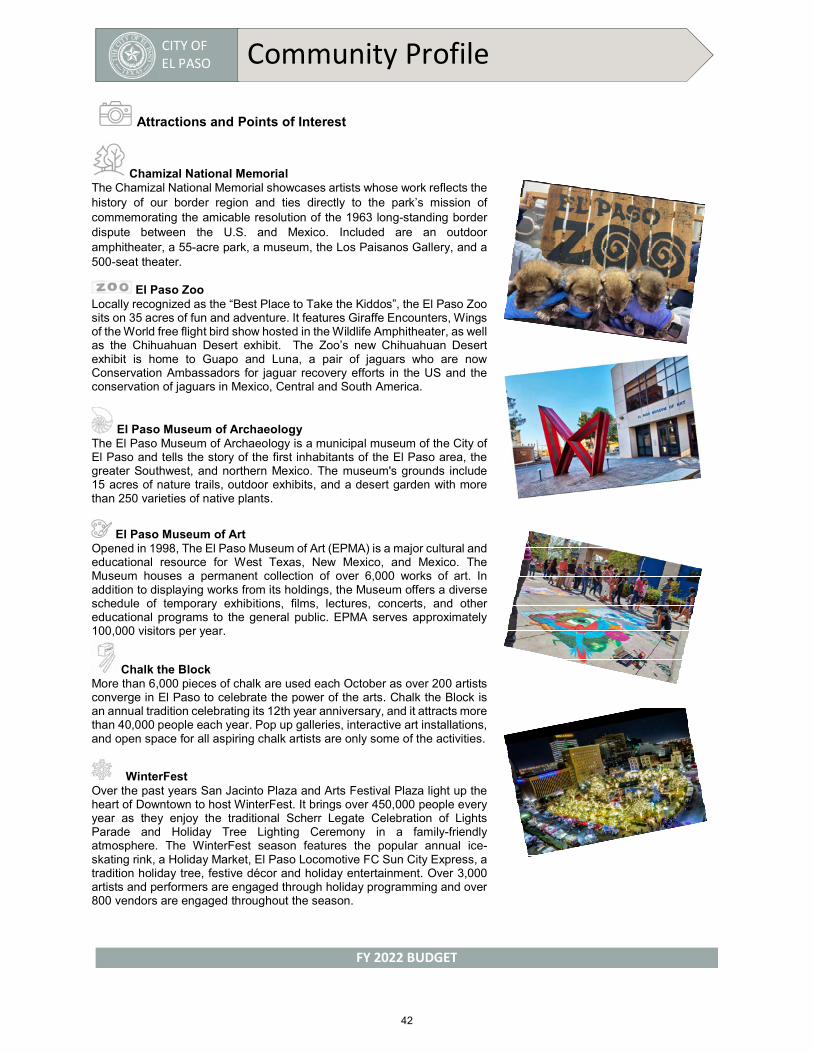
CITY OF EL PASO Community Profile
FY 2022 BUDGET
Attractions and Points of Interest
Chamizal National Memorial The Chamizal National Memorial showcases artists whose work reflects the history of our border region and ties directly to the park’s mission of commemorating the amicable resolution of the 1963 long-standing border dispute between the U.S. and Mexico. Included are an outdoor amphitheater, a 55-acre park, a museum, the Los Paisanos Gallery, and a 500-seat theater.
El Paso Zoo Locally recognized as the “Best Place to Take the Kiddos”, the El Paso Zoo sits on 35 acres of fun and adventure. It features Giraffe Encounters, Wings of the World free flight bird show hosted in the Wildlife Amphitheater, as well as the Chihuahuan Desert exhibit. The Zoo’s new Chihuahuan Desert exhibit is home to Guapo and Luna, a pair of jaguars who are now Conservation Ambassadors for jaguar recovery efforts in the US and the conservation of jaguars in Mexico, Central and South America.
El Paso Museum of Archaeology The El Paso Museum of Archaeology is a municipal museum of the City of El Paso and tells the story of the first inhabitants of the El Paso area, the greater Southwest, and northern Mexico. The museum's grounds include 15 acres of nature trails, outdoor exhibits, and a desert garden with more than 250 varieties of native plants.
El Paso Museum of Art Opened in 1998, The El Paso Museum of Art (EPMA) is a major cultural and educational resource for West Texas, New Mexico, and Mexico. The Museum houses a permanent collection of over 6,000 works of art. In addition to displaying works from its holdings, the Museum offers a diverse schedule of temporary exhibitions, films, lectures, concerts, and other educational programs to the general public. EPMA serves approximately 100,000 visitors per year.
Chalk the Block More than 6,000 pieces of chalk are used each October as over 200 artists converge in El Paso to celebrate the power of the arts. Chalk the Block is an annual tradition celebrating its 12th year anniversary, and it attracts more than 40,000 people each year. Pop up galleries, interactive art installations, and open space for all aspiring chalk artists are only some of the activities.
WinterFest Over the past years San Jacinto Plaza and Arts Festival Plaza light up the heart of Downtown to host WinterFest. It brings over 450,000 people every year as they enjoy the traditional Scherr Legate Celebration of Lights Parade and Holiday Tree Lighting Ceremony in a family-friendly atmosphere. The WinterFest season features the popular annual ice-skating rink, a Holiday Market, El Paso Locomotive FC Sun City Express, a tradition holiday tree, festive décor and holiday entertainment. Over 3,000 artists and performers are engaged through holiday programming and over 800 vendors are engaged throughout the season.
42
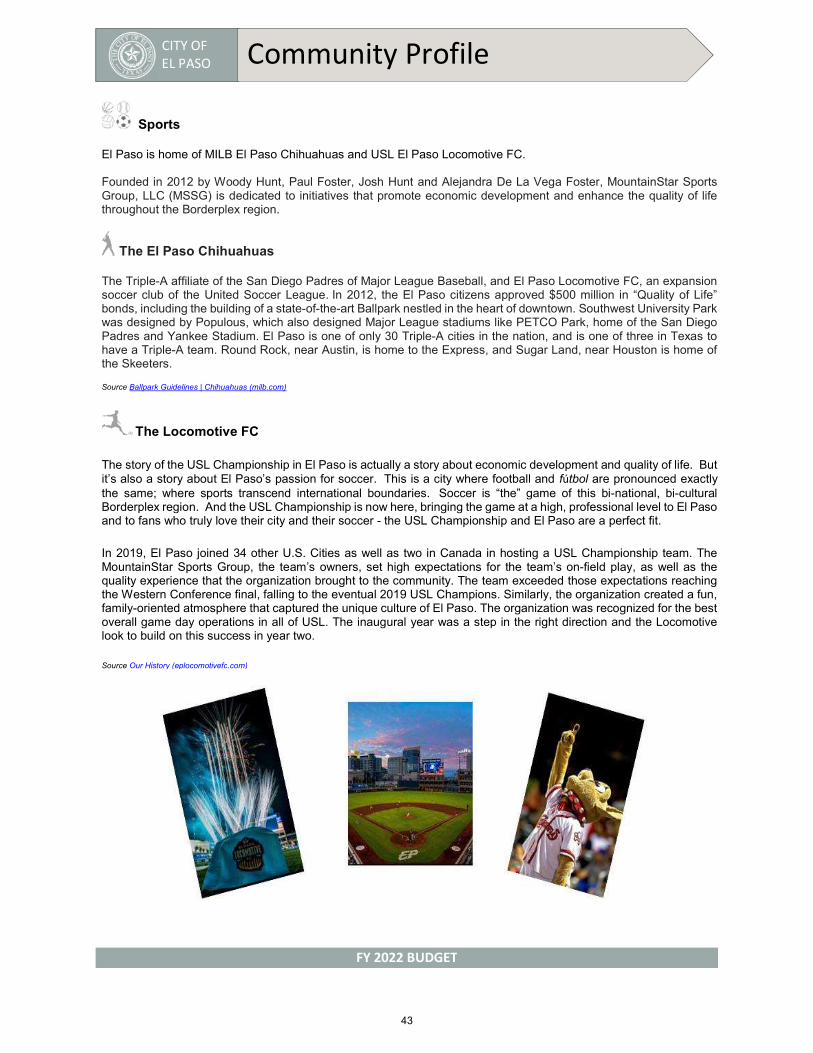
CITY OF EL PASO Community Profile
FY 2022 BUDGET
Sports
El Paso is home of MILB El Paso Chihuahuas and USL El Paso Locomotive FC.
Founded in 2012 by Woody Hunt, Paul Foster, Josh Hunt and Alejandra De La Vega Foster, MountainStar Sports Group, LLC (MSSG) is dedicated to initiatives that promote economic development and enhance the quality of life throughout the Borderplex region.
The El Paso Chihuahuas
The Triple-A affiliate of the San Diego Padres of Major League Baseball, and El Paso Locomotive FC, an expansion soccer club of the United Soccer League. In 2012, the El Paso citizens approved $500 million in “Quality of Life” bonds, including the building of a state-of-the-art Ballpark nestled in the heart of downtown. Southwest University Park was designed by Populous, which also designed Major League stadiums like PETCO Park, home of the San Diego Padres and Yankee Stadium. El Paso is one of only 30 Triple-A cities in the nation, and is one of three in Texas to have a Triple-A team. Round Rock, near Austin, is home to the Express, and Sugar Land, near Houston is home of the Skeeters.
Source Ballpark Guidelines | Chihuahuas (milb.com)
The Locomotive FC
The story of the USL Championship in El Paso is actually a story about economic development and quality of life. But it’s also a story about El Paso’s passion for soccer. This is a city where football and fútbol are pronounced exactly the same; where sports transcend international boundaries. Soccer is “the” game of this bi-national, bi-cultural Borderplex region. And the USL Championship is now here, bringing the game at a high, professional level to El Paso and to fans who truly love their city and their soccer - the USL Championship and El Paso are a perfect fit.
In 2019, El Paso joined 34 other U.S. Cities as well as two in Canada in hosting a USL Championship team. The MountainStar Sports Group, the team’s owners, set high expectations for the team’s on-field play, as well as the quality experience that the organization brought to the community. The team exceeded those expectations reaching the Western Conference final, falling to the eventual 2019 USL Champions. Similarly, the organization created a fun, family-oriented atmosphere that captured the unique culture of El Paso. The organization was recognized for the best overall game day operations in all of USL. The inaugural year was a step in the right direction and the Locomotive look to build on this success in year two.
Source Our History (eplocomotivefc.com)
43

CITY OF EL PASO Community Profile
FY 2022 BUDGET
Top Ten Tax Payers
Source: El Paso Central Appraisal District - Home Page (epcad.org)
General Tax Information
The City of El Paso’s Tax Office provides its clients with a consolidated property tax bill and collects taxes for 38 taxing jurisdictions within the City and County of El Paso, Texas. The City incorporates a unique financing arrangement in which a law firm is contracted to collect delinquent property taxes. These reimbursements help to defray the per parcel cost of tax collection.
Note: These rates apply to land and improvements and are levied per $100 of assessed value.
44

CITY OF EL PASO BUDGET BOOK 2022
GROWTH
FISCAL OVERVIEW
FISCAL
OVER
VIEW
CITY OF EL PASO Fiscal Overview
FY 2022 BUDGET
Budget Policies On March 3, 2020, City Council approved the Budget Policy update. Update included a new section to create a Budget Stabilization Fund. This fund would be used during emergencies or as approved City Council to maintain the tax rate during economic downturns to minimize the impact on the community while still delivering the services they deserve. These policies are the guidelines for budgetary decision making and set standards for sound budgetary practices and fiscal performance. They apply to both operating and capital budgets. Their main objective is to guide the development of the City’s budget and help manage financial pressures to address growing demands upon City resources, while preserving long-term fiscal stability. Budget policies that are consistently followed will assist the City in achieving its Strategic Plan in a fiscally responsible and sustainable manner. The policies address the use of fund balance, reserves, revenue forecasting, and setting fees. The budget policies are as follows:
I. Purpose
The following policies outline the City of El Paso’s (the “City”) guidelines for budgetary decision-making and set standards for sound budgetary practices and fiscal performance. Budget Policies that are consistently followed will assist the City in achieving its current and future goals in a fiscally responsible and sustainable manner.
II. Scope
The scope of this policy spans areas of both operating and capital projects budgeting, revenue management, forecasting, internal controls, and reporting.
III. Objectives
These policies serve to guide the development of the City’s budget and outline standards for revenue generation and the execution of operating expenditures as recommended by the Government Finance Officers Association (GFOA). The budget policies will also help manage financial pressures to address growing demands upon City resources, while preserving long-term fiscal stability.
IV. Budget Process
The purpose of the budget process is to help decision makers make prudent choices about theprovision of services and capital assets and to promote stakeholder participation in the process. The following is a summary of policies that will guide the process.
1. The City Manager and City Council will set parameters/priorities at the beginning of eachbudget cycle.
46
CITY OF EL PASO Fiscal Overview
FY 2022 BUDGET
2. The Office of Management and Budget will publish annually a Budget Preparation Manualguiding departments with the development of their budgets. The manual will include anoperating budget preparation calendar.
3. The budget process should include a five-year financial forecast to assess long-term financialimplications of current and proposed policies, programs, and assumptions that developappropriate strategies to achieve City Council’s goals.
4. Upon submission of the departmental requests, the City Manager reviews and evaluates allbaseline budget requests to determine whether they fulfill City Council goals and objectives,improve management effectiveness, and service delivery.
5. The City Manager submits a Proposed Budget to City Council for approval which includes theCity Manager’s Budget Message, a concise summary of the budget, shall include:
a) Summary of the major changes in priorities or service levels from the current year and thefactors leading to those changes.
b) The priorities and key issues for the new budget period.
c) Identify and summarize major financial factors and trends affecting the budget, such aseconomic factors; long-range outlook; significant changes in revenue collections, tax rates,or other changes; current and future debt obligations; and significant use of or increase inunreserved fund balance.
d) Provide financial summary data on revenues, other resources, and expenditures for at leasta five-year period, including prior year actual, current year budget and/or estimated currentyear actual and the proposed budget.
V. Balanced Budget
The general fund, which is the main operating fund of the City, is required to annually have a balanced budget. The City’s goal is to balance the operating budget with current revenues, whereby, current revenues would match and fund on-going expenditures/expenses. The City considers the budget balanced when total expenditures/expenses are equal to total revenues.
However, the budget is also balanced in situations where total expenditures/expenses are less than total revenues, which is technically a surplus. There are also instances when the City might plan to spend excess fund balances accumulated from previous years (while maintaining established reserves) on one-time or non-routine expenditures. The City considers the budget to be balanced in this case also, provided the funding from previous years is available, and a plan is in place to not include ongoing expenditures/expenses into this type of funding. This type of balanced budget is especially prevalent when capital projects are budgeted using proceeds from the issuance of bonds.
VI. Long Term Planning
It is the policy of the City to maintain a multi-year forecast of revenues, expenditures, and reserves to help guide the decisions of City officials where the decisions impact the long-term finances of the City. The multi-year revenue and expenditure forecast shall be reviewed at least once prior to the budget process and after adoption of the budget. The multi-year forecast will also be updated upon the approval of any capital improvement plan submitted to City Council and should be updated based on any dramatic changes in policy, legislation and the economy. The projection will cover a minimum of three years.
The Office of Management and Budget is responsible for presenting the multi- year forecast to the City Manager and City Council as part of the Proposed Operating Budget cycle. It will outline general approaches the City should follow over the long-term to maintain and increase the ability
47

CITY OF EL PASO Fiscal Overview
FY 2022 BUDGET
of the City to provide services through maintaining and increasing revenues, growing the City’s economy for the purpose of revenue generation, and controlling and managing the cost of services and the method of delivery of services.
VII. Revenue Polices
A. REVENUE DIVERSIFICATION
The City shall maintain a broad revenue base to distribute the revenue burden equitably to minimize the risk exposure of unforeseen down turns in any one- revenue stream supporting the City budget.
During each year of a budget process OMB will review current property tax exemptions approved by City Council and will submit recommendations to City Administration identifying possible increases or decreases in the approved exemptions or any new exemptions being proposed. OMB will also identify both the short and long-range effects on City resources available to fund existing and proposed programs. City Council will review tax exemptions only during the budget process.
Based on economic conditions, OMB will identify specific revenue sources that may be severely impacted. Revenue sources are reviewed on a monthly basis to report any significant changes that may impact the budget and identify corrective action if necessary to City administration. Potential new revenue sources, when identified and evaluated, are to be submitted during the budget process.
Revenue directly related to a restricted fund shall only be used for purposes legally permissible and in a fiscally responsible manner for that fund. Programs and services funded by restricted revenue will be clearly designated as such.
B. ONE-TIME REVENUES
The City shall limit the use of one-time revenues for purposes other than to maintain sustained operating expenses due to the disruptive effects on services due to the non-recurrence of these sources. Such one-time revenue sources shall be solely utilized for the purchase of one-time expenditures, such as capital items or short-term contractual obligations of duration of less than twelve months.
C. UNPREDICTABLE REVENUE
The City shall identify major revenue sources it considers unpredictable. Unpredictable revenue sources are those revenues with a more than normal risk of varying from budget by more than $50,000. The collection of revenue shall be considered when determining whether revenue is unpredictable.
It is important to consider how significant a variation in revenue receipts will affect the City’s financial outlook and ability to operate programs in the current and future budget periods. The City should decide, in advance, on a set of tentative actions to be taken if one or more of these sources generate revenues substantially higher or lower than projected. The plans should be publicly discussed and used in budget decision-making.
D. REVENUE ESTIMATES
City departments that generate revenue are required to submit revenue estimates on a monthly basis in order to prepare for the preceding fiscal year’s budget. OMB will review the estimates and any supporting documentation identifying the methodology utilized in preparing revenue estimates.
Revenues should be estimated using a conservative approach to avoid any budget shortfalls during the fiscal year. Departments should provide estimates annually during the budget process of the revenue generated by their department. There should be a consensus by the Department, the Office of Management and Budget, and the Chief Financial Officer on the estimate prior to inclusion in the proposed budget submitted to City Council for adoption.
48
CITY OF EL PASO Fiscal Overview
FY 2022 BUDGET
E. SETTING CHARGES/FEES
Departments will review at least annually any fees associated with their department and make changes based on factors such as the impact of inflation, indirect cost adjustments, and any other related expenses that impact the cost of providing services to the public. Proposed changes must be submitted to City Attorney for review and OMB during the budget process with full disclosure on proposed changes.
New fees are to be included as part of the budget process and if approved by administration, included in the proposed budget submitted to City Council for adoption.
Fees will be set at a level to fully recover costs, except where there is a greater public benefit through use of a lower fee, such as where full recovery may adversely impact overall revenue or may discourage participation in programs where the participation benefits the overall community. In the event that a fee or license amount is limited by state statute, said fee or license will be established accordingly.
Enterprise Funds shall be self-supporting so that the relationship between costs and revenues is clearly identified.
F. COLLECTION
The City monitors recognized revenue throughout the fiscal year. When revenue is less than estimated, OMB notifies administration with expected impact on the current fiscal year budget and provides recommended corrective action. The City Manager initiates action consistent with prudent financial management and notifies City Council of such action.
G. INDIRECT COSTS
Indirect costs should be recovered from other funds. This is done in accordance with the A-87 Indirect Cost Recovery Plan developed each year by outside consultants.
VIII. Expenditure Policies
A. EXPENDITURE ESTIMATES
Expenditures shall be sufficient to provide quality services at a reasonable cost and within available financial resources. All new requests for program funding should be accompanied with concise statements of program’s mission, objectives, and intended measurable outcomes.
B. SALARIES & BENEFITS “PERSONAL SERVICES”
The budget resolution shall specify the authority Department Heads will have in respect to changing their personal services budgets.
Benefits such as health insurance, life insurance, worker’s compensation, and pension will be budgeted in the department.
During budget process, all personnel requests must be fully justified to show that they will either meet new program purposes or maintain or enhance service delivery. The City Manager shall approve all position additions.
49
CITY OF EL PASO Fiscal Overview
FY 2022 BUDGET
C. REPLACEMENT OF ROLLING STOCK
The City has a major investment in its fleet of cars, trucks, tractors, and other similar equipment. The City anticipates having to replace the existing equipment as necessary and budgets to that end each year. Vehicle and equipment maintenance is also funded in this manner. Vehicles and equipment will be replaced when it is cost effective to do so. Vehicles and equipment purchased will be suitable for their purpose but not exceed the necessary features and capabilities required to meet the day-to-day requirements of the vehicle/equipment. When an existing vehicle is replaced by a new vehicle, every effort is made to utilize the outgoing vehicle somewhere else in the City fleet as long as its condition is suitable for the new purpose.
IX. Operating Contingency
The City will establish as per budget resolution, an operating contingency account, to offset expenditures for unexpected maintenance or other unanticipated expenses that might occur throughout the fiscal year. Expending from the contingency account must have approval from the City Manager or Chief Financial Officer.
X. Reserves
Each year an amount equal to five percent of the prior year’s adopted general fund operating expenditure budget shall be appropriated for the purpose of creating a cash reserve fund to provide coverage for unexpected expenses. Borrowing from the Cash Reserve Fund for unanticipated expenditures requires that funds be paid in full within a year, according to the City Charter.
Per the City Charter, each year an amount equal to five percent of the prior year's adopted general fund operating expenditure budget shall be appropriated for the purpose of creating a cash reserve fund; provided the funds are maintained and may be used in accordance with Section 7.4 of the City Charter. B. The cash reserve fund are maintained as a separate entity in accounting records. Additionally, the balance on deposit in the cash reserve fund must be invested in accordance with state guidelines and income from such investments will remain within the fund, except as may be expended in accordance with Section 7.4 of the City Charter. C. Withdrawals from the cash reserve fund, whether it has attained the required size or not, are made from time to time to meet current expenses until sufficient taxes are collected. Such withdrawals must be approved by city council action. As soon as practical after collection of taxes, the amount so withdrawn shall be repaid to the cash reserve fund so as to keep the fund available for use in the following year.
The reserved and unreserved general fund balance will be maintained to respond to emergencies of general fund expenditures. The City shall have a plan in place to maintain reserves level. Flexibility will be allowed in the use of fund balance but is use should be prioritized in the following order:
1. Unforeseen events or emergencies2. Capital Expenditures3. Future year budgets
Funding of this reserve will come from one-time revenues, excess fund balance and revenues in excess of expenditures.
50
CITY OF EL PASO Fiscal Overview
FY 2022 BUDGET
XI. Stabilization Fund
The City has established a stabilization fund as a reserve of surplus revenues to be used with the purpose of 1) minimizing future tax rate impact, 2) protecting against raising charges for services and fees and 3) providing available funding for specific circumstances as needed to maintain the same levels of service. In such case, the use of the fund resources will be determined and approved by Council action. The stabilization fund serves as a source of financial support for the City’s budget in times of slow or declining revenue growth, as a safeguard to continue funding priorities included in the strategic plan, and as the primary source of protection against having to make drastic cuts in City services in periods of economic downturns.
The amount of funds to be committed will be recommended by the Chief Financial Officer or designee to the City Council. As part of the annual budget process, the City Council will have final approval of the amount maintained in the fund, as well as the planned uses of the fund.
XII. Budget Adoption
The budget shall be adopted by resolution, subject to the Mayor’s veto, not later than the day beforethe first day of the fiscal and budget year but, in the event the budget is not adopted, the appropriation for personnel and essential operating supplies made in the previous year shall be extended until the new budget is adopted
XIII. Budget Controls and Accountability
Each department director, appointed by the City Manager, willbe responsible for the strategic plan and goals adopted byCity Council as part of the budget and for monitoring theirindividual departmental budget for compliance with spendinglimitations.
The Chief Financial Officer and the City Manager may transferfunds within the operations and maintenance or capital lineitems of a departmental budget category, in accordance withthe budget resolution. All other transfers of appropriation orbudget amendments that alter the original adopted budgets atthe fund level require City Manager and City Council approvalas outlined in the following section.
XIV. Amendments to the Budget
Before adoption:
After the public hearing, the City Council may adopt the budget with or without amendments. Inamending the proposed budget, it may add or increase programs or amounts and may delete ordecrease any programs or amounts, except expenditures required by law or for debt service,provided that no amendment to the proposed budget shall increase expenditures to an amountgreater than the estimated income (including the use of available Fund Balance).
After adoption:
a) Department Heads are authorized to make budget transfers not exceeding an establisheddollar limit. Those exceeding this limit will require City Council or City Manager approval,as per Budget Resolution.
51
CITY OF EL PASO Fiscal Overview
FY 2022 BUDGET
b) A budget transfer of personal services appropriations or impacting revenue accountsrequires the approval of the City Manager or his/her designee.
c) A budget transfer must be approved prior to the occurrence of the expenditure except foremergency expenditures when approved by the City Manager or his/her designee andratified by the City Council.
d) The City Manager shall have the authority to establish the budget for any capital projectsthat are approved by the City Council.
e) Budget transfers submitted to City Council shall be accompanied by an explanation fromthe department, approval by OMB, and a recommendation from the City Manager or his/herdesignee. The department’s explanation must be sufficiently clear and provide sufficientdetail for the members of City Council to determine the need for the transfer.
f) The City Manager or his/her designee is authorized to establish budgets and staffing tablechanges for grants and similar awards when the applications for such grants and awardshave been previously approved by the City Council or the City Manager. All grantapplications requiring City Council approval shall be prepared in accordance withestablished procedures. The agenda item shall state clearly the type and amount of therequired City match and the funding source of the grant match.
XV. Reporting
Departments will submit to the Office of Management and Budget an expenditure and revenueanalysis, if necessary, no later than 10 days after the accounting period has been closed.
The Office of Management and Budget will monitor expenditures monthly and report to City Council on a quarterly basis. Quarterly reports will be made available through OMB’s homepage: https://www.elpasotexas.gov/omb. These reports will include the current status of revenues and expenditures to-date compared with the corresponding budgets for each fund.
52
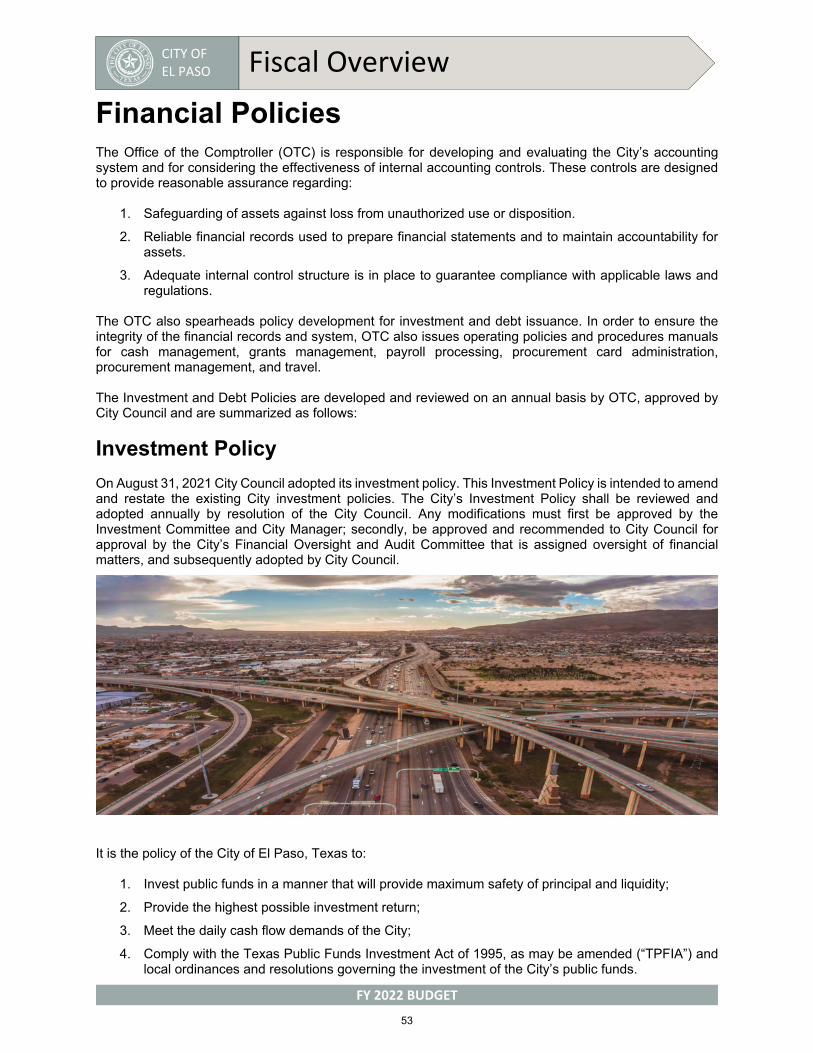
CITY OF EL PASO Fiscal Overview
FY 2022 BUDGET
Financial Policies The Office of the Comptroller (OTC) is responsible for developing and evaluating the City’s accounting system and for considering the effectiveness of internal accounting controls. These controls are designed to provide reasonable assurance regarding:
1. Safeguarding of assets against loss from unauthorized use or disposition.
2. Reliable financial records used to prepare financial statements and to maintain accountability forassets.
3. Adequate internal control structure is in place to guarantee compliance with applicable laws andregulations.
The OTC also spearheads policy development for investment and debt issuance. In order to ensure the integrity of the financial records and system, OTC also issues operating policies and procedures manuals for cash management, grants management, payroll processing, procurement card administration, procurement management, and travel.
The Investment and Debt Policies are developed and reviewed on an annual basis by OTC, approved by City Council and are summarized as follows:
Investment Policy
On August 31, 2021 City Council adopted its investment policy. This Investment Policy is intended to amend and restate the existing City investment policies. The City’s Investment Policy shall be reviewed and adopted annually by resolution of the City Council. Any modifications must first be approved by the Investment Committee and City Manager; secondly, be approved and recommended to City Council for approval by the City’s Financial Oversight and Audit Committee that is assigned oversight of financial matters, and subsequently adopted by City Council.
It is the policy of the City of El Paso, Texas to:
1. Invest public funds in a manner that will provide maximum safety of principal and liquidity;
2. Provide the highest possible investment return;
3. Meet the daily cash flow demands of the City;
4. Comply with the Texas Public Funds Investment Act of 1995, as may be amended (“TPFIA”) andlocal ordinances and resolutions governing the investment of the City’s public funds.
53
CITY OF EL PASO Fiscal Overview
FY 2022 BUDGET
The City of El Paso Investment Policy applies to all cash assets of the City as reported in the City’s Comprehensive Annual Financial Report (CAFR) except for those funds of the Public Employees Retirement System (PERS) and component units, which are governed, by other laws, statutes, and ordinances.
Except for cash in certain restricted and special funds, the City will consolidate cash and reserve balances from all funds to maximize investment earnings and to increase efficiencies with regard to investment pricing, safekeeping and administration.
The objectives of the Investment Policy, in order of priority, are:
1. Preservation and Safety of Principal: Investments of the City shall be undertaken in a manner thatseeks to ensure the preservation of capital in the overall portfolio. The objective will be to mitigatecredit risk and interest rate risk.
2. Liquidity: The City’s investment portfolio will remain sufficiently liquid to enable the City to meet alloperating requirements that might be reasonably anticipated. To a large extent, liquidity shall bedetermined by the flow of revenues and expenditures predicted by the Office of the Comptrollerusing cash flow projections and historical data. These cash flow projections shall be at least one(1) year in length.
3. Yield: The City’s investment portfolio shall be designed with the objective of attaining a rate ofreturn/yield throughout budgetary and economic cycles, commensurate with the City’s investmentrisk constraints and the cash flow characteristics of the portfolio.
In addition, the Investment Policy delineates standards of care, authorized financial institutions, depositories, brokers/dealers, authorized investments, collateralization/limits/custody, safekeeping/ custody, investment parameters, and reporting. The policy also includes an investment strategy, which establishes the investment objectives of each of the fund types covered by the policy based on the needs and characteristics of each of the funds. It also includes a strategy for allocating interest to participating funds which delineates the process of allocating interest earnings. Pursuant to Section 2256 of the Texas Government Code, the City is required to review its Investment Policy on an annual basis and recommend changes. The City’s Investment Policy is adopted by resolution of the City Council after the annual review and modifications are approved by the Investment Committee and the City Manager. A full copy of the investment policy can be found at https://www.elpasotexas.gov/comptroller/fiscal-policies
Debt Management Policy
The City of El Paso adopted a Debt Management Policy on November 25, 2005, and revised in September 2020. It is the policy of the City of El Paso (“City”) to develop and maintain a sound debt management program. This policy sets forth the parameters for issuing new debt as well as managing the outstanding debt portfolio, identifying the types and amounts of permissible debt, and maintaining the current bond rating in order to minimize borrowing costs and preserving access to credit. It is the intent of the City to establish this policy to provide guidance to staff to:
Ensure high quality debt management decisions;
Ensure that debt management decisions are viewed positively by rating agencies, the investmentcommunity and the citizenry-at-large;
Ensure support for debt issuances both internally and externally;
Demonstrate a commitment to long-term financial planning.
The City prepares Capital Improvement Plan (CIP) budgets which are presented to City Council for approval. Since the aggregate cost of desired capital projects generally exceeds available funds, the capital planning process prioritizes projects and identifies the funding needs. Debt is issued for CIP in accordance to this policy.
54

CITY OF EL PASO Fiscal Overview
FY 2022 BUDGET
1. Bonds will be paid back within a period not to exceed, and preferably sooner than, the expecteduseful life of the capital project;
2. Decisions will be made based on a number of factors and will be evaluated against long-term goalsrather than a short-term fix;
3. Debt service funds will be managed and invested in accordance with all federal, state and locallaws.
It is the City’s intent to develop a level of cash and debt funded capital improvement projects that provide the citizens with the desired amount of City services at the lowest cost. The City may use both, general obligation bonds or certificates of obligations, as deemed appropriate by City staff and approved by Council. Generally, proceeds from bonded indebtedness are to be used only for capital expenditures related to the acquisition, construction, improvement or renovation of a City facility or public access roads as well as any permanent public improvement or asset purchase or such other purposes permitted by the City Charter and applicable law.
General obligations bonds will be used if the following criteria are met:
The size of the issuances is based on the capital funding needs of the City at a particular time andthe recommendation of the Chief Financial Officer (CFO) in conjunction with the City’s bond counseland financial advisor
Funds will be used for new and expanded facilities, major repair/ renovations to existing facilities,quality-of-life projects, public safety projects and debt refunding
Useful lives of assets acquired will be fifteen (15) years or more; or will extend the useful life of anasset for more than fifteen (15) years
Voter authorized debt except for bond refunding’s as per section 7.4 5.1.1
1. The total dollar amount of bond election propositions recommended to the voters shall not exceed
the City’s estimated ability to issue said bonds within a normal 10-year period.
2. The use of reimbursement resolutions may be used as a cash management tool for general
obligation debt funded projects.
3. The City may choose to issue general obligation debt which will be issued for the following
projects/acquisitions:
Quality-of-Life (QOL) projects
Construction of new facilities, park projects, zoo projects, and other projects as approvedby the voters 6
Capital asset acquisitions (heavy equipment, vehicles, IT equipment, etc.)
Rehabilitation and/or extension of the useful life of existing facilities, including existing QOLfacilities, by more than 15 years
Street infrastructure projects
Street resurfacing, street lights, ADA modifications, traffic calming devices, stormwater/drainage work, and small equipment related to QOL projects
Public safety projects
Any other purpose permitted by City Charter and applicable laws
55

CITY OF EL PASO Fiscal Overview
FY 2022 BUDGET
Certificates of Obligation can be used for issuance of less than $100 million and do not require voter approval. While it is the City’s priority to fund the majority of capital projects with voter-approved debt, it may become necessary to seek additional financing in order to fund a particular non-quality of life project. Certificates of Obligation may be issued for capital asset acquisitions such as heavy equipment, vehicles, information technology equipment, etc. They may also be used for rehabilitation and/or extension of the useful life of existing facilities; street resurfacing, unpaved rights of way; American Disability Act retrofitting/rehabilitation projects, street lighting, infrastructure projects (street and drainage work); emergency city facilities rehabilitation, major core service facilities (police, fire, streets, etc.), and complete or enhance Quality of Life Projects previously approved by voters and subsequently approved additional funding by City Council.
The issuance of COs or other long-term debt may be considered if there is need to complete or enhance Quality of Life Projects previously approved by voters; need for the project is urgent and immediate, necessary to prevent an economic loss to the City, source of revenue is specific and can be expected to cover the additional debt, and expected debt is the most cost-effective financing option available. In addition, the average maturity of non-voter approved debt shall not exceed the average life of the project financed. Capital items financed with long-term debt shall have a value of at least $5,000 and a life of at least 3 years. Reimbursement resolutions may be used for projects funded through Certificates of Obligations.
The policy also established guidelines for refunding of the debt and debt limits. Currently the policy allows for refunding and forward delivery refunding transactions for savings to be considered when the net present value savings as a percentage of the par amount of refunded bonds is at least 3%. The total principal amount of general obligation bonds together with the principal amount of all other outstanding tax-supported indebtedness of the City shall not exceed ten percent of the total taxable assessed valuation of the City’s tax rolls. Since debt service payments present a fixed expense of the City’s total annual operating budget, net debt service as a percent of net operating revenues should not exceed 20%. Council shall adopt the necessary debt service tax rate up to a maximum amount of forty cents (40¢) per $100 valuation in order to meet debt service principal, interest and fee payments, net of transfers, for each particular fiscal/budget year, subject to any reserve availability.
The policy also established maturity levels not to exceed the useful life of the capital asset or a maximum of 30 years in any case. The average general obligation bond maturities shall be kept at or below 25 years. Guidelines for management of the debt service fund, debt service tax rate, ratings, selection of financial advisors, selection of underwriters, and debt review are also established and can be reviewed at https://www.elpasotexas.gov/comptroller/fiscal-policies.
Basis of Accounting
Governmental funds are accounted for using the current financial resources measurement focus and the modified accrual basis of accounting. This means that only current assets and current liabilities are generally included on the balance sheet. Revenues are recognized when susceptible to accrual (i.e. when they become measureable and available) and expenditures are recorded when the related fund liability is incurred. However, compensated absences, debt service expenditures, claims, judgments, and arbitrage liabilities are recorded only when the liability has matured.
Proprietary and fiduciary funds are accounted for using the accrual basis of accounting. Revenues are recognized when they are earned and expenses are recognized when incurred. These funds are accounted for on a flow of economic resources measurement focus whereby all assets and all liabilities associated with the operation of these funds are included on the balance sheet. The basis of accounting mirrors the basis of budgeting.
56

CITY OF EL PASO Fiscal Overview
FY 2022 BUDGET
Basis of Budgeting
The City of El Paso adopts an annual budget for the general fund, debt service, special revenue, internal service and proprietary funds. Capital project funds are budgeted as authorized. The budgets for all funds are prepared on a modified accrual basis whereby revenue is recognized when it becomes available and measurable and expenditures are recognized when the liability is incurred. Purchases of materials, supplies, and equipment are considered expended when bought and depreciation expense for budgetary purposes is excluded. Encumbrances are considered obligations when the commitment is incurred. All appropriations and encumbrances in all governmental funds, with the exception of certain special revenue and capital projects funds are considered lapsed at the end of the fiscal year. However, some encumbrances can be re-committed in the following year with proper approval. The basis of budgeting mirrors the basis of accounting.
Financial Structure
The City’s financial structure is governed by State Law, City Charter, and accounting principles generally accepted in the United States. The structure and content of the chart of accounts aids in preparation of the City’s budget, monthly financial reports, and the CAFR. Financial transactions of the City are budgeted and recorded in a group of alpha and/or numeric codes as defined by the chart of accounts. The group of codes requires an operating unit, a fund, a division, and an expense and/or revenue classification account. A program, project and/or a grant may be added to the group of codes if applicable.
The operating unit is another name for a departmental organization, which may be comprised of a grouping of divisions. A fund is a grouping of related accounts used to maintain control over resources that have been segregated for specific activities and objectives. The City maintains numerous funds, as needed, to insure proper accountability. A division is a numerical code used to identify a function of the operating unit. The account identifies assets, liabilities, equity, revenues, and expenses. The account defines the natural classification of the financial transactions used for recording and summarizing the data. A program is activities to be undertaken to achieve specific goals and objectives. A project is used for projects that span multiple years. A grant is used to identify projects with federal, state, or local agency funding. The CAFR, structured in accordance with Generally Accepted Accounting Principles and the Governmental Accounting Standards Board; however, the budget is reported at a division level by operating unit to include all sources of funding.
57
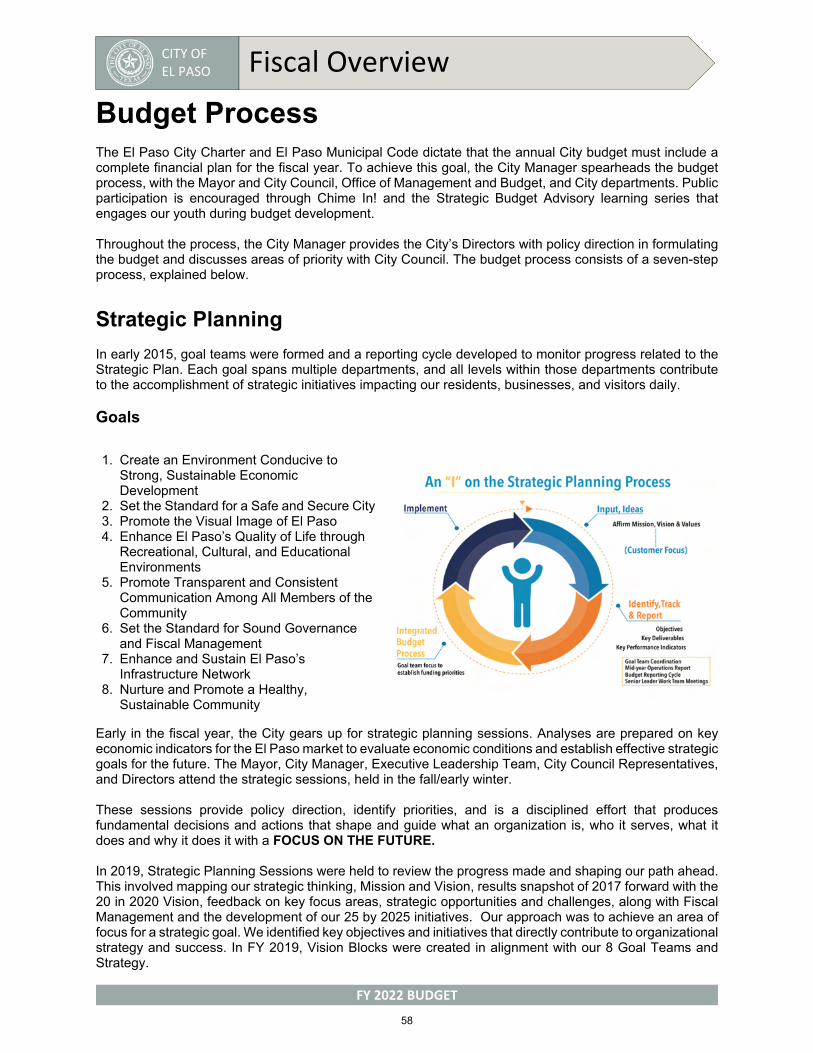
CITY OF EL PASO Fiscal Overview
FY 2022 BUDGET
Budget Process The El Paso City Charter and El Paso Municipal Code dictate that the annual City budget must include a complete financial plan for the fiscal year. To achieve this goal, the City Manager spearheads the budget process, with the Mayor and City Council, Office of Management and Budget, and City departments. Public participation is encouraged through Chime In! and the Strategic Budget Advisory learning series that engages our youth during budget development.
Throughout the process, the City Manager provides the City’s Directors with policy direction in formulating the budget and discusses areas of priority with City Council. The budget process consists of a seven-step process, explained below.
Strategic Planning
In early 2015, goal teams were formed and a reporting cycle developed to monitor progress related to the Strategic Plan. Each goal spans multiple departments, and all levels within those departments contribute to the accomplishment of strategic initiatives impacting our residents, businesses, and visitors daily.
Goals
1. Create an Environment Conducive toStrong, Sustainable EconomicDevelopment
2. Set the Standard for a Safe and Secure City3. Promote the Visual Image of El Paso4. Enhance El Paso’s Quality of Life through
Recreational, Cultural, and EducationalEnvironments
5. Promote Transparent and ConsistentCommunication Among All Members of theCommunity
6. Set the Standard for Sound Governanceand Fiscal Management
7. Enhance and Sustain El Paso’sInfrastructure Network
8. Nurture and Promote a Healthy,Sustainable Community
Early in the fiscal year, the City gears up for strategic planning sessions. Analyses are prepared on key economic indicators for the El Paso market to evaluate economic conditions and establish effective strategic goals for the future. The Mayor, City Manager, Executive Leadership Team, City Council Representatives, and Directors attend the strategic sessions, held in the fall/early winter.
These sessions provide policy direction, identify priorities, and is a disciplined effort that produces fundamental decisions and actions that shape and guide what an organization is, who it serves, what it does and why it does it with a FOCUS ON THE FUTURE.
In 2019, Strategic Planning Sessions were held to review the progress made and shaping our path ahead. This involved mapping our strategic thinking, Mission and Vision, results snapshot of 2017 forward with the 20 in 2020 Vision, feedback on key focus areas, strategic opportunities and challenges, along with Fiscal Management and the development of our 25 by 2025 initiatives. Our approach was to achieve an area of focus for a strategic goal. We identified key objectives and initiatives that directly contribute to organizational strategy and success. In FY 2019, Vision Blocks were created in alignment with our 8 Goal Teams and Strategy.
58

CITY OF EL PASO Fiscal Overview
FY 2022 BUDGET
Strategic Vision Blocks and Goals
Safe + Beautiful Neighborhoods
Safe and Secure City
Infrastructure Network
Healthy, Sustainable Community
Vibrant Regional Economy Strong Sustainable Economic Development
Promote the Visual Image
Recreational, Cultural + Educational Opportunities
Enhance Quality of Life
High Performing Government
Transparent and Consistent Communication
Sound Governance and Fiscal Management
Drafting the City Budget
The City of El Paso uses the performance budgeting concept, which focuses on goals, objectives, evidence, and results, such as the City’s Strategic Plan. Departments build their budget based on their prior year budget while utilizing the Budget Manual, evaluating customer priorities and the priorities of our City Council.
The Budget Manual, distributed by the OMB, explains the entire budget process, policies, and timetable. Departments are also required to submit updated key performance indicators, deliverables, and results to the Performance Office. Revenue generating departments must also include revenue estimates in their requested budget submittals.
In keeping with the budget policies, the City Manager establishes parameters for the upcoming fiscal year and provides programmatic direction to the departments in preparing their operating and capital budget requests in accordance with the City’s Strategic Plan and City Council’s guidance. During this phase, the City Manager addresses any policy or procedural changes as needed. Additionally, the Executive Leadership Team provides guidance and leadership to respective directors throughout the budget process to ensure available resources are maximized and efficiencies are achieved while quality service delivery is maintained.
Upon receipt of the departmental budget requests, the OMB reviews, discusses the budget requests with directors, and identifies major program changes and policy issues. OMB analysts complete the review, formulate recommendations, and ensure all funds are in balance. The finalized figures become the requested budget. The City Manager reviews the requested budget in the next phase and determines whether changes are required based on fund availability and priorities.
59

CITY OF EL PASO Fiscal Overview
FY 2022 BUDGET
City Manager’s Proposed Budget
After the requested budget is finalized, the City Manager, Executive Leadership Team, Directors, and OMB hold budget review meetings. During these meetings, the City Manager addresses any budget concerns with department directors while considering recommendations and financial constraints.
Once the budget reviews are completed and any revisions made, the result becomes the City Manager’s Proposed Budget. The City Manager’s Proposed Budget is filed with the City Clerk and the County Clerk in July distributed to City Council, directors, the media, and posted on the City’s website.
Public Hearings
Upon completion of the City Manager’s Proposed Budget, OMB schedules and coordinates review sessions and public hearings during July and August. A copy of the Proposed Budget is available for review by the citizens in the City Clerk’s Office and electronically on the City’s website. The review sessions and public hearings provide an opportunity for City Council and the citizens to ask questions, make recommendations, and gain a better understanding of the operations of each department.
Budget Adoption
Budget policy dictates the budget be balanced meaning the appropriations from each fund may not exceed the resources available for the fiscal year from September 1 through August 31. These resources include estimated revenues and the unassigned balance in the fund at the beginning of the year. This policy assures that the City does not spend beyond its means.
Any changes made to the City Manager’s Proposed Budget after it is filed must be included as part of the budget resolution, which is voted upon by City Council. Pending final approval, the proposed budget is subject to the Mayor’s revision and/or veto. Budget policies dictate that in the event the budget is not adopted by August 31, appropriations for personnel and essential operating costs made in the prior year can be extended until the new budget is approved. If the Proposed Budget is adopted, it is then distributed to all City departments and is available for public examination in the Municipal Clerk’s Office and the County Clerk’s Office.
Tax Levy
In accordance with the laws of Texas, City Council passes the tax levy ordinance as soon as possible after the tax roll is completed. The Council also holds posted public hearings regarding the property tax rate and sets the rate as prescribed by the State Property Tax Code.
60
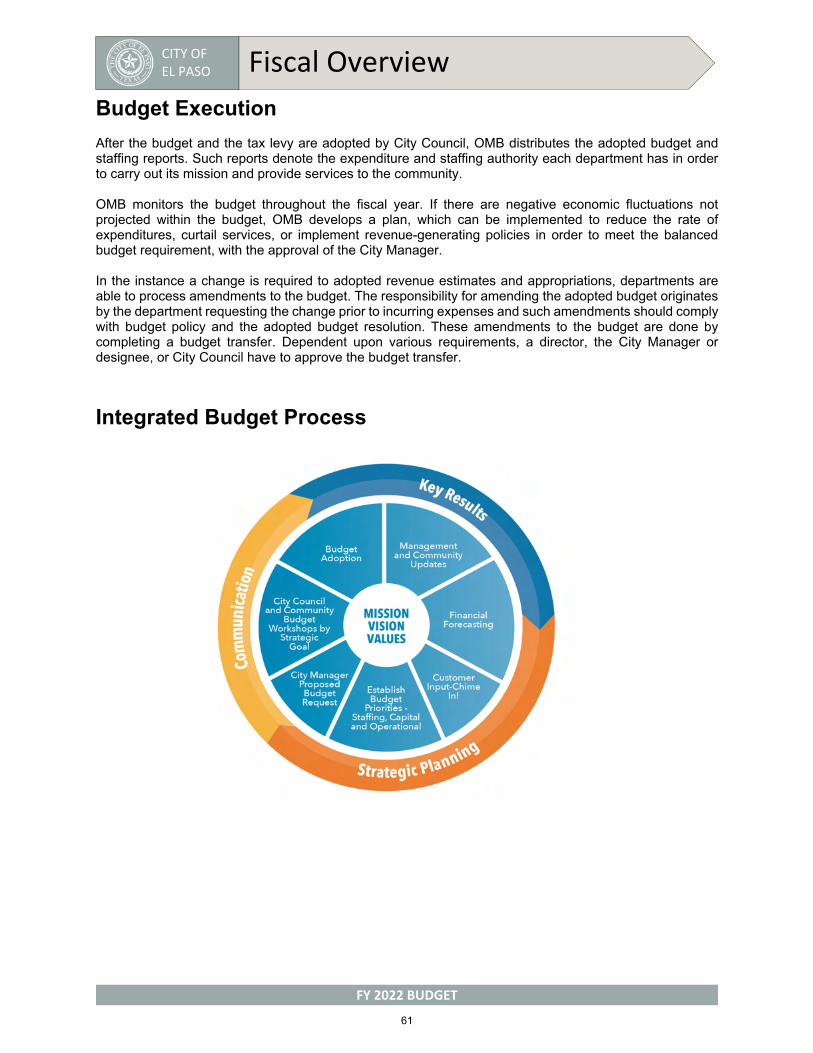
CITY OF EL PASO Fiscal Overview
FY 2022 BUDGET
Budget Execution
After the budget and the tax levy are adopted by City Council, OMB distributes the adopted budget and staffing reports. Such reports denote the expenditure and staffing authority each department has in order to carry out its mission and provide services to the community.
OMB monitors the budget throughout the fiscal year. If there are negative economic fluctuations not projected within the budget, OMB develops a plan, which can be implemented to reduce the rate of expenditures, curtail services, or implement revenue-generating policies in order to meet the balanced budget requirement, with the approval of the City Manager.
In the instance a change is required to adopted revenue estimates and appropriations, departments are able to process amendments to the budget. The responsibility for amending the adopted budget originates by the department requesting the change prior to incurring expenses and such amendments should comply with budget policy and the adopted budget resolution. These amendments to the budget are done by completing a budget transfer. Dependent upon various requirements, a director, the City Manager or designee, or City Council have to approve the budget transfer.
Integrated Budget Process
61
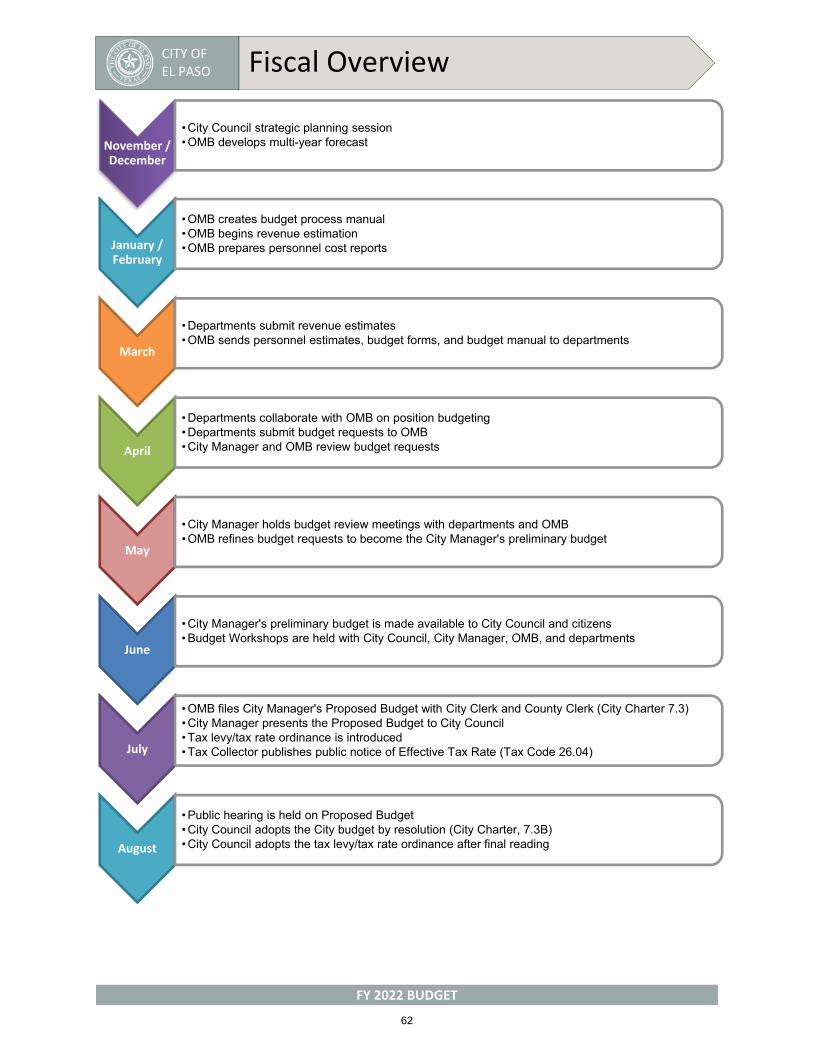
CITY OF EL PASO Fiscal Overview
FY 2022 BUDGET
November / December
• City Council strategic planning session• OMB develops multi-year forecast
January / February
• OMB creates budget process manual• OMB begins revenue estimation• OMB prepares personnel cost reports
March
• Departments submit revenue estimates• OMB sends personnel estimates, budget forms, and budget manual to departments
April
• Departments collaborate with OMB on position budgeting• Departments submit budget requests to OMB• City Manager and OMB review budget requests
May
• City Manager holds budget review meetings with departments and OMB• OMB refines budget requests to become the City Manager's preliminary budget
June
• City Manager's preliminary budget is made available to City Council and citizens• Budget Workshops are held with City Council, City Manager, OMB, and departments
July
• OMB files City Manager's Proposed Budget with City Clerk and County Clerk (City Charter 7.3)• City Manager presents the Proposed Budget to City Council• Tax levy/tax rate ordinance is introduced• Tax Collector publishes public notice of Effective Tax Rate (Tax Code 26.04)
August
• Public hearing is held on Proposed Budget• City Council adopts the City budget by resolution (City Charter, 7.3B)• City Council adopts the tax levy/tax rate ordinance after final reading
62
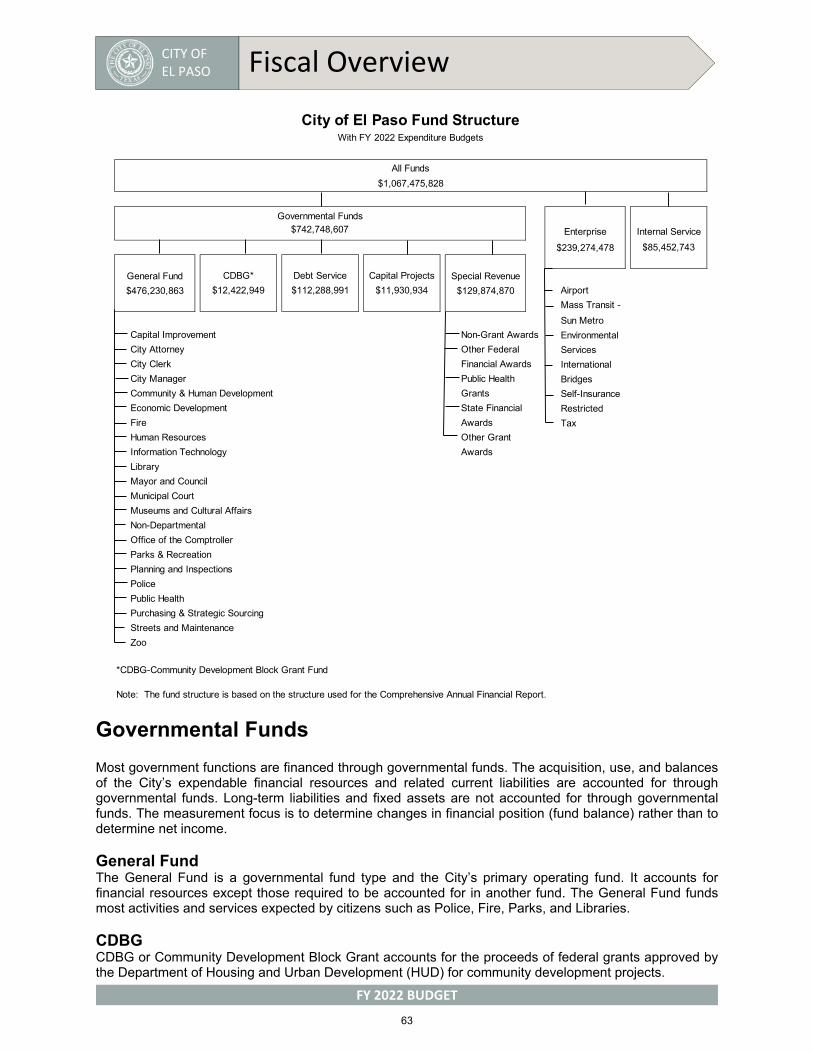
CITY OF EL PASO Fiscal Overview
FY 2022 BUDGET
Governmental Funds
Most government functions are financed through governmental funds. The acquisition, use, and balances of the City’s expendable financial resources and related current liabilities are accounted for through governmental funds. Long-term liabilities and fixed assets are not accounted for through governmental funds. The measurement focus is to determine changes in financial position (fund balance) rather than to determine net income.
General Fund The General Fund is a governmental fund type and the City’s primary operating fund. It accounts for financial resources except those required to be accounted for in another fund. The General Fund funds most activities and services expected by citizens such as Police, Fire, Parks, and Libraries.
CDBG CDBG or Community Development Block Grant accounts for the proceeds of federal grants approved by the Department of Housing and Urban Development (HUD) for community development projects.
Internal Service
$85,452,743
CDBG* Debt Service Capital Projects
$12,422,949 $112,288,991 $11,930,934 Airport
Mass Transit -
Sun Metro
Capital Improvement Non-Grant Awards Environmental
City Attorney Other Federal Services
City Clerk Financial Awards International
City Manager Public Health Bridges
Community & Human Development Grants Self-Insurance
Economic Development State Financial Restricted
Fire Awards Tax
Human Resources Other Grant
Information Technology Awards
Library
Mayor and Council
Municipal Court
Museums and Cultural Affairs
Non-Departmental
Office of the Comptroller
Parks & Recreation
Planning and Inspections
Police
Public Health
Purchasing & Strategic Sourcing
Streets and Maintenance
Zoo
*CDBG-Community Development Block Grant Fund
Note: The fund structure is based on the structure used for the Comprehensive Annual Financial Report.
City of El Paso Fund StructureWith FY 2022 Expenditure Budgets
Governmental Funds
$742,748,607
All Funds
$1,067,475,828
General Fund
$476,230,863
Special Revenue
$129,874,870
Enterprise
$239,274,478
63
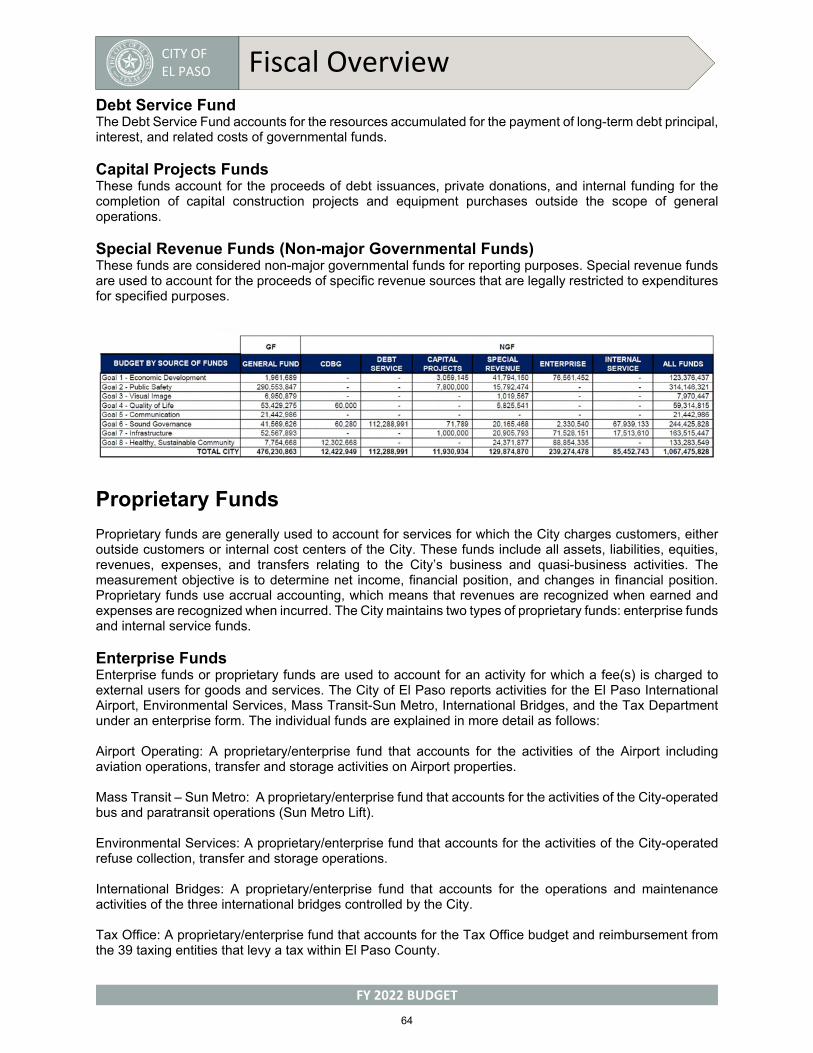
CITY OF EL PASO Fiscal Overview
FY 2022 BUDGET
Debt Service Fund The Debt Service Fund accounts for the resources accumulated for the payment of long-term debt principal, interest, and related costs of governmental funds.
Capital Projects Funds These funds account for the proceeds of debt issuances, private donations, and internal funding for the completion of capital construction projects and equipment purchases outside the scope of general operations.
Special Revenue Funds (Non-major Governmental Funds) These funds are considered non-major governmental funds for reporting purposes. Special revenue funds are used to account for the proceeds of specific revenue sources that are legally restricted to expenditures for specified purposes.
Proprietary Funds
Proprietary funds are generally used to account for services for which the City charges customers, either outside customers or internal cost centers of the City. These funds include all assets, liabilities, equities, revenues, expenses, and transfers relating to the City’s business and quasi-business activities. The measurement objective is to determine net income, financial position, and changes in financial position. Proprietary funds use accrual accounting, which means that revenues are recognized when earned and expenses are recognized when incurred. The City maintains two types of proprietary funds: enterprise funds and internal service funds.
Enterprise Funds Enterprise funds or proprietary funds are used to account for an activity for which a fee(s) is charged to external users for goods and services. The City of El Paso reports activities for the El Paso International Airport, Environmental Services, Mass Transit-Sun Metro, International Bridges, and the Tax Department under an enterprise form. The individual funds are explained in more detail as follows:
Airport Operating: A proprietary/enterprise fund that accounts for the activities of the Airport including aviation operations, transfer and storage activities on Airport properties.
Mass Transit – Sun Metro: A proprietary/enterprise fund that accounts for the activities of the City-operated bus and paratransit operations (Sun Metro Lift).
Environmental Services: A proprietary/enterprise fund that accounts for the activities of the City-operated refuse collection, transfer and storage operations.
International Bridges: A proprietary/enterprise fund that accounts for the operations and maintenance activities of the three international bridges controlled by the City.
Tax Office: A proprietary/enterprise fund that accounts for the Tax Office budget and reimbursement from the 39 taxing entities that levy a tax within El Paso County.
64
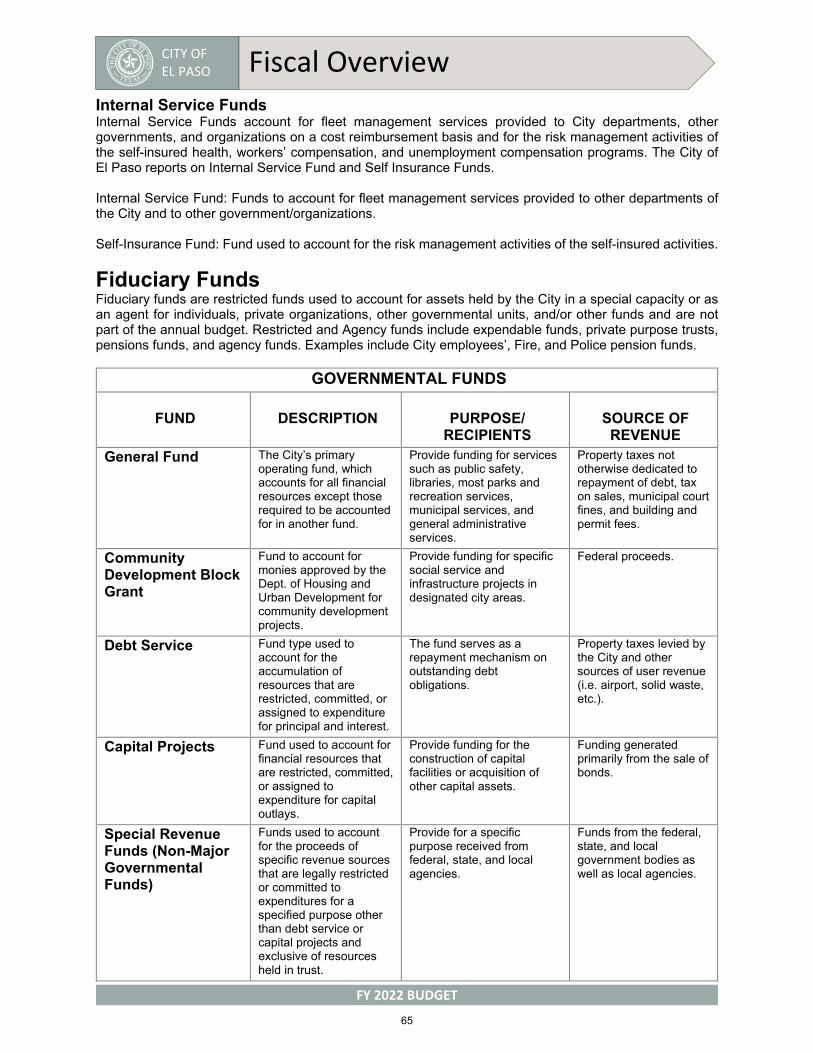
CITY OF EL PASO Fiscal Overview
FY 2022 BUDGET
Internal Service Funds Internal Service Funds account for fleet management services provided to City departments, other governments, and organizations on a cost reimbursement basis and for the risk management activities of the self-insured health, workers’ compensation, and unemployment compensation programs. The City of El Paso reports on Internal Service Fund and Self Insurance Funds.
Internal Service Fund: Funds to account for fleet management services provided to other departments of the City and to other government/organizations.
Self-Insurance Fund: Fund used to account for the risk management activities of the self-insured activities.
Fiduciary Funds Fiduciary funds are restricted funds used to account for assets held by the City in a special capacity or as an agent for individuals, private organizations, other governmental units, and/or other funds and are not part of the annual budget. Restricted and Agency funds include expendable funds, private purpose trusts, pensions funds, and agency funds. Examples include City employees’, Fire, and Police pension funds.
GOVERNMENTAL FUNDS
FUND DESCRIPTION PURPOSE/ RECIPIENTS
SOURCE OF REVENUE
General Fund The City’s primary operating fund, which accounts for all financial resources except those required to be accounted for in another fund.
Provide funding for services such as public safety, libraries, most parks and recreation services, municipal services, and general administrative services.
Property taxes not otherwise dedicated to repayment of debt, tax on sales, municipal court fines, and building and permit fees.
Community Development Block Grant
Fund to account for monies approved by the Dept. of Housing and Urban Development for community development projects.
Provide funding for specific social service and infrastructure projects in designated city areas.
Federal proceeds.
Debt Service Fund type used to account for the accumulation of resources that are restricted, committed, or assigned to expenditure for principal and interest.
The fund serves as a repayment mechanism on outstanding debt obligations.
Property taxes levied by the City and other sources of user revenue (i.e. airport, solid waste, etc.).
Capital Projects Fund used to account for financial resources that are restricted, committed, or assigned to expenditure for capital outlays.
Provide funding for the construction of capital facilities or acquisition of other capital assets.
Funding generated primarily from the sale of bonds.
Special Revenue Funds (Non-Major Governmental Funds)
Funds used to account for the proceeds of specific revenue sources that are legally restricted or committed to expenditures for a specified purpose other than debt service or capital projects and exclusive of resources held in trust.
Provide for a specific purpose received from federal, state, and local agencies.
Funds from the federal, state, and local government bodies as well as local agencies.
65
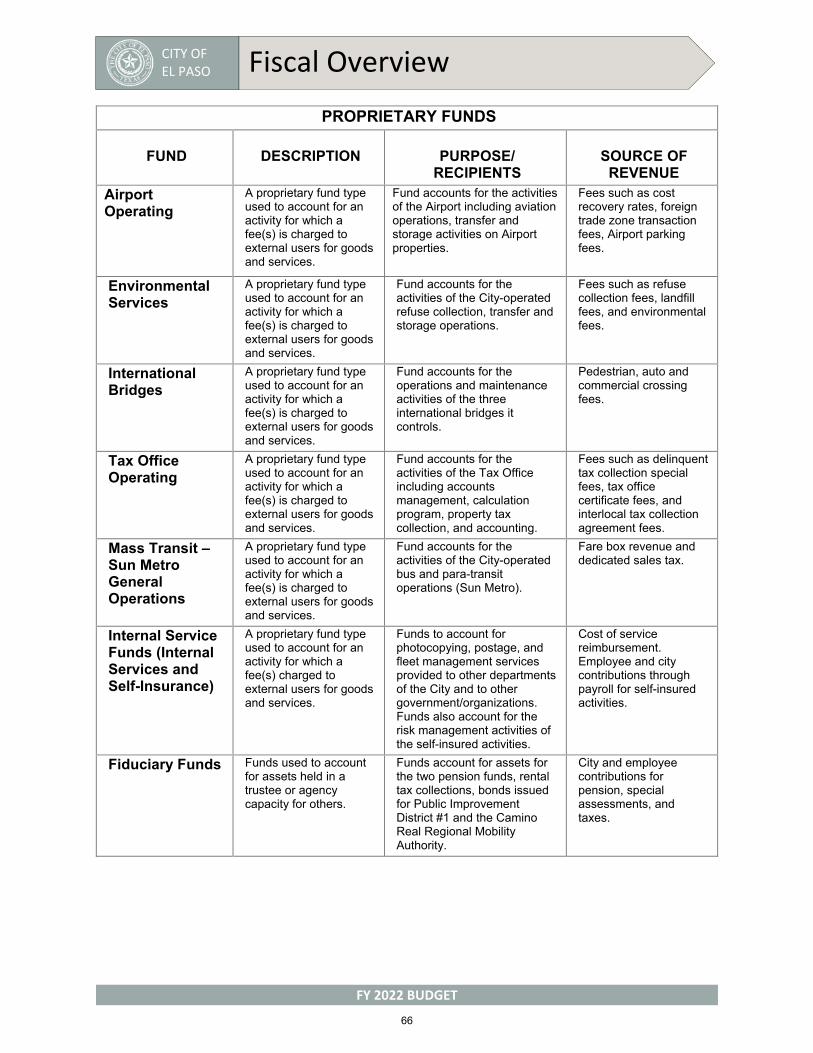
CITY OF EL PASO Fiscal Overview
FY 2022 BUDGET
PROPRIETARY FUNDS
FUND DESCRIPTION PURPOSE/ RECIPIENTS
SOURCE OF REVENUE
Airport Operating
A proprietary fund type used to account for an activity for which a fee(s) is charged to external users for goods and services.
Fund accounts for the activities of the Airport including aviation operations, transfer and storage activities on Airport properties.
Fees such as cost recovery rates, foreign trade zone transaction fees, Airport parking fees.
Environmental Services
A proprietary fund type used to account for an activity for which a fee(s) is charged to external users for goods and services.
Fund accounts for the activities of the City-operated refuse collection, transfer and storage operations.
Fees such as refuse collection fees, landfill fees, and environmental fees.
International Bridges
A proprietary fund type used to account for an activity for which a fee(s) is charged to external users for goods and services.
Fund accounts for the operations and maintenance activities of the three international bridges it controls.
Pedestrian, auto and commercial crossing fees.
Tax Office Operating
A proprietary fund type used to account for an activity for which a fee(s) is charged to external users for goods and services.
Fund accounts for the activities of the Tax Office including accounts management, calculation program, property tax collection, and accounting.
Fees such as delinquent tax collection special fees, tax office certificate fees, and interlocal tax collection agreement fees.
Mass Transit – Sun Metro General Operations
A proprietary fund type used to account for an activity for which a fee(s) is charged to external users for goods and services.
Fund accounts for the activities of the City-operated bus and para-transit operations (Sun Metro).
Fare box revenue and dedicated sales tax.
Internal Service Funds (Internal Services and Self-Insurance)
A proprietary fund type used to account for an activity for which a fee(s) charged to external users for goods and services.
Funds to account for photocopying, postage, and fleet management services provided to other departments of the City and to other government/organizations. Funds also account for the risk management activities of the self-insured activities.
Cost of service reimbursement. Employee and city contributions through payroll for self-insured activities.
Fiduciary Funds Funds used to account for assets held in a trustee or agency capacity for others.
Funds account for assets for the two pension funds, rental tax collections, bonds issued for Public Improvement District #1 and the Camino Real Regional Mobility Authority.
City and employee contributions for pension, special assessments, and taxes.
66
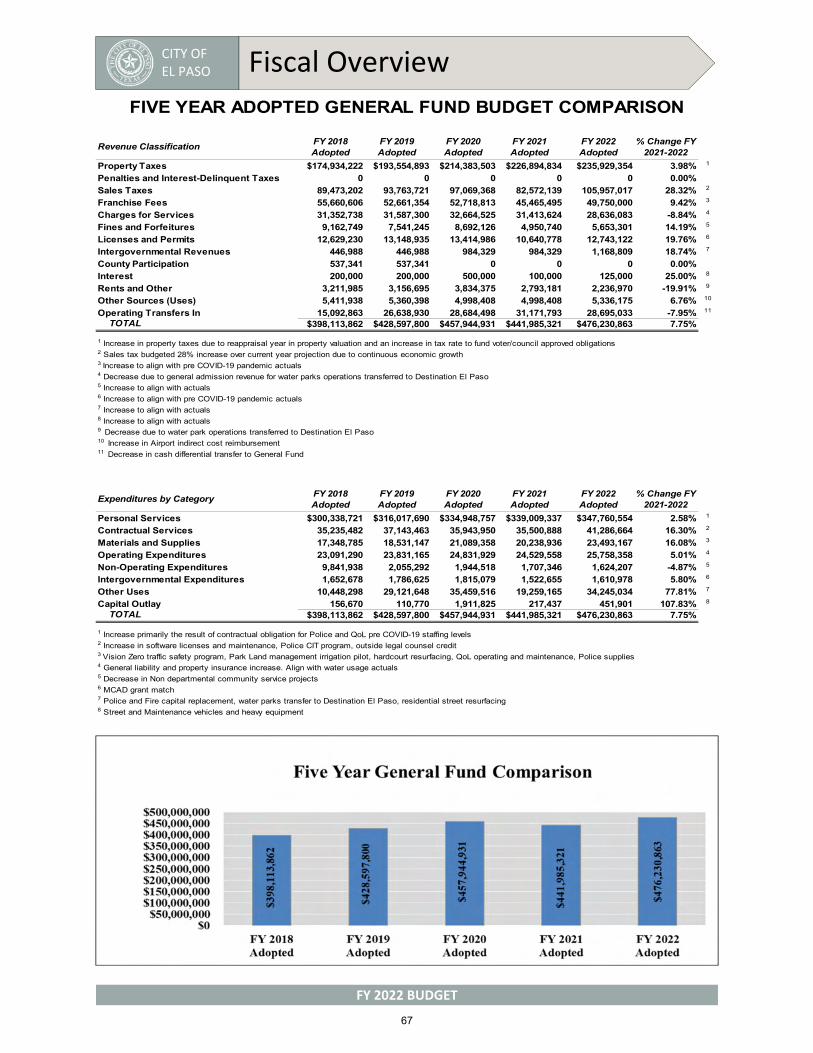
CITY OF EL PASO Fiscal Overview
FY 2022 BUDGET
Revenue ClassificationFY 2018 Adopted
FY 2019 Adopted
FY 2020 Adopted
FY 2021 Adopted
FY 2022 Adopted
% Change FY 2021-2022
Property Taxes $174,934,222 $193,554,893 $214,383,503 $226,894,834 $235,929,354 3.98% 1
Penalties and Interest-Delinquent Taxes 0 0 0 0 0 0.00%
Sales Taxes 89,473,202 93,763,721 97,069,368 82,572,139 105,957,017 28.32% 2
Franchise Fees 55,660,606 52,661,354 52,718,813 45,465,495 49,750,000 9.42% 3
Charges for Services 31,352,738 31,587,300 32,664,525 31,413,624 28,636,083 -8.84% 4
Fines and Forfeitures 9,162,749 7,541,245 8,692,126 4,950,740 5,653,301 14.19% 5
Licenses and Permits 12,629,230 13,148,935 13,414,986 10,640,778 12,743,122 19.76% 6
Intergovernmental Revenues 446,988 446,988 984,329 984,329 1,168,809 18.74% 7
County Participation 537,341 537,341 0 0 0 0.00%
Interest 200,000 200,000 500,000 100,000 125,000 25.00% 8
Rents and Other 3,211,985 3,156,695 3,834,375 2,793,181 2,236,970 -19.91% 9
Other Sources (Uses) 5,411,938 5,360,398 4,998,408 4,998,408 5,336,175 6.76% 10
Operating Transfers In 15,092,863 26,638,930 28,684,498 31,171,793 28,695,033 -7.95% 11
TOTAL $398,113,862 $428,597,800 $457,944,931 $441,985,321 $476,230,863 7.75% - - - - -
Expenditures by CategoryFY 2018 Adopted
FY 2019 Adopted
FY 2020 Adopted
FY 2021 Adopted
FY 2022 Adopted
% Change FY 2021-2022
Personal Services $300,338,721 $316,017,690 $334,948,757 $339,009,337 $347,760,554 2.58% 1
Contractual Services 35,235,482 37,143,463 35,943,950 35,500,888 41,286,664 16.30% 2
Materials and Supplies 17,348,785 18,531,147 21,089,358 20,238,936 23,493,167 16.08% 3
Operating Expenditures 23,091,290 23,831,165 24,831,929 24,529,558 25,758,358 5.01% 4
Non-Operating Expenditures 9,841,938 2,055,292 1,944,518 1,707,346 1,624,207 -4.87% 5
Intergovernmental Expenditures 1,652,678 1,786,625 1,815,079 1,522,655 1,610,978 5.80% 6
Other Uses 10,448,298 29,121,648 35,459,516 19,259,165 34,245,034 77.81% 7
Capital Outlay 156,670 110,770 1,911,825 217,437 451,901 107.83% 8
TOTAL $398,113,862 $428,597,800 $457,944,931 $441,985,321 $476,230,863 7.75% - - - - -
8 Street and Maintenance vehicles and heavy equipment
1 Increase primarily the result of contractual obligation for Police and QoL pre COVID-19 staffing levels2 Increase in software licenses and maintenance, Police CIT program, outside legal counsel credit3 Vision Zero traffic safety program, Park Land management irrigation pilot, hardcourt resurfacing, QoL operating and maintenance, Police supplies 4 General liability and property insurance increase. Align with water usage actuals5 Decrease in Non departmental community service projects6 MCAD grant match7 Police and Fire capital replacement, water parks transfer to Destination El Paso, residential street resurfacing
1 Increase in property taxes due to reappraisal year in property valuation and an increase in tax rate to fund voter/council approved obligations2 Sales tax budgeted 28% increase over current year projection due to continuous economic growth3 Increase to align with pre COVID-19 pandemic actuals
8 Increase to align with actuals
11 Decrease in cash differential transfer to General Fund
5 Increase to align with actuals6 Increase to align with pre COVID-19 pandemic actuals7 Increase to align with actuals
4 Decrease due to general admission revenue for water parks operations transferred to Destination El Paso
9 Decrease due to water park operations transferred to Destination El Paso10 Increase in Airport indirect cost reimbursement
FIVE YEAR ADOPTED GENERAL FUND BUDGET COMPARISON
67
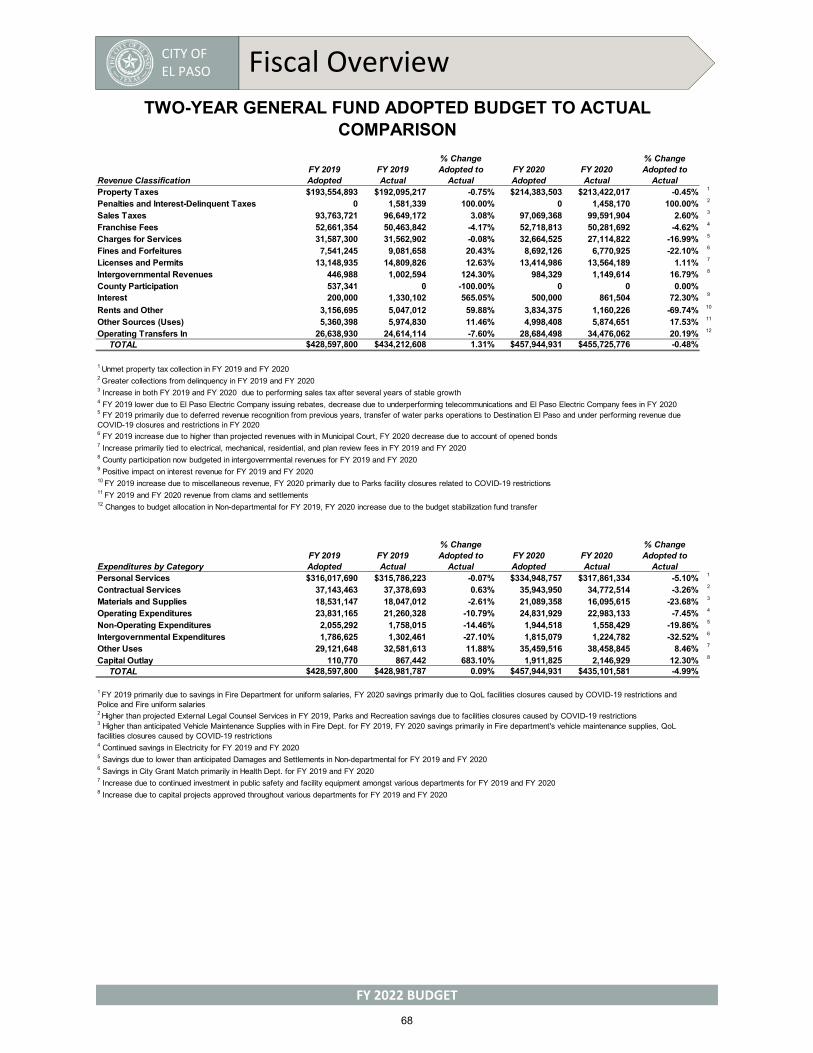
CITY OF EL PASO Fiscal Overview
FY 2022 BUDGET
% Change % Change
Revenue ClassificationFY 2019 Adopted
FY 2019 Actual
Adopted to Actual
FY 2020 Adopted
FY 2020 Actual
Adopted to Actual
Property Taxes $193,554,893 $192,095,217 -0.75% $214,383,503 $213,422,017 -0.45% 1
Penalties and Interest-Delinquent Taxes 0 1,581,339 100.00% 0 1,458,170 100.00% 2
Sales Taxes 93,763,721 96,649,172 3.08% 97,069,368 99,591,904 2.60% 3
Franchise Fees 52,661,354 50,463,842 -4.17% 52,718,813 50,281,692 -4.62% 4
Charges for Services 31,587,300 31,562,902 -0.08% 32,664,525 27,114,822 -16.99% 5
Fines and Forfeitures 7,541,245 9,081,658 20.43% 8,692,126 6,770,925 -22.10% 6
Licenses and Permits 13,148,935 14,809,826 12.63% 13,414,986 13,564,189 1.11% 7
Intergovernmental Revenues 446,988 1,002,594 124.30% 984,329 1,149,614 16.79% 8
County Participation 537,341 0 -100.00% 0 0 0.00%Interest 200,000 1,330,102 565.05% 500,000 861,504 72.30% 9
Rents and Other 3,156,695 5,047,012 59.88% 3,834,375 1,160,226 -69.74% 10
Other Sources (Uses) 5,360,398 5,974,830 11.46% 4,998,408 5,874,651 17.53% 11
Operating Transfers In 26,638,930 24,614,114 -7.60% 28,684,498 34,476,062 20.19% 12
TOTAL $428,597,800 $434,212,608 1.31% $457,944,931 $455,725,776 -0.48%
% Change % Change
Expenditures by CategoryFY 2019 Adopted
FY 2019 Actual
Adopted to Actual
FY 2020 Adopted
FY 2020 Actual
Adopted to Actual
Personal Services $316,017,690 $315,786,223 -0.07% $334,948,757 $317,861,334 -5.10% 1
Contractual Services 37,143,463 37,378,693 0.63% 35,943,950 34,772,514 -3.26% 2
Materials and Supplies 18,531,147 18,047,012 -2.61% 21,089,358 16,095,615 -23.68% 3
Operating Expenditures 23,831,165 21,260,328 -10.79% 24,831,929 22,983,133 -7.45% 4
Non-Operating Expenditures 2,055,292 1,758,015 -14.46% 1,944,518 1,558,429 -19.86% 5
Intergovernmental Expenditures 1,786,625 1,302,461 -27.10% 1,815,079 1,224,782 -32.52% 6
Other Uses 29,121,648 32,581,613 11.88% 35,459,516 38,458,845 8.46% 7
Capital Outlay 110,770 867,442 683.10% 1,911,825 2,146,929 12.30% 8
TOTAL $428,597,800 $428,981,787 0.09% $457,944,931 $435,101,581 -4.99%
TWO-YEAR GENERAL FUND ADOPTED BUDGET TO ACTUAL COMPARISON
1 FY 2019 primarily due to savings in Fire Department for uniform salaries, FY 2020 savings primarily due to QoL facilities closures caused by COVID-19 restrictions and Police and Fire uniform salaries
1 Unmet property tax collection in FY 2019 and FY 20202 Greater collections from delinquency in FY 2019 and FY 20203 Increase in both FY 2019 and FY 2020 due to performing sales tax after several years of stable growth4 FY 2019 lower due to El Paso Electric Company issuing rebates, decrease due to underperforming telecommunications and El Paso Electric Company fees in FY 20205 FY 2019 primarily due to deferred revenue recognition from previous years, transfer of water parks operations to Destination El Paso and under performing revenue due COVID-19 closures and restrictions in FY 20206 FY 2019 increase due to higher than projected revenues with in Municipal Court, FY 2020 decrease due to account of opened bonds7 Increase primarily tied to electrical, mechanical, residential, and plan review fees in FY 2019 and FY 20208 County participation now budgeted in intergovernmental revenues for FY 2019 and FY 20209 Positive impact on interest revenue for FY 2019 and FY 202010 FY 2019 increase due to miscellaneous revenue, FY 2020 primarily due to Parks facility closures related to COVID-19 restrictions11 FY 2019 and FY 2020 revenue from clams and settlements12 Changes to budget allocation in Non-departmental for FY 2019, FY 2020 increase due to the budget stabilization fund transfer
7 Increase due to continued investment in public safety and facility equipment amongst various departments for FY 2019 and FY 20208 Increase due to capital projects approved throughout various departments for FY 2019 and FY 2020
2 Higher than projected External Legal Counsel Services in FY 2019, Parks and Recreation savings due to facilities closures caused by COVID-19 restrictions3 Higher than anticipated Vehicle Maintenance Supplies with in Fire Dept. for FY 2019, FY 2020 savings primarily in Fire department's vehicle maintenance supplies, QoL facilities closures caused by COVID-19 restrictions4 Continued savings in Electricity for FY 2019 and FY 20205 Savings due to lower than anticipated Damages and Settlements in Non-departmental for FY 2019 and FY 20206 Savings in City Grant Match primarily in Health Dept. for FY 2019 and FY 2020
68
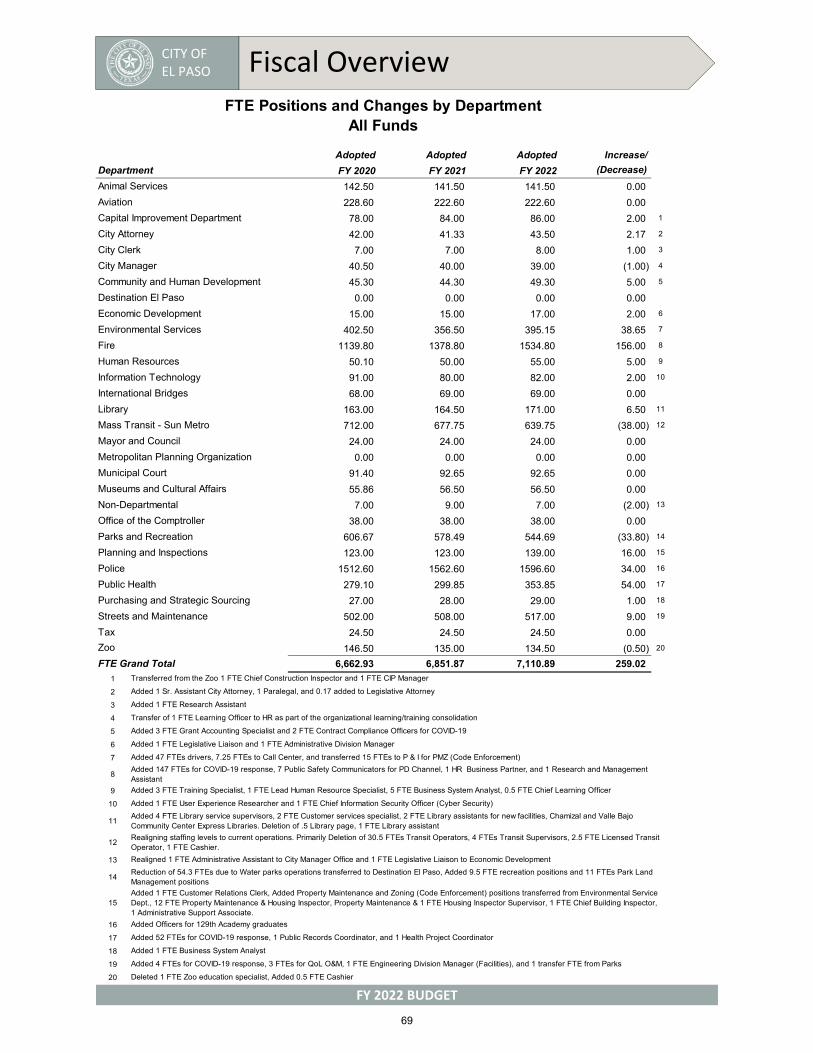
CITY OF EL PASO Fiscal Overview
FY 2022 BUDGET
Adopted Adopted Adopted Increase/
Department FY 2020 FY 2021 FY 2022 (Decrease)
Animal Services 142.50 141.50 141.50 0.00
Aviation 228.60 222.60 222.60 0.00
Capital Improvement Department 78.00 84.00 86.00 2.00 1
City Attorney 42.00 41.33 43.50 2.17 2
City Clerk 7.00 7.00 8.00 1.00 3
City Manager 40.50 40.00 39.00 (1.00) 4
Community and Human Development 45.30 44.30 49.30 5.00 5
Destination El Paso 0.00 0.00 0.00 0.00
Economic Development 15.00 15.00 17.00 2.00 6
Environmental Services 402.50 356.50 395.15 38.65 7
Fire 1139.80 1378.80 1534.80 156.00 8
Human Resources 50.10 50.00 55.00 5.00 9
Information Technology 91.00 80.00 82.00 2.00 10
International Bridges 68.00 69.00 69.00 0.00
Library 163.00 164.50 171.00 6.50 11
Mass Transit - Sun Metro 712.00 677.75 639.75 (38.00) 12
Mayor and Council 24.00 24.00 24.00 0.00
Metropolitan Planning Organization 0.00 0.00 0.00 0.00
Municipal Court 91.40 92.65 92.65 0.00
Museums and Cultural Affairs 55.86 56.50 56.50 0.00
Non-Departmental 7.00 9.00 7.00 (2.00) 13
Office of the Comptroller 38.00 38.00 38.00 0.00
Parks and Recreation 606.67 578.49 544.69 (33.80) 14
Planning and Inspections 123.00 123.00 139.00 16.00 15
Police 1512.60 1562.60 1596.60 34.00 16
Public Health 279.10 299.85 353.85 54.00 17
Purchasing and Strategic Sourcing 27.00 28.00 29.00 1.00 18
Streets and Maintenance 502.00 508.00 517.00 9.00 19
Tax 24.50 24.50 24.50 0.00
Zoo 146.50 135.00 134.50 (0.50) 20
FTE Grand Total 6,662.93 6,851.87 7,110.89 259.02
1
2
3
4
5
6
7
8
9
10
11
12
13
14
15
16
17
18
19
20
Added 4 FTE Library service supervisors, 2 FTE Customer services specialist, 2 FTE Library assistants for new facilities, Chamizal and Valle Bajo Community Center Express Libraries. Deletion of .5 Library page, 1 FTE Library assistant
Realigning staffing levels to current operations. Primarily Deletion of 30.5 FTEs Transit Operators, 4 FTEs Transit Supervisors, 2.5 FTE Licensed Transit Operator, 1 FTE Cashier.
Realigned 1 FTE Administrative Assistant to City Manager Office and 1 FTE Legislative Liaison to Economic Development
Reduction of 54.3 FTEs due to Water parks operations transferred to Destination El Paso, Added 9.5 FTE recreation positions and 11 FTEs Park Land Management positions
Added 1 FTE Customer Relations Clerk, Added Property Maintenance and Zoning (Code Enforcement) positions transferred from Environmental Service Dept., 12 FTE Property Maintenance & Housing Inspector, Property Maintenance & 1 FTE Housing Inspector Supervisor, 1 FTE Chief Building Inspector, 1 Administrative Support Associate.
Added Officers for 129th Academy graduates
Added 52 FTEs for COVID-19 response, 1 Public Records Coordinator, and 1 Health Project Coordinator
Added 1 FTE Business System Analyst
Added 4 FTEs for COVID-19 response, 3 FTEs for QoL O&M, 1 FTE Engineering Division Manager (Facilities), and 1 transfer FTE from Parks
Deleted 1 FTE Zoo education specialist, Added 0.5 FTE Cashier
Added 1 FTE User Experience Researcher and 1 FTE Chief Information Security Officer (Cyber Security)
FTE Positions and Changes by DepartmentAll Funds
Transferred from the Zoo 1 FTE Chief Construction Inspector and 1 FTE CIP Manager
Added 1 Sr. Assistant City Attorney, 1 Paralegal, and 0.17 added to Legislative Attorney
Added 1 FTE Research Assistant
Transfer of 1 FTE Learning Officer to HR as part of the organizational learning/training consolidation
Added 3 FTE Grant Accounting Specialist and 2 FTE Contract Compliance Officers for COVID-19
Added 1 FTE Legislative Liaison and 1 FTE Administrative Division Manager
Added 47 FTEs drivers, 7.25 FTEs to Call Center, and transferred 15 FTEs to P & I for PMZ (Code Enforcement)
Added 147 FTEs for COVID-19 response, 7 Public Safety Communicators for PD Channel, 1 HR Business Partner, and 1 Research and Management Assistant
Added 3 FTE Training Specialist, 1 FTE Lead Human Resource Specialist, 5 FTE Business System Analyst, 0.5 FTE Chief Learning Officer
69
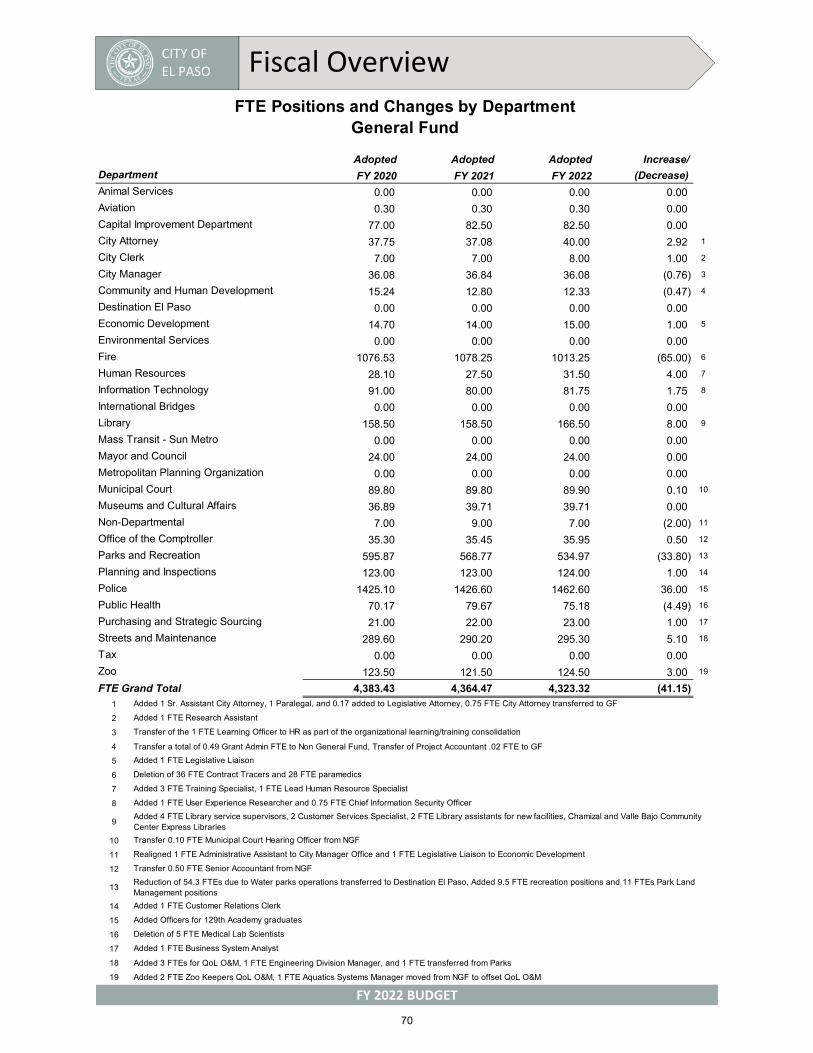
CITY OF EL PASO Fiscal Overview
FY 2022 BUDGET
Adopted Adopted Adopted Increase/
Department FY 2020 FY 2021 FY 2022 (Decrease)
Animal Services 0.00 0.00 0.00 0.00
Aviation 0.30 0.30 0.30 0.00
Capital Improvement Department 77.00 82.50 82.50 0.00
City Attorney 37.75 37.08 40.00 2.92 1
City Clerk 7.00 7.00 8.00 1.00 2
City Manager 36.08 36.84 36.08 (0.76) 3
Community and Human Development 15.24 12.80 12.33 (0.47) 4
Destination El Paso 0.00 0.00 0.00 0.00
Economic Development 14.70 14.00 15.00 1.00 5
Environmental Services 0.00 0.00 0.00 0.00
Fire 1076.53 1078.25 1013.25 (65.00) 6
Human Resources 28.10 27.50 31.50 4.00 7
Information Technology 91.00 80.00 81.75 1.75 8
International Bridges 0.00 0.00 0.00 0.00
Library 158.50 158.50 166.50 8.00 9
Mass Transit - Sun Metro 0.00 0.00 0.00 0.00
Mayor and Council 24.00 24.00 24.00 0.00
Metropolitan Planning Organization 0.00 0.00 0.00 0.00
Municipal Court 89.80 89.80 89.90 0.10 10
Museums and Cultural Affairs 36.89 39.71 39.71 0.00
Non-Departmental 7.00 9.00 7.00 (2.00) 11
Office of the Comptroller 35.30 35.45 35.95 0.50 12
Parks and Recreation 595.87 568.77 534.97 (33.80) 13
Planning and Inspections 123.00 123.00 124.00 1.00 14
Police 1425.10 1426.60 1462.60 36.00 15
Public Health 70.17 79.67 75.18 (4.49) 16
Purchasing and Strategic Sourcing 21.00 22.00 23.00 1.00 17
Streets and Maintenance 289.60 290.20 295.30 5.10 18
Tax 0.00 0.00 0.00 0.00
Zoo 123.50 121.50 124.50 3.00 19
FTE Grand Total 4,383.43 4,364.47 4,323.32 (41.15) 1
2
3
4 Transfer a total of 0.49 Grant Admin FTE to Non General Fund, Transfer of Project Accountant .02 FTE to GF
5
6
7
8
9
10
11
12
13
14
15
16
17
18 Added 3 FTEs for QoL O&M, 1 FTE Engineering Division Manager, and 1 FTE transferred from Parks
19 Added 2 FTE Zoo Keepers QoL O&M, 1 FTE Aquatics Systems Manager moved from NGF to offset QoL O&M
Transfer 0.50 FTE Senior Accountant from NGF
Reduction of 54.3 FTEs due to Water parks operations transferred to Destination El Paso, Added 9.5 FTE recreation positions and 11 FTEs Park Land Management positions
Added 1 FTE Customer Relations Clerk
Added Officers for 129th Academy graduates
Deletion of 5 FTE Medical Lab Scientists
Added 1 FTE Business System Analyst
Realigned 1 FTE Administrative Assistant to City Manager Office and 1 FTE Legislative Liaison to Economic Development
FTE Positions and Changes by DepartmentGeneral Fund
Added 1 Sr. Assistant City Attorney, 1 Paralegal, and 0.17 added to Legislative Attorney, 0.75 FTE City Attorney transferred to GF
Added 1 FTE Research Assistant
Transfer of the 1 FTE Learning Officer to HR as part of the organizational learning/training consolidation
Added 1 FTE Legislative Liaison
Deletion of 36 FTE Contract Tracers and 28 FTE paramedics
Added 3 FTE Training Specialist, 1 FTE Lead Human Resource Specialist
Added 1 FTE User Experience Researcher and 0.75 FTE Chief Information Security Officer
Added 4 FTE Library service supervisors, 2 Customer Services Specialist, 2 FTE Library assistants for new facilities, Chamizal and Valle Bajo Community Center Express Libraries
Transfer 0.10 FTE Municipal Court Hearing Officer from NGF
70

CITY OF EL PASO Fiscal Overview
FY 2022 BUDGET
Adopted Adopted Adopted Increase/
Department FY 2020 FY 2021 FY 2022 (Decrease)
Animal Services 142.50 141.50 141.50 0.00
Aviation 228.30 222.30 222.30 0.00
Capital Improvement Department 1.00 1.50 3.50 2.00 1
City Attorney 4.25 4.25 3.50 (0.75) 2
City Clerk 0.00 0.00 0.00 0.00
City Manager 4.42 3.16 2.92 (0.24) 3
Community and Human Development 30.06 31.50 36.97 5.47 4
Destination El Paso 0.00 0.00 0.00 0.00
Economic Development 0.30 1.00 2.00 1.00 5
Environmental Services 402.50 356.50 395.15 38.65 6
Fire 63.27 300.55 521.55 221.00 7
Human Resources 22.00 22.50 23.50 1.00 8
Information Technology 0.00 0.00 0.25 0.25 9
International Bridges 68.00 69.00 69.00 0.00
Library 4.50 6.00 4.50 (1.50) 10
Mass Transit - Sun Metro 712.00 677.75 639.75 (38.00) 11
Mayor and Council 0.00 0.00 0.00 0.00
Metropolitan Planning Organization 0.00 0.00 0.00 0.00
Municipal Court 1.60 2.85 2.75 (0.10) 12
Museums and Cultural Affairs 18.97 16.79 16.79 0.00
Non-Departmental 0.00 0.00 0.00 0.00
Office of the Comptroller 2.70 2.55 2.05 (0.50) 13
Parks and Recreation 10.80 9.72 9.72 0.00
Planning and Inspections 0.00 0.00 15.00 15.00 14
Police 87.50 136.00 134.00 (2.00) 15
Public Health 208.93 220.18 278.67 58.49 16
Purchasing and Strategic Sourcing 6.00 6.00 6.00 0.00
Streets and Maintenance 212.40 217.80 221.70 3.90 17
Tax 24.50 24.50 24.50 0.00
Zoo 23.00 13.50 10.00 (3.50) 18
FTE Grand Total 2,279.50 2,487.40 2,787.57 300.17 1
2
3
4
5
6
7
8
9
10
11
12
13
14
15
16
17
18
Added 4 FTEs for COVID-19 response
Added 2 FTE Zoo Keepers QoL O&M, 1 FTE moved from NGF to offset QoL O&M, deletion of 1 FTE Zoo Education Specialist, Added 0.5 FTE Cashier
Realigning staffing levels to current operations, deletion of 30.5 FTEs Transit Operators, 4 FTEs Transit Supervisors, 2.5 FTE Licensed Transit Operator, 1 FTE Cashier
Transferred 0.10 FTE Municipal Court Hearing Officer to GF
Transferred 0.5 FTE Senior Accountant to GF
Added Property Maintenance and Zoning (Code Enforcement) positions transferred from Environmental Service Dept. 12 FTE Property Maintenance & Housing Inspector, Property Maintenance & 1 FTE Housing Inspector Supervisor, 1 FTE Chief Building Inspector, 1 Administrative Support Associate
Deletion 2 FTE Senior Crime Analyst
Added 52 FTEs for COVID-19 response, 3 FTE WIC Clinical Assistants, 1 FTE Foodborne Illness Epidemiologist, 1 FTE Public Health Community Aide, and 1 FTE Health Preparedness Education Specialist
Transferred 1.5 FTEs Library Customer Service Specialist FTEs to GF
Transferred from the Zoo – 1 FTE Chief Construction Inspector and 1 FTE CIP Manager
Transferred 0.75 FTE City Attorney to GF
Transferred 0.12 FTE Assistant position to General Fund and deleted 0.12 FTE Assistant position
Added 3 FTE Grant Accounting Spec and 2 FTE Contract Compliance Officers for COVID-19. Transfer of a total of 0.49 Grant Admin FTEs to Non General Fund, Transfer of Project Accountant .02 FTE to GF
Added 1 FTE Administrative Division Manager
Added 47 FTEs to cover for increased collections, 7.25 FTEs to Call Center, and transferred 15 FTEs to P&I for PMZ (Code Enforcement)
Added 221 COVID-19 Response Ops Assistants
Added 0.5 FTE Business System Analyst, .5 FTE Chief Learning Officer
Transferred of 0.25 FTE Chief Information Security Officer from GF
FTE Positions and Changes by DepartmentNon General Fund
71

CITY OF EL PASO Fiscal Overview
FY 2022 BUDGET
Property Tax
Ad Valorem Tax Law
All taxable property within the City is subject to the assessment, levy, and collection by the City of a continuing, direct annual ad valorem tax.
By August 31st, the City Council adopts a tax rate per $100 taxable value for the current year. The tax rate consists of:
1. A rate for debt service.
2. A rate for funding of maintenance and operation expenditures
The El Paso Central Appraisal District is responsible for the appraisal of property within the City. Excluding agricultural and open-space land, which may be taxed on the basis of productive capacity, the Appraisal District is required under the Property Tax Code to appraise all property within the Appraisal District on the basis of 100 percent of its market value and is prohibited from applying any assessment ratios.
The value placed upon property is subject to review by an Appraisal Review Board, consisting of three members appointed by the Board of Directors of the Appraisal District. The Appraisal District is required to review the value of every property within the District at least every three years. The City may require annual review at its own expense and is entitled to challenge the determination of the appraised value of property within the City by petition filed with the Appraisal Review Board.
72
CITY OF EL PASO Fiscal Overview
FY 2022 BUDGET
Tax Rate Limitation In determining the ad valorem tax, the City operates under a home-rule charter (the City Charter), pursuant to Article XI, Section 5, of the Texas Constitution. The City Charter limits the tax rate to $1.85 per $100 assessed valuation for all City purposes. The current tax rate of $0.907301 for FY 2022 remains within the limit set by the City Charter.
Under the Property Tax Code, the City must annually calculate and publicize its effective tax rate and rollback tax rate. A public hearing is then held following a properly posted public notice to the taxpayers. If the adopted tax rate exceeds the rollback tax rate, the qualified voters of the City, by petition, may require an election to determine whether to reduce the tax rate adopted for the current year to the rollback tax rate.
In summer of 2019, the Texas Property Reform and Transparency Act was passed in the Texas Legislature, also known as Senate Bill 2 (SB2). This change possesses legislative challenges such as lowering the tax rate a taxing unit can adopt without voter approval, changing how a city adopts a tax rate, and makes numerous changes to the appraisal process. A tax rate exceeding 3.5% will trigger a mandatory election. This legislation also includes changes to our debt requirement versus operation and maintenance, changing how Certificates of Obligation are paid back.
73
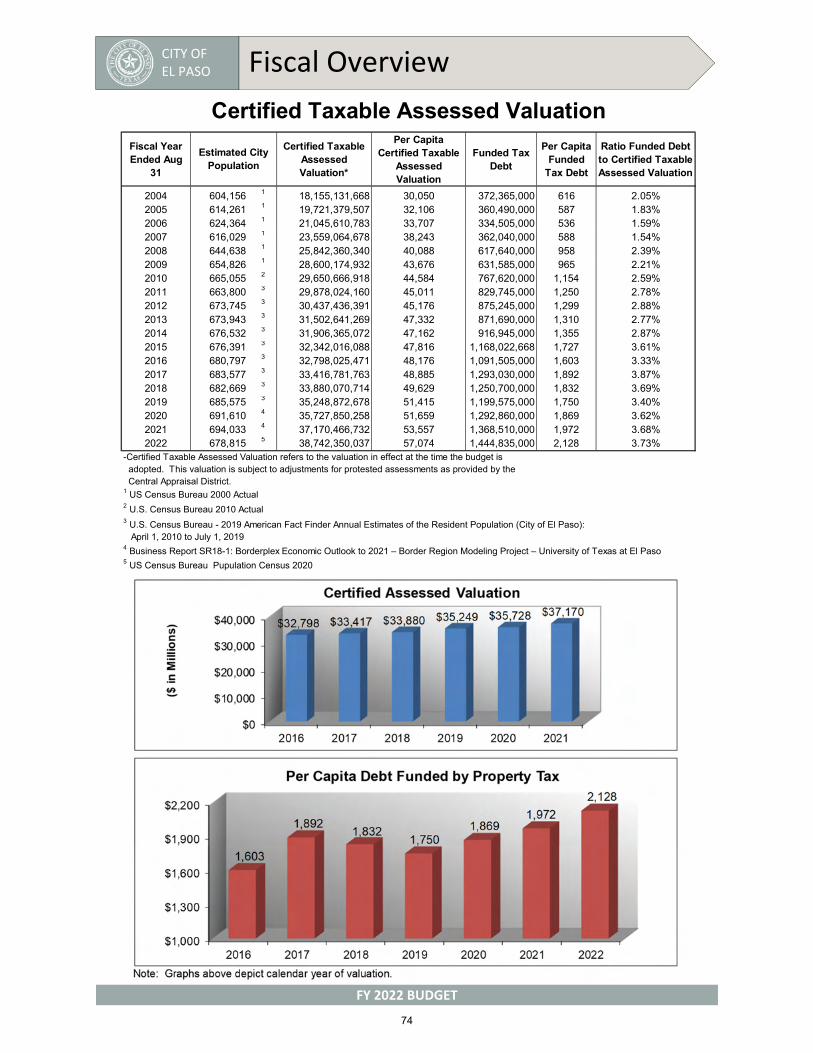
CITY OF EL PASO Fiscal Overview
FY 2022 BUDGET
Fiscal Year Ended Aug
31
Certified Taxable Assessed Valuation*
Per Capita Certified Taxable
Assessed Valuation
Funded Tax Debt
Per Capita Funded
Tax Debt
Ratio Funded Debt to Certified Taxable Assessed Valuation
2004 604,156 1 18,155,131,668 30,050 372,365,000 616 2.05%2005 614,261 1 19,721,379,507 32,106 360,490,000 587 1.83%2006 624,364 1 21,045,610,783 33,707 334,505,000 536 1.59%2007 616,029 1 23,559,064,678 38,243 362,040,000 588 1.54%2008 644,638 1 25,842,360,340 40,088 617,640,000 958 2.39%2009 654,826 1 28,600,174,932 43,676 631,585,000 965 2.21%2010 665,055 2 29,650,666,918 44,584 767,620,000 1,154 2.59%2011 663,800 3 29,878,024,160 45,011 829,745,000 1,250 2.78%2012 673,745 3 30,437,436,391 45,176 875,245,000 1,299 2.88%2013 673,943 3 31,502,641,269 47,332 871,690,000 1,310 2.77%2014 676,532 3 31,906,365,072 47,162 916,945,000 1,355 2.87%2015 676,391 3 32,342,016,088 47,816 1,168,022,668 1,727 3.61%2016 680,797 3 32,798,025,471 48,176 1,091,505,000 1,603 3.33%2017 683,577 3 33,416,781,763 48,885 1,293,030,000 1,892 3.87%2018 682,669 3 33,880,070,714 49,629 1,250,700,000 1,832 3.69%2019 685,575 3 35,248,872,678 51,415 1,199,575,000 1,750 3.40%2020 691,610 4 35,727,850,258 51,659 1,292,860,000 1,869 3.62%2021 694,033 4 37,170,466,732 53,557 1,368,510,000 1,972 3.68%2022 678,815 5 38,742,350,037 57,074 1,444,835,000 2,128 3.73%
-Certified Taxable Assessed Valuation refers to the valuation in effect at the time the budget isadopted. This valuation is subject to adjustments for protested assessments as provided by the Central Appraisal District.
1 US Census Bureau 2000 Actual
5 US Census Bureau Pupulation Census 2020
Certified Taxable Assessed Valuation
Estimated City Population
2 U.S. Census Bureau 2010 Actual3 U.S. Census Bureau - 2019 American Fact Finder Annual Estimates of the Resident Population (City of El Paso):
4 Business Report SR18-1: Borderplex Economic Outlook to 2021 – Border Region Modeling Project – University of Texas at El Paso
April 1, 2010 to July 1, 2019
74

CITY OF EL PASO Fiscal Overview
FY 2022 BUDGET
ASSESSED VALUE AT TIME OF LEVY ALLOCATION-------------------------------------------------------------------- OF TAX RATE
TOTAL ---------------------------CALENDAR ASSESSED TAX GENERAL SINKING
YEAR AMOUNT PERCENT AMOUNT PERCENT VALUE RATE FUND FUND
1990 9,371,605,073 82.51% 1,986,765,547 17.49% 11,358,370,620 0.516160 0.412438 0.103722
1991 9,480,583,878 83.61% 1,858,199,464 16.39% 11,338,783,342 0.560247 0.446042 0.114205
1992 9,602,672,472 83.26% 1,930,114,989 16.74% 11,532,787,461 0.607468 0.466114 0.141354
1993 10,352,379,143 84.29% 1,929,368,217 15.71% 12,281,747,360 0.653229 0.466114 0.187115
1994 10,638,305,036 83.61% 2,085,774,596 16.39% 12,724,079,632 0.643796 0.480097 0.163699
1995 11,903,494,793 83.85% 2,292,148,507 16.15% 14,195,643,300 0.653229 0.480947 0.172282
1996 12,293,694,888 82.90% 2,535,140,475 17.10% 14,828,835,363 0.635926 0.474313 0.161613
1997 12,619,969,776 82.80% 2,620,753,710 17.20% 15,240,723,486 0.635926 0.484313 0.151613
1998 12,825,739,841 82.85% 2,654,935,888 17.15% 15,480,675,729 0.660234 0.487100 0.173134
1999 13,150,744,696 82.80% 2,731,797,207 17.20% 15,882,541,903 0.660234 0.487100 0.173134
2000 13,567,068,101 82.68% 2,841,081,574 17.32% 16,408,149,675 0.660213 0.487100 0.173113
2001 14,292,256,098 82.81% 2,967,016,152 17.19% 17,259,272,250 0.719833 0.542100 0.177733
2002 14,784,642,367 82.99% 3,030,427,427 17.01% 17,815,069,794 0.719833 0.542100 0.177733
2003 15,368,779,857 84.49% 2,820,246,208 15.51% 18,189,026,065 0.719833 0.542100 0.177733
2004 16,947,741,252 85.48% 2,879,856,855 14.52% 19,827,598,107 0.696677 0.524662 0.172015
2005 18,176,200,124 86.19% 2,911,679,293 13.81% 21,087,879,417 0.696677 0.508371 0.188306
2006 20,547,235,658 87.22% 3,011,829,020 12.78% 23,559,064,678 0.672326 0.481419 0.190907
2007 23,170,310,322 88.15% 3,114,201,621 11.85% 26,284,511,943 0.671097 0.453294 0.217803
2008 25,490,006,325 88.35% 3,359,949,875 11.65% 28,849,956,200 0.633000 0.429000 0.204000
2009 26,410,264,519 88.78% 3,338,697,287 11.22% 29,748,961,806 0.633000 0.422000 0.211000
2010 26,634,717,443 88.96% 3,306,986,336 11.04% 29,941,703,779 0.653700 0.428400 0.225300
2011 27,392,765,508 89.03% 3,374,524,819 10.97% 30,767,290,327 0.658404 0.429236 0.229168
2012 28,553,647,354 89.28% 3,426,697,392 10.72% 31,980,344,746 0.658404 0.442148 0.216256
2013 28,887,623,664 89.14% 3,520,190,301 10.86% 32,407,813,965 0.678378 0.445699 0.232679
2014 29,020,607,436 88.69% 3,700,301,826 11.31% 32,720,909,262 0.699784 0.460937 0.238847
2015 29,214,881,176 88.23% 3,898,815,619 11.77% 33,113,696,795 0.729725 0.478130 0.251595
2016 29,792,153,721 88.22% 3,979,926,705 11.78% 33,772,080,426 0.759656 0.485641 0.274015
2017 29,894,806,740 87.68% 4,199,514,669 12.32% 34,094,321,409 0.803433 0.522982 0.280451
2018 31,407,364,143 87.97% 4,294,591,307 12.03% 35,701,955,450 0.843332 0.557239 0.286093
2019 32,282,312,183 87.61% 4,564,404,168 12.39% 36,846,716,351 0.907301 0.610139 0.297162
2020 33,615,916,481 87.98% 4,591,679,049 12.02% 38,207,595,530 0.907301 0.623847 0.283454
2021 35,326,077,122 88.53% 4,577,325,243 11.47% 39,903,402,365 0.907301 0.621636 0.285665
Source: Tax Collection System: Certified Roll Jurisdiction Summary TC500rpt
--------------------------------------------------------------------
SCHEDULE OF ASSESSED VALUATION AND TAX RATECITY OF EL PASO
Personal PropertyReal Property
75
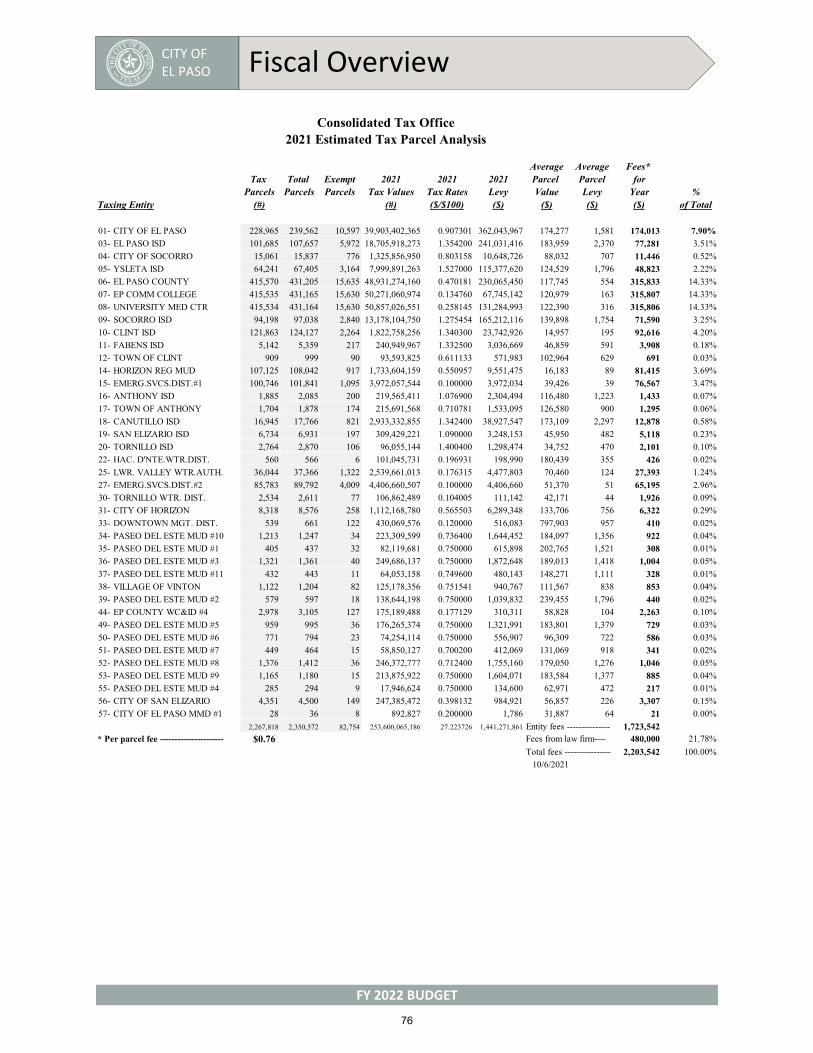
CITY OF EL PASO Fiscal Overview
FY 2022 BUDGET
Average Average Fees* Tax Total Exempt 2021 2021 2021 Parcel Parcel for
Parcels Parcels Parcels Tax Values Tax Rates Levy Value Levy Year %Taxing Entity (#) (#) ($/$100) ($) ($) ($) ($) of Total
01- CITY OF EL PASO 228,965 239,562 10,597 39,903,402,365 0.907301 362,043,967 174,277 1,581 174,013 7.90%
03- EL PASO ISD 101,685 107,657 5,972 18,705,918,273 1.354200 241,031,416 183,959 2,370 77,281 3.51%
04- CITY OF SOCORRO 15,061 15,837 776 1,325,856,950 0.803158 10,648,726 88,032 707 11,446 0.52%
05- YSLETA ISD 64,241 67,405 3,164 7,999,891,263 1.527000 115,377,620 124,529 1,796 48,823 2.22%
06- EL PASO COUNTY 415,570 431,205 15,635 48,931,274,160 0.470181 230,065,450 117,745 554 315,833 14.33%
07- EP COMM COLLEGE 415,535 431,165 15,630 50,271,060,974 0.134760 67,745,142 120,979 163 315,807 14.33%
08- UNIVERSITY MED CTR 415,534 431,164 15,630 50,857,026,551 0.258145 131,284,993 122,390 316 315,806 14.33%
09- SOCORRO ISD 94,198 97,038 2,840 13,178,104,750 1.275454 165,212,116 139,898 1,754 71,590 3.25%
10- CLINT ISD 121,863 124,127 2,264 1,822,758,256 1.340300 23,742,926 14,957 195 92,616 4.20%
11- FABENS ISD 5,142 5,359 217 240,949,967 1.332500 3,036,669 46,859 591 3,908 0.18%
12- TOWN OF CLINT 909 999 90 93,593,825 0.611133 571,983 102,964 629 691 0.03%
14- HORIZON REG MUD 107,125 108,042 917 1,733,604,159 0.550957 9,551,475 16,183 89 81,415 3.69%
15- EMERG.SVCS.DIST.#1 100,746 101,841 1,095 3,972,057,544 0.100000 3,972,034 39,426 39 76,567 3.47%
16- ANTHONY ISD 1,885 2,085 200 219,565,411 1.076900 2,304,494 116,480 1,223 1,433 0.07%
17- TOWN OF ANTHONY 1,704 1,878 174 215,691,568 0.710781 1,533,095 126,580 900 1,295 0.06%
18- CANUTILLO ISD 16,945 17,766 821 2,933,332,855 1.342400 38,927,547 173,109 2,297 12,878 0.58%
19- SAN ELIZARIO ISD 6,734 6,931 197 309,429,221 1.090000 3,248,153 45,950 482 5,118 0.23%
20- TORNILLO ISD 2,764 2,870 106 96,055,144 1.400400 1,298,474 34,752 470 2,101 0.10%
22- HAC. D'NTE.WTR.DIST. 560 566 6 101,045,731 0.196931 198,990 180,439 355 426 0.02%
25- LWR. VALLEY WTR.AUTH. 36,044 37,366 1,322 2,539,661,013 0.176315 4,477,803 70,460 124 27,393 1.24%
27- EMERG.SVCS.DIST.#2 85,783 89,792 4,009 4,406,660,507 0.100000 4,406,660 51,370 51 65,195 2.96%
30- TORNILLO WTR. DIST. 2,534 2,611 77 106,862,489 0.104005 111,142 42,171 44 1,926 0.09%
31- CITY OF HORIZON 8,318 8,576 258 1,112,168,780 0.565503 6,289,348 133,706 756 6,322 0.29%
33- DOWNTOWN MGT. DIST. 539 661 122 430,069,576 0.120000 516,083 797,903 957 410 0.02%
34- PASEO DEL ESTE MUD #10 1,213 1,247 34 223,309,599 0.736400 1,644,452 184,097 1,356 922 0.04%
35- PASEO DEL ESTE MUD #1 405 437 32 82,119,681 0.750000 615,898 202,765 1,521 308 0.01%
36- PASEO DEL ESTE MUD #3 1,321 1,361 40 249,686,137 0.750000 1,872,648 189,013 1,418 1,004 0.05%
37- PASEO DEL ESTE MUD #11 432 443 11 64,053,158 0.749600 480,143 148,271 1,111 328 0.01%
38- VILLAGE OF VINTON 1,122 1,204 82 125,178,356 0.751541 940,767 111,567 838 853 0.04%
39- PASEO DEL ESTE MUD #2 579 597 18 138,644,198 0.750000 1,039,832 239,455 1,796 440 0.02%
44- EP COUNTY WC&ID #4 2,978 3,105 127 175,189,488 0.177129 310,311 58,828 104 2,263 0.10%
49- PASEO DEL ESTE MUD #5 959 995 36 176,265,374 0.750000 1,321,991 183,801 1,379 729 0.03%
50- PASEO DEL ESTE MUD #6 771 794 23 74,254,114 0.750000 556,907 96,309 722 586 0.03%
51- PASEO DEL ESTE MUD #7 449 464 15 58,850,127 0.700200 412,069 131,069 918 341 0.02%
52- PASEO DEL ESTE MUD #8 1,376 1,412 36 246,372,777 0.712400 1,755,160 179,050 1,276 1,046 0.05%
53- PASEO DEL ESTE MUD #9 1,165 1,180 15 213,875,922 0.750000 1,604,071 183,584 1,377 885 0.04%
55- PASEO DEL ESTE MUD #4 285 294 9 17,946,624 0.750000 134,600 62,971 472 217 0.01%
56- CITY OF SAN ELIZARIO 4,351 4,500 149 247,385,472 0.398132 984,921 56,857 226 3,307 0.15%
57- CITY OF EL PASO MMD #1 28 36 8 892,827 0.200000 1,786 31,887 64 21 0.00%
2,267,818 2,350,572 82,754 253,600,065,186 27.223726 1,441,271,861 Entity fees --------------- 1,723,542* Per parcel fee ---------------------- $0.76 Fees from law firm---- 480,000 21.78%
Total fees ---------------- 2,203,542 100.00%
10/6/2021
Consolidated Tax Office2021 Estimated Tax Parcel Analysis
76
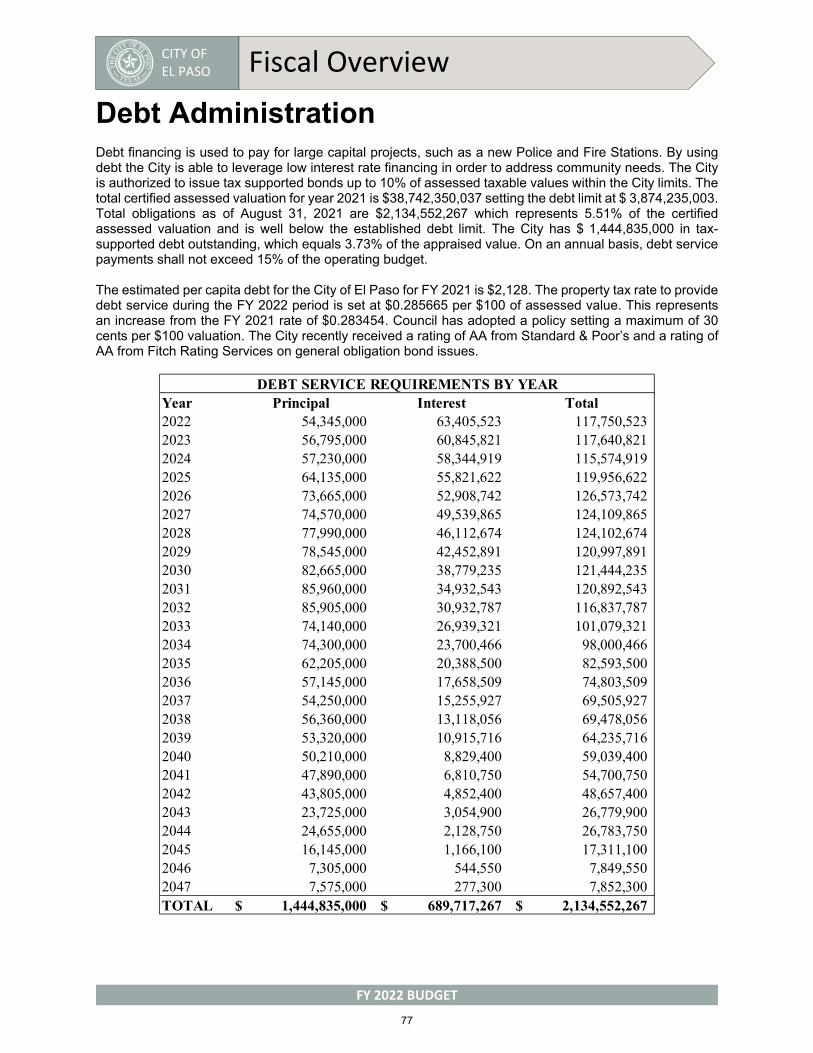
CITY OF EL PASO Fiscal Overview
FY 2022 BUDGET
Debt Administration Debt financing is used to pay for large capital projects, such as a new Police and Fire Stations. By using debt the City is able to leverage low interest rate financing in order to address community needs. The City is authorized to issue tax supported bonds up to 10% of assessed taxable values within the City limits. The total certified assessed valuation for year 2021 is $38,742,350,037 setting the debt limit at $ 3,874,235,003. Total obligations as of August 31, 2021 are $2,134,552,267 which represents 5.51% of the certified assessed valuation and is well below the established debt limit. The City has $ 1,444,835,000 in tax-supported debt outstanding, which equals 3.73% of the appraised value. On an annual basis, debt service payments shall not exceed 15% of the operating budget.
The estimated per capita debt for the City of El Paso for FY 2021 is $2,128. The property tax rate to provide debt service during the FY 2022 period is set at $0.285665 per $100 of assessed value. This represents an increase from the FY 2021 rate of $0.283454. Council has adopted a policy setting a maximum of 30 cents per $100 valuation. The City recently received a rating of AA from Standard & Poor’s and a rating of AA from Fitch Rating Services on general obligation bond issues.
Year Principal Interest Total2022 54,345,000 63,405,523 117,750,5232023 56,795,000 60,845,821 117,640,8212024 57,230,000 58,344,919 115,574,9192025 64,135,000 55,821,622 119,956,6222026 73,665,000 52,908,742 126,573,7422027 74,570,000 49,539,865 124,109,8652028 77,990,000 46,112,674 124,102,6742029 78,545,000 42,452,891 120,997,8912030 82,665,000 38,779,235 121,444,2352031 85,960,000 34,932,543 120,892,5432032 85,905,000 30,932,787 116,837,7872033 74,140,000 26,939,321 101,079,3212034 74,300,000 23,700,466 98,000,4662035 62,205,000 20,388,500 82,593,5002036 57,145,000 17,658,509 74,803,5092037 54,250,000 15,255,927 69,505,9272038 56,360,000 13,118,056 69,478,0562039 53,320,000 10,915,716 64,235,7162040 50,210,000 8,829,400 59,039,4002041 47,890,000 6,810,750 54,700,7502042 43,805,000 4,852,400 48,657,4002043 23,725,000 3,054,900 26,779,9002044 24,655,000 2,128,750 26,783,7502045 16,145,000 1,166,100 17,311,1002046 7,305,000 544,550 7,849,5502047 7,575,000 277,300 7,852,300TOTAL 1,444,835,000$ 689,717,267$ 2,134,552,267$
DEBT SERVICE REQUIREMENTS BY YEAR
77
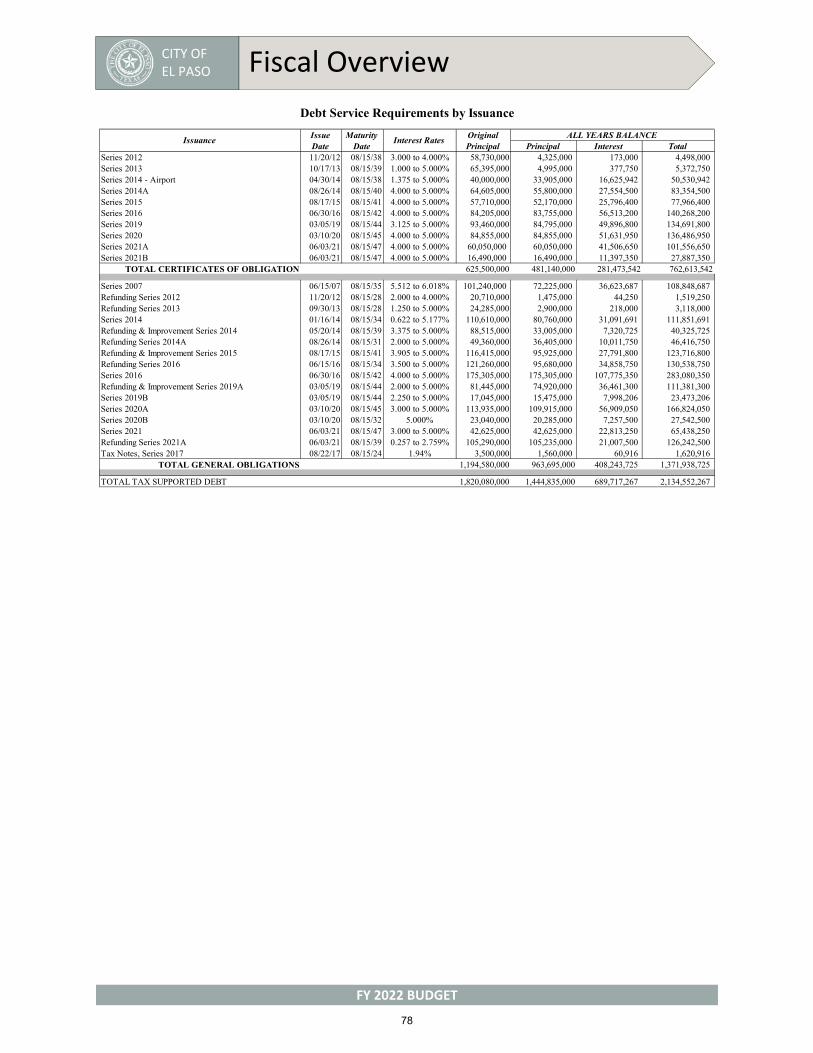
CITY OF EL PASO Fiscal Overview
FY 2022 BUDGET
Principal Interest TotalSeries 2012 11/20/12 08/15/38 3.000 to 4.000% 58,730,000 4,325,000 173,000 4,498,000 Series 2013 10/17/13 08/15/39 1.000 to 5.000% 65,395,000 4,995,000 377,750 5,372,750 Series 2014 - Airport 04/30/14 08/15/38 1.375 to 5.000% 40,000,000 33,905,000 16,625,942 50,530,942 Series 2014A 08/26/14 08/15/40 4.000 to 5.000% 64,605,000 55,800,000 27,554,500 83,354,500 Series 2015 08/17/15 08/15/41 4.000 to 5.000% 57,710,000 52,170,000 25,796,400 77,966,400 Series 2016 06/30/16 08/15/42 4.000 to 5.000% 84,205,000 83,755,000 56,513,200 140,268,200 Series 2019 03/05/19 08/15/44 3.125 to 5.000% 93,460,000 84,795,000 49,896,800 134,691,800 Series 2020 03/10/20 08/15/45 4.000 to 5.000% 84,855,000 84,855,000 51,631,950 136,486,950 Series 2021A 06/03/21 08/15/47 4.000 to 5.000% 60,050,000 60,050,000 41,506,650 101,556,650 Series 2021B 06/03/21 08/15/47 4.000 to 5.000% 16,490,000 16,490,000 11,397,350 27,887,350
TOTAL CERTIFICATES OF OBLIGATION 625,500,000 481,140,000 281,473,542 762,613,542
Series 2007 06/15/07 08/15/35 5.512 to 6.018% 101,240,000 72,225,000 36,623,687 108,848,687 Refunding Series 2012 11/20/12 08/15/28 2.000 to 4.000% 20,710,000 1,475,000 44,250 1,519,250 Refunding Series 2013 09/30/13 08/15/28 1.250 to 5.000% 24,285,000 2,900,000 218,000 3,118,000 Series 2014 01/16/14 08/15/34 0.622 to 5.177% 110,610,000 80,760,000 31,091,691 111,851,691 Refunding & Improvement Series 2014 05/20/14 08/15/39 3.375 to 5.000% 88,515,000 33,005,000 7,320,725 40,325,725 Refunding Series 2014A 08/26/14 08/15/31 2.000 to 5.000% 49,360,000 36,405,000 10,011,750 46,416,750 Refunding & Improvement Series 2015 08/17/15 08/15/41 3.905 to 5.000% 116,415,000 95,925,000 27,791,800 123,716,800 Refunding Series 2016 06/15/16 08/15/34 3.500 to 5.000% 121,260,000 95,680,000 34,858,750 130,538,750 Series 2016 06/30/16 08/15/42 4.000 to 5.000% 175,305,000 175,305,000 107,775,350 283,080,350 Refunding & Improvement Series 2019A 03/05/19 08/15/44 2.000 to 5.000% 81,445,000 74,920,000 36,461,300 111,381,300 Series 2019B 03/05/19 08/15/44 2.250 to 5.000% 17,045,000 15,475,000 7,998,206 23,473,206 Series 2020A 03/10/20 08/15/45 3.000 to 5.000% 113,935,000 109,915,000 56,909,050 166,824,050 Series 2020B 03/10/20 08/15/32 5.000% 23,040,000 20,285,000 7,257,500 27,542,500 Series 2021 06/03/21 08/15/47 3.000 to 5.000% 42,625,000 42,625,000 22,813,250 65,438,250 Refunding Series 2021A 06/03/21 08/15/39 0.257 to 2.759% 105,290,000 105,235,000 21,007,500 126,242,500 Tax Notes, Series 2017 08/22/17 08/15/24 1.94% 3,500,000 1,560,000 60,916 1,620,916
TOTAL GENERAL OBLIGATIONS 1,194,580,000 963,695,000 408,243,725 1,371,938,725
TOTAL TAX SUPPORTED DEBT 1,820,080,000 1,444,835,000 689,717,267 2,134,552,267
Debt Service Requirements by Issuance
ALL YEARS BALANCEIssue Date
Maturity Date
Interest RatesOriginal Principal
Issuance
78
CITY OF EL PASO BUDGET BOOK 2022
GROWTH
FINANCIAL SUMMARIES
FINANCIA
LSU
MMARIES
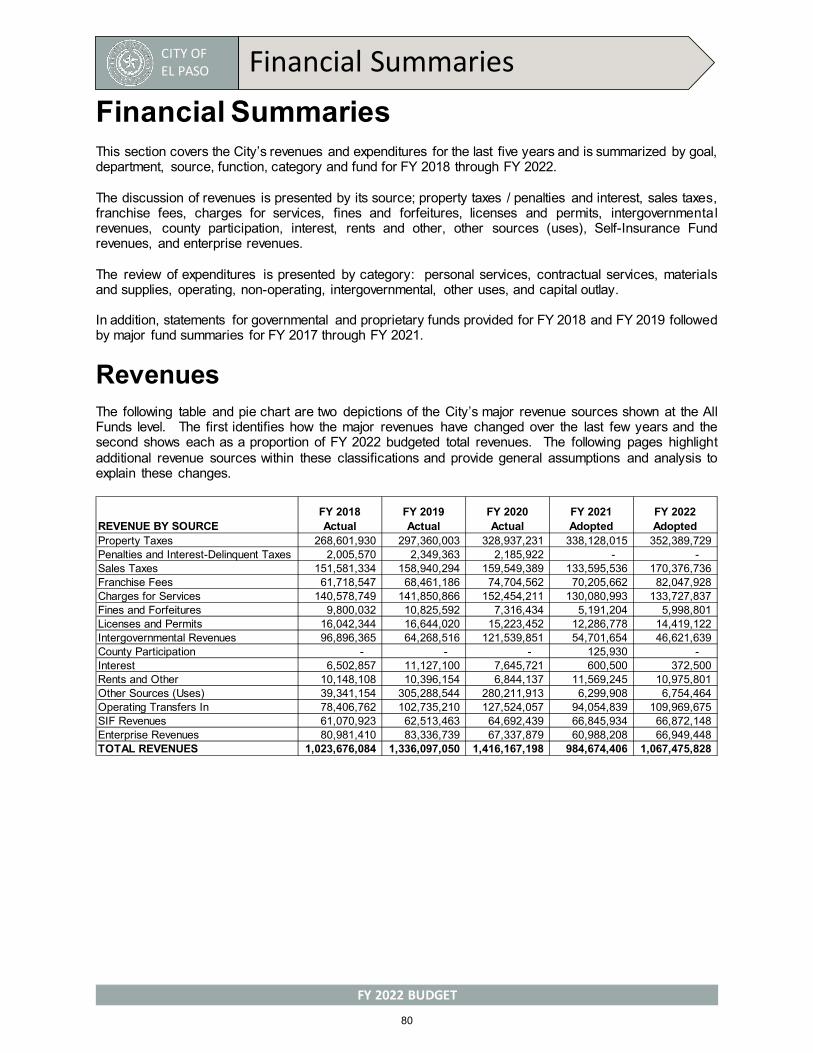
CITY OF EL PASO Financial Summaries
FY 2022 BUDGET
Financial Summaries This section covers the City’s revenues and expenditures for the last five years and is summarized by goal, department, source, function, category and fund for FY 2018 through FY 2022.
The discussion of revenues is presented by its source; property taxes / penalties and interest, sales taxes, franchise fees, charges for services, fines and forfeitures, licenses and permits, intergovernmental revenues, county participation, interest, rents and other, other sources (uses), Self-Insurance Fund revenues, and enterprise revenues.
The review of expenditures is presented by category: personal services, contractual services, materials and supplies, operating, non-operating, intergovernmental, other uses, and capital outlay.
In addition, statements for governmental and proprietary funds provided for FY 2018 and FY 2019 followed by major fund summaries for FY 2017 through FY 2021.
Revenues The following table and pie chart are two depictions of the City’s major revenue sources shown at the All Funds level. The first identifies how the major revenues have changed over the last few years and the second shows each as a proportion of FY 2022 budgeted total revenues. The following pages highlight additional revenue sources within these classifications and provide general assumptions and analysis to explain these changes.
REVENUE BY SOURCEFY 2018 Actual
FY 2019 Actual
FY 2020 Actual
FY 2021 Adopted
FY 2022 Adopted
Property Taxes 268,601,930 297,360,003 328,937,231 338,128,015 352,389,729 Penalties and Interest-Delinquent Taxes 2,005,570 2,349,363 2,185,922 - - Sales Taxes 151,581,334 158,940,294 159,549,389 133,595,536 170,376,736 Franchise Fees 61,718,547 68,461,186 74,704,562 70,205,662 82,047,928 Charges for Services 140,578,749 141,850,866 152,454,211 130,080,993 133,727,837 Fines and Forfeitures 9,800,032 10,825,592 7,316,434 5,191,204 5,998,801 Licenses and Permits 16,042,344 16,644,020 15,223,452 12,286,778 14,419,122 Intergovernmental Revenues 96,896,365 64,268,516 121,539,851 54,701,654 46,621,639 County Participation - - - 125,930 - Interest 6,502,857 11,127,100 7,645,721 600,500 372,500 Rents and Other 10,148,108 10,396,154 6,844,137 11,569,245 10,975,801 Other Sources (Uses) 39,341,154 305,288,544 280,211,913 6,299,908 6,754,464 Operating Transfers In 78,406,762 102,735,210 127,524,057 94,054,839 109,969,675 SIF Revenues 61,070,923 62,513,463 64,692,439 66,845,934 66,872,148 Enterprise Revenues 80,981,410 83,336,739 67,337,879 60,988,208 66,949,448 TOTAL REVENUES 1,023,676,084 1,336,097,050 1,416,167,198 984,674,406 1,067,475,828
80
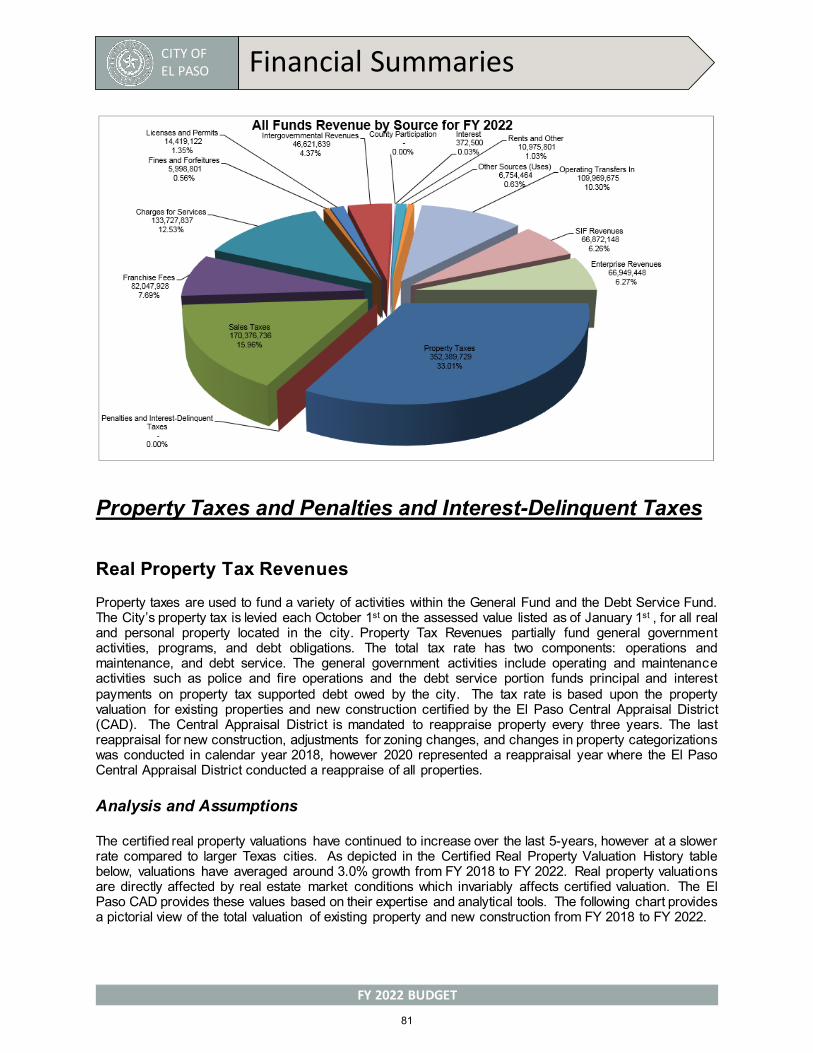
CITY OF EL PASO Financial Summaries
FY 2022 BUDGET
Property Taxes and Penalties and Interest-Delinquent Taxes
Real Property Tax Revenues Property taxes are used to fund a variety of activities within the General Fund and the Debt Service Fund. The City’s property tax is levied each October 1st on the assessed value listed as of January 1st , for all real and personal property located in the city. Property Tax Revenues partially fund general government activities, programs, and debt obligations. The total tax rate has two components: operations and maintenance, and debt service. The general government activities include operating and maintenance activities such as police and fire operations and the debt service portion funds principal and interest payments on property tax supported debt owed by the city. The tax rate is based upon the property valuation for existing properties and new construction certified by the El Paso Central Appraisal District (CAD). The Central Appraisal District is mandated to reappraise property every three years. The last reappraisal for new construction, adjustments for zoning changes, and changes in property categorizations was conducted in calendar year 2018, however 2020 represented a reappraisal year where the El Paso Central Appraisal District conducted a reappraise of all properties.
Analysis and Assumptions
The certified real property valuations have continued to increase over the last 5-years, however at a slower rate compared to larger Texas cities. As depicted in the Certified Real Property Valuation History table below, valuations have averaged around 3.0% growth from FY 2018 to FY 2022. Real property valuations are directly affected by real estate market conditions which invariably affects certified valuation. The El Paso CAD provides these values based on their expertise and analytical tools. The following chart provides a pictorial view of the total valuation of existing property and new construction from FY 2018 to FY 2022.
81

CITY OF EL PASO Financial Summaries
FY 2022 BUDGET
The FY 2022 valuation shows a 5.1% decrease in new construction and growth of 4.4% in the values of existing property when compared to FY 2021. The previously certified values for FY 2021 showed a 1.7% decrease in new construction and a 4.1% increase in existing property over the FY 2020 valuation. The city’s existing property valuation increased by double digits from FY 2007 to FY 2009 but recently, the trend has been closer to 1.4% annually during non-reappraisal years. The real property valuations for FY 2021 increased by 4.0% primarily due to a reappraisal of commercial properties by El Paso CAD; however, a 4.2% increase observed in FY 2022 was due to a strong residential housing market and a reappraisal year.
On August 24, 2021, City Council adopted an overall rate of $0.907301 that generates $0.002211/$100 more for debt service to meet the City’s long-term obligations than in FY 2021 while adopting an operations and maintenance rate that is $0.002211/$100 lower than that of FY 2021.
The City’s General Fund tax revenues also include the dedication of the incremental property valuation increase for eight Transportation Reinvestment Zones (TRZ) and five Tax Increment Reinvestment Zone (TIRZ). TRZ is a specific contiguous zone around a planned transportation project that is established as an institutional arrangement to facilitate capture of the property tax increment arising from a planned project. The tax increments are then used to defray the capital costs of a project. TRZs were authorized by the state legislature during the 2007 legislative session. On May 25, 2010, City Council adopted Ordinance No. 017332 & No. 017333 to establish TRZ 2 and TRZ 3 to promote transportation projects described by Section 222.104 of the Texas Transportation Code. TRZ Number Two provides the City’s share of funding for two of the projects identified in the 2008 Comprehensive Mobility Plan. The two projects identified in the establishment of TRZ 2 are Loop 375 at FM 659 (Zaragoza) and Loop 375 at the I-10/Americas Interchange. TRZ 3 will
Fiscal Year New Construction Existing Property Total Variance
FY 2018 551,441,507$ 33,328,629,207$ 33,880,070,714$ 1.4%FY 2019 517,314,789$ 34,731,557,889$ 35,248,872,678$ 4.0%FY 2020 498,375,817$ 35,229,474,441$ 35,727,850,258$ 1.4%FY 2021 490,017,172$ 36,680,449,560$ 37,170,466,732$ 4.0%FY 2022 464,903,204$ 38,277,446,833$ 38,742,350,037$ 4.2%
Certified Real Property Valuation History
Tax Levy FY 2018 FY 2019 FY 2020 FY 2021 FY 2022O&M Rate $0.522982 $0.557239 $0.610139 $0.623847 $0.621636Debt Seervice Rate $0.280451 $0.286093 $0.297162 $0.283454 $0.285665City Tax Rate $0.803433 $0.843332 $0.907301 $0.907301 $0.907301
Adopted Tax RatePer $100 of Valuation
82
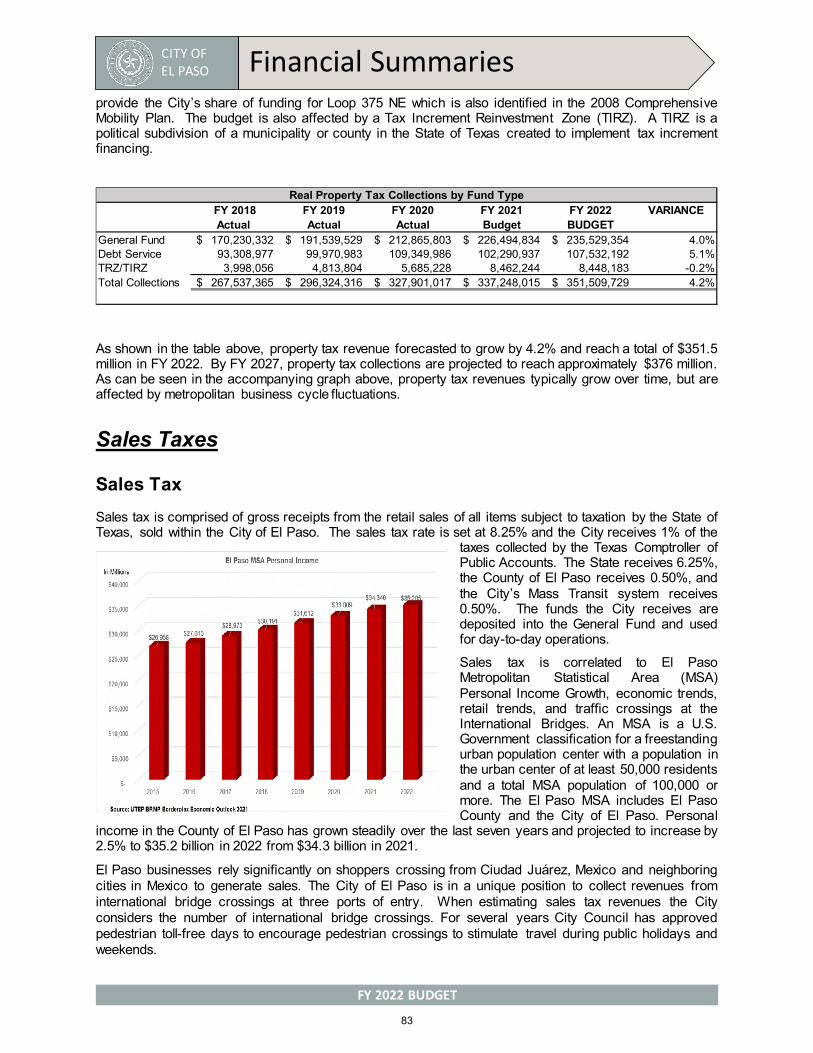
CITY OF EL PASO Financial Summaries
FY 2022 BUDGET
provide the City’s share of funding for Loop 375 NE which is also identified in the 2008 Comprehensive Mobility Plan. The budget is also affected by a Tax Increment Reinvestment Zone (TIRZ). A TIRZ is a political subdivision of a municipality or county in the State of Texas created to implement tax increment financing.
As shown in the table above, property tax revenue forecasted to grow by 4.2% and reach a total of $351.5 million in FY 2022. By FY 2027, property tax collections are projected to reach approximately $376 million. As can be seen in the accompanying graph above, property tax revenues typically grow over time, but are affected by metropolitan business cycle fluctuations.
Sales Taxes
Sales Tax Sales tax is comprised of gross receipts from the retail sales of all items subject to taxation by the State of Texas, sold within the City of El Paso. The sales tax rate is set at 8.25% and the City receives 1% of the
taxes collected by the Texas Comptroller of Public Accounts. The State receives 6.25%, the County of El Paso receives 0.50%, and the City’s Mass Transit system receives 0.50%. The funds the City receives are deposited into the General Fund and used for day-to-day operations.
Sales tax is correlated to El Paso Metropolitan Statistical Area (MSA) Personal Income Growth, economic trends, retail trends, and traffic crossings at the International Bridges. An MSA is a U.S. Government classification for a freestanding urban population center with a population in the urban center of at least 50,000 residents and a total MSA population of 100,000 or more. The El Paso MSA includes El Paso County and the City of El Paso. Personal
income in the County of El Paso has grown steadily over the last seven years and projected to increase by 2.5% to $35.2 billion in 2022 from $34.3 billion in 2021.
El Paso businesses rely significantly on shoppers crossing from Ciudad Juárez, Mexico and neighboring cities in Mexico to generate sales. The City of El Paso is in a unique position to collect revenues from international bridge crossings at three ports of entry. When estimating sales tax revenues the City considers the number of international bridge crossings. For several years City Council has approved pedestrian toll-free days to encourage pedestrian crossings to stimulate travel during public holidays and weekends.
FY 2018 FY 2019 FY 2020 FY 2021 FY 2022 VARIANCEActual Actual Actual Budget BUDGET
General Fund 170,230,332$ 191,539,529$ 212,865,803$ 226,494,834$ 235,529,354$ 4.0%Debt Service 93,308,977 99,970,983 109,349,986 102,290,937 107,532,192 5.1%TRZ/TIRZ 3,998,056 4,813,804 5,685,228 8,462,244 8,448,183 -0.2%Total Collections 267,537,365$ 296,324,316$ 327,901,017$ 337,248,015$ 351,509,729$ 4.2%
Real Property Tax Collections by Fund Type
83
CITY OF EL PASO Financial Summaries
FY 2022 BUDGET
Analysis and Assumptions
The growth in sales tax revenue is a result of economic trends and an increase in pedestrian and automobile crossings into the city. In an effort to create and retain jobs in the City of El Paso, the City offers sales tax incentive programs through the Economic Development department to selected private businesses that will make a measurable difference in achieving economic growth and development.
For several years following the Great Recession, the City experienced steady growth in sales tax collections that averaged 3.4%. Following more than 30 months of growth in current period collections, the City saw flat or decreasing collections for a significant part of FY 2017 and FY 2018; however, for FY 2019, sales tax collections were 5.0% higher than FY 2018 actuals. For FY 2020, sales tax revenue projections prior to COVID-19 were expected to increase by 3.5% over FY 2019 Budget as strong retail activity continued. The impact of business operation disruptions have been offset by stronger than expected pricing power by businesses leading to an expected increase of 25.9% on sales tax collections for FY 2022.
Growth in this category reflects retail sales activity in El Paso and is a function of numerous factors such as personal income growth, border crossings, and the international currency value of the peso. Seasonal patterns for this revenue category follow the calendar in a reliable manner. Sales tax revenue is expected to rebound and continue to grow in FY 2022 primarily driven by higher prices.
Hotel/Motel Occupancy TaxesHotel and motel occupancy tax revenues are affected by general economic conditions, room rates, and a variety of other factors related to business and vacation travel. All non-exempt occupants residing in hotels or motels in the County of El Paso for a period of less than 30 days are charged 17.5% of the room cost. The rate includes 7% dedicated to the city to support and maintain a civic center and encourage tourism. The revenue generated from this source is used to fund the operation of Destination El Paso, various programs in the Department of Museums and Cultural Affairs, and for Economic Development agreements approved by City Council. This source of revenue is tracked under a special revenue fund and currently can only be used to fund the civic center and tourism activities for the City of El Paso. In November 2012, residents of El Paso approved a 2.0% increase to the tax which became effective on January 1, 2013. The election also included a proposition to authorize the City of El Paso to build a baseball stadium funded by a hotel room occupancy tax increase. More than half a million fans have attended the Triple-A El Paso Chihuahuas games in each of the first three seasons and the stadium has hosted an assortment of other events as well.
Analysis and Assumptions
Hotel and motel occupancy tax revenues have fluctuated a little over the last half decade. Strong collections growth started in FY 2015 as a result of the City hosting the United States Bowling Congress (USBC)
FY 2018 FY 2019 FY 2020 FY 2021 FY 2022 VarianceActual Actual Actual Budget Budget
General Fund 89,530,081 93,852,294 97,597,554 81,828,474 103,517,017 26.5%Sun Metro 44,096,840 46,459,738 47,833,634 40,588,397 50,600,000 24.7%Total Collections 133,626,921 140,312,032 145,431,187 122,416,871 154,117,017 25.9%
Sales Tax Collections by Fund Type
84

CITY OF EL PASO Financial Summaries
FY 2022 BUDGET
Bowling Tournament. Despite a large singular event like the USBC tournament in subsequent years, collections have continued to grow. The FY 2021 budget was derived using a conservative approach due to the economic impacts of COVID-19 by analyzing historical collections, occupancy rates, and collaborating input from subject matter experts that work closely with area tourism partners and hotels. In FY 2022 a rebound is expected as hotels are seeing stronger demand. FY 2022 should observe an increase of 8.6%.
Franchise Taxes The third largest source of General Fund revenue, behind property and sales taxes, comes from franchise and easement fees. Franchise fees are collected from both public and private utilities and assessed for the continued use of the public right-of-way. Electric, gas, telephone, water, cable, and telecommunications are among the utilities included in this source of revenue.
El Paso Water Utilities The El Paso Water Utilities (EPWU) is a component of the City of El Paso and managed by the Public Service Board. The Public Service Board established by City Ordinance No.752 in 1952 to manage and operate the water and wastewater system in the City of El Paso. EPWU pays the City 10% of the total gross receipts received from the sale of water in lieu of property taxes (PILOT or PILT). EPWU also pays for solid waste disposal fees, paving inspections, and 5% of the net proceeds from the sale of any land owned by EPWU. In FY 2015, the City Council approved a franchise fee of $3,550,000 to compensate the City for the use of city streets and rights of way for utility lines and wear and tear on city streets. In FY 2020, City Council approved an additional $3,000,000 to the franchise fee, designated for the resurfacing of collector streets, for a total annual amount of $6,550,000.
Analysis and Assumptions
The number of retail water customers has grown by an average of 1.3% or an additional 2,700 customers each year since 2018. In FY 2018, FY 2019 and FY 2020 continued growth in customers and implementation of higher water rates in those years lead to an increase in water franchise revenue. The Public Service Board, not City Council, sets water rates and the City, like other customers must pay for more service when rates increase. In FY 2021, collections expected to decrease by $0.7 million primarily driven by the impact of COVID-19 pandemic and customers’ ability to pay their water bills on time. For FY 2022, collections are projected to remain flat as the regional economy continues to recover from the COVID-19 pandemic impacts on the regional economy.
FY 2018 FY 2019 FY 2020 FY 2021 FY 2022 VarianceActual Actual Actual Budget Budget
HOT REVENUE 11,881,713$ 7,670,541$ 5,806,034$ 7,735,000$ 8,400,000$ 8.6%Total 11,881,713$ 7,670,541$ 5,806,034$ 7,735,000$ 8,400,000$ 8.6%
Hotel/Motel Occupancy Tax
85
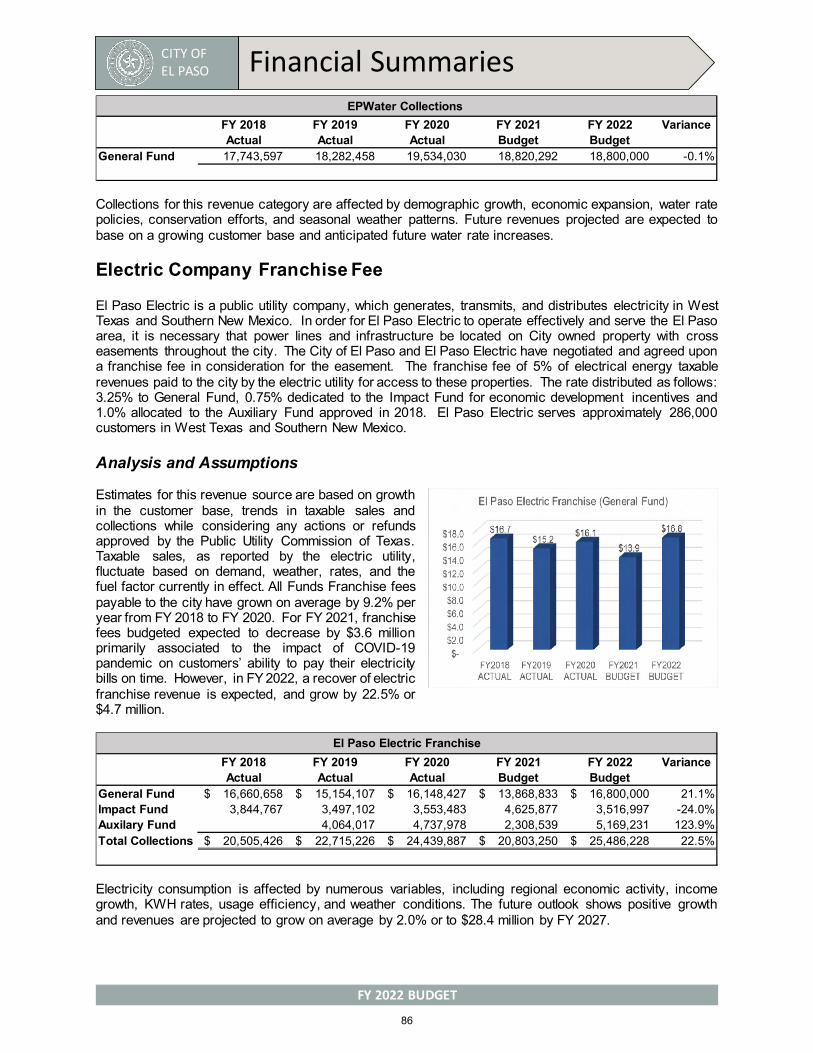
CITY OF EL PASO Financial Summaries
FY 2022 BUDGET
Collections for this revenue category are affected by demographic growth, economic expansion, water rate policies, conservation efforts, and seasonal weather patterns. Future revenues projected are expected to base on a growing customer base and anticipated future water rate increases.
Electric Company Franchise Fee
El Paso Electric is a public utility company, which generates, transmits, and distributes electricity in West Texas and Southern New Mexico. In order for El Paso Electric to operate effectively and serve the El Paso area, it is necessary that power lines and infrastructure be located on City owned property with cross easements throughout the city. The City of El Paso and El Paso Electric have negotiated and agreed upon a franchise fee in consideration for the easement. The franchise fee of 5% of electrical energy taxable revenues paid to the city by the electric utility for access to these properties. The rate distributed as follows: 3.25% to General Fund, 0.75% dedicated to the Impact Fund for economic development incentives and 1.0% allocated to the Auxiliary Fund approved in 2018. El Paso Electric serves approximately 286,000 customers in West Texas and Southern New Mexico.
Analysis and Assumptions
Estimates for this revenue source are based on growth in the customer base, trends in taxable sales and collections while considering any actions or refunds approved by the Public Utility Commission of Texas. Taxable sales, as reported by the electric utility, fluctuate based on demand, weather, rates, and the fuel factor currently in effect. All Funds Franchise fees payable to the city have grown on average by 9.2% per year from FY 2018 to FY 2020. For FY 2021, franchise fees budgeted expected to decrease by $3.6 million primarily associated to the impact of COVID-19 pandemic on customers’ ability to pay their electricity bills on time. However, in FY 2022, a recover of electric franchise revenue is expected, and grow by 22.5% or $4.7 million.
Electricity consumption is affected by numerous variables, including regional economic activity, income growth, KWH rates, usage efficiency, and weather conditions. The future outlook shows positive growth and revenues are projected to grow on average by 2.0% or to $28.4 million by FY 2027.
FY 2018 FY 2019 FY 2020 FY 2021 FY 2022 VarianceActual Actual Actual Budget Budget
General Fund 17,743,597 18,282,458 19,534,030 18,820,292 18,800,000 -0.1%
EPWater Collections
FY 2018 FY 2019 FY 2020 FY 2021 FY 2022 VarianceActual Actual Actual Budget Budget
General Fund 16,660,658$ 15,154,107$ 16,148,427$ 13,868,833$ 16,800,000$ 21.1%Impact Fund 3,844,767 3,497,102 3,553,483 4,625,877 3,516,997 -24.0%Auxilary Fund 4,064,017 4,737,978 2,308,539 5,169,231 123.9%Total Collections 20,505,426$ 22,715,226$ 24,439,887$ 20,803,250$ 25,486,228$ 22.5%
El Paso Electric Franchise
86

CITY OF EL PASO Financial Summaries
FY 2022 BUDGET
AT&T Franchise The City receives revenue on a rate per line for use of public right-of-ways and 1% of gross revenues for video programming services from the telecommunications provider. Payment received from the provider, AT&T, on a quarterly basis.
Analysis and Assumptions
The number of lines that AT&T operates is a key indicator for this revenue source. The number of lines is monitored by staff and used to project future revenues. However, the number of lines is proprietary information and cannot be disclosed.
The City has experienced downward trend in the AT&T Franchise revenue collections in the last few years. That is a consequence of the expansion of cellular telephone usage and other forms of electronic communications as well as a dramatic shift away from basic cable service. More and more customers are moving away from cable service to streaming services. However, in FY 2022, the City expects to see a sharp decrease due to legislative changes to how telecom franchise fees are accessed. AT&T franchise revenues projected to decrease by 29.8% from FY 2021 levels.
The outlook shows that the declining trend will continue especially due to the changes the Texas Legislature approved this past session. Although there will be ongoing demand for land line telephone and cable services, the number of customers moving solely to mobile and choosing to use streaming services will translate to a continued decline of this revenue source.
Natural Gas Franchise Fees
The City currently has two franchise agreements in place with natural gas providers that use city streets for transmission and/or delivery of gas to its customers. The major providers are Texas Gas Services and Oneok. The City negotiated a new franchise agreement with Oneok in 2008, which will be in effect for thirty years until 2028. With the new agreement, Oneok franchise rate increased from 2.5% to 4.0%, an increase of 1.5%. The rate incorporates both the transportation of the commodity and the imputed value of gas at the delivery point if within the city limits. Texas Gas Service also has an agreement in place until February 22, 2030. The calculation of the franchise fee from Texas Gas Service changed in FY 2014, and is calculated by multiplying the franchise rate by the actual gross receipts from the sale and transport of gas to residential, commercial, industrial, irrigation, public authority, and transport customers within the City of El Paso. The franchise rate for FY 2022 is 5.0%.
Analysis and Assumptions
The City has experienced increases in the Texas Gas Service franchise revenue as the result of a new agreement implemented in FY 2014. All gas franchise payments are considered General Fund revenue. For FY 2021, the City expects franchise revenues to decrease by 17.9% from Texas Gas Service and by 47.1% from Oneok. The sharp decrease is attributed to an expected decrease in customers’ ability to pay their gas bills on time, caused by the economic impacts of business closures. However, in FY 2022 a recovery of Gas Franchise revenue is expected and grow by 16.2% or $0.9 million
FY 2018 FY 2019 FY 2020 FY 2021 FY 2022 VarianceActual Actual Actual Budget Budget
General Fund $3,452,566 $3,135,043 $2,280,773 $2,683,848 $1,884,000 -29.8%
AT&T Collections
87

CITY OF EL PASO Financial Summaries
FY 2022 BUDGET
Texas Gas franchise fee revenues are affected by demographic, economic, and weather variables. Revenues in this category are predicted to stabilize over the next few years after recognizing sizable increases resulting from the new franchise agreement.
Charges for Services This source of revenue includes collection of a fee charged in exchange for a service received by a customer. Most of these revenues are Non-General Fund related. The services that are General Fund revenues are mainly for services provided by the Department of Public Health, Parks and Recreation, and Fire Department ambulance services. Non-General Fund related charges for services are predominantly related to enterprise funds, including Community and Human Development department program revenue, fees charged by the Mass Transit Department for transportation services, fees charged by the Streets and Maintenance department for motor fleet usage, equipment maintenance, and fuel and lubricants usage, and fees charged by the Environmental Services Department for recycling and garbage collection. Estimation for service revenues in general involves reviewing service demand trends and activity, fees charged for services, collectability for health related services, and economic factors affecting the population served. For discussion purposes, major revenues generated by enterprise fund departments are discussed separately as a whole under Enterprise Revenues by category.
Ambulance Service The City of El Paso provides life stabilization transport services throughout the city via the emergency medical services division of the Fire Department. The City sets the fee based on the cost of transportation and stabilization services. The ambulance fee is reviewed on an annual basis during the budget process. Texas state law dictates a “profit” cannot be made from services rendered to citizens.
Analysis and Assumptions
Fees are determined by projecting the expected number of medical transports to hospitals. Medical transports have now been redefined as medical incidents. The fee schedule is primarily based on a flat fee implemented in the fiscal year, reviewed annually and increased based on costs incurred during the prior
FY 2018 FY 2019 FY 2020 FY 2021 FY 2022 VarianceActual Actual Actual Budget Budget
Texas Gas 6,188,800$ 6,362,596$ 5,723,829$ 5,338,616$ 6,200,000$ 16.1%Oneok 570,455 473,484 562,170 297,228 350,000 17.8%Total Collections 6,759,256$ 6,836,080$ 6,285,999$ 5,635,844$ 6,550,000$ 16.2%
Selected Gas Franchises
88
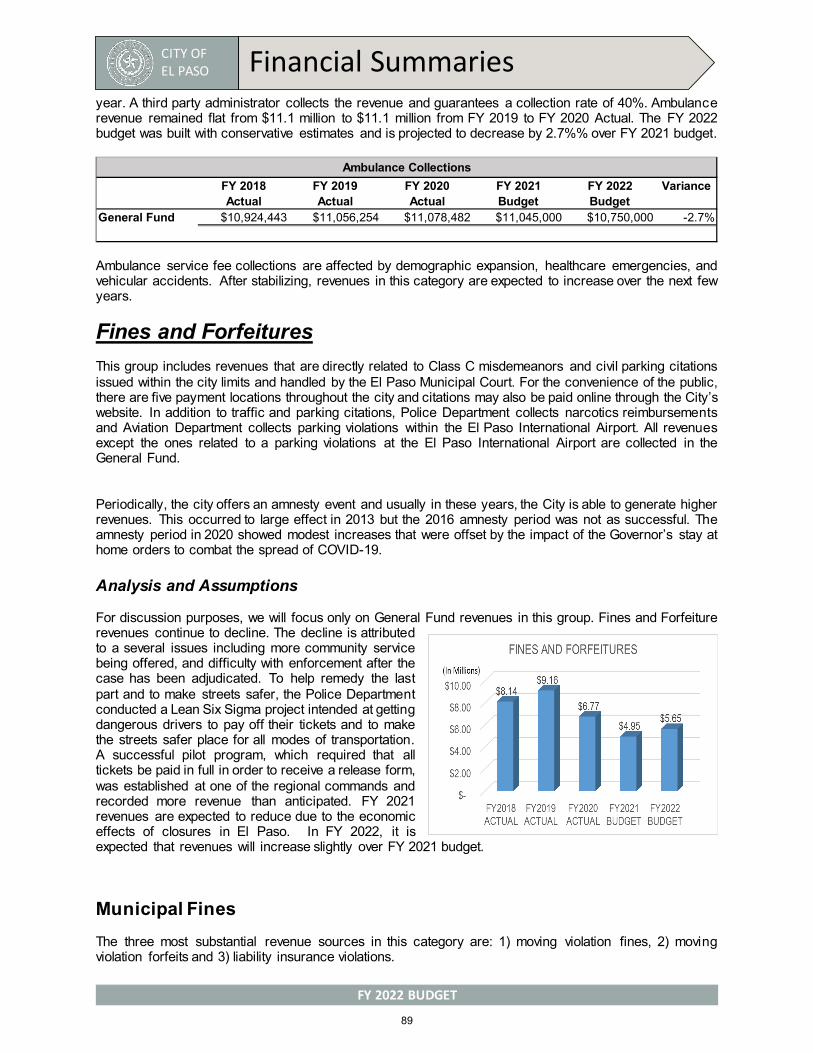
CITY OF EL PASO Financial Summaries
FY 2022 BUDGET
year. A third party administrator collects the revenue and guarantees a collection rate of 40%. Ambulance revenue remained flat from $11.1 million to $11.1 million from FY 2019 to FY 2020 Actual. The FY 2022 budget was built with conservative estimates and is projected to decrease by 2.7%% over FY 2021 budget.
Ambulance service fee collections are affected by demographic expansion, healthcare emergencies, and vehicular accidents. After stabilizing, revenues in this category are expected to increase over the next few years.
Fines and Forfeitures This group includes revenues that are directly related to Class C misdemeanors and civil parking citations issued within the city limits and handled by the El Paso Municipal Court. For the convenience of the public, there are five payment locations throughout the city and citations may also be paid online through the City’s website. In addition to traffic and parking citations, Police Department collects narcotics reimbursements and Aviation Department collects parking violations within the El Paso International Airport. All revenues except the ones related to a parking violations at the El Paso International Airport are collected in the General Fund.
Periodically, the city offers an amnesty event and usually in these years, the City is able to generate higher revenues. This occurred to large effect in 2013 but the 2016 amnesty period was not as successful. The amnesty period in 2020 showed modest increases that were offset by the impact of the Governor’s stay at home orders to combat the spread of COVID-19.
Analysis and Assumptions
For discussion purposes, we will focus only on General Fund revenues in this group. Fines and Forfeiture revenues continue to decline. The decline is attributed to a several issues including more community service being offered, and difficulty with enforcement after the case has been adjudicated. To help remedy the last part and to make streets safer, the Police Department conducted a Lean Six Sigma project intended at getting dangerous drivers to pay off their tickets and to make the streets safer place for all modes of transportation. A successful pilot program, which required that all tickets be paid in full in order to receive a release form, was established at one of the regional commands and recorded more revenue than anticipated. FY 2021 revenues are expected to reduce due to the economic effects of closures in El Paso. In FY 2022, it is expected that revenues will increase slightly over FY 2021 budget.
Municipal Fines The three most substantial revenue sources in this category are: 1) moving violation fines, 2) moving violation forfeits and 3) liability insurance violations.
FY 2018 FY 2019 FY 2020 FY 2021 FY 2022 VarianceActual Actual Actual Budget Budget
General Fund $10,924,443 $11,056,254 $11,078,482 $11,045,000 $10,750,000 -2.7%
Ambulance Collections
89
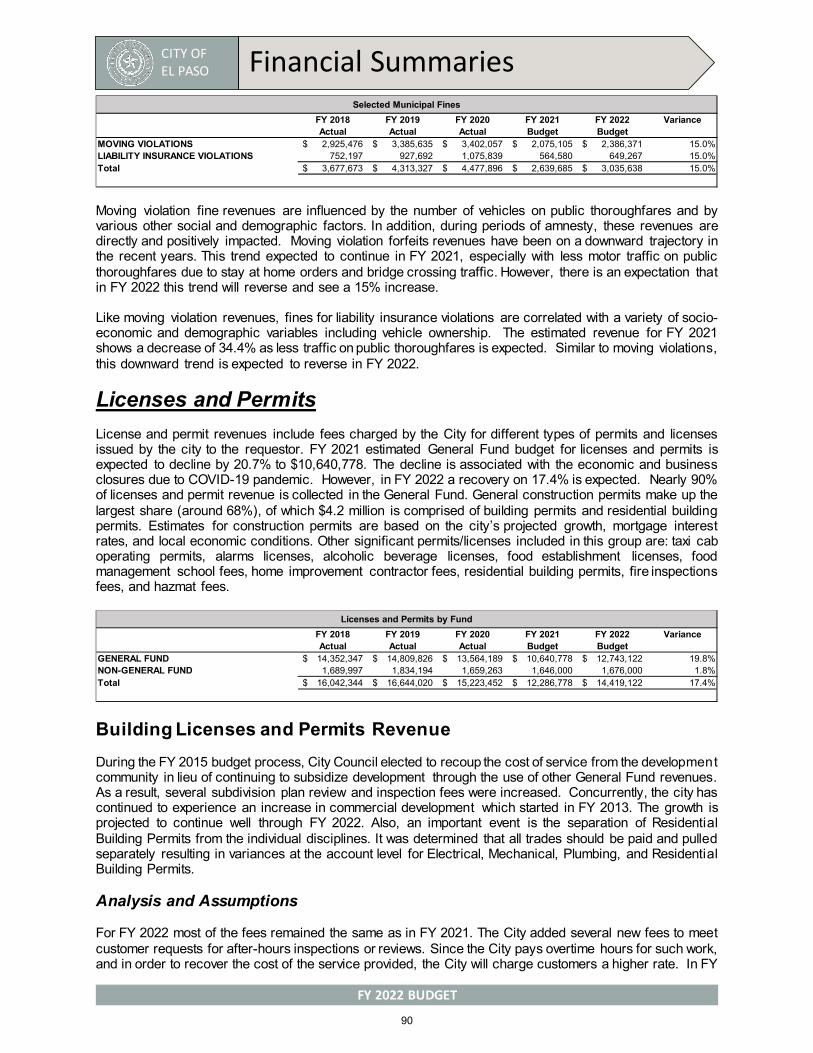
CITY OF EL PASO Financial Summaries
FY 2022 BUDGET
Moving violation fine revenues are influenced by the number of vehicles on public thoroughfares and by various other social and demographic factors. In addition, during periods of amnesty, these revenues are directly and positively impacted. Moving violation forfeits revenues have been on a downward trajectory in the recent years. This trend expected to continue in FY 2021, especially with less motor traffic on public thoroughfares due to stay at home orders and bridge crossing traffic. However, there is an expectation that in FY 2022 this trend will reverse and see a 15% increase.
Like moving violation revenues, fines for liability insurance violations are correlated with a variety of socio-economic and demographic variables including vehicle ownership. The estimated revenue for FY 2021 shows a decrease of 34.4% as less traffic on public thoroughfares is expected. Similar to moving violations, this downward trend is expected to reverse in FY 2022.
Licenses and Permits License and permit revenues include fees charged by the City for different types of permits and licenses issued by the city to the requestor. FY 2021 estimated General Fund budget for licenses and permits is expected to decline by 20.7% to $10,640,778. The decline is associated with the economic and business closures due to COVID-19 pandemic. However, in FY 2022 a recovery on 17.4% is expected. Nearly 90% of licenses and permit revenue is collected in the General Fund. General construction permits make up the largest share (around 68%), of which $4.2 million is comprised of building permits and residential building permits. Estimates for construction permits are based on the city’s projected growth, mortgage interest rates, and local economic conditions. Other significant permits/licenses included in this group are: taxi cab operating permits, alarms licenses, alcoholic beverage licenses, food establishment licenses, food management school fees, home improvement contractor fees, residential building permits, fire inspections fees, and hazmat fees.
Building Licenses and Permits Revenue During the FY 2015 budget process, City Council elected to recoup the cost of service from the development community in lieu of continuing to subsidize development through the use of other General Fund revenues. As a result, several subdivision plan review and inspection fees were increased. Concurrently, the city has continued to experience an increase in commercial development which started in FY 2013. The growth is projected to continue well through FY 2022. Also, an important event is the separation of Residential Building Permits from the individual disciplines. It was determined that all trades should be paid and pulled separately resulting in variances at the account level for Electrical, Mechanical, Plumbing, and Residential Building Permits.
Analysis and Assumptions
For FY 2022 most of the fees remained the same as in FY 2021. The City added several new fees to meet customer requests for after-hours inspections or reviews. Since the City pays overtime hours for such work, and in order to recover the cost of the service provided, the City will charge customers a higher rate. In FY
FY 2018 FY 2019 FY 2020 FY 2021 FY 2022 VarianceActual Actual Actual Budget Budget
MOVING VIOLATIONS 2,925,476$ 3,385,635$ 3,402,057$ 2,075,105$ 2,386,371$ 15.0%LIABILITY INSURANCE VIOLATIONS 752,197 927,692 1,075,839 564,580 649,267 15.0%Total 3,677,673$ 4,313,327$ 4,477,896$ 2,639,685$ 3,035,638$ 15.0%
Selected Municipal Fines
FY 2018 FY 2019 FY 2020 FY 2021 FY 2022 VarianceActual Actual Actual Budget Budget
GENERAL FUND 14,352,347$ 14,809,826$ 13,564,189$ 10,640,778$ 12,743,122$ 19.8%NON-GENERAL FUND 1,689,997 1,834,194 1,659,263 1,646,000 1,676,000 1.8%Total 16,042,344$ 16,644,020$ 15,223,452$ 12,286,778$ 14,419,122$ 17.4%
Licenses and Permits by Fund
90

CITY OF EL PASO Financial Summaries
FY 2022 BUDGET
2021, revenues expected to decline primarily due to the economic impact and business closures associated to COVID-19 pandemic; however, a recovery is projected in FY 2022.
Intergovernmental Revenues and County Participation Included in this group are state/federal grants and revenues received from other governmental entities for joint programs managed by the City. Federal and state grant proceeds are based on grant awards if available or on estimates based on information provided by the grantors. FY 2014 experienced one of the highest Federal Grant Proceeds amounts in recent City of El Paso history. This was predominantly due to Sun Metro receiving grants for construction and busses purchase for BRIO Mesa (a Rapid Transit System on Mesa Street). As the federal government continues to experience difficulty in achieving spending controls, municipal governments are expected to continue seeing declining funds for community programs.
The inter-local tax collection revenue is derived from agreements for tax collection services provided by the City’s Tax Office to all taxing entities within El Paso County. The revenue is based on the cost of providing the service times the number of parcels taxed under each taxing entity.
The HTH agreements and County Participation are agreements with the County of El Paso and five municipal entities for health services provided by the Department of Public Health. The municipal health agreements are based on the number of units multiplied by the cost for providing such services and these agreements are negotiated on an annual basis.
In FY 2022, intergovernmental revenues are expected to decrease by 14.8% from FY 2021 Budget.
FY 2018 FY 2019 FY 2020 FY 2021 FY 2022 VarianceActual Actual Actual Budget Budget
BUILDING PERMITS 2,163,099$ 2,270,745$ 1,814,115$ 1,399,389$ 2,000,000$ 42.9%DEMOLITION PERMITS 24,769 22,971 14,470 13,899 15,290 10.0%ELECTRICAL PERMITS 2,003,493 2,287,320 2,468,627 1,714,871 2,000,000 16.6%GRADING PERMITS 183,626 212,605 182,658 142,342 156,575 10.0%MECHANICAL PERMITS 1,554,352 1,590,918 1,588,357 1,000,339 1,211,531 21.1%PLAN REVIEW FEES 831,779 1,057,813 863,809 780,926 849,492 8.8%PLUMBING PERMITS 851,635 878,298 816,877 597,827 657,607 10.0%ROOFING PERMITS 794,971 718,264 511,532 397,448 437,195 10.0%ZONING BOARD FEES 55,346 47,761 39,830 35,148 38,665 10.0%SUBDIVISION PERMITS 347,451 254,473 298,780 216,693 238,315 10.0%RESIDENTIAL BUILDING PERMITS 2,156,465 2,181,446 2,191,734 1,713,464 2,200,000 28.4%Total 10,966,984$ 11,522,614$ 10,790,790$ 8,012,345$ 9,804,670$ 22.4%
Selected Building and Building Permits
FY 2018 FY 2019 FY 2020 FY 2021 FY 2022 VarianceActual Actual Actual Budget Budget
FEDERAL GRANT PROCEEDS 77,623,140$ 55,081,373$ 111,302,785$ 46,670,034$ 38,606,840$ -17.3%STATE GRANT PROCEEDS 14,992,569 4,761,571 5,064,601 4,509,194 4,488,590 -0.5%OTHER GRANT PROCEEDS 647,897 873,474 1,524,009 22,860 22,860 0.0%CITY MATCH OF GRANT PROCEEDS (31,611) - - - - INTERLOCAL TAX COLLECT AGREEME 1,879,019 1,701,209 1,721,221 1,660,237 1,814,540 9.3%INTERLOCAL AGREEMENTS- HTH 1,785,350 1,850,889 1,927,235 1,839,329 1,688,809 -8.2%TOTAL 96,896,365$ 64,268,516$ 121,539,851$ 54,701,654$ 46,621,639$ -14.8%
Intergovernmental Revenues
FY 2018 FY 2019 FY 2020 FY 2021 FY 2022 VarianceActual Actual Actual Budget Budget
COUNTY PARTICIPATION -$ -$ -$ 125,930$ -$ Total -$ -$ -$ 125,930$ -$
County Participation
91
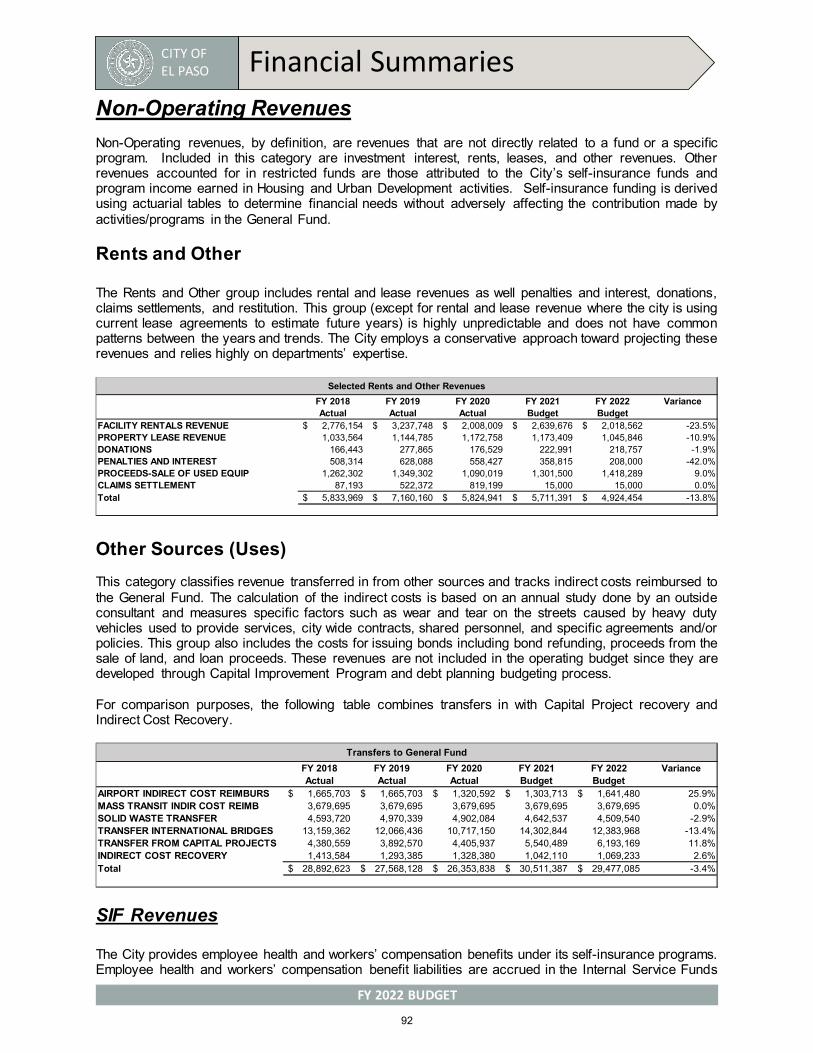
CITY OF EL PASO Financial Summaries
FY 2022 BUDGET
Non-Operating RevenuesNon-Operating revenues, by definition, are revenues that are not directly related to a fund or a specific program. Included in this category are investment interest, rents, leases, and other revenues. Other revenues accounted for in restricted funds are those attributed to the City’s self-insurance funds and program income earned in Housing and Urban Development activities. Self-insurance funding is derived using actuarial tables to determine financial needs without adversely affecting the contribution made by activities/programs in the General Fund.
Rents and Other
The Rents and Other group includes rental and lease revenues as well penalties and interest, donations, claims settlements, and restitution. This group (except for rental and lease revenue where the city is using current lease agreements to estimate future years) is highly unpredictable and does not have common patterns between the years and trends. The City employs a conservative approach toward projecting these revenues and relies highly on departments’ expertise.
Other Sources (Uses) This category classifies revenue transferred in from other sources and tracks indirect costs reimbursed to the General Fund. The calculation of the indirect costs is based on an annual study done by an outside consultant and measures specific factors such as wear and tear on the streets caused by heavy duty vehicles used to provide services, city wide contracts, shared personnel, and specific agreements and/or policies. This group also includes the costs for issuing bonds including bond refunding, proceeds from the sale of land, and loan proceeds. These revenues are not included in the operating budget since they are developed through Capital Improvement Program and debt planning budgeting process.
For comparison purposes, the following table combines transfers in with Capital Project recovery and Indirect Cost Recovery.
SIF Revenues
The City provides employee health and workers’ compensation benefits under its self-insurance programs. Employee health and workers’ compensation benefit liabilities are accrued in the Internal Service Funds
FY 2018 FY 2019 FY 2020 FY 2021 FY 2022 VarianceActual Actual Actual Budget Budget
FACILITY RENTALS REVENUE 2,776,154$ 3,237,748$ 2,008,009$ 2,639,676$ 2,018,562$ -23.5%PROPERTY LEASE REVENUE 1,033,564 1,144,785 1,172,758 1,173,409 1,045,846 -10.9%DONATIONS 166,443 277,865 176,529 222,991 218,757 -1.9%PENALTIES AND INTEREST 508,314 628,088 558,427 358,815 208,000 -42.0%PROCEEDS-SALE OF USED EQUIP 1,262,302 1,349,302 1,090,019 1,301,500 1,418,289 9.0%CLAIMS SETTLEMENT 87,193 522,372 819,199 15,000 15,000 0.0%Total 5,833,969$ 7,160,160$ 5,824,941$ 5,711,391$ 4,924,454$ -13.8%
Selected Rents and Other Revenues
FY 2018 FY 2019 FY 2020 FY 2021 FY 2022 VarianceActual Actual Actual Budget Budget
AIRPORT INDIRECT COST REIMBURS 1,665,703$ 1,665,703$ 1,320,592$ 1,303,713$ 1,641,480$ 25.9%MASS TRANSIT INDIR COST REIMB 3,679,695 3,679,695 3,679,695 3,679,695 3,679,695 0.0%SOLID WASTE TRANSFER 4,593,720 4,970,339 4,902,084 4,642,537 4,509,540 -2.9%TRANSFER INTERNATIONAL BRIDGES 13,159,362 12,066,436 10,717,150 14,302,844 12,383,968 -13.4%TRANSFER FROM CAPITAL PROJECTS 4,380,559 3,892,570 4,405,937 5,540,489 6,193,169 11.8%INDIRECT COST RECOVERY 1,413,584 1,293,385 1,328,380 1,042,110 1,069,233 2.6%Total 28,892,623$ 27,568,128$ 26,353,838$ 30,511,387$ 29,477,085$ -3.4%
Transfers to General Fund
92

CITY OF EL PASO Financial Summaries
FY 2022 BUDGET
based upon actuarially determined estimates of the aggregate liability for unpaid benefits. The city records all health and workers’ compensation claims liabilities, including an estimate for claims incurred but not reported. In addition, the City has a stop-loss policy for health claims. The City is subject to the State of Texas Employment Commission Act. Under this act, the city’s method for providing unemployment compensation is to reimburse the State of Texas (State) for claims paid by the State. Activity for certain self-insurance programs is recorded in the city’s Internal Service Self-Insurance Fund. Assets and obligations related to employee health benefits, workers’ compensation, and unemployment compensation are included in the Self-Insurance Fund. The City is self-insured for general liability (excluding the Mass Transit Department’s fleet of vehicles and liability insurance for the Airport). Expenditures for these liabilities are accounted for in the General Fund, which pays any liabilities incurred. Additionally, the city maintains insurance policies acquired from independent insurance carriers for property insurance, errors and omissions insurance, and auto liability insurance coverage for some of the City’s fleet of vehicles.
Enterprise Revenues
Enterprise funds or proprietary funds are used to account for an activity for which a fee(s) is charged to external users for goods and services. The City of El Paso reports activities for the El Paso International Airport, Environmental Services, Mass Transit-Sun Metro, and International Bridges under an enterprise form.
International Bridges Crossing Fees The City of El Paso borders Ciudad Juárez, Mexico and has bridges joining the two communities, which puts the City in a unique position to generate General Fund revenue from the operation of those bridges. The bridges allow for commercial and passenger vehicle crossings as well as pedestrian crossings for ease of accessibility between the neighboring cities. Fees are collected at the port of entry for vehicles and pedestrians heading south into Mexico. The City’s bridges are: 1) Stanton Bridge located downtown allowing southbound passenger vehicles and pedestrians as well as a dedicated lane allowing northbound traffic using the Sentri-Card, 2) Paso Del Norte Bridge located downtown which allows for northbound passenger vehicles that do not pay but allows northbound and southbound pedestrians with southbound traffic paying a fee; and, 3) the Ysleta-Zaragoza Bridge located on the east side of the city which requires
FY 2018 FY 2019 FY 2020 FY 2021 FY 2022 VarianceActual Actual Actual Budget Budget
CITY - EMPLOYEE DEDUCTIONS 7,241,967$ 6,848,352$ 5,738,703$ 5,156,808$ 5,014,380$ -2.8%FIRE - EMPLOYEE DEDUCTIONS 1,993,881 1,174,800 837,911 1,020,286 1,096,928 7.5%POLICE - EMPLOYEE DEDUCTIONS 3,545,648 3,783,521 2,489,593 1,589,634 2,243,492 41.1%RETIREES DEDUCTIONS (117) - - - - CITY - EMPLOYER CONTRIBUTION 17,754,726 16,596,591 16,906,407 17,949,326 19,983,269 11.3%FIRE - EMPLOYER CONTRIBUTION 8,808,492 11,077,820 12,556,098 13,039,892 13,039,892 0.0%POLICE - EMPLOYER CONTRIBUTION 6,944,501 7,419,576 8,769,327 12,301,392 12,301,392 0.0%WORKERS COMPENSATION CONTRIBUTION 13,153,973 13,781,332 14,976,088 14,138,859 11,588,062 -18.0%UNEMPLOYMENT CONTRIBUTIONS 304,654 318,383 442,961 329,527 335,333 1.8%LIFE INSURANCE CITY CONTRIBUTION 253,936 223,918 355,228 473,623 458,000 -3.3%DENTAL CTY CONTRIBUTION 503,131 545,681 645,845 694,070 694,070 0.0%DENTAL EMPLOYEE DEDDUCTION 72,332 75,290 83,006 82,518 82,518 0.0%VISION CTY CONTRIBUTION 71,531 83,953 86,402 70,000 34,812 -50.3%WORKERS COMPENSATION PAYBACK 422,269 584,247 804,869 Total 61,070,923$ 62,513,463$ 64,692,439$ 66,845,934$ 66,872,148$ 0.0%
SIF Revenues
FY 2018 FY 2019 FY 2020 FY 2021 FY 2022 VarianceActual Actual Actual Budget Budget
Aviation 43,807,188$ 47,038,583$ 37,019,431$ 31,988,200$ 36,064,222$ 12.7%Mass Transit - Sun Metro 8,618,925 8,295,017 4,620,117 7,215,000 5,575,000 -22.7%International Bridges 23,648,205 22,915,884 21,221,165 17,916,888 21,114,760 17.8%Environmental Services 39,175,527 44,053,499 44,053,499 46,457,968 44,500,000 -4.2%Total 115,249,844$ 122,302,983$ 106,914,212$ 103,578,056$ 107,253,982$ 3.5%
Enterprise Revenues by Department
93

CITY OF EL PASO Financial Summaries
FY 2022 BUDGET
payment for southbound pedestrians, passenger, and commercial vehicles. The passenger and commercial fees are designated towards International Bridges Capital Improvement Program and Public-Private Partnership (P3) with the Customs and Border Protection Agency, which aims to expedite wait times at the bridges.
Analysis and Assumptions
Factors considered in the estimation of future revenue streams are economic and market trends affecting both Cuidad Juárez (Mexico) and the city of El Paso, annual and monthly crossing trends, types of crossings, and the changes to corresponding fees. Pedestrian and passenger vehicle crossings are beginnning to improve after a period of bridge closures and long waiting times for bridge crossing. The FY 2021 Budget Bridge Crossing Revenues are estimated to decline by $5.3 million to $17,916,888 as a result of uncertainty of the impact of reduced bridge crossing associated to travel restrictions caused by COVID-19 pandemic. In FY 2022, as border restrictions ease, bridge traffic should increase and lead to higher bridge revenue.
The long-term outlook for crossing revenue looks extremely well. This revenue source is affected by metropolitan economic activity on both sides of the river, tolls charged, population growth, crime levels, and the effective purchasing power of the peso. Those variables frequently overcome the historical seasonal patterns that generally characterize tolled, southbound international bridge crossings.
Aviation Revenues El Paso International Airport (EPIA) is located six miles east of downtown El Paso and just south of Ft. Bliss. EPIA provides passenger and air cargo service to a two-nation region, including West Texas, Southern New Mexico, and northern Mexico. The El Paso International Airport owns nearly 7,000 acres of land and earns rental revenue from multiple businesses such as golf courses, hotels, and business parks. In addition, EPIA owns one of the largest air cargo facilities along the U.S./Mexico border and benefits from a high level of air cargo activity supporting maquiladoras in neighboring Ciudad Juárez, Mexico. El Paso International Airport is one of very few airports in the country that operates on a budget surplus.
FY 2018 FY 2019 FY 2020 FY 2021 FY 2022 VarianceActual Actual Actual Budget Budget
Crossing Revenue 23,648,205$ 22,915,884$ 21,221,165$ 17,916,888$ 21,114,760$ 17.8%Total 23,648,205$ 22,915,884$ 21,221,165$ 17,916,888$ 21,114,760$ 17.8%
International Bridges Revenue
94
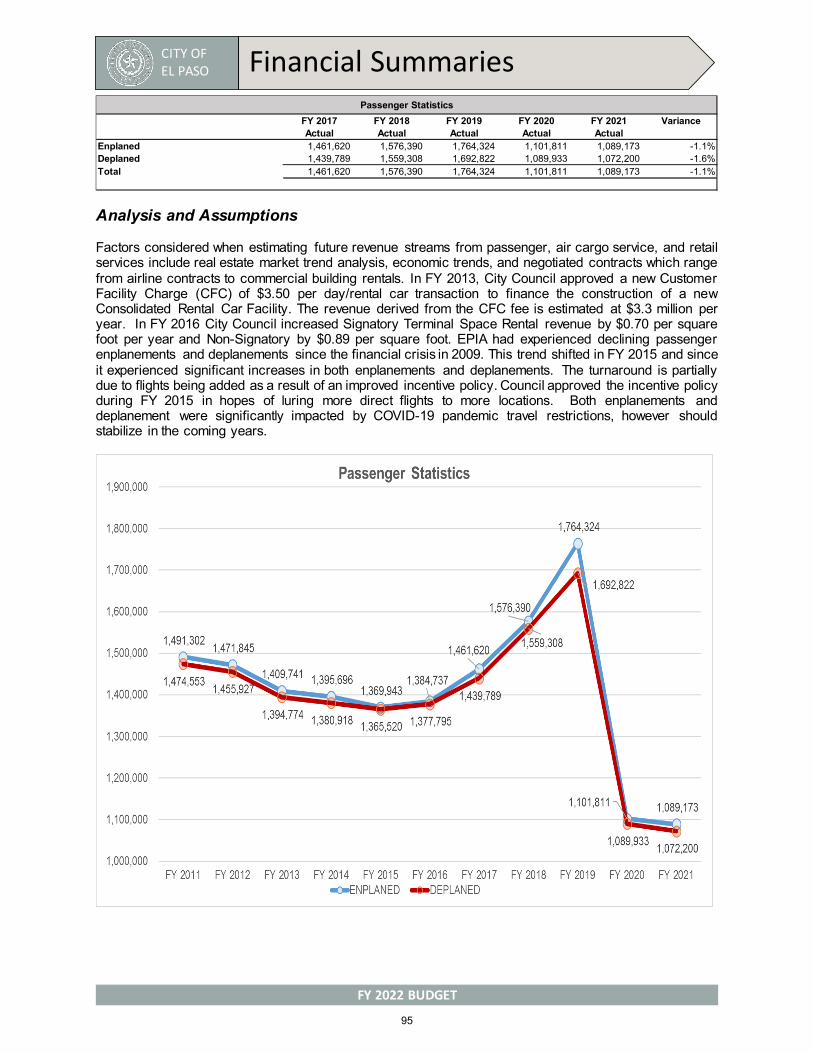
CITY OF EL PASO Financial Summaries
FY 2022 BUDGET
Analysis and Assumptions
Factors considered when estimating future revenue streams from passenger, air cargo service, and retail services include real estate market trend analysis, economic trends, and negotiated contracts which range from airline contracts to commercial building rentals. In FY 2013, City Council approved a new Customer Facility Charge (CFC) of $3.50 per day/rental car transaction to finance the construction of a new Consolidated Rental Car Facility. The revenue derived from the CFC fee is estimated at $3.3 million per year. In FY 2016 City Council increased Signatory Terminal Space Rental revenue by $0.70 per square foot per year and Non-Signatory by $0.89 per square foot. EPIA had experienced declining passenger enplanements and deplanements since the financial crisis in 2009. This trend shifted in FY 2015 and since it experienced significant increases in both enplanements and deplanements. The turnaround is partially due to flights being added as a result of an improved incentive policy. Council approved the incentive policy during FY 2015 in hopes of luring more direct flights to more locations. Both enplanements and deplanement were significantly impacted by COVID-19 pandemic travel restrictions, however should stabilize in the coming years.
FY 2017 FY 2018 FY 2019 FY 2020 FY 2021 VarianceActual Actual Actual Actual Actual
Enplaned 1,461,620 1,576,390 1,764,324 1,101,811 1,089,173 -1.1%Deplaned 1,439,789 1,559,308 1,692,822 1,089,933 1,072,200 -1.6%Total 1,461,620 1,576,390 1,764,324 1,101,811 1,089,173 -1.1%
Passenger Statistics
95

CITY OF EL PASO Financial Summaries
FY 2022 BUDGET
Mass Transit The City of El Paso operates a mass transit system that provides public transportation within the city limits
and service to El Paso County and the City of Sunland Park (New Mexico) through Federal Transit Administration (FTA) funding and service agreements with the entities. The transit system provides fixed route, local rail service (streetcar) and on-demand paratransit service to residents. The system is funded mainly through a half cent sales tax, fares, and grant funding from the FTA. The transit system has completed various service improvements such as the building of transfer centers, investment in new buses, BRIO Mesa Rapid Transit System (RTS), start of the Alameda, Dyer, and Montana RTS and streetcar service. To fund the service improvements the Mass Transit Board authorized a fee increase during
FY 2011 that changed the $1.25 fixed-route fare to $1.50 while the student and military fees were restructured.
Analysis and Assumptions
Factors considered in the estimation of future revenue streams are economic and market trends affecting both Ciudad Juárez and the City of El Paso, annual and monthly ridership trends, and the corresponding fees charged. Additionally, subject matter experts are consulted when an increase in fees is proposed in order to determine the effect on ridership.
Revenue generated from fares has been declining over the last few years. This is partly attributed to lower gas prices and therefore higher use of personally owned vehicles. Another impact on revenue is due to the opening of the Mesa BRIO. That line opened in FY 2015 and several other routes were adjusted. Many riders began using the BRIO and that shifted revenue from Fare Box to Ticket Sales. The BRIO added two lines in FY 2018 along the Alameda and Dyer corridor and as with the first BRIO, other routes will be adjusted. The Montana Brio, the fourth RTS corridor is expected in 2022.
Fully refurbished streetcars started serving El Paso downtown area in 2019 adding to the newly developed multi-modal downtown public transportation system. A small trolley cart was actually introduced to El Paso in 1902, replacing El Paso's mule car system, which had the town's pet "Mandy the Mule" taking passengers across the border and around the downtown area. As El Paso was growing in farming, manufacturing, mining, commerce, and the military, and needed an improved transportation system, the streetcar was introduced in the 1950s, 1960s, and 1970s. Now our city patrons can ride these vintage El Paso original
FY 2018 FY 2019 FY 2020 FY 2021 FY 2022 VarianceActual Actual Actual Budget Budget
FARE BOX REVENUE 5,895,140$ 5,438,995$ 2,800,792$ 4,800,000$ 3,340,000$ -30.4%TICKET SALES 1,320,203 1,465,562 874,338 1,000,000 1,155,000 15.5%FARE BOX COUNTY SERVICE 35,656 131,357 29,910 35,000 20,000 -42.9%FARE BOX CITY OF SUNLAND PARK 40,893 54,206 31,346 40,000 - -100.0%SENIOR CITIZEN BUS PASS 131,500 136,855 89,866 135,000 145,000 7.4%Total Fixed Route Revenue 7,423,392$ 7,226,976$ 3,826,252$ 6,010,000$ 4,660,000$ -22.5%
LIFT BUS REVENUE - TICKETS 326,659$ 338,469$ 207,876$ 350,000$ 310,000$ -11.4%LIFT BUS REVENUE - FARE BOX 354,973 315,487 237,844 400,000 250,000 -37.5%Total LIFT Revenue 681,632$ 653,956$ 445,720$ 750,000$ 560,000$ -25.3%
Total Service Revenue 8,105,023$ 7,880,932$ 4,271,972$ 6,760,000$ 5,220,000$ -22.8%
Mass Transit Fare Revenue
96
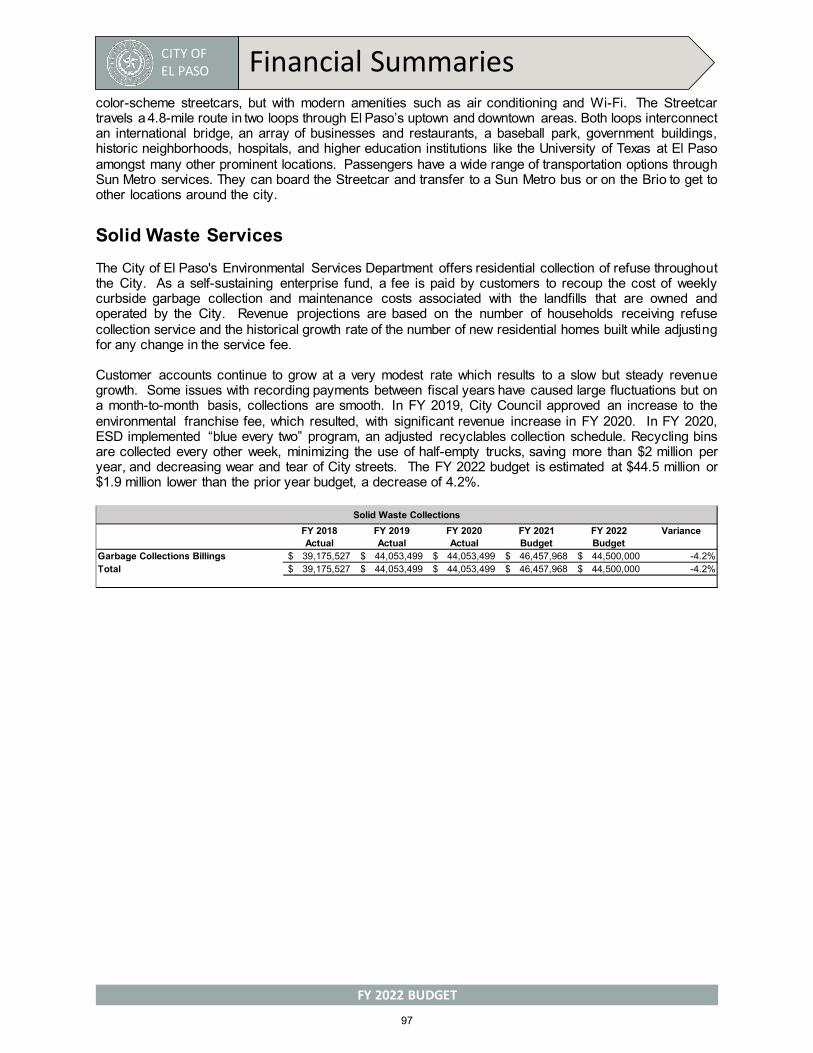
CITY OF EL PASO Financial Summaries
FY 2022 BUDGET
color-scheme streetcars, but with modern amenities such as air conditioning and Wi-Fi. The Streetcar travels a 4.8-mile route in two loops through El Paso’s uptown and downtown areas. Both loops interconnect an international bridge, an array of businesses and restaurants, a baseball park, government buildings, historic neighborhoods, hospitals, and higher education institutions like the University of Texas at El Paso amongst many other prominent locations. Passengers have a wide range of transportation options through Sun Metro services. They can board the Streetcar and transfer to a Sun Metro bus or on the Brio to get to other locations around the city.
Solid Waste Services The City of El Paso's Environmental Services Department offers residential collection of refuse throughout the City. As a self-sustaining enterprise fund, a fee is paid by customers to recoup the cost of weekly curbside garbage collection and maintenance costs associated with the landfills that are owned and operated by the City. Revenue projections are based on the number of households receiving refuse collection service and the historical growth rate of the number of new residential homes built while adjusting for any change in the service fee.
Customer accounts continue to grow at a very modest rate which results to a slow but steady revenue growth. Some issues with recording payments between fiscal years have caused large fluctuations but on a month-to-month basis, collections are smooth. In FY 2019, City Council approved an increase to the environmental franchise fee, which resulted, with significant revenue increase in FY 2020. In FY 2020, ESD implemented “blue every two” program, an adjusted recyclables collection schedule. Recycling bins are collected every other week, minimizing the use of half-empty trucks, saving more than $2 million per year, and decreasing wear and tear of City streets. The FY 2022 budget is estimated at $44.5 million or $1.9 million lower than the prior year budget, a decrease of 4.2%.
FY 2018 FY 2019 FY 2020 FY 2021 FY 2022 VarianceActual Actual Actual Budget Budget
Garbage Collections Billings 39,175,527$ 44,053,499$ 44,053,499$ 46,457,968$ 44,500,000$ -4.2%Total 39,175,527$ 44,053,499$ 44,053,499$ 46,457,968$ 44,500,000$ -4.2%
Solid Waste Collections
97
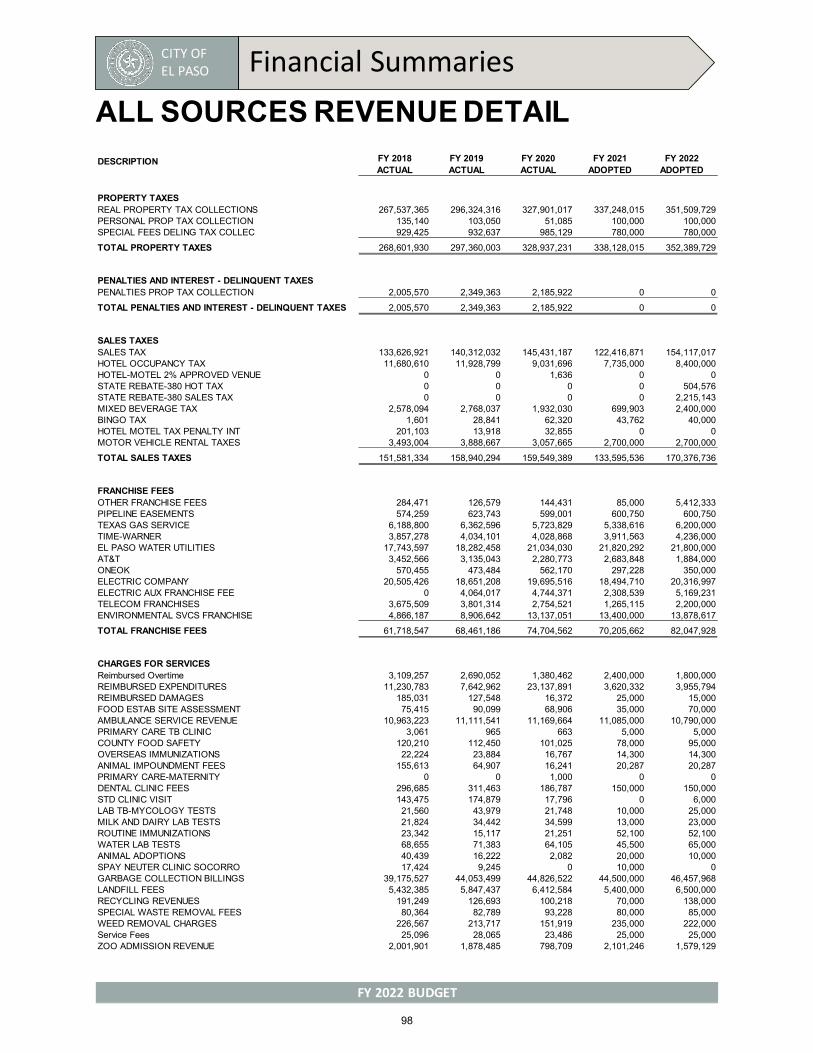
CITY OF EL PASO Financial Summaries
FY 2022 BUDGET
ALL SOURCES REVENUE DETAIL FY 2018 FY 2019 FY 2020 FY 2021 FY 2022ACTUAL ACTUAL ACTUAL ADOPTED ADOPTED
PROPERTY TAXESREAL PROPERTY TAX COLLECTIONS 267,537,365 296,324,316 327,901,017 337,248,015 351,509,729PERSONAL PROP TAX COLLECTION 135,140 103,050 51,085 100,000 100,000SPECIAL FEES DELING TAX COLLEC 929,425 932,637 985,129 780,000 780,000
TOTAL PROPERTY TAXES 268,601,930 297,360,003 328,937,231 338,128,015 352,389,729
PENALTIES AND INTEREST - DELINQUENT TAXESPENALTIES PROP TAX COLLECTION 2,005,570 2,349,363 2,185,922 0 0
TOTAL PENALTIES AND INTEREST - DELINQUENT TAXES 2,005,570 2,349,363 2,185,922 0 0
SALES TAXESSALES TAX 133,626,921 140,312,032 145,431,187 122,416,871 154,117,017HOTEL OCCUPANCY TAX 11,680,610 11,928,799 9,031,696 7,735,000 8,400,000HOTEL-MOTEL 2% APPROVED VENUE 0 0 1,636 0 0STATE REBATE-380 HOT TAX 0 0 0 0 504,576STATE REBATE-380 SALES TAX 0 0 0 0 2,215,143MIXED BEVERAGE TAX 2,578,094 2,768,037 1,932,030 699,903 2,400,000BINGO TAX 1,601 28,841 62,320 43,762 40,000HOTEL MOTEL TAX PENALTY INT 201,103 13,918 32,855 0 0MOTOR VEHICLE RENTAL TAXES 3,493,004 3,888,667 3,057,665 2,700,000 2,700,000
TOTAL SALES TAXES 151,581,334 158,940,294 159,549,389 133,595,536 170,376,736
FRANCHISE FEESOTHER FRANCHISE FEES 284,471 126,579 144,431 85,000 5,412,333PIPELINE EASEMENTS 574,259 623,743 599,001 600,750 600,750TEXAS GAS SERVICE 6,188,800 6,362,596 5,723,829 5,338,616 6,200,000TIME-WARNER 3,857,278 4,034,101 4,028,868 3,911,563 4,236,000EL PASO WATER UTILITIES 17,743,597 18,282,458 21,034,030 21,820,292 21,800,000AT&T 3,452,566 3,135,043 2,280,773 2,683,848 1,884,000ONEOK 570,455 473,484 562,170 297,228 350,000ELECTRIC COMPANY 20,505,426 18,651,208 19,695,516 18,494,710 20,316,997ELECTRIC AUX FRANCHISE FEE 0 4,064,017 4,744,371 2,308,539 5,169,231TELECOM FRANCHISES 3,675,509 3,801,314 2,754,521 1,265,115 2,200,000ENVIRONMENTAL SVCS FRANCHISE 4,866,187 8,906,642 13,137,051 13,400,000 13,878,617
TOTAL FRANCHISE FEES 61,718,547 68,461,186 74,704,562 70,205,662 82,047,928
CHARGES FOR SERVICESReimbursed Overtime 3,109,257 2,690,052 1,380,462 2,400,000 1,800,000REIMBURSED EXPENDITURES 11,230,783 7,642,962 23,137,891 3,620,332 3,955,794REIMBURSED DAMAGES 185,031 127,548 16,372 25,000 15,000FOOD ESTAB SITE ASSESSMENT 75,415 90,099 68,906 35,000 70,000AMBULANCE SERVICE REVENUE 10,963,223 11,111,541 11,169,664 11,085,000 10,790,000PRIMARY CARE TB CLINIC 3,061 965 663 5,000 5,000COUNTY FOOD SAFETY 120,210 112,450 101,025 78,000 95,000OVERSEAS IMMUNIZATIONS 22,224 23,884 16,767 14,300 14,300ANIMAL IMPOUNDMENT FEES 155,613 64,907 16,241 20,287 20,287PRIMARY CARE-MATERNITY 0 0 1,000 0 0DENTAL CLINIC FEES 296,685 311,463 186,787 150,000 150,000STD CLINIC VISIT 143,475 174,879 17,796 0 6,000LAB TB-MYCOLOGY TESTS 21,560 43,979 21,748 10,000 25,000MILK AND DAIRY LAB TESTS 21,824 34,442 34,599 13,000 23,000ROUTINE IMMUNIZATIONS 23,342 15,117 21,251 52,100 52,100WATER LAB TESTS 68,655 71,383 64,105 45,500 65,000ANIMAL ADOPTIONS 40,439 16,222 2,082 20,000 10,000SPAY NEUTER CLINIC SOCORRO 17,424 9,245 0 10,000 0GARBAGE COLLECTION BILLINGS 39,175,527 44,053,499 44,826,522 44,500,000 46,457,968LANDFILL FEES 5,432,385 5,847,437 6,412,584 5,400,000 6,500,000RECYCLING REVENUES 191,249 126,693 100,218 70,000 138,000SPECIAL WASTE REMOVAL FEES 80,364 82,789 93,228 80,000 85,000WEED REMOVAL CHARGES 226,567 213,717 151,919 235,000 222,000Service Fees 25,096 28,065 23,486 25,000 25,000ZOO ADMISSION REVENUE 2,001,901 1,878,485 798,709 2,101,246 1,579,129
DESCRIPTION
98

CITY OF EL PASO Financial Summaries
FY 2022 BUDGET
FY 2018 FY 2019 FY 2020 FY 2021 FY 2022ACTUAL ACTUAL ACTUAL ADOPTED ADOPTED
CHARGES FOR SERVICESGENERAL ADMISSIONS REVENUE 753,893 753,366 264,550 917,643 565,863PARKING FEE REVENUE 1,645,311 1,620,006 843,995 1,053,260 860,000METER REVENUE 1,277,654 1,395,876 1,008,543 540,646 778,628City-Truancy Prev & Diversion 56,943 67,312 104,386 37,621 132,7663RD PARTY INS BUREAU VERITAS 0 88 0 0 0LIBRARY FEES 45,871 47,797 26,158 13,363 13,363EVENT FEES 128,349 146,875 114,193 75,421 74,621INSTRUCTIONAL FEES 530,816 596,986 278,207 446,159 392,631MEMBERSHIP FEES 81,476 83,667 44,118 71,242 48,550CHILD CARE SERVICES 409,911 442,688 217,778 106,020 106,020SALES TO THE PUBLIC 5,052,619 4,723,502 2,544,385 4,306,114 6,604,639ORGANIZED SPORTS LEAGUES FEES 933,271 1,052,923 427,868 673,075 673,075PARKS DEPARTMENT REVENUE 470 210 0 0 0MOTOR POOL USAGE FEES 38,165 34,643 39,238 45,000 45,000EQUIPMENT MAINTENANCE CHARGES 12,275,203 10,811,471 10,943,812 11,000,000 11,611,610FUEL AND LUBRICANTS CHARGES 6,179,302 5,898,100 5,719,355 5,850,000 5,850,000MISC CHARGES-SALES TO DEPTS 604 866 8 0 0INDIRECT COST RECOVERY 5,929,191 5,576,355 5,567,169 6,485,926 5,002,191ENVIRONMENTAL FEES 17,016,525 17,222,406 18,520,233 18,480,000 18,930,756TAX OFFICE CERTIFICATES 37,514 38,221 41,983 36,000 36,000GUS AND GOLDIE ROYALTY REVENUE 30 2,260 90 2,500 2,500REVENUE PROG INCOME FTHB-567 882,173 1,061,703 945,733 359,400 320,000REVENUE PROG INCOME SINLGE 568 404,052 380,157 284,564 573,303 652,903REVENUE PROG INCOME MULTI -569 636,470 1,210,565 900,263 545,100 500,000REVENUE PROG INCOME CHDO-573 292,870 313,351 345,418 485,100 500,000PUBLIC INFOR DISTRIBUTION FEE 17,771 23,996 30,369 13,324 14,698PREP AND RELEASE OF LIENS 42,686 43,038 34,157 40,000 40,000BANK FEES CREDIT CARD FEES 167,559 360,150 347,254 86,913 91,950SOFTWARE MNTC FEE ACCELA 362,450 308,277 297,355 155,000 265,000PHOTOSTATS 169,833 152,938 115,056 150,000 150,000VENDING MACHINE PROCEEDS 37,218 27,343 127,590 30,000 25,000FEES REQUIRED BY ORDINANCE 5,300 21,336 16,050 0 0PARKLAND DEDICATION FEES 324,750 309,064 359,300 0 0ANNUAL REGISTRATION FEE-LOBBY 3,000 2,250 1,900 1,200 1,200CIVIC CENTER REVENUE 258,532 0 255,875 0 0PROGRAM INCOME 6,569,097 8,456,688 8,617,295 1,966,408 1,142,127TRANSFER FROM CAPITAL PROJECTS 4,380,559 3,892,570 4,405,937 5,540,489 6,193,169
TOTAL CHARGES FOR SERVICES 140,578,749 141,850,866 152,454,211 130,080,993 133,727,837
FINES AND FORFEITURESANTICIPATED WARRANT FEES -1,068 -1,192 -50 0 0MOVING VIOLATION FINES 2,925,476 3,385,635 3,402,057 2,075,105 2,386,371PUBLIC INSPECTION VIOLATIONS 31,884 33,613 19,455 8,126 9,345HEALTH CODE VIOLATIONS 14,765 15,959 13,634 6,831 7,856ANIMAL VIOLATIONS 59,894 63,304 51,066 24,513 28,190LIABILITY INSURANCE VIOLATIONS 752,197 927,692 1,075,839 564,580 649,267MISDEMEANORS 122,116 121,396 114,455 59,563 68,497COURT FEE 0 0 9,438 3,000 3,000MOVING WARRANTS 942,565 1,398,126 949,251 680,477 782,549ARREST FEES - MOVING VIOLATION 295,789 323,832 296,022 171,481 197,203PARKING COURT COSTS 77,160 74,759 53,694 35,723 40,856CITY COURT COSTS 174,309 197,899 158,798 98,816 113,638OVERPAYMENT MUNI COURT TICKETS 0 0 141 0 0SPECIAL EXPENSE FEE 442,731 416,348 297,331 198,442 228,208MUNI COURT BLDG SECURITY FUND 182,356 209,313 203,269 119,964 210,000MOVING VIOLATION FORFEITS 237,385 9,757 -1,231,809 0 0PARKING FORFEITS FINES 1,839,288 1,843,854 1,300,485 938,202 1,075,482APPELLATE DOCKET FEES -775 185 150 0 0RECOVERIES - PROFESSIONAL BOND 5,573 7,128 34 0 21,000MUNI COURT TECH FEE COLLECTION 243,162 279,021 242,077 78,000 78,000TIME PAYMENT FEES- MUNI COURT 161,324 198,161 222,648 65,000 30,000CITY - FTA 35,298 36,488 42,144 21,045 24,202NARCOTICS REIMBURSEMENT FEE 15,686 15,826 20,355 12,000 16,000TEEN COURT REVENUE 90 2,460 3,211 10,896 6,780JUDICIAL SALARIES- CITY 36,191 39,469 28,823 19,440 22,356RED LIGHT CAMERA VIOLATIONS 1,205,972 1,225,912 40,691 0 0APPEALS BOARD FEES 665 645 3,225 0 0
TOTAL FINES AND FORFEITURES 9,800,032 10,825,592 7,316,434 5,191,204 5,998,801
DESCRIPTION
99
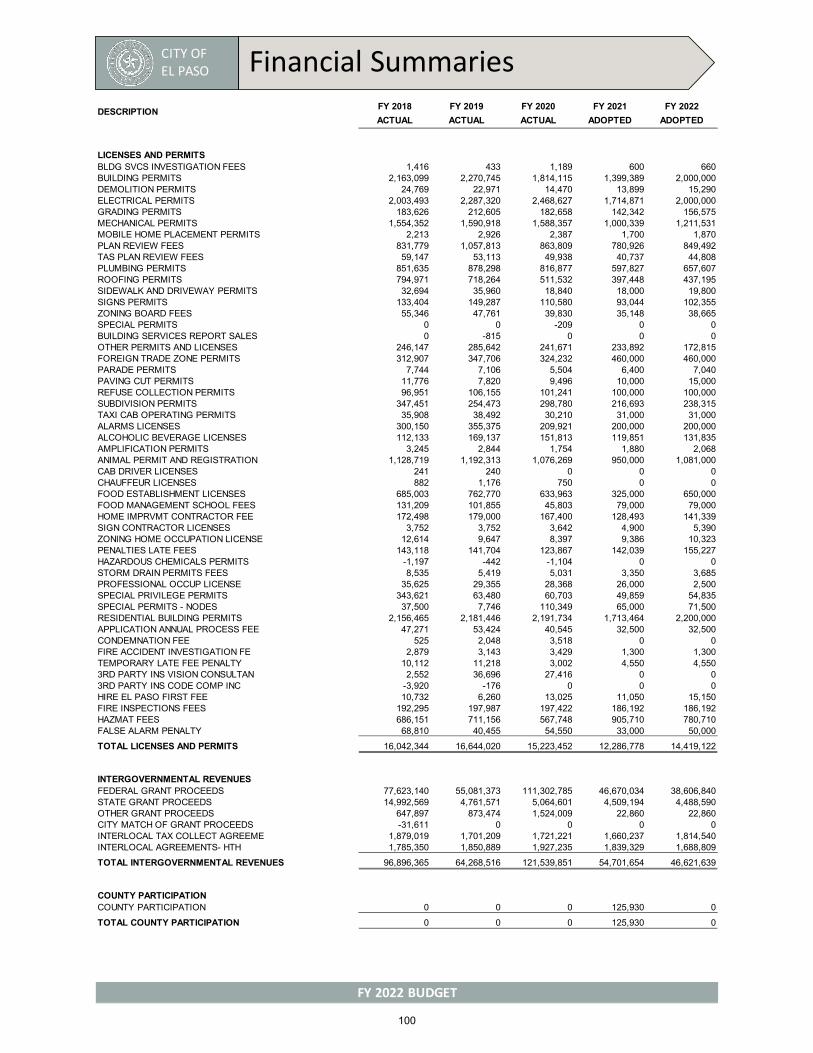
CITY OF EL PASO Financial Summaries
FY 2022 BUDGET
FY 2018 FY 2019 FY 2020 FY 2021 FY 2022ACTUAL ACTUAL ACTUAL ADOPTED ADOPTED
LICENSES AND PERMITSBLDG SVCS INVESTIGATION FEES 1,416 433 1,189 600 660BUILDING PERMITS 2,163,099 2,270,745 1,814,115 1,399,389 2,000,000DEMOLITION PERMITS 24,769 22,971 14,470 13,899 15,290ELECTRICAL PERMITS 2,003,493 2,287,320 2,468,627 1,714,871 2,000,000GRADING PERMITS 183,626 212,605 182,658 142,342 156,575MECHANICAL PERMITS 1,554,352 1,590,918 1,588,357 1,000,339 1,211,531MOBILE HOME PLACEMENT PERMITS 2,213 2,926 2,387 1,700 1,870PLAN REVIEW FEES 831,779 1,057,813 863,809 780,926 849,492TAS PLAN REVIEW FEES 59,147 53,113 49,938 40,737 44,808PLUMBING PERMITS 851,635 878,298 816,877 597,827 657,607ROOFING PERMITS 794,971 718,264 511,532 397,448 437,195SIDEWALK AND DRIVEWAY PERMITS 32,694 35,960 18,840 18,000 19,800SIGNS PERMITS 133,404 149,287 110,580 93,044 102,355ZONING BOARD FEES 55,346 47,761 39,830 35,148 38,665SPECIAL PERMITS 0 0 -209 0 0BUILDING SERVICES REPORT SALES 0 -815 0 0 0OTHER PERMITS AND LICENSES 246,147 285,642 241,671 233,892 172,815FOREIGN TRADE ZONE PERMITS 312,907 347,706 324,232 460,000 460,000PARADE PERMITS 7,744 7,106 5,504 6,400 7,040PAVING CUT PERMITS 11,776 7,820 9,496 10,000 15,000REFUSE COLLECTION PERMITS 96,951 106,155 101,241 100,000 100,000SUBDIVISION PERMITS 347,451 254,473 298,780 216,693 238,315TAXI CAB OPERATING PERMITS 35,908 38,492 30,210 31,000 31,000ALARMS LICENSES 300,150 355,375 209,921 200,000 200,000ALCOHOLIC BEVERAGE LICENSES 112,133 169,137 151,813 119,851 131,835AMPLIFICATION PERMITS 3,245 2,844 1,754 1,880 2,068ANIMAL PERMIT AND REGISTRATION 1,128,719 1,192,313 1,076,269 950,000 1,081,000CAB DRIVER LICENSES 241 240 0 0 0CHAUFFEUR LICENSES 882 1,176 750 0 0FOOD ESTABLISHMENT LICENSES 685,003 762,770 633,963 325,000 650,000FOOD MANAGEMENT SCHOOL FEES 131,209 101,855 45,803 79,000 79,000HOME IMPRVMT CONTRACTOR FEE 172,498 179,000 167,400 128,493 141,339SIGN CONTRACTOR LICENSES 3,752 3,752 3,642 4,900 5,390ZONING HOME OCCUPATION LICENSE 12,614 9,647 8,397 9,386 10,323PENALTIES LATE FEES 143,118 141,704 123,867 142,039 155,227HAZARDOUS CHEMICALS PERMITS -1,197 -442 -1,104 0 0STORM DRAIN PERMITS FEES 8,535 5,419 5,031 3,350 3,685PROFESSIONAL OCCUP LICENSE 35,625 29,355 28,368 26,000 2,500SPECIAL PRIVILEGE PERMITS 343,621 63,480 60,703 49,859 54,835SPECIAL PERMITS - NODES 37,500 7,746 110,349 65,000 71,500RESIDENTIAL BUILDING PERMITS 2,156,465 2,181,446 2,191,734 1,713,464 2,200,000APPLICATION ANNUAL PROCESS FEE 47,271 53,424 40,545 32,500 32,500CONDEMNATION FEE 525 2,048 3,518 0 0FIRE ACCIDENT INVESTIGATION FE 2,879 3,143 3,429 1,300 1,300TEMPORARY LATE FEE PENALTY 10,112 11,218 3,002 4,550 4,5503RD PARTY INS VISION CONSULTAN 2,552 36,696 27,416 0 03RD PARTY INS CODE COMP INC -3,920 -176 0 0 0HIRE EL PASO FIRST FEE 10,732 6,260 13,025 11,050 15,150FIRE INSPECTIONS FEES 192,295 197,987 197,422 186,192 186,192HAZMAT FEES 686,151 711,156 567,748 905,710 780,710FALSE ALARM PENALTY 68,810 40,455 54,550 33,000 50,000
TOTAL LICENSES AND PERMITS 16,042,344 16,644,020 15,223,452 12,286,778 14,419,122
INTERGOVERNMENTAL REVENUESFEDERAL GRANT PROCEEDS 77,623,140 55,081,373 111,302,785 46,670,034 38,606,840STATE GRANT PROCEEDS 14,992,569 4,761,571 5,064,601 4,509,194 4,488,590OTHER GRANT PROCEEDS 647,897 873,474 1,524,009 22,860 22,860CITY MATCH OF GRANT PROCEEDS -31,611 0 0 0 0INTERLOCAL TAX COLLECT AGREEME 1,879,019 1,701,209 1,721,221 1,660,237 1,814,540INTERLOCAL AGREEMENTS- HTH 1,785,350 1,850,889 1,927,235 1,839,329 1,688,809
TOTAL INTERGOVERNMENTAL REVENUES 96,896,365 64,268,516 121,539,851 54,701,654 46,621,639
COUNTY PARTICIPATIONCOUNTY PARTICIPATION 0 0 0 125,930 0
TOTAL COUNTY PARTICIPATION 0 0 0 125,930 0
DESCRIPTION
100

CITY OF EL PASO Financial Summaries
FY 2022 BUDGET
FY 2018 FY 2019 FY 2020 FY 2021 FY 2022ACTUAL ACTUAL ACTUAL ADOPTED ADOPTED
INTERESTINVESTMENT INTEREST REVENUE 6,502,857 11,127,100 7,645,721 600,500 372,500
TOTAL INTEREST 6,502,857 11,127,100 7,645,721 600,500 372,500
RENTS AND OTHERFACILITY MANAGEMENT FEES 0 0 0 4,662,915 4,932,856FACILITY RENTALS REVENUE 2,776,154 3,237,748 2,008,009 2,639,676 2,018,562PROPERTY LEASE REVENUE 1,033,564 1,144,785 1,172,758 1,173,409 1,045,846DONATIONS 166,443 277,865 176,529 222,991 218,757MISC NON-OPERATING REVENUES 5,663,633 5,107,668 2,928,414 2,511,439 2,551,780PENALTIES AND INTEREST 508,314 628,088 558,427 358,815 208,000
TOTAL RENTS AND OTHER 10,148,108 10,396,154 6,844,137 11,569,245 10,975,801
OTHER SOURCES (USES)AIRPORT INDIRECT COST REIMBURS 1,665,703 1,665,703 1,320,592 1,303,713 1,641,480MASS TRANSIT INDIR COST REIMB 3,679,695 3,679,695 3,679,695 3,679,695 3,679,695UNREALIZED GAINS LOSSES 13,319 91,348 556,187 0 0ORIGINAL ISSUES BOND PROCEEDS 0 151,580,000 144,995,000 0 0REFUNDINGS BOND PROCEEDS 0 35,820,000 71,985,000 0 0PREMIUM ON BONDS SOLD 0 16,964,113 42,124,325 0 0BAB TAX CREDIT 2,223,491 1,859,596 815,762 0 0PROCEEDS-SALE OF USED EQUIP 1,262,302 1,349,302 1,090,019 1,301,500 1,418,289PROCEEDS-SALE OF FIXED ASSET 7,468 0 756 0 0PROCEEDS FROM THE SALE OF LAND 29,131 703,222 48,350 0 0CLAIMS SETTLEMENT 87,193 522,372 819,199 15,000 15,000INSURANCE RECOVERY 533,697 93,966 0 0 0CAPITAL CONTRIBUTIONS 24,239,115 85,204,643 6,353,905 0 0OTHER SOURCES OF FUNDS 5,600,040 5,754,585 6,423,121 0 0
TOTAL OTHER SOURCES (USES) 39,341,154 305,288,544 280,211,913 6,299,908 6,754,464
OPERATING TRANSFERS ININTERFUND TRANSFERS (SOURCES) 78,406,762 99,023,957 124,286,617 75,903,590 95,720,503TRANSFER FROM BOND PROCEEDS 0 3,711,253 3,237,440 0 0FUND BALANCE TRANSFERS (SOURCE 0 0 0 18,151,249 14,249,172
TOTAL OPERATING TRANSFERS IN 78,406,762 102,735,210 127,524,057 94,054,839 109,969,675
SIF REVENUESPOS CITY - EMPLOYEE DEDUCTIONS 7,241,967 6,848,352 5,738,703 5,156,808 5,014,380POS FIRE - EMPLOYEE DEDUCTIONS 1,993,881 1,174,800 837,911 1,020,286 1,096,928POS POLICE - EMPLOYEE DEDUCTIO 3,545,648 3,783,521 2,489,593 1,589,634 2,243,492POS RETIREES DEDUCTIONS -117 0 0 0 0POS CITY - EMPLOYER CONTRIB 17,754,726 16,596,591 16,906,407 17,949,326 19,983,269POS FIRE - EMPLOYER CONTRIB 8,808,492 11,077,820 12,556,098 13,039,892 13,039,892POS POLICE - EMPLOYER CONTRIB 6,944,501 7,419,576 8,769,327 12,301,392 12,301,392WORKERS COMPENSATION CONTRIB 13,153,973 13,781,332 14,976,088 14,138,859 11,588,062UNEMPLOYMENT CONTRIBUTIONS 304,654 318,383 442,961 329,527 335,333GROUP LIFE INSURANCE CITY CONT 253,936 223,918 355,228 473,623 458,000GRP DENT CTY CONTRB-FIRE&POLIC 503,131 545,681 645,845 694,070 694,070GRP DENT EMPLOYEE DED-FIRE&POL 72,332 75,290 83,006 82,518 82,518GRP VISION CTY CONTRIB-FIRE&PO 71,531 83,953 86,402 70,000 34,812WORKERS COMPENSATION PAYBACK 422,269 584,247 804,869 0 0EMPLOYEE PENSION DEDUCTIONS 0 0 0 0 0EMPLOYER PENSION CONTRIBUTIONS 0 0 0 0 0
TOTAL SIF REVENUES 61,070,923 62,513,463 64,692,439 66,845,934 66,872,148
ENTERPRISE REVENUESCUSTOMER FACILITY CHARGE 3,799,709 3,788,187 2,672,131 1,500,000 2,272,912PASSENGER VEHICLE CROSSINGS 23,648,205 22,915,884 21,221,165 17,916,888 21,114,760AIRPORT BUILDING LEASE REVENUE 1,656,498 1,594,545 1,624,634 1,640,000 1,691,400AIRPORT PARKING LOT FEES 6,658,349 8,563,121 5,208,544 3,187,500 5,137,872AIRLINE SCHEDULED LANDING FEES 3,384,506 3,264,862 2,577,127 3,400,000 3,400,000NONSCHEDULED LANDING FEES 619,219 519,128 494,652 450,000 450,000AIRPORT GATE USE FEES 158,625 5,839 2,609 78,000 25,000FUEL FLOWAGE FEES 359,832 344,595 436,524 360,000 425,000AIRCRAFT PARKING FEES 390,272 481,781 501,540 415,400 506,000
DESCRIPTION
101

CITY OF EL PASO Financial Summaries
FY 2022 BUDGET
FY 2018 FY 2019 FY 2020 FY 2021 FY 2022ACTUAL ACTUAL ACTUAL ADOPTED ADOPTED
ENTERPRISE REVENUESTERM SPACE RENTAL - AIRLINE 5,508,078 5,447,465 5,598,940 5,720,000 5,600,000TERMINAL SPACE RENTAL-OTHER 695,298 648,783 609,852 655,000 610,000AIRPORT ADVERTISING REVENUES 284,765 268,493 263,401 86,250 200,000AIRPORT FOOD AND BEVE REVENUE 1,452,923 1,562,967 948,330 348,750 677,402AIRPORT GIFTSHOP NEWSTAND REV 668,165 729,974 482,569 253,125 437,984AIRPORT VENDING MACHINE REV 167 161 71 250 250AIRPORT CAR RENTALS 4,721,545 5,159,267 3,754,642 4,000,000 3,500,000AIRPORT LA PLACITA REVENUES 61,024 8,508 5,558 0 2,500AIRPORT TAXI AND LIMOUSINE FEE 84,578 21,000 14,400 11,250 10,000AIRPORT TRANSPORT NETWORKS 0 138,770 124,891 44,625 83,262AIRPORT PHONE TELECOMMUNICATIO 0 0 4,226 0 0AIRPORT EQUIPMENT PARKING RENT 113,521 116,054 118,840 115,200 115,200AIRPORT LOADING BRIDGE CHARGES -4,800 0 0 0 0AIRPORT COST REIMBURSEMENTS 0 977 0 0 0AIRPORT SEC COST REIMBURSMENT 176,330 176,439 99,149 153,000 153,000AIRPORT CANINE COST REIMBURSED 0 202,000 202,000 202,000 202,000AIRPORT UTIL COSTS REIMBURSTMT 386,893 340,929 314,840 326,000 326,000AIRCRAFT TIE DOWN FEES 3,120 3,120 3,120 3,120 3,120T-HANGAR RENTAL FEES 302,802 301,668 300,562 300,000 300,000GROUND RENTALS 8,782,253 8,998,928 8,828,228 8,291,950 8,730,784OTHER AIRPORT REVENUE 30,292 42,908 15,770 32,800 32,800AIRPORT WASHRACK REVENUE 0 157 52 100 100AIRPORT FINGERPRINT REVENUE 202,000 164,102 154,339 162,000 162,000GOLF COURSE GREEN FEES 993,074 951,479 495,191 0 71,250PRO SHOP SALES 169,784 186,252 170,111 0 13,750DRIVING RANGE FEES 23,815 24,849 13,862 0 2,500CARGO SCHEDULED LANDING FEES 813,039 903,428 1,060,976 900,000 900,000FARE BOX REVENUE 5,895,140 5,438,995 2,800,792 4,800,000 3,340,000TICKET SALES 1,320,203 1,465,562 874,338 1,000,000 1,155,000BIKE SHARE FEES 0 0 0 0 0TOKEN SALES 47,290 47,492 25,317 50,000 35,000STREET CAR FARE BOX 0 48,451 3,534 100,000 30,000LIFT BUS REVENUE - TICKETS 326,659 338,469 207,876 350,000 310,000SENIOR CITIZEN BUS PASS 131,500 136,855 89,866 135,000 145,000LIFT BUS REVENUE - FARE BOX 354,973 315,487 237,844 400,000 250,000NON-TRANSPORTATION REVENUE 180,945 17,408 14,953 15,000 15,000UNION DEPOT OFFICE LEASE REVEN 332,957 396,677 333,193 440,000 340,000MT ADVERTISING REVENUE 0 0 0 0 0FTA SUBSIDY 0 0 0 0 0FARE BOX COUNTY SERVICE 35,656 131,357 29,910 35,000 20,000FARE BOX CITY OF SUNLAND PARK 40,893 54,206 31,346 40,000 0POS COBRA DEDUCTIONS 62,853 59,680 73,225 70,000 70,000GAINS ON DISP-PROP FIXED ASSET 71,250 205,144 42,152 0 0PASSENGER FACILITY CHARGES 6,037,217 6,804,337 4,250,689 3,000,000 4,082,602
TOTAL ENTERPRISE REVENUES 80,981,410 83,336,739 67,337,879 60,988,208 66,949,448
TOTAL REVENUES 1,023,676,084 1,336,097,050 1,416,167,198 984,674,406 1,067,475,828
DESCRIPTION
102
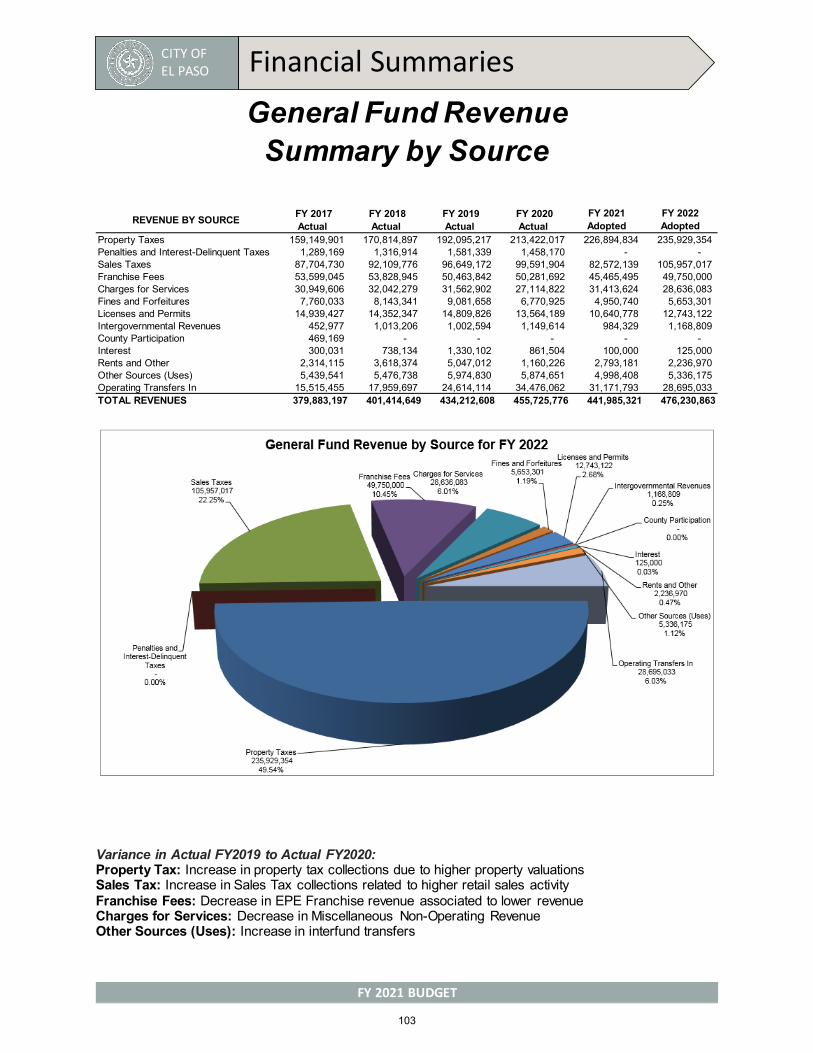
CITY OF EL PASO Financial Summaries
FY 2021 BUDGET
General Fund Revenue Summary by Source
Variance in Actual FY2019 to Actual FY2020: Property Tax: Increase in property tax collections due to higher property valuations Sales Tax: Increase in Sales Tax collections related to higher retail sales activity Franchise Fees: Decrease in EPE Franchise revenue associated to lower revenue Charges for Services: Decrease in Miscellaneous Non-Operating Revenue Other Sources (Uses): Increase in interfund transfers
REVENUE BY SOURCE FY 2017 Actual
FY 2018 Actual
FY 2019 Actual
FY 2020 Actual
FY 2021 Adopted
FY 2022 Adopted
Property Taxes 159,149,901 170,814,897 192,095,217 213,422,017 226,894,834 235,929,354 Penalties and Interest-Delinquent Taxes 1,289,169 1,316,914 1,581,339 1,458,170 - - Sales Taxes 87,704,730 92,109,776 96,649,172 99,591,904 82,572,139 105,957,017 Franchise Fees 53,599,045 53,828,945 50,463,842 50,281,692 45,465,495 49,750,000 Charges for Services 30,949,606 32,042,279 31,562,902 27,114,822 31,413,624 28,636,083 Fines and Forfeitures 7,760,033 8,143,341 9,081,658 6,770,925 4,950,740 5,653,301 Licenses and Permits 14,939,427 14,352,347 14,809,826 13,564,189 10,640,778 12,743,122 Intergovernmental Revenues 452,977 1,013,206 1,002,594 1,149,614 984,329 1,168,809 County Participation 469,169 - - - - - Interest 300,031 738,134 1,330,102 861,504 100,000 125,000 Rents and Other 2,314,115 3,618,374 5,047,012 1,160,226 2,793,181 2,236,970 Other Sources (Uses) 5,439,541 5,476,738 5,974,830 5,874,651 4,998,408 5,336,175 Operating Transfers In 15,515,455 17,959,697 24,614,114 34,476,062 31,171,793 28,695,033 TOTAL REVENUES 379,883,197 401,414,649 434,212,608 455,725,776 441,985,321 476,230,863
103
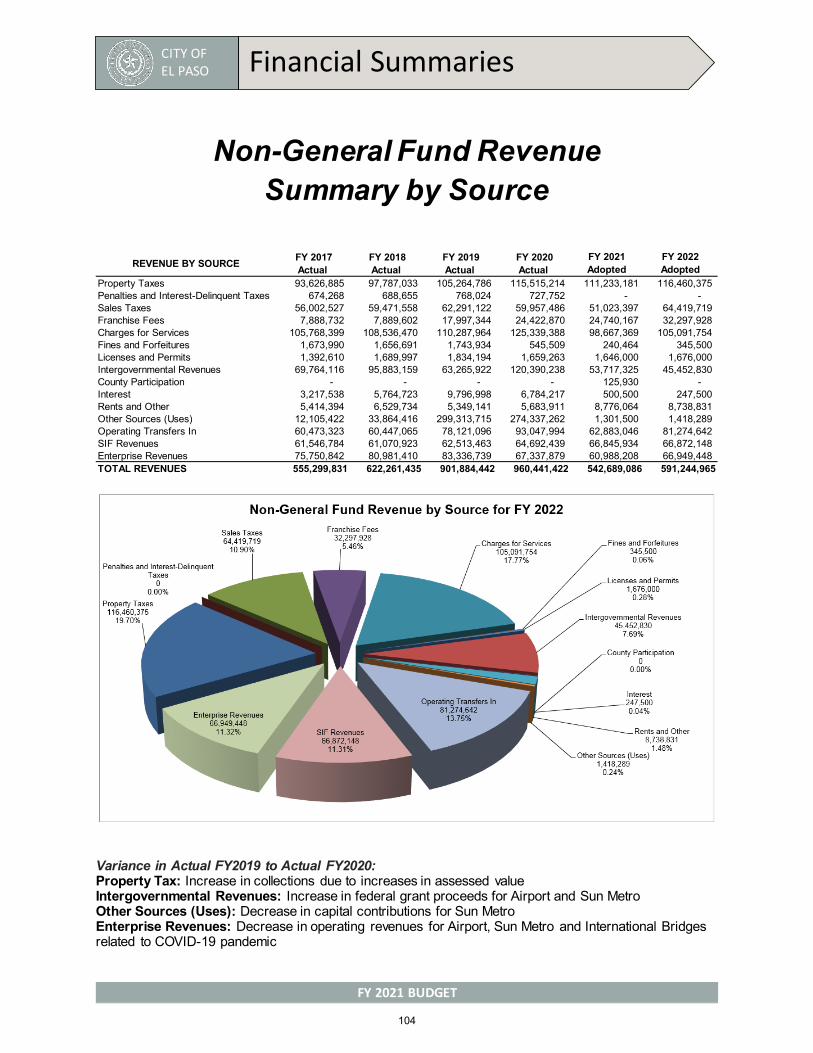
CITY OF EL PASO Financial Summaries
FY 2021 BUDGET
Non-General Fund Revenue Summary by Source
Variance in Actual FY2019 to Actual FY2020: Property Tax: Increase in collections due to increases in assessed value Intergovernmental Revenues: Increase in federal grant proceeds for Airport and Sun Metro Other Sources (Uses): Decrease in capital contributions for Sun Metro Enterprise Revenues: Decrease in operating revenues for Airport, Sun Metro and International Bridges related to COVID-19 pandemic
REVENUE BY SOURCE FY 2017 Actual
FY 2018 Actual
FY 2019 Actual
FY 2020 Actual
FY 2021 Adopted
FY 2022 Adopted
Property Taxes 93,626,885 97,787,033 105,264,786 115,515,214 111,233,181 116,460,375 Penalties and Interest-Delinquent Taxes 674,268 688,655 768,024 727,752 - - Sales Taxes 56,002,527 59,471,558 62,291,122 59,957,486 51,023,397 64,419,719 Franchise Fees 7,888,732 7,889,602 17,997,344 24,422,870 24,740,167 32,297,928 Charges for Services 105,768,399 108,536,470 110,287,964 125,339,388 98,667,369 105,091,754 Fines and Forfeitures 1,673,990 1,656,691 1,743,934 545,509 240,464 345,500 Licenses and Permits 1,392,610 1,689,997 1,834,194 1,659,263 1,646,000 1,676,000 Intergovernmental Revenues 69,764,116 95,883,159 63,265,922 120,390,238 53,717,325 45,452,830 County Participation - - - - 125,930 - Interest 3,217,538 5,764,723 9,796,998 6,784,217 500,500 247,500 Rents and Other 5,414,394 6,529,734 5,349,141 5,683,911 8,776,064 8,738,831 Other Sources (Uses) 12,105,422 33,864,416 299,313,715 274,337,262 1,301,500 1,418,289 Operating Transfers In 60,473,323 60,447,065 78,121,096 93,047,994 62,883,046 81,274,642 SIF Revenues 61,546,784 61,070,923 62,513,463 64,692,439 66,845,934 66,872,148 Enterprise Revenues 75,750,842 80,981,410 83,336,739 67,337,879 60,988,208 66,949,448 TOTAL REVENUES 555,299,831 622,261,435 901,884,442 960,441,422 542,689,086 591,244,965
104

CITY OF EL PASO Financial Summaries
FY 2022 BUDGET
Expenditures The expenditures are categorized in the following main groups: personal services, contractual services, materials and supplies, operating expenditures, non-operating expenditures, intergovernmental expenditures, other uses, and capital outlay.
While FY 2021 Budget was developed amidst the COVID-19 pandemic and under state and local restriction orders that resulted in widespread closures and reduction of services, FY 2022 Budget was developed under premises for phased-in approach for reopening of facilities, programs and restoration of services to pre-COVID-19 levels.
EXPENDITURES BY CATEGORY FY 2017 Actual
FY 2018 Actual
FY 2019 Actual
FY 2020 Actual
FY 2021 Adopted
FY 2022 Adopted
Personal Services 410,051,606 421,464,855 443,623,638 457,249,405 458,280,156 471,028,747 Contractual Services 157,579,058 155,076,980 168,724,587 171,745,946 171,820,247 199,856,785 Materials And Supplies 55,643,719 69,282,447 73,463,976 60,549,748 53,417,277 55,282,601 Operating Expenditures 91,587,076 92,164,812 95,633,446 94,716,611 48,721,359 52,016,011 Non-Operating Expenditures 118,940,513 135,562,518 128,681,945 136,891,213 145,142,108 146,529,278 Intergovernmental Expenditures (349,601) (81,588) 71,318 (9,244) 3,552,864 4,477,072 Other Uses 80,264,829 82,399,298 147,556,333 213,726,936 86,946,171 102,683,986 Capital Outlay 123,259,476 171,607,233 174,621,125 197,743,898 16,794,224 35,601,348
TOTAL EXPENDITURES 1,036,976,677 1,127,476,555 1,232,376,366 1,332,614,514 984,674,406 1,067,475,828
Personal Services471,028,747
44.13%
Contractual Services199,856,785
18.72%
Materials And Supplies55,282,601
5.18%
Operating Expenditures52,016,011
4.87%
Non-Operating Expenditures146,529,278
13.73%
Intergovernmental Expenditures
4,477,072 0.42%
Other Uses102,683,986
9.62%
Capital Outlay35,601,348
3.34%
All Funds Expenditures by Category for FY 2022
105
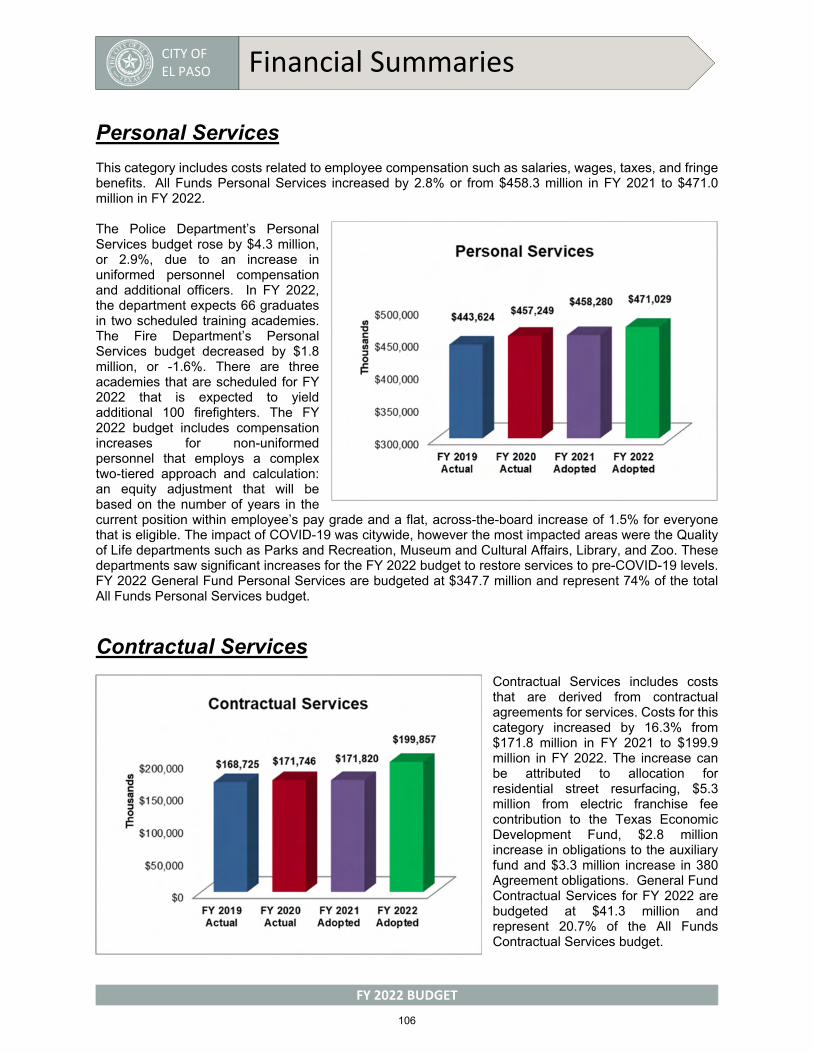
CITY OF EL PASO Financial Summaries
FY 2022 BUDGET
Personal Services
This category includes costs related to employee compensation such as salaries, wages, taxes, and fringe benefits. All Funds Personal Services increased by 2.8% or from $458.3 million in FY 2021 to $471.0 million in FY 2022.
The Police Department’s Personal Services budget rose by $4.3 million, or 2.9%, due to an increase in uniformed personnel compensation and additional officers. In FY 2022, the department expects 66 graduates in two scheduled training academies. The Fire Department’s Personal Services budget decreased by $1.8 million, or -1.6%. There are three academies that are scheduled for FY 2022 that is expected to yield additional 100 firefighters. The FY 2022 budget includes compensation increases for non-uniformed personnel that employs a complex two-tiered approach and calculation: an equity adjustment that will be based on the number of years in the current position within employee’s pay grade and a flat, across-the-board increase of 1.5% for everyone that is eligible. The impact of COVID-19 was citywide, however the most impacted areas were the Quality of Life departments such as Parks and Recreation, Museum and Cultural Affairs, Library, and Zoo. These departments saw significant increases for the FY 2022 budget to restore services to pre-COVID-19 levels. FY 2022 General Fund Personal Services are budgeted at $347.7 million and represent 74% of the total All Funds Personal Services budget.
Contractual Services
Contractual Services includes costs that are derived from contractual agreements for services. Costs for this category increased by 16.3% from $171.8 million in FY 2021 to $199.9 million in FY 2022. The increase can be attributed to allocation for residential street resurfacing, $5.3 million from electric franchise fee contribution to the Texas Economic Development Fund, $2.8 million increase in obligations to the auxiliary fund and $3.3 million increase in 380 Agreement obligations. General Fund Contractual Services for FY 2022 are budgeted at $41.3 million and represent 20.7% of the All Funds Contractual Services budget.
106

CITY OF EL PASO Financial Summaries
FY 2022 BUDGET
Materials and Supplies
Materials and Supplies includes costs of expendable items used by operating activities. Expenditures on Materials and Supplies increased by 3.5%, from $53.4 million in FY2021 to $55.3 million in FY 2022. The variance is primarily due to an ongoing effort for restoration of services to pre COVID-19 levels. Also, eight parks will be equipped with automated irrigation systems as part of a pilot project whose goal is to improve outdoor experiences for El Pasoans. General Fund Materials and Supplies for FY 2022 are budgeted at $23.5 million, or 42.5% of the total Material and Supplies budget.
Operating Expenditures
Operating Expenditures includes items that support day-to-day operations of a department such as utilities, mileage reimbursements, travel, training expenses, and communication costs. Also included are indirect expenditures budgeted by enterprise funds to cover their share of overhead costs in the General Fund. The City contracted with an outside firm to conduct an indirect cost study and, as a result, the enterprise departments reimburse the general fund. The City does not budget for depreciation expense, which explains the large variance from actuals to adopted in this category. Similar to previous categories, Operating Expenditures also saw an increase from FY 2021. The increase is 6.8% and approximately 50.4% of costs in this category are budgeted in the General Fund.
107

CITY OF EL PASO Financial Summaries
FY 2022 BUDGET
Non-Operating Expenditures
This category includes costs such as principal and interest expenses, community service project allocations, housing rehabilitation costs, and damages/settlement costs. It represents 13.7% of the total All Funds budget. The budget for FY 2022 increased by 1.0%, increasing from $145.1 million to $146.5 million predominately due to additional debt service payments for bonds. The City switched from a reimbursement model for debt to issuing debt prior to the construction of projects to take advantage of lower interest rates. A small percentage (1.1%) of the category is budgeted within the General Fund.
Intergovernmental Expenditures
Intergovernmental Expenditures include grant-matching funds in order to leverage federal and state funding. A change in methodology was implemented in FY 2017, where the City continues to seek out grant opportunities and will provide necessary matching dollars. However, the grant dollars will now remain completely separated from match dollars. This change ensures better accounting practices and stops the practice where the match dollars were spent “twice” on the City’s books. The budget for FY 2022 increased by 26.0%, from $3.5 million to $4.5 million, primarily due to grant match for Mass Transit - Sun Metro department.
108
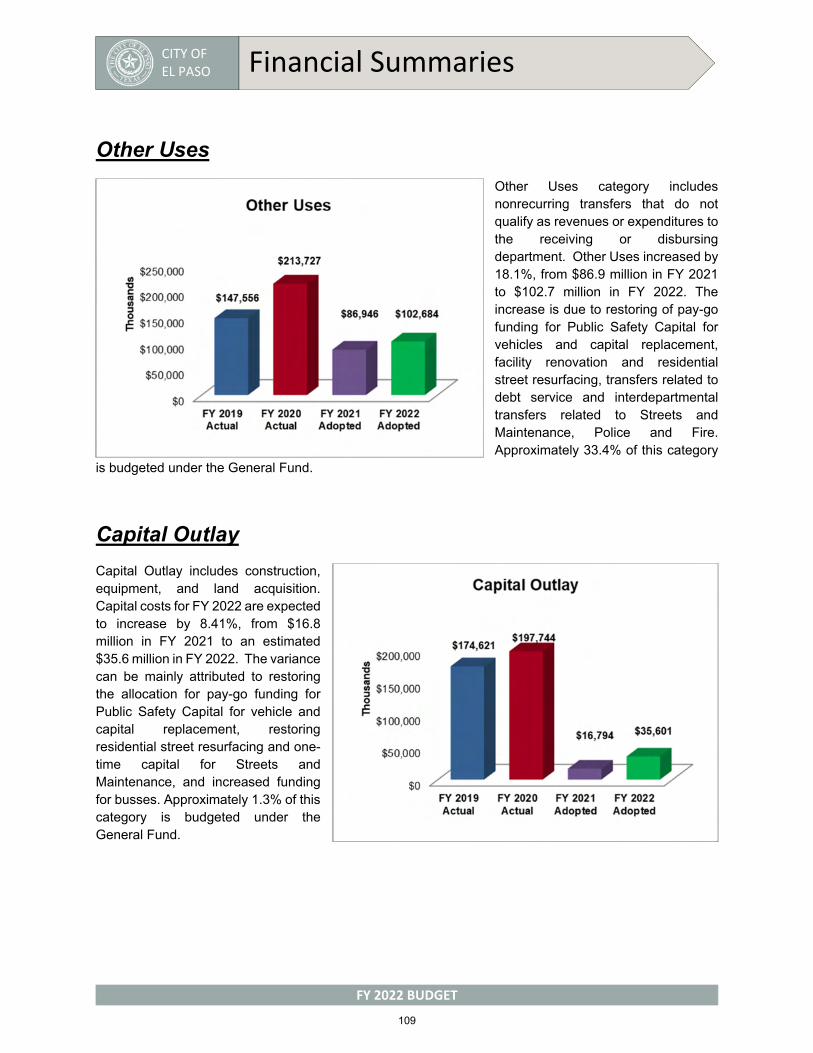
CITY OF EL PASO Financial Summaries
FY 2022 BUDGET
Other Uses
Other Uses category includes nonrecurring transfers that do not qualify as revenues or expenditures to the receiving or disbursing department. Other Uses increased by 18.1%, from $86.9 million in FY 2021 to $102.7 million in FY 2022. The increase is due to restoring of pay-go funding for Public Safety Capital for vehicles and capital replacement, facility renovation and residential street resurfacing, transfers related to debt service and interdepartmental transfers related to Streets and Maintenance, Police and Fire. Approximately 33.4% of this category
is budgeted under the General Fund.
Capital Outlay
Capital Outlay includes construction, equipment, and land acquisition. Capital costs for FY 2022 are expected to increase by 8.41%, from $16.8 million in FY 2021 to an estimated $35.6 million in FY 2022. The variance can be mainly attributed to restoring the allocation for pay-go funding for Public Safety Capital for vehicle and capital replacement, restoring residential street resurfacing and one-time capital for Streets and Maintenance, and increased funding for busses. Approximately 1.3% of this category is budgeted under the General Fund.
109
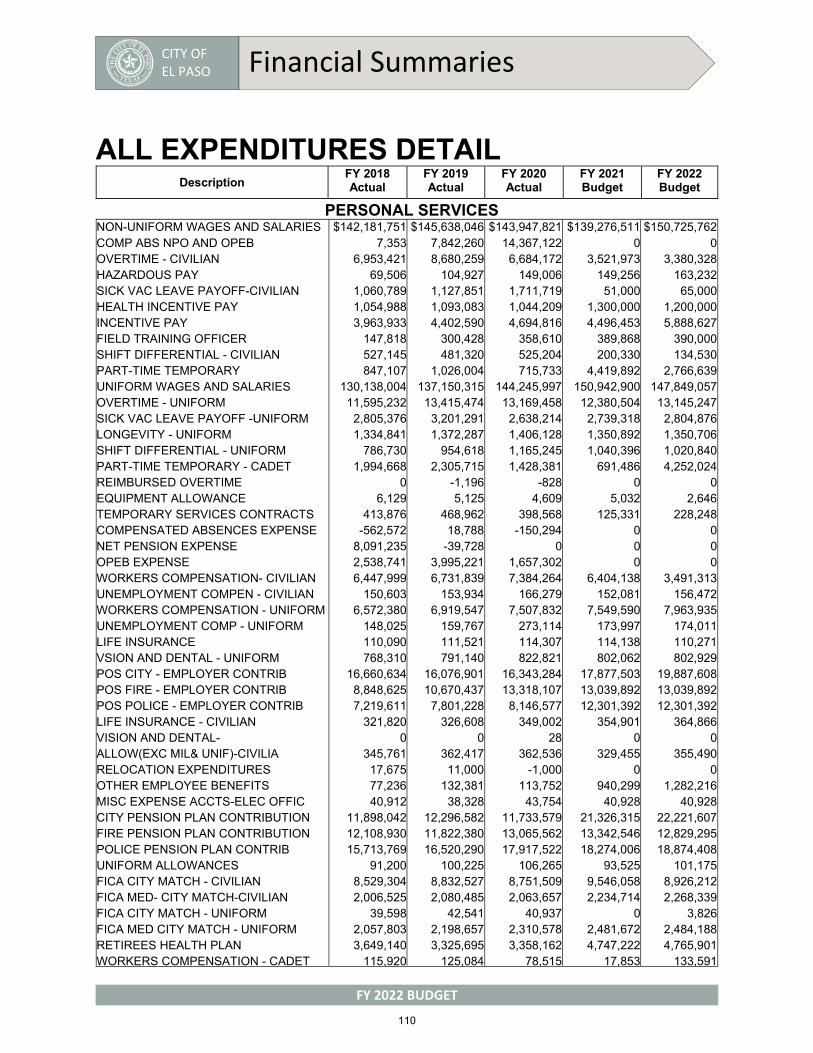
CITY OF EL PASO Financial Summaries
FY 2022 BUDGET
ALL EXPENDITURES DETAIL Description
FY 2018 Actual
FY 2019 Actual
FY 2020 Actual
FY 2021 Budget
FY 2022 Budget
PERSONAL SERVICES NON-UNIFORM WAGES AND SALARIES $142,181,751 $145,638,046 $143,947,821 $139,276,511 $150,725,762 COMP ABS NPO AND OPEB 7,353 7,842,260 14,367,122 0 0 OVERTIME - CIVILIAN 6,953,421 8,680,259 6,684,172 3,521,973 3,380,328 HAZARDOUS PAY 69,506 104,927 149,006 149,256 163,232 SICK VAC LEAVE PAYOFF-CIVILIAN 1,060,789 1,127,851 1,711,719 51,000 65,000 HEALTH INCENTIVE PAY 1,054,988 1,093,083 1,044,209 1,300,000 1,200,000 INCENTIVE PAY 3,963,933 4,402,590 4,694,816 4,496,453 5,888,627 FIELD TRAINING OFFICER 147,818 300,428 358,610 389,868 390,000 SHIFT DIFFERENTIAL - CIVILIAN 527,145 481,320 525,204 200,330 134,530 PART-TIME TEMPORARY 847,107 1,026,004 715,733 4,419,892 2,766,639 UNIFORM WAGES AND SALARIES 130,138,004 137,150,315 144,245,997 150,942,900 147,849,057 OVERTIME - UNIFORM 11,595,232 13,415,474 13,169,458 12,380,504 13,145,247 SICK VAC LEAVE PAYOFF -UNIFORM 2,805,376 3,201,291 2,638,214 2,739,318 2,804,876 LONGEVITY - UNIFORM 1,334,841 1,372,287 1,406,128 1,350,892 1,350,706 SHIFT DIFFERENTIAL - UNIFORM 786,730 954,618 1,165,245 1,040,396 1,020,840 PART-TIME TEMPORARY - CADET 1,994,668 2,305,715 1,428,381 691,486 4,252,024 REIMBURSED OVERTIME 0 -1,196 -828 0 0 EQUIPMENT ALLOWANCE 6,129 5,125 4,609 5,032 2,646 TEMPORARY SERVICES CONTRACTS 413,876 468,962 398,568 125,331 228,248 COMPENSATED ABSENCES EXPENSE -562,572 18,788 -150,294 0 0 NET PENSION EXPENSE 8,091,235 -39,728 0 0 0 OPEB EXPENSE 2,538,741 3,995,221 1,657,302 0 0 WORKERS COMPENSATION- CIVILIAN 6,447,999 6,731,839 7,384,264 6,404,138 3,491,313 UNEMPLOYMENT COMPEN - CIVILIAN 150,603 153,934 166,279 152,081 156,472 WORKERS COMPENSATION - UNIFORM 6,572,380 6,919,547 7,507,832 7,549,590 7,963,935 UNEMPLOYMENT COMP - UNIFORM 148,025 159,767 273,114 173,997 174,011 LIFE INSURANCE 110,090 111,521 114,307 114,138 110,271 VSION AND DENTAL - UNIFORM 768,310 791,140 822,821 802,062 802,929 POS CITY - EMPLOYER CONTRIB 16,660,634 16,076,901 16,343,284 17,877,503 19,887,608 POS FIRE - EMPLOYER CONTRIB 8,848,625 10,670,437 13,318,107 13,039,892 13,039,892 POS POLICE - EMPLOYER CONTRIB 7,219,611 7,801,228 8,146,577 12,301,392 12,301,392 LIFE INSURANCE - CIVILIAN 321,820 326,608 349,002 354,901 364,866 VISION AND DENTAL- 0 0 28 0 0 ALLOW(EXC MIL& UNIF)-CIVILIA 345,761 362,417 362,536 329,455 355,490 RELOCATION EXPENDITURES 17,675 11,000 -1,000 0 0 OTHER EMPLOYEE BENEFITS 77,236 132,381 113,752 940,299 1,282,216 MISC EXPENSE ACCTS-ELEC OFFIC 40,912 38,328 43,754 40,928 40,928 CITY PENSION PLAN CONTRIBUTION 11,898,042 12,296,582 11,733,579 21,326,315 22,221,607 FIRE PENSION PLAN CONTRIBUTION 12,108,930 11,822,380 13,065,562 13,342,546 12,829,295 POLICE PENSION PLAN CONTRIB 15,713,769 16,520,290 17,917,522 18,274,006 18,874,408 UNIFORM ALLOWANCES 91,200 100,225 106,265 93,525 101,175 FICA CITY MATCH - CIVILIAN 8,529,304 8,832,527 8,751,509 9,546,058 8,926,212 FICA MED- CITY MATCH-CIVILIAN 2,006,525 2,080,485 2,063,657 2,234,714 2,268,339 FICA CITY MATCH - UNIFORM 39,598 42,541 40,937 0 3,826 FICA MED CITY MATCH - UNIFORM 2,057,803 2,198,657 2,310,578 2,481,672 2,484,188 RETIREES HEALTH PLAN 3,649,140 3,325,695 3,358,162 4,747,222 4,765,901 WORKERS COMPENSATION - CADET 115,920 125,084 78,515 17,853 133,591
110
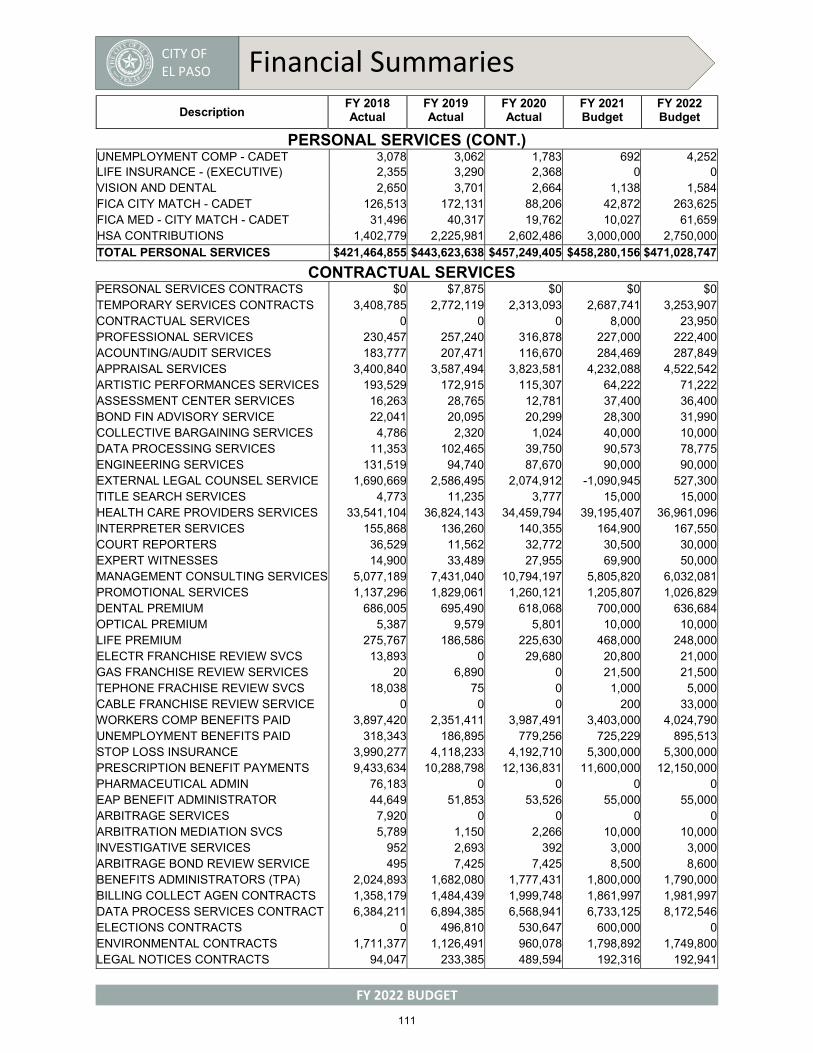
CITY OF EL PASO Financial Summaries
FY 2022 BUDGET
Description FY 2018 Actual
FY 2019 Actual
FY 2020 Actual
FY 2021 Budget
FY 2022 Budget
PERSONAL SERVICES (CONT.) UNEMPLOYMENT COMP - CADET 3,078 3,062 1,783 692 4,252LIFE INSURANCE - (EXECUTIVE) 2,355 3,290 2,368 0 0VISION AND DENTAL 2,650 3,701 2,664 1,138 1,584FICA CITY MATCH - CADET 126,513 172,131 88,206 42,872 263,625FICA MED - CITY MATCH - CADET 31,496 40,317 19,762 10,027 61,659HSA CONTRIBUTIONS 1,402,779 2,225,981 2,602,486 3,000,000 2,750,000TOTAL PERSONAL SERVICES $421,464,855 $443,623,638 $457,249,405 $458,280,156 $471,028,747
CONTRACTUAL SERVICES PERSONAL SERVICES CONTRACTS $0 $7,875 $0 $0 $0 TEMPORARY SERVICES CONTRACTS 3,408,785 2,772,119 2,313,093 2,687,741 3,253,907 CONTRACTUAL SERVICES 0 0 0 8,000 23,950 PROFESSIONAL SERVICES 230,457 257,240 316,878 227,000 222,400 ACOUNTING/AUDIT SERVICES 183,777 207,471 116,670 284,469 287,849 APPRAISAL SERVICES 3,400,840 3,587,494 3,823,581 4,232,088 4,522,542 ARTISTIC PERFORMANCES SERVICES 193,529 172,915 115,307 64,222 71,222 ASSESSMENT CENTER SERVICES 16,263 28,765 12,781 37,400 36,400 BOND FIN ADVISORY SERVICE 22,041 20,095 20,299 28,300 31,990 COLLECTIVE BARGAINING SERVICES 4,786 2,320 1,024 40,000 10,000DATA PROCESSING SERVICES 11,353 102,465 39,750 90,573 78,775 ENGINEERING SERVICES 131,519 94,740 87,670 90,000 90,000 EXTERNAL LEGAL COUNSEL SERVICE 1,690,669 2,586,495 2,074,912 -1,090,945 527,300 TITLE SEARCH SERVICES 4,773 11,235 3,777 15,000 15,000 HEALTH CARE PROVIDERS SERVICES 33,541,104 36,824,143 34,459,794 39,195,407 36,961,096 INTERPRETER SERVICES 155,868 136,260 140,355 164,900 167,550 COURT REPORTERS 36,529 11,562 32,772 30,500 30,000 EXPERT WITNESSES 14,900 33,489 27,955 69,900 50,000 MANAGEMENT CONSULTING SERVICES 5,077,189 7,431,040 10,794,197 5,805,820 6,032,081 PROMOTIONAL SERVICES 1,137,296 1,829,061 1,260,121 1,205,807 1,026,829 DENTAL PREMIUM 686,005 695,490 618,068 700,000 636,684 OPTICAL PREMIUM 5,387 9,579 5,801 10,000 10,000 LIFE PREMIUM 275,767 186,586 225,630 468,000 248,000 ELECTR FRANCHISE REVIEW SVCS 13,893 0 29,680 20,800 21,000 GAS FRANCHISE REVIEW SERVICES 20 6,890 0 21,500 21,500 TEPHONE FRACHISE REVIEW SVCS 18,038 75 0 1,000 5,000CABLE FRANCHISE REVIEW SERVICE 0 0 0 200 33,000 WORKERS COMP BENEFITS PAID 3,897,420 2,351,411 3,987,491 3,403,000 4,024,790 UNEMPLOYMENT BENEFITS PAID 318,343 186,895 779,256 725,229 895,513 STOP LOSS INSURANCE 3,990,277 4,118,233 4,192,710 5,300,000 5,300,000 PRESCRIPTION BENEFIT PAYMENTS 9,433,634 10,288,798 12,136,831 11,600,000 12,150,000 PHARMACEUTICAL ADMIN 76,183 0 0 0 0 EAP BENEFIT ADMINISTRATOR 44,649 51,853 53,526 55,000 55,000 ARBITRAGE SERVICES 7,920 0 0 0 0 ARBITRATION MEDIATION SVCS 5,789 1,150 2,266 10,000 10,000INVESTIGATIVE SERVICES 952 2,693 392 3,000 3,000 ARBITRAGE BOND REVIEW SERVICE 495 7,425 7,425 8,500 8,600BENEFITS ADMINISTRATORS (TPA) 2,024,893 1,682,080 1,777,431 1,800,000 1,790,000 BILLING COLLECT AGEN CONTRACTS 1,358,179 1,484,439 1,999,748 1,861,997 1,981,997 DATA PROCESS SERVICES CONTRACT 6,384,211 6,894,385 6,568,941 6,733,125 8,172,546 ELECTIONS CONTRACTS 0 496,810 530,647 600,000 0 ENVIRONMENTAL CONTRACTS 1,711,377 1,126,491 960,078 1,798,892 1,749,800 LEGAL NOTICES CONTRACTS 94,047 233,385 489,594 192,316 192,941
111

CITY OF EL PASO Financial Summaries
FY 2022 BUDGET
Description FY 2018 Actual
FY 2019 Actual
FY 2020 Actual
FY 2021 Budget
FY 2022 Budget
CONTRACTUAL SERVICES (CONT.) MAINT SVCS CONTRACT-JANITORIAL 3,836,181 3,925,741 3,508,358 4,824,142 4,787,330MANAGEMENT SERVICES CONTRACTS 13,682,983 15,608,063 12,806,934 13,335,190 10,059,326PERSONNEL RECRUITMENT 29,627 7,376 35,398 1,350 1,350PRINTING SERVICES CONTRACTS 626,232 445,714 439,897 623,495 646,460REC AND CULTURAL CONTRACTS 515,839 1,102,989 448,007 508,418 508,418SECURITY CONTRACTS 4,650,038 4,957,758 5,171,453 6,572,056 6,601,120TEMP EMPLOYEE SVCS CONTRACTS 64,558 68,888 19,574 31,900 27,400TRAINING INSTRUCTION CONTRACTS 195,481 182,480 249,562 241,573 279,573OUTSIDE CONTRACTS - NOC 19,554,757 20,122,535 23,134,474 21,900,031 32,801,377INTERLOCAL AGREEMENTS 1,275,026 843,856 5,034,858 816,639 4,588,178GARAGE KEEPER LIENS 12,513 8,401 17,755 0 0PEST CONTROL CONTRACTS 79,533 77,532 69,824 123,334 133,803MAINTENANCE CONTRACTS 0 115,754 336,686 601,500 602,500GROUNDKEEPING HORTI CONTRACTS 3,505,055 3,736,071 2,419,068 3,047,129 3,193,929LINEN AND INDUSTRIAL CONTRACTS 113,299 128,963 144,788 184,836 192,086PUB SAFETY EQUIP MAINT CONTRAC 287,544 343,703 295,254 481,295 422,501BLDGS FACILITIES MAINT CONTRAC 1,897,839 1,878,782 2,104,283 1,846,573 2,011,610PUBLIC ACCESSES MAINT CONTRACT 2,102,833 6,322,763 3,288,790 3,560,628 14,845,546VEH HEAVY EQUIP OFF RD MAINT C 787,808 937,725 881,170 1,738,900 1,427,637OFFICE EQUIP MAINT CONTRACTS 1,889,967 2,051,587 1,772,635 1,883,585 1,980,938VETERINARIAN 29,609 24,819 27,656 65,600 58,700BUS SHELTER CLEANING 179,976 220,409 229,338 170,000 350,000AIRPORT FINGERPRINT EXPENSE 49,000 222,983 49,000 70,000 70,000AIRPORT TERM. RENT EXP. 276,165 203,083 92,310 0 0AIRPORT LANDING FEE EXP. 109,930 738,191 193,550 0 0380 PROPERTY TAX REBATES 2,257,405 2,042,185 2,553,150 3,559,150 2,157,043380 SALES TAX REBATES -14,506 94,379 335,619 1,547,350 2,235,561380 HOTEL OCCUPANCY TAX REBATE 219,913 236,989 0 0 294,336STATE REBATES-380 SALES TAX 0 0 0 0 2,719,719EQUIP MAINT-INTERFUND SVCS 12,065,595 10,699,431 10,843,641 10,051,545 10,415,485MOTOR POOL USAGE FEE-INTERF SV 38,591 40,568 29,888 53,035 52,635PRINT SHOP ALLOC-INTERFUND SVC 68,297 69,927 47,990 73,413 68,459MAIL ROOM CHARGES 265,186 262,419 147,429 204,804 194,635BUILDINGS-LEASES 2,101,518 2,022,174 2,091,655 2,267,591 2,362,770LEASED EQUIPMENT 8,670 8,074 5,125 8,500 8,500BUS STOPS-LEASES 11,882 90 -59 0 0OFFICE EQUIPMENT-LEASES 472,245 486,074 453,366 554,310 555,875PARKING LOTS-LEASES 341,445 354,159 373,080 394,338 408,842VEHICLES-LEASES 451,113 464,430 448,845 339,497 390,607LEASES NOC 636,166 879,010 810,508 701,984 740,657LAND - LEASES 281,984 277,763 273,517 287,521 309,816COPIER CONTRACT SERVICES 101,268 156,147 161,689 190,293 203,801TOTAL CONTRACTUAL SERVICES $155,076,980 $168,724,587 $171,745,946 $171,820,247 $199,856,785
MATERIALS AND SUPPLIES GASOLINE - UNLEADED (OFFSITE) $10 $0 $81 $0 $0 GASOLINE - UNLEADED 3,854,164 3,710,985 3,365,793 3,918,055 4,081,128 COMPRESSED NATURAL GAS 487,382 386,078 313,377 485,000 1,460,000 GASOLINE - REGULAR 0 0 0 0 852 LUBRICANTS ANTIFREEZE 264,133 187,062 222,076 386,575 381,575 DIESEL 2,215,835 2,446,963 2,536,596 2,632,750 2,785,550
112

CITY OF EL PASO Financial Summaries
FY 2022 BUDGET
Description FY 2018 Actual
FY 2019 Actual
FY 2020 Actual
FY 2021 Budget
FY 2022 Budget
MATERIALS AND SUPPLIES (CONT.) PROPANE 4,816 7,335 5,124 30,036 34,668LIQUIFIED NATURAL GAS 2,136,778 1,377,353 1,103,745 2,049,000 215,000 AVIATION FUEL -664 6,082 6,003 0 0 OFFICE SUPPLIES 944,278 950,466 878,547 1,050,142 1,102,454 OTHER SUPPLIES 1,247 26,591 389,405 142,750 163,500 EQUIPMENT PURCHASE UNDER 500 372,096 473,312 489,095 353,175 401,089 PROMOTIONAL SUPPLIES 1,253,660 1,100,131 739,610 576,059 624,730 PUBLICATIONS & SUBSCRIPTIONS 1,885,407 1,829,190 1,477,008 1,443,673 1,566,508 LEGAL LIBRARY AND RESEARCH EXP 5,419 18,983 19,363 66,542 67,000 SUPPLIES COMPUTER EQUIPMENT 578,026 638,405 800,529 762,094 746,928 DESKTOP SOFTWARE SUPPLIES 101,644 366,121 402,263 355,059 162,226 UNDERCOVER SUPPLIES & MATERIAL 61,230 40,831 26,973 51,800 39,700 PHOTOGRAPHY FILM VIDEO SUPPLY 183,194 85,861 95,800 319,894 324,939 TRAINING MATERIALS 186,105 302,062 147,731 106,324 168,390 AMMUNITION SUPPLIES 459,545 569,040 549,965 630,123 660,123 ANIMALS & ANIMAL SUPPLIES 648,906 622,530 730,985 747,172 890,288 CLEANING SUPPLIES 885,272 957,988 955,497 1,077,664 1,120,398 CLINICAL MEDICAL SUPPLIES 2,117,877 2,292,605 3,519,131 2,297,305 2,192,410 LAND MAINTENANCE SUPPLIES 743,142 633,825 703,239 1,338,794 2,090,231 BUILDING MAINTENANCE SUPPLIES 22,103 83,155 44,579 53,618 64,891 FOOD AND BEVERAGES SUPPLIES 900,136 894,261 647,743 678,395 919,537 RECREATIONAL SUPPLIES 374,366 580,524 482,543 571,964 771,859 EQUIP MAINT SUP-LOW COST ITEM 376,665 381,927 333,679 488,624 500,136 EQIPMENT MTNCE SUPPLIES 49 0 0 0 0 VEHICLE MAINTENANCE SUPPLIES 4,379,006 4,834,624 2,593,074 4,638,340 1,814,140 CORE CHARGES-SUPPLIES 0 -18 0 0 0 UNIFORMS AND APPAREL SUPPLIES 1,200,393 1,249,469 1,152,119 1,456,807 1,645,366 INVENTORY PURCH-MAT & SUPPLIES 4,550,277 3,712,439 4,578,369 4,340,217 4,252,669 MAINTENANCE SUPPLIES PARTS NOC 980,582 1,030,782 1,056,460 1,422,986 1,433,011 SAFETY GEAR 1,002,972 1,214,345 1,321,099 1,246,964 1,361,732 FUEL INVENTORY PURCHASES 6,479,215 5,723,300 4,406,760 5,592,105 5,392,106 EQUIP OUTSIDE REPAIRS SVCS NOC 1,725,822 2,026,981 2,061,499 1,746,885 1,858,806 CHEMICAL SUPPLIES 307,295 417,398 484,344 656,476 560,951 FURNITURE 1000 - 4999 99 44,874 18,657 9,755 27,000 55,000 DATA PROCES EQUIP 1000-4999 99 94,969 32,243 130,974 13,975 311,567 OTHER EQUIPMENT 1000 -4999 99 565,248 66,204 163,832 8,900 12,000 PCARD CHARGE CLEARING ACCOUNT 0 0 1,560 0 0 BUILDINGS FACILITIES MAINT REP 4,044,204 3,633,717 4,171,281 2,316,625 3,439,616 FACILITY MAINTENANCE 0 0 0 0 0 EQUIPMENT MAINTENANCE 19,166 27,448 41,843 34,925 31,425 FUELING FACILITY - MAINT & REP 11,675 50,422 110,548 100,000 100,000 LAND LANDSCAPING - MAINT & REP 370,317 265,917 382,185 269,616 321,136 PUBLIC ACCESSES-MAINT & REP 16,448,297 19,914,764 9,644,003 2,698,047 4,548,047 VEHICLES - MAINT & REPAIRS 123,798 213,852 139,073 156,925 178,646 OFFICE EQUIPMENT-MAINT & REP 56,891 33,529 21,226 44,900 46,140 HEAVY EQUIPMENT - MAINT& REP 54,400 53,929 68,508 50,000 50,000 PUBLIC SAFETY EQUIP-MAINT REP 389,698 254,603 268,951 480,700 439,048 PARKING METERS - MAINT & REP 236,511 278,498 84,402 133,700 133,700 AIRFIELD MAINT AND REPAIRS 82,952 135,402 126,020 150,000 150,000 BUILDINGS - INSIDE 5,281 4,470 494,133 8,178 8,178
113

CITY OF EL PASO Financial Summaries
FY 2022 BUDGET
Description FY 2018 Actual
FY 2019 Actual
FY 2020 Actual
FY 2021 Budget
FY 2022 Budget
MATERIALS AND SUPPLIES (CONT.) BUILDINGS - OUTSIDE 59,135 83,705 74,150 46,000 46,000BUILDINGS - FLOOR 42,452 0 0 0 0ELECTRICAL SUPPLIES - REPAIR 559,226 218,307 20,205 24,742 24,750ELEVATORS - ESCALATORS 53,966 54,461 54,444 42,720 60,800HVAC- SUPPLIES & REPAIR 8,814 12,155 7,700 15,100 16,600PLUMBING SUPPLIES & REPAIR 40,937 40,120 38,051 27,245 28,395MAINT & REPAIR FIREFIGHTER EQU 0 0 20,811 0 0SWIMMING POOLS 58,712 62,577 91,222 280,713 122,713SIGNS- TRAFFIC AND OTHER 0 9,845 0 0 0EQUIPMENT MAT 500 - 4 999 99 517,180 337,445 160,139 90,500 80,000MINOR EQUIPMENT 506,605 124,724 222,565 0 0FURNITURE 500 - 4 999 99 249,719 807,462 232,106 96,045 152,245DATA PROCESS EQP 500-4 999 99 729,512 1,222,647 1,952,982 722,125 934,024OTHER EQUIPMENT 500-4 999 99 1,689,131 2,872,135 2,308,885 1,656,032 1,926,990FURNITURE & EQUIP LESS 500 191,752 486,851 256,690 209,198 210,690ARTWORK 338,641 968,899 611,298 0 0TOTAL MATERIAL AND SUPPLIES $69,282,447 $73,463,976 $60,549,748 $53,417,277 $55,282,601
OPERATING EXPENDITURES PHONE & INTERNET $1,885,644 $1,587,127 $1,641,131 $1,841,073 $1,958,464LONG DISTANCE 12,334 20,094 0 4,750 2,650WIRELESS COMMUNICATION SERVICE 1,134,893 957,035 1,066,248 1,325,456 1,365,483POSTAGE 223,223 295,766 320,521 567,836 654,430SHIPPING 76,664 111,461 44,362 104,937 98,421ELECTRICITY 11,102,309 9,918,076 9,596,557 11,725,310 12,001,582WATER 7,539,104 8,408,366 9,235,629 8,901,753 9,649,170NATURAL GAS OTHER 1,464,978 1,472,848 1,231,923 1,573,253 1,691,143TRAVEL EXPENSES - ELECTED OFFI 18,463 29,696 8,342 34,850 31,249TRAVEL EXPENSE 2,118 1,149 740 0 0TRAVEL EXPENSES - EMPLOYEES 1,293,164 1,509,251 848,795 1,350,335 1,375,879TRAVEL EXPENSES - BOARD MEMBER 0 5,941 0 0 0MILEAGE ALLOWANCES 37,270 25,400 15,219 56,334 57,010POSTAGE & SHIPPING 563 0 0 0 0LANDFILL USE EXPENDITURES 1,003,854 1,015,094 0 1,000,000 1,000,000ENVIRONMENTAL SVCS FRANCHISE 2,433,093 0 0 0 0ENVIRONMENTAL QUALITY EXPENSE 455,525 454,189 454,390 503,816 503,895GENERAL LIABILITY INSURANCE EX 1,994,046 2,310,602 3,063,036 2,413,042 3,256,463JUROR EXPENSE 0 0 1,234 4,500 3,500OPERATING CONTINGENCY RESERVE 908,833 273,108 755,352 1,450,734 2,043,907OTHER SERVICES CHARGES EXPENSE 2,254,720 1,292,188 995,126 1,481,541 1,745,504PRISONER CUSTODY EXPENSE 374,093 374,093 374,093 375,000 375,000PROPERTY INSURANCE EXPENSE 676,742 828,515 1,080,355 931,199 1,031,342PUBLIC INFORMATION PUBLICATION 1,962 0 291 0 0PUBLIC INFORMATION SEMINAR 64,657 28,146 83,244 12,509 12,509SALARY ADJUSTMENT RESERVE EXPE 104,219 52,110 26,055 250,000 250,000PROFESSIONAL DEVELOPMENT 3,245 1,200 3,748 3,500 12,600SEMINARS CONTINUING EDUCATION 529,218 599,451 450,685 938,196 1,036,495VEHICLE INSPECTIONS LICENSES E 1,838 3,330 2,601 10,930 10,930PROFESSIONAL LICENSES & MEMBER 1,072,723 1,167,943 1,008,545 990,565 952,968INDIRECT COST EXPENDITURES 11,195,012 10,841,160 10,549,284 10,315,608 10,334,990APPLICANT REIMBURSEMENT 0 4,625 0 0 0VOLUNTEER MILEAGE 30,626 35,210 22,584 1,065 1,065
114
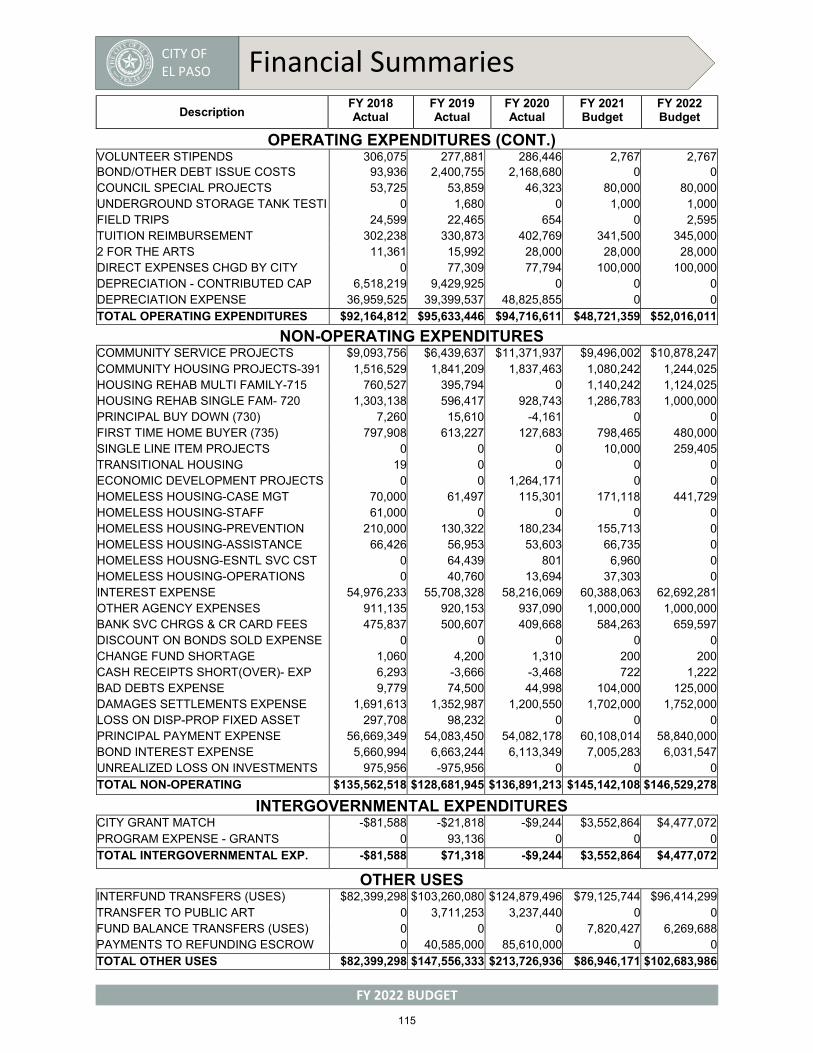
CITY OF EL PASO Financial Summaries
FY 2022 BUDGET
Description FY 2018 Actual
FY 2019 Actual
FY 2020 Actual
FY 2021 Budget
FY 2022 Budget
OPERATING EXPENDITURES (CONT.) VOLUNTEER STIPENDS 306,075 277,881 286,446 2,767 2,767BOND/OTHER DEBT ISSUE COSTS 93,936 2,400,755 2,168,680 0 0COUNCIL SPECIAL PROJECTS 53,725 53,859 46,323 80,000 80,000UNDERGROUND STORAGE TANK TESTI 0 1,680 0 1,000 1,000FIELD TRIPS 24,599 22,465 654 0 2,595TUITION REIMBURSEMENT 302,238 330,873 402,769 341,500 345,0002 FOR THE ARTS 11,361 15,992 28,000 28,000 28,000DIRECT EXPENSES CHGD BY CITY 0 77,309 77,794 100,000 100,000DEPRECIATION - CONTRIBUTED CAP 6,518,219 9,429,925 0 0 0DEPRECIATION EXPENSE 36,959,525 39,399,537 48,825,855 0 0TOTAL OPERATING EXPENDITURES $92,164,812 $95,633,446 $94,716,611 $48,721,359 $52,016,011
NON-OPERATING EXPENDITURES COMMUNITY SERVICE PROJECTS $9,093,756 $6,439,637 $11,371,937 $9,496,002 $10,878,247COMMUNITY HOUSING PROJECTS-391 1,516,529 1,841,209 1,837,463 1,080,242 1,244,025HOUSING REHAB MULTI FAMILY-715 760,527 395,794 0 1,140,242 1,124,025HOUSING REHAB SINGLE FAM- 720 1,303,138 596,417 928,743 1,286,783 1,000,000PRINCIPAL BUY DOWN (730) 7,260 15,610 -4,161 0 0FIRST TIME HOME BUYER (735) 797,908 613,227 127,683 798,465 480,000SINGLE LINE ITEM PROJECTS 0 0 0 10,000 259,405TRANSITIONAL HOUSING 19 0 0 0 0ECONOMIC DEVELOPMENT PROJECTS 0 0 1,264,171 0 0HOMELESS HOUSING-CASE MGT 70,000 61,497 115,301 171,118 441,729HOMELESS HOUSING-STAFF 61,000 0 0 0 0HOMELESS HOUSING-PREVENTION 210,000 130,322 180,234 155,713 0HOMELESS HOUSING-ASSISTANCE 66,426 56,953 53,603 66,735 0HOMELESS HOUSNG-ESNTL SVC CST 0 64,439 801 6,960 0HOMELESS HOUSING-OPERATIONS 0 40,760 13,694 37,303 0INTEREST EXPENSE 54,976,233 55,708,328 58,216,069 60,388,063 62,692,281OTHER AGENCY EXPENSES 911,135 920,153 937,090 1,000,000 1,000,000BANK SVC CHRGS & CR CARD FEES 475,837 500,607 409,668 584,263 659,597DISCOUNT ON BONDS SOLD EXPENSE 0 0 0 0 0CHANGE FUND SHORTAGE 1,060 4,200 1,310 200 200CASH RECEIPTS SHORT(OVER)- EXP 6,293 -3,666 -3,468 722 1,222BAD DEBTS EXPENSE 9,779 74,500 44,998 104,000 125,000DAMAGES SETTLEMENTS EXPENSE 1,691,613 1,352,987 1,200,550 1,702,000 1,752,000LOSS ON DISP-PROP FIXED ASSET 297,708 98,232 0 0 0PRINCIPAL PAYMENT EXPENSE 56,669,349 54,083,450 54,082,178 60,108,014 58,840,000BOND INTEREST EXPENSE 5,660,994 6,663,244 6,113,349 7,005,283 6,031,547UNREALIZED LOSS ON INVESTMENTS 975,956 -975,956 0 0 0TOTAL NON-OPERATING $135,562,518 $128,681,945 $136,891,213 $145,142,108 $146,529,278
INTERGOVERNMENTAL EXPENDITURES CITY GRANT MATCH -$81,588 -$21,818 -$9,244 $3,552,864 $4,477,072PROGRAM EXPENSE - GRANTS 0 93,136 0 0 0TOTAL INTERGOVERNMENTAL EXP. -$81,588 $71,318 -$9,244 $3,552,864 $4,477,072
OTHER USES INTERFUND TRANSFERS (USES) $82,399,298 $103,260,080 $124,879,496 $79,125,744 $96,414,299TRANSFER TO PUBLIC ART 0 3,711,253 3,237,440 0 0FUND BALANCE TRANSFERS (USES) 0 0 0 7,820,427 6,269,688PAYMENTS TO REFUNDING ESCROW 0 40,585,000 85,610,000 0 0TOTAL OTHER USES $82,399,298 $147,556,333 $213,726,936 $86,946,171 $102,683,986
115
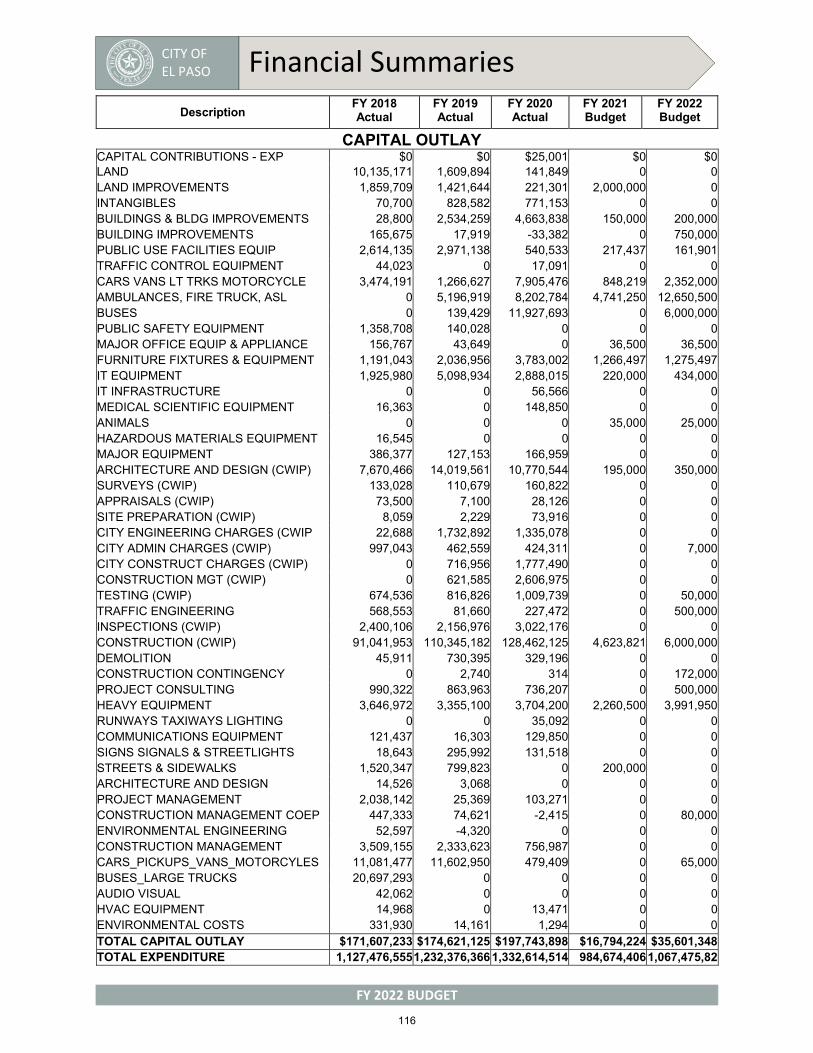
CITY OF EL PASO Financial Summaries
FY 2022 BUDGET
Description FY 2018 Actual
FY 2019 Actual
FY 2020 Actual
FY 2021 Budget
FY 2022 Budget
CAPITAL OUTLAY CAPITAL CONTRIBUTIONS - EXP $0 $0 $25,001 $0 $0LAND 10,135,171 1,609,894 141,849 0 0LAND IMPROVEMENTS 1,859,709 1,421,644 221,301 2,000,000 0INTANGIBLES 70,700 828,582 771,153 0 0BUILDINGS & BLDG IMPROVEMENTS 28,800 2,534,259 4,663,838 150,000 200,000BUILDING IMPROVEMENTS 165,675 17,919 -33,382 0 750,000PUBLIC USE FACILITIES EQUIP 2,614,135 2,971,138 540,533 217,437 161,901TRAFFIC CONTROL EQUIPMENT 44,023 0 17,091 0 0CARS VANS LT TRKS MOTORCYCLE 3,474,191 1,266,627 7,905,476 848,219 2,352,000AMBULANCES, FIRE TRUCK, ASL 0 5,196,919 8,202,784 4,741,250 12,650,500BUSES 0 139,429 11,927,693 0 6,000,000PUBLIC SAFETY EQUIPMENT 1,358,708 140,028 0 0 0MAJOR OFFICE EQUIP & APPLIANCE 156,767 43,649 0 36,500 36,500FURNITURE FIXTURES & EQUIPMENT 1,191,043 2,036,956 3,783,002 1,266,497 1,275,497IT EQUIPMENT 1,925,980 5,098,934 2,888,015 220,000 434,000IT INFRASTRUCTURE 0 0 56,566 0 0MEDICAL SCIENTIFIC EQUIPMENT 16,363 0 148,850 0 0ANIMALS 0 0 0 35,000 25,000HAZARDOUS MATERIALS EQUIPMENT 16,545 0 0 0 0MAJOR EQUIPMENT 386,377 127,153 166,959 0 0ARCHITECTURE AND DESIGN (CWIP) 7,670,466 14,019,561 10,770,544 195,000 350,000SURVEYS (CWIP) 133,028 110,679 160,822 0 0APPRAISALS (CWIP) 73,500 7,100 28,126 0 0SITE PREPARATION (CWIP) 8,059 2,229 73,916 0 0CITY ENGINEERING CHARGES (CWIP 22,688 1,732,892 1,335,078 0 0CITY ADMIN CHARGES (CWIP) 997,043 462,559 424,311 0 7,000CITY CONSTRUCT CHARGES (CWIP) 0 716,956 1,777,490 0 0CONSTRUCTION MGT (CWIP) 0 621,585 2,606,975 0 0TESTING (CWIP) 674,536 816,826 1,009,739 0 50,000TRAFFIC ENGINEERING 568,553 81,660 227,472 0 500,000INSPECTIONS (CWIP) 2,400,106 2,156,976 3,022,176 0 0CONSTRUCTION (CWIP) 91,041,953 110,345,182 128,462,125 4,623,821 6,000,000DEMOLITION 45,911 730,395 329,196 0 0CONSTRUCTION CONTINGENCY 0 2,740 314 0 172,000PROJECT CONSULTING 990,322 863,963 736,207 0 500,000HEAVY EQUIPMENT 3,646,972 3,355,100 3,704,200 2,260,500 3,991,950RUNWAYS TAXIWAYS LIGHTING 0 0 35,092 0 0COMMUNICATIONS EQUIPMENT 121,437 16,303 129,850 0 0SIGNS SIGNALS & STREETLIGHTS 18,643 295,992 131,518 0 0STREETS & SIDEWALKS 1,520,347 799,823 0 200,000 0ARCHITECTURE AND DESIGN 14,526 3,068 0 0 0PROJECT MANAGEMENT 2,038,142 25,369 103,271 0 0CONSTRUCTION MANAGEMENT COEP 447,333 74,621 -2,415 0 80,000ENVIRONMENTAL ENGINEERING 52,597 -4,320 0 0 0CONSTRUCTION MANAGEMENT 3,509,155 2,333,623 756,987 0 0CARS_PICKUPS_VANS_MOTORCYLES 11,081,477 11,602,950 479,409 0 65,000BUSES_LARGE TRUCKS 20,697,293 0 0 0 0AUDIO VISUAL 42,062 0 0 0 0HVAC EQUIPMENT 14,968 0 13,471 0 0ENVIRONMENTAL COSTS 331,930 14,161 1,294 0 0TOTAL CAPITAL OUTLAY $171,607,233 $174,621,125 $197,743,898 $16,794,224 $35,601,348TOTAL EXPENDITURE 1,127,476,555 1,232,376,366 1,332,614,514 984,674,4061,067,475,82
116
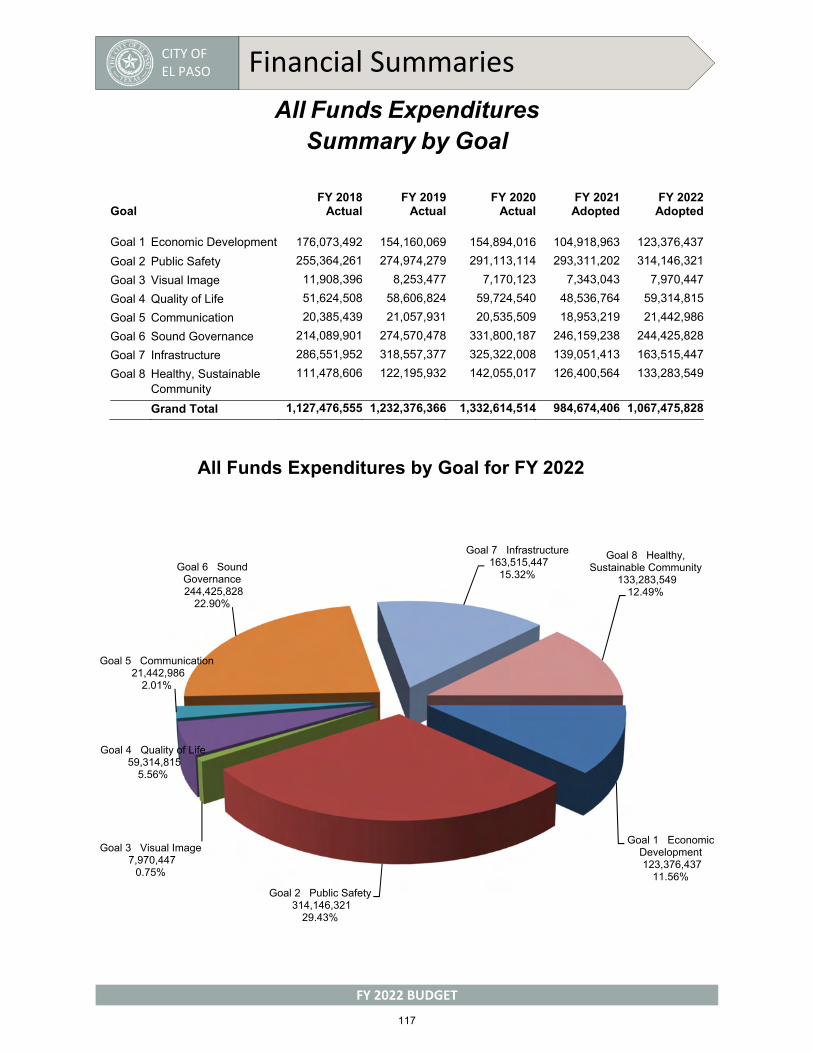
CITY OF EL PASO Financial Summaries
FY 2022 BUDGET
All Funds Expenditures Summary by Goal
Goal FY 2018
ActualFY 2019
ActualFY 2020
ActualFY 2021Adopted
FY 2022Adopted
Goal 1 Economic Development 176,073,492 154,160,069 154,894,016 104,918,963 123,376,437
Goal 2 Public Safety 255,364,261 274,974,279 291,113,114 293,311,202 314,146,321
Goal 3 Visual Image 11,908,396 8,253,477 7,170,123 7,343,043 7,970,447
Goal 4 Quality of Life 51,624,508 58,606,824 59,724,540 48,536,764 59,314,815
Goal 5 Communication 20,385,439 21,057,931 20,535,509 18,953,219 21,442,986
Goal 6 Sound Governance 214,089,901 274,570,478 331,800,187 246,159,238 244,425,828
Goal 7 Infrastructure 286,551,952 318,557,377 325,322,008 139,051,413 163,515,447
Goal 8 Healthy, Sustainable Community
111,478,606 122,195,932 142,055,017 126,400,564 133,283,549
Grand Total 1,127,476,555 1,232,376,366 1,332,614,514 984,674,406 1,067,475,828
Goal 1 Economic Development 123,376,437
11.56%
Goal 2 Public Safety314,146,321
29.43%
Goal 3 Visual Image7,970,447
0.75%
Goal 4 Quality of Life59,314,815
5.56%
Goal 5 Communication21,442,986
2.01%
Goal 6 Sound Governance244,425,828
22.90%
Goal 7 Infrastructure163,515,447
15.32%
Goal 8 Healthy, Sustainable Community
133,283,549 12.49%
All Funds Expenditures by Goal for FY 2022
117
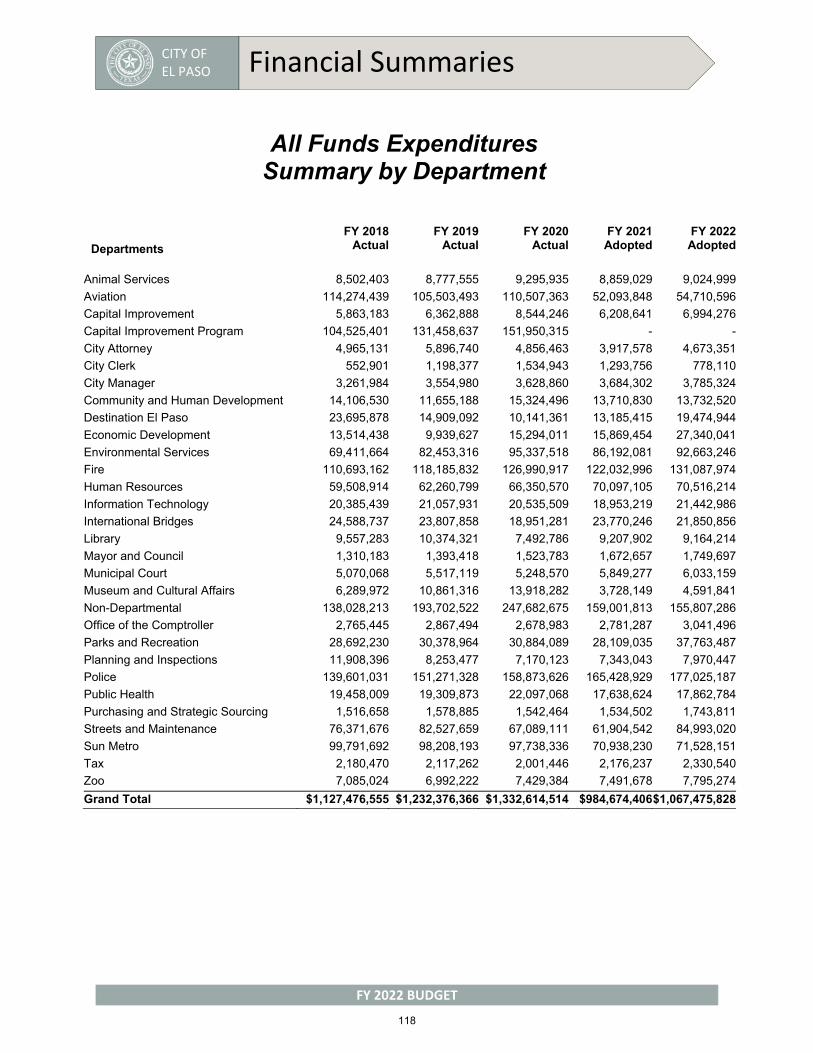
CITY OF EL PASO Financial Summaries
FY 2022 BUDGET
All Funds Expenditures Summary by Department
Departments
FY 2018Actual
FY 2019Actual
FY 2020Actual
FY 2021Adopted
FY 2022Adopted
Animal Services 8,502,403 8,777,555 9,295,935 8,859,029 9,024,999
Aviation 114,274,439 105,503,493 110,507,363 52,093,848 54,710,596
Capital Improvement 5,863,183 6,362,888 8,544,246 6,208,641 6,994,276
Capital Improvement Program 104,525,401 131,458,637 151,950,315 - -
City Attorney 4,965,131 5,896,740 4,856,463 3,917,578 4,673,351
City Clerk 552,901 1,198,377 1,534,943 1,293,756 778,110
City Manager 3,261,984 3,554,980 3,628,860 3,684,302 3,785,324
Community and Human Development 14,106,530 11,655,188 15,324,496 13,710,830 13,732,520
Destination El Paso 23,695,878 14,909,092 10,141,361 13,185,415 19,474,944
Economic Development 13,514,438 9,939,627 15,294,011 15,869,454 27,340,041
Environmental Services 69,411,664 82,453,316 95,337,518 86,192,081 92,663,246
Fire 110,693,162 118,185,832 126,990,917 122,032,996 131,087,974
Human Resources 59,508,914 62,260,799 66,350,570 70,097,105 70,516,214
Information Technology 20,385,439 21,057,931 20,535,509 18,953,219 21,442,986
International Bridges 24,588,737 23,807,858 18,951,281 23,770,246 21,850,856
Library 9,557,283 10,374,321 7,492,786 9,207,902 9,164,214
Mayor and Council 1,310,183 1,393,418 1,523,783 1,672,657 1,749,697
Municipal Court 5,070,068 5,517,119 5,248,570 5,849,277 6,033,159
Museum and Cultural Affairs 6,289,972 10,861,316 13,918,282 3,728,149 4,591,841
Non-Departmental 138,028,213 193,702,522 247,682,675 159,001,813 155,807,286
Office of the Comptroller 2,765,445 2,867,494 2,678,983 2,781,287 3,041,496
Parks and Recreation 28,692,230 30,378,964 30,884,089 28,109,035 37,763,487
Planning and Inspections 11,908,396 8,253,477 7,170,123 7,343,043 7,970,447
Police 139,601,031 151,271,328 158,873,626 165,428,929 177,025,187
Public Health 19,458,009 19,309,873 22,097,068 17,638,624 17,862,784
Purchasing and Strategic Sourcing 1,516,658 1,578,885 1,542,464 1,534,502 1,743,811
Streets and Maintenance 76,371,676 82,527,659 67,089,111 61,904,542 84,993,020
Sun Metro 99,791,692 98,208,193 97,738,336 70,938,230 71,528,151
Tax 2,180,470 2,117,262 2,001,446 2,176,237 2,330,540
Zoo 7,085,024 6,992,222 7,429,384 7,491,678 7,795,274
Grand Total $1,127,476,555 $1,232,376,366 $1,332,614,514 $984,674,406$1,067,475,828
118
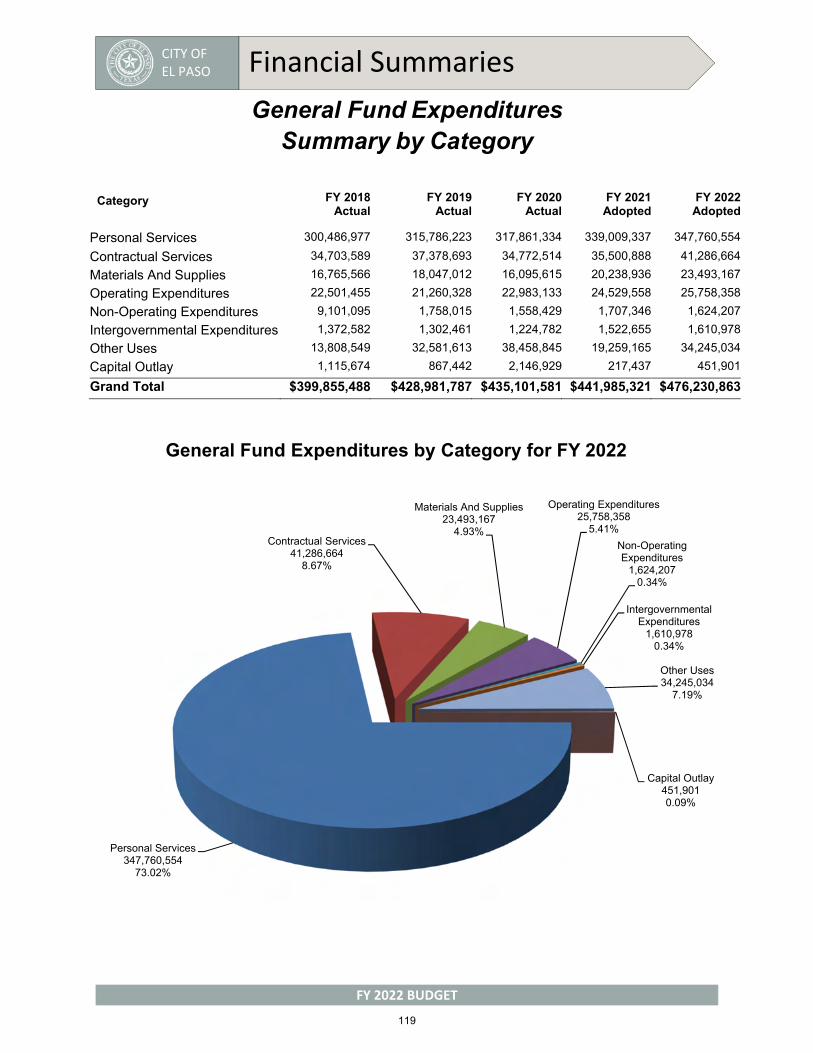
CITY OF EL PASO Financial Summaries
FY 2022 BUDGET
General Fund Expenditures Summary by Category
Category FY 2018Actual
FY 2019Actual
FY 2020Actual
FY 2021Adopted
FY 2022Adopted
Personal Services 300,486,977 315,786,223 317,861,334 339,009,337 347,760,554
Contractual Services 34,703,589 37,378,693 34,772,514 35,500,888 41,286,664
Materials And Supplies 16,765,566 18,047,012 16,095,615 20,238,936 23,493,167
Operating Expenditures 22,501,455 21,260,328 22,983,133 24,529,558 25,758,358
Non-Operating Expenditures 9,101,095 1,758,015 1,558,429 1,707,346 1,624,207
Intergovernmental Expenditures 1,372,582 1,302,461 1,224,782 1,522,655 1,610,978
Other Uses 13,808,549 32,581,613 38,458,845 19,259,165 34,245,034
Capital Outlay 1,115,674 867,442 2,146,929 217,437 451,901
Grand Total $399,855,488 $428,981,787 $435,101,581 $441,985,321 $476,230,863
Personal Services347,760,554
73.02%
Contractual Services41,286,664
8.67%
Materials And Supplies23,493,167
4.93%
Operating Expenditures25,758,358
5.41%
Non-Operating Expenditures
1,624,2070.34%
Intergovernmental Expenditures
1,610,9780.34%
Other Uses34,245,034
7.19%
Capital Outlay451,9010.09%
General Fund Expenditures by Category for FY 2022
119
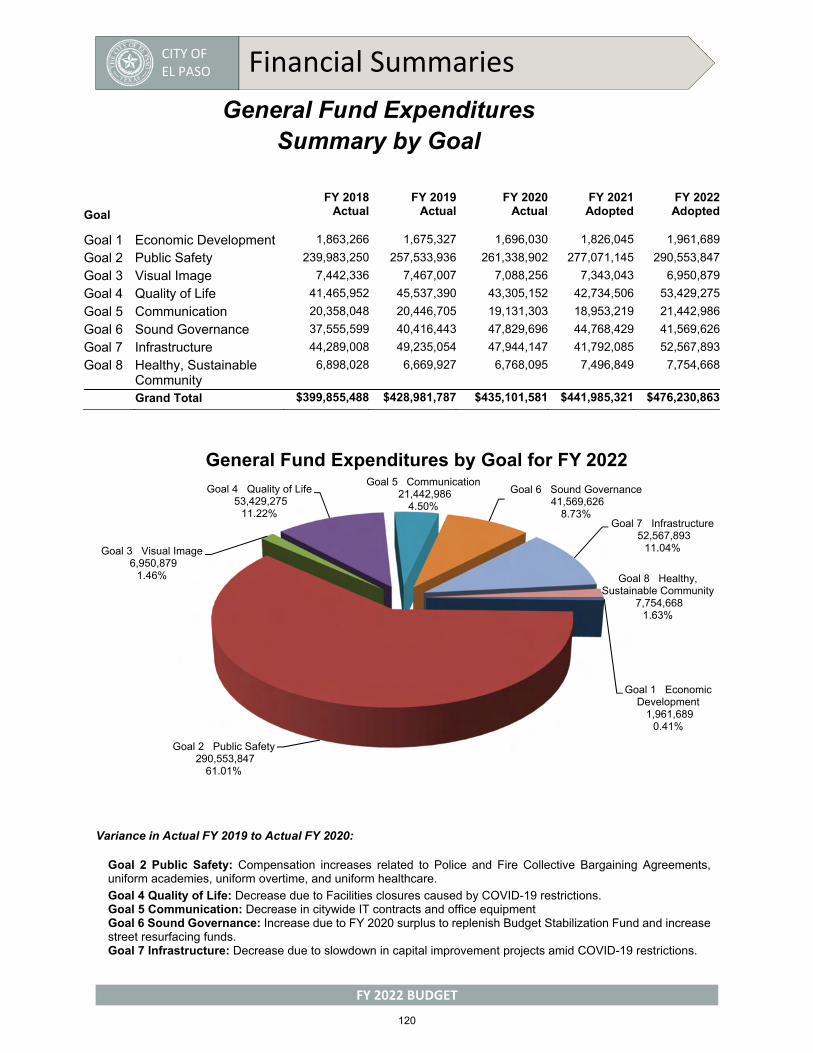
CITY OF EL PASO Financial Summaries
FY 2022 BUDGET
General Fund Expenditures Summary by Goal
Goal
FY 2018Actual
FY 2019Actual
FY 2020Actual
FY 2021Adopted
FY 2022Adopted
Goal 1 Economic Development 1,863,266 1,675,327 1,696,030 1,826,045 1,961,689
Goal 2 Public Safety 239,983,250 257,533,936 261,338,902 277,071,145 290,553,847
Goal 3 Visual Image 7,442,336 7,467,007 7,088,256 7,343,043 6,950,879
Goal 4 Quality of Life 41,465,952 45,537,390 43,305,152 42,734,506 53,429,275
Goal 5 Communication 20,358,048 20,446,705 19,131,303 18,953,219 21,442,986
Goal 6 Sound Governance 37,555,599 40,416,443 47,829,696 44,768,429 41,569,626
Goal 7 Infrastructure 44,289,008 49,235,054 47,944,147 41,792,085 52,567,893
Goal 8 Healthy, Sustainable Community
6,898,028 6,669,927 6,768,095 7,496,849 7,754,668
Grand Total $399,855,488 $428,981,787 $435,101,581 $441,985,321 $476,230,863
Variance in Actual FY 2019 to Actual FY 2020:
Goal 2 Public Safety: Compensation increases related to Police and Fire Collective Bargaining Agreements, uniform academies, uniform overtime, and uniform healthcare.
Goal 4 Quality of Life: Decrease due to Facilities closures caused by COVID-19 restrictions. Goal 5 Communication: Decrease in citywide IT contracts and office equipment Goal 6 Sound Governance: Increase due to FY 2020 surplus to replenish Budget Stabilization Fund and increase street resurfacing funds. Goal 7 Infrastructure: Decrease due to slowdown in capital improvement projects amid COVID-19 restrictions.
Goal 1 Economic Development
1,961,689 0.41%
Goal 2 Public Safety290,553,847
61.01%
Goal 3 Visual Image6,950,879
1.46%
Goal 4 Quality of Life53,429,275
11.22%
Goal 5 Communication21,442,986
4.50%
Goal 6 Sound Governance41,569,626
8.73%Goal 7 Infrastructure
52,567,893 11.04%
Goal 8 Healthy, Sustainable Community
7,754,668 1.63%
General Fund Expenditures by Goal for FY 2022
120
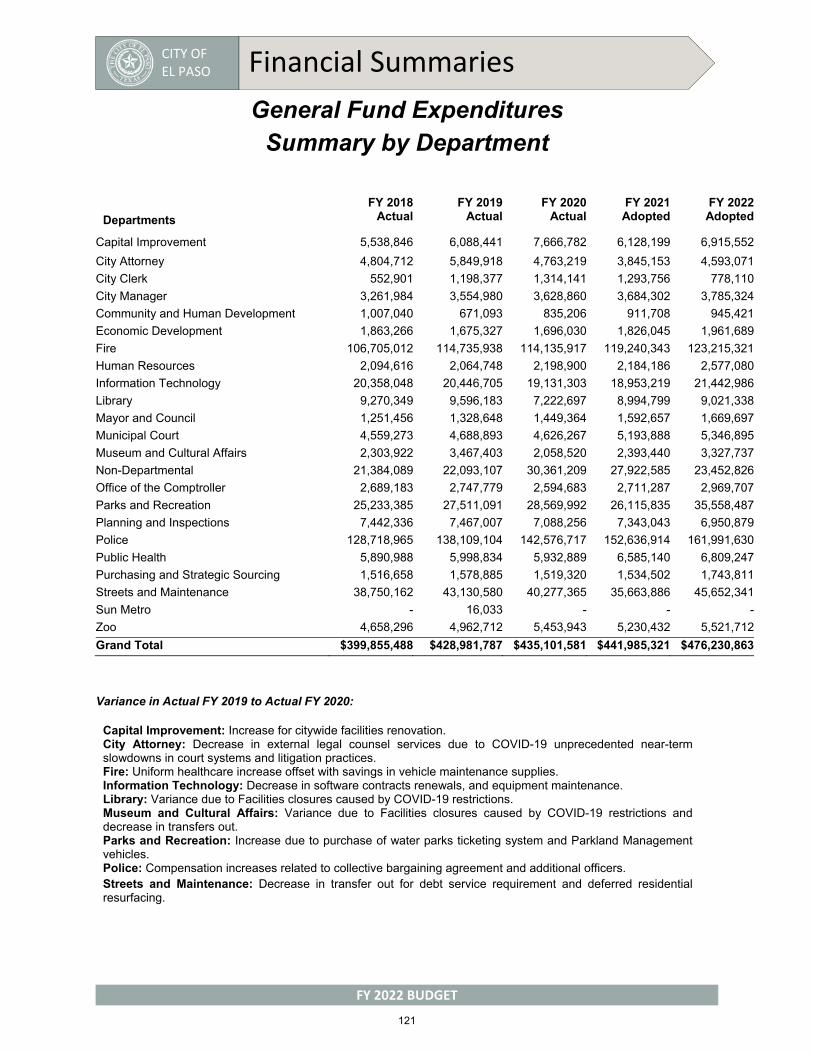
CITY OF EL PASO Financial Summaries
FY 2022 BUDGET
General Fund Expenditures Summary by Department
Departments
FY 2018Actual
FY 2019Actual
FY 2020Actual
FY 2021Adopted
FY 2022Adopted
Capital Improvement 5,538,846 6,088,441 7,666,782 6,128,199 6,915,552
City Attorney 4,804,712 5,849,918 4,763,219 3,845,153 4,593,071
City Clerk 552,901 1,198,377 1,314,141 1,293,756 778,110
City Manager 3,261,984 3,554,980 3,628,860 3,684,302 3,785,324
Community and Human Development 1,007,040 671,093 835,206 911,708 945,421
Economic Development 1,863,266 1,675,327 1,696,030 1,826,045 1,961,689
Fire 106,705,012 114,735,938 114,135,917 119,240,343 123,215,321
Human Resources 2,094,616 2,064,748 2,198,900 2,184,186 2,577,080
Information Technology 20,358,048 20,446,705 19,131,303 18,953,219 21,442,986
Library 9,270,349 9,596,183 7,222,697 8,994,799 9,021,338
Mayor and Council 1,251,456 1,328,648 1,449,364 1,592,657 1,669,697
Municipal Court 4,559,273 4,688,893 4,626,267 5,193,888 5,346,895
Museum and Cultural Affairs 2,303,922 3,467,403 2,058,520 2,393,440 3,327,737
Non-Departmental 21,384,089 22,093,107 30,361,209 27,922,585 23,452,826
Office of the Comptroller 2,689,183 2,747,779 2,594,683 2,711,287 2,969,707
Parks and Recreation 25,233,385 27,511,091 28,569,992 26,115,835 35,558,487
Planning and Inspections 7,442,336 7,467,007 7,088,256 7,343,043 6,950,879
Police 128,718,965 138,109,104 142,576,717 152,636,914 161,991,630
Public Health 5,890,988 5,998,834 5,932,889 6,585,140 6,809,247
Purchasing and Strategic Sourcing 1,516,658 1,578,885 1,519,320 1,534,502 1,743,811
Streets and Maintenance 38,750,162 43,130,580 40,277,365 35,663,886 45,652,341
Sun Metro - 16,033 - - -
Zoo 4,658,296 4,962,712 5,453,943 5,230,432 5,521,712
Grand Total $399,855,488 $428,981,787 $435,101,581 $441,985,321 $476,230,863
Variance in Actual FY 2019 to Actual FY 2020:
Capital Improvement: Increase for citywide facilities renovation. City Attorney: Decrease in external legal counsel services due to COVID-19 unprecedented near-term slowdowns in court systems and litigation practices. Fire: Uniform healthcare increase offset with savings in vehicle maintenance supplies. Information Technology: Decrease in software contracts renewals, and equipment maintenance. Library: Variance due to Facilities closures caused by COVID-19 restrictions. Museum and Cultural Affairs: Variance due to Facilities closures caused by COVID-19 restrictions and decrease in transfers out. Parks and Recreation: Increase due to purchase of water parks ticketing system and Parkland Management vehicles. Police: Compensation increases related to collective bargaining agreement and additional officers. Streets and Maintenance: Decrease in transfer out for debt service requirement and deferred residential resurfacing.
121

CITY OF EL PASO Financial Summaries
FY 2022 BUDGET
Non-General Fund Expenditures Summary by Category
Variance in Actual FY 2019 to Actual FY 2020: Personal Services: Increase due to adding personnel for COVID-19 response, sick leave/vacation payoff and unemployment benefits due to COVID-19 and increase in workers compensation related expenses in the Self-Insurance Fund. Contractual Services: Decrease to Aviation’s Butterfield Trail Golf Course contract, decrease for Sun Metro’s First Transit management contract, increase in community service projects, increase in Non-Departmental interlocal agreements due to restructuring of financial recording for TRZs and increase to healthcare expenses for Self-Insurance Fund. Materials and Supplies: Decrease due to deferred residential street resurfacing projects amid COVID-19 Other Uses: Increase due to the refunding portion of the Certificates of Obligation, Series 2010 Capital Outlay: Increase predominantly due to construction of Quality of Life Bond projects, especially Eastside Regional Park, El Paso Water Parks and closure of Phase 1 of the Greater El Paso landfill.
Personal Services123,268,193
20.85%
Contractual Services158,570,121
26.82%
Materials And Supplies31,789,434
5.38%
Operating Expenditures26,257,653
4.44%
Non-Operating Expenditures144,905,071
24.51%
Intergovernmental Expenditures
2,866,0940.48% Other Uses
68,438,95311.58%
Capital Outlay35,149,447
5.94%
Non-General Fund Expenditures by Category for FY 2022
Category FY 2018 Actual
FY 2019Actual
FY 2020 Actual
FY 2021Adopted
FY 2022Adopted
Personal Services 120,977,877 127,837,414 139,388,071 119,270,820 123,268,193Contractual Services 120,373,391 131,345,894 136,973,433 136,319,359 158,570,121
Materials and Supplies 52,516,880 55,416,963 44,454,133 33,178,341 31,789,434
Operating Expenditures 69,663,358 74,373,118 71,733,478 24,191,800 26,257,653
Non-Operating Expenditures 126,461,424 126,923,930 135,332,785 143,434,762 144,905,071
Intergovernmental Expenditures -1,454,170 -1,231,143 -1,234,026 2,030,209 2,866,094
Other Uses 68,590,749 114,974,720 175,268,090 67,687,006 68,438,953
Capital Outlay 170,491,559 173,753,683 195,596,970 16,576,787 35,149,447
Grand Total $727,621,067 $803,394,579 $897,512,933 $542,689,086 $591,244,965
122

CITY OF EL PASO Financial Summaries
FY 2022 BUDGET
Non-General Fund Expenditures Summary by Goal
Goal FY 2018
ActualFY 2019
ActualFY 2020
ActualFY 2021Adopted
FY 2022Adopted
Goal 1 Economic Development 174,210,225 152,484,742 153,197,986 103,092,918 121,414,747
Goal 2 Public Safety 15,381,011 17,440,343 29,774,212 16,240,057 23,592,474
Goal 3 Visual Image 4,466,060 786,470 81,867 - 1,019,567
Goal 4 Quality of Life 10,158,556 13,069,434 16,419,388 5,802,258 5,885,541
Goal 5 Communication 27,391 611,226 1,404,205 - -
Goal 6 Sound Governance 176,534,302 234,154,035 283,970,490 201,390,809 202,856,202
Goal 7 Infrastructure 242,262,944 269,322,323 277,377,861 97,259,328 110,947,554
Goal 8 Healthy, Sustainable Community
104,580,579 115,526,005 135,286,922 118,903,715 125,528,880
Grand Total $727,621,067 $803,394,579 $897,512,933 $542,689,086 $591,244,965
Variance in Actual FY 2019 to Actual FY 2020:
Goal 2 Public Safety: Increase due to adding personnel for COVID-19 response. Goal 3 Visual Image: Decrease due to transfer of code compliance related programs to Environmental Services Goal 4 Quality of Life: Increase due to design of El Paso Children’s Museum Goal 6 Sound Governance: Increase due to the refunding portion of the Certificates of Obligation, Series 2010 Goal 7 Infrastructure: Increase predominantly due to construction of Quality of Life Bond projects, especially Eastside Regional Park and El Paso Water Parks. Goal 8 Healthy, Sustainable Community: Increase due to vehicle replacements and closure of Phase 1 of the Greater El Paso landfill.
Goal 1 Economic Development 121,414,747
20.54%
Goal 2 Public Safety23,592,474
3.99%Goal 3 Visual Image
1,019,567 0.17%
Goal 4 Quality of Life5,885,541
1.00%
Goal 5 Communication-
0.00%
Goal 6 Sound Governance202,856,202
34.31%
Goal 7 Infrastructure110,947,554
18.77%
Goal 8 Healthy, Sustainable Community
125,528,880 21.23%
Non-General Fund Expenditures by Goal for FY 2022
123
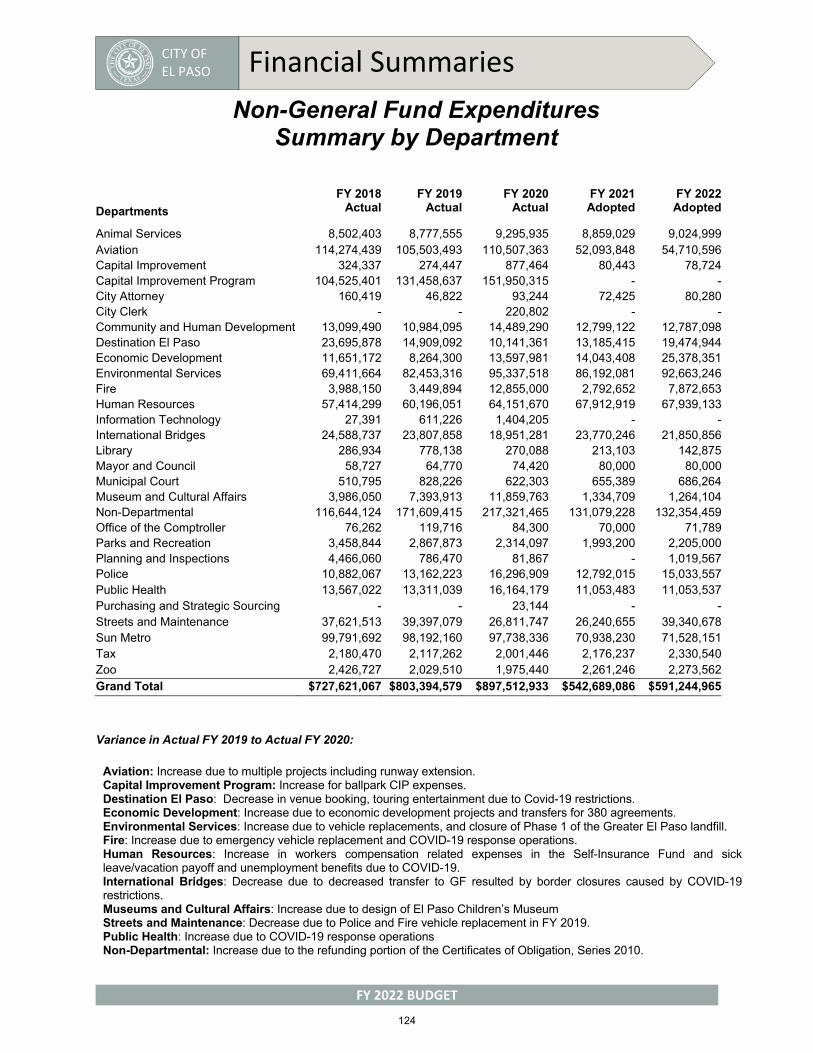
CITY OF EL PASO Financial Summaries
FY 2022 BUDGET
Non-General Fund Expenditures Summary by Department
Departments
FY 2018Actual
FY 2019Actual
FY 2020 Actual
FY 2021Adopted
FY 2022Adopted
Animal Services 8,502,403 8,777,555 9,295,935 8,859,029 9,024,999 Aviation 114,274,439 105,503,493 110,507,363 52,093,848 54,710,596 Capital Improvement 324,337 274,447 877,464 80,443 78,724 Capital Improvement Program 104,525,401 131,458,637 151,950,315 - -City Attorney 160,419 46,822 93,244 72,425 80,280 City Clerk - - 220,802 - -Community and Human Development 13,099,490 10,984,095 14,489,290 12,799,122 12,787,098 Destination El Paso 23,695,878 14,909,092 10,141,361 13,185,415 19,474,944 Economic Development 11,651,172 8,264,300 13,597,981 14,043,408 25,378,351 Environmental Services 69,411,664 82,453,316 95,337,518 86,192,081 92,663,246 Fire 3,988,150 3,449,894 12,855,000 2,792,652 7,872,653 Human Resources 57,414,299 60,196,051 64,151,670 67,912,919 67,939,133 Information Technology 27,391 611,226 1,404,205 - -International Bridges 24,588,737 23,807,858 18,951,281 23,770,246 21,850,856 Library 286,934 778,138 270,088 213,103 142,875 Mayor and Council 58,727 64,770 74,420 80,000 80,000 Municipal Court 510,795 828,226 622,303 655,389 686,264 Museum and Cultural Affairs 3,986,050 7,393,913 11,859,763 1,334,709 1,264,104 Non-Departmental 116,644,124 171,609,415 217,321,465 131,079,228 132,354,459 Office of the Comptroller 76,262 119,716 84,300 70,000 71,789 Parks and Recreation 3,458,844 2,867,873 2,314,097 1,993,200 2,205,000 Planning and Inspections 4,466,060 786,470 81,867 - 1,019,567Police 10,882,067 13,162,223 16,296,909 12,792,015 15,033,557Public Health 13,567,022 13,311,039 16,164,179 11,053,483 11,053,537Purchasing and Strategic Sourcing - - 23,144 - -Streets and Maintenance 37,621,513 39,397,079 26,811,747 26,240,655 39,340,678Sun Metro 99,791,692 98,192,160 97,738,336 70,938,230 71,528,151Tax 2,180,470 2,117,262 2,001,446 2,176,237 2,330,540Zoo 2,426,727 2,029,510 1,975,440 2,261,246 2,273,562Grand Total $727,621,067 $803,394,579 $897,512,933 $542,689,086 $591,244,965
Variance in Actual FY 2019 to Actual FY 2020:
Aviation: Increase due to multiple projects including runway extension. Capital Improvement Program: Increase for ballpark CIP expenses. Destination El Paso: Decrease in venue booking, touring entertainment due to Covid-19 restrictions. Economic Development: Increase due to economic development projects and transfers for 380 agreements. Environmental Services: Increase due to vehicle replacements, and closure of Phase 1 of the Greater El Paso landfill. Fire: Increase due to emergency vehicle replacement and COVID-19 response operations. Human Resources: Increase in workers compensation related expenses in the Self-Insurance Fund and sick leave/vacation payoff and unemployment benefits due to COVID-19. International Bridges: Decrease due to decreased transfer to GF resulted by border closures caused by COVID-19 restrictions. Museums and Cultural Affairs: Increase due to design of El Paso Children’s Museum Streets and Maintenance: Decrease due to Police and Fire vehicle replacement in FY 2019. Public Health: Increase due to COVID-19 response operations Non-Departmental: Increase due to the refunding portion of the Certificates of Obligation, Series 2010.
124

CITY OF EL PASO Financial Summaries
FY 2022 BUDGET
CITY OF EL PASO, TEXAS Statement of Revenues, Expenditures and Changes in Fund Balances
Governmental Funds For the Year Ended August 31, 2019
General Fund
Community Development Block Grants Debt Service
Capital Projects
Non-major Governmental
Funds
Total Governmental
Funds
REVENUES
Property Taxes $ 191,642,579 $ — $ 99,970,983 $ — $ 4,813,802 $ 296,427,364
Penalties and Interest-Delinquent Taxes 1,581,339 — 767,844 — 180 2,349,363
Sales Taxes 96,649,171 — — — — 96,649,171
Hotel Occupancy Tax — — — 4,265,342 11,088,069 15,353,411
Rental Vehicle Tax — — — — 3,888,667 3,888,667
Franchise Fees 50,463,838 — — — 8,340,382 58,804,220
Charges for Services 37,360,998 2,731,147 1,077,401 5,336,202 31,922,233 78,427,981
Fines and Forfeitures 9,081,663 — — — 1,714,248 10,795,911
Licenses and Permits 14,809,829 — — — 1,228,893 16,038,722
Ticket Sales — — — — 279,534 279,534
Intergovernmental Revenues 1,002,594 8,571,283 — 6,837,045 23,375,466 39,786,388
Interest Earnings 1,454,174 71,588 1,280,564 5,055,022 900,405 8,761,753
Rents and Other 5,593,485 238,997 — 261,659 5,122,006 11,216,147
Total Revenues 409,639,670 11,613,015 103,096,792 21,755,270 92,673,885 638,778,632
EXPENDITURES
Current:
General Government 31,734,785 49,576 — 126,751 614,315 32,525,427
Public Safety 248,370,273 — — — 15,962,338 264,332,611
Public Works 38,346,170 — — 19,992,381 13,104,423 71,442,974
Public Health 5,985,981 — — — 12,974,508 18,960,489
Parks Department 27,306,855 113,708 — 97,557 1,781,735 29,299,855
Library 8,984,558 — — 199,720 560,718 9,744,996
Non Departmental 17,529,908 — — 7,423 9,515,625 27,052,956
Culture and Recreation 7,573,727 — — 2,935,836 18,355,009 28,864,572
Economic Development 9,142,330 — — — 7,893,559 17,035,889
Animal Services — — — — 8,588,122 8,588,122
Community and Human Development 671,080 7,023,514 — 4,047 522,467 8,221,108
Debt Service:
Principal — — 54,043,450 — 645,000 54,688,450
Interest Expense — — 54,409,741 — 3,738,176 58,147,917
Fiscal Fees — — 348,772 1,418,358 14,185 1,781,315Capital Outlay 867,442 3,434,141 — 124,528,635 2,310,256 131,140,474
Total Expenditures 396,513,109 10,620,939 108,801,963 149,310,708 96,580,436 761,827,155
Excess(Deficiency) of revenues over(under) expenditures 13,126,561 992,076 (5,705,171) (127,555,438) (3,906,551) (123,048,523)
OTHER FINANCING SOURCES(USES):
Transfers In 23,806,266 — 8,217,515 8,198,482 26,176,056 66,398,319
Transfers Out (31,773,762) — (125,930) (2,065,537) (12,603,839) (46,569,068)
Proceeds from Sale of Capital Assets 71,837 — — 861,250 1,096,984 2,030,071
Capital Contributions — — — — 1,433,048 1,433,048
Face Amount of Bonds Issued — — — 151,580,000 — 151,580,000
Payment to Refunding Bond Escrow Agent — — (40,585,000) — — (40,585,000)
Face Amount of Refunding Bonds Issued — — 35,820,000 — — 35,820,000
Premium on Issuance of Bonds — — 5,825,756 11,138,358 — 16,964,114
Total Other Financing Sources (Uses) (7,895,659) — 9,152,341 169,712,553 16,102,249 187,071,484
Net Change in Fund Balances 5,230,902 992,076 3,447,170 42,157,115 12,195,698 64,022,961
Fund Balances - Beginning of Year 46,379,368 3,703,980 5,775,033 178,996,821 57,556,991 292,412,193
Fund Balances - End of Year $ 51,610,270 $ 4,696,056 $ 9,222,203 $ 221,153,936 $ 69,752,689 $ 356,435,154
125
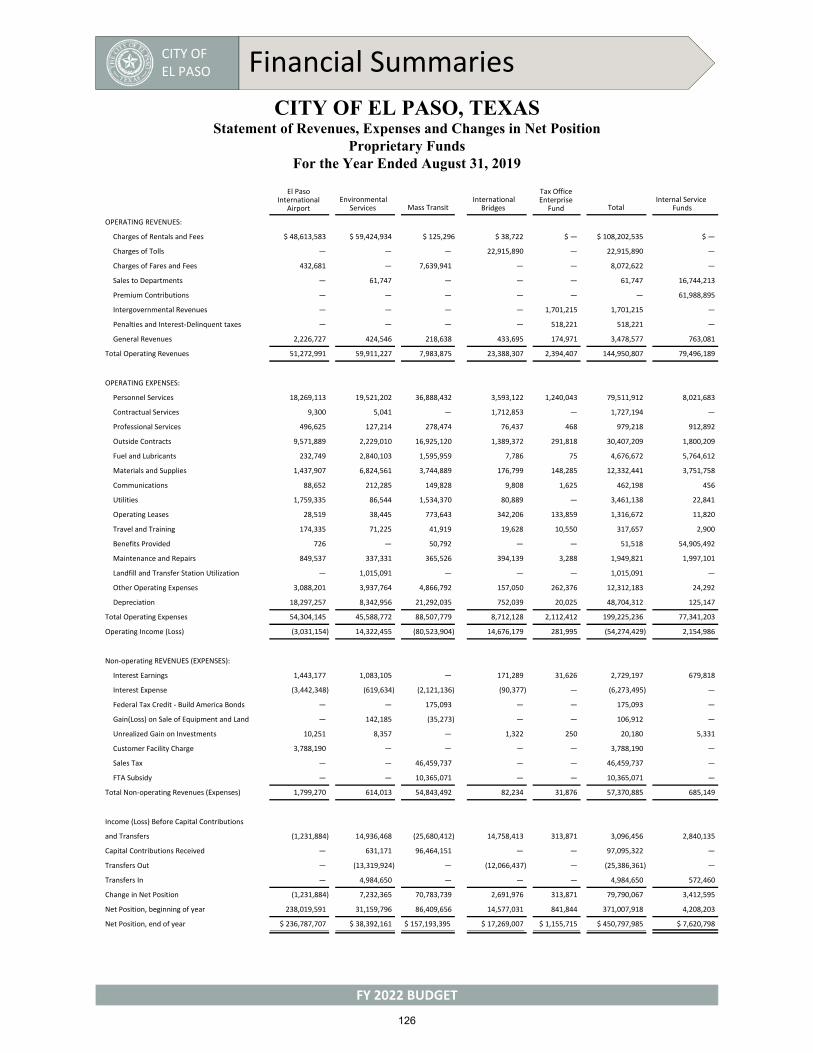
CITY OF EL PASO Financial Summaries
FY 2022 BUDGET
CITY OF EL PASO, TEXAS Statement of Revenues, Expenses and Changes in Net Position
Proprietary Funds For the Year Ended August 31, 2019
El Paso International
Airport Environmental
Services Mass Transit International
Bridges
Tax Office Enterprise
Fund Total Internal Service
Funds
OPERATING REVENUES:
Charges of Rentals and Fees $ 48,613,583 $ 59,424,934 $ 125,296 $ 38,722 $ — $ 108,202,535 $ —
Charges of Tolls — — — 22,915,890 — 22,915,890 —
Charges of Fares and Fees 432,681 — 7,639,941 — — 8,072,622 —
Sales to Departments — 61,747 — — — 61,747 16,744,213
Premium Contributions — — — — — — 61,988,895
Intergovernmental Revenues — — — — 1,701,215 1,701,215 —
Penalties and Interest‐Delinquent taxes — — — — 518,221 518,221 —
General Revenues 2,226,727 424,546 218,638 433,695 174,971 3,478,577 763,081
Total Operating Revenues 51,272,991 59,911,227 7,983,875 23,388,307 2,394,407 144,950,807 79,496,189
OPERATING EXPENSES:
Personnel Services 18,269,113 19,521,202 36,888,432 3,593,122 1,240,043 79,511,912 8,021,683
Contractual Services 9,300 5,041 — 1,712,853 — 1,727,194 —
Professional Services 496,625 127,214 278,474 76,437 468 979,218 912,892
Outside Contracts 9,571,889 2,229,010 16,925,120 1,389,372 291,818 30,407,209 1,800,209
Fuel and Lubricants 232,749 2,840,103 1,595,959 7,786 75 4,676,672 5,764,612
Materials and Supplies 1,437,907 6,824,561 3,744,889 176,799 148,285 12,332,441 3,751,758
Communications 88,652 212,285 149,828 9,808 1,625 462,198 456
Utilities 1,759,335 86,544 1,534,370 80,889 — 3,461,138 22,841
Operating Leases 28,519 38,445 773,643 342,206 133,859 1,316,672 11,820
Travel and Training 174,335 71,225 41,919 19,628 10,550 317,657 2,900
Benefits Provided 726 — 50,792 — — 51,518 54,905,492
Maintenance and Repairs 849,537 337,331 365,526 394,139 3,288 1,949,821 1,997,101
Landfill and Transfer Station Utilization — 1,015,091 — — — 1,015,091 —
Other Operating Expenses 3,088,201 3,937,764 4,866,792 157,050 262,376 12,312,183 24,292
Depreciation 18,297,257 8,342,956 21,292,035 752,039 20,025 48,704,312 125,147
Total Operating Expenses 54,304,145 45,588,772 88,507,779 8,712,128 2,112,412 199,225,236 77,341,203
Operating Income (Loss) (3,031,154) 14,322,455 (80,523,904) 14,676,179 281,995 (54,274,429) 2,154,986
Non‐operating REVENUES (EXPENSES):
Interest Earnings 1,443,177 1,083,105 — 171,289 31,626 2,729,197 679,818
Interest Expense (3,442,348) (619,634) (2,121,136) (90,377) — (6,273,495) —
Federal Tax Credit ‐ Build America Bonds — — 175,093 — — 175,093 —
Gain(Loss) on Sale of Equipment and Land — 142,185 (35,273) — — 106,912 —
Unrealized Gain on Investments 10,251 8,357 — 1,322 250 20,180 5,331
Customer Facility Charge 3,788,190 — — — — 3,788,190 —
Sales Tax — — 46,459,737 — — 46,459,737 —
FTA Subsidy — — 10,365,071 — — 10,365,071 —
Total Non‐operating Revenues (Expenses) 1,799,270 614,013 54,843,492 82,234 31,876 57,370,885 685,149
Income (Loss) Before Capital Contributions
and Transfers (1,231,884) 14,936,468 (25,680,412) 14,758,413 313,871 3,096,456 2,840,135
Capital Contributions Received — 631,171 96,464,151 — — 97,095,322 —
Transfers Out — (13,319,924) — (12,066,437) — (25,386,361) —
Transfers In — 4,984,650 — — — 4,984,650 572,460
Change in Net Position (1,231,884) 7,232,365 70,783,739 2,691,976 313,871 79,790,067 3,412,595
Net Position, beginning of year 238,019,591 31,159,796 86,409,656 14,577,031 841,844 371,007,918 4,208,203
Net Position, end of year $ 236,787,707 $ 38,392,161 $ 157,193,395 $ 17,269,007 $ 1,155,715 $ 450,797,985 $ 7,620,798
126
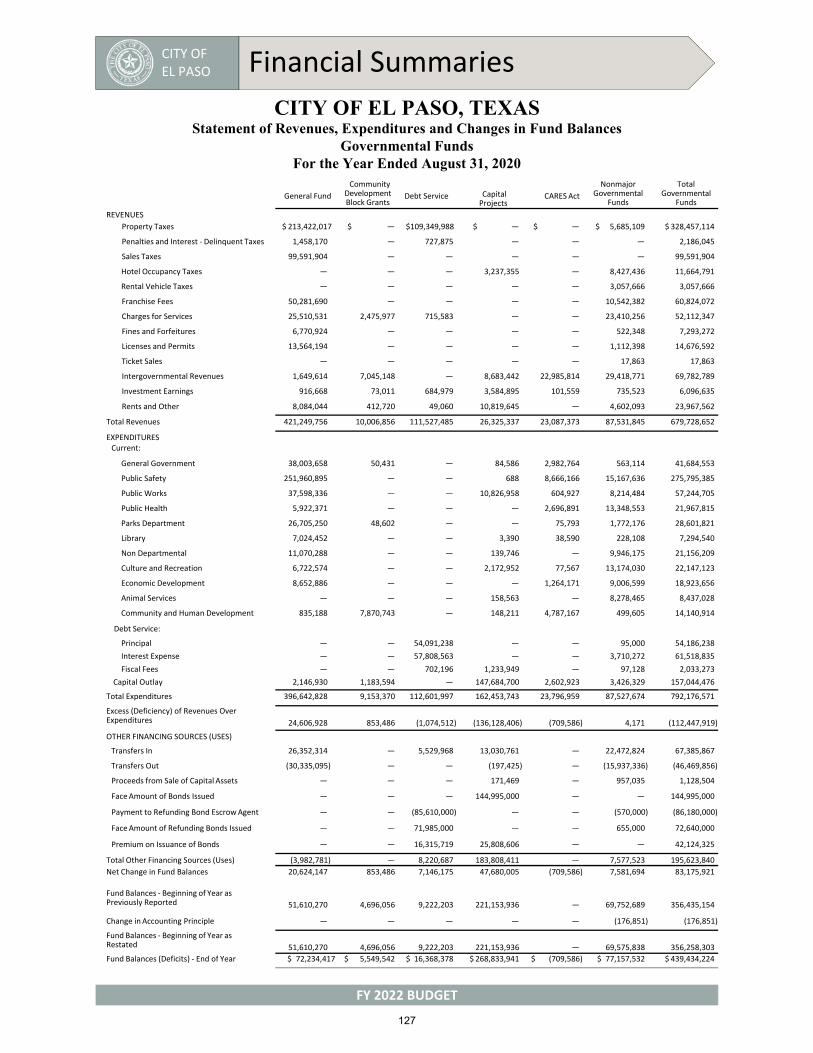
CITY OF EL PASO Financial Summaries
FY 2022 BUDGET
CITY OF EL PASO, TEXAS Statement of Revenues, Expenditures and Changes in Fund Balances
Governmental Funds For the Year Ended August 31, 2020
General Fund
Community Development Block Grants
Debt Service Capital Projects
CARES Act
Nonmajor Governmental
Funds
Total Governmental
Funds
REVENUES
Property Taxes $ 213,422,017 $ — $109,349,988 $ — $ — $ 5,685,109 $ 328,457,114
Penalties and Interest ‐ Delinquent Taxes 1,458,170 — 727,875 — — — 2,186,045
Sales Taxes 99,591,904 — — — — — 99,591,904
Hotel Occupancy Taxes — — — 3,237,355 — 8,427,436 11,664,791
Rental Vehicle Taxes — — — — — 3,057,666 3,057,666
Franchise Fees 50,281,690 — — — — 10,542,382 60,824,072
Charges for Services 25,510,531 2,475,977 715,583 — — 23,410,256 52,112,347
Fines and Forfeitures 6,770,924 — — — — 522,348 7,293,272
Licenses and Permits 13,564,194 — — — — 1,112,398 14,676,592
Ticket Sales — — — — — 17,863 17,863
Intergovernmental Revenues 1,649,614 7,045,148 — 8,683,442 22,985,814 29,418,771 69,782,789
Investment Earnings 916,668 73,011 684,979 3,584,895 101,559 735,523 6,096,635
Rents and Other 8,084,044 412,720 49,060 10,819,645 — 4,602,093 23,967,562
Total Revenues 421,249,756 10,006,856 111,527,485 26,325,337 23,087,373 87,531,845 679,728,652
EXPENDITURES Current:
General Government 38,003,658 50,431 — 84,586 2,982,764 563,114 41,684,553
Public Safety 251,960,895 — — 688 8,666,166 15,167,636 275,795,385
Public Works 37,598,336 — — 10,826,958 604,927 8,214,484 57,244,705
Public Health 5,922,371 — — — 2,696,891 13,348,553 21,967,815
Parks Department 26,705,250 48,602 — — 75,793 1,772,176 28,601,821
Library 7,024,452 — — 3,390 38,590 228,108 7,294,540
Non Departmental 11,070,288 — — 139,746 — 9,946,175 21,156,209
Culture and Recreation 6,722,574 — — 2,172,952 77,567 13,174,030 22,147,123
Economic Development 8,652,886 — — — 1,264,171 9,006,599 18,923,656
Animal Services — — — 158,563 — 8,278,465 8,437,028
Community and Human Development 835,188 7,870,743 — 148,211 4,787,167 499,605 14,140,914
Debt Service:
Principal — — 54,091,238 — — 95,000 54,186,238
Interest Expense — — 57,808,563 — — 3,710,272 61,518,835
Fiscal Fees — — 702,196 1,233,949 — 97,128 2,033,273
Capital Outlay 2,146,930 1,183,594 — 147,684,700 2,602,923 3,426,329 157,044,476
Total Expenditures 396,642,828 9,153,370 112,601,997 162,453,743 23,796,959 87,527,674 792,176,571
Excess (Deficiency) of Revenues Over Expenditures 24,606,928 853,486 (1,074,512) (136,128,406) (709,586) 4,171 (112,447,919)
OTHER FINANCING SOURCES (USES)
Transfers In 26,352,314 — 5,529,968 13,030,761 — 22,472,824 67,385,867
Transfers Out (30,335,095) — — (197,425) — (15,937,336) (46,469,856)
Proceeds from Sale of Capital Assets — — — 171,469 — 957,035 1,128,504
Face Amount of Bonds Issued — — — 144,995,000 — — 144,995,000
Payment to Refunding Bond Escrow Agent — — (85,610,000) — — (570,000) (86,180,000)
Face Amount of Refunding Bonds Issued — — 71,985,000 — — 655,000 72,640,000
Premium on Issuance of Bonds — — 16,315,719 25,808,606 — — 42,124,325
Total Other Financing Sources (Uses) (3,982,781) — 8,220,687 183,808,411 — 7,577,523 195,623,840
Net Change in Fund Balances 20,624,147 853,486 7,146,175 47,680,005 (709,586) 7,581,694 83,175,921
Fund Balances ‐ Beginning of Year as Previously Reported 51,610,270 4,696,056 9,222,203 221,153,936 — 69,752,689 356,435,154
Change in Accounting Principle — — — — — (176,851) (176,851)
Fund Balances ‐ Beginning of Year as Restated 51,610,270 4,696,056 9,222,203 221,153,936 — 69,575,838 356,258,303
Fund Balances (Deficits) ‐ End of Year $ 72,234,417 $ 5,549,542 $ 16,368,378 $ 268,833,941 $ (709,586) $ 77,157,532 $ 439,434,224
127
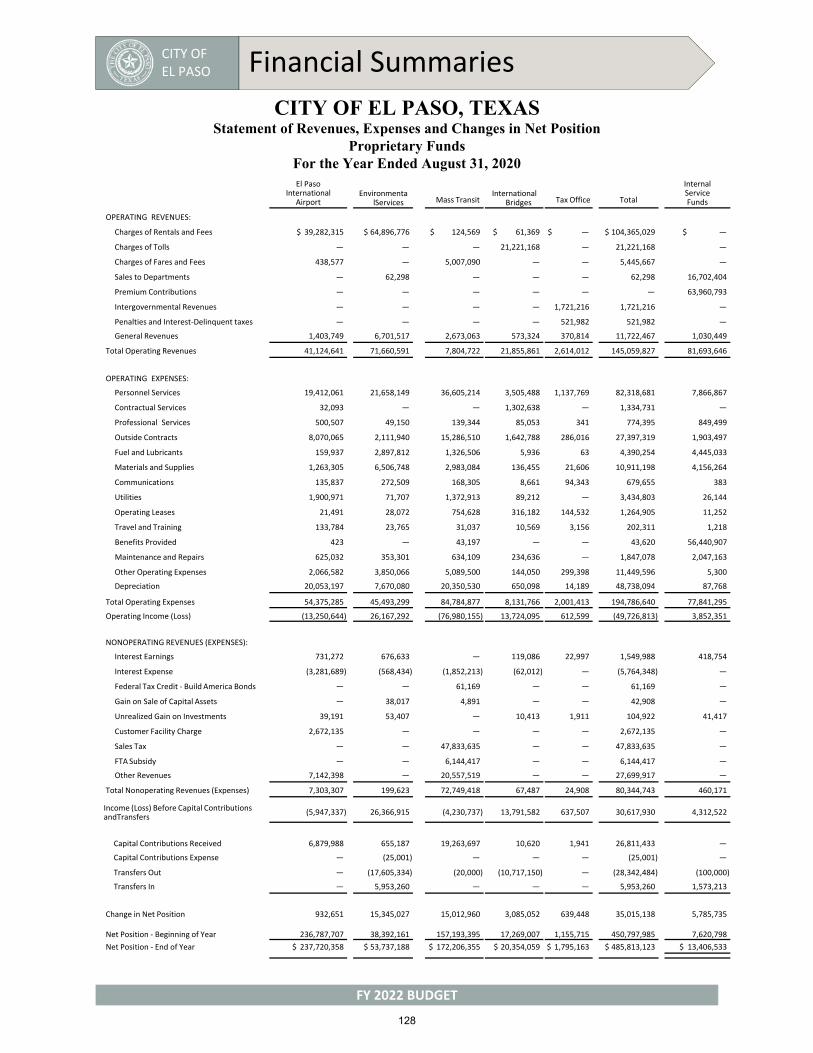
CITY OF EL PASO Financial Summaries
FY 2022 BUDGET
CITY OF EL PASO, TEXAS Statement of Revenues, Expenses and Changes in Net Position
Proprietary Funds For the Year Ended August 31, 2020 El Paso
International Airport
Environmental Services Mass Transit
International Bridges Tax Office Total
Internal Service Funds
OPERATING REVENUES:
Charges of Rentals and Fees $ 39,282,315 $ 64,896,776 $ 124,569 $ 61,369 $ — $ 104,365,029 $ —
Charges of Tolls — — — 21,221,168 — 21,221,168 —
Charges of Fares and Fees 438,577 — 5,007,090 — — 5,445,667 —
Sales to Departments — 62,298 — — — 62,298 16,702,404
Premium Contributions — — — — — — 63,960,793
Intergovernmental Revenues — — — — 1,721,216 1,721,216 —
Penalties and Interest‐Delinquent taxes — — — — 521,982 521,982 —
General Revenues 1,403,749 6,701,517 2,673,063 573,324 370,814 11,722,467 1,030,449
Total Operating Revenues 41,124,641 71,660,591 7,804,722 21,855,861 2,614,012 145,059,827 81,693,646
OPERATING EXPENSES:
Personnel Services 19,412,061 21,658,149 36,605,214 3,505,488 1,137,769 82,318,681 7,866,867
Contractual Services 32,093 — — 1,302,638 — 1,334,731 —
Professional Services 500,507 49,150 139,344 85,053 341 774,395 849,499
Outside Contracts 8,070,065 2,111,940 15,286,510 1,642,788 286,016 27,397,319 1,903,497
Fuel and Lubricants 159,937 2,897,812 1,326,506 5,936 63 4,390,254 4,445,033
Materials and Supplies 1,263,305 6,506,748 2,983,084 136,455 21,606 10,911,198 4,156,264
Communications 135,837 272,509 168,305 8,661 94,343 679,655 383
Utilities 1,900,971 71,707 1,372,913 89,212 — 3,434,803 26,144
Operating Leases 21,491 28,072 754,628 316,182 144,532 1,264,905 11,252
Travel and Training 133,784 23,765 31,037 10,569 3,156 202,311 1,218
Benefits Provided 423 — 43,197 — — 43,620 56,440,907
Maintenance and Repairs 625,032 353,301 634,109 234,636 — 1,847,078 2,047,163
Other Operating Expenses 2,066,582 3,850,066 5,089,500 144,050 299,398 11,449,596 5,300
Depreciation 20,053,197 7,670,080 20,350,530 650,098 14,189 48,738,094 87,768
Total Operating Expenses 54,375,285 45,493,299 84,784,877 8,131,766 2,001,413 194,786,640 77,841,295
Operating Income (Loss) (13,250,644) 26,167,292 (76,980,155) 13,724,095 612,599 (49,726,813) 3,852,351
NONOPERATING REVENUES (EXPENSES):
Interest Earnings 731,272 676,633 — 119,086 22,997 1,549,988 418,754
Interest Expense (3,281,689) (568,434) (1,852,213) (62,012) — (5,764,348) —
Federal Tax Credit ‐ Build America Bonds — — 61,169 — — 61,169 —
Gain on Sale of Capital Assets — 38,017 4,891 — — 42,908 —
Unrealized Gain on Investments 39,191 53,407 — 10,413 1,911 104,922 41,417
Customer Facility Charge 2,672,135 — — — — 2,672,135 —
Sales Tax — — 47,833,635 — — 47,833,635 —
FTA Subsidy — — 6,144,417 — — 6,144,417 —
Other Revenues 7,142,398 — 20,557,519 — — 27,699,917 —
Total Nonoperating Revenues (Expenses) 7,303,307 199,623 72,749,418 67,487 24,908 80,344,743 460,171
Income (Loss) Before Capital Contributions and Transfers
(5,947,337) 26,366,915 (4,230,737) 13,791,582 637,507 30,617,930 4,312,522
Capital Contributions Received 6,879,988 655,187 19,263,697 10,620 1,941 26,811,433 —
Capital Contributions Expense — (25,001) — — — (25,001) —
Transfers Out — (17,605,334) (20,000) (10,717,150) — (28,342,484) (100,000)
Transfers In — 5,953,260 — — — 5,953,260 1,573,213
Change in Net Position 932,651 15,345,027 15,012,960 3,085,052 639,448 35,015,138 5,785,735
Net Position ‐ Beginning of Year 236,787,707 38,392,161 157,193,395 17,269,007 1,155,715 450,797,985 7,620,798
Net Position ‐ End of Year $ 237,720,358 $ 53,737,188 $ 172,206,355 $ 20,354,059 $ 1,795,163 $ 485,813,123 $ 13,406,533
128
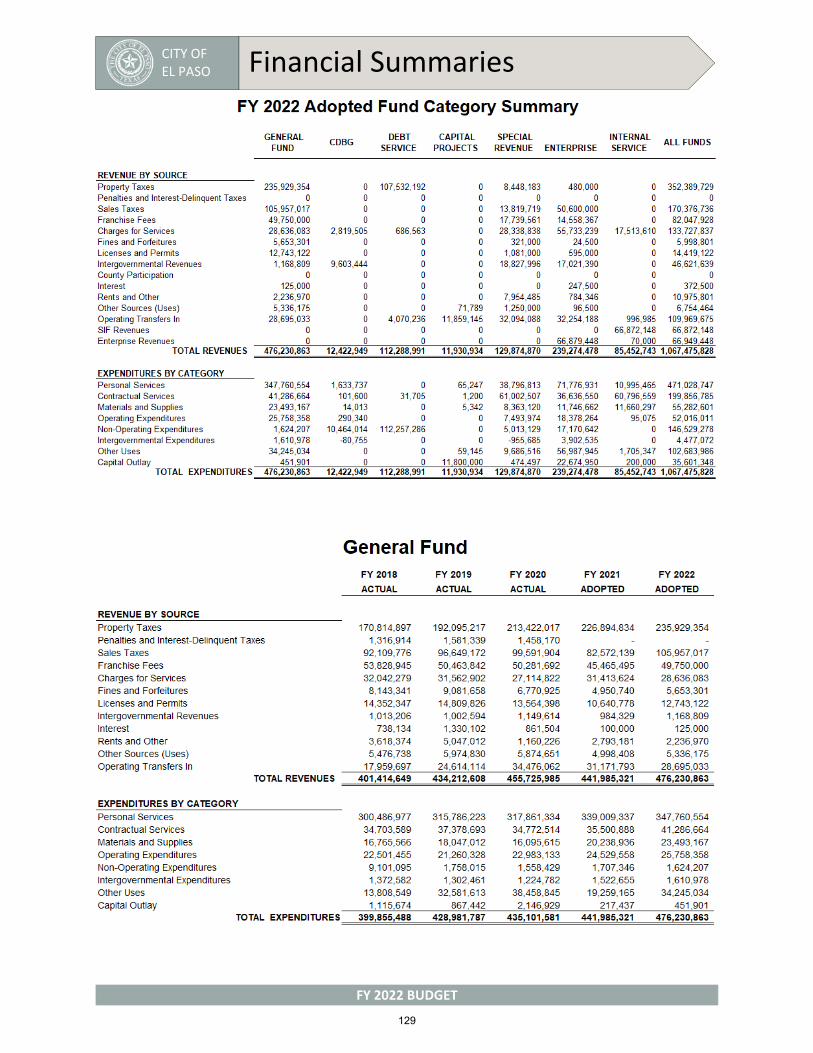
CITY OF EL PASO Financial Summaries
FY 2022 BUDGET
129
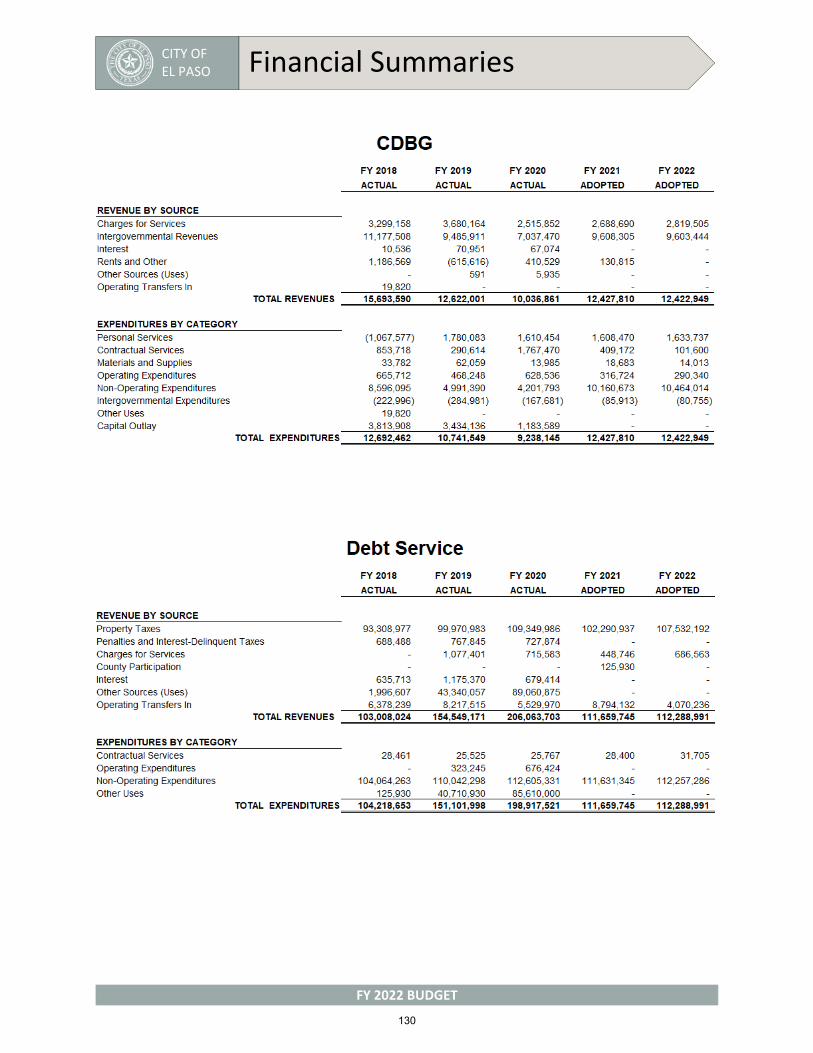
CITY OF EL PASO Financial Summaries
FY 2022 BUDGET
130
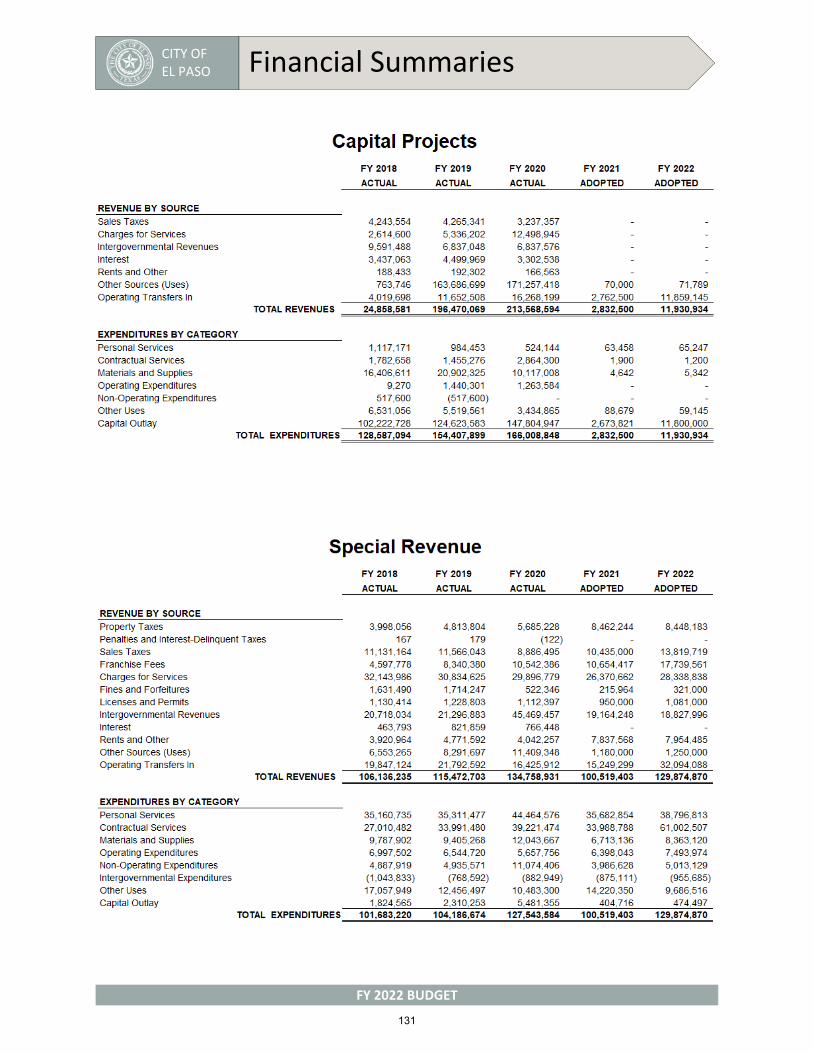
CITY OF EL PASO Financial Summaries
FY 2022 BUDGET
131

CITY OF EL PASO Financial Summaries
FY 2022 BUDGET
132
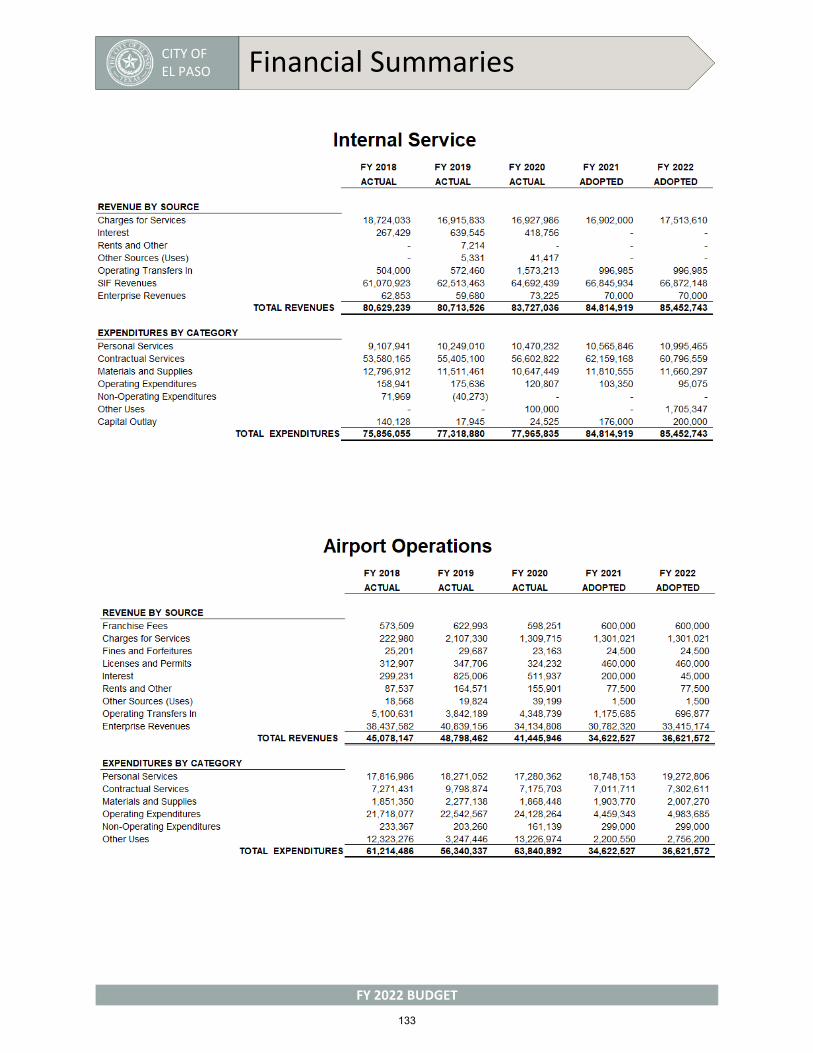
CITY OF EL PASO Financial Summaries
FY 2022 BUDGET
133
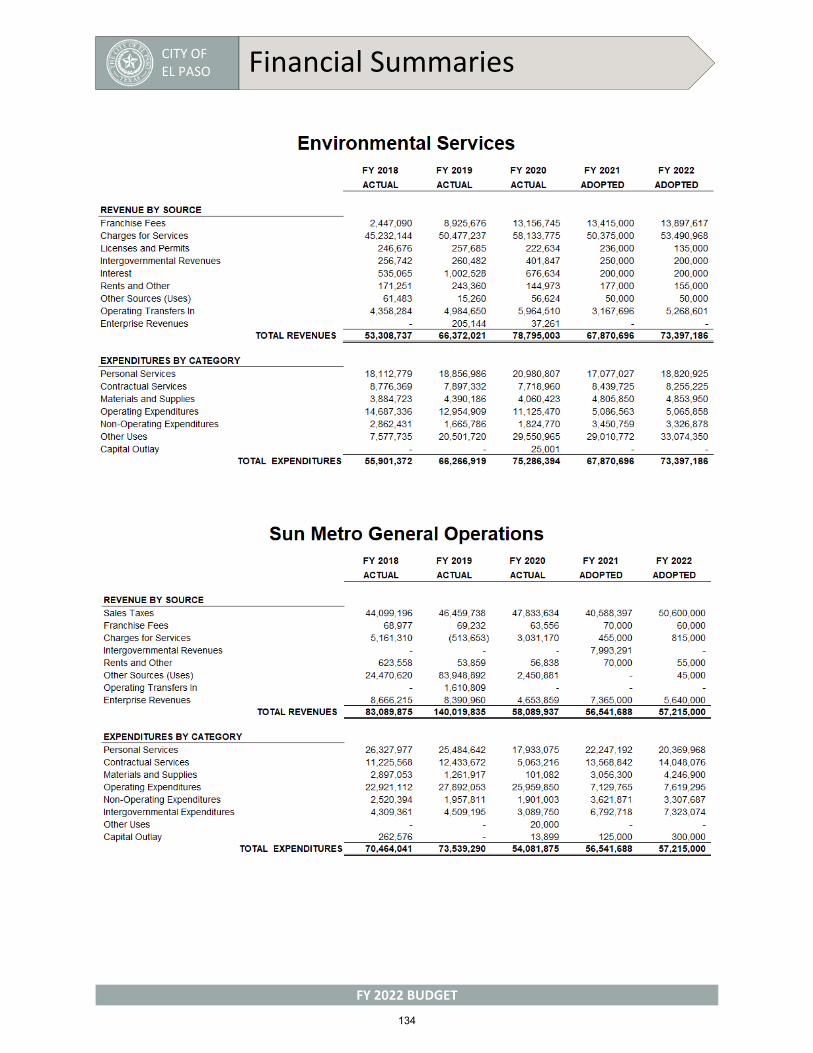
CITY OF EL PASO Financial Summaries
FY 2022 BUDGET
134

CITY OF EL PASO Financial Summaries
FY 2022 BUDGET
135

CITY OF EL PASO Financial Summaries
FY 2022 BUDGET
136
CITY OF EL PASO BUDGET BOOK 2022
GROWTH
BUDGET DETAIL
BUDGET
DETA
IL

CITY OF EL PASO BUDGET BOOK 2022
GROWTH
GOAL 1ECONOMIC DEVELOPMENT
-AVIATION-DESTINATION EL PASO
-ECONOMIC DEVELOPMENT-INTERNATIONAL BRIDGES
22YEAR NO.
GOAL 1
ECONOMIC DEVELOPMENT

FY 2018 FY 2019 FY 2020 FY 2021 FY 2022
ACTUAL ACTUAL ACTUAL ADOPTED ADOPTED AMOUNT PERCENT
Salaries and Wages 24,694,313 25,198,375 24,357,282 20,642,249 23,535,330 2,893,081 14%Employee Benefits 4,634,751 4,360,269 4,761,138 7,586,753 8,019,941 433,188 6%Contractual Services 2,370,346 1,712,852 1,302,637 1,654,000 1,654,000 - 0%Professional Services 6,128,921 1,886,756 1,445,197 2,560,135 2,001,544 (558,591) -22%Outside Contracts 17,473,106 19,389,283 19,268,652 22,215,765 33,611,332 11,395,568 51%Interfund Services 33,391 7,817 20,576 18,700 18,700 - 0%Operating Leases 394,321 420,024 456,560 454,924 456,934 2,010 0%Fuel and Lubricants 250,013 236,974 165,871 272,386 278,243 5,857 2%Materials and Supplies 3,525,383 3,040,728 2,530,314 1,862,826 2,514,803 651,977 35%Maintenance and Repairs 3,067,530 2,342,426 970,114 1,140,800 1,781,192 640,392 56%Minor Equipment and Furniture 519,062 879,031 271,025 218,300 254,700 36,400 17%Communications 188,212 167,984 207,249 390,738 416,820 26,082 7%Utilities 2,701,669 2,237,194 2,482,950 2,901,758 3,530,850 629,092 22%Travel 396,053 360,519 258,174 417,583 549,625 132,042 32%Other Operating Expenditures 21,900,511 23,139,300 23,880,834 3,204,947 4,299,398 1,094,452 34%Community Service Projects 114,000 175,000 1,339,171 578,841 1,494,955 916,114 158%Interest Expense 2,562,063 3,532,724 3,343,701 3,984,486 3,707,077 (277,409) -7%Principal - - - 6,180,000 6,410,000 230,000 4%Other Non-Operating Expenditures 506,835 390,565 356,573 523,144 602,792 79,648 15%Grant Match - - - - - - 0%Operating Transfers Out 45,349,889 35,237,779 49,710,539 25,180,308 24,626,701 (553,608) -2%Capital Outlay 39,263,124 29,444,469 17,765,459 2,930,321 3,611,500 681,179 23%
Total Expenditures 176,073,492 154,160,069 154,894,016 104,918,963 123,376,437 18,457,473 18%
FY 2018 FY 2019 FY 2020 FY 2021 FY 2022
ACTUAL ACTUAL ACTUAL ADOPTED ADOPTED AMOUNT PERCENT
General Government 1,863,266 1,675,327 1,696,030 1,826,045 1,961,689 135,644 7%Community Development Block Grants - - - - - - 0%Debt Service - - - - - - 0%Capital Projects 3,696,597 1,893,099 382,613 2,762,500 3,059,145 296,645 11%Special Revenue 31,458,332 21,669,486 23,471,537 24,466,324 41,794,150 17,327,827 71%Fiduciary Funds - - - - - - 0%Enterprise 139,055,296 128,922,158 129,343,836 75,864,094 76,561,452 697,358 1%Internal Service - - - - - - 0%
Total Funds 176,073,492 154,160,069 154,894,016 104,918,963 123,376,437 18,457,473 18%
FY 2018 FY 2019 FY 2020 FY 2021 FY 2022
ADOPTED ADOPTED ADOPTED ADOPTED ADOPTED AMOUNT PERCENT
General Fund 20.70 21.00 15.00 14.30 15.30 1.00 Non-General Fund 304.65 302.60 296.60 292.30 293.30 1.00
Total Authorized 325.35 323.60 311.60 306.60 308.60 2.00
Positions
FY 2022 ADOPTED OVER/(UNDER) FY 2021 ADOPTED
FY 2022 ADOPTED OVER/(UNDER) FY 2021 ADOPTED
FY 2022 ADOPTED OVER/(UNDER) FY 2021 ADOPTED
Goal 1
Create an Environment Conductive to Strong, Sustainable Economic Development
Expenditures by Group
Source of Funds
139
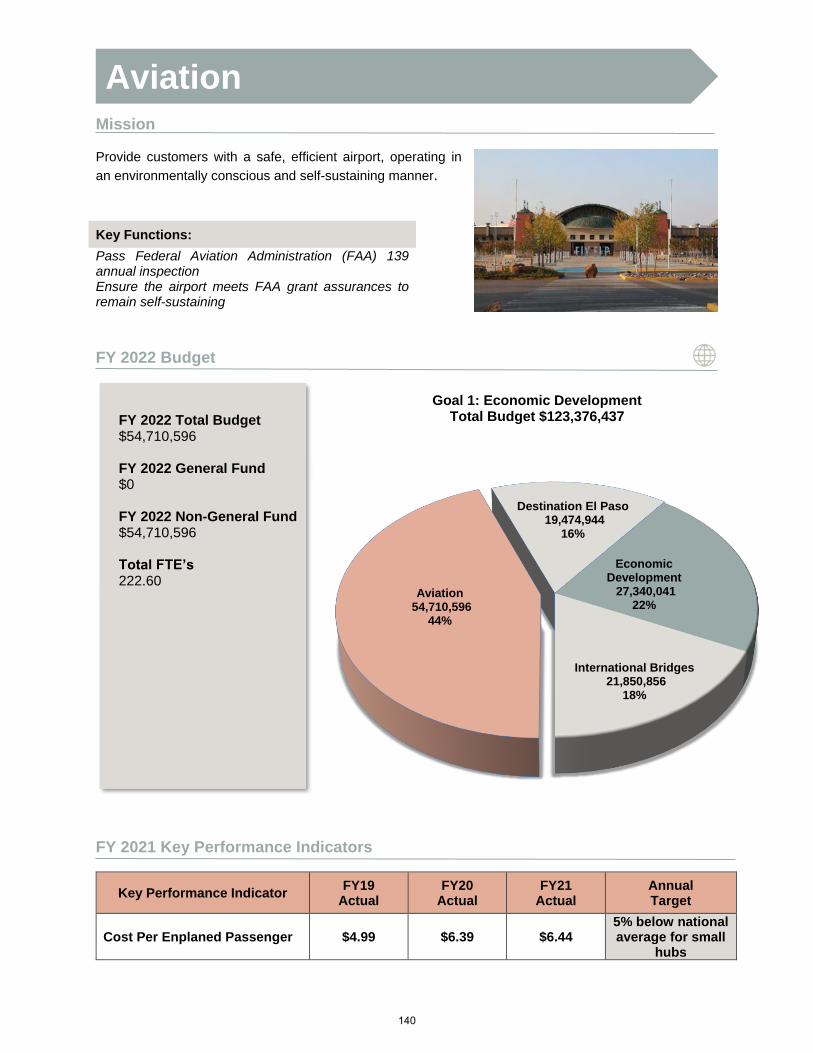
Aviation54,710,596
44%
Destination El Paso19,474,944
16%
Economic Development
27,340,041 22%
International Bridges21,850,856
18%
Goal 1: Economic Development Total Budget $123,376,437
Mission
Provide customers with a safe, efficient airport, operating in
an environmentally conscious and self-sustaining manner.
Key Functions:
Pass Federal Aviation Administration (FAA) 139 annual inspection Ensure the airport meets FAA grant assurances to remain self-sustaining
FY 2022 Budget
FY 2021 Key Performance Indicators
Key Performance Indicator FY19
Actual FY20
Actual FY21
Actual Annual Target
Cost Per Enplaned Passenger $4.99 $6.39 $6.44 5% below national average for small
hubs
Aviation
FY 2022 Total Budget $54,710,596
FY 2022 General Fund $0
FY 2022 Non-General Fund $54,710,596
Total FTE’s222.60
140
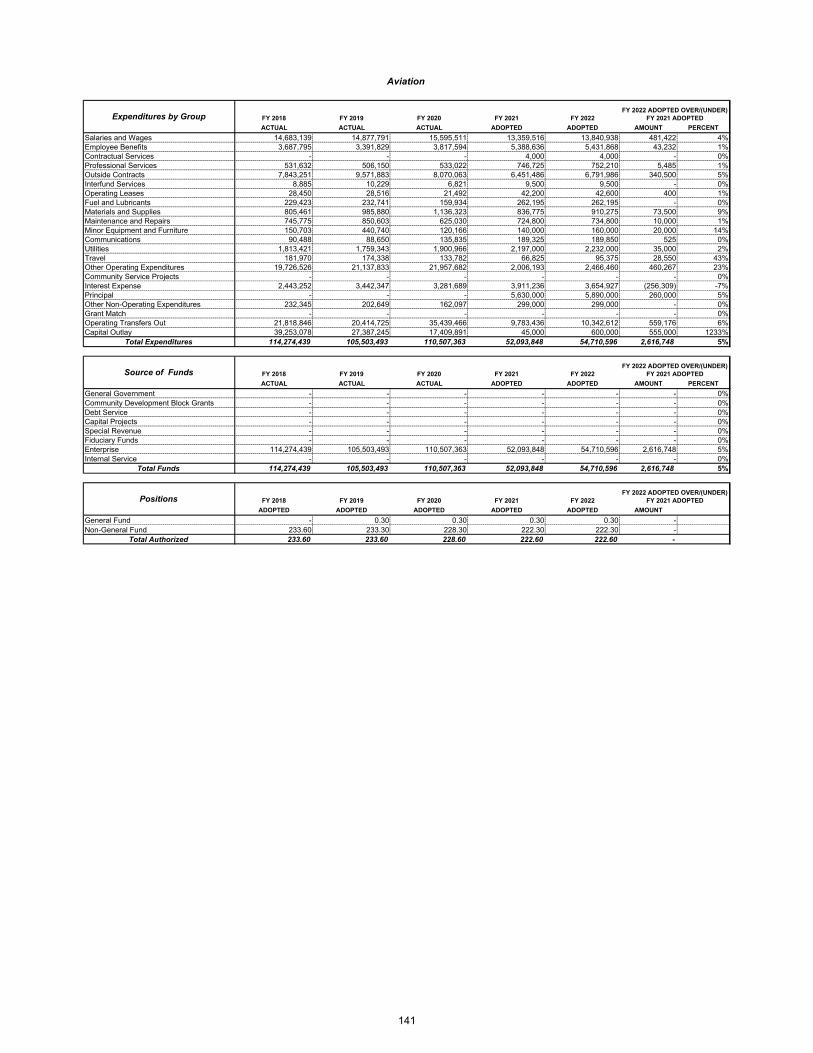
FY 2018 FY 2019 FY 2020 FY 2021 FY 2022
ACTUAL ACTUAL ACTUAL ADOPTED ADOPTED AMOUNT PERCENT
Salaries and Wages 14,683,139 14,877,791 15,595,511 13,359,516 13,840,938 481,422 4%Employee Benefits 3,687,795 3,391,829 3,817,594 5,388,636 5,431,868 43,232 1%Contractual Services - - - 4,000 4,000 - 0%Professional Services 531,632 506,150 533,022 746,725 752,210 5,485 1%Outside Contracts 7,843,251 9,571,883 8,070,063 6,451,486 6,791,986 340,500 5%Interfund Services 8,885 10,229 6,821 9,500 9,500 - 0%Operating Leases 28,450 28,516 21,492 42,200 42,600 400 1%Fuel and Lubricants 229,423 232,741 159,934 262,195 262,195 - 0%Materials and Supplies 805,461 985,880 1,136,323 836,775 910,275 73,500 9%Maintenance and Repairs 745,775 850,603 625,030 724,800 734,800 10,000 1%Minor Equipment and Furniture 150,703 440,740 120,166 140,000 160,000 20,000 14%Communications 90,488 88,650 135,835 189,325 189,850 525 0%Utilities 1,813,421 1,759,343 1,900,966 2,197,000 2,232,000 35,000 2%Travel 181,970 174,338 133,782 66,825 95,375 28,550 43%Other Operating Expenditures 19,726,526 21,137,833 21,957,682 2,006,193 2,466,460 460,267 23%Community Service Projects - - - - - - 0%Interest Expense 2,443,252 3,442,347 3,281,689 3,911,236 3,654,927 (256,309) -7%Principal - - - 5,630,000 5,890,000 260,000 5%Other Non-Operating Expenditures 232,345 202,649 162,097 299,000 299,000 - 0%Grant Match - - - - - - 0%Operating Transfers Out 21,818,846 20,414,725 35,439,466 9,783,436 10,342,612 559,176 6%Capital Outlay 39,253,078 27,387,245 17,409,891 45,000 600,000 555,000 1233%
Total Expenditures 114,274,439 105,503,493 110,507,363 52,093,848 54,710,596 2,616,748 5%
FY 2018 FY 2019 FY 2020 FY 2021 FY 2022
ACTUAL ACTUAL ACTUAL ADOPTED ADOPTED AMOUNT PERCENT
General Government - - - - - - 0%Community Development Block Grants - - - - - - 0%Debt Service - - - - - - 0%Capital Projects - - - - - - 0%Special Revenue - - - - - - 0%Fiduciary Funds - - - - - - 0%Enterprise 114,274,439 105,503,493 110,507,363 52,093,848 54,710,596 2,616,748 5%Internal Service - - - - - - 0%
Total Funds 114,274,439 105,503,493 110,507,363 52,093,848 54,710,596 2,616,748 5%
FY 2018 FY 2019 FY 2020 FY 2021 FY 2022
ADOPTED ADOPTED ADOPTED ADOPTED ADOPTED AMOUNT
General Fund - 0.30 0.30 0.30 0.30 - Non-General Fund 233.60 233.30 228.30 222.30 222.30 -
Total Authorized 233.60 233.60 228.60 222.60 222.60 -
Positions
FY 2022 ADOPTED OVER/(UNDER) FY 2021 ADOPTED
FY 2022 ADOPTED OVER/(UNDER) FY 2021 ADOPTED
FY 2022 ADOPTED OVER/(UNDER) FY 2021 ADOPTED
Aviation
Expenditures by Group
Source of Funds
141
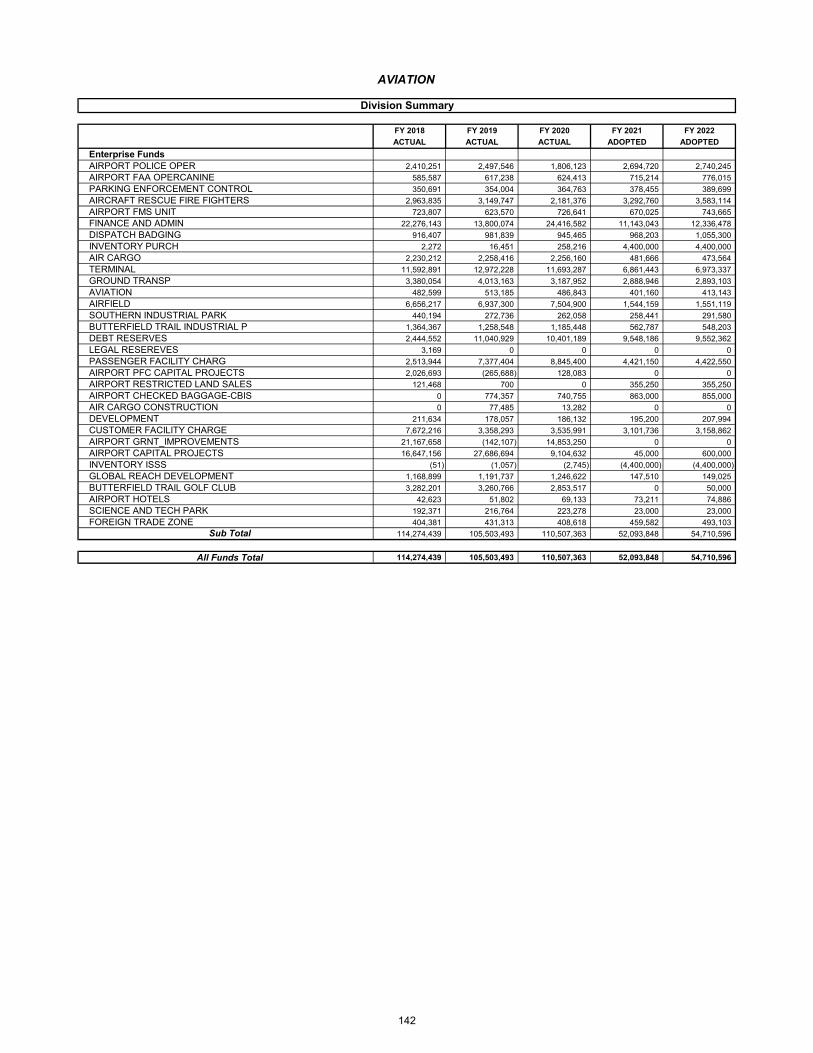
FY 2018 FY 2019 FY 2020 FY 2021 FY 2022
ACTUAL ACTUAL ACTUAL ADOPTED ADOPTED
Enterprise FundsAIRPORT POLICE OPER 2,410,251 2,497,546 1,806,123 2,694,720 2,740,245
AIRPORT FAA OPERCANINE 585,587 617,238 624,413 715,214 776,015
PARKING ENFORCEMENT CONTROL 350,691 354,004 364,763 378,455 389,699
AIRCRAFT RESCUE FIRE FIGHTERS 2,963,835 3,149,747 2,181,376 3,292,760 3,583,114
AIRPORT FMS UNIT 723,807 623,570 726,641 670,025 743,665
FINANCE AND ADMIN 22,276,143 13,800,074 24,416,582 11,143,043 12,336,478
DISPATCH BADGING 916,407 981,839 945,465 968,203 1,055,300
INVENTORY PURCH 2,272 16,451 258,216 4,400,000 4,400,000
AIR CARGO 2,230,212 2,258,416 2,256,160 481,666 473,564
TERMINAL 11,592,891 12,972,228 11,693,287 6,861,443 6,973,337
GROUND TRANSP 3,380,054 4,013,163 3,187,952 2,888,946 2,893,103
AVIATION 482,599 513,185 486,843 401,160 413,143
AIRFIELD 6,656,217 6,937,300 7,504,900 1,544,159 1,551,119
SOUTHERN INDUSTRIAL PARK 440,194 272,736 262,058 258,441 291,580
BUTTERFIELD TRAIL INDUSTRIAL P 1,364,367 1,258,548 1,185,448 562,787 548,203
DEBT RESERVES 2,444,552 11,040,929 10,401,189 9,548,186 9,552,362
LEGAL RESEREVES 3,169 0 0 0 0
PASSENGER FACILITY CHARG 2,513,944 7,377,404 8,845,400 4,421,150 4,422,550
AIRPORT PFC CAPITAL PROJECTS 2,026,693 (265,688) 128,083 0 0
AIRPORT RESTRICTED LAND SALES 121,468 700 0 355,250 355,250
AIRPORT CHECKED BAGGAGE-CBIS 0 774,357 740,755 863,000 855,000
AIR CARGO CONSTRUCTION 0 77,485 13,282 0 0
DEVELOPMENT 211,634 178,057 186,132 195,200 207,994
CUSTOMER FACILITY CHARGE 7,672,216 3,358,293 3,535,991 3,101,736 3,158,862
AIRPORT GRNT_IMPROVEMENTS 21,167,658 (142,107) 14,853,250 0 0
AIRPORT CAPITAL PROJECTS 16,647,156 27,686,694 9,104,632 45,000 600,000
INVENTORY ISSS (51) (1,057) (2,745) (4,400,000) (4,400,000)
GLOBAL REACH DEVELOPMENT 1,168,899 1,191,737 1,246,622 147,510 149,025
BUTTERFIELD TRAIL GOLF CLUB 3,282,201 3,260,766 2,853,517 0 50,000
AIRPORT HOTELS 42,623 51,802 69,133 73,211 74,886
SCIENCE AND TECH PARK 192,371 216,764 223,278 23,000 23,000
FOREIGN TRADE ZONE 404,381 431,313 408,618 459,582 493,103
Sub Total 114,274,439 105,503,493 110,507,363 52,093,848 54,710,596
All Funds Total 114,274,439 105,503,493 110,507,363 52,093,848 54,710,596
AVIATION
Division Summary
142
Strategic Actions
Goal 1: Create an Environment Conducive to Strong, Sustainable Economic Development
Strategy 1.4 Grow the Core Business of Air Transportation Action 1.4.1 Expand domestic and international commercial air service
Action 4.4.2 Expand Airport Development
FY 2021 Key Results
• Addition of new daily flights to Las Vegas, Charlotte, and Austin as well as restoration of all non-
stop routes
• Completion of capital improvement projects including the Convair road and parking lot project and
the FBO ramp and taxiway realignments, as well as terminal architecture and landscape
enhancement
• Recognized in the Business View Magazine for recent economic development efforts at the
airport, including Marmaxx, Butterfield Trail Golf Course, and Million Air Fixed Based Operator
facility
• Programmed events with COVID-19 regulations in mind such as Movies on the Fly at Hanger 7
Studios, Food Trucks on the Fly, October Night Lights, and Holiday Lights
FY 2022 Key Deliverables
• Continue to work with Airline partners to re-establish air service for our community
• Identify opportunities for new or expanded routes and present business cases to Airlines
• Present business cases to U.S. and Mexican Air Carriers for international flights to Mexico
• Market non-aviation development opportunities and partner in business development efforts lead
by Economic Development and Borderplex
• Launch new property development marketing campaign
COVID-19 Response & Recovery
• Implemented numerous safety, sanitation, informational measures to restore passenger
confidence
• Implemented operational adjustments and scheduling changes to reduce exposure for essential
staff
• Implemented touchless technology including parking lot ticket dispensers and TSA ID document
scanner
143

Sam RodriguezChief Operations and Transportation Officer
AviationAdopted FY 2022 Organizational Chart
Aviation Operations & Security Assistant Director
Aviation Assistant Director
Cary Westin Senior Deputy City Manager
Economic Development & Tourism
FY 2021 Adopted FY 2022 Adopted Increase / (Decrease)
GF 0.30 0.30 0.00
Non-General Fund 222.30 222.30 0.00
Total Authorized 222.60 222.60 0.00
Aircraft Rescue Fire Fighters / FMS Unit
Airport Police
144

Aviation
Position Summary - Authorized Staffing Table
Position DescriptionFY 2020 Adopted
FY 2021 Adopted
FY 2022 Adopted
Accounting Manager 1.00 1.00 1.00
Accounting/Payroll Clerk 3.00 1.00 1.00
Accounting/Payroll Specialist 4.00 5.00 5.00
Administrative Analyst 1.00 1.00 1.00
Administrative Assistant 1.00 1.00 1.00
Administrative Secretary 1.00 1.00 1.00
Administrative Services Manager 1.00 1.00 1.00
Administrative Specialist 1.00 1.00 1.00
Airfield Maintenance Supervisor 1.00 1.00 1.00
Airfield Markings & Painting 0.00 0.00 1.00
Airport Assistant Operations Officer 3.00 3.00 2.00
Airport Badging Officer 2.00 2.00 3.00
Airport Communications Supervisor 0.00 0.00 1.00
Airport Facilities Maintenance Superintendent 1.00 1.00 1.00
Airport Labor Supervisor 1.00 1.00 1.00
Airport Operations Manager 1.00 1.00 1.00
Airport Operations Superintendent 0.00 0.00 1.00
Airport Operations Supervisor 8.00 8.00 8.00
Airport Program Coordinator 1.00 1.00 0.00
Airport Programs Manager 0.00 0.00 1.00
Airport Properties & Contracts 0.00 0.00 1.00
Airport Properties Manager 1.00 1.00 1.00
Airport Safety Program Coordinator 1.00 1.00 1.00
Airport Security Coordinator 1.00 1.00 1.00
Airport Security Manager 0.00 0.00 1.00
Aviation Assistant Director 1.00 1.00 2.00
Aviation Development Assistant Director 1.00 1.00 0.00
Aviation Director 1.00 1.00 1.00
Aviation Operations & Security Assistant Director 1.00 1.00 1.00
Business Systems Analyst 1.00 1.00 1.00
Capital Improv Prgm Admin 0.00 0.00 1.00
Carpenter 2.00 2.00 2.00
Construction Superintendent 2.00 2.00 1.00
Custodial Shift Leader 6.00 6.00 6.00
Custodial Supervisor 1.00 1.00 1.00
Departmental Human Resources Manager 1.00 1.00 1.00
Education & Graphics Specialist 1.00 1.00 1.00
Electrician 4.00 4.00 4.00
Electrician Supervisor 1.00 1.00 1.00
Electronics Lead Technician 1.00 1.00 1.00
Electronics Technician 2.00 2.00 2.00
Equipment Operator 4.00 4.00 4.00
145
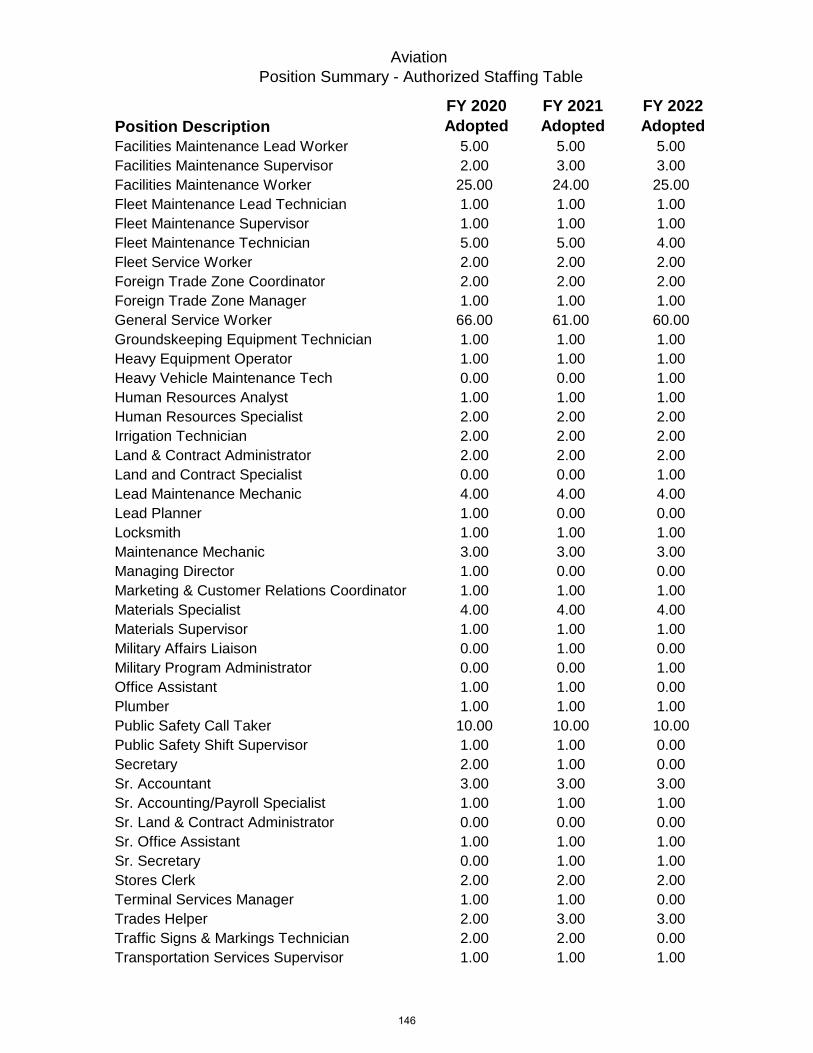
Aviation
Position Summary - Authorized Staffing Table
Position DescriptionFY 2020 Adopted
FY 2021 Adopted
FY 2022 Adopted
Facilities Maintenance Lead Worker 5.00 5.00 5.00
Facilities Maintenance Supervisor 2.00 3.00 3.00
Facilities Maintenance Worker 25.00 24.00 25.00
Fleet Maintenance Lead Technician 1.00 1.00 1.00
Fleet Maintenance Supervisor 1.00 1.00 1.00
Fleet Maintenance Technician 5.00 5.00 4.00
Fleet Service Worker 2.00 2.00 2.00
Foreign Trade Zone Coordinator 2.00 2.00 2.00
Foreign Trade Zone Manager 1.00 1.00 1.00
General Service Worker 66.00 61.00 60.00
Groundskeeping Equipment Technician 1.00 1.00 1.00
Heavy Equipment Operator 1.00 1.00 1.00
Heavy Vehicle Maintenance Tech 0.00 0.00 1.00
Human Resources Analyst 1.00 1.00 1.00
Human Resources Specialist 2.00 2.00 2.00
Irrigation Technician 2.00 2.00 2.00
Land & Contract Administrator 2.00 2.00 2.00
Land and Contract Specialist 0.00 0.00 1.00
Lead Maintenance Mechanic 4.00 4.00 4.00
Lead Planner 1.00 0.00 0.00
Locksmith 1.00 1.00 1.00
Maintenance Mechanic 3.00 3.00 3.00
Managing Director 1.00 0.00 0.00
Marketing & Customer Relations Coordinator 1.00 1.00 1.00
Materials Specialist 4.00 4.00 4.00
Materials Supervisor 1.00 1.00 1.00
Military Affairs Liaison 0.00 1.00 0.00
Military Program Administrator 0.00 0.00 1.00
Office Assistant 1.00 1.00 0.00
Plumber 1.00 1.00 1.00
Public Safety Call Taker 10.00 10.00 10.00
Public Safety Shift Supervisor 1.00 1.00 0.00
Secretary 2.00 1.00 0.00
Sr. Accountant 3.00 3.00 3.00
Sr. Accounting/Payroll Specialist 1.00 1.00 1.00
Sr. Land & Contract Administrator 0.00 0.00 0.00
Sr. Office Assistant 1.00 1.00 1.00
Sr. Secretary 0.00 1.00 1.00
Stores Clerk 2.00 2.00 2.00
Terminal Services Manager 1.00 1.00 0.00
Trades Helper 2.00 3.00 3.00
Traffic Signs & Markings Technician 2.00 2.00 0.00
Transportation Services Supervisor 1.00 1.00 1.00
146
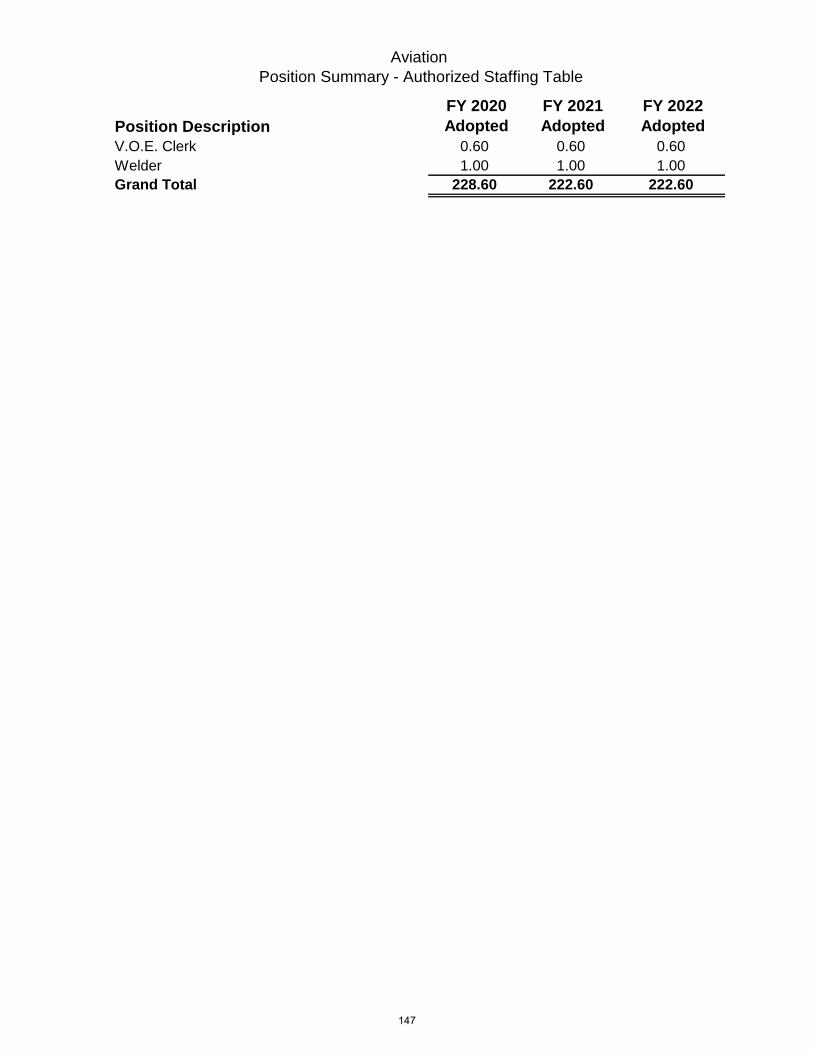
Aviation
Position Summary - Authorized Staffing Table
Position DescriptionFY 2020 Adopted
FY 2021 Adopted
FY 2022 Adopted
V.O.E. Clerk 0.60 0.60 0.60
Welder 1.00 1.00 1.00
Grand Total 228.60 222.60 222.60
147
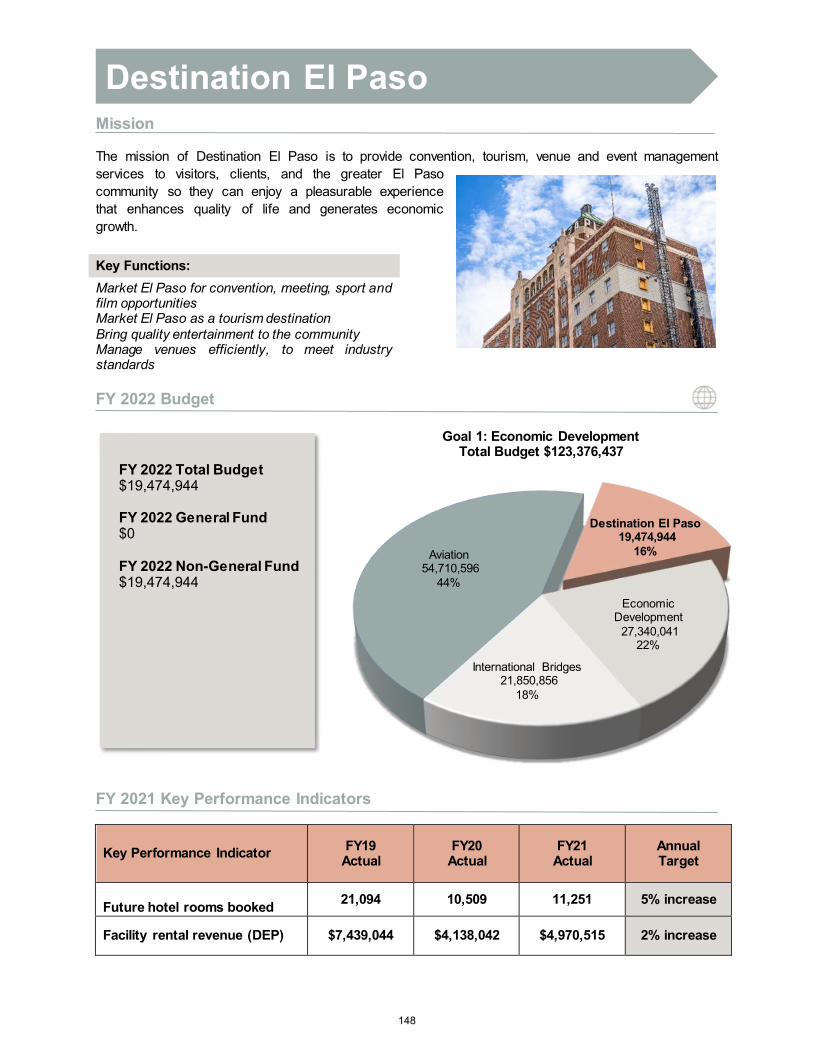
Aviation54,710,596
44%
Destination El Paso19,474,944
16%
Economic Development
27,340,041 22%
International Bridges21,850,856
18%
Goal 1: Economic Development Total Budget $123,376,437
Mission
The mission of Destination El Paso is to provide convention, tourism, venue and event management services to visitors, clients, and the greater El Paso community so they can enjoy a pleasurable experience that enhances quality of life and generates economic growth.
Key Functions: Market El Paso for convention, meeting, sport and film opportunities Market El Paso as a tourism destination Bring quality entertainment to the community Manage venues efficiently, to meet industry standards
FY 2022 Budget
FY 2021 Key Performance Indicators
Key Performance Indicator FY19 Actual
FY20 Actual
FY21 Actual
Annual Target
Future hotel rooms booked 21,094 10,509 11,251 5% increase
Facility rental revenue (DEP) $7,439,044 $4,138,042 $4,970,515 2% increase
Destination El Paso
FY 2022 Total Budget $19,474,944
FY 2022 General Fund $0
FY 2022 Non-General Fund $19,474,944
148

FY 2018 FY 2019 FY 2020 FY 2021 FY 2022
ACTUAL ACTUAL ACTUAL ADOPTED ADOPTED AMOUNT PERCENT
Salaries and Wages 6,428,651 6,500,013 4,998,474 3,919,811 6,113,216 2,193,405 56%Employee Benefits 641 - - 893,735 1,261,419 367,684 41%Contractual Services - - - - - - 0%Professional Services 5,485,468 1,304,170 827,124 1,121,563 1,106,609 (14,954) -1%Outside Contracts 537,127 1,098,640 435,699 1,083,337 1,882,082 798,745 74%Interfund Services 17,000 (10,818) - - - - 0%Operating Leases 23,129 44,578 116,009 60,970 62,580 1,610 3%Fuel and Lubricants 14,000 (3,554) - 2,841 5,198 2,357 83%Materials and Supplies 2,575,698 1,917,288 1,277,049 770,662 1,447,145 676,483 88%Maintenance and Repairs 1,946,541 1,102,408 110,446 177,073 731,402 554,329 313%Minor Equipment and Furniture 348,495 380,717 138,676 63,600 80,000 16,400 26%Communications 82,588 69,355 62,002 180,013 205,870 25,857 14%Utilities 801,905 396,992 492,770 595,258 1,192,850 597,592 100%Travel 136,574 121,717 79,089 322,573 387,742 65,169 20%Other Operating Expenditures 1,164,254 1,170,672 1,188,700 1,127,336 1,755,894 628,559 56%Community Service Projects - - - - - - 0%Interest Expense - - - - - - 0%Principal - - - - - - 0%Other Non-Operating Expenditures 114,316 100,138 86,660 104,144 183,792 79,648 76%Grant Match - - - - - - 0%Operating Transfers Out 4,019,490 252,332 86,096 88,679 59,145 (29,534) -33%Capital Outlay - 464,444 242,567 2,673,821 3,000,000 326,179 12%
Total Expenditures 23,695,878 14,909,092 10,141,361 13,185,415 19,474,944 6,289,529 48%
FY 2018 FY 2019 FY 2020 FY 2021 FY 2022
ACTUAL ACTUAL ACTUAL ADOPTED ADOPTED AMOUNT PERCENT
General Government - - - - - - 0%Community Development Block Grants - - - - - - 0%Debt Service - - - - - - 0%Capital Projects 3,864,027 1,168,688 328,663 2,762,500 3,059,145 296,645 11%Special Revenue 19,831,850 13,740,404 9,812,698 10,422,915 16,415,799 5,992,884 57%Fiduciary Funds - - - - - - 0%Enterprise - - - - - - 0%Internal Service - - - - - - 0%
Total Funds 23,695,878 14,909,092 10,141,361 13,185,415 19,474,944 6,289,529 48%
FY 2018 FY 2019 FY 2020 FY 2021 FY 2022
ADOPTED ADOPTED ADOPTED ADOPTED ADOPTED AMOUNT
General Fund - - - - - - Non-General Fund - - - - -
Total Authorized - - - - - -
Destination El Paso
Source of Funds
Positions
Expenditures by GroupFY 2022 ADOPTED OVER/(UNDER)
FY 2021 ADOPTED
FY 2022 ADOPTED OVER/(UNDER) FY 2021 ADOPTED
FY 2022 ADOPTED OVER/(UNDER) FY 2021 ADOPTED
149
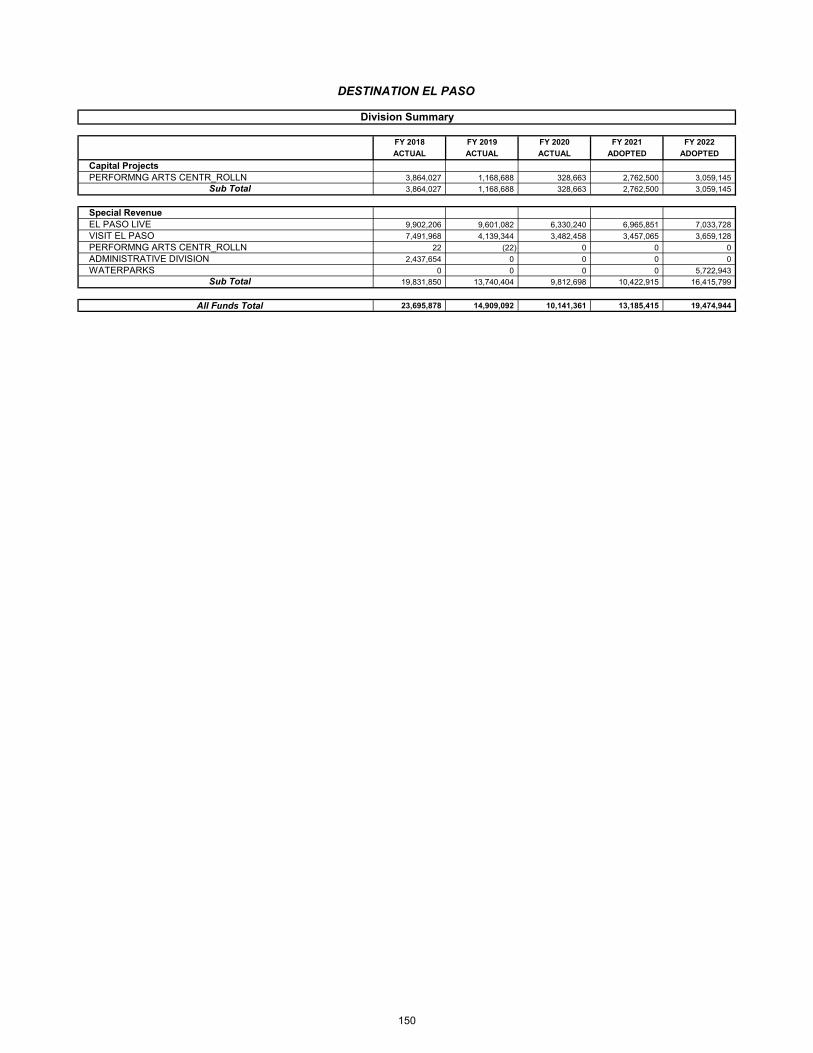
FY 2018 FY 2019 FY 2020 FY 2021 FY 2022
ACTUAL ACTUAL ACTUAL ADOPTED ADOPTED
Capital ProjectsPERFORMNG ARTS CENTR_ROLLN 3,864,027 1,168,688 328,663 2,762,500 3,059,145
Sub Total 3,864,027 1,168,688 328,663 2,762,500 3,059,145
Special RevenueEL PASO LIVE 9,902,206 9,601,082 6,330,240 6,965,851 7,033,728
VISIT EL PASO 7,491,968 4,139,344 3,482,458 3,457,065 3,659,128
PERFORMNG ARTS CENTR_ROLLN 22 (22) 0 0 0
ADMINISTRATIVE DIVISION 2,437,654 0 0 0 0
WATERPARKS 0 0 0 0 5,722,943
Sub Total 19,831,850 13,740,404 9,812,698 10,422,915 16,415,799
All Funds Total 23,695,878 14,909,092 10,141,361 13,185,415 19,474,944
Division Summary
DESTINATION EL PASO
150
Strategic Actions
Goal 1: Create an Environment Conducive to Strong, Sustainable Economic Development
Strategy 1.2 Enhance Visitor Revenue Opportunities Action 1.2.1 Promote El Paso as a desirable destination Action 1.2.2 Catalyze eco-tourism as an economic development driver focused on El Paso’s
Unique and authentic urban desert identity Action 1.2.3 Attract two retail destination anchors
Strategy 1.3 Maximize Venue Efficiencies through Revenue Growth and Control Action 1.3.1 Optimize revenue generated through rentals, parking, food and beverage Action 1.3.2 Manage facilities efficiently to meet or exceed industry standards
FY 2021 Key Results
Opened Camp Cohen, Oasis, Lost Kingdom, Chapoteo Water Parks in less than three months Implemented VenueShield enhanced cleaning and safety protocols Secured GBAC Certification for all venues
FY 2022 Key Deliverables
Maintain strong Hotel Occupancy at 68% or greater to lead Texas
Restore Mexico Leisure Travel Advertising and Marketing
Increased sales initiatives to attract meeting and convention activity, featuring new downtownhotel development and convention center renovations
Three or more virtual and in-person FAM tours and site visits to spur convention activity andintroduce planners to new downtown hotels, Hotel Paso del Norte and Plaza Hotel
Host television programs, travel writers, and site visits to increase media exposure
COVID-19 Response & Recovery
Installed a bio IONIZATION system in all venues of the El Paso Convention Center to helpeliminate airborne viruses
Key staff members completed a Global BioRisk Advisory Council Training Program with anemphasis on SARS and COVID-19
Utilized the El Paso Convention Center as an alternate care site, antibody infusion treatmentcenter, and vaccination site
All downtown hotels reopened Promoting El Paso’s Best Create and produced short videos of local business who have pivoted their service offering during
COVID-19 Provide the highest levels of cleanliness and safety while inspiring customer confidence post
COVID -19
151
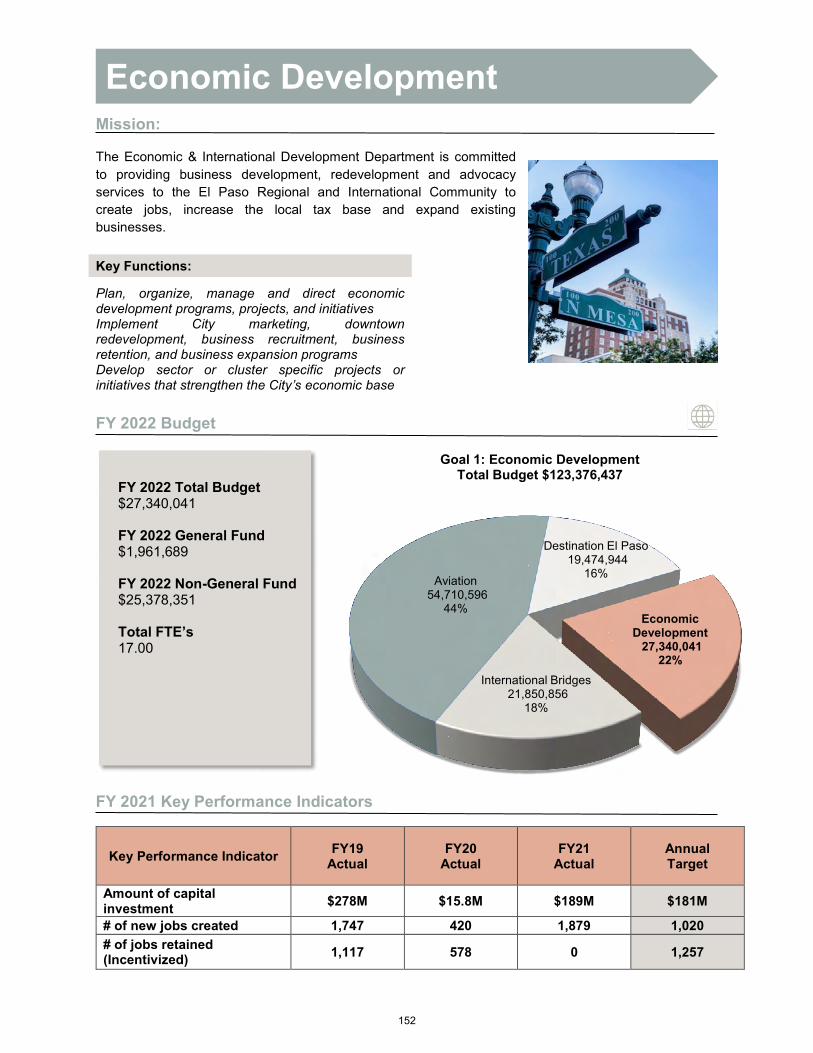
Aviation54,710,596
44%
Destination El Paso19,474,944
16%
Economic Development
27,340,041 22%
International Bridges21,850,856
18%
Goal 1: Economic Development Total Budget $123,376,437
Mission:
The Economic & International Development Department is committed to providing business development, redevelopment and advocacy services to the El Paso Regional and International Community to create jobs, increase the local tax base and expand existing businesses.
Key Functions:
Plan, organize, manage and direct economic development programs, projects, and initiatives Implement City marketing, downtown redevelopment, business recruitment, business retention, and business expansion programs Develop sector or cluster specific projects or initiatives that strengthen the City’s economic base
FY 2022 Budget
FY 2021 Key Performance Indicators
Key Performance Indicator FY19 Actual
FY20 Actual
FY21 Actual
Annual Target
Amount of capital investment $278M $15.8M $189M $181M
# of new jobs created 1,747 420 1,879 1,020 # of jobs retained (Incentivized) 1,117 578 0 1,257
FY 2022 Total Budget $27,340,041
FY 2022 General Fund $1,961,689
FY 2022 Non-General Fund $25,378,351
Total FTE’s 17.00
Economic Development
152
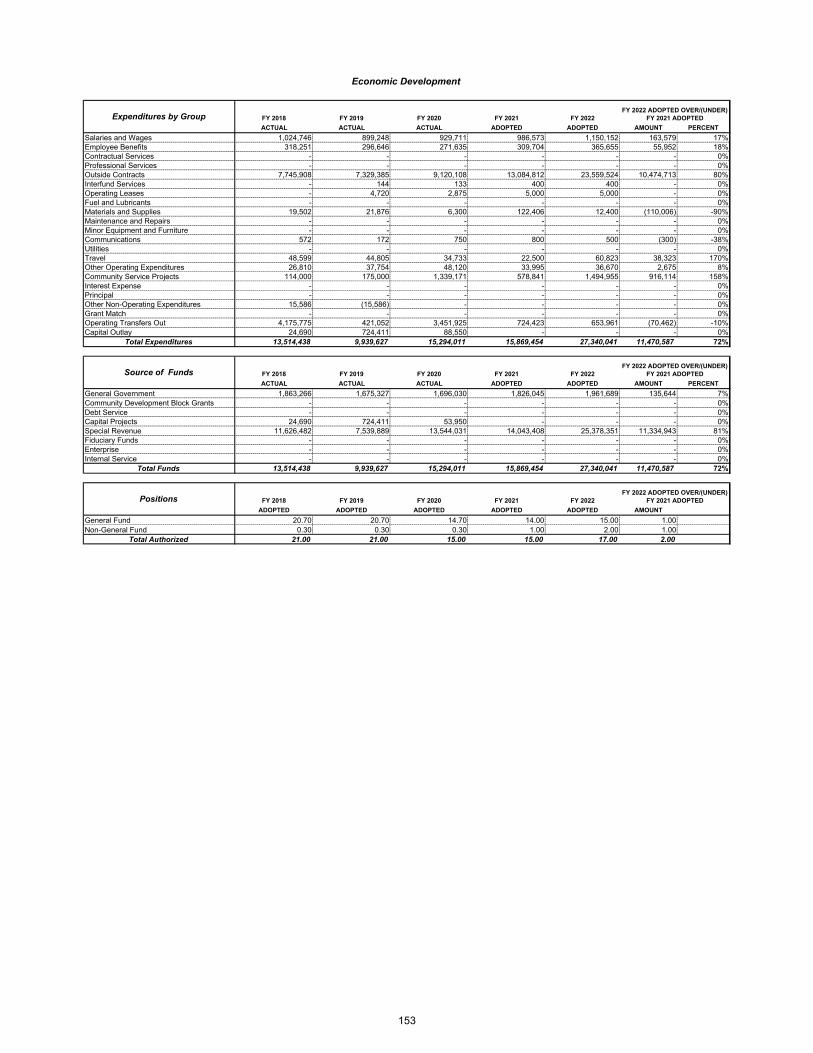
FY 2018 FY 2019 FY 2020 FY 2021 FY 2022
ACTUAL ACTUAL ACTUAL ADOPTED ADOPTED AMOUNT PERCENT
Salaries and Wages 1,024,746 899,248 929,711 986,573 1,150,152 163,579 17%Employee Benefits 318,251 296,646 271,635 309,704 365,655 55,952 18%Contractual Services - - - - - - 0%Professional Services - - - - - - 0%Outside Contracts 7,745,908 7,329,385 9,120,108 13,084,812 23,559,524 10,474,713 80%Interfund Services - 144 133 400 400 - 0%Operating Leases - 4,720 2,875 5,000 5,000 - 0%Fuel and Lubricants - - - - - - 0%Materials and Supplies 19,502 21,876 6,300 122,406 12,400 (110,006) -90%Maintenance and Repairs - - - - - - 0%Minor Equipment and Furniture - - - - - - 0%Communications 572 172 750 800 500 (300) -38%Utilities - - - - - - 0%Travel 48,599 44,805 34,733 22,500 60,823 38,323 170%Other Operating Expenditures 26,810 37,754 48,120 33,995 36,670 2,675 8%Community Service Projects 114,000 175,000 1,339,171 578,841 1,494,955 916,114 158%Interest Expense - - - - - - 0%Principal - - - - - - 0%Other Non-Operating Expenditures 15,586 (15,586) - - - - 0%Grant Match - - - - - - 0%Operating Transfers Out 4,175,775 421,052 3,451,925 724,423 653,961 (70,462) -10%Capital Outlay 24,690 724,411 88,550 - - - 0%
Total Expenditures 13,514,438 9,939,627 15,294,011 15,869,454 27,340,041 11,470,587 72%
FY 2018 FY 2019 FY 2020 FY 2021 FY 2022
ACTUAL ACTUAL ACTUAL ADOPTED ADOPTED AMOUNT PERCENT
General Government 1,863,266 1,675,327 1,696,030 1,826,045 1,961,689 135,644 7%Community Development Block Grants - - - - - - 0%Debt Service - - - - - - 0%Capital Projects 24,690 724,411 53,950 - - - 0%Special Revenue 11,626,482 7,539,889 13,544,031 14,043,408 25,378,351 11,334,943 81%Fiduciary Funds - - - - - - 0%Enterprise - - - - - - 0%Internal Service - - - - - - 0%
Total Funds 13,514,438 9,939,627 15,294,011 15,869,454 27,340,041 11,470,587 72%
FY 2018 FY 2019 FY 2020 FY 2021 FY 2022
ADOPTED ADOPTED ADOPTED ADOPTED ADOPTED AMOUNT
General Fund 20.70 20.70 14.70 14.00 15.00 1.00 Non-General Fund 0.30 0.30 0.30 1.00 2.00 1.00
Total Authorized 21.00 21.00 15.00 15.00 17.00 2.00
Expenditures by Group
Source of FundsFY 2022 ADOPTED OVER/(UNDER)
FY 2021 ADOPTED
FY 2022 ADOPTED OVER/(UNDER) FY 2021 ADOPTED
Economic Development
FY 2022 ADOPTED OVER/(UNDER) FY 2021 ADOPTEDPositions
153

FY 2018 FY 2019 FY 2020 FY 2021 FY 2022
ACTUAL ACTUAL ACTUAL ADOPTED ADOPTED
General GovernmentECONOMIC DEV ADMINISTRATION 966,666 957,676 930,389 918,592 1,150,606
ECONOMIC DEVELOPMENT 830,474 629,906 669,134 799,051 795,413
ECON DEV MARKETING & OUTREACH 66,127 87,745 96,506 108,402 15,670
Sub Total 1,863,266 1,675,327 1,696,030 1,826,045 1,961,689
Capital ProjectsECONOMIC DEVELOPMENT 380 PROJ 24,690 723,761 54,600 0 0
ECONOMIC DEVELOPMENT TIRZ 0 650 (650) 0 0
Sub Total 24,690 724,411 53,950 0 0
Special RevenueECONOMIC DEV ADMINISTRATION 0 0 1,264,171 0 0
ECONOMIC DEVELOPMENT 0 128,744 2,501,000 1,499,938 5,524,732
ECONOMIC DEVELOPMENT 380 PROJ 11,491,430 6,664,749 9,409,900 11,168,826 18,549,437
ECONOMIC DEVELOPMENT TIRZ 128,770 612,244 302,057 1,374,644 1,304,182
ECONOMIC DEV GRANTS 6,280 87,003 9,815 0 0
UPTOWN PARKING DIST-CINCINATTI 0 47,151 57,088 0 0
CAMINO REAL HOTEL 2 (2) 0 0 0
Sub Total 11,626,482 7,539,889 13,544,031 14,043,408 25,378,351
All Funds Total 13,514,438 9,939,627 15,294,011 15,869,454 27,340,041
Division Summary
ECONOMIC DEVELOPMENT
154

Strategic Actions
Goal 1: Create an Environment Conducive to Strong, Sustainable Economic Development
Strategy 1.1 Stabilize and Expand El Paso’s tax base Action 1.1.1 Develop, retain, recruit, and expand business within the community Action 1.1.2 Execute Marketing and Communication strategy in collaboration with
Destination El Paso and the airport Action 1.1.3 Expand El Paso’s retail base to include new, desired targeted retail Action 1.1.4 Attract and retain businesses within the City and County of El Paso Action 1.1.5 Strategically implement a systematic approach to administer the real estate
function Action 1.1.6 Execute a comprehensive citywide redevelopment plan Action 1.1.7 Provide services to the development community in support of orderly and timely
project completions consistent with “Plan El Paso” Action 1.1.8 Identify potential target industries and businesses for investment in the region Action 1.1.9 Identify potential development opportunities
Action 1.1.10 Establish a support mechanism for resilient development practices for private sector projects across El Paso
Action 1.1.11 Activate targeted development and redevelopment Action 1.1.12 Complete renovation of Camino Real Hotel; Multipurpose Cultural and
Performing Arts Center construction underway with parking solutions identified Action 1.1.13 Investment in Downtown historic structures Action 1.1.14 Complete comprehensive livable wages review
FY 2021 Key Results
• $24,750,000 total economic support to promote Small Business Recovery• Three signature projects approved: Marmaxx Operating Corp., McCombs Village LLC., and Great
River Commercial & EPPX• 1,493 El Paso business owners pledged to take additional measures to keep employees and
customers safe
FY 2022 Key Deliverables
• Activate targeted (re)development areas including Cohen, Airport, MCA, Metro 31• Continue expanding Downtown revitalization efforts to increase density with a focus on
residential units, office space and mixed-use• Identify and implement plans for areas of partnership with other partner organizations• Continue aligning and implementing incentive policies with a focused strategy to attract and retain
investment opportunities across key industry sectors• Implementation and enhancement of small business recovery plan
COVID-19 Response & Recovery
• ARPA funding received to support Economic Response and Recovery• 1,549 financial grants to city small businesses, a total of $20.9 million• Celebrate businesses that go above and beyond in COVID-19 mitigation measures• Launched the Buy El Paso campaign aimed at helping local businesses during the downturn
caused by COVID-19• El Paso Business Strong website created as a centralized source of information for local
businesses• Offered Small Business Assistance and Recovery Programing
155
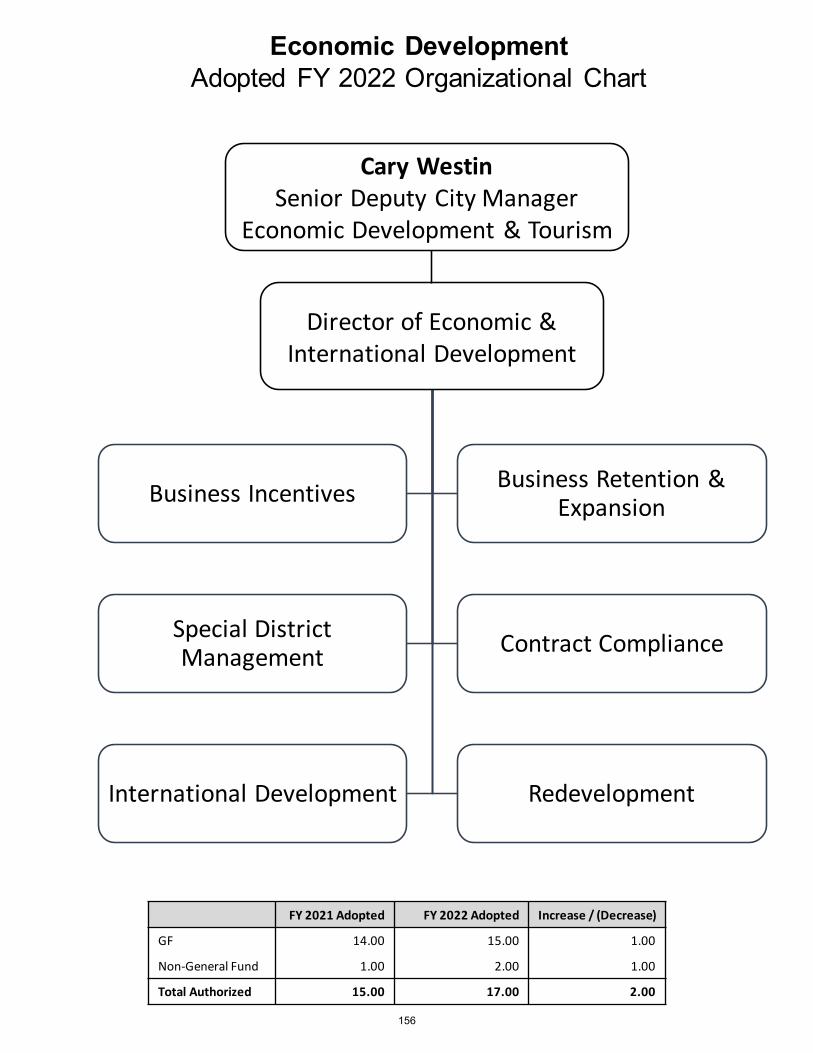
Economic DevelopmentAdopted FY 2022 Organizational Chart
Director of Economic & International Development
Business Incentives Business Retention & Expansion
Special District Management Contract Compliance
International Development Redevelopment
Cary WestinSenior Deputy City Manager
Economic Development & Tourism
FY 2021 Adopted FY 2022 Adopted Increase / (Decrease)
GF 14.00 15.00 1.00
Non-General Fund 1.00 2.00 1.00
Total Authorized 15.00 17.00 2.00
156

Economic DevelopmentPosition Summary - Authorized Staffing Table
Position Description
FY 2020 Adopted
FY 2021 Adopted
FY 2022 Adopted
Accounting/Payroll Specialist 1.00 0.00 0.00Administrative Division Manager 0.00 0.00 1.00Administrative Services Manager 1.00 0.00 0.00Administrative Support Associate 1.00 0.00 0.00Business & Financial Manager 1.00 1.00 1.00Business Development Manager 1.00 0.00 0.00Business Retention & Expansion Specialist 0.00 0.00 0.00Business Services Coordinator 2.00 2.00 2.00Director of Econ & Intl Development 1.00 1.00 1.00Economic Development Assistant Director 2.00 2.00 1.00Economic Development Contract Compliance Coor 1.00 1.00 1.00Economic Development Manager 0.00 1.00 1.00Economic Development Program Administrator 0.00 1.00 1.00Economic Development Specialist 1.00 2.00 2.00History Preservation Officer 0.00 0.00 0.00Land & Contract Administrator 0.00 0.00 0.00Legislative Liaison 0.00 0.00 1.00Marketing & Communications Coordinator 0.00 0.00 0.00Mgr of Innov. and Bus. Retention and Expansion 0.00 0.00 0.00Military Affairs Liaison 0.00 0.00 0.00Planner 0.00 0.00 0.00Real Estate Manager 0.00 0.00 0.00Senior Accounting/Payroll Specialist 0.00 1.00 1.00Senior Econ Dev Compliance Analyst 1.00 1.00 1.00Senior Economic Development Specialist 1.00 0.00 0.00Senior Financial Res Analyst 0.00 1.00 1.00Special District Program Manager 1.00 1.00 1.00Strategic Partnership Officer 0.00 0.00 1.00Grand Total 15.00 15.00 17.00
157
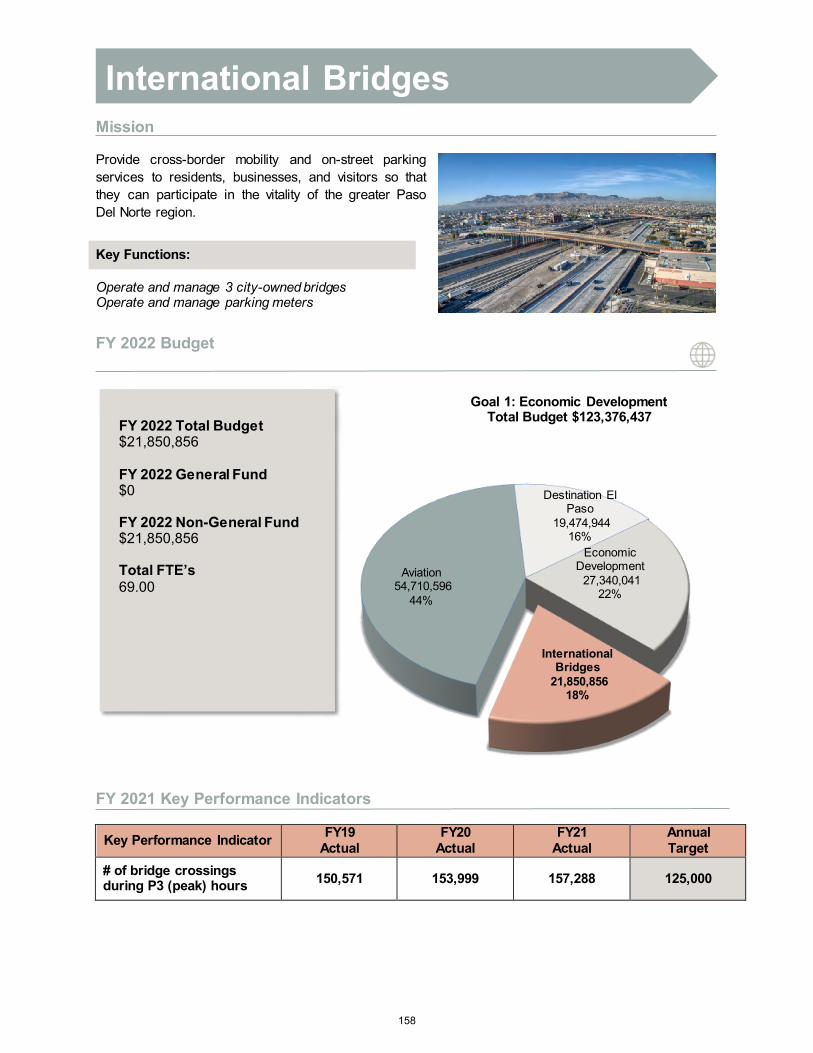
Aviation54,710,596
44%
Destination El Paso
19,474,944 16%
Economic Development
27,340,041 22%
International Bridges
21,850,856 18%
Goal 1: Economic Development Total Budget $123,376,437
Mission
Provide cross-border mobility and on-street parking services to residents, businesses, and visitors so that they can participate in the vitality of the greater Paso Del Norte region.
FY 2022 Budget
FY 2021 Key Performance Indicators
Key Performance Indicator FY19 Actual
FY20 Actual
FY21 Actual
Annual Target
# of bridge crossings during P3 (peak) hours 150,571 153,999 157,288 125,000
Key Functions:
Operate and manage 3 city-owned bridges Operate and manage parking meters
FY 2022 Total Budget $21,850,856
FY 2022 General Fund $0
FY 2022 Non-General Fund $21,850,856
Total FTE’s 69.00
International Bridges
158

FY 2018 FY 2019 FY 2020 FY 2021 FY 2022
ACTUAL ACTUAL ACTUAL ADOPTED ADOPTED AMOUNT PERCENT
Salaries and Wages 2,557,777 2,921,324 2,833,586 2,376,348 2,431,024 54,675 2%Employee Benefits 628,063 671,793 671,908 994,678 960,998 (33,679) -3%Contractual Services 2,370,346 1,712,852 1,302,637 1,650,000 1,650,000 - 0%Professional Services 111,821 76,436 85,051 691,847 142,725 (549,122) -79%Outside Contracts 1,346,820 1,389,375 1,642,782 1,596,130 1,377,740 (218,390) -14%Interfund Services 7,506 8,262 13,623 8,800 8,800 - 0%Operating Leases 342,742 342,209 316,184 346,754 346,754 - 0%Fuel and Lubricants 6,590 7,787 5,936 7,350 10,850 3,500 48%Materials and Supplies 124,722 115,684 110,642 132,983 144,983 12,000 9%Maintenance and Repairs 375,215 389,415 234,638 238,927 314,990 76,063 32%Minor Equipment and Furniture 19,864 57,573 12,183 14,700 14,700 - 0%Communications 14,564 9,808 8,662 20,600 20,600 - 0%Utilities 86,344 80,859 89,215 109,500 106,000 (3,500) -3%Travel 28,910 19,659 10,570 5,685 5,685 - 0%Other Operating Expenditures 982,921 793,041 686,332 37,423 40,374 2,951 8%Community Service Projects - - - - - - 0%Interest Expense 118,811 90,377 62,012 73,250 52,150 (21,100) -29%Principal - - - 550,000 520,000 (30,000) -5%Other Non-Operating Expenditures 144,588 103,363 107,816 120,000 120,000 - 0%Grant Match - - - - - - 0%Operating Transfers Out 15,335,778 14,149,671 10,733,051 14,583,771 13,570,983 (1,012,788) -7%Capital Outlay (14,644) 868,369 24,452 211,500 11,500 (200,000) -95%
Total Expenditures 24,588,737 23,807,858 18,951,281 23,770,246 21,850,856 (1,919,390) -8%
FY 2018 FY 2019 FY 2020 FY 2021 FY 2022
ACTUAL ACTUAL ACTUAL ADOPTED ADOPTED AMOUNT PERCENT
General Government - - - - - - 0%Community Development Block Grants - - - - - - 0%Debt Service - - - - - - 0%Capital Projects (192,120) - - - - - 0%Special Revenue - 389,193 114,807 - - - 0%Fiduciary Funds - - - - - - 0%Enterprise 24,780,857 23,418,665 18,836,473 23,770,246 21,850,856 (1,919,390) -8%Internal Service - - - - - - 0%
Total Funds 24,588,737 23,807,858 18,951,281 23,770,246 21,850,856 (1,919,390) -8%
FY 2018 FY 2019 FY 2020 FY 2021 FY 2022
ADOPTED ADOPTED ADOPTED ADOPTED ADOPTED AMOUNT PERCENT
General Fund - - - - - - Non-General Fund 70.75 69.00 68.00 69.00 69.00 -
Total Authorized 70.75 69.00 68.00 69.00 69.00 -
International Bridges
Expenditures by Group
Source of Funds
FY 2022 ADOPTED OVER/(UNDER) FY 2021 ADOPTED
FY 2022 ADOPTED OVER/(UNDER) FY 2021 ADOPTED
FY 2022 ADOPTED OVER/(UNDER) FY 2021 ADOPTEDPositions
159
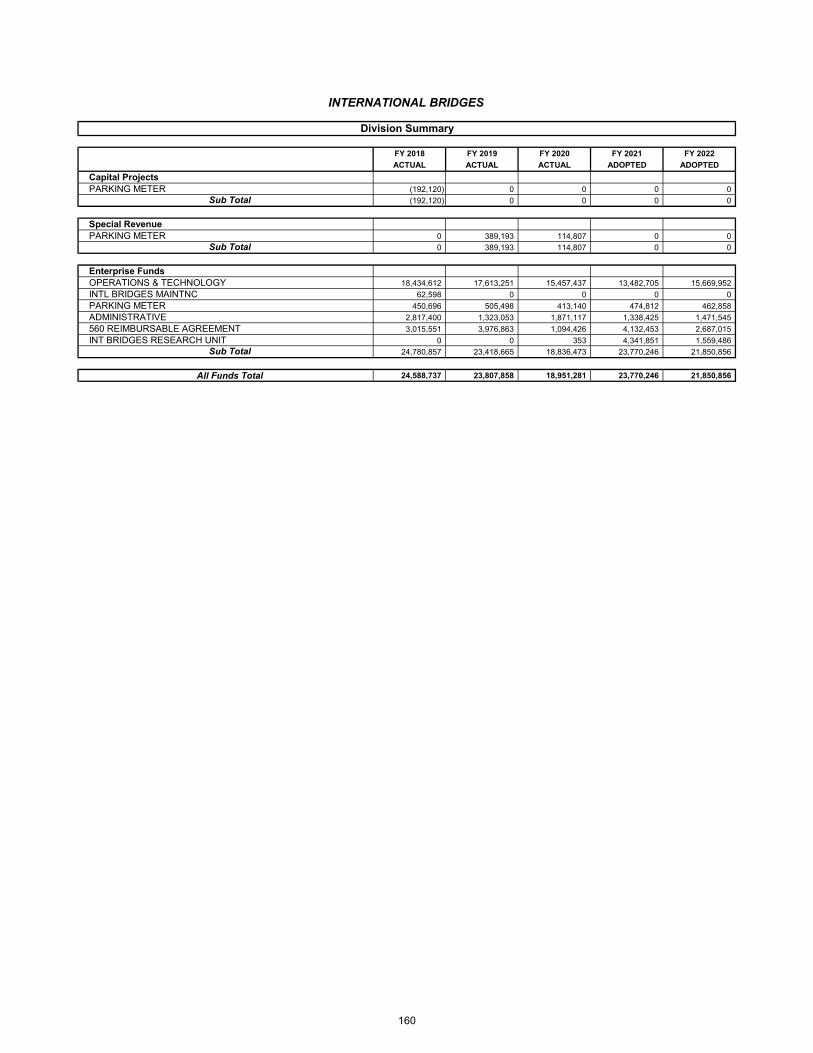
FY 2018 FY 2019 FY 2020 FY 2021 FY 2022
ACTUAL ACTUAL ACTUAL ADOPTED ADOPTED
Capital ProjectsPARKING METER (192,120) 0 0 0 0
Sub Total (192,120) 0 0 0 0
Special RevenuePARKING METER 0 389,193 114,807 0 0
Sub Total 0 389,193 114,807 0 0
Enterprise FundsOPERATIONS & TECHNOLOGY 18,434,612 17,613,251 15,457,437 13,482,705 15,669,952
INTL BRIDGES MAINTNC 62,598 0 0 0 0
PARKING METER 450,696 505,498 413,140 474,812 462,858
ADMINISTRATIVE 2,817,400 1,323,053 1,871,117 1,338,425 1,471,545
560 REIMBURSABLE AGREEMENT 3,015,551 3,976,863 1,094,426 4,132,453 2,687,015
INT BRIDGES RESEARCH UNIT 0 0 353 4,341,851 1,559,486
Sub Total 24,780,857 23,418,665 18,836,473 23,770,246 21,850,856
All Funds Total 24,588,737 23,807,858 18,951,281 23,770,246 21,850,856
INTERNATIONAL BRIDGES
Division Summary
160
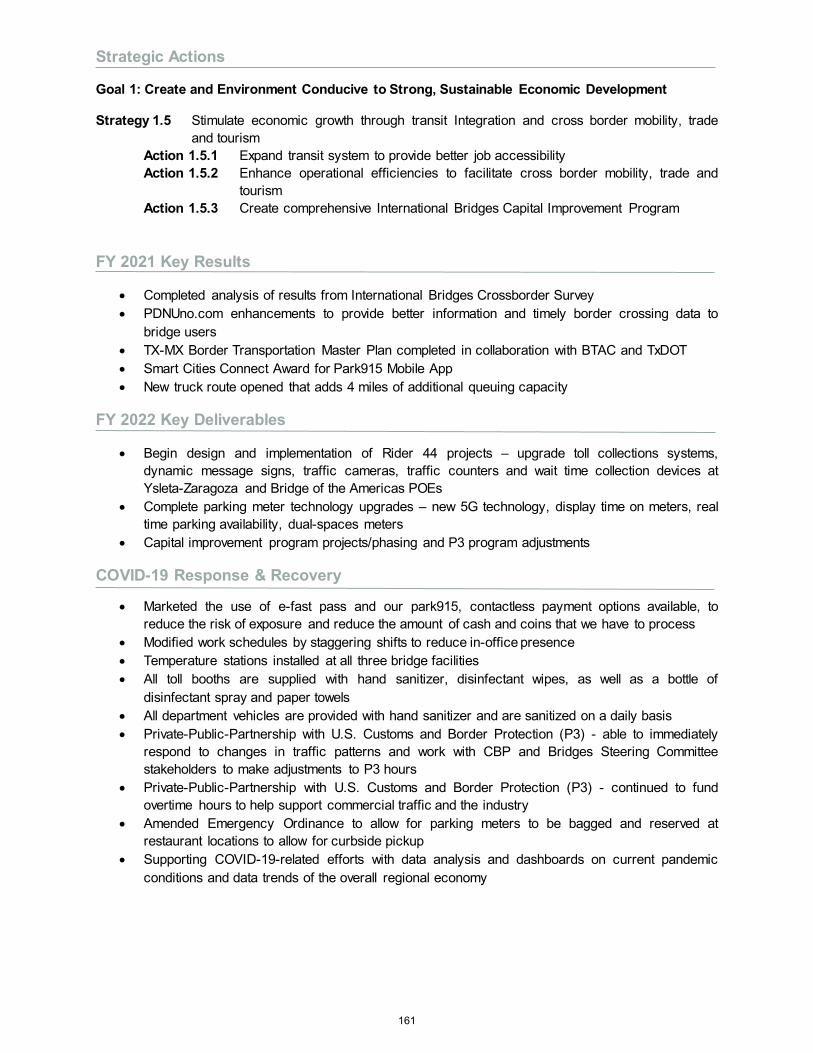
Strategic Actions
Goal 1: Create and Environment Conducive to Strong, Sustainable Economic Development
Strategy 1.5 Stimulate economic growth through transit Integration and cross border mobility, trade and tourism
Action 1.5.1 Expand transit system to provide better job accessibility Action 1.5.2 Enhance operational efficiencies to facilitate cross border mobility, trade and
tourism Action 1.5.3 Create comprehensive International Bridges Capital Improvement Program
FY 2021 Key Results
• Completed analysis of results from International Bridges Crossborder Survey• PDNUno.com enhancements to provide better information and timely border crossing data to
bridge users• TX-MX Border Transportation Master Plan completed in collaboration with BTAC and TxDOT• Smart Cities Connect Award for Park915 Mobile App• New truck route opened that adds 4 miles of additional queuing capacity
FY 2022 Key Deliverables
• Begin design and implementation of Rider 44 projects – upgrade toll collections systems,dynamic message signs, traffic cameras, traffic counters and wait time collection devices atYsleta-Zaragoza and Bridge of the Americas POEs
• Complete parking meter technology upgrades – new 5G technology, display time on meters, realtime parking availability, dual-spaces meters
• Capital improvement program projects/phasing and P3 program adjustments
COVID-19 Response & Recovery
• Marketed the use of e-fast pass and our park915, contactless payment options available, toreduce the risk of exposure and reduce the amount of cash and coins that we have to process
• Modified work schedules by staggering shifts to reduce in-office presence• Temperature stations installed at all three bridge facilities• All toll booths are supplied with hand sanitizer, disinfectant wipes, as well as a bottle of
disinfectant spray and paper towels• All department vehicles are provided with hand sanitizer and are sanitized on a daily basis• Private-Public-Partnership with U.S. Customs and Border Protection (P3) - able to immediately
respond to changes in traffic patterns and work with CBP and Bridges Steering Committeestakeholders to make adjustments to P3 hours
• Private-Public-Partnership with U.S. Customs and Border Protection (P3) - continued to fundovertime hours to help support commercial traffic and the industry
• Amended Emergency Ordinance to allow for parking meters to be bagged and reserved atrestaurant locations to allow for curbside pickup
• Supporting COVID-19-related efforts with data analysis and dashboards on current pandemicconditions and data trends of the overall regional economy
161
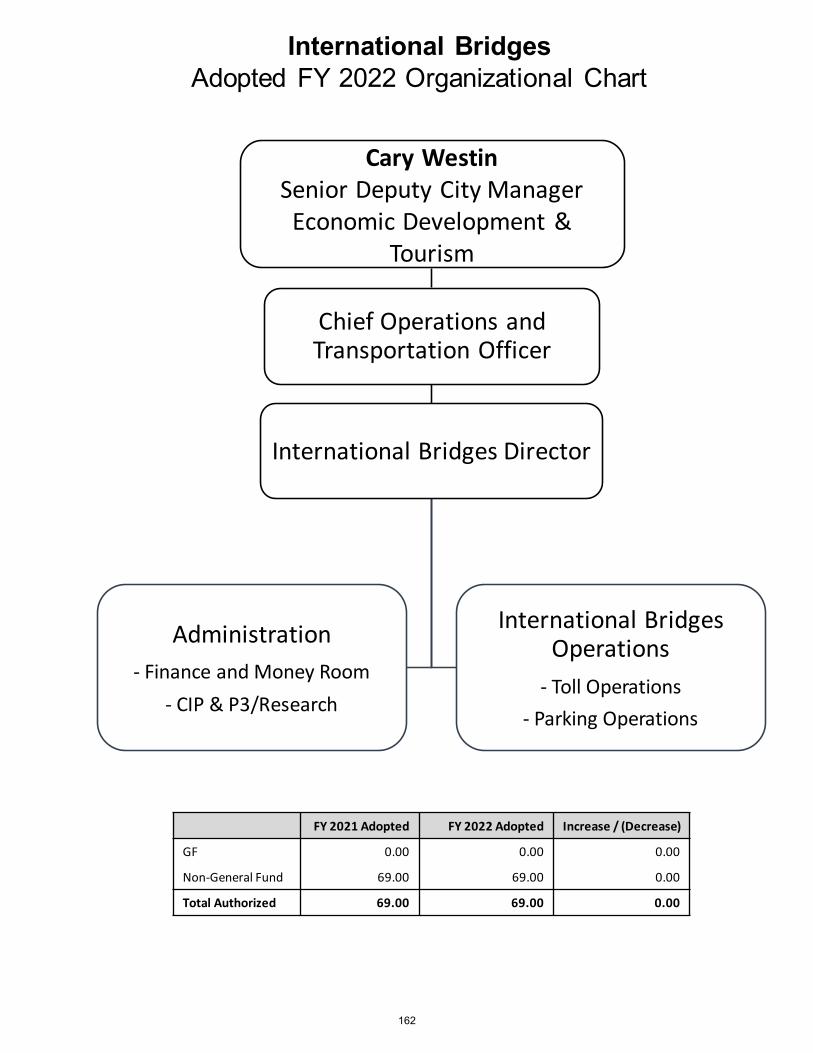
International Bridges Director
Administration- Finance and Money Room
- CIP & P3/Research
International Bridges Operations
- Toll Operations- Parking Operations
International BridgesAdopted FY 2022 Organizational Chart
Cary WestinSenior Deputy City Manager
Economic Development & Tourism
FY 2021 Adopted FY 2022 Adopted Increase / (Decrease)
GF 0.00 0.00 0.00
Non-General Fund 69.00 69.00 0.00
Total Authorized 69.00 69.00 0.00
Chief Operations and Transportation Officer
162
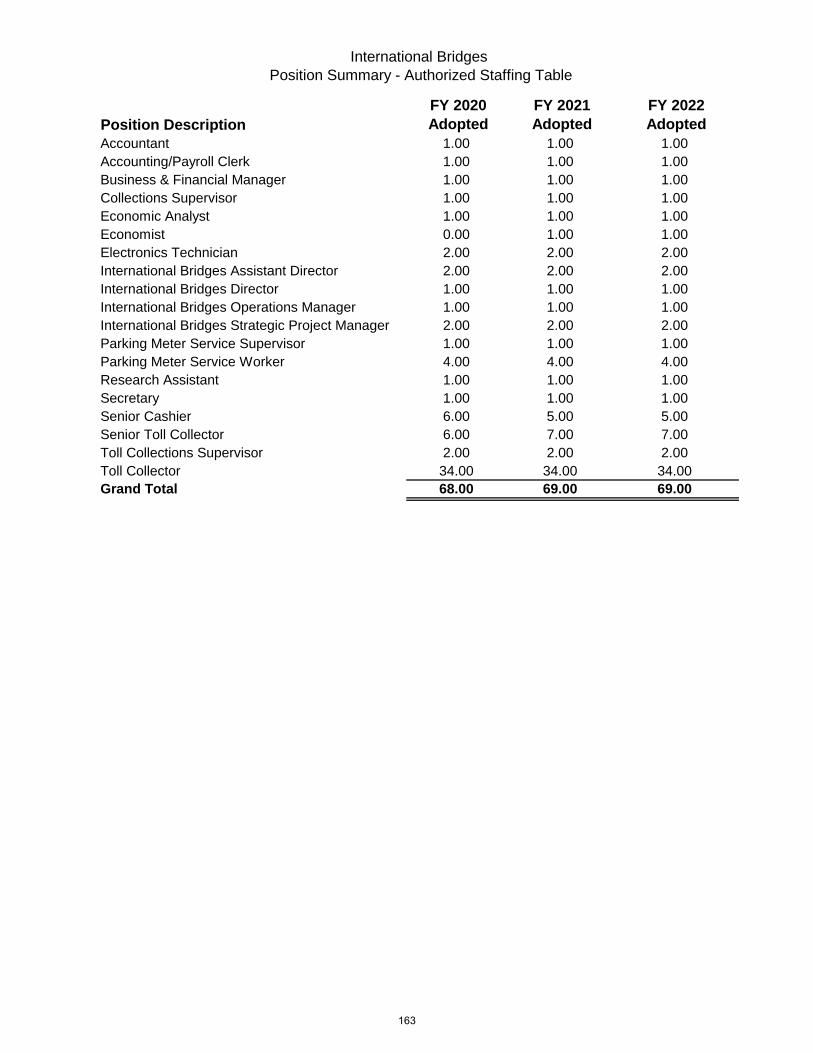
International Bridges
Position Summary - Authorized Staffing Table
Position DescriptionFY 2020 Adopted
FY 2021 Adopted
FY 2022 Adopted
Accountant 1.00 1.00 1.00
Accounting/Payroll Clerk 1.00 1.00 1.00
Business & Financial Manager 1.00 1.00 1.00
Collections Supervisor 1.00 1.00 1.00
Economic Analyst 1.00 1.00 1.00
Economist 0.00 1.00 1.00
Electronics Technician 2.00 2.00 2.00
International Bridges Assistant Director 2.00 2.00 2.00
International Bridges Director 1.00 1.00 1.00
International Bridges Operations Manager 1.00 1.00 1.00
International Bridges Strategic Project Manager 2.00 2.00 2.00
Parking Meter Service Supervisor 1.00 1.00 1.00
Parking Meter Service Worker 4.00 4.00 4.00
Research Assistant 1.00 1.00 1.00
Secretary 1.00 1.00 1.00
Senior Cashier 6.00 5.00 5.00
Senior Toll Collector 6.00 7.00 7.00
Toll Collections Supervisor 2.00 2.00 2.00
Toll Collector 34.00 34.00 34.00
Grand Total 68.00 69.00 69.00
163
CITY OF EL PASO BUDGET BOOK 2021
GROWTH
GOAL 2SAFE AND SECURE
-FIRE-MUNICIPAL COURT
-POLICE
22YEAR NO.
GOAL 2
SAFE AND SECURE

FY 2018 FY 2019 FY 2020 FY 2021 FY 2022
ACTUAL ACTUAL ACTUAL ADOPTED ADOPTED AMOUNT PERCENT
Salaries and Wages 167,794,414 179,038,079 185,072,718 191,611,100 192,778,486 1,167,386 1%Employee Benefits 59,178,798 63,156,665 69,268,823 74,740,054 76,274,442 1,534,388 2%Contractual Services 1,029,985 1,054,226 1,005,456 1,033,741 1,299,907 266,166 26%Professional Services 928,417 1,078,201 738,441 1,047,692 1,137,142 89,450 9%Outside Contracts 6,754,665 7,680,409 7,948,859 8,442,090 9,779,928 1,337,838 16%Interfund Services 2,989,295 2,446,610 2,475,911 2,449,758 2,776,104 326,346 13%Operating Leases 1,744,963 1,707,819 1,757,770 1,735,553 1,812,822 77,269 4%Fuel and Lubricants 2,211,786 2,153,299 1,985,882 2,297,058 2,426,969 129,911 6%Materials and Supplies 5,440,641 5,859,447 5,821,038 5,748,640 5,991,337 242,697 4%Maintenance and Repairs 384,818 378,967 408,594 593,105 573,448 (19,657) -3%Minor Equipment and Furniture 1,556,378 2,621,242 2,897,585 1,149,918 1,373,773 223,855 19%Communications 443,712 494,204 467,475 643,814 680,682 36,868 6%Utilities 47,150 42,326 41,242 66,500 63,500 (3,000) -5%Travel 316,345 471,548 207,071 237,037 138,757 (98,280) -41%Other Operating Expenditures 1,397,217 1,364,704 879,712 1,218,439 1,143,123 (75,316) -6%Community Service Projects - - - - - - 0%Interest Expense 47,309 - - - - - 0%Principal 1,658,210 - - - - - 0%Other Non-Operating Expenditures 24,669 9,956 15,393 19,484 18,900 (584) -3%Grant Match (30,668) - (9,244) 58,000 58,000 (0) 0%Operating Transfers Out 3,840 4,235,850 4,598,299 - 7,800,000 7,800,000 100%Capital Outlay 1,442,319 1,180,727 5,532,089 219,219 8,019,000 7,799,781 3558%
Total Expenditures 255,364,261 274,974,279 291,113,114 293,311,202 314,146,321 20,835,119 7%
FY 2018 FY 2019 FY 2020 FY 2021 FY 2022
ACTUAL ACTUAL ACTUAL ADOPTED ADOPTED AMOUNT PERCENT
General Government 239,983,250 257,533,936 261,338,902 277,071,145 290,553,847 13,482,702 5%Community Development Block Grants - - - - - - 0%Debt Service - - - - - - 0%Capital Projects 151,281 114,070 3,183,837 - 7,800,000 7,800,000 100%Special Revenue 15,229,730 17,046,918 25,880,850 16,240,057 15,792,474 (447,583) -3%Fiduciary Funds - 279,355 710,598 - - - 0%Enterprise - - (1,073) - - - 0%Internal Service - - - - - - 0%
Total Funds 255,364,261 274,974,279 291,113,114 293,311,202 314,146,321 20,835,119 7%
FY 2018 FY 2019 FY 2020 FY 2021 FY 2022
ADOPTED ADOPTED ADOPTED ADOPTED ADOPTED AMOUNT PERCENT
General Fund 2,483.43 2,542.43 2,591.43 2,594.65 2,565.75 (28.90)Non-General Fund 146.87 149.37 152.37 439.40 658.30 218.90
Total Authorized 2,630.30 2,691.80 2,743.80 3,034.05 3,224.05 190.00
Goal 2
Set the Standard for a Safe and Secure City
Positions
FY 2022 ADOPTED OVER/(UNDER) FY 2021 ADOPTED
FY 2022 ADOPTED OVER/(UNDER) FY 2021 ADOPTED
FY 2022 ADOPTED OVER/(UNDER) FY 2021 ADOPTED
Expenditures by Group
Source of Funds
165
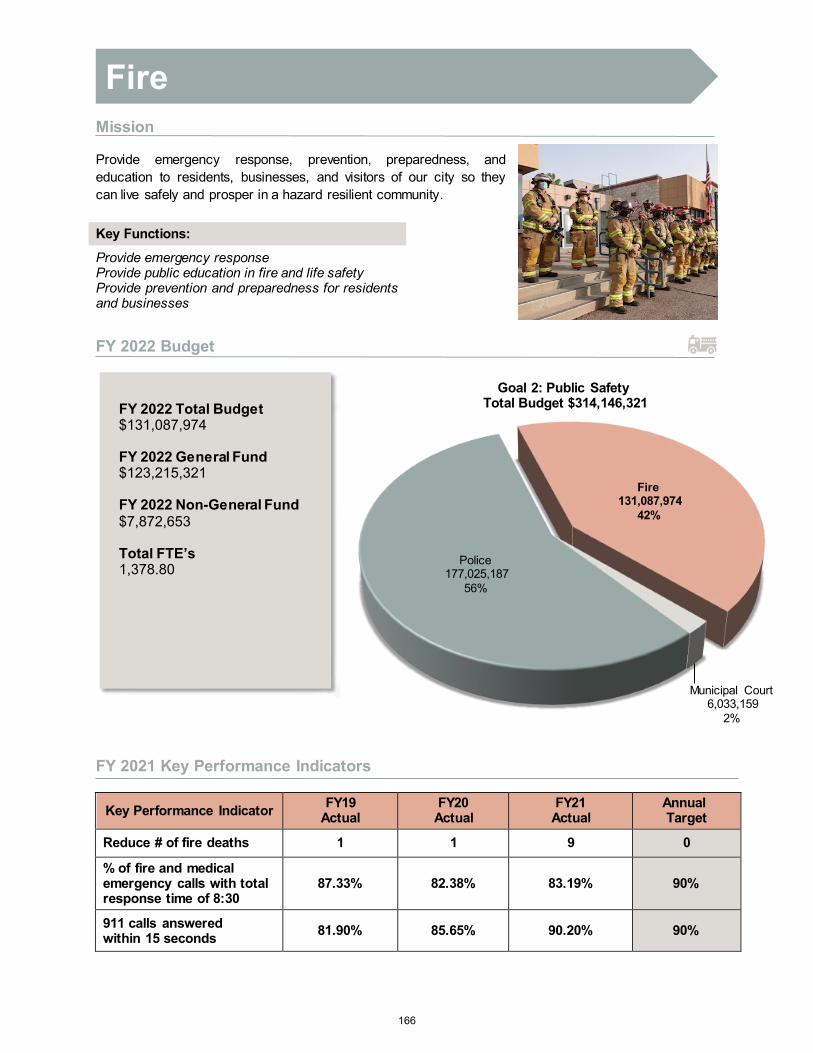
Fire131,087,974
42%
Municipal Court6,033,159
2%
Police177,025,187
56%
Goal 2: Public SafetyTotal Budget $314,146,321
Mission
Provide emergency response, prevention, preparedness, and education to residents, businesses, and visitors of our city so they can live safely and prosper in a hazard resilient community.
Key Functions:
Provide emergency response Provide public education in fire and life safety Provide prevention and preparedness for residents and businesses
FY 2022 Budget
FY 2021 Key Performance Indicators
Key Performance Indicator FY19 Actual
FY20 Actual
FY21 Actual
Annual Target
Reduce # of fire deaths 1 1 9 0
% of fire and medical emergency calls with total response time of 8:30
87.33% 82.38% 83.19% 90%
911 calls answered within 15 seconds 81.90% 85.65% 90.20% 90%
Fire
FY 2022 Total Budget $131,087,974
FY 2022 General Fund $123,215,321
FY 2022 Non-General Fund $7,872,653
Total FTE’s 1,378.80
166

FY 2018 FY 2019 FY 2020 FY 2021 FY 2022
ACTUAL ACTUAL ACTUAL ADOPTED ADOPTED AMOUNT PERCENT
Salaries and Wages 71,291,836 74,656,154 76,722,872 79,192,812 77,040,146 (2,152,666) -3%Employee Benefits 27,142,033 29,166,029 32,809,407 33,043,114 33,377,280 334,166 1%Contractual Services 1,019,269 1,054,226 1,005,456 1,033,741 1,299,907 266,166 26%Professional Services 643,391 656,932 567,170 762,973 795,657 32,684 4%Outside Contracts 1,730,148 2,065,540 2,569,392 2,426,638 2,429,257 2,619 0%Interfund Services 137,727 119,048 109,795 75,159 75,025 (134) 0%Operating Leases 280,051 276,090 270,090 283,232 285,669 2,437 1%Fuel and Lubricants 871,923 837,010 690,916 819,125 817,900 (1,225) 0%Materials and Supplies 3,440,430 3,577,296 3,134,014 3,257,639 3,284,100 26,461 1%Maintenance and Repairs 363,080 368,163 395,853 548,155 530,498 (17,657) -3%Minor Equipment and Furniture 415,898 303,103 975,522 214,112 186,685 (27,427) -13%Communications 7,009 6,547 41,539 21,552 24,752 3,200 15%Utilities - - - - - - 0%Travel 53,601 96,722 54,597 68,285 67,942 (343) -1%Other Operating Expenditures 226,779 180,837 175,227 247,239 273,156 25,917 10%Community Service Projects - - - - - - 0%Interest Expense 47,309 - - - - - 0%Principal 1,658,210 - - - - - 0%Other Non-Operating Expenditures 157 (157) - - - - 0%Grant Match (30,668) - (9,244) - - - 0%Operating Transfers Out 3,634 4,235,850 3,292,612 - 5,300,000 5,300,000 100%Capital Outlay 1,391,345 586,441 4,185,699 39,219 5,300,000 5,260,781 13414%
Total Expenditures 110,693,162 118,185,832 126,990,917 122,032,996 131,087,974 9,054,978 7%
FY 2018 FY 2019 FY 2020 FY 2021 FY 2022
ACTUAL ACTUAL ACTUAL ADOPTED ADOPTED AMOUNT PERCENT
General Government 106,705,012 114,735,938 114,135,917 119,240,343 123,215,321 3,974,978 3%Community Development Block Grants - - - - - - 0%Debt Service - - - - - - 0%Capital Projects 151,281 114,070 3,053,837 - 5,300,000 5,300,000 100%Special Revenue 3,836,869 3,335,824 9,801,163 2,792,652 2,572,653 (219,999) -8%Fiduciary Funds - - - - - - 0%Enterprise - - - - - - 0%Internal Service - - - - - - 0%
Total Funds 110,693,162 118,185,832 126,990,917 122,032,996 131,087,974 9,054,978 7%
FY 2018 FY 2019 FY 2020 FY 2021 FY 2022
ADOPTED ADOPTED ADOPTED ADOPTED ADOPTED AMOUNT PERCENT
General Fund 1,075.53 1,076.53 1,076.53 1,078.25 1,013.25 (65.00)Non-General Fund 59.27 60.27 63.27 300.55 521.55 221.00
Total Authorized 1,134.80 1,136.80 1,139.80 1,378.80 1,534.80 156.00
Source of Funds
Positions
Expenditures by GroupFY 2022 ADOPTED OVER/(UNDER)
FY 2021 ADOPTED
FY 2022 ADOPTED OVER/(UNDER) FY 2021 ADOPTED
FY 2022 ADOPTED OVER/(UNDER) FY 2021 ADOPTED
Fire
167
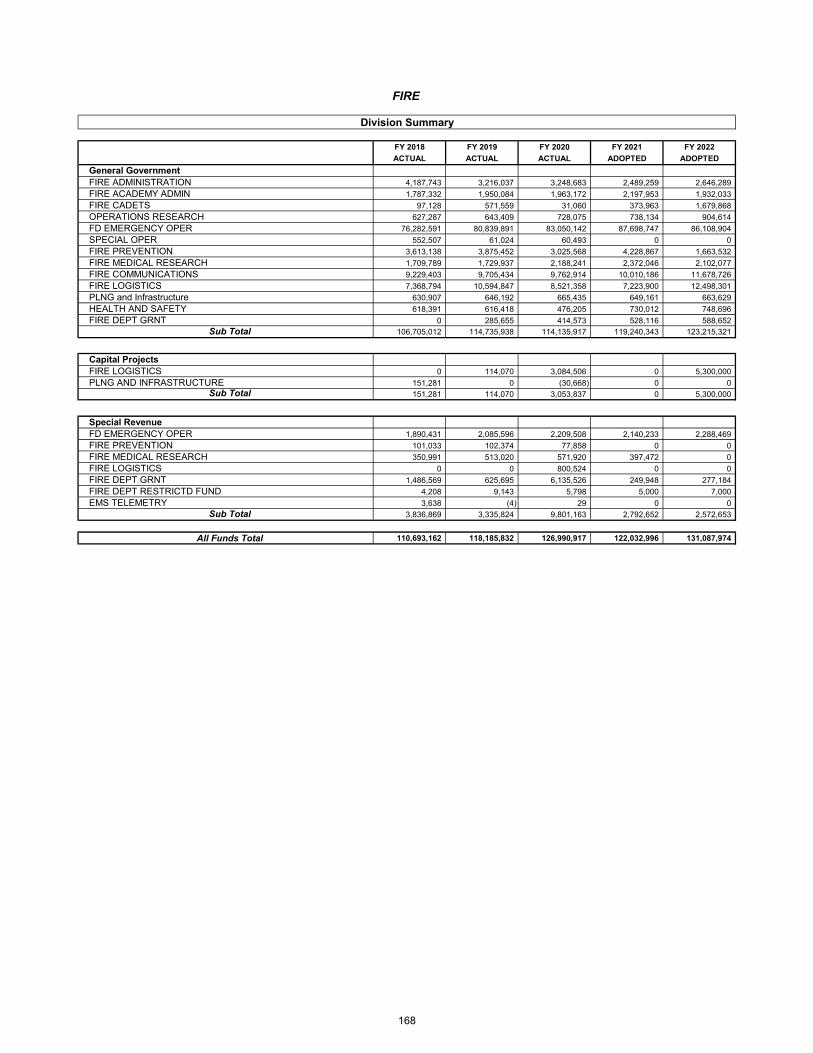
FY 2018 FY 2019 FY 2020 FY 2021 FY 2022
ACTUAL ACTUAL ACTUAL ADOPTED ADOPTED
General GovernmentFIRE ADMINISTRATION 4,187,743 3,216,037 3,248,683 2,489,259 2,646,289
FIRE ACADEMY ADMIN 1,787,332 1,950,084 1,963,172 2,197,953 1,932,033
FIRE CADETS 97,128 571,559 31,060 373,963 1,679,868
OPERATIONS RESEARCH 627,287 643,409 728,075 738,134 904,614
FD EMERGENCY OPER 76,282,591 80,839,891 83,050,142 87,698,747 86,108,904
SPECIAL OPER 552,507 61,024 60,493 0 0
FIRE PREVENTION 3,613,138 3,875,452 3,025,568 4,228,867 1,663,532
FIRE MEDICAL RESEARCH 1,709,789 1,729,937 2,188,241 2,372,046 2,102,077
FIRE COMMUNICATIONS 9,229,403 9,705,434 9,762,914 10,010,186 11,678,726
FIRE LOGISTICS 7,368,794 10,594,847 8,521,358 7,223,900 12,498,301
PLNG and Infrastructure 630,907 646,192 665,435 649,161 663,629
HEALTH AND SAFETY 618,391 616,418 476,205 730,012 748,696
FIRE DEPT GRNT 0 285,655 414,573 528,116 588,652
Sub Total 106,705,012 114,735,938 114,135,917 119,240,343 123,215,321
Capital ProjectsFIRE LOGISTICS 0 114,070 3,084,506 0 5,300,000
PLNG AND INFRASTRUCTURE 151,281 0 (30,668) 0 0Sub Total 151,281 114,070 3,053,837 0 5,300,000
Special RevenueFD EMERGENCY OPER 1,890,431 2,085,596 2,209,508 2,140,233 2,288,469
FIRE PREVENTION 101,033 102,374 77,858 0 0
FIRE MEDICAL RESEARCH 350,991 513,020 571,920 397,472 0
FIRE LOGISTICS 0 0 800,524 0 0
FIRE DEPT GRNT 1,486,569 625,695 6,135,526 249,948 277,184
FIRE DEPT RESTRICTD FUND 4,208 9,143 5,798 5,000 7,000
EMS TELEMETRY 3,638 (4) 29 0 0
Sub Total 3,836,869 3,335,824 9,801,163 2,792,652 2,572,653
All Funds Total 110,693,162 118,185,832 126,990,917 122,032,996 131,087,974
Division Summary
FIRE
168
Strategic Actions
Goal 2: Set the Standard for a Safe and Secure City
Strategy 2.2 Strengthen community involvement in resident safety Action 2.2.2 Provide educational and volunteer opportunities for disaster preparedness
Strategy 2.3 Increase public safety operational efficiency Action 2.3.3 Enhance training and development programs for Firefighters and EMS staff Action 2.3.4 Maintain an Effective Response Force to efficiently handle fire and medical
emergency calls Action 2.3.5 Increase 911 Communication Center operational efficiency Action 2.3.7 Implement technology and/or technology upgrades to improve work flow
efficiencies Action 2.3.8 Locate and apply for grant funding opportunities for technology, equipment and
field operations Action 2.3.9 Enhance city's capability to prepare for, respond to and recover from disasters
Strategy 2.5 Take proactive approaches to prevent fire/medical incidents and lower regional risk Action 2.5.1 Enhance the city's ability to promote disease/injury prevention and encourage
healthy living of residents Action 2.5.2 Promote and improve Fire Prevention through education and code enforcement
Strategy 2.8 Implement effective code enforcement strategies to reduce nuisances, enhance visual appearance and improve overall health and safety
Action 2.8.2 Enhance Health and Safety Program Strategy 2.9 Promote building safety
Action 2.9.1 Improve building standards program results
FY 2021 Key Results
• “Be PowerFlu” free Flu shot campaign• First Mobile Stroke Unit• Communities of Excellence Partnership with UMC and Texas Tech
FY 2022 Key Deliverables
• 37,000 Immunizations and Health Screenings provided thru Community Health• 90% of fire and medical emergency calls with a total Response Time of 8:30• 75% Fires contained to the room of origin• 95% of 911 calls answered within 15 seconds
COVID 19 Response & Recovery
• Received ARPA funding for Public Health and Safety Response and Recovery Programs• COVID-19 Call Center• COVID-19 Vaccine Online Registration• Compliance Enforcement Task Force• Contact Tracing and Monitoring Support• Emergency Operations Center• Drive Thru Testing
169

FireAdopted FY 2022 Organizational Chart
Fire Chief / Managing Director
Administrative Services Performance Office
Technical Services & Professional Development
Capital Assets & Personnel Support
Operations
Dionne MackDeputy City Manager of
Public Safety
FY 2021 Adopted FY 2022 Adopted Increase / (Decrease)
GF 1,078.25 1,013.25 (65.00)
Non‐General Fund 300.55 521.55 221.00
Total Authorized 1,378.80 1,534.80 156.00
170

Fire Department Position Summary - Authorized Staffing Table
Position DescriptionFY 2020 Adopted
FY 2021 Adopted
FY 2022 Adopted
Accounting/Payroll Clerk 0.00 0.00 1.00ARFF Technician I 1.00 1.00 1.00ARFF Training Specialist 1.00 1.00 0.00Business & Financial Manager 1.00 1.00 1.00Certified Firefighter Trainee 1.00 1.00 1.00Collectively Bargained Payroll 3.00 3.00 3.00Communications Assistant Manager 1.00 1.00 1.00Communications Manager 1.00 0.00 0.00Covid-19 Contact Trace Monitor 0.00 150.00 62.00Covid-19 Operations Assistant 0.00 0.00 236.00Departmental Human Resources Manager 1.00 1.00 1.00Emergency Fleet Superintendent 1.00 1.00 1.00Emergency Management Planner 0.00 1.00 1.00Emergency Management Specialist 0.00 5.00 5.00Emergency Medical Technician 0.00 30.00 30.00Facilities Maintenance Lead Worker 1.00 1.00 1.00Facilities Maintenance Worker 1.00 1.00 1.00Financial Research Analyst 2.00 3.00 3.00Fire Assistant Chief 3.00 4.00 4.00Fire Battalion Chief 27.00 28.00 28.00Fire Captain 61.00 61.00 63.00Fire Chief 1.00 1.00 1.00Fire Code Compliance Inspector 10.00 10.00 10.00Fire Code Compliance Plans Examiner 2.00 2.00 2.00Fire Deputy Chief 6.00 6.00 6.00Fire Lieutenant 132.00 132.00 132.00Fire Medic 4.00 4.00 4.00Fire Medical Lieutenant 14.00 14.00 14.00Fire Paramedic 33.00 30.00 29.00Fire Plan & Development Manager 1.00 1.00 1.00Fire Project Manager 0.00 0.00 1.00Fire Records Analyst 1.00 1.00 2.00Fire Suppression Technician 228.00 231.00 239.00Firefighter 418.00 418.00 424.00Fleet Maintenance Lead Technician 2.00 2.00 2.00Fleet Maintenance Technician 10.00 10.00 11.00Fleet Service Worker 2.00 2.00 1.00HR Business Partner 0.00 0.00 1.00Human Resources Analyst 2.00 2.00 3.00Human Resources Specialist 1.00 1.00 2.00Infectious Control/QAQI Nurse 1.00 1.00 1.00Lead COVID-19 Operations Assis 0.00 0.00 10.00Lead Human Resources Specialist 1.00 1.00 1.00
171

Fire Department Position Summary - Authorized Staffing Table
Position DescriptionFY 2020 Adopted
FY 2021 Adopted
FY 2022 Adopted
Lead Planner - Fire 1.00 1.00 1.00Maintenance Service Ticket Writer 1.00 1.00 1.00Materials Specialist 6.00 6.00 6.00Office Assistant 0.00 17.00 15.00Paramedic 0.00 30.00 2.00Patient Care Tech 0.00 2.00 0.00Program Coordinator 1.00 1.00 1.00Public Affairs Manager 0.00 1.00 1.00Public Affairs Specialist 0.00 2.00 2.00Public Safety - Public Information Officer 1.00 1.00 2.00Public Safety Communicator 117.00 117.00 124.00Public Safety Communicator Trainee 1.00 1.00 1.00Public Safety Fiscal Operations Administrator 1.00 1.00 1.00Public Safety Grant Coordinator 0.00 1.00 1.00Public Safety Planner 3.00 0.00 0.00Public Safety Shift Manager 3.00 3.00 3.00Public Safety Shift Supervisor 14.00 14.00 14.00Public Safety Trainer 1.00 1.00 1.00Research & Management Assistant 1.00 1.00 2.00Research Assistant 1.00 1.00 1.00SCBAT Training Instructor 0.80 0.80 0.80Secretary 1.00 1.00 1.00Senior Financial Research Analyst 2.00 1.00 2.00Senior Human Resources Analyst 1.00 1.00 1.00Senior Office Assistant 6.00 6.00 6.00Senior Planner - Fire 1.00 1.00 1.00Stores Clerk 0.00 2.00 2.00Welder 1.00 1.00 1.00Grand Total 1,139.80 1,378.80 1,534.80
172
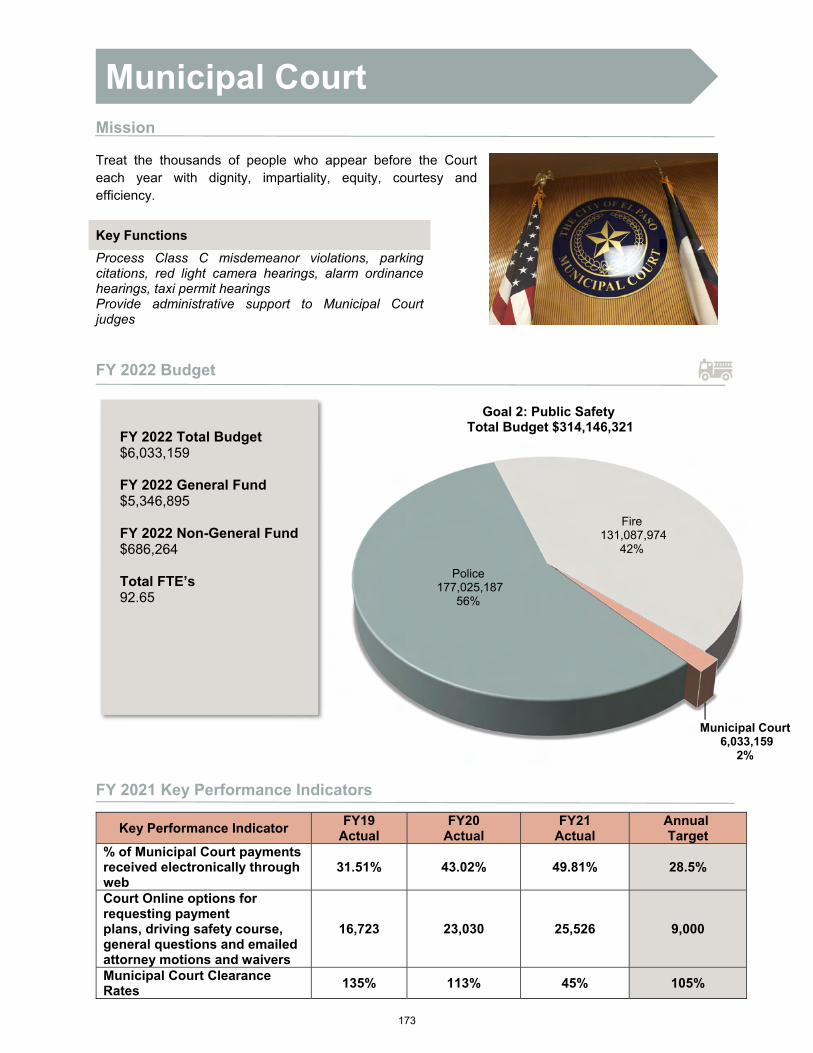
Fire131,087,974
42%
Municipal Court6,033,159
2%
Police177,025,187
56%
Goal 2: Public SafetyTotal Budget $314,146,321
Mission
Treat the thousands of people who appear before the Court each year with dignity, impartiality, equity, courtesy and efficiency.
FY 2022 Budget
FY 2021 Key Performance Indicators
Key Performance Indicator FY19
Actual FY20
Actual FY21
Actual Annual Target
% of Municipal Court payments received electronically through web
31.51% 43.02% 49.81% 28.5%
Court Online options for requesting payment plans, driving safety course, general questions and emailed attorney motions and waivers
16,723 23,030 25,526 9,000
Municipal Court Clearance Rates
135% 113% 45% 105%
Key Functions
Process Class C misdemeanor violations, parking citations, red light camera hearings, alarm ordinance hearings, taxi permit hearings Provide administrative support to Municipal Court judges
FY 2022 Total Budget $6,033,159
FY 2022 General Fund $5,346,895
FY 2022 Non-General Fund $686,264
Total FTE’s 92.65
Municipal Court
173

FY 2018 FY 2019 FY 2020 FY 2021 FY 2022
ACTUAL ACTUAL ACTUAL ADOPTED ADOPTED AMOUNT PERCENT
Salaries and Wages 2,967,274 3,061,445 3,066,951 3,337,128 3,381,310 44,182 1%Employee Benefits 1,029,983 1,044,853 1,089,857 1,168,811 1,289,012 120,202 10%Contractual Services - - - - - - 0%Professional Services 122,058 143,424 103,528 170,000 170,000 - 0%Outside Contracts 502,465 506,101 592,323 605,625 615,123 9,498 2%Interfund Services 3,297 3,300 3,000 3,600 3,600 - 0%Operating Leases 61,379 59,409 69,755 83,040 82,040 (1,000) -1%Fuel and Lubricants - - - - - - 0%Materials and Supplies 59,026 66,879 40,408 82,800 79,400 (3,400) -4%Maintenance and Repairs - - - - - - 0%Minor Equipment and Furniture 42,118 86,222 27,193 30,500 49,000 18,500 61%Communications 171,829 188,061 141,496 270,300 270,300 - 0%Utilities 47,150 42,326 41,242 57,500 57,500 - 0%Travel 8,558 18,747 3,482 17,450 13,849 (3,601) -21%Other Operating Expenditures 7,631 8,294 5,775 17,040 16,125 (915) -5%Community Service Projects - - - - - - 0%Interest Expense - - - - - - 0%Principal - - - - - - 0%Other Non-Operating Expenditures 12,170 (3,617) 3,393 5,484 5,900 416 8%Grant Match - - - - - - 0%Operating Transfers Out - - - - - - 0%Capital Outlay 35,128 291,675 60,167 - - - 0%
Total Expenditures 5,070,068 5,517,119 5,248,570 5,849,277 6,033,159 183,882 3%
FY 2018 FY 2019 FY 2020 FY 2021 FY 2022
ACTUAL ACTUAL ACTUAL ADOPTED ADOPTED AMOUNT PERCENT
General Government 4,559,273 4,688,893 4,626,267 5,193,888 5,346,895 153,008 3%Community Development Block Grants - - - - - - 0%Debt Service - - - - - - 0%Capital Projects - - - - - - 0%Special Revenue 510,795 828,226 622,303 655,389 686,264 30,874 5%Fiduciary Funds - - - - - - 0%Enterprise - - - - - - 0%Internal Service - - - - - - 0%
Total Funds 5,070,068 5,517,119 5,248,570 5,849,277 6,033,159 183,882 3%
FY 2018 FY 2019 FY 2020 FY 2021 FY 2022
ADOPTED ADOPTED ADOPTED ADOPTED ADOPTED AMOUNT PERCENT
General Fund 84.80 84.80 89.80 89.80 89.90 0.10 Non-General Fund 2.10 2.60 1.60 2.85 2.75 (0.10)
Total Authorized 86.90 87.40 91.40 92.65 92.65 0.00
Municipal Court
Expenditures by Group
Source of Funds
Positions
FY 2022 ADOPTED OVER/(UNDER) FY 2021 ADOPTED
FY 2022 ADOPTED OVER/(UNDER) FY 2021 ADOPTED
FY 2022 ADOPTED OVER/(UNDER) FY 2021 ADOPTED
174
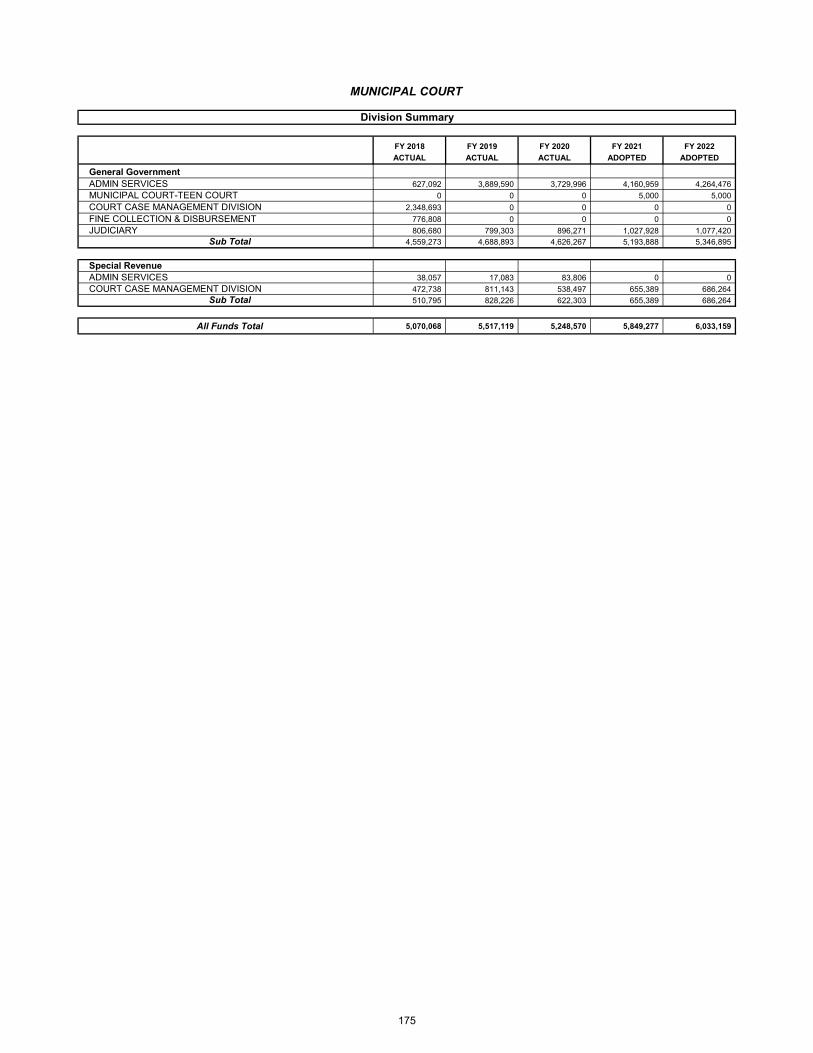
FY 2018 FY 2019 FY 2020 FY 2021 FY 2022
ACTUAL ACTUAL ACTUAL ADOPTED ADOPTED
General GovernmentADMIN SERVICES 627,092 3,889,590 3,729,996 4,160,959 4,264,476
MUNICIPAL COURT-TEEN COURT 0 0 0 5,000 5,000
COURT CASE MANAGEMENT DIVISION 2,348,693 0 0 0 0
FINE COLLECTION & DISBURSEMENT 776,808 0 0 0 0
JUDICIARY 806,680 799,303 896,271 1,027,928 1,077,420
Sub Total 4,559,273 4,688,893 4,626,267 5,193,888 5,346,895
Special RevenueADMIN SERVICES 38,057 17,083 83,806 0 0
COURT CASE MANAGEMENT DIVISION 472,738 811,143 538,497 655,389 686,264
Sub Total 510,795 828,226 622,303 655,389 686,264
All Funds Total 5,070,068 5,517,119 5,248,570 5,849,277 6,033,159
Division Summary
MUNICIPAL COURT
175

Strategic Actions
Goal 6: Set the Standard for Sound Governance and Fiscal Management
Strategy 2.6 Enforce Municipal Court orders
Strategy 2.7 Maximize Municipal Court efficiency and enhance Customer experience
FY 2021 Key Results
2020 Traffic Safety Initiative Award 214,310 Cases set for trial, arraignment and other hearings 98.14% of phone calls answered within 30 seconds 22,791 email requests received
FY 2022 Key Deliverables
100% of warrants recalled to warrant activation 60,000 of transactions made online or through the phone
COVID-19 Response & Recovery
Received ARPA funding for Public Health and Safety Response and Recovery to implement atemporary court and reduce trial and hearing backlog
Virtual and Video hearings offered All locations open to the public May 15 to present Plexi dividers for staff and public at all locations and in courtrooms Additional email group added on web-site for submitting documents and proof Staggered scheduling for staff and staggered scheduled for courts Laptops for staff for telework – ability to log in to Call Centers Night drops for payments and documents at all locations 2 metal detectors with temperature reading installed at Downtown and Northeast Fogging weekly in courtrooms and work areas
176

*JudiciaryMunicipal Court
Clerk
Administrative Division
Assistant Municipal Court Clerk
Court Case Management
Fine Collection & Disbursement
Municipal CourtAdopted FY 2022 Organizational Chart
Dionne MackDeputy City Manager of
Public Safety
FY 2021 Adopted FY 2022 Adopted Increase / (Decrease)
GF 89.80 89.90 0.10
Non-General Fund 2.85 2.75 (0.10)
Total Authorized 92.65 92.65 0.00
*The Municipal Court Department provides administrative support appointed judges
177
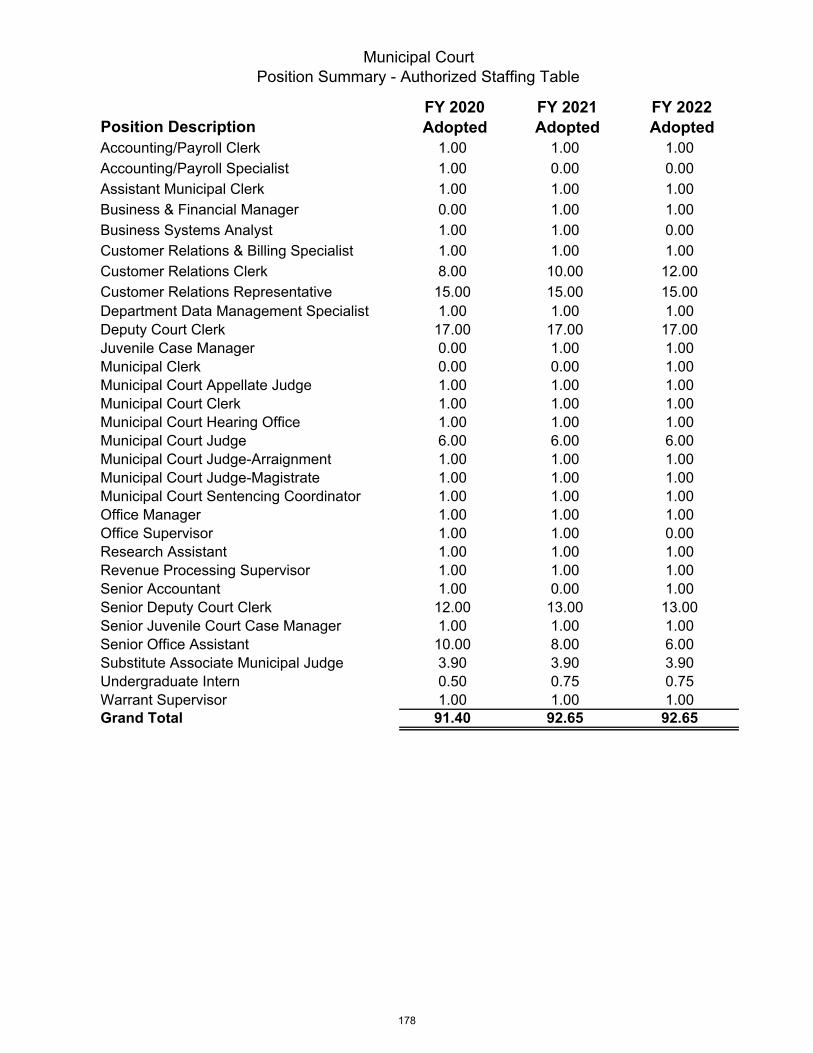
Municipal CourtPosition Summary - Authorized Staffing Table
Position DescriptionFY 2020 Adopted
FY 2021 Adopted
FY 2022 Adopted
Accounting/Payroll Clerk 1.00 1.00 1.00
Accounting/Payroll Specialist 1.00 0.00 0.00
Assistant Municipal Clerk 1.00 1.00 1.00
Business & Financial Manager 0.00 1.00 1.00
Business Systems Analyst 1.00 1.00 0.00
Customer Relations & Billing Specialist 1.00 1.00 1.00
Customer Relations Clerk 8.00 10.00 12.00
Customer Relations Representative 15.00 15.00 15.00Department Data Management Specialist 1.00 1.00 1.00Deputy Court Clerk 17.00 17.00 17.00Juvenile Case Manager 0.00 1.00 1.00Municipal Clerk 0.00 0.00 1.00Municipal Court Appellate Judge 1.00 1.00 1.00Municipal Court Clerk 1.00 1.00 1.00Municipal Court Hearing Office 1.00 1.00 1.00Municipal Court Judge 6.00 6.00 6.00Municipal Court Judge-Arraignment 1.00 1.00 1.00Municipal Court Judge-Magistrate 1.00 1.00 1.00Municipal Court Sentencing Coordinator 1.00 1.00 1.00Office Manager 1.00 1.00 1.00Office Supervisor 1.00 1.00 0.00Research Assistant 1.00 1.00 1.00Revenue Processing Supervisor 1.00 1.00 1.00Senior Accountant 1.00 0.00 1.00Senior Deputy Court Clerk 12.00 13.00 13.00Senior Juvenile Court Case Manager 1.00 1.00 1.00Senior Office Assistant 10.00 8.00 6.00Substitute Associate Municipal Judge 3.90 3.90 3.90Undergraduate Intern 0.50 0.75 0.75Warrant Supervisor 1.00 1.00 1.00Grand Total 91.40 92.65 92.65
178

FY 2022 Total Budget$177,025,187
FY 2022 General Fund$161,991,630
FY 2022 Non-General Fund$15,033,557
Total FTE’s1,596.60
Mission
To provide services with integrity and dedication, to preserve life, to enforce the law, and to work in partnership with the community to enhance the quality of life in the City of El Paso.
Key Functions:
Maintain public orderInvestigate crimesProtect people & property
FY 2022 Budget
FY 2021 Key Performance Indicators
Key Performance IndicatorFY19
ActualFY20
ActualFY21
ActualAnnualTarget
Reduce Part 1 Offense crime rate by 2% from previous year
12,629 12,875 9,012* 12,618
# of motor vehicle fatalities 66 81 62 61
% of Criminal Homicide crime cases that meet or exceed the national average clearance rates
102.50% 88.24% 70.83%* 61.4%*
Police
und
ral Fund Fire131,087,974
42%
Municipal Court6,033,159
2%
Police177,025,187
56%
Goal 2: Public SafetyTotal Budget $314,146,321
* Sept. 1, 2020 through July 31, 2021
179

FY 2018 FY 2019 FY 2020 FY 2021 FY 2022
ACTUAL ACTUAL ACTUAL ADOPTED ADOPTED AMOUNT PERCENT
Salaries and Wages 93,535,304 101,320,480 105,282,896 109,081,160 112,357,030 3,275,870 3%Employee Benefits 31,006,781 32,945,783 35,369,560 40,528,129 41,608,150 1,080,021 3%Contractual Services 10,716 - - - - - 0%Professional Services 162,968 277,845 67,744 114,719 171,485 56,766 49%Outside Contracts 4,522,053 5,108,767 4,787,144 5,409,827 6,735,548 1,325,721 25%Interfund Services 2,848,270 2,324,261 2,363,116 2,370,999 2,697,479 326,480 14%Operating Leases 1,403,534 1,372,321 1,417,924 1,369,281 1,445,113 75,832 6%Fuel and Lubricants 1,339,863 1,316,289 1,294,966 1,477,933 1,609,069 131,136 9%Materials and Supplies 1,941,184 2,215,272 2,646,616 2,408,201 2,627,837 219,636 9%Maintenance and Repairs 21,737 10,804 12,740 44,950 42,950 (2,000) -4%Minor Equipment and Furniture 1,098,362 2,231,916 1,894,869 905,306 1,138,088 232,782 26%Communications 264,873 299,595 284,441 351,962 385,630 33,668 10%Utilities - - - 9,000 6,000 (3,000) -33%Travel 254,186 356,080 148,992 151,302 56,966 (94,336) -62%Other Operating Expenditures 1,162,808 1,175,573 698,709 954,160 853,842 (100,318) -11%Community Service Projects - - - - - - 0%Interest Expense - - - - - - 0%Principal - - - - - - 0%Other Non-Operating Expenditures 12,342 13,730 12,000 14,000 13,000 (1,000) -7%Grant Match - - - 58,000 58,000 (0) 0%Operating Transfers Out 206 - 1,305,686 - 2,500,000 2,500,000 100%Capital Outlay 15,845 302,611 1,286,224 180,000 2,719,000 2,539,000 1411%
Total Expenditures 139,601,031 151,271,328 158,873,626 165,428,929 177,025,187 11,596,258 7%
FY 2018 FY 2019 FY 2020 FY 2021 FY 2022
ACTUAL ACTUAL ACTUAL ADOPTED ADOPTED AMOUNT PERCENT
General Government 128,718,965 138,109,104 142,576,717 152,636,914 161,991,630 9,354,717 6%Community Development Block Grants - - - - - - 0%Debt Service - - - - - - 0%Capital Projects - - 130,000 - 2,500,000 2,500,000 100%Special Revenue 10,882,067 12,882,868 15,457,383 12,792,015 12,533,557 (258,458) -2%Fiduciary Funds - 279,355 710,598 - - - 0%Enterprise - - (1,073) - - - 0%Internal Service - - - - - - 0%
Total Funds 139,601,031 151,271,328 158,873,626 165,428,929 177,025,187 11,596,258 7%
FY 2018 FY 2019 FY 2020 FY 2021 FY 2022
ADOPTED ADOPTED ADOPTED ADOPTED ADOPTED AMOUNT PERCENT
General Fund 1,323.10 1,381.10 1,425.10 1,426.60 1,462.60 36.00 Non-General Fund 85.50 86.50 87.50 136.00 134.00 (2.00)
Total Authorized 1,408.60 1,467.60 1,512.60 1,562.60 1,596.60 34.00
Expenditures by GroupFY 2022 ADOPTED OVER/(UNDER)
FY 2021 ADOPTED
Police
FY 2022 ADOPTED OVER/(UNDER) FY 2021 ADOPTED
Source of Funds
Positions
FY 2022 ADOPTED OVER/(UNDER) FY 2021 ADOPTED
180

FY 2018 FY 2019 FY 2020 FY 2021 FY 2022
ACTUAL ACTUAL ACTUAL ADOPTED ADOPTED
General GovernmentCHIEFS OFFICE 2,228,019 2,430,689 3,814,730 2,206,491 4,813,492
INTERNAL AFFAIRS 2,086,493 2,124,508 2,248,733 2,287,887 2,410,901
POLICE ACADEMY ADMIN 4,028,464 5,126,540 3,026,585 3,430,168 4,180,953
POLICE CADETS 2,409,417 2,611,554 1,592,646 406,011 3,039,475
PD PERSONNEL 2,130,659 2,489,815 2,526,117 2,511,638 2,484,589
PLNG AND RESEARCH 572,586 680,020 818,214 981,679 1,050,245
VEHICLE OPER 4,386,765 3,859,289 3,839,203 3,974,141 4,419,067
GRANT OPER PDHQ 887,364 884,605 806,450 875,973 902,560
COMMUNICATIONS 530,150 550,569 559,768 591,626 697,144
RECORDS 2,617,529 2,679,626 2,737,793 2,809,183 2,684,729
POLICE SUPPLY 730,211 795,983 794,674 969,756 1,091,297
FINANCIAL SERVS 3,179,299 3,160,099 3,256,094 3,488,843 3,622,834
SPECIAL SERVS 2,524,782 2,647,844 2,774,114 3,255,826 3,368,220
CRISIS INTERVENTION TEAM 0 1,945,504 1,957,566 2,005,183 3,239,338
POLICE SPECIAL OPS GROUP 0 0 2,721,615 2,744,732 3,207,192
CENTRAL REGNL COMMAND 19,692,983 20,302,907 20,343,559 22,863,806 21,118,888
MISSN VALLY REGIONL COMMAN 11,077,930 11,255,207 11,227,759 11,926,790 11,973,474
NORTHEAST REGNL COMMAND 12,467,425 13,099,290 12,589,135 13,843,061 13,889,757
PEBBLE HILLS REGNL COMMAND 19,394,844 20,336,015 19,341,535 20,160,544 20,184,404
WESTSIDE REGNL COMMAND 10,889,816 11,649,516 11,850,524 13,380,276 13,469,858
OPERATIONAL SUPPORT 3,974,556 4,516,249 7,768,300 9,447,437 10,239,178
DIRECTED INVESTIGATIONS 12,134,301 13,158,199 13,599,168 14,987,222 15,594,240
CRIMINAL INVESTIGATIONS 10,775,169 11,805,078 12,378,265 13,488,641 14,273,141
CRIMINAL JUSTICE GRNT_PS 0 0 (506) 0 20,359
POLICE HIDTA GRNT 0 0 0 0 16,296
POLICE RESTRI CONFISCATED FUND 205 0 5,686 0 0
ABANDONED AUTO TRUST RESTRCT 0 0 (1,011) 0 0
Sub Total 128,718,965 138,109,104 142,576,717 152,636,914 161,991,630
Capital ProjectsCHIEFS OFFICE 0 0 130,000 0 2,500,000
Sub Total 0 0 130,000 0 2,500,000
Special RevenueCHIEFS OFFICE 737,759 761,265 169,329 61,976 55,450
POLICE ACADEMY ADMIN 459,131 0 0 0 0
PLNG AND RESEARCH 0 0 56,645 0 0
VEHICLE OPER 0 0 0 0 586
CENTRAL REGNL COMMAND 311 483 0 0 0
MISSN VALLY REGIONL COMMAN 0 449 0 0 0
NORTHEAST REGNL COMMAND 0 0 244 0 0
PEBBLE HILLS REGNL COMMAND 0 1,040 203 0 0
WESTSIDE REGNL COMMAND 0 0 2,266 0 0
CRIMINAL JUSTICE GRNT_PS 3,171,415 4,549,844 3,338,402 2,594,290 2,621,949
FEDERAL POLICING GRNT 1,605,162 1,666,253 2,689,435 1,943,462 1,859,173
POLICE HIDTA GRNT 2,283,604 2,272,257 5,794,261 2,411,724 2,411,724
POLICE RESTRI CONFISCATED FUND 413,258 1,024,830 615,773 0 0
ABANDONED AUTO TRUST RESTRCT 2,114,001 2,543,213 2,718,272 2,780,000 2,899,414
PD RESTRCD FUNDS 97,041 63,621 72,554 0 0
PD PROPERTY DIVISION 386 (386) 0 0 0
ENVIRONMENTAL NUISANCE RESPON 0 0 0 3,000,564 2,685,261
Sub Total 10,882,067 12,882,868 15,457,383 12,792,015 12,533,557
Fiduciary FundsPD LOCAL-PRIVATE AWARDS 0 279,355 710,598 0 0
Sub Total 0 279,355 710,598 0 0
Enterprise FundsOPERATIONAL SUPPORT 0 0 (1,073) 0 0
Sub Total 0 0 (1,073) 0 0
All Funds Total 139,601,031 151,271,328 158,873,626 165,428,929 177,025,187
Division Summary
POLICE
181
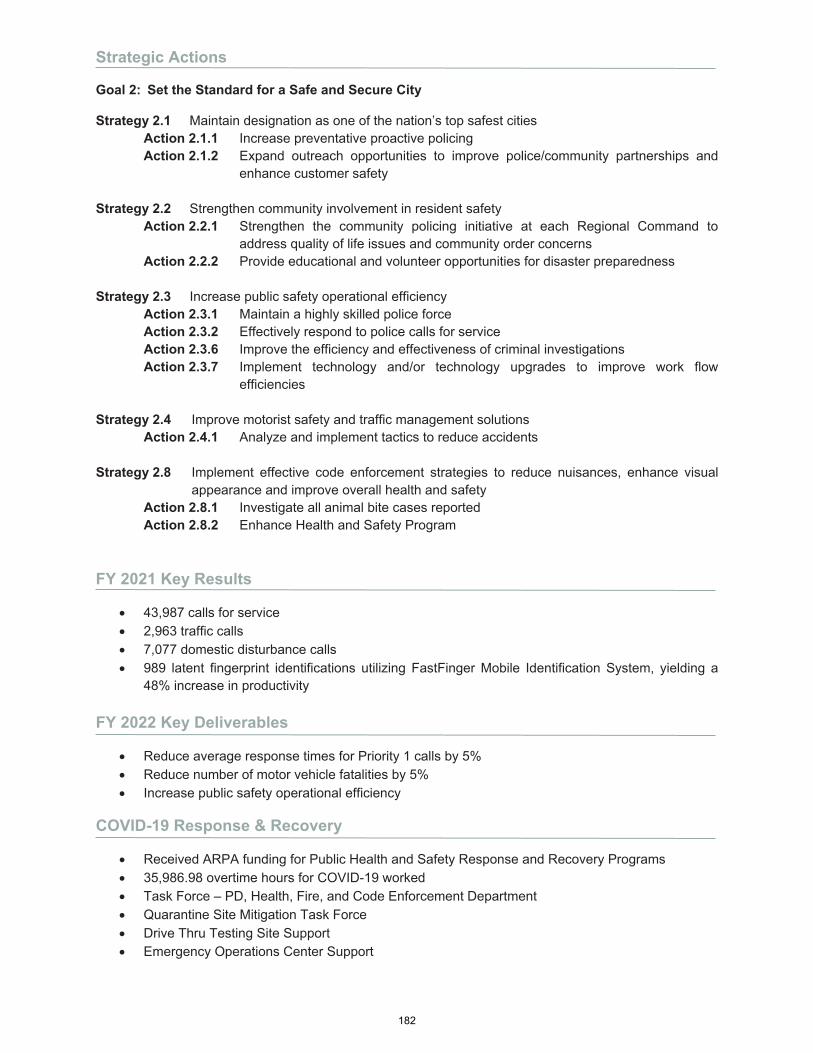
Strategic Actions
Goal 2: Set the Standard for a Safe and Secure City
Strategy 2.1 Maintain designation as one of the nation’s top safest cities Action 2.1.1 Increase preventative proactive policing Action 2.1.2 Expand outreach opportunities to improve police/community partnerships and
enhance customer safety
Strategy 2.2 Strengthen community involvement in resident safety Action 2.2.1 Strengthen the community policing initiative at each Regional Command to
address quality of life issues and community order concerns Action 2.2.2 Provide educational and volunteer opportunities for disaster preparedness
Strategy 2.3 Increase public safety operational efficiency Action 2.3.1 Maintain a highly skilled police force Action 2.3.2 Effectively respond to police calls for service Action 2.3.6 Improve the efficiency and effectiveness of criminal investigations Action 2.3.7 Implement technology and/or technology upgrades to improve work flow
efficiencies
Strategy 2.4 Improve motorist safety and traffic management solutions Action 2.4.1 Analyze and implement tactics to reduce accidents
Strategy 2.8 Implement effective code enforcement strategies to reduce nuisances, enhance visual appearance and improve overall health and safety
Action 2.8.1 Investigate all animal bite cases reported Action 2.8.2 Enhance Health and Safety Program
FY 2021 Key Results
43,987 calls for service 2,963 traffic calls 7,077 domestic disturbance calls 989 latent fingerprint identifications utilizing FastFinger Mobile Identification System, yielding a
48% increase in productivity
FY 2022 Key Deliverables
Reduce average response times for Priority 1 calls by 5% Reduce number of motor vehicle fatalities by 5% Increase public safety operational efficiency
COVID-19 Response & Recovery
Received ARPA funding for Public Health and Safety Response and Recovery Programs 35,986.98 overtime hours for COVID-19 worked Task Force – PD, Health, Fire, and Code Enforcement Department Quarantine Site Mitigation Task Force Drive Thru Testing Site Support Emergency Operations Center Support
182
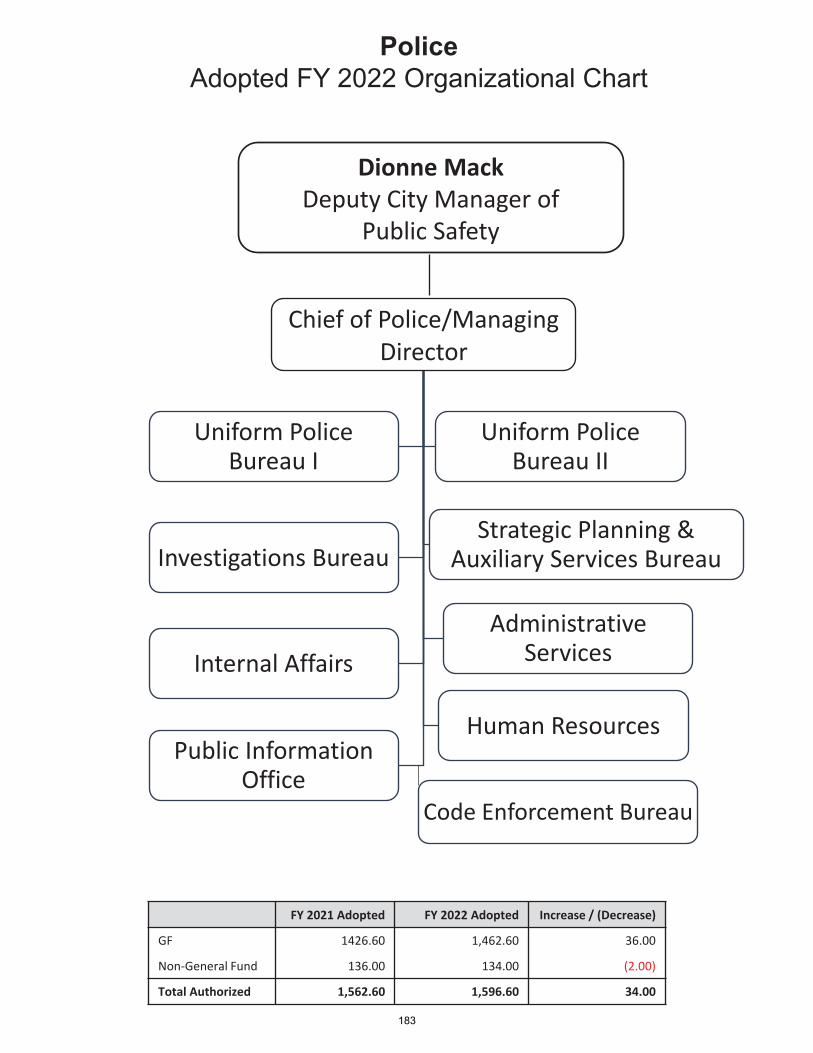
PoliceAdopted FY 2022 Organizational Chart
Chief of Police/Managing Director
Uniform Police Bureau I
Uniform Police Bureau II
Investigations BureauStrategic Planning &
Auxiliary Services Bureau
Internal AffairsAdministrative
Services
Public Information Office
Human Resources
Code Enforcement Bureau
Dionne MackDeputy City Manager of
Public Safety
FY 2021 Adopted FY 2022 Adopted Increase / (Decrease)
GF 1426.60 1,462.60 36.00
Non-General Fund 136.00 134.00 (2.00)
Total Authorized 1,562.60 1,596.60 34.00
183

PolicePosition Summary - Authorized Staffing Table
Position DescriptionFY 2020 Adopted
FY 2021 Adopted
FY 2022 Adopted
Accountant 3.00 3.00 3.00Accounting/Payroll Clerk 2.00 1.00 1.00Accounting/Payroll Specialist 2.00 2.00 2.00Administrative Assistant 1.00 1.00 1.00Administrative Services Manager 1.00 1.00 1.00Associate Code Compliance Officer 0.00 2.00 2.00Auto Theft Public Awareness Manager 1.00 1.00 1.00Business & Financial Manager 1.00 1.00 1.00Code Compliance Administrator 0.00 1.00 0.00Code Compliance Manager 0.00 1.00 1.00Code Compliance Officer 0.00 26.00 26.00Code Compliance Supervisor 0.00 4.00 4.00Code Enforcement Director 0.00 0.00 1.00Code Field Operations Supervisor 0.00 3.00 3.00Collectively Bargained Payroll Clerk 4.00 4.00 4.00Court Liaison Supervisor 1.00 1.00 1.00Crime Analyst 4.00 4.00 5.00Crime Stoppers Coordinator 2.00 2.00 2.00Criminal Intelligence Liaison 1.00 1.00 1.00Departmental Human Resources Manager 1.00 1.00 1.00Financial Research Analyst 0.00 0.00 1.00Fleet & Bldg Maintenance Superintendent 1.00 1.00 1.00Fleet Services Coordinator 1.00 1.00 1.00Grant Project Manager 1.00 1.00 1.00HIDTA Fiscal Administrator 1.00 1.00 1.00Human Resources Analyst 1.00 1.00 1.00Human Resources Specialist 3.00 3.00 3.00Latent Print Examiner 1.00 1.00 1.00Latent Print Examiner Supervisor 1.00 1.00 1.00Lead Human Resources Specialist 1.00 1.00 1.00Lead Public Affairs Coordinator 1.00 0.00 0.00Materials Specialist 2.00 2.00 2.00Neighborhood Relations Coordinator 2.00 2.00 2.00Office Manager 6.00 6.00 6.00Parking & Traffic Controller 13.00 13.00 13.00Parking Enforcement Controller 9.00 9.00 9.00Photographic Laboratory Senior Technician 1.00 1.00 1.00Photographic Laboratory Technician 2.00 2.00 2.00Police Admin Svcs Division Mgr 1.00 1.00 1.00Police Assistant Chief 4.00 4.00 4.00Police Chief 1.00 1.00 1.00Police Commander 7.00 7.00 7.00Police Detective 175.00 175.00 176.00Police Lieutenant 44.00 44.00 44.00Police Officer 884.00 884.00 916.00Police Planner 1.00 1.00 1.00Police Records Specialist 42.00 43.00 43.00
184
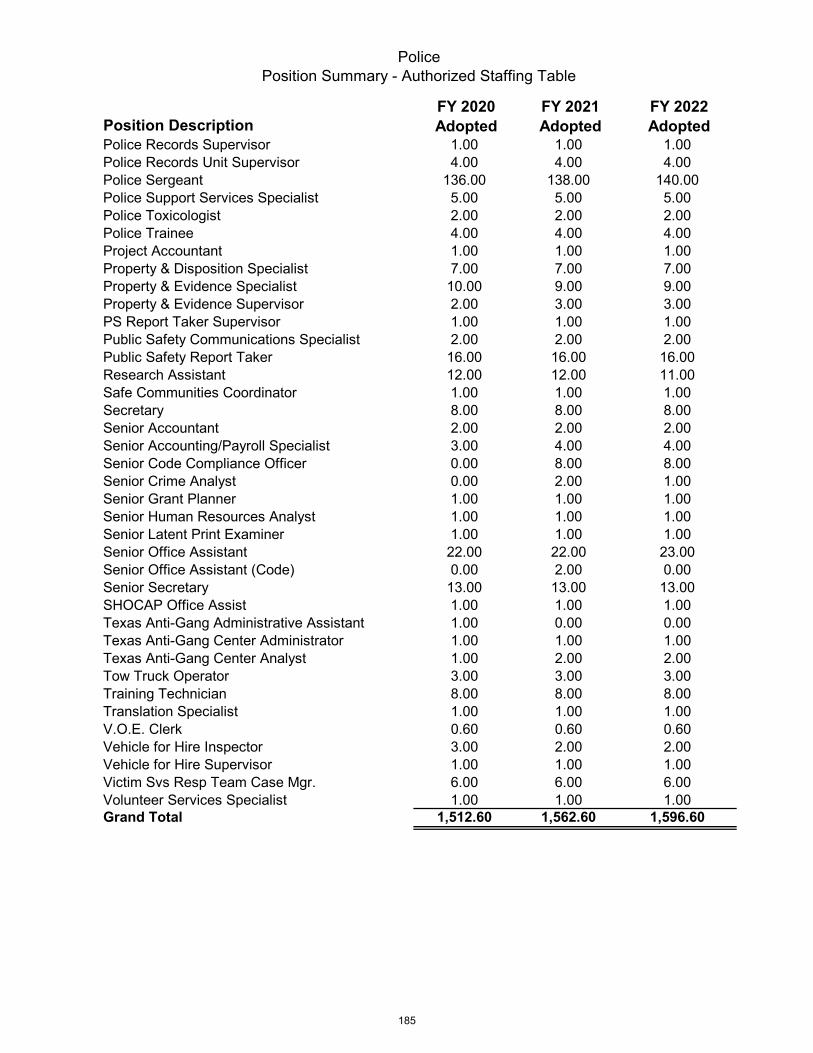
PolicePosition Summary - Authorized Staffing Table
Position DescriptionFY 2020 Adopted
FY 2021 Adopted
FY 2022 Adopted
Police Records Supervisor 1.00 1.00 1.00Police Records Unit Supervisor 4.00 4.00 4.00Police Sergeant 136.00 138.00 140.00Police Support Services Specialist 5.00 5.00 5.00Police Toxicologist 2.00 2.00 2.00Police Trainee 4.00 4.00 4.00Project Accountant 1.00 1.00 1.00Property & Disposition Specialist 7.00 7.00 7.00Property & Evidence Specialist 10.00 9.00 9.00Property & Evidence Supervisor 2.00 3.00 3.00PS Report Taker Supervisor 1.00 1.00 1.00Public Safety Communications Specialist 2.00 2.00 2.00Public Safety Report Taker 16.00 16.00 16.00Research Assistant 12.00 12.00 11.00Safe Communities Coordinator 1.00 1.00 1.00Secretary 8.00 8.00 8.00Senior Accountant 2.00 2.00 2.00Senior Accounting/Payroll Specialist 3.00 4.00 4.00Senior Code Compliance Officer 0.00 8.00 8.00Senior Crime Analyst 0.00 2.00 1.00Senior Grant Planner 1.00 1.00 1.00Senior Human Resources Analyst 1.00 1.00 1.00Senior Latent Print Examiner 1.00 1.00 1.00Senior Office Assistant 22.00 22.00 23.00Senior Office Assistant (Code) 0.00 2.00 0.00Senior Secretary 13.00 13.00 13.00SHOCAP Office Assist 1.00 1.00 1.00Texas Anti-Gang Administrative Assistant 1.00 0.00 0.00Texas Anti-Gang Center Administrator 1.00 1.00 1.00Texas Anti-Gang Center Analyst 1.00 2.00 2.00Tow Truck Operator 3.00 3.00 3.00Training Technician 8.00 8.00 8.00Translation Specialist 1.00 1.00 1.00V.O.E. Clerk 0.60 0.60 0.60Vehicle for Hire Inspector 3.00 2.00 2.00Vehicle for Hire Supervisor 1.00 1.00 1.00Victim Svs Resp Team Case Mgr. 6.00 6.00 6.00Volunteer Services Specialist 1.00 1.00 1.00Grand Total 1,512.60 1,562.60 1,596.60
185
CITY OF EL PASO BUDGET BOOK 2022
GROWTH
GOAL 3VISUAL IMAGE
-PLANNING & INSPECTIONS
22YEAR NO.
GOAL 3
VISUAL IM
AGE
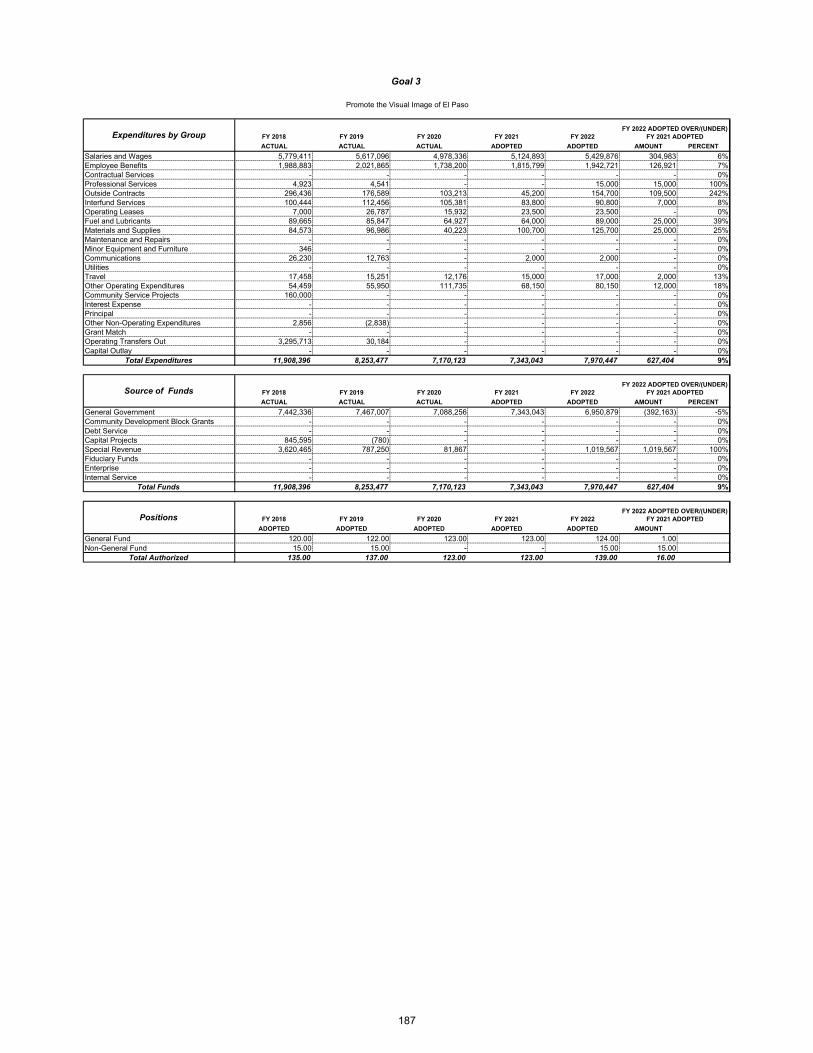
FY 2018 FY 2019 FY 2020 FY 2021 FY 2022
ACTUAL ACTUAL ACTUAL ADOPTED ADOPTED AMOUNT PERCENT
Salaries and Wages 5,779,411 5,617,096 4,978,336 5,124,893 5,429,876 304,983 6%Employee Benefits 1,988,883 2,021,865 1,738,200 1,815,799 1,942,721 126,921 7%Contractual Services - - - - - - 0%Professional Services 4,923 4,541 - - 15,000 15,000 100%Outside Contracts 296,436 176,589 103,213 45,200 154,700 109,500 242%Interfund Services 100,444 112,456 105,381 83,800 90,800 7,000 8%Operating Leases 7,000 26,787 15,932 23,500 23,500 - 0%Fuel and Lubricants 89,665 85,847 64,927 64,000 89,000 25,000 39%Materials and Supplies 84,573 96,986 40,223 100,700 125,700 25,000 25%Maintenance and Repairs - - - - - - 0%Minor Equipment and Furniture 346 - - - - - 0%Communications 26,230 12,763 - 2,000 2,000 - 0%Utilities - - - - - - 0%Travel 17,458 15,251 12,176 15,000 17,000 2,000 13%Other Operating Expenditures 54,459 55,950 111,735 68,150 80,150 12,000 18%Community Service Projects 160,000 - - - - - 0%Interest Expense - - - - - - 0%Principal - - - - - - 0%Other Non-Operating Expenditures 2,856 (2,838) - - - - 0%Grant Match - - - - - - 0%Operating Transfers Out 3,295,713 30,184 - - - - 0%Capital Outlay - - - - - - 0%
Total Expenditures 11,908,396 8,253,477 7,170,123 7,343,043 7,970,447 627,404 9%
FY 2018 FY 2019 FY 2020 FY 2021 FY 2022
ACTUAL ACTUAL ACTUAL ADOPTED ADOPTED AMOUNT PERCENT
General Government 7,442,336 7,467,007 7,088,256 7,343,043 6,950,879 (392,163) -5%Community Development Block Grants - - - - - - 0%Debt Service - - - - - - 0%Capital Projects 845,595 (780) - - - - 0%Special Revenue 3,620,465 787,250 81,867 - 1,019,567 1,019,567 100%Fiduciary Funds - - - - - - 0%Enterprise - - - - - - 0%Internal Service - - - - - - 0%
Total Funds 11,908,396 8,253,477 7,170,123 7,343,043 7,970,447 627,404 9%
FY 2018 FY 2019 FY 2020 FY 2021 FY 2022
ADOPTED ADOPTED ADOPTED ADOPTED ADOPTED AMOUNT
General Fund 120.00 122.00 123.00 123.00 124.00 1.00 Non-General Fund 15.00 15.00 - - 15.00 15.00
Total Authorized 135.00 137.00 123.00 123.00 139.00 16.00
Goal 3
Promote the Visual Image of El Paso
Expenditures by Group
Source of Funds
Positions
FY 2022 ADOPTED OVER/(UNDER) FY 2021 ADOPTED
FY 2022 ADOPTED OVER/(UNDER) FY 2021 ADOPTED
FY 2022 ADOPTED OVER/(UNDER) FY 2021 ADOPTED
187
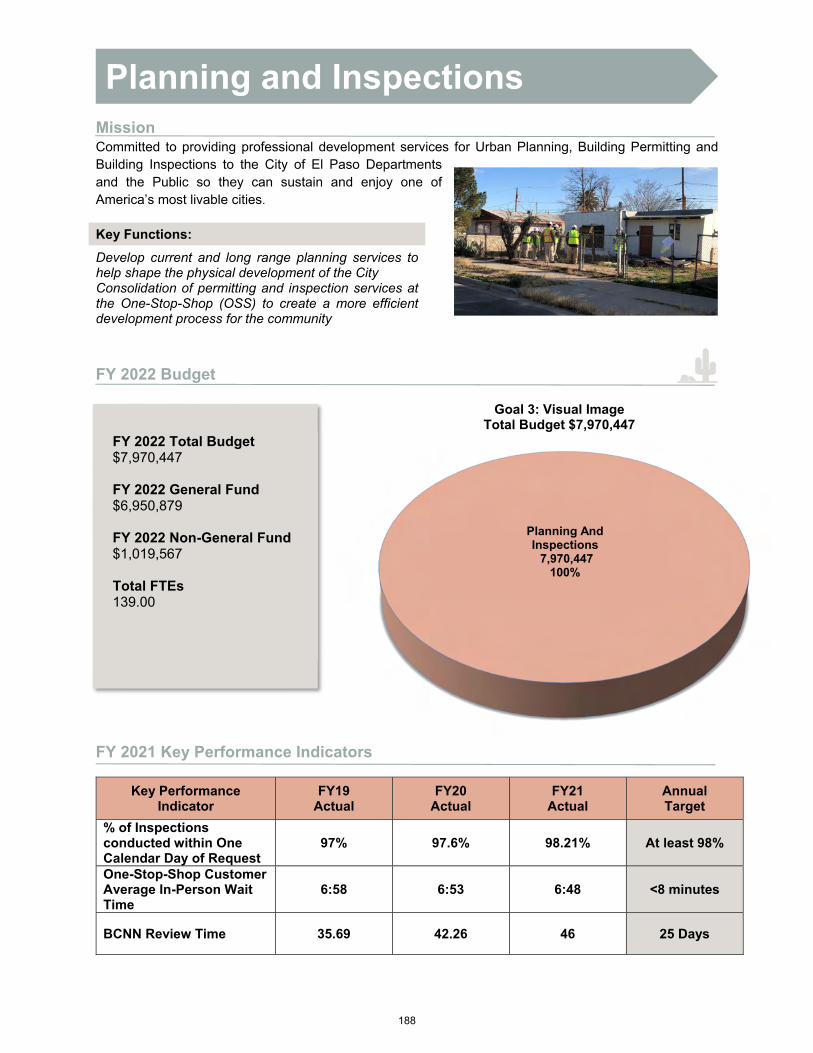
Planning And Inspections
7,970,447 100%
Goal 3: Visual Image Total Budget $7,970,447
Mission Committed to providing professional development services for Urban Planning, Building Permitting and Building Inspections to the City of El Paso Departments and the Public so they can sustain and enjoy one of America’s most livable cities.
Key Functions:
Develop current and long range planning services to help shape the physical development of the City Consolidation of permitting and inspection services at the One-Stop-Shop (OSS) to create a more efficient development process for the community
FY 2022 Budget
FY 2021 Key Performance Indicators
Key Performance Indicator
FY19 Actual
FY20 Actual
FY21 Actual
Annual Target
% of Inspections conducted within One Calendar Day of Request
97% 97.6% 98.21% At least 98%
One-Stop-Shop Customer Average In-Person Wait Time
6:58 6:53 6:48 <8 minutes
BCNN Review Time 35.69 42.26 46 25 Days
Planning and Inspections
FY 2022 Total Budget $7,970,447
FY 2022 General Fund $6,950,879
FY 2022 Non-General Fund $1,019,567
Total FTEs 139.00
188
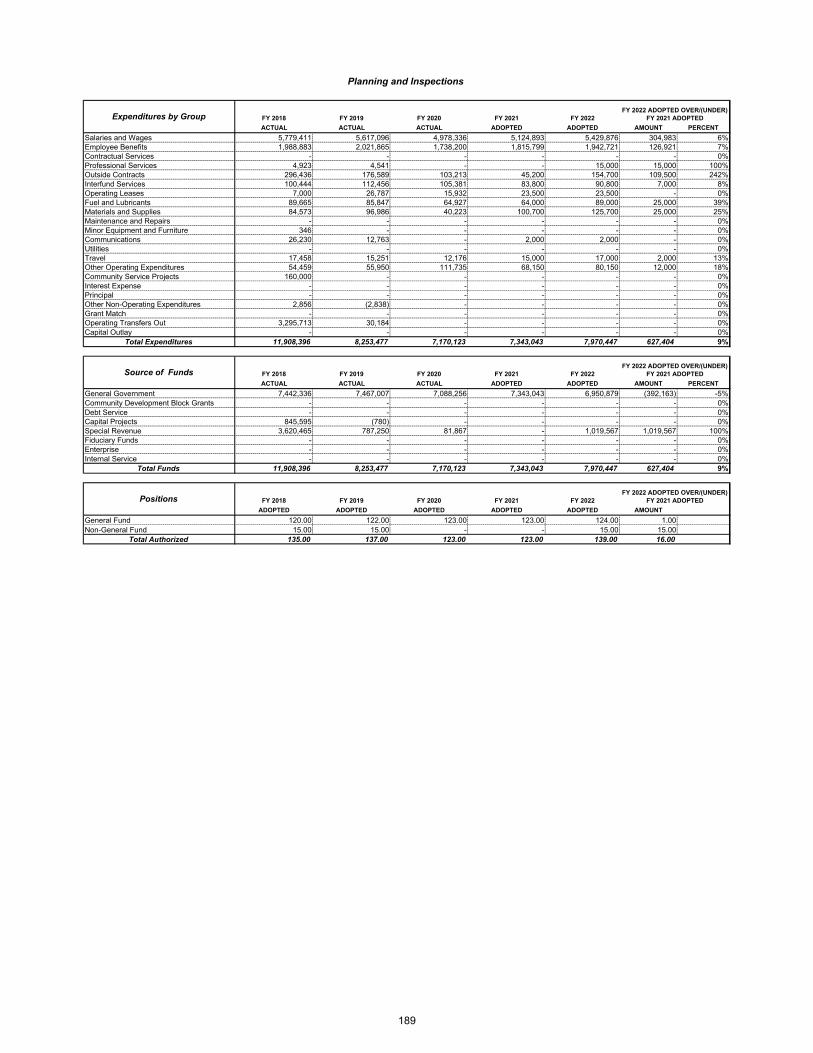
FY 2018 FY 2019 FY 2020 FY 2021 FY 2022
ACTUAL ACTUAL ACTUAL ADOPTED ADOPTED AMOUNT PERCENT
Salaries and Wages 5,779,411 5,617,096 4,978,336 5,124,893 5,429,876 304,983 6%Employee Benefits 1,988,883 2,021,865 1,738,200 1,815,799 1,942,721 126,921 7%Contractual Services - - - - - - 0%Professional Services 4,923 4,541 - - 15,000 15,000 100%Outside Contracts 296,436 176,589 103,213 45,200 154,700 109,500 242%Interfund Services 100,444 112,456 105,381 83,800 90,800 7,000 8%Operating Leases 7,000 26,787 15,932 23,500 23,500 - 0%Fuel and Lubricants 89,665 85,847 64,927 64,000 89,000 25,000 39%Materials and Supplies 84,573 96,986 40,223 100,700 125,700 25,000 25%Maintenance and Repairs - - - - - - 0%Minor Equipment and Furniture 346 - - - - - 0%Communications 26,230 12,763 - 2,000 2,000 - 0%Utilities - - - - - - 0%Travel 17,458 15,251 12,176 15,000 17,000 2,000 13%Other Operating Expenditures 54,459 55,950 111,735 68,150 80,150 12,000 18%Community Service Projects 160,000 - - - - - 0%Interest Expense - - - - - - 0%Principal - - - - - - 0%Other Non-Operating Expenditures 2,856 (2,838) - - - - 0%Grant Match - - - - - - 0%Operating Transfers Out 3,295,713 30,184 - - - - 0%Capital Outlay - - - - - - 0%
Total Expenditures 11,908,396 8,253,477 7,170,123 7,343,043 7,970,447 627,404 9%
FY 2018 FY 2019 FY 2020 FY 2021 FY 2022
ACTUAL ACTUAL ACTUAL ADOPTED ADOPTED AMOUNT PERCENT
General Government 7,442,336 7,467,007 7,088,256 7,343,043 6,950,879 (392,163) -5%Community Development Block Grants - - - - - - 0%Debt Service - - - - - - 0%Capital Projects 845,595 (780) - - - - 0%Special Revenue 3,620,465 787,250 81,867 - 1,019,567 1,019,567 100%Fiduciary Funds - - - - - - 0%Enterprise - - - - - - 0%Internal Service - - - - - - 0%
Total Funds 11,908,396 8,253,477 7,170,123 7,343,043 7,970,447 627,404 9%
FY 2018 FY 2019 FY 2020 FY 2021 FY 2022
ADOPTED ADOPTED ADOPTED ADOPTED ADOPTED AMOUNT
General Fund 120.00 122.00 123.00 123.00 124.00 1.00 Non-General Fund 15.00 15.00 - - 15.00 15.00
Total Authorized 135.00 137.00 123.00 123.00 139.00 16.00
FY 2022 ADOPTED OVER/(UNDER) FY 2021 ADOPTED
FY 2022 ADOPTED OVER/(UNDER) FY 2021 ADOPTED
FY 2022 ADOPTED OVER/(UNDER) FY 2021 ADOPTED
Source of Funds
Positions
Planning and Inspections
Expenditures by Group
189

FY 2018 FY 2019 FY 2020 FY 2021 FY 2022
ACTUAL ACTUAL ACTUAL ADOPTED ADOPTED
General GovernmentADMINISTRATION 868,565 900,536 904,969 861,561 963,937
BUILDING & DEVELOPMENT PERMIT 4,356,723 4,407,280 4,108,422 4,130,961 3,510,501
PLANNING 1,126,827 1,142,645 1,079,063 1,155,530 1,220,447
ONE-STOP-SHOP 1,090,221 1,016,545 995,729 1,194,991 1,255,995
PLNG ADMIN NEW 0 0 72 0 0
Sub Total 7,442,336 7,467,007 7,088,256 7,343,043 6,950,879
Capital ProjectsPLNG ADMIN NEW 845,595 (780) 0 0 0
Sub Total 845,595 (780) 0 0 0
Special Revenue
BUILDING & DEVELOPMENT PERMIT 3,256,671 655,039 0 0 1,019,567
PLNG DEPT GRNT 0 30,184 0 0 0
ECO DEVELOPMENT GRNT 160,000 0 0 0 0
380 ECO DEV. PROJECT 203,794 102,027 81,867 0 0
Sub Total 3,620,465 787,250 81,867 0 1,019,567
All Funds Total 11,908,396 8,253,477 7,170,123 7,343,043 7,970,447
Division Summary
PLANNING AND INSPECTIONS
190

Strategic Actions
Goal 1: Create an Environment Conducive to Strong, Sustainable Economic Development
Strategy 1.1 Stabilize and Expand El Paso’s Tax Base Action 1.1.7 Provide services to the development community in support of orderly and timely
project completions consistent with “Plan El Paso”
Strategy 1.6 Provide Business Friendly Permitting and Inspection Processes Action 1.6.1 Provide exceptional commercial and residential development, permitting,
inspection and licensing services Action 1.6.2 Implement “State of the Field” demand-based service delivery model
Goal 3: Promote the Visual Image of El Paso
Strategy 3.1 Improve the visual impression of the community (gateways, corridors, intersections, and parkland)
Action 3.1.1 Continue strengthening development ordinances impacting the built environment
FY 2021 Key Results
Estimated 35% increase in revenue resulting from options to deliver safe and timely customerservice implemented because of the COVID-19 crisis
Process improvements to El Paso Water Utilities, El Paso Electric, TxDOT and City processesthrough partnership with the development community
Enhanced citywide property maintenance, code compliance and enforcement efforts in all districts
FY 2022 Key Deliverables
Enhance exposure of ombudsman to provide timely resolution of permitting issues Ongoing review and update of department website to provide clear, accessible and precise
information Promote project management as a program, to assist customers to identify key development
issues prior to investment
COVID-19 Response and Recovery
Safety measures implementedo Personal protective equipment available as needed, including cleaning supplieso Creation of safety team
Staff adjustments implementedo Shifted staff seating arrangements to ensure social distancingo Docking stations and laptops for middle managers for better access to software and files
Process modifications implementedo Electronic submittal of plan review and planning applications, along with electronic
review. Additionally, special event applications transitioned to electronic with securityalarm applications currently in process.
o Facilitated renewal of permits/licenses through phone/email
191
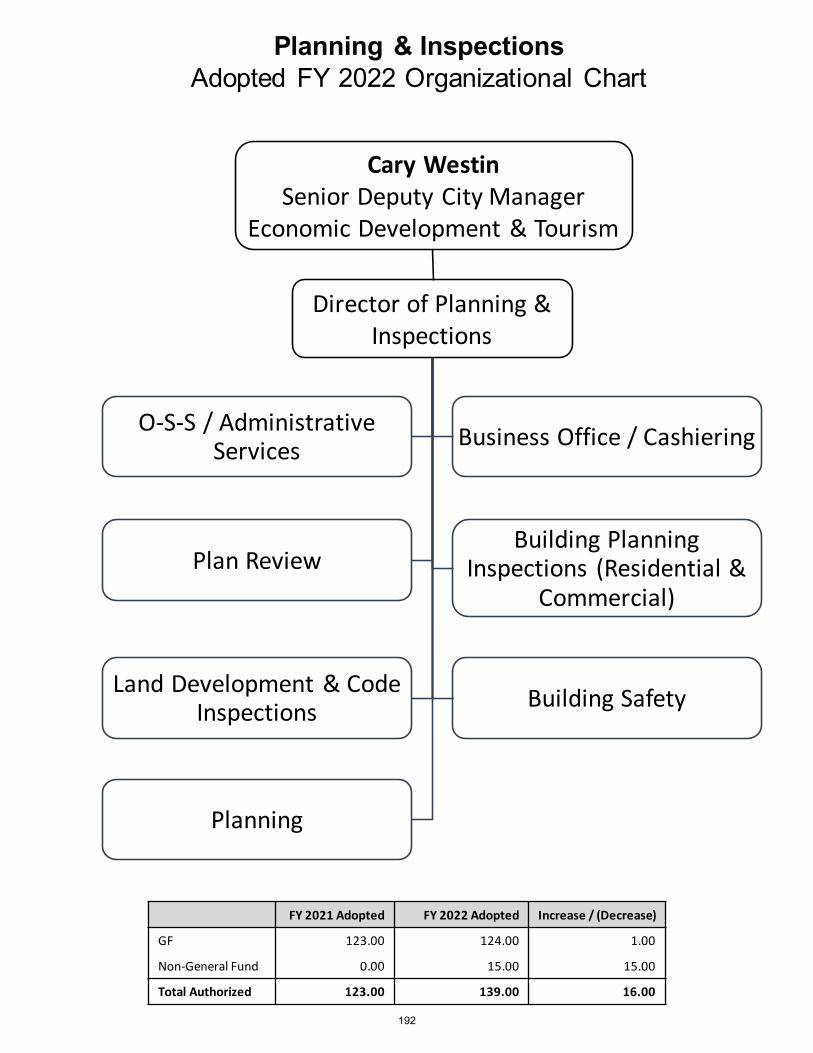
Planning & InspectionsAdopted FY 2022 Organizational Chart
Director of Planning & Inspections
O-S-S / AdministrativeServices Business Office / Cashiering
Plan ReviewBuilding Planning
Inspections (Residential & Commercial)
Land Development & Code Inspections Building Safety
Planning
Cary WestinSenior Deputy City Manager
Economic Development & Tourism
FY 2021 Adopted FY 2022 Adopted Increase / (Decrease)
GF 123.00 124.00 1.00
Non-General Fund 0.00 15.00 15.00
Total Authorized 123.00 139.00 16.00
192

Planning and InspectionsPosition Summary - Authorized Staffing Table
FY 2020 Adopted
FY 2021 Adopted
FY 2022 Adopted
1.00 1.00 1.000.00 0.00 1.000.00 1.00 1.001.00 0.00 0.003.00 3.00 3.009.00 8.00 8.000.00 1.00 1.004.00 4.00 4.006.00 6.00 6.003.00 2.00 2.000.00 1.00 1.001.00 1.00 1.00
10.00 10.00 10.000.00 1.00 1.001.00 0.00 0.002.00 2.00 2.002.00 2.00 3.001.00 1.00 1.001.00 1.00 1.001.00 1.00 1.003.00 4.00 4.000.00 0.00 0.000.00 0.00 0.001.00 1.00 2.00
13.00 7.00 7.006.00 12.00 12.001.00 0.00 0.001.00 1.00 1.003.00 3.00 3.001.00 1.00 1.001.00 1.00 1.001.00 1.00 1.003.00 3.00 3.003.00 3.00 3.001.00 1.00 1.001.00 1.00 1.001.00 1.00 1.001.00 1.00 1.003.00 3.00 3.001.00 1.00 1.002.00 2.00 2.001.00 1.00 1.00
10.00 10.00 9.005.00 5.00 5.00
Position DescriptionAdministrative AssistantAdministrative Support Assoc. Assistant Director of PlanningArchitectBldg Combination Inspector Supervisor Building Combination Inspector(UF)Bldg Combination Inspector Building Combination Inspector Trainee Building InspectorBuilding Inspector/Plans Examiner(UF) Building Insp/Plans Examr Building Permits & Insp Assistant Dir.Building Plans ExaminerBusiness & Customer Serv Asst Mgr Business & Customer Service Manager Business Systems AnalystChief Building InspectorChief Plans ExaminerCity Development Program Manager Civil EngineerCivil Engineering AssociateCode Compliance OfficerCode Field Operations Supervisor Customer Relations & Billing Supervisor Customer Relations ClerkCustomer Relations Representative Deputy Director - PlanningDirector of Planning & Inspections Electrical InspectorElectrical Inspector Supervisor Electrical Plans ExaminerEngineering Division Manager Engineering Lead Technician Engineering Senior TechnicianEvent Permit CoordinatorHistory Preservation OfficerHydrologic EngineerLandscape Plans ExaminerLead PlannerMechanical Engineering Associate Mechanical InspectorOmbudspersonPlannerPlanning SpecialistPlumbing Inspector 4.00 4.00 4.00
193

Planning and InspectionsPosition Summary - Authorized Staffing Table
FY 2020 Adopted
FY 2021 Adopted
FY 2022 Adopted
1.00 1.00 1.000.00 0.00 12.000.00 0.00 1.000.00 2.00 0.000.00 0.00 1.005.00 5.00 5.002.00 1.00 2.002.00 1.00 2.00
Position DescriptionProject ManagerProperty Maint. & Housing Insp.Property Maint. & Housing Insp. Sup. SecretarySenior Financial Research Analyst Senior PlannerSenior Plans ExaminerSenior SecretaryGrand Total 123.00 123.00 139.00
194

CITY OF EL PASO BUDGET BOOK 2022
GROWTH
GOAL 4QUALITY OF LIFE
-LIBRARY-MUSEUMS & CULTURAL AFFAIRS
-PARKS & RECREATION-ZOO
22YEAR NO.
GOAL 4
QUALITY OF LIFE

FY 2018 FY 2019 FY 2020 FY 2021 FY 2022
ACTUAL ACTUAL ACTUAL ADOPTED ADOPTED AMOUNT PERCENT
Salaries and Wages 21,744,620 22,575,106 20,098,477 17,317,682 23,844,676 6,526,994 38%Employee Benefits 7,878,662 8,329,560 8,339,014 9,350,837 8,459,482 (891,355) -10%Contractual Services 4,484 - - - - - 0%Professional Services 255,776 1,780,962 4,372,197 316,501 800,579 484,078 153%Outside Contracts 6,726,937 6,709,327 6,806,314 7,407,715 6,899,943 (507,772) -7%Interfund Services 474,014 470,582 523,208 452,852 451,852 (1,000) 0%Operating Leases 396,062 520,840 412,703 426,626 425,740 (886) 0%Fuel and Lubricants 260,147 252,200 237,863 321,959 326,559 4,600 1%Materials and Supplies 3,831,602 4,172,906 3,785,706 4,606,264 5,344,253 737,989 16%Maintenance and Repairs 505,435 484,897 651,119 680,011 942,661 262,650 39%Minor Equipment and Furniture 679,404 1,874,330 214,068 647,034 669,884 22,850 4%Communications 60,368 108,386 59,096 121,593 101,757 (19,836) -16%Utilities 4,886,020 5,664,306 6,048,661 5,770,754 6,355,999 585,245 10%Travel 121,652 118,471 83,212 167,386 167,636 250 0%Other Operating Expenditures 361,505 422,144 336,387 448,876 452,273 3,397 1%Community Service Projects 393,689 338,435 357,676 164,241 191,010 26,769 16%Interest Expense - - - - - - 0%Principal - - - - - - 0%Other Non-Operating Expenditures 115,802 (67,079) 21,311 79,497 87,167 7,670 10%Grant Match - - (0) 4,500 51,500 47,000 1044%Operating Transfers Out 1,236,290 1,834,432 1,162,653 - 3,384,943 3,384,943 100%Capital Outlay 1,692,039 3,017,019 6,214,875 252,437 356,901 104,464 41%
Total Expenditures 51,624,508 58,606,824 59,724,540 48,536,764 59,314,815 10,778,051 22%
FY 2018 FY 2019 FY 2020 FY 2021 FY 2022
ACTUAL ACTUAL ACTUAL ADOPTED ADOPTED AMOUNT PERCENT
General Government 41,465,952 45,537,390 43,305,152 42,734,506 53,429,275 10,694,768 25%Community Development Block Grants 110,790 113,698 48,602 60,000 60,000 - 0%Debt Service - - - - - - 0%Capital Projects 2,958,847 4,973,930 6,160,348 0 - (0) -100%Special Revenue 7,088,919 7,981,805 10,210,439 5,742,258 5,825,541 83,282 1%Fiduciary Funds - - - - - - 0%Enterprise - - - - - - 0%Internal Service - - - - - - 0%
Total Funds 51,624,508 58,606,824 59,724,540 48,536,764 59,314,815 10,778,051 22%
FY 2018 FY 2019 FY 2020 FY 2021 FY 2022
ADOPTED ADOPTED ADOPTED ADOPTED ADOPTED AMOUNT
General Fund 708.02 725.52 914.76 888.48 865.68 (22.80)Non-General Fund 53.66 57.86 57.27 46.01 41.01 (5.00)
Total Authorized 761.68 783.38 972.03 934.49 906.69 (27.80)
Positions
Educational Environments
FY 2022 ADOPTED OVER/(UNDER) FY 2021 ADOPTED
FY 2022 ADOPTED OVER/(UNDER) FY 2021 ADOPTED
FY 2022 ADOPTED OVER/(UNDER) FY 2021 ADOPTED
Goal 4
Enhance El Paso's Quality of Life through Recreational, Cultural and
Expenditures by Group
Source of Funds
196

Library9,164,214
15%
Museums and Cultural Affairs
4,591,841 8%
Parks And Recreation37,763,487
64%
Zoo7,795,274
13%
Goal 4: Quality Of LifeTotal Budget $59,314,815
Mission
Provide learning spaces, enrichment opportunities, and literacy services to our community so they can create, collaborate, and connect.
Key Functions:
Circulate materials in all formats to Library users Provide public spaces for learning opportunities and community meetings
FY 2022 Budget
FY 2021 Key Performance Indicators
Key Performance Indicator
FY19 Actual
FY20 Actual
FY21 Actual
Annual Target
Program attendance
155,660 *branch
closed due to renovations
70,383 87,460 169,110
Library
FY 2022 Total Budget $9,164,214
FY 2022 General Fund $9,021,338
FY 2022 Non-General Fund $142,875
Total FTE’s 171.00
197

FY 2018 FY 2019 FY 2020 FY 2021 FY 2022
ACTUAL ACTUAL ACTUAL ADOPTED ADOPTED AMOUNT PERCENT
Salaries and Wages 5,124,135 5,039,747 3,864,023 5,284,192 5,268,176 (16,015) 0%Employee Benefits 1,752,615 1,854,041 1,637,450 1,962,406 1,859,997 (102,408) -5%Contractual Services - - - - - - 0%Professional Services 6,123 22,852 2,635 13,100 13,100 - 0%Outside Contracts 520,756 596,369 286,918 503,053 527,435 24,382 5%Interfund Services 58,680 60,466 41,432 43,000 48,000 5,000 12%Operating Leases 8,067 10,605 4,596 10,875 10,875 - 0%Fuel and Lubricants 10,842 8,627 3,375 20,000 25,000 5,000 25%Materials and Supplies 1,750,766 1,698,426 1,397,957 1,262,094 1,246,432 (15,662) -1%Maintenance and Repairs - - - - - - 0%Minor Equipment and Furniture 16,530 388,948 7,011 - - - 0%Communications 12,597 27,294 35,167 61,930 46,000 (15,930) -26%Utilities - - - - - - 0%Travel 18,718 13,078 3,629 9,297 9,297 0 0%Other Operating Expenditures 8,030 24,138 6,713 28,854 28,854 - 0%Community Service Projects - - - - - - 0%Interest Expense - - - - - - 0%Principal - - - - - - 0%Other Non-Operating Expenditures 1,944 (1,248) 2,407 9,102 16,047 6,945 76%Grant Match - - - - - - 0%Operating Transfers Out 267,480 611,629 199,472 - - - 0%Capital Outlay - 19,348 - - 65,000 65,000 100%
Total Expenditures 9,557,283 10,374,321 7,492,786 9,207,902 9,164,214 (43,688) 0%
FY 2018 FY 2019 FY 2020 FY 2021 FY 2022
ACTUAL ACTUAL ACTUAL ADOPTED ADOPTED AMOUNT PERCENT
General Government 9,270,349 9,596,183 7,222,697 8,994,799 9,021,338 26,540 0%Community Development Block Grants - - - - - - 0%Debt Service - - - - - - 0%Capital Projects - 211,246 3,390 - - - 0%Special Revenue 286,934 566,892 266,698 213,103 142,875 (70,228) -33%Fiduciary Funds - - - - - - 0%Enterprise - - - - - - 0%Internal Service - - - - - - 0%
Total Funds 9,557,283 10,374,321 7,492,786 9,207,902 9,164,214 (43,688) 0%
FY 2018 FY 2019 FY 2020 FY 2021 FY 2022
ADOPTED ADOPTED ADOPTED ADOPTED ADOPTED AMOUNT
General Fund 154.50 154.50 158.50 158.50 166.50 8.00 Non-General Fund 3.00 4.50 4.50 6.00 4.50 (1.50)
Total Authorized 157.50 159.00 163.00 164.50 171.00 6.50
Positions
FY 2022 ADOPTED OVER/(UNDER) FY 2021 ADOPTED
FY 2022 ADOPTED OVER/(UNDER) FY 2021 ADOPTED
FY 2022 ADOPTED OVER/(UNDER) FY 2021 ADOPTED
Expenditures by Group
Source of Funds
Library
198

FY 2018 FY 2019 FY 2020 FY 2021 FY 2022
ACTUAL ACTUAL ACTUAL ADOPTED ADOPTED
General GovernmentLIBRY ADMIN 937,523 1,441,788 836,473 800,292 1,007,946
CATALOGING ORDERING PROCESS 1,997,970 1,952,713 1,727,995 1,617,225 1,631,662
MEMORIAL BRANCH OPER 344,199 352,718 243,884 371,537 338,181
ARMIJO BRANCH OPER 367,069 349,287 304,034 385,716 382,404
RICHARD BURGES BRANCH OPER 521,798 539,275 401,668 574,196 547,710
CIELO VISTA BRANCH OPER 336,446 310,218 244,902 274,816 279,506
CLARDY FOX BRANCH OPER 310,325 301,699 196,392 286,461 282,701
IRVING SCHWARTZ BRANCH OPER 396,714 364,393 282,024 428,321 404,559
JUDGE MARQUEZ MISSION VALLEY B 525,477 410,220 262,741 383,608 357,710
WESTSIDE BRANCH OPER 355,163 323,663 222,899 342,506 314,092
YSLETA BRANCH OPER 394,298 345,803 238,565 346,182 265,100
ESPERANZA ACOSTA MORENO -EAST 466,054 616,700 394,680 536,957 540,340
MAIN LIBRY 1,701,693 1,570,377 1,259,415 1,734,284 1,731,512
DORRIS VAN DOREN-WEST REGNL 468,633 565,683 467,133 627,202 630,716
LIBRARY BOOK MOBILE TECHMOBIL2 146,987 151,648 104,561 146,771 144,554
EXPRESS LIBRARY - CHAMIZAL LIB 0 0 20,875 70,194 89,813
EXPRESS LIBRARY - ALAMEDA LIBR 0 0 14,457 68,529 72,833
Sub Total 9,270,349 9,596,183 7,222,697 8,994,799 9,021,338
Capital ProjectsMEMORIAL BRANCH OPER 0 0 3,390 0 0
RICHARD BURGES BRANCH OPER 0 11,525 0 0 0
JUDGE MARQUEZ MISSION VALLEY B 0 99,998 0 0 0
YSLETA BRANCH OPER 0 99,722 0 0 0
Sub Total 0 211,246 3,390 0 0
Special RevenueLIBRY ADMIN 37,794 142,450 12,899 0 0
MEMORIAL BRANCH OPER 3,041 1,215 1,576 0 0
ARMIJO BRANCH OPER 0 0 3,953 0 0
RICHARD BURGES BRANCH OPER 86,675 262,356 28,260 56,958 54,447
CIELO VISTA BRANCH OPER 0 (9) 0 0 0
CLARDY FOX BRANCH OPER 789 822 180 0 0
IRVING SCHWARTZ BRANCH OPER 1,258 (2,065) 2,264 0 0
JUDGE MARQUEZ MISSION VALLEY B 100 0 0 0 0
WESTSIDE BRANCH OPER 100 0 3,019 0 0
YSLETA BRANCH OPER 1,777 1,252 765 0 0
ESPERANZA ACOSTA MORENO -EAST 5,452 34,690 39,359 75,135 54,447
MAIN LIBRY 859 3,538 11,918 0 0
DORRIS VAN DOREN-WEST REGNL 85,130 46,932 80,646 58,408 33,982
TEXAS STATE LIBRY GRNT (16,369) 0 0 0 0
LIBRY PRIVATE LOCAL GRNT 70,665 101,441 80,966 22,603 0
FEDERAL LIBRY GRNT (1,337) 0 0 0 0
LIBRY RESTRCD DONATIONS 0 (25,875) 0 0 0
E-RATE 11,000 0 0 0 0
LIBRARY BOOK MOBILE TECHMOBIL2 0 146 0 0 0
EXPRESS LIBRARY - CHAMIZAL LIB 0 0 446 0 0
EXPRESS LIBRARY - ALAMEDA LIBR 0 0 446 0 0
Sub Total 286,934 566,892 266,698 213,103 142,875
All Funds Total 9,557,283 10,374,321 7,492,786 9,207,902 9,164,214
Division Summary
LIBRARY
199
Strategic Actions
Goal 4: Enhance El Paso’s Quality of Life through Recreational, Cultural and Educational Environments
Strategy 4.1 Deliver bond projects impacting quality of life across the city in a timely, efficient manner Action 4.1.2 Plan, design and implement library improvements
Strategy 4.2 Create innovative recreational, educational and cultural programs Action 4.2.4 Develop Library Services that fuel passion for reading, personal growth and
learning Strategy 4.3 Establish technical criteria for improved Quality of Life facilities Action 4.3.1 Establish expansive technological foundation and service offerings through
design process
FY 2021 Key Results
Fully accredited by the Texas State Library and Archives Commission Reopened seven facilities and resumed bookmobile operations in other branches Achievement of Excellence in Libraries Award Opened the Border Heritage Center 18 graduates of the Career Online High School 1,912 clients engaged with WorkPLACE Job and Small Business training
FY 2022 Key Deliverables
Activate new facilities (Chamizal and Valle Bajo) Continue renovation of existing libraries Continue to phase-in Library services Deliver online services and virtual programming Reimagine the Bookmobile service
COVID-19 Response & Recovery
Return to expanded operating hours at open branches Return children, teen, and in-person programming Implemented temporary borrowing options Story time and programing moved remotely to social media – FB, IG, YouTube, & Twitter Libraries received 625 hotspots through CARES for community connectivity Extended Wi-Fi connectivity in Libraries Parking Lots 8 employees temporarily reassigned to Education Task Force, OEM & Health Business Offices,
Vaccine Registration, EOC response center and Testing Sites and Animal Services
200
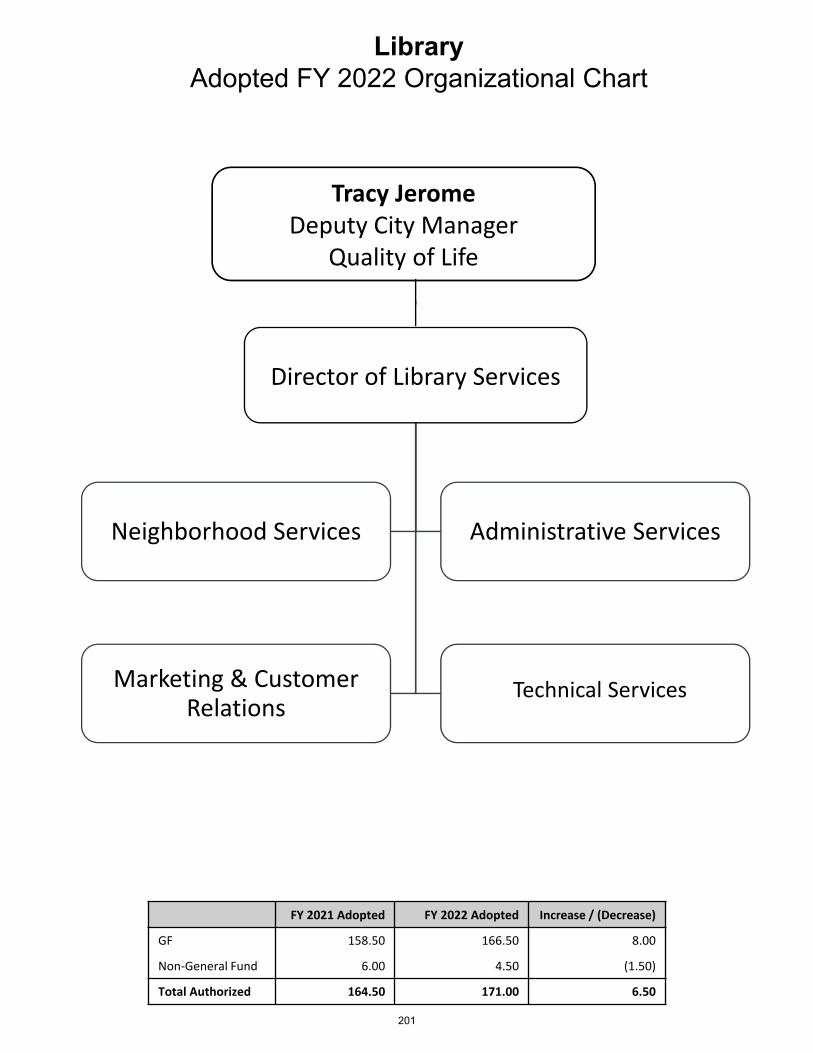
LibraryAdopted FY 2022 Organizational Chart
Tracy JeromeDeputy City Manager
Quality of Life
Director of Library Services
Neighborhood Services Administrative Services
Marketing & Customer Relations
FY 2021 Adopted FY 2022 Adopted Increase / (Decrease)
GF 158.50 166.50 8.00
Non‐General Fund 6.00 4.50 (1.50)
Total Authorized 164.50 171.00 6.50
Technical Services
201
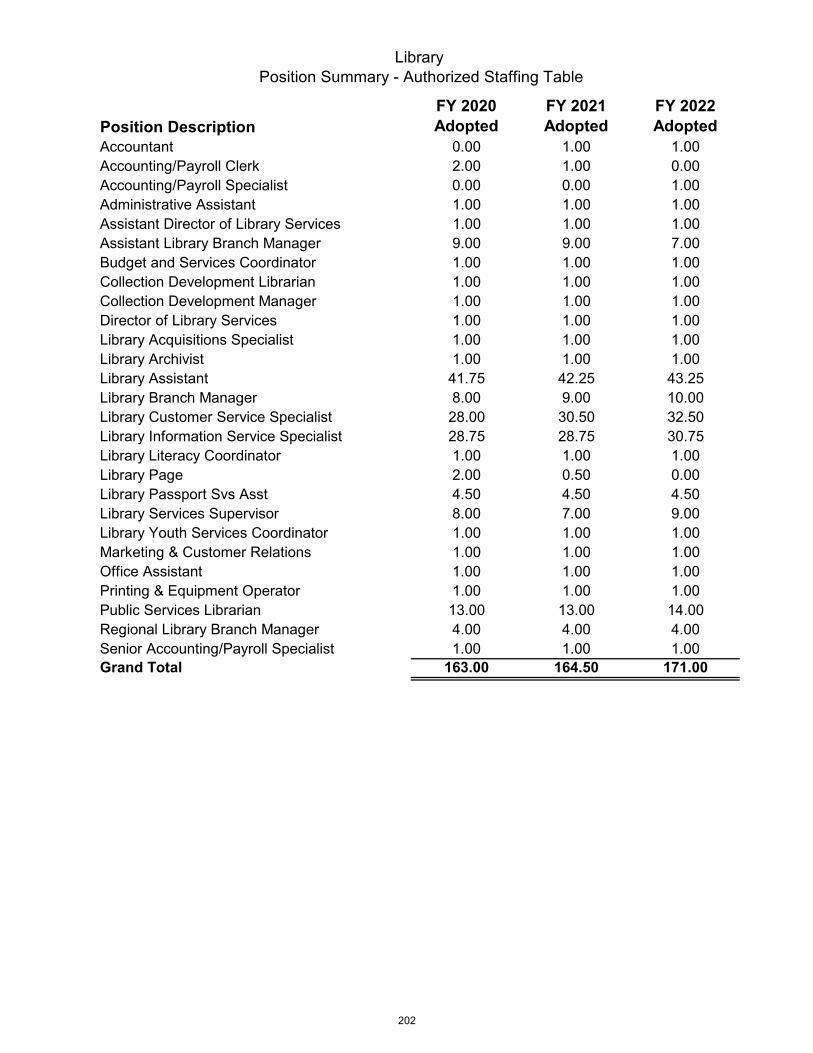
Library Position Summary - Authorized Staffing Table
Position DescriptionFY 2020 Adopted
FY 2021 Adopted
FY 2022 Adopted
Accountant 0.00 1.00 1.00Accounting/Payroll Clerk 2.00 1.00 0.00Accounting/Payroll Specialist 0.00 0.00 1.00Administrative Assistant 1.00 1.00 1.00Assistant Director of Library Services 1.00 1.00 1.00Assistant Library Branch Manager 9.00 9.00 7.00Budget and Services Coordinator 1.00 1.00 1.00Collection Development Librarian 1.00 1.00 1.00Collection Development Manager 1.00 1.00 1.00Director of Library Services 1.00 1.00 1.00Library Acquisitions Specialist 1.00 1.00 1.00Library Archivist 1.00 1.00 1.00Library Assistant 41.75 42.25 43.25Library Branch Manager 8.00 9.00 10.00Library Customer Service Specialist 28.00 30.50 32.50Library Information Service Specialist 28.75 28.75 30.75Library Literacy Coordinator 1.00 1.00 1.00Library Page 2.00 0.50 0.00Library Passport Svs Asst 4.50 4.50 4.50Library Services Supervisor 8.00 7.00 9.00Library Youth Services Coordinator 1.00 1.00 1.00Marketing & Customer Relations 1.00 1.00 1.00Office Assistant 1.00 1.00 1.00Printing & Equipment Operator 1.00 1.00 1.00Public Services Librarian 13.00 13.00 14.00Regional Library Branch Manager 4.00 4.00 4.00Senior Accounting/Payroll Specialist 1.00 1.00 1.00Grand Total 163.00 164.50 171.00
202
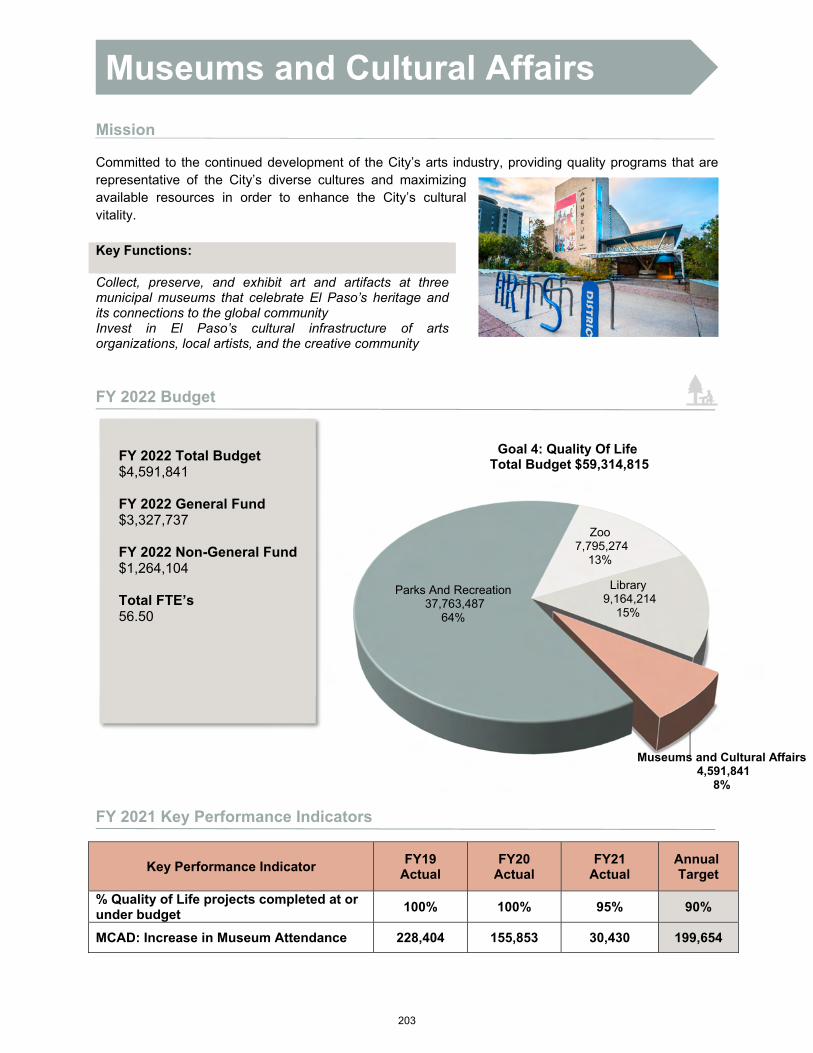
Library9,164,214
15%
Museums and Cultural Affairs4,591,841
8%
Parks And Recreation37,763,487
64%
Zoo7,795,274
13%
Goal 4: Quality Of LifeTotal Budget $59,314,815
Mission
Committed to the continued development of the City’s arts industry, providing quality programs that are representative of the City’s diverse cultures and maximizing available resources in order to enhance the City’s cultural vitality.
FY 2022 Budget
FY 2021 Key Performance Indicators
Key Functions:
Collect, preserve, and exhibit art and artifacts at three municipal museums that celebrate El Paso’s heritage and its connections to the global community Invest in El Paso’s cultural infrastructure of arts organizations, local artists, and the creative community
Key Performance Indicator FY19
Actual FY20
Actual FY21
Actual Annual Target
% Quality of Life projects completed at or under budget
100% 100% 95% 90%
MCAD: Increase in Museum Attendance 228,404 155,853 30,430 199,654
Museums and Cultural Affairs
FY 2022 Total Budget $4,591,841
FY 2022 General Fund $3,327,737
FY 2022 Non-General Fund $1,264,104
Total FTE’s 56.50
203
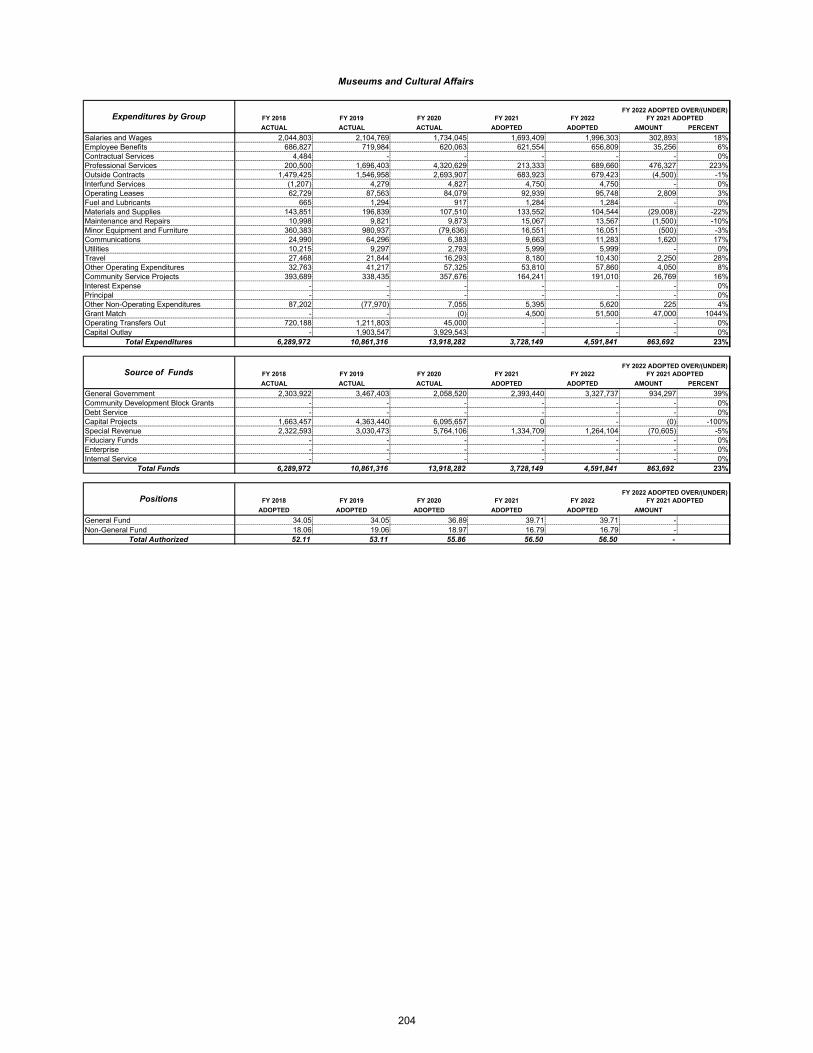
FY 2018 FY 2019 FY 2020 FY 2021 FY 2022
ACTUAL ACTUAL ACTUAL ADOPTED ADOPTED AMOUNT PERCENT
Salaries and Wages 2,044,803 2,104,769 1,734,045 1,693,409 1,996,303 302,893 18%Employee Benefits 686,827 719,984 620,063 621,554 656,809 35,256 6%Contractual Services 4,484 - - - - - 0%Professional Services 200,500 1,696,403 4,320,629 213,333 689,660 476,327 223%Outside Contracts 1,479,425 1,546,958 2,693,907 683,923 679,423 (4,500) -1%Interfund Services (1,207) 4,279 4,827 4,750 4,750 - 0%Operating Leases 62,729 87,563 84,079 92,939 95,748 2,809 3%Fuel and Lubricants 665 1,294 917 1,284 1,284 - 0%Materials and Supplies 143,851 196,839 107,510 133,552 104,544 (29,008) -22%Maintenance and Repairs 10,998 9,821 9,873 15,067 13,567 (1,500) -10%Minor Equipment and Furniture 360,383 980,937 (79,636) 16,551 16,051 (500) -3%Communications 24,990 64,296 6,383 9,663 11,283 1,620 17%Utilities 10,215 9,297 2,793 5,999 5,999 - 0%Travel 27,468 21,844 16,293 8,180 10,430 2,250 28%Other Operating Expenditures 32,763 41,217 57,325 53,810 57,860 4,050 8%Community Service Projects 393,689 338,435 357,676 164,241 191,010 26,769 16%Interest Expense - - - - - - 0%Principal - - - - - - 0%Other Non-Operating Expenditures 87,202 (77,970) 7,055 5,395 5,620 225 4%Grant Match - - (0) 4,500 51,500 47,000 1044%Operating Transfers Out 720,188 1,211,803 45,000 - - - 0%Capital Outlay - 1,903,547 3,929,543 - - - 0%
Total Expenditures 6,289,972 10,861,316 13,918,282 3,728,149 4,591,841 863,692 23%
FY 2018 FY 2019 FY 2020 FY 2021 FY 2022
ACTUAL ACTUAL ACTUAL ADOPTED ADOPTED AMOUNT PERCENT
General Government 2,303,922 3,467,403 2,058,520 2,393,440 3,327,737 934,297 39%Community Development Block Grants - - - - - - 0%Debt Service - - - - - - 0%Capital Projects 1,663,457 4,363,440 6,095,657 0 - (0) -100%Special Revenue 2,322,593 3,030,473 5,764,106 1,334,709 1,264,104 (70,605) -5%Fiduciary Funds - - - - - - 0%Enterprise - - - - - - 0%Internal Service - - - - - - 0%
Total Funds 6,289,972 10,861,316 13,918,282 3,728,149 4,591,841 863,692 23%
FY 2018 FY 2019 FY 2020 FY 2021 FY 2022
ADOPTED ADOPTED ADOPTED ADOPTED ADOPTED AMOUNT
General Fund 34.05 34.05 36.89 39.71 39.71 - Non-General Fund 18.06 19.06 18.97 16.79 16.79 -
Total Authorized 52.11 53.11 55.86 56.50 56.50 -
Source of Funds
Positions
FY 2022 ADOPTED OVER/(UNDER) FY 2021 ADOPTED
FY 2022 ADOPTED OVER/(UNDER) FY 2021 ADOPTED
Museums and Cultural Affairs
FY 2022 ADOPTED OVER/(UNDER) FY 2021 ADOPTED
Expenditures by Group
204
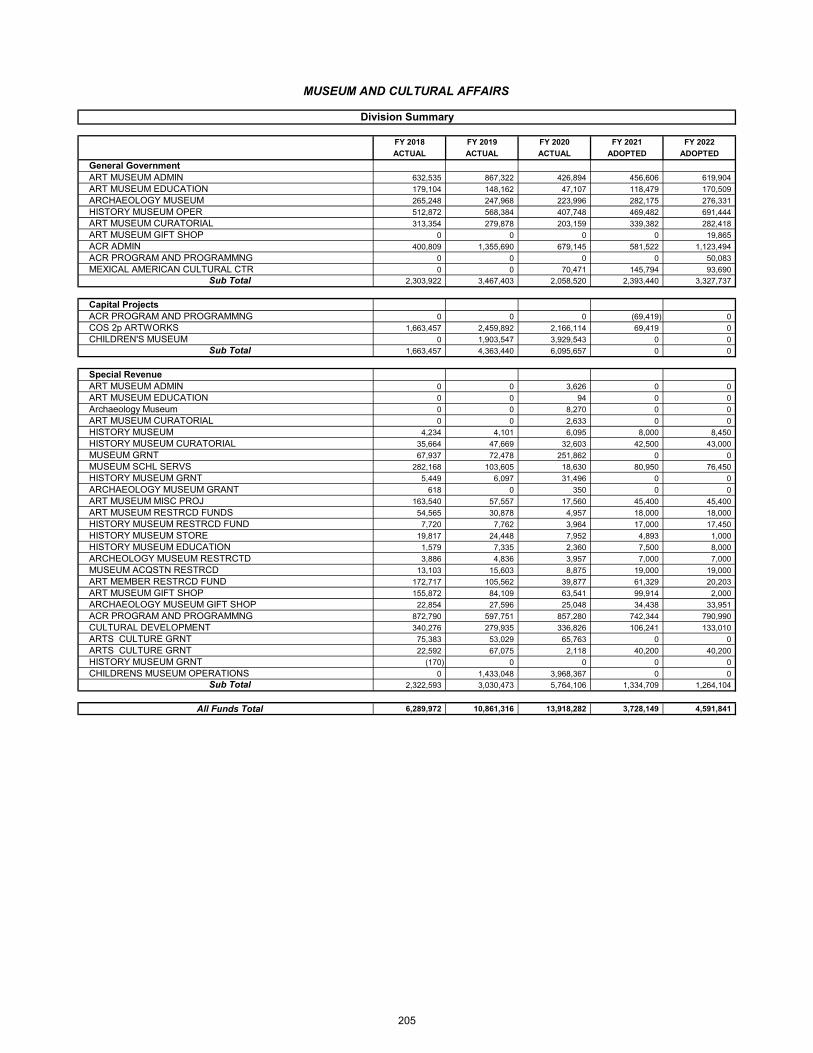
FY 2018 FY 2019 FY 2020 FY 2021 FY 2022
ACTUAL ACTUAL ACTUAL ADOPTED ADOPTED
General GovernmentART MUSEUM ADMIN 632,535 867,322 426,894 456,606 619,904
ART MUSEUM EDUCATION 179,104 148,162 47,107 118,479 170,509
ARCHAEOLOGY MUSEUM 265,248 247,968 223,996 282,175 276,331
HISTORY MUSEUM OPER 512,872 568,384 407,748 469,482 691,444
ART MUSEUM CURATORIAL 313,354 279,878 203,159 339,382 282,418
ART MUSEUM GIFT SHOP 0 0 0 0 19,865
ACR ADMIN 400,809 1,355,690 679,145 581,522 1,123,494
ACR PROGRAM AND PROGRAMMNG 0 0 0 0 50,083
MEXICAL AMERICAN CULTURAL CTR 0 0 70,471 145,794 93,690
Sub Total 2,303,922 3,467,403 2,058,520 2,393,440 3,327,737
Capital ProjectsACR PROGRAM AND PROGRAMMNG 0 0 0 (69,419) 0
COS 2p ARTWORKS 1,663,457 2,459,892 2,166,114 69,419 0
CHILDREN'S MUSEUM 0 1,903,547 3,929,543 0 0
Sub Total 1,663,457 4,363,440 6,095,657 0 0
Special RevenueART MUSEUM ADMIN 0 0 3,626 0 0
ART MUSEUM EDUCATION 0 0 94 0 0
Archaeology Museum 0 0 8,270 0 0
ART MUSEUM CURATORIAL 0 0 2,633 0 0
HISTORY MUSEUM 4,234 4,101 6,095 8,000 8,450
HISTORY MUSEUM CURATORIAL 35,664 47,669 32,603 42,500 43,000
MUSEUM GRNT 67,937 72,478 251,862 0 0
MUSEUM SCHL SERVS 282,168 103,605 18,630 80,950 76,450
HISTORY MUSEUM GRNT 5,449 6,097 31,496 0 0
ARCHAEOLOGY MUSEUM GRANT 618 0 350 0 0
ART MUSEUM MISC PROJ 163,540 57,557 17,560 45,400 45,400
ART MUSEUM RESTRCD FUNDS 54,565 30,878 4,957 18,000 18,000
HISTORY MUSEUM RESTRCD FUND 7,720 7,762 3,964 17,000 17,450
HISTORY MUSEUM STORE 19,817 24,448 7,952 4,893 1,000
HISTORY MUSEUM EDUCATION 1,579 7,335 2,360 7,500 8,000
ARCHEOLOGY MUSEUM RESTRCTD 3,886 4,836 3,957 7,000 7,000
MUSEUM ACQSTN RESTRCD 13,103 15,603 8,875 19,000 19,000
ART MEMBER RESTRCD FUND 172,717 105,562 39,877 61,329 20,203
ART MUSEUM GIFT SHOP 155,872 84,109 63,541 99,914 2,000
ARCHAEOLOGY MUSEUM GIFT SHOP 22,854 27,596 25,048 34,438 33,951
ACR PROGRAM AND PROGRAMMNG 872,790 597,751 857,280 742,344 790,990
CULTURAL DEVELOPMENT 340,276 279,935 336,826 106,241 133,010
ARTS CULTURE GRNT 75,383 53,029 65,763 0 0
ARTS CULTURE GRNT 22,592 67,075 2,118 40,200 40,200
HISTORY MUSEUM GRNT (170) 0 0 0 0
CHILDRENS MUSEUM OPERATIONS 0 1,433,048 3,968,367 0 0
Sub Total 2,322,593 3,030,473 5,764,106 1,334,709 1,264,104
All Funds Total 6,289,972 10,861,316 13,918,282 3,728,149 4,591,841
Division Summary
MUSEUM AND CULTURAL AFFAIRS
205
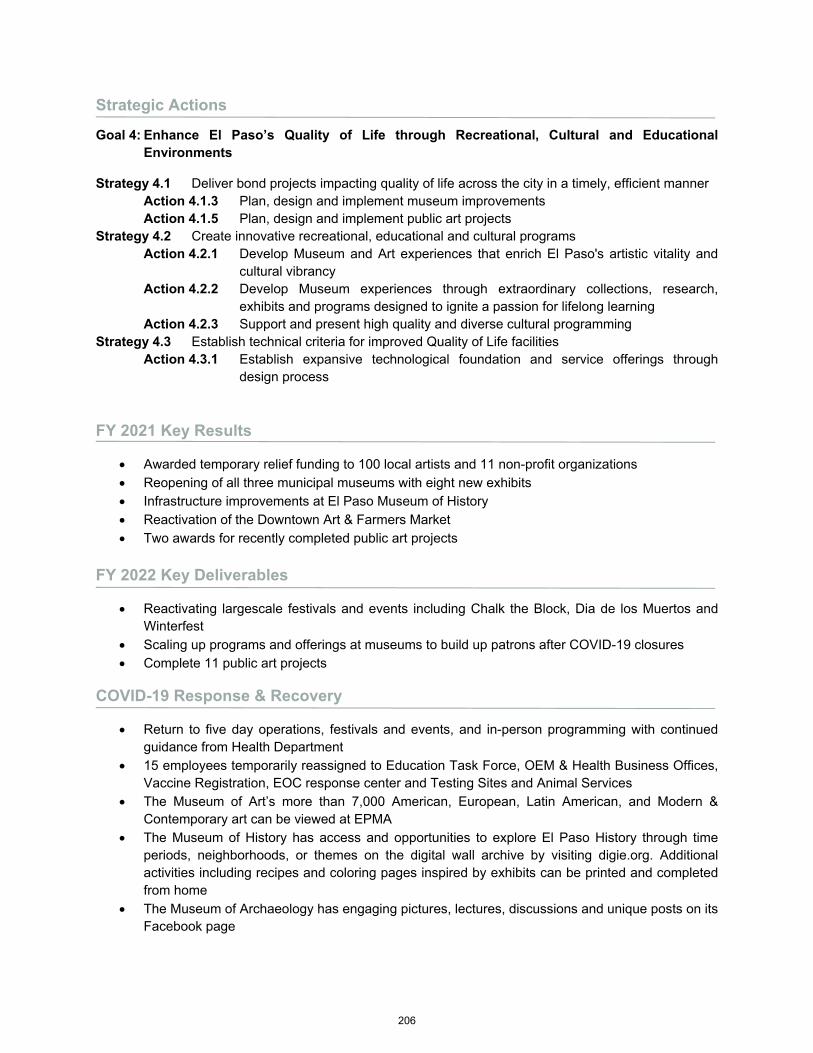
Strategic Actions
Goal 4: Enhance El Paso’s Quality of Life through Recreational, Cultural and Educational Environments
Strategy 4.1 Deliver bond projects impacting quality of life across the city in a timely, efficient manner Action 4.1.3 Plan, design and implement museum improvements Action 4.1.5 Plan, design and implement public art projects
Strategy 4.2 Create innovative recreational, educational and cultural programs Action 4.2.1 Develop Museum and Art experiences that enrich El Paso's artistic vitality and
cultural vibrancy Action 4.2.2 Develop Museum experiences through extraordinary collections, research,
exhibits and programs designed to ignite a passion for lifelong learning Action 4.2.3 Support and present high quality and diverse cultural programming Strategy 4.3 Establish technical criteria for improved Quality of Life facilities Action 4.3.1 Establish expansive technological foundation and service offerings through
design process
FY 2021 Key Results
Awarded temporary relief funding to 100 local artists and 11 non-profit organizations Reopening of all three municipal museums with eight new exhibits Infrastructure improvements at El Paso Museum of History Reactivation of the Downtown Art & Farmers Market Two awards for recently completed public art projects
FY 2022 Key Deliverables
Reactivating largescale festivals and events including Chalk the Block, Dia de los Muertos andWinterfest
Scaling up programs and offerings at museums to build up patrons after COVID-19 closures Complete 11 public art projects
COVID-19 Response & Recovery
Return to five day operations, festivals and events, and in-person programming with continuedguidance from Health Department
15 employees temporarily reassigned to Education Task Force, OEM & Health Business Offices,Vaccine Registration, EOC response center and Testing Sites and Animal Services
The Museum of Art’s more than 7,000 American, European, Latin American, and Modern &Contemporary art can be viewed at EPMA
The Museum of History has access and opportunities to explore El Paso History through timeperiods, neighborhoods, or themes on the digital wall archive by visiting digie.org. Additionalactivities including recipes and coloring pages inspired by exhibits can be printed and completedfrom home
The Museum of Archaeology has engaging pictures, lectures, discussions and unique posts on itsFacebook page
206

Museums and Cultural AffairsAdopted FY 2022 Organizational Chart
Tracy JeromeDeputy City Manager
Quality of Life
FY 2021 Adopted FY 2022 Adopted Increase / (Decrease)
GF 39.71 39.71 0.00
Non‐General Fund 16.79 16.79 0.00
Total Authorized 56.50 56.50 0.00
Administrative Services
Managing Director
City Museums Cultural Affairs
207
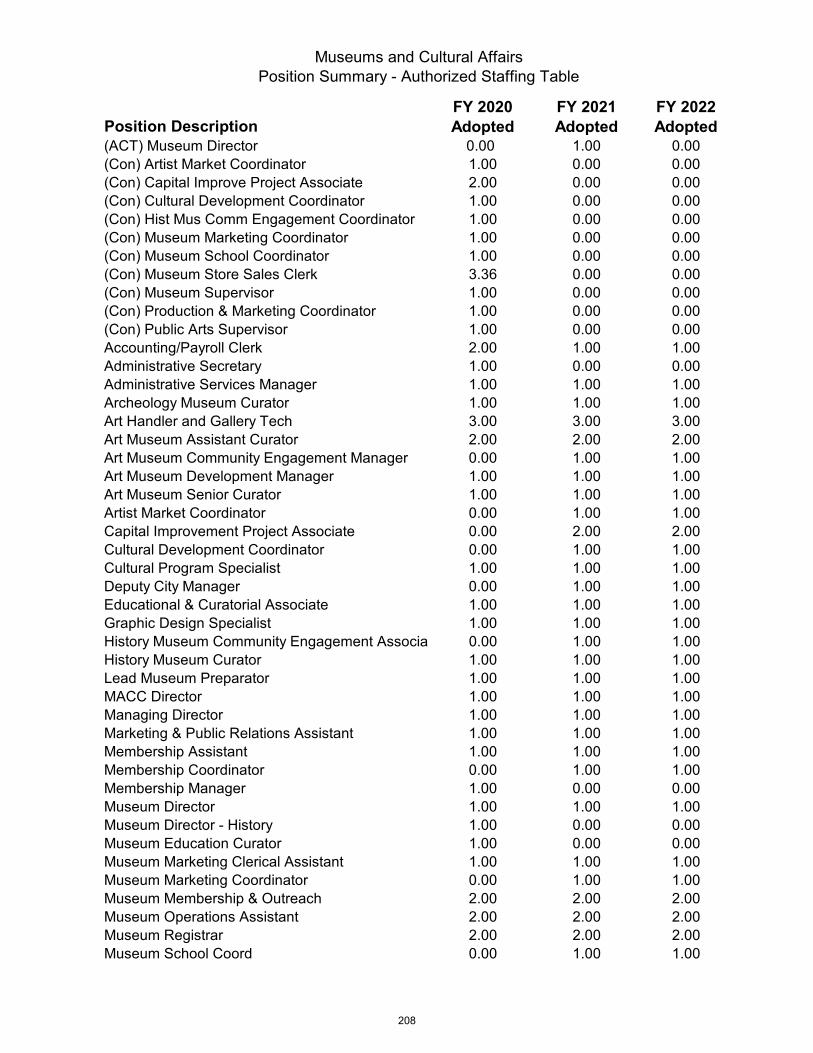
Museums and Cultural Affairs Position Summary - Authorized Staffing Table
Position DescriptionFY 2020 Adopted
FY 2021 Adopted
FY 2022 Adopted
(ACT) Museum Director 0.00 1.00 0.00(Con) Artist Market Coordinator 1.00 0.00 0.00(Con) Capital Improve Project Associate 2.00 0.00 0.00(Con) Cultural Development Coordinator 1.00 0.00 0.00(Con) Hist Mus Comm Engagement Coordinator 1.00 0.00 0.00(Con) Museum Marketing Coordinator 1.00 0.00 0.00(Con) Museum School Coordinator 1.00 0.00 0.00(Con) Museum Store Sales Clerk 3.36 0.00 0.00(Con) Museum Supervisor 1.00 0.00 0.00(Con) Production & Marketing Coordinator 1.00 0.00 0.00(Con) Public Arts Supervisor 1.00 0.00 0.00Accounting/Payroll Clerk 2.00 1.00 1.00Administrative Secretary 1.00 0.00 0.00Administrative Services Manager 1.00 1.00 1.00Archeology Museum Curator 1.00 1.00 1.00Art Handler and Gallery Tech 3.00 3.00 3.00Art Museum Assistant Curator 2.00 2.00 2.00Art Museum Community Engagement Manager 0.00 1.00 1.00Art Museum Development Manager 1.00 1.00 1.00Art Museum Senior Curator 1.00 1.00 1.00Artist Market Coordinator 0.00 1.00 1.00Capital Improvement Project Associate 0.00 2.00 2.00Cultural Development Coordinator 0.00 1.00 1.00Cultural Program Specialist 1.00 1.00 1.00Deputy City Manager 0.00 1.00 1.00Educational & Curatorial Associate 1.00 1.00 1.00Graphic Design Specialist 1.00 1.00 1.00History Museum Community Engagement Associa 0.00 1.00 1.00History Museum Curator 1.00 1.00 1.00Lead Museum Preparator 1.00 1.00 1.00MACC Director 1.00 1.00 1.00Managing Director 1.00 1.00 1.00Marketing & Public Relations Assistant 1.00 1.00 1.00Membership Assistant 1.00 1.00 1.00Membership Coordinator 0.00 1.00 1.00Membership Manager 1.00 0.00 0.00Museum Director 1.00 1.00 1.00Museum Director - History 1.00 0.00 0.00Museum Education Curator 1.00 0.00 0.00Museum Marketing Clerical Assistant 1.00 1.00 1.00Museum Marketing Coordinator 0.00 1.00 1.00Museum Membership & Outreach 2.00 2.00 2.00Museum Operations Assistant 2.00 2.00 2.00Museum Registrar 2.00 2.00 2.00Museum School Coord 0.00 1.00 1.00
208

Museums and Cultural Affairs Position Summary - Authorized Staffing Table
Position DescriptionFY 2020 Adopted
FY 2021 Adopted
FY 2022 Adopted
Museum Store Sales Clerk 0.00 2.50 2.50Museum Supervisor 0.00 1.00 2.00Museums & Cul Affairs Assistant Director 1.00 1.00 1.00Museums & Cultural Affairs Director 1.00 0.00 0.00Preparator / Facility Coordinator 1.00 1.00 1.00Production & Market Coord 0.00 1.00 1.00Proj Accountant 0.00 1.00 1.00Pub Arts Prgm Supv 0.00 1.00 1.00Public Affairs Coordinator 1.00 1.00 1.00Public Art Specialist 1.00 1.00 1.00Research & Management Assistant 0.00 1.00 1.00Secretary 1.00 1.00 1.00Senior Accounting/Payroll Specialist 2.00 2.00 2.00Service & Security Worker 1.00 1.00 1.00Strategic Initiatives Coord 0.00 1.00 1.00Visitor Services Assistant 1.50 2.00 2.00Grand Total 55.86 56.50 56.50
209

Library9,164,214
15%
Museums and Cultural Affairs
4,591,841 8%
Parks And Recreation37,763,487
64%
Zoo7,795,274
13%
Goal 4: Quality Of LifeTotal Budget $59,314,815
Mission
Provide indoor and outdoor leisure services to persons of all ages so they can develop skills, socialize, experience nature, relax, and live a healthier lifestyle.
FY 2022 Budget
FY 2021 Key Performance Indicators
Key Performance Indicator
FY19 Actual
FY20 Actual
FY21 Actual
Annual Target
Recreation program participation
790,797 517,068 503,938 864,665 people
Key Functions: Provide recreation facilities for health, leisure, and enjoyment Provide leisure interest classes and programs that create opportunities for self-fulfillment Maintain landscape and facilities to protect the public investment
Parks and Recreation
FY 2022 Total Budget $37,763,487
FY 2022 General Fund $35,558,487
FY 2022 Non-General Fund $2,205,000
Total FTE’s 544.69
210
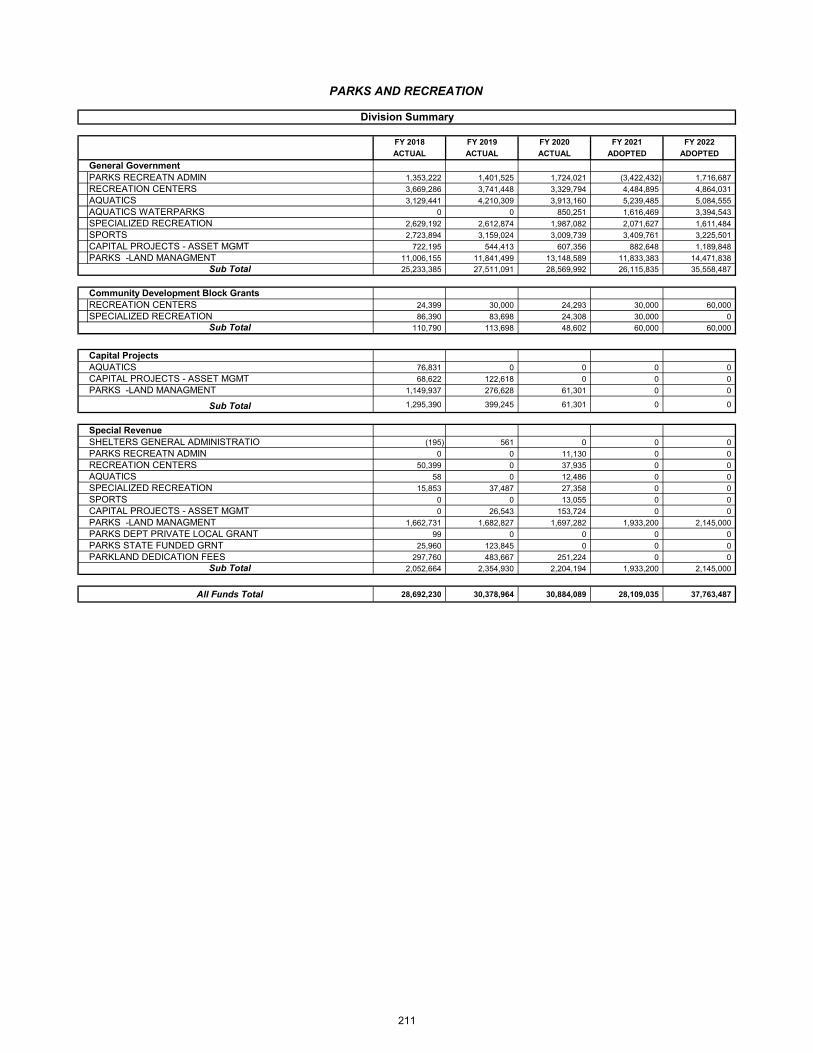
FY 2018 FY 2019 FY 2020 FY 2021 FY 2022
ACTUAL ACTUAL ACTUAL ADOPTED ADOPTED
General GovernmentPARKS RECREATN ADMIN 1,353,222 1,401,525 1,724,021 (3,422,432) 1,716,687
RECREATION CENTERS 3,669,286 3,741,448 3,329,794 4,484,895 4,864,031
AQUATICS 3,129,441 4,210,309 3,913,160 5,239,485 5,084,555
AQUATICS WATERPARKS 0 0 850,251 1,616,469 3,394,543
SPECIALIZED RECREATION 2,629,192 2,612,874 1,987,082 2,071,627 1,611,484
SPORTS 2,723,894 3,159,024 3,009,739 3,409,761 3,225,501
CAPITAL PROJECTS - ASSET MGMT 722,195 544,413 607,356 882,648 1,189,848
PARKS -LAND MANAGMENT 11,006,155 11,841,499 13,148,589 11,833,383 14,471,838
Sub Total 25,233,385 27,511,091 28,569,992 26,115,835 35,558,487
Community Development Block GrantsRECREATION CENTERS 24,399 30,000 24,293 30,000 60,000
SPECIALIZED RECREATION 86,390 83,698 24,308 30,000 0
Sub Total 110,790 113,698 48,602 60,000 60,000
Capital ProjectsAQUATICS 76,831 0 0 0 0
CAPITAL PROJECTS - ASSET MGMT 68,622 122,618 0 0 0
PARKS -LAND MANAGMENT 1,149,937 276,628 61,301 0 0
Sub Total 1,295,390 399,245 61,301 0 0
Special RevenueSHELTERS GENERAL ADMINISTRATIO (195) 561 0 0 0
PARKS RECREATN ADMIN 0 0 11,130 0 0
RECREATION CENTERS 50,399 0 37,935 0 0
AQUATICS 58 0 12,486 0 0
SPECIALIZED RECREATION 15,853 37,487 27,358 0 0
SPORTS 0 0 13,055 0 0
CAPITAL PROJECTS - ASSET MGMT 0 26,543 153,724 0 0
PARKS -LAND MANAGMENT 1,662,731 1,682,827 1,697,282 1,933,200 2,145,000
PARKS DEPT PRIVATE LOCAL GRANT 99 0 0 0 0
PARKS STATE FUNDED GRNT 25,960 123,845 0 0 0
PARKLAND DEDICATION FEES 297,760 483,667 251,224 0 0
Sub Total 2,052,664 2,354,930 2,204,194 1,933,200 2,145,000
All Funds Total 28,692,230 30,378,964 30,884,089 28,109,035 37,763,487
Division Summary
PARKS AND RECREATION
211
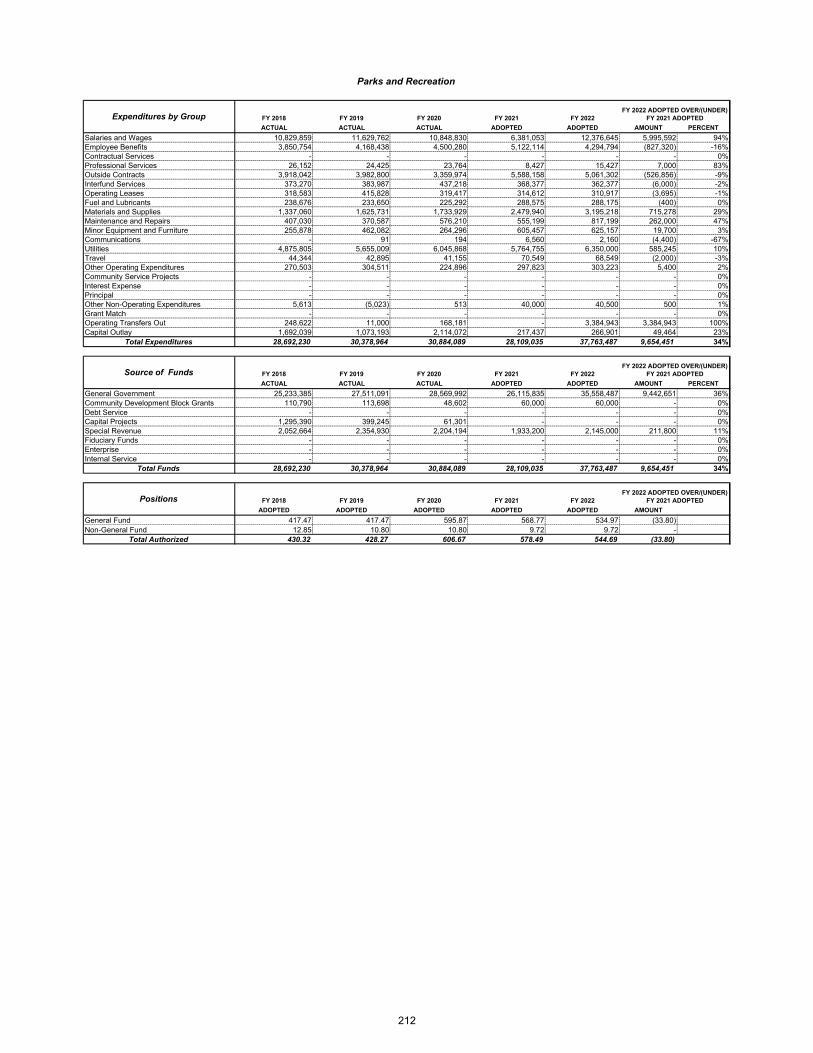
FY 2018 FY 2019 FY 2020 FY 2021 FY 2022
ACTUAL ACTUAL ACTUAL ADOPTED ADOPTED AMOUNT PERCENT
Salaries and Wages 10,829,859 11,629,762 10,848,830 6,381,053 12,376,645 5,995,592 94%Employee Benefits 3,850,754 4,168,438 4,500,280 5,122,114 4,294,794 (827,320) -16%Contractual Services - - - - - - 0%Professional Services 26,152 24,425 23,764 8,427 15,427 7,000 83%Outside Contracts 3,918,042 3,982,800 3,359,974 5,588,158 5,061,302 (526,856) -9%Interfund Services 373,270 383,987 437,218 368,377 362,377 (6,000) -2%Operating Leases 318,583 415,828 319,417 314,612 310,917 (3,695) -1%Fuel and Lubricants 238,676 233,650 225,292 288,575 288,175 (400) 0%Materials and Supplies 1,337,060 1,625,731 1,733,929 2,479,940 3,195,218 715,278 29%Maintenance and Repairs 407,030 370,587 576,210 555,199 817,199 262,000 47%Minor Equipment and Furniture 255,878 462,082 264,296 605,457 625,157 19,700 3%Communications - 91 194 6,560 2,160 (4,400) -67%Utilities 4,875,805 5,655,009 6,045,868 5,764,755 6,350,000 585,245 10%Travel 44,344 42,895 41,155 70,549 68,549 (2,000) -3%Other Operating Expenditures 270,503 304,511 224,896 297,823 303,223 5,400 2%Community Service Projects - - - - - - 0%Interest Expense - - - - - - 0%Principal - - - - - - 0%Other Non-Operating Expenditures 5,613 (5,023) 513 40,000 40,500 500 1%Grant Match - - - - - - 0%Operating Transfers Out 248,622 11,000 168,181 - 3,384,943 3,384,943 100%Capital Outlay 1,692,039 1,073,193 2,114,072 217,437 266,901 49,464 23%
Total Expenditures 28,692,230 30,378,964 30,884,089 28,109,035 37,763,487 9,654,451 34%
FY 2018 FY 2019 FY 2020 FY 2021 FY 2022
ACTUAL ACTUAL ACTUAL ADOPTED ADOPTED AMOUNT PERCENT
General Government 25,233,385 27,511,091 28,569,992 26,115,835 35,558,487 9,442,651 36%Community Development Block Grants 110,790 113,698 48,602 60,000 60,000 - 0%Debt Service - - - - - - 0%Capital Projects 1,295,390 399,245 61,301 - - - 0%Special Revenue 2,052,664 2,354,930 2,204,194 1,933,200 2,145,000 211,800 11%Fiduciary Funds - - - - - - 0%Enterprise - - - - - - 0%Internal Service - - - - - - 0%
Total Funds 28,692,230 30,378,964 30,884,089 28,109,035 37,763,487 9,654,451 34%
FY 2018 FY 2019 FY 2020 FY 2021 FY 2022
ADOPTED ADOPTED ADOPTED ADOPTED ADOPTED AMOUNT
General Fund 417.47 417.47 595.87 568.77 534.97 (33.80)Non-General Fund 12.85 10.80 10.80 9.72 9.72 -
Total Authorized 430.32 428.27 606.67 578.49 544.69 (33.80)
Positions
Source of Funds
Parks and Recreation
FY 2022 ADOPTED OVER/(UNDER) FY 2021 ADOPTED
FY 2022 ADOPTED OVER/(UNDER) FY 2021 ADOPTED
FY 2022 ADOPTED OVER/(UNDER) FY 2021 ADOPTED
Expenditures by Group
212
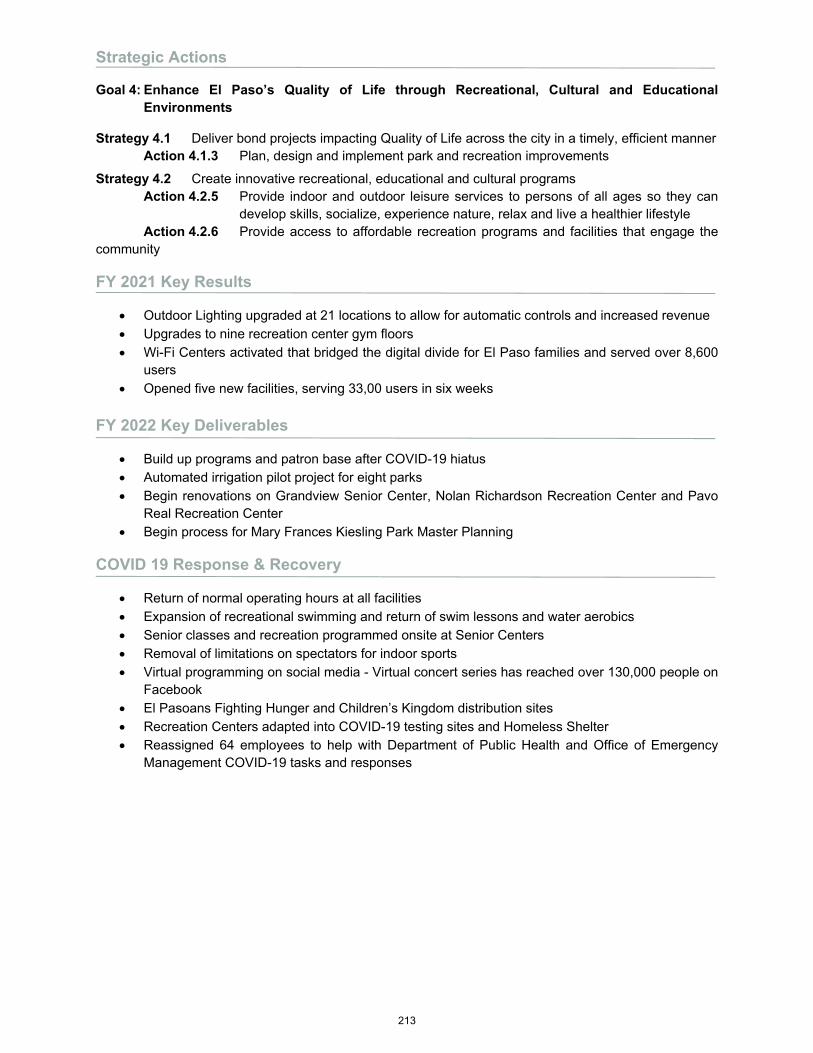
Strategic Actions
Goal 4: Enhance El Paso’s Quality of Life through Recreational, Cultural and Educational Environments
Strategy 4.1 Deliver bond projects impacting Quality of Life across the city in a timely, efficient manner Action 4.1.3 Plan, design and implement park and recreation improvements
Strategy 4.2 Create innovative recreational, educational and cultural programs Action 4.2.5 Provide indoor and outdoor leisure services to persons of all ages so they can
develop skills, socialize, experience nature, relax and live a healthier lifestyle Action 4.2.6 Provide access to affordable recreation programs and facilities that engage the community
FY 2021 Key Results
Outdoor Lighting upgraded at 21 locations to allow for automatic controls and increased revenue Upgrades to nine recreation center gym floors Wi-Fi Centers activated that bridged the digital divide for El Paso families and served over 8,600
users Opened five new facilities, serving 33,00 users in six weeks
FY 2022 Key Deliverables
Build up programs and patron base after COVID-19 hiatus Automated irrigation pilot project for eight parks Begin renovations on Grandview Senior Center, Nolan Richardson Recreation Center and Pavo
Real Recreation Center Begin process for Mary Frances Kiesling Park Master Planning
COVID 19 Response & Recovery
Return of normal operating hours at all facilities Expansion of recreational swimming and return of swim lessons and water aerobics Senior classes and recreation programmed onsite at Senior Centers Removal of limitations on spectators for indoor sports Virtual programming on social media - Virtual concert series has reached over 130,000 people on
Facebook El Pasoans Fighting Hunger and Children’s Kingdom distribution sites Recreation Centers adapted into COVID-19 testing sites and Homeless Shelter Reassigned 64 employees to help with Department of Public Health and Office of Emergency
Management COVID-19 tasks and responses
213
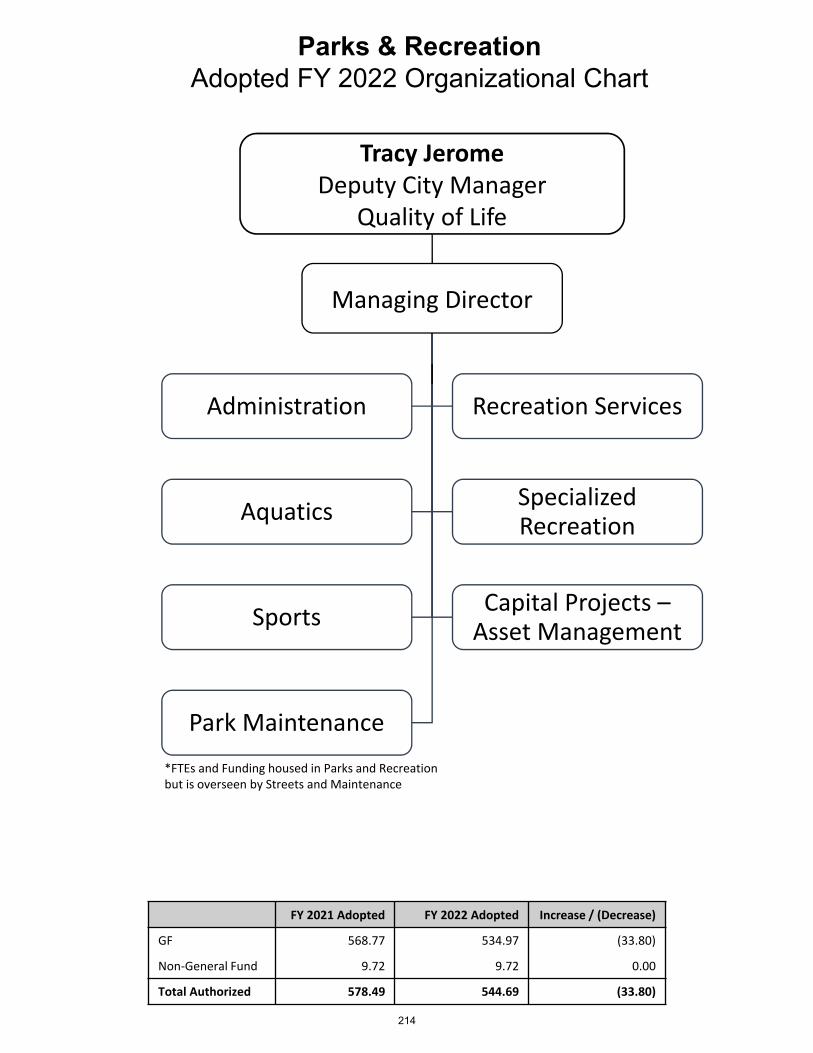
Parks & RecreationAdopted FY 2022 Organizational Chart
Managing Director
Administration Recreation Services
AquaticsSpecialized Recreation
SportsCapital Projects –Asset Management
Park Maintenance
Tracy JeromeDeputy City Manager
Quality of Life
FY 2021 Adopted FY 2022 Adopted Increase / (Decrease)
GF 568.77 534.97 (33.80)
Non‐General Fund 9.72 9.72 0.00
Total Authorized 578.49 544.69 (33.80)
*FTEs and Funding housed in Parks and Recreationbut is overseen by Streets and Maintenance
214
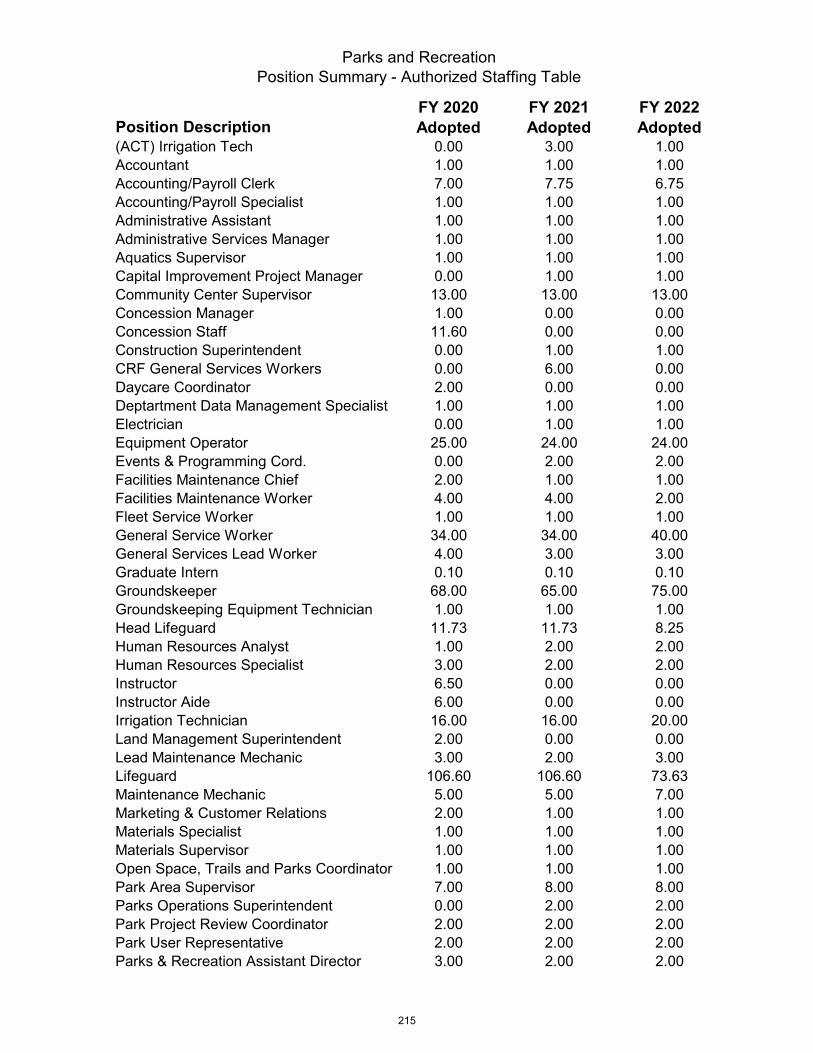
Parks and RecreationPosition Summary - Authorized Staffing Table
Position DescriptionFY 2020 Adopted
FY 2021 Adopted
FY 2022 Adopted
(ACT) Irrigation Tech 0.00 3.00 1.00Accountant 1.00 1.00 1.00Accounting/Payroll Clerk 7.00 7.75 6.75Accounting/Payroll Specialist 1.00 1.00 1.00Administrative Assistant 1.00 1.00 1.00Administrative Services Manager 1.00 1.00 1.00Aquatics Supervisor 1.00 1.00 1.00Capital Improvement Project Manager 0.00 1.00 1.00Community Center Supervisor 13.00 13.00 13.00Concession Manager 1.00 0.00 0.00Concession Staff 11.60 0.00 0.00Construction Superintendent 0.00 1.00 1.00CRF General Services Workers 0.00 6.00 0.00Daycare Coordinator 2.00 0.00 0.00Deptartment Data Management Specialist 1.00 1.00 1.00Electrician 0.00 1.00 1.00Equipment Operator 25.00 24.00 24.00Events & Programming Cord. 0.00 2.00 2.00Facilities Maintenance Chief 2.00 1.00 1.00Facilities Maintenance Worker 4.00 4.00 2.00Fleet Service Worker 1.00 1.00 1.00General Service Worker 34.00 34.00 40.00General Services Lead Worker 4.00 3.00 3.00Graduate Intern 0.10 0.10 0.10Groundskeeper 68.00 65.00 75.00Groundskeeping Equipment Technician 1.00 1.00 1.00Head Lifeguard 11.73 11.73 8.25Human Resources Analyst 1.00 2.00 2.00Human Resources Specialist 3.00 2.00 2.00Instructor 6.50 0.00 0.00Instructor Aide 6.00 0.00 0.00Irrigation Technician 16.00 16.00 20.00Land Management Superintendent 2.00 0.00 0.00Lead Maintenance Mechanic 3.00 2.00 3.00Lifeguard 106.60 106.60 73.63Maintenance Mechanic 5.00 5.00 7.00Marketing & Customer Relations 2.00 1.00 1.00Materials Specialist 1.00 1.00 1.00Materials Supervisor 1.00 1.00 1.00Open Space, Trails and Parks Coordinator 1.00 1.00 1.00Park Area Supervisor 7.00 8.00 8.00Parks Operations Superintendent 0.00 2.00 2.00Park Project Review Coordinator 2.00 2.00 2.00Park User Representative 2.00 2.00 2.00Parks & Recreation Assistant Director 3.00 2.00 2.00
215
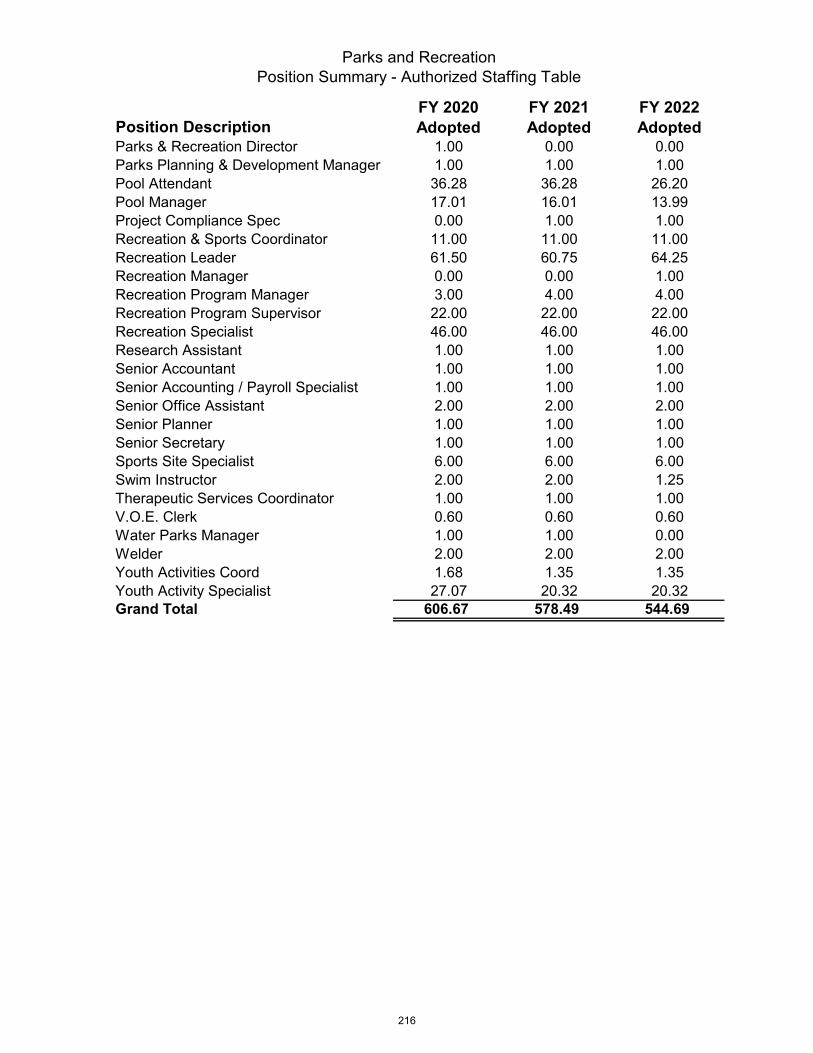
Parks and RecreationPosition Summary - Authorized Staffing Table
Position DescriptionFY 2020 Adopted
FY 2021 Adopted
FY 2022 Adopted
Parks & Recreation Director 1.00 0.00 0.00Parks Planning & Development Manager 1.00 1.00 1.00Pool Attendant 36.28 36.28 26.20Pool Manager 17.01 16.01 13.99Project Compliance Spec 0.00 1.00 1.00Recreation & Sports Coordinator 11.00 11.00 11.00Recreation Leader 61.50 60.75 64.25Recreation Manager 0.00 0.00 1.00Recreation Program Manager 3.00 4.00 4.00Recreation Program Supervisor 22.00 22.00 22.00Recreation Specialist 46.00 46.00 46.00Research Assistant 1.00 1.00 1.00Senior Accountant 1.00 1.00 1.00Senior Accounting / Payroll Specialist 1.00 1.00 1.00Senior Office Assistant 2.00 2.00 2.00Senior Planner 1.00 1.00 1.00Senior Secretary 1.00 1.00 1.00Sports Site Specialist 6.00 6.00 6.00Swim Instructor 2.00 2.00 1.25Therapeutic Services Coordinator 1.00 1.00 1.00V.O.E. Clerk 0.60 0.60 0.60Water Parks Manager 1.00 1.00 0.00Welder 2.00 2.00 2.00Youth Activities Coord 1.68 1.35 1.35Youth Activity Specialist 27.07 20.32 20.32Grand Total 606.67 578.49 544.69
216
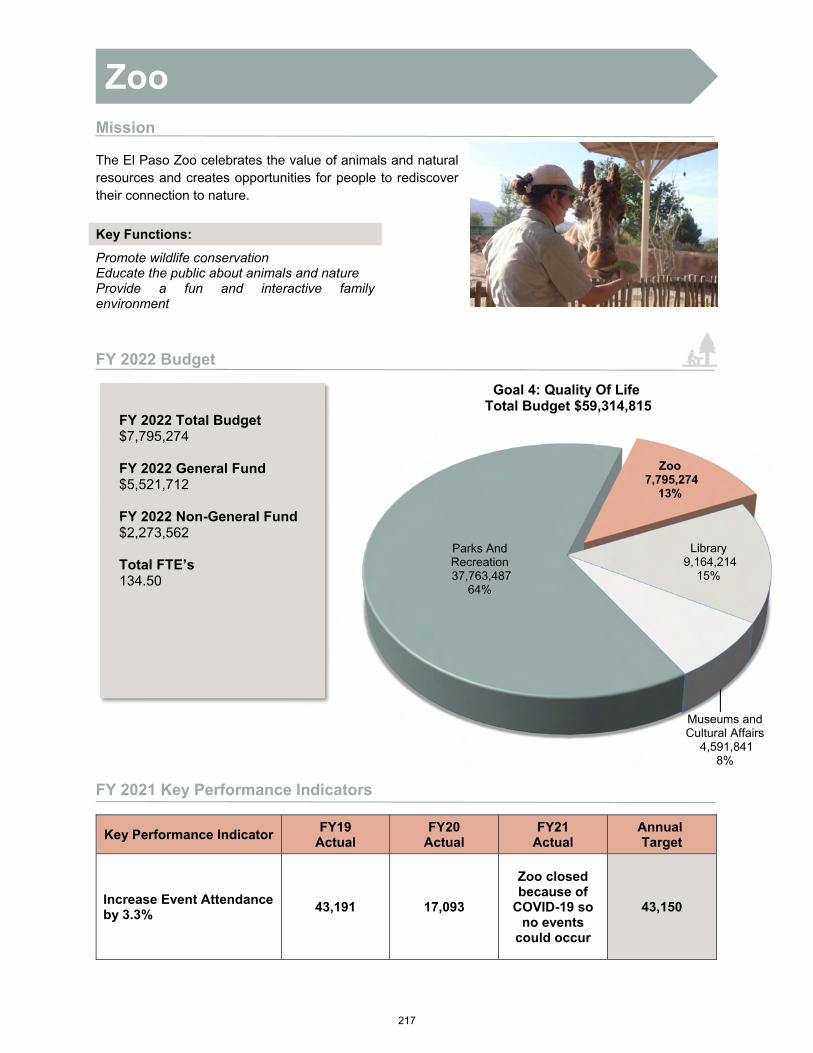
Library9,164,214
15%
Museums and Cultural Affairs
4,591,841 8%
Parks And Recreation37,763,487
64%
Zoo7,795,274
13%
Goal 4: Quality Of LifeTotal Budget $59,314,815
Mission
The El Paso Zoo celebrates the value of animals and natural resources and creates opportunities for people to rediscover their connection to nature.
Key Functions:
Promote wildlife conservation Educate the public about animals and nature Provide a fun and interactive family environment
FY 2022 Budget
FY 2021 Key Performance Indicators
Key Performance Indicator FY19
Actual FY20
Actual FY21
Actual Annual Target
Increase Event Attendance by 3.3%
43,191 17,093
Zoo closed because of
COVID-19 so no events
could occur
43,150
FY 2022 Total Budget $7,795,274
FY 2022 General Fund $5,521,712
FY 2022 Non-General Fund $2,273,562
Total FTE’s 134.50
Zoo
217

FY 2018 FY 2019 FY 2020 FY 2021 FY 2022
ACTUAL ACTUAL ACTUAL ADOPTED ADOPTED AMOUNT PERCENT
Salaries and Wages 3,745,824 3,800,828 3,651,579 3,959,028 4,203,552 244,524 6%Employee Benefits 1,588,466 1,587,098 1,581,222 1,644,765 1,647,882 3,117 0%Contractual Services - - - - - - 0%Professional Services 23,001 37,282 25,169 81,641 82,392 751 1%Outside Contracts 808,714 583,199 465,515 632,581 631,783 (798) 0%Interfund Services 43,271 21,849 39,730 36,725 36,725 - 0%Operating Leases 6,683 6,844 4,611 8,200 8,200 - 0%Fuel and Lubricants 9,965 8,629 8,279 12,100 12,100 - 0%Materials and Supplies 599,926 651,910 546,310 730,678 798,059 67,381 9%Maintenance and Repairs 87,408 104,488 65,036 109,745 111,895 2,150 2%Minor Equipment and Furniture 46,613 42,363 22,396 25,026 28,676 3,650 15%Communications 22,781 16,706 17,352 43,440 42,314 (1,126) -3%Utilities - - - - - - 0%Travel 31,121 40,654 22,134 79,360 79,360 - 0%Other Operating Expenditures 50,209 52,278 47,454 68,389 62,336 (6,053) -9%Community Service Projects - - - - - - 0%Interest Expense - - - - - - 0%Principal - - - - - - 0%Other Non-Operating Expenditures 21,042 17,161 11,337 25,000 25,000 - 0%Grant Match - - - - - - 0%Operating Transfers Out - - 750,000 - - - 0%Capital Outlay - 20,931 171,260 35,000 25,000 (10,000) -29%
Total Expenditures 7,085,024 6,992,222 7,429,384 7,491,678 7,795,274 303,596 4%
FY 2018 FY 2019 FY 2020 FY 2021 FY 2022
ACTUAL ACTUAL ACTUAL ADOPTED ADOPTED AMOUNT PERCENT
General Government 4,658,296 4,962,712 5,453,943 5,230,432 5,521,712 291,281 6%Community Development Block Grants - - - - - - 0%Debt Service - - - - - - 0%Capital Projects - - - - - - 0%Special Revenue 2,426,727 2,029,510 1,975,440 2,261,246 2,273,562 12,315 1%Fiduciary Funds - - - - - - 0%Enterprise - - - - - - 0%Internal Service - - - - - - 0%
Total Funds 7,085,024 6,992,222 7,429,384 7,491,678 7,795,274 303,596 4%
FY 2018 FY 2019 FY 2020 FY 2021 FY 2022
ADOPTED ADOPTED ADOPTED ADOPTED ADOPTED AMOUNT
General Fund 102.00 119.50 123.50 121.50 124.50 3.00 Non-General Fund 19.75 23.50 23.00 13.50 10.00 (3.50)
Total Authorized 121.75 143.00 146.50 135.00 134.50 (0.50)
FY 2022 ADOPTED OVER/(UNDER) FY 2021 ADOPTED
Expenditures by Group
Zoo
FY 2022 ADOPTED OVER/(UNDER) FY 2021 ADOPTED
Source of Funds
PositionsFY 2022 ADOPTED OVER/(UNDER)
FY 2021 ADOPTED
218

FY 2018 FY 2019 FY 2020 FY 2021 FY 2022
ACTUAL ACTUAL ACTUAL ADOPTED ADOPTED
General GovernmentADMINISTRATIVE 613,845 669,760 1,343,485 635,508 745,056
INFRASTRUCTURE 1,060,443 1,221,938 923,136 1,118,116 1,154,245
ANIMAL CARE 2,634,919 2,772,380 2,884,068 3,042,253 3,185,651
COMMUNITY & GUEST EXPERIENCE 349,090 298,635 303,254 434,554 436,760
Sub Total 4,658,296 4,962,712 5,453,943 5,230,432 5,521,712
Special RevenueZOO GENERAL OPER 0 59 0 0 0
ADMINISTRATIVE 214,391 145,014 251,857 113,812 118,507
INFRASTRUCTURE 1,262,538 943,350 949,830 1,142,469 1,113,016
ANIMAL CARE 769,239 773,149 640,478 845,622 885,963
COMMUNITY & GUEST EXPERIENCE 180,560 167,938 133,276 159,344 156,075
Sub Total 2,426,727 2,029,510 1,975,440 2,261,246 2,273,562
All Funds Total 7,085,024 6,992,222 7,429,384 7,491,678 7,795,274
Division Summary
ZOO
219
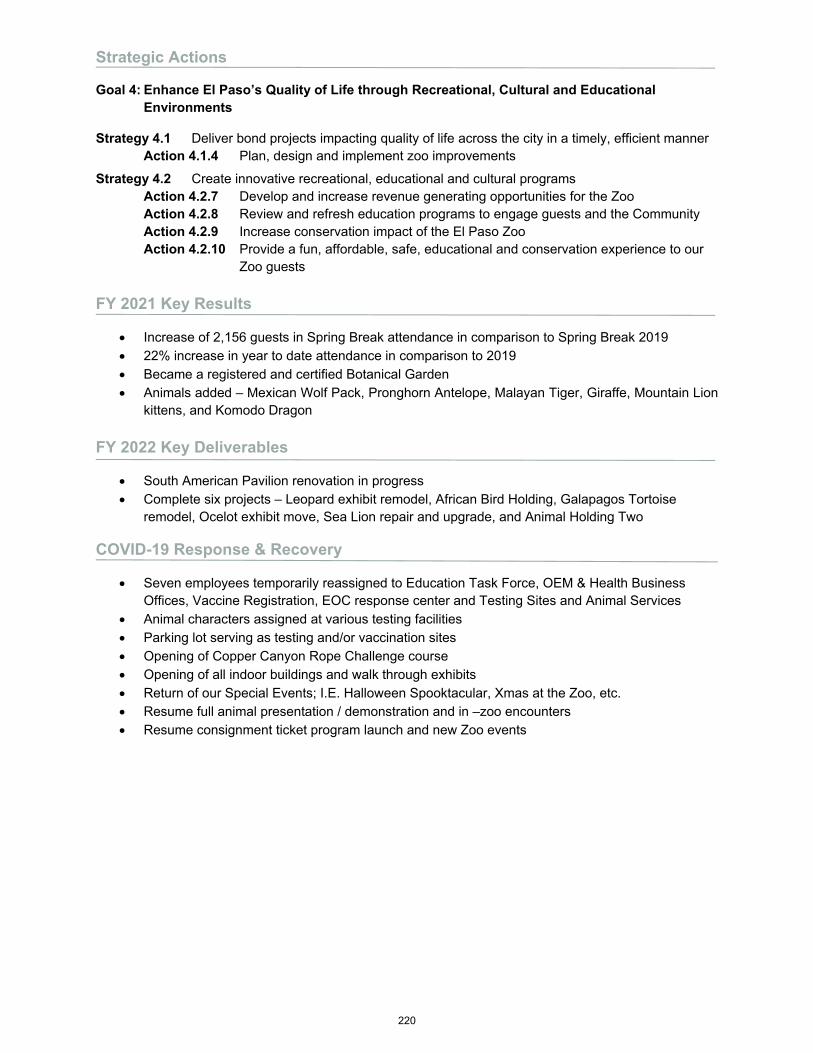
Strategic Actions
Goal 4: Enhance El Paso’s Quality of Life through Recreational, Cultural and Educational Environments
Strategy 4.1 Deliver bond projects impacting quality of life across the city in a timely, efficient manner Action 4.1.4 Plan, design and implement zoo improvements
Strategy 4.2 Create innovative recreational, educational and cultural programs Action 4.2.7 Develop and increase revenue generating opportunities for the Zoo
Action 4.2.8 Review and refresh education programs to engage guests and the Community Action 4.2.9 Increase conservation impact of the El Paso Zoo Action 4.2.10 Provide a fun, affordable, safe, educational and conservation experience to our
Zoo guests
FY 2021 Key Results
Increase of 2,156 guests in Spring Break attendance in comparison to Spring Break 2019 22% increase in year to date attendance in comparison to 2019 Became a registered and certified Botanical Garden Animals added – Mexican Wolf Pack, Pronghorn Antelope, Malayan Tiger, Giraffe, Mountain Lion
kittens, and Komodo Dragon
FY 2022 Key Deliverables
South American Pavilion renovation in progress Complete six projects – Leopard exhibit remodel, African Bird Holding, Galapagos Tortoise
remodel, Ocelot exhibit move, Sea Lion repair and upgrade, and Animal Holding Two
COVID-19 Response & Recovery
Seven employees temporarily reassigned to Education Task Force, OEM & Health BusinessOffices, Vaccine Registration, EOC response center and Testing Sites and Animal Services
Animal characters assigned at various testing facilities Parking lot serving as testing and/or vaccination sites Opening of Copper Canyon Rope Challenge course Opening of all indoor buildings and walk through exhibits Return of our Special Events; I.E. Halloween Spooktacular, Xmas at the Zoo, etc. Resume full animal presentation / demonstration and in –zoo encounters Resume consignment ticket program launch and new Zoo events
220
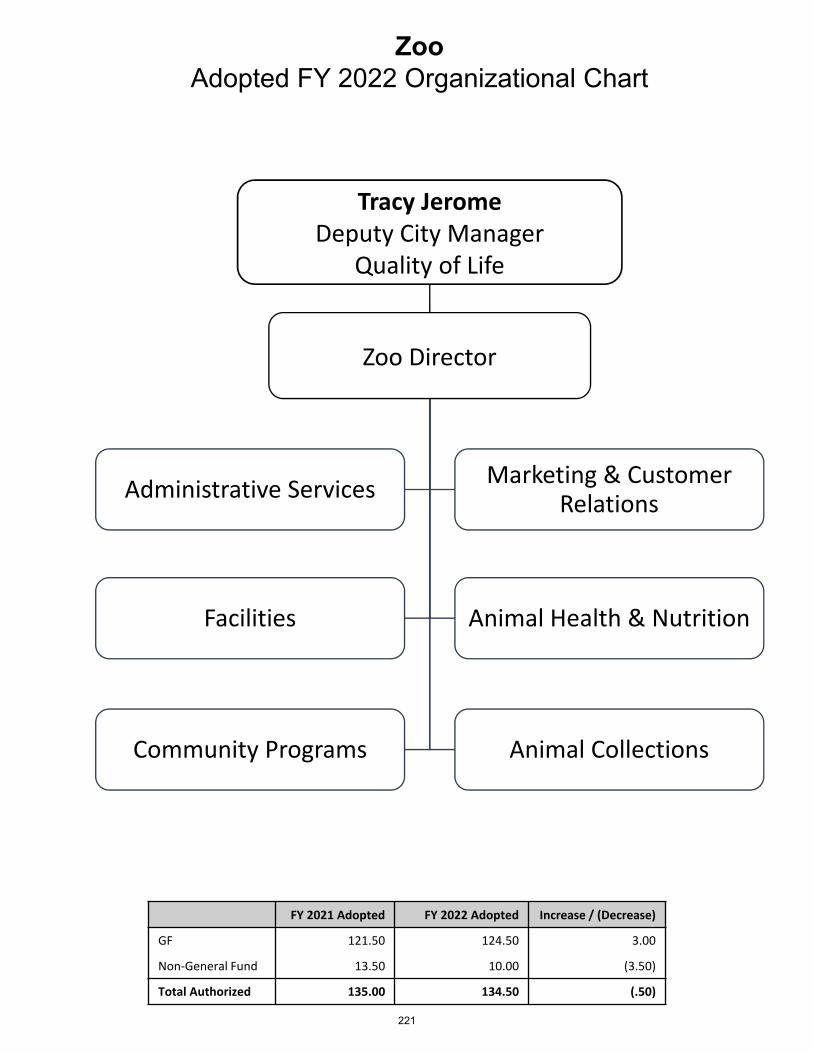
ZooAdopted FY 2022 Organizational Chart
Zoo Director
Administrative ServicesMarketing & Customer
Relations
Facilities Animal Health & Nutrition
Community Programs Animal Collections
Tracy JeromeDeputy City Manager
Quality of Life
FY 2021 Adopted FY 2022 Adopted Increase / (Decrease)
GF 121.50 124.50 3.00
Non‐General Fund 13.50 10.00 (3.50)
Total Authorized 135.00 134.50 (.50)
221

Zoo Position Summary - Authorized Staffing Table
Position DescriptionFY 2020 Adopted
FY 2021 Adopted
FY 2022 Adopted
Accountant 1.00 1.00 1.00
Accounting/Payroll Clerk 1.00 1.00 1.00
Accounting/Payroll Specialist 1.00 1.00 1.00
Administrative Assistant 1.00 1.00 1.00
Administrative Services Manager 1.00 1.00 1.00
Animal Training and Enrichment 1.00 1.00 1.00
Aquatics Systems Manager 1.00 2.00 2.00
Assistant Director 1.00 0.00 0.00
Associate Veterinarian 1.00 0.00 0.00
Audio Visual Technician 1.00 1.00 1.00
Budget & Services Coordinator 1.00 1.00 1.00
Capital Improvements Program Asst 1.00 1.00 0.00
Cashier 5.50 4.50 5.50
Chief Construction Inspector 1.00 1.00 0.00
Chief Veterinarian 1.00 1.00 1.00
Construction Superintendent 1.00 0.00 0.00
Cust. Relations & Billing Supervisor 1.00 1.00 1.00
Departmental Data Management S 1.00 1.00 1.00
Electrician 1.00 1.00 1.00
Facilities Maintenance Superintendent 1.00 1.00 1.00
Facilities Maintenance Supervisor 2.00 2.00 1.00
Facilities Maintenance Worker 5.00 4.00 4.00
General Service Worker 9.00 8.00 8.00
Graphics Technician 1.00 1.00 1.00
Groundskeeper 5.00 5.00 5.00
Lead Maintenance Mechanic 1.00 0.00 0.00
Locksmith 1.00 0.00 0.00
Maintenance Mechanic 1.00 1.00 1.00
Marketing & Cust Rel Coord 1.00 1.00 1.00
Materials Specialist 1.00 1.00 1.00
Materials Supervisor 1.00 1.00 1.00
Plumber 2.00 1.00 1.00
Public Affairs Specialist 1.00 1.00 1.00
Ride & Attraction Supervisor 1.00 1.00 1.00
Rides & Attraction Attendant 4.00 4.00 4.00
Safety Specialist 1.00 0.00 0.00
Senior Safety Specialist 0.00 1.00 1.00
Senior Zoo Keeper 6.00 6.00 6.00
Stores Clerk 1.00 1.00 1.00
Theater Guest Experience Assoc 2.00 1.00 1.00
Trades Helper 4.00 3.00 3.00
Veterinarian 1.00 1.00 1.00
Veterinary Assistant 3.00 3.00 3.00
222
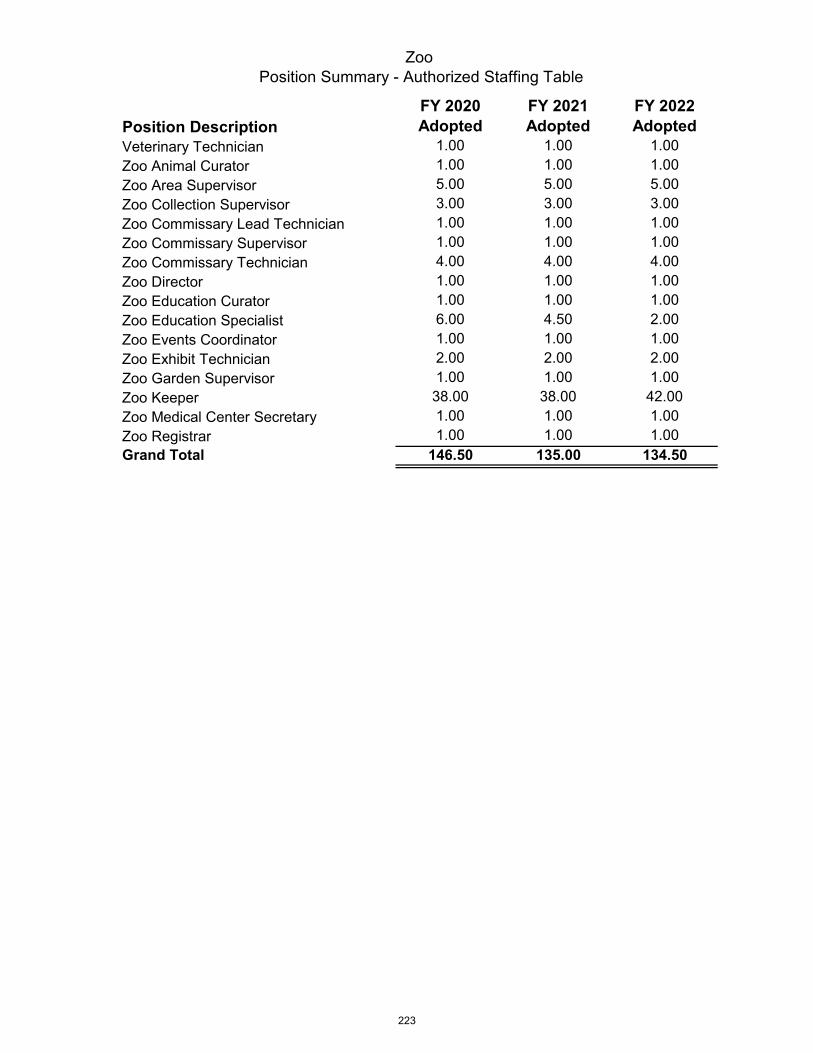
Zoo Position Summary - Authorized Staffing Table
Position DescriptionFY 2020 Adopted
FY 2021 Adopted
FY 2022 Adopted
Veterinary Technician 1.00 1.00 1.00
Zoo Animal Curator 1.00 1.00 1.00
Zoo Area Supervisor 5.00 5.00 5.00
Zoo Collection Supervisor 3.00 3.00 3.00
Zoo Commissary Lead Technician 1.00 1.00 1.00
Zoo Commissary Supervisor 1.00 1.00 1.00
Zoo Commissary Technician 4.00 4.00 4.00
Zoo Director 1.00 1.00 1.00
Zoo Education Curator 1.00 1.00 1.00
Zoo Education Specialist 6.00 4.50 2.00
Zoo Events Coordinator 1.00 1.00 1.00
Zoo Exhibit Technician 2.00 2.00 2.00
Zoo Garden Supervisor 1.00 1.00 1.00
Zoo Keeper 38.00 38.00 42.00
Zoo Medical Center Secretary 1.00 1.00 1.00
Zoo Registrar 1.00 1.00 1.00Grand Total 146.50 135.00 134.50
223

CITY OF EL PASO BUDGET BOOK 2022
GROWTH
GOAL 5COMMUNICATION
-INFORMATION TECHNOLOGY
22YEAR NO.
GOAL 5
COMMUNICATION
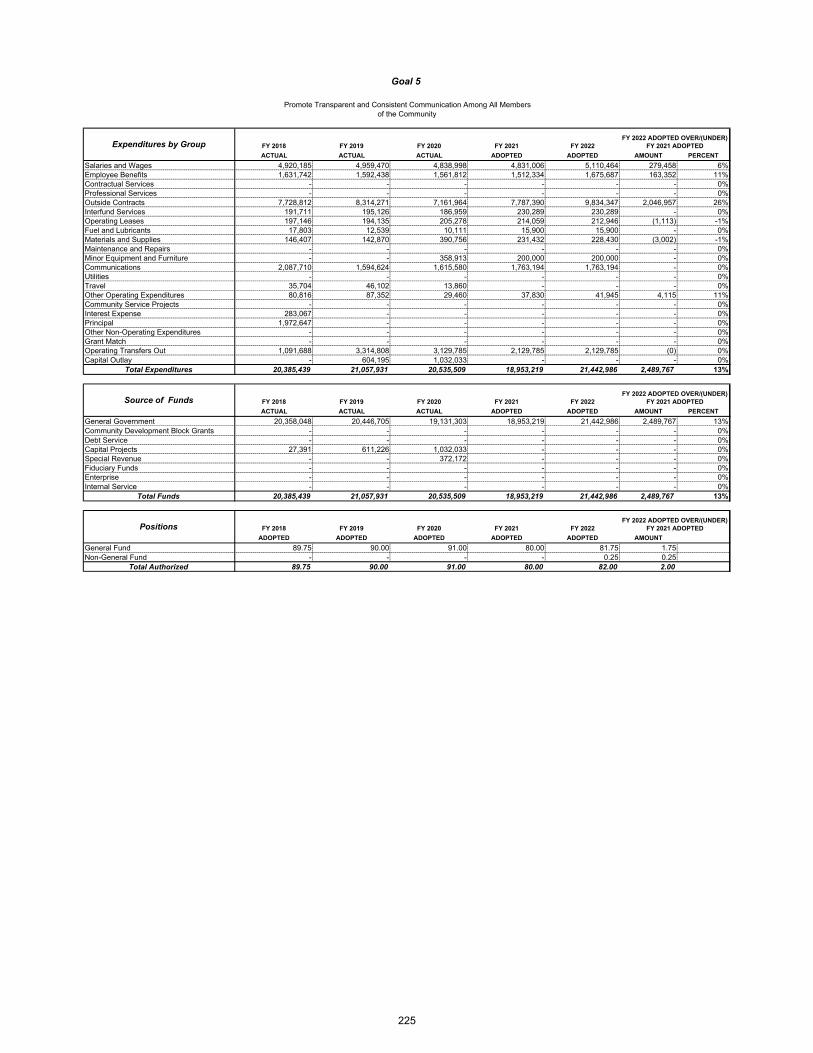
FY 2018 FY 2019 FY 2020 FY 2021 FY 2022
ACTUAL ACTUAL ACTUAL ADOPTED ADOPTED AMOUNT PERCENT
Salaries and Wages 4,920,185 4,959,470 4,838,998 4,831,006 5,110,464 279,458 6%Employee Benefits 1,631,742 1,592,438 1,561,812 1,512,334 1,675,687 163,352 11%Contractual Services - - - - - - 0%Professional Services - - - - - - 0%Outside Contracts 7,728,812 8,314,271 7,161,964 7,787,390 9,834,347 2,046,957 26%Interfund Services 191,711 195,126 186,959 230,289 230,289 - 0%Operating Leases 197,146 194,135 205,278 214,059 212,946 (1,113) -1%Fuel and Lubricants 17,803 12,539 10,111 15,900 15,900 - 0%Materials and Supplies 146,407 142,870 390,756 231,432 228,430 (3,002) -1%Maintenance and Repairs - - - - - - 0%Minor Equipment and Furniture - - 358,913 200,000 200,000 - 0%Communications 2,087,710 1,594,624 1,615,580 1,763,194 1,763,194 - 0%Utilities - - - - - - 0%Travel 35,704 46,102 13,860 - - - 0%Other Operating Expenditures 80,816 87,352 29,460 37,830 41,945 4,115 11%Community Service Projects - - - - - - 0%Interest Expense 283,067 - - - - - 0%Principal 1,972,647 - - - - - 0%Other Non-Operating Expenditures - - - - - - 0%Grant Match - - - - - - 0%Operating Transfers Out 1,091,688 3,314,808 3,129,785 2,129,785 2,129,785 (0) 0%Capital Outlay - 604,195 1,032,033 - - - 0%
Total Expenditures 20,385,439 21,057,931 20,535,509 18,953,219 21,442,986 2,489,767 13%
FY 2018 FY 2019 FY 2020 FY 2021 FY 2022
ACTUAL ACTUAL ACTUAL ADOPTED ADOPTED AMOUNT PERCENT
General Government 20,358,048 20,446,705 19,131,303 18,953,219 21,442,986 2,489,767 13%Community Development Block Grants - - - - - - 0%Debt Service - - - - - - 0%Capital Projects 27,391 611,226 1,032,033 - - - 0%Special Revenue - - 372,172 - - - 0%Fiduciary Funds - - - - - - 0%Enterprise - - - - - - 0%Internal Service - - - - - - 0%
Total Funds 20,385,439 21,057,931 20,535,509 18,953,219 21,442,986 2,489,767 13%
FY 2018 FY 2019 FY 2020 FY 2021 FY 2022
ADOPTED ADOPTED ADOPTED ADOPTED ADOPTED AMOUNT
General Fund 89.75 90.00 91.00 80.00 81.75 1.75 Non-General Fund - - - - 0.25 0.25
Total Authorized 89.75 90.00 91.00 80.00 82.00 2.00
Promote Transparent and Consistent Communication Among All Members
Expenditures by Group
Source of Funds
Positions
FY 2022 ADOPTED OVER/(UNDER) FY 2021 ADOPTED
FY 2022 ADOPTED OVER/(UNDER) FY 2021 ADOPTED
FY 2022 ADOPTED OVER/(UNDER) FY 2021 ADOPTED
Goal 5
of the Community
225
Information Technology21,442,986
100%
Goal 5: Communication Total Budget $21,442,986
Mission
Provide innovation and technology implementation management and support services to all City departments so they can transform the service experience for our community.
FY 2022 Budget
FY 2021 Key Performance Indicators
Key Performance Indicator
FY19 Actual
FY20 Actual
FY21 Actual
Annual Target
Expand Wireless internet through Digital El Paso (9 sites annually; 27 by 2020)
26 16 11 64
IT Availability, Reliability 100% 100% 100% 99%
Key Functions: Leverage and expand the use of current and new technology to reduce inefficiencies and improve communications Enhance internal communication and employee engagement
FY 2022 Total Budget $21,442,986
FY 2022 General Fund $21,442,986
FY 2022 Non-General Fund $0
Total FTE’s 82.00
Information Technology
226

FY 2018 FY 2019 FY 2020 FY 2021 FY 2022
ACTUAL ACTUAL ACTUAL ADOPTED ADOPTED AMOUNT PERCENT
Salaries and Wages 4,920,185 4,959,470 4,838,998 4,831,006 5,110,464 279,458 6%Employee Benefits 1,631,742 1,592,438 1,561,812 1,512,334 1,675,687 163,352 11%Contractual Services - - - - - - 0%Professional Services - - - - - - 0%Outside Contracts 7,728,812 8,314,271 7,161,964 7,787,390 9,834,347 2,046,957 26%Interfund Services 191,711 195,126 186,959 230,289 230,289 - 0%Operating Leases 197,146 194,135 205,278 214,059 212,946 (1,113) -1%Fuel and Lubricants 17,803 12,539 10,111 15,900 15,900 - 0%Materials and Supplies 146,407 142,870 390,756 231,432 228,430 (3,002) -1%Maintenance and Repairs - - - - - - 0%Minor Equipment and Furniture - - 358,913 200,000 200,000 - 0%Communications 2,087,710 1,594,624 1,615,580 1,763,194 1,763,194 - 0%Utilities - - - - - - 0%Travel 35,704 46,102 13,860 - - - 0%Other Operating Expenditures 80,816 87,352 29,460 37,830 41,945 4,115 11%Community Service Projects - - - - - - 0%Interest Expense 283,067 - - - - - 0%Principal 1,972,647 - - - - - 0%Other Non-Operating Expenditures - - - - - - 0%Grant Match - - - - - - 0%Operating Transfers Out 1,091,688 3,314,808 3,129,785 2,129,785 2,129,785 (0) 0%Capital Outlay - 604,195 1,032,033 - - - 0%
Total Expenditures 20,385,439 21,057,931 20,535,509 18,953,219 21,442,986 2,489,767 13%
FY 2018 FY 2019 FY 2020 FY 2021 FY 2022
ACTUAL ACTUAL ACTUAL ADOPTED ADOPTED AMOUNT PERCENT
General Government 20,358,048 20,446,705 19,131,303 18,953,219 21,442,986 2,489,767 13%Community Development Block Grants - - - - - - 0%Debt Service - - - - - - 0%Capital Projects 27,391 611,226 1,032,033 - - - 0%Special Revenue - - 372,172 - - - 0%Fiduciary Funds - - - - - - 0%Enterprise - - - - - - 0%Internal Service - - - - - - 0%
Total Funds 20,385,439 21,057,931 20,535,509 18,953,219 21,442,986 2,489,767 13%
FY 2018 FY 2019 FY 2020 FY 2021 FY 2022
ADOPTED ADOPTED ADOPTED ADOPTED ADOPTED AMOUNT
General Fund 89.75 90.00 91.00 80.00 81.75 1.75 Non-General Fund - - - - 0.25 0.25
Total Authorized 89.75 90.00 91.00 80.00 82.00 2.00
Source of Funds
Positions
Expenditures by GroupFY 2022 ADOPTED OVER/(UNDER)
FY 2021 ADOPTED
FY 2022 ADOPTED OVER/(UNDER) FY 2021 ADOPTED
FY 2022 ADOPTED OVER/(UNDER) FY 2021 ADOPTED
Information Technology
227
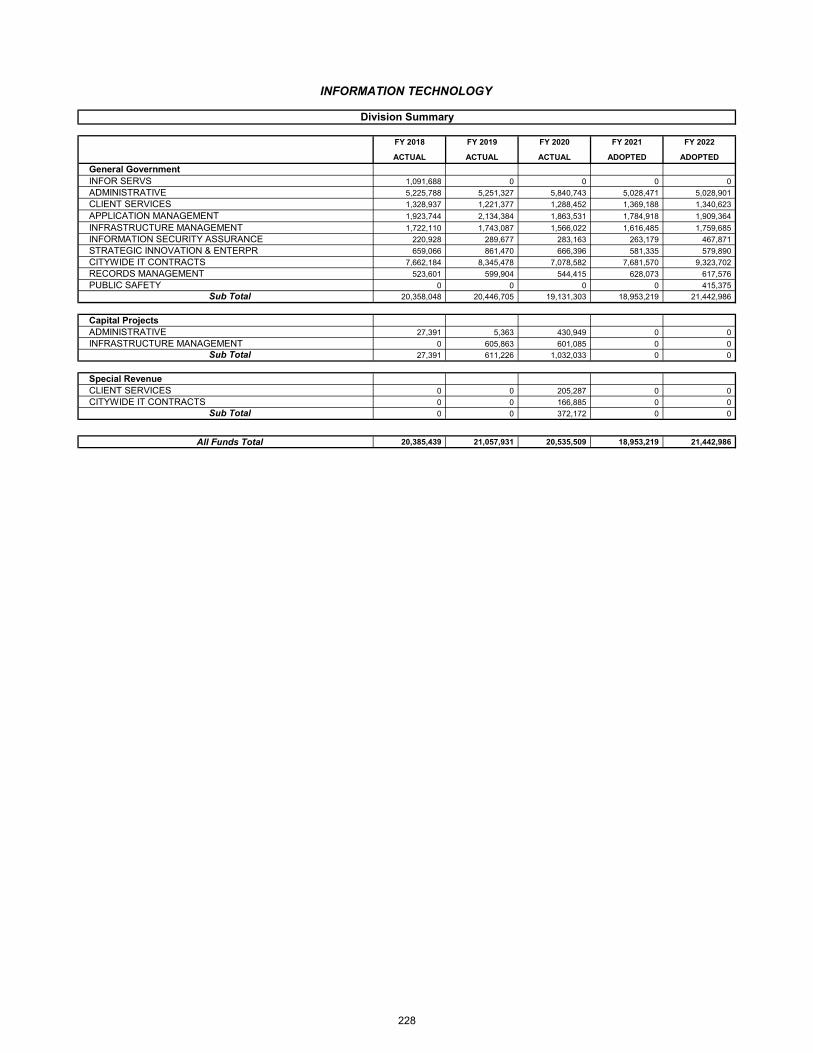
FY 2018 FY 2019 FY 2020 FY 2021 FY 2022
ACTUAL ACTUAL ACTUAL ADOPTED ADOPTED
General GovernmentINFOR SERVS 1,091,688 0 0 0 0
ADMINISTRATIVE 5,225,788 5,251,327 5,840,743 5,028,471 5,028,901
CLIENT SERVICES 1,328,937 1,221,377 1,288,452 1,369,188 1,340,623
APPLICATION MANAGEMENT 1,923,744 2,134,384 1,863,531 1,784,918 1,909,364
INFRASTRUCTURE MANAGEMENT 1,722,110 1,743,087 1,566,022 1,616,485 1,759,685
INFORMATION SECURITY ASSURANCE 220,928 289,677 283,163 263,179 467,871
STRATEGIC INNOVATION & ENTERPR 659,066 861,470 666,396 581,335 579,890
CITYWIDE IT CONTRACTS 7,662,184 8,345,478 7,078,582 7,681,570 9,323,702
RECORDS MANAGEMENT 523,601 599,904 544,415 628,073 617,576
PUBLIC SAFETY 0 0 0 0 415,375
Sub Total 20,358,048 20,446,705 19,131,303 18,953,219 21,442,986
Capital ProjectsADMINISTRATIVE 27,391 5,363 430,949 0 0
INFRASTRUCTURE MANAGEMENT 0 605,863 601,085 0 0
Sub Total 27,391 611,226 1,032,033 0 0
Special RevenueCLIENT SERVICES 0 0 205,287 0 0
CITYWIDE IT CONTRACTS 0 0 166,885 0 0
Sub Total 0 0 372,172 0 0
All Funds Total 20,385,439 21,057,931 20,535,509 18,953,219 21,442,986
Division Summary
INFORMATION TECHNOLOGY
228
Strategic Actions
Goal 5: Promote Transparent and Consistent Communication among All Members of the Community
Strategy 5.2 Leverage and expand the use of current and new technology to reduce inefficiencies and improve communications
Action 5.2.1 Develop technology strategic communication plan
Action 5.2.2 Formalize technology infrastructure refresh plan for core assets (network, servers, Voice over IP (VoIP) and storage)
Strategy 5.3 Promote a well-balanced customer service philosophy throughout the organization
Action 5.3.1 Implement customer service best Expand practices citywide
Strategy 5.4 Enhance internal communication and employee engagement
Action 5.4.1 Strengthen employee engagement
Action 5.4.2 Expand opportunities to receive feedback on various topics and issues
Strategy 5.5 Strengthen messaging opportunities through media outlets and proactive community outreach
Action 5.5.1 use of social media
FY 2021 Key Results
• 99% of employees completed Security Awareness and Phish training• 8.8% reduction in employees falling for phish email through training• Overall City Government Experience Winner – 2nd place
FY 2022 Key Deliverables
• Customer Relationship Management System• E-forms and automation expansion• Expand wireless internet• Video programming for employees• Develop media training for employees• Host employee town hall meetings• Employee broadcast messages• Media roundtable discussion• Public outreach for significant programs and services
COVID-19 Response & Recovery
• Received ARPA funding for broadband infrastructure• Tech for COVID-19 center builds and multiple software implementations• COVID-19 Website development and support – EPCovidVaccine.com• COVID-19 Hotline Call Center• Assisted with temperature scan stations research and pilot testing• Support virtual Council meetings and press conferences• Wi-Fi expansion at 26 QoL facilities• MS Teams and One Drive Training• Telecommuting equipment setup and delivery• On call 24/7 Support & EOC Technical Support
229

Department of Information Technology ServicesAdopted FY 2022 Organizational Chart
Managing Director of Internal Services
Administrative Services Client Services
Applications Management
Infrastructure Management
Enterprise Architecture & Strategic Innovation
Records Management
Information Security Assurance
Robert Cortinas Chief Financial Officer
FY 2021 Adopted FY 2022 Adopted Increase / (Decrease)
GF 80.00 81.75 1.75
Non-General Fund 0.00 0.25 0.25
Total Authorized 80.00 82.00 2.00
230
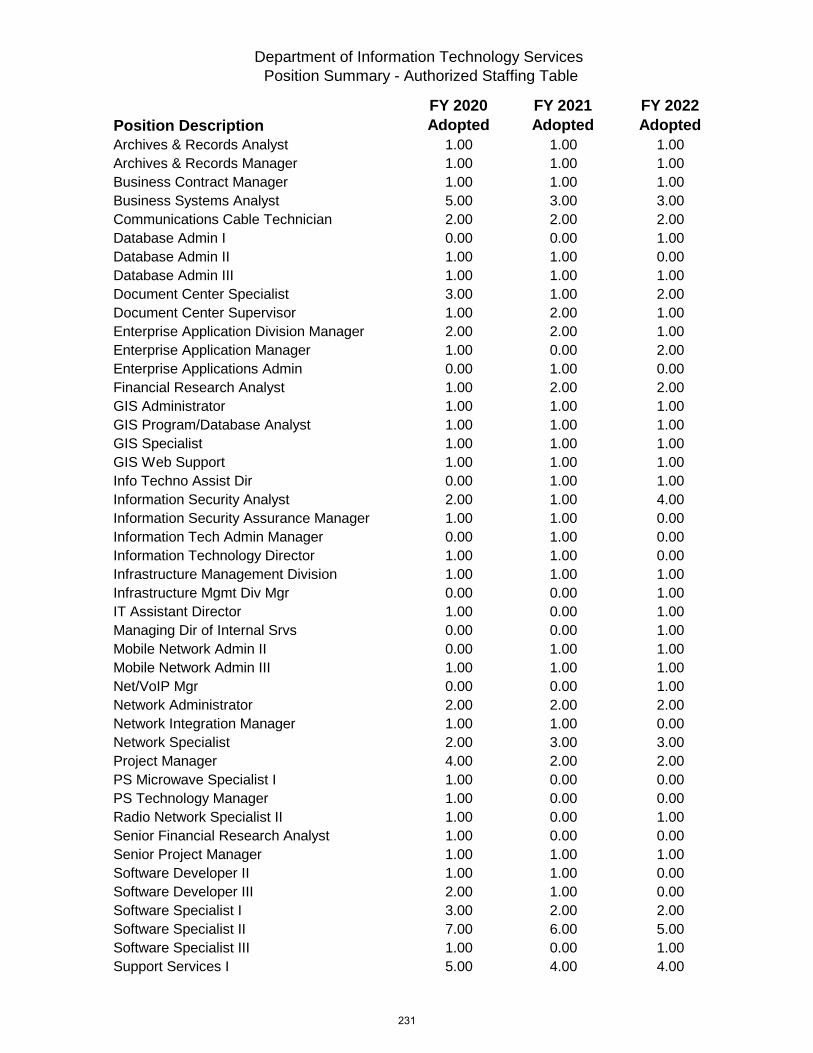
Department of Information Technology Services
Position Summary - Authorized Staffing Table
Position DescriptionFY 2020 Adopted
FY 2021 Adopted
FY 2022 Adopted
Archives & Records Analyst 1.00 1.00 1.00
Archives & Records Manager 1.00 1.00 1.00
Business Contract Manager 1.00 1.00 1.00
Business Systems Analyst 5.00 3.00 3.00
Communications Cable Technician 2.00 2.00 2.00
Database Admin I 0.00 0.00 1.00
Database Admin II 1.00 1.00 0.00
Database Admin III 1.00 1.00 1.00
Document Center Specialist 3.00 1.00 2.00
Document Center Supervisor 1.00 2.00 1.00
Enterprise Application Division Manager 2.00 2.00 1.00
Enterprise Application Manager 1.00 0.00 2.00
Enterprise Applications Admin 0.00 1.00 0.00
Financial Research Analyst 1.00 2.00 2.00
GIS Administrator 1.00 1.00 1.00
GIS Program/Database Analyst 1.00 1.00 1.00
GIS Specialist 1.00 1.00 1.00
GIS Web Support 1.00 1.00 1.00
Info Techno Assist Dir 0.00 1.00 1.00
Information Security Analyst 2.00 1.00 4.00
Information Security Assurance Manager 1.00 1.00 0.00
Information Tech Admin Manager 0.00 1.00 0.00
Information Technology Director 1.00 1.00 0.00
Infrastructure Management Division 1.00 1.00 1.00
Infrastructure Mgmt Div Mgr 0.00 0.00 1.00
IT Assistant Director 1.00 0.00 1.00
Managing Dir of Internal Srvs 0.00 0.00 1.00
Mobile Network Admin II 0.00 1.00 1.00
Mobile Network Admin III 1.00 1.00 1.00
Net/VoIP Mgr 0.00 0.00 1.00
Network Administrator 2.00 2.00 2.00
Network Integration Manager 1.00 1.00 0.00
Network Specialist 2.00 3.00 3.00
Project Manager 4.00 2.00 2.00
PS Microwave Specialist I 1.00 0.00 0.00
PS Technology Manager 1.00 0.00 0.00
Radio Network Specialist II 1.00 0.00 1.00
Senior Financial Research Analyst 1.00 0.00 0.00
Senior Project Manager 1.00 1.00 1.00
Software Developer II 1.00 1.00 0.00
Software Developer III 2.00 1.00 0.00
Software Specialist I 3.00 2.00 2.00
Software Specialist II 7.00 6.00 5.00
Software Specialist III 1.00 0.00 1.00
Support Services I 5.00 4.00 4.00
231
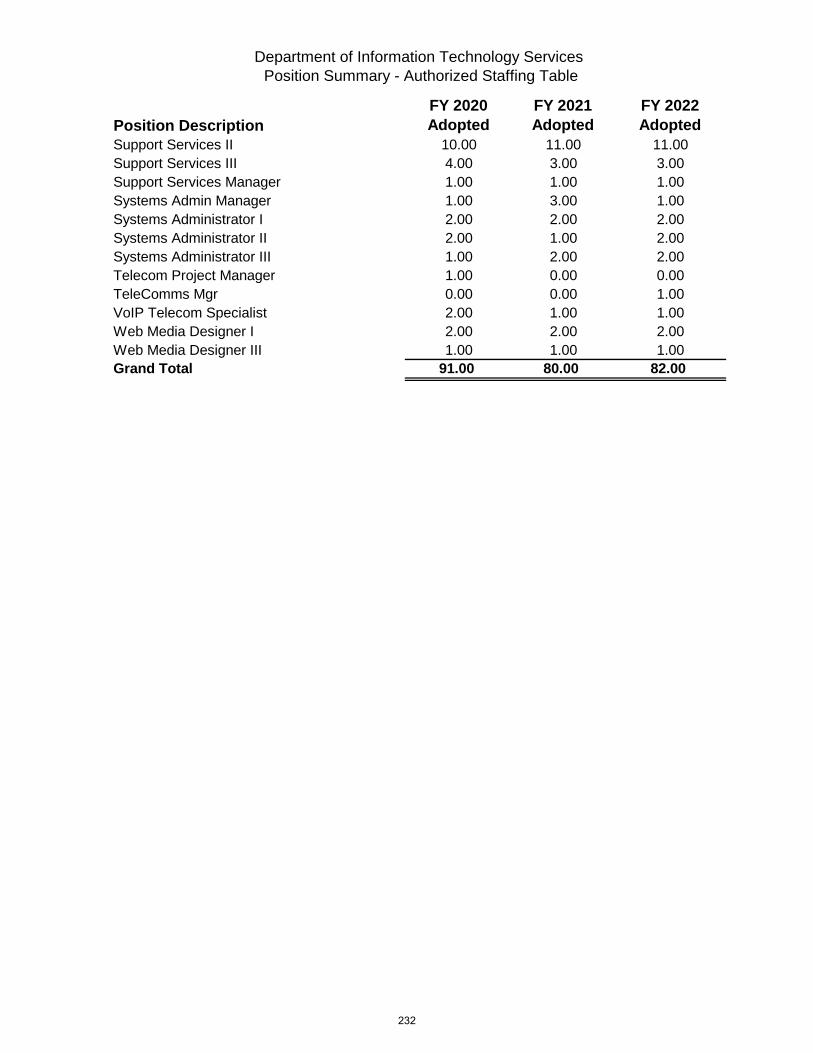
Department of Information Technology Services
Position Summary - Authorized Staffing Table
Position DescriptionFY 2020 Adopted
FY 2021 Adopted
FY 2022 Adopted
Support Services II 10.00 11.00 11.00
Support Services III 4.00 3.00 3.00
Support Services Manager 1.00 1.00 1.00
Systems Admin Manager 1.00 3.00 1.00
Systems Administrator I 2.00 2.00 2.00
Systems Administrator II 2.00 1.00 2.00
Systems Administrator III 1.00 2.00 2.00
Telecom Project Manager 1.00 0.00 0.00
TeleComms Mgr 0.00 0.00 1.00
VoIP Telecom Specialist 2.00 1.00 1.00
Web Media Designer I 2.00 2.00 2.00
Web Media Designer III 1.00 1.00 1.00
Grand Total 91.00 80.00 82.00
232

11111111111111111 1111111111111
N N 0 N
� 0 0 � rs
�
§ � 0 Vl
�
� µ.
0
>-, rs...... u
.,( -- _; -
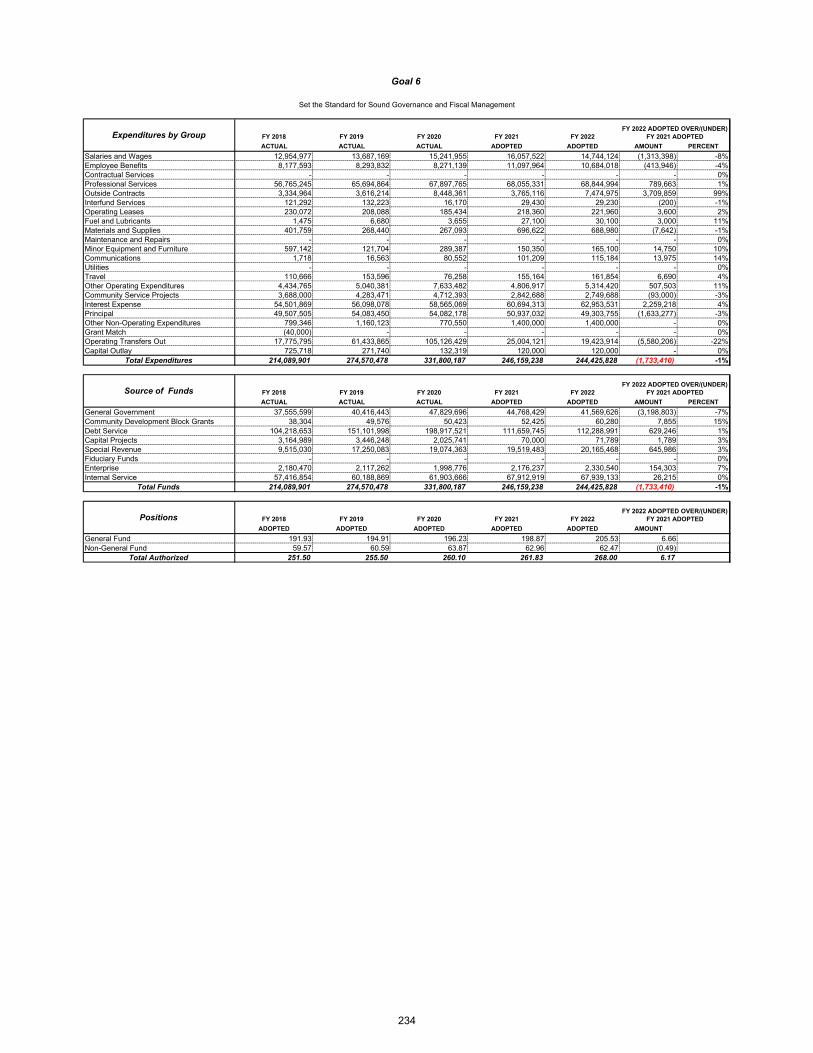
FY 2018 FY 2019 FY 2020 FY 2021 FY 2022
ACTUAL ACTUAL ACTUAL ADOPTED ADOPTED AMOUNT PERCENT
Salaries and Wages 12,954,977 13,687,169 15,241,955 16,057,522 14,744,124 (1,313,398) -8%Employee Benefits 8,177,593 8,293,832 8,271,139 11,097,964 10,684,018 (413,946) -4%Contractual Services - - - - - - 0%Professional Services 56,765,245 65,694,864 67,897,765 68,055,331 68,844,994 789,663 1%Outside Contracts 3,334,964 3,616,214 8,448,361 3,765,116 7,474,975 3,709,859 99%Interfund Services 121,292 132,223 16,170 29,430 29,230 (200) -1%Operating Leases 230,072 208,088 185,434 218,360 221,960 3,600 2%Fuel and Lubricants 1,475 6,680 3,655 27,100 30,100 3,000 11%Materials and Supplies 401,759 268,440 267,093 696,622 688,980 (7,642) -1%Maintenance and Repairs - - - - - - 0%Minor Equipment and Furniture 597,142 121,704 289,387 150,350 165,100 14,750 10%Communications 1,718 16,563 80,552 101,209 115,184 13,975 14%Utilities - - - - - - 0%Travel 110,666 153,596 76,258 155,164 161,854 6,690 4%Other Operating Expenditures 4,434,765 5,040,381 7,633,482 4,806,917 5,314,420 507,503 11%Community Service Projects 3,688,000 4,283,471 4,712,393 2,842,688 2,749,688 (93,000) -3%Interest Expense 54,501,869 56,098,078 58,565,069 60,694,313 62,953,531 2,259,218 4%Principal 49,507,505 54,083,450 54,082,178 50,937,032 49,303,755 (1,633,277) -3%Other Non-Operating Expenditures 799,346 1,160,123 770,550 1,400,000 1,400,000 - 0%Grant Match (40,000) - - - - - 0%Operating Transfers Out 17,775,795 61,433,865 105,126,429 25,004,121 19,423,914 (5,580,206) -22%Capital Outlay 725,718 271,740 132,319 120,000 120,000 - 0%
Total Expenditures 214,089,901 274,570,478 331,800,187 246,159,238 244,425,828 (1,733,410) -1%
FY 2018 FY 2019 FY 2020 FY 2021 FY 2022
ACTUAL ACTUAL ACTUAL ADOPTED ADOPTED AMOUNT PERCENT
General Government 37,555,599 40,416,443 47,829,696 44,768,429 41,569,626 (3,198,803) -7%Community Development Block Grants 38,304 49,576 50,423 52,425 60,280 7,855 15%Debt Service 104,218,653 151,101,998 198,917,521 111,659,745 112,288,991 629,246 1%Capital Projects 3,164,989 3,446,248 2,025,741 70,000 71,789 1,789 3%Special Revenue 9,515,030 17,250,083 19,074,363 19,519,483 20,165,468 645,986 3%Fiduciary Funds - - - - - - 0%Enterprise 2,180,470 2,117,262 1,998,776 2,176,237 2,330,540 154,303 7%Internal Service 57,416,854 60,188,869 61,903,666 67,912,919 67,939,133 26,215 0%
Total Funds 214,089,901 274,570,478 331,800,187 246,159,238 244,425,828 (1,733,410) -1%
FY 2018 FY 2019 FY 2020 FY 2021 FY 2022
ADOPTED ADOPTED ADOPTED ADOPTED ADOPTED AMOUNT
General Fund 191.93 194.91 196.23 198.87 205.53 6.66 Non-General Fund 59.57 60.59 63.87 62.96 62.47 (0.49)
Total Authorized 251.50 255.50 260.10 261.83 268.00 6.17
Positions
FY 2022 ADOPTED OVER/(UNDER) FY 2021 ADOPTED
FY 2022 ADOPTED OVER/(UNDER) FY 2021 ADOPTED
FY 2022 ADOPTED OVER/(UNDER) FY 2021 ADOPTED
Expenditures by Group
Goal 6
Set the Standard for Sound Governance and Fiscal Management
Source of Funds
234

City Attorney4,673,351
2%City Manager
3,785,324 1%
Human Resources70,516,214
29%
Mayor And Council1,749,697
1%City Clerk778,110
0%
Non-Departmental155,807,286
64%
Office Of The Comptroller3,041,496
1%
Purchasing And Strategic Sourcing1,743,811
1%Tax
2,330,540 1%
Goal 6: Sound GovernanceTotal Budget $244,425,828
Mission
To provide excellent quality legal services in a timely and cost effective manner in order to assist in the implementation of the Strategic Plan adopted by the Mayor and City Council.
FY 2022 Budget
FY 2021 Key Performance Indicators
Key Performance Indicator FY19 Actual
FY20 Actual
FY21 Actual
Annual Target
% of legal documents completed within 10 working days 94.1% 99.65% 99.57% 90% % of responses prepared within 10 working days 98.7% 99.57% 97.81% 90% % of complaints prepared within 10 working days 99.15% 69.95% 98.62% 90%
Key Functions:
Provide legal services including: general counsel; document preparation and review; representation in litigation; and prosecution of Class C misdemeanor offenses
City Attorney
FY 2022 Total Budget $4,673,351
FY 2022 General Fund $4,593,071
FY 2022 Non-General Fund $80,280
Total FTE’s 43.50
235

FY 2018 FY 2019 FY 2020 FY 2021 FY 2022
ACTUAL ACTUAL ACTUAL ADOPTED ADOPTED AMOUNT PERCENT
Salaries and Wages 2,223,151 2,158,937 2,065,941 2,160,479 2,806,631 646,152 30%Employee Benefits 448,079 627,564 612,591 665,245 797,320 132,075 20%Contractual Services - - - - - - 0%Professional Services 1,661,818 2,472,265 1,872,450 496,900 456,500 (40,400) -8%Outside Contracts 131,724 15,601 - 2,700 2,700 - 0%Interfund Services - - - - - - 0%Operating Leases 13,481 11,108 7,202 13,900 10,900 (3,000) -22%Fuel and Lubricants - - - - - - 0%Materials and Supplies 19,786 37,047 25,958 81,042 83,500 2,458 3%Maintenance and Repairs - - - - - - 0%Minor Equipment and Furniture - 19,188 17,277 - 18,000 18,000 100%Communications 125 643 151 500 500 - 0%Utilities - - - - - - 0%Travel 9,547 20,568 12,937 42,985 43,000 15 0%Other Operating Expenditures 25,026 25,044 33,037 33,828 34,300 472 1%Community Service Projects - - - - - - 0%Interest Expense - - - - - - 0%Principal - - - - - - 0%Other Non-Operating Expenditures 312,836 372,950 207,396 400,000 400,000 - 0%Grant Match - - - - - - 0%Operating Transfers Out 119,560 135,827 1,523 20,000 20,000 - 0%Capital Outlay - - - - - - 0%
Total Expenditures 4,965,131 5,896,740 4,856,463 3,917,578 4,673,351 755,773 19%
FY 2018 FY 2019 FY 2020 FY 2021 FY 2022
ACTUAL ACTUAL ACTUAL ADOPTED ADOPTED AMOUNT PERCENT
General Government 4,804,712 5,849,918 4,763,219 3,845,153 4,593,071 747,918 19%Community Development Block Grants 38,304 49,576 50,423 52,425 60,280 7,855 15%Debt Service - - - - - - 0%Capital Projects - - - - - - 0%Special Revenue 119,560 4,428 1,523 20,000 20,000 - 0%Fiduciary Funds - - - - - - 0%Enterprise - - - - - - 0%Internal Service 2,555 (7,181) 41,299 - - - 0%
Total Funds 4,965,131 5,896,740 4,856,463 3,917,578 4,673,351 755,773 19%
FY 2018 FY 2019 FY 2020 FY 2021 FY 2022
ADOPTED ADOPTED ADOPTED ADOPTED ADOPTED AMOUNT
General Fund 35.87 37.75 37.75 37.08 40.00 2.92 Non-General Fund 6.13 4.25 4.25 4.25 3.50 (0.75)
Total Authorized 42.00 42.00 42.00 41.33 43.50 2.17
Source of Funds
Positions
Expenditures by Group
City Attorney
FY 2022 ADOPTED OVER/(UNDER) FY 2021 ADOPTED
FY 2022 ADOPTED OVER/(UNDER) FY 2021 ADOPTED
FY 2022 ADOPTED OVER/(UNDER) FY 2021 ADOPTED
236

FY 2018 FY 2019 FY 2020 FY 2021 FY 2022
ACTUAL ACTUAL ACTUAL ADOPTED ADOPTED
General GovernmentATTRNYS AND PARALEGALS 2,136,146 2,260,169 2,069,772 2,250,605 3,037,480
LEGAL SECRETARIAL STAFF 437,655 427,448 449,027 462,341 445,239
LEGAL SUPPORT STAFF 63,013 61,124 72,792 65,009 65,951
LEGAL OPERATING EXP 73,686 120,135 90,259 147,798 165,400
TRIAL OPER EXP DAMAGES SETT 376,474 421,805 269,612 513,400 494,000
OUTSIDE COUNSEL SERVS 1,717,739 2,559,236 1,811,757 406,000 385,000
Sub Total 4,804,712 5,849,918 4,763,219 3,845,153 4,593,071
Community Development Block GrantsLEGAL CD ADMIN 38,304 49,576 50,423 52,425 60,280
Sub Total 38,304 49,576 50,423 52,425 60,280
Special RevenueLOBBYIST 119,560 4,428 1,523 20,000 20,000
Sub Total 119,560 4,428 1,523 20,000 20,000
Internal ServiceATTRNYS AND PARALEGALS 2,555 (7,181) 41,299 0 0
Sub Total 2,555 (7,181) 41,299 0 0
All Funds Total 4,965,131 5,896,740 4,856,463 3,917,578 4,673,351
Division Summary
CITY ATTORNEY
237

Strategic Actions
Goal 6: Set the Standard for Sound Governance and Fiscal Management
Strategy 6.10 Enhance the quality of decision making with legal representation and support Action 6.10.1 Manage and comply with the Texas Public Information Act Action 6.10.2 Engage staff in the defense, resolution and response to claims and lawsuits
FY 2021 Key Results
• Brad D. Bailey Assistant City / County Attorney Award IMLA – 2020 Josette Flores• Speaker - El Paso’s top medical and legal experts give advice on planning events in 2021• IMLA - Women in Law: Where Equality and Equity Exist in Local Government
FY 2022 Key Deliverables • Attract and hire experienced lawyers• Develop onboarding program for new lawyers• Internship curriculum (feeder/succession planning)• Participate in Leadership Training, Baldridge, and Lean Six Sigma• Support for Council’s Legislative Priorities
COVID-19 Response & Recovery
• CARES Funds: Legal Compliance• CARES Purchasing Manual• FAQ COVID-19 Response• Local Emergency Directives/LHAs• Emergency Ordinances
238
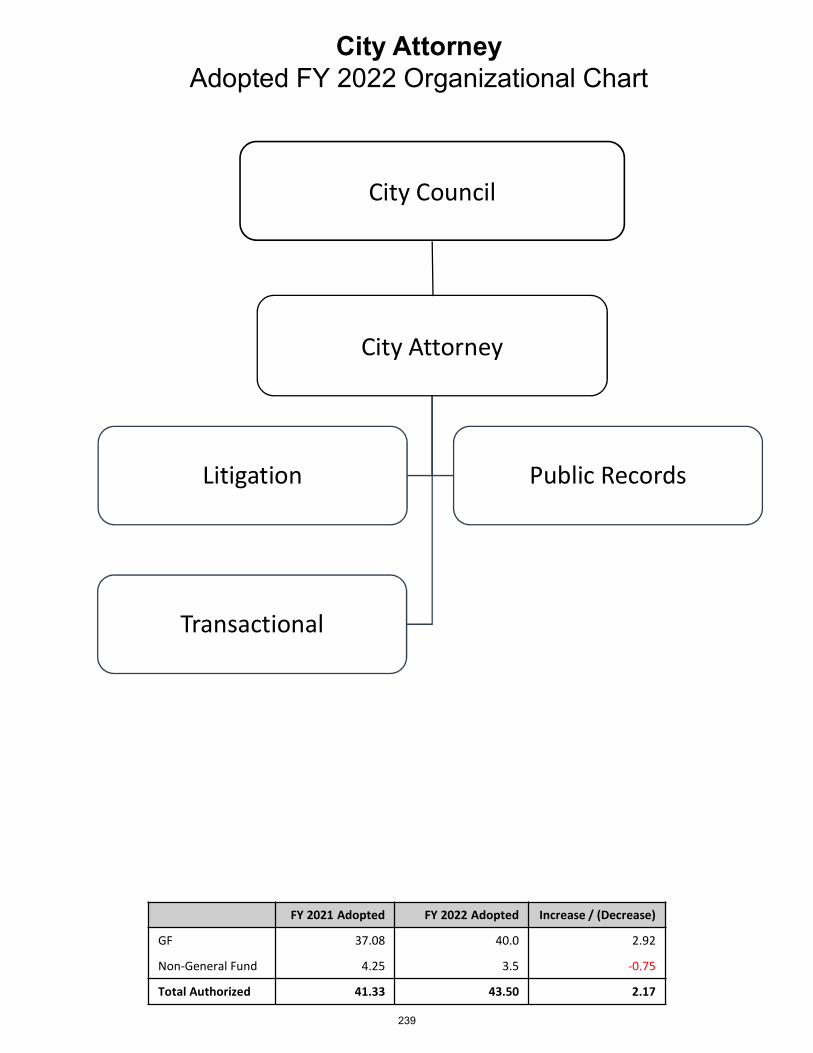
City AttorneyAdopted FY 2022 Organizational Chart
City Attorney
Litigation Public Records
Transactional
City Council
FY 2021 Adopted FY 2022 Adopted Increase / (Decrease)
GF 37.08 40.0 2.92
Non-General Fund 4.25 3.5 -0.75
Total Authorized 41.33 43.50 2.17
239

City Attorney Position Summary - Authorized Staffing Table
Position DescriptionFY 2020 Adopted
FY 2021 Adopted
FY 2022 Adopted
Admin Spec 0.00 1.00 1.00Assistant City Attorney-Senior I 4.00 4.00 4.00Assistant City Attorney-Senior II 0.00 0.00 1.00Assistant City Attorney 15.00 14.50 0.00Assistant City Attorney I 0.00 0.00 11.50Assistant City Attorney II 0.00 0.00 3.00City Attorney 1.00 1.00 1.00Deputy City Attorney 1.00 1.00 1.00Executive Secretary 0.00 0.00 0.00Legal/Contract Secretary 5.00 4.00 3.00Legislative Attorney 1.00 0.83 1.00Office Assistant 1.00 0.00 0.00Office Manager 1.00 1.00 1.00Paralegal 6.00 6.00 7.00Paralegal II 1.00 1.00 1.00Pub Records Coord 2.00 3.00 3.00Public Records Supervisor 1.00 1.00 1.00Real Estate Specialist 0.00 0.00 0.00Research & Mgmt Assist 0.00 0.00 1.00Senior Office Assistant 2.00 2.00 2.00Trial Section Supervisor 1.00 1.00 1.00Grand Total 42.00 41.33 43.50
240

City Attorney4,673,351
2%City Manager
3,785,324 1%
Human Resources70,516,214
29%
Mayor And Council1,749,697
1%
City Clerk778,110
0%
Non-Departmental155,807,286
64%
Office Of The Comptroller
3,041,496 1%
Purchasing And Strategic Sourcing1,743,811
1%
Tax2,330,540
1%
Goal 6: Sound GovernanceTotal Budget $244,425,828
Mission
To support transparent and inclusive government by
providing access to City Council meetings, governmental
records, and election services to the El Paso Community so
they can participate in city government.
FY 2022 Budget
FY 2021 Key Performance Indicators
Key Performance Indicator FY19 Actual
FY20 Actual
FY21 Actual
Annual Target
% of contracts and agreements executed within 30 days of Council approval
94% 97% 98% 96%
% of filed record internal requests provided within 1 hr. 87% 90% 88% 90%
# of Board Meeting Agendas Posted 477 441 355 N/A
Key Functions
Conduct City Council and Mass Transit Board
meetings
Prepare City Council Agendas Conduct City Elections for Mayor, City
Representatives, El Paso Municipal Court and El Paso Municipal Court of Appeals Judges
FY 2022 Total Budget $778,110 FY 2022 General Fund $778,110 FY 2022 Non-General Fund $0 Total FTE’s 8.00
City Clerk
241
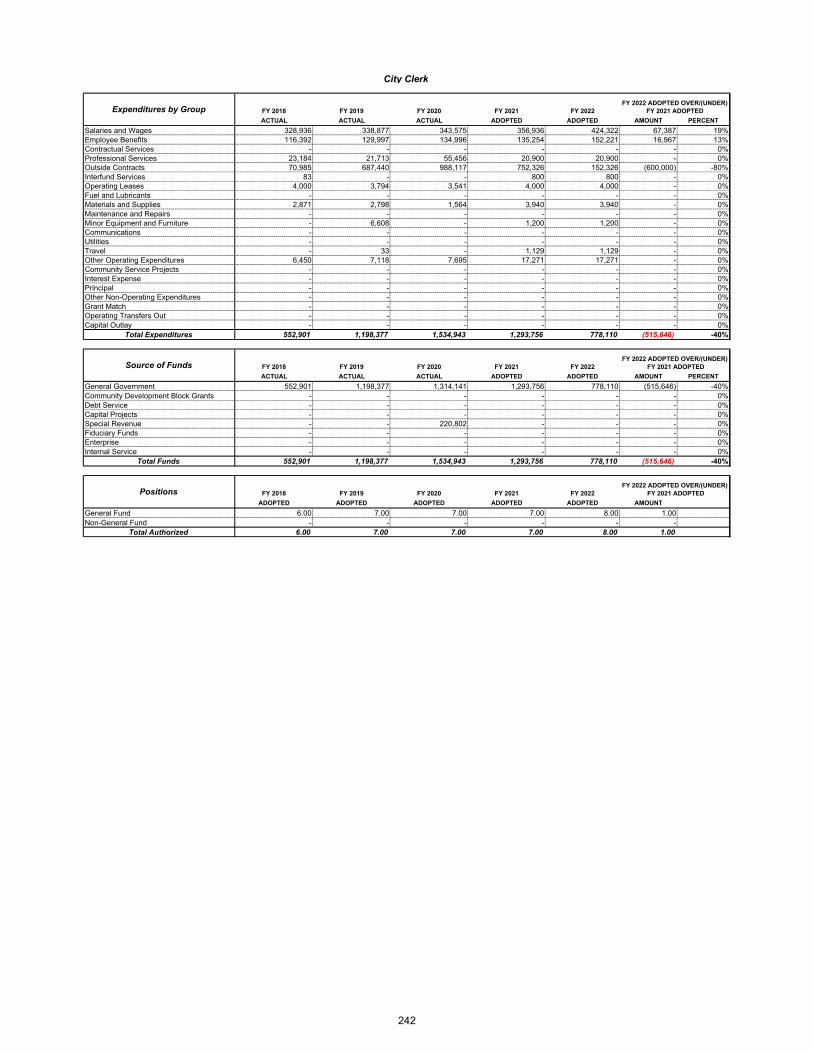
FY 2018 FY 2019 FY 2020 FY 2021 FY 2022
ACTUAL ACTUAL ACTUAL ADOPTED ADOPTED AMOUNT PERCENT
Salaries and Wages 328,936 338,877 343,575 356,936 424,322 67,387 19%Employee Benefits 116,392 129,997 134,996 135,254 152,221 16,967 13%Contractual Services - - - - - - 0%Professional Services 23,184 21,713 55,456 20,900 20,900 - 0%Outside Contracts 70,985 687,440 988,117 752,326 152,326 (600,000) -80%Interfund Services 83 - - 800 800 - 0%Operating Leases 4,000 3,794 3,541 4,000 4,000 - 0%Fuel and Lubricants - - - - - - 0%Materials and Supplies 2,871 2,798 1,564 3,940 3,940 - 0%Maintenance and Repairs - - - - - - 0%Minor Equipment and Furniture - 6,608 - 1,200 1,200 - 0%Communications - - - - - - 0%Utilities - - - - - - 0%Travel - 33 - 1,129 1,129 - 0%Other Operating Expenditures 6,450 7,118 7,695 17,271 17,271 - 0%Community Service Projects - - - - - - 0%Interest Expense - - - - - - 0%Principal - - - - - - 0%Other Non-Operating Expenditures - - - - - - 0%Grant Match - - - - - - 0%Operating Transfers Out - - - - - - 0%Capital Outlay - - - - - - 0%
Total Expenditures 552,901 1,198,377 1,534,943 1,293,756 778,110 (515,646) -40%
FY 2018 FY 2019 FY 2020 FY 2021 FY 2022
ACTUAL ACTUAL ACTUAL ADOPTED ADOPTED AMOUNT PERCENT
General Government 552,901 1,198,377 1,314,141 1,293,756 778,110 (515,646) -40%Community Development Block Grants - - - - - - 0%Debt Service - - - - - - 0%Capital Projects - - - - - - 0%Special Revenue - - 220,802 - - - 0%Fiduciary Funds - - - - - - 0%Enterprise - - - - - - 0%Internal Service - - - - - - 0%
Total Funds 552,901 1,198,377 1,534,943 1,293,756 778,110 (515,646) -40%
FY 2018 FY 2019 FY 2020 FY 2021 FY 2022
ADOPTED ADOPTED ADOPTED ADOPTED ADOPTED AMOUNT
General Fund 6.00 7.00 7.00 7.00 8.00 1.00 Non-General Fund - - - - - -
Total Authorized 6.00 7.00 7.00 7.00 8.00 1.00
FY 2022 ADOPTED OVER/(UNDER) FY 2021 ADOPTED
Expenditures by Group
Source of Funds
Positions
City Clerk
FY 2022 ADOPTED OVER/(UNDER) FY 2021 ADOPTED
FY 2022 ADOPTED OVER/(UNDER) FY 2021 ADOPTED
242
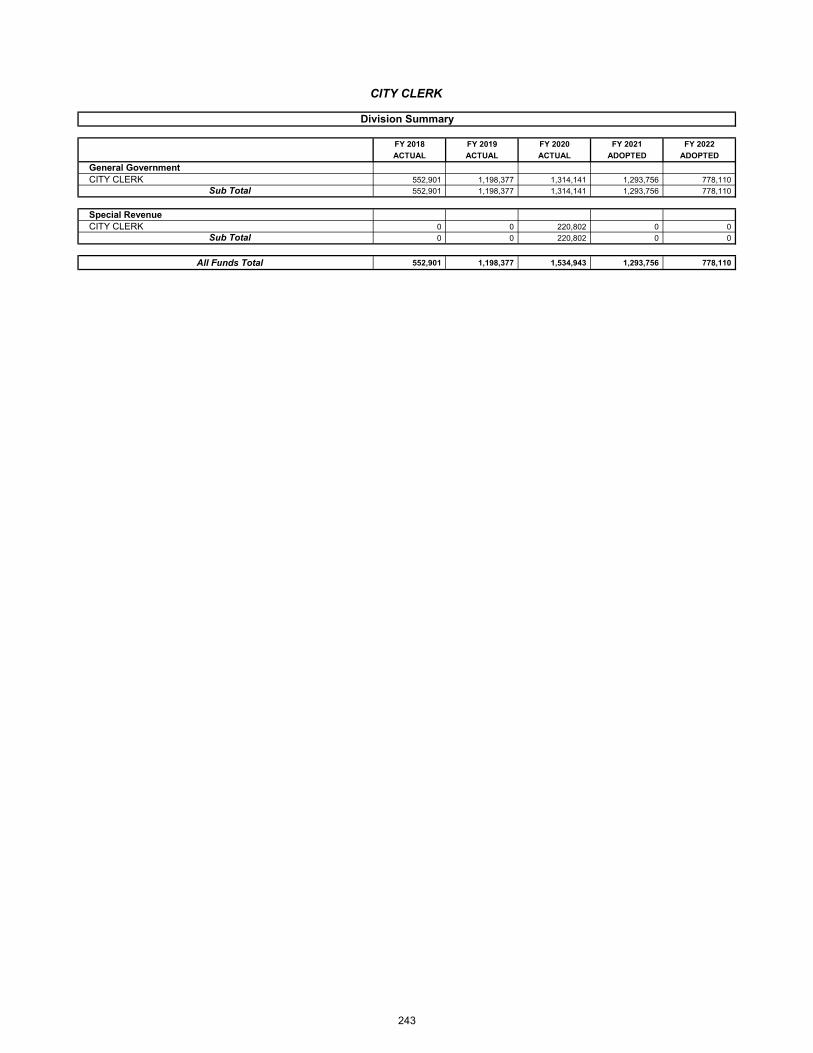
FY 2018 FY 2019 FY 2020 FY 2021 FY 2022
ACTUAL ACTUAL ACTUAL ADOPTED ADOPTED
General GovernmentCITY CLERK 552,901 1,198,377 1,314,141 1,293,756 778,110
Sub Total 552,901 1,198,377 1,314,141 1,293,756 778,110
Special RevenueCITY CLERK 0 0 220,802 0 0
Sub Total 0 0 220,802 0 0
All Funds Total 552,901 1,198,377 1,534,943 1,293,756 778,110
Division Summary
CITY CLERK
243
Strategic Actions
Goal 6: Set the Standard for Sound Governance and Fiscal Management
Strategy 6.8 Support transparent and inclusive government
Action 6.8.1 Comply with the Texas Open Meetings Act & Texas Public Information Act
Action 6.8.2 Administer and record municipal legislation
Action 6.8.3 Maintain functioning boards through staff support
FY 2021 Key Results
• 2020 General Election & Run-off Election
• Agenda software conversion
• First electronic Pension Fund Trustee election
FY 2022 Key Deliverables
• Conduct user training for agenda management software
• Implement a new software application for management of boards and commissions
• Create Ethics/Code of Conduct Training for City Council and Boards and Commissions
• Ensured compliance with TOMA & TPIA – 22% increase in ORR from FY2020
COVID-19 Response & Recovery
• Received $40,940 in ARPA funding for COVID-19 communications
• Implementation of e-filing of liens at the County
• Facilitated City Council video/teleconference meetings through Microsoft Teams
• Sign language interpretation through Microsoft Teams to assist with Municipal Court hearings and
service offered at Planning and Inspections
• Council paperwork submitted electronically and when possible electronic signatures are obtained
244
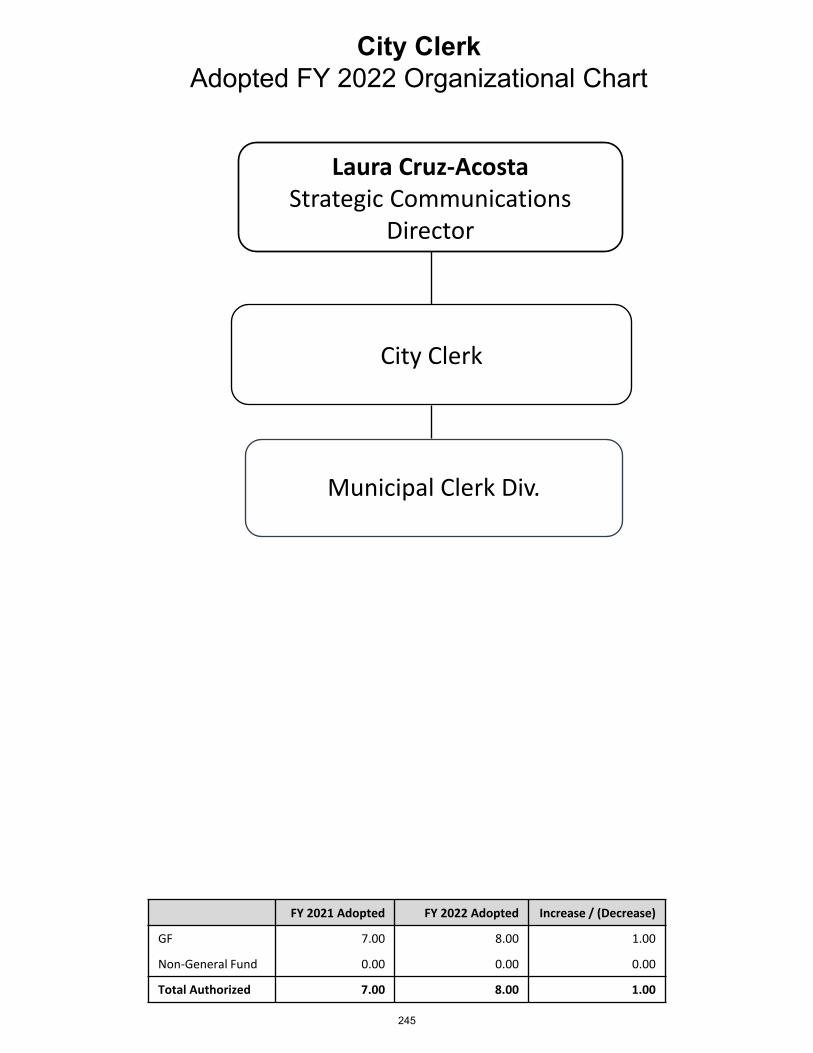
City ClerkAdopted FY 2022 Organizational Chart
City Clerk
Municipal Clerk Div.
Laura Cruz-AcostaStrategic Communications
Director
FY 2021 Adopted FY 2022 Adopted Increase / (Decrease)
GF 7.00 8.00 1.00
Non-General Fund 0.00 0.00 0.00
Total Authorized 7.00 8.00 1.00
245

City ClerkPosition Summary - Authorized Staffing Table
Position DescriptionFY 2020 Adopted
FY 2021 Adopted
FY 2022 Adopted
Administrative Assistant 1.00 1.00 1.00
Assistant Municipal Clerk 1.00 1.00 1.00
City Clerk 1.00 1.00 1.00Customer Relations Clerk 0.00 1.00 1.00Research Assistant 0.00 0.00 1.00Secretary 1.00 1.00 1.00Senior Office Assistant 1.00 0.00 0.00Senior Secretary 1.00 1.00 1.00Sign Language Interpreter 1.00 1.00 1.00Grand Total 7.00 7.00 8.00
246
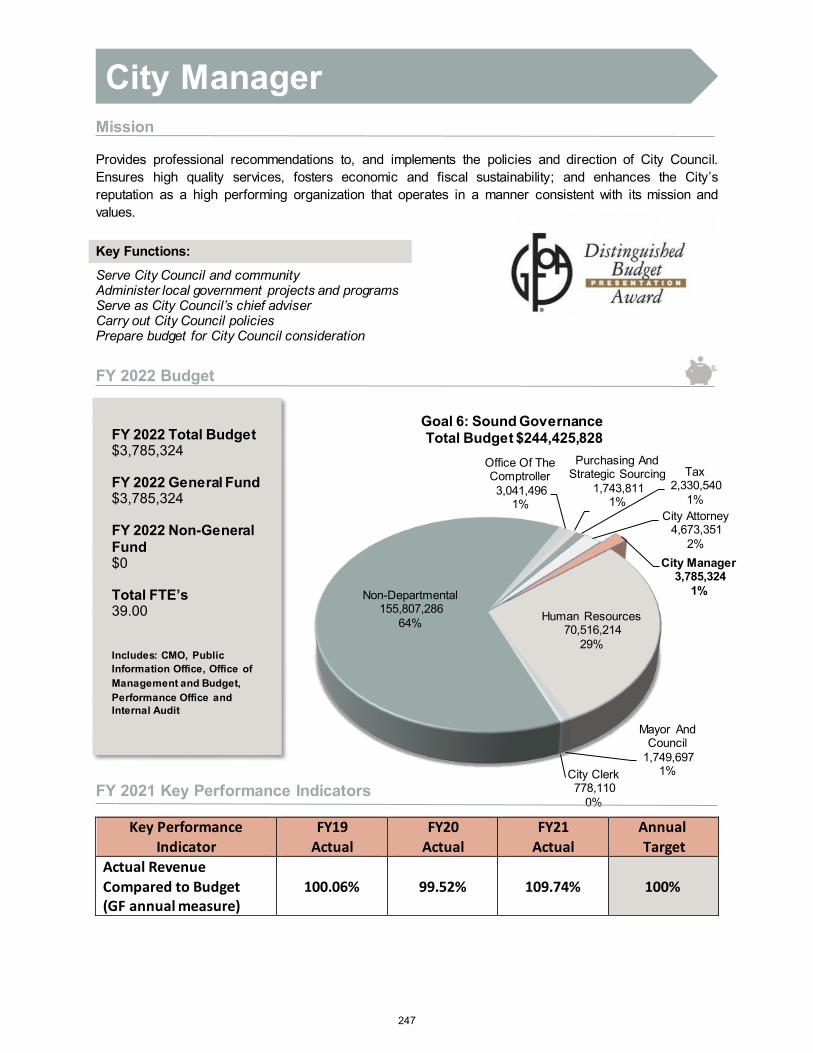
City Attorney4,673,351
2%City Manager
3,785,324 1%
Human Resources70,516,214
29%
Mayor And Council
1,749,697 1%City Clerk
778,110 0%
Non-Departmental155,807,286
64%
Office Of The Comptroller3,041,496
1%
Purchasing And Strategic Sourcing
1,743,811 1%
Tax2,330,540
1%
Goal 6: Sound GovernanceTotal Budget $244,425,828
Mission
Provides professional recommendations to, and implements the policies and direction of City Council. Ensures high quality services, fosters economic and fiscal sustainability; and enhances the City’s reputation as a high performing organization that operates in a manner consistent with its mission and values.
Key Functions:
Serve City Council and community Administer local government projects and programs Serve as City Council’s chief adviser Carry out City Council policies Prepare budget for City Council consideration
FY 2022 Budget
FY 2021 Key Performance Indicators
Key Performance Indicator
FY19 Actual
FY20 Actual
FY21 Actual
Annual Target
Actual Revenue Compared to Budget (GF annual measure)
100.06% 99.52% 109.74% 100%
FY 2022 Total Budget $3,785,324
FY 2022 General Fund $3,785,324
FY 2022 Non-General Fund $0
Total FTE’s 39.00
Includes: CMO, Public Information Office, Office of Management and Budget, Performance Office and Internal Audit
City Manager
247
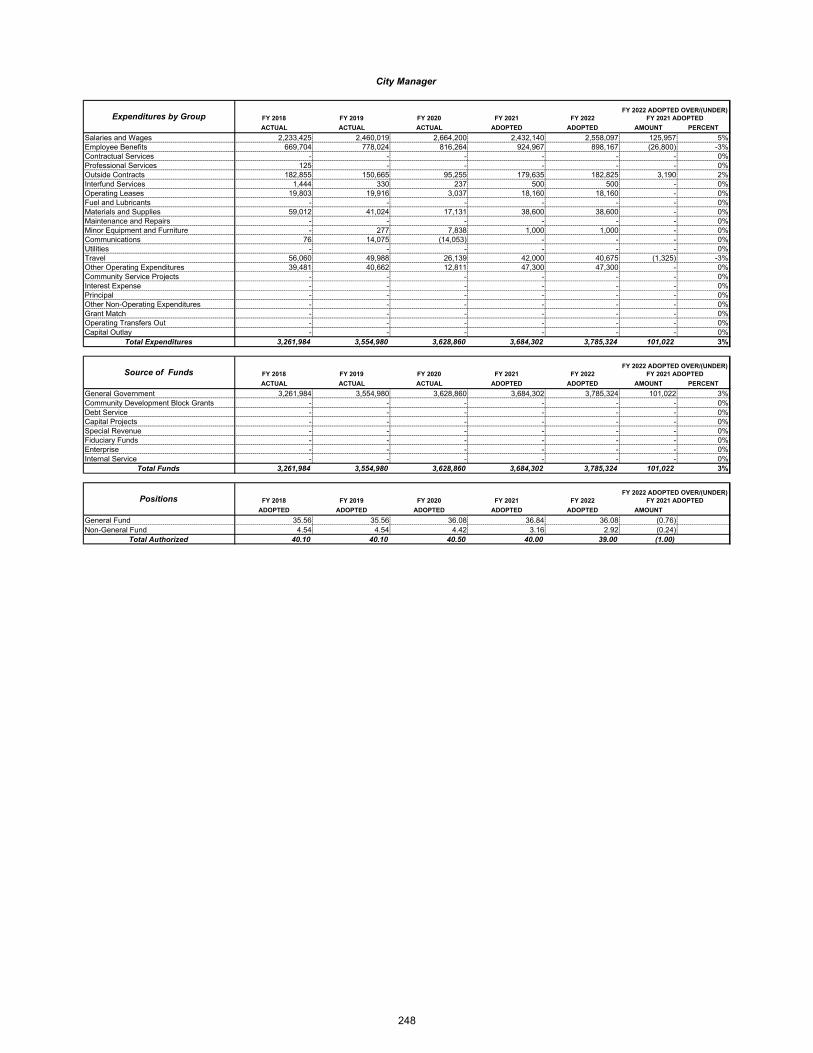
FY 2018 FY 2019 FY 2020 FY 2021 FY 2022
ACTUAL ACTUAL ACTUAL ADOPTED ADOPTED AMOUNT PERCENT
Salaries and Wages 2,233,425 2,460,019 2,664,200 2,432,140 2,558,097 125,957 5%Employee Benefits 669,704 778,024 816,264 924,967 898,167 (26,800) -3%Contractual Services - - - - - - 0%Professional Services 125 - - - - - 0%Outside Contracts 182,855 150,665 95,255 179,635 182,825 3,190 2%Interfund Services 1,444 330 237 500 500 - 0%Operating Leases 19,803 19,916 3,037 18,160 18,160 - 0%Fuel and Lubricants - - - - - - 0%Materials and Supplies 59,012 41,024 17,131 38,600 38,600 - 0%Maintenance and Repairs - - - - - - 0%Minor Equipment and Furniture - 277 7,838 1,000 1,000 - 0%Communications 76 14,075 (14,053) - - - 0%Utilities - - - - - - 0%Travel 56,060 49,988 26,139 42,000 40,675 (1,325) -3%Other Operating Expenditures 39,481 40,662 12,811 47,300 47,300 - 0%Community Service Projects - - - - - - 0%Interest Expense - - - - - - 0%Principal - - - - - - 0%Other Non-Operating Expenditures - - - - - - 0%Grant Match - - - - - - 0%Operating Transfers Out - - - - - - 0%Capital Outlay - - - - - - 0%
Total Expenditures 3,261,984 3,554,980 3,628,860 3,684,302 3,785,324 101,022 3%
FY 2018 FY 2019 FY 2020 FY 2021 FY 2022
ACTUAL ACTUAL ACTUAL ADOPTED ADOPTED AMOUNT PERCENT
General Government 3,261,984 3,554,980 3,628,860 3,684,302 3,785,324 101,022 3%Community Development Block Grants - - - - - - 0%Debt Service - - - - - - 0%Capital Projects - - - - - - 0%Special Revenue - - - - - - 0%Fiduciary Funds - - - - - - 0%Enterprise - - - - - - 0%Internal Service - - - - - - 0%
Total Funds 3,261,984 3,554,980 3,628,860 3,684,302 3,785,324 101,022 3%
FY 2018 FY 2019 FY 2020 FY 2021 FY 2022
ADOPTED ADOPTED ADOPTED ADOPTED ADOPTED AMOUNT
General Fund 35.56 35.56 36.08 36.84 36.08 (0.76)Non-General Fund 4.54 4.54 4.42 3.16 2.92 (0.24)
Total Authorized 40.10 40.10 40.50 40.00 39.00 (1.00)
Source of Funds
Positions
City Manager
FY 2022 ADOPTED OVER/(UNDER) FY 2021 ADOPTED
FY 2022 ADOPTED OVER/(UNDER) FY 2021 ADOPTED
FY 2022 ADOPTED OVER/(UNDER) FY 2021 ADOPTED
Expenditures by Group
248
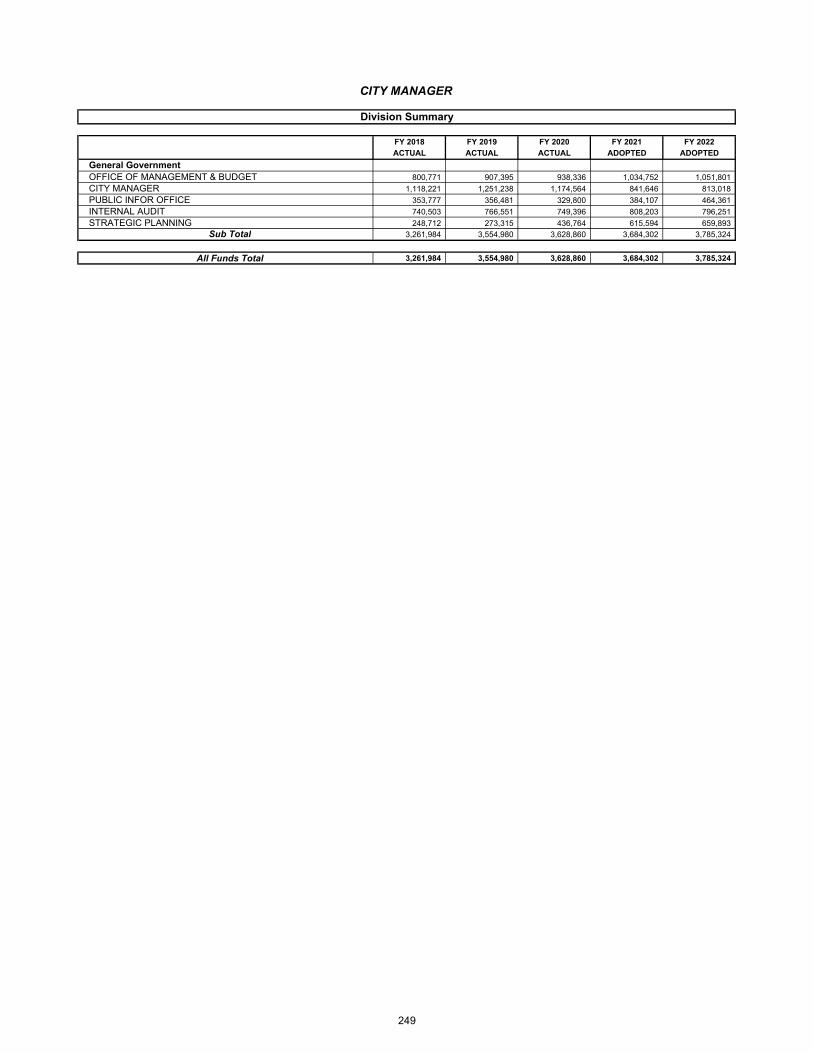
FY 2018 FY 2019 FY 2020 FY 2021 FY 2022
ACTUAL ACTUAL ACTUAL ADOPTED ADOPTED
General GovernmentOFFICE OF MANAGEMENT & BUDGET 800,771 907,395 938,336 1,034,752 1,051,801
CITY MANAGER 1,118,221 1,251,238 1,174,564 841,646 813,018
PUBLIC INFOR OFFICE 353,777 356,481 329,800 384,107 464,361
INTERNAL AUDIT 740,503 766,551 749,396 808,203 796,251
STRATEGIC PLANNING 248,712 273,315 436,764 615,594 659,893
Sub Total 3,261,984 3,554,980 3,628,860 3,684,302 3,785,324
All Funds Total 3,261,984 3,554,980 3,628,860 3,684,302 3,785,324
Division Summary
CITY MANAGER
249
Strategic Actions
Goal 6: Set the Standard for Sound Governance and Fiscal Management
Strategy 6.4 Implement leading-edge practices for achieving quality and performance excellence Action 6.4.1 Align organizational practices and systems using nationally recognized
performance criteria Strategy 6.5 Deliver services timely and efficiently with focus on continual improvement
Action 6.5.1 Streamline and improve efficiency of city operations and staffing structure Action 6.5.2 Meet customers' expectations and requirements in core business areas and daily
operations Strategy 6.6 Ensure continued financial stability and accountability through sound financial
management, budgeting and reporting Action 6.6.3 Provide accurate budgets and financial forecasts
FY 2021 Key Results
• 3rd year of Strategic Advisory Board• Chime In! survey set a new record of more than 8,000 participants – increase of 458%• One of 14 cities in North America selected to participate in Bloomberg Philanthropy• Only local government selected to participate in Stanford University’s d.Leadership program
FY 2022 Key Deliverables
• Deliver refreshed Yellow Belt Training – partnership with UMC• Human Centered Design: deploy pilots focused on youth programming, work to keep senior
population connected, and continue developing organizational coaches in design thinking
COVID-19 Recovery & Response
• City of El Paso received ARPA funds totaling $154.35 M to support Public Health and SafetyResponse and Recovery Programs, Economic Response and Business Recovery Programs, andCommunity Response and Recovery Programs
• City of El Paso created a COVID-19 response cross-functional team in order to: mitigate andrespond to COVID-19 in El Paso region, maintain internal and external communication, developstrategies to ensure the health and safety of El Paso and economic viability of our community,and prepare El Paso for a long-term response
• COVID-19 response cross-functional team consists of 10 multidisciplinary teams focused on:Financial affairs, Community Vulnerabilities & Human Services, Logistics and Education,Compliance and Service Delivery, Economic Recovery, Testing and Communication, DataAnalysis, Infrastructure and Operations, supported by other operational teams
• Financial Stewardship focuses on short- and long-term response while addressing communityand economic response and recovery and employee and customer safety
• Pledge to Safety is a voluntary program that asks El Paso-area businesses to commit to ninesafety protocols (appropriate PPE, hand sanitizer, comply with requirements, social distance,cleaning protocol, employee training, symptoms check, technology and responsiveness tocustomer feedback) to prevent the spread of COVID-19 as our economy reopens. 200+ areabusinesses have taken the pledge and linked to sub-recipient agreements where possible
• Live Active EP is a free platform for the community to join together in a city-wide movement topromote better health and wellness by encouraging physical activity, improved nutrition andstrong mental health
250
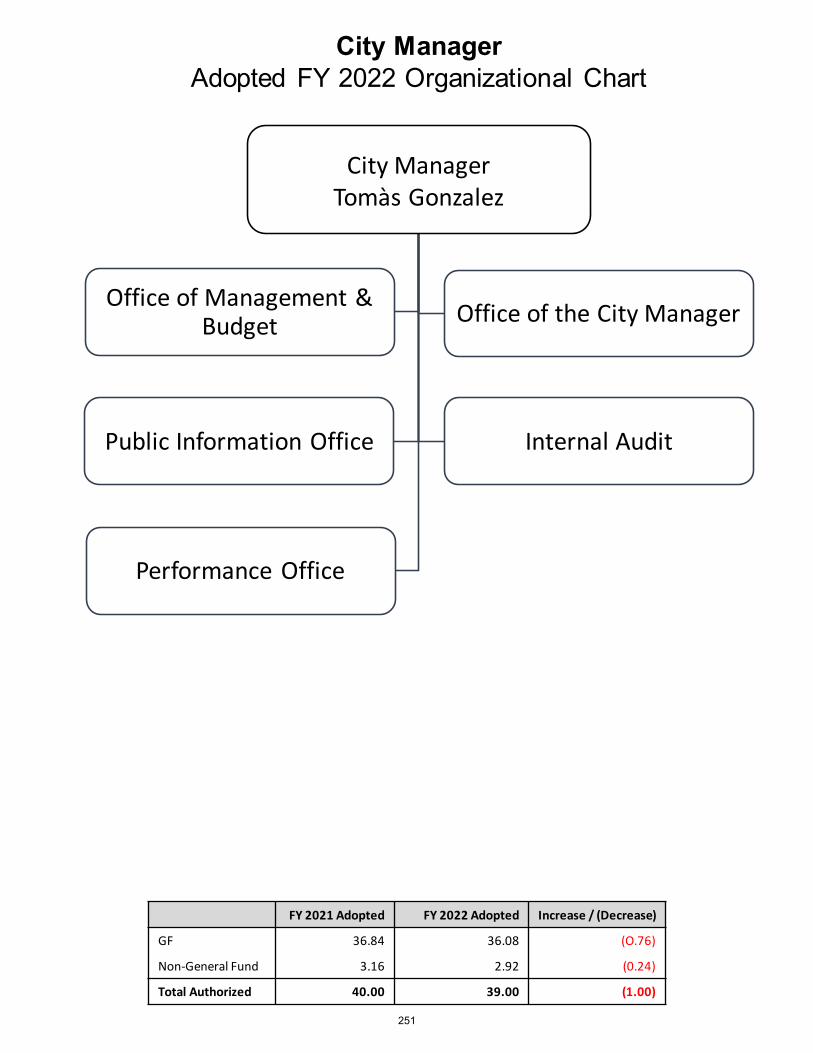
City ManagerTomàs Gonzalez
Office of Management & Budget Office of the City Manager
Public Information Office Internal Audit
Performance Office
City ManagerAdopted FY 2022 Organizational Chart
FY 2021 Adopted FY 2022 Adopted Increase / (Decrease)
GF 36.84 36.08 (O.76)
Non-General Fund 3.16 2.92 (0.24)
Total Authorized 40.00 39.00 (1.00)
251
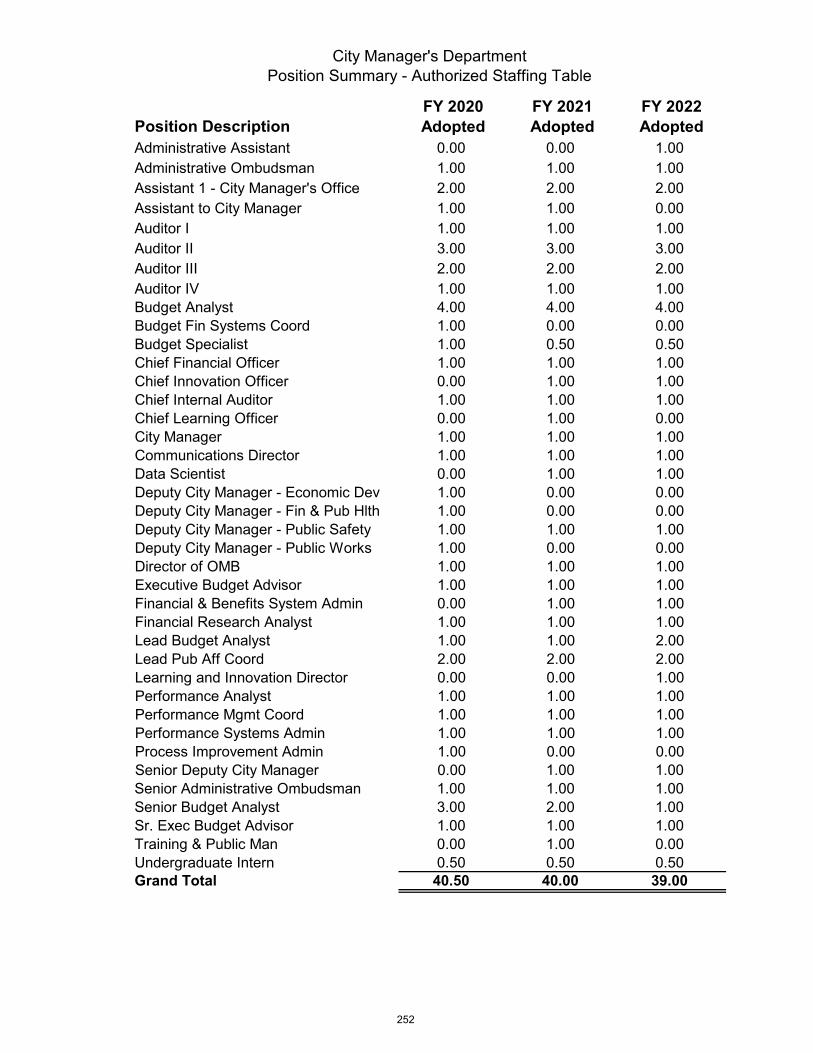
City Manager's DepartmentPosition Summary - Authorized Staffing Table
Position DescriptionFY 2020 Adopted
FY 2021 Adopted
FY 2022 Adopted
Administrative Assistant 0.00 0.00 1.00Administrative Ombudsman 1.00 1.00 1.00Assistant 1 - City Manager's Office 2.00 2.00 2.00Assistant to City Manager 1.00 1.00 0.00Auditor I 1.00 1.00 1.00Auditor II 3.00 3.00 3.00Auditor III 2.00 2.00 2.00Auditor IV 1.00 1.00 1.00Budget Analyst 4.00 4.00 4.00Budget Fin Systems Coord 1.00 0.00 0.00Budget Specialist 1.00 0.50 0.50Chief Financial Officer 1.00 1.00 1.00Chief Innovation Officer 0.00 1.00 1.00Chief Internal Auditor 1.00 1.00 1.00Chief Learning Officer 0.00 1.00 0.00City Manager 1.00 1.00 1.00Communications Director 1.00 1.00 1.00Data Scientist 0.00 1.00 1.00Deputy City Manager - Economic Dev 1.00 0.00 0.00Deputy City Manager - Fin & Pub Hlth 1.00 0.00 0.00Deputy City Manager - Public Safety 1.00 1.00 1.00Deputy City Manager - Public Works 1.00 0.00 0.00Director of OMB 1.00 1.00 1.00Executive Budget Advisor 1.00 1.00 1.00Financial & Benefits System Admin 0.00 1.00 1.00Financial Research Analyst 1.00 1.00 1.00Lead Budget Analyst 1.00 1.00 2.00Lead Pub Aff Coord 2.00 2.00 2.00Learning and Innovation Director 0.00 0.00 1.00Performance Analyst 1.00 1.00 1.00Performance Mgmt Coord 1.00 1.00 1.00Performance Systems Admin 1.00 1.00 1.00Process Improvement Admin 1.00 0.00 0.00Senior Deputy City Manager 0.00 1.00 1.00Senior Administrative Ombudsman 1.00 1.00 1.00Senior Budget Analyst 3.00 2.00 1.00Sr. Exec Budget Advisor 1.00 1.00 1.00Training & Public Man 0.00 1.00 0.00Undergraduate Intern 0.50 0.50 0.50Grand Total 40.50 40.00 39.00
252
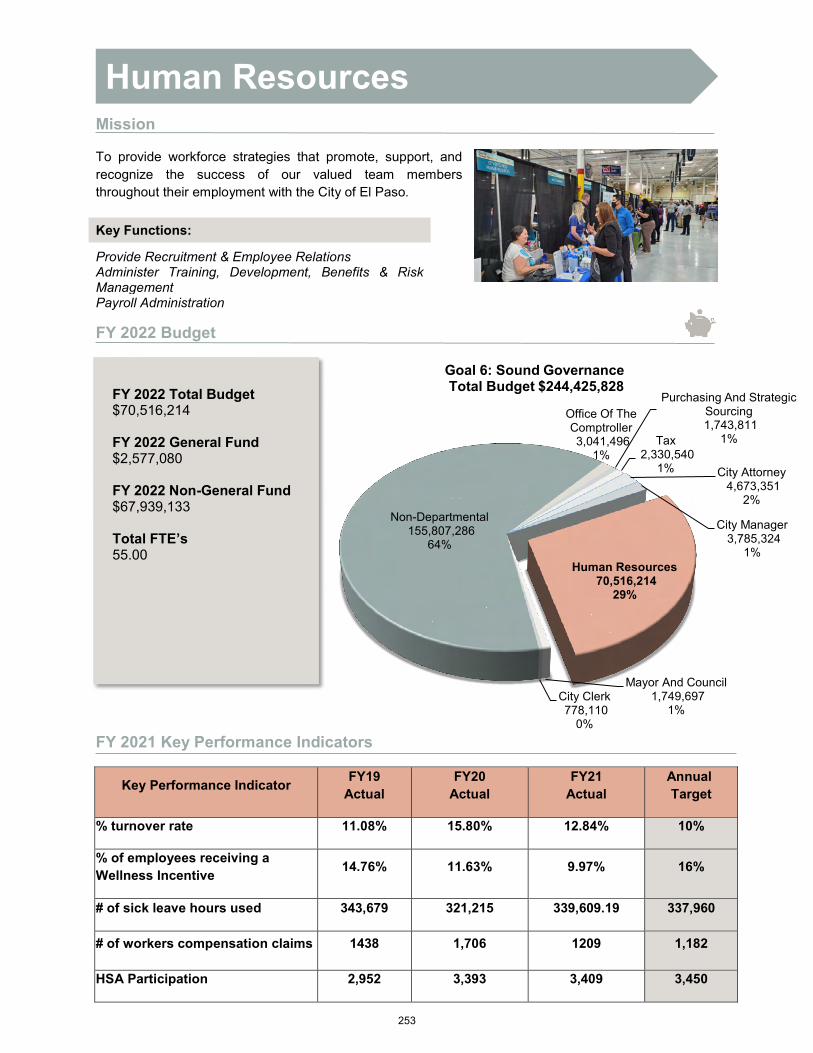
City Attorney4,673,351
2%
City Manager3,785,324
1%Human Resources
70,516,214 29%
Mayor And Council1,749,697
1%City Clerk778,110
0%
Non-Departmental155,807,286
64%
Office Of The Comptroller3,041,496
1%
Purchasing And Strategic Sourcing1,743,811
1%Tax2,330,540
1%
Goal 6: Sound GovernanceTotal Budget $244,425,828
Mission
To provide workforce strategies that promote, support, and recognize the success of our valued team members throughout their employment with the City of El Paso.
FY 2022 Budget
FY 2021 Key Performance Indicators
Key Performance Indicator FY19 Actual
FY20 Actual
FY21 Actual
Annual Target
% turnover rate 11.08% 15.80% 12.84% 10%
% of employees receiving a Wellness Incentive 14.76% 11.63% 9.97% 16%
# of sick leave hours used 343,679 321,215 339,609.19 337,960
# of workers compensation claims 1438 1,706 1209 1,182
HSA Participation 2,952 3,393 3,409 3,450
Key Functions:
Provide Recruitment & Employee Relations Administer Training, Development, Benefits & Risk Management Payroll Administration
FY 2022 Total Budget $70,516,214
FY 2022 General Fund $2,577,080
FY 2022 Non-General Fund $67,939,133
Total FTE’s 55.00
Human Resources
253

FY 2018 FY 2019 FY 2020 FY 2021 FY 2022
ACTUAL ACTUAL ACTUAL ADOPTED ADOPTED AMOUNT PERCENT
Salaries and Wages 3,368,853 3,609,141 5,050,210 3,667,358 3,926,268 258,910 7%Employee Benefits 2,213,292 2,910,062 3,285,511 3,770,733 3,630,591 (140,142) -4%Contractual Services - - - - - - 0%Professional Services 51,343,902 53,598,181 55,505,133 60,116,958 58,740,076 (1,376,882) -2%Outside Contracts 2,105,686 1,708,085 1,966,796 1,860,460 1,851,710 (8,750) 0%Interfund Services 2,344 3,547 3,918 5,880 4,680 (1,200) -20%Operating Leases 17,603 20,610 15,049 17,400 19,000 1,600 9%Fuel and Lubricants - - - - - - 0%Materials and Supplies 35,553 23,501 33,412 40,316 34,366 (5,950) -15%Maintenance and Repairs - - - - - - 0%Minor Equipment and Furniture 9,931 58,466 10,135 23,150 19,900 (3,250) -14%Communications 133 220 110 1,050 25 (1,025) -98%Utilities - - - - - - 0%Travel 6,973 14,547 9,049 12,500 5,500 (7,000) -56%Other Operating Expenditures 337,718 352,564 471,247 581,300 578,750 (2,550) 0%Community Service Projects - - - - - - 0%Interest Expense - - - - - - 0%Principal - - - - - - 0%Other Non-Operating Expenditures 38,126 (38,126) - - - - 0%Grant Match - - - - - - 0%Operating Transfers Out - - - - 1,705,347 1,705,347 100%Capital Outlay 28,800 - - - - - 0%
Total Expenditures 59,508,914 62,260,799 66,350,570 70,097,105 70,516,214 419,109 1%
FY 2018 FY 2019 FY 2020 FY 2021 FY 2022
ACTUAL ACTUAL ACTUAL ADOPTED ADOPTED AMOUNT PERCENT
General Government 2,094,616 2,064,748 2,198,900 2,184,186 2,577,080 392,895 18%Community Development Block Grants - - - - - - 0%Debt Service - - - - - - 0%Capital Projects - - - - - - 0%Special Revenue - - 2,291,689 - - - 0%Fiduciary Funds - - - - - - 0%Enterprise - - (2,386) - - - 0%Internal Service 57,414,299 60,196,051 61,862,367 67,912,919 67,939,133 26,215 0%
Total Funds 59,508,914 62,260,799 66,350,570 70,097,105 70,516,214 419,109 1%
FY 2018 FY 2019 FY 2020 FY 2021 FY 2022
ADOPTED ADOPTED ADOPTED ADOPTED ADOPTED AMOUNT
General Fund 28.20 28.30 28.10 27.50 31.50 4.00 Non-General Fund 15.70 18.60 22.00 22.50 23.50 1.00
Total Authorized 43.90 46.90 50.10 50.00 55.00 5.00
FY 2022 ADOPTED OVER/(UNDER) FY 2021 ADOPTED
FY 2021 ADOPTED OVER/(UNDER) FY 2020 ADOPTEDPositions
Human Resources
Expenditures by Group
Source of Funds
FY 2022 ADOPTED OVER/(UNDER) FY 2021 ADOPTED
254

FY 2018 FY 2019 FY 2020 FY 2021 FY 2022
ACTUAL ACTUAL ACTUAL ADOPTED ADOPTED
General GovernmentHUMAN RESOURCES ADMIN 493,450 492,979 470,925 324,848 378,191
HUMAN CAPITAL MANAGEMENT 501,227 496,830 488,484 497,623 605,940
LABOR RELATIONS 160 0 0 0 0
ORGANIZATIONAL DEVELOPMENT 610,982 618,229 747,722 845,623 1,148,325
BENEFIT SERVICES 36,955 0 0 0 0
PAYROLL, HRIS AND RECORDS 451,841 456,710 491,768 516,093 443,828
WORKERS COMPENSATION 0 0 0 0 797
Sub Total 2,094,616 2,064,748 2,198,900 2,184,186 2,577,080
Special RevenueHUMAN CAPITAL MANAGEMENT 0 0 1,406 0 0
ORGANIZATIONAL DEVELOPMENT 0 0 132,100 0 0
BENEFIT SERVICES 0 0 1,600,795 0 0
UNEMPLOYMENT 0 0 557,387 0 0
Sub Total 0 0 2,291,689 0 0
Enterprise FundsORGANIZATIONAL DEVELOPMENT 0 0 (2,386) 0 0
Sub Total 0 0 (2,386) 0 0
Internal ServiceHUMAN RESOURCES ADMIN 0 0 0 0 50,281
BENEFIT SERVICES 49,096,973 52,687,042 52,517,969 59,387,515 56,225,845
PAYROLL, HRIS AND RECORDS 0 0 0 0 147,262
WORKERS COMPENSATION 7,953,254 7,206,317 8,999,003 8,069,568 11,024,780
UNEMPLOYMENT 364,072 302,691 345,395 455,836 490,965
Sub Total 57,414,299 60,196,051 61,862,367 67,912,919 67,939,133
All Funds Total 59,508,914 62,260,799 66,350,570 70,097,105 70,516,214
HUMAN RESOURCES
Division Summary
255

Strategic Actions
Goal 6: Set the Standard for Sound Governance and Fiscal Management
Strategy 6.1 Recruit and retain a skilled and diverse workforce Action 6.1.1 Provide learning opportunities to maximize employee development and
leadership Action 6.1.2 Sustain a strong pool of management leadership through formal succession
planning Action 6.1.3 Implement policies and practices that will enhance our ability to attract, retain and
reward top talent Strategy 6.2 Implement employee benefits and services that promote financial security
Action 6.2.1 Implement employee benefits and services that promote financial security
Strategy 6.3 Implement programs to reduce organizational risks Action 6.3.1 Mitigate organizational risk/costs
Strategy 6.13 Maintain systems integrity, compliance, and business continuity Action 6.13.1 Ensure adherence to vendor recommended best practices and updates
FY 2021 Key Results
• Launched e-learning – 17 new courses delivered• Launched new Leadership Development series• 49 virtual health podcasts• 8 virtual health coaching referrals• 32 virtual health coach referrals• 242 virtual group fitness classes
FY 2022 Key Deliverables
• HR website redesign• Deploy digital performance evaluation• Deploy EOLearners.com• Tuition Assistance Program process improvement – LSS project
COVID-19 Response & Recovery
• Use of E-Onboarding for new employees• Return to Work Guidelines• Employee Exposure Guidelines• Employees with High Risk Exposure• Employee Responsibilities
256
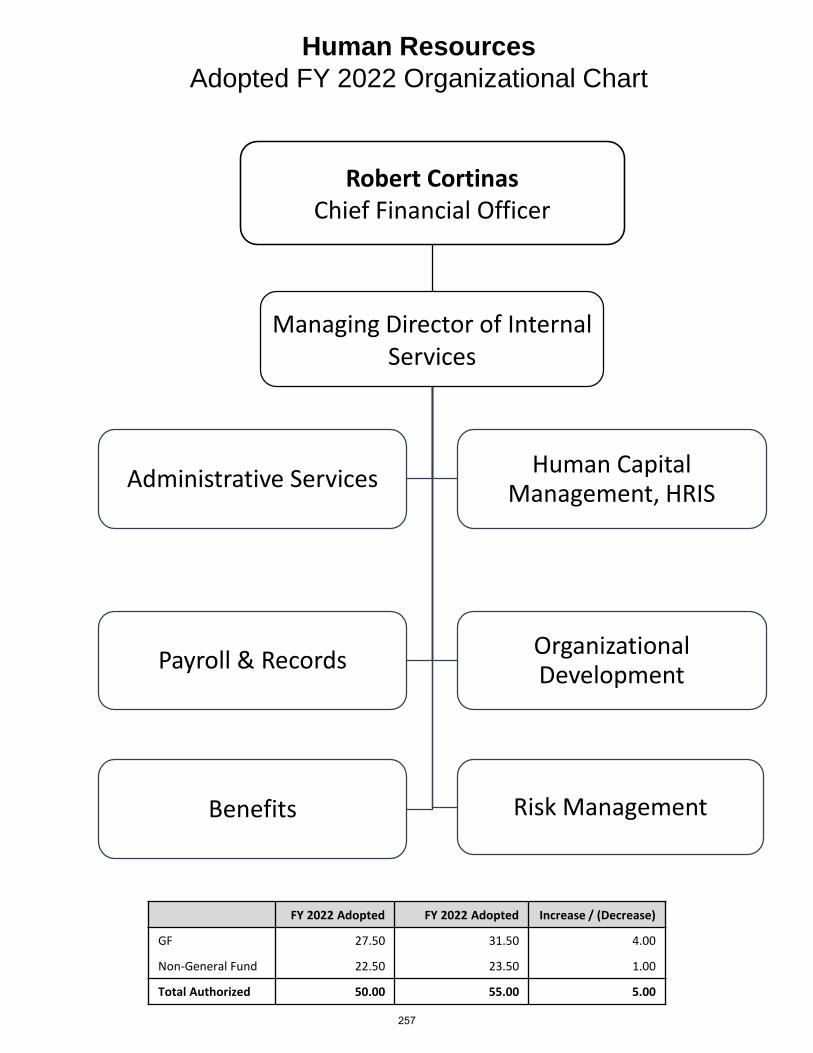
Human ResourcesAdopted FY 2022 Organizational Chart
Managing Director of Internal Services
Administrative ServicesHuman Capital
Management, HRIS
Payroll & RecordsOrganizational Development
Benefits Risk Management
Robert Cortinas Chief Financial Officer
FY 2022 Adopted FY 2022 Adopted Increase / (Decrease)
GF 27.50 31.50 4.00
Non-General Fund 22.50 23.50 1.00
Total Authorized 50.00 55.00 5.00
257

Human Resources
Position Summary - Authorized Staffing Table
Position DescriptionFY 2020 Adopted
FY 2021 Adopted
FY 2022 Adopted
Accountant 2.00 2.00 2.00
Accounting Payroll Specialist 1.00 0.00 0.00
Administrative Assistant 2.00 1.00 1.00
Administrative Specialist 0.60 0.50 0.50
Business Systems Analyst 1.00 1.00 1.00
Chief Learning Officer 0.00 0.00 1.00
Civil Service Commision Record 1.00 1.00 1.00
Human Resources Analyst 2.00 3.00 3.00
Human Resources Asst Director 2.00 2.00 2.00
Human Resources Audit Specialist 0.00 0.00 4.00
Human Resources Business Partner 2.00 2.00 2.00
Human Resources Director 1.00 1.00 1.00
Human Resources Manager 1.00 1.00 2.00
Human Resources Specialist 11.00 12.00 11.00
Office Assistant 2.00 1.00 1.00
Lead Human Resources Specialist 0.00 0.00 3.00
Risk Management Analyst 1.00 1.00 1.00
Risk Manager 1.00 1.00 1.00
Safety Specialist 1.00 1.00 1.00
Senior Human Resources Analyst 8.00 7.00 6.00
Senior Human Resources Special 4.00 4.00 2.00
Senior Office Assistant 1.00 2.00 2.00
Senior Safety Specialist 1.00 1.00 1.00
Training Specialist 4.00 5.00 5.00
Undergraduate Intern 0.50 0.50 0.50
Grand Total 50.10 50.00 55.00
258

City Attorney4,673,351
2%
City Manager3,785,324
1%
Human Resources70,516,214
29%
Mayor And Council1,749,697
1%City Clerk778,110
0%
Non-Departmental155,807,286
64%
Office Of The Comptroller3,041,496
1%
Purchasing And Strategic Sourcing
1,743,811 1%
Tax2,330,540
1%
Goal 6: Sound GovernanceTotal Budget $244,425,828
Mission:
As outlined in the City Charter, the Mayor and City Council may act to accomplish any lawful purpose for the “advancement of the interest, welfare, health, morals, comfort, safety, and convenience of the City and its inhabitants.”
Key Functions:
Respond to citizen concerns Represent various segments of the community Appoint and direct City Manager Enact ordinances and resolutions Approve budget Determine tax rates
FY 2022 Budget
*No Key Deliverables are available for Mayor and Council
FY 2022 Total Budget $1,749,697
FY 2022 General Fund $1,669,697
FY 2022 Non-General Fund $80,000
Total FTE’s 24.00
Mayor and Council
259
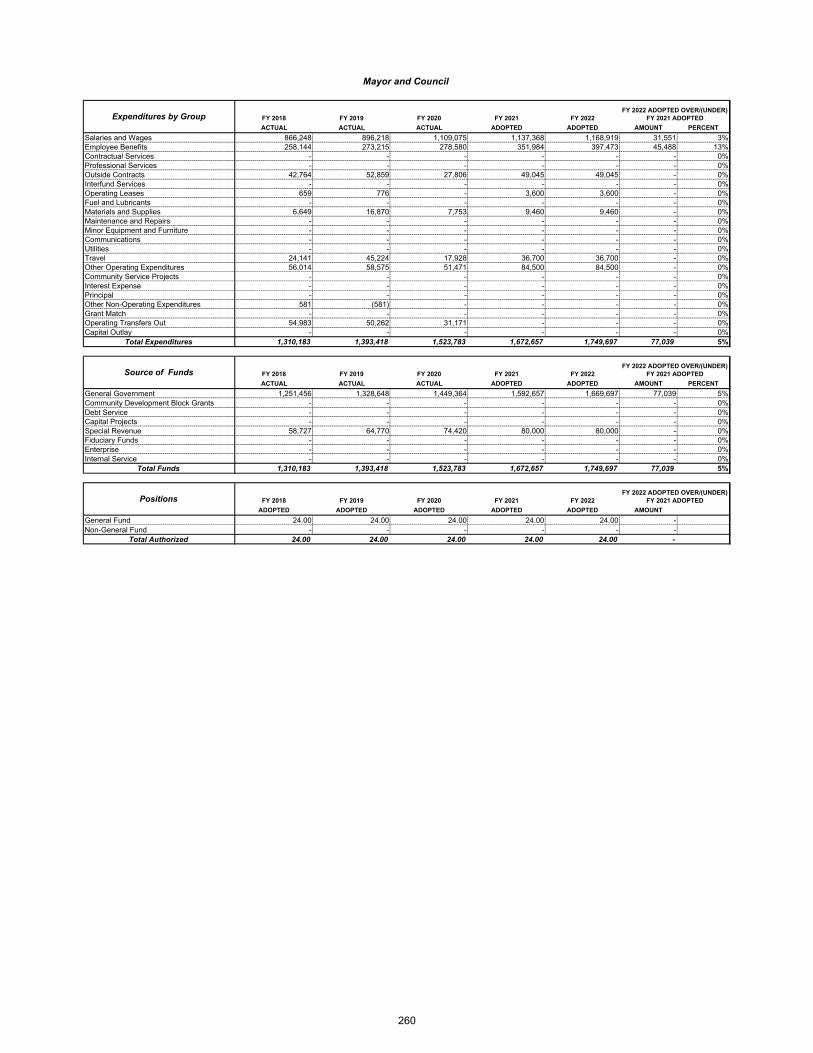
FY 2018 FY 2019 FY 2020 FY 2021 FY 2022
ACTUAL ACTUAL ACTUAL ADOPTED ADOPTED AMOUNT PERCENT
Salaries and Wages 866,248 896,218 1,109,075 1,137,368 1,168,919 31,551 3%Employee Benefits 258,144 273,215 278,580 351,984 397,473 45,488 13%Contractual Services - - - - - - 0%Professional Services - - - - - - 0%Outside Contracts 42,764 52,859 27,806 49,045 49,045 - 0%Interfund Services - - - - - - 0%Operating Leases 659 776 - 3,600 3,600 - 0%Fuel and Lubricants - - - - - - 0%Materials and Supplies 6,649 16,870 7,753 9,460 9,460 - 0%Maintenance and Repairs - - - - - - 0%Minor Equipment and Furniture - - - - - - 0%Communications - - - - - - 0%Utilities - - - - - - 0%Travel 24,141 45,224 17,928 36,700 36,700 - 0%Other Operating Expenditures 56,014 58,575 51,471 84,500 84,500 - 0%Community Service Projects - - - - - - 0%Interest Expense - - - - - - 0%Principal - - - - - - 0%Other Non-Operating Expenditures 581 (581) - - - - 0%Grant Match - - - - - - 0%Operating Transfers Out 54,983 50,262 31,171 - - - 0%Capital Outlay - - - - - - 0%
Total Expenditures 1,310,183 1,393,418 1,523,783 1,672,657 1,749,697 77,039 5%
FY 2018 FY 2019 FY 2020 FY 2021 FY 2022
ACTUAL ACTUAL ACTUAL ADOPTED ADOPTED AMOUNT PERCENT
General Government 1,251,456 1,328,648 1,449,364 1,592,657 1,669,697 77,039 5%Community Development Block Grants - - - - - - 0%Debt Service - - - - - - 0%Capital Projects - - - - - - 0%Special Revenue 58,727 64,770 74,420 80,000 80,000 - 0%Fiduciary Funds - - - - - - 0%Enterprise - - - - - - 0%Internal Service - - - - - - 0%
Total Funds 1,310,183 1,393,418 1,523,783 1,672,657 1,749,697 77,039 5%
FY 2018 FY 2019 FY 2020 FY 2021 FY 2022
ADOPTED ADOPTED ADOPTED ADOPTED ADOPTED AMOUNT
General Fund 24.00 24.00 24.00 24.00 24.00 - Non-General Fund - - - - - -
Total Authorized 24.00 24.00 24.00 24.00 24.00 -
Expenditures by Group
Source of Funds
Positions
FY 2022 ADOPTED OVER/(UNDER) FY 2021 ADOPTED
FY 2022 ADOPTED OVER/(UNDER) FY 2021 ADOPTED
FY 2022 ADOPTED OVER/(UNDER) FY 2021 ADOPTED
Mayor and Council
260
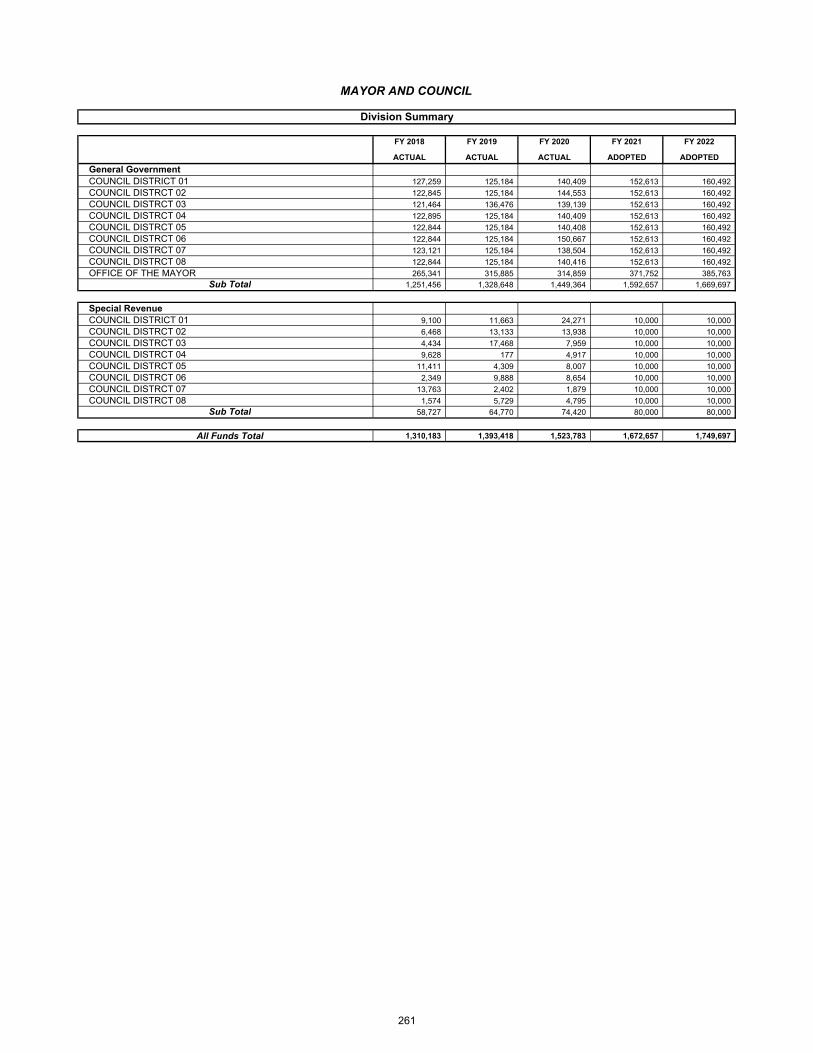
FY 2018 FY 2019 FY 2020 FY 2021 FY 2022
ACTUAL ACTUAL ACTUAL ADOPTED ADOPTED
General GovernmentCOUNCIL DISTRICT 01 127,259 125,184 140,409 152,613 160,492
COUNCIL DISTRCT 02 122,845 125,184 144,553 152,613 160,492
COUNCIL DISTRCT 03 121,464 136,476 139,139 152,613 160,492
COUNCIL DISTRCT 04 122,895 125,184 140,409 152,613 160,492
COUNCIL DISTRCT 05 122,844 125,184 140,408 152,613 160,492
COUNCIL DISTRCT 06 122,844 125,184 150,667 152,613 160,492
COUNCIL DISTRCT 07 123,121 125,184 138,504 152,613 160,492
COUNCIL DISTRCT 08 122,844 125,184 140,416 152,613 160,492
OFFICE OF THE MAYOR 265,341 315,885 314,859 371,752 385,763
Sub Total 1,251,456 1,328,648 1,449,364 1,592,657 1,669,697
Special RevenueCOUNCIL DISTRICT 01 9,100 11,663 24,271 10,000 10,000
COUNCIL DISTRCT 02 6,468 13,133 13,938 10,000 10,000
COUNCIL DISTRCT 03 4,434 17,468 7,959 10,000 10,000
COUNCIL DISTRCT 04 9,628 177 4,917 10,000 10,000
COUNCIL DISTRCT 05 11,411 4,309 8,007 10,000 10,000
COUNCIL DISTRCT 06 2,349 9,888 8,654 10,000 10,000
COUNCIL DISTRCT 07 13,763 2,402 1,879 10,000 10,000
COUNCIL DISTRCT 08 1,574 5,729 4,795 10,000 10,000
Sub Total 58,727 64,770 74,420 80,000 80,000
All Funds Total 1,310,183 1,393,418 1,523,783 1,672,657 1,749,697
MAYOR AND COUNCIL
Division Summary
261
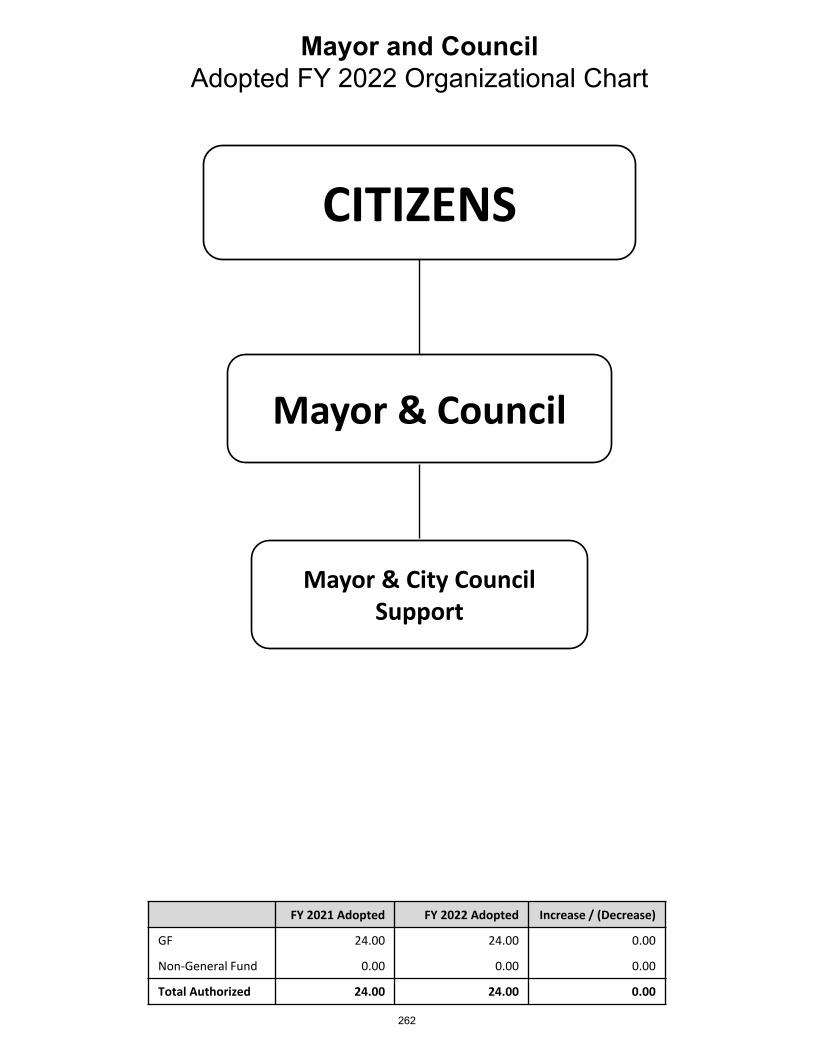
Mayor and Council Adopted FY 2022 Organizational Chart
FY 2021 Adopted FY 2022 Adopted Increase / (Decrease)
GF 24.00 24.00 0.00
Non-General Fund 0.00 0.00 0.00
Total Authorized 24.00 24.00 0.00
CITIZENS
Mayor & Council
Mayor & City Council Support
262
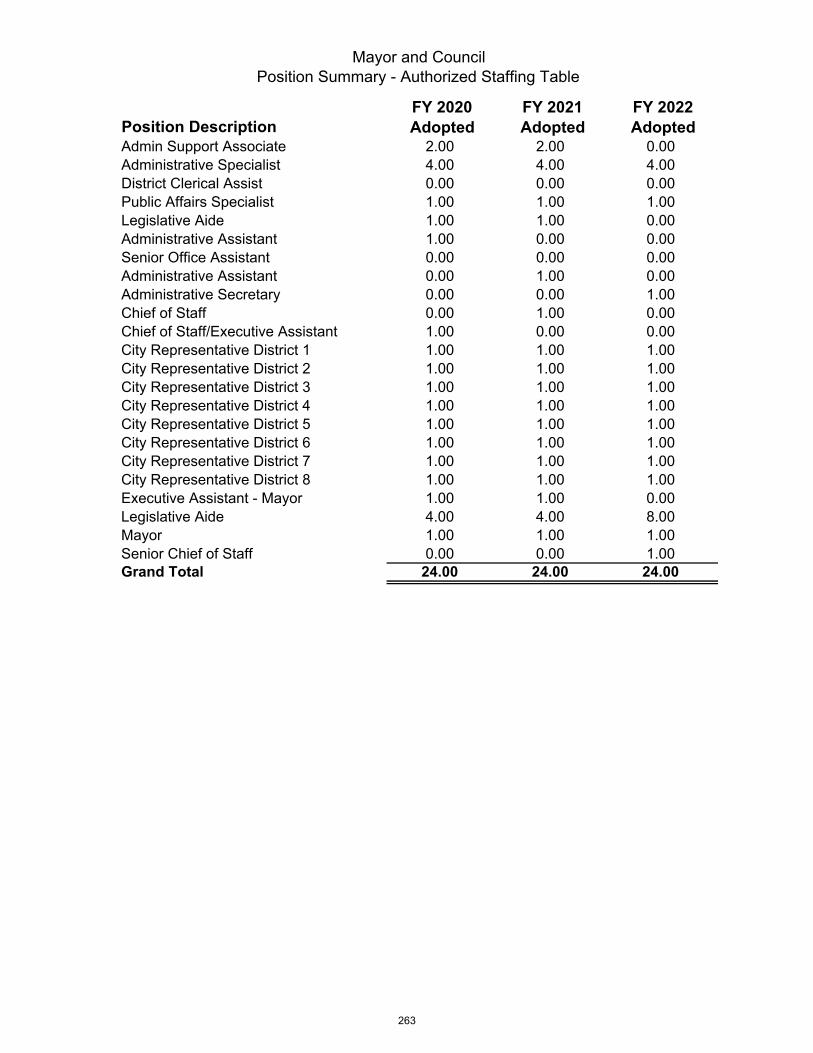
Mayor and CouncilPosition Summary - Authorized Staffing Table
Position DescriptionFY 2020 Adopted
FY 2021 Adopted
FY 2022 Adopted
Admin Support Associate 2.00 2.00 0.00Administrative Specialist 4.00 4.00 4.00District Clerical Assist 0.00 0.00 0.00Public Affairs Specialist 1.00 1.00 1.00Legislative Aide 1.00 1.00 0.00Administrative Assistant 1.00 0.00 0.00Senior Office Assistant 0.00 0.00 0.00Administrative Assistant 0.00 1.00 0.00Administrative Secretary 0.00 0.00 1.00Chief of Staff 0.00 1.00 0.00Chief of Staff/Executive Assistant 1.00 0.00 0.00City Representative District 1 1.00 1.00 1.00City Representative District 2 1.00 1.00 1.00City Representative District 3 1.00 1.00 1.00City Representative District 4 1.00 1.00 1.00City Representative District 5 1.00 1.00 1.00City Representative District 6 1.00 1.00 1.00City Representative District 7 1.00 1.00 1.00City Representative District 8 1.00 1.00 1.00Executive Assistant - Mayor 1.00 1.00 0.00Legislative Aide 4.00 4.00 8.00Mayor 1.00 1.00 1.00Senior Chief of Staff 0.00 0.00 1.00Grand Total 24.00 24.00 24.00
263

City Attorney4,673,351
2%
City Manager3,785,324
1%
Human Resources70,516,214
29%
Mayor And Council
1,749,697 1%
City Clerk778,110
0%
Non-Departmental
155,807,286 64%
Office Of The Comptroller3,041,496
1%
Purchasing And Strategic Sourcing
1,743,811 1%
Tax2,330,540
1%
Goal 6: Sound GovernanceTotal Budget $244,425,828
Mission
To monitor General Government fund expenses that do not apply to a specific department, or miscellaneous expenses that are not associated with any of the operating departments.
FY 2022 Budget
*Non-Departmental has no Key Deliverables or Key Performance Indicators
FY 2021 Total Budget $155,807,286
FY 2021 General Fund $23,452,826
FY 2021 Non-General Fund $132,354,459
Total FTE’s 7.00
Non-Departmental
264

FY 2018 FY 2019 FY 2020 FY 2021 FY 2022
ACTUAL ACTUAL ACTUAL ADOPTED ADOPTED AMOUNT PERCENT
Salaries and Wages 226,814 280,242 422,013 2,393,128 (456,591) (2,849,719) -119%Employee Benefits 3,255,038 2,309,890 1,864,676 3,930,330 3,327,216 (603,113) -15%Contractual Services - - - - - - 0%Professional Services 3,505,290 9,339,175 10,254,567 7,215,104 9,427,049 2,211,945 31%Outside Contracts 471,756 651,281 5,073,579 585,000 4,850,559 4,265,559 729%Interfund Services - 17,000 8,732 17,000 17,000 - 0%Operating Leases 18,000 - - - - - 0%Fuel and Lubricants - 5,336 2,936 24,000 27,000 3,000 13%Materials and Supplies 219,866 80,545 79,344 475,000 475,000 - 0%Maintenance and Repairs - - - - - - 0%Minor Equipment and Furniture 547,724 5,539 254,137 125,000 125,000 - 0%Communications - - - - - - 0%Utilities - - - - - - 0%Travel - (658) - - 15,000 15,000 100%Other Operating Expenditures 3,390,792 4,199,756 6,633,661 3,659,098 4,174,512 515,414 14%Community Service Projects 3,688,000 4,283,471 4,712,393 2,842,688 2,749,688 (93,000) -3%Interest Expense 54,501,869 56,098,078 58,565,069 60,694,313 62,953,531 2,259,218 4%Principal 49,507,505 54,083,450 54,082,178 50,937,032 49,303,755 (1,633,277) -3%Other Non-Operating Expenditures 437,390 836,373 563,335 1,000,000 1,000,000 - 0%Grant Match (40,000) - - - - - 0%Operating Transfers Out 17,601,252 61,247,776 105,033,735 24,984,121 17,698,567 (7,285,554) -29%Capital Outlay 696,918 265,270 132,319 120,000 120,000 - 0%
Total Expenditures 138,028,213 193,702,522 247,682,675 159,001,813 155,807,286 (3,194,527) -2%
FY 2018 FY 2019 FY 2020 FY 2021 FY 2022
ACTUAL ACTUAL ACTUAL ADOPTED ADOPTED AMOUNT PERCENT
General Government 21,384,089 22,093,107 30,361,209 27,922,585 23,452,826 (4,469,759) -16%Community Development Block Grants - - - - - - 0%Debt Service 104,218,653 151,101,998 198,917,521 111,659,745 112,288,991 629,246 1%Capital Projects 3,088,727 3,326,532 1,941,157 - - - 0%Special Revenue 9,336,744 17,180,885 16,462,787 19,419,483 20,065,468 645,986 3%Fiduciary Funds - - - - - - 0%Enterprise - - - - - - 0%Internal Service - - - - - - 0%
Total Funds 138,028,213 193,702,522 247,682,675 159,001,813 155,807,286 (3,194,527) -2%
FY 2018 FY 2019 FY 2020 FY 2021 FY 2022
ADOPTED ADOPTED ADOPTED ADOPTED ADOPTED AMOUNT
General Fund 5.00 5.00 7.00 9.00 7.00 (2.00)Non-General Fund - - - - - -
Total Authorized 5.00 5.00 7.00 9.00 7.00 (2.00)
FY 2022 ADOPTED OVER/(UNDER) FY 2021 ADOPTED
FY 2022 ADOPTED OVER/(UNDER) FY 2021 ADOPTED
Expenditures by Group
Source of Funds
Positions
FY 2022 ADOPTED OVER/(UNDER) FY 2021 ADOPTED
Non-Departmental
265

FY 2018 FY 2019 FY 2020 FY 2021 FY 2022
ACTUAL ACTUAL ACTUAL ADOPTED ADOPTED
General GovernmentPEG 296,837 364,432 538,118 615,419 566,911
NONDEPARTMENTAL 21,087,252 21,728,675 29,823,091 27,307,166 22,885,916
Sub Total 21,384,089 22,093,107 30,361,209 27,922,585 23,452,826
Debt ServiceDEBT REFUNDING 0 0 0 0 3,240,153
CERT OF OBLIGATION 2005-PLAZA 1,208,753 (3) 0 0 0
CERT OF OBLIGATION 2009 2,799,229 1,810,999 495 0 0
CERT OF OBLIGATION 2009A 2,130,254 2,122,779 495 0 0
CERT OF OBLIGATION 2009B 2,382,008 42,513,695 248 0 0
CERT OF OBLIGATION 2009C 200,274 200,397 3,344,813 500 0
CERT OF OBLIGATION 2010B 6,118,147 6,086,702 60,955,071 500 0
CERT OF OBLIGATION 2011 2,865,267 2,862,044 28,399,344 250 0
CERT OF OBLIGATION 2012 4,838,460 4,834,620 4,838,005 4,837,954 4,045,004
CERT OF OBLIGATION 2013 4,315,454 4,312,054 4,315,229 4,315,275 2,407,935
GO BOND 2007A 495 0 0 0 0
GO PENSION BONDS 2007 7,777,152 7,774,251 7,776,750 7,773,872 7,775,196
GO BOND 2008 495 0 0 0 0
GO BOND 2011 REFUNDING 730,595 700,398 703,022 704,966 500
GO BOND 2012 REFUNDING 1,718,729 1,725,316 1,730,602 1,735,082 1,338,948
GO BOND 2013 REFUNDING 654 0 0 0 0
GO BOND 2014 REFUNDING 8,607,174 8,607,133 8,606,880 8,604,215 8,607,063
GO BOND 2014 REF & IMP 10,789,048 7,841,068 7,298,803 7,311,344 7,319,579
CERT OF OBLIGATION 2014A 3,412,554 3,414,082 3,412,557 3,412,850 3,409,585
GO BOND 2014A 2,777,159 3,982,432 5,244,657 5,244,450 5,246,435
CERT OF OBLIGATION 2015 2,476,857 4,145,882 4,152,357 4,144,400 4,147,385
GO BOND 2015 5,596,925 6,440,950 15,133,675 15,139,719 15,131,454
GO SERIES 2016 20,935,454 12,346,979 4,197,954 6,448,000 4,085,485
CO SERIES 2016 11,779,613 11,779,479 11,780,613 11,780,700 11,780,670
2019 CO BONDS 0 5,254,900 8,614,932 4,429,475 5,856,710
2019A GO BONDS 0 3,714,378 5,683,656 5,688,500 5,680,985
2019B GO BONDS 0 1,018,942 1,024,473 1,022,219 1,021,204
2020 CO BONDS 0 0 0 5,307,702 5,690,435
2020A GO REF & IMPROV BONDS 0 0 4,028,612 7,173,050 6,892,735
2020B GO REFUNDING BONDS 0 0 2,451,651 1,882,200 1,880,635
SECO LOAN #CL219 0 637,736 (49,430) 0 0
SECO LOAN #CLS0008 0 314,320 314,320 314,320 0
SECO LOAN #CL244 0 927,576 927,576 927,576 0
TAX NOTE, SERIES 2017 536,580 538,782 539,470 539,964 540,264
2021A CO BONDS 0 0 0 0 2,550,185
2021B CO BONDS 0 0 0 0 701,535
2021 GO BONDS 0 0 0 0 1,500,435
2021A GO REFUNDING BONDS 0 0 0 0 1,438,476
BANK OF AMERICA LEASE 0 1,892,080 645,580 664,947 0
COMPASS MORTGAGE #18 -FIRE 0 229,914 0 0 0
MOTOROLA RADIO SYSTEM 0 2,255,714 2,255,714 2,255,715 0
COMPASS MORTGAGE #26 - FIRE 0 785,864 589,398 0 0
NONDEPARTMENTAL 221,324 30,535 0 0 0
Sub Total 104,218,653 151,101,998 198,917,521 111,659,745 112,288,991
Capital ProjectsGO SERIES 2016 0 0 1,484,960 0 0
2019 CO BONDS 0 788,755 (518,522) 0 0
2019A GO BONDS 0 379,010 (12,705) 0 0
2019B GO BONDS 0 250,592 (3,045) 0 0
2020 CO BONDS 0 0 255,814 0 0
2020A GO REF & IMPROV BONDS 0 0 535,462 0 0
CH RELOCATION MOVING COSTS 2,996 3,749 6,839 0 0
NONDEPARTMENTAL 3,085,731 1,904,426 192,354 0 0
Sub Total 3,088,727 3,326,532 1,941,157 0 0
Special RevenueRESILIENCY & SUSTAINABILITY 10,000 0 0 0 0
PID BONDS - THUNDER CANYON 40,604 43,937 71,514 0 0
PEG 763,271 76,641 287,415 720,000 720,000
NONDEPARTMENTAL 8,522,868 17,060,307 16,103,858 18,699,483 19,345,468
Sub Total 9,336,744 17,180,885 16,462,787 19,419,483 20,065,468
All Funds Total 138,028,213 193,702,522 247,682,675 159,001,813 155,807,286
Division Summary
NON-DEPARTMENTAL
266
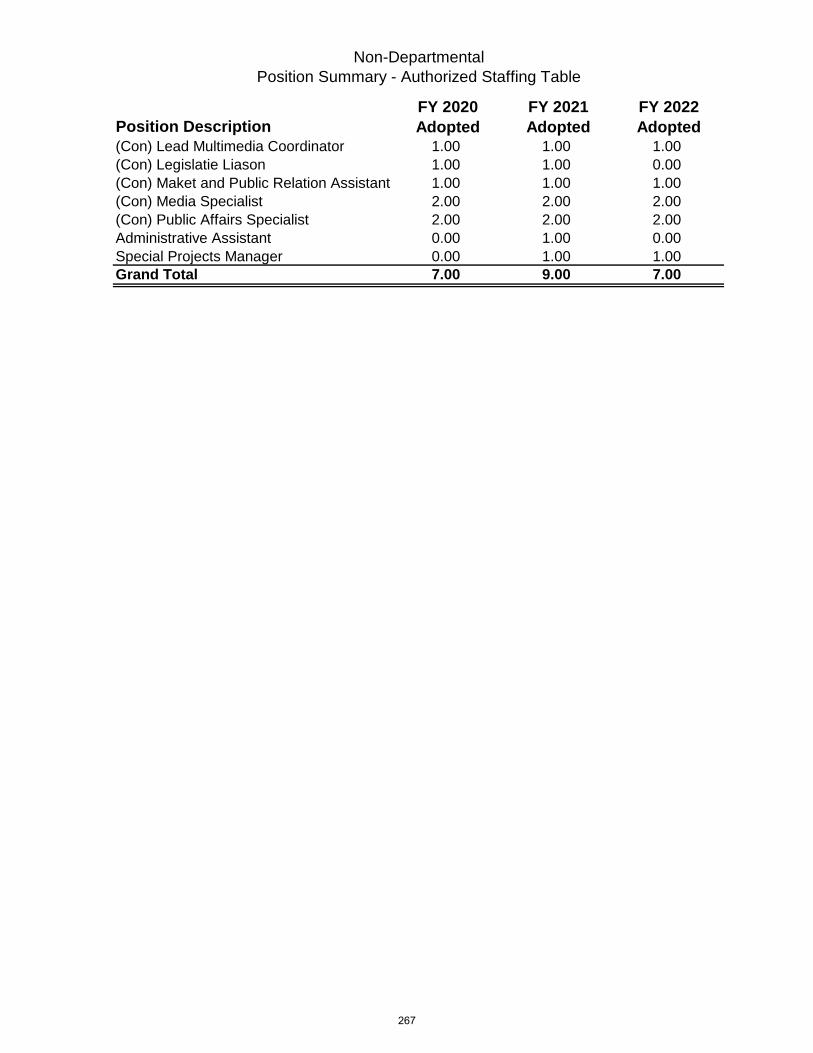
Non-Departmental
Position Summary - Authorized Staffing Table
Position DescriptionFY 2020 Adopted
FY 2021 Adopted
FY 2022 Adopted
(Con) Lead Multimedia Coordinator 1.00 1.00 1.00
(Con) Legislatie Liason 1.00 1.00 0.00
(Con) Maket and Public Relation Assistant 1.00 1.00 1.00
(Con) Media Specialist 2.00 2.00 2.00
(Con) Public Affairs Specialist 2.00 2.00 2.00
Administrative Assistant 0.00 1.00 0.00
Special Projects Manager 0.00 1.00 1.00
Grand Total 7.00 9.00 7.00
267

City Attorney4,673,351
2%
City Manager3,785,324
1%
Human Resources70,516,214
29%
Mayor And Council1,749,697
1%City Clerk778,110
0%
Non-Departmental155,807,286
64%
Office Of The Comptroller
3,041,496 1%
Purchasing And Strategic Sourcing1,743,811
1% Tax2,330,540
1%
Goal 6: Sound GovernanceTotal Budget $244,425,828
Mission
Provide fiscal management, financial reporting, administer treasury services, and provide grant accounting information to City Management and elected officials so they can make informed decisions regarding the provision of City services.
FY 2022 Budget
FY 2021 Key Performance Indicators
Key Performance Indicator
FY19 Actual
FY20 Actual
FY21 Actual
Annual Target
Total portfolio investment earnings per quarter (NEW)
$11,128,086 $8,821,811 $1,444,329 $1,300,000
Key Functions: Responsible for all cash disbursement Facilitate payment to vendors through a decentralized accounts payable process Manage City’s investments in accordance with state law and City Ordinances Administer grants
Office of the Comptroller
FY 2021 Total Budget $2,781,287
FY 2021 General Fund $2,711,287
FY 2021 Non-General Fund $70,000
Total FTE’s 38.00
268
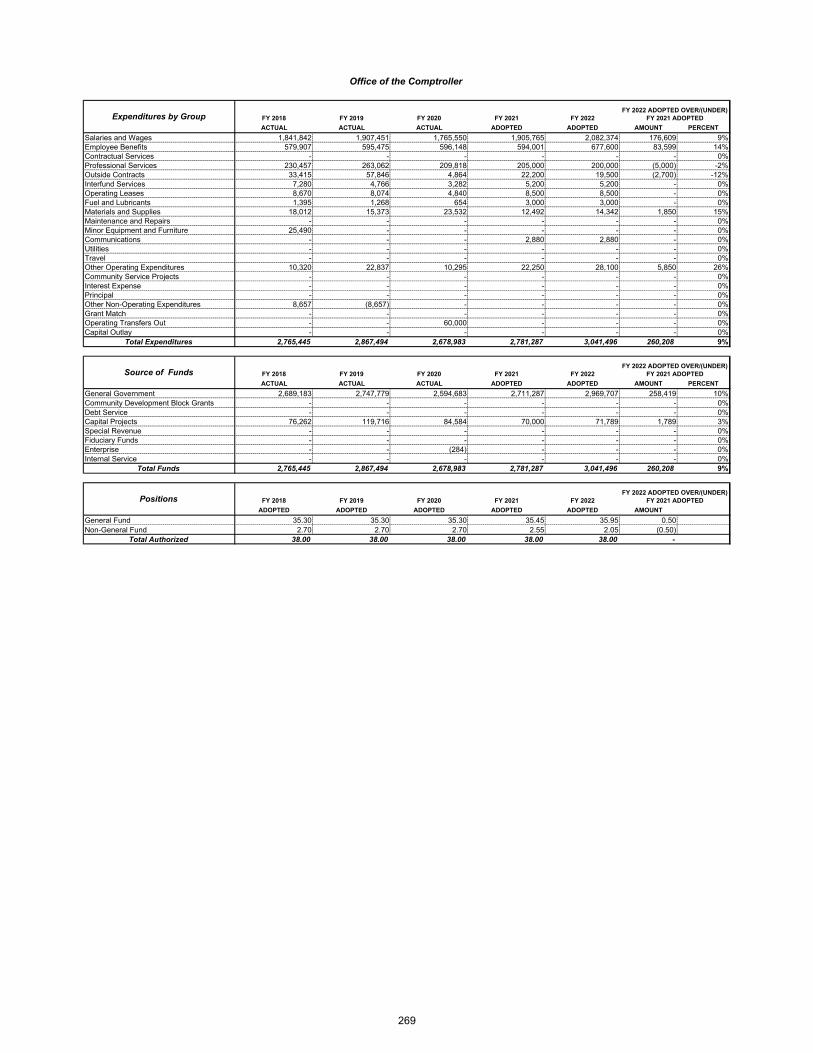
FY 2018 FY 2019 FY 2020 FY 2021 FY 2022
ACTUAL ACTUAL ACTUAL ADOPTED ADOPTED AMOUNT PERCENT
Salaries and Wages 1,841,842 1,907,451 1,765,550 1,905,765 2,082,374 176,609 9%Employee Benefits 579,907 595,475 596,148 594,001 677,600 83,599 14%Contractual Services - - - - - - 0%Professional Services 230,457 263,062 209,818 205,000 200,000 (5,000) -2%Outside Contracts 33,415 57,846 4,864 22,200 19,500 (2,700) -12%Interfund Services 7,280 4,766 3,282 5,200 5,200 - 0%Operating Leases 8,670 8,074 4,840 8,500 8,500 - 0%Fuel and Lubricants 1,395 1,268 654 3,000 3,000 - 0%Materials and Supplies 18,012 15,373 23,532 12,492 14,342 1,850 15%Maintenance and Repairs - - - - - - 0%Minor Equipment and Furniture 25,490 - - - - - 0%Communications - - - 2,880 2,880 - 0%Utilities - - - - - - 0%Travel - - - - - - 0%Other Operating Expenditures 10,320 22,837 10,295 22,250 28,100 5,850 26%Community Service Projects - - - - - - 0%Interest Expense - - - - - - 0%Principal - - - - - - 0%Other Non-Operating Expenditures 8,657 (8,657) - - - - 0%Grant Match - - - - - - 0%Operating Transfers Out - - 60,000 - - - 0%Capital Outlay - - - - - - 0%
Total Expenditures 2,765,445 2,867,494 2,678,983 2,781,287 3,041,496 260,208 9%
FY 2018 FY 2019 FY 2020 FY 2021 FY 2022
ACTUAL ACTUAL ACTUAL ADOPTED ADOPTED AMOUNT PERCENT
General Government 2,689,183 2,747,779 2,594,683 2,711,287 2,969,707 258,419 10%Community Development Block Grants - - - - - - 0%Debt Service - - - - - - 0%Capital Projects 76,262 119,716 84,584 70,000 71,789 1,789 3%Special Revenue - - - - - - 0%Fiduciary Funds - - - - - - 0%Enterprise - - (284) - - - 0%Internal Service - - - - - - 0%
Total Funds 2,765,445 2,867,494 2,678,983 2,781,287 3,041,496 260,208 9%
FY 2018 FY 2019 FY 2020 FY 2021 FY 2022
ADOPTED ADOPTED ADOPTED ADOPTED ADOPTED AMOUNT
General Fund 35.30 35.30 35.30 35.45 35.95 0.50 Non-General Fund 2.70 2.70 2.70 2.55 2.05 (0.50)
Total Authorized 38.00 38.00 38.00 38.00 38.00 -
Expenditures by Group
Source of Funds
Office of the Comptroller
FY 2022 ADOPTED OVER/(UNDER) FY 2021 ADOPTED
FY 2022 ADOPTED OVER/(UNDER) FY 2021 ADOPTED
FY 2022 ADOPTED OVER/(UNDER) FY 2021 ADOPTEDPositions
269

FY 2018 FY 2019 FY 2020 FY 2021 FY 2022
ACTUAL ACTUAL ACTUAL ADOPTED ADOPTED
General GovernmentOFFICE OF THE COMPTROLLER 304,742 381,446 254,293 205,209 376,323
FINANCIAL REPORTING AND GRANTS 1,222,597 1,214,979 1,222,812 1,310,300 1,312,231
GRANT ACCTG 843,688 844,985 818,840 861,455 928,008
TREASURY MANAGEMENT DIVISION 318,157 306,369 298,739 334,323 353,145
Sub Total 2,689,183 2,747,779 2,594,683 2,711,287 2,969,707
Capital ProjectsCITY AUCTIONS 73,292 119,716 84,415 70,000 71,789
OFFICE OF THE COMPTROLLER 2,970 0 169 0 0
Sub Total 76,262 119,716 84,584 70,000 71,789
Enterprise FundsFINANCIAL REPORTING AND GRANTS 0 0 (284) 0 0
Sub Total 0 0 (284) 0 0
All Funds Total 2,765,445 2,867,494 2,678,983 2,781,287 3,041,496
Division Summary
OFFICE OF THE COMPTROLLER
270
Strategic Actions
Goal 6: Set the Standard for Sound Governance and Fiscal Management
Strategy 6.6 Ensure continued financial stability and accountability through sound financial management, budgeting and reporting
Action 6.6.1 Provide timely financial reporting and processing
FY 2021 Key Results Early implementation of GASB 84 for fiduciary activities Capital assets software implementation to track over 1 billion dollars in assets Received GFOA Award in financial reporting for the 20th year 5th year with no financial audit findings
FY 2022 Key Deliverables
Complete the FY22 audit with no financial findings Submit the CAFR to GFOA for 21st award Implement GASB Statement No. 87, Leases Provide Trainings to all departments on financial policies and procedures Begin developing the Popular Annual Financial Report (PAFR)
COVID-19 Response & Recovery
Adjusted AP voucher processing schedule to run 3 times a week instead of 5, picking uptransactions 5 days in advance
Assisting departments with grant compliance, specifically providing guidance and monitoring theCARES Act and ARPA grants
Adjusted investment strategies to still maximize earnings while dealing with current marketconditions
Implemented electronic voucher approval, journal entry approval and billing approval forms topreserve internal controls regarding segregation of duties of approved transactions
271

Office of the ComptrollerAdopted FY 2022 Organizational Chart
Comptroller
Fiscal Operations Treasury Services
Grants Administration
Robert CortinasChief Financial Officer
FY 2021 Adopted FY 2022 Adopted Increase / (Decrease)
GF 35.30 35.95 0.50
Non-General Fund 2.70 2.05 (0.50)
Total Authorized 38.00 38.00 0.00
272
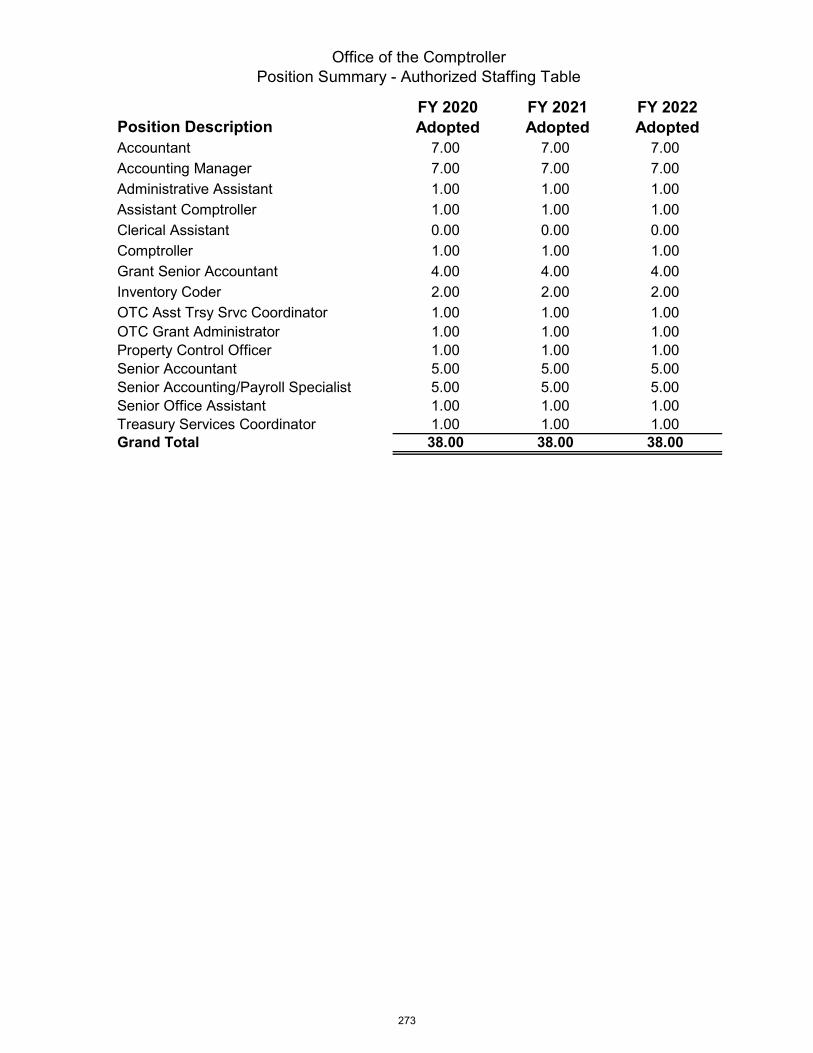
Office of the ComptrollerPosition Summary - Authorized Staffing Table
Position DescriptionFY 2020 Adopted
FY 2021 Adopted
FY 2022 Adopted
Accountant 7.00 7.00 7.00
Accounting Manager 7.00 7.00 7.00
Administrative Assistant 1.00 1.00 1.00
Assistant Comptroller 1.00 1.00 1.00
Clerical Assistant 0.00 0.00 0.00
Comptroller 1.00 1.00 1.00
Grant Senior Accountant 4.00 4.00 4.00
Inventory Coder 2.00 2.00 2.00
OTC Asst Trsy Srvc Coordinator 1.00 1.00 1.00OTC Grant Administrator 1.00 1.00 1.00Property Control Officer 1.00 1.00 1.00Senior Accountant 5.00 5.00 5.00Senior Accounting/Payroll Specialist 5.00 5.00 5.00Senior Office Assistant 1.00 1.00 1.00Treasury Services Coordinator 1.00 1.00 1.00Grand Total 38.00 38.00 38.00
273

City Attorney4,673,351
2%
City Manager3,785,324
1%Human Resources
70,516,214 29%
Mayor And Council1,749,697
1%
City Clerk778,110
0%
Non-Departmental155,807,286
64%
Office Of The Comptroller3,041,496
1%
Purchasing And Strategic Sourcing
1,743,811 1%
Tax2,330,540
1%
Goal 6: Sound GovernanceTotal Budget $244,425,828
Mission
Facilitate the procurement of goods and services in an open, fair, transparent, economically competitive, and respectful process with the goal of maximizing taxpayers’ dollars. Therein promoting and fostering a climate of good business relationships between our suppliers and the City.
FY 2022 Budget
FY 2021 Key Performance Indicators
Key Performance Indicator FY19
Actual FY20
Actual FY21
Actual Annual Target
Increase number of participating vendors in EPMarketplace
32 49 52 50
EP Marketplace Spend $20,416,199 $38,306,634 $40,937,094 $10,000,000
% Local Spend 69% 71% 54% ↑10%
Key Functions:
Monitor annual contracts Contract administration Develop bid specifications Issuing and approving purchase orders Facilitate the bidding and contract awarding process
FY 2022 Total Budget $1,743,811
FY 2022 General Fund $1,743,811
FY 2022 Non-General Fund $0
Total FTE’s 29.00
Purchasing and Strategic Sourcing
274

FY 2018 FY 2019 FY 2020 FY 2021 FY 2022
ACTUAL ACTUAL ACTUAL ADOPTED ADOPTED AMOUNT PERCENT
Salaries and Wages 1,052,876 1,099,500 1,012,411 1,104,467 1,230,499 126,032 11%Employee Benefits 342,709 366,320 353,555 375,711 418,988 43,277 12%Contractual Services - - - - - - 0%Professional Services - - - - - - 0%Outside Contracts 13,171 618 5,932 750 40,750 40,000 5333%Interfund Services 30 56 - 50 50 - 0%Operating Leases 9,706 9,943 7,229 8,500 8,500 - 0%Fuel and Lubricants - - - - - - 0%Materials and Supplies 9,172 9,968 56,796 7,940 7,940 - 0%Maintenance and Repairs - - - - - - 0%Minor Equipment and Furniture - 27,893 - - - - 0%Communications - - - - - - 0%Utilities - - - - - - 0%Travel 5,655 13,343 7,048 5,850 5,850 - 0%Other Operating Expenditures 83,338 51,244 99,494 31,234 31,234 - 0%Community Service Projects - - - - - - 0%Interest Expense - - - - - - 0%Principal - - - - - - 0%Other Non-Operating Expenditures - - - - - - 0%Grant Match - - - - - - 0%Operating Transfers Out - - - - - - 0%Capital Outlay - - - - - - 0%
Total Expenditures 1,516,658 1,578,885 1,542,464 1,534,502 1,743,811 209,309 14%
FY 2018 FY 2019 FY 2020 FY 2021 FY 2022
ACTUAL ACTUAL ACTUAL ADOPTED ADOPTED AMOUNT PERCENT
General Government 1,516,658 1,578,885 1,519,320 1,534,502 1,743,811 209,309 14%Community Development Block Grants - - - - - - 0%Debt Service - - - - - - 0%Capital Projects - - - - - - 0%Special Revenue - - 23,144 - - - 0%Fiduciary Funds - - - - - - 0%Enterprise - - - - - - 0%Internal Service - - - - - - 0%
Total Funds 1,516,658 1,578,885 1,542,464 1,534,502 1,743,811 209,309 14%
FY 2018 FY 2019 FY 2020 FY 2021 FY 2022
ADOPTED ADOPTED ADOPTED ADOPTED ADOPTED AMOUNT
General Fund 22.00 22.00 21.00 22.00 23.00 1.00 Non-General Fund 6.00 6.00 6.00 6.00 6.00 -
Total Authorized 28.00 28.00 27.00 28.00 29.00 1.00
FY 2022 ADOPTED OVER/(UNDER) FY 2021 ADOPTED
Source of Funds
Positions
FY 2022 ADOPTED OVER/(UNDER) FY 2021 ADOPTED
FY 2022 ADOPTED OVER/(UNDER) FY 2021 ADOPTED
Purchasing and Strategic Sourcing
Expenditures by Group
275

FY 2018 FY 2019 FY 2020 FY 2021 FY 2022
ACTUAL ACTUAL ACTUAL ADOPTED ADOPTED
General GovernmentADMINISTRATION 498,307 529,565 570,424 486,430 542,354
SUPPLY CHAIN MANAGEMENT 1,018,351 1,049,321 948,896 1,048,072 1,201,457
Sub Total 1,516,658 1,578,885 1,519,320 1,534,502 1,743,811
Special RevenueADMINISTRATION 0 0 10,191 0 0
SUPPLY CHAIN MANAGEMENT 0 0 12,953 0 0
Sub Total 0 0 23,144 0 0
All Funds Total 1,516,658 1,578,885 1,542,464 1,534,502 1,743,811
Division Summary
PURCHASING AND STRATEGIC SOURCING
276

Strategic Actions
Goal 6: Set the Standard for Sound Governance and Fiscal Management
Strategy 6.7 Deliver effective and efficient processes to maximize value in obtaining goods and services
Action 6.7.1 Increase efficiency of procurement processes to reduce cycle time Action 6.7.2 Leverage technology to expedite delivery of goods and services
FY 2021 Key Results
7th anniversary of the City’s Hire El Paso First Local Bid Preference Program Hosted three events with over 150 registrants and over 75 participants
FY 2022 Key Deliverables
Launch Annual Buying Plan Diversity and Inclusive Business Action Plan Publish Virtual Training Videos Purchasing Online Bidding System Launch Contract Register Dashboard
COVID-19 Response & Recovery
Regional model for collaborative purchasing for public entities El Paso Purchasing Alliance
o Supplier Relationso PPE Sustainment
Hosted virtual bid opening and pre‐bid/proposal conferences
Purchasing and Grant compliance for Coronavirus Relief Funds
277
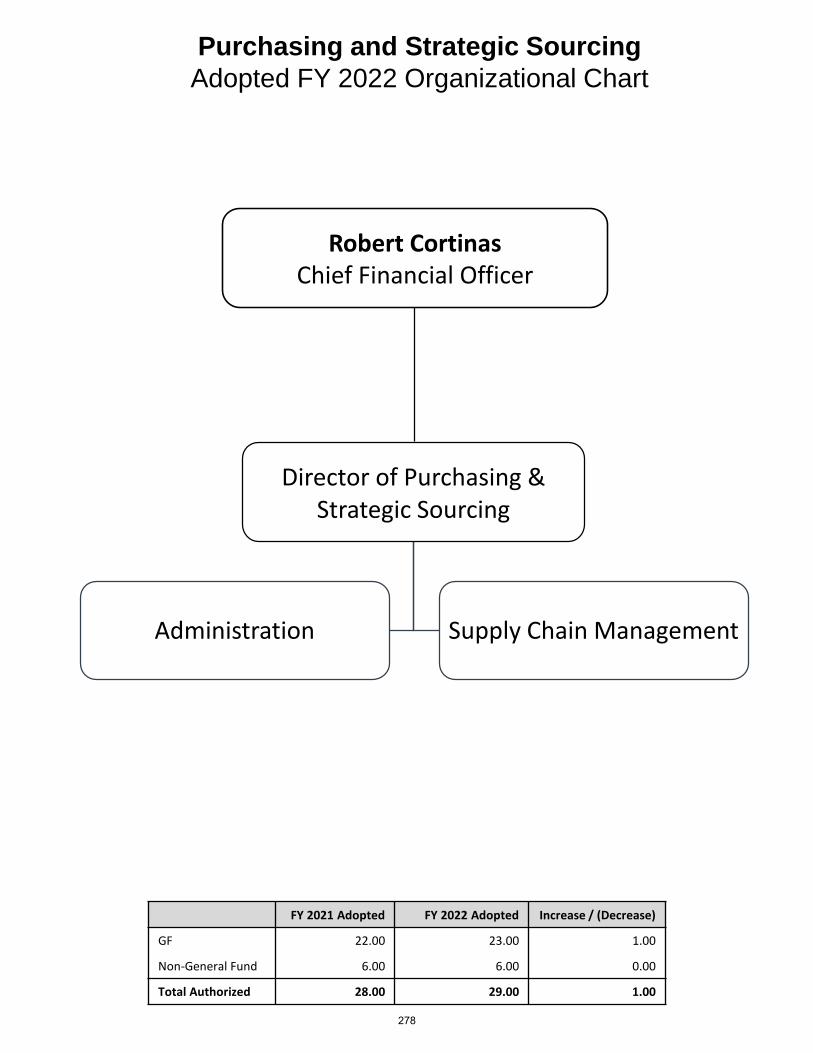
Purchasing and Strategic SourcingAdopted FY 2022 Organizational Chart
Director of Purchasing & Strategic Sourcing
Administration Supply Chain Management
Robert CortinasChief Financial Officer
FY 2021 Adopted FY 2022 Adopted Increase / (Decrease)
GF 22.00 23.00 1.00
Non-General Fund 6.00 6.00 0.00
Total Authorized 28.00 29.00 1.00
278
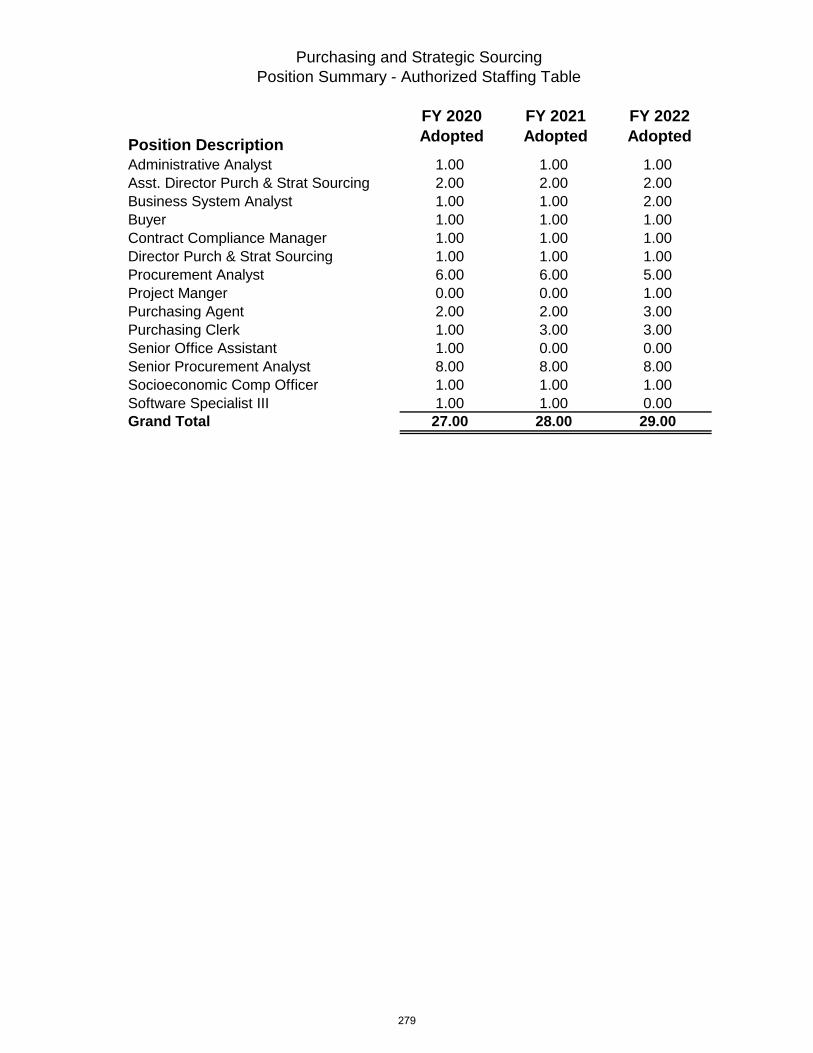
Purchasing and Strategic Sourcing
Position Summary - Authorized Staffing Table
Position Description
FY 2020 Adopted
FY 2021 Adopted
FY 2022 Adopted
Administrative Analyst 1.00 1.00 1.00
Asst. Director Purch & Strat Sourcing 2.00 2.00 2.00
Business System Analyst 1.00 1.00 2.00
Buyer 1.00 1.00 1.00
Contract Compliance Manager 1.00 1.00 1.00
Director Purch & Strat Sourcing 1.00 1.00 1.00
Procurement Analyst 6.00 6.00 5.00
Project Manger 0.00 0.00 1.00
Purchasing Agent 2.00 2.00 3.00
Purchasing Clerk 1.00 3.00 3.00
Senior Office Assistant 1.00 0.00 0.00
Senior Procurement Analyst 8.00 8.00 8.00
Socioeconomic Comp Officer 1.00 1.00 1.00
Software Specialist III 1.00 1.00 0.00
Grand Total 27.00 28.00 29.00
279

City Attorney4,673,351
2%
City Manager3,785,324
1%
Human Resources70,516,214
29%
Mayor And Council1,749,697
1%City Clerk778,110
0%
Non-Departmental155,807,286
64%
Office Of The Comptroller3,041,496
1%
Purchasing And Strategic Sourcing1,743,811
1%
Tax2,330,540
1%
Goal 6: Sound GovernanceTotal Budget $244,425,828
Mission
Provide tax collection and disbursement services to taxpayers and taxing entities so they can each fulfill their civic responsibilities of funding and providing public services.
Key Functions:
Collect property taxes Provide property tax information to the public Distribute funds and reporting to taxing entities
FY 2022 Budget
FY 2021 Key Performance Indicators
Key Performance Indicator FY19
Actual FY20
Actual FY21
Actual Annual Target
Average phone wait time (minutes)
0:33 0:55 1:02 1:30
Tax Office
FY 2022 Total Budget $2,330,540
FY 2022 General Fund $0
FY 2022 Non-General Fund $2,330-540
Total FTE’s 24.50
280

FY 2018 FY 2019 FY 2020 FY 2021 FY 2022
ACTUAL ACTUAL ACTUAL ADOPTED ADOPTED AMOUNT PERCENT
Salaries and Wages 812,833 936,783 808,980 899,881 1,003,605 103,724 12%Employee Benefits 294,328 303,286 328,819 349,739 384,441 34,702 10%Contractual Services - - - - - - 0%Professional Services 469 469 341 469 469 - 0%Outside Contracts 282,608 291,820 286,013 313,000 325,560 12,560 4%Interfund Services 110,111 106,524 - - 1,000 1,000 100%Operating Leases 138,149 133,866 144,536 144,300 149,300 5,000 3%Fuel and Lubricants 80 76 64 100 100 - 0%Materials and Supplies 30,837 41,315 21,603 27,832 21,832 (6,000) -22%Maintenance and Repairs - - - - - - 0%Minor Equipment and Furniture 13,998 3,733 - - - - 0%Communications 1,384 1,626 94,343 96,779 111,779 15,000 15%Utilities - - - - - - 0%Travel 8,289 10,551 3,157 14,000 14,000 - 0%Other Operating Expenditures 485,626 282,582 313,772 330,136 318,453 (11,683) -4%Community Service Projects - - - - - - 0%Interest Expense - - - - - - 0%Principal - - - - - - 0%Other Non-Operating Expenditures 1,758 (1,837) (182) - - - 0%Grant Match - - - - - - 0%Operating Transfers Out - - - - - - 0%Capital Outlay - 6,470 - - - - 0%
Total Expenditures 2,180,470 2,117,262 2,001,446 2,176,237 2,330,540 154,303 7%
FY 2018 FY 2019 FY 2020 FY 2021 FY 2022
ACTUAL ACTUAL ACTUAL ADOPTED ADOPTED AMOUNT PERCENT
General Government - - - - - - 0%Community Development Block Grants - - - - - - 0%Debt Service - - - - - - 0%Capital Projects - - - - - - 0%Special Revenue - - - - - - 0%Fiduciary Funds - - - - - - 0%Enterprise 2,180,470 2,117,262 2,001,446 2,176,237 2,330,540 154,303 7%Internal Service - - - - - - 0%
Total Funds 2,180,470 2,117,262 2,001,446 2,176,237 2,330,540 154,303 7%
FY 2018 FY 2019 FY 2020 FY 2021 FY 2022
ADOPTED ADOPTED ADOPTED ADOPTED ADOPTED AMOUNT
General Fund - - - - - - Non-General Fund 24.50 24.50 24.50 24.50 24.50 -
Total Authorized 24.50 24.50 24.50 24.50 24.50 -
Source of Funds
Positions
Expenditures by GroupFY 2022 ADOPTED OVER/(UNDER)
FY 2021 ADOPTED
FY 2022 ADOPTED OVER/(UNDER) FY 2021 ADOPTED
FY 2022 ADOPTED OVER/(UNDER) FY 2021 ADOPTED
Tax
281
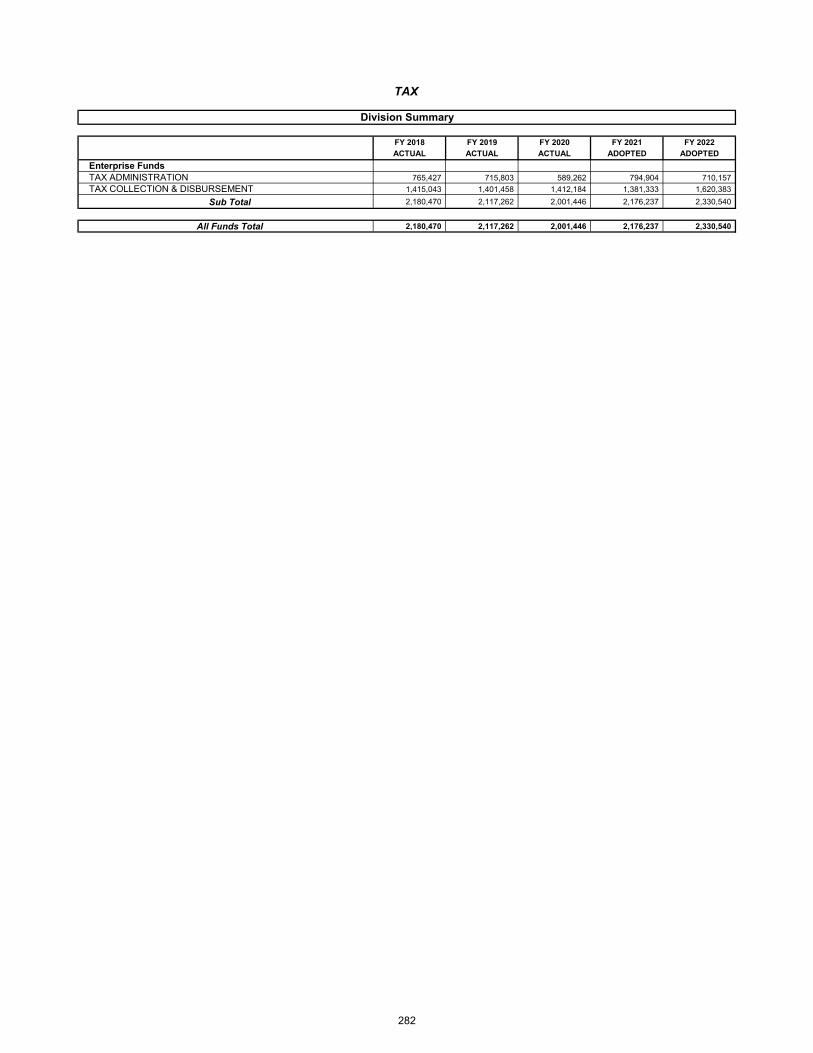
FY 2018 FY 2019 FY 2020 FY 2021 FY 2022
ACTUAL ACTUAL ACTUAL ADOPTED ADOPTED
Enterprise FundsTAX ADMINISTRATION 765,427 715,803 589,262 794,904 710,157
TAX COLLECTION & DISBURSEMENT 1,415,043 1,401,458 1,412,184 1,381,333 1,620,383
Sub Total 2,180,470 2,117,262 2,001,446 2,176,237 2,330,540
All Funds Total 2,180,470 2,117,262 2,001,446 2,176,237 2,330,540
Division Summary
TAX
282
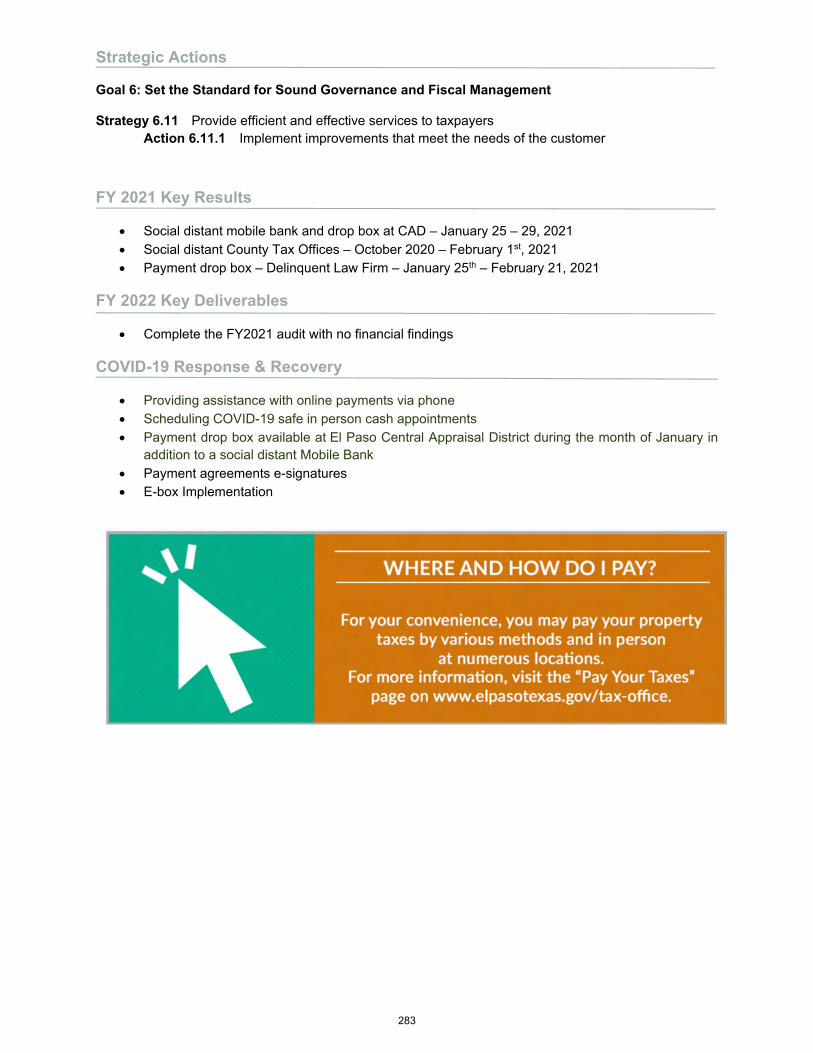
Strategic Actions
Goal 6: Set the Standard for Sound Governance and Fiscal Management
Strategy 6.11 Provide efficient and effective services to taxpayers Action 6.11.1 Implement improvements that meet the needs of the customer
FY 2021 Key Results
Social distant mobile bank and drop box at CAD – January 25 – 29, 2021 Social distant County Tax Offices – October 2020 – February 1st, 2021 Payment drop box – Delinquent Law Firm – January 25th – February 21, 2021
FY 2022 Key Deliverables
Complete the FY2021 audit with no financial findings
COVID-19 Response & Recovery
Providing assistance with online payments via phone Scheduling COVID-19 safe in person cash appointments Payment drop box available at El Paso Central Appraisal District during the month of January in
addition to a social distant Mobile Bank Payment agreements e-signatures E-box Implementation
283

TaxAdopted FY 2022 Organizational Chart
Tax Assessor & Collector
Administrative Services Collections
Accounting Customer Service
Robert CortinasChief Financial Officer
FY 2021 Adopted FY 2022 Adopted Increase / (Decrease)
GF 0.00 0.00 0.00
Non-General Fund 24.50 24.50 0.00
Total Authorized 24.50 24.50 0.00
284
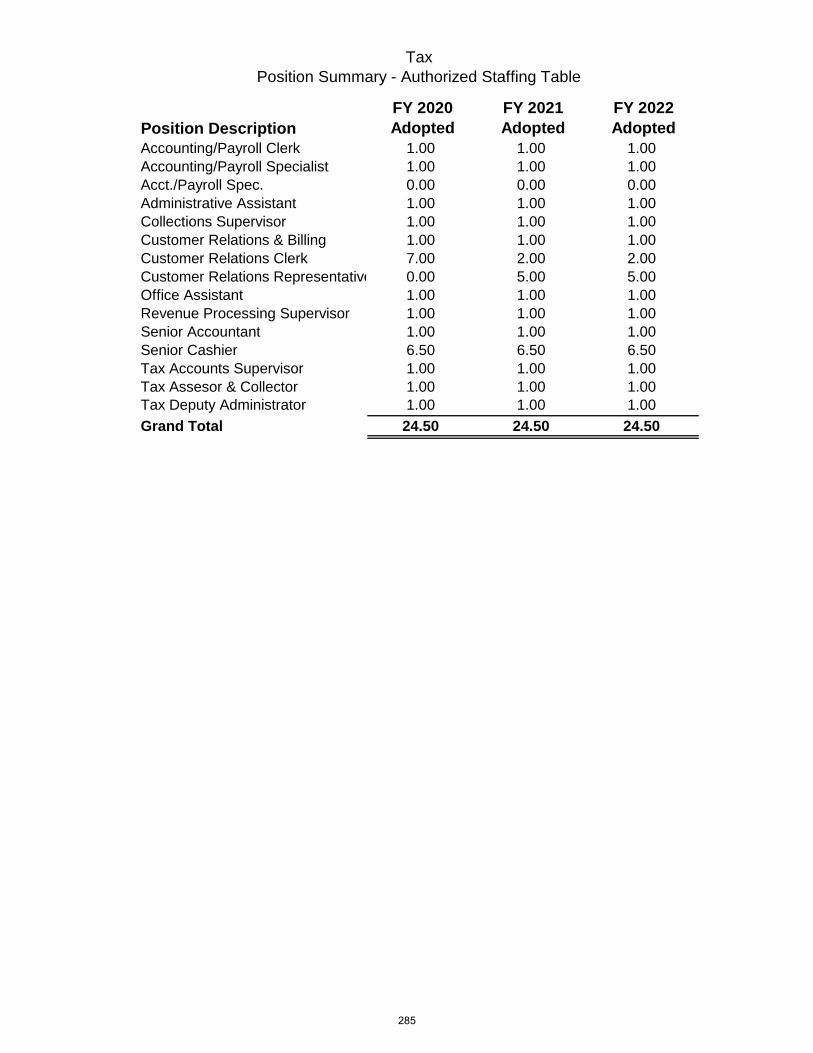
Tax
Position Summary - Authorized Staffing Table
Position DescriptionFY 2020 Adopted
FY 2021 Adopted
FY 2022 Adopted
Accounting/Payroll Clerk 1.00 1.00 1.00
Accounting/Payroll Specialist 1.00 1.00 1.00
Acct./Payroll Spec. 0.00 0.00 0.00
Administrative Assistant 1.00 1.00 1.00
Collections Supervisor 1.00 1.00 1.00
Customer Relations & Billing 1.00 1.00 1.00
Customer Relations Clerk 7.00 2.00 2.00
Customer Relations Representative 0.00 5.00 5.00
Office Assistant 1.00 1.00 1.00
Revenue Processing Supervisor 1.00 1.00 1.00
Senior Accountant 1.00 1.00 1.00
Senior Cashier 6.50 6.50 6.50
Tax Accounts Supervisor 1.00 1.00 1.00
Tax Assesor & Collector 1.00 1.00 1.00
Tax Deputy Administrator 1.00 1.00 1.00
Grand Total 24.50 24.50 24.50
285
CITY OF EL PASO BUDGET BOOK 2022
GROWTH
GOAL 7INFRASTRUCTURE
-CAPITAL IMPROVEMENT DEPARTMENT-STREETS & MAINTENANCE
-MASS TRANSIT - SUN METRO
22YEAR NO.
GOAL 7
INFRASTRUCTURE
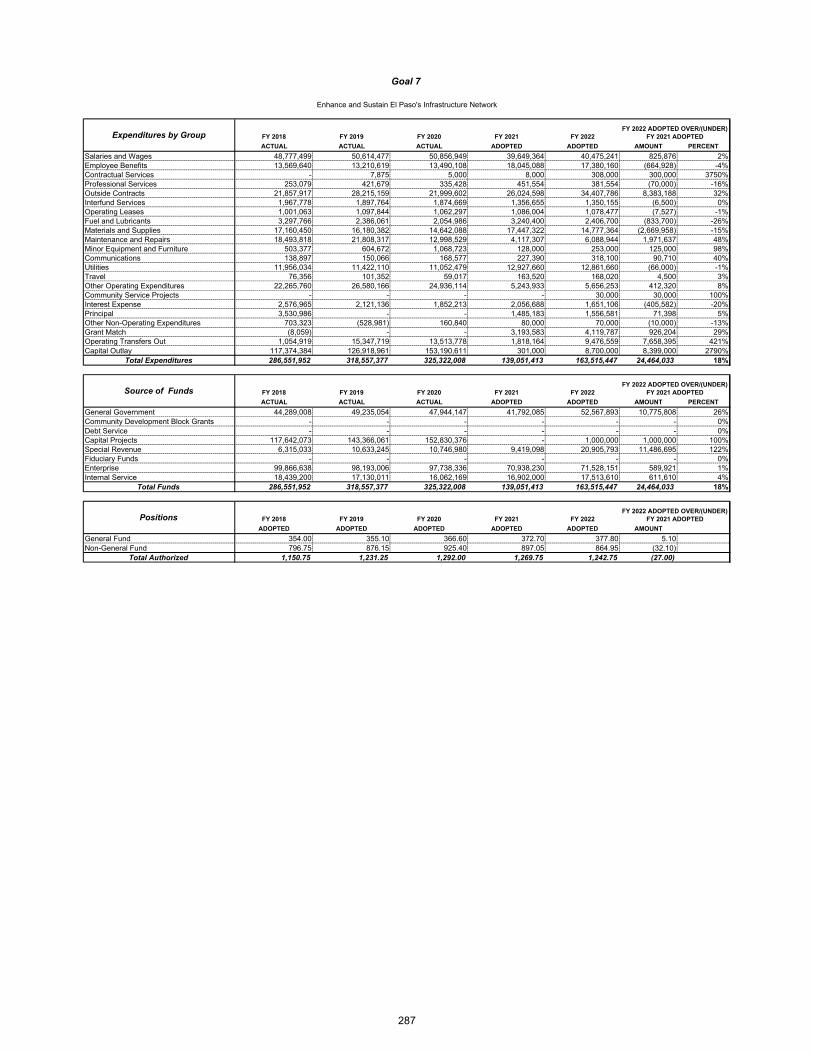
FY 2018 FY 2019 FY 2020 FY 2021 FY 2022
ACTUAL ACTUAL ACTUAL ADOPTED ADOPTED AMOUNT PERCENT
Salaries and Wages 48,777,499 50,614,477 50,856,949 39,649,364 40,475,241 825,876 2%Employee Benefits 13,569,640 13,210,619 13,490,108 18,045,088 17,380,160 (664,928) -4%Contractual Services - 7,875 5,000 8,000 308,000 300,000 3750%Professional Services 253,079 421,679 335,428 451,554 381,554 (70,000) -16%Outside Contracts 21,857,917 28,215,159 21,999,602 26,024,598 34,407,786 8,383,188 32%Interfund Services 1,967,778 1,897,764 1,874,669 1,356,655 1,350,155 (6,500) 0%Operating Leases 1,001,063 1,097,844 1,062,297 1,086,004 1,078,477 (7,527) -1%Fuel and Lubricants 3,297,766 2,386,061 2,054,986 3,240,400 2,406,700 (833,700) -26%Materials and Supplies 17,160,450 16,180,382 14,642,088 17,447,322 14,777,364 (2,669,958) -15%Maintenance and Repairs 18,493,818 21,808,317 12,998,529 4,117,307 6,088,944 1,971,637 48%Minor Equipment and Furniture 503,377 604,672 1,068,723 128,000 253,000 125,000 98%Communications 138,897 150,066 168,577 227,390 318,100 90,710 40%Utilities 11,956,034 11,422,110 11,052,479 12,927,660 12,861,660 (66,000) -1%Travel 76,356 101,352 59,017 163,520 168,020 4,500 3%Other Operating Expenditures 22,265,760 26,580,166 24,936,114 5,243,933 5,656,253 412,320 8%Community Service Projects - - - - 30,000 30,000 100%Interest Expense 2,576,965 2,121,136 1,852,213 2,056,688 1,651,106 (405,582) -20%Principal 3,530,986 - - 1,485,183 1,556,581 71,398 5%Other Non-Operating Expenditures 703,323 (528,981) 160,840 80,000 70,000 (10,000) -13%Grant Match (8,059) - - 3,193,583 4,119,787 926,204 29%Operating Transfers Out 1,054,919 15,347,719 13,513,778 1,818,164 9,476,559 7,658,395 421%Capital Outlay 117,374,384 126,918,961 153,190,611 301,000 8,700,000 8,399,000 2790%
Total Expenditures 286,551,952 318,557,377 325,322,008 139,051,413 163,515,447 24,464,033 18%
FY 2018 FY 2019 FY 2020 FY 2021 FY 2022
ACTUAL ACTUAL ACTUAL ADOPTED ADOPTED AMOUNT PERCENT
General Government 44,289,008 49,235,054 47,944,147 41,792,085 52,567,893 10,775,808 26%Community Development Block Grants - - - - - - 0%Debt Service - - - - - - 0%Capital Projects 117,642,073 143,366,061 152,830,376 - 1,000,000 1,000,000 100%Special Revenue 6,315,033 10,633,245 10,746,980 9,419,098 20,905,793 11,486,695 122%Fiduciary Funds - - - - - - 0%Enterprise 99,866,638 98,193,006 97,738,336 70,938,230 71,528,151 589,921 1%Internal Service 18,439,200 17,130,011 16,062,169 16,902,000 17,513,610 611,610 4%
Total Funds 286,551,952 318,557,377 325,322,008 139,051,413 163,515,447 24,464,033 18%
FY 2018 FY 2019 FY 2020 FY 2021 FY 2022
ADOPTED ADOPTED ADOPTED ADOPTED ADOPTED AMOUNT
General Fund 354.00 355.10 366.60 372.70 377.80 5.10 Non-General Fund 796.75 876.15 925.40 897.05 864.95 (32.10)
Total Authorized 1,150.75 1,231.25 1,292.00 1,269.75 1,242.75 (27.00)
FY 2022 ADOPTED OVER/(UNDER) FY 2021 ADOPTED
Expenditures by Group
Positions
FY 2022 ADOPTED OVER/(UNDER) FY 2021 ADOPTED
FY 2022 ADOPTED OVER/(UNDER) FY 2021 ADOPTEDSource of Funds
Goal 7
Enhance and Sustain El Paso's Infrastructure Network
287
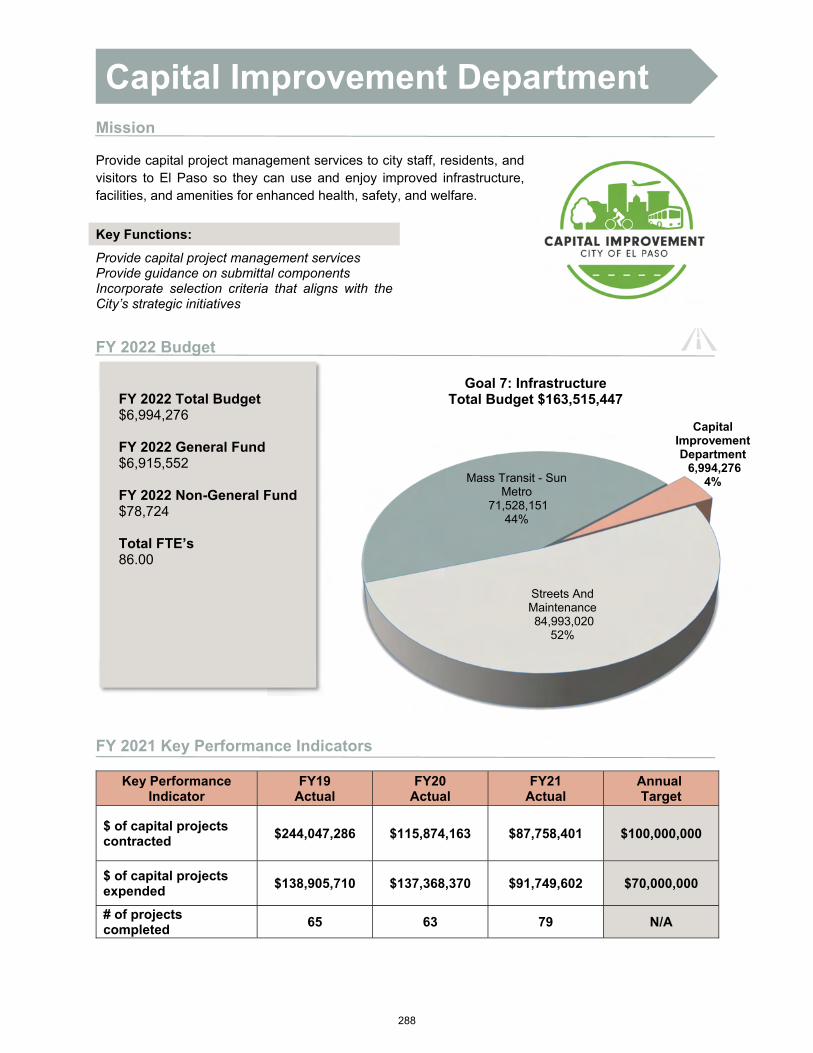
Capital Improvement Department
6,994,276 4%
Streets And Maintenance84,993,020
52%
Mass Transit - Sun Metro
71,528,151 44%
Goal 7: Infrastructure Total Budget $163,515,447
Mission
Provide capital project management services to city staff, residents, and visitors to El Paso so they can use and enjoy improved infrastructure, facilities, and amenities for enhanced health, safety, and welfare.
Key Functions:
Provide capital project management services Provide guidance on submittal components Incorporate selection criteria that aligns with the City’s strategic initiatives
FY 2022 Budget
FY 2021 Key Performance Indicators
Key Performance Indicator
FY19 Actual
FY20 Actual
FY21 Actual
Annual Target
$ of capital projects contracted
$244,047,286 $115,874,163 $87,758,401 $100,000,000
$ of capital projects expended
$138,905,710 $137,368,370 $91,749,602 $70,000,000
# of projects completed
65 63 79 N/A
FY 2022 Total Budget $6,994,276
FY 2022 General Fund $6,915,552
FY 2022 Non-General Fund $78,724
Total FTE’s 86.00
Capital Improvement Department
288

FY 2018 FY 2019 FY 2020 FY 2021 FY 2022
ACTUAL ACTUAL ACTUAL ADOPTED ADOPTED AMOUNT PERCENT
Salaries and Wages 4,098,812 4,364,778 4,572,801 4,410,304 5,066,410 656,107 15%Employee Benefits 1,273,685 1,320,363 1,415,145 1,497,515 1,627,043 129,528 9%Contractual Services - - - - - - 0%Professional Services 35,973 90,119 29,550 50,054 50,054 - 0%Outside Contracts 1,805 1,240 16,873 1,900 1,900 - 0%Interfund Services 22,182 37,236 53,549 23,543 23,543 - 0%Operating Leases 18,063 16,000 10,529 16,292 16,292 - 0%Fuel and Lubricants 25,659 27,448 25,786 28,200 28,200 - 0%Materials and Supplies 47,649 53,114 42,056 72,255 72,255 - 0%Maintenance and Repairs 257,614 212,275 795,466 6,000 6,000 - 0%Minor Equipment and Furniture 21,379 69,838 30,165 15,000 15,000 - 0%Communications - - - 100 100 - 0%Utilities - - - - - - 0%Travel 25,497 42,726 6,766 43,020 43,020 - 0%Other Operating Expenditures 34,682 51,894 25,559 44,458 44,458 - 0%Community Service Projects - - - - - - 0%Interest Expense - - - - - - 0%Principal - - - - - - 0%Other Non-Operating Expenditures 183 (183) - - - - 0%Grant Match - - - - - - 0%Operating Transfers Out - 76,039 1,520,000 - - - 0%Capital Outlay - - - - - - 0%
Total Expenditures 5,863,183 6,362,888 8,544,246 6,208,641 6,994,276 785,635 13%
FY 2018 FY 2019 FY 2020 FY 2021 FY 2022
ACTUAL ACTUAL ACTUAL ADOPTED ADOPTED AMOUNT PERCENT
General Government 5,538,846 6,088,441 7,666,782 6,128,199 6,915,552 787,353 13%Community Development Block Grants - - - - - - 0%Debt Service - - - - - - 0%Capital Projects 253,285 205,886 795,466 - - - 0%Special Revenue 71,052 68,561 81,998 80,443 78,724 (1,718) -2%Fiduciary Funds - - - - - - 0%Enterprise - - - - - - 0%Internal Service - - - - - - 0%
Total Funds 5,863,183 6,362,888 8,544,246 6,208,641 6,994,276 785,635 13%
FY 2018 FY 2019 FY 2020 FY 2021 FY 2022
ADOPTED ADOPTED ADOPTED ADOPTED ADOPTED AMOUNT PERCENT
General Fund 72.50 73.50 77.00 82.50 82.50 - Non-General Fund 1.50 1.50 1.00 1.50 3.50 2.00
Total Authorized 74.00 75.00 78.00 84.00 86.00 2.00
Capital Improvement Department
Expenditures by Group
Source of Funds
Positions
FY 2022 ADOPTED OVER/(UNDER) FY 2021 ADOPTED
FY 2022 ADOPTED OVER/(UNDER) FY 2021 ADOPTED
FY 2022 ADOPTED OVER/(UNDER) FY 2021 ADOPTED
289
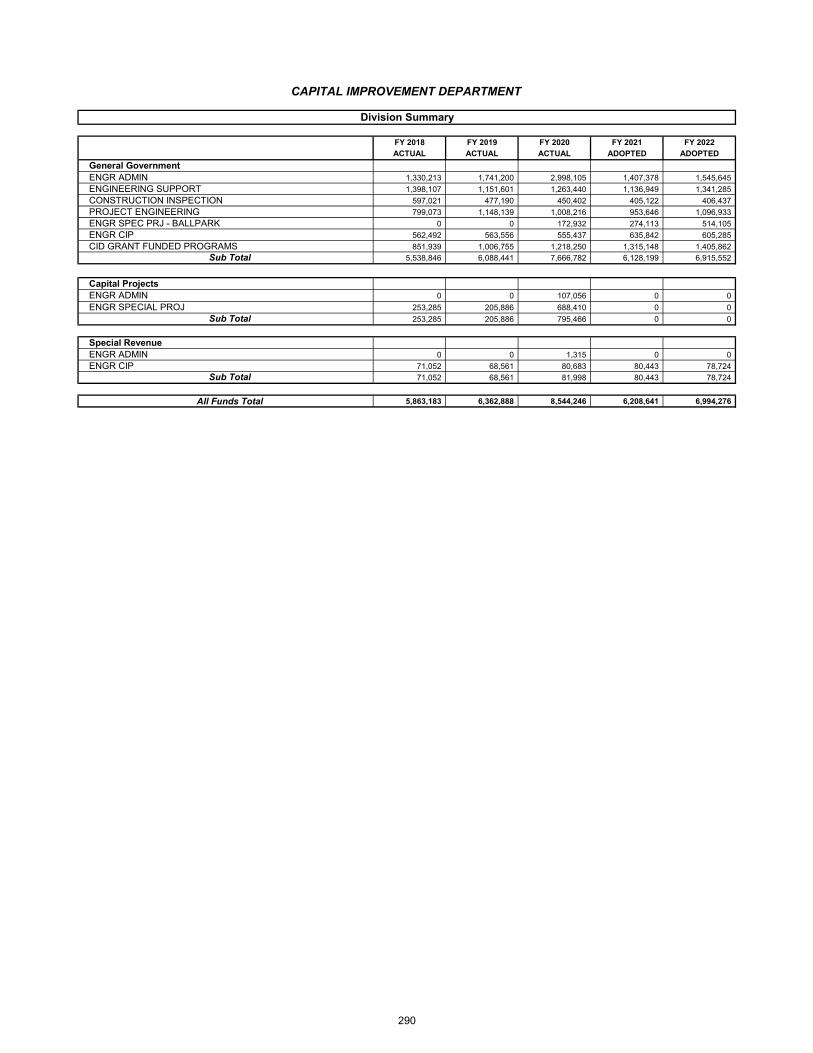
FY 2018 FY 2019 FY 2020 FY 2021 FY 2022
ACTUAL ACTUAL ACTUAL ADOPTED ADOPTED
General GovernmentENGR ADMIN 1,330,213 1,741,200 2,998,105 1,407,378 1,545,645
ENGINEERING SUPPORT 1,398,107 1,151,601 1,263,440 1,136,949 1,341,285
CONSTRUCTION INSPECTION 597,021 477,190 450,402 405,122 406,437
PROJECT ENGINEERING 799,073 1,148,139 1,008,216 953,646 1,096,933
ENGR SPEC PRJ - BALLPARK 0 0 172,932 274,113 514,105
ENGR CIP 562,492 563,556 555,437 635,842 605,285
CID GRANT FUNDED PROGRAMS 851,939 1,006,755 1,218,250 1,315,148 1,405,862
Sub Total 5,538,846 6,088,441 7,666,782 6,128,199 6,915,552
Capital ProjectsENGR ADMIN 0 0 107,056 0 0
ENGR SPECIAL PROJ 253,285 205,886 688,410 0 0
Sub Total 253,285 205,886 795,466 0 0
Special RevenueENGR ADMIN 0 0 1,315 0 0
ENGR CIP 71,052 68,561 80,683 80,443 78,724
Sub Total 71,052 68,561 81,998 80,443 78,724
All Funds Total 5,863,183 6,362,888 8,544,246 6,208,641 6,994,276
Division Summary
CAPITAL IMPROVEMENT DEPARTMENT
290
Strategic Actions
Goal 7: Enhance and Sustain El Paso’s Infrastructure Network
Strategy 7.2 Improve competitiveness through infrastructure investments impacting the Quality of Life Action 7.2.1 Implement and monitor methodologies to ensure operational efficiency Action 7.2.2 Deliver high quality CIP projects
Strategy 7.5 Set one standard for infrastructure across the city Action 7.5.1 Integrate performance based criteria in design scope of work to reinforce
sustainability objectives Action 7.5.2 Identify and implement specific sustainability objectives/factors in project lifecycle
cost analysis Action 7.5.3 Incorporate water harvesting (i.e. swales) and other green infrastructure
techniques in programmed hike and bike trail projects
FY 2021 Key Results
195 Active Capital Projects $722 million of Investments 31 projects started design 21 projects have gone out to bid 19 projects have started construction 72 projects have been completed, 31 transportation related, 41 facility related
FY 2022 Key Deliverables
Align and integrate with financial capacity, operational needs, strategic plan, and communitypriorities
Complete 5 new projects within Federal Portfolio Continuation and completion of design of 20 projects Complete construction of 31 transportation/safety projects
COVID-19 Response & Recovery
Completion of facility build out, utilized all federal funding within the December 2020 deadline Continuation of collaboration during design phase, ability to record meetings to capture all
constituent concerns Strategic planning to maintain fiscal responsibility, completing projects within construction phase
and evaluating those which increase operation and maintenance cost Maintained CDC guidelines, construction projects were not adversely impacted or shut down by
COVID-19
291

Capital Improvement DepartmentAdopted FY 2022 Organizational Chart
Sam RodriguezChief Operations and Transportation Officer
Administration and Labor Compliance
Construction Management and
Inspection
Project Management and Design Services
Project Planning / Programming
CID Grant Funded Programs
FY 2021 Adopted FY 2022 Adopted Increase / (Decrease)
GF 82.50 82.50 0.00
Non‐General Fund 1.50 3.50 2.00
Total Authorized 84.00 86.00 2.00
Community Outreach
292
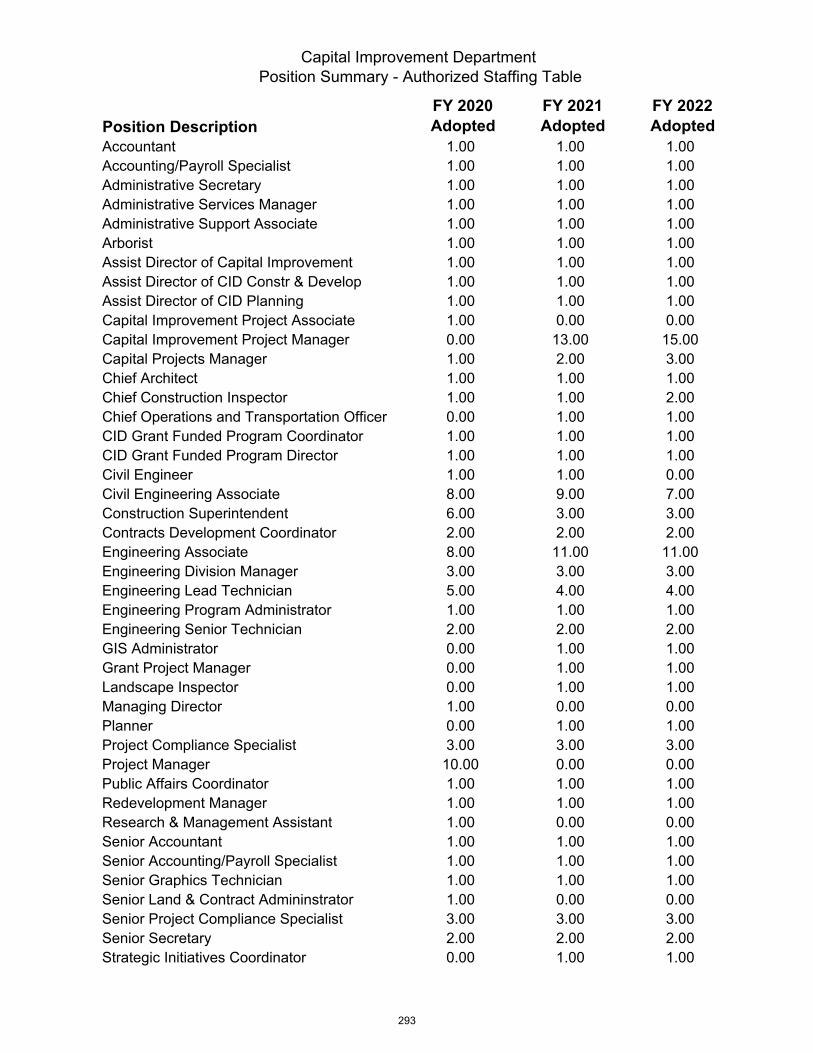
Capital Improvement Department Position Summary - Authorized Staffing Table
Position DescriptionFY 2020 Adopted
FY 2021 Adopted
FY 2022 Adopted
Accountant 1.00 1.00 1.00Accounting/Payroll Specialist 1.00 1.00 1.00Administrative Secretary 1.00 1.00 1.00Administrative Services Manager 1.00 1.00 1.00Administrative Support Associate 1.00 1.00 1.00Arborist 1.00 1.00 1.00Assist Director of Capital Improvement 1.00 1.00 1.00Assist Director of CID Constr & Develop 1.00 1.00 1.00Assist Director of CID Planning 1.00 1.00 1.00Capital Improvement Project Associate 1.00 0.00 0.00Capital Improvement Project Manager 0.00 13.00 15.00Capital Projects Manager 1.00 2.00 3.00Chief Architect 1.00 1.00 1.00Chief Construction Inspector 1.00 1.00 2.00Chief Operations and Transportation Officer 0.00 1.00 1.00CID Grant Funded Program Coordinator 1.00 1.00 1.00CID Grant Funded Program Director 1.00 1.00 1.00Civil Engineer 1.00 1.00 0.00Civil Engineering Associate 8.00 9.00 7.00Construction Superintendent 6.00 3.00 3.00Contracts Development Coordinator 2.00 2.00 2.00Engineering Associate 8.00 11.00 11.00Engineering Division Manager 3.00 3.00 3.00Engineering Lead Technician 5.00 4.00 4.00Engineering Program Administrator 1.00 1.00 1.00Engineering Senior Technician 2.00 2.00 2.00GIS Administrator 0.00 1.00 1.00Grant Project Manager 0.00 1.00 1.00Landscape Inspector 0.00 1.00 1.00Managing Director 1.00 0.00 0.00Planner 0.00 1.00 1.00Project Compliance Specialist 3.00 3.00 3.00Project Manager 10.00 0.00 0.00Public Affairs Coordinator 1.00 1.00 1.00Redevelopment Manager 1.00 1.00 1.00Research & Management Assistant 1.00 0.00 0.00Senior Accountant 1.00 1.00 1.00Senior Accounting/Payroll Specialist 1.00 1.00 1.00Senior Graphics Technician 1.00 1.00 1.00Senior Land & Contract Admininstrator 1.00 0.00 0.00Senior Project Compliance Specialist 3.00 3.00 3.00Senior Secretary 2.00 2.00 2.00Strategic Initiatives Coordinator 0.00 1.00 1.00
293
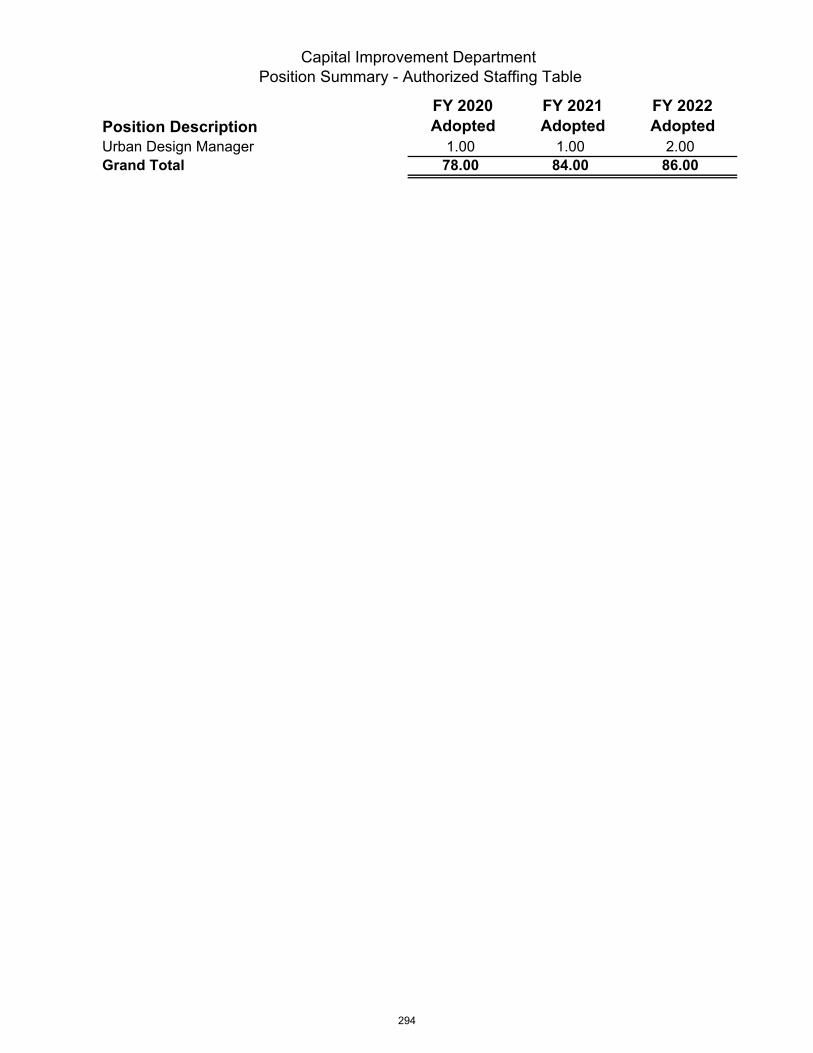
Capital Improvement Department Position Summary - Authorized Staffing Table
Position DescriptionFY 2020 Adopted
FY 2021 Adopted
FY 2022 Adopted
Urban Design Manager 1.00 1.00 2.00Grand Total 78.00 84.00 86.00
294

Capital Improvement Department6,994,276
4%
Streets And Maintenance
84,993,020 52%
Mass Transit - Sun Metro
71,528,151 44%
Goal 7: Infrastructure Total Budget $163,515,447
Mission
Provide the City of El Paso with street infrastructure maintenance and traffic engineering services designed to enhance and sustain the community’s comprehensive transportation network. Other responsibilities include maintaining the City’s fleet and facilities.
Key Functions:
Maintain all assets of City owned right of way Provide traffic engineering services for the City Repair and service City wide rolling stock Maintain and repair City buildings
FY 2022 Budget
FY 2021 Key Performance Indicators
Key Performance Indicator FY19
Actual FY20
Actual FY21
Actual Annual Target
# of pothole repairs annually
61,352 76,139 60,257 50,000
# of service requests 3,573 4,540 2,291 N/A
FY 2022 Total Budget $84,993,020
FY 2022 General Fund $45,652,341
FY 2022 Non-General Fund $39,340,678
Total FTE’s 517.00
Streets and Maintenance
295
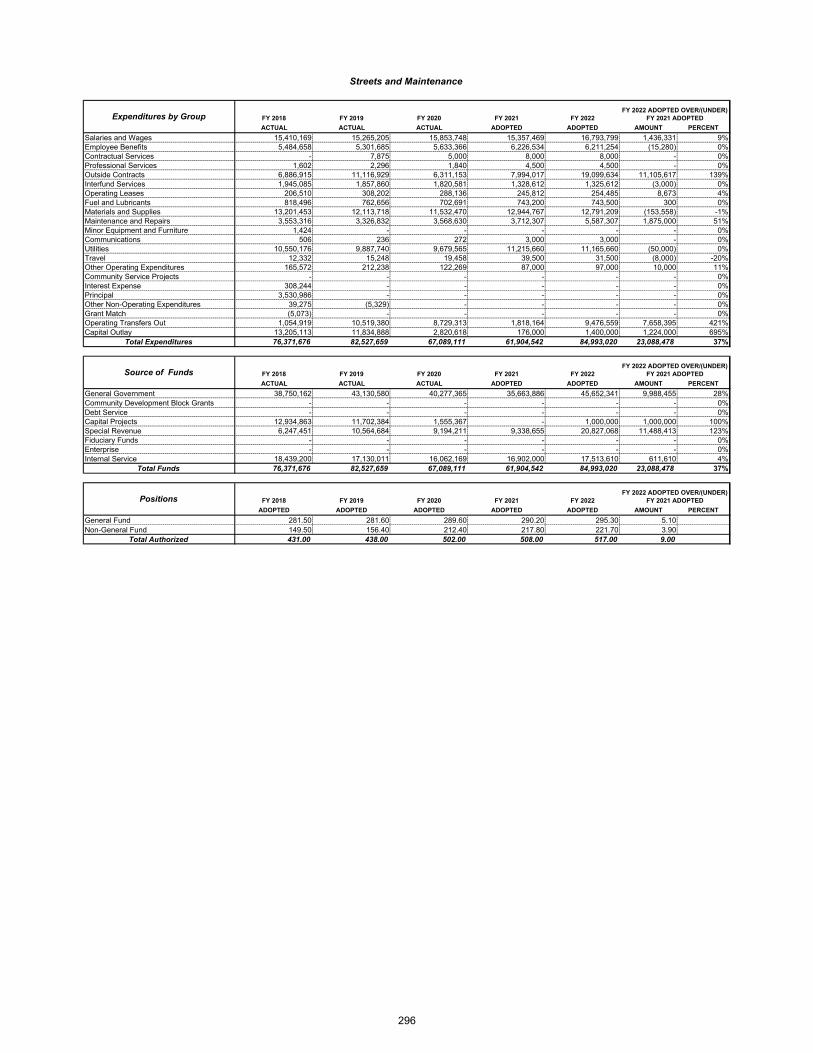
FY 2018 FY 2019 FY 2020 FY 2021 FY 2022
ACTUAL ACTUAL ACTUAL ADOPTED ADOPTED AMOUNT PERCENT
Salaries and Wages 15,410,169 15,265,205 15,853,748 15,357,469 16,793,799 1,436,331 9%Employee Benefits 5,484,658 5,301,685 5,633,366 6,226,534 6,211,254 (15,280) 0%Contractual Services - 7,875 5,000 8,000 8,000 - 0%Professional Services 1,602 2,296 1,840 4,500 4,500 - 0%Outside Contracts 6,886,915 11,116,929 6,311,153 7,994,017 19,099,634 11,105,617 139%Interfund Services 1,945,085 1,857,860 1,820,581 1,328,612 1,325,612 (3,000) 0%Operating Leases 206,510 308,202 288,136 245,812 254,485 8,673 4%Fuel and Lubricants 818,496 762,656 702,691 743,200 743,500 300 0%Materials and Supplies 13,201,453 12,113,718 11,532,470 12,944,767 12,791,209 (153,558) -1%Maintenance and Repairs 3,553,316 3,326,832 3,568,630 3,712,307 5,587,307 1,875,000 51%Minor Equipment and Furniture 1,424 - - - - - 0%Communications 506 236 272 3,000 3,000 - 0%Utilities 10,550,176 9,887,740 9,679,565 11,215,660 11,165,660 (50,000) 0%Travel 12,332 15,248 19,458 39,500 31,500 (8,000) -20%Other Operating Expenditures 165,572 212,238 122,269 87,000 97,000 10,000 11%Community Service Projects - - - - - - 0%Interest Expense 308,244 - - - - - 0%Principal 3,530,986 - - - - - 0%Other Non-Operating Expenditures 39,275 (5,329) - - - - 0%Grant Match (5,073) - - - - - 0%Operating Transfers Out 1,054,919 10,519,380 8,729,313 1,818,164 9,476,559 7,658,395 421%Capital Outlay 13,205,113 11,834,888 2,820,618 176,000 1,400,000 1,224,000 695%
Total Expenditures 76,371,676 82,527,659 67,089,111 61,904,542 84,993,020 23,088,478 37%
FY 2018 FY 2019 FY 2020 FY 2021 FY 2022
ACTUAL ACTUAL ACTUAL ADOPTED ADOPTED AMOUNT PERCENT
General Government 38,750,162 43,130,580 40,277,365 35,663,886 45,652,341 9,988,455 28%Community Development Block Grants - - - - - - 0%Debt Service - - - - - - 0%Capital Projects 12,934,863 11,702,384 1,555,367 - 1,000,000 1,000,000 100%Special Revenue 6,247,451 10,564,684 9,194,211 9,338,655 20,827,068 11,488,413 123%Fiduciary Funds - - - - - - 0%Enterprise - - - - - - 0%Internal Service 18,439,200 17,130,011 16,062,169 16,902,000 17,513,610 611,610 4%
Total Funds 76,371,676 82,527,659 67,089,111 61,904,542 84,993,020 23,088,478 37%
FY 2018 FY 2019 FY 2020 FY 2021 FY 2022
ADOPTED ADOPTED ADOPTED ADOPTED ADOPTED AMOUNT PERCENT
General Fund 281.50 281.60 289.60 290.20 295.30 5.10 Non-General Fund 149.50 156.40 212.40 217.80 221.70 3.90
Total Authorized 431.00 438.00 502.00 508.00 517.00 9.00
FY 2022 ADOPTED OVER/(UNDER) FY 2021 ADOPTED
FY 2022 ADOPTED OVER/(UNDER) FY 2021 ADOPTED
FY 2022 ADOPTED OVER/(UNDER) FY 2021 ADOPTED
Streets and Maintenance
Expenditures by Group
Positions
Source of Funds
296
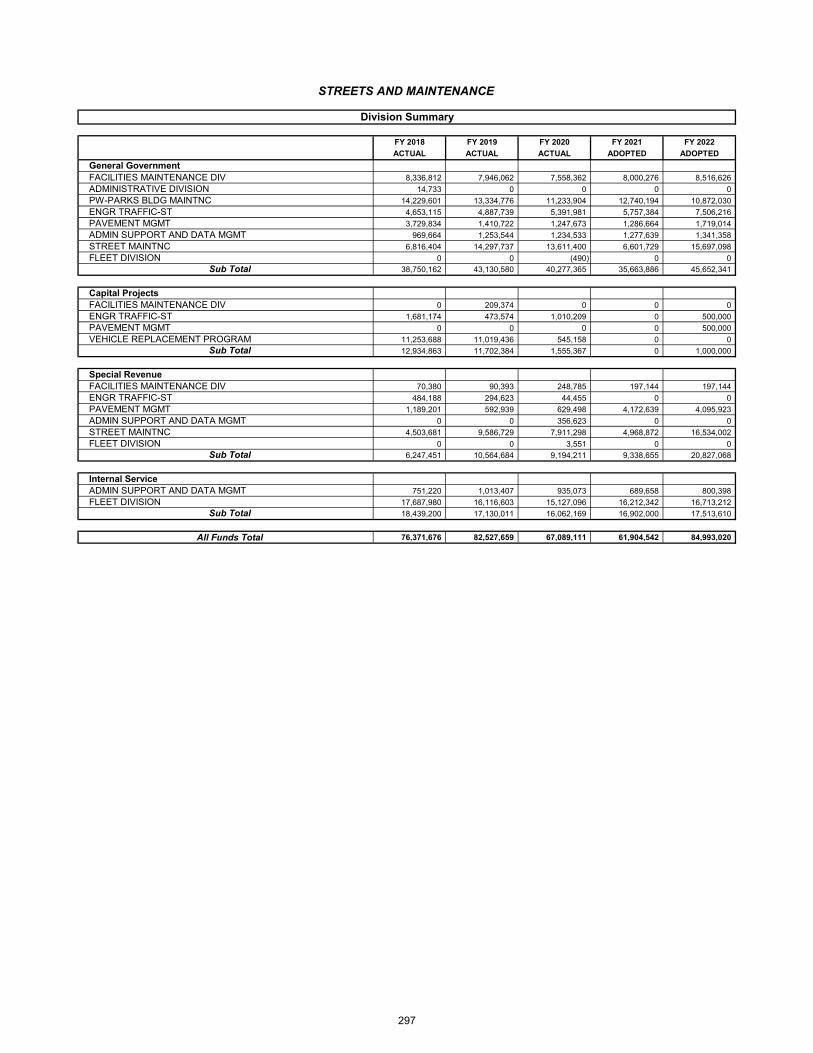
FY 2018 FY 2019 FY 2020 FY 2021 FY 2022
ACTUAL ACTUAL ACTUAL ADOPTED ADOPTED
General GovernmentFACILITIES MAINTENANCE DIV 8,336,812 7,946,062 7,558,362 8,000,276 8,516,626
ADMINISTRATIVE DIVISION 14,733 0 0 0 0
PW-PARKS BLDG MAINTNC 14,229,601 13,334,776 11,233,904 12,740,194 10,872,030
ENGR TRAFFIC-ST 4,653,115 4,887,739 5,391,981 5,757,384 7,506,216
PAVEMENT MGMT 3,729,834 1,410,722 1,247,673 1,286,664 1,719,014
ADMIN SUPPORT AND DATA MGMT 969,664 1,253,544 1,234,533 1,277,639 1,341,358
STREET MAINTNC 6,816,404 14,297,737 13,611,400 6,601,729 15,697,098
FLEET DIVISION 0 0 (490) 0 0
Sub Total 38,750,162 43,130,580 40,277,365 35,663,886 45,652,341
Capital ProjectsFACILITIES MAINTENANCE DIV 0 209,374 0 0 0
ENGR TRAFFIC-ST 1,681,174 473,574 1,010,209 0 500,000
PAVEMENT MGMT 0 0 0 0 500,000
VEHICLE REPLACEMENT PROGRAM 11,253,688 11,019,436 545,158 0 0
Sub Total 12,934,863 11,702,384 1,555,367 0 1,000,000
Special RevenueFACILITIES MAINTENANCE DIV 70,380 90,393 248,785 197,144 197,144
ENGR TRAFFIC-ST 484,188 294,623 44,455 0 0
PAVEMENT MGMT 1,189,201 592,939 629,498 4,172,639 4,095,923
ADMIN SUPPORT AND DATA MGMT 0 0 356,623 0 0
STREET MAINTNC 4,503,681 9,586,729 7,911,298 4,968,872 16,534,002
FLEET DIVISION 0 0 3,551 0 0
Sub Total 6,247,451 10,564,684 9,194,211 9,338,655 20,827,068
Internal ServiceADMIN SUPPORT AND DATA MGMT 751,220 1,013,407 935,073 689,658 800,398
FLEET DIVISION 17,687,980 16,116,603 15,127,096 16,212,342 16,713,212
Sub Total 18,439,200 17,130,011 16,062,169 16,902,000 17,513,610
All Funds Total 76,371,676 82,527,659 67,089,111 61,904,542 84,993,020
Division Summary
STREETS AND MAINTENANCE
297
Strategic Actions
Goal 7: Enhance and Sustain El Paso’s Infrastructure Network
Strategy 7.2 Improve competitiveness through infrastructure improvements impacting the quality of life Action 7.2.1 Implement and monitor methodologies to ensure operational efficiency
Strategy 7.4 Continue the strategic investment in city facilities and technology Action 7.4.1 Maintain City buildings to ensure public welfare through safe and secure facilities
Strategy 7.5 Set one standard for infrastructure across the city. Action 7.5.1 Integrate performance based criteria in design scope of work to reinforce
sustainability objectives
FY 2021 Key Results
40,328 potholes repaired in FY2021 11.8 miles of crosswalk installed citywide Integrated Parks Land Management into the CityWorks Asset Management Program Fueling Stations Upgrade - near completion on a Citywide conversion to the Fuel Focus system
FY 2022 Key Deliverables
Continue aggressive maintenance programs for street operations and traffic management, toinclude traffic control equipment, proactive maintenance of City facilities and vehicles withavailable resources
Utilize restored funding for court surface repairs to address maintenance problems on some ofthe City's deteriorated hardcourt surfaces
Align and integrate with financial capacity, operational needs, strategic plan, and communitypriorities
Complete 5 new projects within Federal Portfolio Continuation and completion of design of 20 projects Complete construction of 31 transportation/safety projects
COVID-19 Response and Recovery
Installed clean air technology in 100 City buildings Installed temperature scanners in every functioning City building Installed temperature check stations and 500 hand sanitizing stations at every City facility
housing employees 119 City facilities have clean air technology systems in the HVAC systems; this included both
ultra-violet ray technology and plasma air Managed COVID PPE inventories – to include procurement, dissemination, and storage Installed cautionary signage on floor and wall markings Citywide Workstation modifications (i.e.- Plexiglas installations, social distance separation) Created in-house disinfecting teams that fog at every presently utilized City facility Partner with PIO to create video presentations to send to residents abutting project scope area
during the NTMP implementation process
298
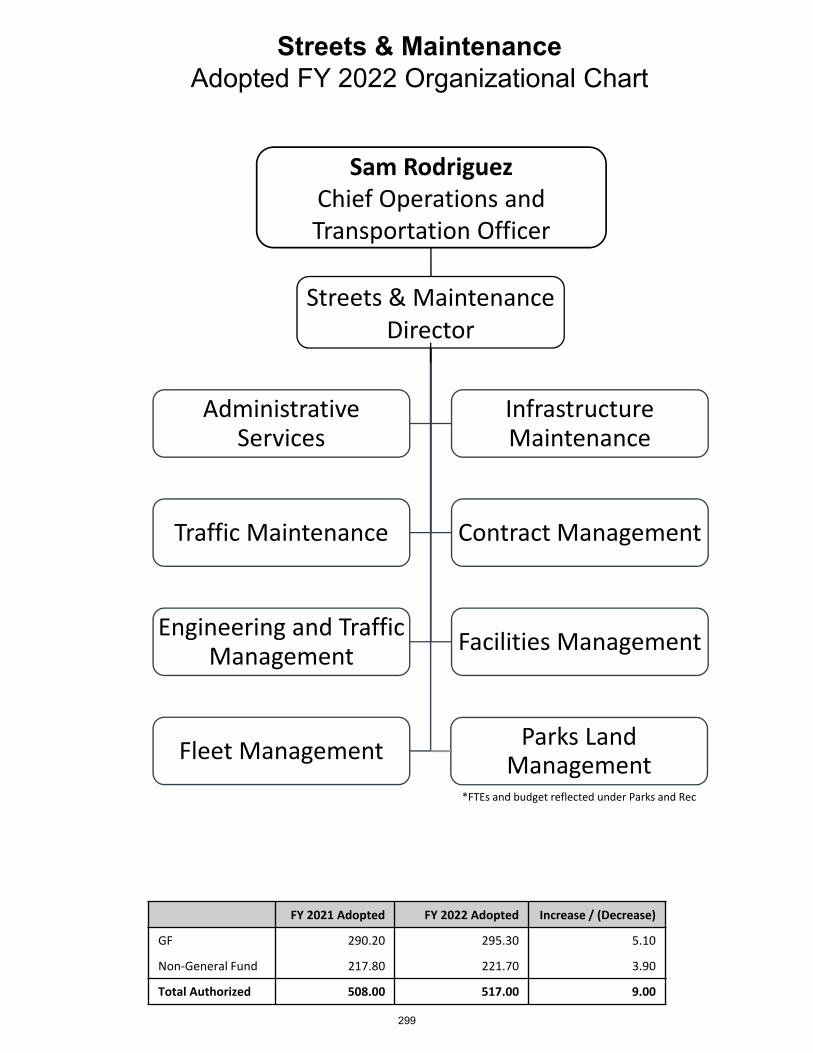
Streets & MaintenanceAdopted FY 2022 Organizational Chart
Streets & Maintenance Director
Administrative Services
Infrastructure Maintenance
Traffic Maintenance Contract Management
Engineering and Traffic Management
Facilities Management
Fleet Management
FY 2021 Adopted FY 2022 Adopted Increase / (Decrease)
GF 290.20 295.30 5.10
Non‐General Fund 217.80 221.70 3.90
Total Authorized 508.00 517.00 9.00
Sam RodriguezChief Operations and Transportation Officer
Parks Land Management
*FTEs and budget reflected under Parks and Rec
299
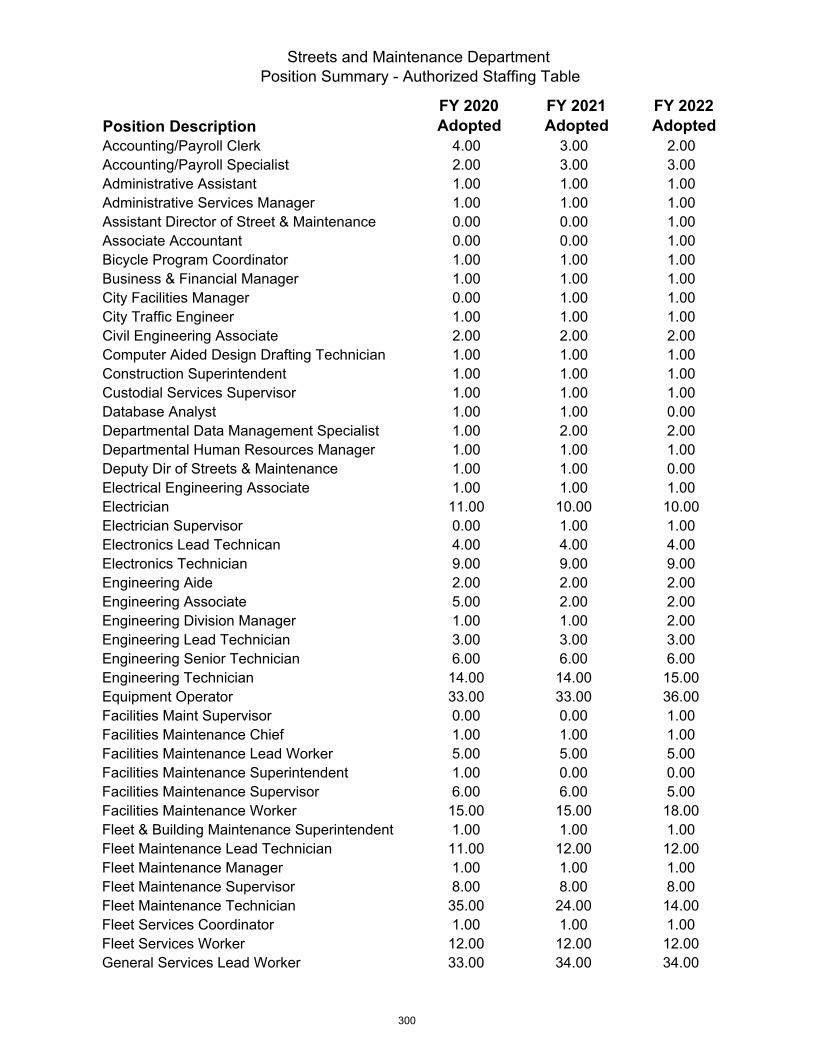
Streets and Maintenance Department Position Summary - Authorized Staffing Table
Position DescriptionFY 2020 Adopted
FY 2021 Adopted
FY 2022 Adopted
Accounting/Payroll Clerk 4.00 3.00 2.00Accounting/Payroll Specialist 2.00 3.00 3.00Administrative Assistant 1.00 1.00 1.00Administrative Services Manager 1.00 1.00 1.00Assistant Director of Street & Maintenance 0.00 0.00 1.00Associate Accountant 0.00 0.00 1.00Bicycle Program Coordinator 1.00 1.00 1.00Business & Financial Manager 1.00 1.00 1.00City Facilities Manager 0.00 1.00 1.00City Traffic Engineer 1.00 1.00 1.00Civil Engineering Associate 2.00 2.00 2.00Computer Aided Design Drafting Technician 1.00 1.00 1.00Construction Superintendent 1.00 1.00 1.00Custodial Services Supervisor 1.00 1.00 1.00Database Analyst 1.00 1.00 0.00Departmental Data Management Specialist 1.00 2.00 2.00Departmental Human Resources Manager 1.00 1.00 1.00Deputy Dir of Streets & Maintenance 1.00 1.00 0.00Electrical Engineering Associate 1.00 1.00 1.00Electrician 11.00 10.00 10.00Electrician Supervisor 0.00 1.00 1.00Electronics Lead Technican 4.00 4.00 4.00Electronics Technician 9.00 9.00 9.00Engineering Aide 2.00 2.00 2.00Engineering Associate 5.00 2.00 2.00Engineering Division Manager 1.00 1.00 2.00Engineering Lead Technician 3.00 3.00 3.00Engineering Senior Technician 6.00 6.00 6.00Engineering Technician 14.00 14.00 15.00Equipment Operator 33.00 33.00 36.00Facilities Maint Supervisor 0.00 0.00 1.00Facilities Maintenance Chief 1.00 1.00 1.00Facilities Maintenance Lead Worker 5.00 5.00 5.00Facilities Maintenance Superintendent 1.00 0.00 0.00Facilities Maintenance Supervisor 6.00 6.00 5.00Facilities Maintenance Worker 15.00 15.00 18.00Fleet & Building Maintenance Superintendent 1.00 1.00 1.00Fleet Maintenance Lead Technician 11.00 12.00 12.00Fleet Maintenance Manager 1.00 1.00 1.00Fleet Maintenance Supervisor 8.00 8.00 8.00Fleet Maintenance Technician 35.00 24.00 14.00Fleet Services Coordinator 1.00 1.00 1.00Fleet Services Worker 12.00 12.00 12.00General Services Lead Worker 33.00 34.00 34.00
300
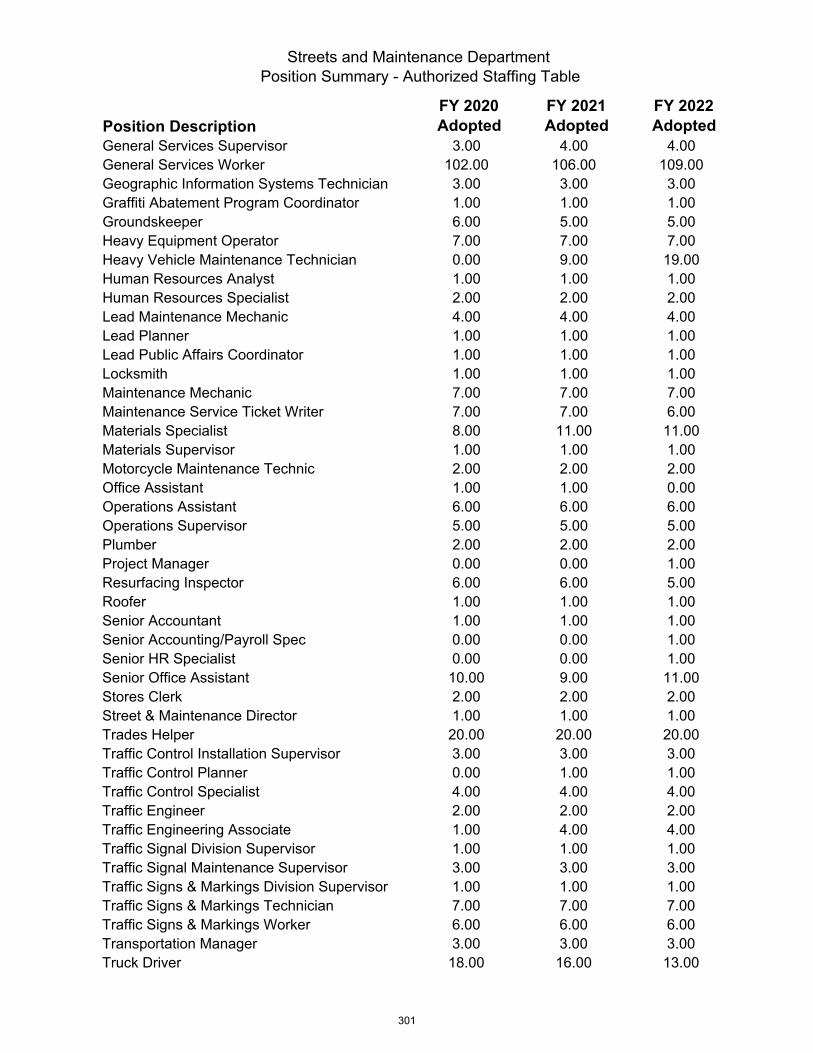
Streets and Maintenance Department Position Summary - Authorized Staffing Table
Position DescriptionFY 2020 Adopted
FY 2021 Adopted
FY 2022 Adopted
General Services Supervisor 3.00 4.00 4.00General Services Worker 102.00 106.00 109.00Geographic Information Systems Technician 3.00 3.00 3.00Graffiti Abatement Program Coordinator 1.00 1.00 1.00Groundskeeper 6.00 5.00 5.00Heavy Equipment Operator 7.00 7.00 7.00Heavy Vehicle Maintenance Technician 0.00 9.00 19.00Human Resources Analyst 1.00 1.00 1.00Human Resources Specialist 2.00 2.00 2.00Lead Maintenance Mechanic 4.00 4.00 4.00Lead Planner 1.00 1.00 1.00Lead Public Affairs Coordinator 1.00 1.00 1.00Locksmith 1.00 1.00 1.00Maintenance Mechanic 7.00 7.00 7.00Maintenance Service Ticket Writer 7.00 7.00 6.00Materials Specialist 8.00 11.00 11.00Materials Supervisor 1.00 1.00 1.00Motorcycle Maintenance Technic 2.00 2.00 2.00Office Assistant 1.00 1.00 0.00Operations Assistant 6.00 6.00 6.00Operations Supervisor 5.00 5.00 5.00Plumber 2.00 2.00 2.00Project Manager 0.00 0.00 1.00Resurfacing Inspector 6.00 6.00 5.00Roofer 1.00 1.00 1.00Senior Accountant 1.00 1.00 1.00Senior Accounting/Payroll Spec 0.00 0.00 1.00Senior HR Specialist 0.00 0.00 1.00Senior Office Assistant 10.00 9.00 11.00Stores Clerk 2.00 2.00 2.00Street & Maintenance Director 1.00 1.00 1.00Trades Helper 20.00 20.00 20.00Traffic Control Installation Supervisor 3.00 3.00 3.00Traffic Control Planner 0.00 1.00 1.00Traffic Control Specialist 4.00 4.00 4.00Traffic Engineer 2.00 2.00 2.00Traffic Engineering Associate 1.00 4.00 4.00Traffic Signal Division Supervisor 1.00 1.00 1.00Traffic Signal Maintenance Supervisor 3.00 3.00 3.00Traffic Signs & Markings Division Supervisor 1.00 1.00 1.00Traffic Signs & Markings Technician 7.00 7.00 7.00Traffic Signs & Markings Worker 6.00 6.00 6.00Transportation Manager 3.00 3.00 3.00Truck Driver 18.00 16.00 13.00
301

Streets and Maintenance Department Position Summary - Authorized Staffing Table
Position DescriptionFY 2020 Adopted
FY 2021 Adopted
FY 2022 Adopted
Welder 2.00 2.00 2.00Grand Total 502.00 508.00 517.00
302
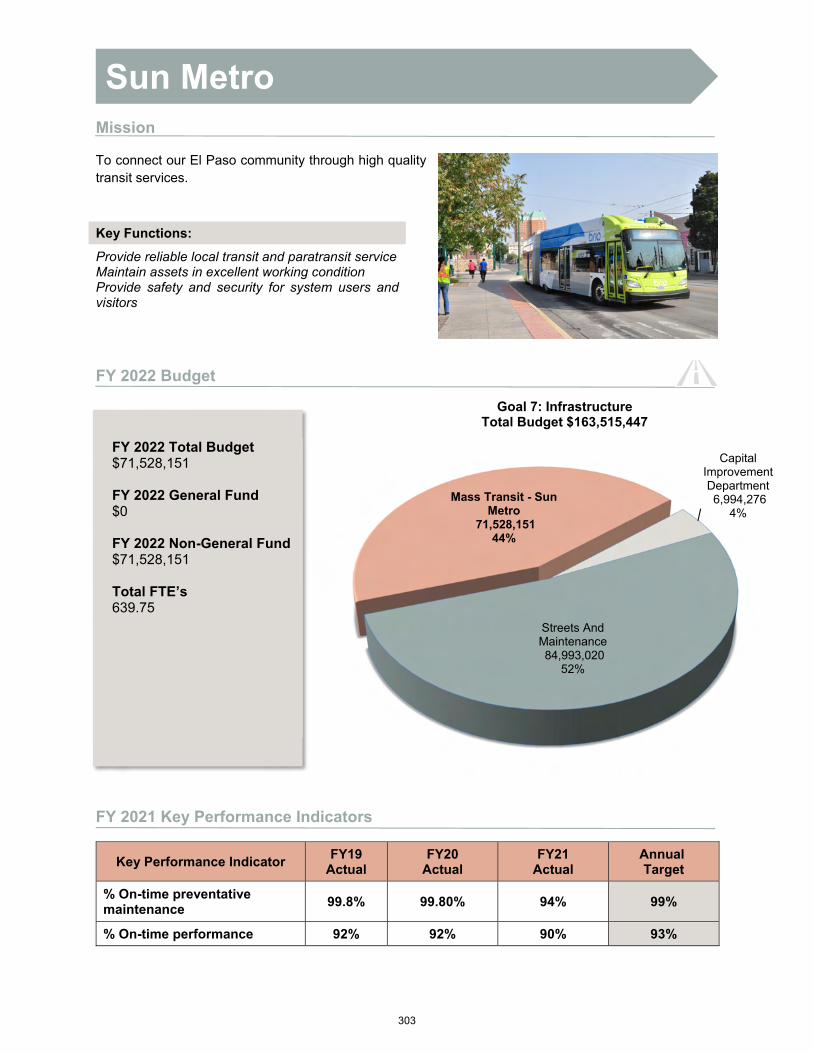
Capital Improvement Department6,994,276
4%
Streets And Maintenance84,993,020
52%
Mass Transit - Sun Metro
71,528,151 44%
Goal 7: Infrastructure Total Budget $163,515,447
Mission
To connect our El Paso community through high quality transit services.
FY 2022 Budget
FY 2021 Key Performance Indicators
Key Performance Indicator FY19
Actual FY20
Actual FY21
Actual Annual Target
% On-time preventative maintenance
99.8% 99.80% 94% 99%
% On-time performance 92% 92% 90% 93%
Key Functions:
Provide reliable local transit and paratransit service Maintain assets in excellent working condition Provide safety and security for system users and visitors
FY 2022 Total Budget $71,528,151
FY 2022 General Fund $0
FY 2022 Non-General Fund $71,528,151
Total FTE’s 639.75
Sun Metro
303
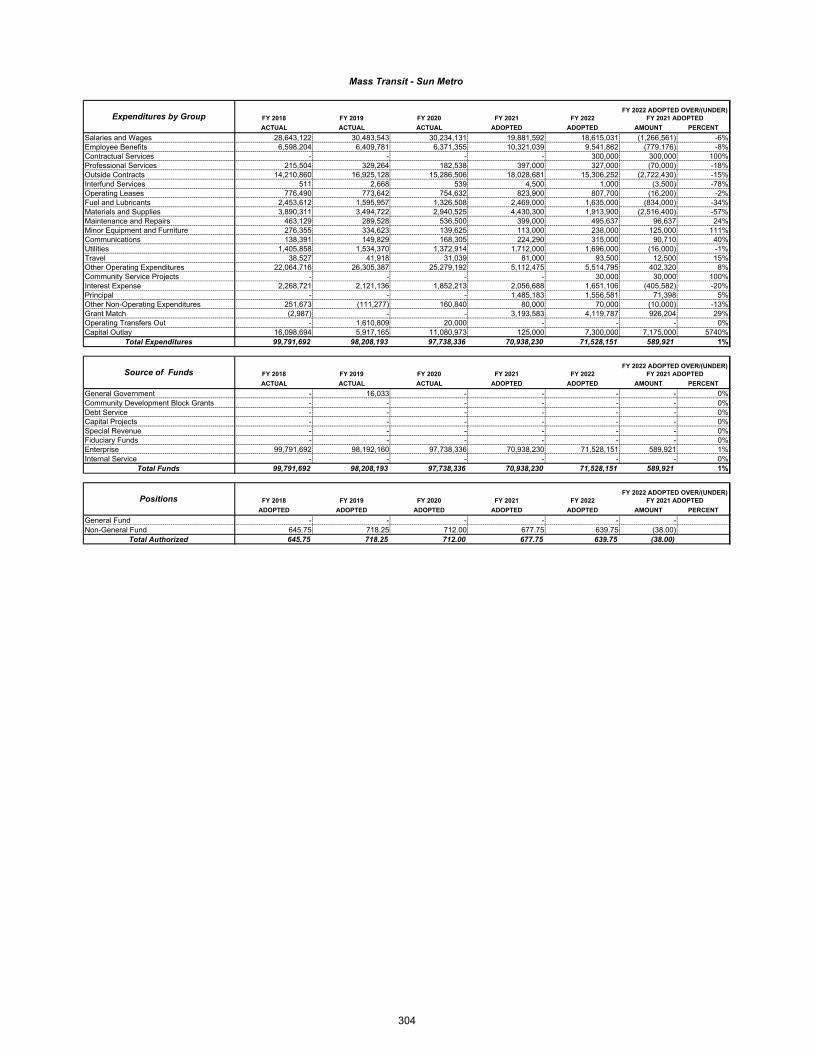
FY 2018 FY 2019 FY 2020 FY 2021 FY 2022
ACTUAL ACTUAL ACTUAL ADOPTED ADOPTED AMOUNT PERCENT
Salaries and Wages 28,643,122 30,483,543 30,234,131 19,881,592 18,615,031 (1,266,561) -6%Employee Benefits 6,598,204 6,409,781 6,371,355 10,321,039 9,541,862 (779,176) -8%Contractual Services - - - - 300,000 300,000 100%Professional Services 215,504 329,264 182,538 397,000 327,000 (70,000) -18%Outside Contracts 14,210,860 16,925,128 15,286,506 18,028,681 15,306,252 (2,722,430) -15%Interfund Services 511 2,668 539 4,500 1,000 (3,500) -78%Operating Leases 776,490 773,642 754,632 823,900 807,700 (16,200) -2%Fuel and Lubricants 2,453,612 1,595,957 1,326,508 2,469,000 1,635,000 (834,000) -34%Materials and Supplies 3,890,311 3,494,722 2,940,525 4,430,300 1,913,900 (2,516,400) -57%Maintenance and Repairs 463,129 289,528 536,500 399,000 495,637 96,637 24%Minor Equipment and Furniture 276,355 334,623 139,625 113,000 238,000 125,000 111%Communications 138,391 149,829 168,305 224,290 315,000 90,710 40%Utilities 1,405,858 1,534,370 1,372,914 1,712,000 1,696,000 (16,000) -1%Travel 38,527 41,918 31,039 81,000 93,500 12,500 15%Other Operating Expenditures 22,064,716 26,305,387 25,279,192 5,112,475 5,514,795 402,320 8%Community Service Projects - - - - 30,000 30,000 100%Interest Expense 2,268,721 2,121,136 1,852,213 2,056,688 1,651,106 (405,582) -20%Principal - - - 1,485,183 1,556,581 71,398 5%Other Non-Operating Expenditures 251,673 (111,277) 160,840 80,000 70,000 (10,000) -13%Grant Match (2,987) - - 3,193,583 4,119,787 926,204 29%Operating Transfers Out - 1,610,809 20,000 - - - 0%Capital Outlay 16,098,694 5,917,165 11,080,973 125,000 7,300,000 7,175,000 5740%
Total Expenditures 99,791,692 98,208,193 97,738,336 70,938,230 71,528,151 589,921 1%
FY 2018 FY 2019 FY 2020 FY 2021 FY 2022
ACTUAL ACTUAL ACTUAL ADOPTED ADOPTED AMOUNT PERCENT
General Government - 16,033 - - - - 0%Community Development Block Grants - - - - - - 0%Debt Service - - - - - - 0%Capital Projects - - - - - - 0%Special Revenue - - - - - - 0%Fiduciary Funds - - - - - - 0%Enterprise 99,791,692 98,192,160 97,738,336 70,938,230 71,528,151 589,921 1%Internal Service - - - - - - 0%
Total Funds 99,791,692 98,208,193 97,738,336 70,938,230 71,528,151 589,921 1%
FY 2018 FY 2019 FY 2020 FY 2021 FY 2022
ADOPTED ADOPTED ADOPTED ADOPTED ADOPTED AMOUNT PERCENT
General Fund - - - - - - Non-General Fund 645.75 718.25 712.00 677.75 639.75 (38.00)
Total Authorized 645.75 718.25 712.00 677.75 639.75 (38.00)
Expenditures by Group
Mass Transit - Sun Metro
FY 2022 ADOPTED OVER/(UNDER) FY 2021 ADOPTED
FY 2022 ADOPTED OVER/(UNDER) FY 2021 ADOPTED
FY 2022 ADOPTED OVER/(UNDER) FY 2021 ADOPTED
Source of Funds
Positions
304

FY 2018 FY 2019 FY 2020 FY 2021 FY 2022
ACTUAL ACTUAL ACTUAL ADOPTED ADOPTED
General GovernmentMASS TRANSIT ADMIN 0 16,033 0 0 0
Sub Total 0 16,033 0 0 0
Enterprise FundsMASS TRANSIT ADMIN 31,476,240 36,304,030 34,216,141 15,747,914 15,814,867
FIXED ROUTE OPER 28,237,616 26,328,844 23,072,764 21,595,556 18,069,390
LIFT OPER 9,711,120 10,521,717 9,381,345 10,843,621 8,689,969
TRANSIT PLANNIN 580,306 (1,389,199) 1,202,646 (54,131) 9,758,847
TRANSIT SAFETY SECURITY 1,880,876 1,898,339 1,989,345 2,628,715 2,486,522
TRANSIT MAINTNC 11,984,461 14,916,767 14,774,961 16,617,955 14,325,709
MASS TRANS INVENTORY PURCHASE 3,980,477 4,203,322 3,297,984 5,050,000 0
MASS TRANSIT INVENTORY ISSS (4,132,247) (5,046,035) (4,536,990) (5,050,000) 0
SUN METRO CAPTL GRNT 15,871,380 7,830,788 11,997,420 0 0
SM STREETCAR OPERATIONS 201,463 2,623,587 2,342,720 3,558,600 2,382,848
Sub Total 99,791,692 98,192,160 97,738,336 70,938,230 71,528,151
All Funds Total 99,791,692 98,208,193 97,738,336 70,938,230 71,528,151
Division Summary
SUN METRO
305
Strategic Actions
Goal 7: Enhance and Sustain El Paso’s Infrastructure Network
Strategy 7.3 Enhance regional comprehensive transportation system Action 7.3.1 Expand and sustain mass transit alternatives Action 7.3.3 Coordinate regional, multimodal transportation strategies, programs, and plans
within the El Paso MPO planning area
FY 2021 Key Results
Purchased six fixed-route units and 10 LIFT units as part of the fleet replacement plan Construction of three Montana Brio projects which are the Far East Transfer Center, the Montana
Airport Station, and Montana RTS
FY 2022 Key Deliverables
Financially sustainable routing and scheduling service. Currently in the process of procuringconsulting services for a complete Service Analysis to include public outreach.
Improved ADA accessibility to enhance 100+ platforms and sidewalk sections New Sun Metro app developed in-house to provide additional features as such mobile pay and
bus information in one app. Deployment in process.
COVID-19 Response & Recovery
Exerted all efforts available to maintain drivers and passengers safe from COVID-19 All staff continued to work during pandemic providing an essential service to the public First Agency Safety Plan approved by TxDOT Operational improvements resulting in higher service efficiency, lower operational cost and waste
reduction Installed Plexiglas barriers in buses and implemented fog disinfecting process COVID-19 Research Demonstration Grant Program for Contactless Payment Systems
306
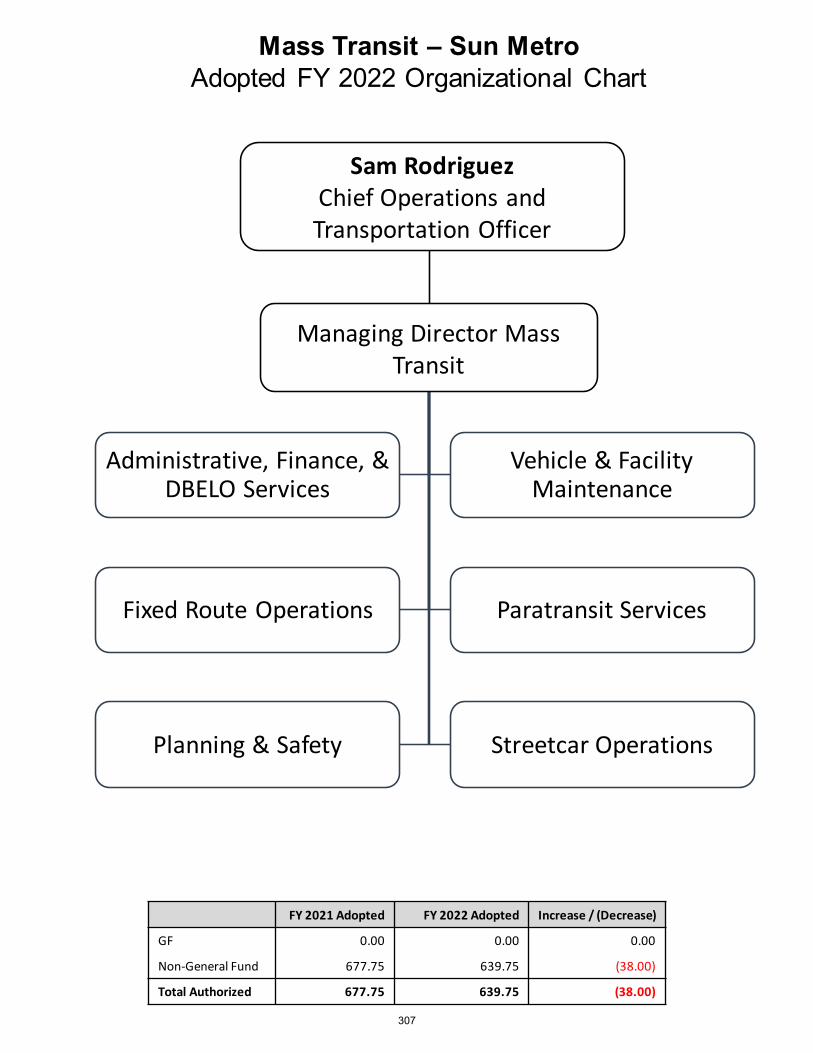
Mass Transit – Sun MetroAdopted FY 2022 Organizational Chart
Managing Director Mass Transit
Administrative, Finance, & DBELO Services
Vehicle & Facility Maintenance
Fixed Route Operations Paratransit Services
Planning & Safety Streetcar Operations
Sam RodriguezChief Operations and Transportation Officer
FY 2021 Adopted FY 2022 Adopted Increase / (Decrease)
GF 0.00 0.00 0.00
Non-General Fund 677.75 639.75 (38.00)
Total Authorized 677.75 639.75 (38.00)
307
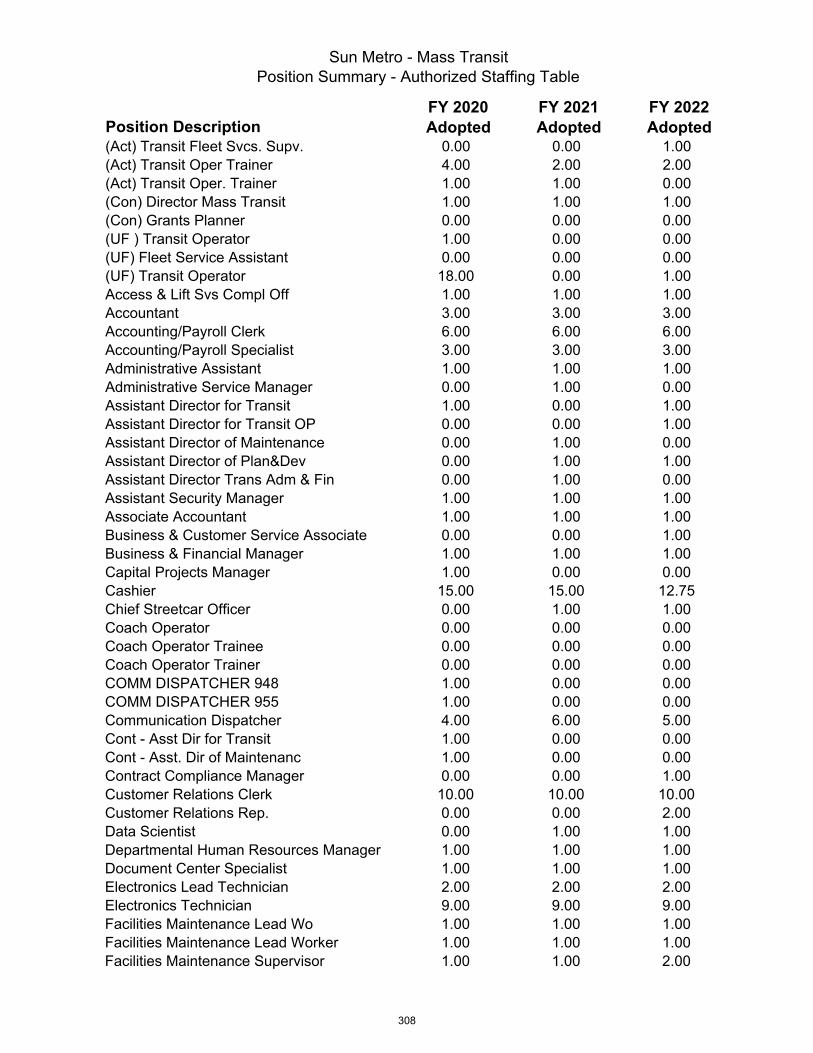
Sun Metro - Mass TransitPosition Summary - Authorized Staffing Table
Position DescriptionFY 2020 Adopted
FY 2021 Adopted
FY 2022 Adopted
(Act) Transit Fleet Svcs. Supv. 0.00 0.00 1.00(Act) Transit Oper Trainer 4.00 2.00 2.00(Act) Transit Oper. Trainer 1.00 1.00 0.00(Con) Director Mass Transit 1.00 1.00 1.00(Con) Grants Planner 0.00 0.00 0.00(UF ) Transit Operator 1.00 0.00 0.00(UF) Fleet Service Assistant 0.00 0.00 0.00(UF) Transit Operator 18.00 0.00 1.00Access & Lift Svs Compl Off 1.00 1.00 1.00Accountant 3.00 3.00 3.00Accounting/Payroll Clerk 6.00 6.00 6.00Accounting/Payroll Specialist 3.00 3.00 3.00Administrative Assistant 1.00 1.00 1.00Administrative Service Manager 0.00 1.00 0.00Assistant Director for Transit 1.00 0.00 1.00Assistant Director for Transit OP 0.00 0.00 1.00Assistant Director of Maintenance 0.00 1.00 0.00Assistant Director of Plan&Dev 0.00 1.00 1.00Assistant Director Trans Adm & Fin 0.00 1.00 0.00Assistant Security Manager 1.00 1.00 1.00Associate Accountant 1.00 1.00 1.00Business & Customer Service Associate 0.00 0.00 1.00Business & Financial Manager 1.00 1.00 1.00Capital Projects Manager 1.00 0.00 0.00Cashier 15.00 15.00 12.75Chief Streetcar Officer 0.00 1.00 1.00Coach Operator 0.00 0.00 0.00Coach Operator Trainee 0.00 0.00 0.00Coach Operator Trainer 0.00 0.00 0.00COMM DISPATCHER 948 1.00 0.00 0.00COMM DISPATCHER 955 1.00 0.00 0.00Communication Dispatcher 4.00 6.00 5.00Cont - Asst Dir for Transit 1.00 0.00 0.00Cont - Asst. Dir of Maintenanc 1.00 0.00 0.00Contract Compliance Manager 0.00 0.00 1.00Customer Relations Clerk 10.00 10.00 10.00Customer Relations Rep. 0.00 0.00 2.00Data Scientist 0.00 1.00 1.00Departmental Human Resources Manager 1.00 1.00 1.00Document Center Specialist 1.00 1.00 1.00Electronics Lead Technician 2.00 2.00 2.00Electronics Technician 9.00 9.00 9.00Facilities Maintenance Lead Wo 1.00 1.00 1.00Facilities Maintenance Lead Worker 1.00 1.00 1.00Facilities Maintenance Supervisor 1.00 1.00 2.00
308
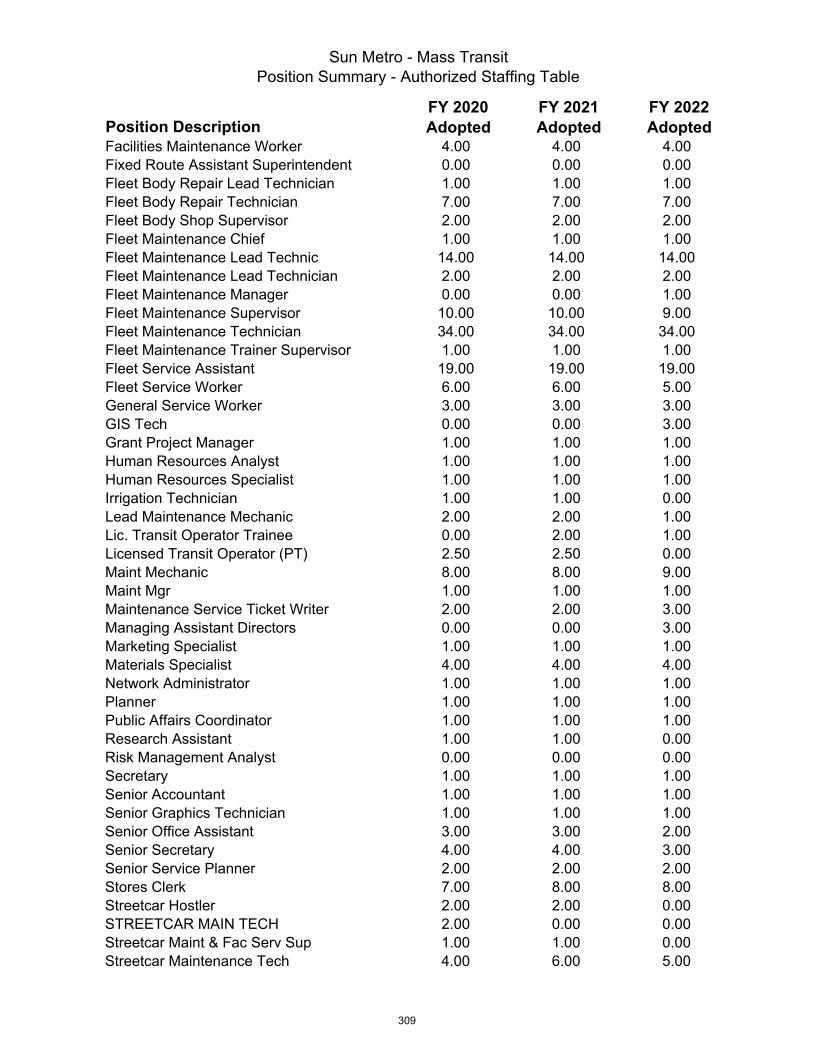
Sun Metro - Mass TransitPosition Summary - Authorized Staffing Table
Position DescriptionFY 2020 Adopted
FY 2021 Adopted
FY 2022 Adopted
Facilities Maintenance Worker 4.00 4.00 4.00Fixed Route Assistant Superintendent 0.00 0.00 0.00Fleet Body Repair Lead Technician 1.00 1.00 1.00Fleet Body Repair Technician 7.00 7.00 7.00Fleet Body Shop Supervisor 2.00 2.00 2.00Fleet Maintenance Chief 1.00 1.00 1.00Fleet Maintenance Lead Technic 14.00 14.00 14.00Fleet Maintenance Lead Technician 2.00 2.00 2.00Fleet Maintenance Manager 0.00 0.00 1.00Fleet Maintenance Supervisor 10.00 10.00 9.00Fleet Maintenance Technician 34.00 34.00 34.00Fleet Maintenance Trainer Supervisor 1.00 1.00 1.00Fleet Service Assistant 19.00 19.00 19.00Fleet Service Worker 6.00 6.00 5.00General Service Worker 3.00 3.00 3.00GIS Tech 0.00 0.00 3.00Grant Project Manager 1.00 1.00 1.00Human Resources Analyst 1.00 1.00 1.00Human Resources Specialist 1.00 1.00 1.00Irrigation Technician 1.00 1.00 0.00Lead Maintenance Mechanic 2.00 2.00 1.00Lic. Transit Operator Trainee 0.00 2.00 1.00Licensed Transit Operator (PT) 2.50 2.50 0.00Maint Mechanic 8.00 8.00 9.00Maint Mgr 1.00 1.00 1.00Maintenance Service Ticket Writer 2.00 2.00 3.00Managing Assistant Directors 0.00 0.00 3.00Marketing Specialist 1.00 1.00 1.00Materials Specialist 4.00 4.00 4.00Network Administrator 1.00 1.00 1.00Planner 1.00 1.00 1.00Public Affairs Coordinator 1.00 1.00 1.00Research Assistant 1.00 1.00 0.00Risk Management Analyst 0.00 0.00 0.00Secretary 1.00 1.00 1.00Senior Accountant 1.00 1.00 1.00Senior Graphics Technician 1.00 1.00 1.00Senior Office Assistant 3.00 3.00 2.00Senior Secretary 4.00 4.00 3.00Senior Service Planner 2.00 2.00 2.00Stores Clerk 7.00 8.00 8.00Streetcar Hostler 2.00 2.00 0.00STREETCAR MAIN TECH 2.00 0.00 0.00Streetcar Maint & Fac Serv Sup 1.00 1.00 0.00Streetcar Maintenance Tech 4.00 6.00 5.00
309
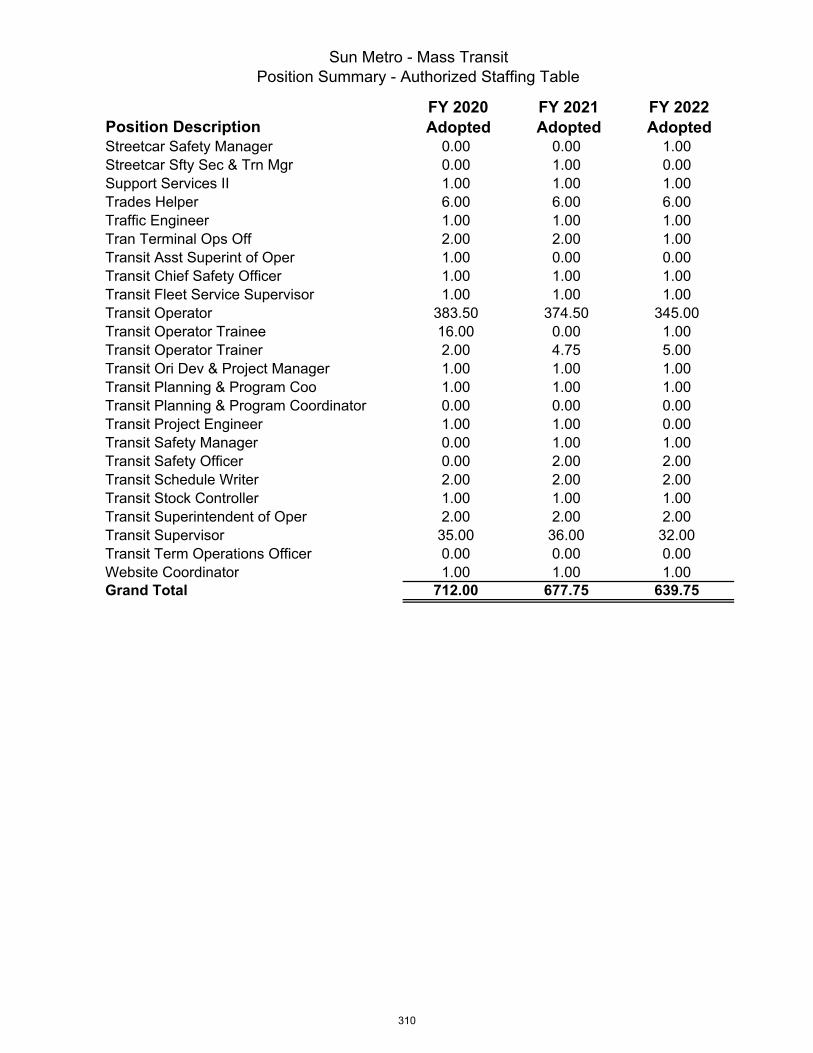
Sun Metro - Mass TransitPosition Summary - Authorized Staffing Table
Position DescriptionFY 2020 Adopted
FY 2021 Adopted
FY 2022 Adopted
Streetcar Safety Manager 0.00 0.00 1.00Streetcar Sfty Sec & Trn Mgr 0.00 1.00 0.00Support Services II 1.00 1.00 1.00Trades Helper 6.00 6.00 6.00Traffic Engineer 1.00 1.00 1.00Tran Terminal Ops Off 2.00 2.00 1.00Transit Asst Superint of Oper 1.00 0.00 0.00Transit Chief Safety Officer 1.00 1.00 1.00Transit Fleet Service Supervisor 1.00 1.00 1.00Transit Operator 383.50 374.50 345.00Transit Operator Trainee 16.00 0.00 1.00Transit Operator Trainer 2.00 4.75 5.00Transit Ori Dev & Project Manager 1.00 1.00 1.00Transit Planning & Program Coo 1.00 1.00 1.00Transit Planning & Program Coordinator 0.00 0.00 0.00Transit Project Engineer 1.00 1.00 0.00Transit Safety Manager 0.00 1.00 1.00Transit Safety Officer 0.00 2.00 2.00Transit Schedule Writer 2.00 2.00 2.00Transit Stock Controller 1.00 1.00 1.00Transit Superintendent of Oper 2.00 2.00 2.00Transit Supervisor 35.00 36.00 32.00Transit Term Operations Officer 0.00 0.00 0.00Website Coordinator 1.00 1.00 1.00Grand Total 712.00 677.75 639.75
310

CITY OF EL PASO BUDGET BOOK 2022
GROWTH
GOAL 8SUSTAINABLE COMMUNITY
-ANIMAL SERVICES-COMMUNITY & HUMAN DEVELOPMENT
-ENVIRONMENTAL SERVICES-PUBLIC HEALTH
22YEAR NO.
GOAL 8
SUSTAINABLE COMMUNITY

FY 2018 FY 2019 FY 2020 FY 2021 FY 2022
ACTUAL ACTUAL ACTUAL ADOPTED ADOPTED AMOUNT PERCENT
Salaries and Wages 29,290,650 31,853,868 34,716,476 27,847,324 29,449,563 1,602,239 6%Employee Benefits 8,448,717 9,114,750 9,657,980 11,050,186 11,224,537 174,351 2%Contractual Services 3,970 5,042 - - 15,950 15,950 100%Professional Services 291,305 376,866 577,891 385,458 402,308 16,850 4%Outside Contracts 5,614,475 4,466,057 6,248,863 5,033,130 4,720,713 (312,417) -6%Interfund Services 6,559,745 5,809,768 5,866,075 5,761,313 5,784,084 22,771 0%Operating Leases 844,921 885,532 915,184 1,045,009 1,148,490 103,481 10%Fuel and Lubricants 2,833,799 2,988,258 3,029,503 3,262,613 3,385,302 122,689 4%Materials and Supplies 2,840,204 3,412,474 3,916,312 3,568,019 3,603,819 35,799 1%Maintenance and Repairs 214,833 333,116 830,401 348,913 358,949 10,036 3%Minor Equipment and Furniture 366,830 719,184 644,964 280,298 387,492 107,194 38%Communications 385,912 426,892 473,733 594,114 681,711 87,597 15%Utilities 515,518 433,354 438,777 533,644 529,886 (3,758) -1%Travel 276,783 304,597 163,330 285,829 261,246 (24,583) -9%Other Operating Expenditures 16,879,614 14,601,242 12,899,419 6,206,381 6,142,967 (63,414) -1%Community Service Projects 9,530,872 5,458,960 9,480,230 10,663,793 10,961,778 297,985 3%Interest Expense 665,954 619,634 568,434 657,860 412,114 (245,746) -37%Principal - - - 1,505,799 1,569,664 63,865 4%Other Non-Operating Expenditures 2,216,551 1,009,312 1,265,481 1,289,060 1,359,160 70,100 5%Grant Match (2,861) 71,318 0 296,781 247,785 (48,995) -17%Operating Transfers Out 12,591,164 26,121,695 36,485,454 32,813,793 35,842,084 3,028,291 9%Capital Outlay 11,109,650 13,184,014 13,876,512 12,971,247 14,793,947 1,822,700 14%
Total Expenditures 111,478,606 122,195,932 142,055,017 126,400,564 133,283,549 6,882,985 5%
FY 2018 FY 2019 FY 2020 FY 2021 FY 2022
ACTUAL ACTUAL ACTUAL ADOPTED ADOPTED AMOUNT PERCENT
General Government 6,898,028 6,669,927 6,768,095 7,496,849 7,754,668 257,820 3%Community Development Block Grants 12,543,368 10,578,275 9,139,121 12,315,384 12,302,668 (12,716) 0%Debt Service - - - - - - 0%Capital Projects 100,321 4,045 393,900 - - - 0%Special Revenue 28,455,710 28,817,887 37,705,377 25,132,183 24,371,877 (760,306) -3%Fiduciary Funds - 3,136 - - - - 0%Enterprise 63,481,179 76,122,662 88,048,525 81,456,148 88,854,335 7,398,187 9%Internal Service - - - - - - 0%
Total Funds 111,478,606 122,195,932 142,055,017 126,400,564 133,283,549 6,882,985 5%
FY 2018 FY 2019 FY 2020 FY 2021 FY 2022
ADOPTED ADOPTED ADOPTED ADOPTED ADOPTED AMOUNT
General Fund 75.17 77.13 85.41 92.47 87.51 (4.96)Non-General Fund 778.38 774.79 783.99 749.68 852.29 102.61
Total Authorized 853.55 851.92 869.40 842.15 939.80 97.65
FY 2022 ADOPTED OVER/(UNDER) FY 2021 ADOPTED
FY 2022 ADOPTED OVER/(UNDER) FY 2021 ADOPTED
FY 2022 ADOPTED OVER/(UNDER) FY 2021 ADOPTEDPositions
Expenditures by Group
Goal 8
Source of Funds
Nurture and Promote a Healthy, Sustainable Community
312
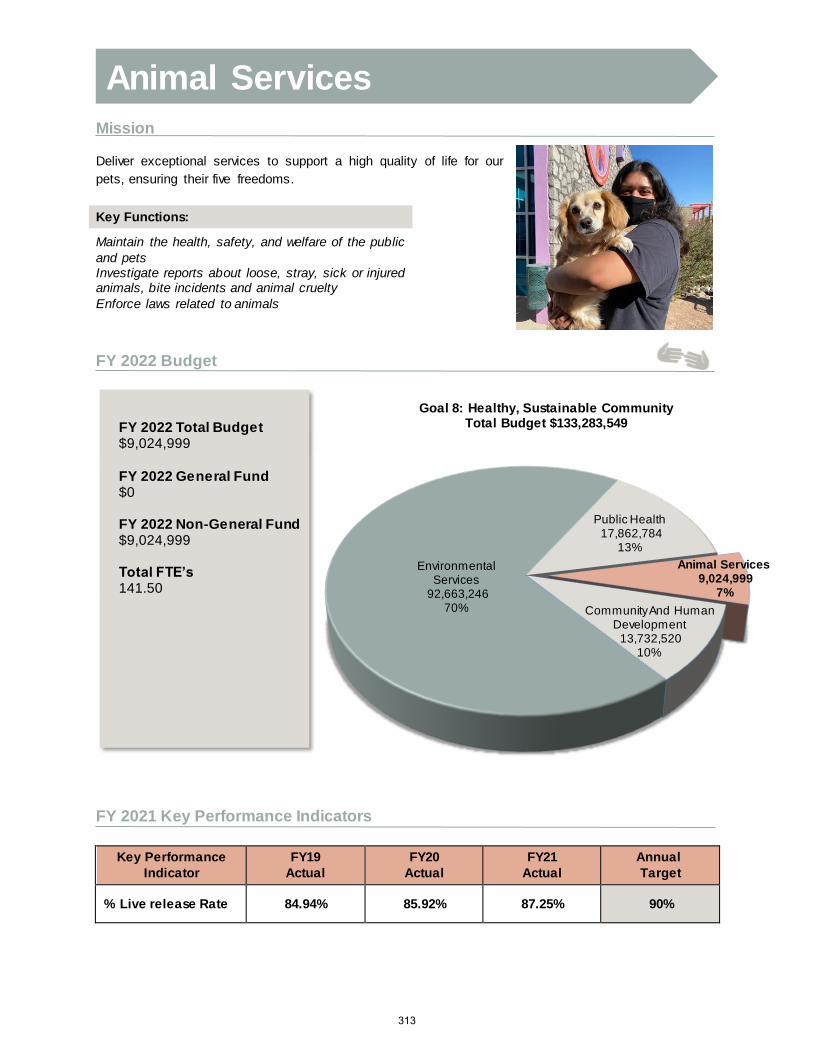
Animal Services9,024,999
7%
Community And Human Development
13,732,520 10%
Environmental Services
92,663,246 70%
Public Health17,862,784
13%
Goal 8: Healthy, Sustainable Community Total Budget $133,283,549
Mission
Deliver exceptional services to support a high quality of life for our
pets, ensuring their five freedoms.
FY 2022 Budget
FY 2021 Key Performance Indicators
Key Performance Indicator
FY19 Actual
FY20 Actual
FY21 Actual
Annual Target
% Live release Rate 84.94% 85.92% 87.25% 90%
Key Functions:
Maintain the health, safety, and welfare of the public
and pets Investigate reports about loose, stray, sick or injured animals, bite incidents and animal cruelty
Enforce laws related to animals
FY 2022 Total Budget $9,024,999
FY 2022 General Fund $0
FY 2022 Non-General Fund $9,024,999
Total FTE’s141.50
Animal Services
313

FY 2018 FY 2019 FY 2020 FY 2021 FY 2022
ACTUAL ACTUAL ACTUAL ADOPTED ADOPTED AMOUNT PERCENT
Salaries and Wages 4,391,159 4,585,406 4,510,387 4,537,710 4,525,356 (12,355) 0%Employee Benefits 1,556,857 1,659,851 1,644,024 1,617,076 1,592,725 (24,352) -2%Contractual Services - - - - - - 0%Professional Services - - - - - - 0%Outside Contracts 561,941 563,108 600,266 701,820 800,610 98,790 14%Interfund Services 99,921 135,618 116,326 130,000 130,000 - 0%Operating Leases 25,253 28,652 23,476 32,000 41,000 9,000 28%Fuel and Lubricants 105,955 107,871 97,866 154,200 144,000 (10,200) -7%Materials and Supplies 968,324 1,222,542 1,110,922 1,368,472 1,460,534 92,062 7%Maintenance and Repairs 18,115 37,104 81,741 55,375 78,000 22,625 41%Minor Equipment and Furniture 50,645 16,008 136,008 39,000 38,100 (900) -2%Communications 649 3,453 180 53,500 54,000 500 1%Utilities 96,433 91,595 87,659 100,000 100,000 - 0%Travel 25,116 30,960 22,700 22,325 18,125 (4,200) -19%Other Operating Expenditures 277,744 15,950 5,469 46,500 41,500 (5,000) -11%Community Service Projects - - - - - - 0%Interest Expense - - - - - - 0%Principal - - - - - - 0%Other Non-Operating Expenditures 3,259 (3,259) - 1,050 1,050 - 0%Grant Match - 90,000 - - - - 0%Operating Transfers Out - - 334,655 - - - 0%Capital Outlay 321,032 192,697 524,259 - - - 0%
Total Expenditures 8,502,403 8,777,555 9,295,935 8,859,029 9,024,999 165,971 2%
FY 2018 FY 2019 FY 2020 FY 2021 FY 2022
ACTUAL ACTUAL ACTUAL ADOPTED ADOPTED AMOUNT PERCENT
General Government - - - - - - 0%Community Development Block Grants - - - - - - 0%Debt Service - - - - - - 0%Capital Projects - - 245,688 - - - 0%Special Revenue 8,502,403 8,777,555 9,050,247 8,859,029 9,024,999 165,971 2%Fiduciary Funds - - - - - - 0%Enterprise - - - - - - 0%Internal Service - - - - - - 0%
Total Funds 8,502,403 8,777,555 9,295,935 8,859,029 9,024,999 165,971 2%
FY 2018 FY 2019 FY 2020 FY 2021 FY 2022
ADOPTED ADOPTED ADOPTED ADOPTED ADOPTED AMOUNT PERCENT
General Fund - - - - - - Non-General Fund 140.50 142.50 142.50 141.50 141.50 -
Total Authorized 140.50 142.50 142.50 141.50 141.50 -
Expenditures by Group
Positions
Source of Funds
FY 2022 ADOPTED OVER/(UNDER) FY 2021 ADOPTED
FY 2022 ADOPTED OVER/(UNDER) FY 2021 ADOPTED
FY 2022 ADOPTED OVER/(UNDER) FY 2021 ADOPTED
Animal Services
314
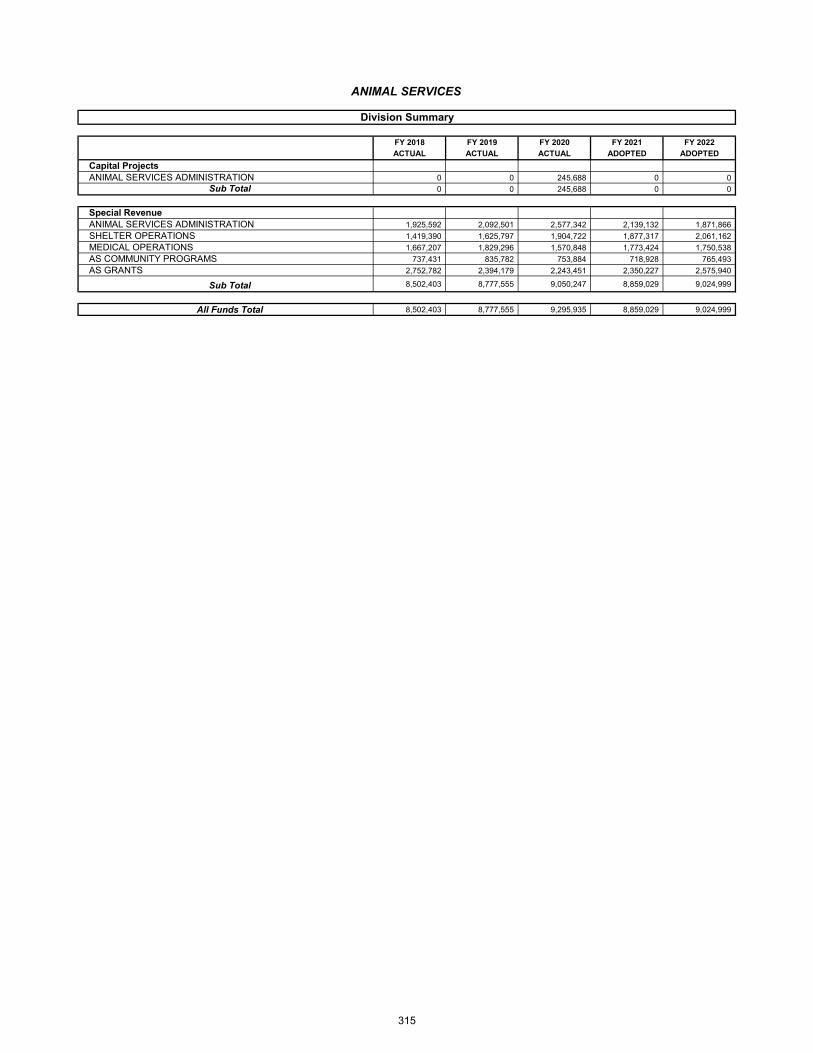
FY 2018 FY 2019 FY 2020 FY 2021 FY 2022
ACTUAL ACTUAL ACTUAL ADOPTED ADOPTED
Capital ProjectsANIMAL SERVICES ADMINISTRATION 0 0 245,688 0 0
Sub Total 0 0 245,688 0 0
Special RevenueANIMAL SERVICES ADMINISTRATION 1,925,592 2,092,501 2,577,342 2,139,132 1,871,866
SHELTER OPERATIONS 1,419,390 1,625,797 1,904,722 1,877,317 2,061,162
MEDICAL OPERATIONS 1,667,207 1,829,296 1,570,848 1,773,424 1,750,538
AS COMMUNITY PROGRAMS 737,431 835,782 753,884 718,928 765,493
AS GRANTS 2,752,782 2,394,179 2,243,451 2,350,227 2,575,940
Sub Total 8,502,403 8,777,555 9,050,247 8,859,029 9,024,999
All Funds Total 8,502,403 8,777,555 9,295,935 8,859,029 9,024,999
Division Summary
ANIMAL SERVICES
315

Strategic Actions
Goal 8: Nurture and Promote a Healthy, Sustainable Community
Strategy 8.3 Enhance animal services to ensure El Paso's pets are provided a safe and healthy
environment
Action 8.3.1 Expand community outreach through education and programming
Action 8.3.2 Continue no kill shelter effort leading to 90% live release rate by 2020
FY 2021 Key Results
• More than 5,200 pets cared for by community Foster Program
• Increase in live release rate
• Decrease in pets entering the shelter
• Decrease in euthanasia
• Reopening of ASD facilities
FY 2022 Key Deliverables
• Continue “no kill” community effort leading to 90% Regional Lifesaving Rate
• Decrease the number of animals (Average daily Inventory) in the Shelter
• Increase the number of pets going to foster homes
• Reduce euthanasia and died in care by 25%
COVID-19 Response & Recovery
• Enhanced safety for staff by modifying workstations with dividers, purchased additional PPE and
cleaning supplies, temperature checking station installed, and minimized direct contact by shifting
to virtual operations
• Changed operations to continue providing key services via virtual, appointment-based, and
curbside service
• Updated website with resources regarding department COVID-19 operations information
• Provide help to families who are facing difficulties caring for their pets
• Emergency foster and volunteer program reinforced
• Animal Protection Officers will only respond to high-priority calls. This includes; EPPD/EPFD
assistance calls, sick and/or injured animals, cruelty, neglect, rabies, quarantine/bite
investigations, traffic hazards, and aggressive animals
316
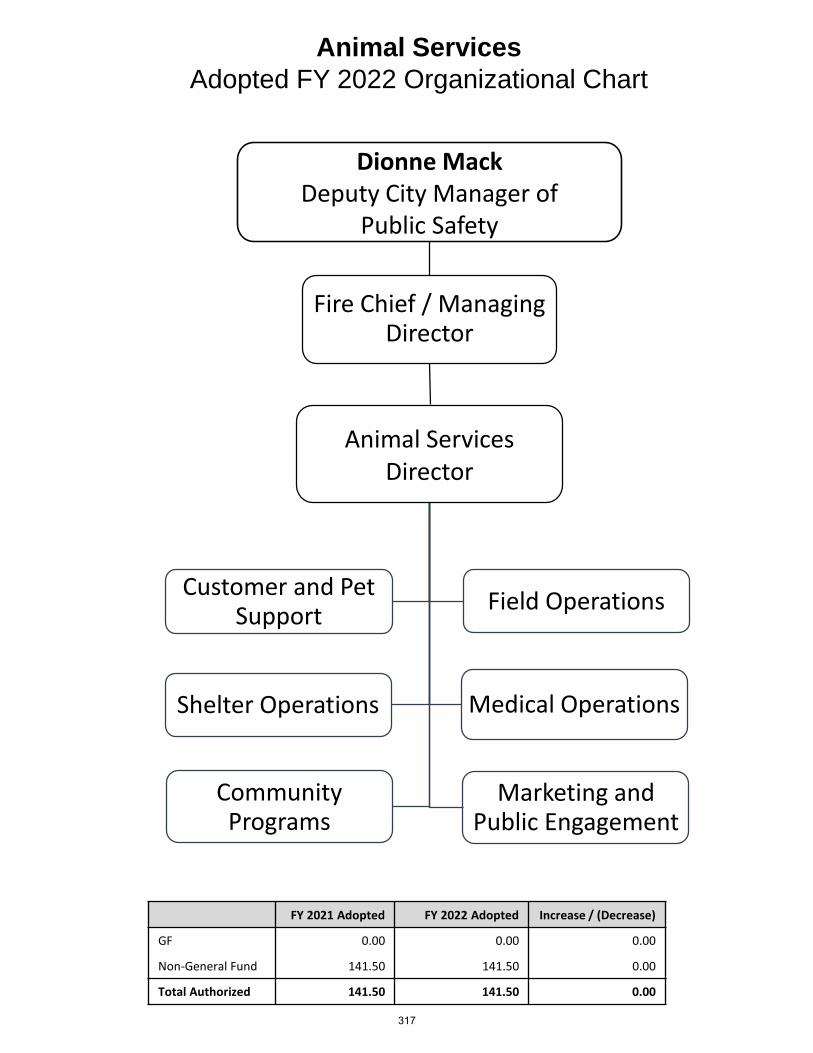
Animal ServicesAdopted FY 2022 Organizational Chart
Fire Chief / Managing Director
Animal Services Director
Customer and Pet Support
Field Operations
Shelter Operations Medical Operations
Community Programs
Marketing and Public Engagement
Dionne MackDeputy City Manager of
Public Safety
FY 2021 Adopted FY 2022 Adopted Increase / (Decrease)
GF 0.00 0.00 0.00
Non-General Fund 141.50 141.50 0.00
Total Authorized 141.50 141.50 0.00
317

Animal Services
Position Summary - Authorized Staffing Table
Position DescriptionFY 2020 Adopted
FY 2021 Adopted
FY 2022 Adopted
Accounting/Payroll Clerk 1.00 1.00 1.00
Animal Care Attendant 38.00 38.00 38.00
Animal Care Officer 0.00 0.00 0.00
Animal Protection Officer 30.00 29.00 29.00
Animal Services Adoption/Outreach Specialist 1.00 1.00 1.00
Animal Services Attendant 0.00 0.00 0.00
Animal Services Development Coordinator 1.00 0.00 0.00
Animal Services Director 1.00 1.00 1.00
Animal Services Education Coordinator 0.00 1.00 1.00
Animal Services Education Specialist 1.00 0.00 0.00
Animal Services Grant Research Assistant 1.00 0.00 0.00
Animal Services Manager 0.00 0.00 0.00
Animal Services Officer 0.00 0.00 0.00
Animal Services Operations Supervisor 2.00 2.00 2.00
Animal Services Shift Supervisor 11.00 12.00 10.00
Animal Training and Enrichment 2.00 2.00 2.00
Assistant Director 0.00 0.00 0.00
Associate Accountant 1.00 0.00 1.00
Chief Veterinarian 1.00 1.00 1.00
Communication Dispatcher 4.50 4.50 4.50
Community Cats Coordinator 1.00 1.00 1.00
Community Program Manager 1.00 1.00 1.00
Customer and Pet Support Super 0.00 0.00 2.00
Customer Relations & Billing Supervisor 1.00 1.00 1.00
Customer Relations Clerk 7.00 7.00 7.00
Customer Relations Representative 2.00 2.00 2.00
Director of Animal Services 1.00 1.00 1.00
General Service Worker 1.00 1.00 1.00
Grant Animal Services Shift Supervisor 0.00 0.00 0.00
Human Resources Analyst 1.00 1.00 1.00
Lead Public Affairs Coordinator 0.00 0.00 0.00
Marketing and Public Engagement Manager 1.00 1.00 1.00
Office Assistant 0.00 0.00 0.00
Office Manager 1.00 1.00 1.00
Population Manager 1.00 2.00 2.00
Public Affairs Coordinator 1.00 1.00 1.00
Public Affairs Specialist 0.00 0.00 0.00
Research and Management Assistant 1.00 1.00 1.00
Safety Specialist 1.00 1.00 1.00
Senior Animal Care Attendant 4.00 4.00 4.00
Senior Animal Care Officer 0.00 0.00 0.00
Senior Animal Protection Officer 4.00 4.00 4.00
Senior Animal Services Attendant 0.00 1.00 0.00
Senior Animal Services Officer 0.00 0.00 0.00
Senior Financial Research Analyst 1.00 1.00 1.00
Senior Office Assistant 1.00 1.00 1.00
Training Specialist 0.00 0.00 0.00
Veterinarian 3.00 3.00 3.00
318
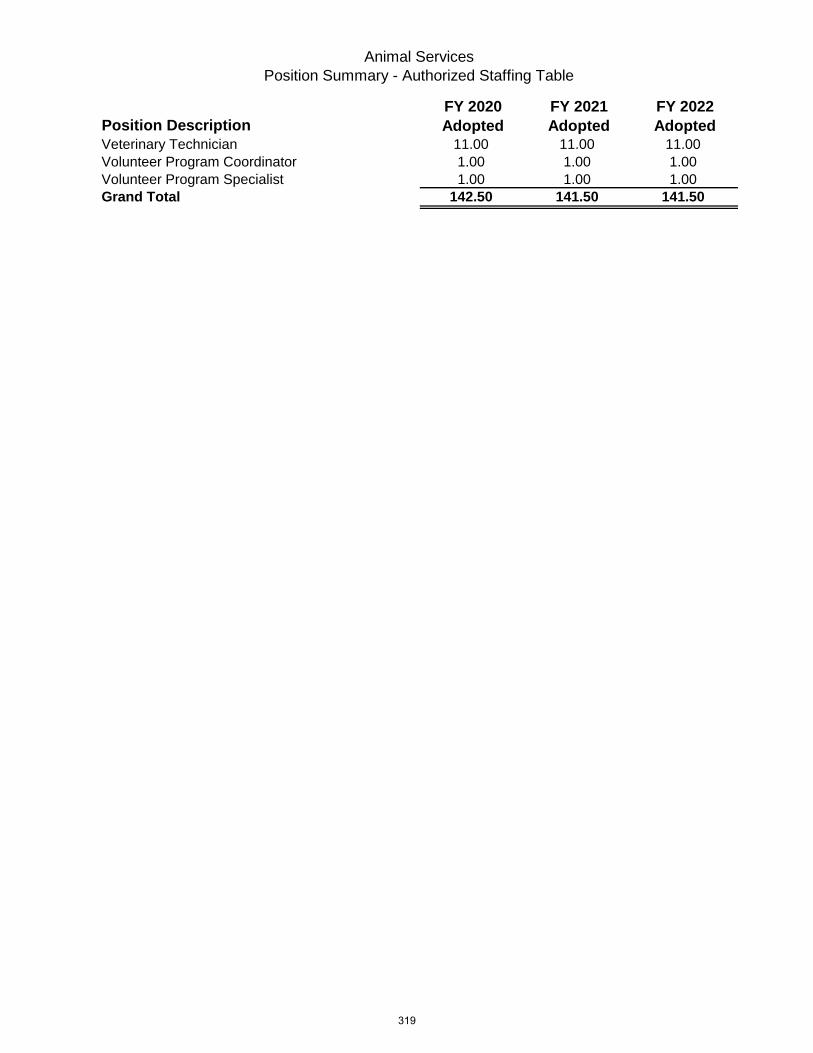
Animal Services
Position Summary - Authorized Staffing Table
Position DescriptionFY 2020 Adopted
FY 2021 Adopted
FY 2022 Adopted
Veterinary Technician 11.00 11.00 11.00
Volunteer Program Coordinator 1.00 1.00 1.00
Volunteer Program Specialist 1.00 1.00 1.00
Grand Total 142.50 141.50 141.50
319
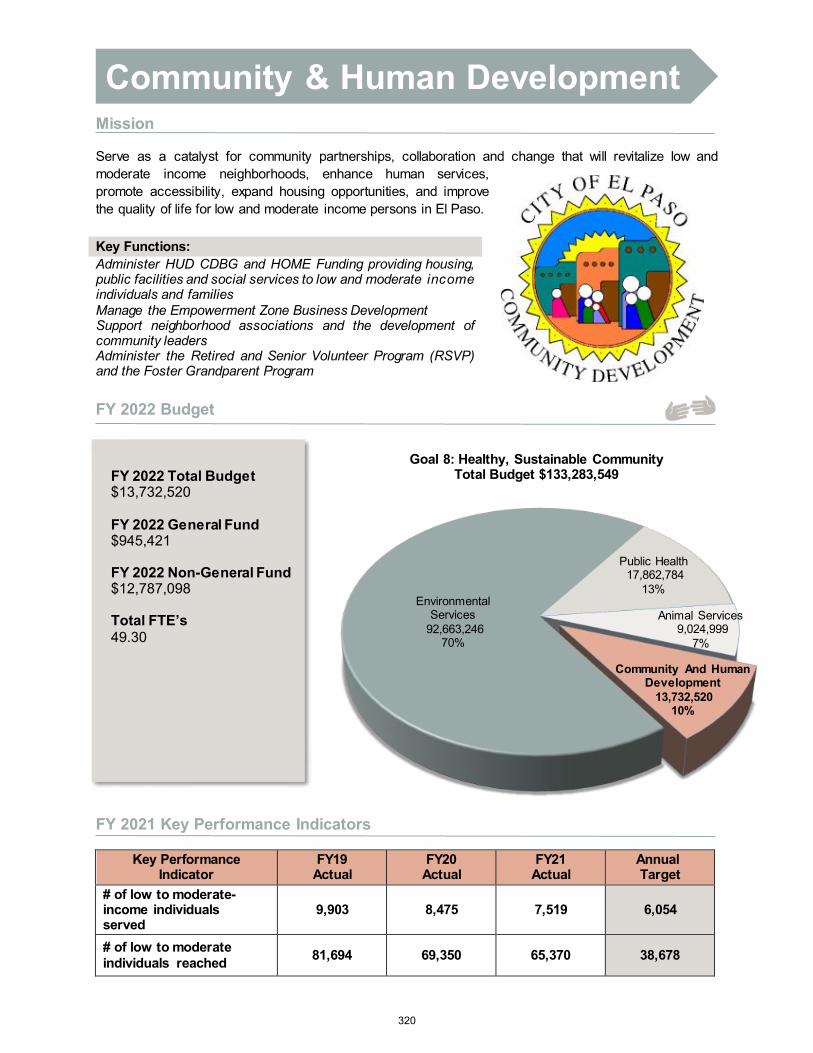
Animal Services9,024,999
7%
Community And Human Development
13,732,520 10%
Environmental Services
92,663,246 70%
Public Health17,862,784
13%
Goal 8: Healthy, Sustainable Community Total Budget $133,283,549
Mission
Serve as a catalyst for community partnerships, collaboration and change that will revitalize low and moderate income neighborhoods, enhance human services, promote accessibility, expand housing opportunities, and improve the quality of life for low and moderate income persons in El Paso.
FY 2022 Budget
FY 2021 Key Performance Indicators
Key Performance Indicator
FY19 Actual
FY20 Actual
FY21 Actual
Annual Target
# of low to moderate-income individuals served
9,903 8,475 7,519 6,054
# of low to moderate individuals reached 81,694 69,350 65,370 38,678
Key Functions: Administer HUD CDBG and HOME Funding providing housing, public facilities and social services to low and moderate income individuals and families Manage the Empowerment Zone Business Development Support neighborhood associations and the development of community leaders Administer the Retired and Senior Volunteer Program (RSVP) and the Foster Grandparent Program
FY 2022 Total Budget $13,732,520
FY 2022 General Fund $945,421
FY 2022 Non-General Fund $12,787,098
Total FTE’s 49.30
Community & Human Development
320

FY 2018 FY 2019 FY 2020 FY 2021 FY 2022
ACTUAL ACTUAL ACTUAL ADOPTED ADOPTED AMOUNT PERCENT
Salaries and Wages (617,689) 1,487,686 1,544,253 1,597,930 1,604,648 6,718 0%Employee Benefits (222,589) 460,597 517,955 552,712 582,005 29,293 5%Contractual Services - - - - - - 0%Professional Services 32,796 20,427 2,487 1,500 1,500 - 0%Outside Contracts 905,827 261,321 1,930,312 323,272 18,800 (304,472) -94%Interfund Services 8,802 19,231 4,623 19,296 19,296 - 0%Operating Leases 16,321 7,822 3,554 83,150 80,050 (3,100) -4%Fuel and Lubricants - - 30 - - - 0%Materials and Supplies 35,254 50,210 17,428 24,297 20,627 (3,670) -15%Maintenance and Repairs - - - - - - 0%Minor Equipment and Furniture - 10,632 2,285 - - - 0%Communications - 214 5,021 2,800 2,800 - 0%Utilities - - - 3,000 2,000 (1,000) -33%Travel 34,093 31,620 37,948 46,962 11,500 (35,462) -76%Other Operating Expenditures 620,061 447,633 599,076 266,205 271,040 4,835 2%Community Service Projects 9,462,740 5,443,020 9,475,934 10,649,793 10,961,778 311,985 3%Interest Expense - - - - - - 0%Principal - - - - - - 0%Other Non-Operating Expenditures 45 (680) - - - - 0%Grant Match (2,861) (18,682) - 139,913 156,476 16,563 12%Operating Transfers Out 19,820 - - - - - 0%Capital Outlay 3,813,908 3,434,136 1,183,589 - - - 0%
Total Expenditures 14,106,530 11,655,188 15,324,496 13,710,830 13,732,520 21,689 0%
FY 2018 FY 2019 FY 2020 FY 2021 FY 2022
ACTUAL ACTUAL ACTUAL ADOPTED ADOPTED AMOUNT PERCENT
General Government 1,007,040 671,093 835,206 911,708 945,421 33,713 4%Community Development Block Grants 12,543,368 10,578,275 9,139,121 12,315,384 12,302,668 (12,716) 0%Debt Service - - - - - - 0%Capital Projects 100,321 4,045 148,211 - - - 0%Special Revenue 455,800 398,638 5,201,958 483,738 484,430 692 0%Fiduciary Funds - 3,136 - - - - 0%Enterprise - - - - - - 0%Internal Service - - - - - - 0%
Total Funds 14,106,530 11,655,188 15,324,496 13,710,830 13,732,520 21,689 0%
FY 2018 FY 2019 FY 2020 FY 2021 FY 2022
ADOPTED ADOPTED ADOPTED ADOPTED ADOPTED AMOUNT
General Fund 6.85 7.11 15.24 12.80 12.33 (0.47)Non-General Fund 35.45 37.19 30.06 31.50 36.97 5.47
Total Authorized 42.30 44.30 45.30 44.30 49.30 5.00
FY 2022 ADOPTED OVER/(UNDER) FY 2021 ADOPTED
Community and Human Development
Expenditures by Group
Source of Funds
Positions
FY 2022 ADOPTED OVER/(UNDER) FY 2021 ADOPTED
FY 2022 ADOPTED OVER/(UNDER) FY 2021 ADOPTED
321
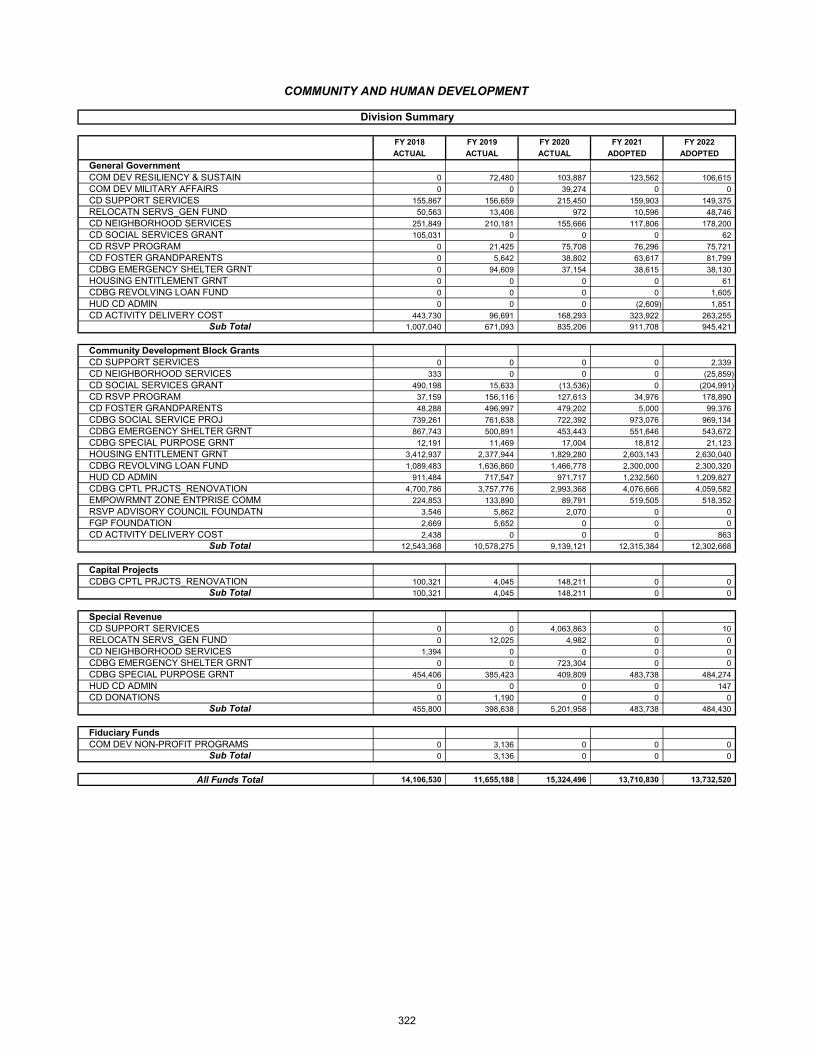
FY 2018 FY 2019 FY 2020 FY 2021 FY 2022
ACTUAL ACTUAL ACTUAL ADOPTED ADOPTED
General GovernmentCOM DEV RESILIENCY & SUSTAIN 0 72,480 103,887 123,562 106,615
COM DEV MILITARY AFFAIRS 0 0 39,274 0 0
CD SUPPORT SERVICES 155,867 156,659 215,450 159,903 149,375
RELOCATN SERVS_GEN FUND 50,563 13,406 972 10,596 48,746
CD NEIGHBORHOOD SERVICES 251,849 210,181 155,666 117,806 178,200
CD SOCIAL SERVICES GRANT 105,031 0 0 0 62
CD RSVP PROGRAM 0 21,425 75,708 76,296 75,721
CD FOSTER GRANDPARENTS 0 5,642 38,802 63,617 81,799
CDBG EMERGENCY SHELTER GRNT 0 94,609 37,154 38,615 38,130
HOUSING ENTITLEMENT GRNT 0 0 0 0 61
CDBG REVOLVING LOAN FUND 0 0 0 0 1,605
HUD CD ADMIN 0 0 0 (2,609) 1,851
CD ACTIVITY DELIVERY COST 443,730 96,691 168,293 323,922 263,255
Sub Total 1,007,040 671,093 835,206 911,708 945,421
Community Development Block GrantsCD SUPPORT SERVICES 0 0 0 0 2,339
CD NEIGHBORHOOD SERVICES 333 0 0 0 (25,859)
CD SOCIAL SERVICES GRANT 490,198 15,633 (13,536) 0 (204,991)
CD RSVP PROGRAM 37,159 156,116 127,613 34,976 178,890
CD FOSTER GRANDPARENTS 48,288 496,997 479,202 5,000 99,376
CDBG SOCIAL SERVICE PROJ 739,261 761,638 722,392 973,076 969,134
CDBG EMERGENCY SHELTER GRNT 867,743 500,891 453,443 551,646 543,672
CDBG SPECIAL PURPOSE GRNT 12,191 11,469 17,004 18,812 21,123
HOUSING ENTITLEMENT GRNT 3,412,937 2,377,944 1,829,280 2,603,143 2,630,040
CDBG REVOLVING LOAN FUND 1,089,483 1,636,860 1,466,778 2,300,000 2,300,320
HUD CD ADMIN 911,484 717,547 971,717 1,232,560 1,209,827
CDBG CPTL PRJCTS_RENOVATION 4,700,786 3,757,776 2,993,368 4,076,666 4,059,582
EMPOWRMNT ZONE ENTPRISE COMM 224,853 133,890 89,791 519,505 518,352
RSVP ADVISORY COUNCIL FOUNDATN 3,546 5,862 2,070 0 0
FGP FOUNDATION 2,669 5,652 0 0 0
CD ACTIVITY DELIVERY COST 2,438 0 0 0 863
Sub Total 12,543,368 10,578,275 9,139,121 12,315,384 12,302,668
Capital ProjectsCDBG CPTL PRJCTS_RENOVATION 100,321 4,045 148,211 0 0
Sub Total 100,321 4,045 148,211 0 0
Special RevenueCD SUPPORT SERVICES 0 0 4,063,863 0 10
RELOCATN SERVS_GEN FUND 0 12,025 4,982 0 0
CD NEIGHBORHOOD SERVICES 1,394 0 0 0 0
CDBG EMERGENCY SHELTER GRNT 0 0 723,304 0 0
CDBG SPECIAL PURPOSE GRNT 454,406 385,423 409,809 483,738 484,274
HUD CD ADMIN 0 0 0 0 147
CD DONATIONS 0 1,190 0 0 0
Sub Total 455,800 398,638 5,201,958 483,738 484,430
Fiduciary FundsCOM DEV NON-PROFIT PROGRAMS 0 3,136 0 0 0
Sub Total 0 3,136 0 0 0
All Funds Total 14,106,530 11,655,188 15,324,496 13,710,830 13,732,520
Division Summary
COMMUNITY AND HUMAN DEVELOPMENT
322
Strategic Actions
Goal 8: Nurture and Promote a Healthy, Sustainable Community
Strategy 8.2 Stabilize neighborhoods through community, housing and ADA improvements Action 8.2.2 Improve living conditions for low and moderate income persons residing in the
City of El Paso Action 8.2.3 Develop programs to address the physical well-being of neighborhoods Action 8.2.4 Increase ADA compliance and accessibility considerations throughout the
community
FY 2021 Key Results • Deployed 96 service contracts to assist in the Community Response and Recovery totaling $30
million• Completed and opened the Center for Civic Empowerment• Initiated the City’s first program specifically aimed at assisting homeless veterans• Awarded RSCP AmeriCorps three year grant
FY 2022 Key Deliverables
• Launch programming at the Center for Civic Empowerment including the newly developed CivicsSeries
• Deploy funding for support services as the community continues recovering from the COVID-19crisis
• Restructure volunteer opportunities for El Paso seniors following impact of COVID-19• Deploy short-term actions identified in the recently completed Food Security Plan focused on
strengthening basic access and expanding healthy food options for El Pasoans
COVID-19 Response & Recovery
• Provided COVID related assistance + shelter for the most vulnerable El Pasoans• Restructure volunteer opportunities for El Paso seniors following impact of COVID-19• Create and deploy Food Security Plan focused on strengthening basic access and expanding
healthy food options for all El Pasoans• Create and deploy Homeless Transition Plan following impact of COVID-19• Create and Implement COVID-19 Community Response + Recovery Plan
323
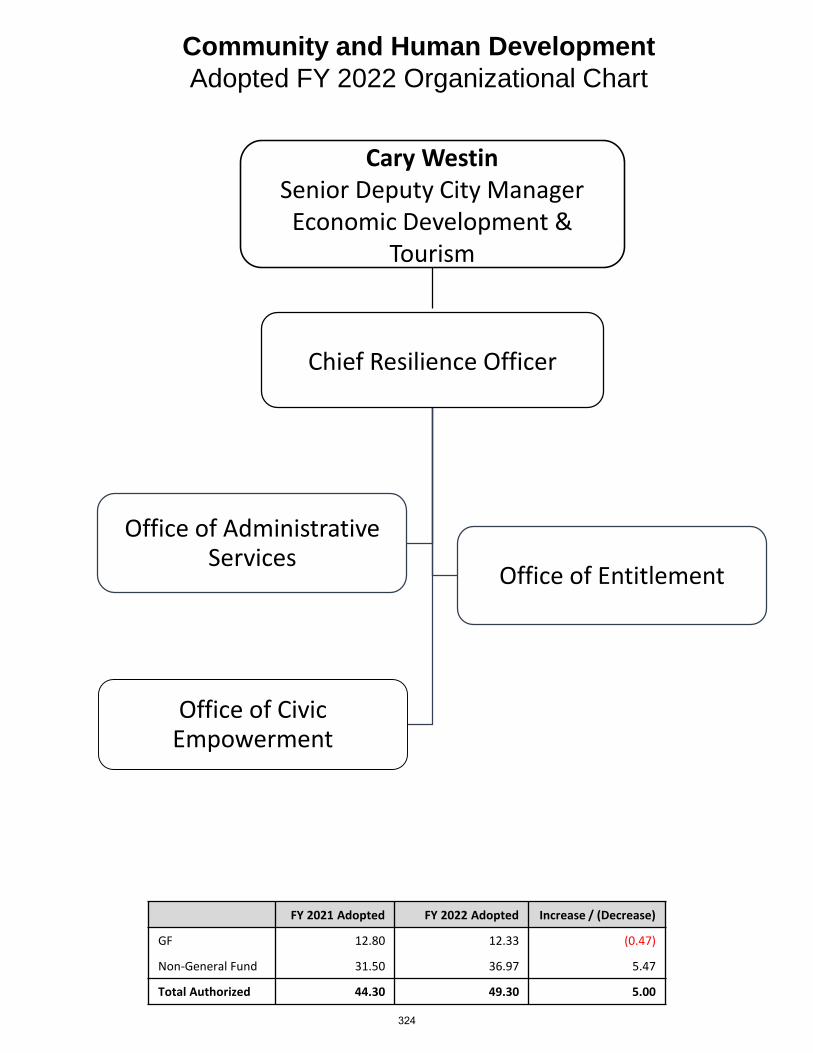
Community and Human DevelopmentAdopted FY 2022 Organizational Chart
Chief Resilience Officer
Office of Administrative Services
Office of Entitlement
Office of Civic Empowerment
Cary WestinSenior Deputy City Manager Economic Development &
Tourism
FY 2021 Adopted FY 2022 Adopted Increase / (Decrease)
GF 12.80 12.33 (0.47)
Non-General Fund 31.50 36.97 5.47
Total Authorized 44.30 49.30 5.00
324
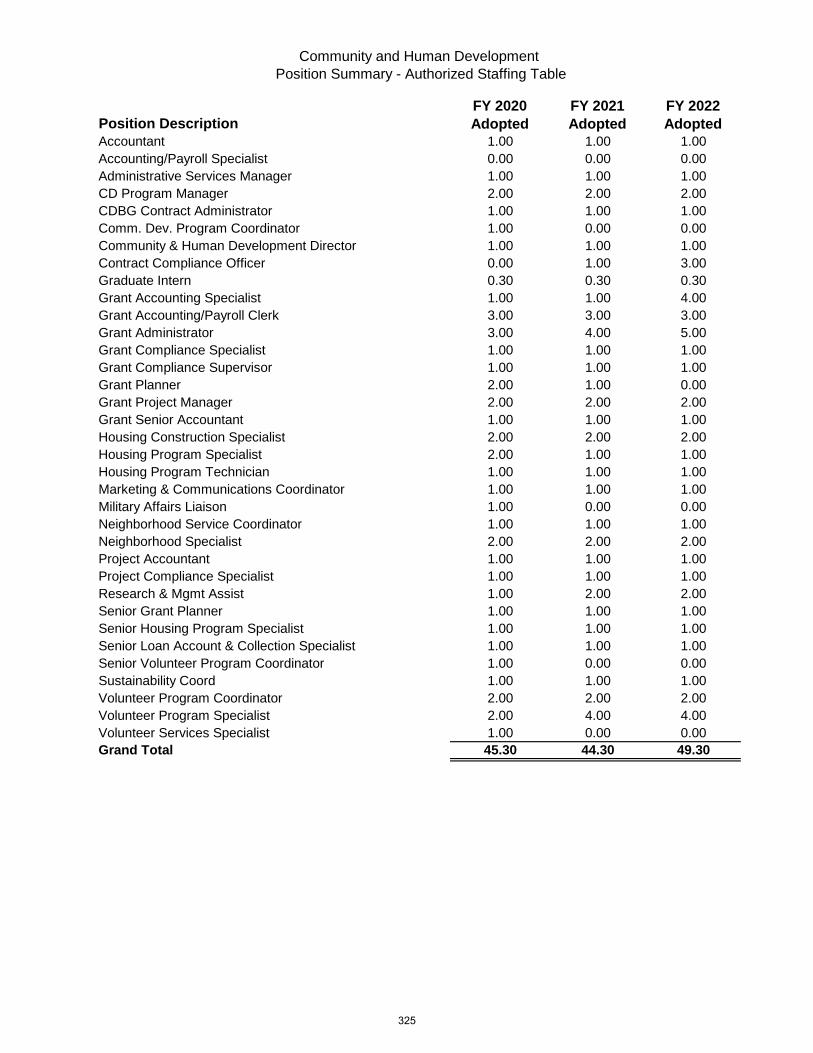
Community and Human Development
Position Summary - Authorized Staffing Table
Position DescriptionFY 2020 Adopted
FY 2021 Adopted
FY 2022 Adopted
Accountant 1.00 1.00 1.00
Accounting/Payroll Specialist 0.00 0.00 0.00
Administrative Services Manager 1.00 1.00 1.00
CD Program Manager 2.00 2.00 2.00
CDBG Contract Administrator 1.00 1.00 1.00
Comm. Dev. Program Coordinator 1.00 0.00 0.00
Community & Human Development Director 1.00 1.00 1.00
Contract Compliance Officer 0.00 1.00 3.00
Graduate Intern 0.30 0.30 0.30
Grant Accounting Specialist 1.00 1.00 4.00
Grant Accounting/Payroll Clerk 3.00 3.00 3.00
Grant Administrator 3.00 4.00 5.00
Grant Compliance Specialist 1.00 1.00 1.00
Grant Compliance Supervisor 1.00 1.00 1.00
Grant Planner 2.00 1.00 0.00
Grant Project Manager 2.00 2.00 2.00
Grant Senior Accountant 1.00 1.00 1.00
Housing Construction Specialist 2.00 2.00 2.00
Housing Program Specialist 2.00 1.00 1.00
Housing Program Technician 1.00 1.00 1.00
Marketing & Communications Coordinator 1.00 1.00 1.00
Military Affairs Liaison 1.00 0.00 0.00
Neighborhood Service Coordinator 1.00 1.00 1.00
Neighborhood Specialist 2.00 2.00 2.00
Project Accountant 1.00 1.00 1.00
Project Compliance Specialist 1.00 1.00 1.00
Research & Mgmt Assist 1.00 2.00 2.00
Senior Grant Planner 1.00 1.00 1.00
Senior Housing Program Specialist 1.00 1.00 1.00
Senior Loan Account & Collection Specialist 1.00 1.00 1.00
Senior Volunteer Program Coordinator 1.00 0.00 0.00
Sustainability Coord 1.00 1.00 1.00
Volunteer Program Coordinator 2.00 2.00 2.00
Volunteer Program Specialist 2.00 4.00 4.00
Volunteer Services Specialist 1.00 0.00 0.00
Grand Total 45.30 44.30 49.30
325

Animal Services9,024,999
7%
Community And Human Development
13,732,520 10%
Environmental Services92,663,246
70%
Public Health17,862,784
13%
Goal 8: Healthy, Sustainable Community Total Budget $133,283,549
Mission
To provide waste management and environmental protection for a better quality of life in El Paso.
Key Functions: Collect and dispose/reuse of residential solid waste and recycle material Provide Environmental Engineering and compliance assistance to all City facilities
FY 2022 Budget
FY 2021 Key Performance Indicators
Key Performance Indicator
FY19 Actual
FY20 Actual
FY21 Actual
Annual Target
% recycling diversion rate 13.61% 11.50% 12.05 20%
# of ozone days exceeding standards 0 0 0 0
FY 2022 Total Budget $92,663,246
FY 2022 General Fund $0
FY 2022 Non-General Fund $92,663,246
Total FTE’s 395.15
Environmental Services
326

FY 2018 FY 2019 FY 2020 FY 2021 FY 2022
ACTUAL ACTUAL ACTUAL ADOPTED ADOPTED AMOUNT PERCENT
Salaries and Wages 15,347,170 15,851,603 17,899,087 12,375,925 14,129,635 1,753,710 14%Employee Benefits 3,717,176 3,669,562 3,765,255 5,402,837 5,437,527 34,690 1%Contractual Services 3,970 5,042 - - - - 0%Professional Services 95,531 127,213 49,149 275,725 280,725 5,000 2%Outside Contracts 2,815,930 2,726,320 2,592,119 3,321,651 3,206,389 (115,262) -3%Interfund Services 6,380,836 5,564,880 5,656,643 5,535,113 5,558,053 22,940 0%Operating Leases 31,589 38,444 28,071 35,000 35,000 - 0%Fuel and Lubricants 2,685,272 2,842,972 2,899,825 3,040,413 3,177,250 136,837 5%Materials and Supplies 894,500 1,092,826 929,153 1,468,337 1,304,262 (164,075) -11%Maintenance and Repairs 161,128 231,423 202,159 232,225 215,725 (16,500) -7%Minor Equipment and Furniture 184,567 291,158 94,916 120,550 219,325 98,775 82%Communications 150,659 215,754 275,657 312,419 395,045 82,626 26%Utilities 133,386 88,539 73,795 104,500 109,742 5,242 5%Travel 70,509 78,170 26,079 112,250 98,274 (13,976) -12%Other Operating Expenditures 14,416,567 12,657,321 10,830,696 4,649,834 4,563,882 (85,952) -2%Community Service Projects 12,668 15,940 4,296 14,000 - (14,000) -100%Interest Expense 665,954 619,634 568,434 657,860 412,114 (245,746) -37%Principal - - - 1,505,799 1,569,664 63,865 4%Other Non-Operating Expenditures 2,186,871 1,027,150 1,252,040 1,273,100 1,345,100 72,000 6%Grant Match (0) - - - - - 0%Operating Transfers Out 12,571,344 26,121,695 36,150,800 32,813,793 35,842,084 3,028,291 9%Capital Outlay 6,886,037 9,187,670 12,039,344 12,940,750 14,763,450 1,822,700 14%
Total Expenditures 69,411,664 82,453,316 95,337,518 86,192,081 92,663,246 6,471,165 8%
FY 2018 FY 2019 FY 2020 FY 2021 FY 2022
ACTUAL ACTUAL ACTUAL ADOPTED ADOPTED AMOUNT PERCENT
General Government - - - - - - 0%Community Development Block Grants - - - - - - 0%Debt Service - - - - - - 0%Capital Projects - - - - - - 0%Special Revenue 5,930,485 6,330,654 7,288,993 4,735,933 3,808,911 (927,022) -20%Fiduciary Funds - - - - - - 0%Enterprise 63,481,179 76,122,662 88,048,525 81,456,148 88,854,335 7,398,187 9%Internal Service - - - - - - 0%
Total Funds 69,411,664 82,453,316 95,337,518 86,192,081 92,663,246 6,471,165 8%
FY 2018 FY 2019 FY 2020 FY 2021 FY 2022
ADOPTED ADOPTED ADOPTED ADOPTED ADOPTED AMOUNT
General Fund - - - - - - Non-General Fund 392.00 391.00 402.50 356.50 395.15 38.65
Total Authorized 392.00 391.00 402.50 356.50 395.15 38.65
Source of FundsFY 2022 ADOPTED OVER/(UNDER)
FY 2021 ADOPTED
FY 2022 ADOPTED OVER/(UNDER) FY 2021 ADOPTEDPositions
Expenditures by GroupFY 2022 ADOPTED OVER/(UNDER)
FY 2021 ADOPTED
Environmental Services
327

FY 2018 FY 2019 FY 2020 FY 2021 FY 2022
ACTUAL ACTUAL ACTUAL ADOPTED ADOPTED
Special RevenueENVIRONMENTAL ENGINEERING 44,070 65,701 71,229 139,000 268,988
ENVIRO CODE COMPLIANCE 51,643 45,410 41,407 61,950 39,462
ENVIRONMENTAL FEE 5,834,772 6,219,543 7,176,357 4,534,983 3,500,461
Sub Total 5,930,485 6,330,654 7,288,993 4,735,933 3,808,911
Enterprise FundsENVIRONMENTAL ENGINEERING 893,080 1,704,398 2,325,164 660,084 745,734
ENVIRO CODE COMPLIANCE 5,404,908 4,766,060 6,621,883 2,669,815 1,954,881
ENVIRONMENTAL SERVS ADMIN 17,631,261 27,488,682 36,579,503 38,749,870 44,704,227
COLLECTIONS 23,996,399 25,658,571 23,840,674 19,455,670 22,552,596
TRAINING & PUBLIC PROGRAMS 374,006 439,925 622,773 244,401 1,982
CLEAN EL PASO 6,176,791 7,658,667 8,559,663 9,367,613 10,828,648
ENV SVCS LANDFILL 9,004,734 8,406,359 9,498,866 10,308,694 8,066,266
Sub Total 63,481,179 76,122,662 88,048,525 81,456,148 88,854,335
All Funds Total 69,411,664 82,453,316 95,337,518 86,192,081 92,663,246
Division Summary
ENVIRONMENTAL SERVICES
328

Strategic Actions
Goal 8: Nurture and Promote a Healthy, Sustainable Community
Strategy 8.5 Improve air quality throughout El Paso Action 8.5.1 Reduce ozone-damaging emissions
Strategy 8.6 Provide long-term, cost effective, sustainable regional solid waste solutions Action 8.6.1 Expand Landfill use Action 8.6.2 Provide efficient solid waste collection services Action 8.6.3 Increase citywide waste diversion rate
Strategy 8.7 Ensure community compliance with environmental regulatory requirements Action 8.7.1 Ensure city compliance of federal and state environmental rules and regulations
Strategy 8.9 Enhance vector control and environmental education to provide a safe and healthy environment
Action 8.9.1 Treat all areas of confirmed mosquito infestation Action 8.9.2 Increase number of outreach events where environmental education is provided
to the community
FY 2021 Key Results
• 106 virtual presentations to the public• 5,847 participants in virtual classes• Launched Recycle Challenge Campaign
FY 2022 Key Deliverables
• Decrease blue bin contamination rate to 28%• Deliver bins to customers within seven business days• Increase the number of opt-in customers• Launch new Recycling campaign challenging the community to reduce contamination by 23% by
2023• Continue the 30+ year contractual partnership with Texas Commission on Environmental Quality
to provide air quality monitoring and enforcement in El Paso• Protect the community through ongoing inspection, trapping and surveillance of mosquito
breeding, and aggressive treatment for both larvae and adults on a regular schedule
COVID-19 Response & Recovery
• Plexi dividers for staff in high traffic areas and in trucks for work crews• Reassigning essential report to work staff to offices with underutilization• Call center staff in telework status since March 2020• PPE Purchasing and distribution• Temperature checking stations installed at MSC• Implemented safety and sanitation protocols to minimize exposure to essential staff• Allowing essential services such as garbage collection and landfill services to continue
329
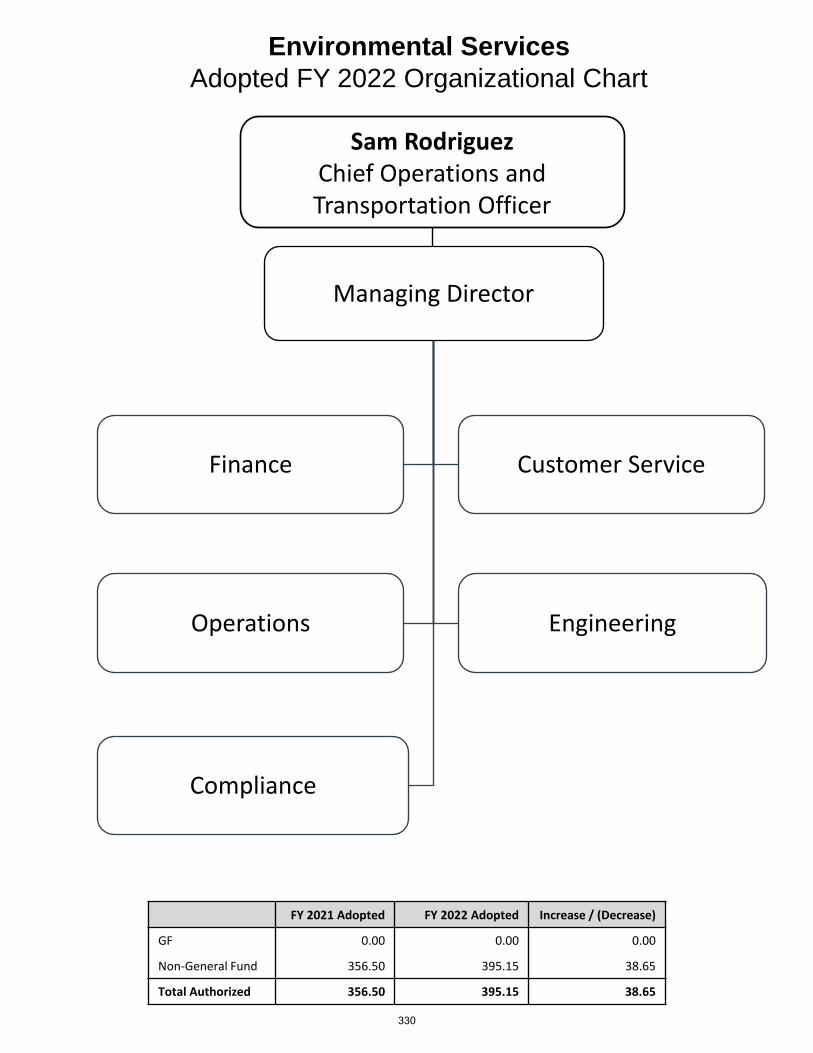
Environmental ServicesAdopted FY 2022 Organizational Chart
Managing Director
Finance Customer Service
Operations Engineering
Compliance
Sam RodriguezChief Operations and Transportation Officer
FY 2021 Adopted FY 2022 Adopted Increase / (Decrease)
GF 0.00 0.00 0.00
Non-General Fund 356.50 395.15 38.65
Total Authorized 356.50 395.15 38.65
330
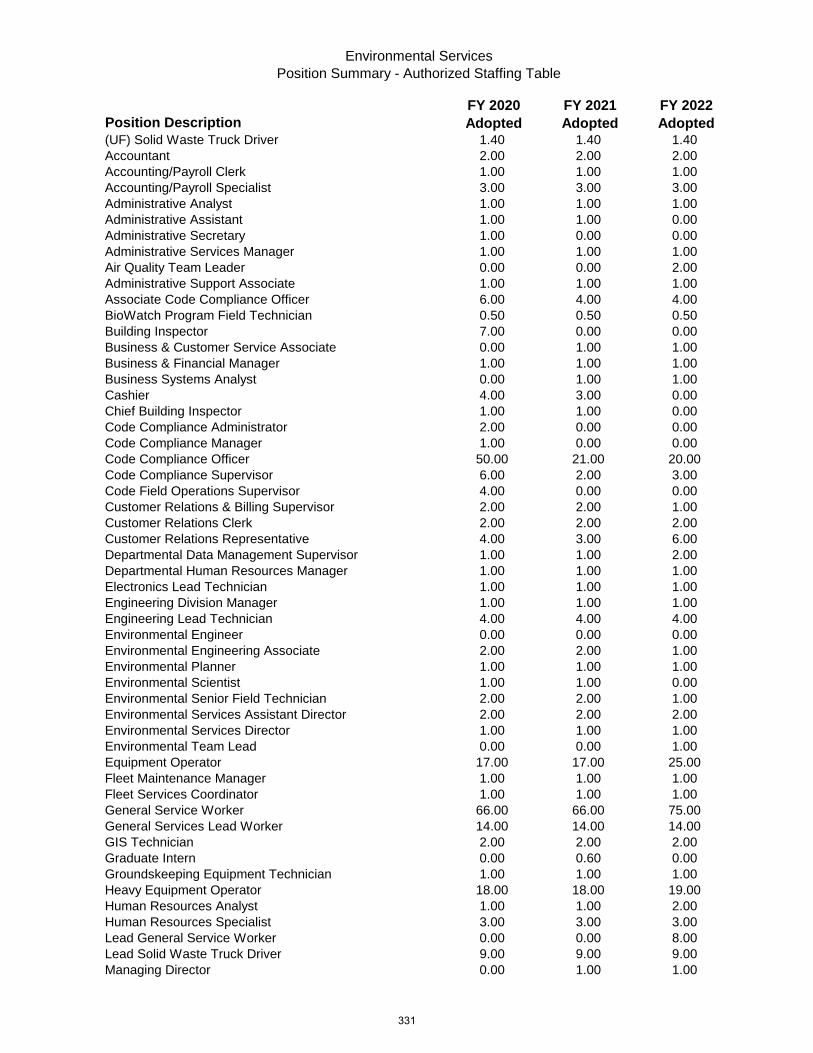
Environmental Services
Position Summary - Authorized Staffing Table
Position DescriptionFY 2020 Adopted
FY 2021 Adopted
FY 2022 Adopted
(UF) Solid Waste Truck Driver 1.40 1.40 1.40
Accountant 2.00 2.00 2.00
Accounting/Payroll Clerk 1.00 1.00 1.00
Accounting/Payroll Specialist 3.00 3.00 3.00
Administrative Analyst 1.00 1.00 1.00
Administrative Assistant 1.00 1.00 0.00
Administrative Secretary 1.00 0.00 0.00
Administrative Services Manager 1.00 1.00 1.00
Air Quality Team Leader 0.00 0.00 2.00
Administrative Support Associate 1.00 1.00 1.00
Associate Code Compliance Officer 6.00 4.00 4.00
BioWatch Program Field Technician 0.50 0.50 0.50
Building Inspector 7.00 0.00 0.00
Business & Customer Service Associate 0.00 1.00 1.00
Business & Financial Manager 1.00 1.00 1.00
Business Systems Analyst 0.00 1.00 1.00
Cashier 4.00 3.00 0.00
Chief Building Inspector 1.00 1.00 0.00
Code Compliance Administrator 2.00 0.00 0.00
Code Compliance Manager 1.00 0.00 0.00
Code Compliance Officer 50.00 21.00 20.00
Code Compliance Supervisor 6.00 2.00 3.00
Code Field Operations Supervisor 4.00 0.00 0.00
Customer Relations & Billing Supervisor 2.00 2.00 1.00
Customer Relations Clerk 2.00 2.00 2.00
Customer Relations Representative 4.00 3.00 6.00
Departmental Data Management Supervisor 1.00 1.00 2.00
Departmental Human Resources Manager 1.00 1.00 1.00
Electronics Lead Technician 1.00 1.00 1.00
Engineering Division Manager 1.00 1.00 1.00
Engineering Lead Technician 4.00 4.00 4.00
Environmental Engineer 0.00 0.00 0.00
Environmental Engineering Associate 2.00 2.00 1.00
Environmental Planner 1.00 1.00 1.00
Environmental Scientist 1.00 1.00 0.00
Environmental Senior Field Technician 2.00 2.00 1.00
Environmental Services Assistant Director 2.00 2.00 2.00
Environmental Services Director 1.00 1.00 1.00
Environmental Team Lead 0.00 0.00 1.00
Equipment Operator 17.00 17.00 25.00
Fleet Maintenance Manager 1.00 1.00 1.00
Fleet Services Coordinator 1.00 1.00 1.00
General Service Worker 66.00 66.00 75.00
General Services Lead Worker 14.00 14.00 14.00
GIS Technician 2.00 2.00 2.00
Graduate Intern 0.00 0.60 0.00
Groundskeeping Equipment Technician 1.00 1.00 1.00
Heavy Equipment Operator 18.00 18.00 19.00
Human Resources Analyst 1.00 1.00 2.00
Human Resources Specialist 3.00 3.00 3.00
Lead General Service Worker 0.00 0.00 8.00
Lead Solid Waste Truck Driver 9.00 9.00 9.00
Managing Director 0.00 1.00 1.00
331

Environmental Services
Position Summary - Authorized Staffing Table
Position DescriptionFY 2020 Adopted
FY 2021 Adopted
FY 2022 Adopted
Marketing and Public Relations Assistant 1.00 1.00 1.00
Media Specialist 1.00 1.00 1.00
Office Assistant 1.00 1.00 8.25
Office Manager 0.00 1.00 2.00
Operations Assistant 2.00 4.00 10.00
Outreach Specialist 2.00 2.00 3.00
Partnership Program Coordinator 1.00 1.00 1.00
Project Manager 1.00 1.00 1.00
Property Maintenance & Housing Inspector 0.00 12.00 0.00
Property Maintenance & Housing Inspector Supervisor 0.00 1.00 0.00
Public Affairs Specialist 0.00 1.00 1.00
Recycling Operations Manager 1.00 0.00 0.00
Research Assistant 1.00 0.00 0.00
Safety Specialist 0.00 0.00 0.00
Secretary 1.00 1.00 1.00
Senior Accountant 2.00 2.00 2.00
Senior Code Compliance Officer 13.00 3.00 3.00
Senior Office Assistant 7.00 6.00 6.00
Senior Secretary 0.00 0.00 0.00
Solid Waste Division Supervisor 11.00 11.00 11.00
Solid Waste Landfill Supervisor 3.00 3.00 3.00
Solid Waste Operations Admin 0.00 0.00 1.00
Solid Waste Operations Coordinator 2.00 3.00 3.00
Solid Waste Operations Manager 4.00 5.00 5.00
Solid Waste Truck Driver 90.00 86.00 96.00
Sr. Cashier 0.00 1.00 4.00
Stores Clerk 0.00 0.00 0.00
Training & Public Programs Manager 0.00 0.00 0.00
Training Specialist 0.00 0.00 0.00
Truck Driver 3.00 3.00 1.00
V.O.E. Clerk 0.60 0.00 0.00
Volunteer Program Coordinator 0.00 0.00 0.00
Welder 2.00 2.00 2.00
Grand Total 402.50 356.50 395.15
332

Animal Services9,024,999
7%
Community And Human Development
13,732,520 10%
Environmental Services
92,663,246 70%
Public Health17,862,784
13%
Goal 8: Healthy, Sustainable Community Total Budget $133,283,549
Mission
Provide Public Health related research, evaluation, education, prevention, intervention, and preparedness services.
Key Functions: Educate and empower people about Health issues Prevent epidemics and spread of disease Promote and encourage healthy behaviors
FY 2022 Budget
FY 2021 Key Performance Indicators
Key Performance Indicator FY19 Actual
FY20 Actual
FY21 Actual
Annual Target
Medicaid Waiver program participants (teen health – HPV, STD, cancer screenings, flu and pneumonia shots for uninsured seniors, etc.)
2,621 2,143 3,066 5,500
FY 2022 Total Budget $ 17,862,784
FY 2022 General Fund $6,809,247
FY 2022 Non-General Fund $11,053,537
Total FTE’s 353.85
Public Health
333
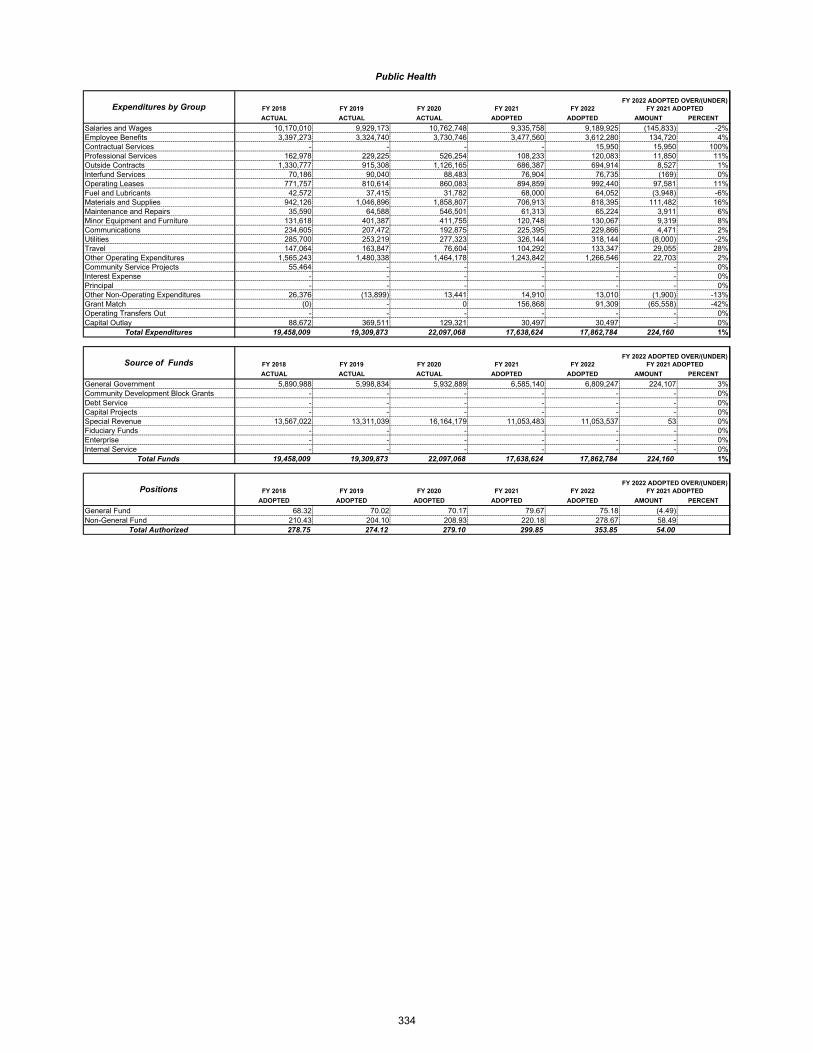
FY 2018 FY 2019 FY 2020 FY 2021 FY 2022
ACTUAL ACTUAL ACTUAL ADOPTED ADOPTED AMOUNT PERCENT
Salaries and Wages 10,170,010 9,929,173 10,762,748 9,335,758 9,189,925 (145,833) -2%Employee Benefits 3,397,273 3,324,740 3,730,746 3,477,560 3,612,280 134,720 4%Contractual Services - - - - 15,950 15,950 100%Professional Services 162,978 229,225 526,254 108,233 120,083 11,850 11%Outside Contracts 1,330,777 915,308 1,126,165 686,387 694,914 8,527 1%Interfund Services 70,186 90,040 88,483 76,904 76,735 (169) 0%Operating Leases 771,757 810,614 860,083 894,859 992,440 97,581 11%Fuel and Lubricants 42,572 37,415 31,782 68,000 64,052 (3,948) -6%Materials and Supplies 942,126 1,046,896 1,858,807 706,913 818,395 111,482 16%Maintenance and Repairs 35,590 64,588 546,501 61,313 65,224 3,911 6%Minor Equipment and Furniture 131,618 401,387 411,755 120,748 130,067 9,319 8%Communications 234,605 207,472 192,875 225,395 229,866 4,471 2%Utilities 285,700 253,219 277,323 326,144 318,144 (8,000) -2%Travel 147,064 163,847 76,604 104,292 133,347 29,055 28%Other Operating Expenditures 1,565,243 1,480,338 1,464,178 1,243,842 1,266,546 22,703 2%Community Service Projects 55,464 - - - - - 0%Interest Expense - - - - - - 0%Principal - - - - - - 0%Other Non-Operating Expenditures 26,376 (13,899) 13,441 14,910 13,010 (1,900) -13%Grant Match (0) - 0 156,868 91,309 (65,558) -42%Operating Transfers Out - - - - - - 0%Capital Outlay 88,672 369,511 129,321 30,497 30,497 - 0%
Total Expenditures 19,458,009 19,309,873 22,097,068 17,638,624 17,862,784 224,160 1%
FY 2018 FY 2019 FY 2020 FY 2021 FY 2022
ACTUAL ACTUAL ACTUAL ADOPTED ADOPTED AMOUNT PERCENT
General Government 5,890,988 5,998,834 5,932,889 6,585,140 6,809,247 224,107 3%Community Development Block Grants - - - - - - 0%Debt Service - - - - - - 0%Capital Projects - - - - - - 0%Special Revenue 13,567,022 13,311,039 16,164,179 11,053,483 11,053,537 53 0%Fiduciary Funds - - - - - - 0%Enterprise - - - - - - 0%Internal Service - - - - - - 0%
Total Funds 19,458,009 19,309,873 22,097,068 17,638,624 17,862,784 224,160 1%
FY 2018 FY 2019 FY 2020 FY 2021 FY 2022
ADOPTED ADOPTED ADOPTED ADOPTED ADOPTED AMOUNT PERCENT
General Fund 68.32 70.02 70.17 79.67 75.18 (4.49)Non-General Fund 210.43 204.10 208.93 220.18 278.67 58.49
Total Authorized 278.75 274.12 279.10 299.85 353.85 54.00
Public Health
Expenditures by Group
Source of Funds
Positions
FY 2022 ADOPTED OVER/(UNDER) FY 2021 ADOPTED
FY 2022 ADOPTED OVER/(UNDER) FY 2021 ADOPTED
FY 2022 ADOPTED OVER/(UNDER) FY 2021 ADOPTED
334
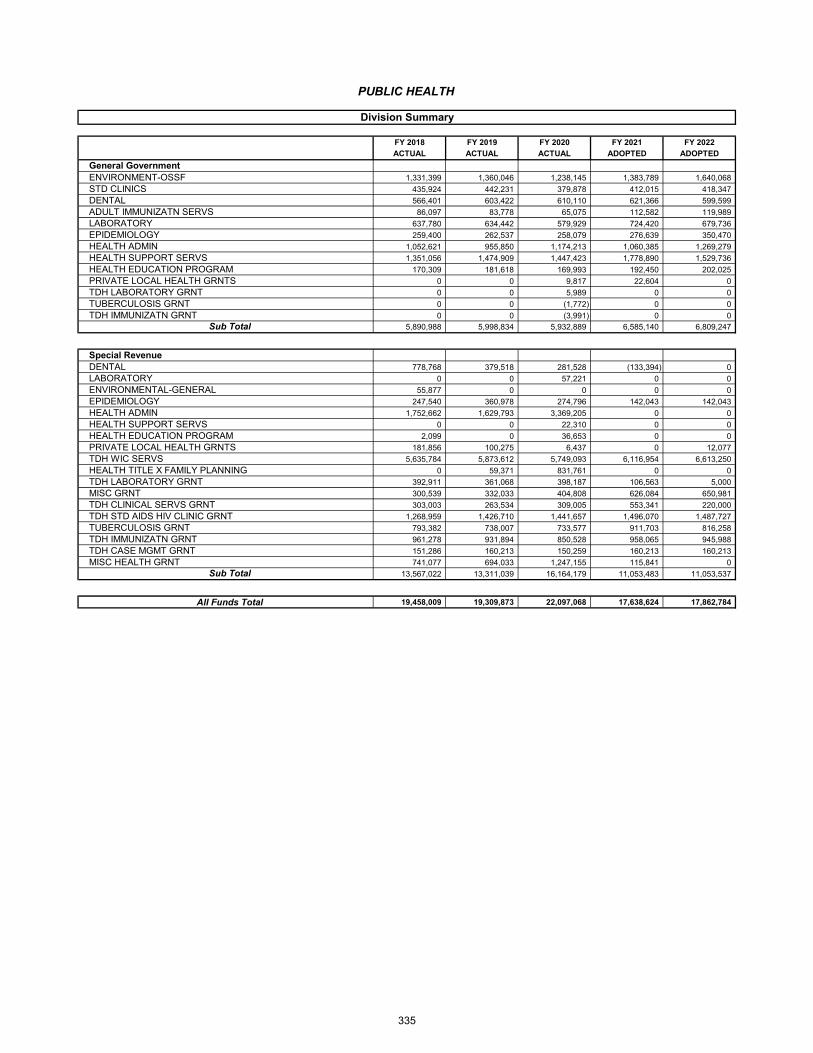
FY 2018 FY 2019 FY 2020 FY 2021 FY 2022
ACTUAL ACTUAL ACTUAL ADOPTED ADOPTED
General GovernmentENVIRONMENT-OSSF 1,331,399 1,360,046 1,238,145 1,383,789 1,640,068
STD CLINICS 435,924 442,231 379,878 412,015 418,347
DENTAL 566,401 603,422 610,110 621,366 599,599
ADULT IMMUNIZATN SERVS 86,097 83,778 65,075 112,582 119,989
LABORATORY 637,780 634,442 579,929 724,420 679,736
EPIDEMIOLOGY 259,400 262,537 258,079 276,639 350,470
HEALTH ADMIN 1,052,621 955,850 1,174,213 1,060,385 1,269,279
HEALTH SUPPORT SERVS 1,351,056 1,474,909 1,447,423 1,778,890 1,529,736
HEALTH EDUCATION PROGRAM 170,309 181,618 169,993 192,450 202,025
PRIVATE LOCAL HEALTH GRNTS 0 0 9,817 22,604 0
TDH LABORATORY GRNT 0 0 5,989 0 0
TUBERCULOSIS GRNT 0 0 (1,772) 0 0
TDH IMMUNIZATN GRNT 0 0 (3,991) 0 0
Sub Total 5,890,988 5,998,834 5,932,889 6,585,140 6,809,247
Special RevenueDENTAL 778,768 379,518 281,528 (133,394) 0
LABORATORY 0 0 57,221 0 0
ENVIRONMENTAL-GENERAL 55,877 0 0 0 0
EPIDEMIOLOGY 247,540 360,978 274,796 142,043 142,043
HEALTH ADMIN 1,752,662 1,629,793 3,369,205 0 0
HEALTH SUPPORT SERVS 0 0 22,310 0 0
HEALTH EDUCATION PROGRAM 2,099 0 36,653 0 0
PRIVATE LOCAL HEALTH GRNTS 181,856 100,275 6,437 0 12,077
TDH WIC SERVS 5,635,784 5,873,612 5,749,093 6,116,954 6,613,250
HEALTH TITLE X FAMILY PLANNING 0 59,371 831,761 0 0
TDH LABORATORY GRNT 392,911 361,068 398,187 106,563 5,000
MISC GRNT 300,539 332,033 404,808 626,084 650,981
TDH CLINICAL SERVS GRNT 303,003 263,534 309,005 553,341 220,000
TDH STD AIDS HIV CLINIC GRNT 1,268,959 1,426,710 1,441,657 1,496,070 1,487,727
TUBERCULOSIS GRNT 793,382 738,007 733,577 911,703 816,258
TDH IMMUNIZATN GRNT 961,278 931,894 850,528 958,065 945,988
TDH CASE MGMT GRNT 151,286 160,213 150,259 160,213 160,213
MISC HEALTH GRNT 741,077 694,033 1,247,155 115,841 0
Sub Total 13,567,022 13,311,039 16,164,179 11,053,483 11,053,537
All Funds Total 19,458,009 19,309,873 22,097,068 17,638,624 17,862,784
Division Summary
PUBLIC HEALTH
335
Strategic Actions
Goal 8: Nurture and Promote a Healthy, Sustainable Community
Strategy 8.1 Deliver prevention, intervention and mobilization services to promote a healthy, productive and safe community
Action 8.1.1 Conduct a mass prophylaxis full-scale exercise to test current plan in preparation for a real event
Action 8.1.2 Reduce the incidence of transmittable diseases and environmental health risks Action 8.1.3 Promote health education and advocacy
FY 2021 Key Results
• Launched Flu prevention mass vaccination – Be PowerFlu Campaign• Visited and assessed 100% of licensed skilled facilities, nursing homes, foster and host homes
for infection control and COVID-19 prevention• Assisted 100% of County correctional facilities, homeless and other shelters for risk
management, infection control, COVID-19 testing and Flu vaccines
FY 2022 Key Deliverables
• Enhance public health epidemiology and surveillance emergency response capabilities by 125%• Increase binational/regional partnerships with three COBINA partnerships• Renew five service contracts for multi-agency coordinated presence with vulnerable populations
COVID-19 Response & Recovery
• Received ARPA funding for Public Health and Safety Response and Recovery Programs• Established self-reporting portal for COVID-19+ patients• Enhanced monitoring of Epidemiology e-fax and e-reporting• Transitioned to multi-user web-based HIPAA compliant database, REDcap, for infectious disease
reporting and surveys• Implement a Flu vaccination campaign• Implement a COVID-19 immunization campaign• Education taskforce door to door Community Outreach for vaccine registration• Routine testing of LTC staff and residents• Transportation to Vaccination Sites for elderly and physically disabled persons• Provide Epidemiology surveillance and investigations on COVID-19 cases reported through
hospitals, doctors offices, laboratories and State drive-thru testing sites• Develop and implement Health Authority Orders, including isolation and quarantine• Conduct community outreach an intervention through education, cluster management, infection
control and environmental assessment task forces• Conduct epidemiological and surveillance assessments• Coordinate testing for vulnerable populations• Conduct crisis communication to maintain public informed on status of the pandemic and other
important messages monitoring: 1. Compliance Task Force and Violation teams enforcesordinance requirements to be followed by residents and businesses; 2. Follow up on investigationcomplaints
336

Health Director
Disease Prevention and Control
Health Promotion
Clinical Services Emergency Preparedness
WIC
Public HealthAdopted FY 2022 Organizational Chart
Dionne MackDeputy City Manager of
Public Safety
FY 2021 Adopted FY 2022 Adopted Increase / (Decrease)
GF 79.67 75.18 (4.49)
Non‐General Fund 220.18 278.67 58.49
Total Authorized 299.85 353.85 54.00
Fire Chief / Managing Director
337

Public Health Position Summary - Authorized Staffing Table
Position DescriptionFY 2020 Adopted
FY 2021 Adopted
FY 2022 Adopted
(ACT) Admin Services Manager 0.00 1.00 0.00(ACT) Dep.Dir of Publi Health 0.00 1.00 0.00(ACT) Health Asst. Director 0.00 1.00 0.00211 Call Ctr & Resources Coord 1.00 1.00 1.00211 Info & Referral Specialist 5.50 5.50 4.00Accountant 4.00 4.00 1.00Accounting/Payroll Clerk 2.00 2.00 1.00Accounting/Payroll Specialist 2.00 2.00 2.00Administrative Assistant 1.00 1.00 0.00Administrative Services Manager 1.00 0.00 0.00Administrative Specialist 0.00 0.00 4.00Administrative Support Associate 1.00 1.00 1.00Assoc Epidemiologist (COVID) 0.00 0.00 3.00Breastfeeding Coordinator 1.00 1.00 1.00Breastfeeding Counselor 5.00 5.00 3.00Chief Dentist 1.00 1.00 1.00Clerical Assistant 4.00 4.00 12.00Clinical Assistant 27.00 22.00 19.00Clinical Service Manager 1.00 0.00 0.00Community Service Aide Breastf 3.00 3.00 3.00Compl & Quality Improv Assist 1.00 1.00 1.00Customer Relations Clerk 11.00 11.00 7.00Customer Services Clerk 1.00 1.00 7.00Dental Assist Clinic/Mobile Un 3.00 3.00 3.00Dental Assistant 2.00 2.00 2.00Dental Hygen Clinic/Mobile Un 1.00 1.00 1.00Dental Hygienist 2.00 2.00 2.00Dental Office Manager 1.00 1.00 1.00Deputy Director of Public Health 1.00 0.00 0.00Disease Intervention Spec 10.00 10.00 10.00Epidemiologist 2.00 2.00 2.00Field Epidemiologist 1.00 4.00 4.00Food Safety Inspector 5.00 5.00 4.00Food Safety Inspector Supervisor 2.00 2.00 1.00Foodborne Illness Epidem 1.00 1.00 1.00Graduate Intern 3.10 3.10 3.10Grant Accounting/Payroll Clerk 1.00 1.00 1.00Grant Project Manager 0.00 0.00 1.00Grants Writer 1.00 1.00 0.00Health Assistant Director 1.00 1.00 2.00Health Director 1.00 1.00 1.00Health Education & Prevention Specialist 5.00 10.00 8.00Health Prepare Education Specialist 1.00 1.00 12.00
338

Public Health Position Summary - Authorized Staffing Table
Position DescriptionFY 2020 Adopted
FY 2021 Adopted
FY 2022 Adopted
Health Preparedness Educator 1.00 1.00 5.00Health Program Manager 3.00 4.00 4.00Health Project Coordinator 2.00 4.00 5.00Health Research Assistant 1.00 1.00 1.00Health Senior Public Affairs Officer 1.00 1.00 0.00Health Training & Promotions M 1.00 1.00 1.00HIV Caseworker 1.50 2.00 2.00HIV Edu Prevention Specialist 3.00 3.00 2.00HIV Educ Outreach Specialist 1.00 1.00 0.00HIV/Disease Intervention Supervisor 2.00 2.00 1.00HIV/Disease Intrv Program Manager 1.00 1.00 1.00Human Resources Analyst 1.00 1.00 1.00Human Resources Manager 1.00 1.00 1.00Human Resources Specialist 1.00 1.00 2.00Info & Referral 211 Spec 1.00 1.00 1.00Lead Epidemiologist 1.00 2.00 2.00Lead Med Laboratory Scientist 1.00 3.00 3.00Licensed Vocational Nurse 0.00 0.00 8.00Materials Supervisor 1.00 1.00 1.00Med Laboratory Scientist 2.00 10.00 11.00Medical Assistant 6.00 5.00 5.00Medical Billing Clerk 1.00 1.00 2.00Medical Billing Supervisor 1.00 1.00 1.00Microbiologist 1.00 0.75 0.75Nurse Practitioner-Entry Level 0.00 0.00 2.00Nutrition Services Manager 1.00 1.00 1.00Nutritionist 9.00 4.00 4.00Office Supervisor 1.00 0.00 0.00Organizational Analyst 0.00 1.00 1.00Outreach Specialist 4.00 4.00 4.00Patient Care Tech 16.50 19.50 31.50Pharmacist 0.50 0.50 0.50PHEP Program Manager 1.00 0.00 0.00Physician 0.25 0.25 0.25PRN Registered Nurse 0.25 0.25 0.00Project Accountant 1.00 2.00 5.00Pub Health Prep Liaison 2.00 2.00 0.00Public Affairs Coordinator 0.00 0.00 2.00Public Health Aide 1.00 1.00 1.00Public Health Caseworker 1.00 0.50 0.00Public Health Community Aide 1.50 0.00 2.00Public Health Dentist 1.25 1.25 1.25Public Health Lab Manager 1.00 1.00 1.00
339
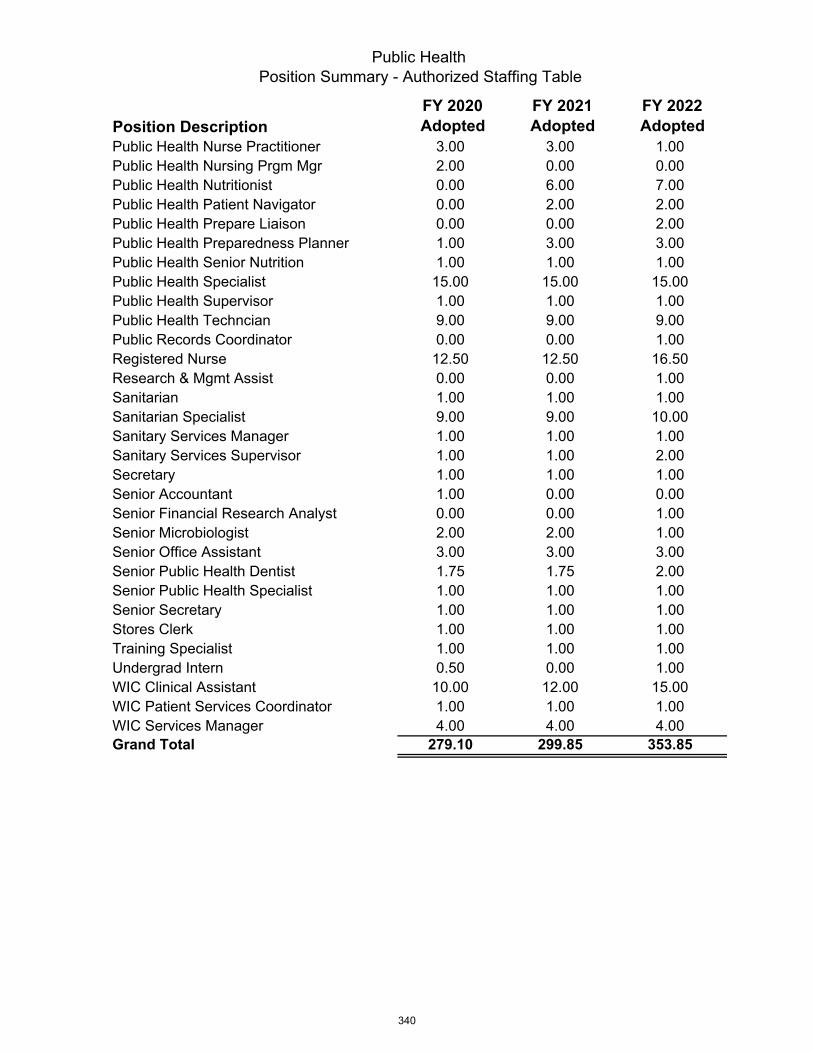
Public Health Position Summary - Authorized Staffing Table
Position DescriptionFY 2020 Adopted
FY 2021 Adopted
FY 2022 Adopted
Public Health Nurse Practitioner 3.00 3.00 1.00Public Health Nursing Prgm Mgr 2.00 0.00 0.00Public Health Nutritionist 0.00 6.00 7.00Public Health Patient Navigator 0.00 2.00 2.00Public Health Prepare Liaison 0.00 0.00 2.00Public Health Preparedness Planner 1.00 3.00 3.00Public Health Senior Nutrition 1.00 1.00 1.00Public Health Specialist 15.00 15.00 15.00Public Health Supervisor 1.00 1.00 1.00Public Health Techncian 9.00 9.00 9.00Public Records Coordinator 0.00 0.00 1.00Registered Nurse 12.50 12.50 16.50Research & Mgmt Assist 0.00 0.00 1.00Sanitarian 1.00 1.00 1.00Sanitarian Specialist 9.00 9.00 10.00Sanitary Services Manager 1.00 1.00 1.00Sanitary Services Supervisor 1.00 1.00 2.00Secretary 1.00 1.00 1.00Senior Accountant 1.00 0.00 0.00Senior Financial Research Analyst 0.00 0.00 1.00Senior Microbiologist 2.00 2.00 1.00Senior Office Assistant 3.00 3.00 3.00Senior Public Health Dentist 1.75 1.75 2.00Senior Public Health Specialist 1.00 1.00 1.00Senior Secretary 1.00 1.00 1.00Stores Clerk 1.00 1.00 1.00Training Specialist 1.00 1.00 1.00Undergrad Intern 0.50 0.00 1.00WIC Clinical Assistant 10.00 12.00 15.00WIC Patient Services Coordinator 1.00 1.00 1.00WIC Services Manager 4.00 4.00 4.00Grand Total 279.10 299.85 353.85
340
CITY OF EL PASO BUDGET BOOK 2022
GROWTH
LONG RANGE PLANNING
LONG RANGE
PLANNING

CITY OF EL PASO Long Range Planning
FY 2022 BUDGET
Long Range Planning Through the vision of the City Council and the hard work of residents and employees, El Paso is affirming and enhancing its position as one-half of the largest bi-national metroplex in the western hemisphere experiencing one of the most dynamic transformations in its history. The transformation can be seen and appreciated all around the city in various forms and includes transportation projects, new retail and entertainment options, downtown redevelopment and quality of life bond projects, all of which underscore our deliberate focus on attaining our strategic vision.
Our Mission, Vision, and Values serve as a heart and foundational structure of our Strategic Plan. The plan is comprised of four levels: goals, strategies, actions and tasks. To ensure focused action, the Strategic Plan links these four levels with measurable outcomes for their implementation. In addition, through cycles of reporting and public presentations, the City Council and staff take necessary steps to focus on accountability with progress made on key deliverables. The eight goals contain multiple strategies and key deliverables are delineated each fiscal year through the integrated budget process.
With the Mission, Vision and Values as its foundation, the Strategic Plan sets the tone and direction for current and future service delivery by aligning Strategic Goals and Objectives with evolving resident needs and requirements. Adopted in 2015 and rooted in ongoing customer engagement and facilitated through customer listening methods, the Strategic Planning Process is a five-step planning process conducted annually, involving key participants: Customers, Partners, Collaborators, Goal Teams, Senior Leaders, and City Council. The short-term planning horizon is the fiscal year and the longer-term planning horizon is five years. Annual action plans are aligned with the Strategic Plan and support agility.
Step 1: Input/Ideas. The Strategic Planning Process (SPP) begins with a series of strategy sessionsorganized by eight Goal Teams (GT) to gather quantitative and qualitative data to: 1) define current operating environment; 2) identify new or restate existing challenges and opportunities; and, 3) reaffirm the City’s Vision for the future, as well as its Mission, Values, and Goals. Data is provided through: 1) performance reports and projections on key organizational measures; 2) reviewing and reporting of short and longer-term financial measures; and, 3) customer feedback, provided through customer listening methods including, but not limited to the annual Chime In! Survey. As a cycle of learning and an identified need for a change, this process indicated the City had not been fully responsive to the youth of the community. As a result, the annual Youth Strategic Budget Advisory (in partnership with the City’s Independent School Districts) and annual follow-up focus group meetings were added to the process.
Step 2: Identify. Using the compiled data and reaffirmed Mission, Vision and Values and Goals, GoalTeams identify and develop Strategic Objectives (SO) to address Strategic Goals (SG) and strategic challenges and opportunities identified in Step One of the SPP. Based on the identified SOs, GTs develop key strategies, actions, tasks, performance measures and timeframes to achieve objectives.
342

CITY OF EL PASO Long Range Planning
FY 2022 BUDGET
Step 3: Integrated Budget Process (IBP). Through the IBP, resources are aligned to ensure key prioritiesand associated strategies, actions and tasks identified in Step Two of the SPP are fully funded.
Step 4: Implementation. Following resource alignment through the IBP, Step Four focuses onimplementation of the strategies, actions and tasks, identified in Step Two of the SPP. GTs are held accountable for progress toward SOs through performance measurement monitoring and semiannual GT Reports, to track and ensure organizational achievement.
Step 5: Integrate. Step Five focuses on integration of the Mission, Vision and Values, Strategic Goals andStrategic Objectives, and the development of action plans that are measurable throughout Departments and cross-functional teams.
Active resident participation in the Strategic Planning Process is critical to guarantee current and future customer expectations are identified and addressed. Recognizing its importance in 2017, summer of 2019, and fall of 2021, the Mayor and City Council gathered for strategic planning sessions to review accomplishments and progress made in the 2015 Strategic Plan. They reviewed and approved customer requirements/expectations set forth with our short term “20 in 2020” visionary incentives and our longer-term strategic objectives with our “25 by 2025” core competencies to ensure connected and continuous cycles of refinement through the SPP. Our City Manager Tommy Gonzalez and Senior Leaders continually work with staff on integrating the strategic plan into every department and sharing the plan with the community. The decisions made over the next four years will shape the future of our city for the next forty years. The Strategic Plan provides clear direction to staff of activities, initiatives, and results needed to accomplish the delivery of necessary services to the community for both the short and longer term planning horizons.
343

CITY OF EL PASO Long Range Planning
FY 2022 BUDGET
25 by 2025
344
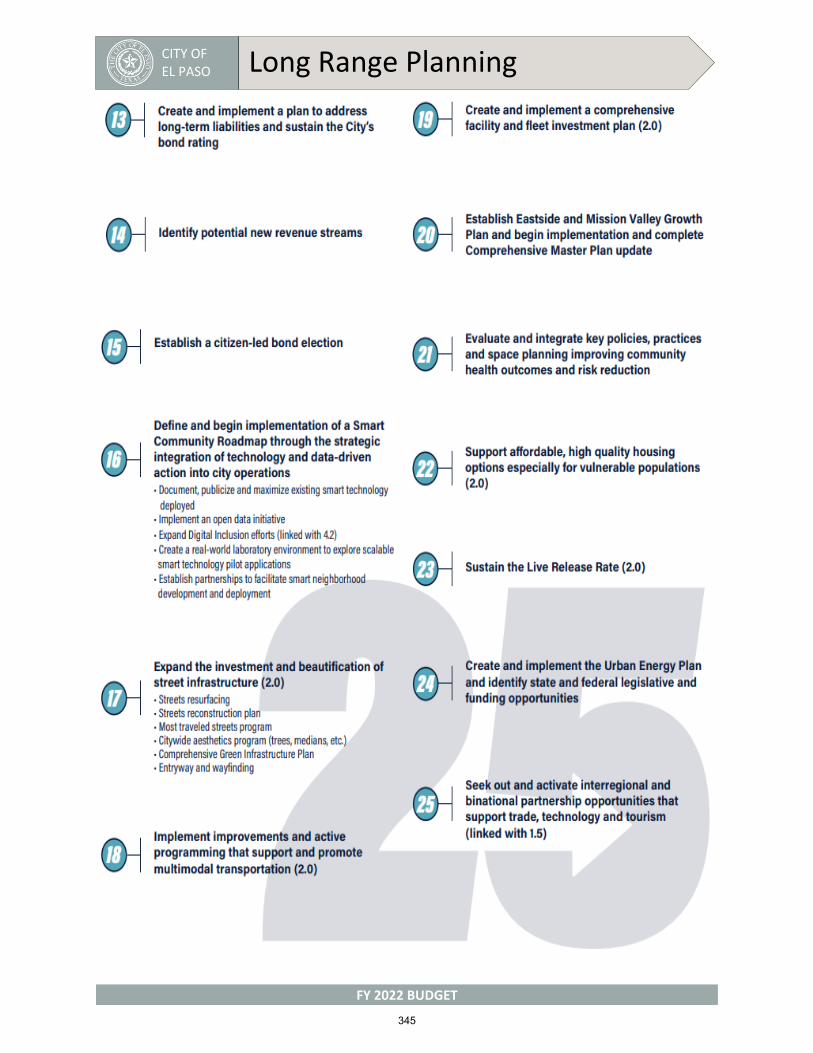
CITY OF EL PASO Long Range Planning
FY 2022 BUDGET
345
CITY OF EL PASO Long Range Planning
FY 2022 BUDGET
Multi – Year Financial Outlook GFOA states, “A government should have a financial planning process that assesses the long-term financial implications of current and proposed policies, programs, and assumptions.”
Financial forecasting is part of Step 1 (Analyze) of our Integrated Budget Process. It includes the annual refresh of the 5-year rolling financial forecast that is presented to the City Leadership and City Council before official Budget Development Process starts. The development of a financial forecast includes a revenue, expenditure, and tax rate analysis to evaluate economic conditions and potential impacts or environmental assessment going forward. Monthly financial reviews throughout the fiscal year at all levels in the organization create accountability for performance to budget and quickly identify areas requiring attention.
In line with GFOA requirements and with the Vision Block for High Performing Government, Strategic Goal 6 or “Set the Standard for Sound Governance and Fiscal Management” and Key Strategy 6.6. “Ensure continued financial stability and accountability through sound financial management, budgeting and reporting”, at the beginning of 2016 the Office of Management and Budget created an Excel based model called Multi-Year Financial Outlook (MYFO). Over 100 interrelated workbooks feed the interactive dashboard which at the same time serves as a scenario manager allowing for a real-time, dynamic modeling, and forecasting. OMB staff are able to adjust assumptions to see how adding additional Police Officers, changing the tax rate, or other factors would affect future years’ budgets. The data used in the model is extracted from the City’s HR and financial system, and as well as performance and trend information gathered from departments, utility companies, other governmental agencies, and other sources.
Since then, MYFO have grown to represent a culture that focuses on our way of thinking and understanding how our current decisions impact near and long-term future. However, we have to stress out that MYFO is intended to serve as a planning tool not a budget, and stimulate long-term and strategic thinking. It highlights strategic challenges of customer expectations with limited resources. This piece of the long-range forecast is incredibly valuable by illustrating current year decisions on future years’ budgets. We identify major budget challenges such as; limited revenue growth with competing priorities, low tax base, primarily residential and highly depended on property taxes which make up 45% of our budget, sales tax, franchise fees charged to utilities for right-of-way access, International Bridges impact by the peso and Mexico violence, and the impact of the House Bill/Senate Bill 2 on the property tax rate cap.
Developing a long-term forecast has it challenges; however developing a forecast during a global pandemic creates a higher level of uncertainty. We started with a $60 million estimated deficit due to the COVID-19 economic impacts on anticipated revenues. The expectations were that the economic impacts of COVID-19 will linger for few more years. The gap was closed by continuing to focus on the basics (police, fire, streets, and workforce), while we weather the storm. We utilized all tools and resources to balance the budget. Some of these adjustments included: scaled-down and phased-in opening of quality of life facilities, maintain a freeze on filling non-essential vacant positions, defer annual pay-go and debt issuance, utilize debt service savings and federal funding where possible, and use of remaining budget stabilization funds.
Developing FY 2022 brought different challenges while we continued to focus on managing the pandemic and increased our testing and vaccination efforts. FY 2022 was developed in light of continued effort for safe restoring of services and reopening of the City facilities. It also brought substantial influx of federal funds through CARES and ARPA acts. We developed a phased-in approach to safely restore our services, while at the same time we increased our vaccination rate to one of the highest in the country.
346

CITY OF EL PASO Long Range Planning
FY 2022 BUDGET
MYFO – Dashboard
1) Scenario Manager – Allows OMB staff to adjust assumptions as needed and see immediateimpact of potential decisions. Adjusting the property tax rate, adding additional police officers,and percentage rates for employee compensation increases are some of the options. Anotherpart of the model includes comprehensive list of assumptions that are used to plan all keyfinancial aspects of the City’s General Fund.
2) Tax Rate Distribution / Outlook – Homeowners pay a larger share of property tax thanbusinesses and the City has enacted policies to grow the business community so the burdenon homeowners decreases. This graph provides City Council the detail so they can see theimpact of their decisions over time.
3) Five Year Forecast – This section built based on the assumptions in the Scenario Managerand illustrates the impact decisions can have over multiple years.
4) Revenues, Expenses, & Tax Rate – Two axis graph showing historical trends and futureimpacts on the structural balance of the City’s budget
5) Reserves Requirement – As the size of the City’s budget grows, so does the size of thecash reserve the City is required to maintain
2) Tax RateOutlook
2) Tax RateDistribution
3) 5 YearForecast
1) ScenarioManager
5) ReservesRequirement
4) RevenuesExpenses
& Tax Rate
347

CITY OF EL PASO Long Range Planning
FY 2022 BUDGET
Five-Year Forecast
General Fund revenue estimates are based on historical data and known factors. Assumptions include no changes to current fee schedule, assumes flat utility (water, electric, and natural gas) rates, maintain our current service levels, property valuation growth, sales tax collection growth, and reflects revenue generated from Quality of Life bond projects. If Senior Leadership and elected officials do not make changes to trending revenues and expenditures, the five-year forecast indicates a potential revenue shortfall. In projecting the long-term financial plan, a number of assumptions are made that reflect the past and future financial environment and trends for the City.
General Fund expense assumptions include; key cost drivers such as public safety costs related to contractual obligations (collective bargaining), Police and Fire academies, growing the police force by 30 officers a year (as part of a ten-year plan), implementation of a civilian equity adjustments and 1.5% across the board compensation increases, includes issuing remaining voter approved debt, also assumes a 2.2% inflation factor in contracts, materials, and supplies, employee compensation increases, healthcare increases and increasing operating and maintenance costs related to Quality of Life Bond projects.
348

CITY OF EL PASO Long Range Planning
FY 2022 BUDGET
The main assumptions include the following:
• Property tax valuation projected increase is an average annual rate of 1.4% on non-reappraisal
years and 4.0% on reappraisal years; however, in FY 2023, 2.0% assumption was used due to a
robust residential housing market
• Sales tax revenue is expected to increase by 3.0% annually
• Total revenues are expected to increase by an average of 2.0% per year
• Salaries and wages for uniform and civilian personnel are expected to increase on average by 5.3%
FY 2023 – FY 2027 primarily due to collective bargaining for Police and Fire and equity increases
for Civilians
• Operating costs are forecasted to increase 9.3% in FY 2023, primarily driven by a recovery and
reopening plan from COVID-19 pandemic and average 4.6% growth in subsequent years of FY
2024 - FY 2027
349
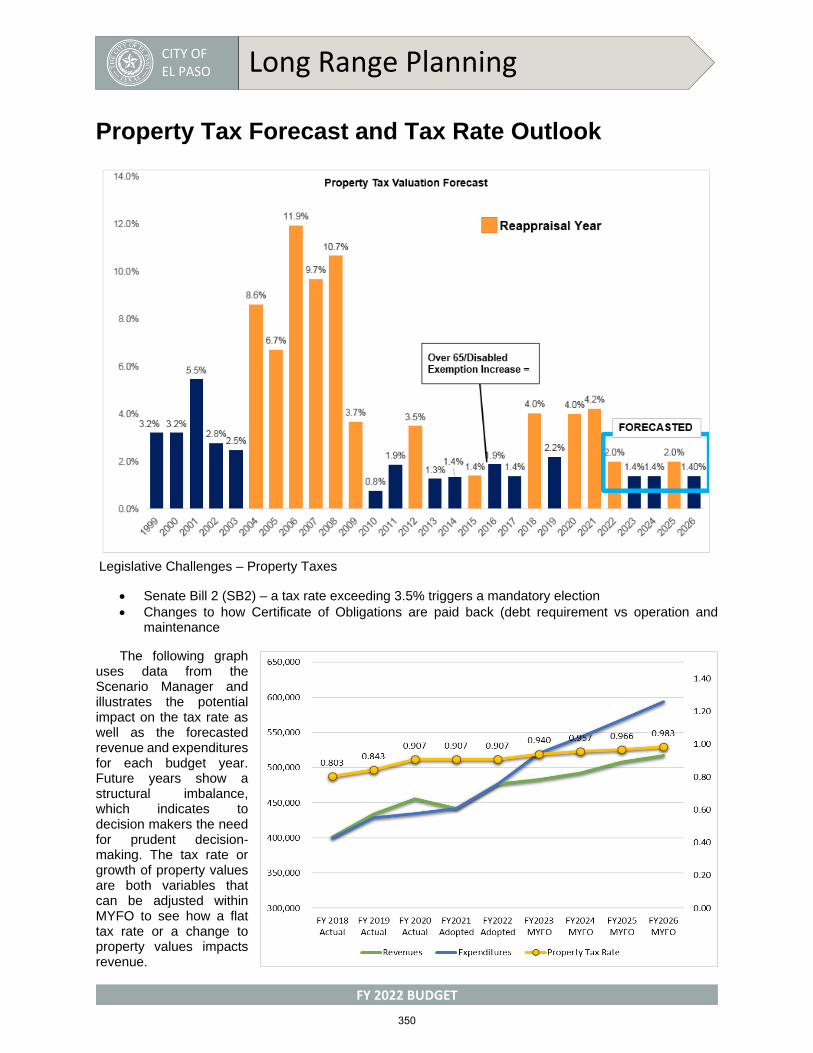
CITY OF EL PASO Long Range Planning
FY 2022 BUDGET
Property Tax Forecast and Tax Rate Outlook
Legislative Challenges – Property Taxes
• Senate Bill 2 (SB2) – a tax rate exceeding 3.5% triggers a mandatory election
• Changes to how Certificate of Obligations are paid back (debt requirement vs operation andmaintenance
The following graph uses data from the Scenario Manager and illustrates the potential impact on the tax rate as well as the forecasted revenue and expenditures for each budget year. Future years show a structural imbalance, which indicates to decision makers the need for prudent decision-making. The tax rate or growth of property values are both variables that can be adjusted within MYFO to see how a flat tax rate or a change to property values impacts revenue.
350
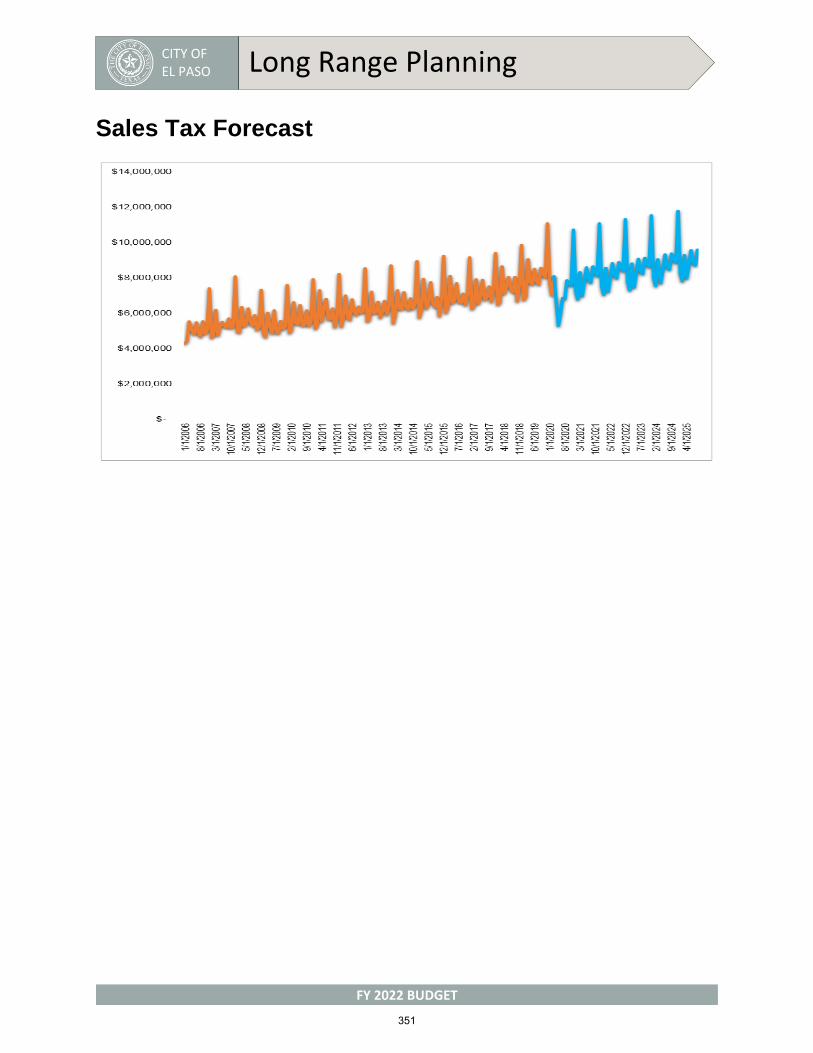
CITY OF EL PASO Long Range Planning
FY 2022 BUDGET
Sales Tax Forecast
351
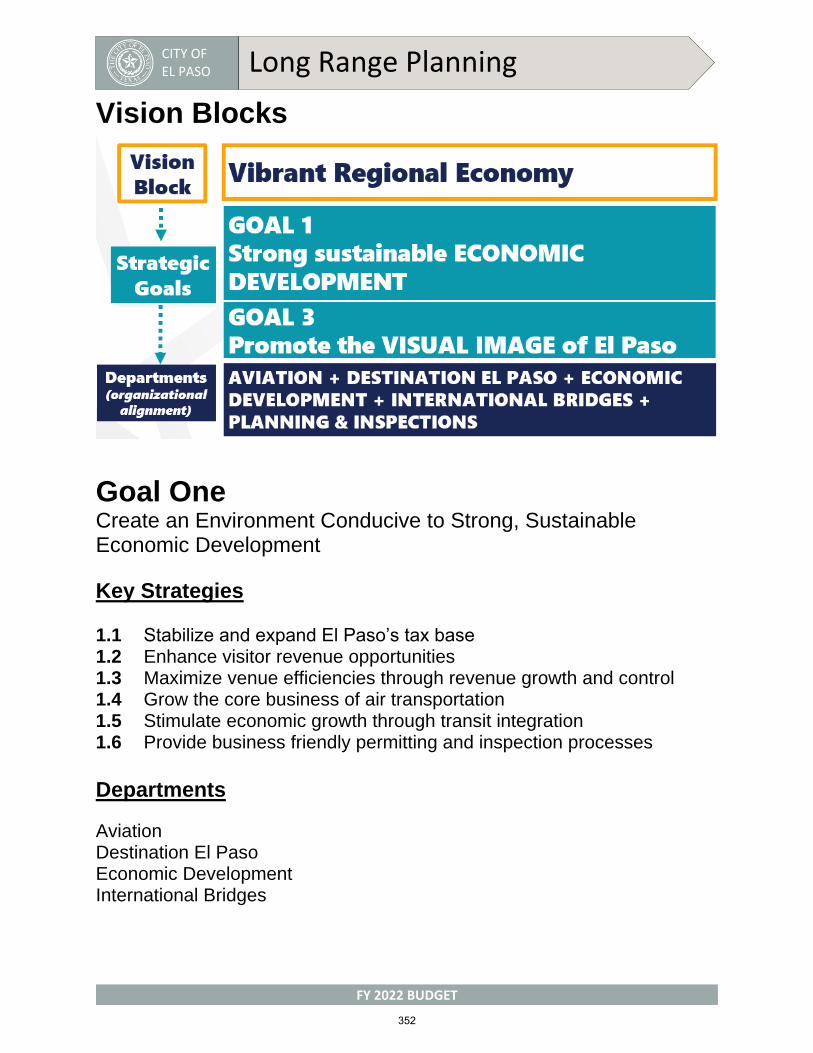
CITY OF EL PASO Long Range Planning
FY 2022 BUDGET
Vision Blocks
Goal One Create an Environment Conducive to Strong, Sustainable Economic Development
Key Strategies
1.1 Stabilize and expand El Paso’s tax base 1.2 Enhance visitor revenue opportunities 1.3 Maximize venue efficiencies through revenue growth and control 1.4 Grow the core business of air transportation 1.5 Stimulate economic growth through transit integration 1.6 Provide business friendly permitting and inspection processes
Departments
Aviation Destination El Paso Economic Development International Bridges
352
CITY OF EL PASO Long Range Planning
FY 2022 BUDGET
Goal Three Promote the Visual Image of El Paso
Key Strategies
3.1 Streamline processes to provide a solid foundation for development3.2 Improve the visual impression of the community (gateways, corridors,
intersections, and parkland) 3.3 Set one standard for infrastructure across the city
Departments
Planning and Inspections
353
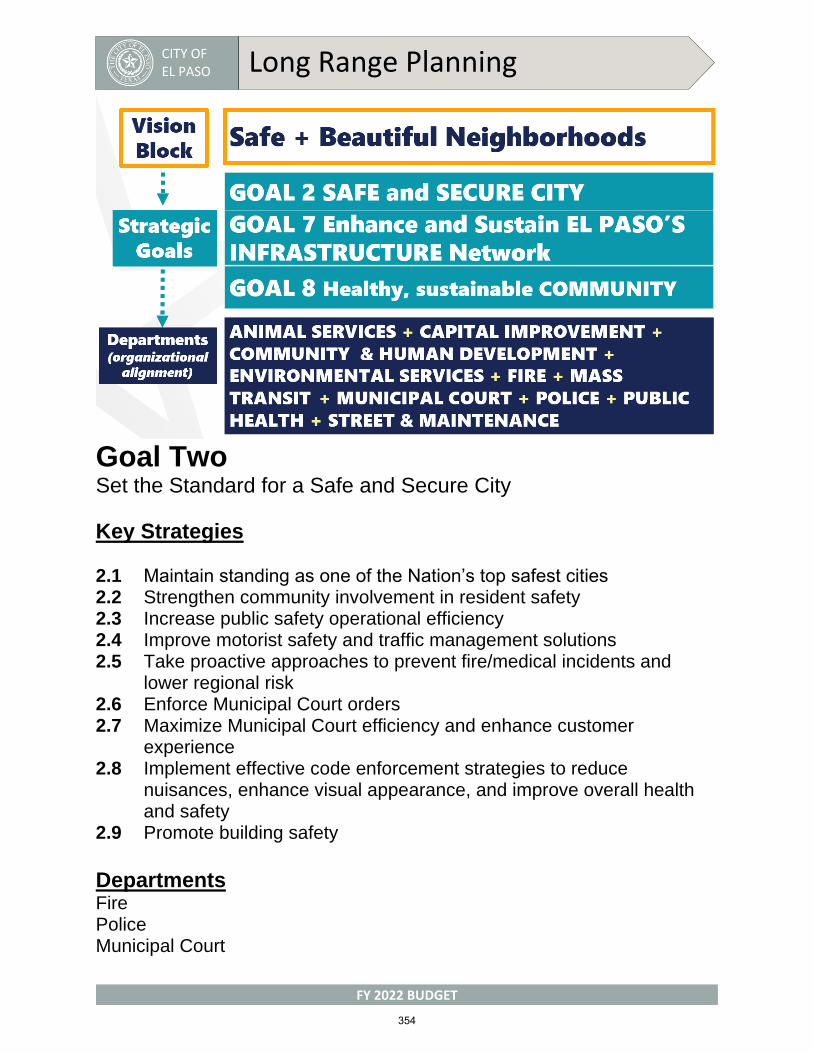
CITY OF EL PASO Long Range Planning
FY 2022 BUDGET
Goal TwoSet the Standard for a Safe and Secure City
Key Strategies
2.1 Maintain standing as one of the Nation’s top safest cities 2.2 Strengthen community involvement in resident safety 2.3 Increase public safety operational efficiency 2.4 Improve motorist safety and traffic management solutions 2.5 Take proactive approaches to prevent fire/medical incidents and
lower regional risk 2.6 Enforce Municipal Court orders 2.7 Maximize Municipal Court efficiency and enhance customer
experience 2.8 Implement effective code enforcement strategies to reduce
nuisances, enhance visual appearance, and improve overall health and safety
2.9 Promote building safety
Departments Fire Police Municipal Court
354

CITY OF EL PASO Long Range Planning
FY 2022 BUDGET
Goal Seven Enhance and Sustain El Paso’s Infrastructure Network
Key Strategies 7.1 Provide reliable and sustainable water supply and distribution systems
7.2 Improve competitiveness through infrastructure improvements impacting the quality of life
7.3 Enhance a regional comprehensive transportation system
7.4 Continue the strategic investment in city facilities and technology
7.5 Set one standard for infrastructure across the city
Departments Capital Improvement Department Mass Transit – Sun Metro Streets and Maintenance
Goal Eight Nurture and Promote a Healthy, Sustainable Community
Key Strategies
8.1 Deliver prevention, intervention and mobilization services to promote a healthy, productive, and safe community
8.2 Stabilize neighborhoods through community, housing and ADA improvements
8.3 Enhance animal services to ensure El Paso’s pets are provided a safe and healthy environment
8.4 Reduce operational energy consumption
8.5 Improve air quality throughout El Paso
8.6 Provide long-term, cost effective, sustainable regional solid waste solutions
8.7 Ensure community compliance with environmental regulatory requirement
8.8 Improve community resilience through education, outreach, and develop the resilience strategy
8.9 Enhance vector control and environmental education to provide a safe and healthy environment
Departments Animal Services Community and Human Development Environmental Services Public Health
355

CITY OF EL PASO Long Range Planning
FY 2022 BUDGET
Goal Four Enhance El Paso’s Quality of Life through Recreational, Cultural and Educational Environments
Key Strategies
4.1 Deliver bond projects impacting quality of life across the city in atimely, efficient manner
4.2 Create innovative recreational, educational and cultural programs4.3 Establish technical criteria for improved quality of life facilities
Departments Library Museums and Cultural Affairs Parks and Recreation Zoo
356

CITY OF EL PASO Long Range Planning
FY 2022 BUDGET
Goal Five Promote Transparent and Consistent Communication Amongst All Members of the Community
Key Strategies
5.1 Set a climate of respect collaboration and team spirit among City
Council, City staff and the community
5.2 Leverage and expand the use of current and new technology to
reduce inefficiencies and improve communications
5.3 Promote a well-balanced customer service philosophy throughout the
organization
5.4 Enhance internal communication and employee engagement
5.5 Advance two way communication of key messages to external
customers
5.6 Strengthen messaging opportunities through media outlets and
proactive community outreach
Departments
Department of Information Technology Services
357
CITY OF EL PASO Long Range Planning
FY 2022 BUDGET
Goal Six
Set the Standard for Sound Governance and Fiscal Management
Key Strategies
6.1 Recruit and retain a skilled and diverse workforce 6.2 Implement employee benefits and services that promote financial
security 6.3 Implement programs to reduce organizational risks 6.4 Implement leading-edge practices for achieving quality and
performance excellence 6.5 Deliver services timely and effectively with focus on continual
improvement 6.6 Ensure continued financial stability and accountability through sound
financial management, budgeting and reporting 6.7 Deliver effective and efficient processes to maximize value in
obtaining goods and services 6.8 Support transparent and inclusive government 6.9 Maximize Municipal Court efficiency and enhance customer service
through technology 6.10 Enhance the quality of decision making with legal representation and
support 6.11 Provide efficient and effective services to taxpayers6.12 Maintain city fleet to ensure safe and reliable vehicles and equipment6.13 Maintain systems integrity, compliance, and business continuity
Departments City Attorney Non-Departmental City Manager’s Office Office of the Comptroller Human Resources Purchasing and Strategic Sourcing Mayor and Council Tax City Clerk
358

CITY OF EL PASO Long Range Planning
FY 2022 BUDGET
PERFORMANCE EXCELLENCE RESULTS Achieving El Paso’s Vision • Fire Department ONE OF SEVEN AGENCIES nationwide both internationally accreditedand ISO Class One
• Only Fire Department facility to rank in top 100 Best Fleets across the globe (3rd
consecutive year)
• Only Office of Emergency Management in southwest to be internationally accredited bythe Emergency Management Accreditation Program
• 2021 Traffic Safety Initiative Award - High Volume Courts for 3rd consecutive year
• Municipal Court received 98,489 calls, 98.14 % were answered within 30 seconds
• FY2021 Collection Program of the Year by Government Collectors Association of Texas
• From 27,511 in FY2016 to 60,257 in FY 2021 patching repairs completed. Theproduction more than doubled due to process improvement project in 2017
• Reduced % pothole service requests from 16% to 6%. 94% of potholes patched fixed
before they became a service request
• Crosswalk Installations, FY2020 –13.8 miles of crosswalk citywide, FY2021(throughQ3) -11.8 miles of crosswalk citywide
• Recognized as GOLD LEVEL Healthy Community by Texas Department of State HealthServices
• 2020 Diane & Bob Hoover Annual Innovation Award by Pethealth Inc.
• Nationally recognized program: Public Health + Fire Department improved access todisease prevention. Flu Prevention Mass Vaccination- BePowerFlu Campaign
• El Paso is a 100RC Exemplar City for powerful incorporation of resilience strategies intoStrategic Plan
• 2019 Texas Chapter of the American Public Works Association’s EnvironmentalExcellence Recognition Program - Recognized for Innovation and “I Am a Solid WasteTruck Driver” program
• Launched recycling challenge campaign, “Become a black belt in recycling!”
• 2019 Texas Environmental Leadership Award - Texas Senate District 29
• Department of Community and Human Development deployed 96 service contracts toassist in the Community Response + Recovery totaling $30 million
359
CITY OF EL PASO Long Range Planning
FY 2022 BUDGET
PERFORMANCE EXCELLENCE RESULTS Achieving El Paso’s Vision • More than $1.17 Billion in new capital investment added over last 5 years
• Over $24.7 million in economic support to during COVID-19 pandemic
• Downtown Snapshot:
• 21 projects in downtown area
• 5 projects in downtown historic district; 4 of which are on the National Register ofHistoric Places
• 280 + new residential units
• 875 + hotel rooms by end of 2020
• 350,000+ sq. ft. of new and rehabilitated office/retail spaces
• Airport Council International (ACI), 2020 Excellence in Airport Marketing,Communications and Customer Experience Awards
• 19 new flight service announcements since 2015 (15 cities non-stop)
• 2018 Best Airport by Size and Category (2-5 million passengers in North America) byAirport Council International’s (ACI) Airport Service Quality (ASQ) Customer ExperienceAwards.
• El Paso Electric awarded the El Paso Airport’s NASA Hangars energy-efficient lightingproject $5,061.60 in incentives - the project was estimated to save 21.09 kW!
• 16% increase in Residential Permits Processed over the previous year
• 100.7% growth in hotel occupancy over previous year
• Over $100 million leveraged for our bridges and hotel development supporting a vibrantregional economy
• $32 million State funding for Bridges Intelligent Transportation Projects
• TX-MX Border Transportation Master Plan 2021 completed in collaboration with BTACand TxDOT
• City of El Paso recognized with the Smart Cities Connect Award for our new Park 915Mobile App
• El Paso Named Top Convention Cities in the USA for 2018 by MeetingSource.com
• El Paso ranked second nationwide in Top Employment Growth Rate (3.3% growth) fromJune 2016 to July 2017 (#1 ranking was Dallas/Plano/Irving – only .3% higher) accordingto Real Estate Center’s Monthly Review of the Texas Economy
• Best Run Cities in America (ranked 1st in Texas) by WalletHub
360

CITY OF EL PASO Long Range Planning
FY 2022 BUDGET
PERFORMANCE EXCELLENCE RESULTS Achieving El Paso’s Vision • Parks and Recreation Department now part of 1% of 12,000 agencies to be accredited
• Close to 290,000 residents participated in Parks and Recreation indoor and outdoorleisure services to persons of all ages
• National Medal recipient Institute of Museum and Library Services
• Over 156K+ people attended targeted programming throughout Museums and culturalprograms
• Fully accredited by the Texas State Library and Archives Commission
• Excellence Award by the Texas Municipal Library Director’s Association
• WorkPLACE Job and Small Business Training has engaged 1912 Clients
• 59 Quality of Life facilities programmed to provide free Wi-Fi service
• Wi-Fi Centers activated serving over 8,600 users
• El Paso Zoo stands in elite company with Quarter Century Award
• 130,000 + enjoyed downtown festivities during last year’s Winterfest offerings (60 daysof winter fun)
• 2018 Best Cities for Recreation (ranked 1st in Texas) by WalletHub in 2018
• Ranked Top Ten Best Places to Live by Areavibes.com in 2017 and 2018
• Forbes ranked #1 Lowest Cost of Living in 2018
• El Paso named a 2018 top-ranking city in Governing and Living Cities Equipt toInnovate survey
• Ranked in the top 25 cities with the best work-life balance by Smart Asset in 2018
• 2018 Top Retirement Destination (profiled in “8 Cities for Downtown Living”) Where toRetire Magazine
• 2018 Best of Texas Awards Winner by the Center for Digital Government
• El Paso Museum of Art awarded the 2018 National Medal for Museum and LibraryServices
361
CITY OF EL PASO Long Range Planning
FY 2022 BUDGET
PERFORMANCE EXCELLENCE RESULTS Achieving El Paso’s Vision• Aetna 2021 Making a Difference Workplace Wellbeing GOLD Award
• 2020 Achievement in Excellence in Procurement for 7th consecutive years
• Top Ten 2020 Digital Cities Survey Winner for Cities (pop > 500,000) for 3rd year in arow
• 2020 2nd Place Overall City Government Experience and Future Ready Award byGovernment Technology
• 99% of the employees completed security and awareness & phish training with 8.8%reduction in employees failing for phish email (60% remote workforce)
• Launched eLEARNING, delivered 17 new courses and had 22,394 attendees
• Launched “the 500” a new leadership development series designed by seniorleaders in 24 short focused courses targeting future City of El Paso leaders (328attendees)
• One of 14 cities in North America selected to participate by Bloomberg Philanthropies
• Only Local Government selected to participate in d.Leadership program by StanfordUniversity d.School – (Stanford Design + Business School (MBA))
• Completed FY20 audit with ZERO FINDINGS, 5TH CONSECUTIVE YEAR
• Strong management, budgetary performance, and financial policies have beenhighlighted by bond raters over last several years
• Improved revenue and expenditure forecasting with 5 consecutive years of General Fundsurplus
• Launched Strategic Budget Advisory in 2018 (YOUTH FOCUS)
• Chime in! Survey 8,000+ community responses a 458% increase over previous year
• Received GFOA Distinguished Budget Award for a 27th consecutive year and GFOAAward in Financial Reporting for 20th consecutive year
• 2021 Animal Grooming Ordinance - 1st in the Nation
• Largest municipality to achieve 2020 Texas Award for Performance Excellence; ONLYorganization across sectors to earn distinction two consecutive years
• Implemented new communication methods, including Council Buzz and targetedcampaigns
• 2018 Best of Texas Awards Winner by the Center for Digital Government “Ask Laura”
• Named a 2018 and 2020 All-America City by the National Civic League
362
CITY OF EL PASO BUDGET BOOK 2022
GROWTH
CAPITAL IMPROVEMENTS
CAPITA
LIM
PROVEM
ENTS

City of El Paso FY 2022 Adopted Budget Capital Improvement Program
Capital Improvement Program
Executive Summary
The Capital Improvement Program (CIP) plan identifies capital improvement projects expected to be completed over the next five fiscal years. Since these projects typically span for more than one fiscal year, the plans are updated annually to track existing projects, to identify new projects, and to update funding estimates and forecasts. Therefore, capital projects are budgeted separately from the operating budget in a series of capital project funds. The CIP helps the City manage capital expenditures to meet the following City strategic priorities.
Economic Development The City of El Paso will create an environment conducive to strong sustainable economic development.
Public Safety The City of El Paso will set the standard for a safe and secure city.
Visual Image The City of El Paso will promote the visual image of El Paso.
Quality of Life The City of El Paso will enhance El Paso’s quality of life through recreational, cultural and educational environments.
Communication The City of El Paso will promote transparent and consistent communication amongst all members of the community.
Sound Governance The City of El Paso will set the standard for sound governance and fiscal management.
Infrastructure The City of El Paso will enhance and sustain El Paso’s infrastructure network.
Healthy Community The City of El Paso will nurture and promote a healthy, sustainable community.
364
City of El Paso FY 2022 Adopted Budget Capital Improvement Program
Capital Improvement Program Definition
Providing infrastructure is a primary function of a local government. Maintaining public safety, city services, parks and recreation facilities, adequate transportation systems, and the community’s quality of life are all heavily dependent on how the City plans for future infrastructure needs.
The Capital Improvement Program (CIP) is a comprehensive, five-year plan of capital projects that will support the continued growth and development of the city. The CIP is used in implementing and supporting the City’s adopted Strategic Plan by developing a prioritized schedule of short-range and long-range community capital needs, evaluating projects, and analyzing the community’s ability and willingness to pay for them in the most cost-effective way. The City uses the CIP as its method in determining future infrastructure requirements and planning the financing of facilities and equipment to maintain the service levels provided to town citizens.
A Capital Improvement Program (CIP) project is defined as a major, non-recurring project that includes one or more of the following:
1. Any acquisition of, or improvement of, land for a public purpose.2. Any construction of a new facility (e.g., a public building, parking lot, road, or bridge etc.), or an
addition to, or extension of, such a facility.3. A nonrecurring rehabilitation that increases the service potential of the building (i.e., something
which is infrequent and would not be considered annual or other recurrent maintenance) or majorrepair of all or a part of a building, its grounds, or a facility.
4. Any planning, feasibility, engineering, or design study related to an individual capital improvementproject or to a program that is implemented through individual capital improvement projects.
The most common examples include the purchase of land and buildings as well as construction of buildings, roads, and bridges. Sources of funding for Capital Improvement Projects may include voter-approved General Obligation Bonds (GOs), Certificates of Obligation (COs), as well as other forms of long-term financing such as Revenue Bonds, operating funds, contributions from other public and private entities, and grants.
The City uses the CIP as an avenue of communication to the public. Through the CIP document, residents and businesses are provided with an accurate and concise view of the City’s long-term direction for capital investment and the City’s need for stable revenue sources to fund large multi-year capital projects.
365
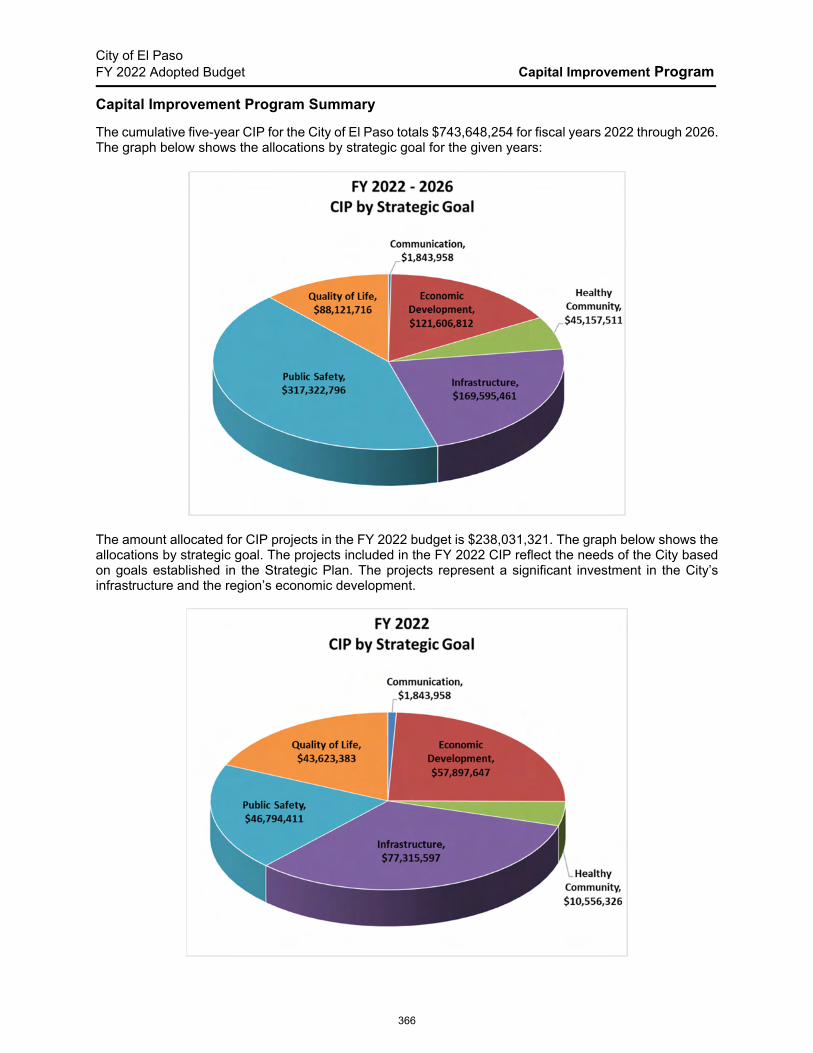
City of El Paso FY 2022 Adopted Budget Capital Improvement Program
Capital Improvement Program Summary
The cumulative five-year CIP for the City of El Paso totals $743,648,254 for fiscal years 2022 through 2026. The graph below shows the allocations by strategic goal for the given years:
The amount allocated for CIP projects in the FY 2022 budget is $238,031,321. The graph below shows the allocations by strategic goal. The projects included in the FY 2022 CIP reflect the needs of the City based on goals established in the Strategic Plan. The projects represent a significant investment in the City’s infrastructure and the region’s economic development.
366
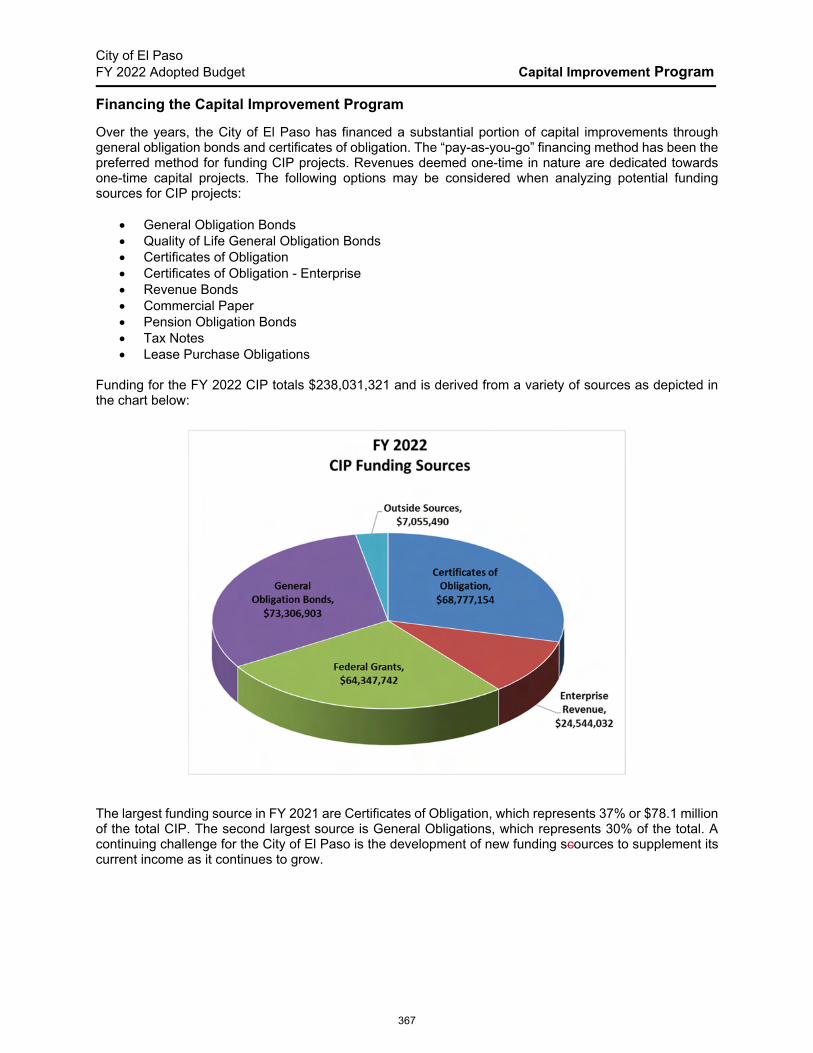
City of El Paso FY 2022 Adopted Budget Capital Improvement Program
Financing the Capital Improvement Program
Over the years, the City of El Paso has financed a substantial portion of capital improvements through general obligation bonds and certificates of obligation. The “pay-as-you-go” financing method has been the preferred method for funding CIP projects. Revenues deemed one-time in nature are dedicated towards one-time capital projects. The following options may be considered when analyzing potential funding sources for CIP projects:
General Obligation Bonds Quality of Life General Obligation Bonds Certificates of Obligation Certificates of Obligation - Enterprise Revenue Bonds Commercial Paper Pension Obligation Bonds Tax Notes Lease Purchase Obligations
Funding for the FY 2022 CIP totals $238,031,321 and is derived from a variety of sources as depicted in the chart below:
The largest funding source in FY 2021 are Certificates of Obligation, which represents 37% or $78.1 million of the total CIP. The second largest source is General Obligations, which represents 30% of the total. A continuing challenge for the City of El Paso is the development of new funding scources to supplement its current income as it continues to grow.
367
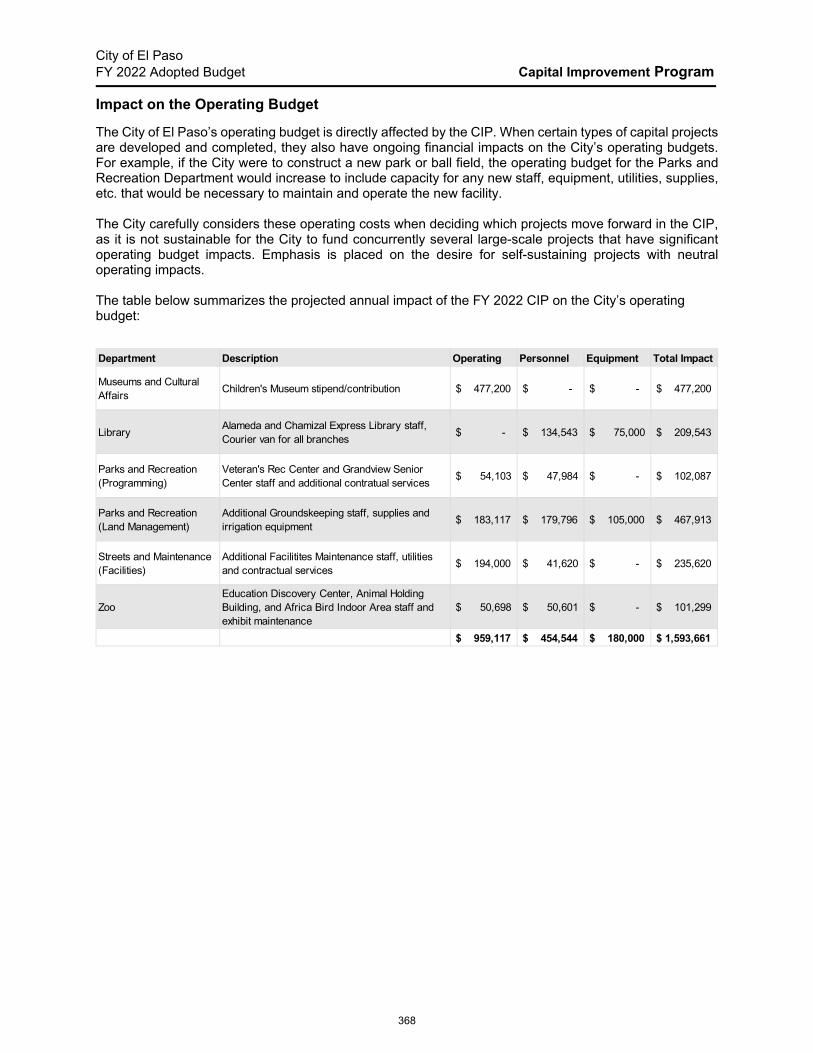
City of El Paso FY 2022 Adopted Budget Capital Improvement Program
Impact on the Operating Budget
The City of El Paso’s operating budget is directly affected by the CIP. When certain types of capital projects are developed and completed, they also have ongoing financial impacts on the City’s operating budgets. For example, if the City were to construct a new park or ball field, the operating budget for the Parks and Recreation Department would increase to include capacity for any new staff, equipment, utilities, supplies, etc. that would be necessary to maintain and operate the new facility.
The City carefully considers these operating costs when deciding which projects move forward in the CIP, as it is not sustainable for the City to fund concurrently several large-scale projects that have significant operating budget impacts. Emphasis is placed on the desire for self-sustaining projects with neutral operating impacts.
The table below summarizes the projected annual impact of the FY 2022 CIP on the City’s operating budget:
Department Description Operating Personnel Equipment Total Impact
Museums and Cultural Affairs
Children's Museum stipend/contribution $ 477,200 $ - $ - $ 477,200
LibraryAlameda and Chamizal Express Library staff, Courier van for all branches
$ - $ 134,543 $ 75,000 $ 209,543
Parks and Recreation (Programming)
Veteran's Rec Center and Grandview Senior Center staff and additional contratual services
$ 54,103 $ 47,984 $ - $ 102,087
Parks and Recreation (Land Management)
Additional Groundskeeping staff, supplies and irrigation equipment
$ 183,117 $ 179,796 $ 105,000 $ 467,913
Streets and Maintenance (Facilities)
Additional Facilitites Maintenance staff, utilities and contractual services
$ 194,000 $ 41,620 $ - $ 235,620
ZooEducation Discovery Center, Animal Holding Building, and Africa Bird Indoor Area staff and exhibit maintenance
$ 50,698 $ 50,601 $ - $ 101,299
$ 959,117 $ 454,544 $ 180,000 $ 1,593,661
368

City of El Paso FY 2022 Adopted Budget Capital Improvement Program
Summary
Projects included in the FY 2022 CIP reflect the combined efforts of all City departments as well as the City Council and El Paso residents. The plan recognizes the added benefits the projects will bring to the City, while understanding the fiscal requirements and obligations each of these projects will entail. The CIP is updated annually, and new projects may be included should additional funding sources be identified.
The FY 2022 CIP attempts to meet the priority needs of the community, while maintaining financial sustainability in future years. The plan as submitted is financially feasible and many of the projects included can be expected to be complete before the end of the fiscal year. As City priorities and policies change, it is imperative that the CIP remain fluid and undergo continual evaluation to ensure the projects and funding sources are in accordance with the City Council priorities and policies.
The tables and documents provided on the following pages offer an in-depth view into the City’s CIP.
Table 1 below shows the five-year CIP for projects under Strategic Goal 1, Economic Development:
Table 1
Project Name 2022 2023 2024 2025 2026Airfield General Improvements 300,000$ ‐$ ‐$ ‐$ ‐$
Airport Industrial Park Monuments 337,640$ ‐$ ‐$ ‐$ ‐$
AmeriStar Hangar Improvements 800,000$ ‐$ ‐$ ‐$ ‐$
Bert Williams / Iron Dust Off Bypass ‐$ 3,000,000$ ‐$ ‐$ ‐$
Cargo General Improvements 300,000$ ‐$ ‐$ ‐$ ‐$
Cargo Ramp Light Upgrade 1,050,000$ ‐$ ‐$ ‐$ ‐$
ConRAC Improvements 655,000$ ‐$ ‐$ ‐$ ‐$
E‐Fast Pass traffic only lane at Stanton ‐$ ‐$ 500,000$ ‐$ ‐$
General bridge facilities operations and maintenance 300,000$ 300,000$ 300,000$ 300,000$ 300,000$
Global Trade Center 500,000$ 500,000$ 500,000$ 500,000$ ‐$
Hangar 7 Rehabilitation ‐$ 950,000$ ‐$ ‐$ ‐$
Holiday Lights & Events Decorations 150,000$ 150,000$ 150,000$ 150,000$ ‐$
HVAC Annual Upgrades FY 16‐25 300,000$ 300,000$ 300,000$ 300,000$ ‐$
Improve ADA accessibility 250,000$ 250,000$ 250,000$ 250,000$ 250,000$
International Bridges Crossborder Survey Project ‐$ 140,000$ 140,000$ 140,000$ 140,000$
ITS at Stanton 1,800,000$ ‐$ ‐$ ‐$ ‐$
Lockheed Landscaping 790,000$ ‐$ ‐$ ‐$ ‐$
Mill & Replace Runway 8R‐26L, Lighting Upgrades & Runway Turn‐offs 12,320,000$ ‐$ ‐$ ‐$ ‐$
Mill & Replace Runway 8R‐26L, Lighting Upgrades & Runway Turn‐offs (Design) 250,000$ ‐$ ‐$ ‐$ ‐$
NASA ‐ STA Hangar & GSE Workshop Roof 714,300$ ‐$ ‐$ ‐$ ‐$
NASA ‐ T‐38 Hangar Roof 562,975$ ‐$ ‐$ ‐$ ‐$
Parking Lot Infrastructure Improvements 650,000$ ‐$ ‐$ ‐$ ‐$
Paso de! Norte b1idge toll collection system uo2rades 1,000,000$ ‐$ ‐$ ‐$ ‐$
PASO DEL NORTE Pedestrian Booth 16,947$ ‐$ ‐$ ‐$ ‐$
PASO DEL NORTE POE ROUNDABOUT 324,615$ ‐$ ‐$ ‐$ ‐$
Pavement markings, striping and lane dividers ‐$ 180,000$ 1,800,000$ 180,000$ ‐$
Pedestrian improvements at Ysleta ‐$ ‐$ ‐$ 750,000$ ‐$
Reconstruct TWY "K2" & "J" North of TWY "K", Remove K1, & New Connector 7,444,445$ ‐$ ‐$ ‐$ ‐$
Redesign pedestrian waiting/ pick‐up area at Ysleta ‐$ ‐$ ‐$ 750,000$ ‐$
Relocation of TWY M ‐$ 13,339,165$ ‐$ ‐$ ‐$
RWY 8 APCH / 5‐Node Intersection Remediation 25,000,000$ ‐$ ‐$ ‐$ ‐$
Security Camera Upgrades 250,000$ 100,000$ ‐$ ‐$ ‐$
Stanton Bridge Bluetooth wait system 1,725$ ‐$ ‐$ ‐$ ‐$
Stanton E‐Fast Pass Office ‐$ 100,000$ 300,000$ ‐$ ‐$
Stanton Street TrafficStudy ‐$ 500,000$ ‐$ ‐$ ‐$
Taxiway U from Customs Ramp to Twy V (Mill and Overlay) ‐$ ‐$ 2,500,000$ ‐$ ‐$
Taxiway U from Customs Ramp to Twy V (Mill and Overlay) (Design) 130,000$ ‐$ ‐$ ‐$ ‐$
Terminal Drive / Airport Bridge Improvements 800,000$ ‐$ ‐$ ‐$ ‐$
Terminal General Improvements 250,000$ ‐$ ‐$ ‐$ ‐$
Terminal Renovation ‐ Ceiling Tile & Lighting* ‐$ ‐$ ‐$ 8,000,000$ ‐$
Terminal Renovation ‐ Curbside Concrete Rehabilitation* ‐$ ‐$ ‐$ 2,000,000$ ‐$
Terminal Renovation ‐ Flooring* ‐$ ‐$ ‐$ 4,000,000$ ‐$
Terminal Renovation ‐ Seating* ‐$ ‐$ ‐$ 1,500,000$ ‐$
Terminal Renovation ‐ Terminal Ramp Light Upgrade * ‐$ ‐$ ‐$ 1,000,000$ ‐$
Terminal Renovation ‐ Terminal Ramp Pavement Rehabilitation (Design)* ‐$ 2,000,000$ ‐$ ‐$ ‐$
Terminal Renovation ‐ Terminal Ramp Pavement Rehabilitation* ‐$ ‐$ ‐$ 10,000,000$ ‐$
Fiscal Year
369
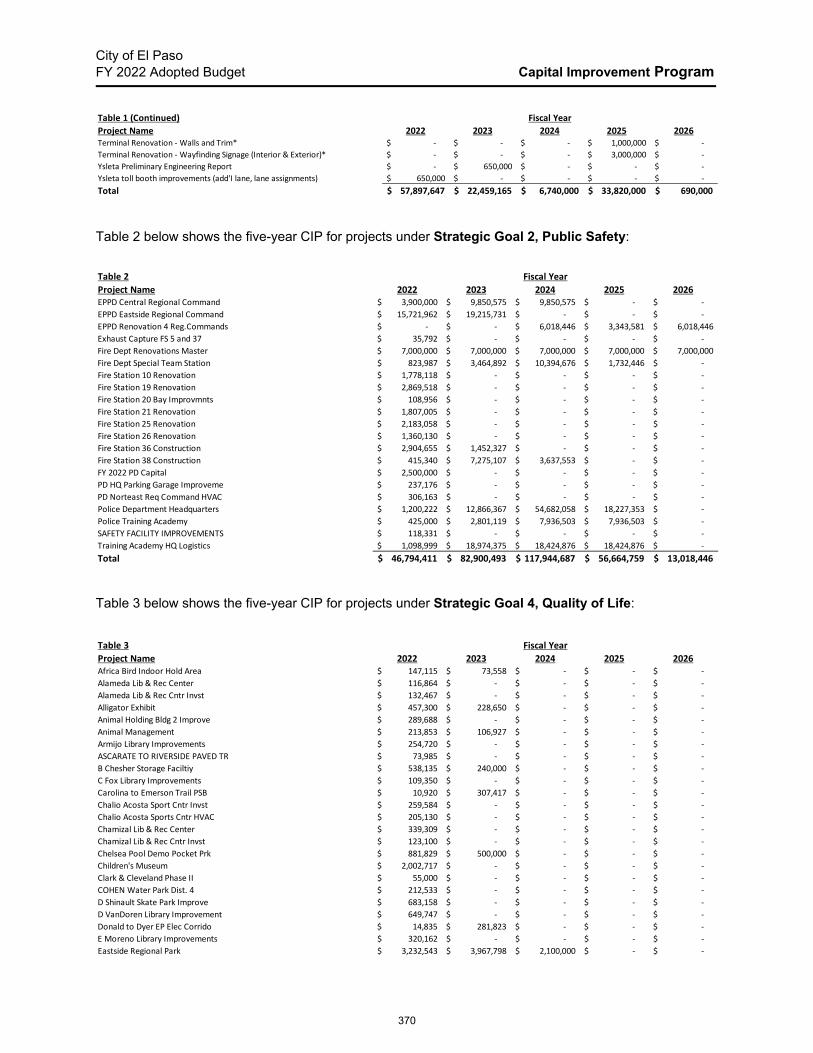
City of El Paso FY 2022 Adopted Budget Capital Improvement Program
Table 2 below shows the five-year CIP for projects under Strategic Goal 2, Public Safety:
Table 3 below shows the five-year CIP for projects under Strategic Goal 4, Quality of Life:
Table 1 (Continued)
Project Name 2022 2023 2024 2025 2026Terminal Renovation ‐ Walls and Trim* ‐$ ‐$ ‐$ 1,000,000$ ‐$
Terminal Renovation ‐ Wayfinding Signage (Interior & Exterior)* ‐$ ‐$ ‐$ 3,000,000$ ‐$
Ysleta Preliminary Engineering Report ‐$ 650,000$ ‐$ ‐$ ‐$
Ysleta toll booth improvements (add'I lane, lane assignments) 650,000$ ‐$ ‐$ ‐$ ‐$
Total 57,897,647$ 22,459,165$ 6,740,000$ 33,820,000$ 690,000$
Fiscal Year
Table 2
Project Name 2022 2023 2024 2025 2026EPPD Central Regional Command 3,900,000$ 9,850,575$ 9,850,575$ ‐$ ‐$
EPPD Eastside Regional Command 15,721,962$ 19,215,731$ ‐$ ‐$ ‐$
EPPD Renovation 4 Reg.Commands ‐$ ‐$ 6,018,446$ 3,343,581$ 6,018,446$
Exhaust Capture FS 5 and 37 35,792$ ‐$ ‐$ ‐$ ‐$
Fire Dept Renovations Master 7,000,000$ 7,000,000$ 7,000,000$ 7,000,000$ 7,000,000$
Fire Dept Special Team Station 823,987$ 3,464,892$ 10,394,676$ 1,732,446$ ‐$
Fire Station 10 Renovation 1,778,118$ ‐$ ‐$ ‐$ ‐$
Fire Station 19 Renovation 2,869,518$ ‐$ ‐$ ‐$ ‐$
Fire Station 20 Bay Improvmnts 108,956$ ‐$ ‐$ ‐$ ‐$
Fire Station 21 Renovation 1,807,005$ ‐$ ‐$ ‐$ ‐$
Fire Station 25 Renovation 2,183,058$ ‐$ ‐$ ‐$ ‐$
Fire Station 26 Renovation 1,360,130$ ‐$ ‐$ ‐$ ‐$
Fire Station 36 Construction 2,904,655$ 1,452,327$ ‐$ ‐$ ‐$
Fire Station 38 Construction 415,340$ 7,275,107$ 3,637,553$ ‐$ ‐$
FY 2022 PD Capital 2,500,000$ ‐$ ‐$ ‐$ ‐$
PD HQ Parking Garage Improveme 237,176$ ‐$ ‐$ ‐$ ‐$
PD Norteast Req Command HVAC 306,163$ ‐$ ‐$ ‐$ ‐$
Police Department Headquarters 1,200,222$ 12,866,367$ 54,682,058$ 18,227,353$ ‐$
Police Training Academy 425,000$ 2,801,119$ 7,936,503$ 7,936,503$ ‐$
SAFETY FACILITY IMPROVEMENTS 118,331$ ‐$ ‐$ ‐$ ‐$
Training Academy HQ Logistics 1,098,999$ 18,974,375$ 18,424,876$ 18,424,876$ ‐$
Total 46,794,411$ 82,900,493$ 117,944,687$ 56,664,759$ 13,018,446$
Fiscal Year
Table 3
Project Name 2022 2023 2024 2025 2026Africa Bird Indoor Hold Area 147,115$ 73,558$ ‐$ ‐$ ‐$
Alameda Lib & Rec Center 116,864$ ‐$ ‐$ ‐$ ‐$
Alameda Lib & Rec Cntr Invst 132,467$ ‐$ ‐$ ‐$ ‐$
Alligator Exhibit 457,300$ 228,650$ ‐$ ‐$ ‐$
Animal Holding Bldg 2 Improve 289,688$ ‐$ ‐$ ‐$ ‐$
Animal Management 213,853$ 106,927$ ‐$ ‐$ ‐$
Armijo Library Improvements 254,720$ ‐$ ‐$ ‐$ ‐$
ASCARATE TO RIVERSIDE PAVED TR 73,985$ ‐$ ‐$ ‐$ ‐$
B Chesher Storage Faciltiy 538,135$ 240,000$ ‐$ ‐$ ‐$
C Fox Library Improvements 109,350$ ‐$ ‐$ ‐$ ‐$
Carolina to Emerson Trail PSB 10,920$ 307,417$ ‐$ ‐$ ‐$
Chalio Acosta Sport Cntr Invst 259,584$ ‐$ ‐$ ‐$ ‐$
Chalio Acosta Sports Cntr HVAC 205,130$ ‐$ ‐$ ‐$ ‐$
Chamizal Lib & Rec Center 339,309$ ‐$ ‐$ ‐$ ‐$
Chamizal Lib & Rec Cntr Invst 123,100$ ‐$ ‐$ ‐$ ‐$
Chelsea Pool Demo Pocket Prk 881,829$ 500,000$ ‐$ ‐$ ‐$
Children's Museum 2,002,717$ ‐$ ‐$ ‐$ ‐$
Clark & Cleveland Phase II 55,000$ ‐$ ‐$ ‐$ ‐$
COHEN Water Park Dist. 4 212,533$ ‐$ ‐$ ‐$ ‐$
D Shinault Skate Park Improve 683,158$ ‐$ ‐$ ‐$ ‐$
D VanDoren Library Improvement 649,747$ ‐$ ‐$ ‐$ ‐$
Donald to Dyer EP Elec Corrido 14,835$ 281,823$ ‐$ ‐$ ‐$
E Moreno Library Improvements 320,162$ ‐$ ‐$ ‐$ ‐$
Eastside Regional Park 3,232,543$ 3,967,798$ 2,100,000$ ‐$ ‐$
Fiscal Year
370

City of El Paso FY 2022 Adopted Budget Capital Improvement Program
Table 3 (Continued)
Project Name 2022 2023 2024 2025 2026Eastside Sports Complex Ph. II 540,280$ 1,080,560$ ‐$ ‐$ ‐$
Education Discovery Center 98,175$ ‐$ ‐$ ‐$ ‐$
Elephant Rhino Exhibit Rehab ‐$ 128,231$ 127,740$ ‐$ ‐$
Ellis Lateral to Valley Creek 29,059$ 240,924$ ‐$ ‐$ ‐$
End Species Breeding Center ‐$ 466,062$ 233,031$ ‐$ ‐$
Existing Sports Field Lighting 449,361$ ‐$ ‐$ ‐$ ‐$
Flat Fields Various Locations 1,050,000$ 2,986,692$ ‐$ ‐$ ‐$
Galapagos Exhibit ‐$ 280,962$ 280,962$ ‐$ ‐$
Grandview Sr Center Improve 320,885$ ‐$ ‐$ ‐$ ‐$
J Cisneros Library Improvement 223,877$ ‐$ ‐$ ‐$ ‐$
Joey Barraza & Vino Prk Lighti 1,029,491$ ‐$ ‐$ ‐$ ‐$
Joey Barraza & Vino Prk Maint 545,611$ 181,870$ ‐$ ‐$ ‐$
Joey Barraza & Vino Prk Ph II 546,451$ ‐$ ‐$ ‐$ ‐$
Kalahari Discovery Center 113,876$ ‐$ ‐$ ‐$ ‐$
Komodo Dragon Exhibit ‐$ ‐$ 942,388$ 3,298,360$ ‐$
Leo Cancellare Pool 563,616$ 563,616$ ‐$ ‐$ ‐$
Leopard Exhibit Renovation 308,130$ ‐$ ‐$ ‐$ ‐$
LIbrary Materials Purchase 293,563$ ‐$ ‐$ ‐$ ‐$
Liz Morayma Gonzalez Park 580,961$ 580,961$ ‐$ ‐$ ‐$
Lomaland Park & Rec Center 183,201$ ‐$ ‐$ ‐$ ‐$
Lomaland Park & Rec Cntr Invst 15,965$ ‐$ ‐$ ‐$ ‐$
M Gomez Park Improvements 2,114,805$ 542,954$ ‐$ ‐$ ‐$
Main Library Improvements 862,442$ 862,442$ ‐$ ‐$ ‐$
Mexican Americ Cultural Center 7,298,148$ 7,298,148$ ‐$ ‐$ ‐$
Montana to I‐10 EP Elec Corrid 69,593$ 1,591,891$ ‐$ ‐$ ‐$
Mountain to River Trail 150,000$ 448,319$ ‐$ ‐$ ‐$
Multipurpose Ctr Instruct Pool 1,591,200$ 145,811$ ‐$ ‐$ ‐$
Museum of History Humidifier 398,924$ ‐$ ‐$ ‐$ ‐$
N Richardson Rec Cntr Improve 502,412$ 167,471$ ‐$ ‐$ ‐$
Nations Tobin Pool Bldg Roof 233,376$ ‐$ ‐$ ‐$ ‐$
Nations Tobin Sports Cntr Roof 78,240$ ‐$ ‐$ ‐$ ‐$
NE Basin Park Construction 139,928$ ‐$ ‐$ ‐$ ‐$
Neigh Improve Projects Master 2,986,227$ 995,409$ ‐$ ‐$ ‐$
Open Space Land Acquisition 1,409,391$ 2,113,937$ ‐$ ‐$ ‐$
O'Rourke Rec Center Improveme 490,008$ 1,470,024$ ‐$ ‐$ ‐$
Park Play Structures Install 1,039,640$ ‐$ ‐$ ‐$ ‐$
Paseo Del Sol Park Improve 50,127$ ‐$ ‐$ ‐$ ‐$
Pavo Real Rec Ctr Improve 223,185$ 223,185$ ‐$ ‐$ ‐$
Penguin Exhibit 660,420$ 660,420$ ‐$ ‐$ ‐$
Purchase of Mobile Technology 426,753$ ‐$ ‐$ ‐$ ‐$
QOL Facility Imprvmnts Invstmn 267,462$ 267,462$ ‐$ ‐$ ‐$
Rainbow Vista to John Hayes Tr ‐$ 288,885$ ‐$ ‐$ ‐$
Rio Grande Trail to Country Cl 134,316$ ‐$ ‐$ ‐$ ‐$
S America Pavillion Restrooms 162,276$ ‐$ ‐$ ‐$ ‐$
Sea Lion Exhibit Upgrade 549,107$ ‐$ ‐$ ‐$ ‐$
Shaded Concessions ‐$ 116,592$ ‐$ ‐$ ‐$
Skyline to Loma Real Trail 49,331$ ‐$ ‐$ ‐$ ‐$
Sports Fields Lighting CIP20 161,683$ ‐$ ‐$ ‐$ ‐$
Support Elements Zoo Wide 896,369$ 298,790$ 99,597$ ‐$ ‐$
THOMAS MANOR PRK IMP CONTRIBUT 57,383$ ‐$ ‐$ ‐$ ‐$
TOM LEA PARK SLOPE REHABILITA ‐$ 5,138,978$ 2,569,489$ ‐$ ‐$
Trail Head Parking Areas 675,026$ ‐$ ‐$ ‐$ ‐$
Trailheads City Wayfinding 277,556$ ‐$ ‐$ ‐$ ‐$
Upgrades to Museums 138,911$ ‐$ ‐$ ‐$ ‐$
Valley Creek to Rio Grande Trl 74,573$ ‐$ ‐$ ‐$ ‐$
Veterans Rec Center Expansion 198,230$ ‐$ ‐$ ‐$ ‐$
Wainwright Park 248,787$ ‐$ ‐$ ‐$ ‐$
Westside Library Imrovements 738,491$ ‐$ ‐$ ‐$ ‐$
Wildlife Theatre Stadium 52,516$ ‐$ ‐$ ‐$ ‐$
Total 43,623,383$ 34,846,768$ 6,353,206$ 3,298,360$ ‐$
Fiscal Year
371
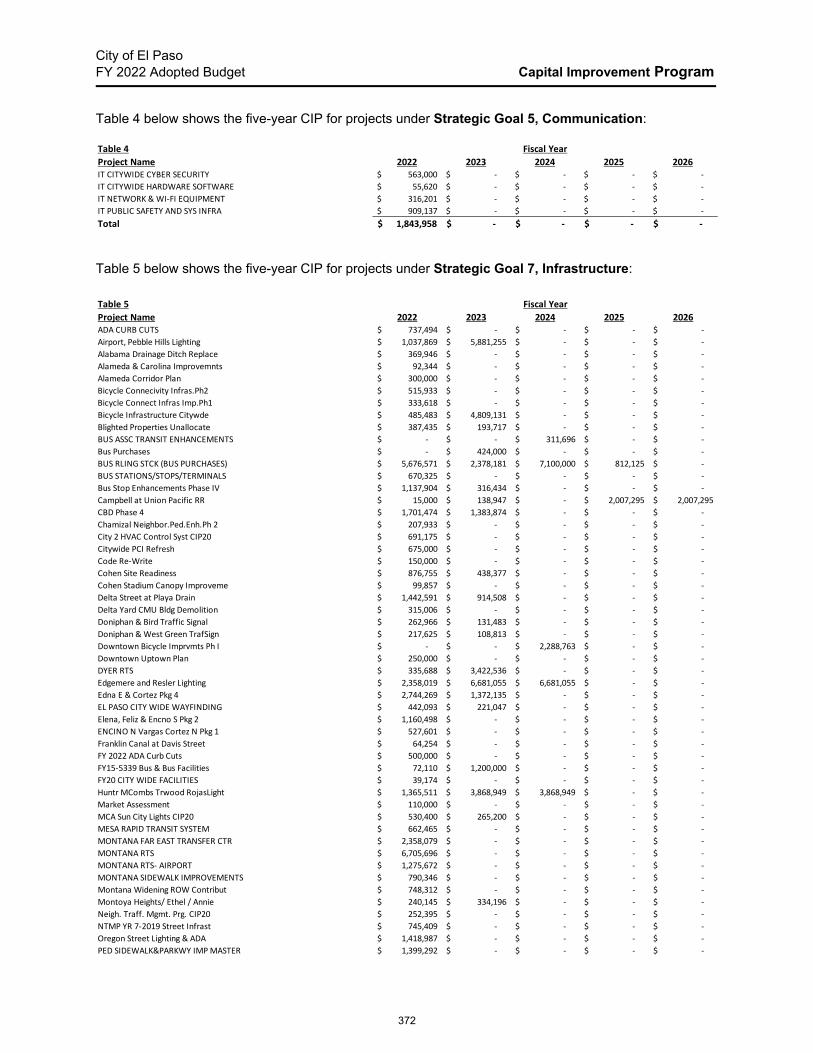
City of El Paso FY 2022 Adopted Budget Capital Improvement Program
Table 4 below shows the five-year CIP for projects under Strategic Goal 5, Communication:
Table 5 below shows the five-year CIP for projects under Strategic Goal 7, Infrastructure:
Table 4
Project Name 2022 2023 2024 2025 2026IT CITYWIDE CYBER SECURITY 563,000$ ‐$ ‐$ ‐$ ‐$
IT CITYWIDE HARDWARE SOFTWARE 55,620$ ‐$ ‐$ ‐$ ‐$
IT NETWORK & WI‐FI EQUIPMENT 316,201$ ‐$ ‐$ ‐$ ‐$
IT PUBLIC SAFETY AND SYS INFRA 909,137$ ‐$ ‐$ ‐$ ‐$
Total 1,843,958$ ‐$ ‐$ ‐$ ‐$
Fiscal Year
Table 5
Project Name 2022 2023 2024 2025 2026ADA CURB CUTS 737,494$ ‐$ ‐$ ‐$ ‐$
Airport, Pebble Hills Lighting 1,037,869$ 5,881,255$ ‐$ ‐$ ‐$
Alabama Drainage Ditch Replace 369,946$ ‐$ ‐$ ‐$ ‐$
Alameda & Carolina Improvemnts 92,344$ ‐$ ‐$ ‐$ ‐$
Alameda Corridor Plan 300,000$ ‐$ ‐$ ‐$ ‐$
Bicycle Connecivity Infras.Ph2 515,933$ ‐$ ‐$ ‐$ ‐$
Bicycle Connect Infras Imp.Ph1 333,618$ ‐$ ‐$ ‐$ ‐$
Bicycle Infrastructure Citywde 485,483$ 4,809,131$ ‐$ ‐$ ‐$
Blighted Properties Unallocate 387,435$ 193,717$ ‐$ ‐$ ‐$
BUS ASSC TRANSIT ENHANCEMENTS ‐$ ‐$ 311,696$ ‐$ ‐$
Bus Purchases ‐$ 424,000$ ‐$ ‐$ ‐$
BUS RLING STCK (BUS PURCHASES) 5,676,571$ 2,378,181$ 7,100,000$ 812,125$ ‐$
BUS STATIONS/STOPS/TERMINALS 670,325$ ‐$ ‐$ ‐$ ‐$
Bus Stop Enhancements Phase IV 1,137,904$ 316,434$ ‐$ ‐$ ‐$
Campbell at Union Pacific RR 15,000$ 138,947$ ‐$ 2,007,295$ 2,007,295$
CBD Phase 4 1,701,474$ 1,383,874$ ‐$ ‐$ ‐$
Chamizal Neighbor.Ped.Enh.Ph 2 207,933$ ‐$ ‐$ ‐$ ‐$
City 2 HVAC Control Syst CIP20 691,175$ ‐$ ‐$ ‐$ ‐$
Citywide PCI Refresh 675,000$ ‐$ ‐$ ‐$ ‐$
Code Re‐Write 150,000$ ‐$ ‐$ ‐$ ‐$
Cohen Site Readiness 876,755$ 438,377$ ‐$ ‐$ ‐$
Cohen Stadium Canopy Improveme 99,857$ ‐$ ‐$ ‐$ ‐$
Delta Street at Playa Drain 1,442,591$ 914,508$ ‐$ ‐$ ‐$
Delta Yard CMU Bldg Demolition 315,006$ ‐$ ‐$ ‐$ ‐$
Doniphan & Bird Traffic Signal 262,966$ 131,483$ ‐$ ‐$ ‐$
Doniphan & West Green TrafSign 217,625$ 108,813$ ‐$ ‐$ ‐$
Downtown Bicycle Imprvmts Ph I ‐$ ‐$ 2,288,763$ ‐$ ‐$
Downtown Uptown Plan 250,000$ ‐$ ‐$ ‐$ ‐$
DYER RTS 335,688$ 3,422,536$ ‐$ ‐$ ‐$
Edgemere and Resler Lighting 2,358,019$ 6,681,055$ 6,681,055$ ‐$ ‐$
Edna E & Cortez Pkg 4 2,744,269$ 1,372,135$ ‐$ ‐$ ‐$
EL PASO CITY WIDE WAYFINDING 442,093$ 221,047$ ‐$ ‐$ ‐$
Elena, Feliz & Encno S Pkg 2 1,160,498$ ‐$ ‐$ ‐$ ‐$
ENCINO N Vargas Cortez N Pkg 1 527,601$ ‐$ ‐$ ‐$ ‐$
Franklin Canal at Davis Street 64,254$ ‐$ ‐$ ‐$ ‐$
FY 2022 ADA Curb Cuts 500,000$ ‐$ ‐$ ‐$ ‐$
FY15‐5339 Bus & Bus Facilities 72,110$ 1,200,000$ ‐$ ‐$ ‐$
FY20 CITY WIDE FACILITIES 39,174$ ‐$ ‐$ ‐$ ‐$
Huntr MCombs Trwood RojasLight 1,365,511$ 3,868,949$ 3,868,949$ ‐$ ‐$
Market Assessment 110,000$ ‐$ ‐$ ‐$ ‐$
MCA Sun City Lights CIP20 530,400$ 265,200$ ‐$ ‐$ ‐$
MESA RAPID TRANSIT SYSTEM 662,465$ ‐$ ‐$ ‐$ ‐$
MONTANA FAR EAST TRANSFER CTR 2,358,079$ ‐$ ‐$ ‐$ ‐$
MONTANA RTS 6,705,696$ ‐$ ‐$ ‐$ ‐$
MONTANA RTS‐ AIRPORT 1,275,672$ ‐$ ‐$ ‐$ ‐$
MONTANA SIDEWALK IMPROVEMENTS 790,346$ ‐$ ‐$ ‐$ ‐$
Montana Widening ROW Contribut 748,312$ ‐$ ‐$ ‐$ ‐$
Montoya Heights/ Ethel / Annie 240,145$ 334,196$ ‐$ ‐$ ‐$
Neigh. Traff. Mgmt. Prg. CIP20 252,395$ ‐$ ‐$ ‐$ ‐$
NTMP YR 7‐2019 Street Infrast 745,409$ ‐$ ‐$ ‐$ ‐$
Oregon Street Lighting & ADA 1,418,987$ ‐$ ‐$ ‐$ ‐$
PED SIDEWALK&PARKWY IMP MASTER 1,399,292$ ‐$ ‐$ ‐$ ‐$
Fiscal Year
372
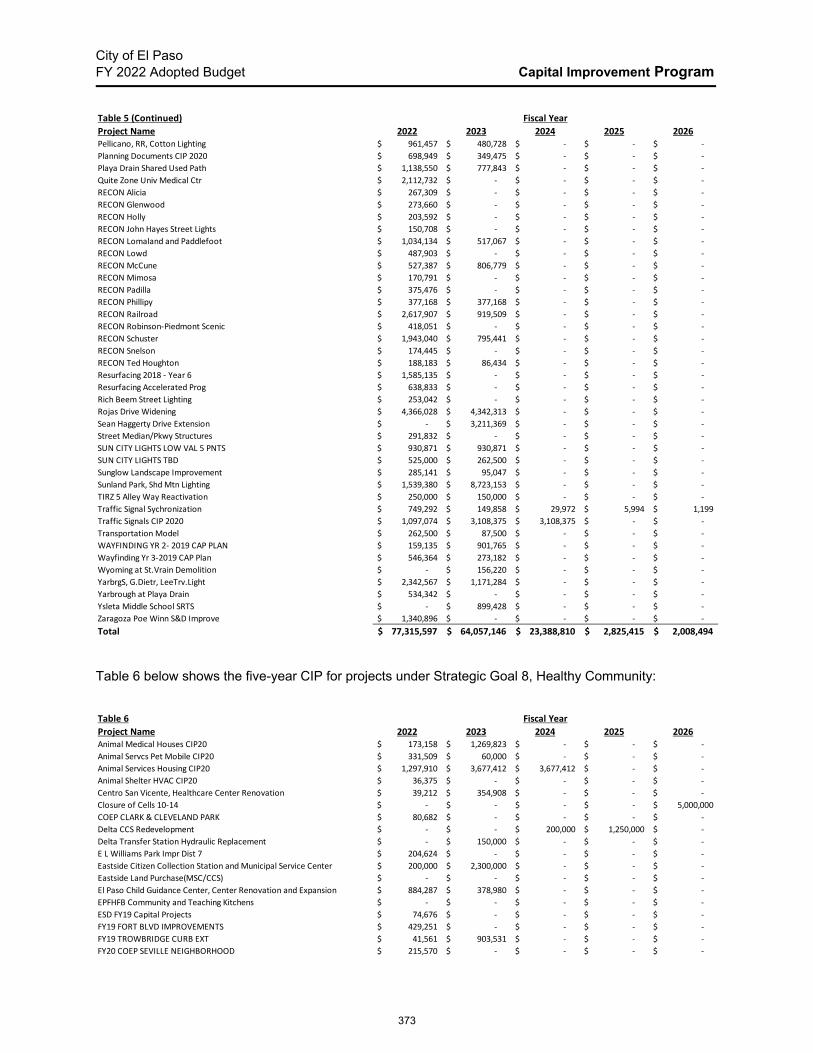
City of El Paso FY 2022 Adopted Budget Capital Improvement Program
Table 6 below shows the five-year CIP for projects under Strategic Goal 8, Healthy Community:
Table 5 (Continued)
Project Name 2022 2023 2024 2025 2026Pellicano, RR, Cotton Lighting 961,457$ 480,728$ ‐$ ‐$ ‐$
Planning Documents CIP 2020 698,949$ 349,475$ ‐$ ‐$ ‐$
Playa Drain Shared Used Path 1,138,550$ 777,843$ ‐$ ‐$ ‐$
Quite Zone Univ Medical Ctr 2,112,732$ ‐$ ‐$ ‐$ ‐$
RECON Alicia 267,309$ ‐$ ‐$ ‐$ ‐$
RECON Glenwood 273,660$ ‐$ ‐$ ‐$ ‐$
RECON Holly 203,592$ ‐$ ‐$ ‐$ ‐$
RECON John Hayes Street Lights 150,708$ ‐$ ‐$ ‐$ ‐$
RECON Lomaland and Paddlefoot 1,034,134$ 517,067$ ‐$ ‐$ ‐$
RECON Lowd 487,903$ ‐$ ‐$ ‐$ ‐$
RECON McCune 527,387$ 806,779$ ‐$ ‐$ ‐$
RECON Mimosa 170,791$ ‐$ ‐$ ‐$ ‐$
RECON Padilla 375,476$ ‐$ ‐$ ‐$ ‐$
RECON Phillipy 377,168$ 377,168$ ‐$ ‐$ ‐$
RECON Railroad 2,617,907$ 919,509$ ‐$ ‐$ ‐$
RECON Robinson‐Piedmont Scenic 418,051$ ‐$ ‐$ ‐$ ‐$
RECON Schuster 1,943,040$ 795,441$ ‐$ ‐$ ‐$
RECON Snelson 174,445$ ‐$ ‐$ ‐$ ‐$
RECON Ted Houghton 188,183$ 86,434$ ‐$ ‐$ ‐$
Resurfacing 2018 ‐ Year 6 1,585,135$ ‐$ ‐$ ‐$ ‐$
Resurfacing Accelerated Prog 638,833$ ‐$ ‐$ ‐$ ‐$
Rich Beem Street Lighting 253,042$ ‐$ ‐$ ‐$ ‐$
Rojas Drive Widening 4,366,028$ 4,342,313$ ‐$ ‐$ ‐$
Sean Haggerty Drive Extension ‐$ 3,211,369$ ‐$ ‐$ ‐$
Street Median/Pkwy Structures 291,832$ ‐$ ‐$ ‐$ ‐$
SUN CITY LIGHTS LOW VAL 5 PNTS 930,871$ 930,871$ ‐$ ‐$ ‐$
SUN CITY LIGHTS TBD 525,000$ 262,500$ ‐$ ‐$ ‐$
Sunglow Landscape Improvement 285,141$ 95,047$ ‐$ ‐$ ‐$
Sunland Park, Shd Mtn Lighting 1,539,380$ 8,723,153$ ‐$ ‐$ ‐$
TIRZ 5 Alley Way Reactivation 250,000$ 150,000$ ‐$ ‐$ ‐$
Traffic Signal Sychronization 749,292$ 149,858$ 29,972$ 5,994$ 1,199$
Traffic Signals CIP 2020 1,097,074$ 3,108,375$ 3,108,375$ ‐$ ‐$
Transportation Model 262,500$ 87,500$ ‐$ ‐$ ‐$
WAYFINDING YR 2‐ 2019 CAP PLAN 159,135$ 901,765$ ‐$ ‐$ ‐$
Wayfinding Yr 3‐2019 CAP Plan 546,364$ 273,182$ ‐$ ‐$ ‐$
Wyoming at St.Vrain Demolition ‐$ 156,220$ ‐$ ‐$ ‐$
YarbrgS, G.Dietr, LeeTrv.Light 2,342,567$ 1,171,284$ ‐$ ‐$ ‐$
Yarbrough at Playa Drain 534,342$ ‐$ ‐$ ‐$ ‐$
Ysleta Middle School SRTS ‐$ 899,428$ ‐$ ‐$ ‐$
Zaragoza Poe Winn S&D Improve 1,340,896$ ‐$ ‐$ ‐$ ‐$
Total 77,315,597$ 64,057,146$ 23,388,810$ 2,825,415$ 2,008,494$
Fiscal Year
Table 6
Project Name 2022 2023 2024 2025 2026Animal Medical Houses CIP20 173,158$ 1,269,823$ ‐$ ‐$ ‐$
Animal Servcs Pet Mobile CIP20 331,509$ 60,000$ ‐$ ‐$ ‐$
Animal Services Housing CIP20 1,297,910$ 3,677,412$ 3,677,412$ ‐$ ‐$
Animal Shelter HVAC CIP20 36,375$ ‐$ ‐$ ‐$ ‐$
Centro San Vicente, Healthcare Center Renovation 39,212$ 354,908$ ‐$ ‐$ ‐$
Closure of Cells 10‐14 ‐$ ‐$ ‐$ ‐$ 5,000,000$
COEP CLARK & CLEVELAND PARK 80,682$ ‐$ ‐$ ‐$ ‐$
Delta CCS Redevelopment ‐$ ‐$ 200,000$ 1,250,000$ ‐$
Delta Transfer Station Hydraulic Replacement ‐$ 150,000$ ‐$ ‐$ ‐$
E L Williams Park Impr Dist 7 204,624$ ‐$ ‐$ ‐$ ‐$
Eastside Citizen Collection Station and Municipal Service Center 200,000$ 2,300,000$ ‐$ ‐$ ‐$
Eastside Land Purchase(MSC/CCS) ‐$ ‐$ ‐$ ‐$ ‐$
El Paso Child Guidance Center, Center Renovation and Expansion 884,287$ 378,980$ ‐$ ‐$ ‐$
EPFHFB Community and Teaching Kitchens ‐$ ‐$ ‐$ ‐$ ‐$
ESD FY19 Capital Projects 74,676$ ‐$ ‐$ ‐$ ‐$
FY19 FORT BLVD IMPROVEMENTS 429,251$ ‐$ ‐$ ‐$ ‐$
FY19 TROWBRIDGE CURB EXT 41,561$ 903,531$ ‐$ ‐$ ‐$
FY20 COEP SEVILLE NEIGHBORHOOD 215,570$ ‐$ ‐$ ‐$ ‐$
Fiscal Year
373

City of El Paso FY 2022 Adopted Budget Capital Improvement Program
Table 6 (Continued)
Project Name 2022 2023 2024 2025 2026FY20 YWCA SHIRLEY LEAVELL REHA 1,329,313$ ‐$ ‐$ ‐$ ‐$
HADDOX FAMILY PARK IMPROVEMENT 83,122$ ‐$ ‐$ ‐$ ‐$
Hondo Pass CCS PDC ‐$ ‐$ ‐$ ‐$ ‐$
HUECO MOUNT PARK IMPROVEMENTS 127,958$ ‐$ ‐$ ‐$ ‐$
JP Shawver Park Handball Court 295,800$ ‐$ ‐$ ‐$ ‐$
Landfil Breakroom ‐$ ‐$ ‐$ ‐$ ‐$
Landfil enterance Road Rebuild ‐$ ‐$ 150,000$ 2,600,000$ ‐$
Landfill Closure Design/Construction Cells 1‐10 ‐$ ‐$ ‐$ ‐$ ‐$
Landfill Scale Replacment ‐$ ‐$ ‐$ ‐$ ‐$
MANHATTAN HEIGHTS ARCHWAY LGHT 102,608$ 51,304$ ‐$ ‐$ ‐$
MSC Shop Upgrades 500,000$ ‐$ ‐$ ‐$ 500,000$
NEIGHB IMP PROG RND4 ENG COSTS 150,000$ 276,640$ ‐$ ‐$ ‐$
New Landfil Cell Design and Construction 14‐18 ‐$ 200,000$ 9,500,000$ ‐$ ‐$
NORTH SKIES PARK IMPROVEMENTS 296,691$ ‐$ ‐$ ‐$ ‐$
Playa Drain Trail (Knights Dr to Yarbrough) 782,111$ 439,727$ ‐$ ‐$ ‐$
Pueblo Viejo Park Improvements 329,552$ ‐$ ‐$ ‐$ ‐$
Tom Lea Lower Park Dog Run 50,436$ 414,418$ ‐$ ‐$ ‐$
Westside CCS P/D/C 2,359,000$ ‐$ ‐$ ‐$ ‐$
YWCA, Joyce Jaynes Branch Renovation 140,920$ 1,247,029$ ‐$ ‐$ ‐$
Total 10,556,326$ 11,723,773$ 13,527,412$ 3,850,000$ 5,500,000$
Fiscal Year
374
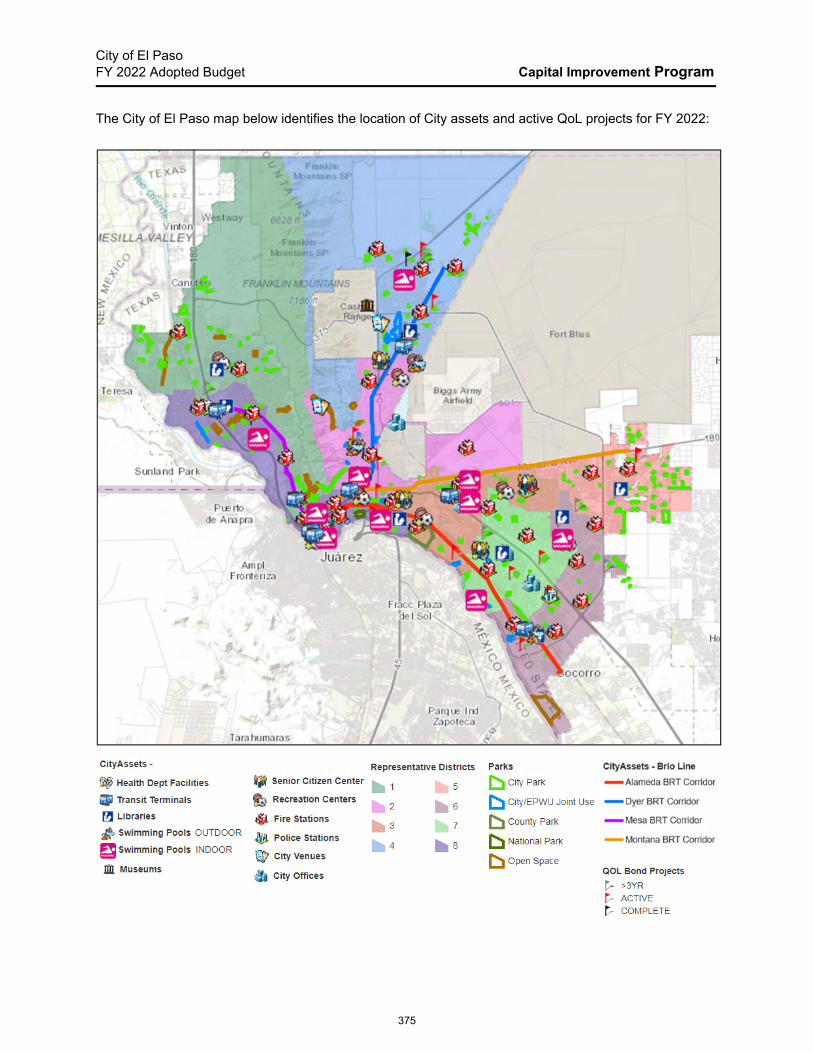
City of El Paso FY 2022 Adopted Budget Capital Improvement Program
The City of El Paso map below identifies the location of City assets and active QoL projects for FY 2022:
375
City of El Paso FY 2022 Adopted Budget Capital Improvement Program
CIP – Project Descriptions
The following are detailed descriptions of the active projects budgeted for FY 2022:
376

ALABAMA BRIDGE RECONSTRUCTION
ALIGNMENT WITH STRATEGIC PLAN: PROJECT ALIGNS WITH THE CITY OF EL
PASO’S STRATEGIC PLAN GOAL 7 - TO “ENHANCE AND SUSTAIN EL PASO’SINFRASTRUCTURE NETWORK.”
PROJECT INFORMATION
☐ This project is part of the bridge reconstruction list for 2020, which includes the Alabama, Davis,Delta, and Yarbrough bridges. The Project will include deck and approaches reconstruction, aswell as an ADA compliant path. The City was awarded with State funding to perform a fullreplacement.
PROJECT DETAILS
☐ Location: From 150 feet North of Rosemont Canyon Road to 150 feet South of RosemontCanyon Road
☐ District: 2☐ Managing Department: Capital Improvement☐ Estimated Completion: Fall 2021
PROJECT GOAL/BENEFITS
☐ Provide a safe crossing for vehicles and pedestrians over a storm water ditch☐ Provide an ADA compliant crossing
PROJECT BUDGET
Sources of Funding:
Initial Budget
Pre FY 2022 Expenditures
FY 2022 Projected
Future FY Expenditures
Projected Budget
2011 CO Issuance 81,000$ 71,235$ -$ -$ 71,235$
2018 CO Issuance 133,193$ 34,687$ 96,440$ -$ 131,127$
Outside Sources 65,880$ 43,050$ -$ -$ 43,050$
TxDOT Capital 1,307,457$ 927,468$ 273,507$ -$ 1,200,975$
Total 1,587,530$ 1,076,440$ 369,946$ -$ 1,446,386$
377

BICYCLE CONNECTIVITY PHASE I
ALIGNMENT WITH STRATEGIC PLAN: PROJECT ALIGNS WITH THE CITY OF EL
PASO’S STRATEGIC PLAN GOAL 7 - TO “ENHANCE AND SUSTAIN EL PASO’SINFRASTRUCTURE NETWORK.”
PROJECT INFORMATION
☐ This project will improve existing conditions following El Paso Bike Plan. Construct bicyclefacilities citywide to include: buffered bike lanes, conventional bike lanes, bicycle boulevards, andshared lane markings. The project will include associated signage, wayfinding, striping, andintersection treatments.
PROJECT DETAILS
☐ Location: Multiple Locations☐ District: 1, 2, 3, 4, & 8☐ Managing Department: Capital Improvement☐ Estimated Completion: Fall 2021
PROJECT GOAL/BENEFITS
☐ Construct safe bicycle facilities citywide☐ Promote the use of bicycles as a means of transportation
PROJECT BUDGET
Sources of Funding:
Initial Budget
Pre FY 2022 Expenditures
FY 2022 Projected
Future FY Expenditures
Projected Budget
2011 CO Issuance 1,747$ 1,747$ -$ -$ 1,747$
TxDOT Capital 2,288,763$ -$ 2,288,763$ 2,288,763$
Total 2,290,510$ 1,747$ -$ 2,288,763$ 2,290,510$
378
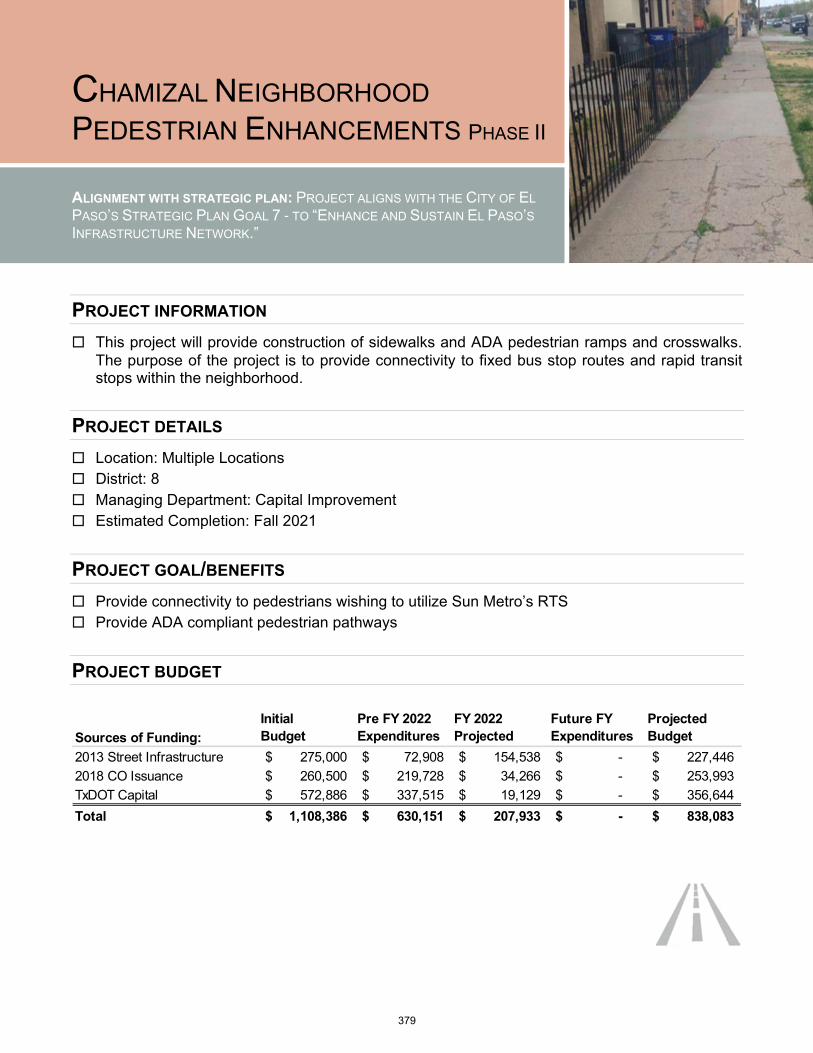
CHAMIZAL NEIGHBORHOOD
PEDESTRIAN ENHANCEMENTS PHASE II
ALIGNMENT WITH STRATEGIC PLAN: PROJECT ALIGNS WITH THE CITY OF EL
PASO’S STRATEGIC PLAN GOAL 7 - TO “ENHANCE AND SUSTAIN EL PASO’SINFRASTRUCTURE NETWORK.”
PROJECT INFORMATION
☐ This project will provide construction of sidewalks and ADA pedestrian ramps and crosswalks.The purpose of the project is to provide connectivity to fixed bus stop routes and rapid transitstops within the neighborhood.
PROJECT DETAILS
☐ Location: Multiple Locations☐ District: 8☐ Managing Department: Capital Improvement☐ Estimated Completion: Fall 2021
PROJECT GOAL/BENEFITS
☐ Provide connectivity to pedestrians wishing to utilize Sun Metro’s RTS☐ Provide ADA compliant pedestrian pathways
PROJECT BUDGET
Sources of Funding:
Initial Budget
Pre FY 2022 Expenditures
FY 2022 Projected
Future FY Expenditures
Projected Budget
2013 Street Infrastructure 275,000$ 72,908$ 154,538$ -$ 227,446$
2018 CO Issuance 260,500$ 219,728$ 34,266$ -$ 253,993$
TxDOT Capital 572,886$ 337,515$ 19,129$ -$ 356,644$
Total 1,108,386$ 630,151$ 207,933$ -$ 838,083$
379
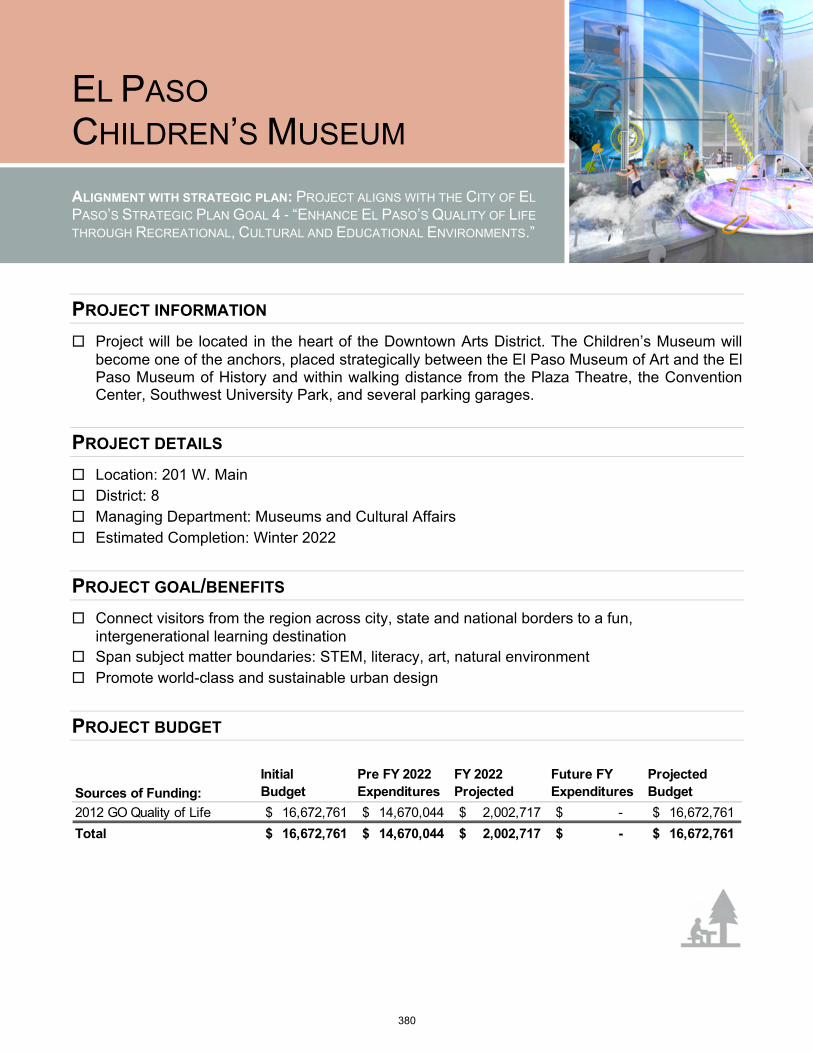
EL PASO CHILDREN’S MUSEUM
ALIGNMENT WITH STRATEGIC PLAN: PROJECT ALIGNS WITH THE CITY OF EL
PASO’S STRATEGIC PLAN GOAL 4 - “ENHANCE EL PASO’S QUALITY OF LIFE
THROUGH RECREATIONAL, CULTURAL AND EDUCATIONAL ENVIRONMENTS.”
PROJECT INFORMATION
☐ Project will be located in the heart of the Downtown Arts District. The Children’s Museum willbecome one of the anchors, placed strategically between the El Paso Museum of Art and the ElPaso Museum of History and within walking distance from the Plaza Theatre, the ConventionCenter, Southwest University Park, and several parking garages.
PROJECT DETAILS
☐ Location: 201 W. Main☐ District: 8☐ Managing Department: Museums and Cultural Affairs☐ Estimated Completion: Winter 2022
PROJECT GOAL/BENEFITS
☐ Connect visitors from the region across city, state and national borders to a fun,intergenerational learning destination
☐ Span subject matter boundaries: STEM, literacy, art, natural environment☐ Promote world-class and sustainable urban design
PROJECT BUDGET
Sources of Funding:
Initial Budget
Pre FY 2022 Expenditures
FY 2022 Projected
Future FY Expenditures
Projected Budget
2012 GO Quality of Life 16,672,761$ 14,670,044$ 2,002,717$ -$ 16,672,761$
Total 16,672,761$ 14,670,044$ 2,002,717$ -$ 16,672,761$
380
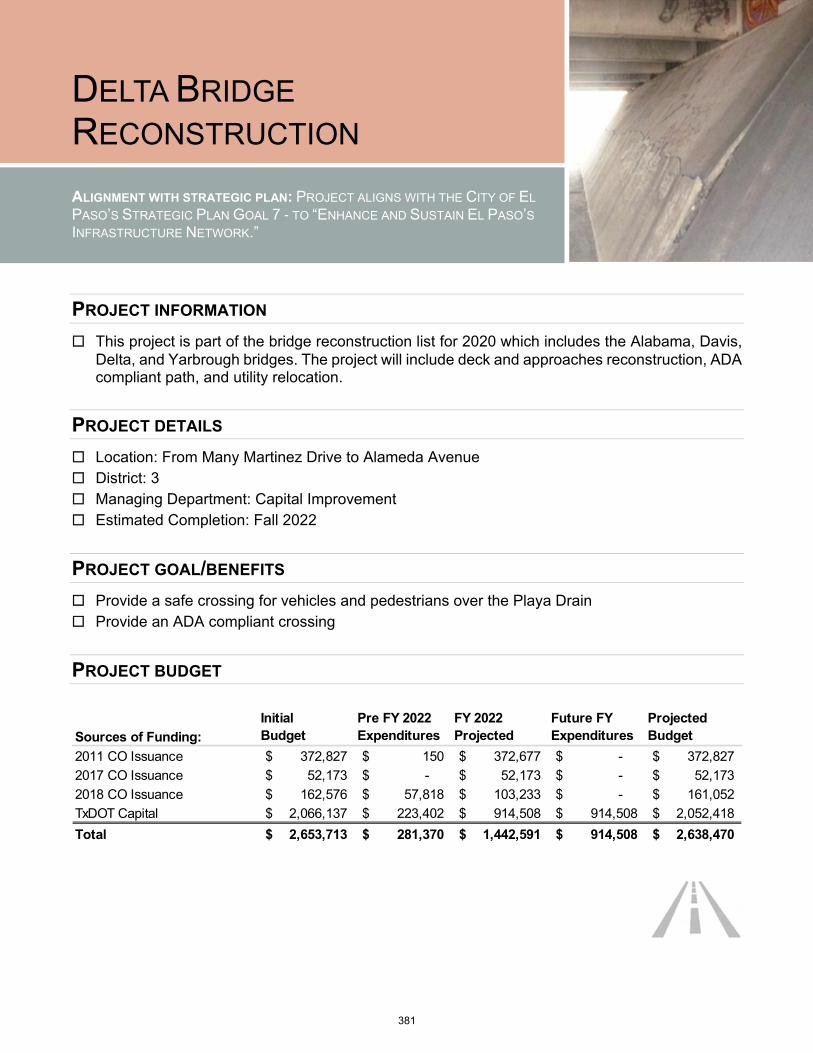
DELTA BRIDGE
RECONSTRUCTION
ALIGNMENT WITH STRATEGIC PLAN: PROJECT ALIGNS WITH THE CITY OF EL
PASO’S STRATEGIC PLAN GOAL 7 - TO “ENHANCE AND SUSTAIN EL PASO’SINFRASTRUCTURE NETWORK.”
PROJECT INFORMATION
☐ This project is part of the bridge reconstruction list for 2020 which includes the Alabama, Davis,Delta, and Yarbrough bridges. The project will include deck and approaches reconstruction, ADAcompliant path, and utility relocation.
PROJECT DETAILS
☐ Location: From Many Martinez Drive to Alameda Avenue☐ District: 3☐ Managing Department: Capital Improvement☐ Estimated Completion: Fall 2022
PROJECT GOAL/BENEFITS
☐ Provide a safe crossing for vehicles and pedestrians over the Playa Drain☐ Provide an ADA compliant crossing
PROJECT BUDGET
Sources of Funding:
Initial Budget
Pre FY 2022 Expenditures
FY 2022 Projected
Future FY Expenditures
Projected Budget
2011 CO Issuance 372,827$ 150$ 372,677$ -$ 372,827$
2017 CO Issuance 52,173$ -$ 52,173$ -$ 52,173$
2018 CO Issuance 162,576$ 57,818$ 103,233$ -$ 161,052$
TxDOT Capital 2,066,137$ 223,402$ 914,508$ 914,508$ 2,052,418$
Total 2,653,713$ 281,370$ 1,442,591$ 914,508$ 2,638,470$
381
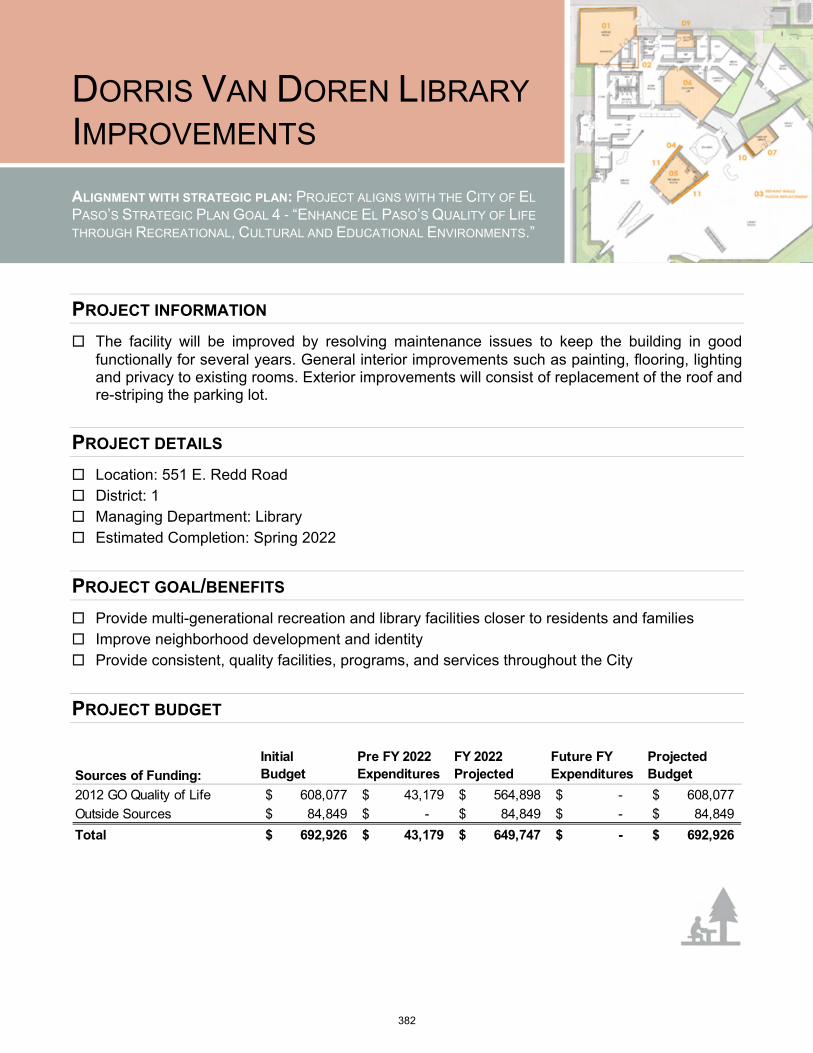
DORRIS VAN DOREN LIBRARY
IMPROVEMENTS
ALIGNMENT WITH STRATEGIC PLAN: PROJECT ALIGNS WITH THE CITY OF EL
PASO’S STRATEGIC PLAN GOAL 4 - “ENHANCE EL PASO’S QUALITY OF LIFE
THROUGH RECREATIONAL, CULTURAL AND EDUCATIONAL ENVIRONMENTS.”
PROJECT INFORMATION
☐ The facility will be improved by resolving maintenance issues to keep the building in goodfunctionally for several years. General interior improvements such as painting, flooring, lightingand privacy to existing rooms. Exterior improvements will consist of replacement of the roof andre-striping the parking lot.
PROJECT DETAILS
☐ Location: 551 E. Redd Road☐ District: 1☐ Managing Department: Library☐ Estimated Completion: Spring 2022
PROJECT GOAL/BENEFITS
☐ Provide multi-generational recreation and library facilities closer to residents and families☐ Improve neighborhood development and identity☐ Provide consistent, quality facilities, programs, and services throughout the City
PROJECT BUDGET
Sources of Funding:
Initial Budget
Pre FY 2022 Expenditures
FY 2022 Projected
Future FY Expenditures
Projected Budget
2012 GO Quality of Life 608,077$ 43,179$ 564,898$ -$ 608,077$
Outside Sources 84,849$ -$ 84,849$ -$ 84,849$
Total 692,926$ 43,179$ 649,747$ -$ 692,926$
382
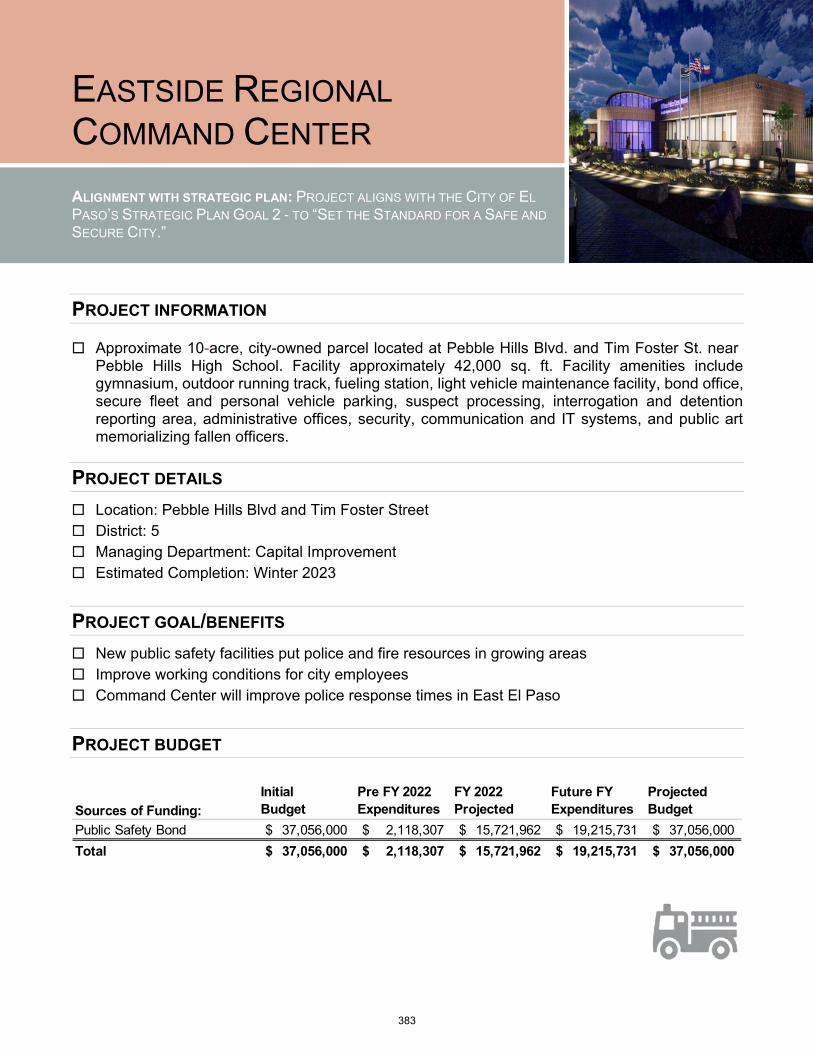
EASTSIDE REGIONAL
COMMAND CENTER
ALIGNMENT WITH STRATEGIC PLAN: PROJECT ALIGNS WITH THE CITY OF EL
PASO’S STRATEGIC PLAN GOAL 2 - TO “SET THE STANDARD FOR A SAFE AND
SECURE CITY.”
PROJECT INFORMATION
☐ Approximate 10-acre, city-owned parcel located at Pebble Hills Blvd. and Tim Foster St. nearPebble Hills High School. Facility approximately 42,000 sq. ft. Facility amenities includegymnasium, outdoor running track, fueling station, light vehicle maintenance facility, bond office,secure fleet and personal vehicle parking, suspect processing, interrogation and detentionreporting area, administrative offices, security, communication and IT systems, and public artmemorializing fallen officers.
PROJECT DETAILS
☐ Location: Pebble Hills Blvd and Tim Foster Street☐ District: 5☐ Managing Department: Capital Improvement☐ Estimated Completion: Winter 2023
PROJECT GOAL/BENEFITS
☐ New public safety facilities put police and fire resources in growing areas☐ Improve working conditions for city employees☐ Command Center will improve police response times in East El Paso
PROJECT BUDGET
Sources of Funding:
Initial Budget
Pre FY 2022 Expenditures
FY 2022 Projected
Future FY Expenditures
Projected Budget
Public Safety Bond 37,056,000$ 2,118,307$ 15,721,962$ 19,215,731$ 37,056,000$
Total 37,056,000$ 2,118,307$ 15,721,962$ 19,215,731$ 37,056,000$
383

THE BEAST URBAN PARK (EASTSIDE REGIONAL PARK) - PHASE II
ALIGNMENT WITH STRATEGIC PLAN: PROJECT ALIGNS WITH THE CITY OF EL
PASO’S STRATEGIC PLAN GOAL 4 - “ENHANCE EL PASO’S QUALITY OF LIFE
THROUGH RECREATIONAL, CULTURAL AND EDUCATIONAL ENVIRONMENTS.”
PROJECT INFORMATION
☐ Phase 2 of Eastside Regional Park consists of two Baseball diamond fields, three flat fields, twosand Volleyball courts, one multiuse court, six handball courts, two public restrooms, a walkingpath around Phase 2, parking and space for food trucks, and a small Maintenance yard. This willcreate a large destination for visitors of all ages throughout El Paso to come and visit the complex.
PROJECT DETAILS
☐ Location: 13501 Jason Crandall☐ District: 5☐ Managing Department: Parks and Recreation☐ Estimated Completion: TBD
PROJECT GOAL/BENEFITS
☐ Promote a healthier community by providing a wide range of amenities☐ Provide various activities for swimmers and non-swimmers☐ Provide additional sports facilities for East El Paso
PROJECT BUDGET
Sources of Funding:
Initial Budget
Pre FY 2022 Expenditures
FY 2022 Projected
Future FY Expenditures
Projected Budget
2017 CO Issuance 11,576,000$ 2,045,235$ 3,176,922$ 6,067,798$ 11,289,954$
Total 11,576,000$ 2,045,235$ 3,176,922$ 6,067,798$ 11,289,954$
384
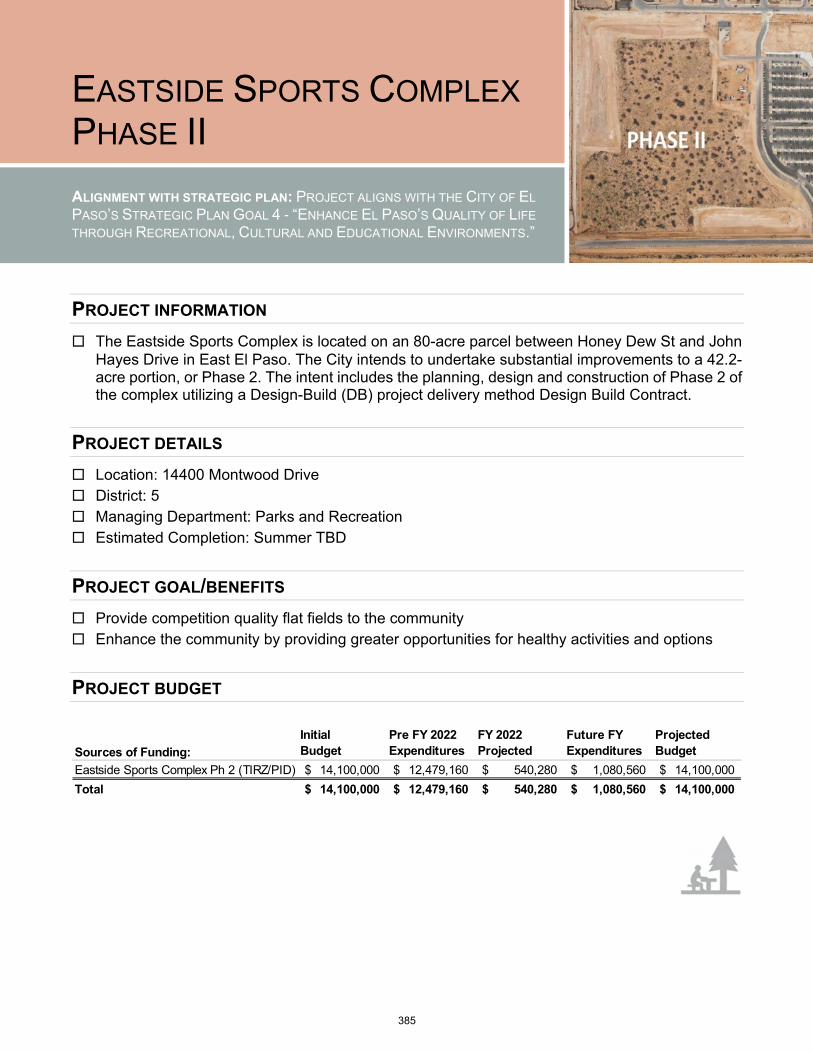
EASTSIDE SPORTS COMPLEX
PHASE II
ALIGNMENT WITH STRATEGIC PLAN: PROJECT ALIGNS WITH THE CITY OF EL
PASO’S STRATEGIC PLAN GOAL 4 - “ENHANCE EL PASO’S QUALITY OF LIFE
THROUGH RECREATIONAL, CULTURAL AND EDUCATIONAL ENVIRONMENTS.”
PROJECT INFORMATION
☐ The Eastside Sports Complex is located on an 80-acre parcel between Honey Dew St and JohnHayes Drive in East El Paso. The City intends to undertake substantial improvements to a 42.2-acre portion, or Phase 2. The intent includes the planning, design and construction of Phase 2 ofthe complex utilizing a Design-Build (DB) project delivery method Design Build Contract.
PROJECT DETAILS
☐ Location: 14400 Montwood Drive☐ District: 5☐ Managing Department: Parks and Recreation☐ Estimated Completion: Summer TBD
PROJECT GOAL/BENEFITS
☐ Provide competition quality flat fields to the community☐ Enhance the community by providing greater opportunities for healthy activities and options
PROJECT BUDGET
Sources of Funding:
Initial Budget
Pre FY 2022 Expenditures
FY 2022 Projected
Future FY Expenditures
Projected Budget
Eastside Sports Complex Ph 2 (TIRZ/PID) 14,100,000$ 12,479,160$ 540,280$ 1,080,560$ 14,100,000$
Total 14,100,000$ 12,479,160$ 540,280$ 1,080,560$ 14,100,000$
385
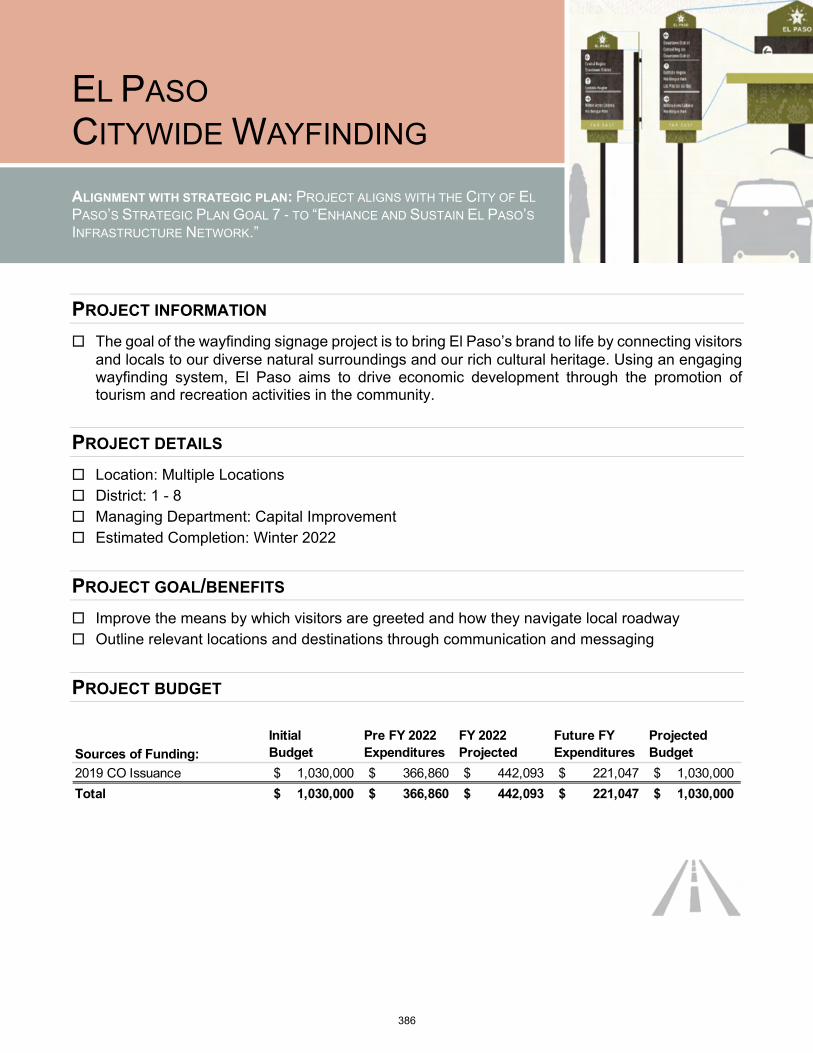
EL PASO CITYWIDE WAYFINDING
ALIGNMENT WITH STRATEGIC PLAN: PROJECT ALIGNS WITH THE CITY OF EL
PASO’S STRATEGIC PLAN GOAL 7 - TO “ENHANCE AND SUSTAIN EL PASO’SINFRASTRUCTURE NETWORK.”
PROJECT INFORMATION
☐ The goal of the wayfinding signage project is to bring El Paso’s brand to life by connecting visitorsand locals to our diverse natural surroundings and our rich cultural heritage. Using an engagingwayfinding system, El Paso aims to drive economic development through the promotion oftourism and recreation activities in the community.
PROJECT DETAILS
☐ Location: Multiple Locations☐ District: 1 - 8☐ Managing Department: Capital Improvement☐ Estimated Completion: Winter 2022
PROJECT GOAL/BENEFITS
☐ Improve the means by which visitors are greeted and how they navigate local roadway☐ Outline relevant locations and destinations through communication and messaging
PROJECT BUDGET
Sources of Funding:
Initial Budget
Pre FY 2022 Expenditures
FY 2022 Projected
Future FY Expenditures
Projected Budget
2019 CO Issuance 1,030,000$ 366,860$ 442,093$ 221,047$ 1,030,000$
Total 1,030,000$ 366,860$ 442,093$ 221,047$ 1,030,000$
386

ESPERANZA MORENO LIBRARY IMPROVEMENTS
ALIGNMENT WITH STRATEGIC PLAN: PROJECT ALIGNS WITH THE CITY OF EL
PASO’S STRATEGIC PLAN GOAL 4 - “ENHANCE EL PASO’S QUALITY OF LIFE
THROUGH RECREATIONAL, CULTURAL AND EDUCATIONAL ENVIRONMENTS.”
PROJECT INFORMATION
☐ The facility will be improved by resolving maintenance issues to keep the building in goodfunctionally for several years. Interior improvements will consist in paint, provide privacy toexisting rooms and the exterior improvements will be the replacement of the roof and screenwalls to minimize noise from the mechanical equipment.
PROJECT DETAILS
☐ Location: 12480 Pebble Hills☐ District: 5☐ Managing Department: Library☐ Estimated Completion: Fall 2021
PROJECT GOAL/BENEFITS
☐ Provide multi-generational recreation and library facilities closer to residents and families☐ Improve neighborhood development and identity☐ Provide consistent, quality facilities, programs, and services throughout the City
PROJECT BUDGET
Sources of Funding:
Initial Budget
Pre FY 2022 Expenditures
FY 2022 Projected
Future FY Expenditures
Projected Budget
2012 GO Quality of Life 706,154$ 470,841$ 235,313$ -$ 706,154$
Outside Sources 84,849$ -$ 84,849$ -$ 84,849$
Total 791,003$ 470,841$ 320,162$ -$ 791,003$
387

FAR EAST TRANSFER CENTER
ALIGNMENT WITH STRATEGIC PLAN: PROJECT ALIGNS WITH THE CITY OF EL
PASO’S STRATEGIC PLAN GOAL 7 - TO “ENHANCE AND SUSTAIN EL PASO’SINFRASTRUCTURE NETWORK.”
PROJECT INFORMATION
☐ The project will include a terminal building with waiting areas, drivers lounge, security office,restrooms, IT room, concessions, community meeting room, bus bays for the Montana RTSbuses and local routes, landscape & illumination, as well as a park and ride parking lot with 156spaces.
PROJECT DETAILS
☐ Location: Edgemere & RC Poe☐ District: 5☐ Managing Department: Mass Transit - Sun Metro☐ Estimated Completion: Winter 2021
PROJECT GOAL/BENEFITS
☐ Provide customers with a Transfer Center on Far East growing area of our region☐ Users will have transportation options, save money and reduce their carbon footprint☐ Offer El Paso Region with a premier form of transportation
PROJECT BUDGET
Sources of Funding:
Initial Budget
Pre FY 2022 Expenditures
FY 2022 Projected
Future FY Expenditures
Projected Budget
2018 CO Issuance 1,000,000$ 621,820$ 378,180$ -$ 1,000,000$
2020 CO Issuance 923,266$ 871,231$ 52,035$ -$ 923,266$
Sun Metro Grants 4,000,000$ 2,072,136$ 1,927,864$ -$ 4,000,000$
Total 5,923,266$ 3,565,187$ 2,358,079$ -$ 5,923,266$
388
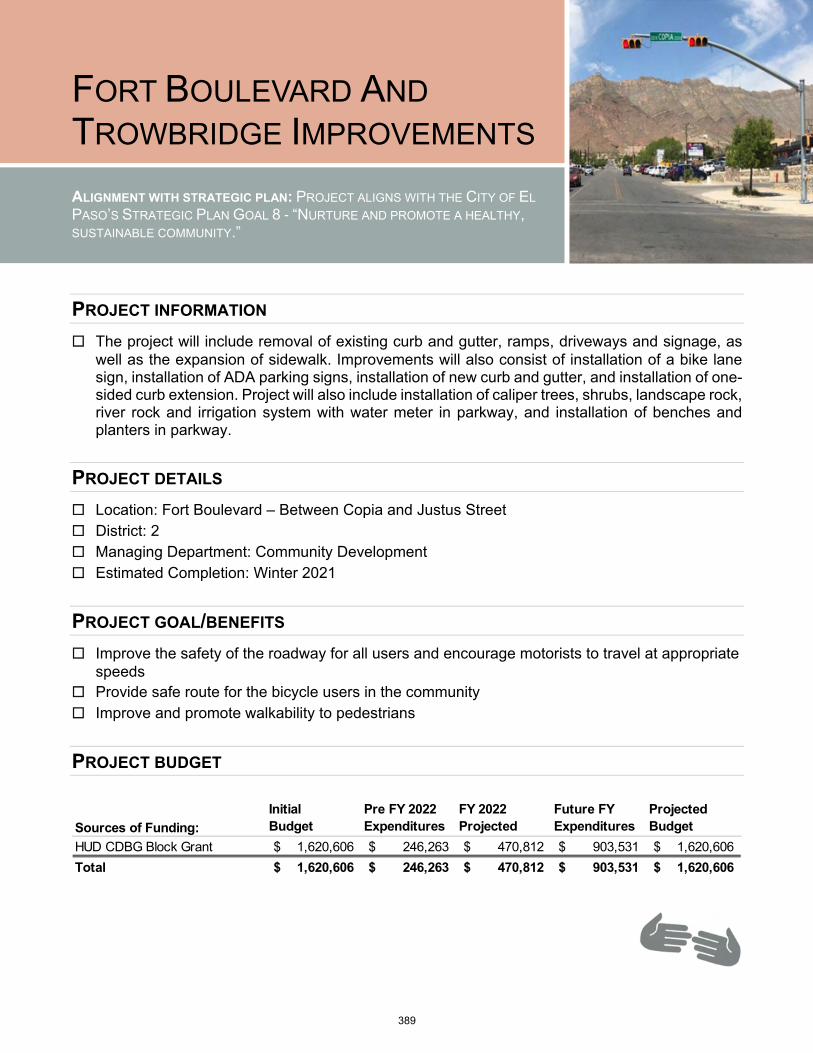
FORT BOULEVARD AND
TROWBRIDGE IMPROVEMENTS
ALIGNMENT WITH STRATEGIC PLAN: PROJECT ALIGNS WITH THE CITY OF EL
PASO’S STRATEGIC PLAN GOAL 8 - “NURTURE AND PROMOTE A HEALTHY,SUSTAINABLE COMMUNITY.”
PROJECT INFORMATION
☐ The project will include removal of existing curb and gutter, ramps, driveways and signage, aswell as the expansion of sidewalk. Improvements will also consist of installation of a bike lanesign, installation of ADA parking signs, installation of new curb and gutter, and installation of one-sided curb extension. Project will also include installation of caliper trees, shrubs, landscape rock,river rock and irrigation system with water meter in parkway, and installation of benches andplanters in parkway.
PROJECT DETAILS
☐ Location: Fort Boulevard – Between Copia and Justus Street☐ District: 2☐ Managing Department: Community Development☐ Estimated Completion: Winter 2021
PROJECT GOAL/BENEFITS
☐ Improve the safety of the roadway for all users and encourage motorists to travel at appropriatespeeds
☐ Provide safe route for the bicycle users in the community☐ Improve and promote walkability to pedestrians
PROJECT BUDGET
Sources of Funding:
Initial Budget
Pre FY 2022 Expenditures
FY 2022 Projected
Future FY Expenditures
Projected Budget
HUD CDBG Block Grant 1,620,606$ 246,263$ 470,812$ 903,531$ 1,620,606$
Total 1,620,606$ 246,263$ 470,812$ 903,531$ 1,620,606$
389

JOEY BARRAZA AND VINO MEMORIAL PARK
ALIGNMENT WITH STRATEGIC PLAN: PROJECT ALIGNS WITH THE CITY OF EL
PASO’S STRATEGIC PLAN GOAL 4 - “ENHANCE EL PASO’S QUALITY OF LIFE
THROUGH RECREATIONAL, CULTURAL AND EDUCATIONAL ENVIRONMENTS.”
PROJECT INFORMATION
☐ This project will continue the development of Northeast Regional Park. The current phase ofdevelopment is scheduled to improve the vacant parkland located to the south of the existingpark facility. The project is scheduled to add the following: Flat fields, new park amenities,expansion of the existing parking area, new dog park, lighting and security cameras, landscaping,and extension of the existing pedestrian pathway throughout the new park development.
PROJECT DETAILS
☐ Location: 11270 McCombs Avenue☐ District: 4☐ Managing Department: Parks and Recreation☐ Estimated Completion: Summer 2022
PROJECT GOAL/BENEFITS
☐ Enhance the existing park for the benefit of the entire Northeast community☐ Provide new turf areas for flat fields☐ Provide a dog park with newest amenities
PROJECT BUDGET
Sources of Funding:
Initial Budget
Pre FY 2022 Expenditures
FY 2022 Projected
Future FY Expenditures
Projected Budget
2012 GO Quality of Life 4,392,946$ 2,089,523$ 2,121,553$ 181,870$ 4,392,946$
Total 4,392,946$ 2,089,523$ 2,121,553$ 181,870$ 4,392,946$
390

JOSE CISNEROS LIBRARY IMPROVEMENTS
ALIGNMENT WITH STRATEGIC PLAN: PROJECT ALIGNS WITH THE CITY OF EL
PASO’S STRATEGIC PLAN GOAL 4 - “ENHANCE EL PASO’S QUALITY OF LIFE
THROUGH RECREATIONAL, CULTURAL AND EDUCATIONAL ENVIRONMENTS.”
PROJECT INFORMATION
☐ The facility will be improved by resolving maintenance issues to keep the building in goodfunctionally for several years. Interior improvements will consist of converting an existing roominto a computer lab and enhancements to the staff area.
PROJECT DETAILS
☐ Location: 1300 Hawkins Blvd☐ District: 3☐ Managing Department: Library☐ Estimated Completion: Fall 2021
PROJECT GOAL/BENEFITS
☐ Provide multi-generational recreation and library facilities closer to residents and families☐ Improve neighborhood development and identity☐ Provide consistent, quality facilities, programs, and services throughout the City
PROJECT BUDGET
Sources of Funding:
Initial Budget
Pre FY 2022 Expenditures
FY 2022 Projected
Future FY Expenditures
Projected Budget
2012 GO Quality of Life 264,808$ 154,846$ 109,962$ -$ 264,808$
2017 CO Issuance 15,612$ -$ 15,612$ -$ 15,612$
Outside Sources 98,303$ -$ 98,303$ -$ 98,303$
Total 378,723$ 154,846$ 223,877$ -$ 378,723$
391
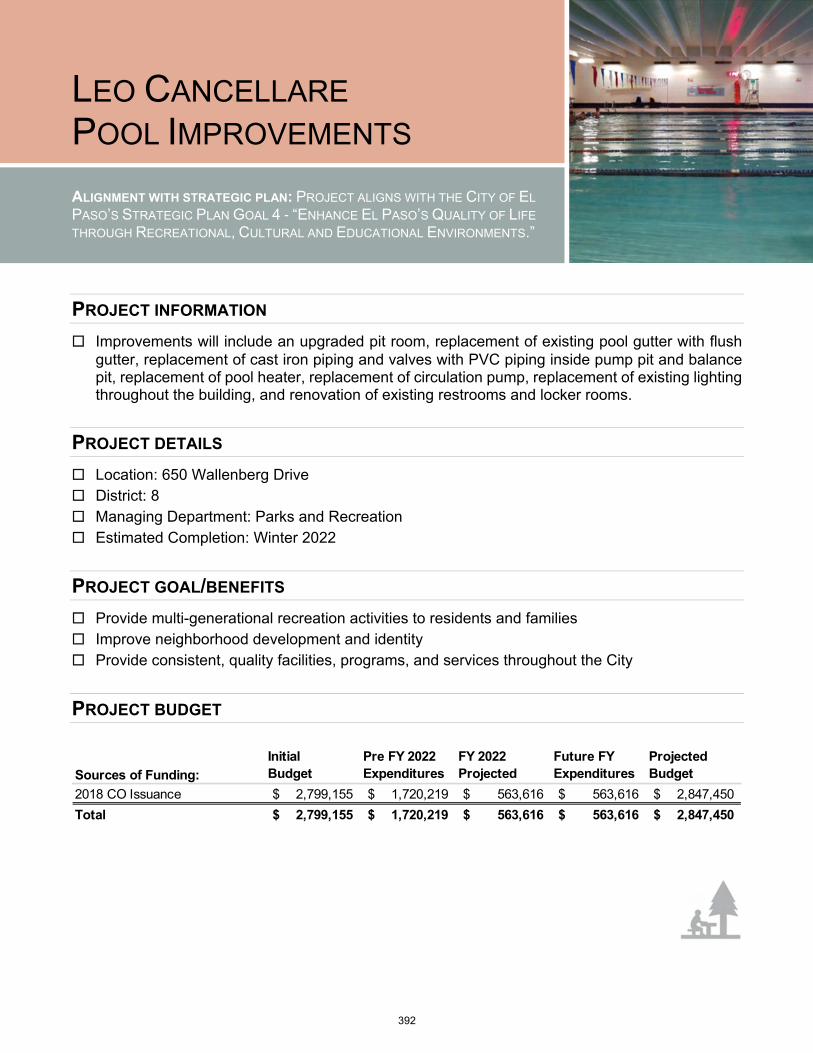
LEO CANCELLARE POOL IMPROVEMENTS
ALIGNMENT WITH STRATEGIC PLAN: PROJECT ALIGNS WITH THE CITY OF EL
PASO’S STRATEGIC PLAN GOAL 4 - “ENHANCE EL PASO’S QUALITY OF LIFE
THROUGH RECREATIONAL, CULTURAL AND EDUCATIONAL ENVIRONMENTS.”
PROJECT INFORMATION
☐ Improvements will include an upgraded pit room, replacement of existing pool gutter with flushgutter, replacement of cast iron piping and valves with PVC piping inside pump pit and balancepit, replacement of pool heater, replacement of circulation pump, replacement of existing lightingthroughout the building, and renovation of existing restrooms and locker rooms.
PROJECT DETAILS
☐ Location: 650 Wallenberg Drive☐ District: 8☐ Managing Department: Parks and Recreation☐ Estimated Completion: Winter 2022
PROJECT GOAL/BENEFITS
☐ Provide multi-generational recreation activities to residents and families☐ Improve neighborhood development and identity☐ Provide consistent, quality facilities, programs, and services throughout the City
PROJECT BUDGET
Sources of Funding:
Initial Budget
Pre FY 2022 Expenditures
FY 2022 Projected
Future FY Expenditures
Projected Budget
2018 CO Issuance 2,799,155$ 1,720,219$ 563,616$ 563,616$ 2,847,450$
Total 2,799,155$ 1,720,219$ 563,616$ 563,616$ 2,847,450$
392

LIZ MORAYMA GONZALEZ PARK IMPROVEMENTS
ALIGNMENT WITH STRATEGIC PLAN: PROJECT ALIGNS WITH THE CITY OF EL
PASO’S STRATEGIC PLAN GOAL 4 - “ENHANCE EL PASO’S QUALITY OF LIFE
THROUGH RECREATIONAL, CULTURAL AND EDUCATIONAL ENVIRONMENTS.”
PROJECT INFORMATION
☐ The park improvements will provide additional amenities to the existing site. The expansion willprovide the following amenities: New futsal courts, new parking Lot, new exercise course,benches, tables, canopies, landscaping, and park lighting.
PROJECT DETAILS
☐ Location: 4500 E. Yandell☐ District: 2☐ Managing Department: Parks and Recreation☐ Estimated Completion: Summer 2022
PROJECT GOAL/BENEFITS
☐ Enhance the park for the benefit of the surrounding community☐ Provide new amenities to make the park more enjoyable☐ Make Improvements throughout the park to promote physical activity
PROJECT BUDGET
Sources of Funding:
Initial Budget
Pre FY 2022 Expenditures
FY 2022 Projected
Future FY Expenditures
Projected Budget
2019 CO Issuance 1,273,080$ 111,157$ 580,961$ 580,961$ 1,273,080$
Total 1,273,080$ 111,157$ 580,961$ 580,961$ 1,273,080$
393
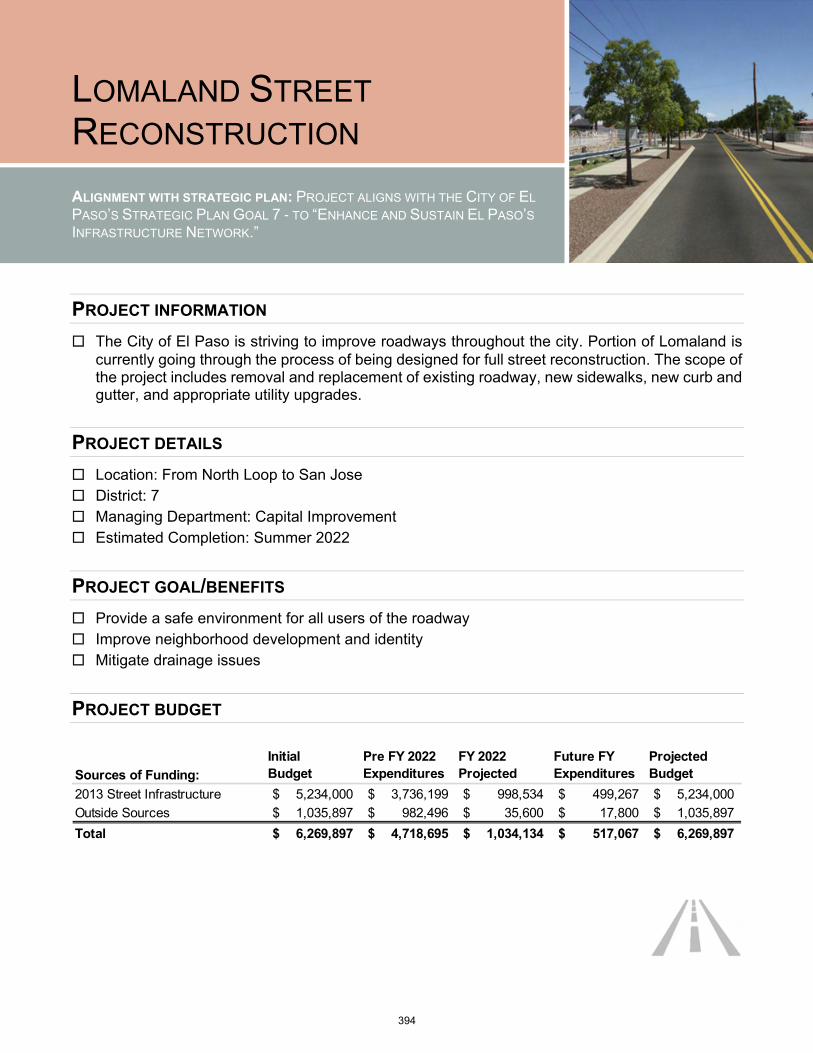
LOMALAND STREET RECONSTRUCTION
ALIGNMENT WITH STRATEGIC PLAN: PROJECT ALIGNS WITH THE CITY OF EL
PASO’S STRATEGIC PLAN GOAL 7 - TO “ENHANCE AND SUSTAIN EL PASO’SINFRASTRUCTURE NETWORK.”
PROJECT INFORMATION
☐ The City of El Paso is striving to improve roadways throughout the city. Portion of Lomaland iscurrently going through the process of being designed for full street reconstruction. The scope ofthe project includes removal and replacement of existing roadway, new sidewalks, new curb andgutter, and appropriate utility upgrades.
PROJECT DETAILS
☐ Location: From North Loop to San Jose☐ District: 7☐ Managing Department: Capital Improvement☐ Estimated Completion: Summer 2022
PROJECT GOAL/BENEFITS
☐ Provide a safe environment for all users of the roadway☐ Improve neighborhood development and identity☐ Mitigate drainage issues
PROJECT BUDGET
Sources of Funding:
Initial Budget
Pre FY 2022 Expenditures
FY 2022 Projected
Future FY Expenditures
Projected Budget
2013 Street Infrastructure 5,234,000$ 3,736,199$ 998,534$ 499,267$ 5,234,000$
Outside Sources 1,035,897$ 982,496$ 35,600$ 17,800$ 1,035,897$
Total 6,269,897$ 4,718,695$ 1,034,134$ 517,067$ 6,269,897$
394

LOWD AVENUE
RECONSTRUCTION
ALIGNMENT WITH STRATEGIC PLAN: PROJECT ALIGNS WITH THE CITY OF EL
PASO’S STRATEGIC PLAN GOAL 7 - TO “ENHANCE AND SUSTAIN EL PASO’SINFRASTRUCTURE NETWORK.”
PROJECT INFORMATION
☐ This project will resolve drainage problems in the area and address accessibility upgrade. Theproposed roadway improvements include new asphalt surface, sidewalks, driveways, ramps curband gutter, parkway improvements, landscaping at any traffic calming elements, and illuminationat select locations.
PROJECT DETAILS
☐ Location: Lowd Avenue between Yarbrough and Cinecue Way☐ District: 7☐ Managing Department: Capital Improvement☐ Estimated Completion: Winter 2021
PROJECT GOAL/BENEFITS
☐ Provide a safe crossing for vehicles and pedestrians over the Playa Drain☐ Provide an ADA compliant crossing
PROJECT BUDGET
Sources of Funding:
Initial Budget
Pre FY 2022 Expenditures
FY 2022 Projected
Future FY Expenditures
Projected Budget
2013 Street Infrastructure 1,944,000$ 1,517,781$ 426,219$ -$ 1,944,000$
Outside Sources 467,681$ 405,997$ 61,684$ -$ 467,681$
Total 2,411,681$ 1,923,778$ 487,903$ -$ 2,411,681$
395
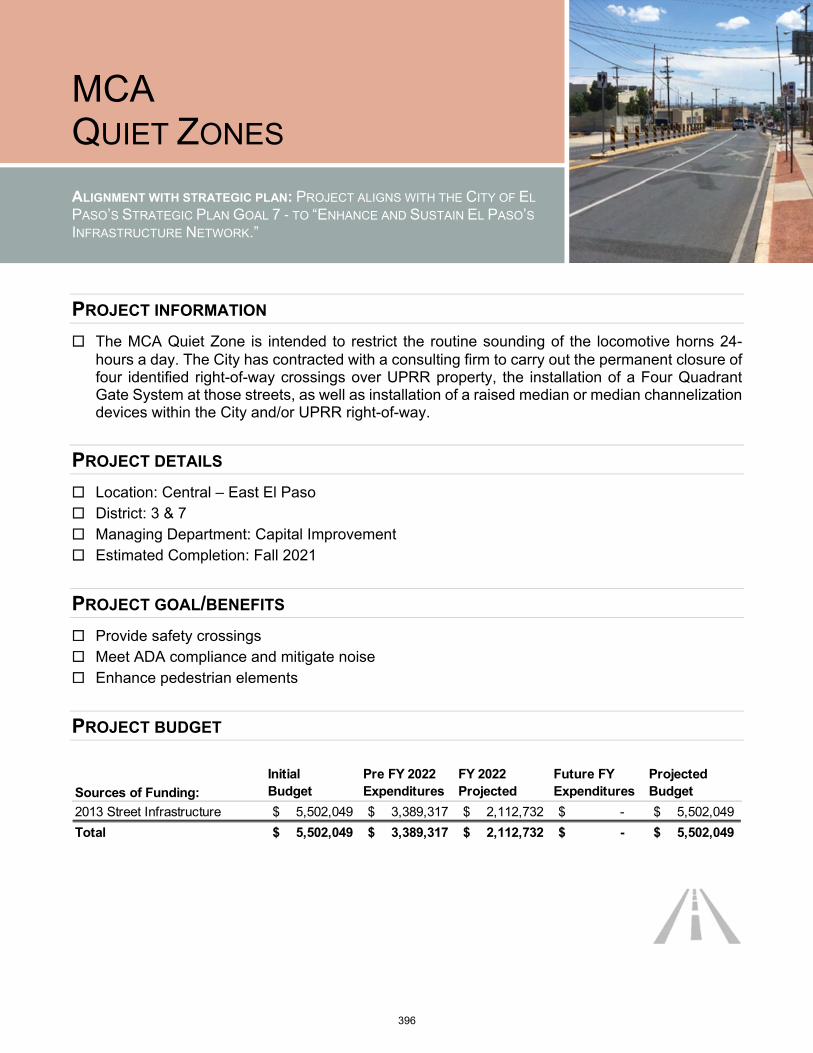
MCA QUIET ZONES
ALIGNMENT WITH STRATEGIC PLAN: PROJECT ALIGNS WITH THE CITY OF EL
PASO’S STRATEGIC PLAN GOAL 7 - TO “ENHANCE AND SUSTAIN EL PASO’SINFRASTRUCTURE NETWORK.”
PROJECT INFORMATION
☐ The MCA Quiet Zone is intended to restrict the routine sounding of the locomotive horns 24-hours a day. The City has contracted with a consulting firm to carry out the permanent closure offour identified right-of-way crossings over UPRR property, the installation of a Four QuadrantGate System at those streets, as well as installation of a raised median or median channelizationdevices within the City and/or UPRR right-of-way.
PROJECT DETAILS
☐ Location: Central – East El Paso☐ District: 3 & 7☐ Managing Department: Capital Improvement☐ Estimated Completion: Fall 2021
PROJECT GOAL/BENEFITS
☐ Provide safety crossings☐ Meet ADA compliance and mitigate noise☐ Enhance pedestrian elements
PROJECT BUDGET
Sources of Funding:
Initial Budget
Pre FY 2022 Expenditures
FY 2022 Projected
Future FY Expenditures
Projected Budget
2013 Street Infrastructure 5,502,049$ 3,389,317$ 2,112,732$ -$ 5,502,049$
Total 5,502,049$ 3,389,317$ 2,112,732$ -$ 5,502,049$
396
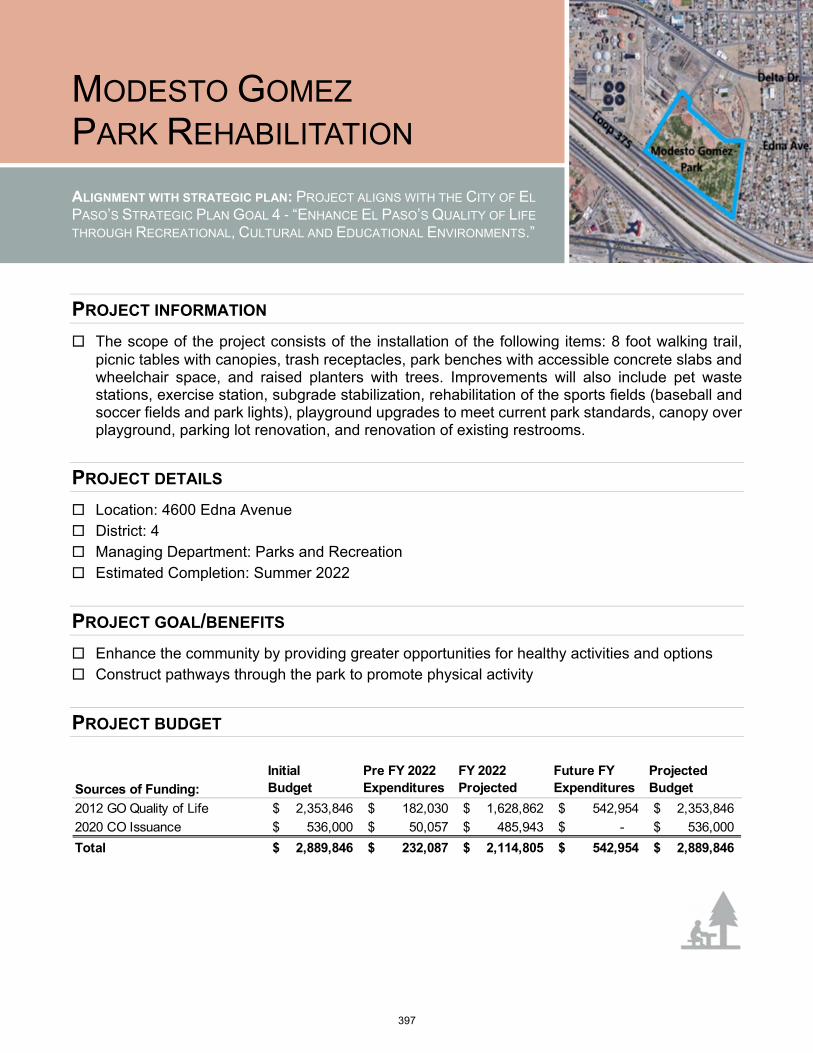
MODESTO GOMEZ PARK REHABILITATION
ALIGNMENT WITH STRATEGIC PLAN: PROJECT ALIGNS WITH THE CITY OF EL
PASO’S STRATEGIC PLAN GOAL 4 - “ENHANCE EL PASO’S QUALITY OF LIFE
THROUGH RECREATIONAL, CULTURAL AND EDUCATIONAL ENVIRONMENTS.”
PROJECT INFORMATION
☐ The scope of the project consists of the installation of the following items: 8 foot walking trail,picnic tables with canopies, trash receptacles, park benches with accessible concrete slabs andwheelchair space, and raised planters with trees. Improvements will also include pet wastestations, exercise station, subgrade stabilization, rehabilitation of the sports fields (baseball andsoccer fields and park lights), playground upgrades to meet current park standards, canopy overplayground, parking lot renovation, and renovation of existing restrooms.
PROJECT DETAILS
☐ Location: 4600 Edna Avenue☐ District: 4☐ Managing Department: Parks and Recreation☐ Estimated Completion: Summer 2022
PROJECT GOAL/BENEFITS
☐ Enhance the community by providing greater opportunities for healthy activities and options☐ Construct pathways through the park to promote physical activity
PROJECT BUDGET
Sources of Funding:
Initial Budget
Pre FY 2022 Expenditures
FY 2022 Projected
Future FY Expenditures
Projected Budget
2012 GO Quality of Life 2,353,846$ 182,030$ 1,628,862$ 542,954$ 2,353,846$
2020 CO Issuance 536,000$ 50,057$ 485,943$ -$ 536,000$
Total 2,889,846$ 232,087$ 2,114,805$ 542,954$ 2,889,846$
397
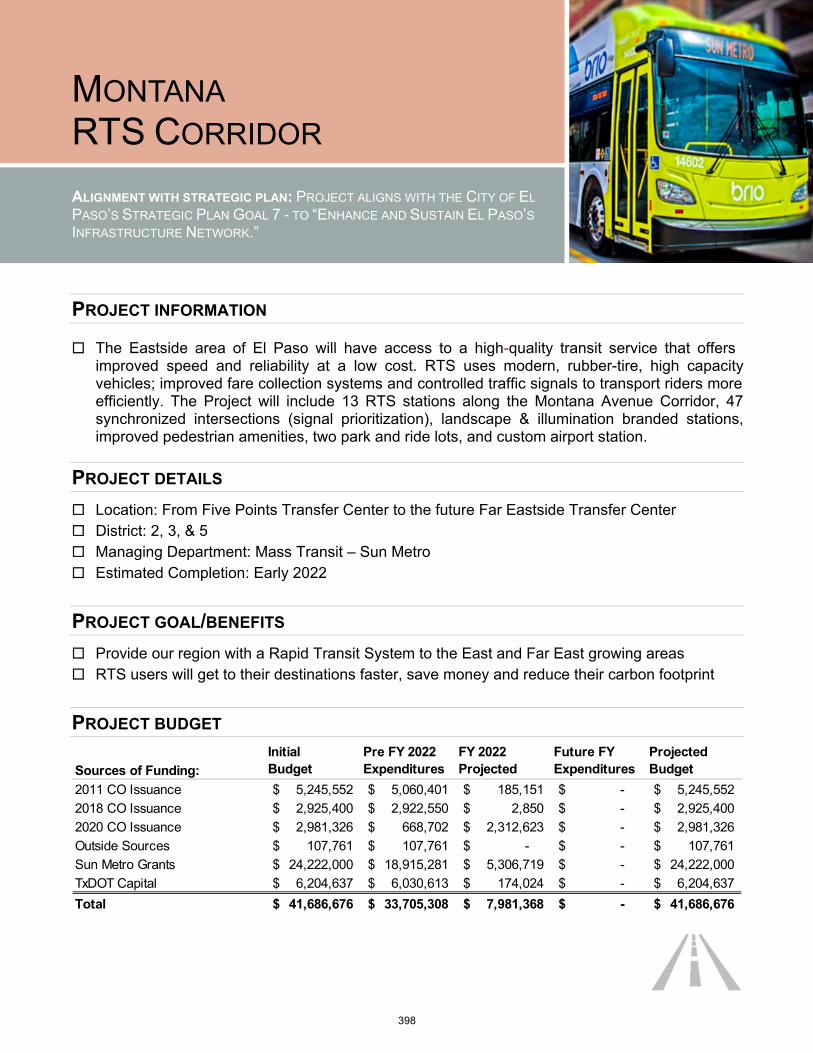
MONTANA RTS CORRIDOR
ALIGNMENT WITH STRATEGIC PLAN: PROJECT ALIGNS WITH THE CITY OF EL
PASO’S STRATEGIC PLAN GOAL 7 - TO “ENHANCE AND SUSTAIN EL PASO’SINFRASTRUCTURE NETWORK.”
PROJECT INFORMATION
☐ The Eastside area of El Paso will have access to a high-quality transit service that offersimproved speed and reliability at a low cost. RTS uses modern, rubber-tire, high capacityvehicles; improved fare collection systems and controlled traffic signals to transport riders moreefficiently. The Project will include 13 RTS stations along the Montana Avenue Corridor, 47synchronized intersections (signal prioritization), landscape & illumination branded stations,improved pedestrian amenities, two park and ride lots, and custom airport station.
PROJECT DETAILS
☐ Location: From Five Points Transfer Center to the future Far Eastside Transfer Center☐ District: 2, 3, & 5☐ Managing Department: Mass Transit – Sun Metro☐ Estimated Completion: Early 2022
PROJECT GOAL/BENEFITS
☐ Provide our region with a Rapid Transit System to the East and Far East growing areas☐ RTS users will get to their destinations faster, save money and reduce their carbon footprint
PROJECT BUDGET
Sources of Funding:
Initial Budget
Pre FY 2022 Expenditures
FY 2022 Projected
Future FY Expenditures
Projected Budget
2011 CO Issuance 5,245,552$ 5,060,401$ 185,151$ -$ 5,245,552$
2018 CO Issuance 2,925,400$ 2,922,550$ 2,850$ -$ 2,925,400$
2020 CO Issuance 2,981,326$ 668,702$ 2,312,623$ -$ 2,981,326$
Outside Sources 107,761$ 107,761$ -$ -$ 107,761$
Sun Metro Grants 24,222,000$ 18,915,281$ 5,306,719$ -$ 24,222,000$
TxDOT Capital 6,204,637$ 6,030,613$ 174,024$ -$ 6,204,637$
Total 41,686,676$ 33,705,308$ 7,981,368$ -$ 41,686,676$
398

MONTANA RTS PEDESTRIAN ENHANCEMENTS
ALIGNMENT WITH STRATEGIC PLAN: PROJECT ALIGNS WITH THE CITY OF EL
PASO’S STRATEGIC PLAN GOAL 7 - TO “ENHANCE AND SUSTAIN EL PASO’SINFRASTRUCTURE NETWORK.”
PROJECT INFORMATION
☐ The improvements are as follows: Traffic signal upgrades (Raynor, Huckleberry, Chelsea andCopia) to include Accessible Pedestrian Signal (APS) systems, ADA accessible sidewalkreconstruction, ADA curb ramps, driveway reconstruction to provide ADA compliant driveways,and landscaping and irrigation where right of way constraints allow.
PROJECT DETAILS
☐ Location: Montana Avenue from Raynor to Chelsea☐ District: 2☐ Managing Department: Capital Improvement☐ Estimated Completion: Winter 2021
PROJECT GOAL/BENEFITS
☐ Improve pedestrian connectivity along the Montana RTS corridor☐ Promote usage of the upcoming Montana Brio route☐ Encourage economic activity by providing improved pedestrian amenities
PROJECT BUDGET
Sources of Funding:
Initial Budget
Pre FY 2022 Expenditures
FY 2022 Projected
Future FY Expenditures
Projected Budget
2010 CO Issuance 711,280$ 214,270$ 497,010$ -$ 711,280$
2018 CO Issuance 85,000$ -$ 85,000$ -$ 85,000$
TxDOT Capital 2,454,445$ 2,246,109$ 208,336$ -$ 2,454,445$
Total 3,250,725$ 2,460,378$ 790,346$ -$ 3,250,725$
399

PADDLEFOOT STREET
RECONSTRUCTION
ALIGNMENT WITH STRATEGIC PLAN: PROJECT ALIGNS WITH THE CITY OF EL
PASO’S STRATEGIC PLAN GOAL 7 - TO “ENHANCE AND SUSTAIN EL PASO’SINFRASTRUCTURE NETWORK.”
PROJECT INFORMATION
☐ Located in the Mission Valley of El Paso, this project was identified as needing reconstruction toproperty address the pavement conditions. The following proposed roadway improvementsinclude new asphalt surface, installation of ADA concrete sidewalks, concrete curb and gutter,driveways, and illumination at select locations.
PROJECT DETAILS
☐ Location: Prado to Prado☐ District: 7☐ Managing Department: Capital Improvement☐ Estimated Completion: Summer 2021
PROJECT GOAL/BENEFITS
☐ Revitalize and enrich the community☐ Mitigate storm water impact on the roadways☐ Improve the roadway and sidewalk areas
PROJECT BUDGET
Sources of Funding:
Initial Budget
Pre FY 2022 Expenditures
FY 2022 Projected
Future FY Expenditures
Projected Budget
2013 Street Infrastructure 5,234,000$ 3,736,199$ 998,534$ 499,267$ 5,234,000$
Outside Sources 1,035,897$ 982,496$ 35,600$ 17,800$ 1,035,897$
Total 6,269,897$ 4,718,695$ 1,034,134$ 517,067$ 6,269,897$
400

PADILLA ROAD
RECONSTRUCTION
ALIGNMENT WITH STRATEGIC PLAN: PROJECT ALIGNS WITH THE CITY OF EL
PASO’S STRATEGIC PLAN GOAL 7 - TO “ENHANCE AND SUSTAIN EL PASO’SINFRASTRUCTURE NETWORK.”
PROJECT INFORMATION
☐ The reconstruction of a portion of Padilla will provide much needed improvements to thisdeteriorating roadway. Traffic improvements shall consist of new street signage and striping. Thefollowing improvements will be installed if determined as needing replacement: ADA compliantsidewalk and driveways, curb and gutter, ADA ramps, and dark sky compliant street lighting. Aninventory shall be conducted to determine locations where ADA compliant sidewalk anddriveways, curb and gutter, ADA ramps, and street lighting need to be installed, repaired orreplaced.
PROJECT DETAILS
☐ Location: Rose Kennedy to Zaragoza☐ District: 6☐ Managing Department: Capital Improvement☐ Estimated Completion: Spring 2022
PROJECT GOAL/BENEFITS
☐ Revitalize and enrich the community☐ Mitigate storm water impact on the roadways☐ Improve the roadway and sidewalk areas
PROJECT BUDGET
Sources of Funding:
Initial Budget
Pre FY 2022 Expenditures
FY 2022 Projected
Future FY Expenditures
Projected Budget
2013 Street Infrastructure 2,249,005$ 1,873,529$ 375,476$ -$ 2,249,005$
Outside Sources 613,098$ 613,098$ -$ -$ 613,098$
Total 2,862,103$ 2,486,627$ 375,476$ -$ 2,862,103$
401
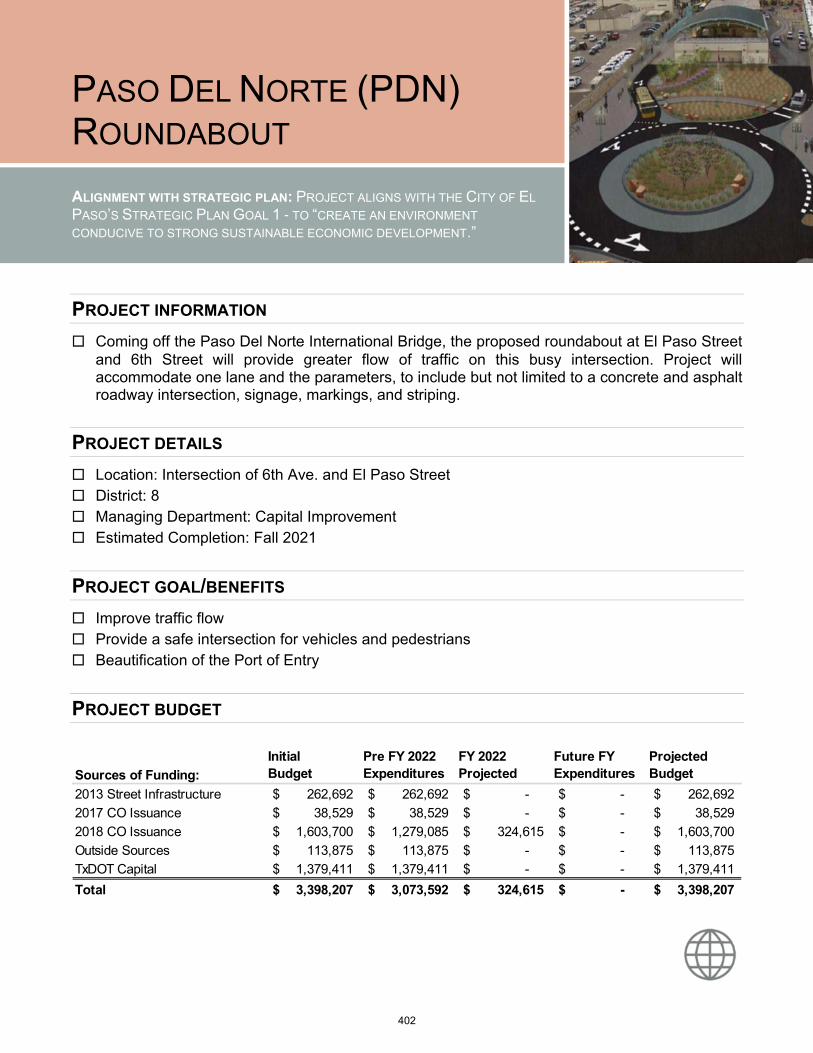
PASO DEL NORTE (PDN) ROUNDABOUT
ALIGNMENT WITH STRATEGIC PLAN: PROJECT ALIGNS WITH THE CITY OF EL
PASO’S STRATEGIC PLAN GOAL 1 - TO “CREATE AN ENVIRONMENT
CONDUCIVE TO STRONG SUSTAINABLE ECONOMIC DEVELOPMENT.”
PROJECT INFORMATION
☐ Coming off the Paso Del Norte International Bridge, the proposed roundabout at El Paso Streetand 6th Street will provide greater flow of traffic on this busy intersection. Project willaccommodate one lane and the parameters, to include but not limited to a concrete and asphaltroadway intersection, signage, markings, and striping.
PROJECT DETAILS
☐ Location: Intersection of 6th Ave. and El Paso Street☐ District: 8☐ Managing Department: Capital Improvement☐ Estimated Completion: Fall 2021
PROJECT GOAL/BENEFITS
☐ Improve traffic flow☐ Provide a safe intersection for vehicles and pedestrians☐ Beautification of the Port of Entry
PROJECT BUDGET
Sources of Funding:
Initial Budget
Pre FY 2022 Expenditures
FY 2022 Projected
Future FY Expenditures
Projected Budget
2013 Street Infrastructure 262,692$ 262,692$ -$ -$ 262,692$
2017 CO Issuance 38,529$ 38,529$ -$ -$ 38,529$
2018 CO Issuance 1,603,700$ 1,279,085$ 324,615$ -$ 1,603,700$
Outside Sources 113,875$ 113,875$ -$ -$ 113,875$
TxDOT Capital 1,379,411$ 1,379,411$ -$ -$ 1,379,411$
Total 3,398,207$ 3,073,592$ 324,615$ -$ 3,398,207$
402
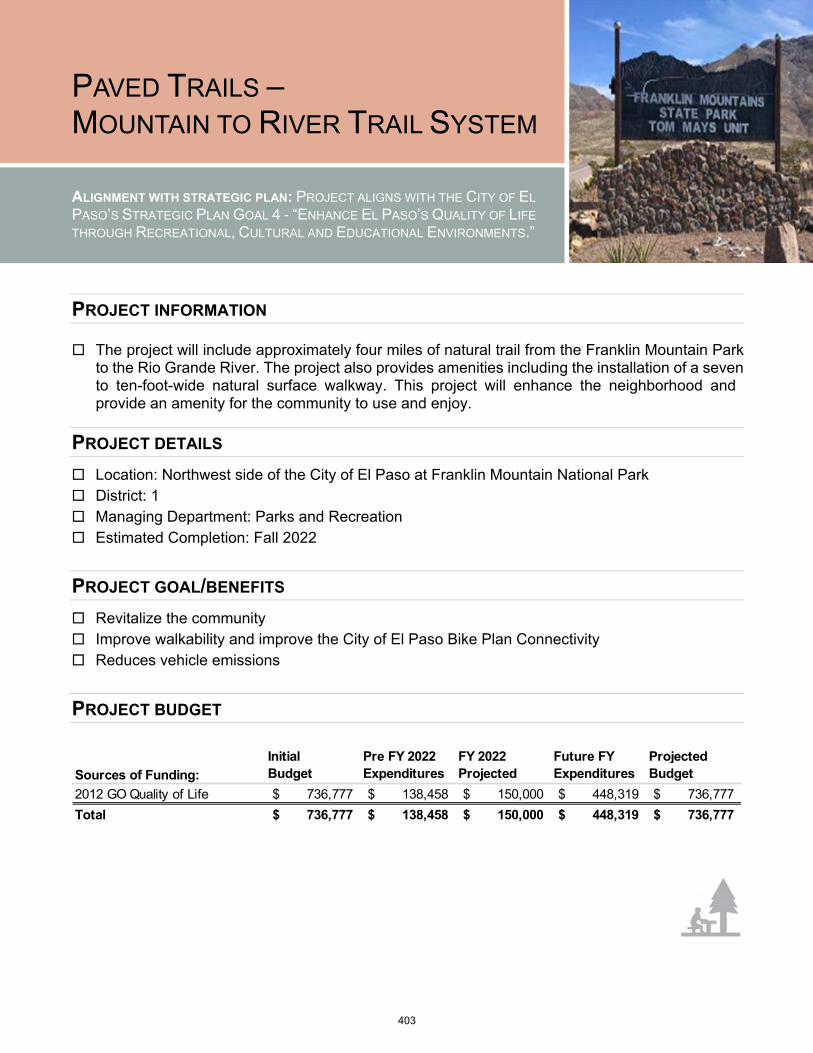
PAVED TRAILS – MOUNTAIN TO RIVER TRAIL SYSTEM
ALIGNMENT WITH STRATEGIC PLAN: PROJECT ALIGNS WITH THE CITY OF EL
PASO’S STRATEGIC PLAN GOAL 4 - “ENHANCE EL PASO’S QUALITY OF LIFE
THROUGH RECREATIONAL, CULTURAL AND EDUCATIONAL ENVIRONMENTS.”
PROJECT INFORMATION
☐ The project will include approximately four miles of natural trail from the Franklin Mountain Parkto the Rio Grande River. The project also provides amenities including the installation of a sevento ten-foot-wide natural surface walkway. This project will enhance the neighborhood andprovide an amenity for the community to use and enjoy.
PROJECT DETAILS
☐ Location: Northwest side of the City of El Paso at Franklin Mountain National Park☐ District: 1☐ Managing Department: Parks and Recreation☐ Estimated Completion: Fall 2022
PROJECT GOAL/BENEFITS
☐ Revitalize the community☐ Improve walkability and improve the City of El Paso Bike Plan Connectivity☐ Reduces vehicle emissions
PROJECT BUDGET
Sources of Funding:
Initial Budget
Pre FY 2022 Expenditures
FY 2022 Projected
Future FY Expenditures
Projected Budget
2012 GO Quality of Life 736,777$ 138,458$ 150,000$ 448,319$ 736,777$
Total 736,777$ 138,458$ 150,000$ 448,319$ 736,777$
403

POLICE AND FIRE
TRAINING ACADEMY
ALIGNMENT WITH STRATEGIC PLAN: PROJECT ALIGNS WITH THE CITY OF EL
PASO’S STRATEGIC PLAN GOAL 2 - TO “SET THE STANDARD FOR A SAFE AND
SECURE CITY.”
PROJECT INFORMATION
☐ This new public safety facility will include a training academy for the Police and Fire Department,Fire Department Headquarters, Fire Department vehicle maintenance and logistics Center.Academy amenities include: Fire training props, indoor shooting range, swift water rescue pool,class rooms/auditorium, fitness gym, a simulation room, Police tactical training facility, mockcourtroom, and emergency vehicle training area.
PROJECT DETAILS
☐ Location: Martin Luther King Jr. Blvd and Officer Andrew Barcena Dr.☐ District: 4☐ Managing Department: Capital Improvement☐ Estimated Completion: Summer 2024
PROJECT GOAL/BENEFITS
☐ New public safety facilities put police and fire resources in growing areas☐ Perform major maintenance and renovation of aging facilities☐ Improve working conditions for city employees☐ Joint FD/PD academy to accommodate future classes and improve training efficiencies
PROJECT BUDGET
Sources of Funding:
Initial Budget
Pre FY 2022 Expenditures
FY 2022 Projected
Future FY Expenditures
Projected Budget
Public Safety Bond 76,032,000$ 9,749$ 1,523,999$ 74,498,253$ 76,032,000$
Total 76,032,000$ 9,749$ 1,523,999$ 74,498,253$ 76,032,000$
404

PELLICANO, RAILROAD, AND COTTON
LIGHTING AND LANDSCAPE
ALIGNMENT WITH STRATEGIC PLAN: PROJECT ALIGNS WITH THE CITY OF EL
PASO’S STRATEGIC PLAN GOAL 7 - TO “ENHANCE AND SUSTAIN EL PASO’SINFRASTRUCTURE NETWORK.”
PROJECT INFORMATION
☐ The Project consists of Roadway Lighting and Landscape Improvements on Pellicano Drive(Vista Del Oro to Loop 375); Railroad Drive (McCombs to Loop 375); and Cotton Street (SanAntonio to Texas and from Missouri to Murchison) The project scope consists of roadwaylighting, median landscape, bringing roadway lighting up to current City standards, and complyingwith Dark Sky Ordinance Requirements.
PROJECT DETAILS
☐ Location: Pellicano Drive, Railroad Drive (Complete), & Cotton Street☐ District: 1, 2, 4, 6, 7, & 8☐ Managing Department: Capital Improvement☐ Estimated Completion: Winter 2021
PROJECT GOAL/BENEFITS
☐ Provide roadway lighting and landscape improvements☐ Improve the roadway environment for all users☐ Enhance the City’s infrastructure
PROJECT BUDGET
Sources of Funding:
Initial Budget
Pre FY 2022 Expenditures
FY 2022 Projected
Future FY Expenditures
Projected Budget
2019 CO Issuance 10,079,200$ 8,637,015$ 961,457$ 480,728$ 10,079,200$
Total 10,079,200$ 8,637,015$ 961,457$ 480,728$ 10,079,200$
405
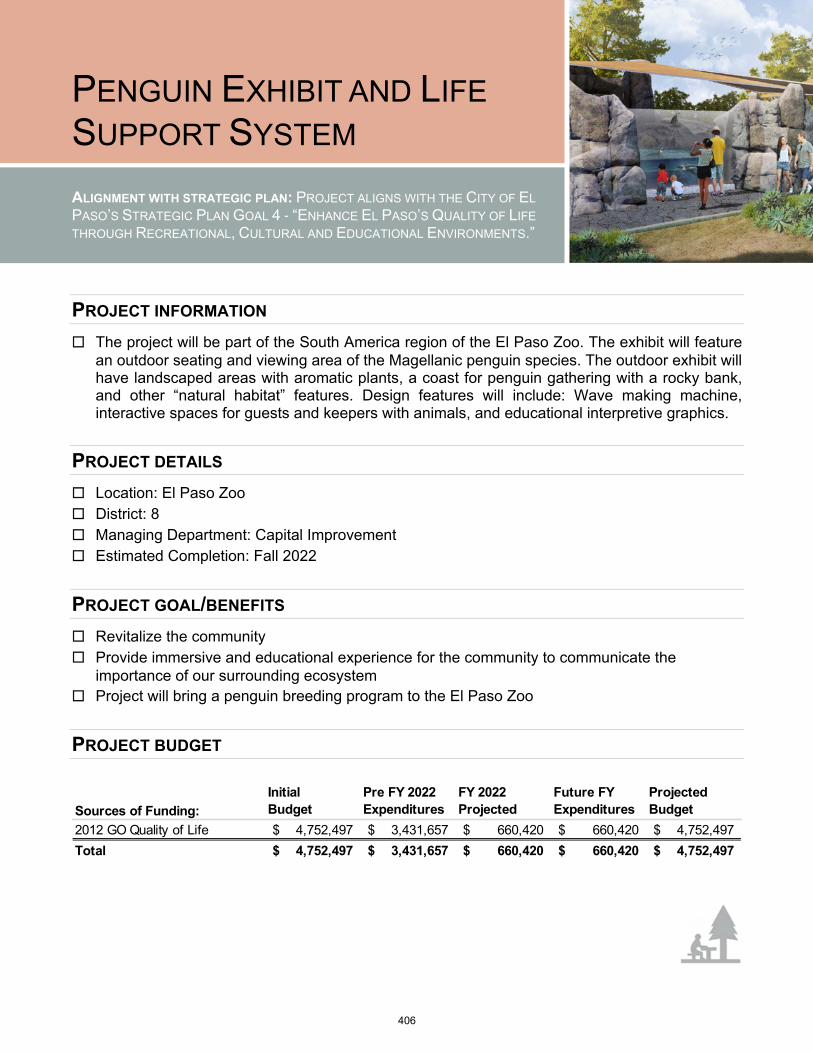
PENGUIN EXHIBIT AND LIFE SUPPORT SYSTEM
ALIGNMENT WITH STRATEGIC PLAN: PROJECT ALIGNS WITH THE CITY OF EL
PASO’S STRATEGIC PLAN GOAL 4 - “ENHANCE EL PASO’S QUALITY OF LIFE
THROUGH RECREATIONAL, CULTURAL AND EDUCATIONAL ENVIRONMENTS.”
PROJECT INFORMATION
☐ The project will be part of the South America region of the El Paso Zoo. The exhibit will featurean outdoor seating and viewing area of the Magellanic penguin species. The outdoor exhibit willhave landscaped areas with aromatic plants, a coast for penguin gathering with a rocky bank,and other “natural habitat” features. Design features will include: Wave making machine,interactive spaces for guests and keepers with animals, and educational interpretive graphics.
PROJECT DETAILS
☐ Location: El Paso Zoo☐ District: 8☐ Managing Department: Capital Improvement☐ Estimated Completion: Fall 2022
PROJECT GOAL/BENEFITS
☐ Revitalize the community☐ Provide immersive and educational experience for the community to communicate the
importance of our surrounding ecosystem☐ Project will bring a penguin breeding program to the El Paso Zoo
PROJECT BUDGET
Sources of Funding:
Initial Budget
Pre FY 2022 Expenditures
FY 2022 Projected
Future FY Expenditures
Projected Budget
2012 GO Quality of Life 4,752,497$ 3,431,657$ 660,420$ 660,420$ 4,752,497$
Total 4,752,497$ 3,431,657$ 660,420$ 660,420$ 4,752,497$
406
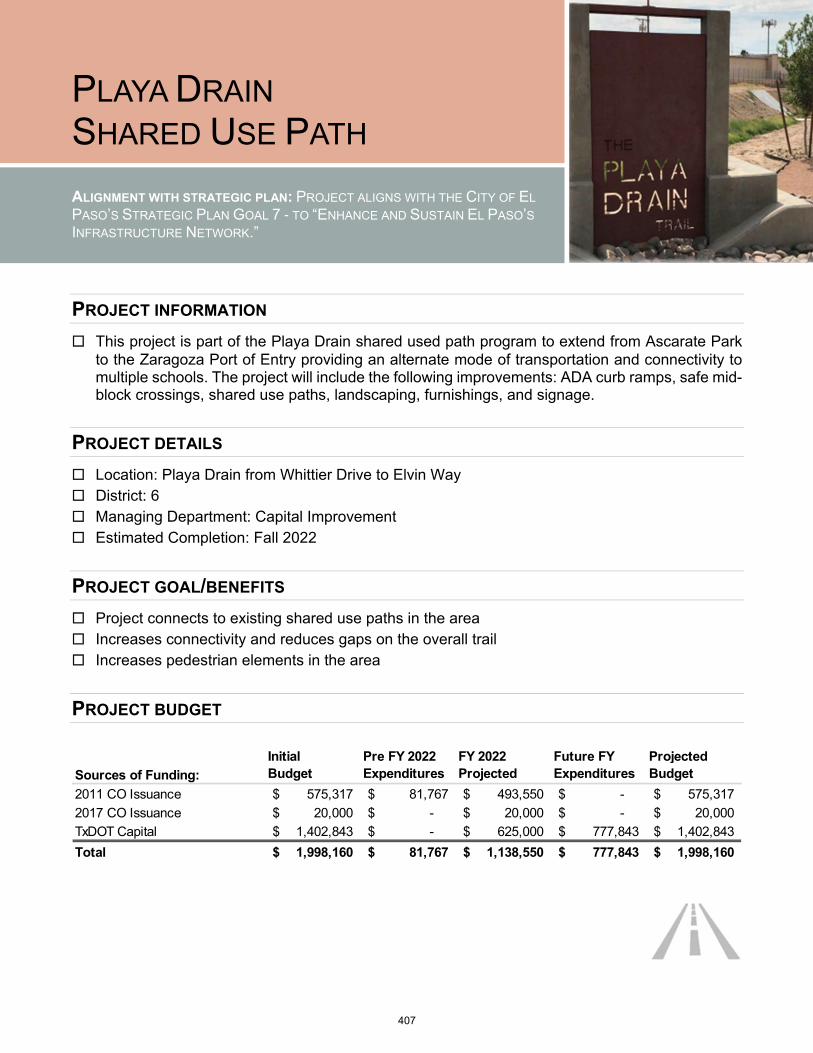
PLAYA DRAIN SHARED USE PATH
ALIGNMENT WITH STRATEGIC PLAN: PROJECT ALIGNS WITH THE CITY OF EL
PASO’S STRATEGIC PLAN GOAL 7 - TO “ENHANCE AND SUSTAIN EL PASO’SINFRASTRUCTURE NETWORK.”
PROJECT INFORMATION
☐ This project is part of the Playa Drain shared used path program to extend from Ascarate Parkto the Zaragoza Port of Entry providing an alternate mode of transportation and connectivity tomultiple schools. The project will include the following improvements: ADA curb ramps, safe mid-block crossings, shared use paths, landscaping, furnishings, and signage.
PROJECT DETAILS
☐ Location: Playa Drain from Whittier Drive to Elvin Way☐ District: 6☐ Managing Department: Capital Improvement☐ Estimated Completion: Fall 2022
PROJECT GOAL/BENEFITS
☐ Project connects to existing shared use paths in the area☐ Increases connectivity and reduces gaps on the overall trail☐ Increases pedestrian elements in the area
PROJECT BUDGET
Sources of Funding:
Initial Budget
Pre FY 2022 Expenditures
FY 2022 Projected
Future FY Expenditures
Projected Budget
2011 CO Issuance 575,317$ 81,767$ 493,550$ -$ 575,317$
2017 CO Issuance 20,000$ -$ 20,000$ -$ 20,000$
TxDOT Capital 1,402,843$ -$ 625,000$ 777,843$ 1,402,843$
Total 1,998,160$ 81,767$ 1,138,550$ 777,843$ 1,998,160$
407

SCHUSTER AVENUE
RECONSTRUCTION
ALIGNMENT WITH STRATEGIC PLAN: PROJECT ALIGNS WITH THE CITY OF EL
PASO’S STRATEGIC PLAN GOAL 7 - TO “ENHANCE AND SUSTAIN EL PASO’SINFRASTRUCTURE NETWORK.”
PROJECT INFORMATION
☐ This project is a complete street reconstruction from Prospect to Campbell Streets.Reconstruction will feature the following services and amenities: Roadway striping and signage,an irrigation system, sidewalk, driveways, ADA compliant ramps, curb and gutter textured/stamped concrete crosswalks, parkway improvements to include street trees and landscaping,dark sky compliant street lighting, and bike lane.
PROJECT DETAILS
☐ Location: Schuster Avenue☐ District: 1 and 8☐ Managing Department: Capital Improvement☐ Estimated Completion: Early 2023
PROJECT GOAL/BENEFITS
☐ Promote investment and promote a sense of place within the neighborhood☐ Encourage appropriate travel for motor vehicles, pedestrians, bicyclists and mass transit users
PROJECT BUDGET
Sources of Funding:
Initial Budget
Pre FY 2022 Expenditures
FY 2022 Projected
Future FY Expenditures
Projected Budget
2018 CO Issuance 7,559,900$ 5,570,242$ 1,443,825$ 545,833$ 7,559,900$
Outside Sources 748,823$ -$ 499,216$ 249,608$ 748,823$
Total 8,308,723$ 5,570,242$ 1,943,040$ 795,441$ 8,308,723$
408
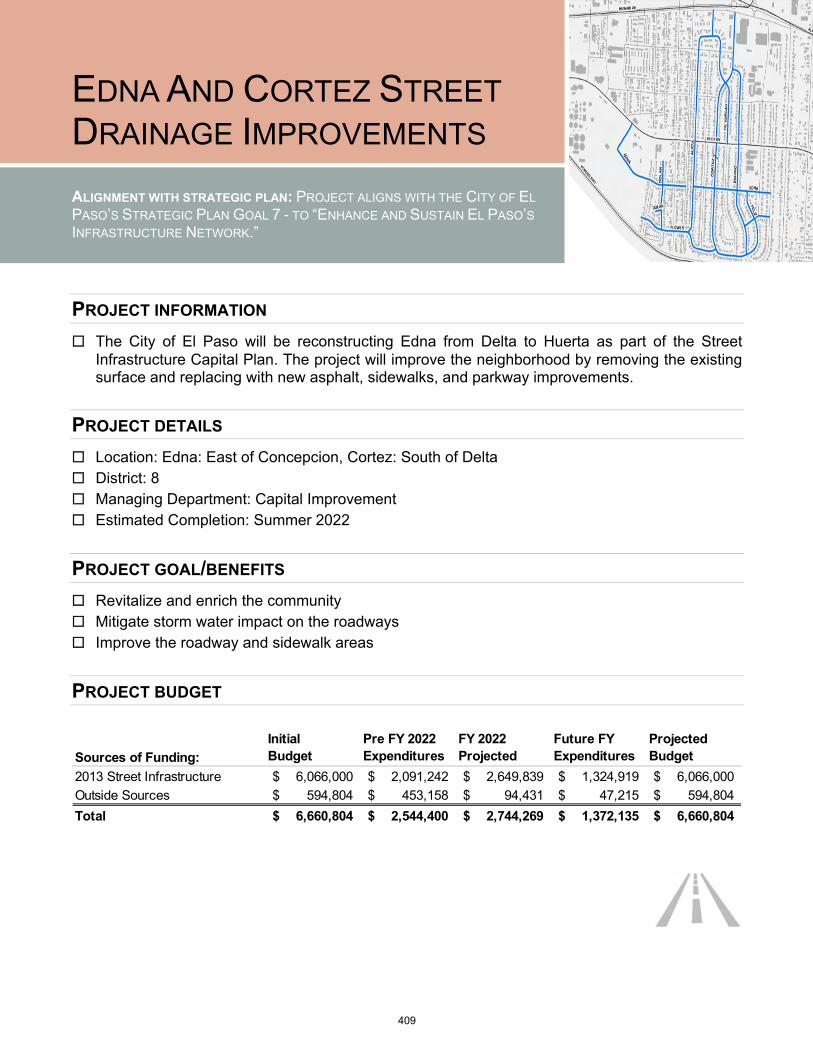
EDNA AND CORTEZ STREET
DRAINAGE IMPROVEMENTS
ALIGNMENT WITH STRATEGIC PLAN: PROJECT ALIGNS WITH THE CITY OF EL
PASO’S STRATEGIC PLAN GOAL 7 - TO “ENHANCE AND SUSTAIN EL PASO’SINFRASTRUCTURE NETWORK.”
PROJECT INFORMATION
☐ The City of El Paso will be reconstructing Edna from Delta to Huerta as part of the StreetInfrastructure Capital Plan. The project will improve the neighborhood by removing the existingsurface and replacing with new asphalt, sidewalks, and parkway improvements.
PROJECT DETAILS
☐ Location: Edna: East of Concepcion, Cortez: South of Delta☐ District: 8☐ Managing Department: Capital Improvement☐ Estimated Completion: Summer 2022
PROJECT GOAL/BENEFITS
☐ Revitalize and enrich the community☐ Mitigate storm water impact on the roadways☐ Improve the roadway and sidewalk areas
PROJECT BUDGET
Sources of Funding:
Initial Budget
Pre FY 2022 Expenditures
FY 2022 Projected
Future FY Expenditures
Projected Budget
2013 Street Infrastructure 6,066,000$ 2,091,242$ 2,649,839$ 1,324,919$ 6,066,000$
Outside Sources 594,804$ 453,158$ 94,431$ 47,215$ 594,804$
Total 6,660,804$ 2,544,400$ 2,744,269$ 1,372,135$ 6,660,804$
409
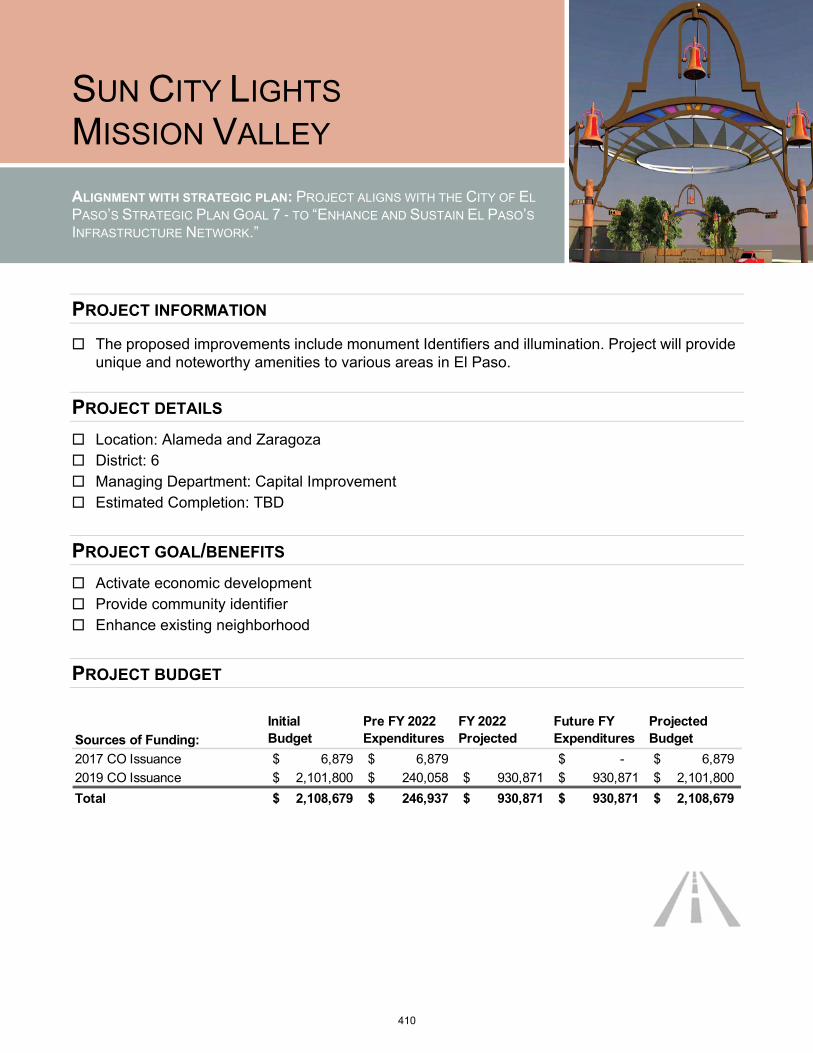
SUN CITY LIGHTS MISSION VALLEY
ALIGNMENT WITH STRATEGIC PLAN: PROJECT ALIGNS WITH THE CITY OF EL
PASO’S STRATEGIC PLAN GOAL 7 - TO “ENHANCE AND SUSTAIN EL PASO’SINFRASTRUCTURE NETWORK.”
PROJECT INFORMATION
☐ The proposed improvements include monument Identifiers and illumination. Project will provideunique and noteworthy amenities to various areas in El Paso.
PROJECT DETAILS
☐ Location: Alameda and Zaragoza☐ District: 6☐ Managing Department: Capital Improvement☐ Estimated Completion: TBD
PROJECT GOAL/BENEFITS
☐ Activate economic development☐ Provide community identifier☐ Enhance existing neighborhood
PROJECT BUDGET
Sources of Funding:
Initial Budget
Pre FY 2022 Expenditures
FY 2022 Projected
Future FY Expenditures
Projected Budget
2017 CO Issuance 6,879$ 6,879$ -$ 6,879$
2019 CO Issuance 2,101,800$ 240,058$ 930,871$ 930,871$ 2,101,800$
Total 2,108,679$ 246,937$ 930,871$ 930,871$ 2,108,679$
410

SUNGLOW MEDIAN
IMPROVEMENTS
ALIGNMENT WITH STRATEGIC PLAN: PROJECT ALIGNS WITH THE CITY OF EL
PASO’S STRATEGIC PLAN GOAL 7 - TO “ENHANCE AND SUSTAIN EL PASO’SINFRASTRUCTURE NETWORK.”
PROJECT INFORMATION
☐ The project is aims at improving the quality of life for those who live and frequent this area. Theproject involves landscape improvements on Sunglow Way medians from Avalon Drive toCessna Drive. It will provide a buffer between the busy arterial (Montana) and the residential areasouth of Sunglow Way.
PROJECT DETAILS
☐ Location: Sunglow Way between Avalon Drive and Cessna Drive☐ District: 3☐ Managing Department: Capital Improvement☐ Estimated Completion: Fall 2022
PROJECT GOAL/BENEFITS
☐ Provide traffic calming measures☐ Promote a sense of place for the community☐ Provide landscape design with native or naturalized trees and shrubs
PROJECT BUDGET
Sources of Funding:
Initial Budget
Pre FY 2022 Expenditures
FY 2022 Projected
Future FY Expenditures
Projected Budget
2013 Street Infrastructure 695,660$ 315,472$ 285,141$ 95,047$ 695,660$
Total 695,660$ 315,472$ 285,141$ 95,047$ 695,660$
411
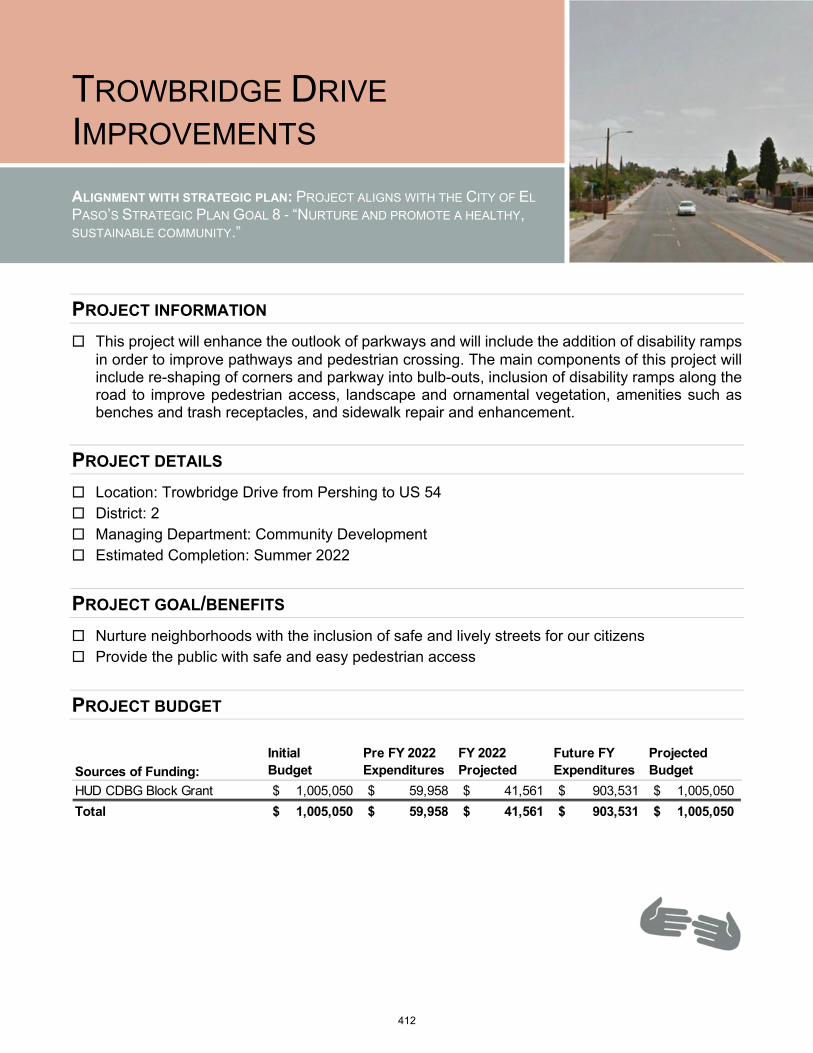
TROWBRIDGE DRIVE
IMPROVEMENTS
ALIGNMENT WITH STRATEGIC PLAN: PROJECT ALIGNS WITH THE CITY OF EL
PASO’S STRATEGIC PLAN GOAL 8 - “NURTURE AND PROMOTE A HEALTHY,SUSTAINABLE COMMUNITY.”
PROJECT INFORMATION
☐ This project will enhance the outlook of parkways and will include the addition of disability rampsin order to improve pathways and pedestrian crossing. The main components of this project willinclude re-shaping of corners and parkway into bulb-outs, inclusion of disability ramps along theroad to improve pedestrian access, landscape and ornamental vegetation, amenities such asbenches and trash receptacles, and sidewalk repair and enhancement.
PROJECT DETAILS
☐ Location: Trowbridge Drive from Pershing to US 54☐ District: 2☐ Managing Department: Community Development☐ Estimated Completion: Summer 2022
PROJECT GOAL/BENEFITS
☐ Nurture neighborhoods with the inclusion of safe and lively streets for our citizens☐ Provide the public with safe and easy pedestrian access
PROJECT BUDGET
Sources of Funding:
Initial Budget
Pre FY 2022 Expenditures
FY 2022 Projected
Future FY Expenditures
Projected Budget
HUD CDBG Block Grant 1,005,050$ 59,958$ 41,561$ 903,531$ 1,005,050$
Total 1,005,050$ 59,958$ 41,561$ 903,531$ 1,005,050$
412
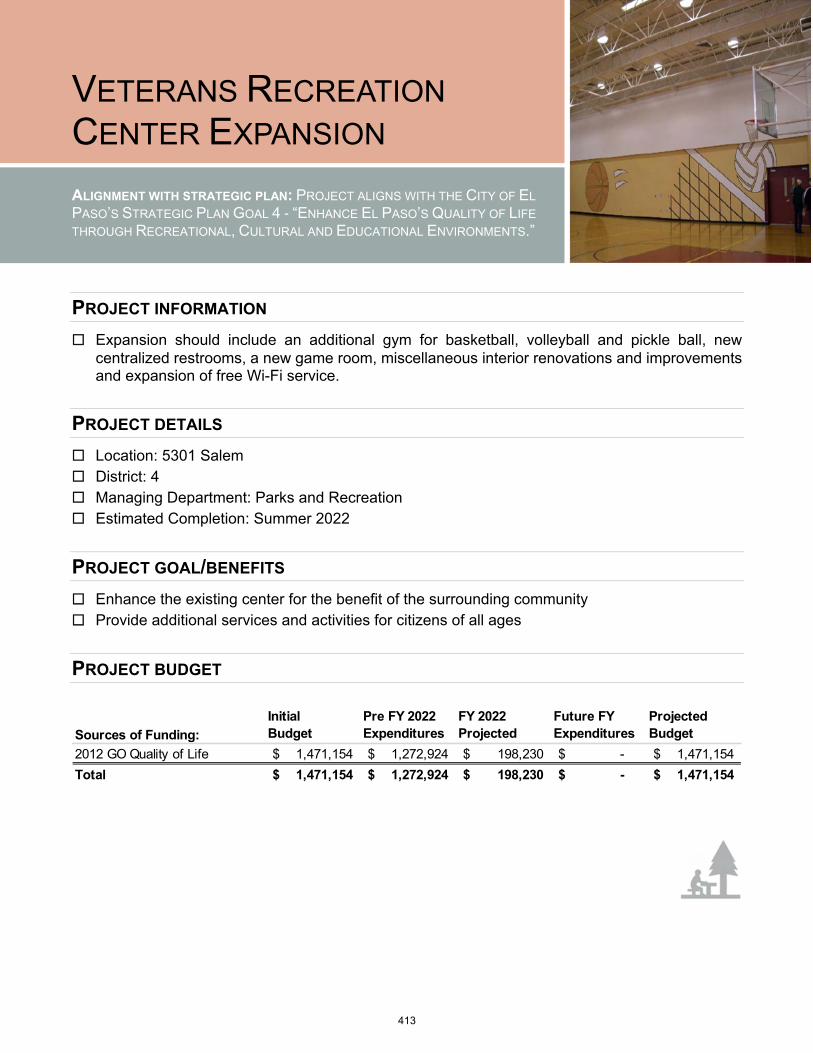
VETERANS RECREATION
CENTER EXPANSION
ALIGNMENT WITH STRATEGIC PLAN: PROJECT ALIGNS WITH THE CITY OF EL
PASO’S STRATEGIC PLAN GOAL 4 - “ENHANCE EL PASO’S QUALITY OF LIFE
THROUGH RECREATIONAL, CULTURAL AND EDUCATIONAL ENVIRONMENTS.”
PROJECT INFORMATION
☐ Expansion should include an additional gym for basketball, volleyball and pickle ball, newcentralized restrooms, a new game room, miscellaneous interior renovations and improvementsand expansion of free Wi-Fi service.
PROJECT DETAILS
☐ Location: 5301 Salem☐ District: 4☐ Managing Department: Parks and Recreation☐ Estimated Completion: Summer 2022
PROJECT GOAL/BENEFITS
☐ Enhance the existing center for the benefit of the surrounding community☐ Provide additional services and activities for citizens of all ages
PROJECT BUDGET
Sources of Funding:
Initial Budget
Pre FY 2022 Expenditures
FY 2022 Projected
Future FY Expenditures
Projected Budget
2012 GO Quality of Life 1,471,154$ 1,272,924$ 198,230$ -$ 1,471,154$
Total 1,471,154$ 1,272,924$ 198,230$ -$ 1,471,154$
413
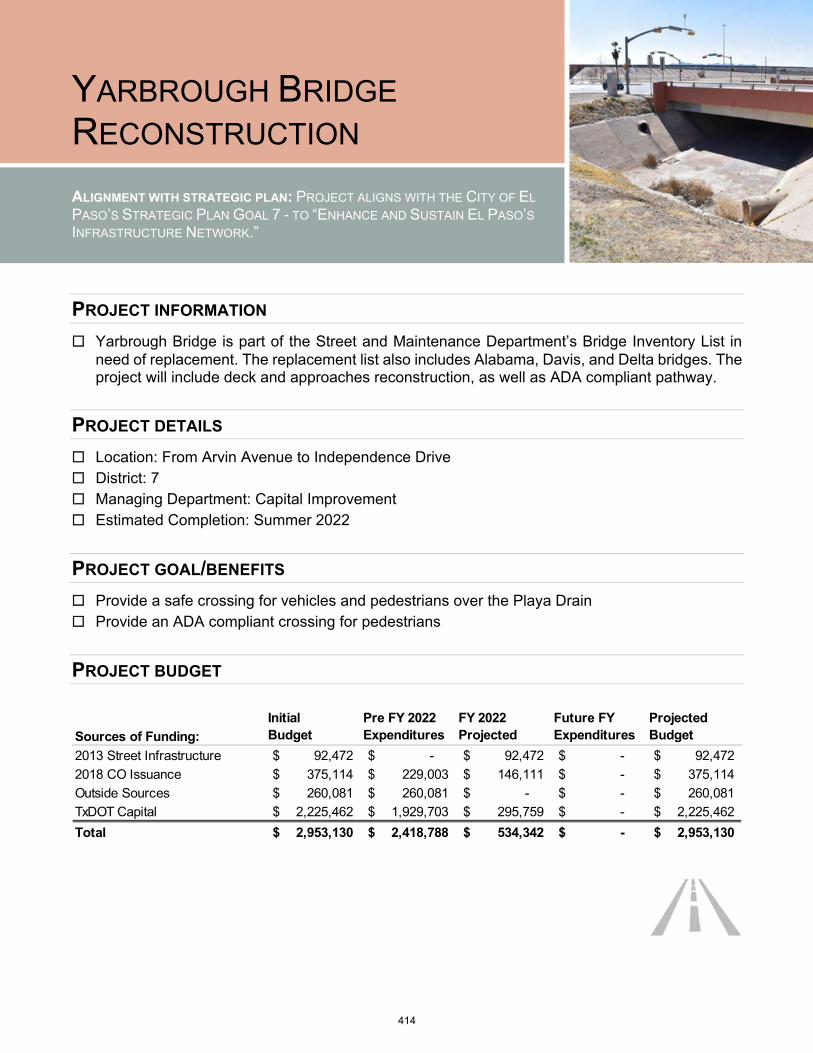
YARBROUGH BRIDGE
RECONSTRUCTION
ALIGNMENT WITH STRATEGIC PLAN: PROJECT ALIGNS WITH THE CITY OF EL
PASO’S STRATEGIC PLAN GOAL 7 - TO “ENHANCE AND SUSTAIN EL PASO’SINFRASTRUCTURE NETWORK.”
PROJECT INFORMATION
☐ Yarbrough Bridge is part of the Street and Maintenance Department’s Bridge Inventory List inneed of replacement. The replacement list also includes Alabama, Davis, and Delta bridges. Theproject will include deck and approaches reconstruction, as well as ADA compliant pathway.
PROJECT DETAILS
☐ Location: From Arvin Avenue to Independence Drive☐ District: 7☐ Managing Department: Capital Improvement☐ Estimated Completion: Summer 2022
PROJECT GOAL/BENEFITS
☐ Provide a safe crossing for vehicles and pedestrians over the Playa Drain☐ Provide an ADA compliant crossing for pedestrians
PROJECT BUDGET
Sources of Funding:
Initial Budget
Pre FY 2022 Expenditures
FY 2022 Projected
Future FY Expenditures
Projected Budget
2013 Street Infrastructure 92,472$ -$ 92,472$ -$ 92,472$
2018 CO Issuance 375,114$ 229,003$ 146,111$ -$ 375,114$
Outside Sources 260,081$ 260,081$ -$ -$ 260,081$
TxDOT Capital 2,225,462$ 1,929,703$ 295,759$ -$ 2,225,462$
Total 2,953,130$ 2,418,788$ 534,342$ -$ 2,953,130$
414

YARBROUGH, GEORGE DIETER, AND LEE
TREVINO LIGHTING AND LANDSCAPE
ALIGNMENT WITH STRATEGIC PLAN: PROJECT ALIGNS WITH THE CITY OF EL
PASO’S STRATEGIC PLAN GOAL 7 - TO “ENHANCE AND SUSTAIN EL PASO’SINFRASTRUCTURE NETWORK.”
PROJECT INFORMATION
☐ The City has designed to develop construction documents that will provide street arterial lightingand landscaping improvements to the Yarbrough corridor between Montana Avenue and I-10.Roadway improvements include LED arterial lighting, underground conduit and cable, andmedian landscaping and irrigation.
PROJECT DETAILS
☐ Location: Yarbrough South, George Dieter Drive, and Lee Trevino☐ District: 7☐ Managing Department: Capital Improvement☐ Estimated Completion: Winter 2021
PROJECT GOAL/BENEFITS
☐ Provide roadway lighting and landscape improvements☐ Improve the roadway environment for all users☐ Enhance City’s infrastructure
PROJECT BUDGET
Sources of Funding:
Initial Budget
Pre FY 2022 Expenditures
FY 2022 Projected
Future FY Expenditures
Projected Budget
2019 CO Issuance 8,327,600$ 4,813,749$ 2,342,567$ 1,171,284$ 8,327,600$
Total 8,327,600$ 4,813,749$ 2,342,567$ 1,171,284$ 8,327,600$
415
CITY OF EL PASO BUDGET BOOK 2022
GROWTH
APPENDIX
APPEN
DIX
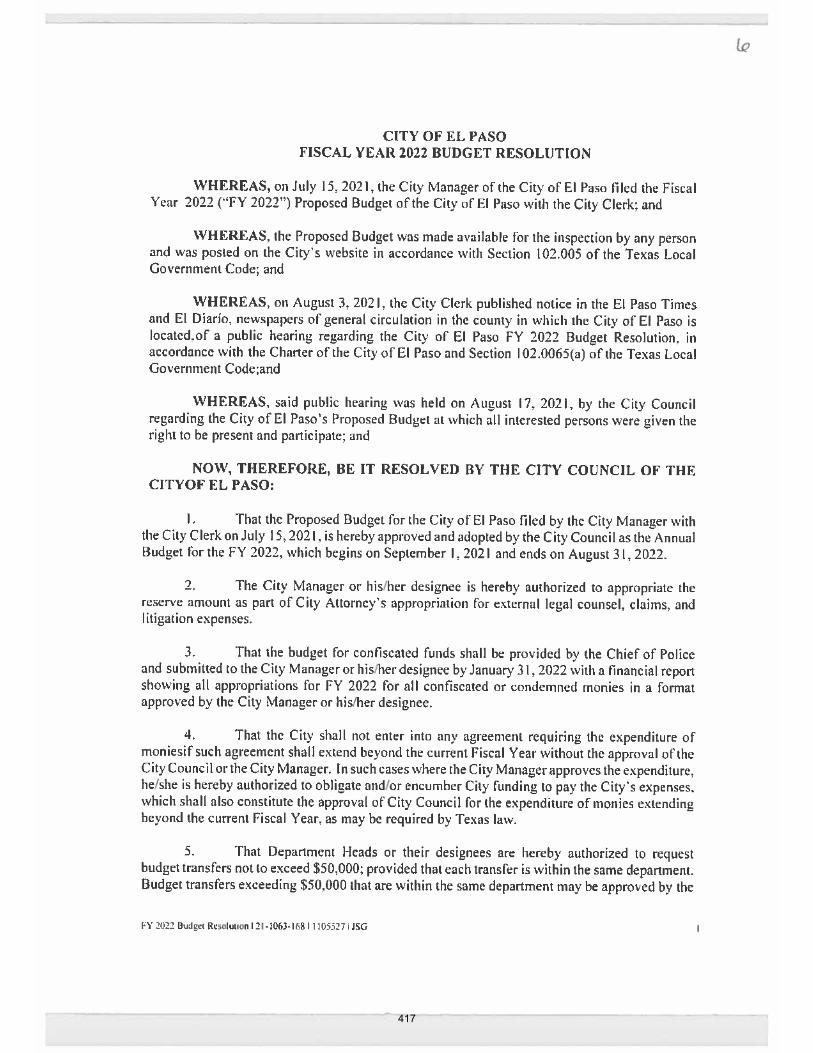
417

418
419

420
421
422

423
424
425

426
427
428
429

Beginning Proposed All Funds Revenues/Expenditures 1,064,492,204
Beginning Proposed General Fund Revenue 473,218,145 Department Division Account Account Description Increase / (Decrease)Non-Departmental 99999 401010 Real Property Tax Collections 3,012,718
Total Revisions to the General Fund Revenue 3,012,718
Total Revised General Fund Revenue 476,230,863
Beginning Proposed General Fund Expenditures 473,218,145 Department Division Account Account Description Inc / (Decrease)Streets and Maintenance 31130 570000 Interfund Transfers (Uses) (1,626,241)
32040 570000 Interfund Transfers (Uses) 500,000 32120 570000 Interfund Transfers (Uses) 4,138,959
Total Revisions to the General Fund Expenditures 3,012,718
Total Revised General Fund Expenditures 476,230,863
Beginning Proposed Non-General Fund Revenue 591,274,058 Department Division Account Account Description Inc / (Decrease)Economic Development 48050 401010 Real Property Tax Collections (684,070) Non-Departmental 99952 470000 Interfund Transfers (Sources) (314,320)
99953 470000 Interfund Transfers (Sources) (927,576) 99971 470000 Interfund Transfers (Sources) (443,490) 99973 460240 County Participation (125,930) 99973 470000 Interfund Transfers (Sources) (2,129,785) 99999 401010 Real Property Tax Collections (2,231,812) 99960 401010 Real Property Tax Collections 454,451 99960 470020 Fund Balance Transfers (Source) (454,451)
Streets and Maintenance 32040 470000 Interfund Transfers (Sources) 500,000 32120 470000 Interfund Transfers (Sources) 6,327,889
Total Revisions to the Non-General Fund Revenue (29,093)
Total Revised Non-General Fund Revenue 591,244,965
Total Revised All Funds Revenue 1,067,475,828
Beginning Proposed Non-General Fund Expenditures 591,274,058 Department Division Account Account Description Inc / (Decrease)Streets and Maintenance 32040 580280 Project Consulting 500,000
32120 522270 Public Accesses Maint Contract 6,327,889 Economic Development 48050 570000 Interfund Transfers (Uses) (684,070) Non-Departmental 99952 553000 Interest Expense (3,890)
99952 554110 Principal Payment Expense (310,430) 99953 553000 Interest Expense (64,700) 99953 554110 Principal Payment Expense (862,876) 99971 553000 Interest Expense (7,006) 99971 554110 Principal Payment Expense (436,484) 99973 553000 Interest Expense (98,603) 99973 554110 Principal Payment Expense (2,157,111) 99999 522170 Interlocal Agreements (6,517) 99999 570020 Fund Balance Transfers (Uses) (2,225,295)
Total Revisions to the Non-General Fund Expenditures (29,093)
Total Revised Non-General Fund Expenditures 591,244,965
Total Revised All Funds Expenditures 1,067,475,828
SCHEDULE AREVENUES AND EXPENDITURES
CHANGES TO THE PROPOSED BUDGET FY 2022
430
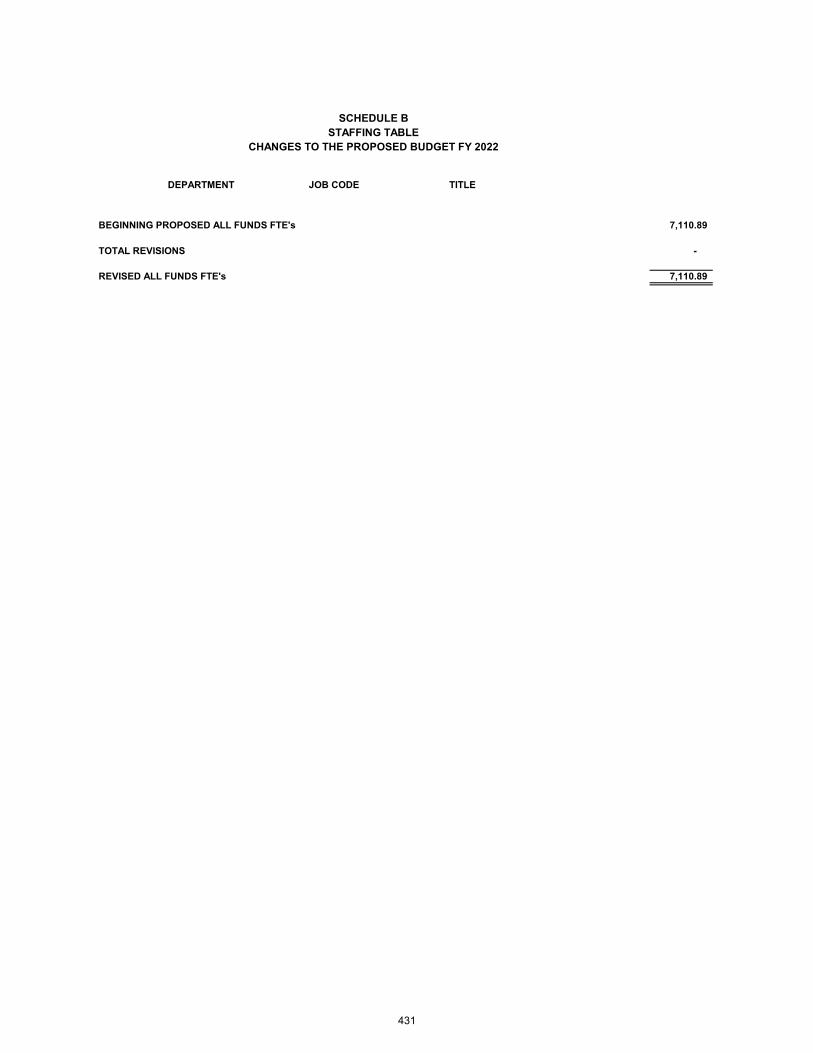
DEPARTMENT JOB CODE TITLE
BEGINNING PROPOSED ALL FUNDS FTE's 7,110.89
TOTAL REVISIONS -
REVISED ALL FUNDS FTE's 7,110.89
SCHEDULE BSTAFFING TABLE
CHANGES TO THE PROPOSED BUDGET FY 2022
431

Schedule B1 – FY22
SCHEDULE B1
3.12 CERTIFICATION PAY
A certification pay program is hereby established and the City Manager is authorized to determine if or when the program will be utilized, and when it shall cease. Employees who are receiving certification pay granted pursuant to Ordinance 8064, as amended, on the effective date of this ordinance shall continue to be eligible to receive such certification pay through August 31, 2012. Effective September 1, 2012 determinations of eligibility to receive certification pay will be made each year by the City Council at the recommendation of the City Manager in the annual budget resolution. Each year those employees who are eligible, if any, will be set forth in a schedule attached to the annual budget resolution. The purpose of the program is to provide an incentive to employees to earn and maintain certifications that can be used in the effective and efficient delivery of core business services. (Passed 02/24/09 and Amended 3/6/12)
A) Eligibility. Employees in the following jobclassifications are eligible to receive certificationpay:
13320 Civil Engineer Associate13370 Electrical Engineering Associate13570 Mechanical Engineering Associate13815 Engineering Lead Technician13820 Engineering Senior Technician13830 Engineering Technician17130 Chief Building Inspector17222 Building Inspector Supervisor17215 Building Combination InspectorSupervisor17235 Building Inspector17225 Building Combination Inspector17230 Electrical Inspector Supervisor17240 Electrical Inspector17220 Mechanical & Plumbing InspectorSupervisor17260 Plumbing Inspector17270 Mechanical Inspector17280 Landscape Inspector17340 Chief Plans Examiner17343 Senior Plans Examiner17350 Building Plans Examiner17365 Building Inspector / Plans Examiner17385 Mechanical & Plumbing Plans Examiner17370 Electrical Plans Examiner17380 Landscape Plans Examiner
B) Listing of Approved Certificates.The following certifications are the onlyrecognized certificates eligible forpayment of certification pay:
Commercial Building InspectorCommercial Electrical InspectorCommercial Plumbing InspectorCommercial Mechanical InspectorBuilding Plans ExaminerElectrical Plans InspectorMechanical Plans ExaminerPlumbing Plans ExaminerResidential Combination InspectorResidential Plan ExaminerCommercial Combination InspectorAccessibility Inspector/PlansExaminerCommercial Energy InspectorResidential Energy Inspector/PlansExaminerCertified Building OfficialFire Inspector IFire Inspector IIFire Plans ExaminerGreen Building Technologies
432
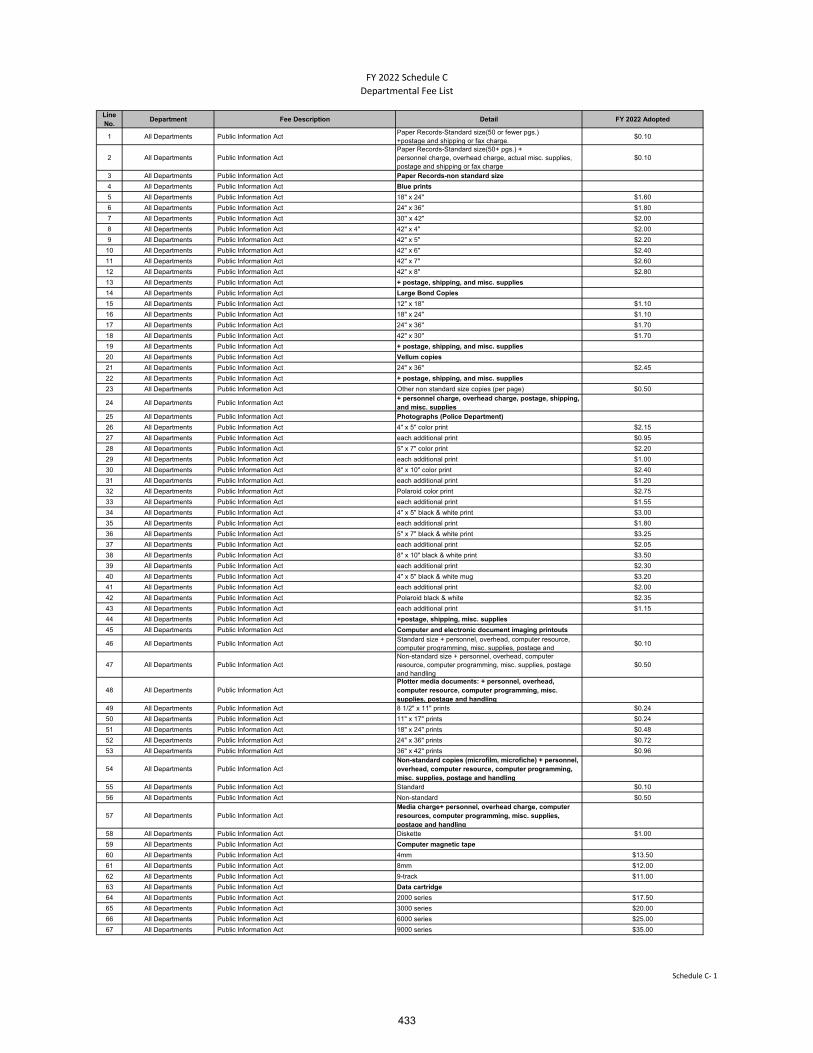
FY 2022 Schedule C
Departmental Fee List
Line No.
Department Fee Description Detail FY 2022 Adopted
1 All Departments Public Information Act Paper Records-Standard size(50 or fewer pgs.)+postage and shipping or fax charge.
$0.10
2 All Departments Public Information Act Paper Records-Standard size(50+ pgs.) +personnel charge, overhead charge, actual misc. supplies, postage and shipping or fax charge
$0.10
3 All Departments Public Information Act Paper Records-non standard size
4 All Departments Public Information Act Blue prints
5 All Departments Public Information Act 18" x 24" $1.60
6 All Departments Public Information Act 24" x 36" $1.80
7 All Departments Public Information Act 30'' x 42" $2.00
8 All Departments Public Information Act 42" x 4" $2.00
9 All Departments Public Information Act 42" x 5" $2.20
10 All Departments Public Information Act 42" x 6" $2.40
11 All Departments Public Information Act 42" x 7" $2.60
12 All Departments Public Information Act 42" x 8" $2.80
13 All Departments Public Information Act + postage, shipping, and misc. supplies
14 All Departments Public Information Act Large Bond Copies
15 All Departments Public Information Act 12" x 18" $1.10
16 All Departments Public Information Act 18" x 24" $1.10
17 All Departments Public Information Act 24" x 36" $1.70
18 All Departments Public Information Act 42" x 30" $1.70
19 All Departments Public Information Act + postage, shipping, and misc. supplies
20 All Departments Public Information Act Vellum copies
21 All Departments Public Information Act 24" x 36" $2.45
22 All Departments Public Information Act + postage, shipping, and misc. supplies
23 All Departments Public Information Act Other non standard size copies (per page) $0.50
24 All Departments Public Information Act + personnel charge, overhead charge, postage, shipping,and misc. supplies
25 All Departments Public Information Act Photographs (Police Department)
26 All Departments Public Information Act 4" x 5" color print $2.15
27 All Departments Public Information Act each additional print $0.95
28 All Departments Public Information Act 5" x 7" color print $2.20
29 All Departments Public Information Act each additional print $1.00
30 All Departments Public Information Act 8" x 10" color print $2.40
31 All Departments Public Information Act each additional print $1.20
32 All Departments Public Information Act Polaroid color print $2.75
33 All Departments Public Information Act each additional print $1.55
34 All Departments Public Information Act 4" x 5" black & white print $3.00
35 All Departments Public Information Act each additional print $1.80
36 All Departments Public Information Act 5" x 7" black & white print $3.25
37 All Departments Public Information Act each additional print $2.05
38 All Departments Public Information Act 8" x 10" black & white print $3.50
39 All Departments Public Information Act each additional print $2.30
40 All Departments Public Information Act 4" x 5" black & white mug $3.20
41 All Departments Public Information Act each additional print $2.00
42 All Departments Public Information Act Polaroid black & white $2.35
43 All Departments Public Information Act each additional print $1.15
44 All Departments Public Information Act +postage, shipping, misc. supplies
45 All Departments Public Information Act Computer and electronic document imaging printouts
46 All Departments Public Information Act Standard size + personnel, overhead, computer resource, computer programming, misc. supplies, postage and
$0.10
47 All Departments Public Information Act Non-standard size + personnel, overhead, computer resource, computer programming, misc. supplies, postage and handling
$0.50
48 All Departments Public Information Act Plotter media documents: + personnel, overhead, computer resource, computer programming, misc. supplies, postage and handling
49 All Departments Public Information Act 8 1/2" x 11" prints $0.24
50 All Departments Public Information Act 11" x 17" prints $0.24
51 All Departments Public Information Act 18" x 24" prints $0.48
52 All Departments Public Information Act 24" x 36" prints $0.72
53 All Departments Public Information Act 36" x 42" prints $0.96
54 All Departments Public Information Act Non-standard copies (microfilm, microfiche) + personnel, overhead, computer resource, computer programming, misc. supplies, postage and handling
55 All Departments Public Information Act Standard $0.10
56 All Departments Public Information Act Non-standard $0.50
57 All Departments Public Information Act Media charge+ personnel, overhead charge, computer resources, computer programming, misc. supplies, postage and handling
58 All Departments Public Information Act Diskette $1.00
59 All Departments Public Information Act Computer magnetic tape
60 All Departments Public Information Act 4mm $13.50
61 All Departments Public Information Act 8mm $12.00
62 All Departments Public Information Act 9-track $11.00
63 All Departments Public Information Act Data cartridge
64 All Departments Public Information Act 2000 series $17.50
65 All Departments Public Information Act 3000 series $20.00
66 All Departments Public Information Act 6000 series $25.00
67 All Departments Public Information Act 9000 series $35.00
Schedule C‐ 1
433
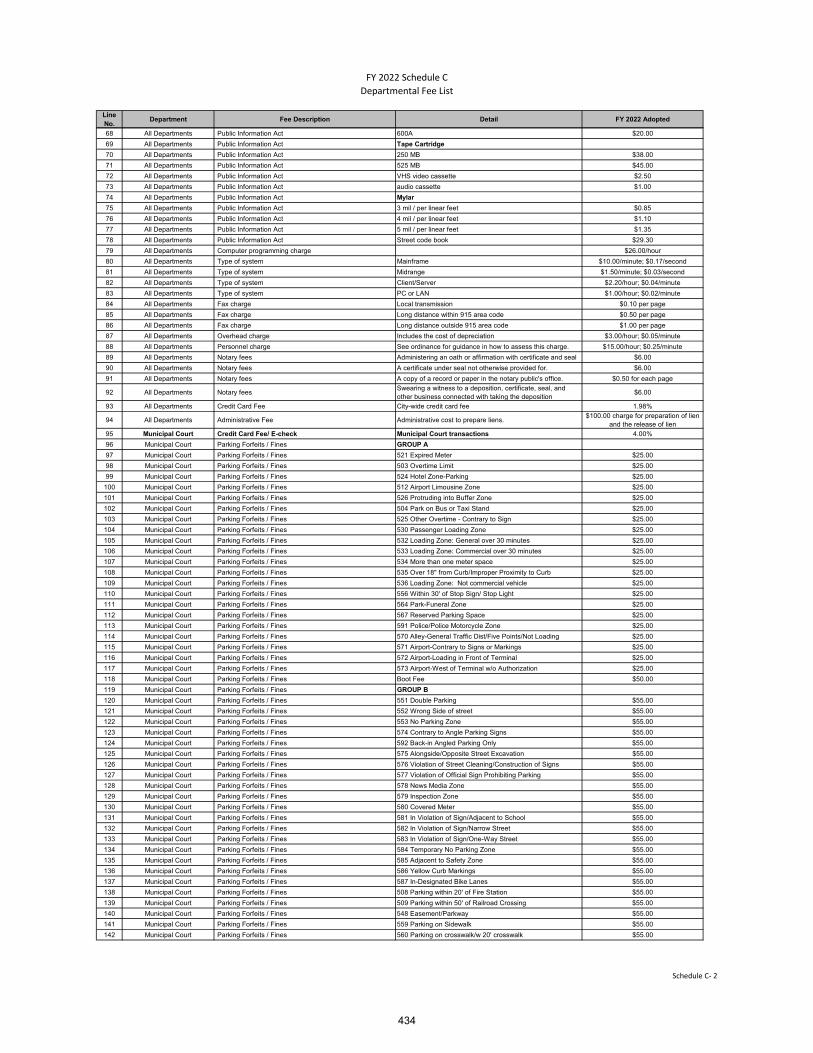
FY 2022 Schedule C
Departmental Fee List
Line No.
Department Fee Description Detail FY 2022 Adopted
68 All Departments Public Information Act 600A $20.00
69 All Departments Public Information Act Tape Cartridge
70 All Departments Public Information Act 250 MB $38.00
71 All Departments Public Information Act 525 MB $45.00
72 All Departments Public Information Act VHS video cassette $2.50
73 All Departments Public Information Act audio cassette $1.00
74 All Departments Public Information Act Mylar
75 All Departments Public Information Act 3 mil / per linear feet $0.85
76 All Departments Public Information Act 4 mil / per linear feet $1.10
77 All Departments Public Information Act 5 mil / per linear feet $1.35
78 All Departments Public Information Act Street code book $29.30
79 All Departments Computer programming charge $26.00/hour
80 All Departments Type of system Mainframe $10.00/minute; $0.17/second
81 All Departments Type of system Midrange $1.50/minute; $0.03/second
82 All Departments Type of system Client/Server $2.20/hour; $0.04/minute
83 All Departments Type of system PC or LAN $1.00/hour; $0.02/minute
84 All Departments Fax charge Local transmission $0.10 per page
85 All Departments Fax charge Long distance within 915 area code $0.50 per page
86 All Departments Fax charge Long distance outside 915 area code $1.00 per page
87 All Departments Overhead charge Includes the cost of depreciation $3.00/hour; $0.05/minute
88 All Departments Personnel charge See ordinance for guidance in how to assess this charge. $15.00/hour; $0.25/minute
89 All Departments Notary fees Administering an oath or affirmation with certificate and seal $6.00
90 All Departments Notary fees A certificate under seal not otherwise provided for. $6.00
91 All Departments Notary fees A copy of a record or paper in the notary public's office. $0.50 for each page
92 All Departments Notary fees Swearing a witness to a deposition, certificate, seal, and other business connected with taking the deposition
$6.00
93 All Departments Credit Card Fee City-wide credit card fee 1.98%
94 All Departments Administrative Fee Administrative cost to prepare liens.$100.00 charge for preparation of lien
and the release of lien
95 Municipal Court Credit Card Fee/ E-check Municipal Court transactions 4.00%
96 Municipal Court Parking Forfeits / Fines GROUP A
97 Municipal Court Parking Forfeits / Fines 521 Expired Meter $25.00
98 Municipal Court Parking Forfeits / Fines 503 Overtime Limit $25.00
99 Municipal Court Parking Forfeits / Fines 524 Hotel Zone-Parking $25.00
100 Municipal Court Parking Forfeits / Fines 512 Airport Limousine Zone $25.00
101 Municipal Court Parking Forfeits / Fines 526 Protruding into Buffer Zone $25.00
102 Municipal Court Parking Forfeits / Fines 504 Park on Bus or Taxi Stand $25.00
103 Municipal Court Parking Forfeits / Fines 525 Other Overtime - Contrary to Sign $25.00
104 Municipal Court Parking Forfeits / Fines 530 Passenger Loading Zone $25.00
105 Municipal Court Parking Forfeits / Fines 532 Loading Zone: General over 30 minutes $25.00
106 Municipal Court Parking Forfeits / Fines 533 Loading Zone: Commercial over 30 minutes $25.00
107 Municipal Court Parking Forfeits / Fines 534 More than one meter space $25.00
108 Municipal Court Parking Forfeits / Fines 535 Over 18" from Curb/Improper Proximity to Curb $25.00
109 Municipal Court Parking Forfeits / Fines 536 Loading Zone: Not commercial vehicle $25.00
110 Municipal Court Parking Forfeits / Fines 556 Within 30' of Stop Sign/ Stop Light $25.00
111 Municipal Court Parking Forfeits / Fines 564 Park-Funeral Zone $25.00
112 Municipal Court Parking Forfeits / Fines 567 Reserved Parking Space $25.00
113 Municipal Court Parking Forfeits / Fines 591 Police/Police Motorcycle Zone $25.00
114 Municipal Court Parking Forfeits / Fines 570 Alley-General Traffic Dist/Five Points/Not Loading $25.00
115 Municipal Court Parking Forfeits / Fines 571 Airport-Contrary to Signs or Markings $25.00
116 Municipal Court Parking Forfeits / Fines 572 Airport-Loading in Front of Terminal $25.00
117 Municipal Court Parking Forfeits / Fines 573 Airport-West of Terminal w/o Authorization $25.00
118 Municipal Court Parking Forfeits / Fines Boot Fee $50.00
119 Municipal Court Parking Forfeits / Fines GROUP B
120 Municipal Court Parking Forfeits / Fines 551 Double Parking $55.00
121 Municipal Court Parking Forfeits / Fines 552 Wrong Side of street $55.00
122 Municipal Court Parking Forfeits / Fines 553 No Parking Zone $55.00
123 Municipal Court Parking Forfeits / Fines 574 Contrary to Angle Parking Signs $55.00
124 Municipal Court Parking Forfeits / Fines 592 Back-in Angled Parking Only $55.00
125 Municipal Court Parking Forfeits / Fines 575 Alongside/Opposite Street Excavation $55.00
126 Municipal Court Parking Forfeits / Fines 576 Violation of Street Cleaning/Construction of Signs $55.00
127 Municipal Court Parking Forfeits / Fines 577 Violation of Official Sign Prohibiting Parking $55.00
128 Municipal Court Parking Forfeits / Fines 578 News Media Zone $55.00
129 Municipal Court Parking Forfeits / Fines 579 Inspection Zone $55.00
130 Municipal Court Parking Forfeits / Fines 580 Covered Meter $55.00
131 Municipal Court Parking Forfeits / Fines 581 In Violation of Sign/Adjacent to School $55.00
132 Municipal Court Parking Forfeits / Fines 582 In Violation of Sign/Narrow Street $55.00
133 Municipal Court Parking Forfeits / Fines 583 In Violation of Sign/One-Way Street $55.00
134 Municipal Court Parking Forfeits / Fines 584 Temporary No Parking Zone $55.00
135 Municipal Court Parking Forfeits / Fines 585 Adjacent to Safety Zone $55.00
136 Municipal Court Parking Forfeits / Fines 586 Yellow Curb Markings $55.00
137 Municipal Court Parking Forfeits / Fines 587 In-Designated Bike Lanes $55.00
138 Municipal Court Parking Forfeits / Fines 508 Parking within 20' of Fire Station $55.00
139 Municipal Court Parking Forfeits / Fines 509 Parking within 50' of Railroad Crossing $55.00
140 Municipal Court Parking Forfeits / Fines 548 Easement/Parkway $55.00
141 Municipal Court Parking Forfeits / Fines 559 Parking on Sidewalk $55.00
142 Municipal Court Parking Forfeits / Fines 560 Parking on crosswalk/w 20' crosswalk $55.00
Schedule C‐ 2
434
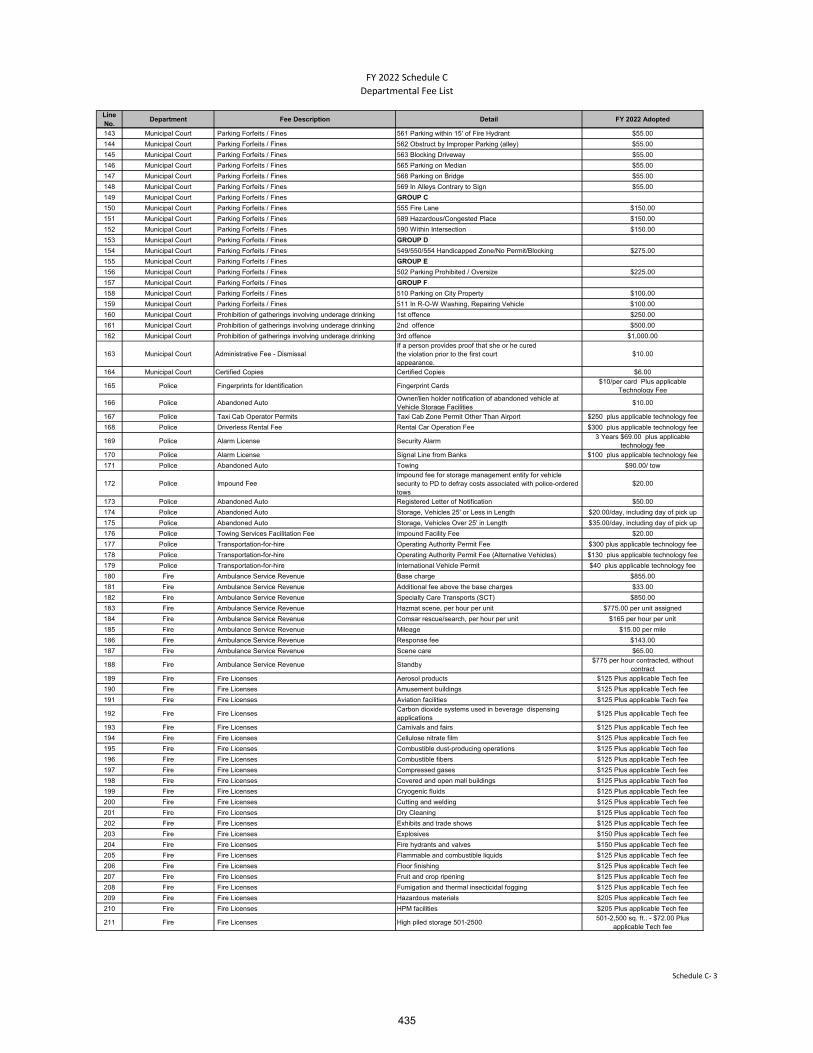
FY 2022 Schedule C
Departmental Fee List
Line No.
Department Fee Description Detail FY 2022 Adopted
143 Municipal Court Parking Forfeits / Fines 561 Parking within 15' of Fire Hydrant $55.00
144 Municipal Court Parking Forfeits / Fines 562 Obstruct by Improper Parking (alley) $55.00
145 Municipal Court Parking Forfeits / Fines 563 Blocking Driveway $55.00
146 Municipal Court Parking Forfeits / Fines 565 Parking on Median $55.00
147 Municipal Court Parking Forfeits / Fines 568 Parking on Bridge $55.00
148 Municipal Court Parking Forfeits / Fines 569 In Alleys Contrary to Sign $55.00
149 Municipal Court Parking Forfeits / Fines GROUP C
150 Municipal Court Parking Forfeits / Fines 555 Fire Lane $150.00
151 Municipal Court Parking Forfeits / Fines 589 Hazardous/Congested Place $150.00
152 Municipal Court Parking Forfeits / Fines 590 Within Intersection $150.00
153 Municipal Court Parking Forfeits / Fines GROUP D
154 Municipal Court Parking Forfeits / Fines 549/550/554 Handicapped Zone/No Permit/Blocking $275.00
155 Municipal Court Parking Forfeits / Fines GROUP E
156 Municipal Court Parking Forfeits / Fines 502 Parking Prohibited / Oversize $225.00
157 Municipal Court Parking Forfeits / Fines GROUP F
158 Municipal Court Parking Forfeits / Fines 510 Parking on City Property $100.00
159 Municipal Court Parking Forfeits / Fines 511 In R-O-W Washing, Repairing Vehicle $100.00
160 Municipal Court Prohibition of gatherings involving underage drinking 1st offence $250.00
161 Municipal Court Prohibition of gatherings involving underage drinking 2nd offence $500.00
162 Municipal Court Prohibition of gatherings involving underage drinking 3rd offence $1,000.00
163 Municipal Court Administrative Fee - DismissalIf a person provides proof that she or he curedthe violation prior to the first courtappearance.
$10.00
164 Municipal Court Certified Copies Certified Copies $6.00
165 Police Fingerprints for Identification Fingerprint Cards$10/per card Plus applicable
Technology Fee
166 Police Abandoned Auto Owner/lien holder notification of abandoned vehicle at Vehicle Storage Facilities
$10.00
167 Police Taxi Cab Operator Permits Taxi Cab Zone Permit Other Than Airport $250 plus applicable technology fee
168 Police Driverless Rental Fee Rental Car Operation Fee $300 plus applicable technology fee
169 Police Alarm License Security Alarm3 Years $69.00 plus applicable
technology fee
170 Police Alarm License Signal Line from Banks $100 plus applicable technology fee
171 Police Abandoned Auto Towing $90.00/ tow
172 Police Impound Fee Impound fee for storage management entity for vehicle security to PD to defray costs associated with police-ordered tows
$20.00
173 Police Abandoned Auto Registered Letter of Notification $50.00
174 Police Abandoned Auto Storage, Vehicles 25' or Less in Length $20.00/day, including day of pick up
175 Police Abandoned Auto Storage, Vehicles Over 25' in Length $35.00/day, including day of pick up
176 Police Towing Services Facilitation Fee Impound Facility Fee $20.00
177 Police Transportation-for-hire Operating Authority Permit Fee $300 plus applicable technology fee
178 Police Transportation-for-hire Operating Authority Permit Fee (Alternative Vehicles) $130 plus applicable technology fee
179 Police Transportation-for-hire International Vehicle Permit $40 plus applicable technology fee
180 Fire Ambulance Service Revenue Base charge $855.00
181 Fire Ambulance Service Revenue Additional fee above the base charges $33.00
182 Fire Ambulance Service Revenue Specialty Care Transports (SCT) $850.00
183 Fire Ambulance Service Revenue Hazmat scene, per hour per unit $775.00 per unit assigned
184 Fire Ambulance Service Revenue Comsar rescue/search, per hour per unit $165 per hour per unit
185 Fire Ambulance Service Revenue Mileage $15.00 per mile
186 Fire Ambulance Service Revenue Response fee $143.00
187 Fire Ambulance Service Revenue Scene care $65.00
188 Fire Ambulance Service Revenue Standby$775 per hour contracted, without
contract
189 Fire Fire Licenses Aerosol products $125 Plus applicable Tech fee
190 Fire Fire Licenses Amusement buildings $125 Plus applicable Tech fee
191 Fire Fire Licenses Aviation facilities $125 Plus applicable Tech fee
192 Fire Fire Licenses Carbon dioxide systems used in beverage dispensing applications
$125 Plus applicable Tech fee
193 Fire Fire Licenses Carnivals and fairs $125 Plus applicable Tech fee
194 Fire Fire Licenses Cellulose nitrate film $125 Plus applicable Tech fee
195 Fire Fire Licenses Combustible dust-producing operations $125 Plus applicable Tech fee
196 Fire Fire Licenses Combustible fibers $125 Plus applicable Tech fee
197 Fire Fire Licenses Compressed gases $125 Plus applicable Tech fee
198 Fire Fire Licenses Covered and open mall buildings $125 Plus applicable Tech fee
199 Fire Fire Licenses Cryogenic fluids $125 Plus applicable Tech fee
200 Fire Fire Licenses Cutting and welding $125 Plus applicable Tech fee
201 Fire Fire Licenses Dry Cleaning $125 Plus applicable Tech fee
202 Fire Fire Licenses Exhibits and trade shows $125 Plus applicable Tech fee
203 Fire Fire Licenses Explosives $150 Plus applicable Tech fee
204 Fire Fire Licenses Fire hydrants and valves $150 Plus applicable Tech fee
205 Fire Fire Licenses Flammable and combustible liquids $125 Plus applicable Tech fee
206 Fire Fire Licenses Floor finishing $125 Plus applicable Tech fee
207 Fire Fire Licenses Fruit and crop ripening $125 Plus applicable Tech fee
208 Fire Fire Licenses Fumigation and thermal insecticidal fogging $125 Plus applicable Tech fee
209 Fire Fire Licenses Hazardous materials $205 Plus applicable Tech fee
210 Fire Fire Licenses HPM facilities $205 Plus applicable Tech fee
211 Fire Fire Licenses High piled storage 501-2500501-2,500 sq. ft.. - $72.00 Plus
applicable Tech fee
Schedule C‐ 3
435

FY 2022 Schedule C
Departmental Fee List
Line No.
Department Fee Description Detail FY 2022 Adopted
212 Fire Fire Licenses High piled storage 2,501-12,0002,501-12,000 sq. ft... - $144.00 Plus
applicable Tech fee
213 Fire Fire Licenses High piled storage (over 12,000 sq. ft.)>12,000 sq. ft... - $216.00 Plus
applicable Tech fee
214 Fire Fire Licenses Hot Work Operations $125 Plus applicable Tech fee
215 Fire Fire Licenses Industrial ovens $125 Plus applicable Tech fee
216 Fire Fire Licenses Lumber yards and woodworking plants $125 Plus applicable Tech fee
217 Fire Fire Licenses Liquid or gas-fueled vehicles or equipment in assembly buildings
$125 Plus applicable Tech fee
218 Fire Fire Licenses LP gas $125 Plus applicable Tech fee
219 Fire Fire Licenses Magnesium $125 Plus applicable Tech fee
220 Fire Fire Licenses Miscellaneous combustible storage $125 Plus applicable Tech fee
221 Fire Fire Licenses Motor fuel-dispensing facilities $125 Plus applicable Tech fee
222 Fire Fire Licenses Open Burning $125 Plus applicable Tech fee
223 Fire Fire Licenses Open flames and torches $125 Plus applicable Tech fee
224 Fire Fire Licenses Open flames and candles $125 Plus applicable Tech fee
225 Fire Fire Licenses Organic coatings $125 Plus applicable Tech fee
226 Fire Fire Licenses Places of assembly $125 Plus applicable Tech fee
227 Fire Fire Licenses Private fire hydrants $150 Plus applicable Tech fee
228 Fire Fire Licenses Pyrotechnic special effects material $150 Plus applicable Tech fee
229 Fire Fire Licenses Pyroxylin plastics $125 Plus applicable Tech fee
230 Fire Fire Licenses Refrigeration equipment $125 Plus applicable Tech fee
231 Fire Fire Licenses Repair garages and motor fuel-dispensing facilities $125 Plus applicable Tech fee
232 Fire Fire Licenses Rooftop heliports $125 Plus applicable Tech fee
233 Fire Fire Licenses Spraying or dipping $125 Plus applicable Tech fee
234 Fire Fire Licenses Storage of scrap tires and tire byproducts $125 Plus applicable Tech fee
235 Fire Fire Licenses Temporary membrane, structures, tents and canopies $125 Plus applicable Tech fee
236 Fire Fire Licenses Tire-rebuilding plants $125 Plus applicable Tech fee
237 Fire Fire Licenses Waste handling $125 Plus applicable Tech fee
238 Fire Fire Licenses Wood products $125 Plus applicable Tech fee
239 Fire Fire Licenses Blasting operations $125 Plus applicable Tech fee
240 Fire Fire Licenses Commercial Day Care Facilities-Children $125 Plus applicable Tech fee
241 Fire Fire Licenses For Use Permit $125 Plus applicable Tech fee
242 Fire Fire Licenses Outside storage of Combustible material permit $125 Plus applicable Tech fee
243 Fire Fire Service Fee Re-Inspection Fee$72.00 flat rate Plus applicable Tech
fee
244 Fire Fire Service Fee Investigation/Inspection/Fire watch/standby Fees-other than regular duty hours (Reimbursed Overtime)
$92.00/hr.(2hr. Min) per ea. Fire Investigator/Inspector Plus applicable
Tech fee245 Fire Fire Service Fee Investigation/Inspection Fees-during regular duty hours $72.00/hr. Plus applicable Tech fee
246 Fire Fire Service Fee Fire Hydrant Flow Request (FHFR)$72.00/hr.(2hr. Min) per ea. Fire
personnel Plus applicable Tech fee
247 Fire Fire Service Fee Fire Watch/Standby-during regular duty hours $72.00/hr. Plus applicable Tech fee
248 Fire Fire Service Fee Site Assessment (consultation)$75.00 flat rate Plus applicable Tech
fee
249 Fire Fire Service Fee Non-Regulatory Inspections $72.00/hr. Plus applicable Tech fee
250 Fire Fire Service Fee Commercial Safety Training$72.00 flat rate Plus applicable Tech
fee
251 Fire Fire Service Fee Fire Plan Review by Appointment $146.00/hr. Plus applicable Tech fee
252 Fire Fire Service Fee Fire Systems/Plan Review $72.00/hr. Plus applicable Tech fee
253 Fire Fire Service Fee Fire Systems Initial Acceptance Test $72.00/hr. Plus applicable Tech fee
254 Fire Fire Service Fee Building Permit Fire Final (BLD) Fee $72.00/hr. Plus applicable Tech fee
255 Fire Fire Service Fee Expedited Services Fees-Site Inspections$144.00 initial (2hr. Min.); $72.00/hr.
thereafter Plus applicable Tech fee
256 International Bridges Parking Meters Meter Rentals $10.00 per day
257 International Bridges Parking Meters Payments with Credit or Debit Card - to include Parking fee and convenience fee
MINIMUM Payment of $1.03/1st hour then $1.00/hour for additional time
258 International Bridges Parking Meters Administrative Fee Per Rental $30.00 per rental
259 International Bridges Toll for International Bridges Tolls Charge Pedestrian, three years or older $0.50
260 International Bridges Toll for International Bridges Tolls Charge, Bicycle $0.50
261 International Bridges Toll for International Bridges Toll Charge, Motorcycle - Pre-Paid $3.00
262 International Bridges Toll for International Bridges Toll Charge, Motorcycle - Cash at booth $3.50
263 International Bridges Toll for International Bridges Tolls Charge Automobiles, pick up trucks, (up to one-ton carrying capacity), panel trucks, vans, recreational trailers - Pre-Paid
$3.00
264 International Bridges Toll for International Bridges Tolls Charge Automobiles, pick up trucks, (up to one-ton carrying capacity), panel trucks, vans, recreational trailers - Cash at booth
$3.50
265 International Bridges Toll for International Bridges Extra Axle for automobiles, pick up trucks, (up to one-ton carrying capacity), panel trucks, vans, recreational trailers - Pre-Paid
$1.50
266 International Bridges Toll for International Bridges Extra Axle for automobiles, pick up trucks, (up to one-ton carrying capacity), panel trucks, vans, recreational trailers - Cash at booth
$1.75
267 International Bridges Toll for International Bridges Tolls Charge Commercial Trucks, Buses, Motor Homes, Tractors, Commercial Towed Trailers - Pre-Paid
$4.00 per axle
268 International Bridges Toll for International Bridges Tolls Charge Commercial Trucks, Buses, Motor Homes, Tractors, Commercial Towed Trailers - Cash at booth
$4.50 per axle
269 International Bridges Toll for International Bridges Toll Charge, Pick Up Trucks with a carrying capacity exceeding one-ton - Pre-paid
$4.00
270 International Bridges Toll for International Bridges Toll Charge, Pick Up Trucks with a carrying capacity exceeding one-ton - Cash at booth
$4.50
Schedule C‐ 4
436
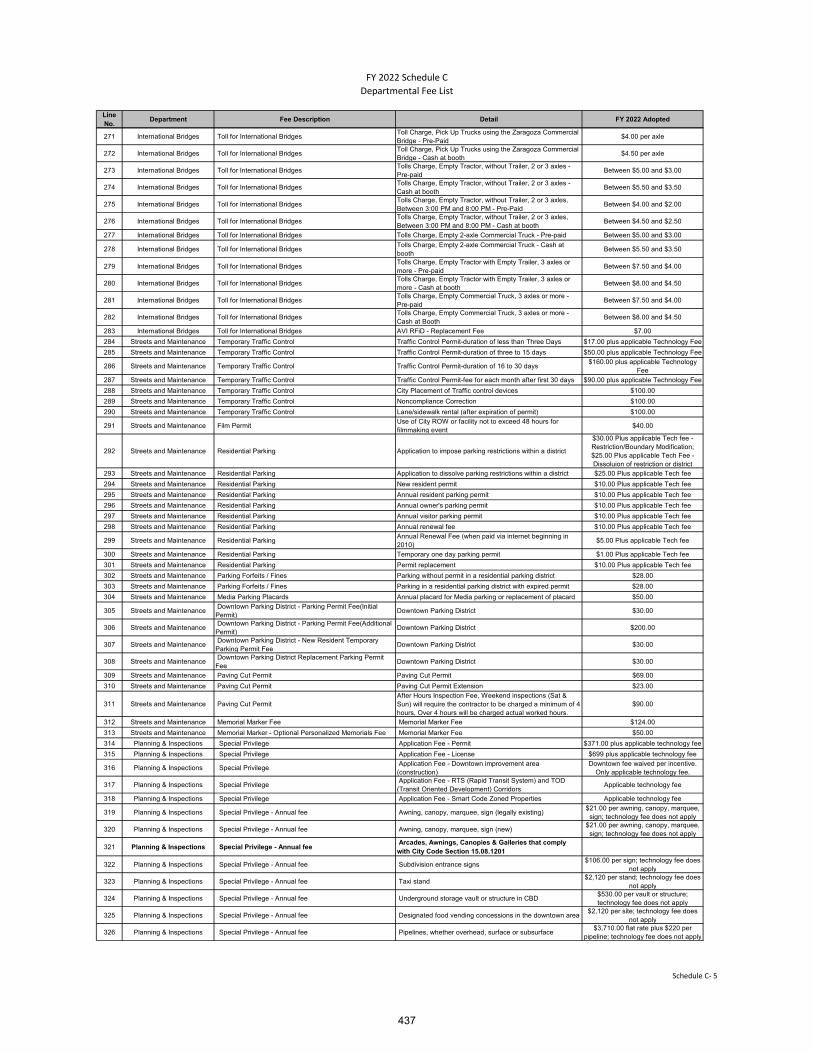
FY 2022 Schedule C
Departmental Fee List
Line No.
Department Fee Description Detail FY 2022 Adopted
271 International Bridges Toll for International Bridges Toll Charge, Pick Up Trucks using the Zaragoza Commercial Bridge - Pre-Paid
$4.00 per axle
272 International Bridges Toll for International Bridges Toll Charge, Pick Up Trucks using the Zaragoza Commercial Bridge - Cash at booth
$4.50 per axle
273 International Bridges Toll for International Bridges Tolls Charge, Empty Tractor, without Trailer, 2 or 3 axles - Pre-paid
Between $5.00 and $3.00
274 International Bridges Toll for International Bridges Tolls Charge, Empty Tractor, without Trailer, 2 or 3 axles - Cash at booth
Between $5.50 and $3.50
275 International Bridges Toll for International Bridges Tolls Charge, Empty Tractor, without Trailer, 2 or 3 axles, Between 3:00 PM and 8:00 PM - Pre-Paid
Between $4.00 and $2.00
276 International Bridges Toll for International Bridges Tolls Charge, Empty Tractor, without Trailer, 2 or 3 axles, Between 3:00 PM and 8:00 PM - Cash at booth
Between $4.50 and $2.50
277 International Bridges Toll for International Bridges Tolls Charge, Empty 2-axle Commercial Truck - Pre-paid Between $5.00 and $3.00
278 International Bridges Toll for International Bridges Tolls Charge, Empty 2-axle Commercial Truck - Cash at booth
Between $5.50 and $3.50
279 International Bridges Toll for International Bridges Tolls Charge, Empty Tractor with Empty Trailer, 3 axles or more - Pre-paid
Between $7.50 and $4.00
280 International Bridges Toll for International Bridges Tolls Charge, Empty Tractor with Empty Trailer, 3 axles or more - Cash at booth
Between $8.00 and $4.50
281 International Bridges Toll for International Bridges Tolls Charge, Empty Commercial Truck, 3 axles or more - Pre-paid
Between $7.50 and $4.00
282 International Bridges Toll for International Bridges Tolls Charge, Empty Commercial Truck, 3 axles or more - Cash at Booth
Between $8.00 and $4.50
283 International Bridges Toll for International Bridges AVI RFiD - Replacement Fee $7.00
284 Streets and Maintenance Temporary Traffic Control Traffic Control Permit-duration of less than Three Days $17.00 plus applicable Technology Fee
285 Streets and Maintenance Temporary Traffic Control Traffic Control Permit-duration of three to 15 days $50.00 plus applicable Technology Fee
286 Streets and Maintenance Temporary Traffic Control Traffic Control Permit-duration of 16 to 30 days$160.00 plus applicable Technology
Fee
287 Streets and Maintenance Temporary Traffic Control Traffic Control Permit-fee for each month after first 30 days $90.00 plus applicable Technology Fee
288 Streets and Maintenance Temporary Traffic Control City Placement of Traffic control devices $100.00
289 Streets and Maintenance Temporary Traffic Control Noncompliance Correction $100.00
290 Streets and Maintenance Temporary Traffic Control Lane/sidewalk rental (after expiration of permit) $100.00
291 Streets and Maintenance Film Permit Use of City ROW or facility not to exceed 48 hours for filmmaking event
$40.00
292 Streets and Maintenance Residential Parking Application to impose parking restrictions within a district
$30.00 Plus applicable Tech fee - Restriction/Boundary Modification; $25.00 Plus applicable Tech Fee - Dissoluion of restriction or district
293 Streets and Maintenance Residential Parking Application to dissolve parking restrictions within a district $25.00 Plus applicable Tech fee
294 Streets and Maintenance Residential Parking New resident permit $10.00 Plus applicable Tech fee
295 Streets and Maintenance Residential Parking Annual resident parking permit $10.00 Plus applicable Tech fee
296 Streets and Maintenance Residential Parking Annual owner's parking permit $10.00 Plus applicable Tech fee
297 Streets and Maintenance Residential Parking Annual visitor parking permit $10.00 Plus applicable Tech fee
298 Streets and Maintenance Residential Parking Annual renewal fee $10.00 Plus applicable Tech fee
299 Streets and Maintenance Residential Parking Annual Renewal Fee (when paid via internet beginning in 2010)
$5.00 Plus applicable Tech fee
300 Streets and Maintenance Residential Parking Temporary one day parking permit $1.00 Plus applicable Tech fee
301 Streets and Maintenance Residential Parking Permit replacement $10.00 Plus applicable Tech fee
302 Streets and Maintenance Parking Forfeits / Fines Parking without permit in a residential parking district $28.00
303 Streets and Maintenance Parking Forfeits / Fines Parking in a residential parking district with expired permit $28.00
304 Streets and Maintenance Media Parking Placards Annual placard for Media parking or replacement of placard $50.00
305 Streets and Maintenance Downtown Parking District - Parking Permit Fee(Initial Permit)
Downtown Parking District $30.00
306 Streets and Maintenance Downtown Parking District - Parking Permit Fee(Additional Permit)
Downtown Parking District $200.00
307 Streets and Maintenance Downtown Parking District - New Resident Temporary Parking Permit Fee
Downtown Parking District $30.00
308 Streets and Maintenance Downtown Parking District Replacement Parking Permit Fee
Downtown Parking District $30.00
309 Streets and Maintenance Paving Cut Permit Paving Cut Permit $69.00
310 Streets and Maintenance Paving Cut Permit Paving Cut Permit Extension $23.00
311 Streets and Maintenance Paving Cut Permit After Hours Inspection Fee, Weekend inspections (Sat & Sun) will require the contractor to be charged a minimum of 4 hours, Over 4 hours will be charged actual worked hours.
$90.00
312 Streets and Maintenance Memorial Marker Fee Memorial Marker Fee $124.00
313 Streets and Maintenance Memorial Marker - Optional Personalized Memorials Fee Memorial Marker Fee $50.00
314 Planning & Inspections Special Privilege Application Fee - Permit $371.00 plus applicable technology fee
315 Planning & Inspections Special Privilege Application Fee - License $699 plus applicable technology fee
316 Planning & Inspections Special Privilege Application Fee - Downtown improvement area (construction)
Downtown fee waived per incentive. Only applicable technology fee.
317 Planning & Inspections Special Privilege Application Fee - RTS (Rapid Transit System) and TOD (Transit Oriented Development) Corridors
Applicable technology fee
318 Planning & Inspections Special Privilege Application Fee - Smart Code Zoned Properties Applicable technology fee
319 Planning & Inspections Special Privilege - Annual fee Awning, canopy, marquee, sign (legally existing) $21.00 per awning, canopy, marquee, sign; technology fee does not apply
320 Planning & Inspections Special Privilege - Annual fee Awning, canopy, marquee, sign (new) $21.00 per awning, canopy, marquee, sign; technology fee does not apply
321 Planning & Inspections Special Privilege - Annual fee Arcades, Awnings, Canopies & Galleries that comply with City Code Section 15.08.1201
322 Planning & Inspections Special Privilege - Annual fee Subdivision entrance signs $106.00 per sign; technology fee does
not apply
323 Planning & Inspections Special Privilege - Annual fee Taxi stand $2,120 per stand; technology fee does
not apply
324 Planning & Inspections Special Privilege - Annual fee Underground storage vault or structure in CBD $530.00 per vault or structure; technology fee does not apply
325 Planning & Inspections Special Privilege - Annual fee Designated food vending concessions in the downtown area $2,120 per site; technology fee does
not apply
326 Planning & Inspections Special Privilege - Annual fee Pipelines, whether overhead, surface or subsurface $3,710.00 flat rate plus $220 per
pipeline; technology fee does not apply
Schedule C‐ 5
437
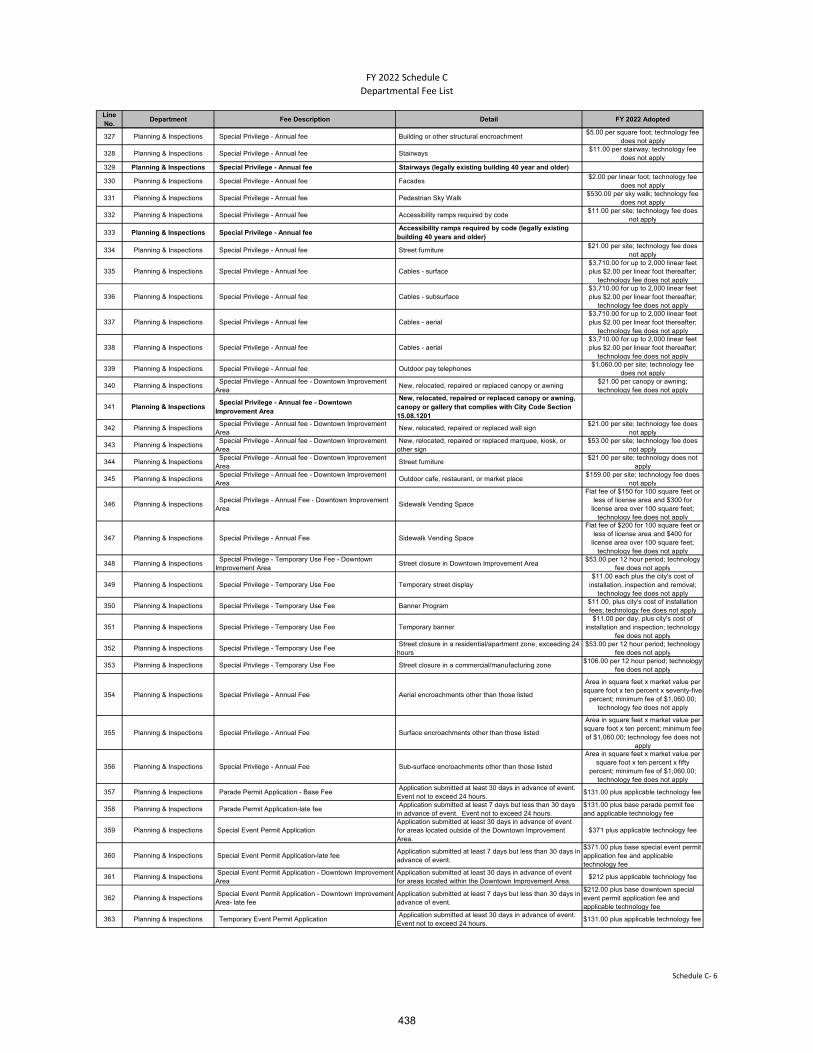
FY 2022 Schedule C
Departmental Fee List
Line No.
Department Fee Description Detail FY 2022 Adopted
327 Planning & Inspections Special Privilege - Annual fee Building or other structural encroachment $5.00 per square foot; technology fee
does not apply
328 Planning & Inspections Special Privilege - Annual fee Stairways $11.00 per stairway; technology fee
does not apply
329 Planning & Inspections Special Privilege - Annual fee Stairways (legally existing building 40 year and older)
330 Planning & Inspections Special Privilege - Annual fee Facades $2.00 per linear foot; technology fee
does not apply
331 Planning & Inspections Special Privilege - Annual fee Pedestrian Sky Walk $530.00 per sky walk; technology fee
does not apply
332 Planning & Inspections Special Privilege - Annual fee Accessibility ramps required by code $11.00 per site; technology fee does
not apply
333 Planning & Inspections Special Privilege - Annual fee Accessibility ramps required by code (legally existing building 40 years and older)
334 Planning & Inspections Special Privilege - Annual fee Street furniture $21.00 per site; technology fee does
not apply
335 Planning & Inspections Special Privilege - Annual fee Cables - surface $3,710.00 for up to 2,000 linear feet plus $2.00 per linear foot thereafter;
technology fee does not apply
336 Planning & Inspections Special Privilege - Annual fee Cables - subsurface $3,710.00 for up to 2,000 linear feet plus $2.00 per linear foot thereafter;
technology fee does not apply
337 Planning & Inspections Special Privilege - Annual fee Cables - aerial $3,710.00 for up to 2,000 linear feet plus $2.00 per linear foot thereafter;
technology fee does not apply
338 Planning & Inspections Special Privilege - Annual fee Cables - aerial $3,710.00 for up to 2,000 linear feet plus $2.00 per linear foot thereafter;
technology fee does not apply
339 Planning & Inspections Special Privilege - Annual fee Outdoor pay telephones $1,060.00 per site; technology fee
does not apply
340 Planning & Inspections Special Privilege - Annual fee - Downtown Improvement Area
New, relocated, repaired or replaced canopy or awning $21.00 per canopy or awning; technology fee does not apply
341 Planning & Inspections Special Privilege - Annual fee - Downtown Improvement Area
New, relocated, repaired or replaced canopy or awning, canopy or gallery that complies with City Code Section 15.08.1201
342 Planning & Inspections Special Privilege - Annual fee - Downtown Improvement Area
New, relocated, repaired or replaced wall sign $21.00 per site; technology fee does
not apply
343 Planning & Inspections Special Privilege - Annual fee - Downtown Improvement Area
New, relocated, repaired or replaced marquee, kiosk, or other sign
$53.00 per site; technology fee does not apply
344 Planning & Inspections Special Privilege - Annual fee - Downtown Improvement Area
Street furniture $21.00 per site; technology does not
apply
345 Planning & Inspections Special Privilege - Annual fee - Downtown Improvement Area
Outdoor cafe, restaurant, or market place $159.00 per site; technology fee does
not apply
346 Planning & Inspections Special Privilege - Annual Fee - Downtown Improvement Area
Sidewalk Vending Space
Flat fee of $150 for 100 square feet or less of license area and $300 for
license area over 100 square feet; technology fee does not apply
347 Planning & Inspections Special Privilege - Annual Fee Sidewalk Vending Space
Flat fee of $200 for 100 square feet or less of license area and $400 for
license area over 100 square feet; technology fee does not apply
348 Planning & Inspections Special Privilege - Temporary Use Fee - Downtown Improvement Area
Street closure in Downtown Improvement Area $53.00 per 12 hour period; technology
fee does not apply
349 Planning & Inspections Special Privilege - Temporary Use Fee Temporary street display $11.00 each plus the city's cost of
installation, inspection and removal; technology fee does not apply
350 Planning & Inspections Special Privilege - Temporary Use Fee Banner Program $11.00, plus city's cost of installation fees; technology fee does not apply
351 Planning & Inspections Special Privilege - Temporary Use Fee Temporary banner $11.00 per day, plus city's cost of
installation and inspection; technology fee does not apply
352 Planning & Inspections Special Privilege - Temporary Use Fee Street closure in a residential/apartment zone, exceeding 24 hours
$53.00 per 12 hour period; technology fee does not apply
353 Planning & Inspections Special Privilege - Temporary Use Fee Street closure in a commercial/manufacturing zone $106.00 per 12 hour period; technology
fee does not apply
354 Planning & Inspections Special Privilege - Annual Fee Aerial encroachments other than those listed
Area in square feet x market value per square foot x ten percent x seventy-five
percent; minimum fee of $1,060.00; technology fee does not apply
355 Planning & Inspections Special Privilege - Annual Fee Surface encroachments other than those listed
Area in square feet x market value per square foot x ten percent; minimum fee of $1,060.00; technology fee does not
apply
356 Planning & Inspections Special Privilege - Annual Fee Sub-surface encroachments other than those listed
Area in square feet x market value per square foot x ten percent x fifty
percent; minimum fee of $1,060.00; technology fee does not apply
357 Planning & Inspections Parade Permit Application - Base Fee Application submitted at least 30 days in advance of event. Event not to exceed 24 hours.
$131.00 plus applicable technology fee
358 Planning & Inspections Parade Permit Application-late fee Application submitted at least 7 days but less than 30 days in advance of event. Event not to exceed 24 hours.
$131.00 plus base parade permit fee and applicable technology fee
359 Planning & Inspections Special Event Permit Application Application submitted at least 30 days in advance of event for areas located outside of the Downtown Improvement Area.
$371 plus applicable technology fee
360 Planning & Inspections Special Event Permit Application-late fee Application submitted at least 7 days but less than 30 days in advance of event.
$371.00 plus base special event permit application fee and applicable technology fee
361 Planning & Inspections Special Event Permit Application - Downtown Improvement Area
Application submitted at least 30 days in advance of event for areas located within the Downtown Improvement Area.
$212 plus applicable technology fee
362 Planning & Inspections Special Event Permit Application - Downtown Improvement Area- late fee
Application submitted at least 7 days but less than 30 days in advance of event.
$212.00 plus base downtown special event permit application fee and applicable technology fee
363 Planning & Inspections Temporary Event Permit Application Application submitted at least 30 days in advance of event. Event not to exceed 24 hours.
$131.00 plus applicable technology fee
Schedule C‐ 6
438

FY 2022 Schedule C
Departmental Fee List
Line No.
Department Fee Description Detail FY 2022 Adopted
364 Planning & Inspections Temporary Event Permit Application-late fee Application submitted at least 7 days but less than 30 days in advance of event. Event not to exceed 24 hours.
$131.00 plus base temporary event permit application fee and applicable technology fee
365 Planning & Inspections Planning Documents Any Other Medium Cost plus applicable technology fee
366 Planning & Inspections Planning Documents Special Publications of City and Geographical Information
367 Planning & Inspections Planning Documents Planning dept. demo pack $19 plus applicable technology fee
368 Planning & Inspections Planning Documents Zoning Map Series $176 plus applicable technology fee
369 Planning & Inspections Planning Documents Plan El Paso $56 plus applicable technology fee
370 Planning & Inspections Planning Documents Plan El Paso (single 11 x 17) $9.00 plus applicable technology fee
371 Planning & Inspections Planning Documents Plan El Paso (single 24 x 36) $18 plus applicable technology fee
372 Planning & Inspections Planning Documents GIS Information
373 Planning & Inspections Planning Documents Maps-size of longest side
374 Planning & Inspections Planning Documents up to 12" $6 plus applicable technology fee
375 Planning & Inspections Planning Documents up to 24" $12 plus applicable technology fee
376 Planning & Inspections Planning Documents up to 36" $18 plus applicable technology fee
377 Planning & Inspections Planning Documents over 36" $21 plus applicable technology fee
378 Planning & Inspections Planning Documents Street Code Book $33 plus applicable technology fee
379 Planning & Inspections Applications - Zoning Zoning Condition or Special Contract - Release or Amendment
$1,195 plus applicable technology fee
380 Planning & Inspections Applications - Zoning Rezoning $1,195 plus applicable technology fee
381 Planning & Inspections Applications - Zoning Special Permit $1,289 plus applicable technology fee
382 Planning & Inspections Applications - Zoning Detailed Site Development Plan - City Council $1,131 plus applicable technology fee
383 Planning & Inspections Applications - Zoning Detailed Site Development Plan Review - City Plan Commission
$648 plus applicable technology fee
384 Planning & Inspections Applications - Zoning Detailed Site Development Plan Review - Administrative Review
$351 plus applicable technology fee
385 Planning & Inspections Applications - Zoning Detailed Site Plan-Administrative Modification $194 plus applicable technology fee.
386 Planning & Inspections Applications - Zoning Comprehensive Sign Plan Review - up to and including 1 acre
$352 plus applicable technology fee
387 Planning & Inspections Applications - Zoning Comprehensive Sign Plan Review - over 1 acre up to and including 3 acres
$415 plus applicable technology fee
388 Planning & Inspections Applications - Zoning Comprehensive Sign Plan Review - over 3 acres up to and including 5 acres
$495 plus applicable technology fee
389 Planning & Inspections Applications - Zoning Comprehensive Sign Plan Review - over 5 acres up to and including 10 acres
$562 plus applicable technology fee
390 Planning & Inspections Applications - Zoning Comprehensive Sign Plan Review - over 10 acres or more $709 plus applicable technology fee
391 Planning & Inspections Applications - Subdivisions Major Preliminary $2,013 plus applicable technology fee
392 Planning & Inspections Applications - Subdivisions Major Final $1,902 plus applicable technology fee
393 Planning & Inspections Applications - Subdivisions Major Combination $2,211 plus applicable technology fee
394 Planning & Inspections Applications - Subdivisions Development Plat $1,846 plus applicable technology fee
395 Planning & Inspections Applications - Subdivisions Minor $878 plus applicable technology fee
396 Planning & Inspections Applications - Subdivisions Re-Subdivision Preliminary $1,695 plus applicable technology fee
397 Planning & Inspections Applications - Subdivisions Re-Subdivision Final $1,857 plus applicable technology fee
398 Planning & Inspections Applications - Subdivisions Extension/Reinstatement $416 plus applicable technology fee
399 Planning & Inspections Applications - Subdivisions Re-Subdivision Combination $2,222 plus applicable technology fee
400 Planning & Inspections Applications - Subdivisions Amending $717 plus applicable technology fee
401 Planning & Inspections Applications - Subdivisions Platting Determination Certificate $80 plus applicable technology fee
402 Planning & Inspections Subdivision Improvements Review Application Review Only .1-10 acres $1000 thereafter $75/acre plus applicable technology fee
403 Planning & Inspections Subdivision Improvements Pre application review for drainage, subdivision, commercial, flood zone
$75.00/hour plus applicable technology fee
404 Planning & Inspections Construction Improvement Permit Improvement Inspection $148 + $60 per hour, plus applicable
technology fee
405 Planning & Inspections Subdivision Inspections 0.1-10.0 acre $148 + $60 per hour, plus applicable
technology fee
406 Planning & Inspections Subdivision Inspections 10.1-30.0 acre $255 + $60 per hour, plus applicable
technology fee
407 Planning & Inspections Subdivision Inspections 30.1-60.0 acre $448 + $60 per hour, plus applicable
technology fee
408 Planning & Inspections Subdivision Inspections 60.1-100.0 acre $815 + $60 per hour, plus applicable
technology fee
409 Planning & Inspections Subdivision Inspections Over 100 acres $1,333 + $60 per hour, plus applicable
technology fee
410 Planning & Inspections Subdivision Inspections Pre final or final inspections $200/hour, Plus applicable technology
fee
411 Planning & Inspections Subdivision Inspections Preparation of Acceptance of Subdivision $75.00/hour
412 Planning & Inspections Applications - Grading Grading Plan - Additional fee is required for additional review, additional inspection, or expedite review
$84 per hour applicable technology fee
413 Planning & Inspections Applications - Subdivision Improvement Plans Subdivision Improvement Plan - Beyond the second review additional fee
$168 per hour applicable technology fee
414 Planning & Inspections Applications - Subdivisions Vesting review of regulations for development applications $297.60 plus applicable technology fee
415 Planning & Inspections Applications - Subdivisions Land Study - 0.0 up to and including 300 acres $4,719 plus applicable technology fee.
416 Planning & Inspections Applications - Subdivisions Land Study - over 300 acres up to and including 600 acres $6,958 plus applicable technology fee.
417 Planning & Inspections Applications - Subdivisions Land Study - over 600 acres up to and including 900 acres $8,906 plus applicable technology fee.
418 Planning & Inspections Applications - Subdivisions Land Study - over 900 acres or more $11,651 plus applicable technology fee.
419 Planning & Inspections Applications - Subdivisions Amended Land Study - 0.0 up to and including 300 acres $2,293 plus applicable technology fee.
420 Planning & Inspections Applications - Subdivisions Amended Land Study - over 300 acres up to and including 600 acres
$3,381 plus applicable technology fee.
421 Planning & Inspections Applications - Subdivisions Amended Land Study - over 600 acres up to and including 900 acres
$4,327 plus applicable technology fee.
422 Planning & Inspections Applications - Subdivisions Amended Land Study - over 900 acres or more $5,661 plus applicable technology fee.
423 Planning & Inspections Applications - MTP Amendment Major Thoroughfare Plan Amendment $645 plus applicable technology fee.
424 Planning & Inspections Comp Plan Amendment Comprehensive Plan Amendment $958 plus applicable technology fee
Schedule C‐ 7
439
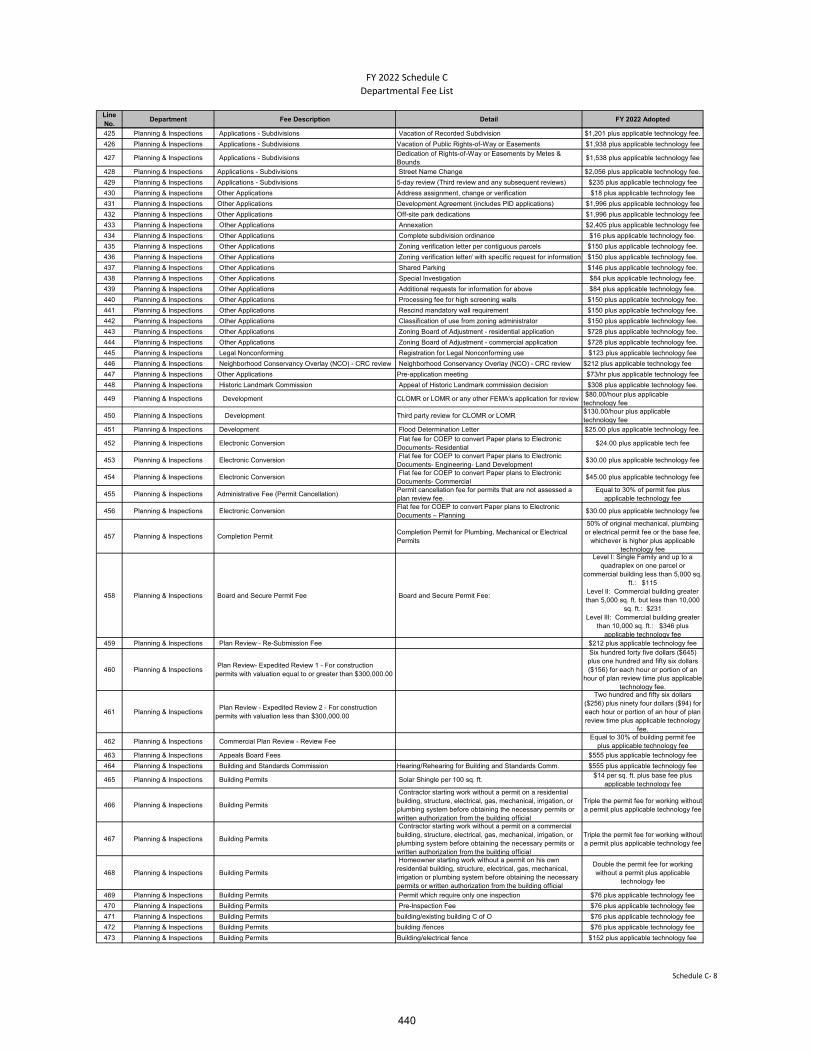
FY 2022 Schedule C
Departmental Fee List
Line No.
Department Fee Description Detail FY 2022 Adopted
425 Planning & Inspections Applications - Subdivisions Vacation of Recorded Subdivision $1,201 plus applicable technology fee.
426 Planning & Inspections Applications - Subdivisions Vacation of Public Rights-of-Way or Easements $1,938 plus applicable technology fee
427 Planning & Inspections Applications - Subdivisions Dedication of Rights-of-Way or Easements by Metes & Bounds
$1,538 plus applicable technology fee
428 Planning & Inspections Applications - Subdivisions Street Name Change $2,056 plus applicable technology fee.
429 Planning & Inspections Applications - Subdivisions 5-day review (Third review and any subsequent reviews) $235 plus applicable technology fee
430 Planning & Inspections Other Applications Address assignment, change or verification $18 plus applicable technology fee
431 Planning & Inspections Other Applications Development Agreement (includes PID applications) $1,996 plus applicable technology fee
432 Planning & Inspections Other Applications Off-site park dedications $1,996 plus applicable technology fee
433 Planning & Inspections Other Applications Annexation $2,405 plus applicable technology fee
434 Planning & Inspections Other Applications Complete subdivision ordinance $16 plus applicable technology fee.
435 Planning & Inspections Other Applications Zoning verification letter per contiguous parcels $150 plus applicable technology fee.
436 Planning & Inspections Other Applications Zoning verification letter/ with specific request for information $150 plus applicable technology fee.
437 Planning & Inspections Other Applications Shared Parking $146 plus applicable technology fee.
438 Planning & Inspections Other Applications Special Investigation $84 plus applicable technology fee.
439 Planning & Inspections Other Applications Additional requests for information for above $84 plus applicable technology fee.
440 Planning & Inspections Other Applications Processing fee for high screening walls $150 plus applicable technology fee.
441 Planning & Inspections Other Applications Rescind mandatory wall requirement $150 plus applicable technology fee.
442 Planning & Inspections Other Applications Classification of use from zoning administrator $150 plus applicable technology fee.
443 Planning & Inspections Other Applications Zoning Board of Adjustment - residential application $728 plus applicable technology fee.
444 Planning & Inspections Other Applications Zoning Board of Adjustment - commercial application $728 plus applicable technology fee.
445 Planning & Inspections Legal Nonconforming Registration for Legal Nonconforming use $123 plus applicable technology fee
446 Planning & Inspections Neighborhood Conservancy Overlay (NCO) - CRC review Neighborhood Conservancy Overlay (NCO) - CRC review $212 plus applicable technology fee
447 Planning & Inspections Other Applications Pre-application meeting $73/hr plus applicable technology fee
448 Planning & Inspections Historic Landmark Commission Appeal of Historic Landmark commission decision $308 plus applicable technology fee.
449 Planning & Inspections Development CLOMR or LOMR or any other FEMA's application for review $80.00/hour plus applicable technology fee
450 Planning & Inspections Development Third party review for CLOMR or LOMR$130.00/hour plus applicable technology fee
451 Planning & Inspections Development Flood Determination Letter $25.00 plus applicable technology fee.
452 Planning & Inspections Electronic Conversion Flat fee for COEP to convert Paper plans to Electronic Documents- Residential
$24.00 plus applicable tech fee
453 Planning & Inspections Electronic Conversion Flat fee for COEP to convert Paper plans to Electronic Documents- Engineering- Land Development
$30.00 plus applicable technology fee
454 Planning & Inspections Electronic Conversion Flat fee for COEP to convert Paper plans to Electronic Documents- Commercial
$45.00 plus applicable technology fee
455 Planning & Inspections Administrative Fee (Permit Cancellation) Permit cancellation fee for permits that are not assessed a plan review fee.
Equal to 30% of permit fee plus applicable technology fee
456 Planning & Inspections Electronic Conversion Flat fee for COEP to convert Paper plans to Electronic Documents – Planning
$30.00 plus applicable technology fee
457 Planning & Inspections Completion Permit Completion Permit for Plumbing, Mechanical or Electrical Permits
50% of original mechanical, plumbing or electrical permit fee or the base fee,
whichever is higher plus applicable technology fee
458 Planning & Inspections Board and Secure Permit Fee Board and Secure Permit Fee:
Level I: Single Family and up to a quadraplex on one parcel or
commercial building less than 5,000 sq. ft.: $115
Level II: Commercial building greater than 5,000 sq. ft. but less than 10,000
sq. ft.: $231Level III: Commercial building greater
than 10,000 sq. ft.: $346 plus applicable technology fee
459 Planning & Inspections Plan Review - Re-Submission Fee $212 plus applicable technology fee
460 Planning & Inspections Plan Review- Expedited Review 1 - For construction permits with valuation equal to or greater than $300,000.00
Six hundred forty five dollars ($645) plus one hundred and fifty six dollars ($156) for each hour or portion of an
hour of plan review time plus applicable technology fee.
461 Planning & Inspections Plan Review - Expedited Review 2 - For construction permits with valuation less than $300,000.00
Two hundred and fifty six dollars ($256) plus ninety four dollars ($94) for each hour or portion of an hour of plan review time plus applicable technology
fee.
462 Planning & Inspections Commercial Plan Review - Review Fee Equal to 30% of building permit fee
plus applicable technology fee
463 Planning & Inspections Appeals Board Fees $555 plus applicable technology fee
464 Planning & Inspections Building and Standards Commission Hearing/Rehearing for Building and Standards Comm. $555 plus applicable technology fee
465 Planning & Inspections Building Permits Solar Shingle per 100 sq. ft. $14 per sq. ft. plus base fee plus
applicable technology fee
466 Planning & Inspections Building Permits
Contractor starting work without a permit on a residential building, structure, electrical, gas, mechanical, irrigation, or plumbing system before obtaining the necessary permits or written authorization from the building official
Triple the permit fee for working without a permit plus applicable technology fee
467 Planning & Inspections Building Permits
Contractor starting work without a permit on a commercial building, structure, electrical, gas, mechanical, irrigation, or plumbing system before obtaining the necessary permits or written authorization from the building official
Triple the permit fee for working without a permit plus applicable technology fee
468 Planning & Inspections Building Permits
Homeowner starting work without a permit on his own residential building, structure, electrical, gas, mechanical, irrigation or plumbing system before obtaining the necessary permits or written authorization from the building official
Double the permit fee for working without a permit plus applicable
technology fee
469 Planning & Inspections Building Permits Permit which require only one inspection $76 plus applicable technology fee
470 Planning & Inspections Building Permits Pre-Inspection Fee $76 plus applicable technology fee
471 Planning & Inspections Building Permits building/existing building C of O $76 plus applicable technology fee
472 Planning & Inspections Building Permits building /fences $76 plus applicable technology fee
473 Planning & Inspections Building Permits Building/electrical fence $152 plus applicable technology fee
Schedule C‐ 8
440
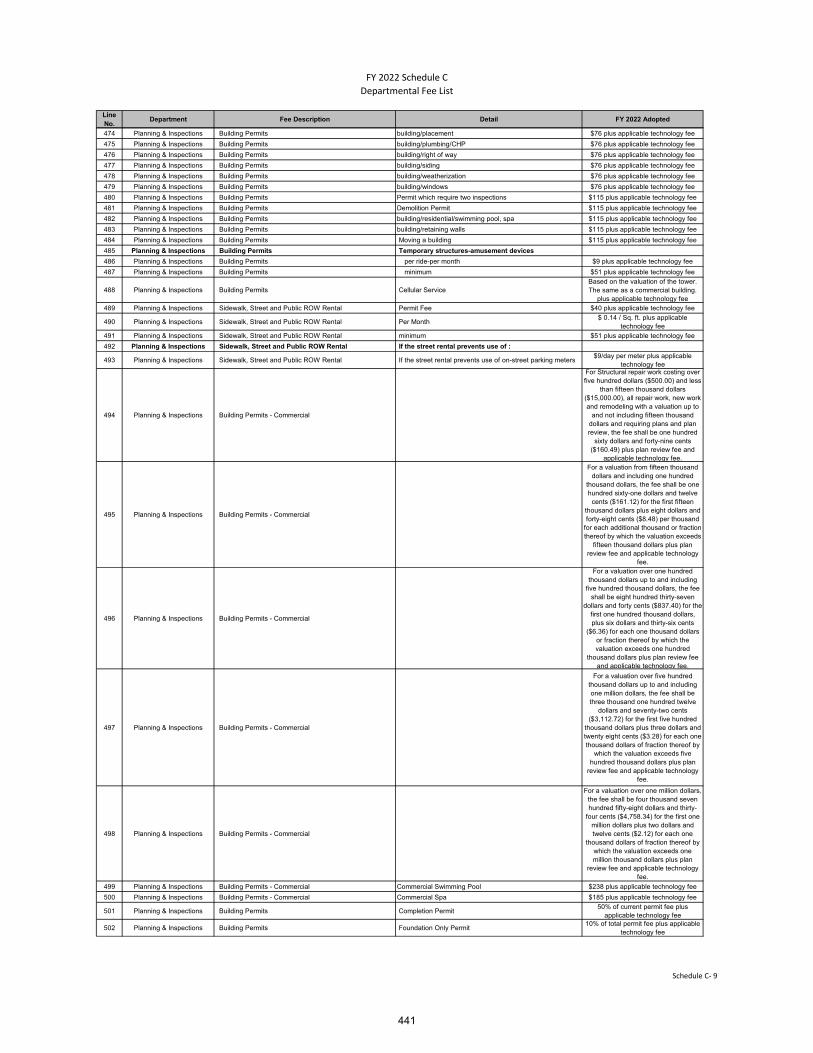
FY 2022 Schedule C
Departmental Fee List
Line No.
Department Fee Description Detail FY 2022 Adopted
474 Planning & Inspections Building Permits building/placement $76 plus applicable technology fee
475 Planning & Inspections Building Permits building/plumbing/CHP $76 plus applicable technology fee
476 Planning & Inspections Building Permits building/right of way $76 plus applicable technology fee
477 Planning & Inspections Building Permits building/siding $76 plus applicable technology fee
478 Planning & Inspections Building Permits building/weatherization $76 plus applicable technology fee
479 Planning & Inspections Building Permits building/windows $76 plus applicable technology fee
480 Planning & Inspections Building Permits Permit which require two inspections $115 plus applicable technology fee
481 Planning & Inspections Building Permits Demolition Permit $115 plus applicable technology fee
482 Planning & Inspections Building Permits building/residential/swimming pool, spa $115 plus applicable technology fee
483 Planning & Inspections Building Permits building/retaining walls $115 plus applicable technology fee
484 Planning & Inspections Building Permits Moving a building $115 plus applicable technology fee
485 Planning & Inspections Building Permits Temporary structures-amusement devices
486 Planning & Inspections Building Permits per ride-per month $9 plus applicable technology fee
487 Planning & Inspections Building Permits minimum $51 plus applicable technology fee
488 Planning & Inspections Building Permits Cellular Service Based on the valuation of the tower. The same as a commercial building.
plus applicable technology fee489 Planning & Inspections Sidewalk, Street and Public ROW Rental Permit Fee $40 plus applicable technology fee
490 Planning & Inspections Sidewalk, Street and Public ROW Rental Per Month $ 0.14 / Sq. ft. plus applicable
technology fee
491 Planning & Inspections Sidewalk, Street and Public ROW Rental minimum $51 plus applicable technology fee
492 Planning & Inspections Sidewalk, Street and Public ROW Rental If the street rental prevents use of :
493 Planning & Inspections Sidewalk, Street and Public ROW Rental If the street rental prevents use of on-street parking meters $9/day per meter plus applicable
technology fee
494 Planning & Inspections Building Permits - Commercial
For Structural repair work costing over five hundred dollars ($500.00) and less
than fifteen thousand dollars ($15,000.00), all repair work, new work and remodeling with a valuation up to
and not including fifteen thousand dollars and requiring plans and plan review, the fee shall be one hundred
sixty dollars and forty-nine cents ($160.49) plus plan review fee and
applicable technology fee.
495 Planning & Inspections Building Permits - Commercial
For a valuation from fifteen thousand dollars and including one hundred
thousand dollars, the fee shall be one hundred sixty-one dollars and twelve
cents ($161.12) for the first fifteen thousand dollars plus eight dollars and forty-eight cents ($8.48) per thousand
for each additional thousand or fraction thereof by which the valuation exceeds
fifteen thousand dollars plus plan review fee and applicable technology
fee.
496 Planning & Inspections Building Permits - Commercial
For a valuation over one hundred thousand dollars up to and including
five hundred thousand dollars, the fee shall be eight hundred thirty-seven
dollars and forty cents ($837.40) for the first one hundred thousand dollars, plus six dollars and thirty-six cents
($6.36) for each one thousand dollars or fraction thereof by which the valuation exceeds one hundred
thousand dollars plus plan review fee and applicable technology fee.
497 Planning & Inspections Building Permits - Commercial
For a valuation over five hundred thousand dollars up to and including one million dollars, the fee shall be three thousand one hundred twelve
dollars and seventy-two cents ($3,112.72) for the first five hundred
thousand dollars plus three dollars and twenty eight cents ($3.28) for each one thousand dollars of fraction thereof by
which the valuation exceeds five hundred thousand dollars plus plan
review fee and applicable technology fee.
498 Planning & Inspections Building Permits - Commercial
For a valuation over one million dollars, the fee shall be four thousand seven hundred fifty-eight dollars and thirty-
four cents ($4,758.34) for the first one million dollars plus two dollars and twelve cents ($2.12) for each one
thousand dollars of fraction thereof by which the valuation exceeds one million thousand dollars plus plan
review fee and applicable technology fee.
499 Planning & Inspections Building Permits - Commercial Commercial Swimming Pool $238 plus applicable technology fee
500 Planning & Inspections Building Permits - Commercial Commercial Spa $185 plus applicable technology fee
501 Planning & Inspections Building Permits Completion Permit 50% of current permit fee plus
applicable technology fee
502 Planning & Inspections Building Permits Foundation Only Permit 10% of total permit fee plus applicable
technology fee
Schedule C‐ 9
441
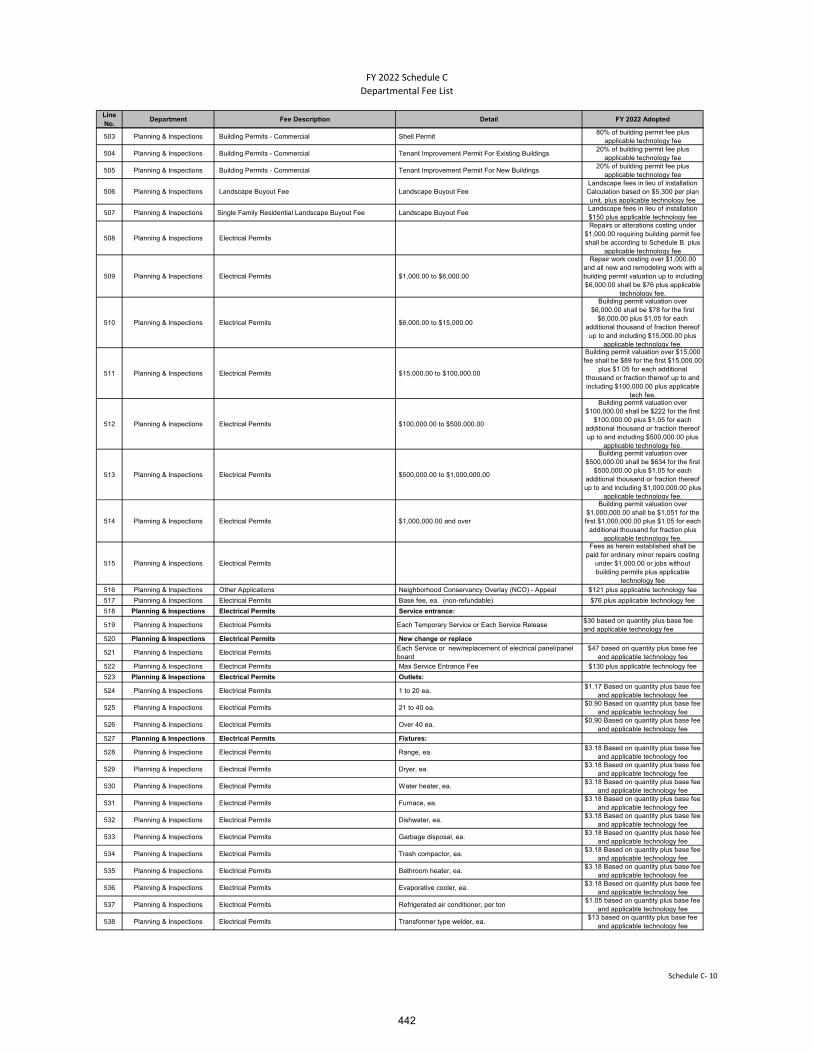
FY 2022 Schedule C
Departmental Fee List
Line No.
Department Fee Description Detail FY 2022 Adopted
503 Planning & Inspections Building Permits - Commercial Shell Permit 80% of building permit fee plus
applicable technology fee
504 Planning & Inspections Building Permits - Commercial Tenant Improvement Permit For Existing Buildings 20% of building permit fee plus
applicable technology fee
505 Planning & Inspections Building Permits - Commercial Tenant Improvement Permit For New Buildings 20% of building permit fee plus
applicable technology fee
506 Planning & Inspections Landscape Buyout Fee Landscape Buyout Fee Landscape fees in lieu of installation Calculation based on $5,300 per plan unit. plus applicable technology fee
507 Planning & Inspections Single Family Residential Landscape Buyout Fee Landscape Buyout Fee Landscape fees in lieu of installation $150 plus applicable technology fee
508 Planning & Inspections Electrical Permits
Repairs or alterations costing under $1,000.00 requiring building permit fee shall be according to Schedule B. plus
applicable technology fee
509 Planning & Inspections Electrical Permits $1,000.00 to $6,000.00
Repair work costing over $1,000.00 and all new and remodeling work with a building permit valuation up to including $6,000.00 shall be $76 plus applicable
technology fee.
510 Planning & Inspections Electrical Permits $6,000.00 to $15,000.00
Building permit valuation over $6,000.00 shall be $78 for the first
$6,000.00 plus $1.05 for each additional thousand of fraction thereof up to and including $15,000.00 plus
applicable technology fee.
511 Planning & Inspections Electrical Permits $15,000.00 to $100,000.00
Building permit valuation over $15,000 fee shall be $89 for the first $15,000.00
plus $1.05 for each additional thousand or fraction thereof up to and including $100,000.00 plus applicable
tech fee.
512 Planning & Inspections Electrical Permits $100,000.00 to $500,000.00
Building permit valuation over $100,000.00 shall be $222 for the first
$100,000.00 plus $1.05 for each additional thousand or fraction thereof up to and including $500,000.00 plus
applicable technology fee.
513 Planning & Inspections Electrical Permits $500,000.00 to $1,000,000.00
Building permit valuation over $500,000.00 shall be $634 for the first
$500,000.00 plus $1.05 for each additional thousand or fraction thereof up to and including $1,000,000.00 plus
applicable technology fee.
514 Planning & Inspections Electrical Permits $1,000,000.00 and over
Building permit valuation over $1,000,000.00 shall be $1,051 for the first $1,000,000.00 plus $1.05 for each
additional thousand for fraction plus applicable technology fee.
515 Planning & Inspections Electrical Permits
Fees as herein established shall be paid for ordinary minor repairs costing
under $1,000.00 or jobs without building permits plus applicable
technology fee516 Planning & Inspections Other Applications Neighborhood Conservancy Overlay (NCO) - Appeal $121 plus applicable technology fee
517 Planning & Inspections Electrical Permits Base fee, ea. (non-refundable) $76 plus applicable technology fee
518 Planning & Inspections Electrical Permits Service entrance:
519 Planning & Inspections Electrical Permits Each Temporary Service or Each Service Release $30 based on quantity plus base fee and applicable technology fee
520 Planning & Inspections Electrical Permits New change or replace
521 Planning & Inspections Electrical Permits Each Service or new/replacement of electrical panel/panel board
$47 based on quantity plus base fee and applicable technology fee
522 Planning & Inspections Electrical Permits Max Service Entrance Fee $130 plus applicable technology fee
523 Planning & Inspections Electrical Permits Outlets:
524 Planning & Inspections Electrical Permits 1 to 20 ea. $1.17 Based on quantity plus base fee
and applicable technology fee
525 Planning & Inspections Electrical Permits 21 to 40 ea. $0.90 Based on quantity plus base fee
and applicable technology fee
526 Planning & Inspections Electrical Permits Over 40 ea. $0.90 Based on quantity plus base fee
and applicable technology fee
527 Planning & Inspections Electrical Permits Fixtures:
528 Planning & Inspections Electrical Permits Range, ea. $3.18 Based on quantity plus base fee
and applicable technology fee
529 Planning & Inspections Electrical Permits Dryer, ea. $3.18 Based on quantity plus base fee
and applicable technology fee
530 Planning & Inspections Electrical Permits Water heater, ea. $3.18 Based on quantity plus base fee
and applicable technology fee
531 Planning & Inspections Electrical Permits Furnace, ea. $3.18 Based on quantity plus base fee
and applicable technology fee
532 Planning & Inspections Electrical Permits Dishwater, ea. $3.18 Based on quantity plus base fee
and applicable technology fee
533 Planning & Inspections Electrical Permits Garbage disposal, ea. $3.18 Based on quantity plus base fee
and applicable technology fee
534 Planning & Inspections Electrical Permits Trash compactor, ea. $3.18 Based on quantity plus base fee
and applicable technology fee
535 Planning & Inspections Electrical Permits Bathroom heater, ea. $3.18 Based on quantity plus base fee
and applicable technology fee
536 Planning & Inspections Electrical Permits Evaporative cooler, ea. $3.18 Based on quantity plus base fee
and applicable technology fee
537 Planning & Inspections Electrical Permits Refrigerated air conditioner, per ton $1.05 based on quantity plus base fee
and applicable technology fee
538 Planning & Inspections Electrical Permits Transformer type welder, ea. $13 based on quantity plus base fee
and applicable technology fee
Schedule C‐ 10
442
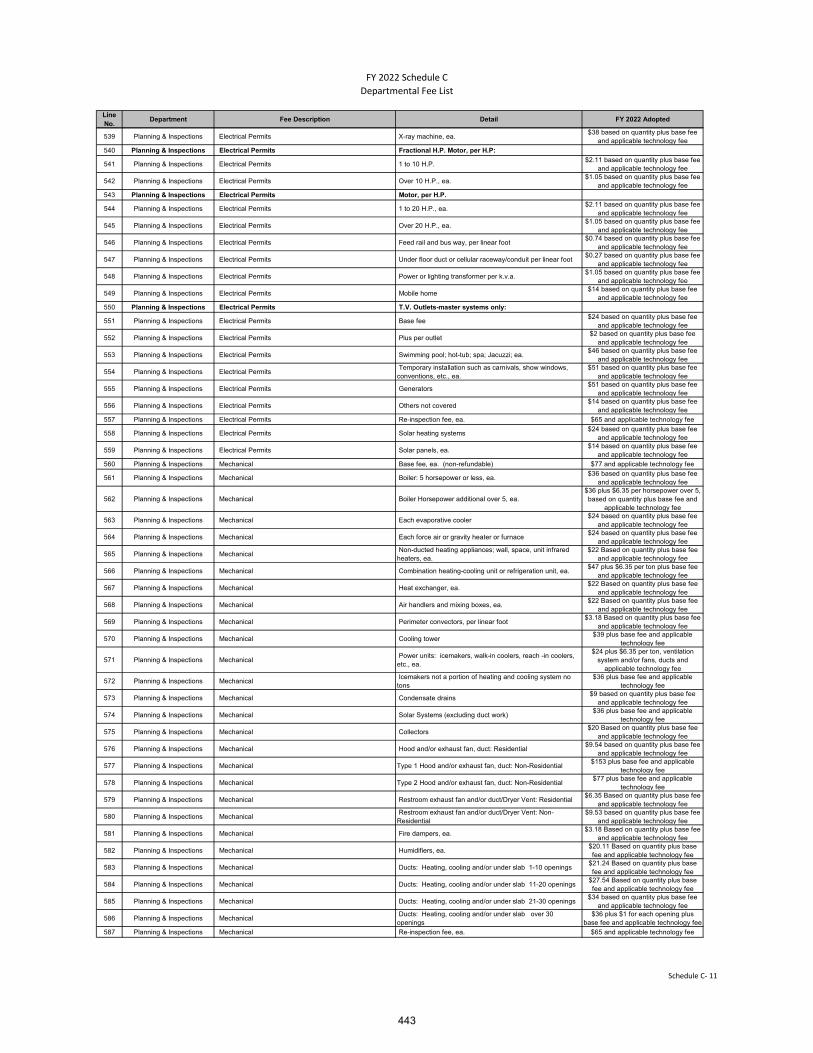
FY 2022 Schedule C
Departmental Fee List
Line No.
Department Fee Description Detail FY 2022 Adopted
539 Planning & Inspections Electrical Permits X-ray machine, ea. $38 based on quantity plus base fee
and applicable technology fee
540 Planning & Inspections Electrical Permits Fractional H.P. Motor, per H.P:
541 Planning & Inspections Electrical Permits 1 to 10 H.P. $2.11 based on quantity plus base fee
and applicable technology fee
542 Planning & Inspections Electrical Permits Over 10 H.P., ea. $1.05 based on quantity plus base fee
and applicable technology fee
543 Planning & Inspections Electrical Permits Motor, per H.P.
544 Planning & Inspections Electrical Permits 1 to 20 H.P., ea. $2.11 based on quantity plus base fee
and applicable technology fee
545 Planning & Inspections Electrical Permits Over 20 H.P., ea. $1.05 based on quantity plus base fee
and applicable technology fee
546 Planning & Inspections Electrical Permits Feed rail and bus way, per linear foot $0.74 based on quantity plus base fee
and applicable technology fee
547 Planning & Inspections Electrical Permits Under floor duct or cellular raceway/conduit per linear foot $0.27 based on quantity plus base fee
and applicable technology fee
548 Planning & Inspections Electrical Permits Power or lighting transformer per k.v.a. $1.05 based on quantity plus base fee
and applicable technology fee
549 Planning & Inspections Electrical Permits Mobile home $14 based on quantity plus base fee
and applicable technology fee
550 Planning & Inspections Electrical Permits T.V. Outlets-master systems only:
551 Planning & Inspections Electrical Permits Base fee $24 based on quantity plus base fee
and applicable technology fee
552 Planning & Inspections Electrical Permits Plus per outlet $2 based on quantity plus base fee
and applicable technology fee
553 Planning & Inspections Electrical Permits Swimming pool; hot-tub; spa; Jacuzzi; ea. $46 based on quantity plus base fee
and applicable technology fee
554 Planning & Inspections Electrical Permits Temporary installation such as carnivals, show windows, conventions, etc., ea.
$51 based on quantity plus base fee and applicable technology fee
555 Planning & Inspections Electrical Permits Generators $51 based on quantity plus base fee
and applicable technology fee
556 Planning & Inspections Electrical Permits Others not covered $14 based on quantity plus base fee
and applicable technology fee
557 Planning & Inspections Electrical Permits Re-inspection fee, ea. $65 and applicable technology fee
558 Planning & Inspections Electrical Permits Solar heating systems $24 based on quantity plus base fee
and applicable technology fee
559 Planning & Inspections Electrical Permits Solar panels, ea. $14 based on quantity plus base fee
and applicable technology fee
560 Planning & Inspections Mechanical Base fee, ea. (non-refundable) $77 and applicable technology fee
561 Planning & Inspections Mechanical Boiler: 5 horsepower or less, ea. $36 based on quantity plus base fee
and applicable technology fee
562 Planning & Inspections Mechanical Boiler Horsepower additional over 5, ea. $36 plus $6.35 per horsepower over 5, based on quantity plus base fee and
applicable technology fee
563 Planning & Inspections Mechanical Each evaporative cooler $24 based on quantity plus base fee
and applicable technology fee
564 Planning & Inspections Mechanical Each force air or gravity heater or furnace $24 based on quantity plus base fee
and applicable technology fee
565 Planning & Inspections Mechanical Non-ducted heating appliances; wall, space, unit infrared heaters, ea.
$22 Based on quantity plus base fee and applicable technology fee
566 Planning & Inspections Mechanical Combination heating-cooling unit or refrigeration unit, ea. $47 plus $6.35 per ton plus base fee
and applicable technology fee
567 Planning & Inspections Mechanical Heat exchanger, ea. $22 Based on quantity plus base fee
and applicable technology fee
568 Planning & Inspections Mechanical Air handlers and mixing boxes, ea. $22 Based on quantity plus base fee
and applicable technology fee
569 Planning & Inspections Mechanical Perimeter convectors, per linear foot $3.18 Based on quantity plus base fee
and applicable technology fee
570 Planning & Inspections Mechanical Cooling tower $39 plus base fee and applicable
technology fee
571 Planning & Inspections Mechanical Power units: icemakers, walk-in coolers, reach -in coolers, etc., ea.
$24 plus $6.35 per ton, ventilation system and/or fans, ducts and
applicable technology fee
572 Planning & Inspections Mechanical Icemakers not a portion of heating and cooling system no tons
$36 plus base fee and applicable technology fee
573 Planning & Inspections Mechanical Condensate drains $9 based on quantity plus base fee
and applicable technology fee
574 Planning & Inspections Mechanical Solar Systems (excluding duct work) $36 plus base fee and applicable
technology fee
575 Planning & Inspections Mechanical Collectors $20 Based on quantity plus base fee
and applicable technology fee
576 Planning & Inspections Mechanical Hood and/or exhaust fan, duct: Residential $9.54 based on quantity plus base fee
and applicable technology fee
577 Planning & Inspections Mechanical Type 1 Hood and/or exhaust fan, duct: Non-Residential $153 plus base fee and applicable
technology fee
578 Planning & Inspections Mechanical Type 2 Hood and/or exhaust fan, duct: Non-Residential$77 plus base fee and applicable
technology fee
579 Planning & Inspections Mechanical Restroom exhaust fan and/or duct/Dryer Vent: Residential $6.35 Based on quantity plus base fee
and applicable technology fee
580 Planning & Inspections Mechanical Restroom exhaust fan and/or duct/Dryer Vent: Non-Residential
$9.53 based on quantity plus base fee and applicable technology fee
581 Planning & Inspections Mechanical Fire dampers, ea. $3.18 Based on quantity plus base fee
and applicable technology fee
582 Planning & Inspections Mechanical Humidifiers, ea. $20.11 Based on quantity plus base fee and applicable technology fee
583 Planning & Inspections Mechanical Ducts: Heating, cooling and/or under slab 1-10 openings $21.24 Based on quantity plus base fee and applicable technology fee
584 Planning & Inspections Mechanical Ducts: Heating, cooling and/or under slab 11-20 openings $27.54 Based on quantity plus base fee and applicable technology fee
585 Planning & Inspections Mechanical Ducts: Heating, cooling and/or under slab 21-30 openings $34 based on quantity plus base fee
and applicable technology fee
586 Planning & Inspections Mechanical Ducts: Heating, cooling and/or under slab over 30 openings
$36 plus $1 for each opening plus base fee and applicable technology fee
587 Planning & Inspections Mechanical Re-inspection fee, ea. $65 and applicable technology fee
Schedule C‐ 11
443
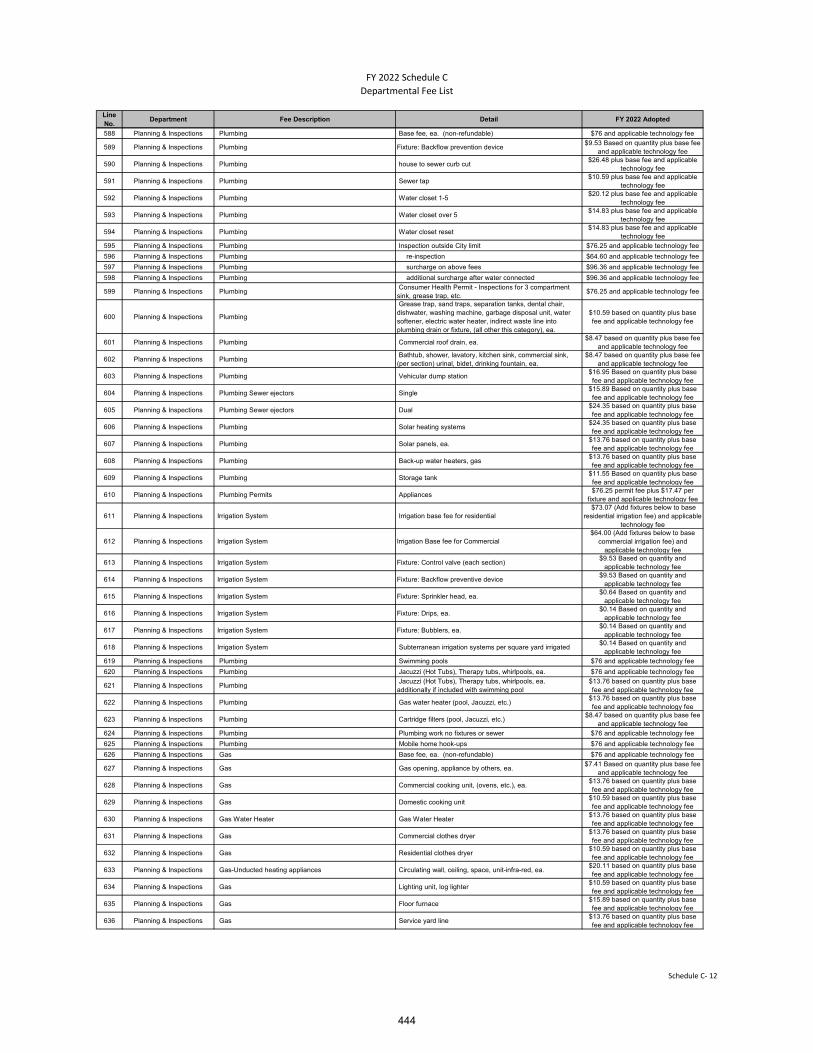
FY 2022 Schedule C
Departmental Fee List
Line No.
Department Fee Description Detail FY 2022 Adopted
588 Planning & Inspections Plumbing Base fee, ea. (non-refundable) $76 and applicable technology fee
589 Planning & Inspections Plumbing Fixture: Backflow prevention device$9.53 Based on quantity plus base fee
and applicable technology fee
590 Planning & Inspections Plumbing house to sewer curb cut $26.48 plus base fee and applicable
technology fee
591 Planning & Inspections Plumbing Sewer tap $10.59 plus base fee and applicable
technology fee
592 Planning & Inspections Plumbing Water closet 1-5 $20.12 plus base fee and applicable
technology fee
593 Planning & Inspections Plumbing Water closet over 5 $14.83 plus base fee and applicable
technology fee
594 Planning & Inspections Plumbing Water closet reset $14.83 plus base fee and applicable
technology fee
595 Planning & Inspections Plumbing Inspection outside City limit $76.25 and applicable technology fee
596 Planning & Inspections Plumbing re-inspection $64.60 and applicable technology fee
597 Planning & Inspections Plumbing surcharge on above fees $96.36 and applicable technology fee
598 Planning & Inspections Plumbing additional surcharge after water connected $96.36 and applicable technology fee
599 Planning & Inspections Plumbing Consumer Health Permit - Inspections for 3 compartment sink, grease trap, etc.
$76.25 and applicable technology fee
600 Planning & Inspections Plumbing
Grease trap, sand traps, separation tanks, dental chair, dishwater, washing machine, garbage disposal unit, water softener, electric water heater, indirect waste line into plumbing drain or fixture, (all other this category), ea.
$10.59 based on quantity plus base fee and applicable technology fee
601 Planning & Inspections Plumbing Commercial roof drain, ea. $8.47 based on quantity plus base fee
and applicable technology fee
602 Planning & Inspections Plumbing Bathtub, shower, lavatory, kitchen sink, commercial sink, (per section) urinal, bidet, drinking fountain, ea.
$8.47 based on quantity plus base fee and applicable technology fee
603 Planning & Inspections Plumbing Vehicular dump station $16.95 Based on quantity plus base fee and applicable technology fee
604 Planning & Inspections Plumbing Sewer ejectors Single $15.89 Based on quantity plus base fee and applicable technology fee
605 Planning & Inspections Plumbing Sewer ejectors Dual $24.35 based on quantity plus base fee and applicable technology fee
606 Planning & Inspections Plumbing Solar heating systems $24.35 based on quantity plus base fee and applicable technology fee
607 Planning & Inspections Plumbing Solar panels, ea. $13.76 based on quantity plus base fee and applicable technology fee
608 Planning & Inspections Plumbing Back-up water heaters, gas $13.76 based on quantity plus base fee and applicable technology fee
609 Planning & Inspections Plumbing Storage tank $11.55 Based on quantity plus base fee and applicable technology fee
610 Planning & Inspections Plumbing Permits Appliances $76.25 permit fee plus $17.47 per
fixture and applicable technology fee
611 Planning & Inspections Irrigation System Irrigation base fee for residential $73.07 (Add fixtures below to base
residential irrigation fee) and applicable technology fee
612 Planning & Inspections Irrigation System Irrigation Base fee for Commercial $64.00 (Add fixtures below to base
commercial irrigation fee) and applicable technology fee
613 Planning & Inspections Irrigation System Fixture: Control valve (each section)$9.53 Based on quantity and
applicable technology fee
614 Planning & Inspections Irrigation System Fixture: Backflow preventive device$9.53 Based on quantity and
applicable technology fee
615 Planning & Inspections Irrigation System Fixture: Sprinkler head, ea.$0.64 Based on quantity and
applicable technology fee
616 Planning & Inspections Irrigation System Fixture: Drips, ea.$0.14 Based on quantity and
applicable technology fee
617 Planning & Inspections Irrigation System Fixture: Bubblers, ea.$0.14 Based on quantity and
applicable technology fee
618 Planning & Inspections Irrigation System Subterranean irrigation systems per square yard irrigated $0.14 Based on quantity and
applicable technology fee
619 Planning & Inspections Plumbing Swimming pools $76 and applicable technology fee
620 Planning & Inspections Plumbing Jacuzzi (Hot Tubs), Therapy tubs, whirlpools, ea. $76 and applicable technology fee
621 Planning & Inspections Plumbing Jacuzzi (Hot Tubs), Therapy tubs, whirlpools, ea. additionally if included with swimming pool
$13.76 based on quantity plus base fee and applicable technology fee
622 Planning & Inspections Plumbing Gas water heater (pool, Jacuzzi, etc.) $13.76 based on quantity plus base fee and applicable technology fee
623 Planning & Inspections Plumbing Cartridge filters (pool, Jacuzzi, etc.) $8.47 based on quantity plus base fee
and applicable technology fee
624 Planning & Inspections Plumbing Plumbing work no fixtures or sewer $76 and applicable technology fee
625 Planning & Inspections Plumbing Mobile home hook-ups $76 and applicable technology fee
626 Planning & Inspections Gas Base fee, ea. (non-refundable) $76 and applicable technology fee
627 Planning & Inspections Gas Gas opening, appliance by others, ea. $7.41 Based on quantity plus base fee
and applicable technology fee
628 Planning & Inspections Gas Commercial cooking unit, (ovens, etc.), ea. $13.76 based on quantity plus base fee and applicable technology fee
629 Planning & Inspections Gas Domestic cooking unit $10.59 based on quantity plus base fee and applicable technology fee
630 Planning & Inspections Gas Water Heater Gas Water Heater $13.76 based on quantity plus base fee and applicable technology fee
631 Planning & Inspections Gas Commercial clothes dryer $13.76 based on quantity plus base fee and applicable technology fee
632 Planning & Inspections Gas Residential clothes dryer $10.59 based on quantity plus base fee and applicable technology fee
633 Planning & Inspections Gas-Unducted heating appliances Circulating wall, ceiling, space, unit-infra-red, ea. $20.11 based on quantity plus base fee and applicable technology fee
634 Planning & Inspections Gas Lighting unit, log lighter $10.59 based on quantity plus base fee and applicable technology fee
635 Planning & Inspections Gas Floor furnace $15.89 based on quantity plus base fee and applicable technology fee
636 Planning & Inspections Gas Service yard line $13.76 based on quantity plus base fee and applicable technology fee
Schedule C‐ 12
444

FY 2022 Schedule C
Departmental Fee List
Line No.
Department Fee Description Detail FY 2022 Adopted
637 Planning & Inspections Gas Gas refrigerator $13.76 based on quantity plus base fee and applicable technology fee
638 Planning & Inspections Gas Re-inspection $65 and applicable technology fee
639 Planning & Inspections Building Permit - Residential For additional lines than 400 square feet $307 and applicable technology fee
640 Planning & Inspections Third party building permit discount Discount for residential permit when builder utilizes third party services for process.
• First 400 TPRN permits issued, $100 reduction in individual permit cost• Subsequent 100 TPRN permits
issued (401 to 500), $125 reduction in permit cost
• Subsequent permits in excess of 500 permits issued, $150 reduction in
permit cost
641 Planning & Inspections Building Permit - Residential
For additions or new single family residential construction between 401-1299 square feet, to include a single structure on one parcel that contains a single family dwelling duplex, triplex, or quadraplex.
$0.87 per square foot plus applicable Technology Fee.
642 Planning & Inspections Building Permit - Residential
For additions or new single family residential construction between 1300-2399 square feet, to include a single structure on one parcel that contains a single family dwelling duplex, triplex, or quadraplex.
$0.82 per square foot plus applicable Technology Fee.
643 Planning & Inspections Building Permit - Residential
For additions or new single family residential construction between 2400-3399 square feet, to include a single structure on one parcel that contains a single family dwelling duplex, triplex, or quadraplex.
$0.81 per square foot plus applicable Technology Fee.
644 Planning & Inspections Building Permit - Residential
For additions or new single family residential construction between 3400-4399 square feet, to include a single structure on one parcel that contains a single family dwelling duplex, triplex, or quadraplex.
$0.72 per square foot plus applicable Technology Fee.
645 Planning & Inspections Building Permit - Residential
For additions or new single family residential construction greater than 4400 square feet, to include a single structure on one parcel that contains a single family dwelling duplex, triplex, or quadraplex.
$0.61 per square foot plus applicable Technology Fee.
646 Planning & Inspections Building Permit - Residential Residential Permit
Total Permit cost will be comprised of the following: Master Permit-66%;
Electrical-20%; Plumbing-7%; Mechanical-7%; applicable technology
fee will be assessed to each permit.647 Planning & Inspections Building Permit Inspection fee-business hours $75 plus applicable technology fee
648 Planning & Inspections Building Permit Inspection fee-non business hours (Two hour minimum) $77 (Two Hour Minimum) plus
applicable technology fee
649 Planning & Inspections Building Permit Inspection fee-Expedited "On-Demand" inspections (Two hour minimum)
$77 (Two Hour Minimum) plus applicable technology fee
650 Planning & Inspections Building Permit Investigative Inspection Permit $75 plus applicable technology fee
651 Planning & Inspections Sign Permits Sign Permit
A basic sign valuation shall be determined for all signs by multiplying
the sign area in square feet by the appropriate value from the following
table:652 Planning & Inspections Sign Permits Sign Height (Ft)
653 Planning & Inspections Sign Permits Non-illuminated Single Face
654 Planning & Inspections Sign Permits 1 up to and including 20 Ft in Height $14.00 plus applicable technology fee
655 Planning & Inspections Sign Permits over 20 ft. up to and including 30 ft. in height $16.00 plus applicable technology fee
656 Planning & Inspections Sign Permits over 30 ft. up to and including 40 ft. in height $17.00 plus applicable technology fee
657 Planning & Inspections Sign Permits over 40 ft. up to and including 50 ft. in height $18.00 plus applicable technology fee
658 Planning & Inspections Sign Permits over 50 ft. up to and including 60 ft. in height $20.00 plus applicable technology fee
659 Planning & Inspections Sign Permits Over 60 ft. in Height $21.00 plus applicable technology fee
660 Planning & Inspections Sign Permits Non-illuminated
661 Planning & Inspections Sign Permits 1 up to and including 20 ft. in Height $20.00 plus applicable technology fee
662 Planning & Inspections Sign Permits over 20 ft. up to and including 30 ft. in height $23.00 plus applicable technology fee
663 Planning & Inspections Sign Permits over 30 ft. up to and including 40 ft. in height $24.00 plus applicable technology fee
664 Planning & Inspections Sign Permits over 40 ft. up to and including 50 ft. in height $26.00 plus applicable technology fee
665 Planning & Inspections Sign Permits over 50 ft. up to and including 60 ft. in height $29.00 plus applicable technology fee
666 Planning & Inspections Sign Permits Over 60 ft. in Height $30.00 plus applicable technology fee
667 Planning & Inspections Sign Permits Sign Height (Ft)
668 Planning & Inspections Sign Permits Illuminated Single Face
669 Planning & Inspections Sign Permits 1 up to and including 20 ft. in Height $25.00 plus applicable technology fee
670 Planning & Inspections Sign Permits over 20 ft. up to and including 30 ft. in height $30.00 plus applicable technology fee
671 Planning & Inspections Sign Permits over 30 ft. up to and including 40 ft. in height $34.00 plus applicable technology fee
672 Planning & Inspections Sign Permits over 40 ft. up to and including 50 ft. in height $37.00 plus applicable technology fee
673 Planning & Inspections Sign Permits over 50 ft. up to and including 60 ft. in height $39.00 plus applicable technology fee
674 Planning & Inspections Sign Permits Over 60 ft. in Height $41.00 plus applicable technology fee
675 Planning & Inspections Sign Permits Illuminated Double Face Double Face
676 Planning & Inspections Sign Permits 1 up to and including 20 ft. in Height $39.00 plus applicable technology fee
677 Planning & Inspections Sign Permits over 20 ft. up to and including 30 ft. in height $47.00 plus applicable technology fee
678 Planning & Inspections Sign Permits over 30 ft. up to and including 40 ft. in height $50.00 plus applicable technology fee
679 Planning & Inspections Sign Permits over 40 ft. up to and including 50 ft. in height $53.00 plus applicable technology fee
680 Planning & Inspections Sign Permits over 50 ft. up to and including 60 ft. in height $56.00 plus applicable technology fee
681 Planning & Inspections Sign Permits Over 60 ft. in Height $59.00 plus applicable technology fee
682 Planning & Inspections Sign Permits Off-Premise Sign Demolition $76.00 plus applicable technology fee
683 Planning & Inspections Sign Permits For sign valuations equal to or less than two hundred dollars ($200.00). Except for temporary real estate signs.
$51.00 plus applicable technology fee
Schedule C‐ 13
445

FY 2022 Schedule C
Departmental Fee List
Line No.
Department Fee Description Detail FY 2022 Adopted
684 Planning & Inspections Sign Permits
For sign valuations of two hundred one ($201.00), up to and including one
thousand, sign permit fee shall be fifty two dollars and forty one cents
($52.41) plus two dollars and eighteen cents ($2.18) for each one hundred or portion thereof over two hundred plus
applicable technology fee.
685 Planning & Inspections Sign Permits
For sign valuation of one thousand one ($1,001.00), up to and including ten
thousand, sign permit fee shall be sixty-eight dollars and seventy-eight cents ($68.78) plus twelve dollars and one
cent ($12.01) for each one thousand or portion thereof over one thousand plus
applicable technology fee.
686 Planning & Inspections Sign Permits
For sign valuations over ten thousand one ($10,001.00), up to and including twenty-five thousand sign permit fee
shall be one hundred seventy five dollars and seventy-eight cents
($175.78) plus twenty-five dollars and forty-two cents ($25.42) for each one thousand or portion thereof over ten thousand plus applicable technology
fee.
687 Planning & Inspections Sign Permits
For sign valuations over twenty-five thousand and one ($25,001.00), sign
permit fee shall be five hundred ninety-two dollars and eighty-five cents
($592.85) plus thirty-eight dollars and twenty-one cents ($38.12) for each one thousand or portion thereof over twenty-
five thousand plus applicable technology fee.
688 Planning & Inspections Fire Permits Fire Sprinkler or Fire Extinguishing System Minimum Fee $77 plus applicable
technology fee
689 Planning & Inspections Fire Permits Number of Sprinkler heads
690 Planning & Inspections Fire Permits 1 to 15 $77 plus applicable technology fee
691 Planning & Inspections Fire Permits 16 to 75 $118 plus applicable technology fee
692 Planning & Inspections Fire Permits 76 to 100 $158 plus applicable technology fee
693 Planning & Inspections Fire Permits 101 to 200 $236 plus applicable technology fee
694 Planning & Inspections Fire Permits 201 to 300 $277 plus applicable technology fee
695 Planning & Inspections Fire Permits Over 300 $316 plus applicable technology fee
696 Planning & Inspections Fire Permits Fire Suppression Systems for Cooking Operations $77 plus applicable technology fee
697 Planning & Inspections Fire Permits Number of Devices
698 Planning & Inspections Fire Permits 1 to 5 $77 plus applicable technology fee
699 Planning & Inspections Fire Permits 6 to 20 $118 plus applicable technology fee
700 Planning & Inspections Fire Permits 21 to 40 $158 plus applicable technology fee
701 Planning & Inspections Fire Permits 41 to 60 $198 plus applicable technology fee
702 Planning & Inspections Fire Permits 61 to 100 $236 plus applicable technology fee
703 Planning & Inspections Fire Permits over 100 $278 plus applicable technology fee
704 Planning & Inspections Fire Permits 1 to 3 fire hydrants $77 plus applicable technology fee
705 Planning & Inspections Fire Permits 4 to 6 fire hydrants $118 plus applicable technology fee
706 Planning & Inspections Fire Permits over 6 fire hydrants $158 plus applicable technology fee
707 Planning & Inspections Building Permit Roofing Permit $118 plus applicable technology fee
708 Planning & Inspections Building Permit Certified Roofing Permit $77 plus applicable technology fee
709 Planning & Inspections Building Permit Sidewalk Permit $77 plus applicable technology fee
710 Planning & Inspections Building Permit Sidewalk Permit- Re-inspection $65 plus applicable technology fee
711 Planning & Inspections Building Permit Driveway Permit $77 plus applicable technology fee
712 Planning & Inspections Building Permit Driveway Permit- Re-inspection $64 plus applicable technology fee
713 Planning & Inspections Building Permit Certificate of Use $398 plus applicable technology fee
714 Planning & Inspections Building Permit Conditional Certificate of Occupancy $398 plus applicable technology fee
715 Planning & Inspections Building Permit Temporary Certificate of Occupancy $169 plus applicable technology fee
716 Planning & Inspections Building Permit Temporary Structures (Tents, construction sheds, seat canopies, etc.)
Minimum $51 ($0.11 per square foot for the total area per month or fraction thereof) plus applicable technology fee
717 Planning & Inspections Building Permit Vacant Building Annual Registration-Commercial less than 5,000 square feet in area
$159 plus applicable technology fee
718 Planning & Inspections Building Permit Vacant Building Annual Registration-Commercial 5,001 square feet to 20,000 square feet in area
$318 plus applicable technology fee
719 Planning & Inspections Building Permit Vacant Building Annual Registration-commercial over 20,001 square feet in area
$477 plus applicable technology fee
720 Planning & Inspections Building Permit Vacant Building commercial and residential fee for registration ownership transfers not requiring a plan review
$80 plus applicable technology fee
721 Planning & Inspections Building Permit Vacant Building Annual Residential Registration Fee $159 plus applicable technology fee
722 Planning & Inspections Building Permit Mobile Home Placement Permit $77 plus applicable technology fee
723 Planning & Inspections Building Permit Duplicate Cards or Licenses $16.84 plus applicable technology fee
724 Planning & Inspections Business Licenses Vendor $48 plus applicable technology fee
725 Planning & Inspections Business Licenses Tax Exempt Vendor No Fee
726 Planning & Inspections Business Licenses Motel $230 plus applicable technology fee
727 Planning & Inspections Business Licenses Hotel $230 plus applicable technology fee
728 Planning & Inspections Business Licenses Lodging house $56 plus applicable technology fee
729 Planning & Inspections Business Licenses Home occupation (New) -Annual $72 plus applicable technology fee
730 Planning & Inspections Business Licenses Home occupation (New) -Bi-Annual $129 plus applicable technology fee
731 Planning & Inspections Business Licenses Home occupation-Annual (Renewal) $55 plus applicable technology fee
Schedule C‐ 14
446
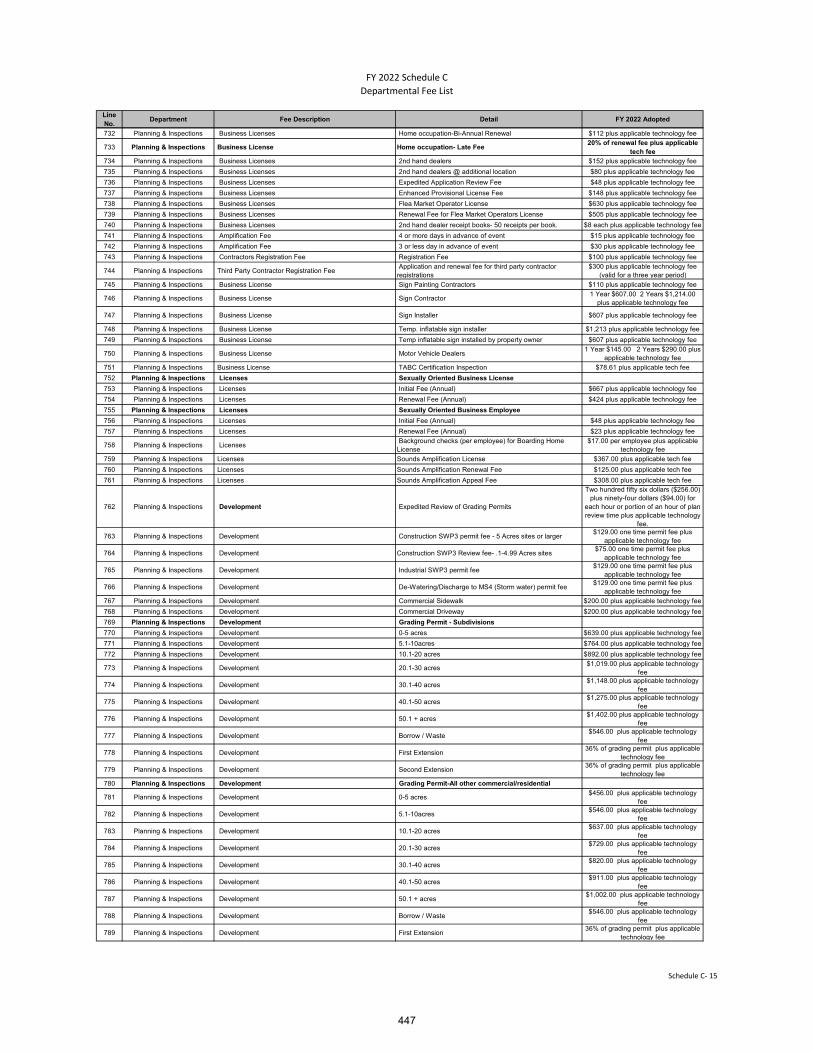
FY 2022 Schedule C
Departmental Fee List
Line No.
Department Fee Description Detail FY 2022 Adopted
732 Planning & Inspections Business Licenses Home occupation-Bi-Annual Renewal $112 plus applicable technology fee
733 Planning & Inspections Business License Home occupation- Late Fee20% of renewal fee plus applicable
tech fee734 Planning & Inspections Business Licenses 2nd hand dealers $152 plus applicable technology fee
735 Planning & Inspections Business Licenses 2nd hand dealers @ additional location $80 plus applicable technology fee
736 Planning & Inspections Business Licenses Expedited Application Review Fee $48 plus applicable technology fee
737 Planning & Inspections Business Licenses Enhanced Provisional License Fee $148 plus applicable technology fee
738 Planning & Inspections Business Licenses Flea Market Operator License $630 plus applicable technology fee
739 Planning & Inspections Business Licenses Renewal Fee for Flea Market Operators License $505 plus applicable technology fee
740 Planning & Inspections Business Licenses 2nd hand dealer receipt books- 50 receipts per book. $8 each plus applicable technology fee
741 Planning & Inspections Amplification Fee 4 or more days in advance of event $15 plus applicable technology fee
742 Planning & Inspections Amplification Fee 3 or less day in advance of event $30 plus applicable technology fee
743 Planning & Inspections Contractors Registration Fee Registration Fee $100 plus applicable technology fee
744 Planning & Inspections Third Party Contractor Registration Fee Application and renewal fee for third party contractor registrations
$300 plus applicable technology fee (valid for a three year period)
745 Planning & Inspections Business License Sign Painting Contractors $110 plus applicable technology fee
746 Planning & Inspections Business License Sign Contractor 1 Year $607.00 2 Years $1,214.00
plus applicable technology fee
747 Planning & Inspections Business License Sign Installer $607 plus applicable technology fee
748 Planning & Inspections Business License Temp. inflatable sign installer $1,213 plus applicable technology fee
749 Planning & Inspections Business License Temp inflatable sign installed by property owner $607 plus applicable technology fee
750 Planning & Inspections Business License Motor Vehicle Dealers 1 Year $145.00 2 Years $290.00 plus
applicable technology fee
751 Planning & Inspections Business License TABC Certification Inspection $78.61 plus applicable tech fee
752 Planning & Inspections Licenses Sexually Oriented Business License
753 Planning & Inspections Licenses Initial Fee (Annual) $667 plus applicable technology fee
754 Planning & Inspections Licenses Renewal Fee (Annual) $424 plus applicable technology fee
755 Planning & Inspections Licenses Sexually Oriented Business Employee
756 Planning & Inspections Licenses Initial Fee (Annual) $48 plus applicable technology fee
757 Planning & Inspections Licenses Renewal Fee (Annual) $23 plus applicable technology fee
758 Planning & Inspections Licenses Background checks (per employee) for Boarding Home License
$17.00 per employee plus applicable technology fee
759 Planning & Inspections Licenses Sounds Amplification License $367.00 plus applicable tech fee
760 Planning & Inspections Licenses Sounds Amplification Renewal Fee $125.00 plus applicable tech fee
761 Planning & Inspections Licenses Sounds Amplification Appeal Fee $308.00 plus applicable tech fee
762 Planning & Inspections Development Expedited Review of Grading Permits
Two hundred fifty six dollars ($256.00) plus ninety-four dollars ($94.00) for
each hour or portion of an hour of plan review time plus applicable technology
fee.
763 Planning & Inspections Development Construction SWP3 permit fee - 5 Acres sites or larger $129.00 one time permit fee plus
applicable technology fee
764 Planning & Inspections Development Construction SWP3 Review fee- .1-4.99 Acres sites$75.00 one time permit fee plus
applicable technology fee
765 Planning & Inspections Development Industrial SWP3 permit fee $129.00 one time permit fee plus
applicable technology fee
766 Planning & Inspections Development De-Watering/Discharge to MS4 (Storm water) permit fee $129.00 one time permit fee plus
applicable technology fee
767 Planning & Inspections Development Commercial Sidewalk $200.00 plus applicable technology fee
768 Planning & Inspections Development Commercial Driveway $200.00 plus applicable technology fee
769 Planning & Inspections Development Grading Permit - Subdivisions
770 Planning & Inspections Development 0-5 acres $639.00 plus applicable technology fee
771 Planning & Inspections Development 5.1-10acres $764.00 plus applicable technology fee
772 Planning & Inspections Development 10.1-20 acres $892.00 plus applicable technology fee
773 Planning & Inspections Development 20.1-30 acres $1,019.00 plus applicable technology
fee
774 Planning & Inspections Development 30.1-40 acres $1,148.00 plus applicable technology
fee
775 Planning & Inspections Development 40.1-50 acres $1,275.00 plus applicable technology
fee
776 Planning & Inspections Development 50.1 + acres $1,402.00 plus applicable technology
fee
777 Planning & Inspections Development Borrow / Waste $546.00 plus applicable technology
fee
778 Planning & Inspections Development First Extension 36% of grading permit plus applicable
technology fee
779 Planning & Inspections Development Second Extension 36% of grading permit plus applicable
technology fee
780 Planning & Inspections Development Grading Permit-All other commercial/residential
781 Planning & Inspections Development 0-5 acres $456.00 plus applicable technology
fee
782 Planning & Inspections Development 5.1-10acres $546.00 plus applicable technology
fee
783 Planning & Inspections Development 10.1-20 acres $637.00 plus applicable technology
fee
784 Planning & Inspections Development 20.1-30 acres $729.00 plus applicable technology
fee
785 Planning & Inspections Development 30.1-40 acres $820.00 plus applicable technology
fee
786 Planning & Inspections Development 40.1-50 acres $911.00 plus applicable technology
fee
787 Planning & Inspections Development 50.1 + acres $1,002.00 plus applicable technology
fee
788 Planning & Inspections Development Borrow / Waste $546.00 plus applicable technology
fee
789 Planning & Inspections Development First Extension 36% of grading permit plus applicable
technology fee
Schedule C‐ 15
447
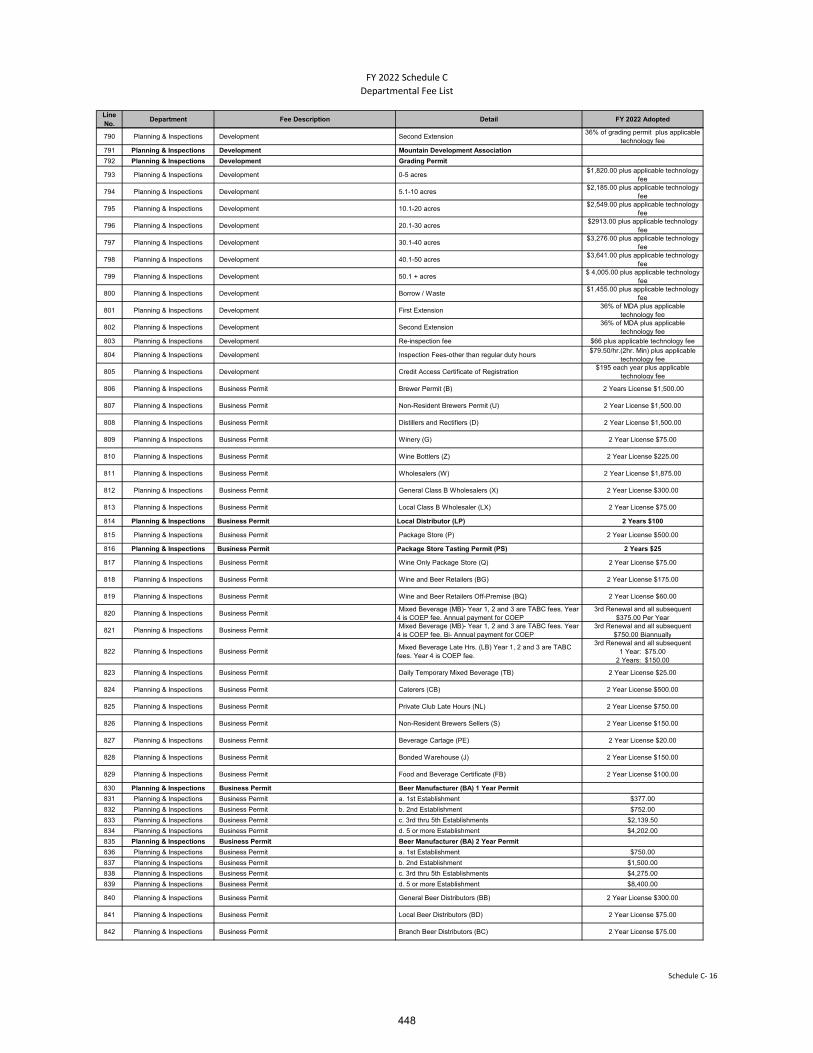
FY 2022 Schedule C
Departmental Fee List
Line No.
Department Fee Description Detail FY 2022 Adopted
790 Planning & Inspections Development Second Extension 36% of grading permit plus applicable
technology fee
791 Planning & Inspections Development Mountain Development Association
792 Planning & Inspections Development Grading Permit
793 Planning & Inspections Development 0-5 acres $1,820.00 plus applicable technology
fee
794 Planning & Inspections Development 5.1-10 acres $2,185.00 plus applicable technology
fee
795 Planning & Inspections Development 10.1-20 acres $2,549.00 plus applicable technology
fee
796 Planning & Inspections Development 20.1-30 acres $2913.00 plus applicable technology
fee
797 Planning & Inspections Development 30.1-40 acres $3,276.00 plus applicable technology
fee
798 Planning & Inspections Development 40.1-50 acres $3,641.00 plus applicable technology
fee
799 Planning & Inspections Development 50.1 + acres $ 4,005.00 plus applicable technology
fee
800 Planning & Inspections Development Borrow / Waste $1,455.00 plus applicable technology
fee
801 Planning & Inspections Development First Extension 36% of MDA plus applicable
technology fee
802 Planning & Inspections Development Second Extension 36% of MDA plus applicable
technology fee
803 Planning & Inspections Development Re-inspection fee $66 plus applicable technology fee
804 Planning & Inspections Development Inspection Fees-other than regular duty hours $79.50/hr.(2hr. Min) plus applicable
technology fee
805 Planning & Inspections Development Credit Access Certificate of Registration $195 each year plus applicable
technology fee
806 Planning & Inspections Business Permit Brewer Permit (B) 2 Years License $1,500.00
807 Planning & Inspections Business Permit Non-Resident Brewers Permit (U) 2 Year License $1,500.00
808 Planning & Inspections Business Permit Distillers and Rectifiers (D) 2 Year License $1,500.00
809 Planning & Inspections Business Permit Winery (G) 2 Year License $75.00
810 Planning & Inspections Business Permit Wine Bottlers (Z) 2 Year License $225.00
811 Planning & Inspections Business Permit Wholesalers (W) 2 Year License $1,875.00
812 Planning & Inspections Business Permit General Class B Wholesalers (X) 2 Year License $300.00
813 Planning & Inspections Business Permit Local Class B Wholesaler (LX) 2 Year License $75.00
814 Planning & Inspections Business Permit Local Distributor (LP) 2 Years $100
815 Planning & Inspections Business Permit Package Store (P) 2 Year License $500.00
816 Planning & Inspections Business Permit Package Store Tasting Permit (PS) 2 Years $25
817 Planning & Inspections Business Permit Wine Only Package Store (Q) 2 Year License $75.00
818 Planning & Inspections Business Permit Wine and Beer Retailers (BG) 2 Year License $175.00
819 Planning & Inspections Business Permit Wine and Beer Retailers Off-Premise (BQ) 2 Year License $60.00
820 Planning & Inspections Business Permit Mixed Beverage (MB)- Year 1, 2 and 3 are TABC fees. Year 4 is COEP fee. Annual payment for COEP
3rd Renewal and all subsequent $375.00 Per Year
821 Planning & Inspections Business Permit Mixed Beverage (MB)- Year 1, 2 and 3 are TABC fees. Year 4 is COEP fee. Bi- Annual payment for COEP
3rd Renewal and all subsequent $750.00 Biannually
822 Planning & Inspections Business Permit Mixed Beverage Late Hrs. (LB) Year 1, 2 and 3 are TABC fees. Year 4 is COEP fee.
3rd Renewal and all subsequent 1 Year: $75.00
2 Years: $150.00
823 Planning & Inspections Business Permit Daily Temporary Mixed Beverage (TB) 2 Year License $25.00
824 Planning & Inspections Business Permit Caterers (CB) 2 Year License $500.00
825 Planning & Inspections Business Permit Private Club Late Hours (NL) 2 Year License $750.00
826 Planning & Inspections Business Permit Non-Resident Brewers Sellers (S) 2 Year License $150.00
827 Planning & Inspections Business Permit Beverage Cartage (PE) 2 Year License $20.00
828 Planning & Inspections Business Permit Bonded Warehouse (J) 2 Year License $150.00
829 Planning & Inspections Business Permit Food and Beverage Certificate (FB) 2 Year License $100.00
830 Planning & Inspections Business Permit Beer Manufacturer (BA) 1 Year Permit
831 Planning & Inspections Business Permit a. 1st Establishment $377.00
832 Planning & Inspections Business Permit b. 2nd Establishment $752.00
833 Planning & Inspections Business Permit c. 3rd thru 5th Establishments $2,139.50
834 Planning & Inspections Business Permit d. 5 or more Establishment $4,202.00
835 Planning & Inspections Business Permit Beer Manufacturer (BA) 2 Year Permit
836 Planning & Inspections Business Permit a. 1st Establishment $750.00
837 Planning & Inspections Business Permit b. 2nd Establishment $1,500.00
838 Planning & Inspections Business Permit c. 3rd thru 5th Establishments $4,275.00
839 Planning & Inspections Business Permit d. 5 or more Establishment $8,400.00
840 Planning & Inspections Business Permit General Beer Distributors (BB) 2 Year License $300.00
841 Planning & Inspections Business Permit Local Beer Distributors (BD) 2 Year License $75.00
842 Planning & Inspections Business Permit Branch Beer Distributors (BC) 2 Year License $75.00
Schedule C‐ 16
448

FY 2022 Schedule C
Departmental Fee List
Line No.
Department Fee Description Detail FY 2022 Adopted
843 Planning & Inspections Business Permit Beer Importers (BI) 2 Year License $20.00
844 Planning & Inspections Business Permit Beer Importers Carriers (BJ) 2 Year License $20.00
845 Planning & Inspections Business Permit Beer Retailers On-Premise (BE) 2 Year License $150.00
846 Planning & Inspections Business Permit Retail Dealers On-Premise Late Hrs. (BL) 2 Year License $250.00
847 Planning & Inspections Business Permit Beer Retailers Off-Premise (BF) 2 Year License $60.00
848 Planning & Inspections Business Permit Brew Pub (BP) 2 Years $500.00
849 Planning & Inspections Business Licenses Boarding Home Facility Annual Permit $262 plus applicable technology fee
850 Planning & Inspections Business License Boarding Home Facility Renewal- Late Fee20% of renewal fee plus applicable
tech fee
851 Planning & Inspections Nodes for Small Cell Networks Application Fee - Network Node
An application fee in the amount of $500.00 per application covering up to five network nodes in each application,
and $100.00 for each additional network node in the application; a maximum of 30 network nodes is
permitted per application.
852 Planning & Inspections Nodes for Small Cell Networks Application Fee - New Node Support PoleAn application fee of $1,000.00 for
each node support pole.
853 Planning & Inspections Nodes for Small Cell Networks Application Fee - Transport Facility
An application fee in the amount of $500.00 per application covering up to five network nodes in each application,
and $250.00 for each additional network node in the application; a maximum of 30 network nodes is
permitted per application.
854 Planning & Inspections Nodes for Small Cell Networks Recurring Annual Rental Rate - Network Nodes
An annual network node site rental rate of $250.00 per Network node site, with
an annual adjustment in an amount equal to one-half the annual change in the Consumer Price Index for All Urban Consumers for Texas as published by the BLS. Recurring fee is payable in
advance and due upon approval of the permit(s). Initial amounts shall be pro-rated, based upon an annual due date of January 1 of each year; thereafter, all payments of recurring fees are due
to the City by January 1 for the following calendar year.
855 Planning & Inspections Nodes for Small Cell Networks Recurring Monthly Rental Rate - Transport Facility
A monthly transport facility rental rate of $28.00 for each network node site, not to exceed the provider's monthly aggregate per-node compensation to the City. Recurring fee is payable in
advance and due upon approval of the permit(s). Initial amounts shall be pro-rated, based upon an annual due date of January 1 of each year; thereafter, all payments of recurring fees are due
to the City by January 1 for the following calendar year.
856 Planning & Inspections Nodes for Small Cell Networks Recurring Annual Rental Rate - Collocation of Network Nodes on Municipally-Owned Service Poles
An annual rate of $20.00 per municipally-owned service pole.
Recurring fee is payable in advance and due upon approval of the
permit(s). Initial amounts shall be pro-rated, based upon an annual due date of January 1 of each year; thereafter, all payments of recurring fees are due
to the City by January 1 for the following calendar year.
857 Planning & Inspections Special Privilege - Annual Fee - Cincinnati Commercial District
Outdoor Café $2.00 per square foot
858 Planning & Inspections Shared Mobility Devices Application Fee $371 Application Review
859 Planning & Inspections Shared Mobility Devices Permit Fee$1/day per device: or Per-Trip
Surcharge of $.25 for each booked trip
860 Planning & Inspections Shared Mobility Devices Annual Fee $50 per device
861 Library Library Fees Overdue Fines $0.15/day
862 Library Library Fees Lost Adult/YA Hardback Fair Market Value to Replace Item
863 Library Library Fees Adult Card/replacement $2.00
864 Library Library Fees Juvenile Card/replacement $1.00
865 Library Library Fees Student Card issue and replacement fees (including non-resident convenience fee) applicable only to students attending schools within city limits
Fees waived for elementary, middle and high school only.
866 Library Library Fees Non-Resident Convenience Fee $50.00 per year/$25.00 per 6 months
867 Library Library Fees Student/Non-Profit Use Scanning of Photographs (low resolution)
$10.00 per image
868 Library Library Fees Student/Non-Profit Use Scanning of Photographs (high resolution)
$15.00 per image
869 Library Library Fees Student/Non-Profit Use Preservation Fee (Applies to all Reproduction Requests)
waived
870 Library Library Fees Scanning of Photographs (low resolution) $20.00
871 Library Library Fees Scanning of Photographs (high resolution) $30.00
872 Library Library Fees Scanning of Maps/Architectural Drawings (low resolution) $25.00
Schedule C‐ 17
449

FY 2022 Schedule C
Departmental Fee List
Line No.
Department Fee Description Detail FY 2022 Adopted
873 Library Library Fees Scanning of Maps/Architectural Drawings (med resolution) $35.00
874 Library Library Fees Scanning of Maps/Architectural Drawings (high resolution) $45.00
875 Library Library Fees Scanning of Maps/Architectural Drawings Fee (in-house) $3 per sheet
876 Library Library Fees Scanning of Maps/Architectural Drawings Fee- Student $15.00
877 Library Library Fees Preservation Fee (Applies to all Reproduction Requests) $1.00
878 Library Library Fees Document Delivery Services $1.00 per page
879 Library Library Fees Commercial Use Fee $10.00
880 Library Library Fees Damaged or missing DVD/Music CD Case $3.00
881 Library Library Fees Damaged or Missing Book Cover $3.00
882 Library Library Fees Damaged or Missing Kit Bag $3.00
883 Library Library Fees Damaged or Missing Audiobook Case $3.00
884 Library Library Fees Damaged or Missing Barcode $3.00
885 Library Library Fees Damaged or Missing Spine Label $3.00
886 Library Library Fees Border Heritage/Interlibrary Loan Postage Fee $3.00 per item
887 Library Library Fees Copy black/white $0.20
888 Library Library Fees Copy color $0.50
889 Library Library Fees Printer black/white $0.20
890 Library Library Fees Printer color $0.50
891 Library Library Fees Scanner $0.10
892 Library Library Fees Fax $1.00
893 Library Library Fees USB Save free
894 Library Library Fees USB Drives $6.00
895 Library Library Fees Damaged or Missing Hotspot Accessory - plastic case, USB cable, charger or adapter
$5.00
896 Library Library Fees Damaged or Missing Hotspot Accessor - SIM card or battery $10.00
897 Library Library Fees Damaged or Missing Hotspot - Entire item $85.00
898 Library Library Fees Damaged or Missing finger puppet, flannelboard piece or toy piece
$3.00
899 Library Library Fees Damaged or Missing iPad $300
900 Environmental Services Residential Base Rate (Residential) $19.00 per month
901 Environmental Services Residential Excess Waste - Administrative Fee $10.00 for one additional lift of the arm.
902 Environmental Services Residential Additional Container (Residential)$19.00 per month for each additional
container, plus service charges
903 Environmental Services Residential Senior and Disabled Citizens Discount 20% reduction of Base Rate
904 Environmental Services Commercial Base Rate (Commercial)$28.00 per month for once a week
collection per container.
905 Environmental Services Commercial Additional Container (Commercial)$28.00 per month for each additional
container.
906 Environmental Services Residential Side door Collection $19.00
907 Environmental Services Residential Residential Refuse Collection $19.00 per month
908 Environmental Services Residential Residential Refuse Collection for on-call Service$25 per service call for 96 gallon
container
909 Environmental Services Other Special Collection Service (Residential)$35.00 up to 5 cubic yards.
$7.00 for each additional cubic yard.
910 Environmental Services Other Dead Animal Collection Fee
$40.00 for domesticated pets; $150.00 for small farm animals within the city limits; $175.00 for large farm animals inside county and outside city limits.
911 Environmental Services Residential Citizen Collection Station Fee
$5.00 for each visit in excess of monthly frequency limit set by Director
with limit of 4 cy, no C&D and no commercial.
912 Environmental Services Residential Citizen Collection Station Fee
$5.00 coupon Non-customer, one visit; standard restrictions; non-commercial; residential solid waste only, excludes
household hazardous waste.
913 Environmental Services Special Collections Property Clean Up FeeLabor, equipment and disposal rates
as set by Director in 1/4 hour increments with 1 hour minimum.
914 Environmental Services General Interest on unpaid balances10% per year (0.83% of invoiced
amount per month)
915 Environmental Services Permits Hauler Permit Fee
$150.00 per vehicle for complete term of permit or $12.50 per vehicle per
month for less than complete term of permit plus applicable tech fees
916 Environmental Services Permits Replacement Decal $10.00 each
917 Environmental Services Permits Reinstatement of Suspended or Revoked Permit
50% of annual Hauler Permit Fee for suspended permit, 100% of annual
Hauler Permit Fee for revoked permit. Plus applicable tech fees
918 Environmental Services Permits Special Waste Disposal Fee-Immediate Disposal
$25.00 surcharge plus regular per ton landfill disposal charge for a scheduled
disposal. $35.00 surcharge plus double the regular per ton landfill
disposal charge for an unscheduled disposal.
919 Environmental Services Permits Permit Fee (Container on Sidewalk/R.O.W.)$72.00 annual fee per container or
$6.00 per month for a partial first year, plus applicable tech fees
920 Environmental Services Disposal Landfill Fees$26.00 per ton, prorated, with a
minimum fee of $16.00. $5.00 charge for unsecured/uncovered load.
921 Environmental Services Disposal Landfill Fee (Brush Waste, Uncontaminated)$26.00 per ton, prorated, with a
minimum fee of $10.00.
Schedule C‐ 18
450

FY 2022 Schedule C
Departmental Fee List
Line No.
Department Fee Description Detail FY 2022 Adopted
922 Environmental Services Disposal Landfill Fees (Materials Requiring Special Handling)
$90.00 per ton, pro-rated, for RACM Non-Friables, foam materials, sponge
or sponge-like materials and other wastes requiring special handling, with
a minimum fee of $90. $5.00 for refrigerant removal.
923 Environmental Services Disposal Landfill Fees (Materials Requiring Special Handling)
$90.00 per ton, pro-rated, for dead animals with a total weight greater than
100 lbs. Small dead animals with a total weight less than 100 lbs. will be
charged the standard landfill rate.924 Environmental Services Disposal Billing Fee for Landfill Charge Accounts $25.00 per month
925 Environmental Services Disposal Disposal Fee (Waste Tires)
Small or Medium tires (19.5 inches or less) $3.00, Large Tires (greater than 19.5 inches but less than 24 inches)
$10.00, tires greater than 24 inches will be charged a rate of $200.00/ton. Rim Removal Fee - Small or Medium tires
$5.00, Rim Removal Fee - Large Tires $15.00.
926 Environmental Services Disposal Disposal Fee (Mattresses)Disposal Charges Per Unit: Twin
$10.00, Full $15.00, Queen $20.00, King $25.00
927 Environmental Services Disposal Prohibited Waste$25.00 surcharge plus applicable disposal and administrative costs.
928 Environmental Services Disposal Transfer Fee$30.00 per ton, prorated, with a
minimum fee of $20.00
929 Environmental Services Disposal Sale of Mulch/Compost
City Departments - Free, El Paso Solid Waste Residential Customers - Free at
CCS or Landfill; Commercial Customers - Free at Landfill;
Commercial Customers within City limits - $15.00 cy if delivered by ESD.
930 Environmental Services Disposal Sale of Safety Vest $10.00 each
931 Environmental Services Disposal RFID (Automated Scale) Tag $25.00 each
932 Environmental Services Other Container Replacement Fee $55.00 per Container
933 Environmental Services Other Service Charge (delivery or removal of container) $25.00 per Event
934 Environmental Services Other Un Authorized Solid Waste Container Removal Fee $25.00 per Event
935 Environmental Services Other Missed Collection Fee $15.00 for pick up
936 Environmental Services Administrative Fee Lien Preparation Fee( Environmental Services)$75.00 charge for administrative costs related to the preparation of property
liens937 Environmental Services Shopping Cart Recovery Shopping Cart Recovery Fee $50.00 per Cart impounded by City
938 Environmental Services Construction or Demolition Manifest Fee$5.00 per manifest; No fee for City -
funded projects
939 Environmental Services Services Environmental Fee (Residential) $5.00 per Residential Living Unit
940 Environmental Services Services Environmental Fee (Commercial) $20.00 per Commercial Establishment
941 Environmental Services Environmental General-Facilities
942 Environmental Services Annual License Fee Public Swimming Pool-Annual 275 plus applicable tech fee
943 Environmental Services Bi-Annual License Fee Public Swimming Pool-Bi-Annual 550 plus applicable tech fee
944 Environmental Services Annual License Fee Spas-annual 175 plus applicable tech fee
945 Environmental Services Bi-Annual License Fee Spas-bi-annual 350 plus applicable tech fee
946 Environmental Services Re-Inspection Fee Public Swimming Pool Or Public Spa Fee Per Inspection 175 plus applicable tech fee
947 Environmental Services Water Sampling Fee Water Sampling of Public Swimming Pools and Public Spas$100 plus lab fees, plus applicable tech
fee
948 Environmental Services Temporary License Above Ground Public Pool (Per Pool) $125.00 plus applicable tech fee
949 Environmental Services Temporary License Above Ground Spa (Per Spa) $125.00 plus applicable tech fee
950 Environmental Services Application Fee Tattoo Studio Application Fee$60.00 Per Application, plus applicable
tech fee
951 Environmental Services Studio Registration Fee Tattoo and Body Art - Biennial2 Year $300.00 or $12.50, per month for terms of less than two years, plus
applicable tech fee
952 Environmental Services Re-Inspection Fee Tattoo and Body Art - Studio Re-inspection$45.00 Per Re-inspection, plus
applicable tech fee
953 Environmental Services Artist License Fee Tattoo and Body Art - Annual $65.00, plus applicable tech fee
954 Environmental Services Re-Inspection Fee Tattoo and Body Art -Artist$40.00 Per Re-inspection, plus
applicable tech fee
955 Environmental Services Annual License Fee Trailer Court Annual $275.00, plus applicable tech fee
956 Environmental Services Re-Inspection Fee Trailer Court $175.00, plus applicable tech fee
957 Environmental Services Annual License Fee Laundries - Annual $175.00, plus applicable tech fee
958 Environmental Services Bi-Annual License Fee Laundries - Bi-Annual $350.00, plus applicable tech fee
959 Environmental Services Re-Inspection Fee Laundries $125.00, plus applicable tech fee
960 Environmental Services Franchise Fee Waste Container Franchise Fee- Per Container$2.00 Per Month, Per approved
container
961 Environmental Services Franchise Fee Waste Container Franchise Fee- Quarterly $2,000.00/ Per Year
962 Environmental Services Franchise Fee Franchise Fee $6.00
963 Animal Services Animal Services
964 Animal Services Adoption Fee - includes age-appropriate vaccinations, license, microchip and sterilization.
Each adoption from no charge to $110.00
965 Animal Services Livestock Permit - Keeping Horses And Cattle-Permit Required-Application-Fee-Term-Suspension Or Revocation
Permit Yearly Renewal $60.00 plus applicable tech fee
966 Animal Services Livestock Permit - Keeping Horses And Cattle-Permit Required-Application-Fee-Term-Suspension Or Revocation
Re-Inspection and/or Amending Permit $45.00 plus applicable tech fee
967 Animal Services Fowl and Rabbits (6 or more)-Restrictions-Permit Requirements
Permit Yearly Renewal $60.00 plus applicable tech fee
968 Animal Services Fowl and Rabbits (6 or more)-Restrictions-Permit Requirements
Re-Inspection and/or Amending Permit $45.00 plus applicable tech fee
969 Animal Services Microchip Fees Initial Issuance from no charge to $15.00
Schedule C‐ 19
451
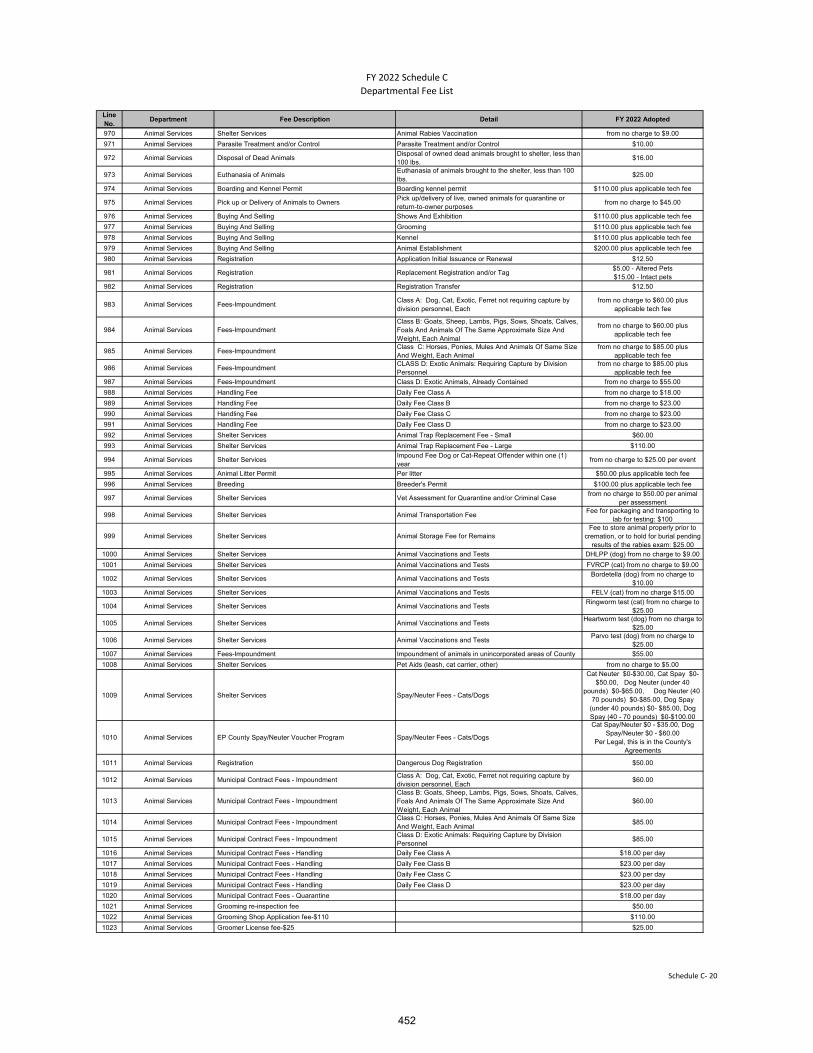
FY 2022 Schedule C
Departmental Fee List
Line No.
Department Fee Description Detail FY 2022 Adopted
970 Animal Services Shelter Services Animal Rabies Vaccination from no charge to $9.00
971 Animal Services Parasite Treatment and/or Control Parasite Treatment and/or Control $10.00
972 Animal Services Disposal of Dead Animals Disposal of owned dead animals brought to shelter, less than 100 lbs.
$16.00
973 Animal Services Euthanasia of Animals Euthanasia of animals brought to the shelter, less than 100 lbs.
$25.00
974 Animal Services Boarding and Kennel Permit Boarding kennel permit $110.00 plus applicable tech fee
975 Animal Services Pick up or Delivery of Animals to Owners Pick up/delivery of live, owned animals for quarantine or return-to-owner purposes
from no charge to $45.00
976 Animal Services Buying And Selling Shows And Exhibition $110.00 plus applicable tech fee
977 Animal Services Buying And Selling Grooming $110.00 plus applicable tech fee
978 Animal Services Buying And Selling Kennel $110.00 plus applicable tech fee
979 Animal Services Buying And Selling Animal Establishment $200.00 plus applicable tech fee
980 Animal Services Registration Application Initial Issuance or Renewal $12.50
981 Animal Services Registration Replacement Registration and/or Tag$5.00 - Altered Pets$15.00 - Intact pets
982 Animal Services Registration Registration Transfer $12.50
983 Animal Services Fees-Impoundment Class A: Dog, Cat, Exotic, Ferret not requiring capture by division personnel, Each
from no charge to $60.00 plus applicable tech fee
984 Animal Services Fees-Impoundment Class B: Goats, Sheep, Lambs, Pigs, Sows, Shoats, Calves, Foals And Animals Of The Same Approximate Size And Weight, Each Animal
from no charge to $60.00 plus applicable tech fee
985 Animal Services Fees-Impoundment Class C: Horses, Ponies, Mules And Animals Of Same Size And Weight, Each Animal
from no charge to $85.00 plus applicable tech fee
986 Animal Services Fees-Impoundment CLASS D: Exotic Animals: Requiring Capture by Division Personnel
from no charge to $85.00 plus applicable tech fee
987 Animal Services Fees-Impoundment Class D: Exotic Animals, Already Contained from no charge to $55.00
988 Animal Services Handling Fee Daily Fee Class A from no charge to $18.00
989 Animal Services Handling Fee Daily Fee Class B from no charge to $23.00
990 Animal Services Handling Fee Daily Fee Class C from no charge to $23.00
991 Animal Services Handling Fee Daily Fee Class D from no charge to $23.00
992 Animal Services Shelter Services Animal Trap Replacement Fee - Small $60.00
993 Animal Services Shelter Services Animal Trap Replacement Fee - Large $110.00
994 Animal Services Shelter Services Impound Fee Dog or Cat-Repeat Offender within one (1) year
from no charge to $25.00 per event
995 Animal Services Animal Litter Permit Per litter $50.00 plus applicable tech fee
996 Animal Services Breeding Breeder's Permit $100.00 plus applicable tech fee
997 Animal Services Shelter Services Vet Assessment for Quarantine and/or Criminal Casefrom no charge to $50.00 per animal
per assessment
998 Animal Services Shelter Services Animal Transportation FeeFee for packaging and transporting to
lab for testing: $100
999 Animal Services Shelter Services Animal Storage Fee for RemainsFee to store animal properly prior to
cremation, or to hold for burial pending results of the rabies exam: $25.00
1000 Animal Services Shelter Services Animal Vaccinations and Tests DHLPP (dog) from no charge to $9.00
1001 Animal Services Shelter Services Animal Vaccinations and Tests FVRCP (cat) from no charge to $9.00
1002 Animal Services Shelter Services Animal Vaccinations and TestsBordetella (dog) from no charge to
$10.00
1003 Animal Services Shelter Services Animal Vaccinations and Tests FELV (cat) from no charge $15.00
1004 Animal Services Shelter Services Animal Vaccinations and TestsRingworm test (cat) from no charge to
$25.00
1005 Animal Services Shelter Services Animal Vaccinations and TestsHeartworm test (dog) from no charge to
$25.00
1006 Animal Services Shelter Services Animal Vaccinations and TestsParvo test (dog) from no charge to
$25.00
1007 Animal Services Fees-Impoundment Impoundment of animals in unincorporated areas of County $55.00
1008 Animal Services Shelter Services Pet Aids (leash, cat carrier, other) from no charge to $5.00
1009 Animal Services Shelter Services Spay/Neuter Fees - Cats/Dogs
Cat Neuter $0-$30.00, Cat Spay $0-$50.00, Dog Neuter (under 40
pounds) $0-$65.00, Dog Neuter (40 -70 pounds) $0-$85.00, Dog Spay
(under 40 pounds) $0- $85.00, Dog Spay (40 - 70 pounds) $0-$100.00
1010 Animal Services EP County Spay/Neuter Voucher Program Spay/Neuter Fees - Cats/Dogs
Cat Spay/Neuter $0 - $35.00, Dog Spay/Neuter $0 - $60.00
Per Legal, this is in the County's Agreements
1011 Animal Services Registration Dangerous Dog Registration $50.00
1012 Animal Services Municipal Contract Fees - Impoundment Class A: Dog, Cat, Exotic, Ferret not requiring capture by division personnel, Each
$60.00
1013 Animal Services Municipal Contract Fees - Impoundment Class B: Goats, Sheep, Lambs, Pigs, Sows, Shoats, Calves, Foals And Animals Of The Same Approximate Size And Weight, Each Animal
$60.00
1014 Animal Services Municipal Contract Fees - Impoundment Class C: Horses, Ponies, Mules And Animals Of Same Size And Weight, Each Animal
$85.00
1015 Animal Services Municipal Contract Fees - Impoundment Class D: Exotic Animals: Requiring Capture by Division Personnel
$85.00
1016 Animal Services Municipal Contract Fees - Handling Daily Fee Class A $18.00 per day
1017 Animal Services Municipal Contract Fees - Handling Daily Fee Class B $23.00 per day
1018 Animal Services Municipal Contract Fees - Handling Daily Fee Class C $23.00 per day
1019 Animal Services Municipal Contract Fees - Handling Daily Fee Class D $23.00 per day
1020 Animal Services Municipal Contract Fees - Quarantine $18.00 per day
1021 Animal Services Grooming re-inspection fee $50.00
1022 Animal Services Grooming Shop Application fee-$110 $110.00
1023 Animal Services Groomer License fee-$25 $25.00
Schedule C‐ 20
452
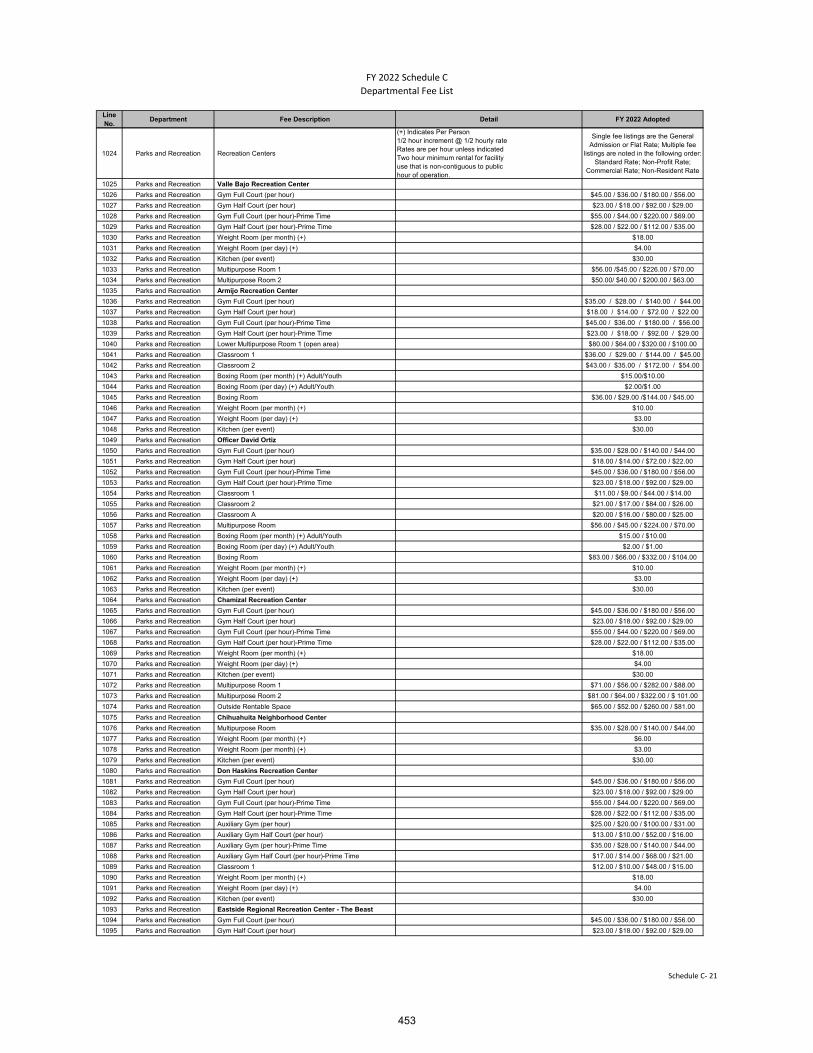
FY 2022 Schedule C
Departmental Fee List
Line No.
Department Fee Description Detail FY 2022 Adopted
1024 Parks and Recreation Recreation Centers
(+) Indicates Per Person1/2 hour increment @ 1/2 hourly rateRates are per hour unless indicatedTwo hour minimum rental for facilityuse that is non-contiguous to publichour of operation.
Single fee listings are the General Admission or Flat Rate; Multiple fee
listings are noted in the following order: Standard Rate; Non-Profit Rate;
Commercial Rate; Non-Resident Rate
1025 Parks and Recreation Valle Bajo Recreation Center
1026 Parks and Recreation Gym Full Court (per hour) $45.00 / $36.00 / $180.00 / $56.00
1027 Parks and Recreation Gym Half Court (per hour) $23.00 / $18.00 / $92.00 / $29.00
1028 Parks and Recreation Gym Full Court (per hour)-Prime Time $55.00 / $44.00 / $220.00 / $69.00
1029 Parks and Recreation Gym Half Court (per hour)-Prime Time $28.00 / $22.00 / $112.00 / $35.00
1030 Parks and Recreation Weight Room (per month) (+) $18.00
1031 Parks and Recreation Weight Room (per day) (+) $4.00
1032 Parks and Recreation Kitchen (per event) $30.00
1033 Parks and Recreation Multipurpose Room 1 $56.00 /$45.00 / $226.00 / $70.00
1034 Parks and Recreation Multipurpose Room 2 $50.00/ $40.00 / $200.00 / $63.00
1035 Parks and Recreation Armijo Recreation Center
1036 Parks and Recreation Gym Full Court (per hour) $35.00 / $28.00 / $140.00 / $44.00
1037 Parks and Recreation Gym Half Court (per hour) $18.00 / $14.00 / $72.00 / $22.00
1038 Parks and Recreation Gym Full Court (per hour)-Prime Time $45.00 / $36.00 / $180.00 / $56.00
1039 Parks and Recreation Gym Half Court (per hour)-Prime Time $23.00 / $18.00 / $92.00 / $29.00
1040 Parks and Recreation Lower Multipurpose Room 1 (open area) $80.00 / $64.00 / $320.00 / $100.00
1041 Parks and Recreation Classroom 1 $36.00 / $29.00 / $144.00 / $45.00
1042 Parks and Recreation Classroom 2 $43.00 / $35.00 / $172.00 / $54.00
1043 Parks and Recreation Boxing Room (per month) (+) Adult/Youth $15.00/$10.00
1044 Parks and Recreation Boxing Room (per day) (+) Adult/Youth $2.00/$1.00
1045 Parks and Recreation Boxing Room $36.00 / $29.00 /$144.00 / $45.00
1046 Parks and Recreation Weight Room (per month) (+) $10.00
1047 Parks and Recreation Weight Room (per day) (+) $3.00
1048 Parks and Recreation Kitchen (per event) $30.00
1049 Parks and Recreation Officer David Ortiz
1050 Parks and Recreation Gym Full Court (per hour) $35.00 / $28.00 / $140.00 / $44.00
1051 Parks and Recreation Gym Half Court (per hour) $18.00 / $14.00 / $72.00 / $22.00
1052 Parks and Recreation Gym Full Court (per hour)-Prime Time $45.00 / $36.00 / $180.00 / $56.00
1053 Parks and Recreation Gym Half Court (per hour)-Prime Time $23.00 / $18.00 / $92.00 / $29.00
1054 Parks and Recreation Classroom 1 $11.00 / $9.00 / $44.00 / $14.00
1055 Parks and Recreation Classroom 2 $21.00 / $17.00 / $84.00 / $26.00
1056 Parks and Recreation Classroom A $20.00 / $16.00 / $80.00 / $25.00
1057 Parks and Recreation Multipurpose Room $56.00 / $45.00 / $224.00 / $70.00
1058 Parks and Recreation Boxing Room (per month) (+) Adult/Youth $15.00 / $10.00
1059 Parks and Recreation Boxing Room (per day) (+) Adult/Youth $2.00 / $1.00
1060 Parks and Recreation Boxing Room $83.00 / $66.00 / $332.00 / $104.00
1061 Parks and Recreation Weight Room (per month) (+) $10.00
1062 Parks and Recreation Weight Room (per day) (+) $3.00
1063 Parks and Recreation Kitchen (per event) $30.00
1064 Parks and Recreation Chamizal Recreation Center
1065 Parks and Recreation Gym Full Court (per hour) $45.00 / $36.00 / $180.00 / $56.00
1066 Parks and Recreation Gym Half Court (per hour) $23.00 / $18.00 / $92.00 / $29.00
1067 Parks and Recreation Gym Full Court (per hour)-Prime Time $55.00 / $44.00 / $220.00 / $69.00
1068 Parks and Recreation Gym Half Court (per hour)-Prime Time $28.00 / $22.00 / $112.00 / $35.00
1069 Parks and Recreation Weight Room (per month) (+) $18.00
1070 Parks and Recreation Weight Room (per day) (+) $4.00
1071 Parks and Recreation Kitchen (per event) $30.00
1072 Parks and Recreation Multipurpose Room 1 $71.00 / $56.00 / $282.00 / $88.00
1073 Parks and Recreation Multipurpose Room 2 $81.00 / $64.00 / $322.00 / $ 101.00
1074 Parks and Recreation Outside Rentable Space $65.00 / $52.00 / $260.00 / $81.00
1075 Parks and Recreation Chihuahuita Neighborhood Center
1076 Parks and Recreation Multipurpose Room $35.00 / $28.00 / $140.00 / $44.00
1077 Parks and Recreation Weight Room (per month) (+) $6.00
1078 Parks and Recreation Weight Room (per month) (+) $3.00
1079 Parks and Recreation Kitchen (per event) $30.00
1080 Parks and Recreation Don Haskins Recreation Center
1081 Parks and Recreation Gym Full Court (per hour) $45.00 / $36.00 / $180.00 / $56.00
1082 Parks and Recreation Gym Half Court (per hour) $23.00 / $18.00 / $92.00 / $29.00
1083 Parks and Recreation Gym Full Court (per hour)-Prime Time $55.00 / $44.00 / $220.00 / $69.00
1084 Parks and Recreation Gym Half Court (per hour)-Prime Time $28.00 / $22.00 / $112.00 / $35.00
1085 Parks and Recreation Auxiliary Gym (per hour) $25.00 / $20.00 / $100.00 / $31.00
1086 Parks and Recreation Auxiliary Gym Half Court (per hour) $13.00 / $10.00 / $52.00 / $16.00
1087 Parks and Recreation Auxiliary Gym (per hour)-Prime Time $35.00 / $28.00 / $140.00 / $44.00
1088 Parks and Recreation Auxiliary Gym Half Court (per hour)-Prime Time $17.00 / $14.00 / $68.00 / $21.00
1089 Parks and Recreation Classroom 1 $12.00 / $10.00 / $48.00 / $15.00
1090 Parks and Recreation Weight Room (per month) (+) $18.00
1091 Parks and Recreation Weight Room (per day) (+) $4.00
1092 Parks and Recreation Kitchen (per event) $30.00
1093 Parks and Recreation Eastside Regional Recreation Center - The Beast
1094 Parks and Recreation Gym Full Court (per hour) $45.00 / $36.00 / $180.00 / $56.00
1095 Parks and Recreation Gym Half Court (per hour) $23.00 / $18.00 / $92.00 / $29.00
Schedule C‐ 21
453

FY 2022 Schedule C
Departmental Fee List
Line No.
Department Fee Description Detail FY 2022 Adopted
1096 Parks and Recreation Gym Full Court (per hour)-Prime Time $55.00 / $44.00 / $220.00 / $69.00
1097 Parks and Recreation Gym Half Court (per hour)-Prime Time $28.00 / $22.00 / $112.00 / $35.00
1098 Parks and Recreation Weight Room (per month) (+) $18.00
1099 Parks and Recreation Weight Room (per day) (+) $4.00
1100 Parks and Recreation Kitchen (per event) $30.00
1101 Parks and Recreation Multipurpose Room $86.00 / $69.00 / $343.00 / $107.00
1102 Parks and Recreation Activity Room $58.00 / $46.00 / $231.00 / $72.00
1103 Parks and Recreation Outside Rentable Space $132.00 / $ 105.00 / $526.00 / $164.00
1104 Parks and Recreation Galatzan Recreation Center
1105 Parks and Recreation Gym Full Court (per hour) $35.00 / $28.00 / $140.00 / $44.00
1106 Parks and Recreation Gym Half Court (per hour) $18.00 / $14.00 / $72.00 / $22.00
1107 Parks and Recreation Gym Full Court (per hour)-Prime Time $45.00 / $36.00 / $180.00 / $56.00
1108 Parks and Recreation Gym Half Court (per hour)-Prime Time $23.00 / $18.00 / $92.00 / $29.00
1109 Parks and Recreation Auxiliary Gym (per hour) $15.00 / $12.00 / $60.00 / $19.00
1110 Parks and Recreation Auxiliary Gym Half Court (per hour) $7.00 / $6.00 / $28.00 / $9.00
1111 Parks and Recreation Auxiliary Gym (per hour)-Prime Time $25.00 / $20.00 / $100.00 / $31.00
1112 Parks and Recreation Auxiliary Gym Half Court (per hour)-Prime Time $13.00 / $10.00 / $52.00 / $16.00
1113 Parks and Recreation Multipurpose Room $66.00 / $53.00 / $264.00 / $82.00
1114 Parks and Recreation Dance Studio $20.00 / $16.00 / $80.00 / $25.00
1115 Parks and Recreation Weight Room (per month) (+) $18.00
1116 Parks and Recreation Weight Room (per day) (+) $4.00
1117 Parks and Recreation Gary del Palacio Recreation Center
1118 Parks and Recreation Gym Full Court (per hour) $45.00 / $36.00 / $180.00 / $56.00
1119 Parks and Recreation Gym Half Court (per hour) $23.00 / $18.00 / $92.00 / $29.00
1120 Parks and Recreation Gym Full Court (per hour)-Prime Time $55.00 / $44.00 / $220.00 / $69.00
1121 Parks and Recreation Gym Half Court (per hour)-Prime Time $28.00 / $22.00 / $112.00 / $35.00
1122 Parks and Recreation Auxiliary Gym (per hour) $25.00 / $20.00 / $100.00 / $31.00
1123 Parks and Recreation Auxiliary Gym Half Court (per hour) $13.00 / $10.00 / $52.00 / $16.00
1124 Parks and Recreation Auxiliary Gym (per hour)-Prime Time $35.00 / $28.00 / $140.00 / $44.00
1125 Parks and Recreation Auxiliary Gym Half Court (per hour)-Prime Time $17.00 / $14.00 / $68.00 / $21.00
1126 Parks and Recreation Multipurpose Room $44.00 / $35.00 / $176.00 / $55.00
1127 Parks and Recreation Dance Studio $26.00 / $21.00 / $104.00 / $32.00
1128 Parks and Recreation Racquetball Court (per month)(+) Adult/Youth $15.00 / $10.00
1129 Parks and Recreation Racquetball Court (per hour)(+) Adult/Youth $2.00 / $1.00
1130 Parks and Recreation Weight Room (per month) (+) $18.00
1131 Parks and Recreation Weight Room (per day) (+) $4.00
1132 Parks and Recreation Kitchen (per event) $30.00
1133 Parks and Recreation Leona Ford Washington Recreation Center
1134 Parks and Recreation Gym Full Court (per hour) $15.00 / $12.00 / $60.00 / $19.00
1135 Parks and Recreation Gym Half Court (per hour) $7.00 / $6.00 / $28.00 / $9.00
1136 Parks and Recreation Gym Full Court (per hour)-Prime Time $25.00 / $20.00 / $100.00 / $31.00
1137 Parks and Recreation Gym Half Court (per hour)-Prime Time $13.00 / $10.00 / $52.00 / $16.00
1138 Parks and Recreation Multipurpose Room-Hall $59.00 / $47.00 / $236.00 / $74.00
1139 Parks and Recreation Weight Room (per month) (+) $10.00
1140 Parks and Recreation Weight Room (per day) (+) $3.00
1141 Parks and Recreation Kitchen (per event) $30.00
1142 Parks and Recreation Sylvia Carreon Recreation Center
1143 Parks and Recreation Gym Full Court (per hour) $45.00 / $36.00 / $180.00 / $56.00
1144 Parks and Recreation Gym Half Court (per hour) $23.00 / $18.00 / $92.00 / $29.00
1145 Parks and Recreation Gym Full Court (per hour)-Prime Time $55.00 / $44.00 / $220.00 / $69.00
1146 Parks and Recreation Gym Half Court (per hour)-Prime Time $28.00 / $22.00 / $112.00 / $35.00
1147 Parks and Recreation Weight Room (per month) (+) $18.00
1148 Parks and Recreation Weight Room (per day) (+) $4.00
1149 Parks and Recreation Kitchen (per event) $30.00
1150 Parks and Recreation Multipurpose Room $53.00 / $43.00 / $214.00 $67.00
1151 Parks and Recreation Activity Room $ 40.00 / $32.00 / $ 160.00 / $50.00
1152 Parks and Recreation Balcony Party Area $46.00 / $37.00 / $185.00 / $58.00
1153 Parks and Recreation Marty Robbins Recreation Center
1154 Parks and Recreation Gym Full Court (per hour) $45.00 / $36.00 / $180.00 / $56.00
1155 Parks and Recreation Gym Half Court (per hour) $23.00 / $18.00 / $92.00 / $29.00
1156 Parks and Recreation Gym Full Court (per hour)-Prime Time $55.00 / $44.00 / $220.00 / $69.00
1157 Parks and Recreation Gym Half Court (per hour)-Prime Time $28.00 / $22.00 / $112.00 / $35.00
1158 Parks and Recreation Multi Purpose Room $44.00 / $35.00 / $176.00 / $55.00
1159 Parks and Recreation Dance Studio $26.00 / $21.00 / $104.00 / $32.00
1160 Parks and Recreation Weight Room (per month) (+) $18.00
1161 Parks and Recreation Weight Room (per day) (+) $4.00
1162 Parks and Recreation Kitchen (per event) $30.00
1163 Parks and Recreation Multipurpose Recreation Center
1164 Parks and Recreation Gym Full Court (per hour) $45.00 / $36.00 / $180.00 / $56.00
1165 Parks and Recreation Gym Half Court (per hour) $23.00 / $18.00 / $92.00 / $29.00
1166 Parks and Recreation Gym Full Court (per hour)-Prime Time $55.00 / $44.00 / $220.00 / $69.00
1167 Parks and Recreation Gym Half Court (per hour)-Prime Time $28.00 / $22.00 / $112.00 / $35.00
1168 Parks and Recreation Multipurpose Room Old Weight room $35.00 / $28.00 / $140.00 / $44.00
1169 Parks and Recreation Ballroom $138.00 / $110.00 / $552.00 / $172.00
1170 Parks and Recreation Dance Studio $27.00 / $22.00 / $108.00 / $34.00
Schedule C‐ 22
454
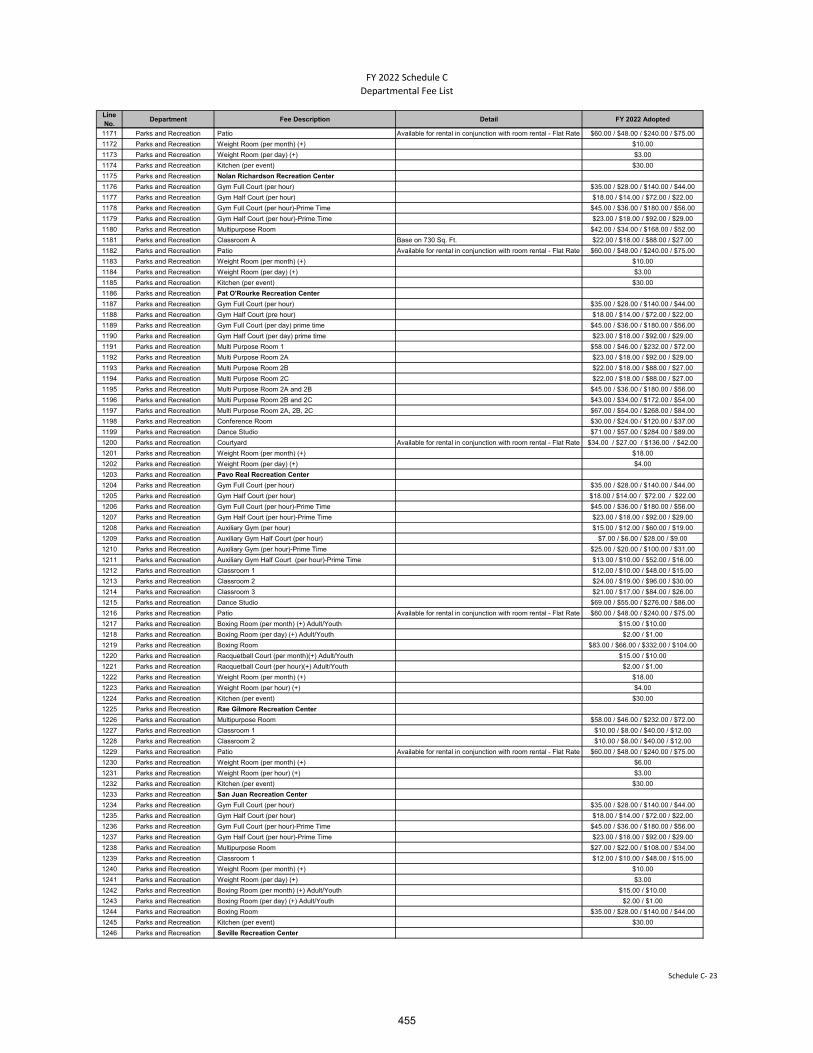
FY 2022 Schedule C
Departmental Fee List
Line No.
Department Fee Description Detail FY 2022 Adopted
1171 Parks and Recreation Patio Available for rental in conjunction with room rental - Flat Rate $60.00 / $48.00 / $240.00 / $75.00
1172 Parks and Recreation Weight Room (per month) (+) $10.00
1173 Parks and Recreation Weight Room (per day) (+) $3.00
1174 Parks and Recreation Kitchen (per event) $30.00
1175 Parks and Recreation Nolan Richardson Recreation Center
1176 Parks and Recreation Gym Full Court (per hour) $35.00 / $28.00 / $140.00 / $44.00
1177 Parks and Recreation Gym Half Court (per hour) $18.00 / $14.00 / $72.00 / $22.00
1178 Parks and Recreation Gym Full Court (per hour)-Prime Time $45.00 / $36.00 / $180.00 / $56.00
1179 Parks and Recreation Gym Half Court (per hour)-Prime Time $23.00 / $18.00 / $92.00 / $29.00
1180 Parks and Recreation Multipurpose Room $42.00 / $34.00 / $168.00 / $52.00
1181 Parks and Recreation Classroom A Base on 730 Sq. Ft. $22.00 / $18.00 / $88.00 / $27.00
1182 Parks and Recreation Patio Available for rental in conjunction with room rental - Flat Rate $60.00 / $48.00 / $240.00 / $75.00
1183 Parks and Recreation Weight Room (per month) (+) $10.00
1184 Parks and Recreation Weight Room (per day) (+) $3.00
1185 Parks and Recreation Kitchen (per event) $30.00
1186 Parks and Recreation Pat O'Rourke Recreation Center
1187 Parks and Recreation Gym Full Court (per hour) $35.00 / $28.00 / $140.00 / $44.00
1188 Parks and Recreation Gym Half Court (pre hour) $18.00 / $14.00 / $72.00 / $22.00
1189 Parks and Recreation Gym Full Court (per day) prime time $45.00 / $36.00 / $180.00 / $56.00
1190 Parks and Recreation Gym Half Court (per day) prime time $23.00 / $18.00 / $92.00 / $29.00
1191 Parks and Recreation Multi Purpose Room 1 $58.00 / $46.00 / $232.00 / $72.00
1192 Parks and Recreation Multi Purpose Room 2A $23.00 / $18.00 / $92.00 / $29.00
1193 Parks and Recreation Multi Purpose Room 2B $22.00 / $18.00 / $88.00 / $27.00
1194 Parks and Recreation Multi Purpose Room 2C $22.00 / $18.00 / $88.00 / $27.00
1195 Parks and Recreation Multi Purpose Room 2A and 2B $45.00 / $36.00 / $180.00 / $56.00
1196 Parks and Recreation Multi Purpose Room 2B and 2C $43.00 / $34.00 / $172.00 / $54.00
1197 Parks and Recreation Multi Purpose Room 2A, 2B, 2C $67.00 / $54.00 / $268.00 / $84.00
1198 Parks and Recreation Conference Room $30.00 / $24.00 / $120.00 / $37.00
1199 Parks and Recreation Dance Studio $71.00 / $57.00 / $284.00 / $89.00
1200 Parks and Recreation Courtyard Available for rental in conjunction with room rental - Flat Rate $34.00 / $27.00 / $136.00 / $42.00
1201 Parks and Recreation Weight Room (per month) (+) $18.00
1202 Parks and Recreation Weight Room (per day) (+) $4.00
1203 Parks and Recreation Pavo Real Recreation Center
1204 Parks and Recreation Gym Full Court (per hour) $35.00 / $28.00 / $140.00 / $44.00
1205 Parks and Recreation Gym Half Court (per hour) $18.00 / $14.00 / $72.00 / $22.00
1206 Parks and Recreation Gym Full Court (per hour)-Prime Time $45.00 / $36.00 / $180.00 / $56.00
1207 Parks and Recreation Gym Half Court (per hour)-Prime Time $23.00 / $18.00 / $92.00 / $29.00
1208 Parks and Recreation Auxiliary Gym (per hour) $15.00 / $12.00 / $60.00 / $19.00
1209 Parks and Recreation Auxiliary Gym Half Court (per hour) $7.00 / $6.00 / $28.00 / $9.00
1210 Parks and Recreation Auxiliary Gym (per hour)-Prime Time $25.00 / $20.00 / $100.00 / $31.00
1211 Parks and Recreation Auxiliary Gym Half Court (per hour)-Prime Time $13.00 / $10.00 / $52.00 / $16.00
1212 Parks and Recreation Classroom 1 $12.00 / $10.00 / $48.00 / $15.00
1213 Parks and Recreation Classroom 2 $24.00 / $19.00 / $96.00 / $30.00
1214 Parks and Recreation Classroom 3 $21.00 / $17.00 / $84.00 / $26.00
1215 Parks and Recreation Dance Studio $69.00 / $55.00 / $276.00 / $86.00
1216 Parks and Recreation Patio Available for rental in conjunction with room rental - Flat Rate $60.00 / $48.00 / $240.00 / $75.00
1217 Parks and Recreation Boxing Room (per month) (+) Adult/Youth $15.00 / $10.00
1218 Parks and Recreation Boxing Room (per day) (+) Adult/Youth $2.00 / $1.00
1219 Parks and Recreation Boxing Room $83.00 / $66.00 / $332.00 / $104.00
1220 Parks and Recreation Racquetball Court (per month)(+) Adult/Youth $15.00 / $10.00
1221 Parks and Recreation Racquetball Court (per hour)(+) Adult/Youth $2.00 / $1.00
1222 Parks and Recreation Weight Room (per month) (+) $18.00
1223 Parks and Recreation Weight Room (per hour) (+) $4.00
1224 Parks and Recreation Kitchen (per event) $30.00
1225 Parks and Recreation Rae Gilmore Recreation Center
1226 Parks and Recreation Multipurpose Room $58.00 / $46.00 / $232.00 / $72.00
1227 Parks and Recreation Classroom 1 $10.00 / $8.00 / $40.00 / $12.00
1228 Parks and Recreation Classroom 2 $10.00 / $8.00 / $40.00 / $12.00
1229 Parks and Recreation Patio Available for rental in conjunction with room rental - Flat Rate $60.00 / $48.00 / $240.00 / $75.00
1230 Parks and Recreation Weight Room (per month) (+) $6.00
1231 Parks and Recreation Weight Room (per hour) (+) $3.00
1232 Parks and Recreation Kitchen (per event) $30.00
1233 Parks and Recreation San Juan Recreation Center
1234 Parks and Recreation Gym Full Court (per hour) $35.00 / $28.00 / $140.00 / $44.00
1235 Parks and Recreation Gym Half Court (per hour) $18.00 / $14.00 / $72.00 / $22.00
1236 Parks and Recreation Gym Full Court (per hour)-Prime Time $45.00 / $36.00 / $180.00 / $56.00
1237 Parks and Recreation Gym Half Court (per hour)-Prime Time $23.00 / $18.00 / $92.00 / $29.00
1238 Parks and Recreation Multipurpose Room $27.00 / $22.00 / $108.00 / $34.00
1239 Parks and Recreation Classroom 1 $12.00 / $10.00 / $48.00 / $15.00
1240 Parks and Recreation Weight Room (per month) (+) $10.00
1241 Parks and Recreation Weight Room (per day) (+) $3.00
1242 Parks and Recreation Boxing Room (per month) (+) Adult/Youth $15.00 / $10.00
1243 Parks and Recreation Boxing Room (per day) (+) Adult/Youth $2.00 / $1.00
1244 Parks and Recreation Boxing Room $35.00 / $28.00 / $140.00 / $44.00
1245 Parks and Recreation Kitchen (per event) $30.00
1246 Parks and Recreation Seville Recreation Center
Schedule C‐ 23
455
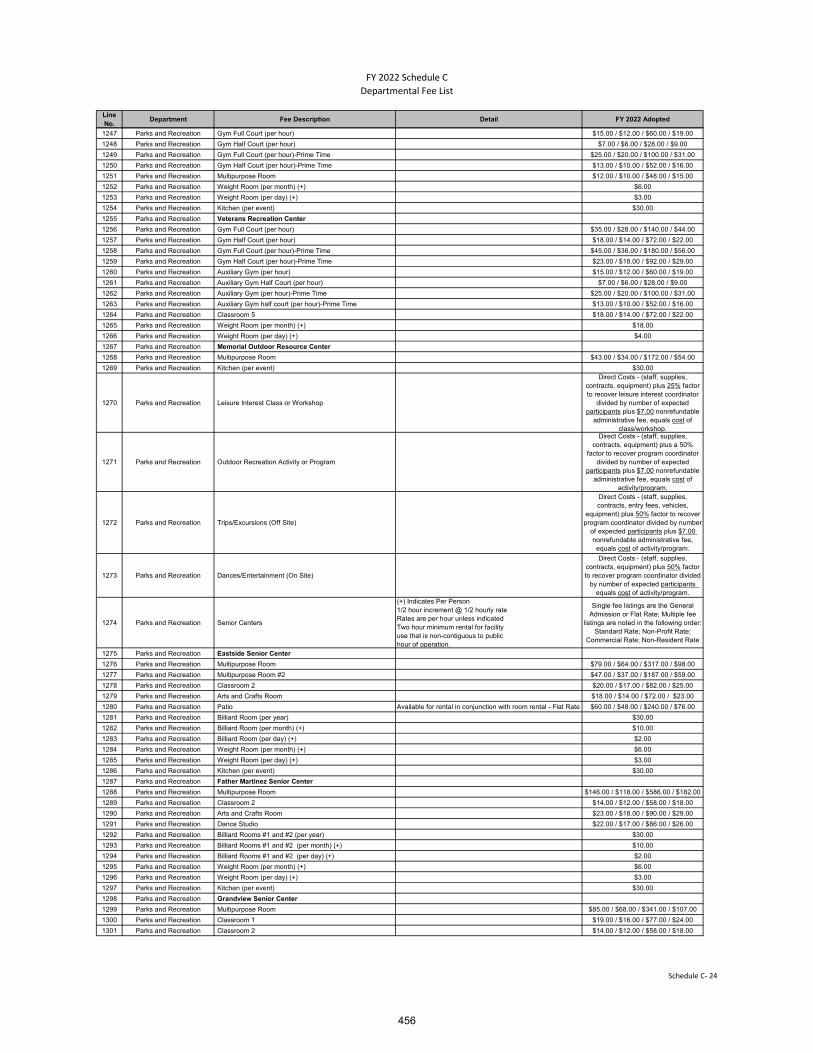
FY 2022 Schedule C
Departmental Fee List
Line No.
Department Fee Description Detail FY 2022 Adopted
1247 Parks and Recreation Gym Full Court (per hour) $15.00 / $12.00 / $60.00 / $19.00
1248 Parks and Recreation Gym Half Court (per hour) $7.00 / $6.00 / $28.00 / $9.00
1249 Parks and Recreation Gym Full Court (per hour)-Prime Time $25.00 / $20.00 / $100.00 / $31.00
1250 Parks and Recreation Gym Half Court (per hour)-Prime Time $13.00 / $10.00 / $52.00 / $16.00
1251 Parks and Recreation Multipurpose Room $12.00 / $10.00 / $48.00 / $15.00
1252 Parks and Recreation Weight Room (per month) (+) $6.00
1253 Parks and Recreation Weight Room (per day) (+) $3.00
1254 Parks and Recreation Kitchen (per event) $30.00
1255 Parks and Recreation Veterans Recreation Center
1256 Parks and Recreation Gym Full Court (per hour) $35.00 / $28.00 / $140.00 / $44.00
1257 Parks and Recreation Gym Half Court (per hour) $18.00 / $14.00 / $72.00 / $22.00
1258 Parks and Recreation Gym Full Court (per hour)-Prime Time $45.00 / $36.00 / $180.00 / $56.00
1259 Parks and Recreation Gym Half Court (per hour)-Prime Time $23.00 / $18.00 / $92.00 / $29.00
1260 Parks and Recreation Auxiliary Gym (per hour) $15.00 / $12.00 / $60.00 / $19.00
1261 Parks and Recreation Auxiliary Gym Half Court (per hour) $7.00 / $6.00 / $28.00 / $9.00
1262 Parks and Recreation Auxiliary Gym (per hour)-Prime Time $25.00 / $20.00 / $100.00 / $31.00
1263 Parks and Recreation Auxiliary Gym half court (per hour)-Prime Time $13.00 / $10.00 / $52.00 / $16.00
1264 Parks and Recreation Classroom 5 $18.00 / $14.00 / $72.00 / $22.00
1265 Parks and Recreation Weight Room (per month) (+) $18.00
1266 Parks and Recreation Weight Room (per day) (+) $4.00
1267 Parks and Recreation Memorial Outdoor Resource Center
1268 Parks and Recreation Multipurpose Room $43.00 / $34.00 / $172.00 / $54.00
1269 Parks and Recreation Kitchen (per event) $30.00
1270 Parks and Recreation Leisure Interest Class or Workshop
Direct Costs - (staff, supplies, contracts, equipment) plus 25% factor to recover leisure interest coordinator
divided by number of expected participants plus $7.00 nonrefundable
administrative fee, equals cost of class/workshop.
1271 Parks and Recreation Outdoor Recreation Activity or Program
Direct Costs - (staff, supplies, contracts, equipment) plus a 50%
factor to recover program coordinator divided by number of expected
participants plus $7.00 nonrefundable administrative fee, equals cost of
activity/program.
1272 Parks and Recreation Trips/Excursions (Off Site)
Direct Costs - (staff, supplies, contracts, entry fees, vehicles,
equipment) plus 50% factor to recover program coordinator divided by number
of expected participants plus $7.00 nonrefundable administrative fee, equals cost of activity/program.
1273 Parks and Recreation Dances/Entertainment (On Site)
Direct Costs - (staff, supplies, contracts, equipment) plus 50% factor to recover program coordinator divided
by number of expected participants equals cost of activity/program.
1274 Parks and Recreation Senior Centers
(+) Indicates Per Person1/2 hour increment @ 1/2 hourly rateRates are per hour unless indicatedTwo hour minimum rental for facilityuse that is non-contiguous to publichour of operation.
Single fee listings are the General Admission or Flat Rate; Multiple fee
listings are noted in the following order: Standard Rate; Non-Profit Rate;
Commercial Rate; Non-Resident Rate
1275 Parks and Recreation Eastside Senior Center
1276 Parks and Recreation Multipurpose Room $79.00 / $64.00 / $317.00 / $98.00
1277 Parks and Recreation Multipurpose Room #2 $47.00 / $37.00 / $187.00 / $59.00
1278 Parks and Recreation Classroom 2 $20.00 / $17.00 / $82.00 / $25.00
1279 Parks and Recreation Arts and Crafts Room $18.00 / $14.00 / $72.00 / $23.00
1280 Parks and Recreation Patio Available for rental in conjunction with room rental - Flat Rate $60.00 / $48.00 / $240.00 / $76.00
1281 Parks and Recreation Billiard Room (per year) $30.00
1282 Parks and Recreation Billiard Room (per month) (+) $10.00
1283 Parks and Recreation Billiard Room (per day) (+) $2.00
1284 Parks and Recreation Weight Room (per month) (+) $6.00
1285 Parks and Recreation Weight Room (per day) (+) $3.00
1286 Parks and Recreation Kitchen (per event) $30.00
1287 Parks and Recreation Father Martinez Senior Center
1288 Parks and Recreation Multipurpose Room $146.00 / $118.00 / $586.00 / $182.00
1289 Parks and Recreation Classroom 2 $14.00 / $12.00 / $58.00 / $18.00
1290 Parks and Recreation Arts and Crafts Room $23.00 / $18.00 / $90.00 / $29.00
1291 Parks and Recreation Dance Studio $22.00 / $17.00 / $86.00 / $26.00
1292 Parks and Recreation Billiard Rooms #1 and #2 (per year) $30.00
1293 Parks and Recreation Billiard Rooms #1 and #2 (per month) (+) $10.00
1294 Parks and Recreation Billiard Rooms #1 and #2 (per day) (+) $2.00
1295 Parks and Recreation Weight Room (per month) (+) $6.00
1296 Parks and Recreation Weight Room (per day) (+) $3.00
1297 Parks and Recreation Kitchen (per event) $30.00
1298 Parks and Recreation Grandview Senior Center
1299 Parks and Recreation Multipurpose Room $85.00 / $68.00 / $341.00 / $107.00
1300 Parks and Recreation Classroom 1 $19.00 / $16.00 / $77.00 / $24.00
1301 Parks and Recreation Classroom 2 $14.00 / $12.00 / $58.00 / $18.00
Schedule C‐ 24
456

FY 2022 Schedule C
Departmental Fee List
Line No.
Department Fee Description Detail FY 2022 Adopted
1302 Parks and Recreation Classroom 3 $10.00 / $7.00 / $38.00 / $12.00
1303 Parks and Recreation Billiard Room (per year) $30.00
1304 Parks and Recreation Billiard Room (per month) (+) $10.00
1305 Parks and Recreation Billiard Room (per day) (+) $2.00
1306 Parks and Recreation Kitchen (per event) $30.00
1307 Parks and Recreation Happiness Senior Center
1308 Parks and Recreation Multipurpose Room $95.00 / $76.00 / $379.00 / $119.00
1309 Parks and Recreation Classroom 1 $13.00 / $11.00 / $53.00 / $17.00
1310 Parks and Recreation Classroom 2 $12.00 / $10.00 / $48.00 / $16.00
1311 Parks and Recreation Billiard Room (per year) (+) $30.00
1312 Parks and Recreation Billiard Room (per month) (+) $10.00
1313 Parks and Recreation Billiard Room (per day) (+) $2.00
1314 Parks and Recreation Kitchen (per event) $30.00
1315 Parks and Recreation Hilos de Plata Senior Center
1316 Parks and Recreation Multipurpose Room $146.00 / $118.00 / $586.00 / $182.00
1317 Parks and Recreation Classroom 2 $17.00 / $13.00 / $67.00 / $20.00
1318 Parks and Recreation Arts and Crafts Room $23.00 / $18.00 / $91.00 / $29.00
1319 Parks and Recreation Billiard Room (per year) $30.00
1320 Parks and Recreation Billiard Room (per month) (+) $10.00
1321 Parks and Recreation Billiard Room (per day) (+) $2.00
1322 Parks and Recreation Weight Room (per month) (+) $10.00
1323 Parks and Recreation Weight Room (per day) (+) $3.00
1324 Parks and Recreation Kitchen (per event) $30.00
1325 Parks and Recreation Memorial Senior Center
1326 Parks and Recreation Multipurpose Room $68.00 / $55.00 / $274.00 / $85.00
1327 Parks and Recreation Multipurpose Room (1,282 sq. ft.) $40.00 / $33.00 / $160.00 / $50.00
1328 Parks and Recreation Classroom 2 $7.00 / $6.00 / $29.00 / $8.00
1329 Parks and Recreation Arts and Crafts Room $25.00 / $20.00 / $101.00 / $31.00
1330 Parks and Recreation Billiard Room (per year) $30.00
1331 Parks and Recreation Billiard Room (per month) (+) $10.00
1332 Parks and Recreation Billiard Room (per day) (+) $2.00
1333 Parks and Recreation Kitchen (per event) $30.00
1334 Parks and Recreation Polly Harris Senior Center
1335 Parks and Recreation Multipurpose Room $85.00 / $68.00 / $341.00 / $107.00
1336 Parks and Recreation Arts and Crafts Room $17.00 / $13.00 / $67.00 / $20.00
1337 Parks and Recreation Billiard Room (per year) $30.00
1338 Parks and Recreation Billiard Room (per month) (+) $10.00
1339 Parks and Recreation Billiard Room (per day) (+) $2.00
1340 Parks and Recreation Kitchen (per event) $30.00
1341 Parks and Recreation San Juan Senior Center
1342 Parks and Recreation Multipurpose Room $92.00 / $74.00 / $370.00 / $115.00
1343 Parks and Recreation Dance Studio $29.00 / $23.00 / $115.00 / $36.00
1344 Parks and Recreation Placita $60.00 / $48.00 / $240.00 / $76.00
1345 Parks and Recreation Billiard Room (per year) $30.00
1346 Parks and Recreation Billiard Room (per month) (+) $10.00
1347 Parks and Recreation Billiard Room (per day) (+) $2.00
1348 Parks and Recreation Kitchen (per event) $30.00
1349 Parks and Recreation South El Paso Senior Center
1350 Parks and Recreation Multipurpose Room $154.00 / $122.00 / $714.00 / $192.00
1351 Parks and Recreation Classroom 2 $28.00 / $22.00 / $110.00 / $35.00
1352 Parks and Recreation Classroom 3 $22.00 / $17.00 / $86.00 / $26.00
1353 Parks and Recreation Classroom 4 $22.00 / $17.00 / $86.00 / $26.00
1354 Parks and Recreation Billiard Room (per year) $30.00
1355 Parks and Recreation Billiard Room (per month) (+) $10.00
1356 Parks and Recreation Billiard Room (per day) (+) $2.00
1357 Parks and Recreation Wellington Chew Senior Center
1358 Parks and Recreation Multipurpose Room $138.00 / $110.00 / $552.00 / $173.00
1359 Parks and Recreation Classroom 1 $17.00 / $13.00 / $67.00 / $20.00
1360 Parks and Recreation Classroom 2 $12.00 / $10.00 / $48.00 / $14.00
1361 Parks and Recreation Classroom 3 $21.00 / $17.00 / $86.00 / $26.00
1362 Parks and Recreation Billiard Room (per year) $30.00
1363 Parks and Recreation Billiard Room (per month) (+) $10.00
1364 Parks and Recreation Billiard Room (per day) (+) $2.00
1365 Parks and Recreation Leisure Interest Class or Workshop
Direct Costs - (staff, supplies, contracts, equipment) plus 25% factor to recover leisure interest coordinator
divided by number of expected participants plus $7.00 nonrefundable
administrative fee, equals cost of class/workshop.
1366 Parks and Recreation Outdoor Recreation Activity or Program
Direct Costs - (staff, supplies, contracts, equipment) plus a 50%
factor to recover program coordinator divided by number of expected
participants plus $7.00 nonrefundable administrative fee, equals cost of
activity/program
Schedule C‐ 25
457

FY 2022 Schedule C
Departmental Fee List
Line No.
Department Fee Description Detail FY 2022 Adopted
1367 Parks and Recreation Trips/Excursions (Off Site)
Direct Costs - (staff, supplies, contracts, entry fees, vehicles,
equipment) plus 50% factor to recover program coordinator divided by number
of expected participants plus $7.00 nonrefundable administrative fee, equals cost of activity/program.
1368 Parks and Recreation Dances/Entertainment (On Site)
Direct Costs - (staff, supplies, contracts, equipment) plus 50% factor to recover program coordinator divided
by number of expected participants equals cost of activity/program.
1369 Parks and Recreation Shelters: Arlington, Braden Aboud, Grandview, Sunrise, Thomas Manor
Single fee listings are the General Admission or Flat Rate; Multiple fee
listings are noted in the following order: Standard Rate; Non-Profit Rate;
Commercial Rate; Non-Resident Rate
1370 Parks and Recreation Per hour $48.00 / $38.00 / $192.00 / $60.00
1371 Parks and Recreation All day $288.00 / $230.00 / $1152.00 /
$360.00
1372 Parks and Recreation Per hour - Prime time $66.00 / $53.00 / $264.00 / $83.00
1373 Parks and Recreation All day - Prime time $396.00 / $317.00 / $1,584.00 /
$494.00
1374 Parks and Recreation Reserves: Memorial
Single fee listings are the General Admission or Flat Rate; Multiple fee
listings are noted in the following order: Standard Rate; Non-Profit Rate;
Commercial Rate; Non-Resident Rate1375 Parks and Recreation Per hour $44.00 / $35.00 / $175.00 / $55.00
1376 Parks and Recreation All day $262.00 / $210.00 / $1,050.00 /
$327.00
1377 Parks and Recreation Per hour - Prime time $56.00 / $45.00 / $225.00 / $70.00
1378 Parks and Recreation All day - Prime time $375.00 / $300.00 / $1,500.00 /
$469.00
1379 Parks and Recreation Pavilions: Veterans, Shawver, Pavo Real
Single fee listings are the General Admission or Flat Rate; Multiple fee
listings are noted in the following order: Standard Rate; Non-Profit Rate;
Commercial Rate; Non-Resident Rate1380 Parks and Recreation Per hour $18.00 / $14.00 / $72.00 / $23.00
1381 Parks and Recreation All day $108.00 / $86.00 / $432.00 / $136.00
1382 Parks and Recreation Per hour - Prime time $24.00 / $19.00 / $96.00 / $30.00
1383 Parks and Recreation All day - Prime time $144.00 / $115.00 / $576.00 / $180.00
1384 Parks and Recreation Plazas: Union Plaza, San Jacinto Plaza, Cleveland Square Plaza, Rambla
Single fee listings are the General Admission or Flat Rate; Multiple fee
listings are noted in the following order: Standard Rate; Non-Profit Rate;
Commercial Rate; Non-Resident Rate1385 Parks and Recreation Per hour Stage with electricity $36.00 / $29.00 / $144.00 / $44.00
1386 Parks and Recreation All day Stage with electricity $216.00 / $173.00 / $864.00 / $270.00
1387 Parks and Recreation Per hour Stage without electricity $12.00 / $10.00 / $48.00 / $14.00
1388 Parks and Recreation All day Stage without electricity $72.00 / $58.00 / $288.00 / $90.00
1389 Parks and Recreation Per hour - Prime time - Stage with electricity $42.00 / $34.00 / $168.00 / $53.00
1390 Parks and Recreation All day - Prime time - Stage with electricity $252.00 / $202.00/ $1,008.00 /
$314.00
1391 Parks and Recreation Per hour - Prime time - Stage w/o electricity $24.00 / $19.00 / $96.00 / $30.00
1392 Parks and Recreation All day - Prime time - Stage w/o electricity $144.00 / $115.00 / $576.00 / $180.00
1393 Parks and Recreation Additional electrical (Union Plaza only) (per event) $96.00
1394 Parks and Recreation San Jacinto Plaza deposit for rental option B $500.00
1395 Parks and Recreation San Jacinto Plaza deposit for rental option C $1,000.00
1396 Parks and Recreation San Jacinto 1 peace officer at $35.00 per hour for rental option C
$35.00
1397 Parks and Recreation San Jacinto Splash Pad operator per hour $15.00
1398 Parks and Recreation Rose Garden Site
Single fee listings are the General Admission or Flat Rate; Multiple fee
listings are noted in the following order: Standard Rate; Non-Profit Rate;
Commercial Rate; Non-Resident Rate1399 Parks and Recreation Per hour $42.00 / $34.00 / $168.00 / $53.00
1400 Parks and Recreation Per hour - Prime time $54.00 / $43.00 / $216.00 / $67.00
1401 Parks and Recreation Park Grounds , Greens, Squares Flat Rate
1402 Parks and Recreation Reserved use of outdoor park areas (per event) (per day) $54.00
1403 Parks and Recreation Trainer/Instructor Permit (Non-exclusive; good for 6 months)
$54.00
1404 Parks and Recreation Aquatics (+) Indicates Per Person1/2 hour increment @ 1/2 hourly rateRates are per hour unless indicated
Single fee listings are the General Admission or Flat Rate; Multiple fee
listings are noted in the following order: Standard Rate; Non-Profit Rate;
Commercial Rate; Non-Resident Rate1405 Parks and Recreation Public Swim/Lap Swim
1406 Parks and Recreation Youth (+) $2.00 Fee waived for children under 2
years of age.
1407 Parks and Recreation Adult (+) $3.00
1408 Parks and Recreation Senior (+) $2.00
1409 Parks and Recreation Swim Passes
Schedule C‐ 26
458
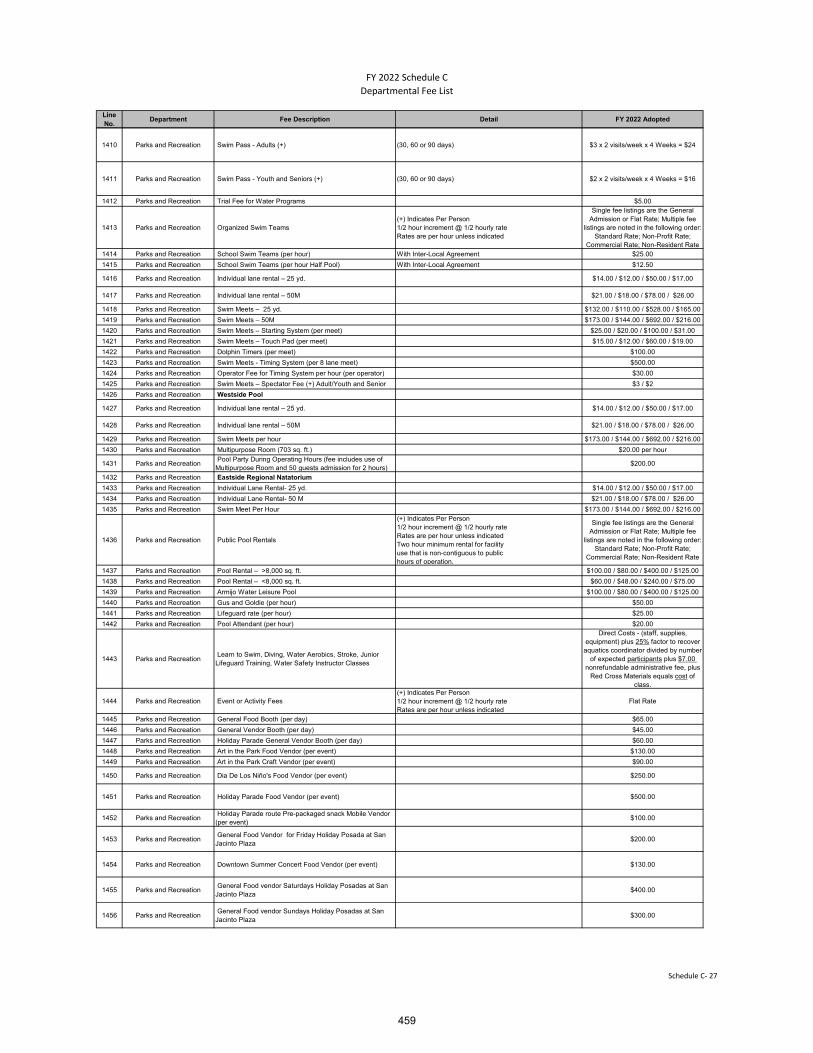
FY 2022 Schedule C
Departmental Fee List
Line No.
Department Fee Description Detail FY 2022 Adopted
1410 Parks and Recreation Swim Pass - Adults (+) (30, 60 or 90 days) $3 x 2 visits/week x 4 Weeks = $24
1411 Parks and Recreation Swim Pass - Youth and Seniors (+) (30, 60 or 90 days) $2 x 2 visits/week x 4 Weeks = $16
1412 Parks and Recreation Trial Fee for Water Programs $5.00
1413 Parks and Recreation Organized Swim Teams (+) Indicates Per Person1/2 hour increment @ 1/2 hourly rateRates are per hour unless indicated
Single fee listings are the General Admission or Flat Rate; Multiple fee
listings are noted in the following order: Standard Rate; Non-Profit Rate;
Commercial Rate; Non-Resident Rate1414 Parks and Recreation School Swim Teams (per hour) With Inter-Local Agreement $25.00
1415 Parks and Recreation School Swim Teams (per hour Half Pool) With Inter-Local Agreement $12.50
1416 Parks and Recreation Individual lane rental – 25 yd. $14.00 / $12.00 / $50.00 / $17.00
1417 Parks and Recreation Individual lane rental – 50M $21.00 / $18.00 / $78.00 / $26.00
1418 Parks and Recreation Swim Meets – 25 yd. $132.00 / $110.00 / $528.00 / $165.00
1419 Parks and Recreation Swim Meets – 50M $173.00 / $144.00 / $692.00 / $216.00
1420 Parks and Recreation Swim Meets – Starting System (per meet) $25.00 / $20.00 / $100.00 / $31.00
1421 Parks and Recreation Swim Meets – Touch Pad (per meet) $15.00 / $12.00 / $60.00 / $19.00
1422 Parks and Recreation Dolphin Timers (per meet) $100.00
1423 Parks and Recreation Swim Meets - Timing System (per 8 lane meet) $500.00
1424 Parks and Recreation Operator Fee for Timing System per hour (per operator) $30.00
1425 Parks and Recreation Swim Meets – Spectator Fee (+) Adult/Youth and Senior $3 / $2
1426 Parks and Recreation Westside Pool
1427 Parks and Recreation Individual lane rental – 25 yd. $14.00 / $12.00 / $50.00 / $17.00
1428 Parks and Recreation Individual lane rental – 50M $21.00 / $18.00 / $78.00 / $26.00
1429 Parks and Recreation Swim Meets per hour $173.00 / $144.00 / $692.00 / $216.00
1430 Parks and Recreation Multipurpose Room (703 sq. ft.) $20.00 per hour
1431 Parks and Recreation Pool Party During Operating Hours (fee includes use of Multipurpose Room and 50 guests admission for 2 hours)
$200.00
1432 Parks and Recreation Eastside Regional Natatorium
1433 Parks and Recreation Individual Lane Rental- 25 yd. $14.00 / $12.00 / $50.00 / $17.00
1434 Parks and Recreation Individual Lane Rental- 50 M $21.00 / $18.00 / $78.00 / $26.00
1435 Parks and Recreation Swim Meet Per Hour $173.00 / $144.00 / $692.00 / $216.00
1436 Parks and Recreation Public Pool Rentals
(+) Indicates Per Person1/2 hour increment @ 1/2 hourly rateRates are per hour unless indicatedTwo hour minimum rental for facilityuse that is non-contiguous to publichours of operation.
Single fee listings are the General Admission or Flat Rate; Multiple fee
listings are noted in the following order: Standard Rate; Non-Profit Rate;
Commercial Rate; Non-Resident Rate
1437 Parks and Recreation Pool Rental – >8,000 sq. ft. $100.00 / $80.00 / $400.00 / $125.00
1438 Parks and Recreation Pool Rental – <8,000 sq. ft. $60.00 / $48.00 / $240.00 / $75.00
1439 Parks and Recreation Armijo Water Leisure Pool $100.00 / $80.00 / $400.00 / $125.00
1440 Parks and Recreation Gus and Goldie (per hour) $50.00
1441 Parks and Recreation Lifeguard rate (per hour) $25.00
1442 Parks and Recreation Pool Attendant (per hour) $20.00
1443 Parks and Recreation Learn to Swim, Diving, Water Aerobics, Stroke, Junior Lifeguard Training, Water Safety Instructor Classes
Direct Costs - (staff, supplies, equipment) plus 25% factor to recover
aquatics coordinator divided by number of expected participants plus $7.00
nonrefundable administrative fee, plus Red Cross Materials equals cost of
class.
1444 Parks and Recreation Event or Activity Fees (+) Indicates Per Person1/2 hour increment @ 1/2 hourly rateRates are per hour unless indicated
Flat Rate
1445 Parks and Recreation General Food Booth (per day) $65.00
1446 Parks and Recreation General Vendor Booth (per day) $45.00
1447 Parks and Recreation Holiday Parade General Vendor Booth (per day) $60.00
1448 Parks and Recreation Art in the Park Food Vendor (per event) $130.00
1449 Parks and Recreation Art in the Park Craft Vendor (per event) $90.00
1450 Parks and Recreation Dia De Los Niño's Food Vendor (per event) $250.00
1451 Parks and Recreation Holiday Parade Food Vendor (per event) $500.00
1452 Parks and Recreation Holiday Parade route Pre-packaged snack Mobile Vendor (per event)
$100.00
1453 Parks and Recreation General Food Vendor for Friday Holiday Posada at San Jacinto Plaza
$200.00
1454 Parks and Recreation Downtown Summer Concert Food Vendor (per event) $130.00
1455 Parks and Recreation General Food vendor Saturdays Holiday Posadas at San Jacinto Plaza
$400.00
1456 Parks and Recreation General Food vendor Sundays Holiday Posadas at San Jacinto Plaza
$300.00
Schedule C‐ 27
459
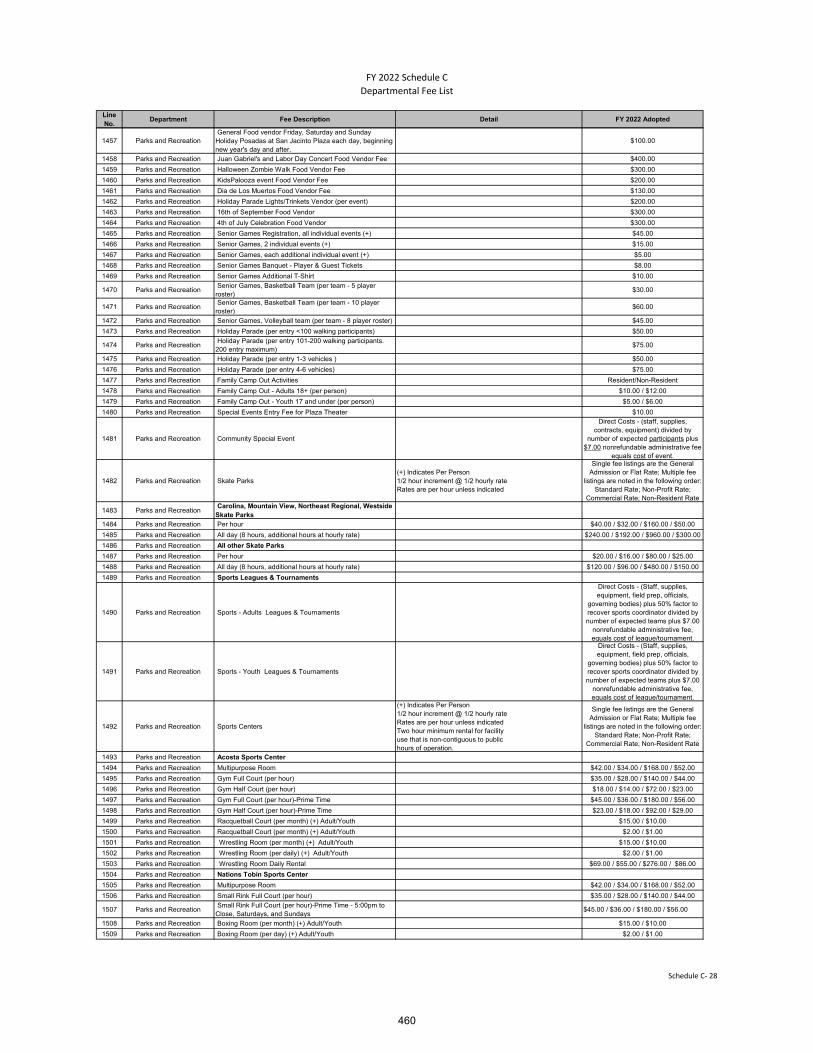
FY 2022 Schedule C
Departmental Fee List
Line No.
Department Fee Description Detail FY 2022 Adopted
1457 Parks and Recreation General Food vendor Friday, Saturday and Sunday Holiday Posadas at San Jacinto Plaza each day, beginning new year's day and after.
$100.00
1458 Parks and Recreation Juan Gabriel's and Labor Day Concert Food Vendor Fee $400.00
1459 Parks and Recreation Halloween Zombie Walk Food Vendor Fee $300.00
1460 Parks and Recreation KidsPalooza event Food Vendor Fee $200.00
1461 Parks and Recreation Dia de Los Muertos Food Vendor Fee $130.00
1462 Parks and Recreation Holiday Parade Lights/Trinkets Vendor (per event) $200.00
1463 Parks and Recreation 16th of September Food Vendor $300.00
1464 Parks and Recreation 4th of July Celebration Food Vendor $300.00
1465 Parks and Recreation Senior Games Registration, all individual events (+) $45.00
1466 Parks and Recreation Senior Games, 2 individual events (+) $15.00
1467 Parks and Recreation Senior Games, each additional individual event (+) $5.00
1468 Parks and Recreation Senior Games Banquet - Player & Guest Tickets $8.00
1469 Parks and Recreation Senior Games Additional T-Shirt $10.00
1470 Parks and Recreation Senior Games, Basketball Team (per team - 5 player roster)
$30.00
1471 Parks and Recreation Senior Games, Basketball Team (per team - 10 player roster)
$60.00
1472 Parks and Recreation Senior Games, Volleyball team (per team - 8 player roster) $45.00
1473 Parks and Recreation Holiday Parade (per entry <100 walking participants) $50.00
1474 Parks and Recreation Holiday Parade (per entry 101-200 walking participants. 200 entry maximum)
$75.00
1475 Parks and Recreation Holiday Parade (per entry 1-3 vehicles ) $50.00
1476 Parks and Recreation Holiday Parade (per entry 4-6 vehicles) $75.00
1477 Parks and Recreation Family Camp Out Activities Resident/Non-Resident
1478 Parks and Recreation Family Camp Out - Adults 18+ (per person) $10.00 / $12.00
1479 Parks and Recreation Family Camp Out - Youth 17 and under (per person) $5.00 / $6.00
1480 Parks and Recreation Special Events Entry Fee for Plaza Theater $10.00
1481 Parks and Recreation Community Special Event
Direct Costs - (staff, supplies, contracts, equipment) divided by
number of expected participants plus $7.00 nonrefundable administrative fee
equals cost of event.
1482 Parks and Recreation Skate Parks (+) Indicates Per Person1/2 hour increment @ 1/2 hourly rateRates are per hour unless indicated
Single fee listings are the General Admission or Flat Rate; Multiple fee
listings are noted in the following order: Standard Rate; Non-Profit Rate;
Commercial Rate; Non-Resident Rate
1483 Parks and Recreation Carolina, Mountain View, Northeast Regional, Westside Skate Parks
1484 Parks and Recreation Per hour $40.00 / $32.00 / $160.00 / $50.00
1485 Parks and Recreation All day (8 hours, additional hours at hourly rate) $240.00 / $192.00 / $960.00 / $300.00
1486 Parks and Recreation All other Skate Parks
1487 Parks and Recreation Per hour $20.00 / $16.00 / $80.00 / $25.00
1488 Parks and Recreation All day (8 hours, additional hours at hourly rate) $120.00 / $96.00 / $480.00 / $150.00
1489 Parks and Recreation Sports Leagues & Tournaments
1490 Parks and Recreation Sports - Adults Leagues & Tournaments
Direct Costs - (Staff, supplies, equipment, field prep, officials,
governing bodies) plus 50% factor to recover sports coordinator divided by number of expected teams plus $7.00
nonrefundable administrative fee, equals cost of league/tournament.
1491 Parks and Recreation Sports - Youth Leagues & Tournaments
Direct Costs - (Staff, supplies, equipment, field prep, officials,
governing bodies) plus 50% factor to recover sports coordinator divided by number of expected teams plus $7.00
nonrefundable administrative fee, equals cost of league/tournament.
1492 Parks and Recreation Sports Centers
(+) Indicates Per Person1/2 hour increment @ 1/2 hourly rateRates are per hour unless indicatedTwo hour minimum rental for facilityuse that is non-contiguous to publichours of operation.
Single fee listings are the General Admission or Flat Rate; Multiple fee
listings are noted in the following order: Standard Rate; Non-Profit Rate;
Commercial Rate; Non-Resident Rate
1493 Parks and Recreation Acosta Sports Center
1494 Parks and Recreation Multipurpose Room $42.00 / $34.00 / $168.00 / $52.00
1495 Parks and Recreation Gym Full Court (per hour) $35.00 / $28.00 / $140.00 / $44.00
1496 Parks and Recreation Gym Half Court (per hour) $18.00 / $14.00 / $72.00 / $23.00
1497 Parks and Recreation Gym Full Court (per hour)-Prime Time $45.00 / $36.00 / $180.00 / $56.00
1498 Parks and Recreation Gym Half Court (per hour)-Prime Time $23.00 / $18.00 / $92.00 / $29.00
1499 Parks and Recreation Racquetball Court (per month) (+) Adult/Youth $15.00 / $10.00
1500 Parks and Recreation Racquetball Court (per month) (+) Adult/Youth $2.00 / $1.00
1501 Parks and Recreation Wrestling Room (per month) (+) Adult/Youth $15.00 / $10.00
1502 Parks and Recreation Wrestling Room (per daily) (+) Adult/Youth $2.00 / $1.00
1503 Parks and Recreation Wrestling Room Daily Rental $69.00 / $55.00 / $276.00 / $86.00
1504 Parks and Recreation Nations Tobin Sports Center
1505 Parks and Recreation Multipurpose Room $42.00 / $34.00 / $168.00 / $52.00
1506 Parks and Recreation Small Rink Full Court (per hour) $35.00 / $28.00 / $140.00 / $44.00
1507 Parks and Recreation Small Rink Full Court (per hour)-Prime Time - 5:00pm to Close, Saturdays, and Sundays
$45.00 / $36.00 / $180.00 / $56.00
1508 Parks and Recreation Boxing Room (per month) (+) Adult/Youth $15.00 / $10.00
1509 Parks and Recreation Boxing Room (per day) (+) Adult/Youth $2.00 / $1.00
Schedule C‐ 28
460

FY 2022 Schedule C
Departmental Fee List
Line No.
Department Fee Description Detail FY 2022 Adopted
1510 Parks and Recreation Boxing Room $69.00 / $55.00 / $276.00 / $86.00
1511 Parks and Recreation Big Rink Full Court (per hour) $65.00 / $50.00 / $240.00 / $85.00
1512 Parks and Recreation Big Rink Full Court (per hour)-Prime Time - 5:00pm to Close, Saturdays, and Sundays
$75.00 / $60.00 / $300.00 / $95.00
1513 Parks and Recreation Sports Administration (+) Indicates Per Person1/2 hour increment @ 1/2 hourly rateRates are per hour unless indicated
Flat Rate
1514 Parks and Recreation Player Fee – Independent Leagues–per player/per season $16.00
1515 Parks and Recreation Player Fee – City Programs–per player/per season $6.00
1516 Parks and Recreation Parent Class PDF Version – per family per year $5.00
1517 Parks and Recreation Parent Class Video Session–per family per year $7.00
1518 Parks and Recreation Background check (+) - Biennial $40.00
1519 Parks and Recreation Youth Coach ID Cards – (+) Biennial $5.00
1520 Parks and Recreation Player ID cards (+) Youth and Adult Youth - annually; Adult (18 years and older) every 5 years. $5.00
1521 Parks and Recreation Tournament Spectator Fee (+) Adult/Youth $2.00 / $1.00
1522 Parks and Recreation Tournament T-Shirt $20.00
1523 Parks and Recreation Tournament Homerun 5 for $20.00, or 1 for $5.00
1524 Parks and Recreation Tournament Bracelet $20.00 per bracelet
1525 Parks and Recreation League Night/Tournament Softballs $5.00 per ball, or $50.00 per case
1526 Parks and Recreation Homerun Derby Entry $20.00 per player
1527 Parks and Recreation Banner Program (per banner) (up to 12 months) Outfield, gym and/or internet $400.00
1528 Parks and Recreation Banner Program Renewal (per banner) (up to 12 months) Outfield, gym and/or internet $300.00
1529 Parks and Recreation Concessions – Small – per quarter $150.00
1530 Parks and Recreation Concessions – Medium – per quarter $300.00
1531 Parks and Recreation Concessions – Large – per quarter $600.00
1532 Parks and Recreation Sports Field Practice Permits Flat Rate
1533 Parks and Recreation Practice Permit (per 60 minutes-without lights) $7.00
1534 Parks and Recreation Sports Field Lighting - per hour, per field $10.00
1535 Parks and Recreation Sports Field Rental Games, Scrimmages, Practice, Tournaments, Other Events (non-game "only" fields)
Single fee listings are the General Admission or Flat Rate; Multiple fee
listings are noted in the following order: Standard Rate; Non-Profit Rate;
Commercial Rate; Non-Resident Rate1536 Parks and Recreation Single field (per day-without lights) $75.00 / $60.00 / $300.00 / $94.00
1537 Parks and Recreation Single field (per hour-without lights) $20.00 / $16.00 / $80.00 / $25.00
1538 Parks and Recreation Sports Game Fields - Game "only" Fields Not available for rental for practice activities - Permit Required
Single fee listings are the General Admission or Flat Rate; Multiple fee
listings are noted in the following order: Standard Rate; Non-Profit Rate;
Commercial Rate; Non-Resident Rate1539 Parks and Recreation East Side Sports Complex
1540 Parks and Recreation Field without lights $30.00 / $25.00 / $102.00 / $36.00
1541 Parks and Recreation Field without lights (per day) $150.00 / $126.00 / $510.00 / $180.00
1542 Parks and Recreation Full complex (per day) $1,200.00 / $1,008.00 / $4,080.00 /
$1,440.00
1543 Parks and Recreation Gate Admission Tournament/league for adult/youth per day
$5.00 / $2.00
1544 Parks and Recreation Westside Sports Complex (11 flat fields)
1545 Parks and Recreation Field without lights $30.00 / $25.00 / $102.00 / $36.00
1546 Parks and Recreation Field without lights (per day) $150.00 / $126.00 / $510.00 / $180.00
1547 Parks and Recreation Full complex (per day) $1,950.00 / $1,560.00 / $6,630.00
/$2,340.00
1548 Parks and Recreation Marty Robbins Sports Complex (4 plex diamond fields)
1549 Parks and Recreation Field without lights $30.00 / $25.00 / $102.00 / $36.00
1550 Parks and Recreation Field without lights (per day) $150.00 / $126.00 / $510.00 / $180.00
1551 Parks and Recreation Full complex (per day) $600.00 / $504.00 / $2,040.00 /
$720.00
1552 Parks and Recreation Joey Barraza & Vino Memorial Park (4-plex diamond fields)
1553 Parks and Recreation Field without lights $30.00 / $25.00 / $102.00 / $36.00
1554 Parks and Recreation Field without lights (per day) $150.00 / $126.00 / $510.00 / $180.00
1555 Parks and Recreation Full complex (per day) $600.00 / $504.00 / $2,040.00 /
$720.00
1556 Parks and Recreation Joey Barraza & Vino Memorial Park (3 flat fields)
1557 Parks and Recreation Field without lights $30.00 / $25.00 / $102.00 / $36.00
1558 Parks and Recreation Field without lights (per day) $150.00 / $126.00 / $510.00 / $180.00
1559 Parks and Recreation Full complex (per day) $450.00 / $378.00 / $1,530.00 /
$540.00
1560 Parks and Recreation Blackie Chesher Sports Complex (5-plex diamond fields)
1561 Parks and Recreation Field without lights $30.00 / $25.00 / $102.00 / $36.00
1562 Parks and Recreation Field without lights (per day) $150.00 / $126.00 / $510.00 / $180.00
1563 Parks and Recreation Full complex (per day) $750.00 / $630.00 / $2,550.00 /
$900.00
1564 Parks and Recreation Blackie Chesher Sports Complex (8-flat fields)
1565 Parks and Recreation Field without lights $30.00 / $25.00 / $102.00 / $36.00
1566 Parks and Recreation Field without lights (per day) $150.00 / $126.00 / $510.00 / $180.00
1567 Parks and Recreation Full complex (per day) $1,200.00 / $1,008.00 / $4,080.00 /
$1,440.00
1568 Parks and Recreation Blackie Chesher Sports Complex (Alex Gutierrez - 1 diamond field)
1569 Parks and Recreation Field without lights $30.00 / $25.00 / $102.00 / $36.00
1570 Parks and Recreation Field without lights (per day) $150.00 / $126.00 / $510.00 / $180.00
1571 Parks and Recreation Full complex (per day) $150.00 / $126.00 / $510.00 / $180.00
Schedule C‐ 29
461
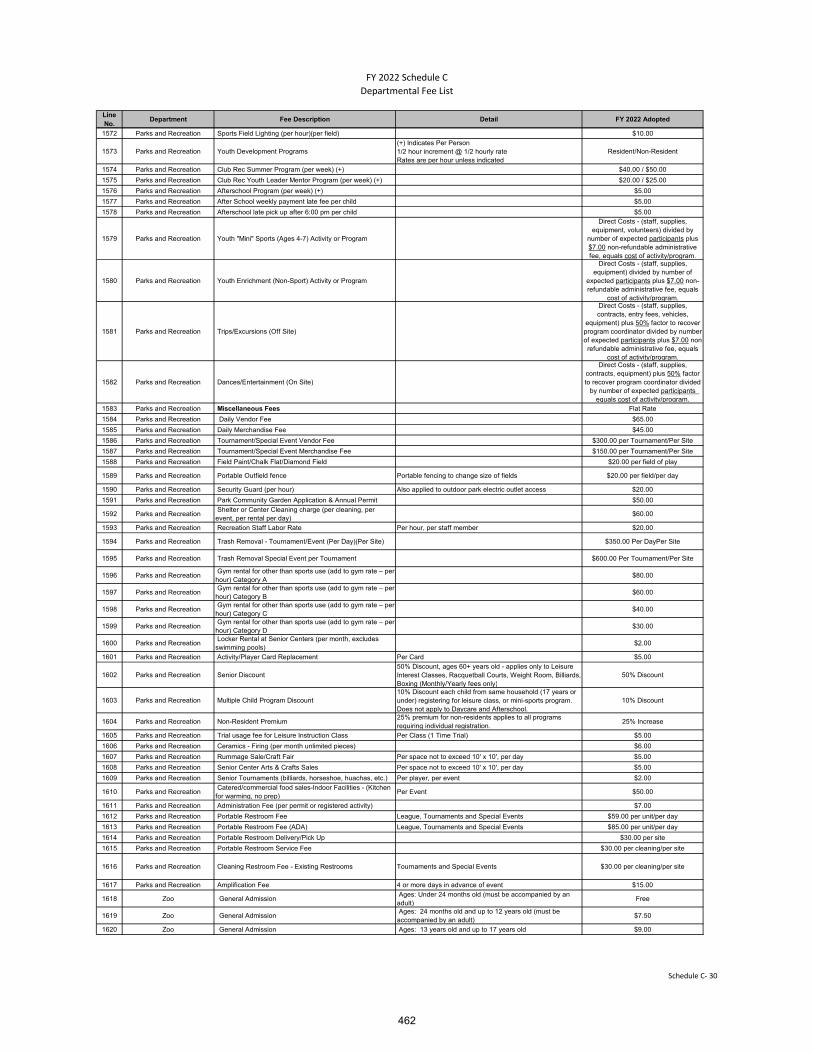
FY 2022 Schedule C
Departmental Fee List
Line No.
Department Fee Description Detail FY 2022 Adopted
1572 Parks and Recreation Sports Field Lighting (per hour)(per field) $10.00
1573 Parks and Recreation Youth Development Programs (+) Indicates Per Person1/2 hour increment @ 1/2 hourly rateRates are per hour unless indicated
Resident/Non-Resident
1574 Parks and Recreation Club Rec Summer Program (per week) (+) $40.00 / $50.00
1575 Parks and Recreation Club Rec Youth Leader Mentor Program (per week) (+) $20.00 / $25.00
1576 Parks and Recreation Afterschool Program (per week) (+) $5.00
1577 Parks and Recreation After School weekly payment late fee per child $5.00
1578 Parks and Recreation Afterschool late pick up after 6:00 pm per child $5.00
1579 Parks and Recreation Youth "Mini" Sports (Ages 4-7) Activity or Program
Direct Costs - (staff, supplies, equipment, volunteers) divided by
number of expected participants plus $7.00 non-refundable administrative fee, equals cost of activity/program.
1580 Parks and Recreation Youth Enrichment (Non-Sport) Activity or Program
Direct Costs - (staff, supplies, equipment) divided by number of
expected participants plus $7.00 non-refundable administrative fee, equals
cost of activity/program.
1581 Parks and Recreation Trips/Excursions (Off Site)
Direct Costs - (staff, supplies, contracts, entry fees, vehicles,
equipment) plus 50% factor to recover program coordinator divided by number of expected participants plus $7.00 non-refundable administrative fee, equals
cost of activity/program.
1582 Parks and Recreation Dances/Entertainment (On Site)
Direct Costs - (staff, supplies, contracts, equipment) plus 50% factor to recover program coordinator divided
by number of expected participants equals cost of activity/program.
1583 Parks and Recreation Miscellaneous Fees Flat Rate
1584 Parks and Recreation Daily Vendor Fee $65.00
1585 Parks and Recreation Daily Merchandise Fee $45.00
1586 Parks and Recreation Tournament/Special Event Vendor Fee $300.00 per Tournament/Per Site
1587 Parks and Recreation Tournament/Special Event Merchandise Fee $150.00 per Tournament/Per Site
1588 Parks and Recreation Field Paint/Chalk Flat/Diamond Field $20.00 per field of play
1589 Parks and Recreation Portable Outfield fence Portable fencing to change size of fields $20.00 per field/per day
1590 Parks and Recreation Security Guard (per hour) Also applied to outdoor park electric outlet access $20.00
1591 Parks and Recreation Park Community Garden Application & Annual Permit $50.00
1592 Parks and Recreation Shelter or Center Cleaning charge (per cleaning, per event, per rental per day)
$60.00
1593 Parks and Recreation Recreation Staff Labor Rate Per hour, per staff member $20.00
1594 Parks and Recreation Trash Removal - Tournament/Event (Per Day)(Per Site) $350.00 Per DayPer Site
1595 Parks and Recreation Trash Removal Special Event per Tournament $600.00 Per Tournament/Per Site
1596 Parks and Recreation Gym rental for other than sports use (add to gym rate – per hour) Category A
$80.00
1597 Parks and Recreation Gym rental for other than sports use (add to gym rate – per hour) Category B
$60.00
1598 Parks and Recreation Gym rental for other than sports use (add to gym rate – per hour) Category C
$40.00
1599 Parks and Recreation Gym rental for other than sports use (add to gym rate – per hour) Category D
$30.00
1600 Parks and Recreation Locker Rental at Senior Centers (per month, excludes swimming pools)
$2.00
1601 Parks and Recreation Activity/Player Card Replacement Per Card $5.00
1602 Parks and Recreation Senior Discount 50% Discount, ages 60+ years old - applies only to Leisure Interest Classes, Racquetball Courts, Weight Room, Billiards, Boxing (Monthly/Yearly fees only)
50% Discount
1603 Parks and Recreation Multiple Child Program Discount 10% Discount each child from same household (17 years or under) registering for leisure class, or mini-sports program. Does not apply to Daycare and Afterschool.
10% Discount
1604 Parks and Recreation Non-Resident Premium 25% premium for non-residents applies to all programs requiring individual registration.
25% Increase
1605 Parks and Recreation Trial usage fee for Leisure Instruction Class Per Class (1 Time Trial) $5.00
1606 Parks and Recreation Ceramics - Firing (per month unlimited pieces) $6.00
1607 Parks and Recreation Rummage Sale/Craft Fair Per space not to exceed 10' x 10', per day $5.00
1608 Parks and Recreation Senior Center Arts & Crafts Sales Per space not to exceed 10' x 10', per day $5.00
1609 Parks and Recreation Senior Tournaments (billiards, horseshoe, huachas, etc.) Per player, per event $2.00
1610 Parks and Recreation Catered/commercial food sales-Indoor Facilities - (Kitchen for warming, no prep)
Per Event $50.00
1611 Parks and Recreation Administration Fee (per permit or registered activity) $7.00
1612 Parks and Recreation Portable Restroom Fee League, Tournaments and Special Events $59.00 per unit/per day
1613 Parks and Recreation Portable Restroom Fee (ADA) League, Tournaments and Special Events $85.00 per unit/per day
1614 Parks and Recreation Portable Restroom Delivery/Pick Up $30.00 per site
1615 Parks and Recreation Portable Restroom Service Fee $30.00 per cleaning/per site
1616 Parks and Recreation Cleaning Restroom Fee - Existing Restrooms Tournaments and Special Events $30.00 per cleaning/per site
1617 Parks and Recreation Amplification Fee 4 or more days in advance of event $15.00
1618 Zoo General Admission Ages: Under 24 months old (must be accompanied by an adult)
Free
1619 Zoo General Admission Ages: 24 months old and up to 12 years old (must be accompanied by an adult)
$7.50
1620 Zoo General Admission Ages: 13 years old and up to 17 years old $9.00
Schedule C‐ 30
462
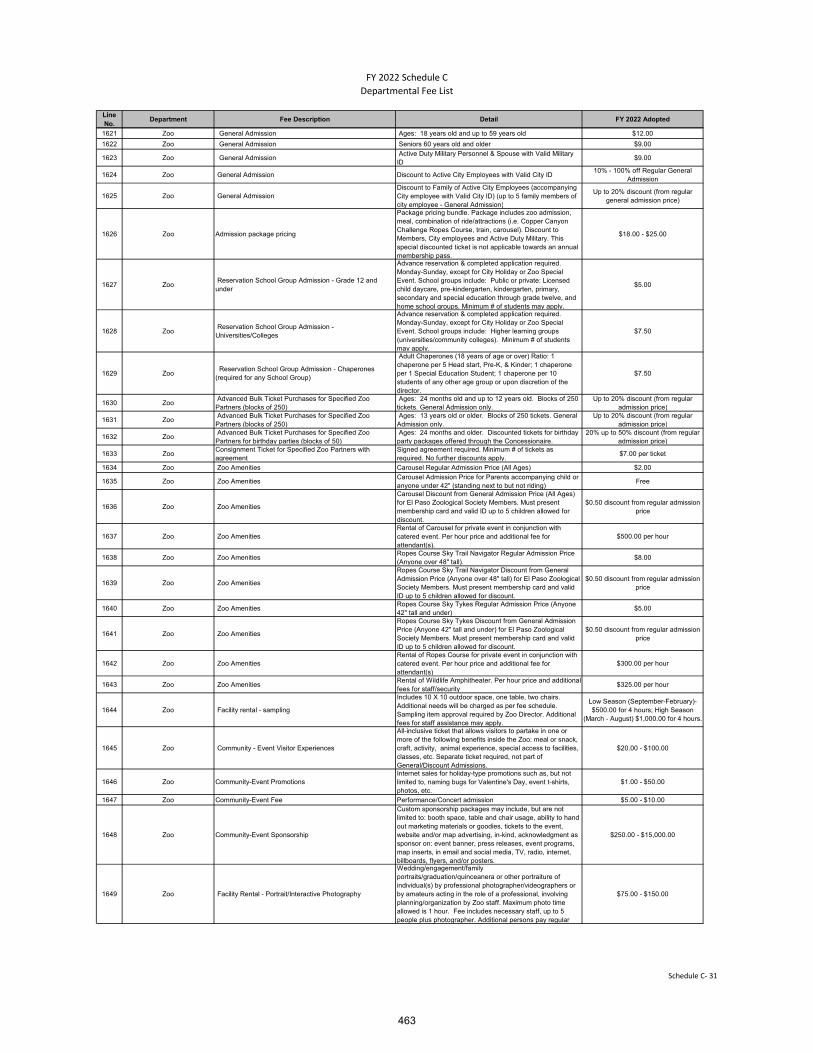
FY 2022 Schedule C
Departmental Fee List
Line No.
Department Fee Description Detail FY 2022 Adopted
1621 Zoo General Admission Ages: 18 years old and up to 59 years old $12.00
1622 Zoo General Admission Seniors 60 years old and older $9.00
1623 Zoo General Admission Active Duty Military Personnel & Spouse with Valid Military ID
$9.00
1624 Zoo General Admission Discount to Active City Employees with Valid City ID10% - 100% off Regular General
Admission
1625 Zoo General Admission Discount to Family of Active City Employees (accompanying City employee with Valid City ID) (up to 5 family members of city employee - General Admission)
Up to 20% discount (from regular general admission price)
1626 Zoo Admission package pricing
Package pricing bundle. Package includes zoo admission, meal, combination of ride/attractions (i.e. Copper Canyon Challenge Ropes Course, train, carousel). Discount to Members, City employees and Active Duty Military. This special discounted ticket is not applicable towards an annual membership pass.
$18.00 - $25.00
1627 Zoo Reservation School Group Admission - Grade 12 and under
Advance reservation & completed application required. Monday-Sunday, except for City Holiday or Zoo Special Event. School groups include: Public or private: Licensed child daycare, pre-kindergarten, kindergarten, primary, secondary and special education through grade twelve, and home school groups. Minimum # of students may apply.
$5.00
1628 Zoo Reservation School Group Admission - Universities/Colleges
Advance reservation & completed application required. Monday-Sunday, except for City Holiday or Zoo Special Event. School groups include: Higher learning groups (universities/community colleges). Minimum # of students may apply.
$7.50
1629 Zoo Reservation School Group Admission - Chaperones (required for any School Group)
Adult Chaperones (18 years of age or over) Ratio: 1 chaperone per 5 Head start, Pre-K, & Kinder; 1 chaperone per 1 Special Education Student; 1 chaperone per 10 students of any other age group or upon discretion of the director.
$7.50
1630 Zoo Advanced Bulk Ticket Purchases for Specified Zoo Partners (blocks of 250)
Ages: 24 months old and up to 12 years old. Blocks of 250 tickets. General Admission only.
Up to 20% discount (from regular admission price)
1631 Zoo Advanced Bulk Ticket Purchases for Specified Zoo Partners (blocks of 250)
Ages: 13 years old or older. Blocks of 250 tickets. General Admission only.
Up to 20% discount (from regular admission price)
1632 Zoo Advanced Bulk Ticket Purchases for Specified Zoo Partners for birthday parties (blocks of 50)
Ages: 24 months and older. Discounted tickets for birthday party packages offered through the Concessionaire.
20% up to 50% discount (from regular admission price)
1633 ZooConsignment Ticket for Specified Zoo Partners with agreement
Signed agreement required. Minimum # of tickets as required. No further discounts apply.
$7.00 per ticket
1634 Zoo Zoo Amenities Carousel Regular Admission Price (All Ages) $2.00
1635 Zoo Zoo Amenities Carousel Admission Price for Parents accompanying child or anyone under 42" (standing next to but not riding)
Free
1636 Zoo Zoo Amenities
Carousel Discount from General Admission Price (All Ages) for El Paso Zoological Society Members. Must present membership card and valid ID up to 5 children allowed for discount.
$0.50 discount from regular admission price
1637 Zoo Zoo Amenities Rental of Carousel for private event in conjunction with catered event. Per hour price and additional fee for attendant(s).
$500.00 per hour
1638 Zoo Zoo Amenities Ropes Course Sky Trail Navigator Regular Admission Price (Anyone over 48" tall).
$8.00
1639 Zoo Zoo Amenities
Ropes Course Sky Trail Navigator Discount from General Admission Price (Anyone over 48" tall) for El Paso Zoological Society Members. Must present membership card and valid ID up to 5 children allowed for discount.
$0.50 discount from regular admission price
1640 Zoo Zoo Amenities Ropes Course Sky Tykes Regular Admission Price (Anyone 42" tall and under)
$5.00
1641 Zoo Zoo Amenities
Ropes Course Sky Tykes Discount from General Admission Price (Anyone 42" tall and under) for El Paso Zoological Society Members. Must present membership card and valid ID up to 5 children allowed for discount.
$0.50 discount from regular admission price
1642 Zoo Zoo Amenities Rental of Ropes Course for private event in conjunction with catered event. Per hour price and additional fee for attendant(s)
$300.00 per hour
1643 Zoo Zoo Amenities Rental of Wildlife Amphitheater. Per hour price and additional fees for staff/security
$325.00 per hour
1644 Zoo Facility rental - sampling
Includes 10 X 10 outdoor space, one table, two chairs. Additional needs will be charged as per fee schedule. Sampling item approval required by Zoo Director. Additional fees for staff assistance may apply.
Low Season (September-February)-$500.00 for 4 hours; High Season
(March - August) $1,000.00 for 4 hours.
1645 Zoo Community - Event Visitor Experiences
All-inclusive ticket that allows visitors to partake in one or more of the following benefits inside the Zoo: meal or snack, craft, activity, animal experience, special access to facilities, classes, etc. Separate ticket required, not part of General/Discount Admissions.
$20.00 - $100.00
1646 Zoo Community-Event PromotionsInternet sales for holiday-type promotions such as, but not limited to, naming bugs for Valentine's Day, event t-shirts, photos, etc.
$1.00 - $50.00
1647 Zoo Community-Event Fee Performance/Concert admission $5.00 - $10.00
1648 Zoo Community-Event Sponsorship
Custom sponsorship packages may include, but are not limited to: booth space, table and chair usage, ability to hand out marketing materials or goodies, tickets to the event, website and/or map advertising, in-kind, acknowledgment as sponsor on: event banner, press releases, event programs, map inserts, in email and social media, TV, radio, internet, billboards, flyers, and/or posters.
$250.00 - $15,000.00
1649 Zoo Facility Rental - Portrait/Interactive Photography
Wedding/engagement/family portraits/graduation/quinceanera or other portraiture of individual(s) by professional photographer/videographers or by amateurs acting in the role of a professional, involving planning/organization by Zoo staff. Maximum photo time allowed is 1 hour. Fee includes necessary staff, up to 5 people plus photographer. Additional persons pay regular
$75.00 - $150.00
Schedule C‐ 31
463
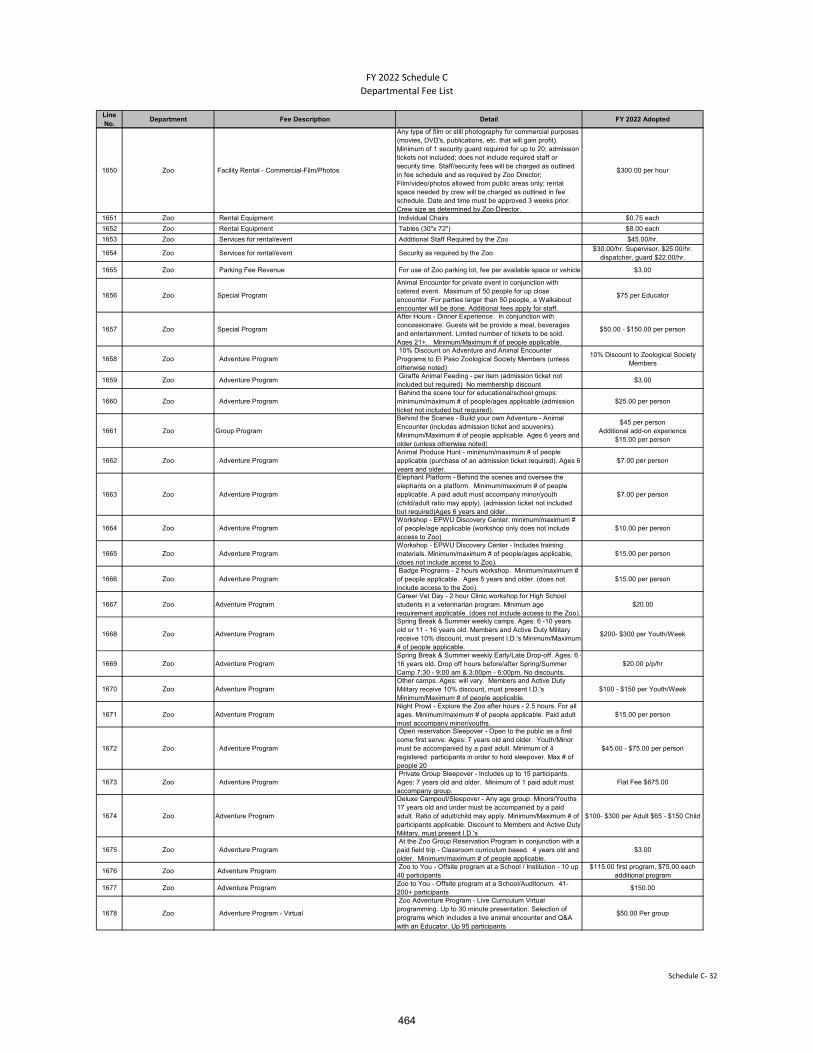
FY 2022 Schedule C
Departmental Fee List
Line No.
Department Fee Description Detail FY 2022 Adopted
1650 Zoo Facility Rental - Commercial-Film/Photos
Any type of film or still photography for commercial purposes (movies, DVD's, publications, etc. that will gain profit). Minimum of 1 security guard required for up to 20; admission tickets not included; does not include required staff or security time. Staff/security fees will be charged as outlined in fee schedule and as required by Zoo Director; Film/video/photos allowed from public areas only; rental space needed by crew will be charged as outlined in fee schedule. Date and time must be approved 3 weeks prior. Crew size as determined by Zoo Director.
$300.00 per hour
1651 Zoo Rental Equipment Individual Chairs $0.75 each
1652 Zoo Rental Equipment Tables (30"x 72") $8.00 each
1653 Zoo Services for rental/event Additional Staff Required by the Zoo $45.00/hr.
1654 Zoo Services for rental/event Security as required by the Zoo $30.00/hr. Supervisor, $25.00/hr.
dispatcher, guard $22.00/hr.
1655 Zoo Parking Fee Revenue For use of Zoo parking lot, fee per available space or vehicle $3.00
1656 Zoo Special Program
Animal Encounter for private event in conjunction with catered event. Maximum of 50 people for up close encounter. For parties larger than 50 people, a Walkabout encounter will be done. Additional fees apply for staff.
$75 per Educator
1657 Zoo Special Program
After Hours - Dinner Experience. In conjunction with concessionaire. Guests will be provide a meal, beverages and entertainment. Limited number of tickets to be sold. Ages 21+. Minimum/Maximum # of people applicable.
$50.00 - $150.00 per person
1658 Zoo Adventure Program 10% Discount on Adventure and Animal Encounter Programs to El Paso Zoological Society Members (unless otherwise noted)
10% Discount to Zoological Society Members
1659 Zoo Adventure Program Giraffe Animal Feeding - per item (admission ticket not included but required) No membership discount
$3.00
1660 Zoo Adventure Program Behind the scene tour for educational/school groups: minimum/maximum # of people/ages applicable (admission ticket not included but required).
$25.00 per person
1661 Zoo Group Program
Behind the Scenes - Build your own Adventure - Animal Encounter (includes admission ticket and souvenirs). Minimum/Maximum # of people applicable. Ages 6 years and older (unless otherwise noted)
$45 per personAdditional add-on experience
$15.00 per person
1662 Zoo Adventure Program Animal Produce Hunt - minimum/maximum # of people applicable (purchase of an admission ticket required). Ages 6 years and older.
$7.00 per person
1663 Zoo Adventure Program
Elephant Platform - Behind the scenes and oversee the elephants on a platform. Minimum/maximum # of people applicable. A paid adult must accompany minor/youth (child/adult ratio may apply). (admission ticket not included but required)Ages 6 years and older.
$7.00 per person
1664 Zoo Adventure Program Workshop - EPWU Discovery Center: minimum/maximum # of people/age applicable (workshop only does not include access to Zoo)
$10.00 per person
1665 Zoo Adventure Program Workshop - EPWU Discovery Center - Includes training materials. Minimum/maximum # of people/ages applicable, (does not include access to Zoo).
$15.00 per person
1666 Zoo Adventure Program Badge Programs - 2 hours workshop. Minimum/maximum # of people applicable. Ages 5 years and older. (does not include access to the Zoo).
$15.00 per person
1667 Zoo Adventure ProgramCareer Vet Day - 2 hour Clinic workshop for High School students in a veterinarian program. Minimum age requirement applicable. (does not include access to the Zoo).
$20.00
1668 Zoo Adventure Program
Spring Break & Summer weekly camps. Ages: 6 -10 years old or 11 - 16 years old. Members and Active Duty Military receive 10% discount, must present I.D.'s Minimum/Maximum # of people applicable.
$200- $300 per Youth/Week
1669 Zoo Adventure ProgramSpring Break & Summer weekly Early/Late Drop-off. Ages: 6 -16 years old. Drop off hours before/after Spring/Summer Camp 7:30 - 9:00 am & 3:00pm - 6:00pm. No discounts.
$20.00 p/p/hr
1670 Zoo Adventure ProgramOther camps. Ages: will vary. Members and Active Duty Military receive 10% discount, must present I.D.'s Minimum/Maximum # of people applicable.
$100 - $150 per Youth/Week
1671 Zoo Adventure ProgramNight Prowl - Explore the Zoo after hours - 2.5 hours. For all ages. Minimum/maximum # of people applicable. Paid adult must accompany minor/youths.
$15.00 per person
1672 Zoo Adventure Program
Open reservation Sleepover - Open to the public as a first come first serve. Ages: 7 years old and older. Youth/Minor must be accompanied by a paid adult. Minimum of 4 registered participants in order to hold sleepover. Max # of people 20
$45.00 - $75.00 per person
1673 Zoo Adventure Program Private Group Sleepover - Includes up to 15 participants. Ages: 7 years old and older. Minimum of 1 paid adult must accompany group.
Flat Fee $675.00
1674 Zoo Adventure Program
Deluxe Campout/Sleepover - Any age group. Minors/Youths 17 years old and under must be accompanied by a paid adult. Ratio of adult/child may apply. Minimum/Maximum # of participants applicable. Discount to Members and Active Duty Military, must present I.D.'s
$100- $300 per Adult $65 - $150 Child
1675 Zoo Adventure Program At the Zoo Group Reservation Program in conjunction with a paid field trip - Classroom curriculum based. 4 years old and older. Minimum/maximum # of people applicable.
$3.00
1676 Zoo Adventure Program Zoo to You - Offsite program at a School / Institution - 10 up 40 participants
$115.00 first program, $75.00 each additional program
1677 Zoo Adventure Program Zoo to You - Offsite program at a School/Auditorium. 41-200+ participants
$150.00
1678 Zoo Adventure Program - Virtual
Zoo Adventure Program - Live Curriculum Virtual programming. Up to 30 minute presentation. Selection of programs which includes a live animal encounter and Q&A with an Educator. Up 95 participants
$50.00 Per group
Schedule C‐ 32
464
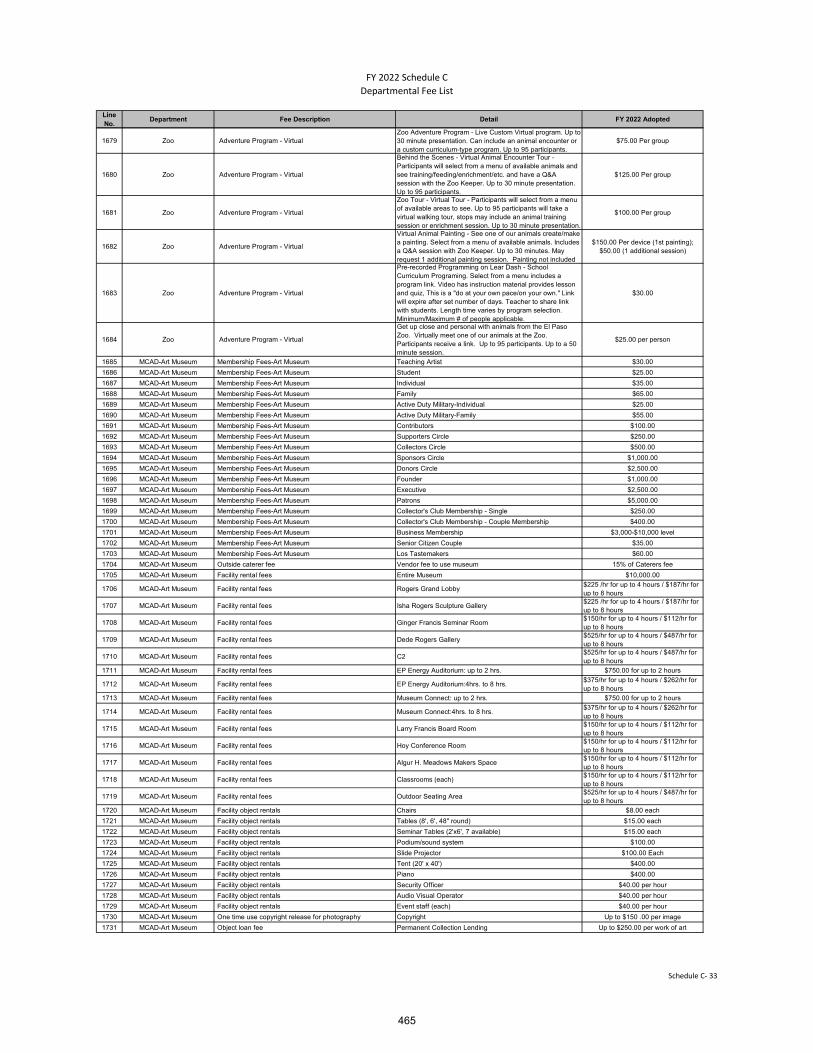
FY 2022 Schedule C
Departmental Fee List
Line No.
Department Fee Description Detail FY 2022 Adopted
1679 Zoo Adventure Program - Virtual Zoo Adventure Program - Live Custom Virtual program. Up to 30 minute presentation. Can include an animal encounter or a custom curriculum-type program. Up to 95 participants.
$75.00 Per group
1680 Zoo Adventure Program - Virtual
Behind the Scenes - Virtual Animal Encounter Tour - Participants will select from a menu of available animals and see training/feeding/enrichment/etc. and have a Q&A session with the Zoo Keeper. Up to 30 minute presentation. Up to 95 participants.
$125.00 Per group
1681 Zoo Adventure Program - Virtual
Zoo Tour - Virtual Tour - Participants will select from a menu of available areas to see. Up to 95 participants will take a virtual walking tour, stops may include an animal training session or enrichment session. Up to 30 minute presentation.
$100.00 Per group
1682 Zoo Adventure Program - Virtual
Virtual Animal Painting - See one of our animals create/make a painting. Select from a menu of available animals. Includes a Q&A session with Zoo Keeper. Up to 30 minutes. May request 1 additional painting session. Painting not included
$150.00 Per device (1st painting); $50.00 (1 additional session)
1683 Zoo Adventure Program - Virtual
Pre-recorded Programming on Lear Dash - School Curriculum Programing. Select from a menu includes a program link. Video has instruction material provides lesson and quiz, This is a "do at your own pace/on your own." Link will expire after set number of days. Teacher to share link with students. Length time varies by program selection. Minimum/Maximum # of people applicable.
$30.00
1684 Zoo Adventure Program - Virtual
Get up close and personal with animals from the El Paso Zoo. Virtually meet one of our animals at the Zoo. Participants receive a link. Up to 95 participants. Up to a 50 minute session.
$25.00 per person
1685 MCAD-Art Museum Membership Fees-Art Museum Teaching Artist $30.00
1686 MCAD-Art Museum Membership Fees-Art Museum Student $25.00
1687 MCAD-Art Museum Membership Fees-Art Museum Individual $35.00
1688 MCAD-Art Museum Membership Fees-Art Museum Family $65.00
1689 MCAD-Art Museum Membership Fees-Art Museum Active Duty Military-Individual $25.00
1690 MCAD-Art Museum Membership Fees-Art Museum Active Duty Military-Family $55.00
1691 MCAD-Art Museum Membership Fees-Art Museum Contributors $100.00
1692 MCAD-Art Museum Membership Fees-Art Museum Supporters Circle $250.00
1693 MCAD-Art Museum Membership Fees-Art Museum Collectors Circle $500.00
1694 MCAD-Art Museum Membership Fees-Art Museum Sponsors Circle $1,000.00
1695 MCAD-Art Museum Membership Fees-Art Museum Donors Circle $2,500.00
1696 MCAD-Art Museum Membership Fees-Art Museum Founder $1,000.00
1697 MCAD-Art Museum Membership Fees-Art Museum Executive $2,500.00
1698 MCAD-Art Museum Membership Fees-Art Museum Patrons $5,000.00
1699 MCAD-Art Museum Membership Fees-Art Museum Collector's Club Membership - Single $250.00
1700 MCAD-Art Museum Membership Fees-Art Museum Collector's Club Membership - Couple Membership $400.00
1701 MCAD-Art Museum Membership Fees-Art Museum Business Membership $3,000-$10,000 level
1702 MCAD-Art Museum Membership Fees-Art Museum Senior Citizen Couple $35.00
1703 MCAD-Art Museum Membership Fees-Art Museum Los Tastemakers $60.00
1704 MCAD-Art Museum Outside caterer fee Vendor fee to use museum 15% of Caterers fee
1705 MCAD-Art Museum Facility rental fees Entire Museum $10,000.00
1706 MCAD-Art Museum Facility rental fees Rogers Grand Lobby$225 /hr for up to 4 hours / $187/hr for up to 8 hours
1707 MCAD-Art Museum Facility rental fees Isha Rogers Sculpture Gallery$225 /hr for up to 4 hours / $187/hr for up to 8 hours
1708 MCAD-Art Museum Facility rental fees Ginger Francis Seminar Room $150/hr for up to 4 hours / $112/hr for up to 8 hours
1709 MCAD-Art Museum Facility rental fees Dede Rogers Gallery$525/hr for up to 4 hours / $487/hr for up to 8 hours
1710 MCAD-Art Museum Facility rental fees C2$525/hr for up to 4 hours / $487/hr for up to 8 hours
1711 MCAD-Art Museum Facility rental fees EP Energy Auditorium: up to 2 hrs. $750.00 for up to 2 hours
1712 MCAD-Art Museum Facility rental fees EP Energy Auditorium:4hrs. to 8 hrs.$375/hr for up to 4 hours / $262/hr for up to 8 hours
1713 MCAD-Art Museum Facility rental fees Museum Connect: up to 2 hrs. $750.00 for up to 2 hours
1714 MCAD-Art Museum Facility rental fees Museum Connect:4hrs. to 8 hrs.$375/hr for up to 4 hours / $262/hr for up to 8 hours
1715 MCAD-Art Museum Facility rental fees Larry Francis Board Room$150/hr for up to 4 hours / $112/hr for up to 8 hours
1716 MCAD-Art Museum Facility rental fees Hoy Conference Room $150/hr for up to 4 hours / $112/hr for up to 8 hours
1717 MCAD-Art Museum Facility rental fees Algur H. Meadows Makers Space$150/hr for up to 4 hours / $112/hr for up to 8 hours
1718 MCAD-Art Museum Facility rental fees Classrooms (each)$150/hr for up to 4 hours / $112/hr for up to 8 hours
1719 MCAD-Art Museum Facility rental fees Outdoor Seating Area$525/hr for up to 4 hours / $487/hr for up to 8 hours
1720 MCAD-Art Museum Facility object rentals Chairs $8.00 each
1721 MCAD-Art Museum Facility object rentals Tables (8', 6', 48" round) $15.00 each
1722 MCAD-Art Museum Facility object rentals Seminar Tables (2'x6', 7 available) $15.00 each
1723 MCAD-Art Museum Facility object rentals Podium/sound system $100.00
1724 MCAD-Art Museum Facility object rentals Slide Projector $100.00 Each
1725 MCAD-Art Museum Facility object rentals Tent (20' x 40') $400.00
1726 MCAD-Art Museum Facility object rentals Piano $400.00
1727 MCAD-Art Museum Facility object rentals Security Officer $40.00 per hour
1728 MCAD-Art Museum Facility object rentals Audio Visual Operator $40.00 per hour
1729 MCAD-Art Museum Facility object rentals Event staff (each) $40.00 per hour
1730 MCAD-Art Museum One time use copyright release for photography Copyright Up to $150 .00 per image
1731 MCAD-Art Museum Object loan fee Permanent Collection Lending Up to $250.00 per work of art
Schedule C‐ 33
465

FY 2022 Schedule C
Departmental Fee List
Line No.
Department Fee Description Detail FY 2022 Adopted
1732 MCAD-Art Museum Teacher Workshops Fees Program Registration Non Member: 3hr - $35/6 hr - $50 Members 20% Discount of Non-
Members fees 1733 MCAD-Art Museum Exhibition Admission fees Entry fees (Adults) - Non member $10.00
1734 MCAD-Art Museum Exhibition Admission fees Entry fees (members) $5.00
1735 MCAD-Art Museum Art classes fees* 4 session Youth Class (ages 6 to 13)
$75.00 non members/ Members 20% Discount of non- member fees/
Employees10% Discount of non-member fees.
1736 MCAD-Art Museum Art classes fees* 8 session Kids Classes (ages 6 to 13)
$85.00 to $120.00 non members/ Members 20% Discount of non-
member fees/ Employees10% Discount of non-member fees.
1737 MCAD-Art Museum Art classes fees* 8 session Adult Classes (ages 14 and above)
$85.00 to $120.00 non members/ Members 20% Discount of non-
member fees/ Employees10% Discount of non-member fees.
1738 MCAD-Art Museum Art classes fees* 4 session Family Classes (ages 3 and up)
$46.00 non members/ Members 20% Discount of non- member fees/
Employees10% Discount of non-member fees.
1739 MCAD-Art Museum Art classes fees* 6 Session Adult Classes - (ages 14 and above)
$65 to $95.00 non members/ Members 20% Discount of non- member fees/
Employees10% Discount of non-member fees.
1740 MCAD-Art Museum Art classes fees* 6 Session Youth Classes - (ages 6 to 18)
$50 to $95.00 non members/ Members 20% Discount of non- member fees/
Employees10% Discount of non-member fees.
1741 MCAD-Art Museum Art classes fees* 1-day Family Classes (ages 3 and above)
$12.00 non members/ Members 20% Discount of non- member fees/
Employees10% Discount of non-member fees.
1742 MCAD-Art Museum Art classes fees* 1-day Youth Workshops (ages 6 to 18)
$38.00 non members/ Members 20% Discount of non- member fees/
Employees10% Discount of non-member fees.
1743 MCAD-Art Museum Art classes fees* 1-day Adult Workshops (ages 14 and above)
$38.00 non members/ Members 20% Discount of non- member fees/
Employees10% Discount of non-member fees.
1744 MCAD-Art Museum Art classes fees* Open Studio/Class
Up to $100.00 non members/ Members 20% Discount of non- member fees/
Employees10% Discount of non-member fees.
1745 MCAD-Art Museum Art classes fees* Artist Workshop (Artist as students)
Up to $1000.00 non members/ Members 20% Discount of non-
member fees/ Employees10% Discount of non-member fees.
1746 MCAD-Art Museum Art classes fees* Independent Study
Up to $75.00 non members/ Members 20% Discount of non- member fees/
Employees10% Discount of non-member fees.
1747 MCAD-Art Museum Event Fees 1 Performance/Concert Admission Free for members/$5.00 non-members
1748 MCAD-Art Museum Art classes fees* 1 Day Supervised Lunch (ages 6 to 14 years), Lunch not Included
$5.00 non members/ Members 20% Discount of non- member fees/
Employees10% Discount of non-member fees.
1749 MCAD-Art Museum Art classes fees* 4 Session Adult Classes
$75.00 non members/ Members 20% Discount of non- member fees/
Employees10% Discount of non-member fees.
1750 MCAD-Art Museum Tour + Studio Special programming
$15.00 non members/ Members 20% Discount of non- member fees/
Employees10% Discount of non-member fees.
1751 MCAD-Art Museum Tour + Lunch Special programming
$15.00 non members/ Members 20% Discount of non- member fees/
Employees10% Discount of non-member fees.
1752 MCAD-History Museum Membership fees- History Museum Membership Discount10% Off Memberships During Special
Promotions
1753 MCAD-History Museum Membership fees- History Museum Gift MembershipBuy 1, Get the second Membership
50% Off
1754 MCAD-History Museum Membership fees- History Museum Student $25.00
1755 MCAD-History Museum Membership fees- History Museum Senior Citizen $25.00
1756 MCAD-History Museum Membership fees- History Museum Active Duty Military - Individual $25.00
1757 MCAD-History Museum Membership fees- History Museum Teaching Artist $30.00
1758 MCAD-History Museum Membership fees- History Museum Senior Citizen Couple $35.00
1759 MCAD-History Museum Membership fees- History Museum Business Membership $3,000 - $10,000
1760 MCAD-History Museum Membership fees- History Museum Military Family active duty $55.00
1761 MCAD-History Museum Membership fees- History Museum Individual $30.00
1762 MCAD-History Museum Membership fees- History Museum Family $60.00
1763 MCAD-History Museum Membership fees- History Museum Contributor $100.00
1764 MCAD-History Museum Membership fees- History Museum Supporters Circle $250.00
1765 MCAD-History Museum Membership fees- History Museum Collectors Circle $500.00
1766 MCAD-History Museum Membership fees- History Museum Sponsors Circle $1,000.00
1767 MCAD-History Museum Membership fees- History Museum Corporate $1,000.00
1768 MCAD-History Museum Facility Rental Fees 1st floor orientation theatre$125.00 for up to 4 hrs / $225.00 for up
to 6 hrs / $300.00 for up to 8 hrs
Schedule C‐ 34
466
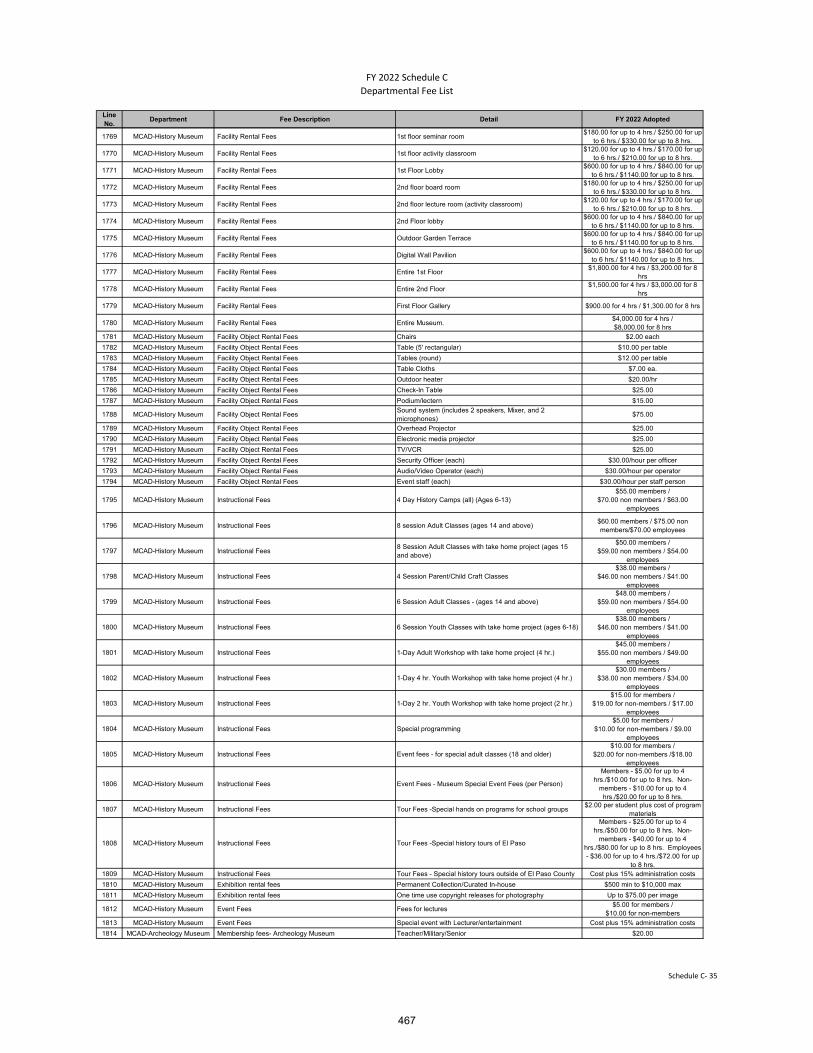
FY 2022 Schedule C
Departmental Fee List
Line No.
Department Fee Description Detail FY 2022 Adopted
1769 MCAD-History Museum Facility Rental Fees 1st floor seminar room$180.00 for up to 4 hrs./ $250.00 for up
to 6 hrs./ $330.00 for up to 8 hrs.
1770 MCAD-History Museum Facility Rental Fees 1st floor activity classroom$120.00 for up to 4 hrs./ $170.00 for up
to 6 hrs./ $210.00 for up to 8 hrs.
1771 MCAD-History Museum Facility Rental Fees 1st Floor Lobby$600.00 for up to 4 hrs./ $840.00 for up
to 6 hrs./ $1140.00 for up to 8 hrs.
1772 MCAD-History Museum Facility Rental Fees 2nd floor board room$180.00 for up to 4 hrs./ $250.00 for up
to 6 hrs./ $330.00 for up to 8 hrs.
1773 MCAD-History Museum Facility Rental Fees 2nd floor lecture room (activity classroom)$120.00 for up to 4 hrs./ $170.00 for up
to 6 hrs./ $210.00 for up to 8 hrs.
1774 MCAD-History Museum Facility Rental Fees 2nd Floor lobby$600.00 for up to 4 hrs./ $840.00 for up
to 6 hrs./ $1140.00 for up to 8 hrs.
1775 MCAD-History Museum Facility Rental Fees Outdoor Garden Terrace$600.00 for up to 4 hrs./ $840.00 for up
to 6 hrs./ $1140.00 for up to 8 hrs.
1776 MCAD-History Museum Facility Rental Fees Digital Wall Pavilion$600.00 for up to 4 hrs./ $840.00 for up
to 6 hrs./ $1140.00 for up to 8 hrs.
1777 MCAD-History Museum Facility Rental Fees Entire 1st Floor$1,800.00 for 4 hrs / $3,200.00 for 8
hrs
1778 MCAD-History Museum Facility Rental Fees Entire 2nd Floor$1,500.00 for 4 hrs / $3,000.00 for 8
hrs
1779 MCAD-History Museum Facility Rental Fees First Floor Gallery $900.00 for 4 hrs / $1,300.00 for 8 hrs
1780 MCAD-History Museum Facility Rental Fees Entire Museum. $4,000.00 for 4 hrs /$8,000.00 for 8 hrs
1781 MCAD-History Museum Facility Object Rental Fees Chairs $2.00 each
1782 MCAD-History Museum Facility Object Rental Fees Table (5' rectangular) $10.00 per table
1783 MCAD-History Museum Facility Object Rental Fees Tables (round) $12.00 per table
1784 MCAD-History Museum Facility Object Rental Fees Table Cloths $7.00 ea.
1785 MCAD-History Museum Facility Object Rental Fees Outdoor heater $20.00/hr
1786 MCAD-History Museum Facility Object Rental Fees Check-In Table $25.00
1787 MCAD-History Museum Facility Object Rental Fees Podium/lectern $15.00
1788 MCAD-History Museum Facility Object Rental Fees Sound system (includes 2 speakers, Mixer, and 2 microphones)
$75.00
1789 MCAD-History Museum Facility Object Rental Fees Overhead Projector $25.00
1790 MCAD-History Museum Facility Object Rental Fees Electronic media projector $25.00
1791 MCAD-History Museum Facility Object Rental Fees TV/VCR $25.00
1792 MCAD-History Museum Facility Object Rental Fees Security Officer (each) $30.00/hour per officer
1793 MCAD-History Museum Facility Object Rental Fees Audio/Video Operator (each) $30.00/hour per operator
1794 MCAD-History Museum Facility Object Rental Fees Event staff (each) $30.00/hour per staff person
1795 MCAD-History Museum Instructional Fees 4 Day History Camps (all) (Ages 6-13)$55.00 members /
$70.00 non members / $63.00 employees
1796 MCAD-History Museum Instructional Fees 8 session Adult Classes (ages 14 and above)$60.00 members / $75.00 non members/$70.00 employees
1797 MCAD-History Museum Instructional Fees 8 Session Adult Classes with take home project (ages 15 and above)
$50.00 members /$59.00 non members / $54.00
employees
1798 MCAD-History Museum Instructional Fees 4 Session Parent/Child Craft Classes$38.00 members /
$46.00 non members / $41.00 employees
1799 MCAD-History Museum Instructional Fees 6 Session Adult Classes - (ages 14 and above)$48.00 members /
$59.00 non members / $54.00 employees
1800 MCAD-History Museum Instructional Fees 6 Session Youth Classes with take home project (ages 6-18)$38.00 members /
$46.00 non members / $41.00 employees
1801 MCAD-History Museum Instructional Fees 1-Day Adult Workshop with take home project (4 hr.)$45.00 members /
$55.00 non members / $49.00 employees
1802 MCAD-History Museum Instructional Fees 1-Day 4 hr. Youth Workshop with take home project (4 hr.)$30.00 members /
$38.00 non members / $34.00 employees
1803 MCAD-History Museum Instructional Fees 1-Day 2 hr. Youth Workshop with take home project (2 hr.)$15.00 for members /
$19.00 for non-members / $17.00 employees
1804 MCAD-History Museum Instructional Fees Special programming$5.00 for members /
$10.00 for non-members / $9.00 employees
1805 MCAD-History Museum Instructional Fees Event fees - for special adult classes (18 and older)$10.00 for members /
$20.00 for non-members /$18.00 employees
1806 MCAD-History Museum Instructional Fees Event Fees - Museum Special Event Fees (per Person)
Members - $5.00 for up to 4 hrs./$10.00 for up to 8 hrs. Non-
members - $10.00 for up to 4 hrs./$20.00 for up to 8 hrs.
1807 MCAD-History Museum Instructional Fees Tour Fees -Special hands on programs for school groups$2.00 per student plus cost of program
materials
1808 MCAD-History Museum Instructional Fees Tour Fees -Special history tours of El Paso
Members - $25.00 for up to 4 hrs./$50.00 for up to 8 hrs. Non-
members - $40.00 for up to 4 hrs./$80.00 for up to 8 hrs. Employees - $36.00 for up to 4 hrs./$72.00 for up
to 8 hrs.1809 MCAD-History Museum Instructional Fees Tour Fees - Special history tours outside of El Paso County Cost plus 15% administration costs
1810 MCAD-History Museum Exhibition rental fees Permanent Collection/Curated In-house $500 min to $10,000 max
1811 MCAD-History Museum Exhibition rental fees One time use copyright releases for photography Up to $75.00 per image
1812 MCAD-History Museum Event Fees Fees for lectures$5.00 for members /
$10.00 for non-members
1813 MCAD-History Museum Event Fees Special event with Lecturer/entertainment Cost plus 15% administration costs
1814 MCAD-Archeology Museum Membership fees- Archeology Museum Teacher/Military/Senior $20.00
Schedule C‐ 35
467

FY 2022 Schedule C
Departmental Fee List
Line No.
Department Fee Description Detail FY 2022 Adopted
1815 MCAD-Archeology Museum Membership fees- Archeology Museum Student $15.00
1816 MCAD-Archeology Museum Membership fees- Archeology Museum Individual $25.00
1817 MCAD-Archeology Museum Membership fees- Archeology Museum Family $40.00
1818 MCAD-Archeology Museum Membership fees- Archeology Museum Military Family $35.00
1819 MCAD-Archeology Museum Membership fees- Archeology Museum Folsom $100.00
1820 MCAD-Archeology Museum Membership fees- Archeology Museum Clovis $250.00
1821 MCAD-Archeology Museum Membership fees- Archeology Museum Keystone $500.00
1822 MCAD-Archeology Museum Membership fees- Archeology Museum Chert (Corporate circle) $1,000.00
1823 MCAD-Archeology Museum Facility Rental Fees Entire Museum. $500.00 for up to 4 hrs./$1,200.00 for
up to 8 hrs.
1824 MCAD-Archeology Museum Facility Rental Fees Auditorium Gallery$150.00 for up to 4 hrs./$350.00 for up
to 8 hrs.
1825 MCAD-Archeology Museum Facility Rental Fees Gazebo$150.00 for up to 4 hrs./$300.00 for up
to 8 hrs.
1826 MCAD-Archeology Museum Facility Rental Fees Lab Room$75.00 for up to 4 hrs./ $150.00 for up
to 8 hrs.
1827 MCAD-Archeology Museum Facility Object Rental Fees Security Officer (each) $30.00/hour
1828 MCAD-Archeology Museum Facility Object Rental Fees Audio Visual Operator (each) $30.00/hour
1829 MCAD-Archeology Museum Facility Object Rental Fees Event staff (each) $30.00/hour
1830 MCAD-Archeology Museum Instructional Fees Camp Fees for all camps (per child up to age to 14)Up to $55.00 for members/up to $70.00
for non-members/up to $63.00 for employees
1831 MCAD-Archeology Museum Instructional Fees Parent/child workshop (1 parent and up to 2 children)Up to $25.00 for members/Up to
$35.00 non-members/Up to $31.00 employees
1832 MCAD-Archeology Museum Instructional Fees Child workshop (ages 6-17)Up to $20.00 for members/Up to
$35.00 non-members/Up to $31.00 employees
1833 MCAD-Archeology Museum Instructional Fees Adult workshops (ages 18 and older)
Up to $50.00 for members plus materials cost/Up to $75.00 for non-members plus materials cost/Up to
$67.00 for employees plus materials cost
1834 MCAD-Archeology Museum Instructional Fees Conference Fees
$35.00 + material fee per person-pre registration/$45.00 + material fee per person at the door/$28.00 + material
fee for students w/ID/$40.00 + material fee for employees
1835 MCAD-Archeology Museum Event Fees Museum special events fees (per person)Members up to $50.00/Non members
up to $85.00
1836 MCAD-Archeology Museum Instructional Fees Creative workshops
Up to $25.00 for up to 4 hours for members, up to $40.00 for up to 4
hours for non-members, $36.00 for up to 4 hours for employees
1837 MCAD-Archeology Museum Tour Fees Archeological tours - in El Paso County
$50.00 for up to 8 hours and $25.00 for up to 4 hours for members; $80.00 for up to 8 hours and $40.00 for up to 4
hours for non-members1838 MCAD-Archeology Museum Tour Fees Archeological tours - outside of El Paso Cost + 15% administration costs
1839MCAD-Archeology Museum;
MCAD-History MuseumEvent Fees Vendor fees for onsite commercial vendors
Up to $60.00 members/Up to $90.00 non-members
1840MCAD-Archeology Museum;
MCAD-History Museum Instructional Fees One Day Camp Fee (per child up to age of 14)
Up to $15.00 members/Up to $20.00 non-members/Up to $18.00 employees
1841MCAD-Archeology Museum;
MCAD-History Museum Object loan fee Permanent Collection Lending Up to $100.00 per object
1842MCAD-Archeology Museum;
MCAD-History Museum; MCAD Art Museum
Event Fees Admission Fees to special art, culture and heritage events, competitions and/or programs
$1.00 to $100.00 per person
1843MCAD-Cultural Affairs
Division Miscellaneous non-operating revenues Vendor booth fees for cultural and heritage tourism events
Up to $750.00 per booth for food, arts & crafts vendors
1844Museum and Cultural Affairs
Department - Public Art Miscellaneous non-operating revenues
Application Fee for request to customize illumination of Artwork called 1-10 corridor aesthetic improvement project
$50 / $45 non-profit
1845 MCAD-Museums Division Miscellaneous non-operating revenues Object loan fee- Non-profit institution (US) with 6 months notice
First object - $150.00 per object/per venue; each additional object -
$50.00/venue; with less than six months notice
1846 MCAD-Museums Division Miscellaneous non-operating revenues Object loan fee- Non-profit institution (US) without 6 months notice
First Object - $250 per object/per venue; each additional object - $200/venue
1847 MCAD-Museums Division Miscellaneous non-operating revenues Object loan fee- Non-profit institution (Foreign) with 9 months notice
First object - $300.00 per object/per venue; each additional object -
$200.00/venue
1848 MCAD-Museums Division Miscellaneous non-operating revenues Object loan fee- Non-profit institution (Foreign) without 9 months notice
First object - $400.00 per object/per venue; each additional object -
$300.00/venue
1849 MCAD-Museums Division Miscellaneous non-operating revenues Object loan fee- For-profit institution (US) with a minimum of 6 months notice
First object - $500.00 per object/per venue; each additional object -
$400.00/venue
1850 MCAD-Museums Division Miscellaneous non-operating revenues Object loan fee- For-profit institution (US) with less than 6 months notice
First object - $750.00 per object/per venue; each additional object -
$650.00/venue
1851 MCAD-Museums Division Miscellaneous non-operating revenues Object loan fee- For-profit institution (foreign) with 9 months notice
First object - $1,500.00 per object/per venue; each additional object -
$1,400.00/venue
1852 MCAD-Museums Division Miscellaneous non-operating revenues Object loan fee- For-profit institution (foreign) without 9 months notice
First object - $2,500.00 per object/per venue; each additional object -
$2,400.00/venue
1853 MCAD-Museums Division Miscellaneous non-operating revenues Fees for exhibitions organized by the El Paso Museum of Art, El Paso Museum of Archaeology or El Paso Museum of History
Package of/ from 5 to 200 objects including framing, educational material,
and graphics - $5,000 to $40,000
1854 MCAD-Museums Division Miscellaneous non-operating revenues Fees for extended loans (over one year)$100.00 per object/per year up to
$5,001.00
Schedule C‐ 36
468

FY 2022 Schedule C
Departmental Fee List
Line No.
Department Fee Description Detail FY 2022 Adopted
1855 EPMH/EPMARCH Event Fees Admission Fees to special art, culture and heritage events, competitions and/or programs and exhibits
Up to $50.00 for up to 8 hours for nonprofit organizations; up to $100.00
for up to 8 hours for for-profit organizations
1856 Aviation FTZ Transaction Fees Transaction Fee $15.00
1857 Aviation FTZ Transaction Fees High Volume Admissions 0-150 $15.00
1858 Aviation FTZ Transaction Fees High Volume Admissions 151-300 $12.00
1859 Aviation FTZ Transaction Fees High Volume Admissions > 301 $10.00
1860 Aviation FTZ Transaction Fees Blanket Admission $100.00
1861 Aviation FTZ Transaction Fees Training Seminar $150.00
1862 Aviation FTZ Transaction Fees Weekly Transportation and Exportation $30.00
1863 Aviation FTZ Transaction Fees Weekly Entry $30.00
1864 Aviation FTZ Transaction Fees Direct Delivery Admission, Daily cumulative 214 $75.00
1865 Aviation FTZ Transaction Fees Direct Delivery Admission, Subsequent 214 $15.00
1866 Aviation FTZ Transaction Fees Cartage Document Fee $15.00
1867 Aviation FTZ Transaction Fees Application Fee, Subzone $10,000.00
1868 Aviation FTZ Transaction Fees Application Fee, New General Purpose Site (Minor Boundary Modification)
$3,000.00
1869 Aviation FTZ Transaction Fees Application Fee, Expansion Site (Magnet) $5,000.00
1870 Aviation FTZ Transaction Permit Activation Fee, General Purpose Site $2,000.00
1871 Aviation FTZ Transaction Permit Activation, Sub-Zone Fee $5,000.00
1872 Aviation FTZ Transaction Permit Alteration Request $300.00
1873 Aviation FTZ Transaction Permit Annual Subzone Fee, per Site in GP Zone $20,000.00
1874 Aviation FTZ Transaction Permit Annual Subzone Fee, per Site outside GP Zone $20,000.00
1875 Aviation FTZ Transaction Permit Annual Fee, Manufacturing Operator $15,000.00
1876 Aviation FTZ Transaction Permit Annual Fee, Distribution Site Operator $20,000.00
1877 Aviation FTZ Transaction Permit Annual Fee, FTZ User/Operator (Reduced by total yearly Transaction Fees)(Minimum is $0)
$2,000.00
1878 Aviation FTZ Event Fees Admission fee for special events, per person) up to $200.00
1879 Aviation Vendor Booth Fees Vendor fees for onsite commercial vendors up to $500.00
1880 Aviation Event Sponsor Fees
Custom sponsorship packages may include, but are not limited to: booth space, table and chair usage, ability to hand out marketing materials or goodies, tickets to the event, website and/or map advertising, in-kind, acknowledgment as sponsor on: event banner, press releases, event programs, map inserts, in email and social media, TV, radio, internet, billboards, flyers, and/or posters.
$250.00 to 15,000.00
1881 Aviation FTZ Transaction Fees FTZ Consulting Fee - Hourly $100.00
1882 Aviation FTZ Transaction Fees Business Analysis Fee - Hourly $100.00
1883 Aviation Customer Facility Charge Fee imposed by the City of El Paso and collected by On-Airport Car Rental Concessionaires on a per transaction day basis.
$3.50 per transaction day
1884 Aviation Aircraft Parking (Dead Storage) Under 80,000 lbs. $30.00/day
1885 Aviation Aircraft Parking (Dead Storage) Over 80,000 lbs. $100.00/day
1886 Aviation Aircraft Parking (RON) Remain Overnight (RON) Aircraft Parking $20.00/day
1887 Aviation Ground Service Equipment Parking Rental of Parking Area for Airline Ground Service Equipment $2.70 per Square Foot per Year
1888 Aviation Fuel Flowage Fees Fuel Flowage Fees $0.08 per gallon
1889 Aviation Annual Shuttle Service Permit Application $150.00 per vehicle
1890 Aviation Off-Airport Rental Car Permit Off-Airport Rental Car Permit 10% gross receipts
1891 Aviation Annual Taxicab Permit Annual Taxicab Permit $250.00 per vehicle or $20.83/mo.
1892 Aviation Cost Recovery Rates SIDA Badge Issue $110.00
1893 Aviation Cost Recovery Rates AOA Badge Issue $45.00
1894 Aviation Cost Recovery Rates AOA Badge Renewal $35.00
1895 Aviation Cost Recovery Rates SIDA/ Sterile area badge renewal $70.00
1896 Aviation Cost Recovery Rates Reimbursement for Lost Not Returned Badges $110.00
1897 Aviation Cost Recovery Rates Daily Terminal Rental Rate (Non-Signatory) - Terminal Rate (Non-Signatory) divided by 360 days X Number of Rented Square Feet = Daily Terminal Rental Rate
Will be based on Rates & Charges
1898 Aviation Cost Recovery Rates Gate Use Fee Charge per Turn Around $125.00
1899 Aviation Cost Recovery Rates International Arrivals Area Charge per Deplaned International Passenger
Will be based on Rates & Charges
1900 Aviation Cost Recovery Rates Administrative Charge for Work Completed by the El Paso International Airport.
Work completed by El Paso International Airport on behalf of airport
tenants will be assessed an administrative charge of $40.00 when
the costs for such work exceeds $100.00.
1901 Aviation Public Parking Short Term (ST) ST 0 – 10 min. Free
1902 Aviation Public Parking Short Term (ST) ST 11 min – 1 hr. $1.00
1903 Aviation Public Parking Short Term (ST) ST Each Additional Hour $1.00
1904 Aviation Public Parking Short Term (ST) ST Max each 24 hrs. $15.00
1905 Aviation Public Parking Long Term (LT) LT 0 – 10 min Free
1906 Aviation Public Parking Long Term (LT) LT 11 min. - 1 hr. $1.00
1907 Aviation Public Parking Long Term (LT) LT Each Additional Hour $1.00
1908 Aviation Public Parking Long Term (LT) LT Max. each 24 hrs. $7.00
1909 Aviation Oversized Vehicle Parking Fee Fee for parking of oversized vehicles such as motor homes, buses, utility vehicles, etc.
Double the otherwise applicable Public Parking Short Term & Long Term
Parking Fee1910 Aviation Premium Parking Fee Reserved Parking Space $20.00 per day
Schedule C‐ 37
469
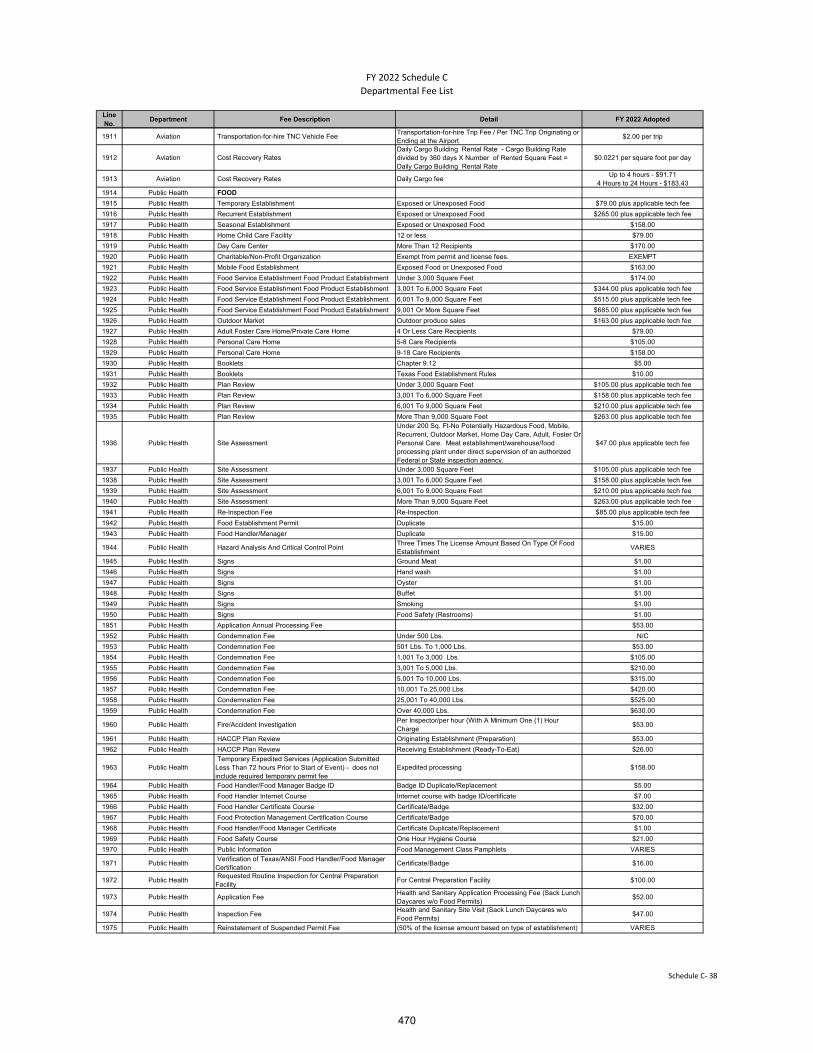
FY 2022 Schedule C
Departmental Fee List
Line No.
Department Fee Description Detail FY 2022 Adopted
1911 Aviation Transportation-for-hire TNC Vehicle Fee Transportation-for-hire Trip Fee / Per TNC Trip Originating or Ending at the Airport
$2.00 per trip
1912 Aviation Cost Recovery Rates Daily Cargo Building Rental Rate - Cargo Building Rate divided by 360 days X Number of Rented Square Feet = Daily Cargo Building Rental Rate
$0.0221 per square foot per day
1913 Aviation Cost Recovery Rates Daily Cargo feeUp to 4 hours - $91.71
4 Hours to 24 Hours - $183.43
1914 Public Health FOOD
1915 Public Health Temporary Establishment Exposed or Unexposed Food $79.00 plus applicable tech fee
1916 Public Health Recurrent Establishment Exposed or Unexposed Food $265.00 plus applicable tech fee
1917 Public Health Seasonal Establishment Exposed or Unexposed Food $158.00
1918 Public Health Home Child Care Facility 12 or less $79.00
1919 Public Health Day Care Center More Than 12 Recipients $170.00
1920 Public Health Charitable/Non-Profit Organization Exempt from permit and license fees. EXEMPT
1921 Public Health Mobile Food Establishment Exposed Food or Unexposed Food $163.00
1922 Public Health Food Service Establishment Food Product Establishment Under 3,000 Square Feet $174.00
1923 Public Health Food Service Establishment Food Product Establishment 3,001 To 6,000 Square Feet $344.00 plus applicable tech fee
1924 Public Health Food Service Establishment Food Product Establishment 6,001 To 9,000 Square Feet $515.00 plus applicable tech fee
1925 Public Health Food Service Establishment Food Product Establishment 9,001 Or More Square Feet $685.00 plus applicable tech fee
1926 Public Health Outdoor Market Outdoor produce sales $163.00 plus applicable tech fee
1927 Public Health Adult Foster Care Home/Private Care Home 4 Or Less Care Recipients $79.00
1928 Public Health Personal Care Home 5-8 Care Recipients $105.00
1929 Public Health Personal Care Home 9-18 Care Recipients $158.00
1930 Public Health Booklets Chapter 9.12 $5.00
1931 Public Health Booklets Texas Food Establishment Rules $10.00
1932 Public Health Plan Review Under 3,000 Square Feet $105.00 plus applicable tech fee
1933 Public Health Plan Review 3,001 To 6,000 Square Feet $158.00 plus applicable tech fee
1934 Public Health Plan Review 6,001 To 9,000 Square Feet $210.00 plus applicable tech fee
1935 Public Health Plan Review More Than 9,000 Square Feet $263.00 plus applicable tech fee
1936 Public Health Site Assessment
Under 200 Sq. Ft-No Potentially Hazardous Food, Mobile, Recurrent, Outdoor Market, Home Day Care, Adult, Foster Or Personal Care. Meat establishment/warehouse/food processing plant under direct supervision of an authorized Federal or State inspection agency.
$47.00 plus applicable tech fee
1937 Public Health Site Assessment Under 3,000 Square Feet $105.00 plus applicable tech fee
1938 Public Health Site Assessment 3,001 To 6,000 Square Feet $158.00 plus applicable tech fee
1939 Public Health Site Assessment 6,001 To 9,000 Square Feet $210.00 plus applicable tech fee
1940 Public Health Site Assessment More Than 9,000 Square Feet $263.00 plus applicable tech fee
1941 Public Health Re-Inspection Fee Re-Inspection $85.00 plus applicable tech fee
1942 Public Health Food Establishment Permit Duplicate $15.00
1943 Public Health Food Handler/Manager Duplicate $15.00
1944 Public Health Hazard Analysis And Critical Control Point Three Times The License Amount Based On Type Of Food Establishment
VARIES
1945 Public Health Signs Ground Meat $1.00
1946 Public Health Signs Hand wash $1.00
1947 Public Health Signs Oyster $1.00
1948 Public Health Signs Buffet $1.00
1949 Public Health Signs Smoking $1.00
1950 Public Health Signs Food Safety (Restrooms) $1.00
1951 Public Health Application Annual Processing Fee $53.00
1952 Public Health Condemnation Fee Under 500 Lbs. N/C
1953 Public Health Condemnation Fee 501 Lbs. To 1,000 Lbs. $53.00
1954 Public Health Condemnation Fee 1,001 To 3,000 Lbs. $105.00
1955 Public Health Condemnation Fee 3,001 To 5,000 Lbs. $210.00
1956 Public Health Condemnation Fee 5,001 To 10,000 Lbs. $315.00
1957 Public Health Condemnation Fee 10,001 To 25,000 Lbs. $420.00
1958 Public Health Condemnation Fee 25,001 To 40,000 Lbs. $525.00
1959 Public Health Condemnation Fee Over 40,000 Lbs. $630.00
1960 Public Health Fire/Accident Investigation Per Inspector/per hour (With A Minimum One (1) Hour Charge
$53.00
1961 Public Health HACCP Plan Review Originating Establishment (Preparation) $53.00
1962 Public Health HACCP Plan Review Receiving Establishment (Ready-To-Eat) $26.00
1963 Public Health Temporary Expedited Services (Application Submitted Less Than 72 hours Prior to Start of Event) - does not include required temporary permit fee
Expedited processing $158.00
1964 Public Health Food Handler/Food Manager Badge ID Badge ID Duplicate/Replacement $5.00
1965 Public Health Food Handler Internet Course Internet course with badge ID/certificate $7.00
1966 Public Health Food Handler Certificate Course Certificate/Badge $32.00
1967 Public Health Food Protection Management Certification Course Certificate/Badge $70.00
1968 Public Health Food Handler/Food Manager Certificate Certificate Duplicate/Replacement $1.00
1969 Public Health Food Safety Course One Hour Hygiene Course $21.00
1970 Public Health Public Information Food Management Class Pamphlets VARIES
1971 Public Health Verification of Texas/ANSI Food Handler/Food Manager Certification
Certificate/Badge $16.00
1972 Public Health Requested Routine Inspection for Central Preparation Facility
For Central Preparation Facility $100.00
1973 Public Health Application Fee Health and Sanitary Application Processing Fee (Sack Lunch Daycares w/o Food Permits)
$52.00
1974 Public Health Inspection Fee Health and Sanitary Site Visit (Sack Lunch Daycares w/o Food Permits)
$47.00
1975 Public Health Reinstatement of Suspended Permit Fee (50% of the license amount based on type of establishment) VARIES
Schedule C‐ 38
470

FY 2022 Schedule C
Departmental Fee List
Line No.
Department Fee Description Detail FY 2022 Adopted
1976 Public Health
After Hours Inspection Fee, Fire/Accident Inspection Fee or Food Condemnation/retention Fee Over 500# (6:00 pm to 7:00 am Monday to Thursday; All Day Friday, Saturday, Sunday, and City Holidays)
Per Hour Inspector (With a Minimum one (1) Hour Charge or Any Portion Thereof.
$86.00
1977 Public Health
Reduced fees for Dental, STD, TB Clinic Self-Pay Patients will be based in accordance with the US Department of Health and Human Services. The Sliding Fee Scale is available at the Department of Public Health for review and discounted fees will be charged after required documentation is received and eligibility determination by department personnel is made.
Medical related fees are set in accordance with Medicaid rates.
1978 Public Health DENTAL
1979 Public Health Initial Oral Exam Initial Oral Exam D0150 $45.00
1980 Public Health Oral Periodic Oral Exam Oral Periodic Oral Exam D0120 $37.00
1981 Public Health Emergency Oral Exam Emergency Oral Exam D0140 $25.00
1982 Public Health Oral Exam 6 Mos. Old. Oral Exam 6 Mos. Old. D0145 $181.00
1983 Public Health Detailed/extensive oral eval B/R Detailed/extensive oral eval B/R D0160 $19.00
1984 Public Health Limited Re-evaluation estab patient Limited Re-evaluation estab patient D0170 $0.00
1985 Public Health Retreat prev RCT molar Retreat prev RCT molar D3348 $342.00
1986 Public Health Comprehensive perio evaluation Comprehensive perio evaluation D0180 $10.00
1987 Public Health Apexification/recal Initial Apexification/recal Initial D3351 $93.00
1988 Public Health Apexification/recal Interim Apexification/recal Interim D3352 $62.00
1989 Public Health Intraoral-Complete Series Intraoral-Complete Series D0210 $92.00
1990 Public Health Int/Oral-Periapical 1st Film Int/Oral-Periapical 1st Film D0220 $16.00
1991 Public Health Int/Oral-Periapical each add Int/Oral-Periapical each add D0230 $15.00
1992 Public Health Intraoral Occlusal Film Intraoral Occlusal Film D0240 $13.00
1993 Public Health Apexification/recal final Apexification/recal final D3353 $124.00
1994 Public Health Extraoral first film Extraoral first film D0250 $24.00
1995 Public Health Bitewings single film Bitewings single film D0270 $6.00
1996 Public Health Bitewings Two Films Bitewings Two Films D0272 $30.00
1997 Public Health Bitewings three films Bitewings three films 0273 $38.00
1998 Public Health Bitewings Four Film Bitewings Four Films D0274 $44.00
1999 Public Health Verticle bitewings 7-8 films Verticle bitewings 7-8 films D0277 $40.00
2000 Public Health Panoramic Film Panoramic Film D0330 $81.00
2001 Public Health Crown buildup, include any pins Crown buildup, include any pins D2950 $56.00
2002 Public Health Interim ther Pin retentiom/tooth, (+rest) Interim ther Pin retentiom/tooth, (+rest) $16.00
2003 Public Health Cast post $ core in add to crn Cast post $ core in add to crn D2952 $109.00
2004 Public Health Each addtl cast post -same tooth Each addtl cast post -same tooth D2953 $54.00
2005 Public Health Pulp vitility tests Pulp vitility tests D0460 $16.00
2006 Public Health Dianostic casts Dianostic casts D0470 $29.00
2007 Public Health Prefab post &core in add to crown Prefab post &core in add to crown D2954 $93.00
2008 Public Health Post Removal (not with endo) Post Removal (not with endo) D2955 $93.00
2009 Public Health Each + prefab post same tooth Each + prefab post same tooth D2957 $47.00
2010 Public Health Lablal veneer (laminate) Chairsd Lablal veneer (laminate) Chairsd D2960 $140.00
2011 Public Health Lablal veneer (porceln lam - lab Lablal veneer (porceln lam - lab D2961 $225.00
2012 Public Health Lablal veneer porce lam lab Lablal veneer porce lam lab D2962 $264.00
2013 Public Health Addtl prc-new crm under exs dent Addtl prc-new crm under exs dent D2971 $140.00
2014 Public Health crown repair by report crown repair by report D2980 $62.00
2015 Public Health Pulpal Therapy anterior primary Pulpal Therapy anterior primary D3230 $48.00
2016 Public Health Adult/Prophy Adult/Prophy D1110 $70.00
2017 Public Health Child/Prophy Child/Prophy D1120 $47.00
2018 Public Health Pulpal Therapy posterior primary Pulpal Therapy posterior primary D3240 $55.00
2019 Public Health Retreat prev RCT anterior Retreat prev RCT anterior D4336 $194.00
2020 Public Health Child/Fluoride Child/Fluoride D1206 $19.00
2021 Public Health Retreat prev RCT bicuspid Retreat prev RCT bicuspid D3347 $256.00
2022 Public Health Adult/Fluoride Adult/Fluoride D1208 $19.00
2023 Public Health Non Dentin Restorative Sealant Non Dentin Restorative Sealant D1352 $49.00
2024 Public Health Space maint remove unilateral Space maint remove unilateral D1520 $96.00
2025 Public Health Oral Hygiene Instruction Oral Hygiene Instruction D1330 $16.00
2026 Public Health Sealant per Tooth Sealant per Tooth D1351 $36.00
2027 Public Health Space Maint/Fixed Unilat Space Maint/Fixed Unilat D1510 $200.00
2028 Public Health Space Maintainer -fixed bil, maxillary Space Maintainer -fixed bil, maxillary D1516 $303.00
2029 Public Health Space Maintainer -fixed bil, mandibular Space Maintainer -fixed bil, mandibular D1517 $303.00
2030 Public Health Recementation of Space Maintainer Recementation of Space Maintainer D1550 $23.00
2031 Public Health Re-cement/re-bond bil. space maintainer - maxillary Re-cement/re-bond bil. space maintainer - maxillary D1551 $23.00
2032 Public Health Re-cement or re-bond bilateral space maintainer - mandibulaRe-cement or re-bond bilateral space maintainer - mandibular D1552
$23.00
2033 Public Health Re-cement or re-bond unilateral space maintainer - per quadRe-cement or re-bond unilateral space maintainer - per quadrant D1553
$23.00
2034 Public Health Removal of fixed unilateral space maintainer - per quadrantRemoval of fixed unilateral space maintainer - per quadrant D1557
$64.00
2035 Public Health Crown - porcelain fused to high noble metal Crown - porcelain fused to high noble metal D2750 $657.00
2036 Public Health Removal of fixed bilateral space maintainer - mandibularRemoval of fixed bilateral space maintainer - mandibular D1558
$64.00
2037 Public Health Periodontal scaling and root planing – one to three teeth perPeriodontal scaling and root planing – one to three teeth per quadrant D4342
$9.00
2038 Public Health AMAL. PRIM (1S) AMAL. PRIM (1S) D2140 $77.00
2039 Public Health AMAL. PERM (1S) AMAL. PERM (1S) D2140 $82.00
2040 Public Health AMAL. PRIM (2S) AMAL. PRIM (2S) D2150 $104.00
2041 Public Health AMAL. PERM (2S) AMAL. PERM (2S) D2150 $104.00
Schedule C‐ 39
471
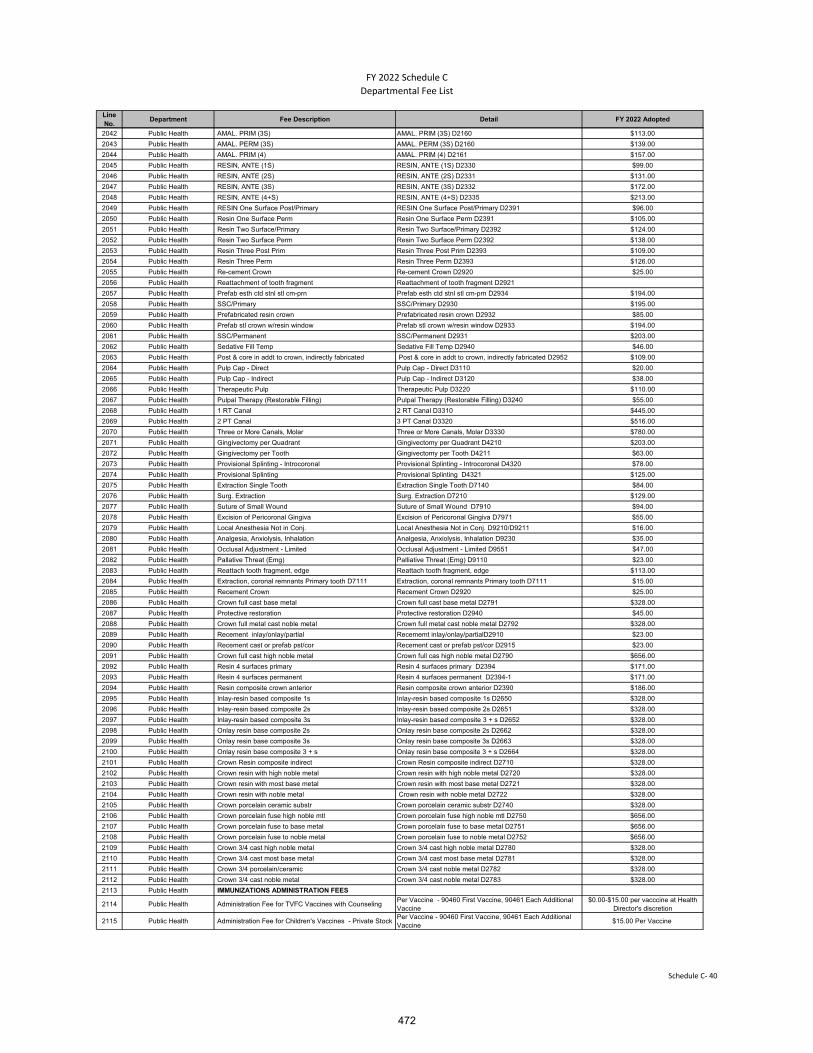
FY 2022 Schedule C
Departmental Fee List
Line No.
Department Fee Description Detail FY 2022 Adopted
2042 Public Health AMAL. PRIM (3S) AMAL. PRIM (3S) D2160 $113.00
2043 Public Health AMAL. PERM (3S) AMAL. PERM (3S) D2160 $139.00
2044 Public Health AMAL. PRIM (4) AMAL. PRIM (4) D2161 $157.00
2045 Public Health RESIN, ANTE (1S) RESIN, ANTE (1S) D2330 $99.00
2046 Public Health RESIN, ANTE (2S) RESIN, ANTE (2S) D2331 $131.00
2047 Public Health RESIN, ANTE (3S) RESIN, ANTE (3S) D2332 $172.00
2048 Public Health RESIN, ANTE (4+S) RESIN, ANTE (4+S) D2335 $213.00
2049 Public Health RESIN One Surface Post/Primary RESIN One Surface Post/Primary D2391 $96.00
2050 Public Health Resin One Surface Perm Resin One Surface Perm D2391 $105.00
2051 Public Health Resin Two Surface/Primary Resin Two Surface/Primary D2392 $124.00
2052 Public Health Resin Two Surface Perm Resin Two Surface Perm D2392 $138.00
2053 Public Health Resin Three Post Prim Resin Three Post Prim D2393 $109.00
2054 Public Health Resin Three Perm Resin Three Perm D2393 $126.00
2055 Public Health Re-cement Crown Re-cement Crown D2920 $25.00
2056 Public Health Reattachment of tooth fragment Reattachment of tooth fragment D2921
2057 Public Health Prefab esth ctd stnl stl cm-prn Prefab esth ctd stnl stl cm-prn D2934 $194.00
2058 Public Health SSC/Primary SSC/Primary D2930 $195.00
2059 Public Health Prefabricated resin crown Prefabricated resin crown D2932 $85.00
2060 Public Health Prefab stl crown w/resin window Prefab stl crown w/resin window D2933 $194.00
2061 Public Health SSC/Permanent SSC/Permanent D2931 $203.00
2062 Public Health Sedative Fill Temp Sedative Fill Temp D2940 $46.00
2063 Public Health Post & core in addt to crown, indirectly fabricated Post & core in addt to crown, indirectly fabricated D2952 $109.00
2064 Public Health Pulp Cap - Direct Pulp Cap - Direct D3110 $20.00
2065 Public Health Pulp Cap - Indirect Pulp Cap - Indirect D3120 $38.00
2066 Public Health Therapeutic Pulp Therapeutic Pulp D3220 $110.00
2067 Public Health Pulpal Therapy (Restorable Filling) Pulpal Therapy (Restorable Filling) D3240 $55.00
2068 Public Health 1 RT Canal 2 RT Canal D3310 $445.00
2069 Public Health 2 PT Canal 3 PT Canal D3320 $516.00
2070 Public Health Three or More Canals, Molar Three or More Canals, Molar D3330 $780.00
2071 Public Health Gingivectomy per Quadrant Gingivectomy per Quadrant D4210 $203.00
2072 Public Health Gingivectomy per Tooth Gingivectomy per Tooth D4211 $63.00
2073 Public Health Provisional Splinting - Introcoronal Provisional Splinting - Introcoronal D4320 $78.00
2074 Public Health Provisional Splinting Provisional Splinting D4321 $125.00
2075 Public Health Extraction Single Tooth Extraction Single Tooth D7140 $84.00
2076 Public Health Surg. Extraction Surg. Extraction D7210 $129.00
2077 Public Health Suture of Small Wound Suture of Small Wound D7910 $94.00
2078 Public Health Excision of Pericoronal Gingiva Excision of Pericoronal Gingiva D7971 $55.00
2079 Public Health Local Anesthesia Not in Conj. Local Anesthesia Not in Conj. D9210/D9211 $16.00
2080 Public Health Analgesia, Anxiolysis, Inhalation Analgesia, Anxiolysis, Inhalation D9230 $35.00
2081 Public Health Occlusal Adjustment - Limited Occlusal Adjustment - Limited D9551 $47.00
2082 Public Health Pallative Threat (Emg) Palliative Threat (Emg) D9110 $23.00
2083 Public Health Reattach tooth fragment, edge Reattach tooth fragment, edge $113.00
2084 Public Health Extraction, coronal remnants Primary tooth D7111 Extraction, coronal remnants Primary tooth D7111 $15.00
2085 Public Health Recement Crown Recement Crown D2920 $25.00
2086 Public Health Crown full cast base metal Crown full cast base metal D2791 $328.00
2087 Public Health Protective restoration Protective restoration D2940 $45.00
2088 Public Health Crown full metal cast noble metal Crown full metal cast noble metal D2792 $328.00
2089 Public Health Recement inlay/onlay/partial Recememt inlay/onlay/partialD2910 $23.00
2090 Public Health Recement cast or prefab pst/cor Recement cast or prefab pst/cor D2915 $23.00
2091 Public Health Crown full cast high noble metal Crown full cas high noble metal D2790 $656.00
2092 Public Health Resin 4 surfaces primary Resin 4 surfaces primary D2394 $171.00
2093 Public Health Resin 4 surfaces permanent Resin 4 surfaces permanent D2394-1 $171.00
2094 Public Health Resin composite crown anterior Resin composite crown anterior D2390 $186.00
2095 Public Health Inlay-resin based composite 1s Inlay-resin based composite 1s D2650 $328.00
2096 Public Health Inlay-resin based composite 2s Inlay-resin based composite 2s D2651 $328.00
2097 Public Health Inlay-resin based composite 3s Inlay-resin based composite 3 + s D2652 $328.00
2098 Public Health Onlay resin base composite 2s Onlay resin base composite 2s D2662 $328.00
2099 Public Health Onlay resin base composite 3s Onlay resin base composite 3s D2663 $328.00
2100 Public Health Onlay resin base composite 3 + s Onlay resin base composite 3 + s D2664 $328.00
2101 Public Health Crown Resin composite indirect Crown Resin composite indirect D2710 $328.00
2102 Public Health Crown resin with high noble metal Crown resin with high noble metal D2720 $328.00
2103 Public Health Crown resin with most base metal Crown resin with most base metal D2721 $328.00
2104 Public Health Crown resin with noble metal Crown resin with noble metal D2722 $328.00
2105 Public Health Crown porcelain ceramic substr Crown porcelain ceramic substr D2740 $328.00
2106 Public Health Crown porcelain fuse high noble mtl Crown porcelain fuse high noble mtl D2750 $656.00
2107 Public Health Crown porcelain fuse to base metal Crown porcelain fuse to base metal D2751 $656.00
2108 Public Health Crown porcelain fuse to noble metal Crown porcelain fuse to noble metal D2752 $656.00
2109 Public Health Crown 3/4 cast high noble metal Crown 3/4 cast high noble metal D2780 $328.00
2110 Public Health Crown 3/4 cast most base metal Crown 3/4 cast most base metal D2781 $328.00
2111 Public Health Crown 3/4 porcelain/ceramic Crown 3/4 cast noble metal D2782 $328.00
2112 Public Health Crown 3/4 cast noble metal Crown 3/4 cast noble metal D2783 $328.00
2113 Public Health IMMUNIZATIONS ADMINISTRATION FEES
2114 Public Health Administration Fee for TVFC Vaccines with Counseling Per Vaccine - 90460 First Vaccine, 90461 Each Additional Vaccine
$0.00-$15.00 per vacccine at Health Director's discretion
2115 Public Health Administration Fee for Children's Vaccines - Private Stock Per Vaccine - 90460 First Vaccine, 90461 Each Additional Vaccine
$15.00 Per Vaccine
Schedule C‐ 40
472
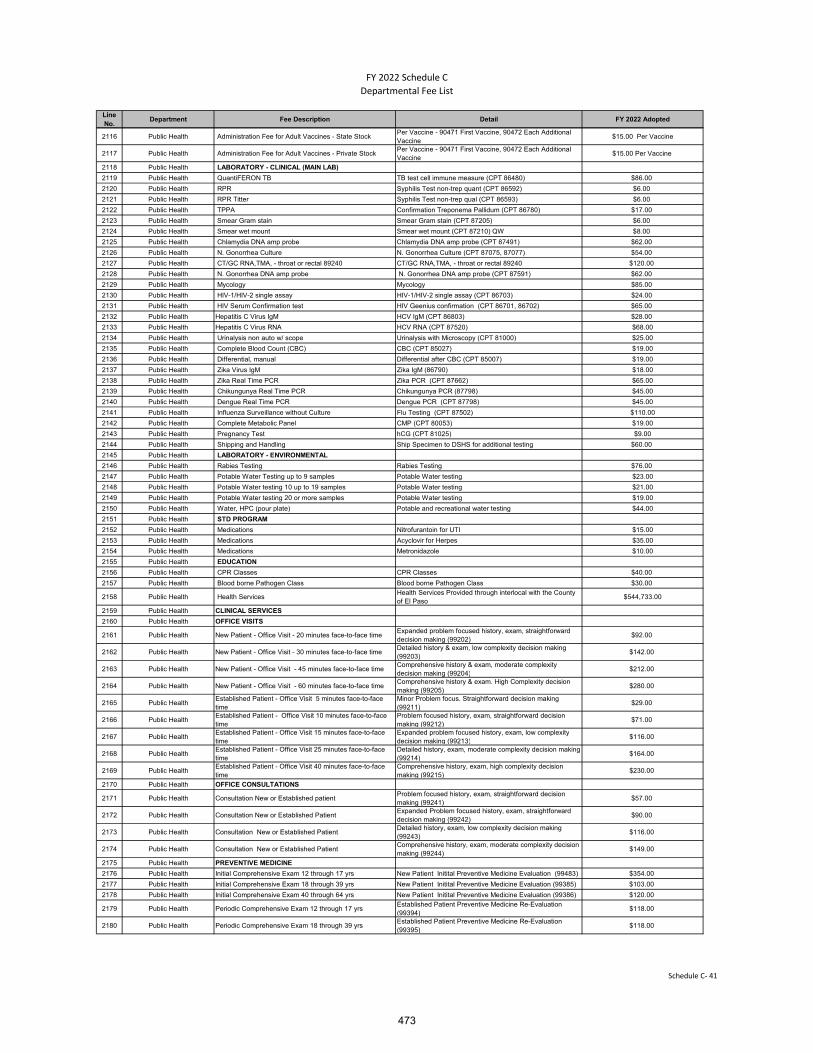
FY 2022 Schedule C
Departmental Fee List
Line No.
Department Fee Description Detail FY 2022 Adopted
2116 Public Health Administration Fee for Adult Vaccines - State Stock Per Vaccine - 90471 First Vaccine, 90472 Each Additional Vaccine
$15.00 Per Vaccine
2117 Public Health Administration Fee for Adult Vaccines - Private Stock Per Vaccine - 90471 First Vaccine, 90472 Each Additional Vaccine
$15.00 Per Vaccine
2118 Public Health LABORATORY - CLINICAL (MAIN LAB)
2119 Public Health QuantiFERON TB TB test cell immune measure (CPT 86480) $86.00
2120 Public Health RPR Syphilis Test non-trep quant (CPT 86592) $6.00
2121 Public Health RPR Titter Syphilis Test non-trep qual (CPT 86593) $6.00
2122 Public Health TPPA Confirmation Treponema Pallidum (CPT 86780) $17.00
2123 Public Health Smear Gram stain Smear Gram stain (CPT 87205) $6.00
2124 Public Health Smear wet mount Smear wet mount (CPT 87210) QW $8.00
2125 Public Health Chlamydia DNA amp probe Chlamydia DNA amp probe (CPT 87491) $62.00
2126 Public Health N. Gonorrhea Culture N. Gonorrhea Culture (CPT 87075, 87077) $54.00
2127 Public Health CT/GC RNA,TMA, - throat or rectal 89240 CT/GC RNA,TMA, - throat or rectal 89240 $120.00
2128 Public Health N. Gonorrhea DNA amp probe N. Gonorrhea DNA amp probe (CPT 87591) $62.00
2129 Public Health Mycology Mycology $85.00
2130 Public Health HIV-1/HIV-2 single assay HIV-1/HIV-2 single assay (CPT 86703) $24.00
2131 Public Health HIV Serum Confirmation test HIV Geenius confirmation (CPT 86701, 86702) $65.00
2132 Public Health Hepatitis C Virus IgM HCV IgM (CPT 86803) $28.00
2133 Public Health Hepatitis C Virus RNA HCV RNA (CPT 87520) $68.00
2134 Public Health Urinalysis non auto w/ scope Urinalysis with Microscopy (CPT 81000) $25.00
2135 Public Health Complete Blood Count (CBC) CBC (CPT 85027) $19.00
2136 Public Health Differential, manual Differential after CBC (CPT 85007) $19.00
2137 Public Health Zika Virus IgM Zika IgM (86790) $18.00
2138 Public Health Zika Real Time PCR Zika PCR (CPT 87662) $65.00
2139 Public Health Chikungunya Real Time PCR Chikungunya PCR (87798) $45.00
2140 Public Health Dengue Real Time PCR Dengue PCR (CPT 87798) $45.00
2141 Public Health Influenza Surveillance without Culture Flu Testing (CPT 87502) $110.00
2142 Public Health Complete Metabolic Panel CMP (CPT 80053) $19.00
2143 Public Health Pregnancy Test hCG (CPT 81025) $9.00
2144 Public Health Shipping and Handling Ship Specimen to DSHS for additional testing $60.00
2145 Public Health LABORATORY - ENVIRONMENTAL
2146 Public Health Rabies Testing Rabies Testing $76.00
2147 Public Health Potable Water Testing up to 9 samples Potable Water testing $23.00
2148 Public Health Potable Water testing 10 up to 19 samples Potable Water testing $21.00
2149 Public Health Potable Water testing 20 or more samples Potable Water testing $19.00
2150 Public Health Water, HPC (pour plate) Potable and recreational water testing $44.00
2151 Public Health STD PROGRAM
2152 Public Health Medications Nitrofurantoin for UTI $15.00
2153 Public Health Medications Acyclovir for Herpes $35.00
2154 Public Health Medications Metronidazole $10.00
2155 Public Health EDUCATION
2156 Public Health CPR Classes CPR Classes $40.00
2157 Public Health Blood borne Pathogen Class Blood borne Pathogen Class $30.00
2158 Public Health Health Services Health Services Provided through interlocal with the County of El Paso
$544,733.00
2159 Public Health CLINICAL SERVICES
2160 Public Health OFFICE VISITS
2161 Public Health New Patient - Office Visit - 20 minutes face-to-face time Expanded problem focused history, exam, straightforward decision making (99202)
$92.00
2162 Public Health New Patient - Office Visit - 30 minutes face-to-face timeDetailed history & exam, low complexity decision making (99203)
$142.00
2163 Public Health New Patient - Office Visit - 45 minutes face-to-face time Comprehensive history & exam, moderate complexity decision making (99204)
$212.00
2164 Public Health New Patient - Office Visit - 60 minutes face-to-face timeComprehensive history & exam. High Complexity decision making (99205)
$280.00
2165 Public HealthEstablished Patient - Office Visit 5 minutes face-to-face time
Minor Problem focus. Straightforward decision making (99211)
$29.00
2166 Public HealthEstablished Patient - Office Visit 10 minutes face-to-face time
Problem focused history, exam, straightforward decision making (99212)
$71.00
2167 Public HealthEstablished Patient - Office Visit 15 minutes face-to-face time
Expanded problem focused history, exam, low complexity decision making (99213)
$116.00
2168 Public HealthEstablished Patient - Office Visit 25 minutes face-to-face time
Detailed history, exam, moderate complexity decision making (99214)
$164.00
2169 Public HealthEstablished Patient - Office Visit 40 minutes face-to-face time
Comprehensive history, exam, high complexity decision making (99215)
$230.00
2170 Public Health OFFICE CONSULTATIONS
2171 Public Health Consultation New or Established patient Problem focused history, exam, straightforward decision making (99241)
$57.00
2172 Public Health Consultation New or Established Patient Expanded Problem focused history, exam, straightforward decision making (99242)
$90.00
2173 Public Health Consultation New or Established Patient Detailed history, exam, low complexity decision making (99243)
$116.00
2174 Public Health Consultation New or Established Patient Comprehensive history, exam, moderate complexity decision making (99244)
$149.00
2175 Public Health PREVENTIVE MEDICINE
2176 Public Health Initial Comprehensive Exam 12 through 17 yrs New Patient Initital Preventive Medicine Evaluation (99483) $354.00
2177 Public Health Initial Comprehensive Exam 18 through 39 yrs New Patient Initital Preventive Medicine Evaluation (99385) $103.00
2178 Public Health Initial Comprehensive Exam 40 through 64 yrs New Patient Initital Preventive Medicine Evaluation (99386) $120.00
2179 Public Health Periodic Comprehensive Exam 12 through 17 yrsEstablished Patient Preventive Medicine Re-Evaluation (99394)
$118.00
2180 Public Health Periodic Comprehensive Exam 18 through 39 yrsEstablished Patient Preventive Medicine Re-Evaluation (99395)
$118.00
Schedule C‐ 41
473
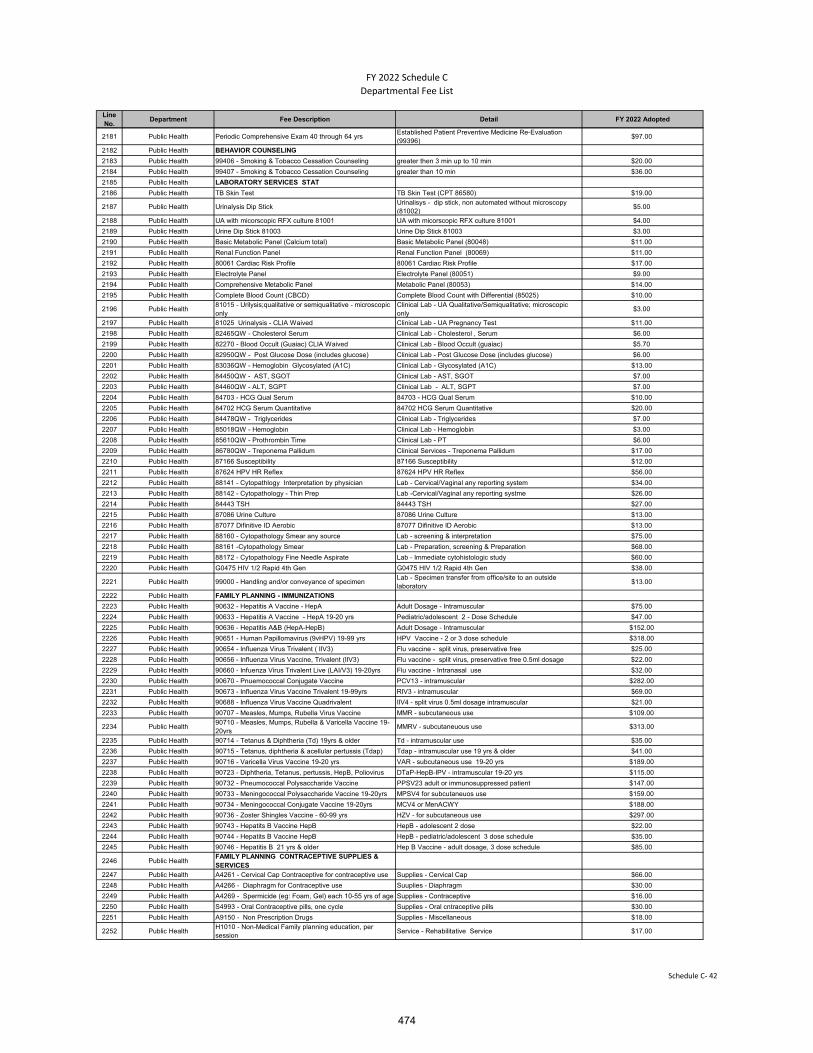
FY 2022 Schedule C
Departmental Fee List
Line No.
Department Fee Description Detail FY 2022 Adopted
2181 Public Health Periodic Comprehensive Exam 40 through 64 yrsEstablished Patient Preventive Medicine Re-Evaluation (99396)
$97.00
2182 Public Health BEHAVIOR COUNSELING
2183 Public Health 99406 - Smoking & Tobacco Cessation Counseling greater then 3 min up to 10 min $20.00
2184 Public Health 99407 - Smoking & Tobacco Cessation Counseling greater than 10 min $36.00
2185 Public Health LABORATORY SERVICES STAT
2186 Public Health TB Skin Test TB Skin Test (CPT 86580) $19.00
2187 Public Health Urinalysis Dip Stick Urinalisys - dip stick, non automated without microscopy (81002)
$5.00
2188 Public Health UA with micorscopic RFX culture 81001 UA with micorscopic RFX culture 81001 $4.00
2189 Public Health Urine Dip Stick 81003 Urine Dip Stick 81003 $3.00
2190 Public Health Basic Metabolic Panel (Calcium total) Basic Metabolic Panel (80048) $11.00
2191 Public Health Renal Function Panel Renal Function Panel (80069) $11.00
2192 Public Health 80061 Cardiac Risk Profile 80061 Cardiac Risk Profile $17.00
2193 Public Health Electrolyte Panel Electrolyte Panel (80051) $9.00
2194 Public Health Comprehensive Metabolic Panel Metabolic Panel (80053) $14.00
2195 Public Health Complete Blood Count (CBCD) Complete Blood Count with Differential (85025) $10.00
2196 Public Health81015 - Urilysis;qualitative or semiqualitative - microscopic only
Clinical Lab - UA Qualitative/Semiqualitative; microscopic only
$3.00
2197 Public Health 81025 Urinalysis - CLIA Waived Clinical Lab - UA Pregnancy Test $11.00
2198 Public Health 82465QW - Cholesterol Serum Clinical Lab - Cholesterol , Serum $6.00
2199 Public Health 82270 - Blood Occult (Guaiac) CLIA Waived Clinical Lab - Blood Occult (guaiac) $5.70
2200 Public Health 82950QW - Post Glucose Dose (includes glucose) Clinical Lab - Post Glucose Dose (includes glucose) $6.00
2201 Public Health 83036QW - Hemoglobin Glycosylated (A1C) Clinical Lab - Glycosylated (A1C) $13.00
2202 Public Health 84450QW - AST, SGOT Clinical Lab - AST, SGOT $7.00
2203 Public Health 84460QW - ALT, SGPT Clinical Lab - ALT, SGPT $7.00
2204 Public Health 84703 - HCG Qual Serum 84703 - HCG Qual Serum $10.00
2205 Public Health 84702 HCG Serum Quantitative 84702 HCG Serum Quantitative $20.00
2206 Public Health 84478QW - Triglycerides Clinical Lab - Triglycerides $7.00
2207 Public Health 85018QW - Hemoglobin Clinical Lab - Hemoglobin $3.00
2208 Public Health 85610QW - Prothrombin Time Clinical Lab - PT $6.00
2209 Public Health 86780QW - Treponema Pallidum Clinical Services - Treponema Pallidum $17.00
2210 Public Health 87166 Susceptibility 87166 Susceptibility $12.00
2211 Public Health 87624 HPV HR Reflex 87624 HPV HR Reflex $56.00
2212 Public Health 88141 - Cytopathlogy Interpretation by physician Lab - Cervical/Vaginal any reporting system $34.00
2213 Public Health 88142 - Cytopathology - Thin Prep Lab -Cervical/Vaginal any reporting systme $26.00
2214 Public Health 84443 TSH 84443 TSH $27.00
2215 Public Health 87086 Urine Culture 87086 Urine Culture $13.00
2216 Public Health 87077 Difinitive ID Aerobic 87077 Difinitive ID Aerobic $13.00
2217 Public Health 88160 - Cytopathology Smear any source Lab - screening & interpretation $75.00
2218 Public Health 88161 -Cytopathology Smear Lab - Preparation, screening & Preparation $68.00
2219 Public Health 88172 - Cytopathology Fine Needle Aspirate Lab - Immediate cytohistologic study $60.00
2220 Public Health G0475 HIV 1/2 Rapid 4th Gen G0475 HIV 1/2 Rapid 4th Gen $38.00
2221 Public Health 99000 - Handling and/or conveyance of specimenLab - Specimen transfer from office/site to an outside laboratory
$13.00
2222 Public Health FAMILY PLANNING - IMMUNIZATIONS
2223 Public Health 90632 - Hepatitis A Vaccine - HepA Adult Dosage - Intramuscular $75.00
2224 Public Health 90633 - Hepatitis A Vaccine - HepA 19-20 yrs Pediatric/adolescent 2 - Dose Schedule $47.00
2225 Public Health 90636 - Hepatitis A&B (HepA-HepB) Adult Dosage - Intramuscular $152.00
2226 Public Health 90651 - Human Papillomavirus (9vHPV) 19-99 yrs HPV Vaccine - 2 or 3 dose schedule $318.00
2227 Public Health 90654 - Influenza Virus Trivalent ( IIV3) Flu vaccine - split virus, preservative free $25.00
2228 Public Health 90656 - Influenza Virus Vaccine, Trivalent (IIV3) Flu vaccine - split virus, preservative free 0.5ml dosage $22.00
2229 Public Health 90660 - Infuenza Virus Trivalent Live (LAI/V3) 19-20yrs Flu vaccine - Intranasal use $32.00
2230 Public Health 90670 - Pnuemococcal Conjugate Vaccine PCV13 - intramuscular $282.00
2231 Public Health 90673 - Influenza Virus Vaccine Trivalent 19-99yrs RIV3 - intramuscular $69.00
2232 Public Health 90688 - Influenza Virus Vaccine Quadrivalent IIV4 - split virus 0.5ml dosage intramuscular $21.00
2233 Public Health 90707 - Measles, Mumps, Rubella Virus Vaccine MMR - subcutaneous use $109.00
2234 Public Health90710 - Measles, Mumps, Rubella & Varicella Vaccine 19-20yrs
MMRV - subcutaneuous use $313.00
2235 Public Health 90714 - Tetanus & Diphtheria (Td) 19yrs & older Td - intramuscular use $35.00
2236 Public Health 90715 - Tetanus, diphtheria & acellular pertussis (Tdap) Tdap - intramuscular use 19 yrs & older $41.00
2237 Public Health 90716 - Varicella Virus Vaccine 19-20 yrs VAR - subcutaneous use 19-20 yrs $189.00
2238 Public Health 90723 - Diphtheria, Tetanus, pertussis, HepB, Poliovirus DTaP-HepB-IPV - intramuscular 19-20 yrs $115.00
2239 Public Health 90732 - Pneumococcal Polysaccharide Vaccine PPSV23 adult or immunosuppressed patient $147.00
2240 Public Health 90733 - Meningococcal Polysaccharide Vaccine 19-20yrs MPSV4 for subcutaneuos use $159.00
2241 Public Health 90734 - Meningococcal Conjugate Vaccine 19-20yrs MCV4 or MenACWY $188.00
2242 Public Health 90736 - Zoster Shingles Vaccine - 60-99 yrs HZV - for subcutaneous use $297.00
2243 Public Health 90743 - Hepatits B Vaccine HepB HepB - adolescent 2 dose $22.00
2244 Public Health 90744 - Hepatits B Vaccine HepB HepB - pediatric/adolescent 3 dose schedule $35.00
2245 Public Health 90746 - Hepatitis B 21 yrs & older Hep B Vaccine - adult dosage, 3 dose schedule $85.00
2246 Public HealthFAMILY PLANNING CONTRACEPTIVE SUPPLIES & SERVICES
2247 Public Health A4261 - Cervical Cap Contraceptive for contraceptive use Supplies - Cervical Cap $66.00
2248 Public Health A4266 - Diaphragm for Contraceptive use Suuplies - Diaphragm $30.00
2249 Public Health A4269 - Spermicide (eg: Foam, Gel) each 10-55 yrs of age Supplies - Contraceptive $16.00
2250 Public Health S4993 - Oral Contraceptive pills, one cycle Supplies - Oral cntraceptive pills $30.00
2251 Public Health A9150 - Non Prescription Drugs Supplies - Miscellaneous $18.00
2252 Public HealthH1010 - Non-Medical Family planning education, per session
Service - Rehabilitative Service $17.00
Schedule C‐ 42
474
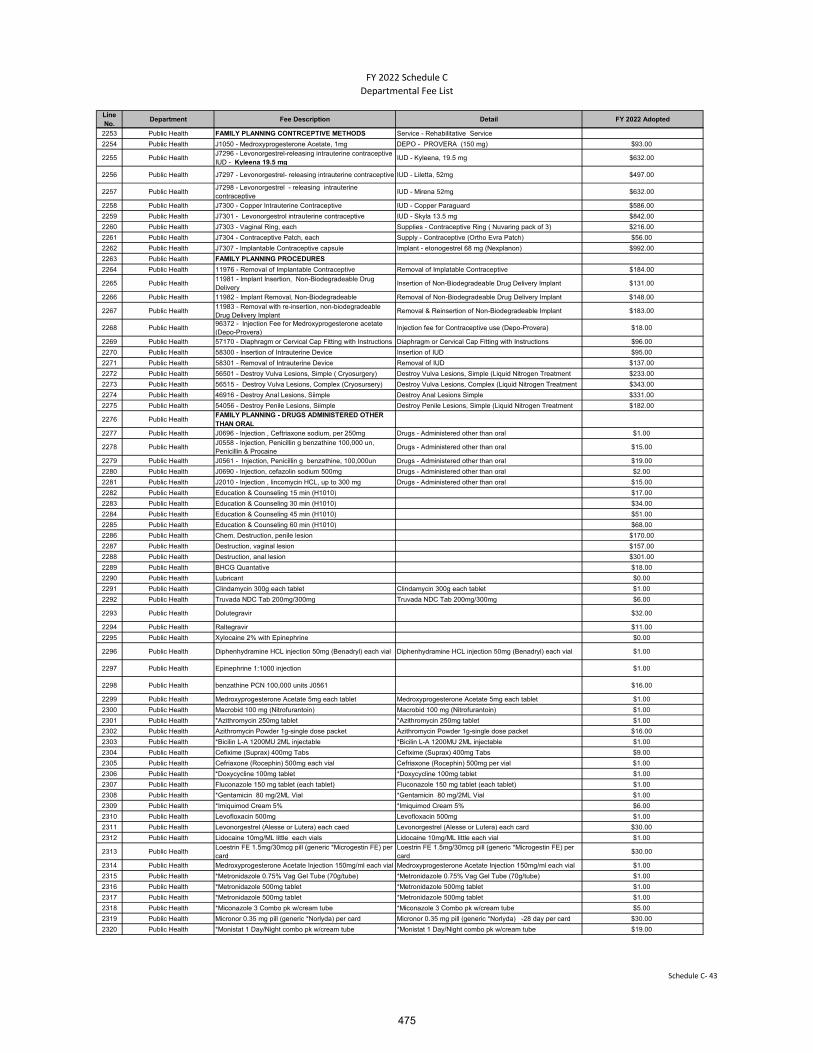
FY 2022 Schedule C
Departmental Fee List
Line No.
Department Fee Description Detail FY 2022 Adopted
2253 Public Health FAMILY PLANNING CONTRCEPTIVE METHODS Service - Rehabilitative Service
2254 Public Health J1050 - Medroxyprogesterone Acetate, 1mg DEPO - PROVERA (150 mg) $93.00
2255 Public HealthJ7296 - Levonorgestrel-releasing intrauterine contraceptive IUD - Kyleena 19.5 mg
IUD - Kyleena, 19.5 mg $632.00
2256 Public Health J7297 - Levonorgestrel- releasing intrauterine contraceptive IUD - Liletta, 52mg $497.00
2257 Public HealthJ7298 - Levonorgestrel - releasing intrauterine contraceptive
IUD - Mirena 52mg $632.00
2258 Public Health J7300 - Copper Intrauterine Contraceptive IUD - Copper Paraguard $586.00
2259 Public Health J7301 - Levonorgestrol intrauterine contraceptive IUD - Skyla 13.5 mg $842.00
2260 Public Health J7303 - Vaginal Ring, each Supplies - Contraceptive Ring ( Nuvaring pack of 3) $216.00
2261 Public Health J7304 - Contraceptive Patch, each Supply - Contraceptive (Ortho Evra Patch) $56.00
2262 Public Health J7307 - Implantable Contraceptive capsule Implant - etonogestrel 68 mg (Nexplanon) $992.00
2263 Public Health FAMILY PLANNING PROCEDURES
2264 Public Health 11976 - Removal of Implantable Contraceptive Removal of Implatable Contraceptive $184.00
2265 Public Health11981 - Implant Insertion, Non-Biodegradeable Drug Delivery
Insertion of Non-Biodegradeable Drug Delivery Implant $131.00
2266 Public Health 11982 - Implant Removal, Non-Biodegradeable Removal of Non-Biodegradeable Drug Delivery Implant $148.00
2267 Public Health11983 - Removal with re-insertion, non-biodegradeable Drug Delivery Implant
Removal & Reinsertion of Non-Biodegradeable Implant $183.00
2268 Public Health96372 - Injection Fee for Medroxyprogesterone acetate (Depo-Provera)
Injection fee for Contraceptive use (Depo-Provera) $18.00
2269 Public Health 57170 - Diaphragm or Cervical Cap Fitting with Instructions Diaphragm or Cervical Cap Fitting with Instructions $96.00
2270 Public Health 58300 - Insertion of Intrauterine Device Insertion of IUD $95.00
2271 Public Health 58301 - Removal of Intrauterine Device Removal of IUD $137.00
2272 Public Health 56501 - Destroy Vulva Lesions, Simple ( Cryosurgery) Destroy Vulva Lesions, Simple (Liquid Nitrogen Treatment $233.00
2273 Public Health 56515 - Destroy Vulva Lesions, Complex (Cryosursery) Destroy Vulva Lesions, Complex (Liquid Nitrogen Treatment $343.00
2274 Public Health 46916 - Destroy Anal Lesions, Siimple Destroy Anal Lesions Simple $331.00
2275 Public Health 54056 - Destroy Penile Lesions, Siimple Destroy Penile Lesions, Simple (Liquid Nitrogen Treatment $182.00
2276 Public HealthFAMILY PLANNING - DRUGS ADMINISTERED OTHER THAN ORAL
2277 Public Health J0696 - Injection , Ceftriaxone sodium, per 250mg Drugs - Administered other than oral $1.00
2278 Public HealthJ0558 - Injection, Penicillin g benzathine 100,000 un, Penicillin & Procaine
Drugs - Administered other than oral $15.00
2279 Public Health J0561 - Injection, Penicillin g benzathine, 100,000un Drugs - Administered other than oral $19.00
2280 Public Health J0690 - Injection, cefazolin sodium 500mg Drugs - Administered other than oral $2.00
2281 Public Health J2010 - Injection , lincomycin HCL, up to 300 mg Drugs - Administered other than oral $15.00
2282 Public Health Education & Counseling 15 min (H1010) $17.00
2283 Public Health Education & Counseling 30 min (H1010) $34.00
2284 Public Health Education & Counseling 45 min (H1010) $51.00
2285 Public Health Education & Counseling 60 min (H1010) $68.00
2286 Public Health Chem. Destruction, penile lesion $170.00
2287 Public Health Destruction, vaginal lesion $157.00
2288 Public Health Destruction, anal lesion $301.00
2289 Public Health BHCG Quantative $18.00
2290 Public Health Lubricant $0.00
2291 Public Health Clindamycin 300g each tablet Clindamycin 300g each tablet $1.00
2292 Public Health Truvada NDC Tab 200mg/300mg Truvada NDC Tab 200mg/300mg $6.00
2293 Public Health Dolutegravir $32.00
2294 Public Health Raltegravir $11.00
2295 Public Health Xylocaine 2% with Epinephrine $0.00
2296 Public Health Diphenhydramine HCL injection 50mg (Benadryl) each vial Diphenhydramine HCL injection 50mg (Benadryl) each vial $1.00
2297 Public Health Epinephrine 1:1000 injection $1.00
2298 Public Health benzathine PCN 100,000 units J0561 $16.00
2299 Public Health Medroxyprogesterone Acetate 5mg each tablet Medroxyprogesterone Acetate 5mg each tablet $1.00
2300 Public Health Macrobid 100 mg (Nitrofurantoin) Macrobid 100 mg (Nitrofurantoin) $1.00
2301 Public Health *Azithromycin 250mg tablet *Azithromycin 250mg tablet $1.00
2302 Public Health Azithromycin Powder 1g-single dose packet Azithromycin Powder 1g-single dose packet $16.00
2303 Public Health *Bicilin L-A 1200MU 2ML injectable *Bicilin L-A 1200MU 2ML injectable $1.00
2304 Public Health Cefixime (Suprax) 400mg Tabs Cefixime (Suprax) 400mg Tabs $9.00
2305 Public Health Cefriaxone (Rocephin) 500mg each vial Cefriaxone (Rocephin) 500mg per vial $1.00
2306 Public Health *Doxycycline 100mg tablet *Doxycycline 100mg tablet $1.00
2307 Public Health Fluconazole 150 mg tablet (each tablet) Fluconazole 150 mg tablet (each tablet) $1.00
2308 Public Health *Gentamicin 80 mg/2ML Vial *Gentamicin 80 mg/2ML Vial $1.00
2309 Public Health *Imiquimod Cream 5% *Imiquimod Cream 5% $6.00
2310 Public Health Levofloxacin 500mg Levofloxacin 500mg $1.00
2311 Public Health Levonorgestrel (Alesse or Lutera) each caed Levonorgestrel (Alesse or Lutera) each card $30.00
2312 Public Health Lidocaine 10mg/ML little each vials Lidocaine 10mg/ML little each vial $1.00
2313 Public HealthLoestrin FE 1.5mg/30mcg pill (generic *Microgestin FE) per card
Loestrin FE 1.5mg/30mcg pill (generic *Microgestin FE) per card
$30.00
2314 Public Health Medroxyprogesterone Acetate Injection 150mg/ml each vial Medroxyprogesterone Acetate Injection 150mg/ml each vial $1.00
2315 Public Health *Metronidazole 0.75% Vag Gel Tube (70g/tube) *Metronidazole 0.75% Vag Gel Tube (70g/tube) $1.00
2316 Public Health *Metronidazole 500mg tablet *Metronidazole 500mg tablet $1.00
2317 Public Health *Metronidazole 500mg tablet *Metronidazole 500mg tablet $1.00
2318 Public Health *Miconazole 3 Combo pk w/cream tube *Miconazole 3 Combo pk w/cream tube $5.00
2319 Public Health Micronor 0.35 mg pill (generic *Norlyda) per card Micronor 0.35 mg pill (generic *Norlyda) -28 day per card $30.00
2320 Public Health *Monistat 1 Day/Night combo pk w/cream tube *Monistat 1 Day/Night combo pk w/cream tube $19.00
Schedule C‐ 43
475
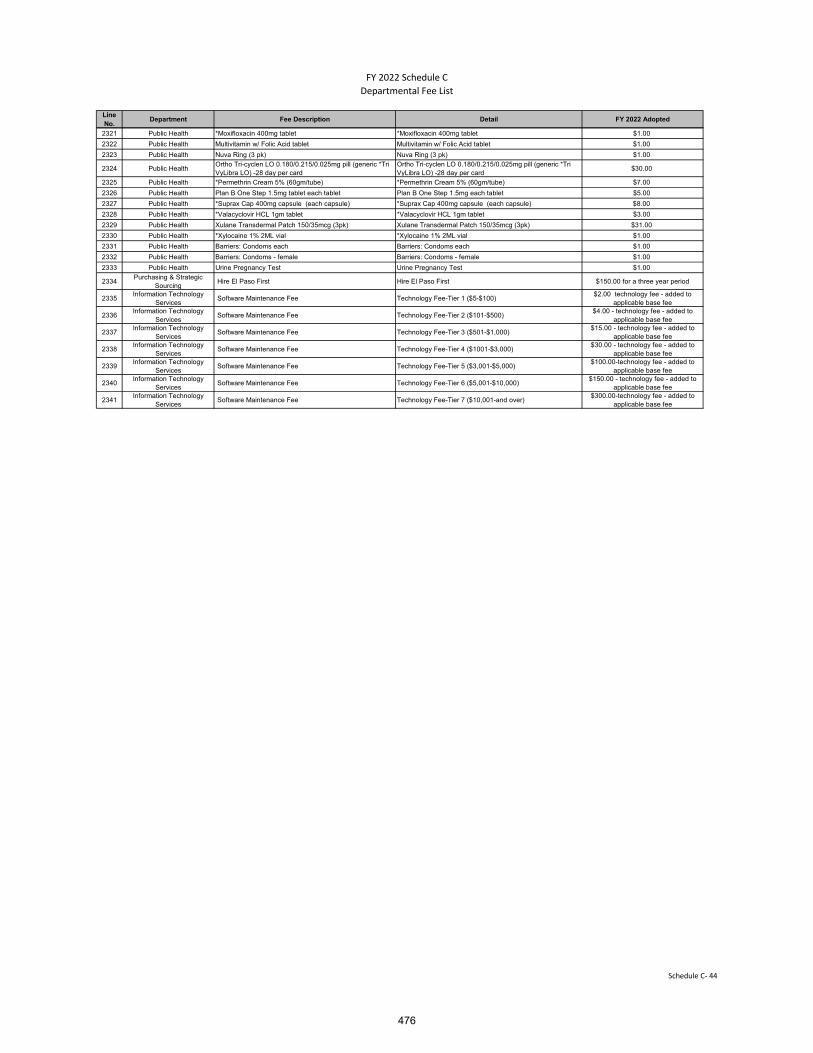
FY 2022 Schedule C
Departmental Fee List
Line No.
Department Fee Description Detail FY 2022 Adopted
2321 Public Health *Moxifloxacin 400mg tablet *Moxifloxacin 400mg tablet $1.00
2322 Public Health Multivitamin w/ Folic Acid tablet Multivitamin w/ Folic Acid tablet $1.00
2323 Public Health Nuva Ring (3 pk) Nuva Ring (3 pk) $1.00
2324 Public HealthOrtho Tri-cyclen LO 0.180/0.215/0.025mg pill (generic *Tri VyLibra LO) -28 day per card
Ortho Tri-cyclen LO 0.180/0.215/0.025mg pill (generic *Tri VyLibra LO) -28 day per card
$30.00
2325 Public Health *Permethrin Cream 5% (60gm/tube) *Permethrin Cream 5% (60gm/tube) $7.00
2326 Public Health Plan B One Step 1.5mg tablet each tablet Plan B One Step 1.5mg each tablet $5.00
2327 Public Health *Suprax Cap 400mg capsule (each capsule) *Suprax Cap 400mg capsule (each capsule) $8.00
2328 Public Health *Valacyclovir HCL 1gm tablet *Valacyclovir HCL 1gm tablet $3.00
2329 Public Health Xulane Transdermal Patch 150/35mcg (3pk) Xulane Transdermal Patch 150/35mcg (3pk) $31.00
2330 Public Health *Xylocaine 1% 2ML vial *Xylocaine 1% 2ML vial $1.00
2331 Public Health Barriers: Condoms each Barriers: Condoms each $1.00
2332 Public Health Barriers: Condoms - female Barriers: Condoms - female $1.00
2333 Public Health Urine Pregnancy Test Urine Pregnancy Test $1.00
2334Purchasing & Strategic
Sourcing Hire El Paso First Hire El Paso First $150.00 for a three year period
2335Information Technology
Services Software Maintenance Fee Technology Fee-Tier 1 ($5-$100)
$2.00 technology fee - added to applicable base fee
2336Information Technology
Services Software Maintenance Fee Technology Fee-Tier 2 ($101-$500)
$4.00 - technology fee - added to applicable base fee
2337Information Technology
Services Software Maintenance Fee Technology Fee-Tier 3 ($501-$1,000)
$15.00 - technology fee - added to applicable base fee
2338Information Technology
Services Software Maintenance Fee Technology Fee-Tier 4 ($1001-$3,000)
$30.00 - technology fee - added to applicable base fee
2339Information Technology
Services Software Maintenance Fee Technology Fee-Tier 5 ($3,001-$5,000)
$100.00-technology fee - added to applicable base fee
2340Information Technology
Services Software Maintenance Fee Technology Fee-Tier 6 ($5,001-$10,000)
$150.00 - technology fee - added to applicable base fee
2341Information Technology
Services Software Maintenance Fee Technology Fee-Tier 7 ($10,001-and over)
$300.00-technology fee - added to applicable base fee
Schedule C‐ 44
476

Job Code Job Description Pay Plan Pay Grade
10025 Foreign Trade Zone Coordinator PM 128
10030 Economic Program Analyst PM 126
10050 Marketing & Customer Relations Coordinator PM 126
10130 Lead Planner PM 130
10140 Senior Planner PM 128
10145 Environmental Planner PM 128
10150 Planner PM 125
10170 Planning Specialist GS 049
10180 Senior Planning Technician GS 046
10190 Planning Technician GS 043
10300 Senior Purchasing Agent PM 131
10310 Purchasing Agent PM 129
10315 Senior Procurement Analyst PM 128
10320 Procurement Analyst PM 126
10340 Buyer GS 054
10350 Project Compliance Specialist PM 122
10360 Purchasing Clerk GS 047
10370 Land & Contract Administrator PM 126
10375 Utility Planner PM 126
10380 Right of Way Agent PM 125
10390 Land & Contract Specialist GS 051
10430 Human Resources Manager PM 134
10435 Risk Manager PM 134
10440 Training & Development Coordinator PM 127
10510 Departmental Human Resources Manager PM 132
10515 Human Resources Business Partner PM 130
10520 Senior Human Resources Analyst PM 128
10530 Human Resources Analyst PM 125
10535 Human Resources Audit Specialist GS 057
10540 Lead Human Resources Specialist GS 056
10545 Senior Human Resources Specialist GS 054
10550 Human Resources Specialist GS 052
10640 Aging Services Coordinator PM 126
10645 Affordable Housing Finance Coordinator PM 132
10650 CDBG Contract Administrator PM 127
10660 Housing Construction Supervisor GS 056
10670 Community Development Program Coordinator PM 127
10700 Neighborhood Service Coordinator PM 130
10710 Senior Grant Planner PM 128
10720 Grant Planner PM 125
10730 Neighborhood Relations Coordinator PM 124
10735 Grant Services Coordinator PM 125
10810 Housing Program Specialist PM 124
10820 Fair Housing and Relocation Officer PM 123
Schedule D
Ordinance 8064 Appendix "A"
Page 1 of 12
477
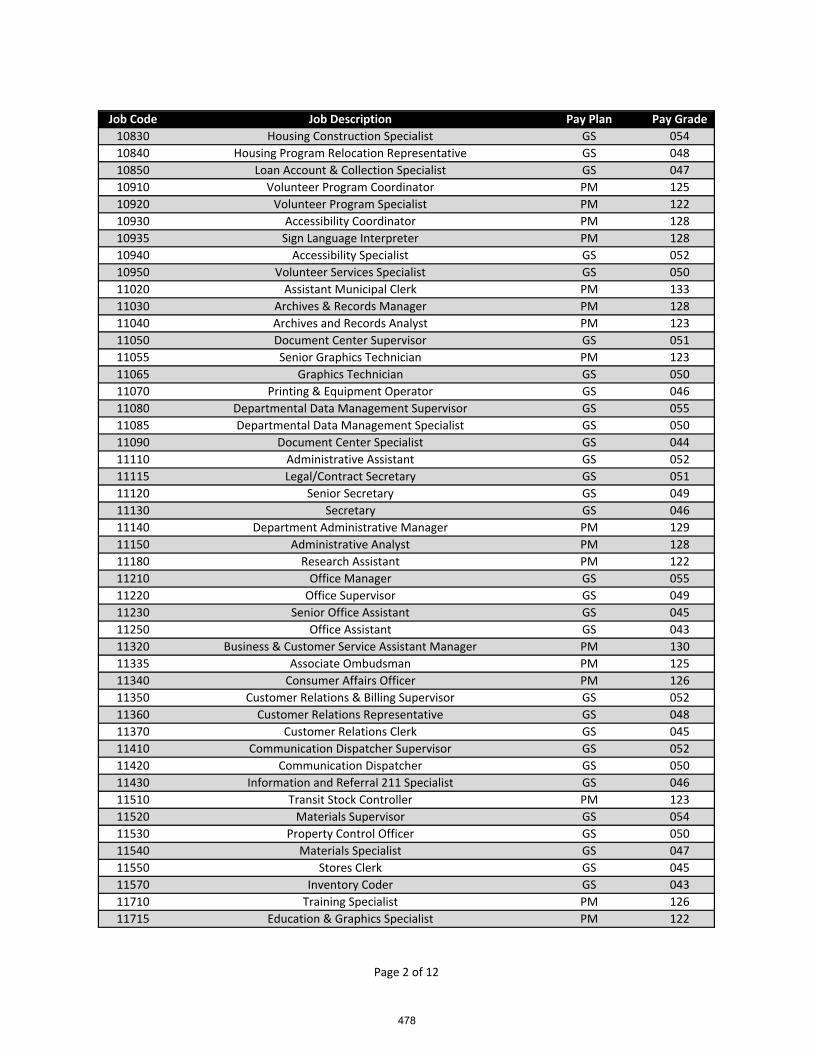
Job Code Job Description Pay Plan Pay Grade
10830 Housing Construction Specialist GS 054
10840 Housing Program Relocation Representative GS 048
10850 Loan Account & Collection Specialist GS 047
10910 Volunteer Program Coordinator PM 125
10920 Volunteer Program Specialist PM 122
10930 Accessibility Coordinator PM 128
10935 Sign Language Interpreter PM 128
10940 Accessibility Specialist GS 052
10950 Volunteer Services Specialist GS 050
11020 Assistant Municipal Clerk PM 133
11030 Archives & Records Manager PM 128
11040 Archives and Records Analyst PM 123
11050 Document Center Supervisor GS 051
11055 Senior Graphics Technician PM 123
11065 Graphics Technician GS 050
11070 Printing & Equipment Operator GS 046
11080 Departmental Data Management Supervisor GS 055
11085 Departmental Data Management Specialist GS 050
11090 Document Center Specialist GS 044
11110 Administrative Assistant GS 052
11115 Legal/Contract Secretary GS 051
11120 Senior Secretary GS 049
11130 Secretary GS 046
11140 Department Administrative Manager PM 129
11150 Administrative Analyst PM 128
11180 Research Assistant PM 122
11210 Office Manager GS 055
11220 Office Supervisor GS 049
11230 Senior Office Assistant GS 045
11250 Office Assistant GS 043
11320 Business & Customer Service Assistant Manager PM 130
11335 Associate Ombudsman PM 125
11340 Consumer Affairs Officer PM 126
11350 Customer Relations & Billing Supervisor GS 052
11360 Customer Relations Representative GS 048
11370 Customer Relations Clerk GS 045
11410 Communication Dispatcher Supervisor GS 052
11420 Communication Dispatcher GS 050
11430 Information and Referral 211 Specialist GS 046
11510 Transit Stock Controller PM 123
11520 Materials Supervisor GS 054
11530 Property Control Officer GS 050
11540 Materials Specialist GS 047
11550 Stores Clerk GS 045
11570 Inventory Coder GS 043
11710 Training Specialist PM 126
11715 Education & Graphics Specialist PM 122
Page 2 of 12
478

Job Code Job Description Pay Plan Pay Grade
11720 Training Technician GS 047
11730 Safety Specialist PM 124
11740 Safety Technician GS 048
12065 Business & Financial Manager PM 132
12095 Benefits Supervisor PM 130
12100 Risk Management Analyst PM 129
12105 Return to Work Specialist PM 124
12106 Benefit Specialist GS 052
12160 Budget & Services Coordinator PM 127
12170 Budget & Management Analyst PM 125
12180 Budget Specialist GS 053
12210 Accounting Manager PM 130
12220 Senior Accountant PM 128
12230 Accountant PM 125
12240 Associate Accountant PM 122
12245 Senior Accounting/Payroll Specialist GS 052
12250 Accounting/Payroll Specialist GS 050
12255 Collectively Bargained Payroll Clerk GS 047
12260 Accounting/Payroll Clerk GS 046
12330 Revenue Processing Supervisor GS 054
12340 Tax Accounts Supervisor GS 054
12400 International Bridges Operations Manager PM 130
12420 Toll Collections Supervisor GS 054
12430 Disbursements Supervisor GS 055
12440 Collections Supervisor GS 051
12450 Senior Toll Collector GS 045
12460 Senior Cashier GS 045
12470 Cashier GS 043
12480 Toll Collector GS 043
12510 Parking Meter Service Supervisor GS 049
12520 Parking Meter Service Worker GS 046
12530 Coin Sorter Operator GS 043
13040 Chief Construction Inspector PM 126
13075 Energy Resources Manager PM 132
13080 Energy Coordinator PM 128
13120 Architect PM 130
13130 Architectural Intern PM 124
13210 Hydrogeologist PM 131
13220 Quality Control Chemist PM 131
13230 Senior Chemist PM 129
13235 Senior Microbiologist PM 128
13240 Associate Hydrogeologist PM 126
13245 Chemist PM 125
13250 Microbiologist PM 125
13310 Civil Engineer PM 132
13320 Civil Engineer Associate PM 128
13360 Electrical Engineer PM 132
Page 3 of 12
479

Job Code Job Description Pay Plan Pay Grade
13370 Electrical Engineering Associate PM 128
13410 Environmental Engineer PM 132
13415 Environmental Senior Scientist PM 130
13420 Environmental Engineer Associate PM 128
13430 Environmental Scientist PM 126
13435 Environmental Staff Scientist PM 124
13440 Environmental Review Specialist PM 122
13510 Industrial Engineer PM 132
13520 Industrial Engineering Associate PM 128
13560 Mechanical Engineer PM 132
13570 Mechanical Engineering Associate PM 128
13610 Traffic Engineer PM 132
13620 Traffic Engineer Associate PM 128
13630 Traffic Control Planner PM 126
13640 Traffic Control Specialist GS 052
13710 Utility Engineer PM 132
13720 Pretreatment Manager PM 132
13730 Utility Engineering Associate PM 128
13740 Pretreatment Engineering Associate PM 128
13750 Pretreatment Assistant Manager PM 125
13810 Engineering Associate PM 126
13815 Engineering Lead Technician GS 056
13820 Engineering Senior Technician GS 054
13825 Environmental Senior Field Technician GS 052
13830 Engineering Technician GS 051
13835 Environmental Field Technician GS 048
13840 Engineering Aide GS 046
14055 Airport Program Coordinator PM 132
14060 Airport Facilities Maintenance Superintendent PM 129
14070 Airport Operations Superintendent PM 131
14080 Airport Security Coordinator PM 129
14090 Airport Operations Supervisor PM 126
14100 Airport Assistant Operations Officer PM 123
14120 Transportation Services Supervisor GS 052
14210 Transit Planning & Program Coordinator PM 132
14230 Transit Superintendent of Operations PM 132
14235 Streetcar Safety Manager PM 132
14240 Paratransit Assistant Superintendent PM 128
14255 Transit Senior Service Planner PM 127
14256 Transit Service Planner PM 125
14258 Transit Assistant Superintendent of Operations GS 058
14260 Transit Call Center Supervisor GS 055
14265 Transit Supervisor GS 053
14300 Transit Fleet Service Supervisor GS 052
14305 Transit Safety Manager PM 130
14307 Transit Safety Officer PM 126
14310 Transit Customer Service Supervisor GS 051
Page 4 of 12
480
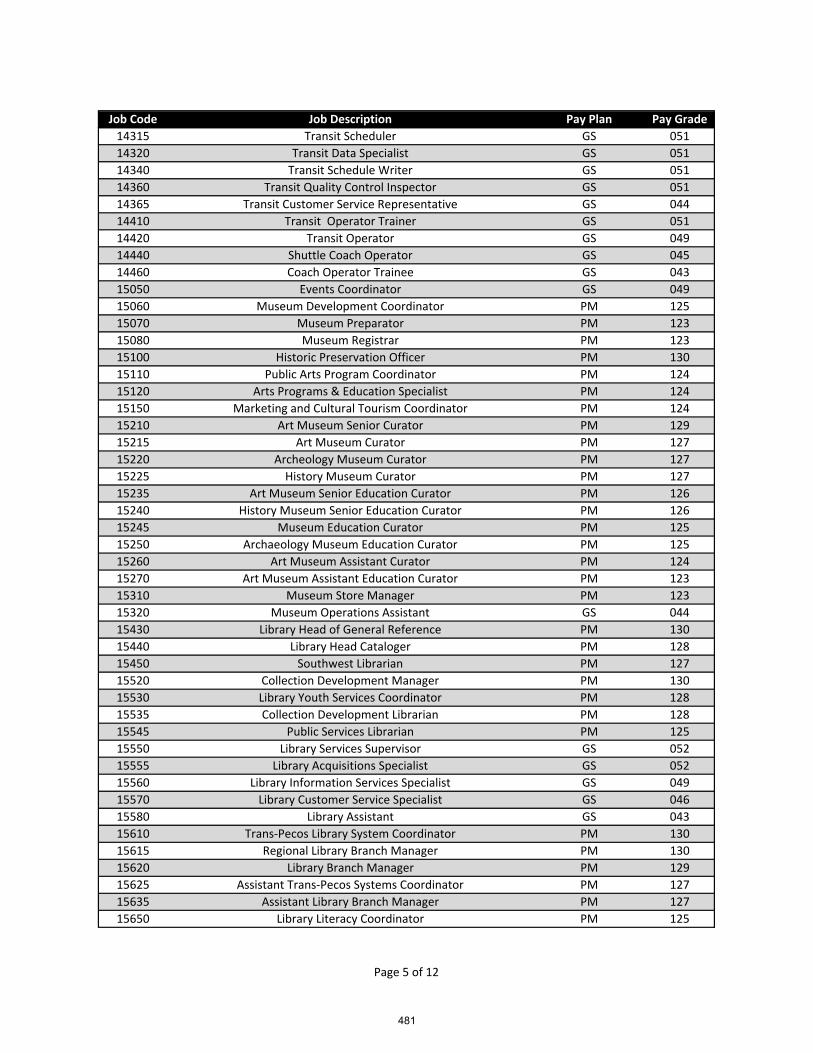
Job Code Job Description Pay Plan Pay Grade
14315 Transit Scheduler GS 051
14320 Transit Data Specialist GS 051
14340 Transit Schedule Writer GS 051
14360 Transit Quality Control Inspector GS 051
14365 Transit Customer Service Representative GS 044
14410 Transit Operator Trainer GS 051
14420 Transit Operator GS 049
14440 Shuttle Coach Operator GS 045
14460 Coach Operator Trainee GS 043
15050 Events Coordinator GS 049
15060 Museum Development Coordinator PM 125
15070 Museum Preparator PM 123
15080 Museum Registrar PM 123
15100 Historic Preservation Officer PM 130
15110 Public Arts Program Coordinator PM 124
15120 Arts Programs & Education Specialist PM 124
15150 Marketing and Cultural Tourism Coordinator PM 124
15210 Art Museum Senior Curator PM 129
15215 Art Museum Curator PM 127
15220 Archeology Museum Curator PM 127
15225 History Museum Curator PM 127
15235 Art Museum Senior Education Curator PM 126
15240 History Museum Senior Education Curator PM 126
15245 Museum Education Curator PM 125
15250 Archaeology Museum Education Curator PM 125
15260 Art Museum Assistant Curator PM 124
15270 Art Museum Assistant Education Curator PM 123
15310 Museum Store Manager PM 123
15320 Museum Operations Assistant GS 044
15430 Library Head of General Reference PM 130
15440 Library Head Cataloger PM 128
15450 Southwest Librarian PM 127
15520 Collection Development Manager PM 130
15530 Library Youth Services Coordinator PM 128
15535 Collection Development Librarian PM 128
15545 Public Services Librarian PM 125
15550 Library Services Supervisor GS 052
15555 Library Acquisitions Specialist GS 052
15560 Library Information Services Specialist GS 049
15570 Library Customer Service Specialist GS 046
15580 Library Assistant GS 043
15610 Trans‐Pecos Library System Coordinator PM 130
15615 Regional Library Branch Manager PM 130
15620 Library Branch Manager PM 129
15625 Assistant Trans‐Pecos Systems Coordinator PM 127
15635 Assistant Library Branch Manager PM 127
15650 Library Literacy Coordinator PM 125
Page 5 of 12
481
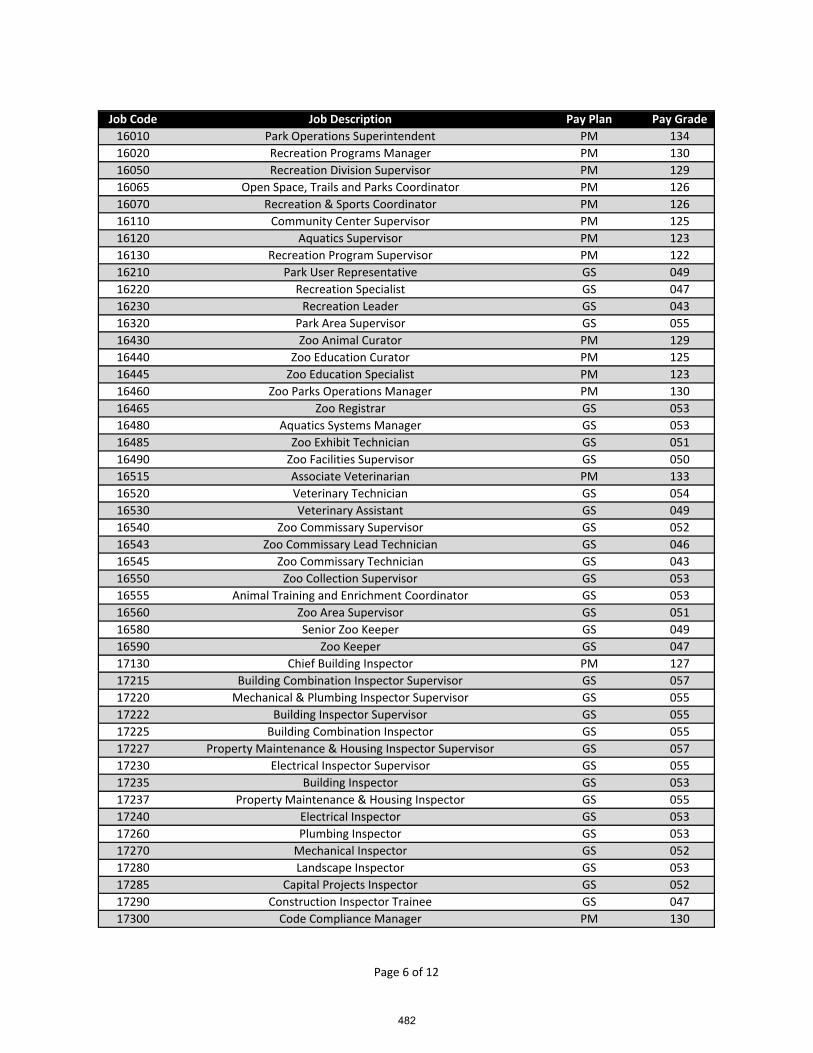
Job Code Job Description Pay Plan Pay Grade
16010 Park Operations Superintendent PM 134
16020 Recreation Programs Manager PM 130
16050 Recreation Division Supervisor PM 129
16065 Open Space, Trails and Parks Coordinator PM 126
16070 Recreation & Sports Coordinator PM 126
16110 Community Center Supervisor PM 125
16120 Aquatics Supervisor PM 123
16130 Recreation Program Supervisor PM 122
16210 Park User Representative GS 049
16220 Recreation Specialist GS 047
16230 Recreation Leader GS 043
16320 Park Area Supervisor GS 055
16430 Zoo Animal Curator PM 129
16440 Zoo Education Curator PM 125
16445 Zoo Education Specialist PM 123
16460 Zoo Parks Operations Manager PM 130
16465 Zoo Registrar GS 053
16480 Aquatics Systems Manager GS 053
16485 Zoo Exhibit Technician GS 051
16490 Zoo Facilities Supervisor GS 050
16515 Associate Veterinarian PM 133
16520 Veterinary Technician GS 054
16530 Veterinary Assistant GS 049
16540 Zoo Commissary Supervisor GS 052
16543 Zoo Commissary Lead Technician GS 046
16545 Zoo Commissary Technician GS 043
16550 Zoo Collection Supervisor GS 053
16555 Animal Training and Enrichment Coordinator GS 053
16560 Zoo Area Supervisor GS 051
16580 Senior Zoo Keeper GS 049
16590 Zoo Keeper GS 047
17130 Chief Building Inspector PM 127
17215 Building Combination Inspector Supervisor GS 057
17220 Mechanical & Plumbing Inspector Supervisor GS 055
17222 Building Inspector Supervisor GS 055
17225 Building Combination Inspector GS 055
17227 Property Maintenance & Housing Inspector Supervisor GS 057
17230 Electrical Inspector Supervisor GS 055
17235 Building Inspector GS 053
17237 Property Maintenance & Housing Inspector GS 055
17240 Electrical Inspector GS 053
17260 Plumbing Inspector GS 053
17270 Mechanical Inspector GS 052
17280 Landscape Inspector GS 053
17285 Capital Projects Inspector GS 052
17290 Construction Inspector Trainee GS 047
17300 Code Compliance Manager PM 130
Page 6 of 12
482
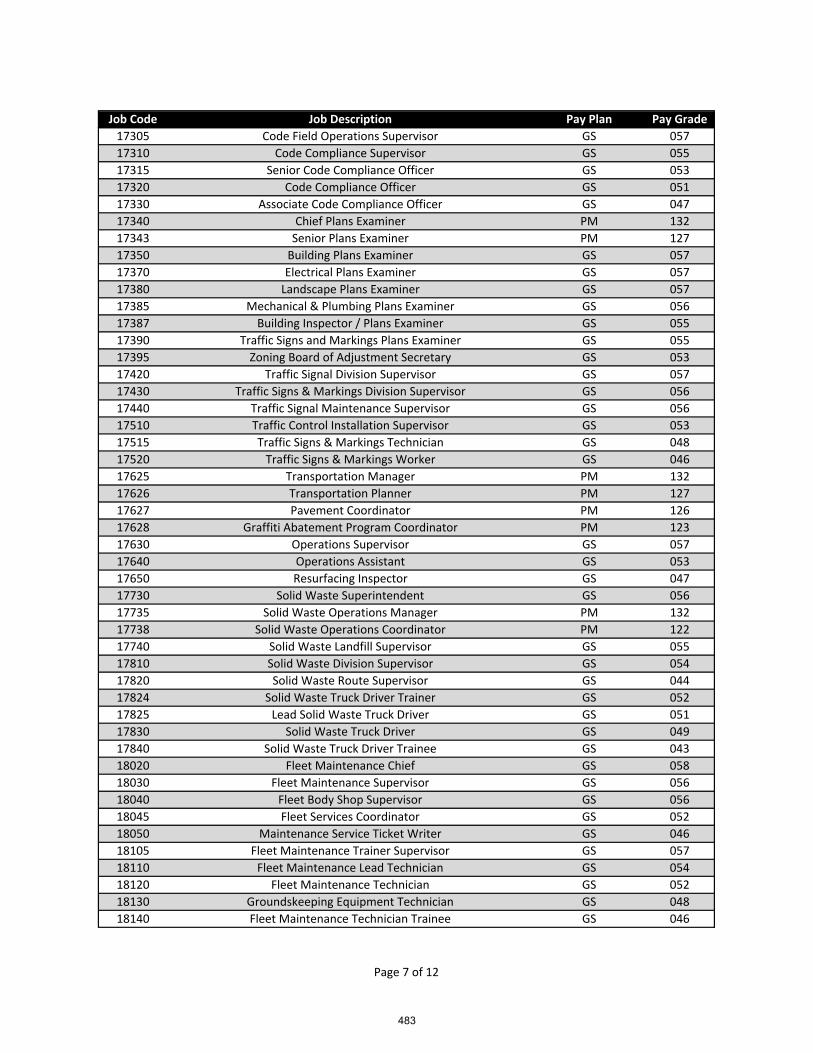
Job Code Job Description Pay Plan Pay Grade
17305 Code Field Operations Supervisor GS 057
17310 Code Compliance Supervisor GS 055
17315 Senior Code Compliance Officer GS 053
17320 Code Compliance Officer GS 051
17330 Associate Code Compliance Officer GS 047
17340 Chief Plans Examiner PM 132
17343 Senior Plans Examiner PM 127
17350 Building Plans Examiner GS 057
17370 Electrical Plans Examiner GS 057
17380 Landscape Plans Examiner GS 057
17385 Mechanical & Plumbing Plans Examiner GS 056
17387 Building Inspector / Plans Examiner GS 055
17390 Traffic Signs and Markings Plans Examiner GS 055
17395 Zoning Board of Adjustment Secretary GS 053
17420 Traffic Signal Division Supervisor GS 057
17430 Traffic Signs & Markings Division Supervisor GS 056
17440 Traffic Signal Maintenance Supervisor GS 056
17510 Traffic Control Installation Supervisor GS 053
17515 Traffic Signs & Markings Technician GS 048
17520 Traffic Signs & Markings Worker GS 046
17625 Transportation Manager PM 132
17626 Transportation Planner PM 127
17627 Pavement Coordinator PM 126
17628 Graffiti Abatement Program Coordinator PM 123
17630 Operations Supervisor GS 057
17640 Operations Assistant GS 053
17650 Resurfacing Inspector GS 047
17730 Solid Waste Superintendent GS 056
17735 Solid Waste Operations Manager PM 132
17738 Solid Waste Operations Coordinator PM 122
17740 Solid Waste Landfill Supervisor GS 055
17810 Solid Waste Division Supervisor GS 054
17820 Solid Waste Route Supervisor GS 044
17824 Solid Waste Truck Driver Trainer GS 052
17825 Lead Solid Waste Truck Driver GS 051
17830 Solid Waste Truck Driver GS 049
17840 Solid Waste Truck Driver Trainee GS 043
18020 Fleet Maintenance Chief GS 058
18030 Fleet Maintenance Supervisor GS 056
18040 Fleet Body Shop Supervisor GS 056
18045 Fleet Services Coordinator GS 052
18050 Maintenance Service Ticket Writer GS 046
18105 Fleet Maintenance Trainer Supervisor GS 057
18110 Fleet Maintenance Lead Technician GS 054
18120 Fleet Maintenance Technician GS 052
18130 Groundskeeping Equipment Technician GS 048
18140 Fleet Maintenance Technician Trainee GS 046
Page 7 of 12
483
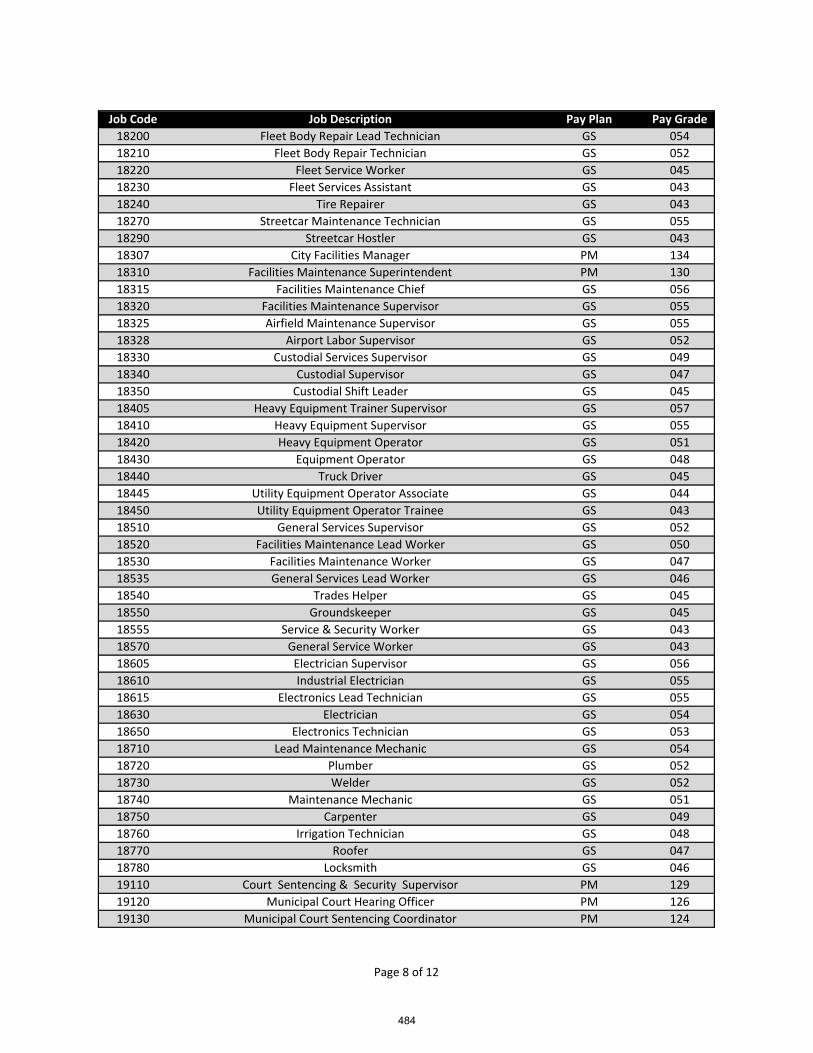
Job Code Job Description Pay Plan Pay Grade
18200 Fleet Body Repair Lead Technician GS 054
18210 Fleet Body Repair Technician GS 052
18220 Fleet Service Worker GS 045
18230 Fleet Services Assistant GS 043
18240 Tire Repairer GS 043
18270 Streetcar Maintenance Technician GS 055
18290 Streetcar Hostler GS 043
18307 City Facilities Manager PM 134
18310 Facilities Maintenance Superintendent PM 130
18315 Facilities Maintenance Chief GS 056
18320 Facilities Maintenance Supervisor GS 055
18325 Airfield Maintenance Supervisor GS 055
18328 Airport Labor Supervisor GS 052
18330 Custodial Services Supervisor GS 049
18340 Custodial Supervisor GS 047
18350 Custodial Shift Leader GS 045
18405 Heavy Equipment Trainer Supervisor GS 057
18410 Heavy Equipment Supervisor GS 055
18420 Heavy Equipment Operator GS 051
18430 Equipment Operator GS 048
18440 Truck Driver GS 045
18445 Utility Equipment Operator Associate GS 044
18450 Utility Equipment Operator Trainee GS 043
18510 General Services Supervisor GS 052
18520 Facilities Maintenance Lead Worker GS 050
18530 Facilities Maintenance Worker GS 047
18535 General Services Lead Worker GS 046
18540 Trades Helper GS 045
18550 Groundskeeper GS 045
18555 Service & Security Worker GS 043
18570 General Service Worker GS 043
18605 Electrician Supervisor GS 056
18610 Industrial Electrician GS 055
18615 Electronics Lead Technician GS 055
18630 Electrician GS 054
18650 Electronics Technician GS 053
18710 Lead Maintenance Mechanic GS 054
18720 Plumber GS 052
18730 Welder GS 052
18740 Maintenance Mechanic GS 051
18750 Carpenter GS 049
18760 Irrigation Technician GS 048
18770 Roofer GS 047
18780 Locksmith GS 046
19110 Court Sentencing & Security Supervisor PM 129
19120 Municipal Court Hearing Officer PM 126
19130 Municipal Court Sentencing Coordinator PM 124
Page 8 of 12
484
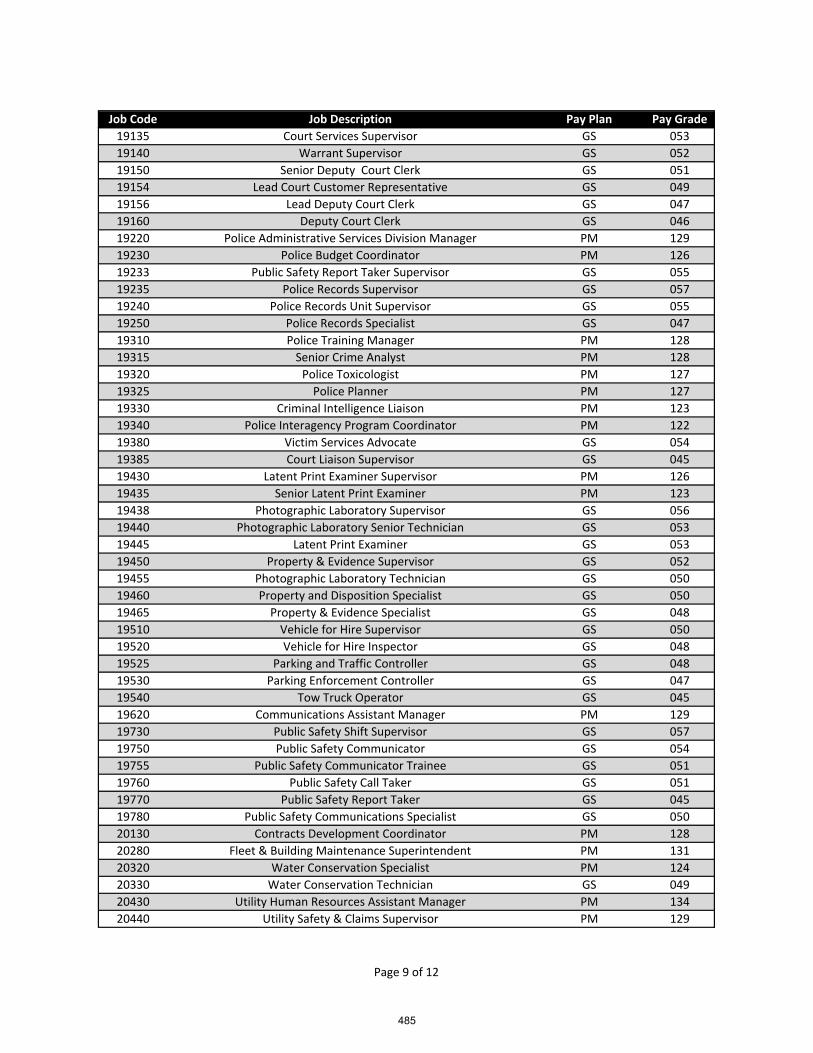
Job Code Job Description Pay Plan Pay Grade
19135 Court Services Supervisor GS 053
19140 Warrant Supervisor GS 052
19150 Senior Deputy Court Clerk GS 051
19154 Lead Court Customer Representative GS 049
19156 Lead Deputy Court Clerk GS 047
19160 Deputy Court Clerk GS 046
19220 Police Administrative Services Division Manager PM 129
19230 Police Budget Coordinator PM 126
19233 Public Safety Report Taker Supervisor GS 055
19235 Police Records Supervisor GS 057
19240 Police Records Unit Supervisor GS 055
19250 Police Records Specialist GS 047
19310 Police Training Manager PM 128
19315 Senior Crime Analyst PM 128
19320 Police Toxicologist PM 127
19325 Police Planner PM 127
19330 Criminal Intelligence Liaison PM 123
19340 Police Interagency Program Coordinator PM 122
19380 Victim Services Advocate GS 054
19385 Court Liaison Supervisor GS 045
19430 Latent Print Examiner Supervisor PM 126
19435 Senior Latent Print Examiner PM 123
19438 Photographic Laboratory Supervisor GS 056
19440 Photographic Laboratory Senior Technician GS 053
19445 Latent Print Examiner GS 053
19450 Property & Evidence Supervisor GS 052
19455 Photographic Laboratory Technician GS 050
19460 Property and Disposition Specialist GS 050
19465 Property & Evidence Specialist GS 048
19510 Vehicle for Hire Supervisor GS 050
19520 Vehicle for Hire Inspector GS 048
19525 Parking and Traffic Controller GS 048
19530 Parking Enforcement Controller GS 047
19540 Tow Truck Operator GS 045
19620 Communications Assistant Manager PM 129
19730 Public Safety Shift Supervisor GS 057
19750 Public Safety Communicator GS 054
19755 Public Safety Communicator Trainee GS 051
19760 Public Safety Call Taker GS 051
19770 Public Safety Report Taker GS 045
19780 Public Safety Communications Specialist GS 050
20130 Contracts Development Coordinator PM 128
20280 Fleet & Building Maintenance Superintendent PM 131
20320 Water Conservation Specialist PM 124
20330 Water Conservation Technician GS 049
20430 Utility Human Resources Assistant Manager PM 134
20440 Utility Safety & Claims Supervisor PM 129
Page 9 of 12
485

Job Code Job Description Pay Plan Pay Grade
20448 Utility Claims Specialist PM 126
20450 Senior Safety Specialist PM 126
20520 Laboratory Services Manager PM 132
20528 Water Operations Control Analyst PM 129
20530 Utility Sample Specialist GS 053
20550 Utility Laboratory Technician GS 050
20555 Utility Laboratory Sampler GS 048
20560 Utility Laboratory Aide GS 043
20600 Utility Call Center Supervisor GS 055
20605 Utility Customer Service Quality Assurance & Training Specialist GS 054
20610 Utility Customer Service Supervisor GS 055
20615 Utility Meter Shop Supervisor GS 053
20620 Utility Field Customer Service Supervisor GS 051
20625 Utility Meter Reader Supervisor GS 050
20630 Utility Field Customer Service Inspector GS 049
20635 Utility Meter Senior Repairer GS 049
20640 Utility Field Customer Service Worker GS 048
20650 Utility Meter Repairer GS 047
20660 Utility Meter Reader GS 046
20705 Stormwater Superintendent PM 130
20710 Water Plant Superintendent PM 130
20720 Wastewater Plant Superintendent PM 130
20730 Water Plant Assistant Superintendent PM 125
20740 Wastewater Plant Assistant Superintendent PM 125
20745 Utility Plant Lead Technician GS 055
20750 Utility Plant Senior Technician GS 052
20760 Wastewater Plant Senior Technician GS 052
20770 Utility Plant Technician GS 050
20810 Water Production Superintendent PM 130
20815 Instrumentation Control Superintendent PM 127
20820 Instrumentation Control Assistant Superintendent PM 125
20830 Water Production Assistant Superintendent PM 125
20840 Instrumentation Control Supervisor GS 057
20850 Instrumentation Control Lead Technician GS 056
20860 Utility Central Control Supervisor GS 054
20870 Utility Central Control Operator GS 054
20875 Instrumentation Control Technician GS 054
20910 Wastewater Lift Station Superintendent PM 128
20930 Pretreatment Inspector Supervisor GS 054
20940 Pretreatment Inspector GS 051
21010 Water Distribution Superintendent PM 130
21015 Wastewater Collection Systems Chief Superintendent PM 130
21020 Wastewater Construction Superintendent PM 128
21025 Wastewater Collection Maintenance Superintendent PM 128
21026 Water Distribution Assistant Superintendent PM 125
21027 Wastewater Collection Maintenance Assistant Superintendent GS 055
21030 Utility Warehouse Supervisor GS 057
Page 10 of 12
486
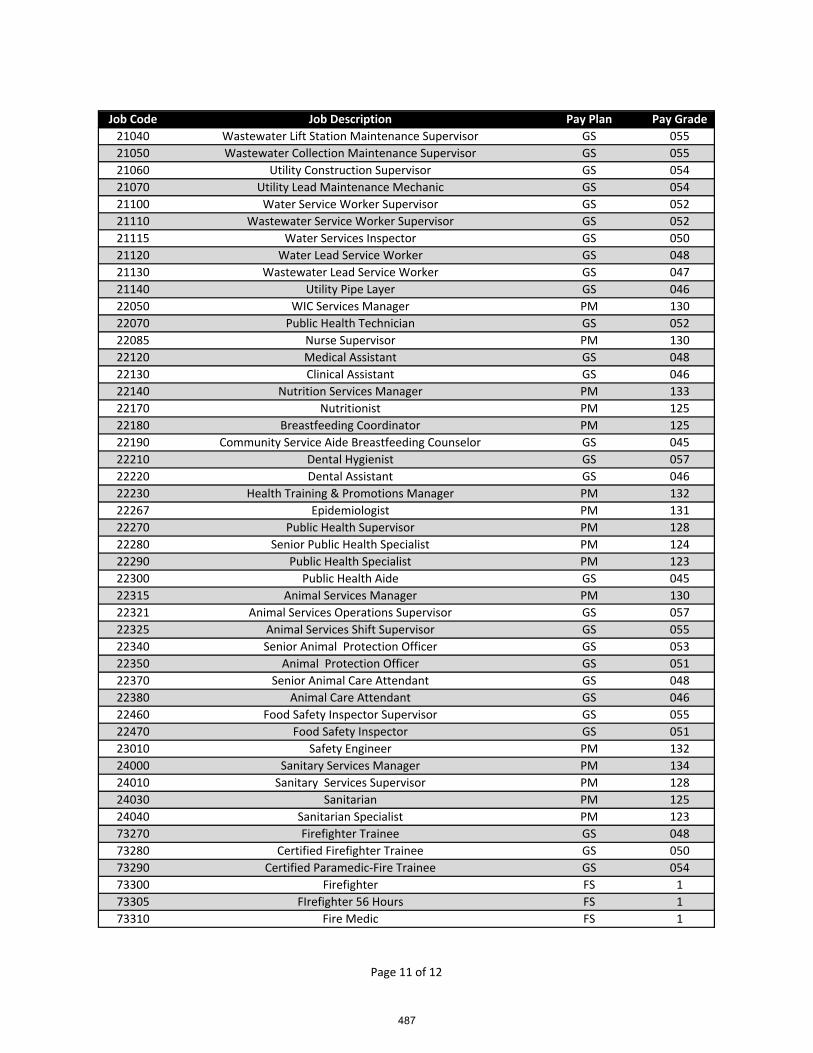
Job Code Job Description Pay Plan Pay Grade
21040 Wastewater Lift Station Maintenance Supervisor GS 055
21050 Wastewater Collection Maintenance Supervisor GS 055
21060 Utility Construction Supervisor GS 054
21070 Utility Lead Maintenance Mechanic GS 054
21100 Water Service Worker Supervisor GS 052
21110 Wastewater Service Worker Supervisor GS 052
21115 Water Services Inspector GS 050
21120 Water Lead Service Worker GS 048
21130 Wastewater Lead Service Worker GS 047
21140 Utility Pipe Layer GS 046
22050 WIC Services Manager PM 130
22070 Public Health Technician GS 052
22085 Nurse Supervisor PM 130
22120 Medical Assistant GS 048
22130 Clinical Assistant GS 046
22140 Nutrition Services Manager PM 133
22170 Nutritionist PM 125
22180 Breastfeeding Coordinator PM 125
22190 Community Service Aide Breastfeeding Counselor GS 045
22210 Dental Hygienist GS 057
22220 Dental Assistant GS 046
22230 Health Training & Promotions Manager PM 132
22267 Epidemiologist PM 131
22270 Public Health Supervisor PM 128
22280 Senior Public Health Specialist PM 124
22290 Public Health Specialist PM 123
22300 Public Health Aide GS 045
22315 Animal Services Manager PM 130
22321 Animal Services Operations Supervisor GS 057
22325 Animal Services Shift Supervisor GS 055
22340 Senior Animal Protection Officer GS 053
22350 Animal Protection Officer GS 051
22370 Senior Animal Care Attendant GS 048
22380 Animal Care Attendant GS 046
22460 Food Safety Inspector Supervisor GS 055
22470 Food Safety Inspector GS 051
23010 Safety Engineer PM 132
24000 Sanitary Services Manager PM 134
24010 Sanitary Services Supervisor PM 128
24030 Sanitarian PM 125
24040 Sanitarian Specialist PM 123
73270 Firefighter Trainee GS 048
73280 Certified Firefighter Trainee GS 050
73290 Certified Paramedic‐Fire Trainee GS 054
73300 Firefighter FS 1
73305 FIrefighter 56 Hours FS 1
73310 Fire Medic FS 1
Page 11 of 12
487
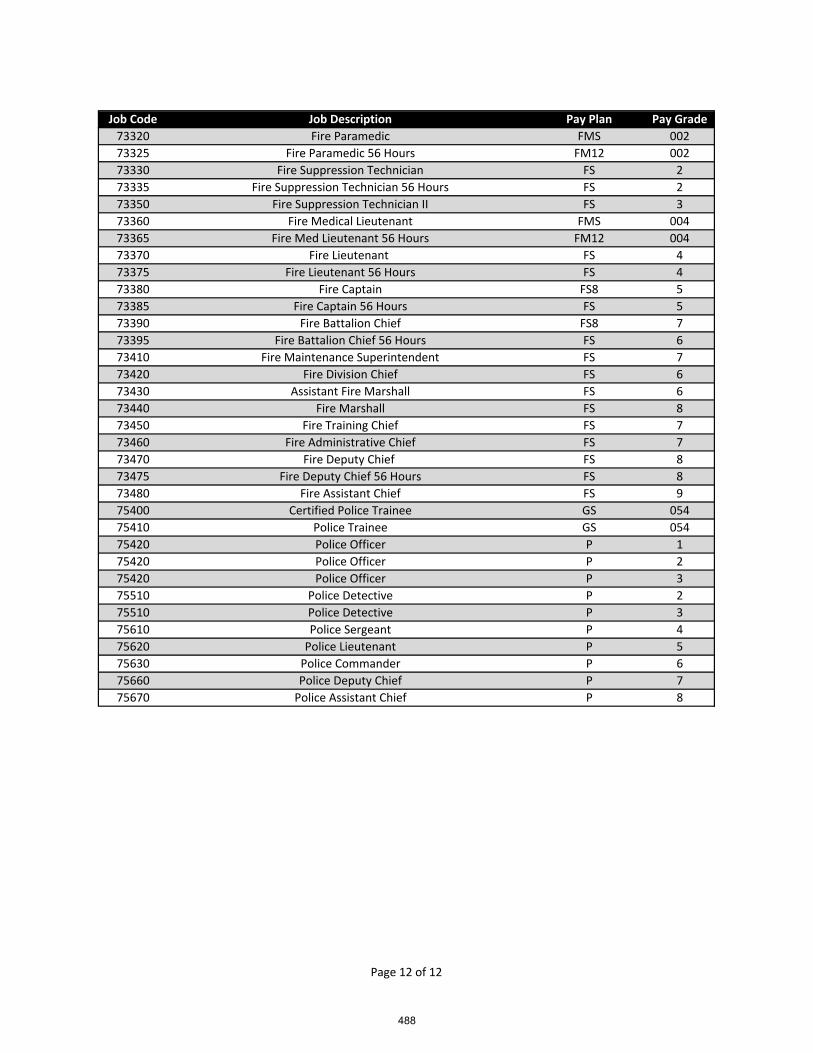
Job Code Job Description Pay Plan Pay Grade
73320 Fire Paramedic FMS 002
73325 Fire Paramedic 56 Hours FM12 002
73330 Fire Suppression Technician FS 2
73335 Fire Suppression Technician 56 Hours FS 2
73350 Fire Suppression Technician II FS 3
73360 Fire Medical Lieutenant FMS 004
73365 Fire Med Lieutenant 56 Hours FM12 004
73370 Fire Lieutenant FS 4
73375 Fire Lieutenant 56 Hours FS 4
73380 Fire Captain FS8 5
73385 Fire Captain 56 Hours FS 5
73390 Fire Battalion Chief FS8 7
73395 Fire Battalion Chief 56 Hours FS 6
73410 Fire Maintenance Superintendent FS 7
73420 Fire Division Chief FS 6
73430 Assistant Fire Marshall FS 6
73440 Fire Marshall FS 8
73450 Fire Training Chief FS 7
73460 Fire Administrative Chief FS 7
73470 Fire Deputy Chief FS 8
73475 Fire Deputy Chief 56 Hours FS 8
73480 Fire Assistant Chief FS 9
75400 Certified Police Trainee GS 054
75410 Police Trainee GS 054
75420 Police Officer P 1
75420 Police Officer P 2
75420 Police Officer P 3
75510 Police Detective P 2
75510 Police Detective P 3
75610 Police Sergeant P 4
75620 Police Lieutenant P 5
75630 Police Commander P 6
75660 Police Deputy Chief P 7
75670 Police Assistant Chief P 8
Page 12 of 12
488
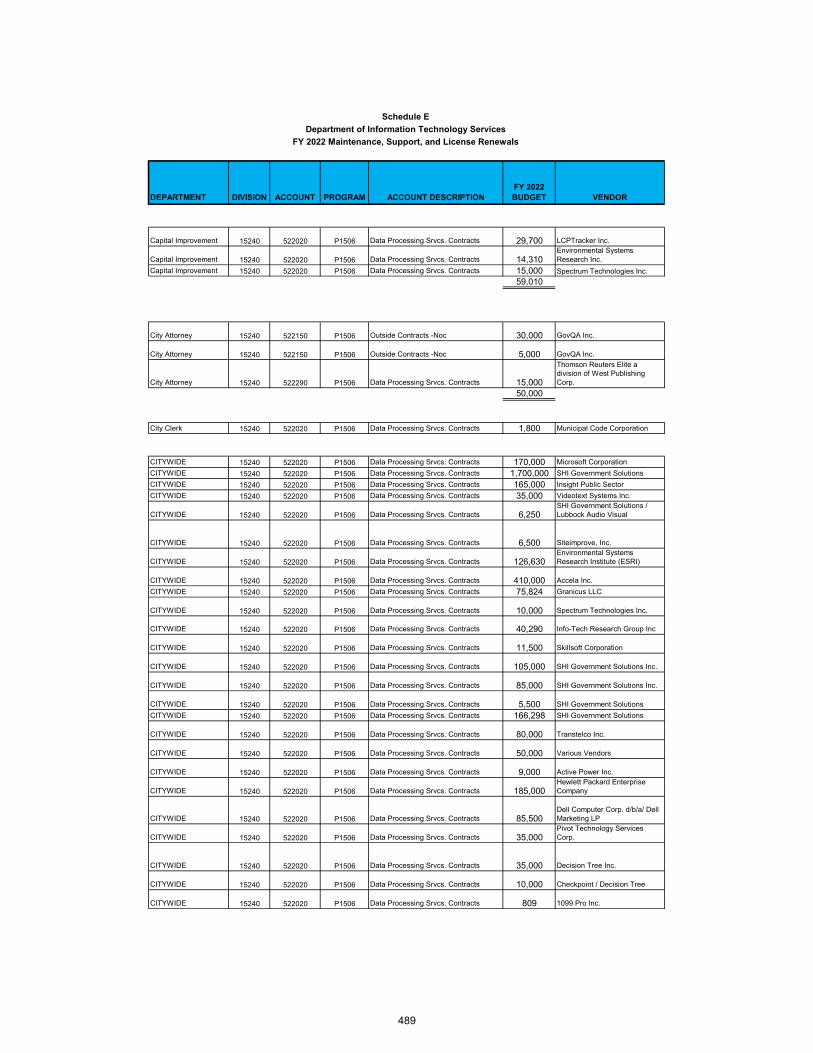
DEPARTMENT DIVISION ACCOUNT PROGRAM ACCOUNT DESCRIPTIONFY 2022 BUDGET VENDOR
Capital Improvement 15240 522020 P1506 Data Processing Srvcs. Contracts 29,700 LCPTracker Inc.
Capital Improvement 15240 522020 P1506 Data Processing Srvcs. Contracts 14,310Environmental Systems Research Inc.
Capital Improvement 15240 522020 P1506 Data Processing Srvcs. Contracts 15,000 Spectrum Technologies Inc. 59,010
City Attorney 15240 522150 P1506 Outside Contracts -Noc 30,000 GovQA Inc.
City Attorney 15240 522150 P1506 Outside Contracts -Noc 5,000 GovQA Inc.
City Attorney 15240 522290 P1506 Data Processing Srvcs. Contracts 15,000
Thomson Reuters Elite a division of West Publishing Corp.
50,000
City Clerk 15240 522020 P1506 Data Processing Srvcs. Contracts 1,800 Municipal Code Corporation
CITYWIDE 15240 522020 P1506 Data Processing Srvcs. Contracts 170,000 Microsoft CorporationCITYWIDE 15240 522020 P1506 Data Processing Srvcs. Contracts 1,700,000 SHI Government Solutions CITYWIDE 15240 522020 P1506 Data Processing Srvcs. Contracts 165,000 Insight Public Sector CITYWIDE 15240 522020 P1506 Data Processing Srvcs. Contracts 35,000 Videotext Systems Inc.
CITYWIDE 15240 522020 P1506 Data Processing Srvcs. Contracts 6,250SHI Government Solutions / Lubbock Audio Visual
CITYWIDE 15240 522020 P1506 Data Processing Srvcs. Contracts 6,500 Siteimprove, Inc.
CITYWIDE 15240 522020 P1506 Data Processing Srvcs. Contracts 126,630Environmental Systems Research Institute (ESRI)
CITYWIDE 15240 522020 P1506 Data Processing Srvcs. Contracts 410,000 Accela Inc. CITYWIDE 15240 522020 P1506 Data Processing Srvcs. Contracts 75,824 Granicus LLC
CITYWIDE 15240 522020 P1506 Data Processing Srvcs. Contracts 10,000 Spectrum Technologies Inc.
CITYWIDE 15240 522020 P1506 Data Processing Srvcs. Contracts 40,290 Info-Tech Research Group Inc
CITYWIDE 15240 522020 P1506 Data Processing Srvcs. Contracts 11,500 Skillsoft Corporation
CITYWIDE 15240 522020 P1506 Data Processing Srvcs. Contracts 105,000 SHI Government Solutions Inc.
CITYWIDE 15240 522020 P1506 Data Processing Srvcs. Contracts 85,000 SHI Government Solutions Inc.
CITYWIDE 15240 522020 P1506 Data Processing Srvcs. Contracts 5,500 SHI Government SolutionsCITYWIDE 15240 522020 P1506 Data Processing Srvcs. Contracts 166,298 SHI Government Solutions
CITYWIDE 15240 522020 P1506 Data Processing Srvcs. Contracts 80,000 Transtelco Inc.
CITYWIDE 15240 522020 P1506 Data Processing Srvcs. Contracts 50,000 Various Vendors
CITYWIDE 15240 522020 P1506 Data Processing Srvcs. Contracts 9,000 Active Power Inc.
CITYWIDE 15240 522020 P1506 Data Processing Srvcs. Contracts 185,000Hewlett Packard Enterprise Company
CITYWIDE 15240 522020 P1506 Data Processing Srvcs. Contracts 85,500Dell Computer Corp. d/b/a/ Dell Marketing LP
CITYWIDE 15240 522020 P1506 Data Processing Srvcs. Contracts 35,000Pivot Technology Services Corp.
CITYWIDE 15240 522020 P1506 Data Processing Srvcs. Contracts 35,000 Decision Tree Inc.
CITYWIDE 15240 522020 P1506 Data Processing Srvcs. Contracts 10,000 Checkpoint / Decision Tree
CITYWIDE 15240 522020 P1506 Data Processing Srvcs. Contracts 809 1099 Pro Inc.
Schedule E Department of Information Technology Services
FY 2022 Maintenance, Support, and License Renewals
489
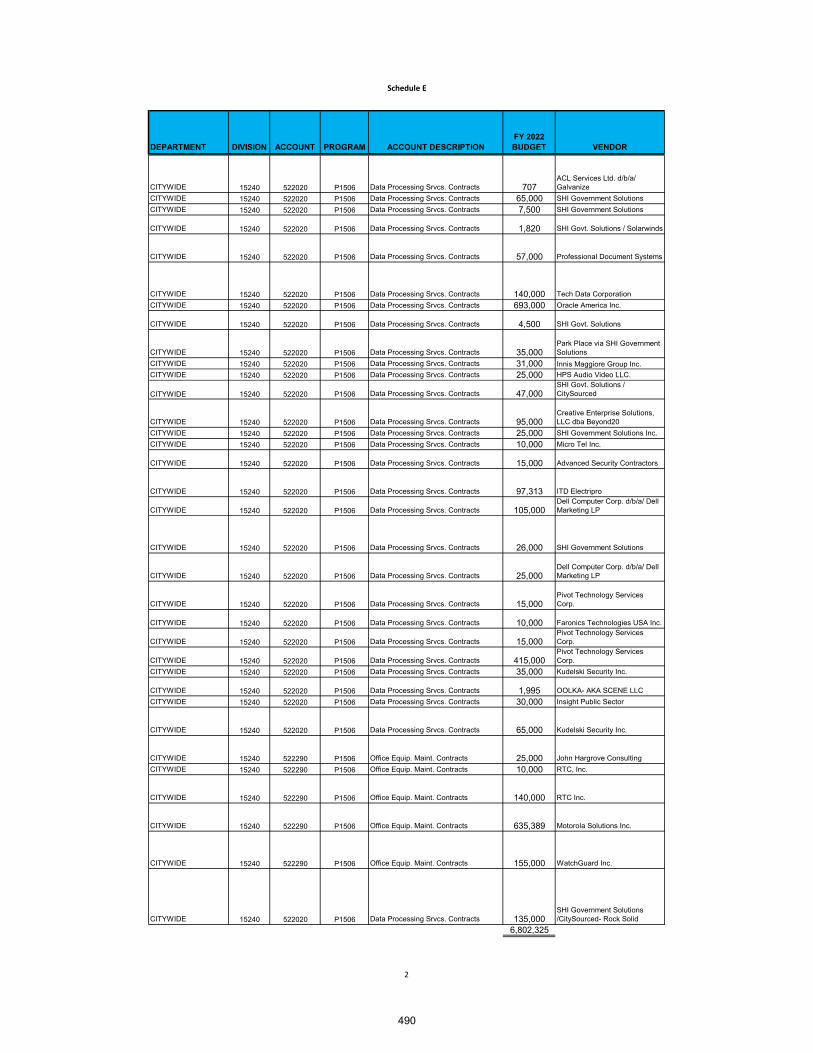
Schedule E
DEPARTMENT DIVISION ACCOUNT PROGRAM ACCOUNT DESCRIPTIONFY 2022 BUDGET VENDOR
CITYWIDE 15240 522020 P1506 Data Processing Srvcs. Contracts 707ACL Services Ltd. d/b/a/ Galvanize
CITYWIDE 15240 522020 P1506 Data Processing Srvcs. Contracts 65,000 SHI Government Solutions CITYWIDE 15240 522020 P1506 Data Processing Srvcs. Contracts 7,500 SHI Government Solutions
CITYWIDE 15240 522020 P1506 Data Processing Srvcs. Contracts 1,820 SHI Govt. Solutions / Solarwinds
CITYWIDE 15240 522020 P1506 Data Processing Srvcs. Contracts 57,000 Professional Document Systems
CITYWIDE 15240 522020 P1506 Data Processing Srvcs. Contracts 140,000 Tech Data Corporation CITYWIDE 15240 522020 P1506 Data Processing Srvcs. Contracts 693,000 Oracle America Inc.
CITYWIDE 15240 522020 P1506 Data Processing Srvcs. Contracts 4,500 SHI Govt. Solutions
CITYWIDE 15240 522020 P1506 Data Processing Srvcs. Contracts 35,000Park Place via SHI Government Solutions
CITYWIDE 15240 522020 P1506 Data Processing Srvcs. Contracts 31,000 Innis Maggiore Group Inc. CITYWIDE 15240 522020 P1506 Data Processing Srvcs. Contracts 25,000 HPS Audio Video LLC.
CITYWIDE 15240 522020 P1506 Data Processing Srvcs. Contracts 47,000SHI Govt. Solutions / CitySourced
CITYWIDE 15240 522020 P1506 Data Processing Srvcs. Contracts 95,000Creative Enterprise Solutions, LLC dba Beyond20
CITYWIDE 15240 522020 P1506 Data Processing Srvcs. Contracts 25,000 SHI Government Solutions Inc. CITYWIDE 15240 522020 P1506 Data Processing Srvcs. Contracts 10,000 Micro Tel Inc.
CITYWIDE 15240 522020 P1506 Data Processing Srvcs. Contracts 15,000 Advanced Security Contractors
CITYWIDE 15240 522020 P1506 Data Processing Srvcs. Contracts 97,313 ITD Electripro
CITYWIDE 15240 522020 P1506 Data Processing Srvcs. Contracts 105,000Dell Computer Corp. d/b/a/ Dell Marketing LP
CITYWIDE 15240 522020 P1506 Data Processing Srvcs. Contracts 26,000 SHI Government Solutions
CITYWIDE 15240 522020 P1506 Data Processing Srvcs. Contracts 25,000Dell Computer Corp. d/b/a/ Dell Marketing LP
CITYWIDE 15240 522020 P1506 Data Processing Srvcs. Contracts 15,000Pivot Technology Services Corp.
CITYWIDE 15240 522020 P1506 Data Processing Srvcs. Contracts 10,000 Faronics Technologies USA Inc.
CITYWIDE 15240 522020 P1506 Data Processing Srvcs. Contracts 15,000Pivot Technology Services Corp.
CITYWIDE 15240 522020 P1506 Data Processing Srvcs. Contracts 415,000Pivot Technology Services Corp.
CITYWIDE 15240 522020 P1506 Data Processing Srvcs. Contracts 35,000 Kudelski Security Inc.
CITYWIDE 15240 522020 P1506 Data Processing Srvcs. Contracts 1,995 OOLKA- AKA SCENE LLCCITYWIDE 15240 522020 P1506 Data Processing Srvcs. Contracts 30,000 Insight Public Sector
CITYWIDE 15240 522020 P1506 Data Processing Srvcs. Contracts 65,000 Kudelski Security Inc.
CITYWIDE 15240 522290 P1506 Office Equip. Maint. Contracts 25,000 John Hargrove ConsultingCITYWIDE 15240 522290 P1506 Office Equip. Maint. Contracts 10,000 RTC, Inc.
CITYWIDE 15240 522290 P1506 Office Equip. Maint. Contracts 140,000 RTC Inc.
CITYWIDE 15240 522290 P1506 Office Equip. Maint. Contracts 635,389 Motorola Solutions Inc.
CITYWIDE 15240 522290 P1506 Office Equip. Maint. Contracts 155,000 WatchGuard Inc.
CITYWIDE 15240 522020 P1506 Data Processing Srvcs. Contracts 135,000SHI Government Solutions /CitySourced- Rock Solid
6,802,325
2
490

Schedule E
DEPARTMENT DIVISION ACCOUNT PROGRAM ACCOUNT DESCRIPTIONFY 2022 BUDGET VENDOR
Economic Development 15240 522020 P1506 Data Processing Srvcs. Contracts 700 C2ER
Economic Development 15240 522020 P1506 Data Processing Srvcs. Contracts 10,434 Chmura Economics & Analytics
Economic Development 15240 522020 P1506 Data Processing Srvcs. Contracts 1,600 Moody's Analytics
Economic Development 15240 522020 P1506 Data Processing Srvcs. Contracts 6,250 Impact Data Source
Economic Development 15240 522020 P1506 Data Processing Srvcs. Contracts 800 Implan Inc.
Economic Development 15240 522020 P1506 Data Processing Srvcs. Contracts 6,250 Citysourced / Rock Solid26,034
Fire 15240 522020 P1506 Data Processing Srvcs. Contracts 1,700 Sydion LLC
Fire 15240 522020 P1506 Data Processing Srvcs. Contracts 98,471 Tiburon Inc. Fire 15240 522020 P1506 Data Processing Srvcs. Contracts 2,550 Ron Turley and AssociatesFire 15240 522020 P1506 Data Processing Srvcs. Contracts 15,000 ESI Acquisition Inc.
Fire 15240 522020 P1506 Data Processing Srvcs. Contracts 80,000Sierra Wireless America Inc. / Insight Public Sector
Fire 15240 522020 P1506 Data Processing Srvcs. Contracts 64,000 Target Solutions Learning Inc.
Fire 15240 522020 P1506 Data Processing Srvcs. Contracts 65,000 Kronos Inc.
Fire 15240 522020 P1506 Data Processing Srvcs. Contracts 20,000 Kronos Inc.
Fire 15240 522020 P1506 Data Processing Srvcs. Contracts 18,000 PulsePoint Foundation
Fire 15240 522020 P1506 Data Processing Srvcs. Contracts 15,868Environmental Services Research Institute Inc.
380,589
Human Resources 15240 522150 P1506 Outside Contracts - Noc 7,500 Economic Research Institute
Human Resources 15240 522150 P1506 Outside Contracts - Noc 58,000GovernmentJobs.com d/b/a Neogov
Human Resources 15240 522150 P1506 Outside Contracts - Noc 132,000GovernmentJobs.com d/b/a Neogov
Human Resources 15240 522020 P1506 Data Processing Srvcs. Contracts 230,000 Kronos Inc.
Human Resources 15240 522020 P1506 Data Processing Srvcs. Contracts 1,500Harland Technology Services a division of Scantron
Human Resources 15240 522020 P1506 Data Processing Srvcs. Contracts 300Engineered Data Products(EDP) LLP
Human Resources 15240 522020 P1506 Data Processing Srvcs. Contracts 540 Acuity Scheduling429,840
Libraries 15240 522290 P1506 Office Equip. Maint. Contracts 123,755SIRSI Corporation d/b/a/ SirisDynix
Libraries 15240 522290 P1506 Office Equip. Maint. Contracts 7,020SIRSI Corporation d/b/a/ SirisDynix
Libraries 15240 522290 P1506 Office Equip. Maint. Contracts 13,134SIRSI Corporation d/b/a/ SirisDynix
Libraries 15240 522290 P1506 Office Equip. Maint. Contracts 9,230SIRSI Corporation d/b/a/ SirisDynix
Libraries 15240 522020 P1506 Data Processing Srvcs. Contracts 29,985 Bibliotheca Inc. Libraries 15240 522020 P1506 Data Processing Srvcs. Contracts 10,606 Bibliotheca Inc.
Libraries 15240 522020 P1506 Data Processing Srvcs. Contracts 3,036 Bibliotheca Inc.
Libraries 15240 522020 P1506 Data Processing Srvcs. Contracts 10,602 Comprise Technologies Inc.
3
491

Schedule E
DEPARTMENT DIVISION ACCOUNT PROGRAM ACCOUNT DESCRIPTIONFY 2022 BUDGET VENDOR
Libraries 15240 522290 P1506 Office Equip. Maint. Contracts 15,827 Comprise Technologies Inc.
Libraries 15240 522020 P1506 Data Processing Srvcs. Contracts 7,500 TechLogic Corporation230,695
MCAD 15240 522020 P1506 Data Processing Srvcs. Contracts 75,000The Gibson Group Touch City Ltd.
MCAD 15240 522020 P1506 Data Processing Srvcs. Contracts 950 PCMG Inc.MCAD 15240 522020 P1506 Data Processing Srvcs. Contracts 2,210 Past Perfect Software Inc.
78,160
OTC 15240 522150 P1506 Outside Contracts - Noc 38,500 Workiva Inc. OTC 15240 522150 P1506 Outside Contracts - Noc 18,136 Apptricity
OTC 15240 522150 P1506 Outside Contracts - Noc 50,200 Prodigiq Inc.
OTC 15240 522020 P1506 Data Processing Srvcs. Contracts 65,000 e-CIVIS Inc. 171,836
OMB 15240 522150 P1506 Outside Contracts - Noc 25,000 Suttech Inc.
Parks 15249 522020 P1506 Data Processing Srvcs. Contracts 43,000 Perfect Mind Inc.
Planning & Inspections 15240 522020 P1506 Data Processing Srvcs. Contracts 25,650 Selectron Technologies Inc.
Planning & Inspections 15240 522020 P1506 Data Processing Srvcs. Contracts 15,000 CityGovApp Inc.
Planning & Inspections 15240 522020 P1506 Data Processing Srvcs. Contracts 10,000 Qless, Inc.
Planning & Inspections 15240 522020 P1506 Data Processing Srvcs. Contracts 7,000Pivot Technology Services Corp.
Planning & Inspections 15240 522020 P1506 Data Processing Srvcs. Contracts 65,000 Carahsoft / ePlansoftPlanning and Inspection 15240 522020 P1506 Data Processing Srvcs. Contracts 11,394 Zonar Systems Inc.
134,044
Police 15240 522020 P1506 Data Processing Srvcs. Contracts 65,000 CDW-G Inc.
Police 15240 522020 P1506 Data Processing Srvcs. Contracts 3,247 CI Technologies Inc.
Police 15240 522020 P1506 Data Processing Srvcs. Contracts 5,000
Citrix Systems Inc. / The Broadleaf Group via SHI Government Solutions Inc.
Police 15240 522020 P1506 Data Processing Srvcs. Contracts 235,947
El Paso County, Texas / Intergraph Corporation d/b/a/ Hexagon Safety and Infrastructure
Police 15240 522020 P1506 Data Processing Srvcs. Contracts 4,417
Intergraph Corporation Hexagon Safety and Infrastructure
Police 15240 522020 P1506 Data Processing Srvcs. Contracts 13,320 Orion Communications, Inc. Police 15240 522020 P1506 Data Processing Srvcs. Contracts 7,500 Orion Communications, Inc.
Police 15240 522020 P1506 Data Processing Srvcs. Contracts 60,000 GOV QA
Police 15240 522020 P1506 Data Processing Srvcs. Contracts 186,299Morpho USA Inc., d/b/a Idemia Identity & Security USA LLC
Police 15240 522020 P1506 Data Processing Srvcs. Contracts 1,700Harland Technology Services a division of Scantron
Police 15240 522020 P1506 Data Processing Srvcs. Contracts 6,760 Noritsu America CorporationPolice 15240 522020 P1506 Data Processing Srvcs. Contracts 5,135 Tyler Technologies Inc.
Police 15240 522020 P1506 Data Processing Srvcs. Contracts 2,000Digital Audio Corp. d/b/a/ Salient Sciences
4
492
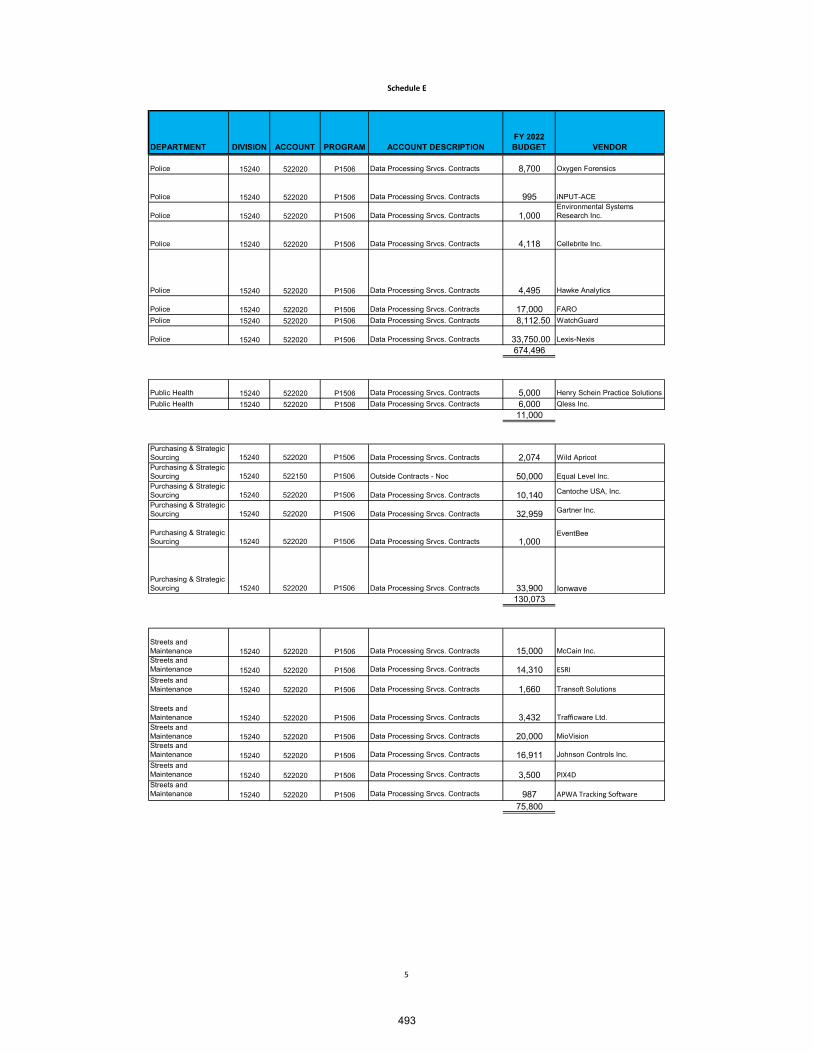
Schedule E
DEPARTMENT DIVISION ACCOUNT PROGRAM ACCOUNT DESCRIPTIONFY 2022 BUDGET VENDOR
Police 15240 522020 P1506 Data Processing Srvcs. Contracts 8,700 Oxygen Forensics
Police 15240 522020 P1506 Data Processing Srvcs. Contracts 995 iNPUT-ACE
Police 15240 522020 P1506 Data Processing Srvcs. Contracts 1,000Environmental Systems Research Inc.
Police 15240 522020 P1506 Data Processing Srvcs. Contracts 4,118 Cellebrite Inc.
Police 15240 522020 P1506 Data Processing Srvcs. Contracts 4,495 Hawke Analytics
Police 15240 522020 P1506 Data Processing Srvcs. Contracts 17,000 FARO Police 15240 522020 P1506 Data Processing Srvcs. Contracts 8,112.50 WatchGuard
Police 15240 522020 P1506 Data Processing Srvcs. Contracts 33,750.00 Lexis-Nexis674,496
Public Health 15240 522020 P1506 Data Processing Srvcs. Contracts 5,000 Henry Schein Practice Solutions Public Health 15240 522020 P1506 Data Processing Srvcs. Contracts 6,000 Qless Inc.
11,000
Purchasing & Strategic Sourcing 15240 522020 P1506 Data Processing Srvcs. Contracts 2,074 Wild ApricotPurchasing & Strategic Sourcing 15240 522150 P1506 Outside Contracts - Noc 50,000 Equal Level Inc. Purchasing & Strategic Sourcing 15240 522020 P1506 Data Processing Srvcs. Contracts 10,140 Cantoche USA, Inc.
Purchasing & Strategic Sourcing 15240 522020 P1506 Data Processing Srvcs. Contracts 32,959 Gartner Inc.
Purchasing & Strategic Sourcing 15240 522020 P1506 Data Processing Srvcs. Contracts 1,000
EventBee
Purchasing & Strategic Sourcing 15240 522020 P1506 Data Processing Srvcs. Contracts 33,900 Ionwave
130,073
Streets and Maintenance 15240 522020 P1506 Data Processing Srvcs. Contracts 15,000 McCain Inc. Streets and Maintenance 15240 522020 P1506 Data Processing Srvcs. Contracts 14,310 ESRIStreets and Maintenance 15240 522020 P1506 Data Processing Srvcs. Contracts 1,660 Transoft Solutions
Streets and Maintenance 15240 522020 P1506 Data Processing Srvcs. Contracts 3,432 Trafficware Ltd.Streets and Maintenance 15240 522020 P1506 Data Processing Srvcs. Contracts 20,000 MioVisionStreets and Maintenance 15240 522020 P1506 Data Processing Srvcs. Contracts 16,911 Johnson Controls Inc. Streets and Maintenance 15240 522020 P1506 Data Processing Srvcs. Contracts 3,500 PIX4DStreets and Maintenance 15240 522020 P1506 Data Processing Srvcs. Contracts 987 APWA Tracking Software
75,800
5
493
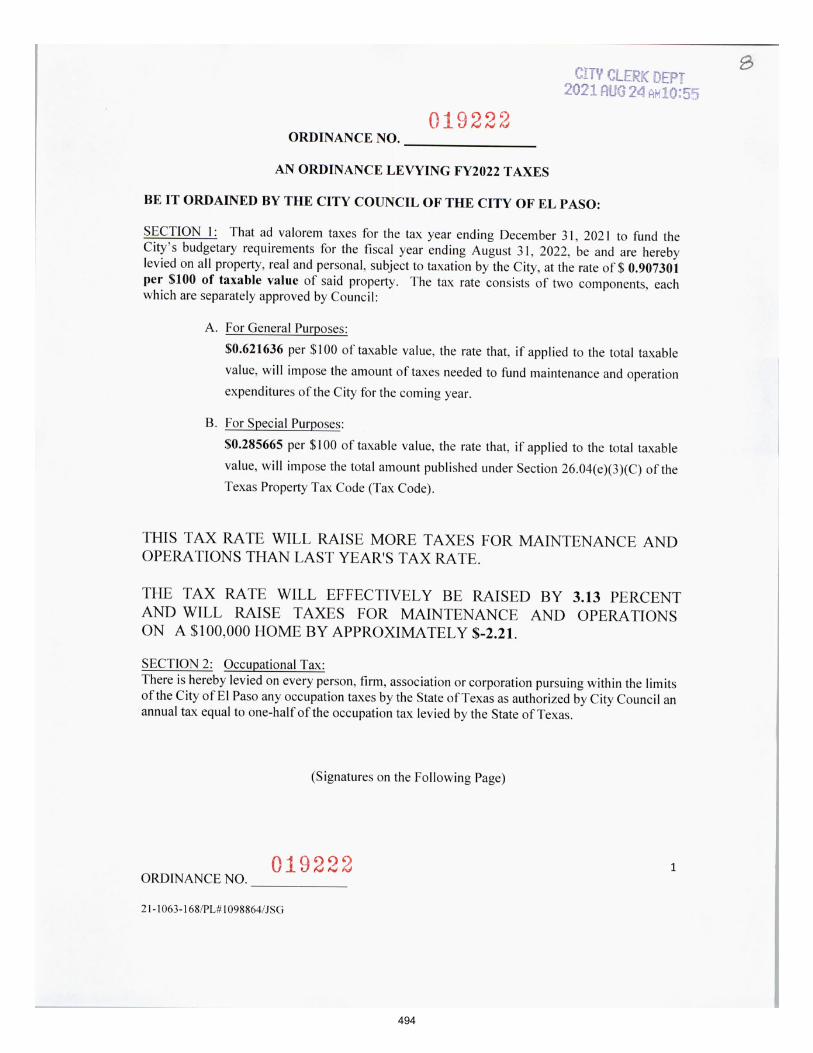
494
495
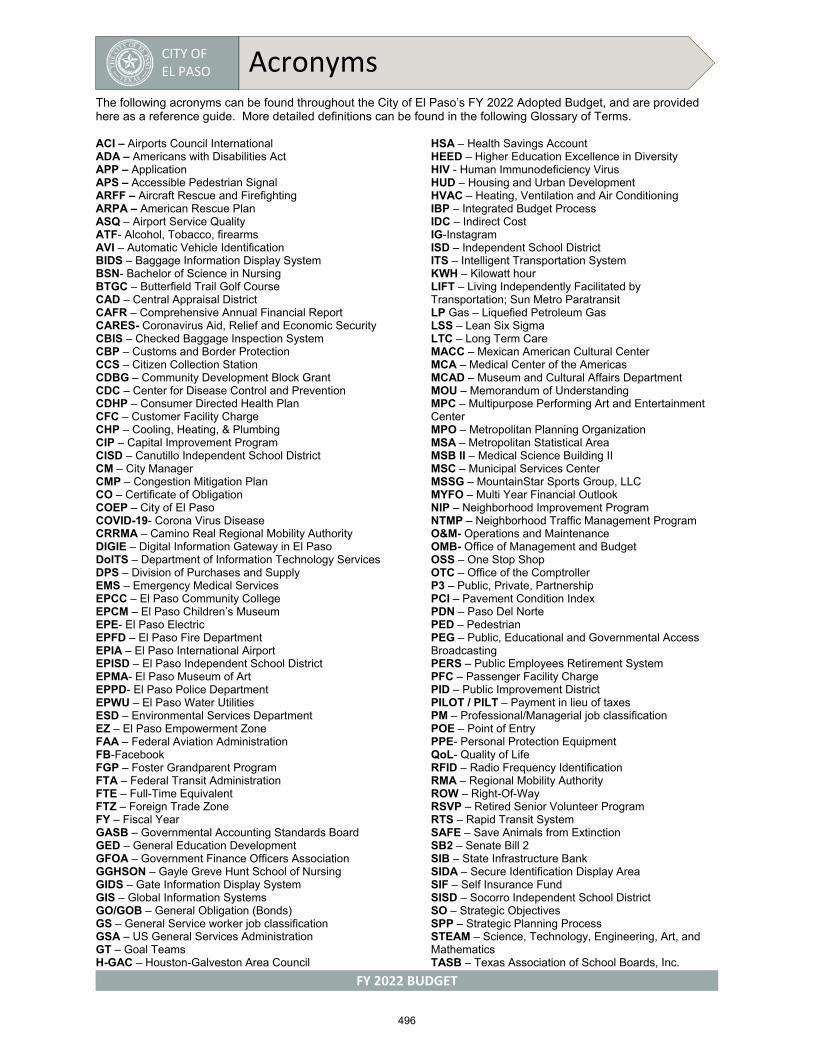
CITY OF EL PASO Acronyms
FY 2022 BUDGET
The following acronyms can be found throughout the City of El Paso’s FY 2022 Adopted Budget, and are provided here as a reference guide. More detailed definitions can be found in the following Glossary of Terms.
ACI – Airports Council International ADA – Americans with Disabilities Act APP – Application APS – Accessible Pedestrian Signal ARFF – Aircraft Rescue and Firefighting ARPA – American Rescue Plan ASQ – Airport Service Quality ATF- Alcohol, Tobacco, firearms AVI – Automatic Vehicle Identification BIDS – Baggage Information Display System BSN- Bachelor of Science in Nursing BTGC – Butterfield Trail Golf Course CAD – Central Appraisal District CAFR – Comprehensive Annual Financial Report CARES- Coronavirus Aid, Relief and Economic Security CBIS – Checked Baggage Inspection System CBP – Customs and Border Protection CCS – Citizen Collection Station CDBG – Community Development Block Grant CDC – Center for Disease Control and Prevention CDHP – Consumer Directed Health Plan CFC – Customer Facility Charge CHP – Cooling, Heating, & Plumbing CIP – Capital Improvement Program CISD – Canutillo Independent School District CM – City Manager CMP – Congestion Mitigation Plan CO – Certificate of Obligation COEP – City of El Paso COVID-19- Corona Virus Disease CRRMA – Camino Real Regional Mobility Authority DIGIE – Digital Information Gateway in El Paso DoITS – Department of Information Technology Services DPS – Division of Purchases and Supply EMS – Emergency Medical Services EPCC – El Paso Community College EPCM – El Paso Children’s Museum EPE- El Paso Electric EPFD – El Paso Fire Department EPIA – El Paso International Airport EPISD – El Paso Independent School District EPMA- El Paso Museum of Art EPPD- El Paso Police Department EPWU – El Paso Water Utilities ESD – Environmental Services Department EZ – El Paso Empowerment Zone FAA – Federal Aviation Administration FB-Facebook FGP – Foster Grandparent Program FTA – Federal Transit Administration FTE – Full-Time Equivalent FTZ – Foreign Trade Zone FY – Fiscal Year GASB – Governmental Accounting Standards Board GED – General Education Development GFOA – Government Finance Officers Association GGHSON – Gayle Greve Hunt School of Nursing GIDS – Gate Information Display System GIS – Global Information Systems GO/GOB – General Obligation (Bonds) GS – General Service worker job classification GSA – US General Services Administration GT – Goal Teams H-GAC – Houston-Galveston Area Council
HSA – Health Savings Account HEED – Higher Education Excellence in Diversity HIV - Human Immunodeficiency Virus HUD – Housing and Urban Development HVAC – Heating, Ventilation and Air Conditioning IBP – Integrated Budget Process IDC – Indirect Cost IG-Instagram ISD – Independent School District ITS – Intelligent Transportation System KWH – Kilowatt hour LIFT – Living Independently Facilitated by Transportation; Sun Metro Paratransit LP Gas – Liquefied Petroleum Gas LSS – Lean Six Sigma LTC – Long Term Care MACC – Mexican American Cultural Center MCA – Medical Center of the Americas MCAD – Museum and Cultural Affairs Department MOU – Memorandum of Understanding MPC – Multipurpose Performing Art and Entertainment Center MPO – Metropolitan Planning Organization MSA – Metropolitan Statistical Area MSB II – Medical Science Building II MSC – Municipal Services Center MSSG – MountainStar Sports Group, LLC MYFO – Multi Year Financial Outlook NIP – Neighborhood Improvement Program NTMP – Neighborhood Traffic Management Program O&M- Operations and Maintenance OMB- Office of Management and Budget OSS – One Stop Shop OTC – Office of the Comptroller P3 – Public, Private, Partnership PCI – Pavement Condition Index PDN – Paso Del Norte PED – Pedestrian PEG – Public, Educational and Governmental Access Broadcasting PERS – Public Employees Retirement System PFC – Passenger Facility Charge PID – Public Improvement District PILOT / PILT – Payment in lieu of taxes PM – Professional/Managerial job classification POE – Point of Entry PPE- Personal Protection Equipment QoL- Quality of Life RFID – Radio Frequency Identification RMA – Regional Mobility Authority ROW – Right-Of-Way RSVP – Retired Senior Volunteer Program RTS – Rapid Transit System SAFE – Save Animals from Extinction SB2 – Senate Bill 2 SIB – State Infrastructure Bank SIDA – Secure Identification Display Area SIF – Self Insurance Fund SISD – Socorro Independent School District SO – Strategic Objectives SPP – Strategic Planning Process STEAM – Science, Technology, Engineering, Art, and Mathematics TASB – Texas Association of School Boards, Inc.
496
CITY OF EL PASO Acronyms
FY 2022 BUDGET
TB – Tuberculosis TBD – To be discussed TCEQ – Texas Commission on Environmental Quality TIRZ – Tax Increment Reinvestment Zone TRZ – Transportation Reinvestment Zone TOD – Transit Oriented Development TOMA – Texas Open Meetings Act TPIA – Texas Public Information Act TPFIA - Texas Public Funds Investment Act of 1995 TSA – Transportation Security Administration TTUHSC – Texas Tech University Health Sciences Center TXDOT – Texas Department of Transportation UMC- University Medical Center UPRR- Union Pacific Railroad USBC - United States Bowling Conference UTEP – University of Texas at El Paso VOIP - Voice over Internet Protocol WIC – Short title for, “The Special Supplemental Nutrition Program for Women, Infants and Children” WSB – Workforce Solutions Borderplex YISD – Ysleta Independent School District ZBA – Zoning Board of Adjustment
497
CITY OF EL PASO
FY 2022 BUDGET
Glossary
211 - A phone number staffed by the City of El Paso’s Public Health Department that provides free health and human service information and referrals to individuals and families within the community.
311 - A toll-free, non-emergency number. Dialing 311 from anywhere within the city of El Paso will provide direct access to a representative who can provide information or process requests for City services.
380 TAX REBATE AGREEMENT - This agreement refers to Section 380.001(a) of the Texas Local Government Code. The agreement provides that the City Council of the City of El Paso, Texas, “may establish and provide for the administration of one or more programs, including programs for making loans and grants of public money and providing personnel and services of the municipality, to promote state or local economic development and to stimulate business and commercial activity in the municipality.”
ACCOUNT - A record of debit and credit entries that shows the effect of transactions and other events involving a particular item or concern.
ACCRUAL BASIS - The basis of accounting recognizing income when earned and expenses when incurred.
ACTUAL - Denotes revenue and expenditure ledger results for operations normally for a specific fiscal year.
AD VALOREM - The central appraisal district sends certified values to the tax assessor, who determines the tax rate to be imposed on the property. "Ad-valorem" is used frequently to refer to such property values.
ADOPTED - Denotes City Council approved revenue and expenditure estimates for a fiscal year.
AGENCY FUNDS - A repository for funds held by the City as an agent for individuals, private organizations, and/or other governmental units.
AIRPORTS COUNCIL INTERNATIONAL (ACI) – A representative of the globe’s airport authorities that develops standards, policies and recommended practices. Represents airports’ interests with government and international organization to provide the public with safe and efficient air transport system.
ALL FUNDS - A summation of governmental, proprietary and fiduciary funds.
APPROPRIATION - A budgetary authorization granted by the City Council or appropriate executive staff that allows staff to incur obligations for purposes specified in the budget.
ARBITRAGE - The excess profit earned from the investment of tax-exempt bond proceeds in higher-yielding taxable securities.
AIRCRAFT RESCUE AND FIREFIGHTING (ARFF) – As required by the Federal Aviation Administration, airports must be able to provide aircraft rescue and firefighting as part of carrier operations.
ASSESSED VALUATION - A valuation set upon real estate or other property by the Central Appraisal District as a basis for levying taxes.
AUTOMATED CLEARING HOUSE (ACH) - An electronic network used for financial transactions that processes large volumes of credit and debit transactions, such as direct deposit payroll, vendor payments, and bill payments.
AUTOMATIC VEHICLE IDENTIFICATION (AVI) PROGRAM - A program that allows participating patrons to have their bridge tolls deducted automatically from their account when crossing the Stanton and Zaragoza International Bridges, which connect El Paso, Texas, and Juarez, Mexico. When patrons open an AVI account they are issued a barcode, which is used instead of cash at the Zaragoza or Stanton toll booths.
BALANCED BUDGET - A budget in which planned expenditures can be met by current revenue from taxation, other government receipts and the use of fund balance within a fiscal year.
BASIS OF ACCOUNTING - Accounting rules concerned with when to record financial transactions and, hence, what really constitutes a transaction. There are three bases of accounting: cash, accrual, and modified accrual.
Cash accounting is an accounting method where income is recorded during the period it is received, and the expenses in the period they are actually paid.
Accrual accounting is an accounting method in which income is recognized when earned and expenses when incurred.
Modified accrual accounting is an accounting method in which income is recognized in the period it becomes available and measurable, and expenses are recognized in the period they are incurred.
BENCHMARK - A statistic/measurement that serves as a standard by which others may be measured or judged.
BOND - A written promise to pay a specified sum of money, called the face value or principal amount, at a specified date or dates in the future, called the maturity date(s), together with periodic interest at a specified rate.
498
CITY OF EL PASO
FY 2022 BUDGET
GlossaryBOND, CERTIFICATES OF OBLIGATION - Legal debt instruments used to finance capital improvement projects. Certificates are backed by the full faith and credit of the governmental entity and are fully payable from a property tax levy. They differ from general obligation debt in that they are approved by the City Council and are not voter approved.
BOND, GENERAL OBLIGATION - A bond secured by the “full faith and credit” of a governmental entity and is fully payable from a property tax levy. This type of debt requires approval by voters in a special election.
BOND PROCEEDS - Funds derived from the sale of bonds for the acquisition of capital equipment and the construction of capital facilities.
BONDS, REVENUE - A type of debt issued for the construction of major capital facilities, where principal and interest on that debt are paid from revenue generated by earnings of a specific entity or program.
BRIO – Sun Metro’s Rapid Transit System.
BUDGET - A financial plan consisting of an estimate of proposed expenditures and their purpose for a given period and the proposed means of financing them.
BUDGET MESSAGE - A general discussion of the proposed budget as presented in writing by the budget-making authority to the legislative body and the general public.
CAMINO REAL REGIONAL MOBILITY AUTHORITY (CRRMA) - Created in 2007, the CRRMA is a local transportation agency tasked with the development of mobility solutions in the El Paso region.
CAPITAL ASSET - Any purchase that has a value of $5,000 or above and an original useful life of more than one year. Examples include tangible assets such as land, buildings, and equipment and intangible assets such as easements and software.
CAPITAL EXPENDITURE - Any purchase of an asset with a value less than $5,000 and whose useful life is less than one year.
CAPITAL BUDGET - A financial plan of proposed capital expenditures and the means of financing them for a specific fiscal period.
CAPITAL IMPROVEMENT PROGRAM (CIP) - A multi-year planning instrument separate from the Annual Budget that identifies: (a) all capital improvements that are proposed to be undertaken during a future five-year fiscal period; (b) the cost estimate for each improvement; (c) the method of financing each improvement; and (d) the recommended time schedule for each project.
CAPITAL IMPROVEMENT PROJECT - Any project which has a value exceeding $50,000 included within a Capital Improvement Program. These projects typically include the purchase of land, design, engineering and construction of building infrastructure items such as streets, bridges, drainage, street lighting, libraries, recreation facilities, bus transfer centers, etc.
CAPITAL OUTLAY - Expenditures for the acquisition of equipment (including heavy equipment, machinery, and rolling stock) using capital funding sources.
CHARACTER - Appropriation classified by type (e.g. personal services, contractual services, materials and supplies, and capital).
CHIME IN – City of El Paso’s annual Budget Survey.
CITIZEN COLLECTION STATION (CCS) - El Paso residents can take trash, household hazardous waste, and bulky items to one of four public drop-off locations, known as Citizen Collection Stations, within the city
CLASS C MISDEMEANORS - A relatively minor criminal act in the U.S. It is generally punishable by a fine only, ranging from $0 up to $500.
CLASSIFICATION - Categorization of the City’s staffing positions.
CO - Bonds, Certificate of Obligation – See definition of “Certificate of Obligation”.
COMMUNITY DEVELOPMENT BLOCK GRANT (CDBG) - Funds provided to the City of El Paso by the United States Department of Housing and Urban Development (HUD) to develop viable urban communities by providing decent housing and a suitable living environment and expanding economic opportunities, principally for persons of low and moderate income.
COMMUNITY POLICING - Philosophy that promotes organizational strategies, which support the systematic use of partnerships and problem-solving techniques, to proactively address the immediate conditions that give rise to public safety issues such as crime, social disorder, and fear of crime.
COMPREHENSIVE ANNUAL FINANCIAL REPORT (CAFR) - A report that provides detailed information on the financial position and results of operations of the City as measured and reported by the financial activity of its various funds. The CAFR is divided into an introductory section, financial section, and a statistical section.
CONSUMER PRICE INDEX - Measures changes in price level of consumer goods and services purchased by households.
499
CITY OF EL PASO
FY 2022 BUDGET
GlossaryCONTRACTUAL SERVICES - Services normally acquired through a 3rd-party contract for professional services such as consulting, outside counsel, billing and collections, plus others such as janitorial, security, etc.
COOLING, HEATING, AND PLUMBING (CHP) PERMITS - Permits issued by Planning & Inspections to contractors who are licensed in the State of Texas.
CORE SERVICES - The City departments' key lines of business. Core services produce the primary deliverables of a department.
CORRIDORS - Texas Department of Transportation rights-of-way. Sun Metro has developed four corridors to meet mobility needs and encourage transit supportive land use. They are located on Mesa, Alameda, Dyer, and Montana.
COST - The monetary value of effort, material, resources, time and utilities consumed, risks incurred, and missed opportunity in the production and delivery of a good or service.
COST OF LIVING INDEX - An index that measures the change in the minimum expenditures that would be incurred by a utility maximizing consumer, whose preferences or tastes remain unchanged, in order to maintaining a given level of utility (or standard of living or welfare).
COVID-19 - an acute respiratory illness in humans caused by a coronavirus, capable of producing severe symptoms and in some cases death, especially in older people and those with underlying health conditions.
CUSTOMER FACILITY CHARGE (CFC) - Fees levied on all rental car contracts issued by car rental operators at the airport.
DEBT SERVICE - Sometimes referred to as the Sinking Fund, it is a payment of interest and principal on an obligation resulting from the issuance of bonds.
DEFICIT - The amount by which a government’s spending exceeds its income over a particular period of time.
DELINQUENT TAXES - Taxes remaining unpaid on and after the date on which a penalty for non-payment is attached.
DEPARTMENT OF STATE HEALTH SERVICES (DSHS) - Current name for what was formerly called TDH – Texas Department of Health.
DIVISION - An organizational unit within a department's structure representing the major functional divisions of work.
EASEMENT - A right given to another person or entity to trespass upon land that person or entity does not own.
EFFECTIVE TAX RATE - Tax rate that when applied to the current year taxable assessed valuation would produce the same total tax revenue as the previous year, after adjustments required by state law. EL PASO EMPOWERMENT ZONE (EZ) - A federally recognized, distressed geographic area in need of sustainable community development as defined by the U.S. Department of Housing and Urban Development (HUD) for economic development activities which assist EZ residents to obtain or retain a job and to help businesses establish or expand into the Empowerment Zone.
ENCUMBRANCES - Obligations, in the form of purchase orders, that are chargeable to an appropriation and for which a part of the appropriation is reserved. They cease to be encumbrances when the obligations are paid or otherwise extinguished. Requisitions are considered pre-encumbrances.
ENPLANEMENT - Occurs when a passenger boards a commercial aircraft.
ENTERPRISE FUNDS - To account for operations financed and operated in a manner similar to private business enterprises; where the intent of the governing body is that the costs (expenses, including depreciation) of providing goods or services to the general public be financed or recovered primarily through user charges.
EL PASO INDEPENDENT SCHOOL DISTRICT (EPISD) - The El Paso Independent School District is the largest district in the Texas Education Agency's Educational Service Center - Region 19. EPISD serves over 64,000 students across 94 campuses, and is the tenth largest district in Texas.
EPIDEMIOLOGY - Branch of medicine that deals with the study of the causes, distribution, and control of disease in populations.
EXPENDITURE - The act of spending cash for goods and services in a governmental fund; money paid out.
FEDERAL AVIATION ADMINISTRATION (FAA) -This is an agency of the United States Department of Transportation that has authority to regulate and oversee all aspects of civil aviation in the U.S.
FEDERAL TRANSIT ADMINISTRATION (FTA) - An agency within the United States Department of Transportation (DOT) that provides financial and technical assistance to local public transit systems.
FIDUCIARY FUND - Any fund held by a governmental unit in a fiduciary capacity, such as agent or trustee.
500
CITY OF EL PASO
FY 2022 BUDGET
GlossaryFISCAL YEAR (FY) - A fiscal year is a twelve-month period of time to which the Annual Budget applies and at the end of which a governmental unit determines its financial position and the results of its operations. The City of El Paso’s fiscal year begins on September 1 and ends on August 31.
FIXED ASSETS - Assets that are intended to continue to be held or used, such as land, buildings, machinery, furniture, and other equipment.
FOSTER GRANDPARENT PROGRAM (FGP) - A federally funded program that provides stipend volunteer opportunities to low- and moderate-income adults, 55 years of age or older. The program provides recruitment, training, and placement for volunteers to work with special or exceptional needs children in schools or non-profit agencies or organizations.
FRANCHISE FEES - User fees charged by the City for use of public rights-of-way by utility companies. The fee is typically a percentage of the gross revenues of a utility company.
FOREIGN TRADE ZONE (FTZ) - An isolated, enclosed and policed area operated as a public utility, in or adjacent to a port of entry, furnished with facilities for loading, unloading, handling, storing, manipulating, manufacturing, and exhibiting goods and for reshipping them by land, water, or air.
FULL-TIME EQUIVALENT (FTE) POSITION(S) - A staff position converted to the decimal equivalent of a full-time position based on 2,080 hours per year. For example, a summer lifeguard working for four months, or 624 hours, would be equivalent to 0.3 of a full-time position.
FUNCTION - A classification of appropriations or expenditures on the basis of the principal purpose for which they are programmed, e.g., street sweeping, building maintenance, etc.
FUND - An independent fiscal and accounting entity with a self-balancing set of trial balance accounts recording cash and/or other assets, together with all related liabilities, for the purpose of carrying on specific activities or attaining certain objectives in accordance with special regulations.
FUND BALANCE - The net worth of a fund, measured by total assets minus total liabilities. Non spendable fund balance—amounts that are not in a spendable form (such as inventory) or are required to be maintained intact (such as the corpus of an endowment fund); Restricted fund balance—amounts constrained to specific purposes by their providers (such as grantors, bondholders, and higher levels of government), through constitutional provisions, or by enabling legislation; Committed fund balance—amounts constrained to specific purposes by a government itself, using its
highest level of decision-making authority; to be reported as committed, amounts cannot be used for any other purpose unless the government takes the same highest-level action to remove or change the constraint; Assigned fund balance—amounts a government intends to use for a specific purpose; intent can be expressed by the governing body or by an official or body to which the governing body delegates the authority; and Unassigned fund balance—amounts that are available for any purpose; these amounts are reported only in the general fund.
FUND TYPE - All funds are classified into eight generic fund types: General, Special Revenue, Debt Service, Capital Projects, and Enterprise, Internal Service, and Agency funds.
GENERAL FUND - The primary government fund which accounts for all general purpose transactions of the city that do not require a special type of fund.
GENERAL GOVERNMENT - Refers to a group of activities associated with the administrative functions of the city such as: Finance, Budget and Management, Planning, Legal, City Clerk, Municipal Court, Personnel, and Purchasing.
GENERALLY ACCEPTED ACCOUNTING PRINCIPLES (GAAP) - Uniform minimum set of standards of and guidelines used for financial accounting and reporting. Adherence to GAAP assures that financial reports of all state and local governments, regardless of jurisdictional legal provisions and customs, contain the same types of financial statements and disclosures, for the same categories and types of funds and account groups, based on the same measurement and classification criteria.
GO - General Obligation (Bonds) - See BOND, GENERAL OBLIGATION.
GOVERNMENTAL FUND - A classification used by the Governmental Accounting Standards Board (GASB) to refer to all funds other than Proprietary and Fiduciary funds. The General Fund, Special Revenue, Capital Project, and Debt Service are the types of funds referred to as “governmental funds.”
GRANT - A grant is an award of funding or materials or equipment by the federal government, social organizations, etc., with no expectation of reimbursement. The contribution is usually made to aid in the support of a specified function but can also be for general purposes and typically requires a matching contribution from the recipient.
GRANT MATCH - City costs or in-kind services required to match federal or state grants.
501
CITY OF EL PASO
FY 2022 BUDGET
GlossaryHOTEL/MOTEL TAX - Tax imposed on a person who pays for a room or space in a hotel costing $15 or more each day. Local hotel taxes apply to sleeping rooms costing $2 or more each day. The tax covers hotels, motels and bed and breakfasts, as well as condominiums, apartments and houses rented for less than 30 consecutive days.
HEATING, VENTILATION AND AIR CONDITIONING (HVAC) - is indoor and vehicular environmental and air quality control providing thermal and cooling comfort.
INFRASTRUCTURE - The basic installations and facilities upon which the continuance and growth of a community rely, such as roads, schools, power plants, and transportation and communication systems.
INTERNAL SERVICE FUND - A fund established to finance and account for services and commodities furnished by a designated department or agency to other departments and agencies within a single governmental unit, or to other governmental units. Amounts expended by the fund are restored either from operating earnings or by transfers from other funds, so that the original fund capital is kept intact.
JOB CODE/GRADE - Code number and salary grade assigned to positions within the City's Classification and Compensation Plan.
LEAN SIX SIGMA - A methodology that relies on a collaborative team effort to improve performance by systematically removing waste and reducing variation.
LIVING INDEPENDENTLY FACILITATED BY TRANSPORTATION (LIFT) - Sun Metro’s paratransit service for ADA paratransit-eligible clients, providing origin to destination (curb to curb), on-demand transportation using small buses equipped with hydraulic mobility device lifts and tie downs; as well as contracting with private operators using regular passenger vehicles.
LP GAS - Liquefied Petroleum (LP) Gas.
MAINTENANCE AND OPERATIONS (M&O) - The revenue generated by the portion of the tax rate that is applied to fund operations and maintenance. (See Tax Rate).
MAJOR FUND - A fund whose revenues, expenditures, assets, or liabilities are at least ten percent of the corresponding totals for all governmental or enterprise funds and at least five percent of the aggregate amount for all governmental and enterprise funds.
MAQUILADORA (OR MAQUILA) - A factory that imports materials and equipment on a duty-free and tariff-free basis for assembly or manufacturing and then re-exports the assembled product usually back to the originating country.
MATERIALS & SUPPLIES - Expendable items consumed by operating activities. Examples include office supplies, repair and replacement parts for equipment, books, and gasoline.
METROPOLITAN PLANNING ORGANIZATION (MPO) - A federally mandated policy-making organization of local government representatives and government transportation authorities created to ensure government-funded transportation projects and programs are based on continuing, cooperative, and comprehensive planning. An MPO is required for urbanized areas with a population greater than 50,000.
METROPOLITAIN STATISTICAL AREA (MSA) - An MSA is a U.S. Government classification for a free-standing urban population center with a population in the urban center of at least 50,000 residents and a total MSA population of 100,000 or more. The El Paso MSA includes El Paso County and the City of El Paso.
MODIFIED ACCRUAL BASIS - An accounting method whereby revenue is recognized when it becomes available and measurable and expenditures are recognized when the liability is incurred.
MULTI YEAR FINANCIAL OUTLOOK (MYFO) – A forecast of revenues and expenditures over a defined period of time based on a specific set of assumptions.
MUNICIPAL SERVICES CENTER (MSC) – Headquarters of the Streets and Maintenance Department.
NEIGHBORHOOD ASSOCIATION - A group of residents or property owners who advocate for or organize activities within a neighborhood.
NEIGHBORHOOD TRAFFIC MANAGEMENT PROGRAM (NTMP) - A city program used to evaluate traffic in residential streets to determine the need for the installation of traffic calming devices to slow down traffic.
NO NEW REVENUE TAX RATE - Tax rate that when applied to the current year taxable assessed valuation would produce the same total tax revenue as the previous year, after adjustments required by state law.
NON-DEPARTMENTAL - Activities that are not associated with or allocated to any particular department. These activities include: outside agency contributions; boards, committees, and commissions; inter-governmental contracts; general government contingency and liability expenses.
NON-OPERATING - Appropriations/expenditures that are not directly related to a fund or program's primary service activities.
502

CITY OF EL PASO
FY 2022 BUDGET
GlossaryNON-RECURRING REVENUE - Proceeds of general obligation and revenue bonds and other one-time revenues restricted to capital improvement projects.
OBJECT - Appropriation/revenue classification by major category within an expenditure character (e.g. contractual services include such objects as professional services, communications, utilities, outside contract services, etc.).
OBJECTIVE - Desired output-oriented accomplishments that can be measured and achieved within a given time frame. Achievement of the objective advances the activity and organization toward a corresponding goal.
ONE-STOP-SHOP - A company or a location that offers a multitude of services to a client or a customer. The idea is to provide convenient and efficient service and also to create the opportunity for the company to sell more products to clients and customers. The City of El Paso’s One-Stop-Shop provides services that include…
OPERATING BUDGET - A budget that applies to all outlay of expenditures other than capital improvements.
OPERATING EXPENDITURES - Department expenditures such as janitorial services, office supplies, and travel as a result of daily operations.
OPERATING FUNDS - Resources derived from recurring revenue sources used to finance recurring operating expenditures and pay-as-you-go capital expenditures specific to a fiscal year.
ORDINANCE - A formal legislative enactment by the City Council of a municipality. If it is not in conflict with any higher form of law, such as a state statute or constitutional provision, it has the full force and effect of law within the boundaries of the municipality to which it applies.
P3 – Private, Public Partnership.
PASSENGER FACILITY CHARGE (PFC) - Charge imposed by a public agency on passengers enplaned at a commercial service airport it controls. The revenue generated by PFC revenue, including any interest earned after such revenue has been remitted to a public agency, may be used only to finance the allowable costs of approved projects at any airport the public agency controls.
PEOPLESOFT - An integrated software package that provides a wide variety of business applications to assist in the day-to-day execution and operation of business processes. Each individual application, such as Financials, Customer Relationship Management and Human Resources, interacts with others to offer an effective and efficient means of working and reporting in an integrated fashion across the enterprise.
KEY PERFORMANCE INDICATORS - Statistical or workload data that quantify or qualify the results of programs, activities, and expenditures plus provide target goals for the upcoming year. Measures typically fall into one of the following categories: outputs, effectiveness, and efficiency.
PERSONAL SERVICES - All costs related to compensating employees of the city including employee benefit costs such as city contributions for retirement, social security, and health and industrial insurance.
PROPERTY TAXES - All ad valorem taxes on real or personal property.
PROPRIETARY FUND - Income-determination or commercial-type funds of a state or local governmental unit. Examples are enterprise funds and internal service funds.
PUBLIC, EDUCATIONAL, AND GOVERNMENT ACCESS TELEVISION (PEG) - Cable channel capacity for local government bodies and other legislative entities to access the cable systems to televise public affairs meetings. Government channels are generally reserved for government purposes and not for Education-access or Public-access television. Governmental entities in El Paso use Channel 15 for this purpose. Money for broadcasting on Channel 15 is captured and reported in a separate fund.
QUALITY OF LIFE - The notion of human welfare (well-being) measured by social indicators rather than by “quantitative” measures of income and production.
QUINT - is a fire truck that serves the dual purpose of an engine and a ladder truck. The functions that a quint provides are: pump, water tank, fire hose, aerial device, and ground ladders.
RADIO FREQUENCY IDENTIFICATION (RFID) - The use of a wireless non-contact system that uses radio-frequency electromagnetic fields to transfer data from a tag attached to an object, for the purposes of automatic identification and tracking.
RAPID TRANSIT SYSTEM (RTS) - A transportation system that includes the use of dedicated running ways, attractive and accessible stations such as enhanced shelters and transit centers, quiet high capacity clean fuel vehicles, high frequency all day services with integrated local and express service with direct rides, an efficient fare collection system, and advanced digital technologies that improve customer convenience, speed, reliability, and operations safety in order to improve customer convenience and system performance.
RECURRING REVENUES - Revenue sources available on a constant basis to support operating and capital budgetary needs.
503
CITY OF EL PASO
FY 2022 BUDGET
GlossaryRESTRICTED FUNDS - Accounting entities used to account for monies held by the City, in a restricted capacity, for organizations, programs, or other funds.
RETIRED SENIOR VOLUNTEER PROGRAM (RSVP) - A federally funded program that provides volunteer opportunities for both retired and working individuals 55 years of age and older. RSVP is part of the Corporation for National and Community Service. The dual purpose is to engage people in volunteer service to meet critical community needs; and to provide a high quality experience that will enrich the lives of volunteers.
REVENUE SOURCE - Classification of revenues by character indicating the major type of revenue such as: taxes, licenses & permits, user fees, fines, etc.
REVENUES - Amounts estimated to be received from taxes and other sources during the fiscal year to support all operations.
REVENUES, SPECIAL - Revenues that are legally restricted to expenditures for limited purposes. State and federal grant aid programs are appropriated and expended from special revenue funds.
RIGHT OF WAY (ROW) - A pathway or road with a specific legal description (e.g. “right to access and egress 20 feet wide along the northern line of Lot 7”) or the right to cross property to go to and from another parcel.
ROLLBACK TAX RATE - The percentage rate of increase above the previous year’s effective tax rate at which citizens can petition for a rollback (8% in Texas).
SENATE BILL 2 (SB2) – Also known as the Texas Property Tax Reform and Transparency Act of 2019, was passed by the Texas Legislature in 2019. At its most fundamental level, S.B. 2 reforms the system of property taxation in three primary ways: (1) lowering the tax rate a taxing unit can adopt without voter approval and requiring a mandatory election to go above the lowered rate; (2) making numerous changes to the procedure by which a city adopts a tax rate; and (3) making several changes to the property tax appraisal process.
STATE INFRASTRUCTURE BANK (SIB) LOAN - A loan agreement between the State of Texas, acting by and through the Texas Department of Transportation, and the City of El Paso; the loan is authorized by law to construct, maintain, or finance a highway improvement project, including the international bridges.
SINKING FUND - See DEBT SERVICE.
SMALL HUB AIRPORTS – Publicly owned airports that process between 0.05 and 0.25 percent of revenue passenger boarding’s annually.
SPECIAL REVENUE FUND - A fund used to account for and report the proceeds of specific revenue sources that are restricted or committed to expenditures for specified purposes other than debt service or capital projects.
STRATEGIC PLAN - The process of developing a vision for a desired future and translating that vision into defined goals or objectives including the steps to achieve them.
SURPLUS - The excess of an entity’s or fund’s assets over its liabilities (See Fund Balance); the accumulation of excess revenues over expenditures or expenses during a single budget year.
SUSTAINABLE GROWTH - Development that meets the needs of the present without compromising the ability of future generations to meet their own needs.
TAX INCREMENT FINANCING (TIF) - A method of funding public investments in an area slated for redevelopment by recapturing, for a time, all or a portion of the increased tax revenue that may result if the redevelopment stimulates private investment.
TAX INCREMENT REINVESTMENT ZONE (TIRZ) - An area where the City has utilized tax increment financing for redevelopment or community improvement projects.
TAX LEVY - The total amount to be raised by general property taxes for purposes specified in the Tax Levy Ordinance.
TAX RATE - The amount of tax levied for each $100 of assessed valuation. The tax rate is comprised of two components: the debt service rate and the operations and maintenance rate.
TAX SUPPORTED DEBT - Bonds and other obligations whose principal and interest are payable exclusively from a particular governmental tax.
TEXAS LOCAL GOVERNMENT RECORDS LAW - State law that includes, but is not limited to, addressing the management and preservation of local government records and the establishment of uniform standards and procedures for the maintenance, preservation, microfilming, or other disposition of local government records.
TEXAS DEPARTMENT OF TRANSPORTATION (TXDOT) - TXDOT is a state department responsible for planning, designing, building, operating, and maintaining the state's transportation system.
TEXAS STATE OPEN RECORDS ACT - Chapter 552 of the Texas Government Code provides a mechanism for citizens to inspect or copy government records.
504
CITY OF EL PASO
FY 2022 BUDGET
Glossary
THIRD PARTY ADMINISTRATORS (TPA) - Third party inspectors hired by Development Services to perform all the necessary inspections on buildings assigned to them as a contractor for the City. The costs of these contractors’ services to the City comprise 25% of the permit fee.
TRANSIT CORRIDOR - A broad geographical band that follow a general directional flow connecting major sources of trips that may contain a number of streets, highways, and transit route alignments. The most desirable corridors are designed with an abundance of walkable areas.
TRANSIT-ORIENTED DEVELOPMENT - A mixed-use residential or commercial area designed to maximize access to public transportation and often incorporates features to encourage transit ridership.
TRANSPORTATION POLICY BOARD - A Metropolitan Planning Organization board consisting of (1) elected officials; (2) officials of public agencies that administer or operate major modes of transportation in the metropolitan planning area; and (3) appropriate state transportation officials as ameans for encouraging greater involvement in themetropolitan transportation planning process.
TRANSPORTATION REINVESTMENT ZONE (TRZ) - An area identified by the City Council within which a portion of tax revenue generated after the creation of the TRZ is segregated and used for identified transportation projects within the area. In 2010, Council created two TRZs to assist in the funding of various major transportation projects.
TRANSPORTATION SECURITY ADMINISTRATION (TSA) - Federal agency that provides security grants to help protect the public and the nation’s critical transportation infrastructure against acts of terrorism and other large-scale events.
VARIANCE - Amount of difference or change.
Vehicle Image and Vehicle Detection System (VIVDS) – Is a traffic camera and computer system used to determine the presence of vehicles at an intersection so signal lights may change accordingly.
WIC - A federal assistance program called, “The Special Supplemental Nutrition Program for Women, Infants and Children” that provides healthcare and nutrition for low-income pregnant women, breast-feeding women, and infants and children under the age of five.
YSLETA DEL SUR PUEBLO - A United States federally recognized tribal entity just outside El Paso, Texas, comprising members of the Tigua Indian tribe who were displaced from New Mexico in 1680 during the Pueblo Revolt.
505