Fiscal Year 2021 Budget - My First Heading
297
FISCAL YEAR 2020 BUDGET | CITY OF CEDAR RAPIDS, IOWA 1 CITY OF CEDAR RAPIDS, IOWA Fiscal Year 2021 Budget Book 1
-
Upload
khangminh22 -
Category
Documents
-
view
2 -
download
0
Transcript of Fiscal Year 2021 Budget - My First Heading

F I S C A L Y E A R 2 0 2 0 B U D G E T | C I T Y O F C E D A R R A P I D S , I O W A 1
CITY OF CEDAR RAPIDS, IOWA
Fiscal Year 2021 Budget Book 1

F I S C A L Y E A R 2 0 2 0 B U D G E T | C I T Y O F C E D A R R A P I D S , I O W A 1
CONTACT INFORMATION
Published by the Finance Department Questions concerning this document may be directed to:
Finance Department 101 1st Street SE Cedar Rapids, IA 52401
City Website: www.cedar-rapids.org
SPECIAL NOTE After the budget was prepared, but prior to the public notification in April 2020, the City received communication from Linn County of a decrease in valuation for a property. The State report has been adjusted for this change. The remainder of the budget book has not been updated as this change resulted in less than a 1% decrease in property tax and backfill revenue.
Also, this budget does not reflect changes as a result of the 2020 coronavirus pandemic. Any changes required will be handled in fiscal year 2021 via the budget amendment process as necessary.
2

Table of Contents FY 2021 Adopted Budget Book – Book 1 Letter from the City Manager 6
Introduction 25 Form of Government 26 Mayor and City Council, Department Directors and Principal Officials 27 City Organization Chart 28 City Vision, Values 29 Distinguished Budget Award 30 Resolution Adopting Budget 31 Resolution Adopting Total Maximum Property Tax Dollars 32
Planning 33
Policies and Guidelines 42
Budget Highlights 54
State Forms 73
Business Units 83 Combined Financial Summary 84 Budget Detail by Fund Type 85
Budget by Major Fund 90
General Fund 96 General Fund Highlights 97 Public Safety
Police 101 Fire 104 Building Services 107 Building Demolition 109
Public Works and Development Public Works 110 Street Lighting 113 School Crossing Guards 114 Bridge Maintenance 115 Community Development 116 Development Services 119
Parks and Recreation 121 Administrative (Information Technology, Finance, Human Resources, Attorney, City Manager, Mayor and Council, City Clerk) 124
3

Other General Fund Areas (Library, Contingent, Cedar Rapids Tourism Office, Civil Rights, Gateways, Downtown, Capital Replacement, Pooled Revenues, Investment Earnings, Memorial, Agricultural Lands, Band)
137
Enterprise Funds 152 Enterprise Fund Highlights 153 Transit 161 Golf 163 Water 166 Water Pollution Control 169 Sanitary Sewer Maintenance 172 Storm Water 175 Solid Waste and Recycling 178 Parking 181 Ice Arena 182 Paramount Theatre 183 U.S. Cellular Center and Doubletree by Hilton 184 The Eastern Iowa Airport 185
Internal Service Funds 186 Internal Service Fund Highlights 187 Joint Communications 188 Facility Maintenance 190 Fleet Services 193 Risk Services 195
Trust and Agency Funds 197 Trust and Agency Fund Highlights 198
Capital Project Funds 199 Capital Project Fund Highlights 200
Debt Service Funds 202 Debt Service Fund Highlights 203
Special Revenue Funds 206 Special Revenue Fund Highlights 207
Capital Improvement Project 5 Year Plan 210 Capital Improvement Project Plan Highlights 211 Significant Non-recurring Capital Expenditures 214 Capital Improvement Project Impact on Operating Budget 216 5 Year Capital Improvement Project Plan Detail 218
Cash Transfers 272 Cash Transfers Report 273
4

Fund Balance 276 Fund Balance Definition, Policy, Fund Balance Report 277
Statistical Information 279 Statistical Information 280
Other Supplemental Information 285 Capital Equipment Requests Included in the Budget 286 Requests Not Included in the Budget 287
Glossary 290 Acronyms 291 Terminology 293
FY 2021 Adopted Budget Book – Book 2 (Detailed Financial Reports) See Book 2 for Detailed Financial Reports
5

Office of the Cedar Rapids City Manager City Hall • 101 First Street SE • Cedar Rapids, Iowa 52401 • (319) 286-5080 • FAX (319) 286-5130
March 24, 2020
Honorable Mayor and City Council members:
I respectfully present the proposed budget for the City of Cedar Rapids for the fiscal year beginning July 1, 2020. The budget serves as the City’s financial and spending plan for the year, and the adoption of the budget is undoubtedly the single-most important action taken by the City’s elected officials each year. The proposed budget will authorize resources and establish a direction for our programs and services for the coming year supporting City Council strategic goals of STRENGTHEN CR, GROW CR, CONNECT CR, GREEN CR, INVEST CR, PROTECT CR, and PROMOTE CR.
As you review the proposed fiscal year 2021 budget, it is the staff’s belief that this budget format enhances the citizens’ of Cedar Rapids understanding of the budget process and the services they receive. It is vital that the City’s policy makers are provided with information needed to ensure that the budget document reflects the public interest. It is our hope that the budget document serves as an effective policy document, financial planning tool, operational tool, and communication tool.
ACCOMPLISHMENTS IN FINANCIAL MANAGEMENT The Government Finance Officers Association of the United States and Canada (GFOA) awarded a Certificate of Achievement for Excellence in Financial Reporting to the City of Cedar Rapids for its Certified Annual Financial Report for the fiscal year ended June 30, 2018. This is the 38th consecutive year that the City has received this prestigious award. In order to be awarded a Certificate of Achievement, a government must publish an easily readable and efficiently organized comprehensive annual financial report. This report must satisfy both accounting principles generally accepted in the United States of America and applicable legal requirements. The City submitted its June 30, 2019 Certified Annual Financial Report in December 2019 to GFOA to determine its eligibility for another certificate.
The Government Finance Officers Association of the United States and Canada awarded its Distinguished Budget Presentation Award to the City of Cedar Rapids for its fiscal year budget beginning July 1, 2019. This is the 9th consecutive year the City has received this prestigious award. The award reflects the commitment of the City and staff to meet the highest principles of governmental budgeting. In order to receive the budget award, the City had to satisfy nationally recognized guidelines for effective budget presentation. These guidelines are designed to assess how well an entity’s budget serves as a policy document, a financial plan, an operations guide, and a communications device. In order to receive the award, the City’s budget document must be rated “proficient” in these four categories and contain fourteen mandatory criteria within those categories.
6

Page 2 of 16
In May 2019, the City’s bond rating for outstanding general obligation debt was rated Aa1 with a stable outlook by Moody’s Investor Services. Aa1 is the second highest rating that can be achieved and is predicated on the City’s large and growing tax base, reserves, revenue raising ability, and fiscal management.
REVIEW OF FISCAL YEAR 2020 PROPERTY TAX LEVY In fiscal year 2020, the City’s overall property tax levy rate compared favorably with other cities in Iowa. Below are the property tax levy rates for fiscal year 2020.
IMPACT OF STATE PROPERTY TAX REFORM ON THE BUDGET In fiscal year 2017, a new class of property was created, called multi-residential. In previous years, these properties were classified as commercial property and the state provided backfill to cities for the loss in property tax revenue due to the state rollback changing from 100% to 90% for commercial properties. Since fiscal year 2017, the multi-residential classification began to shift to the residential classification and rollback value. In fiscal year 2021, multi-residential properties will be taxed at 71.25% of property value. In fiscal year 2024, these properties will have the same rollback percentage as residential properties. For multi-residential, the state does not provide backfill to cities for lost property taxes so the loss is immediate. In fiscal year 2021, the loss of property taxes from the change in rollback for multi-residential is $942,933 and the increase in property taxes due to the increase in taxable valuations in multi-residential is $434,790.
The other part of the state property tax reform is the state backfill for commercial and industrial classes of property. The state property tax reform bill required the State to replace property tax
$10.03
$10.33
$15.44
$15.66
$15.68
$15.83
$16.78
$16.64
$17.55
$18.26
$- $2 $4 $6 $8 $10 $12 $14 $16 $18 $20
Ames
Dubuque
Cedar Rapids FY 2020
Cedar Rapids FY 2021
Sioux City
Iowa City
Davenport
Des Moines
Waterloo
Council Bluffs
FY 2020 Property Tax Levy Rate Per $1000 of Taxable Valuation
7
Page 3 of 16
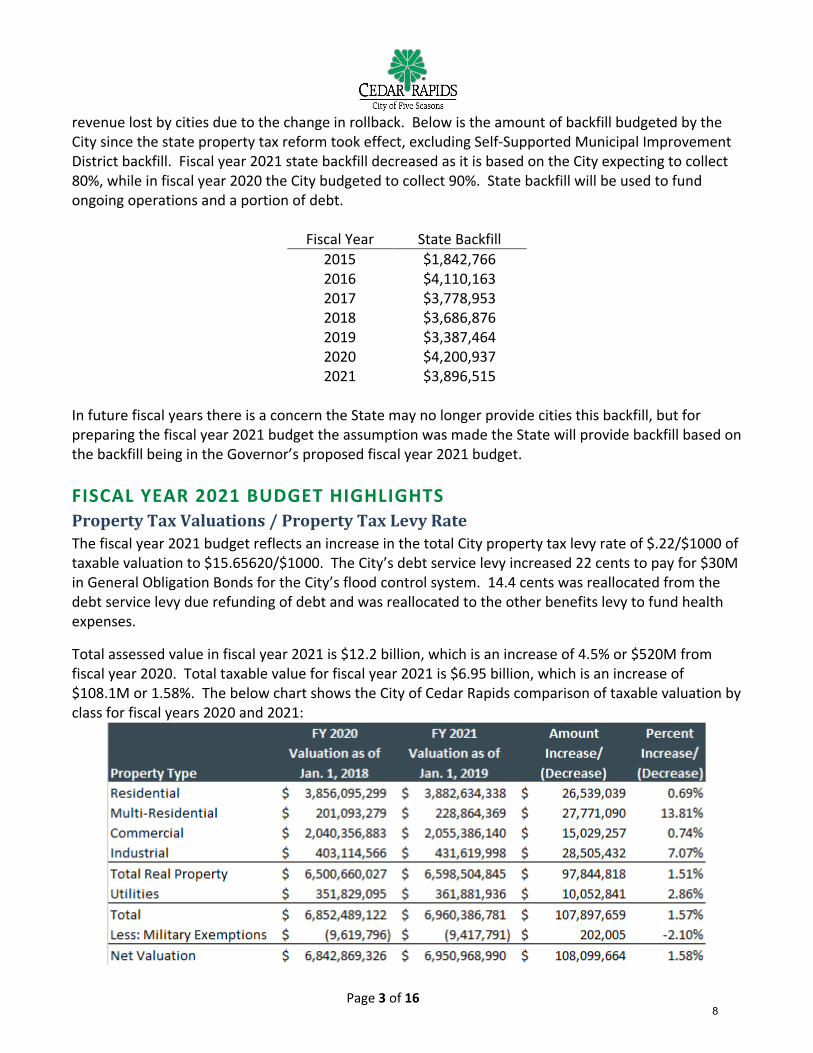
revenue lost by cities due to the change in rollback. Below is the amount of backfill budgeted by the City since the state property tax reform took effect, excluding Self-Supported Municipal Improvement District backfill. Fiscal year 2021 state backfill decreased as it is based on the City expecting to collect 80%, while in fiscal year 2020 the City budgeted to collect 90%. State backfill will be used to fund ongoing operations and a portion of debt.
Fiscal Year
State Backfill
2015 $1,842,766 2016 $4,110,163 2017 $3,778,953 2018 $3,686,876 2019 $3,387,464 2020 $4,200,937 2021 $3,896,515
In future fiscal years there is a concern the State may no longer provide cities this backfill, but for preparing the fiscal year 2021 budget the assumption was made the State will provide backfill based on the backfill being in the Governor’s proposed fiscal year 2021 budget. FISCAL YEAR 2021 BUDGET HIGHLIGHTS Property Tax Valuations / Property Tax Levy Rate The fiscal year 2021 budget reflects an increase in the total City property tax levy rate of $.22/$1000 of taxable valuation to $15.65620/$1000. The City’s debt service levy increased 22 cents to pay for $30M in General Obligation Bonds for the City’s flood control system. 14.4 cents was reallocated from the debt service levy due refunding of debt and was reallocated to the other benefits levy to fund health expenses.
Total assessed value in fiscal year 2021 is $12.2 billion, which is an increase of 4.5% or $520M from fiscal year 2020. Total taxable value for fiscal year 2021 is $6.95 billion, which is an increase of $108.1M or 1.58%. The below chart shows the City of Cedar Rapids comparison of taxable valuation by class for fiscal years 2020 and 2021:
8

Page 4 of 16
In fiscal year 2021, property taxes are proposed to be allocated by the following breakdown.
City Operations, which represents the general fund, is proposed to allocate property taxes according to the following breakdown.
General Fund The fiscal year 2021 budget as presented includes a balanced general fund budget. The total fiscal year 2021 general fund revenue and expenditure budget is $139.6M.
City Operations$80,621,439
73.2%
Transit/Bus$5,615,479
5.1%
Band$115,873
0.1%
Memorial$1,395,894
1.3%
Debt$22,341,847
20.3%
General Government$9,492,495
12%Community
Development$1,700,602
2%
Public Works$6,242,744
8%
Public Safety$50,073,980
63%
Street Lighting$1,345,652
2%
Parks & Recreation$6,001,699
7%
Downtown$123,747
<1%
Library$4,954,327
6%
9
Page 5 of 16
Below are a few general fund programs, which are being enhanced or added in fiscal year 2021: Building Services: The primary role of the City’s housing inspection program is to protect the health, safety, and welfare of those citizens who reside in rental properties in Cedar Rapids. The fiscal year 2021 budget will add two additional housing inspectors to the already existing rental inspection program; this will allow the inspection cycle to be reduced from our current cycle of five years, to a cycle of three years. This reduction in the inspection cycle will allow Building Services to inspect rental properties at a greater frequently, resulting in improved neighborhood standards and quality of life in our neighborhoods. In addition, the program will continue to make sure that rental properties are maintained in a safe and code compliant manner for our citizens. The additional staff will allow for a greater efficiency in performing these inspections. Finally, this reduction of inspection cycle will be more in line with most other communities in the State of Iowa.
Park & Recreation Rolling Recreation Program One of the new funding initiatives in fiscal year 2021 is the rolling recreation program. The Parks and Recreation Department wishes to offer a way to bridge the transportation barriers for children by bringing the fun to them and help activate City neighborhood parks. This mobile recreation program will offer free summer activities with a goal to keep kids active, having fun, and being outdoors in our City park system. The Rollin’ REC Mobile provides a safe and fun place close to home for youth to play. Activities include board games, music, sports, and craft activities monitored by recreation staff. The mobile recreation program would make two hour scheduled stops at nine different parks throughout the City each week during the summer, as well as be utilized at Parks and Recreation special events.
Youth Basketball Program Another new funding initiative is creating a youth basketball program for ages 13 – 18 during the summer. The Parks and Recreation Department believes there is a demand to provide additional youth outreach in the community and engage youth in our core neighborhoods. The City would open the NW Recreation Center gym in the later evening hours on a weekly basis for youth to play basketball, have a free meal, enjoy mentorship (City staff), and have fun. For eight weeks during the summer, recreation staff will provide a safe place for youth to enjoy evenings and interact with City staff.
Information Technology Information Technology Department in fiscal year 2021 will be adding $200K in outsource services in order to meet the needs of City Departments. City Departments continue to need technology to perform their daily duties. Adding an additional $200K in outsourced services will allow the City to address department needs sooner and better use of staff resources. General Fund Revenue & Expenditure summaries: Revenue Property tax revenue, including transfers of property tax revenue from trust and agency funds, is
increasing $2M to $81.5M based on the increase in valuations and the increase in the property tax levy for other benefits.
10

Page 6 of 16
Franchise tax revenue is increasing by $133K to $10.3M based on historical and projected information.
Interest revenue is increasing $657K to $2.3M based on historical and projected information. Police towing revenue decreased $645K based on projected information. Revenue for private development site inspection fees increased $155K to fund two positions
approved as part of the fiscal year 2020 budget process. Library fine revenue of $100K was removed from the budget due to metro area libraries eliminating
overdue fines on library materials effective July 1, 2020.
Personal services expenditures Personal services are the largest general fund expense at $96.6M. Personal service costs account for 69% of the general fund budget. For the fiscal year 2021 budget, 73% of the personal service cost is wages and 27% is benefits. The fiscal year 2021 personal services budget includes wage adjustments for non-bargaining employees based on the external wage study and increases in wages for bargaining employees based on approved bargaining agreements. Overall, general fund full time equivalents (FTEs) are increasing 5.12 FTEs to 963.92 FTEs. Changes include: Adding 2 Housing Inspector FTEs to support the Building Services rental inspection program and
reduce the inspection cycle from five years to three years, which will STRENGTHEN CR by resulting in improved housing conditions and neighborhoods.
Adding 1 Digital Evidence Project Coordinator FTE to support the police digital evidence program enhancing the use of digital technology by having a dedicated position and will STRENGTHEN CR.
Adding 1 new Asset Management FTE in the Information Technology department to team up with utility departments to PROTECT CR by enhancing operations allowing a more comprehensive asset management system.
Adding 1 Right of Way Permit Technician FTE to support the permitting process, 1 Property Acquisition Agent FTE to support the acquisition process for the flood control system, 1 Civil Engineer FTE to support Americans with Disabilities Act compliance under the Public Works department to PROTECT CR.
Increase of .29 seasonal FTE for the new mobile recreation program to STRENGTHEN CR with a goal to keep kids active, provide options to have fun, and enjoy being outdoors in our City park system.
Increase of .19 seasonal FTEs for the new at youth basketball program to STRENGTHEN CR by opening the Northwest Recreation Center gym in the later evening hours for youth to play basketball, have a free meal, mentor with City staff, and have fun.
Various decreases in seasonals based on department needs. Funding includes a $80K increase in building permit revenue based on historical and projected information, utility user fees, a $67K increase in Public Works permit revenue based on historical and projected information, flood general obligation bonds for the flood control position, and increases in various other general fund revenue sources. New expenditure items, changes to existing expenditures, or other revenue changes that support the City Council goals of STRENGTHEN CR, PROTECT CR, GREEN CR, CONNECT CR, and INVEST CR: Police - $59K to fund a second position through Foundation 2 for mental health response.
11

Page 7 of 16
Fire - $42K for consulting services for promotional assessment and recruitment testing materials and $10K for national fire operations reporting system subscription.
Public Works - $40K increase in wages for seasonals, $100K for bridge maintenance, $14K for pavement marking materials, and $16K for maintenance fees associated with a railroad agreement.
Parks & Recreation – Associated costs for the new mobile recreation program ($11K) and new at youth basketball program ($13K), $100K for ash tree removal support, $8K for the downtown ambassador program, $25K for painting and caulking pools, and $58K increase in wages for seasonals.
Information Technology - $268K for software maintenance, $49K for camera storage in squad cars, $200K for external support services, and $47K for imagery services (one time request).
Finance - $34K for eProcurement software to streamline the purchasing process and allow vendors to receive and submit their information electronically.
Library - $40K increase in expenses for security. Increase in public safety health service expenses by $296K to $896K increase based on historic
data. $177K for convention center and arena operating deficits. $1.1M for capital equipment to support department operations (I.e. public safety equipment, audio
visual equipment etc.). $58K increase in dues and memberships for the Mayor & Council budget based on projected
expenses. $399K for economic development operations and application process (includes $100K reallocated
from the Mayor & Council budget). $350K for City Manager and City Council discretionary spending (I.e. neighborhoods, contributions,
grants, etc). $75K to subsidize the fiscal year 2021 budgeted operating shortfall for golf. $60K for visual arts program as approved in 2010 by City Council for the Arts Policy that designated
funding for public art and maintenance. $1M for year four of five of the Neighborhood Finance Corporation commitment for home
improvement forgivable loans to spur private investments. Amphitheater revenue increased $140K to $1.1M. Expenditures increased $146K to $1.1M for a
net budgeted loss of $55K, which is $6K more than fiscal year 2020 budgeted loss. $1.7M in revenue and expenses for a net budgeted profit of $16K relating to the Cedar Rapids
Tourism Office. Various increases/decreases based on historical and projected information. General Fund Reserves The City of Cedar Rapids maintains prudent general fund balances, which protect the City’s financial integrity. At this time, City staff projects the City’s unassigned general fund balance on June 30, 2021 will be 30% ($42M) of fiscal year 2021 annual operating budget of $139.6M.
12

Page 8 of 16
Internal Service Funds Risk Management Property and liability expenses are increasing $263K to $3.6M. This increase is attributable to an increase in property values from adding the Veterans Memorial Building, 2 flood stations, and a water tower as well as projected increases in rates and excess premiums. Workers compensation expenses are decreasing $229K to $4M. This decrease is attributable to the actuary-projected reduction in losses. Health fund expenses are increasing by 11% or $2.3M to $23.8M, which directly correlates to an increase in health claim expenses. Dental expenses are decreasing by $69K to $1.1M, which directly relates to dental claims expenses. Joint Communications The budget includes an increase of $82K for equipment (one time request). Also included is $754K from the E911 Service Board for radio maintenance. $635K is budgeted to replace radios in squad cars based on a 10-year replacement cycle. The radios will be funded from Joint Communication operating reserves. $3.3M or 81% of Joint Communication’s operating expenses are funded by the general fund within the Fire and Police Department’s budgets. Facilities Maintenance In fiscal year 2021, flood local option sales tax revenue will fund flood insurance expenses for City Hall, the City Services Center, and the police station in the amount of $229K. City Hall building rent will increase $19K due to increases in personal service costs. City Services Center building rent will increase $182K due to increases in personal service costs, supplies and materials, and electricity. The police station, maintenance building, and substation rent will decrease $9K due to a reduction in environmental services staffing for this location. The central fire station rent will decrease $4K due to a reduction in technician hours for this location. Fleet Services The fleet budget for maintaining vehicles and equipment includes an increase of $481K in discretionary expenses for costs directly billed to departments based on historical expenses. Fleet plans to purchase $6.1M of purchases of vehicles and equipment, which includes $3.2M general fund areas, $2.8M for enterprise funds, and $45K for internal service funds. Funding is from lease charges and $476K in contributions. The fuel fund includes $60K in expenses for replacing fuel tanks at Bever Park and Ellis Golf Course. Cash on hand in the fuel fund will pay for fiscal year 2021 operating costs and the fuel tank replacements.
Enterprise Funds Utility Rates The City’s utility rate (consisting of water, water pollution control/sanitary sewer, storm water, solid waste, recycling, and yard waste) for fiscal year 2021 is proposed to increase 4.8% which is an increase of $57.36 annually for the typical residential customer defined as a household that uses 10 units of water and 10 units of sewer. The majority of the increase in fiscal year 2021 will be used to fund operations and capital improvement projects for water, water pollution control, storm water, and sanitary sewer. The residential rate for solid waste and yard waste collection will remain unchanged.
13

Page 9 of 16
Water The Water Department is increasing the water service charge by 6.5% for fiscal year 2021. Volumetric steps one and two will increase 6%, step three 4.5% and step four 1.25%. The rate increases will fund operating costs and capital improvement project expenditures. In fiscal year 2021, total planned capital project expenditures are $13.8M. Funding includes $6.5M in revenue bonds, $3.1M in state revolving fund proceeds, and $4.2M from user fees. Included in the budget is $4.5M for water expenses associated with paving for progress projects. The largest budgeted project of $3.1M is for the northwest water treatment plan softener addition. The water department five-year capital improvement project plan for fiscal years 2021 - 2025 is estimated at $87.9M. This plan is based on 4% annual increases in total revenue or rate increases of 6.5-7% annually to support 2% annual increases in operations and capital investments while maintaining current bond ratings. Water Pollution Control In fiscal year 2021, both the sewer service charge and volumetric charge will increase 6.5%. Industrial rates will increase 2.5% for flow and 2% for total suspended solids and total nitrogen. Biochemical oxygen demand rates will increase 1%. Rate increases will fund operating costs and capital improvement project expenditures. Fiscal year 2021 total planned water pollution control capital improvement project expenditures are $12.2M. Funding includes $7.2M in revenue bonds, $1M in state revolving fund proceeds, $2M from user fees, and $2M from cash on hand. The largest budgeted expense relates to upgrading logic controllers. The five-year water pollution control capital improvement project plan for fiscal years 2021 - 2025 is estimated at $64M. This plan is based on 4% annual increases in total revenue or rate increases of 6.5-7% annually to support 2% annual increases in operations and capital investments while maintaining current bond ratings. There is an additional $133M in capital improvement projects that are not included in the five year plan as funding these costs would require alternative funding sources or large annual rate increases. City staff will be reviewing options for additional funding such as a loan through the Water Infrastructure Finance and Innovation Act, State Revolving Funds, seek legislation to support changing debt repayment levels from 20 to 30 years for revenue bonds, etc. Sanitary Sewer Shared revenue from Water Pollution Control Department will increase $396K to $12.7M to meet capital improvement project and operating needs. Total planned fiscal year 2021 sanitary sewer capital improvement project expenditures are $12.8M. Funding includes $4.9M of revenue bonds, $5.2M from sanitary sewer user fees, $1M from the Water Pollution Control Department user fees, $1.5M in developer cost sharing, and $150K in assessments. The largest budgeted expense relates to large diameter sewer repairs and lining sewers.
14

Page 10 of 16
Storm Water The storm water utility rate will increase 5% and will be used to fund capital improvement project and operating needs. Costs to maintain and operate the flood control pump stations in fiscal year 2021 are estimated to be $73K. These costs will continue to increase as the flood control system is constructed to an estimated $500K at full build out of the system. Transit The transit levy rate will remain unchanged at $.80787/$1000 of taxable valuation. The levy rate will produce $5.6M in property tax revenue in fiscal year 2021. The budget includes an increase of 4% or $23K to $574K in service charge revenue from Marion and Hiawatha. Included in the budget is an additional $904K for extending weeknight fixed-route bus service to all bus routes by two additional hours to CONNECT CR. This budget will fund adding 8 FTEs to support these extended hours, additional overtime and call in pay, fuel, and associated internal administrative charges. Assuming property valuations continue to grow, property tax revenue should be sufficient to continue to fund these costs for a few years assuming Transit’s existing reserves will fund buses and other project expenditures over the next 5 years. If revenue does not increase at the same pace as expenses, then it may be necessary to reduce other costs or increase the transit levy. It is anticipated reserves for capital projects will be depleted after 5 years and other funding sources such as general obligation bonds may be necessary to maintain service levels. The fiscal year 2021 budget includes $3.6M in capital improvement projects. Of this, $2.4M is for a new bus maintenance facility (will replace existing facility once 6th Street and Ellis Road connection is made) and $1.2M is for replacing buses. The capital improvement plan for fiscal years 2022 – 2025 estimates $1.3M per year in annual bus replacements with 80% of the costs being funded from federal grants. Golf The golf budget includes $2.92M in revenue and $3M in expenditures, or an operational deficit of $75K. To fund this deficit, the budget includes a transfer from the general fund. Included in the fiscal year 2021 budget is a new mini golf program at Twin Pines Golf Course, which will STRENGTHEN CR. The mini golf course will open in the fall of 2020 and in a typical year be open April – November giving citizens of Cedar Rapids more recreational opportunities. The budget includes $165K in revenue and $41K in expenses to fund an additional 1.12 seasonal FTEs, advertising, course maintenance, and concession expenses. Also included in the golf budget are debt payments of $185K that will be funded with property tax revenue from the debt service levy. Paramount The City transferred its interests to the Paramount Theatre Manager, LLC in October 2012. By fiscal year 2021, the interests in the Paramount Theatre are anticipated to be transferred back to the City. The fiscal year 2021 budget includes $1.6M in revenue and expenses for the Paramount operations. Parking Currently that City has a lease agreement with Downtown Parking Management, Inc. (DPMI) to manage City owned parking facilities and be responsible for setting policy and rates. As a result,
15

Page 11 of 16
revenues and expenditures of Downtown Parking Management Inc. related to operations are not recorded in City financial statements, but instead are handled as assets. Downtown Parking Management Inc. continues to submit an annual operating budget in accordance with their agreement with the City, but their operating budget will not be recorded on the City’s financial statements. The City will continue to record debt payments and capital improvement projects in the Parking fund since these are funded by the City. Included in the City’s fiscal year 2021 parking budget is the City’s activity relating to parking. This includes personal services for the employees originally hired by the City of Cedar Rapids, but managed by DPMI, debt payments, and capital improvement projects associated with deferred maintenance. Hotel / Convention Center / Arena The net income from the hotel portion of the complex will go towards hotel debt payments in fiscal year 2021. The convention center and arena operating deficits are budgeted at ($177K) combined and capital reserve are budgeted at ($1M) combined. The general fund ($177K) and the Downtown TIF ($1M) will fund these deficits. The annual set aside for capital reserve is for future capital needs of the convention center and arena and is used to maintain the appearance and structure of the complex. ImOn Ice Arena The City of Cedar Rapids Ice Arena was renamed ImOn Ice in January 2020. Fiscal year 2021 capital improvement budget includes $3M in building improvements and $250K in improvements per the City’s agreement with the Cedar Rapids Roughriders. The fiscal year 2021 budget shows a deficit of $124K to operate the facility. Funding for these costs will come from hotel motel taxes. Special Revenue Funds Hotel Motel Tax The City is budgeting $3.9M in fiscal year 2021 for hotel motel tax revenue which increased $50K from fiscal year 2020. Expenditures are being budgeted at $3.9M. Included in the expenditures are City debt payments (I.e. portion of hotel, portion of convention center, and art museum), $253K for an internal loan relating to ImOn Ice mechanical improvements, and $250K for other ice arena capital improvements related to the Roughriders agreement. In addition, the City will use some of the hotel motel revenue for organizations who applied for funding through the hotel motel three-year application program. Road Use Tax The City is budgeting $16.4M of road use tax in fiscal year 2021 which is an increase of $200K from fiscal year 2020. The City will transfer $11.9M to the City’s general fund to pay for operating costs related to Public Works, bridge inspections, street lighting, and Forestry. The remainder will be used for capital improvement projects. Tax Increment Finance (TIF) The City is budgeting $13.8M in property taxes in TIF districts for fiscal year 2021 which represents a $2.8M increase from fiscal year 2020. This increase is mainly due to the City increased property
16

Page 12 of 16
valuations in the Central, Consolidated, Fountains, Northtowne, Stone Creek, and Westdale TIFs resulting from increased debt certifications as well as certifying debt in fiscal year 2021 for Commerce Park, Earhart Lane, Grand Living, and Muirfield. Tax Support Capital Improvement Projects Flood Control System The budget for flood control is $45.6M in fiscal year 2021. This represents an increase of $7.7M over fiscal year 2020. Funding in fiscal year 2021 for projects includes $15M of Iowa Flood Mitigation Program funding, $30M of general obligation bonds, and $577K in grants. Fiscal year 2021 represents year seven of a twenty-year agreement with the State of Iowa to receive Iowa Flood Mitigation revenue. Revenue from the State of Iowa portion of the project will be transferred from the Iowa Flood Mitigation Program special revenue fund to specific projects. Other Non-Flood, Non-Enterprise Improvement Projects The total tax supported non-flood capital improvement program expenditure budget is $83.9M. Funding includes $19.7M in general obligation bonds, $4.9M in tax increment financing bond proceeds, $23M in grants, $19.2M in streets local option sales tax revenue, and other revenue sources (I.e. road use tax, contributions, assessments, cash on hand, etc.). Included in this budget is $62.4M for infrastructure projects as shown below. This is an increase of $10.5M from last fiscal year.
The non-infrastructure budget for projects such as parks, trees, swimming pools, etc. for fiscal year 2021 is $21.5M, which includes a fire truck, ADA compliance, facility improvements, information technology improvements, library circulation materials, street trees, Connect CR, and parks and recreational improvements.
Debt Service Fund The City proposes issuing $49.7M in general obligation bonds as follows: $7.47M Public Works $1.4M – Staff time $3.6M – Street Improvements $275K – Traffic Improvements $945K – Sidewalk Improvements
Fiscal Year Fiscal Year Fiscal Year Fiscal Year Fiscal Year 2017 2018 2019 2020 2021
Budget Budget Budget Budget BudgetStreets 39,745,992 32,090,000 40,562,180 44,215,000 56,083,028 Storm Water 2,525,000 3,450,000 2,379,182 3,378,287 4,365,506 Bridge 1,691,667 900,000 950,000 700,000 750,000 Traffic 1,842,000 2,280,000 1,665,000 925,000 1,101,500 Downtown 527,042 50,000 150,000 2,600,000 50,000
46,331,701 38,770,000 45,706,362 51,818,287 62,350,034
17

Page 13 of 16
$50K – Downtown Improvements $1.2M – Trail Improvements
$1.32M Parks, Forestry, Recreation, Aquatics, $798K – Parks Improvements $150K – Street trees $278K – Recreation Improvements $90K – Aquatics Improvements
$855K – Fire pumper truck and educational trailer $500K – Library circulation material $585K – Information Technology Improvements $510K – City Facility Improvements $30M – Flood Control System Improvements $8.5M – Americans with Disabilities Act Improvements The City will increase the debt service 22 cents in fiscal year 2021 to fund flood control system improvements per City Council approved Cedar River Flood Control Financial Plan, which was approved in September 2018. This will be offset by a reduction of 14 cents in fiscal year 2021 due to refunding debt. The City anticipates additional bonding capacity at the end of fiscal year 2021 to be approximately $310.6M or 51% of available debt capacity. The below chart shows the change in reserve debt capacity over the past five years.
The scenario below shows forecasts if the City issues $50M per year and property valuations grow at 2.4% per year. This shows the debt service levy increasing 22 cents per fiscal year. This scenario assumes interest rates for borrowing remain consistent, current debt paid by non-property tax supported sources continue, and state backfill program continues to fund at projected levels.
Actual Actual Actual Projected ProjectedFY 2017 FY 2018 FY 2019 FY 2020 FY 2021
Assessed Value 9,973,793,843$ 10,360,756,078$ 11,153,902,336$ 11,671,429,942$ 12,188,101,602$ Multiplied by 5%Debt Limit 498,689,692$ 518,037,804$ 557,695,117$ 583,571,497$ 609,405,080$
Less: Outstanding Debt Tax Supported 160,955,075$ 160,351,325$ 168,904,887$ 202,212,925$ 216,240,058$ Non-tax Supported 115,429,925$ 111,233,675$ 95,295,113$ 90,457,075$ 82,774,942$ Total 276,385,000$ 271,585,000$ 264,200,000$ 292,670,000$ 299,015,000$
Reserve capacity 222,304,692$ 246,452,804$ 293,495,117$ 290,901,497$ 310,390,080$
Percent of Reserve Capacity 45% 48% 53% 50% 51%
Note: Does not include capi ta l leases
Percent of debt applicable to limit 55% 52% 47% 50% 49%
18

Page 14 of 16
Other Fiscal Year 2021 Budget Items Flood Insurance The budget includes $815K in flood insurance. This represents an increase of $102K from fiscal year 2020 for National Flood Insurance Program (NFIP) insurance and excess flood insurance. For general fund areas, NFIP insurance will be funded with the tort property tax levy and excess flood insurance will be funded with 10% flood local options sales tax revenue. The use of the 10% portion of local option sales tax to cover flood insurance costs is in line with the definition of property tax relief. Neighborhood Finance Corporation The Neighborhood Finance Corporation is a non-profit model that provides home lending products to promote targeted revitalization in older neighborhoods. This initiative involves a partnership between the City, the private lending community, and neighborhood stakeholders to team up to provide additional resources for home purchase and rehabilitation. In fiscal year 2021, the City is planning to invest $1M, which is year four of a five-year commitment.
$0.00
$0.50
$1.00
$1.50
$2.00
$2.50
$3.00
$3.50
$4.00
$4.50
FY 2021 FY 2022 FY 2023 FY 2024 FY 2025Existing Debt 2020AB 2021 2022 2023 2024
City of Cedar RapidsBreakdown of Projected Debt Service Levy
Includes Proposed G.O. Series 2020ABIncludes $50M Annually (2021-2025)
$3.252$3.472
$3.692$3.912
$3.032
19

Page 15 of 16
Economic Development Application Process Starting in fiscal year 2021 the City will allocate economic development funds based on an application process. The purpose of economic development funds is to meet City Council goals as it relates to PROMOTE CR and GROW CR. The application process is currently being finalized and more information will be shared once the final version is available. Future Opportunities Pursuit of Sustainability City staff are continually working to advance environmental, social, and economic sustainability within our operations, meeting the needs of today without preventing future generations from meeting their needs. During fiscal year 2020, the City launched our next phase of action toward these goals with the adoption of the iGreenCR Action Plan. The municipal operations plan is a significant milestone, charting actionable steps we can take to create a meaningful impact today, and items we can introduce today to improve our community’s future and long-term health over time. Sustainability is a fundamental component of strong communities that endure and thrive. The City of Cedar Rapids has worked to weave its ideals into our core philosophies, driving initiatives, goals, and partnerships as we become a national model of sustainability excellence. This pursuit of sustainability is part of the fiscal year 2021 budget.
Future Challenges The City’s financial health remains very strong in fiscal year 2021. As the City looks toward future budgets and the ongoing impact from state property tax relief - as well as the continued need to maintain our existing assets - below are some areas we will need to continue to monitor and look for ways to alleviate their impact on future property tax levies. The City Council in September 2018 approved a funding plan for the flood control system that
will require an annual increase of twenty-two cents to the property tax levy in order to fund a significant portion of the flood control system. Even with that level of commitment from the City, we will continue to look to federal, state, and local agencies to assist with the funding gap of the flood control system.
If the City were to lose the State backfill of $3.9M, it would take an increase of 56 cents to the existing property tax levy to cover this deficit.
Continue to monitor State legislation issues that have a financial and operational impact on the City.
Utility capital needs currently exceed the average utility rate increase the City has been willing to pass onto its citizens on an annual basis. City staff need to continue to look at other funding avenues to ensure utility rate increases do not have a negative impact on citizens and businesses in Cedar Rapids.
Additional information
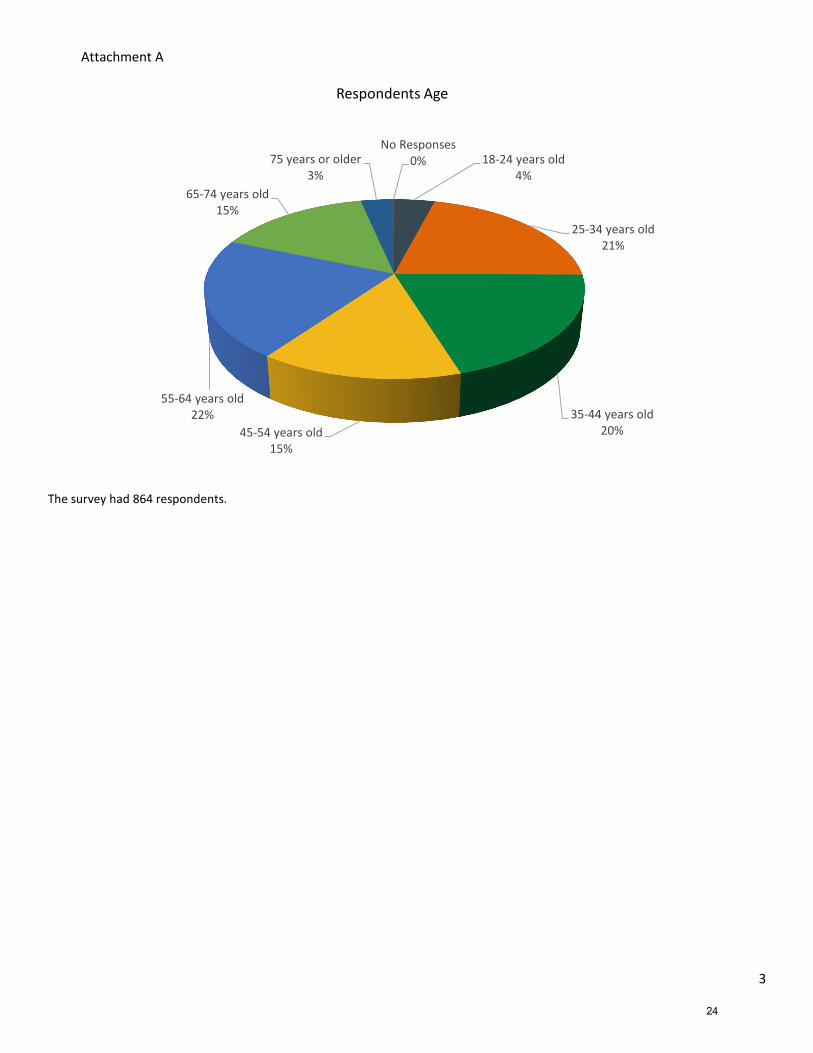
• Citizen Online Survey – For the last six years the City has created an online survey to gather input from citizens regarding the City budget. The number of people completing the survey has grown from 55 in the first year to 864 in the fall of 2019. Attachment A shows the responses to the questions asked.
20

Page 16 of 16
CONCLUSION The fiscal year 2021 budget as presented includes a balanced general fund, additional funding for priority programs identified by the City Council, flood control system projects, and most importantly - commitment to the long term future of Cedar Rapids, and maintaining the City’s financial strength. In addition, this document points out long term financial needs that will help the City Council and citizens of Cedar Rapids understand the level of funding needed in the future. City departments continue to look at ways to reduce expenses while maintaining a high level of service to the citizens of Cedar Rapids. I want to express my personal thanks to members of the City staff for their diligent efforts and serving enthusiastically to develop budgets that reflect the needs of their individual departments and their direct service to Cedar Rapids’ residents. A special note of thanks and appreciation should go to the members of the Finance Department staff for their excellent performance in gathering, analyzing, and presenting information clearly and accurately. The budget presentation team, composed of Finance Director Casey Drew, Assistant Finance Director Heidi Stiffler, Budget Analysts’ Susan Deaton, Ronda Jones, and Amanda Kilts, worked collaboratively and effectively as we reviewed and developed the fiscal year 2021 budget. This budget could not have been developed without the combined efforts of all those involved. I would also like to thank the City’s elected officials for your interest and support in planning and conducting the financial operations of the city in a responsible and progressive manner. Respectfully submitted, Jeffrey A. Pomeranz City Manager
21

Attachment A
1
Fiscal Year 2021 Citizen Budget Survey Results
View a summary and detail through
the City website63%
By attending a public budget
meeting2%
By receiving a summary in the
mail32%
Do not need any information
3%
As a citizen, how would you prefer to access City budget information?
Too low for the level of service
received1%
About right for the level of service
received61%
Too high for the level of service
received27%
Not sure11%
The City provides water, sanitary sewer, storm water, and solid waste (trash, recycling, yard waste collection) services. Do you feel the
amount you pay for these services is...?
22

Attachment A
2
Public Safety -Police, Fire,
Housing & Code Inspections,
Zoning Enforcements,
Nuisances13%
Parks, Aquatic/Pools,
Recreation, Forestry
17%
Maintenance and Improvements to
Streets42%
Library10%
None of these18%
Based on how the City allocates property tax revenue, which city service area would you be willing to pay more property taxes for?
23
Attachment A
3
The survey had 864 respondents.
18-24 years old4%
25-34 years old21%
35-44 years old20%45-54 years old
15%
55-64 years old22%
65-74 years old15%
75 years or older3%
No Responses0%
Respondents Age
24

Introduction
25

FORM OF GOVERNMENT The City of Cedar Rapids was incorporated in 1849 and it operated under the Commission Form of Government from April 6, 1908 through December 31, 2005. Under this form, elected officials held both legislative and executive powers by serving as commissioners operating city departments and as members of the city council. During a special citywide election on June 14, 2005, the citizens of Cedar Rapids voted to adopt a Home Rule Charter, which changed the form of government to the Council Manager Form. This form of government took effect on January 1, 2006. Under this form, the Cedar Rapids City Council consists of eight council members plus the mayor. The mayor and three council members are elected at large. The remaining five council members are elected by voters in each of five districts. The council operates on a part-time basis and meets regularly with City staff. The mayor and council are responsible for setting policy, approving the budget, and determining the tax rate. The mayor is recognized as the political head of the municipality but is a member of the legislative body and does not have the power to veto legislative actions. The city council appoints a full-time city manager to carry out the policies it establishes and to oversee the day-to-day administrative operations of city government. The city manager administers local government projects and programs on behalf of the city council, prepares a recommended budget for the council's consideration, and recruits, hires, and supervises City employees.
Introduction
26

CITY OF CEDAR RAPIDS MAYOR AND CITY COUNCIL DEPARTMENT DIRECTORS & PRINCIPAL OFFICIALS
Brad Hart Mayor
Tyler Olson At Large
Ann Poe At Large
Patrick Loeffler At Large
Marty Hoeger District 1
Scott Overland District 2
Dale Todd District 3
Scott Olson District 4
Ashley Vanorny District 5
City Manager Jeffrey Pomeranz City Clerk Amy Stevenson City Attorney James Flitz Deputy City Manager Sandra Fowler Finance Director Casey Drew Community Development Director Jennifer Pratt Parks & Recreation Director Scott Hock Police Chief Wayne Jerman Fire Chief Greg Smith
*Denotes interim/acting. **Employed by Cedar Rapids Linn County Solid Waste Agency
Public Works Director Jennifer Winter Utilities Director Steve Hershner Airport Director Martin Lenss Cedar Rapids Linn County Solid Waste Agency Executive Director Karmin McShane** Civil Rights Director Janet Abejo-Parker* Library Director Dara Schmidt Veterans Memorial Building Executive Director Paul Pestel
27

CITY OF CEDAR RAPIDS ORGANIZATION CHART
Citizens of Cedar Rapids
Mayor and Council
City Manager
Finance
Human Resources
Parks and Recreation
Police
Fire
Utilities
Transit
Development Services
Public Works
Building Services
Community Development
City Clerk City Attorney The Eastern Iowa Airport
Library Board of Trustees
Other Boards and
Commissions
Civil Rights Commission
Veterans Memorial Commission
City Band Commission
Other Boards & Commissions
28

CITY VISION AND VALUES City Vision Statement “Cedar Rapids, a vibrant urban hometown – a beacon for people and businesses invested in building a greater community now and for the next generation.” Amended January 24, 2012 City Values We Value Accountability and Integrity
o Honest and hardworking employees that our community looks to for excellence. We Value Communication
o Encouraging the open exchange of ideas within our organization and our community. We Value Dignity and Fairness
o Treating everyone with patience and respect. We Value Diversity
o Giving us unity and strength through our ability to learn and grow from one another. We Value Teamwork and Initiative
o Inspiring pride in our work as progressive and creative leaders for our community. We Value Stewardship
o Responsibly managing the resources entrusted to us.
29

DISTINGUISHED BUDGET AWARD The Government Finance Officers Association of the United States and Canada (GFOA) presented a Distinguished Budget Presentation Award to City of Cedar Rapids, Iowa for its annual budget for the fiscal year beginning July 1, 2019. In order to receive this award, a governmental unit must publish a budget document that meets program criteria as a policy document, as a financial plan, as an operations guide, and as a communications device. This award is valid for a period of one year only. We believe our current budget continues to conform to program requirements, and we are submitting it to GFOA to determine its eligibility for another award.
30

RESOLUTION ADOPTING BUDGET
31

RESOLUTION FOR TOTAL MAXIMUM PROPERTY TAX DOLLARS
Note - In 2019 the State implemented changes to the state code effective with FY 2021, requiring cities to adopt a resolution to set the total maximum property tax dollars for the 8.1 general fund levy, transit levy, liability/property/vehicle insurance levy, and special revenue levies associated with employee benefits. This resolution does not include all the levies formally adopted by the City in the FY 2021 budget.
32

Planning
33

Strategic Planning FY 2021 & Beyond GOALS The City Council has seven strategic goals that provide direction and areas of focus for both current and future planning and budget decisions. Annually, City Council meets to formally discuss the goals and specific initiatives, with quarterly updates, accomplishments, and discussions. These goals guide City leaders when making decisions on priorities and funding. The strategic goals are: STRENGHTEN CR - Make bold moves in community planning to retain the character of neighborhoods and
corridors. GROW CR - Make bold moves in future planning to encourage sustainable connections of growth areas to
existing neighborhoods. CONNECT CR - Create a culture that enhances transportation options for pedestrians and cyclists through
complete streets, trails, and public transportation. GREEN CR - Buffer and connect existing parks, trails, and streams to build a natural network in addition to
regional collaborations and individual efforts to improve storm water management, water quality, wildlife habitat, and outdoor recreation.
INVEST CR - Make Cedar Rapids a desirable place for businesses to start, move, and grow by leveraging resources to invest in business districts and amenities that keep and attract a skilled workforce.
PROTECT CR - Provide quality services to increase neighborhood safety and keep moving forward with flood mitigation system.
PROMOTE CR - Lead regionally, think Cedar Rapids first by telling our story strategically, emphasizing intergovernmental relations, and branding and marketing the City of Cedar Rapids.
In June 2018, City Council conducted goal setting sessions to review recent accomplishments, ongoing initiatives, and discuss possible new areas of focus. Based on the discussion, City Council agreed the following are the highest-ranking initiatives for a 2-year period. Determine a funding strategy to complete the Flood Control System. Continue to update the greenway plan and identify funding opportunities for construction of the
enhanced greenway system. Continue to focus on affordable housing, market, and gaps. Focus on youth and senior services and facilities. Development of the former casino site - 1st & 1st West and 33rd Avenue and Rockford Road SW. Determine the best way to address Safe, Equitable and Thriving Communities Task Force recommendations
and proposals. Build on the Iowa Accelerator and NewBo Company programs to create jobs and leverage innovation, arts,
culture, and the spirit of entrepreneurism. Help develop short-term job opportunities for homeless.
5 YEAR FINANCIAL PLAN Based on the strategic goals and initiatives, each year the City creates a five year financial plan. The financial plan provides the financial prospective of the Council’s strategic goals. It uses financial forecasting and analysis to identify future challenges and opportunities and then identify strategies to secure financial sustainability in light of the challenges and opportunities to prevent volatility in taxes or fees and to ensure cash management. The information developed in the financial plan sets the stage for budget and provides a tool that can be used to discuss priorities, needs, legislative impacts, and funding issues prior to the beginning of the budget process. In August 2019, the City prepared a five year financial plan for FY 2021 – FY 2025. It was based on FY 2020 level of services and budget as well as percent increases in the categories of property tax (2% increase per year), personal services (4% increase per year), discretionary expenses (2% increase per year), and non-personal
34

services non-discretionary (4% increase per year) that were based on historical information and projections. The City also reviewed tax supported debt. Assuming no changes in service levels, the 5 year general fund financial plan showed an increasing gap that results from annual increases in expenses such as personal service costs (based on historical averages due to expenses such as retirement contributions and health &wage increases) offset by 2% increases in property tax valuations also based on historical averages and projections. The plan demonstrates the need to control costs, find efficiencies, and identify new revenue streams. The financial plan identifies to the City Council that offering the same level of service as in the past will not be financially feasible without identifying other revenues sources currently not being used or changing how the City delivers services in the future. The financial plan allows City staff to begin the process of addressing these issues now and not waiting until future budget cycles. The City does have financial flexibility and additional revenue options that could be considered if necessary in future years. Several options exist such as availability of other levies, increases in charges for services, or franchise fee increases. Expenditure reducing options could be implemented as well.
The FY 2021 general fund expenditure budget is $139.6M, whereas the FY 2021 financial plan was $138.7M. This is a difference of $900K. The key difference stems from department requested increases that were identified after the financial plan process, many of which have external funding sources. Some expense increases include adding positions and associated costs to shorten the housing inspection cycle, outsourcing support for ash tree removal as well as for information technology professional services. Positions were also added to support the flood control system, right of way permitting process, digital evidence program, asset management, and continued compliance with Americans with Disabilities Act. The initial financial plan for utility areas showed a significant increase in rates. For the typical residential customer that uses 90K gallons of water and sewer, it estimated a rate increase of nearly 9% from FY 2020 to FY 2021. This exceeds the average utility rate increase the City has been willing to pass onto its citizens on an annual basis. As a result Finance and the utilty departments further worked to review and reduce the plan to a more financially sustainable level during the budget process. By further reviewing operations and capital
5 Year Plan Fiscal Year Fiscal Year Fiscal Year Fiscal Year Fiscal YearGrand Total 2021 2022 2023 2024 2025
Revenue:Property Taxes 424,581,760 81,586,949 83,218,688 84,883,062 86,580,723 88,312,338 Other Taxes 50,921,900 10,184,380 10,184,380 10,184,380 10,184,380 10,184,380 Grants 13,726,099 2,735,222 2,740,122 2,745,120 2,750,218 2,755,418 Charges for Services 85,866,063 16,584,311 16,868,491 17,162,756 17,467,475 17,783,031 Licenses & Permits 12,274,045 2,454,809 2,454,809 2,454,809 2,454,809 2,454,809 Fines & Forfeits 24,075,000 4,815,000 4,815,000 4,815,000 4,815,000 4,815,000 Rents & Royalties 3,518,350 686,481 694,821 703,412 712,261 721,375 Use of Money/Property 9,383,862 1,865,388 1,870,924 1,876,614 1,882,462 1,888,474 Other Financing Sources - - - - - - Misc Revenue 8,762,783 1,749,700 1,751,100 1,752,528 1,753,985 1,755,470 Proceeds Fr Sale of Assets 875,000 175,000 175,000 175,000 175,000 175,000 Bonds & Long Term Debt - - - - - - Interfund Transfer 70,399,402 14,018,727 14,058,670 14,082,090 14,097,492 14,142,422 Total Operating Revenue 704,384,263 136,855,966 138,832,005 140,834,771 142,873,804 144,987,717
Expenditures:Personal services 522,578,774 96,867,683 100,781,990 104,852,870 109,086,584 113,489,648 Non-personal services - discretionary 93,825,890 18,083,367 18,417,476 18,758,314 19,106,015 19,460,719 Non-personal services - non-discretionary 106,551,511 19,694,284 20,468,764 21,273,951 22,111,068 23,003,444 Inter fund transfers out 12,438,376 3,219,430 3,096,322 2,069,416 2,041,296 2,011,911 Capital Outlay 4,004,000 800,800 800,800 800,800 800,800 800,800 Total Operating Expenses 739,398,552 138,665,564 143,565,353 147,755,350 153,145,763 158,766,522
Funding Available / (Funding Gap) (35,014,289) (1,809,598) (4,733,348) (6,920,580) (10,271,958) (13,778,806)
35

projects, the FY 2021 budget was adopted with a 4.8% rate increase for the typical residential customer which is in line with recent annual budgeted rate increases. OTHER PLANNING PROCESSES Along with the financial plan process, the City has other planning processes to define priorities and further develop the budget while aligning with City Council goals. The 5 year capital improvement project program is a planning document for future budgets. As part of the plan, departments are given a target they must remain with in for the amount of bonds that will be issued for projects in their area based on what levels are financially affordable and ensure bond ratings are maintained. Only the current year is part of the adopted budget. Future years are adjusted annually based on project priority and the City’s ability to finance projects. The capital expenditures in the program include costs such as design, property acquisition, and construction. The costs are department estimates for planning purposes only, as costs can change over the life of a project due to many factors such as changes in scope or design. Having the goal of current and future financial strength has assisted the City Council in making sure all projects put into the budget can be fully funded prior to the project beginning. The FY 2021 – 2025 plan shows these expenditure levels:
The 5 year plan assumes the City will issue $49-50M per year in general obligation bonds and $17-27M per year in revenue bonds. Other funding sources include utility user fees, external grants, Iowa Flood Mitigation revenue, streets local option sales tax, tax increment financing, assessment, contributions, transfers, and cash on hand. For over 20 years, the utility departments have held an annual meeting with the city’s large industrial users and contributing cities as part of the budget development process to share information on projected rate changes, regulatory matters, and maintenance/operation challenges. Updates on current and future capital infrastructure projects have also been included. Utility leadership also responds to questions from the participants concerning regulatory issues, current environmental conditions like drought or wet weather, critical capital project phasing, as well as hearing updates for users of the system. Community Development’s staff coordinate planning and budget review with other City Departments and stakeholders to capitalize on development opportunities that maintain and enhance the quality of life in the community for everyone. Public outreach is included and can have many focuses such as land use, connectivity, character and design of buildings, streetscapes such as lighting and landscaping, and placemaking such as aesthetics, attractions, and perceptions. Current action plans under review include: 6th Street SW corridor looking at long range plans from 1st Avenue to Highway 30 Czech Village New Bo area loking at strengths, weaknesses, and opportunities for this distinct area River recreation opportunities as well as a creating an implementation plan
The City Planning Commission consists of 9 volunteer members who are appointed by the Mayor & City Council for a term of approximately 3 to 5 years. The City Planning Commission reviews and make recommendations to City Council on various land development issues including proposed City Comprehensive Plans, zoning regulations, requests for the rezoning of land, site development plans, conditional use requests, and subdivision of land. The Corridor Metropolitan Planning Organization is an organization made up of elected officials and appointed representatives of Cedar Rapids, Linn County, Marion, Hiawatha, Robins, Ely, Fairfax, and Palo. The organization is tasked with reviewing and approving transportation investments in the Cedar Rapids metropolitan area.
FY 2021 FY 2022 FY 2023 FY 2024 FY 2025 5 Year Total Flood Control 45,576,500 51,000,000 51,000,000 51,000,000 51,000,000 249,576,500 Non-Flood Control 180,745,587 125,719,127 110,974,915 102,748,281 96,009,461 616,197,370 Total 226,322,087 176,719,127 161,974,915 153,748,281 147,009,461 865,773,870
36

The City uses various methods to obtain feedback on community priorities and needs that should be reviewed as part of the planning and budget process. Such methods include: City Council meetings and Council Committee meetings Public input meetings on various capital improvement projects and initiatives Resident appreciation day City department open houses Bi-annual citizen survey On-line budget survey Twitter, Facebook, CRtalks.com and mobile site www.CRNewsNow.com All of these planning processes, whether with internal or external stakeholders, are used to define, prioritize and/or develop initiatives for the City that align with Council goals to aide in formulating the budget. FY 2021 BUDGET FOCUS In consideration of the planning processes, the FY 2021 budget was created based on the City Council’s seven strategic goals of STRENGTHEN CR, GROW CR, CONNECT CR, GREEN CR, INVEST CR, PROTECT CR, and PROMOTE CR. As in FY 2020, FY 2021 budget continues to: encourage economic development and infill development (INVEST CR, GROW CR) have an affordable and accessible City (STRENGTHEN CR, CONNECT CR) plan and implement improvements for growth (INVEST CR, PROMOTE CR) move forward with flood control, repairing our streets, maintaining our facilities (PROTECT CR, STRENGTHEN
CR) expand City and community projects incorporating sustainable practices and city beautification (INVEST CR,
GREEN CR) maintain financial sustainablility (INVEST CR) continue to update the greenway plan and identify funding opportunities (STRENGTHEN CR, GREEN CR) focus on youth and senior services and facilities (STRENGTHEN CR, CONNECT CR) develop short-term job opportunities for homeless (STRENGTHEN CR)
The overall FY 2021 expenditure budget is $637.2M (net of transfers) which is an increase of $70.1M from the FY 2020 budget of $567.1M. The largest increase in the budget relates to planned expenses for capital improvements. These expenses increased by $48.8M to $247.9M. Some of the larger areas for planned improvements include streets, the flood control system, and The Eastern Iowa Airport. Balanced General Fund Budget The FY 2021 budget has a balanced general fund. The adopted budget represents projections known at the time budget is created. Since the budget is created 18 months prior to fiscal year end, uncertainties surrounding the projections could require a budget amendment to address changes from the original projections. Such uncertainties may include timing of capital improvement project expenditures and/or revenues, fuel costs, and debt refundings. If during the budget year a projection needs to be adjusted, the City will identify the funding source to account for this change. Service Level Changes Planned service level changes in FY 2021 include: Reducing the existing rental housing inspection cycle from five years to three years allowing the City to
inspect rental properties at a greater frequently, resulting in improved neighborhood standards and quality of life in our neighborhoods (STRENGTHEN CR).
Adding a rolling recreation program for children that will bring free weekly activities to neighborhood parks (STRENGTHEN CR).
37

Adding a youth basketball program for ages 13 – 18 during the summer to provide additional youth outreach in the community and engage youth in our core neighborhoods (STRENGTHEN CR).
Extending weeknight fixed-route bus service to all bus routes by two additional hours (CONNECT CR). Adding a mini golf course at Twin Pines Golf Course (STRENGTHEN CR).
Flood Control Flood control is one of City Council’s key initiatives for FY 2021 to PROTECT CR and the work continues to move forward. The budget for flood control is $45.6M in FY 2021 which is an increase of $7.7M over FY 2020. FY 2021 priorities include: Completing preliminary design on majority of the west side system Design will be advanced on the 8th Avenue bridge and riverfront improvement projects to apply for
additional funding Priority construction starts include reconstruction and raising of Shaver Road NE over McLoud Run Emphasis will continue on acquiring real estate for US Army Corps of Engineers components to also proceed
to construction Construction should be substantially completed on major projects including Quaker Oats floodwall and
railroad gate closures, NewBo Parking Lot 44 levee, roadway closure gates on 16th Avenue SE and 3rd Avenue SE and the new McGrath Amphitheater floodwall, restroom and storage building
Since April of 2014, the City has spent $93M on flood control. The following chart shows total expenditures to date by area.
FY 2021 funding includes a grants, Iowa Flood Mitigation program revenue, and $30M in bonds. The bonds will be funded by a 22 cent increase in the property tax levy. FY 2021 is year 2 of the 22 cent annual increase in the levy approved by City Council September 2018 as part of the Cedar River Flood Control Financial Plan. In addition to the $93M that the City has spent on flood control, the US Army Corps of Engineers has spent $15M of their total cost share portion of $76.4M as of March 31, 2020. Infrastructure FY 2021 also focuses on STRENGTHEN CR by maintaining and improving the City’s infrastructure by allocating funding to critical capital improvements that have been determined to be a priority for the community as a whole. The FY 2021 non-flood capital improvement project expenditure budget is $180.7M.
Time Check$13.6M14.6% Kingston
$2.7M2.9%
Czech Village/Penford
$15.1M16.2%
Quaker Oats/Cedar Lake
$19.7M21.1%
Downtown$7.9M8.5%
NewBo/Sinclair$31.6M34.0%
Cargill South$1.8M2.0%
8th Avenue Bridge$0.7M0.7%
38
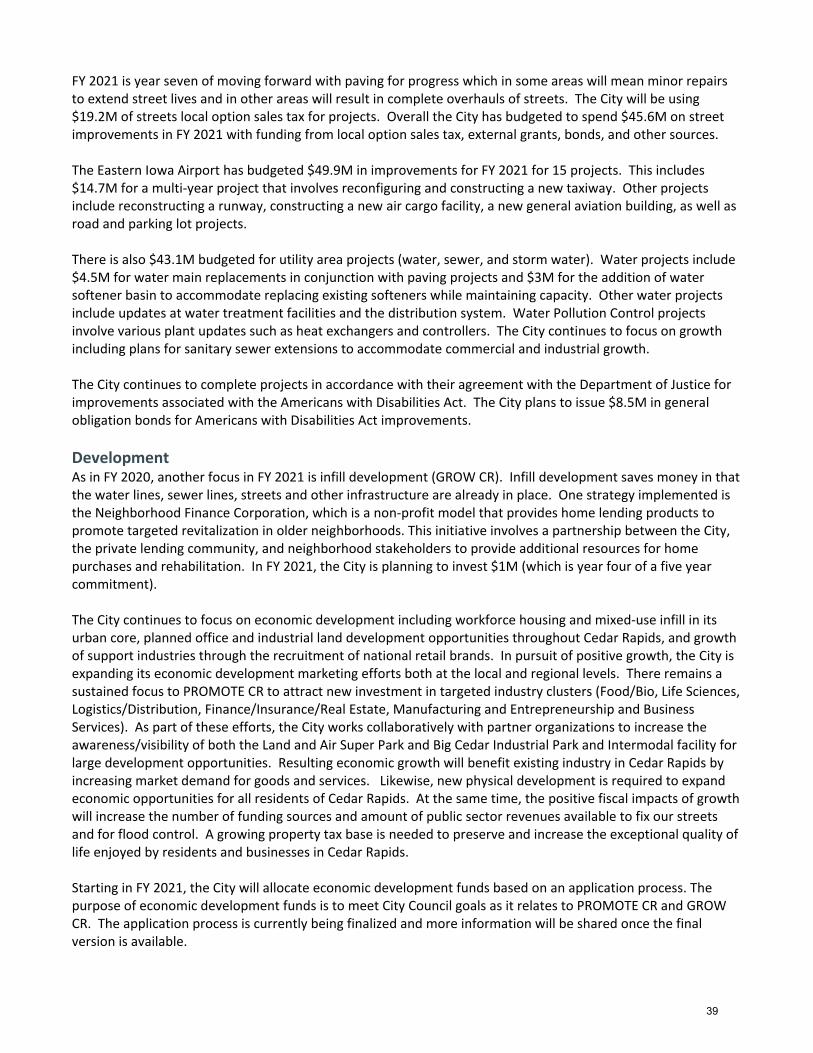
FY 2021 is year seven of moving forward with paving for progress which in some areas will mean minor repairs to extend street lives and in other areas will result in complete overhauls of streets. The City will be using $19.2M of streets local option sales tax for projects. Overall the City has budgeted to spend $45.6M on street improvements in FY 2021 with funding from local option sales tax, external grants, bonds, and other sources. The Eastern Iowa Airport has budgeted $49.9M in improvements for FY 2021 for 15 projects. This includes $14.7M for a multi-year project that involves reconfiguring and constructing a new taxiway. Other projects include reconstructing a runway, constructing a new air cargo facility, a new general aviation building, as well as road and parking lot projects. There is also $43.1M budgeted for utility area projects (water, sewer, and storm water). Water projects include $4.5M for water main replacements in conjunction with paving projects and $3M for the addition of water softener basin to accommodate replacing existing softeners while maintaining capacity. Other water projects include updates at water treatment facilities and the distribution system. Water Pollution Control projects involve various plant updates such as heat exchangers and controllers. The City continues to focus on growth including plans for sanitary sewer extensions to accommodate commercial and industrial growth. The City continues to complete projects in accordance with their agreement with the Department of Justice for improvements associated with the Americans with Disabilities Act. The City plans to issue $8.5M in general obligation bonds for Americans with Disabilities Act improvements. Development As in FY 2020, another focus in FY 2021 is infill development (GROW CR). Infill development saves money in that the water lines, sewer lines, streets and other infrastructure are already in place. One strategy implemented is the Neighborhood Finance Corporation, which is a non-profit model that provides home lending products to promote targeted revitalization in older neighborhoods. This initiative involves a partnership between the City, the private lending community, and neighborhood stakeholders to provide additional resources for home purchases and rehabilitation. In FY 2021, the City is planning to invest $1M (which is year four of a five year commitment). The City continues to focus on economic development including workforce housing and mixed-use infill in its urban core, planned office and industrial land development opportunities throughout Cedar Rapids, and growth of support industries through the recruitment of national retail brands. In pursuit of positive growth, the City is expanding its economic development marketing efforts both at the local and regional levels. There remains a sustained focus to PROMOTE CR to attract new investment in targeted industry clusters (Food/Bio, Life Sciences, Logistics/Distribution, Finance/Insurance/Real Estate, Manufacturing and Entrepreneurship and Business Services). As part of these efforts, the City works collaboratively with partner organizations to increase the awareness/visibility of both the Land and Air Super Park and Big Cedar Industrial Park and Intermodal facility for large development opportunities. Resulting economic growth will benefit existing industry in Cedar Rapids by increasing market demand for goods and services. Likewise, new physical development is required to expand economic opportunities for all residents of Cedar Rapids. At the same time, the positive fiscal impacts of growth will increase the number of funding sources and amount of public sector revenues available to fix our streets and for flood control. A growing property tax base is needed to preserve and increase the exceptional quality of life enjoyed by residents and businesses in Cedar Rapids. Starting in FY 2021, the City will allocate economic development funds based on an application process. The purpose of economic development funds is to meet City Council goals as it relates to PROMOTE CR and GROW CR. The application process is currently being finalized and more information will be shared once the final version is available.
39

Other Focuses The FY 2021 budget continues to include beautifiation programs such as Safe CR to address nuisance properties, upgrading downtown lighting, and median maintenance. In addition to beautification, during FY 2020, the City launched the next phase of action toward these goals with the adoption of the iGreenCR Action Plan. The municipal operations plan is a significant milestone, charting actionable steps we can take to create a meaningful impact today, and items we can introduce today to improve our community’s future and long-term health over time. Sustainability is a fundamental component of strong communities that endure and thrive. The City of Cedar Rapids has worked to weave its ideals into our core philosophies, driving initiatives, goals, and partnerships as we become a national model of sustainability excellence. This pursuit of sustainability is part of the FY 2021 budget. The iGreenCR Action Plan elements include: Resources – The City leads in resource conservation and clean energy. Nature – The City protects and enhances nature to grow health, resilience, and partnerships. Development – The City encourages development that fosters vibrancy, equity, resource conservation, and
fiscal responsibility. Community – The City prioritizes equity and services that help all residents lead lives of purpose, health, and
community. In calendar 2020 the City will be creating a greenhouse gas inventory, holding climate education event, and engaging a climate action planning consultant. CHALLENGES The City categorizes its challenges into short term and long term. Short term challenges are defined as occuring prior to next budget year and long term is defined as anything occuring within two to five years. Once these challenges have been identified the City prepares options to address these challenges. Short Term Challenges Facing the City The City’s financial health remains very strong in FY 2021. As in all fiscal years, internal and external user charges were reviewed to determine the appropriate rate. Revenues were budgeted conservatively with the expectation that actual revenues will meet or exceed budget. The City will continue to monitor State legislation issues that could have a financial and operational impacts on the City. If changes arise during the year, the City will review options ensuring financially sound decisions. Long Term Challenges Facing the City Overall maintaining current levels of service with limited revenue resources will continue to be a challenge the City will face over the next few years. Costs such as wages, benefits, discretionary expenses, and insurance will continue to rise and grow. In addition, balancing golf revenue and expenditures while keeping fees competitive with the surrounding market will remain a focus. State legislative changes in the past and future potential changes will continue to be a concern. Since FY 2017, the multi-residential property classification began to change to the residential classification and decrease to the residential rollback value. This decrease will continue until FY 2024 when mulit-residential properties will have the same rollback percentage as residential properties. For multi-residential, the state does not provide backfill to cities for lost property taxes so the loss is immediate. In FY 2021, the loss of property taxes from the change in rollback for multi-residential is $943K. Also, there is a concern in future fiscal years the State may no longer provide cities property tax backfill on commerical and industrial properties relating to State property tax relief implemented in FY 2017. If the City were to lose the State backfill of $3.9M it would take an increase of 56 cents to the existing property tax levy to cover this deficit. As the City looks toward future budgets and the ongoing impact from state property tax changes, the City will need to continue to monitor and look for ways to alleviate impacts on future property tax levies.
40

Addressing infrastructure needs will remain a challenge. As the City continues to grow, the City will be assessing additional infrastructure needs such as potentially a new fire station. The City will be required to issue debt for ADA improvements and matching funds for items such as street and trail projects in the next several fiscal years. The City will also need to continue to upgrade the street system where at the start of the paving for progress program 34% of pavements were in poor or fair condition. While 10 years of local option sales tax funding will draw significant funding for streets, the City needs to work on communicating the need for this program beyond the initial 10 years. In September 2018, City Council approved a funding plan for the flood control system that will require an annual increase of twenty-two cents to the property tax levy in order to fund a significant portion of the flood control system. Even with that level of commitment from the City, we will continue to look to federal, state, and local agencies to assist with the funding gap of the flood control system. All of this will require the City to continue planning, looking for ways to increase the property tax base, look at revenue diversification options, look at increases to the debt service levy, and continue to look at ways to reduce expenses while maintaining a high level of service to the citizens of Cedar Rapids. 2-10 year utility area capital needs and the associated rate increase to fund those needs, exceed the rate increase the City has been willing to pass onto its citizens on an annual basis. The water department five-year capital improvement project plan for FY 2021 - 2025 is estimated at $87.9M. This plan is based on 4% annual increases in total revenue or rate increases of 6.5-7% annually to support 2% annual increases in operations and capital investments while maintaining current bond ratings. The five-year water pollution control capital improvement project plan for FY 2021 - 2025 is estimated at $64M. This plan is based on 4% annual increases in total revenue or rate increases of 6.5-7% annually to support 2% annual increases in operations and capital investments while maintaining current bond ratings. There is an additional $133M in capital improvement projects that are not included in the five year plan as funding these costs would require alternative funding sources or large annual rate increases. City staff continue to look at timing of projects and other funding sources to ensure utility rate increases do not have a negative impact on citizens and businesses in Cedar Rapids. Beyond the City’s own operating and capital needs, the City will need to maintain a high quality workforce in order to meet the labor needs of existing businesses wanting to expand and new businesses moving into the City. In order to provide a high quality workforce the City will need to continue to develop a diversified housing inventory, provide entertainment options, and quality of life amenities (i.e. trails, parks, safe neighborhoods). Retaining a high quality workforce will allow the City to continue to see property tax growth in both business and residential categories, which is one of the keys to long term sustainability in the City. All of these needs and concerns will continue to be reviewed, monitored, and addressed while ensuring financial sustainability of the City.
41

Policies & Guidelines
42

General Guidelines Budget is truly a year-long process beginning with financial plan, budget, and then budget amendment. FY 2021 will begin in July 2020 and throughout the year, amendments to the budget will be tracked until they are officially reviewed and adopted in May 2021. At the same time FY 2021 commences, the City will begin putting together the next financial plan for FY 2022 – FY 2026. In September 2020, the budget process for FY 2022 will begin and over the course of several months, the budget will be created and then finally adopted in March 2021.
July
August
September
October
November
December
January
February
March
April
May
June
FY 2021 Begins
FY 2021 Budget
Amendment Process Begins
FY 2021 Budget
Amendment Approved
FY 2022 Financial
Plan Begins
FY 2022 Budget Process Begins
FY 2022 Budget
Adopted
43

FINANCIAL PLAN The financial plan is a tool identifying financial needs and issues over a five-year period and the associated funding and service implications as a result of those needs and issues. The financial plan reflects the following financial principles: Sustainability Long-term community affordability Competitive and responsive community services Protecting community investment and value. The City's management team takes a very active role in the financial planning and management of the City for both short-term daily operations and long-range planning. Each year the City prepares a five-year financial plan that identifies potential financing needs of the City, allows for reviewing financial projections, implications, and cash and investment management, and also is a tool for discussing priorities for the community. The financial plan is formulated based on strategic goals and current level of services and budget as well as adjustments to categories such as personal services and non-personal services based on historical information and projections. The financial plan sets the stage for budget, provides a road map into the future, and a framework for future decision making. BUDGET PROCESS The budget process begins around September with the citizen survey. Survey results are reviewed and discussed throughout the budget process. In September, budget instructions and forms are distributed. From September thru November, the budget is formulated. Operations are reviewed and operational funding increase requests, revenue changes, and capital improvement projects are drafted. During this time, Finance meets with departments to review needs and prepare requests. In late November, Finance finalizes the information and creates a variety of reports used in the next stages of the process. In December, Finance and the City Manager review the budget information and requests with departments to determine which requests and charges should become part of the budget. In early January, after property tax information is available, the budget is finalized and the general fund budget is balanced whereas revenues equal to expenditures. Also in January, the City finalizes the capital improvement projects to be included in the budget. The process not only includes reviewing the merits and prioritization of each project as it relates to other projects, but also the overall impact of the recommended funding, operational considerations, and their relationship to the City’s overall budget and related tax levy. In February, the City Manager presents the proposed budget to the City Council and City Council provides feedback. Later in February, the public hearing is held and a resolution is adopted to set the total maximum property tax dollars for the budget for these levies: 8.1 general fund levy Transit levy Tort levy Special revenue levies associated with employee benefits For these levies, if the increase in the property tax revenue for the proposed budget year exceeds 2% of the current year property tax revenue budgeted, the resolution is required to be passed by a 2/3 majority vote. In March, the notice of the public hearing is published in the newspaper. The adopted version of the budget book is made available for citizen inspection on the City’s internet website and a hard copy version is available at the Finance Department, Clerk’s Office, and Library as required by the State of Iowa. Subsequently, the public
44

hearing is held to present the budget and citizens are encouraged to provide comments before or at the public hearing. In order to adopt the budget a vote of yeas is needed by at least the majority of City Council. The budget is certified to the Linn County Auditor by March 31 as required by the State of Iowa. The schedule of the budget process is illustrated below. Other citizen input and department planning occurs throughout the year as well as during the time frames shown below.
BUDGET AMENDMENT PROCESS The City of Cedar Rapids budgets on a line item or object of expenditure level within each department to establish accountability for department operations’, budgetary results however are measured on a total departmental basis. The adopted budget represents projections known at the time budget is created. Since the budget is created 18 months prior to fiscal year end, the City uses the budget amendment process to address changes from the original projections. The budget amendment does not impact property tax levies but is used to meet state
Budg
et T
imet
able
SeptemberCitizen survey available
Operating and capital improvement project process begins
October
Department information pages updated for the budget book
Rollback information available
Information due from general fund, internal service fund areas to Finance
Personal services budget available
Departments provided internal administration charges
November
Citizen survey complete
Information due for all other areas to Finance
Budget information for December meetings reviewed, researched, compiled
December
Budget to Finance Director
Utilities annual meeting with large industrial users and contributing cities
Council budget book drafted
January
Property valuations available from County
Prepare balanced general fund budget
Council budget book finalized
February
Budget presentations to Council
Adopted budget books prepared
Council motion for notice of public hearing for total maximum property tax dollars
Public hearing & resolution to adopt total maximum property tax dollars
March
Council motion for notice of public hearing for adopting budget
Public hearing & resolution to adopt budget
Budget certification to Linn County Auditor (by March 31st)
April Finance drafts budget book for the Government Finance Officers Association award
May Budget book submitted to Government Finance Officers Association for award
45

requirements if actual expenses will exceed originally budgeted amounts. The state does not require revenue amendments however; the City often does amend the budget if actual revenues will materially differ from originally budgeted amounts. Throughout the year, the Finance Department tracks and reports to the City Manager and City Council material budget amendments that will be requested. This process ensures unbudgeted expenditures do not jeopardize the City’s financial strength and ensures department accountability. During March and April, Finance and departments complete a final review of budget amendments needed. In late April, Finance and the City Manager review budget amendment requests with departments. In May, the notice of the public hearing is published, the public hearing is held, and the amendment is adopted. During the public hearing, citizens are encouraged to provide comments. In order to adopt the budget amendment a vote of yeas is needed by at least the majority of City Council. The budget amendment is certified to the Linn County Auditor by May 31st each fiscal year in accordance with the State of Iowa. Below is the typical budget amendment timeline:
BASIS OF ACCOUNTING The basis of accounting refers to when revenues and expenditures are recorded in accounts and reported in financial statements. The City’s funds can be compared to the operating statements in the City’s Comprehensive Annual Financial Report with few exceptions. Enterprise, internal service, and trust and agency funds use the accrual basis of accounting. Revenues are recorded when earned and expenses are recorded when a liability is incurred, regardless of the timing of related cash flows. Property taxes are recognized as revenues in the year for which they are levied and budgeted for. Grants and similar items are recognized as revenue as soon as all eligibility requirements imposed by the provider have been met. All other funds, including the general fund, use the modified accrual basis of accounting. Revenues are recognized as soon as they are both measurable and available (susceptible to accrual). Revenues are considered available when they are collectible within the current period or soon enough thereafter to pay liabilities of the current period. For this purpose, the City considers revenues available if they are collected within 60 days of the end of the current fiscal period. Expenditures generally are recorded when a liability is incurred, as under accrual accounting. However, debt service expenditures, as well as expenditures related to compensated absences, pensions and claims and judgments, are recorded only when payment is due (matured). Property taxes, when levied for, franchise taxes, licenses, permits, fines and forfeitures, rents and royalties, charges for services and interest associated with the current fiscal period are all considered to be susceptible to accrual and so have been recognized as revenues of the current fiscal period. Only the portion of special assessments receivable due within the current fiscal period is considered susceptible to accrual as revenue of the current period. For budgeting purposes, the entire special assessment revenue is budgeted in the current fiscal year. Substantially all shared revenues are recorded when the underlying exchange transaction has
Budg
et A
men
dmen
t Tim
etab
le
July-April Track and report budget amendment requests
April Finance and City Manager review
May
Publish Notice of Public Hearing to present budget
Public hearing and resolution to adopt the budget amendment
Budget certification to Linn County Auditor
46

occurred. Revenue from federal awards is recognized when the City has done everything necessary to meet the eligibility requirements. For budgeting purposes, grant revenue is budgeted in the fiscal year the related expenditures are budgeted. Miscellaneous and other revenues are recorded as revenue when received in cash because they are generally not measurable until actually received. TYPES OF FUNDS BUDGETED Funds are a self-balancing set of accounts used to maintain control over resources that have been segregated for specific activities or objectives. The City of Cedar Rapids has three main groups of funds (governmental, proprietary, and fiduciary). Within these groups are different types of funds shown as follows. Governmental fund types are the general fund, special revenue funds, capital projects fund, and debt service funds. These are used to account for the sources and uses of revenue for the primary unit of government. Proprietary fund types are enterprise funds and internal service funds. These funds are considered self-supporting because they are funded by user charges and fees. Fiduciary fund types are trust and agency funds. These funds are used to account for financial resources held in a trustee capacity. All of the City of Cedar Rapids types of funds (general, special revenue, capital project, debt service, enterprise, internal service, and trust and agency) are appropriated for FY 2021. Actual expenditures may not exceed appropriations. Any fund whose revenues or expenditures constitute more than 10% of the revenues and expenditures of the appropriated budget are considered a major fund. The breakdown of the City’s funds are below (net of transfers).
General Fund$137,048,821
22%
Internal Service Funds
$58,025,245 9%
Trust & Agency Funds
$929,770 0%Tax Supported
Capital Project Funds
$129,476,299 20%
Debt Service Fund$24,605,103
4%
Enterprise Funds$265,669,218
42%
Special Revenue Funds
$21,444,742 3%
Governmental Funds General Fund Special Revenue Funds Capital Project Funds Debt Service Funds
Proprietary Funds Enterprise Funds Internal Service Funds
Fiduciary Funds Trust & Agency Funds
47

FUND DESCRIPTIONS Major Funds The City reports and budgets for the following major funds. General Fund The General Fund is the primary operating fund of the City that accounts for all financial resources and expenditures, except those required to be accounted for by other funds. This fund includes services such as police, fire, public works, library, and parks and recreation. Enterprise Funds Enterprise funds account for operations and activities that are financed and operated in a manner similar to a private business enterprise and where the cost of providing goods and services to the general public on a continuing basis is expected to be financed or recovered primarily through user charges. This fund includes services such as water, sewer, storm water, transit/bus, and solid waste and recycling. Internal Service Funds Internal service funds are used to account for the financing of goods and services provided by a city department or agency to other city departments or agencies on a cost reimbursement basis. This fund includes internal service departments such as risk services, fleet services, joint communications, and facilities maintenance. Capital Project Funds Capital project funds account for expenses and resources related to the acquisition and construction of capital facilities, improvements, and other major fixed assets. These capital project funds are financed with revenue other than enterprise or internal service fund monies. These funds include revenues and expenditures for areas such as street improvements, bridge improvements, flood control improvements, and trail improvements. Non-Major Funds The City reports and budgets for the following non-major funds. Special Revenue Funds Special Revenue Funds are utilized to account for revenues derived from sources for a specific use, which are required to be accounted for as a separate fund. These funds include revenues and expenditures for areas such as tax increment financing districts or for hotel motel. Debt Service Funds Debt service funds are used to account for the accumulation of resources for and the payment of principal, interest, and related costs for general long-term debt. Trust and Agency Funds Trust and agency funds are used to account for assets held by the City in a trustee or custodial capacity for the City’s retirement funds and for other entities, such as individuals, private organizations, or other governmental units. These fund types are further classified as expendable trust funds or pension trust funds.
48

Types of Funds Budgeted Within each fund are organizational general ledger structures called departments used to track revenues and expenditures with a unique function for delivery of services. The departments are as follows. Enterprise Funds
*Water *Water Pollution Control *Sanitary Sewer *Storm Water *Solid Waste & Recycling *Transit *Golf *Parking *Ice Arena *Paramount Theatre *U.S. Cellular and Doubletree by Hilton at The U.S. Cellular Center *The Eastern Iowa Airport
Internal Service Funds *Joint Communications *Facility Maintenance *Fleet Services *Risk Management
Trust & Agency Funds *Fire 411 Pension *Police 411 Pension *Payroll Funds *Building Department Trust
Debt Service Funds *Funds are set up for each debt issue or refunding
General Fund *Police *Fire *Building Services *Building Demolition *Public Works *Street Lighting *School Crossing Guards *Bridge Maintenance *Community Development *Development Services *Parks and Recreation *Information Technology *Finance *Human Resources *Attorney *City Manager *Mayor and City Council *City Clerk *Library *Contingent *Civil Rights *Gateways *Downtown District *Capital Replacement *Pooled Revenues *Investment Earnings *CR Tourism Center *Memorial *Agricultural Lands *Band
Special Revenue Funds *Local Option Sales Tax *Hotel Motel *Road Use Tax *Self-Supported Municipal Improvement District *Tax Increment Financing *Iowa Flood Mitigation Program *Library *Community Development *Civil Rights *Leased Housing *HOME *Ice Arena *Police *Animal Control *Fire *Parks and Public Property *Miscellaneous Special Revenue Other
Capital Improvement Funds *Streets *Storm Water *Bridge *Traffic *Park *Fire *Forestry *Police *Recreation *Riverfront *Ushers Ferry *Veterans Stadium *Veterans Memorial Building *Library *Animal Control *Downtown *Aquatic *Trail *Urban Renewal *Flood Control System *Other Disaster Recovery Funds *Financial System *Miscellaneous *Information Technology *Building Demolitions *City Facilities *Riverwall
49

Policies Budget and financial policies are in place to ensure the effective delivery of necessary services to minimize the financial burden on the taxpayers while maintaining the integrity of the City’s finances. The policies are reviewed annually. The following pages outline the City’s budget and financial policies. POLICY STATEMENTS The City will develop and incorporate financial, service, and program performance measures into its
budgeting process. Budget documentation will include a concise summary and guide to key issues for both the operating and
capital budgets. Charges for services and fees will be utilized in financing governmental goods and services where feasible. Current revenues will be sufficient to support current expenditures. The City will generally avoid budgetary
procedures that utilize existing cash balances to meet current expenditures. The City will endeavor to maintain a diversified and stable revenue system. A review of user fees charged for general governmental services will be made periodically to determine that
all user fees and charges are at a level related to the cost of providing these services. Annually, the increase of actual revenue for the levy of property tax, excluding taxable value gained through
annexation, new construction, and increases mandated by the voters or other governmental jurisdictions, generally will not exceed ten percent.
All enterprises of the City will be expected to maintain revenue sufficient to cover all direct and indirect costs, including an allowance for depreciation over the long-term and a rate stabilization fund.
The City will annually budget for all of its capital improvements. An unreserved, undesignated fund balance within the General Fund equal to twenty-five percent of the
following fiscal year’s budgeted expenditures shall be maintained as an operating reserve. The City will develop specific goals and criteria for its economic development incentives.
BALANCED BUDGET It is City practice to adopt an operating budget that is balanced whereas revenues equal expenditures. The City maintains the policy to use current revenues to support current expenditures and generally avoids budgetary procedures that utilize existing cash balances to meet current expenditures.
In FY 2021, the general fund is balanced whereas revenues equal expenditures. Other operating budgets are generally balanced with current revenues with a few exceptions of where prior year revenue collected in excess of expenditure requirements are being utilized as funding sources. The special revenue and capital project budgets are balanced with current revenues or may use existing cash on hand from past fiscal years to fund expenditures. BUDGETARY CONTROLS & DEPARTMENT ACCOUNTABILITY The City of Cedar Rapids measures budgetary results on a total departmental basis with revenue and expenditures being measured separately. Budget amendments that will be requested are tracked and reported monthly. However, these adjustments are subject to official City Council approval in May. The State of Iowa requires that cities do not spend more than their expenditure budget by program. To ensure compliance with the State and department accountability, the City has the following policies. Revenues Revenues are budgeted conservatively Actual revenues are expected to meet or exceed budgeted amounts
50

Having revenue is in excess of budget or having a fund/project balance does not mean a department can spend more than their expenditure budget
Expenditures Excluding transfers out, total actual expenses may not exceed total budgeted expenses regardless of
funds/cash available Expenses should be charged to the appropriate account based on account definitions regardless if budget is
remaining for the account. Actual expenses can be over for one account and under for another as long as in total budgeted expenses are not exceeded.
Additional policies for general fund departments (fund 101 only) Personal Services – Except for overtime or temporary/seasonals, departments may not reallocate unspent
personal service budget (wages and benefits) for other uses. Reason: Per Council policy established when budget was adopted, savings from vacated positions is
used to balance the general fund. Capital outlay – Departments are authorized to purchase only items approved as part of budget. Changes
from the approved list require conversation with the director team and director level approval. Controllable expenses – Departments are to manage expenses considered controllable expenses, to ensure
total actual expenses do not exceed total budgeted expenses. These expenses include: Overtime, temporary/seasonals, other benefit expenses for uniforms, tuition or stipends Discretionary expenses (I.e. office supplies, training, etc.) Admin charges – other relating to interdepartment charges
Not fully controllable expenses – Budget is set by Finance for expenses that are considered not fully controllable by a department as they are subject to external, normal maintenance, or economic factors. Departments may not reallocate unspent budget. If budget is exceeded due to external/economic factors, Finance will reallocate budget to the department as needed. These expenses include: Fleet Maintenance and Lease charges, Facility Maintenance charges and rent (Note - services and
associated materials provided above the standard service level are considered controllable and departments will need to identify a way to fund the expense)
Non-discretionary expenses (I.e. fuel, electricity, etc.) ONE-TIME REVENUE SOURCES / ONE-TIME EXPENDITURE REDUCTIONS The City does not typically budget for one-time revenue sources or one-time expenditure reductions, as the practice only delays or shifts the financial burden to future budget years. CASH TRANSFERS In order for the City to comply with Iowa law, local ordinances, or for expedience, it is sometimes necessary to transfer revenues and expenditures from one fund/department to another. This is a cash transfer. All transfers in are considered revenues and all transfers out are considered expenditures. City-wide, transfers in must equal transfers out. FUND BALANCE Fund balance is the difference between assets and liabilities on the balance sheet. It is City policy to maintain in reserves a minimum of 25% of the next fiscal year’s budgeted operating expenditures. By maintaining an appropriate reserve balance, the City is able to react to both known and unknown events that will have an impact on the City finances without disrupting services provided to its citizens in the short term.
51

INTERNAL CONTROL The management of the City is responsible for the establishment and continued maintenance of an internal control structure to ensure that all City assets are protected from loss, theft, or misuse. The management must also ensure that adequate accounting data is available to allow for the preparation of financial statements in conformity with generally accepted accounting principles. The internal control structure is designed to provide reasonable assurance these objectives are met. The concept of reasonable assurance recognizes: (1) the cost of a control should not exceed the benefits likely to be derived; and (2) the valuation of costs and benefits requires estimates and judgments by management. CAPITAL FINANCING The City normally relies on internally generated funds and/or grants and contributions from other governments to finance its capital needs. Debt will be issued for a capital project only when it is an appropriate means to achieve a fair allocation of costs between current and future beneficiaries or users, or in the case of an emergency capital need. Debt shall not fund operating expenses with the only exception related to disaster recovery for the 2008 flood, where certain disaster recovery bonds may be sold to fund qualifying expenses as Build America Bonds or Recovery Zone Bonds. Bond proceeds should be limited to financing capital expenditures such as the costs of planning, design, land acquisition, buildings, permanent structures, attached fixtures or equipment, and movable pieces of equipment, such as fire engines, or other costs as permitted by law. Acceptable uses of bond proceeds can be viewed as items, which can be capitalized. Capitalized interest is an eligible item for bonding. Utility revenue bond proceeds may be used to establish a debt service reserve as allowed by federal and State law. Non-capital furnishings and supplies will not be financed from bond proceeds. Refunding bond issues designed to restructure currently outstanding debt are an acceptable use of bonds proceeds. The City will not use short-term borrowing to finance operating needs except in the case of an extreme financial emergency, which is beyond its control or reasonable ability to forecast. Recognizing that bond issuance costs add to the total interest costs of financing, bond financing should not be used if the aggregate cost of projects to be financed by the bond issue does not exceed $1M. DEBT The City has set a target for the City’s general obligation outstanding debt at 80%, (except as a result of extenuating circumstances such as disasters) of the limit prescribed by State statute, which is currently five percent (5%) of actual value of property within the city. These levels are consistent with the City’s creditworthiness objectives. Debt reserve capacity is computed by multiplying the City’s total assessed valuation by 5% and then subtracting the outstanding general obligation debt from the calculated amount. The City strives to repay 30 to 60% of the principal amount of its general obligation debt within five years and at least 60 percent within 10 fiscal years. Capital projects financed through issuance of debt are programmed to be paid off completely within the expected useful life of the capital project. CAPITAL VS OPERATING EXPENDITURES - DEFINITIONS Capital Budgeting – Process of determining which improvements will be funded and their source of funding. Capital Expenditure / Capital Assets – Capital assets includes land, buildings and structures, and
improvements other than buildings, which include infrastructure, construction in progress, and machinery and equipment. Capital expenditures are defined by the City as assets with an initial, individual cost of more than $5,000 and an estimated useful life in excess of two years. Such assets are recorded at historical cost. Donated capital assets are recorded at estimated fair value at the date of donation.
Capital Equipment – Expenditure for capital items of less than permanent nature and normally at a lower costs than a capital improvement.
Capital Improvement / Project – Major outlays for capital assets or improvements that are tracked and capitalized as projects.
52
Operating Expenditures – Expenses of normal maintenance and repairs presumed to benefit the current fiscal period. These expenses are not classified as capital improvement or capital equipment as they do not add value to the asset or materially extend the asset life. These costs are not capitalized.
CAPITAL IMPROVEMENT POLICY STATEMENTS The City’s capital improvement financial management policy objective is to provide future generations the ability to construct improvements through borrowed capital without imposing a severe financial burden. The policy statements are: The City will annually budget for all of its capital improvements. The City will determine the least costly financing method for all new projects. Any capital project financed through the issuance of debt will be programmed to be paid off completely
within the expended useful life of the project. The City will utilize intergovernmental contributions, when available, to finance capital improvements that
are consistent with the City’s plans and priorities. Prior to undertaking a capital project, a projection of the ongoing operations and maintenance costs will be
analyzed in relation to operating budget forecasts. Pay as you go financing of capital improvements will be utilized where feasible. Enterprise funds should
develop reserves to pay for new capital improvements. Total general obligation debt will not exceed five percent of the City’s actual assessed value as required by
Iowa law. Where possible, the City will maintain a project Mini Fund at a minimum level of $1M from which the
investment earnings will be allocated annually to fund capital improvement projects as determined by the City Council.
Where possible and when financially prudent, the City will use special assessments and revenue bonds instead of general obligation bonds.
General obligation debt will be issued and abated by non-property tax revenue in those instances where debt capacity is available and it is financially advantageous to the City.
The City will maintain effective communications with bond rating agencies concerning its financial condition. The City will follow a policy of full disclosure on its financial reports and bond prospectus.
53

Budget Highlights
54

Budget Highlights EXPENDITURES The overall FY 2021 expenditure budget is $637.2M (net of transfers) which is an increase of $70.1M from the FY 2020 budget of $567.1M. The chart below details the change from FY 2020 to FY 2021 by major expenditure object.
The largest increase in the budget relates to planned expenses for capital improvements. These expenses increased by $48.8M to $247.9M. Some of the larger areas for planned improvements include streets, the flood control system, and The Eastern Iowa Airport. The chart below details the FY 2021 expenditure budget (excluding transfers).
FY FY 2020 FY $ Change % Change2019 Adopted 2021 From FY From FY
Actual Budget Budget 2020 2020Personal Services 137,396,423 146,994,984 153,393,363 6,398,378 4%Discretionary Expenses 131,589,289 124,432,094 134,903,669 10,471,575 8%Other Expenses 55,296,003 45,659,584 47,992,254 2,332,670 5%Capital Outlay 135,841,319 199,146,279 247,906,887 48,760,608 24%Debt Service 61,968,015 50,820,053 53,003,024 2,182,971 4%Transfers Out 180,372,085 157,548,695 177,031,792 19,483,097 12%Total Expenditures 702,463,134 724,601,689 814,230,989 89,629,300 12%
Total Expenditures (Net of Transfers Out) 522,091,049 567,052,994 637,199,197 70,146,203 12%
Personal Services$153,393,363
24%
Discretionary Expenses
$134,903,669 21%
Other Expenses$47,992,254
8%
Capital Outlay$247,906,887
39%
Debt Service$53,003,024
8%
55

The chart below details the expenditure budget change from FY 2020 to FY 2021 by fund type.
Enterprise funds have the largest dollar increase of $37.1M to $265.7M which relates planned capital improvement projects. Personal Services Personal service expenses are the salaries, wages, and benefits for full time equivalents (FTEs). The personal services budget is increasing $6.4M to $153.4M due additional positions, changes to wages, and health insurance costs. The Municipal Fire and Police Retirement System of Iowa Board of Trustees has determined the City’s contribution rate, effective July 1, 2020, will be 25.31% which is an increase of .9% from the FY 2020 rate of 24.41%. In FY 2021, $7.5M is budgeted for these retirement expenses, of which $5.6M is funded from the police and fire retirement property tax levy. The history of the City’s contribution is below.
Fund
FY 2020 Adopted
Expenditure Budget
FY 2021 Expenditure
Budget $ Change
From FY 2020% Change
From FY 2020Internal Service 54,566,922$ 58,025,245$ 3,458,322$ 6%General 130,649,277$ 137,048,821$ 6,399,544$ 5%Enterprise 228,533,833$ 265,669,218$ 37,135,385$ 16%Capital Projects 110,114,787$ 129,476,299$ 19,361,512$ 18%Special Revenue 21,556,207$ 21,444,742$ (111,465)$ -1%Debt Service 20,852,417$ 24,605,103$ 3,752,686$ 18%Trust & Agency 779,551$ 929,770$ 150,219$ 19%Total 567,052,994$ 637,199,197$ 70,146,203$ 12%
$5,613,649 $6,017,024
$7,154,324
$7,462,460
$7,008,819
$7,089,930 $6,858,052 $7,140,774 $7,033,353
$7,480,006
$0
$2,000,000
$4,000,000
$6,000,000
$8,000,000
201224.76%
201326.12%
201430.12%
201530.41%
201627.77%
201725.92%
201825.68%
201926.02%
202024.41%
202125.31%
Fiscal Year / City's Contribution Rate
FY 2012 thru FY 2019 reflects fiscal year actual values; FY 2020 and FY 2021 are based on budget
56

Iowa Public Employees’ Retirement System has determined the city’s contribution rate effective July 1, 2020 will be 9.44%, which is unchanged from FY 2020. The FY 2021 FTE count is increasing by 18.24 FTE. Below is a summary of the FY 2021 FTE count compared to the FY 2020 adjusted FTE count.
Summary of FTEs FY 2020 Adjusted Change from FY 2020 FY 2021 Budget City of Cedar Rapids 1438.48 15.24 1453.72 The Eastern Iowa Airport 54.40 3.00 57.40 Combined 1492.88 18.24 1511.12
The FY 2020 adjusted FTE count reflects changes made to the FTE count since creation of the FY 2020 adopted budget due to changes approved via council resolution, reclassifications of positions approved by a position change form, or transfers of positions between departments. FY 2021 FTE changes include: Building Services Adding 2 Housing Inspector FTEs to support the rental inspection program.
Parks & Recreation Adding .29 seasonal FTE to support a new mobile recreation program. Adding .19 seasonal FTE to support a new at risk youth program. Decrease of 2.36 seasonal FTEs based on program needs and to offset seasonal wage increases.
Police Adding 1 Digital Evidence Project Coordinator FTE to support digital evidence program.
Public Works Adding 1 FTE Right of Way Permit Technician FTE to support the permitting process. Adding 1 Flood Control Property Acquisition Agent FTE to support the acquisition process for the flood
control system. Adding 1 Civil Engineer FTE to support Americans with Disabilities Act compliance.
Information Technology Adding 1 Asset Management FTE to support Utilities areas (funding from utility user fees).
Golf Adding 1.12 seasonal FTE to support a new mini golf course program.
Transit Adding 5 Transit Driver FTEs, 1 Transit Operations Supervisor FTE, 1 Transit Operations Clerk FTE, and 1
Service Worker FTE to extend weeknight fixed-route bus service to all bus routes by two additional hours.
Water Adding of 1 Water Utility Service Rep I FTE to support water utility service locating.
The Eastern Iowa Airport Adding 3 operational positions.
On the following page is a five-year history of FTE counts.
57

Fiscal Fiscal Fiscal Fiscal Fiscal ChangeYear Year Year Year Year From 2017 2018 2019 2020 2021 FY 2020
Department Name Adjusted Adjusted Adjusted Adjusted Budget AdjustedInternal Service FundsJoint Communication 27.00 27.00 27.00 27.00 27.00 - Facilities Maintenance 25.00 26.00 26.00 26.00 26.00 - Fleet Services 37.00 36.00 36.00 36.00 36.00 - Internal Service Funds 89.00 89.00 89.00 89.00 89.00 -
General FundAttorney 6.00 6.00 6.00 6.00 6.00 - Building Services 30.00 30.00 30.00 30.00 32.00 2.00 City Clerk 5.50 5.50 5.50 5.50 5.50 - City Manager 14.00 14.00 14.00 15.00 15.00 - Civil Rights 5.00 5.00 5.00 5.00 5.00 - Community Development 14.10 14.10 14.58 14.80 14.80 - Council and Mayor 3.33 3.33 3.33 3.33 3.33 - Development Services 13.00 13.00 13.00 13.00 13.00 - Finance 2 43.75 42.75 46.75 45.25 45.25 - Fire 148.54 148.54 148.54 148.48 148.48 - Human Resources 2 15.00 12.00 9.00 9.00 9.00 - Information Technology 34.00 34.00 34.00 34.00 35.00 1.00 Library 62.21 62.65 63.61 67.59 67.59 - Memorial 9.41 9.41 9.41 8.56 8.56 - Parks & Recreation 1 138.73 127.67 127.18 125.48 123.60 (1.88) Police & Animal Control 254.00 254.00 254.00 266.00 267.00 1.00 Public Works 1 136.09 153.81 157.81 161.81 164.81 3.00 General Fund 932.66 935.76 941.71 958.80 963.92 5.12
Enterprise FundsWater 109.66 112.66 112.49 112.49 113.49 1.00 Water Pollution Control 86.74 85.74 84.74 86.74 86.74 - Solid Waste and Recycling 47.08 48.00 49.00 49.00 49.00 - Transit 55.00 56.00 57.00 57.00 65.00 8.00 Parking 4.00 4.00 3.00 3.00 3.00 - Golf 28.88 26.88 26.42 26.10 27.22 1.12 Sanitary Sewer Maintenance 3 33.35 33.35 35.35 31.35 31.35 - Storm Water 3 9.00 9.00 - The Eastern Iowa Airport 44.00 53.40 53.40 54.40 57.40 3.00 Enterprise Funds 408.71 420.03 421.40 429.08 442.20 13.12
Special Revenue FundsLibrary 2.00 2.00 2.00 2.00 2.00 - Leased Housing 12.00 9.00 9.00 8.00 8.00 - H.O.M.E./CD 8.00 8.00 5.00 5.00 5.00 - SSMID - - - - - - Real Estate Disposal 1.00 1.00 1.00 1.00 1.00 - Special Revenue Funds 23.00 20.00 17.00 16.00 16.00 - Total FTE's 1,453.37 1,464.79 1,469.11 1,492.88 1,511.12 18.24 1 Mowing positions transitioned to the Public Works Department from Parks & Recreation during FY 20182 Safety and Occupational Health programs transitioned to the Finance Department from Human Resources during FY 20183 Storm water positions were moved to the storm water fund during FY 2020. Previously they were budgeted under the sanitary sewer fund.
Full Time Equivalent (FTE) Employee Analysis for FY 2017 - FY 2021
58

Discretionary Expenses Discretionary non-personal service expenses are considered controllable by city departments (I.e. office supplies, training, etc.). Overall discretionary expenses across the City increased $10.5M to $134.9M. Increases include budgeted expenses for the Paramount (related to the anticipated transfer of interests back to the City), health services, and other professional services. These and other changes to this category are outlined for each fund in subsequent sections of this book. Fleet and Facility Expenses Fleet and facility expenses relate to the internal cost of services provided by Fleet Services and Facility Maintenance. The Facility Maintenance budget was built based on FY 2019 actual service levels, supplies, and materials with adjustments for FY 2021 anticipated levels. The custodial hourly rate will increase by $1.75/hour to $61.25/hour due to increases in personal services and operations. The technician hourly rate will increase by $1.75/hour to $77.75/hour due to increases in personal services and operations. City Hall building rent will increase $19K due to increases in personal service costs. City Services Center building rent will increase $182K due to increases in personal service costs, supplies and materials, and electricity. The police station, maintenance building, and substation rent will decrease $9K due to a reduction in environmental services staffing for this location. The central fire station rent will decrease $4K due to a reduction in technician hours for this location. The Fleet Services budget was built based on FY 2019 actual service levels, supplies, and materials with adjustments for FY 2021 anticipated levels. The mechanic rate will increase by $2/hour to $86/hour due to personal service increases. Discretionary expenses are increasing $481K for costs directly billed to departments based on historical expenses. The budget includes $6.1M of purchases of vehicles and equipment, which includes $3.2M general fund areas, $2.8M for enterprise funds, and $45K for internal service funds. Non-discretionary Expenses Non-discretionary expenses are considered not fully controllable by city departments as they are subject to external or economic factors (I.e. fuel, electricity, etc.). The FY 2021 fuel expenditure budget was established in August 2019 based on actual costs over the past year and projections. The budget is using a projection of fuel costing $2.21/gallon for gasoline and $2.51/gallon for diesel. Capital Outlay Capital outlay is capital assets such as land, buildings and structures, and improvements other than buildings that include infrastructure, construction in progress, and machinery and equipment. Capital assets are defined by the City as assets with an initial, individual cost of more than $5K that have an estimated useful life in excess of two years. As previously mentioned, in FY 2021, capital outlay expenditures are increasing $48.8M to $247.9M. This includes planned increases for streets, the flood control system, and The Eastern Iowa Airport. Debt Service Debt service includes the payment of principal, interest, and related costs for debt. Debt service expenses are detailed for funds in subsequent sections of this book.
59

Transfers Out In order for the City to comply with Iowa law, local ordinances, or for expedience, it is sometimes necessary to transfer revenues and expenditures from one fund/department to another. Transferring cash out of a fund is considered a transfer out. In FY 2021, overall transfers out increased $19.5M to $177M, based on planned expenditures, increases in revenue sources, timing of projects, and funding needs. REVENUES The overall FY 2021 revenue budget is $637.2M (net of change in fund balance) which is an increase of $70.1M from the FY 2020 budget of $567.1M.
Regular property tax revenue is increasing $3.4M to $110.6M due to increased valuations, an increase in the property tax levy, offset by a decrease in the State’s residential and multi-residential rollbacks percentages. In FY 2021, the total City property tax levy rate will increase $.22/$1000 of taxable valuation to $15.6562/$1000 to fund flood control system improvements. Tax increment property tax revenue is increasing $2.8M to $13.8M due to increased property valuations in the Central, Consolidated, Fountains, Northtowne, Stone Creek, and Westdale TIFs resulting from increased debt certifications as well as certifying debt in FY 2021 for Commerce Park, Earhart Lane, Grand Living, and Muirfield. Grant revenue increased $3.3M to $91.3M based on planned projects and signed agreements mainly relating to street and trail improvements. Charges for services revenue is increasing $8.5M to $192.3M mainly due to utility rate increases. Proceeds from long term liabilities are increasing. The City plans to issue $49.7M of general obligation bonds compared to $40M budgeted in FY 2020. The increase is mainly for the flood control system. The City also plans to issue $18.6M for revenue bonds which is an increase of $3.6M from FY 2020 that will be used to fund utility area capital improvement projects. Other changes included in the budget were based on historical and projected information.
FY FY 2020 FY $ Change % Change2019 Adopted 2021 From FY From FY
Actual Budget Budget 2020 2020Taxes 146,021,650 151,153,690 157,804,591 6,650,901 4%Licenses & Permits 3,290,385 2,516,479 2,697,262 180,783 7%Intergovernmental Grants 67,034,562 88,038,770 91,328,656 3,289,886 4%Charges for Services 191,552,777 183,840,156 192,307,774 8,467,618 5%Fines & Forfeits 568,878 5,620,000 4,920,000 (700,000) -12%Proceeds of Long Term Liabilities 50,788,308 59,970,000 77,338,673 17,368,673 29%Transfers In 180,372,085 157,548,695 177,031,792 19,483,097 12%Other Revenue 73,794,871 57,665,322 65,653,853 7,988,530 14%Total Revenue 713,423,517 706,353,112 769,082,600 62,729,489 9%Change in Fund Balance (191,332,468) (139,300,118) (131,883,403) 7,416,714 -5%Total Revenue With Change in Fund Balance 522,091,049 567,052,994 637,199,197 70,146,203 12%
60

The chart below depicts the FY 2021 revenue budget by major object of revenue source.
Charges for Services (Largest Budgeted Revenue Source – 30%) Charges for services include charges to internal and external users for the services provided. The charges are based on the cost for providing the service. In FY 2021, 30% or $192.3M of the revenue budget for the City relates to charges for services. The largest charges for service revenue sources include: $60.2M – Waste water service charge and volumetric revenue, special waste water revenue, and contractual
waste water revenue $36.7M – Internal charges for services between departments such as risk charges, funding for Joint
Communications, fleet lease and maintenance charges, facilities charges, Finance and Information Technology Department charges, and internal staff time charges to capital improvement projects
$37.2M – Water service charge and volumetric revenue $11.8M – Solid waste and recycling fees In regard to utilities, total residential utility billings will increase 4.8% which is an increase of $57.36 annually for the typical residential customer defined as a household that uses 7480 gallons of water and sewer per month. Compared to FY 2020, charges for services revenue is increasing $8.5M to $192.3M. The main reason for this increase relates to utility user charges for services provided. Utility Departments determined their operating charges for service revenue based on operating, debt, capital needs, and direction for allowable rate increases. Water revenue increased due to service charge and volumetric rate increases. These increases will fund
operating costs and capital improvement project expenditures relating to updates at water treatment facilities, the distribution system, and water main replacement associated with the Paving for Progress program.
Water Pollution Control / Sanitary Sewer revenue increased due to service charge, volumetric, industrial, and biochemical oxygen demand rates to fund operating costs and capital improvement project expenditures.
Storm Water revenue increased due to rate increases to fund capital improvement project and operating needs.
Taxes 157,804,591
25%
Licenses & Permits
2,697,262 <1%
Intergovernmental Grants
91,328,656 14%
Charges for Services
192,307,774 30%
Fines & Forfeits 4,920,000
1%
Proceeds of Long Term Liabilities
77,338,673 12%
Fund Balance / Transfers In45,148,389
7%
Other Revenue 65,653,853
10%
61

Solid Waste & Recycling rates will remain unchanged. General fund and internal service departments used rate models to determine their rates to recoup the cost of the services provided. The changes for risk charges were determined by the Finance Department after reviewing costs, recent claim trends, and/or projected medical claim costs. Taxes (Second Largest Budgeted Revenue Source – 25%) Taxes include property tax on residential, multi-residential, industrial, and commercial property; along with local option sales tax, hotel-motel tax, and franchise fees. In FY 2021, $157.8M is budgeted for taxes, which is an increase of $6.7M from FY 2020. The budget includes the following revenue sources: Property tax revenue – $110.6M (increase of $3.4M) Tax increment property tax revenue – $13.8M (increase of $2.8M) 1% streets local option sales tax revenue – $19.2M (increase of $300K) Hotel motel tax revenue – $3.9M (increase of $50K) Franchise fee (cable, electric, gas) revenue – $10.3M (increase of $133K) The property tax revenue budget is based on property valuations, the rollback, and the property tax levies. The franchise fee budget was built based on historical levels and projections which includes no change in the 3% gas franchise fee, 3% utility franchise fee, and 5% cable franchise fee. The budgets for local options sales tax and hotel motel tax were built based on recent historical information and a strong local economy. FY 2021 is year 7 for budgeting local option sales tax funds for the paving for progress program. It is estimated the City will generate over $200M of revenue over a ten-year period. The City began receiving this revenue in FY 2015. Below is a history of franchise, hotel motel, and local option sales tax revenue.
$3,353,064 $3,940,424
$6,962,603 $6,666,465 $6,978,250
$9,651,657 $10,184,385 $10,318,852 $10,184,380 $10,317,000
$2,756,086 $2,895,232
$3,035,261 $3,441,535 $3,479,413 $3,705,664 $3,658,802 $3,822,238 $3,850,000 $3,900,000
$18,138,388
$17,939,752
$18,457,259 $19,331,507 $18,255,938
$20,166,423 $19,150,019
$19,231,163
$18,900,000 $19,200,000
$-
$2,500,000
$5,000,000
$7,500,000
$10,000,000
$12,500,000
$15,000,000
$17,500,000
$20,000,000
$22,500,000
FY 2012Actual
FY 2013 Actual
FY 2014 Actual
FY 2015 Actual
FY 2016Actual
FY 2017Actual
FY 2018Actual
FY 2019Actual
FY 2020Budget
FY 2021Budget
Franchise Tax Hotel Motel Local Options Sales Tax
62

The January 1, 2019, property valuation serves as the basis for calculating property taxes in FY 2021. As of January 1, 2019, property tax valuations increased 1.58% to $6.95 billion, which is an increase of $108.1M from FY 2020 (or the January 1, 2018 property valuation). Residential valuations increased $26.5M to $3.9 billion Commercial valuations increased $15M to $2.1 billion Industrial valuations increased $28.5M to $431.6M Multi-residential valuations increased $27.8M to $228.9M The taxable valuation change (without TIFs) by property type is detailed below.
The history of the taxable valuation without TIFs is summarized in the following chart.
The 100% assessed FY 2021 valuation with TIFs is $12.2 billion which is an increase of 4.46% or $520.2M from FY 2020. Residential valuations increased $329M to $7.2 billion Commercial valuations increased $73.8M to $2.6 billion Industrial valuations increased $22.7M to $494.8M Multi-residential valuations increased $75.4M to $351.2M
$5,544$5,687 $5,753 $5,868 $5,979 $6,013$6,379 $6,674 $6,843 $6,951
$2,907
$3,883
$1,938 $2,055
$359 $432 $191 $229 $150
$1,150
$2,150
$3,150
$4,150
$5,150
$6,150
$7,150
$8,150
FY2012
FY2013
FY2014
FY2015
FY2016
FY2017
FY2018
FY2019
FY2020
FY2021
Mill
ions
History of Taxable Valuations without Tax Increment Financing Areas
Total Taxable Value
Residential Property
CommercialPropertyIndustrial Property
Multi- ResidentialProperty
63

The 100% assessed valuation change with TIFs by property type is detailed below.
A 10 year history of the taxable value and estimated actual value of assessed property is shown below.
The average growth in taxable value over the last 10 years is 2.91%. In the last 5 years, the average growth in taxable value is 3.08%, compared to 2.05% in the last 2 years. From 1978 – June 2014, residential property was subject to an assessment limitation order, or “rollback” that limited the amount of annual growth in property tax values to 4%. Since FY 2015, residential and agricultural property value growth has been capped at 3% or whichever is lowest between these two classes.
64

The rollback applied to residential property for FY 2021 set by the Iowa Department of Revenue is 55.0743% of estimated value, which is an decrease of 1.84% from the FY 2020 amount of 56.918%. The 10 year history of the residential rollback percentage is detailed below.
In FY 2014, commercial and industrial property were taxed at 100% of property value. For FY 2015, commercial, industrial, and railroad property were rolled back and taxed at 95% of property value. Since FY 2016 these classes have been rolled back and taxed at 90% of property value. The 10 year history of the commercial and industrial rollback percentages are detailed below.
40.00%
45.00%
50.00%
55.00%
60.00%
FY2012
FY2013
FY2014
FY2015
FY2016
FY2017
FY2018
FY2019
FY2020
FY2021
48.53%
50.75%
52.82%54.40%
55.73% 55.63%56.94%
55.62%56.92%
55.07%
10 Year History of Residential Rollback Percent
50%
60%
70%
80%
90%
100%
FY2012
FY2013
FY2014
FY2015
FY2016
FY2017
FY2018
FY2019
FY2020
FY2021
100%
100%
100%
95%
90%
90%
90%
90%
90%
90%
100%
100%
100%
95%
90%
90%
90%
90%
90%
90%
10 Year History of Commerical & Industrial Rollback Percent
Commercial Industrial
65

In calendar 2013, the State passed a property tax reform bill that moved a percentage of property from the commercial classification to a multi-residential classification. In FY 2015, multi-residential property was rolled back and taxed at 95% of property value and then in FY 2016 this property was taxed at 90% of property value. Then in FY 2017, for an 8 year period the multi-residential classification began it’s shift to the residential classification and rollback value. For FY 2021, multi-residential properties will be taxed at 71.25% of property value. In FY 2024, these properties will have the same rollback percentage as residential properties. The state’s historical and planned rollback value is outlined below.
In FY 2021, the total City property tax levy rate will increase $.22/$1000 of taxable valuation to $15.65620/$1000. A history of the City of Cedar Rapids’ property tax levy is detailed below.
50%
60%
70%
80%
90%
100%
FY2014
FY2015
FY2016
FY2017
FY2018
FY2019
FY2020
FY2021
FY2022
FY2023
100%
95%
90%86.25%
82.5%78.75%
75.00%71.25%
67.5%63.75%
Multi-Residential Rollback Percent
$14.00 $14.20 $14.40 $14.60 $14.80 $15.00 $15.20 $15.40 $15.60 $15.80 $16.00
History of Property Tax Levy Per $1000 of Valuation
66

The City of Cedar Rapids levies are outlined below.
The FY 2021 budget includes $110.1M in property tax revenue that is generated by the levies shown above (excluding self supported municipal improvement districts and ag lands).
For a residential property valued at $150K, the calculation of the annual City property tax is as follows.
Residential Property Value $150,000 Multiplied by Rollback Percentage 55.0743% Equals Taxable Value $82,611 Divided by $1,000 Multiplied by Property Tax Levy Rate $15.65620 Equals City Property Tax Per Year $1,293
City Operations$80,621,439
73.2%
Transit/Bus$5,615,479
5.1%
Band$115,873
0.1%
Memorial$1,395,894
1.3%
Debt$22,341,847
20.3%
Property Tax Revenue
67

For a home valued at $150,000, the application of the rollback and increase in the city levy rate will translate to a decrease of 1.86% or a $25 annual increase in taxes paid to the City of Cedar Rapids. A 5-year history of the City portion of property taxes paid per year on a home valued at $150,000 is outlined below.
For a commercial or industrial property valued at $1M, the application of the rollback and increase in the city levy rate will translate to an increase of 1.43% or a $198 annual increase in taxes paid to the City of Cedar Rapids. A 5-year history of the City portion of property taxes paid per year on a property valued at $1M is outlined below.
For a multi-residential property valued at $1M, the application of the rollback and increase in the city levy rate will translate to a decrease of 3.65% or a $422 annual decrease in taxes paid to the City of Cedar Rapids due to the lowering of the rollback percentage. A 5-year history of the City portion of property taxes paid per year on a property valued at $1M is outlined below.
68

For City operations, the levy rate is $11.60 per $1000 of taxable valuation, which will generate $80M of property tax revenue. Below shows the allocation of the levy rate for City operations.
Below shows the allocation of property tax revenue for City operations.
Property tax revenue for City operations is received to the general fund and trust and agency funds as appropriate.
69

Cedar Rapids continues to maintain one of the lowest property tax rates compared to other Iowa cities. Below are property tax rates for other Iowa cities for FY 2020 in comparison to the City of Cedar Rapids FY 2021 rate.
Intergovernmental Grants (Third Largest Budgeted Revenue Source – 14%) Intergovernmental grant revenue is a combination of federal, state, or local funding that includes sources such as road use tax proceeds, state property tax backfill, Iowa Flood Mitigation Program revenue for flood control, and 28E agreements with other municipalities for improvement projects. In FY 2021, of the $637.2M budgeted for revenue city wide, 14% or $91.3M is budgeted for intergovernmental grants. Included in the grant revenue is $15M for Iowa Flood Mitigation Program revenue. FY 2021 is year 7 for budgeting Iowa Flood Mitigation Program revenue for the flood control system. The City is budgeting $16.4M in FY 2021 for road use tax revenue, which is an increase of $200K from FY 2020. The City will transfer $11.9M to the City’s general fund to pay for operating costs related to Public Works, bridge inspections, street lighting, and Forestry. The remainder will be used for capital improvement projects. Road use tax proceeds are derived from the state fuel tax rate, vehicle registration, and other related fees. The City receives their allocated share from the state to assist with construction, repair, and maintenance of Iowa’s road infrastructure. Other grant funding includes federal and state operating revenue for areas such as Transit and Leased Housing. For FY 2021, departments reviewed their budgeted expenses and grant agreements, and then projected the associated federal, state, and local grant revenue to be budgeted. Iowa Flood Mitigation Program revenue budgeted is based on the agreement with the state. Road use tax revenue was based on historical actual proceeds. Proceeds of Long Term Liabilities (Fourth Largest Budgeted Revenue Source – 12%) Long term liabilities is a combination of general obligation bonds, revenue bonds, and tax increment financing bonds.
$10.03
$10.33
$15.44
$15.66
$15.68
$15.83
$16.78
$16.64
$17.55
$18.26
$- $2 $4 $6 $8 $10 $12 $14 $16 $18 $20
Ames
Dubuque
Cedar Rapids FY 2020
Cedar Rapids FY 2021
Sioux City
Iowa City
Davenport
Des Moines
Waterloo
Council Bluffs
FY 2020 Property Tax Levy Rate Per $1000 of Taxable Valuation
70

The FY 2021 budget includes funding with long term liabilities for capital improvement projects. This includes $49.7M of general obligation bonds as noted: $7.47M Public Works $1.4M – Staff time $3.6M – Street Improvements $275K – Traffic Improvements $945K – Sidewalk Improvements $50K – Downtown Improvements $1.2M – Trail Improvements
$1.32M Parks, Forestry, Recreation, Aquatics, $798K – Parks Improvements $150K – Street trees $278K – Recreation Improvements $90K – Aquatics Improvements
$855K – Fire pumper truck and educational trailer $500K – Library circulation material $585K – Information Technology Improvements $510K – City Facility Improvements $30M – Flood Control System Improvements Also included is $4.9M of tax increment financing bonds for street and stormwater improvements. $18.6M is budgeted for revenue bonds for utility areas. The projects included in the budget were programmed based on their priority, cost, revenue source, purpose, and/or timing. Other Revenues (Fifth Largest Budgeted Revenue Source – 10%) Other revenues include building rental, insurance premiums, special assessments, airport parking, and airport landing fees. The category other revenues is increasing by $8M to $65.7M. Changes to this category are outlined for each fund in subsequent sections of this book. Licenses and Permits License and permit revenue is derived from a number of sources including building, plumbing, mechanical, and electrical permits as well as liquor licenses and right of way permits.
Licenses and permits is increasing from $181K to $2.7M based on historical and projected information. Fines and Forfeits Fines and forfeits include traffic enforcement camera fines as well as court and library fines. Fines and forfeits are decreasing by $700K to $4.9M mainly due to decreasing police towing revenue of $645K based on projected information and due to eliminating fines on overdue library materials. Fund Balance / Transfers In On occasion fund balance is used to fund expenses of the upcoming budget year. Operating budgets are generally balanced with current revenues with a few exceptions of where prior year revenue collection in excess of expenditure requirements are being utilized as funding sources in FY 2021. The special revenue, internal service, and capital project budgets are balanced with current revenues or use existing cash on hand from past fiscal years to fund expenditures due to planned expenditures or the timing of expenditures.
71

The use of fund balance or transfers in is decided by Departments and/or the Finance Department based on needs and availability. The Finance Department confirms if funds can be transferred or used given the circumstance of the expense and original source of the funds. Special Comment In order to avoid repeat commentary, throughout this document several revenue or expenditure changes are the result of the following and are not specifically noted in the department or fund summary of budget changes as almost all departments are affected by one or more of these changes: Adjustments to personal services for wage and step increases, employee health insurance plan changes,
workers compensation, social security contributions, Iowa Public Employees’ Retirement System (IPERS) contributions, Municipal Fire and Police Retirement System of Iowa (MFPRSI) contributions, other retirement plan contributions, and special pays.
Non-discretionary expense changes of property, liability, and vehicle insurance, fleet maintenance and fleet lease charges, facility maintenance and rental, electricity, natural gas, other internal charges, and fuel.
Various adjustments between accounts to reflect where actual revenue or costs are anticipated.
72

State Forms The State of Iowa prescribes forms that are used by all cities in preparing their budgets. These forms are located on the subsequent pages.
73

Dec-18
1
Form 635.1 Department of Management
Adoption of Budget and Certification of City Taxes 57-539Resolution No.:
The City of: County Name: Date Budget Adopted: 4/28/2020 (Date) xx/xx/xx
319-286-5060Telephone Number Signature
County Auditor Date Stamp January 1, 2019 Property Valuations
With Gas & Electric Without Gas & ElectricLast Official Census
Regular 2a 2b
DEBT SERVICE 3a 3b
Ag Land 4a
TAXES LEVIED(A) (B) (C)
Code Dollar Request with Property Taxes
Sec. Limit Purpose Utility Replacement Levied Rate
384.1 8.10000 Regular General levy 5 56,286,618 53,881,279 43 8.10000
(384) Non-Voted Other Permissible Levies12(8) 0.67500 Contract for use of Bridge 6 0 44 012(10) 0.95000 Opr & Maint publicly owned Transit 7 5,613,860 5,373,959 45 0.8078712(11) Amt Nec Rent, Ins. Maint of Civic Center 8 0 46 012(12) 0.13500 Opr & Maint of City owned Civic Center 9 0 47 012(13) 0.06750 Planning a Sanitary Disposal Project 10 0 48 012(14) 0.27000 Aviation Authority (under sec.330A.15) 11 0 49 012(15) 0.06750 Levee Impr. fund in special charter city 13 0 51 012(17) Amt Nec Liability, property & self insurance costs 14 1,034,145 989,952 52 0.1488212(21) Amt Nec Support of a Local Emerg.Mgmt.Comm. 462 0 465 0(384) Voted Other Permissible Levies12(1) 0.13500 Instrumental/Vocal Music Groups 15 115,839 110,889 53 0.0166712(2) 0.81000 Memorial Building 16 1,395,491 1,335,857 54 0.2008212(3) 0.13500 Symphony Orchestra 17 0 55 012(4) 0.27000 Cultural & Scientific Facilities 18 0 56 012(5) As Voted County Bridge 19 0 57 012(6) 1.35000 Missi or Missouri River Bridge Const. 20 0 58 012(9) 0.03375 Aid to a Transit Company 21 0 59 012(16) 0.20500 Maintain Institution received by gift/devise 22 0 60 012(18) 1.00000 City Emergency Medical District 463 0 466 012(20) 0.27000 Support Public Library 23 0 61 028E.22 1.50000 Unified Law Enforcement 24 0 62 0
Total General Fund Regular Levies (5 thru 24) 25 64,445,953 61,691,936384.1 3.00375 Ag Land 26 23,873 23,873 63 2.99996
Total General Fund Tax Levies (25 + 26) 27 64,469,826 61,715,809 Do Not Add
Special Revenue Levies
384.8 0.27000 Emergency (if general fund at levy limit) 28 0 64 0384.6 Amt Nec Police & Fire Retirement 29 5,559,172 5,321,608 0.80000
Amt Nec FICA & IPERS (if general fund at levy limit) 30 5,281,005 5,055,328 0.75997
Rules Amt Nec Other Employee Benefits 31 12,437,258 11,905,767 1.78980
Total Employee Benefit Levies (29,30,31) 32 23,277,435 22,282,703 65 3.34977
Sub Total Special Revenue Levies (28+32) 33 23,277,435 22,282,703
Valuation 386 As Req With Gas & Elec Without Gas & Elec
SSMID 1 (A) 88,196,301 (B) 88,196,301 34 242,540 242,540 66 2.75000SSMID 2 (A) 85,896,594 (B) 85,896,594 35 236,216 236,216 67 2.75000SSMID 3 (A) 33,024,521 (B) 33,024,521 36 41,280 41,280 68 1.24998SSMID 4 (A) (B) 37 0 69 0SSMID 5 (A) (B) 555 0 565 0SSMID 6 (A) (B) 556 0 566 0SSMID 7 (A) (B) 1177 0 1179 0SSMID 8 (A) (B) 1185 0 1187 0
Total Special Revenue Levies 39 23,797,471 22,802,739
384.4 Amt Nec Debt Service Levy 76.10(6) 40 22,335,772 40 21,435,329 70 3.03225384.7 0.67500 Capital Projects (Capital Improv. Reserve) 41 41 0 71 0
Total Property Taxes (27+39+40+41) 42 110,603,069 42 105,953,877 72 15.65620
COUNTY AUDITOR - I certify the budget is in compliance with ALL the following: Budgets that DO NOT meet ALL the criteria below are not statutorily compliant & must be returned to the city for correction.
______ 1) The prescribed Notice of Public Hearing Budget Estimate (Form 631.1) was lawfully published, or posted if applicable, filed proof was evidenced.
______ 2) Budget hearing notices were published or posted not less than 10 days, nor more than 20 days, prior to the budget hearing.
______ 3) Adopted property taxes do not exceed published or posted amounts.
______ 4) Adopted expenditures do not exceed published or posted amounts in each of the nine program areas, or in total.
______ 5) Number of the resolution adopting the budget has been included at the top of this form.
______ 6) The budget file uploaded to the SUBMIT Area matched the paper copy certified by the city to this office. ( County Auditor )
______ 7) The long term debt schedule (Form 703) shows sufficient payment amounts to pay the G.O. debt certified by the city to this office.
7,366,071,988 7,069,116,615
The below-signed certifies that the City Council, on the date stated above, lawfully approved the named resolution adopting a budget for next fiscal year, as summarized on this and the supporting pages.
6,652,009,767126,326
FISCAL YEAR BEGINNING JULY 1, 2020 - ENDING JUNE 30, 2021
7,957,762
6,948,965,140
Cedar Rapids LINN
Attached is Long Term Debt Schedule Form 703 which lists any and all of the debt service obligations of the City.
74

Fo
rm 6
35
.2A
C
ITY
OF
D
ep
art
me
nt
of
Ma
na
ge
me
nt
2021
Fis
cal Y
ears
TIF
SP
EC
IAL
SP
EC
IAL
DE
BT
CA
PIT
AL
BU
DG
ET
RE
-ES
TIM
AT
ED
AC
TU
AL
GE
NE
RA
LR
EV
EN
UE
SR
EV
EN
UE
SS
ER
VIC
EP
RO
JEC
TS
PE
RM
AN
EN
TP
RO
PR
IET
AR
Y20
2120
2020
19(A
)(B
)(C
)(D
)(E
)(F
)(G
)(H
)(I
)(J
)(K
)(L
)R
eve
nu
es
& O
the
r F
ina
nc
ing
So
urc
es
Ta
xes
Le
vie
d o
n P
rop
ert
y1
61,7
15,8
0922
,802
,739
21,4
35,3
290
105,
953,
877
102,
781,
655
98,0
25,9
77L
ess
: U
nco
llect
ed
Pro
pe
rty
Ta
xes-
Le
vy Y
ea
r2
00
00
00
0
Ne
t C
urr
en
t P
rop
ert
y T
axe
s3
61,7
15,8
0922
,802
,739
21,4
35,3
290
105,
953,
877
102,
781,
655
98,0
25,9
77D
elin
qu
en
t P
rop
ert
y T
axe
s4
00
00
00
386,
359
TIF
Re
ven
ue
s5
13,7
53,1
5013
,753
,150
10,9
98,7
039,
505,
012
Oth
er
City
Ta
xes
616
,971
,017
20,1
94,7
3290
0,44
30
38,0
66,1
9237
,373
,332
36,7
77,6
16L
ice
nse
s &
Pe
rmits
72,
587,
462
30,0
0079
,800
2,69
7,26
22,
516,
479
3,29
0,38
5U
se o
f M
on
ey
an
d P
rop
ert
y8
3,14
6,82
450
5,17
40
3,11
00
023
,748
,844
27,4
03,9
5225
,899
,618
32,8
19,9
09In
terg
ove
rnm
en
tal
92,
739,
525
40,6
69,2
500
756,
391
23,6
11,7
4623
,548
,954
91,3
25,8
6688
,038
,769
66,6
20,4
12C
ha
rge
s fo
r F
ee
s &
Se
rvic
e10
17,1
27,6
1231
4,00
00
68,0
000
174,
798,
162
192,
307,
774
183,
840,
157
147,
284,
988
Sp
eci
al A
sse
ssm
en
ts11
100,
000
00
2,67
0,00
022
0,90
02,
990,
900
1,07
9,40
01,
353,
252
Mis
cella
ne
ou
s12
6,82
0,38
250
9,79
20
50,0
000
32,4
48,1
1739
,828
,291
35,9
21,2
7885
,088
,951
S
ub
-To
tal R
eve
nu
es
1311
1,20
8,63
185
,025
,687
13,7
53,1
5023
,095
,273
26,3
99,7
460
254,
844,
777
514,
327,
264
488,
449,
391
481,
152,
861
Oth
er
Fin
an
cin
g S
ou
rce
s:
To
tal
Tra
ns
fers
In
1437
,870
,583
6,45
4,37
80
3,21
1,24
744
,002
,939
014
,439
,472
105,
978,
619
107,
959,
629
103,
072,
818
P
roce
ed
s o
f D
eb
t15
00
00
54,5
96,6
7322
,742
,000
77,3
38,6
7359
,970
,000
50,7
88,3
08
Pro
cee
ds
of
Ca
pita
l Ass
et
Sa
les
1617
5,00
090
,71
00
00
085
,000
350,
710
385,
026
692,
896
To
tal
Re
ven
ue
s a
nd
Oth
er
So
urc
es
1714
9,25
4,21
491
,570
,775
13,7
53,1
5026
,306
,520
124,
999,
358
029
2,11
1,24
969
7,99
5,26
665
6,76
4,04
663
5,70
6,88
3E
xp
en
dit
ure
s &
Oth
er
Fin
an
cin
g U
se
s
Pu
blic
Sa
fety
1866
,248
,872
1,78
5,33
00
068
,034
,202
66,1
97,7
2064
,937
,058
Pu
blic
Wo
rks
1926
,452
,985
00
026
,452
,985
24,4
27,5
6226
,385
,566
He
alth
an
d S
oci
al S
erv
ice
s20
00
00
00
0C
ultu
re a
nd
Re
cre
atio
n21
20,6
90,1
0758
9,98
00
021
,280
,087
19,6
15,5
5217
,977
,926
Co
mm
un
ity a
nd
Eco
no
mic
De
velo
pm
en
t22
4,17
4,79
013
,858
,699
5,93
5,96
80
23,9
69,4
5722
,310
,611
22,0
15,9
41G
en
era
l Go
vern
me
nt
2319
,456
,723
204,
535
00
19,6
61,2
5820
,433
,590
19,3
81,2
07D
eb
t S
erv
ice
24
00
024
,605
,103
024
,605
,103
20,8
52,4
1724
,362
,889
Ca
pita
l Pro
ject
s 25
00
012
9,47
5,86
00
129,
475,
860
110,
114,
787
75,7
20,8
43T
ota
l G
ove
rnm
en
t A
cti
viti
es
Ex
pe
nd
itu
res
2613
7,02
3,47
716
,438
,544
5,93
5,96
824
,605
,103
129,
475,
860
031
3,47
8,95
128
3,95
2,23
925
0,78
1,43
0B
usi
ne
ss T
ype
Pro
pri
etr
ay:
En
terp
rise
& I
SF
2732
3,69
4,46
332
3,69
4,46
328
3,10
0,75
627
0,71
2,06
3T
ota
l G
ov
& B
us
Typ
e E
xp
en
dit
ure
s28
137,
023,
477
16,4
38,5
445,
935,
968
24,6
05,1
0312
9,47
5,86
00
323,
694,
463
637,
173,
414
567,
052,
995
521,
493,
493
To
tal
Tra
ns
fers
Ou
t29
12,2
30,7
3775
,874
,975
6,75
3,43
61,
719,
614
1,12
5,76
80
8,27
4,08
910
5,97
8,61
910
7,95
9,62
910
3,07
2,81
8T
ota
l A
LL
Exp
en
dit
ure
s/F
un
d T
ran
sfe
rs O
ut
3014
9,25
4,21
492
,313
,519
12,6
89,4
0426
,324
,717
130,
601,
628
033
1,96
8,55
274
3,15
2,03
367
5,01
2,62
462
4,56
6,31
1E
xce
ss R
eve
nu
es
& O
the
r S
ou
rce
s O
ver
31(U
nd
er)
Exp
en
ditu
res/
Tra
nsf
ers
Ou
t32
0-7
42,7
431,
063,
746
-18,
197
-5,6
02,2
700
-39,
857,
303
-45,
156,
767
-18,
248,
578
11,1
40,5
72
Be
gin
nin
g F
un
d B
ala
nc
e J
uly
133
147,
333,
173
95,2
06,9
046,
535,
400
76,3
88,2
4118
0,92
5,15
00
712,
793,
393
1,21
9,18
2,26
11,
237,
430,
839
1,22
6,29
0,26
7E
nd
ing
Fu
nd
Ba
lan
ce
Ju
ne
30
3414
7,33
3,17
394
,464
,161
7,59
9,14
676
,370
,044
175,
322,
880
067
2,93
6,09
01,
174,
025,
494
1,21
9,18
2,26
11,
237,
430,
839
AD
OP
TE
D B
UD
GE
T S
UM
MA
RY
Y
EA
R E
ND
ED
JU
NE
30,
Ced
ar R
apid
s
75

Fo
rm 6
31
BC
ITY
OF
C
edar
Rap
ids
De
pa
rtm
en
t of
Ma
na
ge
me
nt
RE
VE
NU
ES
DE
TA
IL F
isca
l Yea
r E
nd
ing
2021
Fis
cal Y
ears
TIF
SP
EC
IAL
SP
EC
IAL
DE
BT
CA
PIT
AL
BU
DG
ET
RE
-ES
TIM
AT
ED
AC
TU
AL
GE
NE
RA
LR
EV
EN
UE
SR
EV
EN
UE
SS
ER
VIC
EP
RO
JEC
TS
PE
RM
AN
EN
TP
RO
PR
IET
AR
Y20
2120
2020
19(B
)(C
)(D
)(E
)(F
)(G
)(H
)(I
)(J
)(K
)(L
)
RE
VE
NU
ES
& O
TH
ER
FIN
AN
CIN
G S
OU
RC
ES
Tax
es L
evie
d on
Pro
pert
y1
61,7
15,8
0922
,802
,739
21,4
35,3
290
105,
953,
877
102,
781,
655
98,0
25,9
77
Le
ss:
Unc
olle
cted
Pro
pert
y T
axes
- L
evy
Yea
r2
00
0N
et C
urre
nt P
rope
rty
Tax
es
(line
1 m
inus
line
2)
361
,715
,809
22,8
02,7
3921
,435
,329
010
5,95
3,87
710
2,78
1,65
598
,025
,977
Del
inqu
ent
Pro
pert
y T
axes
40
038
6,35
9T
IF R
even
ues
513
,753
,150
13,7
53,1
5010
,998
,703
9,50
5,01
2O
ther
City
Tax
es:
U
tility
Tax
Rep
lace
men
t E
xcis
e T
axes
62,
754,
017
994,
732
900,
443
04,
649,
192
4,43
8,95
24,
579,
856
710
,317
,000
10,3
17,0
0010
,184
,380
8,99
2,16
6
Par
imut
uel w
ager
tax
80
00
G
amin
g w
ager
tax
90
00
M
obile
Hom
e T
axes
100
015
2,19
3
Hot
el/M
otel
Tax
es11
3,90
0,00
03,
900,
000
3,85
0,00
03,
822,
238
O
ther
Lo
cal
Op
tio
n T
axes
12
19,2
00,0
0019
,200
,000
18,9
00,0
0019
,231
,163
Sub
tota
l - O
ther
City
Tax
es (
lines
6 t
hru
12)
1316
,971
,017
20,1
94,7
3290
0,44
30
38,0
66,1
9237
,373
,332
36,7
77,6
16Li
cens
es &
Per
mits
142,
587,
462
30,0
0079
,800
2,69
7,26
22,
516,
479
3,29
0,38
5U
se o
f M
oney
& P
rope
rty
153,
146,
824
505,
174
3,11
023
,748
,844
27,4
03,9
5225
,899
,618
32,8
19,9
09In
terg
over
nmen
tal:
F
eder
al G
rant
s &
Rei
mbu
rsem
ents
1610
7,23
68,
385,
036
14,3
38,5
0018
,877
,124
41,7
07,8
9639
,381
,776
29,7
92,9
38
Roa
d U
se T
axes
1716
,300
,000
16,3
00,0
0016
,100
,000
16,3
34,1
72
Oth
er S
tate
Gra
nts
& R
eim
burs
emen
ts18
2,49
8,78
915
,920
,570
075
6,39
16,
595,
246
4,09
7,99
029
,868
,986
27,6
35,2
4919
,011
,735
L
ocal
Gra
nts
& R
eim
burs
emen
ts19
133,
500
63,6
442,
678,
000
573,
840
3,44
8,98
44,
921,
744
1,48
1,56
7
S
ubto
tal -
Int
ergo
vern
men
tal (
lines
16
thru
19)
202,
739,
525
40,6
69,2
500
756,
391
23,6
11,7
4623
,548
,954
91,3
25,8
6688
,038
,769
66,6
20,4
12C
harg
es f
or F
ees
& S
ervi
ce:
W
ater
Util
ity21
40,6
87,8
1740
,687
,817
39,0
95,5
5034
,778
,572
S
ewer
Util
ity22
49,7
68,1
1649
,768
,116
47,4
11,7
5844
,500
,879
E
lect
ric U
tility
230
00
G
as U
tility
240
00
P
arki
ng25
00
0
Airp
ort
265,
706,
340
5,70
6,34
05,
001,
880
5,32
9,74
2
Lan
dfill
/Gar
bage
2719
,879
,577
19,8
79,5
7720
,012
,277
20,4
27,6
60
Hos
pita
l28
00
0
Tra
nsit
2988
8,00
088
8,00
091
8,00
097
6,42
1
Cab
le T
V,
Int
erne
t &
Tel
epho
ne
300
01,
326,
685
H
ousi
ng A
utho
rity
310
00
S
torm
Wat
er U
tility
326,
439,
664
6,43
9,66
46,
133,
013
6,11
3,05
8
Oth
er F
ees
& C
harg
es f
or S
ervi
ce33
17,1
27,6
1231
4,00
068
,000
51,4
28,6
4868
,938
,260
65,2
67,6
7933
,831
,971
Sub
tota
l - C
harg
es f
or S
ervi
ce (
lines
21
thru
33)
3417
,127
,612
314,
000
068
,000
017
4,79
8,16
219
2,30
7,77
418
3,84
0,15
714
7,28
4,98
8S
peci
al A
sses
smen
ts35
100,
000
2,67
0,00
022
0,90
02,
990,
900
1,07
9,40
01,
353,
252
Mis
cella
neou
s3
66,
820,
382
509,
792
50,0
0032
,448
,117
39,8
28,2
9135
,921
,278
85,0
88,9
51O
ther
Fin
anci
ng S
ourc
es:
R
egul
ar O
pera
ting
Tra
nsfe
rs I
n37
37,8
70,5
835,
972,
165
318,
915
43,0
02,9
3912
,060
,581
99,2
25,1
8310
1,21
9,86
798
,884
,332
In
tern
al T
IF L
oan
T
rans
fers
In
3848
2,21
32,
892,
332
1,00
0,00
02,
378,
891
6,75
3,43
66,
739,
762
4,18
8,48
6
Su
bto
tal
AL
L O
per
atin
g T
ran
sfer
s In
3937
,870
,583
6,45
4,37
80
3,21
1,24
744
,002
,939
014
,439
,472
105,
978,
619
107,
959,
629
103,
072,
818
P
roce
eds
of D
ebt
(E
xclu
ding
TIF
Int
erna
l Bor
row
ing)
4054
,596
,673
22,7
42,0
0077
,338
,673
59,9
70,0
0050
,788
,308
P
roce
eds
of C
apita
l Ass
et S
ales
4117
5,00
090
,710
85,0
0035
0,71
038
5,02
669
2,89
6S
ub
tota
l-O
ther
Fin
anci
ng
So
urc
es (l
ine
s 3
8 t
hru
40
)42
38,0
45,5
836,
545,
088
03,
211,
247
98,5
99,6
120
37,2
66,4
7218
3,66
8,00
216
8,31
4,65
515
4,55
4,02
2T
ota
l R
even
ues
exc
ept
for
beg
inn
ing
fu
nd
bal
ance
(l
ines
3,
4, 5
, 13
, 14
, 15
, 20
, 34
, 35
, 36
, &
41)
4314
9,25
4,21
491
,570
,775
13,7
53,1
5026
,306
,520
124,
999,
358
029
2,11
1,24
969
7,99
5,26
665
6,76
4,04
663
5,70
6,88
3B
egin
ning
Fun
d B
alan
ce J
uly
144
147,
333,
173
95,2
06,9
046,
535,
400
76,3
88,2
4118
0,92
5,15
00
712,
793,
393
1,21
9,18
2,26
11,
237,
430,
839
1,22
6,29
0,26
7T
OT
AL
RE
VE
NU
ES
& B
EG
IN B
AL
AN
CE
(lin
es
42
+4
3)
4529
6,58
7,38
718
6,77
7,67
920
,288
,550
102,
694,
761
305,
924,
508
01,
004,
904,
642
1,91
7,17
7,52
71,
894,
194,
885
1,86
1,99
7,15
0
Th
e la
st t
wo
co
lum
ns
wil
l fi
ll i
n o
nce
th
e R
e-E
st f
orm
s ar
e co
mp
lete
d
(A)
U
tility
fra
nchi
se t
ax
(Io
wa
Co
de
Ch
apte
r 36
4.2)
76

F
orm
631
A P
1 C
ITY
OF
C
edar
Rap
ids
Dep
artm
ent o
f M
anag
emen
t
E
XP
EN
DIT
UR
ES
SC
HE
DU
LE
PA
GE
1
F
isca
l Yea
r E
nd
ing
2021
F
isca
l Yea
rsT
IFS
PE
CIA
LS
PE
CIA
LD
EB
TC
AP
ITA
LB
UD
GE
TR
E-E
ST
IMA
TE
DA
CT
UA
LG
EN
ER
AL
RE
VE
NU
ES
RE
VE
NU
ES
SE
RV
ICE
PR
OJE
CT
SP
ER
MA
NE
NT
PR
OP
RIE
TA
RY
20
21
20
20
20
19
(A)
(B)
(C)
(D)
(E)
(F)
(G)
(H)
(I)
(J)
(K)
(L)
PU
BL
IC S
AF
ET
Y P
olic
e D
ep
art
me
nt/
Crim
e P
reve
ntio
n1
40
,81
2,6
10
1,2
26
,58
34
2,0
39
,19
33
9,7
90
,62
53
7,8
23
,84
0 J
ail
20
00
Em
erg
en
cy M
an
ag
em
en
t3
00
0 F
lood
Con
tro
l4
00
00
0 F
ire D
ep
art
me
nt
52
0,4
00
,67
84
97
,46
62
0,8
98
,14
42
0,3
34
,12
82
2,2
47
,87
9 A
mb
ula
nce
60
00
00
Bu
ildin
g I
nsp
ect
ion
s7
3,5
64
,47
50
3,5
64
,47
53
,28
5,8
26
3,5
41
,45
0 M
isce
llan
eo
us
Pro
tect
ive
Se
rvic
es
80
00
An
ima
l Co
ntr
ol
91
,31
8,2
79
40
,00
01
,35
8,2
79
2,5
65
,12
61
,23
6,1
42
Oth
er
Pu
blic
Sa
fety
10
15
2,8
30
21
,28
11
74
,11
12
22
,01
58
7,7
47
TO
TA
L (li
ne
s 1
- 1
0)
11
66
,24
8,8
72
1,7
85
,33
00
68
,03
4,2
02
66
,19
7,7
20
64
,93
7,0
58
PU
BL
IC W
OR
KS
Ro
ad
s, B
ridg
es,
& S
ide
wa
lks
12
20
,51
0,0
32
20
,51
0,0
32
19
,56
9,9
34
16
,79
3,6
16
Pa
rkin
g -
Me
ter
an
d O
ff-S
tre
et
13
00
0 S
tre
et
Lig
htin
g1
42
,22
5,0
00
2,2
25
,00
02
,15
6,0
00
2,0
60
,75
9 T
raff
ic C
on
tro
l an
d S
afe
ty1
53
44
,16
23
44
,16
22
72
,63
92
,57
8,6
77
Sn
ow
Re
mo
val
16
81
4,3
46
81
4,3
46
81
4,3
46
1,5
73
,21
0 H
igh
wa
y E
ng
ine
erin
g1
70
00
Str
ee
t C
lea
nin
g1
82
,19
8,3
04
2,1
98
,30
41
,49
5,3
43
3,1
30
,31
5 A
irpor
t
(
if n
ot
En
terp
ris
e)
19
00
0 G
arb
ag
e
(i
f n
ot
En
terp
ris
e)
20
00
0 O
the
r P
ub
lic W
ork
s2
13
61
,14
13
61
,14
11
19
,30
02
48
,98
9
T
OT
AL
(lin
es
12
- 2
1)
22
26
,45
2,9
85
00
26
,45
2,9
85
24
,42
7,5
62
26
,38
5,5
66
HE
AL
TH
& S
OC
IAL
SE
RV
ICE
S W
elfa
re A
ssis
tanc
e2
30
00
City
Hos
pita
l24
00
0 P
aym
en
ts t
o P
riva
te H
osp
itals
25
00
0 H
ea
lth R
eg
ula
tion
an
d I
nsp
ect
ion
26
00
0 W
ate
r, A
ir, a
nd
Mo
squ
ito C
on
tro
l2
70
00
Co
mm
un
ity M
en
tal H
ea
lth2
80
00
Oth
er
He
alth
an
d S
oci
al S
erv
ice
s2
90
00
TO
TA
L (li
ne
s 2
3 -
29
)3
00
00
00
0
CU
LT
UR
E &
RE
CR
EA
TIO
N L
ibra
ry S
erv
ice
s3
17
,02
6,2
11
53
2,8
48
7,5
59
,05
97
,10
2,4
50
6,4
91
,98
7 M
use
um
, B
an
d a
nd
Th
ea
ter
32
11
9,9
82
01
19
,98
21
18
,60
81
08
,01
0 P
ark
s 3
38
26
,77
54
6,5
90
87
3,3
65
1,6
28
,74
44
,51
7,0
84
Re
cre
atio
n
34
10
,92
2,1
75
10
,54
21
0,9
32
,71
79
,45
7,8
52
5,9
17
,25
2 C
emet
ery
350
00
Co
mm
un
ity C
en
ter,
Zo
o,
& M
arin
a3
60
00
Oth
er
Cu
lture
an
d R
ecr
ea
tion
37
1,7
94
,96
40
1,7
94
,96
41
,30
7,8
98
94
3,5
93
TO
TA
L (
line
s 3
1 -
37
)3
82
0,6
90
,10
75
89
,98
00
21
,28
0,0
87
19
,61
5,5
52
17
,97
7,9
26
GO
VE
RN
ME
NT
AC
TIV
ITIE
S
77

F
orm
63
1 A
P2
CIT
Y O
F
Ce
da
r R
ap
ids
De
pa
rtm
en
t of
Ma
na
ge
me
nt
E
XP
EN
DIT
UR
ES
SC
HE
DU
LE
PA
GE
2F
isca
l Yea
r E
nd
ing
2021
F
isca
l Yea
rsT
IFS
PE
CIA
LS
PE
CIA
LD
EB
TC
AP
ITA
LB
UD
GE
TR
E-E
ST
IMA
TE
DA
CT
UA
LG
EN
ER
AL
RE
VE
NU
ES
RE
VE
NU
ES
SE
RV
ICE
PR
OJE
CT
SP
ER
MA
NE
NT
PR
OP
RIE
TA
RY
2021
2020
2019
(A)
(B)
(C)
(D)
(E)
(F)
(G)
(H)
(I)
(J)
(K)
(L)
CO
MM
UN
ITY
& E
CO
NO
MIC
DE
VE
LO
PM
EN
T C
omm
unity
Bea
utifi
catio
n39
421,
631
00
421,
631
597,
083
1,54
7,14
4 E
cono
mic
Dev
elop
men
t40
3,09
0,45
42,
109,
189
1,52
7,44
66,
727,
089
5,33
3,26
59,
042,
338
Hou
sing
and
Urb
an R
enew
al41
100,
000
7,52
1,17
30
7,62
1,17
37,
633,
724
6,70
4,99
8 P
lann
ing
& Z
onin
g42
00
00
389,
465
0 O
ther
Com
& E
con
Dev
elop
men
t43
562,
705
4,22
8,33
70
4,79
1,04
25,
164,
268
4,72
1,46
1 T
IF R
ebat
es44
4,40
8,52
24,
408,
522
3,19
2,80
60
T
OT
AL
(lin
es 3
9 -
44)
454,
174,
790
13,8
58,6
995,
935,
968
023
,969
,457
22,3
10,6
1122
,015
,941
GE
NE
RA
L G
OV
ER
NM
EN
T M
ayor
, Cou
ncil,
& C
ity M
anag
er46
3,04
5,71
00
3,04
5,71
02,
896,
272
3,06
1,49
5 C
lerk
, Tre
asur
er, &
Fin
ance
Adm
.47
6,06
5,26
90
6,06
5,26
95,
848,
383
5,77
0,45
6 E
lect
ions
480
00
00
Leg
al S
ervi
ces
& C
ity A
ttorn
ey49
899,
465
089
9,46
585
5,70
890
7,48
9 C
ity H
all &
Gen
eral
Bui
ldin
gs50
1,32
2,38
70
1,32
2,38
71,
268,
255
1,13
5,16
6 T
ort L
iabi
lity
511,
457,
336
7,44
71,
464,
783
1,31
3,11
01,
393,
471
Oth
er G
ener
al G
over
nmen
t52
6,66
6,55
719
7,08
86,
863,
645
8,25
1,86
27,
113,
130
T
OT
AL
(lin
es 4
6 -
52)
5319
,456
,723
204,
535
00
19,6
61,2
5820
,433
,590
19,3
81,2
07
DE
BT
SE
RV
ICE
5424
,605
,103
24,6
05,1
0320
,852
,417
24,3
62,8
89
Gov
Cap
ital P
roje
cts
5512
3,61
4,68
712
3,61
4,68
710
5,17
4,78
772
,584
,604
TIF
Cap
ital P
roje
cts
565,
861,
173
5,86
1,17
34,
940,
000
3,13
6,23
9T
OT
AL
CA
PIT
AL
PR
OJE
CT
S57
00
012
9,47
5,86
00
129,
475,
860
110,
114,
787
75,7
20,8
43
TO
TA
L G
ove
rnm
ent
Act
ivit
ies
Ex
pe
nd
itu
res
(line
s 11
+22
+30
+38
+45
+53
+54
+57
)58
137,
023,
477
16,4
38,5
445,
935,
968
24,6
05,1
0312
9,47
5,86
00
313,
478,
951
283,
952,
239
250,
781,
430
BU
SIN
ES
S T
YP
E A
CT
IVIT
IES
P
rop
riet
ary:
En
terp
ris
e &
Bu
dg
ete
d IS
F W
ater
Util
ity59
25,6
15,1
2225
,615
,122
24,5
23,3
1522
,607
,118
Sew
er U
tility
6030
,626
,068
30,6
26,0
6830
,106
,088
25,8
61,6
33 E
lect
ric U
tility
610
00
Gas
Util
ity62
00
0 A
irpor
t63
10,4
76,9
8410
,476
,984
10,2
40,6
1111
,020
,256
Lan
dfill
/Gar
bage
6433
,259
,830
33,2
59,8
3026
,563
,714
20,4
38,0
95 T
rans
it65
10,7
37,1
8610
,737
,186
9,44
5,73
99,
034,
163
Cab
le T
V, I
nter
net &
Tel
epho
ne66
00
0 H
ousi
ng A
utho
rity
670
00
Sto
rm W
ater
Util
ity68
1,64
6,22
81,
646,
228
1,21
8,79
51,
237,
832
Oth
er B
usin
ess
Typ
e (c
ity h
osp.
, IS
F, p
arki
ng, e
tc.)
6986
,005
,128
86,0
05,1
2880
,495
,170
77,5
84,1
99 E
nter
pris
e D
EB
T S
ER
VIC
E70
28,4
82,1
2928
,482
,129
30,0
58,5
2437
,696
,272
Ent
erpr
ise
CA
PIT
AL
PR
OJE
CT
S71
96,8
45,7
8896
,845
,788
70,4
48,8
0065
,232
,495
Ent
erpr
ise
TIF
C
AP
ITA
L P
RO
JEC
TS
720
00
TO
TA
L B
usi
nes
s T
ype
Exp
end
itu
res
(lin
es 5
9 -
73)
7332
3,69
4,46
332
3,69
4,46
328
3,10
0,75
627
0,71
2,06
3
TO
TA
L
AL
L
EX
PE
ND
ITU
RE
S
(line
s 58
+74
)74
137,
023,
477
16,4
38,5
445,
935,
968
24,6
05,1
0312
9,47
5,86
00
323,
694,
463
637,
173,
414
567,
052,
995
521,
493,
493
Reg
ular
Tra
nsfe
rs O
ut75
12,2
30,7
3775
,874
,975
1,71
9,61
41,
125,
768
8,27
4,08
999
,225
,183
101,
219,
867
98,8
84,3
32
I
nter
nal T
IF L
oan
/ Rep
aym
ent
Tra
nsfe
rs O
ut76
6,75
3,43
66,
753,
436
6,73
9,76
24,
188,
486
T
ota
l AL
L T
ran
sfer
s O
ut
7712
,230
,737
75,8
74,9
756,
753,
436
1,71
9,61
41,
125,
768
08,
274,
089
105,
978,
619
107,
959,
629
103,
072,
818
To
tal E
xpen
dit
ure
s &
Fu
nd
Tra
nsf
ers
Ou
t (li
nes
75+
78)
7814
9,25
4,21
492
,313
,519
12,6
89,4
0426
,324
,717
130,
601,
628
033
1,96
8,55
274
3,15
2,03
367
5,01
2,62
462
4,56
6,31
1
En
din
g F
un
d B
alan
ce J
un
e 30
7914
7,33
3,17
394
,464
,161
7,59
9,14
676
,370
,044
175,
322,
880
067
2,93
6,09
01,
174,
025,
494
1,21
9,18
2,26
11,
237,
430,
839
* A
con
tinui
ng a
ppro
pria
tion
is th
e un
expe
nded
bud
gete
d am
ount
from
a p
rior
year
's c
apita
l pro
ject
. The
ent
ry is
mad
e on
the
Con
App
rops
pag
e th
at m
ust a
ccom
pany
the
budg
et fo
rms
if us
ed. S
EE
INS
TR
UC
TIO
NS
FO
R U
SE
.
GO
VE
RN
ME
NT
AC
TIV
ITIE
S
CO
NT
.
78

For
m 7
03
Dep
artm
ent o
f M
anag
emen
t
LO
NG
TE
RM
DE
BT
SC
HE
DU
LE
GE
NE
RA
L O
BL
IGA
TIO
N B
ON
DS
, TIF
BO
ND
S, R
EV
EN
UE
BO
ND
S, L
OA
NS
, LE
AS
E-P
UR
CH
AS
E P
AY
ME
NT
S
PA
GE
1Fi
scal
Year
Cit
y N
am
e:
Ced
ar R
apid
s20
21
GO -
TOTA
L27
,485,0
009,9
14,22
737
,399,2
270
015
,063,4
5522
,335,7
72
NON-
GO T
OTAL
10,06
6,000
5,458
,215
15,52
4,215
00
15,52
4,215
0
GRAN
D TO
TAL
37,55
1,000
15,37
2,442
52,92
3,442
00
30,58
7,670
22,33
5,772
To
tal
Bo
nd
Re
g./
Red
uct
ion
s d
ue
Pa
id f
rom
Am
ou
nt
Typ
e o
fD
eb
tP
rin
cip
alIn
tere
stO
blig
atio
nP
ayin
g A
gen
tto
Re
fin
anci
ng
Fu
nd
s O
TH
ER
TH
AN
Am
ou
nt
Pa
idD
ebt
Nam
eo
fD
eb
tR
es
olu
tio
nD
ue
FY
Du
e F
YD
ue
FY
Fe
es
Du
e F
Yo
r P
rep
aym
en
tC
urr
ent
Yea
rC
urr
ent
Yea
r Is
su
eO
blig
ati
on
Nu
mb
er
20
21
20
21
20
21
20
21
of
Ce
rtif
ied
De
bt
De
bt
Se
rvic
e T
ax
es
De
bt
Se
rvic
e L
evy
(A)
(B)
(C)
(D)
(E)
(F)
=(G
) +
(H)
-(I)
-(J
)=
(K)
(1)
4,170
,000
GO11
29-0
8-06
155,0
008,0
8016
3,080
163,0
800
(2)
3,040
,000
GO06
26-0
6-10
330,0
0013
,200
343,2
0034
3,200
0
(3)
25,83
0,000
GO05
85-0
5-11
1,415
,000
649,4
642,0
64,46
416
9,761
1,894
,703
(4)
32,41
5,000
GO05
89-0
5-11
1,700
,000
143,4
001,8
43,40
01,3
52,30
049
1,100
(5)
11,14
0,000
GO07
27-0
5-12
595,0
0018
7,956
782,9
5625
,676
757,2
80
(6)
11,38
0,000
GO07
28-0
5-12
605,0
0028
6,895
891,8
9589
1,895
0
(7)
57,91
5,000
GO07
29-0
5-12
2,690
,000
1,471
,296
4,161
,296
3,896
,043
265,2
53
(8)
2,915
,000
GO07
30-0
5-12
130,0
0067
,456
197,4
560
197,4
56
(9)
5,830
,000
NON
- GO
0731
-05-
1227
0,000
121,7
6339
1,763
391,7
630
(10)
Gene
ral O
bliga
tion B
onds
Ser
ies 20
12F
14,24
0,000
GO07
32-0
5-12
1,195
,000
120,0
001,3
15,00
086
4,040
450,9
60
(11)
7,755
,000
GO08
19-0
5-13
345,0
0018
0,238
525,2
3817
,225
508,0
13
(12)
1,905
,000
GO08
20-0
5-13
195,0
0023
,035
218,0
3521
8,035
0
(13)
25,85
5,000
GO08
21-0
5-13
1,135
,000
707,7
941,8
42,79
41,7
85,35
357
,441
(14)
5,200
,000
NON
- GO
0822
-05-
1323
5,000
118,6
1335
3,613
353,6
130
(15)
7,265
,000
NON
- GO
0823
-05-
1332
5,000
166,1
0649
1,106
491,1
060
(16)
4,280
,000
GO06
52-0
5-14
230,0
0011
7,294
347,2
9411
,389
335,9
05
(17)
10,47
5,000
GO06
53-0
5-14
655,0
0026
6,719
921,7
1956
1,235
360,4
84
(18)
11,57
0,000
NON
- GO
0629
-05-
1448
0,000
270,4
9475
0,494
750,4
940
(19)
4,570
,000
NON
- GO
0630
-05-
1419
0,000
108,3
3829
8,338
298,3
380
(20)
26,27
0,000
GO07
28-0
5-15
2,155
,000
609,3
382,7
64,33
81,3
43,45
11,4
20,88
7
(21)
11,18
0,000
GO07
29-0
5-15
445,0
0029
7,495
742,4
9524
,349
718,1
46
(22)
7,025
,000
NON
- GO
0730
-05-
1529
5,000
193,7
5648
8,756
488,7
560
(23)
9,945
,000
NON
- GO
0731
-05-
1545
5,000
285,7
6974
0,769
740,7
690
(24)
35,56
5,000
GO06
41-0
5-16
2,660
,000
662,5
873,3
22,58
71,6
29,81
91,6
92,76
8
(25)
5,015
,000
NON
- GO
0643
-05-
1622
0,000
105,4
5032
5,450
325,4
500
(26)
13,83
5,000
NON
- GO
0644
-05-
1655
5,000
390,0
6294
5,062
945,0
620
(27)
32,87
0,000
GO06
27-0
5-17
2,035
,000
1,030
,550
3,065
,550
612,2
802,4
53,27
0
(28)
11,80
5,000
NON
- GO
0629
-05-
1761
0,000
396,9
591,0
06,95
91,0
06,95
90
(29)
11,35
0,000
NON
- GO
0630
-05-
1760
5,000
394,8
3199
9,831
999,8
310
(30)
28,34
0,000
GO05
99-0
5-18
1,235
,000
925,1
062,1
60,10
611
8,618
2,041
,488
SUB-
TOTA
L24
,145,0
0010
,320,0
4434
,465,0
440
020
,819,8
9013
,645,1
54
Gene
ral O
bliga
tion B
onds
Ser
ies 20
14A
Gene
ral O
bliga
tion B
onds
Ser
ies 20
14B
Sewe
r Rev
enue
Bon
ds S
eries
2014
C
Gene
ral O
bliga
tion B
onds
Ser
ies 20
12C
Gene
ral O
bliga
tion B
onds
Ser
ies 20
12D
Wate
r Rev
enue
Bon
ds S
eries
2012
E
Gene
ral O
bliga
tion B
onds
Ser
ies 20
13A
Gene
ral O
bliga
tion B
onds
Ser
ies 20
13B
Gene
ral O
bliga
tion B
onds
Ser
ies 20
06B
Gene
ral O
bliga
tion B
onds
Ser
ies 20
10B
Gene
ral O
bliga
tion B
onds
Ser
ies 20
11A
Gene
ral O
bliga
tion C
apita
l Loa
n Note
s Ser
ies 20
11E
Gene
ral O
bliga
tion B
onds
Ser
ies 20
12A
Gene
ral O
bliga
tion B
onds
Ser
ies 20
12B
Gene
ral O
bliga
tion B
onds
Ser
ies 20
13C
Sewe
r Rev
enue
Bon
ds S
eries
2013
D
Wate
r Rev
enue
Bon
ds S
eries
2013
E
Sewe
r Rev
enue
Bon
ds S
eries
2016
C
Wate
r Rev
enue
Bon
ds S
eries
2016
D
Gene
ral O
bliga
tion B
onds
Ser
ies 20
17A
Sewe
r Rev
enue
Bon
ds 20
17C
Wate
r Rev
enue
Bon
ds 20
17D
Gene
ral O
bliga
tion B
onds
2018
A
Wate
r Rev
enue
Bon
ds S
eries
2014
D
Gene
ral O
bliga
tion B
onds
Ser
ies 20
15A
Gene
ral O
bliga
tion B
onds
Ser
ies 20
15B
Sewe
r Rev
enue
Bon
ds S
eries
2015
C
Wate
r Rev
enue
Bon
ds S
eries
2015
D
Gene
ral O
bliga
tion B
onds
Ser
ies 20
16A
79

For
m 7
03
Dep
artm
ent o
f M
anag
emen
t
LO
NG
TE
RM
DE
BT
SC
HE
DU
LE
GE
NE
RA
L O
BL
IGA
TIO
N B
ON
DS
, TIF
BO
ND
S, R
EV
EN
UE
BO
ND
S, L
OA
NS
, LE
AS
E-P
UR
CH
AS
E P
AY
ME
NT
S
PA
GE
2Fi
scal
Year
C
ity
Na
me
:C
edar
Rap
ids
20
21
To
tal
Bo
nd
Re
g./
Red
uct
ion
s d
ue
Pa
id f
rom
Am
ou
nt
Typ
e o
fD
eb
tP
rin
cip
alIn
tere
stO
blig
atio
nP
ayin
g A
gen
tto
Re
fin
anci
ng
Fu
nd
s O
TH
ER
TH
AN
Am
ou
nt
Pa
idD
ebt
Nam
eo
fD
eb
tR
es
olu
tio
nD
ue
FY
Du
e F
YD
ue
FY
Fe
es
Du
e F
Yo
r P
rep
aym
en
tC
urr
ent
Yea
rC
urr
ent
Yea
r Is
su
eO
blig
ati
on
Nu
mb
er
20
21
20
21
20
21
20
21
of
Ce
rtif
ied
De
bt
De
bt
Se
rvic
e T
ax
es
De
bt
Se
rvic
e L
evy
(A)
(B)
(C)
(D)
(E)
(F)
=(I
) =
(I)
=(I
)=
-(J
)=
(K)
(31)
8,730
,000
GO06
00-0
5-18
405,0
0026
1,112
666,1
1266
6,112
0
(32)
18,07
5,000
NON
- GO
0601
-05-
1897
0,000
630,6
621,6
00,66
21,6
00,66
20
(33)
14,59
5,000
NON
- GO
0602
-05-
1862
5,000
531,2
691,1
56,26
91,1
56,26
90
(34)
20,48
5,000
GO05
64-0
5-19
595,0
0061
9,344
1,214
,344
78,43
31,1
35,91
1
(35)
6,520
,000
GO05
65-0
5-19
330,0
0011
6,935
446,9
3525
6,458
190,4
77
(36)
12,11
0,000
NON
- GO
0566
-05-
1944
5,000
451,8
0089
6,800
896,8
000
(37)
8,635
,000
NON
- GO
0567
-05-
1950
0,000
324,2
5082
4,250
824,2
500
(38)
49,08
0,000
GO01
73-0
2-20
5,715
,000
1,135
,358
6,850
,358
06,8
50,35
8
(39)
535,0
00GO
0173
-02-
2053
5,000
13,57
554
8,575
34,70
351
3,872
(40)
5,955
,000
NON
- GO
TBA
195,0
0020
7,456
402,4
5640
2,456
0
(41)
5,225
,000
NON
- GO
TBA
165,0
0018
2,082
347,0
8234
7,082
0
(42)
39,39
0,000
NON
- GO
N/A
2,029
,000
360,7
632,3
89,76
32,3
89,76
30
(43)
10,90
0,000
NON
- GO
N/A
538,0
0096
,583
634,5
8363
4,583
0
(44)
5,576
,427
NON
- GO
N/A
262,0
0091
,984
353,9
8435
3,984
0
(45)
2,130
,000
NON
- GO
N/A
97,00
029
,225
126,2
2512
6,225
0
(46)
NO S
ELEC
TION
00
(47)
NO S
ELEC
TION
00
(48)
NO S
ELEC
TION
00
(49)
NO S
ELEC
TION
00
(50)
NO S
ELEC
TION
00
(51)
NO S
ELEC
TION
00
(52)
NO S
ELEC
TION
00
(53)
NO S
ELEC
TION
00
(54)
NO S
ELEC
TION
00
(55)
NO S
ELEC
TION
00
(56)
NO S
ELEC
TION
00
(57)
NO S
ELEC
TION
00
(58)
NO S
ELEC
TION
00
(59)
NO S
ELEC
TION
00
(60)
NO S
ELEC
TION
00
TOTA
LS37
,551,0
0015
,372,4
4252
,923,4
420
030
,587,6
7022
,335,7
72
Sewe
r Rev
enue
Bon
ds 20
19C
Wate
r Rev
enue
Bon
ds 20
19D
Gene
ral O
bliga
tion B
onds
2020
A
Gene
ral O
bliga
tion B
onds
2020
B
Sewe
r Rev
enue
Bon
ds 20
20C
Wate
r Rev
enue
Bon
ds 20
20D
Gene
ral O
bliga
tion B
onds
2018
B
Sewe
r Rev
enue
Bon
ds 20
18C
Wate
r Rev
enue
Bon
ds 20
18D
Gene
ral O
bliga
tion B
onds
2019
A
Gene
ral O
bliga
tion B
onds
2019
B
Wate
r SRF
Loan
Ser
ies 20
08
WPC
SRF
Loan
Ser
ies 20
08
WPC
SRF
Loan
Ser
ies 20
11 -
Amen
ded 2
015
WPC
SRF
Loan
Ser
ies 20
15
80

Form 631.1 Department of Management
NOTICE OF PUBLIC HEARINGBUDGET ESTIMATE
FISCAL YEAR BEGINNING JULY 1, 2020 - ENDING JUNE 30, 2021
City of , Iowa
The City Council will conduct a public hearing on the proposed Budget at
on 4/28/2020 at 4:00 PM(Date) xx/xx/xx (hour)
The Budget Estimate Summary of proposed receipts and expenditures is shown below.Copies of the the detailed proposed Budget may be obtained or viewed at the offices of the Mayor,City Clerk, and at the Library.
The estimated Total tax levy rate per $1000 valuation on regular property . . . . . . . . . . $ 15.65620
The estimated tax levy rate per $1000 valuation on Agricultural land is . . . . . . . . . . . $ 2.99996
At the public hearing, any resident or taxpayer may present objections to, or arguments in favor of, any part of the proposed budget. The city budget is subject to protest. More information on protest can be found at https://dom.iowa.gov/local-gov-appeals.
319-286-5060phone number City Clerk/Finance Officer's NAME
Budget FY Re-estimated FY Actual FY2021 2020 2019
(a) (b) (c)Revenues & Other Financing SourcesTaxes Levied on Property 1 105,953,877 102,781,655 98,025,977Less: Uncollected Property Taxes-Levy Year 2 0 0 0 Net Current Property Taxes 3 105,953,877 102,781,655 98,025,977Delinquent Property Taxes 4 0 0 386,359TIF Revenues 5 13,753,150 10,998,703 9,505,012Other City Taxes 6 38,066,192 37,373,332 36,777,616Licenses & Permits 7 2,697,262 2,516,479 3,290,385Use of Money and Property 8 27,403,952 25,899,618 32,819,909Intergovernmental 9 91,325,866 88,038,769 66,620,412Charges for Fees & Service 10 192,307,774 183,840,157 147,284,988Special Assessments 11 2,990,900 1,079,400 1,353,252Miscellaneous 12 39,828,291 35,921,278 85,088,951Other Financing Sources 13 77,689,383 60,355,026 51,481,204Transfers In 14 105,978,619 107,959,629 103,072,818Total Revenues and Other Sources 15 697,995,266 656,764,046 635,706,883
Expenditures & Other Financing UsesPublic Safety 16 68,034,202 66,197,720 64,937,058Public Works 17 26,452,985 24,427,562 26,385,566Health and Social Services 18 0 0 0Culture and Recreation 19 21,280,087 19,615,552 17,977,926Community and Economic Development 20 23,969,457 22,310,611 22,015,941General Government 21 19,661,258 20,433,590 19,381,207Debt Service 22 24,605,103 20,852,417 24,362,889Capital Projects 23 129,475,860 110,114,787 75,720,843Total Government Activities Expenditures 24 313,478,951 283,952,239 250,781,430Business Type / Enterprises 25 323,694,463 283,100,756 270,712,063Total ALL Expenditures 26 637,173,414 567,052,995 521,493,493 Transfers Out 27 105,978,619 107,959,629 103,072,818Total ALL Expenditures/Transfers Out 28 743,152,033 675,012,624 624,566,311Excess Revenues & Other Sources Over
(Under) Expenditures/Transfers Out 29 -45,156,767 -18,248,578 11,140,572Beginning Fund Balance July 1 30 1,219,182,261 1,237,430,839 1,226,290,267Ending Fund Balance June 30 31 1,174,025,494 1,219,182,261 1,237,430,839
Cedar Rapids
3rd Floor City Hall 101 1st St SE
Amy Stevenson
81

For
m F
BW
D
epar
tmen
t of M
anag
emen
t
F
un
d B
alan
ce W
ork
shee
t fo
r C
ity
of
Ced
ar R
apid
s
TIF
To
tal
Gra
nd
Gen
eral
Sp
ecia
l Re v
Sp
ecia
l Rev
Deb
t S
erv
Cap
t P
roj
Per
man
ent
Go
vern
men
tP
rop
riet
ary
To
tal
(1)
( A
)(
B )
( C
)(
D )
( E
)(
G )
( H
)(
I )(
J )
*A
nn
ual
Rep
ort
FY
2019
Beg
inni
ng F
und
Bal
ance
Jul
y 1
(
pg
5, l
ine
134)
*1
147,
145,
541
95,7
07,8
415,
585,
760
75,4
99,4
2917
6,92
0,45
30
500,
859,
024
725,
431,
243
1,22
6,29
0,26
7 A
ctua
l Rev
enue
s E
xcep
t Beg
Bal
(p
g 5
, lin
e 13
2) *
214
2,12
8,94
885
,171
,541
9,52
2,68
628
,546
,999
89,8
21,9
860
355,
192,
160
280,
514,
723
635,
706,
883
Act
ual E
xpen
ditu
res
Exc
ept E
nd B
al
(p
g 9
, lin
e 13
6) *
313
8,31
1,17
688
,883
,683
8,80
6,68
027
,658
,187
82,0
92,2
640
345,
751,
990
278,
814,
321
624,
566,
311
End
ing
Fun
d B
alan
ce J
une
30
(p
g 9
, lin
e 14
7) *
415
0,96
3,31
391
,995
,699
6,30
1,76
676
,388
,241
184,
650,
175
051
0,29
9,19
472
7,13
1,64
51,
237,
430,
839
(2)
Gen
eral
Sp
ec R
evT
IF
S
pec
ial
Rev
Deb
t S
erv
Cap
t P
roj
Per
man
ent
To
t G
ovt
Pro
pri
etar
yG
ran
d T
ota
l *
* R
e-E
stim
ated
FY
2020
Beg
inni
ng F
und
Bal
ance
515
0,96
3,31
391
,995
,699
6,30
1,76
676
,388
,241
184,
650,
175
051
0,29
9,19
472
7,13
1,64
51,
237,
430,
839
Re-
Est
Rev
enue
s
6
141,
131,
091
95,4
59,6
7110
,998
,703
25,1
04,2
0510
6,89
2,29
00
379,
585,
960
277,
178,
086
656,
764,
046
Re-
Est
Exp
endi
ture
s
7
144,
761,
231
92,2
48,4
6610
,765
,069
25,1
04,2
0511
0,61
7,31
50
383,
496,
286
291,
516,
338
675,
012,
624
End
ing
Fun
d B
alan
ce8
147,
333,
173
95,2
06,9
046,
535,
400
76,3
88,2
4118
0,92
5,15
00
506,
388,
868
712,
793,
393
1,21
9,18
2,26
1
(3)
Gen
eral
Sp
ec R
evT
IF
S
pec
ial
Rev
Deb
t S
erv
Cap
t P
roj
Per
man
ent
To
t G
ovt
Pro
pri
etar
yG
ran
d T
ota
l *
*
B
ud
get
F
Y20
21 B
egin
ning
Fun
d B
alan
ce9
147,
333,
173
95,2
06,9
046,
535,
400
76,3
88,2
4118
0,92
5,15
00
506,
388,
868
712,
793,
393
1,21
9,18
2,26
1 R
even
ues
1014
9,25
4,21
491
,570
,775
13,7
53,1
5026
,306
,520
124,
999,
358
040
5,88
4,01
729
2,11
1,24
969
7,99
5,26
6 E
xpen
ditu
res
11
149,
254,
214
92,3
13,5
1912
,689
,404
26,3
24,7
1713
0,60
1,62
80
411,
183,
481
331,
968,
552
743,
152,
033
End
ing
Fun
d B
alan
ce12
147,
333,
173
94,4
64,1
617,
599,
146
76,3
70,0
4417
5,32
2,88
00
501,
089,
404
672,
936,
090
1,17
4,02
5,49
4
*
T
he
fig
ure
s in
sec
tio
n (
1) a
re t
aken
fro
m F
OR
M F
-66(
IA-2
)
ST
AT
E O
F I
OW
A F
INA
NC
IAL
RE
PO
RT
FO
R F
ISC
AL
YE
AR
EN
DE
D J
UN
E 3
0,
2019
**
T
he
rem
ain
ing
tw
o s
ecti
on
s ar
e fi
lled
in b
y th
e so
ftw
are
on
ce A
LL
wo
rksh
eets
are
co
mp
lete
d.
82

Business Units A business unit is an organizational entity that maintains its own transaction data. The City of Cedar Rapids recognizes two business units, the City of Cedar Rapids and the Cedar Rapids/Linn County Solid Waste Agency.
83

Highlights The combined financial information for all City of Cedar Rapids funds and business units is shown below. In FY 2021, expenditures exceed revenues mainly due to the timing of revenue compared to expenses for capital improvement projects. In many instances, revenues will be received in FY 2020, but due to the timing of projects, expenses will occur in FY 2021. All Funds Combined FY
FY 2020 FY $ Change % Change2019 Adopted 2021 From FY From FY
Actual Budget Budget 2020 2020RevenuesTaxes 146,021,650$ 151,153,690$ 157,804,591$ 6,650,901$ Licenses & Permits 3,290,385$ 2,516,479$ 2,697,262$ 180,783$ Intergovernmental Grants 67,034,562$ 88,038,770$ 91,328,656$ 3,289,886$ Charges for Services 191,552,777$ 183,840,156$ 192,307,774$ 8,467,618$ Fines & Forfeits 568,878$ 5,620,000$ 4,920,000$ (700,000)$ Proceeds of Long Term Liabilities 50,788,308$ 59,970,000$ 77,338,673$ 17,368,673$ Transfers In 180,372,085$ 157,548,695$ 177,031,792$ 19,483,097$ Other Revenue 73,794,871$ 57,665,322$ 65,653,853$ 7,988,530$ Total Revenues 713,423,517$ 706,353,112$ 769,082,600$ 62,729,489$ 9%
ExpendituresPersonal Services 137,396,423$ 146,994,984$ 153,393,363$ 6,398,378$ Discretionary Expenses 131,589,289$ 124,432,094$ 134,903,669$ 10,471,575$ Other Expenses 55,296,003$ 45,659,584$ 47,992,254$ 2,332,670$ Capital Outlay 135,841,319$ 199,146,279$ 247,906,887$ 48,760,608$ Debt Service 61,968,015$ 50,820,053$ 53,003,024$ 2,182,971$ Transfers Out 180,372,085$ 157,548,695$ 177,031,792$ 19,483,097$ Total Expenditures 702,463,134$ 724,601,689$ 814,230,989$ 89,629,300$ 12%
Net Revenues over/(under) Expenditures 10,960,383$ (18,248,577)$ (45,148,389)$ (26,899,811)$
84

Combined FY 2021 FINANCIAL DETAILFY 2020
FY 2017 FY 2018 FY 2019 Adopted FY 2021Account Actual Actual Actual Budget BudgetRevenuesTaxes401100 Prop Tax Levy - Current 93,002,954 98,263,417 102,758,027 107,220,607 110,634,441 3,413,834 3%401101 Property Tax Levy - Delinquent 32,233 59,432 386,359 - - - 0%401102 TIF Prop Tax Levy - Current 9,719,785 5,941,143 9,500,423 10,998,703 13,753,150 2,754,447 25%401103 TIF Prop Tax Levy - Delinquent 14,364 2,806 4,589 - - - 0%401104 Other Taxes 23,872,087 22,808,821 23,053,401 22,750,000 23,100,000 350,000 2%401106 Franchise Tax 9,651,657 10,184,385 10,318,852 10,184,380 10,317,000 132,620 1%
136,293,080 137,260,004 146,021,650 151,153,690 157,804,591 6,650,901 4%Licenses & Permits411001 Liquor Licenses 189,391 194,020 177,591 170,000 170,400 400 0%411002 Cigarette Licenses 11,650 11,600 12,525 10,500 11,500 1,000 10%411007 Building Permits 1,531,123 1,976,409 1,861,508 1,552,809 1,632,809 80,000 5%411008 Plumbing Permits 138,906 168,302 194,408 164,000 164,000 - 0%411009 Electrical Permits 255,618 281,476 311,078 252,000 252,000 - 0%411010 Sign Permits 20,434 18,074 24,465 19,000 19,000 - 0%411011 Right of Way Permits 213,282 307,195 305,738 68,000 135,253 67,253 99%411012 Mechanical Permits 148,214 127,659 218,715 134,000 134,000 - 0%411013 Other Licenses 63,409 79,167 44,888 52,500 52,500 - 0%411014 Other Permits 71,810 120,369 139,470 93,670 125,800 32,130 34%
2,643,836 3,284,271 3,290,385 2,516,479 2,697,262 180,783 7%Intergovernmental Grants421001 Federal Operating 34,244,057 25,739,509 15,840,431 11,552,276 11,209,072 (343,204) -3%421003 Federal Capital 12,302,710 15,454,389 14,145,782 27,819,500 30,493,824 2,674,324 10%421005 Sec 8 Fraud Recovery 77,978 102,396 97,528 - - - 0%421006 Transportation Program Revenue 43,366 18,417 800 10,000 5,000 (5,000) -50%422001 State Operating 6,693,694 8,045,440 1,522,934 944,548 1,002,248 57,700 6%422002 State Capital 11,384,179 10,323,878 13,337,190 22,389,557 24,884,936 2,495,379 11%422102 Road Use Tax 16,107,446 15,904,640 16,334,172 16,100,000 16,300,000 200,000 1%422104 State Comm Indus Backfill 3,892,812 3,846,067 4,150,812 4,301,145 3,984,592 (316,553) -7%423000 Local Govt Grants 1,000,771 739,495 1,604,913 4,921,744 3,448,984 (1,472,760) -30%
85,747,012 80,174,231 67,034,562 88,038,770 91,328,656 3,289,886 4%Charges for Services431001 Court Cost, Fees, & Charges 123 17 - - - - 0%431002 Recording Fees 11,376 8,619 3,725 2,070 1,070 (1,000) -48%431003 Laboratory Fees 8,328 8,840 7,890 9,000 9,000 - 0%431004 Zoning & Subdivision Fees 87,064 133,098 124,456 31,500 31,500 - 0%431005 Sale of Maps / Publications 1,707 1,701 1,978 4,030 3,630 (400) -10%431006 Printing & Duplicating of Form 47,231 61,086 63,457 47,500 50,500 3,000 6%431007 Admin Charges - City Mgr Depts 42,752,830 43,120,290 45,045,594 35,108,297 36,699,655 1,591,358 5%431009 Developer Cost Sharing 19,968 32,500 - 1,200,000 1,568,000 368,000 31%431010 Other Charges for Services 22,082,310 24,545,098 25,321,261 24,350,378 25,645,934 1,295,555 5%431011 Admin Charges - Commissions 519,586 550,340 548,880 201,971 646,833 444,862 220%431012 Admin Charges - External 2,970,434 2,441,768 3,352,548 3,053,914 3,324,230 270,316 9%431013 FMS Environmental Svcs Charges 553,438 514,500 174,563 182,219 187,578 5,359 3%431101 Special Police Services 613,703 672,409 556,065 594,524 604,524 10,000 2%431102 Special Fire Services 381,096 391,323 380,298 320,000 320,000 - 0%431103 Protective Inspection Fees 823,193 780,479 868,808 763,000 763,000 - 0%431104 Burglar Alarm Line Charges 126,075 131,000 125,950 115,000 115,000 - 0%431106 Towing Fees 108,120 97,500 64,152 95,000 50,000 (45,000) -47%431201 Library User Fees - Not Fines - - - 600 600 - 0%431301 Vending Sales 53,059 49,997 47,503 43,350 43,850 500 1%431302 Concession Sales 663,100 651,924 589,510 722,752 728,092 5,340 1%431303 Registration Fees 475,306 447,374 459,093 504,895 490,495 (14,400) -3%431305 Admission Fees 1,301,147 1,308,409 1,174,550 1,289,813 1,451,813 162,000 13%431306 League Fees 128,098 138,673 130,542 134,585 135,285 700 1%431307 Tournament Fees 68,272 78,456 84,557 81,000 81,000 - 0%431308 School Fees 8,350 11,351 9,696 8,400 10,300 1,900 23%431309 Special Fees 29,132 22,575 32,227 34,050 34,050 - 0%431311 Pass Fees 790,921 802,726 709,281 734,121 751,721 17,600 2%431312 Gift Certificate Sales 90 (3,812) (2,803) 400 400 - 0%
ChangeFrom FY 2020Incr / (Decr)
85

Combined FY 2021 FINANCIAL DETAILFY 2020
FY 2017 FY 2018 FY 2019 Adopted FY 2021Account Actual Actual Actual Budget Budget
ChangeFrom FY 2020Incr / (Decr)
431314 Advertising Income 111,041 99,146 114,819 126,000 126,000 - 0%431401 Animal Control & Shelter Fees 133,949 134,184 132,281 144,000 144,000 - 0%431502 Snow/Weed Abatements 56,156 48,436 82,078 52,000 70,000 18,000 35%431601 Special Inspection Fees 75 200 50 500 500 - 0%431700 Waste Water - Service Charge 16,843,877 18,705,645 20,257,706 21,558,220 22,600,530 1,042,310 5%431701 Waste Water - Volumetric 6,269,879 6,926,792 6,911,694 7,689,461 7,836,246 146,785 2%431702 Special Waste Water Revenue 26,817,895 25,147,336 25,021,793 24,518,985 25,014,902 495,917 2%431703 Contractual-Waste Wtr Trmnt 4,124,766 4,004,884 3,480,050 4,005,000 4,742,591 737,591 18%431705 Hauler - Septic Waste 257,240 296,187 335,238 280,000 320,000 40,000 14%431706 Waste Sludge 68,250 35,000 - 35,000 5,000 (30,000) -86%431707 Outside Ser Area Indstry Waste 32,118 68,074 4,589 45,000 5,000 (40,000) -89%431708 Shared WPC & Sewer revenue (9,290,545) (10,491,264) (11,600,016) (12,296,000) (12,692,365) (396,365) 3%431800 Water Revenue - Service Charge 7,839,572 8,227,878 8,520,457 8,998,761 9,677,362 678,601 8%431801 Water Revenue - Volumetric 24,548,587 25,654,423 25,229,784 26,676,239 27,536,468 860,229 3%431802 Sundry Billing Receipts 211,628 229,492 237,558 225,000 227,500 2,500 1%431803 Turning Water Off & On 614,017 607,876 598,873 610,000 600,000 (10,000) -2%431804 Water Main Extensions 12,075 37,791 34,176 15,000 30,000 15,000 100%431901 Daily Parking 60,732 52,753 39,500 35,100 19,200 (15,900) -45%432001 Solid Waste Collection Fees 8,444,302 8,754,132 9,194,616 9,146,433 9,146,433 - 0%432002 Sale of Recycleable 40,279 65,459 68,499 29,200 38,550 9,350 32%432003 Recycling & Reduction Fees 2,627,850 2,714,384 2,698,074 2,696,444 2,696,444 - 0%432101 Landfill Fees 6,678,102 7,098,425 7,876,090 7,624,300 7,442,000 (182,300) -2%432102 Misc Waste Sludge - - 12,873 - - - 0%432103 Landfill - Methane Gas Rebate 532,984 472,098 596,197 508,900 534,000 25,100 5%432202 Common Use Janitorial, Mtc, 418,839 430,914 429,587 500,400 465,000 (35,400) -7%432203 Common Use Electric 131,928 140,466 173,643 203,200 189,900 (13,300) -7%432204 Terminal Service 62,525 55,918 78,821 60,000 60,000 - 0%432205 Customer Facility Charge 598,186 621,399 652,379 597,300 703,800 106,500 18%432206 Passenger Facility Charge 2,351,085 2,449,499 2,635,162 2,441,200 3,009,700 568,500 23%432207 Special Police Services - TSA - (120) - - - - 0%432208 Fuel Flowage Fee 9,993 81,201 82,039 80,130 93,530 13,400 17%432211 Fuel Sales - External 437,787 695,018 729,551 629,000 667,760 38,760 6%432301 Passenger Fares-Full Adult 451,810 490,411 503,229 460,000 460,000 - 0%432302 Passenger Fares - Elder/Disab 197,745 196,987 198,229 210,000 210,000 - 0%432303 Passenger Fares - Student 100,852 103,262 96,506 110,000 80,000 (30,000) -27%432307 Blue Ticket 70,331 71,479 72,907 60,000 60,000 - 0%432401 Storm Sewer Transportation Fee 4,690,635 5,332,608 6,113,058 6,133,013 6,439,664 306,651 5%432402 Sanitary/Storm Sewer Main Ext 15,800 60,720 66,908 - - - 0%
181,196,400 186,617,335 191,552,777 183,840,156 192,307,774 8,467,618 5%Fines & Forfeits441000 Court Fines 93,250 105,289 129,087 112,500 112,500 - 0%441001 Library Fines 99,357 95,002 84,656 100,000 - (100,000) -100%441002 Other Fines & Forfeits 12,155,834 1,571,016 355,135 5,407,500 4,807,500 (600,000) -11%
12,348,441 1,771,306 568,878 5,620,000 4,920,000 (700,000) -12%Proceeds of Long Term Liabilities485001 GO Bond Proceeds 33,940,000 37,070,000 26,405,000 40,000,000 49,735,500 9,735,500 24%485003 Revenue Bond Proceeds 23,155,000 32,670,000 20,745,000 15,030,000 18,642,000 3,612,000 24%485005 Premiums on Bonds Sold 4,921,596 3,283,108 3,038,308 - - - 0%485008 TIF GO Bond Proceeds - - 600,000 4,940,000 4,861,173 (78,827) -2%485009 State Revolving Fund Proceeds 10,000 - - - 4,100,000 4,100,000 100%
62,026,596 73,023,108 50,788,308 59,970,000 77,338,673 17,368,673 29%Transfers In483001 Operating Transfer In - Inter 102,447,696 108,220,708 103,251,102 98,581,481 96,271,733 (2,309,748) -2%483002 Operating Transfer In - Intra 121,889,535 110,898,574 77,120,983 58,967,214 80,760,059 21,792,845 37%
224,337,231 219,119,282 180,372,085 157,548,695 177,031,792 19,483,097 12%Other Revenue451000 Interest/Div - Nonproprietary 2,001,976 2,751,807 4,098,554 1,914,820 2,567,242 652,422 34%451001 Penalties 460,074 4,783,339 541,264 475,200 493,600 18,400 4%451002 Gain (Loss) on Sale of Invest (1,669,701) (1,500,076) 2,800,885 - - - 0%461000 Land Rental 841,485 857,994 813,008 779,478 918,278 138,800 18%461001 Building Rental 5,296,660 5,463,974 6,797,068 6,623,336 6,868,851 245,515 4%
86

Combined FY 2021 FINANCIAL DETAILFY 2020
FY 2017 FY 2018 FY 2019 Adopted FY 2021Account Actual Actual Actual Budget Budget
ChangeFrom FY 2020Incr / (Decr)
461002 Other Rental 1,225,373 1,211,454 1,141,100 1,273,091 1,273,091 - 0%461005 Air Rights 42,619 37,635 46,135 31,990 31,990 - 0%461006 Vacating Streets & Alleys 10,737 38,920 22,459 900 900 - 0%461007 Landing Fees 2,553,788 2,400,211 2,301,219 2,471,860 2,360,700 (111,160) -4%461008 Hangar Rent 213,162 211,765 217,815 218,500 349,000 130,500 60%461009 FBO Rent 293,680 521,227 527,307 530,430 542,800 12,370 2%461010 Parking Fees 5,141,407 5,681,302 6,460,403 6,403,420 7,385,400 981,980 15%461011 Concession Fees - Restaurant 549,643 544,886 638,168 591,100 745,800 154,700 26%461012 Concession Fees - Car Rental 1,570,814 1,639,053 1,664,153 1,655,300 1,675,100 19,800 1%461014 Concession Fees - Advertising 62,942 60,000 60,000 60,000 72,000 12,000 20%461015 Concession Fees - Misc 49,396 40,593 39,304 42,400 1,500 (40,900) -96%461018 Apron Use Fee 153,596 151,092 179,803 146,876 175,000 28,124 19%471001 Postage / Handling 4,194 4,467 3,940 3,400 3,400 - 0%471002 Contributions & Donations 2,327,372 3,178,441 7,660,878 1,642,450 1,923,645 281,195 17%471003 Sale of Inventory 1,738,640 1,511,165 1,304,000 1,551,700 1,321,700 (230,000) -15%471004 Damage Recoveries 645,442 908,768 700,104 67,300 62,300 (5,000) -7%471005 Other Miscellaneous Revenue 2,318,280 3,099,519 2,095,180 2,515,751 4,719,941 2,204,190 88%471006 Insurance Premiums 25,968,932 26,218,410 23,721,684 23,439,254 25,660,107 2,220,853 9%471007 Cash Over (Under) 165 581 2,116 - - - 0%471008 Special Assessment Charges 953,011 1,456,785 1,353,252 1,079,400 2,990,900 1,911,500 177%481000 Interest / Div - Proprietary 1,274,586 2,749,917 4,472,484 2,680,917 1,942,700 (738,217) -28%481002 Settlement Reimbursement 673,314 526,015 701,000 - - - 0%481003 Capital Contributions 4,367,305 5,491,687 2,736,697 1,081,423 1,217,197 135,774 13%481004 Build America interest abate 524,138 - - - - - 0%482001 Sale of Fixed Assets 2,180,587 1,785,493 694,891 385,026 350,710 (34,316) -9%
61,773,618 71,826,423 73,794,871 57,665,322 65,653,853 7,988,530 14%
Total Revenues 766,366,216 773,075,959 713,423,517 706,353,112 769,082,600 62,729,489 9%
ExpendituresPersonal Services511100 Regular Employees 83,238,816 85,438,904 88,422,753 97,247,932 101,610,639 4,362,707 4%511200 Temporary/Seasonal Employees 1,797,368 1,857,849 1,986,041 2,337,686 2,422,930 85,244 4%511300 Overtime 3,603,632 3,120,753 3,733,067 2,843,537 3,180,425 336,888 12%511400 Other Special Pays 2,395,547 2,566,949 2,282,007 2,272,444 2,279,017 6,573 0%511500 Leave Accrual 267,932 155,213 340,622 5,000 5,000 - 0%512100 Group Insurance 19,907,825 19,399,620 17,289,616 18,813,151 20,503,561 1,690,410 9%512200 Social Security Contributions 5,161,619 5,133,681 5,344,137 5,974,720 6,287,681 312,961 5%512300 Retirement Contribution 12,717,255 12,487,458 13,293,704 13,890,839 14,714,153 823,314 6%512400 Unemployment Compensation 172,599 148,669 104,359 10,000 10,000 - 0%512500 Workers' Compensation 4,708,905 554,192 4,502,773 4,881,475 4,721,168 (160,307) -3%512600 Other Employee Benefits (345,086) 374,342 97,343 (1,281,799) (2,341,211) (1,059,412) 83%
133,626,411 131,237,629 137,396,423 146,994,984 153,393,363 6,398,378 4%Discretionary Expenses521100 Advertising & Marketing 1,064,018 1,214,856 990,819 937,392 1,023,752 86,360 9%521101 Architectural Services 13,551 - - - - - 0%521102 Auditing & Accounting Services 123,112 121,880 118,278 135,940 149,435 13,495 10%521104 Consulting & Technical Service 1,031,398 875,342 1,148,543 1,153,723 1,103,723 (50,000) -4%521105 External Contracted Labor 14,938,605 16,430,697 16,949,194 24,716,115 26,473,297 1,757,182 7%521106 Health Services 19,572,913 22,424,873 24,841,692 25,088,405 27,578,456 2,490,051 10%521107 Legal Services 134,279 129,042 145,161 144,754 116,254 (28,500) -20%521108 Other Professional Services 13,231,483 7,658,881 7,106,313 9,501,387 11,066,723 1,565,336 16%521109 External Banking/Financial Fee 732,318 769,028 664,041 697,288 740,691 43,404 6%521110 Security Services 83,259 89,261 108,309 97,899 107,219 9,320 10%521111 Management Services 1,235,412 984,238 1,088,713 588,588 703,005 114,417 19%521112 Collection Agency Services 32,214 768,274 133,610 - 20,000 20,000 100%522100 Computer Hardware 368,544 410,072 302,097 406,920 405,770 (1,150) 0%522101 Computer Software Maintenance 1,993,206 2,128,012 2,075,360 2,495,785 2,836,677 340,892 14%522102 IT Services - External 320,417 363,555 413,769 394,942 383,995 (10,947) -3%522103 Radio Maintenance 709,144 62,124 790,190 817,062 820,262 3,200 0%522104 Building & Grounds Services 3,326,471 2,356,427 2,305,855 1,547,010 2,292,410 745,400 48%522105 Equip/Furniture/Fixtures Serv 733,068 380,346 524,673 1,168,245 1,263,745 95,500 8%
87

Combined FY 2021 FINANCIAL DETAILFY 2020
FY 2017 FY 2018 FY 2019 Adopted FY 2021Account Actual Actual Actual Budget Budget
ChangeFrom FY 2020Incr / (Decr)
522106 Vehicles & Rolling Equip Serv 1,041,100 1,057,840 893,507 694,052 839,644 145,592 21%522110 NonCapitalized Project Expense 1,861,262 3,274,736 4,695,835 3,600 3,600 - 0%523101 Fiber Optic Network - 21 - - - - 0%523102 Landfill Fees 1,582,064 1,682,291 1,868,395 1,989,025 2,239,575 250,550 13%523104 Recycling Fees 4,554 8,821 9,444 13,575 13,975 400 3%523105 Sewer Services 75,497 65,623 57,823 80,000 60,000 (20,000) -25%523107 Phone Services 590,850 640,875 647,266 614,982 650,332 35,350 6%523108 Water 361,282 385,396 363,593 400,100 438,700 38,600 10%524101 Rental of Equip & Vehicles 714,862 337,542 431,854 341,260 314,740 (26,520) -8%525100 Appraisal, Recording, Abstract 15,796 7,870 11,965 23,150 31,150 8,000 35%525101 Feeding/Boarding Prisoners 8,275 4,550 8,925 16,000 16,000 - 0%525102 Printing, Binding, & Duplicate 430,631 395,704 378,158 446,435 431,583 (14,852) -3%525105 Other Insurance 499,914 408,852 371,473 251,296 233,005 (18,291) -7%525106 Other Purchased Services 1,220,326 1,979,013 2,285,135 21,450 21,450 - 0%531100 Ammunition, Targets, & Firearm 97,273 78,483 97,672 109,284 113,727 4,443 4%531101 Animal Supplies 71,748 64,418 69,639 78,150 74,150 (4,000) -5%531102 Awards & Recognition 27,164 23,592 26,771 34,545 31,151 (3,394) -10%531103 Books & Subscriptions 650,697 746,437 850,198 746,505 813,252 66,747 9%531104 Chemical Supplies 5,098,715 4,633,629 4,576,470 5,061,155 5,103,763 42,608 1%531105 Cleaning & Janitorial Supplies 209,601 205,395 202,673 152,659 151,299 (1,360) -1%531106 Computer Supplies 60,763 45,235 94,542 79,639 88,353 8,714 11%531107 Concession Supplies 309,438 284,647 261,766 323,400 358,540 35,140 11%531108 Engineering Supplies 2,267 3,832 6,047 2,750 2,750 - 0%531109 Equipment/Furniture/Fixtures 1,203,371 1,116,202 1,000,732 1,427,386 1,548,104 120,719 8%531110 Photography Supplies 3,402 480 614 7,750 7,762 12 0%531111 Lab Supplies 120,427 177,241 170,441 138,000 165,500 27,500 20%531112 Landscaping Materials 503,855 378,707 359,517 334,080 321,580 (12,500) -4%531113 Cost of Goods Sold 201,633 349,724 312,546 313,614 316,065 2,451 1%531114 Miscellaneous Supplies 3,695,619 3,482,595 3,154,904 603,529 1,730,460 1,126,931 187%531115 Musical & Instruments 4,976 3,416 2,289 1,700 1,700 - 0%531116 Office Supplies 174,120 165,765 136,205 202,922 201,162 (1,760) -1%531117 Paint Supplies 96,711 92,415 162,007 104,776 115,426 10,650 10%531118 Program Supplies 248,557 243,661 250,519 312,939 311,028 (1,911) -1%531119 Shop Supplies 545,962 642,684 612,648 615,346 625,036 9,690 2%531120 Sign & Signal Supplies 167,504 162,580 147,737 138,059 140,899 2,840 2%531121 Street & Sewer Materials 3,125,790 1,153,765 1,724,892 1,470,732 1,610,742 140,010 10%531122 Meters 716,785 684,783 683,933 740,000 790,000 50,000 7%531123 Uniforms 262,853 291,417 316,729 296,141 299,802 3,661 1%531124 Personal Protective Gear 206,824 303,242 205,752 208,593 211,586 2,993 1%532102 Kerosene 16,135 45 146,298 250 200 (50) -20%532103 LP Gas 39,303 43,410 48,091 64,825 61,140 (3,685) -6%532104 Oil 51,045 91,878 71,699 84,170 91,360 7,190 9%532105 Other Fuel 405 128,325 90,500 119,800 99,000 (20,800) -17%532106 Other Lubricants 31,457 26,659 24,724 33,000 37,852 4,852 15%533100 Building & Grounds Supplies 1,120,887 977,416 1,147,498 1,339,183 1,184,324 (154,859) -12%533101 Equip/Furniture/Fixtures Parts 1,711,515 1,858,879 1,782,155 2,125,198 2,200,397 75,199 4%533102 Vehicle & Rolling Equip Parts 2,197,130 2,193,037 2,451,955 2,239,711 2,661,264 421,553 19%533103 Tires & Tubes 51,635 72,302 81,320 52,760 - (52,760) -100%533104 Runway Maintenance 47,090 63,845 47,210 80,000 60,000 (20,000) -25%533105 Jetway Maintenance 15,412 14,573 29,084 20,000 40,000 20,000 100%541100 HAP Occupied Units 5,455,564 5,829,910 5,374,409 6,150,000 6,185,912 35,912 1%541104 Moving Costs (5,327) - - - - - 0%541105 Grants 5,028 - - - - - 0%541106 Grants & Contributions 25,847,036 12,092,220 20,459,933 12,733,775 13,942,366 1,208,591 9%541107 Operating Subsidy - 565 - - - - 0%541110 Transit Program 43,368 3,212 800 10,000 5,000 (5,000) -50%542100 Animals 1,189 14,918 25,028 14,000 25,000 11,000 79%542101 Closure/PostClosure Ldfll Exp 236,462 317,765 722,649 663,500 873,100 209,600 32%542102 Conferences, Training, Travel 911,567 957,850 949,224 1,104,125 1,021,622 (82,503) -7%542103 Dues & Memberships 405,797 387,741 368,340 442,236 579,616 137,380 31%542104 Entertainment Expense 6,029 8,543 4,268 500 500 - 0%
88

Combined FY 2021 FINANCIAL DETAILFY 2020
FY 2017 FY 2018 FY 2019 Adopted FY 2021Account Actual Actual Actual Budget Budget
ChangeFrom FY 2020Incr / (Decr)
542105 Settlement 1,360,192 1,412,248 1,915,220 684,527 513,315 (171,212) -25%542106 Licensing Fees 14,324 17,099 22,194 15,265 16,425 1,160 8%542107 Miscellaneous Costs 366,797 166,624 93,633 719,588 190,321 (529,267) -74%542108 Postage & Freight 337,263 302,869 288,779 376,788 358,193 (18,595) -5%542109 Property Tax 562,871 551,474 619,233 12,700 11,060 (1,640) -13%542110 Recording/Filing Fees/Permits 60,114 56,618 77,031 123,350 146,880 23,530 19%542111 Mileage Reimbursement 21,194 19,569 23,911 36,725 40,337 3,612 10%542112 Right of Way / Easement Acq 1,630 210 - - - - 0%542113 Talent Fee Expense 1,355 1,150 1,100 1,900 1,900 - 0%542114 Bad Debt Expense 6,779,922 1,472,771 (68,366) 74,700 69,770 (4,930) -7%542116 Loss of Inventory - 133,816 - - - - 0%
521114 Admin Charges - Inter Departments 8,133,860 6,963,658 7,634,138 6,819,484 6,973,809 154,326 2% 522107 Facility Services - Non-routine - - - - - - 0% 522108 Fleet Services - Abnormal Maint - - - - - - 0% 522108 Fleet Services - Non-Safety Mod - - - - - - 0% 522108 Fleet Services - Accidents - - - - - - 0%
141,684,124 118,931,587 131,589,289 124,432,094 134,903,669 10,471,575 8%Other Expenses521113 City Accounting Services 3,612,142 3,466,394 3,710,494 1,777,134 1,880,022 102,888 6%522109 City Information Tech Services 5,238,404 5,389,836 5,512,820 1,764,203 1,816,986 52,782 3%523100 Electricity 9,784,881 10,352,418 10,809,417 10,354,806 10,965,748 610,942 6%523103 Natural Gas 1,231,608 1,186,357 1,197,353 1,043,746 1,013,250 (30,496) -3%524100 Rental of Land & Buildings 2,778,088 2,940,768 3,925,276 4,019,279 3,996,251 (23,028) -1%524102 City Fleet Rental Charges 5,188,515 5,609,848 5,829,065 6,129,193 6,133,564 4,371 0%525104 Liability Insurance 1,193,337 1,346,859 1,459,848 1,414,032 1,537,972 123,940 9%525107 Property Insurance 2,732,927 2,962,858 3,142,653 3,257,735 3,744,122 486,387 15%525108 Vehicle Insurance 619,457 682,825 701,087 684,474 703,823 19,349 3%532100 Diesel Fuel 2,636,038 3,226,160 3,827,864 3,982,884 4,165,794 182,910 5%532101 Gasoline Fuel 1,625,636 1,988,077 2,065,724 2,250,503 2,305,129 54,625 2%521114 City Inter Department Charges 6,391,085 6,350,955 5,864,955 1,891,310 1,996,206 104,896 6%
522107 Facility Services (Routine) 1,624,316 1,485,543 1,048,346 1,028,142 1,243,793 215,651 21% 522108 Fleet Services (Routine) 5,793,111 5,978,162 6,201,100 6,062,142 6,489,595 427,453 7%
50,449,543 52,967,060 55,296,003 45,659,584 47,992,254 2,332,670 5%Capital Outlay551000 Land 9,429,335 5,079,201 1,360,464 - - - 0%552000 Buildings 10,700,640 20,786,342 20,623,915 5,937,501 23,590,981 17,653,480 297%553000 Improvements Other than Bldgs 94,916,076 91,097,240 99,353,955 175,700,585 208,335,583 32,634,998 19%554000 Vehicles, Equipment, Software 9,984,100 9,554,442 11,155,255 14,664,202 13,156,280 (1,507,922) -10%555000 Depreciation Expense 2,229,979 2,314,898 2,534,691 2,637,500 2,824,043 186,543 7%556000 Controlled assets 648,573 694,954 813,039 206,491 - (206,491) -100%
127,908,704 129,527,077 135,841,319 199,146,279 247,906,887 48,760,608 24%Debt Services561000 Bond Principal 64,660,000 62,095,000 44,650,000 32,477,500 34,390,000 1,912,500 6%561001 Other Debt Principal 2,606,000 3,380,000 2,059,000 2,841,000 2,926,000 85,000 3%561002 Bond Interest Expense 14,335,002 13,772,184 14,144,216 14,871,854 15,040,970 169,117 1%561003 Other Debt Interest Expense 1,224,359 1,136,772 677,370 629,700 646,054 16,355 3%561004 Discount on Bonds 113,599 - - - - - 0%561006 Issuance Costs 539,077 521,827 437,429 - - - 0%
83,478,037 80,905,783 61,968,015 50,820,053 53,003,024 2,182,971 4%Transfers Out571100 Transfer Out-Inter 102,447,696 108,220,708 103,251,102 98,581,481 96,271,733 (2,309,748) -2%571200 Transfer Out-Intra 121,889,535 110,898,574 77,120,983 58,967,214 80,760,059 21,792,845 37%
224,337,231 219,119,282 180,372,085 157,548,695 177,031,792 19,483,097 12%
Total Expenditures 761,484,049 732,688,418 702,463,134 724,601,689 814,230,989 89,629,300 12%
Net Revenues Over / (Under) Expenditures 4,882,166 40,387,541 10,960,383 (18,248,577) (45,148,389) (26,899,811)
89

FY 2021 Budget by Major Fund
90

Fiscal Year 2021 Budget by Fund Trust & Tax Supported
Internal Agency Capital Debt Enterprise Special
General Fund Service Fund Fund Project Fund Service Fund Fund Revenue Fund Total
Account Budget Budget Budget Budget Budget Budget Budget Budget
Revenues
Taxes
Prop Tax Levy ‐ Current 401100 58,872,932 ‐ 23,284,147 ‐ 22,341,847 5,615,479 520,036 110,634,441
TIF Prop Tax Levy ‐ Current 401102 ‐ ‐ ‐ ‐ ‐ ‐ 13,753,150 13,753,150
Other Taxes 401104 ‐ ‐ ‐ ‐ ‐ ‐ 23,100,000 23,100,000
Franchise Tax 401106 10,317,000 ‐ ‐ ‐ ‐ ‐ ‐ 10,317,000
69,189,932 ‐ 23,284,147 ‐ 22,341,847 5,615,479 37,373,186 157,804,591
Licenses & Permits
Liquor Licenses 411001 170,400 ‐ ‐ ‐ ‐ ‐ ‐ 170,400
Cigarette Licenses 411002 11,500 ‐ ‐ ‐ ‐ ‐ ‐ 11,500
Building Permits 411007 1,632,809 ‐ ‐ ‐ ‐ ‐ ‐ 1,632,809
Plumbing Permits 411008 164,000 ‐ ‐ ‐ ‐ ‐ ‐ 164,000
Electrical Permits 411009 252,000 ‐ ‐ ‐ ‐ ‐ ‐ 252,000
Sign Permits 411010 19,000 ‐ ‐ ‐ ‐ ‐ ‐ 19,000
Right of Way Permits 411011 135,253 ‐ ‐ ‐ ‐ ‐ ‐ 135,253
Mechanical Permits 411012 134,000 ‐ ‐ ‐ ‐ ‐ ‐ 134,000
Other Licenses 411013 22,500 ‐ ‐ ‐ ‐ ‐ 30,000 52,500
Other Permits 411014 46,000 ‐ ‐ ‐ ‐ 79,800 ‐ 125,800
2,587,462 ‐ ‐ ‐ ‐ 79,800 30,000 2,697,262
Intergovernmental Grants
Federal Operating 421001 107,236 ‐ ‐ ‐ ‐ 2,816,800 8,285,036 11,209,072
Federal Capital 421003 ‐ ‐ ‐ 14,338,500 ‐ 16,055,324 100,000 30,493,824
Transportation Program Revenue 421006 ‐ ‐ ‐ ‐ ‐ 5,000 ‐ 5,000
State Operating 422001 193,948 ‐ ‐ ‐ ‐ 808,300 ‐ 1,002,248
State Capital 422002 ‐ ‐ ‐ 6,595,246 ‐ 3,289,690 15,000,000 24,884,936
Road Use Tax 422102 ‐ ‐ ‐ ‐ ‐ ‐ 16,300,000 16,300,000
State Comm Indus Backfill 422104 2,105,575 ‐ 833,090 ‐ 756,931 200,918 88,078 3,984,592
Local Govt Grants 423000 133,500 ‐ ‐ 2,678,000 ‐ 573,840 63,644 3,448,984
2,540,259 ‐ 833,090 23,611,746 756,931 23,749,872 39,836,758 91,328,656
Charges for Services
Recording Fees 431002 1,070 ‐ ‐ ‐ ‐ ‐ ‐ 1,070
Laboratory Fees 431003 ‐ ‐ ‐ ‐ ‐ 9,000 ‐ 9,000
Zoning & Subdivision Fees 431004 31,500 ‐ ‐ ‐ ‐ ‐ ‐ 31,500
Sale of Maps / Publications 431005 3,630 ‐ ‐ ‐ ‐ ‐ ‐ 3,630
Printing & Duplicating of Form 431006 50,500 ‐ ‐ ‐ ‐ ‐ ‐ 50,500
Admin Charges ‐ City Mgr Depts 431007 10,636,041 23,161,914 ‐ ‐ ‐ 2,901,700 ‐ 36,699,655
Developer Cost Sharing 431009 ‐ ‐ ‐ 68,000 ‐ 1,500,000 ‐ 1,568,000
Other Charges for Services 431010 1,060,488 ‐ ‐ ‐ ‐ 24,305,446 280,000 25,645,934
Admin Charges ‐ Commissions 431011 206,937 439,897 ‐ ‐ ‐ ‐ ‐ 646,833
Admin Charges ‐ External 431012 1,799,607 1,509,073 ‐ ‐ ‐ 10,550 5,000 3,324,230
FMS Environmental Svcs Charges 431013 ‐ 187,578 ‐ ‐ ‐ ‐ ‐ 187,578
Special Police Services 431101 157,924 ‐ ‐ ‐ ‐ 419,600 27,000 604,524
Special Fire Services 431102 320,000 ‐ ‐ ‐ ‐ ‐ ‐ 320,000
Protective Inspection Fees 431103 763,000 ‐ ‐ ‐ ‐ ‐ ‐ 763,000
Burglar Alarm Line Charges 431104 115,000 ‐ ‐ ‐ ‐ ‐ ‐ 115,000
Towing Fees 431106 50,000 ‐ ‐ ‐ ‐ ‐ ‐ 50,000
Library User Fees ‐ Not Fines 431201 600 ‐ ‐ ‐ ‐ ‐ ‐ 600
Vending Sales 431301 30,350 ‐ ‐ ‐ ‐ 11,500 2,000 43,850
Concession Sales 431302 308,252 ‐ ‐ ‐ ‐ 419,840 ‐ 728,092
Registration Fees 431303 466,995 ‐ ‐ ‐ ‐ 23,500 ‐ 490,495
Admission Fees 431305 329,163 ‐ ‐ ‐ ‐ 1,122,650 ‐ 1,451,813
League Fees 431306 125,085 ‐ ‐ ‐ ‐ 10,200 ‐ 135,285
Tournament Fees 431307 5,000 ‐ ‐ ‐ ‐ 76,000 ‐ 81,000
School Fees 431308 ‐ ‐ ‐ ‐ ‐ 10,300 ‐ 10,300
Special Fees 431309 30,650 ‐ ‐ ‐ ‐ 3,400 ‐ 34,050
Pass Fees 431311 434,321 ‐ ‐ ‐ ‐ 317,400 ‐ 751,721
Gift Certificate Sales 431312 ‐ ‐ ‐ ‐ ‐ 400 ‐ 400
Advertising Income 431314 50,000 ‐ ‐ ‐ ‐ 76,000 ‐ 126,000
Animal Control & Shelter Fees 431401 144,000 ‐ ‐ ‐ ‐ ‐ ‐ 144,000
Snow/Weed Abatements 431502 5,000 ‐ ‐ ‐ ‐ 65,000 ‐ 70,000
Special Inspection Fees 431601 500 ‐ ‐ ‐ ‐ ‐ ‐ 500
Waste Water ‐ Service Charge 431700 ‐ ‐ ‐ ‐ ‐ 22,600,530 ‐ 22,600,530
Waste Water ‐ Volumetric 431701 ‐ ‐ ‐ ‐ ‐ 7,836,246 ‐ 7,836,246
Special Waste Water Revenue 431702 ‐ ‐ ‐ ‐ ‐ 25,014,902 ‐ 25,014,902
Contractual‐Waste Wtr Trmnt 431703 ‐ ‐ ‐ ‐ ‐ 4,742,591 ‐ 4,742,591
Hauler ‐ Septic Waste 431705 ‐ ‐ ‐ ‐ ‐ 320,000 ‐ 320,000
Waste Sludge 431706 ‐ ‐ ‐ ‐ ‐ 5,000 ‐ 5,000
Outside Ser Area Indstry Waste 431707 ‐ ‐ ‐ ‐ ‐ 5,000 ‐ 5,000
Shared WPC & Sewer revenue 431708 ‐ ‐ ‐ ‐ ‐ (12,692,365) ‐ (12,692,365)
Water Revenue ‐ Service Charge 431800 ‐ ‐ ‐ ‐ ‐ 9,677,362 ‐ 9,677,362
Water Revenue ‐ Volumetric 431801 ‐ ‐ ‐ ‐ ‐ 27,536,468 ‐ 27,536,468
Sundry Billing Receipts 431802 ‐ ‐ ‐ ‐ ‐ 227,500 ‐ 227,500
Turning Water Off & On 431803 ‐ ‐ ‐ ‐ ‐ 600,000 ‐ 600,000
Water Main Extensions 431804 ‐ ‐ ‐ ‐ ‐ 30,000 ‐ 30,000
Daily Parking 431901 ‐ ‐ ‐ ‐ ‐ 19,200 ‐ 19,200
Solid Waste Collection Fees 432001 ‐ ‐ ‐ ‐ ‐ 9,146,433 ‐ 9,146,433
Sale of Recycleable 432002 2,000 ‐ ‐ ‐ ‐ 36,550 ‐ 38,550
Recycling & Reduction Fees 432003 ‐ ‐ ‐ ‐ ‐ 2,696,444 ‐ 2,696,444
Landfill Fees 432101 ‐ ‐ ‐ ‐ ‐ 7,442,000 ‐ 7,442,000
Landfill ‐ Methane Gas Rebate 432103 ‐ ‐ ‐ ‐ ‐ 534,000 ‐ 534,000
Common Use Janitorial, Mtc, 432202 ‐ ‐ ‐ ‐ ‐ 465,000 ‐ 465,000
Common Use Electric 432203 ‐ ‐ ‐ ‐ ‐ 189,900 ‐ 189,900
Terminal Service 432204 ‐ ‐ ‐ ‐ ‐ 60,000 ‐ 60,000
Customer Facility Charge 432205 ‐ ‐ ‐ ‐ ‐ 703,800 ‐ 703,800
Passenger Facility Charge 432206 ‐ ‐ ‐ ‐ ‐ 3,009,700 ‐ 3,009,700
91

Fiscal Year 2021 Budget by Fund Trust & Tax Supported
Internal Agency Capital Debt Enterprise Special
General Fund Service Fund Fund Project Fund Service Fund Fund Revenue Fund Total
Account Budget Budget Budget Budget Budget Budget Budget Budget
Fuel Flowage Fee 432208 ‐ ‐ ‐ ‐ ‐ 93,530 ‐ 93,530
Fuel Sales ‐ External 432211 ‐ ‐ ‐ ‐ ‐ 667,760 ‐ 667,760
Passenger Fares‐Full Adult 432301 ‐ ‐ ‐ ‐ ‐ 460,000 ‐ 460,000
Passenger Fares ‐ Elder/Disab 432302 ‐ ‐ ‐ ‐ ‐ 210,000 ‐ 210,000
Passenger Fares ‐ Student 432303 ‐ ‐ ‐ ‐ ‐ 80,000 ‐ 80,000
Blue Ticket 432307 ‐ ‐ ‐ ‐ ‐ 60,000 ‐ 60,000
Storm Sewer Transportation Fee 432401 ‐ ‐ ‐ ‐ ‐ 6,439,664 ‐ 6,439,664
17,127,612 25,298,462 ‐ 68,000 ‐ 149,499,699 314,000 192,307,774
Fines & Forfeits
Court Fines 441000 112,500 ‐ ‐ ‐ ‐ ‐ ‐ 112,500
Other Fines & Forfeits 441002 4,702,500 ‐ ‐ ‐ ‐ ‐ 105,000 4,807,500
4,815,000 ‐ ‐ ‐ ‐ ‐ 105,000 4,920,000
Transfers In
Operating Transfer In ‐ Inter 483001 37,877,892 590,849 ‐ 44,003,378 3,211,247 8,033,990 2,554,378 96,271,733
Operating Transfer In ‐ Intra 483002 ‐ 1,659,930 ‐ 2,545,000 11,581 76,543,548 ‐ 80,760,059
37,877,892 2,250,779 ‐ 46,548,378 3,222,828 84,577,538 2,554,378 177,031,792
Proceeds of LT Liabilities
GO Bond Proceeds 485001 ‐ ‐ ‐ 49,735,500 ‐ ‐ ‐ 49,735,500
Revenue Bond Proceeds 485003 ‐ ‐ ‐ ‐ ‐ 18,642,000 ‐ 18,642,000
TIF GO Bond Proceeds 485008 ‐ ‐ ‐ 4,861,173 ‐ ‐ ‐ 4,861,173
State Revolving Fund Proceeds 485009 ‐ ‐ ‐ ‐ ‐ 4,100,000 ‐ 4,100,000
‐ ‐ ‐ 54,596,673 ‐ 22,742,000 ‐ 77,338,673
Other Revenue
Interest/Div ‐ Nonproprietary 451000 2,500,000 ‐ ‐ ‐ 3,110 1,632 62,500 2,567,242
Penalties 451001 ‐ ‐ ‐ ‐ ‐ 493,600 ‐ 493,600
Land Rental 461000 133,704 ‐ ‐ ‐ ‐ 746,900 37,674 918,278
Building Rental 461001 393,129 3,456,538 ‐ ‐ ‐ 3,019,184 ‐ 6,868,851
Other Rental 461002 118,191 ‐ ‐ ‐ ‐ 749,900 405,000 1,273,091
Air Rights 461005 ‐ ‐ ‐ ‐ ‐ 31,990 ‐ 31,990
Vacating Streets & Alleys 461006 900 ‐ ‐ ‐ ‐ ‐ ‐ 900
Landing Fees 461007 ‐ ‐ ‐ ‐ ‐ 2,360,700 ‐ 2,360,700
Hangar Rent 461008 ‐ ‐ ‐ ‐ ‐ 349,000 ‐ 349,000
FBO Rent 461009 ‐ ‐ ‐ ‐ ‐ 542,800 ‐ 542,800
Parking Fees 461010 ‐ ‐ ‐ ‐ ‐ 7,385,400 ‐ 7,385,400
Concession Fees ‐ Restaurant 461011 ‐ ‐ ‐ ‐ ‐ 745,800 ‐ 745,800
Concession Fees ‐ Car Rental 461012 900 ‐ ‐ ‐ ‐ 1,674,200 ‐ 1,675,100
Concession Fees ‐ Advertising 461014 ‐ ‐ ‐ ‐ ‐ 72,000 ‐ 72,000
Concession Fees ‐ Misc 461015 ‐ ‐ ‐ ‐ ‐ 1,500 ‐ 1,500
Apron Use Fee 461018 ‐ ‐ ‐ ‐ ‐ 175,000 ‐ 175,000
Postage / Handling 471001 ‐ ‐ ‐ ‐ ‐ 3,400 ‐ 3,400
Contributions & Donations 471002 86,850 476,000 ‐ 50,000 ‐ 1,040,795 270,000 1,923,645
Sale of Inventory 471003 17,000 ‐ ‐ ‐ ‐ 1,303,200 1,500 1,321,700
Damage Recoveries 471004 33,000 ‐ ‐ ‐ ‐ 29,300 ‐ 62,300
Other Miscellaneous Revenue 471005 1,868,532 ‐ ‐ ‐ ‐ 2,718,118 133,292 4,719,941
Insurance Premiums 471006 ‐ 25,660,107 ‐ ‐ ‐ ‐ ‐ 25,660,107
Special Assessment Charges 471008 100,000 ‐ ‐ 2,670,000 ‐ 220,900 ‐ 2,990,900
Interest / Div ‐ Proprietary 481000 ‐ 107,500 ‐ ‐ ‐ 1,835,200 ‐ 1,942,700
Capital Contributions 481003 ‐ ‐ ‐ ‐ ‐ 1,217,197 ‐ 1,217,197
Sale of Fixed Assets 482001 175,000 ‐ ‐ ‐ ‐ 85,000 90,710 350,710
5,427,206 29,700,145 ‐ 2,720,000 3,110 26,802,716 1,000,676 65,653,853
Total Revenues 139,565,362 57,249,386 24,117,237 127,544,797 26,324,717 313,067,104 81,213,997 769,082,600
Expenditures
Personal Services
Regular Employees 511100 65,932,253 5,632,611 ‐ ‐ ‐ 29,050,157 995,618 101,610,639
Temporary/Seasonal Employees 511200 1,841,679 ‐ ‐ ‐ ‐ 581,250 ‐ 2,422,930
Overtime 511300 1,651,021 123,982 ‐ ‐ ‐ 1,402,271 3,150 3,180,425
Other Special Pays 511400 1,419,950 60,668 ‐ ‐ ‐ 794,646 3,753 2,279,017
Leave Accrual 511500 ‐ ‐ ‐ ‐ ‐ 5,000 ‐ 5,000
Group Insurance 512100 12,011,273 1,333,494 ‐ ‐ ‐ 6,985,333 173,461 20,503,561
Social Security Contributions 512200 3,372,934 445,023 ‐ ‐ ‐ 2,393,033 76,691 6,287,681
Retirement Contribution 512300 11,105,419 549,146 ‐ ‐ ‐ 2,964,951 94,637 14,714,153
Unemployment Compensation 512400 ‐ ‐ ‐ ‐ ‐ 10,000 ‐ 10,000
Workers' Compensation 512500 1,805,133 788,734 ‐ ‐ ‐ 2,088,177 39,124 4,721,168
Other Employee Benefits 512600 (2,556,425) 17,114 ‐ ‐ ‐ 197,847 253 (2,341,211)
96,583,238 8,950,772 ‐ ‐ ‐ 46,472,665 1,386,687 153,393,363
Discretionary Expenses
Advertising & Marketing 521100 126,942 300 ‐ ‐ ‐ 857,810 38,700 1,023,752
Auditing & Accounting Services 521102 94,035 ‐ ‐ ‐ ‐ 55,400 ‐ 149,435
Consulting & Technical Service 521104 69,737 98,986 ‐ ‐ ‐ 840,000 95,000 1,103,723
External Contracted Labor 521105 2,112,813 ‐ ‐ ‐ ‐ 24,340,484 20,000 26,473,297
Health Services 521106 970,023 25,680,223 900,000 ‐ ‐ 21,910 6,300 27,578,456
Legal Services 521107 52,754 ‐ ‐ ‐ ‐ 50,500 13,000 116,254
Other Professional Services 521108 4,038,584 1,816,189 ‐ 100,000 ‐ 4,915,450 196,500 11,066,723
External Banking/Financial Fee 521109 286,600 ‐ ‐ ‐ 3,110 450,981 ‐ 740,691
Security Services 521110 29,179 ‐ ‐ ‐ ‐ 78,040 ‐ 107,219
Management Services 521111 148,712 ‐ ‐ ‐ ‐ 554,293 ‐ 703,005
Collection Agency Services 521112 ‐ ‐ ‐ ‐ ‐ 20,000 ‐ 20,000
Computer Hardware 522100 269,180 38,490 ‐ ‐ ‐ 73,100 25,000 405,770
Computer Software Maintenance 522101 2,221,632 173,595 ‐ ‐ ‐ 425,450 16,000 2,836,677
IT Services ‐ External 522102 266,395 39,000 ‐ ‐ ‐ 72,850 5,750 383,995
Radio Maintenance 522103 29,225 757,037 ‐ ‐ ‐ 34,000 ‐ 820,262
92

Fiscal Year 2021 Budget by Fund Trust & Tax Supported
Internal Agency Capital Debt Enterprise Special
General Fund Service Fund Fund Project Fund Service Fund Fund Revenue Fund Total
Account Budget Budget Budget Budget Budget Budget Budget Budget
Building & Grounds Services 522104 421,110 631,000 ‐ ‐ ‐ 1,227,800 12,500 2,292,410
Equip/Furniture/Fixtures Serv 522105 74,510 30,185 ‐ ‐ ‐ 1,157,450 1,600 1,263,745
Vehicles & Rolling Equip Serv 522106 9,221 779,423 ‐ ‐ ‐ 51,000 ‐ 839,644
NonCapitalized Project Expense 522110 3,600 ‐ ‐ ‐ ‐ ‐ ‐ 3,600
Landfill Fees 523102 100,530 5,000 ‐ ‐ ‐ 2,131,545 2,500 2,239,575
Recycling Fees 523104 1,875 200 ‐ ‐ ‐ 11,700 200 13,975
Sewer Services 523105 ‐ ‐ ‐ ‐ ‐ 60,000 ‐ 60,000
Phone Services 523107 384,732 108,800 ‐ ‐ ‐ 156,300 500 650,332
Water 523108 ‐ ‐ ‐ ‐ ‐ 438,700 ‐ 438,700
Rental of Equip & Vehicles 524101 30,440 1,500 ‐ ‐ ‐ 282,800 ‐ 314,740
Appraisal, Recording, Abstract 525100 150 ‐ ‐ ‐ ‐ ‐ 31,000 31,150
Feeding/Boarding Prisoners 525101 16,000 ‐ ‐ ‐ ‐ ‐ ‐ 16,000
Printing, Binding, & Duplicate 525102 308,383 4,400 ‐ ‐ ‐ 100,300 18,500 431,583
Other Insurance 525105 ‐ 233,005 ‐ ‐ ‐ ‐ ‐ 233,005
Other Purchased Services 525106 20,250 ‐ ‐ ‐ ‐ 1,100 100 21,450
Ammunition, Targets, & Firearm 531100 110,727 ‐ ‐ ‐ ‐ 3,000 ‐ 113,727
Animal Supplies 531101 58,700 ‐ ‐ ‐ ‐ ‐ 15,450 74,150
Awards & Recognition 531102 25,375 120 ‐ ‐ ‐ 3,606 2,050 31,151
Books & Subscriptions 531103 132,842 10,200 ‐ 500,000 ‐ 34,760 135,450 813,252
Chemical Supplies 531104 881,313 4,500 ‐ ‐ ‐ 4,217,900 50 5,103,763
Cleaning & Janitorial Supplies 531105 47,744 ‐ ‐ ‐ ‐ 103,330 225 151,299
Computer Supplies 531106 60,289 11,100 ‐ ‐ ‐ 16,264 700 88,353
Concession Supplies 531107 152,700 ‐ ‐ ‐ ‐ 205,840 ‐ 358,540
Engineering Supplies 531108 2,000 ‐ ‐ ‐ ‐ 750 ‐ 2,750
Equipment/Furniture/Fixtures 531109 664,061 87,601 ‐ ‐ ‐ 524,850 271,592 1,548,104
Photography Supplies 531110 6,150 ‐ ‐ ‐ ‐ 1,612 ‐ 7,762
Lab Supplies 531111 17,000 ‐ ‐ ‐ ‐ 148,500 ‐ 165,500
Landscaping Materials 531112 52,430 ‐ ‐ 178,000 ‐ 81,100 10,050 321,580
Cost of Goods Sold 531113 8,000 ‐ ‐ ‐ ‐ 306,065 2,000 316,065
Miscellaneous Supplies 531114 936,825 ‐ ‐ ‐ ‐ 793,605 30 1,730,460
Musical & Instruments 531115 1,700 ‐ ‐ ‐ ‐ ‐ ‐ 1,700
Office Supplies 531116 134,222 14,400 ‐ ‐ ‐ 50,040 2,500 201,162
Paint Supplies 531117 95,726 ‐ ‐ ‐ ‐ 19,600 100 115,426
Program Supplies 531118 194,153 ‐ ‐ ‐ ‐ 68,230 48,645 311,028
Shop Supplies 531119 69,406 40,600 ‐ ‐ ‐ 511,930 3,100 625,036
Sign & Signal Supplies 531120 120,559 50 ‐ ‐ ‐ 20,190 100 140,899
Street & Sewer Materials 531121 1,293,732 ‐ ‐ ‐ ‐ 317,010 ‐ 1,610,742
Meters 531122 ‐ ‐ ‐ ‐ ‐ 790,000 ‐ 790,000
Uniforms 531123 163,637 20,500 ‐ ‐ ‐ 115,650 15 299,802
Personal Protective Gear 531124 95,656 1,800 ‐ ‐ ‐ 91,580 22,550 211,586
Kerosene 532102 ‐ ‐ ‐ ‐ ‐ 200 ‐ 200
LP Gas 532103 10,033 100 ‐ ‐ ‐ 51,007 ‐ 61,140
Oil 532104 4,100 150 ‐ ‐ ‐ 87,110 ‐ 91,360
Other Fuel 532105 ‐ ‐ ‐ ‐ ‐ 99,000 ‐ 99,000
Other Lubricants 532106 2,550 100 ‐ ‐ ‐ 35,202 ‐ 37,852
Building & Grounds Supplies 533100 115,571 355,000 ‐ ‐ ‐ 701,753 12,000 1,184,324
Equip/Furniture/Fixtures Parts 533101 75,323 200 ‐ ‐ ‐ 2,123,674 1,200 2,200,397
Vehicle & Rolling Equip Parts 533102 67,317 2,119,827 ‐ ‐ ‐ 474,120 ‐ 2,661,264
Runway Maintenance 533104 ‐ ‐ ‐ ‐ ‐ 60,000 ‐ 60,000
Jetway Maintenance 533105 ‐ ‐ ‐ ‐ ‐ 40,000 ‐ 40,000
HAP Occupied Units 541100 ‐ ‐ ‐ ‐ ‐ ‐ 6,185,912 6,185,912
Grants & Contributions 541106 712,481 ‐ ‐ ‐ ‐ 1,735,650 11,494,236 13,942,366
Transit Program 541110 ‐ ‐ ‐ ‐ ‐ 5,000 ‐ 5,000
Animals 542100 ‐ ‐ ‐ ‐ ‐ ‐ 25,000 25,000
Closure/PostClosure Ldfll Exp 542101 ‐ ‐ ‐ ‐ ‐ 873,100 ‐ 873,100
Conferences, Training, Travel 542102 596,762 46,070 ‐ ‐ ‐ 314,290 64,500 1,021,622
Dues & Memberships 542103 271,810 4,900 ‐ ‐ ‐ 293,906 9,000 579,616
Entertainment Expense 542104 500 ‐ ‐ ‐ ‐ ‐ ‐ 500
Settlement 542105 1,100 486,715 ‐ ‐ ‐ 25,500 ‐ 513,315
Licensing Fees 542106 5,615 500 ‐ ‐ ‐ 10,050 260 16,425
Miscellaneous Costs 542107 31,578 26,500 ‐ ‐ ‐ 112,243 20,000 190,321
Postage & Freight 542108 83,013 4,400 ‐ ‐ ‐ 251,780 19,000 358,193
Property Tax 542109 ‐ ‐ ‐ ‐ ‐ 1,700 9,360 11,060
Recording/Filing Fees/Permits 542110 14,930 ‐ ‐ ‐ ‐ 119,950 12,000 146,880
Mileage Reimbursement 542111 28,025 200 ‐ ‐ ‐ 10,912 1,200 40,337
Talent Fee Expense 542113 1,900 ‐ ‐ ‐ ‐ ‐ ‐ 1,900
Bad Debt Expense 542114 1,000 ‐ ‐ ‐ ‐ 3,770 65,000 69,770
19,435,166 33,632,866 900,000 778,000 3,110 54,264,292 18,916,425 127,929,859
Fleet & Facilities
City Facility Maint Services 522107 861,345 7,831 ‐ ‐ ‐ 374,616 ‐ 1,243,793
City Fleet Services 522108 3,171,388 36,696 ‐ ‐ ‐ 3,280,468 1,044 6,489,595
Rental of Land & Buildings 524100 3,259,379 362,227 ‐ ‐ ‐ 302,793 71,852 3,996,251
City Fleet Rental Charges 524102 3,588,585 52,611 ‐ ‐ ‐ 2,487,106 5,262 6,133,564
10,880,697 459,365 ‐ ‐ ‐ 6,444,983 78,158 17,863,203
Non‐Discretionary Expenses
City Accounting Services 521113 107,638 477,809 29,770 ‐ ‐ 1,198,461 66,344 1,880,022
City Inter Department Charges 521114 3,342,664 340,950 ‐ ‐ ‐ 4,768,552 517,850 8,970,015
City Information Tech Services 522109 14,043 311,639 ‐ ‐ ‐ 1,491,304 ‐ 1,816,986
Electricity 523100 3,019,000 650,634 ‐ ‐ ‐ 7,291,114 5,000 10,965,748
Natural Gas 523103 145,500 145,600 ‐ ‐ ‐ 719,950 2,200 1,013,250
Liability Insurance 525104 656,677 469,357 ‐ ‐ ‐ 407,011 4,927 1,537,972
Property Insurance 525107 351,586 2,327,709 ‐ ‐ ‐ 1,064,827 ‐ 3,744,122
Vehicle Insurance 525108 449,073 16,844 ‐ ‐ ‐ 235,386 2,520 703,823
Diesel Fuel 532100 409,033 1,916,435 ‐ ‐ ‐ 1,840,327 ‐ 4,165,794
Gasoline Fuel 532101 537,239 1,071,090 ‐ ‐ ‐ 695,584 1,216 2,305,129
9,032,452 7,728,067 29,770 ‐ ‐ 19,712,515 600,057 37,102,861
93

Fiscal Year 2021 Budget by Fund Trust & Tax Supported
Internal Agency Capital Debt Enterprise Special
General Fund Service Fund Fund Project Fund Service Fund Fund Revenue Fund Total
Account Budget Budget Budget Budget Budget Budget Budget Budget
Capital Outlay
Buildings 552000 ‐ 315,000 ‐ 679,291 ‐ 22,596,690 ‐ 23,590,981
Improvements Other than Bldgs 553000 ‐ ‐ ‐ 126,181,507 ‐ 82,154,076 ‐ 208,335,583
Vehicles, Equipment, Software 554000 1,117,268 6,939,175 ‐ 1,837,500 ‐ 2,798,922 463,415 13,156,280
Depreciation Expense 555000 ‐ ‐ ‐ ‐ ‐ 4,830,065 ‐ 4,830,065
1,117,268 7,254,175 ‐ 128,698,299 ‐ 110,373,731 463,415 247,906,887
Debt Service
Bond Principal 561000 ‐ ‐ ‐ ‐ 17,771,403 16,618,597 ‐ 34,390,000
Other Debt Principal 561001 ‐ ‐ ‐ ‐ ‐ 2,926,000 ‐ 2,926,000
Bond Interest Expense 561002 ‐ ‐ ‐ ‐ 6,830,589 8,210,381 ‐ 15,040,970
Other Debt Interest Expense 561003 ‐ ‐ ‐ ‐ ‐ 646,054 ‐ 646,054
‐ ‐ ‐ ‐ 24,601,992 28,401,032 ‐ 53,003,024
Transfers Out
Transfer Out‐Inter 571100 2,516,541 972,724 23,187,467 1,125,768 1,719,614 7,301,365 59,448,254 96,271,733
Transfer Out‐Intra 571200 ‐ 1,659,930 ‐ 2,545,000 11,581 76,543,548 ‐ 80,760,059
2,516,541 2,632,654 23,187,467 3,670,768 1,731,195 83,844,913 59,448,254 177,031,792
Total Expenditures 139,565,362 60,657,899 24,117,237 133,147,067 26,336,298 349,514,131 80,892,995 814,230,989
Net Revenues over/(under) Expenditures ‐ (3,408,513) ‐ (5,602,270) (11,581) (36,447,027) 321,002 (45,148,389)
94

Funds A fund is a self-balancing set of accounts used to maintain control over resources that are segregated for specific activities or objectives. The City of Cedar Rapids recognizes seven types of funds; the general fund, enterprise funds, internal services funds, trust and agency funds, capital project funds, debt service funds, and special revenue funds.
95
General Fund The General Fund is the primary operating fund of the City that accounts for all financial resources and expenditures, except those required to be accounted for in other funds. This fund includes areas such as police, fire, public works, library, and parks and recreation.
96

Highlights As in FY 2020, the FY 2021 general fund budget is balanced, meaning revenues equal expenditures. The total FY 2021 general fund revenue and expenditure budget is increasing $4.2M to $139.6M.
Summary of FTEs
FY 2020 Adjusted Change from FY 2020 FY 2021 Budget 958.80 5.12 963.92
The chart below details the FY 2021 budget by major object of expenditure for the general fund.
General Fund FYFY 2020 FY $ Change % Change
2019 Adopted 2021 From FY From FYActual Budget Budget 2020 2020
RevenuesTaxes 66,972,299$ 68,140,534$ 69,189,932$ 1,049,398$ Licenses & Permits 3,196,027$ 2,438,809$ 2,587,462$ 148,653$ Intergovernmental Grants 2,747,971$ 2,685,222$ 2,540,259$ (144,963)$ Charges for Services 26,695,832$ 16,153,821$ 17,127,612$ 973,791$ Fines & Forfeits 543,306$ 5,515,000$ 4,815,000$ (700,000)$ Proceeds of Long Term Liabilities -$ -$ -$ -$ Transfers In 40,458,686$ 36,057,172$ 37,877,892$ 1,820,720$ Other Revenue 6,984,004$ 4,392,524$ 5,427,206$ 1,034,682$ Total Revenues 147,598,125$ 135,383,082$ 139,565,362$ 4,182,281$ 3%
ExpendituresPersonal Services 88,390,606$ 93,208,372$ 96,583,238$ 3,374,866$ Discretionary Expenses 17,827,184$ 20,924,730$ 22,777,829$ 1,853,099$ Other Expenses 24,772,475$ 15,715,375$ 16,570,486$ 855,111$ Capital Outlay 656,357$ 800,800$ 1,117,268$ 316,468$ Debt Service -$ -$ -$ -$ Transfers Out 12,133,730$ 4,733,805$ 2,516,541$ (2,217,264)$ Total Expenditures 143,780,353$ 135,383,082$ 139,565,362$ 4,182,281$ 3%
Net Revenues over/(under) Expenditures 3,817,772$ -$ -$ 0$
Personal Services
$96,583,238 69%
Discretionary Expenses
$22,777,829 16%
Other Expenses$16,570,486
12%
Capital Outlay$1,117,268
1%
Transfers Out$2,516,541
2%
97

The following chart highlights the FY 2021 funding sources used to balance the general fund.
Other revenue includes sources such as interest, building rental, sale of assets, etc. Transfers include moving revenue from other funds (such revenue sources are road use tax, property tax revenue received thru employee benefit levies, etc.). Personal Services Personal services, which include the wage and benefit costs for the services provided by general fund departments, are the largest general fund expense at $96.6M. Personal service costs account for 69% of the general fund budget. For the FY 2021 budget, 73% of the personal service cost is wages and 27% is benefits. The history of wages and benefits is below.
The FY 2021 personal services budget includes: Wage adjustments for non-bargaining employees based on the external wage study and increases in wages
for bargaining employees based on approved bargaining agreements. A $2.8M reduction in personal services for anticipated vacancies during the year based on historical
information and projections. An increase in the City’s contribution to the Municipal Fire and Police Retirement System of Iowa from
24.41% to 25.31%. In FY 2021, $7.5M is budgeted for these expenses.
Funding Increases The budget contains the following key funding increases: Police - $97K to add 1 Digital Evidence Project Coordinator FTE to support the digital evidence program.
Taxes$69,189,932
50%
Licenses & Permits
$2,587,462 2%
Intergovernmental Grants
$2,540,259 2%
Charges for Services
$17,127,612 12%
Fines & Forfeits$4,815,000
3%
Transfers In$37,877,892
27%
Other Revenue$5,427,206
4%
FY 2017 FY 2018 FY 2019 Adopted FY 2021 From FY 2020Actual Actual Actual Budget Budget Incr / (Decr)
Wages 59,157,995 60,566,838 62,929,760 67,866,305 70,844,904 2,978,599 Benefits 26,519,994 26,474,020 25,460,846 25,342,067 25,738,335 396,267
85,677,989 87,040,858 88,390,606 93,208,372 96,583,238 3,374,866
98

Fire - $42K for consulting services for promotional assessment and recruitment testing materials, $10K for national fire operations reporting system subscription.
Building Services - $227K to add 2 Housing Inspector FTEs and associated equipment and training expenses to support the rental inspection program. This increase is partially offset by an increase of $80K in building permit revenue based on historical and projected information.
Public Works - $67K to add 1 Right of Way Permit Technician FTE to support the permitting process (funded by an increase in permit revenue), $104K to add 1 Flood Control Property Acquisition Agent FTE to support the acquisition process for the flood control system (funded from existing bonds for flood control), $90K to add 1 Civil Engineer FTE to support Americans with Disabilities Act compliance, $40K increase in wages for seasonals, $100K for bridge maintenance, $14K for pavement marking materials, and $16K for maintenance fees associated with a railroad agreement.
Parks & Recreation - $11K for a new mobile recreation program (includes adding .29 seasonal FTE), $13K for a new youth basketball program (includes adding .19 seasonal FTE), $100K for ash tree removal support, $8K for the downtown ambassador program, $25K for painting and caulking pools, $58K increase in wages for seasonals, and a decrease of 2.36 FTEs to offset a portion of the seasonal wage increase.
Information Technology - $268K for software maintenance, $49K for arbitrator storage, $200K for external support services, $47K for imagery services (one time request), and $91K for 1 new Asset Management FTE to support utility departments.
Finance - $34K for eprocurement software. Library - $10K overall decrease in revenue from eliminating fines on overdue materials; $40K increase in
expenses for security. Other Key Items in the Budget Increase in public safety health service expenses by $296K to $896K. $59K to fund a second position through Foundation 2 for mental health response. $177K for convention center and arena operating deficits. $1.1M for capital equipment. $58K increase in dues and memberships for the Mayor & Council budget based on projected expenses. $399K for economic development (includes $100K reallocated from the Mayor & Council budget). $350K for City Manager and City Council discretionary spending. $75K to subsidize the FY 2021 budgeted operating shortfall for golf. $60K for visual arts program. $1M for year four of five of the Neighborhood Finance Corporation commitment. Amphitheater revenue increased $140K to $1.1M. Expenditures increased $146K to $1.1M for a net
budgeted loss of $55K, which is $6K more than FY 2020 budgeted loss. $1.7M in revenue and expenses for a net budgeted profit of $16K relating to the Cedar Rapids Tourism
Office. Franchise tax revenue is increasing by $133K to $10.3M based on historical and projected information. Interest revenue is increasing $657K to $2.3M based on historical and projected information. Decreased police towing revenue of $645K based on projected information. $155K in revenue for private development site inspection fees to fund the 2 positions approved as part of
the FY 2020 budget process. Various revenue and expense increases/decreases based on historical and projected information. Allocation of General Fund Budget The total FY 2021 budget by general fund department is detailed below. The largest expenditures relate to public safety, public works, park and recreational activities, library, and information technology.
99

General Fund Reports General fund departments with expenditures in excess of revenues are considered subsidized by the overall general fund. The subsidy is the amount of support from funding sources such as property taxes or franchise fees. When reviewing actual revenue and expenditures of general fund departments, internal department charges (administration charges) from general fund departments to general fund departments are included in actuals to show the cost of service provided. These revenues and expenditures are not included in the adopted budget, but rather are adjusted for during budget amendment. Revenue from internal charges and transfers can fluctuate year to year due to staffing changes and personal service changes. To avoid repeat commentary, such changes that are immaterial to the overall general fund budget are excluded from the “Budget Highlights” on department pages.
% of % of FY 2021 General FY 2021 General
Expenditure Fund Expenditure FundDepartment Budget Budget Department Budget BudgetPolice 42,594,304 31% Human Resources 1,115,367 1%Public Works 23,808,574 17% Attorney 899,465 1%Fire 20,405,678 15% Council & Mayor 644,232 <1%Parks & Recreation 12,271,020 9% City Clerk 633,159 <1%Library 7,026,211 5% Civil Rights 562,705 <1%Information Technology 6,976,231 5% Capital Replacement 335,000 <1%Finance Department 5,432,110 4% Investment Earnings 201,137 <1%Building Services 3,564,475 3% Downtown 196,051 <1%City Manager 2,401,478 2% Band 120,019 <1%Street Lighting 2,225,000 2% Building Demolition 100,000 <1%Cedar Rapids Tourism Center 1,689,464 1% School Crossing Guards 62,830 <1%Community Development 1,643,442 1% Bridge Maintenance 58,270 <1%Memorial 1,632,178 1% Ag Lands 23,873 <1%Development Services 1,572,012 1% Gateway Maintenance 12,596 <1%Contingent 1,358,483 1% Total General Fund 139,565,362 100%
100

Department Description and Core Services The Chief of Police is responsible for the Police Department. The Cedar Rapids Police Department is the primary full service law enforcement agency within the corporate limits of the City of Cedar Rapids. Office of the Chief of Police or Administration provides planning, research and development, accreditation,
public information, fiscal management, SAFE-CR, and professional standards. Patrol consists of all police personnel specifically assigned to perform uniformed services of handling calls
for service, responding to emergencies, and providing for the safety and needs of the citizens through community policing.
Community Services consists of full-time and part-time units assigned to perform various law enforcement and community service functions including school resource officers, traffic unit officers, K9 unit, Police Community Action Team unit, and special operations, which includes the Special Response Team, Hazardous Devices Unit, Honor Guard, Crisis Negotiations, and District Lieutenant community policing.
Criminal Investigation consists of detectives and investigators assigned to the investigation of crimes occurring within the City.
Training manages the recruitment of new police officers and the operation of the Cedar Rapids Police Academy. Training manages and conducts the in-service training program required to maintain the police officers’ state certifications.
Animal Care and Control provides animal control services and sheltering for the City of Cedar Rapids and provides sheltering for the City of Marion.
Did you know? Our Statistics… Police Officers handled over 145K calls for service in calendar 2018. These calls include both citizen and
officer generated activity. The Police records department processed over 21K reports in calendar 2018. In calendar 2018, over 2.5K cases were assigned to investigators within the Criminal Investigation Division. From January 1st - August 31st 2019, the Police Department recovered 99 firearms through criminal
investigations or other police involvement/actions. Animal Control investigated 461 bite reports and 124 animal-on-animal attacks in calendar 2018. Our Recent Accomplishments… The body-worn camera program that started with five pilot program cameras in 2017, has expanded to 200
cameras. Now with 200 cameras utilized by Police Officers, this will allow for full implementation of the body camera program.
The Police Department was awarded full advanced accreditation by the Commission on Accreditation for Law Enforcement Agencies, Inc. on May 4, 2019, through verifying adherence to 484 standards.
The Police Department was awarded a FY 2019 Justice and Mental Health Collaboration Program grant that will allow for the expansion of a partnership with Foundation 2 to improve mental health response.
On December 19, 2018, the Police Department announced the arrest for the 1979 murder of Michelle Martinko. It was through advanced DNA technology and investigative work that cold case investigators were able to identify the suspect.
Challenges & Opportunities Expansion of the proactive policing camera project. (Current locations include Green Square Park and
Redmond Park.) Find innovative ways to maintain and expand the use of digital evidence while effectively managing the
volume of digital evidence.
GENERAL FUND
Police
101

Implementing the municipal infraction process. Continue efforts to reduce gun-related violence in neighborhoods in high-risk areas.
Goals
Department Goal: Continued expansion of both the proactive policing camera system and the voluntary surveillance camera registration program. The expansion of the City camera network and the citizen registered camera systems may aid in the reduction of crime and the apprehension of criminals. Camera footage can be instrumental in solving and prosecuting crimes. Relates to City Goal: Protect CR Time Frame: Working to Meet Goal
Key Measure Target Goal
FY 2018 Actual
FY 2019 Actual
FY 2020 Projected
FY 2021 Projected
Combined total of registered citizen systems and city owned
cameras 300 N/A 119 170 220
Department Goal: Carry out a comprehensive strategy through zero tolerance efforts, community outreach programs, neighborhood enhancements, and crime stoppers, which will deter offenders from committing violent gun crimes thereby reducing the number of gun related crimes of violence incidents that occur in Cedar Rapids. Relates to City Goal: Protect CR Time Frame: Working to Meet Goal
Key Measure Target Goal
Calendar 2017
Actual
Calendar 2018
Actual
Calendar 2019
Projected
Calendar 2020
Projected
Reduce the number of shootings 60 or fewer incidents 103 117 100 80
Financial Summary
Police FYFY 2020 FY $ Change % Change
2019 Adopted 2021 From FY From FYActual Budget Budget 2020 2020
RevenuesTaxes -$ -$ -$ -$ Licenses & Permits 14,279$ 14,060$ 14,060$ -$ Intergovernmental Grants 210,907$ 103,682$ 107,236$ 3,554$ Charges for Services 1,089,619$ 1,161,833$ 1,121,142$ (40,691)$ Fines & Forfeits 324,463$ 5,300,000$ 4,700,000$ (600,000)$ Proceeds of Long Term Liabilities -$ -$ -$ -$ Transfers In 2,877,193$ 3,266,154$ 3,149,056$ (117,098)$ Other Revenue 6,914$ 2,500$ 2,500$ -$ Total Revenues 4,523,376$ 9,848,229$ 9,093,994$ (754,235)$ -8%
ExpendituresPersonal Services 28,319,767$ 30,201,693$ 31,379,588$ 1,177,895$ Discretionary Expenses 4,298,381$ 5,613,120$ 7,119,328$ 1,506,208$ Other Expenses 5,739,058$ 3,536,233$ 3,626,973$ 90,740$ Capital Outlay 118,282$ -$ 5,000$ 5,000$ Debt Service -$ -$ -$ -$ Transfers Out -$ 2,058,312$ 463,415$ (1,594,897)$ Total Expenditures 38,475,488$ 41,409,358$ 42,594,304$ 1,184,946$ 3%
Net Revenues over/(under) Expenditures (33,952,112)$ (31,561,130)$ (33,500,310)$ (1,939,181)$
102

Budget Highlights Summary
of FTEs FY 2020 Adjusted Change from FY 2020 FY 2021 Budget
266.00 1.00 267.00 Highlight of changes: External charges for services revenue increased $4K in association with approved School Resource Officer
agreements. Total budgeted revenue for the nine School Resource Officers is $629K (PROTECT CR). Included in the revenue budget is $107K for a position funded by the High Intensity Drug Trafficking Program
(increase of $4K from FY 2020; PROTECT CR). Decreased towing revenue based on projected information ($645K). Health service expenses are increasing by $99K to $551K based on historical and recent actual costs. Other professional services increased by $59K to fund a second position through Foundation 2 for mental
health response (PROTECT CR). Overtime is increasing $40K to $663K due to bargaining wage adjustments. Decrease of $23K for software maintenance of Police Department body cameras as budget was reallocated
to the Information Technology in FY 2020. Adding 1 Digital Evidence Project Coordinator FTE ($97K) to support digital evidence program (STRENGTHEN
CR).
103

Department Description and Core Services The Fire Chief is responsible for the Fire Department. The Fire Department provides fire suppression, emergency medical services, and fire prevention to citizens, businesses, and visitors to the City of Cedar Rapids. The Emergency Response section includes fire suppression, emergency medical services, hazardous
materials mitigation, and special operations response. The Employee Training and Preparedness section ensures that all Fire Department employees have
adequate training and certifications to provide efficient and effective delivery of fire department programs and emergency services, including emergency medical services, fire suppression, hazardous materials response and mitigation, and technical rescue response.
The Fire Marshal’s Office includes fire inspections, fire investigations, and public education. Fire inspection staff provide fire code compliance inspections, acceptance inspections, and pre-fire plans. Fire inspections ensure that all occupants have a safe means of ingress and egress to buildings, apartments, and major events. Public education provides fire and life safety programs to area schools and businesses, as well as a smoke alarm installation program.
The Administration section is responsible for planning, organizing, and directing all operations of the Fire Department, including personnel administration, customer feedback, performance measures, budget, organization management, procurement, and asset management.
Did you know? Our Statistics… The total fire loss for FY 2019 was $9.3M. However, the total value of properties that had a fire incident was
$99.4M. The Fire Department preserved over $90M of property and content value by efficient and effective fire response.
The Fire Department responded to over 12K incidents in FY 2019, conducted fire inspections at over 4500 businesses and industries, investigated 92 fire and explosive related incidents, and presented fire prevention and life safety information to the community through more than 20 community education programs.
Our Recent Accomplishments… In calendar year 2019, the Fire Department hired a third party consultant to develop and administer the
Assistant Fire Chief promotional assessment process. This is the first time in more than 25 years the Fire Department has used an external agency to develop and administer the promotional assessment process. The use of an external consultant for this process will ensure the validity and reliability of the promotional process.
In the summer of 2019, the Fire Department partnered with the Police Department to train in and deploy the City’s active threat response plan.
The Fire Department’s accredited agency status, earned in August 2018 through the Center for Public Safety Excellence Commission on Fire Accreditation International, requires annual compliance submissions until re-accreditation in 2023. The annual compliance report was submitted, accepted, and approved for 2019, the first annual report of accreditation compliance for this cycle.
Challenges & Opportunities Maintain accreditation process and schedule to ensure the Department is in line to meet annual reporting
obligations to be re-accredited through the Center for Public Safety Excellence in 2023. Partner with Community Development to forecast potential areas of population growth in the City and
complete a comprehensive station location study to forecast station location needs for the next five to ten years.
FUND TYPE
Department GENERAL FUND
Fire
104

Replace the inventory of self-contained breathing apparatus, upgrading to most recent model and most recent requirements of the National Fire Protection Association standards.
Complete the installation of the fire station alerting system, upgrading a 20-year-old system. Goals
Department Goal: Arrive at scene within seven and one half minutes from dispatch at 90% of emergency calls, which was established by Cedar Rapids Fire Department during an accreditation process. Relates to City Goal: Protect CR Time Frame: Working to Meet Goal
Key Measure Target Goal
FY 2018 Actual
FY 2019 Actual
FY 2020 Projected
FY 2021 Budgeted
Percentage of emergency calls from dispatch to arrival on scene
with a response time of seven and one half minutes or less
90% 90% 84.9% 90% 90%
Department Goal: Contain fires to the room or object of origin for at least 75% of all residential and commercial fires to meet national averages on this statistic. Relates to City Goal: Protect CR Time Frame: Working to Meet Goal
Key Measure Target Goal
FY 2018 Actual
FY 2019 Actual
FY 2020 Projected
FY 2021 Budgeted
Percentage of fires contained to the room or object of origin 75% 76.7% 72.8% 75% 75%
Financial Summary
Fire FYFY 2020 FY $ Change % Change
2019 Adopted 2021 From FY From FYActual Budget Budget 2020 2020
RevenuesTaxes -$ -$ -$ -$ Licenses & Permits -$ -$ -$ -$ Intergovernmental Grants 4,451$ -$ -$ -$ Charges for Services 833,517$ 778,830$ 778,830$ -$ Fines & Forfeits -$ -$ -$ -$ Proceeds of Long Term Liabilities -$ -$ -$ -$ Transfers In 1,619,324$ 1,839,433$ 1,702,191$ (137,242)$ Other Revenue 5,625$ 5,000$ 5,000$ -$ Total Revenues 2,462,918$ 2,623,263$ 2,486,021$ (137,242)$ -5%
ExpendituresPersonal Services 17,137,059$ 17,269,999$ 18,049,758$ 779,759$ Discretionary Expenses 1,587,293$ 1,368,203$ 1,055,740$ (312,463)$ Other Expenses 2,571,823$ 1,186,080$ 1,295,179$ 109,099$ Capital Outlay 106,960$ -$ -$ -$ Debt Service -$ -$ -$ -$ Transfers Out -$ 5,000$ 5,000$ -$ Total Expenditures 21,403,134$ 19,829,283$ 20,405,678$ 576,395$ 3%
Net Revenues over/(under) Expenditures (18,940,216)$ (17,206,020)$ (17,919,657)$ (713,637)$
105

Budget Highlights Summary
of FTEs FY 2020 Adjusted Change from FY 2020 FY 2021 Budget
148.48 0.00 148.48 Highlight of changes: Overtime is increasing $18K to $534K due to bargaining wage adjustments. Health service expenses are increasing $197K to $345K based on historical and recent actual costs. Increase of $42K for consulting services for promotional assessment and recruitment testing materials
(PROTECT CR). Increase of $10K for national fire operations reporting system subscription (PROTECT CR).
106

Department Description and Core Services The Building Services Director is responsible for the Building Services Department. The Building Services Department assists builders and the general public with construction codes and other regulations. The Housing Inspections section is responsible for inspections of all residential rental properties within
Cedar Rapids’ limits, as well as rental property complaints. The Building and Trades section provides code inspection for all construction work permitted in Cedar
Rapids, including building, plumbing, electrical, and mechanical permits. The Zoning Enforcement section enforces requirements set forth in the text of chapter 32 of the municipal
code. The Zoning ordinance is adopted with the purpose of improving health, safety, and general welfare of the neighborhoods in our community.
The Nuisance section investigates nuisance complaints and works with property owners and other responsible parties to abate the nuisance in a timely manner. The nuisance ordinance, as set forth in the text of chapters 22, 25, and 29 of the municipal code, governs the abatement of nuisance in our community.
The Administration section is responsible for personnel administration, customer service, training and certification, budget, purchasing, and asset management.
Did you know? Our Statistics… Building Services reviewed 141 new single-family duplex/townhouse dwellings in FY 2019. Building Services issued 18 new multi-family permits covering 630 residential dwelling units with a total
valuation of $67.5M in FY 2019. Building Services performed 18.5K inspections in FY 2019. The reported value for all construction reported in FY 2019 was $330M. Building Services performs 4K regular rental housing inspections and 3.5K re-inspections annually in
enforcement of the City rental housing code. Our Recent Accomplishments… In FY 2019, staff managed the demolition of 11 structures through our nuisance enforcement activities, as
well as provided support for 3 property acquisitions and demolition for the flood control system. Of the 11 structures demolished, 3 structures were done by the City with the property being assessed.
The Building Services Department building and trades inspectors performed 1.9K cross trade inspections in FY 2019. This demonstrates staff commitment of being cross-trained in multi-disciplines for better service to our community.
Building Services streamlined the payment process for customers by offering “bulk” invoicing, which allows customers to pay for multiple permits at once, through an electronic invoice. This allows customers to request inspections immediately after issuance. In the past, inspection requests could not occur until payments were processed. This improves the customer experience and expedites the inspection process.
Created an electronic plan review station for small commercial and residential projects, creating a more coordinated experience for our customers.
Challenges & Opportunities Continue to respond in a timely manner to citizen complaints to our nuisance and zoning division to
eliminate blight and violations in our neighborhoods. Continue to explore new construction products and equipment proposed by the construction industry in
order to determine code compliance meeting national codes and standards. Continue to explore enhancements to the plan review process and inspection request process to enhance
the customer’s experience.
GENERAL FUND
Building Services
107

Goals Department Goal: Provide plan review of single family dwelling construction to meet industry standards. Relates to City Goal: Protect CR Time Frame: Met Goal
Key Measure Target Goal
FY 2018 Actual
FY 2019 Actual
FY 2020 Projected
FY 2021 Budgeted
Plans examination within 3 days of plan submission 95% 99% 98% 95% 95%
Department Goal: Perform inspections to meet industry standards. Relates to City Goal: Protect CR Time Frame: Met Goal
Key Measure Target Goal
FY 2018 Actual
FY 2019 Actual
FY 2020 Projected
FY 2021 Budgeted
Inspections requested from customers should occur in 48 hours of inspection request
95% 98% 98% 95% 95%
Financial Summary
Budget Highlights
Summary of FTEs
FY 2020 Adjusted Change from FY 2020 FY 2021 Budget 30.00 2.00 32.00
Highlight of changes: Increase of $80K in building permit revenue based on historical and projected information. Adding 2 Housing Inspector FTEs and associated equipment and training expenses to support the rental
inspection program ($187K; STRENGTHEN CR).
Building Services FYFY 2020 FY $ Change % Change
2019 Adopted 2021 From FY From FYActual Budget Budget 2020 2020
RevenuesTaxes -$ -$ -$ -$ Licenses & Permits 2,641,190$ 2,167,679$ 2,247,679$ 80,000$ Intergovernmental Grants 3,077$ -$ -$ -$ Charges for Services 447,663$ 323,570$ 323,570$ -$ Fines & Forfeits 54,514$ 22,500$ 22,500$ -$ Proceeds of Long Term Liabilities -$ -$ -$ -$ Transfers In -$ -$ -$ -$ Other Revenue 3,882$ 1,500$ 1,500$ -$ Total Revenues 3,150,326$ 2,515,249$ 2,595,249$ 80,000$ 3%
ExpendituresPersonal Services 2,791,062$ 2,916,314$ 3,180,882$ 264,568$ Discretionary Expenses 128,833$ 174,875$ 178,875$ 4,000$ Other Expenses 621,555$ 194,637$ 204,718$ 10,081$ Capital Outlay -$ -$ -$ -$ Debt Service -$ -$ -$ -$ Transfers Out -$ -$ -$ -$ Total Expenditures 3,541,450$ 3,285,826$ 3,564,475$ 278,649$ 8%
Net Revenues over/(under) Expenditures (391,124)$ (770,577)$ (969,226)$ (198,649)$
108

Department Description and Core Services The Building Services Director is responsible for the Building Demolition department ID. The Building Demolition department ID of the General Fund uses this department ID to track revenues and expenditures for assessed demolitions. Financial Summary
Budget Highlights Highlight of changes: No changes.
Building Demolition FYFY 2020 FY $ Change % Change
2019 Adopted 2021 From FY From FYActual Budget Budget 2020 2020
RevenuesTaxes -$ -$ -$ -$ Licenses & Permits -$ -$ -$ -$ Intergovernmental Grants -$ -$ -$ -$ Charges for Services -$ -$ -$ -$ Fines & Forfeits -$ -$ -$ -$ Proceeds of Long Term Liabilities -$ -$ -$ -$ Transfers In -$ -$ -$ -$ Other Revenue 40,737$ 100,000$ 100,000$ -$ Total Revenues 40,737$ 100,000$ 100,000$ -$ 0%
ExpendituresPersonal Services -$ -$ -$ -$ Discretionary Expenses 43,274$ 100,000$ 100,000$ -$ Other Expenses 15,317$ -$ -$ -$ Capital Outlay -$ -$ -$ -$ Debt Service -$ -$ -$ -$ Transfers Out -$ -$ -$ -$ Total Expenditures 58,591$ 100,000$ 100,000$ -$ 0%
Net Revenues over/(under) Expenditures (17,854)$ -$ -$ -$
FUND TYPE
Department FUND TYPE
Department FUND TYPE
Department FUND TYPE
Department FUND TYPE
Department FUND TYPE
Department FUND TYPE
Department FUND TYPE
Department FUND TYPE
Department FUND TYPE
Department GENERAL FUND
Building Demolition
109

Department Description and Core Services The Public Works Director is responsible for the Public Works Department. The Public Works Department maintains and provides future public works infrastructure for all segments of the City. The Engineering section is responsible for the design and construction of city and private development
projects. The Traffic section is responsible for the engineering, operation, and maintenance of all traffic control on
the City’s transportation network. The Streets section is responsible for maintenance and rehabilitation of streets and winter maintenance/
snow removal. The Real Estate and Right of Way section is responsible for securing property interest for City projects, right
of way use oversight, and the disposition City assets. The Administration section is responsible for planning and directing all operations of the public works
department including asset management, budget, customer service, and training.
Did you know? Our Statistics… The Public Works Department currently maintains over 640 centerline street miles (almost 2K lane miles). The Public Works Department completes over 7K work orders annually. The Engineering Division oversees the design and construction of projects with a total construction cost of
over $60M each year. During a normal winter, which averages 32 inches of snow, over 9K tons of salt are used to improve roadway
conditions during snow and ice events. The Traffic division maintains over 1.8M linear feet of pavement markings and symbols each year. The City
also maintains more than 200 signals, flashers, and other electronic control devices. The City has 72 miles of off and on street bicycle facilities throughout the city and into the county and
earned Bronze status as a Bicycle Friendly Community. In FY 2019, the City issued over 3K right of way permits. In FY 2019, the City completed 296 partial and total acquisitions required for the City’s public improvement
projects. On a rotational basis, streets mows the quadrants of town using routing similar to the sweeping program.
Two mowing rotations of right of way are completed each month, including City owned properties. In FY 2019, Streets completed 69 projects totaling almost 7K cubic yards of concrete. Our Recent Accomplishments… Streets Division completed 24 Paving for Progress projects in 2019, up from 18 in 2018. Traffic staff reviewed and updated the traffic signal timing to 90% of the traffic signals throughout the city,
updating pedestrian timings and improving traffic flow (FY 2019). The Real Estate Division disposed $334K of excess city owned property/right-of-way to facilitate new
development/redevelopment (FY 2019). One-way to two-way conversion has been completed throughout the Downtown District after completing
converting 3rd Avenue (FY 2020).
Challenges & Opportunities Identifying future infrastructure needs and costs for the 5 growth areas in EnvisionCR. Design and construct a flood control system to protect the City from future flooding. Continue to upgrade a street system where at the start of the Paving for Progress Program 34% of
pavements were in poor or fair condition; effectively communicate the need for this program beyond the initial 10 years to the citizens.
GENERAL FUND
Public Works Department
110

Goals Department Goal: Replace aging signalized intersections to improve safe movement of vehicles and people throughout the City. Relates to City Goal: Connect CR Time Frame: Working to Meet Goal
Key Measure Target Goal
FY 2018 Actual
FY 2019 Actual
FY 2020 Projected
FY 2021 Projected
Number of signals replaced 10 12 9 10 12 Department Goal: Utilize the Paving for Progress funds to improve the condition of the City’s street system. Relates to City Goal: Invest CR Time Frame: Working to Meet Goal
Key Measure Target Goal
FY 2018 Actual
FY 2019 Actual
FY 2020 Projected
FY 2021 Projected
Linear miles of roadway improved 15 8.1 11.5 14.5 7.8
Department Goal: Construct a permanent flood control system in accordance with the City Council approved master plan to protect the City from future flooding. Relates to City Goal: Protect CR Time Frame: Working to Meet Goal
Key Measure Target Goal
FY 2018 Actual
FY 2019 Actual
FY 2020 Projected
FY 2021 Projected
Percentage Complete 6% Annually 8% 5% 5% 6%
Financial Summary
Budget Highlights
Summary of FTEs
FY 2020 Adjusted Change from FY 2020 FY 2021 Budget 161.81 3.00 164.81
Public Works FYFY 2020 FY $ Change % Change
2019 Adopted 2021 From FY From FYActual Budget Budget 2020 2020
RevenuesTaxes -$ -$ -$ -$ Licenses & Permits 305,938$ 66,500$ 133,753$ 67,253$ Intergovernmental Grants 90,726$ 78,948$ 78,948$ -$ Charges for Services 4,201,759$ 4,175,433$ 4,733,851$ 558,418$ Fines & Forfeits 500$ -$ -$ -$ Proceeds of Long Term Liabilities -$ -$ -$ -$ Transfers In 10,924,069$ 10,906,748$ 10,907,203$ 455$ Other Revenue 58,897$ 41,500$ 41,500$ -$ Total Revenues 15,581,889$ 15,269,129$ 15,895,255$ 626,126$ 4%
ExpendituresPersonal Services 15,208,509$ 15,557,311$ 16,564,179$ 1,006,868$ Discretionary Expenses 2,944,112$ 2,713,866$ 2,843,866$ 130,000$ Other Expenses 5,955,603$ 3,822,814$ 4,400,528$ 577,714$ Capital Outlay 68,678$ -$ -$ -$ Debt Service -$ -$ -$ -$ Transfers Out -$ -$ -$ -$ Total Expenditures 24,176,902$ 22,093,992$ 23,808,574$ 1,714,582$ 8%
Net Revenues over/(under) Expenditures (8,595,013)$ (6,824,862)$ (7,913,318)$ (1,088,456)$
111

Highlight of changes: The budget includes $4.4M to fund staff time on capital improvement projects with funding sources such as
bonds, enterprise user fees, tax increment financing, streets local option sales tax, and Iowa Flood Mitigation funds.
Internal charges for services revenue decreased by $57K for the Solid Waste Leaf removal program and $8K for traffic signals expenses charged to Street Lighting. These were offset by increases of $10K for traffic control services for Sewer, $14K for other streets materials, and $40K for staff time funded by bonds and enterprise user fees.
The budget includes an additional $155K in other revenues for private development site inspection fees to fund the cost of 2 FTE’s added in FY 2020 to provide this service.
Adding 1 FTE Right of Way Permit Technician FTE to support the permitting process ($67K) funded with an increase in right of way revenue of $67K based on historical and projected information (PROTECT CR).
Adding 1 Flood Control Property Acquisition Agent FTE to support the acquisition process for the flood control system ($104K) funded with approved general obligation bonds for flood control (PROTECT CR).
Adding 1 Civil Engineer FTE to support Americans with Disabilities Act compliance ($90K; PROTECT CR). Increase of temporary seasonal wage budget by $50K of which $40K is wages (CONNECT CR). Increase of $100K for bridge maintenance (PROTECT CR). Increase of $14K for pavement marking materials (CONNECT CR). Increase of $16K for maintenance fees relating to an agreement with Union Pacific Railroad (INVEST CR).
112

Department Description and Core Services The Public Works Director is responsible for the Street Lighting department ID. The Street Lighting department ID of the General Fund uses this department ID to track revenues and expenditures associated with the installation and maintenance of street lights, which includes the associated electricity cost. Financial Summary
Budget Highlights No changes.
Street Lighting FYFY 2020 FY $ Change % Change
2019 Adopted 2021 From FY From FYActual Budget Budget 2020 2020
RevenuesTaxes -$ -$ -$ -$ Licenses & Permits -$ -$ -$ -$ Intergovernmental Grants 2,480$ 2,000$ 2,000$ -$ Charges for Services -$ -$ -$ -$ Fines & Forfeits -$ -$ -$ -$ Proceeds of Long Term Liabilities -$ -$ -$ -$ Transfers In 250,000$ 250,000$ 514,000$ 264,000$ Other Revenue -$ 1,200$ 1,200$ -$ Total Revenues 252,480$ 253,200$ 517,200$ 264,000$ 104%
ExpendituresPersonal Services -$ -$ -$ -$ Discretionary Expenses 12,000$ 12,000$ 12,000$ -$ Other Expenses 2,048,759$ 2,144,000$ 2,213,000$ 69,000$ Capital Outlay -$ -$ -$ -$ Debt Service -$ -$ -$ -$ Transfers Out -$ -$ -$ -$ Total Expenditures 2,060,759$ 2,156,000$ 2,225,000$ 69,000$ 3%
Net Revenues over/(under) Expenditures (1,808,279)$ (1,902,800)$ (1,707,800)$ 195,000$
FUND TYPE
Department FUND TYPE
Street Lighting Department GENERAL FUND
Street Lighting
113

Department Description and Core Services The Public Works Director is responsible for the School Crossing Guard department ID. The School Crossing Guards department ID of the General Fund uses this department ID to track cost-sharing expenses with the Cedar Rapids Community School District for crossing guards at cross walks near schools. Financial Summary
Budget Highlights Highlight of changes: No changes.
School Crossing Guards FYFY 2020 FY $ Change % Change
2019 Adopted 2021 From FY From FYActual Budget Budget 2020 2020
RevenuesTaxes -$ -$ -$ -$ Licenses & Permits -$ -$ -$ -$ Intergovernmental Grants -$ -$ -$ -$ Charges for Services -$ -$ -$ -$ Fines & Forfeits -$ -$ -$ -$ Proceeds of Long Term Liabilities -$ -$ -$ -$ Transfers In -$ -$ -$ -$ Other Revenue -$ -$ -$ -$ Total Revenues -$ -$ -$ -$ 0%
ExpendituresPersonal Services -$ -$ -$ -$ Discretionary Expenses 40,393$ 62,830$ 62,830$ -$ Other Expenses -$ -$ -$ -$ Capital Outlay -$ -$ -$ -$ Debt Service -$ -$ -$ -$ Transfers Out -$ -$ -$ -$ Total Expenditures 40,393$ 62,830$ 62,830$ -$ 0%
Net Revenues over/(under) Expenditures (40,393)$ (62,830)$ (62,830)$ -$
FUND TYPE
Department FUND TYPE
Department GENERAL FUND
School Crossing Guards
114

Department Description and Core Services The Public Works Director is responsible for the Bridge Maintenance department ID. The Bridge Maintenance department ID of the General Fund uses this department ID to track revenues and expenditures associated with the inspection of the bridges of the City. Minor bridge maintenance repairs within the capability and capacity of Public Works Department are performed by the Streets section. More significant repairs, modifications, or modernizations are funded through capital improvement projects. Financial Summary
Budget Highlights Highlight of changes: No changes.
Bridge Maintenance FYFY 2020 FY $ Change % Change
2019 Adopted 2021 From FY From FYActual Budget Budget 2020 2020
RevenuesTaxes -$ -$ -$ -$ Licenses & Permits -$ -$ -$ -$ Intergovernmental Grants -$ -$ -$ -$ Charges for Services -$ -$ -$ -$ Fines & Forfeits -$ -$ -$ -$ Proceeds of Long Term Liabilities -$ -$ -$ -$ Transfers In 48,770$ 48,770$ 48,770$ -$ Other Revenue -$ -$ -$ -$ Total Revenues 48,770$ 48,770$ 48,770$ -$ 0%
ExpendituresPersonal Services -$ -$ -$ -$ Discretionary Expenses 76,943$ 57,920$ 57,920$ -$ Other Expenses 232$ 350$ 350$ -$ Capital Outlay -$ -$ -$ -$ Debt Service -$ -$ -$ -$ Transfers Out -$ -$ -$ -$ Total Expenditures 77,175$ 58,270$ 58,270$ -$ 0%
Net Revenues over/(under) Expenditures (28,405)$ (9,500)$ (9,500)$ -$
FUND TYPE
Department FUND TYPE
Department GENERAL FUND
Bridge Maintenance
115

Department Description and Core Services The Community Development Director is responsible for the Community Development Department. The Community Development Department is responsible for promoting vitality, affordable housing, regional connectivity, and sustainable development. Planning Services provides planning to create healthy and vibrant neighborhoods, with a focus on the cross-
departmental implementation of those plans to achieve results. Housing Services provides coordination and oversight of the federal housing and community development
funds awarded by the United States Department of Housing and Urban Development, including inspections, rent payment, rehabilitation, and creation of new housing.
Corridor Metropolitan Planning Organization performs regional transportation planning and distributes federal funds for transportation projects such as roads, trails, and transit.
Did you know? Our Statistics… Assisted 30 first-time homebuyers with down payment assistance averaging $5K each and assisted an
additional 17 households through our Owner-Occupied Rehab Program for a total of $150K in FY 2019. In FY 2019, Section 8 housing programs served over 1K families, of which more than half are elderly or
disabled, with over $5M in rental assistance paid directly to Linn and Benton County landlords. 53 Family Self-Sufficiency participants had positive escrow savings account balance totaling over $100K, and
9 program participant graduates with savings disbursements near $3K per graduate in FY 2019. Our Recent Accomplishments… One year anniversary of the Neighborhood Finance Corporation’s Cedar Rapids office opening their doors.
They provided 28 households with mortgages in 7 targeted neighborhoods equaling a total public-private investment of $1M. They were able to secure an $8M loan pool from local banks, $1M per year commitment by City for forgivable loans, and $1M in private funds for one-time start-up costs.
In FY 2019, two properties received Local Historic Landmark designation. Distributed $84K in FY 2020 through the City’s Historic Rehabilitation Program to fund 16 projects. Starting in the spring of 2016 and concluding in the fall of 2018, conducted over 40 public outreach
opportunities with hundreds of residents participating in the drafting of the College District Action Plan and the City’s new zoning code – ReZone Cedar Rapids.
The first season of the bike share program (150 bicycles and 30 scooters) concluded with 18K rides on bicycles over the seven months of the season and 12K rides on scooters in two months. The scooter element of the program began in August 2019 to coincide with the return of college students.
Challenges & Opportunities Build partnerships with the Department of Human Services and Foundation 2 Aftercare Services to provide
rental housing assistance for identified young adults who have recently aged out of foster care utilizing newly created United States Department of Housing and Urban Development program funding. Cedar Rapids is the only eligible community in Iowa to agree to participate in this program.
Draft and implement the Czech Village/NewBo Area Action Plan with an emphasis on the opportunities within the former Sinclair site and development of the greenway park in Czech Village.
Coordinating with small scale developers to create a pilot initiative to attract infill development on Ellis Boulevard NW.
Continue to monitor implementation of the zoning code to identify potential improvements. Through the River Recreation Study, identify preferred river recreation amenities and potential funding
sources for implementation.
GENERAL FUND
Community Development
116

Determine future mitigation strategies based on the completed Cedar Lake Watershed Master Plan to support long-term success of ConnectCR.
Continue to monitor and improve bike share program in partnership with VeoRide.
Goals Department Goal: Address changing housing needs by providing safe, sanitary, and sustainable housing assistance throughout the Linn and Benton County area. Relates to City Goal: Strengthen CR Time Frame: Working to Meet Goal
Key Measure Target Goal
FY 2018 Actual
FY 2019 Actual
FY 2020 Projected
FY 2021 Projected
Number of participants 7 annually New Program
New Program
7 25
Provide housing assistance payments
1,000 or more
families annually
1,125 950 1,048 1,100
Department Goal: Provide wide range of quality affordable housing options with housing in core neighborhoods to support businesses and create 24 hours a day, 7 days a week vitality. Relates to City Goal: Strengthen CR Time Frame: Met Goal
Key Measure Target Goal
FY 2018 Actual
FY 2019 Actual
FY 2020 Projected
FY 2021 Budgeted
Construction of new dwelling units (rental & owner occupied)
125 units annually 562 316 510 424
Financial Summary
Community Development FYFY 2020 FY $ Change % Change
2019 Adopted 2021 From FY From FYActual Budget Budget 2020 2020
RevenuesTaxes -$ -$ -$ -$ Licenses & Permits -$ -$ -$ -$ Intergovernmental Grants 2,700$ -$ -$ -$ Charges for Services 566,460$ 564,211$ 578,595$ 14,384$ Fines & Forfeits -$ -$ -$ -$ Proceeds of Long Term Liabilities -$ -$ -$ -$ Transfers In 48$ -$ -$ -$ Other Revenue 503$ -$ -$ -$ Total Revenues 569,711$ 564,211$ 578,595$ 14,384$ 3%
ExpendituresPersonal Services 1,197,631$ 1,316,819$ 1,374,087$ 57,268$ Discretionary Expenses 96,104$ 173,517$ 73,517$ (100,000)$ Other Expenses 405,131$ 67,523$ 70,838$ 3,315$ Capital Outlay -$ -$ -$ -$ Debt Service -$ -$ -$ -$ Transfers Out 78$ 25,000$ 125,000$ 100,000$ Total Expenditures 1,698,943$ 1,582,859$ 1,643,442$ 60,583$ 4%
Net Revenues over/(under) Expenditures (1,129,232)$ (1,018,648)$ (1,064,847)$ (46,199)$
117

Budget Highlights Summary
of FTEs FY 2020 Adjusted Change from FY 2020 FY 2021 Budget
14.80 0.00 14.80 Highlight of changes: No changes.
118

Department Description and Core Services The Deputy City Manager is responsible for the Development Services Department. The Development Services Department provides land and economic development services to the
community. The Development Services project team provides comprehensive reviews of new development and re-development projects submitted to the City, ensuring responsive and efficient service to the development community.
Through Administration, the Development Services project team coordinates closely with these city departments also serving land development functions: Public Works, Community Development, Building Services, and Utilities.
Did you know? Our Statistics… The Development Services Department received 688 commercial building permit requests in FY 2019
equating to a total valuation over $254M. This includes commercial remodels and new construction projects.
The City of Cedar Rapids received 313 applications for new land development cases in FY 2019. Our Recent Accomplishments… During 2018, 46 variances to the previous zoning code were approved. Since the new zoning code was
implemented in January 2019, only three variances to the code were approved.
Challenges & Opportunities Collaborate with the development community and City departments to update the subdivision, sign and
parking lot ordinances. These ordinances will be made consistent with the updated zoning code and statewide engineering design standards.
The City’s innovation working group is assisting Development Services in developing methods for improved site plan compliance.
Goals
Department Goal: Efficiently manage applications to assist development projects and avoid unnecessary delays. Relates to City Goal: Invest CR Time Frame: Working to Meet Goal
Key Measure Target Goal
FY 2018 Actual
FY 2019 Actual
FY 2020 Projected
FY 2021 Projected
# of days to review site development plans 30 or less 37 31 30 30
Department Goal: Cultivate a confidence in the future of Cedar Rapids and continue the momentum of redevelopment and recovery. Relates to City Goal: Invest CR Time Frame: Working to Meet Goal
Key Measure Target Goal
FY 2018 Actual
FY 2019 Actual
FY 2020 Projected
FY 2021 Projected
Valuation of commercial building permits $260M $296M $254M $240M $240M
GENERAL FUND
Development Services
119

Financial Summary
Budget Highlights
Summary of FTEs
FY 2020 Adjusted Change from FY 2020 FY 2021 Budget 13.00 0.00 13.00
Highlight of changes: No changes.
Development Services FYFY 2020 FY $ Change % Change
2019 Adopted 2021 From FY From FYActual Budget Budget 2020 2020
RevenuesTaxes -$ -$ -$ -$ Licenses & Permits 1,841$ 1,880$ 1,880$ -$ Intergovernmental Grants -$ -$ -$ -$ Charges for Services 1,122,970$ 339,228$ 368,600$ 29,372$ Fines & Forfeits -$ -$ -$ -$ Proceeds of Long Term Liabilities -$ -$ -$ -$ Transfers In 102,815$ 104,629$ 108,103$ 3,474$ Other Revenue -$ -$ -$ -$ Total Revenues 1,227,626$ 445,737$ 478,583$ 32,846$ 7%
ExpendituresPersonal Services 1,360,438$ 1,451,006$ 1,526,195$ 75,189$ Discretionary Expenses 26,280$ 31,133$ 31,133$ -$ Other Expenses 137,420$ 11,836$ 14,684$ 2,848$ Capital Outlay 10,171$ -$ -$ -$ Debt Service -$ -$ -$ -$ Transfers Out -$ -$ -$ -$ Total Expenditures 1,534,310$ 1,493,975$ 1,572,012$ 78,037$ 5%
Net Revenues over/(under) Expenditures (306,683)$ (1,048,238)$ (1,093,429)$ (45,191)$
120

Department Description and Core Services The Parks and Recreation Director is responsible for the Parks and Recreation Department. The Parks and Recreation Department is responsible for providing, managing, and maintaining parks and recreation facilities and programs that offer environmental, leisure, and health benefits to the citizens of Cedar Rapids. The Parks section is responsible for managing and maintaining city owned property including formally
named parks, public land held in trust for watershed or wildlife management. The department is responsible for the construction and maintenance of park infrastructure and facilities including recreational buildings, pools, sport complexes, greenhouse operations, trails, and pavilions.
The Forestry section is responsible for the maintenance and care of right-of-way trees. There is an ongoing trim and maintenance plan in place and technology helps direct crews to tree needs.
The Recreation section is responsible for operating programs, activities, and facilities emphasizing personal leisure experiences and focusing on the overall quality of life of citizens of Cedar Rapids and the surrounding area. Specific areas include youth and adult sports and activities, cultural arts, special populations, Ushers Ferry Historical Village, Northwest Recreation Center, Old McDonald’s Farm, along with managing reservation of pavilions, harbor slips, and garden plots.
The Aquatics section is responsible for staffing, programming, and maintenance of three neighborhood swimming pools, two large aquatic centers, and an indoor swimming pool. Swimming lessons, water safety, exercise, and leisure programs are offered.
Did you know? Our Statistics… Nearly 184K people visited the Cedar Rapids pools during FY 2019. Park pavilion rentals average over 1K rentals in 25 pavilions hosting about 94K individuals each year. Parks currently maintains over 4K acres of land including 96 named parks and over 30 miles of trails. Volunteers provided just under 26K hours of service for the Parks & Recreation Department in FY 2019. Tuma Sports Complex receives revenue from league participants and tournament organizers for leagues and
tournaments of over $112K in FY 2019. Parks facilities supported $3.6M in direct spending in the community, including 2K room nights and hosting
18K individuals in sports tourism in FY 2019 The Noelridge Greenhouse grows over 65K plants for beautification of City properties each year. Over 56K individuals “played ball” on the City’s baseball/softball diamonds in FY 2019. The Drop-In recreational programs had over 42K participants for various activities in FY 2019. There are over 5K ash trees remaining in the city tree inventory located in City right-of-way with an
additional 1.5K in the Parks/Golf courses. Ushers Ferry hosted 42K visitors in various events in FY 2019. Our Recent Accomplishments… The 1,000 Acres Pollinator Initiative completed installation of 83 acres of pollinator zones during calendar
year 2019, bringing the total to 293 acres. Forestry removed a total of 1.3K ash trees in FY 2019. The Ambassador Program for downtown began in FY 2019. This program is a partnership with Police,
Library, Transit, Cedar Rapids Metro Economic Alliance, and Willis Dady Homeless Shelter to create and maintain the integrity of the downtown area as well as build relationships with members of the public.
The City has spent $3.6M in Parks & Recreation improvements to ensure compliance with the Americans with Disabilities Act from FY 2016 through FY 2019.
GENERAL FUND
Parks and Recreation
121

Challenges & Opportunities Integration, development, and management of the Flood Control System and Greenway Park Plans. Planning and development of facility updates to the Harbor that will comply with Americans with Disabilities
Act, safety, and community amenity support needs. Extensive loss of ash trees caused by the Emerald Ash Borer, which includes removal of diseased trees and
replacement with new trees. Timetable for removal of all ash trees is seven years (FY 2019 – FY 2025). Constructing next phase of park accessibility improvements. Maintenance needs/costs of existing infrastructure including parks, playgrounds, pools and other
recreational amenities. Improving recreation opportunities for youth engagement. Enhancing recreational activities and amenities that improve our connection to the Cedar River.
Goals
Department Goal: Develop and foster an engaged community. Relates to City Goal: Green CR Time Frame: Working to Meet Goal
Key Measure Target Goal
FY 2018 Actual
FY 2019 Actual
FY 2020 Projected
FY 2021 Budgeted
Number of people served 1.5M or more 1.3M 1.4M 1.5M 1.5M
Department Goal: Optimize the utilization of volunteers by increasing hours annually over prior year. Relates to City Goal: Green CR Time Frame: Working to Meet Goal
Key Measure Target Goal
FY 2018 Actual
FY 2019 Actual
FY 2020 Projected
FY 2021 Budgeted
Number of volunteer hours 40K or more 30K 26K 30K 30K Financial Summary
Parks & Recreation FYFY 2020 FY $ Change % Change
2019 Adopted 2021 From FY From FYActual Budget Budget 2020 2020
RevenuesTaxes -$ -$ -$ -$ Licenses & Permits 42,492$ 23,000$ 23,000$ -$ Intergovernmental Grants -$ -$ -$ -$ Charges for Services 2,321,773$ 2,685,058$ 2,799,649$ 114,591$ Fines & Forfeits -$ -$ -$ -$ Proceeds of Long Term Liabilities -$ -$ -$ -$ Transfers In 1,404,750$ 1,363,000$ 1,363,000$ -$ Other Revenue 559,926$ 443,469$ 468,469$ 25,000$ Total Revenues 4,328,941$ 4,514,527$ 4,654,118$ 139,591$ 3%
ExpendituresPersonal Services 6,519,319$ 7,139,953$ 7,360,681$ 220,728$ Discretionary Expenses 1,835,343$ 2,331,378$ 2,619,320$ 287,942$ Other Expenses 3,468,915$ 2,148,118$ 2,190,580$ 42,462$ Capital Outlay 79,999$ -$ -$ -$ Debt Service -$ -$ -$ -$ Transfers Out 90,352$ 93,576$ 100,439$ 6,863$ Total Expenditures 11,993,928$ 11,713,025$ 12,271,020$ 557,995$ 5%
Net Revenues over/(under) Expenditures (7,664,987)$ (7,198,498)$ (7,616,902)$ (418,404)$
122

Budget Highlights Summary
of FTEs FY 2020 Adjusted Change from FY 2020 FY 2021 Budget
125.48 (1.88) 123.60 Highlight of changes: Amphitheater revenue increased $140K to $1.1M. Expenditures increased $146K to $1.1M for a net
budgeted loss of $55K, which is $6K more than FY 2020 budgeted loss. Adding .29 seasonal FTE and associated costs to support a new mobile recreation program ($11K;
STRENGTHEN CR). Adding .19 seasonal FTE and associated costs to support a new youth basketball program ($13K;
STRENGTHEN CR). Increase of $100K for ash tree removal support (GREEN CR). Increase of $8K for ambassador program in the downtown (PROTECT CR). Increase of $25K for pool painting and caulking (INVEST CR). Decrease of 2.36 seasonal FTEs based on program needs. Increase of temporary seasonal wage budget by $73K of which $58K is wages (INVEST CR).
123

Department Description and Core Services The Finance Director is responsible for the Information Technology Department. The Information Technology Department is responsible for strategy, design, transition, operation, and improvement of services related to technology and its use within the City. The Information Technology Department as a whole focuses on critical security needs for all technology systems. The Enterprise Application Solutions section develops and supports a vast array of software and systems
that are used both citywide and specific to departments within the City. The Customer Support section serves as the customer-facing element between City departments and all
information technology sections. They are the front line interface for computer, mobility devices, new user setup, and software applications, and voice services.
The Geographic Information Systems section is responsible for a comprehensive database of geographical, topological, and statistical information for use in the major development and capital projects of the City. The section also serves as a community resource.
The Infrastructure section is responsible for maintaining the collection of servers, network equipment and connections for voice and data services resulting in high continuity of electronic communications between City facilities. This group also maintains data backups.
Did you know? Our Statistics… Customer support division currently services almost 4K computers, phones, laptops/tablets, and radios. Information Technology received 7K calls and completed 11K customer service tickets in FY 2019. Enterprise Application staff supports over 213 applications and manages 936K City business documents each
year. Geographic Information Systems division handles over 30K utility locates, maintains over 50 data layers,
103K address points, and 15K street segments supporting Linn County regional 911 system each year. The Joint Communication Fiber Network is currently over 141 miles, serving over 60 buildings in the City,
Linn County, and Cedar Rapids Community School District. Infrastructure currently manages three data center locations with over 400 servers and 95% virtualization. There are currently 292K City assets and 17K work orders managed in the City’s Asset Management System. City network currently has over 150 managed switches, 5K connections, and over 150 terabytes of shared
City data. Our Recent Accomplishments… Citywide deployment of Active Threat Application (April 2019). City Asset Management has been implemented in the following departments: Public Works Engineering
(sidewalks, April 2019), Parks & Recreation Forestry (city trees, October 2019), and Public Works Sewer (construction, cleaning and repair program, December 2019).
Closed caption for City Council meeting video (February 2019). The Hexagon Intergraph Computer Aided Dispatch system was upgraded in March 2019. The Cedar Rapids
Police & Fire Departments, Joint Communication Agency, and Linn County Sheriff’s Office use computer aided dispatch to dispatch officers on calls.
Malware Phishing Training for City employees (December 2019). ShoreTel/Mitel phone upgrade (August 2019).
Challenges & Opportunities Enabling Customer Self Service Portals for EnerGov Land System Management and Novotx Assessment
Management applications. Migrating Microsoft Exchange (Outlook) to the Cloud and implementation of Office365.
GENERAL FUND
Information Technology
124

Developing a Request for Proposal for replacement of Records Management System for Cedar Rapids Police Department and Linn County Sheriff’s Office.
Focusing on security and ensuring all applications, data, and hardware have security measures in place. Providing adequate storage for video surveillance and data usage for City Departments. Performing a wireless assessment in all City Facilities for mobile City devices. Goals
Department Goal: Maximum uptime of the City core network by meeting or exceeding industry standards. Relates to City Goal: Connect CR Time Frame: Met Goal
Key Measure Target Goal
FY 2018 Actual
FY 2019 Actual
FY 2020 Projected
FY 2021 Projected
Minimize unintended and unscheduled downtime of City
core network
99.99% uptime 99.98% 99.99% 99.99% 99.99%
Department Goal: Resolve maximum number of calls to service desk on the initial call while meeting or exceeding industry standards. Relates to City Goal: Invest CR Time Frame: Working to Meet Goal
Key Measure Target Goal
FY 2018 Actual
FY 2019 Actual
FY 2020 Projected
FY 2021 Projected
Service desk calls resolved within one day
80% or higher 60% 62% 65% 65%
Financial Summary
Information Technology FYFY 2020 FY $ Change % Change
2019 Adopted 2021 From FY From FYActual Budget Budget 2020 2020
RevenuesTaxes -$ -$ -$ -$ Licenses & Permits -$ -$ -$ -$ Intergovernmental Grants -$ -$ -$ -$ Charges for Services 5,851,078$ 2,041,657$ 2,096,884$ 55,227$ Fines & Forfeits -$ -$ -$ -$ Proceeds of Long Term Liabilities -$ -$ -$ -$ Transfers In 78,146$ 122,560$ 206,363$ 83,803$ Other Revenue 25,313$ -$ -$ -$ Total Revenues 5,954,537$ 2,164,217$ 2,303,246$ 139,029$ 6%
ExpendituresPersonal Services 3,059,448$ 3,551,020$ 3,735,045$ 184,026$ Discretionary Expenses 2,293,046$ 2,189,144$ 2,948,768$ 759,625$ Other Expenses 564,578$ 323,372$ 292,417$ (30,955)$ Capital Outlay 73,764$ -$ -$ -$ Debt Service -$ -$ -$ -$ Transfers Out -$ -$ -$ -$ Total Expenditures 5,990,836$ 6,063,535$ 6,976,231$ 912,696$ 15%
Net Revenues over/(under) Expenditures (36,299)$ (3,899,318)$ (4,672,985)$ (773,666)$
125

Budget Highlights Summary
of FTEs FY 2020 Adjusted Change from FY 2020 FY 2021 Budget
34.00 1.00 35.00 Highlight of changes: Increase of $69K for software maintenance for Police Department body cameras (PROTECT CR). ($23K was
reallocated from the Police Department budget and $46K relates to additional cameras purchased in FY 2020.)
Increase of $222K for various software and maintenance agreements including duo two-factor authentication ($151K), fire station alerting software ($18K), $45K for standard increases, and video redaction software for the Police Department ($9K) (PROTECT CR).
Increase of $49K for arbitrator storage for the Police Department (PROTECT CR). Increase of $200K for outsourced support services (PROTECT CR). Decrease in offsite building rental expense ($55K) based on projected expenses, offset by increases in other
professional services for anticipated costs for contracting services externally (PROTECT CR). During FY 2020, eliminated a vacant position ($118K) and moved the associated budget to other
professional services ($118K) to have the services contracted externally. Increase of $47K for imagery services (one time request; STRENGTHEN CR). Adding 1 Asset Management FTE to support Utilities with funding from Utility areas (PROTECT CR).
126

Department Description and Core Services The Finance Director/Administrative Services is responsible for the Finance Department. The Finance Department is responsible for the accurate and timely recording of all financial transactions of the City and safeguarding the City’s assets and financial resources. The Finance Operations section manages accounts payable, accounts receivable, general ledger, payroll
functions, and treasury operations including project management for the financial and payroll system. This section ensures the accuracy of the general ledger, prepares the annual financial report and other state mandated reports, manages the annual audit, maintains capital assets, and manages grant reporting. In addition, is responsible for the City’s cash and debt management functions.
The Analyst section provides monthly analysis and reporting of financial conditions, prepares annual budget and budget amendment reports and presentations, prepares the City’s annual financial plan, creates cost of service models, and monitors cash flows and debt compliance.
The Risk Services section protects the City’s assets through identifying and analyzing the City’s exposures, evaluating the costs associated with exposures, and implementing the most cost effective methods to eliminate, minimize, transfer or pay for risk and they develop safety awareness through training of departments.
The Contract Management section develops, writes, implements, and maintains citywide contractual policies and procedures for the full lifecycle of contracting activities.
The Purchasing Services section provides procurement services using open and fair competition in accordance with the City's operational purchasing procedures, state and federal regulations, laws, rules, policies, and procedures.
Did you know? Our Statistics… The City’s investment program earned over $6.8M in FY 2019. General Accounting managed 68 active grants in FY 2019 while generating 337 grant reimbursements
totaling $28M. Accounts Payable transactions totaling 97K in FY 2019. Finance issued 15K accounts payable payments, 42K
payroll advices, and 30K accounts receivable invoices during FY 2019. Our Recent Accomplishments… Moody’s Investors Services has rated the City Aa1 for general obligation bonds, in May 2019. Moody’s Investors Services has rated the City Aa2 for revenue bonds, in May 2019. Received Certificate of Achievement in Financial Reporting for FY 2018, in July 2019. Received Certificate of Achievement in Budget for FY 2020 in October 2019. Completed outreach to the small business community to encourage their participating in the bidding
process August 2019.
Challenges & Opportunities Implementation of a citywide e-procurement system. Legislative issues that impact the level of City funding including allowing 30 year revenue bonds to be issued. Maintain financial stability while implementing a flood management system while continuing to provide
funding for services being delivered to citizens.
GENERAL FUND
Finance
127

Goals Department Goal: Maintain 25% or greater general fund reserve balance. Relates to City Goal: Invest CR Time Frame: Met Goal
Key Measure Target Goal
FY 2018 Actual
FY 2019 Actual
FY 2020 Projected
FY 2021 Budgeted
25% or greater general fund reserve
25% or greater 32% 31% 30% 30%
Department Goal: Maintain debt at 80% or less of allowable state debt limit. Relates to City Goal: Invest CR Time Frame: Met Goal
Key Measure Target Goal
FY 2018 Actual
FY 2019 Actual
FY 2020 Projected
FY 2021 Budgeted
Debt limit of 80% or less of allowable state debt limit 80% or less 52% 47% 50% 49%
Financial Summary
Budget Highlights
Summary of FTEs
FY 2020 Adjusted Change from FY 2020 FY 2021 Budget 45.25 0.00 45.25
Highlight of changes: Discretionary expenses will increase $34K for eprocurement software (STRENGTHEN CR).
Finance FYFY 2020 FY $ Change % Change
2019 Adopted 2021 From FY From FYActual Budget Budget 2020 2020
RevenuesTaxes -$ -$ -$ -$ Licenses & Permits -$ -$ -$ -$ Intergovernmental Grants -$ -$ -$ -$ Charges for Services 3,753,188$ 1,809,394$ 1,925,756$ 116,362$ Fines & Forfeits -$ -$ -$ -$ Proceeds of Long Term Liabilities -$ -$ -$ -$ Transfers In 630,957$ 683,613$ 670,414$ (13,199)$ Other Revenue 144,611$ 139,500$ 141,500$ 2,000$ Total Revenues 4,528,756$ 2,632,507$ 2,737,670$ 105,163$ 4%
ExpendituresPersonal Services 3,912,301$ 4,352,357$ 4,510,102$ 157,745$ Discretionary Expenses 412,519$ 607,199$ 641,258$ 34,059$ Other Expenses 826,370$ 286,427$ 280,750$ (5,677)$ Capital Outlay -$ -$ -$ -$ Debt Service -$ -$ -$ -$ Transfers Out 161,226$ -$ -$ -$ Total Expenditures 5,312,416$ 5,245,983$ 5,432,110$ 186,127$ 4%
Net Revenues over/(under) Expenditures (783,660)$ (2,613,475)$ (2,694,440)$ (80,964)$
128

Department Description and Core Services The Human Resources Manager is responsible for the Human Resources Department. The Human Resources Department supports departments to positively impact the quality of services of the City organization. The Compensation and Benefits section is focused on managing a competitive wage and benefit package
and is responsible for developing and implementing benefits and compensation plans as well as compliance reporting. This section is also responsible for creating a culture of wellness in our organization.
The Organization Development section creates and provides employee and leadership training, manages the annual employee survey, and in coordination with City Manager’s office, assists with initiatives that create a positive workplace culture.
The Employee and Labor Relations section provides support to managers and supervisors in order to comply with employment laws, regulations, City personnel policies, and collective bargaining agreements including administration of the bargaining contracts.
The Recruiting section recruits for open City positions both internally and externally and ensures that all hiring and promotion decisions are made according to objective, job related criteria.
The Administration section is responsible for employee records and other required recordkeeping.
Did you know? Our Statistics… Over 91% of employees are satisfied or very satisfied with their jobs based on the 2019 employee survey. Increased overall employee and spouse Wellness participation by 8% over 2018.
Our Recent Accomplishments… Successfully negotiated seven collective bargaining agreements and an extension to the American
Federation of State, County and Municipal Employees contract in FY 2019. Added new benefits for calendar 2020 – Parental leave and increased educational reimbursement.
Challenges & Opportunities Increase the diversity of the City organization in order to maximize creative problem solving. Conclude the wage review project of all non-bargaining unit positions and implement the results. Develop succession plan and processes to ensure successful transitions upon forecasted retirements.
Goals
Department Goal: Achieve a workforce that reflects the diversity of our community. Attract and hire qualified diverse candidates at a rate greater than that achieved in FY 2016 (benchmark year). Relates to City Goal: Invest CR Time Frame: Met Goal
Key Measure Target Goal
FY 2018 Actual
FY 2019 Actual
FY 2020 Projected
FY 2021 Budgeted
Percentage of new hires who are diverse >9% 11% 13% 14% 15%
Department Goal: Maintain industry standard for attrition rate. Relates to City Goal: Invest CR Time Frame: Met Goal
Key Measure Target Goal
FY 2018 Actual
FY 2019 Actual
FY 2020 Projected
FY 2021 Budgeted
Annual attrition rate <20% N/A 9% 9% 9%
GENERAL FUND
Human Resources
129

Financial Summary
Budget Highlights
Summary of FTEs
FY 2020 Adjusted Change from FY 2020 FY 2021 Budget 9.00 0.00 9.00
Highlight of changes: Reallocated $12K to City Manager budget for discretionary costs associated with awards and recognition
and the LeadCR program.
Human Resources FYFY 2020 FY $ Change % Change
2019 Adopted 2021 From FY From FYActual Budget Budget 2020 2020
RevenuesTaxes -$ -$ -$ -$ Licenses & Permits -$ -$ -$ -$ Intergovernmental Grants -$ -$ -$ -$ Charges for Services 1,093,535$ 352,781$ 371,291$ 18,510$ Fines & Forfeits -$ -$ -$ -$ Proceeds of Long Term Liabilities -$ -$ -$ -$ Transfers In 15,000$ 15,000$ 15,000$ -$ Other Revenue 1,235$ -$ -$ -$ Total Revenues 1,109,770$ 367,781$ 386,291$ 18,510$ 5%
ExpendituresPersonal Services 702,808$ 815,584$ 880,306$ 64,722$ Discretionary Expenses 183,392$ 189,727$ 167,527$ (22,200)$ Other Expenses 269,561$ 67,146$ 67,534$ 388$ Capital Outlay -$ -$ -$ -$ Debt Service -$ -$ -$ -$ Transfers Out -$ -$ -$ -$ Total Expenditures 1,155,761$ 1,072,457$ 1,115,367$ 42,910$ 4%
Net Revenues over/(under) Expenditures (45,991)$ (704,676)$ (729,076)$ (24,400)$
130

Department Description and Core Services The City Attorney is responsible for the Attorney Department. The Attorney Department objective is to maintain the level and quality of legal services provided to the City. The City Attorney section represents the City in judicial and administrative proceedings and attends City
Council and other meetings as necessary to address legal issues that arise. The Administration section is responsible for all aspects of legal services to the Mayor, City Council, City
Manager, and appointed boards and commissions. These services include providing legal advice and counsel and also include drafting of opinions, contracts, and the review of ordinances, resolutions, and agreements.
Did you know? Our Statistics… In calendar 2019, the City Attorney’s office provided legal services for the acquisitions of 45 real estate
parcels with a total value of property acquired of $1.4M. In calendar 2019, the City Attorney’s office closed 45 property tax appeals resulting in the preservation of
$81M of taxable valuation and approximately $2.8 million in property tax revenue to the City per year. In calendar 2019, the City Attorney’s office filed 93 municipal infraction cases seeking compliance with the
Cedar Rapids Municipal Code. Our Recent Accomplishments… In January of 2019, the Iowa Supreme Court upheld the City’s Automated Traffic Enforcement (ATE) system
against legal challenge. In March of 2019, the City Attorney’s office negotiated and prepared settlement documents to resolve
professional liability claims regarding a provider of professional services. In June of 2019, the City Attorney’s office concluded a lengthy process to reach a new agreement with the
City of Marion for the future provision of wastewater treatment. In April of 2019, the City Attorney’s office developed legal support that allowed the City to continue to
process union dues checkoff for the Transit Union, preserve federal funding, but not be in violation of Iowa’s new collective bargaining statutes.
Challenges & Opportunities Finding new ways by which delivery of legal services can facilitate quality of life initiatives. Getting harder to handle “big” cases in-house. Increased leveraging of work performed for one department or area to others. Goals
Department Goal: Achieve a court order validating enforcement of at least 75%. Relates to City Goal: Protect CR Time Frame: Met Goal
Key Measure Target Goal
FY 2018 Actual
FY 2019 Actual
FY 2020 Projected
FY 2021 Budgeted
Court order validating enforcement percentage
75% or greater 88% 90% 75% 75%
Department Goal: Turnaround requests for legal services within 5 working days unless different expectations are communicated to requestor. Relates to City Goal: Protect CR Time Frame: Met Goal
Key Measure Target Goal
FY 2018 Actual
FY 2019 Actual
FY 2020 Projected
FY 2021 Budgeted
5 working days or less turnaround time percentage
80% or greater 90% 90% 80% 80%
GENERAL FUND
City Attorney
131

Financial Summary
Budget Highlights
Summary of FTEs
FY 2020 Adjusted Change from FY 2020 FY 2021 Budget 6.00 0.00 6.00
Highlight of changes: No changes.
Attorney FYFY 2020 FY $ Change % Change
2019 Adopted 2021 From FY From FYActual Budget Budget 2020 2020
RevenuesTaxes -$ -$ -$ -$ Licenses & Permits -$ -$ -$ -$ Intergovernmental Grants -$ -$ -$ -$ Charges for Services 545,339$ 224,218$ 232,984$ 8,766$ Fines & Forfeits -$ -$ -$ -$ Proceeds of Long Term Liabilities -$ -$ -$ -$ Transfers In 248,900$ 248,900$ 272,900$ 24,000$ Other Revenue -$ -$ -$ -$ Total Revenues 794,239$ 473,118$ 505,884$ 32,766$ 7%
ExpendituresPersonal Services 770,119$ 794,008$ 835,799$ 41,791$ Discretionary Expenses 10,231$ 24,983$ 24,983$ -$ Other Expenses 127,139$ 36,717$ 38,683$ 1,966$ Capital Outlay -$ -$ -$ -$ Debt Service -$ -$ -$ -$ Transfers Out -$ -$ -$ -$ Total Expenditures 907,489$ 855,708$ 899,465$ 43,757$ 5%
Net Revenues over/(under) Expenditures (113,250)$ (382,590)$ (393,581)$ (10,991)$
132

Department Description and Core Services The City Manager is responsible for the City Manager Department. The City Manager's Office serves the Cedar Rapids City Council, all City Departments reporting to the City Manager, and the community. The City Manager administers local government projects and programs on behalf of the City Council. The City Manager prepares a recommended budget for the Council's consideration, recruits, hires, and supervises City employees, as well as carries out the Council's policies. Financial Summary
Budget Highlights
Summary of FTEs
FY 2020 Adjusted Change from FY 2020 FY 2021 Budget 15.00 0.00 15.00
Highlight of changes: Included in the budget is $12K for discretionary costs associated with awards and recognition and the
LeadCR program that was reallocated from the Human Resources Department.
City Manager FYFY 2020 FY $ Change % Change
2019 Adopted 2021 From FY From FYActual Budget Budget 2020 2020
RevenuesTaxes -$ -$ -$ -$ Licenses & Permits -$ -$ -$ -$ Intergovernmental Grants -$ -$ -$ -$ Charges for Services 1,871,127$ 757,309$ 805,226$ 47,917$ Fines & Forfeits -$ -$ -$ -$ Proceeds of Long Term Liabilities -$ -$ -$ -$ Transfers In 154,953$ 172,471$ 177,404$ 4,933$ Other Revenue 590$ -$ -$ -$ Total Revenues 2,026,671$ 929,780$ 982,630$ 52,850$ 6%
ExpendituresPersonal Services 1,775,278$ 1,813,026$ 1,983,301$ 170,275$ Discretionary Expenses 240,474$ 316,723$ 325,923$ 9,200$ Other Expenses 272,969$ 87,783$ 92,254$ 4,471$ Capital Outlay -$ -$ -$ -$ Debt Service -$ -$ -$ -$ Transfers Out -$ -$ -$ -$ Total Expenditures 2,288,721$ 2,217,532$ 2,401,478$ 183,946$ 8%
Net Revenues over/(under) Expenditures (262,050)$ (1,287,752)$ (1,418,848)$ (131,096)$
FUND TYPE
Department FUND TYPE
Department GENERAL FUND
City Manager
133

Department Description and Core Services The Mayor and City Council are responsible for the Mayor and Council Department. The Cedar Rapids City Council consists of eight council members plus the Mayor. The Mayor and three council members are elected at large and the remaining five council members are elected by voters in each of the five districts. The General Fund uses this department ID to record the revenue and expenditures associated with City Council such as dues and memberships and travel. Financial Summary
Budget Highlights
Summary of FTEs
FY 2020 Adjusted Change from FY 2020 FY 2021 Budget 3.33 0.00 3.33
Highlight of changes: Discretionary budget is decreasing $43K. The key change is an increase for dues and memberships offset by
a decrease of $100K in grants and contributions as the $100K will be reallocated for the economic development application expenses.
Mayor & Council FYFY 2020 FY $ Change % Change
2019 Adopted 2021 From FY From FYActual Budget Budget 2020 2020
RevenuesTaxes -$ -$ -$ -$ Licenses & Permits -$ -$ -$ -$ Intergovernmental Grants -$ -$ -$ -$ Charges for Services 621,470$ 218,329$ 223,190$ 4,861$ Fines & Forfeits -$ -$ -$ -$ Proceeds of Long Term Liabilities -$ -$ -$ -$ Transfers In -$ -$ -$ -$ Other Revenue 75,220$ -$ -$ -$ Total Revenues 696,690$ 218,329$ 223,190$ 4,861$ 2%
ExpendituresPersonal Services 206,836$ 220,730$ 225,421$ 4,691$ Discretionary Expenses 396,153$ 353,365$ 310,865$ (42,500)$ Other Expenses 169,786$ 104,645$ 107,946$ 3,301$ Capital Outlay -$ -$ -$ -$ Debt Service -$ -$ -$ -$ Transfers Out -$ -$ -$ -$ Total Expenditures 772,775$ 678,740$ 644,232$ (34,508)$ -5%
Net Revenues over/(under) Expenditures (76,085)$ (460,411)$ (421,042)$ 39,369$
FUND TYPE
Department FUND TYPE
Department GENERAL FUND
Mayor & Council
134

Department Description and Core Services The City Clerk is responsible for the City Clerk Department. The City Clerk’s office administers the City government’s documentation. Council Proceedings – Prepares the City Council agenda and council packet (consisting of various documents
related to agenda items) and posts on the website for the media and citizens to view. The Clerk’s Office processes all documents related to the agenda such as resolutions, ordinances, contracts/agreements, deeds, bonds and insurance, as well as petitions and reports.
Minutes and Ordinance Codification – The City Clerk attends, transcribes, and publishes minutes of all Council meetings and special sessions, including budget meetings. The department oversees codification of City Ordinances (Municipal Code Book).
Licensing and Permits –13 different licenses and permits are processed through the City Clerk’s Office. Archival – The City Clerk secures and is responsible for the overall management of official City records and
administers the retrieval and archival of various documents. The City Clerk’s Office maintains the official files for appointments to City Boards and Commissions. Election Information and Voter Registration - The City Clerk’s Office can register citizens to vote and is
involved with the processing of election documents regarding the municipal election process and certain special elections.
Did you know? Our Statistics… In FY 2019, the following documents were processed in the City Clerk’s Office: 1,541 resolutions, 61 ordinances, 280 motions, 66 public improvement projects, 275 letters/petitions. 128 cigarette permits, 578 beer/liquor/wine permits, 210 miscellaneous licenses. 10K documents were entered into the document management system (OnBase). 172 board and commission appointments, reappointments, and votes of thanks. Our Recent Accomplishments… In November 2018, the City Council adopted Massage Therapy Business License regulations. Police
Department and City Clerk staff implemented this newly created licensing process in January 2019 and issued 107 massage therapy business licenses.
In December 2018, the City Council adopted a new zoning code. City Clerk staff worked closely with Development Services and Community Development to update sections of this code pertaining to the different licenses processed by the City Clerk’s Office. Licensing processes were then updated due to changes in separation distance for alcohol and tobacco related uses and changes to the Conditional Use Permit process.
In April 2019, the City Clerk’s Office helped the IT Department prepare for a system upgrade to OnBase 17 and then transitioned to using the updated software, which has a new look and offers more features than the previous version. OnBase is the document management software used by employees throughout the City.
In May 2019, the City Council adopted updated alcohol regulations. Police Department and City Clerk staff spent considerable time rewriting this complex chapter of the municipal code and streamlining processes and applications for multiple license types. Efficiencies due to the streamlined processes have been realized internally and externally.
Challenges & Opportunities Assist with the creation and implementation of an after-hours business license process. Upgrade of EnerGov Land Systems Management software and implementation of online licensing module
within EnerGov Land Systems Management software.
GENERAL FUND
City Clerk
135

Continue to update sections of the Cedar Rapids Municipal Code pertaining to licenses/permits issued by the City Clerk’s Office.
Goals Department Goal: Process council proceedings and related documents with 90% accuracy. Relates to City Goal: Promote CR Time Frame: Met Goal
Key Measure Target Goal
FY 2018 Actual
FY 2019 Actual
FY 2020 Projected
FY 2021 Budgeted
Accuracy percentage 90% of the time 95% 95% 95% 95%
Department Goal: Process licenses and permits with 90% accuracy. Relates to City Goal: Promote CR Time Frame: Met Goal
Key Measure Target Goal
FY 2018 Actual
FY 2019 Actual
FY 2020 Projected
FY 2021 Budgeted
Accuracy percentage 90% of the time 95% 95% 95% 95%
Financial Summary
Budget Highlights
Summary of FTEs
FY 2020 Adjusted Change from FY 2020 FY 2021 Budget 5.50 0.00 5.50
Highlight of changes: No changes.
City Clerk FYFY 2020 FY $ Change % Change
2019 Adopted 2021 From FY From FYActual Budget Budget 2020 2020
RevenuesTaxes -$ -$ -$ -$ Licenses & Permits 190,287$ 165,690$ 167,090$ 1,400$ Intergovernmental Grants -$ -$ -$ -$ Charges for Services 316,666$ 136,296$ 133,138$ (3,158)$ Fines & Forfeits 4,600$ 2,500$ 2,500$ -$ Proceeds of Long Term Liabilities -$ -$ -$ -$ Transfers In -$ -$ -$ -$ Other Revenue 910$ 900$ 900$ -$ Total Revenues 512,462$ 305,386$ 303,628$ (1,758)$ -1%
ExpendituresPersonal Services 438,105$ 484,271$ 512,471$ 28,200$ Discretionary Expenses 16,712$ 44,455$ 44,455$ -$ Other Expenses 164,449$ 73,674$ 76,233$ 2,559$ Capital Outlay -$ -$ -$ -$ Debt Service -$ -$ -$ -$ Transfers Out -$ -$ -$ -$ Total Expenditures 619,266$ 602,400$ 633,159$ 30,759$ 5%
Net Revenues over/(under) Expenditures (106,803)$ (297,014)$ (329,531)$ (32,517)$
136

Department Description and Core Services The Library Director is responsible for the Library department ID. The Library is owned by the City of Cedar Rapids and is governed and operated by the Cedar Rapids Library Board of Trustees, a policy-making body deriving their power from specific grants in Chapter 6.02 of the municipal code. The City Council allocates funds to the Library’s annual operating budget. The Library connects people to information, experiences, and services that enhance quality of life so the community can learn, enjoy, and thrive. The library serves all community members and focuses on the strategic goals of literacy, access, and inclusion. The Materials section curates and provides physical and digital items for the community based on the Board
of Trustees Collection Development Policy. The Programming section provides educational and entertaining programs to the community that enhance
and grow all forms of life literacy. The Community Relations section works to embed the library with community partners on major strategic
projects. This section also manages volunteers and marketing. The Public Service section provides core customer service, information literacy, and digital skills support to
patrons during operating business hours.
Did you know? Our Statistics… During FY 2019, the Library had: 624K visits, an increase over the previous year due to the downtown library opening on Sundays; 97K users
of meeting rooms; 792K people visited the Library’s website. Program attendance increased 11% to 58K people attending 1,073 programs. Public computer sessions increased 6% to 120K while connections to public Wi-Fi held steady at 99K. Hosted 319 volunteers who gave over 7K hours at an estimated value of $142K for the community. Overall materials circulation was 1.1M up 12% in FY 2019, even though the circulation of physical materials
was down 9% at 768K. The increase came primarily from a 40% increase in circulation of digital downloadable materials to 171K, a 280% increase in usage of databases and streaming services like Freegal and Kanopy for 216K.
Our Recent Accomplishments… In FY 2019, the Library opened the Opportunity Center at Ladd Library. This was a partnering effort with
Kirkwood Community College, United Way, HACAP, Iowa Legal Aid, Tanager Place, and other community partners to offer pathways to stability and successful employment of citizens residing on the city’s west side.
The Library, partnering with the Cedar Rapids Public Library Foundation, has enrolled nearly 60% of eligible Cedar Rapids children in Dolly Parton’s Imagination Library. Over 100K books have been mailed to children ages zero to five in our city during FY 2019.
The Library completed the first year of a three-year strategic plan in FY 2019, focusing on literacy, access, and inclusion. The Library incorporated Ready 10! into programs and services, using the local Campaign for Grade Level Readings list of ten skills that all four local school districts aged children need to be ready for kindergarten. The Library created a formalized pathway to patron discovery and has applied for grant funding to support a mobile technology unit. The Library used Dolly Parton’s Imagination Library and patron data to target pockets of need and strategically design outreach opportunities.
The Library was selected by Reading into Success partners for FY 2020 to host a Community Literacy Coordinator position to work on goals of improving third grade literacy in the metro area.
The Library, partnering with Parks, Transit, Police, Cedar Rapids Metro Economic Alliance, and Willis Dady Homeless services supported the Downtown Ambassador Pilot Program in FY 2019, which won an Urban Libraries Council Innovation Award for Wellness, Safety, and Sustainability.
GENERAL FUND
Library
137

Challenges & Opportunities Responding to increased usage in both the library and downtown area while keeping the library safe,
comfortable, and welcoming to all. Monitoring continued changing patterns of information access and consumption. As patrons want more
digital access items and circulation declines for physical items. Libraries across the country struggle with varied pricing plans and lack of infrastructure consistency.
Designing additional outreach opportunities to reach patrons with transportation or other barriers to access. Being great stewards of and caring for our much loved and used physical spaces, especially as those
buildings age creating increased maintenance costs. Goals
Department Goal: To provide a safe welcoming library space for all, to increase patron visits. Relates to City Goal: Promote CR Time Frame: Working to Meet Goal
Key Measure Target Goal
FY 2018 Actual
FY 2019 Actual
FY 2020 Projected
FY 2021 Budgeted
Number of Visits 625,000 621,758 623,901 625,000 630,000 Department Goal: To increase active cardholder members that will increase use of a vibrant public library and add to the City’s goal to make Cedar Rapids a desirable place to live, work, and play. Relates to City Goal: Invest CR Time Frame: Working to Meet Goal
Key Measure Target Goal
FY 2018 Actual
FY 2019 Actual
FY 2020 Projected
FY 2021 Budgeted
Active Cardholders 75,000 70,952 70,358 69,645 72,000 Financial Summary
Library FYFY 2020 FY $ Change % Change
2019 Adopted 2021 From FY From FYActual Budget Budget 2020 2020
RevenuesTaxes -$ -$ -$ -$ Licenses & Permits -$ -$ -$ -$ Intergovernmental Grants 129,221$ 195,000$ 245,000$ 50,000$ Charges for Services 394,541$ 287,600$ 325,600$ 38,000$ Fines & Forfeits 84,656$ 100,000$ -$ (100,000)$ Proceeds of Long Term Liabilities -$ -$ -$ -$ Transfers In 5,486,200$ 18,120$ 14,000$ (4,120)$ Other Revenue 79,155$ 151,955$ 153,955$ 2,000$ Total Revenues 6,173,772$ 752,675$ 738,555$ (14,120)$ -2%
ExpendituresPersonal Services 4,333,492$ 5,078,628$ 5,357,512$ 278,885$ Discretionary Expenses 860,170$ 794,056$ 681,804$ (112,252)$ Other Expenses 829,013$ 788,171$ 986,895$ 198,724$ Capital Outlay 100,033$ -$ -$ -$ Debt Service -$ -$ -$ -$ Transfers Out -$ -$ -$ -$ Total Expenditures 6,122,708$ 6,660,854$ 7,026,211$ 365,357$ 5%
Net Revenues over/(under) Expenditures 51,064$ (5,908,179)$ (6,287,656)$ (379,477)$
138

Budget Highlights Summary
of FTEs FY 2020 Adjusted Change from FY 2020 FY 2021 Budget
67.59 0.00 67.59 Highlight of changes: Revenues decreased by $10K overall, from eliminating fines on overdue materials (INVEST CR). Expenses increased by $40K for security (PROTECT CR).
139

Department Description and Core Services The City Manager, Mayor, City Council, and Finance Director/Administrative Services are responsible for the Contingent department ID. The Contingent department ID of the General Fund uses this department ID to set aside funds to cover costs, that at the time the budget is prepared, are typically not known and for one-time expenses. The department ID is used to record revenue from the tort property tax levy and revenue from non-general fund areas to fund a portion of contingent expenses when appropriate. Financial Summary
Budget Highlights Highlight of changes: The tort property tax levy will produce $1M in property tax revenue in FY 2021. Included in the budget are the following expenditures: $2.8M reduction in personal services for anticipated vacancies during the year based on historical
information and projections. $500K for wage/compensation study of non-bargaining employees. $85K for state lobbyist services. $50K for the special duty police officers. $350K for Mayor, Council and City Manager discretionary spending. $177K for enterprise deficits associated with the US Cellular Center (convention center and arena). $1.1M for capital equipment. Vehicles ($40K) for Housing Inspectors for Building Services (one time funding; STRENGTHEN CR). Included in transfers out:
o $399K for economic development.
Contingent FYFY 2020 FY $ Change % Change
2019 Adopted 2021 From FY From FYActual Budget Budget 2020 2020
RevenuesTaxes 994,947$ 1,018,356$ 1,034,443$ 16,087$ Licenses & Permits -$ -$ -$ -$ Intergovernmental Grants 86,136$ 40,501$ 37,012$ (3,489)$ Charges for Services 412,921$ 142,902$ 153,350$ 10,448$ Fines & Forfeits -$ -$ -$ -$ Proceeds of Long Term Liabilities -$ -$ -$ -$ Transfers In 162,970$ 25,800$ 337,268$ 311,468$ Other Revenue 1,530$ -$ -$ -$ Total Revenues 1,658,503$ 1,227,559$ 1,562,073$ 334,514$ 27%
ExpendituresPersonal Services (358,341)$ (990,000)$ (2,130,972)$ (1,140,972)$ Discretionary Expenses 669,637$ 1,173,462$ 701,651$ (471,811)$ Other Expenses 111,060$ 376,230$ 112,140$ (264,090)$ Capital Outlay -$ 800,800$ 1,112,268$ 311,468$ Debt Service -$ -$ -$ -$ Transfers Out 6,312,899$ 2,361,994$ 1,563,396$ (798,597)$ Total Expenditures 6,735,254$ 3,722,486$ 1,358,483$ (2,364,003)$ -64%
Net Revenues over/(under) Expenditures (5,076,750)$ (2,494,927)$ 203,590$ 2,698,517$
GENERAL FUND
Contingent
140
o $75K to subsidize golf FY 2021 budgeted operating shortfall. o $60K for visual arts program. o $30K for the City share of personal services of parking employees. o $1M for year four of five for the Neighborhood Finance Corporation commitment.
141

Department Description and Core Services The Finance Director/Administrative Services is responsible for the Cedar Rapids Tourism Office department ID. VenuWorks manages the Cedar Rapids Tourism Office. The Cedar Rapids Tourism Office department ID of the General Fund uses this department ID to track associated revenues and expenses related to marketing and promoting the City of Cedar Rapids. Financial Summary
Budget Highlights Highlight of changes: The budget includes $1.7M in revenue and $1.7M expenses for a net budgeted profit of $16K.
Cedar Rapids Tourism Office FYFY 2020 FY $ Change % Change
2019 Adopted 2021 From FY From FYActual Budget Budget 2020 2020
RevenuesTaxes -$ -$ -$ -$ Licenses & Permits -$ -$ -$ -$ Intergovernmental Grants -$ -$ -$ -$ Charges for Services 979,499$ -$ -$ -$ Fines & Forfeits -$ -$ -$ -$ Proceeds of Long Term Liabilities -$ -$ -$ -$ Transfers In -$ -$ -$ -$ Other Revenue -$ 1,350,000$ 1,705,682$ 355,682$ Total Revenues 979,499$ 1,350,000$ 1,705,682$ 355,682$ 26%
ExpendituresPersonal Services -$ -$ -$ -$ Discretionary Expenses 891,791$ 1,206,098$ 1,689,464$ 483,366$ Other Expenses -$ -$ -$ -$ Capital Outlay -$ -$ -$ -$ Debt Service -$ -$ -$ -$ Transfers Out -$ -$ -$ -$ Total Expenditures 891,791$ 1,206,098$ 1,689,464$ 483,366$ 40%
Net Revenues over/(under) Expenditures 87,709$ 143,902$ 16,218$ (127,684)$
FUND TYPE
Department GENERAL FUND
Convention Center GENERAL FUND
Cedar Rapids Tourism Office
142

Department Description and Core Services The Civil Rights Director is responsible for the Civil Rights department ID. The Cedar Rapids Civil Rights Commission is a local administrative law agency responsible to secure all individuals within the City of Cedar Rapids from discrimination because of age, color, creed, disability, family status, gender identity, marital status, national origin, race, religion, sex or sexual orientation in connection with employment, public accommodations, housing, credit, and education. Financial Summary
Budget Highlights
Summary of FTEs
FY 2020 Adjusted Change from FY 2020 FY 2021 Budget 5.00 0.00 5.00
Highlight of changes: Other employee benefits is increasing $4K to $6K for employee tuition costs to be funded by a transfer in
from the Civil Rights special revenue fund. Decrease of $35K for the office remodel costs included in the FY 2020 budget.
Civil Rights FYFY 2020 FY $ Change % Change
2019 Adopted 2021 From FY From FYActual Budget Budget 2020 2020
RevenuesTaxes -$ -$ -$ -$ Licenses & Permits -$ -$ -$ -$ Intergovernmental Grants 4,525$ 1,500$ 1,500$ -$ Charges for Services 855$ 1,000$ 1,000$ -$ Fines & Forfeits -$ -$ -$ -$ Proceeds of Long Term Liabilities -$ -$ -$ -$ Transfers In -$ 1,700$ 6,000$ 4,300$ Other Revenue -$ -$ -$ -$ Total Revenues 5,380$ 4,200$ 8,500$ 4,300$ 102%
ExpendituresPersonal Services 336,189$ 497,407$ 506,976$ 9,569$ Discretionary Expenses 24,453$ 63,400$ 28,400$ (35,000)$ Other Expenses 118,307$ 26,769$ 27,329$ 560$ Capital Outlay -$ -$ -$ -$ Debt Service -$ -$ -$ -$ Transfers Out -$ -$ -$ -$ Total Expenditures 478,949$ 587,576$ 562,705$ (24,871)$ -4%
Net Revenues over/(under) Expenditures (473,569)$ (583,376)$ (554,205)$ 29,171$
FUND TYPE
Department FUND TYPE
Department GENERAL FUND
Civil Rights
143
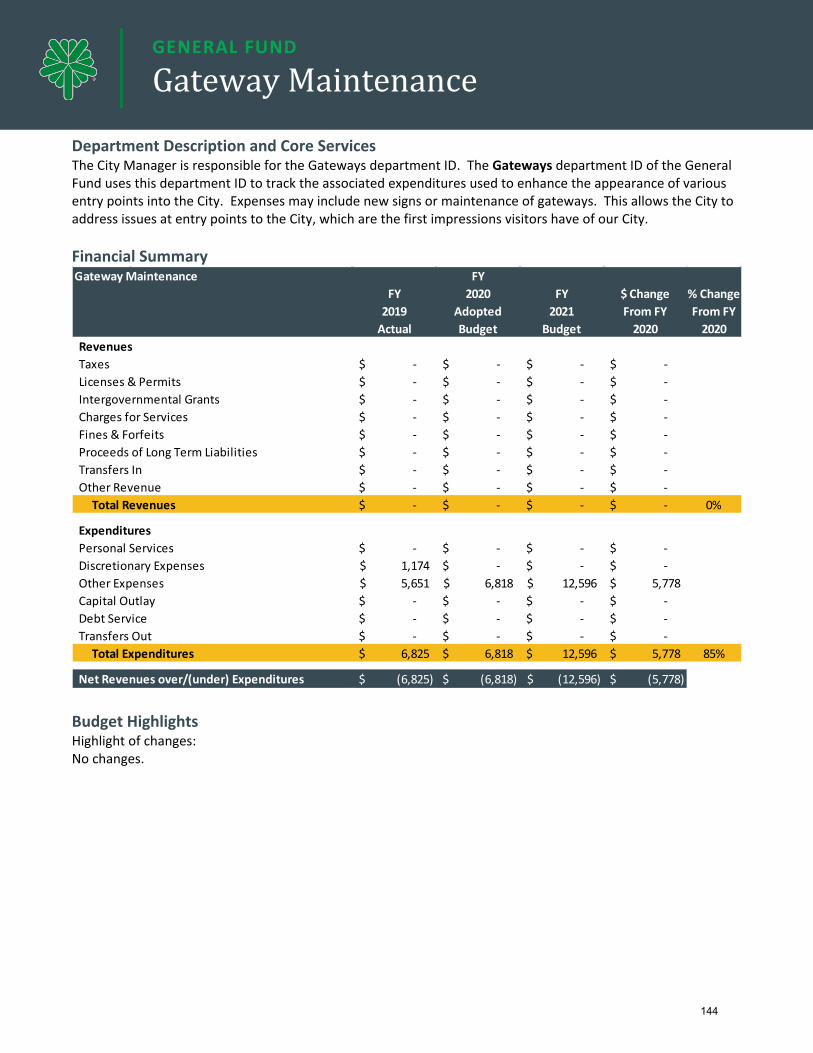
Department Description and Core Services The City Manager is responsible for the Gateways department ID. The Gateways department ID of the General Fund uses this department ID to track the associated expenditures used to enhance the appearance of various entry points into the City. Expenses may include new signs or maintenance of gateways. This allows the City to address issues at entry points to the City, which are the first impressions visitors have of our City. Financial Summary
Budget Highlights Highlight of changes: No changes.
Gateway Maintenance FYFY 2020 FY $ Change % Change
2019 Adopted 2021 From FY From FYActual Budget Budget 2020 2020
RevenuesTaxes -$ -$ -$ -$ Licenses & Permits -$ -$ -$ -$ Intergovernmental Grants -$ -$ -$ -$ Charges for Services -$ -$ -$ -$ Fines & Forfeits -$ -$ -$ -$ Proceeds of Long Term Liabilities -$ -$ -$ -$ Transfers In -$ -$ -$ -$ Other Revenue -$ -$ -$ -$ Total Revenues -$ -$ -$ -$ 0%
ExpendituresPersonal Services -$ -$ -$ -$ Discretionary Expenses 1,174$ -$ -$ -$ Other Expenses 5,651$ 6,818$ 12,596$ 5,778$ Capital Outlay -$ -$ -$ -$ Debt Service -$ -$ -$ -$ Transfers Out -$ -$ -$ -$ Total Expenditures 6,825$ 6,818$ 12,596$ 5,778$ 85%
Net Revenues over/(under) Expenditures (6,825)$ (6,818)$ (12,596)$ (5,778)$
FUND TYPE
Department FUND TYPE
Department GENERAL FUND
Gateway Maintenance
144

Department Description and Core Services The Finance Director/Administrative Services is responsible for the Downtown District department ID. The Downtown District department ID of the General Fund uses this department ID to track the associated revenues and expenditures as per the agreement that was signed with the Downtown Cedar Rapids Self Supported Municipal Improvement District commission in 2018. The agreement requires the City to be responsible for certain expenditures in the Downtown area such as repairing street lights, electricity costs, and funding some annual maintenance costs performed by the Cedar Rapids Downtown District. Financial Summary
Budget Highlights Highlight of changes: No changes.
Downtown FYFY 2020 FY $ Change % Change
2019 Adopted 2021 From FY From FYActual Budget Budget 2020 2020
RevenuesTaxes -$ -$ -$ -$ Licenses & Permits -$ -$ -$ -$ Intergovernmental Grants -$ -$ -$ -$ Charges for Services 189,800$ 67,832$ 68,616$ 784$ Fines & Forfeits -$ -$ -$ -$ Proceeds of Long Term Liabilities -$ -$ -$ -$ Transfers In -$ -$ -$ -$ Other Revenue -$ -$ -$ -$ Total Revenues 189,800$ 67,832$ 68,616$ 784$ 1%
ExpendituresPersonal Services -$ -$ -$ -$ Discretionary Expenses 135,000$ 149,301$ 149,301$ 0$ Other Expenses 11,565$ 46,750$ 46,750$ -$ Capital Outlay -$ -$ -$ -$ Debt Service -$ -$ -$ -$ Transfers Out -$ -$ -$ -$ Total Expenditures 146,565$ 196,051$ 196,051$ 0$ 0%
Net Revenues over/(under) Expenditures 43,235$ (128,219)$ (127,435)$ 784$
FUND TYPE
Department FUND TYPE
Department GENERAL FUND
Downtown
145

Department Description and Core Services The Finance Director/Administrative Services is responsible for the Capital Replacement department ID. The Capital Replacement department ID of the General Fund uses this department ID to track the associated expenditures for the replacement of computers for general fund and enterprise departments. These expenditures are funded with revenues from selling general fund assets through the internet site GovDeals and City enterprise departments. Financial Summary
Budget Highlights Highlight of changes: Equipment increased $80K to $260K to include the replacement of iPads and the full cost of laptops and
workstations to fund full replacement of a general fund user’s primary equipment. Includes a transfer out of $55K to Fleet Services for their portion of revenue from the sale of fixed assets
relating to fleet vehicles and equipment.
Capital Replacement FYFY 2020 FY $ Change % Change
2019 Adopted 2021 From FY From FYActual Budget Budget 2020 2020
RevenuesTaxes -$ -$ -$ -$ Licenses & Permits -$ -$ -$ -$ Intergovernmental Grants -$ -$ -$ -$ Charges for Services 72,771$ 80,000$ 80,000$ -$ Fines & Forfeits -$ -$ -$ -$ Proceeds of Long Term Liabilities -$ -$ -$ -$ Transfers In -$ -$ -$ -$ Other Revenue 249,216$ 175,000$ 175,000$ -$ Total Revenues 321,987$ 255,000$ 255,000$ -$ 0%
ExpendituresPersonal Services -$ -$ -$ -$ Discretionary Expenses 98,328$ 200,000$ 280,000$ 80,000$ Other Expenses -$ -$ -$ -$ Capital Outlay 79,508$ -$ -$ -$ Debt Service -$ -$ -$ -$ Transfers Out -$ -$ 55,000$ 55,000$ Total Expenditures 177,836$ 200,000$ 335,000$ 135,000$ 68%
Net Revenues over/(under) Expenditures 144,150$ 55,000$ (80,000)$ (135,000)$
FUND TYPE
Department FUND TYPE
Department GENERAL FUND
Capital Replacement
146

Department Description and Core Services The Finance Director/Administrative Services is responsible for the Pooled Revenues department ID. The Pooled Revenues department ID of the General Fund uses this department ID to record property tax revenue either directly or via transfers from 8.10 levy, benefit levy, and IPERS and FICA levy for the general fund. Franchise revenue, court fines, state property tax backfill revenue, and interest revenues are also recorded to this department ID. All of these revenues offset unfunded costs of general fund departments. Financial Summary
Budget Highlights Highlight of changes: The 8.10 property tax levy will produce $56.3M in property tax revenue in FY 2021. Franchise tax revenue is increasing by $133K to $10.3M based on historical and projected information. Interest revenue is increasing $657K to $2.3M based on historical and projected information.
Pooled Revenues FYFY 2020 FY $ Change % Change
2019 Adopted 2021 From FY From FYActual Budget Budget 2020 2020
RevenuesTaxes 64,500,739$ 65,611,622$ 66,619,849$ 1,008,227$ Licenses & Permits -$ -$ -$ -$ Intergovernmental Grants 2,155,861$ 2,204,401$ 2,014,473$ (189,928)$ Charges for Services -$ -$ -$ -$ Fines & Forfeits 74,573$ 90,000$ 90,000$ -$ Proceeds of Long Term Liabilities -$ -$ -$ -$ Transfers In 16,454,592$ 16,990,274$ 18,336,220$ 1,345,946$ Other Revenue 2,615,833$ 1,642,060$ 2,298,863$ 656,803$ Total Revenues 85,801,598$ 86,538,357$ 89,359,405$ 2,821,048$ 3%
ExpendituresPersonal Services -$ -$ -$ -$ Discretionary Expenses (800)$ 367,401$ -$ (367,401)$ Other Expenses -$ -$ -$ -$ Capital Outlay -$ -$ -$ -$ Debt Service -$ -$ -$ -$ Transfers Out 5,469,177$ -$ -$ -$ Total Expenditures 5,468,377$ 367,401$ -$ (367,401)$ -100%
Net Revenues over/(under) Expenditures 80,333,221$ 86,170,956$ 89,359,405$ 3,188,449$
FUND TYPE
Department FUND TYPE
Department GENERAL FUND
Pooled Revenues
147

Department Description and Core Services The Finance Director/Administrative Services is responsible for the Investment Earning department ID. The Investment Earnings department ID of the General Fund uses this department ID to record investment expenses and associated charges, as well as to initially record interest revenue that is later allocated to specific funds. Financial Summary
Budget Highlights Highlight of changes: No changes.
Investment Earnings FYFY 2020 FY $ Change % Change
2019 Adopted 2021 From FY From FYActual Budget Budget 2020 2020
RevenuesTaxes -$ -$ -$ -$ Licenses & Permits -$ -$ -$ -$ Intergovernmental Grants -$ -$ -$ -$ Charges for Services -$ -$ -$ -$ Fines & Forfeits -$ -$ -$ -$ Proceeds of Long Term Liabilities -$ -$ -$ -$ Transfers In -$ -$ -$ -$ Other Revenue 2,944,579$ 217,940$ 201,137$ (16,803)$ Total Revenues 2,944,579$ 217,940$ 201,137$ (16,803)$ -8%
ExpendituresPersonal Services -$ -$ -$ -$ Discretionary Expenses 149,677$ 166,500$ 166,500$ -$ Other Expenses 50,395$ 51,440$ 34,637$ (16,803)$ Capital Outlay -$ -$ -$ -$ Debt Service -$ -$ -$ -$ Transfers Out -$ -$ -$ -$ Total Expenditures 200,072$ 217,940$ 201,137$ (16,803)$ -8%
Net Revenues over/(under) Expenditures 2,744,508$ -$ -$ -$
FUND TYPE
Department FUND TYPE
Department GENERAL FUND
Investment Earnings
148

Department Description and Core Services The Executive Director is responsible for the Memorial department ID. The Memorial Department is responsible for the management, development, operations, and maintenance of the Veterans Memorial Building, Veterans Memorial Stadium, and the All Veterans Memorial Park. The Memorial Department expenditures are funded through the Memorial Building property tax levy. Financial Summary
Budget Highlights
Summary of FTEs
FY 2020 Adjusted Change from FY 2020 FY 2021 Budget 8.56 0.00 8.56
Highlight of changes: The Memorial Department is mainly funded through the memorial building property tax levy. The levy rate
will remain unchanged at $0.20082/1000 of taxable valuation. The levy rate will produce $1.4M in property tax revenue in FY 2021.
Includes transfer out of $100K for Veterans Stadium Capital improvement projects. After FY 2021, Memorial will have one year remaining in the agreement to fund $100K per year for the Veterans Stadium capital improvement projects. Also included is an additional transfer out of $104K for Veterans Memorial Building capital improvement projects.
Memorial FYFY 2020 FY $ Change % Change
2019 Adopted 2021 From FY From FYActual Budget Budget 2020 2020
RevenuesTaxes 1,342,408$ 1,374,185$ 1,395,894$ 21,709$ Licenses & Permits -$ -$ -$ -$ Intergovernmental Grants 53,449$ 54,653$ 49,944$ (4,709)$ Charges for Services 9,279$ 6,340$ 6,340$ -$ Fines & Forfeits -$ -$ -$ -$ Proceeds of Long Term Liabilities -$ -$ -$ -$ Transfers In -$ -$ 50,000$ 50,000$ Other Revenue 167,295$ 120,000$ 130,000$ 10,000$ Total Revenues 1,572,431$ 1,555,178$ 1,632,178$ 77,000$ 5%
ExpendituresPersonal Services 680,586$ 738,246$ 731,906$ (6,340)$ Discretionary Expenses 203,651$ 299,419$ 318,509$ 19,090$ Other Expenses 283,769$ 327,589$ 377,471$ 49,882$ Capital Outlay 18,962$ -$ -$ -$ Debt Service -$ -$ -$ -$ Transfers Out 100,000$ 189,923$ 204,291$ 14,368$ Total Expenditures 1,286,968$ 1,555,178$ 1,632,178$ 77,000$ 5%
Net Revenues over/(under) Expenditures 285,463$ -$ -$ 0$
FUND TYPE
Department FUND TYPE
Department GENERAL FUND
Memorial
149

Department Description and Core Services The Public Works Director is responsible for the Agricultural Lands department ID. The Agricultural Lands department ID of the General Fund uses this department ID to track the equipment and discretionary expenditures used for road side vegetation control that are funded through the Ag Land property tax levy. Financial Summary
Budget Highlights Highlight of changes: Agricultural Lands is funded 100% through the agricultural land property tax levy. The levy rate will produce $24K in property tax revenue in FY 2021.
Agriculture Lands FYFY 2020 FY $ Change % Change
2019 Adopted 2021 From FY From FYActual Budget Budget 2020 2020
RevenuesTaxes 22,287$ 22,300$ 23,873$ 1,573$ Licenses & Permits -$ -$ -$ -$ Intergovernmental Grants -$ -$ -$ -$ Charges for Services -$ -$ -$ -$ Fines & Forfeits -$ -$ -$ -$ Proceeds of Long Term Liabilities -$ -$ -$ -$ Transfers In -$ -$ -$ -$ Other Revenue -$ -$ -$ -$ Total Revenues 22,287$ 22,300$ 23,873$ 1,573$ 7%
ExpendituresPersonal Services -$ -$ -$ -$ Discretionary Expenses 48,661$ 22,300$ 23,873$ 1,573$ Other Expenses -$ -$ -$ -$ Capital Outlay -$ -$ -$ -$ Debt Service -$ -$ -$ -$ Transfers Out -$ -$ -$ -$ Total Expenditures 48,661$ 22,300$ 23,873$ 1,573$ 7%
Net Revenues over/(under) Expenditures (26,374)$ -$ -$ -$
FUND TYPE
Department FUND TYPE
Department GENERAL FUND
Agricultural Lands
150

Department Description and Core Services The Band Director is responsible for the Band department ID. The Band department ID of the General Fund uses this department ID to track the associated revenues & expenditures of the Cedar Rapids Municipal Band. The Band has traditionally been funded through the Iowa Band Law, a tax collected in the property taxes of citizens. The expenditure budget is used for the salaries of the contracted performers, the staff, and the conductor as well as the purchase of music and general supplies for performances. Financial Summary
Budget Highlights Highlight of changes: Band is funded 100% through the band property tax levy and backfill from the state. The levy will remain unchanged at $0.01667/1000 of taxable valuation. The levy rate will produce $116K in property tax revenue in FY 2021.
Band FYFY 2020 FY $ Change % Change
2019 Adopted 2021 From FY From FYActual Budget Budget 2020 2020
RevenuesTaxes 111,919$ 114,071$ 115,873$ 1,802$ Licenses & Permits -$ -$ -$ -$ Intergovernmental Grants 4,437$ 4,537$ 4,146$ (391)$ Charges for Services -$ -$ -$ -$ Fines & Forfeits -$ -$ -$ -$ Proceeds of Long Term Liabilities -$ -$ -$ -$ Transfers In -$ -$ -$ -$ Other Revenue 2,033$ -$ -$ -$ Total Revenues 118,389$ 118,608$ 120,019$ 1,411$ 1%
ExpendituresPersonal Services -$ -$ -$ -$ Discretionary Expenses 103,960$ 118,356$ 120,019$ 1,663$ Other Expenses 4,050$ 252$ -$ (252)$ Capital Outlay -$ -$ -$ -$ Debt Service -$ -$ -$ -$ Transfers Out -$ -$ -$ -$ Total Expenditures 108,010$ 118,608$ 120,019$ 1,411$ 1%
Net Revenues over/(under) Expenditures 10,378$ -$ -$ -$
GENERAL FUND
Band
151

Enterprise Funds Enterprise funds account for operations and activities that are financed and operated in a manner similar to a private business enterprise and where the cost of providing goods and services to the general public on a continuing basis is expected to be financed or recovered primarily through user charges. These funds include areas such as water, sewer, storm water, golf, transit, and solid waste and recycling.
152

Highlights The table below summarizes the FY 2021 Enterprise Fund budget.
Summary of FTEs
FY 2020 Adjusted Change from FY 2020 FY 2021 Budget 429.08 13.12 442.20
The FY 2021 budget for enterprise funds increased 13.12 FTEs to 442.2 FTEs. The budget includes: Adding 8 Transit positions to extend weeknight fixed-route bus service to all bus routes by two additional
hours. Golf adding 1.12 seasonal FTE to support a new mini golf course program. Adding of 1 Water Utility Service Rep I FTE to support water utility service locating. The Eastern Iowa Airport adding 3 positions.
The Cedar Rapids Linn County Solid Waste Agency is also an enterprise fund but is a separate business unit. The reports herein this section exclude the Cedar Rapids Linn County Solid Waste Agency. See the section on business units for the Cedar Rapids Linn County Solid Waste Agency report. Of the $328M enterprise fund expenditure budget, the largest budgeted expense of $96.7M are capital outlay expenditures. The capital project funds with the largest budgeted capital outlay expenditures are The Eastern Iowa Airport ($49.9M), Water ($13.8M), Sanitary Sewer ($12.8M), and Water Pollution Control ($12.2M) excluding transfers. Discretionary expenses make up $53.6M or 16% of the FY 2021 enterprise fund budget. The following chart shows the enterprise fund by major object of expenditure for FY 2021.
Enterprise Fund FYFY 2020 FY $ Change % Change
2019 Adopted 2021 From FY From FYActual Budget Budget 2020 2020
RevenuesTaxes 5,398,717$ 5,528,149$ 5,615,479$ 87,330$ Licenses & Permits 86,208$ 47,670$ 79,800$ 32,130$ Intergovernmental Grants 13,972,986$ 26,419,061$ 23,621,572$ (2,797,489)$ Charges for Services 131,748,849$ 135,461,578$ 141,523,699$ 6,062,121$ Fines & Forfeits -$ -$ -$ -$ Proceeds of Long Term Liabilities 29,121,984$ 15,080,000$ 22,742,000$ 7,662,000$ Transfers In 58,769,276$ 67,532,047$ 84,577,538$ 17,045,491$ Other Revenue 25,364,239$ 21,240,563$ 24,516,116$ 3,275,552$ Total Revenues 264,462,258$ 271,309,068$ 302,676,204$ 31,367,136$ 12%
ExpendituresPersonal Services 37,298,848$ 40,502,770$ 42,959,891$ 2,457,121$ Discretionary Expenses 47,550,543$ 49,902,389$ 53,612,592$ 3,710,202$ Other Expenses 22,314,856$ 21,675,996$ 22,553,898$ 877,903$ Capital Outlay 64,892,697$ 71,282,600$ 96,658,788$ 25,376,188$ Debt Service 37,603,405$ 29,970,516$ 28,401,032$ (1,569,484)$ Transfers Out 55,699,881$ 64,467,312$ 83,844,913$ 19,377,601$ Total Expenditures 265,360,230$ 277,801,584$ 328,031,114$ 50,229,530$ 18%
Net Revenues over/(under) Expenditures (897,972)$ (6,492,515)$ (25,354,910)$ (18,862,394)$
153

In FY 2021, the largest budgeted revenue source for enterprise funds is charges for services of $141.5M. The largest revenue sources in the category of charges for services are utility user fees for water, water pollution control, sewer, and solid waste and recycling. The chart below shows the enterprise fund by major revenue source for FY 2021.
Personal Services$42,959,891
13%
Discretionary Expenses
$53,612,592 16%
Other Expenses$22,553,898
7%
Capital Outlay$96,658,788
29%
Debt Service$28,401,032
9%
Transfers Out$83,844,913
26%
Taxes$5,615,479
2%
Licenses & Permits$79,800
0% Intergovernmental Grants
$23,621,572 8%
Charges for Services$141,523,699
47%
Proceeds of Long Term Liabilities
$22,742,000 7%
Transfers In$84,577,538
28%
Other Revenue$24,516,116
8%
154

UTILITIES The City of Cedar Rapids provides the following utilities: Water Water Pollution Control / Sanitary Sewer Storm Water Solid Waste, Recycling, and Yard Waste These utilities are in a combined billing. Total residential utility billings will increase 4.8% for 10 units of water and 10 units of sewer. 1 unit is equivalent to 748 gallons. The following chart details the effect of the rate increase for a typical residential customer.
The majority of the increase in FY 2021 will be used to fund operations and capital improvement projects. WATER The Water Department is increasing the water service charge by 6.5% for FY 2021. Volumetric steps one and two will increase 6%, step three 4.5% and step four 1.25%. The rate increases will fund operating costs and capital improvement project expenditures. The budget includes the addition of 1 Water Utility Service Rep I FTE to support water utility locating. In FY 2021, total planned capital project expenditures are $13.8M. Funding includes $6.5M in revenue bonds, $3.1M in state revolving fund proceeds, and $4.2M from user fees. Included in the budget is $4.5M for water expenses associated with paving for progress projects. The largest budgeted project of $3.1M is for the northwest water treatment plan softener addition. The water department five-year capital improvement project plan for fiscal years 2021 - 2025 is estimated at $87.9M. This plan is based on 4% annual increases in total revenue or rate increases of 6.5-7% annually to support 2% annual increases in operations and capital investments while maintaining current bond ratings. The following charts shows FY 2020 water rates compared to Cedar Rapids’ FY 2021 rate for a typical residential customer using 10 units, or 7,500 gallons of water. Note – the City of Robin’s water is supplied by Cedar Rapids, Cedar Rapids’ water is softened, and all other cities provide non-softened water.
Monthly Monthly Percent AnnualFY 2020 FY 2021 Increase Impact
Water 35.07$ 37.23$ 6.2% 25.92$ Iowa & Local Water ExciseTax** 2.10$ 2.23$ 6.2% 1.56$ Water Pollution Control/Sanitary Sewer 33.38$ 35.54$ 6.5% 25.92$ Storm Water 6.58$ 6.91$ 5.0% 3.96$ Solid Waste/Yard Waste/Recycling 22.53$ 22.53$ 0.0% -$ Total Charges - Monthly Bill 99.66$ 104.44$ 4.8% 57.36$
Cost per Day 3.28$ 3.44$
Note: One CCF unit equals 100 cubic feet or 748 gallons
Typical or Average Consumption for Residential Customer(10 Units Water & 10 Units Sewer)
FY20 Vs FY 21
155

The chart below shows the FY 2020 softened water rates for several cities in the state of Iowa.
$-
$10
$20
$30
$40
$50
$60
$27.50
$35.07 $37.23
$44.89 $45.61
$55.50
Local Cities Without Softened Water Cost for 7,500 Gallons(FY 2020 for Other Cities)
$-
$10
$20
$30
$40
$50
$60
Iowa Cities With Softened Water Cost for 7,500 Gallons(FY 2020 for Other Cities)
156
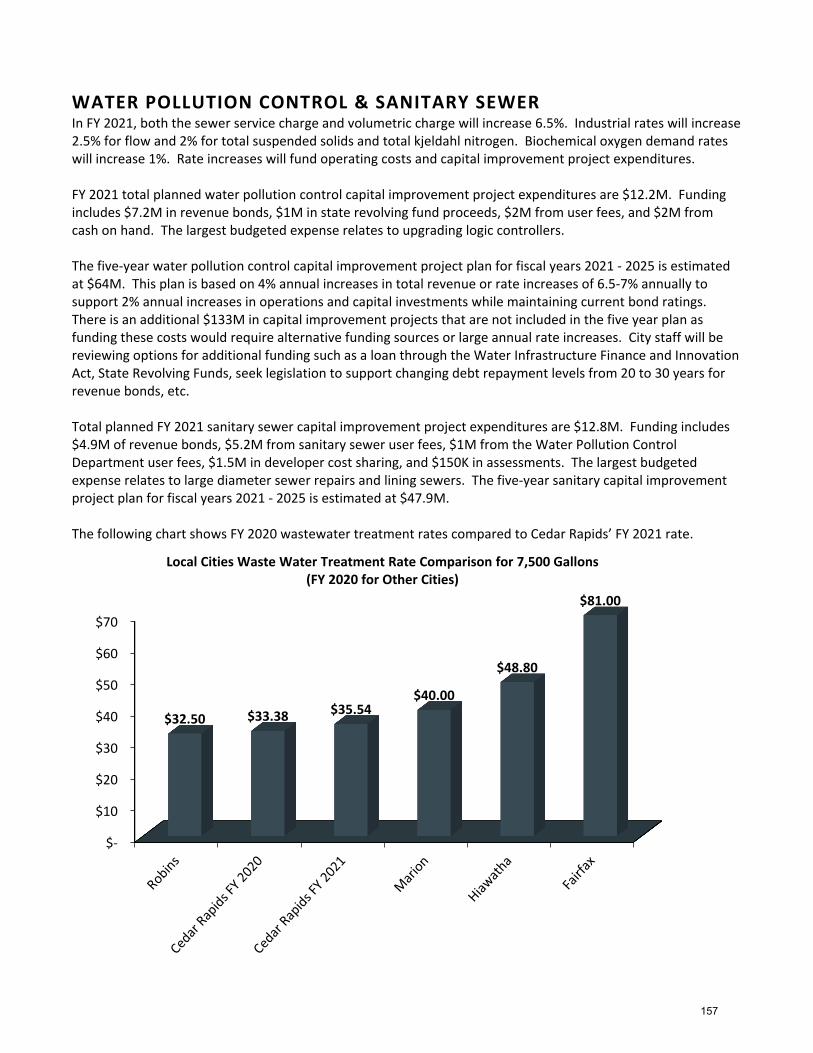
WATER POLLUTION CONTROL & SANITARY SEWER In FY 2021, both the sewer service charge and volumetric charge will increase 6.5%. Industrial rates will increase 2.5% for flow and 2% for total suspended solids and total kjeldahl nitrogen. Biochemical oxygen demand rates will increase 1%. Rate increases will fund operating costs and capital improvement project expenditures. FY 2021 total planned water pollution control capital improvement project expenditures are $12.2M. Funding includes $7.2M in revenue bonds, $1M in state revolving fund proceeds, $2M from user fees, and $2M from cash on hand. The largest budgeted expense relates to upgrading logic controllers. The five-year water pollution control capital improvement project plan for fiscal years 2021 - 2025 is estimated at $64M. This plan is based on 4% annual increases in total revenue or rate increases of 6.5-7% annually to support 2% annual increases in operations and capital investments while maintaining current bond ratings. There is an additional $133M in capital improvement projects that are not included in the five year plan as funding these costs would require alternative funding sources or large annual rate increases. City staff will be reviewing options for additional funding such as a loan through the Water Infrastructure Finance and Innovation Act, State Revolving Funds, seek legislation to support changing debt repayment levels from 20 to 30 years for revenue bonds, etc. Total planned FY 2021 sanitary sewer capital improvement project expenditures are $12.8M. Funding includes $4.9M of revenue bonds, $5.2M from sanitary sewer user fees, $1M from the Water Pollution Control Department user fees, $1.5M in developer cost sharing, and $150K in assessments. The largest budgeted expense relates to large diameter sewer repairs and lining sewers. The five-year sanitary capital improvement project plan for fiscal years 2021 - 2025 is estimated at $47.9M. The following chart shows FY 2020 wastewater treatment rates compared to Cedar Rapids’ FY 2021 rate.
$-
$10
$20
$30
$40
$50
$60
$70
$32.50 $33.38 $35.54$40.00
$48.80
$81.00
Local Cities Waste Water Treatment Rate Comparison for 7,500 Gallons (FY 2020 for Other Cities)
157

The following chart shows FY 2020 wastewater treatment rates across the state of Iowa compared to Cedar Rapids’ FY 2021 rate.
The following chart shows FY 2020 wastewater treatment rates for Midwest cities compared to Cedar Rapids.
$-
$10
$20
$30
$40
$50
$60
$70
$80
$90
$33.39 $33.38 $35.54$44.06
$48.97$52.69
$60.58$65.94
$89.60
State of Iowa Waste Water Treatment Rate Comparison for 7,500 Gallons (FY 2020 for Other Cities)
$-
$10
$20
$30
$40
$50
$60
$70
$33.38$35.54
$39.54
$57.40
$71.67
Midwest Waste Water Treatment Rate Comparison Per Million Gallons Per Day (FY 2020 for Other Cities)
158

The following chart shows biochemical oxygen demand costs per pound.
STORM WATER The storm water utility rate will increase 5%, which will generate $307K of revenue to fund capital improvement projects and operating needs. In FY 2021, $4.1M of storm water user fees will fund capital improvement projects. The largest budgeted project is the expansion of an existing detention basin on E Avenue NW west of 28th Street. The five-year storm water capital improvement project plan for fiscal years 2021 - 2025 is estimated at $22.6M. SOLID WASTE, YARD WASTE, RECYCLING There will be no increase in FY 2021 to the residential rate for solid waste, yard waste, and recycling collection services. The department will continue to monitor growth and service needs as future development occurs. OTHER AREAS Transit The Transit property tax levy rate will remain unchanged in FY 2021 at $.80787/$1000 of taxable valuation. Included in the budget is the expansion of weeknight fixed route bus services that includes an additional 2 hours of service on all routes each weeknight. The Transit expense budget increased $904K for this additional service. Also included in the budget are purchases of new buses as well as a new bus maintenance facility in FY 2021 with the majority of the funding from grants and cash on hand.
- 0.05 0.10 0.15 0.20 0.25 0.30 0.35 0.40 0.45 0.50
$0.043$0.100
$0.110 $0.116$0.156 $0.160 $0.162 $0.181
$0.280$0.309
$0.450$0.867
Biochemical Oxygen Demand Cost Per Pound (FY 2020 for Other Cities)
All Cities Require Pretreatment of Waste Water Except Memphis & Cedar Rapids
159

Golf The FY 2021 budget includes revenue of $2.92M and expenditures of $3M, which reflects an operational deficit of $75K. To fund this deficit, the budget includes a transfer from the general fund. Also included in the budget are revenues ($165K) and expenses ($41K) associated with the opening of a mini golf course at the Twin Pines Golf Course. Parking The FY 2021 Parking budget includes the City’s activity relating to Parking. This includes personal services for the employees originally hired by the City of Cedar Rapids, debt payments, and capital improvement projects. Hotel, Convention Center, Arena The net income from the hotel portion of the complex will go towards hotel debt payments in FY 2021. The convention center and arena portion of the complex operating deficits and capital reserve will be funded by the general fund and central business district tax increment financing revenue. ImOn Ice Arena The FY 2021 ImOn Ice Arena budget shows a deficit of $124K to operate the facility. The deficit will be funded with hotel motel revenue. In addition, the City will be allocating $3.25M from hotel motel revenue to fund capital improvements in FY 2021. Paramount The City transferred its interests to the Paramount Theatre Manager, LLC in October 2012. By FY 2021, the interests in the Paramount Theatre are anticipated to be transferred back to the City. The FY 2021 budget includes $1.6M in revenue and expenses for the Paramount operations. The Eastern Iowa Airport The Eastern Iowa Airport is a component unit of the City of Cedar Rapids. The Cedar Rapids Airport Commission operates and maintains The Eastern Iowa Airport and has adopted FY 2021 budget for The Eastern Iowa Airport. The budget submitted reflects $82M in revenue and $101M in expenses, which is $19M of net expenditures over revenues.
160

Department Description and Core Services The Deputy City Manager is responsible for the Transit Department. The Transit Department is responsible for providing safe, courteous, and dependable transit service in the City of Cedar Rapids, with service also provided to the cities of Marion and Hiawatha. The following transit services are directly provided or partially funded by Cedar Rapids Transit: Fixed-route city bus service with 13 bus routes operating from 5:15AM to 7:00PM Monday through Friday
and from 8:15AM to 5:00PM Saturday. Americans with Disabilities Act mandated paratransit service to provide demand-response service for
passengers with qualifying disabilities during the same hours as the fixed-route city bus service (contracted through Linn County LIFTS service).
Did you know? Our Statistics… Cedar Rapids Transit provided 1.2M passenger trips in FY 2019. Ridership breakdown in FY 2019 was 62% adults, 20% disabled, 12% students, 4% elderly, and 2% children. Cash fares in FY 2019 were $1.50 for adults and $0.75 for students, elderly & disabled and low income. Cedar Rapids Transit currently has a fleet of 30 buses of which 22 are in use during peak service hours. You can currently track the buses in real time at RideCRT.com. Our Recent Accomplishments… Purchased three new replacement buses in May 2019. Since 2009, the entire fleet of buses has been replaced reducing the average age of the bus fleet from 20+
years to 6 years. Funding is in place to replace two heavy-duty buses per year, which will keep the fixed-route bus fleet in a
state of good repair for the near future. Implemented a Sponsored Fare Program for Students with participation from the Cedar Rapids Community
School District, Kirkwood Community College, and Coe College (FY 2020). Installed new high-definition security cameras on all of the fixed-route buses (FY 2019).
Challenges & Opportunities Evening fixed-route and paratransit service expansion proposal for FY 2021. Potential budgetary impacts because of the 2020 Census results. Implementing mobile ticketing options for smart phone users. Goals
Department Goal: Increase Cedar Rapids Transit's fixed-route bus ridership by 2% per fiscal year. Relates to City Goal: Connect CR Time Frame: Working to Meet Goal
Key Measure Target Goal
FY 2018 Actual
FY 2019 Actual
FY 2020 Projected
FY 2021 Projected
Bus ridership 2% increase per year
1,265,721 6% increase
1,246,374 2% decrease
1,271,300 2% increase
1,296,000 2% increase
Department Goal: To have charges for services, intergovernmental grants, and other miscellaneous revenue cover 50% of Cedar Rapids Transit’s operating costs. Relates to City Goal: Connect CR Time Frame: Met Goal
Key Measure Target Goal
FY 2018 Actual
FY 2019 Actual
FY 2020 Projected
FY 2021 Projected
Other Revenue Source Totals 50% 52% 53% 50% 50%
ENTERPRISE FUND
Transit
161

Financial Summary
Budget Highlights
Summary of FTEs
FY 2020 Adjusted Change from FY 2020 FY 2021 Budget 57.00 8.00 65.00
The operating budget includes the following: The transit levy rate will remain unchanged at $.80787/$1000 of taxable valuation. The levy rate will
produce $5.6M in property tax revenue in FY 2021. The budget includes an increase of 4% or $23K to $574K in service charge revenue from Marion and
Hiawatha. (Marion’s charge is $433K; Hiawatha’s is $140K). Passenger fare revenue from students is decreasing $30K to $80K due to the implementation of the student
sponsored fare program. Building rental revenue is increasing 15% or $8K to $63K for the Montessori school rent. Included in the budget is an additional $904K for extending weeknight fixed-route bus service to all bus
routes by two additional hours (CONNECT CR). The budget includes: Addition of 5 Transit Driver FTEs, 1 Transit Operations Supervisor FTE, 1 Transit Operations Clerk FTE,
and 1 Service Worker FTE. Total cost is $615K. Increase in overtime of $150K. Increase in on-call pay of $12K. Increase in fuel of $90K. Increase in internal administrative charges due to the increase of adding 8 FTEs ($37K).
Included in operating expenditures is a transfer out of $108K towards funding bus purchases in FY 2021. The capital improvement project fund budget includes the following: $2.4M for a new bus maintenance facility. Funding includes $600K from grants, $200K due to street
relocating, and $1.6M from cash on hand. $1.2M for buses. Funding includes $1M from grants, $108K from operations and $140K from cash on hand.
Transit FYFY 2020 FY $ Change % Change
2019 Adopted 2021 From FY From FYActual Budget Budget 2020 2020
RevenuesTaxes 5,398,717$ 5,528,149$ 5,615,479$ 87,330$ Licenses & Permits -$ -$ -$ -$ Intergovernmental Grants 5,245,263$ 4,207,104$ 5,668,758$ 1,461,654$ Charges for Services 976,421$ 918,000$ 888,000$ (30,000)$ Fines & Forfeits -$ -$ -$ -$ Proceeds of Long Term Liabilities -$ -$ -$ -$ Transfers In 1,986,837$ 1,378,688$ 182,225$ (1,196,463)$ Other Revenue 247,260$ 178,790$ 387,174$ 208,384$ Total Revenues 13,854,498$ 12,210,731$ 12,741,636$ 530,905$ 4%
ExpendituresPersonal Services 4,799,314$ 5,026,849$ 5,983,188$ 956,339$ Discretionary Expenses 1,330,238$ 1,488,293$ 1,508,293$ 20,000$ Other Expenses 2,904,611$ 2,930,597$ 3,245,706$ 315,109$ Capital Outlay 2,669,396$ 200,000$ 3,637,022$ 3,437,022$ Debt Service -$ -$ -$ -$ Transfers Out 1,939,881$ 1,319,496$ 107,725$ (1,211,771)$ Total Expenditures 13,643,439$ 10,965,235$ 14,481,933$ 3,516,698$ 32%
Net Revenues over/(under) Expenditures 211,058$ 1,245,496$ (1,740,297)$ (2,985,793)$
162

Department Description and Core Services The Parks and Recreation Director is responsible for the Golf Department. The Golf Department is responsible for the operation and maintenance of the City’s golf courses and clubhouses – Ellis, Gardner, Jones, and Twin Pines. Staff provides lesson programming, private and City tournament planning, solicit and provide services for outings, host charity and statewide service club tournaments, and provide daily customer service and advice to public golfers. Seasonal golf staff and volunteers assist full time staff in various support service duties. Golf Operations is committed to land stewardship and efficiencies at all golf course facilities. The golf courses are: Ellis Golf Course – the first nine holes were built in 1919 and the second nine holes in 1949. Course
renovations were completed in 2003. The course is located in Ellis Park. Gardner Golf Course – is an 18-hole championship course built in 1968. It is located outside the City of
Marion in Squaw Creek Park. Twin Pines Golf Course – opened in 1962 as an 18-hole course. The course is located along 42nd Street and
Edgewood Road NE, convenient to interstate 380. Jones Golf Course – Opened as a 9-hole golf course in 1959. Course closed for renovations in spring 2000.
May 2001 course re-opened as an 18-hole course. The course is located in Jones Park.
Did you know? Our Statistics… In FY 2019, 82K golf rounds were played at the four city municipal golf courses. Of the 82K rounds played,
25% of total golf rounds played were by season pass holders. This is a decrease of 27% or 10K rounds from FY 2018. Rounds of golf broken down by golf course: Ellis hosted 25K rounds, Gardner 23K rounds, Twin Pines 25K rounds, and Jones 9K rounds.
In FY 2019, City municipal golf courses hosted 1,502 “Golf for Injured Veterans Everywhere” rounds for disabled veterans. This was a 2.5% or 35 round increase over FY 2018.
Ellis Golf Course turned 100 years old in the summer of 2019. In FY 2019, city golf facilities hosted 116 scheduled outings or tournaments ranging in size from 20 to 144
golfers per event. This is an increase of 1% or two events from FY 2018. Approximately 70 volunteers contributed in excess of 9K hours in FY 2019 to the city golf facilities. Our Recent Accomplishments… During calendar year 2019, the Golf department operated in year two of an organizational structure of
Interim Golf Operations Manager, two Golf Professionals, and four Superintendents. This is a temporary reduction to expenses of one Golf Professional and a permanent reduction of one Superintendent. The Interim Golf Operations Manager position is being filled by a Golf Professional.
During the spring of 2019, City Golf department launched its own Facebook page @cedarrapidsgolf. This has allowed us to promote events and keep golfers up-to-date on happening at the golf courses. We have 399 follows and 385 likes as of November 2019.
During the 2019 calendar-playing season, Cedar Rapids Golf continued to foster partnerships with Junior Optimist Club, key vendors, and local businesses to create alternative revenue sources to supplement operational expenditures.
During the 2019 calendar-playing season, Golf division ran 12 tournaments. This is an increase from nine in 2018. Of the 12 city ran tournaments, 10 were filled to capacity (24 teams/96 players).
Challenges & Opportunities What changes to Jones Golf Course can be made to address the effects of flooding and high financial subsidy
levels. Balance revenue and expenditures, while keeping fees competitive with the surrounding market.
ENTERPRISE FUND
Golf
163

Completing the design and construction of the miniature golf course at Twin Pines. Exploring different revenue enhancing opportunities to complete growing capital improvements needed for
the aging infrastructure of the City golf courses. (Projects include new or renovated clubhouses at Ellis, Twin, and Gardner, new maintenance buildings at Twin Pines and Jones, turf renovation and irrigation system replacement at Gardner and Twin Pines golf courses, and maintenance of parking lots and cart paths at all facilities.)
Goals Department Goal: Increase annual golf rounds by a minimum of 3% annually. Relates to City Goal: Strengthen CR Time Frame: Working to Meet Goal
Key Measure Target Goal
FY 2018 Actual
FY 2019 Actual
FY 2020 Projected
FY 2021 Budgeted
Total golf rounds 3% annual increase
92,097 1.3%
decrease
81,910
11% decrease
101,500 5% increase
94,250 15%
increase1
Department Goal: Maximize use of cost effective processes to contain golf maintenance expenses by incorporating two operational best practices into Golf operations to contain annual maintenance costs. Relates to City Goal: Green CR Time Frame: Met Goal
Key Measure Target Goal
FY 2018 Actual
FY 2019 Actual
FY 2020 Projected
FY 2021 Budgeted
Best practices implemented 2 3 3 2 2 1Calculated increase from FY 2019 Actual. Financial Summary
Golf FYFY 2020 FY $ Change % Change
2019 Adopted 2021 From FY From FYActual Budget Budget 2020 2020
RevenuesTaxes -$ -$ -$ -$ Licenses & Permits -$ -$ -$ -$ Intergovernmental Grants -$ -$ -$ -$ Charges for Services 1,608,287$ 1,797,250$ 1,996,240$ 198,990$ Fines & Forfeits -$ -$ -$ -$ Proceeds of Long Term Liabilities 253,527$ -$ -$ -$ Transfers In 2,608,440$ 439,360$ 259,611$ (179,749)$ Other Revenue 799,677$ 962,200$ 927,200$ (35,000)$ Total Revenues 5,269,931$ 3,198,810$ 3,183,051$ (15,759)$ 0%
ExpendituresPersonal Services 1,087,891$ 1,273,823$ 1,342,826$ 69,004$ Discretionary Expenses 778,390$ 875,255$ 882,805$ 7,550$ Other Expenses 760,333$ 783,536$ 772,843$ (10,693)$ Capital Outlay 144,639$ -$ -$ -$ Debt Service 275,498$ 266,196$ 184,576$ (81,620)$ Transfers Out 33,763$ -$ -$ -$ Total Expenditures 3,080,515$ 3,198,810$ 3,183,051$ (15,759)$ 0%
Net Revenues over/(under) Expenditures 2,189,417$ -$ -$ 0$
164
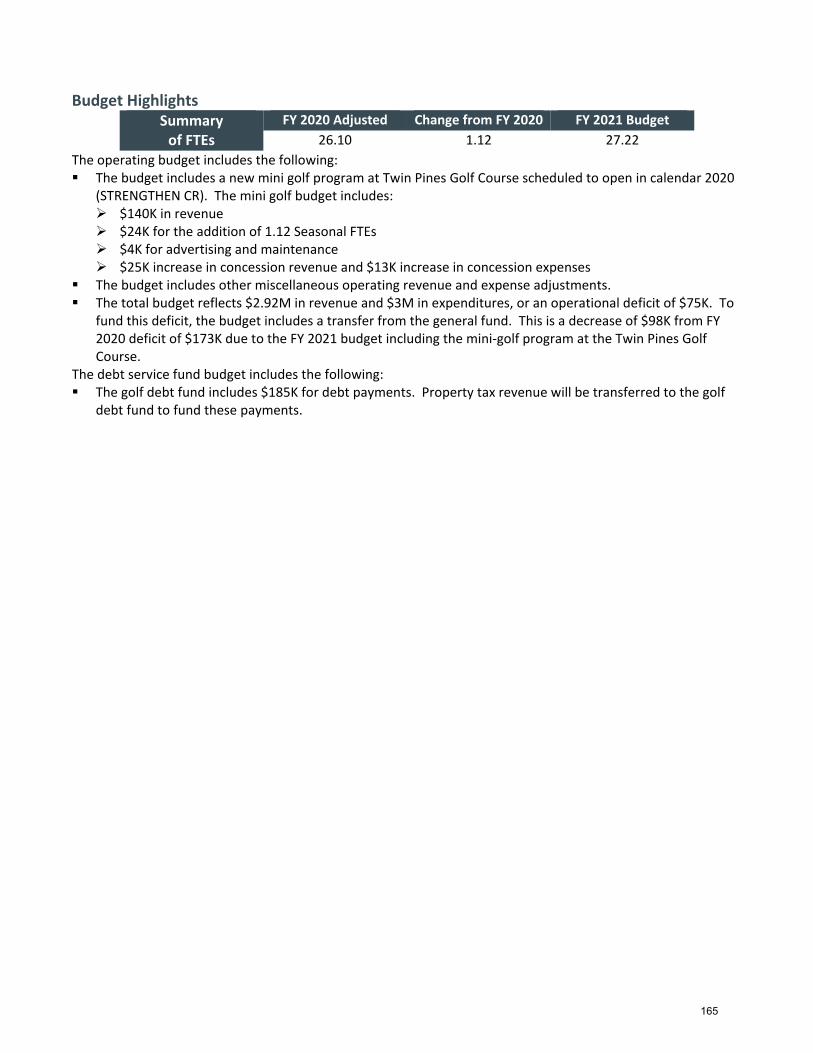
Budget Highlights
Summary of FTEs
FY 2020 Adjusted Change from FY 2020 FY 2021 Budget 26.10 1.12 27.22
The operating budget includes the following: The budget includes a new mini golf program at Twin Pines Golf Course scheduled to open in calendar 2020
(STRENGTHEN CR). The mini golf budget includes: $140K in revenue $24K for the addition of 1.12 Seasonal FTEs $4K for advertising and maintenance $25K increase in concession revenue and $13K increase in concession expenses
The budget includes other miscellaneous operating revenue and expense adjustments. The total budget reflects $2.92M in revenue and $3M in expenditures, or an operational deficit of $75K. To
fund this deficit, the budget includes a transfer from the general fund. This is a decrease of $98K from FY 2020 deficit of $173K due to the FY 2021 budget including the mini-golf program at the Twin Pines Golf Course.
The debt service fund budget includes the following: The golf debt fund includes $185K for debt payments. Property tax revenue will be transferred to the golf
debt fund to fund these payments.
165

Department Description and Core Services The Utilities Director is responsible for the Water Department. The Water Department is responsible for reliable delivery of safe, high quality water to every home, business, and industry at a reasonable price at the quantities needed. The plant Operations section manages treatment plants, remote pumping stations, water storage reservoirs
and tanks, and well-fields to ensure that the treatment and delivery processes function efficiently and effectively.
The plant Maintenance section services and repairs equipment as needed and ensures that facilities, infrastructure, and equipment are maintained in the most cost effective manner.
The Lab and Environmental section tests the drinking water over 1.4K times each month to ensure that it meets requirements of the Safe Drinking Water Act and other regulations.
The Distribution section maintains the water distribution system. The Meter Service and Meter Reading sections provide field customer services such as turning on/off water
service, installing/replacing water meters, locating underground water utilities, tapping water mains for new services, as well as reading meters for billing customers.
The Customer Service and Administration sections are responsible for the accurate billing for all utility services as well as providing customer service, collections, and customer information management for all aspects of the water operation.
The Engineering section manages the capital improvement programs for water treatment plants, distribution system, and the Water Pollution Control facilities.
Did you know? Our Statistics… The Water Department produces and distributes an average of 38M gallons of water per day to customers,
depending on the season. Our largest customer consumes an average of 11-12M gallons of water per day. Currently, there are 679 miles of water mains ranging in size from 4 to 48 inches in diameter. Currently, Water Department meters and charges for water utilized by almost 53K customer agreements. Our Recent Accomplishments… Completed 100% of public water supply and treatment plant compliance requirements for FY 2019. During FY 2019, maintained nitrate concentration in our finished water at safe levels through careful
operation of supply wells. Successfully managed Middle Cedar Partnership Project through United States Department of Agriculture –
Natural Resources Conversation Service (project timeline June 2015-June 2020). New Cedar River Public-Private partnership Regional Conservation Partnership Program project approved by Council. This will increase funding available for conservation practices throughout the Cedar River watershed.
During FY 2019 worked cooperatively with United States Geological Survey to create a computer model of the alluvial aquifer that supplies water to Cedar Rapids.
During FY 2019, J Avenue Plant Phase 2 construction project continued improving softener performance and lime chemical feed performance.
Construction of a new Kirkwood Boulevard elevated tank was completed and in service as of August 2019.
Challenges & Opportunities Upgrades for the original J Avenue plant. Northwest Plant softener addition to improve plant capacity and increase resiliency of this facility during
maintenance work on this key portion of the treatment process.
ENTERPRISE FUND
Water
166

Nitrate management of our source water or construction of nitrate removal processes will be costly. Middle Cedar Partnership Project continues to require significant staff attention, but the new Watershed
Coordinator position approved by Council in FY 2020 budget will provide more capacity in this vital area. Utilities water main work associated with Paving for Progress projects will continue to require significant
capital bonding needs and construction project administration.
Goals Department Goal: Reduce remittance processing and collection costs. Relates to City Goal: Strengthen CR Time Frame: Met Goal
Key Measure Target Goal
FY 2018 Actual
FY 2019 Actual
FY 2020 Projected
FY 2021 Budgeted
Customers participating in the Autopay Program 10,750 12,552 13,382 12,750 13,500
Department Goal: Perform preventative maintenance on each of 5222 fire hydrants every 5 years and paint each hydrant every 10 years. Relates to City Goal: Invest CR Time Frame: Working to Meet Goal
Key Measure Target Goal
FY 2018 Actual
FY 2019 Actual
FY 2020 Projected
FY 2021 Budgeted
Preventative maintenance and painting completed on fire
hydrants
1,045 maintained, 522 painted
per year
1,044 maintained, 750 painted
777 maintained, 503 painted
1,000 maintained, 750 painted
1,000 maintained, 500 painted
Financial Summary
Water FYFY 2020 FY $ Change % Change
2019 Adopted 2021 From FY From FYActual Budget Budget 2020 2020
RevenuesTaxes -$ -$ -$ -$ Licenses & Permits -$ -$ -$ -$ Intergovernmental Grants 19,096$ -$ -$ -$ Charges for Services 37,017,716$ 39,095,550$ 40,687,817$ 1,592,267$ Fines & Forfeits -$ -$ -$ -$ Proceeds of Long Term Liabilities 9,441,380$ 5,000,000$ 9,602,000$ 4,602,000$ Transfers In 15,222,644$ 14,897,089$ 15,265,160$ 368,071$ Other Revenue 1,920,586$ 717,810$ 711,364$ (6,446)$ Total Revenues 63,621,422$ 59,710,449$ 66,266,341$ 6,555,892$ 11%
ExpendituresPersonal Services 11,309,663$ 11,867,501$ 12,412,712$ 545,211$ Discretionary Expenses 6,945,067$ 7,725,228$ 8,109,226$ 383,998$ Other Expenses 4,681,481$ 4,799,459$ 5,099,585$ 300,126$ Capital Outlay 21,103,431$ 12,798,400$ 13,832,353$ 1,033,953$ Debt Service 14,833,938$ 10,940,626$ 11,029,270$ 88,643$ Transfers Out 16,056,447$ 15,264,997$ 15,530,636$ 265,639$ Total Expenditures 74,930,027$ 63,396,212$ 66,013,782$ 2,617,570$ 4%
Net Revenues over/(under) Expenditures (11,308,605)$ (3,685,763)$ 252,559$ 3,938,322$
167
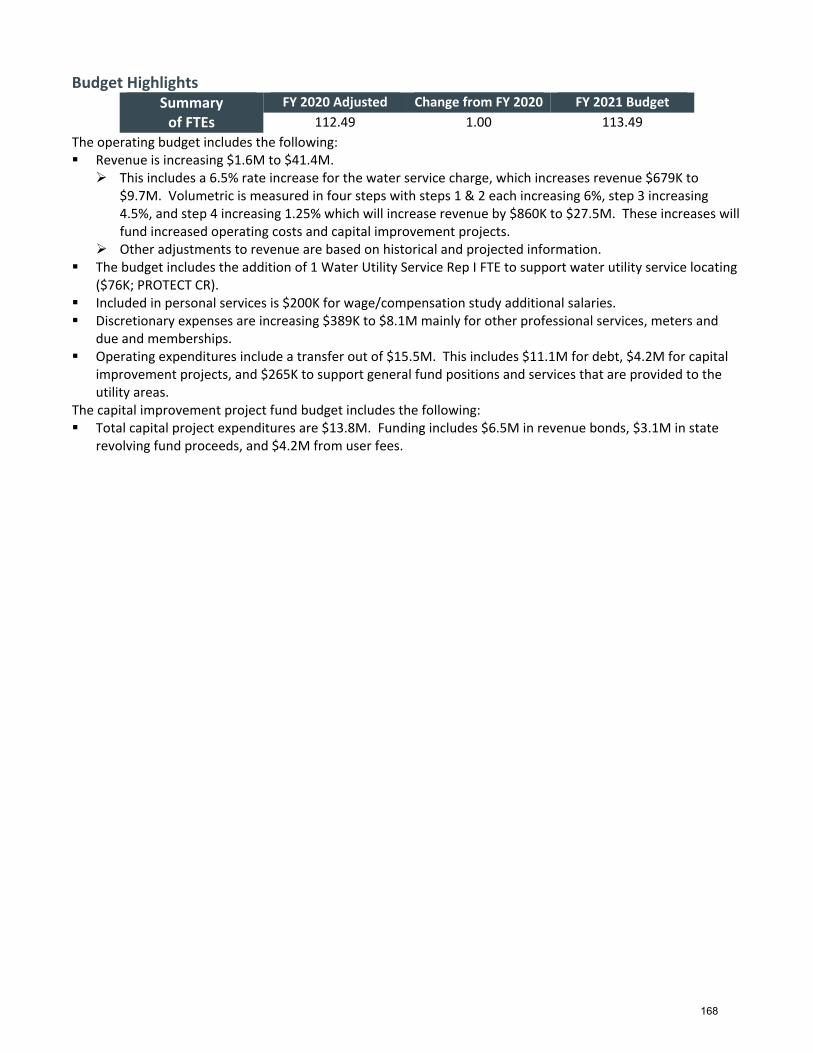
Budget Highlights Summary
of FTEs FY 2020 Adjusted Change from FY 2020 FY 2021 Budget
112.49 1.00 113.49 The operating budget includes the following: Revenue is increasing $1.6M to $41.4M. This includes a 6.5% rate increase for the water service charge, which increases revenue $679K to
$9.7M. Volumetric is measured in four steps with steps 1 & 2 each increasing 6%, step 3 increasing 4.5%, and step 4 increasing 1.25% which will increase revenue by $860K to $27.5M. These increases will fund increased operating costs and capital improvement projects.
Other adjustments to revenue are based on historical and projected information. The budget includes the addition of 1 Water Utility Service Rep I FTE to support water utility service locating
($76K; PROTECT CR). Included in personal services is $200K for wage/compensation study additional salaries. Discretionary expenses are increasing $389K to $8.1M mainly for other professional services, meters and
due and memberships. Operating expenditures include a transfer out of $15.5M. This includes $11.1M for debt, $4.2M for capital
improvement projects, and $265K to support general fund positions and services that are provided to the utility areas.
The capital improvement project fund budget includes the following: Total capital project expenditures are $13.8M. Funding includes $6.5M in revenue bonds, $3.1M in state
revolving fund proceeds, and $4.2M from user fees.
168
Department Description and Core Services The Utilities Director is responsible for the Water Pollution Control Department. The Water Pollution Control Department is responsible for treating wastewater from residents and industries in Cedar Rapids. The department also serves the surrounding communities of Marion, Hiawatha, Robins, Palo, and parts of Linn County. The Operations section ensures proper treatment in accordance with Department of Natural Resources and
Environmental Protection Agency regulations of wastewater before it is returned to the Cedar River. The Maintenance section repairs and maintains the equipment and infrastructure within the treatment
plant, as well as remote lift stations throughout the collection system and downtown floodwall pump stations.
The Lab section tests wastewater and biogas to ensure the facility is in compliance with effluent discharge or air permitting requirements.
The Environmental Services section communicates with regulatory agencies and provides internal evaluation of compliance requirements and needs. The section runs the industrial pretreatment program, which includes permitting and monitoring industrial discharges as well as assisting other City Departments with environmental compliance requirements, such as air permitting, storm water, energy management, sustainability initiatives, and residuals disposal.
The Administration section relates to administrative expenses not directly related to the other sections.
Did you know? Our Statistics… Water Pollution Control treats approximately 1.56B gallons of wastewater per month. The current population equivalent of Biochemical Oxygen Demand treatment capacity is almost 2M people
due to the nature of industrial customers served by Water Pollution Control. The sewer pipe in front of your house is probably 6 or 8 inches in diameter. Sewer pipe diameter when it
arrives at Water Pollution Control is 8 feet in diameter. Water Pollution Control produces 150-250 tons of bio-solids per day or enough to fill 6 to 12 side dump
semi-trucks. Water Pollution Control accepts and treats approximately 2K loads per year of waste from septic tanks,
grease traps, portable toilets, and other hauled wastewater as a regional public health service. According to the Water Pollution Control discharge permit the City must conduct an Industrial Pretreatment
Program. This includes permitting, inspection, and sampling of 33 industrial customers meeting the criteria of this program. Approximately 3.5 FTEs were utilized for this purpose in FY 2019.
Our Recent Accomplishments… Conducted annual meeting with industrial users (2019 will mark 22 years). New Marion Treatment agreement, signed in June 2019, provides an essential service for the City of Marion
and provides funding to the City of Cedar Rapids to cover operational expenses and allocated capacity for treatment of wastewater received from Marion.
A complex Solids and Nutrient Treatment plan was submitted to Iowa Department of Natural Resources explaining Water Pollution Control plan to reduce nutrients and replace aging infrastructure in May 2019.
Challenges & Opportunities Regulatory changes including those already known for nutrients or bio-solids disposal will be costly. Negotiated a contract in FY 2019 with one Group III user to ensure continued discharge into our anaerobic
facility, however, projection of future industrial revenues and loading continues to be a challenge.
ENTERPRISE FUND
Water Pollution Control
169

Coordinate design standards and operating plans for new flood control system pump stations with Flood Program Engineer and associated Public Works engineering staff.
Goals
Department Goal: National Pollutant Discharge Elimination System permit 100% compliance. Relates to City Goal: Green CR Time Frame: Working to Meet Goal
Key Measure Target Goal
FY 2018 Actual
FY 2019 Actual
FY 2020 Projected
FY 2021 Budgeted
NPDES permit limits 100%
compliance 0 violations
99.7% compliance 12 (3,865
parameters) violations
99.9% compliance 11 (3,865
parameters) violations
99.9% compliance 1 violations
thru Nov 2019
100% compliance 0 violations
Financial Summary
Budget Highlights
Summary of FTEs
FY 2020 Adjusted Change from FY 2020 FY 2021 Budget 86.74 0.00 86.74
The operating budget includes the following: The budget includes a rate increase to the sewer service charge of 6.5% and a rate increase to the
volumetric charge of 6.5%. Sewer service charge revenue will increase $646K to $9.9M. Volumetric revenue will increase $147K to $7.8M due to increased rates and an adjustment for projected usage.
Industrial rates will increase 2.5% for flow, 2% for total suspended solids and total kjeldahl nitrogen. Biochemical oxygen demand rates will increase 1%. Overall, there is an expected increase in revenue of $496K to $25M.
Water Pollution Control FYFY 2020 FY $ Change % Change
2019 Adopted 2021 From FY From FYActual Budget Budget 2020 2020
RevenuesTaxes -$ -$ -$ -$ Licenses & Permits -$ -$ -$ -$ Intergovernmental Grants -$ -$ -$ -$ Charges for Services 33,212,798$ 33,915,758$ 35,575,751$ 1,659,993$ Fines & Forfeits -$ -$ -$ -$ Proceeds of Long Term Liabilities 7,270,801$ 7,386,000$ 8,240,000$ 854,000$ Transfers In 15,930,035$ 8,634,294$ 11,113,583$ 2,479,289$ Other Revenue 1,220,846$ 587,633$ 418,068$ (169,565)$ Total Revenues 57,634,480$ 50,523,685$ 55,347,402$ 4,823,717$ 10%
ExpendituresPersonal Services 8,056,433$ 9,152,451$ 9,324,634$ 172,183$ Discretionary Expenses 7,584,490$ 9,304,614$ 9,811,000$ 506,386$ Other Expenses 5,740,402$ 5,810,568$ 6,081,661$ 271,094$ Capital Outlay 6,868,009$ 9,251,000$ 12,469,056$ 3,218,056$ Debt Service 7,099,811$ 7,304,189$ 7,108,600$ (195,589)$ Transfers Out 17,515,714$ 10,083,563$ 12,255,850$ 2,172,288$ Total Expenditures 52,864,860$ 50,906,384$ 57,050,801$ 6,144,417$ 12%
Net Revenues over/(under) Expenditures 4,769,620$ (382,699)$ (1,703,399)$ (1,320,700)$
170

Increase of 18% or $738K to $4.7M for contractual waste water revenue. The largest portion of the increase relates to Marion contractual agreement changes.
Interest revenue is decreasing $185K to $400K based on projected earnings. Increase in shared revenue of $396K or 3% to $12.7M from increased service and volumetric charges for the
Sanitary Sewer Department to meet capital improvement project and operating needs. Other adjustments to revenue are based on historical and projected information. Included in personal services is $200K for wage/compensation study additional salaries. Discretionary expenses are increasing $508K to $9.8M mainly due to increases for other professional
services, building and ground services, and a contribution to Fleet Services for an equipment purchase. Operating expenditures include a transfer out of $10.3M. This includes $7.1M for debt, $1M transfer for the
large diameter sanitary sewer replacements, $2M for water pollution control capital improvement projects, and $142K to support general fund positions and services that are provided to the utility areas.
The capital improvement project fund budget includes the following: Total capital project expenditures are $12.2M. Funding includes $7.2M in revenue bonds, $1M in state
revolving fund proceeds, $2M from user fees, and $2M from cash on hand.
171

Department Description and Core Services The Public Works Director is responsible for the Sanitary Sewer Maintenance Department. The Sewer Maintenance Department is responsible for the operation and maintenance of all sanitary sewers within the City. The goal of the department is to maintain the sewer systems in a condition able to convey design flows thereby providing the public with uninterrupted sewer service while meeting federal, state, and local regulations. The department conducts the following activities to meet this goal: utility locates, sewer condition assessments, emergency response to service interruptions, sewer cleaning, and minor construction projects. Did you know? Our Statistics… Currently, there is approximately 672 miles of sanitary sewer owned and operated by the City and an equal
number of miles of sanitary sewer owned by the residents. This is because the businesses and residents in Cedar Rapids own the service lines that connect their homes and businesses to the public sewer main.
The City receives about 250 sewer service interruption calls annually. All of these calls are investigated immediately, 24 hours a day 7 days per week by City staff. Of the total, 20 or less on average are due to a problem with the public sewer line. Many of the interruptions experienced by residents annually are attributable to private service lines.
Our Recent Accomplishments… Roots from trees and other plants can grow into sewer lines through joints and cracks. Sometimes these
roots can grow so thick they cause blockage. To prevent this, staff cut roots out of sewers. In FY 2019, sewer maintenance staff removed tree roots from 77 miles of sewers.
The last phase of Prairie Creek Trunk Sewer is under construction and will be completed spring of 2020. This project increases sanitary sewer capacity by 300% serving the City southwest growth area and includes 209 miles of 66-inch sanitary sewer pipe.
Challenges & Opportunities Sewer Operations is currently implementing a chemical root treatment program that reduces the rate in
which roots grow into sanitary sewer lines in an effort to reduce the frequency of routine maintenance and root cutting in sewer lines.
Continue to build an accurate Sanitary Sewer Geographical Information System infrastructure database. Strategically reduce routine maintenance by focus rehabilitation processes on high maintenance areas and
correct infrastructure defects causing maintenance issues. Complete implementation of new asset management software.
ENTERPRISE FUND
Sanitary Sewer Maintenance
172

Goals Department Goal: Basement backups and wastewater bypasses do not exceed 6 per 100 miles of sanitary sewer main per year. National average is 21 per 100 miles. Relates to City Goal: Protect CR Time Frame: Met Goal
Key Measure Target Goal
FY 2018 Actual
FY 2019 Actual
FY 2020 Projected
FY 2021 Budgeted
Number of non-inundation sanitary sewer overflows
reported to Department of Natural Resources
36 or less 12 14 20 20
Department Goal: Clean 25 to 30% of the sanitary collection system annually. Relates to City Goal: Protect CR Time Frame: Met Goal
Key Measure Target Goal
FY 2018 Actual
FY 2019 Actual
FY 2020 Projected
FY 2021 Budgeted
Sanitary miles cleaned 180 228 244 180 200 Financial Summary
Budget Highlights
Summary of FTEs
FY 2020 Adjusted Change from FY 2020 FY 2021 Budget 31.35 0.00 31.35
The operating budget includes the following: The budget includes a rate increase to the sewer service charge of 6.5% and a rate increase to the
volumetric charge of 6.5%.
Sanitary Sewer FYFY 2020 FY $ Change % Change
2019 Adopted 2021 From FY From FYActual Budget Budget 2020 2020
RevenuesTaxes -$ -$ -$ -$ Licenses & Permits -$ -$ -$ -$ Intergovernmental Grants 59,887$ -$ -$ -$ Charges for Services 12,395,029$ 13,496,000$ 14,192,365$ 696,365$ Fines & Forfeits -$ -$ -$ -$ Proceeds of Long Term Liabilities 5,829,276$ 2,644,000$ 4,900,000$ 2,256,000$ Transfers In 12,935,725$ 10,138,345$ 8,882,926$ (1,255,419)$ Other Revenue 900,395$ 350,000$ 300,000$ (50,000)$ Total Revenues 32,120,312$ 26,628,345$ 28,275,291$ 1,646,946$ 6%
ExpendituresPersonal Services 2,919,013$ 3,571,911$ 2,835,658$ (736,253)$ Discretionary Expenses 1,699,196$ 844,027$ 1,004,984$ 160,957$ Other Expenses 1,203,613$ 1,211,252$ 1,284,826$ 73,574$ Capital Outlay 6,508,290$ 10,679,349$ 12,810,985$ 2,131,636$ Debt Service 2,406,767$ 2,654,890$ 2,562,288$ (92,602)$ Transfers Out 12,092,761$ 8,026,288$ 7,776,550$ (249,738)$ Total Expenditures 26,829,641$ 26,987,717$ 28,275,291$ 1,287,574$ 5%
Net Revenues over/(under) Expenditures 5,290,671$ (359,372)$ -$ 359,372$
173

Shared revenue from Water Pollution Control Department will increase $396K to $12.7M to meet capital improvement project and operating needs.
Revenue from storm water user fees is decreasing $755K to $120K. The decrease relates to moving personal services for positions that provide storm water services to storm water operations as the positions have been previously budgeted under sanitary operations.
Interest revenue is decreasing $50K from $200K to $150K based on projected earnings. Discretionary expenses are increasing $161K mainly due to increases for a contribution to Fleet Services
relating to an equipment purchase and the rental of equipment. Operating expenditures include a transfer out of $7.8M. This includes $2.6M for debt, $5.2M for capital
improvement projects, and $13K to support general fund positions and services that are provided to the utility areas.
The capital improvement project fund budget includes the following: Total capital projects expenditures are $12.8M. Funding includes $4.9M of revenue bonds, $5.2M from
sanitary sewer user fees, $1M from the Water Pollution Control Department user fees, $1.5M in developer cost sharing, and $150K in assessments.
174

Department Description and Core Services The Public Works Director is responsible for the Storm Water Utility Operations Department. The Storm Water Utility Operations Department is responsible for the maintenance and operation of the storm water conveyance system within the City. The goal of the department is to maintain the sewer systems in a condition able to convey design flows thereby providing the public with uninterrupted sewer service while meeting federal, state, and local regulations. The department conducts the following activities to meet this goal: utility locates, sewer condition assessment, emergency response to service interruptions, sewer cleaning, and minor construction projects. The department operates and maintains storm sewers and structures, public detention basins, and other structures. The department implements and performs the compliance for the National Pollutant Discharge Elimination System storm water permit for the City. National Pollutant Discharge Effluent System Permit Compliance includes outreach, inspection of sites, inspection of City owned facilities, and approval and compliance review for storm water pollutant prevention plans. Did you know? Our Statistics… Sewer maintenance currently operates and maintains over 556 miles of storm sewer, over 100 public and
1,000 private detention basins, and over 24K storm structures. Storm sewer pipes are designed to capture and convey 5-year storm events and overland flow routes are
designed to move 100-year storm events. Our Recent Accomplishments… In calendar year 2019, the Vinton Creek Waterway was cleared of trees and undergrowth allowing for
unrestricted flow, preventing localized flooding. The City’s EZ cost-share program was used on the installation of eight small infiltration practices and five
large infiltration practices in FY 2019. Increased storm water conveyance system inspection by 25% or 2.5 miles in calendar year 2019. Construction of the Rockhurst detention basin is nearing completion. This project provides 34 acre-feet of
detention to minimize the risk of flooding to downstream properties and provide storm water management of upstream undeveloped properties.
Challenges & Opportunities Continue to increase storm sewer cleaning and inspection mileage. Continue to build and improve workflow process to schedule and track storm water overland flow paths that
have been identified as problematic. Continue to build the Geographical Information System and verify its accuracy. City will continue focusing on promoting commercial and industrial storm water best management practice
cost share programs to businesses in an effort to further reduce storm water runoff discharged to the public storm sewer infrastructure.
Implement low maintenance storm water detention basin methods that also benefits wildlife and water quality.
ENTERPRISE FUND
Storm Water
175

Goals Department Goal: Inspect and clean roadway storm inlets annually. Relates to City Goal: Green CR Time Frame: Met Goal
Key Measure Target Goal
FY 2018 Actual
FY 2019 Actual
FY 2020 Projected
FY 2021 Budgeted
Percent of storm inlets inspected 10% 10% 10% 10% 10%
Department Goal: Inspect all public detention basins and 10% of private basins each calendar year. Relates to City Goal: Green CR Time Frame: Met Goal
Key Measure Target Goal
FY 2018 Actual
FY 2019 Actual
FY 2020 Projected
FY 2021 Budgeted
Percent of public basins inspected 100% 100% 100% 100% 100%
Financial Summary
Budget Highlights Summary
of FTEs FY 2020 Adjusted Change from FY 2020 FY 2021 Budget
9.00 0.00 9.00 The operating budget includes the following: The storm water utility rate will increase 5%. This increase will generate $307K of revenue. This increase
will be used to meet capital improvement project and operating needs. Discretionary expenses are decreasing $411K due to removal of a one-time contribution to Fleet relating to
FY 2020.
Storm Water FYFY 2020 FY $ Change % Change
2019 Adopted 2021 From FY From FYActual Budget Budget 2020 2020
RevenuesTaxes -$ -$ -$ -$ Licenses & Permits 25,600$ -$ -$ -$ Intergovernmental Grants 9,686$ -$ -$ -$ Charges for Services 6,113,058$ 6,133,013$ 6,439,664$ 306,651$ Fines & Forfeits -$ -$ -$ -$ Proceeds of Long Term Liabilities -$ -$ -$ -$ Transfers In -$ -$ -$ -$ Other Revenue 72,236$ -$ -$ -$ Total Revenues 6,220,580$ 6,133,013$ 6,439,664$ 306,651$ 5%
ExpendituresPersonal Services -$ -$ 793,645$ 793,645$ Discretionary Expenses 1,188,632$ 1,073,623$ 662,806$ (410,817)$ Other Expenses 49,200$ 106,172$ 164,778$ 58,606$ Capital Outlay -$ 39,000$ 25,000$ (14,000)$ Debt Service -$ -$ -$ -$ Transfers Out 3,395,790$ 4,836,442$ 4,793,436$ (43,006)$ Total Expenditures 4,633,623$ 6,055,237$ 6,439,664$ 384,427$ 6%
Net Revenues over/(under) Expenditures 1,586,957$ 77,776$ -$ (77,776)$
176

Costs to maintain and operate the flood control pump stations in FY 2021 are estimated to be $73K. These costs will continue to increase as the flood control system is constructed to an estimated $500K at full build out of the system. Additional funding sources/methods are being evaluated to cover these costs.
Operating expenditures include a transfer out of $4.8M. This includes $4.1M for capital improvement projects, $120K for shared fleet service costs, and $583K to support general fund positions and services that are provided to the utility areas.
The capital improvement project fund budget includes the following: Capital expenditures are recorded in the non-enterprise, capital improvement project fund for storm water
projects and therefore this financial information is not included in the chart above.
177

Department Description and Core Services The Utilities Director is responsible for the Solid Waste and Recycling Department. Solid Waste and Recycling protects Cedar Rapids’ environment and public health by transporting garbage, recycling, and yard waste materials from Cedar Rapids homes every week. The Garbage section collects garbage from customers and delivers it to the landfill. Customers are provided
35 gallons of garbage disposal each week. Customers disposing of more material in bags or scheduled bulky-item pick-ups pay an additional fee based on the size of the material.
The Recycling section collects co-mingled recycling from customers and delivers it for processing. Customers are not limited in the amount of material they recycle.
The Yard Waste section collects organics from customers and delivers it to the A Street compost facility. Customers are not limited in the amount of organics they set out. This section also provides leaf vacuum collection service in the spring and fall.
The Nuisance Abatement section addresses properties with accumulated refuse or junk and or noxious weeds, tall weeds, grass, and snow and ice on sidewalks. The process involves notifying property owners of the problem, providing time for the property owner to rectify the situation, and if the owner fails to act, cleaning the property and charging the property owner for time and disposal fees.
The Litter and Illegal Dumping section facilitates litter clean-up efforts, investigates cases of illegally dumped material, and cleans property of illegally dumped material.
Did you know? Our Statistics… Tonnage/volume of materials collected in FY 2019: 22K tons of garbage 8K tons of recyclables 14K tons of yard waste 704 tons of bulky items 4K tons of loose leaves 2K bags of litter
Our Recent Accomplishments… Added two new groups, for a total of 54 to the Adopt-A-Road groups for litter collection activities (FY 2019). Completed 10th year of the City’s fall loose leaf collection service (FY 2019). Completed 5th year of weed and tall grass abatement mowing program (FY 2019). Implementation of 18 collection routes versus 12 garbage and 6 yard waste. Change better utilizes
resources and provides flexibility with route collections during weather events (FY 2019).
Challenges & Opportunities Potential repeal of Iowa Bottle Deposit Program will overwhelm City’s recycling program through increased
volumes collected, resulting in increased processing and operating costs. Research and consider purchasing route optimization software to further improve collection efficiencies. Managing service levels due to continued community growth. Prepare and bid a contract for processing curbside recyclables.
ENTERPRISE FUND
Solid Waste and Recycling
178

Goals Department Goal: Increase diversion from landfill by increasing recycling tonnage by 0.5%. Relates to City Goal: Protect CR Time Frame: Met Goal
Key Measure Target Goal
FY 2018 Actual
FY 2019 Actual
FY 2020 Projected
FY 2021 Budgeted
Recycling tonnage per year Increase 0.5% per
year
No % change –
8,061 tons
1.35% increase – 8,170 tons
0.5% increase – 8,156 tons
.65% increase – 8,210 tons
Department Goal: Increase diversion from landfill by holding garbage tonnage to under a 2% increase. Relates to City Goal: Protect CR Time Frame: Working to Meet Goal
Key Measure Target Goal
FY 2018 Actual
FY 2019 Actual
FY 2020 Projected
FY 2021 Budgeted
Garbage/Bulky Item tonnage per year
Less than 2% increase
per year
2.9% increase –
21,557 tons
4.7% increase –
22, 578 tons
2.0% increase –
22,430 tons
2.55% increase –
23,000 tons Department Goal: Increase diversion from landfill by increasing organics diversion by 1%. Relates to City Goal: Protect CR Time Frame: Met Goal
Key Measure Target Goal
FY 2018 Actual
FY 2019 Actual
FY 2020 Projected
FY 2021 Budgeted
Yard Waste/Leaf tonnage per year
Increase 1% per year
17.8% decrease – 15,210 tons
18.0% increase –
17,947 tons
1.0% increase –
16,755 tons
3.25% increase –
17,300 tons Financial Summary
Solid Waste & Recycling FYFY 2020 FY $ Change % Change
2019 Adopted 2021 From FY From FYActual Budget Budget 2020 2020
RevenuesTaxes -$ -$ -$ -$ Licenses & Permits -$ -$ -$ -$ Intergovernmental Grants -$ -$ -$ -$ Charges for Services 11,967,318$ 11,879,077$ 11,903,577$ 24,500$ Fines & Forfeits -$ -$ -$ -$ Proceeds of Long Term Liabilities -$ -$ -$ -$ Transfers In 2,190,458$ -$ -$ -$ Other Revenue 234,954$ 164,500$ 150,500$ (14,000)$ Total Revenues 14,392,730$ 12,043,577$ 12,054,077$ 10,500$ 0%
ExpendituresPersonal Services 4,275,169$ 4,465,242$ 4,703,273$ 238,031$ Discretionary Expenses 2,862,047$ 2,919,253$ 3,377,365$ 458,112$ Other Expenses 3,893,742$ 3,954,357$ 3,670,875$ (283,482)$ Capital Outlay 11,599$ 25,300$ 25,300$ -$ Debt Service -$ -$ -$ -$ Transfers Out 2,255,266$ 46,071$ 47,715$ 1,644$ Total Expenditures 13,297,824$ 11,410,223$ 11,824,528$ 414,305$ 4%
Net Revenues over/(under) Expenditures 1,094,906$ 633,354$ 229,549$ (403,805)$
179

Budget Highlights Summary
of FTEs FY 2020 Adjusted Change from FY 2020 FY 2021 Budget
49.00 0.00 49.00 The operating budget includes the following: No rate increase is planned in FY 2021. Solid waste and recycling revenue is budgeted at $12.1M.
Changes to revenue are based on historical and projected revenue. Discretionary expenses are increasing $458K. This includes a $250K increase for landfill fees relating to
recycling processing. Shared utility and billing system costs increased $234K, offset by a decrease of $57K in expenses relating to services received from Public Works for the leaf collection program.
Operating expenditures include a transfer out of $48K to support general fund positions and services that are provided to the utility areas.
180

Department Description and Core Services The Downtown Parking Management Incorporated manages the parking facilities. The parking funds record the City activity associated with the City’s parking system such as city parking employee wages and benefits, debt, and deferred maintenance capital improvement projects. Financial Summary
Budget Highlights
Summary of FTEs
FY 2020 Adjusted Change from FY 2020 FY 2021 Budget 3.00 0.00 3.00
Although the City maintains the ownership of the parking facilities, Downtown Parking Management Inc. was hired for the management of the facilities and is responsible for setting policy and rates. As a result, beginning with FY 2014, revenues and expenditures of Downtown Parking Management Inc. related to operations were not recorded as such in City financial statements, but instead where handled as assets of the City. The budget reflects this change. Downtown Parking Management Inc. will continue to submit an annual budget in accordance with their agreement with the City. Included in the City’s FY 2021 parking budget is the City’s activity relating to parking. This includes personal services for the employees originally hired by the City of Cedar Rapids. $30K will be transferred from the general fund to pay the City’s share and the remainder will be paid by Downtown Parking Management Inc. Also included is $1.4M for debt payments and $400K in project expenses for deferred maintenance to be funded with previously issued general obligation bonds for deferred maintenance.
Parking FYFY 2020 FY $ Change % Change
2019 Adopted 2021 From FY From FYActual Budget Budget 2020 2020
RevenuesTaxes -$ -$ -$ -$ Licenses & Permits -$ -$ -$ -$ Intergovernmental Grants 1,419,543$ -$ -$ -$ Charges for Services -$ -$ -$ -$ Fines & Forfeits -$ -$ -$ -$ Proceeds of Long Term Liabilities 786,000$ 50,000$ -$ (50,000)$ Transfers In 2,251,469$ 1,198,036$ 414,768$ (783,267)$ Other Revenue 1,379,839$ 961,421$ 1,256,349$ 294,927$ Total Revenues 5,836,851$ 2,209,457$ 1,671,117$ (538,340)$ -24%
ExpendituresPersonal Services 228,957$ 240,252$ 246,766$ 6,514$ Discretionary Expenses (76)$ -$ -$ -$ Other Expenses -$ -$ -$ -$ Capital Outlay 3,699,508$ 850,000$ 400,000$ (450,000)$ Debt Service 863,950$ 1,169,205$ 385,157$ (784,049)$ Transfers Out 2,401,289$ 750,000$ 1,039,195$ 289,195$ Total Expenditures 7,193,627$ 3,009,457$ 2,071,117$ (938,340)$ -31%
Net Revenues over/(under) Expenditures (1,356,776)$ (800,000)$ (400,000)$ 400,000$
ENTERPRISE FUND
Parking
181

Department Description and Core Services VenuWorks manages the ImOn Ice Arena operations. The ImOn Ice Arena fund records the revenues and expenditures associated with the facility. The ice arena is a 4,000-seat multi-purpose arena in Cedar Rapids, located adjacent to the Veterans Memorial Stadium. The arena opened on January 8, 2000. It is home to the Cedar Rapids RoughRiders of the United States Hockey League. Financial Summary
Budget Highlights The City of Cedar Rapids Ice Arena was renamed ImOn Ice in January 2020. The management company for the ImOn Ice Arena, VenuWorks, submitted the FY 2021 operating budget. The budget assumes an operating loss of $124K to be funded with FY 2021 hotel motel revenue. The budget includes $3M in mechanical improvements and $250K in other improvements per the City’s agreement with the Cedar Rapids Roughriders. Funding for these costs will come from hotel motel taxes.
ImOn Ice Arena FYFY 2020 FY $ Change % Change
2019 Adopted 2021 From FY From FYActual Budget Budget 2020 2020
RevenuesTaxes -$ -$ -$ -$ Licenses & Permits -$ -$ -$ -$ Intergovernmental Grants -$ -$ -$ -$ Charges for Services 1,331,806$ 1,512,698$ 1,709,027$ 196,329$ Fines & Forfeits -$ -$ -$ -$ Proceeds of Long Term Liabilities 385,000$ -$ -$ -$ Transfers In 968,663$ 666,384$ 523,520$ (142,864)$ Other Revenue 226,876$ -$ -$ -$ Total Revenues 2,912,345$ 2,179,083$ 2,232,547$ 53,464$ 2%
ExpendituresPersonal Services -$ -$ -$ -$ Discretionary Expenses 1,102,793$ 1,177,085$ 1,329,677$ 152,592$ Other Expenses 469,036$ 459,152$ 503,100$ 43,948$ Capital Outlay 576,851$ 250,000$ 3,250,000$ 3,000,000$ Debt Service 667,515$ 416,384$ 88,520$ (327,864)$ Transfers Out 8,969$ -$ -$ -$ Total Expenditures 2,825,163$ 2,302,622$ 5,171,297$ 2,868,675$ 125%
Net Revenues over/(under) Expenditures 87,182$ (123,539)$ (2,938,750)$ (2,815,211)$
ENTERPRISE FUND
ImOn Ice Arena
182

Department Description and Core Services VenuWorks manages the Paramount Theatre operations. The Paramount Theatre fund records the revenues and expenditures associated with the facility. Financial Summary
Budget Highlights The City transferred its interests to the Paramount Theatre Manager, LLC in October 2012. By FY 2021, the interests in the Paramount Theatre are anticipated to be transferred back to the City. The FY 2021 budget includes $1.6M in revenue and expenses for the Paramount operations.
Paramount Theatre FYFY 2020 FY $ Change % Change
2019 Adopted 2021 From FY From FYActual Budget Budget 2020 2020
RevenuesTaxes -$ -$ -$ -$ Licenses & Permits -$ -$ -$ -$ Intergovernmental Grants -$ -$ -$ -$ Charges for Services -$ -$ -$ -$ Fines & Forfeits -$ -$ -$ -$ Proceeds of Long Term Liabilities -$ -$ -$ -$ Transfers In -$ -$ 249,166$ 249,166$ Other Revenue 5,941$ -$ 1,610,434$ 1,610,434$ Total Revenues 5,941$ -$ 1,859,600$ 1,859,600$ 100%
ExpendituresPersonal Services -$ -$ -$ -$ Discretionary Expenses -$ -$ 1,610,434$ 1,610,434$ Other Expenses -$ -$ -$ -$ Capital Outlay -$ -$ -$ -$ Debt Service -$ -$ 249,166$ 249,166$ Transfers Out -$ -$ -$ -$ Total Expenditures -$ -$ 1,859,600$ 1,859,600$ 100%
Net Revenues over/(under) Expenditures 5,941$ -$ -$ -$
ENTERPRISE FUND
Paramount Theatre
183

Department Description and Core Services Doubletree Management, LLC (“Hilton”) manages the U.S. Cellular Center and the Doubletree by Hilton at the U.S. Cellular Center. The U.S. Cellular Center and the Doubletree by Hilton at the U.S. Cellular Center funds record the revenues and expenditures associated with the convention center, arena, and hotel. Financial Summary
Budget Highlights The U.S. Cellular Center and Doubletree by Hilton opened in June 2013. For FY 2021, the net income from the hotel portion of the complex will be applied to the debt payment for debt issued for the hotel.
U.S. Cellular Center & Double Tree by Hilton FYFY 2020 FY $ Change % Change
2019 Adopted 2021 From FY From FYActual Budget Budget 2020 2020
RevenuesTaxes -$ -$ -$ -$ Licenses & Permits -$ -$ -$ -$ Intergovernmental Grants -$ -$ -$ -$ Charges for Services 21,796,673$ 21,712,352$ 22,424,919$ 712,567$ Fines & Forfeits -$ -$ -$ -$ Proceeds of Long Term Liabilities 5,156,000$ -$ -$ -$ Transfers In 4,675,005$ 7,219,025$ 6,793,456$ (425,569)$ Other Revenue 1,554,805$ 1,081,423$ 1,217,197$ 135,774$ Total Revenues 33,182,483$ 30,012,800$ 30,435,572$ 422,772$ 1%
ExpendituresPersonal Services -$ -$ -$ -$ Discretionary Expenses 20,557,284$ 21,614,145$ 22,241,432$ 627,287$ Other Expenses 960,509$ -$ -$ -$ Capital Outlay 314,783$ -$ -$ -$ Debt Service 11,455,926$ 7,219,025$ 6,793,456$ (425,569)$ Transfers Out -$ 1,179,630$ 1,400,684$ 221,054$ Total Expenditures 33,288,501$ 30,012,800$ 30,435,572$ 422,772$ 1%
Net Revenues over/(under) Expenditures (106,018)$ -$ -$ -$
ENTERPRISE FUND
U.S. Cellular Center & Doubletree by Hilton
184

Department Description and Core Services The Airport Director is responsible for The Eastern Iowa Airport Department. The Eastern Iowa Airport funds record the revenues and expenditures associated with the airport. The Eastern Iowa Airport is owned by the City of Cedar Rapids and operated by the Cedar Rapids Airport Commission. Financial Summary
Budget Highlights
Summary of FTEs
FY 2020 Adjusted Change from FY 2020 FY 2021 Budget 54.40 3.00 57.40
The budget includes the following: The Eastern Iowa Airport is a component unit of the City of Cedar Rapids. The Cedar Rapids Airport Commission operates and maintains The Eastern Iowa Airport and has adopted FY 2021 budget for The Eastern Iowa Airport. The budget submitted reflects $82M in revenue and $101M in expenses, which is $19M of net expenditures over revenues.
Airport FYFY 2020 FY $ Change % Change
2019 Adopted 2021 From FY From FYActual Budget Budget 2020 2020
RevenuesTaxes -$ -$ -$ -$ Licenses & Permits 60,608$ 47,670$ 79,800$ 32,130$ Intergovernmental Grants 7,219,510$ 22,211,957$ 17,952,814$ (4,259,143)$ Charges for Services 5,329,742$ 5,001,880$ 5,706,340$ 704,460$ Fines & Forfeits -$ -$ -$ -$ Proceeds of Long Term Liabilities -$ -$ -$ -$ Transfers In -$ 22,960,826$ 40,893,123$ 17,932,297$ Other Revenue 16,800,825$ 16,236,786$ 17,537,830$ 1,301,044$ Total Revenues 29,410,685$ 66,459,119$ 82,169,907$ 15,710,788$ 24%
ExpendituresPersonal Services 4,622,407$ 4,904,742$ 5,317,190$ 412,448$ Discretionary Expenses 3,502,481$ 2,880,867$ 3,074,570$ 193,703$ Other Expenses 1,651,929$ 1,620,902$ 1,730,524$ 109,622$ Capital Outlay 22,996,191$ 37,189,551$ 50,209,072$ 13,019,521$ Debt Service -$ -$ -$ -$ Transfers Out -$ 22,960,826$ 40,893,123$ 17,932,297$ Total Expenditures 32,773,009$ 69,556,888$ 101,224,479$ 31,667,591$ 46%
Net Revenues over/(under) Expenditures (3,362,325)$ (3,097,769)$ (19,054,572)$ (15,956,803)$
ENTERPRISE FUND
The Eastern Iowa Airport
185

Internal Service Funds Internal service funds account for the financing of goods and services provided by a city department or agency to other city departments or agencies on a cost reimbursement basis. These funds include departments such as risk services, fleet services, joint communications, and facilities maintenance.
186

Highlights INTERNAL SERVICE FUNDS The table below summarizes the FY 2021 Internal Service Fund budget.
Summary of FTEs
FY 2020 Adjusted Change from FY 2020 FY 2021 Budget 89.00 0.00 89.00
The FY 2021 Internal Service Fund expenditure budget is increasing $4.1M to $60.7M and revenue is increasing by $4.3M to $57.2M. The largest change relates to the health fund. Expenses are increasing by 11% or $2.3M to $23.8M, which correlates to an increase in health claim expenses. Overall, the largest FY 2021 Internal Service Fund expense category is discretionary expenses of $33.6M. Of this amount, $25.7M is budgeted for health services. The next largest expense category is personal services of $9M. The largest FY 2021 Internal Service Fund revenue category is other revenue at $29.7M. Of this amount, charges for insurance premiums are the largest revenue source at $25.7M. The second largest revenue category are charges for services at $25.3M, which includes fleet service charges, fleet lease, fuel charges, charges to the Police and Fire Departments for Joint Communications, risk, property and liability insurance charges, and facility maintenance and rental charges.
Internal Service Fund FYFY 2020 FY $ Change % Change
2019 Adopted 2021 From FY From FYActual Budget Budget 2020 2020
RevenuesTaxes -$ -$ -$ -$ Licenses & Permits -$ -$ -$ -$ Intergovernmental Grants 123,337$ -$ -$ -$ Charges for Services 24,133,037$ 23,986,624$ 25,298,462$ 1,311,838$ Fines & Forfeits -$ -$ -$ -$ Proceeds of Long Term Liabilities -$ -$ -$ -$ Transfers In 2,006,847$ 1,626,763$ 2,250,779$ 624,017$ Other Revenue 28,439,536$ 27,305,705$ 29,700,145$ 2,394,440$ Total Revenues 54,702,757$ 52,919,092$ 57,249,386$ 4,330,294$ 8%
ExpendituresPersonal Services 7,290,823$ 8,580,777$ 8,950,772$ 369,995$ Discretionary Expenses 31,897,383$ 31,032,848$ 33,637,962$ 2,605,115$ Other Expenses 7,304,640$ 7,532,307$ 8,182,336$ 650,029$ Capital Outlay 5,163,331$ 7,420,991$ 7,254,175$ (166,816)$ Debt Service -$ -$ -$ -$ Transfers Out 2,317,813$ 2,020,484$ 2,632,654$ 612,170$ Total Expenditures 53,973,989$ 56,587,406$ 60,657,899$ 4,070,493$ 7%
Net Revenues over/(under) Expenditures 728,768$ (3,668,314)$ (3,408,513)$ 259,801$
187

Department Description and Core Services The Chief of Police is responsible for the Joint Communications Department. Joint Communications provides timely, accurate, and complete emergency and non-emergency dispatch services to the public and public safety agencies. The Call Taking Operations section is responsible for receiving, processing, and routing incoming emergency
(9-1-1) and non-emergency (seven-digit number) phone traffic into the Communications Center. Call takers are also responsible for providing emergency medical dispatch, fire, and police instructions in accordance to protocol standards.
The Dispatching Procedures section is responsible for providing professional and accurate dispatching services for the Cedar Rapids Police, Fire, and Animal Control Departments, as well as multiple support agencies.
The Linn County Radio System and Support section provides direct support to the City’s portion of the countywide 800-megahertz radio system, its subscribers, equipment, and infrastructure as well as ancillary support to the overall system.
The 9-1-1 section monitors and maintains the master street address guide and the 9-1-1 jurisdictional boundary changes for proper 9-1-1 call routing. This includes Phase I, II, and Next Generation 9-1-1.
The Warrants section houses, maintains, and serves active warrants for arrest at any given time. Did you know? Our Statistics… Annually, the Joint Communications Department handles approximately 140K police calls for service, 11K
fire calls for service, and 10K animal control calls for service. The Joint Communications Department handles approximately 6K 9-1-1 calls per month. The Joint Communications Department receives over 500K non-emergency calls annually. Our Recent Accomplishments… In FY 2019, Joint Communications completed their portion of the Cedar Rapids Police Department’s
Commission on Accreditation for Law Enforcement Agencies, Inc. accreditation. In FY 2019, Joint Communications completed radio upgrades and connectivity for all public safety
responders to the Iowa Statewide Interoperability Communications network to enhance response and safety.
Challenges & Opportunities Support and maintain standards with the Police Department for the Commission on Accreditation for Law
Enforcement Agencies accreditation. Continue to support the Fire Department with their Center for Public Safety Excellence accreditation. Work with the State of Iowa to continue Text to 9-1-1 enhancements, including seamless transfers to other
dispatch centers. Examine short and long term planning initiatives for dispatching services in Cedar Rapids and the
surrounding area.
INTERNAL SERVICE FUND
Joint Communications
188

Goals Department Goal: Continually examine and improve 9-1-1 calls for service and response times. Relates to City Goal: Protect CR Time Frame: Working to Meet Goal
Key Measure Target Goal
FY 2018 Actual
FY 2019 Actual
FY 2020 Projected
FY 2021 Budgeted
9-1-1 calls answered within 3 rings (10 seconds) 99% 98% 98% 98% 98%
Department Goal: Implement Text to 9-1-1 services in Cedar Rapids for the hearing-impaired community and enhance security for large businesses in the event of a major emergency. Relates to City Goal: Invest CR Time Frame: Met Goal
Key Measure Target Goal
FY 2018 Actual
FY 2019 Actual
FY 2020 Projected
FY 2021 Budgeted
Convert equipment to T911 75% 99% 99% 100% 100% Financial Summary
Budget Highlights
Summary of FTEs
FY 2020 Adjusted Change from FY 2020 FY 2021 Budget 27.00 0.00 27.00
The operating budget includes the following: Interest revenue is increasing $9K to $40K based on historical and projected earnings. The budget includes $754K from the E911 Service Board for radio maintenance. Increase of $82K for equipment (one time request). The capital improvement project fund budget includes the following: $635K for the replacement radios in squad cars to be funded from Joint Communication operating reserves.
Joint Communications FYFY 2020 FY $ Change % Change
2019 Adopted 2021 From FY From FYActual Budget Budget 2020 2020
RevenuesTaxes -$ -$ -$ -$ Licenses & Permits -$ -$ -$ -$ Intergovernmental Grants 123,337$ -$ -$ -$ Charges for Services 3,932,898$ 3,907,282$ 4,065,201$ 157,919$ Fines & Forfeits -$ -$ -$ -$ Proceeds of Long Term Liabilities -$ -$ -$ -$ Transfers In -$ -$ 635,000$ 635,000$ Other Revenue 52,810$ 31,214$ 40,000$ 8,786$ Total Revenues 4,109,044$ 3,938,496$ 4,740,201$ 801,705$ 20%
ExpendituresPersonal Services 2,298,834$ 2,437,638$ 2,507,772$ 70,134$ Discretionary Expenses 1,097,108$ 1,112,522$ 1,182,522$ 70,000$ Other Expenses 379,199$ 388,336$ 332,582$ (55,754)$ Capital Outlay 2,805$ -$ 717,325$ 717,325$ Debt Service -$ -$ -$ -$ Transfers Out -$ -$ 635,000$ 635,000$ Total Expenditures 3,777,946$ 3,938,496$ 5,375,201$ 1,436,705$ 36%
Net Revenues over/(under) Expenditures 331,098$ -$ (635,000)$ (635,000)$
189

Department Description and Core Services The Finance Director is responsible for the Facility Maintenance Department. The Facility Maintenance Department maintains the City of Cedar Rapids' buildings and grounds. The Environmental Services section provides all custodial services, which includes detailed carpet cleaning,
hard surface build up removal and reapplications. Other special projects on request. The Technician Services section provides a variety of construction and building repair services, including
licensed and certified staff for electrical, plumbing, heating, ventilation, and air conditioning services. The Administration section is responsible for the planning, organizing, and directing of facility maintenance
operations as well as energy management and facility assessments. The American with Disabilities Act section manages all facilities, site, and park projects from design through
completion and inspection as it relates to the American with Disabilities Act to ensure full compliance.
Did you know? Our Statistics… Currently the environmental services section maintains eight buildings covering over 251K square feet along
with special projects and programs for City owned facilities. Currently the technician services section provides routine and preventative maintenance and repair to
buildings covering over 1M square feet. The Facilities Maintenance Services staff completed 5K work orders in FY 2019. Our Recent Accomplishments… Completed six major facilities and parks construction projects for American with Disabilities Act (FY 2019). Completed Bender Pool HVAC project (April 2019). Completed East Gateway welcome sign (July 2019). Completed new Noelridge Restroom (August 2019).
Challenges & Opportunities Maintaining City facilities including ADA compliance. Maintaining the citywide energy management system in facilities for future energy efficiencies. Monitoring & directing digital control of all major facilities mechanical systems and energy use, including
green technology. Maintaining an efficient, cost effective waste management system for the facilities. Implement new security upgrades and protocols at our facilities. Monitor emerging alternative energy options as they become viable for the City to pursue.
Goals Department Goal: Maintain the City’s mechanical systems by focusing on reliability centered maintenance, a systematic approach to evaluate a facility’s equipment and resources to achieve a high degree of facility reliability and cost effectiveness. Relates to City Goal: Protect CR Time Frame: Working to Meet Goal
Key Measure Target Goal
FY 2018 Actual
FY 2019 Actual
FY 2020 Projected
FY 2021 Projected
Minimize reactive maintenance work orders.
<10% Reactive 50% 36% 40% 40%
INTERNAL SERVICE FUND
Facility Maintenance
190

Department Goal: Maintain competitive facility maintenance custodial services compared to other government agencies, schools, and universities while providing custodial services that meet or exceed national standards for square footage per custodian. Relates to City Goal: Protect CR Time Frame: Met Goal
Key Measure Target Goal
FY 2018 Actual
FY 2019 Actual
FY 2020 Projected
FY 2021 Projected
Standards based on Association of Physical Plant Administrators
Guideline
~21,600 sq. ft. per
custodian 22,860 22,860 22,860 22,860
Financial Summary
Budget Highlights
Summary of FTEs
FY 2020 Adjusted Change from FY 2020 FY 2021 Budget 26.00 0.00 26.00
The operating budget includes the following: The environmental services (custodial) hourly rate will increase by $1.75/hour to $61.25/hour due to
increases in personal services and operations. Services will be charged to departments monthly at 1/12 of the cost.
The technician hourly rate will increase by $1.75/hour to $77.75/hour due to increases in personal services and operations. Services will be charged to departments monthly based on services used.
Actual supplies and materials used will be billed to departments monthly with no markup. External services and associated materials will be billed based on actual cost. This process remains unchanged from FY 2020.
In FY 2021, flood local option sales tax revenue will fund flood insurance expenses for City Hall, the City Services Center, and the police station in the amount of $229K.
City Hall building rent will increase $19K due to increases in personal service costs.
Facility Maintenance FYFY 2020 FY $ Change % Change
2019 Adopted 2021 From FY From FYActual Budget Budget 2020 2020
RevenuesTaxes -$ -$ -$ -$ Licenses & Permits -$ -$ -$ -$ Intergovernmental Grants -$ -$ -$ -$ Charges for Services 1,182,765$ 1,164,050$ 1,387,564$ 223,514$ Fines & Forfeits -$ -$ -$ -$ Proceeds of Long Term Liabilities -$ -$ -$ -$ Transfers In 688,251$ 842,256$ 643,939$ (198,317)$ Other Revenue 3,254,241$ 3,269,237$ 3,456,538$ 187,301$ Total Revenues 5,125,257$ 5,275,543$ 5,488,041$ 212,498$ 4%
ExpendituresPersonal Services 2,020,257$ 2,131,511$ 2,216,036$ 84,525$ Discretionary Expenses 887,099$ 717,786$ 960,286$ 242,500$ Other Expenses 1,510,556$ 1,547,669$ 1,622,511$ 74,843$ Capital Outlay 9,523$ 513,000$ 315,000$ (198,000)$ Debt Service -$ -$ -$ -$ Transfers Out 380,509$ 535,331$ 364,410$ (170,921)$ Total Expenditures 4,807,944$ 5,445,297$ 5,478,244$ 32,947$ 1%
Net Revenues over/(under) Expenditures 317,313$ (169,754)$ 9,798$ 179,551$
191

City Services Center building rent will increase $182K due to increases in personal service costs, supplies and materials, and electricity.
The police station, maintenance building, and substation rent will decrease $9K due to a reduction in environmental services staffing for this location.
The central fire station rent will decrease $4K due to a reduction in technician hours for this location. The capital improvement project fund budget includes the following: Total capital project expenditures are $315K with funding from building rental charges. Facility projects funded from tax-supported bonds are excluded from this section and are included in the
capital improvement project section of the book.
192

Department Description and Core Services The Finance Director is responsible for the Fleet Services Department. The Fleet Services Department provides fleet maintenance and management services of vehicles and equipment for the City of Cedar Rapids and some external entities. The Maintenance section provides preventive maintenance for all city-owned fleet assets, conducts in-
depth diagnosis and repair of various vehicles and equipment, and provides mandated inspections and maintenance to ensure regulatory compliance.
The Administration section is responsible for procurement and disposal of fleet vehicles and pieces of equipment, specification writing, record keeping, technician training, and fuel management.
Did you know? Our Statistics… Currently, Fleet Services repairs and maintains over 1,300 City vehicles and equipment. Fleet Services completed over 2500 preventative maintenance services on vehicles and equipment in FY
2019. Fleet Services sold 77 vehicles or pieces of equipment generating over $275K in revenue for FY 2019. The average age of our vehicles and equipment has dropped from 12 years old to 10 years old. Prior to
consolidation this number was 17 years old. Our Recent Accomplishments… Fleet reduced the capital cost of new solid waste garbage trucks by purchasing them through contract,
saving the City $150K in FY 2019. Development of a Supervisor Accident Investigation form for departments (February 2019). Fleet technicians trained seasonal employees on the proper use and care of the equipment they would be
using, which helped reduce repairs and abnormal maintenance (June 2019).
Challenges & Opportunities Controlling costs for engine emissions issues while reducing downtime. Maintain financial stability while ensuring departments have vehicles and equipment to perform their jobs. Introducing hybrid vehicles to the city fleet and reducing engine idling. Hiring and retaining auto equipment technicians.
Goals
Department Goal: Improve overall fleet readiness rate to ensure equipment is available when needed. Relates to City Goal: Invest CR Time Frame: Met Goal
Key Measure Target Goal
FY 2018 Actual
FY 2019 Actual
FY 2020 Projected
FY 2021 Budgeted
Manage shop activity and fleet demographic to ensure fleet is
ready for citizen service 95% 98% 99% 99% 99%
Department Goal: Complete 95% of preventive maintenance early or "on-time". Relates to City Goal: Strengthen CR Time Frame: Met Goal
Key Measure Target Goal
FY 2018 Actual
FY 2019 Actual
FY 2020 Projected
FY 2021 Budgeted
Preventive maintenance compliance 95% 95% 95% 95% 95%
INTERNAL SERVICE FUND
Fleet Services
193
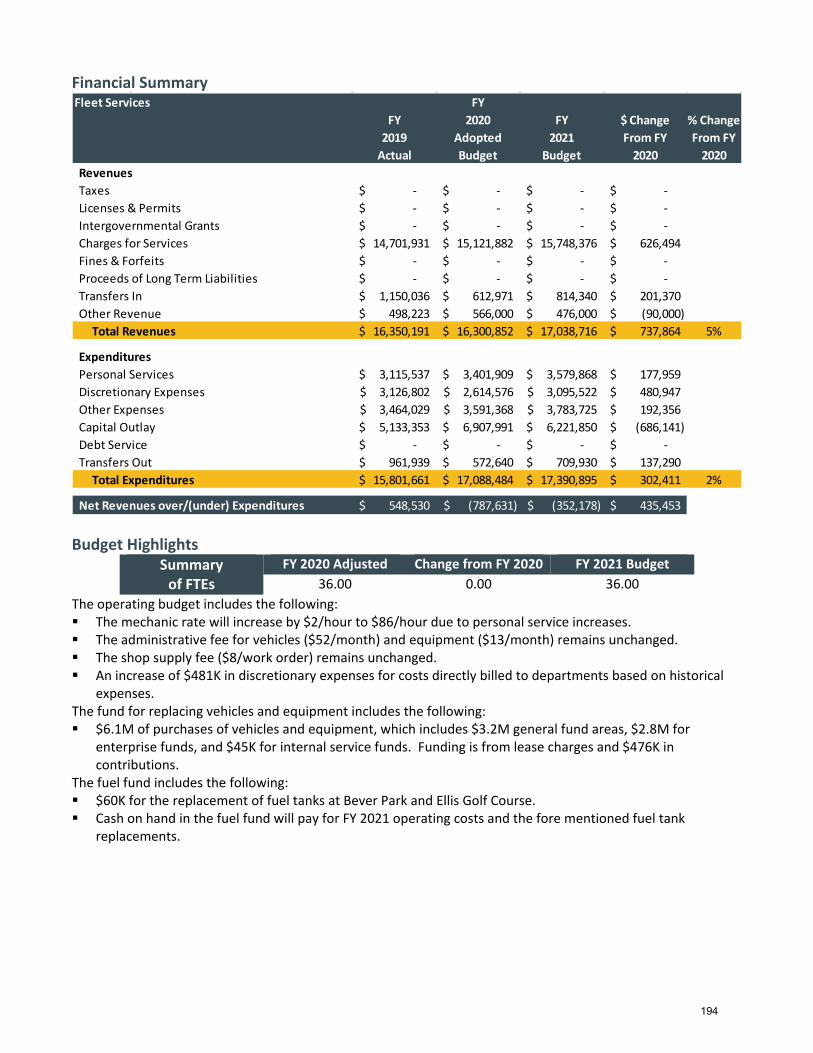
Financial Summary
Budget Highlights
Summary of FTEs
FY 2020 Adjusted Change from FY 2020 FY 2021 Budget 36.00 0.00 36.00
The operating budget includes the following: The mechanic rate will increase by $2/hour to $86/hour due to personal service increases. The administrative fee for vehicles ($52/month) and equipment ($13/month) remains unchanged. The shop supply fee ($8/work order) remains unchanged. An increase of $481K in discretionary expenses for costs directly billed to departments based on historical
expenses. The fund for replacing vehicles and equipment includes the following: $6.1M of purchases of vehicles and equipment, which includes $3.2M general fund areas, $2.8M for
enterprise funds, and $45K for internal service funds. Funding is from lease charges and $476K in contributions.
The fuel fund includes the following: $60K for the replacement of fuel tanks at Bever Park and Ellis Golf Course. Cash on hand in the fuel fund will pay for FY 2021 operating costs and the fore mentioned fuel tank
replacements.
Fleet Services FYFY 2020 FY $ Change % Change
2019 Adopted 2021 From FY From FYActual Budget Budget 2020 2020
RevenuesTaxes -$ -$ -$ -$ Licenses & Permits -$ -$ -$ -$ Intergovernmental Grants -$ -$ -$ -$ Charges for Services 14,701,931$ 15,121,882$ 15,748,376$ 626,494$ Fines & Forfeits -$ -$ -$ -$ Proceeds of Long Term Liabilities -$ -$ -$ -$ Transfers In 1,150,036$ 612,971$ 814,340$ 201,370$ Other Revenue 498,223$ 566,000$ 476,000$ (90,000)$ Total Revenues 16,350,191$ 16,300,852$ 17,038,716$ 737,864$ 5%
ExpendituresPersonal Services 3,115,537$ 3,401,909$ 3,579,868$ 177,959$ Discretionary Expenses 3,126,802$ 2,614,576$ 3,095,522$ 480,947$ Other Expenses 3,464,029$ 3,591,368$ 3,783,725$ 192,356$ Capital Outlay 5,133,353$ 6,907,991$ 6,221,850$ (686,141)$ Debt Service -$ -$ -$ -$ Transfers Out 961,939$ 572,640$ 709,930$ 137,290$ Total Expenditures 15,801,661$ 17,088,484$ 17,390,895$ 302,411$ 2%
Net Revenues over/(under) Expenditures 548,530$ (787,631)$ (352,178)$ 435,453$
194

Department Description and Core Services The Finance Director is responsible for the Risk Services area. The Risk Services section protects the City’s assets through identifying and analyzing the City’s exposures, evaluating the costs associated with exposures, and implementing the most cost effective methods to eliminate, minimize, transfer or pay for risk. The Risk Services objective is to provide support to departments in protecting critical aspects of the City’s operations with regard to staff, property, operations, and continuity of those operations when disruptions occur. The team collaborates with City departments in order to more effectively and efficiently identify, measure, and evaluate options for managing exposures through the use of innovate risk control, claims management, risk financing techniques, regulatory compliance and training of all employees on hazard awareness and how to lead safety. Did you know? Our Statistics… The City handled 155 liability claims, 252 vehicle related claims, 274 reported work injuries, 94 property
claims, and reviewed 1,691 insurance certificates during FY 2019. The City spent $19.7M on health insurance claims during FY 2019. The City recovered from third parties a total of $144K in property and auto damages in FY 2019. Our Recent Accomplishments… Creation of monthly Safety Digest (October 2018). Computer based safety training launched (December 2018). Safety programs & policies updated (April 2019). Internal online site for Risk/Safety Services updated (May 2019). Challenges & Opportunities Collaborate with departments to identify opportunities and options for responding to identified safety
hazards. Develop and maintain a strong and positive safety culture. Goals
Department Goal: Damages billed to third party within 30 days of receiving information used for billing. Relates to City Goal: Protect CR Time Frame: Met Goal
Key Measure Target Goal
FY 2018 Actual
FY 2019 Actual
FY 2020 Projected
FY 2021 Budgeted
Damages billed to third party within 30 days of receiving
information used for billing. 100% 100% 100% 100% 100%
Department Goal: Safety metric information updated and dispatched by 7th of each month. Relates to City Goal: Protect CR Time Frame: Met Goal
Key Measure Target Goal
FY 2018 Actual
FY 2019 Actual
FY 2020 Projected
FY 2021 Budgeted
Safety metric information updated and dispatched by 7th
of each month. 100% 100% 100% 100% 100%
INTERNAL SERVICE FUND
Risk Services
195

Department Goal: New employee computer based hazard awareness training scheduled within 14 days of notice of hiring. Relates to City Goal: Protect CR Time Frame: Working to Meet Goal
Key Measure Target Goal
FY 2018 Actual
FY 2019 Actual
FY 2020 Projected
FY 2021 Budgeted
Training scheduled within 14 days of notice of hiring 100% 100% 90% 100% 100%
Financial Summary
Budget Highlights Property and liability expenses are increasing $263K to $3.6M. This increase is attributable to an increase in property values from adding the Veterans Memorial Building, 2 flood stations, and a water tower as well as projected increases in rates and excess premiums. Workers compensation expenses are decreasing $229K to $4M. This decrease is attributable to the actuary-projected reduction in losses. Health fund expenses are increasing by 11% or $2.3M to $23.8M, which directly correlates to an increase in health claim expenses. Dental expenses are decreasing by $69K to $1.1M, which directly relates to dental claims expenses.
Risk Services FYFY 2020 FY $ Change % Change
2019 Adopted 2021 From FY From FYActual Budget Budget 2020 2020
RevenuesTaxes -$ -$ -$ -$ Licenses & Permits -$ -$ -$ -$ Intergovernmental Grants -$ -$ -$ -$ Charges for Services 4,315,443$ 3,793,411$ 4,097,321$ 303,910$ Fines & Forfeits -$ -$ -$ -$ Proceeds of Long Term Liabilities -$ -$ -$ -$ Transfers In 168,560$ 171,536$ 157,500$ (14,036)$ Other Revenue 24,634,262$ 23,439,254$ 25,727,607$ 2,288,353$ Total Revenues 29,118,265$ 27,404,201$ 29,982,428$ 2,578,227$ 9%
ExpendituresPersonal Services (143,805)$ 609,719$ 647,096$ 37,377$ Discretionary Expenses 26,786,374$ 26,587,964$ 28,399,632$ 1,811,668$ Other Expenses 1,950,856$ 2,004,934$ 2,443,518$ 438,584$ Capital Outlay 17,650$ -$ -$ -$ Debt Service -$ -$ -$ -$ Transfers Out 975,365$ 912,513$ 923,314$ 10,801$ Total Expenditures 29,586,439$ 30,115,130$ 32,413,560$ 2,298,430$ 8%
Net Revenues over/(under) Expenditures (468,174)$ (2,710,929)$ (2,431,132)$ 279,797$
196

Trust & Agency Funds Trust and agency funds account for assets held by the City in a trustee or custodial capacity for the City’s retirement funds and for other entities, such as individuals, private organizations, or other governmental units.
197
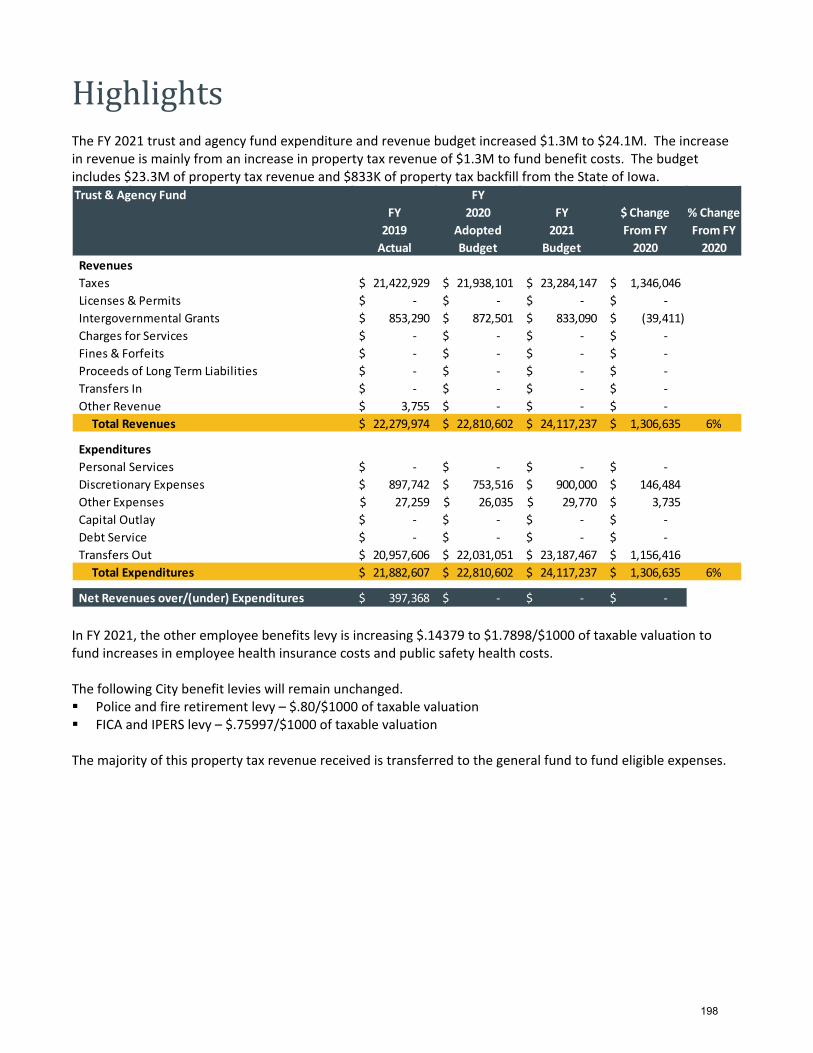
Highlights The FY 2021 trust and agency fund expenditure and revenue budget increased $1.3M to $24.1M. The increase in revenue is mainly from an increase in property tax revenue of $1.3M to fund benefit costs. The budget includes $23.3M of property tax revenue and $833K of property tax backfill from the State of Iowa.
In FY 2021, the other employee benefits levy is increasing $.14379 to $1.7898/$1000 of taxable valuation to fund increases in employee health insurance costs and public safety health costs. The following City benefit levies will remain unchanged. Police and fire retirement levy – $.80/$1000 of taxable valuation FICA and IPERS levy – $.75997/$1000 of taxable valuation The majority of this property tax revenue received is transferred to the general fund to fund eligible expenses.
Trust & Agency Fund FYFY 2020 FY $ Change % Change
2019 Adopted 2021 From FY From FYActual Budget Budget 2020 2020
RevenuesTaxes 21,422,929$ 21,938,101$ 23,284,147$ 1,346,046$ Licenses & Permits -$ -$ -$ -$ Intergovernmental Grants 853,290$ 872,501$ 833,090$ (39,411)$ Charges for Services -$ -$ -$ -$ Fines & Forfeits -$ -$ -$ -$ Proceeds of Long Term Liabilities -$ -$ -$ -$ Transfers In -$ -$ -$ -$ Other Revenue 3,755$ -$ -$ -$ Total Revenues 22,279,974$ 22,810,602$ 24,117,237$ 1,306,635$ 6%
ExpendituresPersonal Services -$ -$ -$ -$ Discretionary Expenses 897,742$ 753,516$ 900,000$ 146,484$ Other Expenses 27,259$ 26,035$ 29,770$ 3,735$ Capital Outlay -$ -$ -$ -$ Debt Service -$ -$ -$ -$ Transfers Out 20,957,606$ 22,031,051$ 23,187,467$ 1,156,416$ Total Expenditures 21,882,607$ 22,810,602$ 24,117,237$ 1,306,635$ 6%
Net Revenues over/(under) Expenditures 397,368$ -$ -$ -$
198

Capital Project Funds Capital project funds account for expenses and resources related to the acquisition and construction of capital facilities, improvements, and other major fixed assets. These capital project funds are typically financed with revenue other than enterprise or internal service fund monies with the exception of storm water projects that are typically funded from storm water utility rates.
199

Highlights FY 2021 capital project fund expenditures are increasing by $21.6M to $133.1M. Excluding transfers, the largest budgeted expenditures are street improvements ($56.1M) and flood control system projects ($45.6M).
This summary does not contain enterprise or internal service capital project funds. These reports are included in the enterprise and internal service fund sections. Funding for FY 2021 capital project fund expenditures are illustrated below.
Capital Projects Fund FYFY 2020 FY $ Change % Change
2019 Adopted 2021 From FY From FYActual Budget Budget 2020 2020
RevenuesTaxes -$ -$ -$ -$ Licenses & Permits -$ -$ -$ -$ Intergovernmental Grants 12,936,127$ 17,165,500$ 23,611,746$ 6,446,246$ Charges for Services 140,184$ -$ 68,000$ 68,000$ Fines & Forfeits -$ -$ -$ -$ Proceeds of Long Term Liabilities 21,528,664$ 44,890,000$ 54,596,673$ 9,706,673$ Transfers In 71,346,943$ 44,921,790$ 46,548,378$ 1,626,587$ Other Revenue 3,013,383$ 810,000$ 2,720,000$ 1,910,000$ Total Revenues 108,965,300$ 107,787,290$ 127,544,797$ 19,757,506$ 18%
ExpendituresPersonal Services 23,528$ -$ -$ -$ Discretionary Expenses 13,118,792$ 677,000$ 778,000$ 101,000$ Other Expenses 78,676$ -$ -$ -$ Capital Outlay 62,499,847$ 109,437,787$ 128,698,299$ 19,260,512$ Debt Service -$ -$ -$ -$ Transfers Out 25,514,735$ 1,397,528$ 3,670,768$ 2,273,240$ Total Expenditures 101,235,578$ 111,512,315$ 133,147,067$ 21,634,752$ 19%
Net Revenues over/(under) Expenditures 7,729,722$ (3,725,025)$ (5,602,270)$ (1,877,245)$
Intergovernmental Grants
$23,611,746 19%
Charges for Services$68,000
0%
Proceeds of Long Term Liabilities
$54,596,673 43%
Transfers In$46,548,378
36%
Other Revenue$2,720,000
2%
200

In FY 2021, $49.7M of expenses will be funded from general obligation bonds (of this, $8.5M is budgeted for ADA projects and $41.2M for annual City projects) and $4.9M from tax increment financing bonds. $23.6M will be funded with federal, state, or local grants. $44M is budgeted from transfers that include $4.4M of road use tax revenue, $19.2M of streets local option sales tax revenue, $15M of Iowa Flood Mitigation Program revenue, $1M from tax increment financing revenue, $304K from general fund operations, and $4.1M from storm water utility user fees. The balance of funding will come from cash on hand in projects, contributions, or assessment charges. Infrastructure Funds Infrastructure funds include street, storm water, bridge, traffic, and downtown projects. The expenditure budget for FY 2021 is $62.4M (net of transfers) which is an increase of $10.5M from FY 2020. Below is a history of expenditures for infrastructure funds.
Non-infrastructure Funds Non-infrastructure funds include areas such as park and recreation, fire, forestry, veteran’s stadium, library, river wall, trail, information technology, and city facility improvement projects. The expenditure budget for FY 2021 is $21.5M (net of transfers). The main projects included in FY 2021 budget are trail improvements, fire truck, Americans with Disabilities Act improvements, Connect CR to design & construct Smokestack Bridge & Cedar Lake amenities, neighborhood planning, facility improvements, information technology, library circulation materials, street trees, park, recreation and aquatics improvements. Flood Control System Funds $45.6M of expenditures are budgeted for flood control system projects. FY 2021 priorities include completing preliminary design on the majority of the west side system, design will be advanced on the 8th Avenue bridge and riverfront improvement projects, priority construction starts including reconstruction and raising of Shaver Road NE over McLoud Run, and emphasis will continue on acquiring real estate for US Army Corps of Engineers components to also proceed to construction.
Construction should be substantially completed on major projects including Quaker Oats floodwall and railroad gate closures, NewBo Parking Lot 44 levee, roadway closure gates on 16th Avenue SE and 3rd Avenue SE and the new McGrath Amphitheater floodwall, restroom and storage building.
Fiscal Year Fiscal Year Fiscal Year Fiscal Year Fiscal Year 2017 2018 2019 2020 2021
Budget Budget Budget Budget BudgetStreets 39,745,992 32,090,000 40,562,180 44,215,000 56,083,028 Storm Water 2,525,000 3,450,000 2,379,182 3,378,287 4,365,506 Bridge 1,691,667 900,000 950,000 700,000 750,000 Traffic 1,842,000 2,280,000 1,665,000 925,000 1,101,500 Downtown 527,042 50,000 150,000 2,600,000 50,000
46,331,701 38,770,000 45,706,362 51,818,287 62,350,034
201

Debt Service Funds Debt service funds account for the accumulation of resources for and the payment of principal, interest, and related costs for general long-term debt and special assessment debt.
202

Highlights FY 2021 debt service fund revenue and expenditures increased $1.2M to $26.3M.
In FY 2021, the debt service cost for general long-term debt is $24.6M. Debt service expenses will be funded from property tax revenue, tax increment financing revenue, backfill proceeds from the state, and cash on hand in the debt service fund. Property tax revenue generated from the debt service levy to fund debt service costs in FY 2021 is $22.3M, which is an increase of $1.1M from FY 2020. A portion of this increase relates to increased valuations. The remainder of the increase relates to an increase in the debt service levy of 22 cents to issue debt for the flood control system, offset by a reduction of 14 cents through refunding of debt service for the US Cellular Complex. A history of the debt service levy rate per $1000 of taxable valuation is detailed below.
Debt Service Fund FYFY 2020 FY $ Change % Change
2019 Adopted 2021 From FY From FYActual Budget Budget 2020 2020
RevenuesTaxes 19,060,655$ 21,203,224$ 22,341,847$ 1,138,623$ Licenses & Permits -$ -$ -$ -$ Intergovernmental Grants 728,215$ 804,484$ 756,931$ (47,553)$ Charges for Services -$ -$ -$ -$ Fines & Forfeits -$ -$ -$ -$ Proceeds of Long Term Liabilities 137,660$ -$ -$ -$ Transfers In 3,077,854$ 3,093,617$ 3,222,828$ 129,211$ Other Revenue 5,851,644$ 2,880$ 3,110$ 230$ Total Revenues 28,856,027$ 25,104,205$ 26,324,717$ 1,220,512$ 5%
ExpendituresPersonal Services -$ -$ -$ -$ Discretionary Expenses 2,345$ 2,880$ 3,110$ 230$ Other Expenses -$ -$ -$ -$ Capital Outlay -$ -$ -$ -$ Debt Service 24,360,542$ 20,849,537$ 24,601,992$ 3,752,455$ Transfers Out 3,604,328$ 4,251,788$ 1,731,195$ (2,520,593)$ Total Expenditures 27,967,215$ 25,104,205$ 26,336,298$ 1,232,093$ 5%
Net Revenues over/(under) Expenditures 888,812$ -$ (11,581)$ (11,581)$
$-
$1.00
$2.00
$3.00
$4.00
History of Debt Service Tax Levy Per $1000 of Valuation
203

CREDIT RATING The City of Cedar Rapids seeks to maintain the highest possible credit ratings for all categories of short and long-term general obligation and revenue debt that can be achieved without compromising the delivery of basic City services and the achievement of adopted City policy objectives. The City recognizes that external economic, natural, or other events may from time to time affect the creditworthiness of its debt. Nevertheless, the City is committed to ensuring that actions within their control are prudent. In May 2019, the City’s bond rating for outstanding general obligation debt was rated Aa1 with a stable outlook by Moody’s Investor Services. Aa1 is the second highest rating that can be achieved and is predicated on the City’s large and growing tax base, reserves, revenue raising ability, and fiscal management. Also in May 2019, the City’s bond rating for outstanding revenue bond debt was rated Aa2. The Aa2 rating for sewer revenue bonds is based on the enterprises healthy liquidity, sound debt service coverage, and unlimited rate setting authority. The Aa2 rating for water revenue bonds is based on a maintaining a healthy financial profile, characterized by strong liquidity, and unlimited rate setting authority. DEBT LIMIT The State Code of Iowa limits the amount of debt that a city can incur to 5% of assessed market value. The City has set a target for the City’s general obligation outstanding debt at 80%, (except due to extenuating circumstances such as disasters) of the limit prescribed by State statute. Below is a history of the debt limit and reserve capacity.
In FY 2021, 72% of the debt is tax supported and 28% is non-tax supported. At the end of FY 2021, the City anticipates additional reserve capacity for bonding to be $310.4M or 51%. All bonds are budgeted by project in the appropriate capital improvement project fund. Prior to issuance, the City confirms the debt needs. Bonds are typically issued in the May – June of the fiscal year. TAX SUPPORTED DEBT PLANNED USES The FY 2021 budget includes issuing $49.7M of general obligation bond tax supported debt as follows: $7.47M Public Works $1.4M – Staff time
Actual Actual Actual Projected ProjectedFY 2017 FY 2018 FY 2019 FY 2020 FY 2021
Assessed Value 9,973,793,843$ 10,360,756,078$ 11,153,902,336$ 11,671,429,942$ 12,188,101,602$ Multiplied by 5%Debt Limit 498,689,692$ 518,037,804$ 557,695,117$ 583,571,497$ 609,405,080$
Less: Outstanding Debt Tax Supported 160,955,075$ 160,351,325$ 168,904,887$ 202,212,925$ 216,240,058$ Non-tax Supported 115,429,925$ 111,233,675$ 95,295,113$ 90,457,075$ 82,774,942$ Total 276,385,000$ 271,585,000$ 264,200,000$ 292,670,000$ 299,015,000$
Reserve capacity 222,304,692$ 246,452,804$ 293,495,117$ 290,901,497$ 310,390,080$
Percent of Reserve Capacity 45% 48% 53% 50% 51%
Note: Does not include capi ta l leases
Percent of debt applicable to limit 55% 52% 47% 50% 49%
204

$3.6M – Street Improvements $275K – Traffic Improvements $945K – Sidewalk Improvements $50K – Downtown Improvements $1.2M – Trail Improvements
$1.32M Parks, Forestry, Recreation, Aquatics, $798K – Parks Improvements $150K – Street trees $278K – Recreation Improvements $90K – Aquatics Improvements
$855K – Fire pumper truck and educational trailer $500K – Library circulation material $585K – Information Technology Improvements $510K – City Facility Improvements $30M – Flood Control System Improvements $8.5M – Americans with Disabilities Act Improvements In FY 2021, the City also plans to issue $4.9M of tax increment financing bonds for street improvements.
205

Special Revenue Funds Special Revenue Funds account for revenues derived from sources for a specific use which are required to be accounted for as a separate fund. These funds include areas such as tax increment financing districts, road use tax, and hotel motel.
206

Highlights FY 2021 special revenue fund expenditures increased $690K to $80.9M. FY 2021 revenue increased $1.4M to $81.2M.
There are 16 FTEs budgeted within special revenue funds.
Summary of FTEs
FY 2020 Adjusted Change from FY 2020 FY 2021 Budget 16.00 0.00 16.00
Local Option Sales Tax Fund In November 2013, the citizens of Cedar Rapids voted to allow a 1% local option sales tax to fund street repairs for a ten year period from July 1, 2014 thru June 30, 2024. These funds are used for improvements that typically would have required the City to issue debt. It is estimated the City will generate $200M over ten years. The City began receiving this revenue in FY 2015. The Finance Director is responsible for this special revenue fund. $19.2M is budgeted in FY 2021, which is a $300K increase from FY 2020 and is based on historical trends. The revenue is received to this special revenue fund and transferred to fund eligible expenses. Hotel Motel Tax Fund Hotel motel tax is imposed on gross receipts from the renting of sleeping rooms at any hotel, motel, bed and breakfast, etc. The Finance Director is responsible for this special revenue fund. The City is budgeting $3.9M in FY 2021 for hotel motel tax revenue which increased $50K from FY 2020. Expenditures are being budgeted at $3.9M. Included in the expenditures are City debt payments (I.e. portion of hotel, portion of convention center, and art museum), $253K for an internal loan relating to ImOn Ice
Special Revenue Fund FYFY 2020 FY $ Change % Change
2019 Adopted 2021 From FY From FYActual Budget Budget 2020 2020
RevenuesTaxes 33,167,050$ 34,343,682$ 37,373,186$ 3,029,504$ Licenses & Permits 8,150$ 30,000$ 30,000$ -$ Intergovernmental Grants 35,147,743$ 40,001,402$ 39,836,758$ (164,644)$ Charges for Services 362,552$ 104,932$ 314,000$ 209,068$ Fines & Forfeits 25,572$ 105,000$ 105,000$ -$ Proceeds of Long Term Liabilities -$ -$ -$ -$ Transfers In 4,712,480$ 4,317,307$ 2,554,378$ (1,762,929)$ Other Revenue 1,453,019$ 895,450$ 1,000,676$ 105,226$ Total Revenues 74,876,566$ 79,797,772$ 81,213,997$ 1,416,225$ 2%
ExpendituresPersonal Services 1,242,381$ 1,355,602$ 1,386,687$ 31,085$ Discretionary Expenses 16,540,970$ 17,665,031$ 19,434,275$ 1,769,244$ Other Expenses 252,652$ 197,272$ 160,365$ (36,907)$ Capital Outlay 86,005$ 2,338,302$ 463,415$ (1,874,887)$ Debt Service 4,069$ -$ -$ -$ Transfers Out 60,143,992$ 58,646,727$ 59,448,254$ 801,527$ Total Expenditures 78,270,070$ 80,202,934$ 80,892,995$ 690,062$ 1%
Net Revenues over/(under) Expenditures (3,393,504)$ (405,161)$ 321,002$ 726,163$
207

mechanical improvements, and $250K for other ice arena capital improvements related to the Roughriders agreement. In addition, the City will use some of the hotel motel revenue for organizations who applied for funding through the hotel motel three-year application program. Road Use Tax Fund Road use tax revenue is funded through a distribution from the State of Iowa relating to fuel taxes and vehicle registration fees. The revenue is received to this special revenue fund and transferred to eligible expenses. The Finance Director is responsible for this special revenue fund. The City is budgeting $16.3M in FY 2021 for road use tax revenue, which is a $200K increase from FY 2020. In FY 2021, $11.9M will be transferred to fund eligible operating expenses (bridge maintenance, street lighting, the Public Works Department, and the forestry division of the Parks & Recreation Department) and the balance of will fund eligible capital improvement projects. SSMID Funds A self-supported municipal improvement district, or SSMID, assists in funding public improvement and other projects within a specified area. SSMID funds are created through an additional tax placed on property owners in the defined district. The City has three SSMID districts: the medical district, the downtown district, and the Czech Village-New Bohemia district. The Finance Director is responsible for these special revenue funds. The FY 2021 budgeted property tax revenue and approved levies are:
District Property Tax
Revenue Levy Rate per $1K of
Taxable Valuation Downtown $242,540 $2.75 Medical $236,216 $2.75 Czech Village-New Bohemia $41,280 $1.24998
Tax Increment Financing Funds Tax increment financing is a financing method that is used to fund redevelopment, infrastructure, and other community-improvement projects in in certain areas. Revenue will fund capital improvement projects, debt payments, economic development payments, internal staff associated time, and contributions. The Community Development Director is responsible for this special revenue fund. The City is budgeting $13.8M in property taxes in TIF districts for FY 2021 which represents a $2.8M increase from FY 2020. This increase is mainly due to the City increased property valuations in the Central, Consolidated, Fountains, Northtowne, Stone Creek, and Westdale TIFs resulting from increased debt certifications as well as certifying debt in fiscal year 2021 for Commerce Park, Earhart Lane, Grand Living, and Muirfield. Iowa Flood Mitigation Fund The City helped pass legislation that allows the City to use incremental growth from the City's sales tax to pay for flood protection. The legislation created a twenty year program that is now estimated to generate $269M towards the City's $750M flood protection plan. Flood protection includes flood walls, levees, gates, pump stations, detention basins, bridge raising, etc., as well as mitigation programs that lessen the impact of future floods. The City began receiving this revenue in FY 2015. The Finance Director is responsible for this special revenue fund. $15M is budgeted in FY 2021, which is unchanged from FY 2020 and based on the estimate from the agreement with the State. The revenue is received to this special revenue fund and transferred to fund eligible flood control system expenses.
208

Other Special Revenue Funds Other special revenue funds are used to account for revenues derived from sources for a specific use, which are required to be accounted for in a separate fund. There are several funds for multiple departments. Departments include Police, Civil Rights, Fire, Community Development, Ice Arena, Library, and Parks & Recreation. The directors responsible for each of these areas are responsible for their respective special revenue funds. $463K is being set aside for the Police Departments’ Proactive Policing program. Other special revenue funds were adjusted based on projections of actual revenue and expenditures for FY 2021.
209

Capital Improvement Project Five Year Plan The 5-year capital improvement project plan is a planning document for future budgets. Only the current year is part of the adopted budget. Future years are adjusted annually based on project priority and the City’s ability to finance projects. The capital expenditures in the program include costs such as design, property acquisition, and construction. The costs are department estimates for planning purposes only, as costs can change over the life of a project. These projects includes areas such as street improvements, water improvements, and flood control system improvements.
210

Capital Improvement Project Plan 5 YEAR CAPITAL IMPROVEMENT PROJECT PLAN The total estimated cost of the 5-year capital improvement project expenditure plan from FY 2021 to FY 2025 is $865.8M. A summary of the 5-year expenditure plan by fund is shown below.
The largest fund in terms of expenditures over the 5-year plan is flood control system improvements. The department estimates $249.6M will be spent on flood control over the next 5 years. The next largest fund area is street improvements with estimated expenditures of $173.4M over the next 5 years. The 5 year plan includes some larger projects such as the Smokestack Bridge and Cedar Lake amenities, the Cedar Rapids Marion trail from 1st Avenue NE to Marion, the Cherokee Trail from Morgan Creek to Cedar River, Americans with Disability Act improvements, sanitary sewer extension west of Edgewood Road from south of Prairie Creek to 76th Avenue, mechanical renovations at the ImOn Ice Arena, and a new transportation bus maintenance facility.
Fund FY 2021 FY 2022 FY 2023 FY 2024 FY 2025 5 Year Total Capital Project Fund ‐ Flood331 Flood Control System 45,576,500 51,000,000 51,000,000 51,000,000 51,000,000 249,576,500 Capital Project Fund ‐ Infrastructure301 Street 56,083,028 34,906,000 27,320,000 26,400,000 28,650,000 173,359,028 304 Stormwater 4,365,506 4,048,108 4,438,541 4,779,340 5,010,517 22,642,012 305 Bridge 750,000 - 250,000 250,000 - 1,250,000 306 Traffic 1,101,500 310,000 300,000 300,000 - 2,011,500 321 Downtown 50,000 50,000 50,000 50,000 - 200,000 Capital Project Fund ‐ Non‐Infrastructure307 Park 797,500 537,500 637,500 462,500 612,500 3,047,500 308 Fire 855,000 850,000 850,000 850,000 850,000 4,255,000 309 Forestry 178,000 178,000 178,000 178,000 178,000 890,000 311 Recreation 278,000 - - 150,000 - 428,000 312 Riverfront - 100,000 - - - 100,000 314 Veterans Stadium 205,000 580,000 - - - 785,000 315 Veterans Memorial Building 144,291 195,000 160,000 150,000 75,000 724,291 316 Library 500,000 500,000 500,000 500,000 500,000 2,500,000 324 Aquatic 90,000 75,000 75,000 100,000 100,000 440,000 325 Trail 7,806,973 4,307,000 2,730,000 1,650,000 - 16,493,973 327 Connect CR 1,000,000 1,000,000 1,000,000 1,000,000 - 4,000,000 353 Miscellaneous 8,600,000 2,500,000 2,500,000 2,500,000 2,500,000 18,600,000 354 Information Technology 585,000 585,000 585,000 585,000 585,000 2,925,000 360 City Facility 510,000 510,000 510,000 510,000 510,000 2,550,000 Enterprise Capital Project Fund515 Airport 49,854,372 32,901,927 29,478,843 18,713,000 12,380,106 143,328,248 555 Ice Arena 3,250,000 250,000 250,000 50,000 50,000 3,850,000 615 Water Pollution Control 12,217,056 12,300,000 13,000,000 13,125,000 13,400,000 64,042,056 625 Water 13,786,353 18,273,000 16,806,000 19,181,500 19,845,000 87,891,853 635 Parking 400,000 - - - - 400,000 655 Sanitary Sewer 12,750,985 9,148,970 7,742,409 9,150,319 9,149,716 47,942,399 665 Transit 3,637,022 1,298,622 1,298,622 1,298,622 1,298,622 8,831,510 Internal Service Capital Project Fund065 Joint Communication 635,000 - - 500,000 - 1,135,000 085 Facility Maintenance 315,000 315,000 315,000 315,000 315,000 1,575,000 Total 226,322,087 176,719,127 161,974,915 153,748,281 147,009,461 865,773,870
211

Also included in the 5-year plan are water and water pollution control projects. Over the 5-year plan, water projects are estimated at $87.9M and water pollution control projects are estimated at $64M. There is an additional $133M in water pollution control projects that are not included in the five year plan as funding these costs would require alternative funding sources or large annual rate increases. City staff will be reviewing options for additional funding for these projects. The largest revenue source over the 5-year plan is general obligation bonds of $244.8M. Other funding sources include revenue bonds, tax increment financing bonds, streets local option sales tax revenue, grants, and revenue from the Iowa Flood Mitigation Program. The 5-year capital improvement project funding plan is illustrated below.
FY 2021 CAPITAL IMPROVEMENT PROJECT PLAN The FY 2021 capital improvement project expenditure budget is $226.3M. The largest areas in terms of expenditures include: Street improvements – $56.1M The Eastern Iowa Airport improvements – $49.9M Flood control system improvements – $45.6M Water improvements – $13.8M Sanitary sewer improvements – $12.8M
Some of the larger street projects include construction of a new roadway with sidewalk and trail from Tower Terrace Road NE from east of C Avenue to Council Street ($6.6M), resurfacing, median and intersection improvements on Williams Boulevard from city limits to 16th Avenue SW ($4.9M), and pavement rehabilitation and curb replacement on 1st Avenue NE from 27th Street to 40th Street ($3.9M). A couple of the larger planned utility projects are water main replacements in conjunction with paving for progress projects ($4.5M), adding a softener basin to the Northwest Water Treatment Plant ($3.1M), and large diameter sanitary sewer repairs and lining along A Street SW ($3.4M).
Go Bonds$244,765,500
28%
Tax Increment Financing Bonds
$11,011,173 1%
Revenue Bonds$109,542,500
13%
Other Debt$18,235,000
2%
External Grants$97,960,191
11%
Iowa Flood Mitigation Program$75,000,000
9%
Paving for Progress/Streets
LOST$96,000,000
11%
Other Transfers In
$193,180,044 22%
Other Revenue$5,288,000
1%
Cash On Hand$14,791,463
2%
212

Flood control projects include design of the 8th Avenue bridge and west side system, acquisition of real estate for US Army Corps of Engineers components, reconstruction and raising of Shaver Road NE over McLoud Run, substantial completion of Quaker Oats floodwall and railroad gate closures, NewBo Parking Lot 44 levee, roadway closure gates on 16th Avenue SE and 3rd Avenue SE and the McGrath Amphitheatre floodwall, restroom and storage building. Airport has 15 projects budgeted at $49.9M that include a multi-year project involving reconfiguring and constructing a new taxiway. Below is a breakdown of projects by cost center: Airfield improvements $21.8M Other buildings & gounds $9.8M General aviation $8M Cargo $8.1M Parking Lot $2.1M 64% or $32.1M of these expenses will be funded with cash reserves and the balance will be from external grants. Funding includes a variety of sources such as: $49.7M of general obligation bonds $18.6M of revenue bonds $19.2M of streets local option sales tax revenue $15M of Iowa Flood Mitigation Program revenue $43M in grants
Funding for FY 2021 capital improvement projects is illustrated below.
Go Bonds$49,735,500
22%
Tax Increment Financing Bonds
$4,861,173 2%
Revenue Bonds$18,642,000
8%
Other Debt$4,100,000
2%External Grants
$42,956,760 19%Iowa Flood Mitigation Program
$15,000,000 7%
Paving for Progress/Streets
LOST$19,200,000
8%
Other Transfers In
$54,446,087 24%
Other Revenue$4,638,000
2%
Cash On Hand$12,742,567
6%
213

SIGNIFICANT NON‐RECURRING CAPITAL IMPROVEMENT EXPENDITURES Included in the FY 2021 budget are several significant non-recurring capital improvement project expenditures. A project is considered significant based on a total project cost of greater than $2M. Non-recurring projects are additions to current infrastructure or new infrastructure and do not include repair or replacement of current infrastructure. In FY 2021, these projects include: Public Works (Streets, Trails)
301446 – Collins Road Widening FY 2021 Project Cost: $150K Projected Total Project Cost: $20.5M
Funding Source: General Obligation Bonds, Grants, Assessments, & Streets Local Option Sales Tax Scope of Project: Reconstruction of Collins Road NE (Iowa Hwy 100) from east of Northland Avenue
to Twixt Town Road. Improvements include an additional through lane in each direction, additional turn lanes at the Lindale Mall / Collins Crossing intersection, new shared use paths on both sides of Collins Road NE, new traffic signals with pedestrian indications and push buttons, and storm water management improvements. Project is expected to be completed during FY 2021.
301666 – Tower Terrace Extension FY 2021 Project Cost: $6.6M Projected Total Project Cost: $15.7M
Funding Source: General Obligation Bonds, Contribution, Road Use Tax, Assessments & Grants Scope of Project: Construct new urban section roadway with new sidewalk on one side and shared
use path on the other side from C Avenue NE to Alburnett Road. Project is expected to be completed during FY 2019 and FY 2025.
301963 – 6th Street NW Extension from B Avenue to Ellis Boulevard FY 2021 Project Cost: $1.2M Projected Total Project Cost: $6M
Funding Source: Tax Increment Financing Bonds, Grant, Streets Local Option Sales Tax Scope of Project: Extension of 6th Street NW to add a connection between Highway 151 and Ellis
Boulevard, with costs to include design, right-of-way, and construction. Project is expected to be completed between FY 2019 and FY 2022.
301972 – Dead Road at Highway 151 roundabout FY 2021 Project Cost: $3.1M Projected Total Project Cost: $5.3M
Funding Source: General Obligation Bonds, Tax Increment Financing Bonds & Grant Scope of Project: Construct a roundabout at the intersection of Dean Road and Highway 151
(Williams Boulevard SW). Includes new lighting, landscaping, storm sewer and water main extension. The new roundabout will increase the safety of the intersection and is expected to be constructed between FY 2020 and FY 2021.
325012, 325042 & 325050 – Cedar Rapids & Marion Trail (CEMAR) FY 2021 Project Cost: $3.4M Projected Total Project Cost: $12.4M
Funding Source: General Obligation Bonds & Grant Scope of Project: The new trail will go from the Cedar Lake Loop trail east along H Avenue NE,
through Daniels Park and then along F Avenue NE, the trail then follows a northeasterly alignment to the intersection of 29th Street NE and B Avenue along 29th Street to 1st Avenue, then northeast to the Cedar Rapids Marion city limits near 3rd Avenue SE. Multiple phases constructed between FY 2017 and FY 2024.
325069 – Cherokee Trail from Morgan Creek to Cedar River FY 2021 Project Cost: $1.8M Projected Total Project Cost: $6M
Funding Source: General Obligation Bonds & Grant
214

Scope of Project: Various aspects of a new on street and off street Portland cement concrete trail development including design, right-of-way acquisition and construction from Morgan Creek Park to the Cedar River on the Northwest side of Cedar Rapids. This will connect to the new trail being developed along Edgewood Road. Multiple Phases will be constructed between FY 2019 and FY 2023.
Connect CR 327 – Connect CR FY 2021 Project Cost: $1M Projected Total Project Cost: $5M
Funding Source: Tax Increment Financing, Grants, & Contributions Scope of Project: Development of Cedar Lake for public accessibility including trailhead, park shelter,
kayak and canoe launch or rental, nature themed playground & general park amenities. Construction of a new bicycle and pedestrian bridge over the Cedar River to connect southwest side and southeast side of Cedar Rapids near Czech / Newbo area. Multiple Phases will be constructed between FY 2021 and FY 2026.
Flood Control System 331 – Flood Control System FY 2021 Project Cost: $45.6M Projected Total Project Cost: $750M
Funding Source: General Obligation Bonds, Grants (including Iowa Flood Mitigation Program), 90% Flood Local Option Sales Tax, Operating Cash on Hand
Scope of Project: The system is a 20 year program to reduce the impact of flooding from the Cedar River and interior drainage for a large portion of the city for both the east and west side of the Cedar River. The system includes 7.5 miles of levee & floodwalls both permanent & removable, 15 storm water pump stations, five storm water detention ponds, 25 roadway, railroad gate and pedestrian closures, and improvements to two bridges by raising them. This is year 7 of the 20 year program.
Miscellaneous Construction ‐ Citywide 353 – Americans with Disability Act FY 2021 Project Cost: $8.5M Projected Total Project Cost: $47M
Funding Source: General Obligation Bonds Scope of Project: The City is making improvements to become compliant with the Americans with
Disabilities Act (ADA). This includes curb ramps, facilities, parks and recreation retrofits, and upgrades as outlined in the Department of Justice (DOJ) report. The budget will be reallocated to projects identified during the fiscal year. The original agreement was for four years and was accepted as complete in FY 2019. The City continues to make improvements to update infrastructure that was not included in the Department of Justice Report budgeted thru FY 2025.
ImOn Ice Arena 555085 – Mechanical Repairs FY 2021 Project Cost: $3M Projected Total Project Cost: $3M
Funding Source: Internal Loan Scope of Project: Project will replace HVAC equipment original to the 20 year old Ice Arena including
rooftop heating/air conditioning units, dehumidification systems, chillers, LED lighting upgrades, and ice surface brine pumps.
Water 6250072 – Northwest Water Treatment Plant Softener Addition FY 2021 Project Cost: $3.1M Projected Total Project Cost: $18.2M
Funding Source: State Revolving Funds & Water User Fees
215

Scope of Project: The addition of a softener basin to accommodate renovation of existing softeners while preserving treatment capacity. The project will improve reliability of operation and flexible time windows for conducting major softener maintenance. This is a multi-year project with expected completion in FY 2023.
Sanitary Sewer 6550034 – Edgewood Road south of Prairie Creek FY 2021 Project Cost: $2M Projected Total Project Cost: $3.4M
Funding Source: Revenue Bonds, Sewer User Fees & Contribution Scope of Project: Project will extend sanitary sewer west of Edgewood Road SW from south of Prairie
Creek to 76th Avenue. The sanitary sewer extension will provide sewer service to a targeted growth area. Anticipated construction completion will occur in FY 2021.
Storm Water 304043 – 18th Street south of O Avenue NW FY 2021 Project Cost: $25K Projected Total Project Cost: $3M
Funding Source: Storm Water User Fees Scope of Project: Project will construct new detention basin sought of O Avenue extending between
18th Street and Highwood Drive NW. This will reduce water runoff and improve storm water quality. Anticipated construction completion will occur in FY 2025.
304465 – Kenwood Sub‐basin FY 2021 Project Cost: $485K Projected Total Project Cost: $4.4M
Funding Source: Storm Water User Fees Scope of Project: Project will construct new detention basin in the Kenwood drainage basin. This will
mitigate the impacts of runoff and improve water quality discharging to Cedar Lake. Anticipated construction completion will occur in FY 2025.
CAPITAL IMPROVEMENT IMPACT ON OPERATING BUDGET The process of determining which projects will be included in the budget includes reviewing not only the merits of the project, priority of the project compared to other projects, the overall impact of the recommended funding, but also the current and future year operating impact. Operating impacts could result in increases/decreases in expenses as well as additional revenue generated. Increases in expenses could include, but are not limited to, increased workload for mowing, snow removal, inspections, utility costs, etc. Decreases in expenses could include less roadway maintenance for filling potholes, fewer repairs of equipment, and lowered costs due to reduced flooding from rainwater runoff.
Typically, projects have minimal operating impacts on the City’s current or future budgets. For instance, the reconstruction of a road may result in reduced operating costs to repairs potholes at that location, however with the volume of repairs needed on streets; the savings on one location is just used on another location with need. However, if you add enough new streets, the City monitors and determines at what point additional police officers will need added or when snow/street material budget will need increased. The addition of a new aquatic center would require the City to review not only the project cost, but the additional staff, furniture, supplies, electricity, and other maintenance costs that would be required to operate and maintain the facility as well as the revenue that would be generated.
In FY 2021, many of the projects included in the budget are to maintain roads, facilities, or utility infrastructure and are a normal piece of the City’s budget. Most of the operational costs associated with the projects are able to be absorbed in the department’s operating budget. The estimated operational impacts of significant projects over the next five years are included below.
216

Fiscal Fiscal Fiscal Fiscal FiscalYear Year Year Year Year
Department Name CIP Project / Description 2021 2022 2023 2024 2025
Internal Service FundsFacilities Maintenance 353 ‐ Americans with Disability Act -
Quarterly code verification checks-$ 3,000$ 3,000$ 6,000$ 6,000$
Internal Service Funds ‐$ 3,000$ 3,000$ 6,000$ 6,000$
General FundParks & Recreation 325042 ‐ Cedar Rapids & Marion Trail
(CEMAR) - Maintenance and repair of new trail
-$ 2,000$ 2,000$ 2,000$ 2,000$
325069 ‐ Cherokee Trail from Morgan Creek to Cedar River - Maintenance and repairs of new trail
-$ 3,500$ 5,900$ 10,700$ 14,000$
331 ‐ Flood Control System - Maintenance and repair of levees, trails and detention basins
-$ 73,000$ 83,000$ 94,000$ 105,000$
353046 ‐ Americans with Disability Act - New concrete and structure maintenance
-$ 3,000$ 3,000$ 3,000$ 3,000$
Public Works 331 ‐ Flood Control System - Maintenance and repair of floodwalls and trails; testing of system
-$ 32,000$ 43,000$ 54,000$ 138,000$
301446 ‐ Collins Road Widening - Maintenance and repair of new lanes
-$ -$ 8,400$ 12,600$ 12,600$
301666 ‐ Tower Terrace Extension - Maintenance and repair of new road
-$ -$ -$ -$ 9,100$
301963 ‐ 6th Street Extension from B Avenue to Ellis Boulevard - Maintenance and repair of new roadway connection
-$ -$ 3,300$ 3,300$ 3,300$
General Fund ‐$ 113,500$ 148,600$ 179,600$ 287,000$
Enterprise FundsImOn Ice Arena 555085 ‐ Mechanical Repairs -
Reduced utilities and lower repair costs(20,000)$ (20,000)$ (20,000)$ (20,000)$ (20,000)$
Water Pollution Control 331 ‐ Flood Control System - Maintenance and repair of pump stations; testing of equipment
-$ 136,000$ 180,000$ 227,000$ 275,000$
Water 6250072 ‐ Northwest Water Treatment Plant Softener - Maintenance and repair of new basin and incremental electricity
-$ -$ -$ 10,000$ 10,000$
Sanitary Sewer 6550034 ‐ Edgewood Road south of Prairie Creek - Maintenance and repair of new sewer pipes
-$ 10,800$ 10,800$ 10,800$ 10,800$
Storm Water 331 ‐ Flood Control System - Maintenance and repair of pump stations, gates and trails; testing of equipment
72,500$ 47,000$ 64,000$ 82,000$ 100,000$
304043 ‐ 18th Street south of O Avenue NW - Maintenance and repair of new detention basin
-$ -$ -$ -$ 1,800$
304465 ‐ Kenwood Sub‐basin - Maintenance and repair of new detention basin
-$ -$ -$ -$ 1,800$
Enterprise Funds 52,500$ 173,800$ 234,800$ 309,800$ 379,400$ Total Impact on Operating Budget 52,500$ 290,300$ 386,400$ 495,400$ 672,400$
Capital Improvement Impact on Operating Budget
217

5 YEAR PLANS The project detail of the 5 year (FY 2021 – FY 2025) capital improvement project plan is located on the following pages. Some funds do not have planned projects and therefore plans are excluded from this book.
218
hjs9052
Stamp

ProjectNumber Project Name
FY 2021Budget
FY 2022Budget
FY 2023Budget
FY 2024Budget
FY 2025Budget Scope of Work
ProjectQuadrant
085 Facility Maintenance Improvements
085133 SW 75,000 50,000 0 50,000 0 Building 16 is part of the original siteand needs to be maintained foraesthetics and protection from theelements.
City Services Center Building 16Painting
085127 SW 50,000 50,000 50,000 75,000 50,000 Replace overhead door as needed atCity Services Center.
City Services Center OverheadDoor Replacement
085134 SW 20,000 0 15,000 0 0 As bulbs age and technology gets moreefficient, we will re lamp the facility aswell as assess lighting needs in the baysand add as needed.
City Services Center Lighting
085144 SW 20,000 0 0 0 30,000 The station is built with precast panels.Due to the Iowa environment offreezing and thawing, the caulk jointson the panels deteriorate and will allowwater to infiltrate the buildingenvelope. Caulking these joints on aregular basis is a necessity.
Police Department PrecastCaulking
085513 SW 20,000 0 0 0 0 Application of an elastomeric coating onthe roof to extend the life of the roofand facility of maintenance shopbuilding.
Police Roof Coating
085099 SW 15,000 15,000 15,000 40,000 15,000 Facility improvements at the CityServices Center.
City Services Center FacilityImprovements
085512 SW 15,000 45,000 40,000 0 0 Replacement of heating, ventilation,and air conditioning systems that are atlife expectancy at City Services CenterBuilding 16.
City Services Center Building 16Heating, ventilation, and airconditioning
085514 SW 15,000 0 0 0 15,000 City Services Center This project wouldreplace the air compressors, which arebeyond their useful life expectancy aswell as the supply lines.
City Services Center Building 16Air Project
085517 SW 15,000 0 15,000 30,000 0 Maintenance of the concrete floors atthe City Services Center.
City Services Center Flooring
085515 SE 10,000 0 0 5,000 0 The brick and concrete exterior atCentral Fire will need to be maintainedto keep its integrity and achieved itslifespan.
Central Fire Tuck Pointing
085518 SW 10,000 55,000 20,000 0 0 Expected maintenance for the exteriorprecast panels at City Services Centerincluding caulk, sealing, and surfacerepairs.
City Services Center PrecastMaintenance
085519 SE 10,000 0 0 0 0 Update City Hall lighting to improveefficiency.
City Hall Lighting Upgrade
085095 SW 5,000 5,000 5,000 10,000 0 Miscellaneous improvements for Policefacility. Reserve Fund
Police Facility Improvements
085096 SE 5,000 0 5,000 5,000 0 Reserve fund for miscellaneousimprovements for Central Fire.
Central Fire Improvements
085132 SW 5,000 5,000 5,000 5,000 5,000 Seal failures and cracked glass due tobuilding movement and environmentalconditions need to be periodicallyreplaced
City Services Center WindowMaintenance
085136 SW 5,000 25,000 0 0 20,000 Maintain heating, ventilation, and airconditioning equipment at the PoliceDepartment.
Police Heating, Ventilation andAir Conditioning Maintenance
085502 SE 5,000 0 0 0 0 City Hall tuck pointing.City Hall Building Tuck Pointing
085504 SE 5,000 0 0 15,000 0 City Hall security of the grounds.City Hall Perimeter Security
219
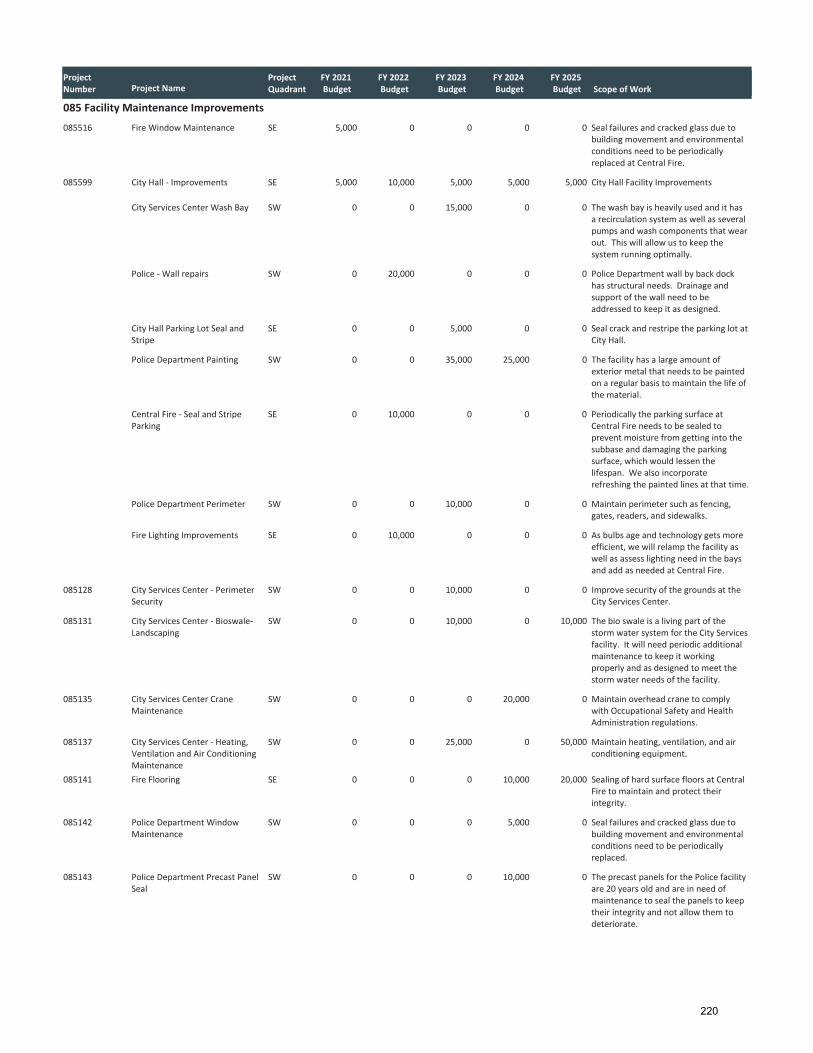
ProjectNumber Project Name
FY 2021Budget
FY 2022Budget
FY 2023Budget
FY 2024Budget
FY 2025Budget Scope of Work
ProjectQuadrant
085 Facility Maintenance Improvements
085516 SE 5,000 0 0 0 0 Seal failures and cracked glass due tobuilding movement and environmentalconditions need to be periodicallyreplaced at Central Fire.
Fire Window Maintenance
085599 SE 5,000 10,000 5,000 5,000 5,000 City Hall Facility ImprovementsCity Hall Improvements
SW 0 0 15,000 0 0 The wash bay is heavily used and it hasa recirculation system as well as severalpumps and wash components that wearout. This will allow us to keep thesystem running optimally.
City Services Center Wash Bay
SW 0 20,000 0 0 0 Police Department wall by back dockhas structural needs. Drainage andsupport of the wall need to beaddressed to keep it as designed.
Police Wall repairs
SE 0 0 5,000 0 0 Seal crack and restripe the parking lot atCity Hall.
City Hall Parking Lot Seal andStripe
SW 0 0 35,000 25,000 0 The facility has a large amount ofexterior metal that needs to be paintedon a regular basis to maintain the life ofthe material.
Police Department Painting
SE 0 10,000 0 0 0 Periodically the parking surface atCentral Fire needs to be sealed toprevent moisture from getting into thesubbase and damaging the parkingsurface, which would lessen thelifespan. We also incorporaterefreshing the painted lines at that time.
Central Fire Seal and StripeParking
SW 0 0 10,000 0 0 Maintain perimeter such as fencing,gates, readers, and sidewalks.
Police Department Perimeter
SE 0 10,000 0 0 0 As bulbs age and technology gets moreefficient, we will relamp the facility aswell as assess lighting need in the baysand add as needed at Central Fire.
Fire Lighting Improvements
085128 SW 0 0 10,000 0 0 Improve security of the grounds at theCity Services Center.
City Services Center PerimeterSecurity
085131 SW 0 0 10,000 0 10,000 The bio swale is a living part of thestorm water system for the City Servicesfacility. It will need periodic additionalmaintenance to keep it workingproperly and as designed to meet thestorm water needs of the facility.
City Services Center BioswaleLandscaping
085135 SW 0 0 0 20,000 0 Maintain overhead crane to complywith Occupational Safety and HealthAdministration regulations.
City Services Center CraneMaintenance
085137 SW 0 0 25,000 0 50,000 Maintain heating, ventilation, and airconditioning equipment.
City Services Center Heating,Ventilation and Air ConditioningMaintenance
085141 SE 0 0 0 10,000 20,000 Sealing of hard surface floors at CentralFire to maintain and protect theirintegrity.
Fire Flooring
085142 SW 0 0 0 5,000 0 Seal failures and cracked glass due tobuilding movement and environmentalconditions need to be periodicallyreplaced.
Police Department WindowMaintenance
085143 SW 0 0 0 10,000 0 The precast panels for the Police facilityare 20 years old and are in need ofmaintenance to seal the panels to keeptheir integrity and not allow them todeteriorate.
Police Department Precast PanelSeal
220

ProjectNumber Project Name
FY 2021Budget
FY 2022Budget
FY 2023Budget
FY 2024Budget
FY 2025Budget Scope of Work
ProjectQuadrant
085 Facility Maintenance Improvements
085145 SE 0 0 0 0 10,000 Rebuild the cooling tower at City Hall.City Hall Cooling Tower
085148 SE 0 0 15,000 0 0 Duct Cleaning and major parts for theheating, ventilation, and airconditioning systems at Central Fire.
Fire Heating, Ventilation and AirConditioning Maintenance
085202 SW 0 0 0 0 75,000 Additional overhead door to increaseefficiencies in operations.
City Services Center Building 16Overhead Door
085503 SE 0 5,000 0 5,000 0 City Hall window glass replacements.City Hall Window GlassReplacement
085509 SE 0 0 15,000 0 10,000 Duct cleaning and maintaining of themajor parts for the heating, ventilation,and air conditioning systems.
City Hall Heating, ventilation,and air conditioning cleaning andmaintenance
085510 SE 0 10,000 0 0 0 Rebuilding of Chiller pumps to extendtheir useful life.
City Hall Chiller Pumps
315,000 315,000 315,000 315,000 315,000Total Expenses
0
Total For Fund
GO Bonds 0 0 0 0
Other Revenue
TIF Bonds
Revenue Bonds
Other Debt
Federal Grants
State Grants
Local Grants
Streets LOST Transfer In
Other Transfer In
Cash on Hand
Transfer Out
0 0 0 0 0
0 0 0 0 0
0 0 0 0 0
0 0 0 0 0
0 0 0 0 0
0 0 0 0 0
0 0 0 0 0
315,000 315,000 315,000 315,000 315,000
0 0 0 0 0
0 0 0 0 0
0 0 0 0 0
315,000 315,000 315,000 315,000 315,000Total Revenue
IFM Transfer In 0 0 0 0 0
221

ProjectNumber Project Name
FY 2021Budget
FY 2022Budget
FY 2023Budget
FY 2024Budget
FY 2025Budget Scope of Work
ProjectQuadrant
301 Street Improvements
301666 NE 6,557,000 320,000 0 500,000 500,000 Construction of a new Portland concreteurban section roadway with sidewalkand a trail. This meets the road use taxdefinition of construction: means thebuilding or development of a road,street, bridge or culvert in a newlocation when: 1) the new locationdeviates substantially from the existingalignment, and 2) the result is anentirely new road or street for thegreater part of the length of the project.
Tower Terrace Road NE from eastof C Avenue to Council Street
301968 WEST 4,905,000 160,000 1,000,000 550,000 0 Improvements include Portland cementconcrete base repair and hot mixasphalt resurfacing, medianimprovements, drainage improvementsand intersection improvements.
Williams Boulevard from CityLimits to 16th Avenue SW
301240 NE 3,943,500 660,000 0 0 0 Rehabilitate existing deterioratedpavement on 1st Avenue using acombination of hot asphalt mixoverlays, patching, curb replacement,and spot locations of reconstruction.
1st Avenue NE from 27th Streetto 40th Street
301972 SW 3,120,000 0 0 0 0 This project will construct a roundaboutat the intersection of Hwy 151 (WilliamsBlvd SW) and Dean Road. Theimprovements will increase the safetyof the intersection.
Williams Boulevard at Dean RoadRoundabout
3012121 NW 3,100,000 4,000,000 500,000 0 0 Complete reconstruction of existingstreet with sidewalk extensions as wellas storm sewer improvements.
O Avenue NW from EdgewoodRoad to Ellis Boulevard
301984 SW 2,636,494 0 0 0 0 Construct a new portland cementconcrete overlay and roadway wideningfor new left and right turn lanes on 6thStreet SW between Tharp Rd andWalford Rd. Improvements includeroadway, storm sewer adjustments,grading, signage, pavement markings,and seeding. Support economicexpansion in the City of Cedar Rapidsthrough construction of newinfrastructure. The improvements willsupport commercial development.
TIF 6th Street from Hosier CreekTharp Road
301695 SW 2,500,000 500,000 100,000 1,180,000 3,000,000 This project includes an asphalt overlay,paved shoulders, and sidewalkextension. The project will be broken upinto two main phases: Phase 1 (2020)from 33rd to Wilson, and Phase 2 (202324) fromWilson to 15th. This meetsthe road use tax definition ofimprovement: means betterment toroad, street, bridge, or culvert thatenhancements beyond original design.
6th Street SW from 16th Avenueto 33rd Avenue
301973 SE 2,285,000 2,590,000 0 0 1,500,000 Improvement of 8th Avenue SE from7th Street SE to 10th Street SE. Projectelements include pavementrehabilitation, ADA sidewalk and curbramp reconstruction, and installation ofstreetscape elements in conjunctionwith the MedQuarter Parkway MasterPlan.
TIF MedQuarter StreetImprovements
3012094 NE 2,120,000 520,000 2,920,000 20,000 20,000 Project includes Portland cementconcrete reconstruction, water main,storm sewer and one way to two waytraffic conversion. Also includes Pavingfor Progress 10 Year CapitalImprovements planning services
Center Point Road NE from JAvenue to Coe Road
222

ProjectNumber Project Name
FY 2021Budget
FY 2022Budget
FY 2023Budget
FY 2024Budget
FY 2025Budget Scope of Work
ProjectQuadrant
301 Street Improvements
(contracts 3012094 01 and 3012094 02).
301992 1,908,580 0 0 0 0 Road use tax to be allocated to capitalimprovement projects as categorized byPublic Works Engineering during thefiscal year. Road use tax definition to beassigned as projects are identified.
Road Use Tax Project
301980 SW 1,775,000 750,000 0 0 0 Improvements to include pavementrehabilitation, as well as intersectionand median improvements. This meetsthe road use tax definition ofreconstruction: means a significantchange to the existing type of road,street, bridge, or culvert; or geometricand structural features.
Edgewood Road from Iowa Hwy100 to Blairs Ferry Road NE
301875 SW 1,772,755 0 0 0 0 Construct approximately 2K feet of newportland cement concrete roadway, 33feet wide. Improvements includeroadway, storm sewer, grading, signage,pavement markings, and seeding.Project support economic expansion inthe City of Cedar Rapids throughconstruction of new infrastructure. Theimprovements will open additionalproperty to industrial and commercialdevelopment.
TIF Commerce Park Drive West of6th Street SW
3012131 SE 1,400,000 2,000,000 0 0 0 Replacement of 12th Avenue SEbetween 7th Street and 19th Street, andan asphalt overlay of McCarthy Road.
12th Avenue SE from 7th Streetto 19th Street and McCarthyRoad SE from 19th Street toMemorial Drive
301995 MULTIPLE 1,377,727 1,500,000 1,500,000 1,500,000 1,500,000 Funding for Public Works staff whodesign, inspect, administer or overseecapital improvement contractsoriginating out of Engineering.
Fiscal Year FTE Funding for CIPService
3012148 NE 1,340,000 1,000,000 2,400,000 500,000 0 This project includes concretereconstruction on Oakland Road fromCenter Street to Regent Street. Therewill also be an asphalt overlay on OldMarion Road from Regent Street to CAvenue. The project includes sidewalkinfill, realignment of the Old MarionRoad / 42nd Street intersection, andutility work.
Oakland Road NE and Old MarionRoad NE from East Center Streetto C Avenue and Center PointRoad NE from 29th Street to 32ndStreet
3012090 SW 1,200,000 1,000,000 400,000 0 0 Phase 1b = FY20/21, Phase 2 = FY22/23,(Phase 1a in FY18). Connected with3012089. Portland cement concretestreet reconstruction with water mainreplacement project. Also includesstorm improvements and sidewalkextension in Phase 1b.
Chandler Street SW from 18thStreet to 20th Street
301963 NW 1,200,000 2,308,000 0 0 0 The City plans to extend 6th Street NWfrom north of B Avenue NW to connectwith Ellis Boulevard. The work willinclude PCC pavement extension, utilitywork, a proposed roundabout at EAvenue, and the addition of a railroadcrossing. Rehabilitation of the existing6th Street NW between B Avenue and1st Avenue will be included with theproject, as well as the replacement ofthe intersection of Ellis Boulevard and FAvenue.
6th Street NW Extension from BAvenue to Ellis Boulevard
301965 SW 1,183,170 0 0 0 0 Improvements include new concretestreet construction to extend EarhartLane south of Wright BrothersBoulevard to Walford Road.
TIF Earhart Lane SW from WrightBrothers Boulevard to WalfordRoad
223
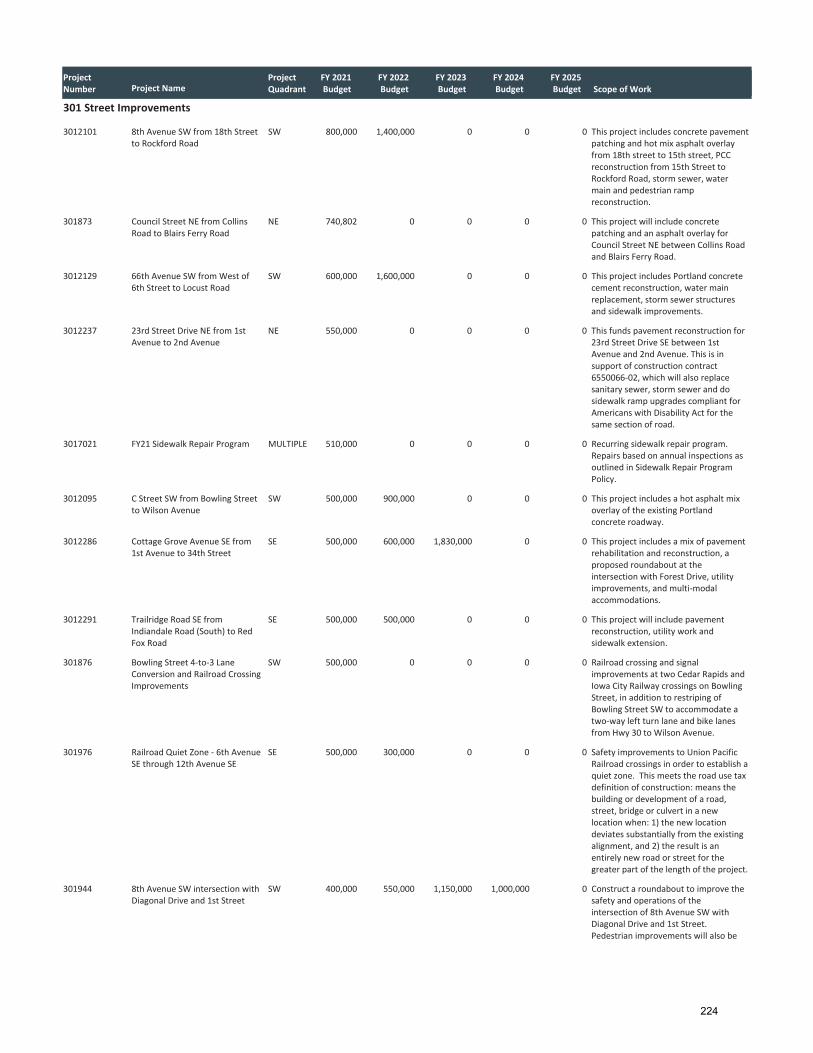
ProjectNumber Project Name
FY 2021Budget
FY 2022Budget
FY 2023Budget
FY 2024Budget
FY 2025Budget Scope of Work
ProjectQuadrant
301 Street Improvements
3012101 SW 800,000 1,400,000 0 0 0 This project includes concrete pavementpatching and hot mix asphalt overlayfrom 18th street to 15th street, PCCreconstruction from 15th Street toRockford Road, storm sewer, watermain and pedestrian rampreconstruction.
8th Avenue SW from 18th Streetto Rockford Road
301873 NE 740,802 0 0 0 0 This project will include concretepatching and an asphalt overlay forCouncil Street NE between Collins Roadand Blairs Ferry Road.
Council Street NE from CollinsRoad to Blairs Ferry Road
3012129 SW 600,000 1,600,000 0 0 0 This project includes Portland concretecement reconstruction, water mainreplacement, storm sewer structuresand sidewalk improvements.
66th Avenue SW fromWest of6th Street to Locust Road
3012237 NE 550,000 0 0 0 0 This funds pavement reconstruction for23rd Street Drive SE between 1stAvenue and 2nd Avenue. This is insupport of construction contract6550066 02, which will also replacesanitary sewer, storm sewer and dosidewalk ramp upgrades compliant forAmericans with Disability Act for thesame section of road.
23rd Street Drive NE from 1stAvenue to 2nd Avenue
3017021 MULTIPLE 510,000 0 0 0 0 Recurring sidewalk repair program.Repairs based on annual inspections asoutlined in Sidewalk Repair ProgramPolicy.
FY21 Sidewalk Repair Program
3012095 SW 500,000 900,000 0 0 0 This project includes a hot asphalt mixoverlay of the existing Portlandconcrete roadway.
C Street SW from Bowling Streetto Wilson Avenue
3012286 SE 500,000 600,000 1,830,000 0 0 This project includes a mix of pavementrehabilitation and reconstruction, aproposed roundabout at theintersection with Forest Drive, utilityimprovements, and multi modalaccommodations.
Cottage Grove Avenue SE from1st Avenue to 34th Street
3012291 SE 500,000 500,000 0 0 0 This project will include pavementreconstruction, utility work andsidewalk extension.
Trailridge Road SE fromIndiandale Road (South) to RedFox Road
301876 SW 500,000 0 0 0 0 Railroad crossing and signalimprovements at two Cedar Rapids andIowa City Railway crossings on BowlingStreet, in addition to restriping ofBowling Street SW to accommodate atwo way left turn lane and bike lanesfrom Hwy 30 to Wilson Avenue.
Bowling Street 4 to 3 LaneConversion and Railroad CrossingImprovements
301976 SE 500,000 300,000 0 0 0 Safety improvements to Union PacificRailroad crossings in order to establish aquiet zone. This meets the road use taxdefinition of construction: means thebuilding or development of a road,street, bridge or culvert in a newlocation when: 1) the new locationdeviates substantially from the existingalignment, and 2) the result is anentirely new road or street for thegreater part of the length of the project.
Railroad Quiet Zone 6th AvenueSE through 12th Avenue SE
301944 SW 400,000 550,000 1,150,000 1,000,000 0 Construct a roundabout to improve thesafety and operations of theintersection of 8th Avenue SW withDiagonal Drive and 1st Street.Pedestrian improvements will also be
8th Avenue SW intersection withDiagonal Drive and 1st Street
224

ProjectNumber Project Name
FY 2021Budget
FY 2022Budget
FY 2023Budget
FY 2024Budget
FY 2025Budget Scope of Work
ProjectQuadrant
301 Street Improvements
constructed with this project. Thismeets the road use tax definition ofreconstruction: means a significantchange to the existing type of road,street, bridge, or culvert; or geometricand structural features.
3012074 MULTIPLE 350,000 200,000 200,000 300,000 1,000,000 Provides for sidewalk infill in areaswhere sidewalk is required by ordinance.
Infill Sidewalk Projects
301989 SE 325,000 0 0 0 0 This project includes full reconstructionof the roadway and conversion to anurban section, replacement of sidewalkon the north side, plus new water mainand storm sewer.
9th Avenue SE Improvementsfrom 3rd Street to the Railroad
3012089 SW 300,000 360,000 200,000 0 0 Phase 2 of 2 (Phase 1 = 3012090).Portland cement concrete streetreconstruction with water mainreplacement project. Also includesstorm sewer improvements.
20th Avenue SW from ChandlerStreet to Jefferson High SchoolEntrance
301975 NE 300,000 1,868,000 0 0 0 Construction of a new diamondinterchange at the intersection of TowerTerrace Road and Interstate 380 on thenorth end of Cedar Rapids. This is a jointproject between multiple jurisdictionsincluding the Iowa Department ofTransportation, the City of CedarRapids, City of Marion, City of Hiawatha,City of Robins and Linn County. The DOTcurrently has this project programmedfor FY20.
Tower Terrace Road fromMillerto Center Point Road NE
3017970 Multiple 270,000 900,000 1,100,000 1,650,000 1,830,000 Projects to be identified each fiscal yearthat will be funded by Streets LocalOption Sales Tax.
FY Street LOST
3012096 NE 250,000 500,000 0 3,600,000 0 This project includes portland cementconcrete patching with hot asphalt mixsurfacing and associated work on 32ndStreet NE from Interstate 380 to 1stAvenue. Funding is also included toreplace pavement on both sides of the32nd Street Bridge over Interstate 380between Rosewood Court and MadisonRoad.
32nd Street NE from 1st Avenueto Center Point Road
301987 220,000 0 0 0 0 Design of roadway improvements andintersection reconfiguration on 1stAvenue W, to prepare for constructionpartially funded by Iowa DOT 3R funds.
1ST Avenue West from 6th Streetto Cedar River
3012100 SW 200,000 1,500,000 2,000,000 2,000,000 0 This project will consist of a mix ofpavement reconstruction andrehabilitation, utility improvements,and ADA sidewalk ramps.
15th Avenue SW from 12th Streetto C Street
3012149 SE 200,000 100,000 1,000,000 1,500,000 0 Concrete patching with an asphaltoverlay.
Mount Vernon Road SE fromMemorial Drive to 10th Street
3012152 NW 200,000 0 0 0 0 This project includes concretereconstruction and water mainimprovements.
Peace Avenue NW fromMidwayDrive to Jacolyn Drive
301945 NE 200,000 0 0 0 0 Funding of match dollars for MPO Fundsfor construction of the Interstate 380interchange at Tower Terrace Road,payable to Iowa Department ofTransportation.
Interstate 380 Interchange atTower Terrace Road
301964 SE 200,000 1,000,000 0 0 0 This project will include pavementresurfacing, curb replacement, andstreetscape improvements for 16th
16th Avenue SE from 2nd Streetto 4th Street
225

ProjectNumber Project Name
FY 2021Budget
FY 2022Budget
FY 2023Budget
FY 2024Budget
FY 2025Budget Scope of Work
ProjectQuadrant
301 Street Improvements
Avenue SE between 2nd Street and 4thStreet.
3012285 NW 160,000 500,000 1,500,000 0 0 This project includes pavementreconstruction and storm sewerextension.
Seminole Avenue NW andCheyenne Road NW
301946 NW 153,000 0 0 0 0 Construction of new sidewalk along thenorth side of Crestwood Drive NW from38th Street NW to west of EdgewoodRoad NW.
Crestwood Drive Sidewalk
301446 NE 150,000 0 0 0 0 Collins Road (IA 100) Phase 1 completestreets improvements andreconstruction from Twixt Town Road toEast of Northland Avenue NE.
Collins Road NE from C Avenue toTwixt Town Road
301994 MULTIPLE 150,000 100,000 100,000 100,000 0 Funding for City expenses in relation torailroad crossing upgrades. Thisincludes concrete on both sides oftracks and work within the road itself.
Fiscal Year Recurring Railroad CIP
301998 MULTIPLE 150,000 0 0 0 350,000 Annual funds for repairs or replacementof existing curb and gutters.
Fiscal Year Recurring Curb Repair
3012176 NE 120,000 0 0 0 0 Two inch hot mix asphalt mill andoverlay. This area will also includereplacing water valves, storm inlets, andhydrants. The intersection of 17thStreet NE with J Avenue NE will bereconstructed fully with full depth hotmix asphalt pavement.
17th Street NE from F Avenue to JAvenue
3012276 WEST 110,000 0 0 0 0 The project includes milling with anasphalt overlay. The work will beperformed by Streets Division.
1st Avenue West from LeroyStreet to Johnson Avenue
3012309 NW 110,000 0 0 0 0 This project includes sanitary sewerreplacement, milling and an asphaltoverlay.
Jacolyn Drive NW fromMidwayDrive to E Avenue
3012187 NW 100,000 600,000 1,400,000 0 0 Asphalt overlay with proposedroundabout at intersection of E AvenueNW and Wiley Boulevard.
E Avenue NW fromWest PostRoad to Edgewood Road
3012195 MULTIPLE 100,000 0 100,000 100,000 100,000 Milling and hot mix asphalt overlayproject for multiple locationsthroughout Cedar Rapids.
Mill and Overlay Contract
3012282 NE 100,000 0 0 0 0 This project includes milling and anasphalt overlay. The intersection of22nd St with B Ave will also bereconstructed, and curb extended, toresolve an ongoing drainage problem atthe intersection.
22nd Street NE from D Avenue to1st Avenue
3012301 SE 100,000 0 0 0 0 This project includes concrete pavementreconstruction and storm sewerreplacement.
Washington Avenue SE from 21stStreet to Forest Drive
301872 SW 100,000 100,000 400,000 250,000 0 Improvements are to include medianreconstruction, along 16th Avenue SWat Williams Boulevard SW. This meetsthe road use tax definition ofimprovement: means betterment toroad, street, bridge, or culvert thatenhancements beyond original design.
Arterial Aesthetic Improvement
301996 MULTIPLE 100,000 0 0 1,000,000 350,000 Funds for street paving patches to beidentified during the fiscal year.
Fiscal Year Recurring LocalPavement Repair
3012293 NE 90,000 0 0 0 0 This project will include concretepatching with an asphalt overlay. Thework will be performed by the StreetsDivision.
19th Street NE from 1st Avenueto C Avenue
226

ProjectNumber Project Name
FY 2021Budget
FY 2022Budget
FY 2023Budget
FY 2024Budget
FY 2025Budget Scope of Work
ProjectQuadrant
301 Street Improvements
3012294 SW 90,000 0 0 0 0 This project includes PCC patching withan asphalt overlay. The work will beperformed by the Streets Division.
29th Street SW from Van BurenDrive to 28th Avenue
3012297 NW 80,000 0 0 0 0 This project includes an asphalt overlay.The work will be performed by theStreets Division.
Wiley Avenue NW from F Avenueto Cedar Crest Court
3012299 SE 70,000 0 0 0 0 This project will include milling with anasphalt overlay. The work will beperformed by the Streets Division.
18th Street SE from 1st Avenue to3rd Avenue
3012278 SW 60,000 0 0 0 0 The project includes milling with anasphalt overlay. The work will beperformed by Streets Division.
7th Avenue SW from 6th Street to8th Street
3012279 SW 60,000 0 0 0 0 The project includes milling with anasphalt overlay. The work will beperformed by Streets Division.
8th Avenue SW from 5th to 7thStreet
3012296 SW 60,000 0 0 0 0 This project includes PCC patching. Thework will be performed by the StreetsDivision.
30th Street SW from Van BurenDrive to 28th Avenue
3012303 NE 60,000 0 0 0 0 This project includes concrete patching.The work will be performed by StreetsDivision.
Falcon Drive NE from Sally Driveto Glass Road
3012305 SE 60,000 0 0 0 0 This project will include milling with anasphalt overlay. The work will beperformed by the Streets Division.
17th Street SE from 1st Avenue to3rd Avenue
3012304 SE 50,000 0 0 0 0 This project includes concrete patchingwith an asphalt overlay. The work willbe performed by the Streets Division
30th Street Drive SE from IndianCreek to Carroll Drive
3012306 SW 50,000 0 0 0 0 This project includes PCC patching withan asphalt overlay. The work will beperformed by the Streets Division.
Southridge Drive SW
3012261 NE 45,000 0 0 0 0 This project will include pavementmilling and an asphalt overlay. Theasphalt will be done by PW Streets.
J Avenue NE from Oakland Roadto Maplewood Drive
3012292 NE 30,000 0 0 0 0 This project will include pavementmilling with an asphalt overlay. Thework will be performed by the StreetsDivision.
Dunreath Drive NE from C Avenueto E Avenue
3012300 NW 30,000 0 0 0 0 This project includes PCC patching. Thework will be performed by the StreetsDivision.
8th Street NW from D Avenue toE Avenue
3012302 NE 30,000 0 0 0 0 This project includes milling with anasphalt overlay. The work will beperformed by the Streets Division.
Gwendolyn Drive NE from CAvenue to E Avenue
3012298 NW 25,000 0 0 0 0 This project includes PCC patching. Thework will be performed by the StreetsDivision.
Black Granite Road NW
3012295 SE 20,000 0 0 0 0 This project includes PCC patching. Thework will be performed by the StreetsDivision.
Green Valley Place SE from GreenValley Terrace to Dead End
3012307 NW 20,000 0 0 0 0 This project includes PCC patching. Thework will be performed by the StreetsDivision.
Blue Stone Street NW from BlueStone Court to Black Granite Road
3012308 SE 10,000 0 0 0 0 This project includes PCC patching. Thework will be performed by the StreetsDivision.
Needles Road SE from 29th StreetDrive to August Drive
MULTIPLE 0 0 0 300,000 0 Recurring sidewalk repair program.Repairs based on annual inspections asoutlined in Sidewalk Repair Program
FY24 Sidewalk Repair Program
227

ProjectNumber Project Name
FY 2021Budget
FY 2022Budget
FY 2023Budget
FY 2024Budget
FY 2025Budget Scope of Work
ProjectQuadrant
301 Street Improvements
Policy.
NE 0 0 470,000 1,600,000 0 Reconstruct Collins Road NE from westof Council Street to east of NorthlandAvenue. Improvements will includedconcrete pavement widening,intersection improvements and newpedestrian facilities on both sides of theroad.
Collins Road from west of CouncilStreet to east of NorthlandAvenue
NW 0 0 0 100,000 3,000,000 This project will include PCC pavementreconstruction, water main, stormimprovements, sidewalk replacementand related work.
Johnson Avenue NW fromEdgewood Road to 18th Street
SW 0 0 0 100,000 2,000,000 This project will include streetreconstruction.
16th Avenue SW from C Street toInterstate 380
MULTIPLE 0 0 300,000 0 0 Recurring sidewalk repair program.Repairs based on annual inspections asoutlined in Sidewalk Repair ProgramPolicy.
FY23 Sidewalk Repair Program
MULTIPLE 0 0 0 200,000 500,000 Reconstruction of sidewalk curb rampsrequired for ADA compliance.
Sidewalk Ramp Recurring
NE 0 200,000 1,700,000 1,600,000 0 This project includes PCC pavementreconstruction, utility improvements,and related work.
35th Street NE from OaklandRoad to F Avenue
MULTIPLE 0 0 0 0 300,000 Recurring sidewalk repair program.Repairs based on annual inspections asoutlined in Sidewalk Repair ProgramPolicy.
FY25 Sidewalk Repair Program
NW 0 0 0 0 1,350,000 Pavement reconstruction and repair onEdgewood Road NW from O AvenueNW to the Cedar River bridge.
Edgewood Road NWImprovements from O AvenueNW to the Cedar River
SW 0 0 0 400,000 150,000 Construction of a roundaboutintersection at 76th Avenue SW and JStreet SW extended/Prairie High SchoolEntrance to improve intersection safetyand efficiency.
76th Avenue SW IntersectionImprovements at J Street SW
NW 0 0 0 100,000 2,000,000 This project will include an HMA overlay.Edgewood Road NW from OAvenue to Bridge over Cedar River
NE 0 0 0 100,000 2,000,000 This project will include an HMA overlay.Blairs Ferry Road NE fromInterstate 380 to Council Street
3012097 NE 0 0 1,400,000 3,600,000 0 Includes mix of portland cementconcrete reconstruction and hot mixasphalt overlay, water main, sidewalkreplacement/extension, and sanitarysewer improvements.
29th Street NE from 1st Avenueto West of Interstate 380
3012156 SE 0 0 900,000 0 0 This project will include an asphaltoverlay and ADA sidewalk rampimprovements.
30th Street SE fromMt VernonRoad to Pioneer Avenue
3012188 NE 0 150,000 200,000 2,000,000 4,500,000 Roadway recommended for Portlandcement concrete or full depth hot mixasphalt. Multiple construction seasonslikely.
42nd Street NE from EdgewoodRoad to Wenig Road
3012227 NE 0 20,000 0 0 0 This project will include concretepatching with an asphalt overlay. Workto be completed by Streets Department.
Lawrence Street NE fromHollywood Boulevard to ArizonaAvenue
3012241 MULTIPLE 0 0 50,000 50,000 50,000 This is an annual project to seal asphaltroad surfaces in various locations toextend the service life of the pavement.
Asphalt Pavement Sealing
301678 SE 0 850,000 0 0 0 Replacement of portland cementconcrete street, new sidewalkconstruction, sanitary sewer
34th Street SE BridgeReplacement
228

ProjectNumber Project Name
FY 2021Budget
FY 2022Budget
FY 2023Budget
FY 2024Budget
FY 2025Budget Scope of Work
ProjectQuadrant
301 Street Improvements
replacement with storm culvertreplacement.
3017022 MULTIPLE 0 150,000 0 0 0 Recurring sidewalk repair program.Repairs based on annual inspections asoutlined in the Sidewalk Repair ProgramPolicy.
FY22 Sidewalk Repair Program
301956 SE 0 1,900,000 2,000,000 0 1,500,000 Construct a roundabout to improve thesafety and operations of theintersection of 8th Avenue SE withMount Vernon Road and 10th Street.Pedestrian improvements will also beconstructed with this project.
Mt Vernon Road and 8th AvenueRoundabout
301979 NE 0 750,000 500,000 500,000 1,150,000 Construct roundabouts at Blairs FerryRoad NE intersections with Miller Roadand with Milburn Road. Additionalelements would include construction ofchannelizing medians, drainageimprovements and sidewalk. Thismeets the road use tax definition ofreconstruction: means a significantchange to the existing type of road,street, bridge, or culvert; or geometricand structural features.
Blairs Ferry Road NE fromMillerRoad to Milburn Road
56,083,028 34,906,000 27,320,000 26,400,000 28,650,000Total Expenses
5,972,727
Total For Fund
GO Bonds 4,740,000 3,870,000 4,700,000 6,950,000
Other Revenue
TIF Bonds
Revenue Bonds
Other Debt
Federal Grants
State Grants
Local Grants
Streets LOST Transfer In
Other Transfer In
Cash on Hand
Transfer Out
4,723,673 4,150,000 2,000,000 0 0
0 0 0 0 0
0 0 0 0 0
7,538,500 2,976,000 0 0 0
6,457,746 500,000 0 0 0
2,650,000 840,000 0 0 0
19,200,000 19,200,000 19,200,000 19,200,000 19,200,000
5,658,580 2,500,000 2,250,000 2,500,000 2,500,000
2,738,000 0 0 0 0
4,045,070 0 0 0 0
2,901,268 0 0 0 0
56,083,028 34,906,000 27,320,000 26,400,000 28,650,000Total Revenue
IFM Transfer In 0 0 0 0 0
229

ProjectNumber Project Name
FY 2021Budget
FY 2022Budget
FY 2023Budget
FY 2024Budget
FY 2025Budget Scope of Work
ProjectQuadrant
304 Stormwater Improvements
304504 NW 892,479 1,125,000 865,000 0 0 Project will expand existing detentionbasin to reduce downstream floodingrisks.
E Avenue NWWest of 28th StreetNW
304465 NE 485,000 585,000 965,000 1,135,000 1,000,000 Project will construct a new detentionbasin in the Kenwood drainage basin.The purpose will be to mitigate theimpacts of storm water runoff andimprove water quality discharging toCedar Lake.
14th Street and 15th Street NEbetween A and B Avenue
304361 SE 370,000 0 0 0 0 Project will replace a box culvert that isin poor condition with a new box culvert.
34th Street Southeast CulvertReplace at Spoon Creek
304510 NW 300,000 300,000 0 0 0 Project will replace storm sewer boxculvert with O Avenue NW pavingproject.
O Avenue from Edgewood to 16th
3040004 MULTIPLE 288,027 298,108 308,541 319,340 330,517 Funding for Public Works staff whodesign, inspect, administer or overseecapital improvement contracts forstorm projects.
Public Works Staff Time
304498 SW 275,000 0 0 0 0 Construction associated with roadwayproject. Improvements includeroadway, storm sewer, grading, signage,pavement markings, and seeding.Project support economic expansion inthe City of Cedar Rapids throughconstruction of new infrastructure. Theimprovements will open additionalproperty to industrial and commercialdevelopment.
TIF Commerce Park Drive West of6th Street SW
304998 Multiple 225,000 225,000 225,000 235,000 225,000 This project will install drain tile in areaswhere there currently is none toaddress sump pump discharge issues,icing issues and/or to protect sidewalkor street pavement.
Fiscal Year Recurring Drain TileProgram
304990 Multiple 220,000 230,000 240,000 260,000 270,000 Repairs to storm sewer structures andpipes at various locations throughoutthe City.
Fiscal Year RecurringMiscellaneous Storm Sewer
304224 SE 200,000 200,000 850,000 225,000 0 Project will extend the existing berm orconstruct a short wall to reduce risk offlooding from Indian Creek.
Cottage Grove Parkway
304429 MULTIPLE 200,000 200,000 50,000 50,000 50,000 Project will enhance safety by modifyinginlets on large diameter storm sewers.
Storm Sewer Inlet Modification
304499 MULTIPLE 200,000 300,000 350,000 400,000 285,000 Project will install new intakes andstorm sewer or provide gradingimprovements to mitigate drainageissues at various locations around theCity. These projects are small(<$75,000) and as such, are not typicallyidentified in the storm water masterplan where they would otherwise bescored and prioritized. These smallprojects will be scored and prioritizedseparately from the master plan.
Annual Small MiscellaneousProjects
304509 180,000 0 0 0 0 Project will replace old storm structureswith new storm structures as part ofstreet improvement project.
Cottage Grove Avenue from 1stAvenue to 34th Street SE
304451 MULTIPLE 100,000 50,000 50,000 50,000 50,000 This project will incorporate stormwater best management practices inCity street reconstruction, Paving forProgress or other projects. It will alsoprovide matching funds for grantfunded best management practiceprojects. The best management
Storm Water Best ManagementPractices Streets
230

ProjectNumber Project Name
FY 2021Budget
FY 2022Budget
FY 2023Budget
FY 2024Budget
FY 2025Budget Scope of Work
ProjectQuadrant
304 Stormwater Improvements
practices will improve water quality andreduce the amount of runoff withinfiltration practices.
304464 MULTIPLE 100,000 0 0 0 0 This project will add valves to existingstorm sewer pipes near river outlet tominimize risk of flooding.
Interim Flood Protection Valveson storm outlets
304458 MULTIPLE 75,000 100,000 200,000 250,000 240,000 Program to provide funding forparticipation in non residential privateproperty storm water best managementpractices. The best managementpractices will improve water quality andreduce the amount of runoff bypromoting infiltration practices.
Storm Water Best ManagementPractices Cost Share ProgramNon Residential
304996 MULTIPLE 60,000 60,000 60,000 60,000 60,000 Project will repair or replace damagedintakes and catch basins.
Fiscal Year Recurring Catch BasinReplacement
304160 MULTIPLE 50,000 50,000 50,000 50,000 50,000 This project will provide improvementsto existing detention basins to restoreto original function and/or to improvetheir function.
Detention Basin (existing)Improvements
304511 SE 50,000 100,000 0 0 0 Project will extend storm sewer and addintake capacity in Washington Avenueat Meadowbrook Terrace SE and ForestDrive to mitigate drainage and flashflooding issues.
Washington Ave fromMeadowbrook to Forest Drive
304496 NW 45,000 0 0 280,000 0 Project will construct a new detentionbasin north of O Avenue NW betweenRichland Drive and Edgewood Road.Purpose is to reduce storm waterrunoff, improve storm water quality andreduce future pump station size for theflood protection system.
Edgewood Road NW (West of)North of O Avenue
304043 NW 25,000 0 0 1,440,000 1,500,000 Project will construct a new detentionbasin south of O Avenue NW between18th Street (extended) and HighwoodDrive. Purpose is to reduce storm waterrunoff and improve storm water quality.
18th Street NW South of OAvenue
304428 MULTIPLE 25,000 25,000 25,000 25,000 25,000 Program to provide funding forparticipation in residential privateproperty storm water best managementpractices. The best managementpractices will improve water quality andreduce the amount of runoff bypromoting infiltration practices.
Storm Water Best ManagementPractices Cost Share Residential
SE 0 50,000 200,000 0 0 Project will replace storm sewer andstructures along with pavingimprovement project.
8th Ave SE from 6th to 10th
304355 MULTIPLE 0 150,000 0 0 0 Project is an annual effort to update andkeep current the StormWater MasterPlan. Updates to the Master Plan beganin FY16 under a phased approach andwill be completed in FY21. The plan willbe refreshed in FY22 and every 5 yearsthereafter. FY21 efforts will continuestorm water modeling and analysis inspecific watersheds to better defineproject implementation within thewatersheds.
Storm Water Master Plan
304497 NE 0 0 0 0 925,000 Project will construct a new detentionbasin to improve water quality to CedarLake and mitigate flooding issues todownstream properties.
27th Street NE (North of) West ofB Avenue
4,365,506 4,048,108 4,438,541 4,779,340 5,010,517Total ExpensesTotal For Fund
231

ProjectNumber Project Name
FY 2021Budget
FY 2022Budget
FY 2023Budget
FY 2024Budget
FY 2025Budget Scope of Work
ProjectQuadrant
304 Stormwater Improvements
0GO Bonds 0 0 0 0
Other Revenue
TIF Bonds
Revenue Bonds
Other Debt
Federal Grants
State Grants
Local Grants
Streets LOST Transfer In
Other Transfer In
Cash on Hand
Transfer Out
137,500 0 0 0 0
0 0 0 0 0
0 0 0 0 0
0 0 0 0 0
137,500 0 0 0 0
0 0 0 0 0
0 0 0 0 0
4,090,506 4,048,108 4,438,541 4,779,340 5,010,517
0 0 0 0 0
0 0 0 0 0
0 0 0 0 0
4,365,506 4,048,108 4,438,541 4,779,340 5,010,517Total Revenue
IFM Transfer In 0 0 0 0 0
232
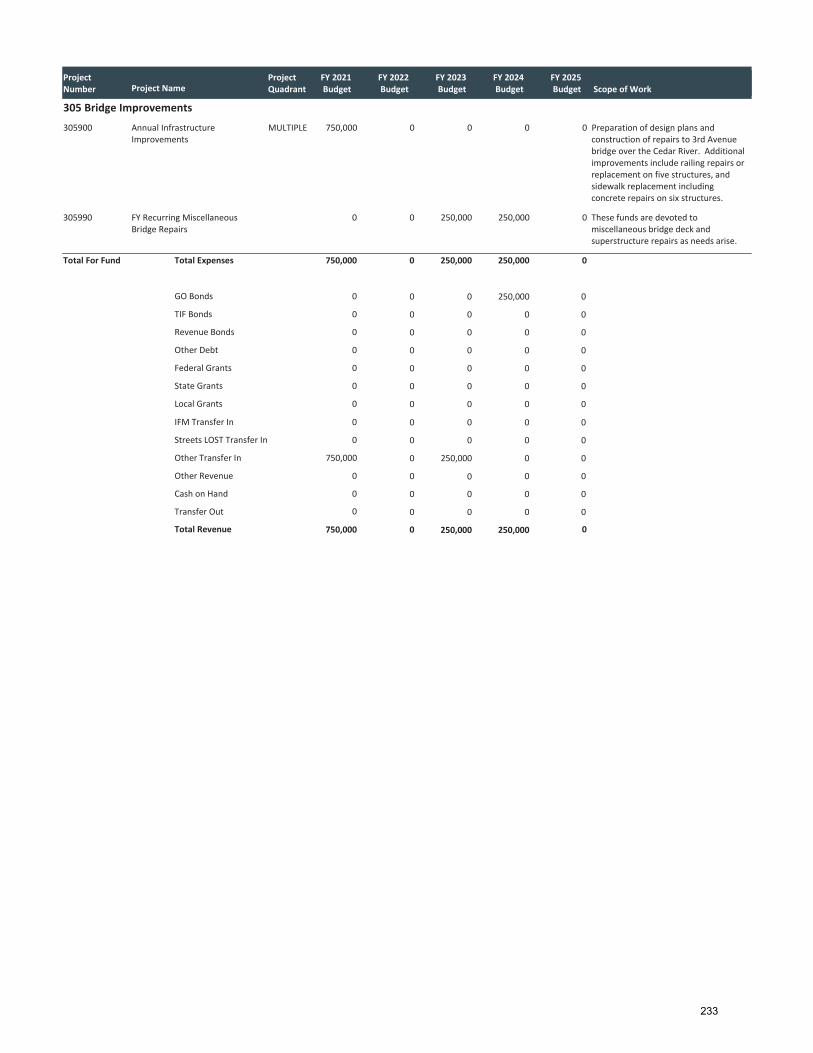
ProjectNumber Project Name
FY 2021Budget
FY 2022Budget
FY 2023Budget
FY 2024Budget
FY 2025Budget Scope of Work
ProjectQuadrant
305 Bridge Improvements
305900 MULTIPLE 750,000 0 0 0 0 Preparation of design plans andconstruction of repairs to 3rd Avenuebridge over the Cedar River. Additionalimprovements include railing repairs orreplacement on five structures, andsidewalk replacement includingconcrete repairs on six structures.
Annual InfrastructureImprovements
305990 0 0 250,000 250,000 0 These funds are devoted tomiscellaneous bridge deck andsuperstructure repairs as needs arise.
FY Recurring MiscellaneousBridge Repairs
750,000 0 250,000 250,000 0Total Expenses
0
Total For Fund
GO Bonds 0 0 250,000 0
Other Revenue
TIF Bonds
Revenue Bonds
Other Debt
Federal Grants
State Grants
Local Grants
Streets LOST Transfer In
Other Transfer In
Cash on Hand
Transfer Out
0 0 0 0 0
0 0 0 0 0
0 0 0 0 0
0 0 0 0 0
0 0 0 0 0
0 0 0 0 0
0 0 0 0 0
750,000 0 250,000 0 0
0 0 0 0 0
0 0 0 0 0
0 0 0 0 0
750,000 0 250,000 250,000 0Total Revenue
IFM Transfer In 0 0 0 0 0
233

ProjectNumber Project Name
FY 2021Budget
FY 2022Budget
FY 2023Budget
FY 2024Budget
FY 2025Budget Scope of Work
ProjectQuadrant
306 Traffic Improvements
306022 EAST 551,500 25,000 0 0 0 Replacement of traffic signals andrelated equipment impacted by 301240(1st Avenue from 27th to 40th).
1st Avenue from 27th Street to40th Street Signal LoopReplacement
306285 NE 300,000 0 0 0 0 RR signal improvements at Stickle Driveneeded to initiate Phase I of theDowntown Quiet Zone rule.
Stickle Drive at 4th Street RailSignal (Quiet Zone)
306990 MULTIPLE 250,000 285,000 300,000 300,000 0 This project includes the fullreplacement of two traffic signalsystems, along with new videodetection systems for five intersections.
Traffic Signal System Replacement
1,101,500 310,000 300,000 300,000 0Total Expenses
275,000
Total For Fund
GO Bonds 310,000 300,000 300,000 0
Other Revenue
TIF Bonds
Revenue Bonds
Other Debt
Federal Grants
State Grants
Local Grants
Streets LOST Transfer In
Other Transfer In
Cash on Hand
Transfer Out
0 0 0 0 0
0 0 0 0 0
0 0 0 0 0
526,500 0 0 0 0
0 0 0 0 0
0 0 0 0 0
0 0 0 0 0
300,000 0 0 0 0
0 0 0 0 0
0 0 0 0 0
0 0 0 0 0
1,101,500 310,000 300,000 300,000 0Total Revenue
IFM Transfer In 0 0 0 0 0
234

ProjectNumber Project Name
FY 2021Budget
FY 2022Budget
FY 2023Budget
FY 2024Budget
FY 2025Budget Scope of Work
ProjectQuadrant
307 Park Improvements
307232 SW 170,000 0 100,000 0 0 This project is for the second phase ofdevelopment for Hughes Park. Theproject will construct a shelter,restroom, playground, and other parkamenities.
Hughes Park Development
307704 SE 162,500 0 0 0 0 Replacing the existing playground atBever Park which is aging and becominghard to maintain. This includes theinstallation of new playgroundequipment which is the main structuresand stand alone equipment andsurfacing.
Bever Park PlaygroundReplacement
307069 Multiple 125,000 150,000 100,000 137,500 125,000 Repair and replace existing roadwayinfrastructure to improve longevity,safety and access to existing facilities.Projects are located at various parksthroughout the system.
Pavement Replacement
307245 MULTIPLE 120,000 0 0 0 0 Replace removed or aged anddeteriorated safety surfacing at existingsplash pads.
Splash Pad Resurfacing
307244 105,000 0 0 0 0 Replace existing playground mainstructures and stand alone with newequipment.
Redmond PlaygroundReplacement
307243 SW 45,000 0 0 0 0 This project will update the CzechVillage Greenway plan and developphase one construction documents forthe area.
Czech Greenway Plan Update andPhase 1 design
307990 MULTIPLE 40,000 50,000 60,000 60,000 60,000 Parks improvements to be identifiedduring the fiscal year.
Parks MiscellaneousImprovements
307230 MULTIPLE 30,000 40,000 40,000 40,000 50,000 Replacement of playground pieces andstand alone equipment like swing sets.These are large replacement pieces forexisting equipment due to wear andsafety concerns.
Playground Changes
NE 0 0 162,500 0 140,000 Remove existing old and failing glassglazing and replace with newpolycarbonate glazing form greaterefficiency on the remaining 2 out of 5total houses. Upgrade controls as well.
Noelridge GreenhouseRehabilitation
MULTIPLE 0 105,000 175,000 175,000 175,000 Replacement of the entire playgroundstructure. Replaces existing playgroundstrucutures that have aged beyond theirlife expectancy and are out of date andinefficient. Actual future playground tobe replaced will be decided annuallybased on condition of playgrounds.
Playground Replacement
SW 0 60,000 0 7,500 0 Project is to fund the purchase of someadditional features and for the design ofa new skatepark and Mini parks.
Skatepark Improvements
NE 0 50,000 0 0 0 Replace existing structurally failingpedestrian bridge at Nixon Park withnew pedestrian bridge. The bridgeconnects the neighborhood to NixonElementary School.
Nixon Bridge Replacement
MULTIPLE 0 82,500 0 42,500 62,500 Remove existing worn out safetysurfacing on splash pads and replacewith new safety surfacing.
Splashpad Safety Surfacing
797,500 537,500 637,500 462,500 612,500Total ExpensesTotal For Fund
235

ProjectNumber Project Name
FY 2021Budget
FY 2022Budget
FY 2023Budget
FY 2024Budget
FY 2025Budget Scope of Work
ProjectQuadrant
307 Park Improvements
797,500GO Bonds 537,500 637,500 462,500 612,500
Other Revenue
TIF Bonds
Revenue Bonds
Other Debt
Federal Grants
State Grants
Local Grants
Streets LOST Transfer In
Other Transfer In
Cash on Hand
Transfer Out
0 0 0 0 0
0 0 0 0 0
0 0 0 0 0
0 0 0 0 0
0 0 0 0 0
0 0 0 0 0
0 0 0 0 0
0 0 0 0 0
0 0 0 0 0
0 0 0 0 0
0 0 0 0 0
797,500 537,500 637,500 462,500 612,500Total Revenue
IFM Transfer In 0 0 0 0 0
236

ProjectNumber Project Name
FY 2021Budget
FY 2022Budget
FY 2023Budget
FY 2024Budget
FY 2025Budget Scope of Work
ProjectQuadrant
308 Fire Improvements
308188 Multiple 850,000 0 0 0 0 Replacement of fire apparatus to meetthe National Fire Protection Associationstandards. Ladder truck purchases aremultiple year purchase due to increasedcosts. This completes the purchase.
Ladder Truck
308190 5,000 0 0 0 0 Fire uses a safety trailer to transport tolocal elementary schools to teachstudents about fire and other safetytopics. The trailer is useful because it isset up as a 'home' through whichstudents can experience smoke fillingthe trailer (via theatrical smoke) andpractice exiting the trailer. The unit alsohas a system to dial 911 and report afire.
Fire and Public Safety EducationTrailer
0 0 0 850,000 0 Apparatus to meet needs for hazardousmaterials releases in the community.
Hazardous Materials ResponseApparatus
0 850,000 850,000 0 850,000 Replacement of fire apparatus to meetthe National Fire Protection Associationstandards.
Fire Pumper / Engine
855,000 850,000 850,000 850,000 850,000Total Expenses
855,000
Total For Fund
GO Bonds 850,000 850,000 850,000 850,000
Other Revenue
TIF Bonds
Revenue Bonds
Other Debt
Federal Grants
State Grants
Local Grants
Streets LOST Transfer In
Other Transfer In
Cash on Hand
Transfer Out
0 0 0 0 0
0 0 0 0 0
0 0 0 0 0
0 0 0 0 0
0 0 0 0 0
0 0 0 0 0
0 0 0 0 0
0 0 0 0 0
0 0 0 0 0
0 0 0 0 0
0 0 0 0 0
855,000 850,000 850,000 850,000 850,000Total Revenue
IFM Transfer In 0 0 0 0 0
237
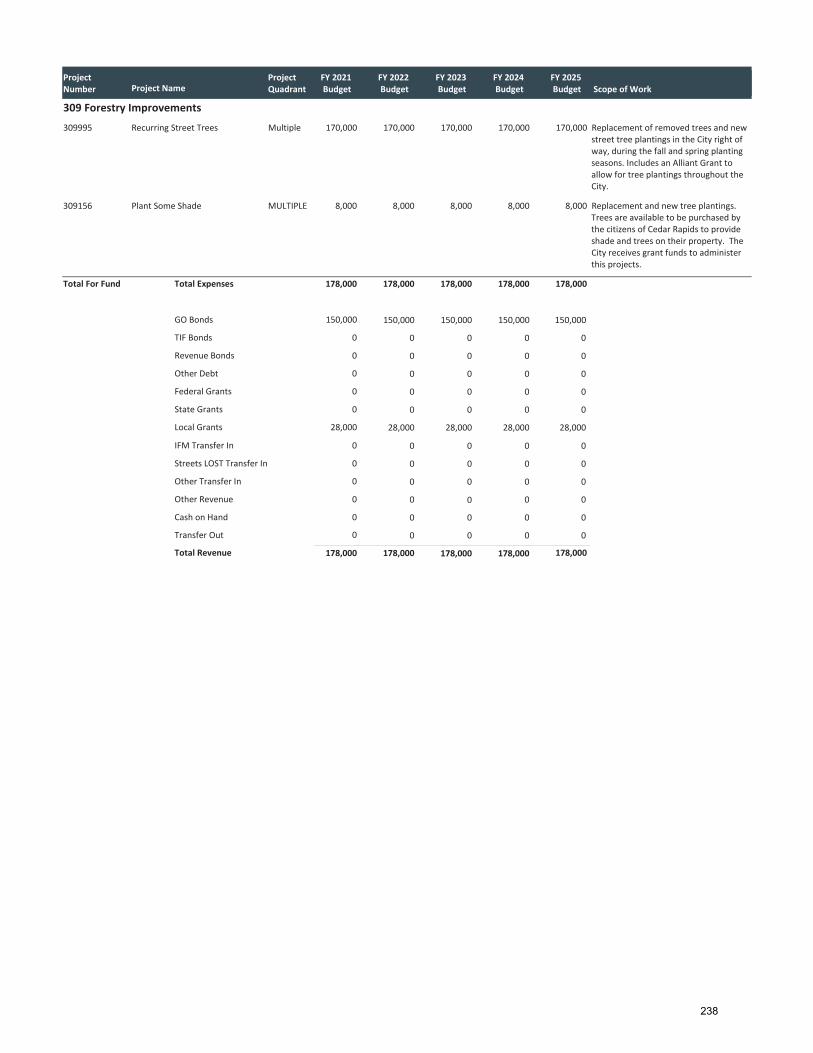
ProjectNumber Project Name
FY 2021Budget
FY 2022Budget
FY 2023Budget
FY 2024Budget
FY 2025Budget Scope of Work
ProjectQuadrant
309 Forestry Improvements
309995 Multiple 170,000 170,000 170,000 170,000 170,000 Replacement of removed trees and newstreet tree plantings in the City right ofway, during the fall and spring plantingseasons. Includes an Alliant Grant toallow for tree plantings throughout theCity.
Recurring Street Trees
309156 MULTIPLE 8,000 8,000 8,000 8,000 8,000 Replacement and new tree plantings.Trees are available to be purchased bythe citizens of Cedar Rapids to provideshade and trees on their property. TheCity receives grant funds to administerthis projects.
Plant Some Shade
178,000 178,000 178,000 178,000 178,000Total Expenses
150,000
Total For Fund
GO Bonds 150,000 150,000 150,000 150,000
Other Revenue
TIF Bonds
Revenue Bonds
Other Debt
Federal Grants
State Grants
Local Grants
Streets LOST Transfer In
Other Transfer In
Cash on Hand
Transfer Out
0 0 0 0 0
0 0 0 0 0
0 0 0 0 0
0 0 0 0 0
0 0 0 0 0
28,000 28,000 28,000 28,000 28,000
0 0 0 0 0
0 0 0 0 0
0 0 0 0 0
0 0 0 0 0
0 0 0 0 0
178,000 178,000 178,000 178,000 178,000Total Revenue
IFM Transfer In 0 0 0 0 0
238
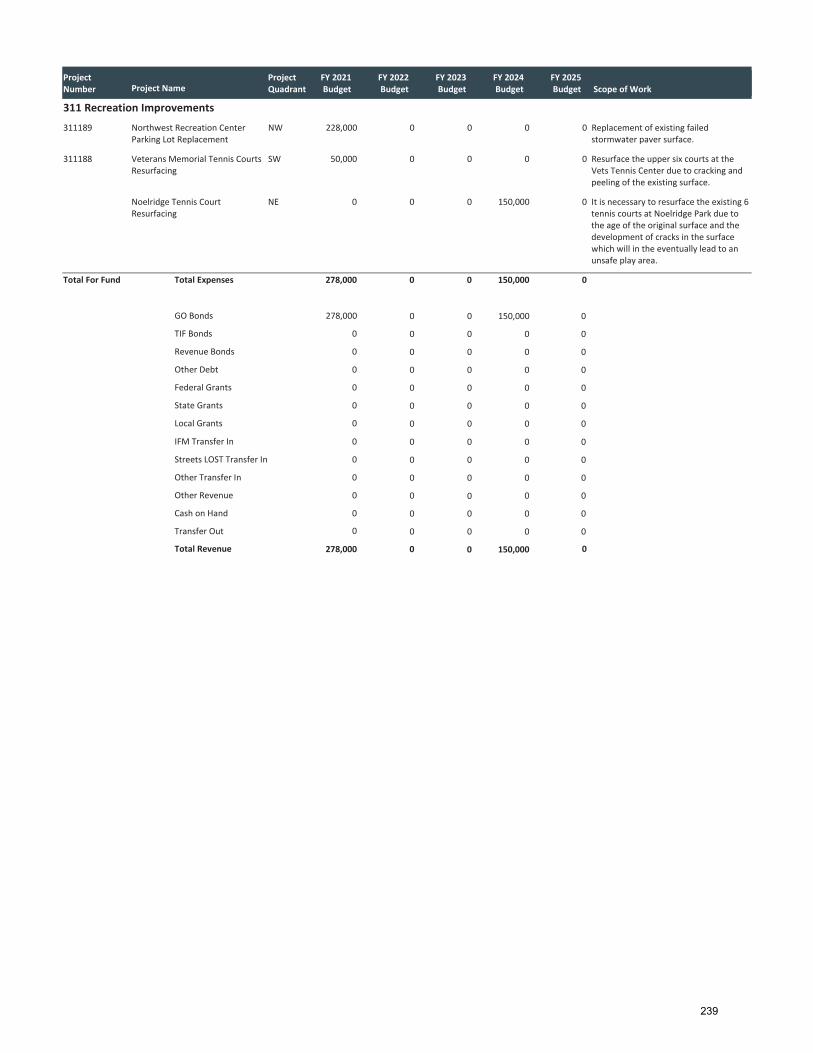
ProjectNumber Project Name
FY 2021Budget
FY 2022Budget
FY 2023Budget
FY 2024Budget
FY 2025Budget Scope of Work
ProjectQuadrant
311 Recreation Improvements
311189 NW 228,000 0 0 0 0 Replacement of existing failedstormwater paver surface.
Northwest Recreation CenterParking Lot Replacement
311188 SW 50,000 0 0 0 0 Resurface the upper six courts at theVets Tennis Center due to cracking andpeeling of the existing surface.
Veterans Memorial Tennis CourtsResurfacing
NE 0 0 0 150,000 0 It is necessary to resurface the existing 6tennis courts at Noelridge Park due tothe age of the original surface and thedevelopment of cracks in the surfacewhich will in the eventually lead to anunsafe play area.
Noelridge Tennis CourtResurfacing
278,000 0 0 150,000 0Total Expenses
278,000
Total For Fund
GO Bonds 0 0 150,000 0
Other Revenue
TIF Bonds
Revenue Bonds
Other Debt
Federal Grants
State Grants
Local Grants
Streets LOST Transfer In
Other Transfer In
Cash on Hand
Transfer Out
0 0 0 0 0
0 0 0 0 0
0 0 0 0 0
0 0 0 0 0
0 0 0 0 0
0 0 0 0 0
0 0 0 0 0
0 0 0 0 0
0 0 0 0 0
0 0 0 0 0
0 0 0 0 0
278,000 0 0 150,000 0Total Revenue
IFM Transfer In 0 0 0 0 0
239
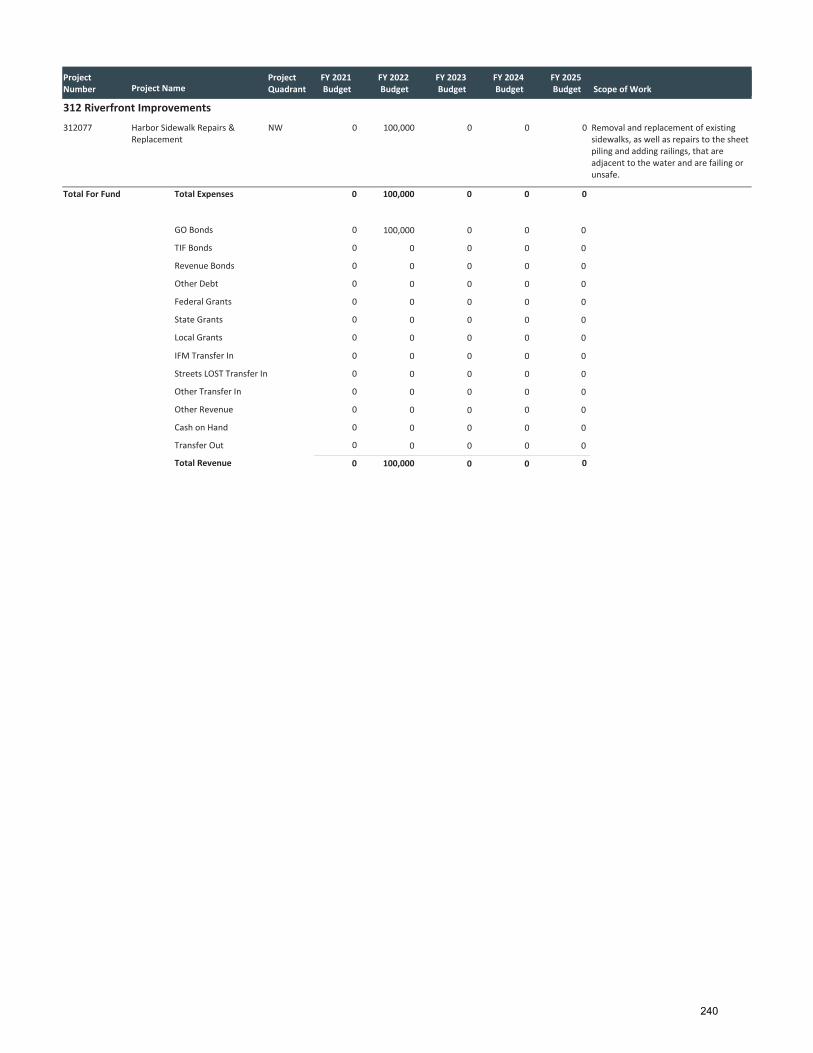
ProjectNumber Project Name
FY 2021Budget
FY 2022Budget
FY 2023Budget
FY 2024Budget
FY 2025Budget Scope of Work
ProjectQuadrant
312 Riverfront Improvements
312077 NW 0 100,000 0 0 0 Removal and replacement of existingsidewalks, as well as repairs to the sheetpiling and adding railings, that areadjacent to the water and are failing orunsafe.
Harbor Sidewalk Repairs &Replacement
0 100,000 0 0 0Total Expenses
0
Total For Fund
GO Bonds 100,000 0 0 0
Other Revenue
TIF Bonds
Revenue Bonds
Other Debt
Federal Grants
State Grants
Local Grants
Streets LOST Transfer In
Other Transfer In
Cash on Hand
Transfer Out
0 0 0 0 0
0 0 0 0 0
0 0 0 0 0
0 0 0 0 0
0 0 0 0 0
0 0 0 0 0
0 0 0 0 0
0 0 0 0 0
0 0 0 0 0
0 0 0 0 0
0 0 0 0 0
0 100,000 0 0 0Total Revenue
IFM Transfer In 0 0 0 0 0
240

ProjectNumber Project Name
FY 2021Budget
FY 2022Budget
FY 2023Budget
FY 2024Budget
FY 2025Budget Scope of Work
ProjectQuadrant
314 Veterans Stadium Improvements
314374 170,000 0 0 0 0 Replacement of field sod at VeteransMemorial Baseball Stadium.
Veterans Stadium Field Sod
314355 SW 25,000 20,000 0 0 0 Rehabilitation or replacement ofheating, ventilation, and airconditioning (HVAC) equipment. Likelyto be an annual cost as equipment ages.
Heating Ventilation AirConditioning Replacement
314349 SW 10,000 10,000 0 0 0 Recurring annual funds for replacementof equipment used to maintain thestadium complex by Kernels staff.
Replacement Funds
SW 0 550,000 0 0 0 This project will include the purchaseand installation of a video board for theVeterans Memorial Stadium.
Video Board
314300 SW 0 0 0 0 0 Recurring annual funds for upgrades tothe stadium per lease agreement #2.Three entities contribute theirdesignated amount over 10 years,ending in FY 2022. Kernels fronted costsin FY 2016, so they will have nocontribution in FY 2017 FY 2019. Cityfronted costs in FY 2013, so their costshare ended in FY 2020, while Memorialand Kernels reach FY 2022.
Transfer Project for Stadium
205,000 580,000 0 0 0Total Expenses
0
Total For Fund
GO Bonds 0 0 0 0
Other Revenue
TIF Bonds
Revenue Bonds
Other Debt
Federal Grants
State Grants
Local Grants
Streets LOST Transfer In
Other Transfer In
Cash on Hand
Transfer Out
0 0 0 0 0
0 0 0 0 0
0 0 0 0 0
0 0 0 0 0
0 0 0 0 0
0 0 0 0 0
0 0 0 0 0
305,000 680,000 0 0 0
50,000 50,000 0 0 0
55,000 430,000 0 0 0
205,000 580,000 0 0 0
205,000 580,000 0 0 0Total Revenue
IFM Transfer In 0 0 0 0 0
241

ProjectNumber Project Name
FY 2021Budget
FY 2022Budget
FY 2023Budget
FY 2024Budget
FY 2025Budget Scope of Work
ProjectQuadrant
315 Veterans Memorial Building Improvements
315540 104,291 0 0 0 0 Transfer cash on hand out to replace airhandling unit project in the VeteransMemorial Building.
Rebuilding and Upgrade
315550 40,000 0 0 0 0 Replacing an existing roof top airhandling unit of Veterans MemorialBuilding.
4th Floor Air Handling UnitReplacement
0 150,000 150,000 0 0 Replace windows at the VeteransMemorial Building.
Window Replacement
0 0 0 0 75,000Gas Conversions
0 0 10,000 0 0Insulation Study
0 0 0 150,000 0Roofing Rehabilitation
0 45,000 0 0 0Building Automation
144,291 195,000 160,000 150,000 75,000Total Expenses
0
Total For Fund
GO Bonds 0 0 0 0
Other Revenue
TIF Bonds
Revenue Bonds
Other Debt
Federal Grants
State Grants
Local Grants
Streets LOST Transfer In
Other Transfer In
Cash on Hand
Transfer Out
0 0 0 0 0
0 0 0 0 0
0 0 0 0 0
0 0 0 0 0
0 0 0 0 0
0 0 0 0 0
0 0 0 0 0
144,291 195,000 160,000 150,000 75,000
0 0 0 0 0
40,000 195,000 160,000 150,000 75,000
40,000 195,000 160,000 150,000 75,000
144,291 195,000 160,000 150,000 75,000Total Revenue
IFM Transfer In 0 0 0 0 0
242

ProjectNumber Project Name
FY 2021Budget
FY 2022Budget
FY 2023Budget
FY 2024Budget
FY 2025Budget Scope of Work
ProjectQuadrant
316 Library Improvements
316750 SE 500,000 500,000 500,000 500,000 500,000 Library needs to continually circulatebooks, periodicals, E books, etc. tomaintain new material for patrons andto be accredited with the State of Iowa.
Books, Periodical andSubscriptions
500,000 500,000 500,000 500,000 500,000Total Expenses
500,000
Total For Fund
GO Bonds 500,000 500,000 500,000 500,000
Other Revenue
TIF Bonds
Revenue Bonds
Other Debt
Federal Grants
State Grants
Local Grants
Streets LOST Transfer In
Other Transfer In
Cash on Hand
Transfer Out
0 0 0 0 0
0 0 0 0 0
0 0 0 0 0
0 0 0 0 0
0 0 0 0 0
0 0 0 0 0
0 0 0 0 0
0 0 0 0 0
0 0 0 0 0
0 0 0 0 0
0 0 0 0 0
500,000 500,000 500,000 500,000 500,000Total Revenue
IFM Transfer In 0 0 0 0 0
243

ProjectNumber Project Name
FY 2021Budget
FY 2022Budget
FY 2023Budget
FY 2024Budget
FY 2025Budget Scope of Work
ProjectQuadrant
321 Downtown Improvements
321546 MULTIPLE 50,000 50,000 50,000 50,000 0 Replacement of deterioratedstreetscape amenities in the downtowndistrict.
Downtown StreetscapeImprovements
50,000 50,000 50,000 50,000 0Total Expenses
50,000
Total For Fund
GO Bonds 50,000 50,000 50,000 0
Other Revenue
TIF Bonds
Revenue Bonds
Other Debt
Federal Grants
State Grants
Local Grants
Streets LOST Transfer In
Other Transfer In
Cash on Hand
Transfer Out
0 0 0 0 0
0 0 0 0 0
0 0 0 0 0
0 0 0 0 0
0 0 0 0 0
0 0 0 0 0
0 0 0 0 0
0 0 0 0 0
0 0 0 0 0
0 0 0 0 0
0 0 0 0 0
50,000 50,000 50,000 50,000 0Total Revenue
IFM Transfer In 0 0 0 0 0
244

ProjectNumber Project Name
FY 2021Budget
FY 2022Budget
FY 2023Budget
FY 2024Budget
FY 2025Budget Scope of Work
ProjectQuadrant
324 Aquatic Improvements
324264 90,000 0 0 0 0 Aquatics has sand play structures at allpools to be replaced.
Sand Playgrounds
MULTIPLE 0 75,000 75,000 100,000 100,000 Replacement of existing outdoor poolfurniture, fixtures and infrastructurewith new due to age, and use. Actualfuture needs will be identified annually.
Pools Improvements
90,000 75,000 75,000 100,000 100,000Total Expenses
90,000
Total For Fund
GO Bonds 75,000 75,000 100,000 100,000
Other Revenue
TIF Bonds
Revenue Bonds
Other Debt
Federal Grants
State Grants
Local Grants
Streets LOST Transfer In
Other Transfer In
Cash on Hand
Transfer Out
0 0 0 0 0
0 0 0 0 0
0 0 0 0 0
0 0 0 0 0
0 0 0 0 0
0 0 0 0 0
0 0 0 0 0
0 0 0 0 0
0 0 0 0 0
0 0 0 0 0
0 0 0 0 0
90,000 75,000 75,000 100,000 100,000Total Revenue
IFM Transfer In 0 0 0 0 0
245

ProjectNumber Project Name
FY 2021Budget
FY 2022Budget
FY 2023Budget
FY 2024Budget
FY 2025Budget Scope of Work
ProjectQuadrant
325 Trail Improvements
325042 NE 3,435,973 1,600,000 0 0 0 Complete the new CEMAR (CedarRapids Marion) trail from 1st Avenue NEto Marion.
CEMAR Trail Phase III
325069 NW 1,800,000 250,000 1,080,000 0 0 Various aspects of on street and offstreet portland cement concrete traildevelopment including design, right ofway acquisition and construction fromMorgan Creek Park to the Cedar River.
Cherokee Trail from MorganCreek to Cedar River
325073 Multiple 1,250,000 1,000,000 550,000 100,000 0 Create a new concrete trail alongEdgewood Road to be accessible fromBlairs Ferry Road to Glass Road.
Edgewood Road Trail from BlairsFerry Road to Glass Road
325036 NE 713,000 0 0 0 0 New trail that will join the northeastside of Cedar Rapids to the northwestside. This trail will be included on thebridge that crosses over the Cedar River.
Edgewood Road Trail from GlassRoad to Ellis Boulevard
325072 SW 608,000 0 0 1,350,000 0 Combination new trail construction,sidewalk construction and on streetbicycle accommodations.
Bowling Street from 33rd Avenueto A Avenue SW
325050 SE 0 1,457,000 1,000,000 200,000 0 This would create a new trail andconnect existing Cedar Rapids Marion(CEMAR) trails down 1st Avenue to goover the Indian Creek bridge. Thisconnector is phase II of the overallCEMAR trail.
CEMAR Lindale Connector
325071 NE 0 0 100,000 0 0 Extension of the Lindale trail from justeast of C Avenue NE west to connectwith the Cedar Valley Nature Trail alongCenter Point Road NE.
Lindale Trail Extension
7,806,973 4,307,000 2,730,000 1,650,000 0Total Expenses
1,172,273
Total For Fund
GO Bonds 1,850,000 2,730,000 1,650,000 0
Other Revenue
TIF Bonds
Revenue Bonds
Other Debt
Federal Grants
State Grants
Local Grants
Streets LOST Transfer In
Other Transfer In
Cash on Hand
Transfer Out
0 0 0 0 0
0 0 0 0 0
0 0 0 0 0
5,697,000 2,457,000 0 0 0
0 0 0 0 0
0 0 0 0 0
0 0 0 0 0
0 0 0 0 0
0 0 0 0 0
937,700 0 0 0 0
0 0 0 0 0
7,806,973 4,307,000 2,730,000 1,650,000 0Total Revenue
IFM Transfer In 0 0 0 0 0
246

ProjectNumber Project Name
FY 2021Budget
FY 2022Budget
FY 2023Budget
FY 2024Budget
FY 2025Budget Scope of Work
ProjectQuadrant
327 Connect CR Improvements
327001 MULTIPLE 1,000,000 1,000,000 1,000,000 1,000,000 0 Design and construction of theSmokestack Bridge and Cedar LakeAmenities as outlined in the ConnectCRMaster Plan. Total Tax IncrementFinancing of $1 million a year for 5years. FY 2021 is year 2.
TIF Connect CR
1,000,000 1,000,000 1,000,000 1,000,000 0Total Expenses
0
Total For Fund
GO Bonds 0 0 0 0
Other Revenue
TIF Bonds
Revenue Bonds
Other Debt
Federal Grants
State Grants
Local Grants
Streets LOST Transfer In
Other Transfer In
Cash on Hand
Transfer Out
0 0 0 0 0
0 0 0 0 0
0 0 0 0 0
0 0 0 0 0
0 0 0 0 0
0 0 0 0 0
0 0 0 0 0
1,000,000 1,000,000 1,000,000 1,000,000 0
0 0 0 0 0
0 0 0 0 0
0 0 0 0 0
1,000,000 1,000,000 1,000,000 1,000,000 0Total Revenue
IFM Transfer In 0 0 0 0 0
247

ProjectNumber Project Name
FY 2021Budget
FY 2022Budget
FY 2023Budget
FY 2024Budget
FY 2025Budget Scope of Work
ProjectQuadrant
330 2008 Flood Recovery Improvements
3300000002 0 0 0 0 0 To fund FY 2021 excess flood insuranceexpenses from 10% flood local optionsales tax proceeds.
10% Flood LOST Proceeds
0 0 0 0 0Total Expenses
0
Total For Fund
GO Bonds 0 0 0 0
Other Revenue
TIF Bonds
Revenue Bonds
Other Debt
Federal Grants
State Grants
Local Grants
Streets LOST Transfer In
Other Transfer In
Cash on Hand
Transfer Out
0 0 0 0 0
0 0 0 0 0
0 0 0 0 0
0 0 0 0 0
0 0 0 0 0
0 0 0 0 0
0 0 0 0 0
0 0 0 0 0
0 0 0 0 0
524,500 0 0 0 0
524,500 0 0 0 0
0 0 0 0 0Total Revenue
IFM Transfer In 0 0 0 0 0
248

ProjectNumber Project Name
FY 2021Budget
FY 2022Budget
FY 2023Budget
FY 2024Budget
FY 2025Budget Scope of Work
ProjectQuadrant
331 Flood Control System Improvements
3318400 MULTIPLE 5,400,000 3,900,000 1,000,000 1,000,000 1,000,000 This project funds design for the new8th Avenue bridge over the Cedar River.
NewBo / Sinclair 8th AvenueBridge Replacement
3315500 SE 4,500,000 5,100,000 4,325,000 5,000,000 5,277,500 These funds will support flood wall andgate improvements not covered byUSACE agreements along USACE Reach2 (City Reach 5).
Reach 2 Cost Share MatchUnited States Army Corps ofEngineers
3317500 SE 4,500,000 5,100,000 4,325,000 5,000,000 5,277,500 This funding is for flood wall and gateimprovements not covered by USACEagreements along USACE Reach 4 (CityReach 7).
Reach 4 Cost Share MatchUnited States Army Corps ofEngineers
331500 MULTIPLE 4,493,750 4,220,000 3,950,500 3,675,000 3,390,000 This project is a holding number foruncommitted IFM funds, and protectsagainst the possibility of year to yearshortfalls in revenue.
IFM Annual Receipts Below Cap
3316500 SE 3,500,000 5,100,000 4,325,000 5,000,000 5,277,500 These funds will pay for flood wall andgate improvements not covered byUSACE agreements along USACE Reach3 (City Reach 6).
Reach 3 Cost Share MatchUnited States Army Corps ofEngineers
3314520 EAST 3,356,500 0 0 0 0 These funds will cover construction ofthe Quaker Oats flood wall, railroadgates, water transmission main, andupgrades to 2 (two) pump stations.
Quaker/Cedar Lake Quaker Oatsfloodwall
3314520 NE 2,945,000 0 0 0 0 This project funds construction of amiter gate where the Union PacificRailroad crosses permanent floodprotection in the Quaker Oats area.
Union Pacific Railroad at Quaker,Miter Gate
3317510 SE 2,700,000 0 0 0 0 This project will fund construction ofstorm sewer improvements in supportof permanent flood control in the Cargillarea.
Otis Road and 16th St StormWater Improvements
3314500 NE 2,000,000 5,100,000 4,325,000 5,000,000 5,277,500 These funds will pay for flood wall andgate improvements not covered byUSACE agreements along USACE Reach1 (City Reach 4).
Reach 1 Cost Share MatchUnited States Army Corps ofEngineers
3315510 SE 2,000,000 0 0 0 0 This project funds construction of a gateon the downtown side of the 3rdAvenue Bridge as part of the FloodControl System.
3rd Avenue Gate
3315410 SE 1,600,000 1,000,000 0 0 0 These funds will support construction ofthe removable flood wall and fixedflood wall along USACE Reach 2 (CityReach 5).
Reach 2 Walls
3312530 SW 1,400,000 0 0 0 0 This project funds construction ofrestrooms at the McGrathAmphitheatre site, which will double asflood protection and storage facilities.
Kingston AmphitheatreRestrooms and Wall
3313420 WEST 786,605 0 0 200,000 200,000 These funds will cover external designcosts for the Czech Village flood wallbetween 12th Avenue and 16th AvenueSW.
Czech Village 12th Avenue to16th Avenue levee and gate at16th Avenue
3312430 WEST 775,000 0 449,500 1,500,000 0 These funds support design of theKingston Village levee and walls fromthe McGrath Amphitheatre to 8thAvenue.
Kingston Amphitheatre to 8thAvenue levee
3314420 EAST 550,000 100,000 0 0 0 These funds will cover external designfor the Quaker Oats flood wall, railroadgates, water main installation and pumpstation upgrades.
Quaker/Cedar Lake Quaker Oatsfloodwall
3311200 WEST 500,000 500,000 500,000 500,000 500,000 These funds will pay for the acquisitionof property and easements in the Time
Timecheck Acquisitions andManagement, not tied to specific
249

ProjectNumber Project Name
FY 2021Budget
FY 2022Budget
FY 2023Budget
FY 2024Budget
FY 2025Budget Scope of Work
ProjectQuadrant
331 Flood Control System Improvements
Check area.contracts
3314200 EAST 500,000 2,000,000 0 0 0 These funds will satisfy the acquisitionand easement needs for flood wallimprovements running from the Cargillnorth tie off at I 380 to the CanadianNational railroad crossing.
Reach 1 Acquisitions
3314510 NE 500,000 5,000,000 0 0 0 This project funds construction toreplace Shave Road bridge and theSchimberg Wall in support of the FloodControl System.
Shaver Road Bridge andSchimberg Wall
3311510 NW 492,500 0 0 0 0 These funds will provide matching fundsin support of private improvementstowards flood mitigation in the TimeCheck area.
Timecheck Private DevelopmentMatch
3311410 NW 377,145 200,000 0 0 0 This project provides funding to designthe Flood Control System for theTimecheck area.
Timecheck Preliminary Design
3314410 NE 300,000 0 0 0 0 These funds will pay for the design ofimprovements to Shaver Road Bridgeand Schimberg Wall in connection withflood control system reach 4.
Shaver Road Bridge andSchimberg Wall
3314300 MULTIPLE 200,000 200,000 200,000 200,000 200,000 These funds cover internal staff time formanaging design for the Time Checkflood wall.
Reach 1 acquisitions andmanagement, not tied to specificcontracts
3315300 WEST 200,000 200,000 200,000 200,000 200,000 These funds pay for design of theKingston Village flood wall.
Reach 2 management andacquisitions, not tied to specificcontracts
3315410 SE 200,000 0 0 0 0 This project funds design for the AAvenue SE Pump Station, whichsupports the downtown Flood ControlSystem.
A Avenue Pump Station
3316300 EAST 200,000 200,000 200,000 200,000 200,000 These funds will pay for design of theNewBo portion of the flood wall on thesoutheast side of Cedar Rapids.
Reach 3 Management NewBoSinclair, not tied to specificcontracts
3317300 EAST 200,000 200,000 200,000 200,000 200,000 These funds will cover internal stafftime devoted to managing design forthe Cargill portion of the flood wall onthe southeast side of Cedar Rapids.
Reach 4 management andacquisitions, not tied to specificcontacts
3315410 SE 125,000 0 0 0 0 This project funds design for the 5thAvenue SE Pump Station, which willsupport the downtown portion of theFlood Control System.
5th Avenue Pump Station Design
3312410 SW 100,000 0 0 0 0 This project provides funding to designthe Flood Control System for theKingston area.
Kingston Preliminary Design
3312430 WEST 100,000 0 0 100,000 0 These funds pay for engineering servicesfor the restrooms and floodwall at thesouth end of the McGrath Amphitheatrein Kingston Village.
Kingston Amphitheatrerestrooms and floodwallsengineering
3315410 SE 100,000 0 0 0 0 This project provides funding to designstorm sewer improvements for 1stStreet SE from 4th Avenue to 5thAvenue related to downtown FloodControl System improvements.
1st Street from 4th Avenue to 5thAvenue StormWaterImprovements
3317410 SE 100,000 0 0 0 0 This project funds services to designstorm sewer facilities adjacent to OtisRoad SE and 16th Street, which supportsthe Cargill area Flood Control System.
Otis Road and 16th Street StormWater Improvements
3311300 WEST 75,000 80,000 85,000 90,000 95,000 These funds will pay for design of theTime Check portion of the flood wall on
Management Time Check
250

ProjectNumber Project Name
FY 2021Budget
FY 2022Budget
FY 2023Budget
FY 2024Budget
FY 2025Budget Scope of Work
ProjectQuadrant
331 Flood Control System Improvements
the northwest side of Cedar Rapids.
3311400 WEST 75,000 75,000 75,000 75,000 100,000 These funds will pay for design of thelevees and walls protecting the TimeCheck area between I 380 and theupstream tie off to high ground.
Engineering: Time Check
3312300 WEST 75,000 80,000 85,000 90,000 95,000 These funds will cover internal stafftime for managing design of theKingston portion of the flood wall.
Management Kingston
3312400 WEST 75,000 75,000 75,000 75,000 100,000 These funds will satisfy the costs fordesign of the flood wall, levees androadway gates adjacent to KingstonVillage from I 380 to 8th Avenue SW.
Engineering Kingston
3313300 WEST 75,000 80,000 85,000 90,000 95,000 These funds will support design for theCzech Village portion of the flood wallon southwest side of Cedar Rapids.
Czech Village ManagementPenford
3313400 WEST 75,000 75,000 75,000 75,000 100,000 These funds cover design for CzechVillage levees, flood walls and roadwaygates stretching from Ingredion to thelandfill.
Czech Village EngineeringPenford Czech Village
3314400 EAST 75,000 250,000 250,000 250,000 100,000 These funds will support engineeringprogram studies and planning for thenorth industrial and Quaker Oats areas.
Quaker Oats Engineeringprogram studies and planning
3315400 EAST 75,000 250,000 250,000 250,000 100,000 These funds support the cost of designfor the flood wall and roadway gates inthe downtown area from A Avenue NEto the Federal Courthouse.
Downtown Engineering ProgramStudies and Planning
3316400 EAST 75,000 250,000 250,000 250,000 100,000 These funds will cover engineeringprogram studies and planning for theNewBo area.
NewBo Engineering programstudies and planning
3317400 EAST 75,000 250,000 250,000 250,000 75,000 These funds will support engineeringprogram studies and planning for theCargill area.
Cargill South Engineeringprogram studies and planning
3318300 MULTIPLE 75,000 75,000 75,000 250,000 250,000 This project funds acquisitions andproject management to replace the 8thAvenue bridge over the Cedar River.
8th Avenue Bridge Managementand Acquisitions
3317200 MULTIPLE 50,000 50,000 0 0 0 This project funds acquisition services insupport of flood protectiondevelopment in the Cargill area.
Contract Acquisition ServicesCargill
3311200 SW 0 0 500,000 0 0 These funds will satisfy acquisition andproject management costs related tothe removable flood wall installedadjacent to the Czech Museum.
Czech Village Acquisitions andManagement, Czech Museum
3311400 MULTIPLE 0 500,000 0 0 0 This project provides funding to plan forthe development of the Flood ControlSystem.
IFM Planning
3311410 NW 0 200,000 0 250,000 0 This project provides funding to designthe Flood Control System for theTimecheck area Penn Avenue to KAvenue underground.
Timecheck Penn Avenue to KAvenue Underground
3311410 NW 0 200,000 0 250,000 0 This project provides funding to designthe Flood Control System for theTimecheck area from K Avenue to FAvenue underground.
Timecheck K Avenue to FAvenue Underground
3311420 NW 0 0 0 500,000 0 This project provides funding to designthe Flood Control System for theTimecheck area Railroad to I 380underground.
Timecheck Railroad to I 380Underground
3311420 NW 0 0 0 1,500,000 950,000 This project provides funding to designthe Flood Control System for the
Timecheck Levee
251

ProjectNumber Project Name
FY 2021Budget
FY 2022Budget
FY 2023Budget
FY 2024Budget
FY 2025Budget Scope of Work
ProjectQuadrant
331 Flood Control System Improvements
Timecheck Levee.
3311420 NW 0 0 0 0 500,000 This project provides funding to designthe Flood Control System for theTimecheck area N Avenue Gatewell.
Timecheck N Avenue Gatewell
3311420 NW 0 0 1,000,000 0 0 This project provides funding to designthe Flood Control System for theTimecheck area from E Avenue to I 380walls and gates.
Timecheck E Avenue to I 380Walls and Gates
3311420 NW 0 0 1,000,000 0 0 This project provides funding to designthe Flood Control System for theTimecheck area E Avenue Pump Station.
Timecheck E Avenue PumpStation
3312410 SW 0 0 0 300,000 0 This project provides funding to designthe Flood Control System for theKingston area from I 380 to 3rd Avenueutility underground.
Kingston I 380 to 3rd AvenueUtility Underground
3312410 SW 0 0 0 250,000 0 This project provides funding to designthe Flood Control System for theKingston area from I 380 to 3rd Avenueremovable floodwalls.
Kingston I 380 to 3rd AvenueRemovable Floodwalls
3312420 SW 0 500,000 0 0 0 This project provides funding to designthe Flood Control System for theKingston area from 3rd Avenue toAmphitheatre utility underground.
Kingston 3rd Avenue toAmphitheatre Utility Underground
3312420 SW 0 0 0 500,000 0 This project provides funding to designthe Flood Control System for theKingston area from 3rd Avenue toAmphitheatre floodwalls and removablefloodwalls.
Kingston 3rd Avenue toAmphitheater Floodwalls andRemovable Floodwalls
3312430 WEST 0 0 930,000 0 0 These funds will support design costsfor a pump station at the northwestcorner of 8th Avenue in the Kingstonarea.
Kingston 8th Avenue pumpstation
3312430 SW 0 250,000 0 0 0 This project provides funding to designthe Flood Control System for theKingston area 8th Avenue festivalgrounds.
Kingston 8th Avenue FestivalGrounds
3312530 SW 0 0 0 4,200,000 4,825,000 This project funds construction ofpermanent flood protection to coverthe Kingston area from theAmphitheatre to 8th Avenue.
Kingston Amphitheatre to 8thAvenue Levee
3313200 WEST 0 1,800,000 0 0 0 These funds will satisfy acquisition andeasement needs for the Ingredionportion of the flood wall.
Ingredion Walls
3313420 SW 0 1,400,000 0 150,000 0 These funds will pay for design of the12th Avenue SW gatewell in CzechVillage.
Czech Village 12th AvenueGatewell and Pump Station
3313430 SW 0 250,000 165,000 0 0 These funds will pay for the installationof a pump station and gatewell toprotect the Ingredion building in CzechVillage and the surrounding area.
Czech Village Ingredion Wall andPump Station
3313430 SW 0 0 0 0 1,515,000 This project provides funding to manageimplementation undergroundinfrastructure of the Flood ControlSystem for the Czech Village area.
Czech Village 16th Avenue toLandfill Underground
3313430 WEST 0 1,200,000 0 0 0 These funds will pay for design of thepump station located in Czech Villagenear Bowling Street.
Penford/Czech Village BowlingStreet pump station
3313430 WEST 0 50,000 0 0 0 These funds will pay for design of thestorm shut off valve adjacent to BowlingStreet SW.
Czech Village Bowling Streetgatewell
252

ProjectNumber Project Name
FY 2021Budget
FY 2022Budget
FY 2023Budget
FY 2024Budget
FY 2025Budget Scope of Work
ProjectQuadrant
331 Flood Control System Improvements
3313520 SW 0 0 0 5,000,000 5,000,000 This project funds construction of apump station in Czech Village near 12thAvenue as part of the Flood ControlSystem.
Czech Village 12th Avenue PumpStation
3313520 SW 0 1,000,000 0 0 0 This project funds construction of anew, removable floodwall section toprotect Czech Village between 12thAvenue and 16th Avenue
Czech Village 12th Avenue to16th Avenue Underground
3313520 SW 0 0 9,500,000 0 0 This project funds construction for alevee and gate structure on the CzechVillage side of the 16th Avenue bridge.
Czech Village 12th Avenue to16th Avenue Levee and Gate at16th Avenue
3313520 WEST 0 0 1,500,000 0 0 These funds will pay for externalengineering and design for the CzechVillage 12th Avenue SW storm shut offgate at the Cedar River.
Czech Village 12th Avenuegatewell
3313530 WEST 0 1,000,000 10,000,000 3,000,000 0 These funds will cover construction ofthe storm water pump station at thelevee adjacent to Bowling Street SW.
Penford/Czech Village BowlingStreet Pump Station
3315200 SE 0 500,000 0 0 0 These funds will support acquisitionservices for removable flood wall,permanent flood wall and floodgates forReach 2 (City Reach 5).
Reach 2 Acquisitions
3316510 SE 0 1,515,000 0 0 0 These funds will pay to relocate thesanitary sewer adjacent to the proposed8th Avenue bridge.
8th Avenue Bridge IngredionSanitary Sewer Relocation
3316510 SE 0 850,000 850,000 0 0 These funds pay for the relocation ofutilities associated with the 8th AvenueBridge and the levee adjacent to ParkingLot 44.
8th Avenue Bridge UtilityRelocation Construction
3318410 SW 0 25,000 0 0 0 These funds will pay for realigning thesanitary sewer main which servesIngredion to reduce conflicts with theproposed Reach 3 flood wall.
8th Avenue Bridge IngredionSanitary Sewer Relocation
3318410 EAST 0 50,000 0 0 0 These funds will support externalengineering and design for relocatingthe sanitary sewer to accommodate the8th Avenue bridge replacement.
Newbo/Sinclair 8th AvenueBridge utility relocation
3318510 SE 0 0 0 5,580,000 10,000,000 These funds will pay for construction ofthe new 8th Avenue bridge, as well asthe levees and flood walls adjacent tothe structure.
Newbo 8th Avenue BridgeReplacement
45,576,500 51,000,000 51,000,000 51,000,000 51,000,000Total ExpensesTotal For Fund
253

ProjectNumber Project Name
FY 2021Budget
FY 2022Budget
FY 2023Budget
FY 2024Budget
FY 2025Budget Scope of Work
ProjectQuadrant
331 Flood Control System Improvements
30,000,000GO Bonds 36,000,000 36,000,000 36,000,000 36,000,000
Other Revenue
TIF Bonds
Revenue Bonds
Other Debt
Federal Grants
State Grants
Local Grants
Streets LOST Transfer In
Other Transfer In
Cash on Hand
Transfer Out
0 0 0 0 0
0 0 0 0 0
0 0 0 0 0
576,500 0 0 0 0
0 0 0 0 0
0 0 0 0 0
0 0 0 0 0
0 0 0 0 0
0 0 0 0 0
0 0 0 0 0
0 0 0 0 0
45,576,500 51,000,000 51,000,000 51,000,000 51,000,000Total Revenue
IFM Transfer In 15,000,000 15,000,000 15,000,000 15,000,000 15,000,000
254

ProjectNumber Project Name
FY 2021Budget
FY 2022Budget
FY 2023Budget
FY 2024Budget
FY 2025Budget Scope of Work
ProjectQuadrant
353 Miscellaneous Improvements
353046 MULTIPLE 8,500,000 2,500,000 2,500,000 2,500,000 2,500,000 Sidewalk ramp replacement and facilityupdates to comply with currentAmericans with Disability Act (ADA)requirements in a timeline outline in theDepartment of Justice (DOJ) report. Theexpenditure budget and bonds will bereallocated to projects in various CapitalImprovement Project funds, once eachproject has costs determined.
ADA Compliance Department ofJustice Agreement
353052 100,000 0 0 0 0 This funding will be utilized for thecompletion of a number of planninginitiatives identified in EnvisionCR.
Neighborhood Planning
8,600,000 2,500,000 2,500,000 2,500,000 2,500,000Total Expenses
8,500,000
Total For Fund
GO Bonds 2,500,000 2,500,000 2,500,000 2,500,000
Other Revenue
TIF Bonds
Revenue Bonds
Other Debt
Federal Grants
State Grants
Local Grants
Streets LOST Transfer In
Other Transfer In
Cash on Hand
Transfer Out
0 0 0 0 0
0 0 0 0 0
0 0 0 0 0
0 0 0 0 0
0 0 0 0 0
0 0 0 0 0
0 0 0 0 0
100,000 0 0 0 0
0 0 0 0 0
0 0 0 0 0
0 0 0 0 0
8,600,000 2,500,000 2,500,000 2,500,000 2,500,000Total Revenue
IFM Transfer In 0 0 0 0 0
255
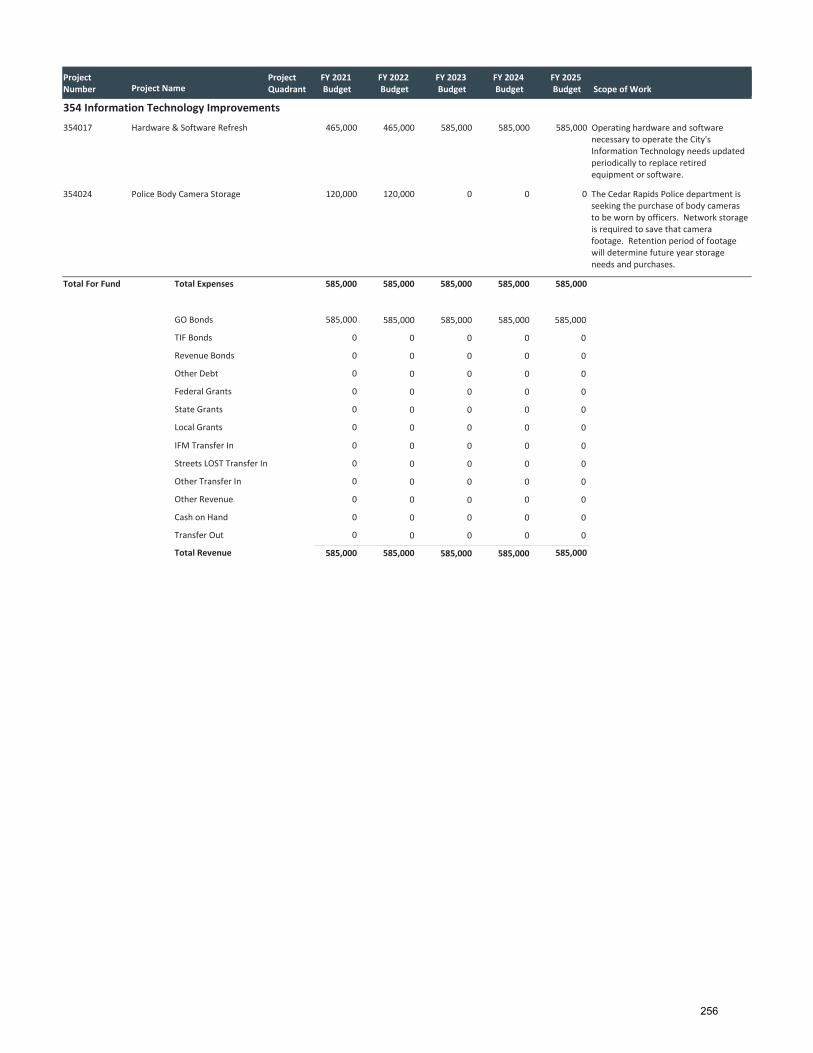
ProjectNumber Project Name
FY 2021Budget
FY 2022Budget
FY 2023Budget
FY 2024Budget
FY 2025Budget Scope of Work
ProjectQuadrant
354 Information Technology Improvements
354017 465,000 465,000 585,000 585,000 585,000 Operating hardware and softwarenecessary to operate the City'sInformation Technology needs updatedperiodically to replace retiredequipment or software.
Hardware & Software Refresh
354024 120,000 120,000 0 0 0 The Cedar Rapids Police department isseeking the purchase of body camerasto be worn by officers. Network storageis required to save that camerafootage. Retention period of footagewill determine future year storageneeds and purchases.
Police Body Camera Storage
585,000 585,000 585,000 585,000 585,000Total Expenses
585,000
Total For Fund
GO Bonds 585,000 585,000 585,000 585,000
Other Revenue
TIF Bonds
Revenue Bonds
Other Debt
Federal Grants
State Grants
Local Grants
Streets LOST Transfer In
Other Transfer In
Cash on Hand
Transfer Out
0 0 0 0 0
0 0 0 0 0
0 0 0 0 0
0 0 0 0 0
0 0 0 0 0
0 0 0 0 0
0 0 0 0 0
0 0 0 0 0
0 0 0 0 0
0 0 0 0 0
0 0 0 0 0
585,000 585,000 585,000 585,000 585,000Total Revenue
IFM Transfer In 0 0 0 0 0
256

ProjectNumber Project Name
FY 2021Budget
FY 2022Budget
FY 2023Budget
FY 2024Budget
FY 2025Budget Scope of Work
ProjectQuadrant
360 City Facility Improvements
3601005 SE 134,000 0 0 0 0 Replace permeable pavement in southside parking lot for Main Library.
Library Parking Lot
3601003 SE 100,000 0 0 0 0 Replace or rebuild the air handler atGround Transportation Center as it is atthe end of its useful life.
Ground Transportation Center AirHandler
3600001 MULTIPLE 86,000 85,000 85,000 85,000 0 Staff time spent on managing capitalimprovement projects throughout theyear.
Facility Maintenance ProjectManagement
3604021 MULTIPLE 60,000 60,000 60,000 60,000 60,000 Rebuild kitchen as they are 20+ yearsold and in disrepair.
Fire Kitchen Remodels
3601004 SE 50,000 0 0 0 0 Replace HVAC components due to ageand functionality.
GTC HVAC Upgrades
360009 MULTIPLE 25,000 0 0 0 125,000 Information Technology has data roomsthroughout City facilities that requireheating and cooling to keep electronicequipment functioning properly.
Data room heating ventilation airconditioning
3603018 SW 25,000 20,000 40,000 0 0 Heating, ventilation, and airconditioning upgrades to extend the lifeof current units at Police Department.
Police Department Heating,ventilation, and air conditioningUpgrades
360099 MULTIPLE 15,000 15,000 15,000 15,000 15,000 This will allow us to have funds forunforeseen capital issues.
Fiscal Year RecurringMiscellaneous FacilityMaintenance
3604016 MULTIPLE 15,000 0 15,000 0 0 The heating, ventilation, and airconditioning units at the Fire Stationswould be replaced as needed becauseof age, while doing so we would replaceunits with an energy efficient unit.
Fire Heating, ventilation, and airconditioning Rotational
SW 0 0 0 0 75,000 Replace boiler which will be at the endof its useful life.
Police Department BoilerReplacement
SE 0 75,000 75,000 75,000 0 Maintain the Library's HVAC system upto standards
Library HVAC Upgrades
SE 0 0 0 30,000 0 Replace roof at Fire Station #6.Fire Station #6 Roof
SW 0 150,000 0 0 60,000 The air handlers are approaching theend of their useful life at the PoliceDepartment facility. This will allow forreplacement or rebuilding of them toensure proper equipment operation.
Police Department Air Handlers
NE 0 0 0 0 45,000 Replace the roof at Noelridge Pool.Noelridge Pool Roof Replacement
SW 0 0 200,000 200,000 0 Replacement of Police DepartmentChiller units.
Police Department Chiller Unit
SE 0 0 0 0 100,000 Make necessary upgrades andrenovation to aging equipment.
Library HVAC upgrades
NE 0 0 0 0 30,000 Replace radiant heat system inapparatus bay of Fire Station #7.
Fire Station #7 Radiant HeatUpgrade
360003 MULTIPLE 0 0 0 45,000 0 Upgrade of system hardware to extendthe life of the Energy ManagementSystem.
Energy Management
3604022 MULTIPLE 0 75,000 20,000 0 0 The doors are nearing the end of theiruseful life. Plan includes stations 2, 4, 5,6, 8, 9's overhead doors to be replaced.
Fire Overhead Doors
3604023 MULTIPLE 0 30,000 0 0 0 Replace the worn carpet in Fire Stations.Fire Carpet Replacement
510,000 510,000 510,000 510,000 510,000Total ExpensesTotal For Fund
257

ProjectNumber Project Name
FY 2021Budget
FY 2022Budget
FY 2023Budget
FY 2024Budget
FY 2025Budget Scope of Work
ProjectQuadrant
360 City Facility Improvements
510,000GO Bonds 510,000 510,000 510,000 510,000
Other Revenue
TIF Bonds
Revenue Bonds
Other Debt
Federal Grants
State Grants
Local Grants
Streets LOST Transfer In
Other Transfer In
Cash on Hand
Transfer Out
0 0 0 0 0
0 0 0 0 0
0 0 0 0 0
0 0 0 0 0
0 0 0 0 0
0 0 0 0 0
0 0 0 0 0
0 0 0 0 0
0 0 0 0 0
0 0 0 0 0
0 0 0 0 0
510,000 510,000 510,000 510,000 510,000Total Revenue
IFM Transfer In 0 0 0 0 0
258

ProjectNumber Project Name
FY 2021Budget
FY 2022Budget
FY 2023Budget
FY 2024Budget
FY 2025Budget Scope of Work
ProjectQuadrant
515 Airport Improvements
49,854,372 32,901,927 29,478,843 18,713,000 12,380,106 Improvements at the Eastern IowaAirport.
Eastern Iowa Airport Projects
49,854,372 32,901,927 29,478,843 18,713,000 12,380,106Total Expenses
0
Total For Fund
GO Bonds 0 0 0 0
Other Revenue
TIF Bonds
Revenue Bonds
Other Debt
Federal Grants
State Grants
Local Grants
Streets LOST Transfer In
Other Transfer In
Cash on Hand
Transfer Out
0 0 0 0 0
0 0 0 0 0
0 0 0 0 0
15,066,324 9,210,402 11,557,504 6,030,000 4,257,095
2,689,690 5,788,828 6,026,010 756,000 337,000
0 0 0 0 0
0 0 0 0 0
32,098,358 17,902,697 11,895,329 11,927,000 7,786,011
0 0 0 0 0
0 0 0 0 0
0 0 0 0 0
49,854,372 32,901,927 29,478,843 18,713,000 12,380,106Total Revenue
IFM Transfer In 0 0 0 0 0
259

ProjectNumber Project Name
FY 2021Budget
FY 2022Budget
FY 2023Budget
FY 2024Budget
FY 2025Budget Scope of Work
ProjectQuadrant
555 Ice Arena Improvements
555085 3,000,000 0 0 0 0 Mechanical repairs at the ice arenafacility.
Mechanical Repairs
555081 200,000 0 0 0 0 Installation of flat decks for high toptables will allow for more group salesand special promotions encouragingattendance and higher food andbeverage per caps. This project is thefirst half of a two year allocation.
East and West Party DeckInstallation
555057 24,000 0 0 0 0 Anticipated mechanical repairs neededthroughout the fiscal year.
Mechanical Heating, Ventilationand Air Conditioning Repairs
555073 20,000 0 0 0 0 Doors to locker rooms and NHL rink onthe ice level are in need of replacement.
Interior Door Replacement
555080 6,000 0 0 0 0 Replacing obsolete machines for IceArena staff members.
Computer Replacement
0 250,000 250,000 50,000 50,000 Improvements at the Ice Arena to beidentified during the fiscal year.
Ice Arena Improvements
3,250,000 250,000 250,000 50,000 50,000Total Expenses
0
Total For Fund
GO Bonds 0 0 0 0
Other Revenue
TIF Bonds
Revenue Bonds
Other Debt
Federal Grants
State Grants
Local Grants
Streets LOST Transfer In
Other Transfer In
Cash on Hand
Transfer Out
0 0 0 0 0
0 0 0 0 0
0 0 0 0 0
0 0 0 0 0
0 0 0 0 0
0 0 0 0 0
0 0 0 0 0
250,000 250,000 250,000 50,000 50,000
0 0 0 0 0
3,000,000 0 0 0 0
0 0 0 0 0
3,250,000 250,000 250,000 50,000 50,000Total Revenue
IFM Transfer In 0 0 0 0 0
260

ProjectNumber Project Name
FY 2021Budget
FY 2022Budget
FY 2023Budget
FY 2024Budget
FY 2025Budget Scope of Work
ProjectQuadrant
615 Water Pollution Control Improvements
6150039 MULTIPLE 2,375,000 1,000,000 0 0 0 Upgrade existing outdated andunsupported programmable logiccontrollers with newest line of AllenBradley programmable logic controllers.
Plant wide programmable logiccontroller conversion
615164 MULTIPLE 2,100,000 0 0 0 0 Replace three aged and corrodinganaerobic treatment process heatexchangers. Tube replacement is noteconomical. New system designsinclude improved means of cleaning.
Anaerobic Heat ExchangeReplacement
6150049 MULTIPLE 1,550,000 0 0 0 0 Repairs to existing carbonaceous returnactivated sludge wetwell concrete,pipes and pumps.
Sludge Wetwell PumpingModifications
615243 MULTIPLE 1,100,000 0 0 0 0 Acquisition of property in vicinity ofWater Pollution Control Facility tocreate development buffer at borders ofplant.
Property Acquisition
6150053 1,000,000 0 0 0 0 Demolition of low pressure oxidationsystem, installation of anaerobicdigesters and gas cleaning equipment.
Phase 1 Improvements SolidsFacilities
6150046 MULTIPLE 600,000 600,000 0 0 0 Upgrades and improvements to gravitybelt thickeners.
Rehabilitate Gravity BeltThickener
6150047 MULTIPLE 600,000 0 2,850,000 0 0 Expand or replace existing gravity beltthickeners.
Additional Gravity Belt Thickener
6150044 MULTIPLE 500,000 1,000,000 500,000 0 0 Replacement/repairs to Indian Creek LiftStation gates, diversion structure, andline between structure and wet well;intended to maintain service toanaerobic process.
Indian Creek Lift StationImprovements
6150052 MULTIPLE 500,000 0 0 0 0 Replace ash lines from incinerator toash lagoons.
Ash Line Replacement
615121 MULTIPLE 500,000 6,000,000 5,000,000 0 0 Assist Public Works Department inrepair and upgrades to main interceptorentering the plant.
Interceptor Repair
615224 MULTIPLE 500,000 0 0 0 500,000 General routine replacement ofequipment related to the anaerobicprocess.
Anaerobic Process General
6150031 MULTIPLE 365,000 0 0 0 0 Replace roof on Centrifuge Building. Inconjunction with Biogas Building,Anaerobic Chemical Building, and NewLime Slaker Building.
Roof Replacements at CentrifugeBuilding
615250 177,056 0 0 0 0 The budget will be reallocated to coverfuture needs of Water Pollution Controlcapital projects, once determined.
Future Capital ImprovementNeeds
615196 MULTIPLE 150,000 0 0 0 0 Repairs to anaerobic sulfide reactor.Pacques Reactor Tank Repairs
615222 MULTIPLE 100,000 50,000 0 0 0 Mapping of facilities, property lines andunderground piping at the facility.Underground piping and miscellaneousburied lines is not comprehensive.
Mapping Survey Property Lines
615162 MULTIPLE 75,000 0 0 0 0 Replacement of Up flow AnaerobicSolids Bioreactor roof.
Roof replacement for UpflowAnaerobic Sludge Blanket reactor
6150054 MULTIPLE 25,000 0 0 0 0 Upgrades to Operation andMaintenance Building and IncineratorBuilding to meet the AmericansDisability Act requirements.
ADA Compliance Upgrades forOperations Building andIncinerator Building
MULTIPLE 0 0 175,000 175,000 0 Connect C Clarifiers to diversion pipe.Connect C Clarifiers to diversionpipe
MULTIPLE 0 0 230,000 600,000 0 Replace internal mechanisms in D4clarifier.
D4 Clarifier Rehabilitation
261

ProjectNumber Project Name
FY 2021Budget
FY 2022Budget
FY 2023Budget
FY 2024Budget
FY 2025Budget Scope of Work
ProjectQuadrant
615 Water Pollution Control Improvements
MULTIPLE 0 400,000 0 900,000 0 Repairs and rehabilitation of Decanttank.
Decant Tank Rehabilitation
MULTIPLE 0 0 0 300,000 600,000 Replace existing internal equipment inD2 clarifier.
Clarifier Rehabilitation D2
MULTIPLE 0 3,050,000 4,045,000 11,000,000 12,300,000 Demolition of low pressure oxidationsystem, installation of anaerobicdigesters, and installation of gascleaning equipment.
Phase 1a Improvements SolidsFacilities
6150042 MULTIPLE 0 0 200,000 150,000 0 Replacing buried decant line that hasreached the end of it's useful life.
Decant Filtrate Line Replacement
6150051 MULTIPLE 0 200,000 0 0 0 Upgrades to Main Lift odor control wetscrubber.
Wet Chemical Scrubber Upgrades
615215 MULTIPLE 0 0 0 0 0 Line item for unexpected repairs andcontingencies.
Contingency and Miscellaneous
12,217,056 12,300,000 13,000,000 13,125,000 13,400,000Total Expenses
0
Total For Fund
GO Bonds 0 0 0 0
Other Revenue
TIF Bonds
Revenue Bonds
Other Debt
Federal Grants
State Grants
Local Grants
Streets LOST Transfer In
Other Transfer In
Cash on Hand
Transfer Out
0 0 0 0 0
7,240,000 10,000,000 10,000,000 10,000,000 10,000,000
1,000,000 0 0 0 0
0 0 0 0 0
0 0 0 0 0
0 0 0 0 0
0 0 0 0 0
3,977,056 2,300,000 3,000,000 3,125,000 3,400,000
0 0 0 0 0
2,000,000 0 0 0 0
2,000,000 0 0 0 0
12,217,056 12,300,000 13,000,000 13,125,000 13,400,000Total Revenue
IFM Transfer In 0 0 0 0 0
262

ProjectNumber Project Name
FY 2021Budget
FY 2022Budget
FY 2023Budget
FY 2024Budget
FY 2025Budget Scope of Work
ProjectQuadrant
625 Water Improvements
6250051 MULTIPLE 4,517,000 3,093,000 4,520,000 5,225,000 3,710,000 Water main installations conducted incoordination with Paving for ProgressProjects. Replacements motivated bybreak history of existing main beneathstreets, need to improve capacity, etc.
Water Main Install Paving ForProgress
6250072 MULTIPLE 3,100,000 9,960,000 4,175,000 0 0 Add a softener basin to accommodaterenovation of existing softeners whilepreserving treatment capacity.
Northwest Water TreatmentPlant softener addition
6250020 MULTIPLE 900,000 0 0 0 0 Cash reserve for Water capitalimprovement projects, depository fortranfers in from operations as available.
Miscellaneous WaterImprovements
6250069 SE 880,000 0 0 0 0 Design and construction work forrenovations/repairs of aging Bever ParkReservoir.
Bever Tank Renovation
6250092 MULTIPLE 700,000 2,450,000 0 0 0 Relocation of mains impacted by theinstallation of the new flood controlsystem on the East side of the CedarRiver.
Flood Control System water mainrelocations East of Cedar River
625884 MULTIPLE 525,000 640,000 1,130,000 825,000 500,000 Installation of new water mains orreplacement of aging water mains,various projects each year. Not Pavingfor Progress related.
Water Main Install Replacement
6250088 MULTIPLE 493,000 130,000 251,000 0 0 Renovation of mechanical and electricalcomponents of 5 in 1 Dam gateoperating equipment such as conduits,conductors, wire rope, hoists, etc.
5 in 1 Dam Refurbishing
6250024 MULTIPLE 462,000 0 0 0 0 Replacement of aging water main withsignificant break history on 1st AvenueEast, in conjunction with streetreconstruction project 301240 andwater chartfield 6252011022.
1st Avenue East From 27th to40th Street
6250056 MULTIPLE 425,000 0 0 0 0 Paving of drives and parking betweenfilter building and softeners. StormWater drainage improvements.
J Avenue Plant Paving step 1
6250073 NE 400,000 525,000 0 0 0 North end (plant entry area)underground utilities repairs andreplacements at the J Avenue Plant.
J Avenue Plant Paving step 2
6250080 NE 300,000 0 0 0 0 Removal of the Blairs Ferry Rd elevatedtank and associated piping. Restorationof the site to grass lawn.
Blairs Ferry Rd Tank Demolition
6250099 MULTIPLE 275,000 275,000 0 0 0 Engineering and construction forriverbank armoring in vicinity of theSeminole Well Field and West Well Field.
Riverbank armoring
6250095 MULTIPLE 250,000 0 0 0 0 Replace pumps in Seminole wells 13through 23, motor replacements atSeminole well 9, 13, 14, 15.
Seminole Wellfield pump/motorreplacements
625650 84,353 0 0 0 0 The budget will be reallocated to coverfuture needs of Water capital projects,once determined.
Future Capital ImprovementNeeds
6250094 MULTIPLE 75,000 0 0 0 0 Engineering of demolition of thehydropower facility at the 5 in 1 Dam inanticipation of east side flood controlimprovements construction in calendaryear 2022. Flood control system relatedexpense.
Hydropower Facility DemolitionEngineering costs
625883 MULTIPLE 60,000 0 0 0 0 New water mains to complete loopsbetween dead end mains in the waterdistribution system as opportunitiesarise.
Water Main Install Loop Closure
263

ProjectNumber Project Name
FY 2021Budget
FY 2022Budget
FY 2023Budget
FY 2024Budget
FY 2025Budget Scope of Work
ProjectQuadrant
625 Water Improvements
6250067 MULTIPLE 50,000 0 0 0 0 Pipe loop study to verify lead andcopper corrosion control for servicelines.
Corrosion Control Pipe Loop Study
625671 MULTIPLE 50,000 0 0 0 0 Repaint ceiling of Northeast BoosterStation at J Avenue plant.
Repaint Ceiling NortheastBooster
625905 MULTIPLE 50,000 0 0 0 0 J Avenue Plant gate exit loop addition,and Northwest Water Treatment Plantentrance gate and fencingreconfiguration.
Access Control System Upgrades
6250087 MULTIPLE 40,000 410,000 0 0 0 Renovation of aging generator buildingat Northwest Water Treatment Plant.
Northwest Water TreatmentPlant Generator BuildingRestoration
6250096 MULTIPLE 35,000 0 0 0 0 Upgrades to Filter and AdministrationBuilding to meet requirements ofAmerican Disability Act.
ADA Compliance J Avenue FilterBuilding
6250097 MULTIPLE 30,000 0 0 0 0 Upgrades to Building 200 at theNorthwest Treatment Plant to meetAmerican Disability Act requirements.
ADA Compliance NorthwestWater Treatment Plant
6250098 NE 20,000 0 0 0 0 Upgrades to Water DistributionMaintenance Building to comply withADA requirements.
ADA Compliance WaterDistribution Maintenance Building
625064 MULTIPLE 15,000 15,000 15,000 15,000 15,000 Routine replacement of aging watersystem valves.
Valve Replacement Program
625065 MULTIPLE 15,000 15,000 15,000 15,000 15,000 Routine replacement of aging ordamaged hydrants.
Hydrant Replacement Program
625569 MULTIPLE 15,000 15,000 15,000 15,000 15,000 Relocation of segments of water mainto accommodate storm or sanitarysewer projects, as needed.
Water Main Sewer Relocations
625013 MULTIPLE 10,000 10,000 10,000 10,000 10,000 Routine purchase of new fire hydrants.New Hydrant Installations
625667 MULTIPLE 10,000 10,000 10,000 10,000 10,000 Installation of new valves, as needed.New Valve Installations
MULTIPLE 0 0 0 0 10,000 Replace existing roof that has reachedthe end of its useful life.
Chemical/Recarb Building roofreplacement
SW 0 0 0 6,500 0 Replace roof on Chandler BoosterStation.
Chandler Booster Building RoofReplacement
NE 0 250,000 1,750,000 1,750,000 0 Demolition of existing standpipe andreplacement with an elevated storagetank.
Glass Road Tank Replacement
MULTIPLE 0 0 300,000 2,000,000 2,000,000 Replace existing softener equipmentthat has reached the end of it's usefullife.
Northwest Water TreatmentPlant Softener Mechanism 1 and2 Replacement
MULTIPLE 0 0 0 0 500,000 Relocate building and equipment to amore appropriate location at the JAvenue plant.
Relocate ammonia feed buildingand scrubber
MULTIPLE 0 30,000 200,000 175,000 0 Replace roofs on various structures: JAvenue Plant aerator, J Avenue Plantmeter building, Bever Park boosterstation, Bowling Booster station, 5 in 1Dam Gatehouse.
Roof Replacements J Avenueaerator, J Avenue meter bldg,Bever Park Booster, BowlingBooster, and Dam Gate Housebuilding
NE 0 0 75,000 0 0 Replace roofs of Aerator Building andRaw Water Meter Building at J AvenuePlant.
Aerator and Meter Building RoofReplacement
MULTIPLE 0 0 0 0 10,000 Replace existing roof that has reachedthe end of its useful life.
J Avenue Plant Maintenance ToolCrib roof replacement
MULTIPLE 0 0 0 0 100,000 Funds available for wetlands mitigationif required as part of next collector welldesign and construction.
Wetlands Improvements andAcquisition
264

ProjectNumber Project Name
FY 2021Budget
FY 2022Budget
FY 2023Budget
FY 2024Budget
FY 2025Budget Scope of Work
ProjectQuadrant
625 Water Improvements
MULTIPLE 0 0 0 1,000,000 1,000,000 New chlorine storage and feed buildingas part of J Avenue PlantImprovements Phase 3.
J Avenue Plant Chlorine StorageImprovements
NE 0 0 0 25,000 0 Inspection and engineering for repairsand rehabilitation of the Boyson RoadTank.
Boyson Road Tank Rehabilitation
SW 0 0 0 25,000 0 Inspection, and preparation ofspecifications for re paint and reconditioning of steel standpipestructure.
60th Avenue StandpipeRehabilitation
MULTIPLE 0 0 0 750,000 0 Water Administration Building Parkinglot re paving.
Water Admin Building Parking LotRepaving
NE 0 25,000 750,000 0 0 Raw water main reinforcement fromMohawk Park to J Avenue Plant.
Raw Water Main Mohawk Park toJ Avenue Plant
MULTIPLE 0 0 0 0 300,000 Demolition of existing slow mix tankspart of Phase 3 improvements.
J Avenue Demolition Slow MixTanks
MULTIPLE 0 0 150,000 2,000,000 4,500,000 River crossing and transmission maininstallation from East Well Field to TimeCheck Area, then south to 36 inchPrairie Valley Feeder near I 380 bridge.Install when flood protection system onEast side north of Quaker Oats makethis necessary, or when needed toprovide redundancy for existing mainthat runs past Quaker Oats on east sideof the river. Funding source may bechanged as project approaches.
Relocate Prairie ValleyTransmission Main
MULTIPLE 0 0 0 50,000 600,000 North end paving at J Avenue Plant.J Avenue Plant Paving step 3
SE 0 0 0 25,000 350,000 Re habilitation and repair of Mt. VernonRoad steel elevated storage tank.
Mt Vernon Road TankRehabilitation
MULTIPLE 0 0 0 0 50,000 Replace existing membrane roof at endof its useful life.
J Avenue Filter Building RoofReplacement
6250023 NE 0 0 325,000 0 650,000 Re location of 2,000 feet of 12 inchwater main in conjunction with CollinsRd widening East of Northland to CAvenue NE.
Collins Road East of Northland
6250050 MULTIPLE 0 0 0 250,000 500,000 Updating Customer Care and Billingsoftware upgrades.
Utility Billing System Update
6250081 SW 0 220,000 220,000 0 0 Install new watermain the developerwill re imburse the City for. EarhartLane SW phase 3. This will close a loopto the water main on 6th Stree SWacross I 380.
Earhart Lane SW Developer
6250082 MULTIPLE 0 0 75,000 0 0 Remove obsolete valves in raw watermains near Ellis Park boat harbor.
Ellis Harbor raw water line valveremovals
6250083 MULTIPLE 0 0 600,000 1,050,000 0 Renovation of valves, piping and filterbeds for 1929 era filters at the J AvenuePlant.
J Avenue Plant 1929 filterrenovations
6250085 MULTIPLE 0 0 300,000 2,000,000 4,000,000 Replacement of softeners and clarifierequipment, and concrete renovations,for softener trains 1 and 2 at the JAvenue Water Treatment Plant.
J Avenue Plant SoftenerRenovations Trains 1 and 2
6250089 MULTIPLE 0 200,000 1,900,000 1,900,000 0 Study, design, and construction ofsecond raw water transmission mainfrom well field to the Northwest WaterTreatment Plant.
Raw Water Line NorthwestWater Treatment Plant
6250090 MULTIPLE 0 0 20,000 60,000 1,000,000 Design and construction of newdehumidification, heating and
J Avenue Plant Heating,Ventilation and Air Conditioning
265

ProjectNumber Project Name
FY 2021Budget
FY 2022Budget
FY 2023Budget
FY 2024Budget
FY 2025Budget Scope of Work
ProjectQuadrant
625 Water Improvements
ventilation equipment at the J AvenueWater Treatment Plant.
replacement
13,786,353 18,273,000 16,806,000 19,181,500 19,845,000Total Expenses
0
Total For Fund
GO Bonds 0 0 0 0
Other Revenue
TIF Bonds
Revenue Bonds
Other Debt
Federal Grants
State Grants
Local Grants
Streets LOST Transfer In
Other Transfer In
Cash on Hand
Transfer Out
0 0 0 0 0
6,502,000 4,313,000 7,931,000 13,681,500 13,545,000
3,100,000 9,960,000 4,175,000 0 0
0 0 0 0 0
0 0 0 0 0
0 0 0 0 0
0 0 0 0 0
4,184,353 4,000,000 4,700,000 5,500,000 6,300,000
0 0 0 0 0
0 0 0 0 0
0 0 0 0 0
13,786,353 18,273,000 16,806,000 19,181,500 19,845,000Total Revenue
IFM Transfer In 0 0 0 0 0
266

ProjectNumber Project Name
FY 2021Budget
FY 2022Budget
FY 2023Budget
FY 2024Budget
FY 2025Budget Scope of Work
ProjectQuadrant
635 Parking Improvements
635099 400,000 0 0 0 0 Deferred maintenance on parkingprojects.
Deferred Maintenance Projects
400,000 0 0 0 0Total Expenses
0
Total For Fund
GO Bonds 0 0 0 0
Other Revenue
TIF Bonds
Revenue Bonds
Other Debt
Federal Grants
State Grants
Local Grants
Streets LOST Transfer In
Other Transfer In
Cash on Hand
Transfer Out
0 0 0 0 0
0 0 0 0 0
0 0 0 0 0
0 0 0 0 0
0 0 0 0 0
0 0 0 0 0
0 0 0 0 0
0 0 0 0 0
0 0 0 0 0
400,000 0 0 0 0
0 0 0 0 0
400,000 0 0 0 0Total Revenue
IFM Transfer In 0 0 0 0 0
267

ProjectNumber Project Name
FY 2021Budget
FY 2022Budget
FY 2023Budget
FY 2024Budget
FY 2025Budget Scope of Work
ProjectQuadrant
655 Sanitary Sewer Improvements
6550077 MULTIPLE 3,400,000 0 500,000 500,000 500,000 Project will repair and line largediameter sanitary sewers (24 inch andlarger) to correct defects identifiedthrough the condition assessmentprogram (CIP 6550048). This Phase 1project will rehabilitate the 42 inchtrunk sewer along A Street SW from thelandfill to Riverside Park.
Large Diameter Sanitary SewerRepairs and Lining
655999 MULTIPLE 2,421,000 2,350,000 2,700,000 2,944,000 3,179,000 Annual program to rehabilitate sanitarysewers that are in poor condition byinstalling a liner within the pipe. Goal isto replace or rehabilitate 1 to 2 percentof the collection system annually (80year cycle).
Fiscal Year Recurring LiningProject
6550034 SW 2,000,000 0 0 0 0 Project will extend sanitary sewer westof Edgewood Road SW from south ofPrairie Creek to 76th Avenue. Thesanitary sewer extension will providesewer service to a targeted growtharea. Construction costs to be fundedby developers.
Edgewood Road South of PrairieCreek
6550065 NE 1,000,000 2,000,000 0 0 0 Project will relocate a portion of the 36inch East Trunk Sewer in the vicinity of416 6th Street NE. It currently extendsunder existing structures.
C Avenue (North of), East of 4thStreet
655990 Multiple 525,000 250,000 250,000 250,000 250,000 Project will provide funding to repairmajor defects in sanitary sewers andmanholes as they are discovered duringinternal inspection activities by SewerMaintenance.
Fiscal Year RecurringMiscellaneous Sanitary Sewer
655032 MULTIPLE 384,000 500,000 500,000 500,000 500,000 Project will facilitate the removal ofinfiltration and inflow from privatesources such as sump pumpconnections or foundation drains. Byremoving excessive infiltration andinflow, there will be less risk ofbasement backups and sanitary sewer
Infiltration and Inflow ReductionProgram
6550084 MULTIPLE 370,985 383,970 397,409 411,319 425,716 Funding for Public Works staff whodesign, inspect, administer or overseecapital improvement contracts forsanitary projects.
Public Works Staff Time
6550087 NE 270,000 0 0 0 0 Project will repair erosion and stabilizeembankment to protect existingsanitary sewer.
Willowbend Drive West ofHarwood NE
6550006 SW 250,000 0 0 0 0 Project will add upgrades to the existinglift station as part of the private topublic lift station program.
Hoover Trail Lift StationImprovements
6550075 SE 250,000 0 0 0 0 Project will replace and relocate asanitary sewer that is in poor conditionas part of a street improvement project(CIP 3012131).
12th Avenue SE from 7th Streetto 19th Street
6550091 MULTIPLE 250,000 250,000 250,000 250,000 250,000 Project will extend drain tiles in areaswhere sump pumps were or could beconnected to sanitary sewer as part ofthe infiltration and inflow reductionstrategy.
Drain Tile Extensions
6550092 NW 250,000 0 0 0 0 Project will replace and line sanitarysewer pipe that are in poor condition aspart of a street reconstruction project(3012121).
O Avenue NW from 16th toEdgewood
655928 SE 225,000 0 0 0 0 Project will replace an aged sanitarysewer that extends through bottom of
34th Street South of CottageGrove Avenue
268

ProjectNumber Project Name
FY 2021Budget
FY 2022Budget
FY 2023Budget
FY 2024Budget
FY 2025Budget Scope of Work
ProjectQuadrant
655 Sanitary Sewer Improvements
existing bridge.
6550048 MULTIPLE 200,000 200,000 200,000 200,000 200,000 Project will provide for televising largetrunk and interceptor sanitary sewersfor condition assessments.
Large Diameter Sanitary SewerCondition Assessment
6550057 MULTIPLE 200,000 200,000 200,000 200,000 200,000 Project will replace orangeburg sanitarysewer service lines in advance of streetreconstruction or overlays. City willfund the televising and property ownerswill fund the replacement. Propertyowners can choose to replace inadvance of City street project or withthe City street project. If done with thestreet project, the property owner isassessed the costs.
Orangeburg Sanitary SewerService Line Replacement
6550016 MULTIPLE 150,000 0 100,000 0 0 Project will provide funding for annualupdates to the sanitary sewer masterplan.
Sanitary Sewer Master Plan
6550044 150,000 0 0 0 0 Project will repair sanitary sewer andreplace manholes as part of a streetreconstruction project.
Center Point Road NE between29th Street and 32nd Street
6559993 SW 150,000 0 0 0 0 Project will repair sanitary sewer andmanholes as part of streetreconstruction project.
Chandler St from 18th to 20thStreet SW
655998 Multiple 125,000 125,000 125,000 125,000 125,000 Annual program to replace orrehabilitate sanitary sewer manholes asidentified during the City's pipeinspection and evaluation program.
Fiscal Year Recurring ManholeProject
655996 Multiple 115,000 1,000,000 1,000,000 2,000,000 2,000,000 Annual program to replace sanitarysewers that are in poor condition asdetermined by the City's pipe inspectionand evaluation program. Goal is toreplace or rehabilitate 1 to 2 percent ofthe sanitary sewers annually (80 yearcycle).
Fiscal Year Recurring ReplaceProject
6550078 SW 65,000 0 0 0 0 Project will repair and rehabilitatesanitary sewers and manholes in 6thStreet SW fromWilson Avenue to 33rdAvenue as part of the streetimprovement project.
6th Street SW fromWilson to33rd Avenue
NE 0 0 50,000 0 0 Project will repair sanitary sewer andreplace manholes as part of a streetreconstruction project (3012097).
29th Street NE from 1st Avenueto Interstate 380
SW 0 120,000 0 0 0 Project will replace and relocatesanitary sewer as part of streetreconstruction project (CIP 3012089).
20th Avenue SW from ChandlerStreet to Jefferson HighschoolEntrance
NE 0 0 100,000 0 0 Project will construct sanitary sewerunder the new Tower Terrace Road at 2locations.
Tower Terrace Rd atMeadowknolls Road
MULTIPLE 0 0 500,000 500,000 500,000 Project will provide upfront cost forsanitary sewer extensions to targetedgrowth areas as defined in the City'scomprehensive plan Envision CR.System development fees will beestablished to recover costs as areasdevelop.
Miscellaneous Growth SanitarySewers
6550012 MULTIPLE 0 20,000 20,000 20,000 20,000 Project provides reimbursement toproperty owners for installation ofbackwater valves in known sanitarysewer problem areas. Currentmaximum reimbursement amount is$800 per Resolution No. 1368 09 12.
Backwater Valve Program
269

ProjectNumber Project Name
FY 2021Budget
FY 2022Budget
FY 2023Budget
FY 2024Budget
FY 2025Budget Scope of Work
ProjectQuadrant
655 Sanitary Sewer Improvements
6550029 SE 0 100,000 0 0 0 Project will extend sanitary sewer toprovide better access to propertiesalong Mount Vernon Road who arecurrently on combined (party) servicelines.
Mount Vernon Rd from 10thStreet to Memorial Drive
6550033 MULTIPLE 0 250,000 250,000 250,000 0 Project will construct Phase 1improvements to convert private liftstations to public lift stations at 7 ormore locations throughout the City.
Lift Station Improvements
6550054 NE 0 400,000 0 0 0 Project will extend sanitary sewer to atargeted growth area as defined in theCity's comprehensive plan EnvisionCRlocated north of East Robins Road andwest of C Avenue NE. Systemdevelopment fees will be established torecover costs as areas develop.
C Avenue NW (West of), North ofEast Robins Road
655625 SE 0 1,000,000 600,000 1,000,000 1,000,000 Project will replace existing sanitarytrunk sewer with a new sanitary sewerto provide additional capacity toupstream areas. Project is a joint effortbetween several jurisdictions.
Indian Creek From Otis Road toDry Run Creek
12,750,985 9,148,970 7,742,409 9,150,319 9,149,716Total Expenses
0
Total For Fund
GO Bonds 0 0 0 0
Other Revenue
TIF Bonds
Revenue Bonds
Other Debt
Federal Grants
State Grants
Local Grants
Streets LOST Transfer In
Other Transfer In
Cash on Hand
Transfer Out
0 0 0 0 0
4,900,000 3,400,000 1,800,000 3,230,000 3,000,000
0 0 0 0 0
0 0 0 0 0
0 0 0 0 0
0 0 0 0 0
0 0 0 0 0
6,200,985 5,598,970 5,792,409 5,770,319 5,999,716
1,650,000 150,000 150,000 150,000 150,000
0 0 0 0 0
0 0 0 0 0
12,750,985 9,148,970 7,742,409 9,150,319 9,149,716Total Revenue
IFM Transfer In 0 0 0 0 0
270

ProjectNumber Project Name
FY 2021Budget
FY 2022Budget
FY 2023Budget
FY 2024Budget
FY 2025Budget Scope of Work
ProjectQuadrant
665 Transit Improvements
665283 NW 2,400,000 0 0 0 0 Construction of new bus maintenancefacility to replace the existingmaintenance and parts storage facilitiesthat will be impacted by the 6th St &Ellis Rd connection.
Bus Maintenance Facility
665277 MULTIPLE 1,032,022 1,083,622 1,083,622 1,083,622 1,083,622 Purchase of new heavy duty buses.Heavy Duty Bus
665159 MULTIPLE 205,000 215,000 215,000 215,000 215,000 Purchase medium duty/light dutybus(es) for our mandated paratransitservice that is contracted with LIFTS.
Buses Light and Medium duty
3,637,022 1,298,622 1,298,622 1,298,622 1,298,622Total Expenses
0
Total For Fund
GO Bonds 0 0 0 0
Other Revenue
TIF Bonds
Revenue Bonds
Other Debt
Federal Grants
State Grants
Local Grants
Streets LOST Transfer In
Other Transfer In
Cash on Hand
Transfer Out
0 0 0 0 0
0 0 0 0 0
0 0 0 0 0
989,000 1,038,898 1,038,898 1,038,898 1,038,898
600,000 0 0 0 0
0 0 0 0 0
0 0 0 0 0
107,725 0 0 0 0
200,000 0 0 0 0
1,740,297 259,724 259,724 259,724 259,724
0 0 0 0 0
3,637,022 1,298,622 1,298,622 1,298,622 1,298,622Total Revenue
IFM Transfer In 0 0 0 0 0
271

Cash Transfers In order for the City to comply with Iowa law, local ordinances, or for expedience, it is sometimes necessary to transfer revenues and expenditures from one fund/department to another. This is a cash transfer. All transfers in are considered revenues and all transfers out are considered expenditures. City wide, transfers in must equal transfers out.
272

CashTransfersFiscal year budgeted transfers approved as part of the budget are summarized below.
Purpose Fund Name
Transfer Out
Amount
Transfer In
Amount
Transfer for Self‐Supported Municipal Improvement District (SSMID) uses TIF Central Business District 392,611.00
TIF Coe‐Mt Vernon 38,461.00
TIF Mid Town 33,683.00
TIF Riverside‐Oak Hill 17,458.00
SSMID ‐ Czech Village New Bo (3,093.00)
SSMID ‐ Downtown (407,721.00)
SSMID ‐ Medical District (71,399.00)
Transfer 10 percent flood local option sales tax funds for flood insurance costs 2008 Flood Recovery 524,500.00
Facility Maint ‐ Operations (228,500.00)
General Fund ‐ Library (14,000.00)
General Fund ‐ Memorial (50,000.00)
Risk ‐ Liability and Property (157,500.00)
Transit ‐ Operations (74,500.00)
Transfer for civil rights operating uses Civil Rights Seminars 6,000.00
General Fund (6,000.00)
Transfer to cost share in fleet expenses related to sharing of equipment Stormwater Utility ‐Operations 119,653.00
Sanitary Sewer ‐ Operations (119,653.00)
Transfer for shared proceeds from the sale of assets General Fund 55,000.00
Fleet ‐ Operations (55,000.00)
Transfer for City share of Parking employees wages and benefits General Fund 29,611.86
Parking ‐ Operations (29,611.86)
Transfer for economic development program General Fund 398,750.00
Economic Development Fund (398,750.00)
Transfer for Envision CR plans General Fund 100,000.00
Improvements ‐ Miscellaneous (100,000.00)
Transfer for fiscal year 2021 golf operating loss General Fund 75,034.49
Golf ‐ Operations (75,034.49)
Transfer for historic rehab program General Fund 25,000.00
Historic Rehab Loan (25,000.00)
Transfer for Neighborhood Finance Corporation program General Fund 1,000,000.00
Neighborhood Finance Corp (1,000,000.00)
Transfer for public safety purposes General Fund 463,414.52
Police ‐ Proactive Policing (463,414.52)
Transfer for remembering when program General Fund 5,000.00
Fire ‐ Safety Education (5,000.00)
Transfer for visual arts program General Fund 60,000.00
Other Special Revenue (60,000.00)
Transfer for internal staff costs associated with the Americans with Disabilities Act
capital projects
General Fund 100,438.84
Facility Maint ‐ Operations (100,438.84)
Transfer for information technology services Water ‐ Operations 85,008.84
WPC ‐ Operations 91,353.84
General Fund (176,362.68)
Transfer for communication services and associated costs Solid Waste ‐ Operations 28,676.95
Water ‐ Operations 28,676.94
WPC ‐ Operations 28,676.95
General Fund (86,030.84)
Transfer for graphic design services Solid Waste ‐ Operations 5,000.00
273

Purpose Fund Name
Transfer Out
Amount
Transfer In
Amount
Water ‐ Operations 15,000.00
WPC ‐ Operations 15,000.00
General Fund (35,000.00)
Transfer for Human Resources applicant software Solid Waste ‐ Operations 5,000.00
Water ‐ Operations 5,000.00
WPC ‐ Operations 5,000.00
General Fund (15,000.00)
Transfer for internal staff costs associated with capital projects Stormwater Utility ‐Operations 288,027.00
Improvements ‐ Stormwater (288,027.00)
Transfer for city newsletter shared expenses Solid Waste ‐ Operations 8,080.00
Water ‐ Operations 20,493.00
General Fund (28,573.00)
Transfer for internal staff costs associated with storm water costs Stormwater Utility ‐Operations 120,000.00
General Fund (120,000.00)
Transfer for internal staff costs Sanitary Sewer ‐ Operations 13,276.55
Stormwater Utility ‐Operations 13,276.55
General Fund (26,553.10)
Transfer for street sweeping costs Stormwater Utility ‐Operations 450,000.00
General Fund (450,000.00)
Transfer for capital projects General Fund ‐ Memorial 100,000.00
Improvements ‐ Vets Stadium (100,000.00)
Transfer for operating, debt, and capital uses Hotel Motel Tax 1,793,990.00
Doubletree Hotel ‐ Debt (750,000.00)
Economic Development Fund (120,000.00)
General Fund (45,000.00)
Ice Arena ‐ Debt (252,500.00)
Ice Arena ‐ Improvements (250,000.00)
Tax Supported Debt (31,500.00)
US Cellular Ctr ‐ Debt (344,990.00)
Transfer Iowa Flood Mitigation revenue for flood control system projects Iowa Flood Mitigation Program 15,000,000.00
Flood Control System (15,000,000.00)
Transfer for joint communication fiber operating costs Joint Comm Network Maintenance 30,000.00
General Fund (30,000.00)
Transfer for organizational health programs Solid Waste ‐ Operations 958.00
Training and Development 21,412.00
Water ‐ Operations 3,194.00
WPC ‐ Operations 2,236.00
General Fund (27,800.00)
Transfer for parks and recreation operating uses P&R ‐ Recreation Trust 6,000.00
General Fund (6,000.00)
Transfer property tax revenue for FICA, IPERS, and other benefit expenses Payroll Funds 18,325,094.00
General Fund (18,325,094.00)
Transfer property tax revenue for public safety expenses Fire 411 Pension 1,702,191.00
Police 411 Pension 3,145,564.00
General Fund (4,847,755.00)
Transfer for internal staff and associated operating costs Risk ‐ Liability and Property 371,122.84
Risk ‐ Workers Compensation 552,191.20
General Fund (923,314.04)
Transfer road use tax funds for operating and capital uses Improvements ‐ Streets 601,268.00
Road Use Tax 16,350,000.00
General Fund (12,542,688.00)
Improvements ‐ Streets (4,408,580.00)
Transfer for capital projects Stormwater Utility ‐Operations 3,802,479.10
Improvements ‐ Stormwater (3,802,479.10)
274

Purpose Fund Name
Transfer Out
Amount
Transfer In
Amount
Transfer streets local options sales tax revenue for capital projects Streets‐Local Option Sales Tax 19,200,000.00
Improvements ‐ Streets (19,200,000.00)
Transfer for capital projects General Fund ‐ Memorial 103,413.43
Improvements ‐ Vets Mem Bldg (103,413.43)
Transfer for debt expenditures New Ballpark Contributions 287,415.31
Parking ‐ Debt 1,039,195.00
Tax Supported Debt 1,719,613.87
TIF Cedar Lake‐Daniels 72,502.99
TIF Central Business District 2,378,891.42
TIF Coe‐Mt Vernon 350,896.97
TIF Council Street 233,560.80
TIF Earhart Lane 39,918.76
TIF Edgewood Town Center URA 49,945.75
TIF Mid Town 1,548,696.69
TIF Riverside‐Oak Hill 393,695.43
TIF Time Check‐St Pat's 144,899.72
TIF Youngs Hill‐Kingston 58,214.69
Doubletree Hotel ‐ Debt (1,286,453.50)
Golf ‐ Debt (184,576.12)
Ice Arena ‐ Debt (21,020.15)
Paramount ‐ Debt (249,165.72)
Parking ‐ Debt (385,156.58)
Tax Supported Debt (3,179,747.11)
US Cellular Ctr ‐ Debt (3,011,328.22)
Transfer for shared staff costs Facility Maint ‐ Operations 49,410.42
Fleet ‐ Operations (49,410.42)
Transfer for development services and associated costs Water ‐ Operations 108,102.84
General Fund (108,102.84)
Transfer for capital projects WPC ‐ Operations 1,000,000.00
Sanitary Sewer ‐ Improvements (1,000,000.00)
Transfer for capital projects TIF Riverside‐Oak Hill 1,000,000.00
Improvements ‐ Connect CR (1,000,000.00)
275

Fund Balance
276

Fund Balance Fund balance is the difference between assets and liabilities on the governmental funds balance sheet. It is City policy to maintain in reserves a minimum of 25% of the next fiscal year’s budgeted general fund expenditures. By maintaining an appropriate reserve balance, the City is able to react to both known and unknown events that will have an impact on the City finances without disrupting services provided to its citizens in the short term. Below is a schedule showing beginning fund balances, increases and decreases in fund balance, and ending fund balances.
Trust & Special Debt Enterprise Capital Project Internal Agency Revenue Service
General Fund Funds Funds Service Funds Funds Funds Funds TotalFund Balance (6/30/2019) 49,263,772 461,322,475 35,702,308 91,499,715 5,442,051 34,503,242 3,329,505 681,063,068
with airport - 678,373,780 - - - - - 678,373,780 with CRLCSWA - 728,625,549 - - - - - 728,625,549
Fund Balance 6/30/2019 49,263,772 728,625,549 35,702,308 91,499,715 5,442,051 34,503,242 3,329,505 948,366,142
FY 2020 Amended RevenueTaxes 68,140,534 5,528,149 - - 21,938,101 34,343,682 21,203,224 151,153,690 Licenses & Permits 2,438,809 47,670 - - - 30,000 - 2,516,479 Intergovermental Grants 2,963,702 15,369,962 9,074,576 - 872,501 42,091,459 804,484 71,176,684 Charges for Services 26,558,821 143,487,978 - 24,488,534 - 104,932 - 194,640,265 Fines & Forfeits 4,915,000 - - - - 105,000 - 5,020,000 Proceeds of Long Term Liabil ities - 64,236,860 53,010,501 - - - 37,298,248 154,545,608 Other Revenue 4,416,724 27,296,828 5,967,687 27,914,005 - 956,847 2,848 66,554,939 Inter Fund Transfers In 37,586,276 14,994,399 58,462,579 698,348 - 3,326,645 3,090,384 118,158,631 Total Revenue 147,019,866 270,961,846 126,515,342 53,100,887 22,810,602 80,958,564 62,399,188 763,766,296
FY 2020 Amended ExpendituresPersonal Services 93,787,025 43,725,351 - 8,580,777 - 1,355,602 - 147,448,756 Discretionary Expenses 26,148,828 52,186,511 2,699,206 32,921,778 900,000 21,132,391 2,848 135,991,563 Fleet & Facil ities 10,080,713 6,537,286 - 473,472 - 112,505 - 17,203,976 Non-discretionary Expenses 18,513,812 18,504,651 - 7,559,985 26,035 681,166 - 45,285,649 Capital Outlay 629,731 78,489,522 115,042,517 9,656,236 - 2,424,683 - 206,242,689 Debt Service - 82,584,353 - - - - 58,205,975 140,790,328 Inter Fund Transfers Out 4,409,008 7,121,316 6,999,525 5,701,210 21,884,567 67,865,390 4,177,615 118,158,631 Total Expenditures 153,569,117 289,148,991 124,741,248 64,893,459 22,810,602 93,571,737 62,386,437 811,121,591
Projected Ending Fund Balance 6/30/2020 42,714,521 710,438,404 37,476,402 79,707,143 5,442,051 21,890,069 3,342,256 901,010,847
FY 2021 Adopted RevenueTaxes 69,189,932 5,615,479 - - 23,284,147 37,373,186 22,341,847 157,804,591 Licenses & Permits 2,587,462 79,800 - - - 30,000 - 2,697,262 Intergovermental Grants 2,540,259 23,749,872 23,611,746 - 833,090 39,836,758 756,931 91,328,656 Charges for Services 17,127,612 149,499,699 68,000 25,298,462 - 314,000 - 192,307,774 Fines & Forfeits 4,815,000 - - - - 105,000 - 4,920,000 Proceeds of Long Term Liabil ities - 22,742,000 54,596,673 - - - - 77,338,673 Other Revenue 5,427,206 26,802,716 2,720,000 29,700,145 - 1,000,676 3,110 65,653,853 Inter Fund Transfers In 37,877,892 8,033,990 44,003,378 590,849 - 2,554,378 3,211,247 96,271,733 Total Revenue 139,565,362 236,523,556 124,999,797 55,589,456 24,117,237 81,213,997 26,313,136 688,322,541
FY 2021 Adopted ExpendituresPersonal Services 96,583,238 46,472,665 - 8,950,772 - 1,386,687 - 153,393,363 Discretionary Expenses 19,435,166 54,264,292 778,000 33,632,866 900,000 18,916,425 3,110 127,929,859 Fleet & Facil ities 10,880,697 6,444,983 - 459,365 - 78,158 - 17,863,203 Non-discretionary Expenses 9,032,452 19,712,515 - 7,728,067 29,770 600,057 - 37,102,861 Capital Outlay 1,117,268 110,373,731 128,698,299 7,254,175 - 463,415 - 247,906,887 Debt Service - 28,401,032 - - - - 24,601,992 53,003,024 Inter Fund Transfers Out 2,516,541 7,301,365 1,125,768 972,724 23,187,467 59,448,254 1,719,614 96,271,733 Total Expenditures 139,565,362 272,970,582 130,602,067 58,997,969 24,117,237 80,892,995 26,324,717 733,470,929
Projected Ending Fund Balance 6/30/2021 42,714,521 673,991,377 31,874,132 76,298,630 5,442,051 22,211,071 3,330,675 855,862,458
0% -5% -15% -4% 0% 1% 0%Change in Fund Balance
277

Tax supported capital project fund balance is budgeted to decrease. This relates to the timing of revenue compared to expenses for capital improvement projects. There are several expenses that will be incurred in FY 2021 while a portion of the funding was received in FY 2020 or will be received in FY 2022. Overall reductions in fund balance in other areas are the result of timing of revenue compared to expenses for capital improvement projects or planned spend down of reserves mainly for one time purchases or projects.
278

Statistical Information
279

Statistical Information ABOUT CEDAR RAPIDS The City of Cedar Rapids lies on both banks of the Cedar River and is the second largest city in Iowa. The City is 71 square miles and is located in Linn County. Cedar Rapids is an important manufacturing, service, and trade area servicing an 8 county area with a combined population estimated at 483,497. Did you know? We are the second largest city in the state. The largest corn-processing city in the world. One of the leading manufacturing regions in the United States. One of the leading bioprocessing and food ingredient centers in North America. Cedar Rapids is home to almost 300 different manufacturing plants and two dozen Fortune 500 companies,
including Collins Aerospace, Aegon, General Mills, Cargill, Penford, Quaker Oats, Archer Daniels Midland, and Nordstrom. Our city anchors Iowa's Creative Corridor.
History of the “City of 5 Seasons” In 1968, a local advertising agency, Creswell, Munsell, Fultz & Zirbel (CMF&Z), created an identity initiative to position Cedar Rapids as a distinctive destination known widely for a valuable asset. They capitalized on the fact that commuting time in Cedar Rapids is much shorter than larger cities in other areas of the country, thereby providing time for more enjoyable lifestyle. Bill Munsell and Gary Anderson created a memorable city identifier… a slogan that defined the City’s important point of difference. Mr. Anderson designed the logo, resembling a five-point star. The new logo and branding line were accompanied by this explanation: “Life is the sum of all the seasons with which it is filled. And if we have time to enjoy the things most important to us, life is rich and full indeed. In Cedar Rapids there is time enough….time to enjoy the seasons as they pass. Extra time. Precious time. A fifth season.” By 1975, the Cedar Rapids Area Convention and Visitors Bureau and the City of Cedar Rapids had adopted the “Five Seasons.” In 1993, Mr. Munsell and Mr. Anderson teamed up again to raise more than $800K in private donations and in-kind contractors’ support to build a 60-foot tall version of the “Five
280

Seasons” logo called the “Tree of Five Seasons,” near the Cedar River in downtown Cedar Rapids. The stainless steel monument was erected on April 3, 1996 and officially dedicated to the city on May 18, 1996. The “City of Five Seasons” symbol and slogan are registered trademarks of the City of Cedar Rapids. Population The population of Linn County based on the 2010 census is 211,226 of which 126,326 reside in Cedar Rapids.
Population by Age Under 20 34,132 20 – 24 9,673 25 – 34 18,837 35 – 49 24,428 50 – 64 22,684 65 and over 16,572
SOURCE: AMERICAN FACT FINDER. (2019).
Road use tax revenue from the State is distributed on a per capita basis for the City. Changes from an official census impacts the revenue a City receives to assist with construction, repair, and maintenance of Iowa’s road infrastructure. Over the past decade the City of Cedar Rapids, which is considered an urban area in Iowa, has seen one of the highest increases in population while rural Iowa communities has seen a decrease in population over the same time period. Taxes In comparing Cedar Rapids to other larger cities in Iowa, Cedar Rapids’ FY 2021 tax rate is the 3rd lowest when compared to other cities FY 2021 tax rates. Based on FY 2019 information, below is a list of the City’s principal property taxpayers. This group consists of utilities, manufacturing, insurance, commercial, and aerospace companies. The variety of companies in the top ten property taxpayers is one reason the City has seen a steady increase in taxable values every year.
SOURCE: LINN COUNTY AUDITOR’S OFFICE. (2019).
Percentage of Total
Taxable EstimatedAssessed Actual
Taxpayer Value Valuation
Alliant Industries 191,479,276 30.38%ADM Corn Processing 150,409,806 23.86%Transamerica Life Insurance Co 57,574,440 9.13%SDG Macerich Properties (Lindale Mall) 41,278,320 6.55%Rockwell International 37,163,654 5.90%International Paper 36,000,000 5.71%Terraza 5 LLC 34,803,720 5.52%St. Lukes Hospital & Clinics 34,594,302 5.49%A Shapiro LLC 26,032,950 4.13%Cedar Rapids City of (Nordstrom Inc Lessee) 21,033,000 3.34%
Total 630,369,468$ 100.00%
281

Economy Cedar Rapids principal employers are in the manufacturing or service industry. The top 10 principal employers in FY 2019 are shown below.
SOURCE: CEDAR RAPIDS AREA CHAMBER OF COMMERCE AND WOODS AND POOLE ECONOMICS. (2019).
The City of Cedar Rapids has a large and diverse tax base due to substantial commercial, health care, food processing, manufacturing, telecommunication, and aerospace companies. This diversification allows the City to continue to see moderate growth in its tax base each year during a time of economic downturn in many communities. Cedar Rapids’ unemployment rate decreased 0.3% to 2.4% for FY ending 2019, which is the same as the state unemployment rate and is lower than the national unemployment rate of 3.7% for the same time period. The Cedar Rapids median household income in 2019 was $65,841 as compared to $59,724 in 2018. The total value of building permits in FY 2019 was approximately $330.8 million. This compares with an amount of $341.8M for FY 2018. Climate Facts: Average Temperature 48.2°F Average Annual Precipitation 34.61 inches Average Annual Snowfall 26.7 inches SOURCE: NATIONAL WEATHER SERVICE. (2010).
The climate can have a strong impact on City services and budget in several departments across the City such as Water, Public Works, Golf, Parks and Recreation, Building Services, and Public Safety. In a typical year, the City budgets for 20 – 25 snow or ice events of which 6 of these events are considered all plows or major events. In years with above average snow and ice events, the City either has to increase funding to public works through use of reserve funds or decrease operating expenditures set aside for spring/summer programs. Minimal rain and no snow as well as comfortable temperatures can extend the golf season late into the year or allow for earlier spring starts. Whereas rain and snow events can impact the season and cause revenues to be under budget. Water revenues can also be impacted during rainy periods as less water is consumed for watering lawns and vegetation, which reduces water revenues.
Employer Employees
Rockwell Collins Inc. 9,400 Transamerica 3,800 St. Luke's Hospital 2,979 Cedar Rapids Community School District 2,879 Hy-Vee Food Stores 2,356 Nordstrom Direct 2,150 Mercy Medical Center 2,140 City of Cedar Rapids 1,309 Four Oaks 1,100 Quaker Foods and Snacks 920
282

Flood Control On June 13, 2008, the Cedar River crested to its highest level in Cedar Rapids history, 31.12 feet. The flood waters penetrated 10 square miles or 14% of the city. This monumental flood impacted 7,198 parcels, including 5,390 houses, dislocated more than 18,000 residents, and damaged 310 City facilities. The Cedar Rapids City Council established a clear action plan for recovery after the flood of 2008. This plan includes a vision and three-part focus for building a greater Cedar Rapids:
1) Improve Flood Protection: We will strengthen the protection of our homes, businesses and public facilities against future flooding. The City's flood management strategy includes temporary barriers to reinforce current levees; construction of a permanent system of floodwalls and levees; and the pursuit of improved state watershed management policies.
2) Reinvest in Housing, Businesses & Neighborhoods: We are reinvesting in the neighborhoods and business districts along the Cedar River to create vibrant centers for our kids, grandkids, and the next generation workforce.
3) Rebuild Public Facilities: We will rebuild and repair the flood-damaged City facilities with a focus on customer service needs and sustainable construction standards that will last for decades to come. Our commitment to sustainability reflects the need to protect our environment, assure long term economic vitality and control the cost of government.
Utilities The City of Cedar Rapids provides the utilities of water, sanitary sewer, storm water, solid waste, recycling, and yard waste. Private entities provide telecommunications, wireless, natural gas, and electric service.
283

The City of Cedar Rapids has a large concentration of industries that take advantage of the water and sewer infrastructure currently in place. For instance, the City distributes enough water to serve approximately 360K residential customers and treats the equivalent sewage strength that would be produced by more than one and half million residential customers. The large infrastructure currently in place makes the City of Cedar Rapids an attractive place to locate an industry. Adding additional industries and other customers increases the property tax base. Transportation Interstate 380 runs north-south through Cedar Rapids. Highways 30, 151, 218, 100, 13 also serve the City. Located 7 minutes from downtown Cedar Rapids is the Eastern Iowa Airport that connects with other regional and international airports. Cedar Rapids Transit provides convenient transportation throughout the City offering services directly provided or partially funded by Cedar Rapids Transit. Parks and Recreation The Parks and Recreation Department provides park maintenance, recreation programs, activities, facilities, and aquatic options. Cedar Rapids offers a variety of cultural, park, and recreational activities such as: 2 outdoor aquatic centers, 3 outdoor pools, 1 indoor pool, and 10 splash pads 4 golf courses – Ellis, Gardner, Twin Pines, and Jones 3,360 acres of city owned park property such as Noelridge Park greenhouse and flower gardens, athletic
fields, pavilions, volleyball courts, and playgrounds A year round schedule of recreational and leisure activities for all ages and special programs for people with
disabilities Ushers Ferry Historic Village – historical perspective of a small town at the turn of the 20th century Trails Farmers market
284

Other Supplemental Information This section contains additional information not detailed in department sections.
285

Capital Equipment As part of the budget process, tax supported departments submit requests to purchase equipment for operations. In December 2019, the director team met to review and determine which capital equipment requests would be included in the FY 2021 budget. CAPITAL EQUIPMENT – INCLUDED IN THE FY 2021 BUDGET Below are capital equipment requests submitted from departments that are included in the budget. Police ($231K) Ballistic Vests Tasers - Agreement Tactical Ballistic Vest Replacement Tactical Ballistic Helmets Tactical Air Purifying Respirators Handgun Replacement - Duty Weapons Ballisitic Shields Canine Tasers - Replacements Exercise Equipment – Elliptical Rifle Refurbishing (partially funded) Fire ($612K) Fire Fighting Turnout Gear Self-Contained Breathing Apparatus Cardiac Monitor/Defibrillator (partially funded) Elliptical & Treadmill Equipment (partially funded) Joint Communications ($82K) Uninterruptible Power Supply Battery Backup with Camera Monitoring South tower Device for Programming Radio Encryption Monitor Public Works ($364K) Hydraulic Power Unit for Core Machine, Trailer and Water Tank Pavement Marking Machine Tachometers for Inspector Testing Equipment Pin Gun Trackless Sidewalk Snow Plow and Blower Mastic Crack Seal Machine Soil Compaction Testing Equipment Global Positioning System Survey Equipment Parks & Recreation ($81K) Water Heater (Jones Pool) Automatic Pool Vacuum Floor Scubber (Bender Pool) Park Signs Inflatable Water Feature
286

Auto Locks (Seminole) Bleacher Planks (Ellis) Ping Pong Table - NW Recreation Center Grills Auto Locks Cedar Valley Holiday Light Decorations - Greene Square Drinking Fountains (partially funded) Information Technology ($334K) Servers Plotter Fire - Mobile Data Computers, Docking Station, and Mounting Hardware Council Chambers Audio Visual Equipment Parks - Camera System Recreation - Smart Drawers, Receipt Printers & Cradle Clerk – Scanner Golf - Camera System (partially funded) Audio Visual Equipment for Conference Rooms (partially funded)
CAPITAL EQUIPMENT – EXCLUDED FROM THE FY 2021 BUDGET Below are capital equipment requests submitted from departments that were excluded from the budget. Police ($136K) Hazardous Devices Robot Use of Force Training Simulator Chairs For Records Department Fire ($55K) Gear Extractor Central Fire Interview Room Equipment Update Body Armor Plate Carrier and Helmet Golf ($5K) Driving Range Mats
Parks & Recreation ($69K) Shade Structures - Tait Ball Complex Walk Behind Parking Lot Stripper Public Address System
Information Technology ($33K) Police - Body Camera Replacements Public Works - Monitor for Streets and Sewer Public Works - Monitor for Traffic Administration Parks - Camera Storage
287

Funding Requests OPERATING REQUESTS Below are operating requests submitted from departments that are not included in the budget. Police ($128K) 1 Kennel Maintenance Worker FTE Ballistic imaging and analysis service Increase for training Increase for accreditation Scanner associated costs Increase for clothing allowance
Fire ($90K) Fire station study – Will be funded in FY 2020
Joint Communications ($227K) 3 Dispatcher FTEs Information Technology ($222K) Time clock maintenance External professional services support for city website Emergency Management Mobile Application International public safety data subscription Citywide power assessment Increase for mobile connectivity fees
Public Works ($231K) 1 Right of Way Permit Technician FTE 1 Utility Coordinator FTE .25 Right of Way Intern FTE .25 Traffic Engineering Intern FTE Increase for intern wages Increase for training and travel Increase for uniforms Increase for dues & memberships
Parks and Recreation ($35K) .48 Forestry Secretary FTE Ash trees replacement for Parks Solid Waste & Recycling ($381K) 1 Solid Waste Recycling Driver Collector FTE and garbage truck
288

Capital Improvement Projects TAX SUPPORTED CAPITAL IMPROVEMENT PROJECTS Below are tax supported capital improvement project requests submitted from departments that are not included in the budget. Parks & Recreation & Golf Improvements ($1.3M) Tait Cummins Foul ball spectator protection Nixon Pedestrian bridge replacement Noelridge Tennis Court Reconstruction Harbor Sidewalk Repairs Clubhouse re-roofing - Gardner, Twin Pines, Ellis Retaining wall re-construction Pump house Repairs - Twin Pines
Public Works Improvements ($9.8M) Collins Rd Fr Northland-Twixt (partially approved) First Ave Fr 27th - 40th Tower Terrace Road W. of I-380 Interchange 4th Street Quiet Zone - Phase 1 - Stickle Drive to 5th Avenue Sidewalk Infill Project - Recurring (partially approved) Collins Road Median Improvements at Northland Avenue Collins Road NE from E. of Northland Avenue to F Avenue Quiet Zone - Phase 2 - South of 5th Avenue Mount Vernon Road Retaining Wall Mt Vernon Road and 8th Avenue Roundabout 1st Ave Signal Loop CEMAR Trail Phase III Signal Improvements for ADA compliant Cedar Rapids Wayfinding Signs Cherokee Trail Bowling Street Trail TIF Downtown River Wall Improvements
UTILITY AREA CAPITAL IMPROVEMENT PROJECTS There are $133M of capital improvement projects submitted from the Water Pollution Control department that are not included in the budget for FY 2022 thru FY 2025. This includes $90M in additional expenses associated with the phase one demolition of the low pressure oxidation system, installation of digesters, and installation of gas cleaning equipment. This also includes $43M associated with phase two demolition of the hearth incinerator, installing a fluidized bed incinerator, nutrient removal, and associated costs.
289

Glossary
290

Glossary ACRONYMNS 911 – EMERGENCY SERVICES PHONE NUMBER ADA – AMERICANS WITH DISABILITIES ACT – A law enacted by the U.S. Congress in 1990 that prohibits, under certain circumstances, discrimination based on disability. ATE – AUTOMATED TRAFFIC ENFORCEMENT CAMERA CALEA – COMMISSION ON ACCREDITATION FOR LAW ENFORCEMENT AGENCIES, INC – A credentialing authority through the joint efforts of law enforcement’s major executive associations that have demonstrated compliance. CCF – CUBIC FEET – one CCF equals 100 cubic feet or 748 gallons CIP – CAPITAL IMPROVEMENT PROJECTS – Account for capital expenses and resources related to a specific capital facility, improvements other than a building, and other major fixed assets. CR – CEDAR RAPIDS DECR – DECREASE E – EAST FCS – FLOOD CONTROL SYSTEM – A system designed and being constructed to convey the same water volume as the flood of 2008, reducing flood risk through the heart of Cedar Rapids on both the west and east sides of the river. The system will include a combination of floodwalls, levees and gates, and incorporate aesthetic elements that reflect our community’s culture, history, and vision. FICA – FEDERAL INSURANCE CONTRIBUTIONS ACT – Is a United States payroll (or employment) tax imposed by the federal government on both employees and employers to fund Social Security and Medicare programs that provide benefits for retirees, the disabled, and children of deceased workers. FMS – FACILITY MAINTENANCE FTE – FULL TIME EQUIVALENT – An FTE is considered available to work 2080 hours annually, which represents a normal work year for a regular full-time employee. FY – FISCAL YEAR – A twelve-month period designated as the operating year for accounting and budgeting purposes. For the City of Cedar Rapids, the fiscal year term is from July thru June. GFOA – GOVERNMENT FINANCE OFFICERS ASSOCIATION OF THE UNITED STATED AND CANADA – A professional association of state/provincial and local finance officers in the United States and Canada, and has served the public finance profession since 1906. GFOA members are dedicated to the sound management of government financial resources. G.O. – General obligation bond backed by the City.
291

I.E. – example. IFM – IOWA FLOOD MITIGATION PROGRAM – Legislation allowing the City to use incremental growth from the City’s sales tax to pay for flood protection. INC – INCORPORATED – Organized and maintained as a legal corporation. INCR – INCREASE IPERS – IOWA PUBLIC RETIREMENT SYSTEM – Provides pension benefits for qualified public employees in Iowa. JC – JOINT COMMUNICATIONS K – THOUSAND LOST – LOCAL OPTION SALES TAX M – MILLION MFPRSI – MUNICIPAL FIRE AND POLICE RETIREMENT SYSTEM OF IOWA - Retirement and disability benefits for eligible police officers and firefighters in Iowa. N – NORTH NE – NORTHEAST NW - NORTHWEST SLOST – STREETS LOCAL OPTION SALES TAX – Approved by citizens of Cedar Rapids vote to have a 1% local option sales tax to fund streets for a period of 10 years starting July 1, 2014, ending June 30, 2024. NPDES – NATIONAL POLLUTANT DISCHARGE ELIMINATION SYSTEM – The NPDES program was created as part of the Federal Clean Water Act Amendments of 1992. The Clean Water Act requires that all local government agencies and major private industries take all practicable measures in reducing pollution discharges into major bodies of water. S – SOUTH SE – SOUTHEAST SW - SOUTHWEST SSMID – SELF SUPPORTED MUNICIPAL IMPROVEMENT DISTRICT – A self-supported municipal improvement district is informally referred to as a SSMID district. Generally, it is an area of contiguous property within a city – often in the downtown or central areas – zoned for either commercial or industrial purposes or a duly designated historic district. A tax levy is imposed on property within the SSMID district in addition to all other tax levies. The added revenues can be used for improvements to the district, administrative fees, and debt for the cost of improvements.
292

STAR – SUSTAINABILITY TOOLS FOR ASSESSING AND RATING – National rating system for communities on sustainability TIF – TAX INCREMENT FINANCING – Financing method to use taxes to finance improvements. W – WEST WPC – WATER POLLUTION CONTROL TERMINOLOGY 28E AGREEMENT – Type of intergovernmental grant agreement between local agencies usually for a specific purpose, project, or use with cost sharing. ACCRUAL BASIS – Recognition of revenues as earned and expenses when incurred. ADMINISTRATIVE CHARGES – General fund departments provide services to enterprise departments. During the 2008 budget process, the City Council provided policy direction that all departments in the City should be charged an internal service cost to reflect the full cost of providing services to City departments. Departments such as the City Manager’s Office, Council & Mayor, Purchasing, Attorney, Human Resources Department, Downtown, and Contingent charge Administrative Charges. ADJUSTED BUDGET – The original adopted budget plus/minus any expected amendments to be submitted to the City Council for budget amendment approval. ADOPTED BUDGET – Represents the budget adopted by the City Council. AMENDED BUDGET – The original adopted budget plus/minus any amendments passed by the City Council each year. APPROPRIATION – A legal authorization to incur obligations and to make expenditures for a specific purpose. ASSESSED VALUATION – A set valuation upon real estate or other property as a basis for levying taxes. An assessed valuation represents the appraised valuation less any exemptions. BACKFILL – Iowa Senate File 295 provision that the state of Iowa agrees to appropriate money to local governments to replace lost revenue due to reductions in valuation of commercial and industrial properties to a 90% level of assessment. BALANCED BUDGET – A budget in which revenues meet expenditures. BONDS – A bond is a debt instrument that promises repayment of money borrowed over a specified period of time at a specified rate of interest. Bonds are usually sold/purchased in the universal amount of $5,000. BUDGET – A budget is a plan of proposed expenditures and the means of financing them. BUDGET TIME TABLE – The schedule of key dates in the preparation and adoption of the budget. BUSINESS UNIT – An organizational entity that maintains its own transaction data.
293

CAPITAL ASSET – Capital asset includes land, buildings and structures, and improvements other than buildings, which include infrastructure, construction in progress, and machinery and equipment. CAPITAL EXPENDITURES – Expenditure for capital items of less than permanent nature and normally at a lower costs than a capital improvement. CAPITAL IMPROVEMENT PROGRAM – Selection & scheduling of improvements over a multi-year period. Contains funds that are financed with tax support debt, enterprise or internal service monies, or other funding sources. CAPITAL PROJECT FUNDS – Account for expenses and resources related to the acquisition and construction of capital facilities, improvements other than buildings, and other major fixed assets. CHARGES FOR SERVICES – Charges to internal and/or external users for the services provided. COLLECTIVE BARGAINING AGREEMENT – A legal contract between the employer and a representative of a recognized bargaining unit for a specific term and condition of employment. COMPREHENSIVE ANNUAL FINANCIAL REPORT – A set of government financial statements comprising the financial report of a state, municipal or other governmental entity that complies with the accounting requirements—generally accepted accounting principles (GAAP)—promulgated by the Governmental Accounting Standards Board (GASB). COMMUNITY DEVELOPMENT BLOCK GRANT – A program of the U.S. Department of Housing and Urban Development to fund local community development activities such as affordable housing. CONTINGENCY – Funds set aside for use by the City Manager or Council for unplanned expenses. DEBT SERVICE FUND – Account for the accumulation of resources for and the payment of principal, interest, and related costs for general long-term debt and special assessment debt. DEFICIT – A deficit is the excess of expenditures over revenues during a fiscal year. DEPARTMENT – An organizational unit of the City that has a unique function in its delivery of services. DEPARTMENT ID – Specific general ledger coding assigned to departments, programs, or sections within the City. DEPRECIATION – Method of allocating the cost of a tangible asset over its useful life. DISCRETIONARY EXPENDITURES – Non-personal service expenses are expenses that are considered controllable by City Departments (I.e. office supplies, training, etc.). ENCUMBRANCE – Encumbrance includes obligations in the form of purchase orders, contracts, or other commitments that are chargeable to an appropriation. ENERGOV – Software to automate and centrally connect critical processes.
294

ENTERPRISE FUND – Account for operations and activities that are financed and operated in a manner similar to a private business enterprise and where the cost of providing goods and services to the general public on a continuing basis is expected to be financed or recovered primarily through user charges. ENVISIONCR – Comprehensive plan to provide a vision for the future of Cedar Rapids. EXPENDITURES – A payment that is a decrease in resources. FEES – Fees are charges for services. FINANCIAL PLAN – A road map into the future and a framework for future decision making. FINES AND FORFEITS – Court fines, library fines, traffic enforcement fines. FRANCHISE FEES – A cable or utility fee paid to the City. FUND –An independent accounting entity with a self-balancing set of accounts. FUND BALANCE – Fund balance is the difference between assets and liabilities on the governmental fund balance sheet. FUNDING INCREASE – A request for funding made a department that may or may not be approved and included in the adopted budget. FUNDING SOURCE – A funding source is the identified dollars allocated to meet budgeted requirements. GENERAL FUND – The primary operating fund of the City that accounts for all financial resources and expenditures, except those required to be accounted for by other funds. GENERAL OBLIGATION BONDS – Debt issuances typically need to finance government improvements benefiting the community as a whole; secured by an unlimited tax levy of the issuer. GOVERNMENTAL ACCOUNTING – Accounting standards set forth by the Governmental Accounting Standards Board (GASB). HOTEL MOTEL TAX – A consumer tax on lodging charges for hotels and motels. INTERGOVERNMENTAL GRANTS – Intergovernmental grant revenue is a combination of federal, state, or local funding usually for a specific purpose, project, or use. INTERNAL SERVICE FUND – These funds are used to account for the financing of goods and services provide by a City Department or agency to other City Departments or agencies on a cost reimbursement basis. LICENSES AND PERMITS – Fees derived from a number of sources including building, plumbing, mechanical, and electrical permits as well as liquor licenses and right of way permits. KERNELS – Nickname of the Cedar Rapids Kernels Class A minor league baseball team that is home base is Veterans Memorial Stadium.
295

MAJOR FUND – A fund whose revenues or expenditures constitute more than 10% of the revenues and expenditures of the appropriated budget. NATIONAL FLOOD INSURANCE PROGRAM – The program created by the Congress of the United States enables property owners in participating communities to purchase insurance protection from the government against losses from flooding. NON-DISCRETIONARY EXPENDITURES – Expenses that are considered not fully controllable by City Departments as they are subject to external or economic factors. OPERATING EXPENSES – Expenses of normal maintenance and repairs presumed to benefit the current fiscal period. These expenses are not classified as capital improvement or capital equipment as they do not add value to the asset or materially extend the asset life. ORDINANCE – A law made by a municipality. OTHER REVENUES – Other revenue in financial summaries refers to a variety of sources such as interest, building rental, parking fees, landing fees, insurance premiums, capital contributions, etc. PAY AS YOU GO CAPITAL IMPROVEMENT FUNDING – Funding capital outlay from current revenues and user fees rather than through borrowing. PERFORMANCE MEASURES – Measure of the progress of accomplishing an objective and focus on the output, result, accomplishment, efficiency, or effectiveness. PERSONAL SERVICES – The salaries, wages, and benefits for full time equivalents (FTEs). PROCEEDS OF LONG TERM LIABILITIES – Revenue from general obligation bonds, revenue bonds, tax increment financing bonds, state revolving fund proceeds, etc. PROGRAM – A service or activity provided. REFUNDING – Procedure (sale) in which an issuer refinances an outstanding bond issue by issuing new bonds in order to take advantage of a declining interest rate environment or obtain debt structure modification. RESOLUTION – An order of a legislative body formally approved. REVENUE – Sources of financing expenditures. REVENUE BONDS – Debt issuances used to finance facilities that have a definable user or revenue base; secured by a specific source of funds usually the revenue stream from operations; not generally subject to referendum. REZONE CEDAR RAPIDS – Project to update zoning code of Cedar Rapids. ROAD USE TAX – Revenue received by the City through a state excise tax on fuel for eligible uses such as road way maintenance, construction, street lighting, bridge maintenance, etc. ROLLBACK – Section 441.21 of the Code of Iowa that provides for the reduction of property tax valuations according to assessment limitations to cushion the impact of inflation.
296

SCHOOL RESOURCE OFFICER – A officer that collaborates with the school and the community as a resource for safety and security issues, engaging in law enforcement, teaching, and mentoring in schools. SECTION – An activity or division of a department. SPECIAL REVENUE FUNDS – Account for revenues derived from sources for a specific use, which are required to be accounted for as a separate fund. STATE REPORTS AND FORMS – Forms and reports prescribed by the State of Iowa, which must be used by all cities in preparing their budgets. STREETS LOCAL OPTION SALES TAX – Approved by citizens of Cedar Rapids vote to have a 1% local option sales tax to fund streets for a period of 10 years starting July 1, 2014, ending June 30, 2024. SUBSIDY – In the case of a general fund department, a department partially or fully supported by property tax or other funding sources not specifically associated to the department’s purpose. TAX RATE – The tax rate is the rate of tax levied per $1000 of assessed valuation. TAXES – A revenue source levied by a government for purposes of funding expenditures. TRANSFERS IN/OUT – Transfers are the authorized exchanges of cash or other resources between funds. TRUST & AGENCY FUNDS – Account for assets held by the City in a trustee or custodial capacity for the City’s retirement funds and for other entities, such as individuals, private organizations, or other governmental units. These fund types are further classified as expendable trust funds or pension trust funds. TYPICAL RESIDENTIAL CUSTOMER – A household that uses 10 units of water and 10 units of sewer. One unit is 100 cubic feet or 748 gallons. USER FEES – Charges to specific users of a service provided.
297