Fiscal Year 2013 CURRENT EXPENSE BUDGET
154
MASSACHUSETTS WATER RESOURCES AUTHORITY Fiscal Year 2013 CURRENT EXPENSE BUDGET
-
Upload
khangminh22 -
Category
Documents
-
view
5 -
download
0
Transcript of Fiscal Year 2013 CURRENT EXPENSE BUDGET

MASSACHUSETTS WATER RESOURCES AUTHORITY
Fiscal Year 2013
CURRENT EXPENSE BUDGET

BOARD OF DIRECTORS
Richard K. Sullivan Jr., Chair
John J. Carroll, Vice Chair
Joseph C. Foti, Secretary
Joel A. Barrera
Kevin L. Cotter
Michael S. Gove
James W. Hunt III
Vincent G. Mannering
Andrew M. Pappastergion
Marie T. Turner
John J. Walsh
Prepared under the direction of
Frederick A. Laskey, Executive Director Michael J. Hornbrook, Chief Operating Officer
Rachel C. Madden, Director, Administration & Finance
together with the participation of MWRA staff.

MASSACHUSETTS WATER RESOURCES AUTHORITY Charlestown Navy Yard
100 First Avenue – Building 39 Boston, MA 02129
Frederick A. Laskey Telephone: (617) 242-6000 Executive Director Fax: (617) 788-4899
TTY: (617) 788-4971
September 2012 Katherine Haynes Dunphy, Chairwoman MWRA Advisory Board 100 First Avenue Boston, MA 02129 Dear Chairwoman Dunphy: This letter transmits to the Advisory Board MWRA’s Current Expense Budget (CEB) for Fiscal Year 2013. The CEB was approved by the MWRA’s Board of Directors at its June 27, 2012 meeting. The Final FY2013 budget resulted in a 3.0% final assessment increase as recommended by the MWRA Advisory Board. MWRA was able to reduce the rate revenue requirement in the Final budget by $5.1 million by reducing Debt Service to reflect the increased defeasance, the latest State Revolving Fund (SRF) structure and the inclusion of $350,000 in anticipated Debt Service Assistance funds. Additionally, the recognition of lower healthcare costs and higher projected investment yields also contributed to lower the Rate Revenue Requirement. The FY2013 total expenses are $635.9 million, of which 59.0% or $375.3 million is for capital financing costs, $214.9 million for direct expenses, and $45.7 million for indirect expenses. Debt Service remains the largest component of the budget and represents the greatest rate management challenge in the future, as significant debt obligations come due. The overall increase from the FY2012 budget is $17.7 million or 2.9%. In line with MWRA’s multi-year rates strategy and past practice, the Authority used the available surplus fund from FY12 to defease debt to achieve targeted rate relief in future years where is needed the most. Additional budget information and a copy of this document are available online at www.mwra.com. Questions or comments on this document should be directed to the MWRA Budget Department at (617) 788-2268. Thank you for your continued support. Sincerely, Frederick A. Laskey Executive Director

WATER & SEWER COMMUNITIESBOARD OF
DIRECTORS WATER & SEWER COMMUNITIES
ADVISORY BOARD
DIRECTORS
Affirmative Action and Compliance
Unit
EXECUTIVE OFFICE
ADVISORY BOARD
LAW DIVISION
OPERATIONS DIVISIONADMINISTRATION
ANDFINANCE DIVISION
EXECUTIVEDIVISION
Operations Division
Administration
Environmental Quality
Field Operations
FacilitiesMgmt
Fleet Services
Wastewater Treatment
Deer Island Engineering
Director's Office
Budget
Planning & Coordination Department
Public Affairs
Litigation
Labor and
Real Property and
Environmental Management
Procurement
Residuals
Clinton
andConstruction
Treasury
Controller
Office of Emergency
Preparedness
InternalAudit
and Employment
Capital and
Operations
Human
LaboratoryServices Risk
Management
Management Information
Systems
Resources

TABLE OF CONTENTS SECTION I: EXECUTIVE SUMMARY MWRA Mission I -1 Community Profiles and Assessments I-18 Revenue and Expenditure Trends I-20 Capital Improvement Program I-22 MWRA Organization and History I-25 Statement of MWRA Financial Position I-28 SECTION II: EXECUTIVE DIVISION Executive Office Budget Summary II -1 Office of Emergency Preparedness II -3 Planning and Coordination Department II -6 Affirmative Action and Compliance Unit II -9 Internal Audit II-11 Public Affairs II-12 SECTION III: OPERATIONS DIVISION Operations Division Budget Summary III -1 Operations Administration III- 9 Wastewater Treatment III-11 Deer Island III-12 Residuals III-16 Clinton III-18 Field Operations III-20 Laboratory Services III-24 Environmental Quality III-26 Engineering and Construction III-27 SECTION IV: LAW DIVISION Law Division Budget Summary IV -1 SECTION V: ADMINISTRATION & FINANCE DIVISION Administration & Finance (A&F) Division Budget Summary V - 1 A&F Division Director's Office V - 5 Rates & Budget V - 6 Treasury V - 8 Controller V -10 Risk Management V -11

SECTION V: ADMINISTRATION & FINANCE DIVISION CONT’D. Facilities Management V-12 Fleet Services V-14 Human Resources V-16 Management Information Systems V-19 Procurement V-24 Real Property and Environmental Management V-27 APPENDICES A. Direct Expense Budget Line Items Descriptions B. Budget Process and Timetable C. Budget and Assessment Policies and Procedures D. MWRA Planning Estimates FY2013 – FY2022 E. Glossary of Financial and Operating Terms F. Capital Financing by Debt Series

Executive Summary

FY13 CEB -- page I-1
Executive Summary MWRA Mission The Massachusetts Water Resources Authority (MWRA) is an independent authority that provides wholesale water and sewer services to its member communities and funds its operations primarily through user assessments and charges. MWRA’s mission is to provide reliable, cost-effective, high-quality water and sewer services that protect public health, promote environmental stewardship, maintain customer confidence, and support a prosperous economy. MWRA’s long-term plan emphasizes improvements in service and systems and includes aggressive performance targets for operating the water and wastewater systems and maintaining new and existing facilities. Parallel to MWRA’s goal of carrying out its capital projects and operating programs is its goal of limiting rate increases by working in partnership with its member communities. The need to achieve and maintain a balance between these two goals continues to be the critical issue facing MWRA. A brief history and organizational summary of MWRA is included at the end of the Executive Summary. During the year, MWRA measures actual performance on a monthly basis using various reporting tools. The monthly financial staff summary reports on actual spending versus the budget and provides summary explanations of the variances at the line item level. At least twice a year staff prepares projections for the year-end with a similar level of explanations. The performance indicator reports (the Orange and Yellow Notebooks) capture a variety of parameters regarding performance of each major functional area, on a monthly and quarterly basis. Overview Each year, MWRA prepares a budget that reflects the best available information for anticipated expenditures and revenues. MWRA transmitted its FY13 Budget to the Advisory Board in February. The Advisory Board has sixty days to review, comment, and provide recommendations. MWRA also hosts a public hearing to solicit comments on the budget and community assessments from citizens in its service area. In June, MWRA's Board of Directors holds hearings on the budget to review recommendations by the Advisory Board and new information available since the budget was developed. Staff incorporates Board decisions from the hearings and presents a final budget for approval in June. The FY13 Budget was approved by the Board on June 27, 2012. FY13 Budget Summary The FY13 Final Budget resulted in a 3.0% final assessment increase versus the 3.9% increase put forth in the FY13 Proposed CEB. MWRA was able to further reduce the Rate Revenue Requirement in the FY13 Final Budget by $5.1 million by reducing Debt Service to reflect the increased defeasance, the latest State Revolving Fund (SRF) structure, and the inclusion of $350,000 in anticipated Debt Service Assistance funds. Additionally, the recognition of lower healthcare costs and higher projected investment income yields also contributed to lower the Rate Revenue Requirement.

FY13 CEB -- page I-2
However, these measures will not be sustainable in future years. The budget decisions made in the near term will have a long-term impact on the future. As MWRA rolls out the final year of the three-year strategy, it must keep to a multi-year rates management strategy and look beyond this three-year snapshot to plan for what lies ahead. Based on the FY13 Budget, projected future rate changes are depicted in the following chart:
Total expenses of $635.9 million, $25.7 million or 4.2% above FY12 actual spending. Capital financing costs remain the largest component of the budget and account for 59% of total expenses. Debt Service Assistance (DSA) of $350,000 is assumed for FY13. While capital financing cost remains the largest component of the budget, other escalating liabilities continue to put pressure on the operating budget. Total expenses include $375.2 million for capital financing costs, 59.0% of total costs, and $260.6 million or 41.0% for operating expenses, of which $214.9 million is for direct expenses and $45.7 million is for indirect expenses. Total expenses increased $25.7 million or 4.2% from the FY12 actuals, $15.2 million which comes from higher operating expenses and $10.5 million of which comes from increased capital financing expenses. The $15.2 million increase in operating expenses from FY12 actuals is mainly due to wages and salaries of $4.2 million for negotiated cost of living adjustments (COLA), the decision to make an additional $3.1 million contribution towards the Authority’s Pension liability, Maintenance of $1.5 million due to increased projects, $1.2 million in additional operating reserve requirements, Watershed of $784,000 mainly for increased Payment in Lieu of Taxes (PILOT) expense, and higher professional services, other services, chemicals, fringe benefits, workers’ compensation, overtime, and utilities. The $10.5 million or 2.9% increase in capital financing expenses before offsets reflects debt service associated with the projected issuances of $100.0 million in new money in June of 2013 as well as new State Revolving Fund (SRF) debt of $64.7 million to be issued in June 2012 and an additional $38.0 million in 2013. Offsetting these issuances, are the impacts of the FY12 $38.7 million defeasance, which is estimated to yield savings of approximately $1.8 million in FY13, $12.2 million in FY14, $18.0 million in FY15, and $7.3 million in FY16.
1.3%
4.4%4.7%
2.5%
5.3%
3.5% 3.5%
7.0%
2.9% 2.9%
6.3%
4.9%4.5% 4.4%
3.8%
1.49%
3.5%3.0%
4.4%
7.4%
6.6%
8.9%
1.6%
4.1%
5.8%
4.3%4.7%
0.0%
2.5%
5.0%
7.5%
10.0%
FY96
FY97
FY98
FY99
FY00
FY01
FY02
FY03
FY04
FY05
FY06
FY07
FY08
FY09
FY10
FY11
FY12
FY13
FY14
FY15
FY16
FY17
FY18
FY19
FY20
FY21
FY22
Historical and Projected Rate Revenue Changes
Actual Projected

FY13 CEB -- page I-3
Total Revenues of $635.9 are budgeted for FY13. The FY13 Final Rate Revenue Requirement is $607.5 million, an increase of $17.8 million or 3.0% over the FY12 Rate Revenue Requirement. FY13 non-rate revenues total $28.3 million, a decrease of $1.9 million or 6.4% from FY12 actuals mainly due to lower investment income assumptions and lower use of Rate Stabilization funding offset by higher other user charges mainly for Chicopee Valley Aqueduct (CVA) adjustments and higher other revenue mainly for higher energy revenue. The FY13 non-rate revenue budget includes $14.5 million for investment income and $13.9 million in other user charges and other revenue – which includes an estimated $2.4 million from the sale of renewable energy portfolio credits and participation in demand response programs.

FY13 CEB -- page I-4
Table I-1 shows MWRA’s FY13 Budget for revenue and expenses compared with FY11 and FY12 actual spending. Changes from FY12 to FY13 are described in the Revenue and Expense section of the Executive Summary. Table I-1
TOTAL MWRA FY11 Actual FY12 Actual FY13 Final
$ %EXPENSES
WAGES AND SALARIES 88,505,698$ 89,887,813$ 94,059,400$ 4,171,587$ 4.6%OVERTIME 3,899,296 3,086,175 3,573,496 487,321 15.8%FRINGE BENEFITS 17,357,068 17,662,544 18,241,926 579,382 3.3%WORKERS' COMPENSATION 2,228,175 1,600,726 2,100,000 499,274 31.2%CHEMICALS 8,697,048 9,271,528 9,963,496 691,968 7.5%ENERGY AND UTILITIES 21,977,295 22,766,837 23,127,198 360,361 1.6%MAINTENANCE 27,964,126 26,776,012 28,229,070 1,453,058 5.4%TRAINING AND MEETINGS 127,569 184,229 385,617 201,388 109.3%PROFESSIONAL SERVICES 5,638,343 5,099,517 5,900,785 801,268 15.7%OTHER MATERIALS 4,327,538 5,513,699 5,591,291 77,592 1.4%OTHER SERVICES 23,551,459 22,985,817 23,743,608 757,791 3.3%TOTAL DIRECT EXPENSES 204,273,615$ 204,834,898$ 214,915,886$ 10,080,991$ 4.9% INSURANCE 1,002,044$ 2,076,962$ 2,097,875$ 20,913$ 1.0%WATERSHED/PILOT 24,709,345 25,629,604 26,413,175 783,571 3.1%HEEC PAYMENT 3,875,371 3,561,130 3,741,915 180,785 5.1%MITIGATION 1,474,834 1,744,579 1,566,923 (177,656) -10.2%ADDITIONS TO RESERVES (407,581) 195,467 1,398,329 1,202,862 615.4%RETIREMENT FUND 5,342,856 7,363,170 10,474,376 3,111,206 42.3%POSTEMPLOYMENT BENEFITS - - - - N/ATOTAL INDIRECT EXPENSES 35,996,869$ 40,570,912$ 45,692,593$ 5,121,681$ 12.6%
DEBT SERVICE (before offsets) 360,157,926$ 365,136,323$ 375,598,070$ 10,461,747$ 2.9% VARIABLE RATE DEBT VARIABLE RATE DEBT/OTHER - BOND REDEMPTIONDEBT SERVICE ASSISTANCE (384,323) (350,000) 34,323 -8.9%TOTAL DEBT SERVICE 360,157,926$ 364,752,000$ 375,248,070$ 10,496,070$ 2.9%
TOTAL EXPENSES 600,428,410$ 610,157,809$ 635,856,549$ 25,698,742$ 4.2%
REVENUE & INCOME
RATE REVENUE 569,800,000 589,700,000 607,512,000$ 17,812,000$ 3.0%OTHER USER CHARGES 7,218,641 7,264,794 7,766,693 501,899 6.9%OTHER REVENUE 7,335,377 5,655,582 6,116,844 461,262 8.2%RATE STABILIZATION 5,029,744 1,091,780 (1,091,780) -100.0%INVESTMENT INCOME 15,193,091 16,267,462 14,461,012 (1,806,450) -11.1%TOTAL REVENUE & INCOME 604,576,853$ 619,979,621$ 635,856,549$ 15,876,931$ 2.6%
ChangeFY13 Final Budget vs
FY12 Actual

FY13 CEB -- page I-5
FY12 Year-End Accomplishments: DITP treated 99.2% of flow through secondary and met secondary permit limits at all times without any
NPDES Permit violations.
Maintained MWRA’s strong credit ratings, Aa1, AA+, AA+ from Moody’s, Standard & Poor’s and Fitch respectively.
Continued the new construction and rehabilitation of facilities including integrated security and surveillance
system improvements.
Successfully negotiated and implemented successor collective bargaining agreements with five collective bargaining units.
Presented to the Board the recommendation of two major studies initiated in FY11 regarding an agency-wide Staffing Assessment and a Five-Year Strategic Information Technology Plan. Both of these studies will serve as a road map of shaping the implementation of new technologies and future staffing needs.
Successfully operated both the water and sewer systems during Tropical Storm Irene in late August 2011
and the unseasonable snow and ice storm in late October 2011. Work included extensive clean-up of downed trees and branches which were limiting access to MWRA’s mid-state aqueducts and waterworks facilities. Staff also assisted with restoration of a downed power line at the Quabbin Reservoir.
Completed the 2011C transaction for an All-In-True Interest Cost of 3.95%, the lowest in MWRA history to that point. On December 8, 2011 MWRA issued $327M in Refunding Bonds. Taking advantage of the low interest rates, the refunding resulted in a net present value savings of 7.17% or $25.3M
Completed the Series 2012 A&B transaction for an All-In-True Interest Cost of 3.93%, the lowest in
MWRA history. On April 19, 2012 MWRA issued $150M in New Money Bonds for the ongoing construction program and $86.8M in Refunding Bonds. Taking advantage of the low interest rates, the refunding resulted in a net present value savings of 5.09% or $5.2M.
Provided information and worked with communities expressing interest in joining the Authority.
Distributed a total of $14 million in grants and interest free loans ($6.3 million in grants and $7.7 million in 5-year loans) to member sewer communities through the Inflow/Infiltration (I/I) Local Financial Assistance Program and $22.7 million in 10-year interest free loans to member water communities as part of the Local Pipeline and Water System Assistance Loan Program.
Generated revenue at two water hydroelectric facilities: $569,000 at the Oakdale Station, $152,000 at the Cosgrove Station, and $42,000 at the Loring Road Station.
Competitively bid Calendar Year 2011 Renewable Energy Portfolio Standard certificates which resulted in
FY12 revenues of $319,000 (Class II) and $885,000 (Class I and Solar) Renewable Portfolio Standards (RPS) certificates.
Conducted a “Reverse Auction” for the purchase of electricity for 43 of the MWRA’s smaller energy accounts that represent four percent of overall electricity demand.
Continued to leverage MWRA’s self-generation assets and participation in the competitive energy market to offset operating costs. The combined impact of participation in the Independent System Operators of New

FY13 CEB -- page I-6
England (ISO-NE) load response program and the non-rate revenue from the sale of Renewable Portfolio Standards Program (RPS) credits resulted in $1.8 million in revenue for FY12. Deer Island also self-generated 24% of the plant’s total required power in FY12.
MWRA is rated as one of the largest bio-fuel users by the Massachusetts Alternative Fuel Coalition
(MAFC). The Authority continues to fuel diesel powered vehicles/equipment with bio-diesel.
Installation and start-up of the Charlestown Wind Turbine at the DeLauri Sewer Pump Station.
Awarded the following major contracts in FY12: Spot Pond Storage Facility Design Build; Deer Island Treatment Plant (DITP) North Main Pump Station (NMPS) Variable Frequency Drives (VFDs); DITP Air Emissions Testing; Northern Intermediate High (NIH) Stoneham-Reading Connection; Five-Year Strategic Information Technology Plan; Bond Counsel Services; North System Hydraulic Study; Purchase and Supply of Electricity Profile Accounts; Wachusett Aqueduct Pump Station Design; Hatchery Pipeline and Hydroelectric Design; Alewife Brook Pump Station Improvements Design; Alewife Brook Combined Sewer Overflow (CSO) Improvements Design; Union Park Operating Contract; Oakdale Phase 1A Electrical Upgrade; Brookline Overflow Conduit Cleaning; Clinton Aeration Efficiency Improvements; Upper Hultman Aqueduct Interconnections; DITP Primary and Secondary Clarifier Flushing System; FY13 Insurance Program; Disclosure Counsel Services; Residuals Processing Facility Technology Options Assessment; South Dike Tree Removal at Wachusett Reservoir; and DITP Fuel Oil Line Abandonment.
Advertised or received bids/proposals/statements for the following: DITP Expansion Joint Repair
Construction 2; Sudbury Aqueduct Pressurization and Connections; Letters of Credit, Liquidity Facilities or Direct Purchases; Nut Island Switchgear Modifications; Caruso Pump Station Improvements Design; Wachusett Aqueduct Emergency Interconnection Valves; DITP Concrete Steel Restoration and Coating, Phase IV; North Dike Tree Removal at Wachusett Reservoir; and DITP Replacement of Four Gravity Thickener Center Columns.
Procured the Authority’s vehicle purchases at the beginning of Fiscal Year 2012 (FY12) including 19
vehicles procured through the use of a “Reverse Auction” format, allowing for ample production and on-time delivery of all vehicles.
Migrated to a dedicated printer/fax/scanner system that replaced the mechanical three-part colored form
Purchase Order printer. Purchase orders are now printed on plain paper and faxed directly from the machine, rather than mailed to vendors. Estimated cost savings are $11,000 per year.
Managed nine (9) permit agreements (six at Turkey Hill and three at Walnut Hill). Coordinated with
Operations for approval of the equipment changes and improving the invoicing system for maintenance reimbursements. Total revenue for the nine agreements is $490,700 of which MWRA and the host community each receive half.
Identified $1.1 million in savings related to: internal audits, management advisory services, consultant
audits, construction contracts regarding labor burden, and true-ups of CY2010 billings by Harbor Energy Electric Company (HEEC) and CY2011 CSO force account billings by the Boston Water and Sewer Commission (BWSC).
Recycled 40.2 tons of paper, 262.2 tons of scrap metal, and 42,900 pounds of brass, copper, stainless steel and aluminum, generating $68,482 in revenues.

FY13 CEB -- page I-7
FY13 Initiatives: Continue close monitoring of financial markets to better position the Authority to take advantage of
any opportunities to reduce debt financing obligations, refund bonds for savings, and maximize investment income.
Continue to prepare for the start-up of Ultra-Violet (UV) Treatment at the CWTP.
Continue to identify, assess, and implement initiatives to reduce energy demand and increase energy self-generation in MWRA’s system. Pursue grant-funding and cost-sharing arrangements to defray costs of implementing these initiatives.
Evaluate and implement the recommendations of the Five-Year MIS Strategic Plan.
Participate in the evaluation of the Staffing Study recommendations and work with senior management and collective bargaining units to implement as needed specific recommendations adopted by the Board of Directors.
Implement New Lawson modules including Strategic Sourcing and Contract Management. The
new applications will allow MIS to retire custom applications including in-house developed Contracts and MBE/WBE applications. In addition, further automate identified workflows facilitating processes and reducing paper usage.
Continue assessment and evaluation of sustainable cost savings opportunities throughout the organization.

FY13 CEB -- page I-8
SOURCES AND USES OF FUNDS MWRA funds its operations primarily through member community assessments. Funds supporting the current expense budget are not subject to appropriation with the exception of debt service assistance. Table I-2 shows MWRA's sources and uses of funds for the FY13 Budget. Revenue
MWRA is required by its enabling act to balance its budget each year by establishing user assessments for water and sewer services that provide funds sufficient to recover the cost of operations (excluding depreciation), maintenance and improvements, and debt service, as well as meeting required reserve levels.
In the FY13 Budget, 95.5% of revenue is derived from rate revenue. The remaining 4.5% of revenue will come from interest on investments, charges to other water and sewer customers, non-recurring revenue, annual charges to sewer system users with permits issued by MWRA's Toxic Reduction and Control Department (TRAC), penalties assessed to holders of sewer use permits, and other miscellaneous sources.
Rate Revenue Under the FY13 Budget, the MWRA will raise $607.5 million of its total revenue requirements from water and sewer assessments to member communities. Of the $607.5 million, $411.5 million will fund the sewerage system, an increase of 1.4% as compared to FY12; and $196.0 million will fund the water system, an increase of 6.6% as compared to FY12. Non-Rate Revenue Other User Charges
Other User Charges include revenues derived from the provision of water and sewer services to communities and other entities under special agreements. Other User Charges in the FY13 Budget total $7.8 million, an increase of $502,000 or 6.9% from the FY12 actuals and includes $4.3 million paid by the Chicopee Valley Aqueduct communities, $1.5 million in water revenue collected from sewer ratepayers to offset the cost of water used for operation at Deer Island, $651,000 in entrance fees paid by Stoughton and Wilmington, $500,000 for the Commonwealth’s partial reimbursement for Clinton Wastewater Treatment Plant expenses, and $492,000 in water revenue and $325,000 in sewer revenue to contract communities and others.
Table I-2
Other User Charges $7.8 1.2%Other Revenue 6.1 1.0%
Investment Income 14.5 2.3%
Rate Revenue 607.5 95.5%Rate Stabilization 0.0 0.0%
TOTAL REVENUE $635.9 100.0%
Total Expenses before Debt Service Offsets $635.9Less: Debt Service Assistance (0.4) Bond Redemption 0.0Sub-Total Net Expenses 635.5
Capital Financing 375.2 59.0%Direct Expenses 214.9 33.8%Indirect Expenses 45.7 7.2%
TOTAL EXPENSES $635.9 100.0%TOTAL EXPENSES Less Offsets $635.5*May not add up due to rounding
SOURCES & USES OF FUNDS*$ in Millions
Sources of Funds
Uses of Funds

FY13 CEB -- page I-9
Other Revenue
Other Revenue is budgeted at $6.1 million, an increase of $461,000 or 8.2% from FY12 actuals mainly due to higher pricing for Renewable Energy Portfolio Credits and the addition of the Charlestown Wind Turbine.
Other Revenue includes $2.2 million in permit fees and penalties, in addition to $2.4 million for the sale of Deer Island’s Renewable Portfolio Credits and revenues for demand response programs.
Permit Fees and Penalties
The FY13 Budget includes $2.2 million in fees charged to industries that discharge toxic materials into the MWRA sewer system. These permit fees partially offset the annual costs of permitting, inspecting, and monitoring these industries.
Miscellaneous Revenue
The FY13 Budget includes $3.9 million in miscellaneous revenues of which $2.4 million pertains to the Authority’s energy programs for the sale of Renewable Portfolio Standard credits and participation in the demand response program, $1.0 million for a large number of miscellaneous revenue items, $303,000 is for hydro-power generated at MWRA’s facilities including the Cosgrove Intake facility, and $128,000 for wind power generated by the Charlestown Wind Turbine.
Investment Income
MWRA earns income by investing reserves and fund balances in a variety of interest-yielding securities. The FY13 Budget includes $14.5 million in investment income, a decrease of $1.8 million or 11.1% from FY12 actuals. The FY13 short-term interest rate is 0.50%, unchanged from the FY12 Budget assumption.
Non-Recurring Revenue
Non-Recurring Revenue is one-time revenue used in a given fiscal year to reduce assessments to member communities. In any fiscal year when annual revenues exceed expenses, MWRA may transfer the unexpended amount to the rate stabilization reserve. Within certain limits, MWRA may use this money to reduce the Rate Revenue Requirement in any subsequent year. Consistent with the requirements of its enabling act and its general bond resolution, MWRA treats transfers from the rate stabilization reserve as revenue in that fiscal year. For the FY13 Budget, no Rate Stabilization fund usage is projected.
Direct Program Expenses
The FY13 direct expense budget is $214.9 million, an increase of $10.1 million or 4.9% above FY12 actual spending. The principal drivers for the increases are wages and salaries due to wage increases, maintenance due to increased projects, professional services, other services, and chemicals due to price increases. To address rising direct costs, the MWRA has actively moved to consolidate operation and maintenance facilities, reorganized and automated facilities, reduced leased space, sold surplus assets, negotiated competitive purchase agreements for energy and chemicals, and increased self-generation and utilization of digester gas for energy production.

FY13 CEB -- page I-10
Line Item Budget Summary Figure I-1 combines related direct expense line items into general cost categories and shows that labor costs (wages and salaries, overtime, fringe benefits, workers’ compensation and training and meetings) are the largest component of the direct expense budget (55%), followed then by maintenance (13%), other services (11%), and utilities (11%).
Within the labor cost category, Wages and Salaries account for $94.1 million, $4.2 million or 4.6% above FY12 actual spending. Of the $94.1 million, $92.6 million is for regular pay. The FY13 Budget assumes a staffing level of 1,200, with an average funded level of 1,195, which is ten (10) positions fewer than funded in the FY12 Budget. New hires and backfills of vacant positions will be managed in the aggregate and addressed on a case-by-case basis by senior management.
Filled positions at MWRA have declined by 580 positions or 33% since the peak of 1,775 in March 1997 to a funded staffing level of 1,195 for FY13.
As the Authority’s major mandated capital initiatives near completion, maintenance expenses to preserve these operating assets will continue to grow. The FY13 Budget for maintenance is $28.2 million, an increase of $1.5 million or 5.4%, compared to the FY12 actual spending. The FY13 funding level is in line with FY11 actual spending.
The FY13 Budget includes $23.7 million for other services, an increase of $758,000 or 3.3% from FY12 actual spending. The budget includes funding of $14.6 million for sludge pelletization, $3.6 million for Space/Lease rentals and related expenses for the CNY and Chelsea facilities, and $1.4 million for voice and data costs.
The FY13 Budget includes $23.1 million for utilities, an increase of $360,000 or 1.6% from FY12 actual spending. The increase for utilities is primarily associated with a $669,000 increase for diesel fuel, mainly at Deer Island due to current year planned purchases and FY13 projected usage. The FY13 Budget assumes funding of $16.1 million for electricity, $4.4 million for diesel fuel, $1.9 million for water, and $515,000 for natural gas. The FY13 energy and utilities budget reflects the most recent pricing outlook based on energy futures and on the latest power purchase contracts for Deer Island, Carroll Water Treatment Plant, and other large FOD facilities. As a result of projected increased self-generation at Deer Island due to improved Steam Turbine Operations and new green energy initiatives, along with efficiency improvements in Field Operations, the total projected electricity usages is 4.6 million kWh or 2.7% lower than the FY12 Budget. In November 2010, a new 4 MW, three-year, fixed block power purchase agreement for the Authority’s larger electrical accounts in Field Operations, including the Carroll Water Treatment Plant, went into effect whereby 80% of demand will be fixed. In May 2011, the Authority entered into a two-year power purchase agreement for Deer Island where the Authority purchased a fixed 10 MW block of power and will purchase the remaining plant energy
Labor$118.4 55%
Chemicals$10.0 5%
Utilities$23.1 11%
Maintenance$28.2 13%
Professional Services
$5.93%
Other Materials$5.63%
Other Services$23.711%
FIGURE I-1Direct Expenses by Category
(in millions)

FY13 CEB -- page I-11
demand in the real-time market. This past February, the Authority entered into a 36-month contract to provide up to 5.8 kWh of power to smaller accounts for a fixed commodity price. With the addition of this new contract, the MWRA has fixed pricing for over 60% of its electricity load, with remaining demand being purchased in the real-time market.
The FY13 Budget includes $10.0 million for chemicals, an increase of $692,000 or 7.5% from FY12 actual spending. The majority of the increase in the budget is for increased usage of several chemicals for process and odor control in the wastewater system based on historical trends and increases in chemical usage associated with ultraviolet dosing changes. The balance of the increase is tied to projected chemical cost increases. Functional Area Budget Summary
For a broader perspective on MWRA's direct expense budget, Figure I-2 presents direct expenses by MWRA functional area and shows that 46% of the FY13 direct expense budget is for Wastewater Transport and Treatment costs, compared to 15% for Water Transmission, Treatment, and Distribution.
Facilities Planning, Design, and Construction
5%
MIS4%
Administration and Support
23%
Metering and Monitoring2%
Water and Wastewater Quality
5%Water Transmission, Distribution, and
Treatment15%
Wastewater Transport12%
Wastewater Treatment 34%
FIGURE I-2Staffing by Functional Area

FY13 CEB -- page I-12
Figure I-3 below illustrates staffing by Functional Area and shows the breakdown of the 1,183 filled positions as of June 2012. Of the 1,183 positions, 59% are devoted to operating and maintaining the water and wastewater treatment and transport systems; 23% to administration and support and MIS functions, and 9% to facilities planning, design, and construction. Water and Wastewater Quality functions and Meter and Monitoring account for the remaining 10% of staff.
Capital Financing
Outstanding Debt and Debt Management
The $7.5 billion spent on MWRA’s modernization efforts to date, has relied heavily on debt financing. Total debt as of June, 30 2012 was $5.9 billion consisting of senior and subordinated debt, as well as Tax-Exempt Commercial Paper. The MWRA enjoys strong unenhanced senior debt ratings of Aa1, AA+, and AA+ from Moody’s, Standard & Poor, and Fitch, respectively.
The Authority’s debt service obligation as a percent of total expenses has increased from 36% in 1990 to 59% in the FY13 Final Budget. Much of this debt service is for completed projects. MWRA’s capital spending, from its inception, has been dominated by court-mandated projects, which in total have accounted for 80% of capital spending to date. Going forward, the majority of capital spending will be geared towards asset protection and water redundancy initiatives.
Facilities Planning, Design, and Construction
9%
MIS5%
Administration and Support
18%
Metering and Monitoring
4%
Water and Wastewater Quality
6%Water Transmission,
Distribution, and Treatment
20%
Wastewater Transport15%
Wastewater Treatment 24%
FIGURE I-3Staffing by Functional Area

FY13 CEB -- page I-13
The FY13 Final capital financing costs total $375.2 million which reflects the $350,000 in anticipated Debt Service Assistance (DSA). The MWRA expects to finance the capital expenditures identified in the FY13 Capital Improvement Program (CIP) through the issuance of revenue bonds as provided for in the Enabling Act, and from the proceeds of federal and state grants and operating revenues. As of June 30, 2012, the MWRA’s indebtedness included $3.5 billion of senior revenue bonds, $1.2 billion of subordinated revenue bonds, approximately $1.1 billion of loans with the SRF, and $144 million of tax-exempt commercial paper notes.
The following graph illustrates the relationship between MWRA’s CIP and outstanding debt as of June 2012.
$0
$100
$200
$300
$400
$500
$600
$700
FY86
FY88
FY90
FY92
FY94
FY96
FY98
FY00
FY02
FY04
FY06
FY08
FY10
FY12
FY14
FY16
FY18
FY20
FY22
FY24
FY26
FY28
FY30
FY32
FY34
FY36
FY38
FY40
FY42
FY44
FY46
FY48
FY50
FY52
FY54
$ in
Mill
ion
s
MWRA Capital Improvement Spending &
Debt Service
Debt Service CIP - Actual CIP - FY13 Final
As of June 30th, 2012, the tota l Indebtedness
is $5.9 billion

FY13 CEB -- page I-14
The Authority has actively managed its debt structure to take advantage of favorable interest rates. Tools used by the MWRA to lower borrowing costs and manage rates include maximizing use of the subsidized State Revolving Fund (SRF) debt, issuance of variable rate debt, current and advanced refunding of outstanding debt, swap agreements, and the use of surplus revenues to defease debt. MWRA also uses Tax Exempt Commercial Paper to minimize the financing cost of construction in process.
In June 2012, MWRA executed a $38.7 million defeasance to achieve debt service reductions through the use of FY12 surplus funds and released reserves. These actions will result in debt service reductions of $1.8 million in FY13, $12.2 million in FY14, $18.0 million in FY15, and $7.3 million in FY16.
As shown on the chart above, since 2006 the Authority has used defeasances to reduce future year’s debt service requirements by $245.7 million.
The FY13 Final capital financing cost totals $375.2 and remains the largest portion of the MWRA’s budget, accounting for 59% of total expenses. The FY13 Final capital financing costs increased (after offsets) by $10.5 million or 2.9% compared with FY12 actual spending. The increase in MWRA’s debt service requirements is the result of new money issues in FY12 and projected FY13 issuances partially offset by the impact of the defeasance and refundings.
$250,000,000
$300,000,000
$350,000,000
$400,000,000
$450,000,000
$500,000,000
$550,000,000
2007 2008 2009 2010 2011 2012 2013 2014 2015 2016
Impact of DefeasancesFY06-FY12
FY06 Projected Debt Service 2006 2007 2008 2009 2010 2011 2012
$18.9M
$20.5M
$7.4M
$5.5M
$38.6M$43.5M
$58.5M$7.3M
$22.8M
Between FY06 and the FY12 defeasance,MWRA has defeased $245.7 million in debt service.
$22.9M

FY13 CEB -- page I-15
The FY13 Final capital financing budget includes:
$193.4 million in principal and interest payments on MWRA’s senior fixed rate bonds. This amount includes $1.8 million to support issuance of $100 million in June 2013;
$93.3 million in principal and interest payments on subordinate bonds;
$73.8 million in principal and interest payments on SRF loans. This amount includes $7.4
million to support issuances of $64.7 million in June 2012 and $38 million in 2013; $8.2 million to fund ongoing capital projects with current revenue and to meet coverage
requirements; $3.6 million to fund the interest expense related to the Local Water Pipeline Assistance
Program; and $3.2 million for the Chelsea Lease.
The FY13 Final Budget assumes a 3.25% interest rate for variable rate debt which is the same level as in FY12. The Authority’s variable rate debt assumption is comprised of three separate elements: the interest rate for the daily and weekly series, liquidity fees for the Standby Bond Purchase Agreement and Letter of Credit providers, and remarketing fees. While MWRA continues to experience unusually low interest rates, they are not reflective of historical averages and there is no guarantee that rates will stay low. The 20-year SIFMA interest rate average for variable rate debt is 2.43% and MWRA current average liquidity and remarketing costs are 74 basis points. The combination of these two costs results in an all-in average cost of approximately 3.17% which is on par with the FY13 Final Budget assumption. Table I-3 provides detail on the FY13 Budget capital financing line item. Table I-3 also illustrates how upgrading the sewerage system has dominated the capital program to date. Nearly 70% of the FY13 capital finance budget is for wastewater improvements. A complete list of the Authority’s indebtedness by series is presented in Appendix F.

FY13 CEB -- page I-16
Indirect Expenses The FY13 Final Indirect Expenses total $45.7 million, an increase of $5.1 million or 12.6% compared to FY12 actual spending. Below are the highlights of major changes: Insurance MWRA purchases property and casualty insurance from external insurance carriers with a self-insured retention of $2.5 million dollars and Worker’s Compensation Excess insurance with a self-insured retention of $500,000 per claim. The FY13 Final Budget includes $2.1 million for Insurance, an increase of $21,000 or 1.0% from FY12 actual spending. The FY13 Budget was based on actual average spending for the past five year, FY07-11. The budget includes $1.8 million for premiums and fees and $283,000 for the projected cost of claims made against the self-insured portion of MWRA coverage. MWRA mitigates the budgetary risk of self-insurance by maintaining an Insurance Reserve. The reserve, which was established as part of the Bond Resolution, requires that an independent insurance consultant review the funding level every three years and provide recommendations as to its adequacy. The Insurance Reserve Fund was reduced from $19 million to $14 million based on the recommended range provided in the most recent review prepared by the outside consultant indicated that the appropriate funding range was between $12 million and $16 million. The released funds were used to cover the costs associated with the May 2010 water main break and August 2010 water leak while the Authority pursues litigation to recover these expenses.
AmountOutstanding
Total FY13 Final Capital Costs
Sewer Water
Total SRF1 Debt $1,120 $73.8 $59.1 $14.7
Total Senior Debt 3,487 193.4 118.6 74.8Total Subordinate Debt 1,192 93.3 76.8 16.5
Total SRF and Debt Service2
$5,799 $360.5 $254.6 $105.9
Water Pipeline Commercial Paper 144 3.6 0.0 3.6
Current Revenue/Capital 3
8.2 6.2 2.1Capital Lease 3.2 2.2 1.0Sub-Total $144 $15.1 $8.4 $6.7
Total Capital Financing (before Debt Service Offsets) $5,943 $375.6 $263.0 $112.6Debt Service Offsets: Debt Service Assistance Total Capital Financing $5,943 $375.6 $263.0 $112.6
2 Numbers may not add due to rounding.
TABLE I-3FY13 Final Current Expense Budget - Capital Financing Detail (as of 6/30/12)
1 SRF debt service payments reflect net MWRA obligations after state and federal subsidies.
3 Current Revenue/Capital is revenue used to fund ongoing capital projects.
$ in Millions
FY13 CEB -- page I-17
Watershed Reimbursement/PILOT The Enabling Act directs MWRA to pay the Commonwealth of Massachusetts for several statutory obligations: Payment in Lieu of Taxes (PILOT) for Commonwealth-owned land in the watersheds, operating expenses of the Division of Water Supply Protection, and debt service costs for purchases of land around the supply reservoirs to protect the watersheds. The FY13 Final Budget includes $26.4 million for the Division of Water Supply Protection (formerly MDC Division of Watershed Management), an increase of $784,000 or 3.1% over FY12 actual spending. The budget is comprised of $13.2 million for reimbursement of operating expenses, $7.6 million for Payment in Lieu of Taxes (PILOT), and $5.6 million for debt service expenses on prior land purchases financed by the Commonwealth. Harbor Electric Energy Company (HEEC) The FY13 Final Budget includes $3.7 million for the Harbor Energy Electric Company (HEEC), an increase of $181,000 or 5.1% from FY12 actual spending. This funding is for the repayment of the capital investment of the Deer Island electric cable and substation which provides electric power to the treatment plant. Mitigation MWRA disburses mitigation funds to communities affected by MWRA projects or facilities pursuant to MWRA's Statement of Mitigation Principles and/or specific agreements with communities. MWRA mitigation may include relieving the direct impacts of construction, meeting environmental and regulatory requirements, long-term operating agreements, or community compensation for impacts over and above those addressed by other mitigation. In rare situations, where the extent and duration of the impact of a project or facility on a community is such that restoring the area to its pre-project state is insufficient to relieve the stress of MWRA’s presence during the project, MWRA funds or contributes to improvements to affected areas. Mitigation expenses are funded in the capital budget and in the current expense budget. The FY13 Final Budget includes $1.6 million for community compensation for impacts, including $820,000 for the City of Quincy and $747,000 for the Town of Winthrop, based on Memoranda of Agreement with the communities. The budget decreased $178,000 or 10.2% from FY12 actual spending mainly due to a one-time payment in FY12 to the Town of Winthrop for ambulance services. Going forward, the Town of Winthrop will supply ambulance services to the Deer Island Treatment Plant. Retirement System Contribution The FY13 Final Budget includes $10.5 million for the Retirement Fund, an increase of $3.1 million or 42.3% over FY12 actual spending. The FY13 funding of $10.5 million includes the required contribution of $5.8 million and an optional contribution of $4.7 million originally directed towards the Authority’s Other Post Employment Benefit (OPEB) liability.

FY13 CEB -- page I-18
GASB 45 – Accounting and Reporting by Employers for Postemployment Benefits Other than Pensions The Authority has complied with the GASB 45, Accounting and Financial Reporting by Employers for Postemployment Benefits Other than Pensions (OPEB), by disclosing this liability in the year-end Financial Statements. The Authority’s fiscal 2013 annual OPEB expense is calculated based on the annual required contribution of the employer (ARC), an amount actuarially determined in accordance with the parameters of GASB Statement No. 45. The ARC represents a level of funding that, if paid on an on-going basis, is projected to cover the normal cost per year and amortize the unfunded actuarial liability over a period of thirty years. As part of the multi-year strategy to address its unfunded liabilities for OPEB and pension holistically, the Board approved a strategy to aggressively pay down our pension liability and upon reaching full funding move to address the OPEB obligation. Additional optional pension contributions were included in the FY08, FY09, FY10, and FY12 approved budgets in line with this funding strategy. In an effort to restore the Authority’s long-term commitment for its liabilities, $4.7 million was included for OPEB in the FY13 Proposed Budget which represented 50% of the actuarial report funding level, under assumption of pre-funding option, issued in January 2010. As of June 2012, the Authority’s OPEB liability was $75.0 million, $14.8 million above the prior year’s level. Operating Reserves
Funding for the Operating Reserve for FY13 is $1.2 million greater than FY12 actual spending. The Operating Reserve balance is in compliance with MWRA General Bond Resolution which requires a balance of one-sixth of annual operating expenses. Based on the FY13 Final Budget, the required balance is $38.8 million versus the $37.4 million required in FY12. Community Profile and Assessments MWRA provides wholesale water and sewer services to 61 communities or local bodies. Fifty-one local bodies purchase water supply services, and 45 local bodies purchase wastewater transport and treatment services. Thirty-five local bodies purchase both. Approximately 2.8 million people, or 43% of the population of Massachusetts, live and work in the communities that purchase water and/or wastewater services from the MWRA. The MWRA’s largest single customer is the Boston Water and Sewer Commission (BWSC), which provides retail services in the City of Boston. In the FY13 Budget, rate revenue from BWSC will account for 31% of MWRA’s total rate revenue. Table I-4, on page I-20, lists MWRA communities, the services received, and the Final MWRA assessments for FY13. Each year MWRA determines preliminary wholesale water and sewer assessments in February and final assessments in June before the beginning of the new fiscal year. These assessments must satisfy the statutory requirement that MWRA fully recover its budgeted water and sewer costs by apportioning net costs among its wholesale water and sewer customers. Table I-5 on page I-21 presents the calculation of the MWRA's FY13 Rate Revenue Requirement. The table shows that most of the MWRA's current expenses are directly attributable to either water or sewer service costs, or to investment in the water or sewer systems. Expenses that support both systems are allocated to water or sewer assessments based on generally accepted cost allocation principles. The allocation methodology used in preparing the FY13 Budget was revised prior to FY02

FY13 CEB -- page I-19
to more accurately estimate the division of support costs between the water and sewer programs. Investment income and other revenues offset water and sewer expenses. The resulting net cost of water and sewer services is the amount the MWRA recovers through water and sewer assessments. Wholesale Assessment Methodology MWRA calculates separate user assessments for water and sewer services. Budgeted water operating and capital costs are allocated based on each community’s share of total water use for the most recent calendar year. The sewer assessment methodology allocates budgeted operating and maintenance costs based on the share of wastewater flow and strength parameters, and capital costs based on proportion of maximum flow, strength, and population. MWRA uses three-year averaging of wastewater flows to calculate the flow-related components of wholesale sewer assessments. Flow averaging moderates the short-term impact of year-to-year changes in community flow, but does not eliminate the long-term impact of changes in each community’s relative contribution to the total flow.

FY13 CEB -- page I-20
Table I-4 Massachusetts Water Resources Authority 27-Jun-12Final FY13 Water and Sewer Assessments
MWRA Fully Served Water and Sewer Customers
Final FY12 Water
Assessment
Final FY13 Water Assessment
Percent Change from
FY12
Final FY12 Sewer
Assessment
Final FY13 Sewer Assessment
Percent Change from
FY12
Final FY12 Combined
Assessment
Final FY13 Combined
Assessment
Dollar Change from
FY12
Percent Change from
FY12
ARLINGTON $4,111,254 $4,706,235 14.5% $7,190,694 $7,404,065 3.0% $11,301,948 $12,110,300 $808,352 7.2%
BELMONT 2,253,543 2,263,350 0.4% 4,490,781 4,593,647 2.3% 6,744,324 6,856,997 112,673 1.7%
BOSTON (BWSC) 66,577,763 71,651,462 7.6% 115,180,467 116,347,350 1.0% 181,758,230 187,998,812 6,240,582 3.4%
BROOKLINE 5,175,607 5,656,061 9.3% 12,047,440 12,401,739 2.9% 17,223,047 18,057,800 834,753 4.8%
CHELSEA 3,056,409 3,406,236 11.4% 6,315,106 6,451,121 2.2% 9,371,515 9,857,357 485,842 5.2%
EVERETT 4,157,781 4,334,567 4.3% 6,907,659 7,243,065 4.9% 11,065,440 11,577,632 512,192 4.6%
FRAMINGHAM 6,859,304 7,355,228 7.2% 10,365,277 10,385,748 0.2% 17,224,581 17,740,976 516,395 3.0%
LEXINGTON 5,049,999 5,145,927 1.9% 6,802,875 6,954,177 2.2% 11,852,874 12,100,104 247,230 2.1%
MALDEN 5,428,405 6,053,825 11.5% 10,847,823 11,319,673 4.3% 16,276,228 17,373,498 1,097,270 6.7%
MEDFORD 5,063,263 5,534,818 9.3% 10,794,857 10,766,699 -0.3% 15,858,120 16,301,517 443,397 2.8%
MELROSE 2,278,579 2,405,858 5.6% 5,382,210 5,437,804 1.0% 7,660,789 7,843,662 182,873 2.4%
MILTON 2,367,833 2,718,549 14.8% 4,797,042 4,985,169 3.9% 7,164,875 7,703,718 538,843 7.5%
NEWTON 8,939,785 9,695,370 8.5% 19,546,086 19,917,866 1.9% 28,485,871 29,613,236 1,127,365 4.0%
NORWOOD 3,181,474 3,372,954 6.0% 5,770,472 5,967,178 3.4% 8,951,946 9,340,132 388,186 4.3%
QUINCY 9,306,539 9,889,803 6.3% 17,658,232 18,073,247 2.4% 26,964,771 27,963,050 998,279 3.7%
READING 1,772,389 1,811,212 2.2% 4,128,058 4,326,182 4.8% 5,900,447 6,137,394 236,947 4.0%
REVERE 4,159,759 4,362,470 4.9% 9,203,347 9,486,795 3.1% 13,363,106 13,849,265 486,159 3.6%
SOMERVILLE 5,834,796 6,167,896 5.7% 13,719,348 13,887,278 1.2% 19,554,144 20,055,174 501,030 2.6%
STONEHAM 2,877,398 3,104,419 7.9% 4,253,379 4,357,938 2.5% 7,130,777 7,462,357 331,580 4.6%
WALTHAM 7,698,671 7,792,300 1.2% 12,347,461 12,485,924 1.1% 20,046,132 20,278,224 232,092 1.2%
WATERTOWN 2,658,770 2,925,467 10.0% 5,542,951 5,471,720 -1.3% 8,201,721 8,397,187 195,466 2.4%
WINTHROP 1,240,299 1,387,397 11.9% 3,125,822 3,036,088 -2.9% 4,366,121 4,423,485 57,364 1.3%
TOTAL $160,049,620 $171,741,404 7.3% $296,417,387 $301,300,473 1.6% $456,467,007 $473,041,877 $16,574,870 3.6%
MWRA Sewer and Partial Water Customers
Final FY12 Water
Assessment
Final FY13 Water Assessment
Percent Change from
FY12
Final FY12 Sewer
Assessment
Final FY13 Sewer Assessment
Percent Change from
FY12
Final FY12 Combined
Assessment
Final FY13 Combined
Assessment
Dollar Change from
FY12
Percent Change from
FY12
CANTON $2,215,262 $2,138,489 -3.5% $3,250,840 $3,313,092 1.9% $5,466,102 $5,451,581 ($14,521) -0.3%
NEEDHAM 610,028 964,345 58.1% 5,291,080 5,381,187 1.7% 5,901,108 6,345,532 444,424 7.5%
STOUGHTON 628,192 700,394 11.5% 4,438,406 4,420,052 -0.4% 5,066,598 5,120,446 53,848 1.1%
WAKEFIELD 1,477,779 1,617,772 9.5% 5,414,681 5,512,303 1.8% 6,892,460 7,130,075 237,615 3.4%
WELLESLEY 1,043,230 854,839 -18.1% 4,999,950 5,078,134 1.6% 6,043,180 5,932,973 (110,207) -1.8%
WILMINGTON 493,375 296,556 -39.9% 2,187,544 2,241,570 2.5% 2,680,919 2,538,126 (142,793) -5.3%
WINCHESTER 1,014,617 974,666 -3.9% 3,605,752 3,634,180 0.8% 4,620,369 4,608,846 (11,523) -0.2%
WOBURN 2,295,113 2,535,816 10.5% 9,041,505 8,959,770 -0.9% 11,336,618 11,495,586 158,968 1.4%
TOTAL $9,777,596 $10,082,877 3.1% $38,229,758 $38,540,288 0.8% $48,007,354 $48,623,165 $615,811 1.3%
MWRA Sewer-only CustomersFinal FY12
Water Assessment
Final FY13 Water Assessment
Percent Change from
FY12
Final FY12 Sewer
Assessment
Final FY13 Sewer Assessment
Percent Change from
FY12
Final FY12 Combined
Assessment
Final FY13 Combined
Assessment
Dollar Change from
FY12
Percent Change from
FY12
ASHLAND $1,996,318 $2,081,319 4.3% $1,996,318 $2,081,319 $85,001 4.3%
BEDFORD 2,951,458 2,909,153 -1.4% 2,951,458 2,909,153 (42,305) -1.4%
BRAINTREE 7,226,112 7,597,309 5.1% 7,226,112 7,597,309 371,197 5.1%
BURLINGTON 4,736,577 4,723,848 -0.3% 4,736,577 4,723,848 (12,729) -0.3%
CAMBRIDGE 21,495,855 20,768,232 -3.4% 21,495,855 20,768,232 (727,623) -3.4%
DEDHAM 4,809,110 4,864,300 1.1% 4,809,110 4,864,300 55,190 1.1%
HINGHAM SEWER DISTRICT 1,501,652 1,513,205 0.8% 1,501,652 1,513,205 11,553 0.8%
HOLBROOK 1,425,395 1,434,900 0.7% 1,425,395 1,434,900 9,505 0.7%
NATICK 4,460,551 4,634,401 3.9% 4,460,551 4,634,401 173,850 3.9%
RANDOLPH 5,177,242 5,393,673 4.2% 5,177,242 5,393,673 216,431 4.2%
WALPOLE 3,252,627 3,300,822 1.5% 3,252,627 3,300,822 48,195 1.5%
WESTWOOD 2,268,632 2,317,405 2.1% 2,268,632 2,317,405 48,773 2.1%
WEYMOUTH 9,865,795 10,131,271 2.7% 9,865,795 10,131,271 265,476 2.7%
TOTAL $71,167,324 $71,669,838 0.7% $71,167,324 $71,669,838 $502,514 0.7%
MWRA Water-only CustomersFinal FY12
Water Assessment
Final FY13 Water Assessment
Percent Change from
FY12
Final FY12 Sewer
Assessment
Final FY13 Sewer Assessment
Percent Change from
FY12
Final FY12 Combined
Assessment
Final FY13 Combined
Assessment
Dollar Change from
FY12
Percent Change from
FY12
LYNNFIELD WATER DISTRICT $424,008 $401,149 -5.4% $424,008 $401,149 ($22,859) -5.4%
MARBLEHEAD 1,829,892 1,825,752 -0.2% 1,829,892 1,825,752 (4,140) -0.2%
NAHANT 323,512 309,977 -4.2% 323,512 309,977 (13,535) -4.2%
SAUGUS 2,896,537 3,151,506 8.8% 2,896,537 3,151,506 254,969 8.8%
SOUTHBOROUGH 727,775 595,717 -18.1% 727,775 595,717 (132,058) -18.1%
SWAMPSCOTT 1,474,802 1,661,956 12.7% 1,474,802 1,661,956 187,154 12.7%
WESTON 1,751,901 1,684,844 -3.8% 1,751,901 1,684,844 (67,057) -3.8%
TOTAL $9,428,427 $9,630,901 2.1% $9,428,427 $9,630,901 $202,474 2.1%
MWRA Partial Water-only CustomersFinal FY12
Water Assessment
Final FY13 Water Assessment
Percent Change from
FY12
Final FY12 Sewer
Assessment
Final FY13 Sewer Assessment
Percent Change from
FY12
Final FY12 Combined
Assessment
Final FY13 Combined
Assessment
Dollar Change from
FY12
Percent Change from
FY12
DEDHAM-WESTWOOD WATER DISTRICT $47,238 $28,781 -39.1% $47,238 $28,781 ($18,457) -39.1%
LYNN (LWSC) 202,576 259,592 28.1% 202,576 259,592 57,016 28.1%
MARLBOROUGH 2,966,308 2,753,457 -7.2% 2,966,308 2,753,457 (212,851) -7.2%
NORTHBOROUGH 747,515 883,118 18.1% 747,515 883,118 135,603 18.1%
PEABODY 666,251 621,271 -6.8% 666,251 621,271 (44,980) -6.8%
TOTAL $4,629,888 $4,546,219 -1.8% $4,629,888 $4,546,219 ($83,669) -1.8%
SYSTEMS TOTAL $183,885,531 $196,001,401 6.6% $405,814,469 $411,510,599 1.4% $589,700,000 $607,512,000 $17,812,000 3.0%

FY13 CEB -- page I-21
Retail Charges
As noted above, MWRA provides water and sewer services to communities on a wholesale basis. Each community then re-sells services on a retail basis. As a result, household water and sewer charges include each household's share of the community's MWRA water and sewer assessments, plus the community's own charges for the provision of local water and sewer services. Each community independently establishes retail rates. When establishing local rates, community officials consider issues related to the pricing of services, level of cost recovery, and the local rate structure or methodology. Several factors contribute to a broad range of local rate structures in the MWRA service area: Differences in the extent to which water and sewer costs are supported through property taxes and
other sources of revenue; Differences in the means by which communities finance investments in their own water and sewer
systems; and Differences in communities’ retail rate methodologies. Some communities have flat unit rates, while others have inclining block rates. Local rates may also provide for differentials among classes of users, such as higher rates for commercial or industrial users, abatements to low-income or elderly residents, and adjusted sewer rates for customers with second meters used for lawn irrigation. Additional information on rate structure within the member communities is available on the MWRA Advisory Board website as part of its annual retail rate survey.
Sewer Water TotalAllocated Direct Expenses $149,032 $65,883 $214,916Allocated Indirect Expenses $14,644 $31,049 $45,693
PLUSCapital Expenses:Debt Service (less offsets) $254,312 $105,878 $360,190Current Revenue for Capital $6,150 $2,050 $8,200Other Capital Expenses $1,989 $4,868 $6,858
PLUSNon-Rate Revenue:Investment Income -$9,422 -$5,039 -$14,461Fees and Other Revenue -$5,195 -$8,689 -$13,884Rate Stabilization
EQUALSRate Revenue Requirement $411,511 $196,001 $607,512
TABLE I-5Calculation of the FY13 Rate Revenue Requirement
(000's)

FY13 CEB -- page I-22
Revenue and Expenditure Trends Because MWRA is required by its enabling act to balance its budget and to establish annual assessments to cover all expenses, revenue must change in concert with the changes in expenses each year. The Rate Revenue Requirement in any year is the difference between MWRA expenses and other revenue sources, most notably investment income and debt service assistance from the Commonwealth (which directly reduces debt service expense). For FY13, community assessments will represent 95.5% of total revenue.
MWRA’s planning estimates are projections based on a series of assumptions about future spending (operating and capital), interest rates, inflation, and other factors. MWRA uses the planning estimates to model and project what future assessments might be based upon these assumptions, as well as to test the impact of changes to assumptions on future assessments. The planning estimates are not predictions of what assessments will be but rather they provide the context and framework for guiding MWRA financial policy and management decision making that ultimately determine the level of actual assessments on an annual basis. Conservative projections of future assessments benefit the MWRA by providing assurance to the rating agencies that MWRA anticipates to raise revenues sufficient to pay for its operations and outstanding debt obligations now and over the long-term. Additionally, conservative forecasts of rate revenue ensure that member communities adequately plan and budget for their expenses. MWRA also updates its estimates of anticipated revenues and expenses over a multi-year planning horizon. These estimates provide a context for budget discussions and allow MWRA to consider multiple-year rates management implications and strategies as it evaluates alternative capital and operating budget options. The table below and Appendix D (in greater detail) present the combined estimated future rate increases and household charges based on the FY13 Final Budget. The planning estimates shown below assume the receipt of $350,000 annually in Debt Service Assistance from the Commonwealth and the use of Rate Stabilization and Bond Redemption reserves through FY2021 to manage the rate increases. For planning purposes, the yearly use of combined reserves is currently limited to a maximum of $12 million. MWRA anticipates the release of additional reserves starting in FY16 as a result of Bond Indenture changes to mitigate rate increases in future years. The release of these reserves are not yet reflected in these projections.
FY13 CEB FY2013 FY2014 FY2015 FY2016 FY2017 FY2018 FY2019 FY2020 FY2021 FY2022Total Rate Revenue ($ in Mil) 607,512$ 634,426$ 681,237$ 725,991$ 790,699$ 803,707$ 836,790$ 885,216$ 923,702$ 967,157$ Rate Revenue Change from Prior Year ($000) 17,812$ 26,914$ 46,811$ 44,754$ 64,707$ 13,008$ 33,084$ 48,426$ 38,486$ 43,456$ Rate Revenue Increase 3.0% 4.4% 7.4% 6.6% 8.9% 1.6% 4.1% 5.8% 4.3% 4.7%Use of Reserves ($ in Mil) -$ 12,000$ 12,000$ 12,000$ 12,000$ -$ 12,000$ 12,000$ 866$ -$
Estimated Household Bill Based on water usage of 61,000 gallons per year 923$ 967$ 1,025$ 1,084$ 1,155$ 1,207$ 1,257$ 1,325$ 1,396$ 1,469$ Based on water usage of 90,000 gallons per year 1,361$ 1,426$ 1,512$ 1,600$ 1,704$ 1,781$ 1,855$ 1,954$ 2,059$ 2,167$
Rates & Budget Projections
Increasing debt service to finance the capital improvement program is the most important factor driving estimates of future budget increases. Over the past several years MWRA’s tax-exempt commercial paper program, debt refinancing, federal grants, SRF loans, and Commonwealth debt service assistance have mitigated the impact on ratepayers of new capital spending. However, new water system improvements, for which there are fewer non-ratepayer sources of funding, and the

FY13 CEB -- page I-23
impact of new financing will increase MWRA capital financing costs over the next several years.
MWRA employs rates management tools where available (e.g. refunding for savings, extended maturities on future borrowings, variable rate debt, and increased use of tax-exempt commercial paper) to help cushion and smooth the growth in capital financing expenses. Despite these initiatives, the size of the capital program will unavoidably continue to drive increases in community assessments.
The second largest budget factor is projected growth of base operating costs. The estimated $91.1 million increase in direct expenses from FY13 to FY22 is primarily the result of an assumed annual inflation rate of 4.0%. Also, over the next ten years, there will be increases in direct expenses as a result of capital improvement projects. The largest increases will be for the operation of new/updated facilities such as the North Dorchester Bay CSO and Carroll Plant UV disinfection project.
MWRA’s planning estimates are projections based on a series of assumptions about future spending (operating and capital), interest rates, inflation, and other factors. The assumptions include: Direct expense inflation rate of 4.0% starting in FY14; CIP inflation rate of 2.5%; Capital spending based on 85% of the CIP expenditure forecast with 10% (two-thirds of the 15%
reduction) added back three years later; Long-term fixed rate debt issues with 30-year terms and 5.5% interest rates in FY13 and 5.75%
rates in FY14, and 40-year terms and 6.00% rates from FY15-30; Variable rate interest projected at 3.25% in FY13, 3.50% in FY14, 3.75% in FY15, and 4.0%
thereafter. MWRA uses the planning estimates to present a picture of what future rates might be and to test the impact of changes to assumptions. The planning estimates are not predictions of rates; rather, they provide the context and framework for the policy decisions that actually shape future Rate Revenue Requirement. The planning estimates generally use conservative assumptions to help communities plan for future payments to MWRA. As each year passes and more up-to-date information becomes available, the planning estimate projections change based on:
Borrowing rates or expected investment income rates;
The planning estimates do not factor in any positive year-end variances which may be used to defease debt or are reserved to offset Rate Revenue Requirements in future years;
Fewer opportunities for SRF borrowing than expected due to Federal Budget cuts; a dollar borrowed through the SRF at 2% replaces the need to borrow a dollar long-term at an assumed 5% rate;
Debt refinancing opportunities;

FY13 CEB -- page I-24
Capital spending; and
Growth in direct expenses, greater than current assumptions is an area of increased concern. Many of the savings in prior years through staffing reductions, optimization of operations, and scope revisions to professional services are already reflected in the budget. More importantly, going forward the MWRA is faced with a growing need to maintain its facilities and ensure that adequate funding is available.
FY13 Capital Improvement Program
Of the total $7.5 billion expended to-date, nearly 80% has funded court-mandated projects such as the Boston Harbor Project, the MetroWest Supply Tunnel, the Carroll Water Treatment Plant, and the Combined Sewer Overflow (CSO) program. The mandated projects represent nearly 46% of projected FY09-13 spending.
Asset Protection and Water Redundancy initiatives account for 30.2% and 17.8% of FY09-13 spending. These percentages grow substantially to 54.6% and 32.9% respectively for the FY14-18 timeframe.
Total Contract FY09-13 FY14-18Beyond
FY18Asset Protection 1,909.8$ 253.4$ 544.2$ 476.8$ Carroll WTP 430.0$ 41.3$ 16.0$ -$ Water Redundancy 1,822.9$ 149.3$ 328.6$ 482.4$ CSO 837.5$ 308.7$ 31.2$ 0.0$ Other 524.7$ 85.4$ 77.2$ (132.7)$ Total 5,524.9$ 838.1$ 997.3$ 826.5$
Asset Protection 34.6% 30.2% 54.6% 57.7%Carroll WTP 7.8% 4.9% 1.6% 0.0%Water Redundancy 33.0% 17.8% 32.9% 58.4%CSO 15.2% 36.8% 3.1% 0.0%Other 9.5% 10.2% 7.7% -16.1%Total 100.0% 100.0% 100.0% 100.0%

FY13 CEB -- page I-25
The graph below displays the projected trend of expenditures by major category for the FY09-22 time period. The following graph represents historical CIP spending through FY11 and projected spending to FY22 based on the FY13 Final CIP.
$24
$44
$120
$149
$196
$304
$413
$504
$608
$580
$437
$377
$447
$498
$392
$333
$365
$297
$194
$168
$152
$178
$196
$182
$211
$139
$149
$156
$193
$208
$203
$196
$197
$212
$200
$162
$93
$0
$100
$200
$300
$400
$500
$600
$700
$ M
illi
ons
MWRA Capital Spending
Actual Projected
$-
$50.0
$100.0
$150.0
$200.0
$250.0
FY13 Final Expenditure Forecast by Major Category
Carroll WTP CSO Water Redundancy Asset Protection Other

FY13 CEB -- page I-26
FY13 Final CIP Expenditures The FY13 Final Capital Improvement Program (CIP) budget totals $5.5 billion, of which $3.4 billion has been expended through FY11 with $2.1 billion in projected future spending. Of the future spending, Wastewater System Improvements represent $1.1 billion or 49.8%, Waterworks System Improvements are $1.0 billion or 48.1%, and Business and Operations Support are $44.6 million or 2.1%.
The FY13 Final CIP (without contingency) includes planned expenditures of $148.8 million and 156.3 million for FY12 and FY13 respectively, and total projected expenditures of $838.1 million for the FY09-13 timeframe. Combined Sewer Overflow (CSO) program continues to drive spending in the FY09-13 timeframe, accounting for $308.7 million or 36.8% of total projected spending. Staff anticipates that by the end of the Cap period, more than 96% of the total CSO program will be completed. For the remainder of the Cap period, specifically FY12 and FY13, the largest spending is projected for the Reserved Channel, Brookline, and Cambridge CSO projects, the Carroll Water Treatment Plant Ultra-violet Disinfection, Spot Pond Design/Build, Lower Hultman (CP6A), and Deer Island’s North Main Pump Station VFD Replacement and Digester Module 1&2 Pipe Replacement.
Wastewater,$1.1
49.8
Business and Operations
Support$45
2.1
Waterworks, $1.048.1
FY 13 CIP Future Spending
Wastewater Business and Ops Waterworks

FY13 CEB -- page I-27
The graph below illustrates a breakdown of the major program spending percentages for the FY09-13 period. Major Planned Spending for Fiscal Year 2013 Capital spending in FY13 is estimated to be $156.3 million. Spending will be driven by several large projects, including the 10 projects listed below, which account for over 78% of budgeted FY13 spending:
ProjectFY13 Spending
Deer Island Plant Asset Protection 31.6$ Carrol Water Treatment Plant 21.9 Spot Pond Storage Facility 21.8 Cambridge Sewer Separation 12.2 Reserved Channel Sewer Separation 12.0 MetroWest Tunnel 9.9 NIH Redundancy and Storage 3.8 Facility Asset Protection 3.6 Watershed Land 2.9 Long Term Redundancy 2.9
Top Ten Projects 122.6$
Total FY13 Spending 156.3$
Top Ten Projects as a percent of FY13 Spending 78.4%
Wastewater (excluding
CSO)24.9%
CSO36.8%
Waterworks33.3%
Business & Operations
Support5.0%

FY13 CEB -- page I-28
CIP Impact on Current Expense Budget In addition to the annual financing costs included in the Current Expense Budget, the Capital Improvement Program affects the annual operating budget when capital facilities come on-line and require adjustments to operating budgets. In prior years, completion of the Deer Island Treatment Plant, the Carroll Water Treatment Plant, and the residuals processing facility in Quincy resulted in significant increases in operating expenses. New facilities are adding operating costs of approximately $725,000 and MIS program related maintenance initiatives are increasing operating costs by nearly $753,000 by FY22. These increases are offset by anticipated savings for energy initiatives at Deer Island, most notably the digester gas fueled Steam Turbine Generator (STG) upgrade as well as water and wastewater Alternative Energy Initiatives including solar, wind, and hydroelectric power projects which will result in energy savings of approximately $1.5 million over the next 10 years. The following table summarizes projected CIP impact by project over the next nine years, beginning in FY14.
Capital Financing and Grant Revenues In the past, MWRA has been able to finance approximately 20 percent of its capital spending with grant receipts, totaling approximately $1.1 billion through FY03. However, since FY03, the MWRA has only received $4.9 million in capital grants. In addition to participating in federal and state grant programs, the MWRA benefitted from the American Recovery and Reinvestment Act of 2009 which is projected to forgive approximately $33.0 million in State Revolving Fund loan principal. The Authority continues to pursue grant funding and take advantage of any possible program available to maximize grant funding opportunities.
Fiscal Year FY14 FY15 FY16 FY17 FY18 FY19 FY20 FY21 FY22 Total
DI Asset Protection $0 $0 ($323) ($58) ($153) $0 $0 ($164) $0 ($699)FERS Biofilter 0 0 0 0 (122) 0 0 0 0 (122)Clinton Wastewater Treatment Plant/Aeration Efficiency Improvement (18) 0 0 0 0 0 0 0 0 (18)Wastewater Alternative Energy Projects 0 (131) (382) 0 0 0 0 0 0 (513)North Dorchester Bay 31 0 0 409 0 0 0 0 0 441Total Wastewater (inflated) $13 ($131) ($705) $351 ($275) $0 $0 ($164) $0 ($911) Carroll Water Treatment Plant $208 $114 $0 $0 $0 $0 $0 $0 $0 $322Quabbin Water Treatment Plant 0 24 0 0 0 0 0 0 0 24Wachusett Algae Treatment Facility 0 0 0 29 30 0 0 0 0 60Alternative Energy 0 0 0 (70) (169) 0 0 0 0 (239)Total Water (inflated) $208 $137 $0 ($41) ($139) $0 $0 $0 $0 $166
Phase II: TRAC Replacement $156 $0 $0 $0 $0 $0 $0 $0 $0 $156
Phase V: LIMS Replacement, GIS & OMS194 0 0 0 0 0 0 0 0 194
SAN II 0 108 0 0 0 0 0 0 0 108SAN III 0 0 0 0 0 127 0 0 0 127NET 2020 52 0 0 0 0 0 0 0 0 52Telecommunications 0 0 0 0 0 32 0 0 0 32NET 2020 DITP & Southborough 0 0 84 0 0 0 0 0 0 84
Total Business and Operations Support (inflated) $402 $108 $84 $0 $0 $158 $0 $0 $0 $753
TOTAL MWRA $623 $115 ($621) $310 ($414) $158 $0 ($164) $0 $7
CEB Impacts (000)

FY13 CEB -- page I-29
MWRA expects to borrow the majority of funds necessary for future capital spending. Borrowing will include the issuance of fixed and variable rate revenue bonds; borrowing from the Commonwealth's Water Pollution Abatement Trust (also known as the State Revolving Loan Fund or SRF), and a tax-exempt commercial paper program.
MWRA Organization and History
The MWRA Enabling Act
MWRA was created by legislative act in 1984, and inherited the Sewerage and Waterworks Divisions of the Commonwealth of Massachusetts Metropolitan District Commission (MDC). In July 1985, MWRA assumed control of the water and sewer systems, including facilities, properties, and the right to utilize water withdrawn from system reservoirs. The Commonwealth, under the management of the MDC Watershed Management Division (now the Department of Conservation and Recreation – Division of Watershed Management), retained ownership of real property, including the reservoirs and watersheds. The Enabling Act also established the MWRA Advisory Board to represent the cities and towns in the service area. The Advisory Board appoints three members of the MWRA Board of Directors, approves the extension of water and sewer services to additional communities, and reviews and makes recommendations on MWRA’s annual Current Expense Budget and Capital Improvement Program. In 1987, the legislature transferred responsibility to operate and maintain the Clinton Wastewater Treatment Plant from the Commonwealth to the MWRA.
History and Accomplishments In 1985, the U.S. District Court for Massachusetts found MDC in violation of numerous aspects of the federal Clean Water Act, and the responsibility for those violations passed to MWRA as successor to MDC. The court issued a detailed compliance schedule for actions to be taken by MWRA to achieve and maintain compliance with the Clean Water Act. MWRA achieved all of the milestones in the schedule related to the construction of treatment facilities on Deer Island, and is working to achieve milestones with respect to implementation of its long-term Combined Sewer Overflow (CSO) control plan. These achievements have made noticeable, measurable improvements in the quality of Boston Harbor and its beaches. MWRA is also working to achieve compliance with an extensive consent order issued by the Massachusetts Department of Environmental Protection (MassDEP) mandating the steps necessary to achieve required improvements to the MWRA water system. Since taking over operation and maintenance of the water and sewer systems from MDC, MWRA has increased annual investment in the system infrastructure from an average of $11 million per year to an average of more than $326 million per year between (FY90 to FY11). This investment has greatly improved the operating efficiency of the existing water and sewer systems, protecting fresh water sources and improving the water quality in Boston Harbor.

FY13 CEB -- page I-30
MWRA Rates Management
Between FY96 and FY02 the MWRA limited rate revenue increases to an average of 3.6% annually as a result of debt service assistance from the Commonwealth, federal grants to support the Boston Harbor Project, lower borrowing costs, use of financing tools that delayed costs to later years, a favorable bid climate for construction projects, and aggressive efforts to control capital and operating costs. As debt service costs resulting from mandated capital investment have steadily increased, MWRA’s dependence on rising debt service assistance (DSA) allocations have similarly increased. DSA reached a high of $52.9 million in FY02. In FY03, in response to a state-wide recession, debt service assistance was eliminated and as a result, MWRA was forced to have an unprecedented mid-year rate adjustment, increasing the rate increase from 2.9% to 6.9% as part of an overall strategy in response to cover the loss. The Authority cut $420.0 million from its capital improvement program and $47.2 million from the current expense budget through various budget cuts including layoffs. Reductions in debt service assistance result in greater reliance on reserves, budget cuts or a combination of these two elements. In response to a strengthening local economy, debt service assistance was restored in FY05 at the level of $8.0 million. In the following three years, the debt service allocation increased to $9.6 million in FY06, $19.0 million in FY07, and $17.0 million in FY08. In light of the economic downturn in FY09, the Commonwealth was forced to eliminate the $15.0 million appropriation in October 2008. The MWRA, after an aggressive budget cutting process, combined with favorable spending trends, was able to make-up this shortfall without a mid-year rate increase. For the FY13 Budget, $350,0000 Debt Service Assistance is assumed. Planning estimates for 2013 through 2022 forecast rate revenue requirement increases of 3.0% in FY13, 4.4% in FY14, 7.4% in FY15, 6.6% in FY16, 8.9% in FY17, 1.6% in FY18, and 4.1, 5.8%, 4.3%, and 4.7% in years FY19, FY20, FY21, and FY22 respectively. In FY06, the MWRA formed a Rates Management Committee to evaluate the Authority’s debt portfolio and credit structure to propose recommendations that deliver responsible short-term solutions for mitigating imminent rate spikes and long-term strategies for achieving predictable and sustainable rates. In line with the Board of Directors’ strategy to deliver long-term predictable and sustainable rates for our 61 ratepayer communities, the MWRA initially preserved the scheduled use of its reserves for future years when projected rate increases are more significant. The changes to the indenture will release $112.0 million in reserves that can be used to mitigate future rate increases, but the release date is now projected to occur in FY16 based on current borrowing projections. While this is a sizable release, it is not the panacea that will address an average Rate Revenue Requirement increase of almost $38.0 million over the next ten years. The FY13 Budget:
Continues to refine planning estimates assumptions to provide greater predictability of future assessments;
Judiciously uses reserves to lower rate increases, but maintain adequate balances; and Continues a multi-year strategy initiated in FY11 to promote moderate and predictable rate
increases over the FY11-FY13 horizon.

FY13 CEB -- page I-31
MWRA Organization MWRA has four separate divisions and the Affirmative Action and Compliance Unit Department (AACU). Each division provides operations or support services to carry out MWRA’s activities under the direction of the Executive Office. MWRA’s organizational structure is included in the document before the Table of Contents. The Executive Office provides centralized MWRA management, direction, and policy development. The budget includes funds for the Office of the Executive Director, the Board of Directors, the Advisory Board, and other advisory committees. It includes the following departments: Office of Emergency Preparedness; Public Affairs; Internal Audit; and Planning and Coordination. The Operations Division operates the water and wastewater treatment systems; the water transmission and distribution system; the wastewater collection, transport, and combined sewer overflow (CSO) systems; and the residuals processing facility. It also provides laboratory and engineering and construction services; enforces sewer use regulations and seeks to limit the discharges of toxic materials; manages environmental studies of Boston Harbor and Massachusetts Bay; and monitors water quality. The Administration and Finance Division was created in 2009 and is responsible for managing the finance and support service functions necessary to support daily operations of the Authority and insure the implementation of the Authority’s long-term goals and strategies. The Administration and Finance (A&F) Division is comprised of eleven departments: Director’s Office; Rates and Budget; Treasury; Controller; Risk Management; Human Resources; Management Information Systems (MIS); Facilities Management; Fleet Services; Procurement; and Real Property and Environmental Management. The Administration and Finance Division ensures that a variety of fiscal management systems are in place to monitor and control the Current Expense Budget (CEB) and Capital Improvement Program (CIP). The Law Division provides legal counsel to all divisions on compliance with federal and state law, real estate matters, labor and employment law, litigation, and construction issues. Division attorneys provide or supervise through outside counsel the representation of MWRA in all litigation. The Affirmative Action and Compliance Unit (AACU) Department develops, administers and monitors compliance of Affirmative Action Plan programs and policies by ensuring equal opportunity and non-discrimination in employment and equitable access of Minority/Women Business Enterprises (MBE/WBE) in Authority Procurement activities.
Statement of Financial Position In accordance with its enabling act, each year MWRA submits annual reports to the Governor, the President of the State Senate, the House of Representatives, the Advisory Board, and the Chairs of the State Senate and House Committees on Ways and Means containing financial statements relating to its

FY13 CEB -- page I-32
operations maintained in accordance with Generally Accepted Accounting Principles in the United States of America (GAAP) and, commencing with the annual reports for 1986, audited by independent certified public accountants. MWRA’s audited financial statements at June 30, 2011 and 2010 are available online at www.mwra.com.

Executive Office
Budget

FY13 Final CEB -- page II-1
EXECUTIVE OFFICE
The Executive Office provides executive management and guides the implementation of MWRA policies established by the Board of Directors. It is responsible for developing and implementing specific goals and programs to achieve MWRA's primary mission of providing reliable and efficient water and sewer services, improving water quality, and for creating a framework within which all divisions can operate effectively. The Executive Office oversees a centralized MWRA-wide security program to preserve and protect MWRA facilities, systems and employees. The Executive Office has direct oversight of the Office of Emergency Preparedness, Internal Audit, Public Affairs, and the Affirmative Action and Compliance Unit (AACU) Department. FY13 Goals: Ensure delivery of reliable and cost-effective water and sewer services to customer communities.
Ensure that water supply and wastewater collection and treatment preserve public health and protect natural
resources.
Provide overall management of the agency and ensure adherence to all applicable policies and regulations. Continue to aggressively pursue renewable and sustainable energy resources to reduce the environmental
impacts of daily operations, increase energy efficiencies and reduce overall operating costs. Manage communication and garner support from key constituents for MWRA programs.
LINE ITEMFY10Actual
FY11Actual
FY12Actual
FY13Final
WAGES & SALARIES 412,601$ 422,374$ 483,283$ 520,918$ 37,635$ 7.8%OVERTIME - - - - - - ONGOING MAINTENANCE - - - - - - TRAINING & MEETINGS - - 695 900 205 29.5%PROFESSIONAL SERVICES 160,031 154,323 142,888 155,432 12,544 8.8%OTHER MATERIALS 4,576 4,231 1,187 3,860 2,673 225.2%OTHER SERVICES 457,955 454,553 439,109 455,490 16,381 3.7%TOTAL 1,035,162$ 1,035,480$ 1,067,161$ 1,136,600$ 69,439$ 6.5%
DEPARTMENTFY10Actual
FY11Actual
FY12Actual
FY13Final
EXECUTIVE OFFICE / BOARD OF DIRECTORS
420,339$ 430,528$ 489,399$ 529,817$ 40,418$ 8.3%
ADVISORY BOARD / OTHER COMMITTEES
614,823 604,952 577,762 606,783 29,021 5.0%
TOTAL 1,035,162$ 1,035,480$ 1,067,161$ 1,136,600$ 69,439$ 6.5%
FY13 Final Current Expense BudgetEXECUTIVE DIVISION
ChangeFY12 to FY13
FY13 Final Current Expense BudgetEXECUTIVE DIVISION by Department
ChangeFY12 to FY13

FY13 Final CEB -- page II-2
The Executive Office budget supports the Executive Director's Office (which includes the Board of Directors’ cost center), the MWRA Advisory Board, and Advisory Committees’ cost centers. The Board of Directors formulates policies to guide MWRA actions and is responsible for major policy and fiscal decision-making. The MWRA Advisory Board was established by the Enabling Act to serve as “watchdog” for MWRA’s customer communities. The Advisory Board makes recommendations to MWRA on annual expense budgets and capital improvement programs. In addition, the Advisory Board reviews and comments on MWRA reports, holds hearings on related matters, and makes recommendations to the Governor and the Legislature. The other advisory committees supported by this budget are the Water Supply Citizens' Advisory Committee and the Wastewater Advisory Committee. The Executive Office budget accounts for less than 1% of the MWRA FY13 Direct Expense Budget. Budget Highlights: The FY13 Final Budget is $1.1 million, an increase of $69,000 or 6.5% from FY12 Actual spending. $521,000 for Wages and Salaries, an increase of $38,000 or 7.8% as compared to FY12 Actual spending. The
final budget includes funding for five positions. $451,000 or 39.7% of the Executive Office final budget in Other Services is needed to fund the MWRA
Advisory Board staff. The final budget increased by $16,000 or 3.7% from FY12 Actual spending. It supports its operating expenses, including wages and salaries, space rental, and general administrative office materials and supplies.
$155,000 or 13.7% of the Executive Office final budget in Professional Services is needed to fund the Water
Supply Citizens’ Advisory Committee and the Wastewater Advisory Committee. This is level funded from the FY12 Budget.

FY13 Final CEB -- page II-3
OFFICE OF EMERGENCY PREPAREDNESS
The Office of Emergency Preparedness (OEP) was created in November 2005 to consolidate Authority-wide security and emergency response functions. It is responsible for oversight of the MWRA’s security and emergency response plans, policies and procedures; implementation and training for the Emergency Response Plan; and management, training, and outfitting of the Emergency Service Unit, which will respond to any intentional or accidental contamination of the water supply. The Director of Operations Support & Emergency Preparedness reports directly to the Executive Director on Emergency Preparedness matters. FY13 Goals: Develop and implement policies and programs to provide security, critical infrastructure protection, and
emergency planning for the MWRA’s water and wastewater systems. Equip, train, and command the Emergency Service Unit (ESU). Develop and exercise emergency plans and procedures. Manage and direct contract security guard and security maintenance contracts.
FY13 Initiatives: Continue to enhance Emergency Response Plans for all water and wastewater facilities. Update Emergency
Action Plans (EAPs) as needed, including Dam EAPs. Continue updating of radios as part of the Department of Conservation and Recreation’s (DCR’s) planned
transition from analog equipment to digital equipment. Deploy radios purchased at the end of FY12, continue work on changing the MWRA radio system to new frequencies as part of the national frequency reallocation program, and continue implementation of a phased radio purchase plan that minimizes purchase cost through reduced deployment and purchasing strategies.
Continue the process of ensuring that new construction and rehabilitation of facilities includes an
integrated security and surveillance system improvement component. Continue task order security enhancement designs for selected water and wastewater critical sites, fencing installation, and other facility hardening initiatives. Continue planning for updating the security monitoring system to replace obsolete equipment.
Implement notification drills, tabletop exercises, and field training exercises (FY13 planned water contamination drill). Continue the community emergency response training program and tabletop exercise series for critical service areas with community staff.
LINE ITEMFY10Actual
FY11Actual
FY12Actual
FY13Final
WAGES & SALARIES 401,615 476,285 357,479 346,517 (10,962)$ -3.1%ONGOING MAINTENANCE 412,907 223,758 235,838 387,000 151,162 64.1%TRAINING & MEETINGS 1,989 0 2,117 0 (2,117) -100.0%PROFESSIONAL SERVICES 1,526,557 1,473,337 1,476,020 1,715,303 239,283 16.2%OTHER MATERIALS 64,892 42,642 50,343 58,185 7,842 15.6%OTHER SERVICES 13,477 20,563 21,000 21,600 600 2.9%TOTAL 2,421,436$ 2,236,586$ 2,142,796$ 2,528,605$ 385,809$ 18.0%
FY13 Final Current Expense BudgetOFFICE OF EMERGENCY PREPAREDNESS
ChangeFY12 to FY13

FY13 Final CEB -- page II-4
Complete security improvements funded by the FY12 awarded Department of Homeland Security (DHS) Grant
associated with the Regional Resiliency review, including purchase of hardened gates for CWTP, Smart boards and security equipment and cyber security improvements.
FY12 Accomplishments: Continued to enhance Emergency Response Plans for all water and wastewater facilities. Completed procurement of a new security services contract. Also, completed procurement of a contract to
consolidate security monitoring at non-critical MWRA field facilities.
Completed procurement of the new security guard services contract. Updated spill control Emergency Action Plans to all water and wastewater facilities subject to spill regulations.
Provided refresher training to all operations staff on spill control procedures.
Purchased 250 vehicle, base and handheld radios to begin updating MWRA radio equipment for DCR’s planned transition from analog equipment to digital equipment.
Responded to the DHS Regional Resiliency review of critical MWRA facilities and was awarded a DHS grant
for implementation of hardening improvements.
Continued the process of ensuring that new construction and rehabilitation of facilities including an integrated security and surveillance system improvement component.
Implemented a major training exercise for a cyber incident response. Also, implemented a five module
emergency response training program and a tabletop exercise series for critical service areas for community staff.
Budget Highlights: The FY13 Final Budget is $2.5 million, an increase of $386,000 or 18.0% from FY12 Actual spending. $347,000 for Wages and Salaries, a decrease of $11,000 or 3.1% from FY12 Actual spending. The final
budget includes funding for four positions. $387,000 for Ongoing Maintenance, an increase of $151,000 or 64.1% from FY12 Actual spending, primarily
due to FY12 underspending on the MWRA-wide security systems maintenance services and materials in FY12. The final budget includes funding of $260,000 to cover the MWRA-wide security systems preventative maintenance and repair service, $105,000 for MWRA-wide Security systems maintenance materials and equipment, including cameras, intrusion detection, card readers, and $22,000 for the intrusion alarm annual and semi-annual monitoring services contracts.
$1.7 million for Professional Services, an increase of $239,000 or 16.2% from FY12 Actual spending,
primarily due to increased funding for security guard services at the various MWRA facilities. The FY13 Final Budget includes $567,000 for security services contract for the Chelsea facility, $607,000 for DITP facility, $348,000 for the Carroll Water Treatment Plant, $40,000 for Charlestown Navy Yard (CNY) facility, $87,000 for the Account Manager, and $47,000 for the Patrol vehicle and Equipment.

FY13 Final CEB -- page II-5
$58,000 for Other Materials, an increase of $8,000 or 15.6% from FY12 Actual spending, primarily due to increased Lab and Testing supplies for contamination monitoring alarms. The final budget includes $28,000 for the annual operation and maintenance of equipment assigned to the Mobile Emergency Laboratory and $27,000 for Health and Safety equipment needs.
$22,000 for Other Services, which is level funded with FY12 Actual spending. The final budget includes
$20,000 for mandatory monthly testing and inspection of Self-Contained Breathing Apparatus (SCBA).

FY13 Final CEB -- page II-6
PLANNING AND COORDINATION DEPARTMENT
The Planning and Coordination Department provides regulatory, public policy and public health advocacy for MWRA’s drinking water and wastewater programs. It provides decision support on planning, policy and operations matters, using a range of technical and analytical tools. Staff administers financial assistance programs to improve the infrastructure of member communities and to promote water conservation. The Department integrates staff efforts and coordinates MWRA activities related to system and capital planning, infrastructure renewal, and watershed management (in conjunction with the Commonwealth’s Department of Conservation and Recreation, (DCR); strategic business planning; agency-wide performance measurement; and industry research. The following functions comprise the Department’s primary responsibilities: Mapping, Modeling, and Data Analysis - Technical staff develops and maintains the Geographic Information Systems (GIS) for the water and wastewater systems, including integration of field and engineering records into GIS for access by planning, engineering, and operations staff. Provides demand analysis and forecasting of water and wastewater flows for master planning and system operations; model reservoir operations, performs drought forecasting and planning; evaluates system expansion requests; and develops and maintains water and wastewater system models in support of master planning, system operations, and optimization. System Planning and Renewal - Staff with expertise in engineering and planning is responsible for water and wastewater system master planning; infrastructure needs assessment, and capital project development. This work is done in coordination with staff across MWRA. Planning and Coordination staff reviews water and wastewater system expansion requests, water supply agreements, and emergency withdrawal requests. Staff also assists the Operations Division on project siting, environmental reviews, and permitting, including impacts on MWRA facilities from other agency projects, and assists in the development of strategies for long-term emergency risk reduction and preparation for MWRA facilities and systems. Regulatory and Policy Matters - Staff work with various regulatory entities to promote cost-effective rule setting that protects the environment and promotes public health. Senior staff members actively work with industry associations and other groups with interests and agendas consistent with MWRA’s to advance water and wastewater regulations that make environmental and economic sense. Senior staff conducts strategic policy research on a broad range of topics and staff conducts public health research, including outreach and water quality reporting and the annual Consumer Confidence Report (CCR). Staff also coordinates with DCR to ensure water protection. Community Support Program - Staff are responsible for inflow/infiltration (I/I) reduction policy development, implementation, and reporting, provide oversight of and reporting on MWRA leak detection and demand management programs, and report on the portions of MWRA's NPDES permit related to demand management and flow limitation activities. Staff administers community assistance programs including sewer inflow/infiltration financial and technical assistance, water pipeline rehabilitation financial assistance, water distribution systems
LINE ITEMFY10Actual
FY11Actual
FY12Actual
FY13Final
WAGES & SALARIES 1,967,082 1,786,851 1,795,643 1,901,401 105,758$ 5.9%OVERTIME 211 18 0 0 - - FRINGE BENEFITS - - - - - - TRAINING & MEETINGS 4,841 1,478 (69) 6,000 6,069 -8795.7%PROFESSIONAL SERVICES 1,975 1,800 3,028 3,100 72 2.4%OTHER MATERIALS 152,250 147,660 161,963 158,375 (3,588) -2.2%OTHER SERVICES 77,336 94,793 74,589 158,062 83,473 111.9%TOTAL 2,203,694$ 2,032,599$ 2,035,152$ 2,226,938$ 191,784$ 9.4%
FY13 Final Current Expense BudgetPLANNING AND COORDINATION
ChangeFY12 to FY13
FY13 Final CEB -- page II-7
technical assistance, water leak detection technical assistance, and water conservation programs. FY13 Goals: With staff from Engineering and Operations, complete the next iteration of the MWRA Master Plan and
MWRA Business Plan, and assist in developing the next five-year CIP cap. Continue to advance other hydro-electric projects toward design, and seek appropriate agreements and
certifications to maximize revenue for existing hydro facilities. Continue to implement MWRA’s water system expansion strategy. With staff from Engineering and Operations, continue work on the North System Hydraulic Optimization study
and the design of Northern Intermediate High (NIH) redundancy improvements, and begin work on the metro area transmission redundancy project.
In conjunction with Engineering and Operations staff, continue to advance concept planning, design, and
environmental review for capital projects, including storage, treatment, and pipeline projects and development of long-term transmission and system redundancy options.
Effectively communicate water quality information to customers and health officials.
Continue to implement the Local Pipeline and Water System Assistance Program to provide interest-free loans
for local water projects. Continue outreach assistance for water conservation and water system leak detection and repair programs. Continue implementation of the Infiltration/Inflow (I/I) Local Financial Assistance Program to provide grants and interest-free loans for local I/I reduction and sewer system rehabilitation projects.
FY12 Accomplishments: Completed procurement and kicked off the North System Hydraulic Optimization study.
Provided information and worked with communities expressing interest in joining the Authority. With Engineering and Operations staff, developed a concept design for a pumping station alternative to provide
redundancy for the Cosgrove Tunnel, advanced the Metropolitan Area Redundancy Plan, and advanced the concept plan for (NIH) redundancy through the completed Massachusetts Environmental Protection Agency (MEPA) review process.
During FY12, MWRA distributed a total of $14 million in grants and interest free loans ($6.3 million in grants and $7.7 million in 5-year loans) to member sewer communities through the Inflow/Infiltration (I/I) Local Financial Assistance Program and $22.7 million in 10-year interest free loans to member water communities as part of the Local Pipeline and Water System Assistance Loan Program.
Planning staff represented MWRA on Environmental Protection Agency’s (EPA’s) Mystic River Steering Committee and its Water Quality Subcommittee and on the Energy and Environmental Affairs (EEA) Sustainable Water Management Initiative and coordinated activities with the Water Supply Citizens Advisory Committee (WSCAC) and Wastewater Advisory Committee (WAC).
Continued to assist local communities to advance water conservation education and water system leak detection and repair.

FY13 Final CEB -- page II-8
Effectively communicated water quality information to customers and health officials through MWRA’s website, e-mails, staff contact, and publication and distribution of the annual Consumer Confidence Report (CCR).
Budget Highlights: The FY13 Final Budget is $2.2 million, an increase of $192,000 or 9.4% from FY12 Actual spending.
$1.9 million for Wages and Salaries, an increase of $106,000 or 5.9% from FY12 Actual spending primarily
due to wage increases. The FY13 CEB includes funding for 22 positions.
$6,000 for Training and Meetings to cover participation in training and conferences primarily focused on water quality regulations and geographic information systems (GIS).
$3,100 for Professional Services to cover costs associated with the translation of the Consumer Confidence Report and also programming of the GIS user interface.
$158,000 for Other Materials, a decrease of $4,000 or 2.2% from FY12 Actual spending. The FY13 CEB includes funding of $131,000 for postage and mailing of the Consumer Confidence Report, $15,000 for water conservation kits, $10,000 for mapping supplies, and $2,000 for office supplies.
$158,000 for Other Services, an increase of $83,000 or 111.9% as compared with FY12 Actual spending. The FY13 CEB includes $134,000 for printing the Consumer Confidence Report, $10,000 for printing the Lead in Tap Water brochures, and $10,000 for reprinting the water conservation bill stuffers. The FY13 Final Budget increase is due to anticipated increased printing cost for production of the Consumer Confidence Report when the current three-year contract expires.

FY13 Final CEB -- page II-9
AFFIRMATIVE ACTION and COMPLIANCE
The Affirmative Action and Compliance Unit (AACU) develops, administers, and monitors compliance of Affirmative Action Plan programs and policies by ensuring equal opportunity and non-discrimination in employment and equitable access of Minority Business Enterprises (MBE), Women Business Enterprises (WBE), and Disadvantaged Business Enterprises (DBE) in Authority procurement activities. FY13 Goals: Assist divisions and departments in the implementation of MWRA’s affirmative action program and promote
MWRA’s policy of non-discrimination for all persons in or recruited into its work force. Maintain adequate internal audit and reporting systems to monitor MWRA’s accomplishments of goal
attainment in identified underutilized job groups for female and minority representation. Communicate to managers and supervisors MWRA's commitment to its equal opportunity policies and
affirmative action programs. Assist the Human Resources department in the coordination and oversight of all external/internal recruitment
and selection activities including interviewing, hiring, transfers, and promotions of protected class candidates. Provide for the equitable participation of minority/women and disadvantaged-owned businesses in procurement
opportunities, ensure that minorities and women are represented in the labor force on construction contracts, and coordinate with other public entities regarding state and federal requirements.
Assist divisions and departments in the understanding and implementation of MBE/WBE/DBE program
policies and practices and monitor and report on contractor compliance and expenditures. FY12 Accomplishments: Provided management guidance in 31 selection committee interviews, sourced 74 outreach contacts, and
referred two qualified candidates to Human Resources for underutilized positions.
Conducted oversight of 72 construction and professional projects including 36 site visits and one compliance audit to ensure contractor compliance with the MWRA’s MBE/WBE/DBE Program.
LINE ITEMFY10Actual
FY11Actual
FY12Actual
FY13Final
WAGES & SALARIES 605,065 550,862 548,888 565,927 17,039$ 3.1%OVERTIME - - - - - - TRAINING & MEETINGS 0 2,420 1,620 2,000 380 23.5%OTHER MATERIALS 1,018 1,347 1,260 1,510 250 19.8%OTHER SERVICES 387 308 580 632 52 9.0%TOTAL 606,470$ 554,937$ 552,348$ 570,069$ 17,721$ 3.2%
FY13 Final Current Expense BudgetAFFIRMATIVE ACTION & COMPLIANCE UNIT
ChangeFY12 to FY13

FY13 Final CEB -- page II-10
Budget Highlights: The FY13 Final Budget is $570,000, an increase of $18,000 or 3.2% from FY12 Actual spending.
$566,000 for Wages and Salaries, an increase of $17,000 or 3.1% from FY12 Actual spending, primarily due
to contractual wage increases. The final budget includes funding for seven positions.
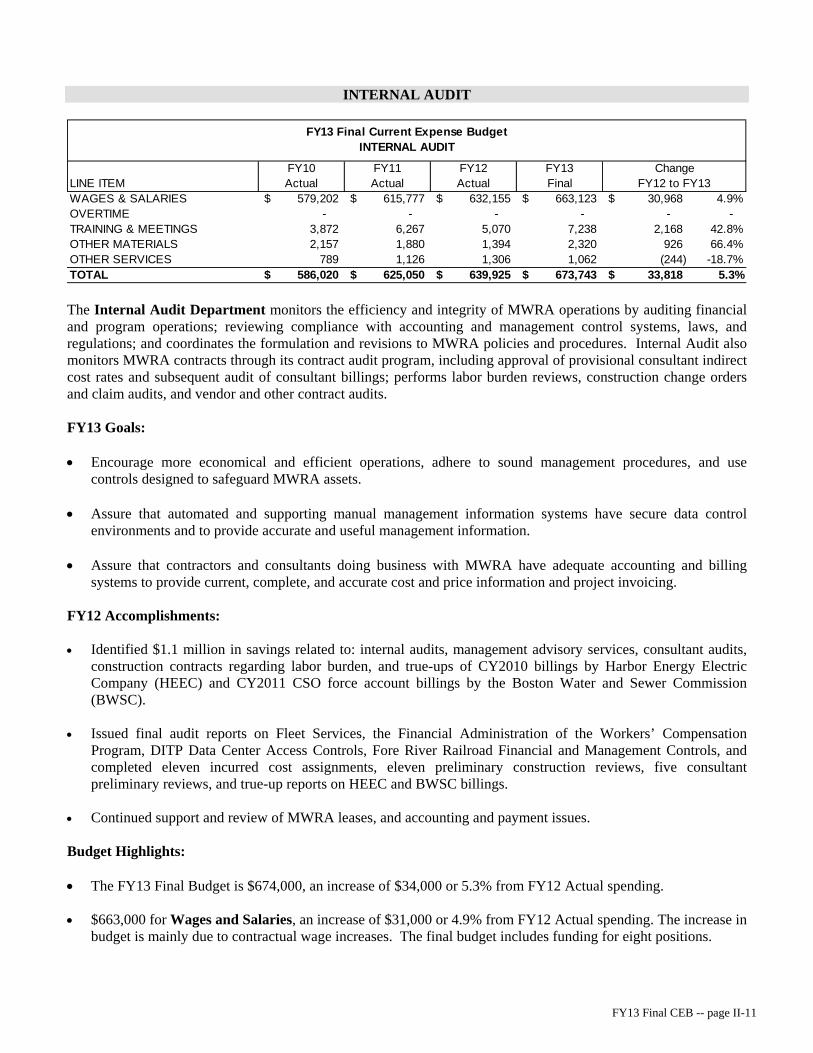
FY13 Final CEB -- page II-11
INTERNAL AUDIT
The Internal Audit Department monitors the efficiency and integrity of MWRA operations by auditing financial and program operations; reviewing compliance with accounting and management control systems, laws, and regulations; and coordinates the formulation and revisions to MWRA policies and procedures. Internal Audit also monitors MWRA contracts through its contract audit program, including approval of provisional consultant indirect cost rates and subsequent audit of consultant billings; performs labor burden reviews, construction change orders and claim audits, and vendor and other contract audits. FY13 Goals: Encourage more economical and efficient operations, adhere to sound management procedures, and use
controls designed to safeguard MWRA assets. Assure that automated and supporting manual management information systems have secure data control
environments and to provide accurate and useful management information. Assure that contractors and consultants doing business with MWRA have adequate accounting and billing
systems to provide current, complete, and accurate cost and price information and project invoicing. FY12 Accomplishments: Identified $1.1 million in savings related to: internal audits, management advisory services, consultant audits,
construction contracts regarding labor burden, and true-ups of CY2010 billings by Harbor Energy Electric Company (HEEC) and CY2011 CSO force account billings by the Boston Water and Sewer Commission (BWSC).
Issued final audit reports on Fleet Services, the Financial Administration of the Workers’ Compensation
Program, DITP Data Center Access Controls, Fore River Railroad Financial and Management Controls, and completed eleven incurred cost assignments, eleven preliminary construction reviews, five consultant preliminary reviews, and true-up reports on HEEC and BWSC billings.
Continued support and review of MWRA leases, and accounting and payment issues. Budget Highlights: The FY13 Final Budget is $674,000, an increase of $34,000 or 5.3% from FY12 Actual spending. $663,000 for Wages and Salaries, an increase of $31,000 or 4.9% from FY12 Actual spending. The increase in
budget is mainly due to contractual wage increases. The final budget includes funding for eight positions.
LINE ITEMFY10Actual
FY11Actual
FY12Actual
FY13Final
WAGES & SALARIES 579,202$ 615,777$ 632,155$ 663,123$ 30,968$ 4.9%OVERTIME - - - - - - TRAINING & MEETINGS 3,872 6,267 5,070 7,238 2,168 42.8%OTHER MATERIALS 2,157 1,880 1,394 2,320 926 66.4%OTHER SERVICES 789 1,126 1,306 1,062 (244) -18.7%TOTAL 586,020$ 625,050$ 639,925$ 673,743$ 33,818$ 5.3%
FY13 Final Current Expense BudgetINTERNAL AUDIT
ChangeFY12 to FY13

FY13 Final CEB -- page II-12
PUBLIC AFFAIRS
The Public Affairs Department is the institutional link to all MWRA constituencies. The department works for passage of legislation necessary to carry out MWRA’s mission, monitors legislation, responds to inquiries by elected and appointed officials, and pursues funding from the state legislature for MWRA projects. The Community Relations Section deals directly with cities and towns in the service area, responds to inquiries about MWRA, proactively incorporates community concerns into MWRA project work, coordinates outreach and education initiatives to highlight MWRA programs, and provides technical expertise for specific projects and initiatives. Community Relations staff also work in conjunction with Planning and Coordination Department staff to ensure compliance with state and local regulations and restrictions. The Communications Section manages media relations, issues press releases and responds to information requests, oversees the design and distribution of MWRA publications, manages the web site, and provides design, editorial, and graphics services for other sections of MWRA. The section is lead by the Special Assistant to the Executive Director, located in the Executive Office. The Education Section is responsible for curriculum development, teacher training workshops, as well as providing school education materials on water quality, water conservation, wastewater topics, and environmental issues. FY13 Goals: Enhance overall public understanding of MWRA’s mission, goals, and benefits to the public through extensive
outreach and effective communication. Develop and implement proactive strategies for educating and informing key MWRA constituencies and the
public at large about MWRA’s mission, projects and progress, and promote understanding for associated costs. Gain public support for MWRA programs and projects, and respond to the needs and concerns of elected and
appointed public officials. Provide support to MWRA staff to ensure that MWRA projects meet regulatory requirements, and provide
input to regulatory agencies in order to ensure MWRA interests are recognized during the development of regulations.
Maintains and updates MWRA’s Community Contact Database. This Community Contacts tracking
application is used to notify MWRA’s communities of any emergencies affecting them or surrounding communities.
LINE ITEMFY10Actual
FY11Actual
FY12Actual
FY13Final
WAGES & SALARIES 1,098,755 1,080,485 1,036,558 1,048,620 12,062$ 1.2%OVERTIME 27 67 0 0 - - TRAINING & MEETINGS 1,226 5,327 (463) 3,365 3,828 -826.8%PROFESSIONAL SERVICES 3,085 2,328 1,050 1,050 - 0.0%OTHER MATERIALS 20,784 29,453 22,391 21,625 (766) -3.4%OTHER SERVICES 35,323 16,974 41,861 47,967 6,106 14.6%TOTAL 1,159,199$ 1,134,634$ 1,101,397$ 1,122,627$ 21,230$ 1.9%
FY13 Final Current Expense BudgetPUBLIC AFFAIRS
ChangeFY12 to FY13

FY13 Final CEB -- page II-13
Implement the recently approved MWRA-BOD Aqueduct Trails Initiative. Budget Highlights: The FY13 Final Budget is $1.1 million, an increase of $21,000 or 1.9% from FY12 Actual spending. $1.1 million for Wages and Salaries, an increase of $12,000 or 1.2% from FY12 Actual spending, primarily
due to contractual wage increases. The final budget includes funding for 12 positions.
$22,000 for Other Materials, a decrease of $766 or 3.4% from FY12 Actual spending.
$48,000 for Other Services, an increase of $6,000 or 14.6% from FY12 Actual spending, mainly due to underspending for printing/duplicating during FY12. This budget supports the printing needs of the department.

Operations Division
Budget

FY13 Final CEB -- page III-1
OPERATIONS DIVISION
The Operations Division integrates wastewater and water system operations and maintenance, treatment, laboratory services, and engineering and construction functions, including implementation of the Combined Sewer Overflow (CSO) plan. The existing Operations Division is described below: The Wastewater Treatment Department, which accounts for 42% of the Operations Division budget, operates and maintains the Deer Island Treatment Plant (DITP), the Clinton Wastewater Treatment Plant, and the Residuals Processing Facility at Fore River Staging Area (FRSA). The Field Operations Department (FOD), which accounts for 45% of the Operations Division budget, is responsible for operating, maintaining, and metering the water and wastewater transport systems. The department also manages the water treatment and wastewater pretreatment functions, including the Carroll Water Treatment Plant (CWTP). The Engineering and Construction Department provides in-house engineering, consultant management, drafting, surveying, construction management, and other technical assistance required for the maintenance, repair, and
Wastewater Treatment
42%
ENQUAD2%
Laboratory Services
4%
Operations Administration
2%
Field Operations
45%
Engineering & Construction
5%
Operations Division
LINE ITEMFY10Actual
FY11Actual
FY12Actual
FY13Final
WAGES & SALARIES 67,744,764$ 66,794,330$ 68,131,174$ 71,338,013$ 3,206,839$ 4.7%OVERTIME 3,893,234 3,850,545 3,046,845 3,512,092 465,247 15.3%FRINGE BENEFITS 69,620 67,373 54,278 69,358 15,080 27.8%CHEMICALS 8,998,799 8,697,048 9,271,529 9,963,496 691,967 7.5%UTILITIES 25,855,089 21,839,172 22,666,107 22,993,521 327,414 1.4%ONGOING MAINTENANCE 22,575,229 24,604,384 23,609,567 24,716,539 1,106,972 4.7%TRAINING & MEETINGS 48,987 74,268 84,117 140,300 56,183 66.8%PROFESSIONAL SERVICES 3,451,755 3,079,940 2,132,514 2,588,257 455,743 21.4%OTHER MATERIALS 3,250,608 3,237,336 4,316,068 3,984,169 (331,899) -7.7%OTHER SERVICES 19,006,986 18,227,609 19,363,042 19,294,304 (68,738) -0.4%TOTAL 154,895,070$ 150,472,004$ 152,675,240$ 158,600,049$ 5,924,809$ 3.9%
DEPARTMENTFY10Actual
FY11Actual
FY12Actual
FY13Final
OPERATIONS ADMINISTRATION 2,729,340$ 2,692,128$ 2,880,947$ 3,214,951$ 334,004$ 11.6%WASTEWATER TREATMENT 68,821,838 61,246,913 64,934,921 66,395,058 1,460,137 2.2%FIELD OPERATIONS 65,926,122 69,613,770 69,117,281 72,123,701 3,006,420 4.3%LABORATORY SERVICES 5,272,058 5,400,095 5,312,799 5,688,037 375,238 7.1%ENQUAD 3,822,093 3,637,550 2,860,161 2,978,192 118,031 4.1%ENGINEERING & CONSTRUCTION 8,323,618 7,881,547 7,569,133 8,200,109 630,976 8.3%TOTAL 154,895,070$ 150,472,004$ 152,675,240$ 158,600,049$ 5,924,809$ 3.9%
FY13 Final Current Expense BudgetOPERATIONS DIVISION
ChangeFY12 to FY13
FY13 Final Current Expense BudgetOPERATIONS DIVISION by Department
ChangeFY12 to FY13

FY13 Final CEB -- page III-2
rehabilitation of wastewater and waterworks systems. The Environmental Quality Department (EnQuad) manages and reports on the monitoring of Boston Harbor and Massachusetts Bay water quality and oversees MWRA's compliance with its National Pollutant Discharge Elimination System (NPDES) permits. The Laboratory Services Department supports various client groups in the Operations Division, the Department of Conservation and Recreation (DCR), and the MWRA member communities, providing field sampling, laboratory testing, and reporting services. Most of the testing is required to meet the strict guidelines of regulatory programs and permits including the Safe Drinking Water Act (SDWA) and MWRA’s NPDES permits. The Operations Administration Department provides oversight and general management support in the areas of finance, contract administration, and personnel. The Operations Administration Department budget also includes funds for MWRA vehicle purchases and division-wide memberships. FY13 Goals: Plan, develop, implement, and operate efficient, reliable, and economical water treatment/delivery and
wastewater transport/treatment systems.
Ensure compliance with state and federal drinking water quality and wastewater discharge regulations including the Safe Drinking Water Act (SDWA), the Clean Water Act, and National Pollutant Discharge Elimination System (NPDES) permits.
Plan and implement rehabilitation of existing facilities and construction of new facilities including pipelines, pump stations, storage facilities, and treatment facilities on schedules that allow for sufficient system capacity and performance.
Dispose of wastewater treatment by-products in a cost-effective and environmentally sound manner.
FY13 Initiatives: Operations, Energy, and New Facilities Start-ups:
Continue to implement and optimize Supervisory Control and Data Acquisition (SCADA) in Wastewater
Operations facilities.
Continue to identify, assess, and implement initiatives to reduce energy demand and increase energy self-generation in MWRA’s system. Pursue grant-funding and cost-sharing arrangements to defray costs of implementing these initiatives.
Self-generate ~30% of Deer Island Treatment Plant’s (DITP) required power through optimization of power generation assets, including the wind turbines and the Steam Turbine Generation (STG) back pressure system modifications.
Engineering & Construction: Award numerous contracts and/or issue Notices To Proceed including the following major contracts:

FY13 Final CEB -- page III-3
o Water System - Carroll Water Treatment Plant (CWTP) Existing Facilities Modification – CP7 - Weston Aqueduct Supply Mains (WASM) MEPA/Design/Construction Administration (CA)/Resident
Inspection (RI) - WASM Sect 36/Watertown/Waltham Connection Construction - Winsor Station Pipeline Rehabilitation and Improvement
o Wastewater System - DITP Clarifier Phase 2 Design - DITP Clarifier Tip Tube Replacement - North Dorchester Bay Outfall Dredging – Construction - DITP Ancillary Modifications – Final Design 4 - DITP North Main Pump Stations Phase 2 Construction - Facility Asset Management Plan (FAMP) Rehabilitation of Section 186 and 4 Construction - DITP Fire Alarm System Replacement Construction
Substantially complete numerous CIP design and construction phases including the following: o Water System
- Northern International High (NIH) Redundancy & Storage Reading/Stoneham Interconnections - NIH Redundancy & Storage Gillis Pump Station Improvements - Lynnfield Pipeline Construction Phase 2 - Dam Safety Modifications & Repairs Construction - Valve Replacement Construction 7 - MetroWest Tunnel Lower Hultman Rehabilitation CP6A - Southern Spine Distribution Mains Sections 21, 43, & 22 Design
o Wastewater System
- Combined Sewer Overflow (CSO) Program North Dorchester Bay Tunnel Design - CSO Program North Dorchester Bay Outfall Dredging - Construction - CSO Program Brookline Sewer Separation Construction - CSO Morrissey Boulevard Drain Design - CSO Brookline Sewer Separation Design
Maintenance: Optimize staff resources, overtime, service contract scopes and use, and use of as-needed design contracts to
complete routine and major maintenance projects.
Continue work on numerous major projects at Deer Island including facility repainting and coating repairs, Zurn boiler maintenance and repairs, electrical system maintenance, motor bearing overhauls, digester mixer replacement, reactor gearbox rebuilds, and critical equipment maintenance.
Work on numerous projects in Field Operations including meter inspection and repairs, manhole rehabilitation, HVAC and lighting efficiency upgrades in metro facilities, dam appurtenances inspections, and water tank inspections.

FY13 Final CEB -- page III-4
Environmental: Pending approval by regulators, plan for and implement requirements of the new National Pollutant Discharge
Elimination System (NPDES) Permits for DITP (assume new permit as of January 2013) and Clinton Wastewater Treatment Plant (assume new permit as of July 2012).
Continue work on other harbor and outfall monitoring initiatives including: calculating revised thresholds, working with the Department of Conservation and Recreation to implement appropriate beach management practices in South Boston, and improving instrumentation on National Oceanic and Atmospheric Administration’s (NOAA’s) weather buoy.
Continue to optimize the new environmental information system in Toxic Reduction and Control (TRAC).
Plan and implement the new round of NPDES-required Local Limit testing in TRAC to reassess industrial discharge limits. This work can commence after the Environmental Protection Agency (EPA) issues the new NPDES permits.
Continue to prepare for the start-up of Ultra-Violet (UV) Treatment at the CWTP.
Conduct invasive species removal and monitoring at water reservoirs. FY12 Accomplishments: Emergencies
Successfully operated both systems during Tropical Storm Irene in late August 2011 and the unseasonable
snow and ice storm in late October 2011. Work included extensive clean-up of downed trees and branches which were limiting access to MWRA’s mid-state aqueducts and waterworks facilities. Staff also assisted with restoration of a downed power line at the Quabbin Reservoir.
Operations, Energy, and New Facilities Start-ups: Completed lighting upgrades at five water and wastewater facilities; initiated installation of Variable Frequency
Drives (VFDs) on exhaust and supply fans and scrubber pumps at two headworks facilities and the Chelsea Screen House; completed the energy audit at Braintree-Weymouth Intermediate Pump Station (IPS).
Assisted the Procurement Department with the procurement of contracts to supply and deliver chemicals for the water and wastewater system facilities. Chemicals procured included liquid oxygen, aqua ammonia, hydrofluosilicic acid, sodium hypochlorite, ferric chloride, carbon dioxide, hydrogen peroxide, sodium bisulfite and polymer.
Generated revenue at two water hydroelectric facilities: $569,000 at the Oakdale Station, $152,000 at the Cosgrove Station, and $42,000 at the Loring Road Station.
Continued to leverage MWRA’s self-generation assets and participation in the competitive energy market to offset operating costs. The combined impact of participation in the Independent System Operators of New England (ISO-NE) load response program and the non-rate revenue from the sale of Renewable Portfolio Standards Program (RPS) credits resulted in $1.8 million in revenue for FY12. Deer Island also self-generated 24% of the plant’s total required power during that period.
Oversaw installation and start-up of the Charlestown Wind Turbine at the DeLauri Sewer Pump Station.

FY13 Final CEB -- page III-5
Processed 109.7 average tons per day of sludge at the Pelletization Plant and disposed of 6,644 tons of grit and screenings through a contracted vendor.
Staff prepared and executed operations plans for the shutdown of the eastern sections of the Hultman Aqueduct to allow the Shaft 5A contractor work to proceed.
As part of a multi-year plan to modernize the communication system, MWRA procured 250 radios to replace
older, obsolescent models and to ensure functionality after the state-wide system transition to digital signal transmission.
Maintenance:
The Operations Division spent $23.6 million on maintenance of which $12.3 million was for materials and $11.3 million was for services.
Completed numerous major maintenance projects including the following:
o Procured and implemented numerous contracts for maintenance services including: thermal and hydropower plant maintenance, Combustion Turbine Generator (CTG) maintenance, elevator maintenance and overhead door maintenance at DITP; janitorial services at the Chelsea facility; boiler and water heater service at numerous facilities; electrical system maintenance and HVAC system maintenance at CWTP; elevator maintenance and repair at numerous facilities; hydraulic equipment services for wastewater facilities; fuel storage tank maintenance and repair and Groundskeeping maintenance for numerous facilities; and paving services for MWRA pipeline projects.
o Procured and implemented numerous contracts for maintenance projects including: energy efficient lighting upgrades at Prison Point; electrical equipment replacement at various sewer pump stations; section 22 pipeline easement clearing; variable drive replacement at Clinton Plant; replacement of two flow control gates at DITP; actuator replacement at CWTP; tree removal at Wachusett Reservoir; and Blue Hills Covered Storage Tank inspection.
o Installed and commenced operation through Supervisory Control and Data Acquisition (SCADA) of seven
units of Contaminant Monitoring Systems.
o Cleared water and wastewater easements in addition to clearing grounds at numerous MWRA facilities. In the water system, exercised 511 and replaced 16 mainline valves; exercised 253 blow-off valves; and
surveyed 131 miles of water mains for leaks.
In the wastewater system, inspected 33.5 miles and cleaned 52.7 miles of MWRA pipeline. Also inspected 1,097 structures and rehabilitated 145 manholes.

FY13 Final CEB -- page III-6
Engineering, Construction, and Planning: Award of contracts or Notice to Proceed for numerous contracts including the following major projects:
o Water System - Dam Safety Modifications & Repairs – Construction - NIH Redundancy and Storage – Reading/Stoneham Interconnections - Spot Pond Storage Facility Design/Build - Long Term Redundancy – Wachusett Aqueduct Pump Station Design/Resident Inspection - Metro West Tunnel – Upper Hultman Rehabilitation
o Wastewater System
- FAMP Section 156 Rehabilitation Design/Build - DITP Process Instrumentation Control System (PICS) Replacement Construction - DITP Digester Modules 1& 2 Pipe Replacement - DITP NMPS Variable Frequency Drive (VFD) Replacement Construction - FAMP Alewife Brook Pump Station Final Design - DITP Clarifier Flush System
Substantially completed numerous projects including the following:
o Water System
- New Connecting Mains Shaft 7 Design - Energy Solar Construction at the Carroll Water Treatment Plant (CWTP) - Water Transmission Redundancy Plan - New Connecting Mains Shaft 7 Construction 5 Northeast Segment - Southern Spine – Section 107 Phase 2 Construction
o Wastewater System
- East Boston Branch Sewer Replacement Design 2 Construction Services (CS) - DITP Electrical Equipment Upgrade Construction 3 - Energy Charlestown Wind Construction - Charles River Combined Sewer Overflow (CSO) Controls Brookline Connection Inflow Controls –
Construction - Braintree-Weymouth Relief Design 2/Construction Services (CS)/Resident Inspection (RI) - DITP Primary and Secondary Clarifier Rehabilitation Construction - FAMP Prison Point HVAC Upgrade Construction
Environmental:
The TRAC Department completed the following Environmental Protection Agency (EPA)-required work for
significant industrial users: 210 inspections, 184 monitoring events, and 378 sampling of connections. This department also issued or renewed 301 permits to Significant Industrial Users (SIUs) and non-SIUs.
The TRAC Department submitted the Industrial Pretreatment Program Annual Report to the EPA for FY11 in October 2011.

FY13 Final CEB -- page III-7
The TRAC Department continued work on the review of local limits at the Clinton Wastewater Treatment Plant as required under the NPDES permit renewal process.
At DITP, treated 99.2% of flow through secondary and met secondary permit limits at all times. Operated DITP without any NPDES Permit violations in FY12.
EnQuad carried out permit-required environmental monitoring of Boston Harbor and Massachusetts Bay water column, sediments, fish and shellfish and CSO receiving water quality. The department finalized 14 technical reports, made monitoring results available on its website and sent reports to government regulators, the Outfall Monitoring Science Advisory Panel and interested members of the public.
Met all water quality and treatment standards for giardia and cryptosporidium in the drinking water system during FY12.
The Department of Laboratory Services (DLS) provided routine laboratory services and analysis for approximately 252,000 tests and also provided as-needed analytical support for numerous projects including the following: drinking water Lead and Copper Rule testing, Somerville Marginal CSO facility special project, National Associations of Clean Water Agencies (NACWA) review of EPA’s proposed testing revisions.
Budget Highlights:
The FY13 Current Expense Budget is $158.6 million, which is $5.9 million or 3.9%, more than FY12 Actual spending. The FY13 CEB continues to reflect efforts to contain rate increases by curtailing spending on less critical items or services wherever possible and implementing efficiency improvements that will result in long-term, sustainable reductions to the Operations Division’s budget.
Significant increases from FY12 Actual spending include:
o Net increase of $3.2 million or 4.7 % for Wages and Salaries primarily due to FY12 and FY13 wage increases offset by the division-wide reduction of $400,000 for six positions to remain unfilled. The FY13 CEB funds 928 filled positions on average during the year; six positions fewer than funded in the FY12 Budget.
o Net increase of $1.1 million or 4.7% for Maintenance due to planned projects for FY13.
o Net increase of $692,000 or 7.5% for Chemicals primarily due to price increases for sodium hypochlorite, ferric chloride, nitrazyme, and other chemicals. The CEB also continues to assume reduced fluoride usage at the Carroll Water Treatment Plant when the new regulations take effect later in FY13.
o Net increase of $465,000 or 15.3% for Overtime primarily due to FY12 storm-related overtime spending
was significantly less than average due to a relatively mild winter and spring. The FY13 CEB is sized based on multi-year spending patterns and includes adjustments for wage increases. The budget also incorporates reduction in overtime for FOD Operations Control Center and headworks facilities due to changes in staffing requirements.
o Net increase of $456,000 or 21.4% for Professional Services primarily due to lower than expected need in FY12 for as-needed task order work in the Harbor and Outfall program and as-needed engineering work at DITP. The FY13 Budget also includes increases for planned energy audits of facilities in the southern part of MWRA’s service district and funding for design of repairs at the Wachusett Dam. Major items in the FY13 budget include $1.4 million for Harbor and Outfall Monitoring; $650,000 for as-needed engineering services to handle specialized work and peak workload; $164,000 for dam analysis, design and inspection

FY13 Final CEB -- page III-8
services; $137,000 for Central Lab’s outsourcing of testing services for specialized work, peak workloads, and second opinions; and $125,000 for energy services primarily for facility audits.
o Net increase of $327,000 or 1.4% for Utilities. The $23 million FY13 Utilities budget, which is 14.5% of
the Operations Division’s total budget, includes $16 million for electricity, $4.4 million for diesel fuel, $1.9 million for water, and $515,000 for natural gas. The increase from FY12 spending is due to larger budgets for diesel fuel, up $669,000 and natural gas, up $103,000. Diesel fuel increases because Deer Island’s FY13 budget assumes seven days of wet-weather CTG use whereas actual use in FY12 was significantly less due to the mild winter/spring weather. The FY13 electricity budget is less than FY12 spending due to expected increases in self-generation and lower usage due to energy projects at Deer Island. The increase in natural gas is due to a budget increase in use based on historical trends verses lower than expected use in FY12.
o Net increases of $56,000 or 67% for Training and Meetings primarily due to planned training for Deer
Island mechanical staff, site visits to other plants in preparation for UV treatment start-up at the CWTP and electrical medium voltage training in FOD facilities.
Significant decreases from FY12 spending include:
o Net decrease of $332,000 or 7.7% for Other Materials primarily due to unbudgeted replacement of radios
in FY12 offset by budgeted increases for vehicle replacements in FY13 due to the aging fleet. Approximately 50% of the active fleet will be seven years or older at the beginning of FY13. The FY13 CEB fund replacement of 47 vehicles is 9.5% of the active fleet.
o Net decrease of $69,000 or 0.4% for Other Services primarily due to expiration of the Deer Island
ambulance contract at the end of FY12. In lieu of procuring a new contract, MWRA has provided a lump sum payment to Winthrop to help defray the cost of a new fire truck and in return, Winthrop will provide ambulance services to the Deer Island Treatment Plant as-required. This reduction is offset by several increases in expenses for permit fees, other services, other rentals and grit and screenings removal. The major expense in FY13 Other Services is $14.6 million for the pelletization contract. The FY13 CEB is based on an average of 105.7 Tons Per Day (TPD); the historical average through FY11, whereas average tonnage in FY12 was 109.7 TPD. The FY13 CEB also includes contractual inflation adjustments for components of the contract.
The FY13 Final Budget is subject to risk in the following areas: timing of the implementation of Deer Island’s
new NPDES permit, chemical and utility usage and prices, sludge quantities, and more than expected emergency-related maintenance and overtime needs

FY13 Final CEB -- page III-9
OPERATIONS ADMINISTRATION
The Operations Administration Department is comprised of the Office of the Chief Operating Officer and Division level support staff. The department goal is to oversee, manage, and implement MWRA policies and procedures pertaining to the following functions: labor relations, finance, contract and general administration
Budget Highlights:
The FY13 CEB is $3.2 million, an increase of $334,000 or 11.6%, from FY12 Actual spending.
$1.5 million for Wages and Salaries, a decrease of $409,000 or 21.4%, from FY12 Actual spending. The funding supports 23 positions. The FY13 Final Budget decrease is due to the inclusion of the $400,000 for a division level vacancy discount .
$25,000 for Professional Services, an increase of $15,000 or 156.7%, from FY12 Actual spending. Funding covers energy consulting services to support procurements and evaluation of projects. The increase from FY12 to FY13 is primarily due to the resizing of division-wide consulting services in FY13 to support on-going energy initiatives.
$1.5 million for Other Materials, an increase of $740,000 or 97.2%, from FY12 Actual spending. Funding of $1.5 million is for the replacement of aged vehicles in MWRA’s fleet. The $740,000 increase reflects efforts to restore a more cost-effective replacement cycle that supports a 10 to 12 year average useful life for MWRA’s passenger vehicles. This is a change from recent years whereby funding was curtailed as part of efforts to contain rate increases. The FY13 Final Budget will allow MWRA to replace 42-50 vehicles which is approximately 8.5% to 10% of the active fleet. Actual spending for vehicle purchases for FY02-FY12 is as follows:
FY02: $ 622,000 FY06: $ 717,381 FY10: $826,513 FY03: $ 120,000 FY07: $1,846,396 FY11: $680,163 FY04: $1,580,000 FY08: $1,425,758 FY12: $784,146 FY05: $1,237,289 FY09: $1,134,779
From FY00 to FY03, MWRA limited replacement of vehicles pending completion of an extensive fleet review. In FY03 MWRA reduced the active fleet by more than 10% (from 561 to 496 vehicles) as a result of this initiative. For example, staff identified opportunities to meet the needs of the new waterworks system facilities
LINE ITEMFY10Actual
FY11Actual
FY12Actual
FY13Final
WAGES & SALARIES 1,789,319$ 1,865,867$ 1,905,682$ 1,497,144$ (408,538)$ -21.4%OVERTIME 798 238 101 - (101) -100.0%FRINGE BENEFITS - - - - - - ONGOING MAINTENANCE - - (342) - 342 -100.0%TRAINING & MEETINGS 468 2,284 6,812 3,700 (3,112) -45.7%PROFESSIONAL SERVICES 6,500 5,467 9,740 25,000 15,260 156.7%OTHER MATERIALS 831,973 713,187 761,665 1,502,000 740,335 97.2%OTHER SERVICES 100,283 105,084 197,288 187,106 (10,182) -5.2%TOTAL 2,729,340$ 2,692,128$ 2,880,947$ 3,214,951$ 334,004$ 11.6%
FY13 Final Current Expense BudgetOPERATIONS ADMINISTRATION
ChangeFY12 to FY13

FY13 Final CEB -- page III-10
through redeployment of existing vehicles rather than adding to the fleet. Approximately 50% of MWRA’s active, operable fleet is seven years or older.
$187,000 for Other Services which are primarily level funded. The majority is for Authority-wide memberships including the American Waterworks Association Research Foundation (AWWARF), National Association of Clean Water Agencies (NACWA), Association of Metropolitan Water Agencies (AMWA), American Waterworks Association (AWWA), and the Boston Harbor Association (BHA) marine debris program. The FY13 Final Budget continues to include partial funding for MWRA’s membership in AWWARF.

FY13 Final CEB -- page III-11
WASTEWATER TREATMENT
The Deer Island Treatment Plant, the Residuals Management Program, and the Clinton Treatment Plant comprise the Wastewater Treatment Department. Together, the budgets for these programs represent 42% of the Operations Division’s FY13 Final Budget and 31% of MWRA’s FY13 Final direct expenses. Incoming wastewater from MWRA customer communities is piped to several headworks facilities where large objects are screened out before the influent is transmitted to Deer Island Treatment Plant through underground tunnels. At Deer Island, wastewater from the north system is pumped through chambers that remove grit and detritus for disposal in an off-island landfill. South system flows undergo preliminary treatment at the Nut Island headworks and are then pumped directly into the primary treatment facility, bypassing the grit removal chambers. The primary treatment facility consists of stacked clarifiers where scum rises to the top and the sludge settles to the bottom. Secondary reactors and clarifiers remove organic matter through biological and gravity treatment. Primary and secondary sludge and scum are thickened, anaerobically digested, and further thickened to reduce the volume of sludge before it is pumped through the Braintree-Weymouth tunnel to MWRA's Residuals Processing Facility at Fore River Staging Area (FRSA). Methane, a byproduct of anaerobic digestion, is used to fuel the plant's boilers, which produce steam to provide heat and generate electricity.
LINE ITEMFY10Actual
FY11Actual
FY12Actual
FY13Final
WAGES & SALARIES 17,553,076$ 16,976,936$ 17,557,330$ 18,219,738$ 662,408$ 3.8%OVERTIME 1,379,720 950,891 764,149 1,063,530 299,381 39.2%FRINGE BENEFITS 28,799 19,075 15,150 19,708 4,558 30.1%CHEMICALS 2,887,823 2,271,711 2,773,772 3,167,788 394,016 14.2%UTILITIES 16,184,157 12,296,072 13,537,849 13,319,505 (218,344) -1.6%ONGOING MAINTENANCE 13,737,428 12,772,381 13,672,935 13,920,802 247,867 1.8%TRAINING & MEETINGS 23,581 1,787 5,439 38,400 32,961 606.0%PROFESSIONAL SERVICES 353,515 346,188 111,911 273,200 161,289 144.1%OTHER MATERIALS 515,596 504,687 525,659 562,991 37,332 7.1%OTHER SERVICES 16,158,142 15,107,184 15,970,726 15,809,398 (161,328) -1.0%TOTAL 68,821,838$ 61,246,913$ 64,934,921$ 66,395,058$ 1,460,137$ 2.2%
FACILITYFY10Actual
FY11Actual
FY12Actual
FY13Final
DEER ISLAND 50,400,723$ 44,246,489$ 46,886,554$ 48,141,547$ 1,254,993$ 2.7%RESIDUALS 16,918,753 15,539,049 16,531,865 16,621,621 89,756 0.5%CLINTON 1,502,362 1,461,375 1,516,502 1,631,890 115,388 7.6%TOTAL 68,821,838$ 61,246,913$ 64,934,921$ 66,395,058$ 1,460,137$ 2.2%
FY13 Final Current Expense BudgetWASTEWATER TREATMENT
ChangeFY12 to FY13
FY13 Final Current Expense BudgetWASTEWATER TREATMENT
ChangeFY12 to FY13

FY13 Final CEB -- page III-12
DEER ISLAND TREATMENT PLANT
Program Description and Goals:
The Deer Island Treatment Plant budget accounts for 30% of the Operations Division’s FY13 Final Budget. DITP has a primary treatment peak capacity of 1.27 billion gallons per day (bgd) and secondary treatment peak capacity of 700 million gallons per day (mgd).
Wastewater "influent" from MWRA customer communities arrives at the plant through four underground tunnels. Pumps then lift the influent 80 to 150 feet, depending on the tunnel, to the head of the plant.
North system flows pass through grit channels and bar screens at the Headworks that remove grit and screenings for disposal in an off-island landfill. South system flows are pre-treated for grit at Nut Island and the Braintree-Weymouth Intermediate Pump Station. Flow is routed to primary treatment clarifiers, which remove about half of the pollutants brought to the plant in typical wastewater (removes 50-60% of total suspended solids and up to 50% of pathogens and toxic contaminants). In the clarifiers, gravity separates sludge and scum from the wastewater.
In secondary treatment, reactors and clarifiers remove non-settleable solids through biological and gravity treatment. The biological process is a pure oxygen-activated sludge system, using microorganisms to consume organic matter that remain in the wastewater flow. Secondary treatment raises the level of pollution removal to over 85%. Approximately 130 tons of pure oxygen is manufactured each day at Deer Island's cryogenic facility to support the biological treatment process.
Sludge from primary and scum from both primary and secondary treatment are thickened in gravity thickeners. Sludge from secondary treatment is thickened in centrifuges. Polymer is used in the secondary thickening process to increase its efficiency. Digestion occurs in the egg-shaped anaerobic digesters at the Deer Island Treatment Plant. There are a total of 12 digesters, each 90 feet in diameter and approximately 130 feet tall. Microorganisms naturally present in the sludge work to break sludge and scum down into methane gas, carbon dioxide, solid organic byproducts, and water. Digestion significantly reduces sludge quantity. The methane gas produced in the digesters is used in the plant's on-site power generating facility to save operating costs by reducing consumption of purchased energy. Digested sludge is pumped through the inter-island Braintree-Weymouth tunnel directly to the MWRA’s Pelletizing Facility at Fore River, where it is further processed into a fertilizer product.
LINE ITEMFY10Actual
FY11Actual
FY12Actual
FY13Final
WAGES & SALARIES 16,854,157$ 16,278,877$ 16,822,253$ 17,462,536$ 640,283$ 3.8%OVERTIME 1,316,066 916,406 717,421 1,011,030 293,609 40.9%FRINGE BENEFITS 27,911 18,716 14,465 18,708 4,243 29.3%CHEMICALS 2,710,193 2,066,352 2,559,694 2,886,242 326,548 12.8%UTILITIES 15,887,447 11,985,464 13,270,049 13,035,371 (234,678) -1.8%ONGOING MAINTENANCE 12,300,411 11,736,526 12,504,338 12,698,571 194,233 1.6%TRAINING & MEETINGS 22,999 1,127 5,439 34,500 29,061 534.3%PROFESSIONAL SERVICES 263,157 344,215 110,273 270,500 160,227 145.3%OTHER MATERIALS 450,148 397,774 385,968 414,200 28,232 7.3%OTHER SERVICES 568,234 501,031 496,653 309,890 (186,763) -37.6%TOTAL 50,400,723$ 44,246,489$ 46,886,554$ 48,141,547$ 1,254,993$ 2.7%
FY13 Final Current Expense BudgetDEER ISLAND TREATMENT PLANT
ChangeFY12 to FY13

FY13 Final CEB -- page III-13
Organizational Structure: The Deer Island Plant has six major functional areas: Operations, Thermal Power Plant, Process Control, Maintenance, Capital Engineering, and Operations and Maintenance (O&M) Support. Operations staff manages the day-to-day operation of plant processing units, performs minor preventative
maintenance activities, and oversees plant functions 24 hours per day, seven days per week. Thermal Power Plant staff manages and operates the Deer Island generation and thermal systems. Power Plant
personnel provide 24 hour operation of the high-pressure, high temperature steam power plant. This facility is capable of producing up to 70 megawatts of emergency electrical power.
Process Control manages and maintains the following programs in support of plant operations; real-time
process instrumentation and control system (PICS), operational data system (OMS), plant performance monitoring and reporting programs, and regulatory compliance programs including all plant permits, water quality, and air quality. The Process Control Unit provides the technical expertise for plant unit operations and routinely performs process optimization studies to help increase performance and reduce operating costs.
Maintenance performs preventive and predictive maintenance and corrective repairs on all equipment, utilizing
a computerized maintenance management system (CMMS) to coordinate scheduling with Operations. Staff has developed the Reliability Centered Maintenance (RCM) program, which has improved plant performance by applying maintenance resources where they are most effective. RCM analyzes the operating systems with the objective of ensuring critical functions operate as required. Implementation of a preventive maintenance program using RCM helps reduce the cost of maintaining the plant and improves the efficiency by anticipating when maintenance will be required. An on-island warehouse, managed by Procurement Department staff, ensures there is adequate stock for maintenance repairs and plant operations.
Capital Engineering provides technical support services for both the Operations and Maintenance Units. Staff
is responsible for all aspects of plant engineering including developing, procuring, and implementing all service contracts, consultant designs, and capital improvement projects at Deer Island. This group also manages the on-island Technical Information Center, which provides services to the Deer Island Treatment Plant (DITP) community and external constituents, and ensures quick access to plant drawings and technical information for operational and maintenance needs.
O&M Support Section is responsible for supporting the business needs of the plant. The Administration and
Finance Unit provides financial and administrative support to meet daily operational needs of the plant. The Safety/Security Unit is responsible for ensuring a safe and healthful work environment for employees and minimizing MWRA’s exposure to liability and property loss or damage.
The Deer Island Director’s Office provides overall policy direction and support in the areas of public access and community agreements.

FY13 Final CEB -- page III-14
Operating Assumptions Deer Island’s FY13 Final Budget assumes treatment of an average flow of 362 mgd based on eleven years of historical data. The projected quantity of digested sludge to be pumped to FRSA (TSS basis) is 105.7 TPD. This is based on data from the six years after the discontinuation of the DSL centrifuges and the start-up of the Braintree-Weymouth tunnel. Deer Island’s FY13 Final Budget accounts for the impact of self-generation of electricity from the steam turbine generator, combustion turbine generators, hydroelectric generators, wind turbine generators, and photovoltaic panels. In total, these assets will meet approximately 30% of the total energy requirements. Deer Island continues to comply with the conditions of the current National Pollutant Discharge Elimination System (NPDES) Permit which expired in FY06. Given the uncertainty regarding the timing of the permit renewal from the Environmental Protection Agency (EPA), Deer Island’s FY13 Final Budget does not assume that the new permit will be in effect for FY13. When the new permit is issued, it is anticipated that Deer Island’s treatment process will be required to kill enterococcus in addition to fecal coliform to comply with the new regulations. Budget Highlights: The FY13 Final Budget is $48.1 million, an increase of $1.3 million or 2.7%, from FY12 Actual spending.
$17.5 million for Wages and Salaries, an increase of $640,000 or 3.8%, from FY12 Actual spending. The FY13 Final Budget funds on average 233 filled permanent positions. The FY13 CEB also includes $149,000 for stand-by pay to support operational and maintenance needs primarily during storms and emergencies.
$1.0 million for Overtime, an increase of $294,000 or 40.9% from FY12 Actual spending. Overtime supports operational coverage, critical maintenance projects, and regulatory requirements (i.e. inspections). The increase is primarily due to lower than anticipated storm coverage and wet weather/high plant flow events in FY12.
$2.9 million for Chemicals, an increase of which is $327,000 or 12.8%, from FY12 Actual spending. The FY13 Final Budget reflects management’s expectation that a new NPDES permit will not be in effect for Deer Island for FY13. The budget includes $1.1 million for sodium hypochlorite, $585,000 for ferric chloride, $314,000 for activated carbon, $266,000 for polymer, and $141,000 for sodium bisulfite. The majority of the increase from FY12 to FY13 is mainly due to the projected chemical price increases. The FY13 CEB usage estimates for disinfection chemicals are based on multi-year averages.
$13.0 million for Utilities, a decrease of $235,000 or 1.8%, from FY12 Actual spending. The FY13 Final Budget includes $9.4 million for electricity, $2.1 million for diesel fuel, and $1.5 million for water. The FY13 Final Budget reflects several years of historical power usage and self-generation and includes a full year’s impact of renewable self-generation primarily from additional solar panels and the new back pressure steam turbine generator (STG), which in total contributes to an approximate decrease of $500,000 in electricity costs from FY12 Actual spending.
$12.7 million for Maintenance, an increase of $194,000 or 1.6%, from FY12 Actual spending. The FY13 Final Budget includes $5.9 million for materials and $6.8 million for services. Of the total, $8.4 million or 66% is for plant and machinery services and materials, $1.9 million is for electrical system maintenance, and $1.3 million is for building and grounds work.
$271,000 for Professional Services, an increase of $160,000 or 145.3%, from FY12 Actual spending. The increase reflects a greater amount for projected spending in the as-needed design contracts to support the development of major maintenance projects.

FY13 Final CEB -- page III-15
$414,000 for Other Materials, an increase of $29,000 or 7.3%, from FY12 Actual spending. The FY13 Final Budget includes $152,000 for health and safety materials, $98,000 for work clothes, and $68,000 for vehicles expenses (tolls, mileage, and gas).
$310,000 for Other Services, a decrease of $187,000 or 37.6%, from FY12 Actual spending. The FY13 Final Budget decrease is due to the elimination of the ambulance service contract of $250,000. The FY13 Final Budget includes $86,000 for permit fees, $50,000 for fax/copier leasing and servicing, $36,000 for telephones, $25,000 for freight charges, and $20,000 for HAZmat/safety services.

FY13 Final CEB -- page III-16
RESIDUALS MANAGEMENT
Program Description and Goals: The Residuals Management Program manages the processing and disposal of approximately 106 dry tons per day total suspended solids (TSS) of sludge from the anaerobic digestion process at Deer Island Treatment Plant, as well as the disposal of grit and screenings from all MWRA facilities. MWRA seeks to dispose of all sludge and grit and screenings in a reliable, economical, and environmentally sensitive manner. MWRA contracts with the New England Fertilizer Company (NEFCo) to operate the sludge processing facility,
and to market and distribute sludge products. A 15-year contract with NEFCo became effective March 1, 2001 and will expire on December 31, 2015. Liquid sludge from Deer Island is pumped through the Braintree-Weymouth cross-harbor tunnel to the Fore River processing facility where it is dewatered, dried, and shipped by either rail or truck for use as fertilizer or to other appropriate disposal. MWRA is committed to the beneficial reuse of biosolids to the greatest extent practicable.
In FY11, MWRA completed a third-party independent condition assessment of the NEFCo facility. The report
found the facility in excellent condition and recommended only minor modifications to several control system devices.
The budget is based on 105.7 tons per day (TPD based on TSS), consistent with historical actual annual tonnage since the start-up of the Braintree-Weymouth tunnel through FY12.
Grit and screenings (minor residuals) from MWRA's headworks and certain pump stations are collected and disposed of in landfills. MWRA contracts with a third party operator for this service. Minor residuals are by-products of wastewater pre-treatment and primary/secondary treatment processes and include grit, screenings, and scum screenings. The current contract commenced in June 2011.
Budget Highlights: The FY13 Final Budget is $16.6 million, an increase of $89,700 or 0.5%, from FY12 Actual spending. $115,000 for Wages and Salaries, an increase of $1,700 or 1.5%, from FY12 Actual spending. The funding
supports one position. This department also receives on-going management oversight and staff support from other departments of the MWRA including Deer Island, Treasury, and Operations Administration.
LINE ITEMFY10Actual
FY11Actual
FY12Actual
FY13Final
WAGES & SALARIES 119,702$ 107,382$ 113,188$ 114,899$ 1,711$ 1.5%OVERTIME - - - - - - FRINGE BENEFITS - - - - - - UTILITIES - - - - - - ONGOING MAINTENANCE 1,226,841 843,858 965,977 1,021,790 55,813 5.8%TRAINING & MEETINGS 582 - - 3,400 3,400 - PROFESSIONAL SERVICES - - - 1,000 1,000 - OTHER MATERIALS - - - 1 1 - OTHER SERVICES 15,571,628 14,587,809 15,452,700 15,480,531 27,831 0.2%TOTAL 16,918,753$ 15,539,049$ 16,531,865$ 16,621,621$ 89,756$ 0.5%
FY13 Final Current Expense BudgetRESIDUALS MANAGEMENT PROGRAM
ChangeFY12 to FY13

FY13 Final CEB -- page III-17
$1.0 million for Maintenance, an increase of $56,000 or 5.8%, from FY12 Actual spending. The funding supports the capital repair, replacement, and improvement component of the NEFCo contract, which includes a specific level per year adjusted to account for inflation. The change from FY12 to FY13 is primarily due to increases in inflation based on market indices.
$14.6 million or 88% of FY13 CEB is for the Sludge Pelletization portion of the NEFCo contract. The FY13
Final Budget is $24,000 or 0.2% less than FY12 Actual spending primarily due to increased spending for excess quantities in FY12. During FY12, short-term process adjustments at the Deer Island Treatment Plant to manage secondary operations resulted in increased sludge quantities. The FY13 CEB is based on an average of 105.7 tons per day, consistent with historical trends since the start-up of the Braintree-Weymouth tunnel through FY12.
$830,000 for Grit and Screenings disposal, an increase of $28,000 or 3.5%, from FY12 Actual spending
primarily due to expected increases in quantity during the clarifier rehabilitation project at the Deer Island Treatment Plant.
$38,000 for Permit Fees, an increase of $27,000 from FY12 Actual spending due to the biennial testing of
sludge dryer stacks as required by the Massachusetts Department of Environmental Protection (MassDEP).

FY13 Final CEB -- page III-18
CLINTON WASTEWATER TREATMENT PLANT
Program Description and Goals:
The Clinton Wastewater Treatment Program provides advanced sewage treatment services to the Town of Clinton and the Lancaster Sewer District. MWRA assumed formal operational responsibility for the Clinton plant in 1987. Since then MWRA has designed and constructed new primary, secondary, and advanced treatment facilities which incorporated rehabilitated portions of the existing plant with new construction. The new facilities, designed to meet all current and projected National Pollutant Discharge Elimination System (NPDES) discharge standards, were completed in 1992.
The plant provides secondary treatment using an activated sludge process in combination with advanced nutrient removal and dechlorination. The major facilities include a headworks, primary settling tanks, digesters, sludge processes, trickling filters, aeration tanks, secondary tanks, and a chemical addition building. The plant discharges its effluent into the South Nashua River in accordance with the discharge limits of the facility's NPDES permit which limits effluent flow to 3.01 million gallons per day (mgd). The plant has a potential peak flow rate of 12 mgd and a 6 mgd peak 24 hour rate. Residual materials are pressed and transported to an MWRA-owned landfill for disposal. Staff also performs regular monitoring of the landfill site.
Budget Highlights:
The FY13 Final Budget is $1.6 million, an increase of $115,000 or 7.6%, from FY12 Actual spending.
$642,000 for Wages and Salaries, an increase of $20,000 or 3.3%, from FY12 Actual spending primarily due to wage increases. The FY13 CEB funds eight positions and one part-time temporary contract clerical position.
$53,000 for Overtime, an increase of $6,000 or 12.4%, from FY12 Actual spending. Overtime is used to meet
the 24 hour, 7 day per week emergency coverage requirement and to provide increased maintenance resulting from an aging facility.
$282,000 for Chemicals, an increase of $70,000 or 31.5% from FY12 Actual spending. Chemicals are used for sludge processing and disposal and wastewater treatment. The change from FY12 to FY13 reflects revised estimates for wastewater treatment chemical use associated with the additional requirements expected in the new National Pollutant Discharge Elimination System (NPDES) permit. The FY13 CEB assumes start-up as of July 2012.
LINE ITEMFY10Actual
FY11Actual
FY12Actual
FY13Final
WAGES & SALARIES 579,217$ 590,677$ 621,889$ 642,303$ 20,414$ 3.3%OVERTIME 63,654 34,485 46,728 52,500 5,772 12.4%FRINGE BENEFITS 888 359 685 1,000 315 46.0%CHEMICALS 177,630 205,359 214,078 281,546 67,468 31.5%UTILITIES 296,710 310,608 267,800 284,134 16,334 6.1%ONGOING MAINTENANCE 210,176 191,997 202,620 200,441 (2,179) -1.1%TRAINING & MEETINGS - 660 - 500 500 - PROFESSIONAL SERVICES 90,358 1,973 1,638 1,700 62 3.8%OTHER MATERIALS 65,448 106,913 139,691 148,790 9,099 6.5%OTHER SERVICES 18,280 18,344 21,373 18,977 (2,396) -11.2%TOTAL 1,502,362$ 1,461,375$ 1,516,502$ 1,631,890$ 115,388$ 7.6%
FY13 Final Current Expense BudgetCLINTON WASTEWATER TREATMENT PROGRAM
ChangeFY12 to FY13

FY13 Final CEB -- page III-19
$284,000 for Utilities, an increase of $16,000 or 6.1%, from FY12 Actual spending. Utilities represent 17% of the FY13 CEB. The budget includes $202,000 for electricity, $62,000 for fuel oil, and $20,000 for water.
$200,000 for Maintenance, a decrease of $2,000 or 1.1%, from FY12 Actual spending primarily due to lower estimates for major project spending in FY13. The FY13 CEB includes $50,000 for major projects based on the most current rolling priority list. The remainder of the budget is for routine materials and services. Maintenance represents 12% of the FY13 Final Budget.
$149,000 for Other Materials, an increase of $9,000 or 6.5%, from FY12 Actual spending due to the expected price increase for landfill gravel. The Other Materials budget includes $136,000 for clean fill for the landfill operation.

FY13 Final CEB -- page III-20
FIELD OPERATIONS
The primary goal of the Field Operations Department (FOD) is to provide high quality, uninterrupted water delivery and wastewater collection services to MWRA communities. The department is responsible for the treatment, transmission, and distribution of water from the Quabbin and Wachusett reservoirs to community water systems. It also manages the collection, transport, and screening of wastewater flow from MWRA communities to the Deer Island Treatment Plant as well as MWRA’s industrial pretreatment, permitting, and monitoring program. FOD consists of six operating units: Toxic Reduction and Control, Wastewater Operations, Metropolitan Maintenance, Water Operations and Maintenance, Operations Support, and Administration. The Toxic Reduction and Control (TRAC) Department operates a multi-faceted program to minimize and control the inflow of hazardous or toxic materials into the MWRA sewer system. TRAC operates MWRA’s Environmental Protection Agency (EPA) approved Industrial Pretreatment Program and is responsible for all associated activities which include conducting inspections (approximately 700 annually), issuing permits (300 annually), conducting sampling (more than 2,000 events annually), and carrying out enforcement activities (approximately 400 annually). The program tracks more than 1,400 permitted facilities and 4,000 gas/oil separators. TRAC uses a software application, Pre-treatment Information Management System (PIMS), to manage an extensive amount of industrial data on analytical test results, compliance status, and facility sampling and permitting requirements. Wastewater Operations operates MWRA’s wastewater transport facilities, including four continuously staffed Headworks facilities; 12 fully automated pumping stations; and seven Combined Sewer Overflow (CSO) facilities
LINE ITEMFY10Actual
FY11Actual
FY12Actual
FY13Final
WAGES & SALARIES 34,959,350$ 34,976,521$ 35,927,958$ 37,861,047$ 1,933,089$ 5.4%OVERTIME 2,333,975 2,655,359 2,102,678 2,318,760 216,082 10.3%FRINGE BENEFITS 39,919 47,180 38,114 47,700 9,586 25.2%CHEMICALS 6,110,976 6,425,336 6,497,757 6,795,706 297,949 4.6%UTILITIES 9,654,098 9,526,403 9,111,793 9,652,882 541,089 5.9%ONGOING MAINTENANCE 8,606,906 11,596,068 9,743,801 10,503,069 759,268 7.8%TRAINING & MEETINGS 23,160 62,590 62,671 86,800 24,129 38.5%PROFESSIONAL SERVICES 618,254 405,450 507,936 717,000 209,064 41.2%OTHER MATERIALS 943,142 1,020,850 2,022,728 956,042 (1,066,686) -52.7%OTHER SERVICES 2,636,342 2,898,013 3,101,845 3,184,695 82,850 2.7%TOTAL 65,926,122$ 69,613,770$ 69,117,281$ 72,123,701$ 3,006,420$ 4.3%
PROGRAMFY10Actual
FY11Actual
FY12Actual
FY13Final
TOXIC REDUCTION & CONTROL 3,436,145$ 3,504,134$ 3,524,789$ 3,602,738$ 77,949$ 2.2%WASTEWATER OPERATIONS 11,624,424 12,120,182 11,877,271 12,971,958 1,094,687 9.2%WATER OPERATIONS & MAINT 21,110,594 26,266,747 25,685,781 26,643,395 957,614 3.7%METRO MAINTENANCE 17,732,922 14,402,761 14,586,284 14,638,114 51,830 0.4%OPERATIONS SUPPORT 7,803,765 8,617,057 8,201,808 8,939,029 737,221 9.0%FOD ADMIN 4,218,272 4,702,889 5,241,348 5,328,467 87,119 1.7%TOTAL 65,926,122$ 69,613,770$ 69,117,281$ 72,123,701$ 3,006,420$ 4.3%
FY13 Final Current Expense BudgetFIELD OPERATIONS by Program
ChangeFY12 to FY13
FY13 Final Current Expense BudgetFIELD OPERATIONS
ChangeFY12 to FY13

FY13 Final CEB -- page III-21
which are similarly un-staffed. FY13 will be the first full-year of operation of the South Boston CSO facilities. The wastewater system is monitored and controlled from the operations control center (OCC) in Chelsea. Water Operations and Maintenance is responsible for the treatment and delivery of approximately 207 million gallons per day (mgd) (three year average) of water from the Quabbin and Wachusett reservoirs to the community water systems. The water system encompasses a service area from Chicopee in the western part of the state to Lynnfield, Wakefield, Marblehead, Norwood and Canton in the metropolitan area. This unit operates and maintains MWRA’s western waterworks facilities, including the Carroll Water Treatment Plant, the MetroWest Tunnel, the Ware Water Treatment Plant, the Cosgrove Intake Facility, the Norumbega Reservoir, and the covered storage facilities. There are two operations centers that provide for monitoring and control of the water system on a 24-hour per day basis. The Metropolitan Operations and Control Center (OCC) is located at MWRA’s Chelsea facility and the Western Operations Center is located at the Carroll Water Treatment Plant.
Metropolitan Maintenance is responsible for the maintenance of MWRA’s wastewater and water systems and facilities within the Route 128 area. Staff maintains pipelines, valves, interceptors, pumps, facility equipment, buildings, and grounds. Metropolitan Maintenance staff maintains a waterworks network of approximately 300 miles of water mains, 4,900 valves, 18 miles of deep rock tunnels, ten pump stations, eight tunnel shafts, eleven distribution storage tanks, a wastewater network of 240 miles of wastewater interceptors and appurtenances, 12 pump stations, four headworks, and six CSO facilities. In addition, this unit performs TV inspections of the wastewater interceptor system and leak detection.
Operations Support provides technical support to Field Operations Department (FOD) in the areas of engineering, quality assurance, data management, metering, and monitoring. Engineering staff coordinates all engineering issues related to the operation of the water and wastewater systems. The Quality Assurance Unit monitors water treatment effectiveness, identifies treatment issues, and develops recommendations for water treatment improvements. Data management activities include performance reporting on water quality, development and maintenance of water quality treatment and optimization models, and tracking and analyzing chemical and hydraulic flow data. The Metering and Monitoring unit maintains 179 revenue water meters, 26 master water meters, 187 revenue wastewater meters, and 35 other wastewater monitoring sites. This unit collects meter data for operational and revenue generating purposes from the water and wastewater systems. It is also responsible for the maintenance of the water and wastewater Supervisory Control and Data Acquisition (SCADA) systems.
FOD Administration provides financial, administrative, planning, and policy oversight functions for the entire Field Operations Department.
Budget Highlights: The FY13 Final Budget is $72.1 million, an increase of $3.0 million or 4.3% from FY12 Actual spending. $37.9 million for Wages and Salaries, which is $1.9 million or 5.4% higher than FY12 Actual spending
primarily due to wage increases. The Wages and Salaries line item accounts for 52% of the FY13 CEB and funds 512 positions. Of the remaining budget, $422,000 is for stand-by pay to support operational and maintenance needs; $97,000 is for temporary employees including two temporary SCADA Technicians and one Engineering Aide; and $53,000 for interns for water quality analysis, grounds maintenance, and engineering assistance to augment engineering staff.
$2.3 million for Overtime, an increase of $216,000 or 10.3% from FY12 Actual spending, due to the addition
of more overtime for snow removal at the western facilities to align the budget with recent historical actuals. The budget includes $1.1 million for emergency related overtime, $578,000 for planned overtime covering scheduled maintenance and training, and $564,000 for operational coverage needs.

FY13 Final CEB -- page III-22
$6.8 million for Chemicals, of which $6.3 million is for water treatment and $517,000 is for wastewater
treatment. The FY13 CEB is $298,000 or 4.6% higher than FY12 Actual spending primarily due to price increases in sodium hypochlorite, liquid oxygen and increased volume for Nitrazyme/VX based on historical usage. The FY13 Final Budget includes $3.2 million for soda ash for alkalinity control, $1.2 million for sodium hypochlorite, $675,000 for hydrofluosilicic acid for fluoridation, $651,000 for liquid oxygen for the Carroll Water Treatment Plant (CWTP) ozone generation, $320,000 for nitrazyme and VX-456 for Framingham Extension Relief Sewer odor and corrosion control, $310,000 for carbon dioxide to control water pH, $218,000 for sodium bisulfite for dechlorination, $200,000 for aqua ammonia for disinfection, and $23,000 for sodium hydroxide to elevate pH and control odor.
$9.7 million for Utilities, an increase of $541,000 or 5.9% from FY12 Actual spending primarily due to
additions to the electricity budget for stations that have added SCADA, the return to service of the Hyde Park Pump Station after a multi-year rehab and a change in calculation method for revenue from the Charlestown Wind Turbine to revenue reimbursement from the previous method of a direct offset to electricity. The FY13 CEB includes $6.3 million for electricity, $2.3 million for diesel fuel which increased $507,000 due to price increases, $515,000 for natural gas which increased $103,000 due to price increases and $404,000 for water which reflects a $99,000 decrease following the repair of several leaks.
$10.5 million for Maintenance, an increase of $759,000 or 7.8% from FY12 Actual spending primarily due to
FY13 maintenance project funding. The FY13 CEB includes $3.7 million in day-to-day projects, $3.5 million for services, $2.8 million in major projects, and $520,000 for energy initiatives. Some of the major projects planned for FY13 include:
Purchase 2 350KW Towable Emergency Generators $337,000 Wachusett Dam North Dike Tree Clearing $300,000 Manhole Rehabilitation Contract $180,000 Bellevue Roof Replacement $150,000 Carpet Replacement - Chelsea Facility $150,000 Replace 10 WW Flow Meters $125,000
$87,000 for Training and Meetings, an increase of $24,000 or 38.5% from FY12 Actual spending primarily
due to less than anticipated training in FY12. This line item primarily covers training required for job duties, health and safety compliance, and job-related licensures and certifications
$717,000 for Professional Services, an increase of $209,000 or 41.2% from FY12 Actual spending due in part to two engineering design projects related to dam repairs along with additional funding for energy audits. The FY13 CEB includes $609,000 for engineering, which is made up of $400,000 for as-needed engineering services, $87,000 for a multiyear dam services contract, and $25,000 for spill control training evaluation; $100,000 for energy audits at various south system facilities; $77,000 for a one-time dam analysis/repair design; $20,000 for the National Pollutant Discharge Elimination System (NPDES) permit related to the Local Limits Study slated for completion early in FY13; $5,000 for lab and testing services related to water quality; and $4,000 for the Dig Safe program.
$956,000 for Other Materials, a decrease of $1.1 million or 52.7% from FY12 Actual spending. FY12 actuals
were high due to the purchase of digital radios to replace the current analog radios due to the state phasing out analog transmitters. The FY13 CEB includes $330,000 for vehicle expenses for gas, mileage reimbursements, and tolls; $235,000 for health and safety supplies; $190,000 for work clothes; and $120,000 for lab and testing supplies.

FY13 Final CEB -- page III-23
$3.2 million for Other Services, an increase of $83,000 or 2.7% from FY12 Actual spending. The FY13 Final budget includes $1.7 million for annual lease payments for the Chelsea office building, $569,000 for telecommunications equipment and services and SCADA needs at various facilities, $381,000 for police details, and $130,000 for invasives control.

FY13 Final CEB -- page III-24
LABORATORY SERVICES
The Department of Laboratory Services (DLS) goal is to provide high quality and responsive laboratory services to MWRA’s water and wastewater treatment programs, including the Department of Conservation and Recreation (DCR) and the MWRA member water and wastewater communities. This includes timely and cost-effective laboratory tests to meet the strict testing guidelines required by all regulatory programs and permits, including the Safe Drinking Water Act (SDWA), Clean Water Act, and National Pollutant Discharge Elimination System (NPDES) permits. The Department supports these functions at five locations: Chelsea, Southboro, Quabbin, the Central Laboratory at the Deer Island Treatment Plant (DITP), and the Clinton Wastewater Treatment Plant. Testing supports drinking water transmission and treatment processes, wastewater operations and process control at Deer Island and Clinton, NPDES compliance, Massachusetts Bay outfall monitoring, Toxic Reduction and Control (TRAC), and wastewater residuals. DLS also conducts the Boston Harbor monitoring program that involves regular sampling for nutrients, bacteria, and water quality parameters throughout Boston Harbor. Laboratory staff track and analyze results for submission to the Environmental Protection Agency (EPA) and the Massachusetts Department of Environmental Protection (MDEP). Most MWRA laboratory testing is done in-house. Certain highly specialized or low volume tests are outsourced, such as tests for dioxins and radioactivity. Budget Highlights: The FY13 Final Budget is $5.7 million, an increase of $375,000 or 7.1%, from FY12 Actual spending. $4.2 million for Wages and Salaries, an increase of $238,000 or 6.0%, from FY12 Actual spending primarily
due to wage increases. The FY13 Final Budget funds 54 positions. The FY13 CEB also includes $84,000 for up to three temporary employee positions to cover peak workload, Harbor and Outfall Monitoring, and the Carroll Water Treatment Plant special testing.
$21,000 for Utilities, an increase of $5,000 or 28.4% from FY12 Actual spending. The FY13 CEB includes the
purchase of gases and cryogenic liquids used for various lab instruments. $283,000 for Maintenance, an increase of $97,000 or 52.0%, from FY12 Actual spending. The FY13 CEB
includes $188,000 for equipment service contracts, $40,000 for Laboratory modifications and $21,000 for Heating Ventilation Air Conditioning (HVAC) services to annually maintain and certify the fume hoods.
LINE ITEMFY10Actual
FY11Actual
FY12Actual
FY13Final
WAGES & SALARIES 4,000,086$ 4,029,511$ 3,983,943$ 4,221,617$ 237,674$ 6.0%OVERTIME 64,595 61,556 67,731 65,102 (2,629) -3.9%FRINGE BENEFITS 423 405 445 1,200 755 169.7%UTILITIES 16,834 16,697 16,464 21,134 4,670 28.4%ONGOING MAINTENANCE 222,466 233,054 186,431 283,303 96,872 52.0%TRAINING & MEETINGS 989 206 773 2,000 1,227 158.7%PROFESSIONAL SERVICES 118,528 97,446 68,265 136,607 68,342 100.1%OTHER MATERIALS 771,432 870,872 921,303 883,369 (37,934) -4.1%OTHER SERVICES 76,705 90,348 67,445 73,705 6,260 9.3%TOTAL 5,272,058$ 5,400,095$ 5,312,799$ 5,688,037$ 375,238$ 7.1%
FY13 Final Current Expense BudgetLABORATORY SERVICES
ChangeFY12 to FY13
FY13 Final CEB -- page III-25
$137,000 for Professional Services, an increase of $68,000 from FY12 Actual spending and covers lab and testing analysis services. The Lab contracts out a variety of complex and/or low volume tests. Outside labs are used for emergencies, “second opinions”, capacity constraints, and unavailability of specialized equipment or economic justification.
$883,000 for Other Materials, a decrease of $38,000 or 4.1%, from FY12 Actual spending. The FY13 CEB includes $574,000 for laboratory and testing supplies and $265,000 for replacement of obsolete or older equipment.
$74,000 for Other Services, an increase of $6,000 or 9.3%, from FY12 Actual spending. The FY13 CEB
primarily covers boat rental service on an as-needed basis, boat dockage for two boats, removal of hazardous waste, and courier service for shipping samples between laboratories.

FY13 Final CEB -- page III-26
ENVIRONMENTAL QUALITY
The Environmental Quality Department manages and reports on environmental findings that may be linked to MWRA operations and projects. The department's main activities are monitoring sewage influent and effluent quality; monitoring the water quality of Boston Harbor, its tributary rivers, and Massachusetts Bay; managing and entering data; and complying with the reporting requirements of MWRA's National Pollutant Discharge Elimination System permits. MWRA submits these permit reports to state and federal regulators, the Outfall Monitoring Science Advisory Panel and its subcommittees, and several libraries; and, as required by the permits, MWRA posts many of these reports on its website, as well as technical reports and water quality information.
Budget Highlights: The FY13 CEB is $3.0 million, an increase of $118,000 or 4.1%, from FY12 Actual spending. $1.5 million for Wages & Salaries, an increase of $52,000 or 3.6% over FY12 Actual spending. The FY13
CEB includes funding for 17 positions. $1.4 million for Professional Services, an increase of $67,000 or 4.9%, from FY12 Actual spending. Outside
laboratory testing and analysis associated with the Harbor and Outfall Monitoring (HOM) Program, including $1.2 million for the HOM 8 contract, which will be completed by several vendors. The balance covers the following contracts which, except for biotoxicity testing, are co-funded through cost-sharing arrangements.
o Biotoxicity testing for Deer Island Treatment Plant, Clinton Treatment Plant, and Combined Sewer
Overflow facilities o National Oceanic and Atmospheric Administration's National Data Buoy Center for required continuous
monitoring o University of Maine’s buoy off Cape Ann o Algae monitoring on buoy off Cape Ann o Cape Cod Bay water quality monitoring o Bays Eutrophication Model o Study of trace organic chemicals (personal care products, pharmaceuticals, and endocrine disruptors).
The FY13 Final Budget continues to reflect the reduction in scope of HOM monitoring that began in CY2011 based on the favorable findings of nine years of monitoring data and regulatory approval. MWRA is saving approximately $800,000 per year in monitoring costs due to the changes compared to before the reductions.
LINE ITEMFY10Actual
FY11Actual
FY12Actual
FY13Final
WAGES & SALARIES 1,451,658$ 1,405,236$ 1,465,986$ 1,518,112$ 52,126$ 3.6%OVERTIME 1,233 465 985 2,100 1,115 113.2%FRINGE BENEFITS - - - - - - ONGOING MAINTENANCE 390 142 (905) - 905 -100.0%TRAINING & MEETINGS 43 1,644 1,405 3,000 1,595 113.5%PROFESSIONAL SERVICES 2,354,958 2,225,388 1,369,550 1,436,450 66,900 4.9%OTHER MATERIALS 9,951 2,104 18,157 14,330 (3,827) -21.1%OTHER SERVICES 3,860 2,570 4,983 4,200 (783) -15.7%TOTAL 3,822,093$ 3,637,550$ 2,860,161$ 2,978,192$ 118,031$ 4.1%
FY13 Final Current Expense BudgetENVIRONMENTAL QUALITY
ChangeFY12 to FY13

FY13 Final CEB -- page III-27
ENGINEERING AND CONSTRUCTION
The Engineering and Construction Department (ECD) manages and coordinates the planning, design, and construction of system improvements that ensure a safe and adequate water supply and a reliable wastewater collection and treatment. Staff is organized into three units including Wastewater Engineering, Water Engineering, and Construction. The department provides in-house engineering, consultant management (during the facilities planning, environmental review, design, and engineering services during construction stages of capital projects), drafting, surveying, construction management, and other technical assistance required for the maintenance, repair, and rehabilitation of wastewater and waterworks systems. The Wastewater Engineering Unit manages all wastewater design and engineering projects including Combined Sewer Overflow (CSO) engineering activities. The unit also maintains the Design Information Services Center (DISC), which provides computer-aided design and drafting (CADD) services. The Water Engineering Unit manages all water design and engineering projects as well as specialized technical services in electrical, structural, mechanical, and civil engineering disciplines. The Construction Unit provides contract management and resident inspection on all MWRA water and wastewater construction and rehabilitation projects, with the exception of Deer Island Treatment Plant. Budget Highlights: The FY13 Final Budget is $8.2 million, an increase of $631,000 or 8.3%, from FY12 Actual spending. $8.0 million for Wages and Salaries, an increase of $730,000 or 10%, from FY12 Actual spending. Wages and
Salaries represent 98% of the FY13 Final Budget and includes funding for 86 positions. FY12 Actual spending reflects seven fewer positions when compared to the FY13 CEB.
$63,000 for Overtime, a decrease of $49,000 or 43.7%, from FY12 Actual spending. Overtime covers resident
inspection at construction sites after regular work hours to ensure monitoring of construction projects. Overtime is also used for unplanned design or survey needs, attendance at evening public meetings, and meeting deadlines. FY13 overtime was reduced when ECD management changed shift hours of resident engineering staff covering the Hultman project. The shift change eliminated four hours of daily overtime.
$9,000 for Maintenance which covers two service contracts for the DISC Unit’s specialized printers and
plotters. FY12 spending decreased when a new copier was purchased and changed the timing of the annual maintenance payment, pushing the contract renewal into FY13.
$6,000 for Training & Meetings, a decrease of $600 or 8.8%, from FY12 Actual spending.
LINE ITEMFY10Actual
FY11Actual
FY12Actual
FY13Final
WAGES & SALARIES 7,991,274$ 7,540,258$ 7,290,274$ 8,020,356$ 730,082$ 10.0%OVERTIME 112,912 182,036 111,200 62,600 (48,600) -43.7%FRINGE BENEFITS 479 713 569 750 181 31.8%ONGOING MAINTENANCE 8,039 2,739 7,647 9,366 1,719 22.5%TRAINING & MEETINGS 745 5,757 7,017 6,400 (617) -8.8%PROFESSIONAL SERVICES - - 65,112 - (65,112) -100.0%OTHER MATERIALS 178,514 125,635 66,557 65,437 (1,120) -1.7%OTHER SERVICES 31,656 24,409 20,755 35,200 14,445 69.6%TOTAL 8,323,618$ 7,881,547$ 7,569,133$ 8,200,109$ 630,976$ 8.3%
FY13 Final Current Expense BudgetENGINEERING AND CONSTRUCTION
ChangeFY12 to FY13

FY13 Final CEB -- page III-28
Professional Service spending in FY12 covered a one-time update of the Construction Unit’s Resident Engineering Manual, performed by a consultant under the multi-discipline technical assistance contracts.
$65,000 for Other Materials, a decrease of $1,000 or 1.7%, from FY12 Actual spending. Funding includes
$21,000 for Fast Lane Tolls, $18,000 for vehicle expense for staff traveling to construction sites, $13,000 for office supplies, $6,000 for MWRA gas cards, and $4,000 for work clothes.
$35,000 for Other Services, an increase of $14,000 or 69.6%, from FY12 Actual spending. Funding includes
$16,000 for printing of in-house design plans and specifications, $11,000 for telephone expenses, $7,000 for memberships and dues, and $1,000 for police details. FY12 Actual spending was lower than the historical average for printing of in-house design plans and specifications.

Law Division
Budget

FY13 Final CEB -- page IV-1
LAW DIVISION
The Law Division provides legal counsel to the Board of Directors, the Executive Director, and staff on compliance with federal and state laws, regulations, court cases, and administrative orders. Staff also handle and provide assistance with respect to litigation matters, real estate matters, labor/employment issues, procurement, and construction issues. The General Counsel interprets the MWRA Enabling Act and provides advice on conflict of interest and Code of Conduct issues. Division attorneys monitor the work of outside counsel when it is necessary to retain such services. Law Division staff, though usually representing MWRA in a defensive posture, also work with Operations Division staff to effectuate cost recovery claims for design errors and omissions by MWRA design professionals. In addition, the Law Division assists in the early resolution of contractor and vendor claims prior to litigation so as to resolve them as favorably and early as possible thereby reducing or eliminating litigation costs and interest payable upon such claims were they to be litigated. FY13 Goals: Timely and cost effective resolution of legal disputes involving MWRA, through litigation or
alternative means of dispute resolution. High quality legal services to support the business and operational needs of MWRA in the areas of
real estate, labor and employment, regulatory compliance, litigation, construction, and business law. Advocacy of MWRA interests in new and developing regulatory issues. Continue to exhaust all opportunities to shift cost of legal representation to insurers and indemnitors
and to litigate insurance coverage disputes as they arise, all in the interest of cost savings. Budget Highlights: The FY13 Final Budget is $1.8 million, an increase of $127,000 or 7.5% from FY12 Actual spending.
$1.6 million for Wages and Salaries, an increase of $83,000 or 5.4% from FY12 Actual spending.
The budget funds 17 positions. The increase from FY12 Actual spending is due to wage increases.
$146,000 for Professional Services, an increase of $35,000 or 31.7% from FY12 Actual spending. The increases from FY12 Actual spending is anticipated need for outside legal counsel and litigation expenses including expert witnesses, depositions, and court filing fees.
LINE ITEMFY10Actual
FY11Actual
FY12Actual
FY13Final
WAGES & SALARIES 1,653,543 1,612,193 1,556,666 1,640,127 83,461$ 5.4%OVERTIME - - 99 - (99) -100.0%TRAINING & MEETINGS 221 845 535 2,000 1,465 273.8%PROFESSIONAL SERVICES 23,882 67,544 110,886 146,000 35,114 31.7%OTHER MATERIALS 4,301 4,095 3,707 7,314 3,607 97.3%OTHER SERVICES 26,042 25,702 25,512 29,147 3,635 14.2%TOTAL 1,707,989$ 1,710,379$ 1,697,405$ 1,824,588$ 127,183$ 7.5%
FY13 Final Current Expense BudgetLAW DIVISION
ChangeFY12 to FY13

Administration & Finance Division
Budget

FY13 Final CEB – page V-1
ADMINISTRATION AND FINANCE DIVISION
The Administration and Finance Division is responsible for managing the finance and support service functions of the Authority. The Administration and Finance (A&F) Division is comprised of eleven departments: Director’s Office; Rates and Budget; Treasury; Controller; Risk Management; Human Resources; Management Information Systems (MIS); Facilities Management; Fleet Services; Procurement; and Real Property and Environmental Management. The Administration and Finance Division performs a multitude of functions that support the daily operations and ensure the implementation of the Authority’s long term goals and strategies. The Administration and Finance Division ensures that a variety of fiscal management systems are in place to monitor and control the Current Expense Budget (CEB) and Capital Improvement Program (CIP).
LINE ITEMFY10Actual
FY11Actual
FY12Actual
FY13Final
WAGES & SALARIES 15,494,376$ 15,166,542$ 15,345,968$ 16,034,754$ 688,786$ 4.5%OVERTIME 72,528 48,666 39,230 61,404 22,174 56.5%FRINGE BENEFITS 15,925,897 17,289,695 17,608,265 18,172,568 564,303 3.2%WORKERS' COMPENSATION 2,226,080 2,228,175 1,600,726 2,100,000 499,274 31.2%UTILITIES 127,177 138,122 100,731 133,678 32,947 32.7%ONGOING MAINTENANCE 2,573,184 3,135,984 2,930,602 3,125,531 194,929 6.7%TRAINING & MEETINGS 33,728 36,965 90,611 223,814 133,203 147.0%PROFESSIONAL SERVICES 922,605 859,070 1,233,132 1,291,642 58,510 4.7%OTHER MATERIALS 1,310,988 858,895 955,387 1,353,932 398,545 41.7%OTHER SERVICES 2,859,420 4,709,830 3,018,817 3,735,344 716,527 23.7%TOTAL 41,545,984$ 44,471,944$ 42,923,470$ 46,232,665$ 3,309,198$ 7.7%
DEPARTMENTFY10Actual
FY11Actual
FY12Actual
FY13Final
DIR OFFICE (FINANCE) 233,549$ 322,759$ 341,064$ 345,630$ 4,566$ 1.3%RATES AND BUDGET 746,583 741,028 761,977 781,386 19,409 2.5%TREASURY 1,099,772 904,827 868,223 981,560 113,337 13.1%CONTROLLER 1,533,605 1,538,224 1,492,769 1,519,203 26,434 1.8%RISK MANAGEMENT 395,661 393,033 406,198 406,019 (179) 0.0%DIVISION DIR (SUPP SER) 174,139 - - - - - HUMAN RESOURCES 20,142,550 21,606,092 21,490,738 22,504,668 1,013,930 4.7%MIS 8,810,394 8,532,999 8,900,651 10,350,041 1,449,390 16.3%FACILITIES MANAGEMENT 2,438,927 2,551,180 2,370,827 2,556,309 185,482 7.8%FLEET SERVICES 1,770,528 1,872,740 1,824,490 2,060,276 235,786 12.9%PROCUREMENT 3,435,590 3,516,243 3,873,820 3,855,164 (18,656) -0.5%REAL PROPERTY / ENVIRONMENTAL MGMT
764,688 2,492,819 592,713 872,410 279,697 47.2%
TOTAL 41,545,984$ 44,471,944$ 42,923,470$ 46,232,665$ 3,309,195$ 7.7%
FY13 Final Current Expense BudgetADMINISTRATION AND FINANCE
ChangeFY12 to FY13
FY13 Final Current Expense BudgetADMINISTRATION AND FINANCE
ChangeFY12 to FY13

FY13 Final CEB – page V-2
FY12 Accomplishments: Continued providing up-to-date, streamlined financial information to the Board of Directors and
external constituencies on both the Current Expense Budget and Capital Improvement Program.
Developed the FY13 Budget consistent with the FY12 planning estimates, for both the Current Expense Budget and the Capital Improvement Program.
Maintained MWRA’s strong credit ratings, Aa1, AA+, AA+ from Moody’s, Standard & Poor’s and Fitch respectively. MWRA’s credit ratings from all three major agencies are only one ratings step below the highest rating of AAA. These high credit ratings enable MWRA to borrow at very advantageous interest rates helping to minimize debt service expenses.
Completed the 2011C transaction for an All–In-True Interest Cost of 3.95%, the lowest in MWRA
history to that point. On December 8, 2011 MWRA issued $327M in Refunding Bonds. Taking advantage of the low interest rates, the refunding resulted in a net present value savings of 7.17% or $25.3M
Completed the Series 2012 A&B transaction for an All-In-True Interest Cost of 3.93%, the lowest in
MWRA history. On April 19, 2012 MWRA issued $150M in New Money Bonds for the ongoing construction program and $86.8M in Refunding Bonds. Taking advantage of the low interest rates, the refunding resulted in a net present value savings of 5.09% or $5.2M.
Established an accounting software users group to provide an open forum for accounting and
purchasing department collaboration with Management Information Systems (MIS). Developed specifications for 21 new replacement vehicles or pieces of equipment of which the
majority of these units will utilize alternative fuel, consistent with the Authority’s goal of purchasing environmentally friendly products.
Created and implemented new Standard Operating Procedures (SOP’s) for preventative maintenance, corrective maintenance, emergency maintenance, vehicle fuel programs, and 2-way radio communications.
Successfully negotiated and implemented successor collective bargaining agreements with five
collective bargaining units. Completed the MIS Five-Year IT Strategic Plan.
Completed an Authority wide Staffing Study
In accordance with the Commonwealth transparency and accountability law, staff implemented the
MWRA Open Checkbook application. This application provides spending data by Employee, Vendor, and Categories of expense to the public and is accessible from MWRA’s web site.
Competitively bid Calendar Year 2011 (CY11) Renewable Energy Portfolio Standard certificates
which resulted in FY12 revenues of $319,000 (Class II). In addition, received FY12 revenues of $885,000 from forward marketing of CY11 (Class I and Solar) Renewable Portfolio Standards (RPS) certificates.

FY13 Final CEB – page V-3
Awarded the following major contracts in FY12: Spot Pond Storage Facility Design Build; Deer Island Treatment Plant (DITP) North Main Pump Station (NMPS) Variable Frequency Drives (VFDs); DITP Air Emissions Testing; Northern Intermediate High (NIH) Stoneham-Reading Connection; Five-Year Strategic Information Technology Plan; Bond Counsel Services; North System Hydraulic Study; Purchase and Supply of Electricity Profile Accounts; Wachusett Aqueduct Pump Station Design; Hatchery Pipeline and Hydroelectric Design; Alewife Brook Pump Station Improvements Design; Alewife Brook Combined Sewer Overflow (CSO) Improvements Design; Union Park Operating Contract; Oakdale Phase 1A Electrical Upgrade; Brookline Overflow Conduit Cleaning; Clinton Aeration Efficiency Improvements; Upper Hultman Aqueduct Interconnections; DITP Primary and Secondary Clarifier Flushing System; FY13 Insurance Program; Disclosure Counsel Services; Residuals Processing Facility Technology Options Assessment; South Dike Tree Removal at Wachusett Reservoir; and DITP Fuel Oil Line Abandonment.
Advertised or received bids/proposals/statements for the following: DITP Expansion Joint Repair
Construction 2; Sudbury Aqueduct Pressurization and Connections; Letters of Credit, Liquidity Facilities or Direct Purchases; Nut Island Switchgear Modifications; Caruso Pump Station Improvements Design; Wachusett Aqueduct Emergency Interconnection Valves; DITP Concrete Steel Restoration and Coating, Phase IV; North Dike Tree Removal at Wachusett Reservoir; and DITP Replacement of Four Gravity Thickener Center Columns.
Recycled 40.2 tons of paper, 262.2 tons of scrap metal, and 42,900 pounds of brass, copper, stainless
steel and aluminum, generating $68,482 in revenues.
Staff acquired easements and negotiated licenses and extensions to support projects such as the Hultman Aqueduct Interconnections, Southern Spine Distribution System Section 156 (license with Berkeley Green), Brookline Conduit (license with Boston University), and Ward Street Headworks (license with Wentworth Institute of Technology). Additionally, provided real estate support on projects such as disposition of property at the former East Boston Steam and Pump Station to the Department of Capital Asset Management (DCAM). At year’s end, working to acquire additional land from DCAM for Ware Disinfection Facility related uses and Massachusetts Department of Transportation (MassDOT) for acquisition of land for Shaft 5/5A.
Continued with the assessment of the oil contamination resulting from the February 2010 spill at the
Cottage Farm Combined Sewer Overflow (CSO) facility. Provided technical support for the assessment and remediation of PCBs at the Chicopee Valley
Aqueduct (CVA) Intake Facility, Alewife Brook Pump Station, and Remote Headworks facilities in conjunction with on-going design of facility upgrades.
FY13 Goals:
Ensure the fiscal strength of MWRA through judicious, informed, and strategic allocation of resources.
Continue the multi-year assessment strategies to ensure predictable, sustainable and reasonable
community assessments and charges. Ensure uniform contract language, standard safeguards, and competitive bids for the MWRA.

FY13 Final CEB – page V-4
Maintain favorable credit ratings for MWRA's revenue bonds. Provide upgrades and enhancements to the integrated Management Information Systems (MIS) to
ensure efficiency, based on the IT Study recommendations. Ensure effective, coordinated operating and capital budget planning throughout MWRA. Maintain effective relationships with the unions representing the MWRA workforce while protecting
and enhancing management flexibility. FY13 Initiatives Continue close monitoring of financial markets to better position the Authority to take advantage of
any opportunities to maximize investment income, refund bonds for savings, and reduce debt financing obligations.
Implement the first phase of the five-year MIS Strategic Plan
Continue assessment, evaluation, and implementation of sustainable cost savings opportunities
throughout the organization. Continue development of a long-term, detailed Strategic Information Technology Plan based on the
IT Study recommendations.

FY13 Final CEB – page V-5
ADMINISTRATION AND FINANCE DIVISION DIRECTOR’S OFFICE
The Administration and Finance (A&F) Division Director's Office oversees a multitude of functions that support the daily operations and ensure the implementation of the Authority’s long-term goals and strategies.
The Director’s Office is responsible for the centralized financial functions of rates development, revenue collection, budgeting, capital financing, debt and investment management, accounting, payroll processing, and risk management as well as the support functions of procurement, human resources, management information systems, fleet services, facilities management, and real property and environmental management. Additionally, the Director’s Office ensures that transactions comply with all rules, regulations, Authority policies and procedures, and contract terms. The Director’s Office manages the development and implementation of policies to uphold the efficient utilization of resources and control of all monies. The Director's Office provides advice and analysis to the Executive Director and the Board of Directors on all administrative and financial issues.
The division’s continuing challenge in FY13 will be maintaining an agency-wide focus on balancing the competing needs to minimize rate increases while ensuring the provision of critical MWRA services. FY13 Goals: Manage and coordinate the Authority’s finance and support service functions. Guide and coordinate division activities to support MWRA’s goals and objectives. Continuously improve processes and performance for greater efficiency. Develop and implement long-term strategies to ensure reasonable rate increases to MWRA’s
communities. Budget Highlights: The FY13 Final Budget is $346,000, an increase of $5,000 or 1.3% from the FY12 Actual spending. The FY13 Final Budget includes $338,000 for Wages and Salaries, an increase of $4,000 or 1.3%
from FY12 Actual spending. The FY13 Final Budget funds three positions.
LINE ITEMFY10Actual
FY11Actual
FY12Actual
FY13Final
WAGES & SALARIES 229,685 316,476 333,417 337,852 4,435$ 1.3%TRAINING & MEETINGS 2,228 1,764 2,214 2,093 (121) -5.5%OTHER MATERIALS 1,204 3,922 4,352 3,200 (1,152) -26.5%OTHER SERVICES 433 597 1,081 2,485 1,404 129.9%TOTAL 233,549$ 322,759$ 341,064$ 345,630$ 4,566$ 1.3%
FY13 Final Current Expense BudgetADMINISTRATION AND FINANCE DIVISION DIRECTOR'S OFFICE
ChangeFY12 to FY13

FY13 Final CEB – page V-6
RATES & BUDGET
The Rates & Budget Department provides the financial analysis that allows MWRA to translate its goals, and legal and financial commitments into cost-effective annual and multi-year programs and budgets. Department staff work closely with divisional staff to coordinate development of the long-term Capital Improvement Program (CIP) and monitor the progress of capital projects compared to projected schedules and budgeted spending. Staff also coordinates the development of MWRA’s annual Current Expense Budget (CEB) and monitors spending compared to the budget throughout the year. The Budget Department also manages the annual process of establishing water and sewer assessments to be paid by MWRA’s member communities and develops planning estimates of future rate projections. FY13 Goals: Continually enhance processes and the management of resources to deliver the final CIP and CEB
timely and accurately. Adhere to all MWRA policies, procedures, and administrative practices as well as all relevant
statutory and regulatory authority, accounting, and budgeting principles. Improve the quality and presentation of budget documents and regularly required reports while
working to develop new reports that will aid the Authority’s Board of Directors, Management, and the MWRA Advisory Board.
FY13 Initiatives: Continue to develop staff skills for cross functionality between CIP and CEB. Continue assessment and evaluation of sustainable cost savings opportunities throughout the
organization.
Develop options and recommendations to ensure predictable, sustainable, and reasonable assessments and charges to our communities.
FY12 Accomplishments: Developed the FY13 Budget consistent with the FY12 planning estimates, for both the Current
Expense Budget and the Capital Improvement Program.
Participated in discussions of reevaluating the current water assessment methodology.
LINE ITEMFY10Actual
FY11Actual
FY12Actual
FY13Final
WAGES & SALARIES 744,737 739,705 760,849 780,618 19,769$ 2.6%TRAINING & MEETINGS - - - - - - PROFESSIONAL SERVICES 0 0 0 0 - - OTHER MATERIALS 447 468 158 368 210 132.9%OTHER SERVICES 1,400 856 970 400 (570) -58.8%TOTAL 746,583$ 741,028$ 761,977$ 781,386$ 19,409$ 2.5%
FY13 Final Current Expense BudgetRATES AND BUDGET
ChangeFY12 to FY13

FY13 Final CEB – page V-7
Drive the development of the next five-year CIP cap as part of the FY14 CIP budget process.
Participated in evaluating options for potential water-system expansion opportunities.
Participated in discussion regarding potential legislative changes to the Payment in Lieu of Taxes (PILOT) program at the state level.
Budget Highlights: The FY13 Final Budget is $781,000, an increase of $19,000 or 2.5% from FY12 Actual spending.
$781,000 for Wages and Salaries, an increase of $20,000 or 2.6%, from FY12 Actual spending. The
FY13 Final Budget funds eight positions.

FY13 Final CEB – page V-8
TREASURY
The Treasury Department secures funds for ongoing operations and capital programs in addition to processing cash disbursements. Department staff collect revenue, disburse funds, and manage grant and loan programs in addition to debt issuance and investments. FY13 Goals: Manage MWRA’s debt portfolio to contribute to the achievement of sustainable and predictable rate
increases. Maximize investment return while maintaining compliance with the General Revenue Bond
Resolution requirements regarding security and liquidity. FY12 Accomplishments:
Maintained MWRA’s strong credit ratings, Aa1, AA+, AA+ from Moody’s, Standard & Poor’s and
Fitch respectively. MWRA’s credit ratings from all three major agencies are only one ratings step below the highest rating of AAA. These high credit ratings enable MWRA to borrow at very advantageous interest rates helping to minimize debt service expenses.
Completed the 2011C transaction for an All-In-True Interest Cost of 3.95%, the lowest in MWRA
history to that point. On December 8, 2011 MWRA issued $327M in Refunding Bonds. Taking advantage of the low interest rates, the refunding resulted in a net present value savings of 7.17% or $25.3M
Completed the Series 2012 A&B transaction for an All-In-True Interest Cost of 3.93%, the lowest in
MWRA history. On April 19, 2012 MWRA issued $150M in New Money Bonds for the ongoing construction program and $86.8M in Refunding Bonds. Taking advantage of the low interest rates, the refunding resulted in a net present value savings of 5.09% or $5.2M.
Successfully re-bid the Bond Counsel professional services contract attracting several well qualified
firms and ensuring completive pricing for bond deals and related legal work for the next three years.
LINE ITEMFY10Actual
FY11Actual
FY12Actual
FY13Final
WAGES & SALARIES 725,927 641,248 677,941 715,090 37,149$ 5.5%OVERTIME 122 309 124 0 (124) -100.0%ONGOING MAINTENANCE 0 0 0 0 - - TRAINING & MEETINGS 0 0 0 0 - - PROFESSIONAL SERVICES 366,400 257,329 183,909 259,050 75,141 40.9%OTHER MATERIALS 614 1,041 52 300 248 476.9%OTHER SERVICES 6,709 4,900 6,196 7,120 924 14.9%TOTAL 1,099,772$ 904,827$ 868,223$ 981,560$ 113,337$ 13.1%
FY13 Final Current Expense BudgetTREASURY
ChangeFY12 to FY13

FY13 Final CEB – page V-9
Budget Highlights: The FY13 Final Budget is $982,000, an increase of $113,000 or 13.1% as compared with FY12
Actual spending.
$715,000 for Wages and Salaries, an increase of $37,000 or 5.5% from the FY12 Budget. The final budget funds nine positions.
$259,000 for Professional Services, an increase of $75,000 or 40.9% as compared with FY12 Actual
spending mainly due to lower than projected need for services in FY12.

FY13 Final CEB – page V-10
CONTROLLER
The Controller Department consists of the Accounting, Accounts Payable, and Payroll units. The department has the responsibility for ensuring integrity within the financial accounting system and integration among the three functions. The department is also responsible for the appropriate treatment, classification and reporting of the MWRA’s assets, liabilities, revenues and expenditures in accordance with accounting principles generally accepted in the United States of America. FY13 Goals: Implement process efficiencies in all department units.
Enhance controls to safeguard Authority assets and ensure accurate and timely reporting. FY13 Initiatives: Integrate new contract accounting software module with existing accounting software.
Complete implementation of electronic vendor remittances. FY12 Accomplishments: Rolled out electronic time sheet approval to nine additional Authority departments.
Established an accounting software users group to provide an open forum for accounting and purchasing department collaboration with Management Information Systems (MIS).
Budget Highlights: The FY13 Final Budget is $1.5 million, an increase of $26,000 or 1.8% as compared to FY12 Actual
spending. $1.4 million for Wages and Salaries, an increase of $25,000 or 1.9% as compared with FY12 Actual
spending mainly due to contractual increases. The final budget funds 18 positions. $160,000 for Professional Services, which is level funded with FY12 Actual spending. The contract
for audit services expires in March, 2013. The FY13 Final Budget reflects anticipated costs associated with the annual financial statement audit, the A-133 Single Audit related to the receipt of federal funds, and the actuarial services related to GASB 45 Other Post Employment Benefits.
LINE ITEMFY10Actual
FY11Actual
FY12Actual
FY13Final
WAGES & SALARIES 1,343,518 1,348,206 1,331,607 1,357,053 25,446$ 1.9%OVERTIME - - - - - - ONGOING MAINTENANCE 0 0 0 0 - - TRAINING & MEETINGS 10 0 0 0 - - PROFESSIONAL SERVICES 189,211 189,000 160,000 160,000 - 0.0%OTHER MATERIALS 79 109 193 300 107 55.4%OTHER SERVICES 787 909 969 1,850 881 90.9%TOTAL 1,533,605$ 1,538,224$ 1,492,769$ 1,519,203$ 26,434$ 1.8%
FY13 Final Current Expense BudgetCONTROLLER
ChangeFY12 to FY13

FY13 Final CEB – page V-11
RISK MANAGEMENT
The Risk Management Department is responsible for all MWRA insurance and risk management functions. Department staff manage all administrative functions relating to the initial reporting, processing, and resolution of construction contract claims and self-insured auto, general liability, and property damage claims. Department staff is responsible for the annual procurement, renewals, and maintenance of all Authority-wide insurance policies and programs and also for managing all aspects of MWRA’s Contractor Insurance Certificate program. Department staff serve as a liaison to insurance industry participants including brokers, insurers, insurance consultants, attorneys, and all MWRA departments. FY13 Goals: Process self-insured automobile, general liability, property damage and construction contract claims
in an efficient and timely manner. Secure the timely, cost effective renewal of Authority-wide insurance contracts. Minimize MWRA’s exposure to financial loss stemming from contractor and vendor activities by
establishing insurance requirements and monitoring compliance. Budget Highlights: The FY13 Final Budget is $406,000, which is level funded with FY12 Actual spending.
$376,000 for Wages & Salaries, an increase of $18,000 or 5.0% from FY12 Actual spending. The
final budget funds four positions. $30,000 for Professional Services, a decrease of $18,000 or 37.7% from FY12 Actual spending
based on a revised level of need for an insurance consultant services.
LINE ITEMFY10Actual
FY11Actual
FY12Actual
FY13Final
WAGES & SALARIES 338,558 351,829 357,568 375,569 18,001$ 5.0%OVERTIME 147 566 0 0 - - TRAINING & MEETINGS - - - - - - PROFESSIONAL SERVICES 56,032 40,134 48,173 30,000 (18,173) -37.7%OTHER MATERIALS 21 (214) 7 0 (7) -100.0%OTHER SERVICES 903 720 450 450 - 0.0%TOTAL 395,661$ 393,033$ 406,198$ 406,019$ (179)$ 0.0%
FY13 Final Current Expense BudgetRISK MANAGEMENT
ChangeFY12 to FY13

FY13 Final CEB – page V-12
FACILITIES MANAGEMENT
The Facilities Management Department provides a range of support services to MWRA staff located at the Charlestown Navy Yard (CNY).
Facilities Management is responsible for coordinating site management activities at CNY. Staff institute maintenance procedures, respond to facilities requests from building occupants, coordinate workspace planning, provide office furnishings, and develop and implement appropriate measures to ensure the safety of MWRA staff and protect and preserve MWRA assets. In addition, staff provides administrative and office support services that facilitate the efficient use of MWRA resources. These responsibilities include providing and managing the motor pools at Chelsea and CNY, general office equipment repairs, transportation, mail, and courier services. Staff coordinates MWRA parking programs and corporate Massachusetts Bay Transportation Authority (MBTA) pass programs. FY13 Goals:
Provide a safe and well-maintained working environment for all MWRA staff at CNY and provide appropriate space for staff by coordinating workspace planning, design, and furniture acquisitions.
Maintain the CNY facility to prevent loss or deterioration of MWRA assets. Implement facility programs in conjunction with MWRA recycling and resource conservation efforts. Support efforts to limit the fleet size while meeting operational needs by providing reliable motor
pool and transportation services. FY12 Accomplishments: Continued work with the landlord to implement facility improvements as provided in our lease
agreements for Charlestown Navy Yard headquarters.
Completed work with MIS and equipment providers to implement multi-function technology for copiers and printers. By utilizing this technology it was possible to replace up to four individual units (printer, copier, scanner and fax) with one piece of equipment that performs all of these functions
LINE ITEMFY10Actual
FY11Actual
FY12Actual
FY13Final
WAGES & SALARIES 426,137 477,655 412,641 414,717 2,076$ 0.5%OVERTIME 20,268 16,019 16,527 24,154 7,627 46.1%FRINGE BENEFITS 162 42 34 0 (34) -100.0%UTILITIES 125,725 136,412 98,749 130,678 31,929 32.3%ONGOING MAINTENANCE 23,377 69,965 12,107 45,900 33,793 279.1%TRAINING & MEETINGS 0 60 0 0 - - PROFESSIONAL SERVICES 0 0 3,200 0 (3,200) -100.0%OTHER MATERIALS 118,851 74,792 7,463 62,733 55,270 740.6%OTHER SERVICES 1,724,406 1,776,235 1,820,106 1,878,128 58,022 3.2%TOTAL 2,438,927$ 2,551,180$ 2,370,827$ 2,556,309$ 185,483$ 7.8%
ChangeFY12 to FY13
FY13 Final Current Expense BudgetFACILITIES MANAGEMENT

FY13 Final CEB – page V-13
providing savings in floor space, power, equipment maintenance, and production costs (cost per page).
Budget Highlights: The FY13 Final Budget is $2.6 million, an increase of $186,000 or 7.8%, as compared with FY12
Actual spending. $415,000 for Wages and Salaries, an increase of $2,000 or 0.5%, as compared to the FY12 Actual
spending. The budget supports six positions. $24,000 for Overtime, an increase of $8,000 or 46.1% as compared to FY12 Actual spending. This
line item is for coverage of facility maintenance and support services. $131,000 for Utilities, an increase of $32,000 or 32.3%, as compared to FY12 Actual spending. This
increase is due to charges on utility bills for lighting efficiency retrofit at CNY. Payments will be completed in FY13.
$46,000 for Ongoing Maintenance, an increase of $34,000 or 279% as compared with FY12 Actual
spending. This line item includes funding for facility and equipment maintenance and services including heating, ventilation and air conditioning (HVAC), plumbing and electrical services for the CNY headquarters and the Marlboro records center and warehouse.
$63,000 for Other Materials, an increase of $55,000 or 740.6% as compared with FY12 actual
spending. This line item includes funding for postage, supplies, furniture and equipment.
$1.9 million for Other Services, an increase of $58,000 or 3.2% as compared with FY12 Actual spending. This item includes funding for rental and operating costs for CNY headquarters facility and the Marlboro Records Center and Warehouse space. The increase is due to escalation increases in the CNY lease agreements.

FY13 Final CEB – page V-14
FLEET SERVICES
The Fleet Services Department manages and maintains MWRA's motor vehicle and equipment fleet. The goal of the Fleet Services Department is to maintain MWRA’s vehicle and equipment fleet to minimize downtime and extend the life of the assets. Fleet Services also manages the Chelsea fuel facility, the gas card program and the development and processing of specifications for new vehicles and equipment. FY13 Goals: Continue to cost effectively maintain Authority fleet of vehicles and pieces of equipment.
Install 275 new 2-Way Mobile and 56 portable radio units. Coordinate the Authority-wide radio re-
banding project. FY12 Accomplishments: Developed specifications for 21 new replacement vehicles or pieces of equipment of which the
majority of these units will utilize alternative fuel, consistent with the Authority’s goal of purchasing environmentally friendly products.
Created and implemented new Standard Operating Procedures (SOP’s) for preventative maintenance, corrective maintenance, emergency maintenance, vehicle fuel program, and 2-way radio communications.
MWRA is rated as one of the largest bio-fuel users by the Massachusetts Alternative Fuel Coalition
(MAFC). The Authority continues to fuel diesel powered vehicles/equipment with bio-diesel. Prepared documentation for the surplus sale of 28 vehicles and pieces of equipment and worked with
the Procurement Department for the auction and disposal of the vehicles/equipment. Continued to work with MIS & Operations staff on the Maximo system upgrade which includes a
transportation module specifically designed for a fleet environment. Developed and continued implementing the Federal Communications Commission (FCC) mandated
frequency re-banding project with Motorola and Nextel.
LINE ITEMFY10Actual
FY11Actual
FY12Actual
FY13Final
WAGES & SALARIES 692,150 669,965 624,570 717,295 92,725$ 14.8%OVERTIME 14,321 14,157 2,078 18,690 16,612 799.4%FRINGE BENEFITS 136 110 15 1,000 985 6566.7%UTILITIES 1,337 1,582 1,981 3,000 1,019 51.4%ONGOING MAINTENANCE 687,044 684,807 650,070 702,750 52,680 8.1%TRAINING & MEETINGS - - - - - - OTHER MATERIALS 374,876 501,346 544,983 613,002 68,019 12.5%OTHER SERVICES 664 772 792 4,539 3,747 473.1%TOTAL 1,770,528$ 1,872,740$ 1,824,490$ 2,060,276$ 235,787$ 12.9%
ChangeFY12 to FY13
FY13 Final Current Expense BudgetFLEET SERVICES

FY13 Final CEB – page V-15
Budget Highlights: The FY13 Final Budget is $2.1 million, an increase of $236,000 or 12.9% as compared to FY12
Actual spending. $717,000 for Wages & Salaries, an increase of $93,000 or 14.8% as compared to FY12 Actual
spending. The final budget supports 11 positions. $703,000 for Ongoing Maintenance, an increase of $53,000 or 8.1% as compared to FY12 Actual
spending. The final budget includes funds for automotive materials and services to maintain MWRA’s vehicle fleet. FY13 maintenance decreased by $21,000 compared to FY12 Budget.
$613,000 for Other Materials, an increase of $68,000 or 12.5% as compared to FY12 Actual
spending. The FY13 Final Budget includes funds for vehicle/equipment fueling which is based on historical fuel usage. Fleet Services procures bulk fuels from state contracts while continuing to meet all governmental alternative fuel directives. It should be noted that the volatility of fuel pricing could impact this line item.

FY13 Final CEB – page V-16
HUMAN RESOURCES
The Human Resources Department is comprised of the following three units: The Employment, Compensation, Benefits and HRIS Unit coordinates and oversees all external recruitment and selection activities including hiring, lateral transfers, and promotions to meet the business needs of MWRA; develops and coordinates MWRA compensation and benefits strategies and programs; and ensures the proper processing and recording of personnel actions. The compensation function also ensures that all MWRA employees possess the necessary licenses and certifications required for their positions. The Labor Relations Unit is responsible for fulfilling MWRA's collective bargaining and contract administration obligations under Massachusetts' public sector collective bargaining law, its workers' compensation responsibilities, and its responsibilities for employee occupational safety and health. The Training Unit develops, coordinates, delivers, and evaluates MWRA technical and professional development training programs and other programs designed to improve employee knowledge, skills, productivity, and the quality of workplace interaction. It is responsible for oversight and tracking of MWRA performance evaluation programs, Employee Assistance, and Tuition Reimbursement programs. In addition, the Human Resources Department includes the Centralized Fringe Benefits cost center, which includes the budget for fringe benefits for all MWRA employees as well as for mandatory payments for unemployment expenses and Medicare. FY13 Goals: Attract and retain a qualified high-performance workforce, hire and promote qualified minority and
female employees, and offer a competitive total compensation package (salary and benefits) to all employees.
LINE ITEMFY10Actual
FY11Actual
FY12Actual
FY13Final
WAGES & SALARIES 1,654,665 1,686,848 1,740,651 1,785,022 44,371$ 2.5%OVERTIME 0 0 0 0 - - FRINGE BENEFITS 15,924,991 17,289,376 17,608,031 18,171,568 563,537 3.2%WORKERS' COMPENSATION 2,226,080 2,228,175 1,600,726 2,100,000 499,274 31.2%ONGOING MAINTENANCE - 18 - - - - TRAINING & MEETINGS 2,692 2,323 1,685 3,963 2,278 135.2%PROFESSIONAL SERVICES 310,962 372,608 512,618 408,020 (104,598) -20.4%OTHER MATERIALS 14,489 15,099 13,465 16,170 2,705 20.1%OTHER SERVICES 8,670 11,647 13,562 19,925 6,363 46.9%TOTAL 20,142,550$ 21,606,092$ 21,490,738$ 22,504,668$ 1,013,930$ 4.7%
AREAFY10Actual
FY11Actual
FY12Actual
FY13Final
EMPLOYEE/COMP/BEN 628,993$ 657,772$ 798,093$ 678,467$ (119,626)$ -15.0%LABOR RELATIONS 995,472 1,035,454 1,041,023 1,078,532 37,509 3.6%TRAINING 329,468 361,950 402,137 432,693 30,556 7.6%CENTRALIZED FRINGE BENEFITS 18,188,616 19,550,916 19,249,485 20,314,975 1,065,490 5.5%TOTAL 20,142,550$ 21,606,092$ 21,490,738$ 22,504,668$ 1,013,930$ 4.7%
ChangeFY12 to FY13
FY13 Final Current Expense BudgetHUMAN RESOURCES by Area
FY13 Final Current Expense BudgetHUMAN RESOURCES
ChangeFY12 to FY13

FY13 Final CEB – page V-17
Maintain effective relationships with the unions representing the MWRA workforce while protecting and enhancing management flexibility. Ensure that collective bargaining objectives are met, support MWRA initiatives by designing and implementing appropriate labor relations strategies, create an environment that fosters safety consciousness and productive work, maximize the number of early returns to work by employees who have incurred on-the-job injuries or illnesses, and aggressively manage the Workers’ Compensation Program to reduce costs.
FY13 Initiatives: Lead procurement efforts for contracts associated with workers’ compensation administrative and
legal services and the MWRA Dental Plan.
Provide training and guidance to MWRA managers in the areas of leave management, time and attendance issues, and matters of employee conduct issues.
Investigate complaints of violations of MWRA policies and Code of Conduct as necessary.
Organize compliance with the bi-annual online State Ethics Training for all employees and maintain training compliance documentation as required by the State Ethics Commission.
Review, document, and streamline Human Resources processes through automation and procedure
documentation.
Assist with implementing recommendations resulting from the Staffing Study.
Provide additional training for Administrative Certificate Program (ACP), Productivity Improvement Program (PIP), and Performance Management Review System (PMRS).
FY12 Accomplishments: Completed an Authority-wide Staffing Study
Successfully negotiated and implemented successor collective bargaining agreements with five
collective bargaining units.
Successfully supported the Authority’s efforts in defending itself in several arbitration hearings.
Successfully provided project management for the Staffing Study contract and resulting consultant report.
Implemented a full enrollment of all employees for GIC Health Insurance. Negotiated a one year extension of the MWRA Dental Program with no increase to insurance
premiums.
Developed, piloted, and implemented agency-wide harassment prevention training for all MWRA employees.
Delivered Administrative Certification Program (ACP) training, Supervisory Development,
Productivity Improvement Program (PIP) and Performance Management training.

FY13 Final CEB – page V-18
Collected the required acknowledgement of the State Ethics Commission’s Summary of the Conflict
of Interest Law from all employees.
Completed a variety of technical training to MWRA employees including Confined Space Entry, Tower Climbing Safety, Spill Containment, Crane and Derrick Rigging and Signal person training, and OSHA Annual Refresher training.
Procured and selected vendors for MWRA’s Employee Assistance Program, medical services
program, and the MWRA Dental Program. Budget Highlights: $1.8 million for Wages and Salaries, an increase of $44,000 or 2.5% over FY12 Actual spending.
The FY13 Final Budget includes funding for 21 positions. $18.2 million for Fringe Benefits, an increase of $564,000 or 3.2% over FY12 Actual spending. The
budget includes $15.7 million for health insurance costs, $1.2 million for Medicare taxes, $1.0 million for dental insurance costs, $150,000 for unemployment insurance payments, and $31,000 for tuition reimbursement. The Health insurance budget increased 3.0% over FY12 Actual spending due to GIC rate increases and Dental insurance increased 4.7% than FY12 Actual spending as a result of increases in Health and Welfare contributions. Additionally, Medicare is 6.4% higher than FY12 Actual spending to reflect increased expenses due to contractual increases in FY13 and Unemployment insurance 16.0% lower than FY12 Actual spending based on historical spending.
$2.1 million for Workers’ Compensation, an increase of $449,000 or 31.2% as compared to FY12 Actual spending. The Human Resources Department is responsible for the management of this program and the coordination with the third-party administrator and legal counsel.
$408,000 for Professional Services, a decrease of $105,000 or 20.4% as compared to FY12 Actual
spending. The FY13 Final Budget includes $155,000 for Professional Development and Technical Training, $121,000 for Workers’ Compensation Claims Administration and Legal Services, $55,000 for Arbitrators and Arbitration Expenses, $43,000 for Medical Evaluation Services, $19,000 for the Employee Assistance Program, and $15,000 for Specialized Investigation Services.

FY13 Final CEB – page V-19
MANAGEMENT INFORMATION SYSTEMS (MIS)
The MIS Department provides MWRA with the information processing services necessary to carry out its mission. Applications in use range from financial to operational, and enhance MWRA’s ability to access data and improve internal controls, reporting, and management performance. In addition to computing systems, the department also provides library and records management services. FY13 Goals: The goal of the MIS department is to support more than 1,000 MWRA users, including those at the Charlestown Navy Yard (CNY), Chelsea, Deer Island, Southboro, Carroll Water Treatment Plant and other remote sites, by ensuring that: The automated business services delivered increase the efficiency of MWRA’s business
processes and improve the effectiveness of the staff while maintaining system security and integrity;
Existing applications, operating systems, hardware, and network resources are cost-effectively maintained, supported, upgraded, and replaced;
Future changes for Information System reflect management priorities and are consistent with the MWRA Master Plan and the five-year IT Strategic Plan; and
Information Technology Service Management is implemented to improve customer satisfaction and improved efficiencies in delivering services.
FY13 Initiatives: Information Technology Management Program
o Establishment of an IT Governance Council. o Establishment of a MWRA Software Development Life Cycle (SDLC). o With the successful completion of the Information Technology Service Management (ITSM)
Certification Program, MIS will proceed to implement a set of policies, procedures, standards, tools and techniques which implement the best practices for ITSM.
o In parallel with the ITSM effort, MIS will be re-organizing to better deliver services. This will include updating Job Descriptions to reflect the changing technologies and the methods of delivery, re-aligning the organization to match the ITSM and SDLC best practices, and focusing
LINE ITEMFY10Actual
FY11Actual
FY12Actual
FY13Final
WAGES & SALARIES 5,052,192 4,972,127 5,148,842 5,416,263 267,421$ 5.2%OVERTIME 4,968 3,510 3,518 2,810 (708) -20.1%FRINGE BENEFITS 6 0 0 0 - - ONGOING MAINTENANCE 2,201,339 2,581,022 2,078,922 2,376,881 297,959 14.3%TRAINING & MEETINGS 24,348 26,311 80,043 172,033 91,990 114.9%PROFESSIONAL SERVICES 0 0 325,233 434,572 109,339 33.6%OTHER MATERIALS 687,062 141,503 277,135 546,582 269,447 97.2%OTHER SERVICES 840,478 808,526 986,958 1,400,901 413,943 41.9%TOTAL 8,810,394$ 8,532,999$ 8,900,651$ 10,350,041$ 1,449,391$ 16.3%
FY13 Final Current Expense BudgetMANAGEMENT INFORMATION SYSTEM
ChangeFY12 to FY13

FY13 Final CEB – page V-20
on how technology can be used to increase efficiency and improve the effectiveness of the Authority’s business processes and staff.
Application Improvement Program o Computerized Maintenance Management System (CMMS) Enhancements Complete the MAXIMO upgrade by combining the two existing systems of the Field
Operations Department (FOD) and Deer Island Treatment Plant (DITP) into a single system. Implement the MAXIMO Calibration Module.
o Geographic Information System (GIS) & Integration Enhancements Implement the GIS FlexViewer in production after user enhancements have been installed
and fully tested. Implement the GIS module of our video inspection system, Granite XP, along with the
Scoring Module. o Enterprise Resource Planning (ERP) System Enhancements Implement New Lawson modules including Strategic Sourcing and Contract Management.
The new applications will allow MIS to retire custom applications including in-house developed Contracts and MBE/WBE applications. In addition, further automate identified workflows facilitating processes and reducing paper usage.
o Pretreatment Information Management System (PIMS) Enhancements TRAC, MIS, and the vendor, IPS will continue to work through business functionality
corrections and enhancements to better meet the needs of the Industrial Wastewater Pretreatment Program.
o Laboratory Information Management System (LIMS) Enhancements Upgrade LIMS to version 6. This is the latest version of the application from the vendor,
LabWare and will implement the electronic lab notebook and the Gas Chromatography equipment automation which will allow the lab technicians to go paperless.
o Develop an enterprise application integration architecture. With the upgrade of LIMS to version 6, the LIMS/PIMS interface will need to be
upgraded. This effort will be used to establish the architecture for the future and the LIMS/PIMS interface and will be the pilot project for the new solution.
o Email and Calendar Enhancements Upgrade Microsoft Exchange to version 2010. This version will provide a more secure
synchronization with mobile devices and enhance the management of in-boxes and archive files.
This effort will provide the design basis for network storage upgrades, archiving, de-duplication, and disaster recovery.
Information Security Program o Implement an Information Security Program for the MWRA in accordance with the Information
Security Policy #ADM.31 approved May 22, 2012. o Continue to explore and implement new technologies for security of desktop and mobile devices;
network infrastructure, operating systems, and cyber security.
Technology Infrastructure Improvement Program o IT System Architecture Development Establish cross-department standards for the following domains: Access, Information,
Application, Integration, Management and Security.
FY13 Final CEB – page V-21
o Implement wireless infrastructure of Distributed Antenna Systems (DAS) at key MWRA locations to provide in-building cell phone coverage signal improvement for service providers. This will allow the migration to the new wireless service provider to be completed.
o Select and implement a Mobile Device Management solution to allow a broader range of mobile devices (like iPads) and smartphones (beyond Blackberries) to be used by staff.
o Continuation of “Green Data Center” initiatives, including virtualizing more physical servers and reducing the variety of application infrastructure component versions and manufacturers (like web servers, application servers, and database servers).
o Explore new technologies for future implementation considerations including new networking technologies for upcoming network upgrade, web and mobile platforms for business and information services, and Voice-Over-IP (VOIP) for communications.
o Implement Core Switches for Phase 2 of Net2020 Project. o Implement Print Management Services. o Finalize and implement storage standards and consolidate configurations.
FY12 Accomplishments: Information Technology Management Program
o Completed the MIS Five-Year IT Strategic Plan o 30 staff attended IT Infrastructure Library (ITIL) Foundation & Cerification training to provide a
foundation for the formal adoption of appropriate ITIL best practices for ITSM at the MWRA. o Started the comprehensive evaluation of overall department training needs and developed an
initial implementation schedule.
Application Improvement Program o Computerized Maintenance Management System (CMMS) Enhancements Migrated the production of MAXIMO database from version 5.2 to 7.5 as a proof of concept
for the MAXIMO upgrade effort. o Emergency Notification System Enhancement Developed an enhancement to the MWRA 911 application that allows a recorded audio file to
be used as an alternative option to using the machine-generated voice file. In addition, developed a new Emergency Contacts Notification Systems (ENS) Launch page for opening the Community Contacts Database and Reverse 911 applications.
Assisted OEP with three drills to contact the ESU group using the remote activation function of Communicator! NXT. Worked with Public Affairs to prepare for communication drills they conducted for CNY, Southborough, and CWTP. The drills were conducted to ensure staff familiarity with the application use, exercise the application, and help validate that contact information is accurate.
Trained Office of Emergency Preparedness (OEP) staff, Public Affairs staff and key users identified by the Security Task Force in the systems that comprise the MWRA ENS (Community Contacts, MWRA 911, Communicator! NXT)
Implemented two new systems of Top View software for Southborough Water Quality and Wastewater Operations to provide automated notifications when operational issues are detected and require immediate communication to staff.
o Enterprise Resource Planning (ERP) System Enhancements Added three new Lawson user fields (personal email, personal cell, work cell phone #2) and
developed a new web application for staff to review their contact information. The new application was used prior to the CNY drill to help ensure staff was properly contacted.

FY13 Final CEB – page V-22
Implemented Lawson Mobile Supply Chain Management (MSCM) at the Chelsea, Southborough, and Deer Island Warehouses.
Planning and infrastructure preparations began for Lawson application upgrade from version 9.0 to 9.0.1 to maintain vendor support and in preparation for the implementation of new application modules. Related systems (check printing, tax software) were upgraded and user testing is currently underway.
Procured new application modules for Lawson which address functionality and application consolidation opportunities identified in the MIS Five-Year IT Strategic Plan.
Supported Payroll and HR with several year-end tasks including successful longevity payments due to all union employees and vacation milestone adjustments for unit 2, 3, and 9 employees.
Upgraded the Lawson database platform to Oracle 11g R2. o Laboratory Information Management System (LIMS) Enhancements Upgraded the current version of the LIMS to version 6 in a test environment. The upgrade
will be implemented in production after a full round of testing has been successfully completed.
o MWRA Transparency Enhancements In accordance with the Commonwealth transparency and accountability law, staff
implemented the MWRA Open Checkbook application. This application provides spending data by Employee, Vendor, and Categories of expense to the public and is accessible from MWRA’s web site.
o MWRA Management Dashboards Enhancements Updated the Community OMMS Website to be compatible with non-Microsoft web
browsers. o System Integration Enhancements o Retired Commbridge application and implemented the state’s new Interchange system for
communicating with the Group Insurance Commission (GIC) and State Retirement Board for weekly and monthly exchanges of data.
Information Security Program o Completed the development and approval process for the MWRA Information Security Program
Policy #ADM.31. o Initiated three-year (with optional 4th year) contract with Integralis for cyber security monitoring
and management (for Firewalls and Intrusion Detection/Prevention System).
Technology Infrastructure Improvement Program o Installed 32 new multi-function devices (MFDs) throughout MWRA facilities consolidating
services (Print, FAX, Scan, Copier) onto one platform. The rollout is anticipated to replace 47 pieces of aged equipment for better than a 2:1 equipment reduction.
o Installed Local Area Network switch replacements at the following sites Deer Island, CNY, Clinton, Fore River Pellet Plant, Nut Island, and Carroll Water Treatment Plant (CWTP). To date, 40 switches have been installed. Chelsea is the only site remaining as part of the Net2020 Project Phase I.
o Continue to support efforts to implement the Contaminate Warning System (CWS) with the implementation of a private wireless network at 18 locations that allow the sampling devices to communicate with the application server located in the Chelsea Data Center.
o Blackberry Enterprise Server (BES) was upgraded to the latest version. Redundancy solution based on Microsoft SQL Mirroring was implemented to ensure High Availability for the Blackberry Infrastructure.

FY13 Final CEB – page V-23
Budget Highlights: The FY13 Final Budget is $10.3 million, an increase of $1.4 million or 16.3%, as compared to the
FY12 Actual spending.
$5.4 million for Wages and Salaries, an increase of $267,000 or 5.2%, as compared to FY12 Actual spending. The budget includes funding for 60 positions.
$2.3 million for Ongoing Maintenance, an increase of $298,000 or 14.3%, as compared to FY12 Actual spending. Maintenance spending is for license and maintenance fees to support administrative, operations, and database applications used by MWRA staff.
$172,000 for Training and Meetings, an increase of $92,000 or 114.9%, as compared to FY12 Actual spending. Funding will support staff training in various computer applications as part of the MIS IT Strategic Plan.
$435,000 for Professional Services, an increase of $109,000 or 33.6%, as compared to FY12 Actual spending. Funding will support the continued development of an MIS Strategic Plan and implementation services requested by the Board of Directors.
$547,000 for Other Materials, an increase of $269,000 or 97.2%, as compared to FY12 Actual spending primarily due to specialized hardware needs.
$1.4 million for Other Services, an increase of $414,000 or 41.9%, as compared to FY12 Actual spending primarily due to the multi-function machine leases, Global Positioning Software services for Authority vehicles, and the FY13 Photo Library Project.

FY13 Final CEB – page V-24
PROCUREMENT
The Procurement Department includes three units. The Purchasing Unit operates a competitive purchasing system for the procurement of materials, goods, and non-professional services in accordance with MWRA policies and procedures. The Contract Management Unit reviews, drafts, and negotiates contracts, amendments, and change orders for all professional, non-professional, and construction services contracts. Staff directs the bid, review, and selection process, and maintains a contracts database. The Materials Management Unit manages an Authority-wide inventory control and management system for better control, storage, distribution, and accounting of MWRA’s inventory. The unit manages three regional warehouses/distribution centers that support all MWRA activities. FY13 Goals: Procure materials, equipment, supplies, construction, professional, and non-professional services in a
timely, efficient, and openly competitive process in accordance with MWRA policies and procedures, including those related to meeting affirmative action goals.
Maintain centralized, efficient, and cost-effective management of spare parts and operating supplies
inventory. Provide timely and high quality services to initiating divisions to enable MWRA programs to meet
their public, production, and schedule responsibilities. Maintain a recycling program in order to contain MWRA operating costs by removing recyclable
materials from the waste stream. FY12 Accomplishments: Competitively bid Calendar Year 2011 (CY11) Renewable Energy Portfolio Standard certificates
which resulted in FY12 revenues of $319,000 (Class II). In addition, received FY12 revenues of $885,000 from forward marketing of CY11 (Class I and Solar) Renewable Portfolio Standards (RPS) certificates.
Awarded the following major contracts in FY12: Spot Pond Storage Facility Design Build; Deer
Island Treatment Plant (DITP) North Main Pump Station (NMPS) Variable Frequency Drives (VFDs); DITP Air Emissions Testing; Northern Intermediate High (NIH) Stoneham-Reading
LINE ITEMFY10Actual
FY11Actual
FY12Actual
FY13Final
WAGES & SALARIES 3,563,732 3,513,516 3,497,314 3,654,211 156,897$ 4.5%OVERTIME 32,689 14,105 16,983 15,750 (1,233) -7.3%FRINGE BENEFITS 602 167 185 0 (185) -100.0%UTILITIES 116 129 0 0 - - ONGOING MAINTENANCE (338,576) (199,828) 189,502 0 (189,502) -100.0%TRAINING & MEETINGS 3,066 4,462 5,435 7,725 2,290 42.1%OTHER MATERIALS 112,590 120,162 106,745 109,608 2,863 2.7%OTHER SERVICES 61,373 63,530 57,656 67,870 10,214 17.7%TOTAL 3,435,590$ 3,516,243$ 3,873,820$ 3,855,164$ (18,656)$ -0.5%
FY13 Final Current Expense BudgetPROCUREMENT
ChangeFY12 to FY13

FY13 Final CEB – page V-25
Connection; Five-Year Strategic Information Technology Plan; Bond Counsel Services; North System Hydraulic Study; Purchase and Supply of Electricity Profile Accounts; Wachusett Aqueduct Pump Station Design; Hatchery Pipeline and Hydroelectric Design; Alewife Brook Pump Station Improvements Design; Alewife Brook Combined Sewer Overflow (CSO) Improvements Design; Union Park Operating Contract; Oakdale Phase 1A Electrical Upgrade; Brookline Overflow Conduit Cleaning; Clinton Aeration Efficiency Improvements; Upper Hultman Aqueduct Interconnections; DITP Primary and Secondary Clarifier Flushing System; FY13 Insurance Program; Disclosure Counsel Services; Residuals Processing Facility Technology Options Assessment; South Dike Tree Removal at Wachusett Reservoir; and DITP Fuel Oil Line Abandonment.
Advertised or received bids/proposals/statements for the following: DITP Expansion Joint Repair
Construction 2; Sudbury Aqueduct Pressurization and Connections; Letters of Credit, Liquidity Facilities or Direct Purchases; Nut Island Switchgear Modifications; Caruso Pump Station Improvements Design; Wachusett Aqueduct Emergency Interconnection Valves; DITP Concrete Steel Restoration and Coating, Phase IV; North Dike Tree Removal at Wachusett Reservoir; and DITP Replacement of Four Gravity Thickener Center Columns.
Continued to work with the Field Operations Department (FOD) and utility companies to establish
energy conservation programs at FOD facilities, using the Green Communities Act, the utilities’ municipal programs, and other programs.
Prepared response for Water Infrastructure Finance Commission concerning qualifications-based
selection of designers; reviewed legislation to Improve Administration of State Government and Finance for applicability to MWRA.
Conducted a “Reverse Auction” for the purchase of electricity for 43 of the MWRA’s smaller energy
accounts that represent four percent of overall electricity demand.
Procured the Authority’s vehicle purchases at the beginning of Fiscal Year 2012 (FY12) including 19 vehicles procured through the use of a “Reverse Auction” format, allowing for ample production and on-time delivery of all vehicles.
Bid the annual copy paper contract and received more favorable pricing than that listed on the State
Blanket contract. Contract and purchasing staff worked cooperatively to redevelop the bid package for Deer
Island janitorial services into a hybrid contract/PO model, which has since been successfully used for Chelsea and Southborough janitorial services. Purchasing and Contract staff worked together on two other hybrid bids: WRA-3224, to purchase Firewalls, IPS and related maintenance and monitoring Services; and WRA-3335, a contract to provide services to upgrade the existing Microsoft Exchange 2003 to 2010.
In FY12, rather than bid clothing items separately, staff combined the yearly clothing items
into one bid package in January of 2012. This has resulted in a more efficient method of clothing distribution and items are ordered well before they are needed.
Processed 11,757 purchase orders in FY12 for a total of $37,401,977.
FY13 Final CEB – page V-26
To date: processed 167 competitive bids, 15 State Blanket contracts, 8 contract amendments, 2 critical need, and 29 sole source purchases for items and services valued over $25,000.
Migrated to a dedicated printer/fax/scanner system that replaced the mechanical three-part colored
form Purchase Order printer. Purchase orders are now printed on plain paper and faxed directly from the machine, rather than mailed to vendors. Estimated cost savings are $11,000 per year.
Developed a Request For Qualifications (RFQ) process to qualify automotive parts and service
providers for Fleet Services.
Updated buyer commodity assignments and distributed the list to Authority staff.
Developed a “Purchasing Procedures Quick Reference Guide” and distributed it to staff in all departments involved in the purchasing process. This was followed up by visits from Purchasing staff to MWRA facilities to educate staff on the procurement process.
Working with the Recycling committee, Purchasing staff continues to seek out environmentally
friendly products, among them recycled toners, batteries, copy paper, hybrid vehicles, and bio-fuels.
Recycled 40.2 tons of paper, 262.2 tons of scrap metal, and 42,900 pounds of brass, copper, stainless steel and aluminum, generating $68,482 in revenues.
Budget Highlights: The FY13 Final Budget is $3.9 million, a decrease of $19,000 or 0.5% from FY12 Actual spending. Wages and Salaries funding of $3.7 million, an increase of $157,000 or 4.5%, as compared to FY12
Actual spending. The funding supports 47 positions.
Other Materials budget of $110,000, an increase of $3,000 or 2.7% as compared to FY12 Actual spending. The increase is for centralized office supply purchases and is based on historical spending trends.
Other Services budget of $68,000, an increase of $10,000 or 17.7% as compared to FY12 Actual
spending and a decrease of $6,000 or 7.5% from the FY12 Budget. This funding supports Advertising and Printing/Duplicating for contract documents and specifications.

FY13 Final CEB – page V-27
REAL PROPERTY and ENVIRONMENTAL MANAGEMENT
The Real Property and Environmental Management Department negotiates the purchase or lease of real estate and land necessary to support MWRA's capital projects and operations and manages the disposition of surplus real property. Staff participates in site selection and negotiates acquisitions or easements. In addition, staff has developed and is maintaining the Real Property database, the compilation of more than 100 years of easements and land rights for the water and sewer systems. Department staff manages environmental regulatory compliance at MWRA facilities and also provide special expertise and assistance to MWRA staff regarding air quality and hazardous material issues. Assistance includes management of oil and hazardous materials site assessment and remediation, air emission permit negotiations, and preparation and submittal of quarterly/annual monitoring reports. FY13 Goals:
Acquire the real property needed to complete MWRA's major capital projects in a timely and cost-effective manner; manage the disposition of surplus real property in an efficient manner; and provide staff and others with current information regarding MWRA’s real property rights.
Manage the centralized environmental management program, providing technical assistance
regarding hazardous waste management, air quality compliance, and related issues during all phases of MWRA projects; monitor and provide assistance in maintaining environmental regulatory compliance at MWRA facilities.
FY13 Initiatives:
Coordinate with Operations staff and Contractor to implement new underground storage tank monthly
inspections and associated monitoring and recordkeeping requirements. Monitor progress of upcoming boiler and emergency generator air emissions regulations amendments
and coordinate implementation of monitoring, maintenance, pollution control retrofits, and recordkeeping requirements.
FY12 Accomplishments: Provided ongoing real estate services, including appraisal and negotiation, on projects such as the
Fore River Railroad track relocation project, Charlestown Navy Yard lease, Chelsea lease, Marlboro lease, and the surplus of land adjacent to Chelsea Headworks.
LINE ITEMFY10Actual
FY11Actual
FY12Actual
FY13Final
WAGES & SALARIES 549,584 448,967 460,569 481,064 20,495$ 4.4%OVERTIME 13 0 0 0 - - TRAINING & MEETINGS 1,385 2,045 1,234 38,000 36,766 2979.4%PROFESSIONAL SERVICES 0 0 0 0 - - OTHER MATERIALS 691 668 835 1,670 835 100.0%OTHER SERVICES 213,014 2,041,138 130,074 351,676 221,602 170.4%TOTAL 764,688$ 2,492,819$ 592,713$ 872,410$ 279,698$ 47.2%
ChangeFY12 to FY13
FY13 Final Current Expense BudgetREAL PROPERTY / ENVIRONMENTAL MANAGEMENT

FY13 Final CEB – page V-28
Managed nine (9) permit agreements (six at Turkey Hill and three at Walnut Hill). Coordinated with Operations for approval of the equipment changes and improving the invoicing system for maintenance reimbursements. Total revenue for the nine agreements is $490,700 of which MWRA and the host community each receive half.
Managed fee assessment for long-term 8M permits on MWRA fee controlled land. 8M fees for these
agreements total $49,000 per year. Also provided assistance to Operations on short-term 8M permit agreements in which fees are assessed.
Staff acquired easements and negotiated licenses and extensions to support projects such as the
Hultman Aqueduct Interconnections, Southern Spine Distribution System Section 156 (license with Berkeley Green), Brookline Conduit (license with Boston University), and Ward Street Headworks (license with Wentworth Institute of Technology). Additionally, provided real estate support on projects such as disposition of property at the former East Boston Steam and Pump Stations to the Department of Capital Asset Management (DCAM). At year’s end, working to acquire additional land from DCAM for Ware Disinfection Facility related uses and Massachusetts Department of Transportation (MassDOT) for acquisition of land for Shaft 5/5A.
Provided real estate support services including deed research and coordination with Planning’s
Geographic Information System (GIS) group and Law to develop/improve comprehensive property maps for the Cochituate, Sudbury, Weston, and Wachusett Aqueducts, and other projects, such as Shafts 5 and 5A, as they arise, to support projects such as the aqueduct trail initiative. Provided real estate research to begin developing a comprehensive facility database which supported feasibility assessment for solar panel sites. Provided daily assistance in concert with Law and GIS to ongoing inquiries regarding MWRA real estate rights and ownership.
Continued with remediation and assessment of oil contamination at the FRSA facility.
Continued with the assessment of the oil contamination resulting from the February 2010 spill at the
Cottage Farm Combined Sewer Overflow (CSO) facility. Provided technical support for the assessment and remediation of PCBs at the Chicopee Valley
Aqueduct (CVA) Intake Facility, Alewife Brook Pump Station, and Remote Headworks facilities in conjunction with on-going design of facility upgrades.
Completed the removal of the failing underground fuel tank at the Weston Reservoir facility,
regulatory follow-up with the Department of Environmental Protection (DEP), and provided input to the design of a replacement fuel tank system.
Completed the removal of the redundant underground fuel tank at the Lexington Street Pump Station
in Waltham, and regulatory follow-up with the Waltham Fire Department
Provided regulatory support following discovery of groundwater contamination at the Newton Street Pump Station in Brookline during an in-house valve replacement project. Regulatory follow-up with DEP is on-going.
Provided regulatory follow-up for three chemical spills at Deer Island. Continued to provide technical and regulatory coordination of the fuel tank maintenance contract.
Completed fuel tank monitoring system upgrades at three facilities and coordinated with Supervisory

FY13 Final CEB – page V-29
Control and Data Acquisition (SCADA) support staff to provide real-time fuel tank system monitoring at wastewater and water Operations Control Center (OCC). Coordinated with Operations staff on new underground storage tank operator training requirements. Coordinated with the Contractor and Operations staff on preparation of training program.
Provided technical support and regulatory liaison for preparation and follow-up response to
information requests for the Carroll Water Treatment Plant National Pollutant Discharge Elimination System (NPDES) annual maintenance discharge application.
Completed updates to Spill Prevention, Control, and Countermeasure (SPCC) Plans for three MWRA
facilities and coordinated with Operations and Consultant to complete training of applicable staff. Implemented the annual inspection procedure for MWRA facilities with SPCC plans. Coordinated with the Field Operations Department (FOD) staff to complete facility modifications to secondary containment systems required by SPCC Plans.
Provided oversight and regulatory support during an in-house installation of the new dry well at the
Ludlow Monitoring Station.
Continued with DEP-required periodic groundwater monitoring around the former wastewater holding tank at Clinton. Completed the five-year internal tank inspection.
Continued to coordinate the periodic sampling requirements and quarterly reporting to the
Environmental Protection Agency (EPA) and the Massachusetts Department of Environmental Protection (MDEP) for Hydroelectric General permits at the Cosgrove Intake Facility and Oakdale Power Station.
Provided technical and environmental regulatory support regarding contaminated soil and
groundwater issues on various design and construction projects, including Stoneham Low Service Covered Storage, Charlestown Wind Turbine, Remote Headworks Rehabilitation, North Dorchester Bay Combined Sewer Overflow (CSO) Pump Station and Force Main, Sections 18, 50, and 51 water line rehabilitation, MetroWest Water Supply Tunnel (MWWST) Shaft 5 Charles River sediment management and disposal, Southern Spine Distribution Mains, West Roxbury Tunnel, Northern Intermediate High Short-Term Improvements and Redundancy projects, Section 36 Watertown-Waltham Connection, DITP Underground Storage Tank (UST) Removals, Oakdale Power Station Electrical Upgrade, Phase VII Valve Replacements, Lynnfield/Saugus Pipeline, Cosgrove Transformer Replacement, and Cottage Farm Oil Spill Regulatory follow-up and the related fuel system upgrade project, Section 156 Sewer Rehabilitation, Sudbury Aqueduct Pressurization Study, Bellevue Tank Roof Repairs, Newton Street Pump Station valve replacement hazmat assessment, berm removal assessment at Chelsea facility, Hingham Pump Station asbestos pipe abatement, Alewife Brook Pump Station facility upgrades, MWR003 Gate, Siphon and Floatables Control project, Brookline Overflow Conduit project, Belchertown hatchery Dedicated Pipeline project, Weston Aqueduct Pump Station project.
Participated in DEP asbestos regulatory reform stakeholder workgroup.
Completed greenhouse gas reporting for Deer Island and the Bio-solids Processing Facility, and completed third party verification of the Deer Island report. Procured a new contract for Deer Island and Bio-solids Processing Facility air emissions testing and environmental compliance support. Purchased carbon dioxide allowances required for Deer Island CTs in the December 2011 Regional Greenhouse Gas Initiative (RGGI) auction. Compiled a list of all MWRA oil-fired boilers and

FY13 Final CEB – page V-30
submitted the list to EPA in accordance with new boiler notification requirements. Worked with Engineering staff to incorporate new regulatory requirements into the annual boiler inspections. Coordinated with DEP and Deer Island staff on establishing new startup limits for the Deer Island boilers. Worked with EPA and Operations staff on defining and implementing diesel engine emission controls for Cottage Farm, Prison Point, and CWTP.
Budget Highlights: The FY13 Final Budget is $872,000, an increase of $280,000 or 47.2%, as compared to FY12 Actual
spending. $481,000 for Wages and Salaries, an increase of $20,000 or 4.4%, as compared to FY12 Actual
spending. The budget supports five positions.
$38,000 for Training and Meetings, an increase of $37,000 as compared to FY12 Actual spending. This increase is due to the addition of Authority-wide training of Operations staff on underground storage tank systems as required by Massachusetts Department of Environmental Protection (MassDEP) regulation.
$352,000 for Other Services, an increase of $222,000 or 170.4%, as compared to FY12 Actual
spending. The increase is due to projected expenditures for the new Underground Storage Tank Inspection and Maintenance Contract which will now include monthly inspections of MWRA tanks.

Appendices

FY13 Final CEB -- page A-1
APPENDIX A
DIRECT EXPENSE BUDGET LINE ITEM DESCRIPTIONS Introduction MWRA’s direct expense budget funds the annual expenses of its operating and support divisions. Though the direct expense budget constitutes less than half of MWRA's total budget, it is these expenses which directly support the provision of water and sewer services to MWRA's customers. The direct expense budget includes the annual costs of operating the water and sewer systems, and funds the policy direction, administrative, financial, and legal support services for MWRA's ongoing operations. The direct expense budget also includes the personnel costs for management and oversight of MWRA’s extensive capital programs. There are 11 line items in the division budgets. The line items are: Wages and Salaries - This line item includes funds for regular pay, shift differential, holiday pay, and standby pay for MWRA staff, as well as funds for interns and temporary staff. Overtime - This line item includes funds for overtime related to operations, maintenance, emergencies, and training. Fringe Benefits - This line item includes funds for health and dental insurance, unemployment compensation, Medicare, and overtime meals. Workers' Compensation - This line item includes funds for compensation payments, medical payments, and settlements of compensation claims. Chemicals - This line item includes funds for the chemicals used in water and wastewater treatment, such as chlorine, sodium hypochlorite, soda ash, sodium bisulfite, and hydrofluosilicic acid. Utilities - This line item includes funds for electricity, diesel fuel, and other utilities such as water and sewer services paid by MWRA to the towns in which it operates facilities. Maintenance - This line item includes funds to purchase materials and services for the maintenance of MWRA's plants and machinery, water and sewer pipelines, grounds, and buildings. Training and Meetings - This line item covers the costs of staff training, meetings, and professional seminars. Professional Services - This line item funds outside consultants supporting MWRA activities, including engineering and construction services, laboratory and testing contracts, computer system consultants, and legal and audit services. Other Materials - This line item includes funds for office materials, equipment, postage, laboratory supplies, MWRA vehicles, work clothes, and computer hardware and software.

FY13 Final CEB -- page A-2
Other Services - This line item includes funds for space leasing, health and safety initiatives, removal of grit and screenings from the sewerage system, and the contracted operation of MWRA's residuals processing plant. Sections II – V present summaries of the MWRA’s budgets with a detailed description of program budgets and highlights within each divisional section.

FY13 Final CEB -- page B-1
APPENDIX B
BUDGET PROCESS AND TIMETABLE
MWRA operates on a fiscal year that starts July 1. The Current Expense Budget development process begins in September and, as described below, continues through a series of interactive reviews and revisions until June, when the Board of Directors approves the final budget. Throughout the formal budget process, MWRA staff maintains an ongoing dialogue with the Board of Directors and Advisory Board to discuss issues, the status of budget development, and other concerns.
MONTH ACTIVITY September Divisions receive budget targets, guidelines, and
manuals for the development of budget requests, and can begin to access MWRA’s interactive budgeting system.
December After the divisions return their budget requests, the Rates and Budget Department consolidates the authority-wide budgets, develops briefing materials for senior management, and identifies major budget issues.
January The Executive Director determines proposed funding levels required to meet operational and financial objectives. Staff may seek appropriate policy direction from the Board.
February MWRA transmits the Proposed Current Expense Budget to the Advisory Board for a 60-day review, during which time MWRA staff meet with Advisory Board staff, respond to questions, and provide updated information on plans and prices.
March – May MWRA hosts public hearings to solicit comments on the proposed budget and community assessments from citizens in its service area. The Advisory Board reviews the proposed budget and transmits comments and recommendations to the MWRA.
June The Board of Directors holds a hearing on the proposed budget and the Advisory Board’s comments and recommendations. The Board of Directors adopts a final Current Expense Budget and a schedule of final wholesale water and sewer assessments.


FY13 Final CEB -- page C-1
APPENDIX C
MASSACHUSETTS WATER RESOURCES AUTHORITY BUDGET AND ASSESSMENT POLICIES AND PROCEDURES
(Revised August 2003 to incorporate changes to capital budget section of Management
Policies adopted by the Board of Directors June 11, 2003) These policies and procedures govern certain budget, assessment, and rates management practices at the Massachusetts Water Resources Authority (MWRA). Policies and procedures may be amended from time to time, provided that changes in provisions governing reporting to or approvals by the Board of Directors or the Advisory Board must be approved by the Board of Directors. If any sections of these policies and procedures are at variance with requirements of MWRA's financing agreements, the latter shall govern.
ASSESSMENT POLICIES AND PROCEDURES Basis of MWRA Assessments MWRA is required by its Enabling Act to establish assessments which, with other revenues, provide sufficient funds each year to pay all current expenses, debt service, and obligations to the Commonwealth; to pay all costs of maintenance, replacement, improvements, extension, and enlargement of the sewer and waterworks systems; to create and maintain reserve funds; and to provide amounts required by financing agreements. These assessments are adopted by MWRA based on the rate revenue requirements set forth in the Current Expense Budget. Costs Recovered MWRA capitalizes certain of its asset costs in accordance with its capitalization policy. Capital expenditures are planned as set forth in the Capital Improvement Program and are recovered through assessments in accordance with MWRA financing agreements. The Current Expense Budget provides detailed information on capital and debt costs, additions to reserves, and all operations and maintenance costs to be recovered with current revenue. Sources of Current Revenue MWRA recovers most of its current expenses from users of the services it provides. In addition to rate revenue requirements, budgeted current revenue includes anticipated fines, fees, investment income on certain fund balances, and payments for contracted services. MWRA is committed to seeking additional sources of current revenue.

FY13 Final CEB -- page C-2
Coverage Requirements MWRA's financing agreements include coverage requirements which provide that each year revenue less operating expenses (net revenue) must be more than the amount required for debt service payments on outstanding bonds. The primary bond coverage requirement is that net revenue must be 120 percent of required debt service fund deposits for bonds outstanding excluding subordinated bonds. The secondary coverage requirement is that net revenue must be 110 percent of required debt service fund deposits for all bonds outstanding, including subordinated bonds. Revenue must be raised annually to meet the primary and secondary bond coverage requirements and may be used for additions to reserves or for payment of obligations to the Commonwealth. Amounts remaining after these uses are used to pay capital costs in order to reduce the need for future borrowing or to reduce current debt service costs. In addition, MWRA has a supplemental bond coverage requirement that amounts contained in its Community Obligation and Revenue Enhancement (CORE) Fund shall equal 10 percent of required debt service fund deposits for bonds outstanding, excluding subordinated bonds. Amounts required to be on deposit in the CORE Fund are recovered through assessments as necessary. Budget Surpluses In any year in which current revenue exceeds both current expenses on a budget basis and amounts required to meet bond coverage tests, the amount of over-recovery is deposited first to reserve funds, if any, which are below the level specified in any financing agreements, and second into MWRA's rate stabilization fund or bond redemption fund. Amounts deposited in these funds are used to offset rate requirements in subsequent years and such, to provide rate relief for our communities. With Board approval, surplus funds can also be used for targeted defeasance in future years and/or to reduce future liabilities, as part of a multi-year rate strategy. MWRA consults with the Advisory Board regarding the yearly use of these funds. Budgeting and Assessment Objectives MWRA follows conservative budgeting practices, and has the following objectives in developing budgets and community assessments: 1. To minimize total costs, consistent with MWRA's statutory responsibilities to provide
effective, environmentally sound wholesale water delivery and wastewater collection and treatment services;
2. To minimize the cost of debt; 3. To avoid single year assessment spikes by prudent management of cost and assessment
increases, and 4. To support inter-generational equity by avoiding unfair assessment burdens on either
current or future ratepayers.

FY13 Final CEB -- page C-3
Allocation of Costs and Revenue to Systems Most of MWRA's current expenses are directly attributable to either water or sewerage service costs or to investment in either the water or sewerage systems. Expenses which support both systems (indirect system costs) are allocated to the water or sewer system based on generally accepted cost allocation principles. Investment, contract, and other income offsets water and sewerage expenses on either a direct or allocated, indirect basis. The resulting net cost of water and sewerage services is the amount to be recovered through water and sewer assessments. Allocation of Rate Revenue Requirements to User Assessments Users of MWRA wholesale water and sewerage services are assessed for those services according to MWRA's water and sewer assessment methodologies. Assessments for water services are computed by MWRA based on metered water use for the preceding calendar year. The total assessment is allocated based on each community’s share of water delivered in the immediately preceding calendar year. Assessments for sewer services are computed on the basis of a combination of metered wastewater flow and loads, and population. Operations and Maintenance (O&M) costs are allocated based on total annual metered
wastewater flow, and total annual average strength, septage, and high strength flow loads. Capital (or debt service) costs are allocated based on a combination of metered wastewater
flow and loads, and population. One-quarter of capital costs are allocated based on maximum month flow, and total annual average strength, septage, and high strength flow loads. The remaining three-quarters of capital costs are allocated based on population. Half of the population allocation is based on census population and half is based on contributing population.
Schedule and Procedure for Adoption of Assessments During the preparation of the proposed Current Expense Budget, required water and sewer rate revenue is determined, and a preliminary calculation of the allocation of costs to user-specific assessments is made. This information is provided to MWRA customers to assist them in their own fiscal planning. As provided in the Enabling Act, the proposed Current Expense Budget and preliminary assessments undergo statutory review, including public hearings and review by MWRA's Advisory Board. Further refinements of projected expenses and revenues also occur during this period. If review and analysis of the proposed Current Expense Budget results in lower projected expenses or higher projected revenue, some or all of such savings from preliminary estimates of assessments can be included in the adopted budget as additions to the rate stabilization fund and used to reduce rate revenue requirements in subsequent years. Alternatively, some or all of such savings can be used to reduce final assessments to customers below preliminary estimates.
FY13 Final CEB -- page C-4
The Current Expense Budget and final water and sewer assessments are adopted in June for the fiscal year beginning in July. The budget adopted in June may differ from the proposed budget as a result of review and further refinement of the proposed budget, although final assessments adopted by MWRA must be sufficient to recover water and sewer rate revenue requirements specified in the adopted budget. Final water and sewer rate requirements and their allocation to users may thus change from preliminary estimates. In addition, any individual community’s final assessment may be higher or lower than the preliminary estimate, both because of changes in the factors which affect the allocation of assessments among wholesale customers, and because of differences between MWRA's proposed and final budgets as approved by the Board of Directors. Review and Dispute Resolution Process MWRA annually determines preliminary and final assessments for water and sewer services in February and June prior to the beginning of the new fiscal year. These assessments must satisfy the requirement that MWRA fully recover its water and sewer costs by apportioning total costs as assessments among its wholesale water and sewer customers pursuant to its water and sewer rate methodologies and to certain specified data including: Calendar year metered water volume and metered wastewater flow obtained from MWRA’s
water and wastewater metering systems; Federal and state community census statistics, and sewered population estimates and other
information supplied on Customer Service Update forms and Municipal Discharge Permits; and
High strength user monitoring data and estimates of community septage volumes as obtained
by MWRA‘s Toxic Reduction and Control Department. The review and dispute resolution process provides MWRA’s wholesale customers with the opportunity to review and comment on the reasonableness of the data used to calculate preliminary water and sewer assessments. During the year, MWRA provides its customers with monthly summaries of water and wastewater flow data distributed, at a minimum, on a bimonthly basis. Because annual metered water and wastewater flows are major components for establishing water and sewer charges for each community, customers are strongly encouraged to review this data closely upon receipt and raise questions with MWRA staff concerning the data. MWRA expects that prompt customer review and comment on meter data will result in the resolution of most water and wastewater metering questions and assure the most consistency between preliminary assessments in February and final assessments announced in June. Community contributions of high strength flow and septage, and population data are made available with the release of preliminary assessments in February. If after an initial review a community believes that specific data used to calculate assessments should be reevaluated, a community may submit a written objection to the Executive Director with a copy to the Rates Manager or their designee. The objection must be signed by the local official on record with MWRA as responsible for water or sewer services in the city, town, or
FY13 Final CEB -- page C-5
district. The objection should state the community’s concern with the data used to calculate community assessments, and should also include information and technical data to support the community’s objection. In order for any data adjustments to be incorporated into the allocation of final fiscal year assessments, all objections to data used to calculate preliminary assessments must be received no later than the date of the final public hearing on the proposed budget and preliminary assessments, held pursuant to Section 10 of the MWRA Enabling Act. MWRA staff will review and evaluate the merits of all written objections. Customers are notified in writing of the results of this review prior to the release of final assessments. Adjustments to preliminary data, if any, are not retroactive beyond the applicable calendar year for proposed assessments. Final fiscal year assessments are calculated incorporating adjustments, if any, resulting from the review and objection process, and final rate revenue requirements as adopted by the Board of Directors. Written objection(s) may also be submitted following the adoption of final fiscal year assessments, but no later than the end of the fiscal year for which the assessments are applicable. Objections submitted in this manner must also be directed to the Executive Director with a copy to the Rates Manager or their designee. Following MWRA staff review, adjustments to assessments resulting from the challenge of rate basis data that are submitted following the adoption of final fiscal year assessments will be applied to the subsequent year’s assessments. Customers are notified in writing of the results of this review and any assessment adjustments prior to the release of the subsequent year’s assessments. Water and Sewer Assessment Payment Schedule MWRA adopts a schedule of assessments and a schedule of payments annually. Any adjustments for prior years resulting from the review and objection process are apportioned to each of the scheduled payment amounts. No interest is paid or billed by MWRA for previous year's adjustments. Assessments are payable to MWRA in ten equal installments due on the first day of August, September, October, November, December, February, March, April, May, and June. Interest Charge on Delinquent Payments For payments received after a payment due date MWRA levies an interest charge of one percent per month or 0.033 percent per day. Interest charges do not accrue until 30 days after the bills are mailed to MWRA's customer communities. Interest charges are added to subsequent regular billings.

FY13 Final CEB -- page C-6
Retail Rates MWRA assessments are for MWRA's provision of wholesale services. Local bodies which receive wholesale services in turn provide retail services to their users at the local level. MWRA encourages its customers to establish retail rates which: 1. Recover the full cost of providing local water and/or sewerage services, including both
direct costs and an allocation or estimate of indirect costs, 2. Charge users of local water and/or sewerage services in a manner which demonstrates to
customers that increased use of services results in increased user costs, 3. Comply with MWRA policies directed to conservation of water; elimination of
infiltration and inflow of surface water and ground water into the sewage collection, treatment, and disposal system; and removal or pretreatment of industrial wastes, and
4. To the extent consistent with #1 and #2, provide assistance to low income users through
lifeline rates.
FY13 Final CEB -- page C-7
CAPITALIZATION POLICY It is the policy of the MWRA that capitalization of expenditures conforms to generally accepted accounting principles. Under such guidelines, MWRA has adopted the provisions of the Financial Accounting Standards Board's Statement No. 71, "Accounting for the Effects of Certain Types of Regulation," which is intended to assure that utility revenues are appropriately matched with incurred costs. Capital expenditures create assets or extend their useful lives. Assets are valued at their cost and provide benefits over an extended period of time. Sources of funds for capital expenditures include grants, proceeds of MWRA borrowing, loans, and current revenue. Asset value created by MWRA is of two kinds. One is the value of tangible assets either created or increased through MWRA capital investments. Such assets include land, buildings, plant, equipment, and the system infrastructure for water and wastewater. The cost of such fixed asset investment includes not only purchase, rehabilitation, and construction cost, but also ancillary expenses necessary to make productive use of the asset. Ancillary costs can include, but are not limited to, costs for planning studies, professional fees, transportation charges, site preparation expenditures, and legal fees and claims directly attributable to the asset. The second kind of asset value created by MWRA investment is the value of intangible assets. While such investment does not result in tangible MWRA assets, it does create a benefit to MWRA and its users over several years. Such assets include the cost of MWRA efforts to establish base-line leak detection information for the water systems of MWRA customers. The cost of providing water consumption-limiting devices to households is another example. Expenditures for tangible assets are included in the Capital Improvement Program and Budget if the expected cost of the individual asset or capital project is $100,000 or more and if the expected useful life is more than one year. Expenditures for intangible assets are capitalized if the expected cost is $100,000 or more and if the expected benefit period is three years or more. Annually recurring costs and expenditures for maintenance of assets are not capitalized, even though their cost may exceed $100,000. Examples of such maintenance expenditures include replacement of vehicles or computers, replacement of inoperable valves or other equipment before the anticipated useful life has been reached, and pipeline or interceptor repairs that do not add significant life to the underlying asset.

FY13 Final CEB -- page C-8
RESERVES FUNDED FROM CURRENT REVENUE Operating Reserve The Operating Reserve has been established to provide a source of funds to be used to pay operating expenses of the sewer or water systems should there not be sufficient funds otherwise available for that purpose. Bond agreements specify that the fund level shall not be less than one-sixth of MWRA's annual operating expenses. Insurance Reserve The Insurance Reserve has been established to provide funds to restore, replace, or reconstruct lost or damaged property or facilities of the water or sewer system. It provides funds reserved against risks for which MWRA does not currently maintain insurance. This self-insurance reduces the cost MWRA might otherwise incur for purchased insurance policies. MWRA periodically evaluates the level of its insurance reserve and every three years a consulting engineer or an insurance consultant recommends an appropriate insurance reserve fund requirement. The current funding level of $14.0 million has been determined to be acceptable and reasonable based on a FY11 Insurance Reserve Fund review performed by an outside insurance consultant who estimated the required fund level in the range of $12 to $16 million. The next Insurance Reserve Fund review is expected to be finalized in February 2014. Renewal and Replacement Reserve The Renewal and Replacement Reserve has been established to pay the costs of emergency repairs or capital improvements to the system when funds are not available in either the Construction Fund or the Operating Fund. Amounts may not be withdrawn until MWRA has specified the project to which the amount will be applied, its estimated cost, and estimated completion date. It must also certify that such expenditures are reasonably required for the continued operation of the systems, or for maintenance of revenues, or that other provisions have not been made for funding such expenditures. Every three years, MWRA receives recommendations from a consulting engineer as to the adequacy of the renewal and replacement reserve fund requirement. The Renewal and Replacement Reserve Fund requirement is presently established at $35 million. The adequacy of the funding requirements for the Operating Reserve Fund and the Replacement Reserve Fund have been confirmed by the Consulting Engineer in its most recent triennial report dated October 2011, prepared and delivered in accordance with the General Resolution. The next Triennial Report is scheduled for October 2014.

FY13 Final CEB -- page C-9
CURRENT EXPENSE BUDGET MANAGEMENT POLICIES AND PROCEDURES
A. Budget Allocations Budget Contingency Holdbacks After the Board of Directors adopts the Current Expense Budget each year, the Executive Director, the Chief Operating Officer, or a division director may reserve between two percent and four percent of a division's approved budget as a budget contingency to be expended only upon approval of the Executive Director. The contingency holdback may be from any line item or cost center or combinations thereof, and any amount reserved as a budget contingency is not to be included in the monthly budget allocation process described below. The Administration and Finance Committee will be notified of all budget contingency holdback amounts. Monthly Allocation of the Annual Current Expense Budget Initial monthly allocations are made for purposes of adopting and filing an operating budget in accordance with MWRA's financing agreements. Before the end of the first reporting period of the fiscal year, divisions, with the assistance of the Rates and Budget Department, allocate the approved budget, less any holdbacks, by month. The allocations set forth planned expenditures and accruals for each of the 12 months of the year to be compared to actual expenditures and accruals as reported in MWRA's monthly variance reports. B. Budget Variance Monitoring and Analysis At the close of each monthly accounting period, the Treasury Department prepares MWRA financial statements. The Rates and Budget Department then prepares monthly variance reports that compare planned to actual revenues and expenses. Variance Analysis Division directors and staff review variance reports and explain variances between planned and actual expenditures as requested by the Rates and Budget Department. Variance explanations are prepared as needed, usually at the end of each quarter of the fiscal year. At least twice each year MWRA staff prepares forecasts of year-end expenditures and revenue. Barring extraordinary circumstances, division directors are responsible for controlling spending within the overall division budget. The Rates and Budget Department reviews all variances and projections so that appropriate measures may be taken to ensure that overall spending is within the MWRA’s budget. Variance explanations are submitted to the Rates and Budget Department in accordance with the schedule developed by the Rates and Budget Department. Each month the Rates and Budget Department prepares a summary of budget variances for inclusion in the Management Indicators Report (Yellow Notebook). The Rates and Budget Department also prepares a monthly staff summary (except for July and August) to the Board of Directors describing major budget

FY13 Final CEB -- page C-10
variances and a quarterly budget variance report for inclusion in the Board of Directors Report on Key Indicators of MWRA Performance (Orange Notebook). At least twice a year, the Rates and Budget Department prepares a staff summary to the Board of Directors on year-end projections of revenue and expenses. C. Budget Amendments An amendment to an MWRA Current Expense Budget is defined as follows: A proposed change in an adopted budget or a proposed budget transmitted to the MWRA Advisory Board in accordance with Section 8(b) of Chapter 372 of the Acts of 1984 which meets any of the following criteria: 1. Any increase in total current expenses. 2. An increase of five percent or more in total division expenses. 3. An increase in any expense line item (subsidiary account) of 15 percent or more if that
line item is at least 2.5 percent of total current expenses. 4. An addition or deletion of a specific new program or initiative, the cost of which is
greater than one percent of total current expenses, unless the addition or deletion has been specifically recommended by the Advisory Board.
The Executive Director, with the concurrence of the Chairman of the Board of Directors and the Chairman of the Administration, Finance, & Audit Committee of the Board of Directors, submits proposed amendments to the Advisory Board for comment and recommendation. At the end of the Advisory Board 30-day review period, the Board of Directors may take action on the amendment.
CAPITAL BUDGET MANAGEMENT POLICIES AND PROCEDURES General Guidelines The Authority shall periodically adopt and revise capital facility programs for the Waterworks and Sewer Systems and capital budgets based on these programs. The Authority shall consult in the preparation of its capital facility programs for the Sewer and Waterworks Systems with the Authority’s Advisory Board and the Executive Office of Environmental Affairs, and may consult with other agencies of federal, state and local government concerned with the programs of the Authority. Proposed capital facility programs and capital expenditure budgets for said systems shall be submitted to the Advisory Board for such consultation no less than sixty days prior to adoption or revision by the Authority. The Authority shall prepare a written response to reports submitted to it by the Advisory Board, which response shall state the basis for any substantial divergence between the actions of the Authority and the recommendations contained in such reports of the Advisory Board. The Authority shall capitalize expenditures in accordance with

FY13 Final CEB -- page C-11
generally accepted accounting principles. Capital expenditures will be planned in accordance with Authority financing agreements and policies for amortization of capital costs. Capital Budget Contingency A contingency for each fiscal year is incorporated into the Capital Improvement Program for the purpose of providing for unanticipated or unpredictable expenditures under the CIP spending cap. Capital Budget Monitoring and Reporting The Authority shall continually monitor the progress of capital projects for purposes of managerial control and decision-making and for financial planning and management. Two capital budget variance analysis reports will be provided to the Board of Directors, one for the first six months of a year and one at year-end. The reports will include planned project schedules and budgets compared to actual performance. The reports will highlight any major changes, either in scope or budget, of any project. Based on these reports, staff may recommend to the Board of Directors revisions, if appropriate, to the annual and five-year caps based upon said changes. In addition, capital budget progress reports shall be provided to the Board of Directors on a regular basis, both as project specific updates and in Quarterly Orange Notebook reports that shall include discussions of project progress compared to schedules. Monthly Financial Summary reports shall include discussions of capital expenditures compared to budget. Capital Budget Spending Cap Beginning in June 2003, the Board of Directors established a five-year Capital Budget Spending cap and annual caps for each year within the cap period. Spending for any year in the cap period may vary within plus or minus 20% of the annual cap, as long as total spending for the five-year period does not exceed the five-year cap. Before the end of each five-year cap period, the Board will adopt a cap for the next five-year period and annual caps for each year in the period. The Board established the second five-year cap for the FY09-13 period at its June 2008 meeting. Expenditures in Excess of the Spending Cap In the event of unanticipated spending requirements, the Executive Director may recommend to the Board of Directors that annual expenditures exceed an annual cap by more than 20% or that five-year expenditures exceed the current five-year CIP spending cap. In such an event, a proposed plan to adjust the five-year cap or any of the annual caps will be presented to the Board. Any such proposed plan will be submitted to the MWRA Advisory Board for review and comment for a period of thirty days. At the end of the thirty-day period, the Board of Directors may take action on the proposed plan.


APPENDIX D
FY2013 FY2014 FY2015 FY2016 FY2017 FY2018 FY2019 FY2020 FY2021 FY2022
COMBINED UTILITIES
EXPENSES
Direct Expenses $214,916 $224,136 $233,216 $241,923 $251,910 $261,573 $272,194 $283,082 $294,241 $306,011
Indirect Expenses 45,693 47,270 48,764 48,411 48,277 54,856 51,997 54,153 58,522 60,958
Capital Financing (before offsets) 375,598 404,521 443,450 483,229 539,187 524,982 563,272 599,617 612,456 642,049Sub-Total Expenses $636,207 $675,927 $725,430 $773,563 $839,375 $841,411 $887,463 $936,853 $965,219 $1,009,018
Debt Service Assistance (350) (350) (350) (350) (350) (350) (350) (350) (350) (350)
Bond Redemption Savings 0 (1,162) (3,500) (2,745) (6,734) 0 (5,846) (12,000) (866) 0
Variable Rate Savings 0 0 0 0 0 0 0 0 0 0
Total Expenses $635,857 $674,415 $721,579 $770,467 $832,291 $841,061 $881,267 $924,503 $964,003 $1,008,668
REVENUE & INCOME
Non-Member and Other Revenue $13,884 $14,786 $15,159 $15,565 $15,968 $16,461 $16,695 $17,092 $17,529 $17,968
Interest Income 14,461 14,365 16,683 19,657 20,359 20,894 21,628 22,194 22,772 23,542
Rate Stabilization 0 10,838 8,500 9,255 5,266 0 6,154 0 0 0
Total Other Revenue $28,345 $39,989 $40,342 $44,476 $41,593 $37,354 $44,477 $39,286 $40,301 $41,510
Total Rate Revenue $607,512 $634,426 $681,237 $725,991 $790,699 $803,707 $836,790 $885,216 $923,702 $967,157
Rate Revenue Change 3.0% 4.4% 7.4% 6.6% 8.9% 1.6% 4.1% 5.8% 4.3% 4.7%
Estimated Annual Household Charge **
Based on water use of 61k gpy (weighted) $923 $967 $1,025 $1,084 $1,155 $1,207 $1,257 $1,325 $1,396 $1,469Based on water use of 90k gpy (weighted) $1,361 $1,426 $1,512 $1,600 $1,704 $1,781 $1,855 $1,954 $2,059 $2,167
WASTEWATER UTILITY FY2013 FY2014 FY2015 FY2016 FY2017 FY2018 FY2019 FY2020 FY2021 FY2022
EXPENSES
Direct Expenses $149,032 $155,264 $161,416 $167,234 $174,269 $180,969 $188,310 $195,842 $203,515 $211,655
Indirect Expenses 14,644 14,882 15,409 14,317 13,404 18,117 14,363 15,639 19,092 19,266
Capital Financing (before offsets) 262,775 277,765 299,321 323,548 373,065 335,929 368,216 390,869 384,479 392,568
Sub-Total Wastewater Expenses $426,451 $447,912 $476,146 $505,099 $560,737 $535,014 $570,889 $602,351 $607,085 $623,489
Debt Service Assistance (323.5) (321) (321) (319) (322) (318) (311) (321) (312) (311)
Bond Redemption Savings 0 0 0 0 (5,783) 0 0 0 0 0
Variable Rate Savings 0 0 0 0 0 0 0 0 0 0
Total Wastewater Expenses $426,127 $447,591 $475,825 $504,780 $554,632 $534,696 $570,578 $602,029 $606,773 $623,178
REVENUE & INCOME
MWRA Planning Estimates FY2013 to FY2022
Non-Member and Other Revenue $5,195 $5,302 $5,424 $5,547 $5,691 $5,787 $5,931 $6,077 $6,207 $6,353
Interest Income 9,422 8,845 10,261 12,123 12,619 12,739 13,104 13,422 13,571 13,789
Rate Stabilization 0 3,803 0 0 1,436 0 0 0 0 0Total Other Revenue $14,617 $17,950 $15,685 $17,670 $19,746 $18,527 $19,036 $19,499 $19,778 $20,142
Wastewater Rate Revenue $411,511 $429,641 $460,141 $487,110 $534,886 $516,170 $551,542 $582,530 $586,995 $603,036
Rate Revenue Change 1.4% 4.4% 7.1% 5.9% 9.8% -3.5% 6.9% 5.6% 0.8% 2.7%
Estimated Annual Household Charge **Based on water use of 61k gpy (weighted) $546 $572 $605 $637 $680 $692 $731 $769 $796 $829
Based on water use of 90k gpy (weighted) $805 $843 $892 $940 $1,004 $1,021 $1,079 $1,135 $1,174 $1,223
WATER UTILITY FY2013 FY2014 FY2015 FY2016 FY2017 FY2018 FY2019 FY2020 FY2021 FY2022
EXPENSESDirect Expenses $65,883 $68,871 $71,799 $74,689 $77,642 $80,604 $83,884 $87,239 $90,726 $94,355
Indirect Expenses 31,049 32,388 33,355 34,094 34,873 36,739 37,634 38,514 39,430 41,693
Capital Financing (before offsets) 112,823 126,756 144,129 159,680 166,123 189,053 195,056 208,748 227,977 249,481
Sub-Total Water Expenses $209,756 $228,015 $249,283 $268,464 $278,638 $306,396 $316,574 $334,502 $358,133 $385,529
Debt Service Assistance (26) (29) (29) (31) (28) (32) (39) (29) (38) (39)
Bond Redemption Savings 0 (1,162) (3,500) (2,745) (951) 0 (5,846) (12,000) (866) 0
Variable Rate Savings 0 0 0 0 0 0 0 0 0 0
Total Water Expenses $209,729 $226,824 $245,754 $265,687 $277,659 $306,364 $310,689 $322,473 $357,230 $385,490
REVENUE & INCOME
Non-Member and Other Revenue $8,689 $9,484 $9,735 $10,018 $10,277 $10,673 $10,764 $11,015 $11,321 $11,616
Interest Income 5,039 5,520 6,422 7,534 7,739 8,154 8,523 8,772 9,202 9,753
Rate Stabilization 0 7,035 8,500 9,255 3,831 0 6,154 0 0 0
Total Other Revenue $13,728 $22,039 $24,657 $26,806 $21,847 $18,827 $25,441 $19,787 $20,523 $21,369
Water Rate Revenue $196,001 $204,785 $221,097 $238,881 $255,812 $287,537 $285,248 $302,686 $336,707 $364,121
Rate Revenue Change 6.6% 4.5% 8.0% 8.0% 7.1% 12.4% -0.8% 6.1% 11.2% 8.1%
Estimated Annual Household Charge **
Based on water use of 61k gpy (weighted) $377 $395 $420 $448 $475 $515 $526 $555 $600 $640
Based on water use of 90k gpy (weighted) $557 $583 $620 $660 $700 $761 $776 $819 $886 $944
** Annual household charges are estimated for communities that receive full water and wastewater services from MWRA weighted by the number of households in each of these core communities. Based on community reponses to the 2011 MWRA Advisory Board's Annual Water and Sewer Retail Rate Survey.
FY13 Final CEB D 1FY13 Final CEB -- D-1

FY13 Final CEB -- page E-1
APPENDIX E
GLOSSARY OF FINANCIAL AND OPERATING TERMS
8M permit: Permission granted by MWRA to persons who wish to construct property improvements on land either adjoining or overlapping MWRA property interests. Permission may be conditioned on various operational and/or engineering concerns. Accrued Costs: Adjustments to paid expenditures to account for materials or services received but for which payment has not been made. Activated Sludge: The sludge that results when primary effluent is mixed with bacteria-laden sludge and then agitated and aerated to promote biological treatment. Advanced Waste Treatment: Wastewater treatment beyond the secondary or biological stage that includes the removal of nutrients such as phosphorus and nitrogen and the removal of a higher percentage of suspended solids and organic matter than primary treatment. Advisory Board: The agency that represents the interests of MWRA’s 61 user communities to the Board of Directors in an advisory capacity in accordance with the provisions of MWRA’s Enabling Act. The Advisory Board elects three members of the Board of Directors, reviews and comments on MWRA’s CIP and CEB, and approves the addition of new communities to the wastewater and water systems. Aerobic: In the presence of free oxygen. Anaerobic: Life or processes such as bacteria that digest sludge that require, or are not destroyed by, the absence of free oxygen. AOC: Assimilable Organic Carbon - One measure of the “food” available to bacteria within a water system. More complex carbon compounds can become assimilable when oxidized by strong disinfectants. ARRA: American Recovery and Reinvestment Act of 2009 – principal forgiveness loans distributed based on the Department of Environmental Protection’s Intended Use Plan. Ash: The inert material remaining after the combustion of wastewater sludge. Ash is either wet or dry depending on combustion system design. Bacteria: One-celled microscopic organisms commonly found in the environment. Bacteria can be harmful, such as pathogens, or helpful and perform a variety of biological treatment processes. BDOC: Biologically Degradable Organic Carbon - Another, more precise, measure of the “food” available to bacteria within a water system.

FY13 Final CEB -- page E-2
BGD: Billion gallons per day. Biofilm: Growth of various bacteria within a water distribution system on the pipe walls. Biofilm growth can contribute to iron corrosion, colored water, poor taste, excessive chlorine demand, and complications with coliform testing. Blow-off valves: Valves operated during pipeline repair to de-water (drain) a portion of a pipeline. BOD: Biochemical Oxygen Demand - An indicator of the amount of biodegradable contaminants in wastewater. Board of Directors: The 11-member governing board of MWRA. Bond Resolution: A document adopted by the Board of Directors that governs MWRA's issuance of revenue bonds and sets forth its obligations to bondholders. Boston Harbor Project: An extensive plan of activities which MWRA developed and implemented to construct new wastewater treatment facilities in response to a federal court order to comply with the provisions of the U.S. Clean Water Act. Business Systems Plan (BSP): The strategic planning framework for MWRA’s management information systems. The BSP is updated annually to reflect ongoing business requirements, new opportunities identified by ongoing MWRA strategic planning efforts, technology changes, and user requests. BWSC: Boston Water and Sewer Commission - The agency responsible for providing water and sewer services to the City of Boston, MWRA’s largest customer. CADD: Computer aided drafting and design. Capital Improvement Program (CIP): A plan which identifies and estimates the nature, schedule, cost, and financing of long-term assets that MWRA intends to build or acquire during a specific period. Capital Investment: Development of a facility or other asset that adds to the long-term value of an organization. CDF: Cosgrove Disinfection Facility Cathodic Protection: A form of corrosion protection that is particularly effective against galvanic corrosion. Galvanic corrosion occurs when pipe metal is in the presence of other metals while immersed in water. The interaction of these elements causes an electric current to flow away from the pipe, taking electrons with it and pitting the pipe as a result. Cathodic protection reverses the current, thereby stopping the corrosion.

FY13 Final CEB -- page E-3
Centrifuge: A machine that uses centrifugal force to separate substances of different densities and remove moisture. MWRA uses centrifuges at the Deer Island Wastewater Treatment Plant to de-water sludge. CFM: Cubic Feet per Minute - A measure of the quantity of a material flowing through a pipe. Chloramination: The process of adding chloramine to drinking water. Chloramine, a form of chlorine and ammonia, is used as a residual disinfectant because it lasts longer in the water distribution system than primary disinfectants. Chloramine: A long lasting residual disinfectant created by combining measured amounts of chlorine and ammonia. Chloramine forms fewer disinfection by-products than chlorine. Chlorination: The process of adding chlorine to drinking water to inactivate pathogens. Chlorine: A relatively strong primary disinfectant, effective against bacteria, giardia, and viruses, but not cryptosporidium. Concerns exist about the health effects of its by-products, some of which are or will be regulated. Clarifiers: Settling tanks or basins in which wastewater is held for a period of time, during which heavier solids settle to the bottom and lighter materials float to the surface. Clean Water Act: A law passed by Congress in 1972, and subsequently amended, which sets national standards for pollution reduction, permits discharges from wastewater treatment plants, and promotes achievement of the national goal that all surface waters be "fishable and swimmable." Cleaning and Lining: Cleaning and cement lining of unlined cast iron water mains to improve hydraulic capacity and extend useful life. CMMS (Computerized Maintenance Management System): Maximo is the computerized maintenance management system which is an essential component of successful asset management. This system is an important tool used in refining the long term maintenance strategy to ensure proper maintenance and replacement of plant assets. Coliform bacteria: A group of lactose fermenting bacteria, which while not of direct health concern, are used as a first line indicator of potential problems. See fecal coliform and E.coli. Comminutor - A machine or process that pulverizes and reduces solids to minute particles. Commonwealth Debt Service Assistance (DSA): Funds appropriated by the Commonwealth to offset MWRA capital financing expenses.

FY13 Final CEB -- page E-4
Community Obligation and Revenue Enhancement (CORE) Fund: A fund established by MWRA’s bond resolution that is used to provide insurance against delays by communities in paying charges due to MWRA. Composting: The process of converting wastewater treatment residuals to a soil-like humus material often used in the horticultural industry. The process involves the aerobic breakdown of the residuals and the addition of sawdust or wood chips. Corrosion Control: Adjustments to the chemistry of treated water to reduce its ability to dissolve lead, copper, other metals, or form hydrogen sulfide. Corrosion control can include adjustments to pH and alkalinity, as well as the addition of corrosion inhibitors such as phosphates or oxidizers. Coverage Requirement: Requirement of MWRA’s bond resolution which provides that each year, revenue less operating expenses (net revenue) must be more than the amount required for debt service payments on outstanding bonds. CP (Construction Package): Major construction projects such as the Carroll Water Treatment Plant or the North Dorchester Bay CSO project will group areas of work into individual construction contracts. Cross-Connection: A point at which potable water piping is connected to a non-potable water source creating an opportunity for the introduction of pollutants into the potable water. Cryogenic oxygen plant: MWRA operates a cryogenic oxygen-based facility as part of its secondary wastewater treatment program at Deer Island. Cryptosporidium: A protozoan parasite that can cause severe gastrointestinal disease in healthy individuals, and may be fatal to people with compromised immune systems. Cryptosporidia exist in the environment as hard walled oocysts that are very resistant to chlorination, but can be inactivated by disinfection with ozone or ultraviolet light. CSO: Combined Sewer Overflow – An overflow point and the discharged flow from a combined sewer system intended to provide hydraulic relief to avoid system flooding and backups during large wet weather events. During large rainstorms, systems can become overloaded, with the excess discharged directly into surface waters. The discharged flow and the discharge location are called CSOs. In the metropolitan Boston area there are approximately 47 active, permitted CSOs that currently discharge into rivers or Boston Harbor.
CSO Facilities: MWRA has six facilities that intercept the flow from CSO pipes. Four of these facilities provide treatment and two provide storage prior to discharge. The CSO facilities have some capacity to store flow and pump it to the Deer Island plant after rainstorms end. CT: Concentration x Contact Time - A measure of disinfection effectiveness established under the Surface Water Treatment Rule. CT is the product of the concentration of disinfectant [C] and the time it has been in contact with the water [T]. Required CT varies by type of disinfectant, organism, temperature, and pH.

FY13 Final CEB -- page E-5
CTG (Combustion Turbine Generator): CTGs are used to generate electricity during planned cable outages, wet weather operations and for participation in price response events. Current Expense Budget: A financial plan that estimates the revenues and expenses associated with MWRA's operations for a fiscal year. C-Value: The carrying capacity of a water main for a specified length and pressure drop that is determined by its diameter and resistance to flow. The friction coefficient "C" of the main is often used as a measure of flow resistance. C-values for new pipe are about 120 for water mains that are 6 to 16-inches in diameter, and 130 and 140 for larger diameter mains. DAF: Dissolved Air Flotation - A process of adding super saturated air into water to cause coagulated solids to rise to the top to be skimmed off. DAF replaces conventional gravity sedimentation (clarification) and is particularly cost-effective for low turbidity waters subject to periodic algae blooms. DBP: Disinfection By-products - Complex compounds formed by the use of oxidizing agents such as chlorine or ozone in waters containing organic matter. D/DBP Stage 1: Disinfectants/Disinfection By-products, Stage 1 Rule - Promulgated 11/1998, and effective 1/2002, this rule set DBP limits at 80 parts per billion for Trihalomethanes and 60 parts per billion for Haloacetic Acids, averaging all samples over four quarters. D/DBP Stage 2: Disinfectants/Disinfection By-products Stage 2 Rule - The rule further regulates the amount of DBPs allowed in water. The 80/60 values set in Stage 1 will now apply to each individual sample location in a "Locational Running Annual Average". Debt Service: In a given fiscal year, the amount of money necessary to pay interest and principal on outstanding notes and revenue bonds. DEP: Department of Environmental Protection - The Massachusetts agency that regulates water pollution control, water supplies, and waterways and dispenses federal and state grant funds to support these activities. Department: A sub-unit of an MWRA division. Department of Conservation and Recreation (DCR): Created in 2003 through the merger of the Metropolitan District Commission and the Department of Environmental Management, DCR manages the Commonwealth’s diverse parks system and protects and enhances natural resources and outdoor recreational opportunities throughout Massachusetts. De-watering: The process of removing water from wastewater treatment residuals. De-watered sludge has the appearance of mud or wet soil material.

FY13 Final CEB -- page E-6
Diffusers: A system of shafts, rising from the end of MWRA’s effluent outfall tunnel to the seabed, which disperses treated wastewater over a large area. Technically, the diffusers are the “sprinkler heads” mounted on top of the riser shafts that lead from the outfall tunnel and disperse wastewater into Massachusetts Bay. Digesters: Tanks for the storage and anaerobic or aerobic decomposition of organic matter present in sludge. Direct Program Expenses: Costs directly associated with providing services or performing activities. Disinfection, Primary: The inactivation (killing) of pathogenic organisms in a water system by the use of chemical or other disinfection agents. Disinfection, Residual: The presence of a measurable residual of disinfectant within a water distribution system to help control bacterial re-growth and guard against contamination. Dissolved Oxygen (DO): A measure of the amount of oxygen in a given amount of water. Adequate levels of DO are needed to support aquatic life. Low dissolved oxygen concentrations can result from inadequate wastewater treatment. Division: A major organizational unit within MWRA, encompassing the activities and resources for providing a major service or function. DLS (Department of Laboratory Services): Laboratory Services is a full service analytical testing and consulting group within the MWRA that primarily serves client groups primarily within the Operations Division. The analytical services that Laboratory Services provides include wet chemistry, metals, organics, and microbiology testing. Related services include field sampling, technical consultation, and contract laboratory management. DMR (Discharge Monitoring Report): Monthly reports that are submitted to federal and state regulators. MWRA monitors the effluent (treated sewage) that is discharged into Massachusetts Bay, to ensure that it meets the standards set out in the NPDES permit. Analytical support to the effluent monitoring program is provided by the Department of Laboratory Services. E.coli: A normal inhabitant of the digestive tract of mammals. The presence of E.coli indicates probable contamination by fecal matter. Effluent: Treated wastewater discharged from a treatment plant. EIR: Environmental Impact Report – A document prepared in adherence with the Massachusetts Environmental Policy Act (MEPA) to review the environmental impact of projects and ensure opportunities for public review and comment.

FY13 Final CEB -- page E-7
EIS: Environmental Impact Statement – A document prepared in adherence with the National Environmental Policy Act to review the environmental impact of projects and ensure opportunities for public review and comment. Enabling Act: Legislation (Chapter 372 of the Acts of 1984) that established MWRA and define its purpose and authority as of January 1, 1985. ENF: Environmental Notification Form - The first step in the MEPA process. EOC: Emergency Operations Center EOEA: Executive Office of Environmental Affairs - The Massachusetts cabinet office that oversees state environmental agencies. EPA: Environmental Protection Agency - The federal government agency responsible for environmental enforcement and investigation. ESWTR: Enhanced Surface Water Treatment Rule - A federal rule that is promulgated in three stages: 1) Interim Enhanced Surface Water Treatment Rule (IESWTR): The IESWTR was promulgated in 1998 and tightened the requirements for the operation of water filtration plants in large systems to take a first step toward controlling cryptosporidium in source waters. IESWTR also added cryptosporidium to the list of issues considered within watershed protection plans for unfiltered systems. 2) LT1ESWTR primarily extends the IESWTR to smaller systems 3) LT2ESWTR: further tightens the standards for the operation of filtration plants and add requirements for 99% inactivation of cryptosporidium and the use of two primary disinfectants for unfiltered systems. The concept of proportional treatment, with less treatment required for cleaner sources, will be implemented as part of the rule. Enterococcus: A pathogen indicator, similar to fecal coliform, that is used in the Massachusetts Water Quality Standards for marine waters, consistent with the Federal Clean Water Act requirements, which indicates potential contamination from human or animal waste. Eutrophication: Nutrient enrichment of a lake or other water body typically characterized by increased growth of planktonic algae and rooted plants. Eutrophication can be accelerated by wastewater discharges and polluted runoff. Expenditures: Payments for goods and services received. Expenses: Costs associated with the operating activities of a period, including expenditures and accrued costs.

FY13 Final CEB -- page E-8
Facility Information System (FIS): The management information system at the Deer Island Treatment Plant. Fecal coliform bacteria: A group of bacteria used as a primary indicator organism for potential contamination from human or animal waste. Also called thermo-tolerant bacteria. Specific organisms in the group may or may not be of health concern (see E.coli). Filtration: A water treatment process involving the removal of suspended particulate matter by passing the water through a porous medium such as sand or carbon. Fiscal Year: The 12-month financial period used by MWRA that begins July 1 and ends June 30 of the following calendar year. MWRA's fiscal year is numbered according to the calendar year in which it ends. Flash coat: A light coat of shotcrete used to cover minor blemishes on a concrete surface. FOD (Field Operations Department): Department within the Operations Division created to provide high quality, uninterrupted water delivery and wastewater collection services to MWRA communities. The department is responsible for the treatment, transmission, and distribution of water from the Quabbin and Wachusett reservoirs to community water systems. It also manages the collection, transport, and screening of wastewater flow from MWRA communities to the Deer Island Treatment Plant as well as MWRA’s industrial pretreatment, permitting, and monitoring programs. Force Main: A pressure pipe joining the pump discharge at a water or wastewater pumping station with a point of gravity flow. FRSA (Fore River Staging Area): The site of the Sludge Pelletization Plant. Giardia: A protozoan parasite that can cause severe gastrointestinal disease, although there is medical treatment available. Giardia exist in the environment as hard-walled cysts, and are moderately resistant to chlorine disinfection. Goal: A statement in general terms of a desired condition, state of affairs, or situation. Goals, which are long-term in nature and not usually directly measurable, provide general direction for the activities of operating units. Global Positioning System (GPS): Also known as an Automatic Vehicle Location system (GPS/AVL), this tool provides real-time transmission alerts utilizing a cell phone/satellite communication system and a web-based mapping system to track vehicles and operator-driven mobile equipment in MWRA’s service area. The system allows MWRA to respond more quickly to emergencies, enhance driver and vehicle safety, reduce fuel costs, track mileage electronically, monitor unauthorized vehicle usage, and improve efficiency.

FY13 Final CEB -- page E-9
Graphitization: A corrosion mechanism that alters the molecular structure of the carbon/iron matrix of cast iron pipe. During the process, iron atoms are forced away from the metal leaving behind an unstable carbon matrix. The result is a weakened pipe, easily susceptible to ruptures. High frequency in the number of breaks causes leakage to be a major problem of graphitized pipe. Grit: Sand-like materials that quickly settle out of wastewater. Groundwater: A body of water beneath the surface of the ground. Groundwater is made up primarily of water that has seeped down from the surface. HAA: Haloacetic Acids - A class of disinfection by-products related to chlorine disinfection. HAAs are regulated under D/DBP Stage 1 Rule at 60 ppb. Harbor Electric Energy Company (HEEC): A subsidiary of NStar which installed a cross harbor power cable and built a sub-station to provide power for construction and operation of the new Deer Island Treatment Plant. Head House: A structure containing the control gates to a conduit such as a sewer pipeline. Headworks: A preliminary treatment structure or device, usually including a screening and de-gritting operation, that removes large or heavy materials such as logs and sand from wastewater prior to primary treatment. Heavy Metals: Metals such as lead, silver, gold, mercury, bismuth, and copper that can be precipitated by hydrogen sulfide in an acid solution. HOM (Harbor and Outfall Monitoring): A comprehensive program to provide environmental data that helps to predict and measure the effect of Deer Island outfall discharge on the marine ecosystem. Incentives and Other Charges: A fee system designed to help recover permitting, inspecting, and monitoring costs incurred by MWRA’s TRAC Program and provide incentives to permitted users to reduce discharges. Indirect Expenses: Costs not directly associated with providing services or performing activities. Infiltration/Inflow (I/I): The problem of clean water flows entering sewers resulting in diminished pipe capacity for sanitary flows and in costly pumping and treatment of unnecessarily large wastewater volumes. Infiltration is groundwater that leaks into the sewerage system through pipe joints and defects. Inflow, primarily a wet-weather phenomenon, refers to water that enters sewers from improperly connected catch basins, sump pumps, land and basement drains, and defective manholes. Inflow also enters through improperly closed or defective tidegates during high tides.

FY13 Final CEB -- page E-10
Influent: The flow of water that enters the wastewater treatment process. Insurance Reserve: A fund established to adequately reserve against risks for which MWRA does not currently maintain insurance. Interceptors: The large pipes that convey wastewater from collection systems to treatment plants. Investment Income: Income derived by investing certain operating and reserve fund balances in interest-yielding securities in accordance with the provisions of MWRA's bond resolution. ISO - NE (Independent System Operator of New England): Non-profit wholesale operator of the regional grid system. The MWRA receives payment from ISO-NE when Deer Island and Carroll Water Treatment Plant remove themselves from the grid. Both plants participate in load response programs offered by ISO-NE which pays larger commercial and industrial electricity consumers to “shed load” during grid peaks. There are several programs available such as price, demand response and load response. MWRA constantly evaluates the options and participates in the most advantageous program. Carroll Water Treatment Plant (CWTP): Water treatment facility for waters from Quabbin and Wachusett Reservoirs with capacity of 405 mgd using ozonation as a primary disinfectant. Labor Costs: Direct costs of employing permanent and temporary personnel, including wages, salaries, overtime pay, fringe benefits, and workers' compensation. Land Application: The use of wastewater treatment residuals on land for agricultural benefits. Landfilling: The disposal of residuals by burial. Modern landfills have double liners, leachate collection systems, and other design features to protect against groundwater contamination. LCR: Lead and Copper Rule – A federal rule that set an action level for lead and copper at “worst case” consumer taps. Optimized corrosion control, notification, education, and lead service replacements are all components of compliance plans. Leachate: Water that drains from a landfill after having been in contact with, and potentially contaminated by, buried residuals. Modern landfills are designed to collect leachate for subsequent treatment. Limnology: The scientific study of physical, chemical, meteorological, and biological conditions in fresh waters. LIMS: Laboratory Information and Management System – An automated database system used to transfer information between MWRA’s Central Laboratory to its client groups and to process information obtained by the Central Laboratory to monitor substances that enter and leave the MWRA wastewater system. Use of LIMS removes the potential for human error in the sampling process by bar coding samples, eliminating the need to transcribe sample data, producing pre-

FY13 Final CEB -- page E-11
printed project-specific sample check-off forms for field crews, and automating testing through pre-set test codes and project-specific parameters. LOX (Liquid Oxygen): Liquid oxygen is used together with electrical energy to generate ozone at the Carroll Water Treatment Plant. Mapping Protocols: Sets of specifications defining the content and format of data to be collected. MCL: Maximum Contaminant Level - The highest level of a contaminant that is allowed in drinking water. MCLs are set as close to MCLGs as feasible using the best available control technology. MCLG: Maximum Contaminant Level Goal - The level of a contaminant in drinking water below which there is no known or expected risk to health. MCLGs allow for a margin of safety. Massachusetts Environmental Policy Act (MEPA) Unit: A unit of the Commonwealth’s Executive Office of Environmental Affairs responsible for implementation of the state environmental review process. Methane: A colorless, nonpoisonous, flammable gas produced as a by-product of anaerobic sludge processing. At Deer Island, MWRA uses methane as fuel to provide heat and hot water and to generate electricity. MGD: Million gallons per day. MIS: Management Information Systems Mission: A description of the fundamental purposes and major activities of an operating unit or program. Mitigation: Financial remuneration or non-financial considerations that MWRA provides to communities to alleviate the negative effects of major construction projects. Molybdenum (Mo): A metallic element that resembles chromium and tungsten in many properties, and is used in strengthening and hardening steel. Mo is a trace element in plant and animal metabolism. The concentration of molybdenum in sludge products is strictly regulated.
NACWA (Nation Association of Clean Water Agencies): NACWA represents the interests of publicly owned wastewater treatment plants. NACWA is involved in all areas of water quality protection including the development of environmental legislation and assisting federal regulatory agencies in the implementation of environmental programs.
NEFCo: New England Fertilizer Company - The contractor responsible for the operation of processing sludge into fertilizer pellets at MWRA’s residuals processing plant located in Quincy. NEFCo is also responsible for marketing and distributing the pellets and disposing of any product that is not marketable.

FY13 Final CEB -- page E-12
National Pollutant Discharge Elimination System (NPDES) Permit: A permit issued by EPA in conjunction with DEP that governs wastewater discharges into surface waters. NHS (Northern High Service): Project that involves a series of water system pipeline improvements in the MWRA’s Northern High Service Area. Nitrification: An aerobic process in which bacteria changes the ammonia and organic nitrogen in wastewater into oxidized nitrogen (usually nitrate). Second-stage BOD is sometimes referred to as the nitrification stage (first-stage BOD is called the carbonaceous stage). Also, a similar process in the water distribution system, where ammonia from chloramine can be used by nitrifying bacteria, resulting in a reduced chlorine residual, and the potential for additional bacteria growth. OCC: Metropolitan Operations Control Center, located at MWRA’s Chelsea Facility. OEP (Office of Emergency Preparedness): The Office of Emergency Preparedness has oversight over security, exercises, emergency operations, planning, the Emergency Services Unit and critical infrastructure protection. OMS (Operations Management Systems): OMS correlates PICS data with laboratory analysis to track and analyze DITP’s process performance with regard to the plant's discharge permit from EPA and DEP and with respect to cost effective operation. Operating Reserve: A fund established to adequately reserve for operating contingencies, required by MWRA’s bond resolution to be not less than one-sixth of the its annual operating expenses. Organic Matter: Material containing carbon, the cornerstone of plant and animal life. It originates from domestic and industrial sources. Other User Charges: Revenue received per agreements MWRA has for provision of water, sewer, and other services to entities other than communities which are charged assessments. Outfall: The pipe or structure where effluent is discharged into receiving waters. Ozonation: The application of ozone to water, wastewater, or air, generally for the purposes of disinfection or odor control. The Carroll Water Treatment Plant (CWTP) employs the ozonation process to inactivate pathogens, including cryptosporidium, with lower levels of DBPs. Ozone: A strong disinfectant made from oxygen and electrical energy. Ozone is effective against cryptosporidium. Pathogens: Harmful organisms, often called germs that can cause disease. Waterborne pathogens (or the diseases they cause) include giardia, cryptosporidium, cholera, typhoid, E.coli, Hepatitis A, legionella, and MAC.

FY13 Final CEB -- page E-13
Payments in Lieu of Taxes (PILOT): Amounts which MWRA pays each fiscal year to cities and towns for land owned by the Commonwealth in the Quabbin, Ware River, Wachusett, and Sudbury watersheds. Consistent with the provisions of MWRA’s Enabling Act, these payments are based on the past commitments of the Commonwealth of Massachusetts. Penalty Revenue: Revenue derived from penalties assessed by MWRA to violators of its sewer use regulations. Performance Measure: An indicator of the work and/or service provided, defined by output, work or service quality, efficiency, effectiveness, or productivity. Performance Objective: A statement of proposed accomplishments or attainments that is short-term in nature and measurable. PICS (Process Instrumentation and Control System): PICS provides real-time operations data from systems throughout Deer Island (including system status, flow, etc.). Plume: The rising discharge of treated wastewater effluent from a treatment plant outfall pipe. Preliminary Treatment: The process of removing large solid objects, sticks, gravel, and grit from wastewater. Pretreatment: The reduction or elimination of pollutant properties in wastewater prior to discharge into a sewer system. Primacy: Primary enforcement authority for Federal Safe Drinking Water Act regulations delegated to a state by the Environmental Protection Agency (EPA). Primary Treatment: A wastewater treatment process that takes place in a rectangular or circular tank and allows substances in wastewater that readily settle or float to be separated from the water being treated. Primary treatment results in 50-60% removal of suspended solids and 30-34% removal of BOD. Program: An organized group of activities and the resources to carry them out aimed at achieving one or more related objectives. Rate Revenue: Revenue received from annual assessments of communities within MWRA’s service area for water and sewer services. Rate Stabilization Reserve: A fund established by the Board of Directors that is used to reduce rate revenue requirements. MWRA finances this reserve with unexpended or surplus funds available from the Current Expense Budget at the end of each fiscal year.

FY13 Final CEB -- page E-14
RCM (Reliability Centered Maintenance): A maintenance strategy adopted at Deer Island in FY00 for critical systems. RCM is a failure modes and effects process that involves maintenance, operations and engineering staff in the development of preventative maintenance and operation plans for plant systems. Relief Sewer: A sewer built to carry flows in excess of the capacity of an existing sewer. RGGI: The Regional Greenhouse Gas Initiative is a mandatory, market-based program in the United States to reduce greenhouse gas emissions. The program involves selling emission allowances through auctions and investing the proceeds in demand-side management and clean energy technology projects. Remote Headworks: The initial structures and devices of a treatment plant set apart by some distance from the plant site. Renewal and Replacement Reserve: A fund established to adequately reserve for the cost of capital improvements not provided for by funds available through the Capital Improvement Program or the Current Expense Budget. Residuals: The by-products of the wastewater treatment process, including scum (floatables), grit and screenings, primary sludge, and secondary sludge. Revenue Bonds: Bonds payable from a specific source of revenue and which do not pledge the full faith and credit of the issuer. RPS (Renewable Portfolio Standards): State policies which mandate a state to generate a percent of its electricity from renewable resources. Qualified renewable generation facilities for the MWRA include: the Steam Turbine Generator (STG) and a variety of Hydroelectric, Wind and Solar units. The MWRA is issued electronic certificates for each megawatt hour of electricity produced from the digester gas, which is considered renewable energy. RPS credits are a source of revenue for the MWRA. Safe Yield Model: The equation used to determine the maximum dependable draft that can be made continuously on a water supply source during a period of years during which the probable driest period or period of greatest deficiency in water supply is likely to occur. SAMS: Sewerage Analysis and Management System – A database which contains specifications of the location, size, and condition of MWRA wastewater interceptors and appurtenances and which produces maps for use by MWRA and outside parties. Sanitary Sewers: In a separate system, pipes that carry only domestic wastewater. SCADA: Supervisory Control and Data Acquisition - Equipment for monitoring and controlling water or wastewater facilities remotely. SCBA: Self-contained breathing apparatus.

FY13 Final CEB -- page E-15
Screenings: Large items such as wood and rags that are collected from wastewater in coarse screens prior to primary treatment. Scum: Floatable materials such as grease, oil, and plastics that are skimmed from the surface of wastewater as it flows through large settling tanks. SDWA: Safe Drinking Water Act - A Federal law enacted in 1986 and amended in 1996 that requires EPA to establish national primary drinking water regulations for water suppliers which consist of MCLs or treatment techniques. Secondary Treatment: Usually following primary treatment, secondary treatment employs microorganisms to reduce the level of BOD and suspended solids in wastewater. Sedimentation Tanks: Settling tanks where solids are removed from sewage. Wastewater is pumped to the tanks where the solids settle to the bottom or float on the top as scum. The scum is skimmed off the top, and solids on the bottom are pumped out for further treatment and/or final disposal. Seeding: The initial filling of sludge into digesters. Sensitive user: A member of a group within the general population likely to be at greater risk than the general population of adverse health effects due to exposure to contaminants in drinking water. Sensitive users include infants, children, pregnant women, the elderly, and individuals with histories of serious illness. Septic Tanks: Tanks used for domestic wastes when a sewer line is not available to carry them to a treatment plant. Periodically, the septage is pumped out of the tanks, usually by commercial firms, and released into a wastewater treatment system. Shotcrete: Mortar or concrete conveyed through a hose and projected at high velocity onto a surface; also known as air-blown mortar, pneumatically applied sprayed mortar, or gunned concrete. Siphon: A closed conduit, a portion of which lies above the hydraulic grade line, resulting in a pressure less than atmospheric and requiring a vacuum within the conduit to start flow. A siphon utilizes atmospheric pressure to effect or increase the flow of water through the conduit. Slip Lining: Insertion by pushing or pulling of lines fabricated of plastic, concrete cylinder pipe, reinforced concrete, or steel through existing conduits from access pits. Sludge: Material removed by sedimentation during primary and secondary treatment. Sludge includes both settled particulate matter and microorganisms and is the single largest component of wastewater residuals. At the time sludge is removed during the treatment process, it contains only 0.5% to 5% solid content by weight. It has the appearance of muddy water.

FY13 Final CEB -- page E-16
Sodium Hypochlorite (NaOCl): A liquid form of chlorine that MWRA uses in the disinfection and/or odor processes at the Deer Island Treatment Plant, various other Wastewater facilities, and the Carroll Water Treatment Plant (CWTP). Storm Sewers: Separate systems of pipes that carry only water runoffs from roofs, streets, and parking lots during storms. Surcharging: Loads on a system beyond those normally anticipated; also, the height of wastewater in a sewer manhole above the crown of the sewer when the sewer is flowing completely full. Suspended Solids: The particulate matter contained in wastewater. SWTR: Surface Water Treatment Rule – A Federal rule promulgated in 1989 that affects all utilities using surface waters or waters under the influence of surface waters. SWTR requires filtration unless certain criteria on source water quality, watershed control, and disinfection effectiveness can be met (see also ESWTR). Telemetry: Remote measuring or monitoring devices connected to a central monitoring station via telephone lines. TCR: Total Coliform Rule – A federal rule that requires monitoring of water distribution systems for coliform bacteria and chlorine residual. No more than 5% of the coliform samples in a month can be positive. TOC: Total Organic Carbon - A measure of the amount of organic material in water. Often used as a surrogate for disinfectant demand or DBP precursors. Transition: A short section of conduit used as a conversion section to unite two conduits having different hydraulic elements. TTHM: Total Trihalomethanes - A class of disinfection by-products, related to primarily chlorine disinfection (see D/DBP Rule). TRAC: Toxic Reduction and Control – The department responsible for MWRA’s industrial pretreatment program. TSS (Total Suspended Solids): A measure of the settleable solids and non-settleable solids in wastewater. During the primary treatment process, flows are routed to primary treatment clarifiers that remove about half of the pollutants brought to the plant in typical wastewater (50-60% of total suspended solids and up to 50% of pathogens and toxic contaminants are removed). United States Geological Survey (USGS): The federal agency that collects Geographic Information System (GIS) data for developing mapping protocols.

FY13 Final CEB -- page E-17
Vactor Jet Truck: A vehicle used to clean and/or remove blockages from sewer lines by pushing and/or pulling fluids in the sewer. VMM: Vehicle Management and Maintenance – The program responsible for management and maintenance of MWRA’s vehicles and heavy equipment. WASM (Weston Aqueduct Supply Mains): Project involving the rehabilitation of the four Weston Aqueduct Supply Mains that carry potable water to MWRA’s service area. When complete, they will transmit about one-third of the water to MWRA’s service area and the City tunnel will carry the remaining two-thirds. Wastewater: The water carried by sewers serving residences and businesses that enters wastewater facilities for treatment. Wastewater is any water that has been adversely affected in quality by anthropogenic influence. It comprises liquid waste discharged by domestic residences, commercial properties, and/or agricultural and can encompass a wide range of potential contaminants and concentrations. Wastewater Treatment Plant (WTP): A facility containing a series of tanks, screens, filters, and other equipment and processes for removing pollutants from wastewater. Watershed Reimbursement: An amount that MWRA pays to the Department of Conservation and Recreation (DCR) each fiscal year for maintaining and managing the primary sources of MWRA's water supply (watersheds) in accordance with the laws of the Commonwealth of Massachusetts. The amount of the reimbursement is determined by prevailing legislation. Wholesale Water and Sewer Services: Potable water and wastewater collection, transport, delivery, and treatment services that MWRA provides to communities. Communities provide the same services directly to retail customers or end users. WOCC: Western Operations Control Center, located at the Carroll Water Treatment Plant.


Projected Outstanding as of
6/30/2012Total Sewer Water
SRF 1
Unrefunded (93A, 93D, 95A,98C) 7,655,000$ 20,844$ 20,844
1999E Sewer 390,871 390,871 -
1999E Water 578,237 - 578,237
1999F 279,865,000 18,619,101 18,619,101 -
2000E Sewer 2,818,620 2,818,620 -
2000E Water 574,868 - 574,868
2001C Water 2,900,000 248,362 - 248,362
2001D Sewer 377,905 377,905 -
2001D Water 81,935 - 81,935
2002H Sewer 3,150,262 3,150,262 -
2002H Water 1,550,069 - 1,550,069
2002I Sewer 102,003 102,003 -
2002I Water 1,495 - 1,495
2003A 954,801 69,658 - 69,658
2003B 2,619,311 222,136 - 222,136
2003C Sewer 1,360,019 1,360,019 -
2003C Water 967,930 - 967,930
2004C Sewer 542,368 542,368 -
2004C Water 90,368 - 90,368
2004D Sewer 3,860,454 3,860,454 -
2004D Water 646,550 - 646,550
2005C Sewer 419,733 419,733 -
2005C Water 69,270 - 69,270
2005D Sewer 3,391,064 3,391,064 -
2005D Water 805,913 - 805,913
2005E Sewer 24,961 24,961 -
2005E Water 5,479 - 5,479
2006C Sewer 7,390,645 488,110 488,110 -
2006D Sewer 3,741,313 3,741,313 -
2006D Water 1,616,040 - 1,616,040
2006E Sewer 22,883 22,883 -
2006E Water 10,281 - 10,281
2007C Sewer 310,573 310,573 -
2007C Water 192,303 - 192,303
2007D Sewer 21,163,128 1,151,501 1,151,501 -
2007E Sewer 3,298,419 3,298,419 -
2007E Water 1,264,733 - 1,264,733
2008G Sewer 406,755 406,755 -
2008G Water 82,446 - 82,446
2009C Sewer 5,762,162 5,762,162 -
2009C Water 1,892,459 - 1,892,459
2009D Sewer 650,227 650,227 -
2009D Water 85,955 - 85,955
2010C Sewer 2010C Water 2010D Sewer 1,427,299 1,427,299 -
2010D Water 1,442,144 - 1,442,144
2011A Sewer 384,544 384,544 -
2011A Water 372,557 - 372,557
2012C Sewer 524,630 524,630
2012C Water 254,577 254,577
Pool 16 SRF Sewer 3,131,660 3,131,660 -
Pool 16 SRF Water 584,671 - 584,671
Pool 17 SRF Sewer 2,761,800 2,761,800
Pool 17 SRF Water 954,035 954,035 Total SRF Debt 1,119,819,124$ 73,804,552$ 59,140,081$ 14,664,470$
368,519
2,064,594
93,540,000
APPENDIX FFY13 Current Expense Budget - Capital Financing Detail (as of 6/30/2012)
13,344,771
63,407,792
5,113,117
40,588,000
9,997,991
60,039,673
6,731,284
66,354,502
78,580,085
426,135
5,869,623
70,268,960
6,016,494
106,977,026
11,356,628
33,035,745
47,697,355
10,859,878
11,995,195
52,637,872
FY13 Final CEB -- page F-1

Projected Outstanding as of
6/30/2012Total Sewer Water
APPENDIX FFY13 Current Expense Budget - Capital Financing Detail (as of 6/30/2012)
MWRA Senior Debt
1993C New/Refunding 28,705,000 7,560,346 6,615,303 945,043
2002J Refunding 296,300,000 15,869,025 14,282,123 1,586,903
2002J New 1,000,000 50,000 25,000 25,000
2004B Refunding 48,950,000 2,447,500 2,141,563 305,938
2005A Refunding 356,665,000 18,304,925 8,237,216 10,067,709
2005B Refunding 80,290,000 4,014,500 1,338,033 2,676,467
2006A New 200,000,000 9,376,800 - 9,376,800
2006B Refunding 263,940,000 12,705,050 9,528,788 3,176,263
2007A New 198,000,000 8,933,188 1,518,642 7,414,546
2007B Refunding 647,950,000 34,017,375 28,574,595 5,442,780
2009A New 91,160,000 8,192,300 6,144,225 2,048,075
2009B Refunding 280,220,000 16,639,394 11,980,363 4,659,030
2010A New 98,895,000 4,757,050 3,329,935 1,427,115
2010B Refunding 183,570,000 9,178,500 5,323,530 3,854,970
2011B New 147,335,000 9,569,125 6,698,388 2,870,738
2011C 327,160,000 16,064,275 6,265,067 9,799,208
2012A 150,000,000 9,679,125 4,839,563 4,839,563
2012B 86,775,000 4,240,325 890,468 3,349,857
FY13 New Money (2013) 1,833,333 916,667 916,667 Total Senior 3,486,915,000$ 193,432,135$ 118,649,467$ 74,782,669$
Subordinate Debt
1999B 62,300,000 2,024,750 1,214,850 809,900
2002C Refunding 35,120,000 1,141,400 380,429 760,971
2002D Refunding 56,450,000 1,991,166 1,991,166 -
2008A Refunding 337,675,000 14,798,777 13,022,923 1,775,853
2008B Refunding 123,130,000 4,001,725 840,362 3,161,363
2008C Refunding 181,700,000 14,657,328 14,071,035 586,293
2008E Refunding 210,670,000 48,679,086 44,784,759 3,894,327
2008F Refunding 184,910,000 6,009,575 540,862 5,468,713 Potential Defeasanc/Restructuring - - - Total Subordinate Debt 1,191,955,000$ 93,303,807$ 76,846,386$ 16,457,421$
Total SRF & MWRA Debt Service25,798,689,124$ 360,540,493$ 254,635,934$ 105,904,559$
Water Pipeline Commercial Paper 144,000,000$ $3,640,517 -$ 3,640,517$
Current Revenue/Capital 3 8,200,000 6,150,000 2,050,000 Capital Lease 3,217,060 1,989,108 1,227,952 Sub-Total 144,000,000$ 15,057,577$ 8,139,108$ 6,918,469$
Total Capital Financing (before Debt Service Offsets)
5,942,689,124$ 375,598,070$ 262,775,042$ 112,823,028$
Debt Service OffsetsDebt Service Assistance 350,000 323,530 26,470 Total Capital Financing 5,942,689,124$ 375,248,070$ 262,451,512$ 112,796,558$
2 Numbers may not add due to rounding.3 Current Revenue/Capital is revenue used to fund ongoing capital projects.
1 SRF debt service payments reflect net MWRA obligations after state and federal subsidies.
FY13 Final CEB -- page F-2