EIGHTH FIVE YEAR PLAN - National Institute of Educational ...
189
DRAFT EIGHTH FIVE YEAR PLAN ( 1992 - 97 ) AND ANNUAL PLAN 1992-93 GENERAL PROFILE GOVERNMENT OF UTTAR PRADESH PLANNING DEPARTMENT DECEMBER, 1991
-
Upload
khangminh22 -
Category
Documents
-
view
1 -
download
0
Transcript of EIGHTH FIVE YEAR PLAN - National Institute of Educational ...

DRAFT
EIGHTH FIVE YEAR PLAN
(1992-97)
AND
ANNUAL PLAN 1992-93
GENERAL PROFILE
GOVERNMENT OF UTTAR PRADESHPLANNING DEPARTMENT
DECEMBER, 1991

Published by :Principal Secretary to Govt, of Uttar Pradesh, Planning Department Lucknow.
This draft—plAn is pr««0nted in thr«e volum«s.
Volume—1 consists of g»n«ral revisws.
Volume—II is of sectoral reviews and
Volume—III of statements
U3RA..Y •• • jgaucac.oa.l
cb. CO Mart.
K«-.v I .iD-lil'^DOC, No *7 VDatt ... f
Printed by United Block Printers, 78 Gautam Budh IVIarg. Lucknow throughThe Director, Information and Public Relations, U.P. Lucknow.

CONTENTS
PART - I
THE ECONOMIC SITUATION
Paae 1
Chapter - I State Economy Some Salient Features 2
Chapter - II Past Performance 16
Chapter - III S t a t e’s Backwardness 33
Chapter - IV Population Growth 44
Chapter - V Land Use 50
Chapter - VI Productivity 56
Chapter - VII Infrastructure 64
Chapter - VIII Poverty 71
Chapter - IX Employment 84
Chapter - X Regional Disparities 114
PART - II
THE EIGHTH FIVE YEAR PLAN (1992-97)
Chapter - XI The Perspective
Chapter - XII Objectives and Strategies
Chapter - XIII Inves'tment and Outlays
Chapter - XIV Minimum Needs Programme,Centrally Sponsored Schemes and Externally Aided Projects
Chapter - XV Planning, Monitoring and Evaluation
124
142
153
164
182

"THE: ECOIM OM XC S X T"CPl=l"r X OIM
CHAPTER - I
STATE OF ECONOMY-SALIENT FEATURES
w^tural resources
1 Uttar Pradesh is the most populous state iri the countryr contributing the highest share of 16.5 percent to its population. Since population is the ultimate beneficiary of development process, it would be appropriate to first review the availability of natural resources in the State in relation to its population.
2 The share of the State ii the country's geographical area is only 9.0 percent as against its share of 16.5 percent in population. The States of haharashtra, Gujarat, Andhra Pradesh and Rajasthan have higher shares in the Country's geographical area than their shares in population. Likewise, the State's share in the country's net area sown and gross cropped area (12.6 percent and 14.9 percent) are also lower than its share in population. In contrast, these shares in 7 states eg. Punjab (3.06 percent and 4.27 perc#*nt), Haryana (2.62 percent and 3-34 percent), Maharasht ra (13.32 percent and 11.60 percent), Gujarat (6.97 percent and 6.47 percent), Madhya Pradesh (13.99 percent and 13.12 percent), Orissa (4.36 percent and 5.48 percent) and Rajasthan (11.81 percent and 10.42 percent) are much higher than their respective shares in population.
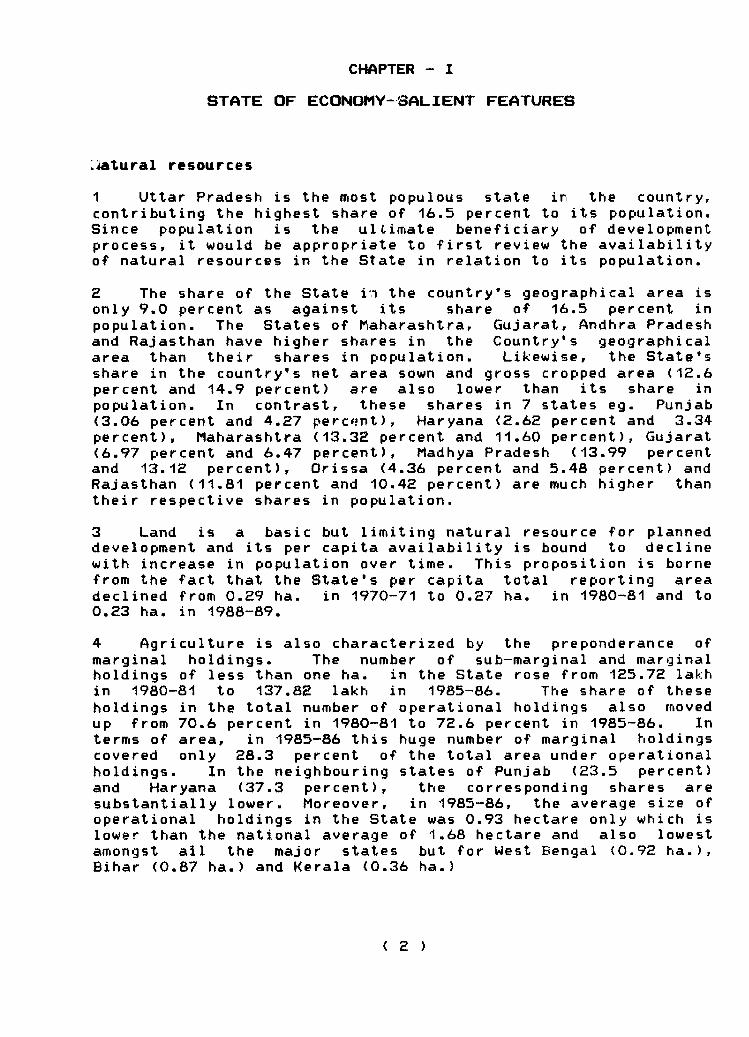
3 Land is a basic but limiting natural resource for planned development and its per capita availability is bound to decline with increase in population over time. This proposition is borne from the fact that the State's per capita total reporting area declined from 0.29 ha. in 1970-71 to 0.27 ha. in 1980-81 and to0.23 ha. in 1988-89.
4 Agriculture is also characterized by the preponderance of marginal holdings. The number of sub-marginal and marginal holdings of less than one ha. in the State rose from 125.72 lakh in 1980-81 to 137.82 lakh in 1985-86. The share of these holdings in the total number of operational holdings also moved up from 70.6 percent in 1980-81 to 72.6 percent in 1985-86. In terms of area, in 1985-86 this huge number of marginal holdings covered only 28.3 percent of the total area under operational holdings. In the neighbouring states of Punjab (23.5 percent) and Haryana (37.3 percent), the corresponding shares are substantially lower. Moreover, in 1985-86, the average size of operational holdings in the State was 0.93 hectare only which is lower than the national average of 1.68 hectare and also lowest amongst ail the major states but for West Bengal (0.92 ha.), Bihar (0.87 ha.) and Kerala (0.36 ha.)

5 The shai of area under fo dgrains in the gross cropped a r e a of the state is 80.4 pe. cent (1987-88)- This is highest amongst all tivi major states except Bihar (90.4 percent) and is also higher than the national average (69.S percent). On the other hand, tine share of area under crops other than foodgrains is only 19.6 percent in comparison to 32.4 percent in Haryana,27.7 percent in Punjab, 31.9 percent in Maharashtra, 58.2 percent in Gujarat and 30.8 percent at the national level. This is yet another feature which accounts for low income in agriculture. The pace of divers ification within agriculture in this state has been slow.
6 The extent of net area sown fed a dequately by natural rainsis also low in this State.It constitutes only 4.0 percent in the country which is lowest amongst all the major States except Gujarat (1.6 percent ), Kar nataka (2.2 percent ) and Tamilnadu (2.4 percent ) . Besides, in terms of tapping both surface and ground water resources, the position of this State, which has a predomin antly agricultural economy, is also not very encouraging. The potential of surface water already tapped is 49 percent of the available potential in this State, while the same percentage is much higher in Tamil Nadu (85 percent), Punjab (84 percent). West Bengal (70 percent) , Rajasth«n ( 69 percent), Andhra Pradesh (67 percent) and Haryana (66 percent). Similarly, the potential of ground water created in the State is 65 percent of the available potential as against cor responding shares of 100 percent in Gujarat, 92 percent in Haryana, 91 percent in Punjab, 86 percent in Rajasthan and 84 percent in Tamil Nadu .
7 The magnitude of both drought prone and flood prone areas inthe State is the highest amongst all the major States. The numberof development blocks under drought prone area is 14.1 percent in this State as against the corresponding shares of 1.5 percent in H a r y a n a , 4.9 percent in Rajasthan, 5.5 percent in West Bengaland 6.3 percent in Orissa. Likewise, the extent of flood prone a rea in the State is as high as 20.0 percent against much smaller areas in Haryana (6.4 percent). West Bengal (10.3 percent), Punjab (11.0 percent) and Bihar (11.6 percent).
H abitationa l Pattern
8 The total population of the state increased from 883.41 lakhin 1971 to 1108.62 lakh in 1981 and further to 1390.31 lakh in1991 . The increases were 25.49 percent and 25.41 percent respectively during the decades 1971-81 and 1981-91. The division of the population in rural and urban areas was 759.52 lakh and 123.89 lakh in 1971, 909 . 6 3 lakh and 198.99 lakh in 1981 and1113.78 lakh and 276.53 lakh in 1991. The rural population of the State thus registered an increase of 19.76 percent and 22.44 percent during the two decades of 1971-81 and 1981-91 respectively as against the increase of 60.62 percent and 38.97 percent in its urban population in these decades. The c omparatively higher increases in urban population led to increasing its share in the State's total population from 14.0

percent in 1971 to 17.9 percent in 1981 and to 19.9 percent in 1991. However, the fact remains that there has been only a marginal increase in the urban population the State and the level of urbanization <1991) is not only lower than the national average of 25.7 percent but is also lower than all the major states except O rissa (13.4 percent) and Bihar (13.2 percent). The component of urban population in developed States like Mahara shtra (38.7 percent), Gujarat (34.4 percent), Tamil Nadu (34.2 percent), Karnataka (30.9 percent) ,Punjab (29.7 percent) and Haryana (24.8 percent)is considerably higher.
9 The increase in population pushed up the S t a t e’s density of population from 300 persons per sq. km. in 1971 to 377 persons in 1981 and to 472 persons in 1991. Consequently, the difference between the density of population in the State and in the country also increased from 123 persons in 1971 to 161 persons in 1981 and to 205 persons in 1991.
10 The State is characterised marked by the abundance of small villages according to population size. This phenomenon itself adds to the magnitude of efforts required for development. The number of villages with populations less than 500 constitute47.3 percent in the State. This year is highest amongst all the major states excepting the undeveloped states like Oriss a (66.4 percent), Madhya Pradesh (58.5 percent), Rajasthan (52.7 percent) and Bihar (50.1 percent). The share of population in these villages is only 14.1 percent in Uttar Pradesh as against 28.1 percent in Orissa, 25.3 percent in Madhya Pradesh, 16.0 percent in Rajasthan and 13.1 percent in Bihar. The share of villages in the population size of 500-1999 is 44.8 percent in this state which is 54.6 percent of the population, while the lowest share of such villages is in Kerala (1.2 percent) with only 0.1 percent of its population. The number of villages in the population size of 2000-4999 is 7.2 percent of the total villages having 25.4 percent of the state's population. In contrast, Tamil Nadu has the highest share of 27.7 percent of such villages with 41.4 percent of its population. The state has only 0.7 percent of the villages in the population size of 5000 and above with a meagre share of 5.9 percent of its population. The only states below these averages are the undeveloped states of Orissa (0.1 percent villages and 1.3% population) and M a dhya Pradesh (0.2 percent villages and 2.5 percent population). In contrast, Kerala has the highest share of such villages (92.5 percent) having the highest share of its population (98.6 percent).
11 Of the five economic regions in the state,Hill region is already recognised as a special problem area. The Western region is relatively more developed. Excep ting some pockets h«re and there the remaining three regions, comprising over 60 percent of state's population, need special attention and care. The disparities in levels of development of these regions have been explained separately a little later in this document. However,

suffice it to say at this place that uneven development and lar^e pockets of backwardness in the state have also contributed to the overall backwardness of the state.
12 The economy of the State is also characterized by highincidence of unemployment and poverty which are symptoms of backwardness. More than open unemployment, it is the incidence of severe under-employment, also referred to as disguised unemployment, which lies at the root of high incidence of poverty. The incidence of severe under -employment isparticularly very high amongst agricultural workers. While these problems of unemployment and poverty have been dealt with in some greater detail a little later in this document,it is sufficient to mention here that neither a higher growth in the overall economy is a sufficient guarantee for the solution of these problems nor can ad-hoc measures, without creating avenues of gainful and self sustaining employment for the poor and unemployed, mitigate these problems. These are,more than anything ,questions of equity in developme nt process and unless a strong bias for such equity is built into this process, the problems of poverty and unemployment will continue to haunt the economy. This particular area in planning process is such where political will has a major role to play.
Structure of State Income
13 The structure of income of an area is an indicator of itsover-all economy and the stage of its economic development. The state income, both at current prices and in real terms i.e. at constant prices shows a continuous rising trend. The total state income at current prices rose from Rs. 14102 crore (1980-81) to Rs. 21,658 crore (1984-85) and to Rs. 40,719 crore (1989-90),recording an increase of 53.6 percent (1981-85) and 88.0 percent (1985-90). Likewise,in real terms i.e. at constant prices of1980-81, it mo ved-up from Rs. 14,102 crore to R s . 16,486 crore and further to Rs. 20,838 crore during the same periods, registering an increase of 16.9 percent (1981-85) and 26.4 percent (1985-90). Despite these increases, the share of the state in total national income (current prices) declined from 12.7 percent in 1980-81 to11.7 percent in 1984-85 and remained at this level in 1989-90 also,while at constant prices (1980-81), it receded from 12.7percent to 12.4 percent and to 11.9 percent respectively in the same period. In other words after making adjustment for inflation, the share of state income declined in 1989-90 also over 1984-85.
14 Like the total State income, per capita income (current prices) in the state also registered an increasing trend. It increased from Rs. 1286 in 1980-81 to Rs. 1812 in 1984-85, and to Rs. 3072 in 1989-90, the increases being 40.9 percent (1981-85) and 69,5 percent (1985-90). However, the gap between the per capita income of the country and of the State increased from Rs. 344 in 1980-81 to Rs. 683 in 1984-85 and to Rs. 1180 in 1989-90. Thus, inspite of the State's economy performing better

during the latter half of the decade ending 1989-90 in comparison to the first four years of the decade, the gap in per capita income became still higher. This was due to the fact that the growth in the country's economy, as a whole, was much better than this State and the growth in S t a t e’s population higher than that of the country.
15 The performance of overall e conomy does not give any idea of the changes that take place in its structure over a period of time. It is necessary for this purpose to know the sectoral pattern of total economy also. The structural pattern of State's economy is therefore, depicted below in table-I
TABLE-I
Structure of State Income (current prices)(Percentage share)
Sectors According to old According to newseries (1970-71) series (1980-81)
1970-71 1980-81 1989-90
(1) (2) (3) (4)
1. Primary 60.2 52.0 41.52. Secondary 14.9 16.3 20.53. Tertiary 24.9 31.7 38.0
T o t a l : 100.0 100.0 100.0
16 It will be seen from this table that the contribution of primary sector to total state income slipped down from 6 0 . S percent in 1970-71 to 52.0 percent in 1980-81and further to 41.5 percent in 1989-90, indicating a decline of 8.2 percentage points during 1980-81 over 1970-71 and of 10.5 percentage points during 1989-90 over 1980-81. On the other hand,the share of secondary sector moved up by 1.4 percentage points from 14.9 percent in 1970-71 to 16.3 percent in 1980-81 and further by 4.2 percentage points to 20.5 percent in 1989-90,while the contribution of tertiary sector in the total state income stood at 24.9 percent in 1970-71,31.7 percent in 1980-81 and 38.0 percent in 1989-90. Thus, amongst these sectors, the tertiary sector recorded the highest increase in its share, having absorbed a major part of the decline which took place in the shares of primary sector. While a decline in the share of primary sector is perhaps inevitable in a growing economy, it is the secondary sector, and not the tertiary sector, which should absorb most of the decline until the State becomes industrially d e v e l o p e d ,whereafter the shift should take place to the tertiary sector.
structure of Mork force:
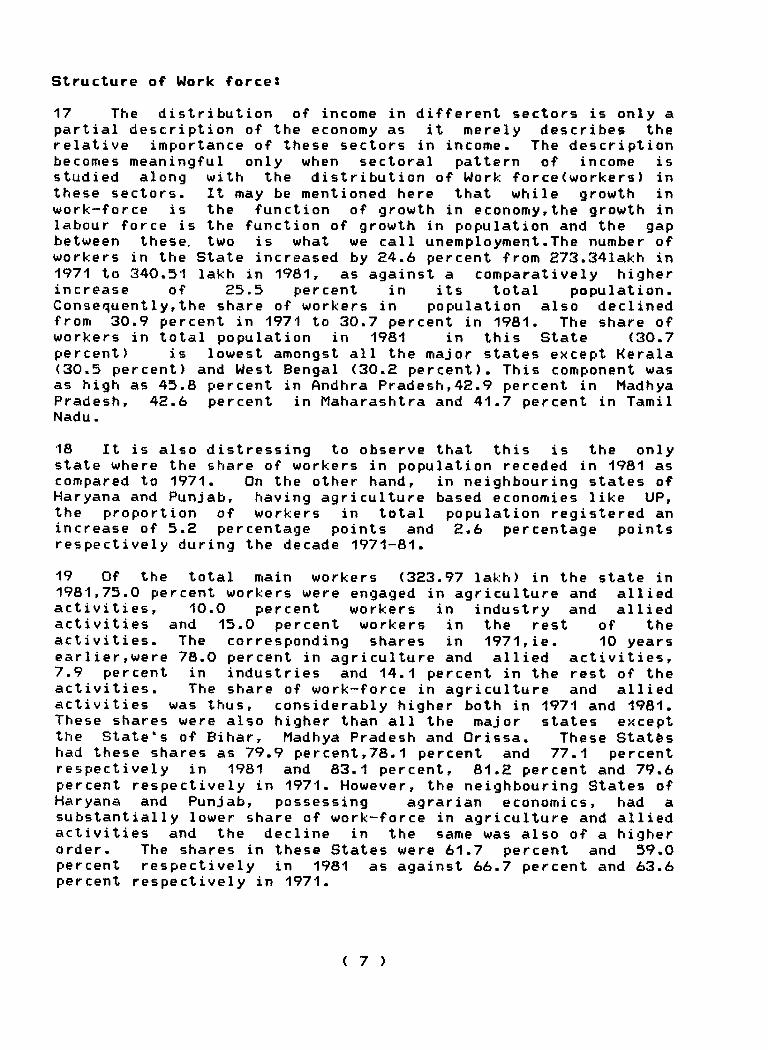
17 The distribution of income in different sectors is only apartial description of the economy as it merely describes therelative importance of these sectors in income. The description becomes meaningful only when sectoral pattern of income isstudied along with the distribution of Work f o r c e ( w o r k e r s ) inthese sectors. It may be mentioned here that while growth inwork-force is the function of growth in economy,the growth inlabour force is the function of growth in population and the gap between these, two is what we call unem ployment-The number ofworkers in the State increased by 24.6 percent from S73.341akh in1971 to 340.51 lakh in 1981, as against a comparatively higherincrease of 25.3 percent in its total population.Conseq uently,the share of workers in population also declinedfrom 30.9 percent in 1971 to 30.7 percent in 1981. The share of workers in total population in 1981 in this State (30.7percent) is lowest amongst all the major states except Kerala(30.5 percent) and West Bengal (30.2 percent). This component wasas high as 45.8 percent in Andhra Pradesh,42.9 percent in Madhya Pradesh, 42.6 percent in Maharashtra and 41.7 percent in TamilNadu -
18 It is also distressing to observe that this is the onlystate where the share of workers in population receded in 1981 as compared to 1971. On the other hand, in neighbouring states of Haryana and Punjab, having agriculture based economies like UP, the proportion of workers in total population registered anincrease of 5.2 percentage points and 2.6 percentage points respectively during the decade 1971-81.
19 Of the total main workers (323.97 lakh) in the state in1981,75.0 percent workers were engaged in agriculture and allied activities, 10.0 percent workers in industry and alliedactivities and 15.0 percent workers in the rest of theactivities. The corresponding shares in 1 971 ,ie. 10 yearsearlier,were 78.0 percent in agriculture and allied activities,7.9 percent in industries and 14.1 percent in the rest of theactivities. The share of work-force in agriculture and alliedactivities was thus, considerably higher both in 1971 and 1981. These shares were also higher than all the major states exceptthe S t a t e’s of Bihar, Madhya Pradesh and Orissa. These Statfeshad these shares as 79.9 percent,78.1 percent and 77.1 percent respectively in 1981 and 83.1 percent, 81.2 percent and 79.6percent respectively in 1971. However, the neighbouring States of Haryana and Punjab, possessing agrarian economics, had asubstantially lower share of work-force in agriculture and alliedactivities and the decline in the same was also of a higher order. The shares in these States were 61.7 percent and 59.0percent respectively in 1981 as against 66.7 percent and 63.6 percent respectively in 1971.
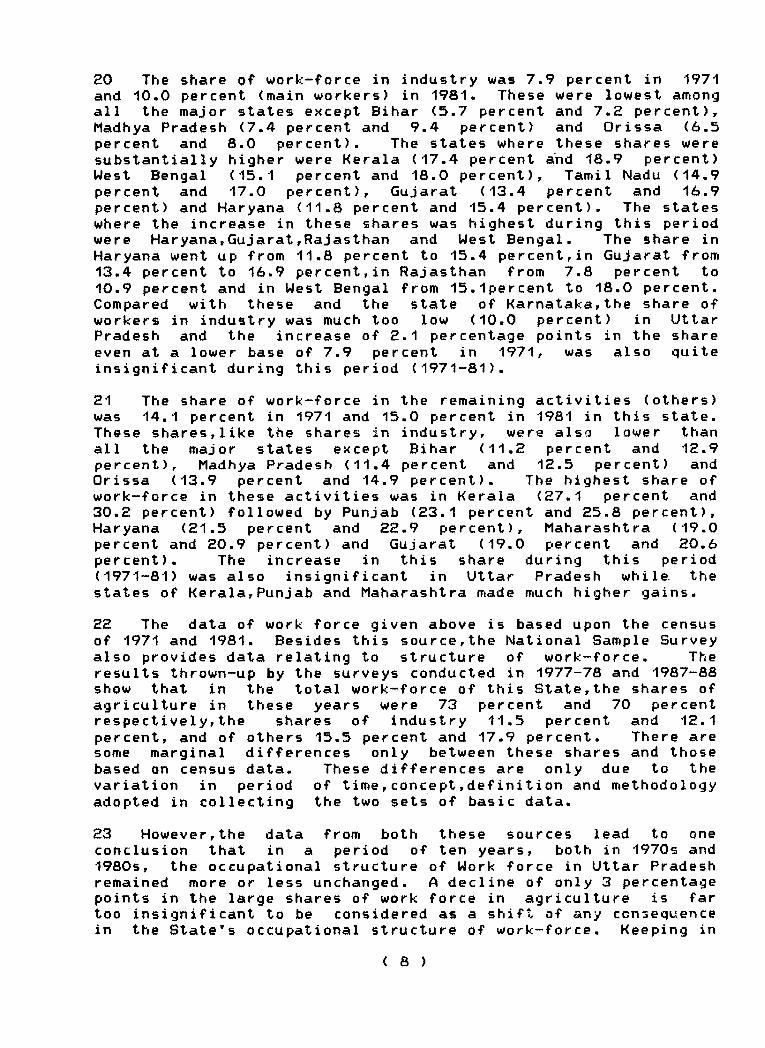
20 The share of work-force in industry was 7.9 percent in 1971 and 10.0 percent (main workers) in 1981. These were lowest among all the major states except Bihar (5.7 percent and 7.2 percent), Madhya Pradesh (7.4 percent and 9.4 percent) and O r i s s a (6.5 percent and 8.0 percent). The states where these shares were substantially higher were Kerala (17.4 percent and 18.9 percent) West Bengal (15.1 percent and 18.0 percent), Tamil Nadu (14.9 percent and 17.0 percent), Gujarat (13.4 percent and 16.9 percent) and Haryana (11.8 percent and 15.4 percent). The states where the increase in these shares was highest during this period were H a r y a n a » G u j a r a t ,Rajasthan and West Bengal. The share in Haryana went up from 11.8 percent to 15.4 percent,in Gujarat from13.4 percent to 16.9 percent,in Rajasth an from 7.8 percent to10.9 percent and in West Bengal from 15.1percent to 18.0 percent. Compared with these and the state of K a r n a t aka,the share of workers in industry was much too low (10.0 percent) in Uttar Pradesh and the increase of 2.1 percentage points in the share even at a lower base of 7.9 percent in 1971, was also quite insignificant during this period (1971-81).
21 The share of work-force in the remaining activiti es (others)was 14.1 percent in 1971 and 15.0 percent in 1981 in this state. These shares,like the shares in industry, were also lower than all the major states except Bihar (11.2 percent and 12.9percent), Madhya Pradesh (11.4 percent and 12.5 percent) and Orissa (13.9 percent and 14.9 percent). The highest share of work-force in these activities was in Kerala (27.1 percent and30.2 percent) followed by Punjab (23.1 percent and 25.8 percent), Haryana (21.5 percent and 22.9 percent), M a h a r a s h t r a (19.0percent and 20.9 percent) and Gujarat (19.0 percent and 20.6percent). The increase in this share during this period (1971-81) was also insignificant in Uttar Pradesh while, thestates of K e r ala,Punjab and Maha r a s h t r a made much higher gains.
22 The data of work force given above is based upon the censusof 1971 and 1981. Besides this source,the National Sample Survey also provides data relating to structure of work-force. The results thrown-up by the surveys conducted in 1977-78 and 1987-88 show that in the total work-force of this State,the shares of agriculture in these years were 73 percent and 70 percent respectively,the shares of industry 11.5 percent and 12.1percent, and of others 15.5 percent and 17.9 percent. There are some marginal differences only between these shares and those based on census data- These d ifferences are only due to thevariation in period of t i m e , c o n c e p t ,definition and methodolog y adopted in collecting the two sets of basic data.
23 However,the data from both these sources lead to one conclusion that in a period of ten years, both in 1970s and 1980s, the occupational structure of Work force in Uttar Pradesh remained more or less unchanged. A decline of only 3 percentage points in the large shares of work force in agriculture is far too insignificant to be considered as a shift of any consequence in the State's occupational structure of work-force. Keeping in

view the fact that occupational structure of work-force in Uttar Pradesh did not undergo significant changes,it may be reasonable to assume that sectoral shares of workers in 1981(census) continued to remain more or less the same in 1987-88 also. Based on this assumption, the structure of state income and itswork-force in 1970-71 and 1987-88 is depicted in table-2.
TABLE-2
Distribution of income and workers in U.P. in 1970-71 and 1987-88
(Per c e n t )
Sector 1970-71 1987-88
income* work ersd income* workers**
1 2 3 4 5
1. Primary 60 78 40 75(Agri culture& allied)
2. Secondary 15 8 22 10<Industry8, allied)
3. Tertiary 25 14 38 15(Others)
Total: 100 100 100 100
* at current prices. S 1971 Census ** 1981 census
24 It will be seen from this table that as against a massivefall of 20 percentage points in the income share of primarysector (Agriculture and allied), from 60 percent in 1970-71 to 40 percent in 1987-88, there was a corresponding decline of only 3 percentage points in the share of its work-force. It is, therefore, implied that the shift of workers was very nominal during a long span of 17 years and that owing to a comparatively very high decline in the share of its Income, the income of workers in this sector were also reduced in 1987-88 as compared to that in 1970-71. A very large proportion of workers, thus, continued to depend on this sector for their livelihood.
25 The table also shows that the share of secondary (Industry and Allied) sector in total income increased by 7 percentage points from 15 percent in 1970-71 to 22 percent in 1987-88. This was, however, accompanied by a nominal increase of 2 percentage points in the share of its workers, the same having moved up from8 percent in 1970-71 to 10 percent in 1987-88. This shows that growth in this sector was largely capital intensive and there were higher gains in income of the workers in this sector.

26 The table further shows that, as against an increase of 13 percentage points in the share of tertiary (others) sector in total income there was an increase of only one percentage point in the share of its work-force in 1987-88 over 1970-71. In terms of i n c o m e - g a i n s , therefore, the situation has been still better for the workers of this sector-
27 The situation which emerges from the above is that the distribut ion of gains from development has not been evenly spread. The growth has been more capital intensive than labour intensive, more urban based than rural based (thereby widening rural urban dichotomy) and the shift in income from primary to other sectors has not been accomp anied by a corresponding shift in workers. Subject to these somewhat general observations, a more detailed review of past performance will be useful at this s t a g e .

Annexure - I
Natural Resources
STATES Percentage Land Resourceshare i n ----------------- ----------------
population Geogra- Net-area Gross1991 phical sown cropped
area area
( 1 ) ( 2 ) ( 3 ) ( 4 ) ( 5)
1. Andhra Pradesh 7.86 8.40 8.33 6.872. Bihar 10.23 5.30 5.51 6.163. Gujarat 4.87 6.00 6.97 6.474. Haryana 1.94 1,30 2.62 3.345. Karnataka 8.31 5.80 7.72 6.986. Ke rala 3.44 1.20 1.59 1.707. Madhya Pradesh 7.84 13.50 13.99 13.128. Maharash tra 9.33 9.40 13.32 11.609. Orissa 3.74 4.70 4.36 5.4810. Punjab 2.40 1 .50 3.06 4.2711. Rajasthan 5.20 10-40 11.81 10.42I S TamiINadu 6.80 4.00 4.26 3.85IS. Uttar Pradesh 16.48 9.00 12.57 14.8914. Ulest Bengal 8.05 2.70 3.89 4.85
All India 100.00 100.00 100.00 100.00
Source Table of General information

STATES Water Resource
Net- Created Created potential Deve- Floodarea Irriga- against available lopment Pronesown tion potential blocks Areaadequ- poten- ------------------ coveredately tial Surface Ground Total by Dro~fed by Water Water ughtRains Prone
Area
(1) (6) (7) (8) <9) (10) (11) (12)
1. Andhra Pradesh 8.1 67 42 64 11.2 -
2. Bihar 15.7 10.9 46 64 55 8.8 11.63. Gujarat 1.6 4.2 39 100 61 7.0 -A. Haryana *■ 4.0 66 92 75 1.5 6.45. Karnataka 2.2 4.1 55 57 56 11.5 -6. Kerala 5.0 1.8 62 39 50 - -7. fladhya Pradesh 24.1 9.0 32 52 40 9.0 -
8. naharashtra 8.9 6.4 44 65 53 12.0 -9. Orissa 13,9 5.2 44 51 47 6.3 -
10. Punjab - 5.8 84 91 88 - 11.011. Rajasthan - 4.5 69 86 77 4.9 -12. Ta«il Nadu 2.4 3.4 85 84 84 7.0 -13. Uttar Pradesh 4.0 22.6 49 65 59 14.1 20.014. West Bengal 12.8 5.4 70 48 57 5.5 10.3
All India 100.0 100.0 - - - - -
Source Table of General infornation

Percentage Distribution of Villages According to Population Size and Percentage share of Population in them (1981)
0 - 499 500 *- 1999 2000 -4999 5000 or aboveSTATES
(1 )
Vill- Popu- Vill- Popu- Vill- P^pu- Vill- Popu-ages lation ages lation ages lation ages lation
(13) (14) (15) (16) (17) (18) (19) ( 20)
1. Andhra Pradesh 32.3 25.3 42.7 58.5 20.5 13.7 4.5 2.52. Bihar 50.1 13.1 39.4 43.2 8.7 28.2 1.8 15.53. Gujarat 26.8 5.9 55.6 46.0 15.0 34.0 2.6 14.14. Haryana 22.2 4.2 54,2 39.3 20.0 39.0 3.6 16.65. Karnataka 41.8 11.0 46.5 47.5 10.1 29.9 1.6 11.66. Kerala 0.4 - 1.2 0.1 5.9 1.3 92.5 98.67. Madhya Pradesh 58.5 25.3 38.4 58.5 2.9 13.7 0.2 2.58. Maharashtra 35.0 9.1 54.1 52.1 9.1 25.7 1.8 13.19. Orissa 66.4 28.1 30.9 56.0 2.6 14.6 0.1 1.310. Punjab 35.9 9.6 52.9 54.6 10.2 29.2 1.0 6.411. Rajasthan 52.7 16.0 40.4 50.3 6.7 25.2 0.2 8.512. Tamil Nadu 15.9 2.2 48.9 27.5 27.7 41.4 7.5 28.913. Uttar Pradesh 47.3 14.1 44.8 54.6 7.2 25.4 0.7 5.914. Uest Bengal 41.9 10.0 44.5 43.4 11.5 32.4 2.1 14.2
All India 48.6 12.5 41.4 45.0 8.4 27.1 1.6 15.4

Trend in Urban Population
STATESl>-ban Population
(Thousand)
1971 19&1 1991
Percentage increase during
1971- 1 19&1-9 1
Percentage shsre in country
1981 19?1
(1) (2) (3) (4) (5) (6) (7) (8)
1. Andhra Pradesh 8403 12488 17&13 48.6 42.6 7.8 8.22. Bihar 5634 8719 11369 54.8 30.4 5.4 5.23. djjarat 7496 10602 14164 41.4 33.6 6.6 6.54. Haryana 1773 2827 4045 59.4 43.1 1.8 1.95. Karnataka 7122 10730 13851 50.7 29.1 6.7 6.46. Kerala 3466 4771 7676 37.7 60.9 3.0 3.57. Madhya Pradesh 6785 10586 15348 56.0 45.0 6.6 7.18. Maharashtra 15711 21994 30496 40.0 38.7 13.8 14.09. Orissa 1845 3110 4232 68.6 36.1 1.9 1.910. Punjab 3216 4648 6001 44.5 29.1 2.9 2.811. Rajasthan 4544 7211 10040 58.7 39.2 4.5 4.612. Tamil Nadu 12465 1S9ti2 19027 28.0 19.3 10.0 8.813. Uttar Pradesh 12389 19899 27653 60.6 39.0 12.5 12.714. Uest Bengal 10967 14447 186?? 31.7 28.9 9.0 8.6
All India 109114 159727 217178 46.4 35.0 100.0 100.0

Occupational Pattern of Work-Force
(Percent)
STATES1971 Census
Agric- Industry ulture & Allied & Allied
1981 Census (Main Workers)
Others Agric- Industry Others ulture & Allied& Allied
(1) (2) (3) (4) (5) (6) (7)
1. Andhra Pradesh 73.4 10.6 16.0 72.0 11.5 16.52. Bihar 83.1 5.7 11.2 79.9 7.2 12.93. Gujarat 67,6 13.4 19.0 62.5 16.9 20.64. Haryana 66.7 11.8 21.5 61.7 15.4 22.95. Karnataka 70.8 12.0 17.2 68.8 14.2 17.06. Kerala 55.5 17.4 27.1 50.9 18.9 30.27. Madhya Pradesh 81.2 7.4 11.4 78.1 9.4 12.58. Maharashtra 66.4 14.6 19.0 63.8 15.3 20.99. Orissa 79.6 6.5 13.9 77.1 8.0 14.910. Punjab 63.6 13.3 23.1 59.0 15.2 25.811. Rajasthan 76.8 7.8 15.4 71.8 10.9 17.312. Tamil Nadu 64.5 14.9 20.6 63.6 17.0 19.413. Uttar Pradesh 78.0 7.9 14.1 75.0 10.0 15.0
(21319) (2159) (3856) (24312) (3251) (4834)14. Uest Bengal 61.4 15.1 23.5 58.2 18.0 23.8
All India 72.0 10.7 17.3 68.8 13.0 18.2
Note Figures in brackets denote no. of workers in thousand.

CHAPTER - II
PAST PERFORMANCE
One of the main objectives of differ ent Plans has been to achieve higher growth both in the total economy as well as in percapita income. The average annual growth in total income and in per capita income of the State vis-a-vis the country is shown below in table~1.
Table - 1
Average annual growth in Total Income and In Per Capita Income of U.P. and All India.
(In Percentages)
Period Annual Growth in total Income
Annual Growth in Per Capi ta Income
U.P. All India U.P. All India
(1) (2) (3) (4) (5)
1. 1951-52 to 1955-56 2.0 3.6 0.5 1.72. 1956-57 to 1960-61 1.9 4.0 0.3 1.93. 1961-62 to 1965-66 1.6 2.2 -0.2 0.04. 1966-67 to 1968-69 0.3 4.0 -1.5 1.85. 1969-70 to 1973-74 2.3 3.3 0.4 1.16. 1974-75 to 1978-79 5.7 5.3 3.3 2.97. 1981-82 to 1984-85* 4.0 4.8 1.8 2.68. 1985-86 to 1989-90* 4.8 5.6 2.7 3.59. 1981-82 to 1989-90* 4.4 5.2 2.3 3.1
* Based on new series with 1980-81 as a base
2 It will be seen from the above table that from the very inception of planning in the country, the annual growth rates in total and per capita income of the State have always remained lower than the national averages during different Plan periods except in Fifth Plan period from 1974-75 to 1978-79. When the per capita income in this State registered an annual growth rate of3.3 percent as against the national average of 2.9 percent. Prior to this, owing to a comparatively higher growth in population in comparision with income, the State's per capita income registered negative growth during the period 1961-62 to 1968-69 . In the remaining period of 1951-74 also the annual growth ratesin S t a t e’s per capita income were nominal (0.3 percent to 0.5percent). It will also be seen that during the period 1981-82 to 1989-90 ,the gap between growth rates in per capita income of theState and the country remained more nr le«»s constant at 0.8percentage point. This only shows that whatever growth in State
income took place during the period 1981-90 was absorbed by the growth in its population. It is imperative, therefore, to effectively control population growth on the one hand, and to achieve substantially higher growth in State's total economy, on the other.
Structure of Economy
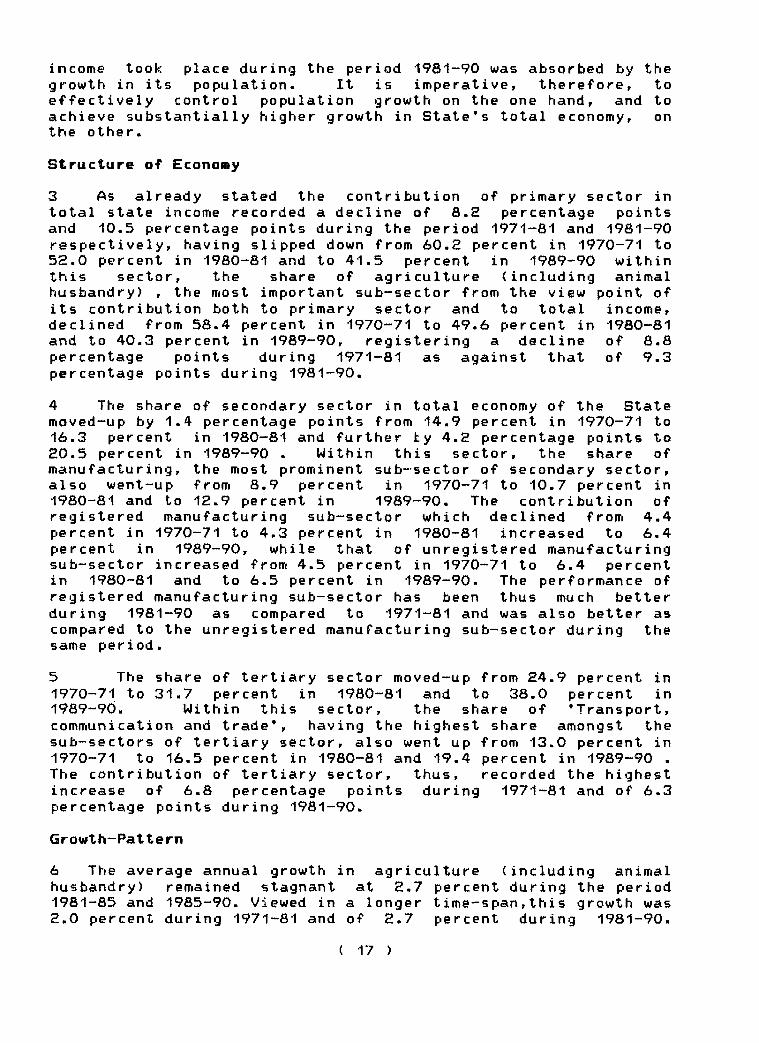
3 As already stated the contribution of primary sector in total state income recorded a decline of 8.2 percentage points and 10.5 percentage points during the period 1971-81 and 1981-90 respectively, having slipped down from 60.2 percent in 1970-71 to52.0 percent in 1980-81 and to 41.5 percent in 1989-90 withinthis sector, the share of agr iculture (including animal husbandry) , the most important sub-sector from the view point ofits contribution both to primary sector and to total income,declined from 58.4 percent in 1970-71 to 49.6 percent in 1980-81 and to 40.3 percent in 1989-90, registering a decline of 8.8percentage points during 1971-81 as against that of 9.3percentage points during 1981-90.
4 The share of secondary sector in total economy of the State m oved-up by 1.4 percentage points from 14.9 percent in 1970-71 to16.3 percent in 1980-81 and further ty 4.2 percentage points to20.5 percent in 1989-90 . Within this sector, the share of manufacturing, the most prominent sub-sector of secondary sector, also went-up from 8.9 percent in 1970-71 to 10.7 percent in1980-81 and to 12.9 percent in 1989-90. The contribution ofregistered manufacturing sub-sector which declined from 4.4 percent in 1970-71 to 4.3 percent in 1980-81 increased to 6.4percent in 1989-90, while that of unregistered manufacturing sub-sector increased from 4.5 percent in 1970-71 to 6.4 percentin 1980-81 and to 6.5 percent in 1989-90. The performance of registered manufacturing sub-sector has been thus much better during 1981-90 as compared to 1971-81 and was also better as compared to the unregistered ma nufacturing sub-sector during the same period.
5 The share of tertiary sector m oved-up from 24.9 percent in1970-71 to 31.7 percent in 1980-81 and to 38.0 percent in 1989-90. Within this sector, the share of 'Transport,communication and trade*, having the highest share amongst the sub-sectors of tertiary sector, also went up from 13.0 percent in1970-71 to 16.5 percent in 1980-81 and 19.4 percent in 1989-90 . The contribution of tertiary sector, thus, recorded the highest increase of 6.8 percentage points during 1971-81 and of 6.3 percentage points during 1981-90.
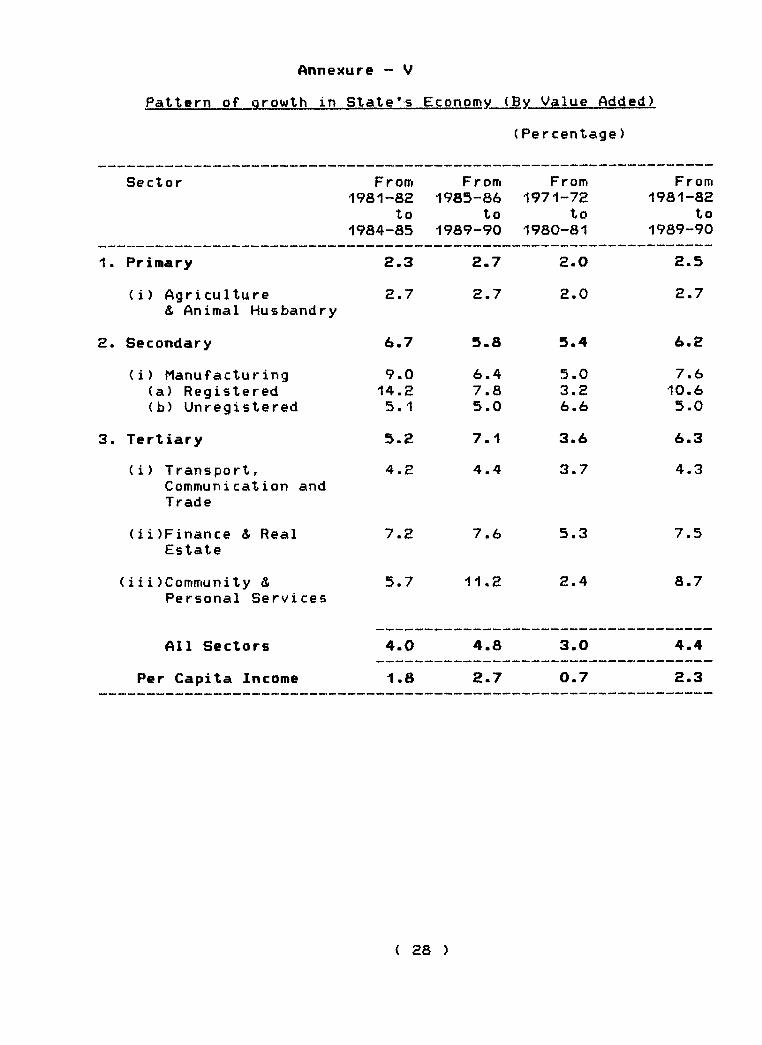
Growth-Pattern
6 The average annual growth in agriculture (including animal husbandry) remained stagnant at 2.7 percent during the period1981-85 and 1985-90. Viewed in a longer t i m e - s p a n ,this growth was2.0 percent during 1971-81 and of 2.7 percent during 1981-90.

The annual growth rates in primary sector were 2.3 percent during 1981"85r 2.7 percent during 1985-90, 2-0 percent during 1971-81and 2.5 percent during 1981-90. It only shows that the growth of primary sector in general and of agriculture sub-sector in particular, did not make any significant head-way, whether in a shorter or a longer time-span during this period. To achieve a higher growth in this sector , steps are required to be taken for maKimisation of productivity of foodgrains and commercial crops, expansion of area under high value crops, m aximum utilization of already created irrigation potential as well as ground water resources and expansion of non-farm activities to maximise animal husbandry products like milk, wool, poultry etc.
7 The annual growth in secondary sector declined from 6.7percent in the first four years to 5.8 percent in the latter five years of 1981-90. Similarly, the annual growth rate inmanufacturing sector fell down from 9.0 percent to 6.4 percent during the same period. The two components of this sub-sector were not exceptions to this trend. The growth rates of registered and unregistered m a n ufac turing receded from 14.2 percent to 7.8 percent per annum and from 5.1 percent to 5.0 percent per annum respectively during the same period. The decline in growth rate of registered manufacturing sub-sector was, however, more pronounced than unregistered manufacturing sub-sector. During the two periods of 1971-81 and 1981-90, the secondary sector grew at a rate of 5.4 percent per annum and 6.2 percent per annum respectively while the ma nufacturing sub-sector registered an annual growth of 5.0 percent and 7.6 percent. The registered manufacturing (3.2 percent and 10.6 percent)and unregistered manufacturing (6.6 percent and 5.0 percent) sub-sectors recorded disproportionat e growth. This pattern ofgrowth is indicative of the fact that whatever growth took place in manuf acturing sub-sector during these periods is primarily due to the growth of its registered manufact uring component and that the unregistered manufactur ing component, compi^ising mainly the entire village industries and a bulk of small industries, grew at a slower pace than the registered manufacturing. It furthershows that deployment of large funds in unorganized sector for the promotion of these industries mainly for employmentgeneration during these years did not yield satisfactory results, in terms of value-added in this sector.
8 The annual growth in tertiary sector increased from 5.2percent (1981-85) to 7.1 percent (1985-90). Amongst the components of this sector, the growth of 'Transport, Communication and T r a d e’ sub-sector moved-up from 4.2 percent (1981-85) to 4.4 percent (1985-90) while that of ’Finance and real e s t a t e s’ went-up from 7.2 percent to 7.6 percent and of 'Community and personal s e r v i c e s’ sub-sector from 5.7 percent to11.E percent during the same period. During the period 1971-81 and 1981--90, the tertiary sector registered a growth rate of 3.6 percent and 6.3 percent per annum respectively. During the same period, its aforesaid three sub-sectors recorded annual growth rates of 3.7 percent and 4.3 percent, 5.3 percent and 7.5 percent
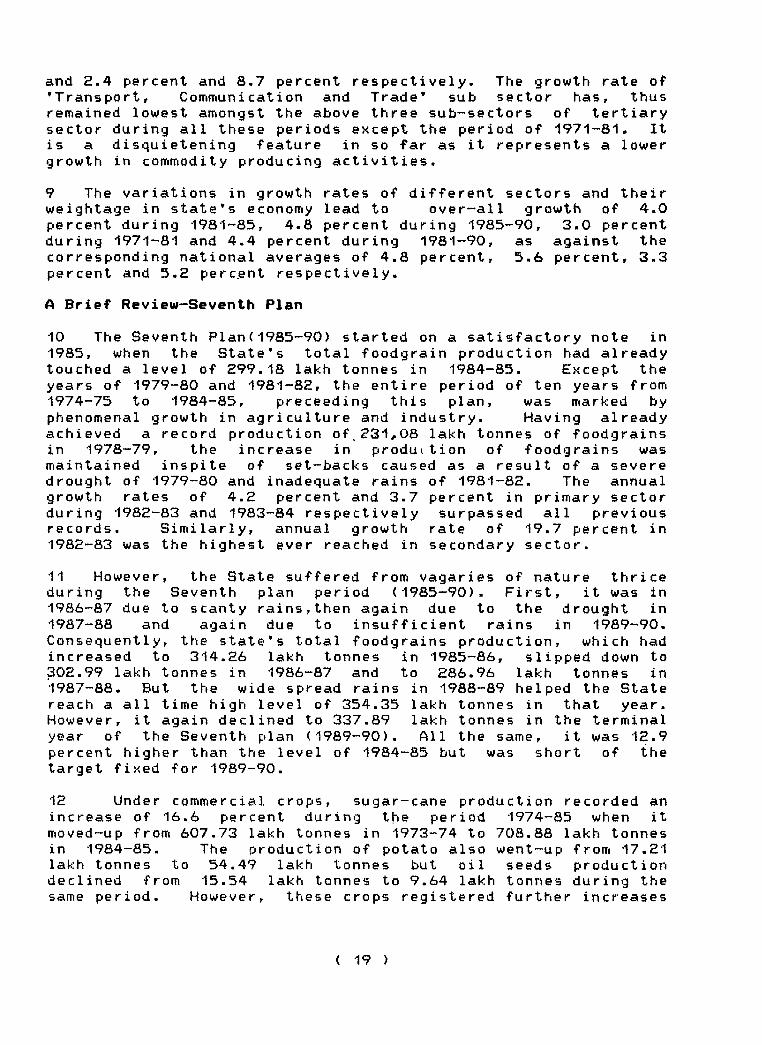
and 2.4 percent and 8.7 percent respectively. The growth rate of•Transport, Corriinuni cat ion and Trade* sub sector has, thusremained lowest amongst the above three sub-sectors of tertiary sector during all these periods except the period of 1971-81. It is a disquietening feature in so far as it represents a lowergrowth in commodity producing activities.
9 The variations in growth rates of different sectors and theirweightage in state's economy lead to over-all growth of 4.0 percent during 1981-83, 4.8 percent during 1985-90, 3.0 percentduring 1971-81 and 4.4 percent during 1981-90, as against the corresponding national averages of 4.8 percent, 5.6 percent, 3.3 percent and 5.2 percent respectively.
A Brief Review-Seventh Plan
10 The Seventh P l a n <1985-90) started on a satisfactory note in 1985, when the State's total foodgrain production had already touched a level of 299.18 lakh tonnes in 1984-85. Except the years of 1979-80 and 1981-82, the entire period of ten years from 1974-75 to 1984-85, preceeding this plan, was marked by phenomenal growth in agriculture and industry. Having already achieved a record production of.2 3 1 , 0 8 lakh tonnes of foodgrains in 1978-79, the increase in produition of foodgrains was maintained inspite of set-backs caused as a result of a severe drought of 1979-80 and inadequate rains of 1981-82. The annual growth rates of 4.2 percent and 3.7 percent in primary sector during 1982-83 and 1983-84 respectively surpassed all previous records. Similarly, annual growth rate of 19.7 percent in1982-83 was the highest ever reached in secondary sector.
11 However, the State suffered from vagaries of nature thriceduring the Seventh plan period (1985-90). First, it was in1986-87 due to scanty rains,then again due to the drought in1987-88 and again due to insufficient rains in 1989-90.Consequently, the state's total foodgrains production, which had increased to 314.26 lakh tonnes in 1985-86, slipped down to 302.99 lakh tonnes in 1986-87 and to 286.96 lakh tonnes in1987-88. But the wide spread rains in 1988-89 helped the State reach a all time high level of 354.35 lakh tonnes in that year. However, it again declined to 337.89 lakh tonnes in the terminal year of the Seventh plan (1989-90). All the same, it was 12.9 percent higher than the level of 1984-85 but was short of the target fixed for 1989-90.
12 Under commercial crops, sugar-cane production recorded anincrease of 16.6 percent during the period 1974-85 when it moved~up from 607.73 lakh tonnes in 1973-74 to 708.88 lakh tonnes in 1984-85. The production of potato also went-up from 17.21 lakh tonnes to 54.49 lakh tonnes but oil seeds production declined from 15.54 lakh tonnes to 9.64 lakh tonnes during the same period. However, these crops registered further increases

of 37.4 percentr 14.3 percent and 15.1 percent respectively when the level of their production reached 974.22 lakh tonnes, 6 2 .28 lakh tonnes and 11,10 lakh tonnes respectively in 1989-90.
13 With slight improvement in the productivity of rice and wheat during 1990-91, the State's production of foodgrains increased to 352.86 lakh tonnes during this year. Likewise, the levels of production of sugarcane, potato and oil seeds also moved up to 1035.33 lakh tonnes, 66.03 lakh tonnes and 13.25 lakh tonnes during 1990-91. Keeping in view the recent past trend of production and the fact that rains were delayed in kharif in 1991-92, production of 355 lakh tonnes of foodgrains, 1050 lakh tonnes of sugarcane, 68 lakh tonnes of potato and 14 lakh tonnes of oil seeds is estimated for 1991-92.
14 The potential of irrigation in 1973-74 was 109.87 lakh ha.With the creation of additional irrigation potential of 78.30 lakh ha. through m ajor,medium and minor irrigation works during 1974-85 it was 188.17 lakh in 1984-85. The increase in percentage terms was 71.3 During the Seventh plan period,additional potential of 46.89 lakh ha. was further created,taking the cumulative figure to 235.06 lakh ha. in 1989-90 the terminal year of this plan. There was thus an increase of 24.9 precent in the potential during 1985-90.
15 Consequently, the gross irrigated area also moved up from84.92 lakh Ha. in 1973-74 to 127.31 lakh Ha. in 1984-85 and to141.13 lakh Ha. in 1988-89. On account of increase in grossi rrigated area, i rrigation intensity in the state also went up from 117.7 percent (1973-74) to 125.4 percent (1984-85) and furthr to 138.8 percent in 1988-89. However, there was decline in the utilisation of the created potential . Th,e gross irrigated area as a percentage of created potential dropped down from 77.3 in 1973-74 to 67.7 in 1984-85 and to 60.0 in 1989-90. Nature has also bestowed on the State ground-water resource in abundance but its utilisation (net recoverable recharge) in the State hasremained only at 30.5 percent in March 1983 and at 30.7 percentin March 1989.
16 The installed power capacity (State sector) in U.P was 1558MW. in 1973-74 which increased to 4148 MW in 1984-85 and to 5527 MW. in 1989-90. However, the share of the State in the c o u n t r y’s total installed power capacity, after increasing from 9.3 percent (1973--74) to 9.7 percent (1984-85) declined to 8.7 percent in Seventh plan (1985-90). The generation of electricity in the state also moved-up from 5889 MU in 1973-74 to 11327 MU in 1984-85 and to 18862 MU in 1989-90 but the share of this State in the c o u n t r y’s total power generation declined from 8.8 percent to7.2 percent during 1974-85. However. it improved marginally to7.7 percent during the Seventh plan. The consumption of electricity was 4152 MU in 1973-74, 10738 MU in 1984-85 and 18079 MU in 1989-90. The share of the state in country*s total power

consumption went-up from 8.3 percent in 1973-74 to 9.4 percent in1984-85 and to 10.3 percent in the terminal year (1989-90) of the seventh plan.
17 A major share of power in the State is consumed inagriculture and industry. Both in 1973-74 and 1984-85, the shares of industry in the State's total power consumption <58.9percent and 39.0 percent) were substan tially higher than agriculture (20.3 percent and 33.8 percent) but there was reversal in this position during Seventh Plan when the share of agriculture (40.2 percent) became higher than that of industry (31.9 p e r c e n t ).
18 As a result of increase in the S t a t e’s total power consumption, per-capita power consumption also rose from 58 units in 1973-74 to 109 units in 1984-85 and to 159 units by the end of 1989-90. However, despite this increase, the gap between per capita consumption of electricity in this State and the country widened from 39 units to 60 units and further to 77 units during the same period.
19 The number of electrified villages in the State went - u p from 29765 in 1973-74 to 63075 in 1984-85. With the addition of 17283 such villages during the Seventh plan period, their number stood at 80358 at the end of 1989-90. The share of electrified villages also moved-up from 26.4 percent in 1973-74 to 56.0 percent in1984-85 and to 71.4 percent by the end of 1989-90.
20 Industrial production in the state has recorded significantincrease in the past few years. Sugar production registered an increase of 43.7 percent during 1974-85 and of 44.7 percent during 1985-90, when it moved-up from 12.08 lakh tonnes in 1973-74 to 17.36 lakh tonnes in 1984-85 and to 25.12 lakh tonnes in 1989-90. Similarly, production of vanaspati also recorded an increase of 93.0 percent and of 20.4 percent during the same period as it went-up from 0.71 lakh tonnes in 1973-74 to 1.37lakh tonnes in 1984-85 and to 1.65 lakh tonnes in 1989-90. Cement production also increased from 5.60 lakh tonnes in 1973-74 to 9.48 lakh tonnes in 1984-85 and to 9.65 lakh tonnes in 1989-90, the increase being 69.3 percent during 1974-85 and 1.8 percent during the Seventh plan period. The over-all progress of industrial sector in terms of its production can be judged from the index of industrial production (1970-71 = 100). This index «ras111.4 in 1973-74 which increased by 165.2 percentage points to276.6 in 1984-85 and by 142.7 percentage points to 419.3 in 1989-90. These figures, obviously show that industrialproduction of the State registered a comparatively higher rate of growth during the Seventh plan period compared to the earlier period (1974-85.).
21 Of the aforesaid industries, sugar industry is the most important agro-based industry in this state from the view point of both income and employment generation. However, it is disquietening to note that the crushing capacity created in

sugar mills of the State could take care of 27-4 percent of state's total sugarcane in -1988--89. As against this, the capacities created in M aha rashtra was about 93.4 percent, inKarnataka 76.5 percent, in Andhra Pradesh 46.9 percent, Punjab43.4 percent and Haryana 43.1 percent in the same year. The quantity of sugarcane crushed in sugar mills has an over-all impact on 'the development of rural areas and income of farmers. It is unfortunate that the state lags far behind many other states in capacities created for crushing of its sugarcane in sugar mills. This aspect, therefore, requires special attention in our development strategy.
22 At the beginning of Seventh Plan (1984-85), 7731 villageswith population of 1500 and above and 4893 villages with population between 1000-1499 were connected with all-weatherroads. The number of these villages increased to 10413 and 6522 respectively by the end of 1989-90. Thus, out of 10899 and 11396 villages of these two categories, 95.5 percent and 57.2 percent villages respectively were connected with all-weather roads by the end of this plan.
23 The length of surfaced roads maintained by PWD rose from31.6 thousand km. in 1973-74 to 56.0 thousand km. and to 67.5thousand kmp in 1989-90. Accordingly, the road density per lakh of population moved-up from 33.9 km in 1973-74 to 46.9 kmp in1984-85 and further to 50.9 kmp in 1989-90. Similarly, road density per 100 sq. km of area increased from 10.7 km to 19.0 kmp and 22.9 km during the same period.
24 The number of Junior Basic Schools was 63695 in 1973-74. Itincreased by 14.5 percent to 72959 in 1984-85 and by 1.8 percent to 74275 in 1989-90. The number of Senior Basic Schools also recorded an increase of 45.0 percent during 1974-85 when it moved-up from 10076 (1973-74) to 14614(1984-85) but it declined marginally to 14549 in 1989-90. The enrolment in class I-V (agegroup 6-11 years) was 11699 thousand in 1973-74, 11707 thousandin 1984-85 and 13496 thousand in 1989-90 while it was 2414 thousand, 3723 thousand and 4149 thousand in class VI-VIII (age group 11”14years) during the same period.
25 Inspite of the increase in the number of Junior BasicSchools and Senior Basic Schools and in the enrolment of students in these schools, literacy percentage did not make much headway. The data of literacy percentages as obtained in 1991 Census is yet to be released by the Census department. However, on the basis of the number of literates and total population released in Paper-I by the Department, the Regional Centre for Urban andEnvironmental Studies, Institute of Public Administration.University of Lucknow has estimated comparable figures of literacy percentage for 1981 and 1991. According to these estimates, the level of literacy in this State went-up from 33.3 percent in 1981 to 41.7 percent in 1991. The corres ponding figures of the country are 43.6 percent and 52.1 percent for these years.
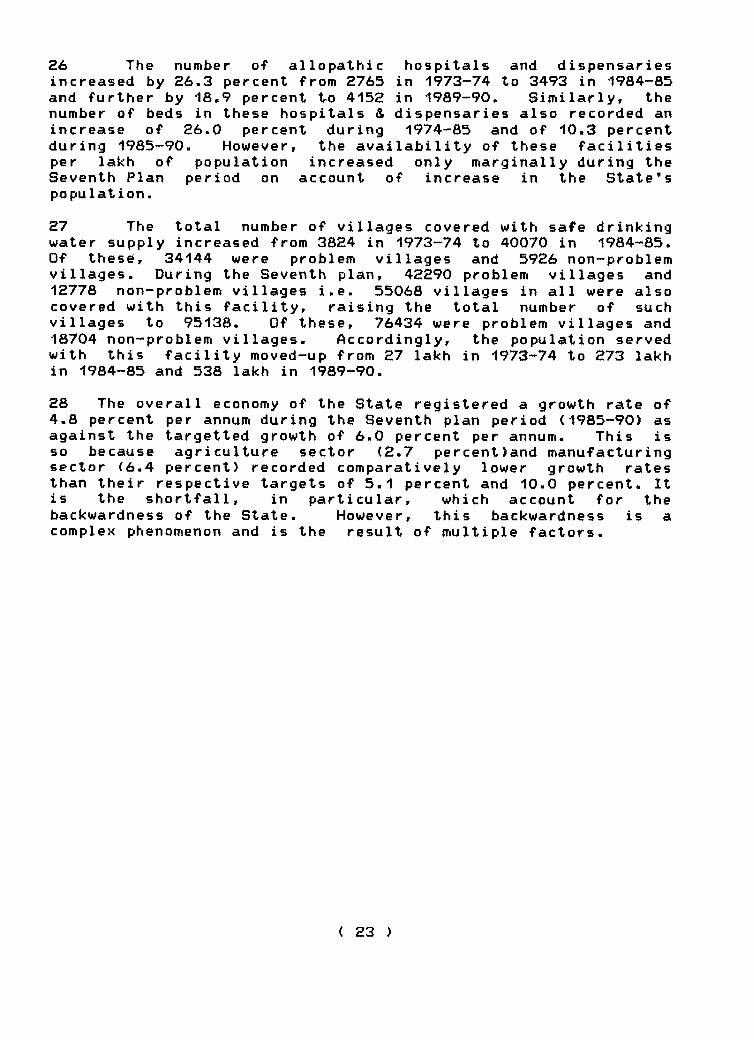
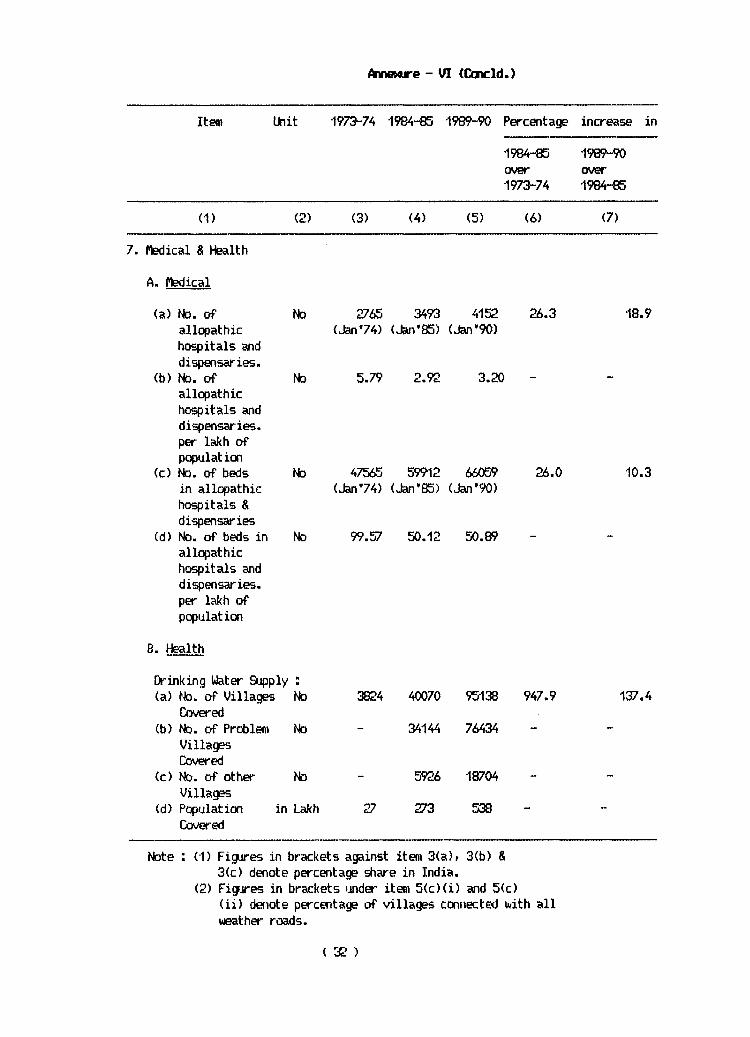
26 The number of allopathic hospitals and dispensaries increased by 26.3 percent from 276S in 1973-74 to 3493 in 1984-85 and further by 18.9 percent to 41S2 in 1989-90. Similarly, the number of beds in these hospitals & dispensaries also recorded an increase of 26.0 percent during 1974-85 and of 10.3 percent during 1985-90. However, the a v a i l a b i l i t y of these facilities per lakh of population increased only m a rginally during the Seventh Plan period on account of increase in the S t a t e’s population.
27 The total number of villages covered with safe drinkingwater supply increased from 3824 in 1973-74 to 40070 in 1984-85. Of these, 34144 were problem villages and 5926 non-problem villages. During the Seventh plan, 42290 problem villages and 12778 n o n - problem villages i.e. 55068 villages in all were also covered with this facility, raising the total number of such villages to 95138. Of these, 76434 were problem villages and18704 n o n - problem villages. Accordingly, the population served with this facility moved-up from 27 lakh in 1973-74 to 273 lakh in 1984-85 and 538 lakh in 1989-90.
28 The overall economy of the State registered a growth rate of4.8 percent per annum during the Seventh plan period (1985-90) as against the targetted growth of 6.0 percent per annum. This is so because agriculture sector (2.7 percent)and manufacturing sector (6.4 percent) recorded comparatively lower growth rates than their respective targets of 5.1 percent and 10.0 percent. It is the shortfall, in particular, which account for the backwardness of the State. However, this backwardness is a complex phenomenon and is the result of multiple factors.

Estimate
Annexure - I
of State and National Income at currentPrices
(In Crore R s . )
Year Estimates at Current Prices
U •P . as percent
U.P. Indiato India
(1) (2) (3) (4)
1970-71 4256 34235 12.41980-81 14102 110685 12.71981-82 15156 128457 11.81982-83 17757 141331 12.61983-84 19704 165818 11.91984-85 21658 184354 11.71985-86 24785 206491 12.01986-87 27413 228708 12.01987-88 30289 257913 11.71988-89X 35626 310015 11,51989-90+ 40719 346994 11.7
X Provisional + Quick estimates

Gap between Per Capita State and National Income
Year Per Capita Income at Current Prices (Rs.)
GapU.P. India Percentage S h o r t f a l 1
(1) (2) (3) (4) (5)
1970-71 486 633 147 23.21980-81 1286 1630 344 21.11981-82 1349 1851 502 27.11982-83 1547 1993 446 22.41983-84 1682 2290 608 26.61984-85 1812 2495 683 27.41985-86 2032 2735 703 25.71986-87 2201 2970 769 25.91987-88 2382 3286 904 27.51988-89X 2744 3875 1131 29.21989-90+ 3072 4252 1180 27.8
x-Provisional +~Quick Estimates

Sectoral Distribution oP State and National Inccme and shares of sectoral State Income in Natiorial Income
(At Qjrrent Prices)
(Percentage)
Year Uttar Pradesh India
Pri- Secon- Ter- Pri- Secon- Ter- mary dary tiary wary dary tiary
Percentage share of U.P. in India
Pri- Secon- Ter-wary dary tiary
1 2 3 4 5 6 7 8 9 10
1970-71 60.2 14.9 24.9 50.1 19.7 30.2 14.8 9.4 10.11980^ 52.0 16.3 31.7 41.3 22.9 35.8 16.1 9.0 11.41981-82 49.A 16.7 33.9 40.8 22.8 36.4 14.3 8.7 11.01982-83 47.7 18.4 33.9 39.4 23.1 37.5 15.2 10.0 11.31 9 8 ^ 46.7 18.3 35.0 40.2 23.3 36.5 13.7 9.3 11.31984-85 45,2 19.0 35.8 38.4 23.9 37.7 13.7 9.3 11.11985-66 44.9 19.5 35.6 36.5 24.6 38.9 14.7 9.4 10.9198<W 43.1 19.8 37.1 35.3 24.8 39.9 14.5 9.5 11.11987-88 42.6 20.1 37.3 34.9 25.0 40.1 14.2 9.3 10.81988-69 43.2 20.2 36.6 36.5 24.1 39.4 13-5 9.5 10.61989-90 41.5 20.5 38.0 34.8 25.1 40.1 13.9 9.5 11.0

Structure of State Income (Current Prices)
(Percentage >
Sector •1970-7-1 •1980-8-1 1984-85 1989-90
1 2 3 4 5
1. Primary 60.2 52.0 45.2 41.5
(i) Agriculture& Animal Husbandry
58.4 49.6 43.7 40.3
2, Secondary •14.9 16.3 19.0 20.5
(i) Manufacturing (a) Registered (b> Unregistered
8.94.44.5
•10.74.36.4
12.25.76.5
12.96.46.5
3. Tertiary 24.9 3-1.7 35.8 38.0
(i) Transport,Communication and T rade
•13.0 16.5 19.4 19.4
(i i )Finance & Real Estate
4.2 6.7 6.4 5.3
(iii)Community &Personal Services
7.7 8.5 10.0 13.3
Total •100.0 •100.0 100.0 100.0
Pattern of growth in State*s E c o n o m y (Bv Value Added)
< P e r c e n t a g e )
Sector From1981-82
to1984-85
F rom1985-86
to1989-90
From1971-72
to1980-81
From1981-82
to1989-90
1. Primary 2-3 2.7 2.0 2.5
(i) Agriculture& Animal Husbandry
2.7 2.7 2.0 2.7
2. Secondary 6.7 5.8 5.4 6.2
(i) Manufacturing(a) Registered(b) Unregistered
9.0 14.25.1
6.47.85.0
5.03.26.6
7.610.65.0
3. Tertiary 5.2 7.1 3.6 6.3
(i ) T r a n s p o r t ,Communication and T rade
4.2 4.4 3.7 4.3
(ii)Finance & Real Estate
7.2 7.6 5*3 7.5
(i i i)Communi ty &Personal Services
5.7 11.2 2.4 8.7
All Sectors 4.0 4.8 3.0 4.4
Per Capita Income 1.8 2.7 0.7 2.3

Past Perforroance -- Physical Achievenients
Item Unit 1973-74 1984-85 1989-90 Percentage increase in
1984-85OMsr1973-74
1989-90over1984^
(1) (2) (3) (4) (5) (6) (7)
1. Agriculture Production
(a) Foodgrains Th.WT. 15563 29?18 33789 92.2 12.9(b) Sigarcane Th.HT. 60773 70888 97422 16.6 37.4(c) Potato Ih.MT. 1721 5449 6PPR 216.6 14.3(d) Oilseeds Th.dT. 1554 964 1110 (--)38.0 15.1
2. Irrigation
(a) Potential Ih.Ha. 10987 18817 23506 71.3 24.9(b) Gross Irrigated fh.Ha. 8492 12731 14113 49.9 10.9
area (1988-89) (198&-89)(c) Gross Irrigated 77.3 67.7 60.0 (-)9.6 (-)7.7
area as percentageto potential
(d) Irrigation % 117.7 125.4 138.8 7.7 13.4Intensity
(e) lAilization of X m 30.5 30.7 - 0.2Ground Water (Dec.1983) (Dec.1989) (1983-89)Resource (Net Recoverable recharge)
3. Power
(a) Installed Capacity (State Sector)
H,W. 1558(9.3)
4148(9.7)
5527(8.7)
166.2
(b) Generation f1. Uhits
(c) Consjjniption Uhits
33.:
5889 11327 18862 92.3 66.5(8.8) (7.2) (7.7)4152 10738 10879 158.6 68.4(8.3) (9.4) (10.3)

Item Uhit 1973-74 1984-85 1989-90 Percentage increase in
1984-85 1989-90 over over 1973-74 1984-85
(1) (2) (3) (4) <5) (6) (7)
(d) Consijunption of power in different uses
(i) Agriculture % 20.3 33.8 40.2(ii) Industry % 58.9 39.0 -(iiDDoniestic % 9.7 14.8 15.9 - -(iv) Other Uses % 11.1 12.4 12.0 - -(e) Per Capita Uhits SB 109 159 87.9 45.9
power consum- ption
(f) Gap in per Units 39 60 77capita power consujnption between State & India
(g) No. of Electri No. 29765 63075 80358 111.9 27.4fied Villages
(h) Percentage of X 26.4 56.0 71.4Villages electrified to total Villages
4. Industry
Production of
(a) 9jgar Th.l1.T. 1206 1736 2512 43.7 44.7(b) Vanaspati TTi.n.T. 71 137 165 93.0 20.4<c) Cement Th.n.T. 560 948 965 69.3 1.8(d) Industrial 111.4 276.6 419.3 148.3 51.6
ProdiictianIndex(1970“71«100)
( 'vi 'I

Iteoi Uhit 1973-74 1984-G5 1989-90 Percentage increase in
1984-85over197^-74
198S -90over1984^
(1) (2) <3) <4> (5) (6) (7)
5. Roads
(a) Length of surfaced roads P.W.D.
(b) Road density(i) Per lakh of
popiilation(ii) Per 100 Sq.
Km. of Area
(c) Nuinber of Villages Connected with all weather roads
(i) With Population 1500 & above (10899)
(ii) With population 1000-1499 (11396)
6. Education
K.W.
K.n.
K.n.
No
No
aiS58 56017 67478
33.9
10.7
m
m
46.9 50.9
7731 10413(70.9) (95.5)
4893 6522(42.9) (57.2)
77.5
38.3
19.0 22.9 77.6
m
20.5
8.5
20.5
34.7
33.3
A. No of Schools(i) Jinior Basic No(ii) Senior Basic No
B. Enrolment (Thousand)(i) Jjnior Basic No
Class I-V(ii) Senior Basic No
Class VI~VIIIC. Literacy X
Percentage
6369510076
11699
2414
7295914614
11707
3723
7427514549
13496
4149
33.3 41.7(1981) (199-1)
14.545.0
0.1
1.8-0.4
15.3
11.4
Item {Jhit 1975-74 1984-85 1989^90 Percentage increase in
1984-85over1973-74
1989-90over1984-85
(1) (2) (3) (4) (5) (6) (7)
5.79
7. ftedical & Health
A- dedical
(a) r4o. of Noallopathic hospitals and dispensaries.
<b) No. of Noallopathic hospitals and dispensaries, per lakh of population
(c) No. of beds Noin allopathic hospitals & dispensaries
(d) No. of beds in Noallopathic hospitals and dispensaries.per lakh of population
B. Health
Drinking Water Sjpply :(a) rto. of Villages No 3824
Covered(b) No. of Problem No
VillagesCovered
(c) No. of other No Villages
(d) Population in Lakh 27 Covered
2765 3493 4152<JanV4) (Jan*85) (Jan*90)
J.92 3.20
47565 59^12 66059(JanV4) (Jan*85) (Jan’90)
99.57 50.12 50.89
40070
34144
5926
273
95138
76434
18704
538
26.3
26.0
947.9
18.9
10.3
137.4
Note : (1) Figures in brackets against item 3(a)r 3(b) &3(c) denote percentage share in India.
(2) Figjres in brackets linder iten» 5(c)(i) and 5(c)(ii) denote percentage of villages connected with all weather roads.

CHAPTER - III
STATE*S BACKWARDNESS
Backwardness is a relative term and is used to describe the level of over-all development of an area or region in comparison with other areas or regions. This backwardness is of two types viz, one, there is chronic backwardness arising ma inly from area specific natural or geographical factors which operate as severe constraints on growth and development or make it far tooexpensive or unremunerative and, therefore, prohibitive- The other backwardness is not so much for geographical reasons or lack of natural resources, but there are historical reasons or inadequate investments or insufficient growth of human skills or a combination of these and some similar other factors which lie at the root of this b a c k w a r d n e s s . Moreover, this has been recognised to be so both by Planning Commission and the various Finance Commissions in the past, and the weightage given tobackwardness by these bodies in the distribution of funds amongst States, helped to some extent in raising the share of this State. However, the marginal advantage enjoyed by the State in this area has proved insufficient and ineffective in taking care of the problem of State's backwardness. There is, therefore, a need to explore some more innovative measures for this problem.
2 The question of State's backwardness assumes specialimportance for two reasons. One, it has been repeated in various five year plans of the country that the achievement of a balanced regional development and reduction of regional inequalities are amongs the important objectives of national planning. It follows from this that one of the responsibilities of central Government and Planning Commission is to initiate such measures within the framework of national plans which can mitigate or, atleast,reduce s t a t e’s backwardness in a given time-frame and raise itslevel of development as close as possible to the more developed states. The planners must realize that the persistence, and still more worse the widening, of disparities between backward and developed states, is a sign of failure of national planning, apart from posing a threat to stability and peace in the country. Two, it' is also against the interests of the country that a state as large as U.P., comprising about one sixth of its population on the one hand, and its rich resources and potentials of high growth, on the other, remains undeveloped merely on account of inadequate exploitation of these resources and potentials.
3 Assessment of backwardness can be made with several indicators . However,the most widely used indicator for this purpose is per capita income. This is so because per capita income is the only indicator which captures, to the maximum extent, the continued impact of various development schemes and programmes. The State's per capita income at current prices in •1970-71 was 23. S percent less than the per capita income of the country. In a period of 19 years in 1989-90, the shortfall in

s t a t e’s per capita income (Rs 3072) against c o u n t r y’s per capita income (Rs 4258)rose to 27.8 per cent.This only shows that after successive four-five year pl ans,from fourth to seventh s t a t e’s equation with the country in terms of level of de velopment became still worse.In other words, s t a t e’s backwardness in relation to the country as a whole measured in terms of per capita income has increased in this period.
4 Backwardness of an area also manifests itself in the incidence of poverty, a bye~product of u n e m ployme nt or severe under employment.The percentage of population below poverty line in the state was 45.3 in 1983 against a much lower figure of 37.4 percent for the country. As we will see a little later in this document in the course of our discussio n on p o v e r t y ,there are strong indications that the incidence of poverty has r e m a i n e d ,more or less, unchanged in the State in 1987-88 also.
5 While these indicators remain quite valid for assessment of S t a t e’s b a c k w a r d n e s s , another composite index based on levels of human development also gives us almost similar results- This index, known as Human Development index ( H D D , is based on three basic elements of life, common to all human beings and to all times.These are longevity,as represented by life expectancy at b i r t h ,k n o w l e d g e ,as represented by literacy percentage and a level of living,as represented by per capita income.The ranking of states by HDI is as shown in the table-1. For the sake of c o m p a r i s o n ,the ranking of states by per capita income and percentage of population below poverty line is also given in this tables-
Table - I
Ranking of States by HlDr SPP per Capita and Povertv Ratio
States Human Development State Domestic Poverty Ratio Index (HDI) Product (SDP) per (1983-84)
Capita (Rs.)(at current prices)
Actual Rank Actual Rank Actual Rank
1. Kerala 0.71 1 2598 10 26.8 112. Punjab 0.66 2 6227 1 13.8 143. ttaharashtra 0.61 3 5155 3 34.9 94. Haryana 0.58 4 5274 2 15.6 135. Karnataka 0.45 5 3602 4 35.0 86, Gujarat 0.42 6 3592 5 24.3 127. Tamil Nadu 0.42 7 3163 8 39.6 58. Uest Bengal 0.38 8 3423 6 39.2 69. Andhra Pradesh 0.31 9 3211 17 36.4 710. Orissa 0.17 10 2438 11 42.8 411. Rajasthan 0.13 11 2122 14 34.3 1012. Bihar 0.13 12 2280 13 49.5 113. Madhya Pradesh 0.12 13 2404 12 46.2 014. Uttar Pradesh 0.07 14 2698 9 45.3 3
India 0.36 - 3835 - 37.4 -Average 0.37 - 3442 - 34.6 -Unweighted coefficient of Variation (CV)
0.59 0.37 0.30

6 The ranking of States by HDI and SDP per capita as shown inthe above table suggests that the movement behaviour of both the indicators is, by and large, identical. Corelating the two, the c o ~ e f f i c i e n t ,which emerges as 0 - 6 6 , also supports this g e n e r a l i s a t i o n . H o w e v e r ,among the except i o n s ,the extreme one is the case of Kerala, which inspite of qualifying for the 10th rank in SDP per capita, occupies the first position in respect of human development.The reasons att ributable to this exceptional situation are mainly twoj(i) Sound performance of extensivewelfare programmes and(ii) regular flow of remittances from migrants from Middle East countries.
7 The averages of HDI and SDP per capita recorded in the abovetable are taken as cut off points to designate the States as forward and b a c k w a r d . T h u s ,most of the identified forward States above the cut off points qualify for higher levels of both HDI and per capita income. Moreover, the States below the cut off point identified as backward in respect of HDI consist of Andhra Pradesh, Orissa, Rajasthan, Bihar, Madhya Pradesh and Uttar Pradesh and those designated backward in respect of SDP percapita comprise Kerala, Tamil Nadu, West Bengal, Andhra Pradesh,
trhan, Bihar, Madhya Pradesh and Uttar Pradesh. States experiencing backwardness in respect of both per capita are Andhra Pradesh, Orissa, Bihar, Madhya Uttar Pradesh. Unfortunately, these are the States suffer from high incidence of poverty.Uttar Pradesh
the bottom in HDI is delineated as the most backward country in respect of human development, in spite of y better in per capita income.
8 The higher coefficient of Variation(0.59) in HDIs among theStates than that of SDP per capita (0.37) suggests that compared to per capita income there are much wider gaps in levels of human development between forward and backward States.These gaps areindicators of technological dichotomy. The forward States occupying higher positions in HDI are better equipped in humanand social c a p a b i 1 i t i e s ,enabling them to make successful andcommercial applications of modern techno l o g y .The backward States, especially Uttar Pradesh because of extremely low level in HDI lack in human or social c a p a b i 1 i t i e s ,and are not able to make commercial applications of modern t e c h n o l o g y .Inadequacy of the desired level of human development therefore, appears to be one of the major obstacle in the path of progress of backward States in general and Uttar Pradesh in particular.
9 It is clear from the above analysis that UP is one of themost backward States of the country .The under development of the State which is both a cause and effect of b a c k w a r d n e s s ,is one of the chief characteristics of its economy. There are numerous
Or i ssa. RajFinally theHDI and SDPPradesh andwhich a Isowhich is atState of thebeing si ight
L”':: • :-K. cEAi.ui
( 35 ) 1’"" ■ <f .viucadoQal• . •■itrarion.rr
■ ' ■ • ’;o Marjj,
■ . 0 ....................■7-..> (.A ..y .a .___
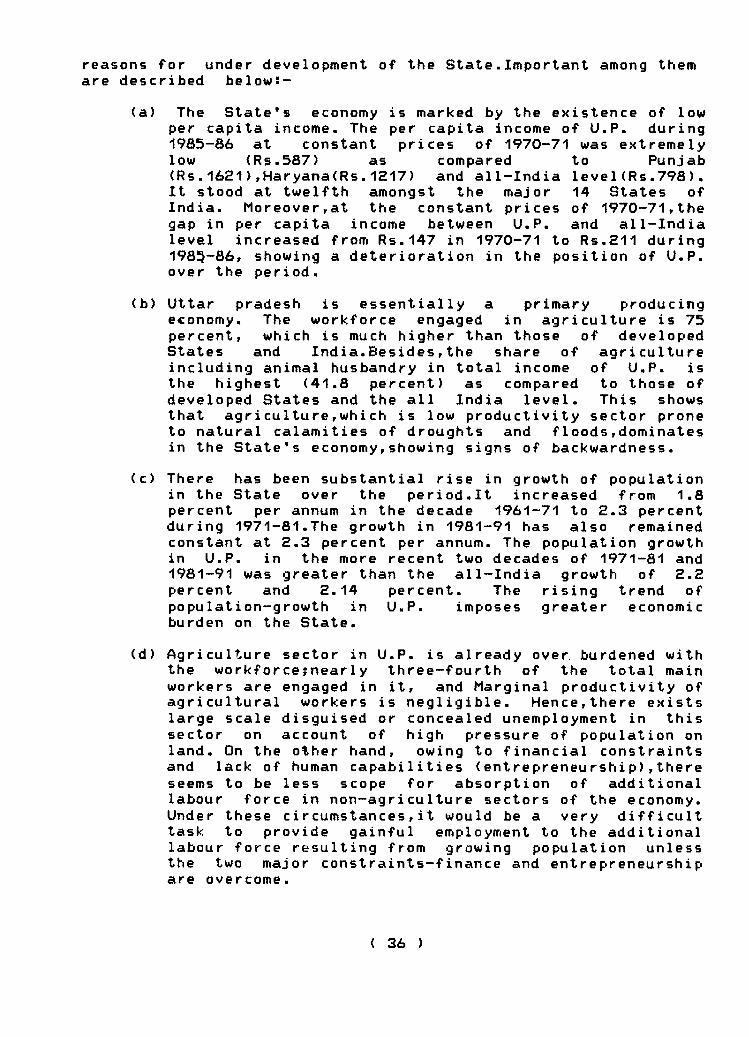
reasons for under development of the S t a t e .Important among them are described belows-
(a) The State's economy is marked by the existence of lowper capita income. The per capita income of U.P. during1985-86 at constant prices of 1970-71 was extremely low <Rs-587) as compared to Punjab(Rs.1621),H a r y a n a ( R s . 1217) and all-India l e v e l ( R s .798). It stood at twelfth amongst the major 14 States ofIndia. Moreover,at the constant prices of 1 970-71, thegap in per capita income between U.P. and all-India level increased from Rs.147 in 1970-71 to Rs.211 during198S-86, showing a d e terio ration in the position of U.P. over the period.
(b) Uttar pradesh is essentially a primary producingeconomy. The workforce engaged in ag riculture is 75 percent, which is much higher than those of developed States and I n d i a . B e s i d e s ,the share of agriculture including animal husbandry in total income of U.P. is the highest (41.8 percent) as compared to those ofdeveloped States and the all India level. This showsthat agricultu re,which is low productivity sector prone to natural calamities of droughts and f l o o d s ,dominates in the State's e c o n o m y ,showing signs of backwardness.
(c) There has been substantial rise in growth of population in the State over the period.It increased from 1.8 percent per annum in the decade 1961-71 to 2.3 percent during 1971-81.The growth in 1981-91 has also remained constant at 2.3 percent per annum. The population growth in U.P. in the more recent two decades of 1971-81 and1981-91 was greater than the all-India growth of 2.2 percent and 2.14 percent. The rising trend of population-growth in U.P. imposes greater economic burden on the State.
(d> Agriculture sector in U.P. is already over burdened with the w orkforcejne arly three-fourth of the total main workers are engaged in it, and Marginal productivity of agricultural workers is negligible. Hence,there exists large scale disguised or concealed unemployment in this sector on account of high pressure of population on land. On the other hand, owing to financial constraints and lack of human capabilities (e n t r e p r e n e u r s h i p ) ,there seems to be less scope for absorption of additional labour force in non-agricultur e sectors of the economy. Under these c i r c u m s t a n c e s ,it would be a very difficult task to provide gainful employment to the additional labour force resulting from growing population unless the two major constraints-finance and entrepreneurship are overcome.

(e) The State suffers from low agricultural productivity.The average yield of foodgrains per ha. in U.P. is extremely low (18.2 qtls.) as compared to 29.9 qtls. in Haryana, and 32,2 qtls. in Punjab. The productivity of sugarcane (in terms of Gur) per ha. in the State is 50.3 qtls,only, as against 107.7 qtls. in Tamil N a d u , 84.4 qtls, in Gujarat and 81.1 qtls. in Maharashtra. Besides,the productivity of potato per ha. in the State is only 184 qtls. as compared to 230 qtls. in West B e n gal,208 qtls. in Gujarat and 206 qtls. in Punjab. Amongs the reasons for low agriculturalproductivity,intensity of cropping in the State is found to be extremely low (146.2 per cent),as compared to171.8 per cent in Punjab and 156.3 per cent in Haryana. Irrigation coverage in the State is also 57.2 per cent only, as against 88.9 per cent in punjab and 64.8 per cent in Haryana. Besides, the consumption of fertilizer per ha. of cropped area in the State is 74.0 Kg. only as compared to 139.8 Kg. in Punjab. Industrial productivity is also low in the State. The value added per industrial worker in U.P. is about Rs-41 thousand only as compared to Rs 69 thousand in Maharashtra and Rs 44 thousand on all-india level. Moreover, average daily employment in registered working factories per lakh of population in the State is 450 workers only, as against 1410 workers in Gujarat, 1309 workers in Punjab and 1253 workers in Maharashtra. With the result, the contribution of manufacturing sector to the totalState income in U.P. is 19.9 per cent only, as against35.5 per cent in Gujarat, 35.1 per cent in Maharashtra and 24.4 per cent on all-India level- B e s i d e s ,within the manufacturing sector, the income growth of registered manufacturing sector in the State during the period1981-89 was 13.7 per cent while the unorganised manufacturing sector recorded a growth of about 5 per cent o n l y ,demonstrating a poor performance of rural industrialisation in the State.
(f) The State is backward in infrastructural facilities also.The proportion of villages electrified to total inhabited villages in the state is 68 percent only,as against 100 percent rural electrification in Punjab, Haryana, Kerala, Tamil Nadu, Himanchal Pradesh and 75 percent on all-india level.The per capita power consumption in the state is 143 kwh only,as against the all-india average of 216 kwh.The length of surfaced road per lakh of population in the state is 45.6 Km. as compared to 184.9 Km in P u n j a b , 141.6 Km in Haryana,138.5 Km in Karnataka and 64.1 Km .on all-India1 eve 1 . M oreov er,the number of junior basic schools per lakh of population in the state works out to 59 only against the national level average of 69. The literacy percentage in the state according to the census-1991 is extremely low (41.71) as compared to 90.59 per cent in

K erala,63.7 2 percent in Tamil Nadu and 52.11 percent on all-india l e v e l - B e s i d e s ,on an a v e r a g e ,there are only three allopathic h o s p ita ls/dispensa ries per lakh of population in the state against the National level average of five. Owing to deficient health cover,the life expectancy in the state is about 52 years only,as against those of 69 years in K e r a l a , 63 years in punjab and 59 years on an a ll-India level.
(g) The S t a t e’s capacity to raise its own resources is severely constrained by its lower per capita income.This is evident from the fact that the per capita own tax revenue of Rs.135 happens to be the lowest amongst the major States but for Bihar (Rs.93) .The share of per capita own tax revenue in per capita income of the Stateis also the lowest (5.7 percent) amongst the majorStates except Bihar (4.7 percent).
The institutional finance mobilised in the State is also very low. The per capita advances made by thescheduled commercial banks in the State amount toRs.414/~ which is the lowest amongst the major states except Bihar (Rs.270). Besides, there are certaincentral term lending financial institutions like Industrial Development Bank of India, Industrial Finance Corporation of India and Industrial Credit and Investment Corporation of India ,Which also make advances to the States for developmental programmes. The per capita advances based on total amount disbursed by these institutions to U.P. till March 1987 amounts to Rs.185, which is also the lowest amongst the major States except Bihar (Rs.78).
The Plan outlays and Central assistance have acrucial bearing on development. Although the total Plan outlay of U.P. increased substantially during the successive Plan periods,the percapita outlays have beengenerally lower than all States average and also lowerthan most of the major States.The per capita plan outlay of Rs.695 in the State (1951-79) is lower by 14.0 per cent in comparison to the all States average of R s.808 and is also the lowest amongst the major Statesexcepting West Bengal (Rs.631) and Bihar (Rs.498). Theper capita plan outlay of Rs.568 allocated to this State(1980-85) is also lower by 18.2 percent than all State average of Rs.694 and is the lowest amongst the major States except West Bengal (Rs.432) and Bihar (Rs.408). The per capita approved plan outlay of Rs.832 allocated to this state (1985-90) is again 18.6 percent less than all States average of Rs. 1010 and is also less than that of the major States except Karnataka (Rs.8 21),Kerala (Rs.734), Rajasthan (Rs.734), West

Bengal (Rs.665) and Bihar <Rs.634).In terms of percapita central assistance also,the position of the State remains generally lower than the all States average.
The per capita central assistance of Rs.331 allocated to this State (1951-79) is lower by 11.7 percent inrelation to all states average of Rs-375 and is also lower than all the major States except Gujrat (Rs.320), Tamil Nadu (Rs.319), Bihar (Rs.300), West Bengal (Rs.297), Haryana (Rs.287) and Maharashtra (R5-256). The per capita central assistance of Rs.192 in the State (1980-85) is also 16.5 percent less than all States average of Rs. 230 and is also lower than all the major states except Kerala (Rs.185) Gujrat (Rs.183) , AndhraPradesh (Rs-182), Mahar a s h t r a (Rs.165), TamilNadu (Rs.153), Karnataka (Rs.142) and West Bengal Rs- (135). The per capita central assistance amounting to Rs. 284. allocated to this State (1985-90) is again lower by 19.3 per cent than all States average of Rs.352. and is also lower than all the major States except Rajasthan Rs.279 , Gujarat Rs.271 Andhra Pradesh Rs.268 , TamilNaduRs.267 , Haryana Rs.253 , Maharashtra Rs.248, PunjabRs.246 Karnataka Rs.205 and West Bengal Rs.196.
10 Because of the lower per capita plan outlays and centralassistan ce together with S t a t e’s poor capacity to raise its own resources, the per capita developmental expenditure in the State has remained very low. This is evident from the fact that theper capita developmental expenditure amounting to Rs. 177 in1980-81, Rs, 329 in 1984-85 and Rs. 406 in 1987-88 in this State is lower than all States average of Rs. 236, Rs. 414 and Rs. 628 respectively. Thus, the per capita developmental expenditure of this State works out to only 75.0 per cent, 79.5 per cent and64.6 per cent of the all States average for the respective years. The per capita developmental expenditures in Punjab and Haryana were much higher as compared to U.P. and all States average.
11 As stated before, higher growth in population, a lower growth in the economy, lower productivity, inadequate development of infrastructure and large undeveloped areas in the State are some chief reasons of s t a t e’s backwardness.

Levels of Achieveaent in respect of selected indicators : Sowe States
State Indicators Punjab Haryana Gujarat Haharashtra Karnataka Uttar IndiaPradesh
1. S.D.P. per capita at 6227 5274 3592 5155 3602 2698 3835current prices , 1988-89(Rs.)
2. Intensity of cropping 171.8 156.3 113.6 110.0 112.2 116.2 126.21985-87 I
3. Percentage of net 88.9 64.8 24.1 10.4 17.2 57.2 30.7irrigated area to netsow are 1986-87
4. Consuiption of fertilizer 139.8 7.7 58.6 46.8 57.9 74.1 60.0per ha. of cropped area,1988-89 (Kg/ha.)
5. Average yield of ^ 1989 506 783 836 1461 1173foodgrains 1987-88 (Kg/ha.)
6. Average yield of 5626 5023 8439 8113 7826 5026 6067sugarcane in tens ofGur, 1988-89 (kg/ha.)
7. Value added per 32,353 43,743 48,281 68,819 44,003 41,618 44,003industrial vorker1986-87 (Rs.)
8. Percentage share of 20.2 19.2 35.5 35.9 26.9 19.9 24.4secondary sector inS.D.P. at current prices, 1988-89
9. Average daily no. of 1309 1146 1401 1253 701 450 754workers in registeredworking factories per lakh of population,1986-87
10. Per capita consuiption 660 328 397 372 233 143 217of electricity m(1988-89)
11. Percentage of villages 100 100 99 96 97* 68 75electrified to totalinhabited villages1987-88

Levels of flchieveienl in respect of selected indicators ■ Soae States
State Indicators Punjab Haryana (iujarat Haharashtra Karnataka UttarPradesh
India
12. Surfaced road length per lakh of population 1983-84 (k»)
184.9 141.6 34.8 53.4 138.5 45.6 64.1
13. No. of allopathic hospitals dispensaries per lakh of population , 1987
11 1 15 15 4 2 5
14. Life expectancy at birth-projected for 1986-91 (yrs.)
62.5 62.7 59.9 62.4 62.7 51.9 58.6
15. Literacy percentage 1991 57.4 55.3 60.9 63.1 56.0 41.7 52.1
16. Credit-deposit ratio , 1988-89
44.5 59.9 58.6 77.0 90.0 44.3 64.7
17. Per capita own tax revenve as percentage of per capita inco®, 1987-88
8.1 10.1 10.7 9.7 10.9 5.7
18. Per capita advances froi coMercial banks Dec, 1987 (Rs.)
1459 944 1045 2239 1243 414 859
19. Per capita dishurseisent of asistance by All india tera lending Institutions, (Cunulative upto Harch 1987 (Rs.)
424 531 818 590 458 185 317
20. Per capita plan outlay, during 1985-90 (Rs.)
1728 1883 1545 1464 821 822 1010
21. Per capita central assistance, during 1985-90 (Rs.)
246 253 271 248 205 284 352
22. Per capita developaent expenditure, 1987-88 (Rs.)
1169 976 940 802 681 406 628

Note on Methodoloijv of H.D.I.
The core of methodology used for construction of State-wise HDI involves three steps. The first step is to define a measure of deprivation that a State suffers in each of the three basic indicators ~ life expectancy (k 1), literacy percentage <xS), and State domestic product (SDP) per capita (k 3). A maximum and minimum value is determined for each of the three indicators given the actual values. The d e p r ivation measure then places a State in the range of zero to one as defined by the difference between the maxi mum and minimum. Thus, lij is the deprivation indicator for the jth State with respect to ith indicator and it is defined as s
(MajxXij~Xij )-------------------------------------------------- . . . < 1 )
(Maj X X i j”M i j n X 4 j )
The second step is to define an average Indicator (Ij). This is worked out by taking a simple average, of the three deprivation indicators :
Ij= Z I l i J ...(E)i = 1
The third step is to measure the human development index (HDI) as one minus the average deprivation index!
(HDI)j = (1-lj) ...(3)

Stalewise Huaan PevelooMnt Index {HDD in India
Major StaUs Life Literacy State expectancy percentage DoMstic at birth- 1991 (x2) Product projected (SDP) per
for capita at 198A-91 current
(Xl) prices, 1988-89
(X3) (Rs)
Deprivation Index in
Life Literacy Expectancy percentage
(D1) (D2)
respect of
SDP per capita
(D3)
Average Huian DeprivationDevelopaent
Index Index (ADI) (KDl)
Average of (1-ADl) D1,D2 & D3
1 2 3 4 5 6 7 8 9
1 Andhra Pradesh 60.7 45.11 3211 0.48 0.87 0.73 0.69 0.312 Bihar 57.6 38.54 2280 0.66 1.00 0.96 0.87 0.133 Gujarat 59.9 60.91 3592 0.52 0.57 0.64 0.58 0.424 Haryana 62.7 55.33 5274 0.36 0.68 0.33 0.42 0.585 Karnataka 62.7 55.98 3602 0.36 0.66 0.64 0.55 0.45b Kerala 68.7 90.59 2598 0.00 0.00 0.88 0.29 0.717 Madhya Pradesh 55.5 43.45 2404 0.79 0.91 0.93 0.88 0.128 Maharashtra 62.4 63.05 5155 0.38 0.53 0.26 0.39 0.619 Orissa 56.1 48.55 2438 0.75 0.81 0.92 0.83 0.1710 Punjab 62.5 57.14 6227 0.37 0.64 0.00 0.34 0.6611 Rajasthan 58.2 38.81 2122 0.63 0.99 1.00 0.87 0.1312 Taail Nadu 60.8 63.72 3163 0.47 0.52 0.75 0.58 0.4213 Uttar Pradesh 51.9 41.71 2698 1.00 0.94 0.86 0.93 0.0714 Uest Bengal 59.7 57.72 3423 0.54 0.63 0.68 0.62 0.^
India 58.6 52.11 3835 0.60 0.74 0.58 0.64 0.36

CHAPTER - IV
POPULATION GROUTH
The problem of higher growth in population is a common feature in under-develope d and develop ing countries and India is no exception to it. The problem is much more acute in Uttar Pradesh, which is also the most populous State, contributing 16 . 5’’ percent to the total population of the country .
2 The population of the State was 883 lakhs in 1971, 1109lakhs in 1981 and 1390 lakhs in 1991. The decennial increases during 1971--81 and 1981~91 were, thus, 25.49 percent and 25.41 percent respectively against 25. 0 0 percent and 2 3 . 5 6 percent in the country, as a whole. The growth in State's population during1971-1991 was, thus, higher than the country, but the margin was much higher (+1.85) during 1981-91 than 0.49 of the earlier decade (1971-81). This was so because whereas there was practically no deceleration in growth in the S t a t e’s population during 1981-91, the decline in the case of the country, as a whole was quite significant (1.44 percent). This is a matter of great concern and calls for a total review of states population policy and programmes. However, the net result of all this has been that the share of the State in the c o u n t r y’s totalpopulation moved up from 16.1 percent in 1971 to 16.2 percent in1981 and still higher to 16.5 percent in 1991.
3 The share of male population was 53.2 percent (738.98 lakh)in S t a t e’s total population of 1390.31 lakhs in 1991. Thecorresponding shares in 1971 and 1981 were 53.2 percent (470.16 lakh) and 53.1 percent (588.19 lakh) respectively. The share of female population was 46.8 percent (651.33 lakhs) in 1991, 46.8percent (413.25 lakhs) in 1971 and 46.9 percent (520.43 lakhs) in 1981. The composition of s t a t e’s total population amongst males and females in terms of their shares were the same in 1991 and 1971. However, during the decade 1971-81, female population registered a higher increase than male population but in subsequent decade of 1981-91 the increase in female population was less than the increase in male population. The sex-ratio (i.e. number of females per thousand of males), therefore, rosefrom 879 in 1971 to 885 in 1981, but decreased again to 881 in 1991. A similar trend in sex-ratio is seen at the national level also where it was 930 in 1971, 933 in. 1981 and 929 in 1991.
4 In the context of growth in economy being expressed in terms of per annum, it is necessary to describe growth in population also in these terms. The growth in S t a t e’s population was 1.79 percent per annum only during 1961-71. This was the lowest amongst the major* States and was also lower than the national average of 2.20 percent. The situation, however, changed in the subsequent decades. During the decade of 1971-81, the s t a t e’s
1. According to census 1991, Provisional results
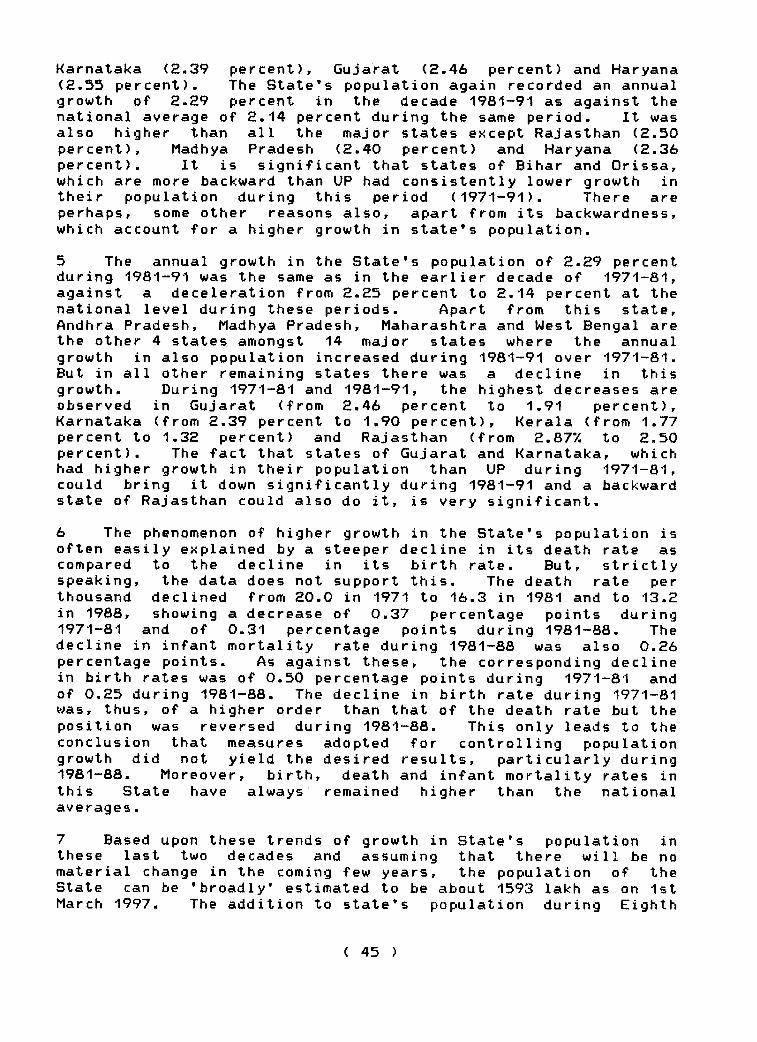
Karnataka (2.39 percent), Gujarat (2-46 percent) and Haryana (2.55 percent). The S t a t e’s population again recorded an annual growth of 2.29 percent in the decade 1981-91 as against the national average of 2.14 percent during the same period. It was also higher than all the major states except Rajasthan (2.50 percent), Madhya Pradesh (2.40 percent) and Haryana (2.36 percent). It is significant that states of Bihar and Orissa, which are more backward than UP had consistently lower growth in their population during this period (1971-91). There are perhaps, some other reasons also, apart from its backwardness, which account for a higher growth in s t a t e’s population.
5 The annual growth in the S t a t e’s population of 2.29 percentduring 1981--91 was the same as in the earlier decade of 1971-81, against a deceleration from 2.25 percent to 2.14 percent at the national level during these periods. Apart from this state, Andhra Pradesh, Madhya Pradesh, Maha r a s h t r a and West Bengal are the other 4 states amongst 14 major states where the annual growth in also population increased during 1981-91 over 1971-81. But in all other remaining states there was a decline in this growth. During 1971-81 and 1981-91, the highest decreases areobserved in Gujarat (from 2.46 percent to 1.91 percent), Karnataka (from 2.39 percent to 1.90 percent), Kerala (from 1.77 percent to 1.32 percent) and Rajasthan (from 2.877. to 2.50 percent). The fact that states of Gujarat and Karnataka, which had higher growth in their population than UP during 1971-81, could bring it down significantly during 1981-91 and a backwardstate of Rajasthan could also do it, is very significant.
6 The phenomenon of higher growth in the S t a t e’s population isoften easily explained by a steeper decline in its death rate as compared to the decline in its birth rate. But, strictlys p e a k i n g , the data does not support this. The death rate per thousand declined from 20.0 in 1971 to 16.3 in 1981 and to 13.2 in 1988, showing a decrease of 0.37 percentage points during1971-81 and of 0.31 percentage points during 1981-88. Thedecline in infant mortality rate during 1981-88 was also 0.26 percentage points. As against these, the corresponding decline in birth rates was of 0.50 percentage points during 1971-81 and of 0.25 during 1981-88. The decline in birth rate during 1971-81 was, thus, of a higher order than that of the death rate but the position was reversed during 1981-88. This only leads to the conclusion that measures adopted for controlling population growth did not yield the desired results, particularly during1981-88. Moreover, birth, death and infant mort ality rates in this State have always remained higher than the nationala v e r a g e s .
7 Based upon these trends of growth in S t a t e’s population in these last two decades and assuming that there will be no material change in the coming few years, the population of the State can be ’broadly* estimated to be about 1593 lakh as on 1st March 1997. The addition to s t a t e’s population during Eighth
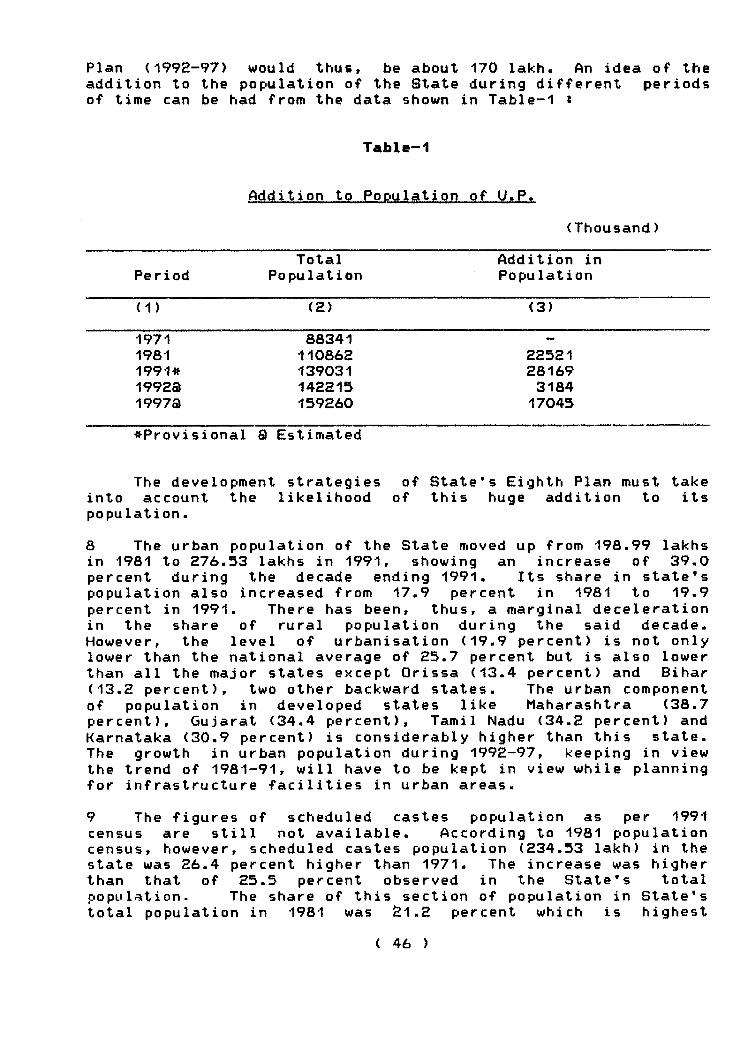
Plan (1992-97) would thus, be about 170 lakh. An idea of the addition to the population of the State during different periods of time can be had from the data shown in Table-1 s
Table-1
Addition to Population of U.P.
( T h o u s a n d )
PeriodTotal
PopulationAddition in Population
( 1 ) (2 ) (3)
1 9 7 119811991*1992a1 9 9 7 a
88341110862139031142215159260
22521281693184
17045
^Provisional a Estimated
The development strateCjies of State's Eighth Plan must take into account the likelihood of this huge addition to its p o p u l a t i o n .
8 The urban population of the State moved up from 198.99 in 1981 to 276.53 lakhs in 1991, showing an increase of percent during the decade ending
increased from 17.9
lakhs 39.0
1991. Its share in state's percent in 1981 to 19.9population also
percent in 1991. There has been, thus, a marginal d e c e l e ration in the share of rural population during the said decade. However, the level of ur banisation (19.9 percent) is not only lower than the national average of 25.7 percent but is also lower than all the major states except Orissa (13.4 percent) and Bihar (13.2 percent), two other backward states. The urban component of population in developed states like Maharash tra (38.7 percent), Gujarat (34.4 percent), Tamil Nadu (34.2 percent) and Karnataka (30.9 percent) is considerably higher than this state. The growth in urban population during 1992-97, keeping in view the trend of 1981-91, will have to be kept in view while planning for infrastructure facilities in urban areas.
9 The figures of scheduled castes population as per 1991 census are still not available. According to 1981 population census, however, scheduled castes population (234.53 lakh) in the state was 26.4 percent higher than 1971. The increase was higher than that of 25.5 percent observed in the State's total population- The share of this section of population in State's total population in 1981 was 21.2 percent which is highest

amongst all the major states except Punjab (26.9 percent) and West Bengal (22.0 percent). The share of S t a t e’s scheduled caste population in their total population was 22.4 percent, much higher than the share (16.5 percent) of State's total population in c o u n t r y’s population. The upliftment of this segment of population needs special attention in the S t a t e’s development s t r a t e g i e s .
10 The number of persons in the age-group of 15--59 years, generally known . to comprise labour force, is considered as the main source of providing the work-force. The share of labour force in s t a t e’s population was 51.4 percent both in 1971 and 1981 but the share of working force in labour force declined form60.2 percent to 59.8 percent in these years. As against this, during the same period, the share of labour force in c o u n t r y’s population went up from 52.0 percent to 53.9 percent and that of working force in labour force from 63.3 percent to 68.2 percent.
11 The share of workers in s t a t e’s population, which constituted 30.9 percent in 1971, declined to 30.7 percent in 1981. As against this, the corresponding share at the national level increased from 32.9 percent to 36.8 percent. Consequently, the share of*this state in c o u n t r y’s total working force also came down from 15.2 percent in 1971 to 13.9 percent in 1981.
12 The continuing higher increase in S t a t e’s population has serious implications for its economy. Apart from neutralizing a substantial part of gains in the economy, a higher growth in S t a t e’s population also calls for more investments mostly in public sector for infrastructure and other public facilities required to meet some basic needs of human beings, inability of the State to make this investments leads to widespread unrest. The pressure on land, which is already very high in this state, also goes up and in the absence of diversification in s t a t e’s economy with desired speed, the trend of declining land~man ratio continues unabated. Land is limited and a scarce resource. The optimum use of land to meet the requirements of growing population, without jeopardizing the interests of the posterity, is equally important for long term development.

AmeMre-'I
PQDulation-Son« key Data
STATES Population Density Sex Ratio Percentage Annual Growth Rate of in lakh Person W 1 of tjrban Population Percentage
199-1 per sq. population--------------------3 km. 199-1 199-1 197-1~8-1 -198-1--91
(1 ) (2) (3) (4) (5) (6) (7)
1. Andhra Pradesh 664 241 973 26.84 2.10 2.172. Bihar 863 497 ?12 13.17 2.17 2.-133. Ojjarat 412 210 936 34.40 2.46 1.914. Haryana 163 369 874 24.79 2.55 2.365. Karnataka 448 234 961 30.9-1 2.39 1.906. Kerala 290 747 1040 26.44 1.77 1.327, Madhya Pradesh 661 149 932 23.2-1 2.27 2.408. (Maharashtra 787 256 935 38.73 2.2-1 2.299. Orissa 202 972 13.43 1.85 1.8010. PJinjab 202 401 29.72 2.16 1.8611. Rajasthan 439 128 9-13 22.88 2.87 2.5012. Tanul Nadu 556 428 972 34.20 1.63 1.4013. Uttiir Pradesh 1390 472 8&1 19.89 2.29 2.2914. West Bengal 680 766 S 17 27.39 2.10 2.22
All India 8443 267 929 25.72 2.25 2.14
3 Provisional as per paper 2 of 199-1 censiis.

Birth ratesrPeath rates and Infant Mortality rates of U,P. and India
(Per thousand)
Birth Rate Death RateYear
Infant Mortality Rate
U.P. India U.P. India U.P. India
(1) (2) (3) (4) (5) (6) (7)
1971 44.6 36.9 20.0 14.9 N.A. 1291981 39.6 33.9 16.3 12.5 150 1101982 38.6 33.8 15.1 11.9 147 1051983 38.4 33.7 15.7 11.9 155 1051984 38.7 33.9 17.8 12.6 154 1041985 37.6 32.9 15.8 11.8 142 971986 37.5 32.6 14.6 11.1 132 961987 37.9 32.2 14.5 10.9 127 951988 37.1 31.5 13.2 11.0 124 94

CHAPTER - V
LAND USE
Among the major resources available to man is land, comprising soil, water and associ ated plants and animals. Land is a complex and dynamic combination of factors geology, topography, hydrology, soils, micro climates and communities of plants and animals that are continously interacting under the influence of climate and people's activities- The use to which land is put, is determined by the owners, farmers, institutions of the Government as the case may be according to their perception as to the needs. Such decisions are influenced by a host of physical factors, such as soil and climate, technology and socio-economic aspirations of the community. Land is a resource base which supports the primary production system as well as provides social environment in terms of shelter roads and other related facilities. Land and soil profile serves as a storage for water, which supports plants and other living organisms as well as replenish surface and ground water flows much after the rain has stopped. The physical, chemical and biological health of soil profile determines the ability of land to serve socio-'economi c needs. With judicious land management and appropriate advanced technology, lesser areas may be able to meet the future escalating demands.In short, life without land is inconceivable. Therefore, for balanced development of economy, a rational policy for optimum use of land is a must. The need for such a policy is compounded by the fact that the land is not only limited and inexpansible but also heterogeneous in different parts of the State with definite set of capabilites and suitabilities for different uses.
2 The increase in population and economic growth has given rise to competing claims on land. Out of 297.98 lakh h a .’’ reporting area in the State, about 173 lakh ha. (58'/.) is net sown area, 51 lakh (17.21 percent) is under forests, 24 lakh ha. (7.91 percent) is under nonagricultural uses, 11 lakh ha. (3.7 percent) is barren and u n c u l t i v a b l e , 3 lakh ha. (1.07 percent) ispermanent pasture and used for gra zi n g , 6 lakh ha. (1.9 percent) is under miscellaneous tree crops and groves not included in net sown area, 11 lakh ha. (3.78 percent) is under culturable waste,11 lakh ha. under current fallow and 8 lakh ha. is under old fallow category. This data shows some imbalance in landuse pattern. About one sixth of the reporting area is under forests whereas according to National Forest Policy-1988, atleast one third of area should be under forests for ecological balance. The area under pasture and grazing land, which is about one percent only of reporting area, is totally inadequate to meet the requirement of large livestock population in the State. It is for this reason that there is free grazing, as a result of which
1. The break-up of this area over-time is given in Annexure-1

there is not only extensive damage to crops and vegetation but soil erosion is also taking place on a large scale. Due to the extensive use of land for cultivation a point of saturation has reached resulting in marginal and sub-marginal lands also being put to cultivation. About 19 lakh ha, (6,4 percent) of reporting area is under current and old fallow and is not put to any productive use due to problems like lack of irrigationr water logging, salinity etc., about -11 lakh ha^ each is undercultivable and noncultivable waste. The productivity of two thirds of the land, which is either under cultivation or forest is also low and large areas of this land are experiencing land degradation in varying degrees. As a result of rapid industrialisation and u rbanization the area undernon-agricultural uses has also increased- The area undsr current fallows shows a rapid and continuous increase which is again a matter of great concern.
3 There are several problems relating to land degradation. These are soil erosion, alkalinity# salinity? gullied and ravines, water logging etc. As much as 136 lakh ha.® of land?which is about 46 percent of total geographical area, is reported to be degraded in one form or the other. Out of this prcblematic area, 68 lakh ha. (50.39 percent) is cultivable land while 20lakh ha. (14,69 percent) is the forest la»d, pastures, barrenland and land put to uses other than agriculture. About 47 lakh ha, (34.9S percent) of total eroded or degraded land is under ravines, usar and reh, diaras, riverine torrents etc» The size of the problem-area is thus quite large and it, will not be desirable to let it remain so in a situation when the pressure on land continues to increase.
The data from Agricultural Censuses also shows that the land under operational holdings decreased by 5,10,S67 ha. during 1970-86 8-
Year Area of totalo perational holdings
(in h a , )1970-71 1,81,58,4671976-77 1,78,60,4431980-81 1,79,70,6451985-86 1,76,48,200
About 34,000 ha. land under operational holdings has been, thus going out of holdings per annum during this period. This is the area under operational holding and according to a roughestimate, its 96 percent is agricultural land and only about 4percent is under non-agricultural uses. The decline in area under operational holdings may be due to the diversion of agricultural land for non-agricultural purposes.
2. The break-up of degraded land (problem area) is given in Annexu r e - I I ,)
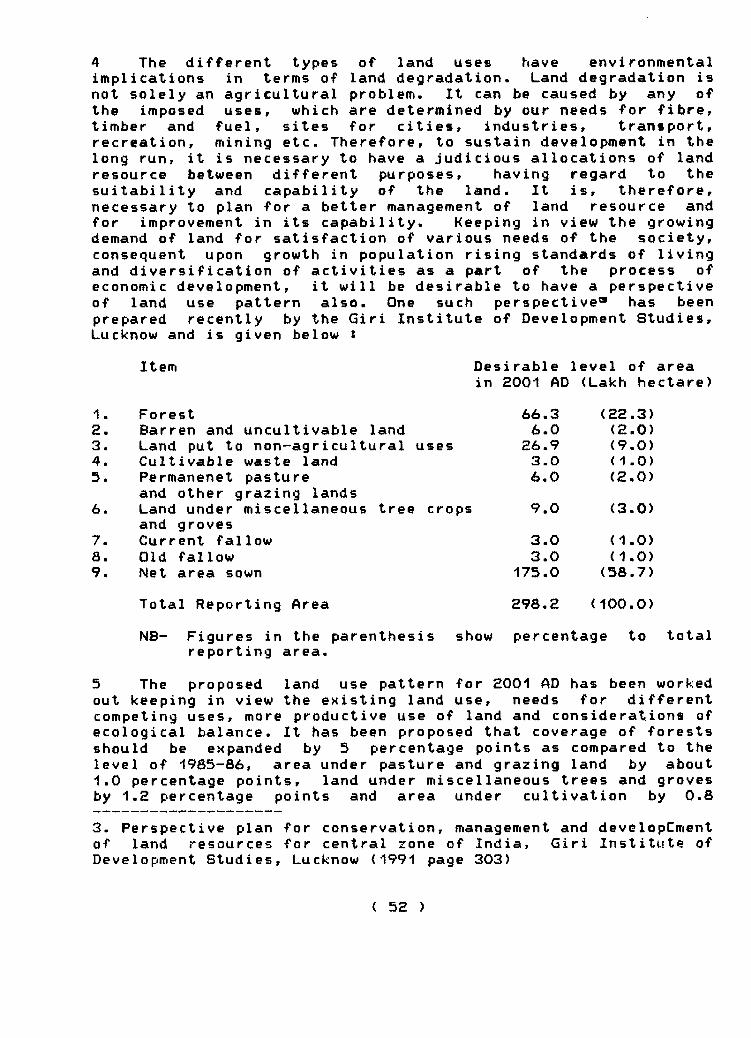
4 The different types of land uses have environmental implications in terms of land degradation. Land degra d a t i o n is not solely an agricultural problem. It can be caused by any of the imposed uses, which are d etermined by our needs for fibre, timber and fuel, sites for cities, industries, transport, recreation, mining etc. Therefore, to sustain development in the long run, it is necessary to have a judicious allocations of land resource between different purposes, having regard to thesuitability and capability of the land. It is, therefore,necessary to plan for a better management of land resource and for improvement in its capability. Keeping in view the growing demand of land for satisfaction of various needs of the society, consequent upon growth in population rising standards of living and diversification of activities as a part of the process of economic development, it will be desirable to have a perspective of land use pattern also. One such perspective® has been prepared recently by the Giri Institute of Development Studies, Lucknow and is given below :
Item Oesi rable level of areain 2001 AD (Lakh hectare)
1. Forest 66.3 (22.3)2. Barren and uncultivable land 6.0 (2.0)3. Land put to non-agricultural uses 26.9 (9.0)4. Cultivable waste land 3.0 (1.0)5. Permanenet pasture 6.0 (2.0)
and other grazing lands6. Land under miscellaneous tree crops 9.0 (3.0)
and groves7. Current fallow 3.0 (1.0)8. Old fallow 3.0 (1.0)9. Net area sown 175.0 (58.7)
Total Reporting Area 298.2 (100.0)
NB- Figures in the parenthesis show percentage to totalreporting area.
5 The proposed land use pattern for 2001 AD has been workedout keeping in view the existing land u s e , needs for differentcompeting uses, more productive use of land and considerations of ecological balance. It has been proposed that coverage of forests should be expanded by 5 percentage points as compared to the level of 1985-86, area under pasture and grazing land by about1.0 percentage points, land under miscellaneous trees and groves by 1.2 percentage points and area under cultivation by 0.8
3. Perspective plan for conservation, management and devclopCment of land resources for central zone of India, Giri Institute of Development Studies, Lucknow (1991 page 303)

percentage points. On the other hand, a reduction in area under category of barren and uncultivable land by 1.7 percentage points, cultivable waste lands by 2.8 percentage points, current fallow by 2.7 percentage points and old fallow by 1.8 percentage points has also been proposed. The proposals made deserve serious consideration and whatever final view may emerge should be followed up by concrete measures including policy decision, in future plans. As a pre-requisite to such measures, the message of optimum use of land and its conservation for future generations should be brought home more effectivily to all those who are participants in this activity. These efforts and other necessary measures which are considered necessary to achieve the objective of a more balanced and optimum use of land should be interwoven with development strategies of future plans. The emphasis land on this objective does not however minimise, the significance of another equally important objective of achieving higher productivity, whether it is land, capital or labour. For it is only through such higher productivity only that a higher growth in economy can be achieved.

Trends in Land Use Pattern in Utter Pradesh ; 1956-57 to 1985-86
(Unit - Lakh Ha.)
Average Area Under the Category DuringLand Use Category
1956-57to
1960-61
1961-62to
1965-66
1966-67to
1970-71
1971-72to
1975-76
1976-77to
1980-81
1980-81to
1985-86
1 2 3 4 5 6 7
1. Reporting Area for Land Utilisation
298.10(100.0)
293.82(100.0)
297.31(100.0)
298.47(100-0)
297.75(100.0)
297,98(100.0)
2. Forests 40.70(13.65)
37.12(12.63)
45.32(15.24)
50.92(17.06)
51.09(17.16)
51.28(17.21)
3. Land Put to Non Agricultural Uses
18.87(6.33)
19.57(6.66)
20.19(6.79)
20.98(7.03)
22.17(7.45)
23.55(7.91)
4. Barren andUncultivable Land
25.74(8.64)
25.45(8.66)
19.56(6.58)
12.98(4«37)
11,59(3.89)
11.12(3.73)
5. Permanent Pastures and Other Grazing Lafjds
0.35(0.12)
0.54(0.18)
0.76(0.26)
1.98(0.66)
2.89(0.97)
3.19(1,07)
6. Land UnderMiscellaneous Tree
10,21(3.42)
8.33(2.84)
9.88(3.32)
9.77(3.27)
7.10(2.38)
5.69(1.91)
Crops and Groves
7. Culturable Waste Lands 17.02 15.53 13.95 14.43 12.94 11.26(5.71) (5.28) (4.69) (4.83) (4.35) (3.78)
8. Current Fallows 1.69 4.33 8.57 9.41 10.63 11.35(0.57) (1.47) (2.88) (3.15) (3.57) (3.81)
9. Old Fallows 13.25 9.89 5.56 5.92 6.35 7.84(4.4) (3.37) (1.87) (1.98) (2.13) (2.63)
10,.Net Area Sown 170.27 173.04 173.52 172.08 172.99 172.68(57.12) (58.91) (58.37) (57.65) (58.10) (57.95)
Source : Bulletin of Agricultural Statistics/ U.P. (Annual)Note : (1) Figures in parenthesis show percentage to total area
(2) Reproduced from prespective plan for conservationmanagement and development of land Resources for Central Zone of India - Giri Institute of Development Studies Lucknow page -127.

Annexure
Problem Area in
- II
the State
Problem Area (in Lakh Ha.)
1"“ Eroded and degraded land
A. Agriculture area 64.41 (50.39)
(i) Rainfed non paddy area 54.50 (40.14)(ii) Current fallow 2.23 (1.64)( iii ) Other fallow 3.01 (2.22)( iv) Culturable waste 7.12 (5.25)( V) Land under misc.trees 1.55 (1.14)
B. Non Agricultural area 19.94 (14.69)
( i ) Forest land 12.12 (8.93)(ii) Pastu res 1.11 (0.82)( iii ) Barren land 2.38 (1.75)(iv) Other than agricultural 4.33 (3.19)
uses
2 . Special problem - Lands 47.40 (34.92)
(i) Rav inous 12.30 (9.06)(ii) Land under usar and reh 12.00 (8.84)(iii) Desert -•(iv) Jhum cultivation “( V) Coastal sandy land - -(vi ) Diara or Khadar land 15.00 (11.05)(vi i ) Torrents N.A.(viii)Water logged 8. 10 (5.97)
Grand Total 135.75 (100.00)
Source s Uttar Pradesh may bhoomi Sanrakshan (Hindi) Agriculture Deptt. (Government of U.P.), June , 1990 page 3-4

CHAPTER - VI
PRODUCTIVITY
Produ ct i exploitation p o t e n t i a l s . indicator of of land can ha. of land f o o d g r a i n s , these major c shown in the
vity is an indicator of the efficiency ac hieved in and utilization of the available capacities and In similar situation, it can also be used as an
economic behavior of human beings. The productivity be described in terms of agriculture production per
Agriculture production comprises items like oilseed, sugarcane and potato. The productiv ity of rops at different points of time in the State is following table 1.
Table-1
Productivity at Different Points of time
Crop Productivity per ha. (in qtls.) percentageincrease dur ina
1978-79 1984-85 1989-90 1990-91 1979-91
(1) (2) (3) (4) (5) (6)
1. Foodgrains 11.61 14.56 16.51 17.37 49.6(a) Rice 11.59 13.00 17.47 18.26 57.5(b) Wheat 15.50 18.69 20.47 21.62 39.5(c) Pulses 7.62 9.37 8.09 8.21 7.7
2. Oilseeds (Pure)
4.60 6.02 7.54 8.27 79.8
3. Sugarcane 381.46 459.36 553.12 557.94 46.34. Potato 155.10 170.00 182.02 189.84 22.4
2 The above table indicates that there has been aconsistent increase in productivity of these crops even thoughthe increase has not been uniform. The productivity offoodgrains increased by about 50 percent during 1979-91. A higher increase in the productivity of rice during this period is encouraging. However, pulses, a component of foodgrains, showed an increase of 7.7 percent only during the same period. Keeping in view the fact that pulses are the main source of protein in our diet, alround efforts are required to improve the productivity of pulses in order to increase its a v a i l abilit y to masses. Oilseeds have shown an increase of about SO percent in their productivity during this period. The productivity of sugarcane also increased by about 46 percent while in case of potato the increase is only about SS percent. Inspite of these trends in the field of productivity of agricultural crops, the state is far far behind several other agricultural states in this m a t t e r .

3 The productivity of foodgrains in the State was 16.51qtls per hactare in 1989-90 which is S5.6 percent and 51-7 percent lower than that obtained in the neighbouring States of Haryana and Punjab respectively. The per hectare yield of sugarcane <in terms of Gur) in the State is also lower than major sugarcane producing States. The S t a t e’s productivity of 55.31 qtls. per ha. (1989-90) in respect of sugarcane (Gur) is 62.3percent of Maharashtra, 64.0 percent of Gujarat, 68.7 percent ofKarnataka, 77.8 percent of Andhra Pradesh and 87.6 percent of Punjab. Similarly, the productivity of potato in the State, which was 182.02 qtls. per ha. in 1989-90, is 82.9 percent of West Bengal, 87.9 percent of Gujarat and 90.0 percent of that of Punjab. This brief analysis only suggests that there is still much room for increasing the productivity of these crops in the Stat e .
4 Some idea of productivity in industries (registeredsector only) can be had by using the indicators of per persongross value of output, output capital ratio and persons employed per lakh of invested capital. For this purpose majorindustry-groupwise information of this State is given at Annexure1,2 and 3.
5 It will be seen from Annexu te-I that per person gross value of output increased from Rs. 48,4 thousands in 1978-79 to Rs. 127.9 thousands in 1984-85 and further to Rs. 152.7 thousand in 1986-87. The per person gross value of output for the country as whole was R s . 178.7 thousand in 1986-87. The fact that per person gross value of output of the country is much higher than this state is a matter of concern. There can be several reasons for this. But, perhaps, this is also indicative of the fact that efficiency of the persons engaged in registered industries in the state is lower than all-India average. Major industry groupwise analysis shows that per person gross value of output is highest (Rs. 1289 thousand) in Rubber plastics and petroleum product group, followed by Basic metal and alloys group (324 thousand). Chemicals (Except petroleum and coal products) (Rs. 303 thousand) and beverages, tobacco and tobacco products (Rs. 227 t h o u s a n d ) - The lowest value of output per person is in Cotton Textile group (Rs. 56 thousand) followed by wood and wood products (Rs.69 thousand) and Non-Metal lie Mineral products (Rs. 93 thousand).
6 The output capital ratio in the State increased from 1.6 in 1978-79 to 1.8 in 1984-85 and further to 1.9 in 1986-87. The all-India output capital ratio in 1986-87 was 1.8. This shows that the efficiency of Capital in terms of output in the state is very close to all-India average. Major industry groupwise analysis indicates that the industry group Rubber plastic and petroleum products has the highest ratio of 3.1. This group is followed by Beverages, tobacco and tobacco products (2.9), Basic Metal and alloys (2.6), Metal products (2.6), and leather and fur products (2.4). The lowest output capital ratio (1.4) is in Cotton textiles, paper printing and publishing. Chemicals,

Machinery (except electricals) and transport equipments industry groups followed by textile products (1.5), Electrical M a c h i n e r y (1.5) and N o n - M e t a l 1 ic Mineral products (1.6).
7 The per person gross value of output in the state beingless than the country's average and the output capital ratio in the state being higher or equal to that of the country may beeither due to lower e fficiency of persons engaged in them anufacturing sector or due to unfavourable i n d u s t r y - m i x . Inthis connection the number of persons engaged in them anufacturing sector per crore of invested capital were alsoworked out and it was found that in comparison to 100 persons in the country, as a whole, the state has more persons (1S7) per cr. of capital invested. Major industry groupwise a nalysis showsthat highest number of persons per cr. of invested capital are inthe industry group of cotton textiles (250) followed by leather and fur products (213), Food Manufac turing (209) and Metal products (except mach i n e r y and transport equipments) (207). Thelowest number of persons per Cr. of invested capital is inrubber, plastic and petroleum products (24) followed by C hemicals (46), transport equipments (76) and Basic Metal and alloys group (81).
8 Plant Loan Factor (P.L.F.) is an indicator ofutilisation of installed capacity in the field of power generation. P.L.F. is defined as actual energy produced by a plant during a given period as a percentage of the m a x imum energy that could have been produced had the plant generated at full capacity during the same period. The plant load factor'* ofthermal units of U.P. State E l e c tricit y Board was 36.5 percent in 1980-81. It declined to 31.6 percent in 1984-85 after touching a level of 37.6 percent in 1981-82 and 39.6 percent in 1982-83. Afterwards, there was continuous improvement in P.L.F. and in 1988-89 it reached a level of about 54.7 percent. Against this situation in the State, the P.L.F. in the country as a whole has shown continuous rising trend during 1980-88 except for 1983-84. It was 45.0 percent in 1980-81 and rose to 49.4 percent in1982-83. After declining to 47.9 percent in 1983-84 it improved again to 50.1 percent in 1984-85. It further rose to 56.5 percent in 1987-88 but went down slightly to 55.0 percent in1988-89.
9 The P.L.F. in the State remained continuously lower than that of the country. The gap between the country and the State in P.L.F. was 8.5 in 1980-81 which increased to 9.8 in1982-83 and 18.5 in 1984-85. It decreased thereafter and was0.3 only in 1988-89. Inspite of the fact that P.L.F. in theState was very close to the All-India average, it is still lower than the P.L.F. of And hra Pradesh (69.6 percent), Tamil Nadu (66.7) Karnataka (66.4 percent), Gujarat (56.1 percent) andPunjab (56.0 percent) in 1988-89. The lower P.L.F. is, again, an
1. Annexure iv

indicator of productivity of huge capital invested in thermal plants of this State and the erratic behavior seen in it for a long period should be a matter of serious concern.

IndustryCode
Name of Industry
1978-79
Year
1984-85 1986-87
(1) (2) (3) (4) (5)
20-21 Food Manufacturing 39.3 89.3 105.222 Beverages, tobacco &
tobacco products77.1 139.5 226.6
23 Cotton textiles 37.5 58.0 55.524 Wool, silk and synthetic
textiles49.8 93.1 155.0
25 Jute & mesta 31.3 110.7 101.526 Textile products
(including wearing apparel78.9
)03.8 165.5
27 Uood and wood products 20.8 47.6 68.628 Paper, printing and
publishing29.0 75.7 122.3
29 Leather and fur products 42.7 105.0 112.930 Rubber plastic &
petroleum products123.7 1474.5 1289.1
31 Chemicals (except petroleum & coal produ'cts)
116.3 284.4 303.3
32 N o n - m e t a l 1 ic mineral products
21.9 59.3 93.3
33 Basic metal and alloys industries
94.2 222.0 323.7
34 Metal products (except mac hinery & transport equipments)
42.2 106.2 124.1
35 Machinery (except electri c a l )
66.0 117.2 166.3
36 Electrical machinery 76.2 160.7 196.537 Transport equipments
& parts37.8 57.2 108.7
38 Misc. manufacturing industries n.e.c.
40.5 62.1 132.3
97 Repair services 18.1 30.7 50.4
ALL GROUPS 48.4 127.9 152.7
• ALL INDIA - - 178.7
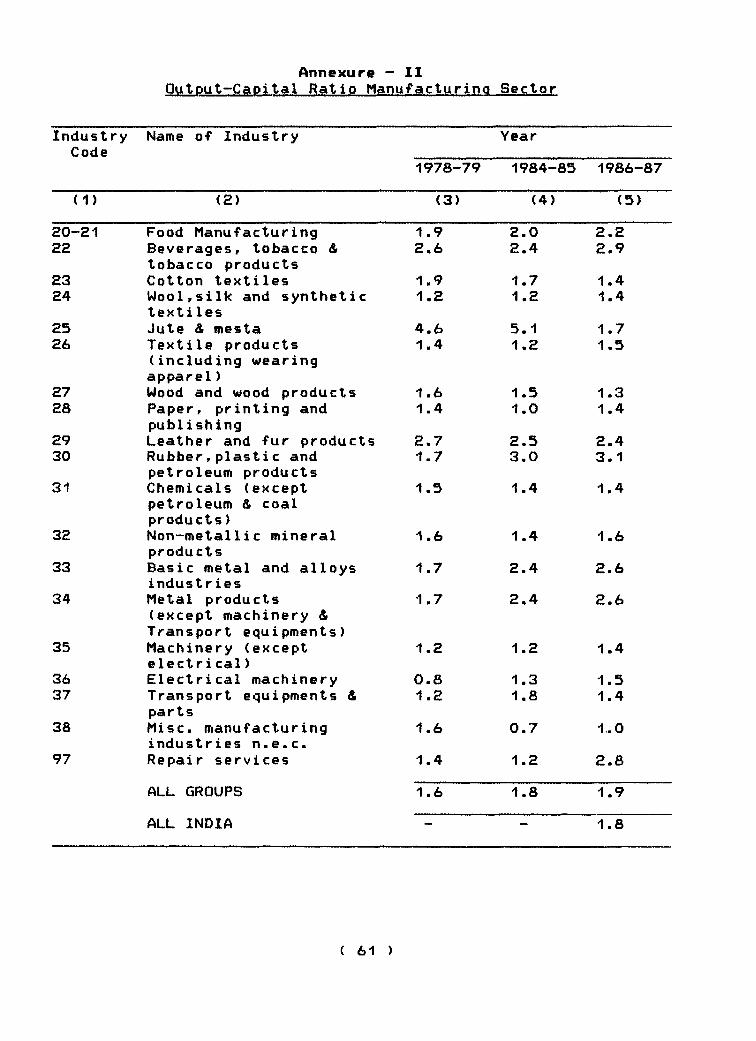
Industry Name of Industry YearCode
1978-79 1984-85 1986-87
(1) (2) (3) (4) (5)
20-21 Food Manufacturing 1.9 2.0 2.222 Beverages, tobacco &
tobacco products2.6 2.4 2.9
23 Cotton textiles 1.9 1.7 1.424 Wool,silk and synthetic
textiles1.2 1.2 1.4
25 Jute & mesta 4.6 5.1 1.726 Textile products
(including wearing a p p a r e l )
1.4 1.2 1.5
27 Uood and wood products 1.6 1.5 1.328 Paper, printing and
publishing1.4 1.0 1.4
29 Leather and fur products 2.7 2.5 2.430 Rubberrplastic and
petroleum products1.7 3.0 3.1
31 Chemicals (except petroleum & coal p r o d u c t s )
1.5 1.4 1.4
32 N o n - m e t a l 1ic mineral products
1.6 1.4 1.6
33 Basic metal and alloys industries
1.7 2.4 2.6
34 Metal products (except machinery & Transport equipments)
1.7 2.4 2.6
35 Machinery (except electri c a l )
1.2 1.2 1.4
36 Electrical machinery 0.8 1.3 1.537 Transport equipments &
parts1.2 1.8 1.4
38 Misc. manufacturing industries n.e.c.
1.6 0.7 1.0
97 Repair services 1.4 1.2 2.8
ALL GROUPS 1.6 1.8 1.9
ALL INDIA — ■— 1.8

Persons per crore Rs, of invested capital
IndustryCode
Name of Industry
1978-79
Year
1984-85 1986-87
(1) (2) (3) (4) (5)
20-21 Food l)1anufacturing 493 222 20922 Beverages, tobacco &
tobacco products334 171 130
23 Cotton textiles 509 292 25024 Mool,silk and synthetic
textiles244 127 88
25 Jute & mesta 1477 461 17026 Textile products
(including wearing a p p a r e l >
182 119 90
27 Mood and wood products 761 320 18428 P a p e r ,printing and
publishing482 129 115
29 Leather and fur products 630 241 21330 R u b b e r ,plastic and
petroleum products138 21 24
31 Chemicals (except petroleum & coal p r o d u c t s )
132 49 46
32 N o n - m e t a l 1 ic mineral products
714 242 175
33 Basic metal and alloys industries
180 108 81
34 Metal products (except machine ry & transport equ i p m e n t s )
411 226 207
35 Machine ry (except electri c a l )
180 106 85
36 Electrical machinery 108 80 7637 Transport equipments
& parts328 319 136
38 Misc. manufacturing industries n.e.c.
403 115 78
97 Repair services 794 382 555
ALL GROUPS 322 141 127
ALL INDIA - -- 100

Statewise Plant Load Factor of Therwal Plants 1980-B1 to 198&-69
STwrES/SErrroRS «---------------------------- y s -----------------------------»
1980-ai 1981-«2 198^63 1 9 8 ^ 1 9 8 ^ 198&-86 1 9 8 W W - 6 8 1980-69
2 3 4 5 6 7 8 9 10 11
1 Andhra Pradesh 36.3 46.6 51.1 54.6 54.4 64.8 69.7 76.2 69.62 Tamil Nadu 34.5 37.8 44.0 39.4 49.0 56.5 64.7 68.7 66.73 Karnataka • ■ ■ n ■ • • • ■ • 33.5 45.6 64.5 66.4A Oujarat 50.0 S3.6 57.9 55.3 54.0 53.2 54.0 60.0 56.15 Punjab 37.6 41.8 51.0 57.0 64.3 58.9 68.3 71.5 56.06 Uttar Pradesh 36,5 37.6 39.6 35.1 31.6 37.3 40.8 47.1 54.7
(9) (12) (10) (11) (13) (11) (11) (11) (7)7 Pteharashtra 52.6 49.4 50.2 52.9 58.6 57.8 50.7 57.9 53.68 Rajasthan • • • • • m 72.3 57.2 57.6 54.8 71.5 52.69 nadhya Pradesh 52.4 49.9 58.5 53.1 51.7 53.3 53.8 53.3 50.110 Haryana 31.7 37.3 32.2 31.1 34.7 32.8 33.8 40.6 41.211 Bihar 31.4 35.5 38.5. 32.8 30.5 34.1 33.3 33.0 37.112 Uest Bengal 42.1 37.6 38.5 35.9 36.5 42.2 41.8 38.6 36.713 Orissa 34.0 35.9 35.2 33.3 32.2 31.7 31.7 32.5 30.914 Assan 36.5 34.8 36.9 34.2 29.6 27.5 18.5 31.0 27.6
Central Sector • • ■ • • ■ 54.8 55.4 61.9 64.9 63.3 67.6Private Sector « • • m 64.1 63.0 57.5 61.1 67.6 63.2
All India 45.0 46.8 49.4 V.9 50.1 52.4 53.2 56«5 55.0

CHAPTER - VII
INFRASTRUCTURE
Infrastructure is a prerequisite for economic development of an area. Though the term is quite comprehensive, its main components are power, irrigation, roads, railways, post offices, banking services, education and health.The development of these facilities is financed mostly by public sector and their growth, therefore, depends primarily on how much public investment is made on creation and expansion of these facilities. The resource-crunch in public sector stifles growth and development of infrastructure and in the process, the pace of growth in the over-all economy also slows down. It has been found that •r a n k - c o r r e l a t i o n - c o - e f f i c i e n t * between per capita income and i n f r a s t r u c t u r e - d e v e l o p m e n t , as expressed in terms of a composite index, is reasonably high.
2 The backward states, including U.P., suffer from p o o r’’ infrastructure on the one hand, and a severe crunch, on the other, impairing their capacity to d e v elop infrastructure which could help to achieve a faster growth in their economy. It is for this reason together with operational efficiency of the infrastructure already developed that there is need for involving private sector also in this field. However, it will still take some time for private sector to come forth into this field in any significant manner, more particularly in backward state's and, therefore, the public sector will have to continue to play an important role in development of their i n f r a s t r u c t u r e .
3 It is in this context that a closer look at the development of infrastructure in this state will be useful. Before going into different components of i n f r a s t r u c t u r e , it may be pointed out that the 'composite® index of relative development of I n f r a s t r u c t u r e’ of U.P. continued to remain lower than most states in a long period, from 1966-67 to 1988-89. The situation is far more worse, as we will see a little later, in more critical components of i n f r a s t r u c t u r e .
4. Power : According to the Central Electrical Authority (CEA), the installed capacity which was 3340 M.W. in 1979-1980 in the State increased by 24.2 percent during the Sixth plan period and it was 4148 M.W.in 1984-85.The installed capacity further increased by 30.5 per cent to 5417 M.W at the end of 1988-89. But the share of the State in the total installed capacity in the country declined from 9.8 percent in 1984-85 to 9.3 percent in1986-87 and remained at the same level in 1988-89 as it was in 1984-85 .The per capita power consumption in the State increased from 109 KWH in 1984-85 to 144 KWH in 1988 -89.Ins pite of the
1. Annexure-1
2. Annexure-2

increase in per capita power consumption in the State during first four years of seventh plan»it lagged far behind the national average of 220 KWH in 1988-89 and states of Punjab (536KWH) ,M a h a r a s h t r a * ( 3 7 4 K W H ) , Tamil Nadu (282 KWH) and Haryana (334 KWH).There were 6307S electrified villages in the State at the end of 1 9 8 4 - 8 5 , 1S451 villages were further electrified during the period 1985-89 and thus, the total number of electrified villages was 78526 by the end of 1988-89. The percentage of electrified villages to the total number of villages in the State increased from 56 in 1984-85 to 69.8 in 1988-89 .However,the level of electrified villages in the state still lagged behind the national average of 72 percent alrea dy achieved in 1986-87 and far behind than the states of Kerala,Tamil Nad u, P u n j a b and H a r y a n a where hundred percent villages have already been electri f i e d .
5 inlater-Resources s The state, on the whole, favourably endowed with highly fertile land and substantial surface and ground water. The latest assessment of ultimate irrigation potential in U.P was 257 lakh ha., the potential of 137 lakh ha.is based on a vailabilit y of surface water exploitable mainly by major and m e diu m irrigation projects/schemes in public sector and 120 lakh ha.based on availabili ty of ground water exploitable by minor irrigation schemes,both in public and private sectors.The investigation by state's ground wa\er and investigating d epartments of available water in the state indicate that the irrigation potential based on ground water in the state is 180 lakh ha. Taking this figure into account, the total irrigation potential works out 317 lakh ha.instead of the earlier estimates of 257 lakh ha.The present assessment of surface and ground water availab ility indicates that the irrigation intensity can be raised to about 184 percent. The total potential created in the state upto the end of seventh plan is 222 lakh ha.through all sources of irrigation which is 70 percent of 317 lakh ha.which is now the latest ultimate irrigation potential.The potential created,as percentage of the ultimate irrigation potential,is much less and still leaves a large chunk of potential corresponding to 95 lakh ha. untapped, the potential created as percentages of ultimate irrigation potential in several other states,is much higher.These percentages are 90 in Punjab,86 in Tamil Nadu, 78 in.Haryana against 70 percent in U.P. Gross area irrigated as a percentage of total gross cropped area (1986-87) is 53.2 in the state against 91.3 of Punjab and 69.1 of Haryana.
6 Transport and Communication s The length of PWD surfaced roads in the state was 45463 Kms. in 1979-80 which increased by 23,5 per cent to 6164 Kms. in 1984-85 and further increased by 12.32 per cent to 62712 Kms. by the end of 1987-88 .The density of surfaced roads per 100 sq, km. of area and per lakh of population in the state was 21.4 Km. .and 49.6 Km. respectively in 1 987-88.This road density was much behind the states of Punjab and Haryan a where the road density in 1983-84 was 73.6 Km.and49.0 Km.respec tively.Simi larly,the density of surfaced roads per lakh of population in the state had been much lower than the

corresponding density in the states of Punjab (209.4 Km.) and haryana (156-0 km.) respectively.The rank of the state among 14 major states, in villages connected with all weather roads is eighth. Only 43 per cent villages of total villages are connected with all weather roads where as the same percentage is 100 in K e r ala,99 in Punjab and 99 in Haryana.
7 Post Offices, Telegraph O f f ices and T e lephones : In11984-85,there were 18148 post offices in the State comprising about 12.5 percent of the total post offices in the country. The number of post offices per lakh of population in the State was 16 as against the national average of 21. The number of post offices in the State* as a percentage of the total post office in the country was 12.7 in '987-88 and the a v ai lability of post offices per lakh of populcition of U.P. was 15 as against 18 at the national level. The number of post offices per lakh of population in the State remained much behind the states of Punjab and Tamil Nadu where the number of post offices was 19 and 22 respectively.
8 Railways s R a i 1ways-routes upto 1988-89 were 8867 kms- inthe State which is 14.3 percent of the total routes length in thecountry. The railway route length per thousand sq. km. area and per lakh of population in the State is 30.2 km. and 6.77 km. respectively against 42.9 km. and 11.06 km. of Punjab, 42.8 km. and 5.96 km. of West Bengal and 84.1 km. and 9.49 km. of Haryana.
9 Banking : Commercial Banks play an important role ineconomic development by extending financial help to various agencies and individuals for this purpose. However, the credit deposit ratio in the State in December, 1988 was 43.4 percent against 94.4 percent of Tamil Nadu, 72 percent of Maharashtra and 61.9 percent of the country as a whole. The number of Bank Offices per lakh of population in the state was 6.16, much less than the States of Punjab (10.87), Kerala (9.51),Haryana (7.75) and Tamil Nadu (7.66).
10 Health s There were 3133 allopathic hospitals anddispensaries at the end of 1978-79 in the state .This number increased to 3439 by the end of 1984-85 and further to 4599 at the end of seventh plan (1989-90). These hospitals and dispensaries had 54.2 thousand beds at the end of 1978-79 which increased by 15.7 percent to 62.7 thousand beds by the end of1984-85 and by 19.5 per cent to 71.49 thousand beds at the end of1989-90 .The state had only 2 state allopathic hospitals and dispensaries and 42 beds for every one lakh population at the end of 1988-89 as againrt four allopathic hospitals and dispensaries and 77 beds at the national level at the end of sixth five plan.The state is also far behind the states of Punjab,Kerala and Maharashtra where hospitals/dispensaries per lakh of population are 11,15 and 15 and hospital beds per lakh of population 118,261 and 133 respectively^

11 Education s The number of junior basic schools, senior basicschools and higher secondary schools in the state increased from 70292, 13173 and 5072 in 1979-80 to 72959, 14614 and 5654 in1984-85 and further to 74683, 116654 and 5752 in 1988-89,Therewere 19 universities and 901 degree colleges in the state in 1984-85 for higher e d u c a t i o n .The number of these institutions increased to 427 including 20 Universities in 1988-89. literacy percentage is 41.7 which is far less than 90.6 in Kerala, 64 in Tamil nadu ,57 in Punjab and 55 in Haryana. It will foe seen from Annexure-1 that the number of schools per lakh of population in U.P.is also far less than Kerala ,Tamil Nadu ,Punjab ,M a h a ra shtra and Haryana.
12 It will be seen from the above that while rapid development of infrastructure is crucial for growth in the state, it is also beyond the capacity of s t a t e’s public sector. The development of infrestructure so as to make it comparable with some more prosperous states can take place only when there is a combined effort, in which apart from the state government, the central government, its railways, the banks, and private sector also contribute their share. A massive mobilization of such effort is called for in the coming few years.

Sector / Iteis « --------------------- States------------------ ------ »
Year U.P. Punjab Haryana Hahar- Gujarat Kerala Ta«il West Bihar Allashtra Nadu Bengal India
(1) (2) (3) (4) (5) (b) (7) (8) (9) (10) (11) (12)
Powf
1. Per capita Consuiption 1988-89 144 556 334 374 405 158 382 135 108 220of electricity (KUH)
2. Percentage of Villages 1988-89 69.8 100 100 99.4 98.8 100 99.9 65.4 64.8 75electrified to total No.of populated villages
Irrigation
1. Percentage of Net area 1986-87 57.2 88.3 64.8 10.4 24.1 13.5 42.5 35.8 38.8 30.7irrigated to total netcropped area
2. Percentage of Gross area 1986-87 53.2 91.3 69.1 12.4 24.7 14.8 43.7 33.3 36.7 31.4irrigated to total grosscropped area
Roads
1. Length of total surfaced 1988 25.2 73.6 49 31.7 26.7 62.1 62.8 29.2 16.5 22.7roads per hundred sq.ki.of area
2. Length of total surfaced 1988 63.4 209.4 156 . 147 146.5 90.6 161.9 45.1 38.8 103.2roads per lakh ofpopulation
3. Percentage of villages 1988 43 99 99 53 74 100 63 41 35 41connected vith allveather road to total villages

Sector / Iteis
(1)
«■ States ■»
Year U.P. Punjab Haryana Hahar- Gujarat Kerala Taiil Uest Bihar Allashtra Nadu Bengal India
(2) (3) (4) (5) (6) (7) (8) (9) (10) (11) (12)
Education
1. Literacy percentage 1991
2. No. of Schoolingfacilities per lakh of population
(a) No. of Priiary/ 1987-88Junior basic school
(b) No. of Senior Basic/ 1987-88 Hiddle schools
(c) No. of Higher 1987-88Secondary/Inter colleges
Health
1. No. of Hospitals / 1988Dispensaries per lakh of population
2. No. of Hospitals bed per 1988 lakh of population Railways
per 1U00 sq.kis of area
Post Offices
No. of Post Offices per lakh of population
Banking
1.7 57.2 55.3 63.1 60.91 90.6 63.7 57.7 38.5 52.1
59 65 33 53 33 24 54 82 64 69
13 7 8 24 41 10 11 7 15 18
5 14 14 12 12 9 8 11 5 9
2 11 1 15 15 15 2 2 1 5
42 118 50 133 109 261 85 87 35 78
1.2 42.9 34.1 17.6 28.3 23.8 30.3 42.8 30.6 19.85
13 19 14 16 22 16 22 13 13 18
1. Per capita deposits (Rs.)
1987 975 3364 1505 3024 1904 1682 1413 1953 725 1377
2. Per capita bank Credit (Rs.)
1987 414 1459 944 2239 1045 1074 1309 982 270 859
3. No. of bank offices per 1989-90 6.16 10.87 5.75 7.41 8.2 9.51 7.66 6.15 5.43 7.2lakh of population

Composite index of Relative Developments of Infra-structure1966 -67 to 1988--89
Stales •1966-67 1978-79 1964-85 1986-87 1988-89
1 2 3 4 5 6
•1. Punjab 208 212 216 2102. Haryana 129 149 154 149 1483. Gu jarat 111 125 128 132 1284. Maharasht ra 117 119 119 118 1135. Tamil Nadu 171 146 138 142 1376. Kerala 135 149 137 140 1377. West Bengal 152 145 123 123 1168. Uttar Pradesh 107 116 108 108 1069. Bi har 98 101 98 99 98
All India 100 100 100 100 100

CHAPTER - VIII
POVERTY
Poverty and unemployment are two main characteristics of b a c k w a r d n e s s . The more backward areas have higher incidence of poverty and unemployment. Even though these are described separately, poverty and unemployment are related phenomenon. Poverty is only an expression of une mployment or severe under employment. So, one is the cause, and in this case unemployment or severe under-employment is the cause, and the other in this case poverty, is the effect. But one thing which is common to both is that these, like any chronic diseases, take much too long to cure. There are no easy prescriptions for an area infested with these diseases to get rid of the same easily. One has to go far deeper into the reasons to find solutions more permanent and self-sustaining than the short cuts which only aggravate the problems in the long run. The only reasons why it has not been possible to make any significant impact on poverty in the state are inadequate rates of growth of its economy, skewed distribution of income and consumption and high rate of growth of population. It is in these directions therefore, that more efforts should be made in our future plans in order to rid the state of these diseases.
2 Having made these some general observations, we will now proceed to examine, first, the problem of poverty and, later, of unemployments. But before we do so, it is ne cessary to be clear about the concept of poverty.
3 The task force on minimum needs and effective consumption demand constituted by the planning commission (1979) considered per capita monthly expenditure of Rs. 49.09 in rural areas and rs. 56.64 in urban areas at 1973-74 p r i c e s ,corresponding to the per capita daily calorie requirements of 2400 in rural areas and 2100 in urban areas as the minimum expenditure required on food and non-food items to survive. These cut off points were described as poverty line and those below this line with per capita monthly expenditure lower than the ones indicated above, were considered poor the planning commission also accepted this as a basis for estimating the number of persons below poverty1 i n e .
4 To obtain corresponding levels of expenditure for more recent years,the 1973-74 levels have been updated by the planning commission using the implicit (C.S.O.) price index obtained from C.S.O*Sa private consumption expenditure data at current and constant prices (old series) and assuming that this index provides a reasonable proxy for price rise in the consumption basket of persons near the poverty line.The updated poverty line was worked out on this basis at the all -india level for 1983 as R s . 101.80 per capita per month in rural areas and Rs. 117.50 in urban areas.At 1987-88 prices,the cut off points were similarly

adjusted as Rs. 130.15 for rural and Rs.155.I33 for urban areas.This means that a house hold comprising an average of S. 37 persons in rural areas and 4.91 in urban areas with consumption expenditure of less than Rs.8387 per annum in rural and R s . 9 1 6 4 per annum in urban areas was below the poverty line in 1987-88.
5 On the basis of the data supplied by the National Sample Survey Organisation, and Central, Statistical Organisation the Planning Commission worked out estimates of persons bel ow the poverty line for 1977-78 and 1983-84 respectively. The estimates were worked out both for different states and the c o u n t r y , as a whole. According to these estimates, 49.7 percent of the S t a t e’s population was below the poverty line in 1977-78 against a corresponding figure of 48.5 percent for the country as a whole, the percentage population below the poverty line in the State in1983-84 was estimated to be 45.3 against a corresponding figure of 37.4 for the country.A1though the percentage population below the poverty line in the State decreased during this period,the number of such persons went up.
6 The persons living below the poverty line in the State came down only marginally from 48.5 percent (1977-78) to 45.3 percent in 1983 against a much sharper reduction from 48.5 percent to 37.4 7. in the country The modest reduction in the State is explained by the fact that the population below the poverty line in absolute numbers, rose b.y 4.9 percent (26 lakh) from 506 lakh (1977-78) to 530.6 lakh (1983) in U.P. However, persons below the poverty line in the country declined by 11.7 percent from 3068 lakh to H710 lakh in the same period.
7 With in the population of 530 lakh living below the povertyline in the State 440.0 lakh were from rural areas and 90.6 lakh from the urban a r e a s ,comprising 47 and 42 percent of their population respectively,yielding an over all percentage of 45.3. Within the not addition of (530.6-504.0) 24.6 lakh in thepopulation below the poverty line in 1983 over 1977-78 the share of rural poors was nearly 70 percent.The incidence of poverty in the rural area in the country was one percent higher than the same incidence in the State in 1977 -78. There was a marginal decrease of 3 percent in this incidence in the State as against significant decrease of 11 percent in the the country .Thereduction in percentage population below the poverty line in urban areas of the State was 9 percent against a correspondingreduction of 10 per cent in the country.The incidence of povertyin rural areas was, thus, not only higher but in a period of 5 years,from 1977-78 to 1983-84, the gap between the incidence of urban and rural poverty which was marginal at 1 percent also increased to 5 percent while the same gap in the country came down from 13 percent to 12 percent in the country.The growth in household expenditure in a period of 5 years,from 1977-78 to1983-84, thus remained heavily in favour of urban areas.

8 The more recent tentative estimates of poverty have been worked fay the planning commission fay utilizing provisional figures of 43rd round supplied fay National Sample Survey Organisation a According to these estimatesr the percentage population below the poverty line in 1987-88 was 33 in the State and 29.23 in the country. In absolute numbers this percentage works out is 422 lakh persons in the stats . H o w e v e r ,since some doufats have been raised about these estimates, an expert group headed by Dr.D.T, Lakdawala has been set up by the Planning Commission to consider in same and the methodology used for preparing these estimates. Until then,these estimates also can not be considered final*
9 An exercise was done at the State level also to prepareestimates of poverty by utilizing the data collected throughnational sample survey during 43rd round (1987-88) in statesample- This data has not been adjusted from C.S.Q*s™ consumerexpenditure data. The estimates are therefore ,likely to be on a higher side. According to these estimates 500.76 lakh persons in rural areas and 98.87 lakh in urban areas in this state,comprising 47.15 percent and 45.13 percent respectively of their total population ,were below the poverty line in 1987-88,yielding an over all population percentage of 46.80. The total population below the poverty line, thus, rose still further by 13 percent from 530.6 lakh (1983) to 599.63 lakh (500.76 + 98.87).
10 The other cut-off points suggested by Professor B.S. Minhas and others for 1987-88 for poverty line are Rs. 121.30 for rural area and Rs. 151.58 for urban areas. Using these cut off points and utilizing the N.S.S data collected during 1987-88 through state sample,the estimates of persons below the poverty work out to 434.02 lakh in rural area and 94.46 lakh in urban areas,making a total of 528.48 lakh persons below the poverty line against the earlier two estimates of 422 lakh and 599 lakh.Within this number (528.46 lakh) 40.86 percent are in rural areas and 43.12 percent in urban a r e a s ,yielding an over all percentage of 41.24 ,against earlier percentages of 33 and 46.8.
11 There are, thus, three sets of figures for 1987-88 ofpoverty in the state.These are 422 lakh,528 lakh and 599 lakh, comprising 33"/. 4 1 . 2 4“/. and 46.87. respectively of state'spopulation.The earlier figure of 1983,which is not disputed was 531 lakh.comprising 45.3% of the State's population of that year, except for the figure of 422 lakh (33%) ,which is significantly lower than the figure of 531 lakh (45.3%) of 1983, the other two estimates of 528 lakh (41.24%) and 599 lakh (46.8 %) are close to the figure of 1983.While the first figure would support this conclusion that between 1983 and 1987, there was a significant reduction of about 12 percentage points in percentage population below poverty line or of 109 lakh persons (20.5%) below this line against an increase of 26 lakh (4.9%) in the earlier period from1977-78 to 1983 .The reversal of the earlier trend in the more recent period on this significant scale is neither supported by other related data of growth in agriculture during this period or

the pattern of land distribution, which is ,the main asset and source of income in the State, nor it agrees with the declining share of UP in per capita income and per capita consumption expenditure of the country.The empirical evidence lends more credibility to the other two estimates and it will be reasonable to assume, for the time being until there is a finality on these estimates, that the number of persons below poverty-line in •1987-88 was not too different from what it was in 1983,even though in terms of percentage, population below this line ,it may have gone down marginally .The conclusion is obvious that the problem of poverty in the state continues to remain alarming and that the measures taken in the past for removal of poverty have not met with any significant success in making major dent on this problem.We can safely assume this as a base for Eighth Plan.
12 There is no foolproof method either to determine and its incidence or to find out how poor are the poor. There are also gradations amongst poor . However, one can get some idea of distribution of population and consumption according to rural and urban sectors from the following table s
Table - 1
Distribution of Population and Consumption
Percentage Consumption
38th round
Grade PopulationPercentage
according to consumption expenditure
32nd round July 1977 • June 1978
43rd round July 1987 - June 1988
Rural Urban Rural Urban Rural Urban
1 2 3 4 5 6 7 8
Bottom <=20 9.23 8.87 9.90 9.47 10.19 9.05>20 and <=40 13.03 12.21 13.73 13.01 13.85 12.32>40 and <=60 16.60 15.61 16.75 16.23 16.88 15.91>60 and <=80 21.58 21.16 21.61 21.87 21.70 20.60
Top >80 and <=100 39.56 42.15 42.15 39.36 37.38 42.12
13 It will be seen from the table that the shares of Bottom 20 per cent population in consumption expenditure, both rural and urban areas, were not only far less but remained almost unchanged in this period. This was true in the case of the next higher 20 percent population. As against this hiatus between their shares in population and consumption e x p e n d i t u r e ,the share of the top 20 percent population in consumption expenditure remained almost twice the same in this period.In other words,the

uneven distribution of consumption expenditure an indicator of disparity in personal incomes,is not under going any significant changes as a result of planning and development.
14 The monthly household per capita e x penditure in rural areas in the state was always lower than urban areas.The gap between per capita monthly household expenditure of these two areas also rose from Rs. 5.85 in 1973-74 to Rs. 73.49 in 1988-89 .The disparity between per capita monthly expenditure thus confined to rise in this period which is a very disturbing feature .
15 The following table shows monthly per capita expenditure of U.P. as a percentage of monthly percapita expenditure at the national level in different periods-
Table S
U.P. as percentage to India as per capita monthlyex pend i tu re
Re r i od
1
Rural
2
Urban Total
4
July '67 to June '68 O c t . '73 to June '74 July '77 to June '78 Jan. to December '83 July '86 to June '87 July '87 to June '88 July '88 to 'June 89
99.699.897.892.9 98.5 94.0 94. 1
93.8 8 6 . 185.8 82.684.686.7 89.3
96.795.8 95.0 90.494.9 90. 1 91 .0
16 The shares show a declining trend. The aggregate share ofper capita monthly expenditure of the State in the same expenditure of the country declined from 96.77. in 1967-68 to91.07. in 1988-89 .This trend is in conformity with the declining share of Sta\te’s per capita income in c o u n t r y’s per capitaincome, which also came down from 89.4 percent (1967-68) to 70.8 percent (1988-89).
17 Out of the total monthly household expenditure of the statein 1973-74, 84.66 percent expenditure was in rural areas and15.34 percent in urban areas .However, the share of rural camedown from 84.66’/ to 75.97 percent in 1988-89 against an increasein the share of urban areas from 15.34 to 24.03 percent in same period.The changes in these shares are not explained by marginal changes in the shares of rural and urban areas in total population and are purely due to inequitous distribution of i n c o m e . Since per capita income is the major determinant of per capita consumption, the latter must also rise with increase in the former. These parameters are used as indicators to evaluate

the success achieved in development. The achievem ents in these respects are however, far from encouraging as will be seem from the following table s
Table - 3
State's share in Country's per capita income and per capita consumption in 1967-68 and 1988-89 at current prices
(P e r c e n t )
Year Per capita consumption Per capitaexpenditure income
1967-68 96.7 89.4
1988-89 91.0 70.8
18 There is no data on incidence of poverty in different regions of the State. We have only macro aggregates for the State as a whole. However, the data of consumption expenditure is available for different regions of the State and it can provide some broad insight into relative levels of poverty also in these regions. It should be seen that divergence in respect of per capitc^ income and per capita consumption between the State and the Country has consistently increased during the period 1967-68 to 1988-89. Consumption being a function of income has followed the movement behaviour of the latter. The per capita income gap which was 10.6 percent (100.0-89.4) in 1967-68 rose to 29.2 percent (100.0-70.8) in 1988-89 showing almost a three fold increase. The per capita consumption also diverged in the same order from 3.3 percent (100.0-96.7) to 9.0 percent (100.0-91.0). It shows that to variable of per capita income, viz, income and population have behaved unfavourably in the State, the former moving comparatively with slower pace and the latter with faster rate vis-a-vis the country. The measures for reducing regional disparities hardly appear to have made any dent on the problem. The divergence gaining momentum in the per capita consumption with one to one correspondence in per capita income only under scores the neutrality of distributive measures.
19 The per capita monthly household expenditure of Rs. 92.68 in rural areas of the Central region the lowest and of Rs. 125.15 in rural area of hills was the highest in 1987-88 .The corresponding figures for western, eastern and Bundelkhand regions are Rs. 119.08 Rs. 96.86 and Rs. 96.36 respectively, as against an expenditure of Rs. 99.83 in rural areas for the State as a whole.
20 Similarly, 68.19 percent of rural population in central region,67.04 percent in Bundelkhand region, 66.38 percent in eastern region,47.60 percent in western region and 45.09 percent

in Hill region were in monthly household expenditure class of less than Rs. 100.00 as against the states average of 59.58percent. The percentage figures within monthl y household expenditure class of -100-200 for the hills, western, eastern, central and Bundelkhand regions were 43.27, 42.16, 29.42,27.6 2and 27.13 respectively as against state's average of 33.81percent .The percentage of population of 11.64 within the expenditure class of Rs. 200 and above in the hills, was the highest and 4.19 percent in Central the lowest,the corresponding percentages for W e s t e r n ,Eastern and Bundelkhand were 10.24,4.20 and 5.83 respectively, against s t a t e’s average of 6.61 percent.
21 As stated in the beginning, the solution to the problem ofpoverty lies mainly in creating opportunities of gainful and self-sustaining employment cor responding to the size of the problem. In our situation, the important task is to raiseemployment Potential of the farm sector and to fully utilize it to raise employment and income levels of those who directl y depend on it. But apart from accomplishing the task, non-farm sectors, particularly the manufacturing sector, should be enabled to grow at a higher rate, providing more remunerative employment for excess labour force in agriculture to divert from farm sector to these sectors.
22 It may be stated in this connection that there is a direct relationship'* between percentage of workers engaged in agriculture and percentage population below poverty line. The States, which with have much higher shares of workers in agriculture and its lower share in their income, have generally, higher incidence of poverty also. The higher the gap between the two, the more is the incidence of poverty. This is obviously a result of severe underemployment amongst agricultural workers in S t a t e s .
23 Regardless of the differences in estimates of population below poverty line, arising mainly out of m e t h o dology used, one thing which is borne out from all these estimates is that about one crore household in the State were leading a life below poverty line in 1987-88. This gives us some broad idea of the magnitude of the problem of poverty as it was found some four years back. There is no evidence to suggest that the incidence of poverty has undergone any significant change in the subsequent four years. If any thing, the number of persons and households below poverty line may have risen still higher in 1991-92 as a result of higher growth in population and a modest growth in the economy of the State during this period.
24 The total eradication of poverty is, therefore, possible only if opportunities of gainful and self sustaining employment are created for about one crore households below the poverty line. This is an impossible task to achieve in a short period of
1. AnneXU r e - 1
( T7 \

five years and consequently total eradication of poverty is also not possible in this period. The incidence of poverty, expressed in terms of percentage population below poverty line alone, does not completely explain the size and complexity of the problem. It is equally n ecessary for this purpose to have some idea of how poor are the poor. There are some amongst these who are closer to the poverty line than the rest in terms of the gap which exists between their per capita monthly household expenditure and the cut-off points which describe poverty line.
25 As stated earlier, the exercise at the State level hasyielded two estimates of persons below poverty line in 1987-88. These are of 599 lakh persons and 528 lakh persons. In order to have some estimates of intensity of poverty also amongst these persons, they were further classified in three categories according to per capita monthly expenditure. This classification together with additional expenditure required to bring them above poverty line is shown in An nexure-2 and their break-ups between rural and urban in Annexures 3 & 4. The additional monthlyexpenditure required in the case of the first estimate (599 lakh persons) is about 200 cr. and in the case of the second estimate. (528 lakh persons) about Rs. 153 crore since between these two estimates, the second one is considered more reasonable both from the point of view of methodolo gy used for arriving it and its proximity to the earlier estimates of 1983 and 1977-78. In observations made in the succeeding based are therefore base upon this estimate only.
26 The household consumption expenditure of the population below poverty line was short by about Rs.1800 cr. (153x12) in1987-88 of the total expenditure which would have raised thispopulation above poverty line. After allowing for annual inflation, this expenditure would work out to about 40 percent of the incremental income (at current prices) in the state in1988-89. It follows, therefore, that in case the population is below poverty line and its structure remains constant and there is no decelerat ion in the rate of growth in the economy, about 407. of incremental income in the state should flow, on a recurring basis, to those below poverty line to ensure that there is no poverty in the state. The redistribution of incremental income on such scale is a very difficult task for planning and d e v e 10 p m e n t .
27 However, this share of 40 percent is percent based on theassumption that total incremental income is available fordistribution amongst the people of the State. This assumption isnot valid, for a significant part of this income is not beingshared by the people of the State nor it is available for private household consumption. The income available for this purpose is less than the total income. Consequently, the share in the incremental income required to raise the population below poverty line above this line will be still higher. This makes the task of eradication o^ poverty still more difficult.

28 However, the fact remains that, redistribution of income, growth in income and population below poverty line are three most important variables of poverty. Keeping in view, these relevant factors, the target for the Eighth Plan is the bring down the estimated percentage population below poverty line from about 39'/. in 1991-92 to about 247. in 1996-97. A reduction of this order in poverty is also very difficult. It not only calls for a great thrust on raising employment-potential in farm sector through diversification within agriculture but also for a higher rate of growth in manufacturing and other non-farm sectors in order to reduce pressure on land. The strategies and targets of eighth plan, more particularly of employment generation, have been drawn up keeping these imperatives in view. However, a lot more thought will have to be given, keeping in view the classification of population below poverty line, to identify programmes and policies to achieve the stipulated reduction in poverty in the Eighth Plan.

Statewise percentaaes of persons below oovertv line (k )and aariculture workers(v)
Sr. States Persons Rank Agriculture Rank d=x-y d=No. below of workers of
poverty (X) (y) (y)line
1 Bihar 49.5 1 79.8 1 0 02 n.p. 46.2 2 78.1 2 0 03 U.P. 45.3 3 75.0 4 -1 14 Orissa 42.8 4 77.1 3 1 15 Tamil Nadu 39.6 5 63.0 9 -4 166 West Bengal 39.2 6 58.2 13 "7 497 Andhara Pradesh 36.4 7 72.0 5 2 48 Karnataka 35.0 8 68.8 7 1 19 Maharashtra 34.6 9 63.8 8 1 1
10 Rajasthan 34.3 10 71.8 6 4 1611 Kerela 26.0 11 50.9 14 -3 912 Gujarat 24.3 12 62.5 10 2 413 Haryana 15.6 13 61.7 11 2 414 Punjab 13.8 14 59.0 12 2 4
I.Rank Correlation (r) = 1- -------n(n«~1)
•16x110
14(142-1)
= 1-0,24 = +0.76
660
2730
2.Coefficient of rank--correlation (r)~ +0.76

Classification of persons below poverty line Cut off points < Rural Rs.130.15
of per capita house hold i Urban Rs.155.33 consumption Expn. per month
Percentage Monthly Expend i tu re Gr ou p
Population (Pe r s o n s )
Percentage Additional (0«00) expenditure
requires per month to bring them up above
the poverty line (Rs.’000)
Per centage additional expenditure (0.00)
•1 2 3 4 5
0-6565-100100 & above
3,561,481 24,296,203 32,104,857
(3)(19)(25)
5.9440.5253.54
267,458 1,151,933
586,158
13.3357.4329.24
Total 59,962,541 (47)100.00 2,005,549 100.00
2. Cut off points-Rural R s . 121.50 -Urban R s . 151.50
0-6565-100100 & above
3,561,48124,296,20324,990,585
(3)(19) (19)
6.7445.9747.29
237,827953,274337,691
15.5662.3522.09
Total 52,848,269 (41)100.00 1,528,792 100.00
NotesF igures in brackets in Col- 2 are percentages (rounded) of total (estimated) population in the state in •1991--92

Classificat ion of persons below the poverty line1.Cut off point Rs.130.1!3
RuralPer Capita Monthly Expn. Group
Population Percentage Additional (Persons) (0.00) expenditure
required per month to bring them above the cut off point
(R s . *000)
Percentage of a d d i
tional exp nditure (0.00)
1 2 3 4 5
6565-100 100 & above
3,306,93421,806,38424,962,272
6.6043.5549.85
242,200 980,272 387,143
15.05 60.9024.05
Total 50,075,590 100.00 1,609,615 100.00
2. Cut off point Rs.121. 50
0-6565-100100 & above
3,306,93421,806,38418,288,940
7.62 50.24 42. 14
213,595791,647166,575
18.2367.5614.21
Total 43,402,258 100.00 1,171,817 100.00
( QZ )

Annexure-4
State U.P.Classification of persons below the poverty line
1.Cut off point Rs.155.53
Urban Percapita (lonthly Expn. Group
Population Percentage Additional (Persons) (0.00) expenditure
required to bring them up above the cut off point
(Rs.’OOO)
Percentageadditionalexpenditure
(0.00)
1 2 3 4 5
0-65 254,547 2.58 25,258 6.3865-100 2r489,819 25.18 171,661 43.36100 & above 7r142r585 72.24 174,274 50.26
Total 9f886,951 100.00 371,193 100.00
2.Cut off point Rs.151. 50
0-65 254,547 2.69 24,232 6.7965-100 2r489r819 26.36 161,627 45.28100 & above 6,701,645 70.95 171,116 47.93
Total 9,446,011 100.00 356,975 100.00

CHAPTER - IX
EMPLOYMENT
The growth in economy takes place mainly through increase in productivity and employment. The reasons for a lower growth in the past in this State than most other states and the country, as a whole, are its lower productivity and smaller expansion in employment. This has been due to several factors. This is, however, not the place to explain these factors also. But what we must understand very clearly is that the situation of unemployment and underemployment, like poverty, is very depressing and that the rate and pattern of growth in s t a t e’s economy were inadequate to create employment on a scale which could meet the demand for employment arising from a huge backlog of unemployed and a higher growth in the S t a t e’s population. It may be stated that employment, in this context, refers to gainful, permanent and self sustaining employment only and not to employment at far too low wages or income or employment of short duration and ad-hoc nature.
2. Even though it is true that growth in employment is linked to growth in income, the best model for dev elopment for a backward State like U.P. is one which combines growth in productivity and employment for achieving a reasonable growth in the economy. While productivity has purely an economic function, employment has a strong social function also. A higher growth mainly through increase in productivity but without any significant reduction in unemployment and severe un deremployment is less desirable for the State than achieving even some slightly lower growth but with a higher increase in employment. It is in this background that we will describe here the situation of unemployment and under employment in the State and the targeted growth in employment during the Eighth Plan.
3. Before we proceed to describe this, it may be stated herefor practical purposes, there is no distinction betweenunemployed and severely under-employed. It is necessar y to have proper assessment of the incidence and intensity of underemployment also in order to have a complete picture of unemployment- This is much more true in the case of this state, where the economy is predominantly a g r i c u l t u r a l , pressure on land is very high, per capita land is very small and the pace of diversification in crops from low value to high value and more labour intensive crops is very slow. There is widespreadunderemployment of varying intensity amongst agricultural workers in the state. Any employment planning which does not take into account the nature and size of this problem also and limits itself to unemployed only will have a very limited impact.
4. The Census, E.M.I. N.S.S. and Annual Survey of Industries (A.S.I.) are the four main sources of employment data. Even though this data suffers from certain limitations due to

conceptual and methodological changes from time to time and it is somewhat difficult to quantify the state of employment and unemployment, all the same it provides a basis for an assessment of the situation and trends.
5. Census provides the number of workers in the state after every ten years. According to 1981 census, the total number of main workers in the state was 324 lakhs, as against 273 lakhs in 1971. There was an increase of 51 lakh workers and yielding an annual growth of 1.71 per cent. The share of main workers to the total population, however, came down to 29 per cent in 1981, as against higher shares of 31 per cent in 1971 and 42 per cent in 1951.
Table-1
Main Workers in Uttar Pradesh(No. in lakhs)
Census No. of workers Percentage in the total population
(1) (2 ) (3)
1951 269 421961 289 391971 273 311981 324 29
6. It may be mentioned here that as regards the share ofworkers in total population, this State lagged behind most States in the country and ranked 18th amongst 22 States. This share was33 per cent in the country, as a whole, in 1981.
7. The growth in employment by industrial clcduring the period 1971-81 shows maximum growth (7.16 mining and quarrying sector. But the number of workers sector was very small. Next to it is the construction which recorded 7.05 per cent growth. The other manufacturing and transport, storage and communication registered a growth of 3.91 per cent and 3.44 per respectively. The growth in agriculture was about 2 on 1 y .
if ication*’r cent) ins in thison s e c t o r ,ect ors ofact ivitiesent growthpe r cent
8. The
to manufacturing and agriculture sector
of wo r k e r s by broad categor ies ind icated ar k e r s from agr i c u 1tu re and alii ed sectorsepai rs act ivit ies and other work s . But theontinu ed to oc cupy a dominan t po sit ion withtotal worke rs still engaged in it The
1. Annexure-I
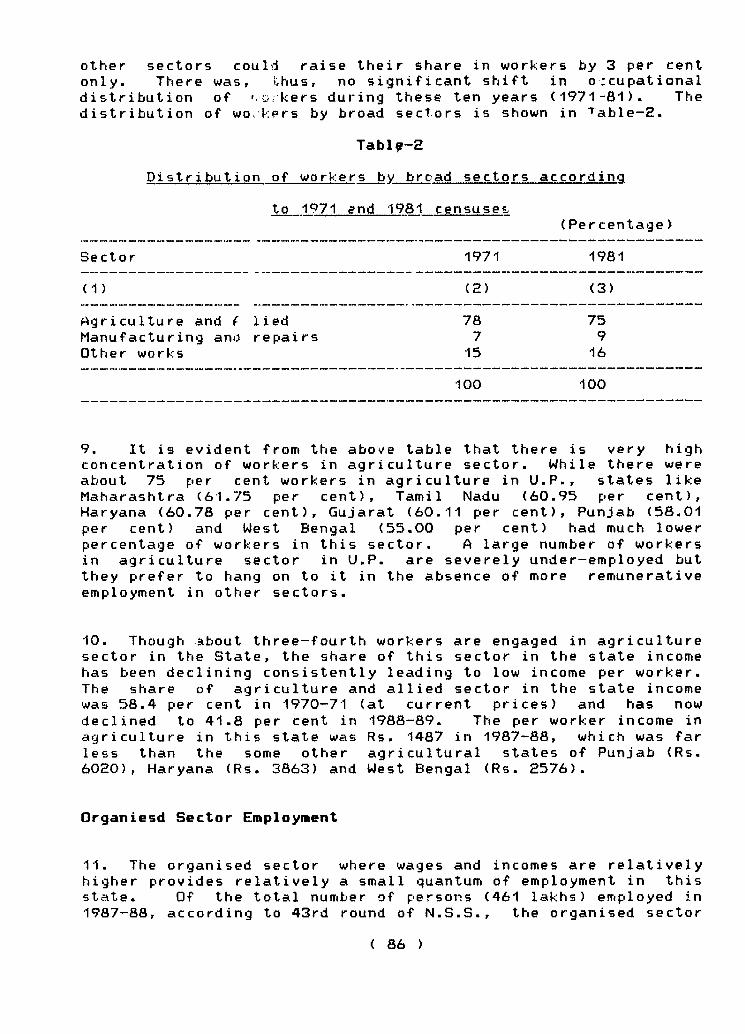
other sectors could raise their share in workers by 3 per cent only. There was, thus, no significant shift in oicupational distribution of '..Drkers during these ten years (1971-81). The distribution of wOv kers by broad sectors is shown in Table-2.
Tabl^-2
Distribution of workers b v broad secto rs accord in >3
to 1971 ^nd 1981 censuses.(Per c e n t a g e )
Sector 1971 1981
(1) (2) (3)
Agriculture and f lied 78 75Manufacturing ano repairs 7 9Other works 15 16
100 100
9. It is evident from the above table that there is very high concentration of workers in agriculture sector. While there were about 75 per cent workers in agriculture in U.P., states like Maharashtra (61.75 per cent), Tamil Nadu (60.95 per cent), Haryana (60.78 per cent), Gujarat (60.11 per cent), Punjab (58.01 per cent) and West Bengal (55.00 per cent) had much lower percentage of workers in this sector. A large number of workers in agriculture sector in U.P. are severely under-emp loyed but they prefer to hang on to it in the absence of more remunerative employment in other sectors.
10. Though about three-fourth workers are engaged in agriculture sector in the State, the share of this sector in the state income has been declining consistently leading to low income per worker. The share of agriculture and allied sector in the state income was 58.4 per cent in 1970-71 (at current prices) and has now declined to 41.8 per cent in 1988-89. The per worker income in agriculture in this state was Rs. 1487 in 1987-88, which was far less than the some other agricultural states of Punjab (Rs. 6020), Haryana (Rs. 3863) and West Bengal (Rs. 2576).
□rganiesd Sector Employment
11. The organised sector where wages and incomes are relatively higher provides relatively a small quantum of employment in this state. Of the total number of persons (461 lakhs) employed in 1987-88, according to 43rd round of N.S.S., the organised sector
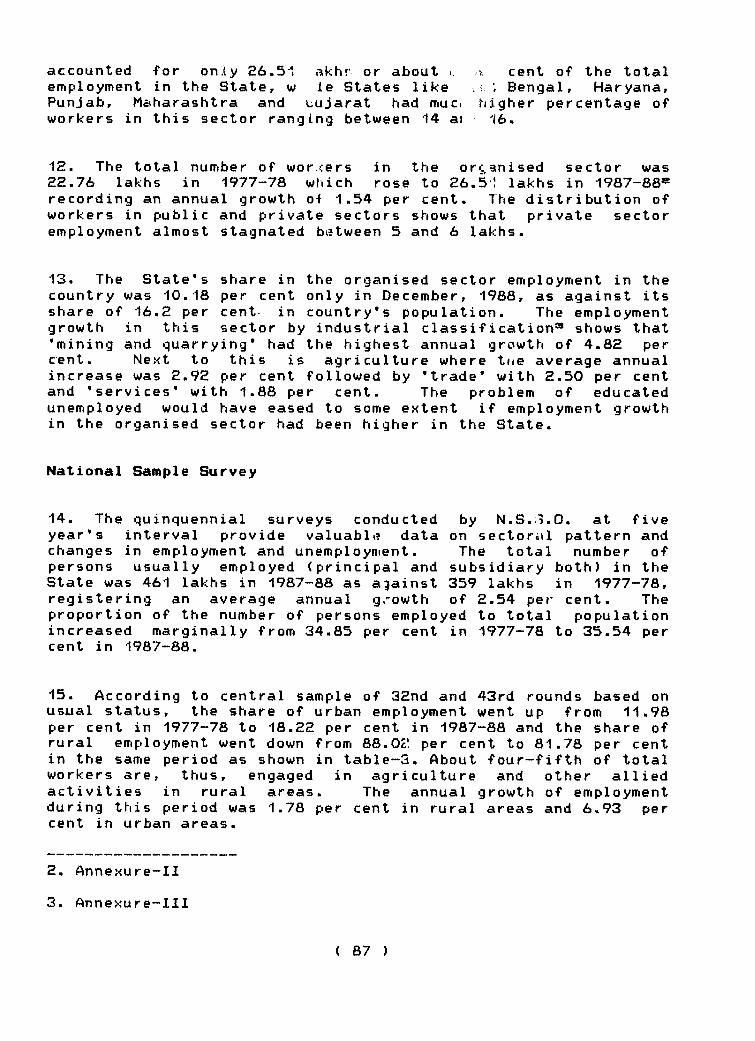
accounted for only S6.51 akhr or about <. *; cent of the totalemployment in the State, w le States like .: ; Bengal, Haryana,Punjab, Maharash tra and Lujarat had muci higher percentage of workers in this sector ranging between 14 ai 16,
12. The total number of workers in the orc,anised sector was 22.76 lakhs in 1977-78 which rose to 26.5! lakhs in 1987-88® recording an annual growth o4 1.54 per cent. The d i st ribution of workers in public and private sectors shows that private sectoremployment almost stagnated b^»tween S and 6 lakhs.
13. The S t a t e’s country was 10.18 share of 16.2 per growth in this 'mining and quarr cent. Next to increase was 2.92 and ’s e r v i c e s’ wi unemployed would in the organised
share in the organised sector employment in the per cent only in December, 1988, as against its cent in c o u n t r y’s population. The employment sector by industrial classification® shows that
y i n g’ had the highest annual growth of 4.82 per this is agriculture where the average annual
per cent followed by ’t r a d e’ with 2.50 per cent th 1.88 per cent. The problem of educated have eased to some extent if employment growth
sector had been higher in the State.
National Sample Survey
14. The »:?uinquennial surveys conducted by N.S.3.0. at five y e a r’s interval provide valuable? data on sectored pattern and changes in employment and unemployment. The total number of persons usually employed (principal and subsidiary both) in the State was 461 lakhs in 1987-88 as against 359 lakhs in 1977-78, registering an average annual growth of 2.54 per cent. The proportion of the number of persons employed to total population increased marginally from 34.85 per cent in 1977-78 to 3 5 .54 per cent in 1987-88.
15. According to central sample of 32nd and 43rd rounds based on usual status, the share of urban employment went up from 11.98 per cent in 1977-78 to 18.22 per cent in 1987-88 and the share of rural employment went down from 88.02 per cent to 81.78 per cent in the same period as shown in table-3. About four-fifth of total workers are, thus, engaged in agriculture and other allied activities in rural areas. The annual growth of employment during this period was 1.78 per cent in rural areas and 6.93 per cent in urban areas.
2. Annexure-II
3. Annexure-III

Table-3
A g gregate usuall v emploved (principal and s u b s i d i a r y_ status) for Rural and Urban areas
(in lakh)
Year No. of Persons employed
Rural Urban Total
(1) (2 ) (3) (4)
•1977-78
1987-88
Compound annual growth rate during 1977-78 to 1987-88 (p e r c e n t )
316( 88 . 02 )377(81.78)1.78
43 (11.98)
84 (18.22) 6.93
359 (100) 461 (100) 2.54
16. The annual growth rate of total employment by industrialclassification*^ shows highest growth of 6.25 per cent inconstruction followed by services with 4.92 per cent. Trade and manufacturing had 3.50 per cent and 2.32 per cent growth respectively. In agriculture, this growth was 2.08 per centonly.
17. The analysis of flows of incremental work force of 102 lakhin this period shows that about 60 per cent workers continued tohang on to agriculture, 16 per cent were absorbed in services and 9 per cent in trade.
18. The data on persons usu ally employed by status ofemployments^* shows that in rural areas about 73 per cent amoni^ males were self-employed in 1987-88 whereas casual and regular labour accounted for 21 and 6 per cent respectively. Between77-78 and 87-88, the share of self employed and regular employeesamong the males in rural areas declined and, the share of casual labour went up from 17 per cent to 21 per cent. Among rural females, the share of casual labour declined from 20 per cent (1977-78) to 18 per cent (1987-88). In urban areas, among males, self employed were as much as 56 per cent of the total employed in 1987-88 followed by regular employed (33 per cent). The proportion (11 per cent) of casual workers had been stagnating since 1977-78 in urban areas. Among urban females, self employed claimed the largest share (67 per cent) while regular employees and casual labour accounted for 25 per cent and 8 per cent
4. Annexure-IV
5. Annexure-V

respectively. It is observed that during this period (1977-78 to1987-88), the share of self-employed and regular employees declined in rural areas and that casual labour had ascendancy in rural areas and descendancy in urban areas.
Annual Survey of Industries
19. This survey covers the registered factories only. Thesurvey shows that during the decade 1973-76 to 1985-86, employment in these factories increased at a rate of 1.65 per cent per annum, while the annual increase in output was 7.31 per cent. The employment elasticity with respect to output for this period was, thus, 0.23. This only shows that employment growthduring the past decade has been very slow in the registeredmanufacturing sector vis-a-vis output- This may be due to the increasing capital intensive growth in this sector in the recent past.
20. NeKt to agriculture and allied sectors, the manufacturing sector employs the largest number of workers. The share of workers in manufacturing sector is about 9 per cent in the State. Though total employment in registered manufacturing sector is increasing, it is declining per lakh of investment^. The employment per lakh investment was 2..!8 in 1975-76 which decreased to 1.82 in 1980-81 and still further to 0.75 in 1985-86 and 0.66 in 1986-87. In view of this declining trend, the unregistered manufacturing sector, which has larger potential of employment, deserves special consideration and support.
Unorganised Sector Employment
21. The total workforce is absorbed in organised and unorganisedsectors. The unorganised or informal sector is a very vast sector covering about 94 per cent workers of the total workforce but it is a n on-reporting sector. However, an attempt has been made here to work out broad estimates of employment growth in this sector also. For this purpose, the total workers based on usual status in 1977-78 and 1987-88, according to 32nd and 43rd rounds of N.S.S. have been taken to be the total work force and the organised sector employment for the respective years has been used to arrive at the estimates of the unorganised sectoremployment. There were about 337 lakh w o rkers^ in theunorganised sector in 1977-78. This workforce rose to about 434 lakhs in 1987-88 with an average annual growth rate of 2.60 per cent. The analysis of employment growth in this sector by industrial classification revealed that the construction sector recorded the highest annual increase of 7.49 per cent followed by
6. Annexure-VI
7. Annexure-VII

services (6.87 per cent) encouraging growth of respectively.
Trade and transport also showed 3.50 per cent and 3.16 per cent
Unemployment - Size and Trends
22. The employment exchanges, D.H.T.P. survey and N.S.S. are the three main sources of data on unemployment and will be here to describe the status of un employment in the state. The total number of job-seekers registered in Live Registers in December, •1990 was 31.19 lakhs. It is observed that the number of job seekers has been continuously increasing since 1981, (as given in table-4)
Table - 4
Growth of job seekers in U,P.(in lakhs)
Year (December) No. on the L.R.
1981 15.061982 16.151983 18.551984 18.771985 25.701986 32.551967 29.591988 29.741989 31.141990 31.19
Source! Records of the Directorate of Training and E m p l o y m e n t ,UP
23. Out of the total 31.19 lakhs unemployed in 1990, 20.66 lakhs were matriculates and above. This figure however, does not give the total picture of educated unemployed because the N.S.S.results indicate that between matriculates and graduates, themselves registered on live If this correction factor number of educated unemployed 35 lakhs. It will also
60 and 80 per cent of unemployed in both rural and urban areas, got registers of employment exchanges, is taken into account the estimated would be somewhere between 26 and be seen that unemployment has been
increasing at a faster rate among educated® persons as the number of 2.76 lakh job seekers with High School qualification in 1979 rose to 7.35 lakhs in 1990, showing 166 per cent increase during the period of 1979-90. In the same period, the number of job seekers with intermediate qualification rose from 3.27 lakhs to 8.35 lakhsr showing 156 per cent increase. The increase of 145

per cent was also recorded among graduates and 224 per cent among post graduates. These figures only speak of the severity of the problem of unemployment amongst the educated manpower.
D-H.T.P, Survey
24, Apart from this incidence of unemployment amongst educated manpower, there is unemployment among scientific and technical*^ manpower also. According to an estimate of C.S.I.R., on the basis of D.H.T.P. Survey conducted alongwith census 1971, the stock of these personnel in the state was about 1.45 lakh in 1971. It is estimated that the stock of these personnel would have risen to 3.75 lakh by 1991. The results of D.H.T.P. Survey, 1981 indicate that only about 58 per cent of this manpower was employed, 19 per cent was unemployed and the remaining 23 percent was out of labour force and its details are given in table-5.
Table-5
Percentage distribution of stock of Scientificand Technical_personnel according to their
a c t i v i t V status - 1981
ActivityStatus
Catego ry
Agr i c u 1tu re Science Eng inee r Med i c ine Total
(1) (2) (3) (4) (5) (6)
Employed Unemployed Out of labour
65.97 15.45
force. 18.58
47. 12 22.07 30.81
74.79 15.22 10. 19
76.2710.4113.22
58.4018.5823.02
Source s Degree holder a\nd Technical Personnel Survey, Census of India, 1981.
25. Due to n o n - a v a i l a b i 1 ity of current data on employment and unemployment amongst technical personnel, the ratios of 1981 are used for estimciting the activitywise break-up of stock for 1991. On the basis of these ratios, about 70 thousand scientific and technical personnel are estimated to be unemployed and 86 thousand out of labour force in 1991. These estimates are comparatble with the figures of Live Register also. According to Live Register statistics, the total unemployment in these categories was 63 thousand by the end of 1990.
9. Scientific and technical personnel includes degree and diploma engineers, doctores, graduates and post graduates in science and ag r i cu1tu r e .
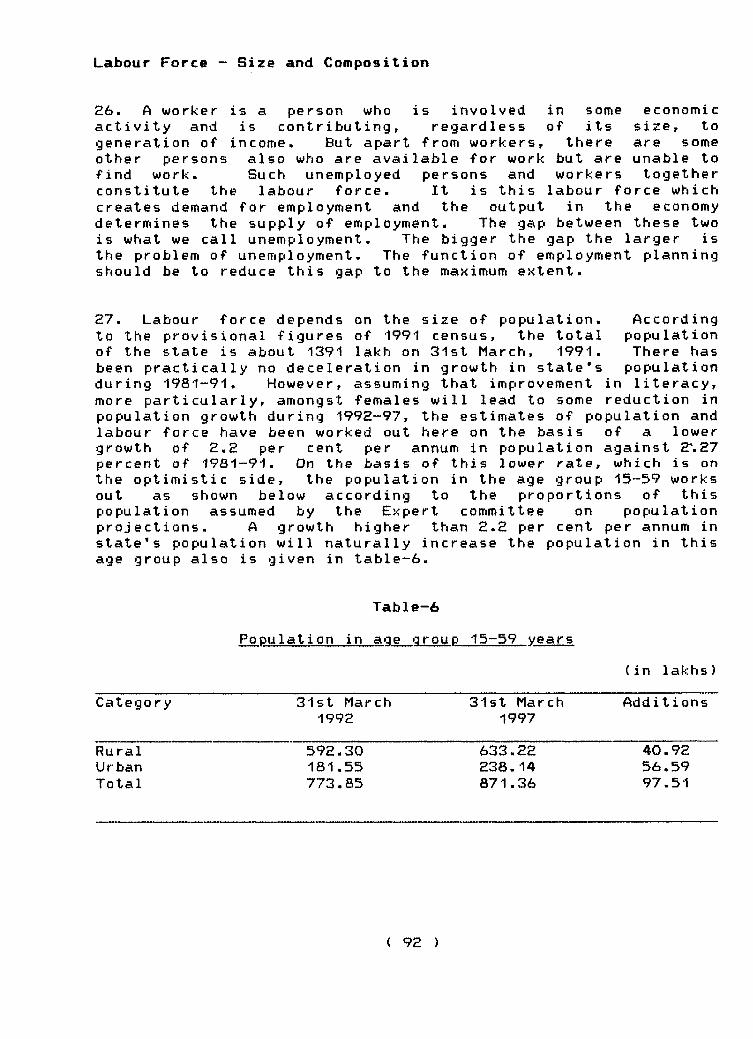
Labour Force ~ Size and Composition
26. A worker is a person who is involved in some economic a ctivity and is contributing, regardless of its size, to generation of income. But apart from workers, there are some other persons also who are a vailable for work but are unable to find work. Such unemployed persons and workers togetherconstitute the labour force. It is this labour force which creates demand for employment and the output in the economy determines the supply of employment. The gap between these two is what we call unemployment- The bigger the gap the larger is the problem of unemployment. The function of employment planning should be to reduce this gap to the maximum extent.
27. Labour force depends on the size of population. According to the provisional figures of 1991 census, the total population of the state is about 1391 lakh on 31st March, 1991. There has been practically no deceleration in growth in state's population during 1981--91. However, assuming that improvement in literacy, more p a r t i c u l a r 1y , amongst females will lead to some reduction in population growth during 1992-97, the estimates of population and labour force have been worked out here on the basis of a lower growth of 2.2 per cent per annum in population against 2^.27 percent of 1981-91. On the basis of this lower rate^ which is on the optimistic side, the population in the age group 15-59 works out as shown below according to the proportions of this population assumed by the Expert committee on population projections. A growth higher than 2.2 per cent per annum in s t a t e’s population will naturally increase the population in this age group also is given in table-6.
Table-6
Population in age group 15-59 years
(in lakhs)
Category 31st March 1992
31st March 1997
Additions
Rural 592.30 633.22 40.92Urban 181.55 238.14 56.59Total 773.85 871.36 97.51
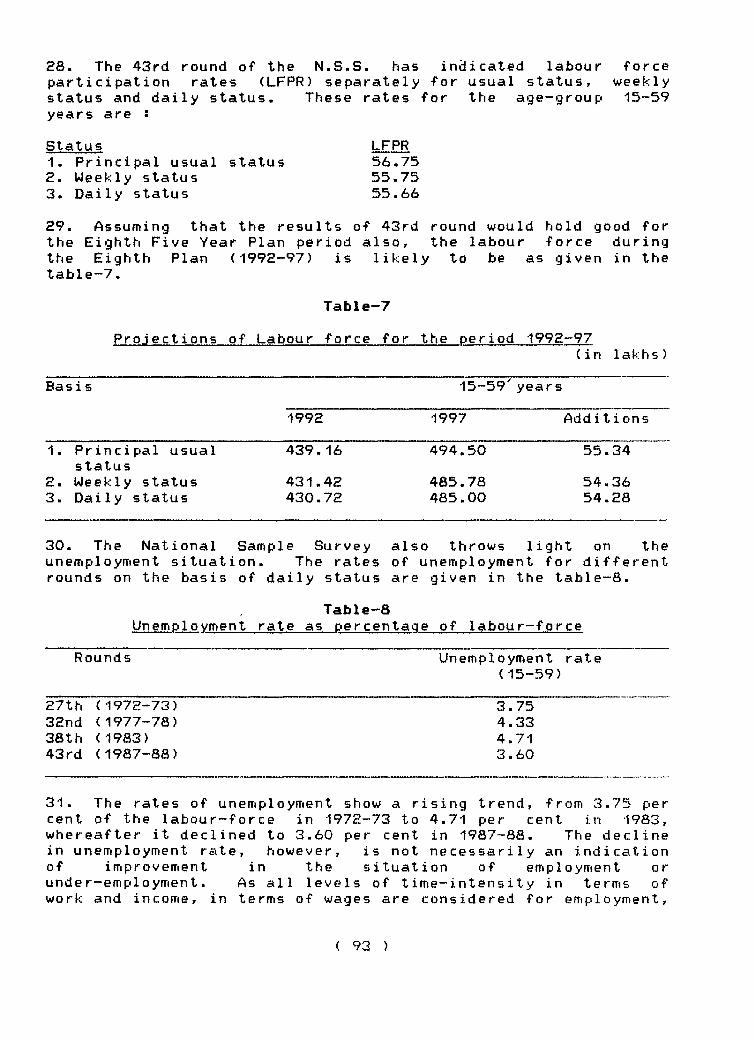
28. The 43rd round of the N.S.S. has indicated labour force participation rates (LFPR) separately for usual status, weekly status and daily status. These rates for the a g e- group 15-59 years are s
Status1. Principal usual status2. Weekly status3. Daily status
LFPR56.7555.75 55.66
29. Assuming that the results of 43rd round would hold good for the Eighth Five Year Plan period also, the labour force during the Eighth Plan (1992-97) is likely to be as given in the table~7.
Table-7
Projections of Labour force for the period 1992-97(in lakhs)
Basi s 15-59" years
1992 1997 Add i t i ons
1. Principal usual status
2. Week ly status3. Daily status
439.16
431.42430.72
494.50
485.78485.00
55.34
54.3654.28
30. The National Sample Survey unemployment situation. The rates rounds on the basis of daily status
also throws light on the of unemployment for different are given in the table-8.
Table-8Unemplovment rate as percentage of labour-force
Rounds Unemployment rate (15-59)
27th (1972-73) 3.7532nd (1977-78) 4.3338th (1983) 4.7143rd (1987-88) 3.60
31. The rates of unemployment show a rising trend, from 3.75 per cent of the labour-force in 1972-73 to 4.71 per cent in 1983, whereafter it declined to 3.60 per cent in 1987-88. The decline in unemployment rate, however, is not n ecessarily an indication of improvement in the situation of employment or under-employment. As all levels of time-intensity in terms of work and income, in terms of wages are considered for employment.

increase in the number of workers without reasonable income, necessary for their sustenance, is not the same as increase in e m p l o y m e n t .
32. The aggregated unemployment rates have been worked out as given in the table-9.
Table-9Unemployment as percentage of population and labour
force ( in parenthesis ) according to 43rd. round of the N.5.S.
Assumptions 15-S9 years
Usual Weekly Dai ly
1. -12 (1.97) •1.57 (2.8) 1.99 (3.60)
33. Of the three approaches the rate based on daily statusappears to be more realistic because it is the average daily pressure of job seekers on the labour market. The other two concepts give figures in terms of numbers who might or might not be wholly employed or umemployed with the result that theestimates based on these approaches might under-estimate or over-estimate the situation. The daily status approach hasyielded a rate of 3.60 per cent of the labour force in the age group 15-59 years and this rate has been used for estimating backlog of unemployment at the beginning of the Eighth Five Year Plan also. According to this rate the total backlog at thebeginning of the Eighth Five Year Plan (1992-1997) would be around 16 lakh person years.
34. Besides unemployment, it is also necessary to consider thequality of employment. This unfor tunately is most difficult to assess. The N.S.S. has been collecting data on 'visible* under-employment also, as expressed in reported willingness to work or to undertake additional work. Thi's visibleunderemployment also establishes the need for creation ofsupplementary work opportunities. The responses ofunder-employed to the questions asked during the 43rd round of N.S.S. for the state and country are summarised in the table-10.
Table-10Perc e n t a ge of workers available for additional work
Ru ral Urban
Mai e Female Male Female
1 . Uttar Pradesh 14.1 4.5 8.7 8.92. All India 22.2 12.7 15.5 20.3
Source : Statement 53rd & 54th, Sarveks'hana, Se p t ., 1990 Specialnumber

35. The above table~10 shows that there is high incidence ofunder-employment among rural males in the State <14.1 per cent)and the country <22,2 percent). When the ratios given intable-10 are applied on the projected level of employment <510 lakh) in the state at the end of 1991-92, it is found that there will be about 56 lakh under-employed in Uttar Pradesh. On the other hand, if the rates of under-employment of the country is applied on the estimated workers of the State, the number of under-employed works out to be about 97 lakh. Economic b a c k w a r d n e s s , lower rate of literacy and low rate of mobility gripping the poorer class in this State might have partly influenced the workers in giving the responses also. The rate of u nder-employment for the State therefore might be on a lower side. The total under-employed in the State at the beginning of the Eighth Plan are, thus, anywhere between 56 lakh and 97 lakh. It will be safer to assume that there are about 76 lakh under-employed in the state at the beginning of the Eighth Plan. This estimate also agrees with another estimate according to which about 76 lakh agricultural workers, nearly one-third of total agricultural workers, are surplus at the present stage of development of agriculture and cropping pattern in the State.
Job requirement during the Eight Five Year Plan (1992-97)
36. As stated earlier, there will be an addition of about 54lakh persons to the labour force during the plan period yielding an annual growth of about 2.4 per cent. A backlog of 16 lakh unemployed person years, as on April 1, 1992 has also beenestimated. Thus, during the Eighth Five Year Plan <1992-97) period, work opportunities equivalent to 70 lakh person years will be needed to provide jobs to clear the backlog and provide employment to new entrants to the labour force on a lower rate of growth <2.2 per cent per annum) in population.
37. These requirements do not include work opportunities required for severely under-employed most of whom <90 per cent) are in rural areas. The majority of underemployed in rural areas is surplus in agriculture but is hanging on to it because there are not enough job opportunities in other sectors to absorb them. As estimated earlier, there are about 76 lakh under-employed persons. If these 76 lakh severely under-employed, with nominal work and little or no earnings are also added for estimating job requirements of the Eighth Plan, additional job opportunities equivalent to about 146 lakh person years are required to be created for removal of total unemployment and severe under employment in the state. Like total eradication of poverty, it is also not possible to create these opportunities of gainful and permanent employment in the next five years to be able to achieve total removal of unemployment.
38. According to 43rd round of N.S.S. <1987-88) the work forceparticipation rate**® in Uttar Pradesh is the lowest amongst the major states. At the same time, unemployment and under

employment rates are also on a lower side in the State. This is mainly because o'/ lower levels of education and urbanization in the State. On account of which both unemployed and severely under-employed feel reconciled to their present status in life and d o n’t generally aspire for more promising avenues. Even otherwise, low level of per capita income in the state is a sufficient proof that there exists huge under employment and unemployment in the state. A lower rate of unemployment in the state is, therefore, quite misleading.
39. Before dealing with projections of employment generation in Eighth Plan (1992-97), it will be useful to recapitulate some of the important aspects of the employment situation in the State. Whether we use Census"’* or N.S.S. figures, the following few facts emerge very clearly s
(i> Agriculture alongwith animal husbandry absorbs the major portion of wcrk force in the State and it still continues to absorb the highest percentage shares of additions to the work force. The share of this sector was never less than 70 per cent in .otal workers and not less than 60 percent in the additions to the work force in the last few years. Except Etihar,"’® the corresponding shares of other major states in additions to the work force, between 1971 and 1981 censuses, were much lower ranging from about 23 per cent in Gujarat to about 58 per cent in Madhya Pradesh. This gives an indication of inadequate expansion of employment opportunities in the state in non-farm sectors.
(ii) Some idea of inadequate growth in employment in the state can be had from the fact that there was an annual increase of 5 lakhs workers only during 1971-81 and 10 lakhs workers during the period from 1977-78 to 1987-88. The shares of agriculture workers were 3 lakhs and 6 lakhs respectively in these annual increases. In industry these shares were 0.93 lakhs and 0.90 lakhs respectively and of the rest sectors 1.13 lakhs and 3.30 lakhs respectively. During both these periods about 60 per cent of the total annual increase in work force took place in agriculture sector only. It is not at all an encouraging sign, keeping in view the incidence of severe under-employment amongst workers in this sector.
(iii)There was a total growth of 28 per ce nt’’'® in workers during
10. Annexure-IX
11. Annexure-X
12. Annexure-XI
13. Annexure-XII

1977-78 to 1987-88 against a growth if 51*6 per \ent in income in real terms (at constant prices cf 1970-71). As against this overall picture, the sectoi-^nl picture is quxte disturbing. In agriculture, which had 70 per cent of total workers, the increase in income had been c3 per cent against 23 per cent increase in workers. In marufacturing sector, employing about 9 per cent workers, the growth in income had been 138 per cent against an increase of 26 per cent in its workers. The rest sectors together with remaining 21 per cent workers, registered an increase of 71.6 per cent in income against an increase of 53 per cent in workers. The sectoral growth in workers and income indicates under-utilisation and lower productivity of workers in agri c u l t u r e .
<iv) The average annual growth of 2.54 per cent in workers during ten years (1977-78 to 1987-88) is mainly due to the addition of 60 lakh workers in agriculture which was about 60 per cent of the total addition of 102 lakh workers. Between 1971 and 1981 the same growth was 1.7 per cent per annum only. The agriculture sector in the state suffers from severe under-employment and induction of more workers in it without considerable increase in its output will make employment situation still worse.
40. On the basis of these broad assessments of employmentstatus and growth in employment in the State, we are led to thefollowing few conclusions s-
(i) The S t a t e’s Eighth Plan should give highest priority togeneration of gainful, productive and self-sustaining employment in adequate number and in a dispe'sed manner.
ii) Amongst different sectors of the economy, agricultureincluding animal husbandry would continue, for still some more time, to absorb major shares of labour-force and additions to the same. This sector should, therefore, also receive highest attention. While every effort should bemade to achieve higher productivity through higher cropping intensity and other labour intensive operations there must be a marked shift from low value crops to high value labour intensive crops and to other on farm activities like milkproduction poultry, egg production and pisciculture.
(iii)Consistent with objectives of growth, efforts should be madeto raise the share of contribution to growth and output from sectors having more employment potentials, and efficient and cost effective labour intensive technologies should beencouraged in all sectors.
(iv) While maximum efforts should be made within the framework of the economy to create employment opportunities, the demand for employment, which is basically a function of population

growth and the pattern of education, should also be managed and contained in such a manner that the mismatch between supply and demand is reduced in a time frame.
41. These few considerations have been kept in view while preparing growth and output profile of S t a t e’s Eighth Plan. The targeted growth rate of Eighth Plan is 6 per cent per annum and, within this, the targeted growth in agriculture is 4.3 per cent against an achievement of 3.2 per cent only in the Seventh Plan. Similarly, the targeted growth rates of manufacturing and the rest of the sectors are 10 and 6-6 per cent respectively, higher than the growth of these sectors in the Seventh Plan. The higher growth will certainly generate more employment in the State.
42. Employment of productive and gainful nature is generated only when income also increases. The ratio of growth in employment to growth in income is called 'employment elasticity*. This elasticity differs from sector to sector. The elasticity also changes over time depending upon the fact whether growth is more capital induced or labour induced. A larger contribution of capital to income generation leads to a lower employment elasticity. The elasticity is higher if the contribution of labour also becomes higher. The employment elasticity has been declining in the past both in the country and the state which is evident from t a b l e - 11
Table-11
E m p l 0 vment elasticities with respect to income g rowth during 1978-88 in U.P.
Se c1 0 rs 1977-78 1983 to 1977-78 toto 1983 1987-88 1987-88
( 1) (2) <3) (4)
1. Agriculture and allied 1.23 0.99 0.952. Manufacturing 0.35 0.16 0.263. Rest 1.13 0.44 0.70
All Sectors 0.77 0.50 0.59
43. The employment elasticity in agriculture, as shown in thecAbove table, is on the higher side. The reason for this is thatsevere underemployment amongst agricultural workers is notadjusted while working out this elasticity. According to one

estimate, this elasticity in the State is now only 0.19. This looks reasonable as most of the growth in agriculture stems from capital intensive techniques.
44. The latest information about workers and employment will be available when final data of 1991 census is published. Pending this data of workers, and subject to such review as may become necessary on the basis of this data, it has been estimated that based upon the targeted 6 per cent annual growth rate, nearly 50 lakhs regular job opportunities will be generated during the Eighth Plan period (1992-97). This estimate has been worked out on the basis of the observed employment elasticity of the State with minor adjustments. The share of employment generation by major sectors is given in t a b l e - 12
Table-12
E m ployment generation in major sectors
Se ctors Employment generation Percentagein ( lakhs ) distribution
(1) (2) (3)
1. Agriculture & allied. 20 402. lianufactur ing 16 323. Rest 14 28
All Sectors 50 100
45. Above projections of employment do not include employment which will be generated in special employment programmes under rural development like J.R.Y. and I.R.D.P. etc. According to latest indications these programmes are likely to be merged and the funds for these programmes will be utilised for employment generation through area based integrated rural development projects. The details of this new approach is still awaited from Planning Commission. Under this revised strategy, employment equivalent to about 20 lakhs will be generated during Eighth P l a n .
46. Assuming a total workforce of 510 lakhs in 1991-92, as against 461 lakhs in 1987-88 (based on 43rd round of M.S.S.) and after adjusting the same by about 76 lakhs severely under employed, the target for creation of 50 lakhs opportunities of full employment at reasonable income together with ad-hoc employment of 20 lakhs through special employment programmes will yield a growth of 3.0 per cent per annum in employment against the estimated growth of 2.4 per cent irf labour-force and targetted growth of 6 per cent per annum in the S t a t e’s income. The employment elasticity (the ratio of growth in employment with respect to growth in output) in the Eighth Plan thus works out to0.5 which is not an easy task to achieve unless special efforts

are made to employ more and more labour intensive techniques, backed up by suitable policy measures, to achieve growth target in the S t a t e’s economy.47. As much as 90 per cent (68 lakhs) of the under-employedbe 1 one) to rural areas, mostly in agriculture sector. Keeping this fact in view, any further growth in workers in agricultureoperations alone will not be worth-while, until theseunder-employed are gainfully employed. The targeted growth in workers in agriculture is therefore, sought to be achieved by maximising i r r i g a t i o n ,cropping intensity, development of land, increase in area and productivity of high value crops like fruits and vegetables, dry land farming, afforestation and by giving a massive thrust to the programmes of production of milk, poultry, eggs and fishes. Efforts will also be made to promote agro-based industries in rural areas.
48. The introduction of new technology in agriculture, certainlyincreases production levels. Consequently, a situation will arise when the supply of agricultural products will be available at faster rate than the demand, with the result that the demand for agricultural labour will be reduced. Since the demand foragricultural products in the aggregate has a low response toprice changes, the negative price effect of the increased output will tend to shift the demand for agricultural labour more than the new technology attracts. The only choice left is to shift the labour force to other sectors. Unfortunately manufacturing sector with registered units has also a high capital content and investment per labour is constantly increasing reducing the possibility of any significant growth in employment opportunity in this sector. The state should therefore attempt to promote the unregistered manufacturing sector and create maximum job opportunities in this and tertiary sectors at a higher rate.
49. While evolving development strategies in informal sector, itshould be kept in mind that the implications of unemployment and poverty are beyond the range of economic parameters. Thus, in the broader setting the promotion and development of the informal sector where most of artisans and other tiny units in all sectors are engaged, requires added significance. There may beconceptual differences regarding the definition and characteristics of informal sector but the role it can play in the development of state is unquestionable.
50. Amongst priorities for creating a supportive environment forgrowth of the informal sector, institutional credit occupies a predominant position. Inaccessibility of institutional credit to the informal sector is among the more important impediments to its growth and development. Shortage of affordable credit inhibits growth of many segments of the informal sector. The dependence of the sector on financial markets has not diminished. While public sector banks have done a commendable job, reaching out to farmers- big and small- they have hardly touched the fringe of the informal sector. Part of the problem lies in established lending procedures and practices. Lack of

collateral, illiteracy among borrowers, the rature of the businesses which may not fit into the established frame work, the belief that small borrowers are bigger risks than large borrowers and sizable units, costs in handling of small loans, are the major factors responsible for inaccessibility. There is,therefore, an imperative need to reorient policies to meet the credit requirements of micro-businesses and the development of commercially viable credit programmes for different segments of the informal sector.
51. The growing problem of educated unemployed is also very serious in the State, as about 5 lakh graduates and postgraduates job seekers are registered on the live register of employment exchanges. Besides, 16 lakhs matriculate and intermediate persons are also registered for the jobs. Direct measures for the relief of educated unemployed have not yielded any encouraging results. The only lasting solution is an improvement in the rate of economic growth. The ’surplus* have appeared because of the recession and the slow pace of the developmental activity in the state.
52. It may be concluded at the end that the thrust of S t a t e’s Eighth Plan should remain on generation of gainful, productive and self-sustaining employment in adequate number and in dispersed manner. The objective should not be of creation of job opportunities at low wages and on some temporary basis. There should be more attention to generate employment opportunities in rural areas and in small towns in the state.

Annexure - I
Workforce Accordi na to Census(In L a k h )
Se ctors Number
•1971
of workers
1981
Increase Annual growth in 1971-81
1 2 3 4 5
Total workers 2 7 3 . 3S 323.97 50.62 1.71
1. Cultivation 156.97 189.58 32.61 1.90
2. Agricultural Labou re rs
54.54 51.77 (~)2.77 _
3. Plantation/ Forestry/ Fisheries/Live stock Hunting
1.68 1.77 0.09 0.52
4. Mining and Quarrying
0. 10 0.20 0.10 7. 16
5. Manufacturing including HousehoId industry
19.92 29.22 9.30 3.91
6. Construction 1.67 3.30 1.63 7.05
7. Trade & Corrimer ce
11.11 14.69 3.58 2.83
8. Transport. Storage & Communi cat i on
4.74 6.60 1.91 3.44
9. Other Serv i ces
22.62 26.79 4.17 1.71

Growth in Organized sector employment
Year March Number of WorkersCin Lakh)
Total Public Private
1 2 3 4
1. 1978 22.76 16.93 5.83
2. 1980 22.91 17.38 5.53
3. 1985 25.72 20.25 5.47
4. 1986 25.97 20.50 5.47
5. 1987 26.32 20.98 5.34
6. 1988 26.51 21.09 5.42

Employment in Organized Sector
Code Industry No.
Number of Persons (in Lakh)
1978 1988
Compound annual growth rate during the decade 1978- 88 (“/.)
1 2 3 4
0. Agri culture. H u nting,fo restry and fishing
0.57 0.76 2.92
1. Mining and Quarrying
0.05 0.08 4.82
Z&3 Manufacturing 4.79 5.34 1. 10
4. Electri c i t y ,Gas & Water Supply
0.86 0.95 1.00
5- Construction 1.48 1.69 1.35
6. Whole sale and retail trades. Restaurant and Hotels
0.25 0.32 2.50
7. Transport,Storage and Communication
3.22 3.47 0.75
&&9 Servi ces 11.54 13.90 1.88
Total 22.76 26.51 1.54

divisions in U.P. (N.S.S..data)
Code Industry N o .
Number of persons (in lakh)
32nd 43rd round round 1977-78 (1987-88)
Compound Annual growth
-rate during the decade 1977-78 to 1987-88
(7.)
1 2 3 4 5
0. Agri c u l t u r e , Hunting, Forestry and Fishing
262 322 2.08
1. Mining and Quarrying
-- - _
2 & 3 M a nufact uring 35 44 2.32
4- Electricity, Gas & Water Supply
- 1 -
S. C onstru ction 6 11 6.25
6. Wh olesale and retail trades Restaurants and Hotels
22 31 3.50
7. Transport, Storage and Commun ication
8 10 2.28
8<&9 Servi ces
Total
26
3S9
42
461
4.92
2.54
Sources 1. 32nd round~N .S-S- report no 298-9 on employmentan4 unemployment Table No-29-
2, 43rd Round All India Special Report No. 1 on employment and unemployment Statement~23.

Annexure - VGrowth of persons asuallv eMlowd bv status of wplovient in Uttar Pradesh (N.S.S. data)
Self*eiployed Regular employees Casual employees All workers
Category 1977-78 1987-88 1977-78 1987-88 1977-78 1987-88 1977-78 1987-88
1 2 3 4 5 6 7 8 9
Urban
(a)Hale 19(50.00) 40(55.56) 14(38.89) 24(33.33) 4(11.11) 8(11.11) 37(100.00) 72(100.00)
(b) FeMle 4(60.00) 8(66.67) 1(20.00) 3(25.00) 1(20.00) 1(8.33) 6(100.00) 12(100.00)
(G) Total 23(51.22) 48(57.14) 15(36.59) 27(32.14) 5(12.19) 9(10.72) 43(100.00) 84(100.00)
Rural
(a)Hale 174(75.45) 200(73.26) 18(7.59) 16(5.86) 39(16.96) 57(20.88) 231(100.00) 273(100.00)
(b) Feaale 67(78.13) 83(79.81) 1(1.56) 2(1.92) 17(20.31) 19(18.27) 85(100.00) 104(100.00)
(c) Total 241(76.04) 283(75.07) 19(6.25) 18(4.77) 56(17.71) 76(20.16) 316(100.00) 377(100.00)
Total
(a)Nale 193(71.92) 240(69.57) 32(11.92) 40(11.59) 43(16.16) 65(18.84) 268(100.00) 345(100.00)
(b) F»ale 70(76.81) 91(78.45) 3(2.90) 5(4.31) 18(20.29) 20(17.24) 91(100.00) 116(100.00)
(c) Total 263(72.95) 331(71.80) 35(10.03) 45(9.76) 61(17.02) 85(18.44) 359(100.00) 461(100.00)

I n v e s t i T i e n t , Workers and Total E m p lo v m e n t in Registered manufacturinq sector in U.P. d u r i n g 1976 - 86
Item Units 1975-76 1980-81 1985-86 1986-87
1 2 3 4 5 6
1- Investment Crore Rs. 2537.51 4237.04 9045.33 10557.90
2- Total No. 577478 772982 680069 695931Employment
3. Employment No. 2.28 1.82 0.75 0.66per lakh of Investment

Errip 1Qvment in unorganised sector
Code N o .
Indust ry Number of < in
(1977--78)
persons Compound lakh) Annual growth------------ rate during(1987-88) the decade
1977-78 to 1987-88 (•/.)
1 2 3 4
0 Agri c u l t u r e , Hunting ,Fores try and Fishing
261.43 321.24 2.08
•1 Mining & Quarrying - - -
Z&2 Manufacturing 30.21 38.66 2.49
4 Electricity, Gas & Water Supply
- 0.05 -
5 Construction 4.52 9.31 7.49
6 Wholesale and Retail trades. Restaurants and Hote 1 s
21.75 30.68 3.50
7 Transport, Storage and Communications
4.78 6.53 3. 16
8&9 Servi ces 14.46 28.10 6.87
Total : 337.15 434.57 2.60
Source : Unorganised sector employment substracting organised sector
is obtained employment
byfrom
usually employed persons (N.S.S. data).

Educated job seekers on Live Register bv level ofeducation
Level of Education Registrants as on December
1979(30th June)
1985 1990
1 High School 275986(100.00)
516381 (187.10)
735221(266.40)
2 Intermediate 326528 (100.00)
597131 (182.87)
834991(255.72)
3 Graduate 166866 (100.00)
326202 (195.49)
408542(244.83)
4 Post Graduate 27069 (100.00)
60569(223.76)
87566(323.49)
Total 796449 ( 100'/.)
1500283 (188.37)
2066320(259.44)
Note: Figures in parenthesis are indices

ANNEXURE - IX
Inter-State percentage of persons aged 5 and above in the principal
status bv sex and residence
usually as well status
employed (WFPR) as subsidiary
States Rural Urban
Male Female Male Female
1 2 3 4 5
1 Andhra Pradesh 59.5 47.0 50.3 21.5
2 Assam 51.4 16.2 51.2 8.4
3 Bihar 50.0 19.3 44.8 7.9
4 Guj rat 55.9 38. 1 51.0 11.2
5 Haryana 47.5 29.7 55.3 12.3
6 Himanchal pradesh 53.9 48.0 46.6 15.6
7 Karnataka 56. S 37.7 49.4 19.6
8 Kerala 50.6 28.6 53.0 19.8
9 Madhya Pradesh 54.6 41.0 48.0 14.4
10 Maharashtra 54.6 46.2 49.6 15.9
11 Orissa 56.6 27.6 49.3 12.5
IE Punjab 56.0 31.7 54.0 12.3
13 Rajasthan 51.2 45.0 47.1 19.1
14 TamilNadu 58.70 46. 1 55.8 22.7
15 Uttar Pradesh 51.8 21.9 48.9 9.4
16 West Bengal 55.0 19.6 53.9 12.5
All India 53.9 32.3 50.6 15.2
Sources National Sample Surveys 43rd Round statement -S3

ANNEXURE - X
Working Force according to Census and H.S.S.(Workers in Lakh)
Industry Census N.S.S.
1971 1981 Addition Annual
Addition
1977-78 1987-88 Addition Annual
Addition
1 2 3 4 5 6 7 8 9
1 Agriculture
and Allied
213.29 243.32 30.03
(59.33)
3.00 262 322 60
(58.82)
6.00
2 Manufacturing 19.92 29.22 9.30
(18.37)
0.93 35 44 9
(8.82)0.90
3 Rest 40.14 51.43 11.29
(22.30)1.13 62 95 33
(32.36)
3.30
4 Total 273.35 323.97 50.62
(100.00)
5.06 359 461 102(100.00)
10.20

Percentage shares of agricultural workers to the incremental work force during 1971-81
State Percentage increase
1 2
1 Bi har 67.5
2 Madhya Pradesh 58.3
3 Uttar Pradesh 59.3
4 Andhra Pradesh 52.3
5 Or i ssa 51.9
6 Haryana 49.7
7 Punjab 36.4
8 Guj rat 22.9
All India 40.9
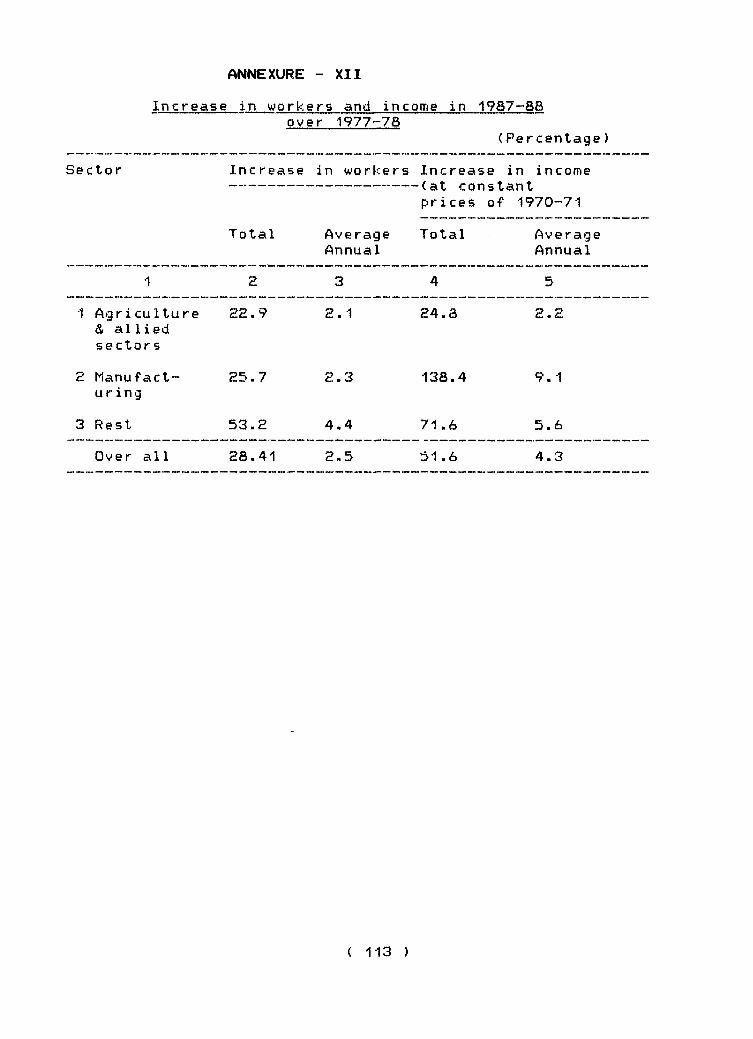
Increase in workers and income in 1987-88 over 1977-78
(P e r c e n t a g e )
Sector In c rease
Total
in workers
AverageAnnual
Increase in income “(at constant prices of 1970-71
Total Average Annual
1 2 3 4 5
1 Agriculture & allied sectors
22.9 2.1 24.8 2.2
2 M a n u f a c t“ u r i n g
25.7 2.3 138.4 9. 1
3 Rest 53.2 4.4 71.6 5.6
Over all 28.41 2,5 51.6 4.3

CHAPTER - X
REGIONAL DISPARITIES
While dealing with the question of S t a t e’s backwardness a little earlier in this document, it was stated that the comrriitments repeatedly made in national five year plans to the objective of achieving a balanced regional development and reduction of regional disparities call for a much more sustained effort than in the past. It was also stated that unless this large state with about one sixth of c o u n t r y’s population is enabled to move out of the morass of b a c k w a r d n e s s , the progress and prosperity of the country will also suffer. Apart from the fact that potentials of growth of s t a t e’s large area having rich resources and a huge manpower will not be fully realised, depriving the country of a significant contribution from the state, the depressed purchasing power of a large segment of c o u n t r y’s population in this state will act as a damper on growth in the rest of the country and its more developed regions.
2 Just as this logic holds true for the country, as a whole, it applies equally to disparities within the State also. The disparities in levels of development between different regions and areas of the State are quite marked. While some disparities in a large and expansive area of a state of U P ’s size are bound to be there, arising mostly out of geographical factors such as differences in soils, incidence of floods, drought etc., these are much more sharp in the State than what can be fully explained by these factors. It is in this context that the questions of intra-state disparities and the need for a balanced regional development also become quite important for our future plans. A higher growth in the State must be achieved now by raising the contribution from its more backward regions. This will be possible only by accelerating the pace of dev elopment of these regions. It is this regional dimension which should be built into the S t a t e’s future plans, both for growth as well as equity.
3. There are five economic regions in the state, comprising contiguous districts having similar cropping pattern, population density, geophysical conditions and agro~climatic f a c t o r s .These are s
1. The Eastern Region2. The BundelKhand Region3. The Hill Region4. The Central Region5. The Western Region
4 Out of these five r e g i o n s ,three regions viz., the Eastern,the BundelKhand and the Hill,are considered relatively backward and are characterised by low productivity,high or low density of population,difficult terrain and t o p o g r a p h y ,inadequate

infrastructure,and recurrence of natural calamities like floods and droughts etc.A broad assessment of disparities in levels of development of these regions can be made from Annexure-I.
5 Even though the need for reduction of regional disparitieshas been recognized since long, efforts made were conceived more in terms of compensatory justice than in terms of some sound development strategy. Weightage to the backwardness of a district in the district sector allotment of outlays since 1 982-83,the year when decentralised district planning was introduced in the State, can be said to be a concrete and notable step taken by the State Government towards reduction of regional disparities. Regional disparities, however, still persist,An empiricalexercise has been made by the Area Planning Division of the State Planning Institute to assess how far development programes have succeeded in reducing regional disparities in the state.For this p u r p o s e ,changes in coefficients of variation across the five regions with regard to some selected indicators of development were worked out at four points of timeviz ., 1 9 6 0 - 6 1 , 1970--71, 1980-81 and 1987-88, extend ing over a period of nearly three decades. It will be seen that the coefficient of variation (cv) of gross value of ag r i c’j 1 tu ral output per hectare of net area sown,which was 17.26 percent in 1 960 -61,touched a peak of 26.47 in 1980-81 and then declined to 22.09 in 1987-88.Considering the performance of industrial sector,the cv of per capita net output from manufacturing sector was as high as 61.60 percent in 1 970 -71,but it come down to 31.39 in 1980-81 and then rose marginally to 32.39 percent in 1987-88.
6 With regard to variabilities in selected indicators of infrastructural development ,it is found that disparities in the availabil ity of irrigation are some what i n c r e a s i n g ,though marginally,The co-efficient, which was 35.92 per cent in 1960-61, slightly declined (35.09 per cent) in 1970-71 but again rose to 37.63 and 36.93 per cent in 1980-81 and 1987-88 respectively. A very substantial decline is noticed in cv of percentage of electrified villages.lt declined from 111.54 percent in 1960-61 to as low as 11,63 percent in 1989-90.The disparity in pucca road per unit of area also narrowed down from 24.83 percent in 1960-61 to 14.47 per cent in 1988-89.But the differentials in a vailability of social infrastructure like schools and hospital facilities we re clearly on the increase.
7 The empirical exercise leads to the conclusion that marked fluctuations are noticed in the values of CV overtime, which are indicative of instabilities or lack of direction in this area. The exercise also shows that disparities have increased in agricultural production, irrigated area and social infrastructure like, schools and hospitals.
8 There are four main factors which account for these regional disparities. First, natural factors, which are very difficult to control in so far as these impose obvious limits on bringing backward regions on par with developed ones. These are, to name a

few, differences in terrain, soils, climate, frequency of natural calamities, n o n-av ailability of raw materials needed for industrialisation etc.
Two, unlike these limiting factors, there is the other factor of poor entrepreneurship, low motivation, lack of initiative, antiquated methods of production and cultural env i r o n m e n t .
Three, there is the factor of high density of population, predominance of small and marginal farmers, greater dependence on agriculture, poor standards of health and some other socio-demographic factors.
Four, regional imbalances in the availabili ty of resources, irrigation facilities, availability of power, provision of transport, communications and marketing facilities also account for poor development in certain regions in comparison to others, having better provision of these facilities. Most of these factors are, to a considerable extent, amenable to human control. Even natural endowments, considered as a r e s o u r c e ~ s y s t e m , can also be improved to some extent. However, what is required is a series of steps to make up for the loss accruing to the region from one or more than one of these factors.
9 It is not possible to spell out in detail the strategy for tackling the problems of disparity and backwardness. However, any strategy for balanced regional development will have to be based on examination of the process of economic development and identification of technical and structural factors which lead to growth of the relatively less developed regions. The nature of the problems and impediments to rapid development in particular fields will have to be carefully studied and appropriate measures taken for accelerated development. The development strategy should be based on natural endowments, development potential and special problems of the regions, and the main theme of the strategy should foe maximum utilisation of resource endowments and resolution of special problems of the backward areas. Besides, it should also be worked how the optimal balancing of macro and micro linkages of programmes can be obtained. The strategy of development should take into consideration as to what patterns of growth or programmes are most appropriate for different areas of the regions,
10 Investment is the sine-qua-non of economic development. The rise in the standard of living depends primarily on the magnitude of investment. In view of the enormity of the special problems faced by the economies of backward regions, coupled with untapped resources, the uplifting of the levels of development of these regions would require much higher investment from all sources. As already mentioned in earlier paragraphs, preference to backward districts in allocation of outlays of the district sector schemes, under the decentralised planning system, is one concrete step which has been taken for reducing inter-district
and inter-regional disparities. However, this could not prove much effective in mitigating the serious problem of regional imbalances because the resource transfers in favour of the backward districts have been of a low order, confined to the adjustments possible within just about 2S percent of the State's plan outlay.
11 As already mentioned in the earlier paragraphs, out of the five economic regions in the State, three regions viz.. Eastern, Hill and Bundelkhand have been recognised as backward regions. Acceleration of the pace of development of these backward regions is one of the vital steps for achieving the goal of balanced regional development. Since there is already a provision for a separate Sub-Plan for the hill region and special central assistance for Hill development, strategy spelt out in the succeeding paragraphs relates to Eastern and Bundelkhand regions onl y .
12 Eastern Region s An overwhelming majority of the farmers in the eastern region belong to the category of marginal and small farmers. There is preponderance of marginal and small holdings, which constitute 93 percent of the total holdings. A real break-through in agricultural economy of the region, which is a source of subsistence living of about 80 percent of the populace of the area, can be made by enhancing per unit production in these holdings. Considering the colossal number of such holdings, even a marginal increase in each unit would add up to an impressive total. The yield per hectare of all important crops in this region is too low. Since agriculture is the mainstay of the inhabitants of the area, agricultural productivity needs to be substantially augmented.
13 A major factor shattering the economy of the region is the recurrence of devastating floods. The severity of the problem can be seen from the fact that the area affected by floods in the region is over 8 lakh hectares annually. The recurrence of floods not only results in colossal loss to crops, cattlehead and property, which the inhabitants of this area can hardly absorb on account of their poor income but also saps their initiative to take other steps for improvement. Much larger efforts are, therefore, needed to save the economically depressed areas of this region from this devastation.
14 The pressure on land is very heavy and employment opportunities in n o n - a g r i c u 1tural sectors are meagre, resulting in unemployment and widespread under-employment. Labour intensive programmes, especially development of village and small scale industries, on much more larger scale than now, can play a vital role in arresting the menace of unemployment and undei—e m p l o y m e n t ,
15 Bundelkhand Region : The special problems of the areaare poor soil fertility, great paucity of roads in rural areas, acute shortage of drinking water in large tracts, existence of

vast areas under culturable waste, meagre irrigation facilities and almost negligible irciastrial development. The strategy for the development of Bund Ikhand Region is briefly spelt out below
1. Massive efforts are needed to increase the yield per hectare in the area, which is the lowest among all the regions of th State.
2. Taking into consideration the rocky topography andtypical soil, having much lesser capacity of moisture retention and irrigation works being too costly, dry farming is much suited for the area and should bepracticed on an extensive scale. The National Bureau ofSoil Survey and Land Use Planning, Nagpur has speltout, in its Study Report entitled, “Land Use Plan forDevelopment of BundeIkhand Region" the desired dry-land agricultural technology that needs to be adopted in the r e g i o n .
3. Recent technological advancements have proved thatsuitable watershed management techniques can conserve water and moisture in large quantities to meet the requi rements of arable farming. The agricultural productivity of this region can be enormously increased by adopting latest techniques of watershed management.
4. Irrigation facilities need to be substantiallyincreased. State and private tubewells may beinstalled, on a much more larger scale, as it is now possible to install these works, with the introductionof latest techniques of remote sensing and using deepboring rig machines (like in-we 11 and D.T.H. RigMa c h i n e s ) .
5. Bundelkhand region is often affected by droughts. Thereis imperative need for formulation of Master Plans of the affected areas, which may ensure a synchronisation of the programmes of agriculture, animal husbandry,irrigation, power etc. The development and relief planning of the affected areas should be integrated.
6. The region possesses some minerals like Bauxite,P y r o p h y l 1i t e , Rock Phosphate and Silica sand. Red sand and soft rocks are also found. The industrialdevelopment plan of the area should, therefore, take into account these locally available raw materials.
16 The strategies mentioned above for the development ofEastern and Esundelkhand regions of the State are, by no means, exhaustive nor they are a complete solution to the problem of backwardness of these regions. These are only indicative strategies based upon Ihe most common appreciation of some basic factors inhibiting growth in these regions. However, in order to
< M S )

make a major dent on the problem of backwardness of these regions, the strategies will have to bs converted into operational long term integrated development plans for these regions. Once these plans have been prepared, resources from different sources will have to be pooled and deployed in the best possible manner for implementation of these plans- A beginning is proposed to be made in this direction during Eighth Plan.
17 As already stated, the weightage yiven to backwardness in the di stribution of 'District Sector Outlay* among districts for district sector schemes does not appear to be by itself a successful measure for tackling the problem of backwardness of these regions. It was this realization which prompted the state government to earmark some lump-sum amounts within its plan outlays for development of these regions. The amounts, thus, earmarked and transferred to a Nidhi (Account) in two years viz., 1990--91 and 1991“92 are Rs. 50 cr. and 12.5 cr. for Eastern and Bundelkhand regions respectively. However, providing these sums which were the best the state could arrange for this purpose in this manner also cannot be said to be a very satisfactory arrangement, both on account of their meagre size and being not tied to some long turm objectives, i.e. projects.
18 These two backward regions of the state can not be left to their own. Nearly 427. of state's population reside in these two regions encompassing about 39% of state's total area. The consequences of a large area of this size continuing to remain backward are far too serious for s t a t e’s progress and peace. It is high time that a beginning is made in right earnest in the Eighth Plan to tackle the problem of backwardness of these regions in a planned manner. An organized effort of this kind will not be possible until the central government and Planning Commission also recognize the gravity of this problem and provide suitable assistance to the state for this purpose.

Regional Variations As Revealed Bv Sone Indicators
Iteni REBIONS
U.P. Eastern Hill B«jndelkhand Central Western
•1 2 3
•1. Density of population per sq. 471 613 115 228 528 601Km. (W1) No.
2. Percentage increase in 25.16 26.24 ^1.46 23.58 23.48 25.55population in 199-1 over 1981(%)
3. Percentage of agricultural 74.5 79.1 69.2 78.3 75.7 59.1workers to total iwain workers(1981 %>
4. Ojltivable area per 0.85 0.69 0.^ 1.84 0.&1 0.88agricultural worked' (1986-87)(Ha.)
5. Net area sown per capita 0.19 0.15 0.17 0.43 0.19 0.20rural population (1986-87) (Ha.)
6. Holdings below 1.0 ha. as 72.6 81.2 70.9 47.3 71.5 65.0percentage of total no. ofholdings (1985-86 agricultural cens«is ) %
7. Percentage of gross area 56.8 46.1 32.6 25.2 53.8 77.1irrigated to gross area sown(1987-88) %
8. Percentage of area sown nwre 42.6 48.5 64.3 11.0 33.2 49.0than once to net area sown(1987-88)(%)
9. Oilturabie waste land as 6.4 3.7 46.3 14.4 4.6 2.9percentage of net area sown(1986-87)(%)
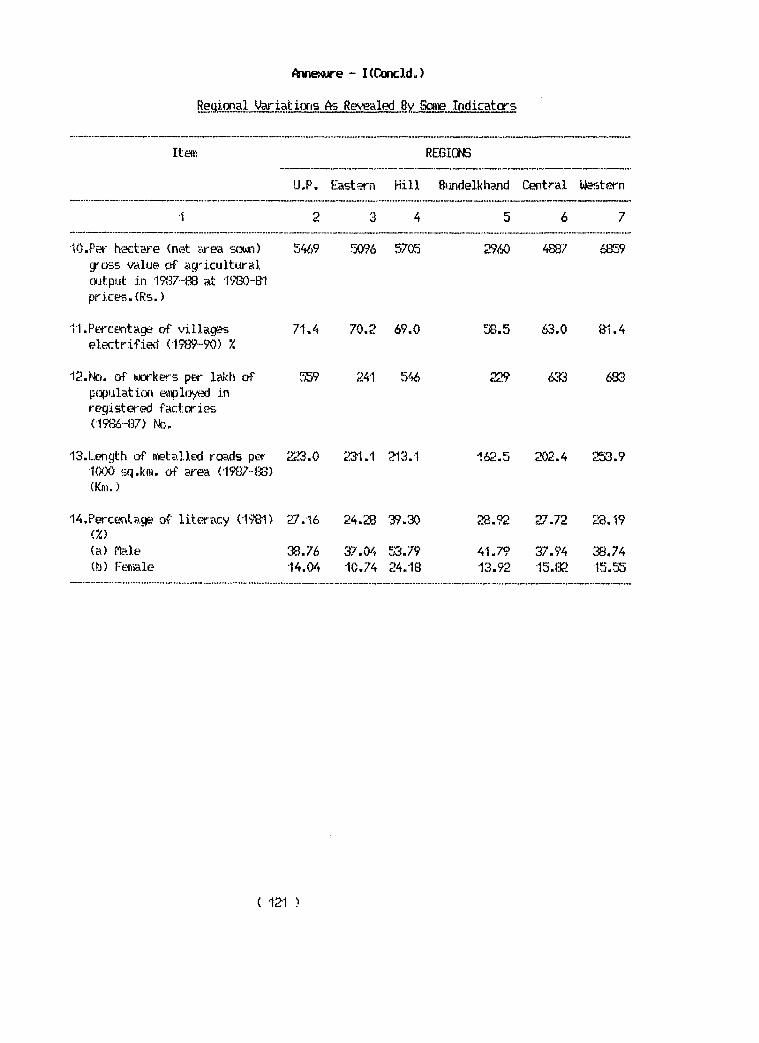
Regional *v^iatiaris As Rev‘ealed By Sonie Indicators
Item REGIONS
y.p. Eastern Hill B».mdelkhand Central Western
•1 2 3 4 5 6 7
•lO.Per hectare (net «i-ea sowi) qross value of aqi''icultfiral cxitput in m y - m at vm-Bi prices.(Rs.)
5469 5705 2960 4887 6859
11.Perc;e?ntaqe of villages electrified (19f39-90) X
71,4 70.2 69.0 58.5 63.0 81.4
of workers per lakh of p(3pfilation e««)l<5yed in recjistered factories (1986-07)
' 59 241 546 229 633 683
13.Lerigth of detailed roads per <5q.km. of area (1W-(38)
(Km.)
c^23.0 c^31.1 213.1 162.5 202.4 1553.9
14.Perce. taqe of’ literacy (1901) (%)
27.16 24.28 39.30 28.92 27.72 28.19
(a) rte.le 38.76 37.04 e^.79 41.79 37.94 C«.74(b) Feftiale 14.(H 10.74 24.13 13.92 15.{32 15.55


"TME: EXC5MTM F^X V EC 1 S >‘7' >

CHAPTER - XI
THE PERSPECTIVE
An attempt has been made in the earlier part of thisdocument to describe some salient features of the State *s economy,its past performance and its most pressing problems like b a c k w a r d n e s s , poverty, unemployment and severe under-employment, poor i n f r a s t r u c t u r e ,low productivity,high growth in population and regional disparities.lt has also been stated how the State has lagged behind much of the rest of the country, in terms of some of the most significant indicators of development, and how as a result of a lower growth in its economy and a higher growth in population, the gap between the State and the country in per capita income and per capita household consumption expenditure continued to grow wider,with no evidence of a reversal of thistrend in sight. The occupational pattern of the work force also does not seem to be responding to the changes taking place in the structure of the S t a t e’s income. This has led to sectoral imbalances in the e c o n o m y ,apart from aggravating the problems of rural-urban dichotomy, and disparity in personal incomes, as revealed by the skewed distribution of private consumption expend i tu r e ,
H This description provides the background against which planning for th© future must take place. Even though the immediate task is formulation of the Eighth Plan from 199E-93 to1996-97, it is also necessary for this purpose to have a perspective of a longer term, say for fifteen years. A medium term of five years is sometimes too short a period for some of the goals and objectives of planning to be realized. It is on the basis of long term needs of d e v e 1o p m e n t ,of goods ands e r v i c e s ,that the perspective of these goals and objectives can also be laid out. It is in the light of this perspective only that the m e dium term Plan of five years should be formulated. There can be no rigidity about such a perspective. It can keep on changing, depending upon the performance of medium term Plans.
3 H o w e v e r ,before we take up this perspective and that of theEighth Plan,we will,very briefly,go over some of the mostsignificant facts relating to the State without indulging in any repetition of what has been already stated. The only reason for doing so is that it is mainly these few facts which would be the basis for perspective-deve 1o p m e n t -
4 The living standard of a person is determined mainly by his consumption expenditure-The growth in this expenditure generally fellows the pattern of growth in his income.A higher growth in per capita private consumption expenditure i s ,t h e r e f o r e ,both an indicator of higher growth in per capita income and a greater improvement in living standard. The data for this expenditure is

available for this State for 1967-68,1983 and 1986-8/ at constant prices of 1967-68.
Table ~ 1 : Per capita household private consumptionexpenditure per month (at 1967-68 constant prices)
Year Expenditure <Rs.)
1967-68 34.481983 38.961986-87 41.82
5 The average annual growth in this expenditure over a long period of about twenty years,from 1967-68 to 1986-87, has been one percent only, which is too insignificant to have made any visible improvement in living standards of the people, as a wholes The picture need not be uniformfor all section of society, particularly so for the more affluent and privileged amongst them. However,the growth in this expenditure in 1 9 8 0’s from 1983 to 1986-87, was 2.4 percent per annum, which was substantially higher than the earlier trend growth rate of 1 percent over the longer period.The growth in this expenditure in the country during the Seventh Plan was 2.9 percent par annum.Though the comparable figure for this State is not a v a i l a b l e ,there is no evidence to believe that this growth in the remaining three years (1987-88 to 1989-90) of the Seventh Plan would be higher than the growth rate of 2.4 percent in the first two years of the plan,for the simple reason that growth in per capita income in two out qf these three years was less than the first two years.It follows, therefore, that an already higher level of expenditure (as mentioned earlier in this document) in the country and a higher growth on this base would also have increased the disparity in living standards of the people of this State and the country.
6 The growth in per capita income shows a similar trend. Dataon per capita income is available for the period from 1950-51 to 1986-87 at constant prices of 1970-71 and for the period from 1980-81 to 1989-90 at constant prices of 1980-81.The trend growth in this income (at constant prices of 1970-71) over a long period of thirty years, from 1950-51 to 1980-81, was ab ysmally low at0.6 percent per annum. However, there was significant improvement in this growth rate in the 1980*s. The growth (at constantprices of 1970-71) in the first six years, from 1980-81 to1986-87, was 2.6 percent per annum, as a result of which thetrend growth in a longer period of twenty six years,from 1950-51 to 1986-87 ,was 0.9 percent, which is again too insufficient to have made much difference in the over-all economy of the State.The annual growth in per capita income at constant prices of 1980-81, in the first four years of 1 9 8 0’s, from 1980-81 to 1984-85, was 1.8 percent, in the latter period,from 1984-85 to1989-90, it was 2.3 percent and, in the longer period from1980-81 to 1989-90, it was 2.7 percent. These rates of growth were much lower than the corresponding rates for the whole

country.Consequently,the gap between the State and the country in per capita income also continued to grow. The per capita income of the State (at current prices) was lower than that of the country by Rs 8 <3 percent) only in 1950“51r but the sameshortfall rose to Rs 1180 (27.8 percent) in 1989-90.
7 Apart from low levels of income and consumption expenditure and a lower growth in these, there are some other aspects which are equally significant from the point of view of future planning. The physical output of agricultural commodities still continues to fluctuate, depending on weather conditions in the S t a t e . These weather-induced fluctuations act as a disincentive for farmers in making the desired investment in agriculture, and inhibits growth in this sector. It is quite disturbing to observe that the growth in this single largest sector of the State's economy has been stagnating at 2.7 percent per annum in the more recent ten years of 1980*s. The picture in the manufacturing sector is still worse. The average annual growth in this sector shows a consistent declining trend. The growth came down from 9.4 percent in the Fifth Plan to 9.0 percent in 1981-85 and still lower to 6.4 percent in 1985-90,with average annual growth of 7.6 percent in the whole decade, from 1981-82 to 1989-90. These are some areas of significant weakness in State's economy which need much more attention in future.
8 A lower growth in the economy itself is a difficult problem for the State to solve.Apart from impairing the capacity of the State government to raise more resources required for a faster growth ,it is leaving little or no surpluses with most people for private investment. But more than the problem of a lower growth rate the other problems arising from inequitous distribution of income are not only far too serious but much too complicated also.These are the problems of p o v e r t y ,unemployment and severe underemployment in rural areas.The rural areas continue to suffer from lack of some basic needs and the quality of life in these areas is still poor.The incidence of poverty in terms of the number of persons below the poverty line is showing no signs of any significant reduction. These problems of unemployment and of severe under- employment in rural areas ,the two single largest factors responsible for high incidence of poverty,have assumed frightening proportions. On top of these,is the problem of a high growth in p o p u l a t i o n ,compounding all other problems still more,and that of a poor social infrastructure. Even though the solution of these problems is linked,to a great extent to over-all growth in the economy,the pattern of growth and the need to build distributive bias into it in favour of the poor and rural areas are more crucial for this purpose. The perspective of development spelt out in subsequent paras centres around some of these aspects only against a time-frame of the next fifteen years covering the Eighth plan (1992-97), Ninth Plan (1997-2002) and Tenth Plan (2002-2007);

9 Per-capita income is the single most reliable and compositeindicator of development. The perspective of development must, therefore, take this parameter as a base for rapid economic growth. Doubling the estimated per capita income of the State from Rs. 1636 of the base year (1991-92) to Rs.3272 in 2007 (at 1980-81 prices) in a period of 15 years should be theperspective. It does not mean that other important goals like removal of unemployment and poverty would take a back seat. These objectives are not mutually exclusive and if planned systematically, economic growth, expansion in employment and rise in living standards can go together.
10 The overall annual growth as observed in the economy during1951-92 was 3.02 percent. The income of the State with thisgrowth rate (3.02 percent) would multiply about 1.56 times in 15 years. If the per capita is to be doubled during this period, the population of the State should have a negative growth of 1.65 percent per annum. This is just not possible in view of past trends. The population has grown at an annual rate of 2.27 percent (1981-91). At this rate, it would multiply 1.39 times in15 years. If the per capita income is to be doubled in thisperiod, the SDP must grow at an annual rate of about 8.0 percent. This is also not possible, going by the past trends. Alternately, if the economy grows with a modest rate of 5 percent per annum, close to the growth in the last three preceding five year plans, and population growth to d e c l i n e’ progress!vely, the per capita income would take 20 years (by 2011-12) to double. However, this will not wipe but the gap between percapita income of the State and the country even after fifteen years. The Planning Commission has already settled for a growth of 5.6 percent per annum for the country in Eighth Plan (1992-97). With a growth of 5 percent in the Eighth Plan and onwards in S t a t e’s economy, the existing gap of Rs. 621 in the base year (1991-92) at 1980-81 prices) would rise® still further to Rs. 793 in 1996-97, Rs.1150 in 2001-02and Rs.1504 in 2006-2007. In this framework, the gap in the per capita income would thus, multiply 2.4 times by 2006-2007 and further about 3.3 times by the end of 2011-12. This is also not an acceptable situation.
11 It implies, therefore, that a lower growth in the State wouId increase the period over which the gap in per capita income can be reduced and vice-versa. However, In the latter case, the intensity of gap will be toned down. In this framework, if we reduce the period to half i.e. from 20 years to 10 years to
1. 1.9'/. in 1991-2001, 1.87. in 2001-12. These are u n d o ubte dly very ambitious targets to achieve, considering there has been no decline in rates of population-growth in the last several years. But without these significant reductions in population-growth, the future of the State will remain very dark.
2. Assuming the same growth rate (5.6%) of the Eighth Plan for the Ninth and Tenth Plans for the Country.

double Stale's per capita income, the economy would require to grow at an average annual rate of more than 10 percent duringthis period (1991-92-2001- O H ) . Keeping in view the pastperformance, the potentials of growth, relatively low level of development and constraints of resources, a growth rate of this order is also beyond the capacity of the State to achieve.
12 The exercises carried out have shown that if the State aims at 6 percent growth in Eighth Plan (1992-97), 6.Spercent in Ninth Plan (1997-2002) and 7.4 percent in the Tenth Plan (2002-07), it would be able to achieve the objective of doubling its per capita income in 15 years time. On this reckoning, the economy in thisperspective period (1992-2007), must grow at a rate of 6.6 perannum. The choice of a higher growth in the Eighth Plan and a modest step-up of about 0.5percent in successive plans is pragmati c .
13 This alternative, growth scenario s
as outlined above gives the following
Table - 2 : Growth Scenario of the State's Economy Durina riaFtKV‘"irimH"ana”TenTF^^^Tat"1v6a-8"r.pril:'eTr~^---------------
At the end of
Part i culars Base Year (1991-92)
Eighth Plan (1992-97)
Ninth P 1an (1997-2002)
Tenth Plan (2002-2007)
1 2 3 4 5Ca) Growth rate — 6 ■ 00 6.54 7.40
(b)('/ per annum) State income 22,974 30,744 42,20'2 60,303
(c)(Rs. in crore) Per capita 1,636 1,983 2503 3272
(d)(income ( R s .) Population (crore) 14.04 15.50 16.86 18.43
14 As mentioned before, the national economy is targetted to grow at a rate of 5.6percent per annum during Eighth Plan. The perspective growth targets for the country are not available. We can therefore, assume the same growth for subsequent plans also. On this basis, the contours of national economy in the corresponding period will be as shown belows
Table - 3
Parti culars
Growth Scenario of the National Economy Durina...
At the end of
Base Year Eighth Plan (1991-92) (1992-97)
Ninth Plan Tenth Plan (1997-2002) (2002-2007
1 2 3 4 5(a ) (jrowth rate
iV, per annum)5.60 5 .60 5 .60
(b) National income (Rs. in crore)
192715 253067 332828 436413
(c) Per capita (income ( R s -)
2257 2685 3370 4096
- (d) P o D u l a t i o n ® (c r o r e ) 85.38 94.25 98.61 106.55
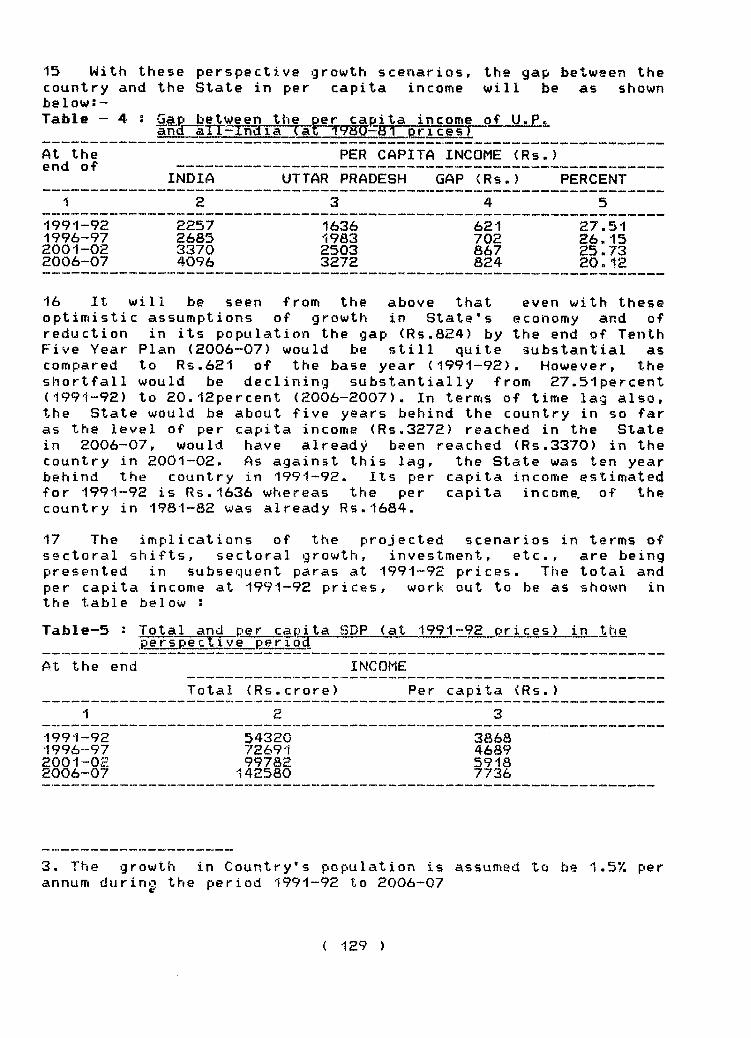
15 With these perspective growth scenarios, the gap between the country and the State in per capita income will be as shown belows-Table - 4 s Gap between the per capita income o f U.P«
and~~aIT-India (at pTic~g¥T
At the end of
•1991-921996-972001-0E2006-07
INDIA
2
2257268533704096
PER C APITA INCOME (Rs.)
UTTAR PRADESH GAP <Rs.) PERCENT ^ ^ „
1636198325033272
621702867824
27.5126,1525.7320-12
16 It will be seen from the above thatoptimistic assumptions of growth in S t a t e’sreduction in its population the gap (Rs.824) by
Plan (2006-07) would be still quiteto Rs.621 of the base year (1991-92)would be declining substantially fr to 20.12percent (2006-2007). In terms o would be about five years behind the c
Five Year compared s h o r t f a l 1 (1991-92) the Stateas the level of per capita income (Rs.3272) reach in 2006-07, would have already been reached country in 2001-02. As against this lag, the St behind the country in 1991-92. Its per capita for 1991-92 is Rs.1636 whereas the per capita country in 1981-82 was already Rs.1684.
even with these economy and of the end of Tenth substantial as
However, the om 27.51percent f time lag also, ountry in so far ed in the State (Rs.3370) in the ate was ten year income estimated income, of the
17 The implications of the projected scenarios in terms of sectoral shifts, sectoral growth, investment, etc., are being presented in subsequent paras at 1991-92 prices. The total andper capita income at 1991-92 prices, work out to be as shown inthe table below !
Tafo1e-5 : Total and per capita SDP (at 1991-92 prices) in theperspective periog~
At the end INCOME
Total (Rs . c r o r e ) Per capita ( R s .)
1 2 3
1991-92 54320 38681996-97 72691 46892001-02 99782 59182006-07 142580 7736
3. The annum
growth in C o u n t r y’s population is assumed to be 1.57. per the period 1991-92 to 2006-07du r in^

Sectoral Shifts
18 The experience of developed as well as developing economies has been that there was a continuous decline in the share of agriculture with cor responding rise in the shares of industry and services. But the data of sectoral shares in the total income of the State for 1981--90 (at 1980-81 prices) show that out of a decline of 8.5 percentage points in the share of primary sector 3.0 has gone to secondary sector and the remaining 5.5 to services sector. This is not a healthy sign for a developing economy and gives rise to an apprehension that, in due course, the share of indust ry like that of agr i c u 1tu re might also be taken over by the services sector, breaching the chronological law of sectoral shifts from agriculture to industry and then to services. The rise in the share of services sector may be attributed to higher wages, more profit-yielding opportunities, lesser gestation or fruition period, more value-added margin, e t c .
19 The projected composition of State income in broad sectors viz (i) agriculture, (ii) man ufacturing and (iii) rest has been presented in the following table.
Table - 6 : Structure of State Income (1992-2007) f f T ~ W 7 T ^ " D r r c e ¥ T -----------------------
Sector 1991-92 1996-97 2001-02 2006-07
1 2 3 4 5
Agri culture
Manufactu ring
Rest
22220 (40.90) 7800 (14.40) 24300 (44.70)
27477(37.80)12576
(17.30)32638
(44.90)
34077 (34.15) 21092 (21.14) 44613
(44.71)
42467(29.78)37084(26.01)63029(44.21)
Overall economy 54320 (100.00)
72691 (100.00)
99782 (100.00)
142580(100.00)
20 The structure of the economy has been the natural sequencing of the sectors. Th sector would decline from about 41percent 30percent in 2006-07, followed by a s manufacturing from about 14percent to 26pe income in rest of the sectors will a (44percent) of the base year would remain level in the perspective period. A mo sectoral composition of State income has al is given in Annexure-I.
projected to follow e share of agriculture in 1991-92 to about tep-up in the share of rcent. Although, the Iso rise but its share almost at the same
re detailed account of so been attempted and
21 The projected sectoral shift in favour of manufacturing is based upon the premise that following the New Economic Policy and the Industrial Policy emphasising liberalisation and deregulation, there will be a spurt in private investment in industries and the growth in this sector will pick-up in subsequent years.

22 The sectoral growth rates on the basis of the structure, outlined above, will be as follows s-
Table-7 s Sectoral Growth Rates (At 1991-92 prices)
Sector
1
Eighth Plan Ninth Plan Tenth Plan 1992-97 2001-02 2006-07
Agri culture Manufactur ing Rest
Overall economy
4.310,06.1
6.0
4.4 10.96.4
6.S
4.512.07.2
7.4
(Disaggregated growth rates in 8 sectors are A n n e x u r e - I I )
given in
23 Against an overall growth rate of 4.8percent per annum and growth of 2.7percent, 6.4percent and 6.6percent in agriculture, manufacturing and rest of the sectors respectively in the Seventh Plan (1985-90), the targeted growth rate in Eighth Plan for the overall economy is 6percent within which agriculture is envisaged to grow at the rate of 4.3percent per annum, manufacturing sector at lOpercent and rest of the sectors at 6.1percent per annum. The physical targets for selected items relating to sub-sectors of the economy to sustain these growth rates in Eighth Plan are given in the document at relevant place. Under the manufacturing sector, the unregistered sector and agro-based industries would be given much greater priority than before in order to gear up the rural economy and to create adequate job opportunities for the rural poor. The perspective of development for the Ninth and Tenth Plans envisages overall annual growth rates of 4.4percent, 10.9percent and 6.4percent in agriculture, manufacturing and rest of the sectors in the former and 4,5percent, 12.0percent and 7.2percent in the latter. Some selected few targets to sustain these growth rates are given in A n n e x u r e - I I I .
24 The rationale behind the targeted growth o the performance of the sector in the re potentialities it has acquired and the prior given to it in the light of objectives and goal plan. Foodgrains production has much beari growth in any year. The State has a targ production of 430 lakh tonnes for the terminal Plan period. It may appear to be a big jump fr of foodgrains production in 1989-90. But it sh that there was a fall of 14percent in the fo1987-88 due to drought and unfavourable weathe State had a record production of 354 lakh t output is estimated to be about 353 lakh tonnes 355 lakh tonnes in 1991-92. Against this
f a sector lies in cent past, the ity proposed to be s of the Eighth ng on agricultural et of foodgrains year of the Eighth om 338 lakh tonnes ould be remembered odgrains output in r. In 1989, the onnes, Foodgrains
in 1990-91 and perspective, the

proposed target of foodgrains production and a growth of 4«3percent for agricultural sector will appear reasonable. This is also an area which still offers large scope for growth by maKimising productivity. The overall growth in economy also depends on the growth achieved in this sector. It is for these reasons that the target of growth for agriculture sector has been raised to 4.3percent in Eighth Plan and to 4-4percent and 4.5percent in Ninth and Tenth Plans.
25 The growth proposed fo Plan is also v^ell within reach been achieved in this sect sector has, further acquired Plan. The infrastructure for during this period. A number projects have also been establ climate, the industrial sector of lOpercent per annum during Ninth Plan and 12percent in th
r industrial sector in the Eighth A growth of 9percent had already
or during 1981-82 - 1984-85. This new capabilities during the Seventh industrial growth has also improved of large and medium industrial
ished. Based on improved industrial is now targetted to grow at a rate
the Eighth Plan, 10.9percent in the e Tenth Plan.
26 The rest of the sectors, which mostly consist of services, will concomitantly grow with more output in agricultural and industrial sectors.
Investment Requirement
27 The incremental capital-output ratio (ICOR) is an indicator of the efficiency of investment. It is also used to estimate investment required for achieving growth in the economy. The overall ICOR in the Seventh Plan is estimated at 4.7:1. However, assuming a decline of about 4percent in this ratio during the perspective span of 15 years, the ICOR of 4 . 5 s 1 has been assumed for this period. In th© long term considerations, extremities and abnormalities usually get smoothened and economy has ample scope for improving its efficiency. The assumed ratio is, therefore, reasonable. The requirement of investment worked out on the basis of this ratio is as under.
Tabl»-8 : Requirement of Investment at 1991-92 Prices(Rs. in crore)
At the end of TotalIncome
AdditionalIncome
Investment
1 2 3 4
1991-92 54320 —
1996-97 72691 18371 826692001-02 99782 27091 1219092006-07 142580 42798 192591

28 The investment requirement at 1991-92 prices for the envisaged growth perspective for the Eighth, Ninth and Tenth Plans is estimated to be Rs.82000, R s . 1,22,000 and R s . 1,93,000 crores respectively.
29 This When the expend!tu requ i red added to outlay, aggregate will be R the Stat remain ing m o b i 1ized later par
is the aggregate component of
re of a recurring for accrual of
the latter, it be The size of State
investment will s.5,000 crore, e*s public sect investment of Rs from other sourc
t of this documen
investment re current expend nature and o the benefit
comes the size *s public sec be Rs.23000 c
making a total or outlay in .59,000 crore es. The detail t s
quired in the economy, iture, which is the plan f non-investment nature s from investment is also of the State,s aggregate
tor investment in this rore. The current outlay of Rs. 28.000 crore as the Eighth Plan. The
<82,000-23,000) will be s of these are given in a
T a b l e - 9 s Size of the State Plan outlay for the Eighth Five Year Plan
(At 91-92 prices)
Parti culars Size ( R s .in c r o r e )
1.Total Investment 820002-Share of State Sector 23000
in total investment3 . Current expenditure 50004 . State Plan outlay (2+3) 28000
Emplovmen t Generation
30 Although, the problems of unemployment and poverty have been alread y dealt with in detail, it might be useful to briefly describe here also the implications of growth perspective for the incidence of unemployment and poverty.
31 On the basis of estimates of employment elasticities with suitable adjustments, which have been explained earlier, the average annual growth in employment works out to 3.0percent for the Eighth Plan, 3.3percent for the Ninth Plan and 3.7percent for the Tenth Plan against projected growth of 6.0percent, 6.5percent and 7.4percent respectively in income. The perspective scenario

of likely employrrient generation is presented in the following table 5-
T able ~10 s Perspective Scenario of Growth in Etnplovment(In lakh persons)
Parti culars Eighth Plan Ninth Plan Tenth Plan (1992-97) (1997-2002) (2002-07)
1.Backlog of U nemployment 92*in the beginning
2.New entrants to the labour 52 force(1S-59 age)
3. Job opportunities to be 50**created
4.Unemployment at the end 945. Growth of employment 3.06.Growth of income 6.0
94
66
78
823.36.5
82
70
123
29377.4
* Includes 76 lakhs u n d e r e m p l o y e d s .** Worked out by Rajya Yojna Ayog, Planning Department and also
reinforced by an exercise carried out by the Perspective Planning Division.
32 It will be seen from the above that the envisaged growthrates would enable the State to almost overcome the problem of unemployment by the end of the perspective period, leaving abacklog of only 29 lakhs against 92 lakhs in the beginning. However, Without suitable policy support, the targets may not be realised even though the targets of overall growth may beachieved. The policies must influence all the major variables which determine employment growth, such as population growth and the participation rates on the supply side and the rate of investment and technologies on the demand side.
Poverty Alleviation s
33 Apart from unemployment, poverty is the other closelyrelated major problem. There is a close relationship between the two and once the problem of unemployment is tackled effectively, poverty will simultaneously be alleviated to a large extent. The fact is that poverty pe.rsists as the gains from growth do not equitably reach the poor and the poor, in turn, are unable tomake any significant contribution to growth.
34 Information on the incidence of poverty is available from quinquennial surveys conducted by the National Sample Survey Organisation (NSSO). The latest data on consumption pertains to the year 1987“88 collected under its 43rd round. On the basis of this data and m inimum nutritional requirement of 2400 calories per day per person in rural areas and 2100 calories in urban

areas, the cut-off points in respect of per capita monthly expenditure worked out at current prices were R s.130.15 for rural areas and Rs.155.S3 for urban areas. In other words, all persons belonging to the househoIds with per capita m o n t h 1y expenditure in 1987-88 below these limits comprised the poor pop»ulation.
35 While preparing estimates of the percentage population below the poverty line for the perspective period, propensity to save was taken as SOpercent for 199E-97, ESpercent for 1997-02 and 23percent for 2002-07. The corresponding assumptions with regard to urban-rural per capita consumptions has been taken as 1.29, 1.25 and 1.25 with a view to reduce consumption disparity between the two segments of population. The estimates of poverty on the basis of this exercise are given below s-
Table-11 : Poverty est imates for the terminal year oftK¥.Ei5Frr.T~WinTh.-------------------------------
Part i culars Area At the end of
BaseYear(1991-92)
EighthPlan(1992-
1997)
Ninth Plan (1997- 2002)
Tenth Plan
( 2002- 2007)
Population below poverty line (percent)
Persons Poverty (lakh)
be 1 ow 1 ine
2 3 4 5 6
Ru ral 40.40 25.27 14.28 6.36Urban 34.31 21.89 11.76 5.37State 38.93 24.32 13.44 5.97
Rural 426.73 279.07 160.90 71.*’40Urban 115.50 94.99 65.77 38.70State 542.23 374.06 226.67 110.10
36 It may be noticed that overall poverty percentage successively declines from about 39percent in the base year to about 24percent in the Eighth Plan, 13percent in the Ninth Plan to about 6percent in the Tenth Plan, against stipulated overall growth rates of 6percent, 6.5percent and 7.4percent. There will be a reduction in absolute number of poor also. About 4.32 crore people would have crossed the poverty line by the end of 2006-07. Rural-Urban disparity would also reduce. The proportion of rural poor, which was about 78percent in the base year will come down 'to about 64percent by 2006-07.
Distributive pattern s
37 The choice of doubling the per capita income in 15 yearstime mainly arises from the challenges of poverty andunemployment, which the State is facing. The expectations andexigencies of the situations hardly leave any ground to hope for soft options anymore. The economy must move with an accelerated pace from one plan to another as conceived here-
38 Growth performance apart, the distributive aspect of growth thus achieved, is very important. In the past, growth has not only been inadequate but it has been distributed very unevenly
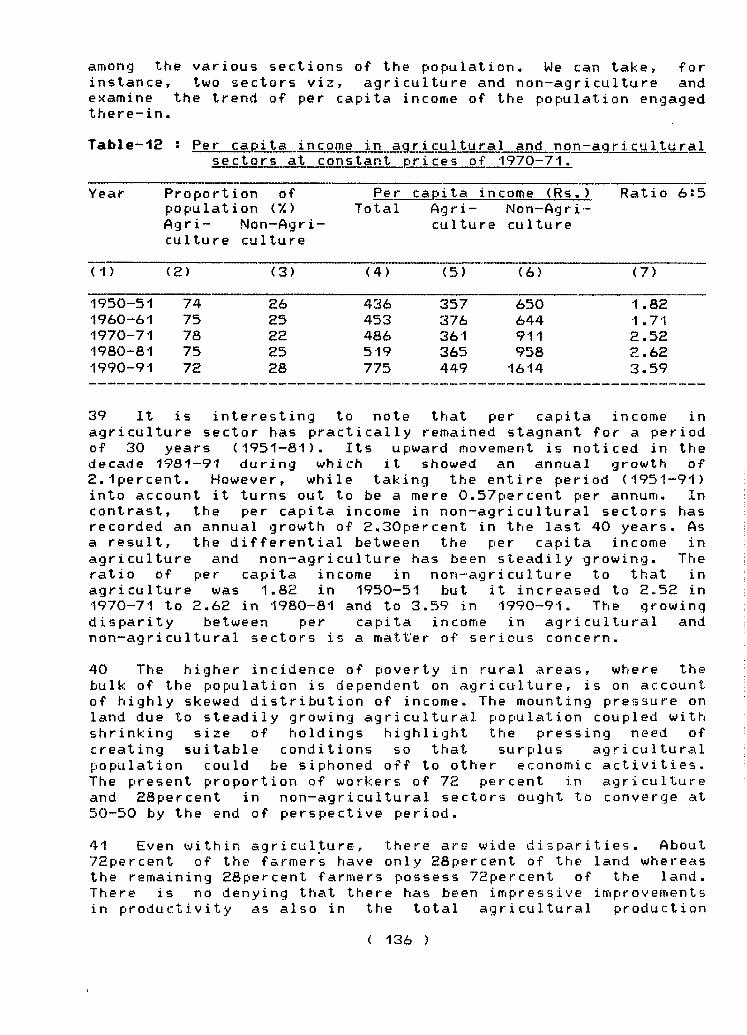
among the various sections of the population. We can take, for instance, two sectors viz, agriculture and non-agriculture and examine the trend of per capita income of the population engaged t h e r e - i n .
Table-12 s Per capita income in agricultural and n o n - a q r i c u 1tural sectors at constant prices of 1970-71,
Year Proportion of population iV.) Agri- Non-Agri culture culture
Per capita income (Rs.) Total Agri- N o n - A g r i
culture culture
Ratio 6:5
( 1 ) (2 ) (3) <4) (5) <6 ) <7)
1950-511960-611970-711980-811990-91
7475 78 75 72
2625222528
436453486519775
357376361365449
650644911958
1614
1 .82 1 .71 2.52 2.62 3.59
39 It is interesting to note that per capita income inagriculture sector has practically remained stagnant for a period of 30 years (1951-81). Its upward movement is noticed in the decade 1981-91 during which it showed an annual growth of S.ipercent. However, while taking the entire period (1951-91) into account it turns out to be a mere 0.57percent per annum. In contrast, the per capita income in n o n - a g r i c u 1tural sectors has recorded an annual growth of 2.30percent in the last 40 years. As a result, the differential between the per capita income inagriculture and non-agriculture has been steadily growing- The ratio of per capita income in n o n - a g r i c u 1ture to that inagriculture was 1.82 in 1950-51 but it increased to 2»52 in1970-71 to 2.62 in 1980-81 and to 3.59 in 1990-91. The growing disparity between per capita income in agricultural and n o n - a g r i c u 1tural sectors is a matter of serious concern.
40 The higher incidence of poverty in rural areas, where thebulk of the population is dependent on a g r i c u l t u r e , is on account of highly skewed distribution of income. The mounting pressure on land due to steadily growing agricultural population coupled with shrinking size of holdings highlight the pressing need ofcreating suitable conditions so that surplus agricultural population could be siphoned off to other economic activities. The present proportion of workers of 72 percent in agriculture and 28percent in n o n - a g r i c u 1tural sectors ought to converge at 50-50 by the end of perspective period.
41 Even within agriculture, there are wide disparities. About 72percent of the farmers have only 28percent of the land whereas the remaining 28percent farmers possess 72percent of the land. There is no denying that there has been impressive improvements in productivity as also in the total agricultural production

over the years in the State. But, the productivity in small and marginal holdings, which dominates the agrarian structure, has not shown any perceptible change.
4E An attempt has also been made keeping in view the characteristics of our economy to identify the key a r e a s / v a r i a b l e s , which play a catalytic role in attaining the objectives and making the impact of developmental efforts really visible and to project their required magnitudes. These are : population; agriculture & infrastructure vis; power, irrigation and roads. Some broad projections in respect of these are also given in A n n e x u r e - I I I .
Population :
43 The gains of development must ultimately reflect in progressive rise in living standards of the people. Unless population growth in checked and checked fast enough, enormous developmental efforts, which the economy is putting forth in each successive plan period, will continue to be neutralized to a large extent.
44 The pace of growth in S t a t e’s population continues to be fast. It increased with at an annual rate of I.Spercent during the decade 1931-61, 1.8percent during 1961-71, 2.3percent during1971-81 and as the provisional results of 1991 Census show, 2.27 per cent in 1981-91. These figures offer little evidence that family planning programme in making the desired impact.
45 The population perspective, for 1992-2007 period, envisages reduced growth of 2.2percent during 1992-97, 2.1percent during1997-2002 and 1. 8per cent during 2002-07 with concommitant decline in birth and death rates. The perspective envisages bringing down the birth rate by 8.1 per thousand from 35.9 in 1992 to 27.8 in 2007. It should not be a difficult target for the State to achieve, for higher achievements have already been made by a number of states viz, Assam (17.8), M a h a rastra (13.1), Kerala (12.3) Karnataka (10.7) and Haryana (11.1) in 1961-78 p e r i o d .
A qri culture s
46 Any future development perspective aimed at faster growth of the economy has to place agricultural sector at a crucial position since State's economy is predominatly agricultural and is likely to continue so for a fairly long time. Hence, a two pronged approach is called for to address itself to the debilitating factors of agricultural growth and also gainfully make use of untapped or under-tapped potential.
47 Foodgrain production is the major determinant (having 83percent share in total agricultural production) of the overall growth of the agricultural sector. An attempt has been made to project foodgrains production. The total foodgrains production

ill consistently rise from the estimated 352.50 lakh M. Ton in991-92 to 640 lakh M. Ton. in the terminal year of theerspective period, amounting to an increase SOpercent. In perapita terms, it turns out to be 37percent, which means growth ate of food production will exceed the growth rate ofopulat i o n .
rriqation :
8 Among the complementary requirements for achieving thenvisaged step-up in growth in agriculture, in general, andoodgrains production in particular, irrigation is a crucial one, rojections of the irrigation potential have been made on the •asis of elasticity of income growth of agriculture sector and hat of irrigation potential. In the envisaged perspective, therrigation potential is sought to be more than double-504 lakhectare in 2006-0 7 from 246 lakh hectare in 1991-92.
9 The creation of a facility and its utilization should goand in hand in a situation of severe constraints on resources,he gross irrigated area in 1988-89 accounted for only3 . 2 per cent (141.13 lakh hectare) of the irrigation potential of 23.34 lakh hectare. This calls for necessary measures forncreasing utilisation of the irrigation potential.
ower 5
0 Power is the most critical infrastructure for socio-economic evelopment of the people. Implicitly, its requirement would u bstantially go up in the envisaged growth scenario of the Itate's economy. Consistent projections, based on elasticities of itate income and total electricity consumption have been made, he perspective of power is that per capita consumption of power »ill increase from about 159 (kwh) in the year 1989-90 to about>90 (kwh) at the end of the perspective period. A jump of about►.5 times in per capita consumption of power may sound quite imbitious. But in view of S t a t e’s requirements for targeted evels of output in agriculture, industrial and tertiary sectors n a 15 years span, bold new initiatives to increas the output of his vital input, as outlined, are urgently called for.
>1 A rate of growth much below the desired rate of growthuring the last four decades coupled with an upsurge inopulation, most of which is poor, caused per capita income ofhe State to move at a snails pace of mere 1.02percent per annumrom 1950-51 to 1991-92. At this rate, it would take 68 years toou bl e the pe r capi ta in come ais against 15 year s env i saged in theerspective. The task ahead is, obviously, tough and toilsome, ranslating the perspective into reality would depend on the xtent to which the implementation gap on both the fronts is ffectively done away with. In other words, the pace of economic irowth will have to be accelerated, on the one hand, and •opulation growth kept under check on the other.

Percentage contribution of different sectors to the state income in the terminal years of Eighths Ninth and Tenth Plans
(Rs. in crores at 1991-92 prices)
Sector
(1)
Base Year (991-92)
(2)
At the end of
EighthPlan(1992-97)
(3)
NinthPlan(1997-2002)
(4)
Tenth plan
(2002-2007)
(5)
1 Agriculture and 22654.56 28036.72 34815.39 43479.32allied (41.71) (38.57) (34.89) (30.49)
2 Mining and quarrying 217.28 298.03 409.11 584.58(0.40) (0.41) (0.41) (0.41)
3 Manufacturing 7800.00 12576.00 21092.00 37084.00
(14.36) (17.30) (21.14) (26.01)a) Registered 4062.24 6542.04 11115.48 20258.99
(7.48) (9.00) (11.14) (14.21)b) Un~registered 3737.76 6033.96 9976.52 16825.08
(6.88) (8.30) (10.00) (11.80)4 Electricityr6as and 597.52 882.29 1297.17 1996.12
water supply (1.10) (1.21) (1.30) (1.40)
5 Construction 2227.10 3053.02 4290,63 6273.52(4.10) (4.20) (4.30) (4.40)
6 Trade 7235.41 9696.98 13330.88 19077.20(13.32) (13.34) (13.36) (13.38)
7 Transport 1363.43 1839.08 2624.28 3892.43(2.51) (2.53) (2.63) (2.73)
8 Services 12224.70 16308.88 21922.54 30192.83(22.50) (22.44) (21.97) (21.18)54320.00 72691.00 99782.00 142580.00
Total (100.00) (100.00) (100.00) (100.00)
N.B, Figures in brackets denote percentage to total.

Growth rate of different sectors during the Eiaht h > N i n t hand Tenth Plans
Sector Groth Rates (Percent)
Eighth Plan Ninth Plan Tenth Plan ( 1992-97) ( -1997-2002 ) < 2 0 02-2007 )
( 1) (2 )
1 Agriculture and 4.30ai 1 i ed
2 Mining and quarrying 6.50
3 Manufacturing 10.00
a) Registered 10.00
b) Un~registered 10.05
4 E 1e c t r i c i t y , gas and 8.11water supply
5 Construction 6.51
6 Trade 6.03
7 Transport 6.17
8 Services 5.94
(3)
4.43
6.54
10.90
11.19
10.58
8.02
7.20
6.57
7.37
6. 10
(4)
4.54
7.40
12 .0 0
12.76
11 .02
9.00
7.90
7.44
8.21
6.62
Total 6.00 6.50 7.40

Projected magnitudes of important items for the perspective period
SI. ItemsKJn
At the end 'ofNO »
Base year (1991-92)
Eighth Plan (1992-1997)
Ninth Plan (1997-2002)
Tenth Plan (2002-2007)
1 2 3 4 5
1 Food grains
(a)Total(lal<h M.T.) 353 430 525 640
(b) Per capita (Kg.) 253 277 310 347
2 Irrigation Potential
(a) Total(lakh hect.) 246 312 395 504
(b)Additional (lakh ha.) 12 66 76 109
3 Power Consumption
(a) TotaKcrore unit) 2091 4230 8144 16381
(b) per capita(Kwh) 159 273 483 889
4 RoadsTotal (lakh Kms)
0.62 3.01 3.70 4.52
5 Birth(Rate per thousand) 35.9 35.1 32.2 27.8
6 Death(Rate per thousand) 13.2 13.1 11.0 9.8
7 Polulation(Rate per thousand)
22.7 22.0 21.2 18.0
8 Population(in Crores) 14.04 15.50 16.86 18.43

CHAPTER - XII
OBJECTIVES AND STRATEGIES
The central purpose of planning is to raise the living standards of the people. The more specific objectives spelt out in successive Five Year Plans are woven around this central purpose, even though these are sometimes described differently. A part of this difference is due to the change in environment whichnecessitates some change in priorities and the directions also,as stated in the preceding Plan. But the major reason for the difference is the new perceptions of planners, their commitments on various socio-economic issues, and their own interpretation of the past data and the emerging trends- While some of these objectives are quantifiable, others are not. These can be stated in more general terms, but all the same they are no lessimportant. These are supposed to be the driving force behind the Plan, and to reflect in its programmes and investmentdecisions, and one would also expect that there will be adequate policy support for this purpose. An effort will be made in the Plan period to achieve these objectives as well.
2 While describing the perspective of development, somequantifiable objectives of the Eighth Plan have already beenstated. These are as follow s-
(i) An over-all average annual growth of 6 percent againstcor responding growth of 4.8 percent in the Seventh Plan, 4 percent in the Sixth Plan <1981-82 to 1984-85)and 5.7 percent in the Fifth Plan. The targetted growthfor the country is 5.6 percent.
(ii) Within this growth (6 percent), the sectoral averageannual growth will be 4.3 percent in agriculture, 10 percent in manufacturing, and 6.6 percent in the rest. The cor responding growth in the Seventh Plan was 2.7 percent in agriculture, 6.4 percent in manufacturing and 6.6 percent in the rest. The targetted growth forthe country is 3 percent in agriculture, and 7.3percent in manufacturing.
(iii)With these growth rates, the sectoral shares inincremental income will be 27.3 percent of agriculture,25.3 percent of m anufacturing and 47.4 percent of the rest. The corresponding shares in the Seventh Plan were25.8 percent ( agri c u l t u r e ) 22.2 percent (manufacturing ) and 52.2 percent (rest). These shares in the country will be 24.4 percent ( a g r i c u l t u r e ), 23.2 percent(manufacturin g), and 52.4 percent (rest).
(iv) The per capita income at 1980-81 prices will rise from Rs.1572 in 1989-90 and Rs. 1636 (likely) in 1991-92 to Rs. 1983 at the end of the Eighth Plan in 1996-97, giving an average annual growth of 3.9 percent in per

capita income against 2.3 percent of the Seventh Plan. This may lead to a growth of about 3 percent per annum in per capita private consumptionagainst a slightly higher growth (3.2 percent to 3.5percent) estimated for the country.
(v) Creation of gainful and self sustaining employmentopportunity for 50 lakh persons, over and above adhoc employment to be generated for 20 lakh persons through special employment programmes under rural development. This will yield employment-growth of 3 percent per annum over 1991-92. Within 50 lakh opportunities of gainful and permanent employment, there will be 20 lakhs in agriculture, 16 lakhs in manufacturing and 14 lakhs in the remaining sectors.
<vi) Significant reduction in poverty by bringing down population below poverty line from 41.2 in 1987-88 and38.9 percent (estimated) in 1991-92 to 24.32 percent at the end of the Plan in 1996-97.
(vii) Reduction in population growth from 2.29 percent per annum during 1981-91 to 2.2 percent in the Plan period.
(viii) Provision of adequate safe drinking water to allvillages, higher literacy rate of 55 percent at theend of the Plan against 41.7 percent (estimated) in 1991, and electrificat ion of 91 percent villages by the end of the Plan.
The other objectives of the plan are as follows s-
(1) To raise income of rural poor, particularly the poorestof the poor.
(2) To improve quality of life in rural areas by providing electricity, safe drinking water,roads and health care in each village.
<3) To ensure that at least 60 percent of plan outlay isspent for the development of rural areas.
(4) To ensure that reasonable share in public facilities is available to poor people.
(5) To maximize productivity in agriculture along withdiversification and mixed farming in small andmarginal holdings and in areas of low productivity.
(6) To bring down population growth to 2.2 per cent per annum.
(7) To achieve a faster growth in manufacturing sector, and promotion of industries which have larger potentialities of employment and a n c i 1 1 iarisat i o n .
(8) To consolidate gains from and to improve efficiency and productivity of past investment and of the existing a s s e t s .

(9) To promote faster development of backward areas in order to reduce intra-State disparities in levels of d e v e l o p m e n t ,
(10) To undertake special measures for the overall economic and social development of the weaker sections of the society, particularly of scheduled castes/scheduled tribes, and of women and children.
(•ID To strengthen panchayati raj institutions in rural areas and local self governing institutions in urban areas and to make them effective media for formulation and implementation of development schemes.
4 It will be the function of each sector of the Plan to keep these objectives in view and to ensure that its programmes and policies in the Eighth Plan serve these objectives also. It will be useful in this context to state here briefly some of the overall strategies which will be pursued in the plan to achieve these objectives. The sectoral strategies must fit into these overall strategies s-
Obj ectives Overall strategies
1. To raise income of rural' poor
i) Giving highest priority to development programmes which maximize productivity of small and marginal holdings, generate self-sustaining additionalemployment including wage employment and self-employment for them in agriculture and non-agricultural activitieswith guaranteed minimum income.
ii) Initiating measures which, apart from raising productivity of assets for rural poor, also lead to accretion in their a s s e t s .
2. To improve quality of life in rural areas
i) Provision of safe andhygienic drinking water in all villages in adequatem e a s u r e .
ii) Saturating all villages with improved net-work of assured electricity.
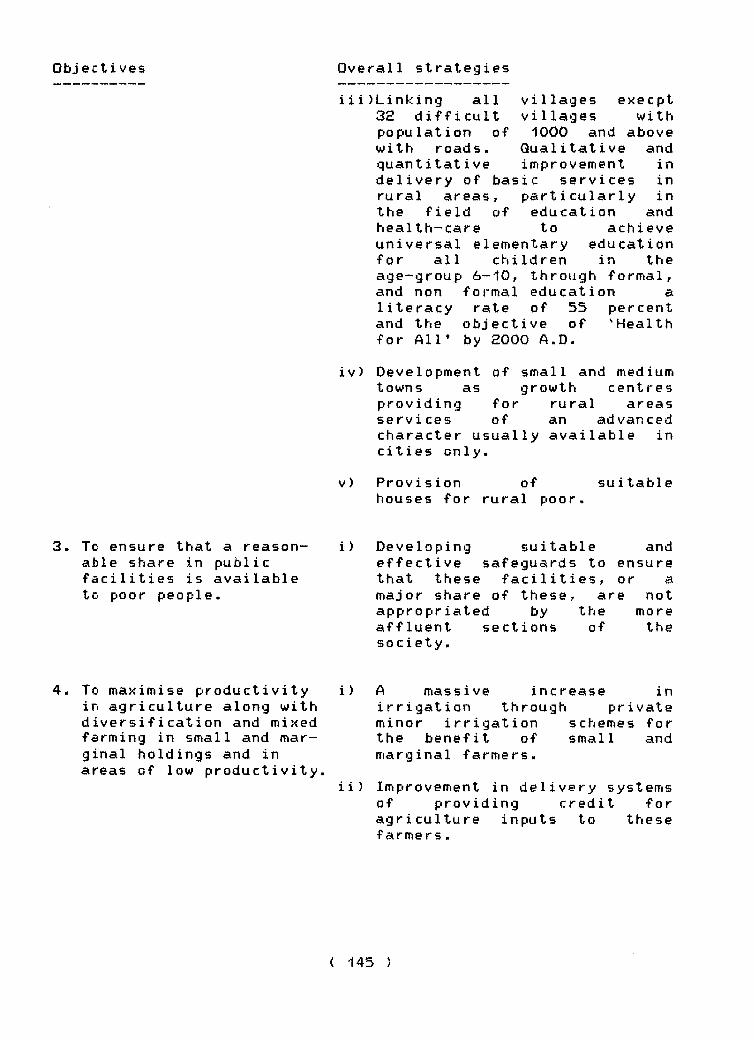
iii)Linking all 32 difficult population of with roads, quantitative
villages execpt villages with 1000 and above
Q ualitative and improvement in
delivery of basic services in rural areas, particularly in the field of education and health-care to achieveuniversal elementary education for all children in the age-group 6-10, through formal, and non formal education aliteracy rate of 55 percent and the objective of 'Health for All* by 2000 A.D.
iv) Development of small and mediumtowns as growth centresproviding for rural areasservices of an advancedcharacter usually available in cities only.
v) Provision of suitablehouses for rural poor.
3. Tc ensure that a reasonable share in public facilities is available to poor people.
i) Developing suitable andeffective safeguards to ensure that these facilities, or a major share of these, are not appropriated by the more affluent sections of the society.
4« To maximise productivity in agriculture along with diversification and mixed farming in small and m a r ginal holdings and in areas of low productivity
i) A massive increase inirrigation through private minor irrigation schemes for the benefit of small and marginal farmers.
ii) Improvement in delivery systems of providing credit for agriculture inputs to these f arme r s .
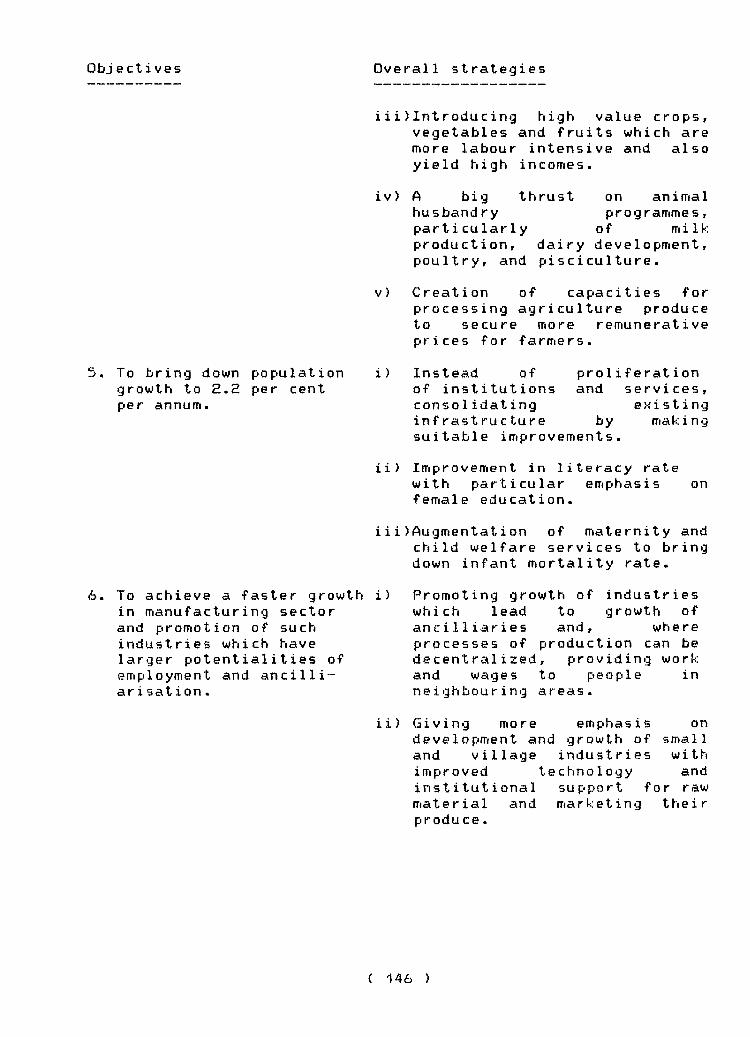
5. To bring down population growth to 2.2 per cent per annum.
i i i )Introducing high value crops, vegetables and fruits which are more labour intensive and also yield high incomes.
iv) A big thrust on animalhusbandry programmes,particularly of milkproduction, dairy development, poultry, and pisciculture.
V)
i)
Creation of capacities for processing agriculture produce to secure more remunerative prices for farmers.
Instead of of institutions c o n s o 1 idat ing infrastructure
proliferation and services,
existing by making
suitable improvements.
ii) Improvement in literacy rate with particular emphasis on female education.
i i i )Augmentati on of maternity and child welfare services to bring down infant mortality rate.
6. To achieve a faster growth in manufacturing sector and promotion of such industries which have larger potentialities of employment and ancilli" ar i sat i o n .
i) Promoting growth of industries which lead to growth of ancilliaries and, whereprocesses of production can be decentralized, providing work and wages to people in neighbouring areas.
ii) Giving more emphasis ondevelopment and growth of small and village industries withimproved technology andinstitutional support for raw material and marketing theirprodu c e .

7. To consolidate gains from and to improve efficiency and productivity of past investment and of the existing assets-
This is more a question of sectoral strategies thanoverall strategy, and the same have been indicated clearly in sectoral reviews.
8. To promote faster devel opment of backward areas in order to reduce intrastate disparities in their levels of development.
i)
ii >
Diversion of more resources to backward areas for economic and social services.
Initiating special measures for removal of the major
constraints on growth, anddevelopment of backward areasand providing 'growth-impulses * development process in thesea r e a s .
'area spes* to f aciocess in
9- To undertake specialmeasures for the overall economic and socialdevelopment of the weaker sections of society,particularly of scheduled castes/scheduled tribes, and women and children.
This is again a question of sectoral s t r a t e g i e s -
10.To strengthen Panchayati Raj Institutions in rural areas and local self governing institutions in urban areas and to make them effective media for formulation and implementation of development s c h e m e s .
This is largely a question of political decision atappropriate level.
5 It has, already been stated that alongwith growth in income, the distributive aspect of income has also received special attention in the Eighth Plan, keeping in view the commitment of objective of social justice. The distributiveaspect of income has two dimensions and both are equallyimportant. One, the distribution of income between mainsectors of the economy and two, the dis tribution of income between people of different strata of income levels. While the former is basically a function of later is a function of overall as well p r o g r a m m e s .
'structure of of sectoral
i n c o m e’, poli cies
theand

6 Agriculture and animal husbandry comtitute the source of livelihood for the highest percentage of population in the State. This sector has its base in rural areas and it is the rural population in particular which benefits from income generated in this sector. The incidence of poverty is predominant in rural areas which account for roughly four fifths of the population in this State. Therefore the larger the share of income of this sector in total income and in the incremental income of the Eighth Plan, and the more the equity in the distribution of this income, the greater will be beneficiaries amongst rural population and rural poor. There are however, limitations of growth in this sector. Subject to these limitations, the objectives of social justice and of reduction in the incidence of poverty can be served to the extent the share of this sector in the incremental income of the plan is maximised, and as many activities or units, as may be possible, contributing to growth in income in manufacturing sector are located in or around rural a r e a s .
Some Physical Targets
7 Some of the salient features of the targets of the plan are as follows s
i - A »3riculture Production s
1. Foodgrains :
Against the foodgrain production of 338 lakh tonnes in 1989-90, 353 lakh tonnes in -1990”91, and a higherproduction of 354 lakh tonnes in the preceding year of •1988-89 the target of 1996-97 is 430 lakh tonnes, 92 lakh tonnes more (27 percent) than the base year (1989-90) and 76 lakh tonnes more (21 percent) than the highest ever produced in 1988-89.
2. Irrigation :
There will be addition of 66 lakh hectares in irrigated potential during the Plan,which is likely to raise gross irrigated area from 141 lakh ha. in 1988-89 to 175 lakh ha. in 1996-97, registering an increase of 24 per cent,
3. Fertilizers s
Increase of 10 lakh tonnes in fertilizer consumption, raising the consumption of fertilizers by 45 per cent, from 22 lakh tonnes in 1990-91 to 32 lakh tonnes in 1996-97,
4. S h o rt-term Credit :
At almost 127 percent increase in short term credit, from Rs.353 cr. in 1990-91 to Rs. 800 cr. in 1996-97.

3, Sugarcane s
Production of sugarcane will go up frofn 1036 lakh tonnes in (1990-91) to 1365 lakh tonnes in (1996-97), registering an increase of 329 lakh tonnes (32 percent) to be achieved through higher productivity.
6. Potato s
8
Production of potato will also go up by 29 lakh tonnes from 62 lakh tonnes in 1990-91 to 91 lakh tonnes in 1996-97, registering an increase of 47 percent.
E xpansion of capacity in Cold storages •
Increase in the capacity of cold storages from 36 lakh tonnes in 1990-91 to 52 lakh tonnes in 1996-97, registering an increase of 44 percent.
Oilseeds s
Oilseed production will register percent, from 13 lakh tonnes tonnes in 1996-97.
an increase in 1990-91 to
of 38 18 lakh
I I . Livestock s
1. Milk s
Increase of 33 lakh tonnes <34 percent) in milk production, raising the level from 97 lakh tonnes in 1990-91 to 130 lakh tonnes in 1996-97.
2e Eggs s
Five fold increase in production of eggs from 46 cr« in 1990-91 to 250 cr. 1996-97.FisJi s
Increase of 0.46 lakh tonnes production, raising the level 1990-91 to 1.50 lakh tonnes in
(44 percent) from 1.04 lakh 1996-97.
in fish tonnes in
III. I n d u s t r y s
1. 2
He.
M obilizing an additional total investment of Rs. 22,500 cr= from all sources for setting up new industries in manufact uring sector, both organised and unorganised.
indsistriai Frodyctiop §
Raising Industrial Production I n d e x < 1970--71~100) from 421 percent in 1989-90 to 788 in 1996“97, signifying an increase of S7 per cent.

A major rise in cane crushing capacity of vacuun pan sugar mills, from 32 per cent of total sugar cane in
per1989-90 to 50 cent in 1996-97.
IV. E n e r g y s
Power
Consumption of 1990-91 to 42300 of 78 percent.
electricity going up from 19731 MU in MU in 1996-97 registering an increase
V. Education s
Overall literacy rate growing up from anticipated for 1991-92 to 55 percent in literacy amongst females registering increase from 26 per cent to 41 per cent
42 per cent 1996-97, with a significant
VI. Health :
Population growth to be brought down from 2.29 per cent per annum in 1981-91 to 2.2 per cent per annum in 1996-97, with birth rate coming down from 38 per thousand to 35-1 per thousand, death rate from 15 to 13.10, and infant m o rtality from 132 to 125 per t h o u s a n d .
VII. Minimum Needs Protjramme s
1. Rural Electrification
91 per cent villages will be electrified by 1996-97, against 73 per cent electrified upto 1990-91.
2. Universal Education
90 per cent enrolment of children ( age group 6-10 )for primary education against 78 per cent in 1990-91, and 56 per cent enrolment of children in age group 11-13 against 43 per cent in 1990-91 through formal education.
Rural Roads
Cent per cent villages with population of 1000 and above will be connected execpt 32 difficult villages with all-weather roads by 1996-97.

4. Rural Water Supply
Cent, per cent villages will be provided with safe and adequate drinking water by 1996-97 against a coverage of 90 per cent only in 1990-91.
5. Rural Health
Opening of 1388 new sub centres, raising their number to H3600. 35 new primary health centres, raising their number to 3816, and 160 new community health centres,raising their number to 266 by the end of the Plan.
8 The targets may appear to be high at first sight. But there are three things to be borne in mind while evaluating these targets. One, the targetted growth rates and reduction in the incidence of poverty and unemployment, as described in this document, cannot be realised without achieving these physical and financial targets. Two, there is a lot of rationale and consistency in these targets. Three, the targets are neither unrealistic nor beyond the State's capacity to achieve.
9 There is evidence to believe that these are achievabletargets. Negative features in part achievements or trends should not be the sole criteria to judge these targets and to pre-determine views about the same. If we were to go only by past achievements or trends, we should have remained content with lower target of growth rate or of removal of poverty and unemployment. In that case, the physical targets could also be scaled down. It was never the main consideration in formulating these targets that the same should be easy to achieve. Instead, the consideration has been to match goals and objectives of theplan with physical and financial targets which , though not easyto achieve, can still be achieved with improved efficiency, more hard work and optimal use of S t a t e’s resources,
10 In the light of the objectives and targets described above, the main thrust areas of the Eighth Plan are as given below s
(i) Consolidation of gains or benefits from past i n v e s t m e n t s .
(ii) Increase in productivity of land and other physical assets together with improvement in efficiency of human resou r c e s .
(iii) Generation of productive and gainful employment for removal of poverty.
(iv) Large-scale expansion of agro-based industries.< V ) Raising income-level of agriculturists.(vi) Development of rural areas and improvement in quality
of life of these areas.(vii) Provision of adequate and safe drinking water, both in
rural and urban a r e a s .<viii) Education with greater emphasis on female education.<ix) Uplift of weaker sections of the society.

11 An effort will be made in this Plan to concentrate energies and resources on priority areas which, as already indicated, are energy, irrigation with much more emphasis on minor irrigation works, roads, education, and health, and to provide all facilities and encouragement to the private sector for a much larger role in development, particularly in energy, industries, more particularly sugar industry, transport and housing. The public sector will undertake to perform only those functions which are crucial for infrastructure development and cannot be performed otherwise. It is in this context that an in-depth review will be made as quickly as posifole of all development schemes in public sector, whether financed from Plan or non-Pl«n, and such schemes which donot make any economic sense or have become redundant in the present context or serve some social purpose which it is otherwise also possible to serve, will be considered for closure to save government for more productive and useful for such review and for taking deci shortly. At the same time, only such in the Plan which are quite necessa better maintenance and improvement schemes and assets will receive prii
nf ru ct ious expendi ture ineful pu rpose. The mechanismons the reon will be decidednew sc heme will be taken upfor d@ velo p m e n t , otherwise
n the e ffec iency of existingi t y .

CHAPTER - XIII
INVESTMENT AND OUTLAYS
A g ijreqate Investment and Qutla
It has been explained in an earlier c h a p t e r ’, that thetargetted aggregate investment for the S t a t e’s Eighth Plan is Rs.82,000 cr. The basis on which this investment has been estimated is also given in this chapter. In addition to this investment, the current Plan expenditure is estimated to be Rs.5000 cr- The aggregate outlay of the Plan, therefore, works out to Rs.87,000 cr. The distinction between investment outlay and current outlay can be explained by saying that, broadly speaking, investment is a one time expenditure of a non-recurring nature meant for creation of assets or capital formation, whereas current expenditure is of rion-investment and recurring nature meant for accrual of benefits from investment.
2 The investment proposed for the State in the Plan is 10-4percent only of the total investment of Rs-792000 cr- proposed® for the National Plan. The aggregate outlay proposed for theState is also 10.2 percent of the total aggregate outlay ofRs . 850000 cr. proposed for the National Plan. These areapparen tly much lower shares than the share of the State (16.4 percent) in the country's population. In fact, considering the State's backwardness and its lower share of 11.7 percent inc o u n t r y’s income, a still higher investment is called for in the State in the Eighth Plan for a faster growth and a higher share in country's income. However, it is not going to be an easy taskfor the State to mobilize even these resources, and unless theState strives very hard, there may be shortfalls in these resources also. In the event of these shortfalls, the growth projections visualized for the Plan may also not materialize, and the State's share in total income of the country may be stilll o w e r .
3 It may alo be mentioned here that these targetted investmentand outlay are also at 1991-92 prices. The extent to which inflation takes place in the Plan period has, therefore,considerable bearing on these investments and outlays. These willbe deflated, in real terms, in proportion to the inflation.Consequently, higher investment and outlay will also be required, at current prices, for the Plan to offset the impact of inflation and to protect the targetted investment and outlay in real terms.
1. Chapter Development perspective-
2. Approach paper-Planning Commission, Government of India

Viewed in this background, the task of mobilizing the required resources for achieving targetted growth in the economy be comes still more difficult.
4 An attempt has also been made to work out a broad pattern of financing the proposed investment in the Eighth Plan. The pattern is as shown below s-
Table-1 Financing Pattern of A g gregate Xnvestment /Qutlav of State *s Eighth Plan (at •1991-92 prices)
(Rs. in crore)
Sou r ce Investment Cu r rent Aggregateout lay out lay outlay
1. Public Sector 38000 5000 43000(467.) (1007.) (497.)
(a)State Govt. 23000 5000 28000(2 8 X ) (327.)
(b)Central Govt. 7500 7500< 97.) (87.)
(c)State Public 6000 6000Corporate Sector (77.) (77.)
(d)Local Bodies •1500 1500(27.) (27.)
2. Private Sector 44000 44000(547.) (517.)
(a)Private Corporate •17000 17000Sector
(217.) (217.)(b)Private Industrial 5500 5500
Un i ts (77.) (77.)<c)Houshold Sector 21500 21500
(267.) (267.)
Total 82000 5000 87000( 1007.) (1007.) ( 1007.)
S It wi sector* i sector 54 are 43 per a backward private se spend mor d e v e 1o ped will be a agg regate levels and
11 be seen from the above that the n aggregate investment is 46 per percent. The respective shares in cent and 57 percent. A higher share state like U.P. where potentialiti
ctor are far less and the obligation e on development of infrastructu States and the country as a whole, i progressive reduction in the share o investment in this State also, improved i n f r a s t r u c t u r e .
share of * pubic cent and of private the National Plan of public sector in es of investment in of the State to
re far greater than s inevitable- There f public sector in with rising income

6 Within an investment of R s . 38000 cr. in public sector, the contribution of R s . 23000 cr. by the State Government will be the highest (61 percent). The balance investment of Rs.ISOOO cr (39 percent) will be mobilized from other sources. Going by the more encouraging trends of the last decade, when the average annual increase in investment by the Central Government non~departmental undertakings was more than Rs. 900 cr. (30 percent), it should not be difficult for the State to secure investment of Rs.7500 cr. from the Centre in the Eighth Plan, with average annual investment of about Rs.1500 cr. against Rs.900 cr. of 1980s. The annual investment in Central Sector in Eighth Plan is bound to be twice as much as it was in 1980s and it is not too ambitious, therefore, for the State to hope for Central investment in the State also to double in this period. But this will be possible only when the State keeps continous track of all proposals of Central investment and is not found wanting to provide what the Centre would expect of it for such investment to take place. It is only then that the State may succeed in attracting a larger share in central investment. The S t a t e’s share in central investment in 1988-89 was 8.6 percent only against its much higher share in c o u n t r y’s population.
7 Apart from these contributions of Rs.23000 cr. (61 percent) and RS.7S00 cr. (20 percent) respectively by the State government and the Central Government in public sector investment, the balance of Rs.7500 cr. (19 percent) will be the share of Public Corporate Sector ( S t a t e’s public enterprises) and Local Bodies, more particularly of Development Authorities. The investment target for public corporate sector is Rs.6000 crore and of local bodies Rs.1500 crore- These are only 27 percent and 48 percent higher than their investments in the Seventh Plan and it should not be difficult for these projections to materialize.
8 The share of private sector in aggregate investment is R s . 44000 cr. The contribution of private corporate sector in this investment will be R s . 17000 cr. (39 percent) which is only about 41 percent higher than the investment made in the Seventh Plan and 11.5 percent only of the targetted investment (148000 cr.) in the country in this sector. An increase of 41 percent and modest share of 11.5 percent only in investment in this sector should not be difficult to achieve in view of the New Economic Policy and the New Industrial Policy of Govt. of India. The investment targets of Rs.5500 cr. (13 percent) in private industrial units, and of R s . 21500 cr- (48 percent) in household sector are also not difficult to realize, going by the past trends and emerging patterns of investment.
9 In addition to these targetted investments of R s . 82000 cr. the current expenditure in S t a t e’s public sector will be Rs»5000 crore, making an aggregate outlay of Rs.87000 cr. for States Eighth Plan. Within this aggregate outlay, the States public sector outlay will be Rs.28000 cr. (32 percent). If the

investment in State's public corporate sector of Rs.6000 cr. is also added to States public sector outlay, the total investment o Rs-34000 cr. will be 39 percent of aggregate outlay. The same share of public sector outlay (Rs.4 00000 cr.) in aggregate outlay (Rs.SSOOOO cr.) of the national Plan is 47 percent. The Stat6 is, thus, keeping the share of its own public sector outlay in aggreagete outlay lower than the corresponding share of the publice sector in the country. A lower share than this would not enable the State to realize the projected aggregate investment or outlay.
10 The current outaly (Rs.3000 cr.) is S2 percent public sector investment (Rs.23000 cr.). This share of current outlay on a higher side compared with the share of 17.0 percent of current outlay in public investment in the national Plan, and a slightly higher share of 17.4 percent in country's Seventh Plan. It is neccessary, therefore, to make efforts to contain the share of current expenditure in public investment in this State also and to lower it in the Eighth Plan. It is only by lowering this share that the share of investment (78 percent) in public sector can be increased. The target should be to bring it is down to a little less than 20 percent. It must be realised that a higher share of public investment is the only way to sustain a higher growth in the economy.
11 The total public sector outlay of the country in the Eighth plan is R s . 400000 cr. The share of State,s public Sector outlay (Rs.28000 cr.) in country's public sector outaly is 7 percent only, which is close to what it used to be in the past. The share of S t a t e’s pubic sector outlay in country's aggregate outlay is3.3 percent, which is marginally less than the corresponding share of the past. Any further reduction in States public sector outlay will amount to reversal of past trends and should be resisted. It may also be mentioned here that the State's public sector outlay works out to 8.6 percent only of the total income (Rs. 3,24,639 crore) of the State in five years of Eighth Plan with 6 percent average annual growth in States income. This is a modest share in the total income and it may be possible to plough it back in the economy. The targetted aggregate investment and outlay also work out to 25-26 percent of States projected total income in the Eighth Plan and do not appear to be on a higher side, considering that there will be larger inflows to the State than before under central assistance, shares in Central taxes and institutional finance.
Sectoral P u t l a vs
12 Having had some idea of how the pro investment and outlay of State's Eighth Plan justified but feasible also, we will now descr how the State's public sector outlay (Rs.28000 cr
posed aggr egateare not only
ibe ve ry br ief ly. ) is pro posed

to be spent in the plan. Though this description is limited to S t a t e’s public sector outlay only, an attempt has been made to workout a broad distribution of the aggregate investment and outlay also in keeping with targetted growth pattern of the plan and the potential areas for private investment. This is a very tentative framework and will need more refinement in due course.
13 Before describing the distribution of S t a t e’s public sectoroutlay in Eighth Plan, it may be useful to mention here that the pattern of expenditure in a plan, and not the pattern of its outlay, is always the basis for the distribution of outlay in thesucceeding plan. The reason for this is obvious. There are alwayssome additions to or substraction from the projects and programmes included in the plan in the beginning. As a result of these changes together with shortfalls in resources and achievements, the level of activities at the end of the plan and the size of spill over liability for the next plan undergoes a significant change. The next plan, naturally takes off from where the last plan rested at the end. It is not correct, therefore, to always compare the pattern of distribution of outlay in a plan with cor responding pattern of the preceding plan. These comparisons are faulty as they ignore a host of changes which have taken place in the course of the last plan.
14 There are two broad categories in which a plan is divided.There are *economic s e r v i c e s’ and ’social s e r v i c e s’. The economic services comprise programmes and activities which are basically oriented towards the objective of economic development and social services comprise programmes and activities oriented towards the objective of social development. The distribution of expenditure between these services in the previous plans shows some significant changes in their shares from plan to plan. In the last Seventh Five Year Plan, the shares of economic services and social services in total expenditure were 77 percent and 23 percent respectively.
15 There are sixty three sectors in which a plan is divided. These sectors are clubbed together under twelve Major Heads of development. The main factors which govern the distribution of outlay between these sectors are s-
i) the spillover liability of continuing projects and p r o g r a m e s .
ii) the objectives, priorities, thrust areas and targets ofthe plan.
iii) the estimated liability for centrally sponsored schemes and externally aided projects in the plan, and
iv) ensuring a minimum share of 60 percent of the outlay forrural areas.

16 Keeping in view these and other re 1evant considerations the outlay of Eighth Plan has been distributed. The distribution of outlay of Eighth plan amongst major heads of development is as shown below :
Table-2 Break-up of S t a t e’s public Sector~outlavin the Eiahth Plan
(R s . in lakh)
MAJOR EIGHTH PLAN y. ageHEAD OF DEVELOPMENT OUTLAY SHARE
1 2 3
A -ECONOMIC SERVICES 2222818 79.4
1 - AGRICULTURE AND ALLIED ACTIVITIES RURAL DEVELOPMENT AND SPECIAL AREA PROGRAMMES
468444 16.7
2 - IRRIGATION AND ENERGY 1273262 45.52.1 IRRIGATION & FLOOD CONTROL 431348 15.42.2 ENERGY 841914 30. 1
3 - INDUSTRY & MINERALS 137335 4.94 - TRANSPORT 320700 11.5S - OTHERS 23077 0.8
B -SOCIAL SERVICES 573182 20.5
1 ~ Education 190215 6.82 - Medical & Public Health 75440 2.73 “ Water Supply & Sanitation 116550 4.24 - OTHERS 194977 7.0
GRAND TOTAL 2800000 100.0
17. It will be seen that the share of ’economic s e r v i c e s’ in the outlay is close to 80 percent and the share of social services 20percent, with Irrigation and Energy together claiming a share of46 percent followed by Agriculture and its allied services claiming the next largest share of 17 percent. The share of education is also significantly higher at 7 percent in this Plan.
18 The sectoral outlays of the Eighth Plan and the increase inthese outlays over the Seventh Plan are given in Annexure - I. Itwill be seen from this Annexure that as against overall increases of 1SS percent and 134 percent in the outlay of Eighth Plan over outlay and expenditure respectively of Seventh Plan, the increases in following sectors are significantly higher mostly on account of their greater priority for employment generation and

raising rural incomes:
1. Soil and Water Conservation,2. Dairy Development,3. Animal Husbandry,4. Rural Employment,3. Irrigation,6. Energy,7. Village & femall Indutries,8. Roads,9. Education
10. Technical Education11. Social Security & Welfare.
19 It may also be stated here that the outlay of the Eighth Plan is higher by R s . 17000 cr. over the Seventh Plan outlay ( R s .1l O O O c r .). It will be seen from the following table that within this increase, R s . 13000 cr. (77 percent) has gone to 13 sectors out of the total 63 sectors of the plan. The share of Energy in this increase is highest (29 percent) followed by Irrigation (12 percent). Roads (11 percent) and Education (7 percent). The share of rural areas in outlay is estimated to be a little over 62 percent.
T a b 1e-3 Sectorwise distribution of incremental o u t l a ys(Rs. in crore)
Sector Increase Over Seventh Plan Out lay
Percentage shares in 17,000
1 2 3
1. Energy 4961 (29.2)2. Irrigation and Flood 2068 (12.2)
Control3. Road and Bridges 1895 (11.1)4. General Education 1115 (6.6)5. C rop Husbandry 520 (3.0)6. Soil Conservation 288 (1.7)7. Animal Husbandry 137 (0.8)8. Dairy Development 111 (0.7)9. Forestry and wild life 290 (1.7)10 Integrated Rural 260 (1.5)
D e v e 10 pment11 Employment Programme 594 (3.5)
(Jawahar Rojgar Yojna etc. )12 Village and small 406 (2.4)
Industries13 Industry 346 (2.0)
Total 12991 (76.4)

20 The details of deployment of sectoral outlays amongst programmes and projects and the physical output or benefits likely to accrue from such deployment are explained in detail in sectoral reviews.

EIGHTO Pim (-1992-97) SECTORS OLniAY (RS IN iMH)
m j o R / m m1 r~Ar\ nr- ro in nDMCVT
Seventh Plan (198&-90) Ei^thPlan
Increase over SeventhrtHy Ur LtVtlJJrlxfi 1
ApprovedOjtlay
Ej penditijrePlan (In Percentages)
rroposeoOitlay Oitlay B-jpenditijre
1 2 3 4 5 6
ECXMWIC SERVICES 9M068382.8%
93-184678.0%
????ai879.4%
•144.1 138.5
1-AGRICULTURE AND ALLIED ACTIVITIES
8?1958.1%
12156410.2%
25&1599.2%
189.4 112.4
Crq3 Hjsbandry 30063 4 1 ^ 82075 173.0 95.9Soil St Water Consers/ation 14250 17454 43000 202.3 146.8Aninial Hisbandry 3525 8096 17215 388.4 112.6Dairy Development 2240 J139 13300 493.7 323.7Fisheries 1250 1360 2500 100.0 83.8Forestry & Wild Life 18995 22110 48000 152.7 117.1FoodrStorage & Uardiousing 966 7m 2082 115.5 166.6Agri. Research & Ed«ication 2447 3561 6650 •171.8 86.7Ag i. Financial Institutions 2450 1999 3500 42.9 75.1Co-operation 12258 20901 16550 35.0 -20.8Other Agri. Programmes 751 275 23207 2990.1 8338.9
IIH^URAL DBmPMENT 626355.7%
1062118.9%
18-12856.5%
189.4 70.7
I.R.D.P 19000 31220 45000 136.8 44.1D.P.A.P. 3800 3084 4000 5.3 29.7I.R.E.P.P.Rijral EhiploynKnt
600 648 1100 83.3 69.8
J.R.Y. 19250 34015 58000 20-1.3 70.5Other Programmes 0 9&18 20500 -100.0 108.8
Land Refornis 9500 13174 22650 •138.4 71.9Other R.D. Programmes 10485 14252 30035 186.5 110.7
III. SPECIAL (!«EA PROGR^WES 19000.2%
35490.3%
290001.0%
1426.3 717.1
IV. IRRIGATION & FLOOD CONTROL 224TO 209464 4^1348 92.1 105.920.4% 17.5% 15.4% -24.5 -12.1
flajor & ftediiifli Irrigation 142000 12450-1 325100 128.9 161.1Minor Irrigation 55400 65254 78398 41.5 20.1Command firea Development 10700 9 126 11050 3.3 2 1.1Flood Control and Drainage 16450 10583 16800 2.1 58.7

fWJOR/tllNDR Seventh Plan <1V8t 90) Eighth Increase over SeventhHEi!» OF DEMElJOPPBfr Plan Plan (In Percentages)
Approved Expenditure Proposed□it lay Outlay Outlay Espenditure
1 2 3 4 5 6
V-£NER6Y 34S0OO 283069 841 14 143.5 197.4ai.4% 23.7% 30.1%
Power 344000 2808?? 142.8 •197.5Non-convent ional Sources •1000 2247 6600 ?66.7 193.7Of Energy
VI-IMXJSTOY & MINERALS 62673 69470 137335 119.1 97.75.7% 5.8% 4.9%
Village & Sntall Industries 18650 17591 59235 217.6 P36.7Industries (Other Than VSI) 40863 48286 75500 84.8 56.4Mining 3160 3593 2600 -17.7 -27.6
VII-TR^WSPORT 115849 127818 320700 176.8 150.910.5% 10.7% 11.5%
Civil Aviation 190 352 1350 610.5 283.5Roads & Bridges 96500 100619 286000 196.4 184.2Road Transport 18959 26797 33150 74.9 23.7Inland water Transport 100 15 0 -100.0 -100.0Other Transport 100 35 200 100.0 471.4
VIII-amJNICATIONS
IX-SCieCErTECHN0LG06Y 1500 2306 4850 223.3 110.3& E^WIRONMENT 0.1% 0.2% 0.2%
Science & Technology 1110 1280 2200 98.2 71.9Ecology & Environn«nt 390 1026 2650 579.5 158.3
X- 3ENERAL E03NOMIC SERVItHi 6581 8395 18??7 177.0 117.10.6% 0.7% 0.7%
Secretariate Economic Services 1569 1316 3B50 145.4 192.6Tourism 3650 5730 10100 176.7 ;^.3Sjrvey & Statistics 1272 953 2106 65.6 121.0Civil Supplies •10 47 0 -100.0 -100.0Other General Eco. Services 80 189 2171 2613.7 1048.7Social Infrastructure Dev. & 0 160 0 -100.0 -100.0Uhtied Rinds

IVUOR/niNGR Seventh Plan (198&-90) Ei^th Increase over SeventhCF DEVELOPMENl Plan Plan (In Percentages)
Approved B-jpenditure Proposed -Oitlay Outlay Ojtlay Ej enditiire
•1 2 3 4 5 6
XI--SOCIAL SERVICES •177945 245476 575182 ?P?.1 133.516.2% 20.5% 20.5%
t
Education 38725 62300 190&15 391.2 205.3
General Education 26294 45546 137/51 423.9 202.4Technical Education 8650 ?147 40000 362.4 337.3^ort & Youth Services 2671 5250 9000 237.0 71.4Art & Culture 1110 2357 3464 212.1 47.0
fledical & Public Health :J1410 45733 75440 140.2 65.0Water Sjipply & Sanitation 43200 45567 116550 169.8 155.8Ho<ising(incl. Police Housing) 1&176 35898 41175 126.5 14.7l>ban Developnvent 24700 21669 52500 112.6 142.3Information & Pijblicity 1250 1600 2150 72.0 34.4Welfare of SC,ST & BC 10905 14950 27075 148.3 81.1Laboijr & Eniployment 3021 4404 7027 132.6 59.6Social Seciirity & Welfare 2088 7398 40390 1834.4 446.0Mitrition 4470 595/ 20660 362.2 246.8Other Social Services
XII-GENERAL SERVICES 11372 1/bbO 4000 -64.8 "77.21.0% 1.5% 0.1% -86.2 -90.3
Jails 80 5?8 0 -100.0 ”100.0Stationery & Printing 1053 699 2000 89.9 186.1Public Works 10239 16323 2000 -80.5 -87.7Other Administrative Services 0 0
G R W TOTAL 1100000 1194872 2800000 154.5 134.3100.0% 100.0% 100.0%

rilNlMUri NEEDS PROGRAMME, CENTRALLY SPONSORED SCHEME ANDEXTERNALLY AIDED PROJECT
There are three significant parts of the plan which we propose to describe briefly in this chapter even through these have been mentioned elsewhere also. These are the Minimum Needs Programme, Centrally Sponsored Programmes and the Externally Aided Projects. The reason for doing so is that apart from their importance, they figure in a number of sectors and the outlays provided for them in the plan account for R s . 10,600 crore, which is 38 Percent of the total outlay.
Minimum Needs Programme
2 The Minimum Needs Programme is an integral part of thestrategies for achieving the objective of Social Justice. This Programme was taken up for the first time in the Fifth Plan and has continued since then. The main objectives of the programme are provision of some basic necessities of life for poorer sections of society and improvement in the quality of the rural masses. Some national norms were laid down under this programme for different items and the States were required to make adequate provisions in their Plans to reach these norms within the stipulated time. In view of the importance of this programme, the outlays provided for it are also treated as earmarked so that there is no diversion from their outlays to other programmes.
3 The details of this Programme, both financial and physical,are given in statement No. VII-A and VII~B. A brief descriptionof this Programme is given in the following paras also.
4 The national norms laid down for more important items ofthis programme are as shown below s
Item Norms
1. Rural At least 65 % of the villages in eachelectrification State to be electrified by 1990 and 100
7. villages by 1994-93.2. Rural roads All remaining villages with a population
of 1500 and above 30 7. of the totalnumber of villages with population of 1000 ~ 1500 to be linked by 1990.
3. Rural water Coverage of all remaining problemsupply villages as supply a priority item,
after which other villages with adequate supply of water by 1990.
4. Elementary 100 7. enrolment in the age-group 6-14education years by 1990, supplemented with non-
formal education.

s. Rural health 1. Establishment of one sub-centre for apopulation of 5000 in plains and 3000 in the tribal and hilly areas by 2000 AD.
2. One PHC for 30,000 population in plainsand 20,000 in tribal and hilly areas
by 2000 AD.3. Establishment of one Community Health
of Centre for a population of one lakh or one Commu n i t y Development Block by 2000 AD.
6. Housing Provision of housing assistance to allassistanceto landless labour households by 1990.Rural landless Assistance to include house-sites,labourers Contruction materials, drinking water
well for a cluster of houses and approach roads.
The Status of this Programme in the State is given in AnneKures-1 and 2. The situation under the Programme is briefly described below s
Rural Electrification s Out of total 1,12,366 villages, 84,153 (74.8 7.) villages will be electrified by the end of 1991-92, leaving a balance of 28,413 (25.2 7.) forthe Eighth Plan out of which 17,725 (15.7 7.) will be electrified in the Plan and the remaining villages numbering 10,688 (9.5 %) by the end of this century, after the Eighth Plan.
4.2 Rural Roads s Out of a total of 10,899 villages with apopulation of 1500 and above 10,747 (98.6 7.) villageswill be linked by the weather pucca roads, by 1991-92 leaving a balance of 152 (1.4 7.) for Eighth Plan. Out of this 120 villages will be linked in the Eighth Plan, 32 villages would still be left and linking them would require an in ordinately high investment. There were 11396 villages with a population of 1000-1499, out of which 7059 (61.9 7.) are likely to be linked by 1991-92 leaving a balance of 4337 (38.1 7.) for the Eighth Plan which will be connected during the the Eighth Plan period. However, there will be 58,563 villages with population of less than 1000, without link roads at the beginning of the Eighth Plan, out of which only 720 villages will be connected with roads in the Eighth Plan, leaving a balance of 57843 villages without r o a d s .
4.3 Education-Eleme ntary Education : It is estimated that there will be 199.33 lakh children in the age-group 6-11 years in the year 1996-97. By the end of 1991-92,

•154.60 lakh children through formal education and 15.08 lakh children through non-formal education i.e. 169.68 lakh children would be enrolled. By the end of 1996-97, 179.40 lakh through formal education and 15.08 lakh through non-formal education i.e. 194.48 (97.6 V,) lakh children will be receiving education in this age~group. Thus, 4.85 lakh (E.4 ’/.) will be left for coverage after the Eighth Plan. As regards the number of children in the age-group 11-14, there will be about 120.94 lakh children in that age-group, out of which 48.80 (40.4 7.) lakh children will be enrolled in the year 1991-92 leaving a balance of 72.14 lakh children (59.6 V,) for coverage in the Eighth Plan. During the Eighth Plan an additional 19.30 lakh (16.0 7.) children will beenrolled taking the enrolment figure to 68.10 lakh(56.3 7.) thus, about 52.84 lakh children (43.7 7.) willbe left after the Eighth Plan.
As for as Junior Basic Schools are concerned86,011 junior basic school are required to meet thenorm, out of which 77,487 (90.1 7.) will be available by the end of 1991-92, leaving a shortfall of 8524 (9.9 7.) for the Eighth Plan. During the Eighth Plan 6595 (7.7 7.) will be opened leaving a balance of 1929 (2.2 7.)schools at the end of the Eighth Plan. In the same manner the requirement of senior basic schools is estimated to be 19324 out of which 14,937 (77.3 7.) schools will be available for admission of children bythe beginning of the Eighth Plan leaving a balance of4387 (22.7 7.) schools for the Eighth Plan out of which 3626 (18.8 Y.) schools will be opened during the EighthPlan. leaving a balance of 761 (3.9 %) for the period after the Eighth Plan.
4.4 Rural Ulater S u pply s There are 1,12,566 villages, outof which 78,050 villages were declared problemVillages. Out of the total villages, (1,12,566), 104373, (92.7 7.) villages will be covered with aminimum of two hand pumps, at an expenditure of Rs-688.77 crore. The remaining 8193 villages will becovered during the Eighth Plan. If about 62 thousand villages which are not fully saturated are aidded to these villages, the requirement works out to be about Rs. 590 crore.
4.5 Rural Health s As per the national norm, 23,600sub-centres are required to meet the needs of the rural population. By the end of 1991-92, 22,212 (94.17,)centres will be functioning, leaving a balance of 1388 (5.9 7.), for the Eighth Plan, which will all beopened during the Eighth Plan. Similarly, 3933. Primary Health Centres are also required out of which

3816 (97.0 7.) Centres will be available by 1991-92,leaving a balance of 117 (3.0 7.) centres for the Eighth Plan out of which 33 (0.9 '/,) will be opened during the Eighth Plan. and 82 (2.1 7. will be left to be openedafter the Eighth Plan. 983 Community Health Centres are required out which 266 centres (27.1 7.) will beready by 1991-92 leaving a balance of 717 (72.9 7.) for the Eighth Plan, Out of these 160 (16.3 X) will beopened in the Eighth Plan and 557 (S6.7 7.) will be left to be opened after the Eighth Plan.
4,6 Housing assistance to Rural landless Labourers s Theobjective is to provide housing assistance to alllandless labour house holds by 1990. Since the inception of the Plan upto the end of 1991-92, 24.17lakh families were allotted house sites and 7.13 lakhhouses were constructed with an expenditure of Rs. 173.43 crore. The target for the Eighth Plan is to allot house-sites to 2.50 lakh families and provide construction assistance to 5.00 lakh families for which an outlay of Rs. 219.25 crore has been earmarked.
5 It may however be emphasised that the requirements underthe above items for the Eighth Plan and beyond are 'tentative* and subject to a detailed scrutiny from the point of view o-f the S t a t e’s policies and commitments.
6 It has been estimated'^ that the total expenditure requiredto reach national norms laid down for important constituents of this programme was Rs, 15775 crore, against which the expenditure upto 1991-92 is likely to be Rs. 3508 crore (22.2 7.) crore. The balance expenditure require at the beginning of the Eighth Plan to reach these norms , thus, works out to Rs, 12267 crore (77.8 7.). As against this requirement, the outlay proposed for these constituents in the Eighth Plan is Rs. 3294 crore (26.97.). It has not been possible to provide more than this for these programmes on account of resource constraints and equally pressing requirements of other programmes. The balance requirement at the close of the Eighth Plan for the state to reach the national norms will be Rs, 8972 crore (73.1 7.). Itmay, thus, take a few more plans for this State to reach these no r m s .
7 The State's requirements for rural roads, ruralelectrificat ion and rural health at the beginning of the Eighth Plan are Rs, 7762 crore., Rs. 1256 crore and Rs. 1710 crore, making a total of Rs. 10,728 crore which is about 87.5 7. of the total requirement. This reveals that the State is still far behind the national norms in these three main programmes of

M.N.P. These short-falls cannot be met until the Central Government comes to the rescue of the State and provides special assistance for the State to bridge these gaps in some reasonable t i m e ~ s p a n .
8 The State has been spending in the past 13 7. to 14 % of itstotal plan expenditure on Minimum Needs Programme. The outlay provided for this programme in the Eighth Plan is Rs 3886 crore, which works out to about 14 7, of its total outlay.
9 The total expenditure on Minimum Needs Programme from1974-75 to 1991-9S was Rs. 3913.94 crore which is 24.4 7. of the total expenditure® incurred on these sectors comprising this Programme. Within this expenditure the largest share of 37.4 (Rs. 1463.20 crore) has been claimed by rural roads followed by rural water supply with a share of 20.7 % (Rs.811.98 crore) and elementary education with a share of 16.2 7. (Rs. 634.87 crore). These 3 items, thus, have claimed total share of 74.3 7 (Rs.2910.05 crore) of the total expenditure incurred on Minimum Needs Programmeduring this period leaving a balance share of 25.7 7(Rs.1003.89 crore) for other programmes. The higher share of expenditure on these items is attributable to the diversion of higher share of their total expenditure towards their Minimum Needs Programme component.
10 The outlays provided in the Eighth Plan for this programmeare as shown below s
Rs. in croreSI.No. Item Outlay Percentage Share
1. Education~Elem entary and Adult education
869.26 22.4
2. Rural health 313.60 8.13. Rural water supply and
sanitation531.86 13.7
4. Rural roads 1230.76 31.65. Rural electrificat ion 424.64 10.96. Rural housing 219.25 5.67. Environmental improvement
of slums64.50 1.7
8. Nutrition 206.60 5.39. Rural fuel wood plantation
and fodder development proj ect
26.00 0.7
10. Civil Supplies — _
Total 3886 .47 100-0

Centrally Sponsored Schemes
11 Some resources from the Cen to States through Centrally Sponso alongwith other State schemes as broadly of two types. There are s financed by the Central Government funded on a matching basis by Stat The S t a t e’s share forms a part o the amount coming from the Centre outlay of the State. However, schemes is reflected in the State
tral Government are red Schemes. These a part of the Plan
ome schemes which and there are othe
es and the Centreal f the State Plan ou is over and abov the entire expendit B u d g e t .
transferred schemes run
These are are fully
rs which are G o v e r n m e n t .
tlay, while e the Plan ure on these
1S These schemes have been a subject of controvercy for the past several years. The States have generally opposed anincrease in the number of these schemes and central assistance committed for the same. Inspite of this, however, the number of these schemes has continued to increase in the past as shown in the following table :
Table 1 : Growth in C e ntral ly Sponsored Schemes(Rs. in c r o r e s )
SI . Plan period No. of schemes in al 1 states
7
Exp. ofQ c ^
No. of schemes in U.P.
Exp. on C.S.S. in U.P.
in all states
Total Stateshare
Centralshare
1 2 3 4 5 6 7 8
1. Fourth Plan (1969-74) 95 1332.00
(100.00)52 70.75 3.75 67.00
(5.03)
2. Fifth Plan (1974-79)
179 2562.00 (100.00)
119 278.10 84.19 193.91(7.57)
3. Annual Plan (1979-80)
75 264.00(100.00)
64 106.62 40.37 66.25(25.09)
4. Sixth Plan (1980-85)
201 9398.00(100.00)
112 1583.40 557.81 1025.59(10.91)
5. Seventh Plan (1985-90)
262 18000.00(100.00)
157 4163.39 1346.00 2817.39(15.65)
(1) » Centrally Sponsored Scheme<2) Figure in brackets in Col. No
of Col.No. 48 or percentage shares

13 It has been argued on behalf of the States that Centrally Sponsored Schemes generally do not lead to the most prudent utilisation of available resources. The rigidity in these schemes, particularly in relation to building and staffing pattern, the failure to account for variations in local conditions from State to State and inadequate appreciation of the conditions in the field by the framers of the schemes, lead to inclusion of un-realistic schemes and programmes. The priorties under different heads also get distorted and the States find that while they do not have adequate funds for schemes vital for the development of their economy, large amounts are available for Cen trally Sponsored Schemes which are of less importance. These schemes also stifle the intiative of States as they limit in the light of the statics circumstances the discreption available to State in a r e a s , whi ch are constitutionally within the competence of states to administer. The larger the number of such schemes and the larger the allocation for them, the smaller is the share of Central assistance available for financing State P l a n s .
14 The Cen trally Sponsored Schemes executed® in the Seventh Plan were 112. As many as 49 of them were in Agriculture and allied areas. The share contributed by the State Government for these IIS schemes was Rs. 1346 crore which was 11 percent of the total expenditure of Rs. 11949 crores in the Seventh Plan.
15 In view of the controversy over these schemes, the future of these schemes has become a source of conjecture. The National Development Council is seized of this question and is likely to take a final decision soon on the recommendations of the committee which was appointed by it to examine this question. The committee has recommended transfer to States of 113 out of the total 262 schemes along with funds involved in these schemes. Out of these 262 schemes, only 157 schemes are in operation in U.P. and out of the 113 schemes proposed for transfer to State, the State has 66 schemes involving an outlay of Rs. 531 crores.
16 Subject to the decision of the National Development Council on this question, outlays have been provided for all Centrally Sponsored Schemes in the Eighth Plan. The total State's share for these schemes is 8.98 percent of the State's Eighth Plan outlay. The details of these schemes are given in the statement VI A. A summary of these details are given in the statement VIA.

Amounts Provided Centrally Sponsored Scheme in the S t a t e’s Plan Proposal are as under s
<Rs. in Crore)
Of whichFinanc ing Pattern
No. of Schemes
1 2
(a) 100-/. funding 110by the Central Government
(b) Sharing basis 117between Centraland State Government
Total 2S7
EighthPlanOutlay
3
2603.53
6614.51
9218.04
Cent ral Share
4
2585.98
4144.93
6730.91
StateShare
5
17.55
2469.58
2487.13
Externally aided projects
17 The externa countries/institut which involve ca assistance may tak know-how. Thecountries/institut nominal rates of charges) and have Therefore, they than conventional
1 assistance made available by donor ions is used for financing development projects pital investment of high magnitude. External e the form of transfer of cash or technical
assistance extended by foreignions has been in the form of loans/grants with
interest (or some time very small service long maturities of about 20 to 25 years, impose a lesser burden on borrowing countries l o a n s .
18 The following are the main donor countries/agencies from whome external assistance has flowed in to our country.
The WORLD BANK (IBRD & IDA)
OIL PRODUCING EXPORTING COUNTRIES (OPEC)UNITED NATION C H I L D R E N’S FUND (UNICEF)INTERNATIONAL FUND FOR AGRICULTURAL DEVELOPMENT (IFAD) ASIAN DEVELOPMENT BANK (ADB)JAPAN
present practice is that the Govt, of India passes on to Central assistance in lieu of external aid received
jects. Earlier only about 70 percent of the aid was being passed on to the States and the balance 30 percent was retained by the Central Govt.. This situation has now changed and
1.2. (A
(B3.4.5.6.7.
19 Thethe Statfor its p

according to the latest decision, the entire aid received for aproject is passed on to the States concerned. The centralassistance received by this State during 1980-91 for externallyaided projects is shown below :
Year Central Assistance (CA) received (in crore Rs.)
1980-81 8.961981-82 11-121982-83 29.071983-84 34.361984-85 30.061985-86 34.601986-87 44.661987-88 96.551988-89 76.551989-90 239.791990-91 292.69
20 The Seventh
outlays/expenditure Plan is shown below s
on externally aided
(Rs.
projects in the
in crore)
Period Seventh Plan
Outlay Expenditure
E x t ernally Aided Projects
Outlay Expenditure
•/. Share in expenditure
1 2 3 4 5 6
1985-90 11000.00 11936.40 2306.2 8 1340.18 11.23
21 The over-all share of outlay for the external 1y-aided projects in the Seventh Plan was thus about 20.97 percent of the total outlay. The share of expenditure for externally aided projects in total expenditure of the State in the Seventh Plan was 11.23 percent.
22 The shares^ of States in total central assistance releasedfor major States (14) in lieu projects show wide variations assistance was 7.74 percent in 1986-87 against shares of 22 Maharashtra during these years, the Seventh Plan that
of aid for The share
1985-86 and percent and
externally aided of U.P. in this 8.36 percent in 16.78 percent of
It was only towards the end of the share of this State picked up

considerably on account of assistance received forexternaj. 1 y-aided Anpara-B Thermal project, raising its share in the Seventh Plan (1985-90) to 15.93 percent. There is, therefore, considerable scope in the State for securing more central assistance in lieu of this aid for its project. This will be possible only when more and more projects are formulated and posed for external aid.
23 The externally aided projects included in the Eighth Plan are 30 in number, of these 19 are countinuing projects and 11 are new projects which will need to be pursued vigorously™ The
''details of these projects are given in Statement No. IV A. Abrief summary of these projects is given below :
(Rs. in crore)
Category Number Est imated cost(Revised)
E x p e n d i t ure upto 1990-91
A n t i c i p ated expend i tu- re in 1991-92
Total ex pen- diture up to 1991-92 (4+5)
Out lay for the Eighth Plan
1 2 3 4 5 6 7
1. Continuing 19 Proj e cts
6869.43 1970.53 1765.76 3736.29 2828.29
2L NewProj ects
11 1289.53 21.53 25. 13 46.66 1397.54
Total 30 8158.96 1992.06 1790.89 3782.95 4225.83
24 The total outlay for these schemes is Rs.4226 cr., which is 15.1 y. of the total outlay. However, there are not many new projects available for for external and the Eighth Plan and efforts are, therefore, required to formulate many more projects in different development departments for external aid.

Financial Requirement and Oitlays
(Cr.Rs.)
SI. Item Total Estiniated B^penditure Balance Ei^th Plan BalanceNo. Expenditure to upto (1992-97) after
reach National 19S 1-92 Ojtlay EighthNorms Proposed Plan
1 2 3 4 5 6 7
1. Ediication-Elementary 1347.28 634.87 712.41 869.26 -156.85and Adult 0.00 0.00
0.00 0.002. Rural Health 2070.29 360.55 1709.74 513.60 1396.14
0.00 0.003. Rural Uater 9ipply & 0.00 0.00
Sanitation : 0.00 0.00Jal Nigam 1278.77 688.77 590.00 391.36 198.64
0.00 0.004. Rural Roads 1463.20 7762.ai 1230.76 653-1.55
0.00 0.005. Rfjral Electrification 1561.53 305.41 1P56.12 424.64 851.48
0.00 0.000.00 0.00
6. Ehvironnental 25 1.39 55.35 236.04 64.50 171.54Improvement of slumsTotal <1-6) 15774.77 3508.15 1PPM.62 3294.12 89/2.50

Physical Progress Achieveaent/Target against National Noras
SI. Itea No.
Unit Requireaent as per national norts
Achieveaentupto1991-92
BalanceUork(Additional
Eighth Plan fl992-97) Target Proposed
(Additional)
BalanceafterEighthPlan
(Additional)
1 2 3 4 5 6 7 8
1. Rural Electrification
Villages electrified No. 112566 84153 28413(100.0)
17725(62.4)
10688(37.6)
2. Rural RoadsVillages Connected
(i). Uith a po|»iation 1500 and above
(ii). Uith a population between 1000-1499
(iii). With a population belov 1000
No.
No.
No.
No.
112566
10899
11396
90271
49514
10747
7059
31708
63052(100.0)
152(100.0)
4337(100.0)58563
(100.0)
5177(8.2)120
(78.9)4337
(100.0)720
(1.2)
57875(91.8)
32(21.1)
57483(98.8)
3.(a)
EducationEnrolaent
4.
S.
6.
A. Eleaentary Education Lakh No. 320.27 203.40 116.87 72.77 44.10(100.0) (62.3) (37.7)
(i). Classes 1-5 (age oroup Lakh No. 199.33 154.60 44.73 19.93 24.806-11) (100.0) (44.6) (55.4)
(ii). Classes 6-8 (aoe qroup Lakh No. 120.94 48.80 72.14 52.84 19.3011-14) (100.0) (73.2) (26.8)
(b) Schools No. 105335 92424 12911 10221 2690(100.0) (79.2) (20.8)
(i). Junior basic school No. 86011 77487 8524 6595 1929(100.0) (77.4) (22.6)
(ii). Senior basic school No. 19324 14937 4387 3626 761(100.0) (82.7) (17.30)
(B) Adult EducationNuaber of Participants Th. No 30107 10007 20100 16700 3400(Age group 15-35) (100.0) (83.1) (16.9)
Rural Health(i). Sub centre No. 23600 22212 1388 1388
(100.0) (100.0) (0.0)(ii). Priaary health centre No. 3933 3816 117 35 82
(100.0) (29.9) (70.1)(iii). Co^nity health centre No. 983 266 717 160 557
(100.0) (22.3) (77.7)Rural Uater Supply
(i). Total Villages Covered No. 112566 104373 8193 8193(100.0) (100.0)
(ii). Problea Villages No. 78050 77682 368 368(100.0) (100.0)
(iii). Other Villages No. 34516 26691 7825 7825(100.0) (100.0)
Rural Housing : No. i 712982 » 500000
Houses Constrected
* Not Available

MINimn NEEDS P R O G R ^ OJOAY f W EXPEM)I-njRE (Rs. in crore)
SI.No.
Item Fifth Plan (1974-79)
Expenditure
1979-80Ej-qaenditure
Total CXit ofwhichtfP
Percentage share of ftp
Total Oit of Percen- which tage tfP share of
Total
•1 2 3 4 5 6 7 8 9
1. Educat ionElementary and Adulteducation 96.47 49.99 51.8 16.33 9.33 57.1 208.17
<5.8) (19.9) (3.7) (7.9) (6.0)2. Rural Health 37.7^ 14.88 39.4 13.42 5.21 38.8 190.79
(2.3) (5.9) (3,1) (4.4) (5.5)3. Rjjral Water Qjcply and 112.43 66.42 59.1 48.89 40.11 82.0 336.57
Sanition (6.8) (26.4) (11.2) (33.9) (9.8)
4. Rural Road 205.74 94.42 45.9 76.76 50.73 66.1 598.78(12.5) (37.6) (17.6) (42.9) (17.4)
5. Rural electrification 1120.23 14.41 1.3 250.47 3.90 1.6 1862.17(67,8) (5.7) (57.3) (3.3) (54.1)
6. Rural hoiising 66.04 2.73 4.1 27.73 5.99 21,6 181.54(4.0) (1.1) (6.3) (5.1) (5.3)
7. Environn»ntal 6.32 2.40 38.0 1.63 1.26 77.3 50.06improvenient of slunis (0.4) (1.0) (0.4) (1-1) (1.5)
8. hkitrition 6.6 6.00 90.9 1.66 1.66 100.0 13.14(0.4) (2.4) (0.4) (1.4) (0.4)
9. R»jral fuelwood - - - - - -plantation and fodderdevelopn>ent project
•10. Civil Sjpply ~ - - - - -
Total 1651.57 251.25 15.2 436.89 118.19 27.1 3441.22(100.0) (100.0) (100.0)(100.0) (100.0)
Total State Plan 2909.23 833.54 6453.12
Percentage share of 8.6 14.2(tP in Total planej-penditjjre

SI.No.
Item Sixth Plan (1980-85)
Expenditure
Seventh Plan (1985-90)
Expenditure
Out ofwhichMNP
Percen- Total tageshare of MNP
Out ofPercen- which tage MNP share of
MNP
Total
1 2 10 11 12 13 14 15
1. Educat ionElementary and Adulteducat ion 97.56 46.9 474.38 287.94 60.7 176.29
(11.0) (7.8) (17.8) (9.8)2. Rural Health 72.42 38.0 442.74 136.62 30.9 221.29
(8.2) (7.3) (8.5) (12.3)3. Rural Water Supply and 216.81 64.4 455.68 299.42 65.7 127.07
Sanit ion (24.7) (7.5) (18.5) (7.1)
4. Rural Road 391.58 65.4 1006.19 566.65 56.3 278.69(44.5) (16.6) (35.1) (15.5)
5. Rural electrification 52.45 2.8 2808.22 159.03 .5.7 777.36(6.0) (46.3) (9.8) (43.2)
6. Rural housing 23.76 13.1 359.83 76.44 21.2 54.85(2.7) (5.9) (4.7) (3.0)
7. Environmental 12.84 25.6 216.68 23.90 11.0 86.04improvement of slums (1.5) (3.6) (1.5) (4.8)
8. Nutrit ion 11.83 90.0 73.96 56.18 76.0 4.82(1.3) (1.2) (3.5) (0.3)
9. Rural fuelwoQfl - 220.99 8.43 3.8 73.63plantation and fodder (3.6) (0.5) (4.1)development project
10. Civil Supply - 0.46 0.37 80.4 0.27(0.0) (0.0) (0.0)
Total 879.25 25.6 6059.13 1614.98 26.7 1800.30(100.0) (100.0) (100.0) (100.0)
Total State Plan 11936.40 3208.23
Percentage share of 13.6 13.5MNP in Total planexpenditure
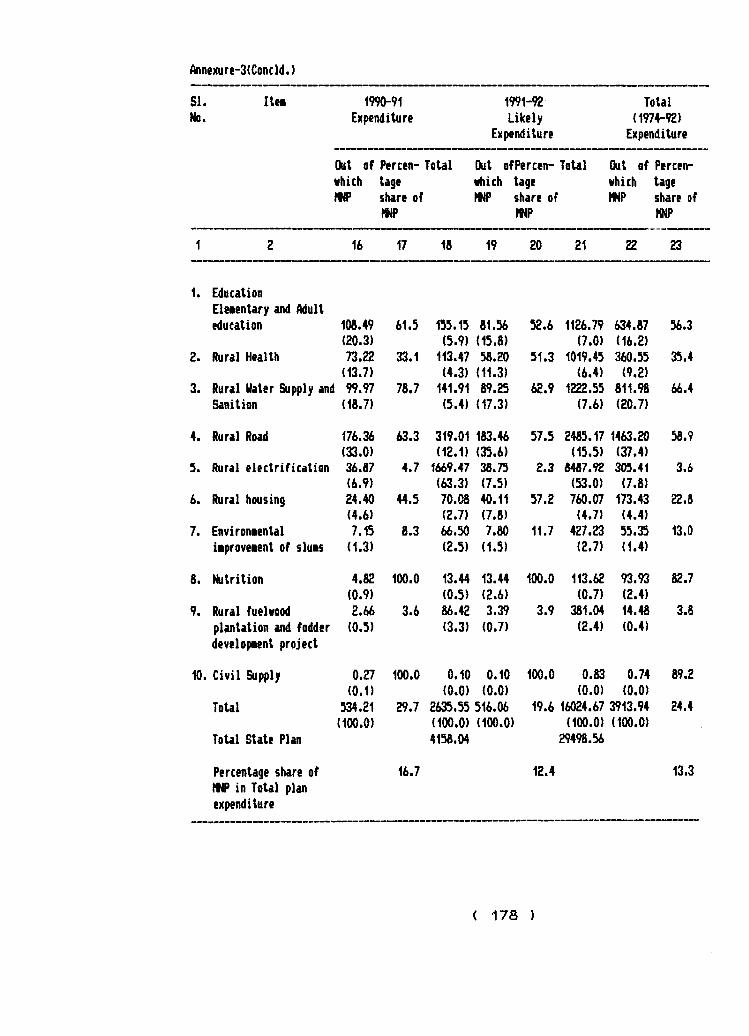
SI.No.
Itei 1990-91
Expenditure
1991-92
Likely
Expenditure
Total
(1974-92)Expenditure
Out of Percen-
which tage
HNP share of HNP
Total Out ofPercen-
vhich tage
HNP share of HNP
Total Out of Percen-
which tage HNP share of
HNP
1 2 16 17 18 19 20 21 22 23
1. Education
Eleientary and Adult
education 108.49 61.5 155.15 81.56 52.6 1126.79 634.87 56.3(20.3) (5.9) (15.8) (7.0) (16.2)
2. Rural Health 73.22 33.1 113.47 58.20 51.3 1019.45 360.55 35.4(13.7) (4.3) (11.3) (6.4) (9.2)
3. Rural Uater Supply and 99.97 78.7 141.91 89.25 62.9 1222.55 811.98 66.4
Sanition (18.7) (5.4) (17.3) (7.6) (20.7)
4. Rural Road 176.36 63.3 319.01 183.46 57.5 2485.17 1463.20 58.9
(33.0) (12.1) (35.6) (15.5) (37.4)5. Rural electrification 36.87 4.7 1669.47 38.75 2.3 8487.92 305.41 3.6
(6.9) (63.3) (7.5) (53.0) (7.8)
6. Rural housing 24.40 44.5 70.08 40.11 57.2 760.07 173.43 22.8(4.6) (2.7) (7.8) (4.7) (4.4)
7. Environiental 7.15 8.3 66.50 7.80 11.7 427.23 55.35 13.0
iiproveient of sluis (1.3) (2.5) (1.5) (2.7) (1.4)
8. Nutrition 4.82 100.0 13.44 13.44 100.0 113.62 93.93 82.7
(0.9) (0.5) (2.6) (0.7) (2.4)
9. Rural fuelvood 2.66 3.6 86.42 3.39 3.9 381.04 14.48 3.8
plantation and fodder (0.5) (3.3) (0.7) (2.4) (0.4)
development project
10. Civil Supply 0.27 100.0 0.10 0.10 100.0 0.83 0.74 89.2
(0.1) (0.0) (0.0) (0.0) (0.0)
Total 534.21 29.7 2635.55 516.06 19.6 16024.67 3913.94 24.4
(100.0) (100.0) (100.0) (100.0) (100.0)
Total State Plan 4158.04 29498.56
Percentage share of 16.7 12.4 13.3
HNP in Total plan
expenditure

Outlay under Centrally Sponsored Schemes
Major Head 1985“-90
Ex p e n d i ture in U.P.Plan
N o . of s'ch ernes unde r C.S.S
E x p e n diture on C.S.S (State s h a r e )
Percentage of Col. 4 against Col. 2
1 2 3 4 5
1. Agriculture and Allied activities
1216 49 276 23
2. Rural Development 1062 5 686 653. Special Area
Programme35 2 32 91
4. Irrigation and flood control
2095 6 95 5
5. Energy 2831 3 45 26. Industry and
Mine rals695 13 48 7
7. T ransport 1278 2 31 2a. Communi cat ion - - — -9. Science and
T echnology23 2 7 30
10 General Economic Servi ce
84 «« . ***"
11 Social services 2455 30 126 5(a) Education
and Sports623 6 20 3
(b> Medical and Public Health
457 5 57 12
(c) Others 1375 19 49 412 General Services 175 — — —
Grand Total 11949 112 1346 11
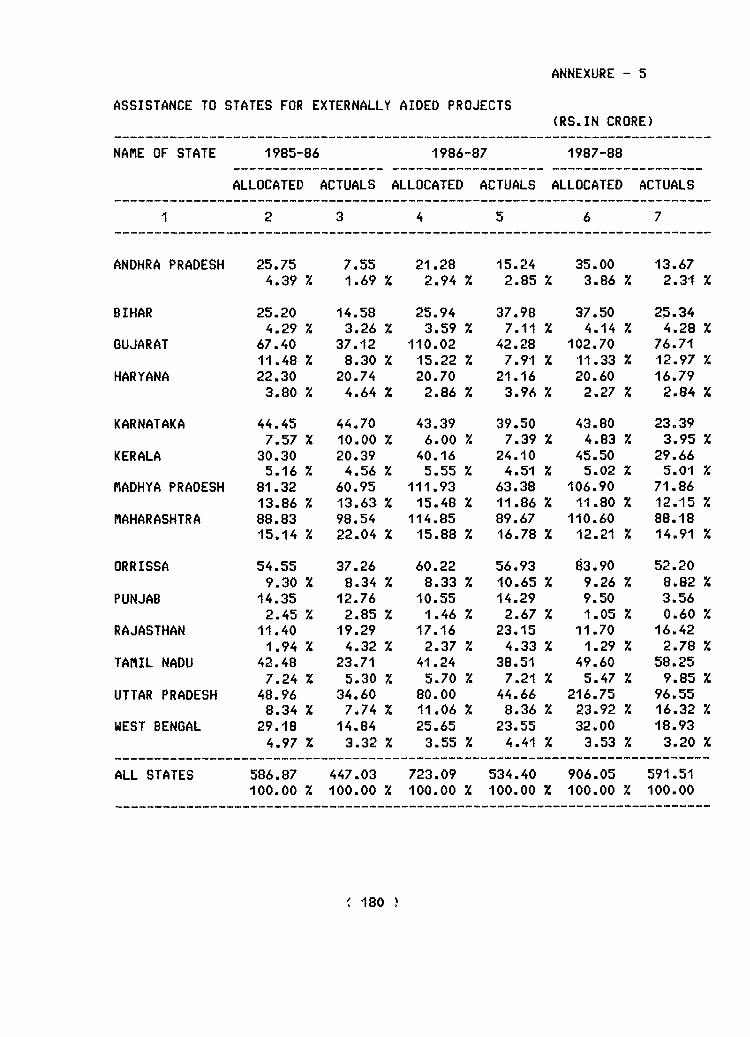
ASSISTANCE TO STATES FOR EXTERNALLY AIDED PROJECTS(RS.IN CRORE)
NAME OF STATE 1985-■86 1986-87 1987-88
ALLOCATED ACTUALS ALLOCATED ACTUALS ALLOCATED ACTUALS
1 2 3 4 5 6 7
ANDHRA PRADESH 25.75 7.55 21.28 15.24 35.00 13.674.39 % 1.69 Z 2.94 Z 2.85 Z 3.86 Z 2.31 Z
BIHAR 25.20 14.58 25.94 37.98 37.50 25.344.29 % 3.26 Z 3.59 Z 7.11 Z 4.14 Z 4.28 Z
GUJARAT 67.40 37.12 110.02 42.28 102.70 76.7111.48 X 8.30 Z 15.22 Z 7.91 Z 11.33 Z 12.97 Z
HARYANA 22.30 20.74 20.70 21.16 20.60 16.793.80 % 4.64 Z 2.86 Z 3.96 Z 2.27 Z 2.84 Z
KARNATAKA 44.45 44.70 43.39 39.50 43.80 23-397.57 X 10.00 Z 6.00 Z 7.39 Z 4.83 Z 3.95 Z
KERALA 30.30 20.39 40.16 24.10 45.50 29.665.16 % 4.56 Z 5.55 Z 4.51 Z 5.02 Z 5.01 Z
MADHYA PRADESH 81.32 60.95 111.93 63.38 106.90 71.8613.86 % 13.63 Z 15.48 Z 11.86 Z 11.80 Z 12.15 Z
MAHARASHTRA 88.83 98.54 114.85 89.67 110.60 88.1815.14 % 22.04 Z 15.88 Z 16.78 Z 12.21 Z 14.91 Z
ORRISSA 54.55 37.26 60.22 56.93 63.90 52.209.30 % 8.34 Z 8.33 Z 10.65 Z 9.26 Z 8.82 Z
PUNJAB 14.35 12.76 10.55 14.29 9.50 3.562.45 % 2.85 Z 1.46 Z 2.67 Z 1.05 Z 0.60 Z
RAJASTHAN 11.40 19.29 17.16 23.15 11.70 16.421.94 Z 4.32 Z 2.37 Z 4.33 Z 1.29 Z 2.78 Z
TAMIL NADU 42.48 23.71 41.24 38.51 49.60 58.257.24 % 5.30 Z 5.70 Z 7.21 Z 5.47 Z 9.85 Z
UTTAR PRADESH 48.96 34.60 80.00 44.66 216.75 96.558.34 % 7.74 Z 11.06 Z 8.36 Z 23.92 Z 16.32 Z
WEST BENGAL 29.18 14.84 25.65 23.55 32.00 18.934.97 % 3.32 Z 3.55 Z 4.41 Z 3.53 Z 3.20 Z
ALL STATES 586.87100.00 %
447.03100.00 Z
723.09100.00 Z
534.40100.00 Z
906.05100.00 Z
591.51100.00

NAME OF STATE 1988-•89 1989-•90 1985-■90
ESTIMATED ACTUALS ESTIMATED ACTUALS ALLOCATED ACTUALS
1 8 9 10 11 12 13
ANDHRA PRADESH 23.75 35.78 100.60 38.09 206.38 110.332.61 % 6.01 X 9.74 X 4.13 X 4.96 X 3.57 X
BIHAR 39.40 32.37 17.18 12.62 145.22 122.894.33 % 5.44 X 1.66 X 1.37 X 3.49 X 3.98 %
GUJARAT 102.30 62.87 145.96 135.99 528.38 354.9711.23 % 10.56 X 14.13 X 14.74 X 12.70 X 11.49 %
HARYANA 23.25 13.76 16.11 21.55 102.96 94.002.55 % 2.31 X 1.56 X 2.34 X 2.48 X 3.04 X
KARNATAKA 16.95 31.03 54.50 44.80 203.09 183.421.86 % 5.21 X 5.28 X 4.86 X 4.88 X 5.94 %
KERALA 47.30 35.35 58.75 24.87 222.00 134.375.19 % 5.94 X 5.69 X 2.70 X 5.34 X 4.35 %
MADHYA PRADESH 84.85 53.32 58.32 89.39 443.02 338.909.32 X 8.96 X 5.65 X 9.69 X 10.65 X 10.97 %
MAHARASHTRA 132.75 81.45 137.80 103.08 584.83 460.9214.58 X 13.69 X 13.34 X 11.18 X 14.06 X 14.91 %
ORRISSA 79.20 62.07 46.56 58.13 327.43 266.578.70 X 10.43 X 4.51 X 6.30 X 7.87 X 8.63 %
PUNJAB 1.00 3.13 35.40 33.740.11 X 0.53 X 0.00 X 0.00 X 0.85 X 1.09 %
RAJASTHAN 22.50 28.13 11.55 9.35 74.31 96.342.47 X 4.73 X 1.12 X 1.01 X 1.79 X 3.12 X
TAMIL NADU 73.60 52.04 98.00 95,49 304.92 268.008.08 X 8.74 X 9.49 X 10.35 X 7.33 % 8.67 %
UTTAR PRADESH 216.70 76.55 241.87 239.79 804.28 492.1523.79 X 12,86 X 23.42 X 26.00 X 19.34 % 15.93 %
WEST BENGAL 47.55 27.24 42.68 49.15 177.06 133.715.22 X 4.58 X 4.13 X 5.33 X 4.26 % 4.33 %
ALL STATES 910.80 595.09 1032.88 922.30 4159.29 3090.33100.00 X 100.00 X 100.00 X 100.00 X 100.00 % 100.00
CHAPTER - XV
PLANNING, MONITORING AND EVALUATION
Apart from the quality of implementation, the success of a Plan also depends on the quality of projects and proposals included in it, the monitoring undertaken and evaluations Tiade. It is the combination of all these inputs which determines to the success of a Plan. We will therefore also deal with these aspects also very briefly in this concluding Chapter.
2. The State has spent about Rs. 25,000 crore on its Five Year Plans during 1952-90. The progress in several areas has also been significant. To name only a few, foodgrains production has risen from 118 lakh tonnes (1951) to 352 lakh tonnes (1990), irrigation potential from 45 lakh ha., to 246 lakh ha., installed capacity of electricity from 179 MW to 5598 MW, length of roads from 14,000* Km to 58,800 km, and literacy from 10.8X to 42%. There are also areas where progress has been tardy. It is, however, not the intention to present here a balance sheet of the successes and failures of the past years. The intention is to cogitate about the planning process of the State, to locate some of its deficiencies and to indicate, very broadly, some improvements required therein.
3. The most significant deficiencies in planning process have been in the field of formulation of Plans. These ares--
(i) There is a distinction between investment andexpenditure, and only investment proposals qualify for inclusion with a Plan. However, in actual practice, this distinction got totally blurred with more and more outlays becoming available in successive Plans. The absence of qualified persons for formulation of the Plans in Government departments and for scrutiny of thesame aggravated this problem still further.
(ii) The projects and schemes undertaken should becompleted within the stipulated time frame so that benefits start flowing to the economy as conceived originally. This requires a proper tie-up between commitment and resources. This tie-up has often beenmissing and new commitments were made without dueregard to the resources required for completion of projects already in hand. This has led to cost andtime over-runs, postponement of benefits and deterioration of viable projects into non-viable ones.
(iii) There are cases when expenditure on a scheme becomes infructuous because the linkages for accrual of benefits from the scheme are missing and could not be

accomiTiodated in the limited resources available. The aspect of complimentarity in planning is often brushed aside for the fear of losing the main scheme aJso leading to wasteful expenditure.
(iv) The Plan is not the only source of expenditure on development. A considerable part of this expenditure is met from the non-Plan. The output finally depends on adequacy and efficiency of expenditure from both these sources. The distinct ion between these expenditures is for the limited purpose of accounting, otherwise for purposes of planning and performance these should be viewed as one. These are, however, seen as belonging to two w atertight compartments and an overall integrated view of these expenditures is seldom taken. A new proposal for expenditure from Plan can be justified only when it is found that the purpose for which this proposal has been made cannot be met from expenditure already being incurred from non-Plan nor is it seen at any stage that some expenditure on non~Plan can be saved or put to better use following inclusion of some new proposals in the Plan. The barrier in development expenditure between Plan and non-Plan should be broken and a new system introduced for taking an integrated view of the total expenditure, regardless of its source.
(v) R e g ar dless of the hopes expressed and promisesmade, planning continues to remain as centralized and bureaucratized as before. The changes are more in form than in essence. The concepts of decentralizedplanning, peoples participat ion and integrated local level planning have still not taken off in the State.
<vi) Planning is seen more as an exercise in allocationand deploy ment of financial resources than an exercisein mana gement and deployment of all available resources for better below performance and higher output- There should be equal emphasis on financial and other inputs, with more and more weightage in favour of 'other inputs* in the years to come.
4. There is nothing new in these deficiencies. These are allwell known but the fact that these have persisted for long only show that these are also not easy to remove. While some of these will have to wait for long term solutions as these are linked to changes in legal and institutional frame work, there are others which are easier to remove in a shorter time. Even marginal improvements in these matters would yield rich dividends for the State. It is proposed, therefore, to constitute an expert group to go into these questions, review the existing process and suggest measures which can be taken to improve the process.

5. There is no mechanism in the Government to watch and monitor, closely and concur r e n t l y , the implementation of objectives and policies set out in the Plan and the overall impact of development and planning on the S t a t e’s economy. Whatever monitoring takes place is confined to individual sectors or projects and programmes of the Plan with greater thrust, most of the time, on pace of expenditure. It is also adhoc, repetitive, more frequent than necessary, less informed and subjective, based on individual preferences and perceptions.
6- While it is necessary, therefore, to restructure the systems of monitoring followed in the Government and make them more purposive, result oriented and less cumbersome; it is equally important that there is also a m echanism to monitor the Plan and the economy in their totality, and not always in their differentsegments. It is only through such monitoring that we will knowwhether money spent and efforts made are also bearing fruits. Whatever may be the form, and content of such a mechanism, its findings should remain open for public scrutiny also, else its usefulness will be severely undermined.
7. It is against this background that an expert group is proposed to set to examine these questions and to suggest a suitable model for monitoring in the Government so that it could become operative from the beginning of the Eighth Plan. The group will also be required to suggest the modus-operandi of how the decisions required on the basis of such monitoring can be taken in the Government without losing time. While doing so, this group will also evaluate the system followed sonie ten years back when there used to be a Cabinet sub-committee for monitoring Sectoral Programmes.
8. Monitoring, whether it is for individual sectors, projectsor the total economy, will be selective and not comprehensive. The more significant and key areas will be identified and monitoring will focus on these areas only. It will be necessary,therefore, to develop some suitable indicators of efficiency forsuch mo nitoring and to concentrate on these only. And, above all, it should not involve too much of paper work and become a source of further embarrassment to every one. While theseindicators will differ from sector to sector and from one project to another, the indicators for the economy, as a whole,will be growth in investment, growth in output, growth inemployment and reduction in disparities.
9. The State is credited with having one of the best evaluationsystems, well equipped and well organised. Its work has earned praise in the past, and the quality of its reports has alwaysbeen highly rated. The response which these reports evoked initially was always very encouraging- This was so because ofthe weight lent to these reports from the highest quarters but there was a change over time. The inputs provided for its work

are no longer there, and nor do we have high powered forums for consideration of its reports. The findings and conclusions of these reports do not receive the same consideration which they receive in the past, leading to frustration amongst evaluators and deterioration in their output.
10. The success and efficacy of evaluation can be judged only by the amount of consideration which its findings receive in the Government. It is necessary, therefore, to develop a suitable mechanism, both for posing the most appropriate subjects for evaluation and for proper consideration of its findings, leading to some tangible action.

are no longer there, and nor do we have high powered orutris for consideration of its reports. The f i n d i n g s and conclusions of these reports do not receive the same consideration which they receive in the past, leading to fr ust r a t i o n amongst evaluators and deterioration in their output.
10. The success and e fficac y of eval u a t i o n can be judged only by the amount of consideration which its findings receive in the Government. It is necessary, therefore,, to develop a suitable mechanism, both for posing the most a.ppropriate subjects for evaluation and for proper consideration of its findings, leading to some tangible action.
LIBBAnY Pj DOCUrv'Hi TAIlO-N m V iB t
National los iitate of EducatKonail
PI j p. n ■' r< Li -i - L r a r lionui 7 - : \ ::>-i A ' : - i ■
V:
NIEPA DC
D07246