Fifth - Five year Plan
169
Fifth Five year Plan 1974-79 NIEPA DC D00655 GOVERNMENT OF INDIA PLANNING COMMISSION
-
Upload
khangminh22 -
Category
Documents
-
view
3 -
download
0
Transcript of Fifth - Five year Plan
FifthFive year Plan1974-79
NIEPA DC
D00655
GOVERNMENT OF INDIA PLANNING COMMISSION

^0 3 . %%

FOREWORD *
The National Development Council is meeting after almost three years. During these years the nation has had to face serious political and economic challenges. The fact that we are here to consider and approve the final version of the Fifth Plan proves that we have been able to cope effectively with these challenges, and have emerged successful.
The presentation of the draft Fifth Plan unfortunately coincided with a major upheaval on the international economic scene which profoundly affected developed and developing countries. Economists and political leaders all over the world were reminded of the collapse of the international economic order in the thirties. The sharp increase in the prices of food, fertilisers and oil seriously upset the assumptions on which the draft Fifth Plan had been framed. These new developments also lent urgency to a time-bound programme of action in order to achieve a measure of self-reliance in food and energy. All other objectives had to be subordinated to the control of inflationary pressures caused by domestic as well as international factors. In the middle of 1974-75 we formulated an anti-inflationary programme which called for several hard decisions on the part of Central and State Governments. Our success in curbing inflation attracte.d world-wide notice.
The new economic programme launched last year served to focus attention on those elements in our Plan which had the tw in objectives of increasing production and promoting social justice. The drive against economic offences and the general atmosphere of discipline and efficiency which national emergency helped to foster led to a significant and all-round improvement in economic performance. The results are now tangible. The production of foodgraini has touched an all-time record of over 118 million tonnes. Almost all parts of the country have contributed to this increase and all sections of the farming community have benefited. There was striking improvement in the operation of power plants and in the production of coal, steel and fertilisers. In some sectors of the economy we were faced with the problem of surpluses rather than shortages. We have achieved a major break-through on the oil front. The potential of^Address of the Prime Minister to the meeting of the National Development Council on September 24, 1976 has been reproduced as Foreword.

Bombay High has been firmly established and commercial production has commenced. Our technologists can legitimately be proud of this achievemerit. The containment of domestic inflation and a well articulated export effort helped to increase our exports by over 18% in 1975-76 at a time when there was a general decline in the volume of international trade. Larger export earnings, together with a massive increase in inward remittances, have led to a welcome accretion to our foreign exchange reserves.
These encouraging trends have enabled us to finalise the Fifth Plan. The formulation and execution of developmental programmes can now take place w ithin a longer time frame. The Deputy Chairman and his colleagues have worked hard to put together a coherent and feasible Plan. In essence, the Plan seeks to make up, to the maximum extent possible, for the loss o f momentum suffered in the first year of the Plan.
We are glad that after a hesitant start we have been able to finalise the Plan. However it would be quite wrong to allege that we have had a Plan holiday. Work has begun on most of the schemes included in the Plan. We have forged ahead particularly in key sectors like agriculture, irrigation and energy. The document which the Planning Commission has now presented to us is, in a sense, a mid-term review of the Plan. The Commission has taken this opportunity to assess the. progress already made in crucial sectors and to allocate adequate funds, in thfe remaining two years of the Plan, for on-going programmes. At the same time, keeping the long-term perspective in view, reasonable provision has been made for new starts and for some projects with long gestation periods.
Our needs are so vast that a Plan, howsoever big, w ill always fall short of expectations. It is understandable that Central Ministries, State Governments and public enterprises should want larger provisions for their programmes. In the last two decades, we have acquired considerable capability in implementing irrigation, power and industrial projects. It has not always been possible to match these capabilities with the necessary physical and financial resources.
Even the Plan as it has emerged w ill call for the exercise of the utmost discipline in the management of our public finances. The effective enforcement of taxation laws, timely recovery of loans and other dues, avoidance of over- staffing and other forms of waste in public expenditure, the selection of projects on sound techno-economic considerations and close monitoring of programmes are some of the essential ingredients of sound fiscal management, without which no Plan can succeed. Public enterprises should be so managed as to yield a reasonable return on investments made. There is still considerable scope for improvement in the working of Electricity Boards. These are not charitable institutions or welfare organisations. Beneficiaries should pay a fair price for the benefits they receive.
We have to raise substantial resources in the next two years. But in
( iv )

view of our firm commitment to the Plan and its objectives I am confident that the target w ill be met.
The finalisation of the Fifth Plan should act as a morale-booster. It provides clinching evidence that the nation has overcome the manifold problems with which it was confronted in the last couple of years, and that it is now in a position to resume the process of growth on a confident note. But our d ifficulties are by no means over; inflation has been contained but not eradicated. Any relaxation w ill bring about a resurgence of inflationary pressures. Money supply is growing at a disconcertingly high rate and must be checked. This w ill not be possibe unless the States and Centre exercise the strictest discipline on all spending programmes. The States should adhere to Plan outlays as approved and avoid tecourse to overdrafts. If we allow prices to rise, the real content of the. Plan will suffer further erosion. The major objectives of the Plan, economic self- reliance and the eradication of poverty, w ill suffer irretrievably.
With larger buffer stock of foodgrains and another good harvest in the offing,the outlook for the economy in the medium term is good. Even the recent upward movement in prices can be reversed.
But the long-term problem of raising the rate of domestic savings and investnent remains as intractable as ever. If the country is to maintain a steady rate ofgrowth of 5-6%, it should aim at a significant increase in investment. This is the crux of the message emerging from successive Plan documents.
Our tasks may become slightly easier if we can explain to our people in simpleterms what the Plan is about, how it is financed and what the consequence of economic stagnation w ill be tor them, their families and the country as a wiole. Planning cannot be an esoteric exercise confined to experts. All peopleat State, district and local levels must be fully involved in the process.
The participation of the people in the implementation of Plan programmes is vital Why is it not possible to kindle the interest of local people so that a new thrust b imparted to programmes such as the construction of rural roads, minor irrigation works, farm forestry and the like ? If the people are convinced that the basic objective of the Plan is social justice, they w ill be interested in programmes and w ill extend their cooperation. No Plan can ignore the deep-seated urges cf our people for greater equality. The reduction of disparities of all kinds— social,economic and regional—must always remain one of the central objectives of our ievelopmental planning. The direction of our planning is to solve over a period of time the problems of the poor of all communities, espacially tribals, Harijare, backward communities and regions.
The provision of fuller employment is one of the surest means of promoting greater social justice. The Planning Commission’s document has devoted
( v )

some thought to this problem. Its study shows that a dent can be made on rural unemployment by augmenting agricultural productivity and vigorously implementing land reforms as envisaged in the 20-Point Programme. A disturbing finding in the Planning Commission's document is that only in 15% of the gross cropped area is the output per hectare about Rs. 1500 per annum. Only 12%, of our districts have achieved a growth rate of more than 5% in agricultural production. Thus employment opportunities can be increased by improving agricu'tural productivity through irrigation, the adoption of improved technology and more equitable distribution of the gains of growth through land reforms. Employment programmes are not isolated but are organically linked w ith those of agricultural production. When the employment situation in rural areas improves, ihe drift into towns and cities w ill slow down. To that extent the problem of urban unemployment w ill also become more manageable and the strain on civic services w ill be relieved. We should also devote closer attention to household industries like handlooms and handicrafts, carpet-weaving, sericulture, etc. Employment in these industries has suffered in the last two years. This process has to be arrested. Programmes connected with these industries should receive high priority. Our country has immense opportunities for self-employment. Villagers need many services and in many areas are capable of paying for them, these needs should be identified and, through imaginative local planning, educated young people should be organised and given financial and other help from public financial institutions and other agencies.
Sometimes it is said that there is no longer the same enthusiasm about planning as in the fifties. An irrigation dam or powerhouse is more exciting while it is being built than when it is completed and operating. Planning has become an inseparable part of our national life. There can be no diminution of our commitment to it. The real irony is that those who were against planning have begun to pay lip sympathy to it, but those who professed to be supporters of planning have become unduly critical of some aspects of our performance. Whenever anything becomes a part of life, there is a danger of its becoming institutionalised. Our plans have, to some extent, been harmed by bureaucratisa- tion. I do not say this to disparage our civil servants. Many of them are devoted champions of planning. By bureaucratisation I mean the tendency to cling to the safe course, shying away from innovation, reluctance to try out bold alternatives. The essence of planning is to attempt more than what plain prudence dictates. This is where the element of faith and adventure comes in.
My father often said that planning is the application of science to national problems. Thanks to planned development our science itself has come a long way, compared to its state when we became free. Visiting many national laboratories and central research laboratories, which one by one have been celebrating their silver jubilees, I have been impressed by their progress and also by their direct contribution to development. The world has begun to take note o f our science and its strides in the search for self-reliance. But I do notice some signs
( vi )

of complacency. Self-reliance does not mean self-satisfaction. As we enter newer and more sophisticated areas of work, there is greater compulsion for our scientists to be equal to the best. In the new list of citizens' duties, a clause points to the importance of striving for excellence. In no branch of life is this search for excellence as crucial or has such direct social consequences as in science.
Concentration on development should focus more pointed attention on its long-term effects. We must inculcate in our engineers and all our people a deep reverence for Nature. Forests must not be recklessly cut down, nor air and water polluted. Technology should work in resonance with natural forces.
Planning has a better chance now to succeed than at any time in the last 25 years. There is a realisation that our tolerance was taken for weakness, which some people exploited in order to obstruct national policies with impunity, either for the promotion of sectional interests or in the hope of gaining political advantage. The new points which we have been recently emphasising are but a part of the general programme of national development. We can and must take advantage of the new climate of improved discipline to take the Plan forward.
A meeting of the NDC to give final approval to a Plan is always an important occasion. A Plan is ultimately neither a mere catalogue of schemes nor a sophisticated exercise in numbers. It is a charter of the progress of a people who refuse to be overwhelmed by the magnitude and vast variety of their problems and difficulties but are courageously struggling to map out a programme of action which w ill step by step and year by year help to overcome them. Sometimes this programme may prove over-ambitious and cause stresses and strains. But this should not frighten us into settling for what some might mistakenly call a more 'realistic' Plan, one which does not call for any special effort or sacrifice. Progress is possible only when we stretch our efforts and abilities almost to the point of breaking. Experience shows that acually, far from breaking, such an endeavour gives greater strength, confidence and satisfaction.
( . vii )
CONTENTSPage
I A REVIEW OF THE ECONOMIC SITUATION 1II THE PERSPECTIVE 5
III RATE AND PATTERN OF GROWTH 23IV FINANCIAL RESOURCES 30
1. Financing of the Public Sector Plan 302. Saving and Investment 403. Balance of Payments 464. General 51
PLAN OUTLAYS AND PROGRAMMES OF DEVELOPMENT 521. Plan Outlays 522. Agriculture and Irrigation 543. Power 594. Industry and Minerals 605. Village and Small Industries 676. Transport and Communications7. Education 75.8. Health, Family Welfare Planning and Nutrition ■789. Urban Development, Housing and Water Supply 81
10. Craftsman Training and Labour Welfare 8311. Hill and Tribal Areas, Backward Classes,
Social Welfare and Rehabilitation 8412. Science and Technology 87
1. RESOLUTION OF THE NATIOAL DEVELOPMENTCOUNCIL ON POWER AND IRRIGATION SYSTEMS 90
2. RESOLUTION OF THE NATIONAL DEVELOPMENTCOUNCIL ON THE FIFTH FIVE YEAR PLAN 91
VII ANNEXURES 93

CHAPTER I
A REVIEW OF THE ECONOMIC SITUATION
The Draft Fifth Five Year Plan was formulated in terms of 1972-73 prices and in the context of the economic situation obtaining in the first half of the fiscal year 1973-74. Thereafter, tw o major developments took place. The inflationary pressures gathered momentum till September, 1974; and the balance of payment position worsened due to the steep rise in the prices of imported oil and other materials.
1.2. The first intimations of the inflationary pressures came in 1972-73, thereafter these pressures gathered strength in 1973-74 and continued unabated right upto September, 1974. During this period, the index rose by 31.8%. Food articles and industrial raw materials accounted for about two-third of the price increase. The prices of machinery, transport equipment and manufactured goods contributed to a little over one-fourth to the overall increase in prices. These pressures were first felt as a result of severe drought conditions in 1972-73, followed by shortages of various essential consumer goods and critical raw-materials and inputs. Shortage of power together w ith higher international prices of imported inputs and their inadequate availability led to the stagnation of industrial production during 1973-74. The price situation was aggravated by continued expansion in money supply partly due to large deficit financing and partly due to excessive expansion of bank credit to the commercial sector. Thus in 1973-74 the money supply increased by 15.4% over and above the increase of 15.9% registered in 1972-73. Acting together with the unaccounted money unregulated expansion of money supply in a situation of shortages provided an added impetus to the activities of speculative and unsocial elements. Owing to the escalation of costs and prices, even the administered prices of important intermediate goods such as steel, coal, cement and aluminium had to be raised as a defensive action. The procurement and issue prices of important cereals such as rice and wheat were also increased significantly. This not only had a direct impact on the cost of living index but also strengthened the inflationary tendencies.
1.3. The balance of payment position also came under severe strain, barge quantities of foodgrains and essential wage goods had to be imported. The

four-fold increase in oil prices and increase in prices of cereals, fertilisers, machinery and equipment, non-ferrous metals and other imported goods severely eroded the resources. The value of the three principal items of imports, namely food, fertilisers and POL accounted for as much as 53.2% of the total import b ill in 1974-75, as against 42.6% in 1973-74 and 23% in 1972-73. In absolute terms the import bill for these items increased from Rs. 431 crores in 1972-73 to Rs. 1260 crores in 1973-74 and to about Rs. 2500 crores in 1974- 75. No doubt value of exports also increased but the balance of trade showed a deteriorating trend. The trade gap turned from a surplus of Rs. 103.4 crores in 1972-73 to a deficit of Rs. 432 crores in 1973-74 and Rs. 1190 crores in 1974-75. This trend was both on account of sharp deterioration in the terms of trade since 1973 and larger imports of certain commodities mentioned above. Borrowings from IMF including special oil facility to the extent of about Rs. 485 crores was resorted to in 1974-75 to meet the deficit in balance of payment. These developments together w ith uneasy economic conditions in some countries abroad and unstable international monetary conditions could not but have an adverse impact on the Plan.
1.4. Inevitably, the financial and physical magnitudes of the Plan as well as the balance of payment position got distorted. Escalation in costs, higher outlays on public consumption and non-development expenditure led to erosion of resources for the Plan resulting in staggering of programmes owing to dimunition in the size of investment in real terms. Investments in the private sector also felt the impact. With such flu idity both at home and abroad, the finalisation of the Plan had to await the emergence of a more stable situation.
1.5. Deferment of the finalisation of the Plan did not imply a Plan holiday but a rephasing of the Plan outlays, in the light of emerging circumstances. It implied that while planning, one had inevitably to pay considerable attention to the short-term management of the economy. Measures had to be devised urgently for containing inflation at home and for keeping the economy in proper alignment with the fast changing international developments. Necessarily priorities had to be defined even amongst the stated priorities, consistent with the objectives of the draft Plan. Naturally, food and energy became the most important sectors for investment planning. The successive Annual Plans had to be formulated on these considerations.
1.6. The Annual Plan 1974-75 was formulated at a time when the inflation rate was quite high. It was, therefore, designed mainly to control inflation and increase production particularly in the key sectors. The Plan outlays had to be kept at a modest level. Yet care was taken to ensure adequate provisions for agriculture including irrigation and fertilisers, energy (power, coal and o il), ongoing projects in steel, non-ferrous metals and certain basic consumer goods industries. Emphasis was on fuller utilisation of the unutilised capacities. The provision for social services was restrained but kept at a reasonable level.
2

1.7. During the year, a comprehensive strategy was evolved and a package of measures—fiscal, monetary and administrative—was introduced. It included mobilisation of additional resources (both by the Centre and the States), allocation of funds to high priority projects, restraint on growth of money supply and a crack down on anti-social elements. Disposable incomes were regulated through impounding of certain additional incomes, imposition of restrictions on dividends and compulsory savings by tax payers in the higher brackets. The procurement prices of major agricultural crops were not allowed to rise. These measures effected deceleration in the rate of growth of mon ey supply, significant improve ment in price situation and easy availability of essential goods. The money supply increased by only 6.9% in 1974-75 as against an increase of 1 5.4% in the previous year. The index of wholesale prices declined by 7.1% between end September, 1974 and end March, 1975.
1.8. Though inflation was contained, yet the economy was still operating under various constraints. Agricultural production in 1974-75 declined by 3.1%. Industrial production grew at 2.5%. While the rate of aggregate investment (net) increased from 13.6% in 1973-74 to 14.8% in 1974-75, the rate o f domestic savings (net) recorded a marginal increase from 12.8% in 1973-74 to 13.1% in 1974-75. As already mentioned the balance of payment deteriorated.
1.9. Having achieved a certain measure of price stability by the end of1974-75, the Annual Plan for 1975-76 could aim at growth under conditions of price stability. Agriculture, Irrigation, Power, Coal, Oil and Fertilisers therefore continued to receive priority. Projects capable of yielding quick results received special attention. Labour discipline and sustained anti-hoarding/smuggling operations created an appropriate climate. An excellent harvest gave timely vigour and push. The national income is estimated to ftave increased by 6 to 6.5% during 1975-76—agricultural production by about 10% and industrial output by 5.7%. Procurement of nearly 13 million tonnes of foodgrains in 1975-76, alongwith imports enabled the build-up of a high level of stocks of foodgrains (17 million tonnes). The wholesale price index fell from 307.1 at end of March, 1975 to 283.0 at the end of March, 1976—by about 8%. The year1975-76 closed with an overall budgetary surplus of over Rs. 200 crores against a deficit of Rs. 490 crores estimated earlier. The balance of trade continued to be a matter for concern during 1975-76 and the trade gap was as high as Rs. 1216 crores. This was in spite of the fact that the value of exports had increased by 18.4% and imports by only 14%. However, as a result of larger inflow of private remittances because of effective action against smuggling and illegal dealings in foreign exchange and increase in net foreign aid the balance of payments was not strained. The foreign exchange reserves reached a high level of Rs. 1885 crores at the end of the year as against Rs. 969 crores at the end of the previous year.
1.10. With stability of prices and growth in'economy achieved during
3

1975-76, a bolder programme of investment was drawn up for 1976-77. The Annual Plan 1976-77 envisages an outlay of Rs. 7852 crores which represents an increase of 31.4% over the original Plan allocation for 1975-76. The New Economic Programme and consideration of social justice could receive greater attention. The high priority accorded to critical sectors of the economy—agriculture including irrigation, energy and intermediate goods was continued. Not only did on-going schemes receive fu ll attention, but new starts in critical sectors could also be envisaged on a selected basis. This strategy together w ith mobilization o f additional resources was expected to maximise the growth potential of the economy.
1.11. Thus, the efforts made so far have succeeded in checking inflationary tendencies and giving the economic situation a promising turn. Some of the constraints which seriously hair.pered the process of growth in the earlier period have been removed to a considerable extent. There is easy availability of essential raw materials and inputs. There is greater economic discipline and a renewed dynamism in the country at present. A considerable measure of price stability has been achieved and it is hoped that the recent increase in price level w ill be contained by effective measures which have been initiated. There is a large buffer stock of foodgrains with the public agencies and the position of foreign exchange is satisfactory. The international monetary system has also stabilised to a certain degree. The Planning Commission, therefore, consider this an appropriate time to finalise the Fifth Plan. With this end in view a meticulous and detailed examination of the development programme for the remaining two years of the Fifth Five Year Plan has been lindertaken. What emerges is a clearer delineation of the targets and policies specially in relation to the priority sectors.
4

CHAPTER II
THE PERSPECTIVE
The objectives in view are removal of poverty and achievement of self- reliance. This chapter seeks to delineate a desirable profile of development, indicating magnitudes which w ill help.to determine options for long term investment and outlining strategies which w ill help to overcome the constraints in achieving the objectives. The strategies relate to growth in the three leading sectors, viz., agriculture, energy and critical intermediates and the creation of additional employment opportunities.
A g ricu ltu ra l Sector
2.2. This is the most vital sector. Gross domestic product at 1960-61 prices, from the agricultural and allied sectors, increased at an annual compound trend rate of 2.07% during the period from 1961 -62 to 1973-74. Table-1 shows that growth in output of foodgrains in the same period is estimated at 2.72% per annum.
Table 1. Annual Compound Growth Rates1 of Output for Selected Crops During 1961-62to 1973-74.
crop growth rate (%)
(0) d )
1. rice 2.082. . wheat 8.853. jowar ( - ) 0.874. bajra 4.39S. maize 3.216. total cereals 3.167. total pulses < - ) 0.518. total foodgrains 2.729. sugarcane (cane) 2.37
10. cotton (lint) 1.1711. jute ( - ) 0.87Z mesta ( - ) 3.81
13. oilseeds (5 major) 1.2614, all crops2 2.45
1 Estimated from semi-log regressions of output data in quantifies on tirtia. z 9ased on Index Numbers of Agricultural Production.

2.3. Neither for the country as a whole nor for any of the States was the output of foodgrains consistently below the estimated trend levels after 1970-71. Thus, there is no evidence to suggest that the foodgrains economy stagnated in the early seventies.
2.4. Studies in growth of output and patterns of growth of input show that in certain regions of the country growth in production of foodgrains is primarily explained by spread of irrigation and multiple cropping, while in others it is due to water, seed gnd fertiliser technology. The picture varies from district to district. Table-2 presents a comparative analysis of the levels of agricultural development in the triennium 1970-71 to 1972-73 based on District level data on gross value of output per hectare and indicators of input such as gross cropped area, consumption of fertilisers, use of tractors, installed pump sets and gross irrigated area. In the early Seventies the gross value of cropped output per hectare was above Rs. 1500 per annum only in 15 per cent of the gross cropped area. This relatively developed part of the rural economy accounted for 27.84 per cent of the aggregate output and approximately 40 per cent of most of the major inputs such as fertilisers, and pump sets. On the other hand, the gross value of cropped output per hectare was less than Rs. 1000 per annum in 60 per cent of the total cropped area, and it accounted for roughly one-third of the total inputs used in the rural sector. Table-3 shows that in growth of agricultural output, rates higher than 5 per cent compound per annum have been achieved in the trienniums, 1962-63—1964-65 to 1970-71—1 972-73, in approximately 12 per cent of the districts of India, accounting for about 14 per cent of the gross cropped area and approximately 20 percent of most of the major inputs. In approximately 30 per cent of the districts, accounting for approximately equal share of the gross cropped area and a somewhat higher share of major inputs, the growth rate of agricultural output has been higher than 3 per cent compound per annum. In another third of the districts accounting for 30.98 per cent of the gross cropped area, the rate of growth has been estimated between 1 to 2.99 per cent compound per annum.. This class of districts corresponds to the modal class and the average growth rate of the agricultural sector also falls in it. The remaining districts showed a growth performance of less than 1 per cent compound per annum. The future strategy w ill need to take note of these factors.
6

Table 2. Summary Profiles of Levels of Agricultural Development in India at the District Levelfor the Triennium 1970-71 to 1972-73
Cumulative Percentages of Total
gross vaiue of gross cropped aggregate cousumption une of output per area output of N.P.K. tractors
hectare (Rs. in all India prices)
pumpsetsinstalled
grossirrigated
area
no. of districts in India
(%)
(0) (1) (2) (3) (4) (5) (6) (7)1. 2500-2799 0.70 1.83 2.37 5.39 0.83 2.2 2 1.062. 2000—2499 3.04 7.18 10.60 12.89 7.82 8.27 3.563. 1500—1999 14.48 27.84 38.93 46.81 40.68 34 08 17.734. 1000 1499 40.30 59.46 67.24 69.90 63.40 64.25 42.915. 500 999 83 96 94.20 93.79 95 88 91.56 95.75 87.946. 54 499 100.00 100.00 100.00 100.00 100.00 100.00 100.00
Source: Centre for Regional Development, Jawahar Lai Nehru University—PerspectivePlanning Division, Planning Commission, Project on Regional Levels ofAgricultural Development in Indiai. Analysis conducted for 19 maincrops.
Table 3. Summary Profile of Growth of Agricultural Development in India at District Level bet-ween the Trienniums 1962-63/64-65 to 1970-71/72-73
Cumulative Percentages of Total in 1970-71/1972-73
annual compound gross aggregate consumption use of pumpsets gross no. ofgrowth rate of cropped output of N P.K. tractors installed i rugated Dis tr ic tsgrOss value of area area in Indiaoutput (%) ("!,) *
(0) (D (2) (3) (4) (5) (6) (?)
1. 11.00 11.35 0 62 0.15 0.02 0.84 0.08 0.09 0.362. 9.00 10.99 1.38 0.98 1.22 2.89 1.26 1.19 1.423. 7.00 8.99 7.93 9.97 14.13 32.47 12.47 16.28 6 38
5.00 6.99 13.89 17.03 20.81 46.46 20.13 24.37 12.415. 3.00— 4.99 29.60 36.13 38.99 67.72 34.68 45.53 29.085. 1 .0 0 - 2.99 60.58 67.75 66.24 83.74 66.63 71.90 62.417. 0.00— 0.99 73.09 80.98 81.92 90.74 80.69 83.81 75.183. negative 100.00 100.00 100.00 100.00 100.00 100.00 100.00
• Growth rate has been computed by valuing output in 1962-63 to 1964-65 and 1970-71 to 1972-73, at average all India Prices for each Crop for the triennium 1970-71 to 1972-73.
Source : Centre for Regional Development, Jawaharlal Nehru University - Perspective Planning Division, Planning Commission, Project on Levels of Agricultural Development in India.
7

2.5. The strategy for long term planning of the agricultural sector centres round detailed assessment and exploitation of ground and surface water, intensification in application of new technologies in agriculture, extension mechanisms and programmes for supply of inputs, apart from attention to the special needs of problem areas and vulnerable sections of the society.
2.6. The growth rate in gross cropped area in the period 1961 -62 to 1972-73, is estimated at 0.54 per cent compound per annum. Based on an elasticity of multiple cropping with respect to gross irrigated area, the National Commission on Agriculture has estimated a growth rate of 0.66 per cent compound per annum in the gross cropped area from 1970-71 to the year 2000. The estimated elasticity of gross cropped area with respect to gross irrigated area for the country as a whole, is 0.20. An increase of 4 per cent per annum in gross irrigated area can be safely postulated for the Fifth Plan. This growth rate will need to be intensified in the later Plan periods. On a somewhat conservative basis, the gross cropped area can be postulated to expand by 0.7 per cent per annum in the Fifth Five Year Plan period and by about 0.6 per cent per annum in the subsequent period.
2.7. The growth rate in the gross cropped area under foodgrains between 1961 -62 and 1972-73 is estimated at 0.49 per cent compound per annum. The growth rate for the Fifth Plan period is postulated at 0.6 per cent per annum. The trend of diversification to non-foodgrains crops is expected to be maintained in the later Plan periods. As regards individual food crops, the growth rate of irrigated area under paddy is likely to be higher than that under wheat. Recent evaluation also suggests that while the expansion of area under high yielding varieties of paddy w ill be considerably intensified in the Fifth Plan period, area under irrigated wheat is likely to be entirely covered by high yielding varieties during this period. High yielding varieties in jowar and some other cereals offer sufficient promise, provided problems relating to pest resistance can be controlled. Exercises in the Planning Commission suggest that towards the end of the next decade, the irrigated area under foodgrains must rise to around 45 per cent of the total area under foodgrain crops.
2.8. The second factor in higher production of foodgrains is increase in yield by 3 per cent per annum during the Fifth Five Year Plan period. The increases in yield are derived from the increases in input. Somewhat conservative assessments are at persent stipulated for yield level possibilities for each crop separately for differing agronomic conditions. However, technological assessments as well as comparative analysis within homogeneous agroclimatic regions suggest that higher yield levels are possible.
2.9. Annexure I gives State-wise position regarding the areas that have been covered by systematic geological surveys. However, 63 per cent of the coverable area has not yet been investigated. The gap is wider for the States of
8
North Eastern Region, Eastern Region (excepting West Bengal), Central Region and Southern Region, which include some of the drought prone areas in the country. In the absence of more reliable data from surveys and exploration, the u ltimate potential of ground water can be tentatively placed at 35 million hectares.
2.10. Allocation of funds for systematic evaluation of the country's ground water resources has been considerably increased in the Fifth Plan. With the availability of more information, it should be possible to develop a detailed land utilisation plan and a coordinated plan for the utilisation of surface and ground water in the Sixth Five Year Plan period and beyond. Such a plan for the national economy needs to be integrated with the local and regional development plans.
Demand fo r Foodgrains
2.11. Estimation of demand for foodgrains is sensitive to the assumptions made on growth and distribution of income. Based on the realised levels of growth of income upto 1 975-76, the target of 5.2 per cent per annum of compound income growth in the remaining years of the Fifth Five Year Plan and the estimated relationships between purchase of foodgrains and growth in total consumption expenditure per capita, the demand for foodgrains in 1978-79 is estimated at 127.69 million tonnes. The targets of income growth presently postulated for the Sixth and the Seventh Plan periods lead to estimates of the demand for foodgrains at 150.9 million tonnes and 178.2 million tonnes respectively, provided the elasticity of demand of foodgrians to consumption expenditure remains constant. These projections are consistent, both methodologically and in quantities, with the upper lim it of requirements of foodgrains in 1985 estimated by the National Commission on Agriculture to be within a range of 150 million tonnes to 163 million tonnes. However, there is a possibility that the demand for foodgrain w ill slacken in the perspective period on account of the growth in per capita consump tion expenditure placing a larger proportion of consumer households in the higher expenditure brackets. This is particularly so since the behaviour of households in purchase of foodgrains varies markedly between households in the different expenditure brackets. The demand for non-foodgrain agricultural products will intensify with the diversification of the basket of consumer expenditure in relation ship with higher levels of living. If the demand for foodgrains reaches 180 kgs. per capita per annum in i 983-84, the aggregate requirement of foodgrains w ill be143.5 million tonnes. As for the following five year period the requirement w ill be 161 million tonnes by 1988-89, if the per capita demand is taken at 190 kgs. On current indications, it w ill be prudent to plan for a requirement of foodgrains within a range of 161 million tonnes to 170 million tonnes (implied per capita availability being 200 kgs) by 1988-89 and to firm up these estimates in the Sixth Plan.
9

Non-foodgrain Crops
2.12. The same strategy, namely of increasing the area under irrigation and of intensifying the spread of the available high yielding varieties, applies to nonfoodgrain crops. The expansion of irrigation facilities in sugarcane and in cotton is expected to continue. It is expected that demand should balance supply in the early part of the Sixth Plan period. The situation with regard to oilseeds is more uncertain on account of the area under irrigation being small and so the need for imports cannot be ruled out. Even with the postulation of a tight land balance, the expected rate of growth in the non-foodgrains crop is presently estimated at 3.94 per cent per annum in the Fifth Plan period, rising to 4.96 per cent per annum in the Seventh Plan period. Given the growth rates in the animal husbandry, fishing and forestry sectors, the rate of growth of the agricultural sector as a whole is postulated at 3.94 per cent in the Fifth Plan period and at approximately 4.30 per cent through the Sixth and Seventh Plan periods.
Fertilisers
2.13. The estimation of fertiliser demand is sensitive to the increase in irrigation facilities and the spread of new technologies. The demand is estimated in terms of nutrients at 4.80 millions tonnes in 1978-79 and approximately 8
million tonnes in 1983-84. Suitable investment decisions in relationship to these fertiliser demands are being made in the area of nitrogenous and phosphatic fertilisers. Still there w ill be some area of uncertainty in estimation of demand arising both from the lack of fully disaggregated data and relationship of fertijiser applications to behavioural responses. Any spurt in demand may, therefore,.have to be met from imports. The requirments of potassic fertilisers w ill continue to be met substantially out of imports.
Forestry
2.14. The forestry sector has to play an important role in the economic development of the country. Forests occupy about 23 per cent of the area and their contribution in the net domestic product at 1960-61 prices is 1.4 per cent. The targets of demand for industrial wood for the perspective period are consistent with the projections of the National Commission on Agriculture. The problems relating to the forestry sector are mainly organisational. In view of the tight land balance being anticipated, coverage by forests has to be integrated with the land utilisation plan. Development of communications is also necessary in relation to the optimal exploitation of the available forest wealth in inaccessible areas.
The Energy Sector
2.15. Issues relating to energy planning have been fu lly examined. Given
10

the non-renewable resource base of the economy, the main emphasis is on coal, electricity and crude oil and substitution of imported source of energy wherever possible. These three leading sectors of energy accounted for 3.96 per cent of the gross value added in the non-agricultural sector in 1973-74. This share is expected to go up to 5.00 per cent by the end of the Fifth Plan period and 5.56 per cent by the end of the Sixth Plan.
2.16. The revised production estimate for the coal sector is placed at124.0 millon tonnes in 1978-79 and is estimated to go up to 185 million tonnes in 1983-84. Long term rates of growth of between 7 to 8 per cent compound per annum for this sector are expected to be sustained through the Seventh Plan period also.
2.17. The power generation programme together with minimisation of transmission ajid distribution losses, aims at meeting the anticipated demand of about 90 billion Kwhs by 1978-79. The rationalisation of power rates is also expected to lead to a more optimal pattern of energy consumption and restrict relatively inessential use. Energy consumption at the end of the Sixth Plan period is presently estimated tentatively at 138 billion units. Taking into account the regional dimensions, peak demand and rationalisation of the transmission and distribution system, investment planning decisions are under way to meet this requirement. The electricity sector is expected to maintain a growth rate of between 8.5 to 9.5 per cent per annum through the Seventh Plan. The slight deceleration in the growth rate is consistent w ith international experience of the declining elasticity of electricity consumption in relation to income growth at higher levels of industrialisation.
2.18. Consumption of refinery products grew at a rate of 8.5 per cent compound per annum in the period from 1960 to 1973. With suitable fiscal measures and appropriate restrictions on the non-essential use of oil products, the consumption in 1974-75 was reduced to the 1972 levels and further demand controlled. The requirements of petroleum products are expected to be of the order of 28.5 million tonnes in 1978-79, even after taking into account the needs of the critical sectors like fertilisers, transport, irrigation, industry and domestic fuel. Simultaneously intensified exploration and processing is likely to give a production of 14.18 million tonnes of crude oil by then, as against the target of 12 million tonnes in the Draft Plan. The crude oil sector is expected to grow at a rate of 14.68 per cent during the period of the Fifth Plan. By 1983-84, the production level is tentatively expected to be 22 million tonnes. The refining capacity in the country w ill be about 31.5 million tonnes by 1978-79; and this is expected to increase during the Sixth Plan. It is estimated that t ill 1980-81, there w ill be no need to raise the absolute level of import of crude oil.
2.19. The Fuel Policy Committee has estimated that the share of noncommercial energy in the domestic sector w ill decrease from 80 per cent in
l l

1978-79 to 60 per cent by the end of the Seventh Plan. Against the estimated availability of 94 million tonnes of forest fuels, the demand is placed at 132 million tonnes in 1978-79 and 122 million tonnes in 1990-91. The need for a coordinated policy towards development of forests and use of soft coke appears inescapable.
Long Term Perspective fo r Non-Renewable Resources
■2.20. Planning for critical intermediates must have relation to the non- renewable resource base, since even w ith recycling, the recovery ratio is less than unity. Major objectives for the development of non-renewable resources from the land and the sea, can be stated as follows :
(a) To prepare detailed inventory of natural resources;
(b) to supply the growing needs at minimum social cost;
(c) to utilise nation's non-renewable resources at optimal depletion rate;
(d) to achieve self-reliance in terms of technology, production and conservation;
(e) to utilise the possibilities of international trade that are consistent with other long-term Plan objectives;
(f) to utilise re-cycling possibilities; and
(g) to undertake research and development.
2.21. In the present stage of industrialisation, the elasticity of mineral consumption with respect to growth of either GDP or manufacturing activity exceeds unity. This experience is consistent w ith the historical experience of other countries in similar stages of industrialisation.
2.22. Annexure 2 shows the status of geological mapping in India. Despite considerable efforts, only 46.14 percent of the total geographical area of the country has been geologically mapped on the scale of 1 : 50000. Geological mapping should have priority in the overall programme of land use and planning utilisation of non-renewable resources.
2.23. Annexure 3 indicates the recoverable reserves as a percentage of total reserves. Reserves of the measured categories, which are the outcome of detailed investigations, are smaller than the requirements for future long-term resource planning. In case of strategically important minerals like kyanite, barytes.
12

chromite, etc. the bulk of the reserves are yet only of the inferred category. Unless detailed exploration is done for these minerals, exploitation may lead to unnecessary extra costs to the economy. Given the fact that the exploration of the nonrenewable resources should be planned within a long-term framework, it is possible that private lease-holds may indulge in socially undesirable decisions on the rates of depletion. Thus a policy perspective needs to be developed.
2.24. Table 4 indicates the long-term perspective of the availability of major minerals based on estimated depletion rates in 1988-89. For many of the strategically important minerals, such as, chromite, kyanite, barytes and manganese. the nation would be depleting the known reserves before the year 2000 even if exports are maintained only at the current levels and production is increased to meet the growing domestic demand. This is a serious matter particularly as substantial deposits of these minerals are under private lease-hold. As for the critical non-ferrous metals viz, copper and zinc, of which India is a net importer, minimum exploitation to ensure self-sufficiency in the short run, w ill deplete the known reserves within fifteen years or so. This has obvious implications both for import planning and for exploitation. Reserves of some of the important minerals like iron ore (both hematite and magnetite) and bauxite seem to be sufficient for meeting growing domestic needs and to provide for exports. Reserves of limestone are abundant but complete inventory in terms of grades and quality has not yet been made.
Tablo 4. Balance Life of Known Reserves at 1988-89 Consumption Levels
minerals balance life at 1988-89 consumption levels in years
(0) (1)
1. coking coal 44
2. non-coking coal
(a) indigenous 168(b) plus exports 159
3. iron ore-hematite
(a) indigenous 165(b) plus exports 62
4. iron ore-magnetite 84
5. manganese ore
(a) indigenous 26(b) plus exports 12
6. chromite
(a) indigenous 47(b) plus exports 13
13

(0) (1)
7. bauxite(a) indigenous 66(b) plus exports 45
8. zinc(a) indigenous —(b) plus imports 11
9. copper(a) indigenous 17(b) plus imports 36
10. lead(a) indigenous 29(b) plus imports 46
11. rock phosphate(a) indigenous —(b) plus imports 12
12. limestone 475
C ritica l Industria l In te rm ed ia tes
2.25. Studies on steel demand indicate that domestic requirements can be met and export of some surpluses maintained t ilt 1983-84 on the basis of fresh capacities expected to be created by investments in stream or possible expansion in the existing plants. Fresh investment decisions may, however, need to be taken for ensuring adequate supplies of finished steel, particularly shaped products, in the earlier part of the Seventh Plan period. The target o f 4 lakh tonnes of aluminium in the Draft Plan is now expected to be reached by the end o f the Sixth Plan period. Fresh capacities w ill need to be created before then. A luminium demand is expected to rise by more than 50 per cent in the Seventh Plan period and decisions on setting up of capacity for mining of bauxite and erection of smelter facilities w ill be necessary.
Dem ographic P ro file
2.26. The National Population Policy lays down a target for birth rate of 25 per thousand and a population growth rate of 1.4 per cent by the end of the Sixth Plan period. The policy envisages a series of fundamental measures including raising of thb minimum age for marriage, female education, spread of population values and the small family norm, strengthening of research in reproductive biology and contraception, incentives for individuals, groups and communities
14

and permitting State Legislatures to enact legislation for compulsory sterilization. The targets laid down in the National Population Policy correspond to those laid down in the Draft Fifth Plan for achievement by the end of the Sixth Plan and are expected to be reached. For the period 1986-91, the population growth rate is estimated at 1.1 percent. The population is estimated at 725.4 million by 1988-1989 and at 744.8 million by 1991. The rural population is estimated at545.1 million by 1988-89 and the urban population at 180.3 million.
S tru c tu re o f O utpu t
2.27. Gross Domestic Product at 1960-61 prices increased at an annual compound growth rate of 3.40 per cent in the period 1961-62 to 1973-74 as shown in Annexure 4. The fastest growing sector was Electricity, gas and water supply (9.90 per cent). The rate of growth of the Registered Manufacturing sector was faster than that of unregistered Manufacturing sector. Broadly speaking, with the growth in the agricultural sector at around 2 per cent per annum, the manufacturing, mining and quarrying and tertiary sectors grew at a rate of around 4 per cent per annum and the national economy at over 3 per cent per annum.
2.28. The structure of output in the perspective period can now be summarised. The constraints of the international economy, the desired patterns of consumption expenditures and the natural resources (including the non-renewable resources) determine the leading sectors of the economy. In addition, the export opportunities (outlined subsequently) and the required levels of investment and public consumption determine the details of the desired structure of output. The growth of gross output in the agricultural sector is estimated at 3.94 per cent in the Fifth Plan period and higher than 4 per cent in the Sixth and Seventh Plan periods (Table 5 : All estimates at 1974-75 prices). The mining sector's gross output is targetted to expand at 12.58 per cent per annum and electricity at 10.12 per cent in the Fifth Plan period. The manufacturing sector is expected to sustain a growth rate of 6.92 per cent compound per annum in the Fifth Plan period and 7.23 per cent in the Sixth and Seventh Plan period. This growth profile is consistent with a growth target of 4.37-per cent for the Fifth Plan period (5.2 per cent for the period 1976-77 to 1978-79), 5.65 per cent for the Sixth Plan period and 6 per cent for the Seventh Plan period.
i 5

Table 5. Projected Sectoral Annual Rates of Growth in Terms of Gross Value of Output and Gross Value Added at Factor Cost 1974-75 to 1988-89
(per cent per annum compound)value of output value added
1978-79 1983-84 1988-89 1978-79 1983-84 1988-89sector over over over over over over
1973-74 1978-79 1983-84 1973-74 1978-79 1983-84
(0) (1) (2) (3) (4) (5) (6)
1. agriculture 3.94 4.35 4.30 3.34 4.00 4.022. mining and manufacturing 7.10 7.29 7.20 6.54 7.43 7.35
(a) mining 12.58 8.77 6.51 11.44 8.70 €.38(b) manufacturing 6.92 7.23 7.32 6.17 7.32 7.43
0) food products 4.63 5.21 6.06 3.73 5.27 6.21
(ii) textile 3.45 6.01 6.85 3.21 6.04 6.79
(iii) wood and paper products 6.75 7.89 8.56 4.90 7.73 8.92
(iv) leather and rubber products 5.50 7.76 7.97 2.47 7.55 7.85
(v) chemical products 10.84 9.16 7.18 10.46 9.13 8.02
(vi) coal and petroleum products
i7.63 6.24 7.20 7.90 5.96 7.91
(vii) non-metal mineral products 7.40 8.26 7.51 7.33 8.10 7.40
(viii) basic metals 14.12 6.42 7.71 13.40 6.03 7.87
(ix) metal products 5.60 8.35 5.68 4.64 7.97 5.63
(x) non-electricalengineering products 8.40 9.37 7.88 7.99 8.30 8.56
(xi). electrical engineering products 7.64 9.46 9.45 6.42 9.36 9.32
(xii) transport equipment 3.73 8.95 7.94 3.12 9.06 7.98
(xiii) instruments 5.39 9.87 8.82 4.45 9.73 8.75
(xiv) miscellaneousindustries 6.75 7.09 7.72 4.42 6.84 7.48
3. electricty 10.12 9.38 8.62 8.15 9.71 7.86
4. construction 5.90 8.28 7.27 5.18 8.28 7.11
5. transport 4.79 6.38 6.68 4.70 5.33 6.39
6. services 4.88 6.82 7.72 4.80 6.77 7.70
7. total 4.37 5.65 6.00
16

2.29. The composition of Gross Domestic Product at factor cost undergoes a change in the perspective period. The agricultural sector shows a higher growth rate : but its share goes down from 50.78 per cent in 1973-74 to 48.15 per cent in 1978-79, 44.40 per cent in 1983-84 and 40.25 per cent in 1988-89. (Table 6). The share of the mining and manufacturing sectors goes up from 15‘78 per cent in 1973-74 to 17.49 per cent in 1978-79, 19.01 per cent in 1983-84 and 20.25 per cent in 1988-89.
Table 6. Sectoral Composition of Gross Domestic Product: 1973-74, 1978-79,1983-84 and 1988-89
(per cent)sectors 1973-74 1978-79 1983-84 1988-89
(0) (1) (2) (3) (4)
1. agriculture 50.78 48.15 44.40 40.25
2. mining and manufacturing 15.78 17 49 19.01 20.25
(a) mining 0.99 1.37 1.58 1.61
(b) manufacturing 14.79 16.11 17.43 18.64
(i) food products 2.13 2.07 2.03 2.05
(ii) textiles 3.50 3.31 3.38 3.50
(iii) wood and paper products 0.58 0.59 0.66 0.75
(iv) leather and rubber products 0.16 0.15 0.16 0.18
(v) chemical products 1.84 2.44 2.87 3.15
(vi) coal and petroleum products 0.23 0.27 0.28 0.30
(vii) non-metallic mineral products 1.58 1.82 2.04 2.18
(viii) basic metals 1.09 1.65 1.68 1.84
(ix) metal products 1.06 1.09 1.22 1.20
(x) non-electrical engineering products 0.61 0.73 0.82 0.93
(xi) electrical engineering products 0.60 0.67 0.79 0.92
(xii) transport equipment 0.96 0.90 1.06 1.16
(xiii) instruments 0.03 0.03 0.04 0.04
(xiv) miscellaneous industries 0.38 0.38 0.40 0.43
3. electricity 0.79 0.94 1.13 1.244. construction 4.06 4.21 4.77 5.02
5. transport 3.43 3.48 3.43 3.49
6. services 25.16 25.73 27.26 29.75
7. total 100.00 100.00 100.00 100.00
17

2.30. The average propensities to save and invest show constancy if the period from 1961-62 to 1973-74 as a whole is considered. The expansion of public investment in the Annual Plans of 1975-76 and 1976-77 led to a step-up in gross capital formation. At 1974-75 prices, the percentage of Gross Investment to GNP is estimated at 18.9 per cent in 1 988-89. Growth projections for the Sixth Plan period and beyond are based on careful assessment of past trends and future possibilities. However, they should not be interpreted as the upper limit of what the economy can achieve. It is eminently desirable that the economy should achieve higher rates of growth than postulated here. Improvement on the growth profile is feasible only if the investment level in the year 1988-89 is higher than what is indicated here. To be consistent with the objectives of removal of poverty, additional investment has to be sustained by greater efforts at resource mobilisation from the more affluent sections of the society,
Exports and Im ports
2.31. The growth of exports has been 7 per cent per annum in the period 1960-61 to 1973-74. Manufactured exports increased by 12.8 per cent per annum in the same period and the share of manufactured items increased from47.5 per cent to 59.2 per cent. This increase was mainly on account of rise in exports of new manufactures and non-traditional goods. This period also witnessed market-wise shift to EEC, OPEC and Socialist countries. However, India's share in total world exports declined as value of world trade grsw at the raje of 12.2 per cent per annum as against value of India's trade at 8 per cent.
2.32. Since 1960-61 import substitution has been significant in the area of industrial machinery, paper, chemicals, iron and steel and non-ferrous metals. The share of imported machinery and equipment in the country's gross (fixed) capital formation declined sharply from 43.4 per cent in 1 960-61 to 25-3 per cent in 1965-66 and 9 6 per cent 1973-74, reflecting increased self-reliance. During the Fourth Plan, the increase in the value of total imports was due to substantial increase in unit values of commodities like wheat, fertilisers, non- ferrous metals and POL products.
2.33. The perspective for India's balance of payment is to pursue policies for the achievement of the objective of self-reliance. In the areas of food, fertilisers and POL, imports are sought to be reduced by pursuing a policy of rapid import substitution through planned investments. The momentum in the growth of exports w ill have to be sustained by exploiting both supply and demand elasticities for export of products of manufacturing sector such as steel, industrial machinery, metal based products, ready-made garments, leather manufactures, marine products, electronics and transport equipment. In exports of natural resources such as iron ore, mica and bauxite, the emphasis would have to be on product-mix-with higher value added component, implying expansion of capacity
18

2.34. It is hoped that markets where India enjoys distinct locational advantage would be tapped. These markets should also open up the possibilities of fiXDort of services in the areas of construction, consultancy and joint ventures.
2.35. As regards imports, it should be possible to reduce the dependence o n th e rest of the world for import of critical wage goods in the Sixth Plan period. As regards machinery, equipment and other industrial imports, the s tra te g y envisaged in perspective calls for careful implementation of a policy of selective import substitution. The constraints of non-renewable resources will have to be kept in mind.
The E m ploym ent Perspective and Standards o f Living
2.36. The problem of employment is a matter of vital concern to the planners and policy makers. Given the structural characteristics of the economy, quantification of the relevant magnitudes presents some serious conceptual and statistical problems. The Expert Committee on Unemployment Estimates had suggested that a multidimensional approach be adopted in this regard. The 27th Round of National Sample Survey was devoted to collecting data based on the recommendations of the Committee. So far, results are available for the first two sub-rounds. Using the concept of Current Activity Status and defining unemployment rates through the disposition of labour time, it is possible to arrive at certain qualitative considerations regarding the problem in the rural areas. The data clearly indicates an urgent need for substantial efforts at generation of employment in the rural areas. However, the real problem is seen in a better perspective if it is realised that a part of the urban unemployment problem also arises from a spill over from the rural areas. In addition, regional unevenness in the character of the problem comes out in sharp focus.
2.37. Growth in employment in the organised sector is estimated at around 3 per cent per annum in the Fourth Plan period. In spite of the conceptual d ifficulties involved, inter-censal comparisons as well as the results of the different rounds of the National Sample Survey suggest that magnitude of employment in the household manufacturing sector including cottage industries has not increased to the required size. In a period of low agricultural growth (1961-62 to 1973- 74), the rates of growth of gross value added at 1960-61 prices, of important household manufacturing industries were low, e.g. food, drink and tobacco (1.83 per cent compound per annum), textile tailoring, leather footwear (2.09 per cent), leather and leather products (1.62 per cent). However, these are compensated to an extent by higher rates of growth (between 3 to 6 per cent) in the chemical and engineering sectors.
2.38. For the purpose of evolving an appropriate policy, it is necessary to identify factors influencing the levels of rural employment on a regional basis.
for pelletisation, production of alumina, fabrication of mica, etc.
19

Studies have been carried out by the Planning Commission using the concept of an NSS region. The relationship of employment per rupee of output with factors such as output per hectare, use of fertilizer per hectare, tractorisation, irrigation, levels of investment and level of inequality of operational land holdings, has been investigated. Employment per rupee of output and per hectare of land depends on variables relating to irrigation such as the number of pump sets installed per hectare of land. Such employment rates are seen to be associated with a higher percentage of land operated in farms equal to or less than 5 acres (2 hectares). It was decided to further investigate this relationship separately for the developed commercialised agricultural regions and the rest. The results were broadly similar to those obtained for the country as a whole. However, fertilizer applications per hectare, a surrogate for the extension of the new technology in agriculture, were also shown to be positively related with employment variables in the commercial regions.
2.39. From the point of view of devising an appropriate strategy and employment policy, there are three inter-related aspects, which need to be borne in mind. The first emphasises the need for implementing a programme using the strategic foci employed in the Plan such as irrigation, agricultural extension involving the use of high yielding varieties etc; the second relates to the fact that aspects of rural employment generation should be inter-woven with a local development strategy; and the third, the most important aspect relates to the creation of a secure rural tenantry and a productive small farmer base by means of tenancy reform.
2.40. The methodology outlined above has several operational implications : Firstly, it means ensuring the availability of critical inputs and their effective utilisation; the Plan has taken care of this aspect in its production and investment planning side. Secondly, employment planning through agriculture has to be area specific in character and, therefore, requires a multi-level approach. Given the soil and agronomic conditions in each area, the availability o f irrigation facilities, both through surface water as well as ground water possibilities, have to be estimated in detail. In the light of past experience, the features of crop specialisation in the area and the demand profile indicated in the Plan, cropping patterns for each sub-region w ill have to be worked out. Realistic assessments have to be made of the possibilities of the extension work with respect to the new varieties, both for areas under irrigated conditions and under assured rainfall conditions and to the extent possible, for dry areas. The production potential for each region has, therefore, to be carefully estimated and the requisite organisational and input support ensured. Care has to be taken to ensure that inconsistencies do not develop. Admittedly, these are difficult tasks. No serious and-worthwhile employment planning can be done without a reasonable assurance that these tasks will be performed.
2.41. The importance of area planning is also highlighted by studies which have shown that certain resource inelasticities which are binding at the national20

level, do not operate with the same level of severity at the local level. Consequently, the available resources, physical as well as human, are subject to augmentation and more efficient utilisation if local knowledge can be used along with popular participation and planning initiative. All this requires the strengthening of the planning machinery, both at the State and local levels ; equally, important would be its harmonisation with national planning.
2.42. As a part of successful local planning, it is important that priorities for land reforms in the 20 Point Programme are observed and the measures implemented. Grant of proprietory rights or ensuring security of tenurial arrangements to the small farmers and share croppers together with production support through agricultural and, more particularly, through special programmes, such as the SFDA and the MFAL programme, is of great importance. Agricultural planning carried out on the basis of a comprehensive area approach is likely to prove effective in generating additional employment through ancillary activities involving animal husbandry, better utilisation of conventional waste materials etc.
2.43. The labour supply projections contained in the Draft Fifth Five Year Plan imply an increase in the labour force for the agricultural sector of 16.2 million in the Fifth Plan period and 18.9 million in the Sixth Plan period. The rates of labour force participation thrown up by the 27th round of National Sample Survey, would be higher because of inclusion of children in the age group 5-14 years and also because of difference in the concepts used in the survey. However, the increase in the labour force estimated according to NSS concepts would be about18.26 to 18.96 million in the Fifth Plan period and 19.57 to 20.39 million in the Sixth Plan period. There is an area of uncertainty in the labour supply projections in an economy of the Indian type. With successful achievement of the targets and policies indicated above, increments to the labour force can be absorbed in the Fifth Plan period and a substantial effort can be made at handling the problem of the backlog of the unemployed in the Sixth Plan period.
2.44. The relationship between employment and output in the registered manufacturing sector has been investigated for 20 groups of industries. Capacity utilisation variables have also been included in this analysis. With the emphasis on public investment and on the aggregate investment, as contemplated in the perspective being achieved, the rate of growth of manufacturing employment in the registered manufacturing sector in the Fifth Plan period is expected to be significantly higher than that recorded in the Fourth Plan period. In perspective the trend should accelerate. Substantial employment opportunities can also be generated if the targets in the sectors of mining, quarrying, construction industry, electricity, railways and other transport and other services are reached.
2.45. In the unregistered manufacturing sector, which consists substantially of the household sector, the employment trends of the past decade need to
21

be reversed. The Fiflh Five Year Plan provides for substantially higher outlays for projectised programmes in the cottage industry sector, particularly in areas such as handloom, coir, carpet weaving and training and for production planning programmes in other sectors. It is expected that the constraints on the use of agro-based supplies for the household sector w ill be less severe. Appropriate use of fiscal, credit and production support policies in this sector is essential for reinforcing capabilities for further generation of employment. Labour intensive technological improvements also need to be developed and diffused. According to the profile contained in the Draft Fifth Plan, the increase in the labour force in the non-agricultural sector is estimated at 8.5 million in the Fifth Plan period and 9.1 million in the Sixth Plan period. Achievement of production targets as postulated in perspective is extremely important in relation to creation of employment opportunities in the non-agricultural sector. Along with the achievement of production targets in perspective and successful implementation of the policies outlined above, specially in relation to the unregistered sector, increments to the labour force in the non-agricultural sector in the Fifth Plan period can be absorbed into productive employment in the Fifth Plan period. Thereafter, a serious effort w ill have to be made in the Sixth Plan to remove the backlog of unemployment.
2.46. The employment strategy suggested in long-term perspective emphasises stepping up rates of public investment in order to realise the output projections contained in the Plans, intensification and refinement of agricultural planning strategies, particularly in their local aspects, realisation of the objectives of land reforms in the 20 Point Programme, production support to small farmers and finally, regeneration of employment in the unregistered sector through an appropriate policy framework. Once the strategy for absorption of the available labour force in gainful activities is achieved, the qualitative aspects of the employment situation should change.
2.47. As regards the level of living, the methodology followed in the Draft Fifth Plan has been used for integrating consumption standards w ith the employment perspective outlined above. The commodity composition of output has been appropriately modified and inter-woven with the structure of output estimated in perspective.
22

CHAPTER III
RATE AND PATTERN OF GROWTH
In 1974-75, the first year of the Fifth Plan period. Gross Domestic Product grew only by 0.2 per cent over the previous year. There was a remarkable improvement in production in 1975-76 resulting in an estimated growth of above 6 per cent in GDP. During 1976-79 the economy is expected to grow at an annual compound rate of 5.2 per cent. With this annual growth profile, the average annual growth in GDP is estimated at 4.37 per cent in the Fifth Plan.
3.2. The realisation of the objectives of removal of poverty and self reliance in the Fifth Plan has to be viewed in the context of the sharp increase in the prices of imported products like fuel, fertilisers and food. The strategy has therefore to be directed towards accelerated pace of agricultural production, particularly foodgrains, exploitation and optimal use of available energy resources, and production and efficient distribution of critical raw materials and wage goods.
Sectora l Rates o f G ro w th
3.3. Mutually consistent sectoral output levels have been estimated by a system of macro-economic model, 66 sector input-output model and a consumption sub-model. Commoditywise production levels have been estimated by working out their supply demand balances through a series of material balance exercises and making them consistent with the sectoral growth rates obtained through input-output model. Some independent studies at the micro-level for specific commodities have also been carried out to cross-check production levels.
3.4. The input-output matrices for the year 1973-74, the base year of the Fifth Plan, as given in the "Technical Note on the Approach to the Fifth Plan" have been updated to 1974-75 prices to conform to commoditywise production levels for 1973-74 and estimates of macro-economic aggregates provided in the latest White Paper of the Central Statistical Organisation. The consumption proportion matrices have also been updated to 1974-75 prices taking into consideration the data on household consumer expenditure of the 25th Round (1970-71) of the National Sample Survey as well as the estimates of private final consump-

tion expenditure on different broad groups of commodities and services as available in the recent White Paper. For the purpose of projections for 1978-79, some of the input coefficients have been projected on technological and behavioural considerations.
3.5. Exports and government expenditure have been estimated exogenously. Public consumption has been assumed to grow on an average by 10.0 per cent per annum, while exports have been assumed to grow at a rate of 8.5 per cent. Private consumption and imports in the terminal year have been estimated endogenously. The envisaged investment outlay for the remaining years of the Fifth Plan has been appropriately phased out over this period.
3.6. Sectoral rates of growth consistent with the envisaged rate of growth in the gross domestic product over the Fifth Plan have been worked out for the terminal year, 1978-79, of the Fifth Plan through the system of models mentioned earlier. Import substitution has been envisaged in these projections fo r important sectors to the extent permitted by the production possibilities and. capacity utilisation in the domestic economy. The pattern of growth in terms o f broad sectors is given in Table 1 and for sixty-six sectors of the economy in Annexure 5. The growth rate in the agricultural and allied sector is estimated at 3.94 per cent. The growth rate of output of the mining sectors is estimated at 12.58 per cent per annum while coal production is expected to grow at a rate of 9.38 per cent and crude oil at 14.68 per cent. The manufacturing sector is expected to grow at a rate of 6.92 per cent. In this sector, fertiliser is expected to grow at22.26 per cent, cement at 7.19 per cent, and iron and steel at 11.31 per cent. Electricity generation is expected to grow at 10.12 per cent.
3.7. The composition of the gross domestic product in 1973-74 and 1978- 79, giving a measure of structural change, amongst some abroad groups o f sectors is also given in Table 1 and for 66 sectors in Annexure 5. As expected, the share of agriculture and allied sectors in total gross value added is expected to decline from 50.8 per cent in 1973-74 to 48.15 per cent in 1978-79 and the share of mining and manufacturing as well as other secondary and tertiary sectors is expected to increase.
24

Table 1. Projected Sectoral Rate of Growth in Gross Value of Output and Gross Value Added at Factor Cost for the Fifth Plan and Sectoral Composition of GVA in 1973-74 and 1978-79
average annual rate of growth (%)
composition of GVA at 1974-75 prices
sector 1978-79 over 1973-74
value of output
valueadded
1973-74 1978-79
(0) (1) (2) (3) (4)
1. agriculture 3.94 3.34 50.78 48.15
2. mining and manufacturing 7.10 6.54 15.78 17.49
(a) mining 12.58 11.44 0.99 1.37
(b) manufacturing 6.92 6.17 14.79 16.11
(0 food products 4.63 3.73 2.13 2.07
(ii) textiles 3.45 3.21 3.50 3.31
(iii) wood and paper products 6.75 4.90 0.58 0.59
(iv) leather and rubber products 5.50 2.47 0.16 0.15
(v) chemical products 10.84 10.46 1.84 2.44
(vi) coal and petroleum products 7.63 7.90 0.23 0.27
(vii) non-metallic mineral products 7.40 7.33 1.58 1.82
(viii) basic metals 14.12 13.40 1.09 1.65
(ix) metal products 5.60 4.64 1.08 1.09
(x) non-electrical engineering products 8.40 7.99 0.61 0.73
(xi) electrical engineering products 7.64 6.42 0.60 0.67
(xii) transport equipment 3.73 3.12 0.96 0.90
(xiii) instruments 5.39 4.45 0.03 0.03
(xiv) miscellaneous industries 6.75 4.42 0.38 0.38
3. electricity 10.12 8.15 0.79 0.94
4. construction 5.90 5.18 4.06 4.21
5. transport 4.79 4.70 3.43 3.48
6. services 4.88 4.80 25.16 25.73
7. total 4.37 100.00 100.00
25

3.8. The projected sectoral rates of growth have been translated into physical targets using a detailed system of materia) balances. For items like coal, crude oil, iron ore and cement, which form independents ectors in the input-output model, the targets have been derived directly from the sectoral growth rates. The targets of some specific commodities have also been cross checked by independent micro-level studies as well as by detailed studies about the completion of projects. The estimated physical outputs of some important items in 1978-79 are presented in Table 2. More detailed estimates for 1978-79 are presented in Annexure 6. The rationale behind the estimated physical output levels for some of the important items is discussed below. In many of the sectors, output targets in 1978*79 are below the levels postulated in the Draft Fifth Plan. This is due to two factors. The base output in 1973-74 actually achieved is in most cases below the levels postulated in the Draft Fifth Plan. Growth of output in 1974-75 was low although there was a significant improvement in 1975-76. Thus, corrections had to be applied to provide for the changes in the base level and the experience in the first two years of the Fifth Plan taken into consideration in the setting of the revised targets.
Table 2. Projections of Physical Output Levels in 1978-79
item unit 1973-74 1978-79
(0) (1) (2) (3)
1. food grains m.t. 1047 125
2. coal m.t. 790 124 0
3. iron ore m.t. 357 5 60
4. crude petroleum m.t. 7 2 14-18
5. cotton cloth (a) m ill sector m. metre 4083 4800(b) decentralised sector m. metre 3863 4700
6. paper and paper board th.t. 776 1050
7. newsprint th.t. 487 8 0 08. petroleum products (including
lubricants) m.t. 19-7 2 7 09. nitrogenous fertilisers (N) th.t. 1058 2900
10. phosphatic fertilisers (P* Os ) th.t. 319 77011. cement m.t. 1467 2 0 812. mild steel m.t. 4-89 8 813. aluminium th.t. 1479 310014. copper it 127 3 7 015. zinc / / 20-8 80-016. electricity generation G.W.H. 72 116-11717. originating traffic in railways m.t. 260
26

3.9. Detailed planning exercises have been carried out for the agricultural sector. Growth of Gross Cropped Areas is forecast on the basis of the relationship between such areas and increase in irrigated area in the past and the postulated increase in aTea under irrigation. Project level exercises have been conducted for allocation of funds for major and medium irrigation to ensure early completion of on-going projects and for starting new projects in relation to needs in the Sixth Plan period. Funds have been provided for expansion in minor irrigation and strengthening of Ground Water Directorates in States where progress has been slow. Increase in HYV area and fertiliser demands have been carefully estimated. Production potential has been estimated on the basis of yield levels moderated for past experience in the field, in the case of HYV yields, irrigated and unirrigated yields. The production estimates have been cross-checked by the use of yardsticks.
3.10. With increased expectations from off-shore exploration, the indigenous production of crude petroleum is anticipated to be 14.18 million tonnes in 1978-79 as against the target of 12 million tonnes in the Draft Fifth Plan. Even with the restricted consumption of petroleum products the demand for crude oil is placed at 29.0'million tonnes in 1978-79 which would necessitate the imports of around 15.0 million tonnes. The production of petroleum products in 1978-79 is anticipated to be 27 million tonnes as against the target of 34.6 million tonnes in the Draft Plan. On account of the sharp rise in oil prices, deliberate steps have been taken to contain the growth in demand for oil products and to fully exploit alternative sources of energy to replace petroleum products. However, adequate provisions, both of naphtha and fuel oil, have been made for the essential needs of economy e.g. manufacture of nitrogenous fertilisers. Similarly, in view of the importance of road transport in the predominantly rural economy of the country, a substantial increase is assumed in the demand for high speed diesel oil. Reasonably high level of demand has also been assumed in the case of LDO because of its important role in the agricultural development programme. In the light of these considerations, it is estimated that consumption of petroleum products would not exceed a level of 28.5 million tonnes in 1978-79. Thus the level of imports of petroleum products in 1978-79 would be about 1.5 million tonnes.
3.11. The exercises based on demand analysis in the power sector indicate that power generation would have to be increased from 76.6 billion kwhrs in1974-75 to 118 billion kwhrs gross in 1978-79. These estimates are based on the expected demand in that year from industries and other sectors. The present indication is that an installed capacity of about 30 million kw w ill be in operation by the end of 1978-79 and the availability of energy is likely to be in the range of 116-117 billion kwhrs. This highlights the need to shorten the construction periods of projects, to transfer power from surplus regions to deficit regions, to improve the efficiency of the power systems (such as. reduction of transmission and distribution losses), and to increase utilisation of available capacity to meet the expected growth in demand for power.
27

3.12. The target of production of coal at 124 million tonnes has been arrived at on the basis of revised estimates of demand for coal. The demand has been analysed on the basis of observed trends in consumption pattern in 1974- 75 and the revised estimate of growth in major coal consuming sectors like steel plants, power plants, railways, major industries, domestic sector etc.
3.13. Steel production in 1978-79 is estimated at 8.8 million tonnes as against a domestic demand of 7.75 million tonnes. Due to the large variety of steel products consumed in the country, it may not be possible to match indigenous product-mix with demand for all sizes and sections of steel products. This would necessitate the import of a few sizes of certain steel products. Such imports are not likely to exceed 0.4 million tonnes in 1978-79. The exportable surplus of steel in 1978-79 is accordingly estimated at about 1.5 million tonnes.
3.14. Demand estimates of non-ferrous metals have been obtained by preparing detailed material balances and cross checking them through input-output model. Supplies are based, on expected capacity levels checked by project level analysis.
3.15. For projecting fertiliser demand, a careful attempt has been made to isolate the expansion that would be necessitated on account of increased emphasis on irrigation facilities and on the spread of new technology, particularly to new areas. Studies made indicate that fertiliser use is highly sensitive to the availability of irrigation facilities, as also to spread of new technology. These shift factors have been taken into account, as also a moderate increase in dosages, under each category of land. Such analysis has beep conducted crop by crop and total fertilizer requirements estimated. These requirements in terms of nutrients for 1978-79 work out to 4.80 million tonnes of NPK, 3.40 million tonnes of N, 0.87 million tonnes of P20 fi and 0.53 million tonnes of KaO. A plant- wise production profile indicates that about 2.9 million tonnes of nitrogen may be produced by 1978-79. The output of P20 s is estimated at 770,000 tonnes. The gap to be met by imports w ill be 1.13 million tonnes—0.50 million tonnes of N, 0.10 million tonnes of P?Os ond 0.53 million tonnes of K20.
3.16. The domestic demand for cement in the terminal year of the Fifth Five Year Plan as worked out by the commodity balance method, taking into account the gross fixed investment in the major economic sectors such as agriculture, power, industry, transport and social services comes to 19.3 million tonnes. Including the export demand as now estimated at 1.5 million tonnes, the total demand for cement goes up to 20.8 million tonnes for 1978-79. These estimates have been cross checked by time series analysis.
3.17. Output of machinery for production of cement, paper and paper board, sugar and rubber products depends on the fresh capacities for the respective commodities to be created by 1978-79 and in the earlier part of Sixth Plan period. Provision has beeen made for the modernisation and replacement needs
28

of the existing plants. In case of certain types of machinery significant exports are possible by 1978-79 and these have been provided for in the machinery output projections. Production levels of other machinery items take into account investment plans, growth of user industries, replacement needs and exports.
3.18. The production of cotton textiles in the organised mill sector is estimated at 4800 million metres in 1978-79 while the production in the decentralised sector is expected to reach 4700 million metres. Shares between cotton and manmade fabrics have been estimated by studies of international cross-sections of consumption of different fibres in relation to income growth. Aggregate demand for textiles has been estimated by using expenditure elasticities and estimated growth in per capita private consumption derived from the macro- economic balance. Increase in share of decentralised sector is expected during the Fifth Plao period and beyond in view of the importance attached to the hand- looms sector and also the relatively faster increase in spinning capacity provided for in the organised sector. With these assumptions, the domestic demand for cotton textfles and manmade fibre fabrics has been estimated. The export demand of cotton textiles has also been taken into consideration and the total demand thus derived for the year 1978-75^ is in agreement with the estimated output levels.
3.19. Estimates of railway freight traffic in 1978-79 comprise of the share of rail transport in the movement of coal, raw materials to and finished products from steel plants, exports of iron ore and traffic on account of movement of other major commodities such as foodgrains, fertilizers, POL, cement and railway materials. The proportion of movement of such commodities by rail is estimated on the basis of the trends observed in the past also. The Railways are expected to carry this traffic (260 mt) on the assumption that there would be improvement in operation.
29

CHAPTER IV
FINANCIAL RESOURCES
1. Financing o f the Public Sector Plan
The resources for the Fifth Plan have been re-assessed in consultation with the Ministry of Finance, State Governments and Union Territory Administrations. For the public sector, these are estimated at Rs. 19396 crores for the first three years of the Plan and at Rs. 19907 crores for the next two years, making a total of Rs. 39303 crores for the five-year period. The estimates for 1974-75 are at current prices while those for the subsequent years are at 1975-76 prices. The total for five-years would undergo a slight change if the resources for 1974-75 were also re-computed in terms of 1975-76 prices.
4.2. The above estimates do not take into account the provision for inventories and the internal resources of public financial institutions utilised for their own investment in fixed assets, as it was decided, subsequent to the formulation of the Draft Fifth Plan, to keep outside the Plan inventory changes and investment of public financial institutions in their own fixed assets. Additions to inventories in the Public Sector during the Fifth Plan period are now estimated at around Rs. 3000 crores. Taking this into account, the total development outlay in the public sector would work out to about Rs. 42300 crores. In money terms, this shows an increase of Rs. 5050 crores over the estimate in the Draft Fifth Plan. If adjustment is also made for internal resources of public financial institutions utilised for their own investment in fixed assets, the increase w ill be approximately Rs. 5150 crores. The estimate in the Draft Plan was, however, tn terms of 1972-73 prices. If allowance is made for the rise in prices since then, Jthe resources in real ternjs would be lower than anticipated earlier.
4.3. In view of the paramount need to promote growth with stability, the Plan has to be financed in a non-inflationary manner. This w ill call for strict fiscfil descipline, further improvement in the performance of public enterprises, additional resource mobilisation and restraint on consumption, especially of the more affluent sections of the community. Monetary policy w ill have to be synchronised with fiscal policy in order to check undge expansion of the aggre-

gate monetary demand. It is becoming more and more clear that alongside planning of investment outlays, there has to be concurrent planning of credit, so that it is more purposefully regulated and kept within strict limits consistent with the requirements of increasing production. At the same time, it w ill be necessary to realise fu lly the production targets indicated in the Plan; this is of crucial importance from the point of view of resource generation as well as maintaining conditions of price stability. Public distribution system w ill have to be enlarged and strengthened and it would be necessary to bring in a comprehsnsive system for stabilising the prices of essential commodities and eliminating short-term and speculative price fluctuations. With substantial food-stocks and foreign exchange reserves, the Government is now in a much better position to deal effectively w ith any possible adverse development in relation to the price situation, but strict vigilance and monitoring of economic trends and development would be neccessary so that prompt remedial measures are taken when necessary.
4.4. The detailed scheme of financing the Fifth Plan in the public sector in set out in the Table on next page. Seperate estimates for the Centre and the States are given in Annexures 7 and 8.
4.5. It w ill be seen that domestic budgetary resources are expected to provide Rs. 32,115 crores, or 81.7 per cent of the total resources required for financing the Plan. External assistance would account for Rs. 5834 crores, or 14.9 per cent of the Plan outlay. However, in view of the sharp rise in import prices of investment and intermediate goods, the effective contribution of external assistance in sustaining investment in real terms has been lower than would appear from this calculation. The balance of the Plan outlay amounting to 3.4 per cent of the total would be met through deficit financing. Brief comments on individual items of financing are given below.
Balance fro m C urrent Revenues
4.6. At 1973-74 rates of taxation, the balance for the Plan from the current revenues of the Central and State Governments in the first three years is estimated at Rs. 3338 crores. This is much below the original expectation, due mainly to revision of emoluments of Government employees, school teachers and employees of local bodies following the steep rise in prices, higher cost of materials, larger food and export subsidies and increased burden of debt service. The tax and non-tax revenues o f the Central and State Governments have also been more buoyant, but this could offset only part of the increase in the non-Plan expenditure.
4.7. For the next two years, the balance from current revenues at 1973-74 rates of taxation is estimated at Rs. 1563 crores. This takes into account the normal growth of tax and non-tax revenue as a result of the anticipated growth of production and incomes and allows for only minimum increases in non-Plan expenditure. Provision for food subsidy has been made at the existing rates
31

in view of the imperative need to stabilise the prices of essential commodities.
Estimates of Financial Resources for the Fifth Plan(Rs. crores)
draftFifthPlan
first 3 years, 1974-77
next 2 years, 1977-79
revised Fifth Plan,
1974-79
(°) (1) (2) (3) (4)
1. domestic budgetary resources 1. balance from current revenues
33807 15208 16907 32115
at 1973-74 rates of taxation 2. gross surplus of public
enterprises at 1973-74 fares.
7348 3338 1563 4901
freights and tariffs 5988 624 225 849(a) railways 649 (—)1005 (—)813 ( —)1818(b) posts and telegraphs 842 181 199 380(c) others 4497 3. market borrowings of Government,
public enterprises and local
1448 839 2287
bodies 7232 3030 2849 68794. small savings 1850 1092 930 20225. state provident funds6. term-loans from financial
1280 1050 937 1987
institutions (net) 895 340 288 6287. commercial credit from banks8. Internal resources of public
financial institutions for own
1185 l l l
investment in fixed assets 9. miscellaneous capital
90 ) l l
receipts [net] 1089 (—)556 1112 55610. additional resource mobilisation 6850 6290 8403 14693
(a) centre 4300 3773 4721 8494(i) 1974-77 measures ' — 3773 3821 7594
(ii) 1977-79 measures — — 900 900(b) states 2550 2517 3682 6199
( ij 1974-77 measures — 2517 2981 £498(ii) 1977-79 measures
11. borrowings against utilisation-- 701* 701*
of foreign exchange reserves II. External assistance (net)
(a) other than oil and special 1 credits J
(b) oil and special credits
2526
600 600
2443908
2400 5834
III. deficit financing 1000 754 600 1354IV. aggregate resources 37250 19396 19907 39303
i Subsequent to the formulation of the Draft Fifth Plan, it was decided to keep these resources as well as the outlays corresponding to them outside the Plan.
* Includes some amount to be raised through better collection of taxes and other Government dues and economies in non-plan expenditure.
32

4.8. On the basis indicated above, the total of the’ balances from current revenues for the Fifth Plan at 1973-74 rates of taxation comes to Rs. 4901 crores as against the original estimate of Rs. 7348 crores. The Central and State Governments and their enterprises have, however, undertaken additional resource mobilisation far in excess of the target in the Draft Fifth Plan. Credit for this has been taken separately.
C o n tr ib u tio n o f Railways
4.9. Based on fares and freight in 1 973-74, the contribution of railways towards the financing of the development programme in the first three years of the Fifth Plan is estimated at Rs. (-) 1005 crores. The sharp deterioration in the contribution as compared to the original anticipation is attributable in a fair measure to slow growth of traffic, increase in working expenses due to revision of emoluments of railway employees and rise in the prices of fuel, stores, etc. and higher interest payments.
4.10. Taking into account the increase in freight traffic, which is expected to rise from an estimated 230 million tonnes in 1 976-77 to about 260 million tonnes in 1978-79 and allowing for further improvement in operational efficiency, the contribution of railways to the Plan is the next two years on the basis of fares and freight in 1973-74 has been taken at (-) Rs. 8 13 crores. On this basis, the total for the Fifth Plan works out to (-) Rs. 181 8 crores. However, the measures taken by the Railways in the first 3 years are expected to yield Rs. 2393 crores over the Fifth Plan period. Thus, at the existing fares and freight the total contribution of railways to the Plan is estimated at Rs. 575 crores. Credit for the yield from the revision of railway fares and freight has been taken separately under additional resource mobilisation.
C o n tr ibu tio n o f Posts and Telegraphs
4.11. The contribution of posts and telegraphs at 1973-74 rates of postal and telecommunication charges is estimated at Rs. 181 crores for the first three years. This too reflects the impact of revision of emoluments of postal employees and increased cost of materials purchased by Posts and Telegraphs. For the next two years, such contribution is estimated at Rs. 199 crores, so that the total for the Fifth Plan works out to Rs, 380 crores. If account is also taken of the additional revenue raised by the Posts and Telegraphes through revision of postal and telecommunication rates so far, the aggregate contribution to the Plan would work ju t to Rs. 1114 crores.
C o n tr ibu tio n o f o th e r Public enterprises
4.12. The contribution of non-departmental enterprises of the Central Government is estimated at Rs. 1615 crores for t'he first three years. There has been a marked improvement in their performance due to better capacity utilisation
33

and improved operational efficiency. Assuming that this trend w ill continue, their contibution for the next two years, on the basis of the existing pricing policies, has been taken at Rs. 1375 crores. The total for the Fifth Plan thus comes to Rs. 2990 crores.
4.13. The contribution of State Government enterprises, mainly State Electricity Boards and Road Transport Corporations, is estimated, at 1973-74 tariffs and rates, at (-) Rs. 167 crores for the first three years. Taking into account the anticipated generation and sale of power and the growth of road traffic, such contribution for the next two years has been taken at (-) Rs. 536 crores, making a total of (-) Rs. 703 crores for the Fifth Plan period as a whole. The deterioration in the contribution as compared to the estimates in the Draft Fifth Plan is due mainly to sharp increase in establishment costs and higher prices of fuels, spares and other materials. These enterprises have, however, gone in for further resource mobilisation which is expected to yield Rs. 2364 crores over the Fifth Plan period. Credit for this amount has been taken under additional resource mobilisation.
M arke t B orrow ings
4.14. Net market borrowings by the Central and State Governments, State entreprises and local bodies during the first three years of the Plan are estimated at Rs. 3030 crores. Taking into account the likely further growth of bank deposits and the investible resources of the Life Insurance Corporation and Employees Provident Fund, such borrowings for the next two years have been taken at Rs. 2849 crores. This assumes investment of a higher proportion of the net accretion to bank deposits in Government and other approved securities, since the additional requirement of bank credit fo r food stocks in these years is not expected to be of a large order. However, while meeting the genuine requirements of the commercial sector, it w ill be necessary, as already mentioned, to observe strict disipline and restraint in the matter of credit expansion. Any excess liquidity in the banking system w ill have to be frozen through a flexible and timely use of monetary policy. Similarly, any return flow of bank funds from the Food Corporation w ill have to be dealt with as part of the overall problem of monetary management. In no case, can it be allowed to lead to any expansion of bank credit for nonpriority or inessential purposes.
Small Savings
4.15. Net collections of small savings in the first three years of the Plan are estimated at Rs. 1092 crores. Taking into account recent trends and other relevent factors, the estimate for the next two years has been taken at Rs. 930 crores; this w ill call for concerted efforts to increase small savings.
34

S ta te P rovident Funds
4.16. Net receipts from State provident funds in the first three years of the Plan are estimated at Rs. 1050 crores. For the next two years, these have been taken at Rs. 937 crores, inclusive o f the credit on account of the payment into provident funds of the first instalment of the DA being impounded in the current year under the extended scheme of compulsory savings, together w ith interest thereon.
Term -loans fro m Financial In s titu tio n s
4.17. For the first three years, such loans are estimated at Rs. 340 crores. For the next two years, gross loans of the LIC to State Electricity Boards as also for water supply and sewerage schemes have been calculated by applying a growth rate of 10 per cent to the current year's allocations. The same procedure has been qdopted in the case of REC loans. LIC loans to State Governments for housing have been tentatively taken at the current year's level for each of next two years. The actual allocation wiJI be determined in consultation with the LIC as part of the Annual Plan exercise. Loans from the Reserve Bank for participation in the share capital of cooperatives are based on assessment of the States' requirements in this respect. The total gross loans for the next two years have been taken at Rs. 485 crores. After providing for repayments, the net loans come to Rs. 288 crores. On this basis, the total net loans in the Fifth Plan would amount to Rs. 628 crores.
M iscellaneous C apita l Receipts
4.18. These reflect the net result of receipts and disbursements under a number of budget heads. The major sources of receipts are loan recoveries from households, special deposits by the Employees' Provident Fund and other non- Government provident funds and net accretion to other deposits and funds, while the major disbursements are loans for non-Plan purposes and capital outlays outside the Plan, including outlay on State trading. The estimates for 19.76-77 also take into account special borrowing of Rs, 480 crores from the Reserve Bank against compulsory deposits.
4.19. It may be noted that loans and other assistance to the Rural Electrification Corporation are being .reckoned as non-Plan disbursement for the purpose of calculating net miscellaneous capital receipts. Since loans by this Corporation are treated as part of the States' Plan resources, assistance to it by the Centre has to be reckoned as non-Plan in order to avoid double counting.
4.20. For the first three years of the Plan, the miscellaneous items on capital account are expected to involve a net outgo of Rs. 556 crores, due mainly to large outlay on account of fertiliser transactions, substantial loans to public enterprises to meet their losses and budget support to the Rural Electrification Corporation and Food C o rp o ra tio n -*^ ^ ^ ^ ^
t g.dicacional fij . o* 35

4.21. Net miscellaneous capital receipts for the next two years are estimated at Rs. 1112 crores. These take into account anticipated receipts from compulsory deposits, special deposits of the Employees' Provident Fund and other non-Government provident funds, etc. and allow for necessary budget support to the Rural Electrification Corporation. The aggregate net miscellaneous capital receipts over the Fifth Plan period work out to Rs. 556 crores. This represents the net result of an inflow of Rs. 2222 crores at the Centre and outflow of Rs. 1666 crores in the States. The net outflow in the States is explained largely by loan repayments to the Centre. The same factor along with the anticipated receipts from compulsory deposits and special deposits of provident funds account for the large inflow at the Centre in spite of heavy non-Plan disbursements.
A dd itio n a l Resource M o b ilisa tion
4.22. The measures adopted by the Central and State Governments and their enterprises during the first three years (inclusive of some measures which are yet to be brought into force) are expected to yield more than Rs. 13,000 crores over the Fifth Plan period, which is only a little less than twice the level of Rs. 6850 crores indicated in the draft Plan (Annexure 9). The increase is shared by the Centre and the States.
4.23. The scheme of financing envisages further resource mobilisation of Rs. 900 crores (inclusive of States' share) by the Central Government and its enterprises over the next two years. Besides, the State Governments and their enterprises are expected to raise additional resources of Rs. 701 crores, inclusive of some amount which is expected to be raised through better collection of taxes and other Government dues and economies in non-Plan expenditure.
4.24. At the Centre, some reliance may have to be placed on indirect taxes. Such taxes may have to be used selectively for achieving certain policy objectives, e. g. curbing conspicuous consumption, promoting economic use of scarce resources and mopping up windfall profits in certain lines of activity. Rationalisation of the pricing policies of public enterprises would also be necessary in order to bring prices in better alignment with costs. Selective taxation 'of commodities and adjustments in product prices would involve only a sectional rise in prices and, given overall monetary restraint, there need be no significant impact on the general price level. In any case, the alternative to raising additional resources would be increased resort to deficit financing. This would inevitably lead to a general rise in prices and affect more seriously the vulnerable sections of the cemmunity. In a sense, therefore, there is hardly any choice in the matter of additional taxation and rationalisation of pricing policies of public enterprises.
4.25. Recently, a Committee has been set up to review the existing structure of indirect taxes—Central, State and Local, and to advise the Government on the measures to be taken in this field. The recommendations of the Committee should
36

help in rationalising and improving this structure in conformity with the normal canons of taxation.
4.26. In the case of States, there is need as well as scope for raising further resources from the agricultural sector. Large public investments have been made for the development of agriculture, but there has been no commensurate increase in the contribution of the agriculturists towards the financing of these investments. The incidence of land revenue is very low, the average rate being about Rs. 6 per acre. Besides, the system is not progressive. Mobilisation of voluntary savings from rural areas by financial institutions is also far from adequate. In view of the increase in agricultural production and incomes and guaranteed support prices for major agricultural products, it would seem reasonable to call upon the agricultural sector, particularly the affluent section of the rural community, to make a larger contribution towards the financing of the development effort. It is, therefore, necessary to take further measures to raise additional resources through agri-cultural taxation.
4.27. There is also need for revision of irrigation rates and electricity tariffs. The State Governments are incurring heavy losses on irrigation works. In 1976- 77, the loss on commercial irrigation is estimated at Rs. 235 crores. In certain States, receipts from irrigation are not sufficient even to cover working expenses, leave apart interest payments and depreciation provision. This, in effect, amounts to subsidising of farmers who benefit from the irrigation facilities provided by Government. It is the more affluent farmers who benefit more from the subsidy. It is, therefore, imperative to adopt suitable measures for reducing progressively the losses on irrigation works and ultimately eliminating these altogether.
4.28. A number of State Electricity Boards are also incurring substantial losses. In 1975-76, 15 State Electricity Boards incurred losses estimated at a total of Rs. 130 crores. In spite of further tarriff revision, 12 State Electricity Boards expect to incur an aggregate loss of Rs. 106 crores rn the current year. It is, therefore, necessary to adopt appropriate measures, including revision of electricity, tariffs for reducing these losses and achieving a reasonable rate of return on investment in power projects. The rates for rural electric supply also need to be reviewed in order to reduce or eliminate the subsidy wherever feasible.
4.29. In certain States, Road Transport Corporations are also incurring losses or making only a small profit. It is necessary to augment their revenues through suitable revision of fares. Besides, the other sources of revenue w ill have to be exploited more intensively and effectively.
B orrow ing Aga inst U tilisa tio n o f Foreign Exchange Reserves
4.30. The foreign exchange position is quite comfortable and the reserves have increased substantially. It would, therefore, seem desirable to draw down
37

these reserves by about Rs. 600 crores in the next two years in order to raise additional resources for the Plan. Accordingly, credit has been taken for an amount of Rs. 600 crores by way of borrowing from Reserve Bank during these years against drawing down of the foreign exchange reserves. The additional imports w ill have to be carefully planned so as to help in increasing investment capacities in core sectors and stabilising prices of essential commodities. The precise areas in which additional imports could be effected w ill have to be looked into continuously. However, the main accent of the policy should be on stabilising the prices of essential commodities. Even if sales of such imported commodities do not yield profits and involve subsidy in some cases, the utilisation of foreign exchange reserves w ill result in a net addition to real resources to sustain the Plan. The interests of domestic producers could be effectively taken care of by ensuring that the issue prices of imported commodities tend to be at par with those of domestic materials. This would avoid any artificial depression of prices and possible consequential dis-incentive to domestic producers.
4.31. The above strategy, it must be emphasised, is intended for normal years. Should there be any year of unfavourable crops, necessitating larger imports of foodgrains and raw materials, the import policy in respect of other commodities w ill have to be suitably modified.
External Assistance
4.32. Following the hike in oil prices and a sharp increase in the import prices of certain other important commodities lik'e-fertilisers and foodgrains, India's balance of payments came under heavy pressure during 1974-75, necessitating recoursoe to larger external assistance. The total net external assistance in that year, inclusive of oil credits (but excluding drawings on IMF and utilisation of the Oil Facility which are not reflected in Government budget) amounted to Rs. 758 crores. In the following year, net external assistance, inclusive of oil credits and special assistance from Iran, went up to Rs. 1389 crores. For the current year, the Budget Estimates place such assistance at Rs. 1287 crores. The total for the first three years thus comes to Rs. 3434 crores. For the next two years, it has been taken at Rs. 1200 crores a year, or a total of Rs. 2400 crores, on the basis of the balance of payments requirements. The total for the Fifth Plan period would work out to Rs. 5834 crores.
D e fic it F inancing *
4.33. Deficit financing has been reduced significantly from the beginning of the Fifth Plan period. In 1974-75, it amounted to Rs. 654 crores. A substantial part of this was, however, on account of payments for stocks in hand of
* Figures cf deficit financing indicated here relate to changes in Government indebtedness (both long-term and short-tetm) to the Reserve Bank of India.
38

imported food and fertilisers. As both these commodities were purchased abroad by drawing down foreign exchange reserves, the payments under reference had no impact on money supply. The remaining deficit was much lower than in the preceding years—Rs. 775 crores in 1973-74, Rs. 848 crores in 1972-73 and Rs. 710 crores in 1971-72. This helped materially in bringing the inflationary forces under control. In 1975-76, there was actually a surplus of Rs. 206 crores. This helped in further strengthening the price stability. The latest estimates for the current year indicate a deficit of Rs. 306 crores. On this basis/the total for the first three years comes to Rs. 754 crores.
4.34. The estimates for the next two years take credit for deficit financing of Rs. 300 crores a year. Given effective and efficient short-term and medium- term management of the economy along the lines indicated earlier, this order of deficit financing is not expected to generate any additional inflationary pressures. With sizeable buffer stocks of foodgrains and comfortable foreign exchange situation, the Government is now in much better position to maintain conditions of price stability, but the emerging economic situation w ill need to be continuously watched in order to take prompt corrective action when necessary.
Central Assistance
4.35. The Central assistance allocated to the States for the first three years adds up to Rs. 3131 crores. The normal Central assistance was kept at 1973-74 level for the first two years and increased by 10 per cent over that level for each State, except Sikkim, for 1976-77. Assistance to Sikkim is being given on the basis of-the assessment of its requirements. Besides, advance Plan assistance has been given to certain States for meeting the gap in their resources for funding the inescapaole requirements of Plan outlay in core sectors. Further, advance Plan assistance was given for accelerating the implementation of selected irrigation and power projects in 1975-76. Following the recommendations of the Sixth Finance Commission, advance Plan assistance is also being given for development works taken up by the States in connection with relief from natural calamities.
4.36. For the Fifth Plan period as a whole, the total Central assistance has been taken at Rs. 6000 crores. Of this, Rs. 450 crores is proposed to be allocated for hill and tribal areas and the NEC. Besides, it seems reasonable to keep apart some amount for providing extra assistance to the States in respect of State Plan scnemes financed with IDA/World Bank assistance. The State Governments have been pointing out that in the case of such schemes, the IDA/World Bank insist on incurring certain order of outlay within a specified period, thereby imposing an additional burden on State Budgets in the Plan period whereas the external assistance accrues to the Central budget. Taking the various factors into consideration, it was agreed last year to provide to the States for that year extra Central assistance amounting to 25 per cent of IDA/World Bank disbursements in respect of the State Plan projects assisted by them. In the rest of the
39

Plan period also, it would seem desirable to give extra Central assistance to the extent of 15-25 per cent of IDA/World Bank disbursements in respect of the State Plan projects assisted by them, depending on the resources position of the States concerned. On the whole, it seems sufficient to reserve an amount of Rs. 100 crores for this“purpose during the Fifth Plan period as a whole. The remaining amount of Rs. 5450 crores is proposed to be allocated among the States on the basis of up-dated calculations in terms of the. Gadgil formula.
4.37. It w ill be recalled that a lump sum allocation was made for Jammu and Kashmir, Assam and Nagaland under the Gadgil formula. Accordingly, it is proposed to make a lump sum allocation for the Fifth Plan period for these states and Himachal Pradesh, other North Eastern States and Sikkim which became States after the Gadgil formula was evolved. The balance of the Central assistance would be distributed among the remaining States on the basis of up-dated calculations in terms of the Gadgil formula. For this purpose, the CSO has made available comparable estimates of per capita income of the States during the three-year period 1 970-71 to 1972-73. Advance Plan assistance given to the States would be adjusted from the total entitlement worked out for them for the Plan period as a whole in order to arrive at the amount to be allocated for the next two years.
4.38. It may be recalled that 8 per cent of the Central assistance in the next two years is to be specifically earmarked against performance in Family Planning. Primarily, this w ill regulate the releases. There will be some saving due to some States not reaching the targets, which w ill get distributed amongst others. The amounts involved, however, would be small and are not expected to affect significantly the scheme of financing.
4.39. Central assistance is being given in the form of block grants and loans. It is proposed to continue the existing pattern of assistance, viz. 30 per cent grant and 70 per cent loan along with the liberalised patterns in force for hill States and hill and tribal areas.
2. Saving and Investm ent
4.40. The revised estimates for the Fifth Five Year Plan envisage a total investment of Rs. 63751 crores. As in the case of Plan outlay and resources, the estimates for 1974-75 are at prices prevailing in that year while those for the subsequent years are at 1975-76 prices. The investment is to be financed by domestic savings of Rs. 58320 crores and a net inflow of Rs. 5431 crores from the rest of the world Thus over 91 per cent of the total investment would be financed from domestic savings as compared to only 84 per cent estimated for the Fourth Plan.
40

4.41 The distribution of the investment between the public and the private sectors is as under:
Public Sector Rs. 36703* crores
Private Sector Rs. 27048 crores
Total Rs. 63751 crores
‘ Includes inventories.
4.42. As stated earlier, the total provision for Plan outlay in the Public Sector is Rs. 39303 crores. Of this Rs.5700 crores represent current development outlay While the balance of Rs. 33603 crores is for investment. Adding to this investment an estimated amount of Rs. 3000 crores for inventories, and Rs. 100 crores for investment of public financial institutions in their own fixed assets, the total Public Sector investment works out to Rs. 36703 crores. Thus, of the aggregate investment under the Fifth Plan about 58 per cent w ill be in the Public Sector and the rest of 42 per cent w ill be in the Private Sector.
Dom estic Savings
4.43. The broad details of the estimates of domestic savings by generating sectors are given in Annexure 10. The summary position is as under:
Domestic Savings by Generating Sectors
(Rs. crores)sector savings
(0) (1)
1. public sector 15028(a) central and state budgets 8536
(b) central and state non-deptt enterprises 6492
2. financial institutions 1263(a) Reserve Bank of India 841(b) others 422
3, private sector 42029
(a) private corporate non-fin. sector 5373
(b) cooperative non-credit instt. 175
(c) household sector 36481
4. tota l domestic savings 58320
41

Of the aggregate domestic savings of Rs. 58320 crores about 27 per cent amounting to Rs. 15994 crores w ill be contributed by the public sector comprising government administration, departmental and non-departmental undertakings, and public financial institutions. The balance of about 73 per cent is accounted for by the private sector comprising corporate enterprises, cooperatives and households. The average rate of domestic saving is estimated to rise from 14.4 per cent of GNP in 1973-74 at 1973-74 prices to 15.9 per cent in 1978-79 at 1975-76 prices. The marginal saving rate based on GNP and domestic savings estimates for 1973-74 converted to 1975-76 prices is estimated at 26 per cent.
4.44. The basic strategy of the Fifth Plan continues to aim at a higher rate of growth of saving in the Public Sector. Accordingly, public savings are projected to grow from 2.5 per cent of GNP in 1973-74 to 4.6 per cent of GNP in 1978-79. Correspondingly, the private savings, though considerably higher by over 40 per cent in nominal terms than the 1973-74 level, are estimated to decline as a proportion of GNP marginally from 11.9 percent in 1973-74 to 11.3 per cent in 1978-79. The details of the estimates of public and private disposable income and saving are given in Annexures 11 and 12. The estimates of savings by Sectors are shown below :
Domestic Savings by Sector of Origin 1973-74 and 1978-79
savings (rupees crores) per cent of GNP
sector at 1973-74 at 1975-76 1973-74 1978-79prices prices1973-74 1978-79
(0) (1) (2) (3) W
1. public sector 1423 4045 2.5 4.6
( i) government 772 2704 1.4 3.1
(ii) autonomous public enterprises 651 1341 1.1 1.5
2. private sector 6824 9868 11.3 11.3
(i) corporate 821 1268 1.4 1.4
(ii) cooperative 65 95 0.1 0.1
(iii) household 5938 8505 10.4 9.8
3. total 8247 13913 14.4 15.9
Governm ent Savings
4.45. Aggregate savings of the Government Administration sector ircluding departmental enterprises are estimated to improve from 1.4 to 3.1 per cent of GNP i.e. by 1.7 percentage points over the Fifth Plan period. In absolute terms
42

Government disposable income is estimated to rise from Rs. 6241 crores in 1 973-74 to Rs. 13297 crores in 1 978-79 while Government savings are estimated to grow from Rs. 772 crores to Rs. 2704 crores during this period.
A utonom ous Public Enterprises
4.46. Savings of the autonomous public enterprises comprise retained profits and depreciation provision of these enterprises. There has been considerable.expansion of public sector investment in such undertakings since the Second Five Year Plan. The return from these enterprises has been rising albeit gradually. It is necessary that these enterprises contribute to the domestic savings in magnitudes commensurate with the investment made. Considering all relevant factors the savings of these enterprises are projected to grow from Rs. 651 crores i.e. 1.1 per cent of GNP in 1 973-74 to Rs. 1341 crores i.e. 1.5 per cent of the GNP in 1978-79.
investm en t and Saving in the P rivate Sector
4.47. The resources available for Private Sector investment out of the savings of this sector are estimated at Rs. 27048 crores. The details of the estimates are as under :
amount (Rs. crores)
(0) (1)
1. own savings 42326
(i) corporate 5373
(ii) cooperative (non-credit) 175
(iii) households 36481
(iv) financial institutions 297
2. net transfers to other sectors 15278
(i) domestic sector 15086
(ii) rest of the world 192
3. tota l resourceavailable (1-2) 27048
43

Transfers from the Public Sector to the Private Sector for investment purposes would add to these resources. Provision for such transfers is included in the Plan outlay of the Public Sector.
Private Corporate Savings
4.48. Private corporate savings are estimated to grow from Rs. 821 crores in 1973-74 to Rs. 1 268 crores in 1978-79 i.e. at a compound rate of about 9 per cent per annum. The estimates of retained profits and depreciation have been made on the basis of anticipated increase in gross value added and growth of gross fixed investment in this sector.
4.49. About 37 per cent of the total private corporate savings would accrue through retained profits and the balance of about 63 per cent would emerge from the depreciation provision. The following table indicates the growth of private corporate savings from 1973-74 to 1978-79.
Saving (Rs. crores) 1973-74 1978-79
Percent of GNP 1973-74 1978-79
(0) (1) (2) (3) (4)
retained profits 337 467 0.6 0.5
depreciation 484 801 0.8 0.9
total 821 1268 1.4 1.4
Household Savings
4.50. The savings of the household sector comprise net increase in financial assets and direct investment in the creation of physical assets. The increase in the net savings of the households in the form of financial assets during the Fifth Plan is estimated at Rs. 18835 crores as shown below :

Iflcrease in Net Financial Assets of the Households during the Fifth Plan Period.
amount(Rs. crores)
(0) (1)
1. deposits 1.2213
(i) commercial banks 10438
(ii) cooperatives 1045
(iii) non-banking companies 680
{Iv) term financing institutions 30
(v) private corporate financial companies 20
2. currency 1216
3. life insurance corporation-life fund 2186
4. provident funds 5062
(i) employees provident fund 2522
(ii) state provident funds 1987
(iii) others 553
5. private corporate and coop, shares and debentures including units. 657
6. govt, obligations- small saving, debts, deposits and misc.i tems 3746
7. total increase in gross financial assets 25080
8. less increase in financial liabilities ( - ) 6245
9. net increase in financial assets 18835
The estimates of increase in the various constituents of gross financialassets and liabilities are based on the latest Reports, other available data and the observed trends in the past.
4.51. The direct investment of the households in physical assets has been estimated following the C.S.O. methodology of estimating gross capital formation under construction, machinery and equipment and changes in stocks, and deducting therefrom the savings of the various sectors-Public, Corporate, Cooperative, Rest of the world and. households financial. The estimate of investment in construction has been made on the basis o f commodity inputs and the observed relation between value added and investment in the Sector. However, due to Jack
45

of data, and conceptual difficulties, Kutcha construction requiring mainly labour inputs has not been taken into account. The estimated investment in machinery and equipment is based on the end use of the projected levels of goods. Estimates of changes in stocks have been worked out on the basis of observed relationship between fixed investment and inventory requirements and cross tested with other available indicators. The total household savings in physical assets are estimated at Rs. 17646 crores during the Fifth Plan period.
In f lo w fro m th e Rest o f the W orld
4.52. The net inflow from rhe rest of the world for financing the current account deficit in the balance of payments is estimated at Rs. 5431 crores as shown below :
amount (Rs. crores)
(0) (1)
inflow
1. gross external assistance
2. commercial credits
outflow
9052
1. IMF (net) •T+) 115
2. repayments of debt services ■(-) 2465
3. aid to foreign countries < - ) 494
4. others ( - ) 473
5. changes in reserves-increase (—) ■(-) 304net in flow 5431
3 Balance o f Paym ents
Review 1974-76
4.53. The momentum of growth in exports witnessed during the last two years of the Fourth Plan, continued in the first two years of the Fifth Plan. Exports rose to Rs. 3329 crores in 1974-75, registering a growth rate of 32 per cent and further rose to Rs. 3942 crores in 1975-76 recording a growth rate of 18 per cent. Imports aggregated to Rs. 4519 crores in 1974-75 as against Rs. 2955 crores in 1973-74. Imports further rose to Rs. 5158 crores in 1975-76, showing an increase of 14 per cent over the previous year. Annxures13
46

and 1 4 show the composition of exports and imports respectively in the first two years of the Fifth Plan.
4.54. India's terms of trade have deteriorated sharply since 1973-74, mostly due to the hike in prices of food, fertilisers and POL. With 1968-69 as base, the unit value indices of imports of these three items shot up from 182, 91 and 334 in 1973-74 to 229, 173 and 736 in 1974-75, and to 276,167 and 829 in 1975-76, respectively. The terms of trade index which showed improvement in the first four years of the Fourth Plan, fell steeply from 124 in 1972-73 to 106, 77 and 70 in the next three years respectively.
4.55. Data on foreign exchange reserves are reproduced below :
(Rs. crores)Year total reserves movements(0) (1) (2)
1973-74 9471974-75 969 +221975-76 1885 +916
The growth in foreign exchange reserves during 1975-76 was to a large extent due to substantial inflows of private remittances through official channels consequent upon government measures against smuggling and illegal dealings in foreign exchange.
F ifth Plan Projections
4.56. The revised projections of the balance of payments for the Fifth Plan period take into account both continuing and related factors having a bearing- onthe rate and pattern of growth. The estimates of the balance are summarised below :
(Rs. crores)
as envisagedin the draft as workedFifth Plan out now
current account (— ) 2231 (— ) 5431capital account 2231 5431
(1) trade( i ) exports 12580 21722( ii) imports (—) 14100 (—) 28524(iii) trade balance (—) 1520 (—) 6802
(2) services (net) 94 431(3) current transfers (net) 326 2377(4) investment income (net)
( i) debt service ( - ) 911 (—) 1180(ii) other than debt (—) 220 ( - ) 257
services
47

(1) private capiial ( - ) 86 ( - ) 210(2) banking capital (net) ( + ) 45(3) official capital (net) ( - ) 45 ( - ) 174(4) debi service ( - ) 1646 ( - ) 2465(5) I.M.F. (net) — ( + ) 115(6) assistance to foreign ( - ) 300 (—) 494
countries (net)(7) lags between export shipments
and receipts (— ) 100 ( - ) 134(8) commercial credits (gross) 400(9) external assistance (gross) 4008 ( + ) 9052
(10) movement in foreign exchangereserves ; increase (—) — ( - ) 304
The revised estimates for the Fifth Plan period indicate a trade deficit of Rs. 6802 crores. The invisibles transactions (including interest payments) are expected to result in a net inflow of Rs. 1371 crores. The current account deficit is thus expected to be of the order of Rs. 5431 crores. The capital transactions are anticipated to result in a net outflow of Rs. 3371 crores of which debt repayment is Rs. 2465 crores. A gross external inflow inclusive of external assistance and commercial credits of Rs. 9052 crores is assumed for the Fifth Plan period.
N et A id
4.57. As indicated above, the gross external inflow required by the economy during the Plan period is now estimated at Rs. 9052 crores. Taking into account the debt service obligation of Rs. 3645 crores (Rs. 1180 crores of interest payments and Rs. 2465 crores of repayments of loans), the net inflow to be utilised w ill be Rs. 5407 crores. In the Fifth Plan projections, a provision of Rs. 494 crores has been made for net aid to foieign countries. Setting off this amount, the balance that w ill be available to meet the various foreign exchange requirements would be only Rs. 4913 crores.
Exports
4.58. Earnings from exports during Fifth Plan period are estimated at Rs. 21722 crores. Annexure15 gives the break-up of exports by major commodities. In real terms. the rate of growth in exports works out to 8.5 per cent per annum for the whole Plan period. The revised projected rate is higher than that envisaged in the Draft Plan and is explained partly by the higher growth rates already achieved during the first two years of the Fifth Plan. In projecting future growth rates account has been taken of the high unit value items especially amongst non-traditional export items such as ready-made garments, engineering goods and leather manufactures. As far as export projections of iron and steel and sugar are concerned, they have been worked out after taking into account expected capacity utilisation, production and domestic demand and the emerging markets. Rice and cement are expected to contribute to higher level of export earnings mainly due to the new markets.
48

4.59. By the end of the Fifth Plan, engineering goods are projected to emerge as the single most important group of items of export. The markets for engineering goods are expanding rapidly and there has been diversification in these exports both in terms of commodities and markets. In textiles, expansion of exports will be sustained in the area of ready-made garments and in leather, additional exports are expected from finished feather as well as leather manufactures. In marine products with our long coastline the potential is indeed vast. Since domestic demand is not a constraint and world exports are expanding at a rapid rate and infrastructure facilities are available, exports can be stepped up considerably during the Fifth Plan period.
4.60. In traditional items of export such as tea, coffee, jute manufactures, spices, coir manufactures etc. modest increases are projected. For Indian handicrafts, there are vast markets in western countries and with better marketing and organisational effort, it should be possible to better the trend in growth rate.
4.61. During the Fifth Plan period the objective of export promotion should be to further strengthen the 'leading' sectors of growth. Exports which are capable of competing without subsidy will have to he given preference and capacity for their production increased.
Imports
4.62. Imports in the Fifth Plan period are now estimated at Rs. 28524 crores. Annexure 16 gives break-up of imports by major commodities. Of the total imports, POL accounts for Rs. 6280 crores (22% ) ; metal products, machinery and transport equipment, Rs. 6034 crores (21 % ) ; steel and non-ferrous metals area and scrap Rs. 2347 crores (8% ) ; and fertilisers and raw materials for fertilisers, Rs. 3168 crores (11% ). The rest including all government imports, foodgrains imports and imports intended to build up buffer stocks of critical wage goods as cushion against uncertainty will amount to Rs. 10738 crores (38% ). During the later period of the Fifth Plan, imports of machinery are exected to increase over the existing level, in spite of increased availability from indigenous sources, particularly to meet special needs in off-shore drilling, tele-communications, space and other technology-intensive sectors. The unit value index of imported machinery and equipment is estimated to have increased by 32.7 per cent in 1975-76 over 1974-75.
4.63. One of the important aspects of import planning relates to its contribution towards creating buffer stocks of critical goods for mass consumption such as foodgrains, edible oils and cotton. Such buffer stock has to be viewed as an instrument for pursuing a path of non'inflationary growth. Recent experience has only highlighted the need for such a form of planning.
4.64. The proposed investment programme in the Fifth Plan provides the
49

thrust to efforts at import substitution in four major sectors ; energy, metals, fertilisers and agriculture. In the case of energy, import substitution will be pursued both by an intensified programme of oil exploration and by energy substitution through increased utilisation of domestic coal and hydro-electric potential. In the field of steel, it is projected that through increased capacity utilisation and capacity expansion under way, steel imports would be restricted to only certain special categories. In the case of non-ferrous metals, the outlook is becoming more favourable as a result of further exploitation of metal resources and higher capacity utilisation in this sector. The envisaged expansion in the capacity for production of fertilisers is expected to bring down imports of manufactured fertilisers by the terminal year of the Fifth Plan. Raw material requirements for domestic manufacture of fertilisers are fully provided for.
Invisibles
4.65. The invisible transactions excluding investment income payments and transfers have been estimated to result in a net inflow of Rs. 431 crores. A receipt of this order under services is made up of the following items :
Projected Net Receipts from Services during the Fifth Plan Period(Rs. crores)
receipts payments net recei
1. foreign travel 589 123 466
2. transportation 1097 977 120
3. insurance 153 94 59
4. government not included elsewhere 121 120 1
5. miscellaneous 315 530 (— ) 215
6. total 2275 1844 431
Transfers
4.66. The private transfer receipts,(which comprise mainly remittances of savings, family maintenance, migrant transfers, personal gifts and receipts for religious and charitable organisations, etc.) have been assumed to increase from Rs. 142 crores in 1973-74 to Rs. 557 crores in 1978-79. Receipts on this account over the five years (1974-79) are estimated at Rs. 2630 crores. In1975-76, the inward remittances registered a marked increase. The receipts for the entire Plan period have, however, been worked out taking into account the past trend. The payments on this account during Fifth Plan period are estimated at Rs. 215 crores. The net receipts have thus been placed at Rs. 2415 crores. Taking into account the net outflow of Rs. 38 crores assumed under official transfers (excluding grants) a credit of Rs. 2377 crores has been taken in the estimates of balance of payments for the Fifth Plan.
50

Capital Account
4.67 Under private capital (non-banking), a credit has been taken for total receipts of Rs. 60 crores. This is, however, more than offset by the payments estimated at Rs. 270 crores. The net outgo during the Fifth Plan period would thus be Rs. 210 crores. A provision of Rs. 174 crores for net outflow on account of official capial transactions has also been made.
4.68 India has been giving assistance to neighbouring countries, A provision for the same has been made in the Fifth Plan amouting to Rs. 494 crores consisting of loans and grants. An outflow of Rs. 134 crores has been projected for the lag between export shipments and the related foreign exchange receipts. The capital account makes a provision of Rs. 2465 crores for repaymfeiits of loans falling due during the Fifth Plan period. The transactions with the I.M.F. would result in a net inflow of Rs. 1 55 crores over the five year period. The other inflow envisaged is under Banking capital amounting to Rs. 45 crores.
4. General
4.69 The estimates of financial resources, savings, investment and balance of payments contained in this chapter are at 1975-76 prices for last four years of the plan and at 1974-75 prices for the first year. Estimates based on input/output model in chapters 2 and 3 are at 1974-75 prices. While domestic prices in1975-76 were marginally lower than in 1974-75, the increase in import prices was somewhat higher, especially prices of imported machinery and equipment prices increased at a much faster rate than prices o1 domestic machinery and equipment in 1975-76 over 1974-75. Effects of these adverse movements in terms of trade have been provided for in working out the macro-economic balances underlying the plan.
51

CHAPTER V
PLAN OUTLAYS AND PROGRAMMES OF DEVELOPMENT
l. Plan Outlays
The Draft Fifth Five Year Plan envisaged an outlay of Rs. 37250 crores in the public sector. The revised Plan outlay is now estimated at Rs 39303 crores excluding provision for inventories.
Public Sector Outlays
5.2. Not only has the Total Plan Outlay been increased from Rs 37250 crores to Rs 39303 crores but the outlay for the next two years has been reckoned at Rs 19902 crores as against the estimate for the first three years of the Plan which aggregate to Rs 19401 crores.
5.3. The break down of the revised outlay under major heads of development is as follow s:
Fifth Five Year Plan Outlay-1974-79(Rs. crores!
draftfifthplan
revisea nrtn pian 1974-77 1977-79 1974-79
(0 ) (1) (2) (3) (4)
1. agriculture and allied 4735.00 2130.19 2513.40 4643.59
2.programmes irrigation and flood control 2681.00 1651.50 1788.68 3440.18
3. power 6190.00 3513.05 3780.85 7293.9Q4. industry and mining 9029.00 5205.35 4995.25 10200:605. transport and communica
tions 7115.00 3552.67 3328.76 6881.436 . educatio i 1726.00 587.77 696.52 1284.297. social and community ser
vices (including economic and general services but excluding education) 5074.00 2322.42 2444.35 4766.77
8 . hill and tribal areas and NEC schemes 500.00 177.50 272.50 450.00
9.
10.
sectoral distribution notyet reported.total 37250.00
260.4419400.89
66.29 19886.601
326.73 39287.491
1 Does not include an amount of Rs. 16 crores for which sectoral'break-up is not worked out.
2 Sectoral break-up does not include an amount of Rs. 203 crores added subsequently.

The outlays for the remaining years of the Plan are based on the following broad considerations :—
(i) The plan priorities of the Draft Fifth Plan have been kept unchanged ;
(ii) the outlays for on-going projects/schemes have been determined' on the basis of present and future demand, past performance, current completion schedules and escalation in costs ;
(iii) provisions have been made for new starts, including those which have long gestation periods, keeping in view the demand pattern for 1 981 -82 and in some cases 1983-84 ; and
(iv) an attempt has been made to see that the investments are not only fruitful but that they also ensure adequate return. In agricultural production, power, irrigation and education sectors targets were suggested keeping in view the national targets, natural resources of States and their present state of preparedness.
5.4. There is substantial step-up in the outlays on irrigation and flood control, power and industry and minerals. In agriculture, education and social services sectors though the revised outlays for the Fifth Plan as a whole are smaller, the outlays for the last two years of the Plan are higher than the outlays for the first three years.
20-Point Economic Programme
5.5. The 20-Point Economic Programme was announced by the Prime Minister on 1st July, 1975. The various constituents of the 20-Point Economic Programme, especially those which require financial investment*, have been identified. Priority has been accorded to the implementation of the schemes falling under this programme. The outlays of the Centre, States and Union Territories for the remaining two years of the plan— 1977-79 and the Fifth Plan are indicated below :
(Rs. crores)------ T376-7T
anticipated
1976-77approvedoutlay
1977-79proposedoutlay
total
(0) (1) (2) (3) (4)centre 119.01 163.71 757.06 1039.78states and U.Ts. 1850.68 2173.97 5334.67 9359.32total 1969.69 2337 .68 6091.73 10399.10
Annexures 21 and 22 indicate the proposed outlays for 1977-79 in respect of different constituents of the 20-Point Economic Programme.
53

Overall Outlay
5.6. The distribution of the outlays by sectors, by Ministries, by States and by Union Territories is shown in Annexures 17-20, Briefly, the revised Plan outlays are as follows :
(Rs. crores)
1. central sector 19954.10
2. states 18265.08
3. union territories 634.06
4. hill and tribal areas 450.00total 39303.24
2 . Agriculture and Irrigation
5.7. Agriculture Production: The methodology followed in arriving at the projections of foodgrains, important commercial crops, irrigated areas and other physical programmes has been explained in the chapter on the Rate and Pattern of Growth. These estimates relate to average weather conditions in a given year. However, in order to allow for variations in the effect of weather, provisions have been made in individual state plans on a slightly higher scale so that the total production is not materially lowered even if some part of the country is affected. If these outlays are utilised with a fair degree of efficiency and if weather conditions are favourable in all the states, the total production would naturally be much higher and could be of the order shown in the table below.
(mt-million tonnes, mh-million hectares,')
item 1973-74level
maximum production estimates
(0 ) (D (2)
foodgrains (mt) 104.7 132.9
oil seeds (mt)-five major 8.9 12.6
sugar cane (mt) 140.8 173.5
cotton (m.h.-170 kg) 6.3 9.0
jute and mesta (m.b.-180 kg) 7.7 7.7high-yielding varieties (mb) 25.8 40.0
fertilizers 2.8 5.0
consumption (mt)minor irrigation (mh) 23.1 31.6
54

5.8. The expenditure on Agriculture and allied programmes during 1974- 77 is likely to be about Rs. 2 1 30 crores. The outlays proposed for the last two years of the Plan period are of the order of Rs. 2513 crores. The Sectorwise outlays, are shown in Annexure 23 and the State-wise allocations are given in Annexure 24.
5.9. Performance of the important programmes, hke DPAP, minor irrigation, production and distribution of high-yielding varieties of seed and distribution of fertilisers have been specifically examined and necessary provision has been made. The outlays for reclamation of alkline, saline and acidic soils and plant protection programmes have been suitably enhanced. Emphasis has also been placed on developing organic sources of manure and higher outlays provided for setting up biogas plants. Adequate provision has also been made for accelerating the minikit seed programme and strengthening of the extension services. Provision has also been made for augmenting storage capacity in the public sector.
Irrigation
5.10. The total irrigation potential likely to be created during the Fifth Plan period is placed at 131 million hectares ; 5 8 million under 'major and medium' and 7 3 million under 'minor'. Allowing for certain adjustments the additional potential should be of an order higher than 11 million hectares.
M ajor and M edium Irrigation
5.11. During the first three years of the Fifth Plan the expenniture on major and medium irrigation projects is likely to be Rs. 1474 crores. For the remaining two years of the Plan, an outlay of Rs. 1 621 crores is indicated keeping in view the progress achieved on each project, new completion schedules, development of additional command and escalation in costs. Where work could be accelerated, higher outlays have been provided for projects such as Nagarjuna- sagar, Sarda Sahayak, Rajasthan Canal, Malaprabha and Kadana. Commitments to international agencies like the World Bank in respect of certain projects and obligation of States to provide matching funds in respect of inter-State projects have been kept in mind.
5.12. An Outlay of Rs. 1013 crores has been provided for new starts during the Plan period. In selecting new projects, priority was accorded to those located in drought prone areas. On the basis of the data furnished by the States and the discussions held recently, an additional potential of 5 8 million hectares is expected to be achieved during the Fifth Plan period. Details indicating the outlays and benefits State-wise are given in Annexures 25 and 26.
5.13. Planning Commission has baen laying great emphasis on
55

modernisation of certain important irrigation schemes urgently, particularly those completed earlier to the Plan periods. Provision has been made for some schemes like Godavari Barrage, Tajewala and Okhla Barrages and Bhimgoda headworks.
Minor Irrigation
5.14. According to the outlays available to the states for the first three years, a maximum potential of nearly 3*4 million hectares is likely to be created during the first three years of the Plan. The provision made in the following two years of the Plan almost equals the provision in the first three years. As a number of the projects are nearing completion, it is expected that an additional 3 ‘9 million hectares will be brought under irrigation during the next two years.
Soil and W ater Conservation
5.15. The programme for treatment of area in river valley catchment of major reservoirs and other soil and water conservation programme made a late start. A considerable step-up in outlays for implementation of these programmes has been made for the remaining two years of the Fifth Plan. In some of the States, soil and water conservation programmes have also been taken up with institutional credit support and the targets of physical performance are likely to be achieved.
Area Development
5.16. This important programme for optimising the use of irrigation water and utilisation of the potential created from selected commands of major irrigation works also took time to make a start. Now the Command Area Development Authorities have been set up and other infrastructure facilities developed. Therefore, the provision in the Central sector would be almost 22 per cent higher for the remaining two years as compared to the outlays for the first three years. The provision in the respective states adequately match the provision made in the Central sector.
Investment in Agricultural Financial Institutions
5.17. More and more institutional finance is being extended to the development programme for rural areas which Iead6 to higher physical achievements with less public sector outlays. Accordingly, for providing support to Agricultural Refinance and Development Corporation, adequate budgetary provision has been made in the Central Sector, which is almost 55 per cent higher than the outlay in the draft Fifth Plan. In the State. sector, provisions have also been made for Investment in agricultural financial institutions which are higher by about 20 per cent. The provision made for the remaining two years in some of the States especially in the eastern region for strengthening of cooperative structure and development of loaning programmes by the Land Development Banks is almost 62% higher than the outlays available for the first three years. The total
56

investment outlay is being raised to Rs. 129 crores. It is to be noted that the major portion of it will go to minor irrigation sector. This should generate sizeable investment and strengthen the operational capability of the Central/State Ground Water Boards.
Forestry
5.18. Taking note of the fact that forestry development has assumed a significant dimension as a source of timber and fuel and for the maintenance of the natural ecological system, special programmes for social forestry and economic plantations have been given high priority. Accordingly, for the remaining two years of the plan, the provision made is almost double the outlays provided for in the first three years of the Plan. Adequate provision has also been made for 'project Tiger' and for the development of National Parks and for strengthening the reserch programme in the forestry sector.
Animal Husbandry and Dairy Farming
5.19. There had been some delay in giving a start to the special livestock development programmes through small and marginal farmers and agricultural labourers. By and large the targets under production oriented projects such as intensive cattle development projects, intensive poultry production-cum-marketing centres, sheep and wool extension centres and fluid milk plants and milk product factories are expected to be achieved in full. There are 85 subsidised projects for cross-breed calf rearing, 57 poultry production projects, 45 piggery production projects and 38 sheep production projects through small and marginal farmers and agricultural labourers in 148 districts. Intergrated milk production-cum-marketing projects would be implemented in the States of Meghalaya, Assam, Sikkim, Himachal Pradesh, J and K, Orissa and Kerala as a second phase of the 'Operation Flood' project. Emphasis will continue to be laid on cross-breeding in cattle through establishment of exotic cattle breeding farms and intensive artificial insemination measures. Particular emphasis will be laid on scientific poultry breeding programme. Programmes for the control of rinderpest and foot and mouth disease would be continued.
Fisheries
5.20. There has been some delay in the start of a few projects but the targets for mechanisation of boats, production of fish seed and development of fishing harbours are expected to be achieve in full. A special Trawler Development Fund will be created in order to help, in particular, smaller entrepreneurs and cooperatives to purchase and operate trawlers for marine fishries. Fish Farmers Development Agencies would be started in the states for augmenting inland fish production and exploitation of water bodies in rural areas.
5.21. The UNDP assisted palagic fishery project would be continued for
57

exploration and exploitation of fishery resources and this scheme would be extended to cover both the West and South East coasts. A survey of the North West coast would be conducted. An intergrated fishery development project around two fishing harbours at Veraval and Mangrol in Gujarat would be taken up with world Bank assistance. A research vessel will be provided to the Central Marine Fishries Research Institute.
Research and Education
5.22. In spite of the fact that the trend of expenditure during the first three years has been low on account of ban on recruitment of staff, the research priorities in different fields of crop production and animal husbandry have been maintained to yield new innovations in developing farm level technology. The coordinated research programmes have been suitably strengthened with the active participation of the Agricultural Universities in different States. A new research complex has been established in the north-eastern region. New institutes have also been established for strengthening cotton research and for developing research programmes on farm tools, equipment and machinery. Provisions have been made for projects with collaboration of agencies of United Nations. The Educational programmes have been further strengthened by setting up new Agricultural Universities which now number 21 covering 16 States.
Cooperation
5.23. Taking note of the desirability of strengthening the cooperative structure, provision has been sufficiently enhanced for Agricultural Stabilisation Fund, rehabilitation of weak Central Cooperative Banks and assistance to cooperative credit institutions in developing States. Thus the revised outlay for 1977-79 is almost 60 per cent higher than the outlays for the first three years of the Fifth Plan. Similarly, adequate provisions have been made in the State sector to provide for strengthening of cooperative structure by organising Farmers Service Societies and LAMPS in the tribal areas. Provisions have also been made for increasing the loaning programmes for minor irrigation, land development and supply of inputs.
Flood Control
5.24. The anticipated expenditure in the first three years is likely to be of the order of Rs. 177 69 crores. For the next two years (1977-79) an outlay of Rs. 167.59 crores has been indicated (Annexure 27).
5.25. Some of the important schemes are the Patna City Protecton Works, flood protection works in North-Bihar and U.P., flood control and drainage works in Jammu and Kashmir, drainage works in Punjab, improvement of lower Damodar system in West Bengal and flood protection works in North Bengal. The provision also covers the flood control works in the Brahmputra valley for
58

which provision has been trade in the Central sector.
5.26. The Centre is also assisting in sharing the cost of flood control component of the Rengali dam in Orissa and anti-sea erosion works in Kerala. It also meets the cost of the flood forecasting system that has been set up in the Department of Irrigation.
3. Power.
5.27. In the Fourth Plan an additional 4280 MW of generating capacity was added, taking the installed capacity to 18456 MW. In the first two years of the Fifth Plan 3524 MW were added, and with the requisite efforts on the part of the project authorities, it might be possible to add 2387 MW capacity during 1976- 77. In the first three years, the outlay on generation projects would be about Rs. 2145 crores. It is now expected that a total of about 12500 MW of generating capacity would be added during the Fifth Plan. Out of the projects which are currently under implementation, generating capacity of about 6000 MW would be still under construction at the end of the Fifth Plan. Experience indicates that management and techniques of construction and monitoring, would need to be considerably improved.
5.28. In finalising the Fifth Plan for Power, emphasis has been placed on the completion of on-going schemes as expeditiously as possible. In recommending outlays, the latest cost of each generation project, status of progress of major items of works, delivery schedules for the equipment and any constraints likely to be faced in implementation were all taken into account. Particular consideration has also been given to intra and inter-State transmission lines, setting up and strengthening of regional load despatch centres, and investments on distribution. Transmission and distribution losses are expected to be reduced. The needs of schemes covered by external assistance have been also kept in view. Rural electrification will also be significantly higher than in the first thrde years of the Fifth Plan. The States will also be attracting institutional finance for rural electrification. The programme of energising pump sets will be accelerated. About 13 lakh (jump sets are expected to be energised during the Fifth Plan period, as against about 6.3 lakh pump sets in the first three years. About81,000 additional villages are also expected to be electrified in the Fifth Plan.
5.29. In planning advance action for the Sixth Plan, the power requirements till the end of the Sixth Plan are being kept in view. It has been assumed that the healthy trends In improved utilisation of capacity which have been observed in the Fifth Plan period and the progress in reduction of distribution losses, will continue. Special attention will be paid towards ensuring that regional grids are strengthened, that there is a balanced development of peaking and base load stations in each region, and that optimal use is made of these
59

stations both by an integrated operation within the region and where necessary oy cooperation between regions. With these considerations in mind, provision has been made for a number of new starts in the thermal and hydel projects including a centrally owned super thermal station. The views of the States were taken note of particularly in regard to aspects like readiness of projects, construction periods and escalation in cost. Many States expressed their willingness to raise additional resources to meet the requirements of new power projects.
5.30. The power position in northern and eastern regions will continue to be comfortable. But western and southern regions are expected to face both peaking and energy deficits.
5.31. Increased outlays are provided fcr training facilities for the operation and maintenance of power system, testing facilities for electrical equipment and R and D in such priority areas as geothermal and tidal power.
5.32. The revised outlays under the various categories are summarised below :
Fifth Plan Power-Financial Outlay(Rs. crores)
item states union territories centre total draftfifthplan
(0 ) (1) (2) (3) (4) (5)
1. generation 3722.71 6.52 665.24 4394.47 3323.81
2. transmission and distribution 1897.73 78.78 104.74 2081.25 1634.27
3. rural electrification
(a) M.N.P. and state plan 360.54 10.74 — 371.28 698.24
(b) rural electrification corporation 314.02 __ — 314.02 400.00
4. survey and investigations 74.92 2.72 55.24 1^2.88 133.68
5. total 6369.92 98.76 825.22 7293.90 6190.00
5.33. The generation schemes which have been or are expected to be commissioned in Fifth Plan period are shown in Annexure 28. The regionwise break up of installed capacity is expected to be as in Annexure 29.
4 . Industry and Minerals
5.34. The stresses and strains in the economy kept the industrial growth low : 2.5% during 1974-75 and 5.7% during 1975-76. Even so, significant increase in production have been achieved in some of the basic industries like steel, coal, cefnent, non-ferrous metals and power generation. Decline was particularly noticed in industries like passenger cars, consumer durables and cotton textiles.
60

5.35. Some of the steps taken to correct this situation can be mentioned. 21 industries including cotton spinning, basic drugs, and industrial machinery, have been delicensed. In respect of 29 selected industries, the existing units including foreign and MRTP companies have been permitted to utilise their installed capacity without limit. In order to promote exports of engineering goods, 1 5 engineering industries have been allowed the facility of automatic growth of capacity «t 5"„ per annum or up to a ceiling of 25% in a Plan period in physical terms. Various facilities have been extended to non-resident Indians fbr the establishment of industrial undertakings and for investing their earnings in selected industries. The resources of IDBI and other term lending institutions are also proposed to be augmented. Conditions are now favourable for maintaining the terr.po of growth in industrial production and investment, achieved during the last quarter of 1975-76.
5.36. In making revised allocations, speedy completion of projects and appropriate action for starting new projects with long gestation periods have been kept in mind. As against an outlay of Rs. 1 3,528 crores envisaged in the draft Fifth Plan, the revised figure is placed at Rs. 16,660 crores : Rs. 9660 crores in the Central and States Public Sectors and Rs. 7000 crores in private and cooperative sectors.
C entral Public Sector
5.37. A detailed list of projects and programmes included in the Central sector of the plan is given in Annexure 30. The broad break up of certain important groups of industries in the public sector is as follows :
Outlays for important groups of industries(Rs. crores)
Industry Outlay Industry Outlay1 . Steel 1675 7. Non-ferrous metals 4682 . Fertilisers 1533 8. Iron are (including 513
Kudremukh Project)3. Coal (including 1147 9. Paper and newsprint 203
lignits)4. Oil exploration, 1575 10. Cement 102
refining and distribution 1 1 . Textiles 104
5. Petro chemicals 349 12. Ship Building 1476 . Machinery and engineering
industries 365
5.38. The targets of production visualised in the Plan for selected industries is given in Annexure 31. The average rate of industrial growth during the Fifth Plan is reckoned to be around 7% per annumr In view of the relatively
61
lower rate of growth in the first 2 years of the plan, the growth rate in industrial production in the temaining 3 years of the Plan will have to be maintained around 9 to 1 0",,.
Steel
5.39. The domestic demand for finished mild steel is estimated at about 7.75 MT by 1978-79, while the production is expected to be 8.8 MT including a production of 1.06 MT from the mini steel plants and re-rollers. Though a few special categories of steel will still need to be imported, on the whole the country has now emerged as a net exporter of steel.
5.40. The 1.7 MT stage of Bokaro is expected to be completed by the end of 1976. This plant, except the cold-rolling mill, is expected to expand to 4.0 MT by June 1979. The work on the expansion of Bhilai steel plant to 4.0 MT is expected to be completed by December 1981. Plans have also been drawn up for rehabilitation and modernisation of the IISCO plant.
5.41. Considering the longer gestation period in the steel industry, various alternatives for expansion and development are under consideration.
Non-Ferrous Metals
5.42. The Korba plant is expected to achieve its full capacity of 100,000 tonnes of aluminium along with associated fabricating facilities, before the end of the Fifth Plan. Along with the capacity existing in the private sector, this will contribute to the total capacity of 325,000 tonnes and will be adequate to meet the domestic requirements.
5.43. With the commissioning of the Khetri copper complex, the current smelting capacity is 57,000 tonnes per annum. Provision has been made for the development of mining projects at Malanjkhand and Rakha and expansion of copper mines in the Bihar belt. The Plan envisages a production target of 37,000 tonnes of copper from domestic ore by 1978-79.
5.44. The capacity for zinc production is expected to increase to 95,000 tonnes by 1978-79 with the completion of the expansion of Debari smelter (45,000 tonnes) and installation of a new smelter at Vizag (30,000 tonnes).
5.45. A provision of Rs. 468 crores has been made in the Plan towards the various, schemes included for the development of non-ferrous metal and associated facilities.
Engineering Industries
5.46. The bulk of the investments is for completing the programme for the production of electric generation equipment and supporting facilities in Bharat
62

Heavy Electricals Limited and for diversification of the production programme of Hindustan Machine Tools for the manufacture of lamp machinery, printing machinery, tractors and watches. Provision has also been made for balancing facilities at Heavy Engineering Corporation and for rehabilitation and diversification programmes of engineering undertakings taken over by the Government.
5.47. A large step up in scooter production is envisaged. The concept of a mother unit supplying components for assembly to a number of subsidiary units has been introduced in the public sector.
5.48. Provision has been made for the Hindustan Shipyard to achieve a production of three ships per annum of 21,600 DWT size. Cochin shipyard will have a capacity of two ships per annum of 75,000 DWT size by 1 977-78. The further expansion to four ships per annum will also be started before the end of the Plan. The establishment of one or more new shipyards is currently under consideration.
5.49. A detailed plan for the development of electronic industry on a scientific basis has been drawn up. Provision has been made for testing facilities and R & D support for the growth of the electronic industry.
Fertilisers5.50. The installed capacity for nitrogenous fertilisers is expected to reach
4.7 million tonnes by 1 978-79. Since a part of this capacity will be realised only in the last year of the Plan, the production target is placed at 2.9 million tonnes.
5.51. The demand for phosphatic fertilisers has not increased to the extent envisaged. Measures have been initiated to stimulate consumption of phosphatic fertilisers. Further expansion of phosphatic fertiliser capacity is being planned.
5.52. Apart from the new plants envisaged in the public sector, it is expected that additional capacity will be promoted in the private sector.
5.53. A total provision of Rs. 1533 crores has been made in the Fifth Plan for fertilser projects as compared ro Rs. 1093.28 crores in the draft Plan. This includes a lumpsum pr.ovision for new fertiliser projects and also fertiliser projects in the cooperative sector.
Oil and Natural Gas
5.54. Programme for the exploration and exploitation is being stepped up to intensify activities in the most promising oil bearing areas where the payback is likely to be quicker. Resources are, therefore, mainly being canalised to the development and production of oil from off-shore and selected on-shore areas.
63

5.55. A time-bound programme has been drawn to develop production of oil from Bombay High to a rated capacity of 10 million tonnes per annum by 1980-81. Studies for optimal exploitation of resources, transportation, processing and utilisation of the oil and associated natural gas are being currently carried out.
5.56.. The draft Plan envisaged a step up of crude oil production from7 .2 million tonnes in 1973-74 to 12.0 million tonYies in 1978-79. The production target for crude oil is now placed at 14.18 million tonnes.
5.57. Taking into account the enlarged programme, the outlays for ONGC during the Fifth Plan, have now been revised to Rs. 1056 crores as compared to Rs. 420 crores in the Draft Fifth Plan.
Oil Refining
5.58. The refinery programme included in the Plan cover the completion of the Haldia refinery, the expansion of Koyali and the establishment of refineries at Mathura and Bongaigaon. All these projects are expected to be completed in the Fifth Plan excepting Mathura refinery which is scheduled to be commissioned by 1980. By the end of the Fifth Plan, refining capacity will be stepped upto31.5 million tonnes. Provision has been made in the Plan for these schemes.
Petrochemica Is
5.59. The first major petrochemicals complex at Baroda will be completed during the Fifth Plan period. The Aromatic Project of the complex has already been commissioned. The Olefines and the downstream units are expected to be commissioned between August, 1977 and April, 1978. The polyester filament yarn project of Petrofils Cooperative Ltd. is also expected to be commissioned in phases between March and July, 1977. A provision of Rs. 349 crores has been made for the abovementionedscherr.es. A Refinery-cum-Petrochemical unit at Bongaigaon has been included in the Plan.
Coal
5.60 In consonance with the broad policy frame for the Energy sector drawn up by the Fuel Policy Committee, the Draft Fifth Plan envisaged a production target of 135 million tonnes by 1978-79.
5.61. A comprehensive programme of advance action involving bulk purchase of standardised plant and equipment and various technical, managerial and administrative improvement together with a favourable industrial climate has resulted in higher production of coal.
5.62. The demand for coal, however, has not kept peace with production.
64

After keeping in view the outlook for coal consuming industries and a review of the current energy situation, the likely demand of coal at the end of the Fifth Plan period has now been projected at 124 million tonnes. Provision has been kept for an export of 2.5 million tonnes of coal in 1978-79 as compared with1.5 million tonnes envisaged earlier. Consistent with the revised outlook in demand, the production programmes are being rephased, in a way which would not hamper the future growth.
5.63. Even with this target, the outlays for the Plan are likely to be of the order of Rs. 1025 crores as against the earlier provision of Rs. 747.60 crores. This includes the requirements for the setting up of 1 0 million tonnes of additional washery Capacity, of which, 4 million tonnes will be operational by 1978- 79. Two units of low temperature carbonisation plants are also contemplated. Adequate provision has been made for better housing facilities and other welfare activities etc.
Lignite
5.64. The draft Fifth Plan made a provision of Rs. 39.80 crores for the Neyveli Lignite Project which was expected to reach a production of 6.0 million tonnes in 1978-79.
5.65. On the basis of the review now carried out, this provision has been increased to Rs. 122.25 crores, mainly on account of escalated cost of the specialised mining equipment which’ is to be imported. In view of the slippages in the implementation of the programme, a production of 4.5 million tonnes of lignite is now expected by the end of the Fifth Plan period, the production of 6 million tonnes being attainable by 1 9 8 0 -8 1.
Iron Ore
5.66. The production target envisaged for iron ore in the Draft Plan was 58 million tonnes. Due to slight fall in the domestic demand, the production now envisaged is 56 million tonnes,
5.67. As currently reckoned Donimalai, Bailadila-5 and Kiriburu expansion projects will be commissioned in 1976-77. The development of Meghahatu- buru project for meeting the requirements of Bokaro steel plant at the 4 million tonnes stage is expected to be taken up shortly. Provision has also been made for establishing pelletisation capacity. A notable feature in the field of iron ore development has been the decision to develop the Kudremukh magnetite deposit for a production of 7.5 million tonnes of magnetite concentrates at a cost of around Rs. 567 crores.
5.68. Based on current estimates, a provision of Rs. 107.57 crores, excluding the investments on Kudermukh Project, has been made in the Plan.
65

Consumer industries
Sugar
5.69. To achieve speedy implementation of licences issued and to make new sugar factories and expansion schemes economically viable, incentives were announced in September, 1975. The capacity is expected to increase from4.3 million tonnes in 1973-74 to 5.4 million tonnes in 1978-79.
Cotton Textiles
5.70. From a production of 7900 million metres of cloth in 1973-74, the production is expected to go upto 9500 million metres in 1978-79. The share of the mill sector is envisaged at 4800 million metres and the decentralised sector would contribute the balance of 4700 million metres.
5.71. The spinning capacity is being expanded so as to ensure adequate availability of yarn to the decentralised sector.
5.72. To accelerate the modernisation of the textile industry, a scheme to extend long term finance at concessional rate is being drawn up. A provision of Rs. 104 crores has been made for the rehabilitation and modernisation of the mills of the National Textile Corporation.
Cement
5.73. The capacity in the cement industry is expected to go up to 23.5 million tonnes by 1978-79 from 19.7 million tonnes in 1973-74.
5.74. The share of the public sector (Central and States) in the cement industry is expected to increase from 2.30 million tonnes in 1973-74 to 3.88 million tonnes, in 1978-79
Drugs and Pharmaceuticals
5.75. The drug industry which was mainly confined to formulation activities and the manufacture of bulk drugs from penultimate intermediates has in a progressive manner entered into the field of manufacture of bulk drugs.
5.76. Public sector has been given a prominent role in the overall development of drug industry. A significant step up in production in the area of antibiotics, synthetic drugs and formulations in public sector is envisaged.
Vegetable Oils and Vanaspati
5.77. The production of vanaspati is expected to increase from 449,000 tonnes in 1973-74 to 610,000 tonnes in 1978-79.
66

Paper and New sprint
5.78. The production of paper and paper board is expected to be stepped up to 1 .05 million tonnes by 1978-79 from 0.77 million tonnes in 1973-74. Provision has been made for initiating construction of two new projects in the Central sector.
5.79. Production of newsprint is envisaged to be stepped up to 80,000 tonnes by 1 978-79. The additional production will be contributed primarily by the expanded capacity of NEPA and the Kerala Newsprint project in the public sector.
5.80. A provision of Rs. 203 crores has been made in the Central Sector of the Plan for the development of paper and newsprint industry.
Industrial and mineral programme re lating to atom ic energy
5.81. The major programmes in this field are the completion of heavy water plants, the schemes under the nuclear fuel complex and the expansion of public sector undertakings under the Department of Atomic Energy. A provision of Rs. 184.18 crores has been made for these programmes.
5. V illage and Sm all Industries
Small Scale Industries
5.82. The number, volume and range of production of small scale industries have continued to grow. Schemes of extension services and increase in institutional finance have materially assisted in this increase. Regional testing centres have been established. A few branches of Small Industries Service Institutes have also been opened.
5.83. For the next two years, adequate provisions have been made both for the continuing schemes and for schemes to be formulated for margin or seed money to facilitate institutional finance and for supply of machines on hire-purchase terms.
Industrial Estates
5.84. Of 455 estates functioning by March, 1974, 347 were located in urban and semi-urban areas and the remaining 108 in rural areas. In these estates, about 10,140 units were functioning providing employment to 1.76 lakh persons.
67

5.85. Adequate provision has been made for the continuing schemes as well as some new schemes.
Khadi and Village Industries
5.86 The employment in Khadi ragistered an increase from 9.78 lakhs in 1974-75 to 10.0 lakh persons in 1975-76. The increase in village industries was from 9.82 lakhs to 11.28 lakh persons.
5.87. A study has recently been completed by the Administrative Staff College, Hyderabad, regarding the viability of some village industries. Meanwhile, provisions have been made for expansion of the existing programmes.
Handloom and Powerloom Industries
5.88. Certain special schemes have been initiated for revitalisation and development of the handloom industry as a part of the 20-point Economic Programme. These schemes include intensive development projects (each covering about 1 0 , 0 0 0 handlooms) and export-oriented production projects (each covering about 1 , 0 0 0 handlooms).
5.89. Adequate provisions for continuing schemes as well as for the States to meet a part of the cost of intensive development projects have been made. For the powerloom industry, provisions have been made for processing facilities and setting up technical service centres. The value o f ' exports of handloom fabrics and manufactures is expected to go up to Rs. 140 crores from the current level of about Rs. 100 crores.
Sericulture
5.90. During the last two years, schemes have been taken up for production of industrial bivoltine mulberry silk in Karnataka, West Bengal, Tamil Nadu and Andhra Pradesh.
5.91. These schemes will be expanded during the next two years. The production of raw silk is expected to increase from the present level of about 3.2 m. Kgs to about 5.0 m. Kgs, by 1978-79 and the exports from Rs. 17.5 crores to Rs. 21.0 crores.
Coir Industry
5.92. Recently, a high-powered Study Team has been set up to review the progress and suggest measures for the development of this industry. Meanwhile, adequate provisions have been made for the continuing schemes. Over the next two years, the value of exports is expected to increase from the present level of about Rs. 19 crores to Rs. 22 crores.
68

Handicrafts
5.93. Recently, a massive scheme for training 30,000 carpet weavers has been initiated which will help to promote larger exports of woollen carpets. Steps have been taken to develop a few selected handicrafts having a high potential for development.
5.94. The value of exports of handicrafts is expected to go upto Rs. 240 crores, as against the present level of about Rs. 190 crores.
General
5.95. The levels of production and exports achieved by some industries are shown in Annexure 32.
5.96. The provisions made for the next two years in the Central and the State sectors for different small industries are shown in Annexure 33.
6. Transport and Communications
5.97. A sectorwise break-up of the provisions in the Central sector for Transport and Communications is indicated in Annexure 34.
Railways
5.98. The expenditure for the first three years of the Plan is likely to be about Rs. 1149 crores; while an outlay of Rs. 1 053 crores is proposed for the next two years.
5.99. By 1 978-79, the railways would be equipped to carry an estimated originating freight traffic of 250 to 260 million tonnes, of which the largest single commodity would be 98 million tonnes of coal. While finalising provision for replacement or acquisition of locomotives and wagons, emphasis has been laid on better utilization of existing track and rolling stock capacity by maximising movement in block rakes and reducing turn-round time.
5.100. In regard to non-suburban passanger traffic,outlays have been provided after taking into consideration past trends and possible growth in the next two years. Provision for suburban traffic takes into consideration the optimisation programmes of the Railways.
5.101. Full provisions have been made for completion of on-going traffic and project oriented lines. Some provision has also been made for new lines of promotional character to the extent permitted by the available resources.
69

5.102. Despite constraints on resources, the electrification projects of Virar- Sabarmati, Panskura-Haldia and Tundla-Delhi sections have been completed. By the end of the Fifth Plan, it is expected that the Madras-Trivellore section will be fully electrified while electrification of Waltair-Kirandul and Madras-Vijayawada sections would have reached an advanced stage.
5.103. Adequate provision has been made for meeting the Railways' share of the investment in Road Transport Corporations. An outlay of Rs. 50 crores has also been provided for Metropolitan Rail Transport scheme.
5.104. Outlays on the different items of the Railway Development programmes are given in Annexure 35.
Roads
5.105. Main emphasis has been on completion of spill over works of the Fourth Plan, which included a number of missing bridges and road links. It is expected that during the last two years of the Plan, work will be largely completed on such of those works which were in progress at the commencement of the Fifth Plan. Besides, provision has also been made for certain new schemes of essential character, particularly those relating to safety of the traffic.
5.106. The revised outlays for the Central programmes are given below. The figures in the brackets refer to spill over schemes.
(Rs. croras)
programmeestimated
expenditure(1974-77)
outlays(1977-79)
revised plan outlay
(0) (1) ( 2) (3)
1. national highways 176.56 151.06 327.62(1 59.79; (93.06; (252.85;
2. strategic roads 14.00 24.00 38.00( 12.00; ( 21.00; (33.00;
3. roads of inter-state and 9.24 20.76 30.00economic importance ('924; (14.76; (24.00;
4. highway research and development 0.20 1.80 2.00
5 . roads in sensitive border areas 1.00 9.00 10.00
6. special road/bridge works of national significance mainly for second Hooghly bridge at Calcutta
9.02 15.98 25.00
7. tools and plants 7.82 5.00 12.828 . total 217.84 227.60 445.44
(181.03) (128.82 ; (309.85)
70

5.107. In the State Plans also emphasis has been laid on completion of the spill over works so that investments already made fructify early. Provision has also been made for rural roads under the Minimum Needs Programme.
5.108. The likely expenditure during the first three years, 1974-77 is reckoned at about Rs. 479.32 crores and the outlays for the next two years are kept at Rs. 423.04 crores.
Road Transport
5.109. The main scheme under the Central sector road transport relates to the Delhi Transport Corporation. At the beginning of the Fifth Plan, the D.T.C. had a total fleet of 1495 buses. During the first three years, the Corporation is likely to acquire 1137 buses, including 682 buses for augmentation and 455 buses for replacement. Provision has been made for acquisition of additional 389 buses based on consideration of traffic growth and efficient fleet utilisation and for construction of additional depots and terminals. A total outlay of Rs. 29.77 crores is envisaged against the Draft Fifth Plan provision of Rs. 23.00 crores.
5.11.0. In the State sector the estimated expenditure on Road transport during 1974-77 is likely to be Rs. 197.08 crores and an outlay of Rs. 205.87 crores is provided for the next two years.
Major Ports
5.111. The traffic handled at Major Ports is expected to increase from 65.84 million tonnes in 1974-75 to about 77 million tonnes in 1978-79. The main increase is expected to be in iron ore and general cargo.
5.112. With the completion of the major spill over projects at Haldia, Madras, Visakhapatnam, Marmugao and Mangalore during 1976-77 the capacity for handling traffic in bulk commodities like iron ore, coal and fertilisers will be considerably augmented. Provision has also been made for work in connection with replacement of oil pipeline at Bombay, Salaya off shore terminal, and Kudremukh Iron ore export at Mangalore.
5.113. The draft Fifth Plan, provided an outlay of Rs. 308 crores for major ports including about Rs. 200 crores for spill-over schemes. The total outlay now envisaged is Rs. 521.46 crores including Rs. 363.55 crores for spill-over schemes.
Minor Ports
5.114. In the revised Fifth Plan, an outlay of Rs. 49.67 crores has been provided for minor ports including Rs. 27.29 crores in the Plans of States and Union Territories. The provision for Central schemes is on account of Minor Ports
71

Survey and Dredging Organisation and development of port facilities in the Andaman and Nicobar Islands and Lakshadweep.
Shipping
5.115. In view of a number of major and far-reaching developments such as decline in the import of crude oil, opening of the Suez Canal, non-materialisation of the projected coastal movement of coal, and escalation in the price of ships, the target for shipping tonnage has been reduced from 8.6 million GRT to6.5 million G RT. Details of the operative tonnage, tonnage on order and tonnage to be acquired are shown in Annexure 36.
5.116. Indian ships, whether new or old are acquired partly by the Shipping Companies out of their own resources and partly through loans granted by the Shipping Development Fund Committee (SDFC) at subsidised rates of interest. A provision of Rs. 410 crores for the Plan period has been made as against the original estimates of Rs. 243 crores.
5.117. Suitable provision has also been made for expansion of training facilities and programmes for the walfare of seamen and for loan assistance to the sailing vessels industry.
Inland W ater Transport
5.118. Outlay of Rs. 14.73 crores for next two years includes development of Rajabagan Dockyard, operations of the Central Inland water Transport Corporation and operation of river services on the Ganga. In the Centrally Sponsored programme, the provision of Rs. 5.83 crores is mainly for dredging of Cum- berjua Canal in Gda, ferry services on Hooghly, improvement of Champakara- Neendakara Canal in Kerala, and improvement of Buckingham Canal in Andhra Pradesh and Tamil Nadu.
5.119. In addition, a provision of Rs. 7.75 crores has been made for the development of Inland Water Transport in the States and Union Territories.
Light Houses5.120. As against the draft Fifth Plan provision of Rs. 12 crores for light
houses and lightships, the revised provision is Rs. 13.66 crores. Of this, the provision for 1977-79 is Rs. 6.13 crores. The revised outlay includes Rs. 6.53 crores for Salaya Decca Chain and Floating Aids for approach channel to the Salaya Off shore Terminal.
Air-lndia
5.121. One Boeing 747 aircraft joined the Air India fleet of 5 Boeing 737 and 9 Boeing 707 during the Plan period. The outlay of Rs. 38.65 crores during
72

1977-79 has been made to cover this liability as well as other supporting facilities including interim arrangements towards establishing real time computer system.
Indian Airlines
5.122. Indian Airlines have already acquired during this Plan period 611B-737 aircraft and placed orders for 3 Air Buses (equivalent to 9B-737 aircraft) which are expected to join Indian Airlines fleet shortly. The old Turboprop aircraft are also to be replaced. A total provision of Rs. 99.45 crores has been made to cover the payment liability of the aircraft acquired or to be acquired and for interim arrangements towards use of real time computer facilities.
International Airports Authority of India
5.123. A sum of Rs. 27.67 crores has been provided for the programme of IAAI in the Fifth Plan. This includes a provision of Rs. 11 crores for a new International and Cargo Terminal Complex at Bombay.
Civil Aviation Department
5.124. The provision of Rs. 65.15 crores inter alia includes outlays of aeronautical communication services and works at aerodromes. Under aeronautical communication services, provision has been made for augmentation of calibration facilities and for improving the aeronautical fixed and mobile telecommunication net work. These would further improve the safety of aircraft operation. As regards works at aerodromes, the emphsis in the Draft Fifth Plan on the development of existing aerodromes rather then the taking up of new works has been continued.
Meteorology
5.125. The Plan provision of Rs. 39.58 crores includes the completion of 2.36 M Telescope by the Indian Institute of Astro-physics. This also includes a provision of Rs. 20 crores for Monsoon 1977 experiment, Monex 1979 and INSAT programme.
Tourism
5.126. A provision of Rs. 23.62 crores has been made for the programme of Department of Tourism and that of Rs. 17.12 crores for the India Tourism Development Corporation (ITDC). The programmes under the Department of Tourism include loans to hotel industry in the private sector, integrated development of tourist resorts at Kovalam, Gulmerg, Goa and Kulu— Manali and construction of a number of youth hotels, tourists bungalows and forest lodges. The programmes under ITDC include expansion of hotels and construction of travellers' lodges, motels and cottages.
73

5.127. In the State Sector also a provision of Rs. 33.21 crores has been made for the development of tourism.
Postal Services
5.128. The Plan provision of Rs. 24.38 crores apart from covering the expenditure bn opening of upgradation of 2520 post offices during the first three years of the Fifth Plan, is expected to enable opening or upgrading of additional 3800 post offices in the next two years.
Telecommunications
5.129. The revised Plan outlay of Rs. 1129.45 crores would enable creation of additional exchange capacity of 8.42 lakh lines.
5.130. Adequate funds have been set apart for expanding the telegraph system and opening of about 45 Telex exchanges with 10,000 lines capacity.
Overseas Communication Services
5.131. The revised provision of Rs. 35.87 crores includes funds for INTELSAT Dehradun Earth Station, SPC Telex Exchange at Bombay and Indo-USSR Tropo Link. Token provisions have also been made for a wide-band submarine Link between India and Malayasian Peninsula as well as the new schemes relating to Indo-Afghan Tropo-scatter Link, Andaman Earth Station and Third Earth Station at Calcutta.
I.T.I. and Hindustan Teleprinters Limited
5.132. Adequate provision has been made for the continuing and the expansion programmes of these industries.
5.133. The statement below gives the programme-wise outlays:
Fifth Plan Outlay : Communicationsprogramme outlay
(Rs. crores)
(0 ) (1)
1. P and T Department 1153.83(i) postal services 24.38
(ii) telecommunications 1129.45
2. other communications 112.78(i) indian telephone industries 52.85
(ii) overseas communications service 35.87(iii) hindustan teleprinters limited 3.00(iv) monitoring organisation
(for radio frequency management)1.06
(v) INSAT 20.00
3 total 1266.61
74
Sound Broadcasting
5.134. The revised provision of Rs. 37.63 crores lays emphasis on completion of continuing schemes costing Rs. 32.52 crores. The balance provision is fo r initiating action for new Transmitter schemes, improvement of studio facilities, software requirements and construction of staff quarters.
Television
5.135. The revised Fifth Plan outlay for TV is Rs. 50.98 crores, of which Rs. 33.41 crores is for continuing schemes and Rs. 17.57 crores for new schemes. The new schemes include setting up of 2 transmitters of 10 KW each at Hyderabad and Jaipur and 4 low-power transmitters of 400 watts at Gul- barga, Sambalpur, Muzaffarpur and Raipur. These transmitters would serve about 40 per cent of the villages covered under the Satellite Instructional Television Experiment (SITE) programme after the termination of Experiment. For Community Viewing, provision has been made for about 3000 conventional TV sets and modificatipn of about 2400 special sets deployed under the SITE programme. The Plan also provides for software schemes to improve the quality of programme.
7. Education
5.136. Plan outlays for education during the first three years of the plan have been somewhat modest because of the economic situation but the growth in the total governmental expenditure on education, both plan and non-plan, must be considered substantial. The total expenditure is estimated to rise from Rs. 1450 crores in 1974-75 to about Rs. 2287 crores in 1 976-77.
5.137. Elementary Education : Very high priority has been given to this programme. Adequate provision has been made for additional enrolment in terms of teaching personnel and construction of class-rooms, especially in backward areas.
5.138. The table below indicates the additional enrolments, which are likely to be achieved by the end of the Fifth Plan :
75
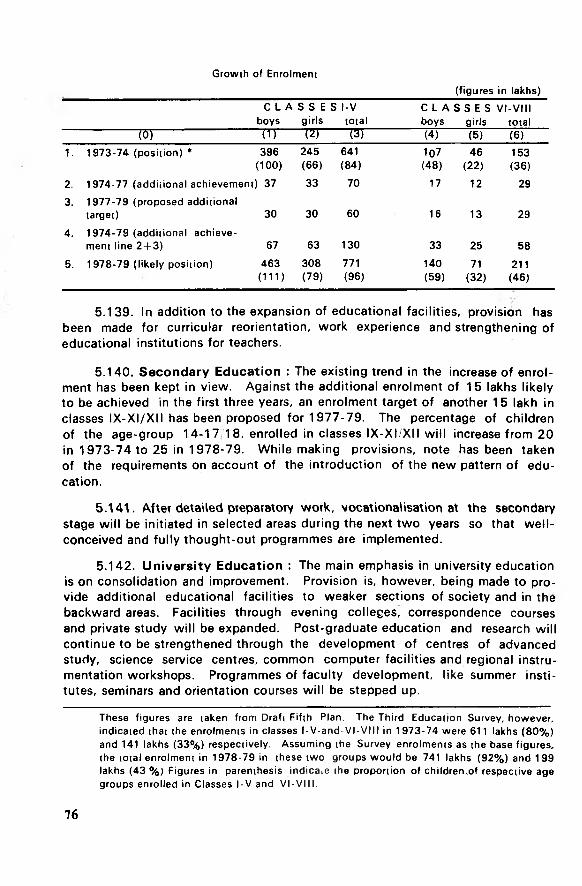
Growth of Enrolment(figures in lakhs)
C L A S S E S l-V boys girls total
C L A S S E S boys girls
V I-V IIItotal
(0) ( 1) (2) (3) (4) (5) (6)1. 1973-74 (position) * 396 245 641 107 46 153
(100) (66) (84) (48) (22) (36)
2. 1974-77 (additional achievement) 37 33 70 17 12 29
3. 1977-79 (proposed additionaltarget) 30 30 60 16 13 29
4. 1974-79 (additional achievement line 2 + 3 ) 67 63 130 33 25 58
5. 1978-79 (likely position) 463 308 771 140 71 211(111) (79) (96) (59) (32) (46)
5.139. In addition to the expansion of educational facilities, provision has been made for curricular reorientation, work experience and strengthening of educational institutions for teachers.
5.140. Secondary Education : The existing trend in the increase of enrolment has been kept in view. Against the additional enrolment of 15 lakhs likely to be achieved in the first three years, an enrolment target of another 15 lakh in classes IX -X I/X II has been proposed for 1 977-79. The percentage of children of the age-group 14-17 18, enrolled in classes IX-XI/XII will increase from 20 in 1973-74 to 25 in 1 978-79. While making provisions, note has been taken of the requirements on account of the introduction of the new pattern of education.
5.141. Aftei detailed ptepatatory woik, vocationalisation at the secondary stage will be initiated in selected areas during the next two years so that well- conceived and fully thought-out programmes are implemented.
5.142. University Education : The main emphasis in university education is on consolidation and improvement. Provision is, however, being made to provide additional educational facilities to weaker sections of society and in the* backward areas. Facilities through evening colleges, correspondence courses and private study will be expanded. Post-graduate education and research will continue to be strengthened through the development of centres of advanced study, science service centres, common computer facilities and regional instrumentation workshops. Programmes of faculty development, like summer institutes, seminars and orientation courses will be stepped up.
These figures are taken from Draft Fifth Plan. The Third Education Survey, however, indicated that the enrolments in classes l-V-and-VI-VIII in 1973-74 were 611 lakhs (80% ) and 141 lakhs (33%) respectively. Assuming the Survey enrolments as the base figures, the total enrolment in 1978-79 in these two groups would be 741 lakhs (92%) and 199 lakhs (43 %) Figures in parenthesis indicaie the proportion of children.of respective age groups enrolled in Classes l-V and VI - V111.
76

5.143 Non-Formal Education: With the strengthening of existing programmes of non-formal education, about 16 lakh participants are expected to be covered under these programmes. The existing programmes are intended to be reviewed.
5.144 Scholarships: 12,000 awards are being given every year from 1974-75 onwards, from the non-plan budget. The number of annual awards un* der the National Scholarship Scheme was 3,000 in each of the first two years of the Plan and 5000 in 1 976-77. Provision has been made to increase the number to7,000 in 1977-78 and to 10,000 in 1978-79. Provision has also been made for continuing 20 ,000 yearly national loan scholarship awards during the Fifth Plan period. The number of national scholarships for talented children from rural areas, which was 10,000 each year during 1974-77, will be increased to 15,000 per year during 1977-79; thus increasing the number of scholarships per community development block from 2 to 3. Other programmes of scholarships will be continued.
5.145. Language D eve lopm ent: Provision has been made for the appointment of 2000 additional Hindi teachers in middle and secondary schools during 1977-79, in non-Hindi speaking States. These are in addition to 4,000 teachers appointed during 1974-77. This programme will be reviewed with a view to determining its benefits. The Central Institute of Indian Languages (Mysore), the Kendriya Hindi Sansthan (A^ra), the Rashtriya Sanskrit Sansthan (New Delhi) and the Central Institute of English and Foreign Languages (Hyderabad) will be further developed.
5.146. Other Programmes : Provision has been made for strengthening the existing Nehru Yuvak Kendras and for setting up some more Kendras at approved places. While the coverage of the National Service Scheme will be expanded. National Service Volunteers Scheme is expected to be launched on a pilot basis. Facilities for games and sports, coaching camps and rural sports will be expanded. Provision 'has been made for the development of Central Libraries.
5.147. Technical Education : Generally, the emphasis is on consolidation and quality improvement in terms of faculty development, replacement of obsolete equipment and diversification of courses. Centres of studies in material science, cryogenic engineering, energy studies and ocean engineering are expected to be established in close collaboration with user agencies. Provision has been made for augmenting physical facilities at the existing Institutes of Management, and preparatory work will be started for establishment of the fourth Institute at Lucknow. Reginal Engineering Colleges and the Engineering Departments in the universities will be further developed.
5.148. Cultural Programmes : Provision has been made, inter alia, for further development of the three national academies of Sahitya, Sangeet Natak
77

and Lalit Kala, propagation of culture among college and school students, revision of district gazetteers and development of various activities of the Archa- cological Survey of India.
5.149. 20- Point-Socio-Economic Programmes : Three components of this programme are provision of books and stationery to students at cheaper rates, supply of essential commodities to hostel students at subsidised prices and expansion of apprenticeship training programme. The capacity of the textbook printing presses is being developed farther. Book banks will continue to be established in educational institutions. The coverage of apprenticeship scheme is being expanded.
5.150. Outlays : For completing the various tasks related to educational development, an outlay of Rs. 1285 crores has been provided for different sectors as indicated below :
^R ^cro res^
sub-headlikely expenditure
1974-77proposed1977-79
proposed fifth plan outlay
(0) ( 1) (2) (3)
1. elementary education 180 230 410
2. secondary education 111 139 250
3. university education 140 152 292
4. special education 9 9 18
5. other programmes 57 65 122
6. total (general education) 497 595 1092
7. technical education 75 81 156
8 . art and culture 16 21 37
9. total education 588 697 1285
In relation to the first three years, the proposed outlay in the next two years marks a considerable step-up.
8 . Health Fam ily W elfa re Planning and Nutrition
Health
Central Sector
5.151. In the draft Fifth Plan, an amount of Rs. 252.79 crores was provided for this sector. The expenditure during the first three years is likely to be Rs. 152 93 crores. An outlay of Rs. 182 90 crores has been recommended for the last two
78
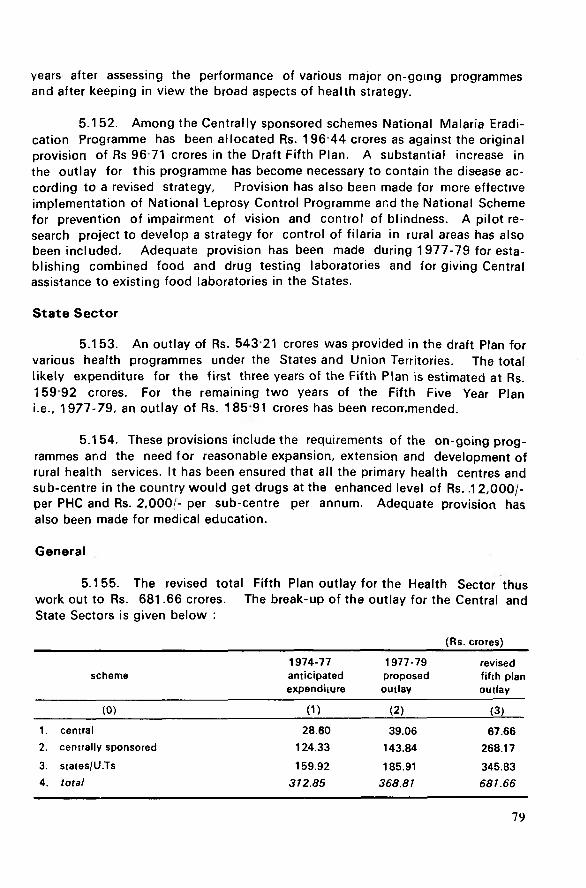
years after assessing the performance of various major on-going programmes and after keeping in view the broad aspects of health strategy.
5.152. Among the Centrally sponsored schemes National Malaria Eradication Programme has been allocated Rs. 196 44 crores as against the original provision of Rs 96 71 crores in the Draft Fifth Plan. A substantial increase in the outlay for this programme has become necessary to contain the disease according to a revised strategy. Provision has also been made for more effective implementation of National Leprosy Control Programme and the National Scheme for prevention of impairment of vision and control of blindness. A pilot research project to develop a strategy for control of filaria in rural areas has also been included. Adequate provision has been made during 1977-79 for establishing combined food and drug testing laboratories and for giving Central assistance to existing food laboratories in the States.
S ta te Sector
5.153. An outlay of Rs. 543 21 crores was provided in the draft Plan for various health programmes under the States and Union Territories. The total likely expenditure for the first three years of the Fifth Plan is estimated at Rs. 159 92 crores. For the remaining two years of the Fifth Five Year Plan i.e., 1977-79, an outlay of Rs. 185 91 crores has been recommended.
5.154. These provisions include the requirements of the on-going programmes and the need for reasonable expansion, extension and development of rural health services. It has been ensured that all the primary health centres and sub-centre in the country would get drugs at the enhanced level of Rs. .1 2 ,000/- per PHC and Rs. 2 ,000/- per sub-centre per annum. Adequate provision has also been made for medical education.
General
5.155. The revised total Fifth Plan outlay for the Health Sector thus work out to Rs. 681.66 crores. The break-up of the outlay for the Central and State Sectors is given below :
(Rs. crores)
scheme1974-77anticipatedexpenditure
1977-79proposedoutlay
revised fifth plan outlay
(0 ) (1) (2) (3)
1. central 28.60 39.06 67.662. centrally sponsored 124.33 143.84 268.17
3. states/U.Ts 159.92 185.91 345.834. total 312.85 368.81 681.66
79

Family W elfare Planning Programmes
5.156. In the draft Plan an amount of Rs. 516.00 crores was provided for programmes relating to family welfare planning. The likely expenditure during the first three years of the Fifth Plan is expected to be of the order of Rs. 237.65 crores.
5,1 57. An outlay of Rs. 259 71 crores has been recommended for the period 1977-79. The family planning programmes will be carried forward in an integrated manner along with Health Maternity and Child Health Care and Nutrition services on the basis of the strategy outlined in the draft Fifth Plan. Firm and bold steps envisaged in the National Population Policy to improve the tempo of the programme has been kept in view in recommending the revised outlays. To cope with the increasing demand for sterilisation, facilities will be expanded at 1000 selected Primary Health Centres and 325 Taluka level hospitals during1976-79. Two hundred additional post-partum centres beyond the original targets in the draft Fifth Plan are also proposed to be opened. Another unit of the Hindustan Latex Ltd. will be set up at Farakka to the meet increased demand of Nirodh. The India Population Project with SI DA/I DA assistance will be carr.pleted by the end of the Fifth Plan. Special multi-media motivation campaigns on pilot basis will be launched in Uttar Pradesh, Andhra Pradesh, and West Bengal. Maternal and child health programmes will be vigorously pursued and funds for this purpose will be made available on the basis of performance. Research and evaluation facilities will be strengthened. Funds for completion of incomplete buildings and for construction of essential buildings for Rural Family Welfare Planning Centres have been provided. 288 New Rural Family Welfare Planning Centres will be opened in a phased manner.
5.158. A total provision of Rs. 497.36 crores has been envisaged in the revised Fifth Plan. Summary of the outlays is given in the enclosed statement (Annexure 37).
Nutrition
Central Sector
5.159. Indraft Fifth Plan, an amount of Rs. 70 crores was provided in the Central Sector. Rs. 50 crores were earmarked for the Subsidiary Food and a Nutrition Scheme of the Department of Food, and Rs. 20 crores for the Applied Nutrition Programme of the Department of Rural Development.
Nutrition Schemes of the Department of Food
5.160. The likely expenditure during the first three years of the Fifth Plan is placed at Rs. 6.53 crores. Under the revised Fifth Plan an outlay of Rs. 6.70 crores has been provided during 1977-79 for production of nutritions foods. An amount of Rs. 1.27 crores has also been recommended during 1977-79 for other schemes like fortification of Food Stuffs, nutrition education through mass media.
80

Pilot Research Projects etc. An outlay of Rs. 7.97 crores has thus been recommended for 1977-79 making up a Fifth Plan provision of Rs. 14.50 crores.
Applied Nutrition Programme (Deptt. of Rural Development)
5.161. The outlay of Rs. 20 crores provided in the draft Fifth Plan was meant for providing Central assistance to the on going Applied Nutrition Blocks, opening of 700 new blocks and maintenance of post operational blocks for one year after existence for a period of five years. Due to constraint of resources in the social Services Sector only 192 blocks were set up in the first two years (1974-76) of the Plan. The likely expenditure during the first three years of the Plan is Rs. 4.48 crores. A sum of Rs. 8.51 crores has been recommended for 1977-79. The total outlay under the revised Fifth Plan works out to Rs. 1 2.99 crores.
State Sector
5.162. In the draft Fifth Five Year Plan, an amount of Rs. 330.00 crores was provided for the States and Union Territories, for the supplementary Feeding programmes, i. e.. Mid-day Meals Programme for the School going children and Special Nutrition Programme for the children in the age group of 0-6 years and expectant and lactating mothers. Likely expenditure during the first three years of the Plan is placed at Rs. 44.24 crores. The slow progress in the initial years of the Fifth Plan was mainly due to the financial constraint and non-availabiijty of funds in the non-Plan budgets of the State Governments for meeting cost of food, administration and transport for the beneficiaries. For the remaining years of the Fifth Plan adequate provision has been made from the non-Plan resources of the State for beneficiaries cf special nutrition programme at the end of the Fourth Plan. After taking into account a reasonable expansion, a provision of Rs. 43.94 crores has been recommended by Planning Commision for 1977-79. The revised outlay under the Fifth Plan thus works out to Rs. 88.18 crores. A statement showing programme-wise break-up under the revised Fifth Plan is attached (Annexure 38).
9. Urban Development, Housing and W a te r Supply
Urban Development
5.163. Provision-made in the State Plans for integrated Urban Development are being supplemented by funds provided for the scheme of Intecrated Urban Development in the Central Sector. This scheme provides loan assistance to State Governments for developing the necessary infrastructure. It is expected that over a period of time the State Governments will be able to build up a corpus of seed money for expansion programmes
5.164. Urban Development progrmmes were taken up in the three metropolitan cities of Callcutta, Bombay and Madras and nine other cities in 1974-75.
81

Additional six cities were taken up in 1975-76 and it is expected that six more will be taken up during 1976-77. Work for the preparation of Plans for some other cities is in hand
5.165. In the view of the progress made so far, total provision of Rs. 256.13 crores has been made for Urben Development for next two years against a likely expenditure of Rs. 249.33 crores during 1974-77, as indicated in Annexure 39.
Housing
5.166. The main thrust of the programmes in the Fifth Plan is directed towards ameliorating the conditions of the backward sections of the society. This is sought to be achieved by augmenting the programmes for the construction of housing colonies by State Housing Boards and by taking up on a large scale a programme for the provision of house-sites for landless labourers in rural areas. While the bulk of this programme is being undertaken in the State Plans, the activities of the Housing and Urban Development Corporation in the Central sector is being geared up to meet the expanding demand. A provision is being made to increase the Equity participation in HUDCO to enable it to generate resources of the order of Rs. 150 crores in the Fifth Plan period. Separate provisions have been made for the scheme of subsidised housing for plantation labourers and Dock labourers. Adequate emphasis has also been placed on research and development activities for generating better and cheaper designs. The outlays for various programmes in the State and Central sectors have been indicated in Annexure 40.
W ater Supply and Sanitation
Rural W ater Supply
5.167. The main objective is to provide safe water supply in difficult and problem villages. At the end of the Fourth Plan period, it had been estimated that there were 1.13 lakhs of such villages. It is expected that in the first three years of the Fifth Plan with a provision of Rs. 201.10 crores, about 57,800 villages would have been covered. The allocation made for the remaining two years is on the basis of providing safe water supply for additional 53,900 villages. The provision which has been made is of the order of Rs. 180.14 crores (inclusive of Rs. 157.87 crores under the MNP). The revised Fifth Plan outlay would now be Rs. 381.24 crores.
Urban W ater Supply and Sanitation
5.168. Particular emphasis is being laid on completion of spill over schsmes. In rhe first three years with an investment of Rs. 257.54 crores, about 266 towns are likely to be covered with water supply and 46 towns with sewerage and drainage systems. With an outlays of Rs. 281.63 crores for the remaining two years of the Fifth Plan, about 254 towns are likely to be covered with water supply and 38 with sewerage and drainage systems. The outlay mentioned above will be supplemented from the Central sector scheme of Integrated Urban Development
82

in cities of national importance such as Bombay, Calcutta, Madras, Hyderabad, Ahmedabad, Bangalore, Kanpur, Lucknow, Agra, Allahabad, Varanasi, etc. The outlay in the Fifth Plan amuunts to Rs. 539.17 crores against the outlay Rs.431.00 crores in the Draft Fifth Plan.
5.169. The revised Fifth Plan also provides for an outlay of Rs. 10.27 crores for supporting programmes such as public Health Engineering training to train about 3000 Public Health Engineering personal and mechanical composting to set up 27 mechanical compost plants along with 60 mechanical sieve plants in different cities. A provision also exist for converting about 30,000-35,000 dry latrines into sanitary latrines.
5.170 The revised outlays for water Supply and saintation are given in Annexure 41.
10. C raftsm an Training and Labour W elfare
Central Plan
5.171. In the draft Fifth Plan, an amount of Rs. 14.57 crores was provided in the Central Plan. The likely expenditure during the first three years of the Fifth Plan is placed at Rs. 4.01 crores.
5.172. For the two year period 1977-79 a provision of Rs. 10.17 crores has been made. This will cover (i) the requirements of the major on-going training institutions such as the Central Staff Training and Research Institute, the Foreman Training Institute, and the Central Training Institutes lor instructors ; (ii) the strengthening/extension of the Advanced Training Institute; (iii) the expansion of the Apprenticeship Training programme ; (iv) Vocational Training in Women's occupations ; and (v) Sche.nes relating to research, surveys and studies to be undertaken by various institutes.
Plans of States Union Territories
5.173. In the draft Fifth Plan, an amount of Rs. 42.37 crores was provided for States and Union Territories. The likely expenditure during the first three years of the Plan is placed at Rs. 15.69 crores.
5.174. For the two year period 1977-79, an outlay of Rs. 20.27 crores has been suggested keeping in view the requirements of (i) the industrial training institutes ; (ii) the expansion of the Apprenticeship Training Programmes in the establishments ; (iii) the strenghtening of the employment service organisations;(iv) the setting up of labour welfare centres, and promoting safety measures; and(v) the Employees' State Insurance Scheme.
83

Revised Fifth Plan Outlays for Craftsmen Training and Labour Welfare.
draft fifth five year plan
1974-77anticipatedexpenditure
1977-79proposedoutlay
(Rs. lakhs) revised fifth plan outlay
(0 ) ( 1) ( 2) (3) (4)
centre 1457 401 1017 1418
state 3751 1407 1685 3092
union territories 486 162 342 504
total 5694 1970 3044 5014
11. Hill and Tribal Areas, B ackw ard Classes Social w e lfa re and Rehabilitation
Hill Areas
5.175. This scheme refers to the hill regions of Assam, Tamil Nadu, U.P., West Bengal and the Western Ghats region. Programmes of significance are funded party from the State Plan and partly from the sub-plan allocations. During the fisrt three years of the Plan, Central allocations would be of the order of Rs. 76 crores while the States are likely to invest about Rs. 68 crores.
5.176. With the experience gained so far, the programme is now expected to gather momentum. A provision of Rs. 94 crores is earmarked for the next two years in the Central Plan.
Tribal Areas
5.177. Tribal sub-plans incorporating programmes of particular significance to the tribal economy are being prepared for areas, with large concentration of Scheduled Tribes, in 16 States and 2 Union Territories. These programmes are funded through provisions in the State Plans, and Central assistance. So far about 40, out of 145 Integrated Tribal Development projects have been formu' lated and an amount of Rs. 65 crores is likely to be spent during the first three years of the Plan.
5.178. Initial difficulties are now expected to be overcome and it is expected that the rest of the ITDPs would be formulated and implemented in the remaining period of the Fifth Plan. On this basis, a provision of Rs. 125 crores of Central assistance is being made for the next two years.
5.179. Priority has been accorded to regional Schemes of agriculture, power
84

and communications forwarded by NEC for securing a balanced development of the north-eastern region. It is expected that in the first three years an expenditure of Rs. 28 crores would be incurred on such schemes. Due to initial difficulties in identifying and implementing schemes, the programme has had a slow start. It is, however, now gathering pace. A provision of Rs. 62 crores has been kept for the next two years.
5.180. A statement below :
indicating the outlays for these programmes is given
(Rs. crores)anticipated outlays totalexpenditure for fifth1974-77 1977-79 plan
(0 ) (1) (2) (3)1. hill areas 76 94 1702. N.E.C. 28 62 903 . tribal areas 65 125 1904. total 169 281 450
W elfare of Backward Classes
5.181. The revised Fifth Plan outlays for the Centre and the States have been raised to Rs. 119 crores and Rs 208 crores respectively. The details are given in Annexure 42.
In the Central Plan, emphasis has been placed on post-matric scholarships, schemes lor coaching of students and gills' hostel. In the State Plans, provision has been madh inter-alia for educational incentives, subsidised housing, various agricultural programmes and requirement of development Corporations.
Social W elfare
5.182. The revised Fifth Plan outlays for the Centre and States are Rs. 63.53 crores and Rs. 22.60 crores respectively. Details are given in Annexure 43.
5.183. These outlays are related to the progress reported in the implementation of the various schemes. Care has been taken to ensure that important programmes like Intergrated Child Care Services, Working Girls Hostels, Scholarships for Handicapped Persons in the Central Sector and women and child w elfare Programmes and Programmes of Social Defence in the State sector are provided adequate funds.
Rehabilitation
5.184. The Draft Fifth Plan envisaged the resettlement of 65827 families.
85

This figure has now been reassessed at 67827 familes. It is expected that against an overall expenditure of Rs. 47.62 crores in the first three years of the Plan, 55767 families would have been recently resettled. The outlays for the next two years of the Fifth Plan are based on the following considerations :
(i) Sri Lanka : Of the expected 28,434 families, 16,434 have so far been resettled at a cost of Rs. 14.17 crores. It is expected that 12,000 families would be resettled during the next two years at an approximate cost of Rs. 1.4 crores.
(ii) Dandakarnaya : Of the 9120 families in camp, 3120 have been resettled in the first three years at an approximate cost of Rs. 13.54 crores. It is expected that 6000 families would be resettled in the remaining period of the Plan at an approximate cost of Rs. 12 crores. Besides the direct cost of resettlement, the outlays include expenditure on major irrigation projects and other infrastructure development.
(iii) Residual problems o f rehab ilita tion in W est Bengal : Onthe basis of the recommendations contained in the report of the working Group set up by the Department of Rehabilitation, a provision of Rs. 10.20 crores has been made. This is based on an assessment that besides acceleration of the SFDA/MFAL programmes in areas where these migrants were concentrated and outlays required for the provision of medical facilities, 8000 plots in the colonies of displaced persons located in the Calcutta Metropolitan District and 4000 other urban plots would be developed.
(iv) O ther Schemes : With regard to progammes for the resettlement of repatriates from Burma, West Pakistan, Uganda, Zaire and migrants from Indian enclaves in former East Pakistan, an expenditure of Rs. 17.73 crores has been incurred in the first three years of the Plan, to resettle 15843 families, it is expected that in the remaining two years 11300 families would require resettlement for which a provision of Rs. 17.50 crores has been made.
5.185. Scheme-wise outlays provided in the Fifth Plan are given in Annexure 44.
86

12 . Science and Technology
5.186. In finalising the Fifth Five-Year Plan for Science and Technology (S&T) an attempt has been made to restructure research programmes as far as practicable into projects with predetermined time spans, costs and expected benefits. In a departure from previous practice, the S&T programmes of the different Ministries were the subject of separate discussions at which emphasis was placed on aligning research programmes to conform more closely with plan priorities and promoting quicker interaction between the users of research and the research agencies, so that problems are more sharply defined and transfer of technology is facilitated.
5 187. Particular attention is expected to be paid to fuller use of existing facilities, avoiding of unplanned duplication of research into similar problems by different agencies, minimising sub-critical funding by spreading resources over too many projects, and closer monitoring of research programmes right up to the stage of their application in the field.
5.188. The thrust of the various sectoral programmes broadly remain as outlined in the draft Fifth Plan. In agriculture, specific emphasis will be placed on programmes to control crop diseases crop sequencing, dry farming, agricultural implements, post harvesting technology etc. New agro-industrial complexes, setting up of a fish farm and increased support to agricultural institutes, animal sciences and fisheries institutes are envisaged in the Plan. Programmes for improving the technology used In village and rural industries are proposed to be intensified. Activities proposed cover beekeeping, pottery, palm gur, gur and khandsari. To acquire a closer insight into the problems of optimal management of water resources, a n . Institute of Hydrology is proposed to be set up. Steps will be taken to see that central R & D irrigation schemes are not sub- critically funded and a mechanism is set up to see that research findings are expeditiously applied in the field.
5.189. In the area of energy, a multi-pronged approach to develop biogas technology, as well as new sources such as solar energy, tidal and wind power has been initiated. A major programme on magnet hydro dynamics is being undertaken as an inter-institutional project. Programmes for improved mining techniques, mine safety, transportation and gassification of coal have been given priority. Programmes for developing storing materials, improved instruments, and processes for upgrading coal are being funded.
5.190 In power engineering, test facilities, specially those connected with high voftage/DC transmission lines have been given special attention. No
87

significant departures from the draft Fifth Plan programmes have been proposed in the research programmes of the Department of Atomic Energy except for the power reactor fuel reprocessing plants and investment in facilities for making seamless steel tubes for ball bearings and power plants.
5 191 In steel, the major thrust in use of S8T has been to improve the productivity and capacity utilisation of the steel plants utilise low grade materials improve refractory quality, develop new alioys and work on new techniques for making sponge iron. A wide range of chemicals particularly pesticides, drugs, and intermediates hitherto imported, is being developed by several institutions, in particular by CSIR laboratories and the public sector companies in these fields. In heavy engineering, the setting up of a research institute for welding deserves special mention.
5 192. Special emphasis is being paid to surveying and research on deve- ping the country's natural resources. The programmes of bodies such as the National Remote Sensing Agency, geological and other surveying agencies and National Institutes of Oceanography have been given high priority. These are being supplemented by the programme of the Department of Space for launching satellite with remote sensing capabilities and institutional research facilities for petroleum exploration and reserve studies. Tree breeding and prevention of disease in important species have been given special attention. In meteorology, apart from, strengthening the existing institutes, a major new programme is India's participation in Monsoon 77 in collaboration with USSR and Monex (monsoon experiment) as a part of a world-wide study of the factors which affect the weather. Provision has been made for INSAT-1,the proposed Indian-owned geo-synchronous satellite which will provide a variety of meteorological data.
5.193. In hearth, the focus has been placed on research into new methods of family planning, integrated system for delivery of health care services to infants, and control and prevention of communicable diseases including malaria, tuberculosis and cholera.
5.194. The priority area in housing and urban development is the development of new low cost housing designs and materials, rural sanitation and waste water treatment. Agencies concerned with environmental protection have been given due attention.
5.195. In the area of electronics, substantially more funds will be given to various institutions for research in the indigenisation of a large variety of electronic components. In addition, the Department of Electronics will establish major multi-user regional computer centres m certain metropolitan cities and set up a corporation for making semi-conductor devices. Support will be given to developing the infra-structure for electronic standards and .testing techniques at various institutes like NPL and the national test houses. The Department has already established corporation for maintaining computers developing trade and
88

technology in electronic items. Tele-communication research will concentrate on indigenising many of the component hitherto imported and development work on electronic communication system, the major emphasis being on instruments, transmission system and exchange equipment. An Asian Telecommunication Training Centre is proposed to be set up at Ghaziabad.
5.196. The major efforts in space research will be to gear up research work and develop components to enable a series of variants of the SLV III launcher being produced and more advanced satellites being launched in collaboration with other countries. The proposed INSAT-1 which, in addition to meteorological equipment will have various tele-cummunication and other capabilities, will give added relevance to these programmes.
5.197. Under the Department of Science & Technology, plans have been finalised for making a beginning with the national Information system on science and technology (NISSAT). Provision has been made for the manufacture of fernites and electronic ceramics by a new company and for a substantial step-up in funds for sponsored projects under the science and Engineering Research Council.
5.198. Considerable effort is proposed to be put into developing new instruments for operation, process control, measurement and research by a variety of agencies. Coordinating inputs are proposed to be provided by the Instrument Development Division of the Department of Science & Technology.
5.199. Testing facilities under agencies like the National Test House and Indian Standards Institution will be strengthened.
5.200. In order to stimulate indigenous research, industrial licensing regulations have been liberalised in the Gase of industries which are proposed to be set up based on R&D developed in-house or by national laboratories. The question of levying R&D cess is under consideration.
5.201 A Department wise distribution of the outlays for Science and Technology is indicated in Annexure 45. A provision of Rs. 5 crores has been included in the outlays of each of the Ministries of Information & Broadcasting and Tourism & Civil Aviation (Meteorology) for INSAT.
89

Vh-1. Resolution o f the National Development Council on Pow er and Irrigation Systems
Resolution on Power and Irrigation Systems
Heavy investments have been made by the country in irrigation and power system and it is certain that these sectors will, in the forseeble future, continue to absorb a large share of plan resources. It is, therefore, a matter of prime importance that these sectors should no longer be a burden on the States' finances but should contribute something to them.
In the case of power systems, while there is scope to raise tariffs, the improvement in financial results should come largely from a higher level of utilisation of the existing' capacity, particularly thermal povver plants, reduction in overheads and operating expenses, reduction in transmission and distribution losses, better collection of dues, prevention of theft and timely completion of projects. In addition, full advantage should be taken of the opportunities for the exchange of surplus power between States and regions and for integrated operation of hydel and thermal plants so that capacities are optimally utilised.
The major opportunity for covering expenses and increasing revenues in irrigation projects lies in raising water rates whenever they are far below the cost. There is also considerable scope for improved management of the irrigation systems and for ensuring that projects are implemented on schedule.
Taking note of the above -
The National Development Council hereby resolves that irrigation systems should cover working expenses and yield, if possible, something more and that power systems should cover working expanses and yield reasonable returns on investment by taking steps expeditiously to-
(1 ) fnake maximum use of the capacity already created in the power and irrigation systems,
( 2 ) reduce costs by cutting overheads and operating expenses, minimising losses and thefts and improving collection of dues,
(3 ) complete projects on schedule through efficient project management,
(4) raise rates where necessary.
90

2 .Resolution o f the National Development Council on the F ifth Five Year Plan
Fully considering the Draft of the Fifth Five Year P|an as finalised;
Re-affirming the objectives of self-reliance and removal of poverty;
Noting, the effective steps taken to curb the inflationary tendencies;
Endorsing the emphasis on Agriculture, irrigation, energy and related core sectors; and
Appreciating the strength and purposiveness of the Nation in its desire to implement the new Economic Programme;
Realising the continued need for maximising return on the massive investments made and the imperative necessity for mobilising resources;
The National Development Council at its meeting in September 1976 hereby adopts the Fifth Five Year Plan; and
Appeals to all sections of the people to cooperate in the national effort to fulfil the targets set out in the Plan.
91

VII. ANNEXURES

ANNEXURE1
Systematic Hydrogeological (as on 1.1.1975)
Survey(Chapter II, Para 2.9)
region/state coverable area in survey 9 a psq. km. completed ( 1- 2 ) (% )
(0 ) ( 1) ( 2) (3) (4)
1. northern region2. Uttar Pradesh 271293 170070 101223 37.33. north western region4. Jammu and Kashmir 24926 10550 14376 57.65. Delhi 1485 1483 2 0.16. Punjab 50362 41715 8647 17.27. Haryana 44222 40190 4032 9.28 . Chandigarh 115 115 — 0.09. Himachal Pradesh 19453 3900 15553 79.9
10. western region-11. Rajasthan 342214 239515 102699 30.012. Gujarat 195984 69175 126809 64.713. eastern region14. Bihar 173876 43870 130006 74.715. West Bengal 87743 72140 15603 17.816. Orissa 155782 34845 117939 75.717. Andaman and Nicobar 8293 2200 6093 73.418. north eastern region19. Assam 78523 21820 56703 72.220. Meghalaya 22489 50 22439 99.721. Arunachal Pradesh 48738 20 48718 99.922. Tripura 10477 2550 7927 75.623. Nagaland 14367 600 13767 95.824. Mizoram 21496 625 20871 97.025. Manipur 21087 21087 100.026. central region27. Madhya Pradesh 442841 78730 364111 82.228. Maharashtra 307762 60240 247522 80.429. Goa, Diu and Daman 3813 2275 1538 40.330. southern region31. Andhra Pradesh 276811 96720 180094 65.032. Tamil Nadu 128769 45975 82794 64.233. Pondicherry 480 — 480 100.034. Kerala 38759 20080 18679 48.135. Laccadive Islands 32 - 32 100.036. Karnataka 191773 38720 153053 79.837. total 2983968 1101173 1882795 63.0
95

Status of Geological Mapping in India (1;63360/50,000; fas on 1.1.1975;
ANNEXURE 2(Chapter II, Para 2.22)
states/union territories area of the area mappedstate (sq. kmj sq. km. _ %
(0 ) (1) (2) (3)
1. Assam 99610 39857 40.012. Meghalaya 22489 1140 5.073. Arunachal Pradesh 81424 2015 2.484. Mizoram 21090 352 3.055. Nagaland 16527 316 1.916 . Manipur 22356 552 2.377. Tripura 10477 3419 32.638 . Andaman and Nicobar 8293 — 0.009. West Bengal 87853 57770 65.76
10. Bihar 173876 116443 66.9711. Orissa 155842 109767 70.4312. eastern region 699837 331631 47.3913. Uttar Pradesh 294413 60352 20.5014. Jammu and Kashmir 222236 59913 26.9615. Delhi 1483 984 66.3516. Punjab-Haryana 94699 27794 29.3517. Himachal Pradesh 55673 25302 45.6118. northern region 668504 174435 26 .0919. Madhya Fradesh 442841 325544 73.5120. Maharashtra 307762 51057 16.3921. Goa, Diu and Daman 3813 0.0022. Rajasthan 342214 244538 71.4623. Guiatai \ 95984 1908A 9.7424. western-central region 1292614 640220 49.5325. Andhra Pradesh 276814 141287 51.0426. Tamil Nadu 130069 115310 88.6527. Pondicherry 480 373 77.7128. Kerala 38864 31024 79.8329. Karnataka 191773 87879 45.8230. Laccadive 32 — 0.0031. total 638032 375873 5 9.9132. southern region 3298987 1522159 46.14
96

ANNEXURE 3(Chapter II, Para 2.23)
Estimates of Recoverable Reserves as Percentage of Total Reserves of Major Industrial Minerals from known In situ Reserves (as on 1.1.1 975)
mineralsrecoverable reserves as percentage
of total reserves
( 0 ) ( 1 )
1. coking coal (prime) 30.0
2 . non-coking coal 50.0
3. crude oil N.A.
4. iron o re
(a) hematite 90.0
(b) magnetite 34.0
5. manganese ore 70.0(a) low grade 87.0(b) medium grade 82.1(c) high grade 56.4
6 . chromite 80.0
7. nickel ore1 0.85
8 . bauxite 90.0
9 copper ore1 1.36
10. lead ore1 2.66
11. zinc ore1 2.32
12. rock phosphate 50.0
13 limestone 80.0
14 dolomite 80.0
15 barytes 77.6
16 kyanite N.A.
17 asbestos N A
18 magnesite 11.5
19. mica N.A
'In terms of metal contant
97

ANNEXURE4(Chapter II, Para 2.27)
Growth Rate in Gross Domestic Product at Factor Cost1 (1961-62 to 1973-74)
sector growth rate (per cent)
( 0 ) ( 1 )
1. agriculture and allied 2.07
2. mining and quarrying 4.04
3. manufacturing (total) 4.21
4. manufacturing (registered) 4.95
5. manufacturing (unregistered) 2.89
6. construction 4.80
7. electricity, gas and water supply 9.90
8. railways. 3.27
9. other transport 5.16
10. other services 4.35
11. total 3 .40
Estimated from a semi-log regression against time. cource : C.S.O Estimates
98

Rate of Growth of Gross O’Jtput and Gross Value Added over the Fifth Plan Period by Sectors and Sub-Sectors and Sectoral Composition of
Gross Value Added in 1973-74 and 1978-79(per cent)
ANNEXURE 5(Chapter III, Para 3.6)
rate of growth composition of gross
sector/sub-sector gross gross value added atoutput value •1973-74 prices
added 1974-75 1978-79
(0 ) ( 1 ) (2 ) (3) (4)
agriculture 3.94 3 .34 50 .78 48.15
1. foodgrains 3.62 2.47 21.50 19.58
2 . other field crops 3.94 3.70 21.68 21.00
3 . animal husbandry and fishing 4.27 4.26 6.09 6.06
4. plantations 3.33 3.31 0.32 0.31
5. forestry 4.70 4.70 1.18 1.20
mining and manufacturing 7.10 6.54 15.78 17.49
(a) mining 12.58 11.44 0.99 1.37
6. coal 9.38 8.75 0.55 0.67
7. iron ore 9.54 9.35 0.08 0.10
8. crude petroleum 14.68 13.76 0.21 0.33
9. other minerals 18.38 17.52 0.15 0.28
( 6 ) manufacturing 6.92 6.17, 74 79 16.11
( t) food products 4.63 3.73 2.13 2 07
10. sugar and gur 4.85 4.55 0.30 0,31
11 . vegetable oils 6.62 6.33 0.29 0.31
12. tea and coffee 3.16 2.92 0.11 0.10
13. other food products 4.23 3.06 1.43 1.35
(/'/') textiles 3.45 3.21 3.50 3.31
14. cotton textiles 2.85 2.62 2.02 1.86
15. jute textiles 3.54 3.54 0.31 0.30
16. other textiles 4.36 2.50 0.17 0.15
99

(Contd.)
(0)_______________ 0 ) (2) (3) (4)
17. miscellaneous textiles products 4.62 4.38 1.00 1.00(H i) wood and paper products 6.75 4.90 0.58 0.59
18. wood products 5.49 5.19 0.52 0 5 4
19. paper and paper products 8.13 2.25 0.06 0.06(/V) leather (t rubber products 5.50 2.47 0.16 0.15
20. leather products 4.76 2.56 0.05 0.05
21. rubber products 5.79 2.43 0.11 - 0.10(v) chemical products 10.84 10.46 1.84 2.44
22. fertilisers 22.26 21.91 0.30 0.64
23. inorganic heavy chemicals 10.26 9.84 0.20 0.2624. organic heavy chemicals 11.06 10.48 0.06 0.08
25. plastics and paints 10.35 8.74 0.10 0.12
26. cosmetics and drugs 4.89 5.00 0.22 0.22
27. man-made fibres 5.14 2.73 0.04 0.04
28. other chemicals 7.35 7.55 0.93 1.08
(vi) coat and petroleum products 7.63 7.90 0.23 0.27
29. miscellaneous coal products 10.69 9.93 0.09 0.12
30. petroleum products 6.96 6.45 0.14 0 1 5(v ii) non- metallic miners/
products 7.40 7.33 1.58 1.82
31. cement 7.19 7.13 0.18 0.21
32. refractories 7.69 7.43 0.05 0.06
33. other non-mstallic minerals products 7.43 7.35 1.35 1.55
(v iii) basic metals- 14.12 13.40 1.09 1.65
34. iron and steel 11.31 11.21 0.79 1.00
35. non-ferrous metals 18.38 18.35 0.31 0.57(;* ) metal products 5.60 4.64 1.08 1.09
36. bolts and nuts 7.24 7.16 0.05 0.06
37. metal containers 8.30 5.68 0.05 0.06
38. other metallic products (x) non-electrical engineering
5.27 4.44 0.98 0.98
products 8.40 7.99 0.61 0.73
100

(Contd.)
(0 ) (1) (2) (3) (4)
39. ball bearings 6.62 6.02 0.05 0.0540. office and domestic equipment
10.19 8.74 0.06 0.0741. agricultural implements 4.97 3.95 0.11 0.1042. machine tools 11.03 11.04 0.11 0.1543. other machinery 8.66 8.30 0.30 0.36
(*/') electrical engineeringproducts 7.64 6.42 0.60 0 .67
44. electrical motors 6.39 4.94 0.06 0.0645. electrical wires 8.03 3.92 0.12 0.1146. electronics 10.45 7.57 0.05 0.0647. batteries 5.88 5.61 0.05 0.0548. electrical household goods 6.40 4.29 0.05 0.0549. radios 4.82 4.31 0.05 0.0550. telephone & telegraphic
equipment 4.91 4.12 0.04 0.0451. other electricals 9.67 9.52 0.19 0.24
(x ii) transport equipments 3.73 3.12 0.96 0 .9052. motor cycles 7.40 5.78 0.06 0.0653. motor vehicles 2.53 2.53 0.30 0.2754. ships and boats 6.39 6.36 0.03 0.0455. aircraft 6.43 6.27 0.04 0.0456. railway equipment 3.00 1.89 0.40 0.3657. other transport equipment 5.17 4.99 0.13 0.13
(x iii) instruments 5.39 4.45 0.03 0.0358. watches and clocks 5.08 3.43 0.01 0.0159. miscellaneous scientific
instruments 5.51 4.82 0.02 0.02(xiv) miscellaneous industries 6.75 4.42 0.38 0.38
60. other industries 6.58 2.42 0.24 0.2161. printing 7.21 7.38 0.14 0.17
III. electricity 10.12 8.15 0.79 0.9462. electricity 10.12 8.15 0,79 0.94IV. construction 5.90 5.18 4.06 4.2163. construction 5.90 5.18 4.06 4.21
V. transport 4.79 4.70 3.43 3 .4864. ra ilways 4.63 4.44 1.02 1.0365. other transport 4.91 4.80 2.40 2.45VI. services 4.88 4.80 25 .16 25 .73oe. services 4.88 4.80 25.16 25.7367. total 4.37 100.00 100.00
101

Projections of Physical Output Levels in 1978-79
for Selected Items
ANNEXURE 6(Chapter III, Para 3.8)
item unit 1973-74 1978-79
(0) ( 1) (2 ) (3)
foodgrains and other agriculture
1. foodgrains m. t. 104.7 125
2. sugarcane m. t. 140.8 165.0
3. cotton lakh bales (each of 170 kgs.)
63 1 80 0
4 . jute & meSta lakh bales
(each of 180 kgs.)76.8 77.0
5. oilseeds lakh tonnes 93 9 1206 . coal m. t. 79 0 124.0
7. iron ore m. t. 35.7 56.08 . crude petroleum m. t. 7.2 14.18
f ood products9. sugar m. t. 3.95 5.4
10. vanaspati th. t. 449 610
textiles11. cotton yarn m kgs. 1000 1150
12. cotton cloth
mill sector nv. mis 4083 4800decentralised sector m. mts. 3863 4700
13. jute manufactures th. t. 1074 1280
paper and paper products
14. paper and paper board th t. 776 105015. newsprint th. t. 48 7 80.0
leather and rubber products
16. leather footwear m pairs 14.6 18.017. automobile tyres m. nos. 4.66 8 018. bicycle tyres m. nos. 24.03 30.019. rubber footwear m. pairs 38.8 50.0
petroleum products
20. petroleum products (includinglubricants) m. t. 19.7 27.0
102

(0) (1) (2) (3)
chemical products
21. nitrogenous fertilisers (N) th. t. 1058 290022. phosphatic fertilisers (P2O5) 319 77023. sulphuric acid 1343 270024. caustic soda 419 61025. soda ash 480 71026. methanol 23 5027. synthetic rubber 23.3 4028. DDT 3.9 4.429. B.H.C. 21 2830. rayon filament 37 4031. rayon staple fibre 62 10032. rayon tyre cord 16.9 2033. nylon filament and staple 11.3 1734. polyester filament and staple 15.1 24.035. acrylic fibre — 636. D.M.T. 4.2 24.037. nylon tyre cord
non-metallic mineral products2.2 6.0
38. cement m. t. 14.67 20.839. refractories
basic metats
th. t. 710 1020
40. pig iron for sale m. t. 1.59 2,5041. mild steel 4.89 8.8042 tool, alloy 8- special steel th. t. 339 57043. aluminium ■ * 147.9 310.044. copper 12.7 37.045. zinc
metal products
20.8 80.0
46. steel castings th. t. 67 10047. steel forgings 97.3 130
non-electrical engineering products48. ball & roller bearings m. nos. 24.4 34.049. dumpers & scrapers nos. 215 45050. crawler tractors nos. 278 45051. road rollers 1566 120052. agricultural tractors th. nos. 24.2 55.053. machine tools 1 Rs. m. 673 130054. cotton textile machinery 458 130055. coal & other mining machinery1 62.3 20056. cement machinery1 81 150
103

(Contd.)
(0) (1) (2) (3)
57. sugar machinery! Rs. m. 223 40058. printing machinery1 •• 9.3 6059. rubber machinery1 " 14.5 10060. paper and pulp machinery1 51.7 28061. type writers1 th. nos. 33.7 6062. sewing machines1
electrical engineering products257 415
63. hydro turbines m. kw. 0.7 1.464. thermal turbines , , 1.4 2 565. electric transformers m. kva. 12.42 20.066. electric motors m.H.P. 3.24 4.567. A.C.S.R. and A.A. conductors th.t. 46.4 90
68. dry batteries m. nos. 654 800.69. storage batteries2 th. nos. 1293 1500
70. electric bulbs m. nos. 120.6 18071. flourescent tubes
transport equipmentm. nos. 12.7 20
72. passenger cars th. nos. 44.2 3273. commercial vehicles •• 42.9 6074. motor cycles, scooters & mopeds 150.7 32075. diesel locomotives numbers 145 160
76. electric locomotives 50 7077. railway coaches •* 1308 120078. railway wagons th. nos. 12.2 1579. bicycles*
electricity
»• 2575 3000
80. electricity generation GWH 72 116-117
81. originating traffic in railways m. tonnes 260
1 Actual production in 1973-74 is at current prices and the projections of output are at 1974-75 prices.
2 Organised sector only.
104

ANNEXURE 7 (Chapter IV. 1, Para 4.4)
Estimate of Financial Resources for the Fifth Plan-Centre1(Rs. crores)
first next revised3 years. 2 years. Fifth Plan,1974-77 1977-79 1974-79
(0 ) (1) (2) (3)
1. domestic budgetary resources 9144 10254 19398
1. balance from current revenues 1768 285 2053at 1973-74 rates of taxation
2. gross surplus of public enter 761 791 1552prises at 1973-74 fares and freights(a) railways -1 0 0 5 - 8 1 3 1818(b) posts and telegraphs 181 199 380(c) others 1615 1375 2990
3. market borrowings (net) 1799 1947 37464. small savings 233 310 5435. state provident funds 601 568 11696 . miscellaneous capital receipts 559 1663 2222
(nets)7. additional resource mobilisation 3393 4120 7513
(net of state's share)(a) 1974-75 measures 2601 2182 4783(b) 1975-76 measures 515 606 1121(c) 1976-77 measures 277 552 829(d) 1977-79 measures — 780 780
8 . borrowings against utilisation — 600 600of foreign exchange reserves
II. external assistance (net)(a) other than oil & special credits 2526 1 2400 ] 5834(b) oil and special credits 908 i
III. deficit financing 754 600 1354IV. aggregate resources 13332 13254 26586V. assistance for state plans —3131 —2869 -6 0 0 0
VI. total resources for the plan 10201 10385 20586
1 Separate estimates of resources for the Centre and States were not worked out at the time of formulation of the Fifth Plan.
105

ANNEXURE8 (Chapter IV. 1, Para 4.4)
Estimates of Financial Resources for the Fifth Plan—States1(Rs. crores)
first 3 years, 1974-77
next 2 years, 1977-79
revised Fifth Plan,
1974-79
(0) (1) (2) (3)
1. balance from current revenues at 1973-74 rates of taxation
1570 1278 2848
2. gross surplus of public enterprises at 1973-74 fares and tariffs
— 167 - 5 3 6 — 703
(a) state electricity boards — 48 — 420 —468(b) road transport corporations - 1 3 4 — 114 —248(c) others + 15 — 2 + 1 3
3. market borrowings of state govts, public enterprises and local bodies (net)
1231 902 2133
4. small savings 859 620 14795. state provident funds 449 369 8186. term loans of financial institutions (net) 340 28 8 62 8
(a) from LIC 353 298 651(b) from RBI 42 45 87(c) from REC 191 142 333(d) less ; repayments to financial
institutions—246 — 197 — 443
7. miscellaneous capital receipts — 1115 —551 — 16668. share in addl. resources mobilisation
by centre380 601 981
(a) 1974-75 measures 143 120 263(b) 1975-76 measures 205 283 488(c) 1976-77 measures 32 78 110(d) 1977-79 measures — 120 120
•9, addl. resource mobilisation by states 2517 3682 6199(a) 1974-75 measures 1732 1633 3365(b) 1975-76 measures 545 756 1301(c) 1976-77 measures 240 592 832(d) 1977-79 measures — 701 701total resources 6064 6653 12717
11. assistance for the state plans 3131 2869 600012. aggregate resources for the plan 9195 9522 18717
1 Separate estimates of resources for the Centre and States were not worked out at the time of the formulation of the Fifth Plan.
106
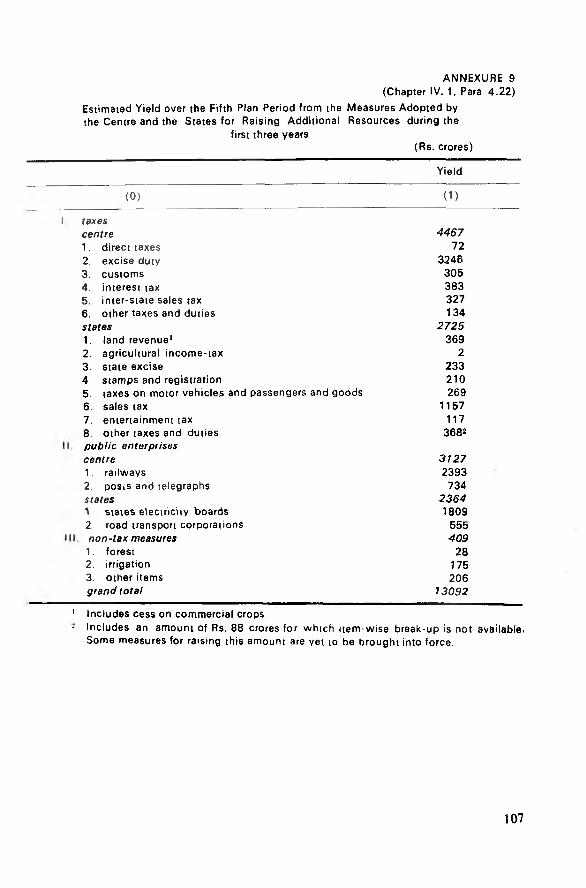
ANNEXURE 9 (Chapter IV. 1. Para 4.22)
Estimated Yield over the Fifth Plan Period from the Measures Adopted by the Centre and the States for Raising Additional Resources during the
first three years(Rs. crores)
Yield
(0) (1 )
I taxescentre 44671. direct taxes 722. excise duty 32463. customs 3054. interest tax 3835. inter-state sales tax 3276. other taxes and duties 134states 27251. land revenue1 3692. agricultural income-tax 23. state excise 2334 stamps and registration 2105. taxes on motor vehicles and passengers and goods 2696. sales tax 11577. entertainment tax 1178. other taxes and duties 3682public enterprisescentre 31271. railways 23932. posis and telegraphs 734states 2364
states electricity boards 18092. road transport corporations 555non-tax measures 4091. forest 282. irrigation 1753. other items 206grand total 13092
1 Includes cess on commercial crops- Includes an amount of Rs. 88 crores for which item-wise break-up is not available.
Some measures for raising this amount are vet io be brought into force.
107

A N N E X U R E 10 (Chapter IV. 2, Para 4.43)
Estimated Saving and Investment duringJhe Fifth Plan —In d ia : 1973-74 to 1978-79
(Rs. crores) 1974-79
(0) (1)
1. public savings 15028(i) budgetary 8536
(ii) public enterprises 64922. private corporate savings 53733. cooporative savings non-credit societies 1754. financial institutions' savings 1263
(i) RBI 841(ii) scheduled commercial banks 100
(iii) financial institutions 65(iv) private corporate financial institutions 23(v) cooperative credit societies 234
5. household savings 36481(i) financial assets-gross 25080
(a) increase in currency 1216(b) increase in deposits 12213
1. scheduled commercial banks 104382. cooperative societies 10453. non-banking companies 6804. term-lending institutions 305. private corporate financing Institutions 20
(c ) LIC— increase in life fund 21 86(d ) provident funds 5062
1. centre and states 19872. E.P.F. 25223. others
(e ) corporate and cooperative shares and553
debentures incl. units (f) small saving, debts deposits and misc. govt.
657
obligations 3746(ii) less financial liabilities (— )6 2 4 5
(iii) financial assets-net 18835(iv) physical assets 17646
6. aggregate domestic savings 583207. inflow from the rest of the world 54318. total resources available for investment 63751
108

A N N E X U R E 11 (Chapter IV. 2, Para 4.44)
Macro-Economic Balance : Disposable Income, Consumption,Saving and Investment : 1973-74
(Rs. crores at current prices)
govt.incl.deptt.enterprises
domestic sector
public sector
non- total pvt. deptt. sector enter- incl. prises house
hold
total restoftheworld
tota
(0) (1) (2) (3) (4) (5) (6) (7)
1. NDP at facfor cost 285 233 568 48580 49148 332 494802. depreciation 146 368 514 2240 2754 — 27543. GDP at factor cost 431 651 1082 50320 51902 332 522344. indirect taxes
less subsidies 5405 — 5405 — 5405 — 54055. indirect taxes 5970 5970 — 5970 — 59706. subsidies ( - - ) 565 (— )565 — (— ) 565 - (-- ) 5657. GDP at mkt. prices 5836 651 6487 50820 57307 332 576398. inter-sectoral
transfers 405 — 405 (— ) 405 — — —9. direct taxes 1665 — 1665 (— )1665 — — —10. misc. govt, receipts 150 — 150 ( - ) 150 — — —11. interest on national
debt. (—-) 502 — ( - ) 502 502 — — —12. current transfer
from govt, to pvt.sectoi ( — ) 908 ) 908 908 — — —
13. disposable income 6241 651 6892 50415 57307. 332 5763914. consumption 5469 5469 43591 49060 — 4906015. savings 772 651 1423 6824 8247 332 857916. net import of goods
and non-factor services — — — — 123 12317. aggregate savings
for investment 772 651 1423 6824 8247 455 870218. ratio of gross dome
stic savings to GNP 1.4 1.1 2.5 11.9 14.4 0.8 15.2
109

A N N E X U R E 12
(Chapter IV. 2,Para 4.35)
Macro-Economic Balance : Disposable Income. Consumption Saving and Investment : 1978-79
(Rs. crores at 1975-76 prices)
domestic sector
public sector pvt. total rest total
govt. incl. non-deptt. total sector ofdept. enter incl. theenter- prises house worldprise holds
(0) (1) (2) (3) (4) (5) (6) (7)
1. NDP at factorcost 1318 524 1842 70683 72525 380 72905
2. depreciation 230 817 1047 3113 4160 — 41603. GDP at factor
cost 1548 1341 2889 73796 76685 380 770654. indirect taxes
less subsidies 10879 — 1087g — 10879 — 108795. indirect taxes 11714 — 11714 — 11714 — 117146. subsidies ( — )835 — ( — )835 __ r - )8 3 5 — ( — )8357. GDP at mkt.
prices 12427 1341 13768 13796 87564 380 879448. inter-sectoral
transfers 870 — 870 ( — )870 — — —9. direct taxes 3010 — 3010 (— ) 3010 — — —
10. misc. govt.receipts 230 — 230 ( — )230 — — —
11. interest onnational debt [-11050 — ( — )1050 1050 — — —
12. current transfers from govt.sector [.-]1 320 — ( — )1 320 1320 _ —
13. disposableincome 13297 1341 14638 72926 87564 380 87944
14. consumption 10593 — 10593 63058 73651 — 7365115. savings 2704 1341 4045 9868 13913 380 1429316. net import of
goods & nonfactor services — — — — 532 532
17 aggregatesavings for investment 2704 1341 4045 9868 13913 912 14825
18 ratio of grossdom&stic savingsto GNP 3.1 1.5 4.6 11.3 15.9 1.0 16.9
110

Exports of Principal Commodities During 1974-75 and 1975-76
(Rs. crores)
A N N E X U R E 13(Chapter IV. 3 ,Para 4.53)
Item 1974-75 1975-76
(0) (1) (2)
1. tea 228.1 236.8
2 jute manufactures 296,8 248.3
3. coffee 51.4 66.7
4. tobacco unmanufactured 80.4 93.1
5. vegetable oils (non-essential) 33.7 33.3
6. oil cakes 96.0 86.2
7. cashew kernels 118.2 96.1
8. spices 81.4 71.0
9. raw cotton 15.2 38.8
10. fish and fish preparations 66.2 126.6
11. sugar 339.0 472.3
12. rice 21.5 13.0
13. lac 24.3 12.7
14. coal 6.6 16.7'
15. iron ore 160.4 213.816. maganese ore 17.6 17.517. mica 18.2 14.618. cotton piece goods man made 129.6 119.4
19. cotton piece goods— handloom 29.3 39.420. cotton apparel 96.9 144.921. coir yam 8- manufactures 17.9 19.022. fabrics of man made fibres 18.3 15.023. leather 8- leather manufactures
(excl. footwear) 145.0 201.324. footwear 20.3 21.225. chemical 8- allied products 82.9 84.426. rubber tyres and tubes 10.8 7.4127. engineering goods 356.6 408.728. iron & steel 21.1 68.229. handicrafts
(i) pearls, precious stones etc. 98.4 123.0(ii) other handicrafts 88.2 101.2
30. others 568.3 731.031. total 3328.8 3941.6
1 Tentative figures, as the actual figures for nine months only (April-December) areavailable.
111

ANNEXURE 14 (Chapter IV. 3 Para 4.53)
Imports of Principal Commodities during 1974-75 and 1975-76
(Rs. crores)
items 1974-75 1975-76
(0) (1) (2)
1. metals, ores and scrap 608.3 423.52. metal products, machinery and transport
equipment 723.2 910.63. petroleum crude, products and lubricants 1156.9 1225.74. fertilisers and raw materials for fertilisers 486.2 463.45. others 1544.2 2134.6
(i) cereal Er cereal preparations 763.8 1338.3(ii) cashew nuts (unprocessed) 36.6 33.6
(iii) crude rubber 6.9 6.8(iv) fibres 67.1 7 2.1
(a) raw cotton 27 A 28.2(b) raw wool 27.5 25.9(c) raw jute 3.7 3.3(d) others 8.5 15.3
(v ) oil seeds(vi) animal €r vegetable oils and fats 34.8 18.3
(vii) chemicals 249.9 286.8(a) chemicals elements and compounds 186.2 177.4(b) dyeing, tanning & colouring materials 11.4 11.6(c) medicinal and pharmaceutical products 34,2 36.2(d) others 64.1 61.6
(viii) pulp and waste paper 9.8 16.3(ix) paper, paper board and newsprint 59.5 56.2(x) non-metallic manufactures 62.6 96.3
(xi) misc. and unclassified 208.6 209.3
6. total 451B.8 5157.8
112

A N N E X U R E 15 (Chapter IV. 3, Para 4.58)
Export Projections for the Fifth Plan Period(Rs. crores)
item draft plan revisedprojections
(0) (1) (2)
1. tea 840 1233
2. jute manufactures 1200 1317
3. coffee 190 3684. tobacco manufactures 335 5505. oil cakes 315 4816. cashew kernels 405 6327. spices 170 365
8. raw cotton 115 75
9. fish and fish preparations 580 853
10. sugar 115 1424
11. iron ore 980 1373
12. coal 40 76
13 mica and mica products 120 22014. cotton textiles-mill made1 1000 158515. handloom piece-goods 155 25616. coir yarn and manufactures 90 13117. fabrics of man-made fibres 80 1431 8. leather and leather manufactures
including footwear 945 135219. chemical and allied products 370 56720. rubber 60 8821. engineering goods 1500 232822. iron and steel 240 78623. handicrafts 905 1237
(i) pearls, precious stones 600 695(ii) other handicrafts 305 542
24. total (1 -2 3 ) 10750 1743925. others 1830 428326. grand total 12580 21722
i Including piece goods, yarn, apparel, hosiery and other cotton manufactures.
113

A N N E X U R E 16(Chapter IV. 3. Para 4.62)
(Rs. crores)Import projections for the Fifth Plan Period
item draft plan revised
(0) (1) (2)
1. metal, ores and scrap 1920 2347
2. metal products, machinery and transport equipment including components and spare parts 4010 6034
3. petroleum crude, products and lubricants (PO L) 3080 6280
4. fertilisers and raw materials for fertilisers
1450 3168
5. others1 3640 107056. total 14100 28524
1 Revised estimates include provisions for food-grains' imports.
114

Fifth Five Year Plan (1974-79)Sectoral Outlays (Centre, States and Union Territories)
A N N E X U R E 17(Chapter V. 1, Para 5,6)
draft fifth plan 1974-77 1977-79
(Rs. crores)
fifth plan
head of development centre states total8
U .Ts .
centre states 8
U. Ts.
total centre states 8
U. Ts.
total centre states 8
U. Ts.
total
(0 ) (1) (2) (3) (4) (5) (6) (7) (8) (9) (10) (11) (12)
1. agriculture andallied programmes 2140.00 2795.00 4935.00 826.00 1304.19 2130.19 1077.40 1436.00 2513.40 1903.40 2740.19 4643.59
2. irrigation andflood control 140.00 2541.00 2681.00 35.82 1615.68 1651.50 47.26 1741.42 1788.68 83 08 3357.10 3440.18
3. power 738.00 5452.00 6190.00 392.27 3120.78 3513.05 432.95 3347.90 3780.85 825.22 6468.68 7293.904. industry and
mining 8270.00 759.00 9029.00 4760.46 444.89 5205.35 4566.06 429.19 4995.25 9326.52 874.08 10200.60b. transport and
communications 5727.00 1388.00 7115.00 41.52 711.15 3552.67 2664.38 664.38 3328.76 4505.90 1375.53 6881.436. education 484.00 1242.00 1726.00 191.23 396.54 587.77 214.06 482.46 695.52 405.29 879.00 1284.297. social and com
munity services (incl. economic and general services but excluding education) 2078.00 2996.00 5074.00 873.13 1449.29 2322.42 1031.56 1412.79 2444.35 1904.69 2862.08 4766.77
8. hill and tribal areas and N.E.C. schemes — 500.00 500.00 177.50 177.50 272.50 272.50 450.00 450.00
9. sectoral distribution not yet reported — _ _ 260.44 260.44 66.29 66.29 326.73 326.73
10. total 19577.00 17673.00 3 7250.002 9920.43 9480.46 19400.89 10033.67 9852.931 19886.60 19954.10 19333.39 39287.49
1 Does not include an amount of Rs. 16 crores for which sectoral break-up is yet to be worked out.2 Does not include an amount of Rs.203 crores added subsequently.

Fifth Five Y^ar Plan-Central
A N N E X U R E 18
(Chapter V. 1, Para 5 ,6)
ministry/department(Rs, crores)
revised fifth plan
(0) (1)
1. agriculture 1828.092. atomic energy 619.083. civil supplies and cooperation 148.934. coal 1147585. commerce 207.33.6. communications 1266.617. C. S. I. R. 81.778. education and culture 405.299. electronics 46.37
10. fertilisers and chemicals 1602.0611. finance 131.7312. health and family planning 833.1913. heavy industry 365.4314. home affairs 143.1215. industrial development 609.5916. information and Broadcasting 109.1817. irrigation 114.6318. labour 14.1819. mines 550.5920. personnel 0.5021. planning 25.2422. petroleum 2051.5323. power 557.4524. railways 2202.0025. rehabilitation 102.6126. science and Technology 58.9627. shipping and transport 1682.6128. social welfare 63.5329. space 128.2730. steel 2237.4231. supply 2.1532. tourism and civil aviation 375.5933. works and housing 241.4934. total 19954.10
I 16

A N N E X U R E 19(Chapter V.1, Para 5.6)
Fifth Five Year Plan— States
staterevised fifth
plan
(Rs. crores)
(0 ) (1)
1. Andhra Pradesh 1333.582. Assam 473.843. Bihar 1296.06
4. Gujarat 1166.62
5. Haryana 601.34
6. Himachal Pradesh 238.957. Jammu and Kashmir 362.648. Karnataka 997.67
9. Kerala 568.9610. Madhya Pradesh 1379.7111. Maharashtra 2347.6112. Manipur 92.8613. Meghalaya 89.5314. Nagaland 83.6315. Orissa 585.0216. Punjab 1013.4917. Rajasthan 709.2418. Sikkim 39.6419. Tamil Nadu 1122.3220. Tripura 69.6821. Uttar Pradesh 2445.8622. West Bengal 1246.8323. all states 18265.08
117

Fifth Five Year Plan— Union Territories
A N N E X U R E 20(Chapter V.1. Para 5.6)
revised fifth plan
(Rs. crores)(0 ) (1 )
1. Andaman and Nicobar Islands 33.722. Arunachal Pradesh 60.30
3. Chandigarh 39.76
4. Dadra and Nagar Haveli 9.41
5. Delhi 316.01
6. Goa, Daman and Diu 85.007. Lakshadweep 6.23
8. Mizoram 46.59
9. Pondicherry 34.04
10. total 634.06
118

ANNEXUR E 21 (Chapter V.1, Para 5.5)
Proposed Plan Allocations in the Central Sector under the 25 Point Programme ; 1977-79
item 1977-79 (Rs. lakhs)
(0) (1)
1. power
(a) deptt. of power 22093(b) deptt. of atomic energ. 13640(c) D.V.C. 7562
2. V.S.I. (handloom) 30003. agriculture & allied prog.
(a) agricultural credit 21840(b) consumer cooperative 1525(c) miner irrigation 1800
4. labour and employmentapprenticeship training 46
5. education(a) book banks 300(b) student aid fund(c) apprenticeship training
130
under technical education 2706. total 75706
119

Proposed Plan Outlays for 1977-79 in resp9Ct of 20-Point Economic Programme— (Chapter V. 1, Para 5.5)States/Union Territories
A N N E X U R E 22
stateland
reformsminor
irrigationmajor andmediumirrigation
co-opera-tion
power handloom housesites appren industry for land- ticeship
less agri. training labour
(Rs. lakhs)
- free supply of books and stationery & establishment of total book banks
(0) (1) (2) (3) (4) (5) (6) (7) (8) (9) (10)
1. Andhra Pradesh 101 1150 18265 1100 26358 252 210 6 15 474572 Assam 331 1400 1726 638 4540 141 52 4 60 87923. Bihair 850 5185 12600 692 17095 180 200 10 55 368674. Gujarat 550 2035 12500 1177 18350 39 140 6 20 348175. Haryana 32 200 9111 546 9696 67 28 3 2 196856. Himachal Pradash 93 412 400 14o 1930 32 — 3 30 30407. Jammu & Kashmir 110 986 2150 100 3350 50 25 6 5 67828. Karnataka 950 2350 10570 1150 14870 171 200 22 40 303239. Kerala 1325 775 4110 375 5359 165 340 16 60 12 525
10. Madhya Pradesh 410 4043 12923 1158 29984 97 300 12 130 4906211. Maharashtra 62 5000 24480 1150 43495 191 130 80 90 7467812. Manipur 15 145 830 65 245 80 — 1 12 139313. Meghalaya 25 135 10 105 724 22 - 1 15 103714. Nagaland 43 110 — 63 230 7 — 1 7 46115. Orissa 390 1350 5350 785 10592 55 75 2 40 1863916. Punjab - 1400 3440 866 16292 5 75 6 3 2208717. Rajasthan 25 510 9525 305 9338 40 8 5 3 1975918. Sikkim — 60 45 35 150 6 3 _ 10 30919. Tamil Nadu N.A. 1350 4654 441 19000 448 120 11 15 2603920. Tripura 45 212 10 - 69 385 38 12 1 7 77921. Uttar Pradesh 1500 5500 21704 1660 48159 915 240 15 300 7999322. West Bengal 1150 2900 4000 800 22154 187 195 11 170 3156723. all states 7907 37208 158408 13420 302296 3188 2353 222 1089 526091
1 The total outlay for Major and Medium Irrigation, will be Rs. 28480 lakhs including Rs. 4000 lakhs under Employment Guarantee Scheme.

union territories1. Andaman and Nicober
Island 4 7 — 25 121
2. Arunachal Pradesh N A 192 — 97 260
3. Chandigarh — 17 — 7 2294. Oadra and Nagar Haveli 14 28 182 6 415. Delhi — 126 — 74 30466. Goa. Daman and Diu 55 101 1115 45 5657. Laksbdweep - — - 25 358. Mizoram N.A. 60 55 2759. Pondicherry 20 70 48 25 125
10. total uJs. 93 601 1345 359 469711. grand total 8000 37809 159753 13779 306993
N.A. — Not Available
— — — 1 15812 ' — - 8 569— — 1 3 257
- — - 1 27230 20 40 40 3376
1 12 4 8 1906— — Neg. - 60
39 — Neg. 8 43717 24 6 6 341
99 56 51 75 73763287 2409 273 1164 533467

A N N E X U R E 23(Chapter V .2, Para 5.8)
Sector-wise Break-up of Revised Fifth Five Year Plan Outlays under Agricultureall Allied Services
(Rs. lakhs)
heed of development centre states unionterritories
total
(0 ) (1) (2) (3) (4)
1. agriculture excluding landreforms 78530.20 51522 2162.94 132215.14
2. land reforms 1200.36 15053 — 16253.363. minor Irrigation 3107.00 75116 1009.10 79232.104. soil conservation 4190.00 17181 742.54 22113.545. area development. 10000.00 10659 — 20629.006. food 11852.55 518 — 12350.557. animal husbandry and dairy
development21925.70 20784 1096.81 43770.51
8. fisheries 6804.81 7508 686.84 14999.659. forests 2912.00 16452 1205.59 20589.5910. investment in agril. 39116.00 12861 — 51977.00
financial institutions11. community development 442.00 11842 460.97 12744.9712. cooperation 20280.00 26624 670.04 37574.0413. total 190340.60 265984 8034.83 4643S9.4B
122

A N N E X U R E 24 (Chapter V. 2, Para 5.8)
State-wise Outlays under Agriculture and Allied Services
(Rs. lakhs)
state/UT draft fifth plan
1974-77 anticipated expenditure
1977-79proposed
outlay
revised fifth plan outlay
(0 ) (1) (2) (3) (4 )
states 1. Andhra Pradesh 12986 5046 6650 116962. Assam 9334 4491 5489 99803 Bihar 20472 9914 11488 214024. Gujarat 17753 9536 9426 189625. Haryana 8773 2771 2996 57676. Himachal Pradesh 5554 3002 2674 56767. Jammu and Kashmir 6047 2231 2751 49828. Karnataka 18240 8964 9650 186149. Kerala 10484 5652 5565 11217.
10. Madhya Pradesh 21231 10719 12651 2337011. Maharashtra 31883 14877 14323 2920012. Manipur 1469 774 861 163513. Meghalaya 1894 1148 1049 219714. Nagaland 2037 1177 1181 235815. Orissa 10300 4589 5336 992516. Punjab 10913 6476 7716 1419217. Rajasthan 8222 3510 4052 756218. Sikkim 1027 312 729 104119. Tamil Nadu 20327 6814 6093 12907
0. Tripura 1741 930 1235 216521. Uttar Pradesh 38308 14886 16380. 3126622. West Bengal 14802 8970 10900 168ft)l23. total states 273797 126789 139159 265984
union territories 1. Andaman and Nicobar 913.00 298.20 515.00 813.20
Island 2. Arunachal Pradesh 1695.00 615.00 1039.00 1654.003. Chandigarh 95.00 49.17 74.80 123.974. Dadra Nagar Haveli 174.00 113.47 118.90 232.375. Delhi 547.00 358.00 432.00 790,006. Goa Daman and Diu 1569.00 930.51 737.56 1668.077. Lakshadweep 216.00 100.15 137.85 238.008. Mizoram 1567.00 743.92 903.00 1646.929. Pondicherry 863.00 421.30 447.00 868.30
10. allU .Ts. 7639,00 3629,71 4405.11 8034.8311. total all India 281436.00' 130418.12 143600.11 274018.83
The Draft Plan provision of Rs. 27.95 crores has subsequently been increased by Rs. 19.36 crores.
123

Major and medium Irrigation Programme Fifth P la n - Outlays
(Rs. crores)
A N N E X U R E 25(Chapter V. 2, Para 5.12)
state
U T
draft
fifthplanoutlays
revised fifth plan outlay 1974-77 1977-79 total
col (2 + 3 )
(0) (1) (2) (3) (4)
1. Andhra Pradesh 198.00 145.46 182.65 328.11
2. Assam 21.00 11.74 17.26 29.00
3. Bihar 239.70 129.00 126.00 255.00
4. Gujarat 218.00 133.34 125.00 258.34
5. Haryana 103.00 65.44 91.11 156.55
6 Himachal Pradesh 1.05 0.58 4.00 4.58
7. Jammu and Kashmir 28.25 13.21 21.50 34.71
8. Karnataka 201.00 79.72 105.70 185.42
9. Kerala 82.00 40.43 41.10 8153
10, Madhya Pradesh 200.00 121.29 129.28 250.57
1 1 . Maharashtra 375.06 197.59 244.80 442.39
12. Manipur •10.26 8.05 14.46 22.51
13. Meghalaya 0.41 0.07 0.10 0.17
14. Nagaland - - - —
15. Orissa 71.00 42.41 53.50 95.91
16. Punjab 30.00 31.22 3440 65.62
17. Rajasthan 133.95 113.85 95.25 209.10
18. Sikkim — 0.50 0.45 0.95
19. Tamil Nadu 68.03 38.58 46.54 85.12
20. Tripura 0.09 0.07 0.10 0.17
21. Uttar Pradesh 294.71 257.25 217.04 474.2922. West Bengal 56.25 29.83 40.00 69.83
total— states 2331.76 1459.63 1590.24 3049.871. Dadra and Nagar Haveli 4.99 0.61 1.82 2.432. Goa, Daman and Diu 11:12 5.54 11.15 16.693 Pondicherry 0.67 0.28 0.48 0.76
total U . Ts. 16.78 6.43 13.45 19.88central sector 52.90 7.7 6 17.42 25.18grand lotal 2401.44 1473.82 1621.11
(+ 4 0 EGS)3094.93
(+ 4 0 EQS)
124

A N N E X U R E 26(Chapter V. 2, Para 5.12)
Major and Medium Irrigation Programme Fifth Plan-Benefits
('000 ha)
state/U.T. benefits additional in fifth plandraft fifth plan revised fifth planaddl. pot. addl. pot.
(0) (1) (2)
1. Andhra Pradesh 570 311
2. Assam 70 58
3. Bihar 880 476
4. Gujarat 370 2955. Haryana 250 1706. Himachal Pradesh ------ —
7. Jammu and Kashmir 30 188. Karnataka 340 224
9. Kerala 160 9810. Madhya Pradesh 630 38211. Maharashtra 515 43512. Manipur 25 513. Meghalaya — ------
14. Nagaland — —
15. Orissa 240 20016. Punjab 200 12017. Rajasthan 410 25118. Sikkim — __19. Tamil Nadu 55 5020. Tripura - _21. Uttar Pradesh 1375 181222. West Bengal 125 200
total states 6245 51051. Dadra and Nagar Haveli — _2. Goa, Daman and Diu — _3. Pondichery 2 2
total U.Ts. 2 2central sector __unallocated _ 700grand total 6247 5807
125

A N N E X U R E 27(Chapter V .2, Para 5.24)
Flood Control Programme Fifth Five Year Plan
(Rs. crores)
states UTs. draft fifth plan outlay
revised fifth plan outlay 1974-77 1977-79 total
(0) (1) (2) (3) (4)
states1. Andhra Pradesh 2.00 11.59 7.50 19.09
2. Assam 7.00 5.76 9.00 14.76
3. Bihar 32.00 37.80 22.50 60.30
4. Gujarat 9.00 3.05 8.00 11.05
5. Haryana 9.00 3.54 4.01 7.556. Himachal Pradesh 0.40 0.40 0.20 0.607. Jammu and Kashmir 8.00 4.45 6.00 10.458. Kerala 23.00 5.17 3.50 8.679. Karnataka 2.00 0.76 1.00 1.76
10. Madhya Pradesh 0.50 0.89 1.00 1.8911. Maharashtra 1.50 0.15 0.20 0.3512. Manipur 1.50 0.98 0.75 1.7313. Meghalaya 0.55 0.44 0.32 0.7614. Nagaland — — ' — —
15. Orissa 5.00 5.71 6.00 11.7116. Punjab 16.00 12.30 10.00 22.3017. Rajasthan 2.22 1.80 1.25 3.0518. Sikkim — 0.10 0.15 0.2519. Tamil Nadu 4.00 2.47 1.46 3.9320. Tripura 1.19 0.54 0.60 1.1421. Uttar Pradesh 20.00 17.93 18.00 35.9322. West Bengal 47.75 27.17 28.00 55.17
total -states 192.61 143.00 129.44 272.44total UTs. 14.92 6.63 8.30 14.93centra1 sector 93.50 23,05 29.85 57.90grand total 301.03 177.68 167.59 345.27
126

Benefits in the Fifth Plan from Generation
Schemes (Public Utilities)
ANNEXURE 28 (Chapter V.3, Para 5.33)
region/scheme benefits
M W
(0) (1)
northern region
1. Faridabad Thermal (Haryana) 120
2. Panipat Thermal (Haryana) 220
3. Bhatinda thermal (Punjab) 44o
4. Beas I (Haryana. Punjab and Rajasthan) 660
5. Beas II (Haryana. Punjab and Rajasthan) 240
6. Sumbal HE (J& K ) 11
7. Chenani H.E. (J& K ) 9
8. Lower Jhelum HE (J& K ) 105
9. Giri H.E. (HP) 60
10. Bassi Extension H.E. (H P ) 15
11. Yamuna Stage II (U P) 240
12. Yamuna Stage IV (UP) 30
13. Ramganga HE (U P ) 198
14. Rishikesh-Hardwar (U P ) 36
15. Obra Thermal Extn. 1 (U P ) 200
16. Obra Thermal Extn. II (U P ) 600
17. Obra Thermal Extn. Ill (U P ) 20018. Harduaganj Stage V (UP) 11019. Harduaganj Stage VI (U P ) 110
20. Panki Thermal (U P) ?20
21. Badarpur Thermal Extn. (Central) 260
22. Badarpur Thermal Extn. (Central) 200
23. Baira— siul HE ( „ ) 201
24. Rajasthan Atomic Stn. ( „ ) 220
total 4645
western region
1. Ukai H.E. Scheme (Gujarat) 300
2. Gandhi Nagar Thermal (Gujarat) 240
127

(Contd.)
(0) (1)
3. Ukai Thermal (Gujarat) 240
4. Ukai Thermal Exten.(Gujarat) 400
5. Ahmedabad Thermal (Private) 110
6. Korba Thermal Station Extn. (M P) 120
7. Amarkantak Thermal Extn. (M P) 240
8. Satpura Thermal Station Extn. (M P) 200
9. Vir HE (Maharashtra) 9
10. Bhatgar HE (Maharashtra) 16
11. Koyna HE Stage III (Maharashtra) 320
12. Vaitarna HE (Maharashtra) 60
13. Koyna Dam PH (Maharashtra) 18
14. Koradi Thermal Stn. (Maharashtra) 480
15. Koradi Thermal Extn. (Maharashtra) 200
16. Nasik Thermal Stn. Extn. (Maharashtra) 200
total 3153
'southern region
1. Kothagudem Thermal Stage III (AP) 220
2. Kothagudem Thermal Stage IV (AP) 220
3. Vijayawada Thermal (AP) 200
4. Lower Sileru HE ( « P ) 400
5; Nagarjunasagar HE (Conventional) (AP) 110
6. Srisailam HE (AP) 110
7. Idikki Stage I (Kerala) 390
8. Sharavathi HE Stage III (Karnataka) 178.2
9. Linganmakki HE (Karnataka) 55
10. Kalinadi HE (Karnataka) 270
11- Kundah HE Stage IV (T N ) 110
12. Suruliar HE (T N ) 35
13. Ennore Thermal Extn. (T N ) 110
14. Tuticorin Thermal Station (T N ) 200
15. Madras Atomic Station (Central) 235
total 2843.
128

(0) (1)
eastern region
1. Kosi H.E (Bihar) 5
2. Subernarekha HE (Bihar) 130
3. Pathratu Extn. (Bihar) 220
4. Balimela HE (Orissa) 240
5. Talcher Thermal (Orissa) 220
6. Santaldiah Thermal Extn. (W B ) 360
7. Jaldhaka HE Stags II (W B ) 8
8. Kurseong HE (W B ) 2
9. Lower Lagyap HE (Sikkim) 12
10. Chandrapura Thermal (D V C ) 360
11. Durgapur Thermal Extn. (D VC) 200
total 1757
north-eastern region
1. Namrup Thermal Extn. (Assam) 30
2. Krydam Kulai HE (Meghalaya) 60
3. Dzuza HE (Nagaland) 1'5
4. Gumti HE (Tripura) 10
total 101.5
grand total 12499.7
129

A N N £ X U R E 29 (Chapter V.3, Para 5.33)
Regionwise Breakup of the Installed Capacity as at the end of the Fourth Plan and Fifth Plan by type of Plant
(capacity in M M )
region as on 31.3.1974 as on 31.3.1979
hydro thermal nuclear total hydro thermal nuclear total
(0) ( 1 ) (2) (3) (4) (5) (6) (7 ) (8)
1 . northern 2200 1759 220 4179 4005 4379 440 88242. western 1037 2612 420 4069 1760 5042 420 72223.' southern 3080 1437 - 4517 4738 2387 235 73604. eastern 580 3102 — 3682 977 4462 - 54395. north eastern 67 147 — 214 138 177 - 3156. other U . Ts. — 3 — 3 — 3 — 37. utilities total8. non-utilities total9. grand total
6964 9060 640 166641792
18466
11618 16450 1095 291631792
30955

Outlay on Industrial and Mineral Programmes in the Central Sector(Rs. crores)
A N N E X U R E 30(Chapter V. 4, Para 5.37)
ministry/department revised fifth plan outlay
(0) ( 1 )
1 . Ministry of Steel and Mines (Department of Steel)
2237.42
2. Ministry ot Steal and mines (Department of Mines)
850.59
3. Ministry of Energy (Department of Coal)
1147.58
4. Ministry of Petroleum 2051.53
(a) petroleum (1691.28)(b) petrochemicals (360.25)
5. Ministry of Chemicals and Fertilisers 1602.07
(a) Fertilisers (1488.16)(b) Chemicals (113.91)
6. Ministry of Industry(Department of Industrial Development)
380.22
7. Ministry of Industry (Department of Heavy Industries)
365.43
8. Department of Atomic Energy 184.189. Department of Electronics 46.3710. Ministry of Shipping and Transport 146.581 1 . Ministry of Commerce 143.1812. Ministry of Civil Supplies and Coopera'ion 46.1313. Ministry of Finance 131.73
to u l 9033.00
131

Central Industrial and Mineral Programmes
(Rs. crores)
A N N E X U R E 30A(Chapter V. 4 , Para 5.37)
organisation project location' revised fifth plan outlay
(0) (1) 12)
1. Ministry, of Steel and Mines 2237,42(Department of Steel)
1.1 Bokaro (4 million tonnes) Bokaro 825.32
1.2 Bhilai Steel Plant
(a) Bhilai 4 M .T. expansion
(b) refractory plant
(c) other continuing schemes
Bhilai
513.87
21.49
42.16
1.3 Rourkela Steel Plant(a) spirally welded pipe plant
(b) CRGO project
(c ) other schemes-slaggranulation. naphtha reformer etc.
Rourkela
18.283.22
24.37
1.4 Durgapur Steel Plant
(a) Seamless tube project(b) Other continuing schemes
Durgapur
1.005.49
1.5 Durgapur Alloy Steel Plant Durgapur 1.00
1.6 Hindustan Steel Ltd. common
outlays likereplacement and balancing facilities
township etc.
135.32
1.7 IISCO Burnpur 35.00
1.8 V.I.S.L. Forge Shop Project Bhadravati 2.58
1.9 Steel Authority of India
(a) new steel plants
(b) ferro vanadium project(c) other common outlays, feasibility
studies etc.
46.103.201.77
1.10 A.P.I.D.C.-Sponge iron project Hyderabad 1.50
1.11 Water supply projects
(a) Mahanadi reservoir(b) Tanughat Dam
12.19
1.68
1.12 Metallurgical and Engineering Consultants Ltd.
1.20
1.13 Hindustan Steel Construction Ltd 19.75

(0) (1) (2)
1.14 National Mineral Developmsnt Corporation 107.57(a) Kiruburu Mines Expansion Kiruburu 7.10(b ) Bailadila Mines-5 and 14 Bailadila 36.58(c) Donimalai Mines Donimalai 16.23(d ) Meghahataburu Mines Meghahataburu 32.00(e) Pellet plants Donimalai and
Bailadila1.70
(f) feasibility reports and advance 4.20action
(g ) replacement outlays 9.74(h) R & D laboratory 0.02
1.15 Second pellet plant, Goa Goa 2.55
1.16 Iron Ore Board 3.45
1.17 Kudremukh Iron Ore project Kudremukh 399.24
1.18 Manganese Ore India Ltd. 1.00
1.19 Exploration and R & D for 0.50manganese and chromite ore.ferro chrome project
1.20 Science and Technology 6.62
2.0 M inistry of Steel and'Mines 550.59(Deptt. of Mines)
2.1 Bharat Aluminium Co. Ltd. 202.62(a) Korba project Korba 187.12(b) Ratnagiri project Ratnagiri 15.50
2.2 Hindustan Zinc Ltd. 130.81(a) Debari Zinc smelter Debari 25.14(b) Vizag zinc smelter Vizag 39.55(c) Balaria mines Balaria 17.97(d) Maton rock phosphate Maton 3.19(e) Tundoo lead smelter Tundoo 0.83
(expansion and modernisation)(f) Rajpura-Dariba mines Rajpura 24.03(g) Zawarmala-Baroi Zawarmala 13.58(h) Sargipalli lead mines Sargipalli 5.77(i) Feasibility studies 0.75
2.3 Hindustan copper Ltd. 115.59(a) Khetri smelter complex Khetri 37.80(b) Rakha phase I Rakha 4.03(c) Rakha phase II Rakha 7.00(d) Chandmari mines Chandmari 2.79(e) Chandmari expansion Chandmari 2.70(f) Bandalamottu mines Bandalamottu 0.66(g) Mosabani expansion Mosabani 5.00(h) Surda expansion Surda 2.31(i) Malanjkhand deposits Malanjkhand 44.08(j) Metallurgical and chemical plants
small deposits, Surda phase II, Chapri 8.47(k) Pre Feasibility studies 0.75
2.4 Bharat Gold Mines Ltd. Kolar'Ramgiri 8.00
133

( Contd.)
(°) (1) (2)
2.5 Mineral Exploration Corporation 34.55
2.6 Geological Survery of India including A M SE 40.03
2.7 Indian Bureau of Mines 1 3 q
2.8 Meghadrighada dam for water Meghadrighada 0.61 •uppiy to Vizag zinc plant
2.9 Sukinda Nickel Sukinda 10.60
2.10 Science and Technology g.48
3.0 M inistry of Energy / 147.58 (Department of Coal)
3.1 Coal India Limited 966.14(a) Investment on mines 787.15
(b) New washeries 45.33 sudandih, Monidih and others
(c) C.M .P.D.I. and others 12.30
(d ) L.T.C. Plant Dhankuni 11.00
(e) Explosives Plant Bhandara 6.70(f) Other programmes (S and T . mining 10.31
Engg., and coal controller'sorganisation)
(g ) Exploration including advance 32.85 action
(h ) infra-structure including mine 60.50 safety, sand showing, powersupply, welfare, etc.
3.2 Singaimi Collieries Co. Ltd. 59.19(a) Investment on mines 44.00
(b) Advance action 4.00
(c) L.T.C. Plant Ramakrishnapuram 11.19
3.3 Neyveli Lignite Corporation Neyveli 122.25
4.0 M inistry of Petroleum 2051.53 A-exp lora tio n and Refining 1691.28
4.1 Oil & Natural Gas Commission 1056.13
(a) on-shore programme 414.13(b ) off-shore programme 599.90(c) overseas operations 39.60
(d ) research Institutes 2.50
.4.2 Oil India Limited 137.79
(a) exploration in Dum Ouma & Ningru 28.62
(b ) pipeline projects 48.26
(c ) captive power plants Duliajan 10.36
(d ) capital equipment and facilities 50.55 and other schemes
134

(0) (1) (2)
44.3 Indian Oil Corporation Limited 387.14(a) Mathura Refinery Mathura 99.48(b) Haldia Refinery Haldia 18.40(c) Gujarat Refinery Expansion Koyali 56.38(d ) secondary processing facilities Koyali 22.61(e) Crude oil pipe line Salaya 135.00
Koyali-Mathura —(f) Marketing Division 47.74(g ) R and D Centre Faridabad 4.81(h) other schemes 2.72
44.4 Madras Refineries Ltd. Madras 1.00
44.5 HPC-Debottlenecking project Bombay 4.70
44.6 Cochin Refineries Cochin 0.30
44.7 Bongaigaon Refinery and Petrochemicals Ltd. Bongaigaon 90.32
(a) Crude distillation and kerosene 10.70treating units
(b ) Delayed coker and Calcination Unit 12.91
(c) Petrochemicals schemes including offsites 12.08
(d) captive power plant 28.27
(e) offsites utilities township 26.36
41.8 Bitumen Marketing Corporation Ltd, 1.00
41.9 Lubrizol India Limited 2.90
44.10 new schemes including secondry fecilitieS 10.00
B-Petro-chemleals 3 4 8 96
44.11 Indian Petrochemicals Corporation Ltd. Baroda 321.90
(a) petrochemicals complex 312.28
(b) Research and Development 4.62
(c ) Expansion scheme 5.00
4 U 2 Petrofils Cooperative Ltd. 11.78
41.13 Cl PET 0.28
41.14 New Petro-chemicals schemes 15.00
41.15 Indo-Burmah Petroleum Company 11.29
(a) Petroleum Division 1.05
(b) Chemicals Division (Explosives) 3.79
(c ) Engineering Division 0.64
(d ) Balmer Lawrie and Co. Ltd. 0.81
(e) Bieceo Lawrie and Co. Ltd. 2.00
(f) Bridge and Roof Co. (India) Ltd. 3.00
135

(Contd.)
(0 )__________ :_______________ (1)__________________________ (2)
M inistry of Chemicals & Fertilisers 1602.07
A-Fertilisers 1488.16
Fertiliser Corporation of India 963.64
(a) Durgapur Durgapur 22.41
(b ) Barauni Barauni 23.18
(c ) Namrup Expansion Namrup 24.03(d ) Sindri rationalisation Sindri 23.39
(e) Sindri Modernisation Sindri 141.55
(f) Sindri renovation Sindri 14.72
(g ) Gorakhpur expansion Gorakhpur 10.80(h ) Gorakhpur optimisaton Gorakhpur 0.34
(i) Nangal expansion Nangal 111.78(j) Ramagundam Ramagundam 96.39(k) Talcher Talcher 98.56
(1) Haldia Haldia 190.20(m ) Trom bay-IV Trombay 70.92(n ) Trom bay-V 82.00(o ) captive power plant-Trombay .. 6.00(p ) slurry explosives scheme 1.00(q ) pollution control 5.00(r) Plant Oparational Improvement Prog. 8.50(s) Sectoral loan 20.00(t) miscellaneous schemes 12.87
F A C T 60.07
(a ) Cochin 1 Cochin 10.57
(b ) Cochin II Cochin 48.85(c ) diversification scheme 0.65
National Fertilisers Ltd. 348.34
(a) Bhatinda Bhatinda 174.13
(b ) Panipat Panipat 174.21
N ew Fertiliser Plants including Korba and Mathura
116.11
B-Chemicals 113.91
Pyrites, Phosphates and Chemicals Ltd. 8,49
Indian Drugs & Pharmaceuticals Ltd. 58.74
Hindustan Antibiot'cs Ltd. 9.89
5.8 Hindustan Insecticides Ltd. 22.44
5.9 Hindustan Organic Chemicals Ltd. 14.35
136

____________w________________________________ a)_______________ (2)
6.0 M inistry of Industry 380.22 (Department of Industrial Development)
6.1 Hindustan Paper Corporation 197.23
(a ) Nagaland Pulp and Paper Project Tuli 43.35
(b) Mandya National Paper Mills Balagula 21.63
(c) Nowgong Paper Project Nowgong 50.00
(d) Cachar Paper Project Cachar
(e) Kerala Newsprint Project Vaikom 75.00
(f) Misc. — Including investigation 2.25 for sixth plan projects.
(g ) Newspaper/newsprint schemes 5.00
6.2 Nepa Paper Mills expansion and Nepa Nagar 5.58 effluent treatment
6.3 Cement Corporation of .India 102.08
(a) Paonta Paonta 14.15
(b) Mandhar expension and Improvement Mandhar 5.01
(c) Bokajan Bokajan 7.96
(d ) Kurkunta Expansion Kurkunta 1.01
(e) Neemuch Neemuch
(f) Akaltara Akaltara 67.31
(g) Yerraguntla Yerraguntala
(h) two new projects 5.00
( i ) other outlays 1.64
6.4 Instrumentation Limited Kota 6.42
(a) Control safety valves, etc. — Palghat 3.32
(b ) Unified system Kota 1.60
(c) pollution control „ 1.40
(d ) manufacture of bellows and „ 0.10 membranes
6.5 National Instruments Limited Jadavpur 1.39
(a) Camera project .. 0.43
(b) Diversification programme „ 0.96
6.6 Hindustan Cables Ltd. 5.27
(a) continuing schemes at Rupnarainpur Rupnarainpur 2.65
(b) Continuing schemes at Hyderabad Hyderabad 1.10
(c) New coaxial cable schemes — 0.30
(d ) Replacement, modernisation township — 1.22
137

(Contd.)
(0) (1) (2)
6.7 Bharat Ophthaimic GlassTank pressure and disinfection schemes
0.33
6.8 Tannery and Footwear Corporation Kanpur 3.71
6.9 Bharat Leather Corporation 0.50
6.10 Hindustan Photo Films Ooty 3.43
6.11 National Productivity Council New Delhi 0.92
6.12 Indian Standard Institute New Delhi 1.35
6.13 National Institution of design Ahmedabad 0.34
6.14 Hindustan Salts Limited 2.20
6.15 Andrew Yule and Co. (belting project) 0.85
6.16 subsidy for backward areas 43.00
6.17 Feasibility studies 0.35
6.18 Science and Technology programme 5.28
7.0 M inistry of Industry (Deptt. of Heavy Industry)
365.43
7.1 Hindstan Machine Tools Ltd. 55.27
7.2 Bharat Heavy Electricals Ltd. 183.84
(a) BHEL Hardwar Plant Hardwar 5.11
(b) BHEL Hyderabad Plant Ramchandrapuram 10.67(c ) BHEL Tiruchi Tiruchi 22.17
(d ) BHEL Bhopal Plant Bhopal 9.22
BHEL Transformer Plant Jhansi 21.22
(f) Central Foundry Forge Project Hardwar 33.23
(g ) Seamless Tube Plant Tiruchi 45.10
(h) -Common Corporate Outlays 37.12
7.3 Heavy Engineering Corporation 'Ranchi 17.95
7.4 Bharat Pumps & Compressors Ltd. Allahabad 16.09
7.5 Scooters India Ltd. Lucknow 22.69
7.6 Jessops Ltd. Calcutta 13.10
7.7 Richardson & Cruddas Ltd. Bombay 6.93
7.8 Mining & Allied Machinery Corpn. Durgapur 5.64
7.9 Bharat Heavy Plates & Vessels Ltd. Vesakhapatnam 3.69
7.10 Braithwaite & Co. Calcutta 2.63
7.11 ISW Burn 9.50
7.12 Arthur Butler Muzzaffarpur 1.40
7.13 Britannia Engineering Works Mokameh 1.19
138

7.14 Triveni Structurals Ltd. Allahabad 0.41
7.15 Tungabhadra Steel Products Tungabhadra 0.58
7.16 Central Machine Tool Institute Bangalore 3.00
7.17 Feasibility studies 0.35
7.18 Commercial Vehicles Factory 10.10
7.19 Science & Technology 11.07
8.0 Department of Atom ic Energy 184.18
8.1 Bhaba Atomic Research Centre (B A R C ) 7.40
(a) Central workshop Phase I and II- 1.52
(b) Irradiation facilities 0.03
(c) Power reactor fuel reprocessing Plant 1.20
(d) Cobalt 60 facility 0.03
(e) Nuclear material storage facility 0.39
(f) Blutonium plant expansion 3,21
(g) Uranium metal plant expansion 0.36
(h) Radio pharmaceuticals production unit 0.60
(i) Other hew schemes 0.06
8.2 Nuclear Fuel Complex (N F C ) 37.57
(a) Special materials plant (expansion) 0.07
(b) Stainless steel tubes plant 12.18
(c) Seamless tube plant (expansion for ball bearing steel tube) 19.66
(d) Zirconium plant 3.30
(e) Housing facilities and administrative buildings 0.83
(f) Invar and Kovar plant v 0.'30
(g) Expansion facility for production of non-enriched fuels 1.00
(h) F.B.T.R. fuel facility 0.41
8.3 Heavy Water Plants 103.27
8.4 Power reactor fuel reprocessing plant 1.00
8.5 Development of Mining by Atomic Mineral Division 0.44
8.6 Public Sector Undertakings
(a) Indian Rare Earths Ltd. 17.20
(b) Electronic Corporation of India Ltd. 14.96
(c) Uranium Corporation of India Ltd. 2.16
(0 ) (1 ) (2 )
139

(Contd.)
__________ W_________________ (D_________ (2)9.0 Department of Electronics j g g j
9.1 semi-conductor corporation g qq
9.2 electronics trade and development ̂ 00 corporation
9.3 computor maintenance corporation 1 gg
9.4 national information centre Delhi 5 60
9.5 national centre for SD and C T Bombay V 04
9.0 regional computer centre Calcutta 1.30
9.7 regional computer centres Kanpur and o.25
Bangalore
9.8 software development project q 25
9.9 appropriate automation promotion 1^0 programme
9.10 development and production of 010 special control components
9.11 standard infrastructure development 1.25
9.12 pilot plant for special components 2.00 and material
9.13 special tube production project 0109.14 state electronics promotion 3 00
programme
9.16 headquarters 0.80
9.16 ecience, and Technology (T D C + N R C + D P C ) 18.73
10.0 M inistry of Shipping and Transport 146.58
10.1 Hindustan Shipyard Ltd. Visakhapatnam 15.31
(a ) development programme till stagei/ITA 10,31
(b ) development programme stageIB and II 5.00
10.2 Cochin Shipyard Ltd. Cochin 99.71
(a ) original project 84.71
(b ) stage I expansion 15.00
10.3 new shipyards 5.00
10.4 Central Marine and Design 2.16 Research Organisation
10.5 subsidy for ship-building 24.40
140

11.0 M inistry of Commerce 143.18
11.1 N ational Textile Corporation 104’47
(a) working capital 4.43
(b) modernisation 84.97
(c) labour rationalisation 10.07
(d) marketing 5.00
11.2 Pilot Test House Bombay 0.50
11.3 Electronics Export Processing Zone Bombay 3.07
11.4 Marine Products Export Development 2.76 Authority
11.5 Plantation 30.75
(a) Tea 12.33
(b) Coffee 6.68
(c) Rubber 9.80
(d) Cardamom 1.94
11.6 Science and Technology Programme 1.63
12.0 M inistry of C iv il Supplies and Co-operation 46.13
12.1 Weights and Measures schemes 1.73
12.2 Co-operative Fertilisers project 44.40
( i ) I.F.F.C.O.
(a) Kandla and Kalol Kandla and Kalol 7.20
(b ) Phulpur Phulpur 31.20
(c ) Phosphoric Acid, Plant, Kandla Kandla 2.00
(ii) Maharashtra Co-operative Fertilisers Tarapur 4.00 and Chemicals Tarapur
13.0 M inistry of Finance 131.73
13.1 Deptt. of Revenue and Banking 106-82
A. Banking Wing 105.03
B. Revenue Wing 1.79
(a) Alkaloid Project, Neemuch Neemuch 1.19
(b) Project for extraction of 0.60
alkaloids from lanced poppystraw
(0) (1) (2)
141

(Contd.)
(0) (1) (2)
13.2 Deptt. of Economic Affairs 24.91
(a) Bank Note Press Dewas 7.61
(i) continuing and expansion schemes
7.21
(ii) housing scheme phase II 0.40
(b ) India Security Press Nasik 6.54
(i) expansion and modernisation of stamp press
2.08
(ii) expansion and modernisation of currency note press.
3.50
(iii) housing programme 0.96
(c ) Security Paper Mill Hoshangsbad 10.34
(i) modernisation of mill 10.00
(ii) mould cover plant and other schemes
0.34
(d) Bombay Mint-housing scheme Bombay 0.32
(e) Hyderabad Mint-Expansion Hyderabad 0.10
142

Capacity and Production Target for Selected Industries for 1978-79
A N N E X U R E 31
(Chapter V.4, Para 5.38)
1973-74 1975-76 1978-79
industry unit actualproduction
estimatedproduction
targetcapacity
targetproduction
(0) (1) (2) (3) (4) (5)
1. mining
(i) coal Mill, tonnes 79.00 99.80 — 124.00
(ii) lignite ■■ 3.30 3.02 — 4.50
(iii) petroleum crude ■■ 7,20 8.44 14.18 14.18
(iv) iron ore ■■ 35.70 40.96 56.00
2. basic metals
(i) pig iron for sale ■■ 1.59 1.63 2.26 2.50
(ii) steel ingots ■ ■ 6.32 7.65 16.40 11.32
(iii) finished steel 4.89 5.49 13.02 8.80
(iv) alloy and special steel 000 tonnes 339.00 400.00 750.00 570.00
(v ) aluminium .. 147.90 187.00 325.00 310.00
(vi) copper 12.70 23.90 57.00 37.00
(vii) zinc « 20.80 27.80 95.00 80.00
(viii) lead >• 2.70 5.10 18.00 16.00
3. metal products
(i) steel castings .. 67.00 62. 5 200.Q0 100.00
(ii) steel forgings " 97.30 100. 0 250.00 130.00
4. non-metallic mineral products
(i) cement Mill, tonnes 14.67 17.20 23.50 20.80
(ii) refractories '000 tonnes 710.00 729.00 1745.00 1020.00
5. petroleum products(includinglubricants)
Mill, tonnes 19.70 20.70 31.50 27.00
143

(Contd.)
(0) (1) (2 ) (3) (4) (5)
basic chemicals (i) sulphuric acid ‘000 tonnes 1343.00 1416.00 3804.00 2700.00
00 caustic soda , , 419.00 470.00 755.40 610.00
(iii) soda ash , , 480.00 555.00 999.00 710.00
(iv) methanol , , 23.00 27.00 84.50 50.00
(y) industrialoxygen m.c.m. 60.70 64.30 130.00 130.00
agriculturalchemicals
(i) fertilisers (N ) 000 tonnes 1058.00 1535.00 4728;00 2900.00
(ii) fertilisers(P2 0 5) 319.00 302.00 1311.00 770.00
(Hi) pesticides(technicalmaterials) 29.00 36.00 70.00 60.00
(iv) B.H.C. , , 21.00 24.30 28.90 28.00
(v) D .D .T. ■■ 3.90 4.40 4.20 4.40
. thermo plastics and synthetic rubbers (i) L.D. polyethylene 000 tonnes 28.20 27.20 113.00 60.00
(ii) H.D. polyethylene 22.90 19.50 30.00 27.00
(iii) P.V.C. ,, 46.40 41.80 71.10 55.00
(iv) polystyrene „ 14.40 9.20 17.50 13.00
poty propylene ,, - - 30.00 15.00
(Vi) synthetic rubbers » 23.30 24.10 50.00 40.00
synthetic fibres and intermediates(i) D .M .T. '000 tonnes 4.20 19.60 24.00 24.00
(ii) caprolactum - 13.00 20.00 20.00
(iii) viscose filament yarn 37.00 28.50 42.70 40.00
(iv) viscose staple fibre ft 62.00 66.70 132.50 100.00
(v) viscose tyre cord „ 16.90 19.70 21.00 20 0 0
(Vi) nylon filament yarn 11.30 14.20 19.20 17.00
(vii) nylon tyre cord and other industrial yarn 2.20 4.30 9.99 6.00
(viii) polyester filament yarn and staple fibre 15.10 19.30 30.10 24.00
(ix) acrylic fibre „ - - 12.00 6.00
144

(0) ( ! ) (2) (3) (4) (5)
. drugs and pharmaceuticals
(0 anti-biotics-
penicillin M M U 247.50 251.80 575.00 520.00
(ii) streptomycin tonnes 179.85 191.10 490.00 400.00
(iii) anti-diabetesdrugs(insulin) M M U 898.00 812.00 1500.00 1200.00
(iv) anti-dysentrydrugs tonnes 72.80 123.70 539.40 450.00
(v ) anti-leprosydurgs 8.70 14.70 25.60 22.00
(v i) anti-malarialdrugs 22.86 60.00 303.00 200.00
(vii) anti-pyretics and analgesics .. 977.10 1587.00 3055.00 2000.00
(viii) anti-tuberculosis drugs 594.00 046.00 1702.00 1050.00
(ix) sulpha drugs • ! 1297.00 1055.00 2730.00 1750.00
(x) vitamin-A M M U 48.30 30.00 60.00 54.00
(xi) Other vitamins tonnes - 370.00 665.00 500.00
food products
(0 sugar Mill, tonnes 3.95 4.30 5.40 5.40
(ii) vanaspati '000 tonnes 449.00 489.00 1350.00 610.00
textiles
(•) cotton yarns Mill. Kgs. 1000.00 1005.00 - 1150.00
(ii) cotton cloth (mill sector)
Mill. Metres 4083.00 4026.00 - 4800:00
(iii) cotton cloth(decentralisedsector)
n 3863.00 4100.00
'
4700.00
(iv) art silk fabrics 840.00 900.00 1435.00
(v) jute manufactures *000 tonnes 1074.00 1302.00 1350.00 1280.00
I. paper and paper products
(i) paper andpaper board '000 tonnes 776.00 829.00 1300.00 1050.00
(ii) newsprint 48.70 53.00 155.00 80.00
145

(Contd.)
(0 ) (1) (2) (3) (4) (5)
leather and rubbergoods
(i) leatherfootwear Mill, pairs 14.60 15.30 24.60 18.00
(ii) rubber footwear 38.80 39.40 57.00 50.00
(iii) bicycle tyres Mill. Nos. 24.03 24.25 34.00 30.00
(iv) automobile tyres 4.66 4.73 9.90 8.00
other consumer products
(i) soap '000 tonnes 234.00 265.0a 273.00 320.00(ii) synthetic
detergents 72.00 75.00 235.00 125.00
industrialmachinery
(i) machine tools Rs. million 673.00 1080.00 1700.00 1300.00(ii) mining
machinery 62.30 85.00 300.00 200.00(including coal machinery)
(iii) metallurgical machinery 260.00 320.00 600.00 380.00
(iv) cement machinery 81.00 60.00 260.00 150.00
(v) chemical and pharmaceutical machinery „ 313.00 485.00 850.00 650.00
(vi) sugar machinery 223.00 '330.00 450.00 400.00(vii) rubber machinery 14.50 73.00 125.00 100.00
(viii) paper and pulp machinery 51.70 187.50 400.00 280.00
(ix) printing machinery 9.30 36.00 126.00 60.00
(x) cotton textile machinery 458.00 1000.00 2130.00 1300.00
(xi) boilers (powerand industrial) „ 825.10 1400.00 _ 1750.00
electric power equipment(i) steam turbines Mill. K.W. 1.40 2.50 2.50
(ii) hydro turbines 0.70 1.2 - 1.40(iii) transformers Mill.KVA 12.42 13.34 31.00 20.00(iv) motors Mill.H.P. 3.24 3.5 6.7 4.50
146

(0) (1 ) (2 ) (3 ) (4 ) (5 )
10. construction machinery
(i) crawler tractors Nos 278 391 600 450
(ii) dumpers andscrapers ,, 215 310 788 450
(iii) road rollers „ 1566 750 1900 1200
19. agricultural machinery
(i) tractors '000 Nos. 24.2 33.3 70 55
20. rail and water transport
(i) diesel locomotives Nos 145 80 160 160
(ii) electric locomotives ,, 50 54 80 70
(iii) railway coaches „ 1308 1000 1500 1200
(iv) railway wagons '000 Nos. 12.2 10 26.8 15
(v) shipbuilding '000 G R T 30.00 33 180.2 130.2
21. road transport
(i) commercialvehicles '000 Nos. 42.90 43.8 64 60
(ii) passenger cars 44.20 22.45 47.4 32
(iii) jeeps „ 12.40 7.10 13.00 10.00
(iv) scooters, motor cycles andmopeds „ 150.70 217 600 320
(v) bicycles ., 2576 2250 4019 3000
22. mechanical com
ponents and consumer durables
(i) ball and rollerbearings Mill. Nos, 24.4 24 40 34
(ii) typewriters '000 Nos. 33.70 49.4 74.4 60
(iii) sewingmachines „ 257 270 533.5 415
147

(Contd.)
(0) (1) (2) (3 ) (4) (5)
23. electrical components and consumer durables
(i) conductors ‘000 (A.C.S.R. and tonneis A .A .)
46.40 59.10 113.12 90.00
(ii) cables (PVC and VIR) Million
metre551.00 383.00 1281.00 550.00
(iii) dry battery Million Nos. 654.00 516.00 1291.00 800.00
(iv) storagebattery 1.29 1.41 2.20 1.50
(v) G.L.S. lamps „ 120.60 138.10 200.00 180.00
(vi) fliorescenttubes 12.70 17.20 22.00 20.00
(vii) electric fans '000 Nos. 2118.00 2209.00 3200.00 2500,00
24. electronics
(i) consumerelectronics Rs. million 615.00 930 - - 1990.00
(ii) medicalelectronics 40.00 65 — 140.00
(iii) instruments .. 118.00 195 — 460.Q0
(iv) computers and calculators 95.00 190 510.00
(v) control andIndustrialelectronics 70.00 170 300.00
(vi) components 550.00 760 — 1300.00
(vii) materials „ 65.00 120 — 315.00
(viii) telemetry and two-way communications 64.00 72 138.00
148

Physical Targets and Achievements Village and Small Industries
A N N E X U R E 32(Chapter V.5 ,Para 5.95)
draftfifthplan
1974-75
(actuals)
1975-76
(likely)
1976-77(anticipated)
(0) (1) (2) (3) (4)
production
1. cotton cloth handloomand powerloom (m. metres) 4,800 3,800 4,100 4,200
2. khadi- quantity (m. metres) — 59.72 61.20 63.00value (Rs. crores) — 43,28 52.50 53.85
3. raw silk (m.kgs) 4.6 3.00 3.2 3.8
4. village industriesi- value (Rs. crores) 135.31 155.46 176.11
exports
5 cotton handloom fabrics and manufactures 92.0 , 97.0 107.0
6.
(Rs. crores)
silk fabrics and waste (Rs. crores) 21.0 12.7 17.5 18.5
7. coir products —
quantity (000' tonnes) 42.0 36.0 40.0
value (Rs. crores) 19.0 17.9 19.0 20.0
8 handicrafts (Rs. crores) 220.00 190.4 192.0 205.0
1 The figures relate to the centres assisted by the Khadi and Village
Industries Commission.
- Export projection for rhe five year period (1974-79) in respect of handloom piece goods was envisaged at Rs 155 crores under the
Draft Fifth Five Year Plan.
3 Although credit was taken in the export projection for handicrafts in the Fifth Plan for Rs. 220 crores in 1978-79, the endeavour was to be made to increase it furtheT to Rs. 250 crores.
149

A N N E X U R E 33Chapter V.5, Para 5.96)
Revised Fifth Five Yeat Plan Expenditure and Outlays for Village and Small Industries
industry1974-77 (anti, exp.)
centre states/ total U.Ts.
1977-79 (proposed) centre states total
U.Ts.
(Rs. crores)
1974-79 (revised-fifth plan) centra states/ total
U.Ts.
(0) (1) (2) (3) (4) (5) (6) (7) (8) . (9)
1. small scale industries 22.31 44.91 67.22 48.49 62.89 111.38 70.80 107.80 178-62. industrial estates — 11.03 11.03 10.03 10.03 21.06 21.063. khadi and village industries 70.76 4.67 75.43 62.80 4.75 67.55 133.56 9.42 142.984. handloom industry 7.30 29.75 37.05 30.00 32.87 62.87 37.30 62.62 99.925. powerlooms 0.14 1.43 1.57 0.02 1.66 1.68 0-16 3.09 3.256. sericulture 3.21 9.24 12.45 4.75 12.48 17.23 7.96 21.72 29.687. coir industry 0.93 2.08 3.01 2.00 2.65 4.65 2.93 4.73 7.668. handicrafts 3.73 5.01 8.74 15.00 6.06 21.06 18.73 11.07 29.809. rural industries projects1 12.13 — 12.13 9.00 — 9.00 21.13 — 21.13
10. collection of statistics1 0.15 — 0.15 0.80 0.80 0.95 — 0.9511. total 120.66 108.12 228.78 172.86 J 33.39 306.25 293.52 241.51 535.03
iCentrally-sponsored schemes.

A N N EX UR E 34 (Chapter V. 6, Para 5.97)
Revised Fifth Plan— Transport, Tourism and Communications Central Sector
(Rs. crores)
item draftfifthplan
1974-77anticipatedexpenditure
1977-79proposedoutlay
revisedfifthplan
(0) (1) (2) (3) (4)
1. railways 2550.00 1149.00 1053.00 2202.002. roads 714.00 217.84 227.60 445.443. road transport 26.00 49.97 8.20 58.174. ports 2 330.00 358.75 184.83 543.585. shipping 258.00 233.11 216.89 450.006. inland water transport 40.00 10.19 14.73 24.927. lighthouses 12.00 7.53 6.13 13.668. farakka barrage 22.00 16.55 15.00 31.559. civil air transport 391.00 155.87 178.98 334.85
10 tourism 78.00 22.06 18.68 40.7411. communications 1176.00 572.28 694.33 1266.6112. broadcasting 120.00 48.37 46.01 94.3813. total 5717.001 2841.52 2664.38 5505.90
1 In the Draft plan document a provision of Rs. 5727 crores has been shown.2 Provision for Dock Labour Housing Scheme included unde Housing and Urban
Development.
151

A N N EX U R E 36(Chapter V. 6, Para 5.104)
Fifth Plan Outlay on Railways
(Rs. crores)
programme expenditure outlay 1974-77 1977-79
total1974-79
(0 ) (1) (2) (3)
1. rolling stock 556.8 500.0 1056.82. workshops/sheds 35.9 42.0 77.93. machinery and plant 23.7 18.0 41.74. track renewals 104.1 105.0 209.15. bridge works 23.3 24.0 47.36. line capacity works 169.9 146.0 315.97. signalling and safety 39.2 32.0 71.28. electrification 59.1 42.0 101.19. other electrical works 13.0 10.0 23.0
10. newlines 55.2 42.0 97.211. staff quarters 15.2 ■12. staff welfare 8.6 , 31.0 67.213. users'amenities 7.014. other specified works 5.4 -I15. investment in road 22.7 26.0 48.7
services16. inventories (-- ) 15.3 10.0 ( - ) 5 .317. total 1123.8 1028.0 2151.818. Metropolitan transport 25.2 25.0 50.219. grand total 1149.0 1053.0 2202.0
152
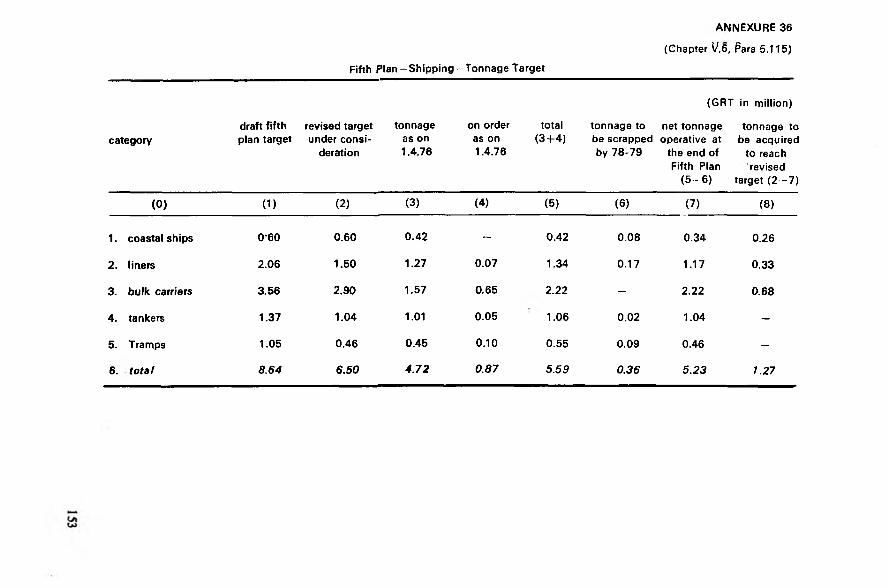
Fifth P la n -S h ip p in g -To n n a g e Target
A N N E X U R E 36
(Chapter V.6, Para 5.115)
categorydraft fifth plan target
revised target under consi
deration
tonnage as on 1.4.76
on order as on 1.4.76
total(3 + 4 )
tonnage to be scrapped by 78-79
(G R T
net tonnage operative at
the end of Fifth Plan
( 5 - 6 )
in million)
tonnage to be acquired
to reach revised
target (2 — 7)
(0 ) (1) (2) (3) (4) (5) (6 ) (7) (8 )
1. coastal ships 0-60 0.60 0.42 - 0.42 0.08 0.34 0.26
2. liaers 2.06 1.50 1.27 0.07 1.34 0.17 1.17 0.33
3. bulk carriers 3.56 2.90 1.57 0.65 2.22 - 2.22 0.68
4. tankers 1.37 1.04 1.01 0.05 1.06 0.02 1.04 -
5. Tramps 1.05 0.46 0.45 0.10 0.55 0.09 0.46 -
6. total 8.64 6.50 4.72 0.87 5.59 0.36 5.23 1.27

ANNEXURE3*(Chapter V. 8 ,Para 5.1
Summary of Plan outlay for Family Welfare Planning Programmes during the Fifth Plan
(Rs. crow
programmes draftfifthplan
1974-77 anticipated expenditure
recommendedoutlay
1977-79proposed
revise#fifthplan
outlay
(0) (1 ) (2) (3) (4)
1. services and supplies 422.53 197.74 221.67 419.41
2. training 13.54 6.17 5.90 12.07
3. mass education 22.00 6.45 6.68 13.13
4. research and evaluation 14.33 3 4 5 5.58 9.03
5. world bank project 19.50 15.68 9.06 24.746. maternal and child health 15.00 2.73 5.84 8.57
7. organisation 9.10 543 3.98 9.41
8. total 516.00 237.65 259.71 497.361
■Includes provision of Rs. 1 crore for new schemes to be formulated by the Department of Family Planning.
154

/IN N EX U R E 38(Chapter V. 8,Para 5.162)
Nutrition Programmes(Rs. crores)
scheme sector draftfifthfiveyearplan
1974-77 anticipated
expenditure
1977-79recomm
endedoutlay
revisedfifthplan
outlay
(0) (1) (2) (3) (4) (5)
t . minimum needs programme
statesunion
territories
330.00 44.24 43.94 88.18
2. subsidiary food and nutrition schemes of the union deptt. of food.
central 50.00 6.53 7.97 14.50
3. schemes of the union deptt. of rural development applied nutrition programme
centrallysponsored
20.00 4.48 8.51 12.99
4. total 400.00 55.25 60.42 115.67
155

ANNEXURE39 (Chapter V. 9, Para 5.155J
Revised Fifth Plan Outlay for Urban Development(Rs. crores)
scheme draftfifth
plan
1974-77anticipated
expenditure
1977-79outlay
revisedfifth
planoutlay
(0) (1) (2) (3) (4)
state sector 474.60 183.20 167.45 350.75
1. state plans 272.35 93.70 89.10 182.80
2 U.T. plans 26.60 10.93 13.00 23.93
3. integrated development of
calcutta metropolitan area and state capital projects 175.65, 78.57 65.35 143.92central sector 252.00 66,13 88.68 154.81
1. integrated urban development of metropolitan cities and areas of national importance 230.00 64.51 85.00 149.51
2 development of rational capital region 20.00 1.59 3.50 5.09
3 research and development
in L.S.G., urban development and financial assistance
for studies in urban and
regional planning 2.00 0 03 0.18 0.21total 726.60 249.33 256.13 505.46
156

Revised Fifth Plan outlays for Housing
including Police Housing(Rs. crores)
A N N E X U R E 40
(Chapter V. 9, Para 5.166)
scheme draft
fifthplan
1974-77
anticipated
expen
diture
1977-79
outlay
revised
fifth
plan
outlay
(0) (1) (2) (3) (4)
state sector 379.57 260.09 245.47 505.56
1. state plans 338.39 243.71 220.95 464.66
2. U .T. plans 41.18 16.38 24.52 40.90
central sector 237.16 40.09 55.27 95.36
1. General Pool Office and
Residential Accommodation 100.00 21.12 30.00 51.12
2. Housing and Urban Develop ment Corporation 90.00 5.00 9.00 14.00
3. Subsidised Industrial
Housing for Plantation
Labour 5.00 2.40 2.60 5.00
4. National Buildings Organisation Schemes 4.00 0.83 0.85 1.68
5. National Building Mate
rials Development Corporation 35.00 0.05 0.10 0.15
6. Hindustan Housing Factory 2.00 0.05 0.10 0.15
7. Subsidised Industrial Housing scheme for Dock Labour 1.16 0.14 0.12 0.26
8. sub-total (1 to 7) 237.16 29.59 42.77 72.369. Police Housing 10.50 12.50 23.00
10. total 616.73 300.18 300.74 600.92
157

(Rs crores)
A N N E X U R E 4 !
(Chapter V. 9, para 5.17Q
Revised Fifth Plan outlays for Water Supply and Sanitation
draft 1974-77 1977 revisedfifth anticipated 79 fifhplan expen Outlay plan
diture outlay
(0) (1 ) (2 ) (3) (4)
states and union territories 1004.00 458.64 461.77 920.41other than MNP 431.00 287.24 303.90 691.14MNP 573.00 171.40 157.87 329.27central sector 16.60 2.68 7.59 10.27total 1020.60 461.32 469.36 930.68
158

ANNEXUR E 42 (Chapter V. 11, Para 5.181)
Fifth Five Year Plan-Outlays and Expenditure— Development of Backward Classes
(Rs. crores)
head draft fifth 1974-77 1977-79 revisedplan outlay anticipated proposed fifth plan
expenditure outlay outlay
(0) (1) (2) (3) (4)
Centre 85.00 52.19 66.69 118.881. tribal development blocks 10.00 7.29 7.29
2. post-matric scholarships 53.00 38.09 61.91 100.003. girls hostels 4.00 2.04 1.73 3.77
4. coaching and allied schemes 3.00 0.82 0.76 1.585. co-operation 3.00 1.34 0.10 1.44
6. research and training 3.00 0.86 0.46 1.327. aid to voluntary
organisations 4.00 1.58 1.39 2.978. machinery for enforcement
of untouchability (offences)act 5.00 0.17 0.34 0.51
states and union territories 173.14 112.63 95.47 208. t0grand total 258.14 164.82 162.16 326.98
159

ANNEXURE 4 j (Chapter V. 11, Para 5.1 s i|
Fifth Five Year Plan-Outlays and Expenditure-Social Welfare.(Rs. crores)
programmes draft fifth plan outlay
1974-77anticipatedexpenditure
1977-79proposedoutlay
revised, fifth plan outlay
(0) (1) (2) (3) (4)
1.cenral schemes
family and child welfare projects 3.20 2.08 0.32 2.40
2. women welfare 21.00 5.25 9.40 14.65
3. welfare of handicapped 9.00 3.82 3.51 7.33"
4. planning, research, training and evaluation 8.10 2.02 2.13 4.15
5. grants-in-aid to voluntary organi sations by the central social welfare board and strangthening its field organisations 8.00 4.83 4.49 9.32
6. grants-in-aid to all India voluntary organisations 3.50 0.78 1.04 1.82
7. education work for prohibition 0.20 0.10 0.10 0.20Centrally Sponsored Schemes
1. child welfare 145.00 13.45 8.64 22.092. women welfare 1.00 1.003. welfare of the
handicapped 2.00 0.39 0.18 0.57total centre and centrally sponsored schemes 200.00 32.72 30.81 63.53states and union territories 29.72 10.01 12.59 22.60grand total 229.72 42.73 43.40 86.13
160

(Rs. crores)
A N N E X U R E 44(Chapter V II, Para 5.186)
Revised Fitfh Plan-Rehabilitation
schemes anticipated cutlays fifth Plansugges- outlay
expenditure . ted for (1974-79)1974-77 1977-79
(°) (1) (2) (3)
rehabilitation of1. migrants in West Bengal 3.30 2.80 6.102. migrant outside West Bengal
(a) areas other thandandakarnaya and Andamans
(i) agri, families 4.27 2.25 6.52(ii) non-agri. families 2.24 2.75 4.99
(b) Dandakarnaya 13.54 12.00 25.54(c) Andoman and nicobar 2.18 1.6 3.78
3. Sri Lanka repatriates 14.17 14.00 28.174. Burma repatriates 2.25 2.00 4.255. Chhamb refugees 4.41 6.59 11.006. Uganda and zaire repatriates7. Rehabilitation industries
corporation 0.86 0.60 1.468 Residuary schemes of west
Pakistan refugees9. rehabilitation of migrants
from Indian enclaves informer East Pakistan 0.40 0.40 0.80
10. residual problems ofrehabilitation in west Bengal(a) SFDA/MFAL — 6.00 6.00(b) dev. of D. P Colonies — 2.50 2.50'(c) medical facilities for
new migranties ----- 1.50 1.5011. total 47.62 64.99 102.61
1 For the first phase
161

Fifth Plan - S and T Outlay(Rs. croiajj
ANNEXURE(Chapter V. Para 5.t
ministry/department draft 5th plan
1974-77 1977-79
(0 ) (1) (2) (3)
1. atomic energy (r and d) 111.13 83.12 34.01 1 6 7 :#2. space 90.00 66.18 62.09 l i s S j3. science and technology — csir 104.50 37.66 44.11 81,^7
— dst 109.98 23.02 35.944. supply — n.t.h. 2.50 0.61 1.49 2110
sub-total (1 — 4) 418.11 210.59 227.645. industry and c.s. — heavy ind. 70.00 6.61 22.15
industrial davelopment 25.00 3.97 6.35 10.326. commerce 5.00 0.56 1.07 1.637. steel and mines - steel 20.00 2.12 4.50 6.&Z
— mines 18.33 1.48 5.00 6.48— gsi and ibm 39.85 18.53 22.85 41
8. labour (coal mines safety) 0.53 0.04 0.11 0.1$9. energy — power 15.00 2.28 6.41 < *
— coal 10.29 1.39 5.0010. electronics 20^00 6.23 12.50 I t f f t11. shipping and transport — shipping 10.00 0.31 0.68 o i l
— transport 9.00 0.20 1.30 2.0$12. communications 32.28 10.87 11.52 22.3®13. tourism and c. aviation — c.a. 0.80 0.18 0.20 0.5(8'
— imd Instts. 30.00 9.05 10.53 1 * # '14. information and broadcasting 0.50 0.27 0.50 0.7?15. pet. and chemicals— petroleum 16.00 7.35 4.73 12.0#
— chemicals 15.00 1.13 1.22 2.3S16. works and housing 23.75 0.03 0.5017. irrigation 38.00 2.49 5.99 8.4S18. agriculture — ICAR (excluding edn.) 110.16 46.55 55.93 102.40
— forest research 14.84 1.21 2.50 3.71— others — 1.40 1.80 3 2 0
health and F.P. — icmr, health & F.P. 36.00 9.92 11.40 21.32' sub-total (5 to 19) 560.33 134.17 1 95.24 329*41
20. grand total 978.44 344.76 422.88 767.64
An additional Rs. 30 crores for INSAT-1 has been provided under the following ministries : communications— Rs. 20 crores; information and broadcasting - Rs. 5 crores; tourism and civil aviation — Rs. 5 crores.