NEW BEDFORD, THIRD FIVE-YEAR REVIEW REPORT, 09 ...
227
THIRD FIVE-YEAR REVIEW REP ORT FOR NEW BEDFORD HARBOR SUPER FUND SITE BRISTOL COUNTY, MASSACHUSETTS • s 0 Pre p ared by U.S. Environmental Protection Agency Region 1 Boston, Massachusetts September 2015 CIJ/2D.JtS n, Acti ng Division Director Date
-
Upload
khangminh22 -
Category
Documents
-
view
3 -
download
0
Transcript of NEW BEDFORD, THIRD FIVE-YEAR REVIEW REPORT, 09 ...
THIRD FIVE-YEAR REVIEW REPORT FOR NEW BEDFORD HARBOR SUPERFUND SITE
BRISTOL COUNTY, MASSACHUSETTS
• ~ s ~ 0
Prepared by
U.S. Environmental Protection Agency Region 1
Boston, Massachusetts September 2015
CIJ/2D.JtS n, Acting Division Director Date

i
TABLE OF CONTENTS
NEW BEDFORD HARBOR FIVE-YEAR REVIEW REPORT Section Page Number
LIST OF ACRONYMS iii EXECUTIVE SUMMARY E-1 FIVE-YEAR REVIEW SUMMARY FORM E-4 1.0 INTRODUCTION 1 2.0 PROGRESS SINCE THE LAST REVIEW 2
2.1 Protectiveness Statements from Last Review 2 2.2 Status of Recommendations and Follow-Up Actions from the Last Review 2
2.3 Remedy Implementation Activities 5 2.4 System Operation/Operation and Maintenance Activities 8 3.0 FIVE-YEAR REVIEW PROCESS 10
3.1 Administrative Components 10 3.2 Community Notification and Involvement 10 3.3 Document Review 10 3.4 Data Review 10 3.5 Site Inspection 18 3.6 Interviews/Questionnaires 19
4.0 TECHNICAL ASSESSMENT 20 4.1 Question A: Is the remedy functioning as intended by the decision documents? 20 4.2 Question B: Are the remedial action objectives, exposure assumptions, toxicity data, and cleanup levels used at the time of remedy selection still valid? 27 4.3 Question C: Has any other information come to light that could call into question the protectiveness of the remedy? 38 4.4 Technical Assessment Summary 38
5.0 ISSUES/RECOMMENDATIONS AND FOLLOW-UP ACTIONS 39 6.0 PROTECTIVENESS STATEMENT 41 7.0 NEXT REVIEW 41 8.0 REFERENCES 41 APPENDIX A – ADDITIONAL SITE INFORMATION A.1 SITE CHRONOLOGY A-1 A.2 BACKGROUND A-5
A.2.1 Physical Characteristics and Land and Resource Use A-5 A.2.2 History of Contamination A-5 A.2.3 Initial Response A-6 A.2.4 Basis for Taking Action A-8
A.3 REMEDIAL ACTIONS A-9 A.3.1 Operable Unit 1 Remedy Selection A-9 A.3.2 Operable Unit 1 Remedy Implementation A-11 A.3.3 Operable Unit 2 (Hot Spot) Remedy Selection A-16 A.3.4 Operable Unit 2 (Hot Spot) Remedy Implementation A-17 A.3.5 Operable Unit 3 (Outer Harbor) Remedy Selection A-18
ii
APPENDIX B – ADDITIONAL MAPS, FIGURES AND DATA 1 - SITE LOCATION MAP 2 - THE 1979 STATE FISHING BAN – MAP OF FISH CLOSURE AREAS 3 - MAJOR COMPONENTS OF THE HYDRAULIC DREDGING PROCESS 4 - AREAS DREDGED THROUGH 2014 2015 HYDRAULIC DREDGE AREAS
5 - AMBIENT AIR DATA: - TABLE E-1 AMBIENT AIR MONITORING PROGRAM - TOTAL DETECTABLE PCB
HOMOLOGUES (AS OF AUGUST 2015) - AMBIENT AIR MONITORING STATION LOCATIONS - PUBLIC EXPOSURE TRACKING SYSTEM (PETS) CURVES FOR THE AEROVOX AND
COFFIN AVE AMBIENT AIR MONITORING LOCATIONS 6 - SEAFOOD MONITORING PROGRAM DATA SUMMARY 7 - BLUE MUSSEL PCB BIOACCUMULATION DATA 8 - LTM DATA
- PCB LEVELS IN TOP 2 CM OF SEDIMENT OVER TIME - BENTHIC COMMUNITY INDICES OVER TIME
9 - MAPS OF SIGNAGE LOCATIONS FOR UPPER, LOWER AND OUTER HARBOR 10 - 2015 FENCING AND SIGNAGE INSTITUTIONAL CONTROL INSPECTION 11 - OU3 PILOT CAP AND STATE’S MITIGATION CAP EXPANSION AREA 12 - SUMMARY OF PLANNED AND/OR IMPLEMENTED ICS 13 - LOWER HARBOR CAD CELLS AND SER NAVIGATIONAL DREDGING 14 - OUTER HARBOR SER NAVIGATIONAL DREDGING
APPENDIX C – PUBLIC NOTICE/OUTREACH AND FYR INTERVIEWS PUBLIC NOTIFICATION INTERVIEWS/QUESTIONNAIRES SEPTEMBER 2015 UPDATED SEAFOOD CONSUMPTION ADVISORY APPENDIX D – RISK ASSESSMENT UPDATES DERMAL/INCIDENTAL CONTACT RISK UPDATE MEMO SEAFOOD TISSUE RISK UPDATE MEMO
iii
LIST OF ACRONYMS
AAL Allowable Ambient Limit
AAR After Action Report
AED EPA’s Office of Research & Development, Atlantic Ecology Division Laboratory in Narragansett, Rhode Island
ARAR Applicable and Relevant and Appropriate Requirement
ARRA American Recovery and Reinvestment Act
AWQC Ambient Water Quality Criteria
CAA Clean Air Act
CAD Confined Aquatic Disposal
CalEPA State of California Environmental Protection Agency
CDE Cornell Dubilier Electronics, Inc.
CDF Confined Disposal Facility
CERCLA Comprehensive Environmental Response, Compensation, and Liability Act
CFR Code of Federal Regulations
CIC Community Involvement Coordinator
CIP Community Involvement Plan
CSF Cancer Slope Factor
CSO Combined Sewer Overflow
CWA Clean Water Act
cy cubic yard(s)
DPA Designated Port Area
EA Early Action
EPA U.S. Environmental Protection Agency
ESD Explanation of Significant Difference (documents changes to a ROD)
FDA Food and Drug Administration
FFE Focused Feasibility Evaluation
FS Feasibility Study
FYR Five-Year Review
HDC New Bedford Harbor Development Commission
IA Inter-Agency Agreement
iv
ICs Institutional Controls
IRIS Integrated Risk Information System
IUR Inhalation Unit Risk
LHCC Lower Harbor CAD Cell
LTM Long Term Monitoring
MA Massachusetts
MassDEP Massachusetts Department of Environmental Protection
MassDPH Massachusetts Department of Public Health
MassDMF Massachusetts Department of Marine Fisheries
MHW Mean High Water
MOA Memorandum of Agreement
NBH New Bedford Harbor
NCP National Contingency Plan
NLD North Lobe Dredging
NMFS National Marine Fisheries Service
NOAA National Oceanic and Atmospheric Administration
NPDES National Pollutant Discharge Elimination System
NPL National Priority List (EPA’s list of Superfund sites)
NRD Natural Resource Damage(s)
NRWQC National Recommended Water Quality Criteria
NTCRA Non-Time Critical Removal Action
NWS North of Wood Street
OL Organic Layer
O&M Operation and Maintenance
OSWER Office of Solid Waste and Emergency Response (EPA)
OU Operable Unit
PAHs Polyaromatic Hydrocarbons
PCB Poly-chlorinated Biphenyl
PETS Public Exposure Tracking System
ppb parts per billion
ppm parts per million
v
PRP Potentially Responsible Party
RA Remedial Action
RAO Remedial Action Objective
RI/FS Remedial Investigation/Feasibility Study
RfD Reference Dose
ROD Record of Decision
RPM Remedial Project Manager
SER State Enhanced Remedy
SFO Oral Cancer Slope Factor
TCL Target Cleanup Level
TEF Toxicity Equivalency Factor
TOC Total Organic Carbon
TSCA Toxic Substance Control Act
USACE U.S. Army Corps of Engineers
VOCs Volatile Organic Carbons
WHG Woods Hole Group

E-1
EXECUTIVE SUMMARY
This is the third Five-Year Review (FYR) for the New Bedford Harbor Superfund Site (the Site) located in New Bedford, Bristol County, Massachusetts covering the years 2010 through 2015. The purpose of this FYR is to review information to determine if the remedy is and will continue to be protective of human health and the environment. The triggering action for this statutory FYR was the signing of the previous FYR on 9/30/2010. This Five-Year Review is for the entire Site (Operable Units One, Two and Three). The United States Environmental Protection Agency (EPA), Region I, conducted this review pursuant to the Comprehensive Environmental Response, Compensation, and Liability Act (CERCLA) Section 121(c), 42 U.S.C. § 9621(c); National Contingency Plan (NCP), 40 C.F.R. § 300.400(f)(4)(ii); and it is consistent with OSWER Directive 9355.7-03B-P (June 2001). EPA has segmented the 18,000 acre Site into three operable units (OUs). OU1 covers the Upper and Lower Harbors and an interim action in the Outer Harbor, with a Record of Decision (ROD) issued in 1998 (EPA, 1998) (and modified to date by five Explanations of Significant Differences (ESDs) issued in 2001 (ESD1), 2002 (ESD2), 2010 (ESD3), 2011 (ESD4) and 2015 (ESD5)) (EPA, 2001; EPA, 2002; EPA, 2010; EPA, 2011; EPA, 2015c). The OU1 remedy, as modified by the ESDs, includes removal of roughly 900,000 cubic yards (cy) of PCB-contaminated sediment and disposal of this sediment off-site or in a Confined Aquatic Disposal Cell being constructed in the Lower Harbor. In addition, a small volume of contaminated sediment is disposed in the Pilot confined disposal facility (CDF) that was constructed on the shoreline in the Upper Harbor in 1988. OU2 addressed an area characterized as the “Hot Spot” sediment, generally located in a five acre area near the former Aerovox facility in the Upper Harbor defined by sediment containing PCB levels above 4,000 ppm. The Hot Spot ROD was issued in 1990 (modified by two ESDs issued in 1992 and 1995), an Amended ROD was issued in 1999, and the Hot Spot remedy was completed in 2000 (EPA, 1990, 1992, 1995, 1999, 2000). One of the Hot Spot areas, designated as Area B, was not dredged during the Hot Spot dredging operations due to its proximity to submerged high voltage power lines serving the City of New Bedford. This area will be addressed under OU1. All excavated OU2 contaminated sediment was disposed in a licensed off-site disposal facility. OU3 encompasses the entire 17,000 acre Outer Harbor area; a ROD for OU3 has not yet been issued. However, localized areas of PCB-contaminated sediment located just outside the hurricane barrier in OU3 were capped as an interim remedy under OU1. The most significant activity that occurred during this FYR period is the entry of a Supplemental Consent Decree to the 1992 Consent Decree (through two reopener clauses) with AVX Corp., whose corporate predecessor, Aerovox Corp., owned and operated the former Aerovox facility, the primary source of PCB contamination in the harbor (EPA, 2013c). In September 2013, the U.S. District Court approved a landmark $366.25 million cash-out settlement which will be used to fund the remaining cleanup of the Site. Due to prior limitations in Superfund funding (which had typically been $15 million per year for this Site), the project was expected to take another 40 years. With this settlement, this project will be accelerated to be substantially completed within 5 to 7 years.
E-2
To summarize this Five-Year Review, EPA continues to expect the Upper and Lower Harbor OU1 remedy to be protective of human health and the environment upon completion, and in the interim, exposure pathways that could result in unacceptable risks have been, or are being, controlled to the maximum extent practicable. As described further below, the three exposure pathways of concern are: 1) consumption of local PCB-contaminated seafood, 2) dermal contact with, or accidental ingestion of, PCB-contaminated shoreline sediment, and 3) ecological risks due to the highly contaminated sediment and sediment pore water at the Site.
Based on annual seafood monitoring performed by the Massachusetts Department of Environmental Protection (MassDEP) since 2003, EPA determined that, based on CERCLA risk standards, the state fishing ban issued in 1979 was not sufficiently protective regarding the human consumption of certain species of fish and shellfish in particular areas of the harbor. In 2010 and 2015, EPA issued more stringent seafood consumption recommendations to augment the 1979 fishing restrictions, including more stringent guidance for nursing mothers, women of child-bearing age, and children. In 2015, EPA issued the “New Bedford Harbor Superfund Site Community Involvement Plan and Institutional Control Plan for Seafood Consumption,” which formalizes the specific steps EPA has taken and will continue to take to implement the institutional controls for local seafood consumption and collaborate with others to reduce consumption of local PCB-contaminated seafood. EPA is performing outreach and education, consistent with the Plan, to inform the community of local seafood consumption health risks and our seafood consumption advisory recommendations. Despite these efforts, given the 18,000 acre size of the Site, coupled with the area’s cultural diversity and reliance on local fishing, complete control of PCB-contaminated seafood consumption will continue to be problematic until the risk-based site-specific PCB level for seafood is reached. Institutional controls, outreach and education shall continue until protective levels for PCBs in local seafood are consistently achieved throughout the Site. EPA has taken actions to minimize dermal contact/incidental ingestion risks from PCB-contaminated shoreline areas. Accelerated cleanups were performed in 2001, 2002/2003 and in 2005 to remediate the highest priority residential and public access areas at the Site along the Acushnet River north of the Wood Street bridge. To control remaining dermal contact/incidental ingestion risks until full remediation occurs, EPA will continue to use shoreline fencing and signage, as appropriate. As a result of the recent settlement, EPA has now initiated planning for intertidal remediation efforts to address remaining dermal contact/incidental ingestion risks. By the end of 2015, EPA will have completed a sampling program covering the intertidal areas of both the Upper and Lower Harbor areas for delineation and remediation planning. Priority intertidal remediation efforts are expected to begin later in 2015, and all intertidal remediation efforts to address dermal contact/incidental ingestion risks will be scheduled over the next 5-7 years as the accelerated cleanup progresses. Ecological risks will continue until after Site remediation is completed as noted in the 1998 ROD. Current water column PCB levels are greater than ten times the National Recommended Water Quality Criteria (NRWQC) of 0.03 ppb which is based on a Final Residue Value protective of the marine food chain for the protection of aquatic receptors.
E-3
Along with evaluating the protectiveness of the remedy, this Five-Year Review documents the significant progress that has been made since the last Five-Year Review. This progress includes, among others things, another 5 seasons of hydraulic dredging in the Upper Harbor; issuance of ESD4 selecting the Lower Harbor CAD Cell (LHCC) as an element of the remedy for sediment disposal and the construction of the LHCC; issuance of ESD5 eliminating confined disposal facilities (CDFs) A, B and C in favor of off-site disposal and designating the Pilot CDF located at EPA’s Sawyer Street facility as a permanent TSCA disposal facility; significant navigational dredging performed under the State Enhanced Remedy (SER) component of the ROD; and, as noted above, the issuance of the Supplemental Consent Decree which provides funding to accelerate the remedy.
This Five-Year Review did not identify any issues or recommendations that could impact
the protectiveness of the remedy. The long term monitoring program implemented at the Site has shown significant improvements in benthic populations and decreases in surficial PCB sediment concentrations in the Lower and Outer Harbor, supporting the conclusion that EPA’s Superfund remedial dredging and the navigational dredging performed under the SER process are improving sediment quality in the harbor.

E-4
Five-Year Review Summary Form
Issues/Recommendations
OU(s) without Issues/Recommendations Identified in the Five-Year Review:
OU1, OU2 and OU3
SITE IDENTIFICATION
Site Name: New Bedford Harbor Superfund Site
EPA ID: MAD980731335
Region: 1 State: MA City/County: New Bedford/Bristol County
SITE STATUS
NPL Status: Final
Multiple OUs? Yes
Has the site achieved construction completion? No
REVIEW STATUS
Lead agency: EPA [If “Other Federal Agency”, enter Agency name]:
Author name (Federal or State Project Manager): Ginny Lombardo/EPA, Elaine Stanley/EPA, Dave Lederer/EPA, Rick Sugatt/EPA, Joe Coyne/MassDEP and Paul Craffey/MassDEP
Author affiliation: EPA Region 1 and MassDEP
Review period: 10/1/2010 - 9/30/2015
Date of site inspection: Not applicable
Type of review: Statutory Review number: 3
Triggering action date: 9/30/2010
Due date (five years after triggering action date): 9/30/2015

E-5
Protectiveness Statement(s)
Operable Unit: OU1
Protectiveness Determination: Will be Protective
Addendum Due Date (if applicable): NA
Protectiveness Statement: The remedy for OU1 is expected to be protective of human health and the environment upon completion, and in the interim, exposure pathways that could result in unacceptable risks have been or are being controlled to the maximum extent practicable.
Operable Unit: OU2
Protectiveness Determination: Short-term Protective
Addendum Due Date (if applicable): NA
Protectiveness Statement: The remedy for OU2 currently protects human health and the environment because the sediment with the highest concentrations of PCBs (ranging from 4,000 ppm to over 100,000 ppm) have been dredged from the Upper Harbor and have been safely transported to an off-site TSCA landfill. However, in order for the remedy to be protective in the long term, the remaining contaminated sediment in this geographical area will be addressed under OU1. All future work, including institutional controls, are now within the scope of OU1.
Operable Unit: OU3
Protectiveness Determination: Cannot be made at this time.
Addendum Due Date (if applicable): NA
Protectiveness Statement: A remedy has not been selected for OU3, thus a protectiveness statement for it cannot be made at this time. An RI/FS has been initiated to characterize the nature and extent of contamination.

1
1.0 INTRODUCTION
The purpose of a Five-Year Review (FYR) is to evaluate the implementation and performance of a remedy in order to determine if the remedy will continue to be protective of human health and the environment. The methods, findings, and conclusions of reviews are documented in FYR reports. In addition, FYR reports identify issues found during the review, if any, and document recommendations to address them.
The U.S. Environmental Protection Agency (EPA) prepares FYRs pursuant to the Comprehensive Environmental Response, Compensation, and Liability Act (CERCLA) Section 121 and the National Contingency Plan (NCP). CERCLA 121 states:
“If the President selects a remedial action that results in any hazardous substances, pollutants, or contaminants remaining at the site, the President shall review such remedial action no less often than each five years after the initiation of such remedial action to assure that human health and the environment are being protected by the remedial action being implemented. In addition, if upon such review it is the judgment of the President that action is appropriate at such site in accordance with section [104] or [106], the President shall take or require such action. The President shall report to the Congress a list of facilities for which such review is required, the results of all such reviews, and any actions taken as a result of such reviews.”
EPA interpreted this requirement further in the NCP; 40 Code of Federal Regulations
(CFR) Section 300.430(f)(4)(ii), which states:
“If a remedial action is selected that results in hazardous substances, pollutants, or contaminants remaining at the site above levels that allow for unlimited use and unrestricted exposure, the lead agency shall review such actions no less often than every five years after the initiation of the selected remedial action.”
EPA Region 1 conducted a FYR on the remedy implemented at the New Bedford Harbor
Superfund Site in New Bedford, Bristol County, Massachusetts. EPA Region 1 is the lead agency for developing and implementing the remedy for the Site. Massachusetts Department of Environmental Protection (MassDEP), as the support agency representing the Commonwealth of Massachusetts, has reviewed all supporting documentation and provided input to EPA during the FYR process.
This is the third FYR for the New Bedford Harbor Superfund Site. The triggering action for this statutory review is the completion date of the second FYR on 9/30/2010. The FYR is required due to the fact that hazardous substances, pollutants, or contaminants remain at the Site above levels that allow for unlimited use and unrestricted exposure. The Site consists of three Operable Units, all of which are addressed in this FYR.
2
2.0 PROGRESS SINCE THE LAST REVIEW
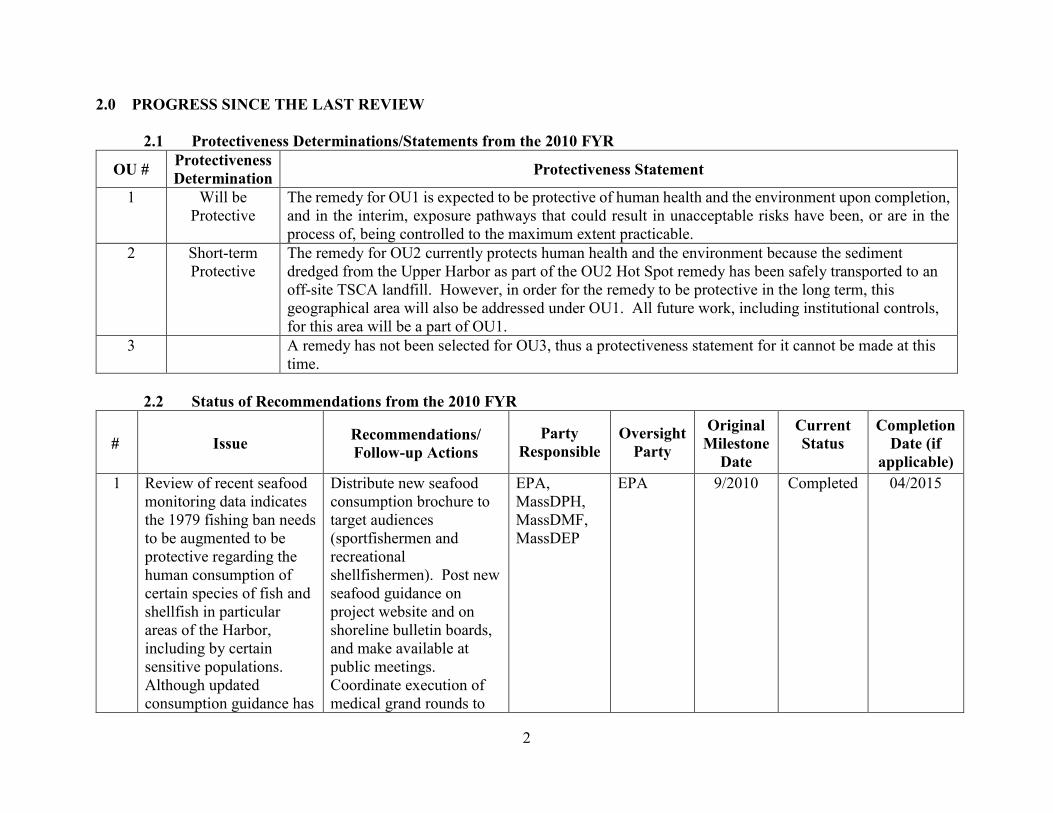
2.1 Protectiveness Determinations/Statements from the 2010 FYR
OU # Protectiveness Determination Protectiveness Statement
1 Will be Protective
The remedy for OU1 is expected to be protective of human health and the environment upon completion, and in the interim, exposure pathways that could result in unacceptable risks have been, or are in the process of, being controlled to the maximum extent practicable.
2 Short-term Protective
The remedy for OU2 currently protects human health and the environment because the sediment dredged from the Upper Harbor as part of the OU2 Hot Spot remedy has been safely transported to an off-site TSCA landfill. However, in order for the remedy to be protective in the long term, this geographical area will also be addressed under OU1. All future work, including institutional controls, for this area will be a part of OU1.
3 A remedy has not been selected for OU3, thus a protectiveness statement for it cannot be made at this time.
2.2 Status of Recommendations from the 2010 FYR
# Issue Recommendations/ Follow-up Actions
Party Responsible
Oversight Party
Original Milestone
Date
Current Status
Completion Date (if
applicable) 1 Review of recent seafood
monitoring data indicates the 1979 fishing ban needs to be augmented to be protective regarding the human consumption of certain species of fish and shellfish in particular areas of the Harbor, including by certain sensitive populations. Although updated consumption guidance has
Distribute new seafood consumption brochure to target audiences (sportfishermen and recreational shellfishermen). Post new seafood guidance on project website and on shoreline bulletin boards, and make available at public meetings. Coordinate execution of medical grand rounds to
EPA, MassDPH, MassDMF, MassDEP
EPA 9/2010 Completed 04/2015
3
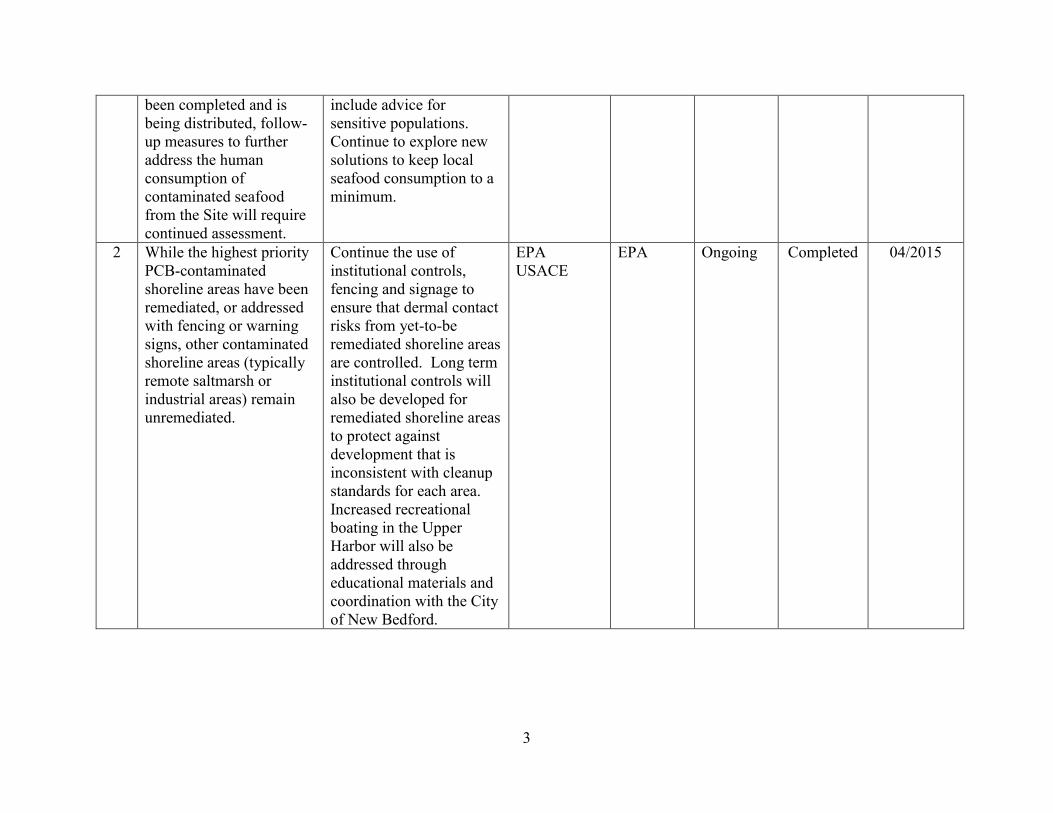
been completed and is being distributed, follow-up measures to further address the human consumption of contaminated seafood from the Site will require continued assessment.
include advice for sensitive populations. Continue to explore new solutions to keep local seafood consumption to a minimum.
2 While the highest priority PCB-contaminated shoreline areas have been remediated, or addressed with fencing or warning signs, other contaminated shoreline areas (typically remote saltmarsh or industrial areas) remain unremediated.
Continue the use of institutional controls, fencing and signage to ensure that dermal contact risks from yet-to-be remediated shoreline areas are controlled. Long term institutional controls will also be developed for remediated shoreline areas to protect against development that is inconsistent with cleanup standards for each area. Increased recreational boating in the Upper Harbor will also be addressed through educational materials and coordination with the City of New Bedford.
EPA USACE
EPA Ongoing Completed 04/2015
4
2.2.1 Efforts Performed to Address Issues/Recommendations from the 2010 FYR
Due to the size of the Site and the area’s cultural diversity and reliance on local fishing,
EPA recognizes that complete control of seafood consumption will continue to be problematic until risk-based levels in fish tissue are achieved. EPA continues to implement institutional controls, including fishing restrictions and advisories, signage, and educational outreach to minimize and, where possible, prevent exposure to contamination that could result in unacceptable risk.
In April 2015, EPA issued the “New Bedford Harbor Superfund Site Community
Involvement Plan and Institutional Control Plan for Seafood Consumption”: http://www2.epa.gov/sites/production/files/2015-05/documents/574395.pdf (EPA, 2015b). EPA prepared this plan based on community interviews and other relevant information. The 2015 CIP and Seafood IC Plan specifically addresses the recommendations and follow-up actions identified in the 2010 FYR. The Community Involvement Plan (CIP) element specifies the community relations activities that EPA has and will continue to take during remedial response at the New Bedford Harbor Superfund Site. Further, the Institutional Control Plan for Seafood Consumption (Seafood IC Plan) element specifies the steps EPA has and will continue to take to implement the institutional controls for seafood consumption and collaborate with others to reduce consumption of local PCB-contaminated seafood.
The 2015 CIP and Seafood IC Plan includes a new seafood consumption advisory
brochure that is being used for outreach and education efforts. This brochure is posted on the project website and is available in Spanish, Portuguese, and Vietnamese. In September 2015, EPA updated its advisories to include a seafood consumption recommendation for tautog in closure area 3. The updated EPA advisories are included in Appendix C and are available at http://www2.epa.gov/new-bedford-harbor/fish-consumption-regulations-and-recommendations. EPA’s seafood consumption advisory brochure will be revised to reflect the updated information. The 2015 CIP and Seafood IC Plan includes actions for the distribution of seafood consumption advisory brochures to target audiences, including sportfishermen and recreational shellfishermen. The 2015 CIP and Seafood IC Plan was presented at EPA’s spring 2015 public meeting, and is posted on the project website, and copies of the new brochure were made available at the spring public meeting. The 2015 CIP and Seafood IC Plan also includes new actions that EPA will implement going forward to minimize seafood consumption, including the creation of new signage, a new video, and targeted outreach using culturally related peers. These new actions are underway. Further, the 2015 CIP and Seafood IC Plan confirms that EPA will assist in raising awareness of health risks associated with consumption of PCB-contaminated seafood through participation in Grand Rounds at local hospitals when MassDPH schedules such events.
As documented in the 2015 CIP and Seafood IC Plan, EPA continues to use and maintain
fencing and signage, including informational kiosks (i.e., shoreline bulletin boards), to address both seafood consumption and dermal contact/incidental ingestion risks. EPA conducts inspections of fencing and signage at least annually to ensure these institutional controls remain in place and are protective. The results of the 2015 fencing and signage inspection is attached in Appendix B.10.
5
To control remaining dermal contact/incidental ingestion risks until full remediation
occurs, EPA will continue to use shoreline fencing and signage, including informational kiosks, as appropriate. As a result of the recent settlement, EPA has now initiated planning for intertidal remediation efforts to address remaining dermal contact/incidental ingestion risks. By the end of 2015, EPA will have completed a sampling program covering the intertidal areas of both the Upper and Lower Harbor for delineation and remediation planning. Priority intertidal remediation efforts are expected to begin later in 2015 and all intertidal remediation efforts to address dermal contact/incidental ingestion risks will be scheduled over the next 5-7 years as the accelerated cleanup progresses. EPA is also reviewing state laws concerning various types of land use restrictions to determine appropriate institutional controls for properties abutting the intertidal remediation areas once cleanup levels have been achieved. 2.2.2 Status of Issue #1 - Completed
The 2015 CIP and Seafood IC Plan documents the actions EPA has and will continue to take to satisfy its obligations under the 1998 Record of Decision (ROD) (1998 ROD) to implement institutional controls to minimize ingestion of local PCB-contaminated seafood and addresses the recommendations identified for Issue #1 in the 2010 FYR. As such, EPA considers Issue #1 from the 2010 FYR to be completed. Until such time as PCB levels in seafood reach EPA’s risk-based, site-specific threshold of 0.02 ppm (or other level if this criteria is updated), institutional controls will remain in place and EPA will follow the 2015 CIP and Seafood IC Plan (or an update to that plan should one be issued). Institutional controls are necessary since it could take many years, even after the sediment remediation efforts are completed, before PCB levels in seafood species reach safe levels for consumption. Institutional controls shall continue until protective levels for PCBs in local seafood are consistently achieved throughout the Site. 2.2.3 Status of Issue #2 - Completed
The 2015 CIP and Seafood IC Plan also documents the actions EPA has and will continue to take to satisfy its obligations under the 1998 ROD to minimize dermal contact/incidental ingestion risks, including outreach to the recreational boating community, fencing and signage, and addresses the recommendations identified for Issue #2 in the 2010 FYR. As such, EPA considers Issue #2 from the 2010 FYR to be completed. These institutional controls will continue to be implemented until such time as PCB levels in shoreline intertidal areas meet applicable dermal contact/incidental ingestion cleanup levels and/or long term institutional controls are developed for remediated shoreline areas to protect against development that is inconsistent with cleanup standards for each area. As noted above, EPA now has funding in place for intertidal remediation efforts to address remaining dermal contact/incidental ingestion risks and delineation of intertidal/shoreline areas are ongoing.
2.3 Remedy Implementation Activities
Below is a brief summary of enforcement and decision documents issued and major remedial implementation activities that have occurred since the previous FYR. Links are
6
provided for enforcement and decision documents. Remedial implementation activities that occurred during this FYR period are discussed in further detail in Section 4.1. Supplemental remedial implementation information and discussion of historical remedial implementation activities is provided in Appendix A.3.2.
Supplemental Consent Decree and Settlement: In 2013, EPA entered into a Supplemental
Consent Decree to the 1992 Consent Decree (through two reopener clauses) with AVX Corp., whose corporate predecessor, Aerovox Corp., owned and operated the former Aerovox facility, the primary source of PCB contamination in the harbor http://www2.epa.gov/sites/production/files/2013-09/documents/547266.pdf (EPA, 2013b). In September 2013, the U.S. District Court approved a landmark $366.25 million cash-out settlement which will be used to fund the remaining cleanup of the Site. Due to prior limitations in Superfund funding (which had typically been $15 million per year for this Site), the project was expected to take another 40 years. With this settlement, this project will be accelerated to be substantially completed within 5 to 7 years. For further information, see http://www2.epa.gov/new-bedford-harbor/harbor-cleanup-plans-and-legaladministrative-records under “Supplemental Consent Decree with AVX Corp.”
Five More Seasons of Hydraulic Dredging in the Upper Harbor: For years 2011 through
2013, with $15 million per year of Site funding, dredging of contaminated subtidal sediment occurred for approximately 40 to 45 days per year. In 2014, with a portion of the settlement funding EPA received in 2013, EPA was able to make significant improvements to the dredging and treatment systems as well as allow for 118 days of dredging and off-site disposal. The total volume of dredged sediment from 2011 through 2014 was 141,883 cy. The total volume of sediment removed from the harbor under the OU1 ROD through 2014 is approximately 354,570 cy. EPA plans on dredging an estimated 80 days in the 2015 dredge season yielding approximately 47,000 cy of contaminated sediment. Dredging for the 2015 season, season twelve, commenced in August and is expected to run through November. Additional information is provided in Section 4.1.
Fourth Explanation of Significant Difference - Lower Harbor CAD Cell (ESD4): ESD4, issued in March 2011, modified the OU1 remedy to include the construction and use of a Lower Harbor CAD cell (LHCC) for disposal of approximately 300,000 cy of mechanically dredged sediment from the lower portion of the Upper Harbor and from areas in the Lower Harbor. Construction and use of the LHCC will be conducted using best management practices to minimize environmental impacts, including maintaining water quality performance standards, and water and air quality monitoring will be performed to ensure that no exceedances of project performance standards occur and that the placed sediments stay within the LHCC. ESD4, including responses to public comments received on the draft ESD, is available at http://www.epa.gov/region1/superfund/sites/newbedford/479471.pdf (EPA, 2011).
LHCC Construction: In 2011, EPA signed a Cooperative Agreement with the Harbor Development Commission of the City of New Bedford (HDC) to provide funding for the design and construction of the LHCC in two phases. The first phase of the CAD cell was completed during the spring of 2014. The second phase of the construction of the LHCC is
7
scheduled to be completed in the fall of 2015. Most recently, in 2015, the U.S. Army Corps of Engineers (USACE) was tasked by EPA to design and contract out the dredging and disposal of contaminated sediment into the LHCC. Dredging and disposal of the sediment are scheduled to occur from late-2015-2018. After a period of time to allow the consolidation of material, the CAD will be capped and institutional controls will be implemented to ensure the integrity of the CAD.
Fifth Explanation of Significant Difference (ESD5): In July 2015, EPA issued ESD5,
available at http://www2.epa.gov/sites/production/files/2015-07/documents/577652.pdf (EPA, 2015c). ESD5 eliminated construction of the planned CDFs A, B and modified-C and selected off-site disposal for the sediment slated for disposal in those planned confined disposal facilities. Further, in ESD5, EPA confirmed that a Pilot CDF previously constructed at the Site is protective and made this Pilot CDF a permanent TSCA disposal facility. As part of the cleanup plan, following completion of remedial dredging activities, the Pilot CDF will be covered with a clean cover/cap meeting all applicable federal and state standards and institutional controls will be enacted to protect the cap over time.
Intertidal/Shoreline Sampling Program: In 2015, EPA initiated an intertidal/shoreline sampling program to support the characterization of intertidal sediments to address remaining dermal contact/incidental ingestion risks.
State Enhanced Remedy – Final Determination for South Terminal: In November 2012, EPA issued the Final Determination for the Commonwealth of Massachusetts’ South Terminal Project for construction of a confined disposal facility for navigational dredged material as part of the State Enhanced Remedy (SER), available at http://www.epa.gov/region1/superfund/sites/newbedford/525556.pdf (EPA, 2012). The Final Determination allowed for the construction of the approximately 28.45 acre marine terminal, consisting of a CDF and upland area, as well as associated dredging including the dredging and filling of a confined aquatic disposal cell (CAD cell). The Final Determination required that the Commonwealth comply with certain conditions to ensure that the work performed would be protective of human health and the environment and meet the substantive requirements of ARARs. The Final Determination was modified to address changes to the conditions and/or proposed work through three modifications, issued February 2013, September 2013 and September 2014 (available at http://www2.epa.gov/new-bedford-harbor/new-bedford-harbor-cleanup-plans-technical-documents-and-environmental-data, under State Enhanced Remedy) (EPA, 2013a; EPA, 2013b; EPA, 2014c). In February 2015, construction of the South Terminal Project was substantively completed. This project entailed the dredging of over 262,000 cy of PCB-contaminated sediment from the Lower Harbor (Appendix B.13). This sediment had low levels of PCB contamination and was disposed of in the newly created navigational CAD cell 3. Removal and isolation of this significant volume of PCB-contaminated sediment that would not otherwise be addressed by the Superfund cleanup provided an important enhancement to the remedy, consistent with the objective of the SER program. The Commonwealth continues to complete mitigation projects required by the Final Determination and the State’s Final Mitigation Plan for the New Bedford Marine Commerce Terminal (MassDEP, 2012). Included in the mitigation
8
projects is supplemental capping adjacent to the OU3 Pilot Cap (discussed further below in Section 3.4.6).
Other SER Projects: During 2014-2015, the Commonwealth of Massachusetts proposed and
executed the Federal Interim Channel Dredging project under the SER program. Under the program, the Federal Channel was dredged to a minimum depth of -29 MLLW to allow the approach of large draft vessels to the South Terminal project. Approximately 117,000 cy of PCB-contaminated dredge material was disposed of in navigational CAD Cells 2 and 3 from the project which was substantially completed in June 2015 (Appendix B.13 and B.14).
SER MOA Update: In January 2015, the Memorandum of Agreement (MOA) between EPA
and MassDEP describing the division of responsibilities for the SER was amended and renewed to allow for continued operation of the program for the next ten years, available at http://www2.epa.gov/sites/production/files/2015-01/documents/568191.pdf (MassDEP and EPA, 2015). [See Appendix A.3.1 for an explanation of the SER program.]
Former Aerovox Facility: The former Aerovox facility is the primary source of PCB contamination in the harbor. In May 2013, EPA issued a certification of completion of work for a non-time-critical removal action (NTCRA) performed by AVX Corporation (AVX), successor of Aerovox Corporation, pursuant to a 2010 Administrative Settlement Agreement and Order on Consent between EPA and AVX to demolish the former Aerovox building and cap the 10 acre former Aerovox property. AVX is performing an investigation and cleanup of the former Aerovox property under the State hazardous cleanup program pursuant to a 2010 Administrative Consent Order and Notice of Responsibility (Release Tracking Number 4-0601). The City of New Bedford, owner of the property, also entered into a 2010 Cooperation Settlement Agreement with AVX which established a framework for long-term monitoring and maintenance of the site as well as potential redevelopment plans. Control of the primary source of PCB contamination in the harbor is important to a successful harbor remediation, and EPA continues to coordinate the harbor cleanup activities and schedule with the ongoing investigation, cleanup efforts, and schedule at the Aerovox property.
2.4 System Operation/Operation and Maintenance Activities
Below is a brief description of major remedial action monitoring activities that have been
implemented at the Site to monitor various aspects of the remedy over time. The data from these monitoring activities covering the period since the previous FYR, along with additional detail, is discussed in Sections 3.4 and 4.1.
Long Term Monitoring Program (LTM) Round VI (2014): EPA has been collecting long
term monitoring (LTM) data approximately every five years at the Site since 1993 to assess sediment conditions and quantify the long term environmental effects and effectiveness of remediation efforts in the harbor. The LTM program began in 1993 (Round I), considered the baseline event, with subsequent rounds taking place in 1995 (Round II), 1999 (Round III), 2004 (Round IV), 2009 (Round V) and, most recently, 2014 (Round VI).
9
Seafood Monitoring Program: Since 2003, pursuant to the State Superfund Contract, MassDEP has been conducting annual seafood monitoring to evaluate the levels of PCBs in edible seafood species in New Bedford Harbor and surrounding Buzzards Bay – covering the three fish closure areas established by Massachusetts Department of Public Health (MassDPH). As reported in the 2010 FYR, the seafood tissue data collected through the annual seafood monitoring program was used to establish EPA seafood advisories and recommendations.
Remedial Dredging Water Quality Monitoring: EPA and the USACE utilize a site-specific
turbidity-based monitoring program that produces immediate sampling results, as a protective and quantitative approach to monitoring the dredging process in real-time rather than having to wait days to receive laboratory data.
Ambient Air Monitoring: Airborne PCB samples have been and continue to be collected at
various locations as part of every remedial activity involving removal of PCB-contaminated sediment. To account for the long term nature of the harbor cleanup, as well as the chronic nature of PCB toxicity, EPA uses a “public exposure tracking system” (PETS) to ensure that the public’s long term exposure to airborne PCBs remains below health-based levels.
North of Wood Street (NWS) Sediment Monitoring: Subtidal and intertidal areas north of
the Wood Street bridge were remediated and restored in 2001, 2002/2003 and 2005. EPA has been monitoring PCB sediment levels here since that time.
OU3 Pilot Cap Monitoring: Cornell Dubilier Electronics, Inc., which was located just south
of the New Bedford Harbor hurricane barrier, was another historical source of PCBs to the harbor. The OU1 ROD included dredging as an interim action to address an area just south of the hurricane barrier in the Outer Harbor, near the Cornell-Dubilier mill, a known area in the Outer Harbor that contained PCB levels above the Lower Harbor’s 50 ppm cleanup standard. In 2004 and 2005, an opportunity for an alternative accelerated cleanup approach for this area presented itself at no cost to EPA: rather than dredging the area, clean sand generated by the port of New Bedford’s navigational dredging (implemented pursuant to the SER) could be used to create an underwater cap. Construction of the approximately 19-acre cap was completed in 2005. Since that time, the pilot underwater capped area has been monitored for changes in spatial extent, thickness of cap through bathymetric surveys, PCB levels and TOC of the cap. Monitoring of the cap has been performed in 2006, 2007, 2009, 2010, 2011 and 2012.
Sawyer Street Groundwater Monitoring: Since 1992, EPA has conducted periodic
groundwater monitoring of 6 groundwater wells located at EPA’s Sawyer Street facility along the perimeter of the Pilot CDF and Cell #1, to ensure PCBs and VOCs are not released from these areas and allowed to migrate in groundwater.
10
3.0 FIVE-YEAR REVIEW PROCESS
3.1 Administrative Components
The public was notified of the initiation of this Five-Year Review on 1/5/2015. The New Bedford Harbor Superfund Site FYR was led by Ginny Lombardo, EPA Team Leader for the Site, with technical support from Elaine Stanley and Dave Lederer, Site remedial project managers (RPMs), and community involvement support from Kelsey O’Neil, the Community Involvement Coordinator (CIC). Joseph Coyne and Paul Craffey, Project Managers for the MassDEP, assisted in the review as the representative for the support agency.
The FYR process was initiated with a ‘kick-off’ meeting on 2/23/2015. In attendance at the meeting were the Site team leader, Site RPMs, Site risk assessor, Site attorney and CIC for the Site. The review consisted of the following components:
Community Involvement; Document Review; Data Review; and FYR Report Development and Review.
3.2 Community Notification and Involvement
A press release was issued on 1/5/2015 notifying the public that a Five-Year Review was
initiated and inviting the public to submit any comments to the EPA. A copy of the press release is included in Appendix C. The results of the review and the report will be made available on the project website and at the Site information repository located at EPA Region 1 Records Center, 5 Post Office Square, Boston, Massachusetts and New Bedford Free Public Library, 613 Pleasant Street, New Bedford, Massachusetts.
3.3 Document Review
This Five-Year Review consisted of a review of relevant documents including long term monitoring reports, annual seafood tissue monitoring reports, water and sediment quality data reports, ambient air monitoring data reports, groundwater monitoring report, and dredge season-end reports. Applicable sediment cleanup levels, as listed in the 1998 ROD, were also reviewed.
3.4 Data Review
3.4.1 Long Term Monitoring EPA has been collecting long term monitoring (LTM) data approximately every five years at the Site since 1993 to assess sediment conditions and quantify the long term environmental effects and effectiveness of remediation efforts in the harbor. The LTM program began in 1993 (Round I), considered the baseline event, with subsequent rounds taking place in 1995 (Round II), 1999 (Round III), 2004 (Round IV), 2009 (Round V) and, most recently, 2014 (Round VI). The 2014 LTM Report is available at http://www2.epa.gov/sites/production/files/2015-09/documents/583617.pdf (Battelle, 2015d).
11
Sediment grabs are collected for chemical and physical testing as well as benthic community analysis to assess sediment conditions. Surficial sediment (top 2 cm) is analyzed for PCBs (measured as the sum of the 18 NOAA congeners), total organic carbon (TOC) content and grain size distribution. Sediment from the biologically-active zone (top 10 cm) are analyzed for benthic infauna and grain size. The benthic community evaluation assesses the effectiveness of the remedy in terms of marine bottom (benthic) species abundance and richness (Nelson et al., 1996).
The LTM data are evaluated by EPA’s Office of Research & Development, Atlantic Ecology Division laboratory in Narragansett, Rhode Island (EPA-AED) in the context of the overall program to assess spatial and temporal data trends and to monitor the effects and effectiveness of the remedial Site activities. EPA-AED’s evaluation of the 2014 LTM data is available at http://www2.epa.gov/sites/production/files/2015-09/documents/583616.pdf (Bergen, 2015). Under the LTM program, sediments are analyzed for 18 of the 209 PCB congeners. These are the same 18 congeners that are used in the National Oceanic and Atmospheric Administration’s (NOAA) National Status and Trends Program to assess marine environmental quality (Calder, 1986).
There is a distinct spatial gradient in surficial sediment PCB concentration from the
Upper Harbor to the Lower Harbor to the Outer Harbor. This spatial pattern is consistently demonstrated in each of the six long-term monitoring collections (1993, 1995, 1999, 2004, 2009, and 2014). In Nelson and Bergen (2012), there was a detailed analysis of the LTM data from the first five long term monitoring collections, which confirmed that the cleanup activities had resulted in significant improvement in surface sediment and benthic quality in 2009 compared to the 1993 baseline data for the Lower and Outer Harbor areas. The 2014 sediment data continue the trends described in that analysis and are shown visually in the interpolated sediment PCB concentration maps included in Appendix B.8 (Bergen, 2015).
In the Upper Harbor, the % surface area (interpolated from the LTM surface sediment
stations) below 10 ppm PCBs (measured as the sum of the 18 NOAA congeners) has continued to increase from 11% in 2009 to 19% in 2014. Of course, this data is only for the recently deposited material in the top 2 cm of sediment but does indicate that the last 5 years of Upper Harbor dredging has not spread any appreciable contamination to the sediment surface in the Upper Harbor. In the Lower Harbor, 10% of the surface sediment LTM stations were above 10 ppm PCBs (measured as the sum of the 18 NOAA congeners) in 2009; however, in 2014, that percentage dropped to zero, demonstrating improving surface sediment conditions in the Lower Harbor and showing that CAD cell work and flux from the Upper Harbor have not caused sediment surface PCB levels to increase in the Lower Harbor. In the Outer Harbor, the differences were smaller given the overall lower concentrations but the area greater than 1.0 ppm PCBs (measured as the sum of the 18 NOAA congeners) decreased from 0.7% in 2009 to zero in 2014.
As noted in Nelson and Bergen (2012), all of the harbor sections (as of the 2004
sampling) have shown statistically significant decreases (p<0.05) in surface PCB concentrations when compared to the 1993 baseline sampling. In the 2014 collection, the Upper Harbor PCB concentrations at most stations were not different from 2009 but 7 stations exhibited significant
12
decreases while the average concentration for the area remained the same. In the Outer Harbor, 20 of 23 stations showed decreased concentrations and the mean concentration dropped from 0.24 to 0.17 ppm PCBs (measured as the sum of the 18 NOAA congeners) although this decrease is not statistically significant. The Lower Harbor did exhibit a statistically significant decrease (p<0.05) in mean PCB concentration (measured as the sum of the 18 NOAA congeners) from 5.1 ppm to 2.8 ppm with 21 of 29 stations exhibiting decreasing PCB concentrations. The totality of the PCB surface sediment data points to a decrease in overall PCB concentrations in all areas of the Site, demonstrating that remedial operations to date have resulted in notable improvements in surface sediment conditions. The sum of the 18 NOAA congeners is multiplied by a conversion factor of 2.6 to estimate total PCBs (FWEC, 2001; FWEC, 2002); as such, the mean PCB concentration measured during the 2014 LTM program for the Lower Harbor is approximately 7 ppm.
There are several benthic indices that can be calculated from the LTM benthic infauna
data. One that has been used at this Site is the Environmental Monitoring and Assessment Program’s (EMAP) benthic index for the Virginian Biogeographical Province (Paul, et. al, 2001). This biodiversity index was developed to assess estuarine benthic condition from Cape Cod, MA to the mouth of Chesapeake Bay, VA. The original index was based on three metrics: salinity-normalized Gleason’s D, salinity-normalized tubificid abundance, and abundance of spionids. For the New Bedford Harbor study, only two of these metrics are used: Gleason’s D and Spionid abundance. Tubificid abundance is only considered important in low salinity waters (close to zero salinity), and the New Bedford Harbor study area is saline. A value of zero is considered the cut-off for distinguishing “Good” and “Poor” conditions: positive values are good, negative values are poor.
Consistent with the results found for the other LTM variables, there is a similar spatial
pattern for the EMAP benthic index; the Upper Harbor exhibits the worst condition, as evidenced by the large negative values observed each collection year (i.e., degraded condition), the Lower Harbor is significantly improved relative to the Upper Harbor, with values near zero, and the Outer Harbor is always significantly highest with positive values, indicative of a good benthic community (see maps in Appendix B.8). Temporally, the percent of stations in each harbor segment exhibiting a positive or “good” benthic index for each year of the LTM program are shown in Appendix B.8. The Outer Harbor stations are almost all positive for every year. A consistent increase in the number of stations with “good” benthic condition can be seen in the Lower Harbor and this matches up well with the documented decreasing PCB surface concentrations. Even in the Upper Harbor, an increase in the percent of stations with “good” benthic readings can be seen when comparing the 2009 and 2014 data.
The overall increase in benthic health, combined with the decreasing PCB concentrations,
points to the improvement in the Site condition. It is logical with the advent of increased remediation that these trends should continue and accelerate. Although monitoring data indicates progress towards achieving the 1998 ROD’s sediment cleanup goals, the remedy for the Site is still under construction and these goals are not expected to be achieved until construction is complete.
13
3.4.2 Seafood Monitoring Program Seafood tissue monitoring performed at the Site includes both the annual seafood monitoring program and the blue mussels monitoring program. The seafood monitoring program, initiated in 2003, is coordinated by the Commonwealth of Massachusetts, with oversight by EPA Region 1. Edible tissue of a variety of locally caught species from all three fish closure areas in New Bedford Harbor and surrounding Buzzards Bay are sampled annually for PCB levels. Consistent with the requirements of the 1998 ROD, the purpose of the seafood monitoring program has been to support the implementation of seafood advisory institutional controls for the Site. The seafood monitoring reports are available at http://www2.epa.gov/new-bedford-harbor/new-bedford-harbor-cleanup-plans-technical-documents-and-environmental-data under “Annual Seafood Monitoring”. During this FYR period, the seafood monitoring reports for 2009, 2010, 2011, 2012, 2013 and 2014 were issued (MassDEP, 2010; MassDEP, 2011; MassDEP, 2012a; MassDEP, 2014a; MassDEP, 2014b; MassDEP, 2015). EPA utilized the historical seafood tissue data (2002-2009) to perform risk assessments that led to site-specific seafood consumption advisories and recommendations that were updated in 2010 and discussed in the 2010 FYR. As part of the development of the 2015 CIP and Seafood IC Plan and this third FYR, EPA performed an updated risk evaluation of the seafood tissue data collected under the seafood monitoring program, including data from 2010-2014, and confirmed that the seafood advisories and recommendations established by EPA in 2010 remain protective. EPA has documented that evaluation for this FYR in a risk assessment update included in Appendix D. That update also evaluated new data for tautog, collected in 2013 and 2014, which supports a new advisory for closure area 3 for that species. In September 2015, EPA updated its advisories to include a seafood consumption recommendation for tautog in closure area 3. The updated EPA advisories are included in Appendix C and available at http://www2.epa.gov/new-bedford-harbor/fish-consumption-regulations-and-recommendations. PCB concentrations in seafood tissue levels measured since 2003 have remained fairly consistent. A summary of the seafood tissue data over time for several key species is provided in Appendix B.6. Significant seafood tissue reductions are not expected to occur until the remedial action is complete and it could take many years, even after the sediment remediation efforts are completed, before PCB levels in seafood species reach safe levels for consumption. EPA is currently working with MassDEP to optimize the seafood monitoring program towards tracking seafood tissue decreases over time to demonstrate seafood tissue reductions as the cleanup progresses and following completion of remedy construction. EPA will periodically evaluate whether seafood tissue reductions observed support revisions to the site-specific seafood consumption advisories.
The seafood monitoring program is augmented by the deployment of blue mussels (Mytilus edulis) as another element of the long-term monitoring program for the Site (Nelson and Bergen, 2012). Mussel deployments have been conducted twice annually since 1993 by EPA-AED at three stations: NBH-2-Coggeshall Street, NBH-4-Hurricane Barrier, and a control site
14
NBH-5-West Island. In addition, there were monthly deployments during the 1994-1995 Hot Spot remediation for a total of 51 28-day deployments.
The mean total PCBs (as the sum of 18 congeners) in the blue mussel tissue for all three
stations for the period 1993 through 2014 are shown in Appendix B.7. As might be expected, there is a significant spatial gradient among stations. There is an approximate five-fold decrease in overall mean concentration between stations NBH-2 (35 ppm) and NBH-4 (8 ppm) and over an order of magnitude decrease between station NBH-4 (8 ppm) and NBH-5 (0.5 ppm). The PCB differences among stations are maintained over time; however, all stations exhibit seasonal variability due to the mussel reproductive cycle where lipid-rich gametes increase during the year (along with lipophilic organic contaminants such as PCBs), then decrease during spawning. This pattern has also been observed in the New Bedford Harbor indigenous ribbed mussel population as well (Bergen et al., 2001). Monthly deployments during the Hot Spot remediation demonstrated that increases in mussel bioaccumulation were more closely linked to storm events than any dredging activity (Bergen et al., 2005).
The data set indicates that in the period between 1993 and 2014, no net change in PCB
water column concentration and subsequent mussel bioaccumulation has occurred, primarily because the exposure to PCBs has not been altered dramatically along this gradient over time. While the overall mass of PCBs removed from the harbor has been significant, especially during the Hot Spot removal, the average water column PCB concentrations near the mussel stations have not appreciably decreased. It is reasonable to expect that once full remediation is complete, surface water PCB concentrations will decrease, leading to a concomitant decrease in mussel PCB tissue concentrations. Both monitoring programs demonstrate that PCB tissue levels in sampled species are above the site-specific goal of 0.02 ppm for PCB concentrations in seafood (Appendix B.6 and B.7). PCB tissue levels vary by species and closure area, and generally show a decreasing north to south gradient, i.e., samples closer to the Aerovox source area have higher PCB residues than those further south. These two programs continue to demonstrate the need for the harbor PCB cleanup, in terms of unacceptable risks to both human health and the marine ecosystem. These monitoring programs also demonstrate that the remedy is being implemented in a safe manner that does not exacerbate PCB bioaccumulation within the local marine food chain, as PCB concentrations in biota have remained fairly constant and increases during active remedy implementation have not been observed.
3.4.3 Water Quality Monitoring
EPA developed site-specific turbidity-based monitoring programs that produce immediate sampling results, as a protective and quantitative approach to monitoring the dredging process in real-time rather than having to wait days to receive laboratory data. The objective of the water quality monitoring is to minimize environmental impacts, limit recontamination of previously dredged areas, ensure that the dredging activities are conducted in a manner which does not hinder the seasonal migration of anadromous fish to and from the Acushnet River, and to determine the degree and extent of sediment plumes advecting away from the Site during dredging operations. Trigger level exceedances would result in the collection of water samples
15
for chemical and toxicity analyses as a follow up or discontinuing dredging operations, as necessary to lessen turbidity. In addition, best management practices have reduced turbidity impacts due to sediment scour from workboats, prop-wash and pipeline groundings.
The extensive water quality monitoring data base collected since the last FYR shows that all in-water construction and dredging operations performed to date have complied with the turbidity criterion. Reports for Upper Harbor water quality monitoring are available for review at http://www2.epa.gov/new-bedford-harbor/new-bedford-harbor-cleanup-plans-technical-documents-and-environmental-data, under “Water Quality Monitoring” (WHG, 2011b, 2012b, 2013d, 2014; Battelle, 2015b). Turbidity plumes that were observed during dredging and dredge-related activities have generally been confined to within 100 feet of active operations. The continuous monitoring systems employed have also documented that high turbidity events can occur naturally when no dredging operations are underway (Battelle, 2015b). 3.4.4 Ambient Air Monitoring Through an extensive air monitoring program, a comprehensive data base of airborne PCB levels has been developed for the New Bedford Harbor Site. Ambient air PCB samples have been and continue to be collected as part of every remedial activity involving removal of PCB-contaminated sediment. To ensure that the airborne PCB levels reported are truly the total of all detectable PCBs, the analytical method used at the Site since 1999 quantifies all ten of the PCB homolog groups. To account for the long term nature of the harbor cleanup, as well as the chronic nature of PCB toxicity, the Site team established a “public exposure tracking system” (PETS) based on a site-specific risk evaluation to ensure that the public’s long term exposure to airborne PCBs remains below health-based levels. To assist public understanding of the program, the PETS process graphs a linear acceptable exposure level over time, and plots the actual monitored exposure levels at various receptors over time: as long as the field monitored values remain below the “budgeted” cumulative exposure line then health risks from airborne PCBs remain insignificant. During the FYR period, EPA continued its extensive air monitoring efforts. In the Upper Harbor, monitoring continued in conjunction with the hydraulic dredging program under the Final Plan for the Sampling of Ambient Air PCB Concentrations to Support Decisions to Ensure the Protection of the Public During Remediation Activities, Revision No. 3 (Jacobs, 2006). In the Lower Harbor, monitoring was conducted to monitor PCBs in ambient air during construction of the LHCC starting in 2013 pursuant to the Final Plan for the Sampling of Ambient Air PCB Concentrations During Lower Harbor CAD Cell Construction available at http://www2.epa.gov/sites/production/files/2014-10/documents/538677.pdf (Jacobs, 2013c). See Appendix B.5 for a table of ambient air monitoring data for 1999-2015, along with a map of the sampling locations, and for the 2015 PETS curve for the Aerovox and Coffin Ave monitoring locations, offered as examples of the PETS program. Air monitoring data is also posted on the project website at http://www2.epa.gov/sites/production/files/2015-09/documents/581891.pdf (Jacobs, 2015d). Ambient air monitoring data collected during the past five years continue to show that cumulative exposure from PCBs measured in ambient air remains below risk-based exposure budgets that are protective of human health.
16
In response to community concerns about the potential for air emissions from the LHCC, EPA took several steps. During the planning phase for the LHCC project, EPA conducted modeling to project potential air emissions from the LHCC project. The conclusion of the modeling effort was that emissions would be well below any health-based standards for the project and these results were incorporated into ESD4. Under the 2013 Final Plan for the Sampling of Ambient Air PCB Concentrations During Lower Harbor CAD Cell Construction, EPA expanded its historic air monitoring network through the addition of four additional air monitoring stations in the Lower Harbor: two monitoring stations near the LHCC site in Fairhaven, one in New Bedford, and one on board the dredge plant. Pursuant to the 2013 air plan, stations in the Lower Harbor were monitored prior to, during, and after the top of CAD material was removed from both the Phase I and Phase II LHCC projects. Ambient air monitoring efforts performed during construction of both phases showed no levels of PCB emissions approached the level of any health-based standards established for the project. In order to account for the expedited remediation schedule planned with the settlement funding, which will provide for longer dredge seasons and increased production and concurrent hydraulic and mechanical dredging in the Upper and Lower Harbor, the EPA updated its air monitoring plan in 2015. The Draft Final Ambient Air Monitoring Plan for Remediation Activities, issued in July 2015, (2015 Air Monitoring Plan), available at http://www2.epa.gov/sites/production/files/2015-08/documents/577154.pdf (Jacobs, 2015c), will be implemented for all remaining remediation activities starting with the 2015 dredge season, which began in August 2015. Under the 2015 Air Monitoring Plan, EPA updated risk-based ambient air goals and again expanded its air monitoring network in the Lower Harbor in preparation for the dredging of material in conjunction with the LHCC project, and its disposal in the LHCC. Four new Lower Harbor stations were added to provide fuller monitoring coverage of any potential emissions from the project. The new stations will begin operation by late 2015. 3.4.5 North of Wood Street Monitoring
Subtidal and intertidal areas north of the Wood Street bridge (NWS) in the Upper Harbor were remediated and restored in 2001, 2002/2003 and 2005. EPA has been monitoring PCB levels in sediment in this area since 2004. During this FYR period, post-remediation monitoring for the NWS cleanup occurred in 2011 and 2012 (WHG, 2011d; WHG, 2012c).
PCB levels in NWS subtidal sediments have fluctuated up and down over the course of
post-remediation monitoring since 2003 with a general increasing trend in concentration. Only one of the ten river (or subtidal) sediment stations sampled in 2012 tested below the 1998 ROD cleanup level of 10 ppm PCBs for subtidal areas of the Upper Harbor. However, six out of ten sampling stations contain lower concentrations of PCB when compared to 2011. The stations containing the thickest layer of OL (organic layer) corresponded to the stations with the highest concentrations of PCBs, as PCBs tend to bind to organics.
For the shoreline/intertidal sediment, concentrations of PCBs have remained consistently
low and fluctuate slightly up and down at the sample locations. Sampling results for recreational use areas show PCB concentrations below the 1998 ROD cleanup level of 25 ppm for recreational shoreline land use. For all post-remediation residential shoreline locations,
17
monitoring results show PCB concentrations have fluctuated slightly up and down but are less than 1 ppm PCBs (the 1998 ROD cleanup level for residential shoreline areas), with the exception of three locations. For one station, the PCB concentration was slightly above 1 ppm PCBs in 2011 but fell below 1 ppm PCBs in 2012. For the two other stations, results showed PCB concentrations below 1 ppm PCBs in 2011 and in 2012 slightly exceeded 1 ppm PCBs. EPA did not monitor the sediment in 2013 and 2014 due to limited funding in 2013 and a decision to address recontamination under the accelerated cleanup strategy. In 2015, EPA began and continues to obtain extensive sediment data to comprehensively design a remediation strategy that will achieve cleanup goals across the Site. As part of EPA’s accelerated cleanup plan, any NWS areas that have been re-contaminated above the applicable cleanup levels will be reassessed as the remedial action efforts progress towards completion. See Section 4.1 for additional discussion. 3.4.6 OU3 Pilot Cap Monitoring
As an alternative to the dredging interim remedy in the 1998 ROD, in 2004/2005, EPA constructed an approximately 19-acre pilot cap to permanently isolate sediment contaminated with PCBs above 50 ppm in the Outer Harbor, using clean sand and gravel from a navigational CAD cell constructed as part of the State Enhanced Remedy. Since that time, the pilot underwater cap has been monitored for changes in spatial extent, thickness of cap through bathymetric surveys, PCB levels and TOC (total organic carbon) of the cap. During this FYR period, monitoring events were performed in 2010 (after the second FYR), 2011 and 2012 (WHG, 2011a; Jacobs, 2011a; Jacobs, 2012; WHG, 2013a). OU3 Pilot Cap monitoring reports are available at http://www2.epa.gov/new-bedford-harbor/new-bedford-harbor-cleanup-plans-technical-documents-and-environmental-data#OuterHarborStudy. As of the 2012 monitoring event, cap surface sediment monitoring data show PCB concentrations were all less than 4 ppm: samples within the pilot cap ranged from 0.04 to 3.11 ppm with an average of 0.56 ppm (excludes three stations located outside the cap area) (WHG, 2013a). Monitoring data continue to support that the pilot capping operation was successful, and that additional capping efforts in this area would be justified. The benthic environment has been robustly re-colonized, indicating that such capping presents only a short-term impact.
In 2011, EPA requested that the U.S. Coast Guard establish the capped area as a “Regulated Navigation Area” and, through the Department of Homeland Security, published a Final Rule in the Federal Register with an effective date of July 20, 2011 which prohibits all vessels and persons from activities that would disturb the seabed within the regulated navigation area, including but not limited to anchoring, dragging, trawling and spudding. Vessels may otherwise transit or navigate within this area without reservation.
Pursuant to the South Terminal Final Determination and the Final Mitigation Plan (MassDEP, 2012b) for that SER Project, the State is capping an additional area adjacent to the existing OU3 Pilot Cap (see Section 2.3). When the pilot cap was placed in 2004/2005, the cap material was placed over all sediments above 50 ppm; however, some areas closest to the Hurricane Barrier, with PCB concentrations of less than 50 ppm, that were slated for capping under this project remained uncapped due to technical limitations of the placement method and
18
the shallow depth of the area. The South Terminal mitigation effort will utilize clean sand from construction of the bottom of the EPA CAD Cell to cap an area nearest to the Hurricane Barrier adjacent to the existing OU3 Pilot Cap, an area of approximately 20 acres (extending the existing OU3 Pilot Cap and addressing much of the area slated for capping in 2005 that was not capped during that effort). This mitigation project was initiated in July 2015 and is expected to be completed in October 2015. See Appendix B.11 for a figure of the OU3 Pilot Cap and proposed State’s cap expansion area. The final remedy for this area will be included as part of OU3. In the interim, monitoring activities will continue to ensure the cap is functioning as designed.
3.4.7 Sawyer Street Groundwater Monitoring
Since 1992, EPA has conducted periodic groundwater monitoring of 6 groundwater wells
located at EPA’s Sawyer Street facility along the perimeter of the Pilot CDF and Cell #1, to ensure PCBs and VOCs are not released from these areas and allowed to migrate in groundwater. During this FYR period, annual groundwater monitoring of the Sawyer Street well network was conducted in 2010, 2011, 2012, 2014 (WHG, 2011e; WHG, 2012a; WHG, 2013c; Battelle, 2015a) and is scheduled for Fall 2015. Sawyer Street groundwater monitoring reports are available at http://www2.epa.gov/new-bedford-harbor/new-bedford-harbor-cleanup-plans-technical-documents-and-environmental-data, under “Sawyer Street Groundwater Monitoring”. Groundwater data has consistently shown that PCBs are not migrating from the Pilot CDF or Cell #1 areas of EPA’s Sawyer Street facility. In addition, in March 2015, EPA issued the “Modeling Analysis of Potential Environmental Impact of the Pilot Confined Disposal Facility,” (Jacobs, 2015a) which concluded that discharge of PCBs from the groundwater to the harbor would unlikely be measurable.
3.4.8 Other
In addition to these monitoring programs, the Site team undertakes a variety of sediment PCB monitoring projects as needed to assist in the implementation of the ongoing remedial actions. These include additional characterization sampling and “progress” sampling during remedial operations.
3.5 Site Inspection A Site inspection specific to the FYR was not performed. Site inspections for the OU1 remedy are conducted routinely throughout each year since USACE is on site full time for construction oversight and EPA is frequently on site for coordination and oversight activities. In addition, inspections occur daily during the dredging season by the USACE, with additional oversight from EPA. An overall evaluation of the operations is prepared and documented yearly in a year-end dredge data report prepared by the USACE contractor. Annual dredge season data reports are posted on the project website at http://www2.epa.gov/new-bedford-harbor/new-bedford-harbor-cleanup-plans-technical-documents-and-environmental-data#AnnualDredgingReports (Jacobs, 2011b; Jacobs 2013a; Jacobs 2013b; Jacobs 2014; Jacobs 2015b). Applicable data from recent site inspection activities is summarized below:

19
3.5.1 Signage for Seafood Advisories and Signage and Fencing for Contaminated Shorelines Signage and fencing at the Site installed as part of the remedial institutional controls are inspected annually, at a minimum. Most recently, in May 2015, USACE’s contractor inspected the seafood advisory and contaminated sediment signage, including informational kiosks, along the Upper, Lower and Outer Harbor areas. The report on the 2015 inspection is included in Appendix B.10. All signs that were missing or in poor condition were replaced in June 2015. Signage will continue to be monitored by EPA, USACE and their contractors and missing and/or damaged signs will be replaced as needed. Fencing in areas with contaminated shoreline sediment adjacent to parks and residential areas was also inspected and found to be in good condition. Fencing in these areas will continue to be monitored by EPA, USACE and their contractors and missing and/or damaged fencing will be replaced as needed. 3.5.2 Dredging, Desanding and Dewatering Operations
Dredging operations (including desanding and dewatering activities) are continuously monitored by the USACE during the dredging season. During off-dredging season periods, operations facilities and temporary waste disposal areas are inspected by USACE staff based at the Site, as well as by contracted security personnel.
3.6 Interviews
As noted above, in April 2015, EPA issued the 2015 CIP and Seafood IC Plan. A large part of the plan was developed using feedback from community interviews on the EPA cleanup and outreach efforts. There were a number of community groups and individuals interviewed from various geographic and socioeconomic spectrums in New Bedford, Fairhaven, Dartmouth and Acushnet. The 2015 CIP and Seafood IC Plan details the interviews and feedback, as well as plans for action relative to the community’s feedback. EPA began implementation of the plan in the summer of 2015. The feedback from the community reflected positively on the EPA’s cleanup of the harbor and gave numerous suggestions for increased education and outreach.
EPA coordinates on a daily basis with the USACE implementation team and USACE contractors performing the work. EPA also communicates regularly with other harbor stakeholders and the community. During the FYR process, EPA conducted interviews with MassDEP, the City of New Bedford and the New Bedford Harbor Development Commission (HDC). The purpose of the interviews was to document any perceived problems or successes with the remedy that has been implemented to date. Interview records were issued to the interviewees via email. Completed interview records were submitted on 6/2/2015, 7/17/2015 and 7/31/2015. Interviews are summarized below and completed interview questionnaires are included in Appendix C.
All interviewees are confident that, with the AVX settlement in place, the cleanup will achieve the desired positive effect on the harbor and surrounding communities. There is agreement that EPA has effectively taken advantage of the funding in the cleanup planning and implementation. The EPA establishment of a Team Leader position is considered beneficial to
20
all aspects of the cleanup work. All interviewees agree that the EPA has effectively and efficiently responded to community concerns and complaints. Public meetings, especially in the form of the poster session held in October 2014, are effective. Some recommendations to improve resident’s take-aways from public meetings are to develop data and graphics to hand out to the public for them to bring home from meetings, rather than references to the project website.
The interviews focus on the strong collaboration and cooperation of EPA with MassDEP, the City and HDC on all elements of the cleanup. The main focus from the HDC is to continue to make effective use of the SER process and to increase port activity. The HDC leadership would like to work with EPA to develop a mechanism to keep the SER process, or a similar process, in place once the EPA cleanup is complete. The City believes that the great working relationship with the EPA on a number of city plans, including those for future use of the harbor area, have been positively enhanced with the use of settlement funds.
4.0 TECHNICAL ASSESSMENT The technical assessment was only conducted for OU1, since OU2 is complete and requires no further action (including no O&M) and a ROD has not yet been issued for OU3.
4.1 Question A: Is the remedy functioning as intended by the decision documents?
Yes. The remedy is being implemented in accordance with the requirements of the 1998 ROD; the 2001, 2002, 2010, 2011 and 2015 ESDs; and design specifications. The remedy is expected to be protective when it is completed. With the recent settlement, this project will be accelerated to be substantially completed within 5 to 7 years. Key remedial actions at the Site are discussed below, along with a summary of the remedial activities conducted during the period covered by the FYR, and a discussion on how they are meeting the intent of the decision documents.
4.1.2 Dredging of Harbor Sediment USACE, through its contractor, continues hydraulic dredging activities in the Upper Harbor. Appendix B.3 shows the major components of the hydraulic dredging process. The depth to which sediment has to be removed in a particular dredge area is based on core sampling data, a z-star (z*) predictive model for dredging depth, and bathymetric survey data. EPA’s focus to date has been on removing the most highly contaminated PCB sediment layers to achieve the greatest risk reductions with the limited funding that had been available historically.
For years 2011 through 2013, with $15 million per year of Site funding, dredging of contaminated subtidal sediment occurred for approximately 40 to 45 days per year. Approximately 64,571 cy of contaminated sediment and debris was processed and shipped off-site by rail or truck to licensed disposal facilities during the 2011-2013 period. In 2014, with a portion of the settlement funding EPA received in 2013, EPA was able to make significant improvements to the dredging and treatment systems as well as allow for 118 days of dredging and off-site disposal of approximately 77,312 cy of in-situ sediment. The total volume of
21
dredged sediment from 2011 through 2014 was 141,883 cy. The total volume of sediment removed from the harbor under OU1 through 2014 is approximately 354,570 cy. EPA plans on dredging an estimated 80 days in the 2015 dredge season yielding approximately 47,000 cy of contaminated sediment. The 2015 dredging season commenced in August 2015 and is expected to run through November 2015. Appendix B.4 includes a figure showing the areas where dredging has occurred through 2014 and a figure showing the areas where dredging is ongoing and to be performed in 2015. Appendix A.3.2, Table 2, lists all Site sediment remediation efforts and volumes to date.
Recommendations for improvements to the operations (lessons learned) are made at the
end of each season. These lessons learned since the second FYR are documented in the dredge season data reports (Jacobs, 2011b; Jacobs 2013a; Jacobs 2013b; Jacobs 2014; Jacobs 2015b). Recommended improvements to the operations have been incorporated into current year operations.
The 2014 improvements to the dredge/treatment system that increased production efficiency and lowered the unit cost of dredging, as presented in the 2014 dredge-season end report (Jacobs, 2015b), are discussed below: Installed a larger more robust desanding unit and larger pump system to better separate sands
from the slurry. These improvements led to significantly less sand being classified as TSCA material (>50 ppm). In 2014, 82% of sand was determined to be non-TSCA sand, which was shipped to a solid waste landfill accepting lower concentrations of PCB-containing waste at a cost savings to the project.
Installed a gravity thickener in the dewatering operation to remove a portion of the water from the slurry using polymers, thereby thickening the slurry prior to dewatering by filter press. This unit also provides 45,000 gallons more slurry storage upstream of the filter presses.
Added two additional filter presses for a total of eight presses to the dewatering system for a 33% increase in capacity. The additional slurry capacity provided by the gravity thickener helped ensure the filter presses had adequate feed material to keep them all on-line throughout the season.
Added upgraded dredging software program to allow the dredge operator to more accurately program dredge cuts and track vertical and horizontal progress, reducing the dredge overlap to one foot which allowed dredge crews to cover more area per day and greatly reduced the amount of water introduced into the hydraulic treatment train by 42% as compared to previous seasons.
The daily dredge volume production average for the years 2005 through 2013 was approximately 454 cy per day, while for the 2014 dredge season, the average daily production was approximately 665 cy per day, a 46% increase.
In order to determine progress in meeting the target dredge elevation and to confirm the
removal of contaminated sediment to concentrations at or below the remediation criteria, sediment conditions are assessed during and following dredging operations. The results indicate that the overall thickness of the highly contaminated sediment layers in the northern reaches of the Upper Harbor have been significantly reduced across all dredged regions, as presented in the sediment monitoring data since the second FYR (WHG, 2011c; WHG, 2012d; WHG, 2013b;
22
Battelle, 2015c). As compared to pre-dredging PCB concentrations, post-dredge concentrations have varied, but in general indicate that PCB concentrations are lower in areas where little overlying organic silt remains (i.e., where native sediment, typically clay in the northern Upper Harbor, was reached). The post-dredge monitoring also suggests that, at least in the highly contaminated northern reaches of the Upper Harbor, the z* predictive model may be underestimating the required depth of dredging. With the settlement funding now available to fund an accelerated remedial effort, EPA and USACE are in the process of performing comprehensive characterization of the remaining PCB-contaminated sediment area for implementation of remedial efforts to achieve established cleanup levels.
4.1.2 Construction and Filling of Lower Harbor Confined Aquatic Disposal Cell (LHCC)
In 2011, EPA signed a Cooperative Agreement with the City of New Bedford Harbor
Development Commission to provide funding for the design and construction of the LHCC in two phases (location shown in Appendix B.13). The first phase of the CAD cell was completed during the spring of 2014. The second phase of the LHCC is scheduled to be completed in the fall of 2015. Prior to construction, in 2012, EPA held technical workgroup meetings with interested stakeholders to discuss risk assessment and modeling results, technical considerations and design of the CAD cell, dredging protocols, and ambient air information and monitoring plans. Information from those meetings, along with the LHCC plans and specifications, is available at http://www2.epa.gov/new-bedford-harbor/lower-harbor-confined-aquatic-disposal-cad-cell. In addition, in September 2014, EPA participated in a Fairhaven Board of Selectmen meeting to respond to community concerns, primarily focused on the construction and use of the LHCC. Following the meeting, EPA prepared a summary information document in an effort to respond to the majority of concerns raised by the community. The summary document is available at http://www2.epa.gov/sites/production/files/2014-10/documents/538674.pdf. Most recently, in 2015, USACE was tasked by EPA to design and contract out the dredging and disposal of PCB contaminated sediment into the LHCC. Dredging and disposal of the sediment is expected to occur beginning late-2015 through 2018. After a period of settling, the CAD will be capped and institutional controls will be implemented to ensure the integrity of the CAD. A technical workgroup meeting to discuss the design of the Lower Harbor dredge areas was held in July 2015. The information from the July 2015 meeting is available at http://www2.epa.gov/new-bedford-harbor/july-7-2015-technical-workgroup-meeting-documents.
4.1.3 Intertidal Excavations, Restorations and Monitoring Excavation and restorations activities were completed North of Wood Street (NWS) in 2001, 2002/2003 and 2005. See also Section 3.4.5 above. These areas were targeted for accelerated cleanups due to the residential and recreational shoreline land use and the high levels of PCB contamination (prior to cleanup) in these areas. These areas are periodically monitored for soil and sediment PCB levels to assess whether recontamination due to tidal action is occurring. During this FYR period, NWS monitoring occurred in 2011 and 2012 (WHG, 2011d; WHG, 2012c). As of the most recent monitoring event for these areas, completed in 2012, there is evidence of low levels of recontamination; however, these levels have fluctuated up and down over the course of post-monitoring sampling since 2003. PCB concentrations in the NWS

23
subtidal/river sediments have shown a general increasing trend, suggesting that PCBs have been actively transported up-river (tidally) from the known sources of PCB contamination downstream. For NWS shoreline sediment, post-remediation sampling results suggest that the remediation remains effective, although several post-remediation residential shoreline locations have been fluctuating slightly above the 1 ppm PCB cleanup level. As part of EPA’s accelerated cleanup plan, any areas that have been recontaminated above the applicable cleanup levels will be reassessed as the remedial action efforts progress towards completion. The lower PCB concentrations between shoreline/intertidal sediment and river/subtidal sediment NWS may be due to differences in exposure to contaminants transported by tidal currents. Most shoreline stations are located above mean high water (MHW) on the marsh surface and are only flooded during spring tides. Consequently, shoreline stations receive far less exposure to contaminants suspended in river water than subtidal sediment stations, reducing the likelihood of recontamination. Conversely, subtidal sediment stations can be exposed to contaminated sediment during every tidal cycle, and have a greater opportunity to accumulate contaminated sediment. No additional intertidal remediation and restoration activities occurred during this FYR period. However, as a result of the recent settlement, EPA has now initiated planning for intertidal remediation efforts to address remaining dermal contact/incidental ingestion risks. By the end of 2015, EPA will have completed a sampling program covering the intertidal areas of both the Upper and Lower Harbor areas for delineation and remediation planning. Priority intertidal remediation efforts are expected to begin later in 2015 and all intertidal remediation and restoration efforts will be scheduled over the next 5-7 years as the accelerated cleanup progresses.
4.1.4 Construction of Confined Disposal Facilities The 2002 and 2015 ESDs eliminated the construction of CDFs A, B, C and D. Sediment initially slated for CDFs A, B and C will be disposed off-site. Sediment slated for CDF D will be disposed off-site or in the Lower Harbor CAD Cell.
A pilot CDF to contain contaminated dredged sediment was constructed just north of the end of Sawyer Street as part of the 1988/89 pilot study. This pilot CDF was modified in the early 1990s as part of the Hot Spot ROD implementation to allow construction of a lined sediment holding cell (Cell #1). The original contents of the pilot CDF are now contained along the shoreline directly to the east of Cell #1; it is this shoreline area that is now referred to as the Pilot CDF. The Pilot CDF contains approximately 19,000 cy of PCB-contaminated sediment and debris. Groundwater and air monitoring performed at the Pilot CDF since 1992, along with groundwater modeling, demonstrate that PCBs are not migrating from the Pilot CDF area. See Section 3.4.7 above. In ESD5, EPA designated the Pilot CDF a permanent TSCA disposal facility and a final remedy for the area pursuant to TSCA 40 CFR § 761.61(c), consistent with the process described in ESD1 (EPA, 2015c). EPA will continue to utilize the Pilot CDF area as a staging and storage area for sand from the desanding operations and debris generated from dredging operations. There may be
24
additional incidental disposal of sand from the desanding operations in the Pilot CDF over the course of remaining remedial dredging operations. Pursuant to ESD5, following completion of remedial dredging activities, the Pilot CDF will be capped and institutional controls and long term monitoring and maintenance will be implemented. Cell #1 is used for interim disposal of PCB- and VOC-contaminated sediments that were dredged during operations near the Aerovox shoreline area. In ESD3, EPA determined that there are no existing risks associated with the temporary disposal in Cell #1 (EPA, 2010). When funding allows, EPA intends to remove all the material from Cell #1 and dispose of it at an appropriately licensed landfill.
4.1.5 Construction and Operation of Water Treatment Facilities
A 2,000 gpm water treatment system is part of the dewatering facilities at Area D. A desanding facility at Area C, which receives slurry from the dredge to separate coarse-grained materials (e.g. sand, gravel, shells, etc.) prior to dewatering, is also part of the sediment processing operation. Both facilities have been in operation since the start of the dredge season in 2004. Since the start of full-scale dredging, a ferric sulfate injection system was added upstream of the desanding facility, along with other operational measures, to address the formation of hydrogen sulfide (H2S) in the building. Overall, the treatment systems are functioning as intended as the effluent concentrations for PCBs and selected metals are in compliance with the stringent project effluent discharge criteria (Jacobs, 2011b – Table C-4; Jacobs, 2013a – Table B-5; Jacobs, 2013b – Table B-5; Jacobs, 2014 – Table B-5, Jacobs, 2015b – Table B-5).
4.1.6 Seafood Advisories and Other Institutional Controls
As discussed above, complete control of PCB-contaminated seafood consumption will
continue to be problematic until the risk-based site-specific PCB level for seafood is reached. Appendix B.12 provides a summary table of planned and implemented institutional controls for the OU1 remedy. EPA has implemented the following institutional controls to minimize and, where possible, prevent exposure to contamination that could result in unacceptable risk. ICs planned for the future are also briefly discussed: Fishing restrictions and advisories. In 1979, MassDPH promulgated regulations prohibiting
fishing and lobstering throughout the Site due to elevated PCB levels in area seafood (See Appendix B.2), and enforcement is the responsibility of MassDPH. EPA also performed risk assessments that led to site-specific seafood consumption advisories and recommendations. In 2010, EPA issued more stringent seafood consumption recommendations to augment the 1979 fishing restrictions, including more stringent guidance for nursing mothers, women of child-bearing age, and children. Institutional controls in the form of seafood consumption advisories are necessary since it could take many years, even after the sediment remediation efforts are completed, before PCB levels in seafood species reach safe levels for consumption. These institutional controls shall continue until protective levels for PCBs in local seafood are consistently achieved throughout the Site. In April 2015, EPA issued the 2015 CIP and Seafood IC Plan. EPA prepared this plan based on community interviews and
25
other relevant information. The Seafood IC Plan element specifies the steps EPA has and will continue to take to implement the institutional controls for seafood consumption and collaborate with others to reduce consumption of local PCB-contaminated seafood. The 2015 CIP and Seafood IC Plan includes a new seafood consumption advisory brochure that is being used for outreach and education efforts. This brochure is available in Spanish, Portuguese, and Vietnamese. In September 2015, EPA updated its advisories to include a seafood consumption recommendation for tautog in closure area 3. The updated EPA advisories are included in Appendix C and available at http://www2.epa.gov/new-bedford-harbor/fish-consumption-regulations-and-recommendations. EPA’s seafood consumption advisory brochure will be revised to reflect the updated information. The 2015 CIP and Seafood IC Plan also includes new actions that EPA will implement going forward to minimize seafood consumption, including the creation of new signage, a new video and targeted outreach using culturally related peers.
Fencing. Fencing has been erected along the New Bedford shoreline in residential and
recreational shoreline areas where they abut sediment with elevated levels of PCBs that may represent dermal contact/incidental ingestion risk. As documented in the 2015 CIP and Seafood IC Plan, EPA continues to use, monitor and maintain fencing to address both seafood consumption and dermal contact/incidental ingestion risks. EPA conducts at least annual inspections of fencing to ensure this institutional control remains in place. The results of the 2015 fencing and signage inspection is attached in Appendix B.10.
Signage. Signage is used extensively at the Site, both to communicate the fishing advisory as
well as to warn against dermal contact/incidental ingestion with PCB-contaminated sediment. As documented in the 2015 CIP and Seafood IC Plan, EPA continues to use, monitor and maintain signage, including informational kiosks, to address both seafood consumption and dermal contact/incidental ingestion risks. EPA conducts annual inspections of signage to ensure this institutional control remains in place and protective. The results of the 2015 fencing and signage inspection is attached in Appendix B.10. The 2015 CIP and Seafood IC Plan also provided for the installation of signage at additional locations along the Upper and Lower Harbor. The figure of the signage and kiosk locations is included in Appendix B.9. Further, the 2015 CIP and Seafood IC Plan called for new signage depicting the message “do not eat fish”. These new signs have been designed and will be installed at all signage locations by the end of 2015.
Additional Educational Materials. In addition to outreach materials on the seafood
consumption advisories and recommendations, the 2015 CIP and Seafood IC Plan includes educational and outreach materials created in 2008 that will continue to be distributed at boating or crew-racing events in the Upper or Lower Harbor where there is a risk of exposure to contaminated sediment and physical hazards from dredging operations. The brochure explains the potential risks and the measures boaters can take to avoid exposure.
ICs for CDFs, LHCC, OU3 cap and other EPA property. The only CDF that will remain as a permanent element of the OU1 remedy is the Pilot CDF. Following completion of remedial dredging activities, the Pilot CDF will require final capping, institutional controls and long term monitoring and maintenance. Institutional controls will be required to restrict reuse of

26
the area to passive recreational use and ensure that the integrity of the cap and the Pilot CDF’s sidewalls are maintained for long term protectiveness. In 2011, ICs were placed to protect the OU3 cap. Once completed and capped, the LHCC will require similar institutional controls as those already in place for the OU3 pilot cap area, and the OU3 pilot cap area will be re-evaluated with the State once the additional subtidal mitigation capping is completed. EPA maintains security, including fencing and security staff, around all of its facilities where contaminated sediment is treated or stored. EPA has issued licenses to the HDC and a local fisheries company to be able to use the marine bulkhead at the EPA’s Hervey Tichon dewatering facility (Area D) for marine industrial uses (primarily for docking commercial fishing boats) that are compatible with the remedial activities being conducted at the property.
4.1.7 Long Term Monitoring Program
EPA has been collecting long term monitoring (LTM) data approximately every five years at the Site since 1993 to assess sediment conditions and quantify the long term environmental effects and effectiveness of remediation efforts in the harbor. See discussion above in Section 3.4.1. Overall, the long term monitoring program confirms that the cleanup activities to date have resulted in significant improvement in surface sediment and benthic quality in 2014 compared to the 1993 baseline data for the Lower and Outer Harbor areas (Appendix B.8).
4.1.8 Seafood Monitoring Program Seafood tissue monitoring performed at the Site includes both the annual seafood
monitoring program and the blue mussel monitoring program. See discussion above in Section 3.4.2. Overall, the levels of PCBs in New Bedford Harbor area seafood continue to be above the site-specific goal and are consistent with levels expected during ongoing, long term, active sediment remediation. EPA and USACE are continuing work on a food chain modeling effort to update the 1990 food chain model performed in support of the 1998 ROD. The food web model will be utilized to make predictions of biota PCB concentrations post remediation so EPA can estimate potential seafood consumption risk reductions over time and the estimated time after completion of the OU1 remediation to reach the risk-based fish tissue target level of 0.02 ppm. As noted above, EPA is working to optimize the seafood monitoring program towards tracking seafood tissue decreases over time to demonstrate seafood tissue reductions as the cleanup progresses and following completion of remedy construction. Following completion of remedy construction, seafood tissue data will be used to refine model predictions.
4.1.8 Summary In summary, the remedy is proceeding as intended and with the recent settlement, this project will be accelerated to be substantially completed within 5 to 7 years. EPA will continue to work with project stakeholders to implement the remedy going forward. Major remedial activities scheduled over the next five years include: continued subtidal hydraulic dredging in the Upper Harbor; mechanical dredging of portions of the Upper Harbor and the Lower Harbor for disposal in the LHCC; intertidal/shoreline remediation and restoration; and the development of
27
LHCC, Pilot CDF and shoreline ICs. Long term monitoring shows an improvement in overall sediment and benthic quality in the Lower and Outer Harbor areas compared to 1993 baseline data, and the historical seafood monitoring data set has been used to establish protective seafood consumption advisories and recommendations. It could take many years, even after the sediment remediation efforts are completed, before PCB levels in seafood species reach safe levels for consumption. In the interim, EPA will continue its ongoing measures and implement the community relations activities and institutional controls for seafood consumption activities outlined in the 2015 CIP and Seafood IC Plan. At this time, there are no known problems with the remedy that would affect its long term protectiveness.
4.2 Question B: Are the remedial action objectives (RAOs), exposure assumptions, toxicity data and cleanup levels used at the time of the remedy selection still valid?
Yes, the RAOs, exposure assumptions and cleanup levels used at the time of remedy
selection are still valid; however, toxicity data used at the time of remedy selection have changed. The analysis presented below is for OU1. No evaluation is needed for OU2 because all excavated Hot Spot sediment has been disposed off-site. An evaluation was not conducted of OU3, since a remedy has not yet been selected.
4.2.1 Remedial Action Objectives The following are the remedial action objectives as summarized in the 1998 ROD: 1. To reduce risks to human health by reducing PCB concentrations in seafood, by lowering
PCB concentrations in sediment and in the water column; 2. To ensure that contact with shoreline sediment does not present excessive risks to human
health as a result of dermal contact with or accidental ingestion of PCB-contaminated sediment in areas prone to beach combing or in areas where residences abut the Harbor; and
3. To improve the quality of the seriously degraded marine ecosystem by a) reducing marine organisms’ exposure to PCB contaminated sediment while minimizing consequent harm to the environment, and b) reducing surface water PCB concentrations to comply with chronic AWQC by reducing PCB sediment concentrations.
These remedial action objectives remain valid. The overall long term goals of the
remedy also remain appropriate (e.g., eventual lifting of the state fishing bans and EPA seafood consumption advisories (seafood consumption may not be safe for other reasons, such as due to wastes from CSOs),
reduction of human health risks associated with dermal contact with and
incidental ingestion of shoreline sediment, and compliance with the PCB national recommended water quality criterion).
4.2.2 Exposure Assumptions The exposure assumptions used at the time of remedy selection are still valid. The environmental media which were considered in the 1998 ROD include surface water, harbor sediment, marine biota and Site area air. Direct contact with and incidental ingestion of
28
shoreline sediment and ingestion of contaminated seafood were identified as the human health exposure pathways of primary concern. The original human health risk assessment in 1989 evaluated the cancer and non-cancer risks of PCBs, cadmium, copper, and lead in adults, young children (age 0-5 years), and older children (age 6-16 years) exposed via sediment contact, sediment ingestion, ingestion of aquatic biota, and inhalation of airborne contaminants. PAHs were found to be collocated with PCBs, but were not assessed for risk because it was concluded that the PAHs resulted from non-point sources and would be effectively addressed with PCB remediation. Screening results performed under conservative exposure conditions indicated that exposure to PCBs in surface water and air did not represent a significant exposure pathway. However, EPA established water quality and ambient air monitoring programs to ensure that the remediation efforts did not cause unacceptable impacts to surface water and air and to confirm ambient air levels remained below levels protective of human health. These risk assessment scenarios and exposure assumptions remain valid.
4.2.3 Toxicity Data
EPA toxicity values, including reference doses (RfDs) and cancer slope factors (CSFs), are routinely re-evaluated and updated. As such, some of the exposure factors used in the 1989 risk assessment have changed. Carcinogen Assessment Group Potency Factors have been replaced with CSFs. Currently, the primary source of toxicity values is EPA’s Integrated Risk Information System (IRIS) database. In addition, some of the toxicity data used at the time of the 1989 risk assessment have also changed. These toxicity values are used in the calculations of risk and the development of site-specific and more generic risk-based screening values or clean-up goals. Changes have occurred to toxicity values used for the OU1 human health risk assessment for PCBs.
The following summarizes changes in risk assessment toxicity factors and approaches that have occurred since the time of the 1989 risk assessment: 1. Changes in Exposure Factors: In 2014, EPA finalized a Directive to update standard default
exposure factors and frequently asked questions associated with these updates. http://www.epa.gov/oswer/riskassessment/superfund_hh_exposure.htm (items # 22 and #23 of this web link) (EPA, 2014a and b). Many of these exposure factors differ from those used in the 1989 risk assessment supporting the ROD. In general, these changes result in a slight decrease of the risk estimates for most chemicals. Specific changes of default exposure factors related to fish consumption include: increase in adult body weight from 70 kg to 80 kg, decrease in total resident exposure duration from 30 years to 26 years, decrease in adult resident exposure duration from 24 years to 20 years, and change of fish ingestion rate from 5 x 10⁴ mg/day (i.e., 50 grams/day) to a recommendation to use site-specific values.
2. Changes in Toxicity and Other Contaminant Characteristics: Changes have occurred to the toxicity values for PCBs used for the fish consumption and inhalation exposure pathways in the 1989 human health risk assessment. Toxicity values for other chemicals assessed for risk at the Site (cadmium, copper, lead) have not been considered because PCBs are overwhelmingly the primary risk driver at the Site and remedial actions (dredging, excavation, isolation and subaqueous capping) for PCBs will result in the removal and/or
29
elimination of exposure to metals as the contaminants are collocated with PCBs. The risks of dioxin-like PCBs were not evaluated at the time of the 1989 risk assessment. Therefore, the following information on dioxin-like PCBs is offered as new information, available since the last FYR, rather than changes to toxicity data used at the time of remedy selection. Dioxin-like PCBs have been detected at very low concentrations.
a. Total PCBs Toxicity Values:
i. Cancer: PCB cancer toxicity values have changed for the fish consumption
pathway and for the inhalation pathway. ORAL: The oral cancer slope factor (SFO) used in the 1989 seafood
consumption risk assessment was 7.7 per mg/kg-day. According to the IRIS file on PCBs, the current recommended oral cancer slope factor for PCBs in fish is 2.0 mg/kg-day, representing the oral cancer slope factor for “high risk” PCBs. Since the SFO decreased since the 1989 risk assessment, the cancer risk would be lower.
INHALATION: For inhalation cancer risk, the current recommended inhalation unit risk (IUR) for evaporated PCB congeners is 1 x 10⁻⁴ per ug/m3, which is based on conversion of the middle tier (i.e., “low risk”) SFO of 0.4 per (mg/kg)/day. Prior to this FYR, inhalation cancer risks were calculated using an inhalation slope factor calculated by route to route conversion of the SFO for Aroclor 1242. Aroclor 1242 is the Aroclor that most closely matched the congener pattern of detected PCB congeners in air samples collected prior to the dredging program.
ii. Non-Cancer: ORAL: PCB non-cancer toxicity values are available in the IRIS database for
the oral route for Aroclor 1016 and Aroclor 1254. The RfD used in the 1989 risk assessment was 1 x 10⁻⁴ mg/kg-day, based on conversion from an EPA chronic drinking water health advisory. The non-cancer Reference Dose (RfD) has been revised to 2 x 10⁻⁵ mg/kg-day for Aroclor 1254. Since the RfD decreased since the 1989 risk assessment, the non-cancer risk would be higher.
INHALATION: Non-cancer inhalation toxicity values have not been recommended under the EPA IRIS program since the time of the 1989 risk assessment. However, historically, under the air monitoring program, EPA developed non-cancer risk-based levels based on occupational limits for PCBs. However, the cancer-based values were lower than these non-cancer limits and were the driver for the monitoring program historically.
b. Dioxin-like PCBs Toxicity Values: i. Cancer:
ORAL: Although the EPA IRIS database does not recommend any cancer toxicity values for dioxin, the EPA Regional Screening Level database recommends the use of an oral slope factor of 1.3 x 10+5 per (mg/kg)/day.
30
This value is a Tier 3 value derived from CalEPA values. The values are used in the Toxicity Equivalency Factor (TEF) approach to calculate cancer risk of dioxin-like PCBs.
INHALATION: Although the EPA IRIS database does not recommend any cancer toxicity values for dioxin, the EPA Regional Screening Level database recommends the use of an inhalation unit risk of 3.8 x 10+1 per ug/m3. This values is a Tier 3 value derived from CalEPA values. The values are used in the TEF approach to calculate cancer risk of dioxin-like PCBs.
ii. Non-cancer: ORAL: On February 17, 2012, EPA finalized the non-cancer toxicity
assessment for the most potent dioxin, 2,3,7,8-Tetrachlorodibenzodioxin, or 2, 3, 7, 8-TCDD, indicating that non-cancer health effects from exposure to dioxin and dioxin-like PCB congeners can now be quantified. EPA’s dioxin reassessment has been developed and undergone review for many years, with the participation of scientific experts in EPA and other federal agencies, as well as scientific experts in the private sector and academia. EPA followed current guidelines and incorporated the latest data and physiological/ biochemical research into the reassessment. With the release of the final human health non-cancer dioxin reassessment, EPA also published an oral non-cancer toxicity value, or reference dose (RfD), of 7x10⁻¹⁰ mg/kg-day, for 2, 3, 7, 8-TCDD in IRIS. The dioxin oral RfD was approved for use at Superfund sites to ensure protection of human health. As a result, non-cancer hazard from exposure to dioxin-like PCBs can now be quantified using the TEF approach, using the non-cancer toxicity factor for dioxin.
INHALATION: Although the IRIS database does not recommend a value for non-cancer effects of dioxin via inhalation, the EPA Regional Screening Level database recommends an inhalation Reference Concentration (RfCi) of 4 x 10-
8 mg/m3. This value is a Tier 3 value from CalEPA. Tier 3 values are usable in the absence of an IRIS value or a Provisional Peer Reviewed Toxicity Value (PPRTV).
3. Changes in Risk Assessment Methods: Changes have occurred since the last FYR to
methods used to evaluate vapor intrusion exposures, exposures to asbestos, exposure to arsenic, and exposures to mutagenic carcinogens. Of these exposures, only exposure to mutagenic carcinogens is potentially applicable because some of the PAHs are mutagenic carcinogens; however, PAH risks are not being re-evaluated because PCBs overwhelmingly drive risk at the Site and it is expected that the remedial actions will decrease or sequester PAHs to exposure levels consistent with anthropogenic background.
4.2.4 Impact of Changes to Toxicity Data
Oral: EPA evaluated the impact of the exposure factor and oral toxicity value changes outlined in Section 4.2.3 on the risk-based fish tissue target level of 0.02 ppm. Recalculation of cancer and non-cancer risks resulted in confirmation that the 0.02 mg/kg total PCB seafood tissue target level remains protective for both cancer and non-cancer effects of total PCBs. The

31
risks of dioxin-like PCBs were also evaluated and results show that the contribution of dioxin-like PCB risk to total PCB risk was quite variable, with factors ranging from about 0.1 to 10 between dioxin-like risk and total PCB risk. Although dioxin-like PCBs contributed significantly in most species to the cancer and non-cancer risk of total PCBs, the recalculated risks of seafood consumption are approximately the same as in the original risk assessment, leading to no significant change to the seafood consumption advisories due to dioxin-like PCBs or to the site-specific fish tissue target level of 0.02 ppm total PCBs. Since the proportion of dioxin-like PCB risk to total PCB risk is quite variable among seafood species, development of a seafood tissue cleanup level for dioxin-like PCBs is not practical. As noted above, as part of the development of the 2015 CIP and Seafood IC Plan and as part of this third FYR, EPA evaluated the seafood tissue data collected under the Seafood Monitoring Program from 2010-2014 and confirmed that the seafood advisories and recommendations established by EPA in 2010 remain protective. That update also evaluated new data for tautog, collected in 2013 and 2014, which supports a new advisory for closure area 3 for that species. In September 2015, EPA updated its advisories to include a seafood consumption recommendation for tautog in closure area 3. EPA’s seafood consumption advisory brochure will be revised to reflect the updated information. The seafood consumption advisories continue to be protective if complied with by the public. EPA has documented these conclusions in a risk assessment update included in Appendix D. Inhalation: EPA evaluated the impact of the exposure factor and inhalation toxicity value changes outlined in Section 4.2.3 on the risk-based ambient air goals used in the ambient air monitoring program. As noted above in Section 3.4.4, the EPA updated its air monitoring plan in 2015. The 2015 Air Monitoring Plan (Jacobs, 2015c) will be implemented for all remaining remediation activities starting with the 2015 dredge season, which began in August 2015. In this Plan, EPA recalculated ambient air risks using updated exposure factor and inhalation toxicity values (Appendix A of the plan). The risks of dioxin-like PCBs were also evaluated as part of the 2015 update and recalculation of air risks (Appendix B of the plan). The calculated inhalation cancer risks were much lower using the updated IUR, with correspondingly higher risk-based goals, but, for conservativeness and consistency, the previously selected cancer risk-based goal (previously called the allowable ambient limit, or AAL) is being retained as a risk management trigger in the ambient air monitoring program. To date, the air monitoring program has demonstrated that the cumulative exposure from PCBs measured in ambient air remain below risk-based exposure budgets that are protective of human health. In addition, in the 2015 Air Monitoring Plan, EPA used route to route extrapolation from the oral reference dose of Aroclor 1016 to calculate a non-cancer risk-based goal. This approach was used by EPA Region 2 for the Hudson River PCBs Superfund Site to develop a risk management action level for monitoring impacts of dredging activity. The calculated non-cancer risk-based goal is 110 ng/m3. This concentration is the chronic air concentration associated with a Hazard Quotient of one for a child resident, age birth to 6 years. This is the lowest risk-based goal for any type of human receptor at the Site. The chronic time-weighted average concentration in air samples taken at the Site is below this level; therefore protective. The cancer risk of dioxin-like PCBs was approximately the same as the cancer risk of total PCBs, resulting in an approximate doubling of the cancer risk; however, this additional risk is not significant with regard to risk management decisions because the combined risk is lower
32
than EPA’s acceptable cancer risk range of 1 x 10⁻⁶ to 1 x 10⁻⁴. The dioxin-like PCBs in air samples had non-cancer risks well below a hazard quotient of 1, and did not contribute significantly to the non-cancer risk of total PCBs. Therefore, continued monitoring of total PCBs in ambient air under the 2015 Air Monitoring Plan is protective for both total PCB and dioxin-like PCB risk.
4.2.5 Cleanup Levels The sediment cleanup levels established at the time of remedy selection are still valid. In
selecting the cleanup levels for the various areas in the Harbor in the 1998 ROD, EPA balanced protection of public health and the environment. Prior to issuing the 1998 ROD, EPA performed a human health and ecological risk assessment at the Site. With respect to sediment cleanup levels that would result in safe seafood consumption, EPA first considered the U.S. Food and Drug Administration’s (FDA) tolerance level of 2 ppm PCBs in seafood tissue: FDA levels are based on nationwide seafood consumption patterns of the general public and are balanced by economic considerations. Public health agencies typically use FDA levels in regulating seafood consumption. At Superfund sites, EPA assesses risk and derives target levels in seafood which are protective of public health by utilizing a site-specific risk assessment process. This process relies on reasonable assumptions about exposure and up-to-date scientific information about toxicity. Accordingly, EPA developed a target site-specific risk-based level of 0.02 ppm for PCBs in fish tissue (i.e., to achieve an incremental cancer risk of one in one hundred thousand, or 10-5). Based on this target site-specific risk-based level in fish tissue, EPA determined the target cleanup level for PCB-contaminated sediment at the Site. At the time of the ROD, EPA noted that:
“For seafood to meet both the FDA and site specific levels at the end of 10 years, EPA
believes that a TCL for sediment dredging of 1 ppm would be necessary. However, dredging to that level would cause severe adverse environmental impacts to the Harbor.”
“Although the ecological risk assessment pointed to a 1 ppm sediment PCB threshold for
protection of marine organisms, achieving this TCL was believed to cause more harm than good due to the radical alterations to the harbor and adverse environmental impacts that would result given the widespread nature of the PCB contamination.”
“In order to balance both protection of human health and the environment, EPA has
determined that using a slightly higher TCL together with institutional controls on seafood consumption allows the remedy to remain protective of human health yet does not impose as severe adverse impacts to the Harbor ecosystem.”
“The selected remedy includes various institutional controls and a long term seafood
monitoring program to keep the consumption of contaminated local seafood below safe levels.” EPA selected the cleanup levels in the 1998 ROD based on careful consideration of
multiple factors including: how to best balance the protection of public health with the protection of sensitive ecosystems, such as the Site’s valuable saltmarsh habitat; the large geographic area covered by the Site (the Upper Harbor is approximately 187 acres and the Lower Harbor is
33
approximately 750 acres); the wide range of potential direct contact exposure rates at the Site, varying with shoreline land uses; and the fact that portions of OU1’s Lower Harbor are within the Designated Port Area (DPA), as classified by the Massachusetts Office of Coastal Zone Management, with concentrated maritime industrial uses.
EPA selected different cleanup levels for different areas of the Harbor. The site-specific
rationale for these varying cleanup levels is provided below. For subtidal areas, the cleanup levels, to attain applicable water quality and seafood
consumption standards, are the following:
• 10 parts per million (ppm) PCBs for subtidal and mudflat sediment in the Upper Harbor (north of the Coggeshall Street bridge), which has the highest concentrations of PCB contamination since the Aerovox Facility was located adjacent to the Upper Harbor shoreline. The 10 ppm PCBs cleanup level was applied to the Upper Harbor portion of the Site in order to balance protection of public health with ecological health (i.e., avoiding the adverse ecosystem impacts that would result from larger scale sediment and saltmarsh removal).
• 50 ppm PCBs for subtidal and mudflat sediment in the Lower Harbor (between the Coggeshall Street bridge and the New Bedford Hurricane Barrier). In contrast to the Upper Harbor, much of the Lower Harbor portion of the Site is a DPA, with a working waterfront, and it is lined with industrial and commercial facilities along the New Bedford shoreline. Among other factors, EPA considered the current and future use of an area, such as an urban port, in selecting appropriate cleanup levels. In addition, most if not all of the remaining Lower Harbor will be dredged for navigational purposes over time, as provided in the 1998 OU1 ROD’s State Enhanced Remedy. Therefore, the 50 ppm PCBs cleanup level for the Lower Harbor was determined to be appropriate given the Lower Harbor’s current and future anticipated use and the enhancement of the cleanup due to the State Enhanced Remedy. For the shoreline/intertidal areas, the cleanup levels, to reduce risk from human contact with
contaminated sediment, are the following:
• 1 ppm PCBs for areas bordering residential areas; • 25 ppm PCBs for shoreline areas bordering recreational areas; and • 50 ppm PCBs for other shoreline areas with little or no public access, including
saltmarshes. The Upper Harbor contains large fragile saltmarsh habitats which include ecologically important breeding, nursery, and feeding areas for aquatic life. EPA selected a 50 ppm PCBs cleanup level for saltmarshes with limited expected access to minimize adverse impacts to these marshes while still protecting against dermal contact/incidental ingestion risks to the occasional beachcomber.
Based on modeling performed in support of the 1998 ROD, after the cleanup is complete,
the Harbor and surrounding areas are expected in the long term to become open for safe seafood consumption in regard to the reduction of PCBs in seafood tissue. (Note that although PCB contamination will be reduced, shellfish consumption may not be safe due to bacterial contamination from CSOs). It should also be noted that the national recommended water quality
34
criterion (formerly known as ambient water quality criterion) for PCBs in salt water of 0.03 parts per billion (ppb) is expected, based on modeling performed in support of the 1998 ROD, to be attained throughout the Harbor ten years after the cleanup is complete.
In the 1998 ROD, EPA integrated the SER of navigational dredging and onsite disposal into EPA’s OU1 Remedy. The SER provides for the removal of sediment containing PCBs up to 50 ppm and co-located heavy metals that EPA’s OU1 cleanup would not be addressing in the Lower Harbor. Under the SER, navigational dredging will address an estimated 1.7 million cy of sediment contaminated with heavy metals and lower levels of PCBs (below 50 ppm PCBs). Since 2005, navigational dredging under the State Enhanced Remedy of approximately 545,000 cy of sediment contaminated with low levels of PCBs from the Lower and Outer Harbor has occurred. See Appendix A.3.2, Table 4, Appendix B.13 and Appendix B.14.
It is important to note that a) the 1998 ROD states, in the Upper Harbor, with a subtidal
sediment cleanup level of 10 ppm, naturally occurring sedimentation will result in residual PCB levels that will approach 1 ppm over time; and b) in the Lower Harbor, in general, navigational dredging is expected over the long term to leave residual PCB levels of 1 ppm or less over most if not all of the area.
The LTM assesses the overall remedial effectiveness by quantifying long term sediment quality and ecological effects on species abundance and richness from exposure to Upper, Lower and Outer Harbor sediment and water column. As discussed in Sections 3.4.1 and 4.1.7, EPA’s LTM program, which assesses remedial effectiveness every five years, found in 2014 the average concentration levels of surficial sediment (2 cm) in the Lower Harbor to be approximately 7 ppm PCBs (Appendix B.8). In addition, the long term benthic community monitoring confirms that the cleanup activities to date have resulted in significant improvement in benthic quality in 2014 compared to the 1993 baseline data for the Lower and Outer Harbor areas (Appendix B.8).
With respect to the subtidal cleanup levels, considering that the rationale for the cleanup
levels established in the 1998 ROD remains valid, the cleanup is ongoing, and the long term monitoring program confirms that cleanup activities to date have resulted in significant improvements in the sediment and benthic quality in the Lower and Outer Harbors, these cleanup levels remain valid.
With respect to the intertidal cleanup levels, EPA has evaluated the impact of the exposure factor and toxicity value changes and concluded that the changes do not significantly change the sediment cleanup levels established in the 1998 ROD for addressing dermal contact/incidental ingestion risks (see Appendix D). The use of many of the properties abutting the harbor have changed since the time of the 1998 ROD, but the ROD includes cleanup levels for various adjacent uses and those levels remain protective for associated dermal contact/incidental ingestion risk. As discussed in Section 4.2.6 below, intertidal/shoreline areas where adjacent property use has changed since the time of the 1998 ROD will be cleaned up to the level appropriate for the new actual or foreseeable future use.

35
4.2.6 Changes in Land Use of Shoreline Areas Abutting the Site EPA has observed an overall trend towards a more publicly accessible shoreline in the Upper Harbor (e.g., Riverside Park and River Road Park in New Bedford and Riverview Park in Acushnet) as well as towards conversion of shoreline mills to residential use (e.g., Rope Works building, Whalers Cove assisted living, Victoria Riverside Lofts, Manomet Place, Riverbank Lofts). It is expected that additional shoreline properties developed before remediation is performed or completed will trigger the more stringent shoreline cleanup levels. Further, the City of New Bedford is in the process of designing a shoreline “Riverwalk,” envisioned as a passive recreational walkway to reconnect the community with the view-scape and environmental resource that the river represents. Significant habitat restoration is planned as part of the Riverwalk. In addition, Buzzards Bay Coalition, in collaboration with the Towns of Acushnet and Fairhaven, are planning for the Acushnet River Reserve project, envisioned to provide public access trails and observation decks along a large area of the saltmarsh along the eastern shoreline of the Upper Harbor. EPA will continue to work with the local municipalities and private shoreline landowners to assess changes in shoreline land use and incorporate them into the remedy, as appropriate. It should also be noted that the City has future plans for a boat house to be located in the vicinity of EPA’s Sawyer Street facility. The City has, in past years, held rowing/boating events. In an effort to allow safe rowing in the Upper Harbor when EPA was not actively dredging, EPA, the New Bedford Harbor Development Commission (HDC) and the New Bedford Community Rowing program worked together to coordinate these past events. The HDC provided a controlled (cordoned off the bank) public viewing area near the end of Sawyer Street. EPA moved steel sheet piles used during dredging operations so that they were outside of the rowing course. Rowers launched their boats from Pope’s Island and rowed to the Upper Harbor. EPA had representation at Pope’s Island and the viewing area to hand out the rowing safety information for the harbor and to discuss decontamination with the rowers. Increased use of the Upper Harbor for recreational boating in the future will need to be coordinated with ongoing dredging and other remedial activities to prevent recreational exposure to contaminated sediment, as well as safety hazards.
4.2.7 ARAR Review In order to evaluate the protectiveness of the remedy, the Applicable or Relevant and Appropriate Requirements (ARARs) in the 1998 ROD (and subsequent modifications to the ROD) were checked for changes in standards; newly promulgated standards and TBCs (to be considered) were also evaluated. An ARAR Review was only conducted for OU1, since the OU2 remedy is complete and requires no operation and maintenance, and the ROD for OU3 has not been issued. The 2010 FYR identified certain changes to location and action-specific ARARs that were either rescinded or required as a result of modifications to the OU1 remedy. Standards promulgated at 40 CFR Part 6, Appendix A, pursuant to Executive Orders 11988 (Management of Floodplains) and 11990 (Protection of Wetlands) were rescinded. ESD1 and ESD2 included risk-based TSCA determinations for temporary storage of PCB remediation waste at the pilot
36
study CDF and for the handling and management of PCB remediation waste for offsite disposal instead of disposal into CDF D, respectively. ESD3 modified the use of Cell #1 to include the temporary disposal of hazardous waste (VOC-impacted sediment removed during Aerovox shoreline dredging) as well as PCB-remediation waste and EPA invoked statutory waivers for certain state hazardous waste surface impoundment regulations and determined that certain identified site conditions were equally protective. During the current FYR period, EPA issued two additional ESDs: ESD4 modified the remedy to replace off-site disposal of a certain volume of contaminated sediments with mechanical dredging and onsite disposal in a LHCC; and ESD5 eliminated the construction of the planned CDFs A, B and modified design of CDF C and selected off-site disposal for the sediment slated for disposal in those planned confined disposal facilities and confirmed that the Pilot CDF is protective and will become a permanent TSCA disposal facility. As a result of a review of the ARARs in the 1998 ROD since the last FYR and the issuance of the two additional ESDs, certain ARARs and TBC were affected as described below. Chemical-Specific ARARs: Both Cancer Slope Factors (CSFs) and Reference Doses (RfD) were identified as TBCs in the 1998 ROD; therefore, EPA’s only task is to identify changes to these values and determine whether the remedy remains protective. As explained above in Section 4.2.3, changes have occurred to update the standard default exposure factors (increased adult body weight, decrease exposure durations and change in fish ingestion rate) and toxicity values for PCBs used for fish consumption and inhalation exposure pathways (both cancer and non-cancer values). In addition, because dioxin-like PCBs have been detected at very low concentrations, EPA evaluated risk from dioxin-like PCBs in seafood when updating and recalculating the human health risk. As explained in Section 4.2.3, EPA’s primary source of toxicity values is the IRIS database; however, because IRIS does not recommend oral or inhalation cancer toxicity values or inhalation for non-cancer toxicity values for dioxin, the CalEPA values were used to derive Tier 3 values for these pathways. Since Table 8 of the 1998 ROD already includes EPA Cancer Slope Factors and Reference Doses, below, EPA is identifying, as additional chemical-specific TBCs, those guidance documents which affected the updated standard default exposure factors, toxicity values, and those related to toxicity values that were used to update and recalculate the human health risk at the Site.
Human Health Evaluation Manual, Supplemental Guidance: Update of Standard Default Exposure Factors, OSWER Directive 9200.1-120 (February 6, 2014) (EPA, 2014a);
Frequently Asked Questions (FAQs) about update of standard default exposure factors (OSWER Directive 9285.6‐03, dated February 6, 2014) (EPA, 2014b);
California Department of Health Services (CDHS), 1986. “Technical Support Document Report on Chlorinated Dioxins and Dibenzofurans. Part B. Health Effects of Chlorinated Dioxins and Dibenzofurans”. The California EPA unit risk and slope factor for 2, 3, 7, 8-TCDD are presented in “Appendix A: Hot Spot Unit Risk and Cancer Potency Values”
37
http://www.oehha.ca.gov/air/hot_spots/2009/AppendixA.pdf and in http://www.oehha.ca.gov/air/hot_spots/pdf/AppCdioxinTEFs013111.pdf. In light of these changes in exposure factors and oral toxicity values, including dioxin-
like PCBs, in 2015 EPA recalculated the human health cancer and non-cancer risks of total PCBs and dioxin-like PCBs in seafood and determined that the 0.02 mg/kg total PCB seafood tissue target level remains protective. (See section 4.2.4 above for full discussion.) EPA also recalculated ambient air risks in its updated 2015 Air Monitoring Plan using the updated exposure factor and inhalation toxicity values, including dioxin-like PCBs, and determined the cancer risks were much lower using the updated IUR; however, more conservative risk-based levels will be used as risk management triggers in the air monitoring program. A non-cancer risk-based goal of 110 ng/m3 was also established in the Plan (see section 4.2.4 for further discussion). To date, the cumulative exposure from PCBs measured in ambient air remain below these risk-based exposure budgets that are protective of human health. Non-cancer and cancer risks from dioxin-like PCBs in air were less than EPA’s hazard quotient of 1 and within EPA’s cancer risk range of 10-4 and 10-6. Continued monitoring of total PCBs in ambient air under the 2015 Air Monitoring Plan is protective for both total PCB and dioxin-like PCB risk.
Location Specific ARARs
With the rescission of the former floodplain and wetland regulations, both ESD4 and ESD5 identified as relevant and appropriate FEMA regulations at 44 C.F.R. Section 9 which set forth the policy, procedures and responsibilities to implement and enforce Executive Orders 11988 (Management of Floodplains) and 11990 (Protection of Wetlands). In each ESD, after soliciting public comment on this issue, EPA determined that citing a LHCC (ESD4) and the Pilot CDF (ESD5) in floodplains was the least damaging practicable alternative and that these remedial actions would be implemented in compliance with the FEMA regulations within the 500-year floodplains of New Bedford Harbor.
Subsequent to the issuance of ESD4, but prior to the issuance of ESD5, in January 2015
Executive Order 13690 was issued that revised Executive Order 11988 which included a Floodplain Standard to address the impacts of climate change and required that all federal agencies issue regulations to implement the new Executive Order. Draft regulations were issued for public comment until February 2015, later extended to May 2015. Final regulations have not yet been promulgated.
Although the substantive requirements of Executive Order 13690 were not identified as a
TBC in ESD5, EPA finds that the remedy, as modified by its subsequent ESDs, remains protective. This finding is based on a number of factors including: (1) The 1998 ROD no longer includes CDFs A, B, C or D, all of which would have occupied and modified the floodplains; (2) both ESD4 and ESD5 included the FEMA regulations as ARARs (many provisions of the FEMA regulations were included in the proposed draft regulations, including the 500-year flood elevation requirement); (3) each ESD contains independent risk-based determinations of protectiveness pursuant to TSCA 40 CFR section 761.61(c) provided certain conditions are met as well as detailed findings pursuant to Section 404 Guidelines of the CWA and 314 CMR 9.06(1-2) that the modifications represent the least damaging environmental alternative; and (4)
38
consistent with ESD3, the storage of material in Cell #1 is temporary and all material will be removed and disposed at an off-site TSCA- and/or RCRA hazardous waste-permitted facility under the OU1 cleanup plan. EPA will review the final promulgated regulations and determine if the remedy remains protective in light of any substantive provisions in the final regulations.
In 2012, the Atlantic sturgeon was divided into four distinct population segments which
were federally listed as endangered with a fifth segment listed as threatened. Although New Bedford Harbor is not designated as critical habitat for the Atlantic Sturgeon, as part of the SER South Terminal Project, National Marine Fisheries Service (NMFS) stated that the Atlantic sturgeon may use New Bedford Harbor for foraging from March through November. As part of EPA’s annual dredging plan, EPA has instituted mitigation measure to ensure fish, including the Atlantic sturgeon, have passage during all dredging activities and therefore does not believe dredging activities will adversely affect the Atlantic sturgeon. As part of its yearly consultation with NMFS, EPA has communicated to NMFS its determination that, based on our past experiences dredging in the harbor and the continued successful implementation of the Fish Migration Plan, our dredging activities will not adversely affect the Atlantic sturgeon. NMFS has noted that, based on the location of the action in New Bedford Harbor, and the rare occurrence of Atlantic sturgeon in that area, NMFS is not be opposed to EPA making a no effect determination. Should NMFS provide additional information in the future, EPA will evaluate whether or not a supplement to this Five Year review is necessary.
Based on a review of the ARARs in Table 8 of the 1998 ROD and those identified in subsequent ESDs, this FYR identified updated CSFs and RfD values, noted the addition of the Atlantic sturgeon as a newly identified endangered species that may forage in the harbor during certain times of the year, and noted the issuance of a new Executive Order to address climate change impacts on floodplains. A re-evaluation of the human health risks in light of the changes to the CSFs and RfD concluded the remedy remains protective of human health. With respect to the identification of FEMA regulations, EPA determined that the LHCC and the Pilot CDF will be constructed in compliance with these FEMA regulations within the 500-year flood plain of New Bedford Harbor. In addition, EPA has communicated to NMFS its determination that, based on our past experiences dredging in the harbor and the continued successful implementation of the Fish Migration Plan, our dredging activities will not adversely affect the Atlantic sturgeon. All of these findings enables EPA to conclude that the remedy is also protective of the environment during implementation.
4.3 Question C: Has any other information come to light that could call into question the protectiveness of the remedy?
No other information has come to light that could call into question the protectiveness of the remedy.
4.4 Technical Assessment Summary Based on the data reviewed, observations from regular Site inspections, and the interviews conducted, the remedy continues to function as intended by the ROD. There have been no changes in regulatory statutes that affect target sediment cleanup levels, and no new pathways for exposure identified, that would call into question the goals of the remedy as set
39
forth in the 1998 ROD as modified by the five ESDs. Some of the toxicity data used at the time of the 1989 risk assessment have changed. In 2015, EPA updated the evaluation of risks for seafood consumption and dermal contact/incidental ingestion and concluded that the changes in toxicity data did not significantly change the target site-specific risk-based level of 0.02 ppm for PCBs in fish tissue or the cleanup levels established for dermal contact/incidental ingestion risks (Appendix D). The seafood consumption risk update also evaluated new data for tautog, collected in 2013 and 2014, which supports a new advisory for closure area 3 for that species. In September 2015, EPA updated its seafood consumption advisories to include a seafood consumption recommendation for tautog in closure area 3. Further, in 2015, EPA updated the ambient air monitoring plan and updated risk-based goals in the 2015 Air Monitoring Plan are reflective of updated toxicity data and include even more conservative risk-based goals. In addition, subtidal and intertidal cleanup levels established in the 1998 ROD remain valid. A new Executive Order and draft regulations concerning climate change impacts to floodplains was noted; however, EPA’s incorporation of FEMA floodplains regulations into ESD4 and ESD5, which include construction of structures or facilities in floodplains, ensure the remedy remains protective. Likewise, EPA has communicated to NMFS its determination that, based on our past experiences dredging in the harbor and the continued successful implementation of the Fish Migration Plan, our dredging activities will not adversely affect the Atlantic sturgeon. Two issues that were identified in 2010 FYR as impacting the short term protectiveness of the remedy to human health were: 1) the ongoing consumption of local PCB-contaminated seafood, and 2) the potential for access to unremediated PCB-contaminated shorelines. EPA continues to work to control these risks to the maximum extent practicable through the use of educational and outreach efforts and with institutional controls such as fencing and signage. In 2015, EPA issued the CIP and Seafood IC Plan that documents the actions EPA has and will continue to take to implement institutional controls to minimize ingestion of local PCB-contaminated seafood and dermal contact/incidental ingestion risk, as well as new actions it will take to augment existing controls. See Sections 2.2.2 and 2.2.3 for additional details on how EPA has addressed these issues since the 2010 FYR. Finally, ecological risks from the PCB contamination continue in the interim until the remedy is complete. 5.0 ISSUES/RECOMMENDATIONS AND FOLLOW-UP ACTIONS
This Five-Year Review did not identify any issues or recommendations that could impact the protectiveness of the remedy.
The following recommendations will improve the effectiveness of the remedy, but do not
affect the current protectiveness of the remedy:
EPA must continue to implement the 2015 CIP and Seafood IC Plan to minimize ingestion of local PCB-contaminated seafood and minimize dermal contact/incidental ingestion risks. The Plan outlines educational and outreach actions, along with institutional controls such as
40
fencing and signage, including informational kiosks, to control these risks to the maximum extent practicable. Further, consistent with the Plan, EPA will continue to collaborate with others to reduce consumption of local PCB-contaminated seafood, including providing advisory brochures for inclusion in local shellfishing and State finfishing licenses and collaborating with MassDPH through participation in Grand Rounds at local hospitals when MassDPH schedules such events. The Plan includes new implementation actions to minimize seafood consumption, including the creation of new signage, a new video and targeted outreach using culturally related peers. It is recommended that, after these new actions have been implemented, EPA assess their effectiveness, along with the effectiveness of other continued outreach and education and IC actions, and update the 2015 CIP and Seafood IC Plan, if necessary, to address any lessons learned that support further educational and outreach and/or IC improvements.
As noted above, the 2015 updated risk evaluation of seafood tissue data included an evaluation of new data for tautog, collected in 2013 and 2014 (Appendix D). Data for this species was not available prior to 2013. The 2013-2014 data supports a new advisory for closure area 3 for tautog of consumption of no more than 1 meal per month. In September 2015, EPA updated its advisories to include a seafood consumption recommendation for tautog in closure area 3. The updated EPA advisories are included in Appendix C and are available at http://www2.epa.gov/new-bedford-harbor/fish-consumption-regulations-and-recommendations. EPA’s seafood consumption advisory brochure will be revised to reflect the updated information as soon as possible and no later than early-2016.
As noted above, as a result of the recent settlement, EPA has now initiated planning for intertidal remediation efforts to address remaining dermal contact/incidental ingestion risks. By the end of 2015, EPA will have completed a sampling program covering the intertidal areas of both the Upper and Lower Harbor for delineation and remediation planning. It is recommended that, once adequate intertidal PCB sampling data is available for remediation planning, EPA assess the need for interim actions where PCB levels in intertidal sediments exceed applicable cleanup levels and prioritize intertidal cleanup efforts, considering potential human health risks and the overall remediation schedule, taking into consideration the potential for recontamination from subtidal sediments. Priority intertidal remediation efforts are expected to begin later in 2015 and all intertidal remediation efforts to address dermal contact/incidental ingestion risks will be scheduled over the next 5-7 years as the accelerated cleanup progresses. EPA is also reviewing state laws concerning various types of land use restrictions to determine appropriate institutional controls for properties abutting the intertidal remediation areas once cleanup levels have been achieved. It is recommended that EPA complete its evaluation of the various land use restrictions and make a determination on the potential institutional controls that could be employed for shoreline properties, where needed.
41
6.0 PROTECTIVENESS STATEMENT Protectiveness Statement(s)
Operable Unit: OU1
Protectiveness Determination: Will be Protective
Addendum Due Date (if applicable): NA
Protectiveness Statement: The remedy for OU1 is expected to be protective of human health and the environment upon completion, and in the interim, exposure pathways that could result in unacceptable risks have been or are being controlled to the maximum extent practicable.
Operable Unit: OU2
Protectiveness Determination: Short-term Protective
Addendum Due Date (if applicable): NA
Protectiveness Statement: The remedy for OU2 currently protects human health and the environment because the sediment with the highest concentrations of PCBs (ranging from 4,000 ppm to over 100,000 ppm) have been dredged from the Upper Harbor and have been safely transported to an off-site TSCA landfill. However, in order for the remedy to be protective in the long term, the remaining contaminated sediment in this geographical area will be addressed under OU1. All future work, including institutional controls, are now within the scope of OU1.
Operable Unit: OU3
Protectiveness Determination: Cannot be made at this time.
Addendum Due Date (if applicable): NA
Protectiveness Statement: A remedy has not been selected for OU3, thus a protectiveness statement for it cannot be made at this time. An RI/FS has been initiated to characterize the nature and extent of contamination.
7.0 NEXT REVIEW
The next FYR report for the New Bedford Harbor Superfund Site is required five years from the completion date of this review in September 2020. 8.0 REFERENCES AGM Marine Contractors, Inc, (AGM), 2012. Letter to MassDEP regarding AGM Project Closeout. October 24, 2012. Apex Companies LLC (Apex), 2007. Post-Dredge/Existing Conditions Report, New Bedford Harbor Dredge Project Phase II, prepared for New Bedford Harbor Development Commission. January 2007.
42
Apex Companies, LLC (Apex), 2010. Post-Dredge/Existing Conditions Report, New Bedford Harbor Dredge Project Phase III, prepared for New Bedford Harbor Development Commission. March 2010. Apex Companies, LLC (Apex), 2014. Email from Chet Myers, Apex, to Paul Craffey, MassDEP, regarding South Terminal Dredging. December 4, 2014. Apex Companies, LLC (Apex), 2015. Draft After Action Report, Interim Federal Navigation Dredging Project, prepared for Massachusetts Executive Office of Energy and Environmental Affairs, Office of Coastal Zone Management. August 2015. Battelle, 2015a. Draft Final Sawyer Street Semi-annual Groundwater Monitoring Technical Memorandum, Environmental Monitoring, Sampling, and Analysis New Bedford Harbor Superfund Site, New Bedford, MA. March 2015. Battelle, 2015b. Draft Final Water Quality Monitoring Summary Report, 2014 Remedial Dredging Season, Environmental Monitoring, Sampling, and Analysis, New Bedford Harbor Superfund Site, New Bedford, MA. April 2015. Battelle, 2015c. Draft Final Sediment Monitoring Summary Report, Environmental Monitoring, Sampling, and Analysis Report, 2014 Remedial Dredging Season, New Bedford Harbor Superfund Site, New Bedford, MA. June 2015. Battelle, 2015d. Final New Bedford Harbor Long-Term Monitoring Survey VI: Summary Report, New Bedford Harbor Superfund Site. September 2015. Bergen, B.J., W.G. Nelson, J.G. Quinn, and S. Jayaraman, 2001. Relationships among total lipids, lipid classes and PCB concentrations in two indigenous populations of ribbed mussels (Geukensia demissa) over an annual cycle. Environmental Toxicology and Chemistry 20 (3): 575-581. Bergen, B.J., W.G. Nelson, J. Mackay, D. Dickerson, and S. Jayaraman, 2005. Environmental Monitoring of Remedial Dredging at the New Bedford Harbor, MA, Superfund Site. Environmental Monitoring and Assessment 111:257-275. Bergen, 2015. New Bedford Harbor (NBH) Long Term Monitoring (LTM) Program: Comparative analysis of the 2014 LTM collection. September 23, 2015. Calder, J.A., 1986. Marine Environmental Quality: NOAA’s national status and trends program. In Oceans ’86 Conference Record (pp. 1351-1354). Cat. No 86CH2363-0. Washington, DC: Marine Technical Society IEEE. Foster Wheeler Environmental Corporation (FWEC), 2001. Technical Memorandum Comparison of PCB NOAA Congener with Total Homologue Group Concentrations, New Bedford Harbor Superfund Site. May 2001.

43
Foster Wheeler Environmental Corporation (FWEC), 2002. Draft Technical Memorandum, Comparison of PCB NOAA Congener with Total Homologue Group Concentrations (Inclusion of Phase III Results), New Bedford Harbor Superfund Site. June 2002. Jacobs Engineering Group (Jacobs), 2006. Final Plan for the Sampling of Ambient Air PCB Concentrations to Support Decisions to Ensure the Protection of the Public During Remediation Activities, Revision No. 3, New Bedford Harbor Superfund Site. Revised November 2006. Jacobs Engineering Group (Jacobs), 2011a. Final 2010 Bathymetric Survey of Pilot Underwater Cap, New Bedford Harbor Superfund Site, New Bedford, MA. February 2011. Jacobs Engineering Group (Jacobs), 2011b. Final 2010 Dredge Season Data Submittal, New Bedford Harbor Remedial Action, New Bedford Harbor Superfund Site, New Bedford, MA. March 2011. Jacobs Engineering Group (Jacobs), 2012. Final 2011 Bathymetric Survey of Pilot Underwater Cap, New Bedford Harbor Superfund Site, New Bedford, MA. June 2012. Jacobs Engineering Group (Jacobs), 2013a. Final 2011 Dredge Season Data Submittal, New Bedford Harbor Remedial Action, New Bedford Harbor Superfund Site, New Bedford, MA. March 2013. Jacobs Engineering Group (Jacobs), 2013b. 2012 Dredge Season Data Submittal, New Bedford Harbor Remedial Action, New Bedford Harbor Superfund Site. May 2013. Jacobs Engineering Group, 2013c. Final Plan for the Sampling of Ambient Air PCB Concentrations During Lower Harbor CAD Cell Construction, New Bedford Harbor Superfund Site, New Bedford, MA. October, 2013. Jacobs Engineering Group (Jacobs), 2014. 2013 Dredge Season Data Submittal, New Bedford Harbor Remedial Action, New Bedford Harbor Superfund Site. December 2014. Jacobs Engineering Group (Jacobs), 2015a. Modeling Analysis of Potential Environmental Impact of the Pilot CDF, New Bedford Harbor Superfund Site, New Bedford, MA. March 2015. Jacobs Engineering Group (Jacobs), 2015b. Draft 2014 Dredge Season Data Submittal, New Bedford Harbor Superfund Site. May 2015. Jacobs Engineering Group (Jacobs), 2015c. New Bedford Harbor Superfund Site, Draft Final Ambient Air Monitoring Plan for Remediation Activities. July 2015. Jacobs Engineering Group (Jacobs), 2015d. Table E-1: Ambient Air Monitoring Program – Total Detectable PCB Homologues, New Bedford Harbor Superfund Site, Current as of 8/19/15 and Figure 3-4: Ambient Air Sampling Station Locations. September 2015.

44
Massachusetts Department of Environmental Protection (MassDEP), 2010. Contaminated Monitoring Report for Seafood Harvested in 2009 from the New Bedford Harbor Superfund Site. October 2010. Massachusetts Department of Environmental Protection (MassDEP), 2011. Contaminated Monitoring Report for Seafood Harvested in 2010 from the New Bedford Harbor Superfund Site. February 2011. Massachusetts Department of Environmental Protection (MassDEP), 2012a. Contaminated Monitoring Report for Seafood Harvested in 2011 from the New Bedford Harbor Superfund Site. August 2012. Massachusetts Department of Environmental Protection (MassDEP), 2012b. Final Mitigation Plan, New Bedford Marine Commerce Terminal, New Bedford, MA. November 2012. Massachusetts Department of Environmental Protection (MassDEP), 2012c. MassDEP Meeting Notes regarding U.S. Army Corps of Engineers Hurricane Barrier Dredging. April 26, 2012. Massachusetts Department of Environmental Protection (MassDEP), 2014a. Monitoring Report for Seafood Harvested in 2012 from the New Bedford Harbor Superfund Site. August 2014. Massachusetts Department of Environmental Protection (MassDEP), 2014b. Monitoring Report for Seafood Harvested in 2013 from the New Bedford Harbor Superfund Site. June 2014. Massachusetts Department of Environmental Protection (MassDEP), 2015. Monitoring Report for Seafood Harvested in 2014 from the New Bedford Harbor Superfund Site. August 2015. Massachusetts Department of Environmental Protection (MassDEP) and U. S. Environmental Protection Agency (EPA), 2015. First Amendment to the Memorandum of Agreement between the Commonwealth of Massachusetts through the Massachusetts Department of Environmental Protection and the U.S. Environmental Protection Agency, New England Region, for the New Bedford Harbor Superfund Site. January 2015. Nelson, W.G. and Bergen, B.J., 2012. The New Bedford Harbor Superfund Site Long-Term Monitoring Program (1993-2009). Environmental Monitoring and Assessment 184:7531-7550. Paul, J.F., K.J. Scott, D.E. Campbell, J.H. Gentile, C.S. Strobel, R.M. Valente, S.B. Weisberg, A.F. Holland, J.A. Ranasinghe. 2001. Developing and applying a benthic index of estuarine condition for the Virginian Biogeographic Province. Ecological Indicators 1: 83-99. Tetra Tech Foster Wheeler Inc. (TTFW), 2005a. After Action Report for North of Wood Street Remediation, OU1, New Bedford Harbor Superfund Site. April 2005. Tetra Tech Foster Wheeler Inc. (TTFW), 2005b. After Action Report for North Lobe Dredging, OU1, New Bedford Harbor Superfund Site. August 2005.
45
U. S. Environmental Protection Agency (EPA), 1990. Record of Decision OU 2 Hot Spot. April 6, 1990. U. S. Environmental Protection Agency (EPA), 1992. Explanation of Significant Differences OU2 Hot Spot. April 27, 1992. U. S. Environmental Protection Agency (EPA), 1995. Explanation of Significant Differences for Continued Storage of Hot Spot Sediments, OU2, New Bedford Harbor Superfund Site. October 30, 1995. U. S. Environmental Protection Agency (EPA), 1997. Report on the Effects of the Hot Spot Dredging Operations, New Bedford Harbor Superfund Site, New Bedford, MA. October 1997. U.S. Environmental Protection Agency (EPA), 1998. Record of Decision for the Upper and Lower Harbor Operable Unit, New Bedford Harbor Superfund Site, New Bedford, MA. September 1998. U. S. Environmental Protection Agency (EPA), 1999. Amended Record of Decision OU2 Hot Spot. April 27, 1999 U. S. Environmental Protections Agency (EPA0, 2000. Final Remedial Action Report, Hot Spot Operable Unit, New Bedford Harbor Superfund Site, New Bedford, Massachusetts. September 2000. U. S. Environmental Protection Agency (EPA), 2001. Explanation of Significant Differences for the Upper and Lower Harbor Operable Unit, New Bedford Harbor Superfund Site, New Bedford, MA. September 2001. U. S. Environmental Protection Agency (EPA), 2002. Explanation of Significant Differences for the Upper and Lower Harbor Operable Unit, New Bedford Harbor Superfund Site, New Bedford, MA. August 2002. U. S. Environmental Protection Agency (EPA), 2010. Third Explanation of Significant Differences, New Bedford Harbor Superfund Site Operable Unit #1, New Bedford, MA. March 2010. U. S. Environmental Protection Agency (EPA), 2011. Forth Explanation of Significant Differences for Use of a Lower Harbor CAD Cell (LHCC), New Bedford Harbor Superfund Site Operable Unit #1, New Bedford, MA. March 2011. U. S. Environmental Protection Agency (EPA), 2012. Final Determination for the Commonwealth of Massachusetts’ South Terminal Project. November 2012. U. S. Environmental Protection Agency (EPA), 2013a. Modification to Appendix E, Final Determination for the South Terminal Project. February 4, 2013.
46
U. S. Environmental Protection Agency (EPA), 2013b. Second Modification to EPA’s Final Determination for the South Terminal Project – Additional Dredging and Blasting for Rock Removal. September 30, 2013. U. S. Environmental Protection Agency (EPA), 2013c. Supplemental Consent Decree with Defendant AVX Corporation. September 2013. U. S. Environmental Protection Agency (EPA), 2014a. EPA OSWER Directive 9200.1-120, Human Health Evaluation Manual, Supplemental Guidance: Update of Standard Default Exposure Factors. February 6, 2014. U. S. Environmental Protection Agency (EPA), 2014b. EPA OSWER Directive 9285.6‐03. Frequently Asked Questions (FAQS) About Update of Standard Default Exposure Factors. February 6, 2014. U. S. Environmental Protection Agency (EPA), 2014c. Third Modification to EPA’s Final Determination for the South Terminal Project – Additional Dredging to Widen Channel and Associated Blasting for Rock Removal. September 30, 2014. U. S. Environmental Protection Agency (EPA), 2015a. New Bedford Harbor Superfund Site Operable Unit 1 Focused Feasibility Evaluation: Comparison of Confined Disposal Facilities (CDFs) A, B, and C versus Off-Site Disposal for PCB Contaminated Sediment. April 2015. U. S. Environmental Protection Agency (EPA), 2015b. New Bedford Harbor Superfund Site Community Involvement Plan and Institutional Control Plan for Seafood Consumption. April 2015. U. S. Environmental Protection Agency (EPA), 2015c. Fifth Explanation of Significant Differences for the New Bedford Harbor Superfund Site, Upper and Lower Harbor Operable Unit 1 (OU1), New Bedford, MA. July 2015. Woods Hole Group (WHG), 2011a. Memorandum on 2010 OU3 Cap Monitoring Update. February 11, 2011. Woods Hole Group (WHG), 2011b. Final Water Quality Monitoring Summary Report, 2010 Dredging, New Bedford Harbor Superfund Site OU1. April 2011. Woods Hole Group (WHG), 2011c. Final Sediment Monitoring Summary Report, 2010 Remedial Dredging, New Bedford Harbor Superfund Site OU1. April 2011. Woods Hole Group (WHG), 2011d. Final North of Wood Street Post Remediation Monitoring April 2011 Monitoring Event, New Bedford Harbor Superfund Site OU1. July 2011. Woods Hole Group (WHG), 2011e. Final Report, 2010 Environmental Monitoring, Sampling, and Analysis Reports. New Bedford Harbor Superfund Site, New Bedford, MA. July 2011.

47
Woods Hole Group (WHG), 2012a. Final 2011 Biannual Groundwater Monitoring Sawyer Street Pilot Study Confined Disposal Facility, New Bedford, Massachusetts. April 2012. Woods Hole Group (WHG), 2012b. Final Water Quality Monitoring Summary Report, 2011 Dredging, New Bedford Harbor Superfund Site OU1. April 2012. Woods Hole Group (WHG), 2012c. Final North of Wood Street Post Remediation Monitoring April 2012 Monitoring Event, New Bedford Harbor Superfund Site OU1. August 2012. Woods Hole Group (WHG), 2012d. Final Sediment Monitoring Summary Report, 2011 Remedial Dredging, New Bedford Harbor Superfund Site OU1. August 2012. Woods Hole Group (WHG), 2013a. Final Technical Memorandum, Operable Unit #3 Pilot Cap Sediment Monitoring, November 2012 Sediment Sampling Event, New Bedford Harbor Superfund Site OU3. March 2013. Woods Hole Group (WHG), 2013b. Final Sediment Monitoring Summary Report, 2012 Remedial Dredging, New Bedford Harbor Superfund Site OU1. May 2013. Woods Hole Group (WHG), 2013c. Final 2012 Biannual Groundwater Monitoring Report, Sawyer Street Pilot Study Confined Disposal Facility, New Bedford, Massachusetts. May 2013. Woods Hole Group (WHG), 2013d. Final Water Monitoring Quality Summary Report, 2012 Remedial Dredging, New Bedford Harbor Superfund Site OU1. June 2013. Woods Hole Group (WHG), 2014. Final Water Quality Monitoring Summary Report, 2013 Remedial Dredging, New Bedford Harbor Superfund Site OU1. August 2014.

APPENDIX A – ADDITIONAL SITE INFORMATION
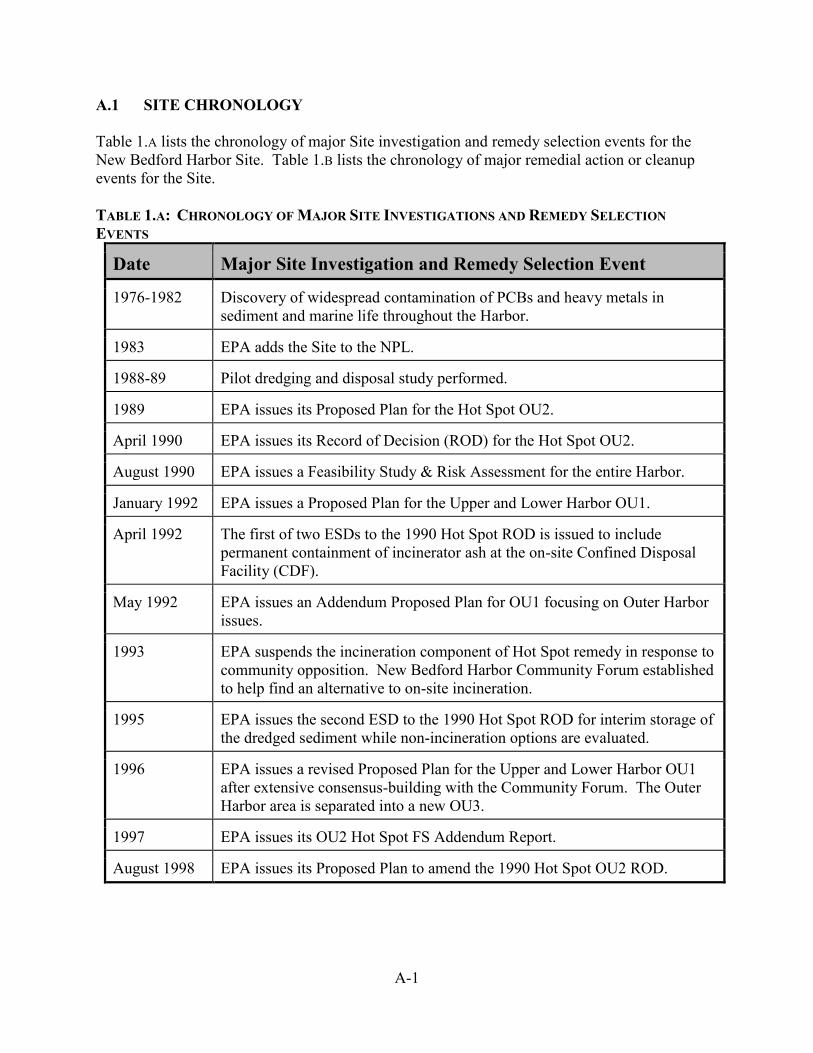
A-1
A.1 SITE CHRONOLOGY Table 1.A lists the chronology of major Site investigation and remedy selection events for the New Bedford Harbor Site. Table 1.B lists the chronology of major remedial action or cleanup events for the Site. TABLE 1.A: CHRONOLOGY OF MAJOR SITE INVESTIGATIONS AND REMEDY SELECTION EVENTS
Date Major Site Investigation and Remedy Selection Event
1976-1982 Discovery of widespread contamination of PCBs and heavy metals in sediment and marine life throughout the Harbor.
1983 EPA adds the Site to the NPL.
1988-89 Pilot dredging and disposal study performed.
1989 EPA issues its Proposed Plan for the Hot Spot OU2.
April 1990 EPA issues its Record of Decision (ROD) for the Hot Spot OU2.
August 1990 EPA issues a Feasibility Study & Risk Assessment for the entire Harbor.
January 1992 EPA issues a Proposed Plan for the Upper and Lower Harbor OU1.
April 1992 The first of two ESDs to the 1990 Hot Spot ROD is issued to include permanent containment of incinerator ash at the on-site Confined Disposal Facility (CDF).
May 1992 EPA issues an Addendum Proposed Plan for OU1 focusing on Outer Harbor issues.
1993 EPA suspends the incineration component of Hot Spot remedy in response to community opposition. New Bedford Harbor Community Forum established to help find an alternative to on-site incineration.
1995 EPA issues the second ESD to the 1990 Hot Spot ROD for interim storage of the dredged sediment while non-incineration options are evaluated.
1996 EPA issues a revised Proposed Plan for the Upper and Lower Harbor OU1 after extensive consensus-building with the Community Forum. The Outer Harbor area is separated into a new OU3.
1997 EPA issues its OU2 Hot Spot FS Addendum Report.
August 1998 EPA issues its Proposed Plan to amend the 1990 Hot Spot OU2 ROD.
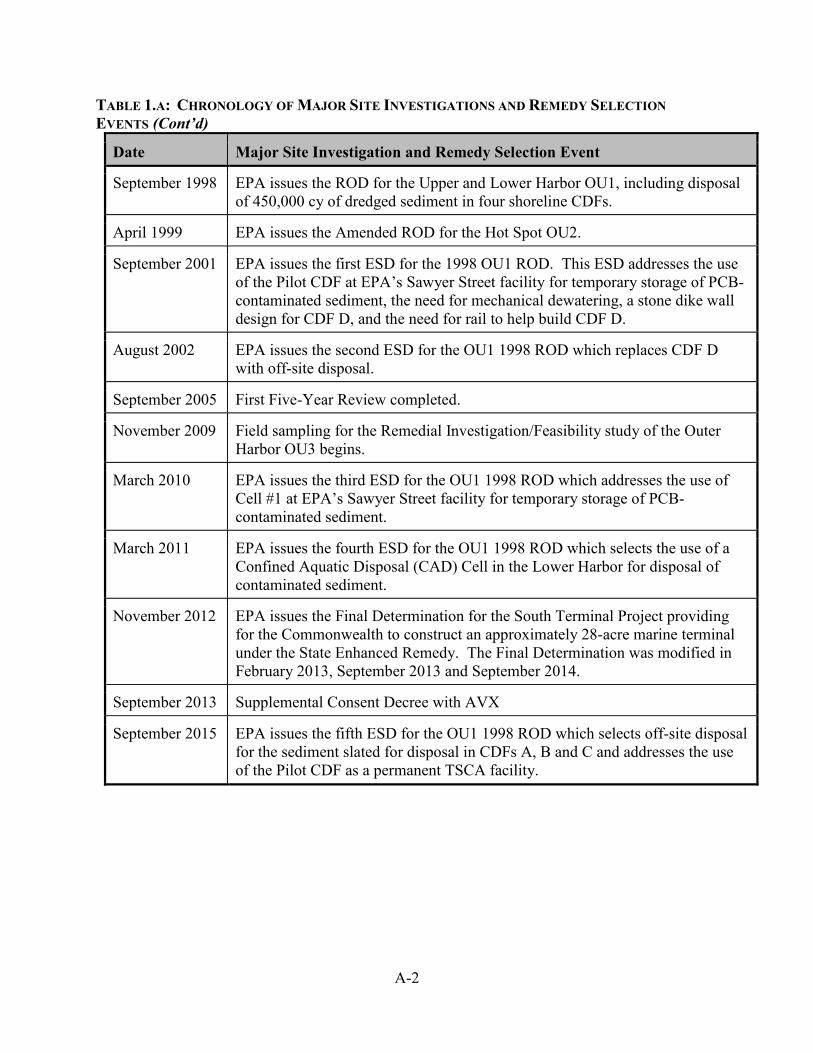
A-2
TABLE 1.A: CHRONOLOGY OF MAJOR SITE INVESTIGATIONS AND REMEDY SELECTION EVENTS (Cont’d)
Date Major Site Investigation and Remedy Selection Event
September 1998 EPA issues the ROD for the Upper and Lower Harbor OU1, including disposal of 450,000 cy of dredged sediment in four shoreline CDFs.
April 1999 EPA issues the Amended ROD for the Hot Spot OU2.
September 2001 EPA issues the first ESD for the 1998 OU1 ROD. This ESD addresses the use of the Pilot CDF at EPA’s Sawyer Street facility for temporary storage of PCB-contaminated sediment, the need for mechanical dewatering, a stone dike wall design for CDF D, and the need for rail to help build CDF D.
August 2002 EPA issues the second ESD for the OU1 1998 ROD which replaces CDF D with off-site disposal.
September 2005 First Five-Year Review completed.
November 2009 Field sampling for the Remedial Investigation/Feasibility study of the Outer Harbor OU3 begins.
March 2010 EPA issues the third ESD for the OU1 1998 ROD which addresses the use of Cell #1 at EPA’s Sawyer Street facility for temporary storage of PCB-contaminated sediment.
March 2011 EPA issues the fourth ESD for the OU1 1998 ROD which selects the use of a Confined Aquatic Disposal (CAD) Cell in the Lower Harbor for disposal of contaminated sediment.
November 2012 EPA issues the Final Determination for the South Terminal Project providing for the Commonwealth to construct an approximately 28-acre marine terminal under the State Enhanced Remedy. The Final Determination was modified in February 2013, September 2013 and September 2014.
September 2013 Supplemental Consent Decree with AVX
September 2015 EPA issues the fifth ESD for the OU1 1998 ROD which selects off-site disposal for the sediment slated for disposal in CDFs A, B and C and addresses the use of the Pilot CDF as a permanent TSCA facility.
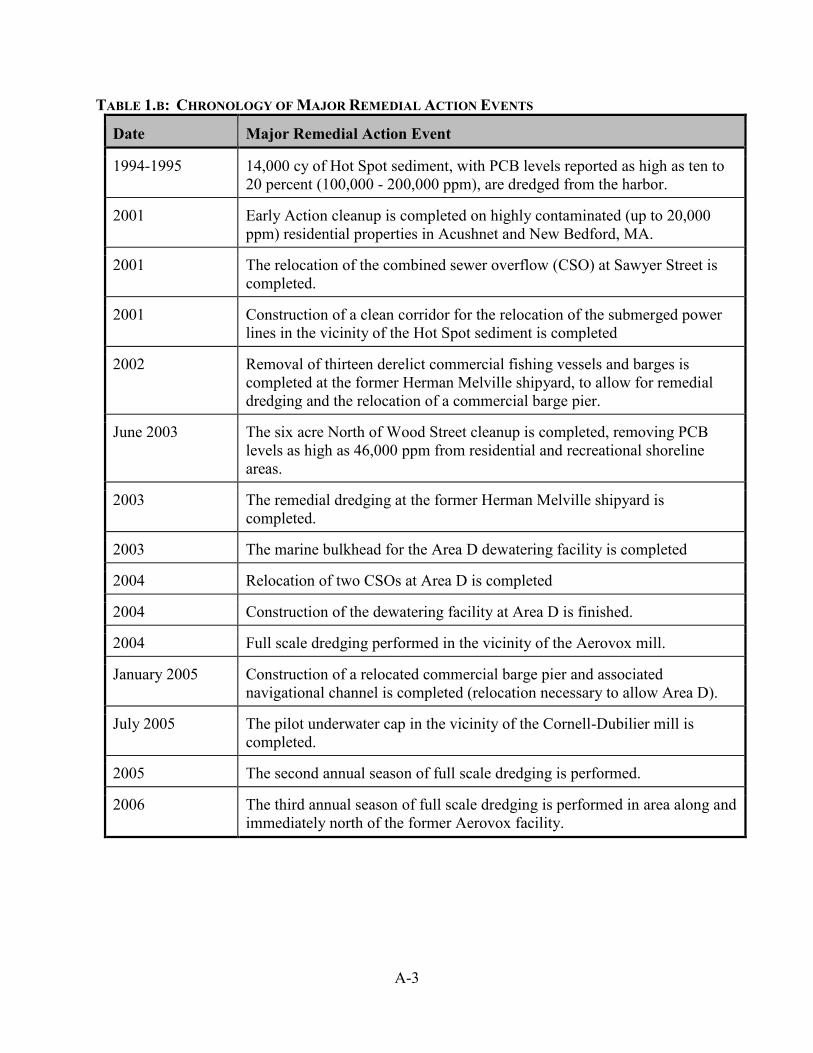
A-3
TABLE 1.B: CHRONOLOGY OF MAJOR REMEDIAL ACTION EVENTS
Date Major Remedial Action Event
1994-1995 14,000 cy of Hot Spot sediment, with PCB levels reported as high as ten to 20 percent (100,000 - 200,000 ppm), are dredged from the harbor.
2001 Early Action cleanup is completed on highly contaminated (up to 20,000 ppm) residential properties in Acushnet and New Bedford, MA.
2001 The relocation of the combined sewer overflow (CSO) at Sawyer Street is completed.
2001 Construction of a clean corridor for the relocation of the submerged power lines in the vicinity of the Hot Spot sediment is completed
2002 Removal of thirteen derelict commercial fishing vessels and barges is completed at the former Herman Melville shipyard, to allow for remedial dredging and the relocation of a commercial barge pier.
June 2003 The six acre North of Wood Street cleanup is completed, removing PCB levels as high as 46,000 ppm from residential and recreational shoreline areas.
2003 The remedial dredging at the former Herman Melville shipyard is completed.
2003 The marine bulkhead for the Area D dewatering facility is completed
2004 Relocation of two CSOs at Area D is completed
2004 Construction of the dewatering facility at Area D is finished.
2004 Full scale dredging performed in the vicinity of the Aerovox mill.
January 2005 Construction of a relocated commercial barge pier and associated navigational channel is completed (relocation necessary to allow Area D).
July 2005 The pilot underwater cap in the vicinity of the Cornell-Dubilier mill is completed.
2005 The second annual season of full scale dredging is performed.
2006 The third annual season of full scale dredging is performed in area along and immediately north of the former Aerovox facility.
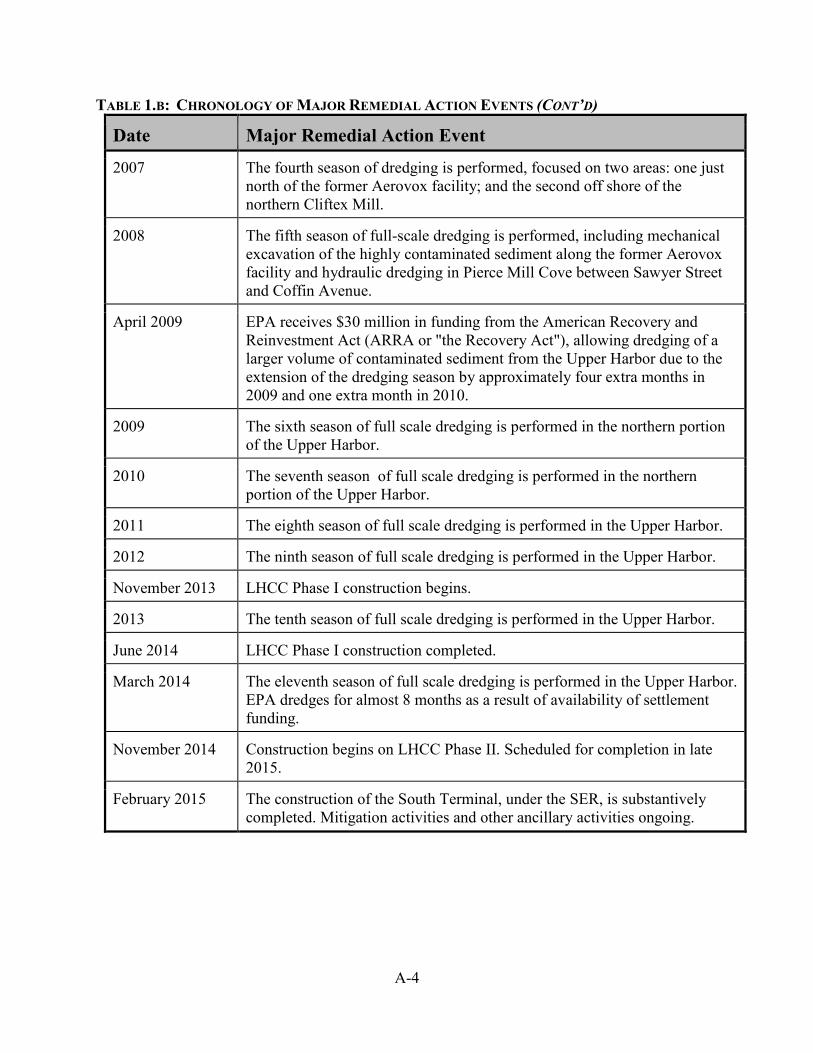
A-4
TABLE 1.B: CHRONOLOGY OF MAJOR REMEDIAL ACTION EVENTS (CONT’D)
Date Major Remedial Action Event
2007 The fourth season of dredging is performed, focused on two areas: one just north of the former Aerovox facility; and the second off shore of the northern Cliftex Mill.
2008 The fifth season of full-scale dredging is performed, including mechanical excavation of the highly contaminated sediment along the former Aerovox facility and hydraulic dredging in Pierce Mill Cove between Sawyer Street and Coffin Avenue.
April 2009 EPA receives $30 million in funding from the American Recovery and Reinvestment Act (ARRA or "the Recovery Act"), allowing dredging of a larger volume of contaminated sediment from the Upper Harbor due to the extension of the dredging season by approximately four extra months in 2009 and one extra month in 2010.
2009 The sixth season of full scale dredging is performed in the northern portion of the Upper Harbor.
2010 The seventh season of full scale dredging is performed in the northern portion of the Upper Harbor.
2011 The eighth season of full scale dredging is performed in the Upper Harbor.
2012 The ninth season of full scale dredging is performed in the Upper Harbor.
November 2013 LHCC Phase I construction begins.
2013 The tenth season of full scale dredging is performed in the Upper Harbor.
June 2014 LHCC Phase I construction completed.
March 2014 The eleventh season of full scale dredging is performed in the Upper Harbor. EPA dredges for almost 8 months as a result of availability of settlement funding.
November 2014 Construction begins on LHCC Phase II. Scheduled for completion in late 2015.
February 2015 The construction of the South Terminal, under the SER, is substantively completed. Mitigation activities and other ancillary activities ongoing.
A-5
A.2 BACKGROUND A.2.1 Physical Characteristics and Land and Resource Use The Site, located in Bristol County, Massachusetts, extends from the shallow northern reaches of the Acushnet River estuary south through the commercial harbor of New Bedford and into 17,000 adjacent areas of Buzzards Bay (Appendix B.1 – Site Location Map). The Site has been divided into three areas consistent with geographical features of the area and gradients of contamination. The Upper Harbor comprises approximately 200 acres. The boundary between the Upper and Lower Harbor is the Coggeshall Street bridge where the width of the harbor narrows to approximately 100 feet. The Lower Harbor comprises approximately 750 acres. The boundary between the Lower and Outer Harbor is the 150 foot wide opening of the New Bedford hurricane barrier (constructed in the mid-1960s). The Outer Harbor is comprised of approximately 17,000 acres with its southern extent (and the Site's boundary) formed by an imaginary line drawn from Rock Point (the southern tip of West Island in Fairhaven) southwesterly to Negro Ledge and then southwesterly to Mishaum Point in Dartmouth. The Site is also defined by three fishing closure areas, promulgated by the Massachusetts Department of Public Health (MassDPH) in 1979, extending approximately 6.8 miles north to south and encompassing approximately 18,000 acres in total (See Appendix B.2). The City of New Bedford (the City), located along the western shore of the Site, is approximately 55 miles south of Boston. During most of the 1800s, New Bedford was a world renowned center of the whaling industry, which attracted a large community of immigrants from Portugal and the Cape Verde islands. As of 2010, more than 1/3 of New Bedford’s 93,768 residents spoke a language other than English in their homes (US Census Bureau, 2010). Including the neighboring towns of Acushnet, Fairhaven and Dartmouth, the combined 2010 population was approximately 155,000. New Bedford is currently home port to a large offshore fishing fleet and is a densely populated manufacturing and commercial center. By comparison, the eastern shore of New Bedford Harbor is predominantly saltmarsh and open space in the Upper Harbor and residential and commercial/industrial marine use in the Lower Harbor. A large, approximately 70 acre, saltmarsh system has formed along almost the entire eastern shore of the Upper Harbor. The Acushnet River discharges to New Bedford Harbor in the northern reaches of the Site, contributing relatively minor volumes of fresh water to the tidally influenced harbor. Numerous storm drains, combined sewer overflows (CSOs) and industrial discharges, as well as smaller brooks and creeks, also discharge directly to the Site. The Upper and Lower Harbors are believed to be areas of net groundwater discharge and are generally described as a shallow, well-mixed estuary. A.2.2 History of Contamination Industrial and urban development surrounding the harbor has resulted in sediment becoming contaminated with high concentrations of many pollutants, notably polychlorinated biphenyls (PCBs) and heavy metals, with contaminant gradients decreasing from north to south. From the 1940s into the 1970s two capacitor manufacturing facilities, one located near the northern boundary of the site (Aerovox) and one located just south of the New Bedford Harbor
A-6
hurricane barrier (Cornell Dubilier Electronics, Inc.) discharged PCB-wastes either directly into the harbor or indirectly via discharges to the City’s sewerage system. Identification of PCB-contaminated sediment and seafood in and around New Bedford Harbor was first made in the mid-1970s as a result of EPA region-wide sampling programs. In 1979, MassDPH promulgated regulations prohibiting fishing and lobstering throughout the Site due to elevated PCB levels in area seafood (See Appendix B.2). Elevated levels of heavy metals in sediment (notably cadmium, chromium, copper and lead) were also identified during this time frame. PCB levels in the Upper Harbor sediment currently range from below detection to greater than 10,000 ppm. PCB levels in the Lower Harbor sediment range from below detection to approximately 400 ppm. Sediment PCB levels in the Outer Harbor are generally low, mostly around 1 ppm or less, with only a small localized areas of PCBs in the 10-20 ppm range near the Cornell-Dubilier facility based on 2009 sampling. The area of highest contamination near the Cornell-Dubilier mill was capped in 2005. Further characterization of the Outer Harbor OU3 area continues as part of the OU3 RI/FS, initiated in 2009. A.2.3 Initial Response The Site was proposed for the Superfund NPL in 1982, and finalized on the NPL in September 1983. Pursuant to 40 CFR 300.425(c)(2), the Commonwealth of Massachusetts (the Commonwealth) nominated the Site as its priority site for listing on the NPL. In addition to listing the harbor and pursuing a remedial action for the Site, separate CERCLA removal actions have been conducted in past years, as described below, to address various mainland sources of PCBs that have contributed contamination to the Harbor. Prior to the listing of the Site on the NPL, in 1982 signs were erected around the Site warning against fishing and wading. Upon listing, EPA’s site-specific remedial investigations began in 1983 and 1984 with a Remedial Action Master Plan and the Acushnet River Estuary Feasibility Study. Site investigations continued throughout the rest of the 1980s and early 1990s, including among others a pilot dredging and disposal study in 1988 and 1989, and extensive hydrodynamic and bioaccumulation computer modeling, additional feasibility studies and risk assessments all published in 1990. These studies are summarized in more detail in the 1998 ROD for the Upper and Lower Harbor (EPA, 1998). Information collected by the remedial investigations identified the Aerovox facility as the primary source of PCBs to the Site1. PCB wastes were discharged from Aerovox’s operations directly to the Upper Harbor through open trenches and discharge pipes, or indirectly throughout the Site via CSOs and the City’s sewage treatment plant outfall. Additional inputs of PCBs were also made from the Cornell Dubilier Electronics, Inc. (CDE) facility just south of the New Bedford hurricane barrier2.
1 The Aerovox facility is a separate CERCLA removal site (in addition to being regulated under TSCA and State authority) and is not part of the harbor NPL Site. 2 The CDE facility is a separate CERCLA removal site (in addition to being regulated under TSCA and the Clean Water Act) and is not part of the harbor NPL Site.
A-7
In May 1982, Aerovox, Inc. signed an administrative Consent Order with EPA regarding contamination on its property adjacent to the Upper Harbor. As a result of investigations conducted pursuant to that Consent Order, Aerovox installed a sheet pile wall along the eastern side of its property as well as a cap system over contaminated soil. Through a subsequent Supplemental Order, Aerovox instituted a Long Term Monitoring and Maintenance Plan. Also in May 1982, CDE and EPA signed an administrative consent agreement and final order under the Toxic Substance Control Act (TSCA). This agreement addressed PCB handling procedures, discharges, releases to the municipal sewer system and surrounding areas, and groundwater monitoring requirements. Subsequently, in September 1983, EPA issued an administrative order, as part of a separate CERCLA removal action, requiring CDE to remove PCB-contaminated sediment from portions of the municipal sewer system downstream of the CDE plant. The removal and disposal of this sediment took place in the fall of 1984. EPA also issued an administrative order to the City of New Bedford under section 106 of CERCLA, as part of a separate CERCLA removal action, in September 1983 requiring the City to assist CDE in the sewer line clean-up and to monitor PCB levels from the City’s municipal wastewater treatment plant3. On December 9, 1983, the United States filed a complaint on behalf of the National Oceanic and Atmospheric Administration (NOAA) under section 107 of CERCLA seeking damages for injury to natural resources at and near the Site caused by releases of PCBs. The next day, the Commonwealth of Massachusetts (the Commonwealth) filed its own section 107 action. The cases were subsequently consolidated. In February 1984, the complaint was amended to include claims on behalf of EPA for recovery of response costs incurred, or to be incurred, under section 107, and for injunctive relief under section 106 of CERCLA and other environmental statutes. The United States brought this action against six companies which, at various times, owned and/or operated either of the two capacitor manufacturing facilities at the Site. On December 31, 1985, the Commonwealth issued a notification of responsibility to the City of New Bedford pursuant to the state’s hazardous waste regulations regarding the build-up of PCB-contaminated grit in one of the main interceptors of the City’s sewerage system. Severe amounts of PCB-contaminated grit had accumulated within the interceptor especially in the area between Coffin Avenue and Campbell Street; PCB levels in this grit averaged 265 ppm on a dry weight basis. The City subsequently encased and abandoned approximately one and one-half mile of this sewer interceptor. In 1991 and 1992, the Unites States, the Commonwealth and five defendants in the litigation - Aerovox Incorporated, Belleville Industries, Inc., AVX Corporation, Cornell-Dubilier Electronics, Inc., and Federal Pacific Electric Company (FPE) - reached settlement regarding the governments’ claims. The government’s claims against the sixth defendant, RTE Corporation,
3 The City’s sewer system and wastewater treatment plant are not part of the harbor NPL Site, but has previously been addressed under EPA’s CERCLA removal and State authority, and currently is regulated under TSCA and the federal Clean Water Act.
A-8
were dismissed on jurisdictional grounds. The federal and state governments recovered a total of $99.6 million, plus interest, from the five settling defendants. The terms of the settlements are set forth in three separate consent decrees. Under the first consent decree, Aerovox Incorporated and Belleville Industries, Inc. were required to pay a total of $12.6 million, plus interest, to the United States and the Commonwealth for damages to natural resources and for past and future Site remedial response costs. The court approved and entered this consent decree in July 1991. Under the second consent decree, AVX Corporation was required to pay $66 million, plus interest, to the governments for natural resource damages and for past and future Site remedial response costs. This decree was approved and entered by the court in February 1992. Under the third consent decree, CDE and FPE paid $21 million, plus interest, to the governments for natural resource damages and for past and future Site remedial response costs. This decree was approved and entered by the Court in November 1992. A.2.4 Basis for Taking Action Hazardous substances that have been detected at the Site in each media are identified below. A more complete discussion can be found in Section V of the 1998 ROD for the Upper and Lower Harbor Operable Unit (EPA, 1998). Sediment Surface Water Biota Air PCBs PCBs PCBs PCBs PAHs Copper Cadmium Chromium Copper Lead A baseline public health risk assessment was performed to estimate the probability and magnitude of potential adverse health effects, both carcinogenic and non-carcinogenic, from exposure to Site contaminants. In addition to PCBs, this evaluation also identified cadmium, copper and lead as contaminants that could potentially contribute to significant adverse health effects. The exposure pathways found to be of most concern were:
- ingestion of contaminated seafood - direct contact with contaminated shoreline sediment, and - (for children ages 1-5) incidental ingestion of contaminated shoreline sediment.
Ecological risk studies have concluded that aquatic organisms are at significant risk due to exposure to PCBs in New Bedford Harbor. A more complete discussion of the human health and ecological risks posed by the Site can be found in Section VI of the OU1 1998 ROD.

A-9
A.3 REMEDIAL ACTIONS The Site has been divided into three operable units (OUs), or phases of site cleanup: The Upper and Lower Harbor (OU1); the Hot Spot (OU2); and the Buzzards Bay or Outer Harbor (OU3). A summary of the remedy selection and implementation is presented below for OU1 and OU2. The ROD for OU3 is currently unscheduled pending the completion of the RI/FS investigations in the Outer Harbor. A.3.1 Operable Unit 1 Remedy Selection The ROD for OU1 was signed on September 25, 1998 (1998 ROD). The remedial action objectives developed for the OU1 remedy are presented in Section 4.2.1. The cleanup plan selected in the 1998 ROD consisted of the following components:
1. construction of four shoreline confined disposal facilities (CDFs) and water treatment facilities;
2. dredging of sediment and shoreline soils with PCB concentrations above the selected cleanup goals (See Section 4.2.5);
3. operation of the CDFs and water treatment facilities; 4. saltmarsh excavation, restoration and monitoring; 5. preliminary capping and sediment consolidation within the filled CDFs; 6. final capping, long term monitoring and maintenance, and beneficial reuse of the
CDFs; 7. long term site wide monitoring, and 8. seafood advisories and other institutional controls.
The 1998 ROD also included, at the request of the Commonwealth, a State Enhanced Remedy (SER) pursuant to 40 CFR 300.515(f) for the removal of navigational sediment not otherwise covered by the ROD. This portion of the remedy is funded and managed by the Commonwealth in conjunction with the City of New Bedford and the New Bedford Harbor Development Commission (HDC), with oversight by EPA. It serves to increase the remedy’s protectiveness since lower concentration PCB-contaminated sediment, not covered by the OU1 ROD, are removed and disposed of as part of the port’s navigational dredging program. As discussed in Section 2.4, the SER has also provided clean underwater cap material for contaminated sediment near the Cornell-Dubilier facility. In September 2001 EPA issued a change to the 1998 harbor cleanup plan using a process known as an Explanation of Significant Difference (ESD) (EPA, 2001). This ESD described five refinements of the remedy that arose as the design phase progressed following issuance of the 1998 ROD. These changes included: (i) the use of mechanical dewatering for the dredged sediment (to among other things reduce the volume of processed sediment needing disposal); (ii) the incorporation of a rail spur; (iii) a revised wall design at CDF D – the largest of the CDFs, (iv) ongoing use of the pilot CDF at EPA's Sawyer Street facility as an interim TSCA facility; and (v) the remediation and monitoring of two additional intertidal areas near residential land use areas in the Upper Harbor along the Acushnet River, in order to reduce dermal contact/incidental ingestion risks. The 2001 ESD also noted that the estimate of in situ sediment requiring disposal
A-10
pursuant to the ROD could be as high as 800,000 cy.
In August 2002 EPA issued a second ESD for the 1998 ROD (EPA, 2002). This ESD eliminated the construction of the 17 acre CDF D, and instead selected off-site disposal for the dredged and dewatered PCB contaminated sediment slated for the CDF. A smaller shoreline facility, now known as Area D, replaced CDF D in the same area to support both the sediment dewatering building and the rail car (or truck or barge) loading area required for off-site disposal of the dredged sediment.
In March 2010 EPA issued a third ESD for OU1 (EPA, 2010), which documents EPA's use of Cell #1 (located at Sawyer Street) for temporary storage of both PCB- and hazardous waste-contaminated sediment from OU14. EPA invoked a CERCLA waiver of the Massachusetts Hazardous Waste Regulations that requires temporary storage facilities to have a double liner rather than the single liner. The basis for the waiver was that the single liner, in combination with site conditions and facility monitoring, is equally as protective as a double liner for the temporary storage facility. In addition, this ESD documented that Cell #1 does not pose a risk to health and the environment due to the temporary storage of PCBs under TSCA, and that the use of Cell #1 for temporary storage of contaminated sediment is consistent with a previous risk-based finding concerning the facility made in 2001 in the first OU1 ESD.
In March 2011, EPA issued the fourth ESD revising the OU1 remedy (ESD4) (EPA,
2011). ESD4 incorporated the construction and use of the LHCC for permanent disposal of approximately 300,000 cy of mechanically dredged sediment. The fourth ESD also updated the volume of total in situ contaminated sediment to be addressed to meet cleanup levels to be approximately 900,000 cy, of which approximately 425,000 cy would be disposed of off-site5, approximately 300,000 cy would be disposed of in the LHCC, and approximately 175,000 cy would be disposed of in remaining CDFs A, B, and C.6
In January 2014, EPA modified the conceptual design of CDF C such that no CDF structure would be constructed within the area between the southern boundary of Sawyer Street and Coggeshall Street or within the Acushnet River adjacent to these properties. Therefore, the overall size of CDF C could be limited to only the area adjacent to the Pilot CDF. This remedial design change was determined to be a non-significant or minor change. This change was estimated to result in a reduction in capacity of CDF C by one-half to two-thirds the original conceptual design capacity (CDF modified-C).
4 A limited area of removed contaminated sediment abutting the former Aerovox facility (as discussed in Section 4.2.5, below) contained sufficient volatile organic compounds (VOCs) to exceed thresholds for being regulated as hazardous waste. No other contaminated sediment removed from the Harbor, to date, have exceeded hazardous waste standards and, so only applicable TSCA standards have applied to these PCB-contaminated sediment under the CERCLA remedy. 5 Included in this estimate of 425,000 cy is approximately 10,000 cy of contaminated sediment in the Outer Harbor just south of the New Bedford Hurricane Barrier near the New Bedford shore that have been addressed by a pilot underwater cap. 6 It is important to note that these volumes represent the amount of sediment to be dredged, not the reduced volumes of material that will be disposed of after desanding and dewatering processes are applied to the dredged sediment. See Section III.A, below, for further discussion of this issue.
A-11
In July 2015, EPA issued the fifth ESD which eliminated the construction of the planned CDFs A, B and modified-C and selected off-site disposal for the sediment slated for disposal in those planned confined disposal facilities (EPA, 2015c). Further, in the fifth ESD, EPA confirmed that the Pilot CDF is protective, and made the Pilot CDF a permanent TSCA disposal facility. As part of the cleanup plan, following completion of remedial dredging activities, the Pilot CDF will be covered with a clean cover/cap meeting all applicable federal and state standards that is technically equivalent to a cap conforming to the design requirements at 40 CFR § 761.61(a)(7). Appropriate institutional controls will also be implemented. ESDs as well as other Site information are available for review at the New Bedford Free Public Library at 613 Pleasant Street, New Bedford (in the reference section) and at EPA's Boston records center at 5 Post Office Square and on-line at the New Bedford Harbor website (www.epa.gov/ne/nbh). A.3.2 Operable Unit 1 Remedy Implementation Remedial implementation activities for the OU1 remedy were discussed in the body of the FYR. This section is limited to historical activities not covered in the body of the FYR report and supplemental remedial action information in support of data discussed in the body of the FYR. Early Cleanup Activities The first remedial action taken after issuance of the 1998 ROD was to erect fencing in 1999 along the New Bedford shoreline in residential and public access areas where new sediment sampling showed very high levels of shoreline PCBs. Additional “no fishing” signs were also added throughout the Site. This was followed in 2000/2001 by the “Early Action” cleanup which excavated approximately 2,500 cy of highly contaminated residential shoreline areas in Acushnet followed by restoration of the impacted shoreline. These early actions were followed by the accelerated cleanup of approximately six acres of the Acushnet River north of the Wood Street bridge, including the riverbed and shoreline areas in 2002/2003 and 2005. EPA prioritized this effort due to the very high PCB levels along the shoreline in this area (up to 46,000 ppm) along with the fact that two parks and many residences abut the shoreline in this stretch of the river. Two temporary dams were built to dewater this stretch of the river, to allow approximately 15,600 cy of contaminated sediment to be excavated in near-dry conditions. Approximately 2,500 cy (2,606 tons) of vegetated soil was excavated and trucked off-site for disposal. The remaining excavated soil and sediment was transported to EPA’s Sawyer Street facility and placed in cell #1 for interim storage. Upon removal of the contaminated sediment to the target PCB clean-up levels applicable to each area, the shorelines were restored with imported clean fill and native riparian plantings. As part of this shoreline restoration, large stands of the invasive common weed (Phragmites australis) were removed and replaced with a higher value native saltmarsh. This North of Wood Street (NWS) cleanup was completed in March 2003, with the saltmarsh and upland plantings completed in June 2003 (TTFW, 2005a). Annual post-remediation monitoring of the NWS area

A-12
identified two small areas on the eastern shoreline requiring additional remediation, which was performed in 2005. Judging from the monitoring data and the fact that this area had been thickly vegetated when initially sampled, it is believed that these two areas are areas that the initial NWS characterization missed, rather than areas that were recontaminated from the harbor to the south. Preparation for Full Scale Dredging In addition to accelerated cleanups in the northern-most part of the Site, numerous advance projects and business relocations had to be completed to prepare for full scale dredging (see Table 1.B). Dredging of a clean corridor across the Upper Harbor to relocate thirteen submerged high voltage power cables was completed in 2001. Construction of a five acre sediment dewatering and transfer facility (the dewatering facility or Area D) at Hervey Tichon Avenue in New Bedford for processing the dredged sediment was completed in 2004. Relocation of two CSOs that previously discharged in the area of the dewatering facility at Area D was also completed in 2004. Relocation of a commercial barge pier necessary for construction of Area D was completed in 2005, including removal of abandoned fishing vessels and associated environmental dredging (TTFW, 2005b). Dredged sediment is sent through a pipeline in the harbor to the desanding facility at EPA’s Sawyer Street facility, where sand, gravel, shells and other coarse material within the dredged slurry are removed. The slurry is then sent through an underwater pipeline in the harbor to the dewatering facility at Area D. Using a series of mechanical processes, the plant squeezes most of the water out of the slurry so that a "filter cake" is produced. The “filter cake” is then sent off-site to a TSCA disposal facility in Michigan via rail or truck. Full Scale Dredging See Section 4.1.2. Table 2 summarizes the volumes of dredging performed in the Upper Harbor by hydraulic dredging (Jacobs, 2011b; Jacobs 2013a; Jacobs 2013b; Jacobs 2014; Jacobs 2015b), while Tables 3 and 4 summarize volumes of dredging in the Lower Harbor by mechanical dredging with CAD Cell disposal. All the volume in Table 2 and 3 have been carried out with funding by EPA.
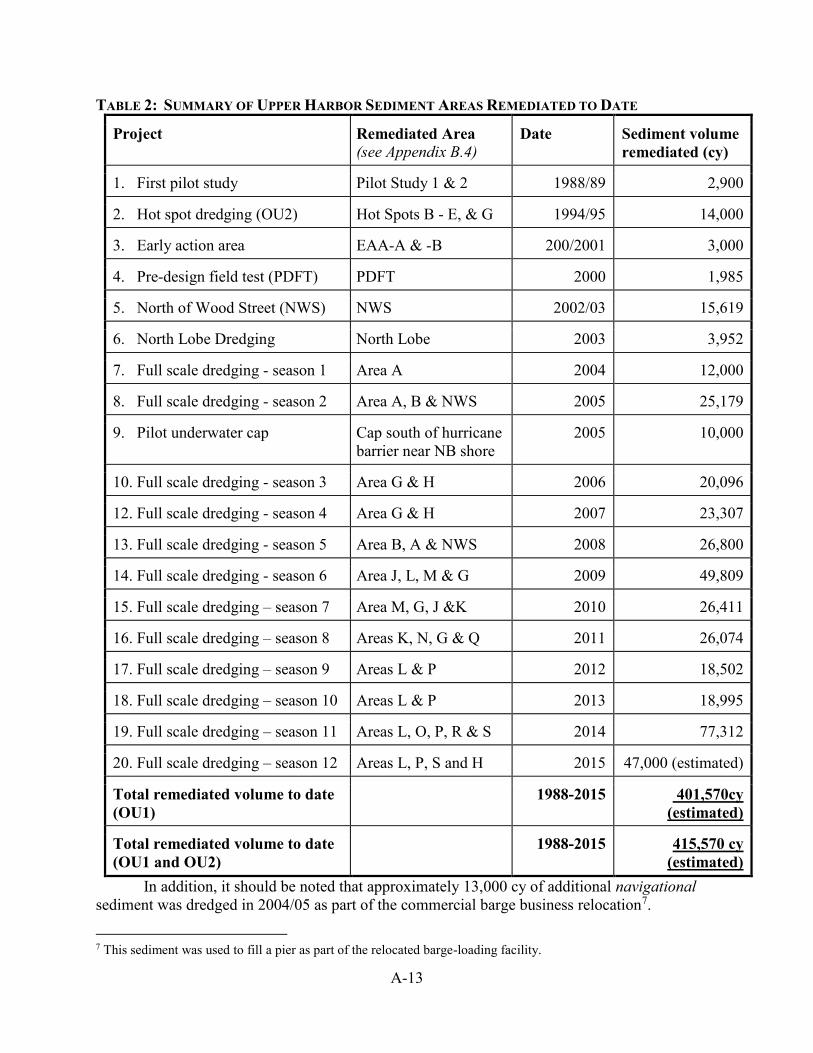
A-13
TABLE 2: SUMMARY OF UPPER HARBOR SEDIMENT AREAS REMEDIATED TO DATE
In addition, it should be noted that approximately 13,000 cy of additional navigational sediment was dredged in 2004/05 as part of the commercial barge business relocation7.
7 This sediment was used to fill a pier as part of the relocated barge-loading facility.
Project Remediated Area (see Appendix B.4)
Date Sediment volume remediated (cy)
1. First pilot study Pilot Study 1 & 2 1988/89 2,900
2. Hot spot dredging (OU2) Hot Spots B - E, & G 1994/95 14,000
3. Early action area EAA-A & -B 200/2001 3,000
4. Pre-design field test (PDFT) PDFT 2000 1,985
5. North of Wood Street (NWS) NWS 2002/03 15,619
6. North Lobe Dredging North Lobe 2003 3,952
7. Full scale dredging - season 1 Area A 2004 12,000
8. Full scale dredging - season 2 Area A, B & NWS 2005 25,179
9. Pilot underwater cap Cap south of hurricane barrier near NB shore
2005 10,000
10. Full scale dredging - season 3 Area G & H 2006 20,096
12. Full scale dredging - season 4 Area G & H 2007 23,307
13. Full scale dredging - season 5 Area B, A & NWS 2008 26,800
14. Full scale dredging - season 6 Area J, L, M & G 2009 49,809
15. Full scale dredging – season 7 Area M, G, J &K 2010 26,411
16. Full scale dredging – season 8 Areas K, N, G & Q 2011 26,074
17. Full scale dredging – season 9 Areas L & P 2012 18,502
18. Full scale dredging – season 10 Areas L & P 2013 18,995
19. Full scale dredging – season 11 Areas L, O, P, R & S 2014 77,312
20. Full scale dredging – season 12 Areas L, P, S and H 2015 47,000 (estimated)
Total remediated volume to date (OU1)
1988-2015 401,570cy (estimated)
Total remediated volume to date (OU1 and OU2)
1988-2015 415,570 cy (estimated)

A-14
TABLE 3: SUMMARY OF EPA’S LOWER HARBOR CAD CELL RELATED PROJECT DREDGING—CONTAMINATED DREDGE MATERIAL ONLY
Component Date Approximate Sediment
Volume (cy)
Top of LHCC, Phase I; Disposal in CAD 3 November 2013 to July 2014
24,800
Top of LHCC, Phase II; Disposal in LHCC Phase I November 2014 to March 2015
36,000
Total 60,800
State Enhanced Remedy The Commonwealth in conjunction with the City is performing navigational dredging pursuant to the state enhanced remedy (SER) portion of the 1998 OU1 ROD. As of September 2015, numerous dredging projects have been undertaken pursuant to the SER. The City has used an existing depression in the harbor bottom (the “borrow pit”) and a series of excavated CAD cells for the disposal of contaminated navigational sediment. Clean glacial material excavated to create the CAD cells has been used for EPA’s pilot capping project in the Outer Harbor or disposed of at an approved open water disposal site. These projects are summarized in Table 4 below and shown in Appendix B.13 and B.14. As part of the reporting for the SER, based on pre- and post-dredging sediment PCB levels, it has been estimated that over 545,000 cy of PCB contaminated sediment have been dredged (AGM, 2012; Apex 2007; Apex, 2010; Apex, 2014; Apex, 2015; MassDEP 2012c). EPA has issued TSCA Determinations in support of the disposal of PCB-contaminated sediment as part of the SER navigational dredging in SER CAD cells. The totals of Table 3 and 4 show that over 605,000 cy of contaminated sediment have been dredged from the Lower and Outer Harbor and disposed in State or EPA CAD Cells between the efforts of EPA (under CERCLA) and the Commonwealth of Massachusetts (under SER).
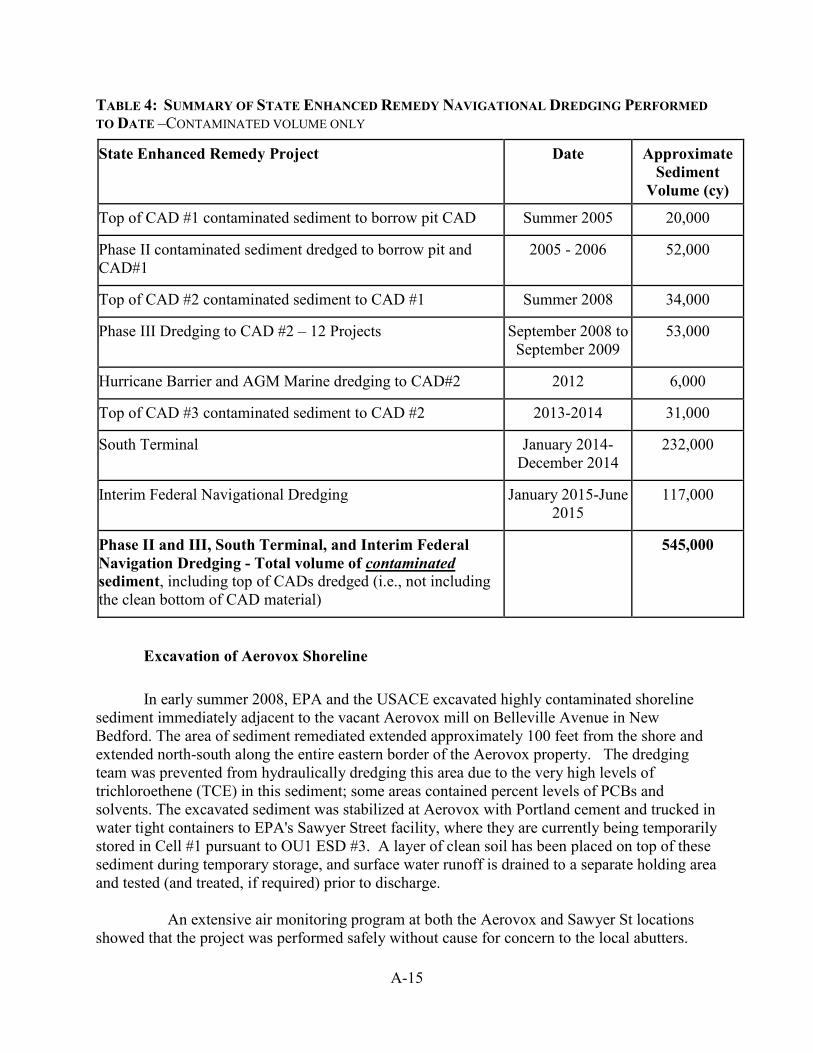
A-15
TABLE 4: SUMMARY OF STATE ENHANCED REMEDY NAVIGATIONAL DREDGING PERFORMED TO DATE –CONTAMINATED VOLUME ONLY
State Enhanced Remedy Project Date Approximate Sediment
Volume (cy)
Top of CAD #1 contaminated sediment to borrow pit CAD Summer 2005 20,000
Phase II contaminated sediment dredged to borrow pit and CAD#1
2005 - 2006 52,000
Top of CAD #2 contaminated sediment to CAD #1 Summer 2008 34,000
Phase III Dredging to CAD #2 – 12 Projects September 2008 to September 2009
53,000
Hurricane Barrier and AGM Marine dredging to CAD#2 2012 6,000
Top of CAD #3 contaminated sediment to CAD #2 2013-2014 31,000
South Terminal January 2014-December 2014
232,000
Interim Federal Navigational Dredging January 2015-June 2015
117,000
Phase II and III, South Terminal, and Interim Federal Navigation Dredging - Total volume of contaminated sediment, including top of CADs dredged (i.e., not including the clean bottom of CAD material)
545,000
Excavation of Aerovox Shoreline In early summer 2008, EPA and the USACE excavated highly contaminated shoreline sediment immediately adjacent to the vacant Aerovox mill on Belleville Avenue in New Bedford. The area of sediment remediated extended approximately 100 feet from the shore and extended north-south along the entire eastern border of the Aerovox property. The dredging team was prevented from hydraulically dredging this area due to the very high levels of trichloroethene (TCE) in this sediment; some areas contained percent levels of PCBs and solvents. The excavated sediment was stabilized at Aerovox with Portland cement and trucked in water tight containers to EPA's Sawyer Street facility, where they are currently being temporarily stored in Cell #1 pursuant to OU1 ESD #3. A layer of clean soil has been placed on top of these sediment during temporary storage, and surface water runoff is drained to a separate holding area and tested (and treated, if required) prior to discharge.
An extensive air monitoring program at both the Aerovox and Sawyer St locations showed that the project was performed safely without cause for concern to the local abutters.
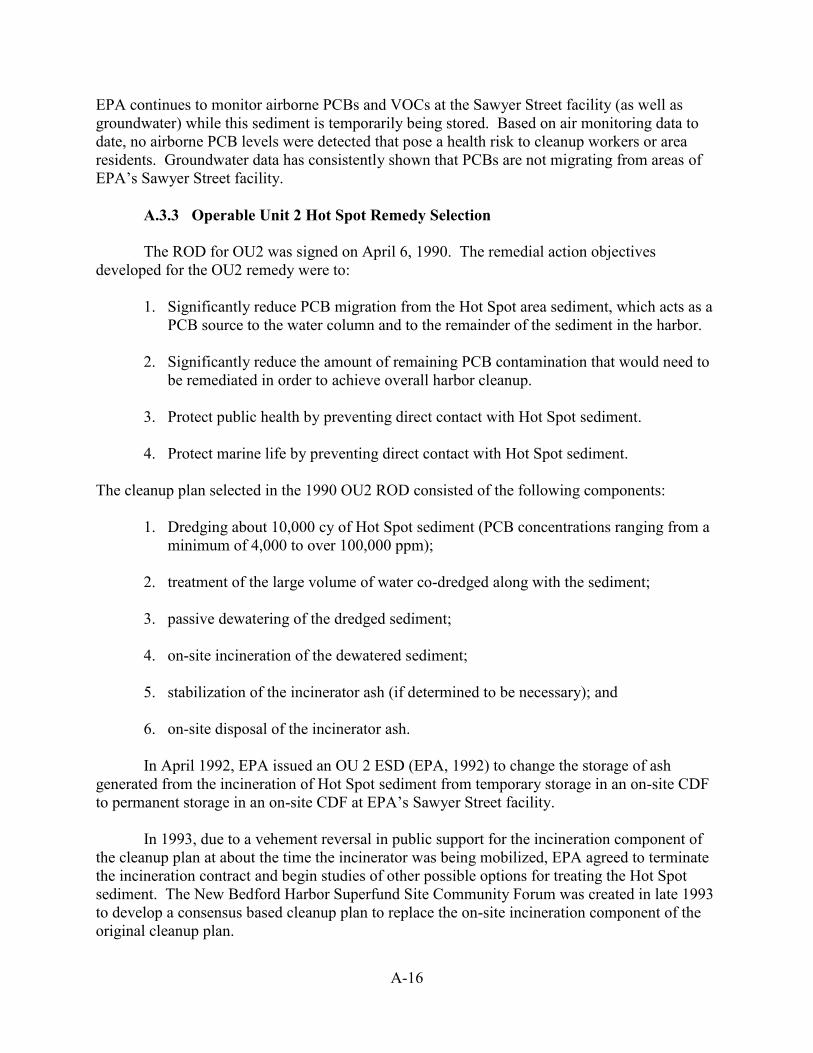
A-16
EPA continues to monitor airborne PCBs and VOCs at the Sawyer Street facility (as well as groundwater) while this sediment is temporarily being stored. Based on air monitoring data to date, no airborne PCB levels were detected that pose a health risk to cleanup workers or area residents. Groundwater data has consistently shown that PCBs are not migrating from areas of EPA’s Sawyer Street facility. A.3.3 Operable Unit 2 Hot Spot Remedy Selection The ROD for OU2 was signed on April 6, 1990. The remedial action objectives developed for the OU2 remedy were to:
1. Significantly reduce PCB migration from the Hot Spot area sediment, which acts as a PCB source to the water column and to the remainder of the sediment in the harbor.
2. Significantly reduce the amount of remaining PCB contamination that would need to
be remediated in order to achieve overall harbor cleanup.
3. Protect public health by preventing direct contact with Hot Spot sediment.
4. Protect marine life by preventing direct contact with Hot Spot sediment. The cleanup plan selected in the 1990 OU2 ROD consisted of the following components:
1. Dredging about 10,000 cy of Hot Spot sediment (PCB concentrations ranging from a minimum of 4,000 to over 100,000 ppm);
2. treatment of the large volume of water co-dredged along with the sediment;
3. passive dewatering of the dredged sediment;
4. on-site incineration of the dewatered sediment;
5. stabilization of the incinerator ash (if determined to be necessary); and
6. on-site disposal of the incinerator ash.
In April 1992, EPA issued an OU 2 ESD (EPA, 1992) to change the storage of ash generated from the incineration of Hot Spot sediment from temporary storage in an on-site CDF to permanent storage in an on-site CDF at EPA’s Sawyer Street facility. In 1993, due to a vehement reversal in public support for the incineration component of the cleanup plan at about the time the incinerator was being mobilized, EPA agreed to terminate the incineration contract and begin studies of other possible options for treating the Hot Spot sediment. The New Bedford Harbor Superfund Site Community Forum was created in late 1993 to develop a consensus based cleanup plan to replace the on-site incineration component of the original cleanup plan.

A-17
During the 1994-95 construction seasons the dredging component of the 1990 Hot Spot remedy decision was implemented. Dredging of about 14,000 cubic-yards in volume over an area covering five acres began in April 1994 and was completed in September 1995. In October 1995, EPA issued a second OU2 ESD (EPA, 1995) to document the need for interim storage of the dredged Hot Spot sediment in Cell #1 at EPA’s Sawyer Street facility while studies of treatment options other than on-site incineration were conducted. In December 1997, EPA issued a Hot Spot Feasibility Study Addendum Report which presented the evaluation of the non-incineration treatment options investigated. In August 1998, EPA issued a Proposed Plan to amend the incineration component of the 1990 Hot Spot cleanup plan. The 1998 Proposed Plan called for dewatering the Hot Spot sediment and transporting them to a permitted off-site hazardous waste landfill. In April 1999, EPA signed an amendment to the 1990 ROD (EPA, 1999) which calls for off-site landfilling instead of on-site incineration. The amended cleanup plan consisted of the following activities:
1. Upgrade the existing site facilities as needed; 2. Sediment dewatering and water treatment; 3. Transportation of dewatered sediment to an off-site TSCA permitted landfill; 4. Air monitoring program.
The dredging component of the remedy remained unchanged. A.3.4 Operable Unit 2 Remedy Implementation The implementation of the OU2 remedy is briefly summarized below. A more detailed description can be found in the Report on the Effects of the Hot Spot Dredging Operations (EPA, 1997) and the Remedial Action Report for OU2 (EPA, 2000). About 14,000 cubic-yards of Hot Spot sediment were dredged from the Upper Harbor during the 1994-95 construction seasons. The Hot Spot sediment was temporarily stored in Cell #1 at EPA’s Sawyer Street facility while alternatives to on-site incineration were evaluated. As discussed above, in April 1999, EPA signed an amendment to the 1990 OU2 ROD which called for off-site landfilling instead of on-site incineration. A contract to implement the amended Hot Spot remedy was awarded in October 1999. The sediment was stabilized with lime, excavated from Cell #1, and loaded on to trucks for off-site disposal. Transportation of the passively dewatered Hot Spot sediment to an off-site TSCA permitted hazardous waste disposal facility started in December 1999 and was completed in May 2000. One of the Hot Spot areas, designated as Area B, was not dredged during the Hot Spot dredging operations due to its proximity to submerged high voltage power lines serving the City of New Bedford. This area will be addressed under OU1.
A-18
In order for the remedy to be protective in the long term, this geographical area will also be addressed under OU1. All future work, including institutional controls, for this area will be a part of OU1. A.3.5 Operable Unit 3 (Outer Harbor) Remedy Selection The EPA has not yet selected a remedy for the 17,000 acre OU3, but is currently performing a remedial investigation for this area.

APPENDIX B – ADDITIONAL MAPS, FIGURES AND DATA

1 - SITE LOCATION MAP

6
6Coggeshall Street
Bridge
hurricanebarrier
Sconticut Neck WestIsland
WilburPoint
Ricketson's Point
SmithNeck
MishaumPoint
Clark'sPoint
Cornell-Dubilier
Outer Harbor
LowerHarbor
UpperHarbor
Aerovox Site
195195
Dartmouth
FairhavenNew Bedford
Mattapoisett
Acushnet
B u z z a r d sB a y
EPA Region 1 GIS Center 09/10/2010. Map Tracker 7136.
New Bedford Harbor Superfund SiteNew Bedford, MA
Figure 1Site Location Map
MA
CT RI
0 1 2Miles
Upper Harbor
Lower Harbor
Outer Harbor

2 - THE 1979 STATE FISHING BAN – MAP OF FISH CLOSURE AREAS


3 - MAJOR COMPONENTS OF THE HYDRAULIC DREDGING PROCESS
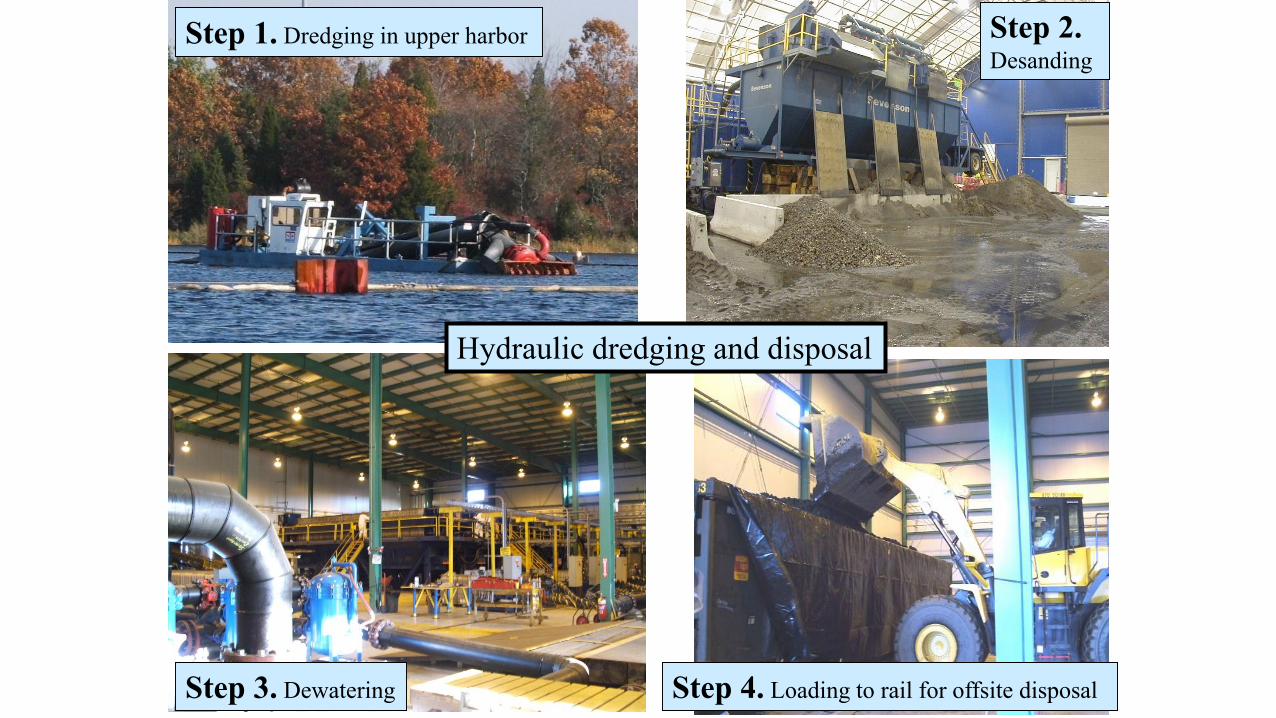
Hydraulic dredging and disposal
Step 1. Dredging in upper harbor Step 2.Desanding
Step 3. Dewatering Step 4. Loading to rail for offsite disposal

4 - AREAS DREDGED THROUGH 2014 2015 HYDRAULIC DREDGE AREAS
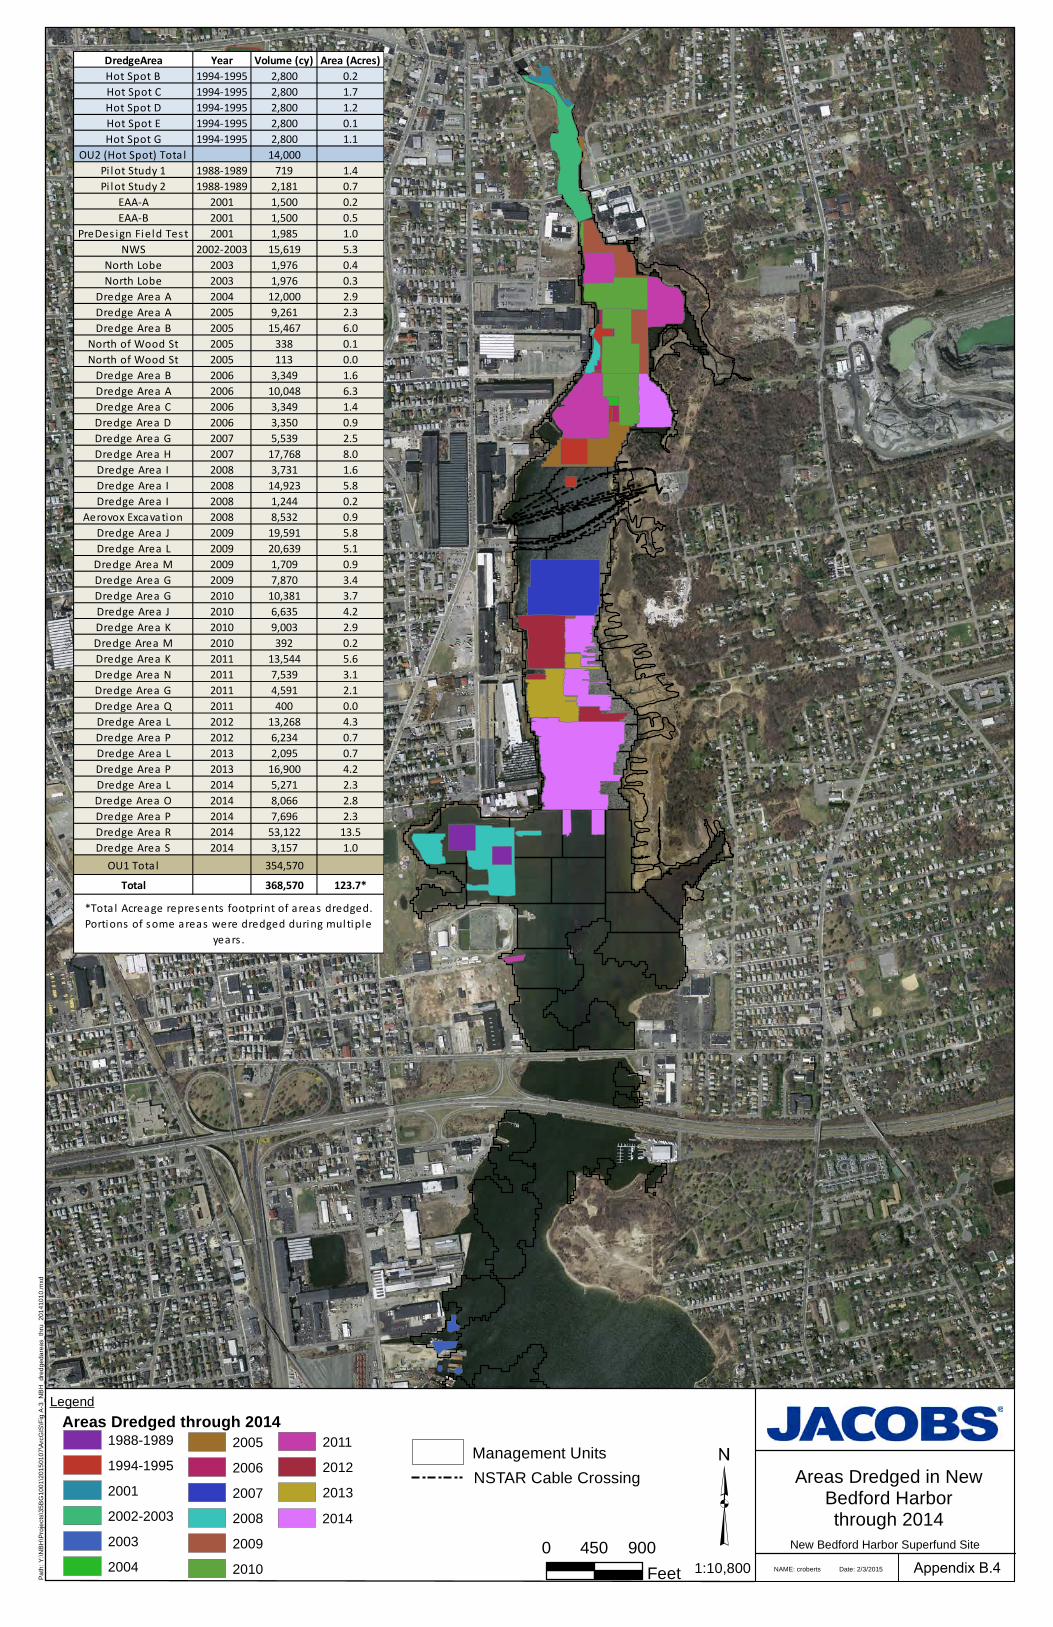
Legend
Pa
th:
Y:\
NB
H\P
roje
cts\
35
BG
10
01
\20
15
01
07
\Arc
GIS
\Fig
A-3
_N
BH
_d
red
ge
da
rea
s_th
ru_
20
14
10
10
.mxd
0 900450
Feet 1:10,800 NAME: croberts
New Bedford Harbor Superfund Site
Date: 2/3/2015 Appendix B.4
Areas Dredged in NewBedford Harborthrough 2014
Management Units
NSTAR Cable Crossing
Areas Dredged through 20141988-1989
1994-1995
2001
2002-2003
2003
2004
2005
2006
2007
2008
2009
2010
2011
2012
2013
2014
DredgeArea Year Volume (cy) Area (Acres)Hot Spot B 1994-1995 2,800 0.2Hot Spot C 1994-1995 2,800 1.7Hot Spot D 1994-1995 2,800 1.2Hot Spot E 1994-1995 2,800 0.1Hot Spot G 1994-1995 2,800 1.1
OU2 (Hot Spot) Tota l 14,000Pi lot Study 1 1988-1989 719 1.4Pi lot Study 2 1988-1989 2,181 0.7
EAA-A 2001 1,500 0.2EAA-B 2001 1,500 0.5
PreDes ign Field Test 2001 1,985 1.0NWS 2002-2003 15,619 5.3
North Lobe 2003 1,976 0.4North Lobe 2003 1,976 0.3
Dredge Area A 2004 12,000 2.9Dredge Area A 2005 9,261 2.3Dredge Area B 2005 15,467 6.0
North of Wood St 2005 338 0.1North of Wood St 2005 113 0.0
Dredge Area B 2006 3,349 1.6Dredge Area A 2006 10,048 6.3Dredge Area C 2006 3,349 1.4Dredge Area D 2006 3,350 0.9Dredge Area G 2007 5,539 2.5Dredge Area H 2007 17,768 8.0Dredge Area I 2008 3,731 1.6Dredge Area I 2008 14,923 5.8Dredge Area I 2008 1,244 0.2
Aerovox Excavation 2008 8,532 0.9Dredge Area J 2009 19,591 5.8Dredge Area L 2009 20,639 5.1
Dredge Area M 2009 1,709 0.9Dredge Area G 2009 7,870 3.4Dredge Area G 2010 10,381 3.7Dredge Area J 2010 6,635 4.2Dredge Area K 2010 9,003 2.9Dredge Area M 2010 392 0.2Dredge Area K 2011 13,544 5.6Dredge Area N 2011 7,539 3.1Dredge Area G 2011 4,591 2.1Dredge Area Q 2011 400 0.0Dredge Area L 2012 13,268 4.3Dredge Area P 2012 6,234 0.7Dredge Area L 2013 2,095 0.7Dredge Area P 2013 16,900 4.2Dredge Area L 2014 5,271 2.3Dredge Area O 2014 8,066 2.8Dredge Area P 2014 7,696 2.3Dredge Area R 2014 53,122 13.5Dredge Area S 2014 3,157 1.0
OU1 Tota l 354,570Total 368,570 123.7*
*Tota l Acreage represents footprint of areas dredged. Portions of some areas were dredged during multiple
years .
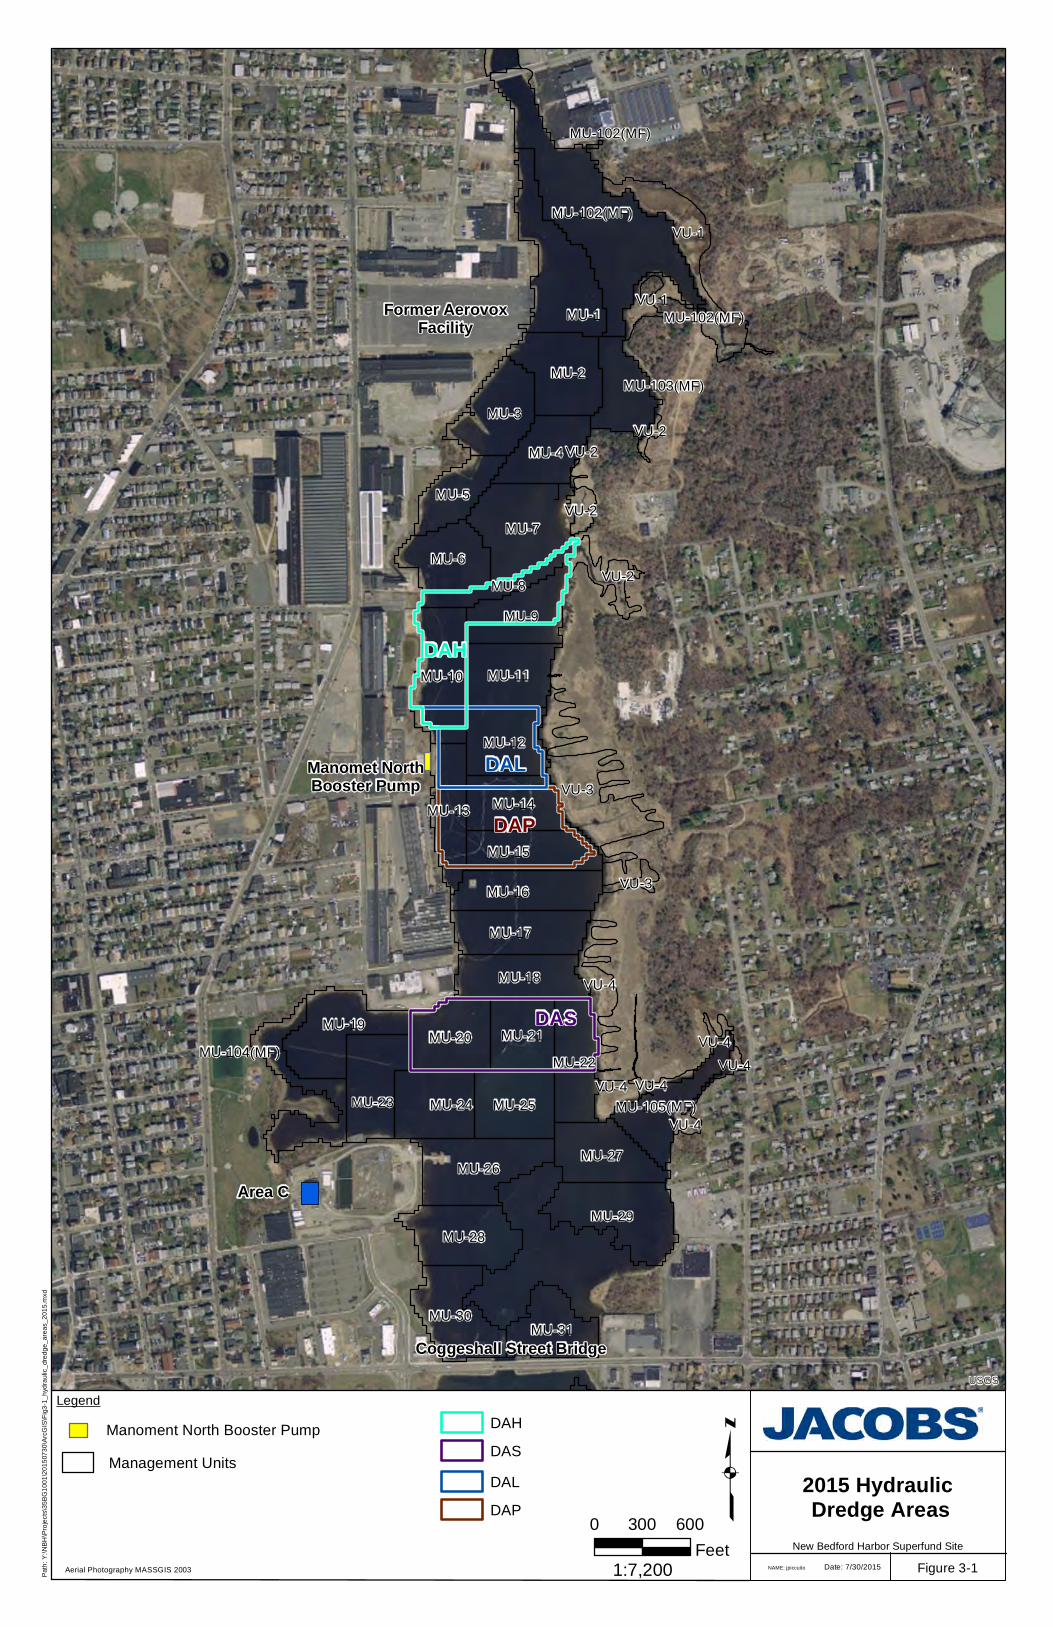
Former AerovoxFacility
Manomet NorthBooster Pump
Area C
Coggeshall Street Bridge
MU-1
VU-3
MU-7
MU-102(MF)
MU-2
MU-29
VU-1
MU-26
MU-3
MU-10
MU-19
MU-9
MU-28
MU-30
MU-6
MU-17
MU-16
MU-23
MU-4
MU-18
MU-24 MU-25
MU-11
MU-27
MU-20
MU-12
MU-14
MU-15
MU-22
MU-31
MU-5
MU-21
MU-13
VU-4
MU-8
MU-104(MF)
MU-105(MF)
VU-2
MU-103(MF)
VU-1
VU-2
MU-32
VU-3
VU-4
VU-4
VU-4
VU-2
VU-4
VU-4
VU-2
MU-102(MF)
MU-102(MF)
USGS
Legend
Management Units
0 600300
Feet1:7,200
New Bedford Harbor Superfund Site
2015 Hydraulic Dredge Areas
Figure 3-1
Manoment North Booster Pump
Aerial Photography MASSGIS 2003
Pat
h:
Y:\
NB
H\P
roje
cts\
35
BG
10
01
\20
15
073
0\A
rcG
IS\F
ig3
-1_
hyd
rau
lic_
dre
dg
e_a
rea
s_2
01
5.m
xd
Date: 7/30/2015NAME: jpiccuito
DAH
DAS
DAL
DAP
DAH
DAL
DAP
DAS

5 - AMBIENT AIR DATA:
- TABLE E-1 AMBIENT AIR MONITORING PROGRAM - TOTAL DETECTABLE PCB HOMOLOGUES (AS OF AUGUST 2015)
- AMBIENT AIR MONITORING STATION LOCATIONS - PUBLIC EXPOSURE TRACKING SYSTEM (PETS) CURVES FOR THE AEROVOX AND
COFFIN AVE AMBIENT AIR MONITORING LOCATIONS

Table E-1Ambient Air Monitoring Program - Total Detectable PCB Homologues
New Bedford Harbor Superfund Site Current as of 8/19/2015
47 48 49 50 51 528/26/2015 62 45.9/35.3 21.9 18.8 35.5 83.9 13.23 20.7 35.2 NS NS 32.5 NS NS 1902.3 1.16 NS 14.62 2015 Hydraulic Dredging in Upper Harbor - Area S. Unvalidated results.
7/21/2015 44.1 47.6 10.3 44.1 20.1 37.2 19 27.2 15.8 NS NS 11.1/15.4d NS NS NS 7.19 NS 11.5 2015 Pre-Dredge Samples for the Upper Harbor. Unvalidated results.
6/3/2015 44.8 37.5 0.973 17.1 4.23 8.58 1.24 5.59 12.7/14.1d NS NS 16.1 NS NS NS 1.89 1.15 1.25 NS 2015 Off Season Data Collection. Unvalidated results.
4/22/2015 52.1 25.9 NA 20.3 3.4 15.9 7.57 12.3 0.0391 NS NS 3.62 NS NS NS 4.94 NS 5.72 NS
2015 Off Season Data Collection and Pre-dredge sampling for the Upper Harbor.
Pump at Station #27 failed to run long enough to collect a viable sample so it was
not analyzed. Unvalidated results.
4/6/2015 NS NS NS NS NS NS 5.12 NS NS NS NS 8.46 NS NS NS NS NS 2.23 NS
Lower Harbor CAD Cell Construction Phase II (Post Top of CAD Cell dredging);
Unvalidated results. Pump at Station #50 failed to run the same duration as the
duplicate so only the duplicate sample was analyzed. This sample is considered
the primary sample so there is no duplicate for this post-dredge sampling event.
3/11/2015 NS0.552/0.38
6dNS 0.191 NS NS 0.53 0.147 1.00 NS NS 0.558 NS NS NS 0.115 NS 0.527 2.43
Lower Harbor CAD Cell Construction Phase II (Top of CAD Cell dredging);
Unvalidated results. Stations 24, 27, 42, and 43 were inaccessible for sampling due
to obstructions from snow/ice piles.
2/6/2015 NS NS NS NS NS NS0.1419/
0.1738NS NS NS NS 0.0992 NS NS NS NS NS 0.1469 NS
Lower Harbor CAD Cell Construction Phase II (Top of CAD Cell dredging);
Unvalidated results. The dredge sample media was found broken at the dredge and
therefore was not analyzed.
1/13/2015 0.58 0.55 0.16000.11 /
0.15d0.87 1.4 0.17 0.075 0.43 NS NS 1.3 NS NS NS 0.05 0.12 0.230 2.48 Lower Harbor CAD Cell Construction Phase II (top of CAD Cell dredging).
12/29/2014 NS NS NS NS NS NS 0.98 NS NS NS NS 0.5 NS NS NS NS NS 1.6/1.9d 3.5Rapid TAT data. Lower Harbor CAD Cell Construction Phase II (top of CAD Cell
dredging).
12/18/2014 NS NS NS NS NS NS 1.00 NS NS NS NS 0.49 NS NS NS NS NS 2.3 3.5/4.6dRapid turn around time (TAT) data. Lower Harbor CAD Cell Construction Phase II
(top of CAD Cell dredging). Reissue of data due to error in laboratory calculations.
12/15/2014 6.7 7.2 0.73 5.6 2.3 3.6 1.6 2.7 4.4 NS NS 3.7/4.3d NS NS NS 1.6 0.51 1.1 4.7Lower Harbor CAD Cell Construction Phase II (top of CAD Cell dredging). Off-
season data collection included on January 5, 2015 as received from laboratory.
11/4/2014 43 21.4 9.9 26.8 8.9 17.41 24.2 21 4.85 NS NS 7.43 NS NS NS 4.38 7.0515.72/
5.19dNS
2014 Post-Dredge Operation for Upper Harbor. Pre-Dredge sampling for the Lower
Harbor CAD Cell Phase II (#44, 50 and 64).
10/6/2014 150 98/110d 5.2 180 3.6 17 21 70 21 NS NS 21 NS NS 90 NS NA 12 NS 2014 Hydraulic Dredging in Areas L & S.
9/3/2014 91 44 9.1 39 36 53 12/10d 10 20 NS NS 11 NS NS 100 NS 3.8 11 2014 Hydraulic Dredging in Area R-east.
8/5/2014 75 72 8 61 17 37 17 42 55 NS NS 23 NS NS 260 NS 4.9 8.5 2014 Hydraulic Dredging in Area R-east.
7/8/2014 82 25 23 36 19 43 34 24 33/33d NS NS 22 NS NS 110 NS 4.2 15 2014 Hydraulic Dredging in Area R-east.
6/16/2014 200 90 12/13d 100 25 35 27 50 25 NS NS 20 NS NS 320 NS 21 8.6 2014 Hydraulic Dredging in Area R.
5/7/2014 56.9 32.6 NS 33.8 10.86 29.7 24.3 38.28 13.38 NS NS 10.96 NS NS 194 NS 7.01 11.56 2014 Hydraulic Dredging in Area R.
3/18/2014 17 5.80.36/0.4
2d4.5 2.2 1.7 0.41 ND 3.3 NS NS 2.8 NS NS NS NS 0.14 0.22 2014 Pre-Dredge Samples for the Upper Harbor.
3/18/2014 0.41 2.8 0.22 NS Post-Dredge Samples for the Lower Harbor.
12/19/2014 2.32 3.5/3.02d 3.13 0.89
12/4/20133.31/3.
0d0.643 2.16 3.57
11/20/2013 2.17 3.551.68/2.0
d6.21
9/25/2013 25.6 26.5 2.65 14.7 8.05 11.2 NS 4.1 NS NS NS 13.3/12.8d NS NS NS NS NS NS 2013 Post-Dredge Operation.
8/20/2013 230 130 15 160 18 61 NS 60/57d 29 NS NS 29 NS NS 240 NS NS NS 2013 Hydraulic Dredging in Area P.
7/16/2013 240 110 8.1 130 22 36 16 48 110 NS NS 69 NS NS 510 NS NS 14.4 2013 Hydraulic Dredging in Area P.
3/26/2013 14 1.4 3.2 NS 6.6 8.3 1.1 0.65 NS NS NS NS NS 0.49 NS NS NS 1.8/1.8d 2013 Pre-Dredge Samples for the Upper Harbor.
3/26/2013 1.1 0.49 1.8/1.8d NS 2013 Pre-Dredge Samples for the Lower Harbor.
10/1/2012 98 18 17/18d 25 17 87 18 NS NS 14 0.56 NS NS NS 15 NS NA
2012 Post Dredge Operation; Sample at Station 62 had insufficient air volume and
was not analyzed. Due to several vandalized samples this station has been
discontinued.
8/21/2012 67 28 23 17 19 67 14/16d NS NS 20 4 NS NS NA 0.00033 NS 182012 Hydraulic Dredging in Area P; Sample at Station 53 had insufficient air
volume and was not analyzed.
7/16/2012 220 1.2 24/24d 110 36 140 26 NS NS 57 10 NS NS 280 10 NS 3.3 2012 Hydraulic Dredging in Area L.
7/2/2012 NA NA NA NA NA NA NA NS NS NA NA NS NS NA NA NA NAAll samples collected were voided due to out of temperature specification upon
arrival at laboratory.
5/21/2012 51 NS 67/66d 0.81 NS NS NS NS NS NS NS NS NS NS NS NS NS 0.00292012 Pre-Dredge Samples; Station 27 is a new location in 2012 season for eastern
residential receptor.
10/11/2011 36 NS NS 42 10 18 11 NS NS 25 17 NS NS NS 420 18 0.29 2011 Post-Dredge Operation.
9/14/2011 480 NS NS 120 29 61 93 NS NS 220 0.62 NS NS 460 28 57 NS2011 Hydraulic Dredging in Area N. Sample at Station 62 was tampered and not
analyzed.
8/23/2011 280 NS NS 60 80 94 NS NS NS220/20
0d16 NS NS 1800 48 13 52 2011 Hydraulic Dredging in Area K.
7/26/2011 NS NS NS NS NS NS NS NS NS NS NS NS NS NS NS NS NS 51 Excavation of Area Q.
7/13/2011 1100 NS NS 130 40 43 43 NS NS 78 110 NS NS1000/110
0d79 25 6.7 NS 2011 Hydraulic Dredging in Area K.
55 Aerovox
West
56 Acushnet
Park
57 Riverside
Park
61 South Fence
64 Pilgrim
63 Boathouse
Lower Harbor CAD Cell Construction Phase 1 (top of CAD Cell dredging)
25 Manomet
30 Fibre Leather
Area D44 Taber
PCB Concentration by Location(ng/m3 in 24-hour time-weighted average)
Activity PeriodSampling Date Area C24
Aerovox25
Cliftex
42 NSTAR North
46 Coffin
62 Century House
65 LHCC
Dredge
43 Veranda
53 Dredge
27 Porter
Page 1 of 3

Table E-1Ambient Air Monitoring Program - Total Detectable PCB Homologues
New Bedford Harbor Superfund Site Current as of 8/19/2015
47 48 49 50 51 52
55 Aerovox
West
56 Acushnet
Park
57 Riverside
Park
61 South Fence
64 Pilgrim
63 Boathouse
25 Manomet
30 Fibre Leather
Area D44 Taber
PCB Concentration by Location(ng/m3 in 24-hour time-weighted average)
Activity PeriodSampling Date Area C24
Aerovox25
Cliftex
42 NSTAR North
46 Coffin
62 Century House
65 LHCC
Dredge
43 Veranda
53 Dredge
27 Porter
5/25/2011 56 NS NS NS NS NS NS NS NS NS NS NS NS NS 93/97d NS 0.68 25 2011 Pre-Dredge Samples; Station 63 is a new location in 2011 season for Area Q.
10/13/2010 80 NS NS 36 9 7.4 21 NS NS 24 4.4 NS NS NS 19 5.9 1.1 NS 2010 Post-Dredge Operation.
8/18/2010 1800 NS NS 300 25 36 31 NS NS 130 37 NS NS 560/580d 200 11 13
7/20/2010 270 NS NS 29 NS 26 47 NS NS 79/73d 37.0 NS NS 450 93 26 2.7
6/30/2010 120.0 NS NS 7.3 0.0013 82.0 13 NS NS 32 3.3 NS NS 230 3.20 12.0 44/41d
5/21/2010 86 NS NS NS 0.042 NS NS NS NS NS NS NS NS NS NS NS ND/NDd 2010 Pre-Dredge Samples.
5/13/2010 void NS NA NS void NS NS NS NS NS NS NS NS NS NS NS void
2010 pre-dredge samples. Sample location at Century House Resturant (#62) in
Acushnet added at the direction of the EPA. Samples taken on 5/13/10 were
damaged during shipment.
12/16/2009 3.3 NS NS 0.134 23.8 9.12 0.171 NS NS 1.78 NS 0.184 NS NS0.372/0.3
53d0.63 2009 Post-Dredge Operation.
11/9/2009 45.2 NS NS 20.4/31d 25.3 55.2 32.8 NS NS 51.8 NS 2.92 NS 205.1 8.31 17.2
10/14/2009 48.79 NS NS 11.77 17.92 10.018.8/6.0
7dNS NS 13.26 NS 3.75 NS 0.13 10.00 2.62
9/17/2009 160 NS NS 24 2.2 51 13 NS NS 35 NS 42 NS 180 14 10/9.8d
8/13/2009 130 NS NS 21 14 49 14 NS NS 32 NS 31 NS 130 28/30d 20
7/13/2009 130 NS NS 18 39 110 36 NS NS 77/76d NS 5.3 NS 290 7.4 6
6/16/2009 150 NS NS 77 10 33 35 43 NS NS NS 32 NS 120 33 8.2
11/10/2008 NS NS NS NS NS 15 1.3 NS NS 6.2 NS ND NS NS NS NS 0.11 2008 Post-Dredge Operation.
10/7/2008 NS NS NS NS NS NS 5.2 NS NS NS NS NS NS NS NS NS NS
9/24/2008 NS NS NS NS NS 18 NS NS NS 42 NS NS NS 1.5 NS NS 15.0
8/21/2008 NS NS NS NS NS 31.66 121.9 NS NS123.4/
116.4dNS 2.85 NS 178.0 NS NS 37.46
7/16/2008 NS NS NS NS NS NS NS NS NS NS NS NS NA 68.6 NS 286.5
7/8/2008 NS NS NS NS NS NS NS NS NS NS NS NS NA 8.7 NS 26.1
6/25/2008 NS NS NS NS NS NS NS NS NS NS NS NS NA 5.52 NS NS
6/19/2008 NS NS NS NS NS NS NS NS NS NS NS NS NA 8.9 NS NS
6/12/2008 NS NS NS NS NS NS NS NS NS NS NS NS NA 7.3 NS 43.1
6/8/2008 NS NS NA NS NS NS NS NS NS NS NS NS NA 25.9 NS 34.4
11/9/2007 19.7 NS 20.2 NS 15.7 1.86 9.29 NS NS NS 4.39 NS NA NS NS 2007 Post-Dredge Operation.
9/18/2007 176 NS 120 NS 16.3 21.4 57.1 NS NS 48.7 NS NS 130 NS NS
8/21/2007 282 NS 147 NS 19.2 36.1 46.9 NS NS 36.7 NS NS 138 NS NS
11/19/2006 41.1 NS 0.14 NS NS 4.05 NS NS 81.4 2.6 NS NS NA NS NS 2006 Post-Dredge Operation.
10/6/2006 2,357 NS 451 NS NS 108 NS NS 157 NS NS 197 13430 NS NS
8/31/2006 1,629 NS 176 NS NS 70.4 39.2 NS NS NS 67.3 NS 2336 NS NS
12/29/2005 83.2 NS 10.9 NS 21.4 65.1 7.4 NS NS NS 2.2 NS NA 10.8 13.5 2005 Post-Dredge Operation.
11/18/2005 15.9 NS 0.1 NS 63.6 0.1 NS 0.1 3.7 NS NS NS 913.0 0.1 3.8
10/28/2005 15.4 NS NS NS 32.3 2.1 NS 4.6 12.3 0.0 NS NS 505.0 4.0 2.7
10/6/2005 1822.0 NS 251.0 NS 119.0 130.0 NS 60.1 114.0 81.7 NS NS 6315.0 222.0 180.0
9/29/2005 383.0 NS 104.0 NS 5.3 124.0 NS 17.3 44.2 24.2 NS NS 391.0 87.0 77.9
9/23/2005 178.0 NS 35.2 NS 83.3 115.0 NS 19.1 97.0 0.3 NS NS 780.0 2.6 23.9
9/15/2005 1490.0 NS 58.2 NS 22.5 99.8 NS 14.9 83.6 0.5 NS NS 1280.0 37.6 102.0
8/11/2005 216.0 NS 103.0 NS 25.9 37.2 NS NS 29.3 NS NS 21.3 NA 42.1 49.9 2005 Pre-Dredge Samples.
12/3/2004 30 NS 27 NS 40 15 22 NS 26 22 NS 31 NA 9.33 1.52 2004 Post-Dredge Operation.
11/5/2004 578 NS 61 NS 73 80 NS NS 28 NS NS NS 351 28.42 39.08
10/19/2004 559 NS 259 NS NS 36 47 48 66 17 74 100 704 NS NS
9/28/2004 9557 NS 423 NS NS 342 35 165 207 80 75 115 2734 NS NS
9/23/2004 588 NS 97 NS NS 5 7 10 17 6 5 19 1212 NS NS
9/14/2004 1449 NS 229 NS NS 48 64 64 86 38 39 61 98 NS NS
9/9/2004 1024 NS 167 NS NS 145 28 37 56 20 16 47 723 NS NS
6/29/2004 2286 NS NS NS NS NS NS NS NS NS 56 NS NS NS No Dredging Activities. March-May
200076 NS 35 NS 29 35 61 61 61 6.8 6.8 6.8 NS NS
Dec 1999-
Feb 200032 NS 3.2 NS 9.9 3.2 89 89 89 3.4 3.4 3.4 NS NS
Sept-Nov
199967 NS 22 NS 24 22 43 43 43 5.9 5.9 5.9 5.2 5.2
June-August
1999130 NS 46 NS 31 46 33 33 33 12 12 12 NS NS
Notes:
d = field duplicate result P = Pending results
NA = sample collected but not analyzed
2008 Hydraulic Dredging.
2009 Hydraulic Dredging.
2010 Hydraulic Dredging.
2008 Land-Based Excavation of Shoreline at Aerovox. Sample Station 61 - South
Fence was used only during the excavation timeframe.
No Dredging Activities. Data from Foster-Wheeler.
Initial MU-2 Dredging During Startup.
2004 Hydraulic Dredging.
2005 Hydraulic Dredging.
2006 Hydraulic Dredging.
2007 Hydraulic Dredging
Page 2 of 3
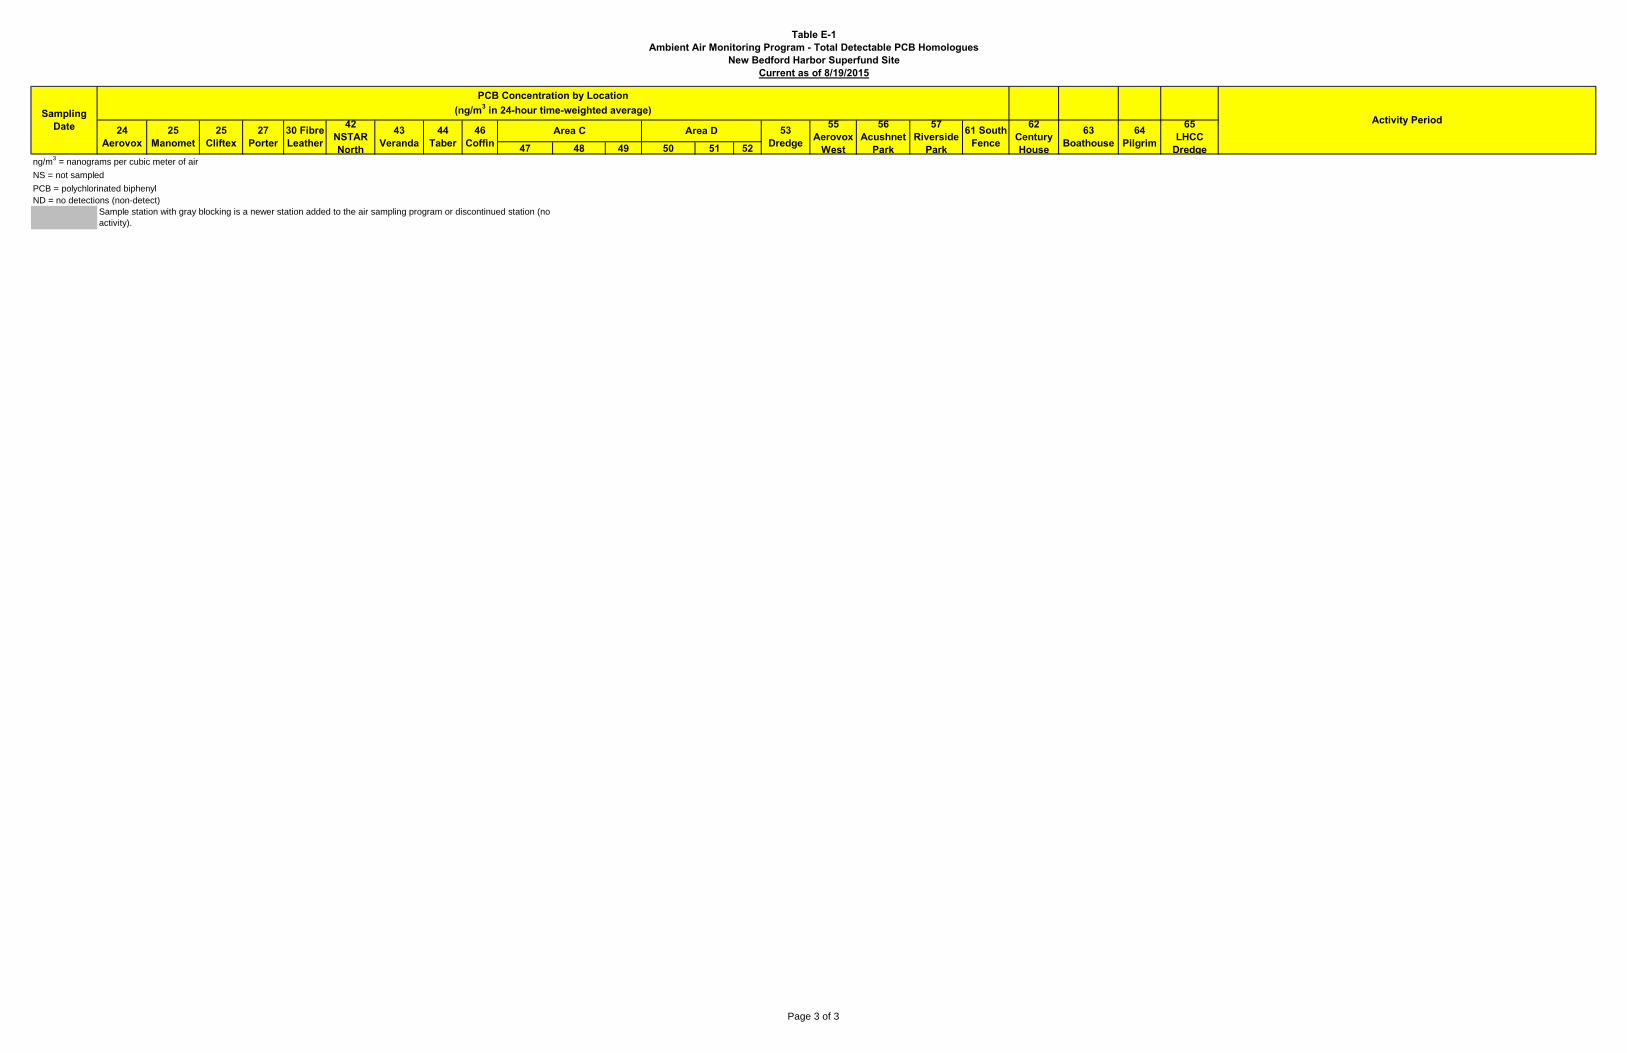
Table E-1Ambient Air Monitoring Program - Total Detectable PCB Homologues
New Bedford Harbor Superfund Site Current as of 8/19/2015
47 48 49 50 51 52
55 Aerovox
West
56 Acushnet
Park
57 Riverside
Park
61 South Fence
64 Pilgrim
63 Boathouse
25 Manomet
30 Fibre Leather
Area D44 Taber
PCB Concentration by Location(ng/m3 in 24-hour time-weighted average)
Activity PeriodSampling Date Area C24
Aerovox25
Cliftex
42 NSTAR North
46 Coffin
62 Century House
65 LHCC
Dredge
43 Veranda
53 Dredge
27 Porter
NS = not sampled
ND = no detections (non-detect)
PCB = polychlorinated biphenyl
Sample station with gray blocking is a newer station added to the air sampling program or discontinued station (no
activity).
ng/m3 = nanograms per cubic meter of air
Page 3 of 3
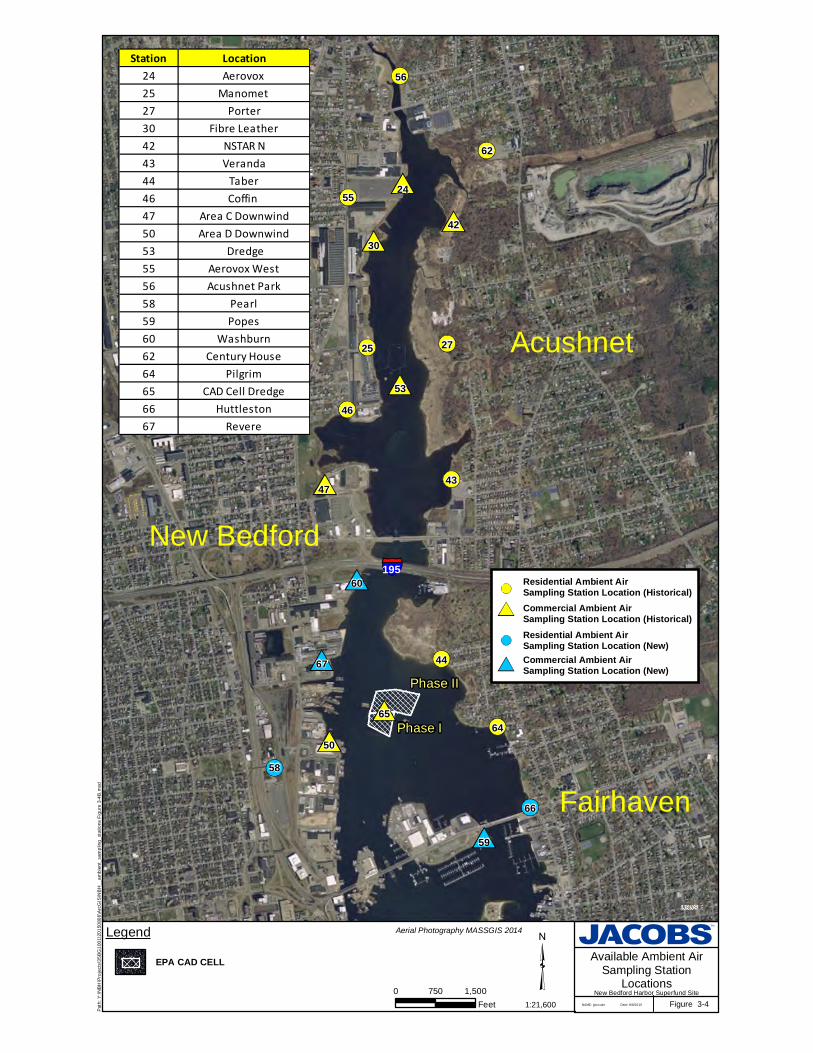
New Bedford
Acushnet
Fairhaven
195
56
55
62
53
50
47
46
44
43
4230
2725
24
67
65
66
60
59
58
64
USGS
New Bedford Harbor Superfund Site
Available Ambient AirSampling Station
Locations
Figure 3-4
0 1,500750
Feet 1:21,600
Legend
Pat
h: Y
:\N
BH
\Pro
ject
s\3
5B
G1
001\
201
5080
6\A
rcG
IS\N
BH
__a
mbi
ent_
sam
plin
g_
stat
ions
Fig
ure
3-4
B.m
xd
Date: 8/6/2015NAME: jpiccuito
Phase I
Phase II
EPA CAD CELL
Aerial Photography MASSGIS 2014
Residential Ambient Air Sampling Station Location (Historical)Commercial Ambient Air Sampling Station Location (Historical)Residential Ambient Air Sampling Station Location (New)Commercial Ambient Air Sampling Station Location (New)
Station Location24 Aerovox 25 Manomet 27 Porter30 Fibre Leather42 NSTAR N43 Veranda44 Taber46 Coffin 47 Area C Downwind50 Area D Downwind53 Dredge55 Aerovox West56 Acushnet Park58 Pearl59 Popes60 Washburn62 Century House64 Pilgrim65 CAD Cell Dredge66 Huttleston67 Revere
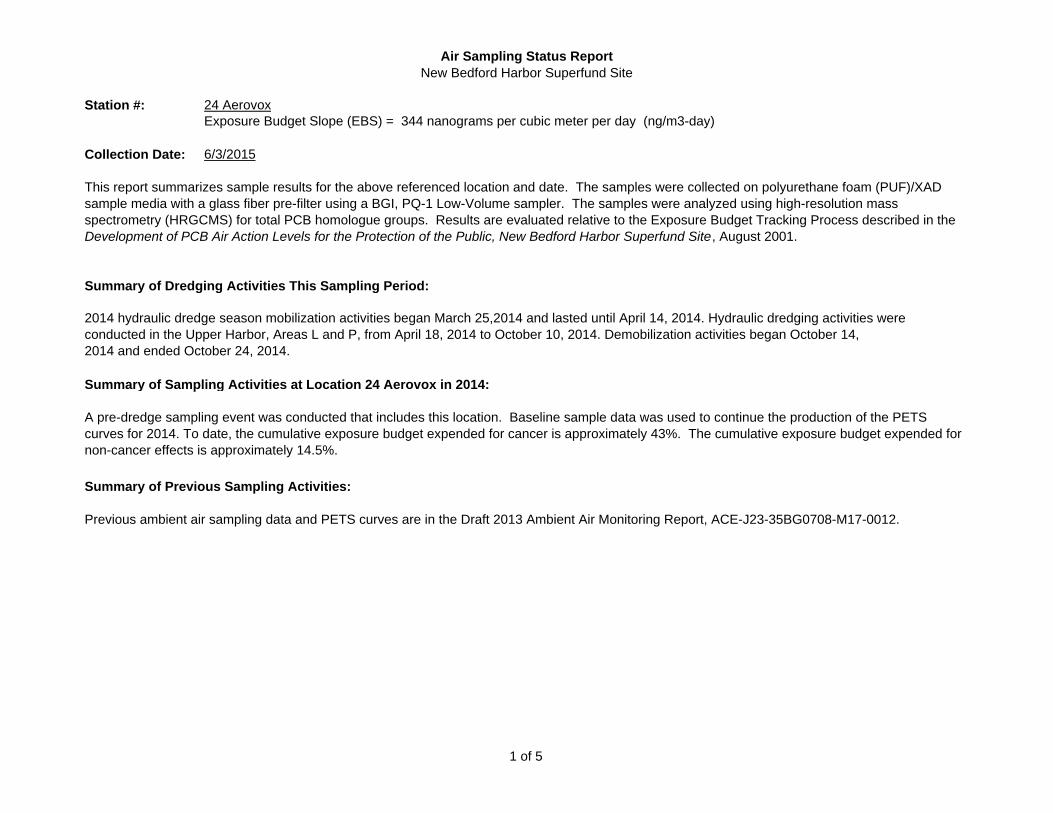
Air Sampling Status ReportNew Bedford Harbor Superfund Site
Station #: 24 AerovoxExposure Budget Slope (EBS) = 344 nanograms per cubic meter per day (ng/m3-day)
Collection Date: 6/3/2015
Summary of Dredging Activities This Sampling Period:
Summary of Sampling Activities at Location 24 Aerovox in 2014:
Summary of Previous Sampling Activities:
Previous ambient air sampling data and PETS curves are in the Draft 2013 Ambient Air Monitoring Report, ACE-J23-35BG0708-M17-0012.
This report summarizes sample results for the above referenced location and date. The samples were collected on polyurethane foam (PUF)/XAD sample media with a glass fiber pre-filter using a BGI, PQ-1 Low-Volume sampler. The samples were analyzed using high-resolution mass spectrometry (HRGCMS) for total PCB homologue groups. Results are evaluated relative to the Exposure Budget Tracking Process described in the Development of PCB Air Action Levels for the Protection of the Public, New Bedford Harbor Superfund Site, August 2001.
A pre-dredge sampling event was conducted that includes this location. Baseline sample data was used to continue the production of the PETS curves for 2014. To date, the cumulative exposure budget expended for cancer is approximately 43%. The cumulative exposure budget expended for non-cancer effects is approximately 14.5%.
2014 hydraulic dredge season mobilization activities began March 25,2014 and lasted until April 14, 2014. Hydraulic dredging activities wereconducted in the Upper Harbor, Areas L and P, from April 18, 2014 to October 10, 2014. Demobilization activities began October 14, 2014 and ended October 24, 2014.
1 of 5
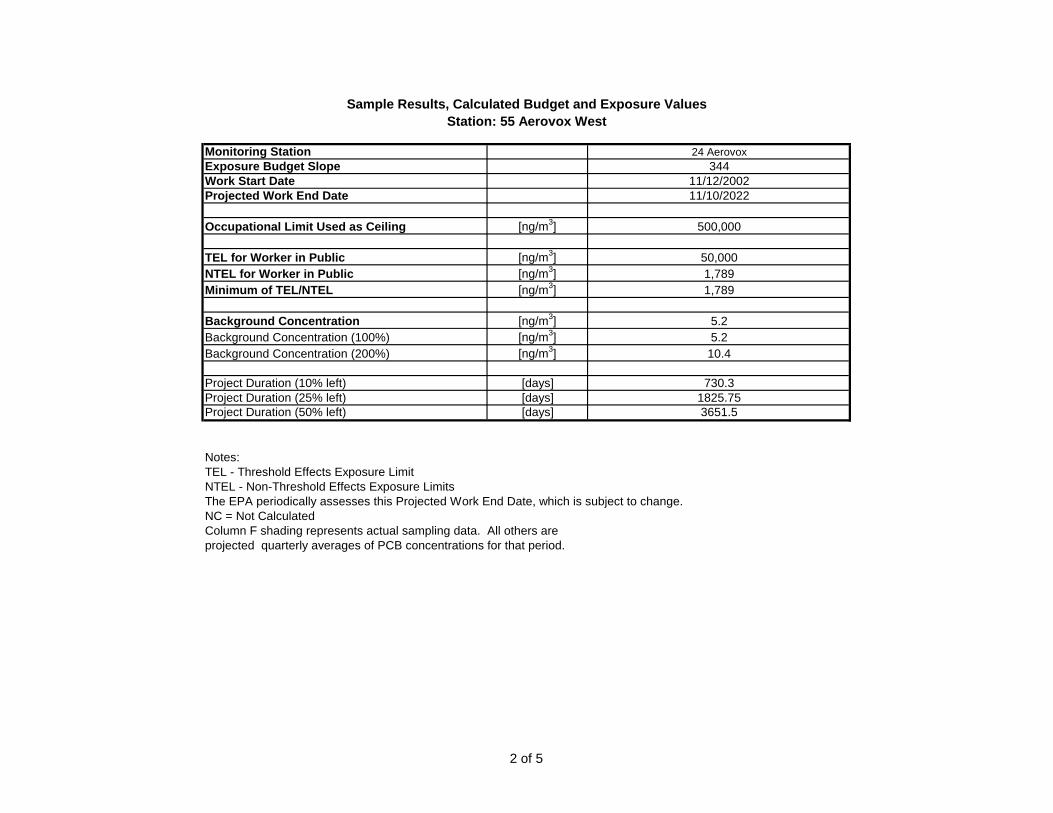
Sample Results, Calculated Budget and Exposure ValuesStation: 55 Aerovox West
Monitoring Station 24 AerovoxExposure Budget Slope 344Work Start Date 11/12/2002Projected Work End Date 11/10/2022
Occupational Limit Used as Ceiling [ng/m3] 500,000
TEL for Worker in Public [ng/m3] 50,000NTEL for Worker in Public [ng/m3] 1,789Minimum of TEL/NTEL [ng/m3] 1,789
Background Concentration [ng/m3] 5.2Background Concentration (100%) [ng/m3] 5.2Background Concentration (200%) [ng/m3] 10.4
Project Duration (10% left) [days] 730.3Project Duration (25% left) [days] 1825.75Project Duration (50% left) [days] 3651.5
Notes:TEL - Threshold Effects Exposure LimitNTEL - Non-Threshold Effects Exposure LimitsThe EPA periodically assesses this Projected Work End Date, which is subject to change.NC = Not CalculatedColumn F shading represents actual sampling data. All others are projected quarterly averages of PCB concentrations for that period.
2 of 5
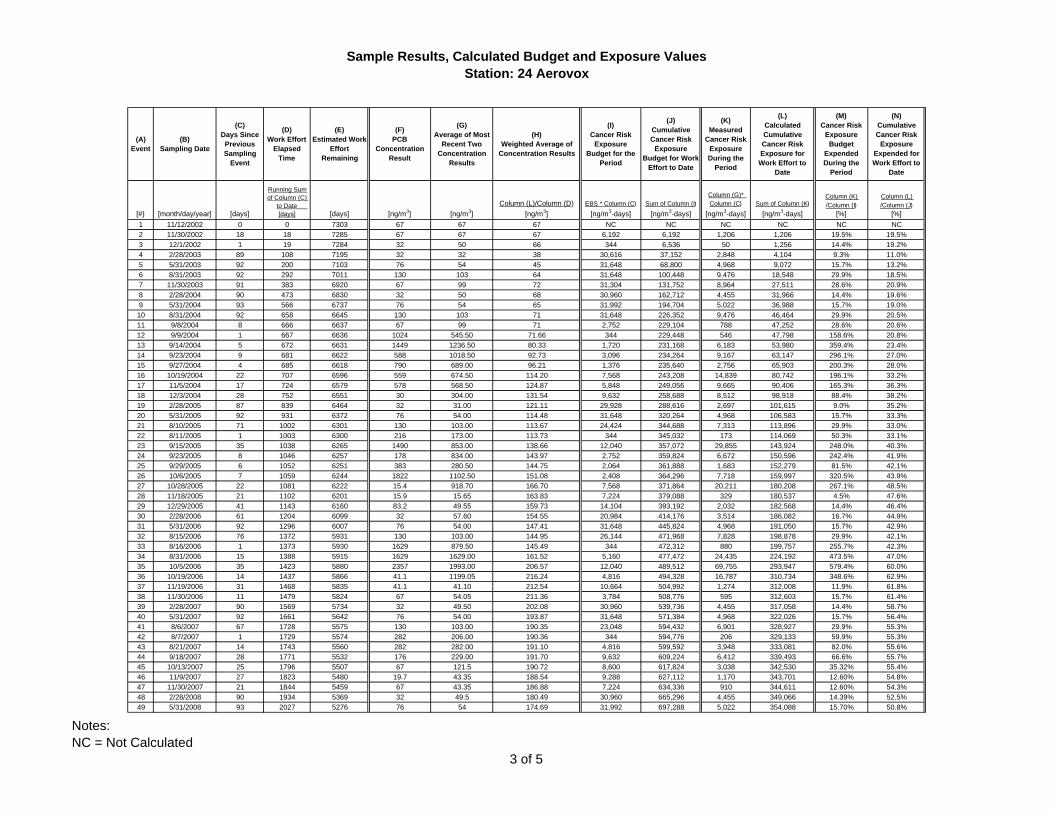
Sample Results, Calculated Budget and Exposure ValuesStation: 24 Aerovox
(A) Event
(B) Sampling Date
(C) Days Since
Previous Sampling
Event
(D) Work Effort
Elapsed Time
(E) Estimated Work
Effort Remaining
(F) PCB
Concentration Result
(G) Average of Most
Recent Two Concentration
Results
(H) Weighted Average of
Concentration Results
(I) Cancer Risk
Exposure Budget for the
Period
(J) Cumulative Cancer Risk
Exposure Budget for Work
Effort to Date
(K) Measured
Cancer Risk Exposure During the
Period
(L) Calculated Cumulative Cancer Risk Exposure for Work Effort to
Date
(M) Cancer Risk
Exposure Budget
Expended During the
Period
(N) Cumulative Cancer Risk
Exposure Expended for Work Effort to
Date
[#} [month/day/year] [days]
Running Sum of Column (C)
to Date [days] [days] [ng/m3] [ng/m3]
Column (L)/Column (D)
[ng/m3]
EBS * Column (C)
[ng/m3-days]
Sum of Column (I)
[ng/m3-days]
Column (G)* Column (C)
[ng/m3-days]
Sum of Column (K)
[ng/m3-days]
Column (K) /Column (I)
[%]
Column (L) /Column (J)
[%]
1 11/12/2002 0 0 7303 67 67 67 NC NC NC NC NC NC
2 11/30/2002 18 18 7285 67 67 67 6,192 6,192 1,206 1,206 19.5% 19.5%
3 12/1/2002 1 19 7284 32 50 66 344 6,536 50 1,256 14.4% 19.2%
4 2/28/2003 89 108 7195 32 32 38 30,616 37,152 2,848 4,104 9.3% 11.0%
5 5/31/2003 92 200 7103 76 54 45 31,648 68,800 4,968 9,072 15.7% 13.2%
6 8/31/2003 92 292 7011 130 103 64 31,648 100,448 9,476 18,548 29.9% 18.5%
7 11/30/2003 91 383 6920 67 99 72 31,304 131,752 8,964 27,511 28.6% 20.9%
8 2/28/2004 90 473 6830 32 50 68 30,960 162,712 4,455 31,966 14.4% 19.6%
9 5/31/2004 93 566 6737 76 54 65 31,992 194,704 5,022 36,988 15.7% 19.0%
10 8/31/2004 92 658 6645 130 103 71 31,648 226,352 9,476 46,464 29.9% 20.5%
11 9/8/2004 8 666 6637 67 99 71 2,752 229,104 788 47,252 28.6% 20.6%
12 9/9/2004 1 667 6636 1024 545.50 71.66 344 229,448 546 47,798 158.6% 20.8%
13 9/14/2004 5 672 6631 1449 1236.50 80.33 1,720 231,168 6,183 53,980 359.4% 23.4%
14 9/23/2004 9 681 6622 588 1018.50 92.73 3,096 234,264 9,167 63,147 296.1% 27.0%
15 9/27/2004 4 685 6618 790 689.00 96.21 1,376 235,640 2,756 65,903 200.3% 28.0%
16 10/19/2004 22 707 6596 559 674.50 114.20 7,568 243,208 14,839 80,742 196.1% 33.2%
17 11/5/2004 17 724 6579 578 568.50 124.87 5,848 249,056 9,665 90,406 165.3% 36.3%
18 12/3/2004 28 752 6551 30 304.00 131.54 9,632 258,688 8,512 98,918 88.4% 38.2%
19 2/28/2005 87 839 6464 32 31.00 121.11 29,928 288,616 2,697 101,615 9.0% 35.2%
20 5/31/2005 92 931 6372 76 54.00 114.48 31,648 320,264 4,968 106,583 15.7% 33.3%
21 8/10/2005 71 1002 6301 130 103.00 113.67 24,424 344,688 7,313 113,896 29.9% 33.0%
22 8/11/2005 1 1003 6300 216 173.00 113.73 344 345,032 173 114,069 50.3% 33.1%
23 9/15/2005 35 1038 6265 1490 853.00 138.66 12,040 357,072 29,855 143,924 248.0% 40.3%
24 9/23/2005 8 1046 6257 178 834.00 143.97 2,752 359,824 6,672 150,596 242.4% 41.9%
25 9/29/2005 6 1052 6251 383 280.50 144.75 2,064 361,888 1,683 152,279 81.5% 42.1%
26 10/6/2005 7 1059 6244 1822 1102.50 151.08 2,408 364,296 7,718 159,997 320.5% 43.9%
27 10/28/2005 22 1081 6222 15.4 918.70 166.70 7,568 371,864 20,211 180,208 267.1% 48.5%
28 11/18/2005 21 1102 6201 15.9 15.65 163.83 7,224 379,088 329 180,537 4.5% 47.6%
29 12/29/2005 41 1143 6160 83.2 49.55 159.73 14,104 393,192 2,032 182,568 14.4% 46.4%
30 2/28/2006 61 1204 6099 32 57.60 154.55 20,984 414,176 3,514 186,082 16.7% 44.9%
31 5/31/2006 92 1296 6007 76 54.00 147.41 31,648 445,824 4,968 191,050 15.7% 42.9%
32 8/15/2006 76 1372 5931 130 103.00 144.95 26,144 471,968 7,828 198,878 29.9% 42.1%
33 8/16/2006 1 1373 5930 1629 879.50 145.49 344 472,312 880 199,757 255.7% 42.3%
34 8/31/2006 15 1388 5915 1629 1629.00 161.52 5,160 477,472 24,435 224,192 473.5% 47.0%
35 10/5/2006 35 1423 5880 2357 1993.00 206.57 12,040 489,512 69,755 293,947 579.4% 60.0%
36 10/19/2006 14 1437 5866 41.1 1199.05 216.24 4,816 494,328 16,787 310,734 348.6% 62.9%
37 11/19/2006 31 1468 5835 41.1 41.10 212.54 10,664 504,992 1,274 312,008 11.9% 61.8%
38 11/30/2006 11 1479 5824 67 54.05 211.36 3,784 508,776 595 312,603 15.7% 61.4%
39 2/28/2007 90 1569 5734 32 49.50 202.08 30,960 539,736 4,455 317,058 14.4% 58.7%
40 5/31/2007 92 1661 5642 76 54.00 193.87 31,648 571,384 4,968 322,026 15.7% 56.4%
41 8/6/2007 67 1728 5575 130 103.00 190.35 23,048 594,432 6,901 328,927 29.9% 55.3%
42 8/7/2007 1 1729 5574 282 206.00 190.36 344 594,776 206 329,133 59.9% 55.3%
43 8/21/2007 14 1743 5560 282 282.00 191.10 4,816 599,592 3,948 333,081 82.0% 55.6%
44 9/18/2007 28 1771 5532 176 229.00 191.70 9,632 609,224 6,412 339,493 66.6% 55.7%
45 10/13/2007 25 1796 5507 67 121.5 190.72 8,600 617,824 3,038 342,530 35.32% 55.4%
46 11/9/2007 27 1823 5480 19.7 43.35 188.54 9,288 627,112 1,170 343,701 12.60% 54.8%
47 11/30/2007 21 1844 5459 67 43.35 186.88 7,224 634,336 910 344,611 12.60% 54.3%
48 2/28/2008 90 1934 5369 32 49.5 180.49 30,960 665,296 4,455 349,066 14.39% 52.5%
49 5/31/2008 93 2027 5276 76 54 174.69 31,992 697,288 5,022 354,088 15.70% 50.8%
Notes:NC = Not Calculated
3 of 5
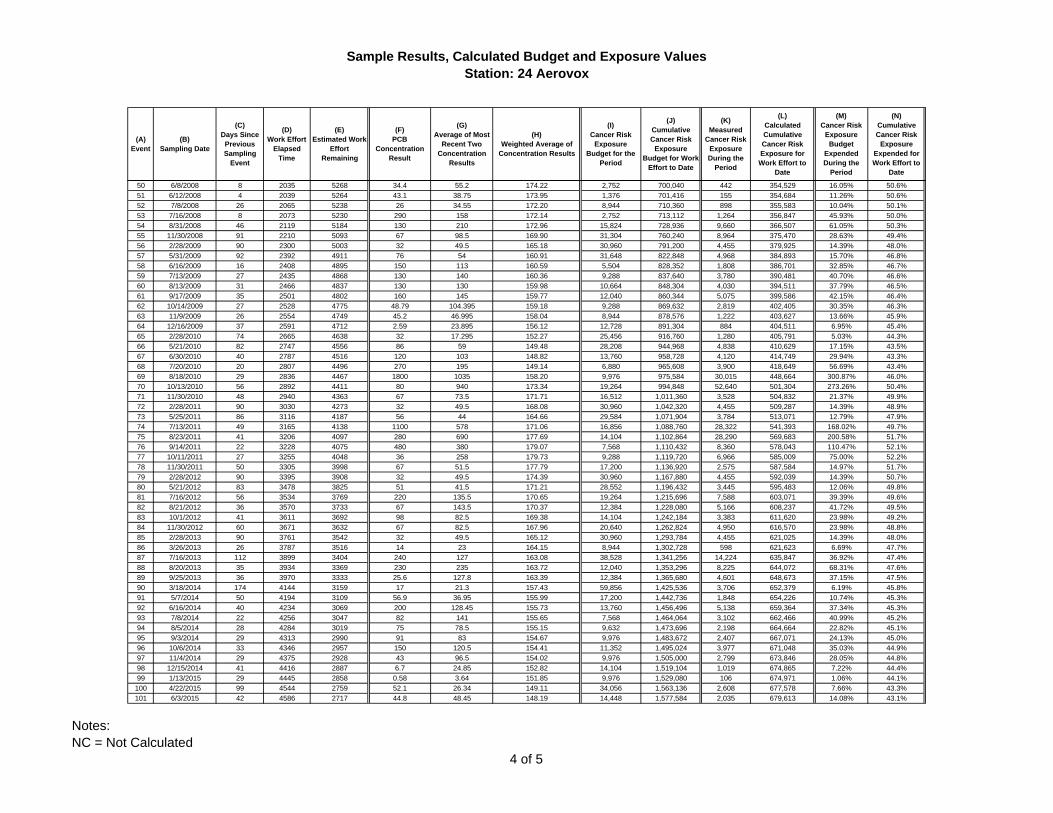
Sample Results, Calculated Budget and Exposure ValuesStation: 24 Aerovox
(A) Event
(B) Sampling Date
(C) Days Since
Previous Sampling
Event
(D) Work Effort
Elapsed Time
(E) Estimated Work
Effort Remaining
(F) PCB
Concentration Result
(G) Average of Most
Recent Two Concentration
Results
(H) Weighted Average of
Concentration Results
(I) Cancer Risk
Exposure Budget for the
Period
(J) Cumulative Cancer Risk
Exposure Budget for Work
Effort to Date
(K) Measured
Cancer Risk Exposure During the
Period
(L) Calculated Cumulative Cancer Risk Exposure for Work Effort to
Date
(M) Cancer Risk
Exposure Budget
Expended During the
Period
(N) Cumulative Cancer Risk
Exposure Expended for Work Effort to
Date
50 6/8/2008 8 2035 5268 34.4 55.2 174.22 2,752 700,040 442 354,529 16.05% 50.6%
51 6/12/2008 4 2039 5264 43.1 38.75 173.95 1,376 701,416 155 354,684 11.26% 50.6%
52 7/8/2008 26 2065 5238 26 34.55 172.20 8,944 710,360 898 355,583 10.04% 50.1%
53 7/16/2008 8 2073 5230 290 158 172.14 2,752 713,112 1,264 356,847 45.93% 50.0%
54 8/31/2008 46 2119 5184 130 210 172.96 15,824 728,936 9,660 366,507 61.05% 50.3%
55 11/30/2008 91 2210 5093 67 98.5 169.90 31,304 760,240 8,964 375,470 28.63% 49.4%
56 2/28/2009 90 2300 5003 32 49.5 165.18 30,960 791,200 4,455 379,925 14.39% 48.0%
57 5/31/2009 92 2392 4911 76 54 160.91 31,648 822,848 4,968 384,893 15.70% 46.8%
58 6/16/2009 16 2408 4895 150 113 160.59 5,504 828,352 1,808 386,701 32.85% 46.7%
59 7/13/2009 27 2435 4868 130 140 160.36 9,288 837,640 3,780 390,481 40.70% 46.6%
60 8/13/2009 31 2466 4837 130 130 159.98 10,664 848,304 4,030 394,511 37.79% 46.5%
61 9/17/2009 35 2501 4802 160 145 159.77 12,040 860,344 5,075 399,586 42.15% 46.4%
62 10/14/2009 27 2528 4775 48.79 104.395 159.18 9,288 869,632 2,819 402,405 30.35% 46.3%
63 11/9/2009 26 2554 4749 45.2 46.995 158.04 8,944 878,576 1,222 403,627 13.66% 45.9%
64 12/16/2009 37 2591 4712 2.59 23.895 156.12 12,728 891,304 884 404,511 6.95% 45.4%
65 2/28/2010 74 2665 4638 32 17.295 152.27 25,456 916,760 1,280 405,791 5.03% 44.3%
66 5/21/2010 82 2747 4556 86 59 149.48 28,208 944,968 4,838 410,629 17.15% 43.5%
67 6/30/2010 40 2787 4516 120 103 148.82 13,760 958,728 4,120 414,749 29.94% 43.3%
68 7/20/2010 20 2807 4496 270 195 149.14 6,880 965,608 3,900 418,649 56.69% 43.4%
69 8/18/2010 29 2836 4467 1800 1035 158.20 9,976 975,584 30,015 448,664 300.87% 46.0%
70 10/13/2010 56 2892 4411 80 940 173.34 19,264 994,848 52,640 501,304 273.26% 50.4%
71 11/30/2010 48 2940 4363 67 73.5 171.71 16,512 1,011,360 3,528 504,832 21.37% 49.9%
72 2/28/2011 90 3030 4273 32 49.5 168.08 30,960 1,042,320 4,455 509,287 14.39% 48.9%
73 5/25/2011 86 3116 4187 56 44 164.66 29,584 1,071,904 3,784 513,071 12.79% 47.9%
74 7/13/2011 49 3165 4138 1100 578 171.06 16,856 1,088,760 28,322 541,393 168.02% 49.7%
75 8/23/2011 41 3206 4097 280 690 177.69 14,104 1,102,864 28,290 569,683 200.58% 51.7%
76 9/14/2011 22 3228 4075 480 380 179.07 7,568 1,110,432 8,360 578,043 110.47% 52.1%
77 10/11/2011 27 3255 4048 36 258 179.73 9,288 1,119,720 6,966 585,009 75.00% 52.2%
78 11/30/2011 50 3305 3998 67 51.5 177.79 17,200 1,136,920 2,575 587,584 14.97% 51.7%
79 2/28/2012 90 3395 3908 32 49.5 174.39 30,960 1,167,880 4,455 592,039 14.39% 50.7%
80 5/21/2012 83 3478 3825 51 41.5 171.21 28,552 1,196,432 3,445 595,483 12.06% 49.8%
81 7/16/2012 56 3534 3769 220 135.5 170.65 19,264 1,215,696 7,588 603,071 39.39% 49.6%
82 8/21/2012 36 3570 3733 67 143.5 170.37 12,384 1,228,080 5,166 608,237 41.72% 49.5%
83 10/1/2012 41 3611 3692 98 82.5 169.38 14,104 1,242,184 3,383 611,620 23.98% 49.2%
84 11/30/2012 60 3671 3632 67 82.5 167.96 20,640 1,262,824 4,950 616,570 23.98% 48.8%
85 2/28/2013 90 3761 3542 32 49.5 165.12 30,960 1,293,784 4,455 621,025 14.39% 48.0%
86 3/26/2013 26 3787 3516 14 23 164.15 8,944 1,302,728 598 621,623 6.69% 47.7%
87 7/16/2013 112 3899 3404 240 127 163.08 38,528 1,341,256 14,224 635,847 36.92% 47.4%
88 8/20/2013 35 3934 3369 230 235 163.72 12,040 1,353,296 8,225 644,072 68.31% 47.6%
89 9/25/2013 36 3970 3333 25.6 127.8 163.39 12,384 1,365,680 4,601 648,673 37.15% 47.5%
90 3/18/2014 174 4144 3159 17 21.3 157.43 59,856 1,425,536 3,706 652,379 6.19% 45.8%
91 5/7/2014 50 4194 3109 56.9 36.95 155.99 17,200 1,442,736 1,848 654,226 10.74% 45.3%
92 6/16/2014 40 4234 3069 200 128.45 155.73 13,760 1,456,496 5,138 659,364 37.34% 45.3%
93 7/8/2014 22 4256 3047 82 141 155.65 7,568 1,464,064 3,102 662,466 40.99% 45.2%
94 8/5/2014 28 4284 3019 75 78.5 155.15 9,632 1,473,696 2,198 664,664 22.82% 45.1%
95 9/3/2014 29 4313 2990 91 83 154.67 9,976 1,483,672 2,407 667,071 24.13% 45.0%
96 10/6/2014 33 4346 2957 150 120.5 154.41 11,352 1,495,024 3,977 671,048 35.03% 44.9%
97 11/4/2014 29 4375 2928 43 96.5 154.02 9,976 1,505,000 2,799 673,846 28.05% 44.8%
98 12/15/2014 41 4416 2887 6.7 24.85 152.82 14,104 1,519,104 1,019 674,865 7.22% 44.4%
99 1/13/2015 29 4445 2858 0.58 3.64 151.85 9,976 1,529,080 106 674,971 1.06% 44.1%
100 4/22/2015 99 4544 2759 52.1 26.34 149.11 34,056 1,563,136 2,608 677,578 7.66% 43.3%
101 6/3/2015 42 4586 2717 44.8 48.45 148.19 14,448 1,577,584 2,035 679,613 14.08% 43.1%
Notes:NC = Not Calculated
4 of 5

Sample Results, Calculated Cancer Budget and Exposure ValuesStation: 24 Aerovox
Sample Station : 24 Aerovox
Collection Date: 6/3/2015Measured PCB Concentration (ng/m3): 44.8
Exposure Budget Expended During This Period: 14.1%
Cumulative Exposure Budget Expended to Date: 43.1%
Response Level: No Triggers Identified
Response: No Response Necessary
Triggers:
0
500,000
1,000,000
1,500,000
2,000,000
0 365 730 1095 1460 1825 2190 2555 2920 3285 3650 4015 4380 4745 5110
Cum
ulat
ive
Expo
sure
(ng/
m3 -
days
)
Time Since Start of Work (days)
Comparison of Monitored Cumulative Airborne PCB Exposures to the Commercial Risk-Based Exposure Budget
Cancer ExposureBudget for WorkEffort to Date
MonitoredExposure forWork Effort toDate
LEGEND
5 of 5

Air Sampling Status ReportNew Bedford Harbor Superfund Site
Station #: 46 Coffin Exposure Budget Slope (EBS) = 202 nanograms per cubic meter per day (ng/m3-day)
Collection Date: 12/15/2014
Summary of Dredging Activities This Sampling Period:
Summary of Sampling Activities at Location 46 Coffin in 2014:
Summary of Previous Sampling Activities:
Previous ambient air sampling data and PETS curves are in the Draft 2012 Ambient Air Monitoring Report, ACE-J23-35BG0708-M17-0012.
This report summarizes sample results for the above referenced location and date. The samples were collected on polyurethane foam (PUF)/XAD sample media with a glass fiber pre-filter using a BGI, PQ-1 Low-Volume sampler. The samples were analyzed using high-resolution mass spectrometry (HRGCMS) for total PCB homologue groups. Results are evaluated relative to the Exposure Budget Tracking Process described in the Development of PCB Air Action Levels for the Protection of the Public, New Bedford Harbor Superfund Site, August 2001.
Baseline sample data was used to continue the production of the PETS curves for 2014. The cumulative non-cancer exposure budget for a child receptor expended is approximately approximately 30% as a six-year running average. The cumulative cancer budget for an adult residential resident expended to date is approximately 16%.
2014 hydraulic dredge season mobilization activities began March 25,2014 and lasted until April 14, 2014. Hydraulic dredging activities wereconducted in the Upper Harbor, Areas L and P, from April 18, 2014 to October 10, 2014. Demobilization activities began October 14, 2014 and ended October 24, 2014.
1 of 5
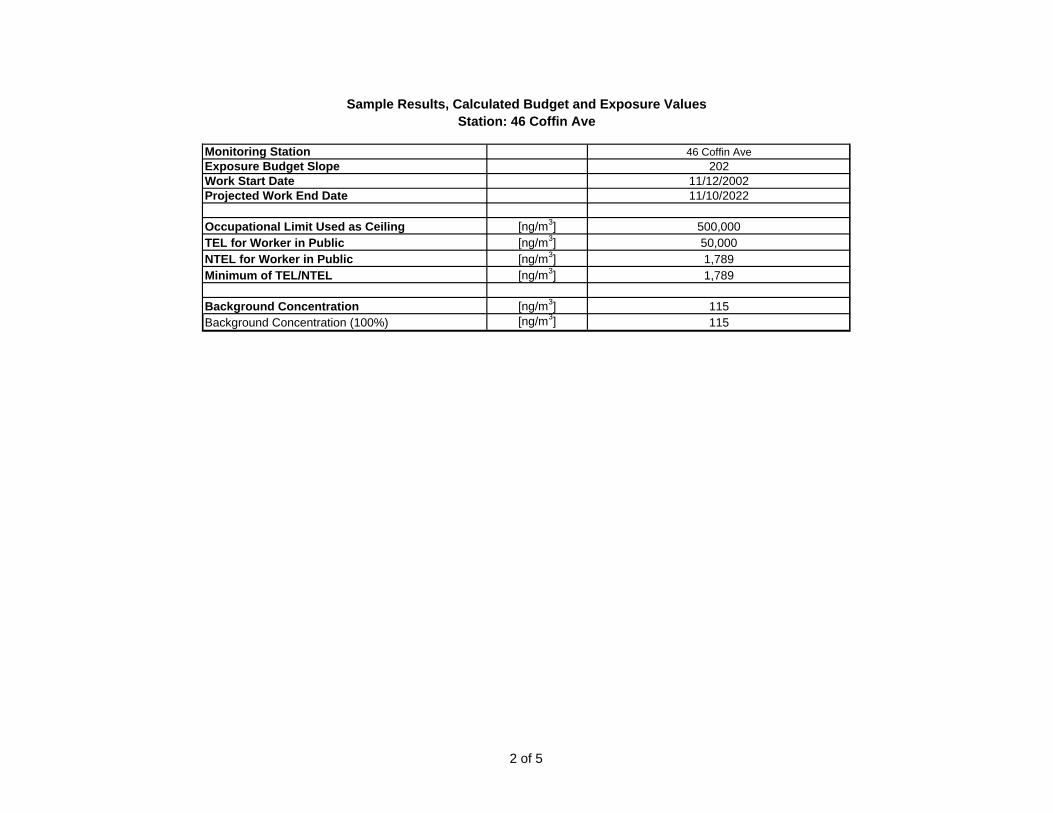
Sample Results, Calculated Budget and Exposure ValuesStation: 46 Coffin Ave
Monitoring Station 46 Coffin AveExposure Budget Slope 202Work Start Date 11/12/2002Projected Work End Date 11/10/2022
Occupational Limit Used as Ceiling [ng/m3] 500,000TEL for Worker in Public [ng/m3] 50,000NTEL for Worker in Public [ng/m3] 1,789Minimum of TEL/NTEL [ng/m3] 1,789
Background Concentration [ng/m3] 115Background Concentration (100%) [ng/m3] 115
2 of 5
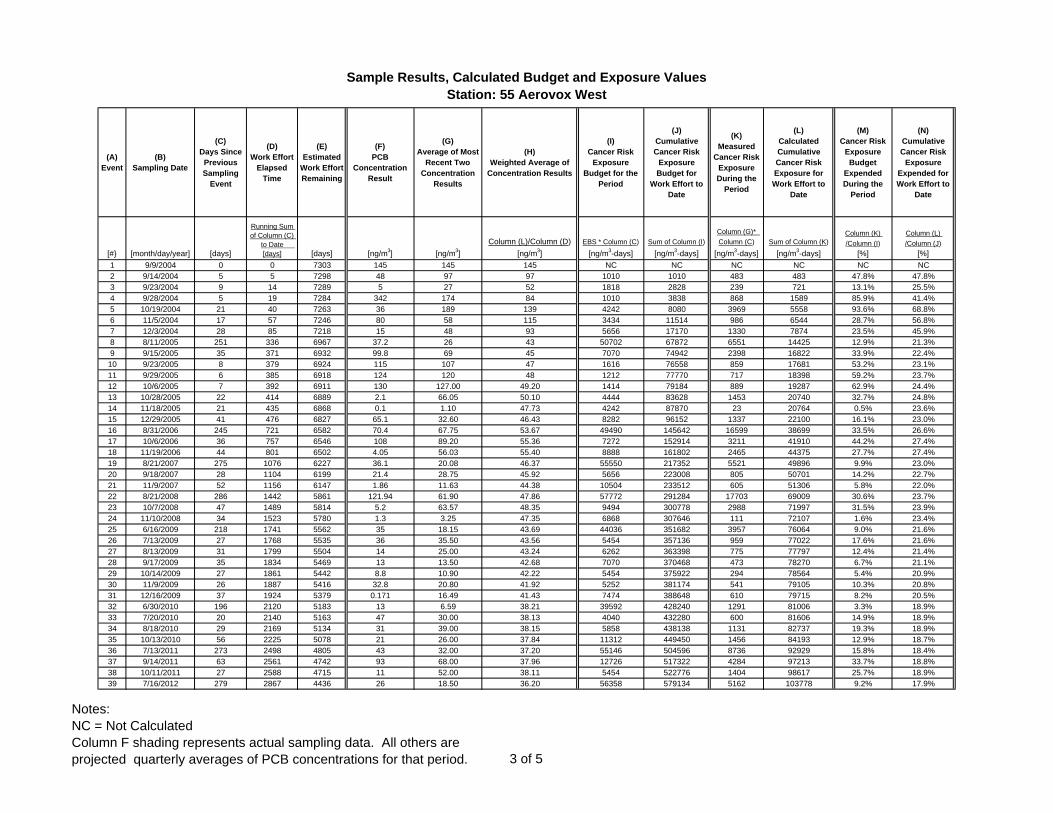
Sample Results, Calculated Budget and Exposure ValuesStation: 55 Aerovox West
(A) Event
(B) Sampling Date
(C) Days Since
Previous Sampling
Event
(D) Work Effort
Elapsed Time
(E) Estimated
Work Effort Remaining
(F) PCB
Concentration Result
(G) Average of Most
Recent Two Concentration
Results
(H) Weighted Average of
Concentration Results
(I) Cancer Risk
Exposure Budget for the
Period
(J) Cumulative Cancer Risk
Exposure Budget for
Work Effort to Date
(K) Measured
Cancer Risk Exposure During the
Period
(L) Calculated Cumulative Cancer Risk Exposure for Work Effort to
Date
(M) Cancer Risk
Exposure Budget
Expended During the
Period
(N) Cumulative Cancer Risk
Exposure Expended for Work Effort to
Date
[#} [month/day/year] [days]
Running Sum of Column (C)
to Date [days] [days] [ng/m3] [ng/m3]
Column (L)/Column (D)
[ng/m3]
EBS * Column (C)
[ng/m3-days]
Sum of Column (I)
[ng/m3-days]
Column (G)*
Column (C)
[ng/m3-days]
Sum of Column (K)
[ng/m3-days]
Column (K)
/Column (I)
[%]
Column (L)
/Column (J)
[%]
1 9/9/2004 0 0 7303 145 145 145 NC NC NC NC NC NC2 9/14/2004 5 5 7298 48 97 97 1010 1010 483 483 47.8% 47.8%3 9/23/2004 9 14 7289 5 27 52 1818 2828 239 721 13.1% 25.5%4 9/28/2004 5 19 7284 342 174 84 1010 3838 868 1589 85.9% 41.4%5 10/19/2004 21 40 7263 36 189 139 4242 8080 3969 5558 93.6% 68.8%6 11/5/2004 17 57 7246 80 58 115 3434 11514 986 6544 28.7% 56.8%7 12/3/2004 28 85 7218 15 48 93 5656 17170 1330 7874 23.5% 45.9%8 8/11/2005 251 336 6967 37.2 26 43 50702 67872 6551 14425 12.9% 21.3%9 9/15/2005 35 371 6932 99.8 69 45 7070 74942 2398 16822 33.9% 22.4%
10 9/23/2005 8 379 6924 115 107 47 1616 76558 859 17681 53.2% 23.1%11 9/29/2005 6 385 6918 124 120 48 1212 77770 717 18398 59.2% 23.7%12 10/6/2005 7 392 6911 130 127.00 49.20 1414 79184 889 19287 62.9% 24.4%13 10/28/2005 22 414 6889 2.1 66.05 50.10 4444 83628 1453 20740 32.7% 24.8%14 11/18/2005 21 435 6868 0.1 1.10 47.73 4242 87870 23 20764 0.5% 23.6%15 12/29/2005 41 476 6827 65.1 32.60 46.43 8282 96152 1337 22100 16.1% 23.0%16 8/31/2006 245 721 6582 70.4 67.75 53.67 49490 145642 16599 38699 33.5% 26.6%17 10/6/2006 36 757 6546 108 89.20 55.36 7272 152914 3211 41910 44.2% 27.4%18 11/19/2006 44 801 6502 4.05 56.03 55.40 8888 161802 2465 44375 27.7% 27.4%19 8/21/2007 275 1076 6227 36.1 20.08 46.37 55550 217352 5521 49896 9.9% 23.0%20 9/18/2007 28 1104 6199 21.4 28.75 45.92 5656 223008 805 50701 14.2% 22.7%21 11/9/2007 52 1156 6147 1.86 11.63 44.38 10504 233512 605 51306 5.8% 22.0%22 8/21/2008 286 1442 5861 121.94 61.90 47.86 57772 291284 17703 69009 30.6% 23.7%23 10/7/2008 47 1489 5814 5.2 63.57 48.35 9494 300778 2988 71997 31.5% 23.9%24 11/10/2008 34 1523 5780 1.3 3.25 47.35 6868 307646 111 72107 1.6% 23.4%25 6/16/2009 218 1741 5562 35 18.15 43.69 44036 351682 3957 76064 9.0% 21.6%26 7/13/2009 27 1768 5535 36 35.50 43.56 5454 357136 959 77022 17.6% 21.6%27 8/13/2009 31 1799 5504 14 25.00 43.24 6262 363398 775 77797 12.4% 21.4%28 9/17/2009 35 1834 5469 13 13.50 42.68 7070 370468 473 78270 6.7% 21.1%29 10/14/2009 27 1861 5442 8.8 10.90 42.22 5454 375922 294 78564 5.4% 20.9%30 11/9/2009 26 1887 5416 32.8 20.80 41.92 5252 381174 541 79105 10.3% 20.8%31 12/16/2009 37 1924 5379 0.171 16.49 41.43 7474 388648 610 79715 8.2% 20.5%32 6/30/2010 196 2120 5183 13 6.59 38.21 39592 428240 1291 81006 3.3% 18.9%33 7/20/2010 20 2140 5163 47 30.00 38.13 4040 432280 600 81606 14.9% 18.9%34 8/18/2010 29 2169 5134 31 39.00 38.15 5858 438138 1131 82737 19.3% 18.9%35 10/13/2010 56 2225 5078 21 26.00 37.84 11312 449450 1456 84193 12.9% 18.7%36 7/13/2011 273 2498 4805 43 32.00 37.20 55146 504596 8736 92929 15.8% 18.4%37 9/14/2011 63 2561 4742 93 68.00 37.96 12726 517322 4284 97213 33.7% 18.8%38 10/11/2011 27 2588 4715 11 52.00 38.11 5454 522776 1404 98617 25.7% 18.9%39 7/16/2012 279 2867 4436 26 18.50 36.20 56358 579134 5162 103778 9.2% 17.9%
Notes:NC = Not CalculatedColumn F shading represents actual sampling data. All others are projected quarterly averages of PCB concentrations for that period. 3 of 5
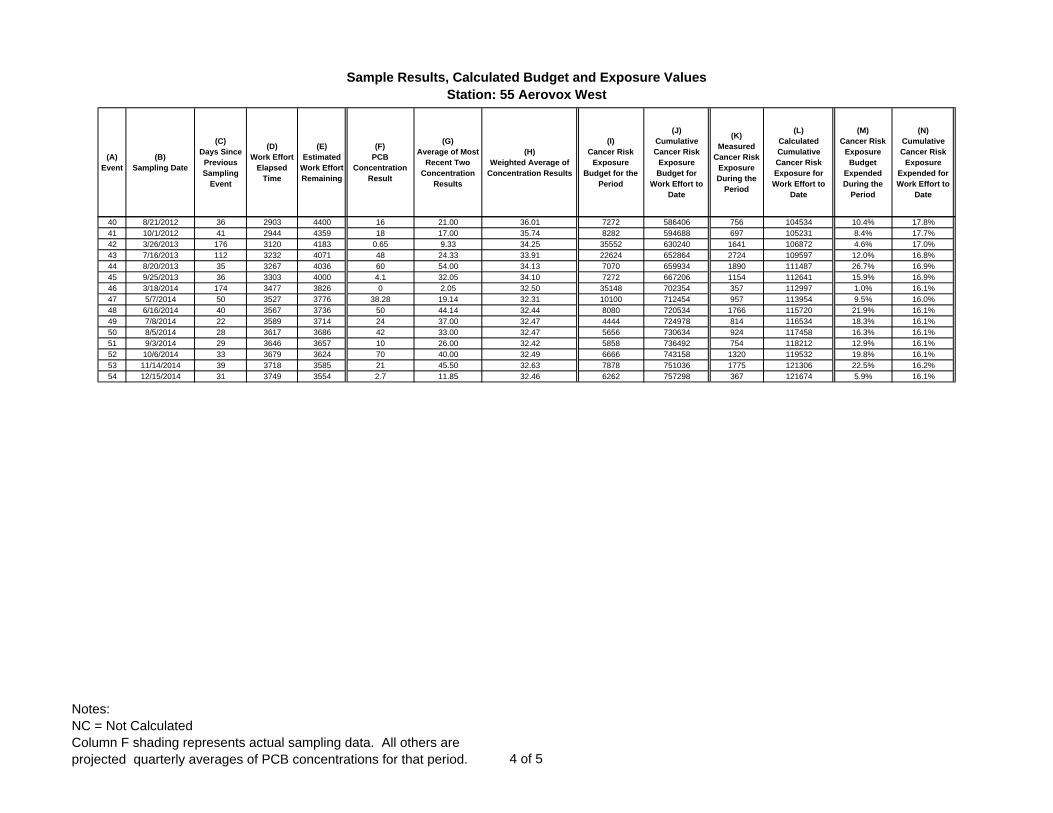
Sample Results, Calculated Budget and Exposure ValuesStation: 55 Aerovox West
(A) Event
(B) Sampling Date
(C) Days Since
Previous Sampling
Event
(D) Work Effort
Elapsed Time
(E) Estimated
Work Effort Remaining
(F) PCB
Concentration Result
(G) Average of Most
Recent Two Concentration
Results
(H) Weighted Average of
Concentration Results
(I) Cancer Risk
Exposure Budget for the
Period
(J) Cumulative Cancer Risk
Exposure Budget for
Work Effort to Date
(K) Measured
Cancer Risk Exposure During the
Period
(L) Calculated Cumulative Cancer Risk Exposure for Work Effort to
Date
(M) Cancer Risk
Exposure Budget
Expended During the
Period
(N) Cumulative Cancer Risk
Exposure Expended for Work Effort to
Date
40 8/21/2012 36 2903 4400 16 21.00 36.01 7272 586406 756 104534 10.4% 17.8%41 10/1/2012 41 2944 4359 18 17.00 35.74 8282 594688 697 105231 8.4% 17.7%42 3/26/2013 176 3120 4183 0.65 9.33 34.25 35552 630240 1641 106872 4.6% 17.0%43 7/16/2013 112 3232 4071 48 24.33 33.91 22624 652864 2724 109597 12.0% 16.8%44 8/20/2013 35 3267 4036 60 54.00 34.13 7070 659934 1890 111487 26.7% 16.9%45 9/25/2013 36 3303 4000 4.1 32.05 34.10 7272 667206 1154 112641 15.9% 16.9%46 3/18/2014 174 3477 3826 0 2.05 32.50 35148 702354 357 112997 1.0% 16.1%47 5/7/2014 50 3527 3776 38.28 19.14 32.31 10100 712454 957 113954 9.5% 16.0%48 6/16/2014 40 3567 3736 50 44.14 32.44 8080 720534 1766 115720 21.9% 16.1%49 7/8/2014 22 3589 3714 24 37.00 32.47 4444 724978 814 116534 18.3% 16.1%50 8/5/2014 28 3617 3686 42 33.00 32.47 5656 730634 924 117458 16.3% 16.1%51 9/3/2014 29 3646 3657 10 26.00 32.42 5858 736492 754 118212 12.9% 16.1%52 10/6/2014 33 3679 3624 70 40.00 32.49 6666 743158 1320 119532 19.8% 16.1%53 11/14/2014 39 3718 3585 21 45.50 32.63 7878 751036 1775 121306 22.5% 16.2%54 12/15/2014 31 3749 3554 2.7 11.85 32.46 6262 757298 367 121674 5.9% 16.1%
Notes:NC = Not CalculatedColumn F shading represents actual sampling data. All others are projected quarterly averages of PCB concentrations for that period. 4 of 5
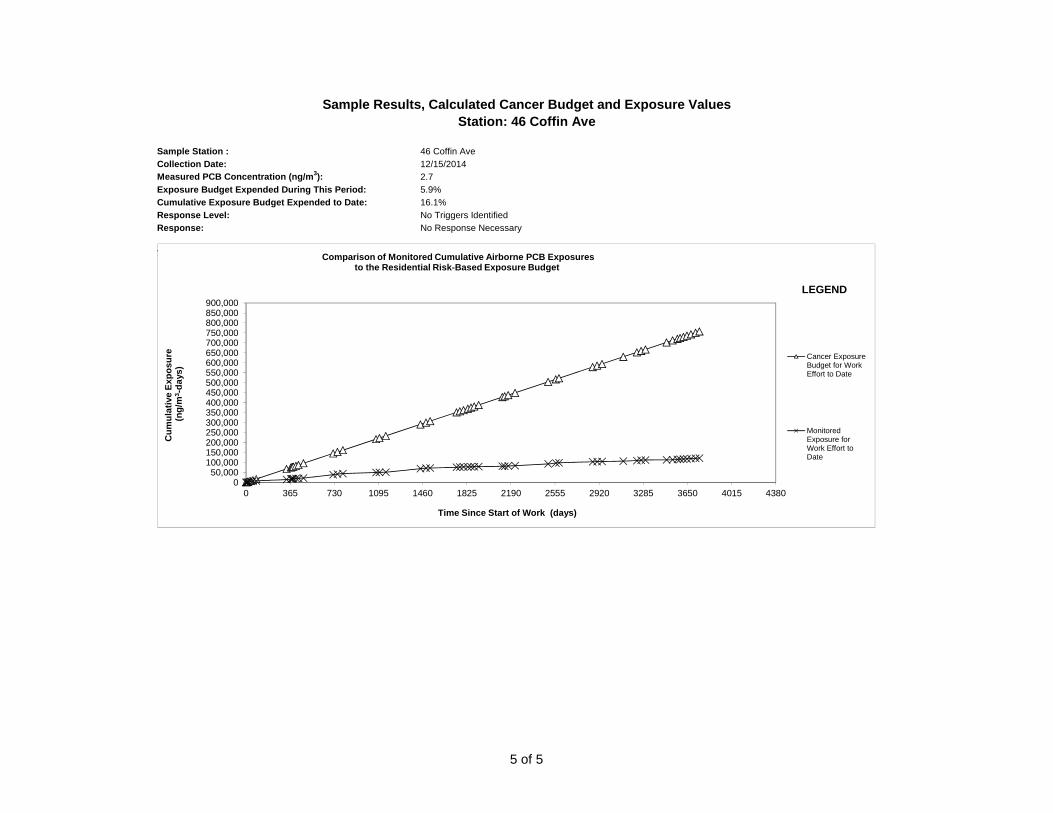
Sample Results, Calculated Cancer Budget and Exposure ValuesStation: 46 Coffin Ave
Sample Station : 46 Coffin Ave
Collection Date: 12/15/2014Measured PCB Concentration (ng/m3): 2.7
Exposure Budget Expended During This Period: 5.9%
Cumulative Exposure Budget Expended to Date: 16.1%
Response Level: No Triggers Identified
Response: No Response Necessary
Triggers:24
25
26
27
28
29
30
31
32
33
34
35
36
37
38
394041424344
050,000
100,000150,000200,000250,000300,000350,000400,000450,000500,000550,000600,000650,000700,000750,000800,000850,000900,000
0 365 730 1095 1460 1825 2190 2555 2920 3285 3650 4015 4380
Cum
ulat
ive
Expo
sure
(ng/
m3 -
days
)
Time Since Start of Work (days)
Comparison of Monitored Cumulative Airborne PCB Exposuresto the Residential Risk-Based Exposure Budget
Cancer ExposureBudget for WorkEffort to Date
MonitoredExposure forWork Effort toDate
LEGEND
5 of 5

6 - SEAFOOD MONITORING PROGRAM DATA SUMMARY
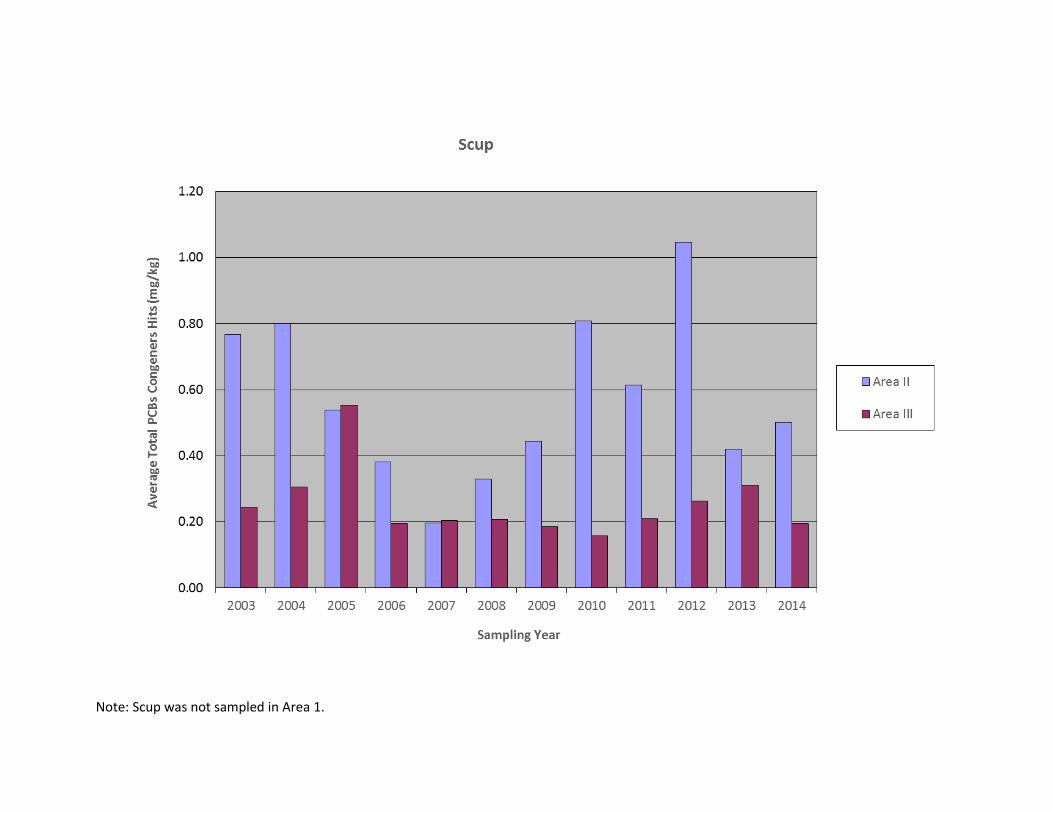
Note: Scup was not sampled in Area 1.
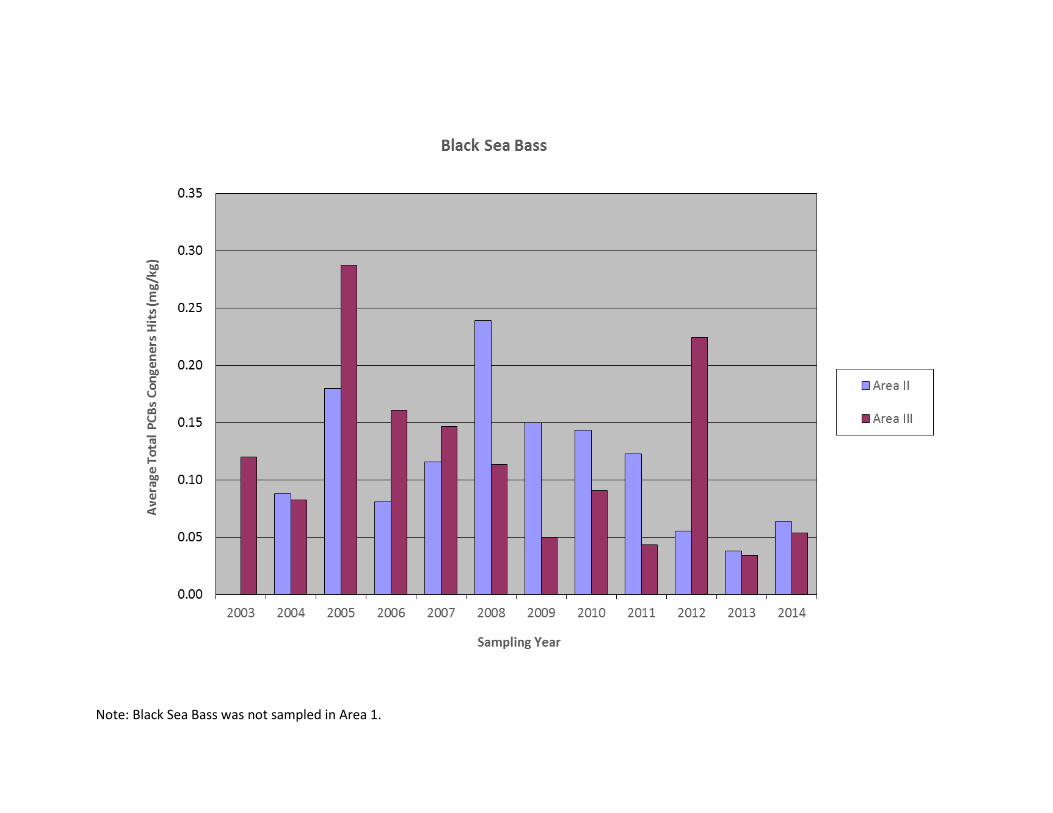
Note: Black Sea Bass was not sampled in Area 1.
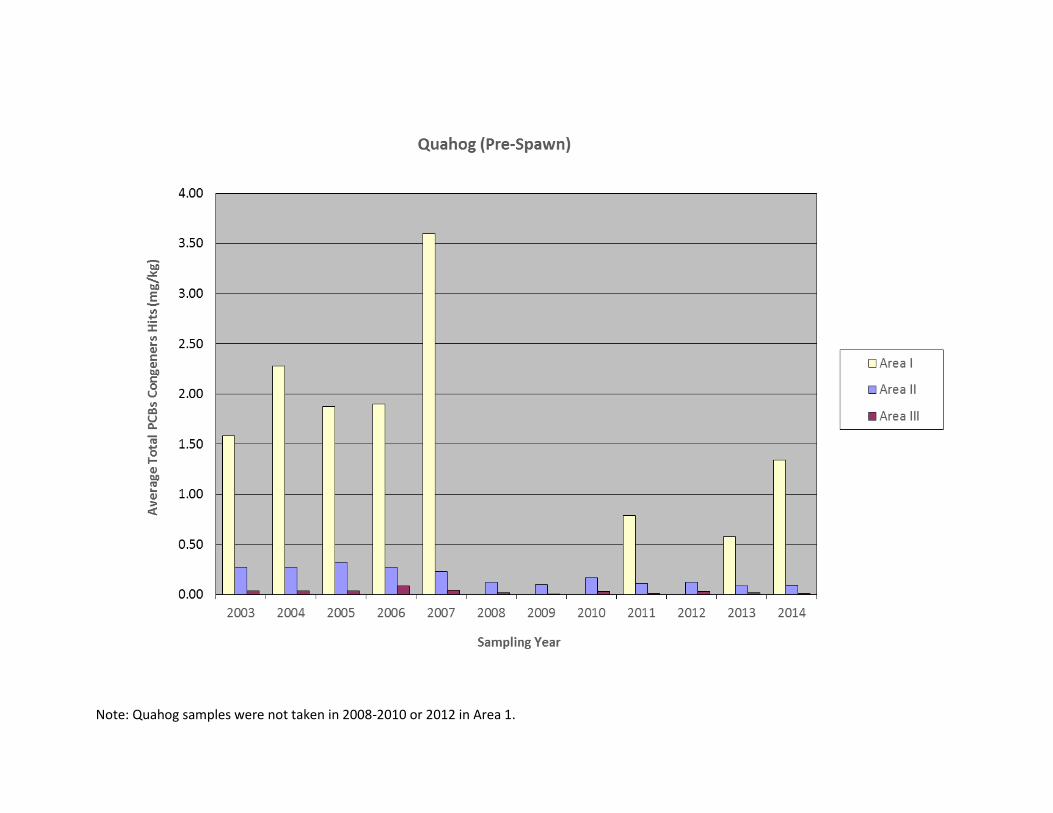
Note: Quahog samples were not taken in 2008-2010 or 2012 in Area 1.

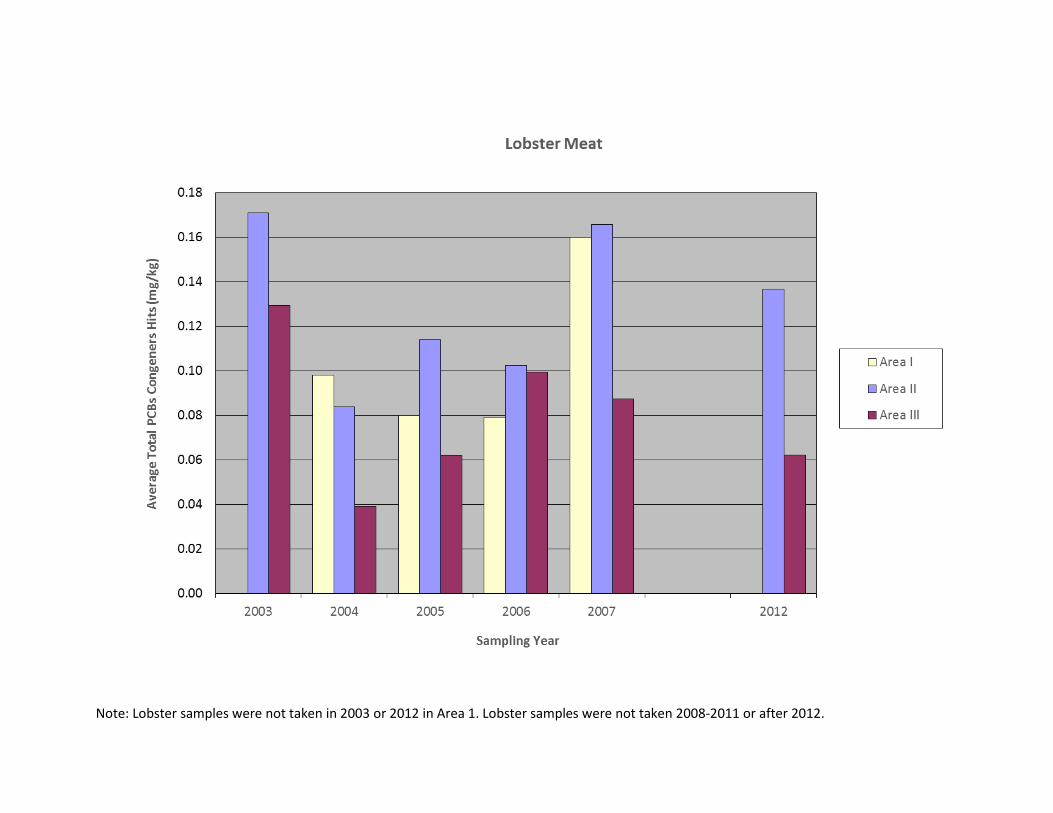
Note: Lobster samples were not taken in 2003 or 2012 in Area 1. Lobster samples were not taken 2008-2011 or after 2012.

Note: Lobster samples were not taken in 2003 or 2012 in Area 1. Lobster samples were not taken 2008-2011 or after 2012.

7 - BLUE MUSSEL PCB BIOACCUMULATION DATA

0
10
20
30
40
50
60
70
930709
931201
940523
940629
940808
940916
941019
941122
941220
950117
950221
950323
950518
950614
950713
950907
951005
960524
961025
970602
971104
980604
981022
990525
991103
000605
001003
010711
011021
020617
021210
030701
031210
040706
041123
050713
051201
061201
070710
071121
080608
090709
091125
100602
110803
111122
120611
121026
130705
140707
141015
Tota
l PC
B (p
pm)
NBH-2
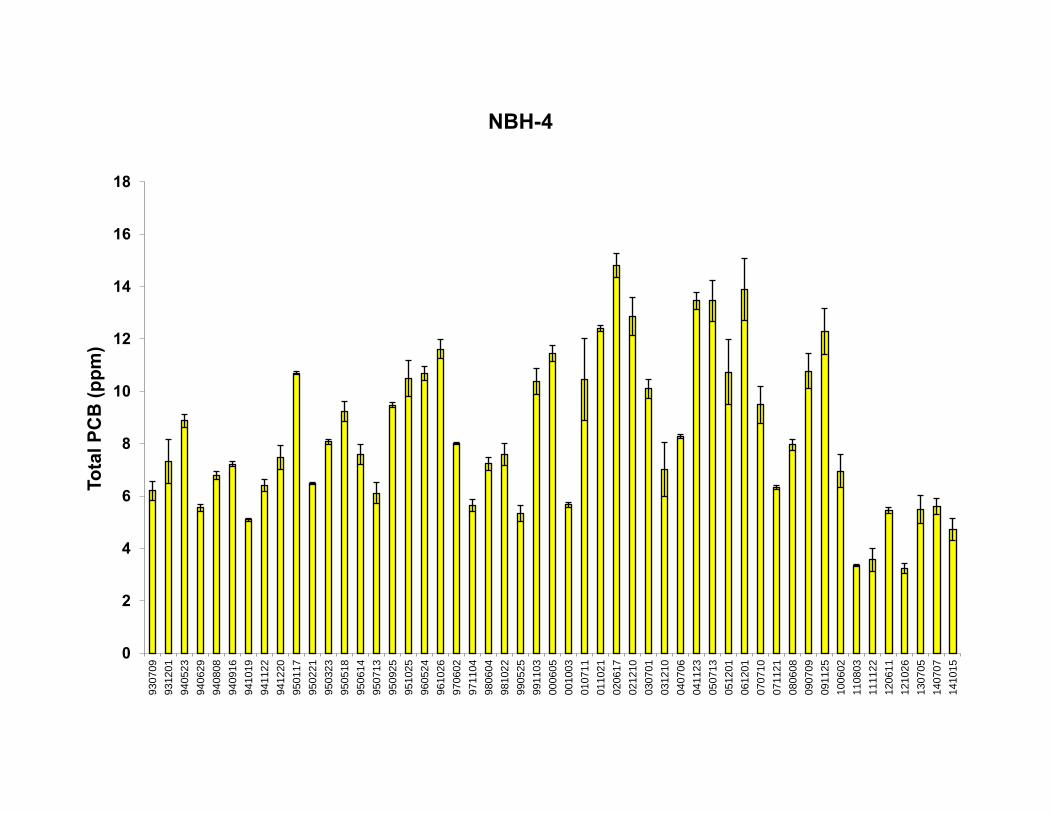
0
2
4
6
8
10
12
14
16
18
930709
931201
940523
940629
940808
940916
941019
941122
941220
950117
950221
950323
950518
950614
950713
950925
951025
960524
961026
970602
971104
980604
981022
990525
991103
000605
001003
010711
011021
020617
021210
030701
031210
040706
041123
050713
051201
061201
070710
071121
080608
090709
091125
100602
110803
111122
120611
121026
130705
140707
141015
Tota
l PC
B (p
pm)
NBH-4
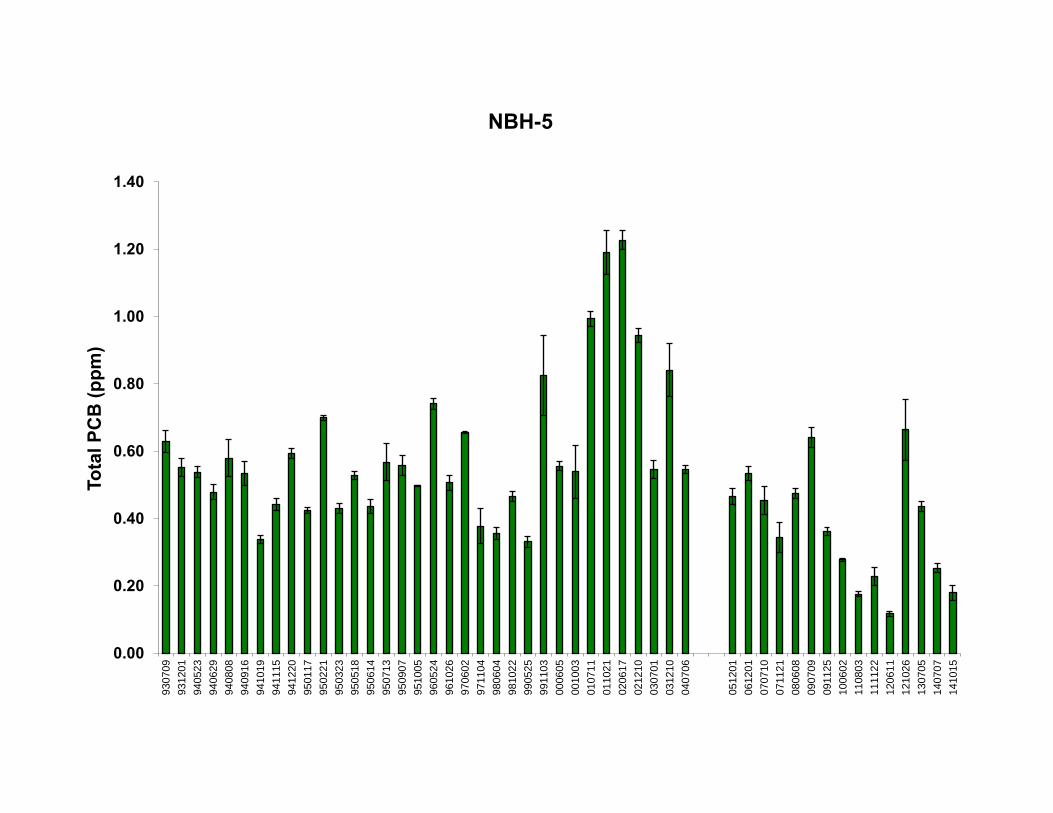
0.00
0.20
0.40
0.60
0.80
1.00
1.20
1.40930709
931201
940523
940629
940808
940916
941019
941115
941220
950117
950221
950323
950518
950614
950713
950907
951005
960524
961026
970602
971104
980604
981022
990525
991103
000605
001003
010711
011021
020617
021210
030701
031210
040706
051201
061201
070710
071121
080608
090709
091125
100602
110803
111122
120611
121026
130705
140707
141015
Tota
l PC
B (p
pm)
NBH-5

8 - LTM DATA - PCB LEVELS IN TOP 2 CM OF SEDIMENT OVER TIME - BENTHIC COMMUNITY INDICES OVER TIME
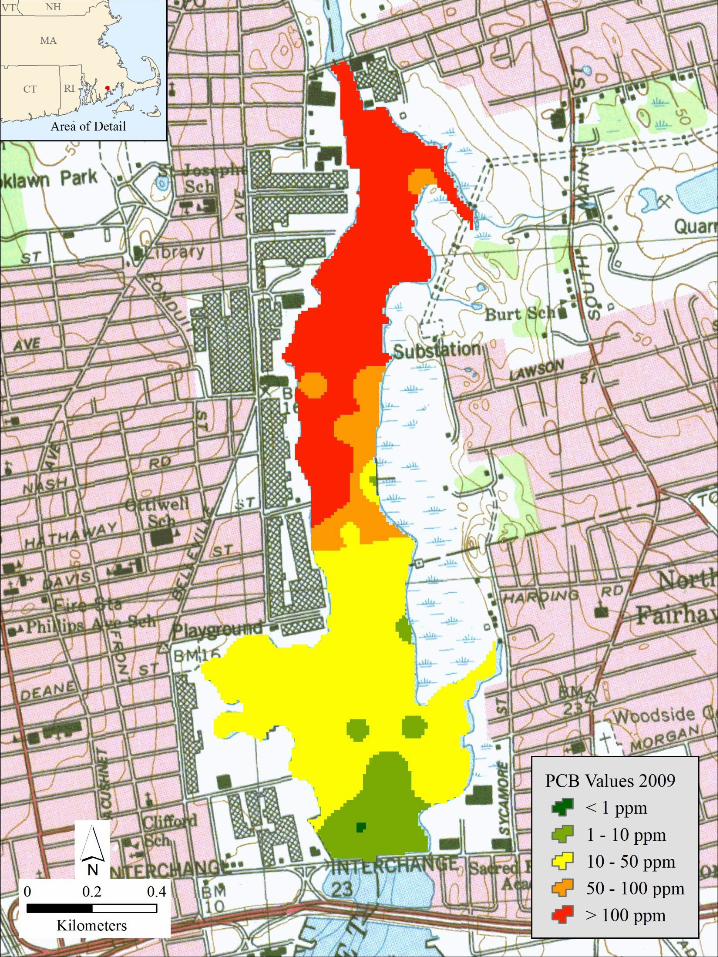
VT NH
MA
CT
PCB Values 2009
,. < 1 ppm
,. 1 - 10 ppm
Q 10- 50 ppm
(;] 50 - 100 ppm
,. > 100 ppm
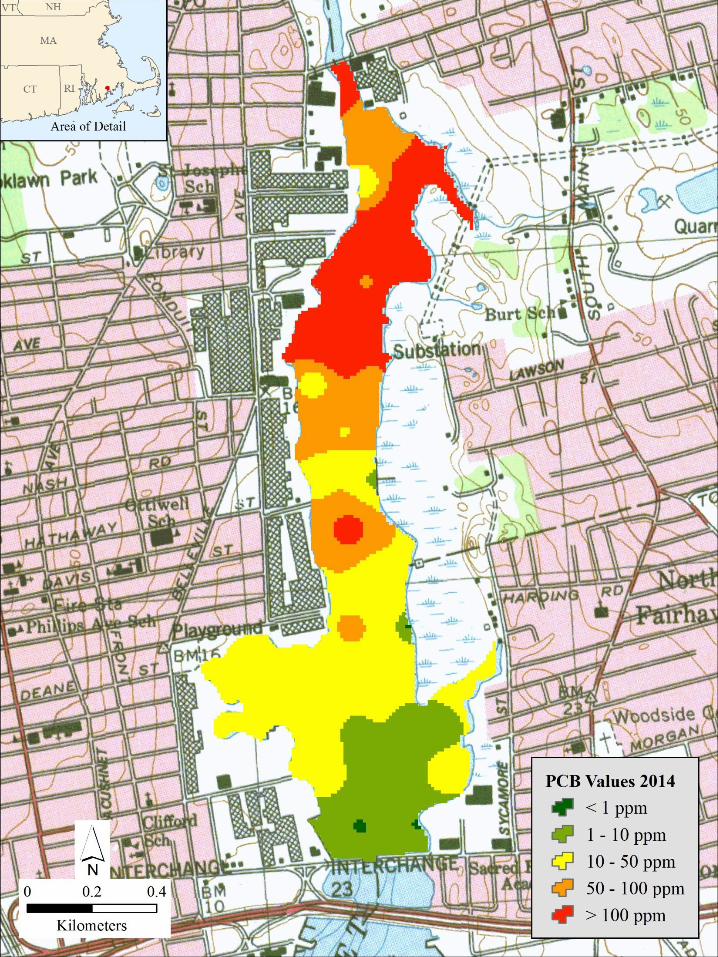
VT NH
MA
CT
PCB Values 2014
,. < 1 ppm
,. 1 - 10 ppm
Q 10- 50 ppm
(;] 50 - 100 ppm
,. > 100 ppm
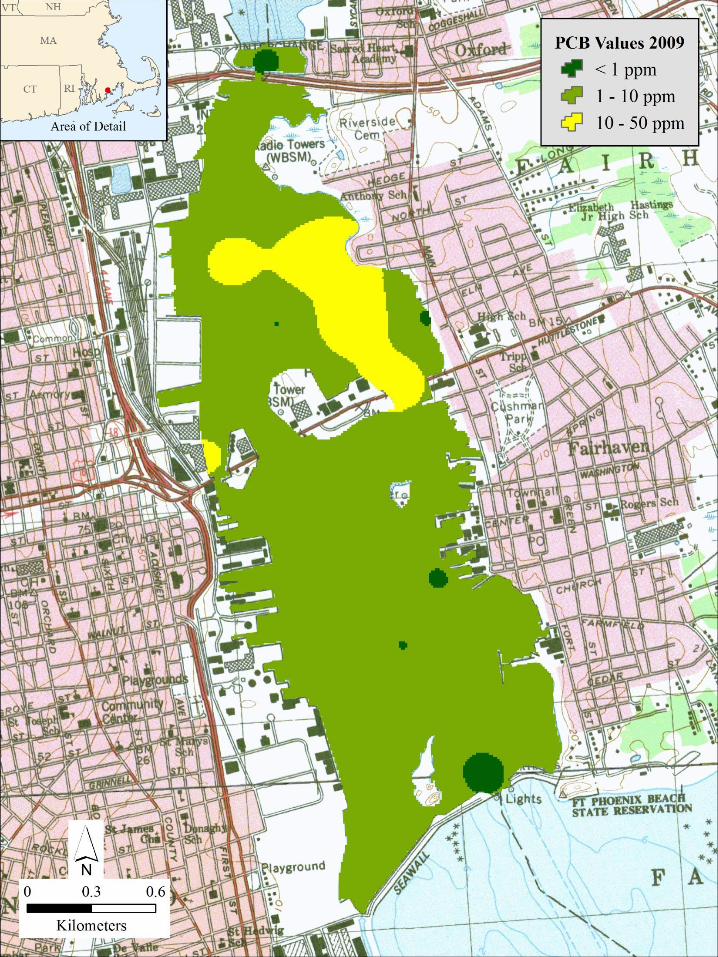
VT NH
MA
CT
Ughts
\ \ \ \
~ < lppm
~ 1- 10 ppm
Q 10-50ppm
"
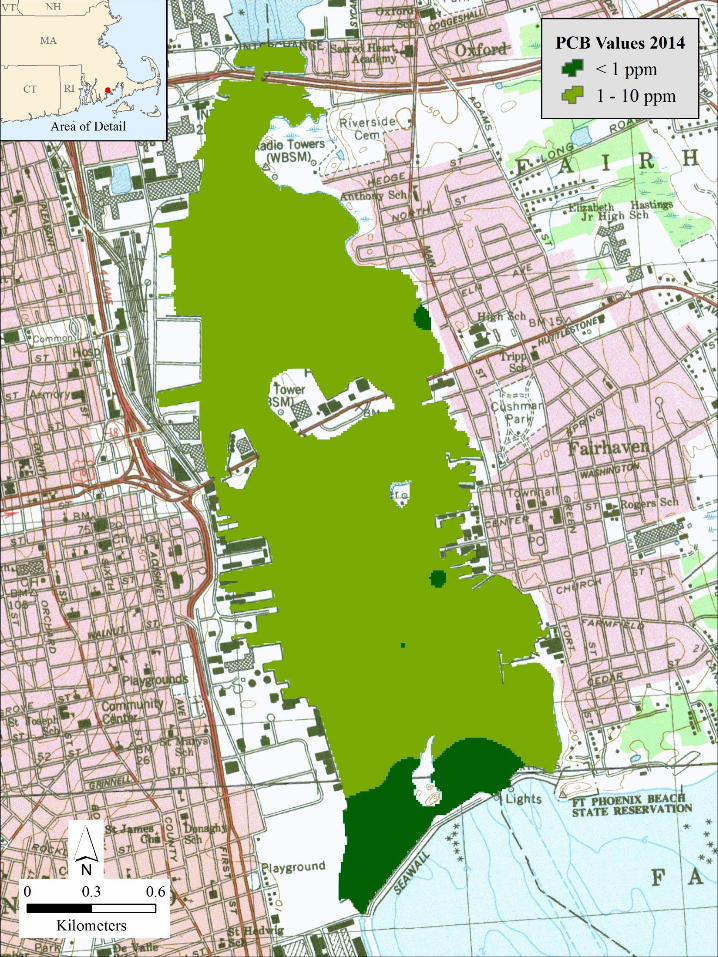
VT NH
MA
CT
Ughts
\ \ \ \
lfM < 1 ppm
~ 1- 10 ppm
"

.. :_:,··
., I
i. -- - I -- 0
.::,
I
~ I
D N - 1·
1
Kilometers
2
, -Nasketucket Bay,.._i I
Ii A y
L
PCB Values 2009
~ < lppm
~ 1 - 10 ppm
··.
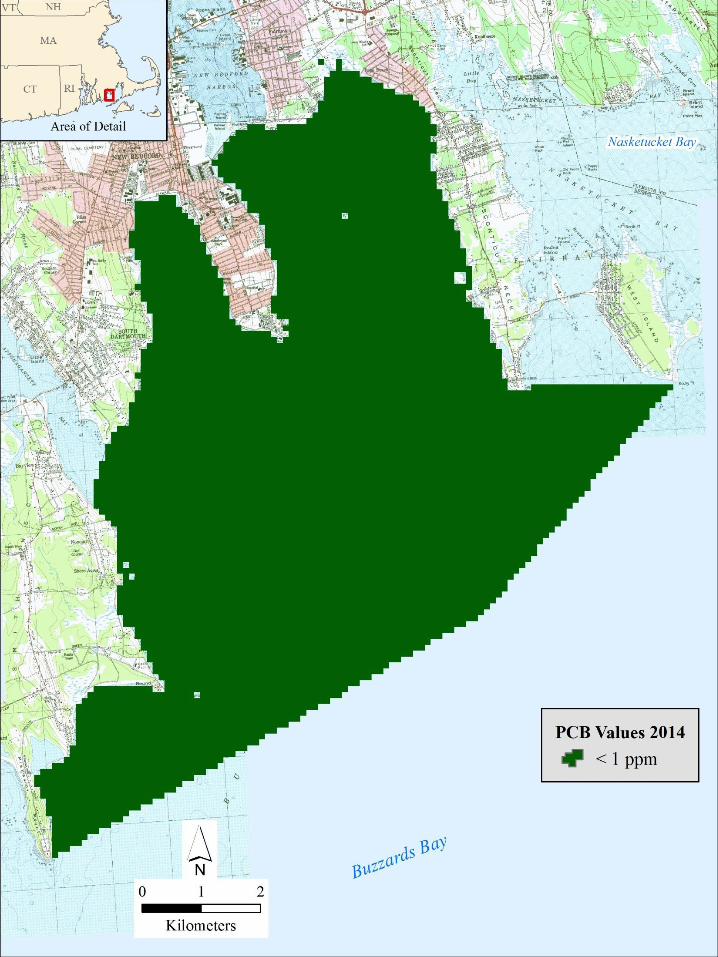
.. :_:,··
., I
i. -- - I -- 0
.::,
I
~ I
D N - 1·
1
Kilometers
2
, -Nasketucket Bay,.._i I
Ii A y
L
PCB Values 2014
~ < lppm
··.
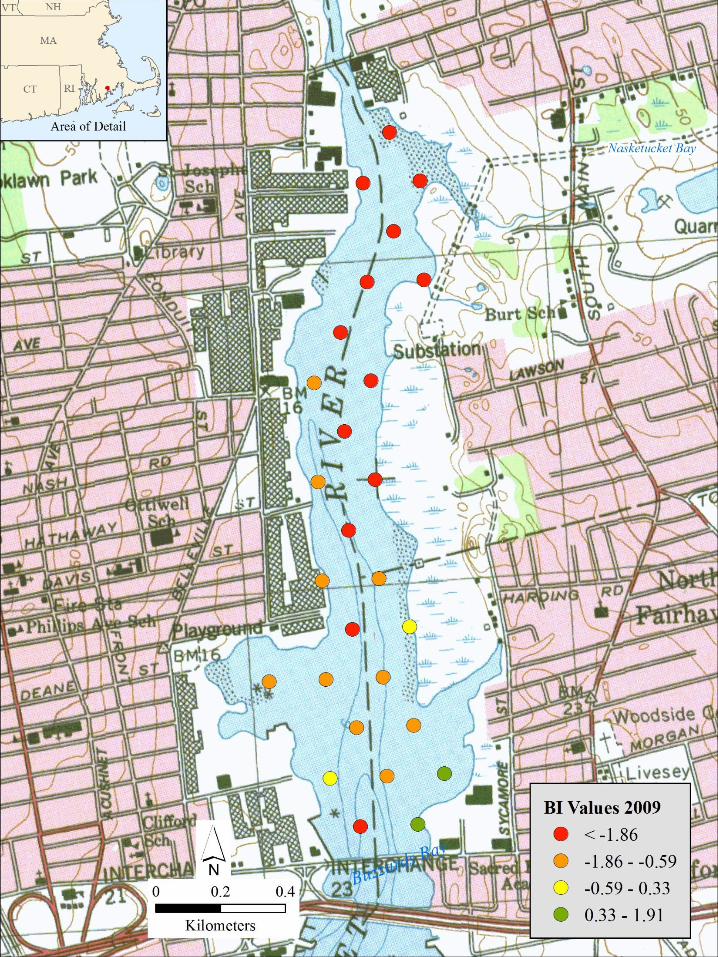
VT NH
MA
CT
BI Values 2009
• < -1.86
0 -1.86 - -0.59
0 -0.59 - 0.33
• 0.33 - 1.91
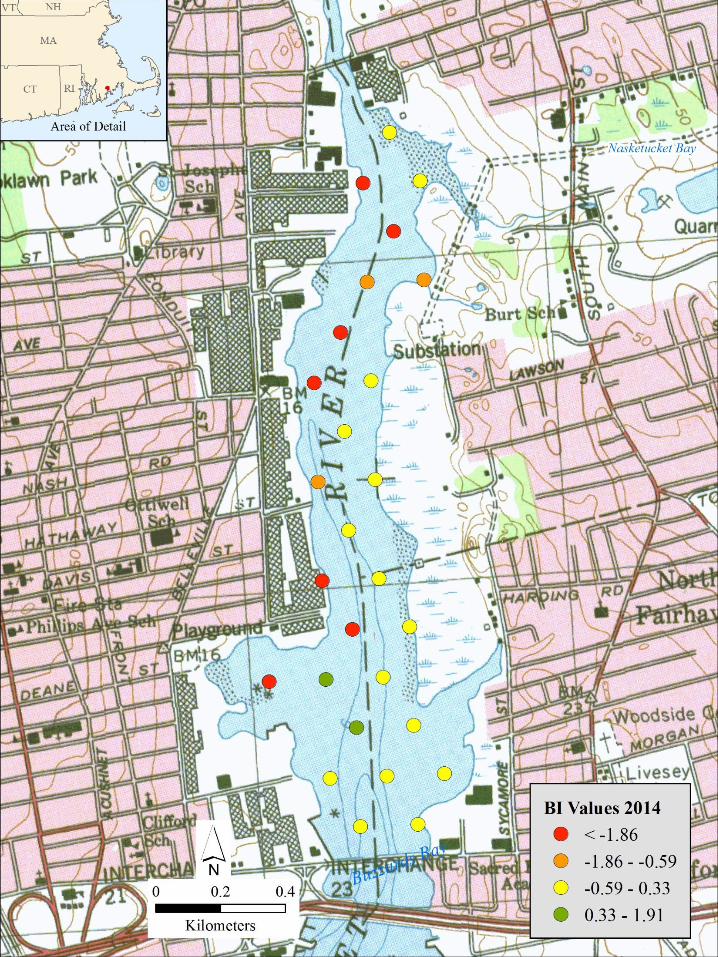
VT NH
MA
CT
BI Values 2014
• < -1.86
0 -1.86 - -0.59
0 -0.59 - 0.33
• 0.33 - 1.91
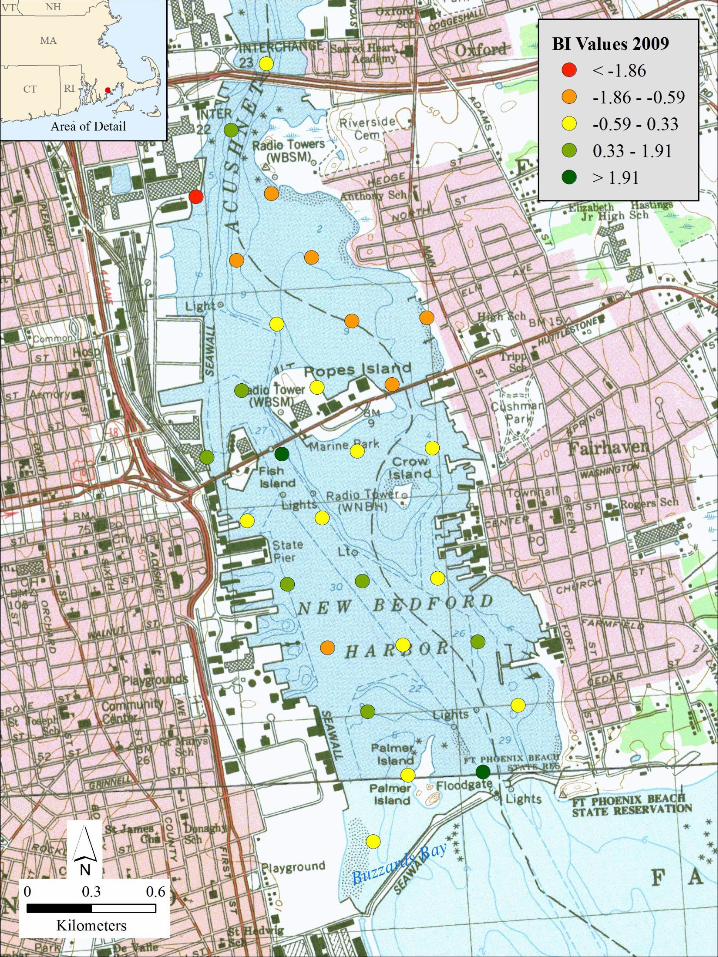
VT NH
MA
CT
Ughts
\ \ \ \
BI Values 2009
• < -1.86
0 -1.86 - -0.59
0 -0.59 - 0.33
• 0.33 - 1.91
• > 1.91
"
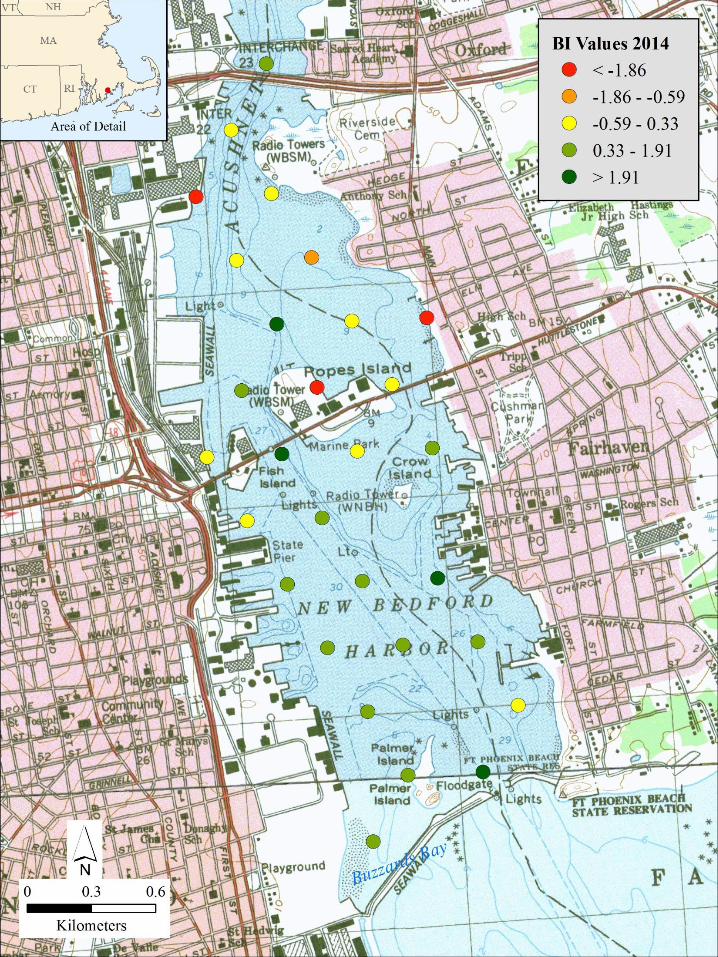
VT NH
MA
CT
Ughts
\ \ \ \
BI Values 2014
• < -1.86
0 -1.86 - -0.59
0 -0.59 - 0.33
• 0.33 - 1.91
• > 1.91
"

VT NH
MA
CT
• IP~ ..
- .-, -
,. • -1-
• •
• 1+
I
~
- ; -
D N
- 1-- 0 1 2
Kilometers
• •
•
•
. ··:: .. ~ ••.• A._ ,,_
•
..
J.:
•
.r~" " A ,.
... .. ,
·~
.·., • i., . '":.. ._ .. ·,•
BI Values 2009
• 0.33 - 1.91
• > 1.91
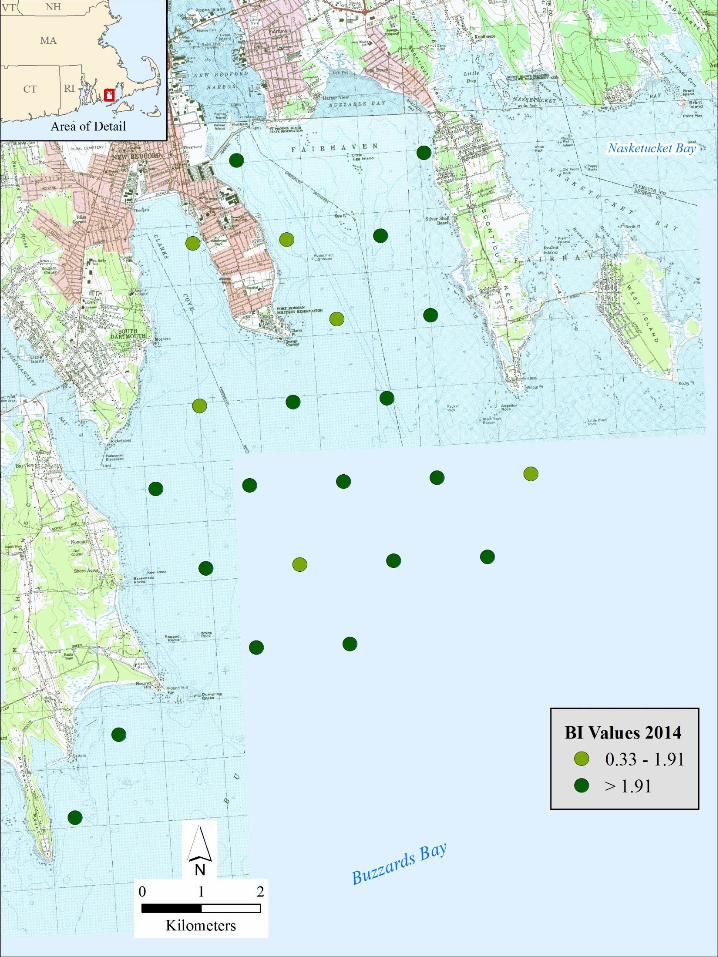
VT NH
MA
., I
- 1--
- ; -
I. -1-
•
1+
I
~
D N
\~· "1f:'w-..:-.:.~ \ .... \ I :;. ', FAIRHA V E N
', ,__ . f-P '-'•"" ,,
... , ,, " I, ~'-! . ,_,,··--
1 • " ·· ... \ \. I
I P~ ..
•
11 I \1
- .. 1 I 1\ I
,1 I
- . -1 ' I
I \ I I I
i \ . \ - . - 1-
• •
•
• •
\ I \ I
•
0 1 ~-c:::~2 Kilometers
I j--1
• J._ .
•
"·~· · -· . ··:: .. ~ ••.• A._ ,,_
•
..
•
·~
Nasketucket Ba- "' y ,\
.r~" " A ,.
... .. ,
.· ., • i., .
BI Values 2014
• 0.33 - 1.91
• > 1.91
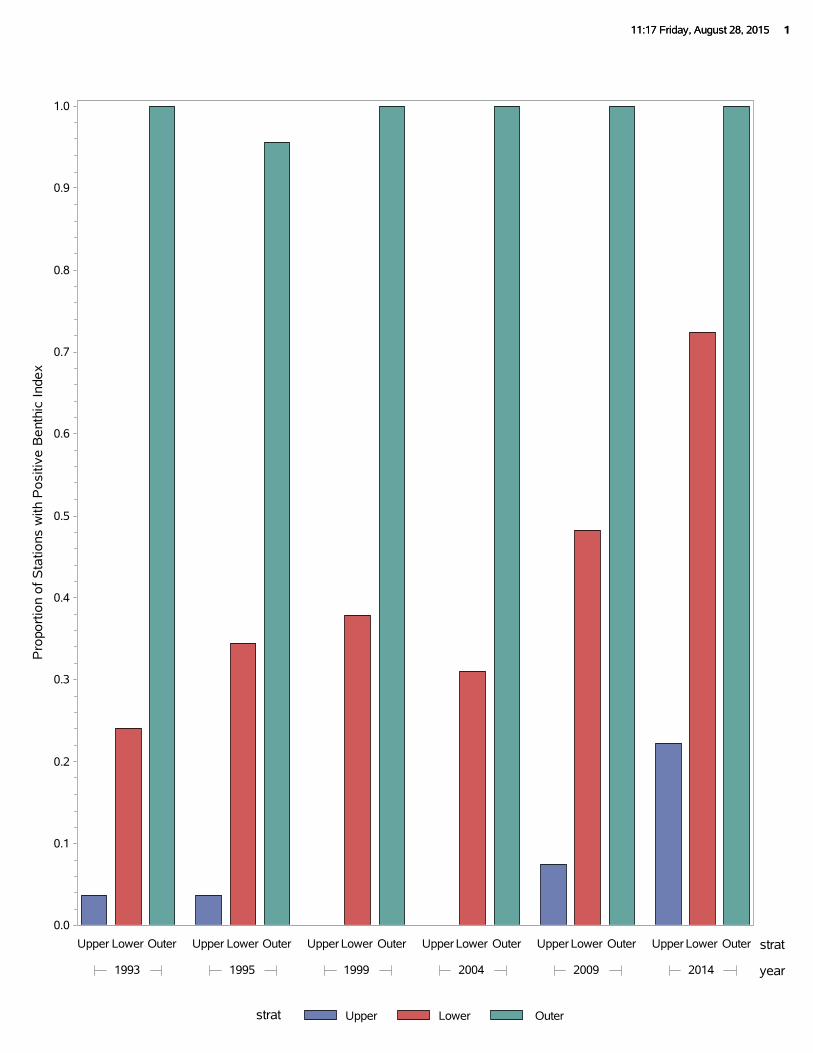
11:17 Friday, August 28, 2015 111:17 Friday, August 28, 2015 1
strat Upper Lower Outer
Pro
port
ion
of
Sta
tions
with
Po
sitiv
e B
ent
hic
Inde
x
0.0
0.1
0.2
0.3
0.4
0.5
0.6
0.7
0.8
0.9
1.0
strat
year1993 1995 1999 2004 2009 2014
Upper Lower Outer Upper Lower Outer Upper Lower Outer Upper Lower Outer Upper Lower Outer Upper Lower Outer

9 - MAPS OF SIGNAGE LOCATIONS FOR UPPER, LOWER AND OUTER HARBOR
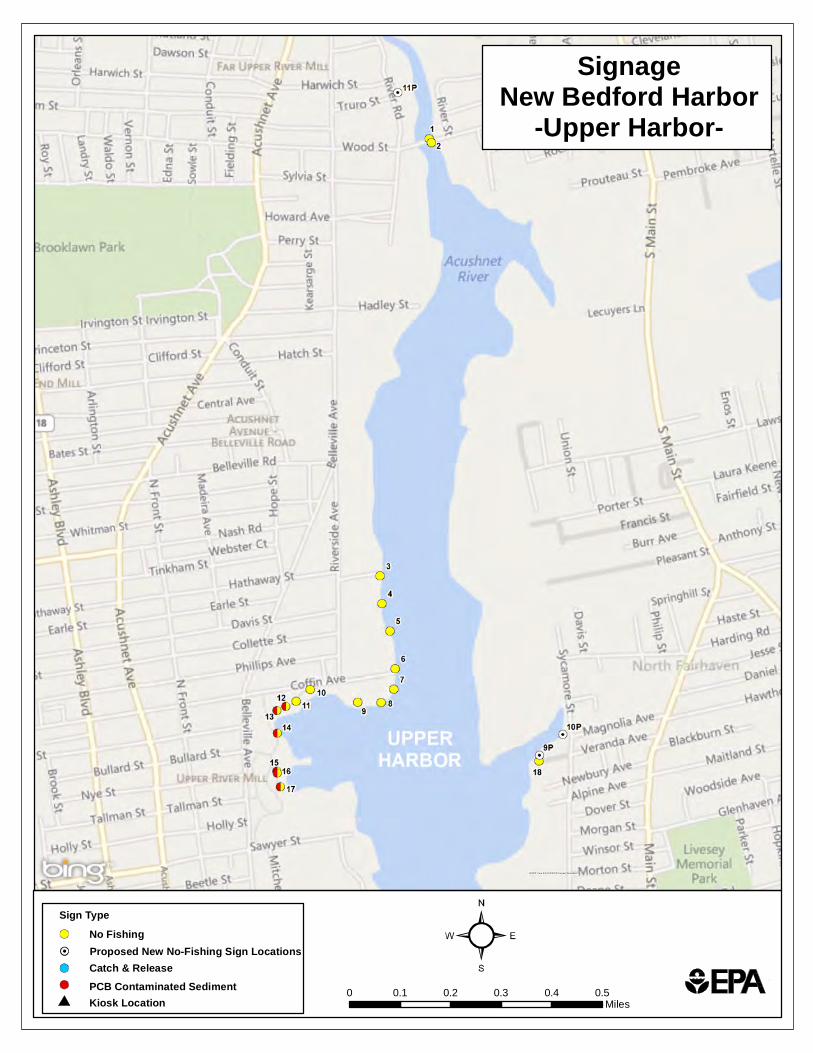
SignageNew Bedford Harbor
-Upper Harbor-
0 0.1 0.2 0.3 0.4 0.5Miles
No Fishing
Catch & ReleasePCB Contaminated SedimentKiosk Location
Sign Type
Proposed New No-Fishing Sign Locations
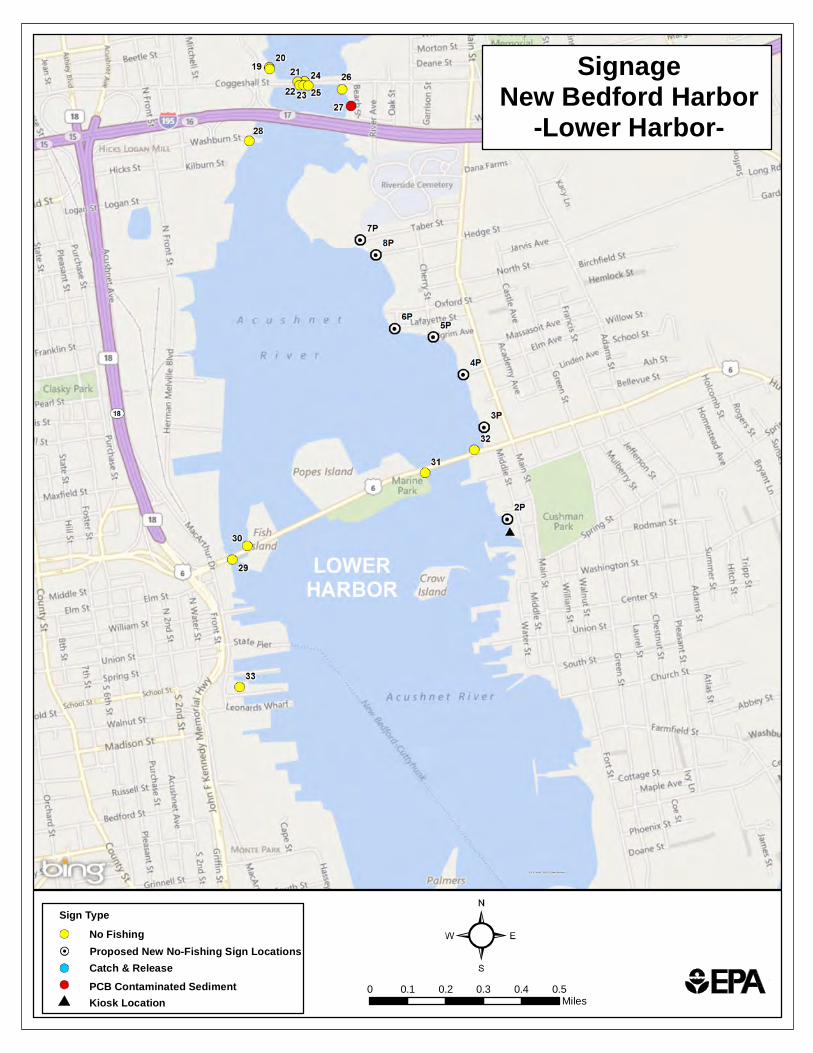
SignageNew Bedford Harbor
-Lower Harbor-
0 0.1 0.2 0.3 0.4 0.5Miles
No Fishing
Catch & ReleasePCB Contaminated SedimentKiosk Location
Sign Type
Proposed New No-Fishing Sign Locations
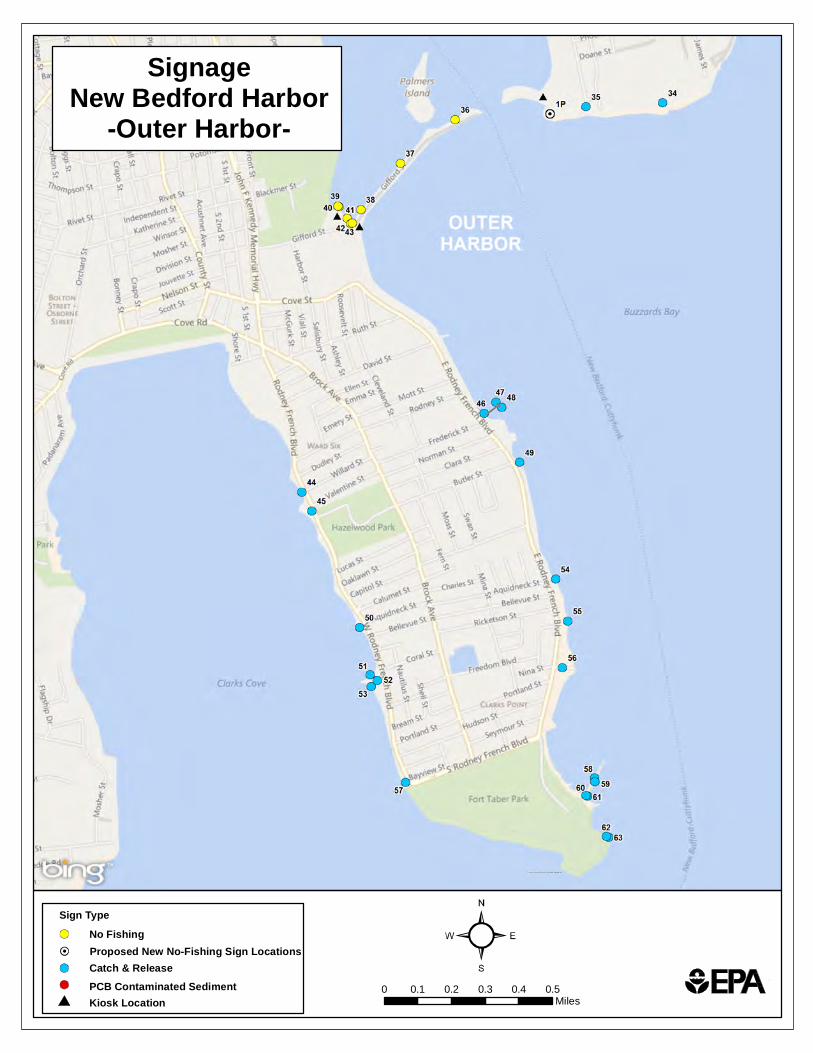
No Fishing
Catch & ReleasePCB Contaminated SedimentKiosk Location
Sign Type
SignageNew Bedford Harbor
-Outer Harbor-
0 0.1 0.2 0.3 0.4 0.5Miles
Proposed New No-Fishing Sign Locations

10 - 2015 FENCING AND SIGNAGE INSTITUTIONAL CONTROL INSPECTION
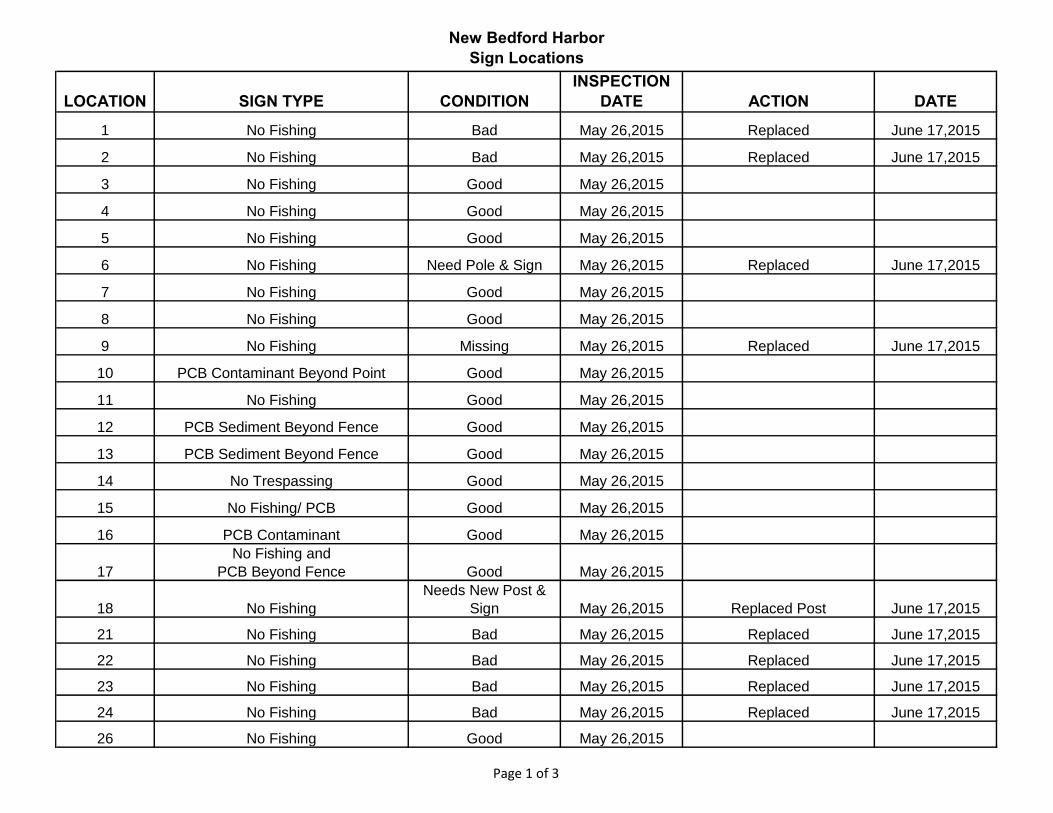
New Bedford Harbor Sign Locations
LOCATION SIGN TYPE CONDITIONINSPECTION
DATE ACTION DATE
1 No Fishing Bad May 26,2015 Replaced June 17,2015
2 No Fishing Bad May 26,2015 Replaced June 17,2015
3 No Fishing Good May 26,2015
4 No Fishing Good May 26,2015
5 No Fishing Good May 26,2015
6 No Fishing Need Pole & Sign May 26,2015 Replaced June 17,2015
7 No Fishing Good May 26,2015
8 No Fishing Good May 26,2015
9 No Fishing Missing May 26,2015 Replaced June 17,2015
10 PCB Contaminant Beyond Point Good May 26,2015
11 No Fishing Good May 26,2015
12 PCB Sediment Beyond Fence Good May 26,2015
13 PCB Sediment Beyond Fence Good May 26,2015
14 No Trespassing Good May 26,2015
15 No Fishing/ PCB Good May 26,2015
16 PCB Contaminant Good May 26,2015
17
No Fishing and
PCB Beyond Fence Good May 26,2015
18 No Fishing
Needs New Post &
Sign May 26,2015 Replaced Post June 17,2015
21 No Fishing Bad May 26,2015 Replaced June 17,2015
22 No Fishing Bad May 26,2015 Replaced June 17,2015
23 No Fishing Bad May 26,2015 Replaced June 17,2015
24 No Fishing Bad May 26,2015 Replaced June 17,2015
26 No Fishing Good May 26,2015
Page 1 of 3
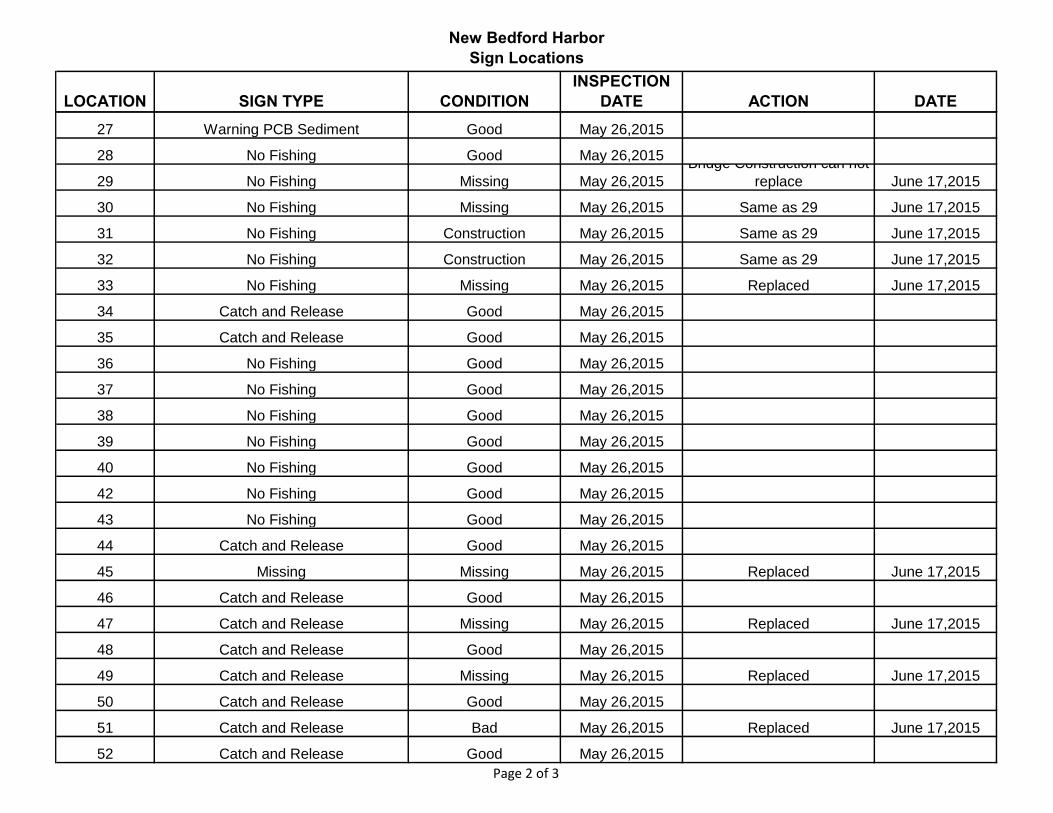
New Bedford Harbor Sign Locations
LOCATION SIGN TYPE CONDITIONINSPECTION
DATE ACTION DATE27 Warning PCB Sediment Good May 26,2015
28 No Fishing Good May 26,2015
29 No Fishing Missing May 26,2015
Bridge Construction can not
replace June 17,2015
30 No Fishing Missing May 26,2015 Same as 29 June 17,2015
31 No Fishing Construction May 26,2015 Same as 29 June 17,2015
32 No Fishing Construction May 26,2015 Same as 29 June 17,2015
33 No Fishing Missing May 26,2015 Replaced June 17,2015
34 Catch and Release Good May 26,2015
35 Catch and Release Good May 26,2015
36 No Fishing Good May 26,2015
37 No Fishing Good May 26,2015
38 No Fishing Good May 26,2015
39 No Fishing Good May 26,2015
40 No Fishing Good May 26,2015
42 No Fishing Good May 26,2015
43 No Fishing Good May 26,2015
44 Catch and Release Good May 26,2015
45 Missing Missing May 26,2015 Replaced June 17,2015
46 Catch and Release Good May 26,2015
47 Catch and Release Missing May 26,2015 Replaced June 17,2015
48 Catch and Release Good May 26,2015
49 Catch and Release Missing May 26,2015 Replaced June 17,2015
50 Catch and Release Good May 26,2015
51 Catch and Release Bad May 26,2015 Replaced June 17,2015
52 Catch and Release Good May 26,2015
Page 2 of 3
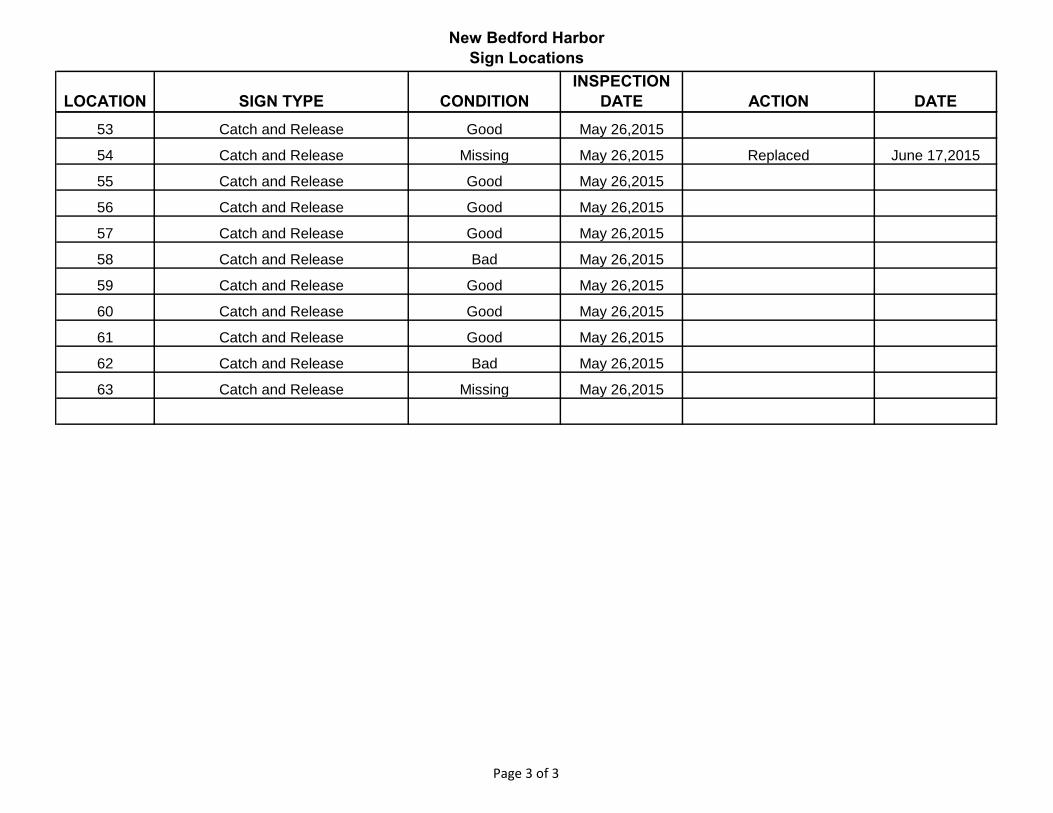
New Bedford Harbor Sign Locations
LOCATION SIGN TYPE CONDITIONINSPECTION
DATE ACTION DATE53 Catch and Release Good May 26,2015
54 Catch and Release Missing May 26,2015 Replaced June 17,2015
55 Catch and Release Good May 26,2015
56 Catch and Release Good May 26,2015
57 Catch and Release Good May 26,2015
58 Catch and Release Bad May 26,2015
59 Catch and Release Good May 26,2015
60 Catch and Release Good May 26,2015
61 Catch and Release Good May 26,2015
62 Catch and Release Bad May 26,2015
63 Catch and Release Missing May 26,2015
Page 3 of 3

11 - OU3 PILOT CAP AND STATE’S MITIGATION CAP EXPANSION AREA
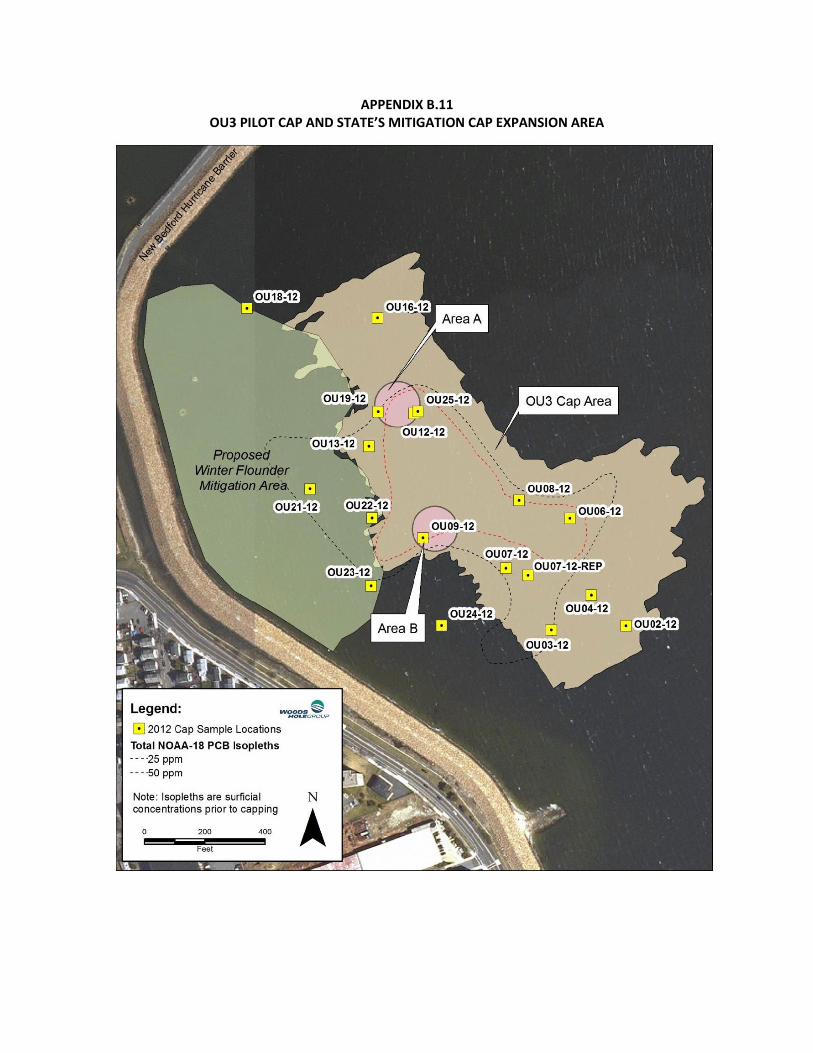
APPENDIX B.11 OU3 PILOT CAP AND STATE’S MITIGATION CAP EXPANSION AREA

12 - SUMMARY OF PLANNED AND/OR IMPLEMENTED ICS
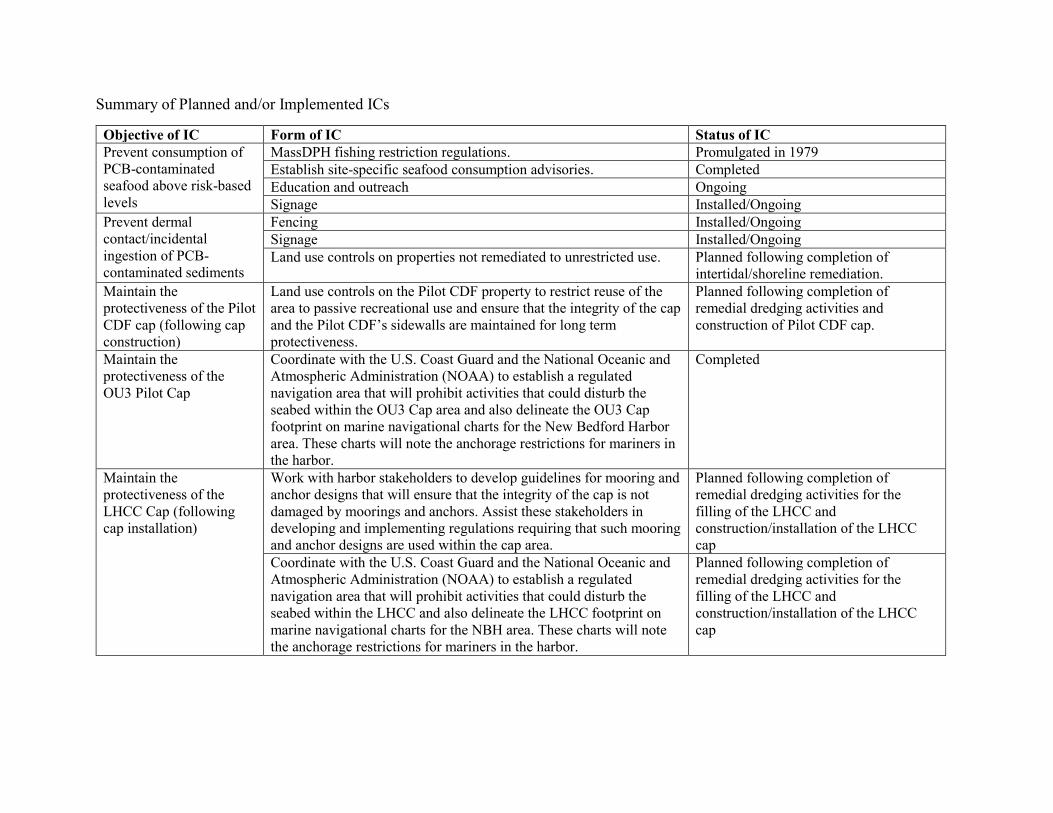
Summary of Planned and/or Implemented ICs
Objective of IC Form of IC Status of IC Prevent consumption of PCB-contaminated seafood above risk-based levels
MassDPH fishing restriction regulations. Promulgated in 1979 Establish site-specific seafood consumption advisories. Completed Education and outreach Ongoing Signage Installed/Ongoing
Prevent dermal contact/incidental ingestion of PCB-contaminated sediments
Fencing Installed/Ongoing Signage Installed/Ongoing Land use controls on properties not remediated to unrestricted use. Planned following completion of
intertidal/shoreline remediation. Maintain the protectiveness of the Pilot CDF cap (following cap construction)
Land use controls on the Pilot CDF property to restrict reuse of the area to passive recreational use and ensure that the integrity of the cap and the Pilot CDF’s sidewalls are maintained for long term protectiveness.
Planned following completion of remedial dredging activities and construction of Pilot CDF cap.
Maintain the protectiveness of the OU3 Pilot Cap
Coordinate with the U.S. Coast Guard and the National Oceanic and Atmospheric Administration (NOAA) to establish a regulated navigation area that will prohibit activities that could disturb the seabed within the OU3 Cap area and also delineate the OU3 Cap footprint on marine navigational charts for the New Bedford Harbor area. These charts will note the anchorage restrictions for mariners in the harbor.
Completed
Maintain the protectiveness of the LHCC Cap (following cap installation)
Work with harbor stakeholders to develop guidelines for mooring and anchor designs that will ensure that the integrity of the cap is not damaged by moorings and anchors. Assist these stakeholders in developing and implementing regulations requiring that such mooring and anchor designs are used within the cap area.
Planned following completion of remedial dredging activities for the filling of the LHCC and construction/installation of the LHCC cap
Coordinate with the U.S. Coast Guard and the National Oceanic and Atmospheric Administration (NOAA) to establish a regulated navigation area that will prohibit activities that could disturb the seabed within the LHCC and also delineate the LHCC footprint on marine navigational charts for the NBH area. These charts will note the anchorage restrictions for mariners in the harbor.
Planned following completion of remedial dredging activities for the filling of the LHCC and construction/installation of the LHCC cap

13 - LOWER HARBOR CAD CELLS AND SER NAVIGATIONAL DREDGING
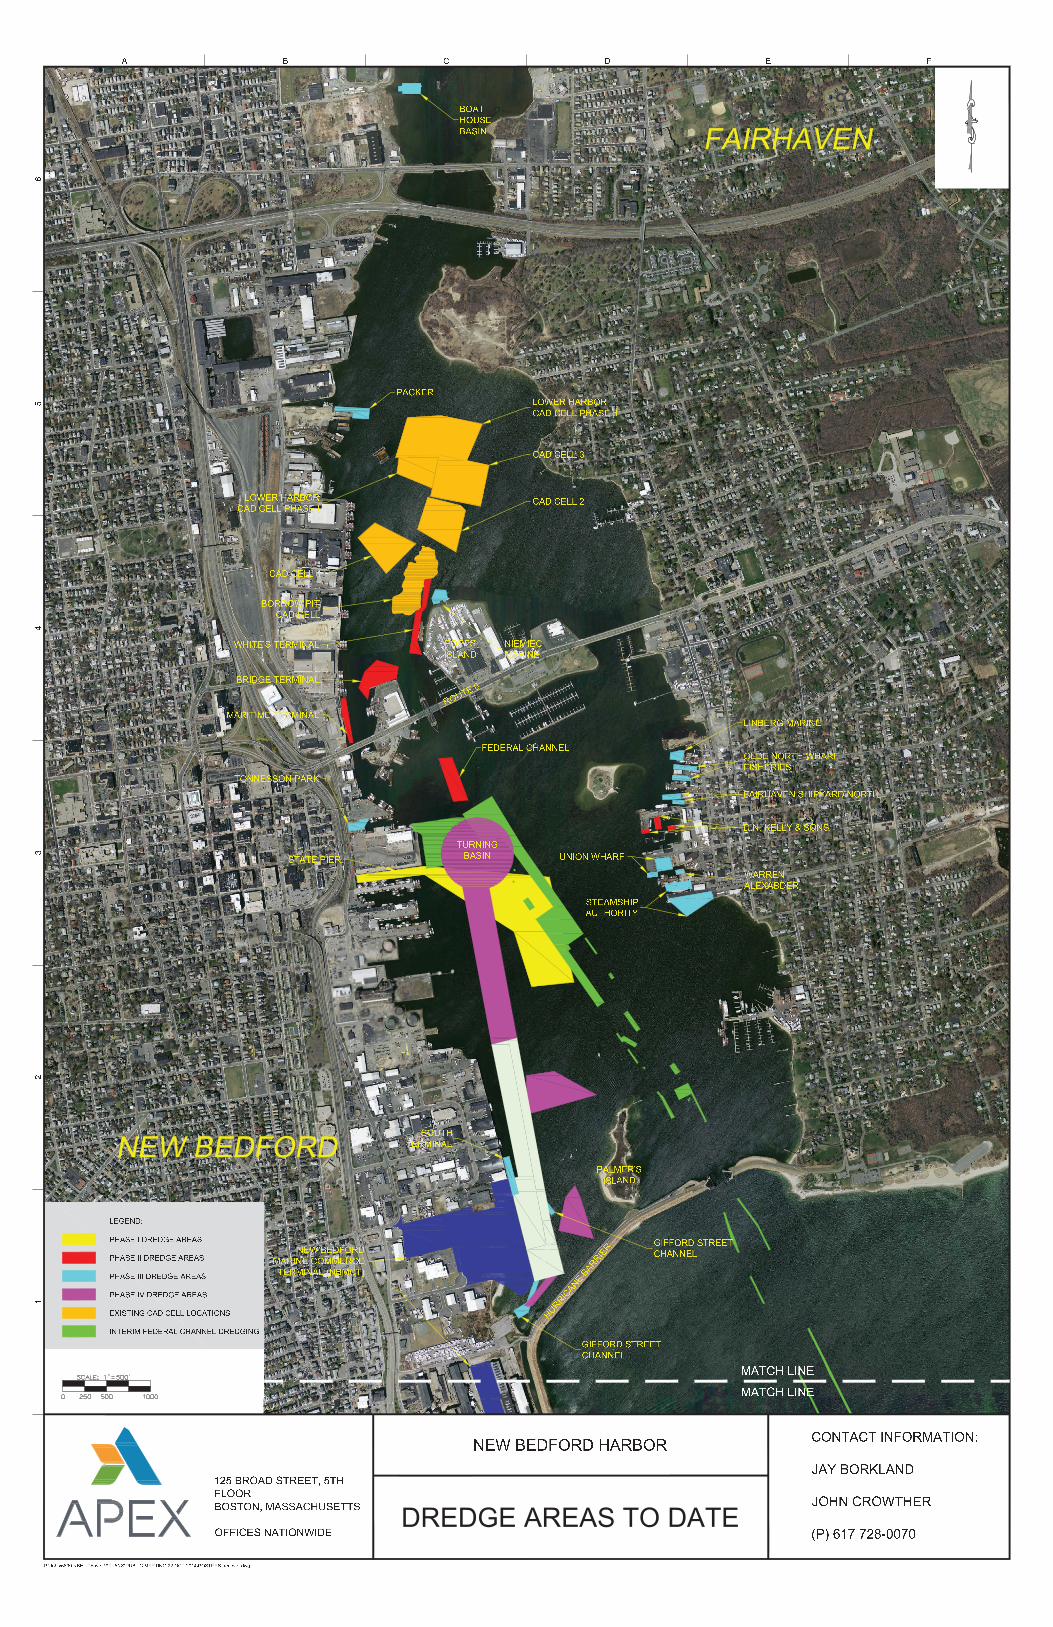
� � � � � � � � � � � � � � � � � � � � �� � � � � �
� � � � � �� � � � ! " # $ % &
' ( ) * + , - . / + , 0 ( , 1 . ,) ( 2 ) + - - ' 0 ( 3 + 4 4- . / + , 0 ( , 1 . ,) ( 2 ) + - - ' 0 ( 3 + 4) ( 2 ) + - - 5) ( 2 ) + - - 6) ( 2 ) + - - 7
1 . , , . / ' 4 8) ( 2 ) + - - 9 4 + : 4 + ): ( , 4 9 +/ 0 4 8 + ; 3 8 + , : 4 9 ( -. - 2 + 9 . , 8 0 / 0 ( , << 4 3 0 + , 4 + 3
/ ( , , + 9( - + = ( 1 2 + ,
9 + / 1 + 2 < . , 2: ( , 4 9 + ) . : : + , ) +8 + , : 4 9 ( - > 9 1 : ) 8 ?
1 , 4 2 @ + 8 + , : 4 9 ( -: ( , 4 8 4 : + 8 + , : 4 9 ( -8 . 9 9 + 3 3 . 9 ' ( , * < + 2 + , ( - ) 0 ( 9 9 + - - 4 9 1 + , @ : ( , 4 9 +3 8 ( 8 + ' 4 + , 2 A 9 A * + - - B C 3 . 9 3< ( 4 , 0 ( D + 9 3 0 4 ' B ( , 2 9 . , 8 0E 9 4 . 9 / 0 ( , <3 8 + ( : 3 0 4 '( E 8 0 . , 4 8 B
3 . E 8 08 + , : 4 9 ( -@ 4 < < . , 2 3 8 , + + 8) 0 ( 9 9 + -
@ 4 < < . , 2 3 8 , + + 8) 0 ( 9 9 + -
1 . ( 80 . E 3 +1 ( 3 4 9
8 E , 9 4 9 @1 ( 3 4 9
F G H G I J KL M N O G P J Q G J H G N Q G N OL M N O G P P J Q G J H G N Q G N OL M N O G P P P J Q G J H G N Q G N OL M N O G P R J Q G J H G N Q G N OG S P O T P I H U N J U G F F F V U N T P V I OP I T G Q P W X G J G Q N F U M N I I G F J Q G J H P I HYZ [ \ ] ^ _ ` a b c ^ d d c e \ c fg h _ _ ^] _ b c _ i e j ` b b ` k f l b d c c b_ g g m k d b i ` c m _ i n m a d
o p q r s t
u
v
w
x
y
z { | } ~ z } � | � { � � ~ } � { | �� ~ � � { � � � ~ | �� { � | z � { � } � � �� � � � � � � � � � � � � �� � � � � � � � � � � ¡ ¢ £ ¤ � ¥ ¦ � § ¨ © � � ª « ¡ ¬ � � ¢ ª ®̈ ¯ ° ° ± ¨ ¡ ² ³ ³ ´ ® ± ³ µ ¶ � � ´ ¬ ± ° · ¬ ¤ ¸ § ¹ � º § ¸ »¼ ½ ¾¿ À Á  À Ã Ä Å Æ Ã Ç È Æ Â Å Æ É Ê Ë Ì Í Î Ï Ð ÑÉ Ê Ë Ì Í Î Ï Ð Ñ

14 - OUTER HARBOR SER NAVIGATIONAL DREDGING
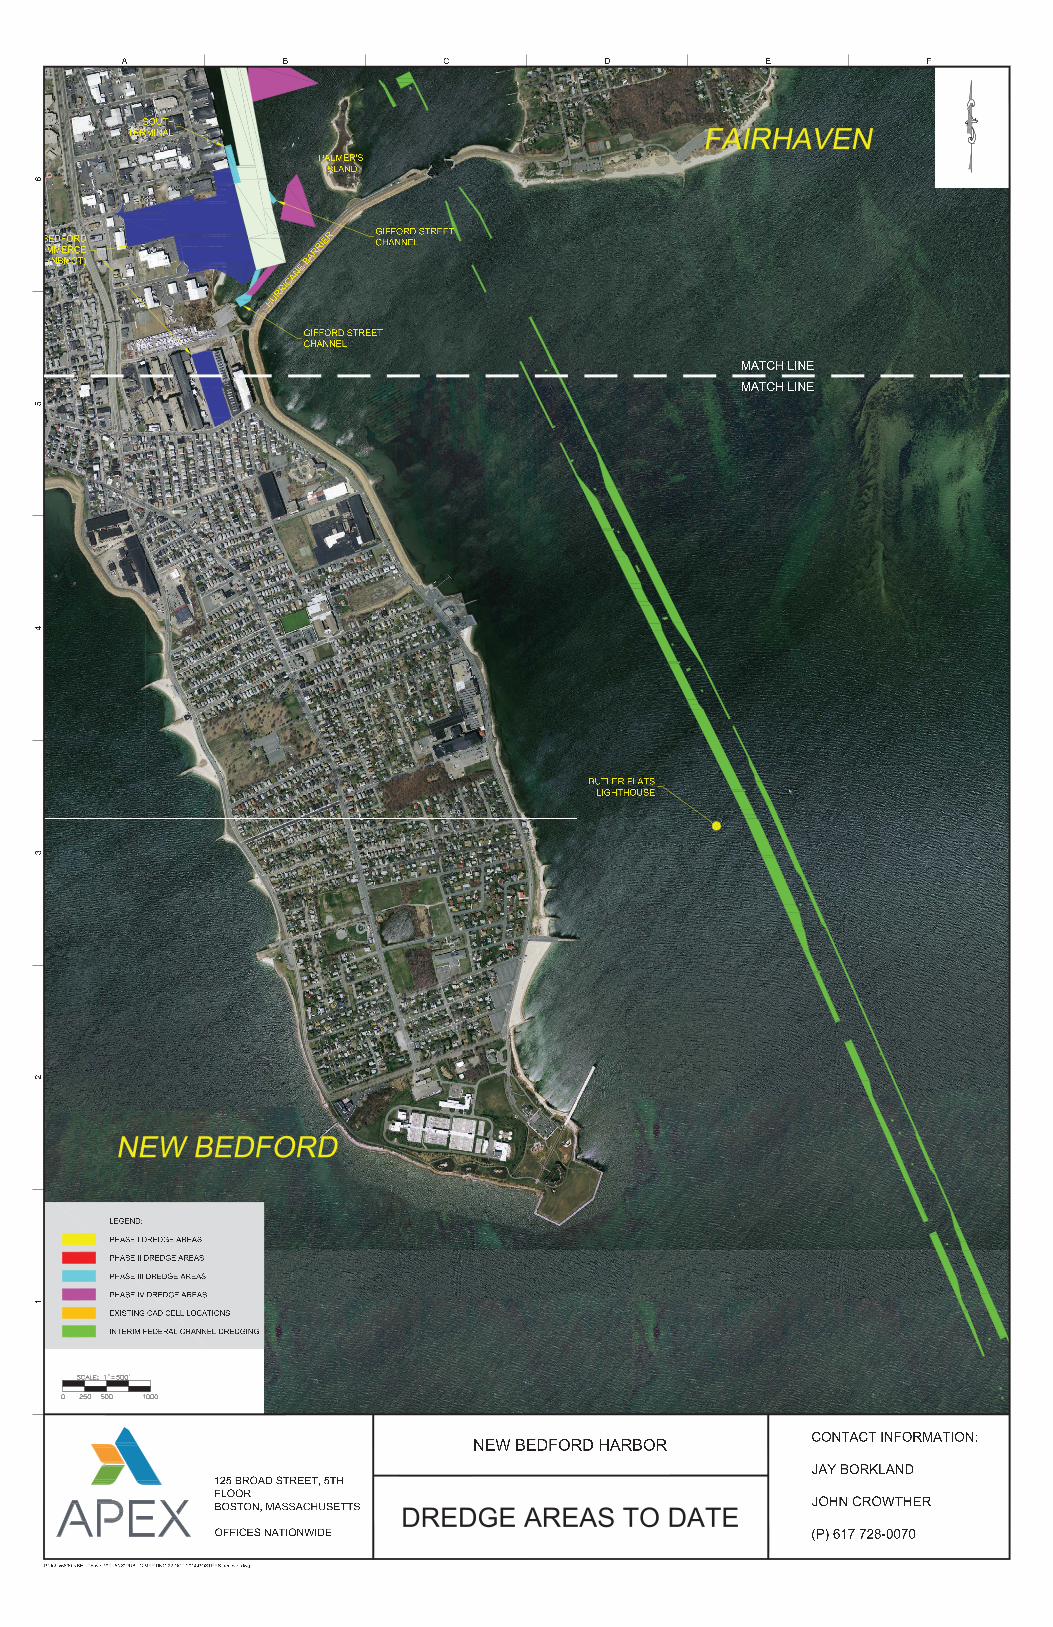
� � � � � � � � � � � � � � � � � � � � �� � � � � �� � � � � � �� � � � � � �� ! � � � " #
� $ " � � � � � % " &� ' ( ) " ) � $ & �
& � $ " )" � � � ' ! % �( ' � � � � � & " � � � "� ) % ! ! � �
( ' � � � � � & " � � � "� ) % ! ! � �
* + , + - . /0 1 2 3 + 4 . 5 + . , + 2 5 + 2 30 1 2 3 + 4 4 . 5 + . , + 2 5 + 2 30 1 2 3 + 4 4 4 . 5 + . , + 2 5 + 2 30 1 2 3 + 4 6 . 5 + . , + 2 5 + 2 3+ 7 4 3 8 4 - , 9 2 . 9 + * * * : 9 2 8 4 : - 34 - 8 + 5 4 ; < + . + 5 2 * 9 1 2 - - + * . 5 + . , 4 - ,=> ? @ A B C D E F G B H H G I @ G JK L C C BA C F G C M I N D F F D O J P F H G G FC K K Q O H F M D G Q C M R Q E H
S T U V W X
Y
Z
[
\
]
^ _ ` a b ^ a c ` d _ e f b a c _ ` gh b i j _ e k l b ` mh _ n ` ^ e _ o a n p eq r s t u v v w x y z z v z{ | } ~ � � � } � � � � � � � � { � � � � � � } { � � � � } { � � � �� � � � � � � � � � � � � � � � � } { � � � � � � � � � � � � � � � ¡ ¢£ ¤ ¥ ¦ ¤ § ¨ © ª § « ¬ ª ¦ © ª
® ¯ ° ± ² ³ ´ µ ® ¯ ° ± ² ³ ´ µ

APPENDIX C – PUBLIC NOTICE/OUTREACH AND FYR INTERVIEWS PUBLIC NOTIFICATION INTERVIEWS/QUESTIONNAIRES SEPTEMBER 2015 UPDATED SEAFOOD CONSUMPTION ADVISORY
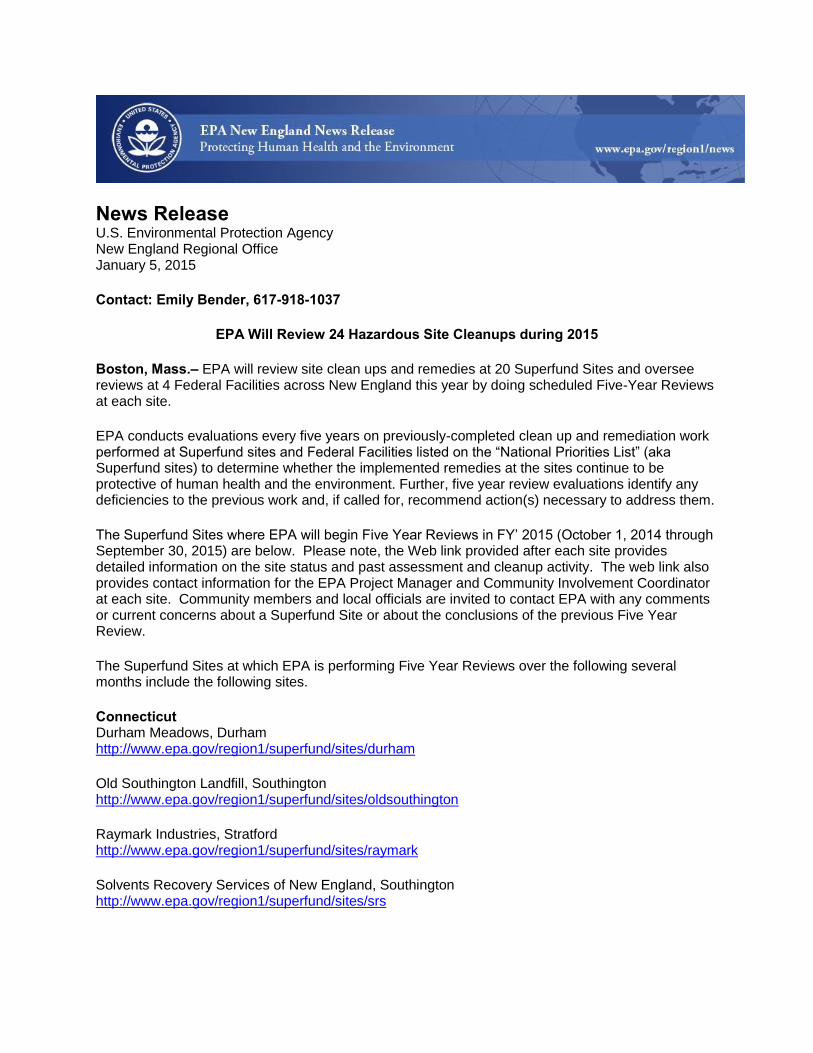
News Release
U.S. Environmental Protection Agency New England Regional Office January 5, 2015
Contact: Emily Bender, 617-918-1037
EPA Will Review 24 Hazardous Site Cleanups during 2015
Boston, Mass.– EPA will review site clean ups and remedies at 20 Superfund Sites and oversee reviews at 4 Federal Facilities across New England this year by doing scheduled Five-Year Reviews at each site.
EPA conducts evaluations every five years on previously-completed clean up and remediation work performed at Superfund sites and Federal Facilities listed on the “National Priorities List” (aka Superfund sites) to determine whether the implemented remedies at the sites continue to be protective of human health and the environment. Further, five year review evaluations identify any deficiencies to the previous work and, if called for, recommend action(s) necessary to address them.
The Superfund Sites where EPA will begin Five Year Reviews in FY’ 2015 (October 1, 2014 through September 30, 2015) are below. Please note, the Web link provided after each site provides detailed information on the site status and past assessment and cleanup activity. The web link also provides contact information for the EPA Project Manager and Community Involvement Coordinator at each site. Community members and local officials are invited to contact EPA with any comments or current concerns about a Superfund Site or about the conclusions of the previous Five Year Review.
The Superfund Sites at which EPA is performing Five Year Reviews over the following several months include the following sites.
Connecticut Durham Meadows, Durham http://www.epa.gov/region1/superfund/sites/durham
Old Southington Landfill, Southington http://www.epa.gov/region1/superfund/sites/oldsouthington
Raymark Industries, Stratford http://www.epa.gov/region1/superfund/sites/raymark
Solvents Recovery Services of New England, Southington http://www.epa.gov/region1/superfund/sites/srs
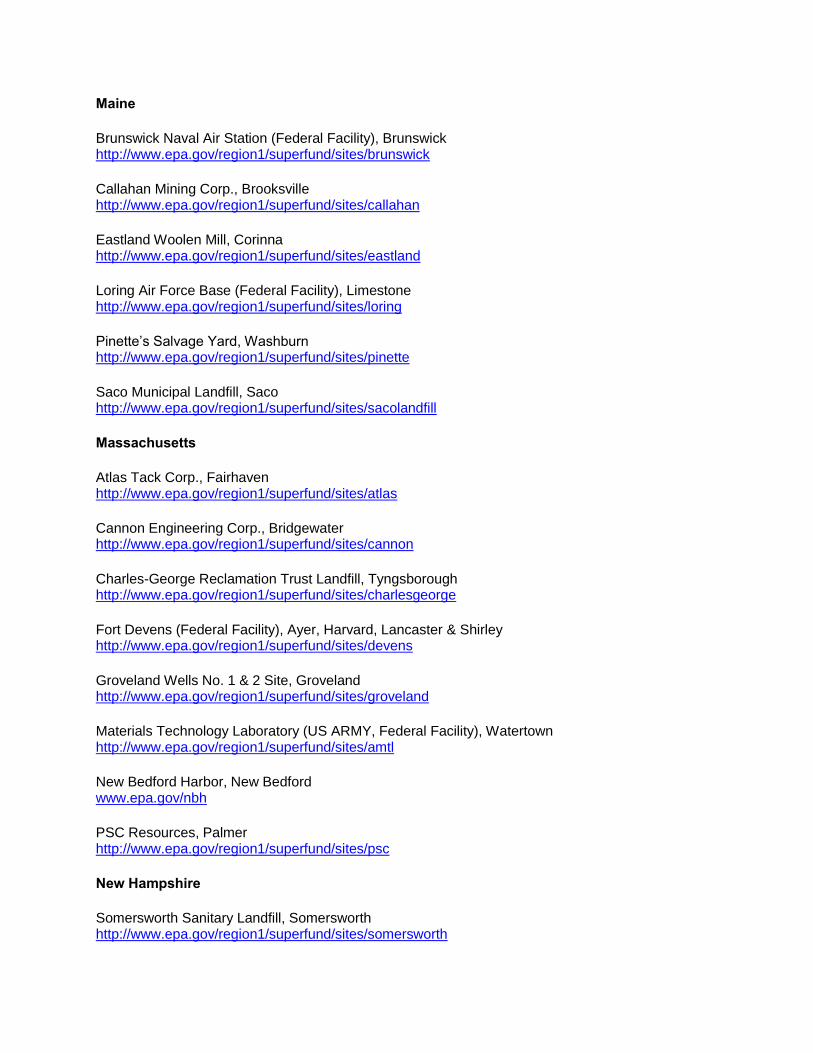
Maine
Brunswick Naval Air Station (Federal Facility), Brunswick http://www.epa.gov/region1/superfund/sites/brunswick
Callahan Mining Corp., Brooksville http://www.epa.gov/region1/superfund/sites/callahan
Eastland Woolen Mill, Corinna http://www.epa.gov/region1/superfund/sites/eastland
Loring Air Force Base (Federal Facility), Limestone http://www.epa.gov/region1/superfund/sites/loring
Pinette’s Salvage Yard, Washburn http://www.epa.gov/region1/superfund/sites/pinette
Saco Municipal Landfill, Saco http://www.epa.gov/region1/superfund/sites/sacolandfill
Massachusetts
Atlas Tack Corp., Fairhaven http://www.epa.gov/region1/superfund/sites/atlas
Cannon Engineering Corp., Bridgewater http://www.epa.gov/region1/superfund/sites/cannon
Charles-George Reclamation Trust Landfill, Tyngsborough http://www.epa.gov/region1/superfund/sites/charlesgeorge
Fort Devens (Federal Facility), Ayer, Harvard, Lancaster & Shirley http://www.epa.gov/region1/superfund/sites/devens
Groveland Wells No. 1 & 2 Site, Groveland http://www.epa.gov/region1/superfund/sites/groveland
Materials Technology Laboratory (US ARMY, Federal Facility), Watertown http://www.epa.gov/region1/superfund/sites/amtl
New Bedford Harbor, New Bedford www.epa.gov/nbh
PSC Resources, Palmer http://www.epa.gov/region1/superfund/sites/psc
New Hampshire
Somersworth Sanitary Landfill, Somersworth http://www.epa.gov/region1/superfund/sites/somersworth
South Municipal Water Supply Well (Five Year Review Addendum), Peterborough http://www.epa.gov/region1/superfund/sites/southmuni
Troy Mills Landfill, Troy http://www.epa.gov/region1/superfund/sites/troymills
Rhode Island
Stamina Mills Inc., North Smithfield http://www.epa.gov/region1/superfund/sites/stamina
West Kingston Town Dump/URI Disposal Area, South Kingstown http://www.epa.gov/region1/superfund/sites/wkingston
Vermont
Burgess Brothers Landfill, Woodford and Bennington http://www.epa.gov/region1/superfund/sites/burgess
Learn More about the Latest EPA News & Events in New England (http://www.epa.gov/region1/newsevents/index.html)
Follow EPA New England on Twitter (http://twitter.com/epanewengland)
Connect with EPA New England on Facebook (https://www.facebook.com/EPARegion1)
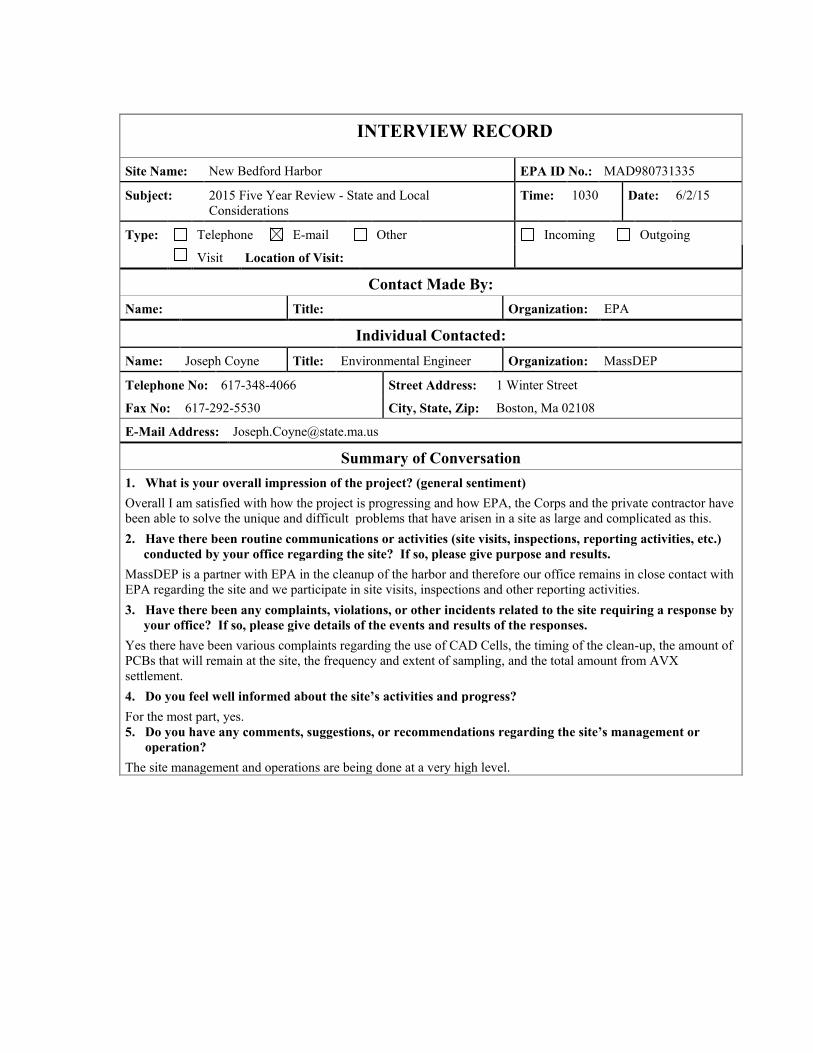
INTERVIEW RECORD
Site Name: New Bedford Harbor EPA ID No.: MAD980731335
Subject: 2015 Five Year Review - State and Local Considerations
Time: 1030 Date: 6/2/15
Type: Telephone E-mail Other Incoming Outgoing Visit Location of Visit:
Contact Made By: Name: Title: Organization: EPA
Individual Contacted: Name: Joseph Coyne Title: Environmental Engineer Organization: MassDEP
Telephone No: 617-348-4066 Street Address: 1 Winter Street
Fax No: 617-292-5530 City, State, Zip: Boston, Ma 02108
E-Mail Address: [email protected]
Summary of Conversation 1. What is your overall impression of the project? (general sentiment) Overall I am satisfied with how the project is progressing and how EPA, the Corps and the private contractor have been able to solve the unique and difficult problems that have arisen in a site as large and complicated as this. 2. Have there been routine communications or activities (site visits, inspections, reporting activities, etc.)
conducted by your office regarding the site? If so, please give purpose and results. MassDEP is a partner with EPA in the cleanup of the harbor and therefore our office remains in close contact with EPA regarding the site and we participate in site visits, inspections and other reporting activities. 3. Have there been any complaints, violations, or other incidents related to the site requiring a response by
your office? If so, please give details of the events and results of the responses. Yes there have been various complaints regarding the use of CAD Cells, the timing of the clean-up, the amount of PCBs that will remain at the site, the frequency and extent of sampling, and the total amount from AVX settlement. 4. Do you feel well informed about the site’s activities and progress? For the most part, yes. 5. Do you have any comments, suggestions, or recommendations regarding the site’s management or
operation? The site management and operations are being done at a very high level.
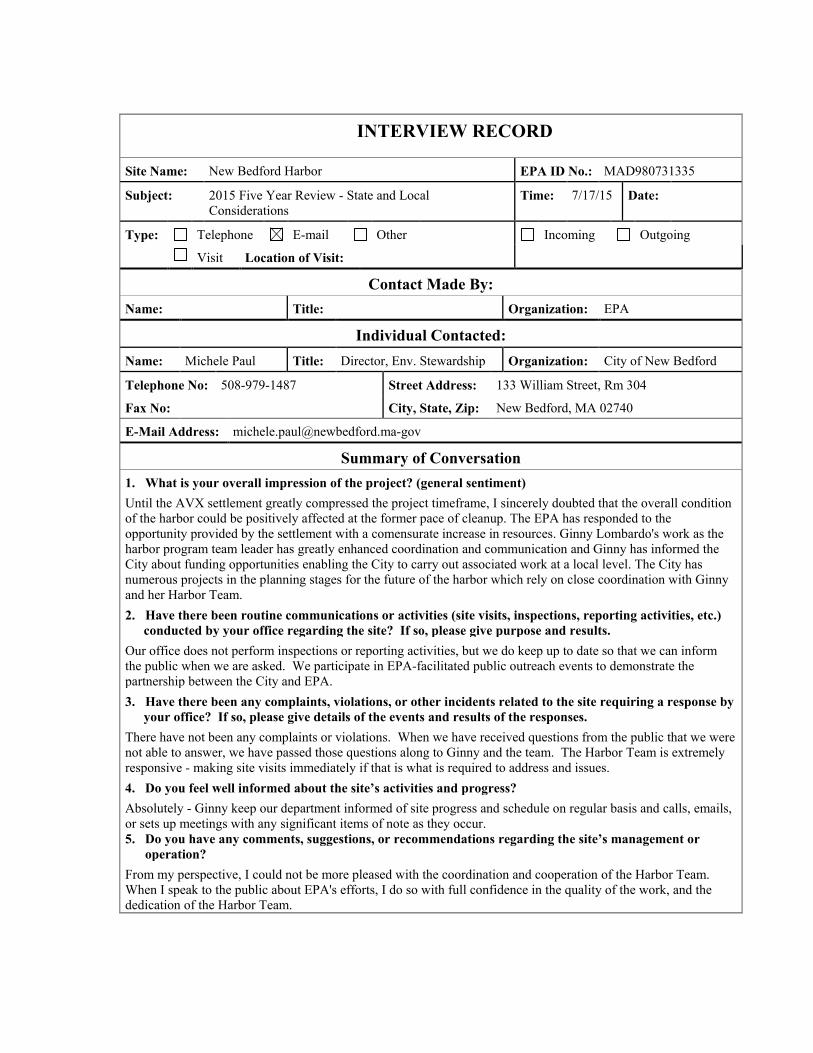
INTERVIEW RECORD
Site Name: New Bedford Harbor EPA ID No.: MAD980731335
Subject: 2015 Five Year Review - State and Local Considerations
Time: 7/17/15 Date:
Type: Telephone E-mail Other Incoming Outgoing Visit Location of Visit:
Contact Made By: Name: Title: Organization: EPA
Individual Contacted: Name: Michele Paul Title: Director, Env. Stewardship Organization: City of New Bedford
Telephone No: 508-979-1487 Street Address: 133 William Street, Rm 304
Fax No: City, State, Zip: New Bedford, MA 02740
E-Mail Address: [email protected]
Summary of Conversation 1. What is your overall impression of the project? (general sentiment) Until the AVX settlement greatly compressed the project timeframe, I sincerely doubted that the overall condition of the harbor could be positively affected at the former pace of cleanup. The EPA has responded to the opportunity provided by the settlement with a comensurate increase in resources. Ginny Lombardo's work as the harbor program team leader has greatly enhanced coordination and communication and Ginny has informed the City about funding opportunities enabling the City to carry out associated work at a local level. The City has numerous projects in the planning stages for the future of the harbor which rely on close coordination with Ginny and her Harbor Team. 2. Have there been routine communications or activities (site visits, inspections, reporting activities, etc.)
conducted by your office regarding the site? If so, please give purpose and results. Our office does not perform inspections or reporting activities, but we do keep up to date so that we can inform the public when we are asked. We participate in EPA-facilitated public outreach events to demonstrate the partnership between the City and EPA. 3. Have there been any complaints, violations, or other incidents related to the site requiring a response by
your office? If so, please give details of the events and results of the responses. There have not been any complaints or violations. When we have received questions from the public that we were not able to answer, we have passed those questions along to Ginny and the team. The Harbor Team is extremely responsive - making site visits immediately if that is what is required to address and issues. 4. Do you feel well informed about the site’s activities and progress? Absolutely - Ginny keep our department informed of site progress and schedule on regular basis and calls, emails, or sets up meetings with any significant items of note as they occur. 5. Do you have any comments, suggestions, or recommendations regarding the site’s management or
operation? From my perspective, I could not be more pleased with the coordination and cooperation of the Harbor Team. When I speak to the public about EPA's efforts, I do so with full confidence in the quality of the work, and the dedication of the Harbor Team.

INTERVIEW RECORD
Site Name: New Bedford Harbor EPA ID No.: MAD980731335
Subject: 2015 Five Year Review - State and Local Considerations
Time: Date: 7/31/15
Type: Telephone E-mail Other Incoming Outgoing Visit Location of Visit:
Contact Made By: Name: Kelsey O'Neil Title: Community Involvement
Coordinator Organization: EPA
Individual Contacted: Name: Edward Anthes-
Washburn Title: Acting Port Director Organization: New Bedford Harbor
Development Commission
Telephone No: 508-961-3000 Street Address: 52 Fishermans Wharf
Fax No: City, State, Zip: New Bedford, MA 02740
E-Mail Address:
Summary of Conversation 1. What is your overall impression of the project? (general sentiment) The AVX settlement has provided a needed funding source and a welcome increase in the pace of the harbor clean up. The HDC appreciates the cooperation and collaboration of the EPA team with respect to all aspects of the project. As the clean up moves forward, one of the HDC's primary concerns is to continue to make effective use of the State Enhanced Remedy (SER) Process to increase port activity and provide for additional dredging while removing additional PCBs from the environment. Without the SER process, the port would not be able to maintain and deepen vital channels and berths. In the months and years ahead, we look forward to further use of the SER process for federal channel maintenance dredging, Phase V berth dredging, the design of additional bulkheads in the North terminal and construction of a new Route 6 bridge. As the Superfund clean up progresses, we look forward to EPA's cooperation in working with the HDC and City to develop a mechanism for the SER, or a similarly efficient process, to be available once the EPA harbor clean up is completed. 2. Have there been routine communications or activities (site visits, inspections, reporting activities, etc.)
conducted by your office regarding the site? If so, please give purpose and results. HDC staff meets weekly with the EPA and Army Corps project team to review the progress of construction on the Lower Harbor CAD cell. These weekly meeting provide an excellent method to coordinate federal, state and city interests in the timely completion of CAD cell construction and other issues related to the harbor clean up. We appreciate the project teams' responsiveness to our requests for information and updates. 3. Have there been any complaints, violations, or other incidents related to the site requiring a response by
your office? If so, please give details of the events and results of the responses. Complaints and concerns regarding EPA operations have been expeditiously addressed by the EPA/Army Corps project team. 4. Do you feel well informed about the site’s activities and progress? Yes. 5. Do you have any comments, suggestions, or recommendations regarding the site’s management or
operation?

Public outreach efforts are well planned and executed - particularly the public meeting held in the Fairhaven Town Hall. One recommendation is to develop data and graphic handouts for the public as take aways from public meetings. Handouts could show work areas, pollution concentrations, etc. Handouts with key data and mapping would be welcomed by community members rather than a reference to a web page and could be used to inform and educate others.
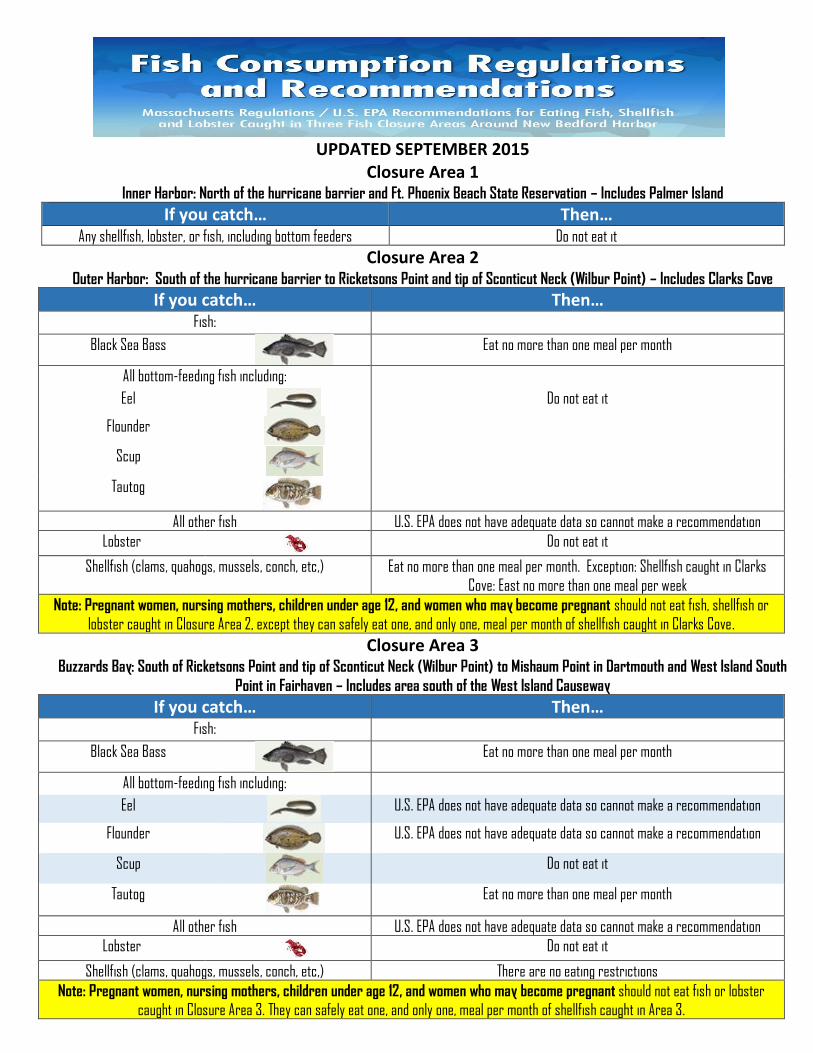
UPDATED SEPTEMBER 2015 Closure Area 1
Inner Harbor: North of the hurricane barrier and Ft. Phoenix Beach State Reservation – Includes Palmer Island
If you catch… Then… Any shellfish, lobster, or fish, including bottom feeders Do not eat it
Closure Area 2 Outer Harbor: South of the hurricane barrier to Ricketsons Point and tip of Sconticut Neck (Wilbur Point) – Includes Clarks Cove
If you catch… Then… Fish:
Black Sea Bass
Eat no more than one meal per month
All bottom-feeding fish including: Eel
Do not eat it
Flounder
Scup
Tautog
All other fish U.S. EPA does not have adequate data so cannot make a recommendation
Lobster Do not eat it
Shellfish (clams, quahogs, mussels, conch, etc,) Eat no more than one meal per month. Exception: Shellfish caught in Clarks
Cove: East no more than one meal per week
Note: Pregnant women, nursing mothers, children under age 12, and women who may become pregnant should not eat fish, shellfish or
lobster caught in Closure Area 2, except they can safely eat one, and only one, meal per month of shellfish caught in Clarks Cove.
Closure Area 3 Buzzards Bay: South of Ricketsons Point and tip of Sconticut Neck (Wilbur Point) to Mishaum Point in Dartmouth and West Island South
Point in Fairhaven – Includes area south of the West Island Causeway
If you catch… Then… Fish:
Black Sea Bass
Eat no more than one meal per month
All bottom-feeding fish including: Eel
U.S. EPA does not have adequate data so cannot make a recommendation
Flounder
U.S. EPA does not have adequate data so cannot make a recommendation
Scup
Do not eat it
Tautog
Eat no more than one meal per month
All other fish U.S. EPA does not have adequate data so cannot make a recommendation
Lobster Do not eat it
Shellfish (clams, quahogs, mussels, conch, etc,) There are no eating restrictions
Note: Pregnant women, nursing mothers, children under age 12, and women who may become pregnant should not eat fish or lobster
caught in Closure Area 3. They can safely eat one, and only one, meal per month of shellfish caught in Area 3.
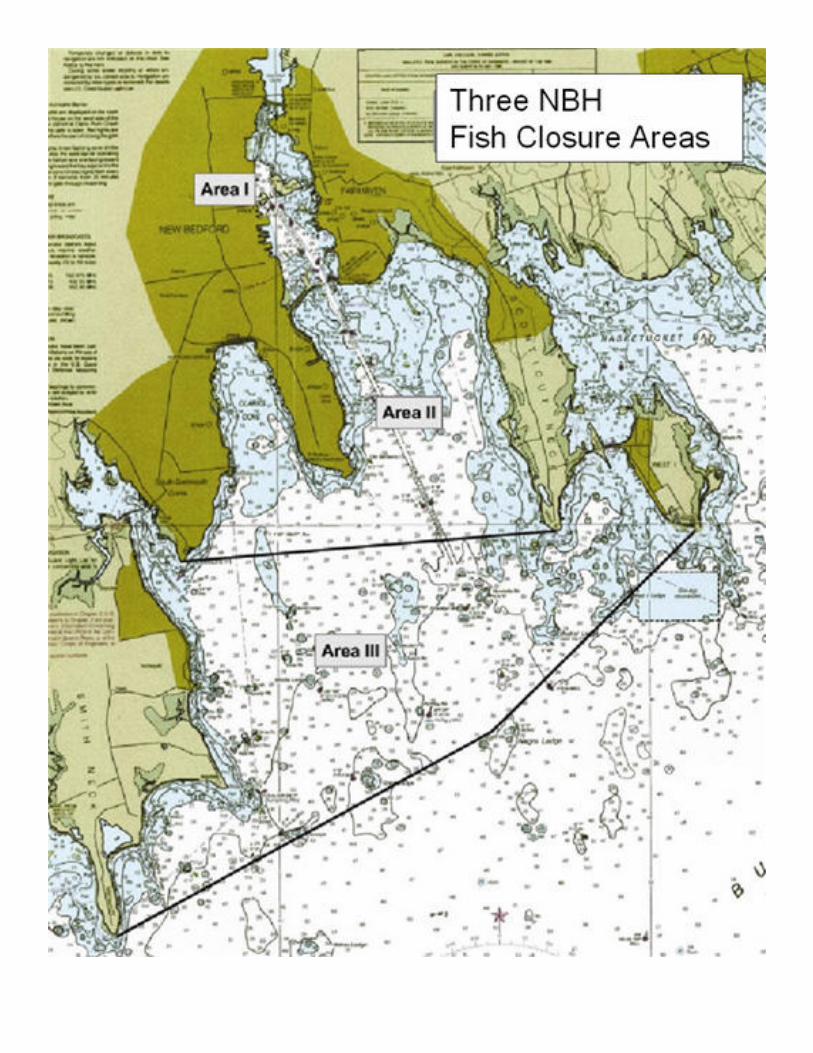
Thrree NB,H Fish Closure Areas
..
•
.. • .. ..
• .. .. "' • .. .. ... Iii .. I!! , ..
• ,. • .. • • ... \) .. • •
,_ • 0 -• .. -· ~ • .,
• .. .. . .. .. .. .. .. Ill Ii • • ·- "'

APPENDIX D – RISK ASSESSMENT UPDATES DERMAL/INCIDENTAL CONTACT RISK UPDATE MEMO SEAFOOD TISSUE RISK UPDATE MEMO
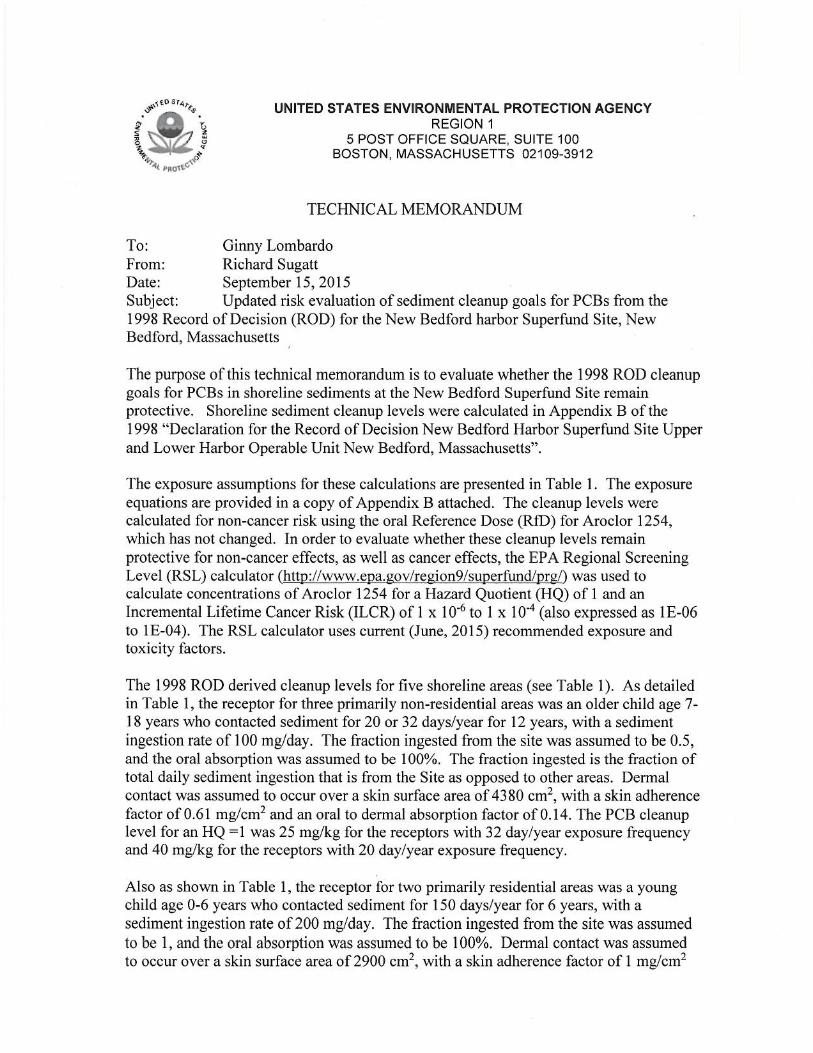
UNITED ST ATES ENVIRONMENT AL PROTECTION AGENCY REGION 1
5 POST OFFICE SQUARE, SUITE 100 BOSTON, MASSACHUSETTS 02109-3912
TECHNICAL MEMORANDUM
To: Ginny Lombardo From: Richard Sugatt Date: September 15, 2015 Subject: Updated risk evaluation of sediment cleanup goals for PCBs from the 1998 Record of Decision (ROD) for the New Bedford harbor Superfund Site, New Bedford, Massachusetts
The purpose of this technical memorandum is to evaluate whether the 1998 ROD cleanup goals for PCBs in shoreline sediments at the New Bedford Superfund Site remain protective. Shoreline sediment cleanup levels were calculated in Appendix B of the 1998 "Declaration for the Record of Decision New Bedford Harbor Superfund Site Upper and Lower Harbor Operable Unit New Bedford, Massachusetts".
The exposure assumptions for these calculations are presented in Table 1. The exposure equations are provided in a copy of Appendix B attached. The cleanup levels were calculated for non-cancer risk using the oral Reference Dose (RID) for Aroclor 1254, which has not changed. In order to evaluate whether these cleanup levels remain protective for non-cancer effects, as well as cancer effects, the EPA Regional Screening Level (RSL) calculator (http://www.epa.gov/region9/superfund/prg/) was used to calculate concentrations of Aroclor 1254 for a Hazard Quotient (HQ) of 1 and an Incremental Lifetime Cancer Risk (ILCR) of 1 x 10⁻⁶ to 1 x 10⁴ (also expressed as 1 E-06 to lE-04). The RSL calculator uses current (June, 2015) recommended exposure and toxicity factors.
The 1998 ROD derived cleanup levels for five shoreline areas (see Table 1 ). As detailed in Table 1, the receptor for three primarily non-residential areas was an older child age 7-18 years who contacted sediment for 20 or 32 days/year for 12 years, with a sediment ingestion rate of 100 mg/day. The fraction ingested from the site was assumed to be 0.5, and the oral absorption was assumed to be 100%. The fraction ingested is the fraction of total daily sediment ingestion that is from the Site as opposed to other areas. Dermal contact was assumed to occur over a skin surface area of 4380 cm2, with a skin adherence factor of 0.61 mg/cm2 and an oral to dermal absorption factor of 0.14. The PCB cleanup level for an HQ = l was 25 mg/kg for the receptors with 32 day/year exposure frequency and 40 mg/kg for the receptors with 20 day/year exposure frequency.
Also as shown in Table 1, the receptor for two primarily residential areas was a young child age 0-6 years who contacted sediment for 150 days/year for 6 years, with a sediment ingestion rate of 200 mg/day. The fraction ingested from the site was assumed to be 1, and the oral absorption was assumed to be l 00%. Dermal contact was assumed to occur over a skin surface area of 2900 cm2, with a skin adherence factor of 1 mg/cm2
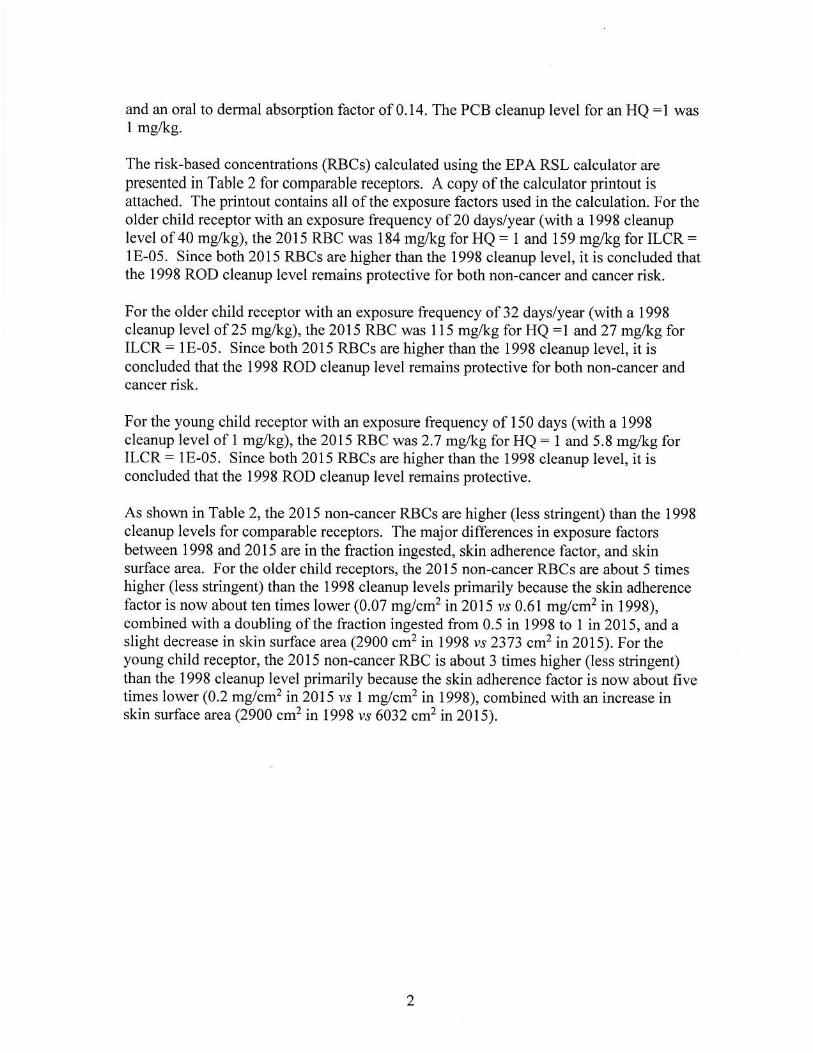
and an oral to dermal absorption factor of 0.14. The PCB cleanup level for an HQ =1 was l mg/kg.
The risk-based concentrations (RBCs) calculated using the EPA RSL calculator are presented in Table 2 for comparable receptors. A copy of the calculator printout is attached. The printout contains all of the exposure factors used in the calculation. For the older child receptor with an exposure frequency of20 days/year (with a 1998 cleanup level of 40 mg/kg), the 2015 RBC was 184 mg/kg for HQ = 1 and 159 mg/kg for ILCR = 1 E-05. Since both 2015 RBCs are higher than the 1998 cleanup level, it is concluded that the 1998 ROD cleanup level remains protective for both non-cancer and cancer risk.
For the older child receptor with an exposure frequency of 32 days/year (with a 1998 cleanup level of 25 mg/kg), the 2015 RBC was 115 mg/kg for HQ = l and 27 mg/kg for ILCR = lE-05. Since both 2015 RBCs are higher than the 1998 cleanup level, it is concluded that the 1998 ROD cleanup level remains protective for both non-cancer and cancer risk.
For the young child receptor with an exposure frequency of 150 days (with a 1998 cleanup level of 1 mg/kg), the 2015 RBC was 2.7 mg/kg for HQ = 1 and 5.8 mg/kg for ILCR = 1 E-05. Since both 2015 RB Cs are higher than the 1998 cleanup level, it is concluded that the 1998 ROD cleanup level remains protective.
As shown in Table 2, the 2015 non-cancer RBCs are higher (less stringent) than the 1998 cleanup levels for comparable receptors. The major differences in exposure factors between 1998 and 2015 are in the fraction ingested, skin adherence factor, and skin surface area. For the older child receptors, the 2015 non-cancer RBCs are about 5 times higher (less stringent) than the 1998 cleanup levels primarily because the skin adherence factor is now about ten times lower (0.07 mg/cm2 in 2015 vs 0.61 mg/cm2 in I 998), combined with a doubling of the fraction ingested from 0.5 in 1998 to 1in 2015, and a slight decrease in skin surface area (2900 cm2 in 1998 vs 2373 cm2 in 2015). For the young child receptor, the 2015 non-cancer RBC is about 3 times higher (less stringent) than the 1998 cleanup level primarily because the skin adherence factor is now about five times lower (0.2 mg/cm2 in 2015 vs 1 mg/cm2 in 1998), combined with an increase in skin surface area (2900 cm2 in 1998 vs 6032 cm2 in 20 I 5).
2
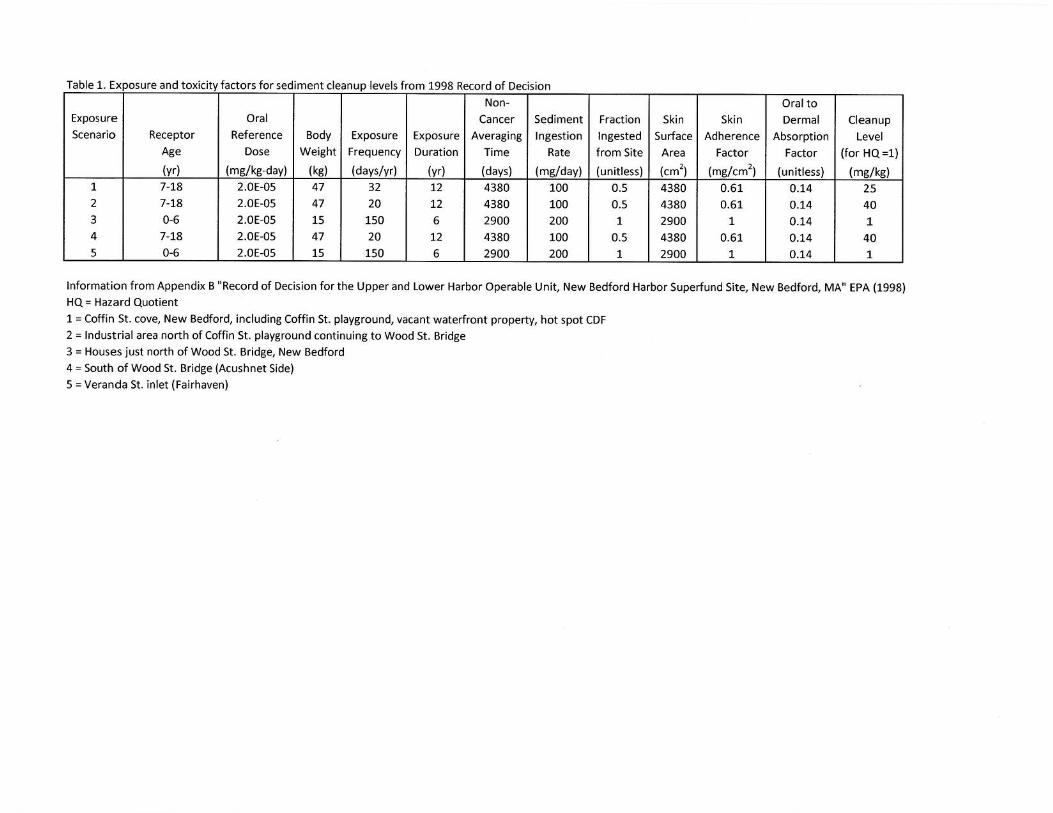
Table 1. Exposure and toxicity factors for sediment cleanup levels from 1998 Record of Decision
Non- Oral to Exposure Oral Cancer Sediment Fraction Skin Skin Dermal Cleanup Scenario Receptor Reference Body Exposure Exposure Averaging Ingestion Ingested Surface Adherence Absorption Level
Age Dose Weight Frequency Duration Time Rate from Site Area Factor Factor (for HQ=l)
(yr) (mg/kg-day) (kg) (days/yr) (yr) (days) (mg/day) (unitless) (cm2) (mg/cm2
) (unitless) (mg/kg) 1 7-18 2.0E-05 47 32 12 4380 100 0.5 4380 0.61 0.14 25 2 7-18 2.0E-05 47 20 12 4380 100 0.5 4380 0.61 0.14 40 3 0-6 2.0E-05 15 150 6 2900 200 1 2900 1 0.14 1 4 7-18 2.0E-05 47 20 12 4380 100 0.5 4380 0.61 0.14 40 5 0-6 2.0E-05 15 150 6 2900 200 1 2900 1 0.14 1
Information from Appendix B "Record of Decision for the Upper and Lower Harbor Operable Unit, New Bedford Harbor Superfund Site, New Bedford, MA" EPA (1998) HQ= Hazard Quotient
1 = Coffin St. cove, New Bedford, including Coffin St. playground, vacant waterfront property, hot spot CDF 2 = Industrial area north of Coffin St. playground continuing to Wood St. Bridge 3 = Houses just north of Wood St. Bridge, New Bedford
4 = South of Wood St. Bridge (Acushnet Side)
5 =Veranda St. inlet (Fairhaven)
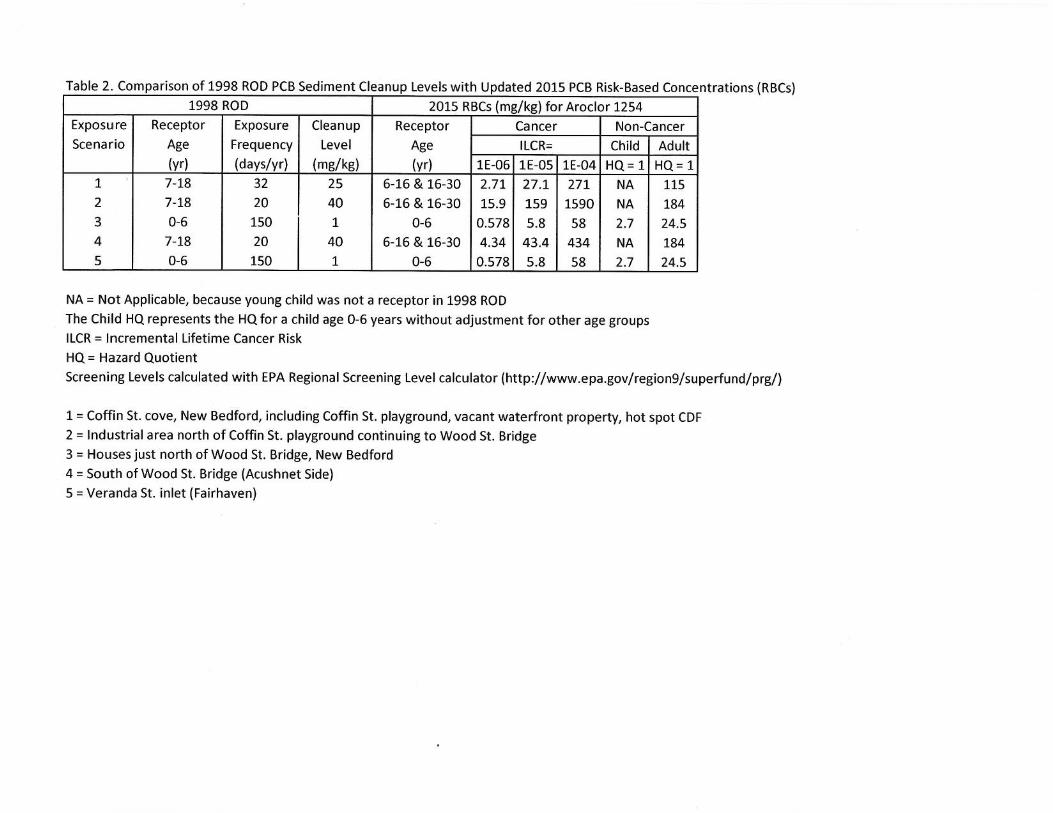
Table 2. Comparison of 1998 ROD PCB Sediment Cleanup Levels with Updated 2015 PCB Risk-Based Concentrations (RBCs) 1998 ROD 2015 RBCs (mg/kg) for Aroclo r 1254
Exposure Receptor Exposure Cleanup Receptor Cancer Non-Cancer Scenario Age Frequency Level Age ILCR= Child
(yr) (days/yr) (mg/kg) (yr) lE-06 lE-05 lE-04 HQ= 1 1 7-18 32 25 6-16 & 16-30 2.71 27.1 271 NA 2 7-18 20 40 6-16 & 16-30 15.9 159 1590 NA
3 0-6 150 1 0-6 0.578 5.8 58 2.7 4 7-18 20 40 6-16 & 16-30 4.34 43.4 434 NA 5 0-6 150 1 0-6 0.578 5.8 58 2.7
NA= Not Applicable, because young child was not a receptor in 1998 ROD
The Child HQ represents the HQ for a child age 0-6 years without adjustment for other age groups ILCR = Incremental lifetime Cancer Risk
HQ= Hazard Quotient
Adult
HQ= 1
115
184
24.5
184
24.5
Screening Levels calculated with EPA Regional Screening Level calculator (http://www.epa.gov/region9/superfund/prg/)
1 = Coffin St. cove, New Bedford, including Coffin St . playground, vacant waterfront property, hot spot CDF 2 = Indust rial area north of Coffin St. playground continuing to Wood St. Bridge 3 = Houses j ust north of Wood St. Bridge, New Bedford 4 =South of Wood St. Bridge (Acushnet Side)
5 =Veranda St. inlet (Fairhaven)
APPENDIX B
CALCULATIONS SUPPORTING UPDATED SHORELINE CLEANUP LEVELS
NEW BEDFORD BARBOR SUPERFUND SITE - ROD 2
1. Coffin Street cove, New Bedford: This area contains three subareas; the Coffin Street playground area, a recently cleared waterfront property and the hot spot CDF area.
a. Coffin Street playground: This is a well established playground with swings, a playset, ballfield, hockey court and an old outdoor shower. Adjacent and very close to this area is the shoreline bordered by a narrow strip of saltmarsh. There is currently a fence between the playground and shoreline although there is evidence that individuals can trespass over the fence. In addition, well worn paths are present within the fenced area to the shoreline. The playground is surrounded by homes. It is reasonable to assume that an older child aged seven to eighteen could access the shoreline and saltmarshes two times per week during the summer months of June, July and August and one time per week during May and September.
b. Vacant waterfront property: This area was cleared of an old (Pierce) mill complex in 1997. The City of New Bedford has proposed use of at least part of this area as a "Riverside" park. Since the fringe saltrnarsh conditions are very similar to those bordering the Coffin Street playground, the potential exposures and receptor are assumed to be the same as for the playground area.
c. CDF: It is reasonable to assume that the hot spot CDF could be converted into a recreational or park area in the future to match the land use of the other properties bordering the cove. As with the playground and vacant waterfront property, it is likely that the fringe saltmarsh in this area would remain and act as a buffer limiting complete access to the shoreline. Based on this future scenario, a future exposure scenario and receptor could be the same as for these other waterfront properties bordering the cove.
d. Proposed cleanup level: All three areas of the Cove have the same receptor and exposure pathways, thus the same cleanup level should be attained in all three areas. The 95% Upper Confidence Level on the arithmetic mean of exposed sediments in these areas should meet the cleanup goal derived below since this is the statistic utilized in assessing exposure in risk assessments.
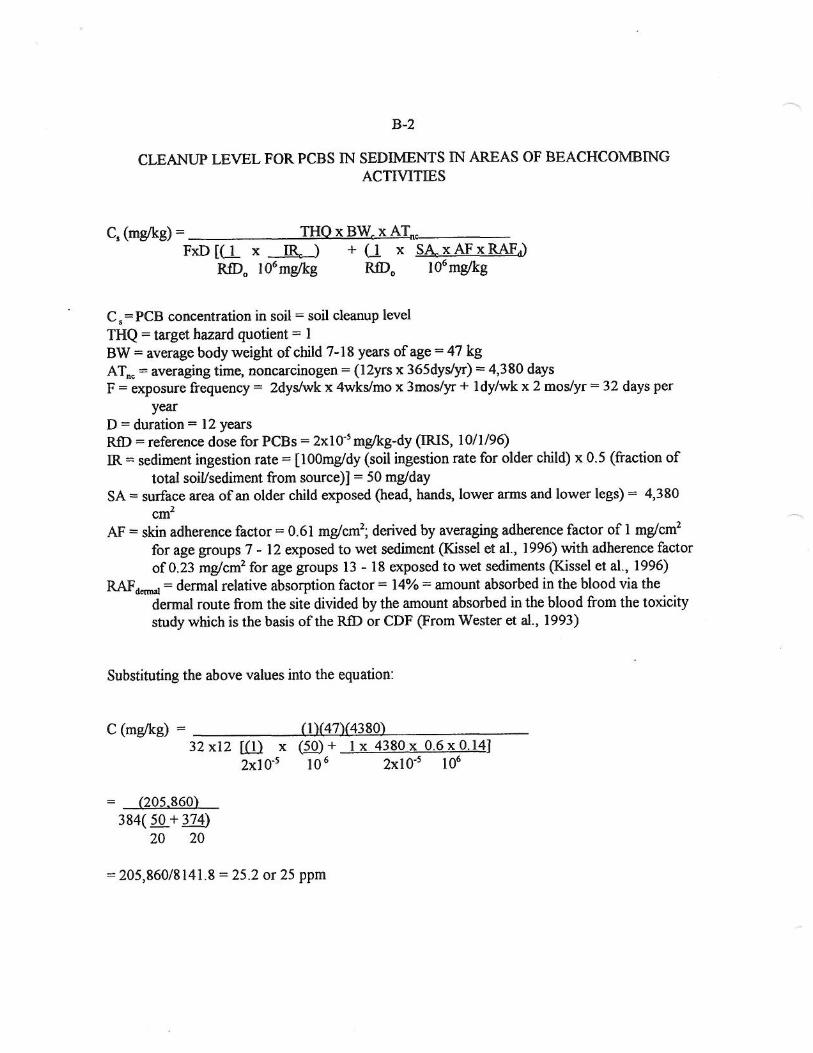
B-2
CLEANUP LEVEL FOR PCBS IN SEDIMENTS IN AREAS OF BEACHCOMBING
ACTMTIES
C, (mg/kg)= THO X BWc X ATnie------FxD [(l x IR., ) + U x SA., x AF x RAF~
RID 0 I 06 mg/kg RID 0 106 mg/kg
Cs= PCB concentration in soil = soil cleanup level
THQ = target hazard quotient = 1 BW =average bodyweight of child 7-18 years of age= 47 kg AT0 c = averaging time, noncarcinogen = (12yrs x 365dys/yr) == 4,380 days F = exposure frequency = 2dys/wk x 4wks/mo x 3mos/yr + 1 dy/wk x 2 mos/yr = 32 days per
year D = duration = 12 years RID= reference dose for PCBs = 2x10-s mg/kg-dy (IRIS, 10/1/96)
IR= sediment ingestion rate = [lOOmg/dy (soil ingestion rate for older child) x 0.5 (fraction of
total soil/sediment from source)]= 50 mg/day SA= surface area of an older child exposed (head, hands, lower arms and lower legs)= 4,380
cm2
AF== skin adherence factor = 0.61 mg/cm2; derived by averaging adherence factor of 1 mg/cm2
for age groups 7 - 12 exposed to wet sediment (Kissel et al., 1996) with adherence factor
of 0.23 mg/cm2 for age groups 13 - 18 exposed to wet sediments (Kissel et al., 1996)
RAF c1mna1 = dermal relative absorption factor = 14% = amount absorbed in the blood via the
dermal route from the site divided by the amount absorbed in the blood from the toxicity
study which is the basis of the RID or CDF (From Wester et al., 1993)
Substituting the above values into the equation:
C (mg/kg) = (1)(47)(4380) 32 xl2 [ill x (50) + 1 x 4380 x 0.6x0.14]
2xJ0·5 10 6 2x10-s 106
(205.860) 384( N. + 374)
20 20
= 205,860/8141.8 = 25.2 or 25 ppm
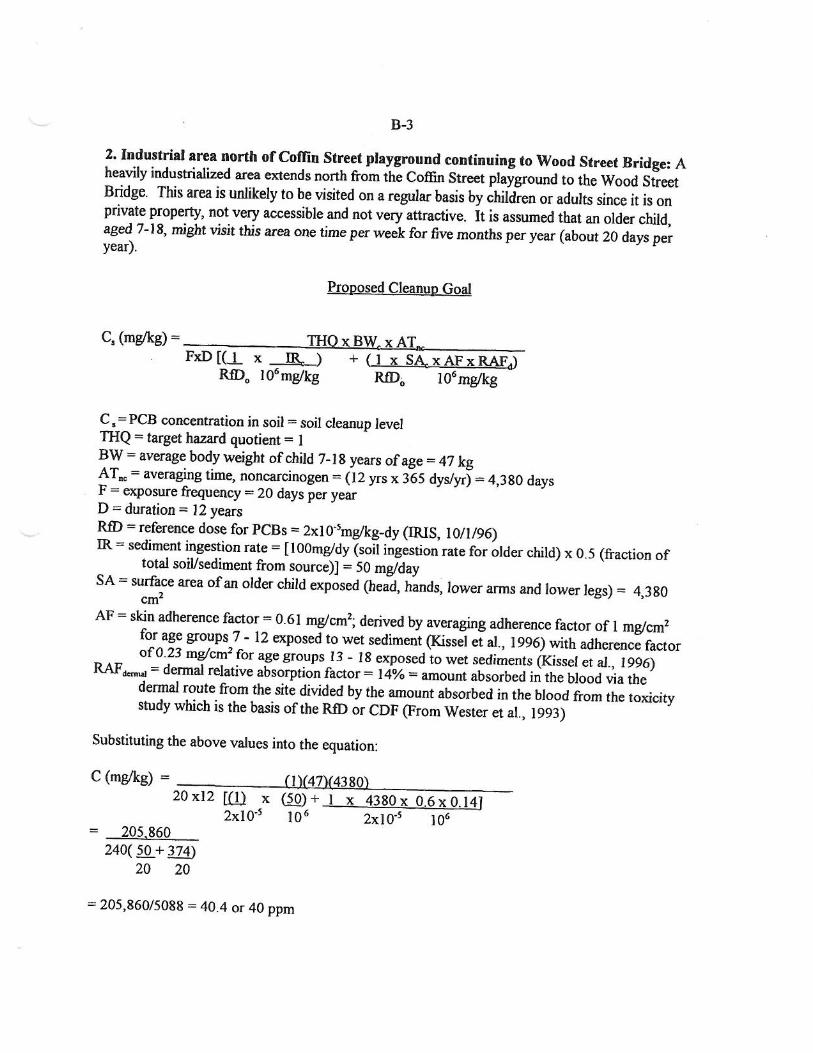
B-3
2. Industrial area north of Coffin Street playground continuing to Wood Street Bridge: A heavily industrialized area extends north from the Coffin Street playground to the Wood Street Bridge. This area is unlikely to be visited on a regular basis by children or adults since it is on private property, not very accessible and not very attractive. It is assumed that an older child, aged 7-J 8, might visit this area one time per week for five months per year (about 20 days per year).
Proposed Cleanup Goal
Cs (mg/kg)= THO X BWc X ATnc FxD [ (J_ x I& ) + ( I x SA x AF x RAF .J
RID 0 106 mg/kg RfD0 106 mg/kg
C 1 = PCB concentration in soil = soil cleanup level 1HQ = target hazard quotient = 1 BW =average body weight of child 7-18 years of age= 47 kg ATnc =averaging time, noncarcinogen = (12 yrs x 365 dys/yr) = 4,380 days F = exposure frequency = 20 days per year D = duration = J 2 years RID= reference dose for PCBs = 2xl0·5mg/kg-dy (IRIS, 10/1/96) IR = sediment ingestion rate= [lOOmg/dy (soil ingestion rate for older child) x 0.5 (fraction of
total soiVsediment from source)]= 50 mg/day SA = surface area of an older child exposed (head, hands, lower anns and lower legs) = 4,380 cm2
AF= skin adherence factor = 0.61 mg/cm2; derived by averaging adherence factor of 1 mg/cm2
for age groups 7 - 12 exposed to wet sediment (Kissel et al., 1996) with adherence factor of0.23 mg/crn2 for age groups 13 - 18 exposed to wet sediments (Kissel et al., 1996) RAF6cnno1 =dermal relative absorption factor = 14% =amount absorbed in the blood via the dennal route from the site divided by the amount absorbed in the blood from the toxicity study which is the basis of the RID or CDF (From Wester et al., 1993)
Substituting the above values into the equation:
C (mg/kg) = (1)(47)(4380) 20 x12 [(l) x (50) + 1 x 4380 x 0.6 x 0.141
2x10-s 10 6 2x10·5 106
= 205 860 240( 2.Q_ + 374)
20 20
= 205,860/5088 = 40.4 or 40 ppm
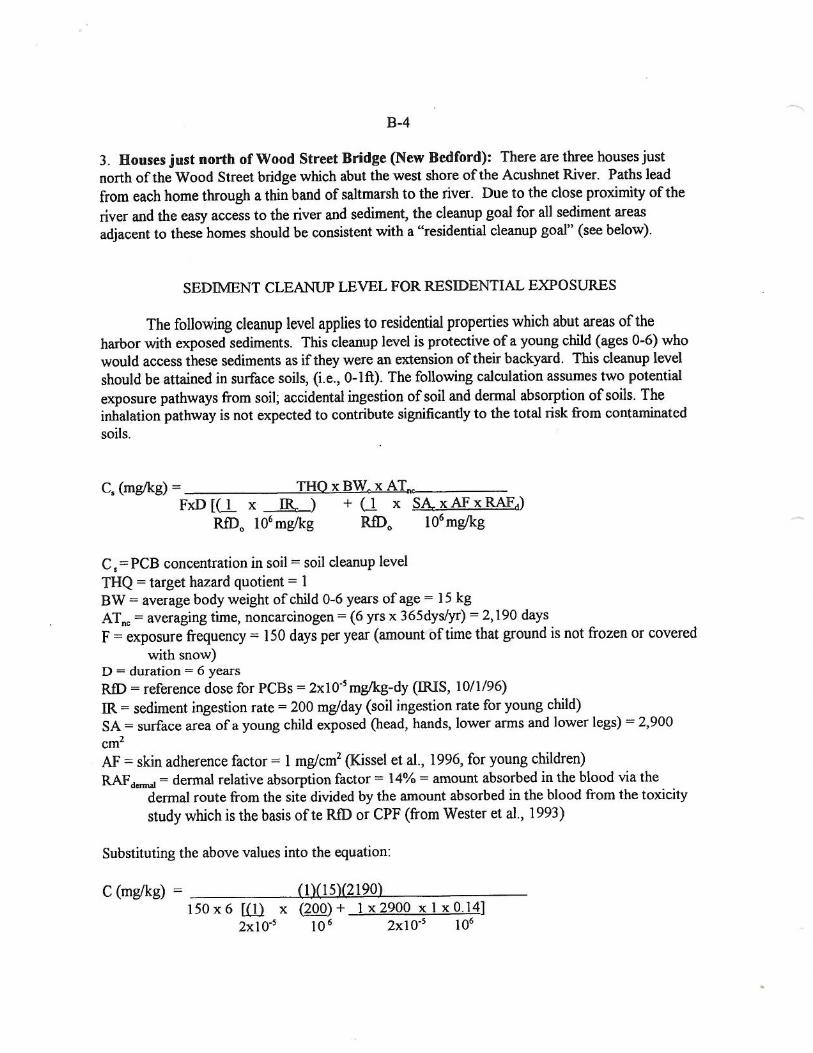
B-4
3. Houses just north of Wood Street Bridge {New Bedford): There are three houses just
north of the Wood Street bridge which abut the west shore of the Acushnet River. Paths lead
from each home through a thin band of saltmarsh to the river. Due to the close proximity of the
river and the easy access to the river and sediment, the cleanup goal for all sediment areas
adjacent to these homes should be consistent with a "residential cleanup goal" (see below).
SEDIMENT CLEANUP LEVEL FOR RESIDENTIAL EXPOSURES
The following cleanup level applies to residential properties which abut areas of the
harbor with exposed sediments. This cleanup level is protective of a young child (ages 0-6) who
would access these sediments as if they were an extension of their backyard. This cleanup level
should be attained in surface soils, (i.e., 0-1 ft) . The following calculation assumes two potential
exposure pathways from soil; accidental ingestion of soil and dermal absorption of soils. The
inhalation pathway is not expected to contribute significantly to the total risk from contaminated
soils.
C, (mg/kg)= THO X BWc X ATnc-------FxD [(.l x IR: ) + U x SA xAF xRAFd)
RID0 106 mg/kg RfD0 106 mg/kg
C, = PCB concentration in soil = soil cleanup level
THQ = target hazard quotient = 1 BW = average body weight of child 0-6 years of age = 15 kg ATru: =averaging time, noncarcinogen = (6 yrs x 365dys/yr) = 2, 190 days
F = exposure frequency = 150 days per year (amount of time that ground is not frozen or covered
with snow) D = duration = 6 years RID = reference dose for PCBs = 2xl0-5 mg/kg-dy (IRIS, 10/ 1/96)
IR = sediment ingestion rate = 200 mg/day (soil ingestion rate for young child)
SA = surface area of a young child exposed (head, hands, lower arms and lower legs) = 2,900
cm2
AF = skin adherence factor = 1 mg/cm2 (Kissel et al., 1996, for young children)
RAFdama1 =dermal relative absorption factor = 14% =amount absorbed in the blood via the
dermal route from the site divided by the amount absorbed in the bJood from the toxicity
study which is the basis of te RID or CPF (from Wester et al., 1993)
Substituting the above values into the equation:
C (mg/kg) = (1)(15)(2190) 150 x 6 [.(ll x (200) + 1x2900 x Ix 0.14]
2x10⁻⁵ 10 6 2x10-s 106
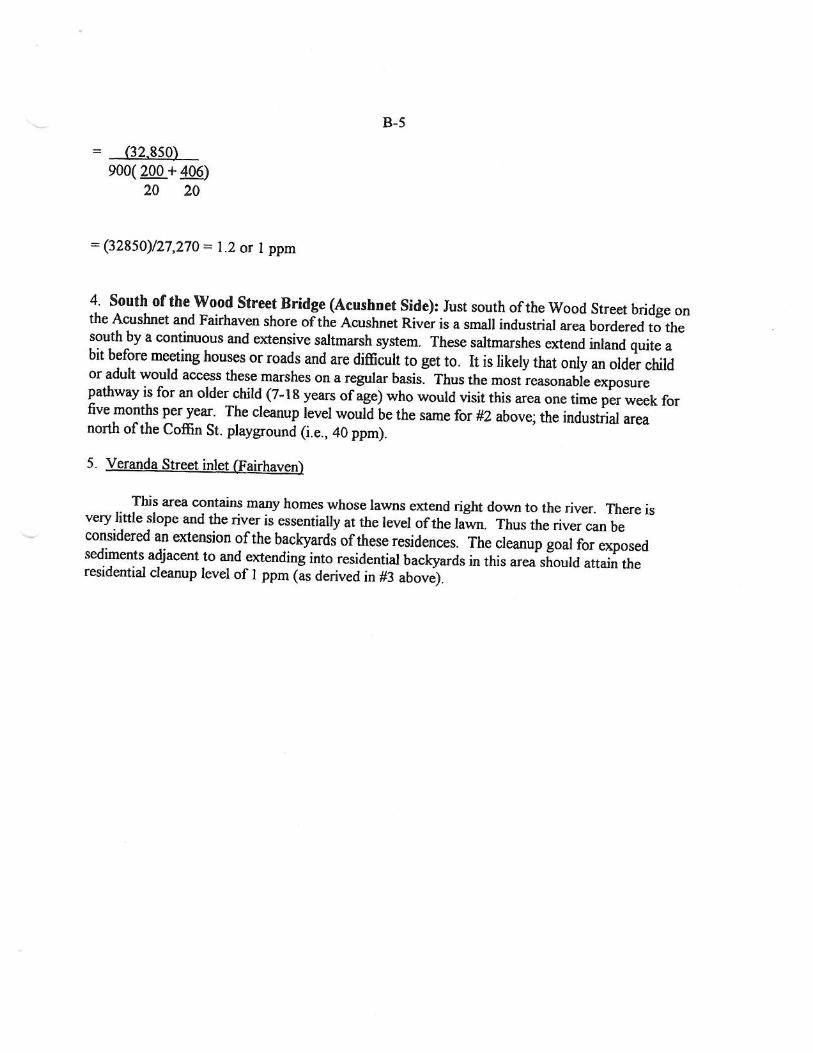
= (32.850) 900( 200 + 406)
20 20
= (32850)/27,270 = 1.2 or l ppm
B-5
4. South of the Wood Street Bridge (Acushnet Side): Just south of the Wood Street bridge on the Acushnet and Fairhaven shore of the Acushnet River is a small industrial area bordered to the south by a continuous and extensive saltmarsh system. These saltmarshes extend inland quite a bit before meeting houses or roads and are difficult to get to . It is likely that only an older child or adult would access these marshes on a regular basis. Thus the most reasonable exposure pathway is for an older child (7-18 years of age) who would visit this area one time per week for five months per year. The cleanup level would be the same for #2 above; the industrial area north of the Coffin St. playground (i.e., 40 ppm).
5. Veranda Street inlet (Fairhaven)
This area contains many homes whose lawns extend right down to the river. There is very little slope and the river is essentially at the level of the lawn. Thus the river can be considered an extension of the backyards of these residences. The cleanup goal for exposed sediments adjacent to and extending into residential backyards in this area should attain the residential cleanup level of l ppm (as derived in #3 above).

Site-specific Recreator Equation Inputs for Soil
Variable TR (target cancer risk) unitless
SArecsc (skin surface area - child) cm 2tday
SArecsa (skin surface area - adult) cm 2 !day
SAo-2 (skin surface area - mutagenic) cm 2tday
SA2_6 (skin surface area - mutagenic) cm 2tday
SA6_16 (skin surface area - mutagenic) cm 2/day
SA, 6_30 (skin surface area - mutagenic) cm 2/day
SArecsa (skin surface area - adult) cm 2tday
THQ (target hazard quotient) unitless
Value 1.0E-6
2373
6032
2373
2373
6032
6032
6032
1 LT (lifetime - recreator) year 70 IFSrar_.,,~; (age-adj usted soil ingestion factor) mg/kg 2100 DFS:~r~~~; (age-adjusted soil dermal factor) mg/kg 5908 IFSM:~r~~~; (mutagenic age-adjusted soil ingestion factor) mg/kg 9533.333 DFSM:~-:~~~; (mutagenic age-adjusted soil dermal factor) mg/kg 24472 ~:J EF,'-., (exposure frequency) day/year 20 ·~ EF.,_,. (exposure frequency) day/year 20 EF ,__ 1,. (exposure frequency) day/year 20 EF 1 ,._~ri (exposure frequency) day/year 20 EFrarcr (exposure frequency - child) day/year 20
EF rare -:. (exposure frequency - adult) day/year 20
EFrare"' (exposure frequency - adult) day/year 20 EF rare {exposure frequency - recreator) day/year 20 IRS"-., (soil intake rate) mg/day 200 IRS.,_,. {soil intake rate) mg/day 200 IRS,._1 ,. (soil intake rate) mg/day 100 IRS 1 ,__~ri {soil intake rate) mg/day 100 IRSrarcr {soil intake rate - child) mg/day 200 IRSrecsa (soil intake rate - adult) mg/day 100
Output generated 25AUG2015:09:46:02
1

Site-specific Recreator Equation Inputs for Soil
Variable IRS,.,,...,.,, (soil intake rate - adult) mg/day ED(\_, (exposure duration) year
ED,_,:; (exposure duration) year
EDui:; (exposure duration) year
ED1 i:;_<f'\ (exposure duration) year
ED,.,,...,.,.. (exposure duration - child) year
ED,.,,...,..,, (exposure duration - adult) year
ED,.,,...,..,. (exposure duration - adult) year
ED,.,,...,. (exposure duration - recreator) year
ET(\_, (exposure time) hr/day
ET,_,:; (exposure time) hr/day
ET u,:; (exposure time) hr/day
ET1 i:;_<f'\ (exposure time) hr/day
ET,.,,...,.,. (exposure time - child) hr/day
ET,.,,..,..,. (exposure time - adult) hr/day
ET,.,,.., .,. (exposure time - adult) hr/day
ET,0
,...,. (exposure time - recreator) hr/day
BW (\_., (body weight) kg
BW.,..h (body weight) kg
BW i:;_ 1,:; (body weight) kg
BW 1 ,:;_ <(\ (body weight) kg
BW ,0
,..,.,. (body weight - child) kg
BW ,0
,..,.,, (body weight - adult) kg
BW ,.,,..,..,. (body weight - adult) kg
AF o-~ -C~kin adherence factor) mg/cm 2
AF2_6 (skin adherence factor) mg/cm 2
AF 6_ 16 (skin adherence factor) mg/cm 2
AF16_30 (skin adherence factor) mg/cm2
AF recsc (skin adherence factor - child) mg/cm 2
Output generated 25AUG2015:09:46:02
2
Value 100
2
4
10 10
6
20
20
26
4
4
2
2
4
2
2
2.462
15
15
80
80
15
80
80
0.2
0.2
0.07
0.07
0.2
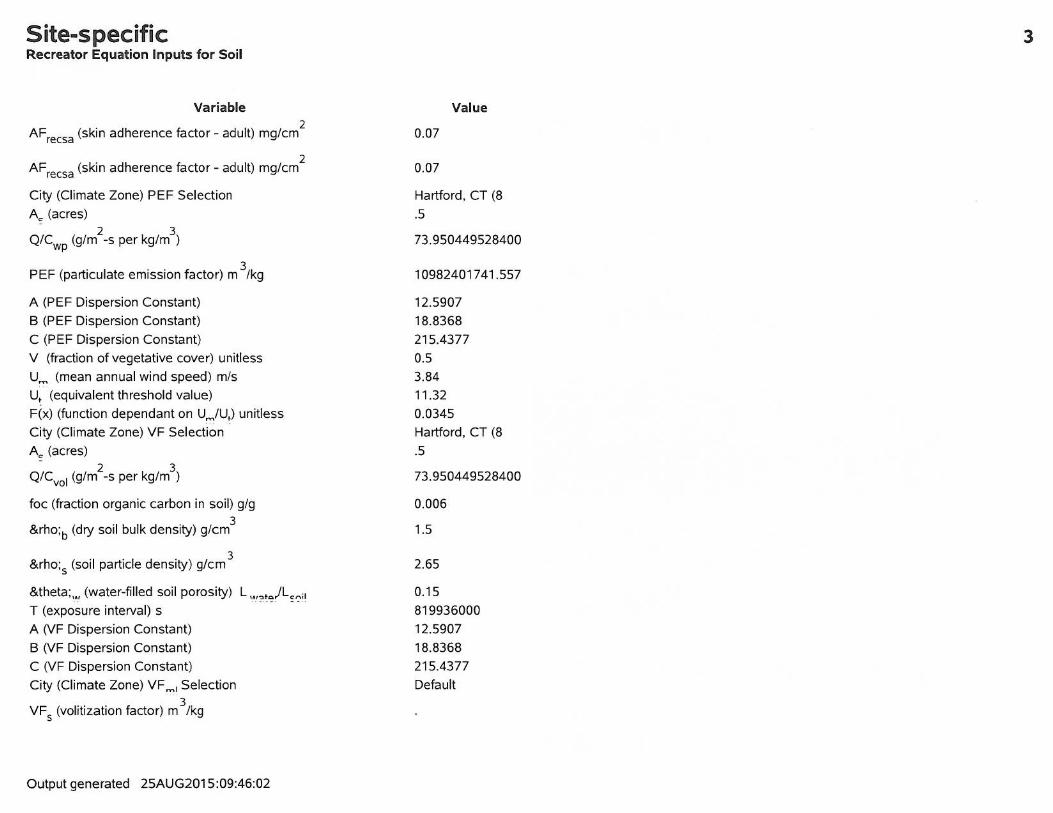
S ite-s pee ific Recreator Equation Inputs for Soil
Variable
AFrecsa (skin adherence factor - adult) mg/cm2
AFrecsa (skin adherence factor - adult) mg/cm 2
City (Climate Zone) PEF Selection
Ae (acres) 2 3
Q/Cwp (g/m -s per kg/m )
PEF (particulate emission factor) m 3tkg
A (PEF Dispersion Constant)
B (PEF Dispersion Constant)
C (PEF Dispersion Constant)
V (fraction of vegetative cover) unitless
um (mean annual wind speed) mis
u. (equivalent threshold value)
F(x) (function dependant on Um/U,) unitless
City (Climate Zone) VF Selection
A"' (acres) 2 3
Q/Cvol (g/m -s per kg/m )
foe (fraction organic carbon in soil) g/g
ρb (dry soil bulk density) g/cm3
ρ5
(soil particle density) g/crn 3
&theta: . ., (water-filled soil porosity) L ... .,,,.)L"";' T (exposure interval) s
A (VF Dispersion Constant)
B (VF Dispersion Constant)
C (VF Dispersion Constant)
City (Climate Zone) VF ,......1 Selection
VF s (volitization factor) m 3 /kg
.. -·--· - . ..
Output generated 25AUG2015 :09:46:02
Value
0.07
0.07
Hartford, CT (8
.5
73.950449528400
109824017 41.557
12.5907 18.8368 215.4377 0.5 3.84 11.32 0.0345 Hartford, CT (8
.5
73.950449528400
0.006
1.5
2.65
0.15
819936000 12.5907 18.8368 215.4377 Default
3

Site-specific Recreator Equation Inputs for Soil
Variable 2 3
Q/Cvol {g/m -s per kg/m )
A" (acres) -
T (exposure interval) yr
de (depth of source) m
ρb (dry soil bulk density) g/cm3
A (VF Dispersion Constant - Mass Limit)
B (VF Dispersion Constant - Mass Limit)
C (VF Dispersion Constant - Mass Limit)
Output generated 25AUG2015:09:46:02
Value
68.18365
.5 26
1.5
11.911
18.4385
209.7845
4
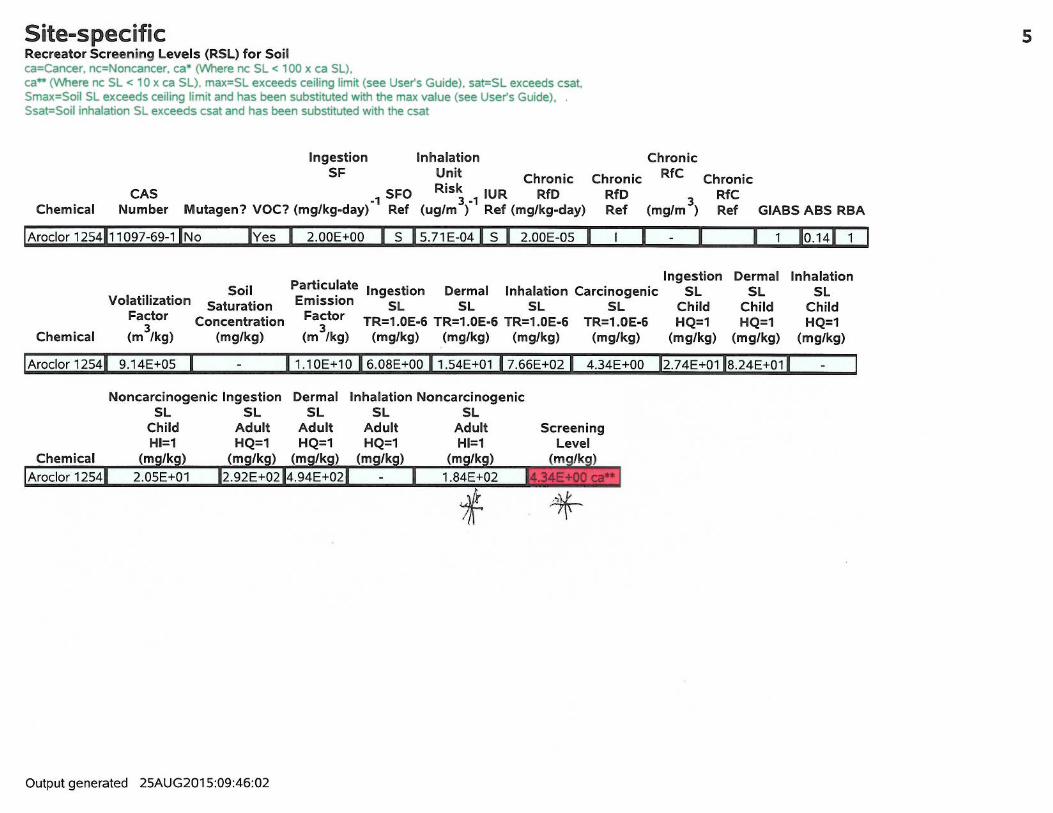
Site-specific Recreator Screening Levels (RSL) for Soil ca=Cancer. nc=Noncancer. ca• (Where nc SL< 100 x ca SL). ca• (Where nc SL< 10 x ca SL). max=SL exceeds ceiling limit (see User's Guide). sat=SL exceeds csat. Smax=Soil SL exceeds ceiling limit and has been substituted with the max value (see User's Guide), Ssat=Soil inhalation SL exceeds csat and has been substituted with the csat
Ingestion Inhalation Chronic SF Unit Chronic Chronic RfC Chronic
CAS •1 SFO Ris~ •1 IUR RfD RfD 3 RfC Chemical Number Mutagen? VOC? (mg/kg-day) Ref (ug/m ) Ref (mg/kg-day) Ref (mg/m ) Ref GIABS ABS RBA
lAroclor 1254111097-69-1 INo Ives I 2.00E+OO I s I 5.71E-o4 I s I 2.00E-05 I I I - I I 1 lo.141 1 I
Chemical
Volatilization Factor
3 (m /kg)
Soil Saturation
Concentration (mg/kg)
. Ingestion Part~cu!ate Ingestion Dermal Inhalation Carcinogenic SL Emission SL SL SL SL Child Fa~tor TR=1 .OE-6 TR=1 .OE-6 TR=1 .OE-6 TR=1 .OE-6 HQ=1 (m /kg) (mg/kg) (mg/kg) (mg/kg) (mg/kg) (mg/kg)
Dermal SL
Child HQ=1
(mg/kg)
Inhalation SL
Child HQ=1
(mg/kg)
!Aroclor1254I 9.14E+OS I - l1.10E+1of6.08E+Ool154E+01 17.66E+o2I 4.34E+OO [2.74E+o118.24E+o1I - I
Noncarcinogenic Ingestion SL SL
Child Adult Hl=1 HQ=1
Chemical (mg/kg) _ . (mg/kg) Aroclor 1254
~
Output generated 25AUG2015:09:46:02
5
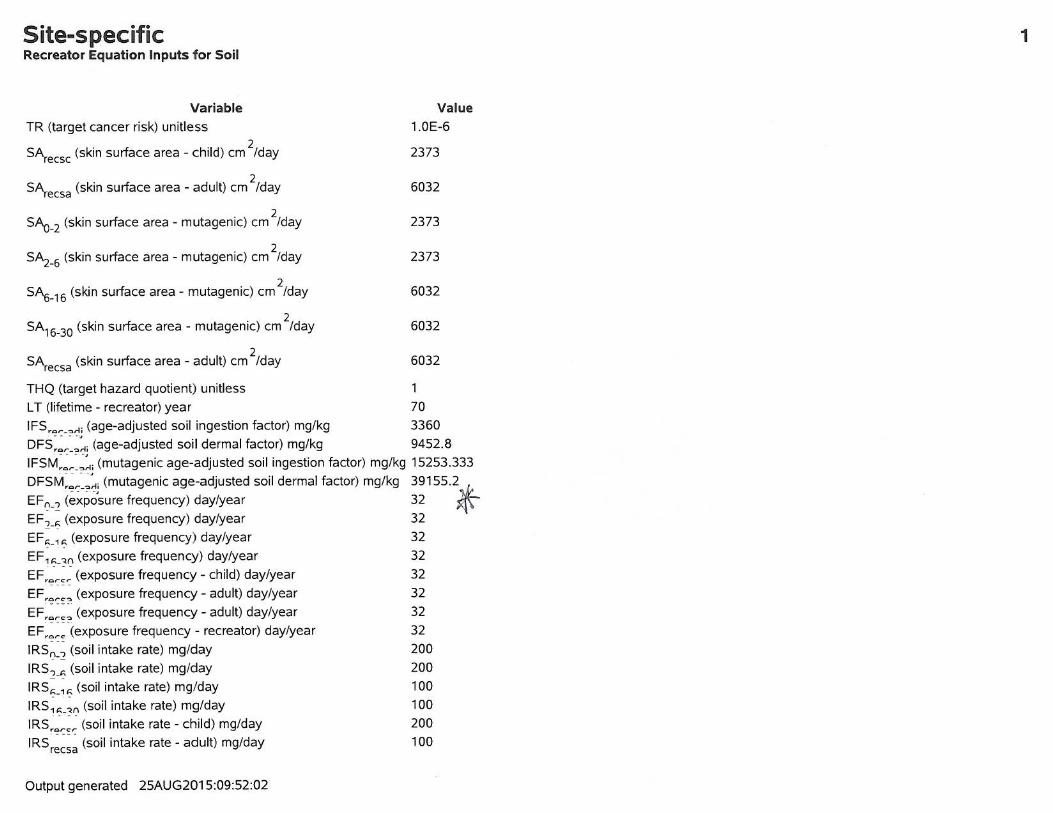
Site-specific Recreator Equation Inputs for Soil
Variable TR (target cancer risk) unitless
SArecsc (skin surface area - child) cm 2 tday
SArecsa (skin surface area - adult) cm 2/day
SAcJ_2 (skin surface area - mutagenic) cm 2tday
SA2_6 (skin surface area - mutagenic) cm 2 tday
SA6_16 (skin surface area - mutagenic) cm2tday
SA16_30 (skin surface area - mutagenic) cm 2/day
SArecsa (skin surface area - adult) cm 2 tday
THQ (target hazard quotient) unitless
Value 1.0E-6
2373
6032
2373
2373
6032
6032
6032
1
LT (lifetime - recreator) year 70
IFS,,,r_,,,ii (age-adjusted soil ingestion factor) mg/kg 3360 DFS~~r~~~. (age-adjusted soil dermal factor) mg/kg 9452.8 IFSM:~r~~~. (mutagenic age-adjusted soil ingestion factor) mg/kg 15253.333
DFSM~~c~~~; (mutagenic age-adjusted soil dermal factor) mg/kg 39155.2 Ik_ EF(\_., (exposure frequency) day/year 32 ~\
EF.,_k (exposure frequency) day/year 32
EFuk (exposure frequency) day/year 32 EF 1 k. <() (exposure frequency) day/year 32 EF rorcr (exposure frequency - child) day/year 32
EF,.,rc-., (exposure frequency - adult) day/year 32 EF,,,rc"' (exposure frequency - adult) day/year 32 EF •ore (exposure frequency - recreator) day/year 32 IRS(\_., (soil intake rate) mg/day 200 IRS.,_k (soil intake rate) mg/day 200 IRSi:;_1 i:; (soil intake rate) mg/day 100
IRS1 i:;_<() (soil intake rate) mg/day 100 IRS,,,rcr (soil intake rate - child) mg/day 200 IRSrecsa (soil intake rate - adult) mg/day 100
Output generated 25AUG2015:09:52:02
1
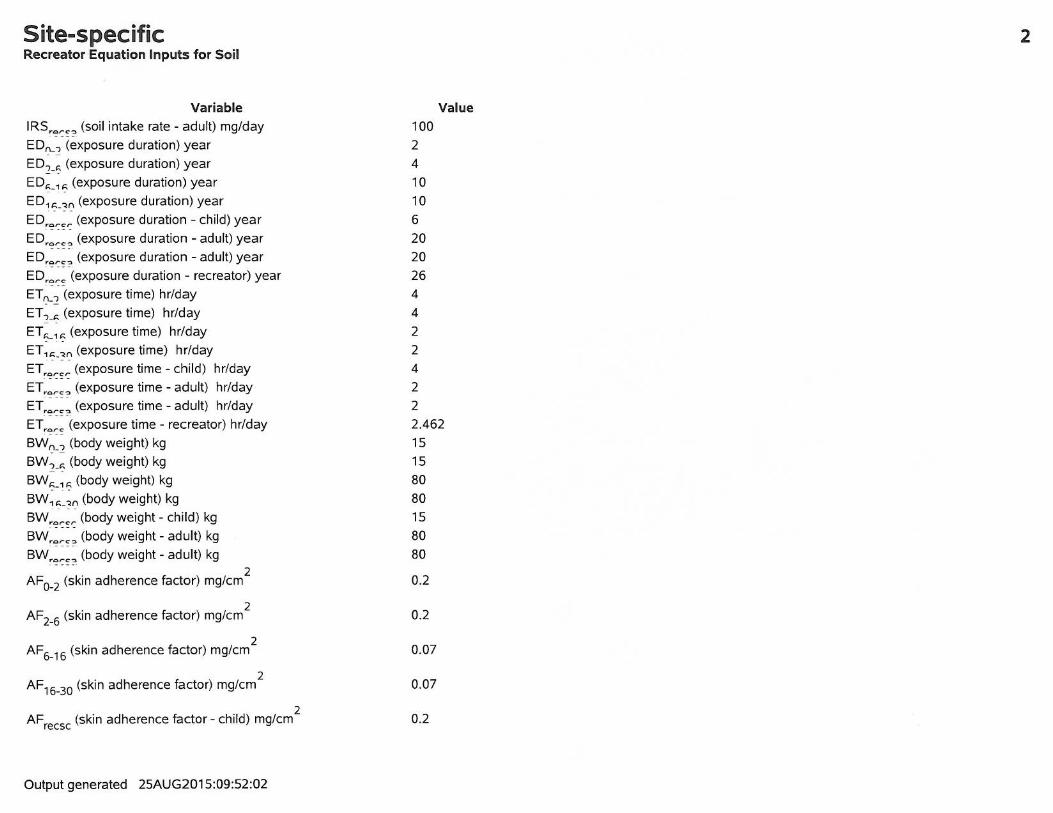
Site-specific Recreator Equation Inputs for Soil
Variable IRS,.,r.,.., (soil intake rate - adult) mg/day
ED''-' (exposure duration) year ED,_k (exposure duration) year EDk_,k (exposure duration) year
ED, k-<n (exposure duration) year ED,
0rer (exposure duration - child) year
ED,0 r., .., (exposure duration - adult) year ED,.,r., .,. (exposure duration - adult) year ED,.,r., (exposure duration - recreator) year
ET"-' (exposure time) hr/day ET,_k (exposure time) hr/day ETuk (exposure time) hr/day
ET,k_<n (exposure time) hr/day ET,.,rer (exposure time - child) hr/day ET,.,rc:-,, (exposure time - adult) hr/day ET,.,r.,.,. (exposure time - adult) hr/day ET,.,rc: (exposure time - recreator) hr/day
SW"-' (body weight) kg sw,_k (body weight) kg BWk_,k (body weight) kg
BW 1 k-<" (body weight) kg BW,
0rer (body weight - child) kg
BW rorc:.., (body weight - adult) kg BW •ore:-,, (body weight - adult) kg
AF0_~ -(-~kin adherence factor) mg/cm 2
AF2_6 (skin adherence factor) mg/cm 2
AF6_16 (skin adherence factor) mg!cm2
AF 16_30 (skin adherence factor) mg/cm 2
AFrecsc (skin adherence factor - child) mg/cm 2
Output generated 25AUG2015:09:52:02
Value 100
2 4 10
10
6 20 20 26 4 4 2 2 4
2 2 2.462 15 15
80 80 15 80 80
0.2
0.2
0.07
0.07
0.2
2
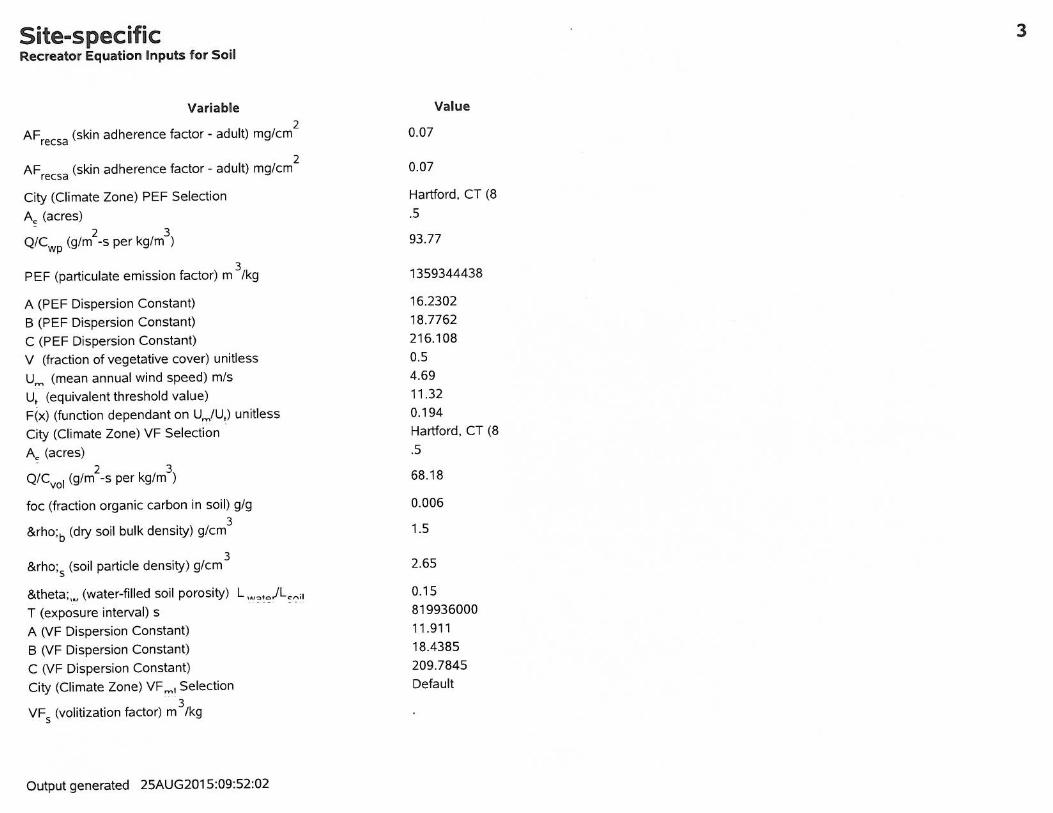
Site-specific Recreator Equation Inputs for Soil
Variable
AFrecsa (skin adherence factor - adult) mg/cm2
AFrecsa (skin adherence factor - adult) mg/cm2
City (Climate Zone) PEF Selection
Ac (acres) 2 3
Q/Cwp (g/m -s per kg/m )
PEF (particulate emission factor) m 31kg
A (PEF Dispersion Constant)
B (PEF Dispersion Constant)
C (PEF Dispersion Constant)
V (fraction of vegetative cover) unitless
u ..... (mean annual wind speed) mis
U1 (equivalent threshold value)
F(x) (function dependant on U"./U,) unitless
City (Climate Zone) VF Selection
Ac (acres) . 2 3
QICvol (glm -s per kglm )
foe (fraction organic carbon in soil) gig
ρb (dry soil bulk density) g/cm3
ρ5
(soil particle density) glcm 3
θ,., (water-filled soil porosity) L •••:.1 .. )Lc";' .. - · · ...
T (exposure interval) s
A (VF Dispersion Constant)
B (VF Dispersion Constant)
C (VF Dispersion Constant)
City (Climate Zone) VF""'' Selection
VF s (volitization factor) m 3 lkg
Output generated 25AUG2015:09:52:02
Value
0.07
0.07
Hartford, CT (8
.5
93.77
1359344438
16.2302 18.7762 216.108 0.5 4.69 11.32 0.194 Hartford, CT (8
.5
68.18
0.006
1.5
2.65
0.15 819936000
11.911 18.4385 209.7845
Default
3
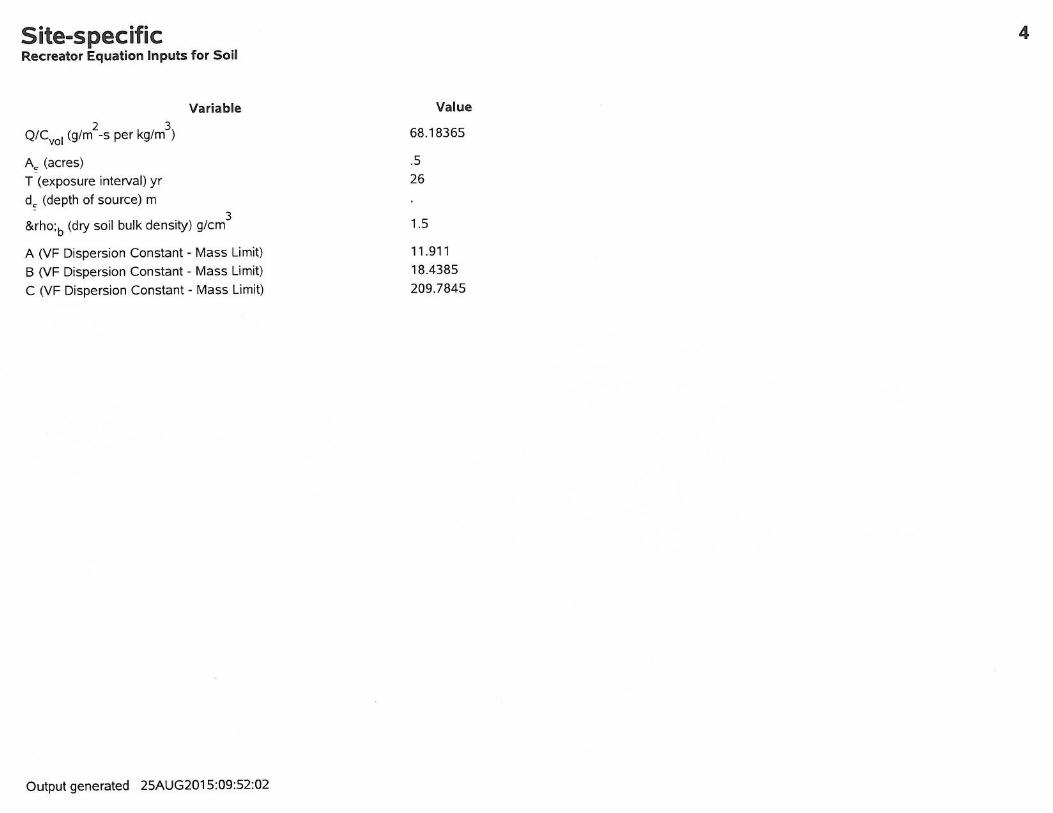
Site-specific Recreator Equation Inputs for Soil
2 3 Q/Cvol (g/m -s per kg/m )
Ac (acres)
T (exposure interval) yr
de (depth of source) m
Variable
ρb (dry soil bulk density) g/cm3
A (VF Dispersion Constant - Mass Limit)
B (VF Dispersion Constant - Mass Limit)
C (VF Dispersion Constant - Mass Limit)
Output generated 25AUG2015:09:52:02
Value
68.18365
.5
26
1.5
11 .911
18.4385
209.7845
4

Site-specific Recreator Screening Levels (RSL) for Soil ca=Cancer. nc=Noncancer. ca• (Where nc SL< 100 x ca SL). ca** (Where nc SL< 10 x ca SL). max=SL exceeds ceiling limit (see User's Guide), sat=SL exceeds csat, Smax=Soil SL exceeds ceiling limit and has been substituted with the max value (see User's Guide). Ssat=So1l inhalation SL exceeds csat and has been substituted with the csat
Ingestion Inhalation Chronic
SF Unit Chronic Chronic RfC Chronic CAS _
1 SFO Ris~ _
1 IUR RfD RfD
3 RfC
Chemical Number Mutagen? VOC? (mg/kg-day) Ref (ug/m ) Ref (mg/kg-day) Ref (mg/m ) Ref GIABS ABS RBA
!Aroclor 1254111097-69-1 INo Ives I 2.00E+OO I S I s.71 E-04 I S I 2.00E-05 I I I - I I 1 lo.14 I 1 I
Particulate Ingestion Ingestion Dermal Inhalation
Soil Dermal Inhalation Carcinogenic SL SL SL Volatilization Saturation Emission SL SL SL SL Child Child Child
Factor Concentration Factor TR=1.0E·6 TR=1.0E·6 TR=1.0E·6 TR=1.0E·6 HQ=1 HQ=1 HQ=1 3 3 Chemical (m /kg) (mg/kg) (m /kg) (mg/kg) (mg/kg) (mg/kg) (mg/kg) (mg/kg) (mg/kg) (mg/kg)
Wo-Clor1254!8.43E+os I --_ --- I 1.36E+o9-l3.80E+oo l9.65E+oo l4.41E+o2 I 2.71E+oo l1.71E+o115.15E+o1 I - I
Noncarcinogenic Ingestion SL SL
Child Adult Hl=1 HQ=1
Chemical (mg/kg) (mg/kg)
Aroclor 1254
+
Output generated 25AUG2015:09:52:02
5
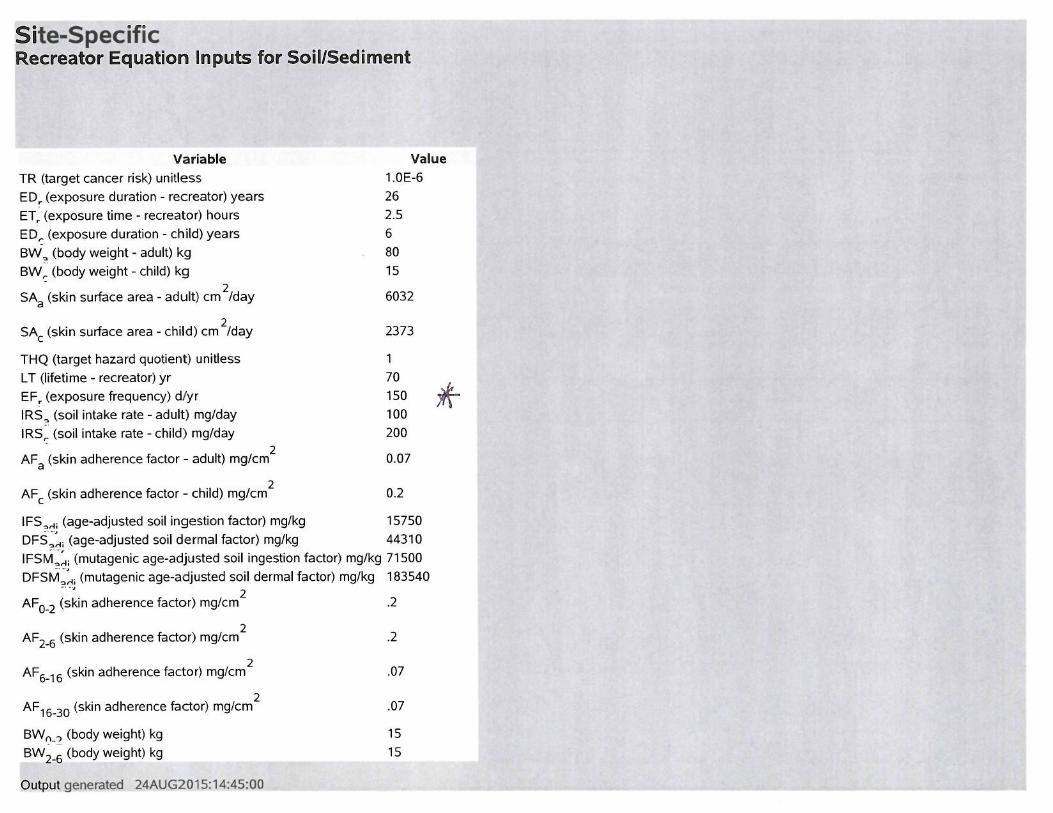
Site-Specific Recreator Equation Inputs for Soil/Sediment
Variable Value TR (target cancer risk) unitless 1.0E-6
ED, (exposure duration - recreator) years 26
ET, (exposure time - recreator) hours 2.5
EDr (exposure duration - child) years 6
BW" (body weight - adult) kg 80
BW,. (body weight - child) kg 15
SAa (skin surface area - adult) cm 2/day 6032
SAc (skin surface area - child) cm 2/day 2373
THQ (target hazard quotient) unitless 1
LT (lifetime - recreator) yr 70
EF, (exposure frequency) d/yr 150
IRS" (soil intake rate - adult) mg/day 100
IRS,. (soil intake rate - child) mg/day 200 2
AF a (skin adherence factor - adult) mg/cm 0.07
AF c (skin adherence factor - child) mg/cm 2
0.2
IFS.,.r1, (age-adjusted soil ingestion factor) mg/kg 15750
DFS~~. (age-adjusted soil dermal factor) mg/kg 44310
IFSt.(~, (mutagenic age-adjusted soil ingestion factor) mg/kg 71500
DFSM~~; (mutagenic age-adjusted soil dermal factor) mg/kg 183540
AF0_2 ~~~in adherence factor) mg/cm2
.2
AF2
_6
(skin adherence factor) mg!cm2
AF 6_ 16 (skin adherence factor) mg/cm 2
AF 16_30 (skin adherence factor) mg/cm 2
BW (I_, (body weight) kg
BW 2_6 (body weight) kg
Output generated 24AUG2015:14:45:00
.2
.07
.07
15
15
*
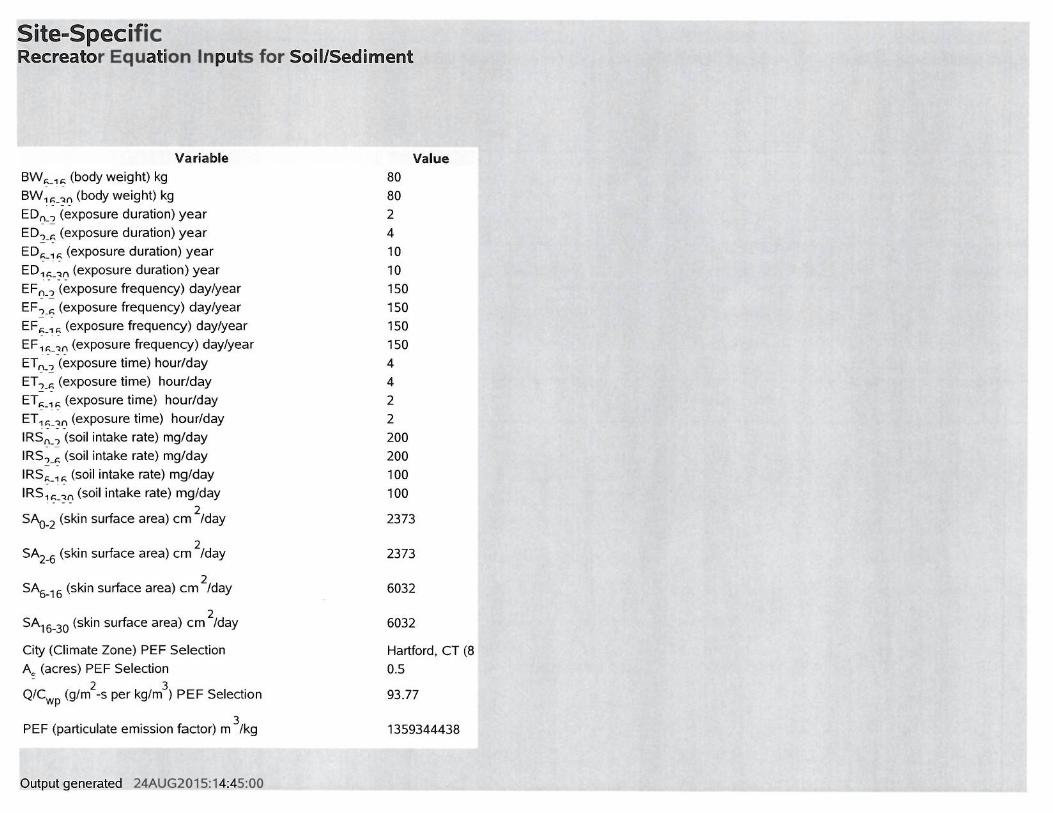
:site-Specific Recreator Equation Inputs for Soil/Sediment
BWu,::; (body weight) kg
BW1 "'-•" (body weight) kg
Variable
ED"-' (exposure duration) year ED.,_,:; (exposure duration) year
ED,::;_1 ,::; (exposure duration) year ED1 ,::;.<n (exposure duration) year EF "-., (exposure frequency) day/year EF.,_,::; (exposure frequency) day/year
EF "'-1 "' (exposure frequency) day/year EF 1 "-•" (exposure frequency) day/year ET"-., (exposure time) hour/day
ET'-"' (exposure time) hour/day ET,::;_1 ,::; (exposure time) hour/day
ET1 ,::;_<n (exposure time) hour/day IRSn..., (soil intake rate) mg/day IRS.,_,:; (soil intake rate) mg/day
IRS,::;_1 ,::; (soil intake rate) mg/day IRS, ,::;.<n (soil intake rate) mg/day
SAa.2 (skin surface area) cm 2tday
SAi.6 (skin surface area) cm 2tday
SAo-16 (skin surface area) cm 2 /day
SA16-30 (skin surface area) cm 2tday
City (Climate Zone) PEF Selection A,, (acres) PEF Selection
Q/Cwp (gtm2-s per kg/m
3) PEF Selection
PEF (particulate emission factor) m 3tkg
Output generated 24AUG2015:14:45:00
Value 80 80 2 4 10 10 150 150 150 150 4 4 2 2 200 200 100 100
2373
2373
6032
6032
Hartford, CT (8
0.5
93.77
1359344438
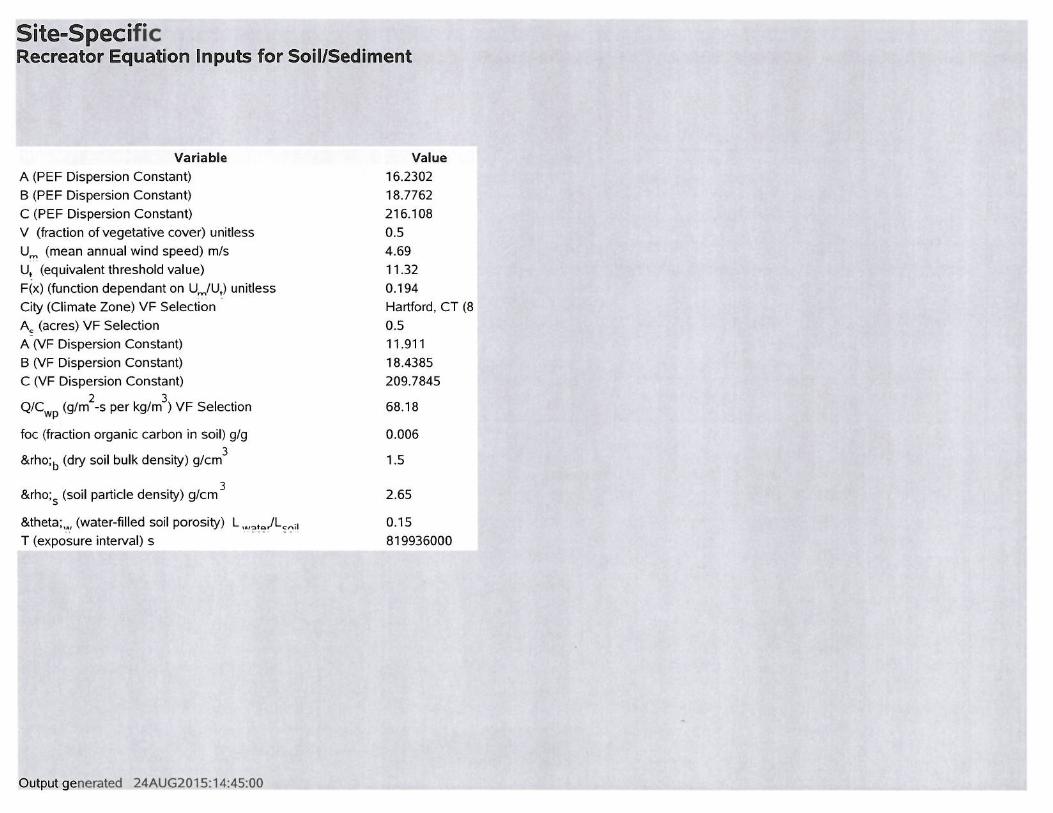
·site-Specific Recreator Equation Inputs for Soil/Sediment
Variable A (PEF Dispersion Constant) B (PEF Dispersion Constant) C (PEF Dispersion Constant) V (fraction of vegetative cover) unitless um (mean annual wind speed) mis Ut (equivalent threshold value) F(x) (function dependant on U,)Ut) unitless City (Climate Zone) VF Selection Ac (acres) VF Selection A (VF Dispersion Constant) B (VF Dispersion Constant) C (VF Dispersion Constant)
Q/Cwp (g/m2-s per kg/m
3) VF Selection
foe (fraction organic carbon in soil) g/g
ρb (dry soil bulk density) g/cm3
ρ5
(soil particle density) g/cm 3
θ,., (water-filled soil porosity) L ... ,,, .. )L.,,.,a . . . . -·· - . -- .. T (exposure interval) s
Output generated 24AUG2015: 14:45:00
Value 16.2302 18.7762 216.108 0.5 4.69
11.32 0.194 Hartford, CT (8 0.5 11.911 18.4385 209.7845
68.18
0.006
1.5
2.65
0.15 819936000
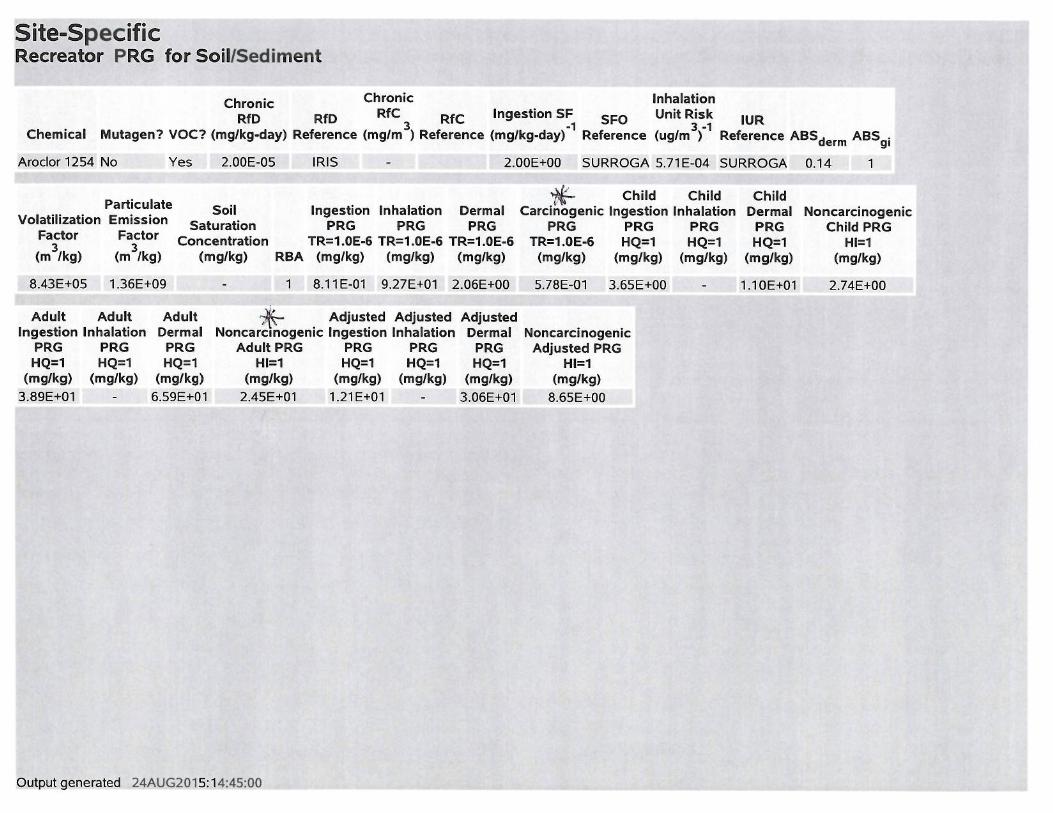
;site-Specific Recreator PRG for Soil/Sediment
Chronic RfD RfD
Chronic Inhalation RfC RfC Ingestion SF SFO Unit Risk IUR 3 _, 3 _,
Chemical Mutagen? VOC? (mg/kg-day) Reference (mg/m ) Reference (mg/kg-day) Reference (ug/m ) Reference ABSderm ABS91
Aroclor 1254 No Yes 2.00E-05 IRIS - 2.00E+OO SURROGA 5.71E-04 SURROGA 0.14 1
Particulate Volatilization Emission
Factor Factor
jf. Child Child Ingestion Inhalation Dermal Carcinogenic Ingestion Inhalation
PRG PRG PRG PRG PRG PRG TR=1.0E-6 TR=1 .0E-6 TR=1 .0E-6 TR=1.0E-6 HQ=1 HQ=1 3 3
(m /kg) (m /kg)
Soil Saturation
Concentration (mg/kg) RBA (mg/kg) (mg/kg) (mg/kg) (mg/kg) (mg/kg) (mg/kg)
8.43E+OS 1.36E+09 1 8.11 E-01 9.27E+01 2.06E+OO 5. 78E-01 3.65E+OO
Adult Adult Adult *- Adjusted Adjusted Adjusted Ingestion Inhalation Dermal Noncarcmogenic Ingestion Inhalation Dermal Noncarcinogenic
PRG PRG PRG Adult PRG PRG PRG PRG Adjusted PRG HQ=1 HQ=1 HQ=1 Hl=1 HQ=1 HQ=1 HQ=1 Hl=1
(mg/kg) (mg/kg) (mg/kg) (mg/kg) (mg/kg) (mg/kg) (mg/kg) (mg/kg) 3.89E+01 - 6.59E+01 2.45E+01 1.21E+01 - 3.06E+01 8.65E+OO
Output generated 24AUG2015:14:45:00
Child Dermal
PRG HQ=1
(mg/kg)
1.10E+01
Noncarcinogenic Child PRG
Hl=1 (mg/kg)
2.74E+OO

UNITED STATES ENVIRONMENTAL PROTECTION AGENCY REGION 1
5 POST OFFICE SQUARE, SUITE 100 BOSTON, MASSACHUSETTS 02109-3912
TECHNICAL MEMORANDUM To: Ginny Lombardo From: Richard Sugatt Date: September 29, 2015 RE: Evaluation of protectiveness of risk-based target levels in seafood and EPA seafood consumption advisories for the New Bedford Harbor Superfund site One purpose of this memorandum is to evaluate the human health risk-based target level (RBTL) for finfish and shellfish for the New Bedford Harbor Superfund site to ensure that the target level is still protective. Additional purposes are to evaluate the cancer and non-cancer risks of specific species of finfish and shellfish based on the tissue contaminant data available up to 2014 and use that risk information to confirm whether the EPA seafood consumption advisories remain protective. Risk-based Target Level for total PCBs The current risk-based target level for the ROD for seafood is 0.02 mg/kg. To evaluate the protectiveness of this level, cancer and non-cancer risks of total PCBs were calculated using current exposure assumptions and toxicity values for one meal per month and 4 meals per month for adult, older child, younger child and lifelong resident receptors. The risks were calculated for each receptor for total PCB concentrations of 0.02 mg/kg, 0.03 mg/kg, and 0.04 mg/kg. The exposure and toxicity assumptions are presented in Table 1, along with the equations for cancer risk and non-cancer risk. Cancer risk, expressed as the Elevated Lifetime Cancer Risk (ELCR), is the probability of getting cancer (e.g. 1 x 10⁻⁶, or 1 in 1 million, or 1E-06) due to exposure related to the site. Non-cancer risk (i.e. for health effects other than cancer) is expressed as a Hazard Quotient (HQ) which is the number obtained by dividing the site-related dose by the safe Reference Dose (RfD). EPA’s acceptable risk levels at Superfund sites are ELCR within a range of 1 x 10⁻⁶ to 1 x 10⁻⁴, and a HQ of 1 or less. The fraction ingested (FI) was conservatively assumed to be 1, meaning that 100 % of the total seafood consumption of the specified seafood species was assumed to be from the specified area of New Bedford Harbor. The Exposure Frequency (EF) was assumed to be either 12 events per year (i.e. once per month) or 52 events/year (once per week, or about 4 times per month). The EF of 12 events/yr was designated as the Central Tendency Exposure (CTE), and the EF of 52 events/yr was designated as the Reasonable Maximum Exposure (RME). The exposure duration (ED) was assumed to be 55 years for the adult (age 16 to 70 years), 10 years for the older child (age 6 to 15 years), and 5 years for the young child (age 1-6 years). The exposure duration of the lifelong resident was assumed to be 70 years. The body weight (BW) was assumed to be 70 kg for the adult, 40 kg for
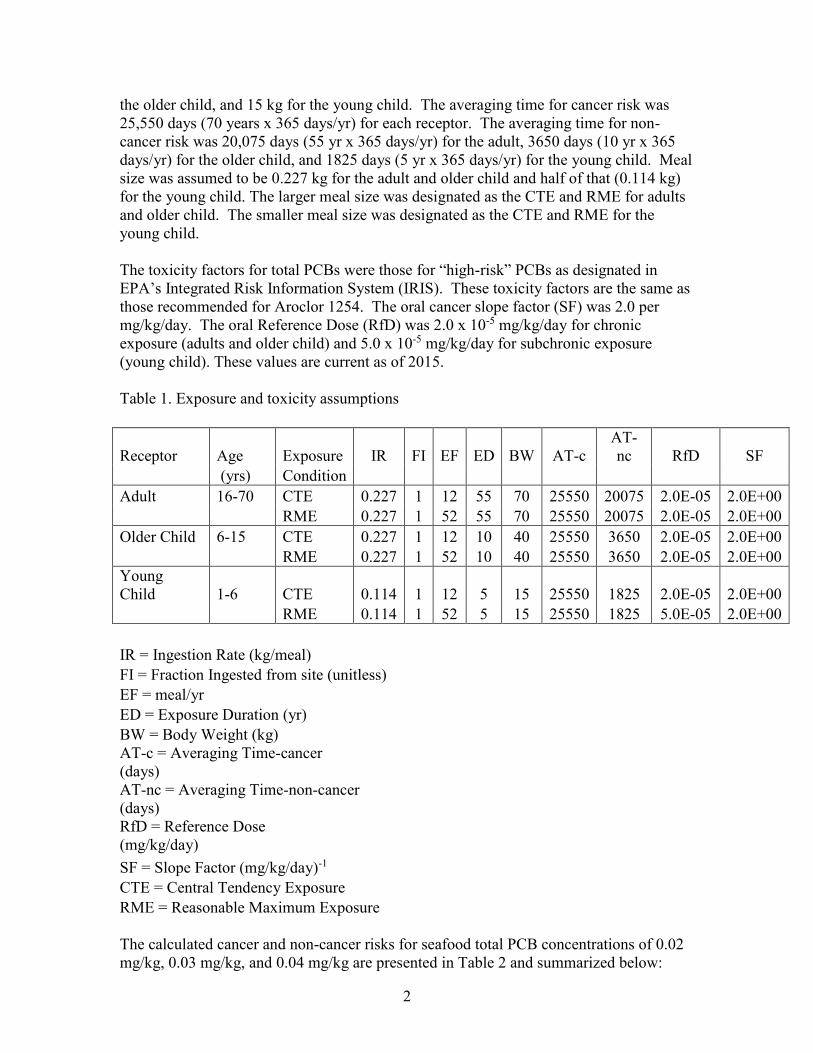
2
the older child, and 15 kg for the young child. The averaging time for cancer risk was 25,550 days (70 years x 365 days/yr) for each receptor. The averaging time for non-cancer risk was 20,075 days (55 yr x 365 days/yr) for the adult, 3650 days (10 yr x 365 days/yr) for the older child, and 1825 days (5 yr x 365 days/yr) for the young child. Meal size was assumed to be 0.227 kg for the adult and older child and half of that (0.114 kg) for the young child. The larger meal size was designated as the CTE and RME for adults and older child. The smaller meal size was designated as the CTE and RME for the young child. The toxicity factors for total PCBs were those for “high-risk” PCBs as designated in EPA’s Integrated Risk Information System (IRIS). These toxicity factors are the same as those recommended for Aroclor 1254. The oral cancer slope factor (SF) was 2.0 per mg/kg/day. The oral Reference Dose (RfD) was 2.0 x 10⁻⁵ mg/kg/day for chronic exposure (adults and older child) and 5.0 x 10⁻⁵ mg/kg/day for subchronic exposure (young child). These values are current as of 2015. Table 1. Exposure and toxicity assumptions
Receptor Age Exposure IR FI EF ED BW AT-c
AT-nc RfD SF
(yrs) Condition Adult 16-70 CTE 0.227 1 12 55 70 25550 20075 2.0E-05 2.0E+00
RME 0.227 1 52 55 70 25550 20075 2.0E-05 2.0E+00
Older Child 6-15 CTE 0.227 1 12 10 40 25550 3650 2.0E-05 2.0E+00
RME 0.227 1 52 10 40 25550 3650 2.0E-05 2.0E+00
Young Child 1-6 CTE 0.114 1 12 5 15 25550 1825 2.0E-05 2.0E+00
RME 0.114 1 52 5 15 25550 1825 5.0E-05 2.0E+00
IR = Ingestion Rate (kg/meal) FI = Fraction Ingested from site (unitless)
EF = meal/yr ED = Exposure Duration (yr)
BW = Body Weight (kg) AT-c = Averaging Time-cancer
(days) AT-nc = Averaging Time-non-cancer
(days) RfD = Reference Dose
(mg/kg/day) SF = Slope Factor (mg/kg/day)-1 CTE = Central Tendency Exposure RME = Reasonable Maximum Exposure
The calculated cancer and non-cancer risks for seafood total PCB concentrations of 0.02 mg/kg, 0.03 mg/kg, and 0.04 mg/kg are presented in Table 2 and summarized below:

3
Total PCB Maximum HQ ELCR
(mg/kg) CTE RME CTE RME 0.02 0.2 0.8 1E-05 2E-05 0.03 0.3 1.2 8E-06 3E-05 0.04 0.4 1.6 1E-05 4E-05
CTE = Central Tendency Exposure (one meal per month) RME = Reasonable Maximum Exposure (4 meals per month) HQ = Hazard Quotient ELCR = Elevated Lifetime Cancer Risk The number in bold exceeds EPA’s risk limit for non-cancer (HQ ≤ 1) Based on uncertainty inherent in the risk assessment process, HQ and ELCR values should be rounded to the nearest whole number; therefore, the above HQ values of 1.2 should be rounded to 1, and an HQ of 1.6 would be rounded to 2. The results indicate that the cancer and non-cancer risks of PCB concentrations of 0.02 mg/kg and 0.03 mg/kg are within EPA’s risk limits for both cancer and non-cancer effects, but that the PCB concentration of 0.04 mg/kg exceeds the non-cancer risk limit, based on a rounded HQ of 2 for the RME condition of 4 meals per month. The PCB concentration of 0.04 mg/kg would have acceptable non-cancer risk for 1 meal per month. Since a PCB concentration of 0.03 mg/kg is acceptable for both cancer and non-cancer risk for both 1 meal per month and 4 meals per month, it is concluded that the ROD risk target of 0.02 mg/kg in seafood is protective. Risks of Seafood and Comparison to EPA Consumption Advisories The 1979 Massachusetts Department of Public Health (MassDPH) and 2010 EPA seafood consumption advisories for New Bedford Harbor are summarized in Table 3. The advisories categorize receptors as either “sensitive receptors” or “other” receptors. Sensitive receptors include pregnant women, nursing mothers, children under age 12, and women who may become pregnant. Massachusetts Division of Marine Fisheries (MassDMF) and Massachusetts Department of Environmental Protection (MassDEP) have collected and analyzed seafood for total PCB congeners and dioxin-like PCB congeners on an annual basis since 2003. Seafood was collected from Area 1 of Operable Unit 1 (OU1), Area 2 and 3 of OU3, and a Reference Area (Sippican Harbor) and analyzed for PCB congeners. The available data (from 2003 to 2013, assuming zero concentration for non-detected congeners) were used in the 2014 draft risk assessment for OU 3 (AMEC, 2014) to calculate Exposure Point Concentrations (EPCs) for those species which had sufficient data to calculate an Upper Confidence Level (UCL) of the arithmetic mean. These included: Lobster meat (Area 2, Area 3, Reference); Lobster meat and tomalley (Area 2, Area 3, Reference); Quahogs (Area 2, Clark’s Cove, Area 3, Reference); Scup (Area 2, Area 3, Reference); and Black Sea Bass (Area 2, Area 3). These EPCs are summarized in Table 4. The EPC tables from the draft risk assessment are provided in the attachment to this memorandum. The UCLs in the draft risk
4
assessment were calculated and selected using EPA’s ProUCL software. The selected UCL is often the 95% UCL of the arithmetic mean, but the software selects the most statistically appropriate UCL type. The statistical basis for each UCL is identified in the EPC tables from the draft risk assessment in the attachment to this memorandum. Although these EPCs were calculated before 2014 data were available, the 2014 data are consistent with past years so the EPCs will not change significantly. There were insufficient data to calculate a UCL for three additional species (eel, flounder, and tautog) that have MassDPH and EPA consumption advisories. The individual data, and mean and maximum concentrations of available data from 2003 to 2014 for these species from designated areas are provided in Table 5. The EPC for EPA risk assessments is usually the UCL or maximum, whichever is lower. Since there were insufficient data to calculate a statistical UCL EPC for eel, flounder, and tautog, the maximum concentration would normally be used for risk assessment purposes; however, both the maximum and mean concentrations for these three species are evaluated for risk to understand the level of uncertainty given that there were so few samples. The maximum and mean concentrations for these species are summarized in Table 4 along with the EPCs for the other species. The cancer and non-cancer risks of the EPCs for lobster, quahog, scup, black sea bass, and the maximum and mean concentrations for eel, flounder, and tautog, were calculated for the adult, young child, older child, and lifelong receptor using the toxicity factors and exposure assumptions for PCBs previously described in Table 1. In addition, for lobster, quahog, and black sea bass, the risks of dioxin-like PCBs were calculated using the same exposure assumptions and dioxin Toxicity Equivalence values (TEQ) for the dioxin-like PCB congeners. The TEQ value for a particular dioxin-like PCB congener is expressed as a proportion of the toxicity of the most toxic dioxin, 2, 3, 7, 8- Tetrachlorodibenzodioxin (2, 3, 7, 8-TCDD). The non-cancer toxicity factor for 2, 3, 7, 8-TCDD is an oral Reference Dose of 7.0 x 10⁻¹⁰ mg/kg from the EPA Integrated Risk Information System (IRIS). There is no cancer toxicity value for 2, 3, 7, 8-TCDD on IRIS; however, the EPA Regional Screening Level database (http://www3.epa.gov/region09/superfund/prg/) recommends the use of the California EPA cancer oral slope factor of 1.6 x 10⁵ per mg/kg., which was used here. The risks of dioxin-like PCBs for eel, flounder, and tautog were not calculated due to lack of data on dioxin-like PCBs. The risks are summarized in Table 6 (Area 2), Table 7 (Clark’s Cove), Table 8 (Area 3) and Table 9 (Reference area). The consumption advisory information from Table 3 has been added to these risk tables to facilitate comparison of the risks with the advisory recommendation for that species or type of seafood. Since both the young child receptor (age 1-6 years) and older child receptor (age 6-15 years) include ages below 12 years, both types of child receptors are considered to be “sensitive” receptors for comparison of risks with advisories. The “other” receptor advisory category therefore includes adults but not children. The lifelong receptor risks include both childhood and adult exposure, but are not compared with advisories because there is no separate advisory category for “lifelong” receptors.

5
Although there are no advisories associated with the Reference Area, the risks of seafood from the Reference Area have been calculated to evaluate risks from a New England coastal area unaffected by contamination from New Bedford Harbor. The risk values in the tables are colored green if they are acceptable (HQ ≤ 1; ELCR ≤ 1 x 10⁻⁴) or bolded red if they are unacceptable (HQ > 1; ELCR > 1 x 10⁻⁴). These risk management criteria are used by EPA at Superfund sites. The individual risk calculations are documented in un-numbered tables in the attachment to this memorandum. The protectiveness of current advisories and recommendations for Area 2 and Area 3 of OU3 are described below. Area 1 was not further evaluated because the existing advisory is to not eat any seafood from Area 1, and the available data indicate that PCB concentrations in seafood from this area remain above acceptable risk levels for all receptors. Area 2 The advisory for Area 2 recommends that sensitive receptors should not eat fish, shellfish or lobster caught in Area 2 (except for shellfish from Clark’s Cove in Area 2, see below) . As shown in table 6 (Area 2), the advisory for Area 2 is still protective for sensitive receptors (0 meals/month) because the risks at both the RME (4 meals/month) and the CTE (1 meal/month) are still unacceptable for children for each species at the UCL EPC or maximum concentration. The advisory of no consumption of any fish species in Area 2 for sensitive receptors ensures protectiveness for children. The advisory for “non-sensitive” receptors (adults) is to eat no bottom-feeding fish or lobster from Area 2 and no more than one meal per month of black sea bass or shellfish (clams, quahog, mussels, etc.) and no recommendation for all other fish due to lack of data. This advisory is still protective because the CTE risks (1 meal/month) for black sea bass and quahog are acceptable. [Note that quahog data have been used to establish the advisory for all shellfish, including clams, quahog, mussels, etc.] Clark’s Cove The advisory related to Clark’s Cove recommends that sensitive receptors can safely eat one, and only one, meal per month of shellfish caught in Clark’s Cove. Other receptors can safely eat no more than one meal per week (e.g. 4 meals/month) of shellfish. For this advisory, shellfish are considered to be “clams, quahogs, mussels, etc.” but not lobster. As shown in Table 7 (Clark’s Cove), there is acceptable risk for both 1 meal per month (CTE) and 4 meals per month (RME) of quahogs for non-sensitive (adult) receptors; therefore, the advisory of 4 meals per month for non-sensitive receptors is still protective. Although the CTE and RME for the child receptor is acceptable, the RME (4 meals per month) risk for the older child (which is included in the ‘sensitive’ receptor group) is unacceptable. The CTE (1 meal/month) risk for the older child is acceptable; therefore the advisory of no more than 1 meal/month remains protective for sensitive receptors. Advisories for species other than quahog are not shown in Table 7 because the advisories for Area 2 apply to these species. Area 3 The advisories related to Area 3 for non-sensitive receptors recommend no more than 1 meal/month for black sea bass, no consumption of lobster or scup, no restrictions for eel,
6
flounder, tautog, and no recommendation for all other fish due to lack of data. Also, sensitive receptors should not eat lobster or fish but can eat one, and only one, meal per month of shellfish (clams, quahog, mussels, etc.) caught in Area 3. As shown in Table 8, the advisories are still protective for sensitive receptors for shellfish. Although the CTE and RME for the child receptor is acceptable, the RME (4 meals/month) risk for the older child (which is included in the ‘sensitive’ receptor group) is unacceptable. The CTE (1 meal/month) risk for the older child is acceptable; therefore the advisory of no more than 1 meal per month for shellfish remains protective for sensitive receptors. As shown in Table 8, the advisory of no more than one meal per month for black sea bass is still protective because the CTE risks are acceptable whereas the RME risks are unacceptable. The advisory of no consumption for scup and lobster meat & tomalley is still protective because both the RME and CTE risks are unacceptable. The advisory for non-sensitive receptors is “There are no eating restrictions” (NR in table 8) for eel, flounder and tautog. There are no contaminant data for eels in Area 3 so a protectiveness conclusion concerning the non-restricted consumption of eel from Area 3 by sensitive or non-sensitive receptors cannot be made. It is recommended that the advisory for eel of “no restriction” (NR) be changed to “EPA has insufficient data so cannot make a recommendation” (i.e., ND). The limited data for flounder (2 fish from 2003) indicate that the risk may be unacceptable for both the RME and CTE at the mean and maximum PCB concentration; therefore, the advisory of no restriction (NR) may be of concern. Since the flounder data from Area 3 are limited and more than 10 years old, it is recommended that the advisory for flounder be changed from “no restriction (NR) to “EPA has insufficient data so cannot make a recommendation” (i.e., ND). These recommended changes for eel and flounder will be protective because the MassDMF indicated that it is unlikely that there is any significant consumption of these species from Area 3 (Vincent Malkoski, personal communication-see attachments) because eel do not aggregate enough to catch them easily, and the flounder fishery is in serious decline. The data for tautog (8 fish) indicate that the risk is acceptable for the CTE (1 meal/ month), for both mean and maximum PCB concentrations, but not acceptable for the RME (4 meals/month) at mean and maximum PCB concentrations; therefore, the advisory of unrestricted consumption should be changed to no more than one meal per month for tautog. Reference Area Although there are no known seafood consumption advisories for seafood from the Reference Area, the risks of total PCB congeners and dioxin-like PCBs were calculated for lobster meat, lobster meat & tomalley, scup, and quahog to evaluate risks of seafood from a New England coastal area unaffected by contamination from New Bedford Harbor. As shown in Table 9, the risks were acceptable for lobster meat (but not lobster meat & tomalley) and quahog for both CTE and RME consumption rates by children and adults. Risks of scup were unacceptable for both CTE and RME consumption rates by
7
children and for the RME consumption rate by adults. Although the concentrations of total PCBs and dioxin-like PCBs were lower than in the same biota from Area 2 and Area 3 at New Bedford Harbor, it should be noted that the total PCB EPCs in lobster and scup (but not quahog) from the Reference Area were higher than the 0.02 mg/kg biota target concentration in the ROD for New Bedford Harbor, suggesting that the ROD target tissue concentration may be lower than background for some types of seafood. Conclusions
1. It is concluded that the ROD target biota concentration of 0.02 mg/kg total PCBs is still protective. It is also concluded that the current seafood consumption advisories are still protective, although the following changes should be made:
2. The current “no restriction” advisory for eel and flounder in Area 3 for non-
sensitive receptors should be changed to “insufficient data for EPA to make a recommendation” because there are no eel data and only two samples of flounder from Area 3 from 2003. The current “no restriction” advisory has probably been protective because these fish are unlikely to be caught by recreational fishers in Area 3 due to scarcity. For the same reason, the change to “insufficient data for EPA to make a recommendation” will be protective. There is also a “do not eat” advisory for sensitive receptors for all fish from Area 3.
3. The current “no restriction” advisory for tautog in Area 3 for non-sensitive
receptors should be changed from “no restriction” to “no more than 1 meal per month”. This new recommendation is based on data collected in 2013 and 2014. Data for this species was not available prior to 2013. The change will be protective because the mean and maximum concentration in tautog (8 samples) has acceptable risk for adults at a CTE consumption rate of 1 meal per month.
References AMEC Environmental & Infrastructure, Inc. 2014. 2014 Revised Draft Baseline Human Health Risk Assessment Operable Unit #3 New Bedford Harbor Superfund Site New Bedford, Massachusetts. Prepared for Army Corps of Engineers, New England District. March 26, 2014. Personal Communication. Email dated September 28, 2015 from Vincent Malkoski (MassDMF) to Ginny Lombardo (EPA).
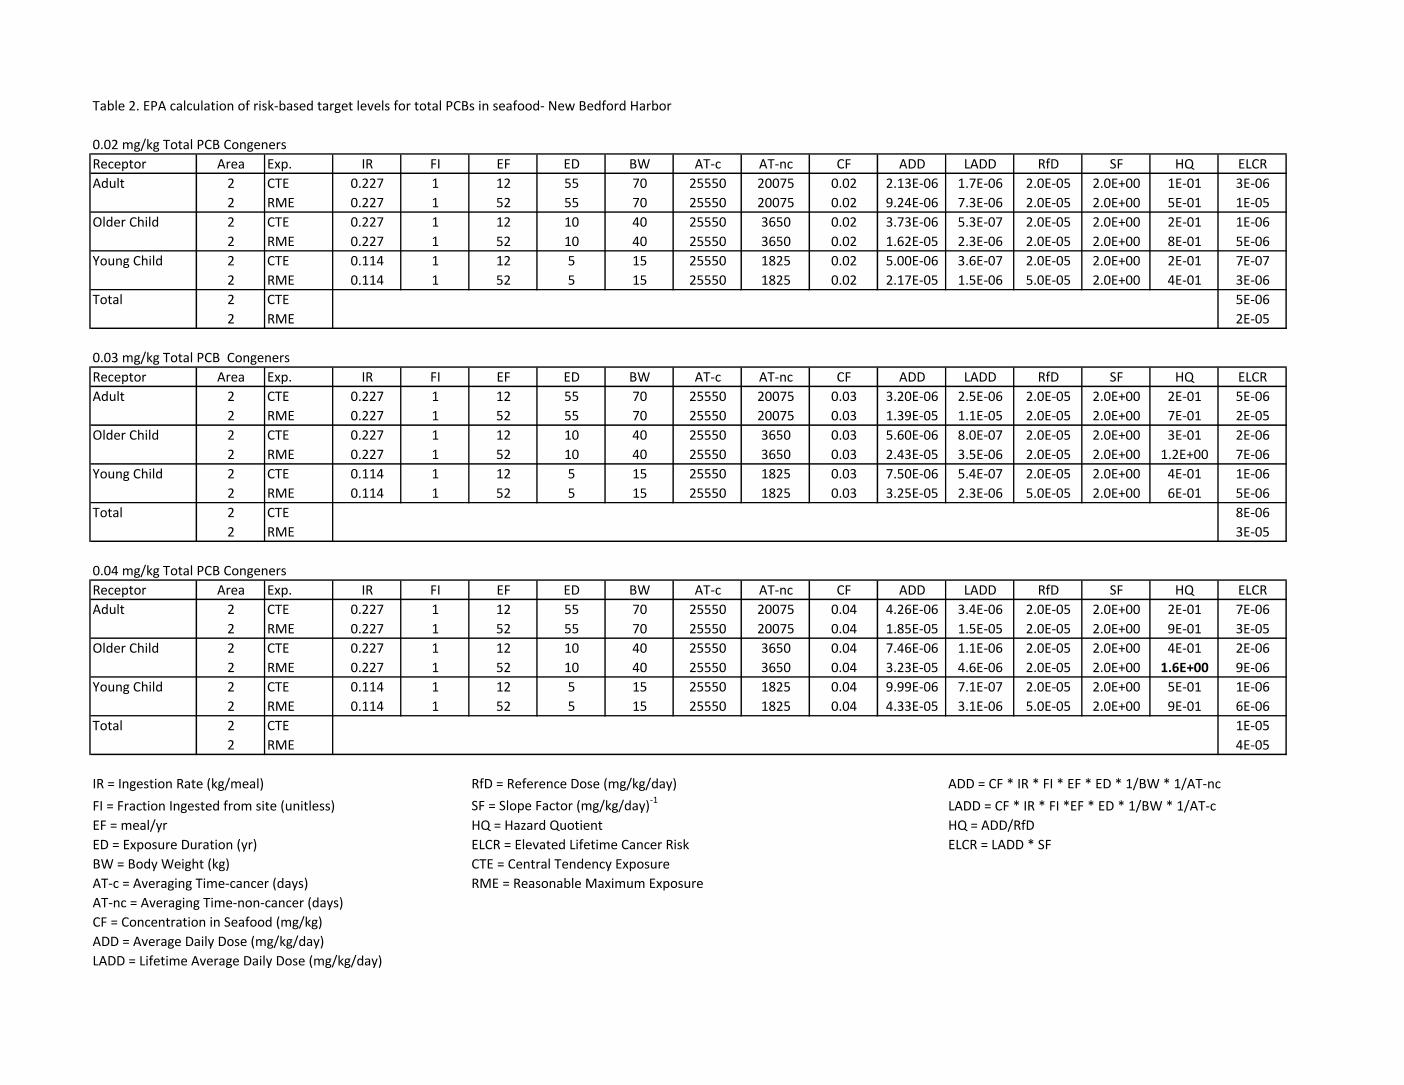
Table 2. EPA calculation of risk-based target levels for total PCBs in seafood- New Bedford Harbor
0.02 mg/kg Total PCB Congeners
Receptor Area Exp. IR FI EF ED BW AT-c AT-nc CF ADD LADD RfD SF HQ ELCR
Adult 2 CTE 0.227 1 12 55 70 25550 20075 0.02 2.13E-06 1.7E-06 2.0E-05 2.0E+00 1E-01 3E-06
2 RME 0.227 1 52 55 70 25550 20075 0.02 9.24E-06 7.3E-06 2.0E-05 2.0E+00 5E-01 1E-05
Older Child 2 CTE 0.227 1 12 10 40 25550 3650 0.02 3.73E-06 5.3E-07 2.0E-05 2.0E+00 2E-01 1E-06
2 RME 0.227 1 52 10 40 25550 3650 0.02 1.62E-05 2.3E-06 2.0E-05 2.0E+00 8E-01 5E-06
Young Child 2 CTE 0.114 1 12 5 15 25550 1825 0.02 5.00E-06 3.6E-07 2.0E-05 2.0E+00 2E-01 7E-07
2 RME 0.114 1 52 5 15 25550 1825 0.02 2.17E-05 1.5E-06 5.0E-05 2.0E+00 4E-01 3E-06
Total 2 CTE 5E-06
2 RME 2E-05
0.03 mg/kg Total PCB Congeners
Receptor Area Exp. IR FI EF ED BW AT-c AT-nc CF ADD LADD RfD SF HQ ELCR
Adult 2 CTE 0.227 1 12 55 70 25550 20075 0.03 3.20E-06 2.5E-06 2.0E-05 2.0E+00 2E-01 5E-06
2 RME 0.227 1 52 55 70 25550 20075 0.03 1.39E-05 1.1E-05 2.0E-05 2.0E+00 7E-01 2E-05
Older Child 2 CTE 0.227 1 12 10 40 25550 3650 0.03 5.60E-06 8.0E-07 2.0E-05 2.0E+00 3E-01 2E-06
2 RME 0.227 1 52 10 40 25550 3650 0.03 2.43E-05 3.5E-06 2.0E-05 2.0E+00 1.2E+00 7E-06
Young Child 2 CTE 0.114 1 12 5 15 25550 1825 0.03 7.50E-06 5.4E-07 2.0E-05 2.0E+00 4E-01 1E-06
2 RME 0.114 1 52 5 15 25550 1825 0.03 3.25E-05 2.3E-06 5.0E-05 2.0E+00 6E-01 5E-06
Total 2 CTE 8E-06
2 RME 3E-05
0.04 mg/kg Total PCB Congeners
Receptor Area Exp. IR FI EF ED BW AT-c AT-nc CF ADD LADD RfD SF HQ ELCR
Adult 2 CTE 0.227 1 12 55 70 25550 20075 0.04 4.26E-06 3.4E-06 2.0E-05 2.0E+00 2E-01 7E-06
2 RME 0.227 1 52 55 70 25550 20075 0.04 1.85E-05 1.5E-05 2.0E-05 2.0E+00 9E-01 3E-05
Older Child 2 CTE 0.227 1 12 10 40 25550 3650 0.04 7.46E-06 1.1E-06 2.0E-05 2.0E+00 4E-01 2E-06
2 RME 0.227 1 52 10 40 25550 3650 0.04 3.23E-05 4.6E-06 2.0E-05 2.0E+00 1.6E+00 9E-06
Young Child 2 CTE 0.114 1 12 5 15 25550 1825 0.04 9.99E-06 7.1E-07 2.0E-05 2.0E+00 5E-01 1E-06
2 RME 0.114 1 52 5 15 25550 1825 0.04 4.33E-05 3.1E-06 5.0E-05 2.0E+00 9E-01 6E-06
Total 2 CTE 1E-05
2 RME 4E-05
IR = Ingestion Rate (kg/meal) RfD = Reference Dose (mg/kg/day) ADD = CF * IR * FI * EF * ED * 1/BW * 1/AT-nc
FI = Fraction Ingested from site (unitless) SF = Slope Factor (mg/kg/day)-1LADD = CF * IR * FI *EF * ED * 1/BW * 1/AT-c
EF = meal/yr HQ = Hazard Quotient HQ = ADD/RfD
ED = Exposure Duration (yr) ELCR = Elevated Lifetime Cancer Risk ELCR = LADD * SF
BW = Body Weight (kg) CTE = Central Tendency Exposure
AT-c = Averaging Time-cancer (days) RME = Reasonable Maximum Exposure
AT-nc = Averaging Time-non-cancer (days)
CF = Concentration in Seafood (mg/kg)
ADD = Average Daily Dose (mg/kg/day)
LADD = Lifetime Average Daily Dose (mg/kg/day)

Table 3. EPA Seafood Advisories
Seafood
Type
Sensitive Others Sensitive Others Sensitive Others Sensitive Others
Any fish, lobster, shellfish 0 0 0 0 0 0 0 NR
Any bottom feeding fish 0 0 0 0 0 0 0 ND
Black Sea Bass 0 0 0 1 0 1 0 1
Scup 0 0 0 ND 0 ND 0 0
Lobster 0 0 0 0 0 0 0 0
Shellfish other than lobster 0 0 0 1 1 4 1 NR
Eel 0 0 0 0 0 0 0 NR
Flounder 0 0 0 0 0 0 0 NR
Tautog 0 0 0 0 0 ND 0 NR
All other fish 0 0 0 ND 0 ND 0 ND
Sensitive receptors: pregnant women, nursing mothers, children under age 12, women who may become pregnant
ND = No Data (therefore EPA cannot make a recommendation)
NR = No Restrictions
A value of 0 meals/month means "do not eat"
A value of 4 meals/month is equivalent to "no more than one meal/week"
Area 1 Area 2
Clark's Cove
Area 3
Maximum Meals/Month
Receptors Receptors Receptors Receptors
Other Area 2
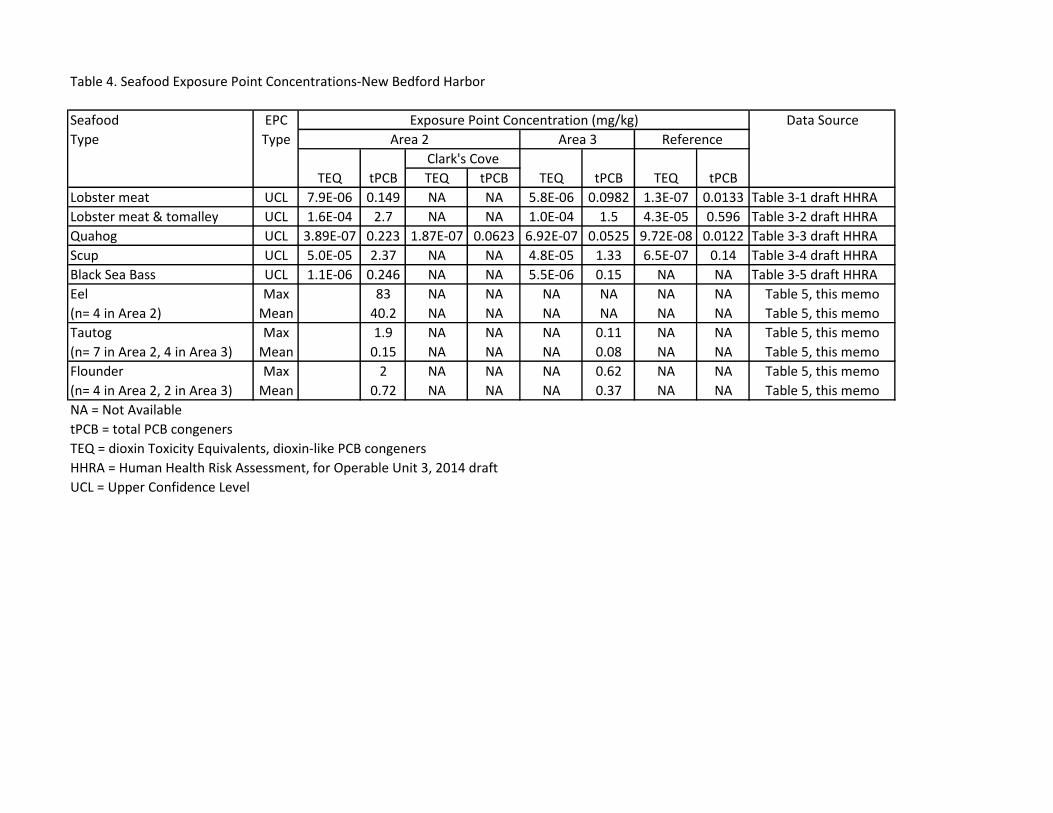
Table 4. Seafood Exposure Point Concentrations-New Bedford Harbor
Seafood EPC Data Source
Type Type
TEQ tPCB TEQ tPCB TEQ tPCB TEQ tPCB
Lobster meat UCL 7.9E-06 0.149 NA NA 5.8E-06 0.0982 1.3E-07 0.0133 Table 3-1 draft HHRA
Lobster meat & tomalley UCL 1.6E-04 2.7 NA NA 1.0E-04 1.5 4.3E-05 0.596 Table 3-2 draft HHRA
Quahog UCL 3.89E-07 0.223 1.87E-07 0.0623 6.92E-07 0.0525 9.72E-08 0.0122 Table 3-3 draft HHRA
Scup UCL 5.0E-05 2.37 NA NA 4.8E-05 1.33 6.5E-07 0.14 Table 3-4 draft HHRA
Black Sea Bass UCL 1.1E-06 0.246 NA NA 5.5E-06 0.15 NA NA Table 3-5 draft HHRA
Eel Max 83 NA NA NA NA NA NA Table 5, this memo
(n= 4 in Area 2) Mean 40.2 NA NA NA NA NA NA Table 5, this memo
Tautog Max 1.9 NA NA NA 0.11 NA NA Table 5, this memo
(n= 7 in Area 2, 4 in Area 3) Mean 0.15 NA NA NA 0.08 NA NA Table 5, this memo
Flounder Max 2 NA NA NA 0.62 NA NA Table 5, this memo
(n= 4 in Area 2, 2 in Area 3) Mean 0.72 NA NA NA 0.37 NA NA Table 5, this memo
NA = Not Available
tPCB = total PCB congeners
TEQ = dioxin Toxicity Equivalents, dioxin-like PCB congeners
HHRA = Human Health Risk Assessment, for Operable Unit 3, 2014 draft
UCL = Upper Confidence Level
Area 2 Area 3 Reference
Clark's Cove
Exposure Point Concentration (mg/kg)
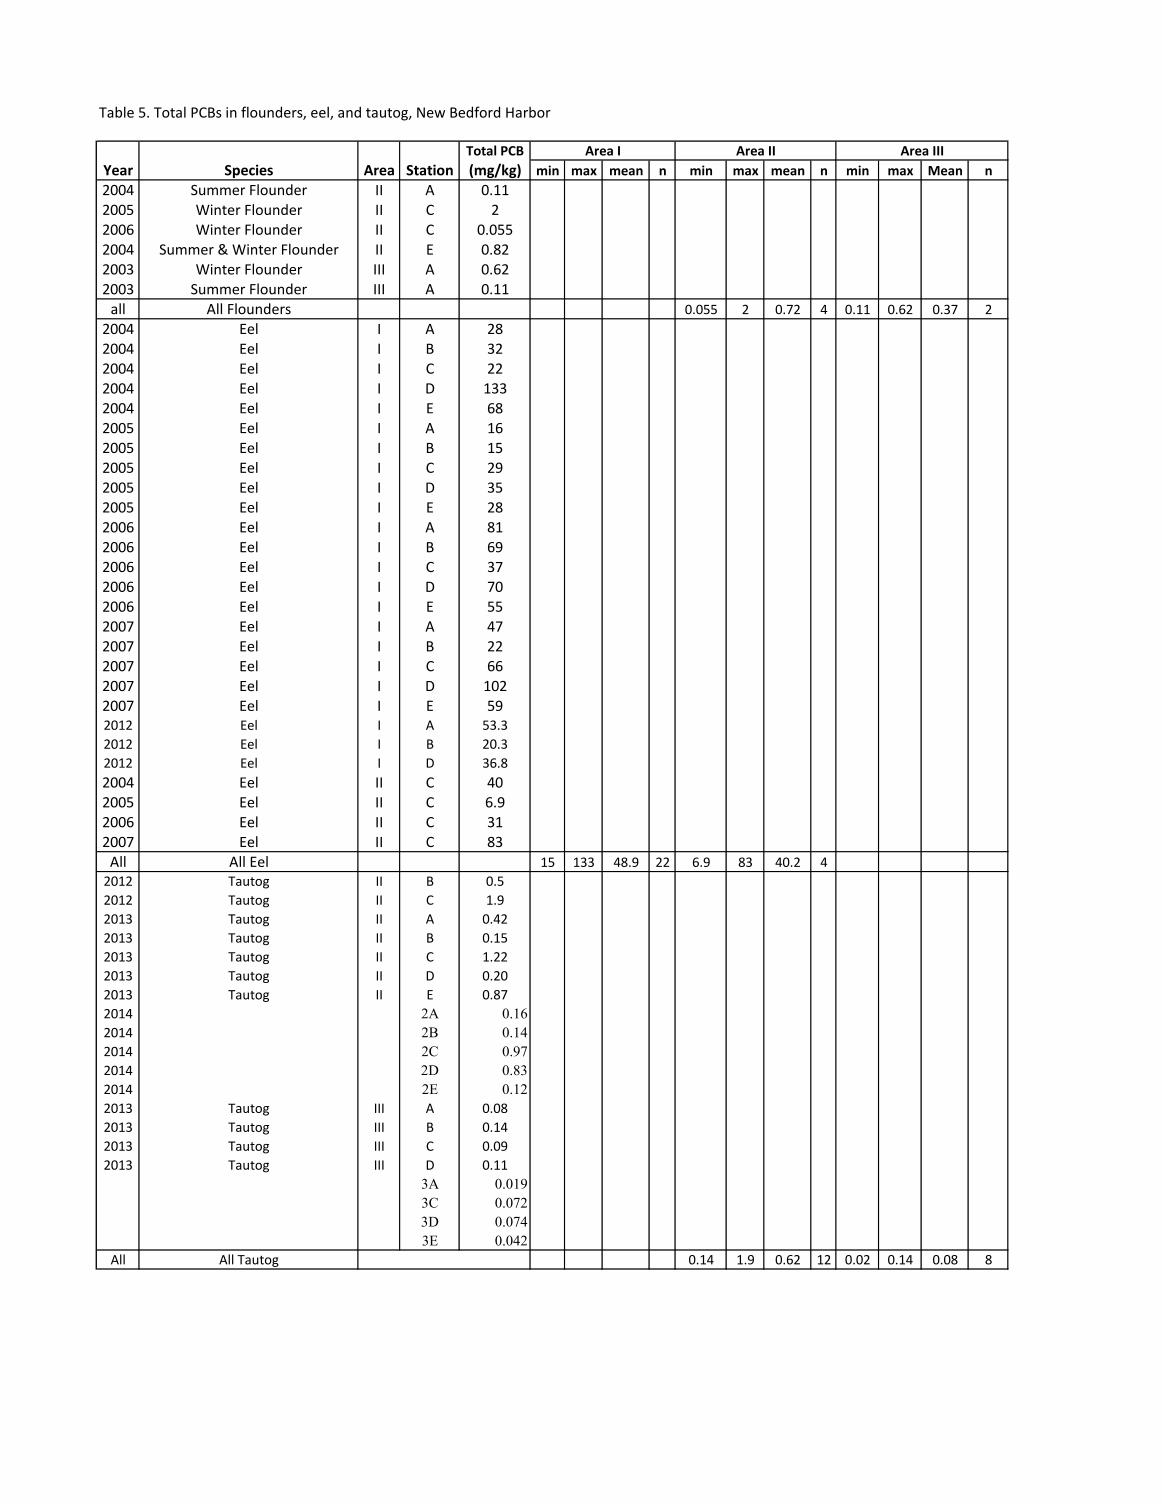
Table 5. Total PCBs in flounders, eel, and tautog, New Bedford Harbor
Total PCB
Year Species Area Station (mg/kg) min max mean n min max mean n min max Mean n
2004 Summer Flounder II A 0.112005 Winter Flounder II C 22006 Winter Flounder II C 0.0552004 Summer & Winter Flounder II E 0.822003 Winter Flounder III A 0.622003 Summer Flounder III A 0.11
all All Flounders 0.055 2 0.72 4 0.11 0.62 0.37 2
2004 Eel I A 282004 Eel I B 322004 Eel I C 222004 Eel I D 1332004 Eel I E 682005 Eel I A 162005 Eel I B 152005 Eel I C 292005 Eel I D 352005 Eel I E 282006 Eel I A 812006 Eel I B 692006 Eel I C 372006 Eel I D 702006 Eel I E 552007 Eel I A 472007 Eel I B 222007 Eel I C 662007 Eel I D 1022007 Eel I E 592012 Eel I A 53.3
2012 Eel I B 20.3
2012 Eel I D 36.8
2004 Eel II C 402005 Eel II C 6.92006 Eel II C 312007 Eel II C 83
All All Eel 15 133 48.9 22 6.9 83 40.2 4
2012 Tautog II B 0.5
2012 Tautog II C 1.9
2013 Tautog II A 0.42
2013 Tautog II B 0.15
2013 Tautog II C 1.22
2013 Tautog II D 0.20
2013 Tautog II E 0.87
2014 2A 0.162014 2B 0.142014 2C 0.972014 2D 0.832014 2E 0.122013 Tautog III A 0.08
2013 Tautog III B 0.14
2013 Tautog III C 0.09
2013 Tautog III D 0.11
3A 0.0193C 0.0723D 0.0743E 0.042
All All Tautog 0.14 1.9 0.62 12 0.02 0.14 0.08 8
Area IIArea I Area III
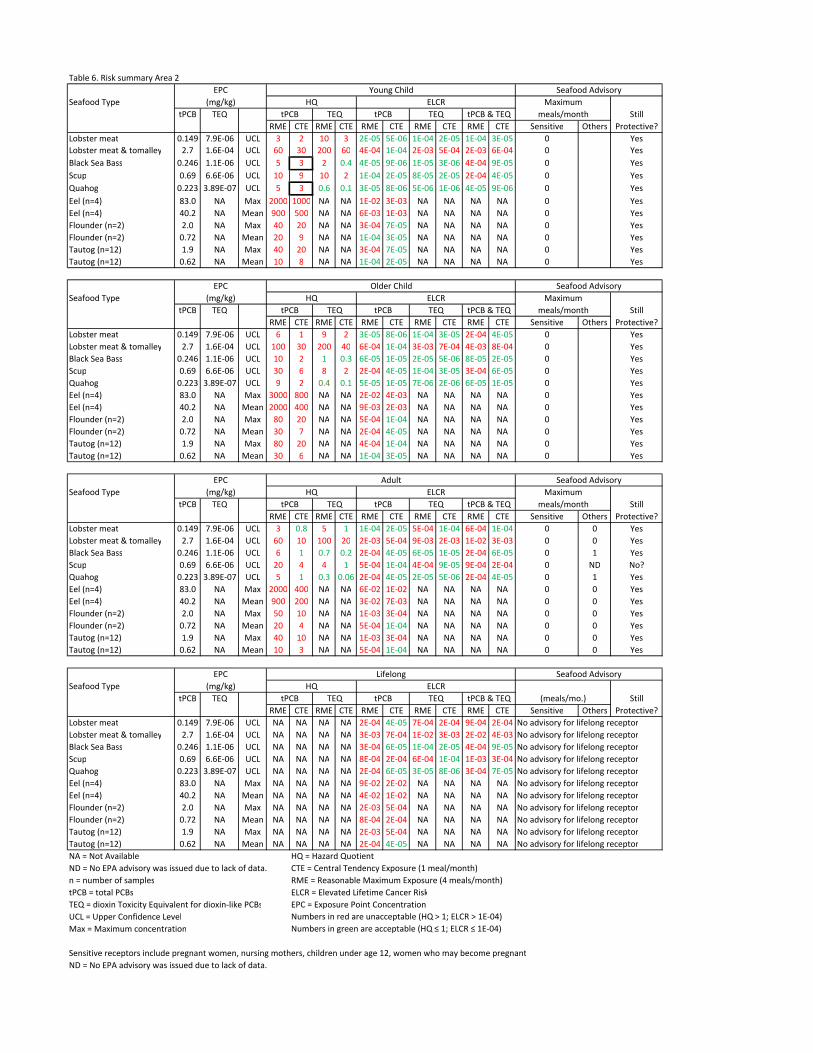
Table 6. Risk summary Area 2
Seafood Type
tPCB TEQ Still
RME CTE RME CTE RME CTE RME CTE RME CTE Sensitive Others Protective?
Lobster meat 0.149 7.9E-06 UCL 3 2 10 3 2E-05 5E-06 1E-04 2E-05 1E-04 3E-05 0 Yes
Lobster meat & tomalley 2.7 1.6E-04 UCL 60 30 200 60 4E-04 1E-04 2E-03 5E-04 2E-03 6E-04 0 Yes
Black Sea Bass 0.246 1.1E-06 UCL 5 3 2 0.4 4E-05 9E-06 1E-05 3E-06 4E-04 9E-05 0 Yes
Scup 0.69 6.6E-06 UCL 10 9 10 2 1E-04 2E-05 8E-05 2E-05 2E-04 4E-05 0 Yes
Quahog 0.223 3.89E-07 UCL 5 3 0.6 0.1 3E-05 8E-06 5E-06 1E-06 4E-05 9E-06 0 Yes
Eel (n=4) 83.0 NA Max 2000 1000 NA NA 1E-02 3E-03 NA NA NA NA 0 Yes
Eel (n=4) 40.2 NA Mean 900 500 NA NA 6E-03 1E-03 NA NA NA NA 0 Yes
Flounder (n=2) 2.0 NA Max 40 20 NA NA 3E-04 7E-05 NA NA NA NA 0 Yes
Flounder (n=2) 0.72 NA Mean 20 9 NA NA 1E-04 3E-05 NA NA NA NA 0 Yes
Tautog (n=12) 1.9 NA Max 40 20 NA NA 3E-04 7E-05 NA NA NA NA 0 Yes
Tautog (n=12) 0.62 NA Mean 10 8 NA NA 1E-04 2E-05 NA NA NA NA 0 Yes
Seafood Type
tPCB TEQ Still
RME CTE RME CTE RME CTE RME CTE RME CTE Sensitive Others Protective?
Lobster meat 0.149 7.9E-06 UCL 6 1 9 2 3E-05 8E-06 1E-04 3E-05 2E-04 4E-05 0 Yes
Lobster meat & tomalley 2.7 1.6E-04 UCL 100 30 200 40 6E-04 1E-04 3E-03 7E-04 4E-03 8E-04 0 Yes
Black Sea Bass 0.246 1.1E-06 UCL 10 2 1 0.3 6E-05 1E-05 2E-05 5E-06 8E-05 2E-05 0 Yes
Scup 0.69 6.6E-06 UCL 30 6 8 2 2E-04 4E-05 1E-04 3E-05 3E-04 6E-05 0 Yes
Quahog 0.223 3.89E-07 UCL 9 2 0.4 0.1 5E-05 1E-05 7E-06 2E-06 6E-05 1E-05 0 Yes
Eel (n=4) 83.0 NA Max 3000 800 NA NA 2E-02 4E-03 NA NA NA NA 0 Yes
Eel (n=4) 40.2 NA Mean 2000 400 NA NA 9E-03 2E-03 NA NA NA NA 0 Yes
Flounder (n=2) 2.0 NA Max 80 20 NA NA 5E-04 1E-04 NA NA NA NA 0 Yes
Flounder (n=2) 0.72 NA Mean 30 7 NA NA 2E-04 4E-05 NA NA NA NA 0 Yes
Tautog (n=12) 1.9 NA Max 80 20 NA NA 4E-04 1E-04 NA NA NA NA 0 Yes
Tautog (n=12) 0.62 NA Mean 30 6 NA NA 1E-04 3E-05 NA NA NA NA 0 Yes
Seafood Type
tPCB TEQ Still
RME CTE RME CTE RME CTE RME CTE RME CTE Sensitive Others Protective?
Lobster meat 0.149 7.9E-06 UCL 3 0.8 5 1 1E-04 2E-05 5E-04 1E-04 6E-04 1E-04 0 0 Yes
Lobster meat & tomalley 2.7 1.6E-04 UCL 60 10 100 20 2E-03 5E-04 9E-03 2E-03 1E-02 3E-03 0 0 Yes
Black Sea Bass 0.246 1.1E-06 UCL 6 1 0.7 0.2 2E-04 4E-05 6E-05 1E-05 2E-04 6E-05 0 1 Yes
Scup 0.69 6.6E-06 UCL 20 4 4 1 5E-04 1E-04 4E-04 9E-05 9E-04 2E-04 0 ND No?
Quahog 0.223 3.89E-07 UCL 5 1 0.3 0.06 2E-04 4E-05 2E-05 5E-06 2E-04 4E-05 0 1 Yes
Eel (n=4) 83.0 NA Max 2000 400 NA NA 6E-02 1E-02 NA NA NA NA 0 0 Yes
Eel (n=4) 40.2 NA Mean 900 200 NA NA 3E-02 7E-03 NA NA NA NA 0 0 Yes
Flounder (n=2) 2.0 NA Max 50 10 NA NA 1E-03 3E-04 NA NA NA NA 0 0 Yes
Flounder (n=2) 0.72 NA Mean 20 4 NA NA 5E-04 1E-04 NA NA NA NA 0 0 Yes
Tautog (n=12) 1.9 NA Max 40 10 NA NA 1E-03 3E-04 NA NA NA NA 0 0 Yes
Tautog (n=12) 0.62 NA Mean 10 3 NA NA 5E-04 1E-04 NA NA NA NA 0 0 Yes
Seafood Type
tPCB TEQ Still
RME CTE RME CTE RME CTE RME CTE RME CTE Sensitive Others Protective?
Lobster meat 0.149 7.9E-06 UCL NA NA NA NA 2E-04 4E-05 7E-04 2E-04 9E-04 2E-04 No advisory for lifelong receptor
Lobster meat & tomalley 2.7 1.6E-04 UCL NA NA NA NA 3E-03 7E-04 1E-02 3E-03 2E-02 4E-03 No advisory for lifelong receptor
Black Sea Bass 0.246 1.1E-06 UCL NA NA NA NA 3E-04 6E-05 1E-04 2E-05 4E-04 9E-05 No advisory for lifelong receptor
Scup 0.69 6.6E-06 UCL NA NA NA NA 8E-04 2E-04 6E-04 1E-04 1E-03 3E-04 No advisory for lifelong receptor
Quahog 0.223 3.89E-07 UCL NA NA NA NA 2E-04 6E-05 3E-05 8E-06 3E-04 7E-05 No advisory for lifelong receptor
Eel (n=4) 83.0 NA Max NA NA NA NA 9E-02 2E-02 NA NA NA NA No advisory for lifelong receptor
Eel (n=4) 40.2 NA Mean NA NA NA NA 4E-02 1E-02 NA NA NA NA No advisory for lifelong receptor
Flounder (n=2) 2.0 NA Max NA NA NA NA 2E-03 5E-04 NA NA NA NA No advisory for lifelong receptor
Flounder (n=2) 0.72 NA Mean NA NA NA NA 8E-04 2E-04 NA NA NA NA No advisory for lifelong receptor
Tautog (n=12) 1.9 NA Max NA NA NA NA 2E-03 5E-04 NA NA NA NA No advisory for lifelong receptor
Tautog (n=12) 0.62 NA Mean NA NA NA NA 2E-04 4E-05 NA NA NA NA No advisory for lifelong receptor
NA = Not Available HQ = Hazard Quotient
ND = No EPA advisory was issued due to lack of data. CTE = Central Tendency Exposure (1 meal/month)
n = number of samples RME = Reasonable Maximum Exposure (4 meals/month)
tPCB = total PCBs ELCR = Elevated Lifetime Cancer Risk
TEQ = dioxin Toxicity Equivalent for dioxin-like PCBs EPC = Exposure Point Concentration
UCL = Upper Confidence Level Numbers in red are unacceptable (HQ > 1; ELCR > 1E-04)
Max = Maximum concentration Numbers in green are acceptable (HQ ≤ 1; ELCR ≤ 1E-04)
Sensitive receptors include pregnant women, nursing mothers, children under age 12, women who may become pregnant.
ND = No EPA advisory was issued due to lack of data.
Young Child
Older Child
HQ ELCR
HQ
tPCB TEQ tPCB TEQ tPCB & TEQ
ELCR
Adult
tPCB TEQ tPCB
Lifelong
ELCR
tPCB TEQ tPCB TEQ tPCB & TEQ
TEQ tPCB & TEQ
HQ
HQ ELCR
tPCB TEQ tPCB TEQ tPCB & TEQ
EPC
(mg/kg)
EPC
(mg/kg)
EPC
(mg/kg)
(mg/kg)
EPC
Seafood Advisory
Seafood Advisory
(meals/mo.)
Maximum
meals/month
Maximum
meals/month
Maximum
meals/month
Seafood Advisory
Seafood Advisory
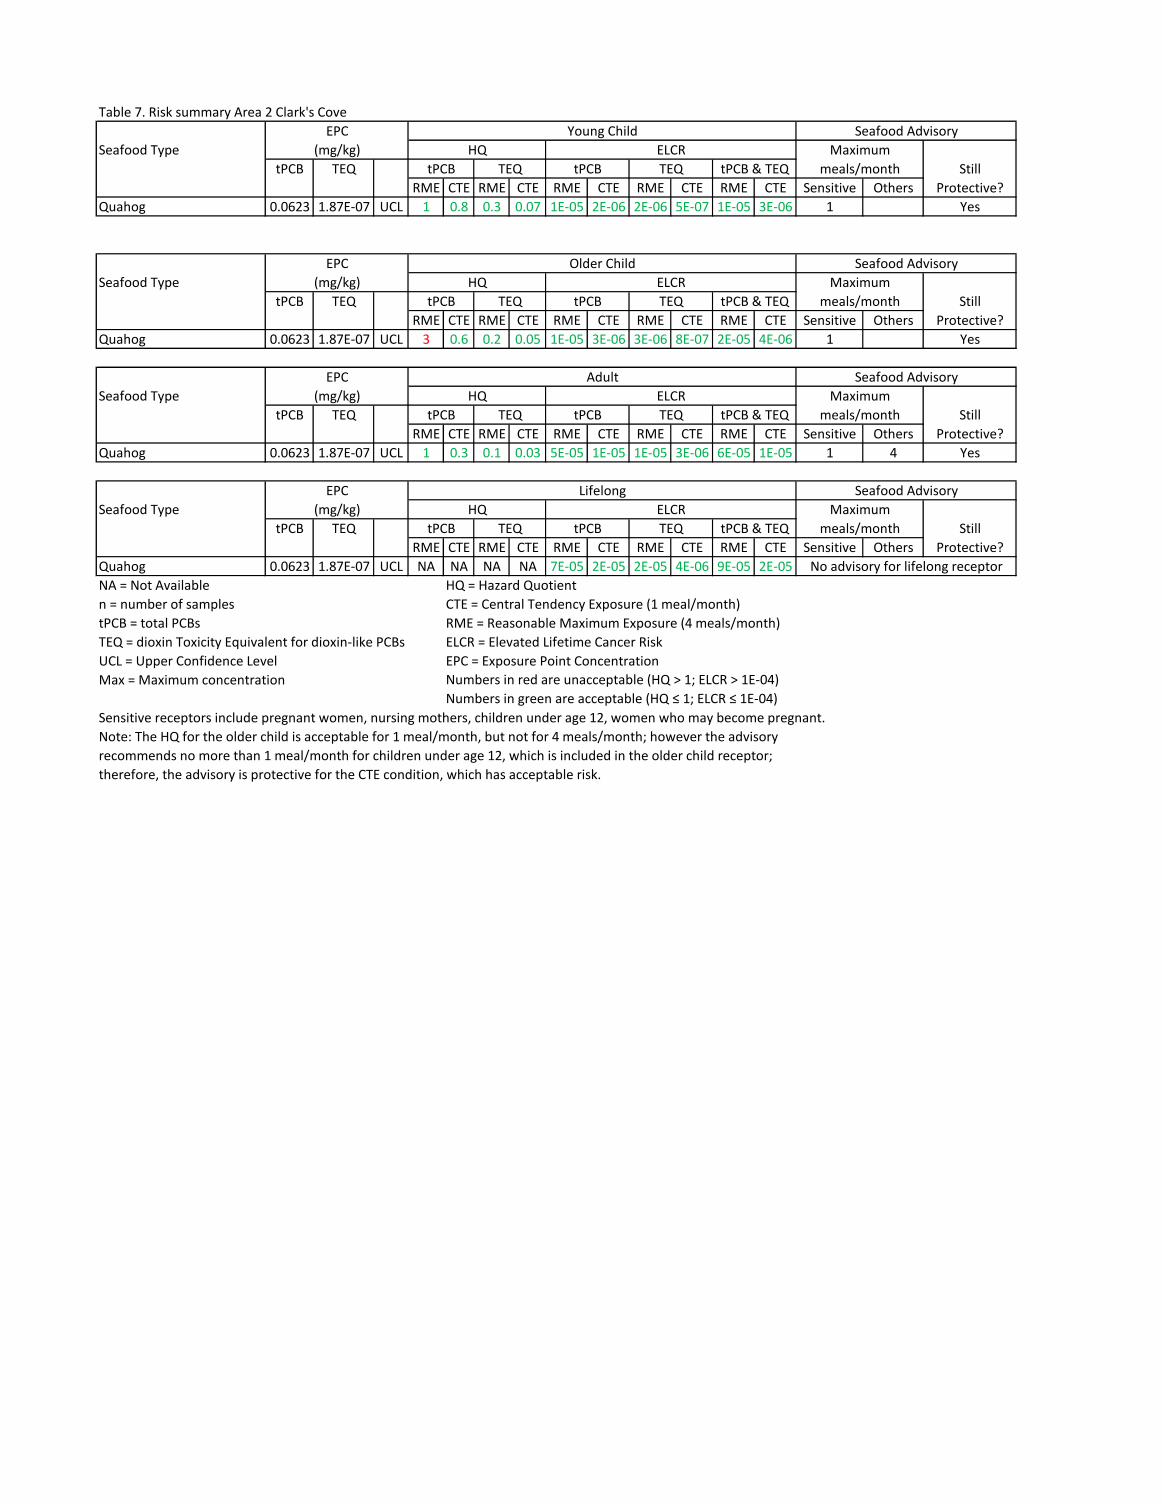
Table 7. Risk summary Area 2 Clark's Cove
Seafood Type
tPCB TEQ Still
RME CTE RME CTE RME CTE RME CTE RME CTE Sensitive Others Protective?
Quahog 0.0623 1.87E-07 UCL 1 0.8 0.3 0.07 1E-05 2E-06 2E-06 5E-07 1E-05 3E-06 1 Yes
Seafood Type
tPCB TEQ Still
RME CTE RME CTE RME CTE RME CTE RME CTE Sensitive Others Protective?
Quahog 0.0623 1.87E-07 UCL 3 0.6 0.2 0.05 1E-05 3E-06 3E-06 8E-07 2E-05 4E-06 1 Yes
Seafood Type
tPCB TEQ Still
RME CTE RME CTE RME CTE RME CTE RME CTE Sensitive Others Protective?
Quahog 0.0623 1.87E-07 UCL 1 0.3 0.1 0.03 5E-05 1E-05 1E-05 3E-06 6E-05 1E-05 1 4 Yes
Seafood Type
tPCB TEQ Still
RME CTE RME CTE RME CTE RME CTE RME CTE Sensitive Others Protective?
Quahog 0.0623 1.87E-07 UCL NA NA NA NA 7E-05 2E-05 2E-05 4E-06 9E-05 2E-05
NA = Not Available HQ = Hazard Quotient
n = number of samples CTE = Central Tendency Exposure (1 meal/month)
tPCB = total PCBs RME = Reasonable Maximum Exposure (4 meals/month)
TEQ = dioxin Toxicity Equivalent for dioxin-like PCBs ELCR = Elevated Lifetime Cancer Risk
UCL = Upper Confidence Level EPC = Exposure Point Concentration
Max = Maximum concentration Numbers in red are unacceptable (HQ > 1; ELCR > 1E-04)
Numbers in green are acceptable (HQ ≤ 1; ELCR ≤ 1E-04)
Sensitive receptors include pregnant women, nursing mothers, children under age 12, women who may become pregnant.
Note: The HQ for the older child is acceptable for 1 meal/month, but not for 4 meals/month; however the advisory
recommends no more than 1 meal/month for children under age 12, which is included in the older child receptor;
therefore, the advisory is protective for the CTE condition, which has acceptable risk.
No advisory for lifelong receptor
meals/month
EPC Young Child
(mg/kg) HQ ELCR Maximum
tPCB TEQ tPCB TEQ tPCB & TEQ
Seafood Advisory
meals/month
EPC Older Child
(mg/kg) HQ ELCR Maximum
Seafood Advisory
tPCB TEQ tPCB TEQ tPCB & TEQ
meals/month
EPC Adult
(mg/kg) HQ ELCR Maximum
tPCB TEQ tPCB TEQ tPCB & TEQ
Seafood Advisory
meals/month
EPC Lifelong
(mg/kg) HQ ELCR Maximum
tPCB TEQ tPCB TEQ tPCB & TEQ
Seafood Advisory
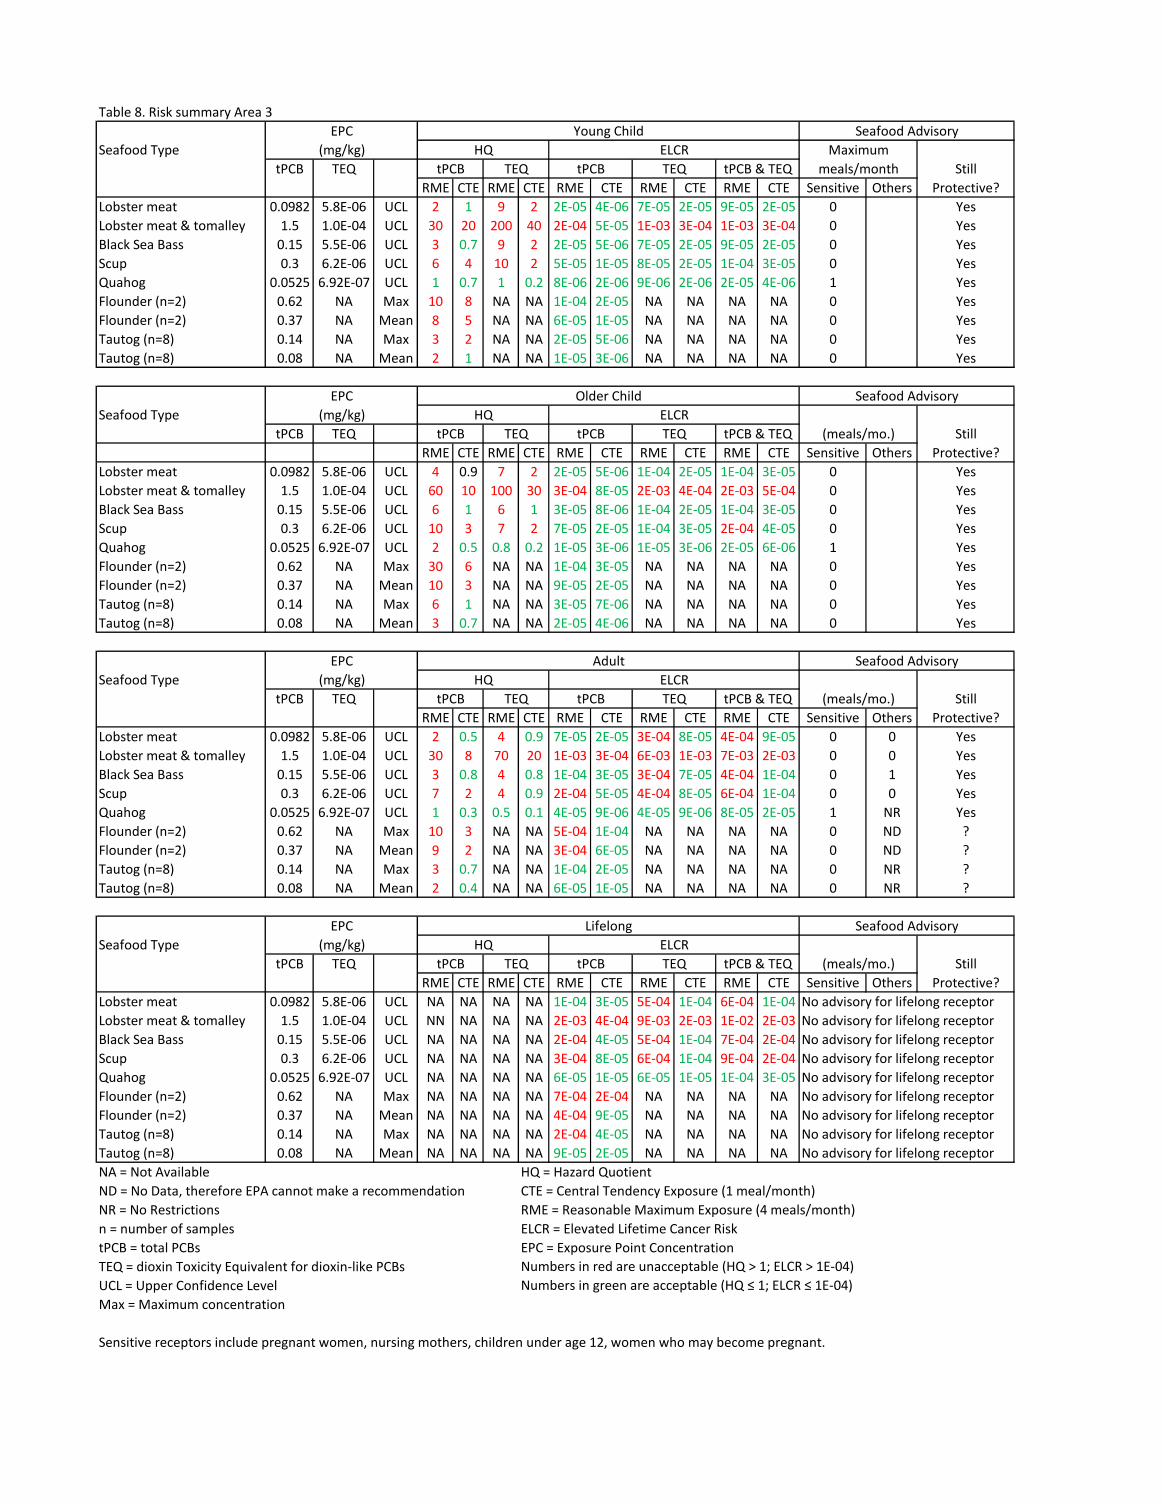
Table 8. Risk summary Area 3
Seafood Type
tPCB TEQ Still
RME CTE RME CTE RME CTE RME CTE RME CTE Sensitive Others Protective?
Lobster meat 0.0982 5.8E-06 UCL 2 1 9 2 2E-05 4E-06 7E-05 2E-05 9E-05 2E-05 0 Yes
Lobster meat & tomalley 1.5 1.0E-04 UCL 30 20 200 40 2E-04 5E-05 1E-03 3E-04 1E-03 3E-04 0 Yes
Black Sea Bass 0.15 5.5E-06 UCL 3 0.7 9 2 2E-05 5E-06 7E-05 2E-05 9E-05 2E-05 0 Yes
Scup 0.3 6.2E-06 UCL 6 4 10 2 5E-05 1E-05 8E-05 2E-05 1E-04 3E-05 0 Yes
Quahog 0.0525 6.92E-07 UCL 1 0.7 1 0.2 8E-06 2E-06 9E-06 2E-06 2E-05 4E-06 1 Yes
Flounder (n=2) 0.62 NA Max 10 8 NA NA 1E-04 2E-05 NA NA NA NA 0 Yes
Flounder (n=2) 0.37 NA Mean 8 5 NA NA 6E-05 1E-05 NA NA NA NA 0 Yes
Tautog (n=8) 0.14 NA Max 3 2 NA NA 2E-05 5E-06 NA NA NA NA 0 Yes
Tautog (n=8) 0.08 NA Mean 2 1 NA NA 1E-05 3E-06 NA NA NA NA 0 Yes
Seafood Type
tPCB TEQ Still
RME CTE RME CTE RME CTE RME CTE RME CTE Sensitive Others Protective?
Lobster meat 0.0982 5.8E-06 UCL 4 0.9 7 2 2E-05 5E-06 1E-04 2E-05 1E-04 3E-05 0 Yes
Lobster meat & tomalley 1.5 1.0E-04 UCL 60 10 100 30 3E-04 8E-05 2E-03 4E-04 2E-03 5E-04 0 Yes
Black Sea Bass 0.15 5.5E-06 UCL 6 1 6 1 3E-05 8E-06 1E-04 2E-05 1E-04 3E-05 0 Yes
Scup 0.3 6.2E-06 UCL 10 3 7 2 7E-05 2E-05 1E-04 3E-05 2E-04 4E-05 0 Yes
Quahog 0.0525 6.92E-07 UCL 2 0.5 0.8 0.2 1E-05 3E-06 1E-05 3E-06 2E-05 6E-06 1 Yes
Flounder (n=2) 0.62 NA Max 30 6 NA NA 1E-04 3E-05 NA NA NA NA 0 Yes
Flounder (n=2) 0.37 NA Mean 10 3 NA NA 9E-05 2E-05 NA NA NA NA 0 Yes
Tautog (n=8) 0.14 NA Max 6 1 NA NA 3E-05 7E-06 NA NA NA NA 0 Yes
Tautog (n=8) 0.08 NA Mean 3 0.7 NA NA 2E-05 4E-06 NA NA NA NA 0 Yes
Seafood Type
tPCB TEQ Still
RME CTE RME CTE RME CTE RME CTE RME CTE Sensitive Others Protective?
Lobster meat 0.0982 5.8E-06 UCL 2 0.5 4 0.9 7E-05 2E-05 3E-04 8E-05 4E-04 9E-05 0 0 Yes
Lobster meat & tomalley 1.5 1.0E-04 UCL 30 8 70 20 1E-03 3E-04 6E-03 1E-03 7E-03 2E-03 0 0 Yes
Black Sea Bass 0.15 5.5E-06 UCL 3 0.8 4 0.8 1E-04 3E-05 3E-04 7E-05 4E-04 1E-04 0 1 Yes
Scup 0.3 6.2E-06 UCL 7 2 4 0.9 2E-04 5E-05 4E-04 8E-05 6E-04 1E-04 0 0 Yes
Quahog 0.0525 6.92E-07 UCL 1 0.3 0.5 0.1 4E-05 9E-06 4E-05 9E-06 8E-05 2E-05 1 NR Yes
Flounder (n=2) 0.62 NA Max 10 3 NA NA 5E-04 1E-04 NA NA NA NA 0 ND ?
Flounder (n=2) 0.37 NA Mean 9 2 NA NA 3E-04 6E-05 NA NA NA NA 0 ND ?
Tautog (n=8) 0.14 NA Max 3 0.7 NA NA 1E-04 2E-05 NA NA NA NA 0 NR ?
Tautog (n=8) 0.08 NA Mean 2 0.4 NA NA 6E-05 1E-05 NA NA NA NA 0 NR ?
Seafood Type
tPCB TEQ Still
RME CTE RME CTE RME CTE RME CTE RME CTE Sensitive Others Protective?
Lobster meat 0.0982 5.8E-06 UCL NA NA NA NA 1E-04 3E-05 5E-04 1E-04 6E-04 1E-04 No advisory for lifelong receptor
Lobster meat & tomalley 1.5 1.0E-04 UCL NN NA NA NA 2E-03 4E-04 9E-03 2E-03 1E-02 2E-03 No advisory for lifelong receptor
Black Sea Bass 0.15 5.5E-06 UCL NA NA NA NA 2E-04 4E-05 5E-04 1E-04 7E-04 2E-04 No advisory for lifelong receptor
Scup 0.3 6.2E-06 UCL NA NA NA NA 3E-04 8E-05 6E-04 1E-04 9E-04 2E-04 No advisory for lifelong receptor
Quahog 0.0525 6.92E-07 UCL NA NA NA NA 6E-05 1E-05 6E-05 1E-05 1E-04 3E-05 No advisory for lifelong receptor
Flounder (n=2) 0.62 NA Max NA NA NA NA 7E-04 2E-04 NA NA NA NA No advisory for lifelong receptor
Flounder (n=2) 0.37 NA Mean NA NA NA NA 4E-04 9E-05 NA NA NA NA No advisory for lifelong receptor
Tautog (n=8) 0.14 NA Max NA NA NA NA 2E-04 4E-05 NA NA NA NA No advisory for lifelong receptor
Tautog (n=8) 0.08 NA Mean NA NA NA NA 9E-05 2E-05 NA NA NA NA No advisory for lifelong receptor
NA = Not Available HQ = Hazard Quotient
ND = No Data, therefore EPA cannot make a recommendation CTE = Central Tendency Exposure (1 meal/month)
NR = No Restrictions RME = Reasonable Maximum Exposure (4 meals/month)
n = number of samples ELCR = Elevated Lifetime Cancer Risk
tPCB = total PCBs EPC = Exposure Point Concentration
TEQ = dioxin Toxicity Equivalent for dioxin-like PCBs Numbers in red are unacceptable (HQ > 1; ELCR > 1E-04)
UCL = Upper Confidence Level Numbers in green are acceptable (HQ ≤ 1; ELCR ≤ 1E-04)
Max = Maximum concentration
Sensitive receptors include pregnant women, nursing mothers, children under age 12, women who may become pregnant.
meals/month
EPC Young Child
(mg/kg) HQ ELCR Maximum
tPCB TEQ tPCB TEQ tPCB & TEQ
Seafood Advisory
(meals/mo.)
EPC Older Child
(mg/kg) HQ ELCR
tPCB TEQ tPCB TEQ tPCB & TEQ
Seafood Advisory
(meals/mo.)
EPC Adult
(mg/kg) HQ ELCR
tPCB TEQ tPCB TEQ tPCB & TEQ
Seafood Advisory
(meals/mo.)
EPC Lifelong
(mg/kg) HQ ELCR
tPCB TEQ tPCB TEQ tPCB & TEQ
Seafood Advisory
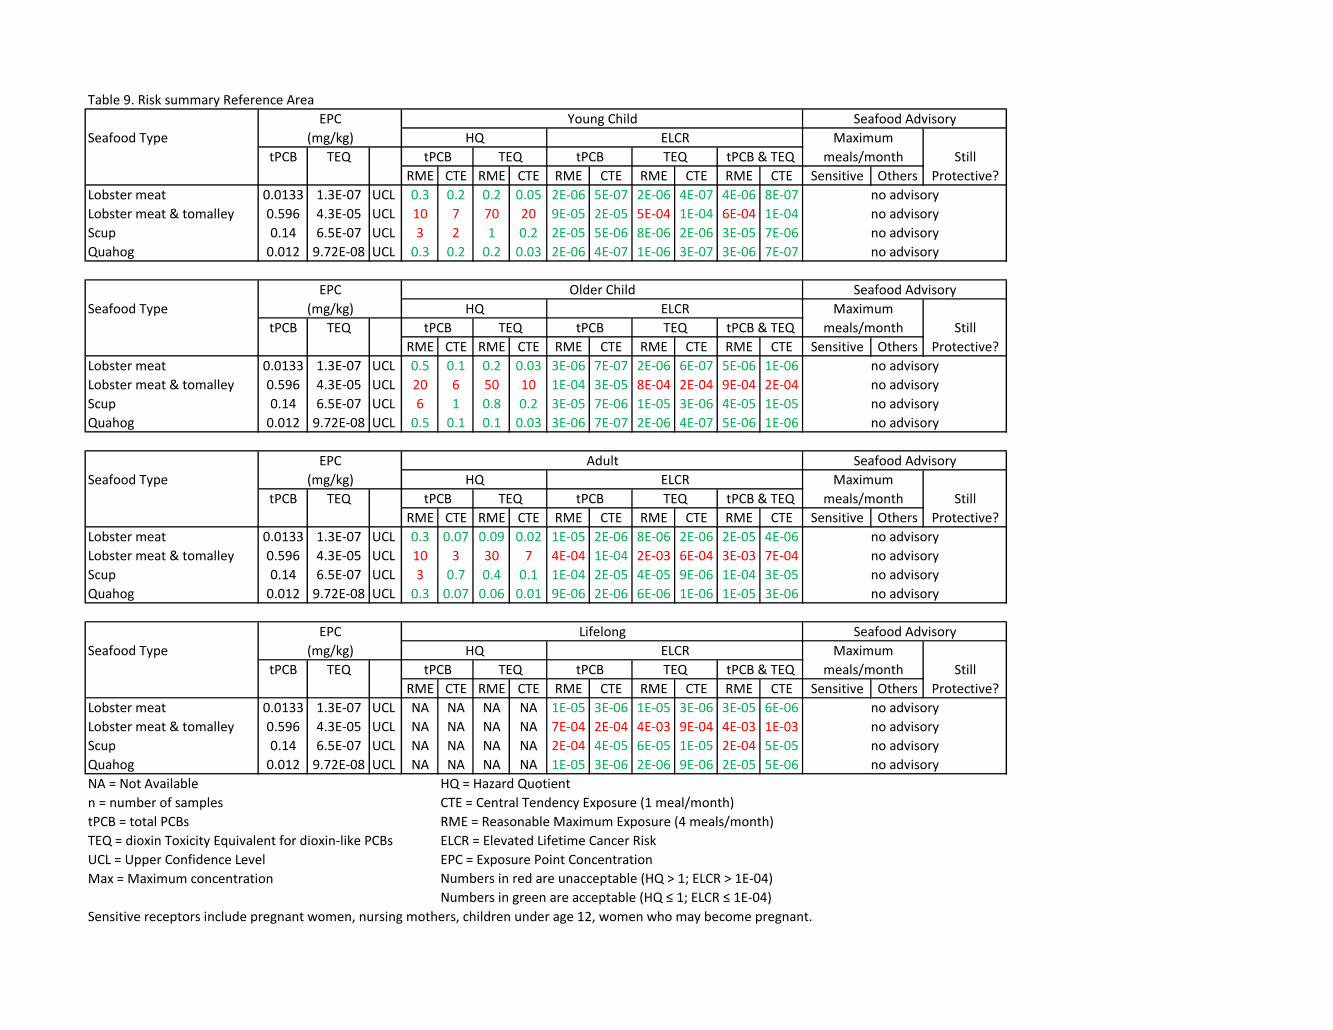
Table 9. Risk summary Reference Area
Seafood Type
tPCB TEQ Still
RME CTE RME CTE RME CTE RME CTE RME CTE Sensitive Others Protective?
Lobster meat 0.0133 1.3E-07 UCL 0.3 0.2 0.2 0.05 2E-06 5E-07 2E-06 4E-07 4E-06 8E-07
Lobster meat & tomalley 0.596 4.3E-05 UCL 10 7 70 20 9E-05 2E-05 5E-04 1E-04 6E-04 1E-04
Scup 0.14 6.5E-07 UCL 3 2 1 0.2 2E-05 5E-06 8E-06 2E-06 3E-05 7E-06
Quahog 0.012 9.72E-08 UCL 0.3 0.2 0.2 0.03 2E-06 4E-07 1E-06 3E-07 3E-06 7E-07
Seafood Type
tPCB TEQ Still
RME CTE RME CTE RME CTE RME CTE RME CTE Sensitive Others Protective?
Lobster meat 0.0133 1.3E-07 UCL 0.5 0.1 0.2 0.03 3E-06 7E-07 2E-06 6E-07 5E-06 1E-06
Lobster meat & tomalley 0.596 4.3E-05 UCL 20 6 50 10 1E-04 3E-05 8E-04 2E-04 9E-04 2E-04
Scup 0.14 6.5E-07 UCL 6 1 0.8 0.2 3E-05 7E-06 1E-05 3E-06 4E-05 1E-05
Quahog 0.012 9.72E-08 UCL 0.5 0.1 0.1 0.03 3E-06 7E-07 2E-06 4E-07 5E-06 1E-06
Seafood Type
tPCB TEQ Still
RME CTE RME CTE RME CTE RME CTE RME CTE Sensitive Others Protective?
Lobster meat 0.0133 1.3E-07 UCL 0.3 0.07 0.09 0.02 1E-05 2E-06 8E-06 2E-06 2E-05 4E-06
Lobster meat & tomalley 0.596 4.3E-05 UCL 10 3 30 7 4E-04 1E-04 2E-03 6E-04 3E-03 7E-04
Scup 0.14 6.5E-07 UCL 3 0.7 0.4 0.1 1E-04 2E-05 4E-05 9E-06 1E-04 3E-05
Quahog 0.012 9.72E-08 UCL 0.3 0.07 0.06 0.01 9E-06 2E-06 6E-06 1E-06 1E-05 3E-06
Seafood Type
tPCB TEQ Still
RME CTE RME CTE RME CTE RME CTE RME CTE Sensitive Others Protective?
Lobster meat 0.0133 1.3E-07 UCL NA NA NA NA 1E-05 3E-06 1E-05 3E-06 3E-05 6E-06
Lobster meat & tomalley 0.596 4.3E-05 UCL NA NA NA NA 7E-04 2E-04 4E-03 9E-04 4E-03 1E-03
Scup 0.14 6.5E-07 UCL NA NA NA NA 2E-04 4E-05 6E-05 1E-05 2E-04 5E-05
Quahog 0.012 9.72E-08 UCL NA NA NA NA 1E-05 3E-06 2E-06 9E-06 2E-05 5E-06
NA = Not Available HQ = Hazard Quotient
n = number of samples CTE = Central Tendency Exposure (1 meal/month)
tPCB = total PCBs RME = Reasonable Maximum Exposure (4 meals/month)
TEQ = dioxin Toxicity Equivalent for dioxin-like PCBs ELCR = Elevated Lifetime Cancer Risk
UCL = Upper Confidence Level EPC = Exposure Point Concentration
Max = Maximum concentration Numbers in red are unacceptable (HQ > 1; ELCR > 1E-04)
Numbers in green are acceptable (HQ ≤ 1; ELCR ≤ 1E-04)
Sensitive receptors include pregnant women, nursing mothers, children under age 12, women who may become pregnant.
no advisory
Seafood Advisory
no advisory
no advisory
no advisory
no advisory
Seafood Advisory
no advisory
no advisory
no advisory
no advisory
Seafood Advisory
no advisory
no advisory
no advisory
no advisory
Seafood Advisory
no advisory
no advisory
no advisory
meals/month
meals/month
Maximum
meals/month
Maximum
meals/month
Maximum
EPC Young Child
(mg/kg) HQ ELCR Maximum
tPCB TEQ tPCB TEQ tPCB & TEQ
EPC Older Child
(mg/kg) HQ ELCR
tPCB TEQ tPCB TEQ tPCB & TEQ
EPC Adult
(mg/kg) HQ ELCR
tPCB TEQ tPCB TEQ tPCB & TEQ
EPC Lifelong
(mg/kg) HQ ELCR
tPCB TEQ tPCB TEQ tPCB & TEQ

8
ATTACHMENTS
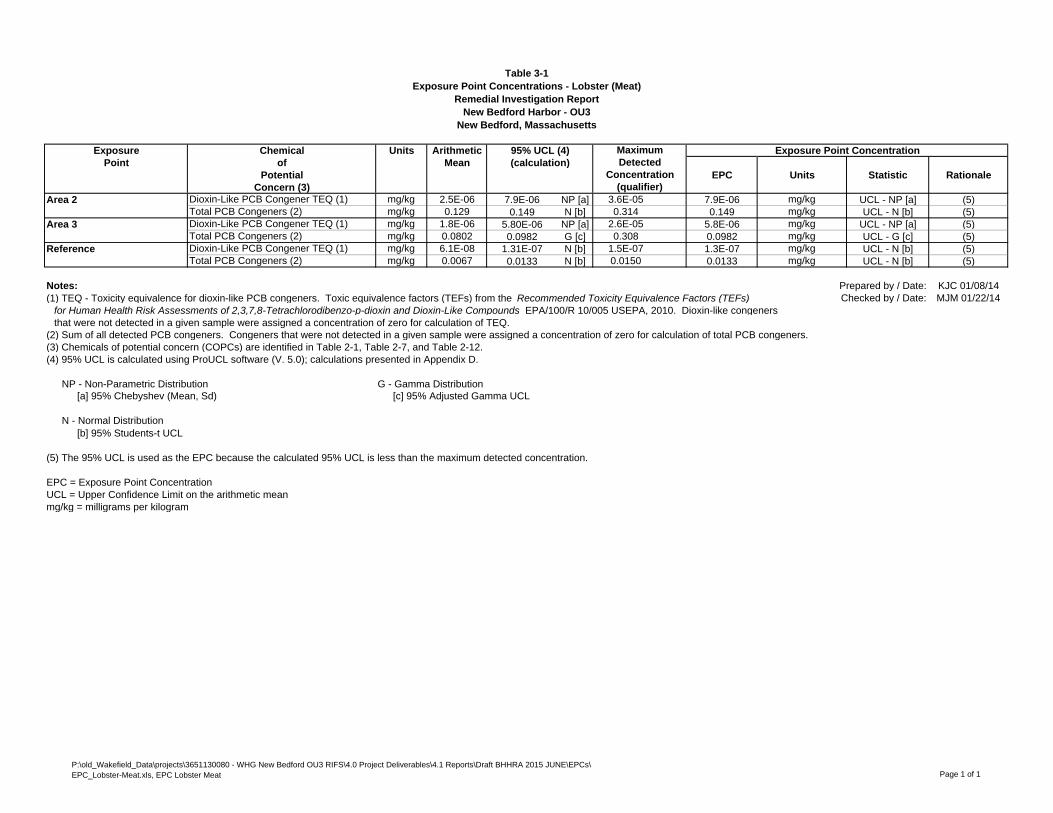
Table 3-1Exposure Point Concentrations - Lobster (Meat)
Remedial Investigation ReportNew Bedford Harbor - OU3
New Bedford, Massachusetts
Exposure Chemical Units Arithmetic 95% UCL (4) Exposure Point ConcentrationPoint of Mean (calculation)
Potential EPC Units Statistic RationaleConcern (3)
Area 2 Dioxin-Like PCB Congener TEQ (1) mg/kg 2.5E-06 7.9E-06 NP [a] 3.6E-05 7.9E-06 mg/kg UCL - NP [a] (5)Total PCB Congeners (2) mg/kg 0.129 0.149 N [b] 0.314 0.149 mg/kg UCL - N [b] (5)
Area 3 Dioxin-Like PCB Congener TEQ (1) mg/kg 1.8E-06 5.80E-06 NP [a] 2.6E-05 5.8E-06 mg/kg UCL - NP [a] (5)Total PCB Congeners (2) mg/kg 0.0802 0.0982 G [c] 0.308 0.0982 mg/kg UCL - G [c] (5)
Reference Dioxin-Like PCB Congener TEQ (1) mg/kg 6.1E-08 1.31E-07 N [b] 1.5E-07 1.3E-07 mg/kg UCL - N [b] (5)Total PCB Congeners (2) mg/kg 0.0067 0.0133 N [b] 0.0150 0.0133 mg/kg UCL - N [b] (5)
Notes: Prepared by / Date: KJC 01/08/14(1) TEQ - Toxicity equivalence for dioxin-like PCB congeners. Toxic equivalence factors (TEFs) from the Recommended Toxicity Equivalence Factors (TEFs) Checked by / Date: MJM 01/22/14
for Human Health Risk Assessments of 2,3,7,8-Tetrachlorodibenzo-p-dioxin and Dioxin-Like Compounds EPA/100/R 10/005 USEPA, 2010. Dioxin-like congeners that were not detected in a given sample were assigned a concentration of zero for calculation of TEQ.
(2) Sum of all detected PCB congeners. Congeners that were not detected in a given sample were assigned a concentration of zero for calculation of total PCB congeners.(3) Chemicals of potential concern (COPCs) are identified in Table 2-1, Table 2-7, and Table 2-12. (4) 95% UCL is calculated using ProUCL software (V. 5.0); calculations presented in Appendix D.
NP - Non-Parametric Distribution G - Gamma Distribution[a] 95% Chebyshev (Mean, Sd) [c] 95% Adjusted Gamma UCL
N - Normal Distribution[b] 95% Students-t UCL
(5) The 95% UCL is used as the EPC because the calculated 95% UCL is less than the maximum detected concentration.
EPC = Exposure Point ConcentrationUCL = Upper Confidence Limit on the arithmetic meanmg/kg = milligrams per kilogram
MaximumDetected
Concentration(qualifier)
P:\old_Wakefield_Data\projects\3651130080 - WHG New Bedford OU3 RIFS\4.0 Project Deliverables\4.1 Reports\Draft BHHRA 2015 JUNE\EPCs\EPC_Lobster-Meat.xls, EPC Lobster Meat Page 1 of 1
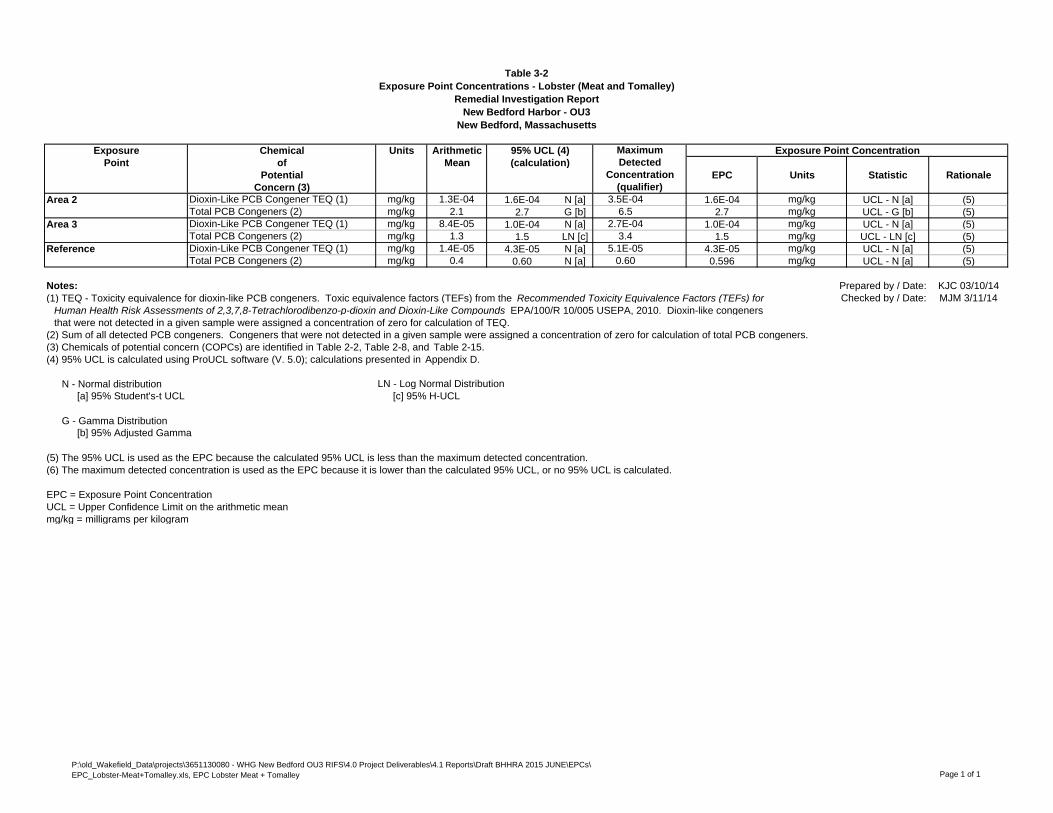
Table 3-2Exposure Point Concentrations - Lobster (Meat and Tomalley)
Remedial Investigation ReportNew Bedford Harbor - OU3
New Bedford, Massachusetts
Exposure Chemical Units Arithmetic 95% UCL (4) Exposure Point ConcentrationPoint of Mean (calculation)
Potential EPC Units Statistic RationaleConcern (3)
Area 2 Dioxin-Like PCB Congener TEQ (1) mg/kg 1.3E-04 1.6E-04 N [a] 3.5E-04 1.6E-04 mg/kg UCL - N [a] (5)Total PCB Congeners (2) mg/kg 2.1 2.7 G [b] 6.5 2.7 mg/kg UCL - G [b] (5)
Area 3 Dioxin-Like PCB Congener TEQ (1) mg/kg 8.4E-05 1.0E-04 N [a] 2.7E-04 1.0E-04 mg/kg UCL - N [a] (5)Total PCB Congeners (2) mg/kg 1.3 1.5 LN [c] 3.4 1.5 mg/kg UCL - LN [c] (5)
Reference Dioxin-Like PCB Congener TEQ (1) mg/kg 1.4E-05 4.3E-05 N [a] 5.1E-05 4.3E-05 mg/kg UCL - N [a] (5)Total PCB Congeners (2) mg/kg 0.4 0.60 N [a] 0.60 0.596 mg/kg UCL - N [a] (5)
Notes: Prepared by / Date: KJC 03/10/14(1) TEQ - Toxicity equivalence for dioxin-like PCB congeners. Toxic equivalence factors (TEFs) from the Recommended Toxicity Equivalence Factors (TEFs) for Checked by / Date: MJM 3/11/14
Human Health Risk Assessments of 2,3,7,8-Tetrachlorodibenzo-p-dioxin and Dioxin-Like Compounds EPA/100/R 10/005 USEPA, 2010. Dioxin-like congeners that were not detected in a given sample were assigned a concentration of zero for calculation of TEQ.
(2) Sum of all detected PCB congeners. Congeners that were not detected in a given sample were assigned a concentration of zero for calculation of total PCB congeners.(3) Chemicals of potential concern (COPCs) are identified in Table 2-2, Table 2-8, and Table 2-15. (4) 95% UCL is calculated using ProUCL software (V. 5.0); calculations presented in Appendix D.
N - Normal distribution LN - Log Normal Distribution[a] 95% Student's-t UCL [c] 95% H-UCL
G - Gamma Distribution[b] 95% Adjusted Gamma
(5) The 95% UCL is used as the EPC because the calculated 95% UCL is less than the maximum detected concentration. (6) The maximum detected concentration is used as the EPC because it is lower than the calculated 95% UCL, or no 95% UCL is calculated.
EPC = Exposure Point ConcentrationUCL = Upper Confidence Limit on the arithmetic meanmg/kg = milligrams per kilogram
MaximumDetected
Concentration(qualifier)
P:\old_Wakefield_Data\projects\3651130080 - WHG New Bedford OU3 RIFS\4.0 Project Deliverables\4.1 Reports\Draft BHHRA 2015 JUNE\EPCs\EPC_Lobster-Meat+Tomalley.xls, EPC Lobster Meat + Tomalley Page 1 of 1
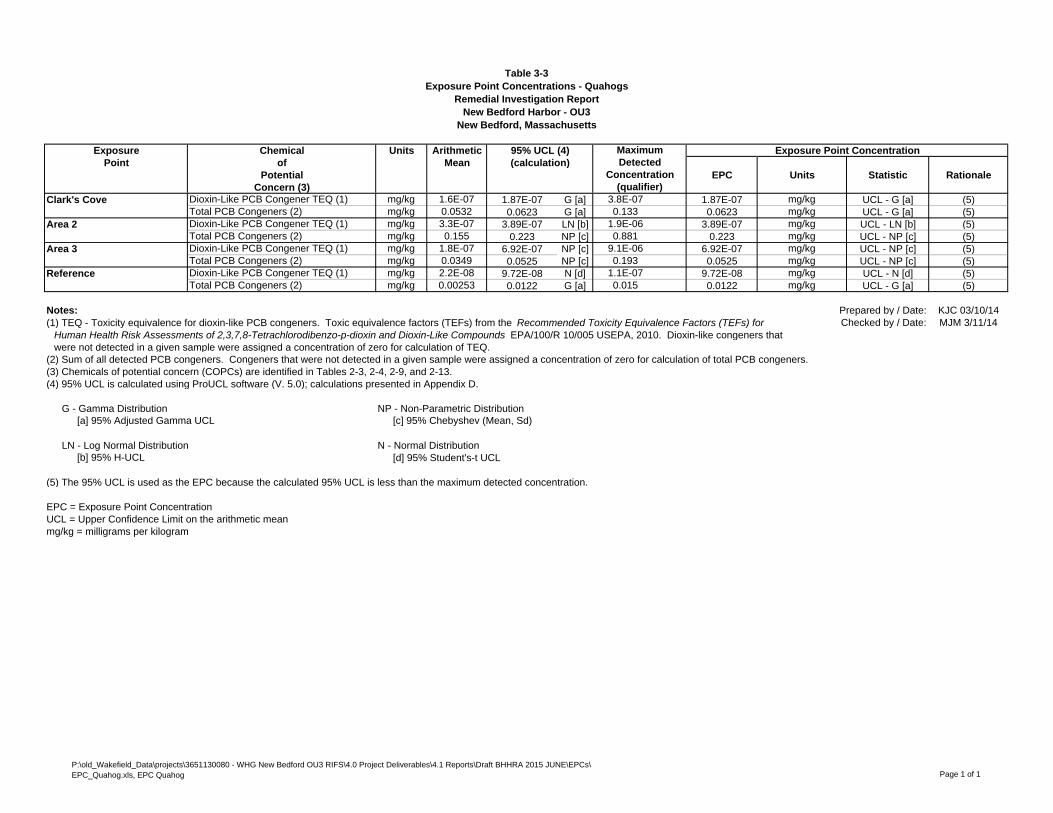
Table 3-3Exposure Point Concentrations - Quahogs
Remedial Investigation ReportNew Bedford Harbor - OU3
New Bedford, Massachusetts
Exposure Chemical Units Arithmetic 95% UCL (4) Exposure Point ConcentrationPoint of Mean (calculation)
Potential EPC Units Statistic RationaleConcern (3)
Clark's Cove Dioxin-Like PCB Congener TEQ (1) mg/kg 1.6E-07 1.87E-07 G [a] 3.8E-07 1.87E-07 mg/kg UCL - G [a] (5)Total PCB Congeners (2) mg/kg 0.0532 0.0623 G [a] 0.133 0.0623 mg/kg UCL - G [a] (5)
Area 2 Dioxin-Like PCB Congener TEQ (1) mg/kg 3.3E-07 3.89E-07 LN [b] 1.9E-06 3.89E-07 mg/kg UCL - LN [b] (5)Total PCB Congeners (2) mg/kg 0.155 0.223 NP [c] 0.881 0.223 mg/kg UCL - NP [c] (5)
Area 3 Dioxin-Like PCB Congener TEQ (1) mg/kg 1.8E-07 6.92E-07 NP [c] 9.1E-06 6.92E-07 mg/kg UCL - NP [c] (5)Total PCB Congeners (2) mg/kg 0.0349 0.0525 NP [c] 0.193 0.0525 mg/kg UCL - NP [c] (5)
Reference Dioxin-Like PCB Congener TEQ (1) mg/kg 2.2E-08 9.72E-08 N [d] 1.1E-07 9.72E-08 mg/kg UCL - N [d] (5)Total PCB Congeners (2) mg/kg 0.00253 0.0122 G [a] 0.015 0.0122 mg/kg UCL - G [a] (5)
Notes: Prepared by / Date: KJC 03/10/14(1) TEQ - Toxicity equivalence for dioxin-like PCB congeners. Toxic equivalence factors (TEFs) from the Recommended Toxicity Equivalence Factors (TEFs) for Checked by / Date: MJM 3/11/14
Human Health Risk Assessments of 2,3,7,8-Tetrachlorodibenzo-p-dioxin and Dioxin-Like Compounds EPA/100/R 10/005 USEPA, 2010. Dioxin-like congeners that were not detected in a given sample were assigned a concentration of zero for calculation of TEQ.
(2) Sum of all detected PCB congeners. Congeners that were not detected in a given sample were assigned a concentration of zero for calculation of total PCB congeners.(3) Chemicals of potential concern (COPCs) are identified in Tables 2-3, 2-4, 2-9, and 2-13. (4) 95% UCL is calculated using ProUCL software (V. 5.0); calculations presented in Appendix D.
G - Gamma Distribution NP - Non-Parametric Distribution[a] 95% Adjusted Gamma UCL [c] 95% Chebyshev (Mean, Sd)
LN - Log Normal Distribution N - Normal Distribution[b] 95% H-UCL [d] 95% Student's-t UCL
(5) The 95% UCL is used as the EPC because the calculated 95% UCL is less than the maximum detected concentration.
EPC = Exposure Point ConcentrationUCL = Upper Confidence Limit on the arithmetic meanmg/kg = milligrams per kilogram
MaximumDetected
Concentration(qualifier)
P:\old_Wakefield_Data\projects\3651130080 - WHG New Bedford OU3 RIFS\4.0 Project Deliverables\4.1 Reports\Draft BHHRA 2015 JUNE\EPCs\EPC_Quahog.xls, EPC Quahog Page 1 of 1
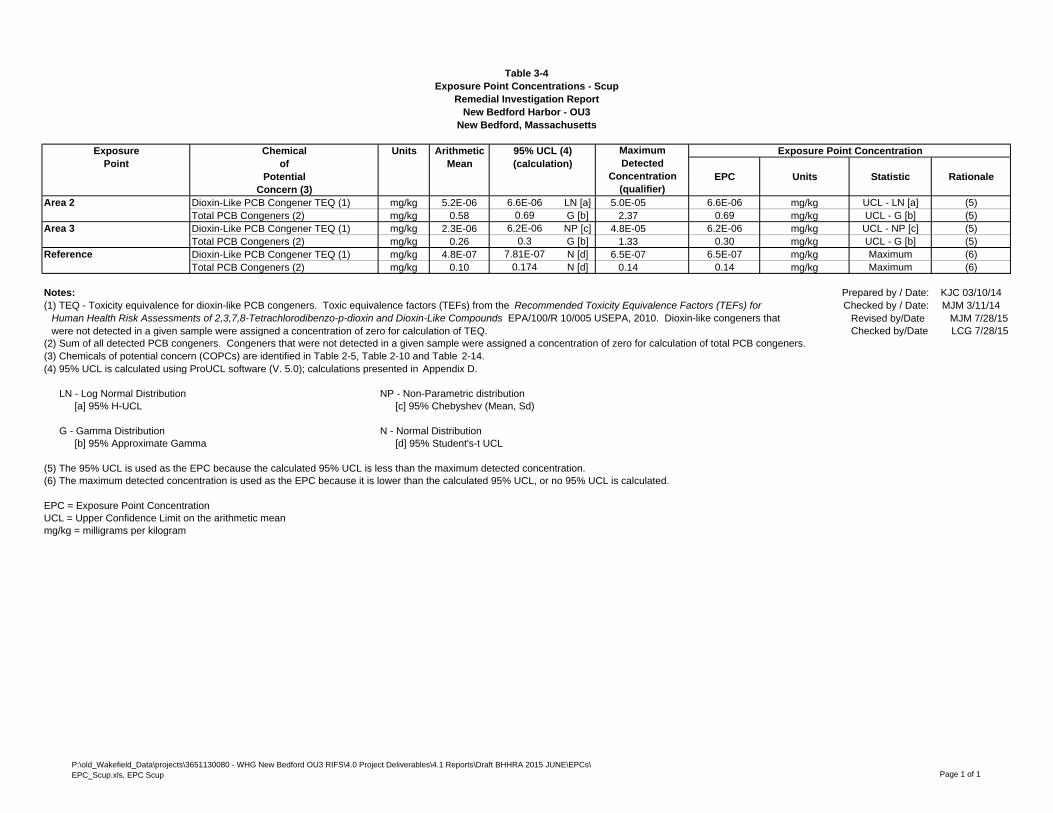
Table 3-4 Exposure Point Concentrations - Scup
Remedial Investigation ReportNew Bedford Harbor - OU3
New Bedford, Massachusetts
Exposure Chemical Units Arithmetic 95% UCL (4) Exposure Point ConcentrationPoint of Mean (calculation)
Potential EPC Units Statistic RationaleConcern (3)
Area 2 Dioxin-Like PCB Congener TEQ (1) mg/kg 5.2E-06 6.6E-06 LN [a] 5.0E-05 6.6E-06 mg/kg UCL - LN [a] (5)Total PCB Congeners (2) mg/kg 0.58 0.69 G [b] 2.37 0.69 mg/kg UCL - G [b] (5)
Area 3 Dioxin-Like PCB Congener TEQ (1) mg/kg 2.3E-06 6.2E-06 NP [c] 4.8E-05 6.2E-06 mg/kg UCL - NP [c] (5)Total PCB Congeners (2) mg/kg 0.26 0.3 G [b] 1.33 0.30 mg/kg UCL - G [b] (5)
Reference Dioxin-Like PCB Congener TEQ (1) mg/kg 4.8E-07 7.81E-07 N [d] 6.5E-07 6.5E-07 mg/kg Maximum (6)Total PCB Congeners (2) mg/kg 0.10 0.174 N [d] 0.14 0.14 mg/kg Maximum (6)
Notes: Prepared by / Date: KJC 03/10/14(1) TEQ - Toxicity equivalence for dioxin-like PCB congeners. Toxic equivalence factors (TEFs) from the Recommended Toxicity Equivalence Factors (TEFs) for Checked by / Date: MJM 3/11/14
Human Health Risk Assessments of 2,3,7,8-Tetrachlorodibenzo-p-dioxin and Dioxin-Like Compounds EPA/100/R 10/005 USEPA, 2010. Dioxin-like congeners that Revised by/Date MJM 7/28/15were not detected in a given sample were assigned a concentration of zero for calculation of TEQ. Checked by/Date LCG 7/28/15
(2) Sum of all detected PCB congeners. Congeners that were not detected in a given sample were assigned a concentration of zero for calculation of total PCB congeners.(3) Chemicals of potential concern (COPCs) are identified in Table 2-5, Table 2-10 and Table 2-14.(4) 95% UCL is calculated using ProUCL software (V. 5.0); calculations presented in Appendix D.
LN - Log Normal Distribution NP - Non-Parametric distribution[a] 95% H-UCL [c] 95% Chebyshev (Mean, Sd)
G - Gamma Distribution N - Normal Distribution[b] 95% Approximate Gamma [d] 95% Student's-t UCL
(5) The 95% UCL is used as the EPC because the calculated 95% UCL is less than the maximum detected concentration. (6) The maximum detected concentration is used as the EPC because it is lower than the calculated 95% UCL, or no 95% UCL is calculated.
EPC = Exposure Point ConcentrationUCL = Upper Confidence Limit on the arithmetic meanmg/kg = milligrams per kilogram
MaximumDetected
Concentration(qualifier)
P:\old_Wakefield_Data\projects\3651130080 - WHG New Bedford OU3 RIFS\4.0 Project Deliverables\4.1 Reports\Draft BHHRA 2015 JUNE\EPCs\EPC_Scup.xls, EPC Scup Page 1 of 1
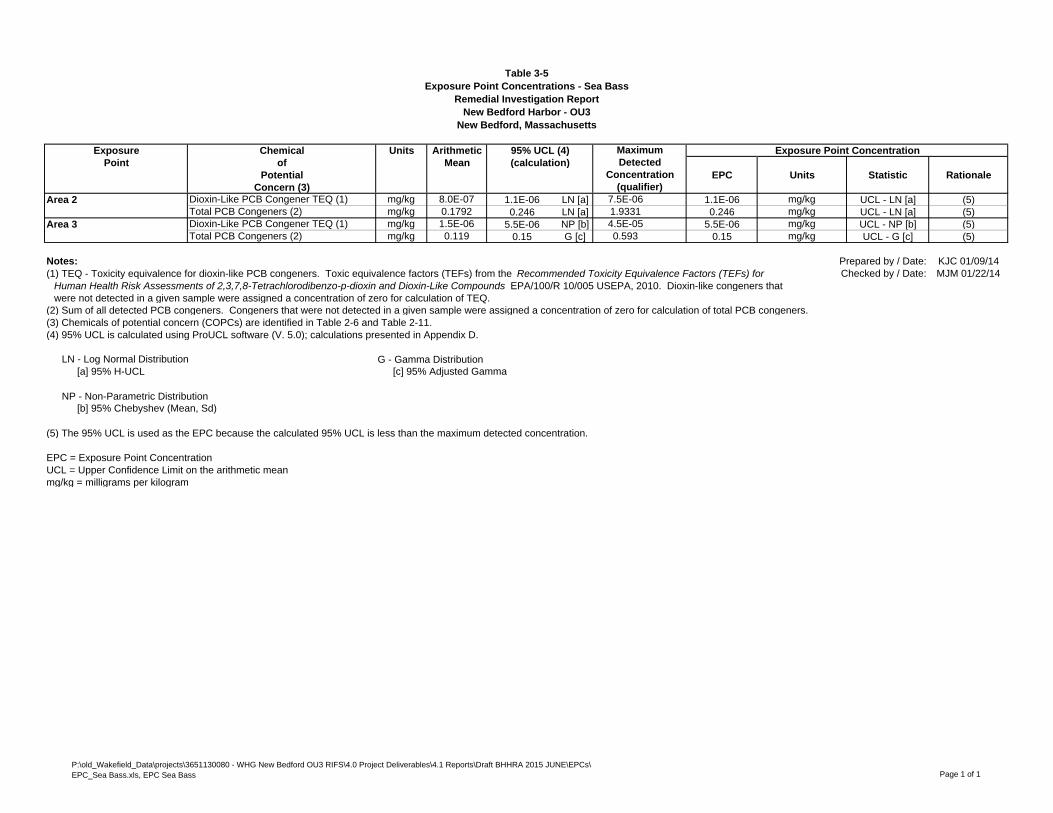
Table 3-5Exposure Point Concentrations - Sea Bass
Remedial Investigation ReportNew Bedford Harbor - OU3
New Bedford, Massachusetts
Exposure Chemical Units Arithmetic 95% UCL (4) Exposure Point ConcentrationPoint of Mean (calculation)
Potential EPC Units Statistic RationaleConcern (3)
Area 2 Dioxin-Like PCB Congener TEQ (1) mg/kg 8.0E-07 1.1E-06 LN [a] 7.5E-06 1.1E-06 mg/kg UCL - LN [a] (5)Total PCB Congeners (2) mg/kg 0.1792 0.246 LN [a] 1.9331 0.246 mg/kg UCL - LN [a] (5)
Area 3 Dioxin-Like PCB Congener TEQ (1) mg/kg 1.5E-06 5.5E-06 NP [b] 4.5E-05 5.5E-06 mg/kg UCL - NP [b] (5)Total PCB Congeners (2) mg/kg 0.119 0.15 G [c] 0.593 0.15 mg/kg UCL - G [c] (5)
Notes: Prepared by / Date: KJC 01/09/14(1) TEQ - Toxicity equivalence for dioxin-like PCB congeners. Toxic equivalence factors (TEFs) from the Recommended Toxicity Equivalence Factors (TEFs) for Checked by / Date: MJM 01/22/14
Human Health Risk Assessments of 2,3,7,8-Tetrachlorodibenzo-p-dioxin and Dioxin-Like Compounds EPA/100/R 10/005 USEPA, 2010. Dioxin-like congeners that were not detected in a given sample were assigned a concentration of zero for calculation of TEQ.
(2) Sum of all detected PCB congeners. Congeners that were not detected in a given sample were assigned a concentration of zero for calculation of total PCB congeners.(3) Chemicals of potential concern (COPCs) are identified in Table 2-6 and Table 2-11. (4) 95% UCL is calculated using ProUCL software (V. 5.0); calculations presented in Appendix D.
LN - Log Normal Distribution G - Gamma Distribution[a] 95% H-UCL [c] 95% Adjusted Gamma
NP - Non-Parametric Distribution[b] 95% Chebyshev (Mean, Sd)
(5) The 95% UCL is used as the EPC because the calculated 95% UCL is less than the maximum detected concentration.
EPC = Exposure Point ConcentrationUCL = Upper Confidence Limit on the arithmetic meanmg/kg = milligrams per kilogram
MaximumDetected
Concentration(qualifier)
P:\old_Wakefield_Data\projects\3651130080 - WHG New Bedford OU3 RIFS\4.0 Project Deliverables\4.1 Reports\Draft BHHRA 2015 JUNE\EPCs\EPC_Sea Bass.xls, EPC Sea Bass Page 1 of 1

EPA 2014 draft RI Calculation of Risks of Black Sea Bass in Area 2, OU#3 New Bedford Harbor Superfund Site
Total PCB Congeners (mg/kg)
Receptor Area Exp. IR FI EF ED BW AT-c AT-nc CF ADD LADD RfD SF HQ ELCR
Adult 2 CTE 0.227 1 12 55 70 25550 20075 0.246 2.62E-05 2.1E-05 2.0E-05 2.0E+00 1E+00 4E-05
2 RME 0.227 1 52 55 70 25550 20075 0.246 1.14E-04 8.9E-05 2.0E-05 2.0E+00 6E+00 2E-04
Older Child 2 CTE 0.227 1 12 10 40 25550 3650 0.246 4.59E-05 6.6E-06 2.0E-05 2.0E+00 2E+00 1E-05
2 RME 0.227 1 52 10 40 25550 3650 0.246 1.99E-04 2.8E-05 2.0E-05 2.0E+00 1E+01 6E-05
Young Child 2 CTE 0.114 1 12 5 15 25550 1825 0.246 6.15E-05 4.4E-06 2.0E-05 2.0E+00 3E+00 9E-06
2 RME 0.114 1 52 5 15 25550 1825 0.246 2.66E-04 1.9E-05 5.0E-05 2.0E+00 5E+00 4E-05
Total 2 CTE 6E-05
2 RME 3E-04
Dioxin-Like PCBs- TEQ (mg/kg)
Receptor Area Exposure IR FI EF ED BW AT-c AT-nc CF ADD LADD RfD SF HQ ELCR HQ ELCR
Adult 2 CTE 0.227 1 12 55 70 25550 20075 1.1E-06 1.17E-10 9.2E-11 7.0E-10 1.6E+05 2E-01 1E-05 1E+00 6E-05
2 RME 0.227 1 52 55 70 25550 20075 1.1E-06 5.08E-10 4.0E-10 7.0E-10 1.6E+05 7E-01 6E-05 6E+00 2E-04
Older Child 2 CTE 0.227 1 12 10 40 25550 3650 1.1E-06 2.05E-10 2.9E-11 7.0E-10 1.6E+05 3E-01 5E-06 3E+00 2E-05
2 RME 0.227 1 52 10 40 25550 3650 1.1E-06 8.89E-10 1.3E-10 7.0E-10 1.6E+05 1E+00 2E-05 1E+01 8E-05
Young Child 2 CTE 0.114 1 12 5 15 25550 1825 1.1E-06 2.75E-10 2.0E-11 7.0E-10 1.6E+05 4E-01 3E-06 3E+00 1E-05
2 RME 0.114 1 52 5 15 25550 1825 1.1E-06 1.19E-09 8.5E-11 7.0E-10 1.6E+05 2E+00 1E-05 7E+00 5E-05
Total 2 CTE 2E-05 9E-05
2 RME 1E-04 4E-04
IR = Ingestion Rate (kg/meal) SF = oral Slope Factor (per mg/kg/day)
FI = Fraction Ingested (unitless) HQ = Hazard Quotient
EF = Exposure Frequency (meals/yr) ELCR = Elevated Lifetime Cancer Risk
ED = Exposure Duration (years)
BW = Body Weight (kg) ADD = CF*IR*FI*ED*EF*1/BW*1/AT-nc
AT-c = Averaging Time-carcinogenic (days) LADD = CF*IR*FI*ED*EF*1/BW*1/AT-c
AT-nc = Averaging Time-non-carcinogenic HQ = ADD/RfD
CF = Concentration in Fish (mg/kg) ELCR = LADD*SF
ADD = Average Daily Dose (mg/kg/day)
LADD = Lifetime Average Daily Dose (mg/kg/day)
RfD = Reference Dose (mg/kg/day)
PCB&TEQ

EPA 2014 draft RI Calculation of Risks of Black Sea Bass in Area 3, OU#3 New Bedford Harbor Superfund Site
Total PCB Congeners (mg/kg)
Receptor Area Exp. IR FI EF ED BW AT-c AT-nc CF ADD LADD RfD SF HQ ELCR
Adult 3 CTE 0.227 1 12 55 70 25550 20075 0.15 1.60E-05 1.3E-05 2.0E-05 2.0E+00 8E-01 3E-05
3 RME 0.227 1 52 55 70 25550 20075 0.15 6.93E-05 5.4E-05 2.0E-05 2.0E+00 3E+00 1E-04
Older Child 3 CTE 0.227 1 12 10 40 25550 3650 0.15 2.80E-05 4.0E-06 2.0E-05 2.0E+00 1E+00 8E-06
3 RME 0.227 1 52 10 40 25550 3650 0.15 1.21E-04 1.7E-05 2.0E-05 2.0E+00 6E+00 3E-05
Young Child 3 CTE 0.114 1 12 5 15 25550 1825 0.15 3.75E-05 2.7E-06 5.0E-05 2.0E+00 7E-01 5E-06
3 RME 0.114 1 52 5 15 25550 1825 0.15 1.62E-04 1.2E-05 5.0E-05 2.0E+00 3E+00 2E-05
Total 3 CTE 4E-05
3 RME 2E-04
Dioxin-Like PCBs- TEQ (mg/kg)
Receptor Area Exposure IR FI EF ED BW AT-c AT-nc CF ADD LADD RfD SF HQ ELCR HQ ELCR
Adult 3 CTE 0.227 1 12 55 70 25550 20075 5.5E-06 5.86E-10 4.6E-10 7.0E-10 1.6E+05 8E-01 7E-05 2E+00 1E-04
3 RME 0.227 1 52 55 70 25550 20075 5.5E-06 2.54E-09 2.0E-09 7.0E-10 1.6E+05 4E+00 3E-04 7E+00 4E-04
Older Child 3 CTE 0.227 1 12 10 40 25550 3650 5.5E-06 1.03E-09 1.5E-10 7.0E-10 1.6E+05 1E+00 2E-05 3E+00 3E-05
3 RME 0.227 1 52 10 40 25550 3650 5.5E-06 4.45E-09 6.4E-10 7.0E-10 1.6E+05 6E+00 1E-04 1E+01 1E-04
Young Child 3 CTE 0.114 1 12 5 15 25550 1825 5.5E-06 1.37E-09 9.8E-11 7.0E-10 1.6E+05 2E+00 2E-05 3E+00 2E-05
3 RME 0.114 1 52 5 15 25550 1825 5.5E-06 5.96E-09 4.3E-10 7.0E-10 1.6E+05 9E+00 7E-05 1E+01 9E-05
Total 3 CTE 1E-04 2E-04
3 RME 5E-04 7E-04
IR = Ingestion Rate (kg/meal) SF = oral Slope Factor (per mg/kg/day)
FI = Fraction Ingested (unitless) HQ = Hazard Quotient
EF = Exposure Frequency (meals/yr) ELCR = Elevated Lifetime Cancer Risk
ED = Exposure Duration (years)
BW = Body Weight (kg) ADD = CF*IR*FI*ED*EF*1/BW*1/AT-nc
AT-c = Averaging Time-carcinogenic (days) LADD = CF*IR*FI*ED*EF*1/BW*1/AT-c
AT-nc = Averaging Time-non-carcinogenic HQ = ADD/RfD
CF = Concentration in Fish (mg/kg) ELCR = LADD*SF
ADD = Average Daily Dose (mg/kg/day)
LADD = Lifetime Average Daily Dose (mg/kg/day)
RfD = Reference Dose (mg/kg/day)
PCB&TEQ

EPA 2014 draft RI Calculation of Risks of Scup in Area 2, OU#3 New Bedford Harbor Superfund Site
Total PCB Congeners (mg/kg)
Receptor Area Exp. IR FI EF ED BW AT-c AT-nc CF ADD LADD RfD SF HQ ELCR
Adult 2 CTE 0.227 1 12 55 70 25550 20075 0.69 7.36E-05 5.8E-05 2.0E-05 2.0E+00 4E+00 1E-04
2 RME 0.227 1 52 55 70 25550 20075 0.69 3.19E-04 2.5E-04 2.0E-05 2.0E+00 2E+01 5E-04
Older Child 2 CTE 0.227 1 12 10 40 25550 3650 0.69 1.29E-04 1.8E-05 2.0E-05 2.0E+00 6E+00 4E-05
2 RME 0.227 1 52 10 40 25550 3650 0.69 5.58E-04 8.0E-05 2.0E-05 2.0E+00 3E+01 2E-04
Young Child 2 CTE 0.114 1 12 5 15 25550 1825 0.69 1.72E-04 1.2E-05 2.0E-05 2.0E+00 9E+00 2E-05
2 RME 0.114 1 52 5 15 25550 1825 0.69 7.47E-04 5.3E-05 5.0E-05 2.0E+00 1E+01 1E-04
Total 2 CTE 2E-04
2 RME 8E-04
Dioxin-Like PCBs- TEQ (mg/kg)
Receptor Area Exposure IR FI EF ED BW AT-c AT-nc CF ADD LADD RfD SF HQ ELCR HQ ELCR
Adult 2 CTE 0.227 1 12 55 70 25550 20075 6.6E-06 7.04E-10 5.5E-10 7.0E-10 1.6E+05 1E+00 9E-05 5E+00 2E-04
2 RME 0.227 1 52 55 70 25550 20075 6.6E-06 3.05E-09 2.4E-09 7.0E-10 1.6E+05 4E+00 4E-04 2E+01 9E-04
Older Child 2 CTE 0.227 1 12 10 40 25550 3650 6.6E-06 1.23E-09 1.8E-10 7.0E-10 1.6E+05 2E+00 3E-05 8E+00 6E-05
2 RME 0.227 1 52 10 40 25550 3650 6.6E-06 5.34E-09 7.6E-10 7.0E-10 1.6E+05 8E+00 1E-04 4E+01 3E-04
Young Child 2 CTE 0.114 1 12 5 15 25550 1825 6.6E-06 1.65E-09 1.2E-10 7.0E-10 1.6E+05 2E+00 2E-05 1E+01 4E-05
2 RME 0.114 1 52 5 15 25550 1825 6.6E-06 7.15E-09 5.1E-10 7.0E-10 1.6E+05 1E+01 8E-05 3E+01 2E-04
Total 2 CTE 1E-04 3E-04
2 RME 6E-04 1E-03
IR = Ingestion Rate (kg/meal) SF = oral Slope Factor (per mg/kg/day)
FI = Fraction Ingested (unitless) HQ = Hazard Quotient
EF = Exposure Frequency (meals/yr) ELCR = Elevated Lifetime Cancer Risk
ED = Exposure Duration (years)
BW = Body Weight (kg) ADD = CF*IR*FI*ED*EF*1/BW*1/AT-nc
AT-c = Averaging Time-carcinogenic (days) LADD = CF*IR*FI*ED*EF*1/BW*1/AT-c
AT-nc = Averaging Time-non-carcinogenic HQ = ADD/RfD
CF = Concentration in Fish (mg/kg) ELCR = LADD*SF
ADD = Average Daily Dose (mg/kg/day)
LADD = Lifetime Average Daily Dose (mg/kg/day)
RfD = Reference Dose (mg/kg/day)
PCB&TEQ
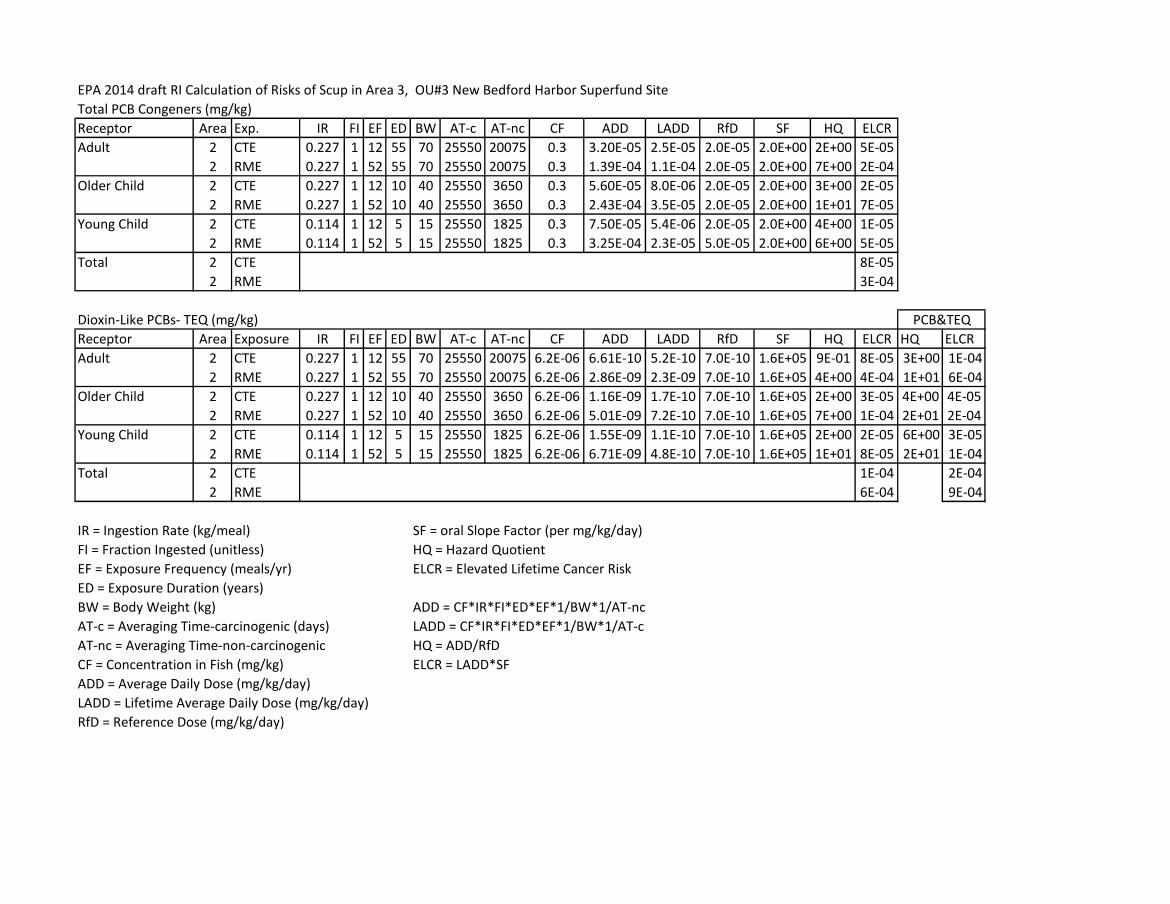
EPA 2014 draft RI Calculation of Risks of Scup in Area 3, OU#3 New Bedford Harbor Superfund Site
Total PCB Congeners (mg/kg)
Receptor Area Exp. IR FI EF ED BW AT-c AT-nc CF ADD LADD RfD SF HQ ELCR
Adult 2 CTE 0.227 1 12 55 70 25550 20075 0.3 3.20E-05 2.5E-05 2.0E-05 2.0E+00 2E+00 5E-05
2 RME 0.227 1 52 55 70 25550 20075 0.3 1.39E-04 1.1E-04 2.0E-05 2.0E+00 7E+00 2E-04
Older Child 2 CTE 0.227 1 12 10 40 25550 3650 0.3 5.60E-05 8.0E-06 2.0E-05 2.0E+00 3E+00 2E-05
2 RME 0.227 1 52 10 40 25550 3650 0.3 2.43E-04 3.5E-05 2.0E-05 2.0E+00 1E+01 7E-05
Young Child 2 CTE 0.114 1 12 5 15 25550 1825 0.3 7.50E-05 5.4E-06 2.0E-05 2.0E+00 4E+00 1E-05
2 RME 0.114 1 52 5 15 25550 1825 0.3 3.25E-04 2.3E-05 5.0E-05 2.0E+00 6E+00 5E-05
Total 2 CTE 8E-05
2 RME 3E-04
Dioxin-Like PCBs- TEQ (mg/kg)
Receptor Area Exposure IR FI EF ED BW AT-c AT-nc CF ADD LADD RfD SF HQ ELCR HQ ELCR
Adult 2 CTE 0.227 1 12 55 70 25550 20075 6.2E-06 6.61E-10 5.2E-10 7.0E-10 1.6E+05 9E-01 8E-05 3E+00 1E-04
2 RME 0.227 1 52 55 70 25550 20075 6.2E-06 2.86E-09 2.3E-09 7.0E-10 1.6E+05 4E+00 4E-04 1E+01 6E-04
Older Child 2 CTE 0.227 1 12 10 40 25550 3650 6.2E-06 1.16E-09 1.7E-10 7.0E-10 1.6E+05 2E+00 3E-05 4E+00 4E-05
2 RME 0.227 1 52 10 40 25550 3650 6.2E-06 5.01E-09 7.2E-10 7.0E-10 1.6E+05 7E+00 1E-04 2E+01 2E-04
Young Child 2 CTE 0.114 1 12 5 15 25550 1825 6.2E-06 1.55E-09 1.1E-10 7.0E-10 1.6E+05 2E+00 2E-05 6E+00 3E-05
2 RME 0.114 1 52 5 15 25550 1825 6.2E-06 6.71E-09 4.8E-10 7.0E-10 1.6E+05 1E+01 8E-05 2E+01 1E-04
Total 2 CTE 1E-04 2E-04
2 RME 6E-04 9E-04
IR = Ingestion Rate (kg/meal) SF = oral Slope Factor (per mg/kg/day)
FI = Fraction Ingested (unitless) HQ = Hazard Quotient
EF = Exposure Frequency (meals/yr) ELCR = Elevated Lifetime Cancer Risk
ED = Exposure Duration (years)
BW = Body Weight (kg) ADD = CF*IR*FI*ED*EF*1/BW*1/AT-nc
AT-c = Averaging Time-carcinogenic (days) LADD = CF*IR*FI*ED*EF*1/BW*1/AT-c
AT-nc = Averaging Time-non-carcinogenic HQ = ADD/RfD
CF = Concentration in Fish (mg/kg) ELCR = LADD*SF
ADD = Average Daily Dose (mg/kg/day)
LADD = Lifetime Average Daily Dose (mg/kg/day)
RfD = Reference Dose (mg/kg/day)
PCB&TEQ

EPA 2014 draft RI Calculation of Risks of Scup in Reference Area, OU#3 New Bedford Harbor Superfund Site
Total PCB Congeners (mg/kg)
Receptor Area Exp. IR FI EF ED BW AT-c AT-nc CF ADD LADD RfD SF HQ ELCR
Adult 2 CTE 0.227 1 12 55 70 25550 20075 0.14 1.49E-05 1.2E-05 2.0E-05 2.0E+00 7E-01 2E-05
2 RME 0.227 1 52 55 70 25550 20075 0.14 6.47E-05 5.1E-05 2.0E-05 2.0E+00 3E+00 1E-04
Older Child 2 CTE 0.227 1 12 10 40 25550 3650 0.14 2.61E-05 3.7E-06 2.0E-05 2.0E+00 1E+00 7E-06
2 RME 0.227 1 52 10 40 25550 3650 0.14 1.13E-04 1.6E-05 2.0E-05 2.0E+00 6E+00 3E-05
Young Child 2 CTE 0.114 1 12 5 15 25550 1825 0.14 3.50E-05 2.5E-06 2.0E-05 2.0E+00 2E+00 5E-06
2 RME 0.114 1 52 5 15 25550 1825 0.14 1.52E-04 1.1E-05 5.0E-05 2.0E+00 3E+00 2E-05
Total 2 CTE 4E-05
2 RME 2E-04
Dioxin-Like PCBs- TEQ (mg/kg)
Receptor Area Exposure IR FI EF ED BW AT-c AT-nc CF ADD LADD RfD SF HQ ELCR HQ ELCR
Adult 2 CTE 0.227 1 12 55 70 25550 20075 6.5E-07 6.93E-11 5.4E-11 7.0E-10 1.6E+05 1E-01 9E-06 8E-01 3E-05
2 RME 0.227 1 52 55 70 25550 20075 6.5E-07 3.00E-10 2.4E-10 7.0E-10 1.6E+05 4E-01 4E-05 4E+00 1E-04
Older Child 2 CTE 0.227 1 12 10 40 25550 3650 6.5E-07 1.21E-10 1.7E-11 7.0E-10 1.6E+05 2E-01 3E-06 1E+00 1E-05
2 RME 0.227 1 52 10 40 25550 3650 6.5E-07 5.26E-10 7.5E-11 7.0E-10 1.6E+05 8E-01 1E-05 6E+00 4E-05
Young Child 2 CTE 0.114 1 12 5 15 25550 1825 6.5E-07 1.62E-10 1.2E-11 7.0E-10 1.6E+05 2E-01 2E-06 2E+00 7E-06
2 RME 0.114 1 52 5 15 25550 1825 6.5E-07 7.04E-10 5.0E-11 7.0E-10 1.6E+05 1E+00 8E-06 4E+00 3E-05
Total 2 CTE 1E-05 5E-05
2 RME 6E-05 2E-04
IR = Ingestion Rate (kg/meal) SF = oral Slope Factor (per mg/kg/day)
FI = Fraction Ingested (unitless) HQ = Hazard Quotient
EF = Exposure Frequency (meals/yr) ELCR = Elevated Lifetime Cancer Risk
ED = Exposure Duration (years)
BW = Body Weight (kg) ADD = CF*IR*FI*ED*EF*1/BW*1/AT-nc
AT-c = Averaging Time-carcinogenic (days) LADD = CF*IR*FI*ED*EF*1/BW*1/AT-c
AT-nc = Averaging Time-non-carcinogenic HQ = ADD/RfD
CF = Concentration in Fish (mg/kg) ELCR = LADD*SF
ADD = Average Daily Dose (mg/kg/day)
LADD = Lifetime Average Daily Dose (mg/kg/day)
RfD = Reference Dose (mg/kg/day)
PCB&TEQ

EPA 2014 draft RI Calculation of Risks of Quahogs in Area 2, OU#3 New Bedford Harbor Superfund Site
Total PCB Congeners (mg/kg)
Receptor Area Exp. IR FI EF ED BW AT-c AT-nc CF ADD LADD RfD SF HQ ELCR
Adult 2 CTE 0.227 1 12 55 70 25550 20075 0.223 2.38E-05 1.9E-05 2.0E-05 2.0E+00 1E+00 4E-05
2 RME 0.227 1 52 55 70 25550 20075 0.223 1.03E-04 8.1E-05 2.0E-05 2.0E+00 5E+00 2E-04
Older Child 2 CTE 0.227 1 12 10 40 25550 3650 0.223 4.16E-05 5.9E-06 2.0E-05 2.0E+00 2E+00 1E-05
2 RME 0.227 1 52 10 40 25550 3650 0.223 1.80E-04 2.6E-05 2.0E-05 2.0E+00 9E+00 5E-05
Young Child 2 CTE 0.114 1 12 5 15 25550 1825 0.223 5.57E-05 4.0E-06 2.0E-05 2.0E+00 3E+00 8E-06
2 RME 0.114 1 52 5 15 25550 1825 0.223 2.41E-04 1.7E-05 5.0E-05 2.0E+00 5E+00 3E-05
Total 2 CTE 6E-05
2 RME 2E-04
Dioxin-Like PCBs- TEQ (mg/kg)
Receptor Area Exposure IR FI EF ED BW AT-c AT-nc CF ADD LADD RfD SF HQ ELCR HQ ELCR
Adult 2 CTE 0.227 1 12 55 70 25550 20075 3.89E-07 4.15E-11 3.3E-11 7.0E-10 1.6E+05 6E-02 5E-06 1E+00 4E-05
2 RME 0.227 1 52 55 70 25550 20075 3.89E-07 1.80E-10 1.4E-10 7.0E-10 1.6E+05 3E-01 2E-05 5E+00 2E-04
Older Child 2 CTE 0.227 1 12 10 40 25550 3650 3.89E-07 7.26E-11 1.0E-11 7.0E-10 1.6E+05 1E-01 2E-06 2E+00 1E-05
2 RME 0.227 1 52 10 40 25550 3650 3.89E-07 3.15E-10 4.5E-11 7.0E-10 1.6E+05 4E-01 7E-06 9E+00 6E-05
Young Child 2 CTE 0.114 1 12 5 15 25550 1825 3.89E-07 9.72E-11 6.9E-12 7.0E-10 1.6E+05 1E-01 1E-06 3E+00 9E-06
2 RME 0.114 1 52 5 15 25550 1825 3.89E-07 4.21E-10 3.0E-11 7.0E-10 1.6E+05 6E-01 5E-06 5E+00 4E-05
Total 2 CTE 8E-06 7E-05
2 RME 3E-05 3E-04
IR = Ingestion Rate (kg/meal) SF = oral Slope Factor (per mg/kg/day)
FI = Fraction Ingested (unitless) HQ = Hazard Quotient
EF = Exposure Frequency (meals/yr) ELCR = Elevated Lifetime Cancer Risk
ED = Exposure Duration (years)
BW = Body Weight (kg) ADD = CF*IR*FI*ED*EF*1/BW*1/AT-nc
AT-c = Averaging Time-carcinogenic (days) LADD = CF*IR*FI*ED*EF*1/BW*1/AT-c
AT-nc = Averaging Time-non-carcinogenic HQ = ADD/RfD
CF = Concentration in Fish (mg/kg) ELCR = LADD*SF
ADD = Average Daily Dose (mg/kg/day)
LADD = Lifetime Average Daily Dose (mg/kg/day)
RfD = Reference Dose (mg/kg/day)
PCB&TEQ

EPA 2014 draft RI Calculation of Risks of Quahogs in Clark's Cove, OU#3 New Bedford Harbor Superfund Site
Total PCB Congeners (mg/kg)
Receptor Area Exp. IR FI EF ED BW AT-c AT-nc CF ADD LADD RfD SF HQ ELCR
Adult 2 CTE 0.227 1 12 55 70 25550 20075 0.0623 6.64E-06 5.2E-06 2.0E-05 2.0E+00 3E-01 1E-05
2 RME 0.227 1 52 55 70 25550 20075 0.0623 2.88E-05 2.3E-05 2.0E-05 2.0E+00 1E+00 5E-05
Older Child 2 CTE 0.227 1 12 10 40 25550 3650 0.0623 1.16E-05 1.7E-06 2.0E-05 2.0E+00 6E-01 3E-06
2 RME 0.227 1 52 10 40 25550 3650 0.0623 5.04E-05 7.2E-06 2.0E-05 2.0E+00 3E+00 1E-05
Young Child 2 CTE 0.114 1 12 5 15 25550 1825 0.0623 1.56E-05 1.1E-06 2.0E-05 2.0E+00 8E-01 2E-06
2 RME 0.114 1 52 5 15 25550 1825 0.0623 6.75E-05 4.8E-06 5.0E-05 2.0E+00 1E+00 1E-05
Total 2 CTE 2E-05
2 RME 7E-05
Dioxin-Like PCBs- TEQ (mg/kg)
Receptor Area Exposure IR FI EF ED BW AT-c AT-nc CF ADD LADD RfD SF HQ ELCR HQ ELCR
Adult 2 CTE 0.227 1 12 55 70 25550 20075 1.87E-07 1.99E-11 1.6E-11 7.0E-10 1.6E+05 3E-02 3E-06 4E-01 1E-05
2 RME 0.227 1 52 55 70 25550 20075 1.87E-07 8.64E-11 6.8E-11 7.0E-10 1.6E+05 1E-01 1E-05 2E+00 6E-05
Older Child 2 CTE 0.227 1 12 10 40 25550 3650 1.86E-07 3.47E-11 5.0E-12 7.0E-10 1.6E+05 5E-02 8E-07 6E-01 4E-06
2 RME 0.227 1 52 10 40 25550 3650 1.87E-07 1.51E-10 2.2E-11 7.0E-10 1.6E+05 2E-01 3E-06 3E+00 2E-05
Young Child 2 CTE 0.114 1 12 5 15 25550 1825 1.87E-07 4.67E-11 3.3E-12 7.0E-10 1.6E+05 7E-02 5E-07 8E-01 3E-06
2 RME 0.114 1 52 5 15 25550 1825 1.87E-07 2.02E-10 1.4E-11 7.0E-10 1.6E+05 3E-01 2E-06 2E+00 1E-05
Total 2 CTE 4E-06 2E-05
2 RME 2E-05 9E-05
IR = Ingestion Rate (kg/meal) SF = oral Slope Factor (per mg/kg/day)
FI = Fraction Ingested (unitless) HQ = Hazard Quotient
EF = Exposure Frequency (meals/yr) ELCR = Elevated Lifetime Cancer Risk
ED = Exposure Duration (years)
BW = Body Weight (kg) ADD = CF*IR*FI*ED*EF*1/BW*1/AT-nc
AT-c = Averaging Time-carcinogenic (days) LADD = CF*IR*FI*ED*EF*1/BW*1/AT-c
AT-nc = Averaging Time-non-carcinogenic HQ = ADD/RfD
CF = Concentration in Fish (mg/kg) ELCR = LADD*SF
ADD = Average Daily Dose (mg/kg/day)
LADD = Lifetime Average Daily Dose (mg/kg/day)
RfD = Reference Dose (mg/kg/day)
PCB&TEQ

EPA 2014 draft RI Calculation of Risks of Quahogs in Area 3, OU#3 New Bedford Harbor Superfund Site
Total PCB Congeners (mg/kg)
Receptor Area Exp. IR FI EF ED BW AT-c AT-nc CF ADD LADD RfD SF HQ ELCR
Adult 2 CTE 0.227 1 12 55 70 25550 20075 0.0525 5.60E-06 4.4E-06 2.0E-05 2.0E+00 3E-01 9E-06
2 RME 0.227 1 52 55 70 25550 20075 0.0525 2.43E-05 1.9E-05 2.0E-05 2.0E+00 1E+00 4E-05
Older Child 2 CTE 0.227 1 12 10 40 25550 3650 0.0525 9.80E-06 1.4E-06 2.0E-05 2.0E+00 5E-01 3E-06
2 RME 0.227 1 52 10 40 25550 3650 0.0525 4.24E-05 6.1E-06 2.0E-05 2.0E+00 2E+00 1E-05
Young Child 2 CTE 0.114 1 12 5 15 25550 1825 0.0525 1.31E-05 9.4E-07 2.0E-05 2.0E+00 7E-01 2E-06
2 RME 0.114 1 52 5 15 25550 1825 0.0525 5.68E-05 4.1E-06 5.0E-05 2.0E+00 1E+00 8E-06
Total 2 CTE 1E-05
2 RME 6E-05
Dioxin-Like PCBs- TEQ (mg/kg)
Receptor Area Exposure IR FI EF ED BW AT-c AT-nc CF ADD LADD RfD SF HQ ELCR HQ ELCR
Adult 2 CTE 0.227 1 12 55 70 25550 20075 6.92E-07 7.38E-11 5.8E-11 7.0E-10 1.6E+05 1E-01 9E-06 4E-01 2E-05
2 RME 0.227 1 52 55 70 25550 20075 6.92E-07 3.20E-10 2.5E-10 7.0E-10 1.6E+05 5E-01 4E-05 2E+00 8E-05
Older Child 2 CTE 0.227 1 12 10 40 25550 3650 6.92E-07 1.29E-10 1.8E-11 7.0E-10 1.6E+05 2E-01 3E-06 7E-01 6E-06
2 RME 0.227 1 52 10 40 25550 3650 6.92E-07 5.59E-10 8.0E-11 7.0E-10 1.6E+05 8E-01 1E-05 3E+00 2E-05
Young Child 2 CTE 0.114 1 12 5 15 25550 1825 6.92E-07 1.73E-10 1.2E-11 7.0E-10 1.6E+05 2E-01 2E-06 9E-01 4E-06
2 RME 0.114 1 52 5 15 25550 1825 6.92E-07 7.49E-10 5.4E-11 7.0E-10 1.6E+05 1E+00 9E-06 2E+00 2E-05
Total 2 CTE 1E-05 3E-05
2 RME 6E-05 1E-04
IR = Ingestion Rate (kg/meal) SF = oral Slope Factor (per mg/kg/day)
FI = Fraction Ingested (unitless) HQ = Hazard Quotient
EF = Exposure Frequency (meals/yr) ELCR = Elevated Lifetime Cancer Risk
ED = Exposure Duration (years)
BW = Body Weight (kg) ADD = CF*IR*FI*ED*EF*1/BW*1/AT-nc
AT-c = Averaging Time-carcinogenic (days) LADD = CF*IR*FI*ED*EF*1/BW*1/AT-c
AT-nc = Averaging Time-non-carcinogenic HQ = ADD/RfD
CF = Concentration in Fish (mg/kg) ELCR = LADD*SF
ADD = Average Daily Dose (mg/kg/day)
LADD = Lifetime Average Daily Dose (mg/kg/day)
RfD = Reference Dose (mg/kg/day)
PCB&TEQ

EPA 2014 draft RI Calculation of Risks of Quahogs in Reference Area, OU#3 New Bedford Harbor Superfund Site
Total PCB Congeners (mg/kg)
Receptor Area Exp. IR FI EF ED BW AT-c AT-nc CF ADD LADD RfD SF HQ ELCR
Adult 2 CTE 0.227 1 12 55 70 25550 20075 0.0122 1.30E-06 1.0E-06 2.0E-05 2.0E+00 7E-02 2E-06
2 RME 0.227 1 52 55 70 25550 20075 0.0122 5.64E-06 4.4E-06 2.0E-05 2.0E+00 3E-01 9E-06
Older Child 2 CTE 0.227 1 12 10 40 25550 3650 0.0122 2.28E-06 3.3E-07 2.0E-05 2.0E+00 1E-01 7E-07
2 RME 0.227 1 52 10 40 25550 3650 0.0122 9.86E-06 1.4E-06 2.0E-05 2.0E+00 5E-01 3E-06
Young Child 2 CTE 0.114 1 12 5 15 25550 1825 0.0122 3.05E-06 2.2E-07 2.0E-05 2.0E+00 2E-01 4E-07
2 RME 0.114 1 52 5 15 25550 1825 0.0122 1.32E-05 9.4E-07 5.0E-05 2.0E+00 3E-01 2E-06
Total 2 CTE 3E-06
2 RME 1E-05
Dioxin-Like PCBs- TEQ (mg/kg)
Receptor Area Exposure IR FI EF ED BW AT-c AT-nc CF ADD LADD RfD SF HQ ELCR HQ ELCR
Adult 2 CTE 0.227 1 12 55 70 25550 20075 9.72E-08 1.04E-11 8.1E-12 7.0E-10 1.6E+05 1E-02 1E-06 8E-02 3E-06
2 RME 0.227 1 52 55 70 25550 20075 9.72E-08 4.49E-11 3.5E-11 7.0E-10 1.6E+05 6E-02 6E-06 3E-01 1E-05
Older Child 2 CTE 0.227 1 12 10 40 25550 3650 9.72E-08 1.81E-11 2.6E-12 7.0E-10 1.6E+05 3E-02 4E-07 1E-01 1E-06
2 RME 0.227 1 52 10 40 25550 3650 9.72E-08 7.86E-11 1.1E-11 7.0E-10 1.6E+05 1E-01 2E-06 6E-01 5E-06
Young Child 2 CTE 0.114 1 12 5 15 25550 1825 9.72E-08 2.43E-11 1.7E-12 7.0E-10 1.6E+05 3E-02 3E-07 2E-01 7E-07
2 RME 0.114 1 52 5 15 25550 1825 9.72E-08 1.05E-10 7.5E-12 7.0E-10 1.6E+05 2E-01 1E-06 4E-01 3E-06
Total 2 CTE 2E-06 5E-06
2 RME 9E-06 2E-05
IR = Ingestion Rate (kg/meal) SF = oral Slope Factor (per mg/kg/day)
FI = Fraction Ingested (unitless) HQ = Hazard Quotient
EF = Exposure Frequency (meals/yr) ELCR = Elevated Lifetime Cancer Risk
ED = Exposure Duration (years)
BW = Body Weight (kg) ADD = CF*IR*FI*ED*EF*1/BW*1/AT-nc
AT-c = Averaging Time-carcinogenic (days) LADD = CF*IR*FI*ED*EF*1/BW*1/AT-c
AT-nc = Averaging Time-non-carcinogenic HQ = ADD/RfD
CF = Concentration in Fish (mg/kg) ELCR = LADD*SF
ADD = Average Daily Dose (mg/kg/day)
LADD = Lifetime Average Daily Dose (mg/kg/day)
RfD = Reference Dose (mg/kg/day)
PCB&TEQ

EPA 2014 draft RI Calculation of Risks of Lobster (Meat & Tomalley) in Area 2, OU#3 New Bedford Harbor Superfund Site
Total PCB Congeners (mg/kg)
Receptor Area Exp. IR FI EF ED BW AT-c AT-nc CF ADD LADD RfD SF HQ ELCR
Adult 2 CTE 0.227 1 12 55 70 25550 20075 2.7 2.88E-04 2.3E-04 2.0E-05 2.0E+00 1E+01 5E-04
2 RME 0.227 1 52 55 70 25550 20075 2.7 1.25E-03 9.8E-04 2.0E-05 2.0E+00 6E+01 2E-03
Older Child 2 CTE 0.227 1 12 10 40 25550 3650 2.7 5.04E-04 7.2E-05 2.0E-05 2.0E+00 3E+01 1E-04
2 RME 0.227 1 52 10 40 25550 3650 2.7 2.18E-03 3.1E-04 2.0E-05 2.0E+00 1E+02 6E-04
Young Child 2 CTE 0.114 1 12 5 15 25550 1825 2.7 6.75E-04 4.8E-05 2.0E-05 2.0E+00 3E+01 1E-04
2 RME 0.114 1 52 5 15 25550 1825 2.7 2.92E-03 2.1E-04 5.0E-05 2.0E+00 6E+01 4E-04
Total 2 CTE 7E-04
2 RME 3E-03
Dioxin-Like PCBs- TEQ (mg/kg)
Receptor Area Exposure IR FI EF ED BW AT-c AT-nc CF ADD LADD RfD SF HQ ELCR HQ ELCR
Adult 2 CTE 0.227 1 12 55 70 25550 20075 1.6E-04 1.71E-08 1.3E-08 7.0E-10 1.6E+05 2E+01 2E-03 4E+01 3E-03
2 RME 0.227 1 52 55 70 25550 20075 1.6E-04 7.39E-08 5.8E-08 7.0E-10 1.6E+05 1E+02 9E-03 2E+02 1E-02
Older Child 2 CTE 0.227 1 12 10 40 25550 3650 1.6E-04 2.99E-08 4.3E-09 7.0E-10 1.6E+05 4E+01 7E-04 7E+01 8E-04
2 RME 0.227 1 52 10 40 25550 3650 1.6E-04 1.29E-07 1.8E-08 7.0E-10 1.6E+05 2E+02 3E-03 3E+02 4E-03
Young Child 2 CTE 0.114 1 12 5 15 25550 1825 1.6E-04 4.00E-08 2.9E-09 7.0E-10 1.6E+05 6E+01 5E-04 9E+01 6E-04
2 RME 0.114 1 52 5 15 25550 1825 1.6E-04 1.73E-07 1.2E-08 7.0E-10 1.6E+05 2E+02 2E-03 3E+02 2E-03
Total 2 CTE 3E-03 4E-03
2 RME 1E-02 2E-02
IR = Ingestion Rate (kg/meal) SF = oral Slope Factor (per mg/kg/day)
FI = Fraction Ingested (unitless) HQ = Hazard Quotient
EF = Exposure Frequency (meals/yr) ELCR = Elevated Lifetime Cancer Risk
ED = Exposure Duration (years)
BW = Body Weight (kg) ADD = CF*IR*FI*ED*EF*1/BW*1/AT-nc
AT-c = Averaging Time-carcinogenic (days) LADD = CF*IR*FI*ED*EF*1/BW*1/AT-c
AT-nc = Averaging Time-non-carcinogenic HQ = ADD/RfD
CF = Concentration in Fish (mg/kg) ELCR = LADD*SF
ADD = Average Daily Dose (mg/kg/day)
LADD = Lifetime Average Daily Dose (mg/kg/day)
RfD = Reference Dose (mg/kg/day)
PCB&TEQ
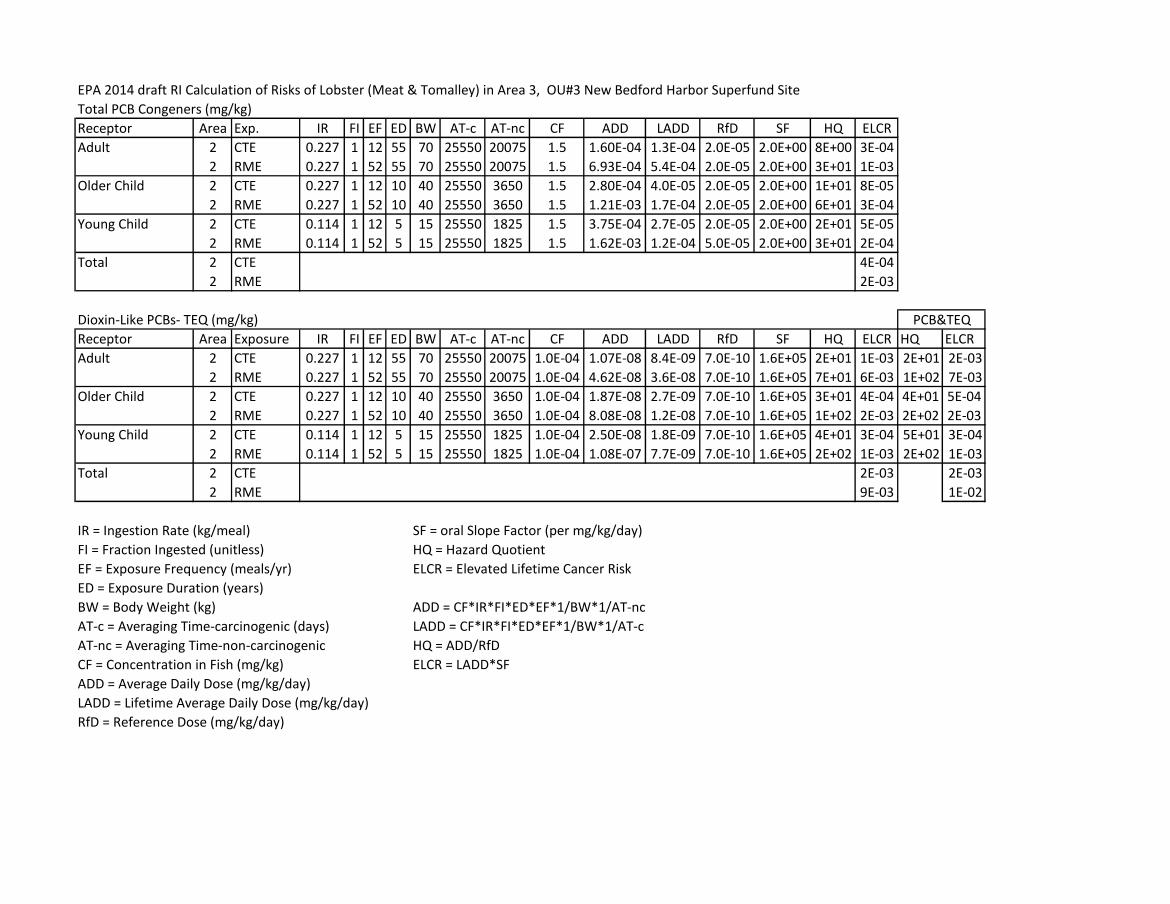
EPA 2014 draft RI Calculation of Risks of Lobster (Meat & Tomalley) in Area 3, OU#3 New Bedford Harbor Superfund Site
Total PCB Congeners (mg/kg)
Receptor Area Exp. IR FI EF ED BW AT-c AT-nc CF ADD LADD RfD SF HQ ELCR
Adult 2 CTE 0.227 1 12 55 70 25550 20075 1.5 1.60E-04 1.3E-04 2.0E-05 2.0E+00 8E+00 3E-04
2 RME 0.227 1 52 55 70 25550 20075 1.5 6.93E-04 5.4E-04 2.0E-05 2.0E+00 3E+01 1E-03
Older Child 2 CTE 0.227 1 12 10 40 25550 3650 1.5 2.80E-04 4.0E-05 2.0E-05 2.0E+00 1E+01 8E-05
2 RME 0.227 1 52 10 40 25550 3650 1.5 1.21E-03 1.7E-04 2.0E-05 2.0E+00 6E+01 3E-04
Young Child 2 CTE 0.114 1 12 5 15 25550 1825 1.5 3.75E-04 2.7E-05 2.0E-05 2.0E+00 2E+01 5E-05
2 RME 0.114 1 52 5 15 25550 1825 1.5 1.62E-03 1.2E-04 5.0E-05 2.0E+00 3E+01 2E-04
Total 2 CTE 4E-04
2 RME 2E-03
Dioxin-Like PCBs- TEQ (mg/kg)
Receptor Area Exposure IR FI EF ED BW AT-c AT-nc CF ADD LADD RfD SF HQ ELCR HQ ELCR
Adult 2 CTE 0.227 1 12 55 70 25550 20075 1.0E-04 1.07E-08 8.4E-09 7.0E-10 1.6E+05 2E+01 1E-03 2E+01 2E-03
2 RME 0.227 1 52 55 70 25550 20075 1.0E-04 4.62E-08 3.6E-08 7.0E-10 1.6E+05 7E+01 6E-03 1E+02 7E-03
Older Child 2 CTE 0.227 1 12 10 40 25550 3650 1.0E-04 1.87E-08 2.7E-09 7.0E-10 1.6E+05 3E+01 4E-04 4E+01 5E-04
2 RME 0.227 1 52 10 40 25550 3650 1.0E-04 8.08E-08 1.2E-08 7.0E-10 1.6E+05 1E+02 2E-03 2E+02 2E-03
Young Child 2 CTE 0.114 1 12 5 15 25550 1825 1.0E-04 2.50E-08 1.8E-09 7.0E-10 1.6E+05 4E+01 3E-04 5E+01 3E-04
2 RME 0.114 1 52 5 15 25550 1825 1.0E-04 1.08E-07 7.7E-09 7.0E-10 1.6E+05 2E+02 1E-03 2E+02 1E-03
Total 2 CTE 2E-03 2E-03
2 RME 9E-03 1E-02
IR = Ingestion Rate (kg/meal) SF = oral Slope Factor (per mg/kg/day)
FI = Fraction Ingested (unitless) HQ = Hazard Quotient
EF = Exposure Frequency (meals/yr) ELCR = Elevated Lifetime Cancer Risk
ED = Exposure Duration (years)
BW = Body Weight (kg) ADD = CF*IR*FI*ED*EF*1/BW*1/AT-nc
AT-c = Averaging Time-carcinogenic (days) LADD = CF*IR*FI*ED*EF*1/BW*1/AT-c
AT-nc = Averaging Time-non-carcinogenic HQ = ADD/RfD
CF = Concentration in Fish (mg/kg) ELCR = LADD*SF
ADD = Average Daily Dose (mg/kg/day)
LADD = Lifetime Average Daily Dose (mg/kg/day)
RfD = Reference Dose (mg/kg/day)
PCB&TEQ
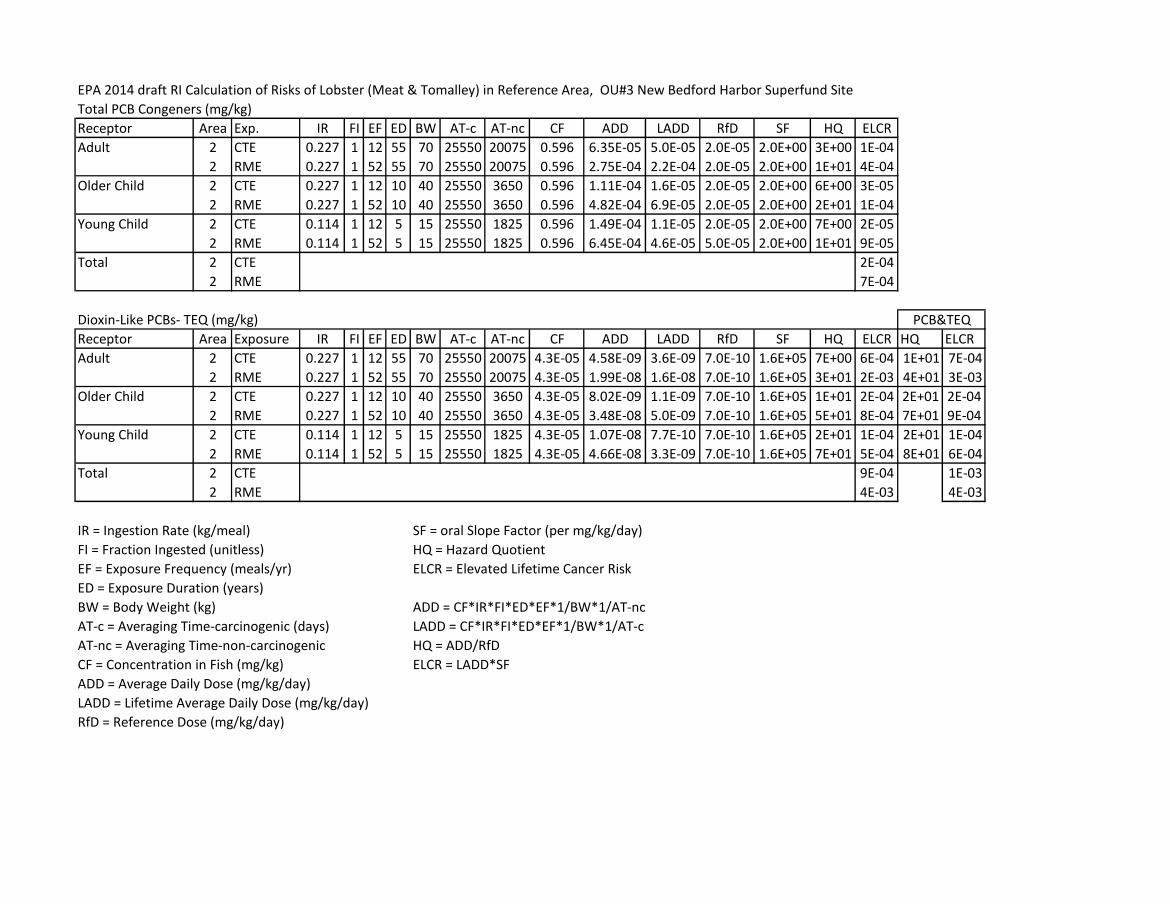
EPA 2014 draft RI Calculation of Risks of Lobster (Meat & Tomalley) in Reference Area, OU#3 New Bedford Harbor Superfund Site
Total PCB Congeners (mg/kg)
Receptor Area Exp. IR FI EF ED BW AT-c AT-nc CF ADD LADD RfD SF HQ ELCR
Adult 2 CTE 0.227 1 12 55 70 25550 20075 0.596 6.35E-05 5.0E-05 2.0E-05 2.0E+00 3E+00 1E-04
2 RME 0.227 1 52 55 70 25550 20075 0.596 2.75E-04 2.2E-04 2.0E-05 2.0E+00 1E+01 4E-04
Older Child 2 CTE 0.227 1 12 10 40 25550 3650 0.596 1.11E-04 1.6E-05 2.0E-05 2.0E+00 6E+00 3E-05
2 RME 0.227 1 52 10 40 25550 3650 0.596 4.82E-04 6.9E-05 2.0E-05 2.0E+00 2E+01 1E-04
Young Child 2 CTE 0.114 1 12 5 15 25550 1825 0.596 1.49E-04 1.1E-05 2.0E-05 2.0E+00 7E+00 2E-05
2 RME 0.114 1 52 5 15 25550 1825 0.596 6.45E-04 4.6E-05 5.0E-05 2.0E+00 1E+01 9E-05
Total 2 CTE 2E-04
2 RME 7E-04
Dioxin-Like PCBs- TEQ (mg/kg)
Receptor Area Exposure IR FI EF ED BW AT-c AT-nc CF ADD LADD RfD SF HQ ELCR HQ ELCR
Adult 2 CTE 0.227 1 12 55 70 25550 20075 4.3E-05 4.58E-09 3.6E-09 7.0E-10 1.6E+05 7E+00 6E-04 1E+01 7E-04
2 RME 0.227 1 52 55 70 25550 20075 4.3E-05 1.99E-08 1.6E-08 7.0E-10 1.6E+05 3E+01 2E-03 4E+01 3E-03
Older Child 2 CTE 0.227 1 12 10 40 25550 3650 4.3E-05 8.02E-09 1.1E-09 7.0E-10 1.6E+05 1E+01 2E-04 2E+01 2E-04
2 RME 0.227 1 52 10 40 25550 3650 4.3E-05 3.48E-08 5.0E-09 7.0E-10 1.6E+05 5E+01 8E-04 7E+01 9E-04
Young Child 2 CTE 0.114 1 12 5 15 25550 1825 4.3E-05 1.07E-08 7.7E-10 7.0E-10 1.6E+05 2E+01 1E-04 2E+01 1E-04
2 RME 0.114 1 52 5 15 25550 1825 4.3E-05 4.66E-08 3.3E-09 7.0E-10 1.6E+05 7E+01 5E-04 8E+01 6E-04
Total 2 CTE 9E-04 1E-03
2 RME 4E-03 4E-03
IR = Ingestion Rate (kg/meal) SF = oral Slope Factor (per mg/kg/day)
FI = Fraction Ingested (unitless) HQ = Hazard Quotient
EF = Exposure Frequency (meals/yr) ELCR = Elevated Lifetime Cancer Risk
ED = Exposure Duration (years)
BW = Body Weight (kg) ADD = CF*IR*FI*ED*EF*1/BW*1/AT-nc
AT-c = Averaging Time-carcinogenic (days) LADD = CF*IR*FI*ED*EF*1/BW*1/AT-c
AT-nc = Averaging Time-non-carcinogenic HQ = ADD/RfD
CF = Concentration in Fish (mg/kg) ELCR = LADD*SF
ADD = Average Daily Dose (mg/kg/day)
LADD = Lifetime Average Daily Dose (mg/kg/day)
RfD = Reference Dose (mg/kg/day)
PCB&TEQ
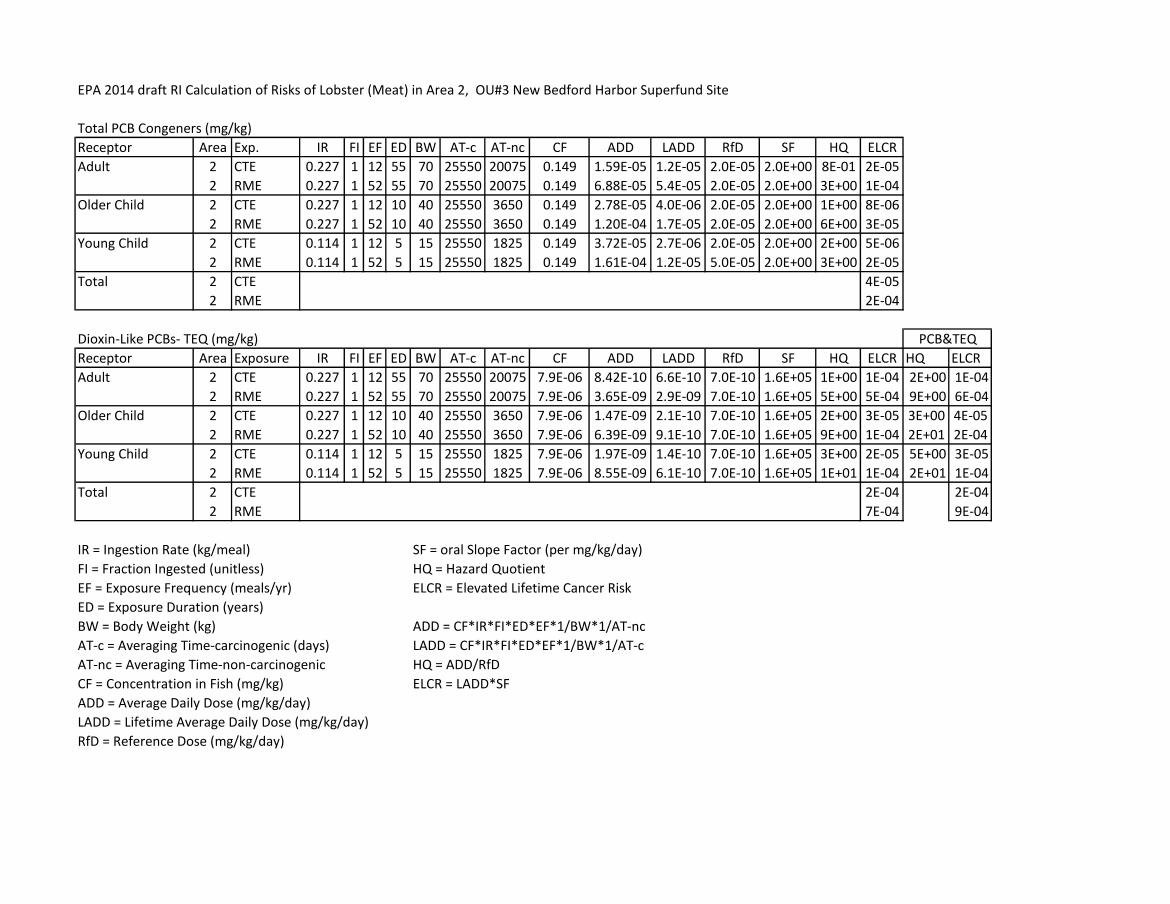
EPA 2014 draft RI Calculation of Risks of Lobster (Meat) in Area 2, OU#3 New Bedford Harbor Superfund Site
Total PCB Congeners (mg/kg)
Receptor Area Exp. IR FI EF ED BW AT-c AT-nc CF ADD LADD RfD SF HQ ELCR
Adult 2 CTE 0.227 1 12 55 70 25550 20075 0.149 1.59E-05 1.2E-05 2.0E-05 2.0E+00 8E-01 2E-05
2 RME 0.227 1 52 55 70 25550 20075 0.149 6.88E-05 5.4E-05 2.0E-05 2.0E+00 3E+00 1E-04
Older Child 2 CTE 0.227 1 12 10 40 25550 3650 0.149 2.78E-05 4.0E-06 2.0E-05 2.0E+00 1E+00 8E-06
2 RME 0.227 1 52 10 40 25550 3650 0.149 1.20E-04 1.7E-05 2.0E-05 2.0E+00 6E+00 3E-05
Young Child 2 CTE 0.114 1 12 5 15 25550 1825 0.149 3.72E-05 2.7E-06 2.0E-05 2.0E+00 2E+00 5E-06
2 RME 0.114 1 52 5 15 25550 1825 0.149 1.61E-04 1.2E-05 5.0E-05 2.0E+00 3E+00 2E-05
Total 2 CTE 4E-05
2 RME 2E-04
Dioxin-Like PCBs- TEQ (mg/kg)
Receptor Area Exposure IR FI EF ED BW AT-c AT-nc CF ADD LADD RfD SF HQ ELCR HQ ELCR
Adult 2 CTE 0.227 1 12 55 70 25550 20075 7.9E-06 8.42E-10 6.6E-10 7.0E-10 1.6E+05 1E+00 1E-04 2E+00 1E-04
2 RME 0.227 1 52 55 70 25550 20075 7.9E-06 3.65E-09 2.9E-09 7.0E-10 1.6E+05 5E+00 5E-04 9E+00 6E-04
Older Child 2 CTE 0.227 1 12 10 40 25550 3650 7.9E-06 1.47E-09 2.1E-10 7.0E-10 1.6E+05 2E+00 3E-05 3E+00 4E-05
2 RME 0.227 1 52 10 40 25550 3650 7.9E-06 6.39E-09 9.1E-10 7.0E-10 1.6E+05 9E+00 1E-04 2E+01 2E-04
Young Child 2 CTE 0.114 1 12 5 15 25550 1825 7.9E-06 1.97E-09 1.4E-10 7.0E-10 1.6E+05 3E+00 2E-05 5E+00 3E-05
2 RME 0.114 1 52 5 15 25550 1825 7.9E-06 8.55E-09 6.1E-10 7.0E-10 1.6E+05 1E+01 1E-04 2E+01 1E-04
Total 2 CTE 2E-04 2E-04
2 RME 7E-04 9E-04
IR = Ingestion Rate (kg/meal) SF = oral Slope Factor (per mg/kg/day)
FI = Fraction Ingested (unitless) HQ = Hazard Quotient
EF = Exposure Frequency (meals/yr) ELCR = Elevated Lifetime Cancer Risk
ED = Exposure Duration (years)
BW = Body Weight (kg) ADD = CF*IR*FI*ED*EF*1/BW*1/AT-nc
AT-c = Averaging Time-carcinogenic (days) LADD = CF*IR*FI*ED*EF*1/BW*1/AT-c
AT-nc = Averaging Time-non-carcinogenic HQ = ADD/RfD
CF = Concentration in Fish (mg/kg) ELCR = LADD*SF
ADD = Average Daily Dose (mg/kg/day)
LADD = Lifetime Average Daily Dose (mg/kg/day)
RfD = Reference Dose (mg/kg/day)
PCB&TEQ
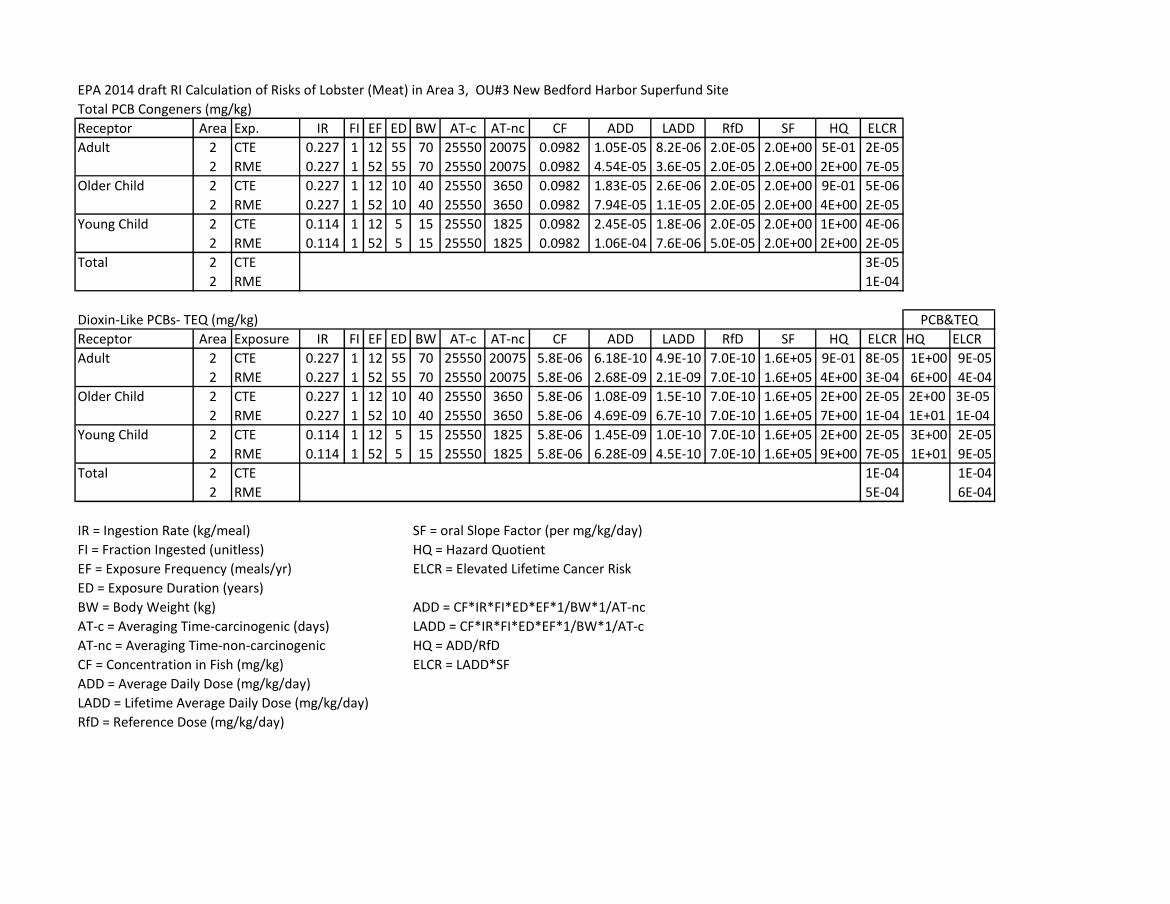
EPA 2014 draft RI Calculation of Risks of Lobster (Meat) in Area 3, OU#3 New Bedford Harbor Superfund Site
Total PCB Congeners (mg/kg)
Receptor Area Exp. IR FI EF ED BW AT-c AT-nc CF ADD LADD RfD SF HQ ELCR
Adult 2 CTE 0.227 1 12 55 70 25550 20075 0.0982 1.05E-05 8.2E-06 2.0E-05 2.0E+00 5E-01 2E-05
2 RME 0.227 1 52 55 70 25550 20075 0.0982 4.54E-05 3.6E-05 2.0E-05 2.0E+00 2E+00 7E-05
Older Child 2 CTE 0.227 1 12 10 40 25550 3650 0.0982 1.83E-05 2.6E-06 2.0E-05 2.0E+00 9E-01 5E-06
2 RME 0.227 1 52 10 40 25550 3650 0.0982 7.94E-05 1.1E-05 2.0E-05 2.0E+00 4E+00 2E-05
Young Child 2 CTE 0.114 1 12 5 15 25550 1825 0.0982 2.45E-05 1.8E-06 2.0E-05 2.0E+00 1E+00 4E-06
2 RME 0.114 1 52 5 15 25550 1825 0.0982 1.06E-04 7.6E-06 5.0E-05 2.0E+00 2E+00 2E-05
Total 2 CTE 3E-05
2 RME 1E-04
Dioxin-Like PCBs- TEQ (mg/kg)
Receptor Area Exposure IR FI EF ED BW AT-c AT-nc CF ADD LADD RfD SF HQ ELCR HQ ELCR
Adult 2 CTE 0.227 1 12 55 70 25550 20075 5.8E-06 6.18E-10 4.9E-10 7.0E-10 1.6E+05 9E-01 8E-05 1E+00 9E-05
2 RME 0.227 1 52 55 70 25550 20075 5.8E-06 2.68E-09 2.1E-09 7.0E-10 1.6E+05 4E+00 3E-04 6E+00 4E-04
Older Child 2 CTE 0.227 1 12 10 40 25550 3650 5.8E-06 1.08E-09 1.5E-10 7.0E-10 1.6E+05 2E+00 2E-05 2E+00 3E-05
2 RME 0.227 1 52 10 40 25550 3650 5.8E-06 4.69E-09 6.7E-10 7.0E-10 1.6E+05 7E+00 1E-04 1E+01 1E-04
Young Child 2 CTE 0.114 1 12 5 15 25550 1825 5.8E-06 1.45E-09 1.0E-10 7.0E-10 1.6E+05 2E+00 2E-05 3E+00 2E-05
2 RME 0.114 1 52 5 15 25550 1825 5.8E-06 6.28E-09 4.5E-10 7.0E-10 1.6E+05 9E+00 7E-05 1E+01 9E-05
Total 2 CTE 1E-04 1E-04
2 RME 5E-04 6E-04
IR = Ingestion Rate (kg/meal) SF = oral Slope Factor (per mg/kg/day)
FI = Fraction Ingested (unitless) HQ = Hazard Quotient
EF = Exposure Frequency (meals/yr) ELCR = Elevated Lifetime Cancer Risk
ED = Exposure Duration (years)
BW = Body Weight (kg) ADD = CF*IR*FI*ED*EF*1/BW*1/AT-nc
AT-c = Averaging Time-carcinogenic (days) LADD = CF*IR*FI*ED*EF*1/BW*1/AT-c
AT-nc = Averaging Time-non-carcinogenic HQ = ADD/RfD
CF = Concentration in Fish (mg/kg) ELCR = LADD*SF
ADD = Average Daily Dose (mg/kg/day)
LADD = Lifetime Average Daily Dose (mg/kg/day)
RfD = Reference Dose (mg/kg/day)
PCB&TEQ
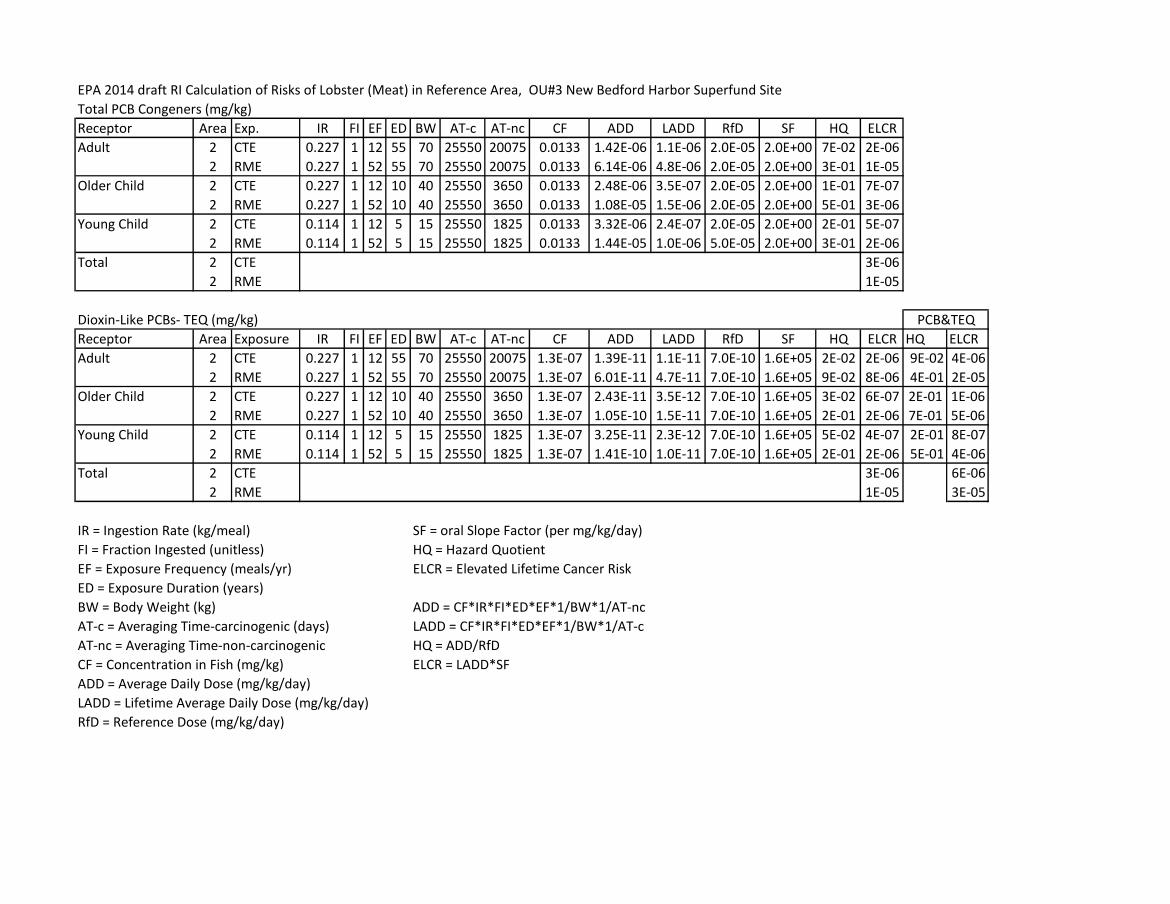
EPA 2014 draft RI Calculation of Risks of Lobster (Meat) in Reference Area, OU#3 New Bedford Harbor Superfund Site
Total PCB Congeners (mg/kg)
Receptor Area Exp. IR FI EF ED BW AT-c AT-nc CF ADD LADD RfD SF HQ ELCR
Adult 2 CTE 0.227 1 12 55 70 25550 20075 0.0133 1.42E-06 1.1E-06 2.0E-05 2.0E+00 7E-02 2E-06
2 RME 0.227 1 52 55 70 25550 20075 0.0133 6.14E-06 4.8E-06 2.0E-05 2.0E+00 3E-01 1E-05
Older Child 2 CTE 0.227 1 12 10 40 25550 3650 0.0133 2.48E-06 3.5E-07 2.0E-05 2.0E+00 1E-01 7E-07
2 RME 0.227 1 52 10 40 25550 3650 0.0133 1.08E-05 1.5E-06 2.0E-05 2.0E+00 5E-01 3E-06
Young Child 2 CTE 0.114 1 12 5 15 25550 1825 0.0133 3.32E-06 2.4E-07 2.0E-05 2.0E+00 2E-01 5E-07
2 RME 0.114 1 52 5 15 25550 1825 0.0133 1.44E-05 1.0E-06 5.0E-05 2.0E+00 3E-01 2E-06
Total 2 CTE 3E-06
2 RME 1E-05
Dioxin-Like PCBs- TEQ (mg/kg)
Receptor Area Exposure IR FI EF ED BW AT-c AT-nc CF ADD LADD RfD SF HQ ELCR HQ ELCR
Adult 2 CTE 0.227 1 12 55 70 25550 20075 1.3E-07 1.39E-11 1.1E-11 7.0E-10 1.6E+05 2E-02 2E-06 9E-02 4E-06
2 RME 0.227 1 52 55 70 25550 20075 1.3E-07 6.01E-11 4.7E-11 7.0E-10 1.6E+05 9E-02 8E-06 4E-01 2E-05
Older Child 2 CTE 0.227 1 12 10 40 25550 3650 1.3E-07 2.43E-11 3.5E-12 7.0E-10 1.6E+05 3E-02 6E-07 2E-01 1E-06
2 RME 0.227 1 52 10 40 25550 3650 1.3E-07 1.05E-10 1.5E-11 7.0E-10 1.6E+05 2E-01 2E-06 7E-01 5E-06
Young Child 2 CTE 0.114 1 12 5 15 25550 1825 1.3E-07 3.25E-11 2.3E-12 7.0E-10 1.6E+05 5E-02 4E-07 2E-01 8E-07
2 RME 0.114 1 52 5 15 25550 1825 1.3E-07 1.41E-10 1.0E-11 7.0E-10 1.6E+05 2E-01 2E-06 5E-01 4E-06
Total 2 CTE 3E-06 6E-06
2 RME 1E-05 3E-05
IR = Ingestion Rate (kg/meal) SF = oral Slope Factor (per mg/kg/day)
FI = Fraction Ingested (unitless) HQ = Hazard Quotient
EF = Exposure Frequency (meals/yr) ELCR = Elevated Lifetime Cancer Risk
ED = Exposure Duration (years)
BW = Body Weight (kg) ADD = CF*IR*FI*ED*EF*1/BW*1/AT-nc
AT-c = Averaging Time-carcinogenic (days) LADD = CF*IR*FI*ED*EF*1/BW*1/AT-c
AT-nc = Averaging Time-non-carcinogenic HQ = ADD/RfD
CF = Concentration in Fish (mg/kg) ELCR = LADD*SF
ADD = Average Daily Dose (mg/kg/day)
LADD = Lifetime Average Daily Dose (mg/kg/day)
RfD = Reference Dose (mg/kg/day)
PCB&TEQ
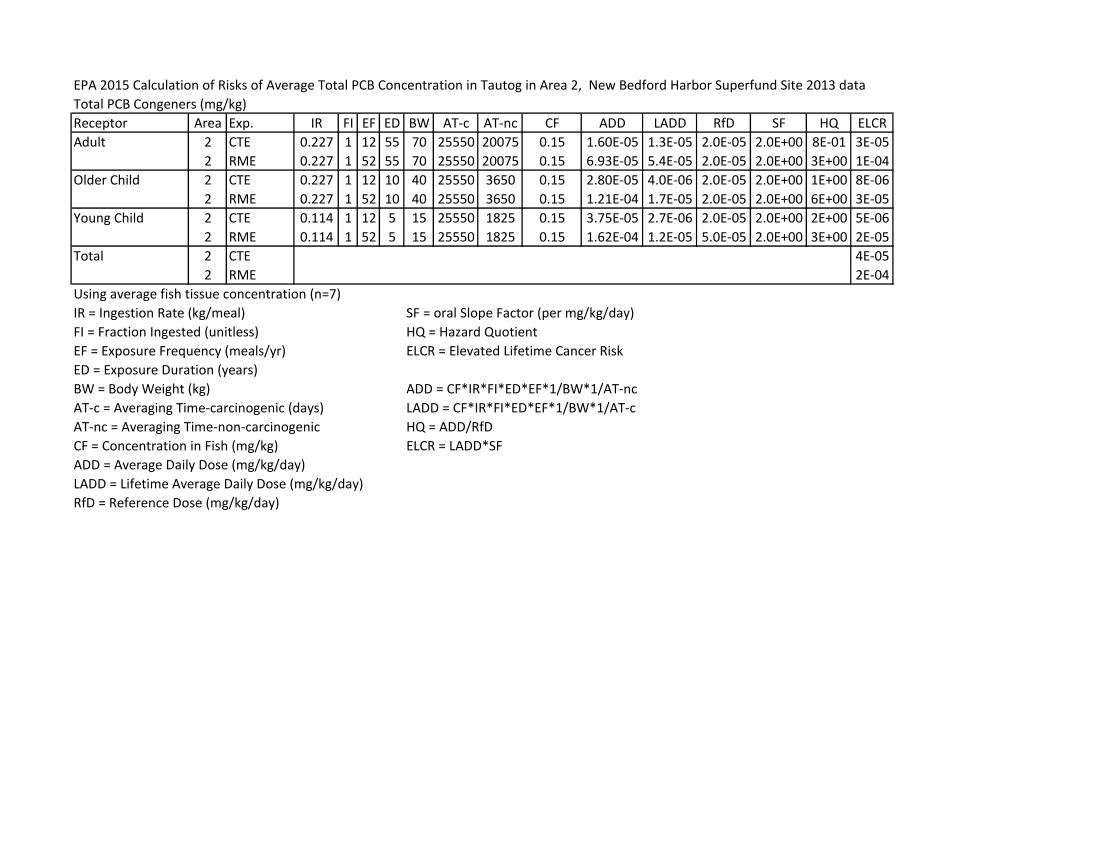
EPA 2015 Calculation of Risks of Average Total PCB Concentration in Tautog in Area 2, New Bedford Harbor Superfund Site 2013 data
Total PCB Congeners (mg/kg)
Receptor Area Exp. IR FI EF ED BW AT-c AT-nc CF ADD LADD RfD SF HQ ELCR
Adult 2 CTE 0.227 1 12 55 70 25550 20075 0.15 1.60E-05 1.3E-05 2.0E-05 2.0E+00 8E-01 3E-05
2 RME 0.227 1 52 55 70 25550 20075 0.15 6.93E-05 5.4E-05 2.0E-05 2.0E+00 3E+00 1E-04
Older Child 2 CTE 0.227 1 12 10 40 25550 3650 0.15 2.80E-05 4.0E-06 2.0E-05 2.0E+00 1E+00 8E-06
2 RME 0.227 1 52 10 40 25550 3650 0.15 1.21E-04 1.7E-05 2.0E-05 2.0E+00 6E+00 3E-05
Young Child 2 CTE 0.114 1 12 5 15 25550 1825 0.15 3.75E-05 2.7E-06 2.0E-05 2.0E+00 2E+00 5E-06
2 RME 0.114 1 52 5 15 25550 1825 0.15 1.62E-04 1.2E-05 5.0E-05 2.0E+00 3E+00 2E-05
Total 2 CTE 4E-05
2 RME 2E-04
Using average fish tissue concentration (n=7)
IR = Ingestion Rate (kg/meal) SF = oral Slope Factor (per mg/kg/day)
FI = Fraction Ingested (unitless) HQ = Hazard Quotient
EF = Exposure Frequency (meals/yr) ELCR = Elevated Lifetime Cancer Risk
ED = Exposure Duration (years)
BW = Body Weight (kg) ADD = CF*IR*FI*ED*EF*1/BW*1/AT-nc
AT-c = Averaging Time-carcinogenic (days) LADD = CF*IR*FI*ED*EF*1/BW*1/AT-c
AT-nc = Averaging Time-non-carcinogenic HQ = ADD/RfD
CF = Concentration in Fish (mg/kg) ELCR = LADD*SF
ADD = Average Daily Dose (mg/kg/day)
LADD = Lifetime Average Daily Dose (mg/kg/day)
RfD = Reference Dose (mg/kg/day)
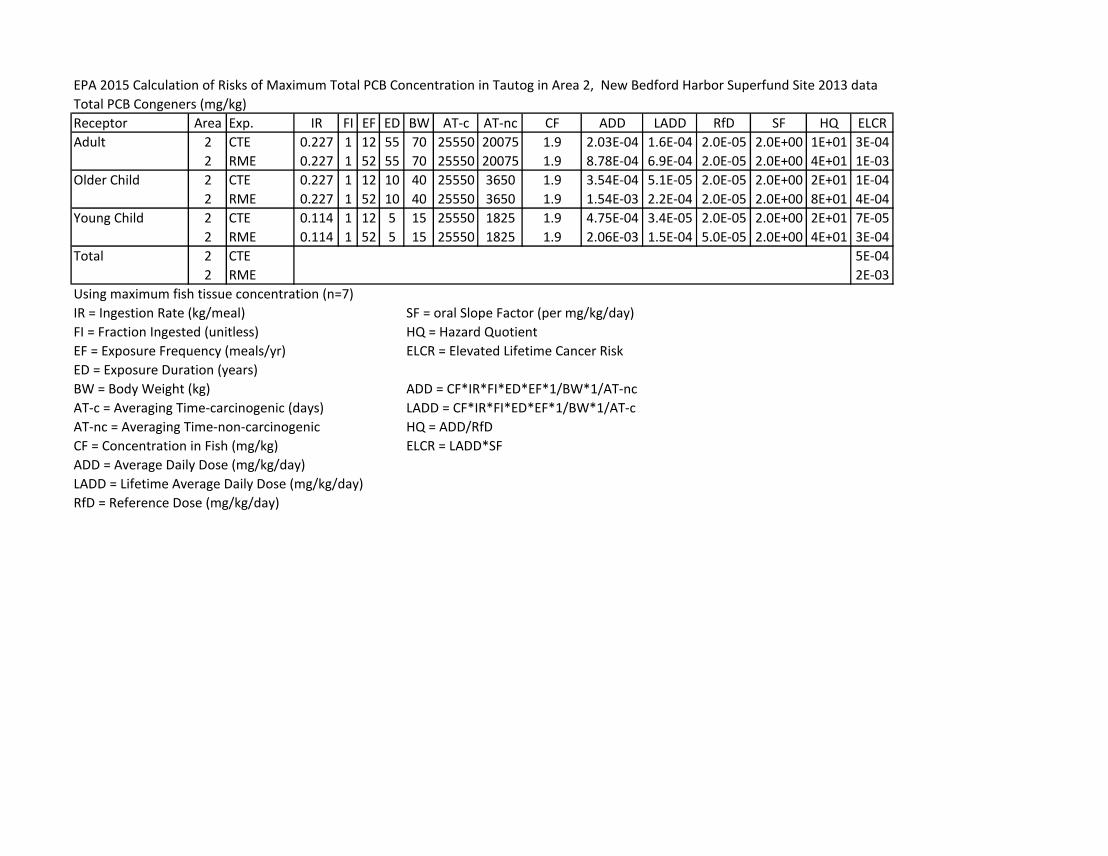
EPA 2015 Calculation of Risks of Maximum Total PCB Concentration in Tautog in Area 2, New Bedford Harbor Superfund Site 2013 data
Total PCB Congeners (mg/kg)
Receptor Area Exp. IR FI EF ED BW AT-c AT-nc CF ADD LADD RfD SF HQ ELCR
Adult 2 CTE 0.227 1 12 55 70 25550 20075 1.9 2.03E-04 1.6E-04 2.0E-05 2.0E+00 1E+01 3E-04
2 RME 0.227 1 52 55 70 25550 20075 1.9 8.78E-04 6.9E-04 2.0E-05 2.0E+00 4E+01 1E-03
Older Child 2 CTE 0.227 1 12 10 40 25550 3650 1.9 3.54E-04 5.1E-05 2.0E-05 2.0E+00 2E+01 1E-04
2 RME 0.227 1 52 10 40 25550 3650 1.9 1.54E-03 2.2E-04 2.0E-05 2.0E+00 8E+01 4E-04
Young Child 2 CTE 0.114 1 12 5 15 25550 1825 1.9 4.75E-04 3.4E-05 2.0E-05 2.0E+00 2E+01 7E-05
2 RME 0.114 1 52 5 15 25550 1825 1.9 2.06E-03 1.5E-04 5.0E-05 2.0E+00 4E+01 3E-04
Total 2 CTE 5E-04
2 RME 2E-03
Using maximum fish tissue concentration (n=7)
IR = Ingestion Rate (kg/meal) SF = oral Slope Factor (per mg/kg/day)
FI = Fraction Ingested (unitless) HQ = Hazard Quotient
EF = Exposure Frequency (meals/yr) ELCR = Elevated Lifetime Cancer Risk
ED = Exposure Duration (years)
BW = Body Weight (kg) ADD = CF*IR*FI*ED*EF*1/BW*1/AT-nc
AT-c = Averaging Time-carcinogenic (days) LADD = CF*IR*FI*ED*EF*1/BW*1/AT-c
AT-nc = Averaging Time-non-carcinogenic HQ = ADD/RfD
CF = Concentration in Fish (mg/kg) ELCR = LADD*SF
ADD = Average Daily Dose (mg/kg/day)
LADD = Lifetime Average Daily Dose (mg/kg/day)
RfD = Reference Dose (mg/kg/day)

EPA 2015 Calculation of Risks of Average Total PCB Concentration in Tautog in Area 3, New Bedford Harbor Superfund Site 2013 data
Total PCB Congeners (mg/kg)
Receptor Area Exp. IR FI EF ED BW AT-c AT-nc CF ADD LADD RfD SF HQ ELCR
Adult 2 CTE 0.227 1 12 55 70 25550 20075 0.08 8.53E-06 6.7E-06 2.0E-05 2.0E+00 4E-01 1E-05
2 RME 0.227 1 52 55 70 25550 20075 0.08 3.70E-05 2.9E-05 2.0E-05 2.0E+00 2E+00 6E-05
Older Child 2 CTE 0.227 1 12 10 40 25550 3650 0.08 1.49E-05 2.1E-06 2.0E-05 2.0E+00 7E-01 4E-06
2 RME 0.227 1 52 10 40 25550 3650 0.08 6.47E-05 9.2E-06 2.0E-05 2.0E+00 3E+00 2E-05
Young Child 2 CTE 0.114 1 12 5 15 25550 1825 0.08 2.00E-05 1.4E-06 2.0E-05 2.0E+00 1E+00 3E-06
2 RME 0.114 1 52 5 15 25550 1825 0.08 8.66E-05 6.2E-06 5.0E-05 2.0E+00 2E+00 1E-05
Total 2 CTE 2E-05
2 RME 9E-05
Using average fish tissue concentration (n=4)
IR = Ingestion Rate (kg/meal) SF = oral Slope Factor (per mg/kg/day)
FI = Fraction Ingested (unitless) HQ = Hazard Quotient
EF = Exposure Frequency (meals/yr) ELCR = Elevated Lifetime Cancer Risk
ED = Exposure Duration (years)
BW = Body Weight (kg) ADD = CF*IR*FI*ED*EF*1/BW*1/AT-nc
AT-c = Averaging Time-carcinogenic (days) LADD = CF*IR*FI*ED*EF*1/BW*1/AT-c
AT-nc = Averaging Time-non-carcinogenic HQ = ADD/RfD
CF = Concentration in Fish (mg/kg) ELCR = LADD*SF
ADD = Average Daily Dose (mg/kg/day)
LADD = Lifetime Average Daily Dose (mg/kg/day)
RfD = Reference Dose (mg/kg/day)

EPA 2015 Calculation of Risks of Maximum Total PCB Concentration in Tautog in Area 3, New Bedford Harbor Superfund Site 2013 data
Total PCB Congeners (mg/kg)
Receptor Area Exp. IR FI EF ED BW AT-c AT-nc CF ADD LADD RfD SF HQ ELCR
Adult 2 CTE 0.227 1 12 55 70 25550 20075 0.11 1.17E-05 9.2E-06 2.0E-05 2.0E+00 6E-01 2E-05
2 RME 0.227 1 52 55 70 25550 20075 0.11 5.08E-05 4.0E-05 2.0E-05 2.0E+00 3E+00 8E-05
Older Child 2 CTE 0.227 1 12 10 40 25550 3650 0.11 2.05E-05 2.9E-06 2.0E-05 2.0E+00 1E+00 6E-06
2 RME 0.227 1 52 10 40 25550 3650 0.11 8.89E-05 1.3E-05 2.0E-05 2.0E+00 4E+00 3E-05
Young Child 2 CTE 0.114 1 12 5 15 25550 1825 0.11 2.75E-05 2.0E-06 2.0E-05 2.0E+00 1E+00 4E-06
2 RME 0.114 1 52 5 15 25550 1825 0.11 1.19E-04 8.5E-06 5.0E-05 2.0E+00 2E+00 2E-05
Total 2 CTE 3E-05
2 RME 1E-04
Using maximum fish tissue concentration (n=4)
IR = Ingestion Rate (kg/meal) SF = oral Slope Factor (per mg/kg/day)
FI = Fraction Ingested (unitless) HQ = Hazard Quotient
EF = Exposure Frequency (meals/yr) ELCR = Elevated Lifetime Cancer Risk
ED = Exposure Duration (years)
BW = Body Weight (kg) ADD = CF*IR*FI*ED*EF*1/BW*1/AT-nc
AT-c = Averaging Time-carcinogenic (days) LADD = CF*IR*FI*ED*EF*1/BW*1/AT-c
AT-nc = Averaging Time-non-carcinogenic HQ = ADD/RfD
CF = Concentration in Fish (mg/kg) ELCR = LADD*SF
ADD = Average Daily Dose (mg/kg/day)
LADD = Lifetime Average Daily Dose (mg/kg/day)
RfD = Reference Dose (mg/kg/day)

EPA 2015 Calculation of Risks of Average Total PCB Concentration in Flounder in Area 2, New Bedford Harbor Superfund Site 2013 data
Total PCB Congeners (mg/kg)
Receptor Area Exp. IR FI EF ED BW AT-c AT-nc CF ADD LADD RfD SF HQ ELCR
Adult 2 CTE 0.227 1 12 55 70 25550 20075 0.72 7.68E-05 6.0E-05 2.0E-05 2.0E+00 4E+00 1E-04
2 RME 0.227 1 52 55 70 25550 20075 0.72 3.33E-04 2.6E-04 2.0E-05 2.0E+00 2E+01 5E-04
Older Child 2 CTE 0.227 1 12 10 40 25550 3650 0.72 1.34E-04 1.9E-05 2.0E-05 2.0E+00 7E+00 4E-05
2 RME 0.227 1 52 10 40 25550 3650 0.72 5.82E-04 8.3E-05 2.0E-05 2.0E+00 3E+01 2E-04
Young Child 2 CTE 0.114 1 12 5 15 25550 1825 0.72 1.80E-04 1.3E-05 2.0E-05 2.0E+00 9E+00 3E-05
2 RME 0.114 1 52 5 15 25550 1825 0.72 7.80E-04 5.6E-05 5.0E-05 2.0E+00 2E+01 1E-04
Total 2 CTE 2E-04
2 RME 8E-04
Using average fish tissue concentration for summer and winter flounder (n=4)
IR = Ingestion Rate (kg/meal) SF = oral Slope Factor (per mg/kg/day)
FI = Fraction Ingested (unitless) HQ = Hazard Quotient
EF = Exposure Frequency (meals/yr) ELCR = Elevated Lifetime Cancer Risk
ED = Exposure Duration (years)
BW = Body Weight (kg) ADD = CF*IR*FI*ED*EF*1/BW*1/AT-nc
AT-c = Averaging Time-carcinogenic (days) LADD = CF*IR*FI*ED*EF*1/BW*1/AT-c
AT-nc = Averaging Time-non-carcinogenic HQ = ADD/RfD
CF = Concentration in Fish (mg/kg) ELCR = LADD*SF
ADD = Average Daily Dose (mg/kg/day)
LADD = Lifetime Average Daily Dose (mg/kg/day)
RfD = Reference Dose (mg/kg/day)

EPA 2015 Calculation of Risks of Maximum Total PCB Concentration in Flounder in Area 2, New Bedford Harbor Superfund Site 2013 data
Total PCB Congeners (mg/kg)
Receptor Area Exp. IR FI EF ED BW AT-c AT-nc CF ADD LADD RfD SF HQ ELCR
Adult 2 CTE 0.227 1 12 55 70 25550 20075 2 2.13E-04 1.7E-04 2.0E-05 2.0E+00 1E+01 3E-04
2 RME 0.227 1 52 55 70 25550 20075 2 9.24E-04 7.3E-04 2.0E-05 2.0E+00 5E+01 1E-03
Older Child 2 CTE 0.227 1 12 10 40 25550 3650 2 3.73E-04 5.3E-05 2.0E-05 2.0E+00 2E+01 1E-04
2 RME 0.227 1 52 10 40 25550 3650 2 1.62E-03 2.3E-04 2.0E-05 2.0E+00 8E+01 5E-04
Young Child 2 CTE 0.114 1 12 5 15 25550 1825 2 5.00E-04 3.6E-05 2.0E-05 2.0E+00 2E+01 7E-05
2 RME 0.114 1 52 5 15 25550 1825 2 2.17E-03 1.5E-04 5.0E-05 2.0E+00 4E+01 3E-04
Total 2 CTE 5E-04
2 RME 2E-03
Using maximum fish tissue concentration for summer and winter flounder (n=4)
IR = Ingestion Rate (kg/meal) SF = oral Slope Factor (per mg/kg/day)
FI = Fraction Ingested (unitless) HQ = Hazard Quotient
EF = Exposure Frequency (meals/yr) ELCR = Elevated Lifetime Cancer Risk
ED = Exposure Duration (years)
BW = Body Weight (kg) ADD = CF*IR*FI*ED*EF*1/BW*1/AT-nc
AT-c = Averaging Time-carcinogenic (days) LADD = CF*IR*FI*ED*EF*1/BW*1/AT-c
AT-nc = Averaging Time-non-carcinogenic HQ = ADD/RfD
CF = Concentration in Fish (mg/kg) ELCR = LADD*SF
ADD = Average Daily Dose (mg/kg/day)
LADD = Lifetime Average Daily Dose (mg/kg/day)
RfD = Reference Dose (mg/kg/day)

EPA 2015 Calculation of Risks of Average Total PCB Concentration in Flounder in Area 3, New Bedford Harbor Superfund Site 2013 data
Total PCB Congeners (mg/kg)
Receptor Area Exp. IR FI EF ED BW AT-c AT-nc CF ADD LADD RfD SF HQ ELCR
Adult 2 CTE 0.227 1 12 55 70 25550 20075 0.37 3.94E-05 3.1E-05 2.0E-05 2.0E+00 2E+00 6E-05
2 RME 0.227 1 52 55 70 25550 20075 0.37 1.71E-04 1.3E-04 2.0E-05 2.0E+00 9E+00 3E-04
Older Child 2 CTE 0.227 1 12 10 40 25550 3650 0.37 6.90E-05 9.9E-06 2.0E-05 2.0E+00 3E+00 2E-05
2 RME 0.227 1 52 10 40 25550 3650 0.37 2.99E-04 4.3E-05 2.0E-05 2.0E+00 1E+01 9E-05
Young Child 2 CTE 0.114 1 12 5 15 25550 1825 0.37 9.24E-05 6.6E-06 2.0E-05 2.0E+00 5E+00 1E-05
2 RME 0.114 1 52 5 15 25550 1825 0.37 4.01E-04 2.9E-05 5.0E-05 2.0E+00 8E+00 6E-05
Total 2 CTE 9E-05
2 RME 4E-04
Using average fish tissue concentration for summer and winter flounder (n=2)
IR = Ingestion Rate (kg/meal) SF = oral Slope Factor (per mg/kg/day)
FI = Fraction Ingested (unitless) HQ = Hazard Quotient
EF = Exposure Frequency (meals/yr) ELCR = Elevated Lifetime Cancer Risk
ED = Exposure Duration (years)
BW = Body Weight (kg) ADD = CF*IR*FI*ED*EF*1/BW*1/AT-nc
AT-c = Averaging Time-carcinogenic (days) LADD = CF*IR*FI*ED*EF*1/BW*1/AT-c
AT-nc = Averaging Time-non-carcinogenic HQ = ADD/RfD
CF = Concentration in Fish (mg/kg) ELCR = LADD*SF
ADD = Average Daily Dose (mg/kg/day)
LADD = Lifetime Average Daily Dose (mg/kg/day)
RfD = Reference Dose (mg/kg/day)
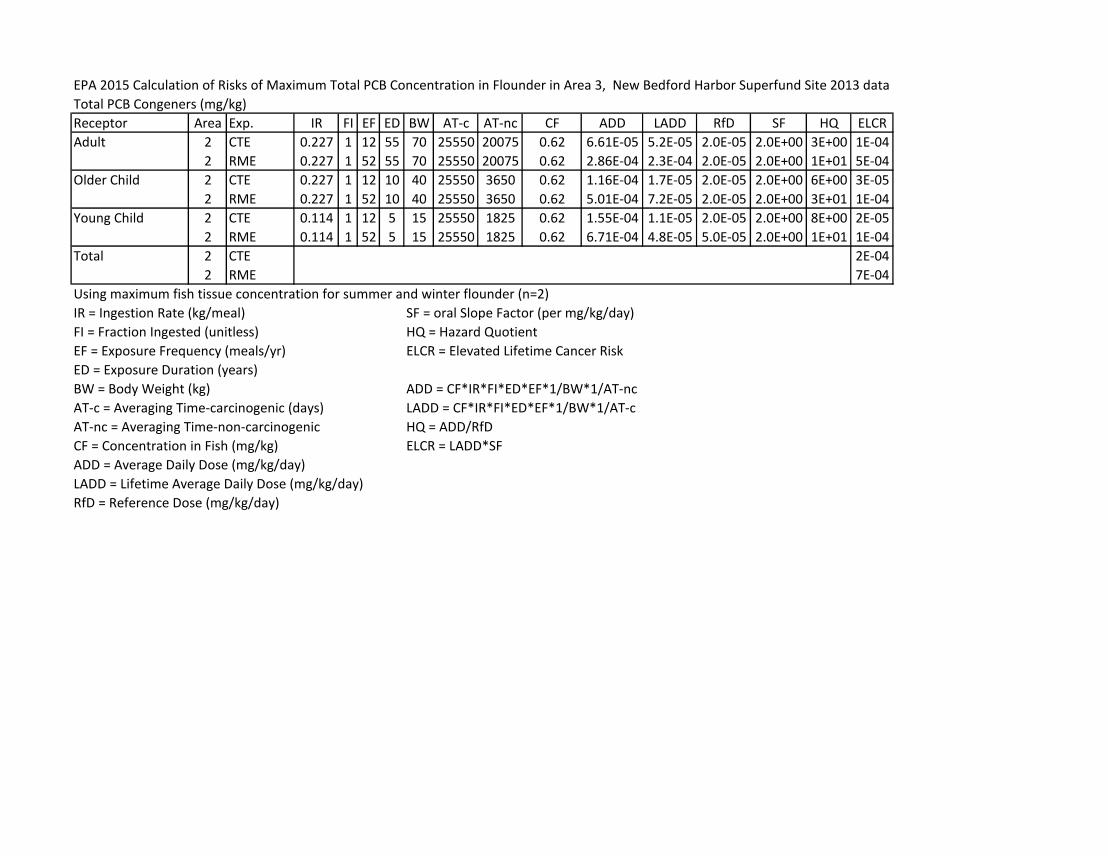
EPA 2015 Calculation of Risks of Maximum Total PCB Concentration in Flounder in Area 3, New Bedford Harbor Superfund Site 2013 data
Total PCB Congeners (mg/kg)
Receptor Area Exp. IR FI EF ED BW AT-c AT-nc CF ADD LADD RfD SF HQ ELCR
Adult 2 CTE 0.227 1 12 55 70 25550 20075 0.62 6.61E-05 5.2E-05 2.0E-05 2.0E+00 3E+00 1E-04
2 RME 0.227 1 52 55 70 25550 20075 0.62 2.86E-04 2.3E-04 2.0E-05 2.0E+00 1E+01 5E-04
Older Child 2 CTE 0.227 1 12 10 40 25550 3650 0.62 1.16E-04 1.7E-05 2.0E-05 2.0E+00 6E+00 3E-05
2 RME 0.227 1 52 10 40 25550 3650 0.62 5.01E-04 7.2E-05 2.0E-05 2.0E+00 3E+01 1E-04
Young Child 2 CTE 0.114 1 12 5 15 25550 1825 0.62 1.55E-04 1.1E-05 2.0E-05 2.0E+00 8E+00 2E-05
2 RME 0.114 1 52 5 15 25550 1825 0.62 6.71E-04 4.8E-05 5.0E-05 2.0E+00 1E+01 1E-04
Total 2 CTE 2E-04
2 RME 7E-04
Using maximum fish tissue concentration for summer and winter flounder (n=2)
IR = Ingestion Rate (kg/meal) SF = oral Slope Factor (per mg/kg/day)
FI = Fraction Ingested (unitless) HQ = Hazard Quotient
EF = Exposure Frequency (meals/yr) ELCR = Elevated Lifetime Cancer Risk
ED = Exposure Duration (years)
BW = Body Weight (kg) ADD = CF*IR*FI*ED*EF*1/BW*1/AT-nc
AT-c = Averaging Time-carcinogenic (days) LADD = CF*IR*FI*ED*EF*1/BW*1/AT-c
AT-nc = Averaging Time-non-carcinogenic HQ = ADD/RfD
CF = Concentration in Fish (mg/kg) ELCR = LADD*SF
ADD = Average Daily Dose (mg/kg/day)
LADD = Lifetime Average Daily Dose (mg/kg/day)
RfD = Reference Dose (mg/kg/day)

EPA 2015 Calculation of Risks of Maximum Total PCB Concentration in Eel in Area 1, New Bedford Harbor Superfund Site 2013 data
Total PCB Congeners (mg/kg)
Receptor Area Exp. IR FI EF ED BW AT-c AT-nc CF ADD LADD RfD SF HQ ELCR
Adult 2 CTE 0.227 1 12 55 70 25550 20075 133 1.42E-02 1.1E-02 2.0E-05 2.0E+00 7E+02 2E-02
2 RME 0.227 1 52 55 70 25550 20075 133 6.14E-02 4.8E-02 2.0E-05 2.0E+00 3E+03 1E-01
Older Child 2 CTE 0.227 1 12 10 40 25550 3650 133 2.48E-02 3.5E-03 2.0E-05 2.0E+00 1E+03 7E-03
2 RME 0.227 1 52 10 40 25550 3650 133 1.08E-01 1.5E-02 2.0E-05 2.0E+00 5E+03 3E-02
Young Child 2 CTE 0.114 1 12 5 15 25550 1825 133 3.32E-02 2.4E-03 2.0E-05 2.0E+00 2E+03 5E-03
2 RME 0.114 1 52 5 15 25550 1825 133 1.44E-01 1.0E-02 5.0E-05 2.0E+00 3E+03 2E-02
Total 2 CTE 3E-02
2 RME 1E-01
Using maximum fish tissue concentration (n=22)
IR = Ingestion Rate (kg/meal) SF = oral Slope Factor (per mg/kg/day)
FI = Fraction Ingested (unitless) HQ = Hazard Quotient
EF = Exposure Frequency (meals/yr) ELCR = Elevated Lifetime Cancer Risk
ED = Exposure Duration (years)
BW = Body Weight (kg) ADD = CF*IR*FI*ED*EF*1/BW*1/AT-nc
AT-c = Averaging Time-carcinogenic (days) LADD = CF*IR*FI*ED*EF*1/BW*1/AT-c
AT-nc = Averaging Time-non-carcinogenic HQ = ADD/RfD
CF = Concentration in Fish (mg/kg) ELCR = LADD*SF
ADD = Average Daily Dose (mg/kg/day)
LADD = Lifetime Average Daily Dose (mg/kg/day)
RfD = Reference Dose (mg/kg/day)

EPA 2015 Calculation of Risks of Average Total PCB Concentration in Eel in Area 1, New Bedford Harbor Superfund Site 2013 data
Total PCB Congeners (mg/kg)
Receptor Area Exp. IR FI EF ED BW AT-c AT-nc CF ADD LADD RfD SF HQ ELCR
Adult 2 CTE 0.227 1 12 55 70 25550 20075 48.9 5.21E-03 4.1E-03 2.0E-05 2.0E+00 3E+02 8E-03
2 RME 0.227 1 52 55 70 25550 20075 48.9 2.26E-02 1.8E-02 2.0E-05 2.0E+00 1E+03 4E-02
Older Child 2 CTE 0.227 1 12 10 40 25550 3650 48.9 9.12E-03 1.3E-03 2.0E-05 2.0E+00 5E+02 3E-03
2 RME 0.227 1 52 10 40 25550 3650 48.9 3.95E-02 5.6E-03 2.0E-05 2.0E+00 2E+03 1E-02
Young Child 2 CTE 0.114 1 12 5 15 25550 1825 48.9 1.22E-02 8.7E-04 2.0E-05 2.0E+00 6E+02 2E-03
2 RME 0.114 1 52 5 15 25550 1825 48.9 5.29E-02 3.8E-03 5.0E-05 2.0E+00 1E+03 8E-03
Total 2 CTE 1E-02
2 RME 5E-02
Using average fish tissue concentration (n=22)
IR = Ingestion Rate (kg/meal) SF = oral Slope Factor (per mg/kg/day)
FI = Fraction Ingested (unitless) HQ = Hazard Quotient
EF = Exposure Frequency (meals/yr) ELCR = Elevated Lifetime Cancer Risk
ED = Exposure Duration (years)
BW = Body Weight (kg) ADD = CF*IR*FI*ED*EF*1/BW*1/AT-nc
AT-c = Averaging Time-carcinogenic (days) LADD = CF*IR*FI*ED*EF*1/BW*1/AT-c
AT-nc = Averaging Time-non-carcinogenic HQ = ADD/RfD
CF = Concentration in Fish (mg/kg) ELCR = LADD*SF
ADD = Average Daily Dose (mg/kg/day)
LADD = Lifetime Average Daily Dose (mg/kg/day)
RfD = Reference Dose (mg/kg/day)

EPA 2015 Calculation of Risks of Average Total PCB Concentration in Eel in Area 2, New Bedford Harbor Superfund Site 2013 data
Total PCB Congeners (mg/kg)
Receptor Area Exp. IR FI EF ED BW AT-c AT-nc CF ADD LADD RfD SF HQ ELCR
Adult 2 CTE 0.227 1 12 55 70 25550 20075 40.2 4.29E-03 3.4E-03 2.0E-05 2.0E+00 2E+02 7E-03
2 RME 0.227 1 52 55 70 25550 20075 40.2 1.86E-02 1.5E-02 2.0E-05 2.0E+00 9E+02 3E-02
Older Child 2 CTE 0.227 1 12 10 40 25550 3650 40.2 7.50E-03 1.1E-03 2.0E-05 2.0E+00 4E+02 2E-03
2 RME 0.227 1 52 10 40 25550 3650 40.2 3.25E-02 4.6E-03 2.0E-05 2.0E+00 2E+03 9E-03
Young Child 2 CTE 0.114 1 12 5 15 25550 1825 40.2 1.00E-02 7.2E-04 2.0E-05 2.0E+00 5E+02 1E-03
2 RME 0.114 1 52 5 15 25550 1825 40.2 4.35E-02 3.1E-03 5.0E-05 2.0E+00 9E+02 6E-03
Total 2 CTE 1E-02
2 RME 4E-02
Using average fish tissue concentration (n=4)
IR = Ingestion Rate (kg/meal) SF = oral Slope Factor (per mg/kg/day)
FI = Fraction Ingested (unitless) HQ = Hazard Quotient
EF = Exposure Frequency (meals/yr) ELCR = Elevated Lifetime Cancer Risk
ED = Exposure Duration (years)
BW = Body Weight (kg) ADD = CF*IR*FI*ED*EF*1/BW*1/AT-nc
AT-c = Averaging Time-carcinogenic (days) LADD = CF*IR*FI*ED*EF*1/BW*1/AT-c
AT-nc = Averaging Time-non-carcinogenic HQ = ADD/RfD
CF = Concentration in Fish (mg/kg) ELCR = LADD*SF
ADD = Average Daily Dose (mg/kg/day)
LADD = Lifetime Average Daily Dose (mg/kg/day)
RfD = Reference Dose (mg/kg/day)

EPA 2015 Calculation of Risks of Maximum Total PCB Concentration in Eel in Area 2, New Bedford Harbor Superfund Site 2013 data
Total PCB Congeners (mg/kg)
Receptor Area Exp. IR FI EF ED BW AT-c AT-nc CF ADD LADD RfD SF HQ ELCR
Adult 2 CTE 0.227 1 12 55 70 25550 20075 83 8.85E-03 7.0E-03 2.0E-05 2.0E+00 4E+02 1E-02
2 RME 0.227 1 52 55 70 25550 20075 83 3.83E-02 3.0E-02 2.0E-05 2.0E+00 2E+03 6E-02
Older Child 2 CTE 0.227 1 12 10 40 25550 3650 83 1.55E-02 2.2E-03 2.0E-05 2.0E+00 8E+02 4E-03
2 RME 0.227 1 52 10 40 25550 3650 83 6.71E-02 9.6E-03 2.0E-05 2.0E+00 3E+03 2E-02
Young Child 2 CTE 0.114 1 12 5 15 25550 1825 83 2.07E-02 1.5E-03 2.0E-05 2.0E+00 1E+03 3E-03
2 RME 0.114 1 52 5 15 25550 1825 83 8.99E-02 6.4E-03 5.0E-05 2.0E+00 2E+03 1E-02
Total 2 CTE 2E-02
2 RME 9E-02
Using maximum fish tissue concentration (n=4)
IR = Ingestion Rate (kg/meal) SF = oral Slope Factor (per mg/kg/day)
FI = Fraction Ingested (unitless) HQ = Hazard Quotient
EF = Exposure Frequency (meals/yr) ELCR = Elevated Lifetime Cancer Risk
ED = Exposure Duration (years)
BW = Body Weight (kg) ADD = CF*IR*FI*ED*EF*1/BW*1/AT-nc
AT-c = Averaging Time-carcinogenic (days) LADD = CF*IR*FI*ED*EF*1/BW*1/AT-c
AT-nc = Averaging Time-non-carcinogenic HQ = ADD/RfD
CF = Concentration in Fish (mg/kg) ELCR = LADD*SF
ADD = Average Daily Dose (mg/kg/day)
LADD = Lifetime Average Daily Dose (mg/kg/day)
RfD = Reference Dose (mg/kg/day)
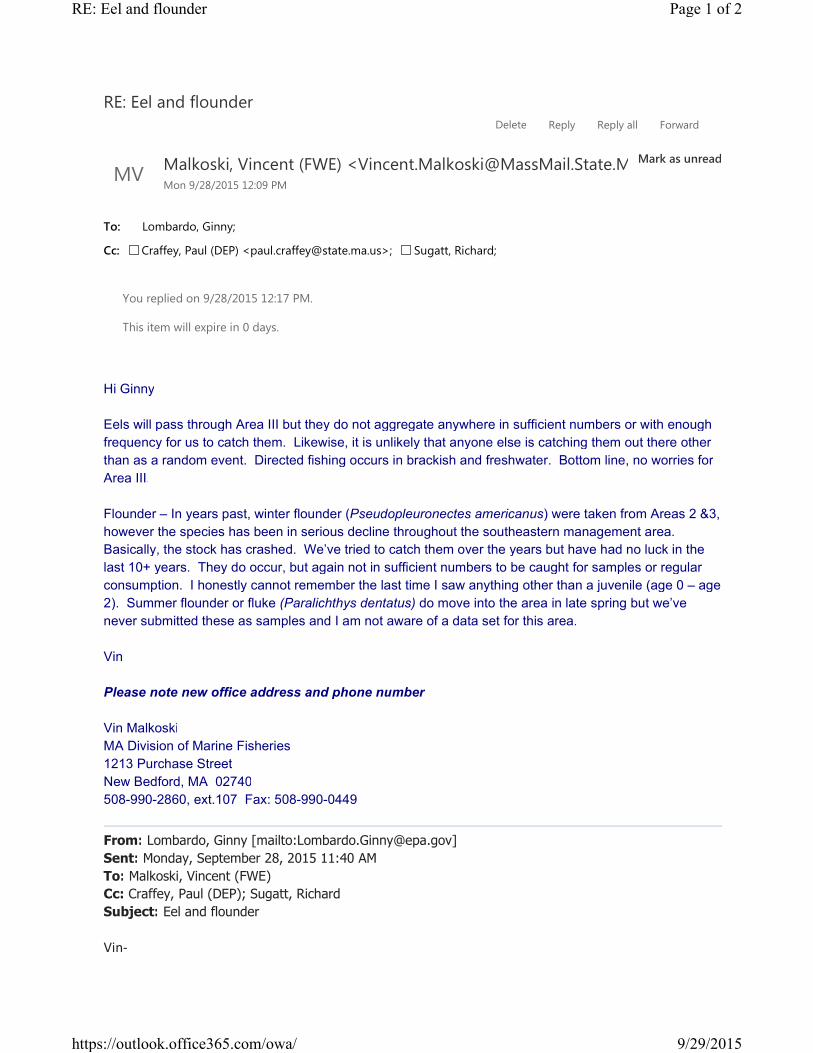
Hi Ginny
Eels will pass through Area III but they do not aggregate anywhere in sufficient numbers or with enough
frequency for us to catch them. Likewise, it is unlikely that anyone else is catching them out there other
than as a random event. Directed fishing occurs in brackish and freshwater. Bottom line, no worries for
Area III.
Flounder – In years past, winter flounder (Pseudopleuronectes americanus) were taken from Areas 2 &3,
however the species has been in serious decline throughout the southeastern management area.
Basically, the stock has crashed. We’ve tried to catch them over the years but have had no luck in the
last 10+ years. They do occur, but again not in sufficient numbers to be caught for samples or regular
consumption. I honestly cannot remember the last time I saw anything other than a juvenile (age 0 – age
2). Summer flounder or fluke (Paralichthys dentatus) do move into the area in late spring but we’ve
never submitted these as samples and I am not aware of a data set for this area.
Vin
Please note new office address and phone number
Vin Malkoski
MA Division of Marine Fisheries
1213 Purchase Street
New Bedford, MA 02740
508-990-2860, ext.107 Fax: 508-990-0449
From: Lombardo, Ginny [mailto:[email protected]]
Sent: Monday, September 28, 2015 11:40 AM
To: Malkoski, Vincent (FWE)
Cc: Craffey, Paul (DEP); Sugatt, Richard
Subject: Eel and flounder
Vin-
RE: Eel and flounder
Mark as unread
To:
Cc:
<[email protected]>Malkoski, Vincent (FWE) Mon 9/28/2015 12:09 PM
MV
Lombardo, Ginny;
Craffey, Paul (DEP) <[email protected]>; Sugatt, Richard;
You replied on 9/28/2015 12:17 PM.
This item will expire in 0 days.
Delete Reply Reply all Forward
Page 1 of 2RE: Eel and flounder
9/29/2015https://outlook.office365.com/owa/
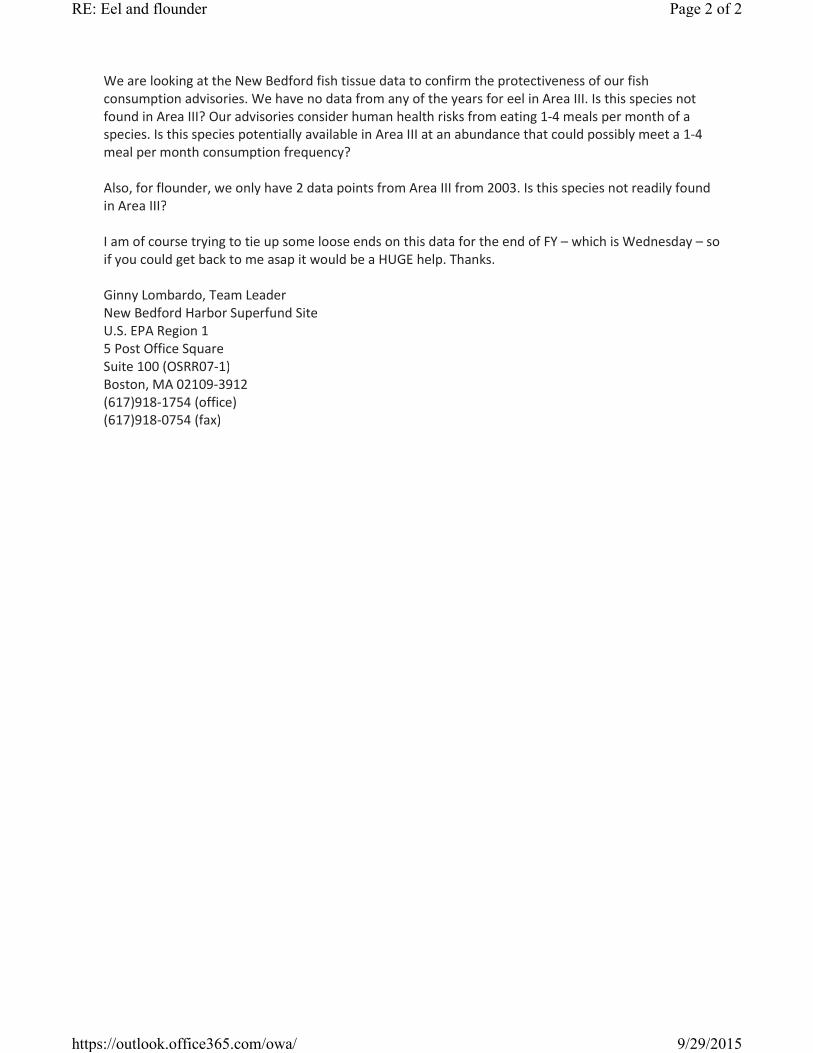
We are looking at the New Bedford fish tissue data to confirm the protectiveness of our fish
consumption advisories. We have no data from any of the years for eel in Area III. Is this species not
found in Area III? Our advisories consider human health risks from eating 14 meals per month of a
species. Is this species potentially available in Area III at an abundance that could possibly meet a 14
meal per month consumption frequency?
Also, for flounder, we only have 2 data points from Area III from 2003. Is this species not readily found
in Area III?
I am of course trying to tie up some loose ends on this data for the end of FY – which is Wednesday – so
if you could get back to me asap it would be a HUGE help. Thanks.
Ginny Lombardo, Team Leader
New Bedford Harbor Superfund Site
U.S. EPA Region 1
5 Post Office Square
Suite 100 (OSRR071)
Boston, MA 021093912
(617)9181754 (office)
(617)9180754 (fax)
Page 2 of 2RE: Eel and flounder
9/29/2015https://outlook.office365.com/owa/