SHRP-LTPP Overview: Five-Year Report - Transportation ...
327
SHRP-P-416 SHRP-LTPP Overview: Five-Year Report William O. Hadley Hadley and Associates Strategic Highway Research Program National Research Council Washington, DC 1994
-
Upload
khangminh22 -
Category
Documents
-
view
0 -
download
0
Transcript of SHRP-LTPP Overview: Five-Year Report - Transportation ...

SHRP-P-416
SHRP-LTPP Overview:
Five-Year Report
William O. HadleyHadley and Associates
Strategic Highway Research ProgramNational Research Council
Washington, DC 1994

SHRP-P-416ISBN 0-309-05815-5Product No.: 5000
Program Manager: Neil F. HawksFive-Year Report Manager: A. Robert Raab
Program Area Secretaries: Cynthia Baker, Francine A. BurgessProduction Editor: Margaret S. Milhous
June 1994
key words:asphalt concretejointed plain concrete pavementjointed reinforced concrete pavementcontinuously reinforced concrete pavementportland cement concreteDIPstick
load equivalence factors
Strategic Highway Research ProgramNational Research Council2101 Constitution Avenue N.W.
Washington, DC 20418
(202) 334-3774
The publication of this report does not necessarily indicate approval or endorsement by the National Academyof Sciences, the United States Government, or the American Association of State Highway and TransportationOfficials or its member states of the findings, opinions, conclusions, or recommendations either inferred or
specifically expressed herein.
©1994 National Academy of Sciences
1.5M/NAP/694

Acknowledgments
The research described herein was supported by the Strategic Highway Research Program(SHRP). SHRP is a unit of the National Research Council that was authorized by section128 of the Surface Transportation and Uniform Relocation Assistance Act of 1987.
The authors/editors of this Overview Report are Dr. William O. Hadley (all sections), Dr.Virgil Anderson (Section 3), Mr. Jonathan Groeger (Sections 2 and 4), Mr. John German(Section 8), and Mr. Charlie Copeland (Section 6). All authors were associated with TexasResearch and Development Foundation (TRDF) during the Long-Term PavementPerformance program. Contributions by Mr. Gonzalo Rada of PCS/Law (Section 5), Mr.Amir Hanna of SHRP and Dr. Shiraz Tayabji of PCS/Law (Section 3), and Dr. BrentRauhut of Brent Rauhut Engineering Inc. (BRE) and Dr. Gilbert Baladi of Michigan StateUniversity (Section 7) are gratefully recognized. The manuscript was prepared by Ms. JanZeybel.
The publication of this report does not necessarily indicate approval or endorsement by theNational Academy of Sciences, by the Federal Highway Administration, or by any statehighway or transportation department of the findings, opinions, conclusions, orrecommendations either inferred or specifically expressed herein.
°°.
III

Contents
List of Figures ..................................................... xiii
List of Tables .................................................... xvii
Abstract ......................................................... xix
Section 1, Introduction ................................................ 1Background of SHRP-LTPP ....................................... 2
The Strategic Transportation Research Study (STRS) ...................... 2The Strategic Highway Research Program (SHRP) ....................... 2The Long-Term Pavement Performance (LTPP) Program ................... 3
Goals and Objectives ....................................... 4Summary .................................................... 4References ................................................... 5
Section 2, General Pavement Studies (GPS) ................................. 7Introduction .................................................. 7SHRP Regions ................................................ 7GPS Sampling Templates ......................................... 9
Evolution of GPS ......................................... 9Revisions to GPS ......................................... 9Design of GPS Program ..................................... 9Sampling Design Templates ................................. 10GPS-I: Asphalt Concrete (AC) on Granular Base .................. 10GPS-2: AC on Bound Base .................................. 12
GPS-3: Jointed Plain Concrete Pavement (JPCP) ................... 12GPS-4: Jointed Reinforced Concrete Pavement (JRCP) .............. 12GPS-5: Continuously Reinforced Concrete Pavement (CRCP) .......... 15GPS-6: AC Overlay of AC Pavement .......................... 15GPS-7: AC Overlay of Portland Cement Concrete (PCC) Pavement ..... 15GPS-9: Unbonded PCC Overlay of PCC Pavement ................. 20
Initial Project Recruitment ....................................... 20Additional Recruitment .................................... 24
Project Approval Process ........................................ 24Project Selection ......................................... 24

Project Verification ...................................... 25Field Verification ....................................... 26
Location of Monitoring Test Section ...................... 26Bore Holes ....................................... 26Test Section Identification ............................. 27Videotaping of Test Section ............................ 27Field Verification Form .............................. 27
Distress Survey .................................... 27Projects Approval ....................................... 27
Project Status Classifications ..................................... 30Status as of July 1992 ......................................... 32Data Collection Activities ....................................... 32References ................................................. 39
Section 3, Specific Pavement Studies (SPS) ................................ 41Background ................................................. 41Initial Modification of SPS (1988) .................................. 42SPS-1 and SPS-2: Structural Factors ................................ 42
SPS-I: Structural Factors for Flexible Pavements .................. 42
SPS-2: Structural Factors for Rigid Pavements .................... 42SPS-3 and SPS-4: Preventive Maintenance ............................ 43
SPS-3: Preventive Maintenance Effectiveness for AC Pavements ....... 43
SPS-4: Preventive Maintenance Effectiveness for Rigid Pavements ...... 43SPS-5, SPS-6, and SPS-7: Pavement Rehabilitation Studies ................ 46
SPS-5: Hot Recycling of AC ................................ 46SPS-6: Restoration and Overlay of Jointed PCC Pavement ............ 46SPS-7: Bonded PCC Overlay of PCC Pavement ................... 48
SPS-8: Study of Environmental Factors in the Absence of Heavy Loads ....... 48SPS Program Analyses (1989-90) .................................. 48Revised SPS Experimental Designs (1990) ............................ 51SPS-I: Strategic Study of Structural Factors for Flexible Pavements .......... 51SPS-2: Strategic Study of Structural Factors for Rigid Paveraent ............. 51SPS-3: Preventive Maintenance of AC Pavements ....................... 54SPS-4: Preventive Maintenance of JCP .............................. 54SPS-5: Rehabilitation of AC Pavements .............................. 54SPS-6: Rehabilitation of Jointed PCC Pavements ....................... 54
SPS-7: Bonded Concrete Overlays of Concrete Pavements ................. 54SPS-8: Study of Environmental Effects in the Absence of Heavy Loads ....... 59Project Participation Requirements .................................. 59
Project Requirements ...................................... 63Test Site Requirements ..................................... 64
Project Recruitment and Approval Process ............................ 64Project Solicitation and Nomination ............................ 67Project Verification ....................................... 67Project Approval ......................................... 71
Construction Guidelines ......................................... 72
vi

Status as of May 1992 .......................................... 73References .................................................. 75
Section 4, Pavement Materials Characterization .............................. 77Introduction ................................................. 77
Background ............................................ 77Field Materials Sampling and Testing ............................... 78
GPS Field Materials Sampling and Field Testing ................... 78Organizational Structure ............................... 78Field Materials Sampling Guide ......................... 80Conduct of Field Materials Sampling ...................... 80Sample Numbering, Packaging, and Shipment ................ 85Data Collection Guidelines ............................. 85
Quality Assurance/Quality Control in the Field ............... 85Status of GPS Materials Sampling and Testing ............... 86
SPS Materials Sampling and Field Testing ....................... 87Special Considerations for SPS Field Sampling andField Testing ....................................... 87Field Materials Sampling and Testing Guidelines ............. 88Data Collection Guidelines for SPS Field Materials Sampling ..... 88Conduct of Field Materials Sampling ...................... 88
SPS-3 and SPS-4 Field Sampling and Field Testing Plans ............ 88Field Sampling, Testing and Data Collection ................ 89SPS-3 Construction Monitoring, Sampling, and Field Tests ...... 89SPS-3 Materials Sampling After Construction ................ 90SPS-4 Materials Sampling Prior to Construction .............. 90SPS-4 Materials Acceptance Sampling ..................... 90SPS-4 Construction Monitoring Sampling and Field Tests ....... 91SPS-4 Special Testing After Construction ................... 91
Laboratory Materials Handling and Testing ........................... 91Organizational Structure .................................... 91Laboratory Materials Testing Guide ............................ 93
Protocol Development ................................ 94Future Use ........................................ 94
Conduct of Laboratory Materials Testing ........................ 94PCC Laboratory Material Testing ........................ 94Bituminous, Treated, and Unbound Materials Testing .......... 96Pavement Layering .................................. 96General Laboratory Testing ............................ 96Laboratory Test Procedures for AC ....................... 99Laboratory Testing of Treated Materials .................... 99Laboratory Testing of Unbound Granular Base, Subbase, and
Untreated Subgrade Soils ............................ 101Quality Assurance/Quality Control in the Laboratory ............... 101SHRP Proficiency Testing Program ........................... 103Data Collection Guidelines ................................. 103
Summary Statistics and Information ........................... 103
vii

Status of GPS Laboratory Materials Testing ..................... 104SPS-1,-2,-5,-6,-7, and-8 Laboratory Materials Ha dlingand Testing ............................................. 104
Conduct of Laboratory Materials Testing .................. 104Requirements for Individual SPS Experiments .............. 105QA/QC in the Laboratories ............................ 105Summary Statistics and Information ...................... 105
SPS-3 and SPS-4 Laboratory Materials Handling and Testing ......... 105Summary .................................................. 108References ................................................. 108
Section 5, Monitoring Activities ....................................... 113Introduction ................................................ 113Distress ................................................... 113
Distress Interpretation Procedure ............................. 113PASCO Distress Interpretation ......................... 114Manual Distress Interpretation .......................... 116Certification Requirements ............................ 116
Rater Accreditation ...................................... 116Status of Distress Activities ................................ 117
Deflection .................................................. 117
Devices/Storage ......................................... 117Quality Assurance/Quality Control (QA/AC) Procedures ............ 118Status of Deflection Activities ............................... 119
Initial FWD Data Analysis ............................ 119Deflection Measurement Program Issues .................. 120Recommended FWD Activities ......................... 120
Profile .................................................... 120
Theory of Operation ..................................... 121Law Profilometer Evaluations ............................... 121
Saturation Data Anomaly .................................. 121Lost Lock Data Anomaly .................................. 124Face DIPstick Device ..................................... 124
Profilometer-DIPstick Profile Comparisons ...................... 124Comments on Status ..................................... 127
Traffic Monitoring ............................................ 128Traffic Data Collection Requirements ......................... 128
Site-Specific Versus Site-Related Data Collection ............ 128Traffic Data in the LTPP NPPDB ............................ 130
International Traffic Data Requirements ........................ 130Surface Friction .............................................. 130
Friction Data Collection Frequency and Timing .................. 130Routine Monitoring Frequency ......................... 130Timing of Friction Measurements and Seasonal Variation ...... 132Monitoring Before and After Rehabilitation/MaintenanceTreatment ........................................ 132
Friction Measurement Procedure/Equipment ..................... 132
ooo
VIII

Equipment ....................................... 132Operating Speed and Air Temperature .................... 132Friction Data Collection on 500 ft. GPS Test Sections ......... 132Friction Data Collection on 1000 ft. SPS Test Sections ........ 133
Data Reporting ......................................... 133Skid Number ...................................... 133Other Data Elements ................................ 133
Other Monitoring: Maintenance ................................... 133Maintenance Policy ...................................... 134Scope and Objective ..................................... 134Maintenance Control Zone ................................. 134Maintenance Requirements ................................. 134Routine or Preventative Maintenance .......................... 136Restoration or Rehabilitation Treatments ....................... 136Maintenance Data Collection ............................... 137Maintenance Data for SPS Test Sections ....................... 137
Other Monitoring: Rehabilitation .................................. 137Historical Rehabilitation Data ............................... 138SHRP Accumulated Rehabilitation Data for GPS Test Sections ........ 138Rehabilitation Data for SPS Test Sections ...................... 138
Instrumentation .............................................. 142Present Status .......................................... 142
Pilot Studies ...................................... 142Pavement Type .................................... 142Measurement Equipment ............................. 143Temperature Measurements ........................... 143Moisture Measurements .............................. 143Frost Measurements ................................. 143Water Table Depth ................................. 143Temporary Benchmark ............................... 144Installation ....................................... 144
References ................................................. 144
Section 6, Information Management System (IMS) .......................... 149Background ................................................. 149LTPP Information Management Systems ............................ 149SHRP-LTPP Regions .......................................... 150Information Sources ........................................... 152Data Collection Guide ......................................... 152Schema Report .............................................. 153
Key Fields ............................................ 153Other Fields ........................................... 153
Data Dictionary Report ......................................... 155Data Types, Elements, and Sources ............................... 157IMS QA Process ............................................. 157
RIMS/NIMS Data Entry Checks ............................. 160Level l: Section Release .................................. 160
ix

Level 2: Experiment Release ................................ 164Data Availability ............................................. 167
Specific Data .......................................... 170Status of/MS Releases ................................... 170
IMS Products ............................................... 170References ................................................. 172
Section 7, Data Analysis Studies ....................................... 175Introduction ................................................ 175
Data Analysis: General Pavement Studies (GPS) Materials artdConstruction Variability ........................................ 176
Approach ............................................. 177Construction Variability in Rigid Pavements .......................... 177
Rigid Pavement Construction Variability Factors .................. 177Longitudinal Roughness in Rigid Pavements, log(IRI I, . ............. 181AASHO Serviceability Loss ................................ 181
Construction Variability in Flexible Pavements ........................ 182Flexible Pavement Construction Variability Factors ................ 183log(Layer Rutting) ....................................... 183log(Deep Rutting) ....................................... 184AASHO Serviceability Loss ................................ 185
Conclusions ................................................ 185
Improvement of Load Equivalence Factors (LEFs) from SHRP-LTPP Data .... 186LEF Evaluation Approach ................................. 186Rigid Pavement LEF Evaluation ............................. 188Evaluation of log(IRI) .................................... 188Evaluation of log(PSI-Loss) ................................ 189Possible Effect on LEF Values for Rigid Pavements ............... 189Flexible Pavement LEF Evaluation ........................... 190
Evaluation of Rutting ..................................... 191Evaluation of Roughness (IRI) .............................. 191Evaluation of AASHO Serviceability Loss ...................... 192Evaluation of SHRP Serviceability Loss [K/1-K)(p-2.0)] ............ 192Possible Effect on LEF Values for Flexible Pavements ............. 193Conclusions and Recommendations ........................... 195
Rutting Initiation Studies ....................................... 195Introduction ........................................... 195
Analytical Approach ..................................... 197Definition of Rutting Type ................................. 200Type of Rutting ......................................... 200Rut Prediction Equations .................................. 205Applications ........................................... 208
SHRP Data Analysis Contract .................................... 211Introduction ........................................... 211
Limitations Resulting from Data Shortcomings ................... 211Sensitivity Analyses and Results .................................. 212
Summary of Sensitivity Analysis Results for HMAC Pavements ....... 217
X

Summary of Sensitivity Analysis Results for PCC Pavements ......... 219Design Recommendations for JPCP ...................... 219Design Recommendations for Jointed Reinforced ConcretePavement (JRCP) .................................. 221Design Recommendations for CRCP ..................... 221
Evaluation of the AASHTO Flexible Pavement Design Equation ...... 222Evaluation of the AASHTO Rigid Pavement Design Equation ........ 224Improved Design Equations: Applications and Limitations ........... 229HMAC Pavements ....................................... 229PCC Pavements ......................................... 230Evaluation of the 1993 AASHTO Overlay Design Equations ......... 231Recommendations for Future Analyses ......................... 233
SHRP Data Analysis Contract: Michigan State University ................ 236Premises of the AASHTO Design Procedure for Flexible Pavements .... 236Mechanistic Evaluation/Calibration of the AASHTO DesignProcedure ............................................. 237
Pavement Maintenance Cost-Effectiveness ........................... 240Canadian SHRP (CSHRP)--LTPP Technical Analysis Project ............. 240United Kingdom, Science and Engineering Research Council Research Grant:Information Management System for Predicting Long-Term PavementPerformance ................................................ 242References ................................................. 243
Section 8, Traffic Data Collection and Analysis ............................ 245Background ................................................. 245Traffic Expert Task Group (ETG) Activities .......................... 245Traffic Data Collection Program .................................. 246
Site-Specific versus Site-Related Data Collection ................. 247Traffic Data Collection Plans ............................... 248Historical Data ......................................... 249Traffic Data in the LTPP Database ........................... 249FHWA Monitoring Standards ............................... 251Role of the Regional Offices ................................ 251International Traffic Data Requirements ........................ 251Traffic Data Analysis Studies ............................... 251
Summary .................................................. 252References ................................................. 252
Section 9, International Participation .................................... 255Introduction ................................................ 255Initiation of International Cooperation Activities ....................... 255International Conferences ....................................... 255International Data and the LTPP National Information ManagementSystem (NIMS) .............................................. 257
Data Flow ............................................. 257Types of Modifications ................................... 257
International Participants ....................................... 258
xi

Level of Participation .................................... 258Data Collection Activities ................................. 258
Section 10, Expected Results, Products and Benefits ......................... 263Introduction ............................................... 263Initial Results .............................................. 263Summary ................................................. 265References ................................................ 266
Bibliography ...................................................... 267
xii

List of Figures
Figure 2.1 SHRP-LTPP Regional Boundaries ............................ 8Figure 2.2 Sampling Template and Cell Identification Numbers for GPS-1
(Asphalt Concrete on Granular Base) ......................... 11Figure 2.3 Sampling Template and Cell Identification Numbers for GPS-2
(Asphalt Concrete on Bound Base) ........................... 13Figure 2.4 Sampling Template and Cell Identification Numbers for GPS-3
(Jointed Plain Concrete Pavement) ........................... 14Figure 2.5 Sampling Template and Cell Identification Numbers for GPS-4
(Jointed Reinforced Concrete Pavement) ....................... 16Figure 2.6 Sampling Template and Cell Identification Numbers for GPS-5
(Continuously Reinforced Concrete Pavement) .................. 17Figure 2.7 Sampling Template and Cell Identification Numbers for GPS-6A
(Existing Asphalt Concrete Overlay of Asphalt Concrete) ........... 18Figure 2.8 Sampling Template and Cell Identification Numbers for GPS-6B
(Planned Asphalt Concrete Overlay of Asphalt ConcretePavement) ............................................ 19
Figure 2.9 Sampling Template and Cell Identification Numbers for GPS-7A(Existing Asphalt Concrete Overlay of Portland CementConcrete) ............................................ 21
Figure 2.10 Sampling Template and Cell Identification Numbers for GPS-7B(Planned Asphalt Concrete Overlay of Portland CementConcrete Pavement) ..................................... 22
Figure 2.11 Sampling Template and Cell Identification Numbers for GPS-9(Unbonded Portland Cement Concrete Overlay of PortlandCement Concrete Pavement) ............................... 23
Figure 2.12 Sign and Paint Configuration for GPS Test Site .................. 28Figure 2.13 Details of GPS Monitoring Site Paint Configuration ............... 29Figure 2.14 Flow Diagram of the Project Approval Process .................. 31Figure 2.15 SHRP-LTPP GPS Studies ................................. 33Figure 2.16 Distribution of Approved GPS Sections ....................... 36Figure 2.17 Distribution of Flexible Pavement Sections Among GPS Experiments .. 37Figure 2.18 Distribution of Rigid Pavement Sections Among GPS Experiments .... 38Figure 3.1 Test Section Layout for SPS-1 and SPS-2: Strategic Studies
of Structural Factors ..................................... 44
xiii

Figure 3.2 Test Section Layout for SPS-3 and SPS-4: Studies of PreventiveMaintenance Effectiveness ................................. 45
Figure 3.3 Test Section Layout for SPS-5 and SPS-6: Pavemc,_t RehabilitationStudies ............................................. 47
Figure 3.4 Test Section Layout for SPS-7: Bonded PCC Over_ay of PCCPavements ........................................... 49
Figure 3.5 Test Section Layout for SPS-8: Study of Environrr :;ntal Factorsin the Absence of Heavy Loads ............................. 50
Figure 3.6 Project Recruitment and Approval Process ..................... 66Figure 3.7 Sample SPS Nomination Form .............................. 68Figure 4.1 Agencies Involved in LTPP GPS Field Drilling an.I S_unpling
Operations ............................................ 79Figure 4.2 Locations of Approved GPS Sites ........................... 81Figure 4.3 Typical Sampling Point Locations for GPS-1, GPS-2, GPS-6,
and GPS-7 (Flexible) Pavements ............................ 82Figure 4.4 Typical Sampling Point Locations for GPS-3, GPS-4, GPS-5,
and GPS-9 (Rigid) Pavements .............................. 83Figure 4.5 Agencies Involved in LTPP GPS Laboratory Operations ............ 92Figure 4.6 Example of Laboratory Testing Plan for a Flexible GPS Test Section . . 97Figure 4.7 Example of Laboratory Testing Plan for a Rigid GPS Test Section .... 98Figure 5.1 Distress Interpretation Procedure ........................... 115Figure 5.2 Example of Randomly Generated Data Anomalies in a Profilometer
Run ............................................... 122Figure 5.3 Example of Profilometer Run Free of Data Anomalies ............ 123Figure 5.4 Comparison of Law Profilometer and Face DIPstick
Profiles--Flexible Pavement .............................. 125
Figure 5.5 Comparison of Law Profilometer and Face DIPstickProfiles--Rigid Pavement ................................ 126
Figure 5.6 LTPP Central Traffic Database Primary Loading Estimates ......... 131Figure 5.7 Illustration of Maintenance Control Zone ..................... 135Figure 5.8 Inventory Data Sheet ................................... 139Figure 6.1 SHRP-LTPP Regional Boundaries .......................... 151Figure 6.2 Schema Reports for Two Tables Developed form Inventory Data .... 154Figure 6.3 Data Dictionary Excerpt for Friction (SKID) ................... 156Figure 6.4 Data Flow in the LTPP IMS .............................. 159Figure 6.5 IMS Level 1 (Section) Release Quality Check .................. 162Figure 6.6 Data Level Advancements with Quality Control Checks ........... 163Figure 6.7 IMS Level 2: F Checks .................................. 165Figure 6.8 IMS Level 2: G Check .................................. 166Figure 6.9 IMS Level 2: H Check .................................. 168Figure 6.10 IMS Level 2: I Check ................................... 169Figure 7.1 Construction Variability Factors ............................ 178Figure 7.2 Distress Prediction Model ................................ 179Figure 7.3 Actual Analytical Approach ............................... 180Figure 7.4 Example of Intermediate Point to Higher Elevation Between
Starting Point (X5) and Ending Point (X14) of a S_raightedge ....... 196Figure 7.5 Pavement Distortion Possibilities ........................... 198
xiv

Figure 7.6 Environmental Zones for SHRP-LTPP Experiments .............. 199Figure 7.7 Source of Rutting: HMAC on Stabilized Base .................. 201Figure 7.8 Source of Rutting - HMAC on Granular Base .................. 203Figure 7.9 Source of Rutting - HMAC Overlay of HMAC ................. 204Figure 7.10 Rut Depth Regression Equations - HMAC on Granular Base ........ 206Figure 7.11 Rut Depth Regression Equations - HMAC on Stabilized Base ....... 207Figure 7.12 Rut Depth Regression Equations - HMAC Overlay of HMAC ....... 209Figure 7.13 Rut Depth Regression Equations - HMAC Overlay of PCC ......... 210Figure 7.14 Results from Sensitivity Analysis for Rutting in HMAC Granular
Base ............................................... 215Figure 7.15 Results from Sensitivity Analysis for Rutting in HMAC on Granular
Base ............................................... 216Figure 7.16 Predicted KESALs versus Actual KESALs for JPCP and JRCP
Using Original AASHTO Prediction Models ................... 227Figure 7.17 Predicted KESALs versus Actual KESALs for JPCP, JRCP, and CRCP
Using 1993 AASHTO Prediction Models ..................... 228
XV

List of Tables
Table 2.1 SHRP-LTPP GPS Sites: Section Totals per State/Province .......... 34Table 3.1 Experimental Design for SPS-I: Strategic Study of Structural
Factors for Flexible Pavements ............................. 52Table 3.2 Experimental Design for SPS-2: Strategic Study of Structural
Factors for Rigid Pavements ............................... 53Table 3.3 Experimental Design for SPS-3: Preventive Maintenance of AC
Pavements ............................................ 55Table 3.4 Experimental Design for SPS-4: Preventive Maintenance of
Jointed Concrete Pavements ............................... 56Table 3.5 Experimental Design for SPS-5: Rehabilitation of AC Pavements ..... 57Table 3.6 Experimental Design for SPS-6: Rehabilitation of Jointed PCC
Pavements ............................................ 58Table 3.7 Experimental Design for SPS-7: Bonded PCC Overlays ............ 60Table 3.8 Experimental Design for SPS-8: Study of Environmental Effects
in the Absence of Heavy Loads ............................. 61Table 3.9 Number of Test Sites Required in Each Climatic Region ........... 65Table 3.10 Distribution of Approved SHRP SPS sections ................... 74Table 4.1 PCC Laboratory Tests Required for GPS Pavements .............. 95Table 4.2 Summary of AC Core Locations and Required Tests ............. 100Table 4.3 Laboratory Tests for Unbound Granular Base and Subbase
Materials and for Untreated Subgrade Soils .................... 102Table 4.4 Laboratory Materials Testing Common to the SPS Experiments ...... 106Table 4.5 List of Lab Protocols Used for SPS-3 and SPS-4 Testing .......... 107Table 5.1 Traffic Data Collection Equipment Preferences ................. 129Table 5.2 Maintenance and Rehabilitation Work Type Codes ............... 140Table 6.1 IMS Data Processing Summary ............................ 158Table 6.2 Examples of Level 1 Releases ............................. 171Table 7.1 Flexible and Rigid Pavement Sections Included in the LEF Study .... 187Table 7.2 Possible LEF Changes Identified in this Study .................. 194Table 7.3 Coefficients for Regression Equations Developed to Predict
Rutting in HMAC on Granular Base for the Wet-Freeze Dataset ..... 214Table 7.4 Sensitivity Analysis Results: HMAC ........................ 218Table 7.5 Sensitivity Analysis Results: PCC .......................... 220
Table 7.6 Use of LTPP Predictive Models for Evaluating a JRCP DesignExample ............................................ 232
xvii

Table 7.7 Results from Comparative Evaluation of 1993 AASHO OverlayEquations ........................................... 234
Table 8.1 Sample Traffic Data Availability Matrix for LTPP Sits ............ 250Table 9.1 International LTPP Sites ................................. 259Table 9.2 International Data Collection Activities ....................... 260
o°°
XVlll

Abstract
This report provides an overview of the first 5 years of the SHRP-LTPP program. Thebackground, LTPP history, activities and approaches, and decision-making processes of theprogram are detailed. Included are summaries of the studies initiated for general and specificpavement types, the characterization of pavement materials, monitoring activities, the LTPPdatabase and Information Management System, data analysis, traffic data collection andanalysis, as well as a summary of the contributions made by international participants. Thegeneral LTPP program is described and the expected results, products, and benefits are alsooutlined.
xix

Section 1Introduction
This report documents the research and analytical activities undertaken by the StrategicHighway Research Program (SHRP) and its contractors in the Long-Term PavementPerformance (LTPP) program. The goals, tasks, and accomplishments of the SHRP-LTPPprogram are presented in the following documents:
• Overview Report• General Pavement Studies (GPS)• Specific Pavement Studies (SPS)• SHRP-LTPP Information Management System• SHRP-LTPP Materials Characterization Program• SHRP-LTPP Monitoring Program• Traffic Data Collection and Analysis• Data Analysis Studies for the SHRP-LTPP Program• International Participation• Selected Bibliography
This document provides an overview of the 5-year SHRP-LTPP program. It describes thebackground, approaches, and decision making used throughout SHRP-LTPP. It should behelpful to future researchers and users of SHRP-LTPP data and products.
This section of the overview report concerns the origins of SHRP-LTPP. The remainingsections are
2. General Pavement Studies (GPS)3. Specific Pavement Studies (SPS)4. Pavement Materials Characterization5. Monitoring Activities6. Information Management System (LMS)7. Data Analysis Studies8. Traffic Data Collection and Analysis9. International Participation
10. Expected Results, Products, and Benefits
These sections summarize each portion of SHRP-LTPP. From the overview report, readersshould obtain a general understanding of all aspects of SHRP-LTPP activities. The reader canpursue areas of interest in more detail by consulting the individual in-depth documents thatcomprise the remainder of the SHRP-LTPP Reports.

Background of SHRP-LTPP
The U.S. highway system represents a massive public investment and is essential to theeconomy, market competitiveness, and defense of the nation. The design and construction ofthe interstate highway network was launched by Congress in 1956 and was essentiallycompleted in 1992. A 30-year investment and countless person-years of effort have createdthe most massive and modern transportation system in the world. However, 15 years beforethe system's completion, serious concerns were already being expressed about thedeterioration of U.S. highways. This debate was fueled by numerous gloomy reports in themedia and elsewhere concerning the status and future of the U.S. infrastructure. It appearedthat the nation's massive investment in the transportation of goods, people, and services wasbeing compromised because of the huge reinvestment needed to maintain, rehabilitate, andoperate the existing network. Major steps had to be taken to f'mdways to rectify the situation(L1).
The Strategic Transportation Research Study (STRS)
In October 1982, the Federal Highway Administration (FHWA) of the U.S. Department ofTransportation commissioned the Transportation Research Board of the National ResearchCouncil to coordinate an industry-wide investigation of the role of research in revitalizing theU.S. highway transportation system. A massive infusion of funds for highway maintenanceand rehabilitation using existing technology would not be cost-effective in the long run. Newand improved materials, equipment, and processes were needed to operatethe systemefficiently.
The Strategic Transportation Research Study (STRS) was conducted in 1983 and early 1984,resulting in the Transportation Research Board publication of Special Report 202: America'sHighways: Accelerating the Search for Innovation (1.1). This report documented the U.S.highway industry's allocation of a much smaller percentage of expenditures to research thanvirtually any other industry, and it revealed that highway research spending had steadilydeclined over the previous decade. The report identified six areas in which concentratedresearch efforts could dramatically reduce expenditures for design, construction, maintenance,and rehabilitation of highway systems. These areas were asphalt, maintenance cost-effectiveness, protection of concrete bridge components, cement concrete in highwaystructures, control of snow and ice on highways, and long-term pavement performance.
In each case, priorities were established for these problem areas for which major innovationswould increase the productivity, effectiveness, and safe operation of the nation's highwaysystem.
The Strategic Highway Research Program (SHRP)
A study was conducted in the 1984--86 period with f'mancial, staff, and administrative supportof the American Association of State Highway and Transportation Officials (AASHTO),
2

FHWA, the Transportation Research Board, and the National Research Council. In thiseffort, detailed research plans were developed for the six strategic problem areas, withparticular emphasis on long-term pavement performance. Support for the necessary fundinglegislation was generated. Procedures for this activity were finalized, and the StrategicHighway Research Program (SHRP) was established as an independent unit of the NationalResearch Council. Consequently, SHRP was fully operational when funding became availablein April 1987. The first SHRP contracts were signed October 6, 1987.
The 6 STRS research areas were combined into the following SHRP research programs:
• Asphalt• Highway Operations• Concrete and Structures
• Long-Term Pavement Performance (LTPP)
The Long-Term Pavement Performance (LTPP) Program
Approximately $20 billion per year is spent replacing and rehabilitating pavements in theUnited States. In addition to the repair needs of interstate and primary systems, state, county,and local highways and city streets require massive expenditures to preserve investments inpavements. Despite these expenditures, no comprehensive research on long-term pavementperformance had been conducted since the AASHO Road Test--a large-scale accelerated fieldexperiment conducted under one set of climate and soil conditions--was completed in 1960.
Fundamental questions concerning climatic effects, maintenance practices, long-term loadeffects, materials variations, and construction practices remain unanswered, and answerscannot be found without intensive long-term study of a large number of actual fieldconditions.
SHRP designated $510 million for the 5-year LTPP research effort. This research willcontinue for an additional 15 years after SHRP under the auspices of FHWA.
This undertaking has required an unprecedented long-term commitment of funding and humanresources. Nevertheless, the cost represents less than one thousandth of what the nation willspend on pavements during the 20 years of LTPP field testing. Furthermore, it is expectedthat many early results and analyses will be obtained in time to reshape future pavementdesign and expenditures. In this manner, LTPP could reduce future costs that motorists incurfrom driving on deteriorated highways and could provide public officials with the informationnecessary to make better-informed decisions on axle load limits, cost allocations amongvarious classes of highway vehicles, and restrictions on truck dimensions and configurations.
The overall objective of LTPP and other SHRP-related research programs is to provide thetools for increasing pavement performance and service life in order to better serve the needsof the motoring public, and to provide for the delivery of goods and services without majorincreases in financial resources. A major component of LTPP that will enable researchers to
3

meet this objective is the establishment of a National Pavement Perfommnce Database(NPPDB). The NPPDB contains inventory information and performance histories ofpavements with various design features, materials, waffle loads, environmental conditions, andmaintenance practices. Most of the information included in the NPPDB comes from GPS testsections located in existing or in-service pavements (see Section 2) and from SPS test sectionsbuilt and instrumented for more intensive evaluation of selected factors (see Section 3).
Goals and Objectives
The goal for LTPP studies established by STRS and adopted by the SHRP PavementPerformance Advisory Committee was "to increase pavement life by investigation of variousdesigns of pavement structures and rehabilitated pavement structures, using different materialsand under different loads, environments, subgrade soil, and maintenance practices" (1.2).
The Advisory Committee developed the following LTPP objectives (1.2):
• Evaluation of existing methods• Development of improved strategies and design procedures for the rehabilitation of
existing pavements• Development of improved design equations for new and reconstructed pavements• Determination of the effects on pavement distress and performance of 1) loading, 2)
environment, 3) materials properties and variability, 4) construction quality, and 5)maintenance levels
• Determination of specific design procedures to improve pavement performance• Establishment of a database (NPPDB) to support these objectives and future needs
It was essential that the experimental designs for LTPP be developed with a clear relationshipto these objectives. The last objective, the NPPDB, has been and will be used to attain theother five objectives developed by the Advisory Committee.
Summary
It was stated early in SHRP-LTPP that "only one aspect of the project is clearly stable andnon-changing. That aspect is that the entire project is in a state of evolution" (1.3). Thosewords, written in September 1987, have held mJe since. The project under FHWA guidancewill no doubt continue to change.
4

References
1.1 America's Highways: Accelerating the Search for Innovation (Special Report 202,Sl_ategic Transportation Research Study: Highways). Transportation Research Board,National Research Council. Washington, D.C., 1984.
1.2 Strategic Highway Research Program Research Plans, Final Report. TransportationResearch Board, National Research Council. Washington, D.C., 1986.
1.3 Brown, J. L. "The LTPP Experiment of SHRP--An Evolving Process." Presented atthe Roads and Traffic Safety on Two Continents Conference. G6teborg, Sweden,September 9-11, 1987.

Section 2General Pavement Studies (GPS)
Introduction
The General Pavement Studies (GPS) are a series of selected in-service pavement studiesstructured to develop a comprehensive National Pavement Performance Database (NPPDB)that meets the objectives of the Strategic Highway Research Program Long-Term PavementPerformance (SHRP-LTPP) program. These studies are restricted to pavements of strategicfuture importance that incorporate materials and designs representing good engineeringpractice. The studies were limited to pavement types in common use across the UnitedStates and did not include some pavement types with excellent performance characteristicsbut limited applicability (2.1).
SHRP Regions
The four SHRP regions were selected primarily on the basis of climatic considerations(2.2). The region boundaries were adjusted to correspond to state boundaries as illustratedin Figure 2.1 (2.3). The North Atlantic region corresponds to the wet-freeze AmericanAssociation of State Highway and Transportation Officials (AASHTO) classification, whilethe Southern region is primarily a wet-nonfreeze zone. The North Central region ispredominantly wet-freeze, while the Western region contains both dry-freeze and dry-nonfreeze.
Four regional offices were established to coordinate and communicate SHRP-LTPP-relatedactivities across the United States and Canada. Each region included a group of statesand/or provinces in its jurisdiction, with test sections located throughout the definedboundaries. Each regional office operated as central data collection and validation centersfor GPS and Specific Pavement Studies (SPS) experiments in its region. Inventory,maintenance, rehabilitation, and traffic data were collected at the state level and were thenforwarded to the appropriate regional center. The regional centers supplemented these databy collecting test and monitoring data on the various test sites.
7


GPS Sampling Templates
Evolution of GPS
The goal of GPS was the development of a database consisting of materials, traffic,environment, and performance data for many different types of pavements. The ninepavement types or studies originally planned for the GPS (2.4) were
1. Asphalt Concrete (AC) on Granular Base2. AC on Stabilized Base
3. Jointed Plain Concrete Pavement (JPCP)4. Jointed Reinforced Concrete Pavement (JRCP)5. Continuously Reinforced Concrete Pavement (CRCP)6. AC Overlay of AC Pavement7. AC Overlay of Jointed Concrete Pavement (JCP)8. Bonded JCP Overlay of Concrete Pavement9. Unbonded JCP Overlay of Concrete Pavement
Revisions to GPS
Revisions and changes in GPS occurred early in SHRP-LTPP (2.5). A total of ten individualstudies evolved (2.6):
GPS-I: AC on Granular BaseGPS-2: AC on Bound BaseGPS-3: JPCPGPS-4: JRCPGPS-5: CRCP
GPS-6A: Existing AC Overlay of AC PavementGPS-6B: Planned AC Overlay of AC PavementGPS-TA: Existing AC Overlay of Portland Cement Concrete (PCC) PavementGPS-7B: Planned AC Overlay of PCC PavementGPS-9: Unbonded PCC Overlay of PCC Pavement
Design of GPS Program
Factors expected to affect the performance of each pavement type were selected as a basis forthe development of sampling factorials (2.6). The factors were defined as either qualitative(i.e., values with distinct levels) or quantitative (i.e., continuous functions).
The qualitative factors included in most of the GPS sampling factorials were

• Moisture conditions: Wet or Dry• Temperature conditions: Freeze or Nonfreeze• Subgrade type: Fine or Coarse
Because the quantitative factors are continuous functions, midpoints were established toseparate values into low and high. The quantitative factors varied with each GPS experimentbut generally included characteristics such as traffic rate and material thickness. Two levelswere defined for all quantitative factors, except that three levels were defined for ACthickness in GPS-1. The study of bonded JCP overlay of concrete pavement study (GPS-8)was deleted from the GPS program because of a lack of potential projects.
Sampling Design Templates
The sampling design templates were developed to illustrate how the individual SHRP sectionsfit within the overall design layout with respect to levels of qualitative and quantitativefactors. The layouts were devised so that all combinations of levels of the design factorswould appear in the template. The squares within the sampling template represent specificcombinations of levels of the various factors and are known as sampling cells. The factornames are listed in the upper left-hand comer of each template, and levels of the factors areidentified by appended rows and columns.
The sampling template layout for GPS-1 (Figure 2.2) includes Low (L) and High (H)designations for the various factors. (As mentioned above, the GPS-1 template also includesa Medium [M] level for AC thickness.) The midpoints of the ranges of the quantitativefactors are listed at the bottom of the sampling design. The letters "L" and "H" within thetemplate for the quantitative factors indicate that the value for the cell is lower or higher thanthe factor midpoint. Qualitative factor levels are defined within the sampling template bywords (Wet or Dry for moisture conditions; Freeze or Nonfreeze for temperature conditions)or letters CF" and "C" for fine- and coarse-grained subgrade types).
Initial cell assignments were made on the basis of the availability of as-built/designinformation provided by the responsible highway agency. After the design/constructioncharacteristics of the project were def'med by in situ drilling and sampling, the cell numberwas subject to change depending on the actually defined factor values. For example, if aGPS-1 project with an initial assignment of 56 was found to have an AC thickness that waslow (less than 3 in.) rather than medium (3 to g in.), the project would be reassigned to Cell52 in the template.
GPS-I : Asphalt Concrete (AC) on Granular Base
Acceptable pavements for GPS-1 included a dense-graded hot-mix asphalt concrete (HMAC)surface layer with or without other HMAC sublayers constructed over an untreated granularbase or with no base. One or more subbase layers could be present but were not required.
10

e,_.¢"_ WET DRY, "_ _"_ FREEZE NO FREEZE NO
_""_'_-"<'-r, "-..,:o.."_'_'%" FREEZE FREEZEc c c c
L 1 13 25 37 49 61 73 85 97 109 121 133 145 157169 181L
H 2 14 26 38 50 62 74 86 98 110 122 134 146 158 170 182L
L 3 15 27 39 51 63 75 87 99 111 123135 147 159 171 183H
a 4 16 28 i 40 52 64 76 88 100 112 124 136 148 160 172 184
L 5 17 29 41 53 65 77 89 101 113 12.= 137149 161 173 85L
H 6 18 30 42 54 66 78 90 102 114 12( 138 150 162 74 18E
MH L 7 19 31 43 55 67 79 91 103!115 127 139 151 163 175 187
H 8 20 32 44 56 68 80 92 104 116 128 140 152 164 76 188
L 9 21 33 45 57 69 81 931051171o.9141153165177189LH 10 22 i 34 46 58 70 82 94 106 118 : 30 142 54 166 178 190
HL 11 23 35 47 591 71 83 95 107119131143 55,167179 91
HH 12 24 36 48 60 72 84 96 108 120 132 144!156 168 180 192
QuantitativeFactorMidpoints
Trafficrate: 85 KESALs/yearAC stiffness: 650 ksiBasethickness: 10 InchesAC thickness: 3 and8 Inches
Figure2.2 SamplingTemplateandCellIdentificationNumbersforGPS-I (AsphaltConcreteonGranularBa,_e)
II
Two or more consecutive lifts of the same mixture design were treated as one layer. If atreated subgrade was present, it was designated as a subbase.
"Full-depth" AC pavements were also allowed in this study. This designation was defined asan HMAC surface layer combined with one or more subsurface HMAC layers with aminimum total HMAC thickness of 6 in. placed directly on a treated or untreated subgrade.For full-depth AC pavements, a base layer of zero thickness and a material classification codefor "No Base" were necessary.
Seal coats or porous friction courses were allowed on the surface, but not in combination; thatis, a porous friction course placed over a seal coat was not acceptable. Seal coats were alsopermissible on top of granular base layers. At least one layer of dense-graded HMAC wasrequired, regardless of the existence of seal coats or porous friction courses. Figure 2.2shows the sampling template for GPS-1.
GPS-2: AC on Bound Base
Acceptable pavements for GPS-2 included a dense-graded HMAC surface layer with orwithout other HMAC layers, placed over a bound base layer. Bound bases could consist ofhot-mix asphalt base, cement-treated base, lime-treated base, or cold-mix asphalt base. Oneor more subbase layers could be present but were not required. Seal coats or porous frictioncourses were permitted on the surface, but not in combination; that is, a porous friction courseplaced over a seal coat was not acceptable.
This experiment included a wide variety of treated bases and combinations, and an overallperformance analysis could be complex and inconsistent. GPS-2 will undoubtedly requireintense study to ascertain the type of analyses that should be undertaken. Figure 2.3 showsthe sampling template for GPS-2.
GPS-3: Jointed Plain Concrete Pavement (JPCP)
Acceptable pavements for GPS-3 included jointed plain (i.e., unreinforced) PCC slabs placedover most types of base layer (2.6), excluding fine-grained soil/aggregate mixtures or crackedand seated PCC layers. A seal coat was also permissible just above a granular base layer.The joints could have no load-transfer devices or could include smooth dowel bars, butjointed slabs with load-transfer devices other than dowel bars were not acceptable. Figure 2.4shows the sampling template for GPS-3.
GPS-4: Jointed Reinforced Concrete Pavement (JRCP)
Acceptable pavements for GPS-4 included jointed reinforced PCC pavements with doweledjoints spaced less than 20 ft. apart. The slab could rest directly on a layer of most types ofmaterial, excluding fine-grained soil/aggregate mixtures, cracked and seated PCC layers, or
12

NO NOFREEZE FREEZE FREEZE FREEZE
Fc F CF C C"__.___ L H L H L H L H L H L H L H L H
L 1 9 17 25 33 41 49 57 65 73 81 89 97 105!113 121LD
O 2 10 18_ 26 34 42 50 58 66 74 82 90 98 106 114 122H
=_ LI-- 3 11 19 27 35 43 51 59 67 75 83 91 99 107 115 123
HH 4 12 20 28 36 44 52! 60 68 76 84 92 100 108116124
ca L 5 13 21 29; 37 45 53 61 69 77 85i93 101_109117125o L
z H 6 14 22 30 38 46 54 62 70 78 86 94 102 110 118 126
I-
L 7 15;23 31 3947 55 63 71 7918795 103111119127_: Hoz H 8 16 24 32 40 48 56 64 72 80 88 96 104 112 121 128
QuantitativeFactorMidpoints
Trafficrate: 85 KESALs/yearAC thickness: 4.5 inchesBase thickness: 8.0 inches
Figure2.3. SamplingTemplateand Cell IdentificationNumbersfor GPS-2 (AsphaltConcreteon BoundBase)
]3

, , WET DRY
__ F C F C F C F C_ L H L H L H L H L H L H L H L H\
rr N 1 9 17 25 33 41 49 57 65 73 81 89 97 105 113 121_<: L"J Y 2 10 18 26 34 42 50 58=66 74 82 90 98,106 114_12._C)Z<1: N 3 11 19 27 35 43 51 59 67 75 83 91 99 107 115 125nr" HL',',9 Y 4 12 20 28 36 44 52 60 68 76 84 92 10(3108,11E 124
N 5 13 21 29 37 45 53 61 69 77 85 93 101 109 117 12_au.,i L_N Y 6 14 22 30 38 46 54 62 70 78 86 94 10_ 110 118 12_..Jrn<1: N 7 15 23 31 39 47 55 63 71 79 87 95 103 111 11c. 12;I-- HU_ Y 8 16 24 32 40 48 56 64 72 80 88 96 10= 112 120 12_
QuantitativeFactorMidpoints
Traffic rate: 200 KESAL/yearPCC thickness: 9.5 inches
Figure 2.4 Sampling Template and Cell Identification Numbers for GPS-3(Jointed Plain Concrete Pavement)
14

unstabilized coarse-grained subgrade soils. A base layer and one or more subbase layerscould exist but were not required.
A seal coat was also permissible just above a granular base layer. JRCPs placed directly on afine-grained soil/aggregate layer or a fine-grained subgrade were not considered for this study.JRCPs without load-transfer devices or with devices other than smooth dowel bars at the
joints were not acceptable. Figure 2.5 shows the sampling template for GPS-4.
GPS-5: Continuously Reinforced Concrete Pavement (CRCP)
Acceptable pavements for GPS-5 included continuously reinforced PCC pavements placeddirectly on a layer of any type of material, excluding fine-grained soil/aggregate mixtures,cracked and seated PCC layers, or unstabilized coarse-grained subgrades. One or moresubbase layers could exist but were not required. A seal coat was also permissible just abovea granular base layer. Figure 2.6 shows the sampling template for GPS-5.
GPS-6: AC Overlay of AC Pavement
Acceptable pavements for GPS-6A and GPS-6B included a dense-graded HMAC surface layerwith or without other HMAC layers placed over an existing AC pavement meeting therequirements of GPS-1 or GPS-2.
The designation "6A" refers to SHRP sections that were existing overlaid pavements whenaccepted in the GPS program. The designation "6B" refers to LTPP sections for which aplanned overlay of existing flexible pavement was undertaken after the SHRP section hadbeen either previously accepted in GPS-1 or GPS-2 or specifically selected for initialinclusion in GPS-6B.
Seal coats or porous friction courses were allowed, but not in combination. Fabric interlayersand stress-absorbing membrane interlayers (SAMIs) were permitted between the originalsurface and the overlay. The total thickness of HMAC used in the overlay was to be at least1.0 in. Pavements that had been overlaid more than once since originally constructed werenot acceptable. Figures 2.7 and 2.8 show the sampling templates for GPS-6A and GPS-6B.
GPS-7: AC Overlay of Portland Cement Concrete (PCC) Pavement
Acceptable pavements for GPS-7A and GPS-TB included a dense-graded HMAC surface layerwith or without other HMAC layers placed on either JPCP, JRCP, or CRCP.
The designation "7A" refers to SHRP sections that were existing overlaid pavements whenaccepted in the GPS program. The designation "7B" refers to SHRP sections for which aplanned overlay was undertaken after the SHRP section had either been previously acceptedin GPS-3, GPS-4, or GPS-5 or specifically selected for initial inclusion in GPS-7B.
15

WET DRY
_ L H L H L H L H L H L H L H
L _ 5 9 13 17 21 25' 29 33 37 41 45 49 53 57 61L
H 2 6 10 14 18 22 26 30 34 38 42 46 50 54 58 62
L 3 7 11 15 19 23 27 31 35 39 43 47 51 55 59 63
HH 4 8 12 16 20 24 28 32 36 40 44 48 52 56 60 64
QuantitativeFactorMidpoints
Traffic rate: 200 KESALs/yearJointspacing: 40 feetPCC thickness: 9.5 inches
Figttre 2.5 SamplingTemplateand Cell IdentificationNumbersfor GPS-4 (JointedReinforcedConcretePavement)
16

,, WET DRY
_--_,_ FREEZE NOFREEZE FREEZE NOFREEZE_\ F C F C F C F C
_ L H L H L H L H L H L H L H L H
L _ 5 9 13 17 21 25 29 33 37 41 45 49 53 57 61L
H 2 6 10 14 18 22 26 30 34 38 42 46 50 54 58 62
L 3 7 11 15 19 23 27 31 35 39 43 47 51 55 59 63H
H 4 8 12 16 20 24' 28 32 36 40 44 48 52 56 60 64
QuantitativeFactorMidpoints
Traffic rate: 300 KESALs/yearPercentagereinforcement: 0.61PCC thickness: 8.5 inches
Figure2.6 SamplingTemplateand Cell IdentificationNumbersfor GPS-5 (ContinuouslyReinforcedConcretePavement)
17

WET DRY
__ NO NO
FREEZE FREEZE FREEZE FREEZE
_ F C F C F C F C'_ _ L H L H L H L H L H I H L H L H
L 1 9 17 25 33 41 49 57 65 73 81 89 97105113 121L
H 2 10 18 26 34 42 50 58 66 74 82 90 98 106 114122
LL 3 11 19 27 35 43 51 59 67 75 83 91 99 107115125
HH 4 12 20 28 36 44 52 60 68 76 84 92 100 108 116 124
L S 13 21 29 37 45 53 61 6g 77 85 93 101 109 117 125L
H 6 14 22 30 38 46 54 62 70 78 86 94 102 110 118126
H "L 7 15 23 31 39 47 55 63 71 79 87 95 103 111 119127
HH 8 16 24 32 40 48 56 64 72 80 88 96 104 112 120_128
Quantitative Factor Midpoints:
Traffic Rate 130 KESAL/yearOriginalPvt.StructuralNo. 3.6OverlayStiffness 650 ksiOverlayThickness 2.5 inches
Figure2.7 SamplingTemplate and Cell IdentificationNumbersfor GPS-6A(existingAsphaltConcreteOverlayof AsphaltConcrete)
18

WET DRYFREEZE FREEZE FREEZE FREEZE
F C F C F C F CL H L H L H L H L H L H L H L H
B 1 9 17 25 33 41 49 57 65 73 81 89 97 105113 121
LG 2 10 18 26 34 42 50 58 66 74 82 90 98 106 114 122
L IB 3 11 19 27 35 43 51 59 67_75 83 91 99:107115 123
HG 4 12 20 28 36 44 52 60 68 76 84 92 100 108 116,124
B 5 13 21 29 37 45 53 61 69 77 85 93 101 109117!125
LG 6 14 22 30 38 46 54 62 70 78 86 94 102 110 118 126
Ha 7 15 23 31 39 47 55 63 71 79 87 95 103 111 119127
HG s 16 24 32 40 48 56 64 72 80 88 96 104 112 120 128
Quantitative FactorMidpoints
Traffic rate: 130 KESALs/yearOriginalpavementstructuralnumber: 3.6Overlay thickness: 2.5 inches
Figure 2.8 Sampling Template and Cell Identification Numbers forGPS-6B (Planned Asphalt Concrete Overlay of AsphaltConcrete Pavement)
19

The slab could rest on any combination of base and/or subbase layer types, excluding fine-grained soil/aggregate mixtures or cracked and seated PCC layers..The existing concrete slabcould also rest directly on a lime- or cement-treated fine- or coarse-grained subbase or onuntreated coarse-grained subgrade soil. Slabs placed directly on untreated fine-grainedsubgrade were not acceptable.
Seal coats or porous friction courses were permissible, but not in combination. Fabricinterlayers and SAMIs were acceptable when placed between the original surface (concrete)and the overlay. Overlaid pavements involving aggregate interlayers and open-graded ACinterlayers were not considered in this study. The total thickness of HMAC used in theoverlay was defined as at least 1.5 in. Pavements that had been overlaid more than oncesince originally constructed were not acceptable. Figures 2.9 and 2.10 show the samplingtemplates for GPS-7A and GPS-7B.
GPS-9: Unbonded PCC Overlay of PCC Pavement
Acceptable pavements for GPS-9 included unbonded JPCP, JRCP, or CRCP overlays with aminimum thickness of 5 in. placed over an existing JPCP, JRCP, or CRCP pavement. Aninterlayer was required to prevent bonding of the two slabs. The overlaid concrete pavementcould rest on any acceptable base and subbase types or directly on the subgrade. Figure 2.11shows the sampling template for GPS-9.
Initial Project Recruitment
In the early stages of SHRP-LTPP, the GPS consisted of nine separate studies: five fororiginal pavements and four for fh'st-time rehabilitated pavements. The designs for eachstudy were factorial sampling templates whose cells represent all possible combinations of thedesign factor levels. The sampling units identified by each cell were the test sections thatsatisfied the GPS design specifications.
Preliminary analytical results indicated that two sections should be selected to fit thecharacteristics of each design cell. With six or seven factors for each pavement type and twosections for each combination of factors, a very large number of sections would be requiredto completely fill the sampling designs. Fractional designs were considered but notrecommended for reasons related to the difficulty of locating specific types of projects at theexpense of omitting others readily available.
As part of the initial LTPP recruitment process, approximately 2200 candidate projects weresubmitted by all fifty U.S. states and participating Canadian provinces. The set of projectsdefined by the GPS sampling designs essentially defined the population of pavement sectionsfrom which an appropriate sample could be selected. In addition, the projects submitted byeach highway agency were assumed to be representative of highways that exist throughouteach state or province. The entire range of condition levels was to be represented within the
20

WET DRYNO NO_'O FREEZE FREEZE FREEZE FREEZE
c c c c_ L H L H L H L H L H L H L H L H
k
JPCP 1 13 25 37 49 61 73 85 97 109 121 133 145 157 169 181
L JRCP 2 14 26, 38 50 62 74 86 98 110 122 134 14£ 158 170 182
L CRCP 3 15! 27 39 51 63 75 87 99 111 23135 147 159!171 183
JPCP 4 16 28 40 52 64 76 88 10(] 112 124 13( 148 160 172 184
H JRCP 5 17 29 41 53 65 77 89101 113125137149 161173185
CRCP 6 18 3o 42 54 66 78; 90 1021141126138150 162174186
JPCP 7 19 31 43 55 67 79, 91 1103 115 127 139 151 163 175 187
L JRCP 8 20 32 44 56 68 80 92'104116128140152:164176188
H CRCP 9 21 33 45 57 69 81 93 105 117 129 141 153 165 1771189
JPCP 10 22 34 46 58 70 82 94 106 18130 142154 166 178190
H JRCP 11 23 35 47 59171 83 95 107119131143155167179191
3RCP 12 24 36 48 60 72 84 96 108!120 32 144156 168 180 192
Quantitative Factor Midpoints:
Traffic Rate 130 KESAL/yearOverlay Stiffness 650 ksiOverlay Thickness 3.5 inches
Figure 2.9 Sampling Template and Cell Identification Numbers for GPS-7A(Existing Asphalt Concrete Overlay of Portland Cement Concrete)
21

WET DRY
">",z.:. FREEZE FR!IEZEFREEZE FREEZE
F C F C F C F C
L H L H t_ H L H L H L H L H L H
B t 13 25 37 _ _l 15 8"a !97 109 121 3_ 145 1[_7 109 1_51
LG 2 14 26 38 50 62 74 86 98 I10 22 34 146 158 170 182
JPCPB [5 15 9_7 39 51 63 75 87 99 111 :'23 1155 147 1.59 171 183
Hg -" 16 2_ 40 52 64 76 88 lOG I 12 ' 24 [56 14.8 160 172 184
B 5 17 29 41 53 65 77 89 101 11.3 .25 1,37 149 161 173 185
LG 6 18 :50 42 ,._A i66 78 90 102 114,26 138 150 162 174 186
JRCP
7 19 .51 43 55 67 79 91 103 1!5 '27 39 "511 163 175 187H
g _ 20 32 /'4 56 68 80 92 104 i 16 128 40 "52 164 176 88
B _ 21 33 45 57 69 81 93 105 111729 141 15.3 165 _77 1E9
LG io 22 .54 46 _P, 70 82 94 106 118 [50 142 ]54 166 178 190
CRCPB 11 ?'3 35 a7 59 71 83 95 ilo/ 119 1311143 155 167 179 19
H I
G 121 24 36 46 60 72 84 96 108 !20 132 44 156 168 '50 192
Quantitative Factor Midpoints
Traffic rate: 300 KESALs/yearOverlay thickness: 3.5 inches
Figure 2.10. Sampling Template and Cell Identification Numbers for GPS-7B (PlannedAsphalt Concrete Overlay of Portland Cement Concrete Pavement)
52

'?_'_'<"/,",_,,_,_ W ET D RY
L 1 19 37 55JPCP
H 2 2O 38 56
L 3 21 39 57JPCP JRCP
H 4 22 40 58
L 5 23 41 59CRCP
H 6 24 42 60
L 7 25 43 61JPCP
H 8 26 44 62
L 9 27 45 63JRCP JRCP
H 10 28 46 64
L 11 29 47 65CRCP
H 12 30 48 66
L 13 31 49 67JPCP
H 14 32 50 68
L 15 33 51 69CRCP JRCP
H 16 34 52 70
L 17 35 53 71CRCP
H 18 36 54 72
Quantitative Factor Midpoints
Overlay thickness: 3.5 inchee
Figure 2. ! ]. Sampling Template ancl Cell identlficaUonNumbers for GPS-9 (UnboncleclPorffand Cement Concrete Overlay of Portland Cement Concrete Pavement) 23
project. Pavements that exhibited the best performance were not to be submitted to theexclusion of poor- or average-performing pavements.
In order to complete the designs, test sections were identified and located within the existingpavement projects. From each selected project, 500 ft. test sections were identified. When asuitable section was found, it was classified as "Approved" and identified with the proper cellof the design factorials. Following approval, the various data collection activities could bescheduled. Sections that did not satisfy the GPS requirements were released from furtherconsideration, and the highway agencies were notified when these determinations occurred.
The process used in selecting test sections involved the collection of the best estimate of eachdesign factor and information from available historical records, followed by the assignment ofa specific cell of each sampling design template (2.6).
The classification of sections within the respective design cells and the ensuing selectionreduced the number of candidates to about 650. Approximately 550 projects were eventuallyapproved for GPS use.
Additional Recruitment
After the initial effort was complete, many design cells still did not have identified candidateprojects. This led to a major evaluation of the sampling designs. Templates were modified,design parameters were revised, allowable materials were added, and selection criteria wereamended. Recruitment of additional projects was also strongly encouraged among allparticipating highway agencies. With the completion of additional recruitment, the number ofGPS projects increased to about 780 (2.6).
Project Approval Process
Before a pavement test section was approved for assignment to GPS, a recruited project wasfirst selected as a potential project and then verified by an on-site inspection. Theterminology "test section" or "section" refers to the physical 500 ft. length of pavement thatwas actually studied for GPS, while "project" refers to a greater length of pavement includingthe section that exhibited the same general characteristics. The selection, verification, andapproval processes for the test sections are discussed below.
Project Selection
The first step in project selection was the submission of candidate projects by theparticipating highway agencies for inclusion in SHRP-LTPP. The highway agenciessubmitted Candidate Data Forms that included information on critical site characteristics,
pavement configuration, and traffic composition for each candidate project. These forms weresubmitted to a Regional Coordination Office (RCO) for review. If the information provided
24

on the Candidate Data Forms matched one of the GPS sampling designs, the forms weresubmitted to the technical assistance contractor for further review and potential selection (2.6).
Project Verification
The selected GPS projects were subsequently verified in the field to ensure that the projectsdid in fact possess characteristics needed to fill the particular design cell. The verificationprocess constituted the first on-site activity.
Project verification was performed by the RCO engineers. Prior to on-site inspection, theengineers visited participating state highway agency (SHA)" offices to familiarize themselveswith the selected project. This process resulted in quicker and better data verification in thefield.
During these SHA office visits, RCO engineers performed the following tasks:
• Review of project records, including as-built plans and pertinent specifications
• Confirmation of candidate project data by comparison of as-built plans and previouslysubmitted data
• Review of traffic data, including assessment of the effect of traffic rates on the safetyof materials sampling and monitoring activities
• Review of photologs or other available site-specific data
• Identification of recent or planned maintenance or rehabilitation activities that couldaffect the project
• Collection of information pertaining to pavement condition prior to overlay (for theGPS overlay studies)
• Identification of potential test sections within the project
Potential test sections within the project were identified using project plans and appropriatedocuments. Within the boundaries of the sections, the as-built profile was compared with thenatural ground profile to eliminate areas with highly variable subgrade conditions. Wheneverpossible, test sections on deep cuts or fills were rejected to avoid inconsistent subgradesupport and drainage conditions related to highway geometry rather than soil characteristics.Typical sections were located within consistent cut, fill, or at-grade conditions. Transitionalareas (cut to fill, shallow fill to deep fill, etc.) were avoided.
* Throughoutthisdocument,all CanadianprovincialhighwayagenciesandU.S. statehighwayagencieswillbecollectivelydenoted"statehighwayagencies."
25

Within the uniform cut, fill, or at-grade areas, potential monitoring m_ctions were identified asroadway sections that did not include major structures, sharp horizontal or vertical curvature,or steep grade.
Field Verification
The on-site activities of the RCO engineers are described below.
Location of Monitoring Test Section
During the field visit, the actual monitoring (500 ft.) test section was selected from among thepotential test sections noted at the SHA office. In general, the longest available section waschosen that was representative of the general roadway condition and would also be safe fortraffic control and monitoring personnel during lane closure.
All test sections were chosen to ensure sufficient buffer distance (ideally, 250 ft.) before and
after the designated section to allow space for verification boring and subsequent materialssampling and testing. These buffer sections were of the same cross-section as the monitoringtest section.
The start of the test section was located with respect to some physical feature (bridge,overpass, intersection, etc.) by measuring distances from the beginning station to the selectedfeature. This method provided a technique for locating the beginning of test sections forfuture LTPP activities.
Bore Holes
It was requested that all projects be bored to a depth of 4 to 6 ft., extending at least to thesubgrade, to verify layer thickness and material types. Two borings were made in ACpavements. In PCC pavements with flexible shoulders, a bore hole at the pavement-shoulderjoint was made. No bore holes were made if an SHA gave the assurance that its records wereaccurate and that there was no need for bore hole measurements. Approximately 5% of thesections fell into this category. (These borings were part of the verification process andshould not be confused with the process described in Section 4 of this report.)
Borings for AC pavements were completed in the outer wheeipath at points located aminimum of 50 ft. before the start and beyond the end of the 500 ft. monitoring test section.Borings for PCC pavements were completed at least 50 ft. beyond the end of the test section(i.e., downstream of traffic) in the shoulder at the shoulder/pavement interface. If the bufferextended less than 50 ft. from the test section, the point farthest from the end of the testsection but still considered typical of the section was chosen for the bore hole location.
26
Test Section Identification
The sign and paint conventions and configuration used for GPS test sections are illustrated inFigures 2.12 and 2.13. The test site sign was located 500 ft. before the beginning of themonitoring test section, and delineators were installed at the beginning and end of the section.The paint striping and site identification requirements are also indicated in Figures 2.12 and2.13.
Videotaping of Test Section
The test section was videotaped to provide a record of site features, pavement condition, andcharacteristics of the surrounding area.
Field Verification Form
A verification form (2.6) was completed in the field. It included specific project and sectionidentification information, geometric details, and measurements from the boring operations.
Distress Survey
A manual (i.e., visual) condition survey of the 500 ft. monitoring test section was conductedat each site. Type, amount, and severity level were recorded for each distress. Distressesobserved for pavements with AC surface layers included alligator cracking, block cracking,patch deterioration, pumping, raveling/weathering, transverse cracking, bleeding, and rutdepth. This information helped provide a record of the initial condition of the pavementsurface.
Distresses observed for pavements with PCC surface layers included "D" cracking, joint sealdamage, longitudinal cracking, patch or slab replacement deterioration, pumping, transversecracking, comer breaks, and faulting.
Projects Approval
As noted above, the candidate projects were tentatively assigned to specific cells in thesampling template for each study and were selected on a study/cell basis. Final approval ofprojects as GPS monitoring test sections depended on the results of the verification process.
If, after field verification, the section met all other general GPS criteria and remained in theoriginal design cell assignment, then the section was approved for GPS monitoring. If thefield verification data required a transfer in design cell assignment, then an extended approvalprocess was initiated to confirm a new cell assignment for the section. Projects not approved
27

I--=
f WhiteIC_aintstripe,250' past end ofMonitonngSite
,
y D!lineator locatedatendof MonitoringSite
Maintenance 500' t
Control-Zone Monitoring-Site _fel_lnoena..t orri/joc _titeede
at beginning
PAVEMENTTESTSITE
Located 500' in advanceof Test Section
B
" _ White paintstripe
Locationof trafficmeasurementequipment
Figure2.12. Signand paintconfigurationfor GPS testsite.
28

NOT TO SCALE _ _"
I j°E s
t=
PAINT CROSS
(Maximum 12= by 12"with lines 4" wide)
+,,_wQ-J
O
�˜�500'MONITORING
SITE _)I,,,-
-t-"
1 io e/*--SPIKE
,q,
H- "\Lane WidthSHRPSECTION IDNUMBER
Figure 2.13. Details of GPS monitoringsite paint configuration.
29

for inclusion in a GPS study were released. Figure 2.14 is a flow diagram of the projectapproval process.
Project Status Classifications
GPS test sections were classified into the following categories:
1. Selected, Not Verified: Two projects for each cell in the sampling design (whenavailable) were selected from the "primary, not selected" classification. These projectswere then forwarded to the regions for verification.
2. Approved: These projects were visited, a location for the sea;tion identified, anddesign factor levels verified (including pavement layer materials and thicknesses byboring). They were then officially approved for GPS.
3. Approved, Not Verified: These sections met the same conditions as "approved"sections except that pavement layer thicknesses were not verified by boring. Oncepavement layer thicknesses were verified (usually during materials sampling), thestatus of the section was changed to "approved."
4. Verified, On Hold, Same Cell: This category indicates that a section was verified andfit within a proper design cell, but certain features of the section were such thatanother project with the same design factor levels, if available, was to be consideredfor study.
5. Verified, On Hold, New Cell: This category was similar to the previous one exceptthat one or more of the design factor levels changed for the section and it wasassigned to a new cell. If the new cell was empty or had only one section selected orapproved, the section that had just moved into the new cell was approved. However,if two sections were already selected for that cell, the section that moved into the cellremained on hold until the status of the other two sections was determined.
6. Primary, Not Selected: When a project was f'u'st submitted, it was usually classifiedinto this category. These sections served as the primary source to fill gaps in thesampling designs or to replace approved sections that were released.
7. Returned: In the early phases of GPS project selection, many more projects wereoriginally submitted by the SHAs than could ever be selected or approved. Thesesurplus projects were returned and were not considered for use in GPS.
8. Released: This category was reserved for previously selected or approved sections thatwere no longer considered suitable for inclusion in GPS for reasons unrelated topavement condition.
30

I Project IverificationI
ND TM = I Secbon ,Sapproved }--
Yes st_h_A2p_eJn_c_l _ Yes No L I
approved'_
Updatecell populal_oncan notbe > 2
I Release test seclJonJ I Place test sectionson hold I
==,...-
Release project(s) ]on hold status
I Assess projects on hold I
and approvemostbeneficialsectionforstudy
I Release prolect(s)on holdstatusnot approved
I
Iv collecbon _
Figure2.14 Flowdiagramof the projectapprovalprocess
31

9. Out of Study: This category contains projects that have come to the end of theirperformance periods and for which data collection activities have been discontinued.If an SHA plans to overlay a project and it has already been overlaid once (and isassigned to GPS-6A, -6B, -7A, -7B, or -9) or the project cannot be moved into one ofthe overlay sampling templates, it is taken "out of study." Data collected from thesesections over time are considered the primary source to achieve overall LTPPobjectives.
Status as of July 1992
Approved GPS sections are shown by location in Figure 2.15 and are listed by GPSexperiment type in Table 2.1. A total of 777 sections were approved for all GPSexperiments. During the verification process, 13 sections were "released" from GPS and threesections were declared "out of study."
As of July 1, 1992, the GPS program included 437 flexible pavement sections and 340 rigidpavement sections (see Figure 2.16). Figures 2.17 and 2.18 show the distribution of thesesections among the various GPS experiments.
Data Collection Activities
The data to be collected in LTPP-GPS have been grouped into ten data modules (2.6, 2.7):
• Inventory• Materials and Laboratory Test* Traffic• Distress• Profile• Deflection• Friction• Environment• Maintenance• Rehabilitation
Details of the information contained in these modules are discussed in Reference 2.7.
32


TABLE 2.1. SHRP-LTPP GPS Site,,.
Section Totals per State/Province
State/Province 1 2 3 4 5 6A 6B 7A 7B 9 Totals
Alabama 6 3 1 2 2 2 2 18Alaska 4 1 1 6Arizona 16 2 2 1 4 25Arkansas 4 1 5 2 2 14California 4 15 11 1 1 2 3 37Colorado 4 1 2 2 3 2 2 16Connecticut 1 2 1 4Delaware 1 2 2 5District of Columbia 1 1Florida 15 4 7 4 30
Georgia 4 7 8 1 1 1 1 23Hawaii 3 1 4Idaho 9 2 1 1 13Illinois 2 3 7 1 3 2 18Indiana 2 2 4 2 2 1 3 1 17Iowa 1 1 5 2 1 2 12Kansas 3 3 6 2 2 1 17
Kentucky 3 1 1 2 7Louisiana 1 1 2Maine 5 2 1 8
Maryland 4 1 5Massachusetts 3 3
Michigan 5 2 1 1 1 1 2 13Minnesota 9 2 8 1 1 1 3 25
Mississippi 3 6 2 1 4 5 2 1 1 25Missouri 3 7 1 1 2 2 3 19Montana 2 1 2 2 7Nebraska 1 5 1 1 1 4 1 1 15Nevada 2 3 3 8
New Hampshire 1 1New Jersey 3 4 1 1 9New Mexico 4 2 1 4 11New York 1 2 2 1 6North Carolina 12 4 5 3 24North Dakota 1 2 1 4Ohio 1 2 1 1 2 2 9Oklahoma 3 7 4 3 2 l 1 21
Oregon 1 6 2 3 12
34

Table 2.1 (Continued)
State/Province 1 2 3 4 5 6A 6B 7A 7B 9 Totals
Pennsylvania 3 2 2 2 2 2 5 2 20Rhode Island 1 1South Carolina 4 1 3 1 9South Dakota 1 6 3 2 1 13Tennessee 3 6 2 4 15Texas 39 10 3 5 19 5 3 2 4 90Utah 3 7 4 14Vermont 2 2 1 5Virginia 2 2 4 4 12Washington 5 7 5 1 18West Virginia 1 2 1 1 5Wisconsin 13 2 1 16Wyoming 2 8 1 3 14Puerto Rico 2 2 4
Alberta 3 1 1 5British Columbia 1 1 2 4Manitoba 1 1 1 2 1 6New Brunswick 2 1 1 4Newfoundland 3 3Nova Scotia 1 1Ontario 3 3 6Prince Edward Island 2 1 3Quebec 3 1 4 1 9Saskatchewan 2 2 2 6
TOTALS 218 113 124 56 79 57 49 33 23 25 777
Pavement Type Codes:
1 AC on Granular Base2 AC on Stabilized Base3 JPCP4 JRCP5 CRCP
6A Existing AC Overlay of AC6B Planned AC Overlay of AC7A Existing AC Overlay of PCC7B Planned AC Overlay of PCC9 Unbonded PCC Overlay of PCC
35

• 'd Pavements34O
Flexible Pavements437
Figure2.16 Distribution of Approved GPS Sections
36

AC on Granular Base (GPS-1)218
_2.-'.2..""_:.':m:::::_':".__---'m_-- - -
Planned AC Overlay of AC(GPS-6B)
49
AC on Stabilized Base (GPS-2)
113 Existing AC Overlay of AC (GPS-6A)57
Total: 437
Figure 2.17 Distribution of Flexible Pavement Sections Among GPS Experiments
37

IpcP (GPS-3)124
JRCP (GPS-4)56
Unbondcd PCC Overlay of PCC(GPS-9)
25
Planned AC Overlay of PCC (GPS-7B)
CRCP (GPS-5) 23
79 Existing AC Overlay of PCC (GPS-7A)33
Total: 340
Figure 2.18 Distribution of Rigid Pavement Sections Among GPS Experiments
38

References
2.1 Report on the Evolution and Development of GPS. Texas Research and DevelopmentFoundation, Austin, Texas, December 1990.
2.2 Operations and Quality Assurance Manual. SAIC, Oak Ridge, Tennessee, April1990.
2.3 Long-Term Pavement Performance Information Management System ResearchersGuide. Strategic Highway Research Program, National Research Council,Washington, D.C., July 1991.
2.4 "Final Development of General Pavement Studies Sampling Plan." Prepared byTexas Research and Development Foundation, Austin, Texas, June 1988.
2.5 Benson, K., et al. "Recruitment Guidelines for Additional GPS Candidate Projects."Prepared by Texas Research and Development Foundation, Austin, Texas, October1988.
2.6 "Guidelines for Initial State Visits, Section Selection, and Section Verification."Texas Research and Development Foundation, Austin, Texas, July 6, 1988.
2.7 "Data Collection Guide for Long-Term Pavement Performance Studies" (SHRPOperational Guide SHRP-LTPP-OG-001). Strategic Highway Research Program,National Research Council, Washington, D.C., revised January 1990.
39

Section 3Specific Pavement Studies (SPS)
Background
The original Long-Term Pavement Performance (LTPP) program included three potentialtypes of studies (3.1): General Pavement Studies (GPS), Specific Pavement Studies (SPS), andAccelerated Pavement Testing (APT). The GPS program was scheduled to consist of a largeexperiment involving a large number of site selection factors, with the expectation of a broadrange of results and products. On the other hand, the SPS program was expected to involvemore specific and limited goals, construction needs, and experimental approaches. The APTstudies were not instituted but were considered as future activities.
The SPS program consists of generally limited factorials involving highway sectionsspecifically designed and constructed or rehabilitated through a cooperative effort withinterested state highway agencies (SHAs) (3.1). The general topics selected for intensiveexperiments for rigid and flexible pavements in the original plans for SPS experiment designs(1986) included
1. Portland Cement Concrete (PCC) Preventive Maintenance2. PCC Load Equivalence Factors3. PCC Restored Jointed Concrete Pavement (JCP)4. PCC Subsurface Drainage5. PCC Environmental Distrgss
6. High-Strength PCC7. Continuously Reinforced Concrete Pavement (CRCP) Overlays8. PCC with Non-Erodible High-Su'ength Bases9. PCC Retrofit Shoulder
10. PCC Shoulder Design11. Pretreated JCP with Asphalt Concrete (AC) Overlay12. AC Subdrainage13. AC Hot Recycling14. AC Cold Recycling15. AC Preventive Maintenance16. AC Low-Volume Roads
17. AC Load Equivalency Factors (LEFs)18. AC Environmental Distress
41

Initial Modification of SPS (1988)
In 1987 an effort was undertaken to reduce the number of original SPS design plans and todefine the methods required to analyze the data from each (3.2). Because one of thecontemplated analyses involved linear regression analysis (3.1), it would be necessary touse state-to-state variation as the basis for all statistically significant tests. This peculiarityin the original design would then require special consideration of errors in the regressionanalysis of the SPS data.
At that time the decision was made to divide SPS into five majoi categories (3.2):
A. Structural FactorsB. Preventive MaintenanceC. Pavement RehabilitationD. Environmental Factors
E. Load Equivalencies
SPS-1 and SPS-2: Structural Factors
The initial SPS structural factors experiments consisted of SPS-I for flexible pavements andSPS-2 for rigid pavements.
SPS-I: Structural Factors for Flexible Pavements (3.2)
The experimental design for SPS-1 included eight factors, each at two levels. Three of thefactors described environmental conditions at the test site: moisture (wet or dry),temperature (freeze or nonfreeze), and roadbed subgrade soil type (fine or coarse). Foreach of the eight factor combinations, all test sites would have relatively high rates oftraffic, at least 100 KESALs (thousands of equivalent single axle loads) per year.
Four of the remaining experimental design factors were to be allocated to pavementstructure from among the following: surface layer thickness and stiffness, base and subbaselayer thickness, and base and subbase strength/stability. The remaining factor defined thebase/subbase drainage conditions related to the absence and/or presence of different types ofdrainage enhancement used in construction.
SPS-2: Structural Factors for Rigid Pavements (3.2)
The experimental design for SPS-2 also included eight factors, each at two levels. Threefactors described environmental conditions at the test site: moisture (wet or dry),temperature (freeze or nonfreeze), and roadbed subgrade soil type (fine or coarse). Foreach of the eight factor combinations, all test sites would have relatively high rates oftraffic, at least 200 KESALs/yr.
42

The five remaining experimental design factors were to be allocated to the pavementstructure. Three factors were to be allocated to the surface layer: one for thickness, one forstrength, and one for type of reinforcement. Two other structural factors were to be allocatedto the base/subbase: one for strength/stability and the other for drainage.
Figure 3.1 shows the test section layout for SPS-1 and SPS-2.
SPS-3 and SPS-4: Preventive Maintenance
The initial SPS preventive maintenance experiments included SPS-3 for flexible pavementsand SPS-4 for rigid pavements.
SPS-3: Preventive Maintenance Effectiveness for AC Pavements
The AC preventive maintenance study (SPS-3) required that the effectiveness of four differentmaintenance treatments be compared with each other and with a control (nontreated) section.Within each project, one section (the control section) would receive no experimentalmaintenance treatment; the remaining four sections would be treated by either chip seal,slurry seal, crack seal, or thin AC overlay. All five sections were to be located within apavement project with environmental, traffic, and structural factors at specified nominal levelsand were to be treated over a range of combinations of these factors.
Figure 3.2 shows the layout for SPS-3 sections within GPS projects. The types of sectionsrequired for SPS-3 would generally be found within projects that contain sections designatedfor GPS-1 (AC on Granular Base). SPS-3 maintenance treatments were to be applied toexisting pavements that were in good, fair, or poor condition prior to treatment. Although themajor interest revolved around the first two condition levels, some effort would have beenmade to investigate the degree to which life extension is possible for pavements in poorcondition.
SPS-4: Preventive Maintenance Effectiveness for Rigid Pavements
The preventive maintenance study for rigid pavements (SPS-4) would have examinedmaintenance effectiveness for JCPs that were either in a condition that warranted subsealingor in a condition for which subsealing was not unwarranted. For projects in the no-subsealstate, two test sections would be identified: one control section and one section that receivedonly joint-seal maintenance. For projects in the subseal state, one control section wouldreceive no treatment, another would receive both joint-seal and subseal treatments, and thethird would receive only the joint-seal treatment. Many but not all sections needed for SPS-4would generally be found among projects that contain sections designated for GPS-3 (JointedPlain Concrete Pavement [JPCP]) and GPS-4 (Jointed Reinforced Concrete Pavement[JRCP]). In all such cases the GPS test section would serve as the control section for SPS-4.Figure 3.2 shows the layout for SPS-4 test sections.
43

Oneof twotestsitesfor I
eachof eight climate-soilI•_.,'_::_._.:_._ combinations
,......
Eight test sections at one ofsixteensitesfor SPS-1 or SPS-2
Approximatelyone lane-mileoftestpavementper site
Potentialforadditionalsectionsof localinterest
,,, ,,
Figure 3.1. Test Section Layout for SPS-I and SPS-2: Strategic Studies of Structural Factor=
44

___..__PS-I projectin good,fair,orpoorcondition
B. SPS-4: JCP Preventative Maintenance Effectiveness
-3 or GPS-4 project in non-subseal state
or GPS-4projectinsubsealstate -Control Joint-Seal -_.: "::(GPS) & Subseal " :. ... . ....
o'_nt-......:: .. • .._... ::.......i:" .. :...
Figure 3.2. Test Section Layout for SPS-3 and SPS-4: Studies of PreventiveMaintenance Effectiveness
45

SPS-5, SPS-6, and SPS-7: Pavement Rehabilitation Studies
These studies all required that the respective rehabilitation treatments be applied to sectionsof existing pavement. It was anticipated that most of the required test sites for therehabilitation studies would be selected within projects that contain GPS test sections.
SPS-5." Hot Recycling of AC (3.2)
The initial experimental design for SPS-5 was expected to involve all four climates andwould be restricted to fine roadbed soils and relatively high traffic: rates. Within eachclimate four GPS-1 projects would be selected so that two were in poor condition and twowere in fair condition. The condition criteria were not specified but might be stated interms of rutting and/or cracking severity. Pavement designs for all projects were looselydefined to be GPS-1 designs with respect to surfacing and base/subbase thicknesses.
If some of the required SPS-5 sites did not exist among GPS-1 projects, particularly withrespect to pavement condition, it was anticipated that non-GPS-1 projects would be selectedfrom corresponding pavements that were scheduled to be overlaid by the SHAs.
Four 500 ft. test sections were to be identified within each project, two for hot-mix asphaltconcrete (HMAC) recycling using two different recycling agents (A and B) and two for twothicknesses of AC overlay. The overlay sections were intended to provide directcomparisons between the effectiveness of recycling and overlay treatments. Furtherdevelopment of SPS-5 would specify the aggregate ratio, the two recycling agents for hotrecycling, and the overlay designs.
Figure 3.3 shows the layout for SPS-5 sections. Note that the GPS-I sections that were notrehabilitated would serve as control sections for SPS-5 projects.
SPS-6." Restoration and Overlay of Jointed PCC Pavement (3.2)
The initial experimental design for SPS-6 involves six factors. Three are environmentalfactors (i.e., moisture, temperature, and subgrade soil); the remaining three factors are rigidpavement type (JPCP, JRCP), restoration method (A, B), and overlay thickness. The SPS-6sites were to be limited to locations with fine-grained soils, jointed rigid pavements, andtraffic rates exceeding 200 KESALs/yr. No sites in the dry-nonfreeze environmental zonewere anticipated.
Four 500 ft test sections were proposed for each project: two each for HMAC overlaysusing two thicknesses (thin, thick) with two restoration methods (A and B). Figure 3.3shows the layout for SPS-6 sections; note that GPS-3 and GPS-4 would have been usedwhenever possible.
46

One of 16 test sites(a) SPS-5: AC Hot Recycling (in difference states)
GPS.-1 l!ii.Jo_,. ,./!.:i...I _oct. (2)!:.i!!?!:SPS-5,,,
(1) Hot Recycle, Agent A
(2) Hot Recycle, Agent B
(3) AC Overlay, Thin
(4) AC Oveday, Thick
(b) SPS-6: JCP Restoration and AC Overlay One of 24 test sites
jpOh_._-........1...._ (in different states)
"1-:.! SPS__ !:?-1• .:.::._PS SPS-6 :.,. -
Sect. (4) :: :.":Section Rehab Treatment
Restoration Method A(1) & Thin AC Overlay
Restoration Method B
(2) & Thin AO Overlay
(3) Restoration Method A& Thick AO Overlay
Restoration Method B
(4) & Thick AC Overlay
Figure 3.3 Test Section Layout for SPS-5 and SPS-6: Pavement Rehabilitation Studies
47

SPS-7: Bonded PCC Overlay of PCC Pavement
Figure 3.4 shows the layout for SPS-7 sections. The SPS-7 sites were to be located in allfour climatic zones, with three projects within each zone. The three projects would consist ofeither two JCP projects and one CRCP project or one JCP project and two CRCP projects.All projects were to be situated at locations with fine-grained subgrade soils and a projectedtraffic rate of 200 KESALs/yr. Within each climatic zone, the two projects of the same type(i.e., JCP or CRCP) were to be selected from different states.
SPS-8: Study of Environmental Factors in the Absence of Heavy Loads
One of the primary purposes of SPS-8 was to provide data for the verification or revision ofassumptions that have been made in the revised American Association of State Highway andTransportation Officials (AASHTO) pavement design guide with respect to serviceabilitylosses that are induced by environmental effects rather than load. It was recommended thatenvironmental effects for both flexible and rigid pavements should be determined from asingle study that incorporated both pavement types at each test site. Figure 3.5. shows thelayout for SPS-8 sections.
SPS-8 covered all four climates, and within each climate three types of roadbed subgrade soilwere specified: fine-grained non-expansive soil, fine-grained expansive soil, and coarse-grained soil. Two test sites (in different states) would be used for eight of the twelvecombinations of climate-soil conditions.
Two flexible pavement and two rigid pavement test sections were to be constructed at each ofthe 20 test sites. One flexible concrete pavement section was to have the same constructionspecifications as the "median pavement structure" defined in SPS-1 experiment. The otherflexible structure was to be a "normal parkway" structure that represents current designconstruction practices for flexible pavements that carry only high-volume auto traffic.
Similarly, the two rigid pavement structures at each test site were to represent the "medianpavement structure" specified for SPS-2 sections and a "normal parkway" structure for rigidpavements.
SPS Program Analyses (198g g0)
During 1989 and 1990 a number of studies and analyses were undertaken to further define theSPS designs. In particular, Strategic Pavement Design Initiatives for SPS-1 and SPS-2 (3.3)were considered and the value of fractional factorials in SPS-1 and SPS-2 was investigated(3.4). These investigations led to the development of experimental design and research plansfor SPS-1 (3.5) and SPS-2 (3.6, 3.7). In addition, crucial analysis requirements for SPS-1were developed (3.8, 3.9).
48

SectionC
One of 12 SPS-7 test sites
Section ._ (in different states)
Section
SPS-7 s ionTest Sections A
Section
SPS-7OverlayFac_ocl "_
Preparation Useof PCCOveday SPS-7 SectionMethod Gn:xJt?Thid_ess Section
2" AMl'll;ng Noand 4" BSand
Blast Yes 2" C E4" D
Shot No 2" EBlast 4" F
2" GYes
4" HGPS-3GPS-4 _"
Possible GPS orsection GPS-5
Section "o
Figure 3.4. Test Section Layout for SPS-7: Bonded PCC Overlay of PCC Pavements
49

Rtg_d Pavement Sections,RMS = median structure in SPS-2RNP = normal parkway structure
for rigid pavements
Figure 3.5. Test Section Layout for SPS.8P Study of Environmental Factors in the Absenseof Heavy Loads
5O

During the same time frame, guidelines were developed for nomination and evaluation ofcandidate projects for SPS-6 (3.10, 3.11) and SPS-7 (3.12). Analytical studies of errorvariation in the SPS experiments (3.13) and of the number of error terms required in the SPSexperiments (3.14) were also conducted.
Revised SPS Experimental Designs (1990)
The experimental design and research plans for the experiments on structural factors (SPS-1and SPS-2) and rehabilitation (SPS-5, SPS-6, SPS-7) were prepared in cooperation with SHApersonnel. The final experimental design and research plan for the experiment onenvironmental effects (SPS-8) is still under development, but a preliminary experimentaldesign has been included for reference (3.14). Guidelines and information for nominating testsites for the experiments on structural factors (SPS-1 and SPS-2) and rehabilitation (SPS-5,SPS-6, SPS-7) have been prepared (3.14).
SPS-I: Strategic Study of Structural Factors for Flexible Pavements
This experiment examined the effects of environmental region (wet-freeze, wet-nonfreeze,dry-freeze, or dry-nonfreeze), subgrade soil (fine- or coarse-grained), and traffic rate (as acovariant) on pavement sections incorporating different levels of structural factors. Thesefactors include drainage (presence or lack of it as provided by an open-graded permeableasphalt-treated drainage layer and edge drains), AC surface thickness (4 or 7 in.), base type(dense-graded untreated aggregate, dense-graded asphalt-treated, or combination thereof), andbase thickness (8 or 12 in. for undrained sections; 8, 12, or 16 in. for drained sections). Thisexperiment (3.15), designed in a fractional factorial manner to enhance implementationpracticality, is presented in Table 3.1 and includes 196 test sections located at 16 test sites.
SPS-2: Strategic Study of Structural Factors for Rigid Pavement
This experiment examined the effects of environmental region (wet-freeze, wet-nonfreeze,dry-freeze, or dry-nonfreeze), subgrade soil (fine- or coarse-grained), and traffic rate (as acovariant) on doweled JPCP sections incorporating different levels of structural factors (3.16).These factors include drainage (presence or lack of it as provided by an open-gradedpermeable asphalt-treated drainage layer and edge drains), concrete thickness (8 or 11 in.),base type (dense-graded untreated aggregate or lean concrete), concrete flexural strength (550or 900 psi at 14 days), and lane width (12 or 14 ft.). This experiment designed in a fractionalfactorial manner to enhance implementation practicality, is presented in Table 3.2 andincludes 192 test sections located at 16 test sites.
51

Table 3.1 Experimental Design for SPS-I" Strategic Study of Structural Factors
for Flexible Pavements
FACTORS FOR MOISqlJRE. TEN_I_RATURE.SUBGRADE TYPE, AND LOCATION
PAVEMENT STRUCTURE WET DRYCOMBINATIONS
FRI:__YI__ NO FR l:wTw FREW7__ NO FRI:_'_
DRAINAGE BASE TOTALTYPE BASE SURFACE FINE .'OARSE FINE =OARS_ FINE COARSI FINE =OARSE
_ICZ _Icz _ K L . N o P _ R s r o v w x Y4- zl .1 oi oi sl Iol .1! Y18"
7" J1 LI N1 P1 R1 T1 Vl X1AGG
4" J2 L2 N2 P2 R2 T2 V21 X212"
7" K2 M2 02 Q2 $2 U2 W2 I Y2
4" J3 L3 N3 P3: R3 T3 V3 X38"
7" K3 M3 03 03 $3 U3 W3 Y3NO ATB
4" K4 M4 04 Q4 $4 U4 W4 Y412"
7" 74 L4 N4 P41 R4 T4 V4 X4 :
4" J5 L5 N5 P5! R5 TS V_ X5!8"
AT_ 7" K5 H5 05 IU5 W5'4"AG------G Q5 S5 ¥5J
4" 06K6 M6 Q6 $6 U_ W6 _ Y612"
7" J6 L6 N6 p( R6 T6 V( X6
4" J71 L7 N7 P7 R7 T7 V7 X78"
7" K7 M7 _O7 Q7 $7 U7 W7 Y7
PATB 4" K8 M8 08 Q8 S8 U8 W8 Y8AGG 12"
7" J8 L8 N8 P8 R8 T8 V8 X8
4" K9 M9 09 Q9 $9 U9 W9 Y916"
7" 39 L9 'N9 P9 R9 T9 V9 X9YEs
4" KIC _10 _i( _10 _IC 21C 110 YI08"
7- 31( Ll( NI0 FlC RI0 T1O [JIC _10
4" 311 L1 NIl PII RI1 Ill ¢ii XI]ATB 12"
PAT--"-B 7" Eli FIll Dl] Qll Sll 21l NI]; Y1
4" _1_ '-12 hi12 >i: RI: r12 11; _I_16-
7" Z12 _12 D12 :)12 _12 Ul ,_12 t'12
AGG = Dense-gradeduntreatedaggregatebaseATB = Dense-graded asphalt-treated base
PATB = 4"thickopen-gradedpermeableasphalt-treateddrainagelayer,underneath ATB or over AGG base
4"AGG = 4"thickdense-gradedunu'catcdaggregatebaselayerunderneathATB
52

Table 3.2 Experimental Design for SPS-2: Strategic Study of Structural Factors for RigidPavements
PAVEMENT STRUCTURE CLIMATEZONES, SUBGRADE,SITEPCC WET DRY
DRAIN BASE LANE FREEZE NO FREEZE FREI:TI:_ NO FREEZETYPE THICK 5TRENGTF WIDTH FINE COARSE FINE EOARSE FINE COARSE FINE ,'OARSE
In. psl ft J K L M N O P O R S T O V W X y
12 Jl r.1 N1 Pl R1 T1 _i _i550
14 K1 MI Ol Q1 Sl Ol _1 Y18
12 K2 M2 02 02 $2 02 b72 Y2900
NO AGG 14 J2 L2 N2 P2 R2 T2 _2 X2
12 K3 M3 03 Q3 $3 U3 ;43 Y3550
14 J3 L3 N3 P3 R3 I"3 V3 X3II
12 J4 L4 N4 P4 R4 I"4 V4 X4900
14 K4 M4 04 04 $4 U4 W4 Y4
12 J5 L5 N5 P5 R5 T5 V5 X5550
14 K5 H5 0S :Q5 S5 U5 W51 Y58
12 K6 M6 06 Q6 $6 06 W6 Y6900
14 J6 L6 N6 P6 R6 T6 _/6 X6NO LCB
12 K7 M7 07 Q7 $7 U7 W7 Y7550
14 J7 L7 N7 P7 R7 T7 V7 X711
12 J8 L8 N8 P8 R8 r8 v8 x8900
14 K8 M8 )8 08 _8 08 _8 Y8
12 J9 L9 N9 P9 R9 T9 V9 X9550
14 K9 M9 09 09 $9 09 ,_9 Y98
12 (1C MIC C)IC _2¢ ;1C JlO _1C _'109O0
PeTI_. 14 TIC ,1o _I( 71( RII 1"1o lIc (I(
ATB 12 (1] _11 311 _11 _11 Jll _11 _11:550
14 J11 Lll _11 Pll P,ll I'll V1] (1]11
12 Jl_ L12 _I_ PI_ F_I"_ 1"12 _2-_ (I:90O
14 <1_ M12 312 _12 ;1_ 012 '/1_ f12
AGG = Dense-graded untreated aggregate baseLCB = Lean concrete base
Perm. ATB = Permeable asphalt-treated baseAll perpendicular doweled joints at 15 ft. spacing
53

SPS-3: Preventive Maintenance of AC Pavement
This experiment examined the effects of environmental region (wet-freeze, wet-nonfreeze,dry-freeze, or dry-nonfreeze), subgrade type (fine- or coarse-grained), traffic rate, ratio ofstructural capacity, and condition of pavement (good, fair, or poor) on preventive maintenanceof AC pavements. Table 3.3 presents the experimental design for SPS-3.
SPS-4: Preventive Maintenance of JCP
This experiment examined the effects of environmental region (wet--freeze, wet-nonfreeze,dry-freeze, or dry-nonfreeze), subgrade type (fine- or coarse-grained), base type (densegranular or stabilized), and pavement type (plain or reinforced) on preventive maintenance ofJCPs. Table 3.4 present the experimental design for SPS-4.
SPS-5: Rehabilitation of AC Pavement
This experiment (3.15) examined the effects of environmental region (wet-freeze, wet-nonfreeze, dry-freeze, or dry-nonfreeze), condition of existing pavement (fair or poor), andtraffic rate (as a covariant) on pavement sections incorporating different methods ofrehabilitation with AC overlays. Rehabilitation methods used in this study included surfacepreparation (routine preventive maintenance or intensive preparation with cold milling andassociated repairs), asphalt overlay type (virgin or recycled), and overlay thickness (2 or 5in.). The experimental design for SPS-5 is presented in Table 3.5 and includes 128 testsections located at 16 test sites.
SPS-6: Rehabilitation of Jointed PCC Pavements
This experiment (3.16) examined the effects of environmental regions (wet-freeze, wet-nonfreeze, dry-freeze, or dry-nonfreeze), type of pavement (plain or reinforced), condition ofexisting pavement (fair or poor), and traffic rate (as a covariant) on pavement sectionsincorporating different methods of rehabilitation with and without AC overlays.Rehabilitation methods used in this study included surface preparation (a limited preparationand full concrete pavement restoration) with a 4-in. thick asphalt concrete overlay or withoutan overlay, crack/break and seat with thin and thick AC overlays (4 and 8 in.), and limitedsurface preparation with a 4-in. thick AC overlay with sawed and sealed joints. Theexperimental design for SPS-6 is presented in Table 3.6 and includes 168 test sections locatedat 24 test sites.
SPS-7: Bonded Concrete Overlay of Concrete Pavements
This experiment examined the effects of environmental region (wet-freeze, wet-nonfreeze,dry-freeze, or dry-nonfreeze), type of pavement (JPCP or CRCP), and condition of existing
54

_ N
•_ _ _,_,_ _
"_ 0i_o _ z _: q,_ _ _ _ _ _
55

Table 3.4 Experimental Design for SPS-4: Preventive Maintenance of JointedConcrete Pavements
__ FREEZE NO-FREEZE
I
FINE COARSE F1NE COARSE
D IJ I_} IS I_ZENS
W EET S 12 14 16 18
TP AL BA
N ENS
D ERyS 1!_ 112 _4
TAB
R D ILZ _ 121E EI NN SF WE0 E 'P8 I2C _R T sC TE AD B
DENSE = Dense granular baseSTAB = Stabilized base
56

Table 3.5. Experimental Design for SPS-5: Rehabilitation of AC Pavements
Factors for
Moisture, Wet Dry
Temperature,
Pavementand Freeze Nonfreeze Freeze Nonfreeze
ondition Fair Poor Fair Poor Fair Poor Fair Poor
Rehabilitation
Procedures
Surface Overlay OverlayPrep. Material Thickness
Routine
Maint. 0 xx xx xx xx xx xx xx xx
(Control)
Recycled 2 in. xx xx xx xx xx xx xx xxAC
5 in. xx xx xx xx xx xx xx xx
Minimum Virgin 2 in. xx xx xx xx xx xx xx xxAC
5 in. xx xx xx xx xx xx xx xx
Recycled 2 in. xx xx xx xx xx xx xx xxAC
5 in. xx xx xx xx xx xx xx xx
Intensive Virgin 2 in. xx xx xx xx xx xx xx xxAC
5 in. xx xx xx xx xx xx xx xx
Each "x" designates a test section.
Subgrade Soil: Fine
Traffic: >_100 KESALs/Yr
57
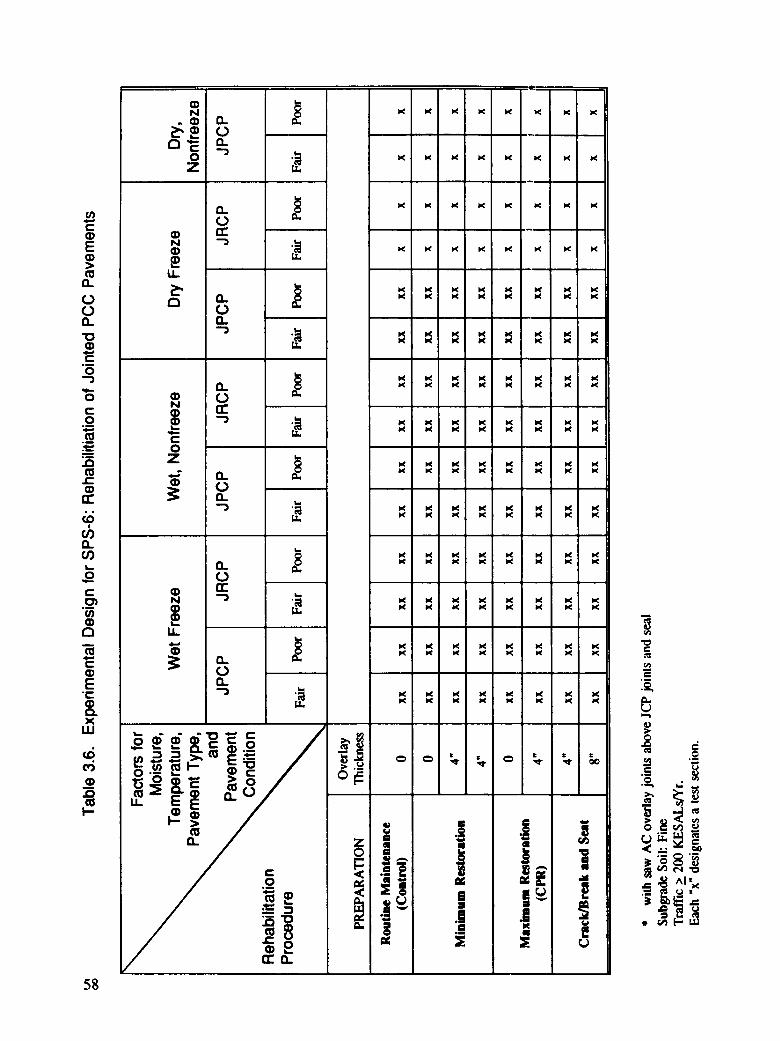
" l 'l'l'IL..
>m
n
0
.c_0
0
0 "_
- _. _ _¢-
c _
(s)
x
_ (,- .- _ _ _ •
/ _'_

pavement and traffic (as covariants) on pavement sections incorporating differentrehabilitation methods and concrete overlays (3.17). Rehabilitation techniques used in thisstudy included different surface preparation methods (cold milling plus sandblasting orshotblasting), bonding agents (neat cement grout or none) and overlay thickness (3 or 5 in.).The experimental design for SPS-7 is presented in Table 3.7 and includes 96 test sectionslocated at 12 test sites.
SPS-8: Study of Environmental Effects in the Absence of Heavy Loads
This experiment investigated the effects of environmental region (wet-freeze, wet-nonfreeze,dry-freeze, or dry-nonfreeze) and subgrade type (frost-susceptible, expansive, fine, or coarse)on pavement sections incorporating different flexible and rigid pavements subjected to verylimited traffic. The target pavement structures included two levels (low/high) of highwaydesign. For flexible pavements, these structural sections consisted of 4 or 7 in. AC surfacelayers resting on 8 or 12 in. thick dense-graded untreated granular base, respectively. Forrigid pavements, the test sections consisted of pavement structures of 8 or 11 in. thickdoweled jointed plain concrete pavements on 6 in. thick dense-graded granular base. Theexperimental design for SPS-8 is presented in Table 3.8 and includes 48 test sections at 12test sites. A preliminary experimental design has been prepared (3.14).
Project Participation Requirements
Projects considered for inclusion in the SPS experiments must meet certain criteria to ensurethat the relative performance between the test sections is due to the design parametersincorporated in the experiment and not to other associated factors such as changes in subgradeor traffic patterns.
The following basic criteria were considered in evaluating the suitability of projects forinclusion in the SPS experiments (3.19).
1. For the experiments on structural factors and environmental effects, the project mustinclude new construction of all pavement layers along a new route, or as part ofrealignment, reconstruction, or construction of an experimental parallel roadway. Therehabilitation experiments must include restoration and/or overlay of pavements intheir first performance cycle. The experiment on asphalt-aggregate mixturespecifications may include new construction or resurfacing of an existing pavement.The test site for the experiments on pavement maintenance must include a GPSapproved test section. Finally, projects in which the proposed experimental sectionsare to be constructed as added lanes or as a partial reconstruction (removal andreplacement of surface layers only) are not considered suitable for an SPS project.
59

Q.a) _ x x x x x x x
0 Q. X X X X X X X
(.) x x x x x x x x
O_ O.
O _ n" x x x x x x x(_ _ N
a)
g _ x x x x x x x _X X X X X X X
"o _- o..a_ _ _ n" x x x x x x x x"o • c)'- i-0
m _£ "e0 x x x x x x x x
_ _ x x x x x x x xO.
13" X X X X X X X X,- J_ ®o_ o N (,.,)"_ ,_ ®
e-_ u. u. o.o x x x _ _ x x xX x X
C
E._--
Q.XLU
,.: oo_:_ ._ _' o
"L° _ o _ o _ _:__ _o z _. z _.
0. m_I._ I--

0N
;D^.noV x x x x 6 "_
E _ " _ "_.
° _ _'_ _ _i
_ ° _ _ _ _ _ _-
•_ .,_
°_
e_
o
"._ _._ _ _ ,o
p,
61

2. The construction project must include sufficient length of highway to provide anaccommodation for all experiment test sections. In order to accommodate specificchanges in layer thickness, materials, or other study parameters, the constructionproject must include appropriate transition lengths between the individual test sections.
3. Test site selection is based on presence of subgrade soils of similar classification andcharacteristics.
4. Test sections are located on portions of a project that are relatively straight, with lessthan 4% vertical grade and horizontal curves less than 3". All test sections on aproject must have the same transverse cross-section profile ot' the pavement surface toensure similar surface drainage conditions.
5. Ideally, all test sections are to be located on shallow fills. The entire length of eachtest section, however, should be located completely in either a cut or a fillconfiguration. Cut-fill transitions and side-hill fills should be avoided.
6. It is highly desirable that the test sections be opened to traffic at the same time.
7. Each test section should be free of culverts, pipes, and other substructures beneath thepavement. If subsurface structures are required, they should be located in thetransition zones between test sections.
8. The projects should be located on a route with an expected traffic level that conformsto the following criteria: _>100 KESALs/yr. for SPS-1 and SPS-5; _>200 KESALs/yr.for SPS-2, SPS-6, and SPS-7; and < 10 KESALs/yr. for SPS-8.
9. Traffic flow should be uniformly applied over all the test sections on a project. Allsections should carry essentially the same traffic stream. Minor variations in trafficrates between test sections at the site due to intersections, on-off ramps, etc., areallowed. However, these variations should not occur within any of the test sections.As a result, intersections, rest stops, on-off ramps, weaving areas, quarry entrances,etc., should be avoided on and between test sections on a project.
10. Pavement sections that are obviously excessively under- or over-designed for existingsite conditions should be avoided for rehabilitation experiments.
11. For rehabilitation projects, distress type, extent, and severity should be reasonablyuniform over the project and representative of the type of distress observed within theSHA's jurisdiction.
Candidate projects are evaluated individually to determine the extent of compliance with thesecriteria. The impact of deviations from these criteria on test section performance and thesuitability of the test site for inclusion in the experiment are assessed in determining projectacceptance. Variation in traffic level on the test sections at a specific site due to intermediateintersections and/or interchanges and deviation from the desired geometrical requirementshave been assessed in some cases as part of the SPS project acceptance process.
62

Project Requirements
The participating SHAs agreed to perform several activities in order to ensure uniformity inconstruction and obtain needed data on materials characteristics, traffic rates, climaticconditions, and other factors at each test site. Agencies participating in SPS were expected tocomply with the following conditions.
1. All test sections required by a given experimental design must be constructed duringthe same construction season, and the treatments within the length of the test sectionsmust be applied across all lanes in the direction of travel. For the experiments, theSHA is responsible for developing appropriate asphalt or concrete mixture designs andfor testing the materials and mixtures used for the test sections in accordance with thespecified procedures.
2. A traffic data collection station shall be installed at or near the site to monitor traffic
that passes over the test sections. For the experiments on rehabilitation and asphalt-aggregate mixture specifications (SPS-5, SPS-6, and SPS-7), this station must beoperated to obtain, as a minimum, continuous automated vehicle classification andprovide for four 1-week sessions of seasonal weigh-in-motion each year. For theexperiments on structural factors (SPS-1 and SPS-2), the station must providecontinuous weigh-in-motion. For the experiment on environmental effects (SPS-8), thestation must provide continuous automated vehicle classification supported by portableweigh-in-motion on an as-needed basis. For the experiments on pavementmaintenance (SPS-3 and SPS-4), traffic data collected for the on-site GPS test sectionare considered applicable to the SPS test site.
3. A weather station shall be installed and operated at SPS-1, SPS-2, and SPS-8 test sitesif sites are not located in proximity to an existing station.
4. Except for test sites on pavement maintenance (SPS-3 and SPS-4), the SHA willperform and/or provide for drilling, coring, sampling, and testing of in-place pavementmaterials and materials used in construction or rehabilitation. The sampling andtesting plans must be tailored to the site and must conform to SHRP operationalmemorandums and guides.
5. The SHA shall prepare plans, specifications, quantities, and all other documentsnecessary as a part of contracting procedures. The SHA must also provideconstruction control, inspection, and management in accordance with its standardquality control and quality assurance procedures.
6. If an existing pavement is to become part of the test sections, the SHA will providehistorical information on pavement inventory features, traffic levels and loads, andmaintenance data similar to that required for the GPS test sections.
63

7. Periodic traffic control will be provided by the SHA for on-site data collectionactivities such as materials drilling and sampling, deflection measurements, and othermonitoring activities.
8. Maintenance activities on the test sections shall be coordinaa_ to prevent prematureapplication of treaunents that alter the characteristics of the test sections and limit theiruse in the study.
9. The SHA shall provide and maintain signing and marking of test sites.
10. Finally, the SHA will notify SHRP when any of the test sections reach an unsafecondition or become candidates for rehabilitation to allow recording of the conditionof the test sections prior to rehabilitation.
To aid the participating SHAs in performingthese functions,SHRP prepared a series ofreports that outline guidelines for the different facets of participation, such as procedures forevaluating candidate projects, sampling and testing needs, and construction requirements.
Test Site Requirements
The SPS experiments were developed to study the effects of certain important factors onpavement performance. To accomplish this objective, a number of test sites with specificcharacteristics are sought in each climatic region. Table 3.9 lists the number of test sitesrequired in each climatic region for each site-specific condition for the experiments onstructural factors, rehabilitation, and environmental effects. A total of 106 sites are requiredfor these experiments. These include 56 test sites of new pavement construction orreconstruction and 50 sites of pavement rehabilitation. The new construction projects include28 sites of flexible pavements and 28 sites of rigid pavements. The rehabilitation projectsinclude 16 sites of flexible pavement rehabilitation and 34 sites of rigid pavementrehabilitation. Thus, these SPS experiments include 44 test sites of flexible pavement and 62test sites of rigid pavements.
The experiments on pavement maintenance include 128 test sites. These include 81 sites offlexible pavement maintenance and 47 sites of rigid pavement maintenance. Thus, the entireSPS program (SPS-1 through SPS-8) includes 234 test sites distributed throughout the UnitedStates and Canada.
Project Recruitment and Approval Process
A systematic procedure was followed in selecting the test sites for the experiments onstructural factors, rehabilitation, environmental effects, and asphalt-aggregate mixturespecifications. This procedure involved a request for nomination of test sites, evaluation ofcandidate projects, and approval of selected test sites. Figure 3.6 illustrates this process.
64

EZ
65

$HRP
Requestfor
Nominations
Participating SHA
Nomination
Development
SHRP - RCOC*
Review"- of
Nomination
Project SHRP - DC Technical
Rejected/ _ AssistanceRevision _ Review _.. Conn"actor
of ---Requested Nomination Review
ProjectAccepted
into
Experiment
* RCOC = Regional Coordinationoffice Contractor
Figure 3.6. Project Recruitment and Approval Process
66

Project Solicitation and Nomination
Guidelines for nomination and evaluation of candidate projects were developed for eachexperiment to assist the SHAs in nominating test sites for the SPS experiments. Theseguidelines outlined project selection criteria and participation requirements and includedproject nomination forms and instructions. The project selection criteria detailed the specificrequirements for the test site and its desired characteristics. Participation requirementsoutlined the responsibilities of the participating SHA concerning construction, testing,monitoring, and other related activities. The nomination forms were completed by theparticipating SHA to provide detailed information on the proposed project to help assess itssuitability for the experiment.
An SHA desiring to participate in SPS completed the nomination forms for the experiment inwhich participation was sought. A sample of these nomination forms, for the SPS-1experiment on structural factors for flexible pavements, is shown in Figure 3.7. These formsprovide information on project location, Iraffic rate, project layout and geometry, and SHAconstruction plans. In addition, these forms provide information on anticipated contract andconstruction schedule as well as the SHA's deadline for SHRP's decision concerning theapproval of the proposed test site.
The nomination forms were generally submitted to the appropriate SHRP regional office.Based on a review of the nomination form, the regional staff determined the suitability of theproposed test site for the intended experiment. If the proposed project was deemed apotential candidate for the study, a project verification followed. Otherwise, the participatingSHA was notified of the unsuitability of the nominated project for inclusion in the study.
Project Verification (3.19)
Project verification consisted of two parts: a project record review, conducted in theparticipating SHA office, and a field site visit. These two verification steps were performedby the Regional Coordination Office Cona'actor's (RCOC) staff together with representativesfrom the participating SHA office and, when possible, the SHRP Regional Engineer.
The project record review allowed the RCOC staff to become familiar with the project priorto the site visit and thus expedite the field verification process. During this review, theRCOC staff performed the following activities:
• Review of project records, including as-built plans, cross-sections, profiles, andspecifications for maintenance and rehabilitation projects
• Review of available information on soil borings and materials along the project toevaluate subgrade uniformity at the test site
• Confirmation candidate project data by comparison of as-built plans and data furnishedon the nomination forms
67

SI4F_ETA. SPS-1 CANDIDATE PROJECT NOMINATION AND INFORMATION FORM
STATE SHRP SECTION NO
GENERAL PROJECT INFORMATION
PROJECT LOCATION
ROUTE NUMBER
ROUTE SIGNING [ ] Interstate [ ] Sta_ [ ] CountyOther
PROJECT LOCATION Star[ Milepost End Milepos¢
Start Scatim _ S_oa
DIRECTION OF TRAVEL []NorthB. []SouthB. []WestB. [] F.a_B.
PROJECT IX)CATION DESCRIFFION
COUNTY
HIGHWAY AGENCY DISTRICT NUMBER
SHRP ENVIRONMENTAL ZONE
[ ] WET FRFT:7_F. [ ] WET NONFR_I:Y_I:- [ ] DRY FR_:T:7_. [ ] DRY NONFR_P_
SIGNIFICANT DATES
LATEST DATE OF APPROVAL NOTIFICATION FROM SHRP
CONTRACT LE'ITING DATA
ESTIMATED CONSTRUCTION START DATE
ESTIMATED DATE TEST SECTIONS OPENED TO TRAFFIC
ESTIMATED CONSTRUCTION COMPLETION DATE
PROJECT DESCRIPTION
PROJECT TYPE [ ] New Route [ ] Removal and Reconslroction [ ] Parallel Roadway
Other
FACILITY [ ] Divided [ ] Undivided NUMBER OF LANES (One Way)
DESIGN TRAFFIC DATA
ANNUAL AVERAGE DAILY TRAFFIC (TWO DIRECTIONS)
% HEAVY TRUCKS AND COMBINATIONS (OF AADT)
ESTIMATED 18K ESAL APPLICATIONS IN DESIGN LANE
TOTAL DESIGN 18K ESAL APPUCATIONS IN DESIGN LANE
DESIGN PERIOD (Ye,m_)
Figure 3.7. Sample SPS Nomination Form
68

SHEET B. SPS-1 CANDIDATE PROJECT NOMINATION AND INFORMATION FORM
STATE SHRP SECTION NO
AGENCY'S PAVEMENT STRUCTURE DESIGN FOR SITE
LAYER I LAYER 2 MATERIAL TYPE 3 THICKNESS 4 STRUCTURAL _
NO. DESCRIPTION CODE CLASS CODE (INCHES) COEFFICIENT
1 SUBGRADE (7)
2 __ . 0.
3 __ . 0.
4 . 0.
5 . 0.
6 . 0.
7 . 0.
8 . 0.
9 . 0.
STRUCTURAL DESIGN METHOD [ ] 1972 AASHTO [ ] 1986 AASHTO [ ] MODIFIED AASHTOOther
AASHTO DESIGN RELIABILITY FACTORS R% SoOUTSIDE SHOULDER TYPE
[ ] Turf [ ] Granular [ ] Asphalt Concrete [ ] Surface Treatment
[ ] PCC [ ] Curb and Gutter Other
OUTSIDE SHOULDER TYPE (Feet)
SUBSURFACE EDGE DRAINS [ ] Yes [ ] No
NOTES
1. Layer 1 is the rlatural OCCU/Tingsubgrade soil The pavement surface will have the largest assigned layernumber.
2. Layer description codes;
Surface Layer ....03 Base Layer ....... 05 Subgrade .............. 07Subsurface HMAC ..04 Subbase Layer .... 06 Embankment (Fill) ..... 11
3. Refer to Table 1 through 4 for material class codes.
4. If subgrade depth to a rigid layer is known, enterthis depth for subgrade thickness, otherwise leave subgradelayer thickness blank.
5. Enter AASHTO structural layer coefficient value, as appropriately modified, used in pavement design ortypical coefficient used by agency for this materiaL For the subgrade, enter either AASHTO soil supportvalue or resilient modules value (psi) used in design.
Figure 3.7. (Continued)
69

SI-II=.ETC. SPS-I CANDIDATE PROJECT NOMINATION AND INFX)RMATION FORM
STATE SHRP SECrlON NO
TEST SECTION LAYOUT
NUMBER OF TEST SECTIONS ENTIRELY ON: FII_L CUT
SHORTEST TRANSITION BETWEEN CONSECUTIVE TEST SECTIONS (Feet)
VERTICAL GRADE (Avg %) (+ upgrade; - downgrade)
HORIZONTAL CURVATURE (Degree) [ ] Tangent °
COMMENTS ON DEVIATIONS FROM DESIRED SITE LOCATION CRITERLA
OTHER SHRP TEST SECTIONS
DOES AGENCY DESIGN CONFORM TO GPS-I OR (3PS-2 PROJECT CRI'I'F.RIA? [ ] Yes [ ] No
DISTANCE TO NEAREST GPS TEST SECTION ON SAME ROUTE (Miles)
TEST SECTION NUMBER OF NEAREST GPS SECTION
SUPPLEMENTAL TEST SECTIONS
IF SUPPLEMENTAL EXPERIMENTAL TEST SECTIONS ARE PROPOSED, COMPLETE THE FOLLOWING
TOTAL NUMBER OF SUPPLEMENTAL TEST SECTIONS
FACTORS TO BE INVESTIGATES
Figure 3.7 (Continued)
7O

• Identification of potential test section locations within the project by inspection ofgeometric, drainage, and other relevant factors
• Review of traffic and safety considerations
• Review of photologs or other site-specific data, if available, to help identify suitabletest section locations
• Identification of any planned maintenance, rehabilitation, or other construction thatmight affect the suitability of the project for inclusion in the study
• Review of available information on traffic rates and patterns to confLrm suitability ofthe test site for the intended experiment
Also during the office review, the potential locations of the test sections at the site wereidentified. The suitability of these locations was then confu'med during the field visit.
During the field visit, the actual test sections were located after a review of the potentiallocations identified as part of the project record review. For rehabilitation experiments, asurvey of pavement condition and distress was made to assess the uniformity and similarity ofthese test sections. Also during the field visit, the previously identified locations of thesubsurface structures and intersections were confirmed.
Project Approval
Following the office record review and the field verification visit, the SHRP regional officestaff furnished SHRP headquarters with copies of project plans, cross-sections, profiles, andother details indicating the proposed locations of the test sections. SHRP staff, inconsultation with the LTPP technical assistance contractor's staff, reviewed the furnished
details to assess the suitability of the proposed test site for inclusion in the experiment. Inthis assessment, consideration was given to factors that could affect the usefulness of the testsite in achieving the experiment's objectives. These include
• Suitability of the project to accommodate all of the test sections• Traffic rate and possible change in traffic flow along the test site• Subgrade material and variation along the test site• Alignment and geometry of test sections• Locations of culverts, pipes, and subsurface structures within the limits of test sections
• For rehabilitation projects, variation in pavement condition and distress along the testsite
• For rehabilitation projects, structural design of the existing pavement and whether it isover- or underdesigned for the prevailing traffic levels
Based on the results of this evaluation, the proposed project was assessed and classified inone of three categories: approved, tentatively approved, or unacceptable. Projects classified
71

as "approved" met all of the requirements stipulated for the experiment or require minormodifications. Projects classified as "tentatively approved" met the essential requirements forthe experiment, but required some adjustments to conform to other criteria. Projects classifiedas "unacceptable" did not meet the essential requirements for the experiment.
Following this review, SHRP headquarters informed the SHRP regional office of the reviewfindings and the decision concerning the approval of the proposed project. Because theexperiments on structural factors for flexible and rigid pavements (SPS-1 and SPS-2) requiredthe construction of 12 of the 24 possible test sections at each site, the approval of test sitesfor these experiments identified the specific experimental set that had to be constructed at theevaluated test site. The SHRP regional office then notified the nominating SHA of the resultsof the review and approval process. For projects classified as "tentatively approved," theregional office coordinated with the nominating SHA to revise test site locations and/ordetails to conform to the experiment requirements. The revised plans were then submitted toSHRP headquarters for review and final approval.
Following the approval of a test for inclusion in SPS, the RCOC staff, together with theSHRP Regional Engineer, coordinated with the participating SHA in the completion of thedifferent activities required for project implementation. This ensured that the test site wasconstructed in accordance with the guidelines stipulated for the experiment and thus wouldprovide the information needed to achieve the objectives of the experiment.
Construction Guidelines
Construction guidelines were developed in cooperation with SHAs and the Federal HighwayAdministration to ensure practical and implementable procedures for constructing the testsections. The construction guidelines addressed items that should be considered by theparticipating SHAs when preparing plans, technical provisions, bid documents, and otherrelated information to ensure adherence to the study requirements. Specifically, the guidelinesaddressed the following items:
• The experimental levels that must be included in the test site• The primary construction features and details that must be incorporated in the test
sections
• Specifications for the construction materials and details required for the test sections• Typical cross-sections and details for the different test sections• Construction operations and as-built requirements• Special considerations and limitations that should be observed
The final construction guidelines for each experiment were distributed to all SHAs. Inaddition, SHRP, the technical assistance contractors, and the RCOCs provided clarification ofitems included in the guidelines when requested by a participating SHA.
72

Status as of May 1992
As of May 6, 1992, a total of 205 test sites have been identified in SHRP-LTPP for the SPStest sites (Table 3.10). Of these, 127 test sites have been constructed and 48 have beennominated and/or approved. In addition, nominations for 35 test sites were anticipated. If allpotential candidate test sites are nominated and approved, 40 test sites will still be needed tocomplete the experiments on structural factors (SPS-1 and SPS-2), on rehabilitation (SPS-5,SPS-6, and SPS-7), and on environmental effects (SPS-8). No additional sites are beingsought for the experiment on maintenance treatment of flexible and rigid pavements (SPS-3and SPS--4).
73

+ !0'"
o go
o_kt_
o_
- _ _
•+.__ _- _
I• .$ 15•= N N ._
oo
74

References
3.1 Strategic Highway Research Program Research Plans, Final Report.Transportation Research Board, National Research Council, Washington, D.C.,May 1986.
3.2 Strategic Highway Research Program. "Development of Specific PavementStudies." Washington, D.C., September 1988.
3.3 High, R. "Strategic Pavement Design Initiatives for SPS-1 and SPS-2." (TRDFTechnical Memorandum AU-35). Texas Research and Development Foundation,Austin, Texas, February 1989.
3.4 Anderson, V. and R. High. "Value of Fractional Factorials for SPS-1 and SPS-2Experimental Designs." (TRDF Technical Memorandum AU-56). TexasResearch and Development Foundation, Austin, Texas, March 1989.
3.5 Strategic Highway Research Program. "Specific Pavement Studies. ExperimentalDesign and Research Plan for Experiment SPS-I: Strategic Study of StructuralFactors for Flexible Pavements." Washington, D.C., February 1990.
3.6 Strategic Highway Research Program. "Specific Pavement Studies. ExperimentalDesign and Research Plan for Experiment SPS-2: Strategic Study of StructuralFactors for Rigid Pavements." Washington, D.C., April 1990.
3.7 High, R. "SPS-2 Experimental Design Development" (TRDF TechnicalMemorandum AU-90). Texas Research and Development Foundation, Austin,Texas, May 1990.
3.8 Anderson, V. "Crucial Analyses for SPS-I" (TRDF Technical MemorandumAU-162). Texas Research and Development Foundation, Austin, Texas,September 1990.
3.9 Anderson, V. "Recommendations" (Addendum to TRDF TechnicalMemorandum AU-162). Texas Research and Development Foundation, Austin,Texas, October 25, 1990.
3.10 Hudson, W.R. and P. Irick. "Draft Report on Further Development of SPS-6"(TRDF Technical Memorandum AU-45). Texas Research and DevelopmentFoundation, Austin, Texas, January 24, 1989.
3.11 Strategic Highway Research Program. "Specific Pavement Studies Guidelinesfor Nomination and Evaluation of Candidate Projects for Experiment SPS-6:Rehabilitation of JPCC Pavements." Washington, D.C., November 1989.
75

3.12 Strategic Highway Research Program. "Specific Pavelnent Studies Guidelinesfor Nomination and Evaluation of Candidate Projects fbr Experiment SPS-7:Bonded PCC Overlays." Washington, D.C., June 1990.
3.13 Anderson, V. "Error Variation for GPS and SPS." (TRDF TechnicalMemorandum AU- 171). Texas Research and Development Foundation, Austin,Texas, November 25, 1990.
3.14 Strategic Highway Research Program. "Specific Pavement Studies. ExperimentalDesign and Participation Requirements." (SHRP Operational MemorandumSHRP-LTPP-OM-005R), Washington, D.C., July 1990.
3.15 Strategic Highway Research Program. "Specific Pavement Studies. ExperimentalDesign and Research Plan for SPS-5: Rehabilitation of Asphalt ConcretePavements." Washington, D.C., November 1989.
3.16 Strategic Highway Research Program. "Specific Pavement Studies. ExperimentalDesign and Research Plan for SPS-6: Rehabilitation of Jointed Portland CementConcrete Pavements." Washington, D.C., November 1!)87.
3.17 Strategic Highway Research Program. "Specific Pavement Studies. ExperimentalDesign and Research Plan for SPS-7: Bonded Portland Cement ConcreteOverlays." Washington, D.C., February 1990.
3.19 Hanna, A. N., and S. D. Tayabji. The Specific Pavement Studies." A StatusReport (SHRP-LTPP Report 5). Washington, D.C., October 1993.
76

Section 4Pavement Materials Characterization
Introduction
Background
The Strategic Highway Research Program Long-Term Pavement Performance (SHRP-LTPP) program was structured to include General Pavement Studies (GPS) of existingpavement sections and Specific Pavement Studies (SPS) of new or rehabilitated pavementsections (4.1, 4.2). The basic parameters and variables used in the selection process for theGPS and SPS studies included climate, traffic, pavement age, and subgrade type. In theSHRP-LTPP program, many basic materials properties (i.e., resilient modulus) wereconsidered essential data requirements. Therefore, all GPS and SPS sites were subjected todetailed materials characterization evaluations. The SHRP-LTPP Pavement MaterialsCharacterization." Five-Year Report (4.3) should be consulted if the reader desiresadditional information concerning this facet of LTPP.
Characterization of materials properties and knowledge of the variations in these propertiesbetween and within test sections are required to evaluate causes of performance differencesbetween test sections and to provide a basis for improving/defining models for use inpavement design methods. Materials characterization includes parameters used in currentpavement design models and mechanistic analysis models, as well as the engineeringproperties generally required to assess the characteristics and behavior of materials.
During SHRP-LTPP it was necessary, indeed critical, to have site-specific materialsinformation. GPS and SPS pavement performance depend on many interrelated factors, notthe least of which is the thickness and quality of the materials constituting the pavements atthe monitored sites. SHRP sought to acquire samples for materials characterization andprovide site-specific, detailed, and accurate information regarding thickness, quality,strength, modulus, and other attributes of the pavement layers from the GPS and SPS sites.SHRP, therefore, set out to develop a two-tiered materials characterization programconsisting of field materials sampling and laboratory materials testing. This information isimperative in subsequent verification of project experiment cells and other detailed dataanalysis functions (4.4).
77

Field Materials Sampling and Testing
As part of the overall SHRP-LTPP objectives, the field materials sampling and field testingportion of this study provided important information to the National Pavement PerformanceDatabase (NPPDB). A primary source of the information to be included in the NPPDB wasthe field data collected on the GPS in-service pavements and the SPS test secdons built andinstrumented for more intensive evaluation of selected factors. The SHRP field materials
sampling and field testing program encompasses all fifty U.S. states, ten Canadian provinces,and Puerto Rico.
GPS Field Materials Sampling and Field Testing
The GPS field sampling program contained 777 test sections located throughout the NorthAmerican continent. Each of these sections was drilled and samplexl to obtain in situinformation and testable core specimens. This program was conducted in strict conformanceto a SHRP-prepared drilling and sampling guide (4.5).
The SHRP GPS drilling and sampling operations were conducted in the vicinity of the testsection but not within the test section. This approach was adopted because samples retrievedfrom within the test sections could have induced abnormal distress manifesting over time withcracking emanating from the core locations within the test section. The patched core holesand abnormal distress development could have resulted in spurious measurements frommonitoring devices such as falling weight deflectometers (FWDs) and profilometers (4.4).
Organizational Structure
A number of agencies were involved in the LTPP GPS operations (Figure 4.1). Efficient andtimely conduct of field materials sampling and field testing activities required a clearunderstanding of the administrative, supervisory, and operational responsibilities of thevarious agency personnel.
The SHRP Regional Engineer was responsible for administration and management of allSHRP contracts in the region, including the contract for drilling and sampling. The SHRPRegional Engineer also provided coordination between the various regional contractors andstate highway agencies (SHAs) and resolved questions and concerns that arose during theday-to-day operations of the field sampling and testing program.
The SHRP Regional Engineer also was responsible for supervision and approval of the SHRPRegional Coordination Office Contractor (RCOC) staff. The RCOC staff providedcoordination between the activities of all contractors in their respective regions.
The RCOC designated a drilling supervisor (SHRP Authorized Representative) to provideprimary on-site supervision during the drilling and sampling operations. The SHRPAuthorized Representative was responsible for the direction of field operations and worked
78

°_ I '_® <_c _oz
._ _ _ _
° g•c _- ___ -_ E'
z _'
_L _ m n
_,_ ._Q,.'_
• _" O0 0
i _ _
I=.
.oo,_0.. cl o @"_, _.,_ _ __ ._.
o _ _.__,_o f_rr l..C: r_ m _.
_-I_o :_ _.
o0
79

with the drilling and sampling contractor to ensure effective, efficient, and safe operationsat the work site. The SHRP Authorized Representative performed all day-to-daycoordination between SHRP central staff, the SHRP Regional Engineer, the RCOC, thefield materials sampling contractor, and the laboratory materials tc_;ting contractor.
Field Materials Sampling Guide
A critical element of the drilling and sampling program was the development and evolutionof the "SHRP-LTPP Guide for Field Materials Sampling, Handling, and Testing" (4.5).The outline for later revisions of the Field Guide was begun in October 1987 with theissuance of the "Materials Sampling and Testing Guide for Long-Term PavementPerformance Studies" (4.6). Subsequent to this guide, a field sampling guide designatedSHRP Operational Guide OG-006 (4.5) was developed that identified the requirements ofthe GPS sampling operations and provided explicit directions to the drilling and samplingcontractors, SHRP Authorized Representatives, and RCOCs. The primary objective of theLTPP field materials sampling guide was to achieve consistency and high quality in thefield activities of the regional drilling and sampling contractors.
Conduct of Field Materials Sampling
Each SHRP region conducted its field drilling and sampling operations under differentschedules and with different drilling and sampling contractors. However, adherence to theguidelines defined in the "SHRP-LTPP Guide for Field Materials Sampling, Handling, andTesting" (4.5) ensured that the quality of specimens and field testing remained consistentand that similar results were obtained. The number of test sections to be sampled rangedfrom approximately 135 in the North Atlantic region to 260 in the Southern region. TheWestern and North Central regions drilled and sampled approximately 180 and 200 testsections, respectively. Figure 4.2 shows the approximate locations of the SHRP testsections. These test sections were located throughout the continental United States, Canada,Alaska, Hawaii, and Puerto Rico.
Typical layouts for materials sampling points and field testing points are shown in Figures4.3 and 4.4. More detailed sampling and testing plans for each type of test section areshown in Appendix B of the "SHRP-LTPP Guide for Field Materials Sampling, Handling,and Testing" (4.5).
Coring of asphalt concrete (AC) and portland cement concrete (PCC) was conducted using4, 6, and 12 in. diamond drill bits with water as a coolant. Special care was taken toensure minimum use of water so as not to contaminate lower unbound layers of thepavement structure during this operation. Coring was often performed with a truck-mounted drill rig or a tractor-mounted drill rig for smaller diameter core holes. Prior toextraction from the pavement, all cores were marked with an arrow to indicate the directionof traffic. This arrow was subsequently used in the laboratory to align the cores for certain
8O

81

09+g -- -- o
_1 0_.ou _j "
omo
0t,+_- 0 _ _: .-
1 + ++_++oj oj(J __ -- =:-i_
i _o_, _
++i i; =_ _ ®®",,+ ;=z
II ++i_ ""'+ _"_+ ,,°++ =----_° °o_=
+ ;,+.+ °o° = ._,3= IOe + =l t_
,'-, © 0o+
o_ .o o ®®1_1_1<:_1'_w_leue-1"_t
g_

o_. �`�0._"_ _ "_.0_ _ o "r_
- _- _
o _ _ _ u_z3__ iJ
Cl "_, G) C "_- _
E_ ._- r_
o -- _ '--_ <c,,, IT== =>
C_
-- ,-, _ :->. o_o e,z0 '_ ._= o Ck -_-- • _:c
w u6 _ _,_- -,__ _ _< _ ,.. _ c ",R
(_) .00. O_ m _ m .0 m O -_ I.
o
_P F- "_ _- _( O O---_- - _ X_--_ _'- < --_ '..,_ o_. j_ _/)uu cr _) _- _ .. c_ c_
E. 5 _ "" _: >'''-' _ E _
• . ¢'_ "_" "_ _- O _-_ _ ¢_ _D _ _b _
_'_ _ _ _ U r_ __ ,--- ---C__ _ c _ c _
m m _ m . x3 m c_ n- _ _ _ o _o
00+0---- _ c_ _ r u) O O --_ -- _- _ "_- -- _" "
Ot,'O _ _ _ _ _... _ .., ,-, x,_ _, ,_ _ .-I0 _ _ _" . '- _" X :D._ _'_ _
0- _--', " =__ _ cj _m 0--
=-0- _,_o...-o_o. ._oo+eo.... _,,,_09-0- "_,0 0 _,,,
_n,,<xfJ)w
, 83

test procedures. Layer thicknesses and the condition of extracted ,:ores were recorded onthe appropriate data sheet.
After removal of the bound layers for the 6 in. and 12 in. diameter core holes, theremaining layers were augered. This activity was conducted using American Association ofState Highway and Transportation Officials standards, AASHTO I'203-82(86), "SoilInvestigation and Sampling by Auger Borings," and AASHTO MI46-70(80), "TermsRelating to Subgrade Soil-Aggregate and Fill Materials."
Undisturbed samples of the natural subgrade or fill material were obtained to a depth of 4ft. below the top of the subgrade, using (if appropriate) thin-walled shelby tube sampling.
When thin-wall shelby tubes were not appropriate due to soil conditions, splitspoon sampleswere recovered. Blow counts were recorded, and splitspoon samples were opened,examined, and logged as to the length of recovery and description of the soil.
The inclusion of a test pit in the field drilling and sampling plan provided the bestopportunity to obtain site-specific data and information that was not available from anyother source. The SHRP drilling and sampling contractors used an excavation machine(usually a backhoe), a pneumatic pavement breaker, a chisel, and a dump truck to performthe test pit excavations.
The pavement was sawn, along with treated layers if present, to the specified overalldimensions. These pavement components were cut into smaller pieces as necessary forremoval. One 12 in. by 12 in. sample of an AC pavement surface was recovered intact forpackaging and shipment to the laboratory. No samples of PCC pavement surface or treatedlayers were retained, except for when cores of such layers suitable for testing were notobtained elsewhere from the test section.
After removal of the surface and treated layers, the untreated layer,_ (including thesubgrade) were tested using the nuclear density gauge. Bulk samples of all unbound layerswere obtained. Excavations of the subgrade continued to 12 in. below the top of thesubgrade. Also, one 12 in. by 12 in. sample of AC pavement was recovered and retainedfor shipment to the laboratory.
Upon completion of test pit operations, the test pit was restored to as near originalcondition as possible by SHA personnel and/or drilling and sampling contractor personnel.Test pits for asphalt sections and non-continuously reinforced concrete pavements wereusually completed the same day as the drilling and sampling operations.
A shoulder auger probe was employed in the field drilling and sampling operations todetermine whether bedrock or other significantly dense layers existed within 20 ft. of thepavement surface. Augering was performed with a 6 in., continuous flight, solid, helicalauger by a drill rig mounted on the truck. Augering was performed to a depth of 20 ft. orrefusal, whichever came first. In some cases, when refusal occurred prior to 20 ft., anotherprobe was initiated at a nearby location to confirm that a hard layer was present. If refusal
84

occurred at the second location, the auger probe activity was terminated and refusal wasreported.
Sample Numbering, Packaging, and Shipment
After cleaning, drying, wrapping, and packaging, all samples were marked separately with asample number prior to shipment to the laboratory. Every sample was identified in
accordance with the directions in the drilling and sampling guide. Samples were shipped tothe appropriate laboratory within 5 days of sampling using wooden boxes of standardconstruction.
Data Collection Guidelines
The primary objective of the drilling and sampling program was to provide acomprehensive evaluation of the pavement layer structure and layer thicknesses of the GPSpavement layer materials, as well as to provide high-quality samples/specimens for furtherlaboratory materials characterization. To facilitate the collection of these data, standard dataentry sheets and standard materials codes were developed to record all data collected in thefield (4.7).
The guidelines for recording data collected from the field materials sampling program arecontained in Appendix C of SHRP-LTPP-OG-006, "SHRP-LTPP Guide for Field MaterialsSampling, Handling, and Testing" (May 1990). Data collection sheets were completedprimarily by the drilling and sampling contractor's crew chief and were subsequentlyreviewed by the SHRP RCOC for completeness and accuracy prior to entry in the NPPDB.
Detailed descriptions of field materials sampling and field testing operations and datacollection are available in Reference 4.5. This document, along with the 1MS ResearchersGuide (4.8), should be used to comprehend fully the data collection activities for the fieldmaterials characterization program.
Quality Assurance/Quality Control in the Field
The field materials sampling and field testing work conducted for GPS was unprecedentedin terms of geographic coverage, specificity of requirements, and magnitude of work.Throughout this effort, SHRP required consistent, high-quality field materials sampling andfield testing from all drilling and sampling contractors. To achieve this goal, SHRPimplemented uniform quality assurance (QA) and quality control (QC) procedures in eachregion (4.9).
The QA/QC procedures instituted requirements related to the quality of field materialssampling and field testing and were followed to an extent consistent with the production ofan acceptable quality of coring, boring, augering, disturbed and undisturbed sampling, bulk
85

sampling from the test pits, and in situ field testing. The first step in the QA/QC process wasthe adherence to the SHRP guidelines for field materials handling Ind testing (4.5).
SHRP RCOC personnel were responsible for checking the field data packets for completenessand reasonableness. This included checks of the documentation regarding sample receipt bythe laboratories. These documents were cross-checked with the field shipping forms to ensurethat the number, type, and condition of the specimens shipped from the field matched thosethat reached the laboratory. In addition, the RCOC personnel coov_-Linatedactivities betweenthe SHRP drilling and sampling contractor and the appropriate SHIC_Plaboratory. All of theseactivities helped to avoid sampling error and added to the consistency and accuracy of thefield sampling and testing data.
As part of the QA/QC process, the drilling and sampling contractor's equipment wasadequately maintained and calibrated so that quality samples and test data could be obtained.A preventive maintenance program was implemented to reduce the downtime of theequipment on the project. Other equipment was inspected on a frexluent basis to ensureefficient operation. Additionally, the SHRP Quality Assurance Consultant visited severaldrilling operations to ensure that appropriate QA/QC procedures were followed.
Periodically, nuclear moisture-density equipment was calibrated using standard materials ofknown density and moisture. A verification/calibration program was established to ensure theaccuracy and consistency of the data obtained by these devices (4.10). This was essentialbecause the in situ moisture and density data were collected by four different contractorsusing different nuclear equipment on different material types in four geographic regions.Materials of known density (traceable to the National Institute of Standards and Technology(NIST)) were used to verify that the device was recording measurements within an acceptablerange of the known density and moisture. The nuclear density gauges were calibrated basedon the results of this verification procedure.
Status of GPS Materials Sampling and Testing
All of the GPS sites that were scheduled for initial drilling and sampling were completedduring SHRP-LTPP. Additional GPS sections that may be added as the program continueswill have to be drilled and sampled, probably by SHA personnel according to SHRPguidelines. Drilling and sampling of GPS-6B (planned AC overlay of AC) and GPS-7B(planned AC overlay of PCC) test sections that have been overlaid after the initial round ofdrilling and sampling will have to be drilled and sampled to obtain the cores of the pavementoverlay.
Most of the GPS drilling and sampling program has been completed, and a major effort is notexpected in this portion of the materials characterization program for the remainder of theLTPP program.
86

SPS Field Materials Sampling and Field Testing
The SPS experiments were developed to investigate the performance of selected flexibleand rigid pavement structures, maintenance treatments of flexible and rigid pavements,rehabilitation treatments for flexible and rigid pavements, environmental effects in theabsence of heavy loads, and asphalt mix performance, generally within a factorial designthat included different subgrade types and environmental conditions. The structural factorsincluded surface layer and base layer thicknesses. Rehabilitation and maintenance
treatments ranged from crack sealing and minor repair to extensive surface preparationfollowed by asphalt or concrete overlay.
The SPS experiments consist of individual sites composed of multiple test sections, witheach site having similar details and materials according to the various experimentrequirements. These sites are distributed among climatic regions as well as subgrade soiltypes. The experimental designs and construction considerations for the experiments aredescribed in the experimental design and research plan documents published for eachexperiment (4.11, 4.12, 4.13, 4.14, 4.15, 4.16). Construction features and details of theexperiments are described in the construction guidelines documents published for eachexperiment (4.17, 4.18, 4.19, 4.20, 4.21, 4.22).
Special Considerations for SPS Field Sampling and Field Testing
SPS experiments include both existing pavements and new construction. As a consequence,field sampling and testing plans must address the need to minimize destructive samplingand testing activities in both existing and finished pavements. Constraints on access causedby construction schedules must also be addressed. The GPS sampling and testing programsought to maximize the information obtained while limiting the number of destructive testlocations near the test section to prevent influences on performance resulting from theseactivities. This same policy applied in SPS but is complicated by the number of sections ata site, the number of different pavement structures at a site after completion of theconstruction, and the desired objectives of sampling and testing during constructionactivities.
Experiments dealing with rehabilitation of existing pavements require the same type ofsampling as in GPS. An adequate number of core locations, a test pit, and shoulder probeswere distributed throughout the project site, based on the assumed subgrade variability.This is termed preconstruction sampling. Experiments involving new pavementconstruction required that a program of sampling and testing be conducted throughout theconstruction process. As layers were completed, sampling and testing were performed.
The materials sampling and testing plan had to be tailored to the specific featuresencountered on each project; therefore, the sampling and testing plan was site-specific. Anexample of materials sampling and testing procedures and a conceptual site plan for anSPS-8 project site (with flexible pavement sections) is presented in the Pavement MaterialsCharacterization." Five-Year Report (4.3).
87

Field Materials Sampling and Testing Guidelines
Field materials sampling and testing guidelines have been publisbed by SHRP for the SPS-1, -2, -5, -6, -7, and -8 experiments (4.23, 4.24, 4.25, 4.26, 4.27, 4.28). These documentscombine the sampling plans and instructions with the laboratory lesting requirements foreach experiment. The sampling procedures are based on the "SHRP-LTPP Guide for FieldMaterials Sampling, Handling, and Testing" (4.5).
Data Collection Guidelines for SPS Field Materials Sampling
Data elements obtained as part of the field materials sampling and testing activities for SPSexperiments are classified into the following groups:
• Test Section Location Reference Table• Construction Data
• Field Materials Sampling and Testing Data• Laboratory Materials Testing Data
The data collection and reporting process for SPS test sites required the completion ofspecific data sheets from the "Data Collection Guide for LTPP Studies" (4.7) developed forGPS and additional data sheets developed specifically for SPS. The SPS project-specificdata sheets address construction data and other aspects of the materials sampling and testingactivities. Data collection guideline documents have been published for SPS-1, -2, -5, -6, -7, and -8 (4.29, 4.30, 4.31, 4.32, 4.33, 4.34).
Conduct of Field Materials Sampling
The field materials sampling and field testing activities provided pavement material samplesfor laboratory testing and yielded in-situ moisture and density data for each test site, densitydata for new AC, and measurements of air content of fresh concrete, depth to rigid layer,and modulus of subgrade reaction. Field sampling and field testing operations wereperformed during the different phases of pavement construction to fully characterize thepavement structure in each test section. This information was used in evaluating the servicelife and long-term performance of the different pavement structures and design proceduresused in the various experiments.
SPS-3 and SPS-4 Field Sampling and FieM Testing Plans
The purpose of the SPS-3 and SPS-4 studies was to develop a database that will permitincreased understanding of selected maintenance treatments in extending pavement servicelife or reducing the evidence of pavement distress. This included an evaluation of theeffectiveness of the pavement maintenance treatments and establishment of a studymethodology that can be followed by SHAs to evaluate other maintenance treatments.
88

The study includes six specific preventive treatments:
• Chip seals, thin overlays, slurry seals, and crack sealing for flexible pavements
• Undersealing and joint and crack sealing for rigid pavements
The study of the treatments applied to flexible pavements was designated SPS-3, and thestudy of the treatments applied to rigid pavements was designated SPS-4.
Field Sampling, Testing, and Data Collection
There were four phases of field data sampling, testing, and data collection in addition to thestandard condition monitoring. In the first phase, the initial conditions prior to treatmentapplication were defined. This was part of the site verification process. In the second, thematerials to be used in the treatments were sampled. In the third, information was collectedduring the treatment application to determine the quality of the treatment process, includingthe materials being used at each site. In the fourth, tests determined how the pavementschange over time after treatment application.
SPS-3 Construction Monitoring, Sampling, and Field Tests
The RCOC collected the samples of the materials during construction. These samples werethen marked, packaged, and shipped to the regional testing lab in accordance with the SHRP-LTPP field materials sampling and field testing guide (4.5). The samples were identified withthe section identification number from which they were taken. When samples were takenother than in a section, they were identified with the section number of the next section towhich they were to be applied.
The RCOC was responsible for monitoring the application process and for conducting severalchecks, including equipment calibration checks, temperature checks, distance measurements,area measurements, and similar checks.
The physical measurements for crack sealing included the temperature of the air, temperatureof the sealant, and width of cracks and sealant. Relative humidity was based on local weatherinformation. Temperature of the sealant was based on the temperature gauge on the sealantheating equipment.
The physical measurements for slurry seals included moisture content of the aggregate,ambient temperature, and relative humidity. Relative humidity was based on local weatherinformation. The application rate measurement was based on the equipment readings, whichvaried with the type of machine.
The physical measurements for chip seals included moisture content of the aggregate, ambienttemperature, and relative humidity. Relative humidity was based on local weather
89

information. The emulsion application rate was based on measurements of the emulsifiedasphalt quantity in the distributor.
All data were recorded on the data collection sheets described below. All data were then
entered into the NPPDB by RCOC personnel.
SPS-3 Materials Sampling After Construction
The final materials sampling will occur approximately 2 years after construction and will berepeated biennially until the section is removed from the study. A single asphalt core will beobtained from each site. The hole will then be filled in accordance with SHA requirements.The cores will be marked, wrapped, packaged, and shipped in accordance with the SHRP-LTPP field materials sampling guide requirements.
SPS-4 Materials Sampling Prior to Construction
Assurance coring was included in the site verification process. Construction records werealso reviewed to ensure that there was no change in surface thickness. At least one 6 in.diameter core was obtained from the paved shoulder adjacent to each test section andextended to the subgrade. Each layer material, thickness, and subgrade type was identified.No laboratory testing of cores or materials obtained during verification sampling wasconducted.
A distress survey was conducted within 90 days prior to application of the treatments. Thisand subsequent distress surveys were to include a measurement of faulting and edge dropoff.FWD deflection and roughness testing was also conducted on all SPS-4 sections prior totreatment applications and biennially thereafter. Standard loss-of-support testing for undersealsections was conducted using the benkelman beam (Field Protocol H32F) to determine whichjoints and cracks to underseal.
SPS-4 Materials Acceptance Sampling
Joint and crack sealant material samples were conducted in accordance with ASTM D 3405.Joint and crack sealant material samples were obtained, marked, packaged, and shipped inaccordance with the SHRP-LTPP field materials sampling and field testing guide (4.5).Sample material was identified with the section identification number when sectionidentification numbers were required.
9O

SPS-4 Construction Monitoring Sampling and Field Tests
The monitoring QA/QC program included initial deflection tests, stability tests, equipmentcalibration, material volumes, locations, temperatures, and other similar tasks andmeasurements.
Specific data required for joint and crack sealing activities included air temperature, relativehumidity, temperature of the sealant, width of joint and cracks, depth of sealant belowpavement surface, depth of backer rod, application pressure, and thickness of sealant.Relative humidity was based on local weather information. Temperature of the AmericanSociety for Testing and Materials (ASTM) D3405 sealant was based on the calibratedtemperature gauge on the sealant heating equipment.
SPS-4 Special Testing After Construction
A distress survey will be conducted 6 months after application, 1 year after application, andon an annual basis thereafter. Initial and subsequent condition surveys are to includemeasurements of faulting and edge drop off. Deflection testing of the underseal sectionshould include benkelman beam testing (Field Protocol H32F) in addition to FWD testing(Field Protocol H30F) using the SPS-4 testing plan for these devices.
Laboratory Materials Handling and Testing
Organizational Structure
A number of people were involved in the LTPP GPS laboratory materials operations (Figure4.5). Efficient and timely conduct of the laboratory materials testing operation required aclear understanding of the administrative, supervisory, and operational responsibilities of thevarious personnel. The organizational structure is similar to that of the GPS field materialssampling and testing program.
The SHRP Regional Engineer was responsible for administration and management of allSHRP contracts within the region (including the contract for the laboratory materials testing)and provided coordination among the various regional contractors, SHAs, and technicalassistance contractors. The SHRP Regional Engineer was also responsible for supervision andapproval of the SHRP RCOC staff.
The SHRP Regional Engineer and the RCOC provided coordination between the regionallaboratory materials testing contractor and the regional drilling and sampling contractor. TheSHRP Regional Engineer and the designated RCOC staff worked with the regional laboratorymaterials testing contractor to assure effective, efficient, and safe operations in the materialslaboratory at all times. The RCOC also worked jointly with the SHRP Regional Engineer toensure data integrity and quality assurance throughout the laboratory testing program.
91


Laboratory Materials Testing Guide
SHRP developed a comprehensive, detailed guide for materials testing. The guide, entitled"SHRP-LTPP Interim Guide for Laboratory Materials Handling and Testing (PCC,Bituminous Materials, Aggregates, and Soils)" (4.35), was first issued in November 1989,revised in February 1991, and finalized in August 1992. The guide provides specificinstructions regarding sample handling, storage, testing, reporting, and discarding. The1,200-page guide is organized as follows:
Section 1 Introduction
Section 2 Field Sampling and Laboratory Testing OperationsSection 3 Lab Testing of Bituminous Materials, Aggregates, and SoilsSection 4 Lab Testing of Portland Cement ConcreteSection 5 Verification and PaymentSection 6 Laboratory Test Data QualityAppendix A Organizations and Personnel Contact NamesAppendix B. 1 Lab Testing Program by GPS Experiment TypeAppendix B.2 Lab Testing Program by SPS Experiment TypeAppendix C. 1 SHRP Standard Forms for GPS Laboratory TestingAppendix C.2 SHRP Standard Forms for SPS-1, -2, -5, -6, -7, and -8
Laboratory TestingAppendix C.3 SHRP Standard Forms for SPS-3 and SPS-4 Laboratory
TestingAppendix D SHRP Terminology for Pavement Materials and SoilsAppendix E. 1 SHRP Protocols for GPS Laboratory TestingAppendix E.2 SHRP Protocols for SPS-1, -2, -5, -6, -7, and -8 Laboratory
TestingAppendix E.3 SHRP Protocols for SPS-3 and SPS-4 Laboratory TestingAppendix F GPS Field Sampling PlansAppendix G Laboratory Tracking Tables for the GPS Experiments
Each of these sections and appendices is necessary to understand and complete thelaboratory materials testing operations.
One of the most important facets of the guide is the standardization of the procedures usedto conduct each laboratory test. These protocols outline step-by-step instructions for eachtest procedure and include sections concerning sample handling, data reporting, and otherinformation related to SHRP needs (e.g., sample identification and location). This type ofstandardization was of paramount importance in obtaining accurate, usable test data.
The guide was initially and primarily developed for the GPS testing program, and sectionsconcerning the SPS materials testing program were added at a later date. However, thematerials testing program for the SPS experiments uses the same principles as the GPSprogram, and the guide is very useful for SPS laboratory materials testing purposes.
93

Protocol Development
All of the protocols used in the GPS testing program were developed by an expert in thefield of materials or by a group of experts for the more complicated test procedures (i.e.,resilient modulus). Development began in late 1988 and continued throughout SHRP-LTPP. The bulk of the guide was completed in November 1989. After that time, SHRPinstituted a series of Materials Directives that were used to updat.c the testing protocolsbetween revisions to the guide. Final development of all protocols; was completed inOctober 1992 with the issuance of the latest version of the guide.
Future Use
The guide is an instrumental tool in the materials characterization testing program for theGPS and SPS experiments. In the future, this guide can be used by other organizations thatwish to perform a similar laboratory testing program. Additionally, this guide will be usedextensively in the SPS program for many years to come.
The guide was provided to SHRP Regional Engineers, RCOCs, the laboratory materialstesting contractors, and others. In effect, the guide served as the control for the laboratorymaterials testing program. This guide is the definitive source of information on themethodology used by SHRP in conducting laboratory materials testing operations (4.4).
Conduct of Laboratory Materials Testing
Each SHRP region conducted its laboratory materials handling and testing operations underdifferent schedules and with different contractors. However, due to the use of the "Guidefor Laboratory Materials Handling and Testing," the quality of testing and specimenhandling was consistent and provided similar results. Laboratory materials testingoperations began in late 1989 and continued through the end of 1991. Currently, only theresilient modulus testing (Protocols P07, P33, and P46) remains to be completed for theGPS program. Approximately half of all GPS testing was completed in mid-1993. Theremainder of the GPS testing will be completed in U.S. Department of TransportationFederal Highway Administration (FHWA) continuation of the LTPP program.
PCC Laboratory Material Testing
The National Laboratory PCC Testing Contractor worked under the supervision of theSHRP contract manager in Washington, D.C. This laboratory conducted the testing for allPCC pavement layers. All other cement-treated materials (including econocrete, leanconcrete, cement-aggregate, etc.) were tested by the SHRP Regional BituminousLaboratory.
Table 4.1 contains a list of the laboratory tests required on PCC pavement cores by theLaboratory PCC Testing Contractor.
94

Table 4.1. PCC Laboratory Tests Required for GPS Pavements
Tests Per PCC Layer Protocols
PC01. Compressive Strength 1'61
PC02. Splitting Tensile Strength 1'62
PC04. Static Ela.qtic Modulus P64
PC06. Visual Examination and Thickness P66
95

Bituminous, Treated, and Unbound Materials Testing
The remaining laboratory materials testing for the GPS program dealt with AC, extractedaggregate from the AC bound (stabilized) base, subbase, subgrade, and unbound granularbase/subbase/subgrade materials.
To ensure consistency and QC in the laboratory materials testing process, each regionallaboratory conformed to the set of SHRP laboratory testing protocols and all procedures in thelaboratory testing guide (4.35). The regional laboratories were required to maintain closecoordination with the SHRP Regional Engineers and RCOCs, starting when samples werereceived from the field and continuing until final disposal of the materials.
Pavement Layering
One of the more critical goals of the SHRP materials characterization program was theestablishment of pavement structure layering for each test section. The pavement structurewas preliminarily determined by the laboratory after the sample receipt process. Pavementstructures, layer descriptions, and layer types were established early in the laboratory testingprocess and adjusted (if necessary) at the completion of the laboratory testing activities. Afterthe completion of this process, the appropriate forms were submitted to the SHRP RegionalEngineer for review and approval. After this step, the laboratory began testing the pavementmaterials. Figures 4.6 and 4.7 illustrate a typical pavement structtm; and testing program forflexible and rigid pavements, respectively.
General Laboratory Testing
The regional soils and bituminous laboratory materials testing contractors completed testingon the following materials:
1. AC (for each layer including hot-mix, hot-laid, and bituminous surface layers andother HMAC layers). These materials include AC mixtures and extracted aggregates.
2. Treated (bound or stabilized) materials (for each layer). These include asphalt-treatedbase (ATB) materials and other than asphalt-treated base (OTB) materials. OTBmaterials include cement-treated materials, econocrete, lean concrete, lime-treatedmaterials and materials treated or stabilized with chemicals.
3. Unbound granular materials (for each layer). These include soil-aggregate mixturesand naturally occurring materials used in base or subbase layers.
4. Subgrade soils. These include all cohesive, non-cohesive, and granular soils present inthe top 5 ft. of subgrade. Typically these are untreated soils.
96

Iq
_ °_
_'_ Ig g I _o_
I _ _ I _ _ _
_oI o_ o_1_ -_o_ 0 _ _ _-I Io. h
i_ I _ _ , _" _ • ._ ® _ _ m
!,,., i
I I I I I _ ._
_ _1 _ °_o_, _.._ ._, _.I _ ._ • o_ I _ o
o_8 _ , "o ® ®'-' ""
,,_ _ 0 _ : r_ _ ._ ._ _ •
"' _ _s '_" _ '_ III .o ._ _ -
. o •
0 _ m _ _ _
III _ "-""""'--'_ _ _ 0 • .r..z_
I _, o _ ._ ..o,.o• _ ¢_ _ m .,_ _
_ _l _ _ _, ._ o .o ._._• _ o
° _ _ 0 o _ _
9'7

,_ o_ _ _n. ,-4
i I I _ _ I I ._
I
t) -_ V _._
ii ] _ _ __=__o _ _
_ _-/-- _" ' m --_ --3_4
III _"® _ __o _ o{D _ n
, _ _ ® _ - _.
E ._ o_ _ _ _'_.._ CD _)
i 1¢ °* "_ _)
_;111 o _ o " 0
-_:o_ .'__ _ . o _ ®
_ _ _ _ o ®J_ 0 _ _j --_ 0
!
98 '.'E-

Laboratory Test Procedures for AC
AC testing was conducted on core specimens and block samples retrieved from thepavement test section. Table 4.2 lists AC core locations and the required test proceduresfor each specimen. Testing (except for core examination and thickness) was conducted oneach AC layer. Cores that contained more than one AC layer were sawed in the laboratory.The AC Core Examination and Thickness Test was the first test performed on all AC corespecimens. It identifies and determines the thickness of the individual layers within a core.
The Bulk Specific Gravity Test (test AC02) and Maximum Specific Gravity Test (testAC03) were conducted on 6 in. AC cores. Asphalt content tests (test AC04) wereperformed on block samples and 12 in. core specimens. The aggregate obtained from theAC04 test was used for sieve analysis using SHRP Protocol P14. Additionally, the fineportion of the aggregate specimen was used to perform a particle shape test using SHRPProtocol P14A. This testing (P14A) was performed by the National AggregateAssociation's Joint Research Laboratory (NAA-JRL). No testing was performed onextracted asphalt cement.
The Resilient Modulus and Tensile Strength Test, SHRP Designation AC07, was conductedon 4 in. core specimens from the pavement test section using SHRP Protocol P07.Appendices 1 and 2 of the Materials Characterization: Five-Year Report (4.3) documentsthe entire process undertaken for the resilient modulus testing program.
Laboratory Testing of Treated Materials
The testing of treated materials was conducted on core specimens, chunks, and pieces ofpavement materials. SHRP Protocol P31, "Identification and Description of Treated Baseand Subbase Materials, and Determination of Type of Treatment," was used for preliminaryidentification and detailed description of treated materials and treatment types. Thethickness of these materials was also determined using this test procedure. Based on theresults of the P31 test, laboratory tests using SHRP Protocol P32 or P33 (depending onmaterial type) were required.
Protocol P32, "Compressive Strength of OTB Material," was used to test treated materialsother than asphalt-treated base materials (lean concrete, econocrete, soil cement, lime-treated soils, and chemical stabilized soils). The asphalt-treated materials were tested usingProtocol P33, "Resilient Modulus of Asphalt-treated Materials."
99

TABLE 4.2. Summary of AC Core Locations and Required Tests
Sample/Core Sample Tests Per Each 1.$ in. SHRPLocations Size or Thicker Layer Protocol
All C-type 4 in. diam. AC01. AC Core Examination P01AI, A2 cores and thickness
C8, C9, CI0, and 4 in. diam. AC07. AC Resilient Modulus P07C20, C21, C22 Cores
(C7, C19 if needed)
AI, A2 Cores (C12, 6 in. diam. AC02. AC Bulk Specific P02C24 if needed) Gravity
AI, A2 Cores 6 in. diam. AC03. AC Maximum Specific P03Gravity
BAI or other 12 in. diam. AC03. AC Maximum Specific P04BA type core Gravity
Block from Test 12 in. x 12 in. AC04. AC Asphalt Extraction P04Pit or BA type core,if no test pit
100

Laboratory Testing of Unbound Granular Base, Subbase, and Untreated
Subgrade Soils
The testing of unbound materials was conducted on bulk samples of the material. Thesesamples were taken from 12 in. diameter bore holes or from the test pit location at the testsection and were sent to the laboratory in bags. In the laboratory, these bulk samples werecombined, prepared, and reduced to a representative test size in accordance with procedurescontained in the laboratory materials testing guide.
Layer thicknesses for these layers were determined by the laboratory from the field drillingand sampling logs provided by the drilling and sampling contractor. The thickness of thelayer was then averaged from this information. The laboratory assigned a detailedclassification for the soil after performing all designated tests on the samples. Table 4.3 liststhe laboratory tests required for the unbound materials in the GPS program.
For subgrade soils, thin-walled tube samples were retrieved from sections containing cohesivesubgrade soils. These extracted tube samples were then used for resilient modulus testingusing protocol P46. If tube samples were not available from a pavement test section, bulksamples were reconstituted and used for this testing.
Quality Assurance�Quality Control in the Laboratory
Because high-quality, accurate materials testing data were critical to the attainment of theobjectives of LTPP, SHRP required that the testing contractors maintain their own in-houseQA programs. Another important requirement in the QA/QC process was the accreditation ofeach laboratory through the AASHTO Accreditation Program (AAP). All SHRP contractlaboratories were accredited by AAP, thereby providing SHRP with important external QAchecks (4.4).
The laboratory materials testing guide was the first stage of the QA/QC process. Strictadherence to the use of the guide was intended to ensure regional data quality andinterregional data consistency. The guide contains all laboratory test data forms, protocols,and other laboratory instructions. Strict conformance to the SHRP protocols and samplehandling and storage requirements was essential to the success of the laboratory materialstesting process.
A commitment to QA/QC was required throughout all levels of SHRP-LTPP, including theSHRP Regional Engineer, SHRP Project Manager, RCOC staff, laboratory materials testingcontractors, and SHRP technical assistance contractors.
101

TABLE 4.3. Laboratory Tests for Unbound Granular Base and Subbase
Materials and for Untreated Subgrade Soils
Laboratory Tests Per Layer * SHRP Protocol
(a) Unbound Granular Base Material
UG10. Natural Moisture Content P49UG01. Gradation P41andUG02.
UG04. Atterberg Limits P43UG08. Classification and Description P47UG05. Moisture-Density Relations P44UG07. Resilient Modulus P46
Co) Unbound Granular Subbase Material
UG 10. Natural Moisture Content P49UG01. Gradation P41andUG02.
UG04. Atterberg Limits P43UG08. Classification and Description P47UG05. Moisture-Density Relations P44UG07. Resilient Modulus P46
(c) Subgrade Soils
SS09. Natural Moisture Content P49
SS01. Sieve Analysis P51SS02. Hydrometer Analysis P42SS03. Atterberg Limits P43SS04. Classification and Description P52SS05. Moisture-Density Relations P55SS07. Resilient Modulus P46
* Recommended sequence of testingfor each layer.
102

SHRP Proficiency Testing Program
After extensive consultation and careful study of the AAP and of SHRP's QA/QC needs,supplemental proficiency testing programs were identified and designed. Six programs,were approved for implementation:
1. Type 1 (Granular) Soil Proficiency Sample Program - Resilient Modulus (ProtocolP46)
2. Type 2 (Cohesive) Proficiency Sample Program - Resilient Modulus (Protocol P46)
3. Soil Moisture Proficiency Sample Program (Protocol P49)
4. PCC Core Proficiency Sample Program - Static Modulus of Elasticity, Poisson'sRatio, Splitting Tensile Strength, and Compressive Strength (Protocols P61, P62, andP64)
5. AC Core Proficiency Sample Program - Resilient Modulus (Protocol P07)
6. Laboratory Molded AC Core Proficiency Sample Program - Resilient Modulus(Protocol P07)
Data Collection Guidelines
The guidelines for recording data generated from the laboratory materials testing work arecontained in Appendix C of SHRP-LTPP-OG-004, "SHRP-LTPP Interim Guide forLaboratory Materials Handling and Testing" (4.35). The data forms identified in thisdocument are primarily completed by the laboratory material testing contractor and aresubsequently reviewed by the RCOC for completeness and accuracy prior to entry in theInformation Management System (IMS).
Summary Stat&tics and Information
At the conclusion of the GPS laboratory materials testing program, the estimated number oftests performed will be as follows:
1. PCC 6,600 tests2. AC 18,700 tests3. Extracted Aggregate 2,100 tests4. Treated Base/Subbase 1,800 tests5. Unbound Base/Subbase 17,000 tests6. Subgrade 13,000 tests
Total: 59,200 tests
103

All of this materials characterization information will be recorded in the NPPDB and will,in itself, be an important and unique storehouse of information fi,r highway pavementresearchers (4.4).
Status of GPS Laboratory Materials Testing
All laboratory tests of samples shipped from GPS sites were completed by mid-1993. Themain effort in this area is the transfer of the data from the laboratories into the NPPDB so
that the data can be used by researchers.
SPS-1, -2, -5, -6, -7, and-8 Laboratory Materials Handling and Testing
Materials property data needs for SPS experiments have been developed over time througha process of proposal and review by different agencies and contractors. Much of the workconducted for GPS was incorporated into SPS, with additional needs provided in the formof new "SPS only" protocols. Each experiment contains many elements that are similar butalso contain unique items. The individual laboratory test plans provide the minimumnumber of results required for the specified protocols. These plans are the culmination ofthe data needs process.
As stated in Section 3, SPS laboratory testing plans were developed individually for eachproject. This was necessitated by the inherent variability in pavement cross-sections andsubgrade properties. Guidelines for design of laboratory testing plans are contained inseveral SHRP Operational Memoranda (4.23, 4.24, 4.25, 4.26, 4.27, 4.28).
The guidelines include tabular summaries that specify the test protocols, the numbers oftests to be conducted, and the specific source of the test specimen from within the projectsite for a generic project. The principles contained in these guidelines were then used todevelop site-specific laboratory testing plans.
The laboratory protocols in the guide address testing of subgrade soils, unbound aggregatematerials, asphalt-stabilized materials, hardened PCC, and AC. Each of these areas containsnumerous protocols that refer to AASHTO and ASTM testing standards with modificationsspecifically for use in SHRP. Laboratory testing protocols were developed as data needswere identified.
Conduct of Laboratory Materials Testing
Most SPS testing is the responsibility of the participating SHA. The SHA may choose tocontract this work to a consultant or may perform the work using its own resources. In anycase, the test plans and standard laboratory protocols are used. Most SPS testing, includingresilient modulus, creep, and interface bond testing, is conducted under separate contract bythe FHWA to ensure regional consistency.
104

Requirements for Individual SPS Experiments
Guidelines for each SPS experiment contain many similarities as well as significant, uniquerequirements. Subgrade soils, unbound aggregate materials, cementitious/pozzolanic treatedbases, and asphalt-treated bases are all tested in essentially the same way for each SPSexperiment, as shown in Table 4.4. The additional testing requirements for each experimentare explained in detail in several SHRP reports (4.23, 4,2.4, 4.25, 4.26, 4.27, 4.28).
QA/QC in the Laboratories
As in the GPS laboratory testing program, the accuracy of materials testing data was ofcritical importance to attainment of the objectives of LTPP. For SPS, laboratories arerequired to undergo AASHTO Materials Reference Laboratory (AMRL) inspection andperform a reasonable amount of QA/QC on their own initiative.
The implementation of the procedures contained in the laboratory materials testing guide isanother important part of the QA/QC program. Strict adherence to the guide was intended toensure regional data quality and interregional data consistency. A program similar to thatused in GPS ensures accurate materials testing data.
Summary Statistics and Information
At the conclusion of the SPS-1, -2, -5, -6, -7, and -8 laboratory materials testing program, anestimated 40,000 individual laboratory test results will have been generated.
SPS-3 and SPS-4 Laboratory Materials Handling and Testing
The objective of the SPS-3 and SPS-4 research effort was to compare the effectiveness ofmechanisms by which the selected maintenance treatments preserve and extend pavementservice life, safety, and ride quality. This was done over a range of environmental conditions,traffic volume, and other factors that were incorporated into the analysis. An important partof this project was the laboratory materials characterization plan for these studies. Table 4.5lists the protocols and tests used for completion of the SPS-3 and SPS-4 studies. These testswere all conducted by one laboratory under contract to SHRP.
105

TABLE 4.4. Laboratory Materials Testing Common to the SPS Experiments
Subgrade Soils Sieve AnalysisHydrometer to 0.001 mmAtterberg LimitsClassification
Moisture- Density RelationsResilient Modulus
Unit WeightNatural Moisture Content
Unconfined Compressive Slrength
Unbound Granular Base Particle Siz_ AnalysisSieve Analysis (washed)Atterberg LimitsMoisture-Density RelationsResilient ModulusClassification
PermeabilityNatural Moisture Content
Permeable Asphalt- Core Examination/ThicknessTreated Base Bulk Specific Gravity
Maximum Specific GravityAsphalt Content (Extraction)Moisture SusceptibilityResilient Modulus
Asphalt-Treated Base Core Examinationfl'hicknessBulk Specific GravityMaximum Specific GravityAsphalt Content (Extraction)Moisture SusceptibilityResilient Modulus
Cementitious/Pozzolanic Core Examinati_icknessTreated Base Compressive Strenglh
106

TABLE 4.5. List of Lab Protocols Used for SPS-3 and SPS-4 Testing
SHRP
Test Protocol
Number Number Name
AC08 H01L Preparation of Asphalt Cores for Aging TestsAE01 H02L Recovery of Asphalt from Solution by Abson MethodAE02 H03L Penetration of Bituminous Material
AE06 H04L Viscosity of AsphaltsSC01 H05L Standard Methods of Testing Emulsified AsphaltsSC02 H06L Sand Equivalent Values of Soils and Fine AggregatesSC03 H07L Crushed Stone, Crushed Slag, and Gravel for Single or Multiple
Bituminous Surface Treatments
SC04 H08L Determination of Flakiness Index of AggregatesSC05 H09L Design, Testing, and Conslrucfion of Slurry SealSC06 HIOL Test Method for Measurement of Excess Asphalt in Bituminous
Mixtures by Use of a Loaded Wheel Tester and Sand CohesionSC07 H11L Wet Slripping for Cured Slurry Seal MixesSC08 H12L Determination of Slurry System CompatibilitySC09 HI3L Mixing, Setting, and Water Resistance Test to Identify "Quick Set"
Emulsified AsphaltsSCI0 HI4L Sieve Analysis of Seal Coat AggregatesSCI 1 HI5L Chip Seal Mix DesignSC12 H19L Quantitative Extraction from Slurry Seal SampleSC13 H2OL Accelerated Polishing of AggregateCS01 H16L Joint Sealants, Hot-Poured, for Cement and Asphalt PavementsCS02 H17L Joint Sealants, Silicone
US01 HI8L Compressive Strength of Hydraulic Cement Mortar Blocks
107

Summary
All materials characterization information will be recorded in the NPPDB and will, in itself,be an important and unique storehouse of information for highway pavement researchers.Perhaps most important of all, SHRP will have met its goal and provided present and futurepavement researchers with high-quality, detailed, accurate materi_ds characterizationinformation regarding thickness, quality, strength, and other attributes of the pavementlayers from the LTPP GPS and SPS sites (4.4).
References
4.1 Strategic Highway Research Program. SHRP-LTPP Gener, d Pavement Studies."Five-Year Report (Report No. SHRP-P-387). National Research Council,Washington, D.C., 1994.
4.2 Strategic Highway Research Program. SHRP-LTPP Specifu: Pavement Studies: Five-Year Report (Report No. SHRP-P-395). National Research Council, Washington,D.C., 1994.
4.3 Strategic Highway Research Program. SHRP-LTPP Materials Characterization:Five-Year Report. National Research Council, Washington, D.C., Forthcoming.
4.4 Pelzner, A. SHRP-LTPP Pavement Materials Characterization, Interim Report(unpublished). Strategic Highway Research Program, National Research Council,Washington, D.C., April 1990.
4.5 Strategic Highway Research Program. "SHRP-LTPP Guide for Field MaterialsSampling, Handling, and Testing." (Operational Guide SHRP-LTPP-OG-006).Washington, D.C., May 1990.
4.6 Gardner, M. and B. Rauhut. "Materials Sampling and Testing Guide for Long-TermPavement Performance Studies" (Draft). Brent Rauhut Engineering Inc., Austin,Texas, October 1987.
4.7 Strategic Highway Research Program. "Data Collection Guide for Long-TermPavement Performance Studies." (Operational Guide SHRP-LTPP-OG-001). NationalResearch Council, Washington, D.C., Revised January 1990.
4.8 Strategic Highway Research Program. "Long-Term Pavement PerformanceInformation Management System Researchers Guide." National Research Council,Washington, D.C., January 1991.
4.9 Groeger, J. "Quality Assurance/Quality Control of SHRP-LTPP Field Drilling andSampling" (Technical Memorandum EC-45). Texas Research and DevelopmentFoundation, Austin, Texas, April 16, 1990.
108

4.10 Strategic Highway Research Program. "National Verification of Nuclear MoistureDensity Equipment Used by SHRP Drilling and Sampling Contractors" (SHRP-LTPP Materials Directive No. 15). National Research Council, Washington, D.C.,October 5, 1989.
4.11 Strategic Highway Research Program. "Specific Pavement Studies ExperimentalDesign and Research Plan for Experiment SPS-I: Strategic Study of StructuralFactors for Flexible Pavements." National Research Council, Washington, D.C.,February 1990.
4.12 Strategic Highway Research Program. "Specific Pavement Studies ExperimentalDesign and Research Plan for Experiment SPS-2: Strategic Study of StructuralFactors for Rigid Pavements." National Research Council, Washington, D.C., April1990.
4.13 Strategic Highway Research Program. "Specific Pavement Studies ExperimentalDesign and Research Plan for Experiment SPS-5: Rehabilitation of Asphalt ConcretePavements." National Research Council, Washington, D.C., April 1989.
4.14 Strategic Highway Research Program. "Specific Pavement Studies ExperimentalDesign and Research Plan for Experiment SPS-6: Rehabilitation of Jointed PortlandCement Concrete Pavements." National Research Council, Washington, D.C., April1989.
4.15 Strategic Highway Research Program. "Specific Pavement Studies ExperimentalDesign and Research Plan for Experiment SPS-7: Bonded Portland Cement ConcreteOverlays." National Research Council, Washington, D.C., February 1990.
4.16 Strategic Highway Research Program. "Specific Pavement Studies ExperimentalDesign and Research Plan for Experiment SPS-8: Study of Environmental Effects inthe Absence of Heavy Loads." National Research Council, Washington, D.C.,February 1992.
4.17 Strategic Highway Research Program. "Specific Pavement Studies ConstructionGuidelines for Experiment SPS-I: Strategic Study of Structural Factors for FlexiblePavements" (Operational Memorandum SHRP-LTPP-OM-017). National ResearchCouncil, Washington, D.C., December 1990.
4.18 Strategic Highway Research Program. "Specific Pavement Studies ConstructionGuidelines for Experiment SPS-2: Strategic Studies of Structural Factors for RigidPavements" (Operational Memorandum SHRP-LTPP-OM-018). National ResearchCouncil, Washington, D.C., December 1990.
4.19 Strategic Highway Research Program. "Specific Pavement Studies ConstructionGuidelines for Experiment SPS-5: Rehabilitation of Asphalt Concrete Pavements"(Operational Memorandum SHRP-LTPP-OM-012). National Research Council,Washington, D.C., June _1990.
109

4.20 Strategic Highway Research Program. "Specific Pavement Studies ConstructionGuidelines for Experiment SPS-6: Rehabilitation of Jointed Portland CementConcrete Pavements" (Operational Memorandum SHRP-L'IPP-OM-013). NationalResearch Council, Washington, D.C., July 1990.
4.21 Strategic Highway Research Program. "Specific Pavement Studies ConstructionGuidelines for Experiment SPS-7: Bonded Portland Cement Concrete Overlays"(Operational Memorandum SHRP-LTPP-OM-016). National Research Council,Washington, D.C., December 1990.
4.22 Strategic Highway Research Program. "Specific Pavement Studies ConstructionGuidelines for Experiment SPS-8: Study of Environmental Effects in the Absence ofHeavy Loads" (Operational Memorandum SHRP-LTPP-OM-029). National ResearchCouncil, Washington, D.C., March 1992.
4.23 Strategic Highway Research Program. "Specific Pavement Studies MaterialsSampling and Testing Requirements for Experiment SPS-I: Strategic Study ofStructural Factors for Flexible Pavements" (Operational Memorandum SHRP-LTPP-OM-021). National Research Council, Washington, D.C., February 1991.
4.24 Strategic Highway Research Program. "Specific Pavement Studies MaterialsSampling and Testing Requirements for Experiment SPS-2: Strategic Study ofStructural Factors for Rigid Pavements" (Operational Memorandum SHRP-LTPP-OM-022). National Research Council, Washington, D.C., April 1991.
4.25 Strategic Highway Research Program. "Specific Pavement Studies MaterialsSampling and Testing Requirements for Experiment SPS-5: Rehabilitation of AsphaltConcrete Pavements" (Operational Memorandum SHRP-LTPP-OM-014). NationalResearch Council, Washington, D.C., October 1990.
4.26 Strategic Highway Research Program. "Specific Pavement Studies MaterialsSampling and Testing Requirements for Experiment SPS-6: Rehabilitation of JointedPortland Cement Concrete Pavements" (Operation Memorandum SHRP-LTPP-OM-019). National Research Council, Washington, D.C., January 1991.
4.27 Strategic Highway Research Program. "Specific Pavement Studies MaterialsSampling and Testing Requirements for Experiment SPS-7: Bonded Portland CementConcrete Overlays" (Operational Memorandum SHRP-LTPP-OM-020). NationalResearch Council, Washington, D.C., January 1991.
4.28 Strategic Highway Research Program. "Specific Pavement Studies MaterialsSampling and Testing Requirements for Experiment SPS-8: Study of EnvironmentalEffects in the Absence of Heavy Loads" (Operational Memorandum SHRP-LTPP-OM-030). National Research Council, Washington, D.C., March 1992.
4.29 Strategic Highway Research Program. "Specific Pavement Studies Data CollectionGuidelines for Experiment SPS-I: Strategic Study of Structural Factors for Flexible
110

Pavements" (Operational Memorandum SHRP-LTPP-OM-026). National ResearchCouncil, Washington, D.C., December 1991.
4.30. Strategic Highway Research Program. "Specific Pavement Studies Data Collection
Guidelines for Experiment SPS-2: Strategic Studies of Structural Factors for RigidPavements" (Operational Memorandum SHRP-LTPP-OM-028). National ResearchCouncil, Washington, D.C., February 1992.
4.31 Strategic Highway Research Program. "Specific Pavement Studies Data CollectionGuidelines for Experiment SPS-5: Rehabilitation of Asphalt Concrete Pavements"(Operational Memorandum SHRP-LTPP-OM-015). National Research Council,Washington, D.C., October 1990.
4.32 Strategic Highway Research Program. "Specific Pavement Studies Data CollectionGuidelines for Experiment SPS-6: Rehabilitation of Jointed Portland CementConcrete Pavements" (Operational Memorandum SHRP-LTPP-OM-023). NationalResearch Council, Washington, D.C., May 1991.
4.33 Strategic Highway Research Program. "Specific Pavement Studies Data CollectionGuidelines for Experiment SPS-7: Bonded Portland Cement Concrete Overlays"(Operational Memorandum SHRP-LTPP-OM-024). National Research Council,Washington, D.C., July 1991.
4.34 Strategic Highway Research Program. "Specific Pavement Studies Data CollectionGuidelines for Experiment SPS-8: Study of Environmental Effects in the Absence ofHeavy Loads" (Operational Memorandum SHRP-LTPP-OM-031). National ResearchCouncil, Washington, D.C., September 1992.
4.35 Strategic Highway Research Program. "SHRP-LTPP Interim Guide for LaboratoryMaterials Handling and Testing (PCC, Bituminous Materials, Aggregates, andSoils)" (Operational Guidelines SHRP-LTPP-OG-0O4). National Research Council,Washington, D.C., September 1992.
111

Section 5Monitoring Activities
Introduction
A goal of the Strategic Highway Research Program Long-Term Pavement Performance(SHRP-LTPP) project was to develop and implement a plan to uniformly and thoroughlymonitor the performance of pavements identified in the General Pavement Studies (GPS)and Specific Pavement Studies (SPS). The Pavement Monitoring Task was established toprovide guidelines and procedures for SHRP personnel and contractors to ensure that datacollection efforts yielded consistent, comprehensive, high-quality data for the SHRPNational Pavement Performance Database (NPPDB).
Specific areas of interest in pavement monitoring include pavement distress, deflection,profile, friction, instrumentation (for temperature, moisture, and deflection), and seasonalmonitoring.
Distress
Distress surveys have always been one of the more problematic areas of pavement datacollection. Difficulties include the length of time over which distress must be observed,determination of the time at which various distresses are initiated, the difficulty of capturingthe data, the repeatability of results, and the various ways in which data are collected.These problems have traditionally hindered development of good predictive models fromdistress data.
The primary focus of the Pavement Distress activity was to document the long-termperformance of the pavement through distress histories developed by monitoring pavementdistresses. The distresses that are observed will eventually be used to confirm or calibrateexisting models and to develop new predictive models of pavement performance (orpavement life).
Distress Interpretation Procedure
Pavement distress observations were collected photographically on 35 mm movie film,thereby providing a time-related "snapshot" of distress. The eventual accumulation of aseries of distress snapshots will provide a documented historical record of pavementperformance over a long period. The type, severity, and amount of distress for eachpavement section is quantified through computer-assisted interpretation of the film.
113

PASCO Distress Interpretation
Early activities included preparation of the initial PASCO Distress ,ktentification Manual (5.1),review of the initial PASCO distress film, formulation of the PASCO film acceptance reviewprocess (5.2) and development of certification criteria for the PASCO Film Motion Analyzer(FMA) technician (5.3). In addition, PASCO Distress Interpretation Procedures (5.4) weredeveloped that incorporated the distress interpretation flow diagram: shown in Figure 5.1.
To evaluate the FMA process and to further define interpretive procedures, a pilot study wasconducted on 30 SHRP-LTPP sections (5.5) to finalize the interpretive procedures prior toinitiation of production distress interpretation. In the pilot study the foUowing interpretivefindings were identified:
Experience is a critical factor in accurate distress interpretation. Surface distressessuch as raveling and weathering, bleeding, and scaling are particularly subject tomisinterpretation.
The texture and nature of the pavement surfaces can be a hindrance in identifying boththe presence and extent of different types of low-severity cracking. Continuouslyreinforced concrete pavement (CRCP) and jointed concrete pavement (JCP) areparticularly subject to problems because they often have fined or broomed surfaces,while the light color of these pavements can lead to film overexposure or washout inthe middle of the frame. Both these factors can make crack interpretation a difficultor even impossible task with the Pa_..vementDi.._stressAnalysis ._,stem (PADIAS) F_ilmM_..otionAnalyzer (FMA) method.
In order to determine if some cracks were actually indistinguishable on the FMAscreen, the film was projected on a large screen using a slide projector fitted with afilm strip viewing attachment. The clarity and detail obtained from the projector wasmuch higher than with the FMA. Cracks that were barely perceptible on the FMAwere clearly visible through the projector.
In addition to the projector, video tapes recorded by regional personnel in the initialsection verification process were found to be extremely useful to the FMA operator.This represents a valuable enhancement to FMA since video film should be availablefor every GPS test section. In some instances, the video commentary implied evenmore distress existed in asphalt concrete (AC) pavements than was revealed by reviewof the film with the slide projector. In addition, the review process utilizing theprojector displayed cracks that were not visible in the FMA review.
In the distress interpretation system there were limitations that must be taken intoaccount to insure that a truly accurate picture of pavement distress is obtained. Theselimitations are:
114

[ReceiveDistressFilm ]
Fill Out Film Logs
Note GPS Irregularities Send Film Logs to Note Generaland Coordinatewith SHRP and Regional Condition of
P-001 Personnel Engineer Section
rDistress
iomination Videotape m Interpretationand Rut Depth Film process
I 3enerate Nomination = GenecateData Base Report v Reports
Initial QualityControlReview
Send Data toRCOC's
RCOC Quality
ControlReview I
Data _ NO YESIn RIMS
* RIMS = Regional Information Management System
Figure 5.1. Distress Interpretation Procedure 115

• Difficulty in perceiving low-severity cracking due to pavement texture, color,or film exposure.
• Surface distresses such as bleeding, raveling, and weathering and scalingrequire extensive viewing experience to make valid comparative evaluations.
• Joint seal damage cannot be perceived from distress film.
These limitations can be overcome through operator experience, the use of a slideprojector adaptor to enhance film resolution, and supplemental information gainedfrom video tapes and manual distress surveys when possible (5.5).
During production interpretation of the PASCO distress film, the list of distress manifestationsthat could not be consistently defined was extended to include shoving for the flexiblepavements and polished aggregate, water bleeding and pumping, lane-to-shoulder dropoff, andlane-to-shoulder separation for both flexible and rigid pavements (5.6).
Manual Distress Interpretation
Manual distress surveys using the Distress Identification Manual (5.7) were conducted insituations for which the photographic equipment was not available. To facilitateinterpretation, recommendations for quality control of manual distress data (5.8) andcertification procedures for manual distress survey personnel (5.9) were developed.
Certification Requirements
A series of training and evaluation materials were developed for manual and automatedsurvey techniques that lead to certification of people performing distress surveys. Thecertification process is an important element in ensuring high-quality, repeatable distress datacollection.
Rater Accreditation
The accreditation process is administered in a workshop situation. The raters are brought to asingle location for 1 week of classroom and field work. Classroom training is limited inscope due to the level of experience required for attendance; the primary emphasis is onchanges or revisions to the Distress Identification Manual along with any changes in fieldprocedures. A general review of distress types is also conducted using slides and video toreinforce the attendees' knowledge of these changes and revisions. Field survey exercises areconducted to "calibrate" the raters. Sections in the early portion of the field exercises containonly a few distresses, while more complex sections are used in later exercises. The objectiveof these surveys is to determine the individual rater's biases and to ameliorate or correct thosebiases as necessary.
116

Status of Distress Activities
During SHRP-LTPP, two rounds of distress surveys were conducted on all current SHRP GPStest sections and most of the existing SPS test sections. In addition, a third round of distresssurveys on all SHRP GPS and SPS sections was nearly complete (October 1992). Manual(visual) distress surveys were required on a few test sections due to their remote nature or totime constraints that made photographic surveys impossible.
Interpretation of the distress photographs has been completed for the initial round of GPS andSPS surveys, including all quality assurance checks, corrections where necessary, and reportgeneration. Interpretation has also been completed for the second round of GPS and mostSPS surveys, but quality checks have been conducted on only a subset of these sections. It isanticipated that all second-round interpretation activities for GPS and SPS sections will becompleted within the SHRP-LTPP timeframe; however, interpretation of the third round ofsurveys be completed in the Federal Highway Administration (FHWA) LTPP continuationeffort.
Deflection
Deflection testing with the falling weight deflectometer (FWD) represents a primary sourcefor assessing structural capacity and variations within the various elements of the pavement.The FWD testing activity was undertaken in two distinct phases. The first phase was linkedto the original drilling and sampling scheme for the LTPP sections, while the second phasewas concerned with the seasonal monitoring program. The phases involved deflection basintesting for flexible pavements and basin and load transfer tests for rigid pavements.
Devices�Storage
The Dynatest FWD was selected as the standard SHRP deflection testing equipment. Fourdevices were purchased and were used to collect deflection data in each region. Because ofincreased data collection demands due to SPS, state highway agency (SHA) FWDs weresometimes used to supplement the SHRP devices. Calibration centers were established tohelp ensure interregional calibration and calibration of the non-SHRP devices. SHRP hasdeveloped generic calibration procedures for FWDs to allow devices from differentmanufacturers to be calibrated.
Standard procedures for FWD testing were developed for GPS sites (5.10), and supplementalguidelines have been developed for use in tests of SPS sites (5.10). The standards alsoinclude considerations for supplemental data collection (temperature, joint/crack widths, etc.).
The FWD data acquisition system can store the full history of the applied load pulse andresulting deflection response. However, because of database storage limitations, 25% of theload-deflection historical data are stored off-line on optical disks, while the peak magnitudesof the impulse load and deflection responses are stored in the NPPDB.
117

Quality Assurance�Quality Control (QA/QC) Procedures
A uniform drop sequence is used for all test points throughout the test section. Thesequence is initiated with three drops of a seating load followed by four repeat drops ateach drop height (or load level) used. Four drop heights are used for flexible pavements,while three drop heights are used for rigid pavement test sections.
QA checks on the SHRP-LTPP FWD data are conducted at three levels:
1. Data Collection Software (5.10)2. FWD Scan (5.11)3. FWD Check (5.12)
The field data collection software automatically performs five validity checks (5.10):
1. A check to verify that sensor signals attenuate with time2. A check that sensor deflections are lower at locations further from the load3. A check to verify that sensor deflections are less than 80 mils or 2000 microns4. A check at a specific location that the load for a particular drop is within 200
pounds (or 12 KPa contact pressure) of the average load for that drop height5. A check at a specific location that the normalized deflection (based on load) for a
particular drop is within 0.24 mils (6 microns) of the average normalized deflectionfor that drop height
The FWDSCAN program is "intended to check FWD data files for completeness andreadability, and generates an output file summarizing the results of the checking process"(5.11). The objective of this program is to flag potential errors or problems and not toeliminate data.
The FWDCHECK program is "intended to check FWD data files for:
• Section homogeneity• Nonrepresentative test pit and section data• General reasonableness of structural capacity." (5.12)
As a rule, the checks included in the FWDCHECK program do not eliminate data butprovide reasons for flagging potential problems. During SHRP-LTPP, there was nostandardized set of rules or procedures by which regional FWD QA/QC personnel couldassess the quality of any questionable deflection data.
The present QA/QC checks included in the FWD software programs include verificationsthat the deflections are within sensor limits (i.e., 80 mils or 2000 microns), that thedeflections decrease with distance from the load, and that the load falls within acceptableranges. Although these checks identify possible data anomalies, there are no formalizedrules for assessing the quality of the data. The FWD data are generally transferred to the
118

NPPDB, regardless of the results of QA/QC checks, unless regional personnel make adetermination to exclude the data.
The present FWD QA/QC software program uses normalized deflections based on theapplied load (i.e., deflections per unit load) to assess section homogeneity and to conductcomparisons between test pit FWD results (i.e., outside the LTPP section) and FWD resultswithin the section. This approach should be augmented with normalized deflections basedon the sixth sensor (i.e., D0/D36, Ds/D36, ..., 1.0, D60/D36). This approach would not onlyameliorate the problems associated with "noise" in the load pulse (which would yieldimproper deflection/load values), but also is believed to provide a more fundamentalapproach to assessment of deflection basin data (5.14).
Status of Deflection Activities
Since the initiation of SHRP, significant progress has been made in the deflection testingarena. Actual field testing of GPS sections was initiated in the early months of 1989. Overthe past 3 years, the first round of testing on the GPS test sites identified to date has beencompleted, and second-round testing is progressing rapidly. Also, most of the requireddeflection testing of SPS sections has been completed. The focus of deflection testing isshifting from the initial inventory-type testing of GPS sections to the more intensive testingfor the evaluation of moisture- and temperature-related variations in pavement response,testing of SPS sections as they are constructed, and long-term monitoring of GPS sectionsthrough testing at 5-year intervals.
Initial FWD Data Analysis
Like the rest of the LTPP data, the raw deflection data are stored in the NPPDB and willultimately be available to all researchers. SHRP undertook a back-calculation exercise asan initial analysis of the LTPP data. The endeavor was undertaken with the full expectationthat it would be a preliminary analysis of these deflection data. The layer moduli derivedfrom this endeavor were used to supplement the raw deflection data stored in the NPPDB.
In order to estimate in-situ layer moduli, SHRP developed a back-calculation procedureconsisting of an existing back-calculation program and a series of application rules (5.13).The term "back-calculation program" or "software" means just that--computer programsused in back-calculation. However, the manner in which a back-calculation program isused is in some cases more important than which program is used. Hence "back-calculationprocedure" refers not only to the software but also to the "rules" by which that software isapplied. Too much, however, remains to be learned about the art and science of back-calculation for this program to be regarded as anything more than a first step.
119

Deflection Measurement Program Issues
At this stage of the LTPP, FWD hardware has been obtained and large amounts of FWD datahave been acquired. Hardware, software, and procedural problems have been identified andmost have been addressed; data collection processes have been developed and data collected.However, some important issues remain to be addressed, including noise in the FWD loadpulse, calibration "consistency" between the SHRP FWDs, and between SHRP FWDs andSHA b'WDs, and QA/QC interpretation of the FWD data for inclusion in the NPPDB.
The occasional "noise" issue has complicated the deflection testing program. High-frequencynoise can introduce an occasional "glitch" in the pulse, which is not necessarily transmitted tothe pavement structure. When this phenomenon coincides with the peak load magnitude, anerroneously high peak load is obtained. Such erroneous data, if traJnsferred to the NPPDB,would represent a data anomaly that could significantly affect back-calculated values.
Calibration consistency can be addressed through use of the calibration centers andstandardized periodic checks of FWD operation. Furthermore, the QA/QC issue can beaddressed with the development of detailed guidelines for assessing the quality of FWD data.
Recommended FWD Activities
An analysis and assessment of FWD data collection requirements should be undertaken todetermine if a reduction in the number of FWD test points could be allowed (e.g., from 25 ft.spacing to 50 ft. [15.2 m] or 100 ft [30.5 m] spacing). A similar analysis could be conductedto directly assess the need for the present number of drop heights (or load levels) and/or thepresent number of drops at a specific drop height (or load level). Reduced testingrequirements could lead to savings in time, effort, and money, with the concomitantadvantage that site scheduling conflicts could be reduced.
Profile
The general serviceability concept developed during the AASHO Road Test (5.15), in whichthe performance of a pavement was defined by its ability to serve traffic over time, has beenmaintained in SHRP-LTPP. Because AASHO serviceability was influenced by bothlongitudinal and transverse profile, as well as by the amount of cracking and patching, it isapparent that SHRP-LTPP can likewise provide an opportunity for serviceability assessmentsby combining profilometer data (longitudinal profile), PASCO cross-profile data (lateralprof'de), and distress data from FMA fdrn interpretation (cracking and patching).
The principal factor in the AASHO Present Serviceability Index (PSDequation is slopevariance, which represents a measure of variation in longitudinal profile or roughness (5.15).SHRP selected the K.J. Law profilometer to monitor longitudinal profile or roughnessvariation within each GPS and SPS section (5.16, $.17).
120

Theory of Operation
The Law road profilometer uses a non-contact light sensor system to measure the distancebetween the vehicle frame and the road surface. The profilorneter is equipped with twosensors, one in each wheel path. The sensor consists of a light source, a light receiver, andan electronic enclosure. The light receiver uses a rotating scanning minor assembly fordetecting signals in measuring the road profde.
The relative displacement between the vehicle and the road measured by the non-contact lightsensor is one input to the profile equation. The other input, vertical vehicle motion isprovided by a precision servo-balanced accelerometer. The difference between the vehicledisplacement and the relative motion between the vehicle and the road surface provides theactual raw road profile output.
Law Profilometer Evaluations
Acceptance-type testing was completed and comparative analyses were completed for thethree identical SHRP profilometers as well as for the fourth SHRP-FHWA profilometer (5.18,5.19, 5.20). In addition, the first "rough-off" comparative testing program for all four SHRPprof'dometers was conducted at Austin, Texas in February 1990 (5.21, 5.22). A secondprof'dometer rough-off was conducted at Ann Arbor, Michigan in June 1991 (5.23). The firstrough-off included six flexible pavement sections, while the second rough-off was conductedon four flexible and four rigid pavement sections.
QA/QC recommendations for profile data collection (5.24, 5.25, 5.26) and data processing(5.27, 5.28, 5.29) have been developed based on the results of the first rough-off.Recommendations for identifying influential effects of "saturation spikes" and "lost lock" onprof'de roughness (5.30, 5.31, 5.32) were developed.
Saturation Data Anomaly
Distortion in the non-contact light sensor output caused by application of an external lightsource to the detectors will cause the signals to saturate. This "fools" the non-contact sensorelectronics into interpreting the road profile as being closer to the vehicle than it actually is.This saturated non-contact signal is then combined with the accelerometer signal and distortsthe output of the raw road profile as illustrated at stations 250 and 450 in Figure 5.2. Notethat this example of a saturation spike was extracted from a profilometer run on an Austintest site during the first rough-off. A second run on the same site resulted in a profilerelatively free of large spikes (Figure 5.3). There are, however, apparent small spikes atstations 3+00 and 4+25.
121
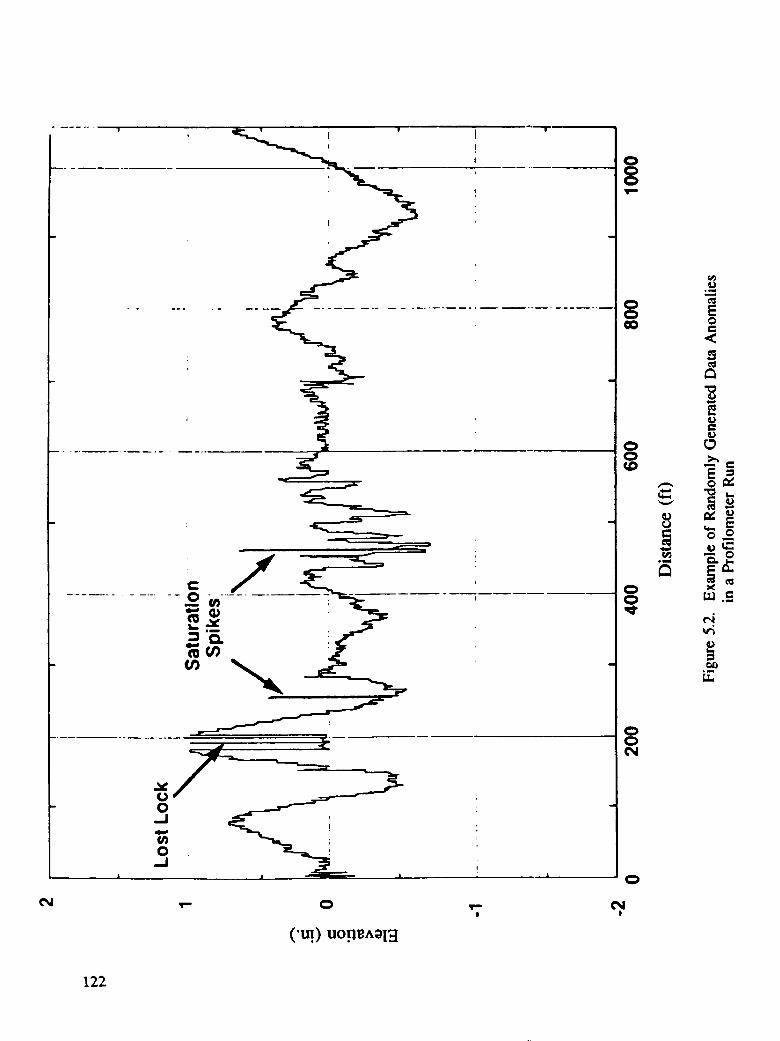
• _ I _
. _
- _ ' 0 ,__,.
•.___. _ ___o
__7_____ -................ . _ m._
_'_. :
J J t_
I |
122

o
=o- _ <
.................. oo
8_" ed
_d.o
LI.
o. {NJ
L
Ao
e |
('U].)UO.I]I_A_I3
123

Lost Lock Data Anomaly
Another distortion of the raw road profile output is created when the road pulse signal is lostdue to changes in road surface reflectivity. As the vehicle proceeds down the lane and theroad surface changes from a high light-reflective surface to a high light-absorbing surface, theroad signal pulse is greatly attenuated. In this instance, the non-contact sensor output thenreduces to a zero or flat output, and the resulting raw road profile output consists only of theaccelerometer output. An example of this type of data anomaly was observed during thesame profilometer run at station 2+00 (Figure 5.2). It is interesting to note that a saturationdata anomaly also developed within about 50 ft. (15.2 m) of the location of the lost lockanomaly. A second run on the same site (Figure 5.3) resulted in a dynamic profile free of"lost locks."
Face DIPstick_ Device
Although the Law inertial profilometer was the primary device selecled for use inmeasurement of longitudinal profile variations, the profilometer was sometimes unavailabledue to scheduling, equipment difficulties, or inaccessibility (e.g., Puerto Rico and Hawaii). Inthese instances the Digital Increment Profiler (DIPstick@) manufactured by Face ConstructionTechnologies, Inc. was selected as the backup device for profile measurements (5.33).
For proper use of the DIPstick device, a data handling plan (5.34) was developed andacceptance testing was conducted for the devices (5.35, 5.36). In addition, an evaluation ofroughness indices developed from DIPstick profile data (5.37) was completed. This enableddirect comparisons between the roughness indices generated by the Law profilometer and bythe DIPstick (5.33).
Profilometer-DIPstick Profile Comparisons
The present SHRP policy, in which the Dipstick profile data are substituted for Lawprof'flometer profile data, implies in its application that the two profiles are compatible. Thisimplication is not necessarily true, as indicated in Figure 5.4, for a flexible pavement site inAustin, Texas (from rough-off #1) or in Figure 5.5 for a rigid pavement site in Ann Arbor,Michigan (from rough-off #2). In addition, profile data for the Law profilometer aregenerated every 6 in. while the DIPstick data can only be developed at 12 in. spacings.
The calculation of roughness indices such as International Roughness Index (IRI), slopevariance (SV), and root-mean-square vertical acceleration (RMSVA) will no doubt yielddifferent results for these indices if the profiles do not match and the data point spacings aredifferent. There is a need to identify, characterize, and/or calibrate the relationship betweenthe profilometer and DIPstick data.
124

8
o_
8
• • • • • • • O
,,- 0 '7
(.m.) uo.u_^_13
125

PROFILOMETER PROFILEWorkshop 2, Rigid Section
02 [I
Q1
0
--ol.=_
--02oE -.O3._
-0.4-
--05-
--OB l l i l
0 200 4.00
I._tion(ft.)LWP
DIPSTICK PROFILEWorkshop 2, Rigid Section
01
O07
0.08
00_
00.4.=_•c_ 0 o3
rv 002
001".._
°--oo_--0O2
--OO.3
--0.04
--0.0_
-0.08
--0 07
-....O08 i i I i
O 2OO
(ft.)Forward
Figure 5.5. Comparison of Law Profilometer and Face DIPstick Prof'des--Rigid Pavement
126

In addition, the slope variance estimates developed for the Law profilometer are calculatedfrom Equation 5.1, which is based on slope values established from a horizontal baseline:
y_y2. (1/n)(_y)2
SVv = (5.1)n-1
where
SVp = prof'dometer slope variance,Y = difference in elevation of two points 1 ft. apart,
and
n -- number of readings.
This is at variance with the classical AASHO baseline for slope calculations, which wasdefined by a line connecting the back fire of the pulling vehicle and the wheel of thelongitudinal profilometerwa distance of 25.5 ft. The AASHO slope variance was calculatedusing Equation 5.2:
a ii
SVo = E Xi2 - (1/n)(_ XO2i-1 i-1
n- 1 (5.2)where
SV, = AASHTO slope variance,Xi = the it_ slope measurement,
andn = total number of measurements.
Comments on Status
There is a need to ensure that quality data are obtained in measuring the longitudinal profilewith either the Law profilometer, the Face DIPstick, or any other devices adopted by FHWA.In addition, it is essential to ensure compatibility of profile data among the four SHRPprof'dometers, with particular attention to the FHWA profilometer (located in the NorthCentral region), which has a shorter sensor spacing. The quality assurance activity could beaccomplished in annual profile workshops, reviews of quality assurance procedures, and on-site observations of profilometer operations.
127
Traffic Monitoring
Traffic Data Collection Requirements
After considering initial traffic needs (5.38) and available options ($.39), the traffic datacollection plan eventually adopted by SHRP-LTPP involved three levels (5.40):
1. A preferred approach that relied upon continuously operated weigh-in-motion (WIM)equipment
2. A desirable level that substituted automated vehicle classifiers (AVCs) for WIMequipment and added portable WIM measurements for a week each quarter
3. A minimum response that was similar to the desirable level but reduced the length oftime for the portable WIM counts
As noted in Table 5.1, the SHAs preferred the option that allows fi_r the installation of AVCsat GPS test sites, with portable WlM measurements on a quarterly basis to collect weightdata. With SHRP-LTPP impetus and a desire for better traffic data, the SHAs significantlyincreased the number of WIM sites (5.41) at LTPP sites.
The three alternatives for monitoring traffic data were further defined as follows:
• Preferred traffic data collection: permanent, year-round WIM equipment installed ateach site and operated continuously
• Desirable traffic data collection: a permanent, year-round site-specific AVCsupplemented by 1-week of WIM measurements for each season of the year at eachstudy site
• Minimum traffic data collection: a year-round AVC counting a minimum of 1 full yearduring each 5-year period, supplemented by one 48-hour weekend and one 48-hourweekday WIM session conducted during each season of the year
Site=Specific Versus Site-Related Data Collection
As envisioned in the SHRP-LTPP plan, all traffic data collection would take placeimmediately upstream or downstream of the LTPP pavement test sections (5.42). Thus, agiven traffic loading estimate for a particular LTPP section would be site-specific because itwould be based on traffic data collected from the particular test location. The traffic datacollection equipment was placed to ensure that no interruption or interference would develop.In instances where the traffic counting and weighing station is separated from the test location
128

TABLE 5.1. Traffic Data Collection Equipment Preferences
Region WIM AVC Other or Unknown Total Sites
N. Atlantic 58 59 18 135Southern 53 209 0 262Western 54 129 0 183N. Central 108 88 2 198Totals: 273 485 20 778Percentage: 35% 62% 3% 100%
129

and truck traffic varies between the two sites, additional traffic daa must be collected ateach site to document the relative difference in traffic loading at taaetwo sites.
Traffic Data in the L TPP NPPDB
The specific traffic data elements included in the LTPP NPPDB c,:msist of the Level 1Primary Loading Estimates (Figure 5.6) from the LTPP Central Traffic Database (5.43).These Level 1 records represent the "best estimate" of the traffÉc lc.ads experienced at eachLTPP site for each calendar year since the particular LTPP site wa:s opened to traffic. Theloading estimates are presented as the number of axles by weight range and axle type(singles, tandems, tridems, and quadrems) to which the LTPP pavement test section wasexposed that year. The FHWA 13-Class vehicle classification system and the standardFHWA formats are used in reporting traffic volume, classification, and weight data (5.44).
Equivalent single axle load (ESAL) estimates based on the traffic data and the pavementstructure identified in the NPPDB are stored in the two databases (5.45).
International Traffic Data Requirements
The traffic data requirements for international GPS test locations are to be the same asthose set for U.S. and Canadian sites. To help coordinators from the various countries tounderstand these requirements, an "International Traffic Data Collection Handbook" (5.46)was compiled incorporating the most important technical memoranda, reports, anddocuments. The handbook was initially distributed at the International CoordinatorsMeeting in England in November 1990.
Surface Friction
The LTPP pavement condition monitoring program included periodic surface friction datacollection on GPS and SPS test sections. This is accomplished through frictionmeasurements of LTPP sections conducted by the SHAs.
Friction Data Collection Frequency and Timing
Routine Monitoring Frequency
Routine monitoring was performed on GPS and SPS test sections during normal monitoringcycles if no major maintenance or rehabilitation action (e.g., an overlay, seal coat, or porousfriction course) had been undertaken on the test section. Routine friction measurementswere taken once every 2 years, or more frequently if desired by the participating agency.
130

Revised December 15, 1989
Study site locationYear
Data Availability Index (3 digits)Study site lane volume Standard Dev. Of Volume Est.
Sample Size (N) for Vol. Est.
Single axle weight distributionSingle axles counted Single axles weighedSingle axles estimated for the year
weight category 1: Definition _ Number of Axlesweight category 2: Definition _ Number of Axlesell;.
Tandem axle weight distributionTandem axles counted Tandem axles weighedTandem axles estimated for the year
weight category 1: Definition _ Number of Axlesweight category 2: Definition _ Number of Axlesetc.
Triple axle weight distributionTriple axles counted Triple axles weighedTriple axles estimated for the year
weight category 1: Definition _ Number of Axlesweight category 2: Definition _ Number of Axlesetc.
Quad + axle weight distributionQuad + axles counted Quad + axles weighedQuad + axles estimated for the year
weight category 1: Definition _ Number of Axlesweight category 2: Definition _ Number of Axlesetc.
Total Number of Truck & Combinations
Std Dev. of Truck Voi. Est. Sample Size for Truck VoI.ESt.
Annual ESAL for study site this year Std Dev. of ESAL Est.Weighted N for ESAL Est.
SN (structural number) for study site this yearD (Depth of concrete pavement)Number of historical modifications (version number)Cock for method used to estimate AADT
Date this update was createdComments
Repeat this record once for each year since the pavement section was opened for traffic. The entire set ofrecords is then repeated for each study site.
Figure 5.6. LTPP Central Traffic Database Primary Loading Estimates
131

Timing of Friction Measurements and Seasonal Variation
Each SHA selected the most appropriate time of year for conducting friction measurements inits area, based on the local experience and consideration of seasonal variation. Friction datawere collected for the same time of year with each round of routine monitoring cycles.
Monitoring Before and After Rehabilitation/Maintenance "l'reatment
Additional friction measurements were performed on the GPS and SPS test sections beforeand after a major maintenance or rehabilitation action (e.g., overlay, seal coat, or porousfriction course) had been completed. Guidelines for timing of friction measurements wasprovided by SHRP.
Friction Measurement Procedure�Equipment
Equipment
The locked-wheel friction tester (used in accordance with AASHTO T242, American Societyfor Testing Materials [ASTM] E274, supplemented with Appendix B of FHWA TechnicalAdvisory T 5040.17) was the preferred method for obtaining friction measurements.
Operating Speed and Air Temperature
The friction data and air temperature were collected with a calibrated locked-wheel frictiontester at 40 mph. Tests could be conducted at a lower speed if the legal maximum postedspeed was less than 40 mph. For QA/QC restrictions, friction measturements were notconducted when the air temperature fell outside the range of 32°F to 110°F.
Friction Data Collection on 500 ft. GPS Test Sections
Friction data were collected on 500 ft. GPS test sections at two locations. Because the SHRPsections were marked at 100 ft. stations, the first friction measurement was completed on thefirst half of the section between stations 0 and 2, while the second friction measurement wasobtained near the end of the section between stations 3 and 5. All measurements were
obtained from the center of the inner wheel path. Skid Data Sheet 1 (5.47) was used torecord the friction data for the 500 ft. GPS sections.
132

Friction Data Collection on 1000 ft. SPS Test Sections
Friction measurements were conducted at four locations within the 1000 ft. SPS sections:
1. First measurement (at the beginning) between stations 0 and 22. Second measurement (interior) between stations 3 and 53. Third measurement (interior) between stations 5 and 74. Fourth measurement (near the end) between stations 8 and 11
All measurements were conducted in the center of the inner wheel path. Skid Data Sheet 2(5.47) was used to record the friction data for 1000 ft. SPS sections.
Data Reporting
Skid Number
The surface friction data were reported as a Skid Number (SN), which is the ratio of thefrictional force to the test wheel load multiplied by 100.
Other Data Elements
The following data elements were also recorded on the skid data sheets: section identificationand operator data, date and time of measurements, equipment brand and model, SHAequipment number, date of last calibration, pavement surface type, air temperature, andcomments.
Other Monitoring: Maintenance
The maintenance activities undertaken on the LTPP sections will no doubt influence or affectthe results of the pavement studies. Within SHRP-LTPP, maintenance performed on a testsection was limited to that which would maintain the pavement in a safe and serviceablecondition (5.48). Because any previous maintenance perfom_ on an LTPP section couldaffect the pavement performance, both ongoing and historical maintenance data wereconsidered essential to pavement performance evaluation of SHRP-LTPP data. Revisions inthe type and level of maintenance or specific deferment or elimination of maintenance
strategies could bias pavement performance results (5.48). To minimize the impact of suchaction, it was necessary to establish maintenance guidelines for SHRP-LTPP.
133

Maintenance Policy
A maintenance policy was developed for the GPS test sections to establish a set of rules thatpermit a "reasonable" level of maintenance to be performed on the monitoring sections. Thepolicy was based on representative SHA preventive or routine maintenance procedures (5.49).The monitored sections were not to receive an artificially high amount of maintenanceattention simply because of designation as a national pavement test site. Maintenancetreatments were to be applied to a section in response to an observed pavement need, not inresponse to edicts to expend apportioned maintenance funds.
Scope and Objective
Maintenance guidelines were developed to ensure application of the same routine maintenanceaction to a SHRP-LTPP section as would be initiated at any similar site not included inSHRP. Specific guidelines were developed to ensure that maintenance actions were limited tothose that would not influence the structural response of the pavement. In particular,limitations were placed on activities that would reduce, limit, or mask the type and amount ofpavement performance information that could be obtained from the test site.Non--pavement--related maintenance activities for guard rails, lighting, and signs were not tobe restricted by the guidelines (5.49).
Maintenance Control Zone
A maintenance control zone (Figure 5.7) was established for each SHRP-LTPP monitored testsection to coordinate maintenance activities at the site and to reduce the influence of othertypes of maintenance activities on the performance of the pavement sections (5.48, 5.49).The zone was delineated to restrict maintenance within the conf'mes of the zone to specificallydesignated activities. The SHRP-LTPP maintenance guidelines were, therefore, only to beapplicable to maintenance activities performed within the maintenance control zone (5.48).
Safety-related maintenance could be performed at any time in accordance with the governingSHA standards. Safety-related maintenance activities included in this category are
• Spot patching of potholes• Punchouts
• Blowups• Other surface defects and restoration of skid resistance
Maintenance Requirements
The SHRP Regional Coordination Office Contractors (RCOCs) were to be advised, prior tocommencement of a maintenance operation in the control zone, of any actions that wouldcover the pavement surface and "hide" distresses or change the structural characteristics(5.48). Maintenance treatments within the control zone were to be completed using the
134

oT=;f Pavementmarking(paintstripe)
250-500' past endof MonitoringSite
- ,
/--- Po_aiar_te_at_ter_ndofMS_o_._/d_l:l_r_teOr
Maintenance 500' - _ l
Control- Monitoring- _lPM_oan_ite_o__ niSP_ofZone Site _ I delineator
Pavement marking(paintstripe)located500' inadvanceofMonitoringSite
Figure 5.7 Illustration of MaintenanceConu'olZone
135

SHA's standard procedures and materials. Details concerning all rnaintenance activities forthe LTPP-monitored sites were to be recorded on appropriate SHRP maintenance data forms.
For slowly deteriorating safety conditions, it was desirable that the SHA notify the SHRPRCOC in advance of any corrective action so that an assessment o1'the pavement conditioncould be made prior to application of the treatment. To ensure the attainment of the greatestamount of structural performance information from a test section, use of hot-mix asphaltconcrete (HMAC) overlays to restore skid resistance in the control :rune was discouraged.
Routine or Preventive Maintenance
The types of "routine" or "preventive" maintenance activities that were allowed on a SHRP-monitored section without RCOC notification included
• Crack sealing• Joint cleaning/sealing• Isolated spot pavement repairs
Other types of maintenance activities that were allowed on the SHRP-monitored sections butrequired coordination with the RCOC included application of the following types of sealcoats:
• Sand seal
• Chip seal• Aggregate seal• Slurry seal• Fog seal
Restoration or Rehabilitation Treatments
Maintenance, restoration, or rehabilitation treatments that should not be applied at the SHRP-monitored pavement sections in their first performance period (non-overlaid) include
• Milling, grinding, or use of heater-planer• Undersealing• HMAC or portland cement concrete (PCC) overlays• Slab jacking• Retrofitted underdrains or edge drains• Other specialized types of maintenance activities that affect the structural response or
performance of the test section
136

Maintenance Data Collection
The maintenance data collection plan addresses two separate time periods referred to as (1)historical data and (2) SHRP accumulated data. Historical data consist of informationcollected on or near the monitoring site prior to initiation of the site-specific SHRPmaintenance data collection program. SHRP accumulated data is defined as the informationcollected anytime after the initiation of SHRP monitoring of the site. The SHRPmaintenance data are accumulated using the collection system described in the remainder ofthis document. Historical data are recorded on a single maintenance data sheet, while theSHRP accumulated data are recorded on a series of maintenance data sheets.
The maintenance sheets were intended to record data items concerning maintenanceactivities that reasonably identify
• Existing pavement conditions prior to treatment• Properties and quantities of materials used• Construction techniques applied during treatment
Maintenance Data for SPS Test Sections
The data collection and reporting process for SPS test sites required the completion ofspecific data sheets, including some extracted from the "Data Collection Guide for Long-Term Pavement Performance Studies" (5.50), and other data sheets developed specificallyfor SPS. The SPS project-specific data sheets address construction data and special aspectsof the materials sampling and testing activities.
In general, data obtained from monitoring activities performed after construction will bereported on data forms similar to those used for GPS test sections (5.51, 5.52, 5.53, 5.54).In contrast to the GPS test sections, each SPS site is composed of several test sections.Monitoring data on SPS sections, however, are recorded as section-specific data. Therefore,all maintenance activities performed on these SPS test sections, after completion ofconstruction, should be recorded on a test section basis using appropriate data sheetscontained in Chapter 6 of the "SHRP-LTPP Data Collection Guide" (5.50).
Other Monitoring: Rehabilitation
The collection of rehabilitation data for SHRP test sections is separated into distinct"before" and "after" time periods. Rehabilitation data for the pre-SHRP period weregleaned from historical data on existing pavement sections. The data accumulated duringSHRP-LTPP studies were obtained through real-time data collection activities. The entry ofboth historical and current data in the LTPP National Pavement Performance Database (orin the National Information Management System) is essential because rehabilitation actionscan significantly affect pavement performance of the test sections and hence monitoringdata results.
137

Historical Rehabilitation Data
Historical rehabilitation data consisted of the information collect,ed on the test section from
original construction until initiation of site-specific SHRP rehabilitation data collectionactivities. The historical data for GPS and SPS sections are recorded on a single InventoryData Sheet (Figure 5.8) which is described in Chapter 2 of the "l)ata Collection Guide" forLTPP studies (5.55). The maintenance and work activities to be reported as historical dataare presented in Table 5.2.
SHRP Accumulated Rehabilitation Data for GPS Test Sections
Rehabilitation of the approved GPS test sections was not permitted during the SHRPmonitoring performance period, except when the condition of the test section dropped to alevel that required a rehabilitative measure. In this event, the RCOC was to coordinate thelast round of evaluation measurements with the scheduled rehabilitation action. Examplesof such rehabilitation actions are
* Extensive milling, grinding, grooving, or use of heater planer• Undersealing• Overlays (HMAC/PCC)• Slab jacking• Retrofitting underdrains or edge drains• Other specific types of activities that affect the structural response of the monitoring
site
For SHRP-LTPP these measures should have been applied to the pavement within aminimum of the designated 1250 ft. maintenance control zone (i.e., 500 ft. prior to the testsection, 500 ft. within the test section, and 250 ft. beyond the test section), as described inChapter 7 of the SHRP-LTPP "Data Collection Guide" (5.56).
If an activity is planned for the area outside of but not included within the maintenancecontrol zone, a transition zone between the treatment and the control zone should be ofsufficient length to ensure that the monitoring site is not influenced by the rehabilitativeactivity. The recommended transition zone length is 200 ft.
Rehabilitation Data for SPS Test Sections
The data collection and reporting process for SPS test sites requires the completion ofspecific data sheets, including some--extracted from the "Data Collection Guide for Long-Term Pavement Performance Studies" (5.56)--which were developed for the GPS and otherdata sheets developed specifically for SPS. The SPS project-specific data sheets addressconstruction data and special aspects of the materials sampling and testing activities. Dataobtained from monitoring activities performed after construction will be reported on dataforms similar to those used for the GPS test sections. In contrast to the GPS test sections,
138

*STATE ASSIGNED ID [ ]
SHEET 4 *STATE CODE [__ __]
INVENTORY DATA *SHRP SECTION ID [ j
LTPP PROGRAM
AGE AND MAJOR PAVEMENT IMPROVEMENTS
* 1.DATE OF LATEST (RE)CONSTRUCTION (MONTH/YEAR) L _./._ _J
* 2.DATE SUBSEQUENTLY OPENED TO TRAFFIC (MONTH/YEAR) [_._ __J_ _]
3J.,ATEST (RE)CONSTRUCTION COST PER LANE MILE
ON THOUSANDS OF DOLLARS) I ..... ,
MAJOR IMPROVEMENTS SINCE LATEST (RE)CONSTRUCTION
*4. *5. "6. 7. 8.WORK TOTAL COST l
WORK QUANTITY (THOUSANDS OFTYPE CODE (TABLE A. 17 THICKNESS DOLLARS PER
YEAR (TABLE A. 17) for units) (INCHF.S) LANE-MILE)
[-- --] [_ _] L _.] _ _ _
[_ _] [_ _] [ _.] .......
L _] L _] [...... ] .......
[_ _] [_ _] [ _.] .......
[_ _] [_ _] [ _.] .......
L __] [_ _] [ _.] _ __
* 9.YEAR WHEN ROADWAY WIDENED [ _]
*I0.ORIGINAL NUMBER OF LANES (ONE DIRECTION) [ ]
* 1I.FINAL NUMBER OF LANES (ONE DIRE,CTION) [ ]
*I2.LANE NUMBER OF LANE ADDEEF [. ]
NOTES: 1. Cost is to represent pavement structure cost. Non-pavement costs such as cut and f'dl work,work on bridges, culverts, lighting, and guard rails arc to be excluded.
2. A lane created by roadway widening should not be used for SHRP LTPP unless the pavementstructure under the entire lane was constructed at the same time and is uniform.
Figure 5.8. Inventory Data Sheet
139

Table 5.2. Maintenance and Rehabilitation Work Type Codes
Code
Crack Sealing (linear ft) ....................................................... 01Transverse Joint Sealing (linear fi) ............................................... 02Lane-Shoulder, Longitudinal Joint Sealing (linear fl) .................................. 03Full Depth Joint Repair Patching of PCC (sq yd) ..................................... 04Full Depth Patching of PCC Pavement Other than at Joint (sq yd) ......................... 05Partial Depth Patching of PCC Pavement Other than at Joint (sq yd) ......................... 06PCC Slab Replacement (sq yd) .................................................. 07PCC Shoulder Restoration (sq yd) ............................................... 08PCC Shoulder Replacement (sq yd) ............................................... 09AC Shoulder Restoration (sq yd) ................................................. 10AC Shoulder Replacement (sq yd) ................................................ 11Grinding/MiRing Surface (sq yd) ................................................ 12Grooving Surface (sq yd) ...................................................... 13Pressure Grout Subsealing (no. of holes) .......................................... 14Slab Jacking Depressions (no. of depressions) ....................................... 15Asphalt Subsealing (no. of holes) ................................................ 16Spreading of Sand or Aggregate (sq yd) ........................................... 17Reconstruction (Removal and Replacement) (sq yd) ................................... 18AC Overlay (sq yd) ......................................................... 19PCC Overlay (sq yd) ........................................................ 20Mechanical Premix Patch (using motor grader and roller) (sq yd) .......................... 21Manual Premix Spot Patch (hand spreading and compacting withroller) (sq yd) .............................................................. 22Machine Premix Patch (placing premix with paver, compacting
with roller) (sq yd) ........................................................ 23Full Depth Patch of AC Pavement (removing damaged material, repairing supporting
material, and repairing) (sq yd) ................................................ 24Patch Pot Holes - Hand Spread, Compacted with Truck (no. of holes) ...................... 25Skin Patching (hand tools/hot pot to apply liquid asphalt and aggregate) (sq yd) ............... 26Strip Patching (using spreader and distributor to apply hot liquid asphalt and
aggregate) (sq yd) ......................................................... 27Surface Treatment, single layer (sq yd) ............................................ 28Surface Treatment, double layer (sq yd) ........................................... 29Surface Treatment, three or more layers (sq yd) ...................................... 30Aggregate Seal Coat (sq yd) ................................................... 31Sand Seal Coat (sq yd) ....................................................... 32Slurry Seal Coat (sq yd) ...................................................... 33Fog Seal Coat (sq yd) ........................................................ 34Prime Coat (sq yd) .......................................................... 35Tack Coat (sq yd) ........................................................... 36Dust Layering (sq yd) ........................................................ 37Longitudinal Subdrains (linear It) ................................................ 38Transverse Subdrainage (linear ft) ............................................... 39Drainage Blankets (sq yd) ..................................................... 40Well System .............................................................. 41Drainage Blankets with Longitudinal Drains ........................................ 42
140

Table 5.2 (Continued)
Code
Hot-Mix Recycled AC (sq yd) .................................................. 43Cold-Mix Recycled AC (sq yd) ................................................. 44Heater Scarification, Surface Recycled AC (sq yds) ................................... 45Crack and Seat PCC Pavement as Base for New AC Surface (sq yd) ....................... 46Crack and Seat PCC Pavement as Base for New PCC Surface (sq yd) ...................... 47Recycled PCC (sq yd) ........................................................ 48Pressure Relief Joints in PCC Pavements (linear ft) ................................... 49Joint Load Transfer Restoration in PCC Pavements (linear ft) ............................ 50
Mill Off Existing Pavement and Overlay with AC (sq yd) ............................... 51Mill Off Existing Pavement and Overlay with PCC (sq yd) .............................. 52Other ................................................................... 53
Partial Depth Patching of PCC Pavement at Joints (sq yd) ............................... 54
141

each SPS site includes several test sections. Monitoring data on SI:'S sections will berecorded as section-specific data.
Instrumentation
The deterioration of the nation's highways during the past 15 years was the catalyst for theinitiation and implementation of SHRP-LTPP (5.57). The LTPP effort was undertaken in partto develop a better understanding of the impact of a number of environmental and smacturalfactors on pavement performance (5.38). The performance and behavior of the various GPSand SPS sections were scheduled for monitoring over time and across diverse environments,traffic loads, materials, pavement designs, maintenance strategies, and other influential factors(5.58).
Because of the combined number of GPS and SPS sites within LTPP, data acquisition formost monitoring activities was an annual affair. During SHRP-LTPP there have been two orthree rounds of FWD, profile, and distress data acquisition. In the normal data acquisitionprogram, there is no way to consistently investigate seasonal environmental effects onpavement behavior (i.e., present deflection response) or performance (i.e., distress, increase indeflection over time, etc.) because the measurements are taken within a few days out of eachyear.
In the latter portion of LTPP the pavement monitoring program was extended to includeseasonal testing of FWD deflection, accompanied by installation of instrumentation capable ofmonitoring short-term temperature and moisture fluctuations as well as longer term effectsdue to temperature and moisture regimes (e.g., frost heave). Instrumentation capable ofmeasuring these conditions was installed at a number of selected GPS and SPS sites.
Present Status
Pilot Studies
During the SHRP-LTPP instrumentation program two pilot studies were undertaken to exploreinstallation techniques, costs, and effectiveness of currently available sensors for measurementof temperature and moisture. One of the pilot installations was located in New York State(5.59); the other was located in Idaho (5.60).
Pavement Type
The Syracuse, New York, site is a flexible pavement section with a thick 9_ in. (23.5 cm)HMAC layer on a thick 22 in. (56 cm) granular base resting on a clayey silt with gravelsubgrade. The Idaho site is a rigid pavement section with a 91,_in. (23.5 cm) to 9_A in. (24cm) thick PCC layer over a 5 in. (12.7 cm) thick crushed gravel base and a 4 in. (10.2 cm) to
142

5 in. (12.7 cm) poorly graded gravel and sand subbase, resting on a silt to silty sandsubgrade.
Measurement Equipment
The equipment installed at the sites included instrumentation to measure temperature,moisture, frost depth, and depth to water table.
Temperature Measurements
Two types of sensors, thermocouples and thermistors, were used to measure temperature. Thesensors were arranged in strings and installed in such a way that temperatures could bemeasured at different depths beneath the pavement surface. The temperature measurementswith depth were expected to define the location of the freezing front; however, it was foundat the New York site that a resistivity probe could provide a more definitive location for thisphenomenon.
Moisture Measurements
The moisture measurement instrumentation included time-domain reflectometry (TDR) sensorsand a frequency-domain moisture monitor (Troxler Sentry 200). The TDR equipment isnormally used to locate breaks in buried cable; the frequency-domain equipment is generallyused for agriculture purposes.
Frost Measurements
The instrumentation for measuring frost penetration included a Cold Region Research andEngineering Laboratory (CRREL) resistance probe and a resistivity probe. The CRRELmeasurement method consists of measuring the contact resistance between adjacent probesunder an alternating current. The resistivity probe technique used standard geophysicalequipment to _ure both current and voltage.
Water Table Depth
A piezometer was used to measure the depth to the water table at the Idaho site. A waterlevel observation well consisting of a perforated plastic pipe surrounded by sand and extendedto ground level by a solid plastic pipe was used at the New York site.
143

Temporary Benchmark
Because the sites were located in regions where frost penetrates into the roadbed, the detectionof frost heave, volume expansion of wet materials, and growth of ice lenses was paramount.A temporary benchmark was established at each site to provide the capability for monitoringfrost heave and volume expansion. The benchmark at the New York site consisted of a 15 ft.(4.6 m) rod anchored at the bottom by a "Borros Point." A similar installation was used at theIdaho site.
Installation
Installation procedures and recommendations were developed for the two sites by SHRP loanstaff, the instrumentation engineer, and the appropriate regional personnel. The experiencegained by the two pilot studies should be helpful in future instrumentation activities.
References
5.1 Strategic Highway Research Program. "Distress Identification Manual for the PASCOFilms (PASCO-DIM)." Washington, D.C., March 1990.
5.2 Gibson, S. "PASCO Film Acceptance Review" (TRDF Technical Memorandum AU-148). Texas Research and Development Foundation, Austin, Texas, July 13, 1990.
5.3 Gibson, S. "Recommended Certification Criteria for PASCO FMA InterpretationTechnician" (TRDF Technical Memorandum AU-149). Texas Research andDevelopment Foundation, Austin, Texas, July 13, 1990.
5.4 Roper, H. "PASCO Distress Interpretation Procedure" (TRDF Technical MemorandumAU-154). Texas Research and Development Foundation, Austin, Texas, August 13,1990.
5.5 Gibson, S., H. Roper, and W. O. Hadley. "Pilot Study for PASCO DistressInterpretation" (TRDF Technical Memorandum AU-164). Texas Research andDevelopment Foundation, Austin, Texas, September 10, 1990.
5.6 Richter, C., Personal correspondence to Shahed Rowshan concerning IMS Level 1QA/QC checks for distress (PADIAS). Strategic Highway Research Program,Washington, D.C., June 16, 1992.
5.7 Benson, K., et al. Distress Ident(fication Manual for the Long-Term PavementPerformance (LTPP) Studies (Report No. SHRP-P-338). National Research Council,Strategic Highway Research Program, Washington, D.C., 1990.
144

5.8 Benson, K. "Recommended Quality Control of the Manual Distress Survey Data"(TRDF Technical Memorandum AU-158). Texas Research and DevelopmentFoundation, Austin, Texas, August 15, 1990.
5.9 Benson, K. "Recommended Certification Procedures for the Manual Distress Survey"(TRDF Technical Memorandum AU-156). Texas Research and DevelopmentFoundation, Austin, Texas, August 23, 1990.
5.10 Strategic Highway Research Program. "SHRP-LTPP Manual for FWD Testing andOperational Field Guide. Version 1.0" (Operational Guide No. SHRP-LTPP-OG-002).Washington, D.C., January 1989.
5.11 P-001 Technical Advisory Staff. "Data Readability and Completeness" in FWDSCAN(Version 1.20) Program Background and User's Guide, August 1989.
5.12 P-001b Technical Advisory Staff. "Analysis of Section Homogeneity, NonrepresentativeTest Pit and Section Data, and Structural Capacity" in FWDCHECK Version 2.00,Volume II User's Guide, January 1991.
5.13 Strategic Highway Research Program. "Layer Moduli BackcalculationProcedures--Rules and Guidelines." Washington, D.C., January 1992.
5.14 Hadley, W. O. "Quality Assurance Checks on FWD Data" (TRDF TechnicalMemorandum AU-207). Texas Research and Development Foundation, Austin, Texas,May 18, 1992.
5.15 The AASHO Road Test, Report 5, Pavement Research. Highway Research BoardSpecial Report 61E. National Academy of Sciences, National Research CouncilPublication No. 954. Washington, D.C., 1962.
5.16 Roper, H. "Plan for Evaluation and Acceptance of K.J. Law Profilometer" (TRDFTechnical Memorandum AU-53). Texas Research and Development Foundation,Austin, Texas, February 28, 1989.
5.17 Roper, H. "Personnel/Operator Requirements for SHRP K.J. Law Profilometers" (TRDFTechnical Memorandum AU-54). Texas Research and Development Foundation,Austin, Texas, February 28, 1989.
5.18 Roper, H. "Statistical Analyses of IRI from SHRP Profilometers" (TRDF TechnicalMemorandum AU-66). Texas Research and Development Foundation, Austin, Texas,July 13, 1989.
5.19 Roper, H. "Preliminary Profilometer Data Analysis" (TRDF Technical MemorandumAU-67). Texas Research and Development Foundation, Austin, Texas, May 31, 1989.
5.20 Roper, H. "FHWA Profilometer Data Analysis" (TRDF Technical Memorandum AU-77). Texas Research and Development Foundation, Austin, Texas, October 29, 1989.
145

5.21 High, R. "Experimental Plan for the Comparisons of SHRP Profilometers" (TRDFTechnical Memorandum AU-100). Texas Research and Dexelopment Foundation,Austin, Texas, January 26, 1990.
5.22 Roper, H. "Profilometer Test Plan" (TRDF Technical Memorandum AU-101). TexasResearch and Development Foundation, Austin, Texas, Janttary 29, 1990.
5.23 Turay, S. "Ann Arbor Comparative Testing Results" Pavement Management Systems(PMS) Ltd. Memorandum, August 28, 1992.
5.24 Roper, H. "Profile Data Collection Quality Control and Quality Assurance" (TRDFTechnical Memorandum AU-82). Texas Research and Development Foundation,Austin, Texas, September 29, 1989.
5.25 Roper, H. "Profile Field QC Procedures" (TRDF Technical Memorandum AU-83).Texas Research and Development Foundation, Austin, Texas, October 6, 1989.
5.26 Roper, H. "Profile QC Procedures for Data Collection Assurance" (TRDF TechnicalMemorandum AU-85). Texas Research and Development Foundation, Austin, Texas,October 7, 1989.
5.27 Roper, H. "Guidelines of Profile Data Processing" (TRDF Technical Memorandum AU-98). Texas Research and Development Foundation, Austin, Texas, December 31, 1989.
5.28 Roper, H. "Profile Quality Assurance Software" (TRDF Technical Memorandum AU-138). Texas Research and Development Foundation, Austin, Texas, June 15, 1990.
5.29 Roper, H. "Initial Evaluation of the Pre-Processor for Profile Data Processing" (TRDFTechnical Memorandum AU-156). Texas Research and Development Foundation,Austin, Texas, August 14, 1990.
5.30 Hadley, W. O. "Initial Statistical Analysis of the February 1!)90 SHRP ProfilometerWorkshop Results" (TRDF Technical Memorandum AU- 131). Texas Research andDevelopment Foundation, Austin, Texas, May 4, 1990.
5.31 Hadley, W. O. "Status and Plan of Action for Task 2.2.01, Comparative Testing"(TRDF Technical Memorandum AU-140). Texas Research and DevelopmentFoundation, Austin, Texas, June 19, 1990.
5.32 Hadley, W. O. and H. Roper. "Comparative Testing of SHRP Profilometers"(Transportation Research Record 1311). Washington, D.C. 1991.
5.33 Roper, H. "Recommendations on the Specifications for the Purchase of Dipstick"(TRDF Technical Memorandum AU-76). Texas Research and Development Foundation,Austin, Texas, October 29, 1989.
146

5.34 Roper, H. "Dipstick Data Handling Plan" (TRDF Technical Memorandum AU-153).Texas Research and Development Foundation, Austin, Texas, August 13, 1990.
5.35 Roper, H. "SHRP-LTPP Dipstick Acceptance Testing" (TRDF Technical MemorandumAU-92). Texas Research and Development Foundation, Austin, Texas, November 22,1989.
5.36 Roper, H. "SHRP-LTPP Dipstick Acceptance Testing for Southern Region" (TRDFTechnical Memorandum AU-142). Texas Research and Development Foundation,Austin, Texas, June 22, 1990.
5.37 High, R. "Dipstick Data Analysis" (TRDF Technical Memorandum AU-94). TexasResearch and Development Foundation, Austin, Texas, December 1, 1989.
5.38 Strategic Highway Research Program Research Plans, Final Report. TransportationResearch Board, Washington, D.C. May 1986.
5.39 Hallenbeck, M. and K. Gupta. "The SHRP Traffic Data Requirements." WashingtonState Transportation Center (TRAC), Seattle, Washington, August 1991.
5.40 Strategic Highway Research Program. "Framework for Traffic Data Collection at GPSTest Locations." Washington, D.C., January 1989.
5.41 "SHRP Traffic Data Collection and Analysis Expert Task Group meeting notebook."Compiled by Texas Research and Development Foundation, Austin, Texas, May 1992.
5.42 German, J. L. "SHRP-LTPP Guidelines for Traffic Data Collection Plans." StrategicTexas Research and Development Foundation, Austin, Texas, October 1991.
5.43 Hallenbeck, M. "SHRP-LTPP Traffic Database Design." Strategic Highway ResearchProgram, Washington, D.C., August 1990.
5.44 Traffic Monitoring Guide. US Department of Transportation, Federal HighwayAdministration. Washington, D.C. June 1985.
5.45 Hallenbeck, M. "Procedures for Manipulating SHRP-LTPP Traffic Data." WashingtonState Transportation Center (TRAC), Seattle, Washington, August 1990.
5.46 German, J. L. "SHRP-LTPP International Traffic Data Collection Handbook." TexasResearch and Development Foundation, Austin, Texas, September 1991.
5.47 Strategic Highway Research Program. "Skid Data Collection for SHRP Test Sections"(TRDF Reference Number MG0014). Washington, D.C., May 5, 1989.
5.48 Strategic Highway Research Program. "SHRP Guidelines for Maintenance of GeneralPavement Studies (GPS) Test Sections" (Operational Memorandum SHRP-LTPP-OM-001). Washington, D.C., July 1988.
147

5.49 Elkins, G. E. "Policy for Pavement Maintenance on GPS Sections" (TRDF TechnicalMemorandum T-001). Texas Research and Development Foundation, Austin, Texas,May 26, 1988.
5.50 Strategic Highway Research Program. "Data Collection Guide for Long-Term PavementPerformance Studies," Chapter 6: "Maintenance Data Collect!ion" (Operational GuideSHRP-LTPP-OG-001). Washington, D.C., January, 1990.
5.51 Strategic Highway Research Program. "SPS Data Collection Guidelines for ExperimentSPS-1, Study of Structural Factors for Flexible Pavements" (Operational MemorandumNo. SHRP-LTPP-OM-026). Washington, D.C., December 1'_'91.
5.52 Strategic Highway Research Program. "SPS Data Collection Guidelines for ExperimentSPS-2, Strategic Study of Structural Factors for Rigid Pavements" (OperationalMemorandum No. SHRP-LTPP-OM-028). Washington, D.C.., February 1992.
5.53 Strategic Highway Research Program. "SPS Data Collection Guidelines for ExperimentSPS-5, Rehabilitation of Hot Mix Asphalt Concrete Pavements" (OperationalMemorandum No. SHRP-LTPP-OM-015). Washington, D.C., October 1990.
5.54 Strategic Highway Research Program. "SPS Data Collection Guidelines for ExperimentSPS-6, Rehabilitation of Jointed Portland Cement Concrete Pavements" (OperationalMemorandum No. SHRP-LTPP-OM-023). Washington, D.C., May 1991.
5.55 Strategic Highway Research Program. "Data Collection Guide for Long-Term PavementPerformance Studies," Chapter 2: "Inventory Data Collection for LTPP." (OperationalGuide No. SHRP-LTPP-OG-001). Washington, D.C., January 1990.
5.56 Strategic Highway Research Program. "Data Collection Guide for Long-Term PavementPerformance Studies," Chapter 7: "Rehabilitation Data Collection." (Operational GuideNo. SHRP-LTPP-OG-001). Washington, D.C., January 1990.
5.57 America's Highways: Accelerating the Search for Innovation (Special Report 202,Strategic Transportation Research Study: Highways). Transportation Research Board,Washington, D.C. 1984.
5.58 High, R. "Data Analysis Plan for LTPP Studies" (TRDF Technical Memorandum AU-36). Texas Research and Development Foundation, Austin, Texas, March 29, 1989.
5.59 Pavement Management Systems (PMS) Ltd. "Seasonal Testing Instrumentation Pilot"(GPS 361011; IH481.5.B). E. Syracuse, New York, October 1991.
5.60 Nichols Consulting Engineers. "Seasonal Instrumentation Pilot Study" (InstrumentationInstallation, Section 163023IN - Idaho). Reno, Nevada. June 1992.
148

Section 6Information Management System (IMS)
Background
A major impediment to past pavement research efforts was the availability and accessibility ofcomprehensive, diverse, yet consistent traffic materials, structural, and climatic data fordifferent pavement types. There is no doubt that datasets containing variable and inconsistentdata make it extremely risky to develop inferential conclusions. Because of historicalproblems with data comprehensiveness, quality, and consistency, it is of strategic importanceto develop a national database that can overcome these flaws and allow researchers to pursuestudies of long-term pavement performance with confidence.
The principal goal of the Strategic Highway Research Program Long-Term PavementPerformance (SHRP-LTPP) program was to design an approach for the collection ofinformation and development of analysis procedures capable of providing short-, intermediate-and long-term findings for improving overall pavement performance. As a consequence, amajor activity of SHRP-LTPP was the establishment of a National Pavement PerformanceDatabase (NPPDB) to support the goals, objectives, and needs of LTPP.
LTPP Information Management Systems
From the outset, one of the basic objectives of SHRP was the establishment of the NPPDB to
store all the data being collected and generated through LTPP (6.1). The following types ofdata are collected in LTPP and stored in the N'PPDB:
• Inventory (as built)• Materials Characterization
• Longitudinal Profile• Deflection
• Transverse (Cross) Profile• Distress• Friction• Maintenance• Rehabilitation• Climate• Traffic
149

An Information Management System (IMS) consisting of four regional systems and a centralsystem was developed in SHRP-LTPP to service the NPPDB. The National InformationManagement System (NIMS) is the central system (6.2). The NIMS comprises the hardwareand software systems that were assembled to house the NPPDB. Fhis system is administeredby and resides at the Transportation Research Board (TRB). The four regional systems aredesignated Regional Information Management Systems (RIMS). LTPP data were generallyreceived, checked, and entered at the RIMS by the Regional Coordination Office Contractor(RCOC) personnel under the direction of a SHRP Regional Engineer. Periodic uploads weremade from the RIMS to the NIMS.
A critical function of the IMS is the verification and validation of the accuracy and correctnessof the data received and stored in the NPPDB. The NPPDB data must pass several IMS-basedquality assurance (QA) checks before being released to the public from NIMS. These checksverify the presence, reasonableness, and validity of the data. The procedures for data checksand data uploads to the NIMS are critical elements in the SHRP-LTPP IMS.
SHRP-LTPP Regions
Regional offices were established to coordinate SHRP-LTPP-related activities across theUnited States and Canada. Each region includes several states and/or provinces, with testsections located throughout the boundaries. These offices operate as regional data collectionand validation centers for pavement test section data.
The four SHRP regions were selected primarily on the basis of climatic considerations (6.2).The region boundaries were adjusted to correspond to state boundaries as illustrated in Figure6.1 (6.3). The North Atlantic region corresponds roughly to the wet-freeze AmericanAssociation of State Highway and Transportation Officials (AASHTO) classification, while theSouthern region is primarily a wet-nonfreeze zone. The North Central region is predominantlywet-freeze, while the Western region contains both dry-freeze and dry-nonfreeze.
Note that the climatic zone designations do not necessarily represent the environmentalconditions at a specific location within that region. For example, a wet-nonfreeze region (e.g.,West Coast states) could in fact contain wet-freeze areas at higher elevations.
RIMS functions involve primarily data collection, data validation, and data entry. Regionalstaff members maintain a working relationship with all the data providers and have thetechnical expertise to judge data quality; hence their participation is essential to the success ofthe IMS.
Inventory, maintenance, rehabilitation, and traffic data are collected at the state level andforwarded to the appropriate regional center. The regional centers are responsible for thecollection of test and monitoring data on the pavement sections. All data collected are enteredin the RIMS through a menu-driven system or are loaded by programs that read the data frommachine-readable media. Quality checks are incorporated into all update programs,
150

151

and reports are designed to provide additional checks. Pavement data are transferred to theNIMS after validation at the regional level.
Information Sources
Several information sources describe in detail the data housed wilhin the LTPP database and
how it was collected for the NPPDB. The SHRP-LTPP "Data Collection Guide" (DCG) (6.4)is the main source of data collection instructions and data sheets lbr the LTPP program.Detailed data collection guides have been developed for the materials characterization andsampling program and for most of the activities defined within the pavement monitoringprogram (6.4).
An IMS schema report describes the data structure as it is implemented in the OracleRelational Database Management Systems and illustrates the data tables (logical groups ofdata) and the fields (or data elements) contained within those tables. The schema alsoidentifies the key (index) fields and the data types associated with each field.
The IMS data dictionary report provides a more thorough description of each of the fields (ordata elements) and various items of interest about each of the fields.
The IMS schema and data dictionary reports are updated as the IMS develops and evolves,and they are provided on disk to researchers requesting SHRP data. The current versions ofthe reports are normally included in the latest version of the Database Structure ReferenceManual (6.5) of the LTPP IMS Manuals.
Data Collection Guide
The primary purpose of the DCG is to provide a uniform basis for data collection during long-term monitoring of the performance of LTPP test sections. Data items considered to be ofhigh priority for achieving the goals of LTPP are identified, but data items that are desirablefor inclusion in the NPPDB for other purposes are also included. The DCG is able toincorporate modifications and additions that will become necessary as technical advances aremade and other research needs become better defined. To ensure that critical data will be
available for the future development of pavement performance models, particular emphasis isplaced on collection of data items considered essential to long-term pavement performance.
The DCG was initially developed for use with General Pavement Studies (GPS) sections, butmany of the DCG sheets are also used with Specific Pavement Studies (SPS) sections.Additional data sheets and tables have been designed and used to record data collected fromthe SPS sections.
152

Schema Report
The schema report defines the various tables (categories of data) and fields (individual piecesof data) housed within NPPDB and identifies how they are stored in the database. Inaddition, the schema identifies the fields in the database that belong together as a record, therecords that reside in a certain table, and the tables that constitute a specific data module.
Each of the data modules (inventory, traffic, distress, etc.) consists of numerous tablesencompassing one or more data sheets. These tables represent a collection of informationabout a specific item (the location of all LTPP pavement sections by state, elevation,coordinates, etc.). Each table is a collection of records that contain data about a specificpavement section. Each record consists of individual fields that represent the smallestcategory of information in the database.
Excerpts from the inventory (INV) data module of the IMS schema are presented in Figure6.2. Specifically, the INV_AGE and INV_GENERAL tables are included in the figure. Oneof the records in the Inventory Module is the type of pavement surface (i.e.,PAVEMENT_TYPE) existing when a specific pavement section (SHRP_ID andSTATE_CODE) was accepted in the LTPP program. This field and many other closelyrelated fields (LANE_WIDTH, SUB_DRAINAGE_TYPE, etc.) that further describe thepavement section are combined to form the IMS INV_GENERAL table. The inventory dataare related to one of the seven modules constituting the LTPP IMS database.
Key Fields
Key fields identify a unique set of fields (dataset) that form a record within a table. Similarto indices for arrays, the key fields define how the data will be stored or retrieved. The twoprincipal key fields within the IMS are SHRP_ID and STATE_CODE, which are the twounique fields that identify a specific pavement section. Storage for all data for a particularsection is related to these two fields. The key fields are identified in the schema by left-justified names composed of all capital letters. For example, the key fields for IMS tableINV_AGE (Figure 6.2) are SHRP_ID, STATE_CODE, CONSTRUCTION_NO, andCONSTRUCTION_DATE; the key fields for table INV_GENERAL are SHRP ID,STATE_CODE, and CONSTRUCTION_NO.
Other Fields
The other fields (i.e., besides the key fields) are used to identify the individual pieces of datain records and are identified by capitalized name combinations indented one column space tothe right. For example, the other fields in IMS table INV_AGE (Figure 6.2) that are relatedto the project identified by the key fields are TRAFFIC_OPEN_DATE,CONSTRUCTION_COST, YEAR_WIDENED, ORIGINAL_NO_LANES,FINAL_NO_LANE, LANE_ADDEDNO, and RECORD_STATUS.
153

INV_AGE Age of pavement data (Data Sheet: Inveng,ry 4).
SHRP_ID NUMBER(4.0)
Key Fields STATE_CODE NUMBER(2,O)CONSTRUCTION_NO NUMBER(2,O)CONSTRUCTION_DATE DATF_(7)
TRAFFIC_OPEN_DATE DATE(7)CONSTRUCTION_COST NUMBER(5,0)
Other Fields YEAR_WIDENED NUMBER(2,0)ORIGINAL NO LANES NUMBER(I,0)FINAL NO LANES NUMBER(I,0)LANE_ADDED_NO NUMBER(1,0)RECORD_STATUS CHAR(I)
INV_GENERAL Geometric, drainage, and other general information requiring the cons_ction number. (DataSheets: Inventory 1, 2, 3).
SHRP_ID NUMBER(4,0)
Key Fields STATE_CODE NUMBER(2,0)CONSTRUCTION_NO NUMBER(2,0)
NO_OFLANES NUMBER(I,0)PAVEMENT_TYPE NUMBER(2,0)PAVEMENT_TYPE_OTHER CHAR(40)LANE_WIDTH NUMBER(3,1LANE_NO NUMBER(I,0)
Other Fields SUB_DRAINAGE_LOCATION NUMBER(I,0)SUB_DRAINAGE_TYPE NUMBER(I,0)SUB_DRAINAGE_TYPE_OTHER CHAR(40)LONG_DRAIN_DIAMETER NUMBER(2,1)LATERALS_SPACING NUMBER(3,0)DEPTH TO RIGID NUMBER(3,1)
RECORD_STATUS CHAR(i)
Figure 6.2. Schema Reports for Two Tables Developed from Inventory Data
154

These fields can be composed of several types or forms, such as NUMBER, CHAR(acter), orDATE. The assignment of numerical fields (or NUMBER) must be made with a knowledgeof the expected ranges of values, based on engineering knowledge and judgments. Theassignment of a numeric value, including the total number of digits and decimal digits,implies an absolute range that will be stored in the IMS database. For example,NUMBER(5,2) implies a maximum of five total digits with two of the digits located to theright of the decimal (e.g., 123.45). The maximum value that could be stored in this field is999.99 and the minimum value would be -99.99 (the minus sign counts as a digit).Therefore, NUMBER(5,2) sets an absolute value range for numeric fields. CHAR(10) typefields are alphanumeric fields that may contain any valid alphanumeric character up to thenumber specified in the parentheses--10 in this example.
Data Dictionary Report
The data dictionary is a supplemental report that provides the IMS user with descriptions ofthe various fields or data elements in each table. The Data Dictionary entry identifies theorigin of the data (data sheet and item, etc.) and presents a brief description of the field (datatype), data ranges, and associated information. An excerpt of the Data Dictionary for portionsof the (SKID) data module is presented in Figure 6.3.
The rules associated with the IMS data dictionary determine the amount and type of data thatcan be input in each field. For example, the data dictionary defines the length of a field, thetype of data to be entered (numeric, alphabetic, date, etc.), and the acceptable ranges for thedata (e.g., a positive number from 1 to 100). For example, in Figure 6.3 SKID_SURFACE isidentified as a number (1.0) data type or integer (i.e., length of 1 with no decimal). Thesurface type can then be either AC (1), Concrete (2), Surface Treatment (3), or Other (4).
Range checks are conducted to ensure that the numeric field values fall within defined limits.Some ranges are absolute and define the maximum (and/or minimum) values possible for thatdata element. For example, in a sieve analysis the value must be less than or equal to 100%passing a sieve (i.e., maximum limit of 100) and greater than or equal to 0% passing a sieve(i.e., minimum limit of 0). In this case the absolute range would be 0 to 100. Other rangechecks represent comparisons of numeric data with normally expected limits of the dataelement (e.g., a SKID_NO_BEGIN or SKID_NO_END is expected to be between 30 and 70for treaded fires).
When data are entered in a field, the computer QA program checks the data in the fieldagainst the format specified for that field in the data dictionary. If the data fall outside thenormal expected range but within the absolute limits, the computer displays warning messagesbut allows data entry to continue. In this situation the data can be double-checked foraccuracy. If the data fall outside absolute limits, an error message is displayed, the value willnot be allowed as input, and data entry correction is required before moving from theparticular field.
155

SKID NO BEGIN IMS Table: MON_SKID
The skid number (friction number) between the vehicle wheel tire and the ptvement at the beginning of thesection (be_weon station 0-2).
Data Type: NUMBER(2,0)Units: Percent Validation:
QA Minimum: X QA Range: 30 - 70Source: MONITORING SKID SHEET 1. Item number: 3
SKID_NO_END IMS Table: MON_SKID
The skid number (friction number) betwee.a the vehicle wheel tire and the pavement at the end of the sectionCoetween station 3-5).
Data Type: NUMBER(2,O)Units: Percent Validation:
QA Minimum: X QA Range: 30 - 70Source: MONITORING SKID SHEET 1. Item number: 4
SKID_SPEED IMS Table: MON_SKID
The speed at which the vehicle was traveling when the skid numbers were obtained.
Data Type: NUMBER(2,0)Units: MPH Validation:
QA Minimum: X QA Range: 35 -45Source: MONITORING SKID SHEET I Itemnumber: 5
SKID_SURFACE IMS Table: MON_SKID
Code for the general type of pavement surface.
Data Type: NUMBER(I,0)Units: Validation: AC (1), Concrete (2),
Surface Treatment (3),Other(4)
QA Minimum: QA Range:Source: MONITORING SKID SHEET I ItemNumber:.II
Figure 6.3. Data Dictionary Excerpt for Friction (SKID)
156

Certain fields (particularly the primary key fields) are mandatory and cannot be successfullycompleted until an acceptable entry has been entered in that field. Because some recordsdepend on information residing in basic parent records, data for parent records must beentered before data can be entered in dependent records, or an error message will occur.
Data Types, Elements, and Sources
The NPPDB (or NIMS) is the central repository for all LTPP data. The NPPDB consists ofdata uploaded from the four regional centers along with data entered direcOy at the nationalcenter. All requests for LTPP information or data fries from the user community areprocessed at the NPPDB (or NIMS). The data processed directly at the NIMS include theenvironmental data and all administrative data (e.g., information for new pavement sections,experiment assignments, and code tables). Each region is responsible for the data on theSHRP pavement sections located within its assigned states; therefore, there is no datacollection overlap between states. Table 6.1 presents an IMS data processing summary.
The process of transferring data from the RIMS to the NIMS is termed a NIMS upload, andthe collection of programs that control the process is called NIMS upload software.Administrative data are periodically sent to the RIMS. All new procedures, modifications tothe IMS structure, and code changes are also initiated at the NIMS. This process oftransferring data from the NIMS to the RIMS is termed a NIMS download. The proceduresfor the transfer of information are described in the SHRP Programmer's Reference Manual(6.6) and in the LTPP NIMS and RIMS User Manuals (6.7, 6.8).
IMS QA Process
The QA concept of data checks is presented graphically in Figure 6.4. The data checksinvolve (1) internal QA checks by state highway agencies (SHAs) of historical data, (2) QAchecks by SHRP contractors of specific data such as environmental and distress data, (3)regional QA checks of all data by RCOCs, and (4) sophisticated and comprehensive QAchecks of all data within the NPPDB. The final checks result in the eventual release of data
at the section (Level 1) or experiment (Level 2) levels. This QA process is necessary toassure the researchers that the data can be trusted and that their f'mdings andrecommendations are based on quality data.
Specifically, the components of the IMS QA plan are performed in the following sequence:
1. Data collection procedures are documented and executed for each module in the IMS to
ensure that historical and monitored data are collected in similar format, types, conditions,etc. Internal QA checks are instituted to check for obvious mistakes, data anomalies, etc.
157

Table 6.1. IMS Data Processing Summary (6.4)
Data Type Collection Frequency Source
Inventory Once SHAMaintenance Per activity SHA
MonitoringFalling Weight Deflectometer Varies (1) FWDDistress Every 1 to 2 years PASCO/ManualTransverse Prof'de Every 1 to 2 years PASCO/DipstickProfile Annual Profilometer/
DipstickSkid Every 2 years SHA
Rehabilitation Per activity SHAMaterials Testing Once SHRP Testing LabTraffic Varies (2) National Traffic Database (NTDB)Climate Update every 2 years National Climatic Database (3)
(NCDB)
(1) 12--14 times per year in alternate years for seasonal monitoring; once every 5 years for other sites.(2) Continuous weigh-in-motion (WIM) or continuous automated vehicle classification plus seasonal WIM.(3) Data obtained from National Climatic Data Center (NCDC).
158

Data from SHAs(Internal QA Checks)
Data availableto the source Data in
oily QuestionRIMS
from SHRPContractors
(QA Checks)Data in
Data in QuestionQuestion
QA Check atRegions
i IJ Climatic lil NIMS -," | Traffic ]i!J
Database
...............; ,............JJ Summaries .....................................................i1 I Summaries __
Datain JI l O_tainQuestion Question '_
at NIMS //........... _:i7
,eve,,W/ ,ove,_%,/'ovo'_N--Release-__ ,,.Q.A.C.h.e._.k,_.,_ ......R.e!e.a.s°.._7
Public Research-'_.,
_" Community _"\ .......................................................................#
Figure 6.4. Data Flow in the LTPP IM$
159

2. Regional review of all input at RIMS is undertaken to identify cJbvious data collection anddata entry errors.
3. Internal checks are executed at the NIMS to identify data entry problems and errors.
4. The formal IMS QA software programs are executed at the NIMS. This componentinvolves nine categories of QA checks defined within two release levels.
The formalized computer-based QA checks involve data entry checks at the RIMS and NIMS,five QA checks at the NIMS on a section-by-section basis, and four QA checks at the NIMSon an experiment-by-experiment basis.
RIMS/NIMS Data Entry Check
Data entry checks programmed in the RIMS/NIMS include mandatory, logic, range, and dataverification checks (6.9). The mandatory checks involve checks for non-null entries in all keyfields and other designated fields. The RIMS will require entry in these positions or willinvoke an audible warning and message that data are required in the field.
Logic checks are also included to ensure data compatibility across uLbles. An example of alogic check is checking that the minimum data value is less than or equal to the mean, whichis less than or equal to the maximum for a given parameter.
Range checks are enforced to ensure that numeric field values fall within defined limits.Absolute limits (i.e., theoretically possible range limits) and warning or expected limits (i.e.,practical range limits) are used.
Verification checks are instituted systemwide in the NIMS to verify that the SHRP-LTPPsections have been authorized for LTPP and are included within the
EXPERIMENT_SECTION table before any data from that section can be entered in the IMS.
Level 1: Section Release
The In'st release level is a section-by-section release process involving five individual QAchecks defined as A through E checks (6.3, 6.10). The Level 1 release QA checks arepresented in Figure 6.5 and involve the following activities:
Check Description
A Random checks to ensure correct RIMS-NIMS upload exchangeB Data dependency checks to ensure that basic, essential section information
is recorded in NIMS (location, elevation, etc.)C Minimum data search for critical elements (e.g., friction data should include
skid number)
160

D Expanded range checks to identify data elements that fall outside anexpected range
E Intramodular checks to verify the consistency of data within data modules
These Level 1 data checks are structured to ensure data quality in a particular SHRP section,but do not address QA requirements between sections, states, and regions. These moresophisticated checks are required at the next release level.
The five checks (A--E) in the Level 1 release category (6.9) are hierarchical in concept andmust be conducted in succession as indicated in Figures 6.5 and 6.6. In this concept, the datadependency checks (i.e., B check) will not be processed until the RIMS-NIMS data checktransfer (i.e., A check) has been successfully completed. Similarly, the E--level checks(intramodular) are not initiated until the range checks (D check) have been successfullycompleted. After the E check has been conducted and the data in the particular IMS tablepasses the check, that IMS table can be released for public use.
It should be noted that the QA checks are conducted on the individual tables within IMS andnot on the SHRP sections as a whole. For that reason, the Level 1 release could allow somedata to be released for a section (e.g., friction results) while other section data that fail tomeet the checks (e.g., climate) would not achieve the release status.
Once records have passed through sublevel E, the data are available for a section release(6.10). These data are accompanied by an appropriate disclaimer from SHRP:
SHRP-LTPP Section Release Disclaimer
The SHRP-LTPP data are available for release at two levels. The first level of datarelease (Level 1) involves section-by-section data availability searches of the IMS, andincludes a minimal number of pre-release data checks on the individual SHRP test
sections. The second level of release data checks on the data availability searches ofthe IMS on an experiment-by-experiment basis, and requires the completion of adesignated number of global data checks before approval for release.
The SHRP-LTPP information and data from a Level 1 release represent a release on asection-by-section basis. At this time there are insufficient data available in the IMSto support a Level 2 release. Because of this situation, it is recommended that thedata and information only be used for evaluation and analysis at an individual sectionlevel. If a report, paper, or technical document is generated using results from thisrelease, then a statement must be included indicating that the SHRP-LTPP informationand data were obtained from a SHRP-LTPP Level 1 release and the date the datawere obtained.
161

E
"1"
' J
_ _' _'_]4'
162

I.--
163

During SHRP-LTPP, the Level 1 checks were defined and installed within the NIMS. FourLevel 1 data releases have been completed using the checks. In tl_: process the checks havebeen reviewed, expanded, and revised as necessary.
Level 2: Experiment Release
A Level 2 IMS release is classified as an experiment release and includes QA checks acrossdata modules (6.11), confirmation of GPS experiment and cell assignments (6.12), andstatistical checks on the data and IMS tables (6.13) within each designated GPS experiment.The successful completion of these checks means that the LTPP data would be available for ageneral experiment-by-experiment evaluation and analysis. The IMS Level 2 release QAchecks involve the following activities:
Check Description
F Intermodular cross-checks applied to verify existence and consistency ofdata for related categories
G Experiment and cell assignment checks based on collected dataH Various checks involving frequency distributions and bimodal and variance
checksI Statistical checks for outliers, missing data, and completeness of experiment
Figure 6.7 presents an example of the type of intermodular cross-checks (QA Check F)included in the QA program. For assessing falling weight deflectometer (FWD) deflectiondata at SHRP sites, it would be essential to have information on environment (temperature),materials (layer thicknesses and resilient modulus estimates), and depth to rigid layer.Similarly, an analysis of AASHTO performance such as the Present Serviceability Index (PSI)would require information on roughness (profile), cracking and patching (disla'ess), rutting,and surface material types. This check is in fact conducted for a specific SHRP-LTPP sectionbut is representative of the checks that are performed across data modules.
This check must be completed before the initiation of the experiment and cell assignmentchecks (or G check).
The experiment and cell verification (G check) is essential for establishing the completenessof each GPS experiment matrix. As illusla'ated in Figure 6.8, the process is conducted foreach SHRP section and involves
• Confm'nation of the GPS experiment assignment• Confmnation of the cell assignment within the GPS experiment matrix• Assessment of experiment completeness
In essence, this IMS QA check is used to ensure appropriate GPS experiment assignment andto confirrn that the distribution of LTPP sections within the experiment matrix is good enoughto ensure unbiased data. This check must be successfully completed before checks H and Icommence.
164

INTERMODULAR CROSS CHF.CKSBehavior Considerations
Nondestructive testing: FWD - Load deflection
Environment - Mean monthly
temperature
Materials - Layer thickness
Materials - Depth to rigid layer
Materials - Mr values
INTERMODULAR CROSS CHECKSPerformance Considerations
Profile - International Roughness
Index (IRI)
Distress - Cracking & patching
Rutting - Rut depth
Materials/Inventory - Surface type
Figure 6.7. IMS Level 2: F Checks
165

EXPERIMENT / CELL VERIFICATION
,_ • GPS ExperimentConfirmation
Experiment Cell Confirmation.:.:.:.:.:.:.:.:i:i:i:!:_:_:i:i:
.........:.:.:.::.:.:..:.:.:.:.:.:.:..........................................
Completenessof Experiment
GPS Experiment Definition
GPS-1 Asphalt Concrete (AC) on Granular BaseGPS-2 AC on Bound BaseGPS-3 Jointed Plain Concrete PavementGPS-4 Jointed Reinforced Concrete Pavement
GPS-5 Continuously Reinforced Concrete PavementGPS-6A Existing AC Overlay of AC PavementGPS-6B Planned AC Overlay of AC PavementGPS-7A Existing AC Overlay of Portland Cement Concrete (PCC) PavementGPS-7B Planned AC Overlay of PCC PavementGPS-8 Unbound PCC Overlay of PCC Pavement
Figure 6.8. IMS Level 2: G Check
166

The variation in data across and within regions for each experiment will be analyzed as partof the H check to assess nonuniformity in variance distributions and to check for unusualoccurrences or biases that may affect future analyses. Examples of this type of QA check arepresented in Figure 6.9.
The final check before an IMS Level 2 release is illustrated in Figure 6.10 and involvesstatistical checks of each GPS experiment to identify missing and aberrant data and toconfirm oudiers. The process includes initial variance analyses at both regional and nationallevels and preliminary regression analyses to investigate important factors and variabilitymaterials and construction.
Once the data and IMS tables have passed through Checks A--I, the data are available for anexperimental analysis release (6.3, 6.9). These data are accompanied by the followingdisclaimer from SHRP:
SHRP-LTPP Experiment Analysis Release Disclaimer
The SHRP-LTPP data are available for release at two levels. The first level of datarelease (Level 1) involves section-by- section data availability searches of the IMS,and includes a minimal number of pre-release data checks on the individual SHRP testsection. The second level of release (Level 2) involves data availability searches ofthe IMS on an experiment-by-experiment basis, and requires the completion of adesignated number of global data checks before approval for release.
The SHRP LTPP information and data from a Level 2 release represent a release onan experiment-by-experiment basis. Unless specifically notified otherwise, thereshould be no limitation on evaluation or analysis of the released data. If a report,paper, or technical document is generated using the results from this release, then astatement must be included indicating that the SHRP-LTPP information and data wereobtained from a SHRP-LTPP Level 2 release and the date the data were obtained.
Data Availability
Data are generally made available to the public from the NIMS after appropriate QA checkshave been concluded. To obtain LTPP data from the NIMS, requests must be made to theTRB IMS Administrator using a completed LTPP IMS data request form. All data requestsare processed at TRB by the IMS Administrator.
In return, TRB will provide the requester with a package including the data on the requestedmedia, a diskette containing significant portions of the Database Structure Reference Manual(6.5), and a notice describing major changes to the database in the previous 6 months. Thepackage will include a detailed LTPP schema and the LTPP data dictionary. The schemaidentifies the fields in each IMS table along with the columns where these data are availablein flat ASCII files. The LTPP data dictionary includes a description of each field including
167

f FREOOE.OYVAR,A.CE"1OA STR,eOT,O.C.ECKS
Western_Region\ / "" No.h
entralRegion
Frequency
Thickness
FREQUENCY VARIANCE "_BIMODAL DISTRIBUTION CHECKS
Frequency
i
Structural Number
Figure 6.9. IMS Level 2 - H Check
168

STATISTICAL CHECKS / ANALYSES
Data Investigation
• Missing data• Aberrant data
Initial Variance Analyses
• Regional• National
Regression Analyses (Prelim)
• Important Factors• Materials/construction
variability
Figure 6.10. EMS Level 2: I Check
169

the size, units, and expected ranges, and it identifies the names ot the table where these fieldscan be found.
Specific Data
Requests can be submitted for individual sections, states, regions, or experiment types. Tospecify data for a specific SHRP test section, however, the researcher must supply the SHRPsection number. States can be specified by entering the standard two-character abbreviation orthe full state name.
Status of lMS Releases
During SHRP-LTPP, four public data releases were conducted, all at Level 1 involving onlyGPS data. The releases were completed at 6-month intervals because of the large volume ofdata inserted in the RIMS during this start-up period. This can be seen in the amount of datathat was released each time as shown in Table 6.2. The table nanles (e.g., INV_ID) wereselected to represent the status of the tables' associated data modules.
The first data release (January 1991) was the initial trial of both tile data release proceduresand the QA checking software. As expected, this initial release produced many anomaliesinvolving missing inventory data. This information would never be available because it wasnever collected originally or had been lost or destroyed over the years since the GPS section inquestion had been built. Accordingly, a COMMENTS table (6.141) was added to the IMSstructure so that the regions could document the missing data and allow the data to passthrough the QA process without being permanently held at that level (and never beingreleased). The initial release included 226 releasable sections (see INV_ID), and the onlyother module to successfully pass through Level 1 was Friction (skid). The first release ofdistress data (MON_DIS and MON_DIS_PADIAS) occurred during the fourth release.
MON RUT MASTER is the table that contains the Cross-Profile data. REF LAYER
represents the Materials and Testing Data Module, which includes records for each pavementlayer. MON_DEFL_MASTER represents the FWD data, MNT_HISTORY represents theMaintenance data, RHB_IMP represents Rehabilitation data, and MON_PROFILE_MASTERrepresents the Profilometer data.
IMS Products
The products generated during development of the IMS include the NIMS and RIMSdatabases, the supplemental databases, and the QA methodology. All these items representsignificant improvements in the entry, acceptance, and processing of pavement performancedata. These products should facilitate future pavement performance research and evaluation.
170

Table 6.2. Examples of Level 1 Releases
Release Dates
Table Jan. 91 July 91 Jan 92 July 92
INV_ID 226 561 660 668MON_SKID 95 416 560 720MON_RUT_MASTER 2 355 896REF_LAYER 118 296 456MON_DEFL_MASTER 497 515 6MNT_HIST 9 25RHB_IMP 1 2MON_PROFILE_MASTER 2860 4288COMMENTS 913 2386 2800TRF_BASIC_INFO 2386 121
(Historical Traffic Only)MON_DIS (Manual) - 398MON_DIS_PADIAS - 457
171

References
6.1 Strategic Highway Research Program Research Plans, Final Report. TransportationResearch Board, National Research Council, Washington, DC., May 1986.
6.2 Long-Term Pavement Performance Information Management System Operations andQuality Assurance Manual. Strategic Highway Research Pro,gram, National ResearchCouncil, Washington, D.C., April 1990.
6.3 Long-Term Pavement Performance Information Management System ResearchersGuide. Strategic Highway Research Program, National Research Council, Washington,D.C., July 1991.
6.4 "Data Collection Guide for Long-Term Pavement Performance Studies" (OperationGuide SHRP-LTPP-OG-001). Strategic Highway Research Program, National ResearchCouncil, Washington, D.C., January 1990.
6.5 "Database Structure Reference Manual." Long-Term Pavement PerformanceInformation Management System. Strategic Highway Research Program, NationalResearch Council, Washington, D.C., January 1990.
6.6 "Programmer's Reference Manual." Long-Term Pavement Performance InformationManagement System. Strategic Highway Research Program, National Research Council,Washington, D.C., July 1989.
6.7 "NIMS Users Manual." Long-Term Pavement Performance Information ManagementSystem. Strategic Highway Research Program, National Research Council, Washington,D.C., March 1990.
6.8 "RIMS Users Manual." Long-Term Pavement Performance Information ManagementSystem. Strategic Highway Research Program, National Research Council, Washington,D.C., January 1990.
6.9 LTPP IMS Data Quality Assurance Checks (Draft). Long-Term Pavement PerformanceInformation Management System. Strategic Highway Research Program, NationalResearch Council, Washington, D.C., May 1992.
6.10 Hadley, W. O., C. Copeland, R. High, and H. Roper, "LTPP Data Availability PolicyRecommendations." (IMS Message No. TRDF-40, Revised). Texas Research andDevelopment Foundation, Austin, Texas, October 25, 1990.
6.11 Hadley, W. O. "IMS Level 2: F Checks--Intermodal" (IMS Message No. TRDF-134).Texas Research and Development Foundation, Austin, Texas, September 29, 1992.
172

6.12 Hadley, W. O. "IMS Level 2: G Checks--Experiment and Cell Verification" (IMSMessage No. TRDF-88). Texas Research and Development Foundation, Austin, Texas,September 23, 1991.
6.13 High, R. and W. O. Hadley. "IMS Level 2: Statistical Quality Control and AssuranceProcedures" (IMS Message No. TRDF-134a). Texas Research and DevelopmentFoundation, Austin, Texas, September 11, 1992.
6.14 Copeland, C. "Comments Table Review and Usage Recommendations for SHRP-LTPPRegions." (IMS Message No. TRDF-56). Texas Research and DevelopmentFoundation, Austin, Texas, May 3, 1991.
173

Section 7Data Analysis Studies
Introduction
The principal objective of the Strategic Highway Research Program Long-Term PavementPerformance (SHRP-LTPP) program was the development of a comprehensive database forpavement performance data covering a wide range of conditions and service life factors (7.1).The database was structured to address pavement management and engineering design issuesincluding
• Pavement rehabilitation design and construction procedures• Effects of pavement maintenance• Cost of deferred maintenance• Climatic and environmental effects
• Long-term load effects• Validity of the American Association of State Highway and Transportation Officials
(AASHTO) Road Test load equivalency factors (LEFs)• Relative effects and interactions of load, environmental conditions, and materials
properties• Effects of subgrade material• Load carrying capacity beyond pavement design life• Effects of alternative drainage designs (7.1)
The extent and scope of information contained within the LTPP Information ManagementSystem (IMS) also provides the resources not only to evaluate or revise existing designequations but to develop new ones.
A more specific research plan was developed for the LTPP program with the stated goal "toincrease pavement life by investigation of various designs of pavement structures andrehabilitated pavement structures, using different materials and under different loads,environments, subgrade soil and maintenance practices" (7.2). In this effort six specificobjectives were established:
1. To evaluate existing design methods
2. To develop improved design methods and strategies for pavement rehabilitation
3. To develop improved design equations for new and reconstructed pavements
175

4. To determine the effects of load, environment, materials properties, variability,construction quality, and maintenance levels on pavement .fistress and performance
5. To determine the effects of specific design features on pavement performance
6. To establish a national long-term pavement performance d;r:abase to support SHRPobjectives and future needs
During SHRP-LTPP a series of data analysis studies were undertaken to "exercise" theNational Pavement Performance Database (NPPDB), to define awtilability, and to undertakethe initial studies and evaluations using SHRP-LTPP data. The data _malysis studies weregenerally targeted toward the goals and objectives of SHRP-LTPP.
The principal SHRP technical assistance contract involved data analysis related toconstruction variability (Objective 4), SHRP LEF approach (Objective 5), and pavementrutting (Objective 4).
The principal SHRP data analysis contract involved data analysis activities related toevaluation of existing design methods (Objective 1), improved design equations (Objective3), effects of load and environment on pavement distress and performance (Objective 4),and effects of specific design features on pavement performance (Objective 5). The secondSHRP data analysis contract represented an initial effort to evaluate the AASHTO equationsusing mechanistic-empirical analysis techniques. A separate SHRP contract was undertakento assess the effectiveness of six pavement maintenance treatments, in response to Objective2.
Several non-SHRP contracts are also pursuing LTPP goals. The Canadian (CSHRP)SHRP--LTPP program is exploring high-risk research aimed at developing procedures todetermine the cost-effectiveness of rehabilitation alternatives. The University ofBirmingham (U.K.) is pursuing two contracts related to a proposed approach for SHRPdatabase analysis; these approaches involve measurements of pavement life cycle costsensitivity to traffic, materials, and maintenance and rehabilitation processes, as well asdevelopment of network-level pavement performance models.
Data Analysis: General Pavement Studies (GPS) Materials and
Construction Variability
One of the objectives of SHRP-LTPP was to investigate the effect,; of materials properties,materials variability, and construction quality on pavement performance (7.2). The goalwas to find a way to incorporate these variables into specific predictive equations for rigidand flexible pavement performance parameters. The basic analytical approach was outlinedin a previous document (7.3). A detailed presentation of this stud)' is included in theSHRP-LTPP Data Analysis: Five-Year Report (7.4).
176

Approach
The construction variability factors were classified as Distress and Performance Variables,Primary Structural Factors, Materials Properties, and Nonstructural Variables (Figure 7.1).Consequently, the conceptual distress prediction model is composed of a nonstructuralvariables component (traffic, environment, age, etc.), a structural and materials factor means
component, and a third component involving structural and materials factor variances (Figure7.2).
The actual analytical approach used in this investigation consisted of a linear regressionanalysis relating the logarithm (log) of a pavement performance or distress variable to the logsof the nonstructural variables, logs of mean structural and materials factors, logs of variancesof structural and materials factors, and their cross-products (Figure 7.3). The factorscomposing the regression equations can then be used to identify the factors and/or variancesthat significantly affect the specific pavement performance or distress variable.
Construction Variability in Rigid Pavements
The construction variability factors included in the rigid pavement investigation are identifiedbelow. The specific site information and data for the LTPP sections investigated in the rigidpavement construction variability study are presented in the SHRP-LTPP Data Analysis." Five-Year Report (7.4).
Rigid Pavement Construction Variability Factors
Distress and Performance Variables (D)International Roughness Index (IRI)
AASHO PSI-Loss
Primary Structural Variables (S)Portland Cement Concrete (PCC) Layer Thickness
PCC Layer ModulusPCC Layer Poisson's Ratio
Modulus of Subgrade Reaction (K)
Nonstructural Variables (E)Age (years)
Traffic (KESALs)Temperature (freeze vs. nonfreeze)
Moisture (wet vs. dry)
Regression analyses were completed for the performance variables of roughness (IRI) andAASHO Serviceability Loss. The serviceability loss quantities were estimated from therelationship PSI = 7.06 - 1.79 log(IRI), which was developed in the report PSI Estimates .from
177

Distress and Performance Variables (D)
• Rutting• Roughness• Present Serviceability Index (PSI)• Cracking
Primary Structural Factors (S)
• Layer Thicknesses• Layer Moduli• Subgrade Moduli
Materials Properties (M)
• Mix Design Variables• Layer Properties
Nonstructural Variables (E)
• Traffic (KESALs)• Environment• Moisture
Figure 7.1. Construction Variability Factors
178

D, distress function, is a function of
f (ESALs; Environment)
g (Structural Factor Means $1, $2, etc.;
Materials Factor Means MI, M2, etc.)
h (Structural Factor Variances S 2 21,$2, etc.;
Materials Factor Variances M 2 M 2 etc.)1 _ 2 _
Figure 7.2 Distress Prediction Model
179
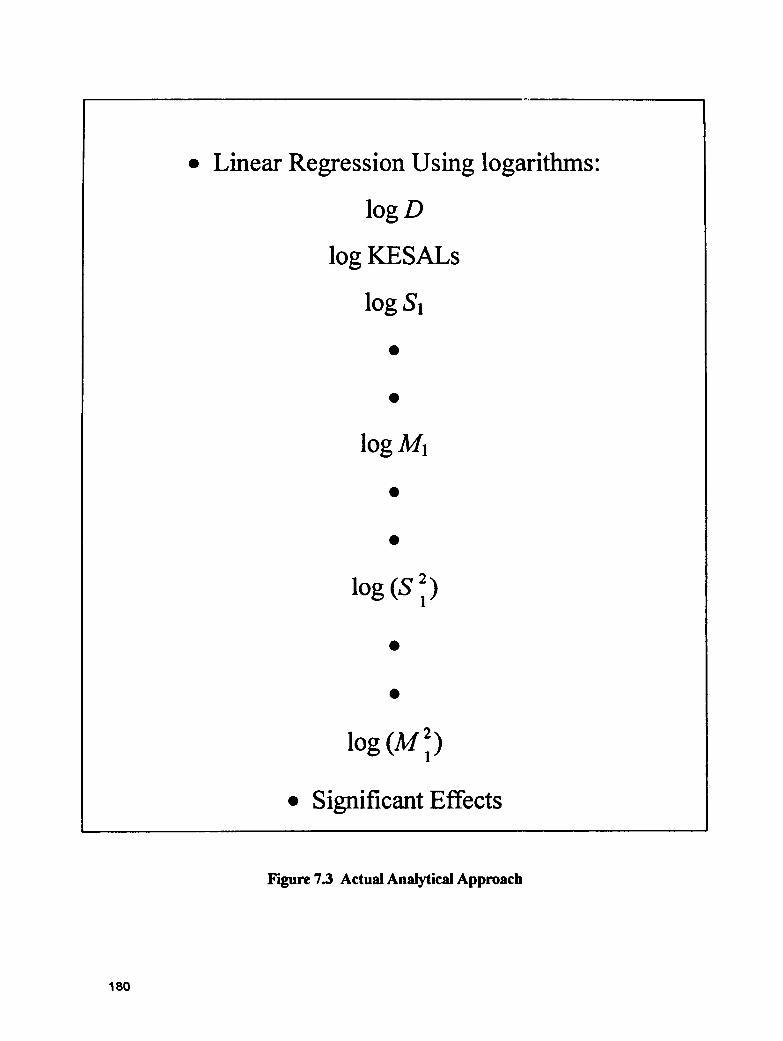
• Linear Regression Using logarithms:
log D
log KESALs
log Sl
log M1
log (S 21)
log (M 2)1
• Significant Effects
Figure 7.3 Actual Analytical Approach
180

SHRP Profilometer Roughness (7.5). The equations resulting from this investigation arepresented in the SHRP-LTPP Data Analysis: Five-Year Report (7.4).
Longitudinal Roughness in Rigid Pavements, log(IRI)
The predictive equation for log(IRI) included main effects of
log(KESALs)log(Mod)log(K),log(MOIST)Iog(KESALs) * log(K-Var)log(AGE) * log(Mod-Var)Iog(SUBG) * log(Ts-Var)
where
IRI = pavement roughness as measured in IRI values from SHRPprofilometer data
KESALs = cumulative traffic in thousands of equivalent single axle loads(KESALs) based on historical traffic data
MOD = surface (PCC layer) modulusK -- modulus of subgrade reaction (pci)MOIST = moisture conditions: dry +1, wet +2AGE = age of section (yrs)Ts = thickness of surface PCC layer (in.)K-Var,Mod-Var,
Ts-Var = variances of K, Mod, and Ts, respectively.SUBG = subgrade type: fine-grained +1, coarse-grained +2
These results indicated that pavement roughness generally increased with lower modulus ofsubgrade reaction (K), wetter environments, higher surface modulus, greater pavement age, andgreater variation in surface modulus (Mod). It should be noted that the variabilities in K,Mod, and surface thickness (Ts) apparently contributed to pavement roughness.
AASHO Serviceability Loss
The predictive equation for Iog(AASHO Serviceability Loss) contains no main effects but iscomposed of eight interaction or cross-product terms. Four of the interactions involve meanvalues of the factors, and four involve variances of the factors. The equation includes
181

Iog(KESALs) * Iog(TEMP)log(K) * log(Ts)Iog(TEMP) * Iog(SUBG)Iog(SUBG) * log(PR)Iog(KESALs) * log(PR-Var)log(AGE) * log(K-Var)log(SUBG) * log(Ts-Var)log(Ts) * log(Ts-Var)
where
AASHO PSI Loss = 4.5 - p where p is present serviceabilityKESALs = cumulative traffic (KESALs) based on historical traffic
data
TEMP = temperature zone: nonfreeze +1, freeze +2K = modulus of subgrade reaction, (pci)Ts = thickness of surface PCC layer (in.)SUBG = subgrade type: fine-grained +1, coarse-grained +2PR = Poisson's ratio of surface PCC layerAGE = age of section (yrs)PR-Var, K-Var,
Ts-Var = variances of PR, K, and Ts, respectively
The significant consideration in this relationship was the large number of variance terms. Thisinvestigation indicated that the variation in surface layer thickness (Ts), surface layer Poissonratio (PR), and modulus of subgrade reaction (K) apparently had a significant influence onAASHTO Serviceability Loss. These variances translate into primary structural influences(i.e., Ts, K) and materials influences (i.e., PR). In addition, the serviceability loss was affectedby various combinations of traffic (KESALs), environment (TEMP), and primary structuralfactors (i.e., K, Ts, SUBG, and PR).
Construction Variability in Flexible Pavements
The construction variability factors included in the flexible pavement investigation areidentified below. The specific site information and data for the LTPP sections investigated inthe flexible pavement construction variability study are presented in the SHRP-LTPP DataAnalysis: Five-Year Report (7.4).
182

Flexible Pavement Construction Variability Factors
Distress and Performance Variables (D)Rutting (Layer)
Rutting (Deep-Seated)IRI
AASHO PSI-Loss
Primary Structural Variables (S)Surface Layer Thickness (Ts)
Base Layer Thickness (Tb)Structural Number (SN)
Surface Layer Modulus (Es)Base Layer Modulus (Eb)Subgrade Modulus (Esg)Subgrade Type (SUBG)
Materials Properties (M)Asphalt Content (AC)
Nonstructural Variables (E)Age (Yrs)
Traffic (KESALs)Temperature (freeze vs. nonfreeze)
Moisture (wet vs. dry)
Regression analyses were completed for the distress and performance variables of rutting(within upper pavement layers), deep-seated rutting (including the subgrade), and AASHOServiceability Loss. The equations developed in this investigation are presented in the SHRP-LTPP Data Analysis: Five-Year Report (7.4). It should be noted that the rut typeclassification method developed in the Rut Initiation Studies (7.6) was used here to categorizerutting as either "layer" or "deep-seated." The AASHTO Serviceability Loss variable wasestimated for the various SHRP-LTPP sections through a relationship developed as a part ofthis study (7.6).
log(Layer Rutting)
The predictive equation for log(Layer Rutting) included a main traffic (or log KESALs) effectand four interaction factors (or cross-products) involving traffic and subgrade modulus (logKESALs * log Esg), asphalt content and structural number (log AC * log SN), asphalt contentand surface layer thickness (log AC * log Ts), and subgrade modulus and surface layerthickness (log Esg * log Ts). The predictive equation is presented in the SHRP-LTPP DataAnalysis: Five-Year Report (7.4).
183

The interaction terms included in the predictive equation involved II,rimarily mean valueeffects, with only a single variance term for surface thickness present. This investigationindicated that increased layer rutting corresponds to
• Increased traffic
• Lower subgrade modulus at any traffic rate and minimum sttrface thickness• Higher asphalt contents and higher pavement structural numbers• Thinner surface layers• Higher surface thickness variation with any subgrade modulus
One of the important results in this investigation is the influence of surface thickness variationon layer rutting. Closer control of surface thickness in the construction process could helpprevent rutting.
It is interesting to note that the combination of the interaction terms involving asphalt content(AC) could shed light on the compromises that are possible between structural number (SN)and surface layer thickness (Ts). The combined terms from the layer rutting predictiveequation are
log(AC)*[0.754 * log(SN) - 1.127 * log(Ts)]
For a given AC value, an increase in SN (i.e., generally a thicker section) apparently resultsin the potential for greater rutting because of the positive coefficient (+0.754) associated withlog(SN). This effect can be offset, however, by an appropriate selection of Ts becauselog(Ts) has a negative coefficient (-1.127). Hence an appropriate selection of SN and Tsvalues could be beneficial in minimizing layer rutting.
log(Deep-Seated Rutting)
The predictive equation for log(Deep-Seated Rutting) developed in this analysis includes nomain effects but is composed of four interaction or cross-product terms. Three of these cross-product terms involve variances of subgrade modulus, surface layer thickness, and surfacelayer modulus. Structural number, temperature zone, subgrade classification, and KESALsare also included in the interaction terms.
This investigation indicated that deep-seated rutting corresponds to
• Colder locations with coarse-grained soils• Lower structural numbers
• Greater age and higher variation in surface layer thickness• Lower variation in surface layer modulus at any traffic rate
The phenomenological difference between layer rutting and deep-seated rutting can beobserved in the impact of the structural number factor. Layer rut_g is more likely in
184

pavements with higher structural numbers, while deep-seated rutting is less likely in similarpavements with high structural numbers.
AASHO Serviceability Loss
The predictive equation for Iog(AASHO Serviceability Loss - 4.2 present serviceability, p)contains no main effects but does include eight interaction terms. Four of these cross-productterms include variance terms for subgrade modulus, surface layer thickness, and surfacemodulus. Temperature zone, age, subgrade classification, moisture conditions, structuralnumber, KESALs, and subgrade modulus were included in the equation.
This investigation indicated that greater serviceability loss corresponds to
• Older pavements• Higher structural numbers• Higher trafficrates and higher variance in surface modulus• Thinner surface layers• Lower subgrade modulus with associated subgrade modulus variance• Greater variance in surface layer thickness in the wetter zones
It is important to note that mean structural number and surface layer thickness wereinfluential and apparently affect the amount of serviceability loss. The variances of surfacelayer modulus and surface layer thickness likewise can influence serviceability. Because allthese items are related to the structural/materials design process, it appears possible to identifyspecification controls, construction methods, and other measures that could be used to"harness" these factors and reduce pavement serviceability loss.
Conclusions
This investigation of materials and construction variability within rigid and flexible SHRP-LTPP pavement sections successfully identified significant effects, interactions, and variancesof effects that can influence pavement distress and performance.
The results represent an initial effort in defining construction variability and should beexpanded to include more LTPP sections, as well as other distress and performance variablesas they become available in the LTPP database.
The analytical approach used in this study (7.3) appears to produce valid results and shouldbe considered for use in future analytical efforts to define construction variability.
185

Improvement of Load Equivalency Factors (LEFs) From SHRP-LTPP Data
How to improve LEFs was one of the questions posed in America'_ Highways: Acceleratingthe Search for hmovation (7.1). It was proposed that the effects ol"varying pavementstrengths (or structural support), pavement structures, types of materials, and environments onthe AASHO Road Test LEFs could be investigated in a comprehensive database such asSHRP-LTPP. This study was undertaken to define an approach (or approaches) that could beused to investigate LEFs from the SHRP-LTPP database.
There is no doubt that improved LEFS--which are specific to a particular distress andapplicable to wider ranges of pavement structure and environmental conditions---wouldprovide a basis for justifying decisions on cost allocation, pavement management, andmaintenance and rehabilitation strategies. One consideration relative to LEFs is whether theSHRP-LTPP database contains sufficient data to investigate distress-specific LEFs. Anapproach must be defined that uses the LTPP database in an assessment of improvements ofLEFs from SHRP-LTPP data.
In the course of the SHRP-LTPP LEF study (7.7), it was recognized that present serviceabilityestimates (7.8), serviceability loss (7.9), and traffic estimates (7.10) would be needed toaccomplish the proposed evaluation. The results of these previous work efforts have beencombined herein to complete an evaluation of the LEF approach (7.7) proposed for this study(7.11). The evaluation included both rigid and flexible pavement sections (see Table 7.1). Adetailed presentation of this study is included in the SHRP-LTPP Data Analysis: Five-YearReport (7.4).
LEF Evaluation Approach
For this exploratory study, a family of LEFs and resultant cumulative equivalent single axleload (ESAL) estimates were generated. The elements included not only the AASHO LEFs butalso ranges on either side of the AASHTO values. LEF values were developed for a varietyof B 1 and B2 exponent values using the basic AASHO Road Test LEF equation:
LEF(XL) = (Ll/18)BI/(L2)/32
where
LEF(XL) = load equivalency factors for axle load XLL t = axle group weightZ 2 = number of axles in the axle groupB_, B2 = exponents
Conventional multiple regression analysis techniques were used to generate individual distressprediction equations for roughness, rutting, and serviceability loss in the case of flexiblepavements, and for roughness and serviceability loss in the case of rigid pavements. It wasoriginally proposed that the evaluation include cracking in both the flexible and rigid
186

Table 7.1. Flexible and Rigid Pavement Sections Included in the LEF Study
Section State Pavement Type
062051 California Flexible062647 California Flexible068201 California Flexible182008 Indiana Flexible382001 North Dakota Flexible512004 Virginia Flexible063042 California Rigid124000 Florida Rigid183031 Inclhna Rigid385002 North Dakota Rigid485336 Texas Rigid537409 Washington Rigid
187

pavements; however, the paucity of distress data in the SHRP-LTPP database eliminated thisoption.
For a given LTPP section a series of regression equations for the various combinations of Btand B2 exponents were developed that relate pavement performance (e.g., rutting, roughness,PSI loss) to cumulative ESALs, annual ESALs, and pavement structural and siteenvironmental conditions. The ESAL estimates for this analysis were obtained through thetransformation of traffic load information by LEFs appropriate to the combinations of axleloads and axle configurations. The LEF values were developed for various combinations ofexponents B_ and B2 using the basic AASHO equation described above.
Each regression analysis produced a coefficient of determination (R2), a standard error ofestimate (RMSE), and a coefficient of variation (CV). These statistics quantify the goodnessof fit of the particular predictive equation. It was expected that comparisons of these statistics,along with consideration of the regression coefficients and their standard errors, would indicatewhich combinations of Bt and B2 values lead to "best" fits.
Interaction effects (represented by cross-product terms of ESALs, pavement structure, andenvironment) are expected to be important indicators of the extent to which ESAL effects varywith structural and environmental factors.
Rigid Pavement LEF Evaluation
The pavement performance indicators evaluated in this study included roughness and PSI loss.The roughness indicator is the International Roughness Index (IRI) generated by the SHRPLaw profilometers. PSI-Loss was defined as the difference between an assumed initial PSI
value of about 4.5 (similar to AASHO Road Test Analysis (7.12) and the present serviceabilityvalue. The present serviceability value was developed from the lbllowing equation using theprofilometer-generated IRI value:
PSI = 7.06 - 1.79 log(IRI) (7.8)
Evaluation of log(IRI)
The equation for roughness, measured as IRI, for the rigid pavement sections is a logarithmicform including cross-products of log(Annual ESALs) and log of moisture and temperature.The form is as follows:
log(IRI) = K t + K 2 * [log(ESALs) * log(MOIST)] + K3 * [log(ESALs) * log(TEMP)]
where
188

MOIST = moisture conditions: dry +1, wet +2TEMP = temperature zone: nonfrecze +1, freeze +2K_, K2, g 3 = regression coefficients
The combination of B_ = 4.0 and Bz = 3.0 represents the normal AASHO-type LEFcoefficients. In this analysis, however, the combination of B_ = 3.0 and B2 = 3.5 produced thehighest R2 value, the lowest RMSE, and the lowest CV for the previous equation. Thiscombination apparently fulfills the best fit criteria and can be considered in possibledevelopment of new I.EFs.
Evaluationof log(PSI-Loss)
The equation for AASHO PSI-Loss (4.2 - present serviceability, p) for rigid pavementsections is a logarithmic form including cross-products of log(Cumulative ESALs) and log ofmoisture and log of temperature. The form of the equation is
log (PSI-Loss) = K, + K2 Log(Cumulative ESALs) * log(MOIST)+ K3 log(Cumulative ESALs) * Iog(TEMP)
where
MOIST = moisture conditions: dry +1, wet +2TEMP = temperature zone: nonfrecz¢ +1, freeze +2K l, K2, K 3 = regression coefficients
In this instance the combination of B_ = 3.0 and B2 = 3.5 again produced the best fit (thehighest R2 and the lowest RMSE and CV), although all other combinations yielded similarcharacteristics. It should be noted that the CV for the equation is high, at about 34%.
Possible Effect on LEF Values for Rigid Pavements
A comparison of the LEF values of the best fit combination (3.0, 3.5) with the AASHOcombination (4.0, 3.0) leads to the conclusion that the acceptance of the use of thecombination of B_ = 3.0 and B z = 3.5 could result in the following changes in AASHO-type(IRI) and log(PSI-Loss):
Increase in LEFs
Single Axles below 18 kipsTandem Axles below 12 kips
189

_crease in LEF8Single Axles above 18 kips
Tandem Axles above 12 kipsTridem Axles (all loads)
Quadrem Axles (all loads)
Flexible Pavement LEF Evaluation
The pavement performance indicators evaluated in this study included rutting, roughness, andPSI-Loss. The rutting indicator is defined with a classical AASHTO definition in units ofmillimeters, while the roughness is characterized by the IRI values generated by the SHRP-LTPP Law prof'flometer. PSI-Loss is defined in two ways. The first involves a value definedas the difference between an initial estimate of 4.2 (similar to that assumed in the AASHORoad Test equation) and the present serviceability level. It should be noted that this approachnegates the influence of variation in initial serviceability esfmates, since a fixed value of 4.2is defined for all sections. The second method involves the use of the PSI-Loss estimates
obtained from the following equations that were developed as a pan of this study:
SHRP PSI Loss = K/(1-IO * (po-2.0) (7.9)
where
p, = present serviceability at time n, andK is defined by the following equations:
K = 0.6718 + 0.156 * ('rEMP) + 2.605 x lif e * (ESALs)+ 0.0625 * (SUBG*MOIST) - 0.8306 x 10"6* (ESALs*SN)
where
TEMP = temperature zone: nonfreeze -1, freeze +1n
ESALs = annual ESALs rate of ]:ESALs/n yearso
SUBG = subgrade type: fine-grained +1, coarse-grained +2MOIST = moisture conditions: dry -1, wet +1SN = swdctural number of the pavement section
The present serviceability value was estimated from the following equation using theprof'dometer-generated IRI value:
PSI = 7.06 - 1.79 logORI) (7.8)
190

Evaluation of Rutting
The equation for rutting (in millimeters) for the flexible pavement sections was a logarithmicform including a main effect of log(Cumulative ESALs) and a cross-product containinglog(Surface Layer Modulus) and log(Cumulative ESALs). The form of the equation is
log(RUT) = K l + K2 * LogCZESALs) + K3 * log(Estrar) * Iog(EESALs)
where
I;ESALs = cumulative ESALs based on Ba and B2 valuesEstau: = surface layer modulus in ksiK_, K2, and K3 - regression coefficients
In this instance the combination of B_ = 5.0 and B2 = 2.0 produced the equation with thehighest R2 value, lowest RMSE, and lowest CV. The AASHTO combination of B t and B2yielded the next best combination of regression equation attributes (i.e., R2, RMSE, and CV).It should be noted that a B_ coefficient of 5.0 is relatively high and could indicate theprincipal influence and magnitude of wheel load on the development of rutting.
Evaluation of Roughness (IRI)
The equation for roughness also exhibited a logarithmic form, including a main effect oflog(Cumulative ESALs) and a cross-product of log(Cumulative ESALs) and log(SurfaceLayer Modulus). The form of the equation is
log(IRI) = K l + K 2 * Iog(ZESALs) + K3 * log(Estn_) * Iog(ZESALs)
where
EESALs - cumulative ESALs based on B_ and B2 values,Est_ - surface layer modulus in ksiK_, K 2, K3 - regression coefficients
In a review of the regression analysis results, there were four combinations of B t and 82values that yielded high R2 values; however, the AASHO combination produced the equationwith the highest R2 (.95), lowest RMSE (.037), and lowest CV (1.89). Therefore, in the caseof longitudinal roughness in flexible pavements, the AASHO LEFs apparently producecumulative ESAL estimates that correspond to the level of roughness developed in theflexible pavement sections included in this study.
191
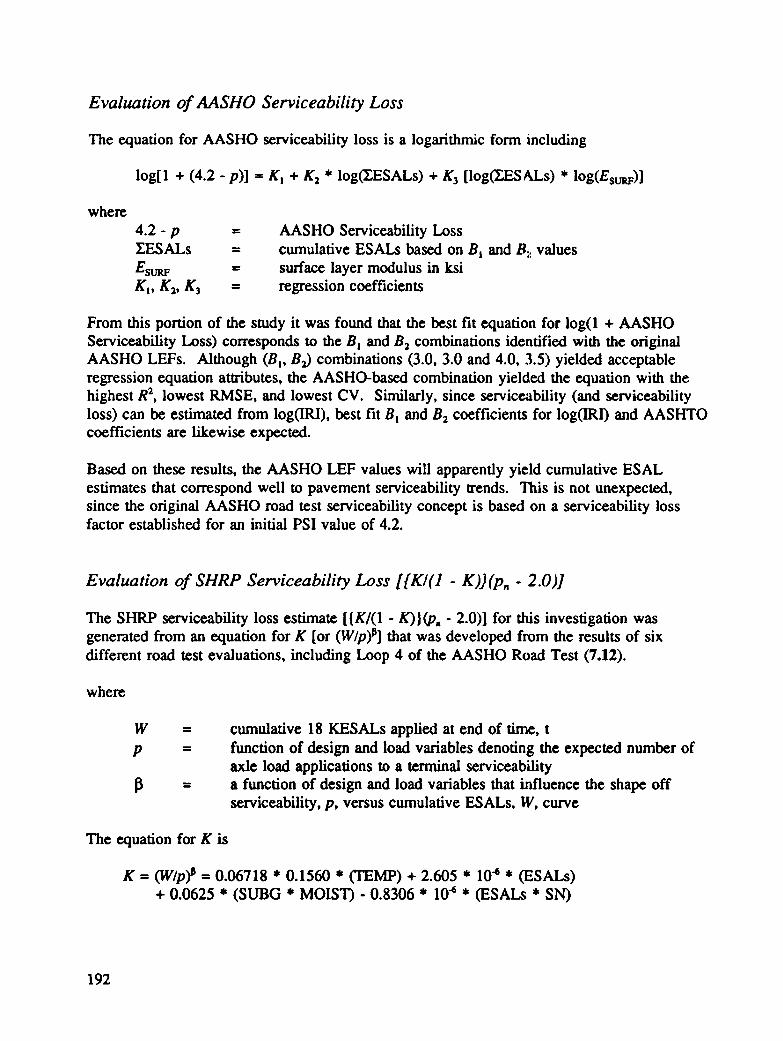
Evaluation of AASHO Serviceability Loss
The equation for AASHO serviceability loss is a logarithmic form including
log[l + (4.2 - p)] = K I + K2 * Iog(ZESALs) + K3 [Iog0_ESALs) * log(Estmr)]
where
4.2 -p = AASHO Serviceability LossZESALs = cumulative ESALs based on B i and Bz valuesEstmF = surface layer modulus in ksiK_, K2, K 3 = regression coefficients
From this portion of the study it was found that the best fit equation for log(1 + AASHOServiceability Loss) corresponds to the Bl and B2 combinations identified with the originalAASHO LEFs. Although (B_, Ba) combinations (3.0, 3.0 and 4.0, 3.5) yielded acceptableregression equation attributes, the AASHO-based combination yielded the equation with thehighest R2, lowest RMSE, and lowest CV. Similarly, since serviceability (and serviceabilityloss) can be estimated from log(IRI), best fit Bt and B 2 coefficients for log0RI) and AASHTOcoefficients are likewise expected.
Based on these results, the AASHO LEF values will apparently yield cumulative ESALestimates that correspond well to pavement serviceability u'ends. "llais is not unexpected,since the original AASHO road test serviceability concept is based on a serviceability lossfactor established for an initial PSI value of 4.2.
Evaluation of SHRP Serviceability Loss [{K/(1 - K))(pn - 2.0)]
The SHRP serviceability loss estimate [{K/(1 - hO}(p, - 2.0)] for this investigation wasgenerated from an equation for K [or (W/p) _] that was developed from the results of sixdifferent road test evaluations, including Loop 4 of the AASHO Road Test (7.12).
where
W = cumulative 18 KESALs applied at end of time, tp = function of design and load variables denoting the expected number of
axle load applications to a terminal serviceabilityI_ = a function of design and load variables that influence the shape off
serviceability, p, versus cumulative ESALs, W, curve
The equation for K is
K = (W/p) p = 0.06718 * 0.1560 * (TEMP) + 2.605 * 10"_* (ESALs)+ 0.0625 * (SUBG * MOIST) - 0.8306 * 10"_* (ESALs * SN)
192

where
TEMP = temperaturezone:nonfi'cczc-I,fi'cczc+In
ESALs = annualaverageESAL rate(T_,ESALs/n)o
SUBG = subgradctype:f'mc-grained+I,coarse-grained+2MOIST = moistureconditions:dry-I,wet+ISN = structuralnumberofthepavementsection
Thc equationfortheSHRP-cstimatedserviceabilitylossforflexiblepavementsectionsisalogarithmicformincludingcross-productsoflog(SubgradcModulus)by log(CumulativeESALs) andlog(Precipitation)by log(Daysover90°F).The formoftheequationisasfollows:
Iog(SHRP PSI Loss) = K, +/(2 * [log(Esg) * Iog(ZESALs)]+ K3 * [Iog(PRECIP) * log(DAYS)]
where
SHRP PSI Loss = [K/(K-1)] * (p,, - 2.0)p, = Present Serviceability Index (PSI)Esg = subgrade modulus in ksiZESALs = cumulative ESALs for combination of 8_ and B2 valuesPRECIP = annual precipitation in inchcs/ycarDAYS = average annual number of days over 90°FK_,/(2, K3 = regression coefficients
Three combinations of B_ and B2--(2, 2), (3, 3), (3, 3.5)--produced equations with betterattributes than the AASHO combination of B_ and B2. Of the four combinations, however,the best fit was obtained for the combination of 81 = 3 and 82 = 3.5. The equation has thehighest R2, the lowest RMSE, and the lowest CV.
In a general assessment of the equation, it can be infcrrcd that serviceability loss is reducedfor higher subgradc moduli, higher precipitation rates, and highcr number of days exceeding90°F.
Possible Effect on LEF Values for Flexible Pavements
A comparison of the best fit combinations of B_ and B2 for the four performance variablesleads to the possibility that the acceptance of best fit values could result in the LEF changesidentified in Table 7.2. No changes are expected in AASHTO LEFs for IRI and AASHOPSI-Loss. On the other hand, the AASHO LEFs could be significantly increased for all axleconfigurations if pavement rutting is predicted. In the case of the SHRP serviceability loss,the LEFs could be increased for loads below 18,000 pounds and decreased for loadsexceeding 18,000 pounds.
193
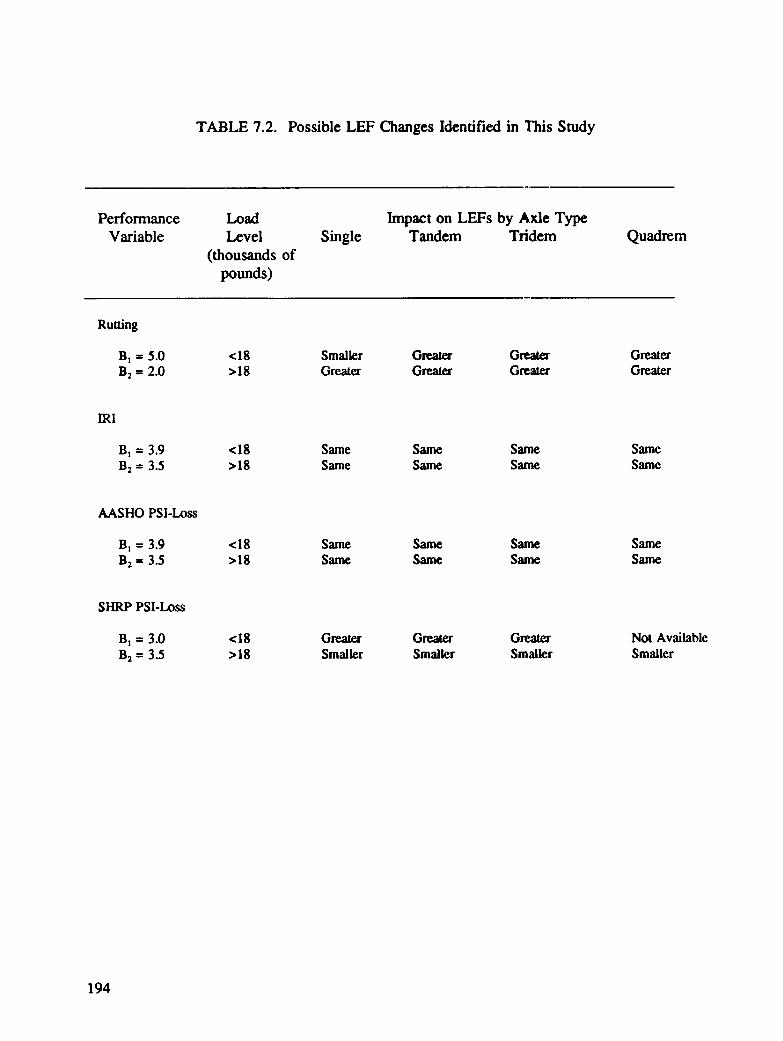
TABLE 7.2. Possible LEF Changes Identified in ]'his Study
Performance Load Impact on LEFs by Axle TypeVariable Level Single Tandem Tridem Quadrem
(thousands ofpounds)
Rutting
B_ = 5.0 <18 Smaller Greater Greater GreaterB2= 2.0 >18 Gre.a_ Greater Greater Greater
IRI
B_ = 3.9 <18 Same Same Same SameB2= 3.5 >18 Same Same Same Same
AASHO PSI-Loss
B_ = 3.9 <18 Same Same Same SameB 2 _- 3.5 >18 Same Same Same Same
SHRP PSI-Loss
B_ = 3.0 <18 Greater Greater Greawx Not AvailableB 2 ffi 3.5 >18 Smaller Smaller Smaller Smaller
194

Conclusions and Recommendations
The results of this study indicate that the approach proposed for improving AASHO LEFsusing SHRP-LTPP data is viable. In addition, it appears that the data contained in the SHRP-LTPP database are sufficient to conduct a comprehensive study. It is recommended that anexpanded analysis be undertaken in the near future when additional performance data areavailable.
Rutting Initiation Studies
Introduction
The development of rutting in flexible pavements is an expected phenomenon that affectspavement serviceability and influences rehabilitation decisions. The rutting phenomenon iscomplicated; it can develop within the pavement layers (i.e., layer rutting) because of layerdensification or possible material shoving, or it can occur within the total pavement structureincluding the subgrade soil (i.e., deep-seated rutting). The definition of the source or cause ofinitiation of rutting within a pavement structure is needed to enhance flexible pavementdesign and evaluation.
An evaluation of the distortion in a pavement cross-profile can be used to establish pavementrut depth but can also provide insight into the underlying cause or location of initiation of therutting phenomenon. The availability of PASCO cross-profile data for all SHRP flexiblepavement sections offers an excellent opportunity to investigate the rutting phenomenon,particularly since detailed section information on pavement structure, environmentalconditions, material values, traffic, and geographic information is available in the NPPDB.
This data analysis effort was undertaken to develop information on factors influencing type ofrutting (i.e., layer or deep-seated), source of rut initiation, and distortion of the pavementcross-profile that develops within a pavement structure. The factors to be investigatedincluded prevailing moisture and temperature conditions, subgrade type, traffic, and layerthickness. Regression equations were developed that related the amount of rutting and extent(or type) of rutting to the various factors.
A majority of the raw, wansverse profile data for SHRP GPS sections is collected in anautomated fashion using the PASCO Data Collection Vehicle (7.13). In addition, cross-prof'de information for some of the GPS sections is generated using the Face DiPstick TM.
The PADIAS data generation package developed by PASCO (7.14) includes a method forestimating rut depths from cross-profde data. In many instances, however, the PASCOtechnique does not conform to the classic straightedge measurement method. Because of thissituation, a technique was developed (see Figure 7.4) to estimate rut depths by simulatingplacement of straightedges of variable length on the existing PASCO cross-profile data (7.15,7.16). In addition, a pavement distortion assessment method was developed as an aid in
195

The peak between the two endpointsforces a raised angle for the straight edge span
Y / This point is exactly the length
i / Straightedge / of.the straightedge from the starting
................ x_trmghteage starting point
Figure 7.4 Example of Intermediate Point to Higher Elevation Between StartingPoint (X5) and Ending Point (X14) of a Straightedge
196

identifying possible causes and location of rutting (7.15). The pavement distortion possibilitiesare presented in Figure 7.5. A detailed presentation of this study is included in the SHRP-LTPP Data Analysis: Five-Year Report (7.4).
Analytical Approach
Several parameters were considered and subsequently selected to investigate their influence oninitiation and extent of rutting. Distortion in pavements can be caused by consolidation of oneor more of the structural layers and/or the subgrade; consequently, rutting can develop in thesubgrade, base, or surface layers. This pavement distress can arise from deformation undertraffic loading and can be affected by the climatic condition as well as the moisture content ofthe subgrade. This analysis of rutting will involve a number of factors:
• Structural number (SN). The SN, which is an index number reflecting pavementstructural capacity (including influence of material type and thickness of the pavementlayers), was generated by a program developed for estimating the results from on-sitedrilled cores of inventory data.
• Structure (ST). Four types of pavement structure were considered:
1. Asphalt concrete over granular base (AC/GB)2. Asphalt concrete over stabilized base (AC/SB)3. Asphalt concrete overlay of asphalt concrete (AC/AC)4. Asphalt concrete overlay of portland cement concrete (AC/PCC)
• Surface thickness (Ts). The thickness of the surface layer was defined from drillingand sampling results for the particular SHRP-LTPP section.
• Type of subgrade (SG). The subgrade type was defined as either FINE or COARSE onthe basis of inventory data from the GPS studies.
• Modulus (E). The modulus was computed for every layer from falling weightdeflectometer (FWD) data. The pavement structure was characterized as a three-layersystem with the three modulus values Esg, Eb, and Es identifying the modulus ofsubgrade, base, and surface layers, respectively.
• Moisture condition (M). The moisture condition reflects the moisture content expectedin the subgrade soil for that LTPP section and was categorized as either WET for highmoisture content or DRY for low moisture content. The weather condition
classifications are based on SHRP environmental regions (see Figure 7.6).
197

Net distortion is negative.(no + values)
Y1 Y30
Case 1: Deep Subgrade Rutting
Net Distortion is near zero.
Case 2: Rutting Within Pavement Layer
Net distortion is positive.
Case 3: Shoving Within Upper Layer
Figure 7.5 Pavement Distortion Possibilities
198

• Environmental Condition (C). The environmental condition characterizes the climaticstate at the pavement sections and indicates the influence o:' weather on the surfacedistortion caused during rutting. This parameter was classified as either a freeze ornonfreeze situation in accordance with the SHRP-LTPP en,vironmental regions (Figure7.6).
• Traffic rate (TF). The amount of traffic was defined in KESALs and was obtainedfrom the state highway agency (SHA) historical traffic data
Definition of Rutting Type
The pavement cross-profiles vary from one section to another, producing different rut depthvalues as well as varying total distortion for each pavement. The rutting at each section isclassified as deep-seated or layer type. This classification is based on the amount of distortionat each pavement, established from the PASCO cross-profile data, and provides an insight intothe type of rutting phenomenon. The deep-seated distortion would be indicative of a subgradebreakdown, while the surface distortion type would be related to distress in the surface andother pavement layers. This classification of the distortion was developed for each pavementsection and was considered for analysis as a rutting type parameter (Rr).
The deep-seated case was identified as rutting type 1, while the intermediate and the surfacecases were classified as type 2. In addition, rut type could be classified as case 3 (i.e.,shoving within the upper layer) or case 4 (i.e., heaving).
Sixty sections were investigated, forming a matrix of twelve fields tbr sixty observations. Thesections were selected from the four SHRP regions to provide a uniform distribution ofpavement characteristics across the United States. AC/GB, AC/SB, AC/AC, and AC/PCCpavements were designated types 1 through 4, respectively.
Type of Rutting
The type of rutting (i.e., layer or deep-seated) was analyzed by linear regression techniques toidentify variables influencing rutting development. The analysis was completed for an HMACsurface layer over a stabilized base, an HMAC surface layer over a granular base, and anHMAC overlay of an original HMAC surface layer. Deep-seated rutting developed in onlyone of the five sections with an HMAC surface layer over a granular base.
• HMAC on stabilized base. The source of rutting regression equation for HMAC on astabilized base is presented in Figure 7.7 along with the particulars associated with theequation. The dependent variable is RT, which approaches a value of-1 for a deep-seated rutting condition and +1 for a layer rutting condition.
200

Rr = 0.5- 0.36(Ts - 2.73)- 0.42(Es-750)- 0.55(C) + 0.55 (M* C)
where
Rr = rut type: layer +1, deep -1
Ts = surface thickness (in.)
E_ = surface modulus
C = temperature zone: freeze + 1, nonfreeze -1
M = moisture condition: wet + 1, dry -1
Ra = 0.65
RMSE = 0.64
CV = 173.9
18 sites
Figure 7.7. Source of Rutting: EI_LAC on Stabilized Base
201

The equation incorporates four independent variables including surface thickness Ts,temperature (C) and moisture (M) zones, and surface layer modulus. The signs of thecoefficients of these variables provide an indication of the effect of the variables ontype of rutting (i.e., layer or deep-seated) expected to develop. The interaction (orcross-product) between the temperature and moisture zone._, M * C, must beconsidered.
In general, an increase in surface thickness Ts, or surface rnodulus, Es, tends to producedeep-seated rutting when the negative coefficients (-0.36 and -.42) are considered. Inaddition, sections in the colder (C = +1) and drier (M = -1) climatic zones would tendto develop deep-seated rutting (-0.42(1) + 0.55(-1 * +1) = -0.97). On the other hand,the sections within the warmer (C = -1) and drier (M = -1) climatic zones would tendto develop rutting in the layers.
An interesting phenomenon could exist in the colder (C = ���•wetter (M = +1)climatic zones because the main effects of temperature (C) could essentially cancel theeffect of the interaction between temperature and moisture (i.e., M :_ C). In this casethe surface layer thickness becomes the apparent dominant effect.
• HMAC on granular base. The source of rutting regression equation is presented inFigure 7.8 for HMAC on a granular base, along with the characteristics associated withthe equation. The equation incorporates the two independent main effects of moisturecondition (M) and pavement structural number (SN). The value of the moisturecoefficient (0.63) indicates that moisture exerts a significant influence on rut type inwet environments, since it results in a Rr value of +1 (layer rutting) for structuralnumbers of about 4.7. Deep-seated rutting (R Tof-1) could be expected for pavementsections located in dry environments with structural numbers approaching 6.0.
• HMAC overlay of HMAC. The source of rutting regression equation for an overallflexible pavement is presented in Figure 7.9. The equation was developed from theresults of ten LTPP sections. The equation incorporates two independent main effects:moisture condition (M) and overlay layer thickness (ToL). The coefficient of 0.63implies that the moisture condition has a significant direct influence on type of ruttingdeveloped; however, the overlay thickness must also be considered to produce a nearunit value (positive or negative) for the dependent rut type term.
• Shoving (case 3) distortion. Shoving within the upper layer was observed in four ofthe twenty-six sections included in the analysis of the flexible pavements withstabilized bases. In these four sections the subgrade soil was classified in inventorydata as coarse-grained. It is important to note that none of the flexible pavements withgranular bases were found to exhibit a shoving distortion.
202

Rr = 0.47 - 0.68(SN - 4.72) + 0.63(M)
where
Rr = rut type: layer +1, deep -1
SN = structural number
M = moisture condition: wet +1, dry -1
R2 = 0.97
RMSE = 0.225
5 sites
Figure 7.8. Source of Rutting - EiMAC on Granular Base
203

Rr = 0 + 0.63(M) - 0.25(ToL - 3.87)
where
Rr = rut type: layer + 1, deep -1
M = moisture condition: wet + 1, dry -1]
TOE = overlay thickness (in.)
R2 = 0.76
RMSE = 0.56
10 sites
Figure 7.9 Source of Rutting - HMAC Overlay of HMAC
204
• Heaving (case 4) distortion. Heaving was defined for five of the twenty-six sectionsincluded in the study of LTPP flexible pavement sections with stabilized bases. Infour of the five sections the inventory subgrade classification was designated as a fine-grained soil. Three of the sites were located in the warmer-drier climatic zones, whilethe other two were located in the cooler-wetter climatic zone. In addition, none of theseven flexible pavement sections with granular bases were found to exhibit pavementheaving.
Rut Prediction Equations
Once the rut type was designated for each SHRP-LTPP section included in this study,equations for predicting the magnitude of each type of rutting (layer or deep-seated) for eachpavement type were developed by simple linear regression techniques.
• HMAC on granular base. Equations for estimating rut depth (in millimeters) for layerand deep-seated distortion are presented in Figure 7.10. Both equations have relativelyhigh R2 values (0.80 for deep-seated and 0.85 for layer) but were developed from asmall number of sites (four and three). These equations should therefore beconsidered preliminary and should eventually be confirmed with additional results.
The magnitude of rut depth in the deep-seated category is primarily a function of thestructural number (SN) or structural capacity of the section. An increase in SN wouldproduce lower rut depths. Therefore the composite effect of the pavement structureinfluences the magnitude of rutting throughout the total pavement structure (includingthe subgrade).
The rut depth that develops in the upper layers of a pavement structure is primarilyrelated to the thickness of the top pavement layer. Greater rut depths are expected fora pavement with a thicker surface layer.
• HMAC on stabilized base. The equations for estimating rut depth (in millimeters) forlayer and deep-seated distortion are presented in Figure 7.11. Both equations havereasonable R2 values (0.83 for deep-seated and 0.62 for layer) and were developedfrom a total of seventeen sites. These equations should also be considered preliminaryand should be confirmed with additional results.
The magnitude of rut depth in the deep-seated category is a function of the subgrademodulus and thickness of the HMAC surface layer. From the deep-seated rutequation, it can be observed that lower subgrade moduli combined with thicker surfacelayers contribute to distortion within the overall pavement structure.
The magnitude of rut depth that could possibly develop in the upper layers of apavement structure (i.e., layer rutting) is related to the asphalt content, subgrademodulus, and age). From this relationship it can be observed that layer ruttingincreases with age, lower layer moduli, and lower asphalt contents.
205

Deep-seated RD = 6.3 - 2.4(SN - 4.72)
where
SN = structural number
R2 - 0.80
RMSE = 1.4
4 sites
Layer RD = 7.1 + 0.8 (Ts- 2.7)
where
Ts = surface thickness
R2 = 0.85
RMSE = 1.2
3 sites
Figure 7.10. Rut Depth Regression Equations - HMAC on Granular Base
206

Deep RD = 5.8 - 0.2(EsG - 22.0)
where
ESG = subgrade modulus (ksi)
Ts = surface thickness (in.)
/t2 = 0.83
RMSE = 1.2
5 sites
Layer RD = 6.1 - 1.69(AC - 5.16) - 0.05(Eso- 25.5) + 0.302(AGE - 10.9)
where
AC = asphalt content (%)
ESG = subgrade modulus (ksi)
Age = age of pavement (yrs.)
R2 = 0.62
RMSE = 1.6
12 sites
Figure 7.11. Rut Depth Regression Equations - HMAC on Stabilized Base
207

• HMAC overlay of HMAC. The equations for estimating rut depth development inflexible overlay sections are presented in Figure 7.12. Both equations have relativelyhigh R 2 values (0.90 for deep-seated and 0.91 for layer rutti:qg) and were developedfrom a total of ten SHRP-LTPP sites. These equations should be consideredpreliminary and should be confirmed in future analyses.
From Figure 7.12, it can be observed that deep-seated rutting is a function oftemperature zone (C), subgrade modulus (Es6), original layer modulus (EoL), andsurface layer modulus (Es). Deep-seated rutting would apparently be greater for dryclimates (C = -1), lower subgrade moduli, and higher original and surface layer moduli.
On the other hand, the magnitude of layer rutting is influenced primarily by themodulus of the original surface layer, with higher moduli values resulting in greaterrutting depths.
• HMAC overlay of PCC. The equation for estimating rut depth development in anHMAC overlay layer of a rigid pavement (Figure 7.13) is a fhnction of subgrade type(fine- or coarse-grained), overlay layer thickness, and moisture conditions. Theequation has a reasonable R2 (0.68) and is based on the results from ten SHRP-LTPPsections. Because of the structure, deep-seated rutting would not develop in this typepavement.
From Figure 7.13, it can be observed that the magnitude of rutting is expected to begreater for coarse subgrades (SG = +1), thicker overlays, and wetter climates (M = +1).
Applications
The equations presented in this document can be used in the initial pavement design selectionprocess to identify pavement structural sections that are prone to develop greater rutting depthsand cross-profile distortion.
The RTequations (Figures 7.7, 7.8, and 7.9) could be used to identify the type of rutting (layeror deep-seated) that could be expected to develop within the proposed design section.Preliminary adjustments in the designs could be made to minimize the potential ofdevelopment of both layer and deep-seated rutting.
Once the rut type is established for the proposed design section, the appropriate rut depthprediction equation (Figures 7.10, 7.11, 7.12, and 7.13) could be used estimate the expectedmagnitude of long-term rutting. At this point in the process, the design section specificallycould be adjusted (i.e., Ts, AC, Es, Eo0 to minimize the predicted magnitude of rutting.
This proposed process is based on rutting only. The possible development of other types ofdistress (e.g., fatigue) in the pavement structure should be considered in developing finalflexible pavement structural sections.
208

Deep RD = 3.6 - 1.75(C) - 0.06(EsG - 31)- 0.001 (Eot. - 300)+ 0.005(E -750)
where
C = temperature zone: freeze + 1, nonfreeze -1
Es6 = subgrade modulus (ksi)
EoL = original layer modulus (ksi)
Es = overlay layer modulus (ksi)
R2 = 0.90
RMSE = 0.8
6 sites
Layer RD = 7.4 + 0.005(Es- 750)
where
E_ = overlay layer modulus (ksi)
R2 = 0.91
RMSE = 0.4
4 sites
Figure 7.12. Rut Depth Regression Equationa - RMAC Overlay of EIMAC
209

RD = 1.0 + 4.1(Sc) + 6.8(ToL - 2.2) + 6.8(M)
where
S_ = subgrade: coarse+l, free-1
ToL = overlay thickness (in.)
M = moisture conditions: wet + 1, dry- 1
R2 = 0.68
RMSE = 3.8
10 sites
Figure 7.13. Rut Depth Regression Equations - HMAC Overlay of PCC
210

SHRP Data Analysis Contract
Introduction
The fu'st analysis of the SHRP-LTPP data has been completed by Brent Rauhut EngineeringInc. (BRE) and ERES Consultants Inc. (ERES). BRE conducted the flexible pavementanalyses and ERES the rigid pavement analyses. SHRP's objectives for this research effortwere to (1) develop and implement a strategic approach to the analysis of LTPP data tosupport the overall goals of SHRP and LTPP and (2) to develop data analysis plans to befollowed in future analyses with LTPP data. The results of this study are included in fivevolumes (7.17, 7.18, 7.19, 7.20, 7.21).
To accomplish these objectives, the following activities were conducted:
1. Data were received and processed into suitable databases for analysis, and statisticalevaluations of the databases were conducted.
2. The LTPP data were used to evaluate the AASHTO design equations, and improveddesign equations were developed.
3. Sensitivity analyses were conducted to identify independent variables with significanteffects on pavement performance and quantify the relative effects of each.
4. The experience gained from these early data analyses was used to recommend futuredata analysis requirements and approaches.
Several databases were formed, each representing a combination of distress type andpavement type. The statistical evaluations of the separate databases providedcharacterizations of the data in the databases and identified shortcomings in the data. Thisinformation will allow future planning to overcome these shortcomings.
Limitations Resulting from Data Shortcomings
This project involved the analysis of data observed on in-service pavements, and none of theearly results should be expected to be of better quality than the database from which they aredeveloped. There are limitations to the studies that are an unavoidable consequence of thetiming of the early data analyses. Data was analyzed which had not been exposed to thecomprehensive quality assurance, quality control checks at either the regional informationmanagement system (RIMS) or the national information management system (NIMS). Forinstance, excellent traffic data from the monitoring equipment recently installed will beavailable for future data analysts; however, this early data analysis was based on estimates ofpast ESALs of very limited accuracy. While years of time-sequence monitoring data willeventually become available, these studies included distress measurements for only one pointin time, or at most two. For most distresses, an additional data point could be inferred forconditions immediately after construction (e.g., rutting, cracking, and faulting of joints maygenerally be taken as zero initially). For most test sections, analyses for roughness increasesdepended on educated estimates for initial roughness (derived from SHA estimates of initial
211

PSI). Similarly, the evaluations of the AASHTO design equations ,depended on the SHAestimates of initial PSI.
Another shortcoming of the databases that influenced the results involved missing items ofinventory data, particularly the data from SHA project files concerning the design andconstruction of the pavements. Some data elements were available [br all the test sections,while other data for some test sections were unknown and unavailable. Unfortunately, it willnot be possible to obtain much of this missing inventory data, which will be missing forfuture analyses as well.
Many of the test sections were not yet displaying distresses, and those with distresses wouldgenerally exhibit only one or two types. The only type of distress that was generallyavailable for all test sections was roughness in the SHRP-LTPP time flame, and it wastherefore necessary to estimate the initial roughness to study increases in roughness. Forflexible pavements, rutting information was also available for nearly all test sections. It wasnot possible to study alligator cracking in flexible pavements because only 18 test sectionswere reported to have any alligator cracking. Similarly, raveling and weathering could not bestudied because only three test sections had experienced this distress. The only three distresstypes for flexible pavements for which sufficient data were available to support the studieswere rutting, change in roughness (measured as IRI), and transverse (or thermal) cracking.
Predictive models for PCC pavements could be developed for ten combinations of pavementtype and distress type. The models included joint faulting for doweled and non-doweledjoints, Iransverse cracking for jointed plain concrete pavement (JPCP), transverse crackdeterioration for jointed reinforced concrete pavement (JRCP), joint spalling for JPCP andJRCP, and IRI for doweled JPCP, non-doweled JPCP, JRCP, and continuously reinforcedconcrete pavement (CRCP). Insufficient data were available to develop regional predictivemodels.
The study of overlaid pavements was to have been of high priority. Pavement conditionbefore overlay was considered a critically important variable; however, this information wasnot available for pavements that were overlaid before to entering GPS. It was decided earlyin the implementation of the LTPP studies that pavement test sections would be sought forwhich overlays were imminent, so that the condition before overlay would be available.Several test sections have been implemented, but none are old enough to have appreciabledistress. The total numbers of overlaid pavements were limited, and few had sufficientinformation for successful analyses. Consequently, analyses for the overlaid pavements werelimited to an evaluation the 1993 AASHTO Overlay Design Equations. More overlaid testsections exhibiting more distress would benefit future studies.
Sensitivity Analyses and Results
"Sensitivity analysis" is not a term commonly used by either research engineers orstatisticians, but it has come to have a specific meaning to some from both disciplines. Inthis research effort, sensitivity analyses are defined as statistical studies to determine the
212

sensitivity of a dependent variable to variations in independent variables (sometimes calledexplanatory variables) over reasonable ranges.
There is no single method of conducting sensitivity analyses; however, all approaches requiredevelopment of an adequate equation (or model) as a beginning. The procedures used forthese studies involved setting all explanatory or independent variables in a predictive equationat their means and then varying them one at a time from one standard deviation above to onestandard deviation below the mean. The relative sensitivity of the distress prediction for aparticular variable is the change in the predicted distress across the range of two standarddeviations. These changes in predicted stresses are compared with distress changes when theother explanatory variables are varied in the same manner.
It became apparent early in the analysis that satisfactory predictive flexible pavement(HMAC) models could not be developed from all the data in the NPPDB because of the sizeof the inference space, which included all of the United States and parts of Canada.Consequently, where sufficient test sections displaying the distress of interest were available,regional databases were formed for each of the four environmental regions and separatepredictive HMAC models were developed. This regionalization was not possible for the PCCpavements because the resulting regional databases would include too few data.
An example of a sensitivity analysis is presented in Table 7.3 for the predictive equation forrutting in a wet-freeze environmental zone. The form of the equation is presented at the topof the table, and the explanatory variables or interactions are included in the table, along withthe coefficients that provide the details of the equation. The exponents B and C arecalculated by multiplying the explanatory variables or interactions in the left column by theregression coefficients bi and c; and adding the results. For example, the constant bl for thismodel is 0.183 and is equal to B because all the other b,.'s are 0. To calculate C, the constantterm is 0.0289, the log of air voids in HMAC is multiplied by -0.189, and so forth.
The results of the sensitivity analyses conducted with this predictive equation appear asFigure 7.14. From Figure 7.14, it can be seen that the greatest effect on the occurrence ofrutting in the wet-freeze environment may be expected to be the number of KESALs. Thedashed lines to the left indicate that reductions in KESALs decrease rutting; however, itshould be recognized in this case that the standard deviation for KESALs is greater than themean, and negative KESALs are not possible. Freeze index is the next most important,followed by percent of the HMAC aggregate passing a #4 sieve, air voids, and so forth. Itcan also be seen from the directions of the arrows that increasing KESALs and freeze indexmay be expected to increase rut depths, while increasing amounts of aggregate passing the #4sieve, air voids, and asphalt thickness may be expected to decrease rutting.
To illustrate how the sensitivities may differ from one environmental region to another, thesensitivity analysis results for the dry-nonfreeze environmental zone are included as Figure7.15. In comparing the results of the two datasets, it can be seen that the majority of thevariables are the same but that there are some differences and that the relative levels ofsensitivities vary between environmental zones.
213

Table 7.3. Coefficients for Regression Equations Developed to Predict Ruttingin HMAC on Granular Base for the Wet-Freeze Datasct
Rut Depth = N s 10c
where
N - number of cumulative KESALs (In.)B = bl+b2xl+bsx2+...+b_x,.. 1C = c I +c 2x I +c_.r,. z+... +c mxn. l
Explanatory Variablf or Interaction Coefficients for Terms InFreeze Indcx (xi) Units
bi Ci
Constant Term -- 0.183 0.0289
log(Air Voids in HMAC) % by volume 0 -0.189Iog(HMAC Thickness) In. 0 -0.181log(HMAC Aggregate < #4 Sieve) % by weight 0 -0.592Asphalt Viscosity at 140°F Poise 0 1.80 x 10slog(Base Thickness) In. 0 -0.0436Annual Precipitation In. 0
Degree-days 0 3.23 x 10⁶,
n = 41Rz = 0.73
Adjusted Rz = 0.68RMSE in logm(Rut Depth) = 0.19
214

,_.. .... - KESALs
, -_ Freeze Index
_- ! HMAC Aggr. <#4
_- ' HMAC Air Voids
i- HMAC Thickness
[ -, Annual Precipitationl
.- ; Base Thickness,...--.
:-- Viscosity at 140*F
ii i
.15 .20 .25 .30 .35 .40
Wet.Freeze Dataset
Figure 7.14. Results from Sensitivity Analysis for Ruttingin HMAC Granular Base
215

___,._._ KESALs
HMAC Air Voids ,-
Days > 90°F ,
L-nnual Precipitation
HMAC Aggr. < #4 :-
Subgrade < #200 {. -_
HMAC Thickness
Base Thickness ,,.. ,I
fI I ! w i
•15 .20 .25 .30 .35 .40
Dry - Nonfreeze Dataset
Figure 7.15. Results from Sensitivity Analysis for Rutting in HMAC on Granular Base
216

Similar studies were conducted for rutting in other environmental regions, as well as forincreases in roughness and transverse crack spacing in all four environmental regions. ForPCC pavements, equations to predict the occurrence of distresses were developed using theentire databases, and sensitivity analyses were carried out in the same manner.
While the sensitivity analyses offer useful insight, it must be remembered that most of thesepavements are in very good shape, so some important interactive effects---such as waterseeping through cracks and expediting deterioration in lower layers---are not necessarilyrepresented in these results.
Summary of Sensitivity Analysis Results for HMAC Pavements
The twelve significant variables from the sensitivity analyses for HMAC pavements are listedin Table 7.4 by distress type, by relative ranking, with the most significant variable at the topand the least significant at the bottom.
Nine variables were significant in all three distress types. The exceptions are listed below:
• Air-void level in HMAC was not significant for transverse cracking
• Percentage of HMAC aggregate passing a #4 sieve was not significant for change inroughness
• Annual number of freeze-thaw cycles was not significant for rutting
• Average annual minimum temperature and daily temperature range were significantonly for rutting and change in roughness, respectively
In addition, four environmental variables were found to be significant for rutting, five forchange in roughness, and four for transverse cracking.
Some recommendations and comments associated with the sensitivity analyses follow:
1. Most of the rutting for these pavements apparently occurred soon after they wereopened to traffic. These pavements do not necessarily represent the case of advanceddeterioration.
2. It is important to achieve sufficient compaction so that the early compaction undertraffic is not excessive.
3. The amount of HMAC aggregate passing the #4 sieve was selected to represent theeffects of gradation. Within the inference spaces of the separate datasets, increasingamounts of aggregate passing the #4 sieve appeared to reduce rutting.
217

Table 7.4. Sensitivity Analysis Results: HMAC
Rutting Change in Roughness Transverse Cracking
KESALs KESALs AgeAir Voids in HMC AsphaltViscosity AnntudPrecip.HMAC Thickness Days with Temp. > 90*F HMAC ThicknessBase Thickness HMAC Thickness Base Thickness
Subgrade < #200 Sieve Base Thickness Asphalt ViscosityDays with Temp. > 90*F Freeze Index Base CompactionHMAC Aggregate < #4 Sieve Subgrade < #200 Sieve Freeze IndexAsphalt Viscosity Air Voids in HMAC Days with Temp. >90*FAnnual Precipitation Base Compaction Snbgrade < #200 SieveFreeze Index Annual Precipitation KESALsBase Compaction Daily Temp. Range AamualFreeze-Thaw CyclesAverage Annual Min. Temp. Annual Freeze-Thaw HMAC Agg. < #4 Sieve Cycles
218

4. As expected, traffic loading is the strongest contributor to rutting and roughness, whilepavement age had the strongest effect on transverse cracking.
5. Thicker HMAC surfaces and granular base layers may be expected to generallydecrease all three types of distress.
Some of these results are difficult to explain. For example, the studies indicate that increasesin base compaction, annual precipitation, asphalt viscosity, or annual freeze-thaw cycles (orfreeze index) tend to increase transverse crack spacing (reduce cracking). These results aredifficult to understand and cannot be explained entirely in terms of reliabilities of theequations, since the regional equations had fairly good statistics.
In summary, most of the results from the sensitivity analyses for HMAC pavements appear tobe reasonable; however, other results appear as surprises that may (1) result from the specificcharacteristics of the datasets on which they are based, (2) represent mechanisms not yetunderstood, (3) result from interactions not explained by the equation forms, or (4) resultfrom other unknown causes.
Summary of Sensitivity Analysis Results for PCC Pavements
The results of the sensitivity analyses on PCC pavements are presented in Table 7.5. Theindependent variables are listed below in order of "combined rankings," one based on averagerankings and one based on number of models in which the variable was included (in case of atie, the other ranking basis was used to order the two).
The rankings are almost identical for the two methods. However, the results in Table 7.5 donot tell the whole story, since the rankings depend on type of pavement and type of distress.Conclusions concerning the three PCC pavement types (JPCP, JRCP, and CRCP) have beendeveloped from the results of the sensitivity analysis and past experience. The conclusionsare presented in the following sections.
Design Recommendations for JPCP
1. Use of dowels of sufficient size for the traffic loadings (the larger the dowel diameter,the less faulting) will ensure that faulting will not become significant and cause severeroughness. Use of dowels is particularly important for heavy traffic in cold and wetclimates. Thicker slabs by themselves do not reduce faulting significantly.Longitudinal subdrainage will help reduce faulting of non-doweled joints. Use of atied concrete shoulder will reduce doweled joint faulting.
2. Increased slab thickness has a very strong effect on reducing transverse slab crackingand providing a smoother JPCP (lower IRI) over time.
219

Table 7.5. Sensitivity Analysis Results: F'CC
Ranking Ranking by Numberby Average of Models Found Significant
Age AgeCumulative ESALs Cumulative ESALsSlab Thickness Slab ThicknessStatic k Value Static k ValuePrecipitation PrecipitationJoint Spacing Edge Support(Tied Shoulders)PercentSteel Joint SpacingEdge Support(Tied Shoulders) PercentSteelAnnual Freeze-ThawCycles Annual Freeze-ThawCyclesType of Subgrade Type of SubgradePCC Flexural Strength PCC FlexuralStrengthMonthly TemperatureRange Monthly TemperatureRangeWidenedTraffic Lane Widened TrafficLaneFreeze Index Freeze IndexDowel Diameter Dowel DiameterSubdrainage SubdminageType of Base Type of Base
220

3. Provision of increased subgrade support, as indicated by the back-calculated k value,results in lower IRI and a smoother pavement. Increased support over an existing softsubgrade would likely require either treatment of the soil or a thick granular layer overthe subgrade.
4. Use of shorter slabs for JPCP will reduce the amount of joint faulting and transversecracking and will result in a smoother pavement (lower IRI) over time.
5. Specification of durable concrete in freeze climates is desirable, so that freeze and
thaw cycles and other climatic factors do not result in significant joint spalling.
Design Recommendations for Jointed Reinforced Concrete Pavement (JRCP)
1. Use of dowels of sufficient size for the traffic loadings (the larger the dowel diameter,the less faulting) will ensure that faulting will not become significant and cause severeroughness. Use of dowels is particularly important for heavy traffic in cold and wetclimates. Thicker slabs by themselves do not reduce faulting significantly.Longitudinal subdrainage will help reduce faulting of non-doweled joints. Use of atied concrete shoulder will reduce doweled joint faulting.
2. Increased slab thickness has a very strong effect on reducing transverse slab crackingand providing a smoother JPCP (lower IRI) over time.
3. Provision of increased subgrade support, as indicated by the back-calculated k value,results in lower IRI and a smoother pavement. Increased support over an existing softsubgrade would likely require either treatment of the soil or a thick granular layer overthe subgrade.
4. Use of shorter JRCP slabs will reduce the amount of joint faulting.
Design Recommendations for CRCP
1. Increased percentage of longitudinal reinforcement provides a smoother CRCP (lowerIRI) over time. The increased percentage of steel reduces the number of punchoutsand the deterioration of transverse cracks.
2. Increased subgrade support results in fewer deteriorated transverse cracks and a lowerIRI (smoother pavement). Increased support over an existing soft subgrade wouldlikely require either treatment of the soil or placement of a thick granular layer overthe subgrade.
3. Widened traffic lanes will provide a smoother CRCP (lower IRI) over time.
221

4. Increased slab thickness results in somewhat smoother CRq'P (lower IRI) over time,probably because there are fewer punchouts as a result of the thicker slab.
Evaluation of the AASHTO Flexible Pavement Design Equation
The equation to be evaluated is the one included in the 1986 AASHTO Guide for Design ofPavements:
log W = Zk * S,, + (G, /13)+ 2.32 log Mr - 8.07
where
G, = 13(log W- log p) = log (APSI/2.7)W = number of 18-kip ESALs19 = 0.64 (SN + 1) TM
[3 = 0.4 + 1094/(SN + 1) 5'19
SN = a_ D_ + a2 Dz m2 + a3 D3 m3 + ... + an On m,,D i = thickness of Layer i (in.)aj = structural coefficient for the material in Layer imi = drainage coefficient for the material in Layer iZR = standard normal deviateS,, = overall standard deviationM r = resilient modulus (psi)
Because this equation was used for research instead of design, a 50% reliability was assumed,which resulted in Zn = 0.
The original equation for calculating current PSI was reported in the AASHO Road Test Report5 as follows:
PSI = 5.03 - 1.91 log(1 + sv) - 1.38rd 2 - 0.01 c +p
where
sv = average slope variance as collected using the CHLOE profilographrd = average rut depth based on a 4-ft straightedgec = Class 2 and Class 3 cracking (ft2 per 1000 ft2)p = bituminous patching (ft2 per 1000 ftz)
This equation, commonly used in the past for estimating PSI, was used to determine currentPSI values for the SHRP-LTPP sections from values of slope variance derived from surfaceprofiles measured with a Law profilometer and rut depths measured by PASCO's RoadReconunit. The cracking and patching terms were not included in the calculation of the current PSI,since significant cracking and patching (C&P) were noted for only a few test sections. Inaddition, the effect of the C&P term was not considered significant because its coefficient
222

was only 0.01. The mean value of current PSI for the SHRP-LTPP sections included in thisanalysis was 3.53, with a standard deviation of 0.49.
Observed PSI loss was defined as the difference between the initial PSI and the calculatedcurrent PSI value. The mean value for observed PSI loss was 0.70 and the standard deviation
was 0.51. Initial values of PSI were estimated by the SHAs, resulting in a mean value of4.25 and a standard deviation of 0.23.
The basic AASHTO equation was used to predict the total KESALs required to cause theobserved losses in PSI. Rearranging the equation slightly results in
z_t'SI = 2.7 (WIpS,,)p
where
S. -- (Mr) 2"32 * 10"s'°7
The predicted PSI losses caused by the traffic estimated by the SHAs were calculated withthis equation.
Resilient moduli estimates for the subgrade (M,) were obtained from the back-calculationprocedures recommended in the 1986 Gu/de, using the deflections measured by an outersensor of an FWD. Historical traffic data provided by the SHAs were used for the trafficdata (W) in these calculations. The cumulative KESALs for each section were divided by thenumber of years since the test section was opened to traffic to obtain average values per year.This allowed extrapolation to an extra year or two beyond 1989 to obtain traffic levelestimates associated with the dates of monitoring activities. Most of the monitoring data usedwere obtained in 1990 or 1991.
During the investigation it was found that the KESALs were consistently much higher thanthose estimated by the SHAs. Only 9 of the 244 predictions were lower than the SHAestimates, while the predictions were more than 100 times the SHA estimates for 112 testsections. As the predictions from the design equation appeared to be very poor for in-servicepavements, the thrust of the research turned toward identifying its problems and developingmore reliable equations.
As partial explanation, it was noted that 74% of the in-service test sections in this study hadexperienced a loss in PSI of 1.0 or less, while those in the road test experienced losses of 2 to3. Further, the average absolute deviation of observed PSI from the computed curves at theAASHTO Road Test was 0.46, so some 39% of the in-service test sections in this study hadexperienced losses of PSI within the "noise" at the road test.
Linear regressions conducted on the database resulted in an equation with an R2 of 0.09,indicating that the equation form simply did not represent in-service pavement performance.Additional factorial studies indicated that the equation appears to falter for structural numbersless than 3, cumulative traffic greater than 5 million ESALs, or subgrade moduli greater than
223

10,000 psi (a value of 3000 psi was assumed for the road test data).--that is, for conditionsoutside the inference space of the AASHO Road Test.
Linear regression analyses were also conducted to model the ratio of predicted to observedtraffic. These analyses resulted in a model with R2 of 0.77, which included structural number,subgrade modulus, and PSI loss but also average annual rainfall and average number of daysbelow freezing. Attempts have been made through the years to extrapolate the equationoutside its inference space, but these have apparently been unsuccessful.
The back-calculated subgrade moduli appeared to be quite high, but laboratory testing forresilient moduli was just getting started when these analyses were being conducted.Subsequent comparisons of 106 test sections for which laboratory results became availableindicated that the mean ratio of back-calculated to laboratory-derived moduli was 4.48, with astandard deviation of 2.47. These 106 laboratory moduli were substituted for the back-calculated moduli, and the ratios of predicted to observed ESALs were considerablydecreased. The number of "reasonable predictions" (with ratios of 2 or less) changed from 13with the back-calculated subgrade moduli to 60 with the laboratory moduli. While thepredictions improved greatly, the ratios for 46 predictions still ranged from 2 to more than100, corroborating the weaknesses in the equation noted throughout the studies. It appearscertain that future design equations must take into account differences between back-calculated and laboratory-derived resilient moduli.
Other limitations of the flexible pavement design equation were noted:
1. The accelerated trafficking to "failure" at the road test was not representative of in-service pavements. Pavement engineers typically intercede with overlays or otherrehabilitation long before serviceability loss approaches the level considered as failureat the road test.
2. The subgrade elastic moduli were assumed to be 3000 psi for the development ofequations at the road test, whereas much higher rnoduli result from back-calculation orcurrent laboratory protocols.
Evaluation of the AASHTO Rigid Pavement Design Equation
The analyses were carried out using the original AASHO design equation and the 1986extension of the original design equation, which was unchanged in the 1993 guide. Theanalysis using the AASHO original equation was undertaken to determine whether theimprovements to the prediction model were beneficial.
The AASHO design equations were evaluated by comparing the predicted 18-kip (80-kN)ESALs for each test section determined from the design equation to the "observed" ESALs(estimated from traffic data) carded by the section. The predicted ESALs are calculated withthe concrete pavement equations from the original Road Test and the latest extended form inthe 1986 AASHTO Design Guide for Pavement Structures.
224

The original 1960 AASHO design equation is a relationship between serviceability loss, axleloads and types, and slab thickness:
Gt = 13(1ogIV,- log p) = 1og([4.5 -p,] / [4.5 - 1.5])
where
G, = logarithm of the ratio of loss in serviceability at time t to the potentialloss taken to a point at which serviceability equals 1.5
13 = a function of design and load variables that influence the shape of thep-versus-W serviceability curve
W, = cumulative 18-kip ESALs applied at end of time tp = a function of design and load variables that denotes the expected number
of axle load applications to a terminal serviceability indexlogp = 7.35 log(D+ 1)-0.06D = slab thickness (in.)4.5 = mean initial serviceability value of all sectionsp, = terminal serviceability
In the 1986 and 1993 AASHTO Design Guides, the PCC pavement design model is given as:
1 ( APSI
°g_4.:5 - i.5)log WI8 = ZnSo + 7.35 log(D + 1) - 0.06 + 1.624 * 107
1+(D + 1)TM
11.,i/D 18.42+ (4.22 - 0.32p/) log 15.63 J 0.75 (E_/k)°'2_
where
APSI = loss of serviceability (Pi - P,)D = thickness of PCC pavement (in.)S" = modulus of rupture of concrete (psi)Cd = drainage coefficientEc = elastic modulus of concrete (psi)k = modulus of subgrade reaction (psi/in.)J = joint load transfer coefficientW18 = cumulative 18 kip ESALs at end of time tp_ = initial serviceabilityp, = terminal serviceability
225

ZR = standard normal deviateSo = overall standard deviation
Five sets of analyses were performed individually for GPS experiments 3 (_PCP), 4 (/RCP),and 5 (CRCP) to examine the ability of the equations to predict the amount of traffic actuallysustained by each test section. Initially, analyses were conducted on all data available foreach experiment. Then the datasets for each pavement type OPCP. JRCP, and CRCP) werefurther separated by environmental regions. Analyses were then performed for each of thefour environmental regions for each of the pavement types.
The predicted KESALs were plotted against the estimated KESALs on scattergrams tovisually examine the scatter of the data. The results were also presented in bar graphsshowing the ratio of predicted to actual KESALs.
As an example, the plot of predicted versus actual KESALs using the original AASHO modelappears in Figure 7.16 for JPCP and JRCP. If the predictions were unbiased for all regions,half the points would fall on each side of the line of equality.
It can be seen that the original AASHO model overpredicts KESALs for a majority of testsections (78% of JPCP and 82% of JRCP). Similar scatterpiots were developed for separateenvironmental regions.
The plots of predicted versus actual KESALs for JPCP, using the 1986 or 1993 AASHTOmodel, are shown in Figure 7.17. It can be seen that the 1993 model predicted much betterthan the original AASHO model for these analysis datasets, suggesting that the addition ofseveral design factors considerably improved the performance prediction of the model.However, there is much scatter about the lines of equality, even on these log-log plots. Thisscatter may be due to several causes, including inadequacies in the model, errors in theinputs, and random performance variations (or pure error). Similar plots were prepared andevaluated for JPCP and CRCP.
To analytically determine the ability of the AASHTO concrete pavement design model topredict the actual KESALs observed for the pavement sections, a statistical procedure wasfollowed that determined whether two sample datasets (actual and predicted) are from thesame population. The paired-difference method, using the Student t distribution, was used todetermine whether the KESALs as predicted by the AASHTO equation statistically belong tothe same population as the actual measured KESALs.
Appropriate statistical analysis tools were used to compare the observed KESALs with thosepredicted by the AASHTO equations. The calculated t statistic (t-calc) was compared with atabulated t statistic (t table) for a specific confidence level. If t calc is greater than t table,the null hypothesis (that they are from the same population) is rejected with a 5% chance oferror, since the confidence level selected for this analysis is 95%.
It was observed that t calc is greater than t table for half the datasets when the originalAASHTO model was used, which indicates that the original AASHTO model is not a reliablepredictor of the ESALs actually sustained by the pavement sections. However, for the 1993
226

JPCP - All R_;Ions JRCP -All Regions
_._ooo _ _coc
- ;/ _ =oo_5
Q'J I la u kl] II u u.I
-_ _o "0 _o ,
I
- _ o _ - _Actual KESAL Actua_ XESAI.
Figure 7.16 Predicted KESALs versus Actual KESALs for JPCP and
PRCP Using Original AASHTO Prediction Models
227

JPCP - All _egJons J_C; _ - All Roglcns
_=_0 _000
I /RI Bi., , -" :.oooo'• i ,r,, 7___b,_
" I I ._., m |
/_ J - I / l
Actual KESAL Actual KESAL
J
C_CP - All Roglons
Z3GCO0
J' /1_._ooo I,T' "
_.oo T'"_ ]L1
/LI
.LS J- o _ _ _ _
Actual KESAL
i
Figure 7.17 Predicted KESALs versus Actual KESALs for JPCP, JRCP,
and CRCP Using 1993 AASHTO Prediction Models
228

AASHTO model, the results show that the null hypothesis is not rejected. This holds true forall climatic regions. These results show that the improvements to the original AASHO modelincreased the accuracy of the design equation.
Another comparison was made between the actual KESALs and predicted KESALs at aparticular level of design reliability. Thus, the mean log W_o,_prediction is reduced by ZRSo(where ZR = 1.64 for 95% reliability and So = 0.35). The predicted (at 95% reliability) versusactual KESALs were plotted. Most of the points were below the line of equality, indicatingthat the consideration of design reliability definitely results in a large proportion of sections(77%) with a conservative design, a desirable result. A statistical test was also conducted asbefore.
The results of these studies were then summarized. The 1986 (or 1993) model appears toprovide more or less unbiased predictions in that the plots of predicted versus actual KESALstend to center on the lines of equality. Although the scatter is not very apparent on the log-log plots, which are used to include all the data points, the actual scatter is obvious whenreviewed arithmetically. Thus, even though collectively the adjustments to the 1993 modelseem to have improved prediction capabilities in comparison with the original AASHTOmodel, the evaluation points to the need for further improvements to increase the accuracy ofthe predictions.
Improved Design Equations: Applications and Limitations
It became apparent early in the research that most of the highway community was not totallyinterested in continuing use of the PSI for design. The preference was for separate designequations for the several significant distress types, so that the equations could be used bothfor pavement management and for balanced designs to minimize the distresses individually.This was the approach followed in this research.
For any proposed pavement structure, the key distress and roughness indicators are predictedusing the best available LTPP models over the design traffic and life. The adequacy of thedesign is judged by the predicted performance in terms of individual distresses, includingroughness. Design modifications can be made if any aspect of performance is found to bedeficient. This sequence can then be repeated until an acceptable design is obtained. Anexample of this approach is provided below.
HMAC Pavements
The distress types considered to be significant were alligator cracking, rutting, transverse (orthermal) cracking, increases in roughness, and loss of surface friction. However, alligatorcracking could not be studied at this early stage, since only 18 pavements displayed thatdistress and the data collected were inadequate for modeling loss of surface friction.
229

The original intent was to rearrange the models developed for the ,ensitivity analyses asdesign equations, but separate consideration of HMAC and unbour,d base thicknesses wasproblematic because the separate effects for some distress types and environmental zones werenot additive. That is, increasing thickness of either did not necessarily result in a decreasedrequired thickness for the other. Consequently, it was decided to use structural number, in lieuof the HMAC and unbound base thicknesses separately, to develop models that were morereasonable.
The models were redeveloped on the basis of structural number, bat the results discussedabove are still reflected in the design models. These models for separate environmental zoneshad values of adjusted R2 that varied from 0.69 to 0.88 and are similar in format to theexample in Table 7.3.
The researchers were unable to satisfactorily explain this surprising result, but they do knowfrom the sensitivity analyses that increasing base thickness for the dry-freeze dataset stronglyindicates increasing roughness. Assuming that the base compaction provided for thesepavements was not sufficient or later deteriorated because of environmental or other effects, itcan be seen that increasing depths of base could result in more differential rutting and thusroughness. Future studies should be conducted to gain understanding of unexpected results, asin this example.
While these models may prove over time to be reasonable, they are based in this early analysison very limited time sequence data (generally an initial point and another in 1990 or 1991 forthe distresses) and should be used with care and only as design checks in concert with otherdesign procedures. While a good distribution of pavement ages undoubtedly helped inexplaining "curvature" in the relationship that could well be enhanced by future time sequencedata, these models are not recommended for general use at this time.
PCC Pavements
The same approach described above for HMAC pavements was used for the PCC pavements,and the same limitations on quality of models apply. The distress rnodels described previouslyfor the PCC sensitivity analyses are available for use in design checks.
The following presentation illustrates the potential use of distress models for evaluation ordevelopment of pavement designs. Future versions of these models should be greatlyimproved and should be adequate for use in design. A JRCP pavement design has beenproposed, based on an SHA standard design procedures and design standards. The valuesselected for the required design inputs for the LTPP models are summarized below:
230

Design life: 30 yearsTraffic: 30 million ESALs in design laneClimate: PRECiPitation = 30 in. (762 ram)
TemperatureRANGE = 60°F (33.3°C)Subgrade: STATIC subgrade reaction = 300 psi/in. 82.7
Pa/mm)Base: Treated granular materialSlab: THiCKness = 9 in. (229 mm)
%STEEL = 0.12% area
Joints: Jspacing = 40 ft. (12 m)dowel diameter = 1.25 in.
(32 mm)Shoulders: Asphalt concrete, edge support = 0
These pavement design inputs and characteristics were used with all the predictive models forJRCP to estimate performance over the 30-year design life and beyond (note that predictionbeyond about 20 years exceeds the inference space for the current LTPP models). Jointfaulting, joint spalling, transverse crack deterioration, and IRI were predicted. Since somereaders may not be familiar with the values of the IRI, the corresponding PSI has beenestimated with a recently developed model from user panel data. The results are shown inTable 7.6. Some interesting results are summarized as follows:
• Faulting of only 0.10 in. (2.5 mm) was predicted at 30 years. A level ofapproximately 0.25 in. (6.4 mm) is critical from a roughness standpoint for a JRCPwith long joint spacing. Thus, joint load transfer is adequate over the 30-year period.
• Joint spalling (convened from percent joints deteriorated to number of joints per mile)is predicted to increase rapidly after 15 years until at 30 years about 106 joints permile (67 joints/km) have deteriorated. Joint repair will be required after about 15 to20 years to keep the pavement in service unless some improvement in joint design isobtained.
• Transverse crack deterioration is relatively low over most of the 30-year design period.However, crack deterioration increases greatly at about 30 years, requiring consider-able repair. Increased reinforcement would reduce the amount of crack deteriorationas subsequently shown.
• The IRI remains within an acceptable range over the 30-year design period asindicated by the PSR values.
Evaluation of the 1993 AASHTO Overlay Design Equations
The 1993 revisions to the AASHTO overlay design procedure were intended to provideoverlay thicknesses that address a pavement with a structural deficiency. A structuraldeficiency arises fi'om any conditions that impair the load-carrying capability of the pavement
231

wI
k,
[,. d||
.g
,< _ ,.-. ,- m232 J

structure. These conditions include inadequate thickness as well as cracking, distortion, anddisintegration.
The AASHTO pavement overlay design procedures are based on the concept that time andtraffic loading reduce a pavement's ability to carry loads. An overlay is designed to increasethe pavement's ability to carry loads over a future design period. The structural capacityrequired for a PCC or HMAC pavement to carry future traffic is calculated with theappropriate AASHTO 1993 pavement design equation. The effective structural capacity ofthe existing pavement is evaluated using procedures for overlay design presented in theGuide. These procedures can be based on visual survey and materials testing results, on theremaining life of the pavement in terms of the traffic that can be carried, or on nondestructivetesting (NDT) of the existing pavement. An overlay is then designed on the basis of thestructural deficiency represented by the difference between the structural capacity required forfuture traffic and the effective structural capacity of the existing pavement.
LTPP data from GPS-6A, GPS-6B, GPS-7A, GPS-7B, and GPS-9 were used to evaluate the
1993 version of the AASHTO overlay design equations. While data on design life and levelsof reliability sought were not available, a limited set of test sections was identified that had
sufficient data for limited evaluations. The set included nine sections with HMAC overlaysof HMAC, five with HMAC overlays of PCC, and six with unbonded PCC overlays of PCC.Even for these test sections, it was necessary to use existing data to estimate values for someof the inputs to the design equations.
The design equations were then used to predict overlay thicknesses required, and thesethicknesses were compared with the thicknesses of the overlays actually constructed. Theresults from recent profile measurements and distress surveys were also used to evaluate theadequacy of the AASHTO design equation for establishing an appropriate design overlaythickness. Table 7.7 is a summary of the results from these comparative evaluations.
Although these evaluations were seriously constrained by data limitations, for this smalldataset of five test sections the equation appears to work quite well for AC overlays of PCC.The evaluations were generally inconclusive for AC overlays of AC and unbonded PCCoverlays of PCC.
It is hoped that in the future, data will be available with sufficient design periods and levelsof reliability appropriate to design of overlays that can be used for comparative evaluations.Conclusive evaluations are probably not possible until this information becomes available sothat the comparisons can be made on the same design basis.
Recommendations for Future Analyses
One of the primary objectives of this research was to provide recommendations for futureanalyses when more time series data will be available. Some of the many products achievedwere-
233

Table 7.7. Results from Comparative Evaluation of 1993 AASHO Overlay Equations
!
Test Section Type of Remits From ComparisonsNumber Pavement ,,
Conservative Adequate Inadequate Inconclusive
016012 AC/AC X016109 " X351002 " X356033 " X356401 " X486079 " @95%486086 " Reliability X486160 " X486179 " X
Subtotals for AC/AC: 1 3 0 5
087035 AC/PCC X175453 " X283097 " X287012 " X467049 " X
Subtotals for AC/PCC: 0 4 1 0
69049 PCC/PCC X89019 " X89020 " X269O29 " X269O3O " X489167 " X
Subtotals for PCC/PCC: 0 0 1 5
Overall subtotals: 1 7 2 10
234

1. Usable databases for combinations of pavement and distress types2. Statistical characterizations of the data3. Identification of biases in the data4. Distress models
5. Valuable insight into the need for regional models6. Procedures for developing models from LTPP data7. Identification of variables with significant effects on specific distresses8. Procedures for conducting sensitivity analyses on LTPP data9. Identification of procedures that don't work10. Identification of mechanistic variables and "clusters" for future modeling11. Identification of the shortcomings of the AASHTO design equations12. Identification of potential improvements to the AASHTO design equations13. Recommendations to follow in future analyses
Some additional studies that were not included in the contract but that the research staff
hoped to achieve were (1) development of mechanistic-empirical models, using mechanisticresponses (stresses and strains) as independent variables in nonlinear regression models; and(2) development of load equivalence factors separately for specific distresses modeled. Thesestudies can be undertaken later as more time sequence data become available.
Future analytical objectives should include (1) development of distress models for use indesign procedures, pavement management, and sensitivity analyses; (2) calibration of existingmechanistic-empirical models using LTPP data; (3) combining knowledge from SHRP studiesof asphalt, concrete, and long-term performance to improve performance models and gainadditional insight into effects of independent variables on performance; (4) development ofmodels for layer stiffnesses in terms of component characteristics; (5) follow-up onunexpected phenomena resulting from analyses; and (6) evaluation of seasonal changes inlayer stiffnesses and surface profiles.
Several modeling techniques were suggested by various experts for future analyses, each withits own set of strengths and weaknesses. Techniques that should be considered during futureanalyses should include (1) those developed for these early analyses, (2) discriminate analysis,(3) techniques using "censored data" (World Bank procedures used in the Brazil Study andothers), (4) survival analysis, (5) neural network approaches (relatively new applications toengineering systems), and (6) other nonlinear models.
As a final comment on future analyses of LTPP data, the processing of data into databasesand the analyses for a spectrum of combinations of pavement type and distress type andanalytical objectives are both time consuming and expensive. Future analyses should besufficiently funded to fully harvest the results from the $100 milliorr-plus effort undertakenby SHRP, FHWA, and the SHAs.
235

SHRP Data Analysis Contract: Michigan State University
This study is based on mechanistic evaluations of the AASHTO design procedures using thedata from the SHRP database relative to the asphalt-surfaced GPS _,,ctions. The results of themechanistic analysis were originally to be used to accomplish the following objectives:
1. Calibrate the AASHTO design equations.2. Verify and calibrate the concept of the AASHTO drainage coefficient.3. Revise the AASHTO LEFs.
4. Develop mechanistic-empirical models.
Because of the gaps in the database and missing data elements (e.g., layer moduli or layercoefficients) that are required for the mechanistic analysis, the research plan was modified asfollows:
1. Establish a full-factorial experiment design matrix that consists of 243 artificialflexible pavement sections. For each section, assign material properties and trafficvolumes (in terms of 18-kip ESAL) within the typical ranges used by various SHAs.Design each pavement section (determine the required layer thicknesses) by theAASHTO design procedure. Use the layer thicknesses and the materials properties tocalculate the mechanistic responses (stresses, strains, and deflections) of eachpavement section.
2. Analyze the sensitivity of the mechanistic responses to the layer thicknessesdetermined by the AASHTO procedure. Evaluate and revise as possible the AASHTOdesign equation and the concept of drainage coefficients.
Based on the results of this study, several observations and conclusions were made and aresummarized below.
Premises of the AASHTO Design Procedure for Flexible Pavements
The findings of the sensitivity analyses of the layer thicknesses of the 243 pavement sectionsand of the AASHTO flexible pavement design equations have confirmed the presentknowledge regarding the AASHTO design procedure. These findings are enumerated below:
1. The dependent variable of the AASHTO flexible pavement design equation is thestructural number (SN) of the pavement. The SN is a function of the traffic volume(in terms of 18-kip ESAL), design reliability, overall standard deviation, total loss ofserviceability during the performance period, and resilient modulus of the roadbed soil.The structtaal number is computed so that the pavement will have the structuralcapacity required to carry the anticipated traffic load and volume and will experiencethe specified loss of serviceability during the performance period. Hence, for anypavement structure, the AASHTO required structural number is independent of thequality and properties of the asphalt, base, and subbase layers. The properties (e.g.,
236

layer coefficients) of these layers play a major role in determining the thickness ofeach layer but not the overall pavement structural capacity in terms of the SN.
2. After determining the required SN of a pavement section, the layer thicknesses arecomputed by the AASHTO recommended layer analysis method. In this regard, theAASHTO method assumes that the structural capacity of the pavement is the sum ofthe structural capacity of each of its layers. Further, the SN of any pavement layer isthe product of its layer and drainage coefficients and its thickness. That is, thestructural capacity of a relatively weak pavement layer can be enhanced by increasingits thickness.
3. Although the AASHTO design guide advocates the use of good-quality materials withreasonable costs, the AASHTO procedure assumes that the effects of drainage onpavement performance can be eliminated by adjusting the thickness (by using adrainage coefficient) of the affected layer. That is, a base layer with an excellentdrainage quality would perform exactly the same as one with poor drainage quality ifthe thickness of the layer is increased by the ratio of the values of their drainagecoefficients.
4. The effects of serviceability loss due to environmental conditions (freeze-thaw andswelling soils) can be eliminated by increasing the structural capacity (SN) of thepavement. Higher environmental loss of serviceability requires higher structuralcapacity.
Mechanistic Evaluation�Calibration of the AASHTO Design Procedure
After the 243 pavement sections were designed and the thicknesses of the various pavementlayers were determined by the AASHTO design procedure, the mechanistic responses(stresses, strains, and deflections) of each pavement section were computed by using thelinear option of the MICHPAVE computer program (a linear/nonlinear finite elementprogram). The findings of the sensitivity analyses of the mechanistic outputs and results ofcomparison with the present knowledge of the AASHTO design procedure (previous section)are presented below:
1. For pavement sections with various layer properties that have been designed by theAASHTO procedure to be supported on the same roadbed soil, to carry the sametraffic volume, and to have the same serviceability loss during an equal performanceperiod, the mechanistic analyses indicate that:
a) The peak pavement surface deflection (a mechanistic response) is almost thesame for all sections. Hence the amount of the overall damage due tocompression delivered to the various pavement sections (or the overallprotection level) is constant and independent of the layer properties. Thisfinding implies that the AASHTO design procedure produces a balanced designrelative to the global damage delivered to the pavements. Stated differently,
237

the results of the mechanistic analyses tend to support the structure and validityof the SN concept of the main AASHTO design equation.
b) The induced stresses and strains experienced by any one layer vary from onepavement section to another. Hence, the amount of damage delivered to anyone pavement layer is a function of the material properties of that layer. Thisimplies that while the AASHTO design procedure ensures that the globaldamage of the pavement sections remains constant (item 1), the relativedamage delivered to each layer is not. Thus, the remits of the mechanisticanalyses do not support the AASHTO layer coefficient or the AASHTOconcept that the SN of the pavement is the sum of the SNs of its layers.
c) The tensile stress and the ratio of the tensile stress to the asphalt layer modulusinduced at the bottom of the AC layer depend on the properties and thicknessesof all pavement layers. This implies that the AASHTO design procedure doesnot produce pavement sections with equal fatigue life. However, the globaldamage due to compression in the pavement sections remains the same. Onceagain, the results of the mechanistic analyses do not support the AASHTOlayer coefficient or the AASH'I_ concept that the SN of the pavement is thesum of the SNs of its layers.
2. For those pavement sections with the same layer properties that have been designed bythe AASHTO procedure to be supported on various roadbed soils, to carry the sametraffic volume, and to have the same serviceability loss during an equal performanceperiod, the mechanistic analyses indicate that the stresses, swains, and deflectionsinduced in the pavements are not the same. This implies that the role of the resilientmodulus of the roadbed soil in the AASHTO main design equation needs to becalibrated.
3. For those pavement sections with the same layer properties but different drainagecoefficients that have been designed by the AASHTO procedure to be supported onthe same roadbed soils, to carry the same waffle volume, and to have the sameserviceability loss during an equal performance period, the results of the mechanisticevaluations indicate the following:
a) The magnitude of deflections (amount of compression) experienced by thevarious pavement sections under a 9000-1b load varies from one pavementsection to another. That is, the amount of damage delivered to each section isnot the same, and so the loss of serviceability is not equal.
b) The magnitudes of the stresses and strains induced in the pavement sectionsand in each layer vary from one pavement section to another. Stateddifferently, the amount of damage experienced by pavement layer varies withthe structure, and this variability causes different losses of serviceability.
These two findings indicate that the role of the drainage coefficient (in adjusting thelayer thicknesses) in the AASHTO design procedure is not accurate. Mechanistic
238

calibration of the role of the drainage coefficient was undertaken. After several trials,the following mechanistic modifications in the role of the AASHTO drainagecoefficients are recommended:
aci = (ai)(m_)°5
MR_sd = (MR_)(m3) °'s
where
aci = effective layer coefficient of layer ia_ = layer coefficient of layer imi = drainage coefficient of layer iMR4u_d= design value of the resilient modulus of the roadbed soilMRcn_ = effective resilient modulus of the roadbed soil
m3 = drainage coefficient of the subbase material or the layerimmediately above the roadbed soil
The mechanistic modification of the effects of the AASHTO drainage coefficients onthe pavement design produces layer thicknesses such that the amount of damagedelivered to the pavement sections in terms of stresses, strains, and deflections isalmost the same.
4. The effect of the drainage coefficient on pavement performance was also analyzedfrom a different perspective. Rather than using the drainage coefficient to decrease orincrease the layer thicknesses, the effect of the quality of drainage on the service lifeof the pavement was assessed and presented in an easy-to-read nomograph. Themethod allows the pavement design engineer to analyze the cost and benefit ofimproving the drainage quality. This makes the effect of drainage quality on thepavement performance comparable with that for loss of serviceability due toenvironmental factors.
5. Results of the mechanistic evaluation of the AASHTO concept of loss of serviceabilitydue to environmental factors indicate the following:
a) The AASHTO loss of serviceability concept is linear (the total loss ofpavement serviceability is the sum of the loss of serviceability due to trafficand the losses due to swelling and frost heave potentials). The concept doesnot account for the interaction between the various serviceability losses.However, from the mechanistic viewpoint, the AASHTO concept seems to bereasonable.
b) The loss of serviceability due to environmental conditions can also beexpressed in terms of the effective roadbed resilient modulus.
239

Pavement Maintenance Cost-Effectiveness
This 5-year study began in October 1987 and assesses the effectiver_.ss of six pavementmaintenance treatments. The study is being conducted under the direction of SHRP'sHighway Operations Program and is included here for completeness and to heightenawareness of this important pavement performance study. Preventive maintenance treatmentsfor flexible pavements to be studied include chip seals, thin overlays., slurry seals, and cracksealings (SPS-3). Preventive maintenance treatments for rigid pavements include jointsealing, crack sealing, and undersealing (SPS-4). The test sites for SPS-3 were constructedduring the summer and fall of 1990 and are adjacent to GPS sites to make use of trafficmonitoring and to expedite data collection. Each site also has a control section without anymaintenance treatment. Construction of SPS-4 test sections began in the late fall of 1990 andwill extend through the summer of 1991.
Analysis of this pavement performance data will quantify the ability of different maintenancetreatments to extend service life or reduce distress rates. This information will be of greatvalue to efforts to develop pavement life-cycle cost models.
Canadian SHRP (CSHRP)--LTPP Technical Analysis Project
The Canadian Strategic Highway Research Program Long-Term Pavement Performance(CSHRP--LTPP) program is exploring high-risk research aimed at developing procedures todetermine the cost-effectiveness of rehabilitation alternatives. Clayton, Sparks, and AssociatesLtd. (CSA) and Decision Focus Inc. (DFI) have prepared two draft reports, A Review of theTechnical Analysis for the C-LTPP Project and Design of a Long-Term Pavement MonitoringSystem for the Canadian SHRP. This work focuses primarily on asphalt concrete overlaystudies (7.23).
In the first report, the data being assembled in the CSHRP-LTPP and SHRP-LTPP programswill be reviewed to determine whether they support statistical analysis. The data to bereviewed include the 53 C-LTPP sections, the 11 Canadian sections committed to GPS-6
(asphalt concrete overlays of asphalt concrete), the 95 U.S. sections committed to GPS-6, andthe 128 overlaid asphalt concrete pavement sections at 16 sites planned for the SPS-5experiment. For the 53 C-LTPP and the 128 SPS-5 pavement sections, the performanceobservations will start at the time of construction. Of the 16 SPS-5 sites desired, 6 have been
constructed, 6 are being designed, and 2 have been nominated. Thus, it may be several yearsbefore significant results are provided. On the other hand, there is currently only one GPS-6data observation for each pavement section at various times throughout the life of the project.In short, after a review of data types, quality, and quantity, CSA and DFI concluded thataugmenting the C-LTPP database with SHRP data would fail to provide a large enoughsample for regression analysis. Thus, they have proposed to apply a Bayesian statisticalapproach to address the problem of small sample size. They also advise that it is necessaryto integrate costs into the analysis to meet the C-LTPP objectives.
240

In the second report, CSA and DFI describe an incremental and systematic multiphaseprogram to develop pavement management systems from LTPP monitoring information. Thecontractors consider it essential to develop an understanding of the effects of monitoring dataon pavement management decisions.
The first phase will use Bayesian statistical methods to assemble and process C-LTPPinformation. The first task in this phase will outline a design for the overall Bayesianstatistical method tO be used. A detailed description of the expected data will be prepared. Acommercial statistical data management package will be selected to accept and store the rawinput data. Plans will be developed for a customized software system to implement theBayesian statistical approach to retrieve the data and calculate results. The way criticalpavement deterioration information inferred from the monitoring data will be presented willalso be developed. Guidelines for coordinating existing information with these new C-LTPPresults will be developed to support decision making by pavement managers. Finally, thedesign flexibility to accommodate future changes will be developed.
In the second task, commercial statistical packages will be reviewed to identify the one mostsuitable for the C-LTPP Bayesian statistical program. The third task will be to prepare acomprehensive and detailed paper design of the Bayesian statistical module. The design willbegin with the development of the prior probability distribution, the likelihood function, andthe posterior probability distribution based on a linear model. The simple model will first beextended to the multivariate case with linear pavement deterioration functions. Considerationwill be given to several key issues: autocorrelation in the data when error terms are stronglycorrelated with error terms in one or more prior years, missing variable bias,heteroscedasticity (differences of the variances in the error terms), and nonlinear pavementdeterioration models. A detailed technical report will be produced outlining the Bayesianstatistical equations to be programmed, the flowchart logic, the required inputs, and the modeloutputs.
The fourth task is to implement testing of the Bayesian statistical module. A programminglanguage will be selected that is compatible with the statistical package and meets the speedand other requirements; the most likely choices are FORTRAN, PASCAL, and C. To test themodule, C-LTPP will provide three realistic and difficult databases: one with a small samplesize, a systematically autocorrelated database, and a very large database. The deliverable forthis task will be the basic multivariate Bayesian statistical module operating withoutautocorrelation or heteroscedasticity.
The fifth task will interface the Bayesian statistical module with the selected commercialstatistical data management package. Following this implementation, the capabilities will beincorporated to deal with the three most troublesome complexities in the database:autocorrelation, multicollinearity, and heteroscedasticity. The basic Bayesian module will beextended to accept more complex dynamic pavement deterioration functional forms and errorterms to increase the predictive power of the data. Standard classical regression analysisapproaches to deal with multicollinearity will be extended to accommodate the Bayesianapproach. Additionally, the Bayesian module will be extended to deal with heteroscedasticityerrors in data.
241

Final tasks of this phase will be to prepare a hypothetical database _P test the statisticalpackage with the Bayesian statistical module, as well as a user manual and a trainingprogram. This phase, which will produce a mathematical means to integrate new informationobtaine,d from the monitoring programs with current knowledge, began in January 1991 and isexpected to last about 16 months.
Later phases proposed by CSA and DFI consist of implementation activities that may befunded by CSHRP at a later date.
United Kingdom, Science and Engineering Research Council ResearchGrant: Information Management System for Predicting Long-TermPavement Performance
The University of Birmingham has conducted two contracts related to its proposed approachfor SHRP database analysis. In the first, Pavement Design Sensitivity to Errors in Data, thesensitivity of pavement total life-cycle costs was related to traffic loads, material parameters,and maintenance and rehabilitation practices. In the second, Development of a Road NetworkModel Based on Indicators of Pavement Condition, network-level pavement performancemodels have been developed.
In addition, the University of Birmingham was awarded the present contract to conductsimilar work by the U.K. Government Science and Engineering Re_a'ch Council. This 3-year study that began in April 1990. The research is in two concurrent parts. The first is incollaboration with the LTPP study and will derive relationships to predict pavementperformance. The second part is to extend this work to include data from maintenancemanagement systems. It is proposed to screen maintenance management systems databases tocollect pavement condition data for all combinations of traffic loads, pavement type, andmaintenance history. The analysis method will adopt a statistical approach; rather thansimply taking the average change in condition from year to year, the distribution of themagnitudes of the changes will be collected.
The specific work plan is to record the annual change in defect severity levels in the form ofstatistical distributions. These will show the variability in pavement deterioration within eachmatrixcell.Thisdatawillbeanalyzedfurthertoyieldinformationon theperformanceofthenetworkintheformofstatisticaldistributions.From these,theaveragedefectseveritylevels,
togetherwiththestandarddeviations,canbecalculated.Theseprocedureswillbe
implementedtorunon a microcomputer.
242

References
7.1 America's Highways: Accelerating the Search for Innovation (Special Report 202,Strategic Transportation Research Study: Highways, pp. 93m94). TransportationResearch Board, National Research Council, Washington, D.C., 1984.
7.2 Strategic Highway Research Program Research Plans, Final Report (pp. TRA2m6).Transportation Research Board, National Research Council, Washington, D.C., May1986.
7.3 Irick, P., and W. O. Hadley, "Pilot Study of the Effects of Materials and ConstructionVariabilities on Pavement Distress and Performance" (TRDF Technical MemorandumAU-203). Texas Research and Development Foundation, Austin, Texas, April 6, 1992.
7.4 Hadley, W. O. SHRP-LTPP Data Analysis: Five-Year Report (Report No. SHRP-P-688). Strategic Highway Research Program, National Research Council, Washington,D.C., Forthcoming.
7.5 Hadley, W. O. "PSI Estimates from SHRP Profilometer Roughness" (TRDF TechnicalMemorandum AU-219). Texas Research and Development Foundation, Austin, Texas,October 16, 1992.
7.6 Hadley, W. O. "Rutting Initiation Studies" (TRDF Technical Memorandum AU-214).Texas Research and Development Foundation, Austin, Texas, September 31, 1992.
7.7 Hadley, W. O. "Approach for Improving AASHTO Load Equivalence Factors UsingSHRP-LTPP Data" (TRDF Technical Memorandum AU-218). Texas Research andDevelopment Foundation, Austin, Texas, October 13, 1992.
7.8 Hadley, W. O. "PSI Estimates from SHRP Profilometer Roughness" (TRDF TechnicalMemorandum AU-215). Texas Research and Development Foundation, Austin, Texas,October 12, 1992.
7.9 Hadley, W. O. "A Method of Estimating Serviceability Loss for Existing SHRP-LTPPFlexible Pavement Sections" (TRDF Technical Memorandum AU-216). Texas Researchand Development Foundation, Austin, Texas, October 12, 1992.
7.10 Hadley, W. O. "Traffic Data Assessment for the SHRP-LTPP Load Equivalence FactorImprovement Study" (TRDF Technical Memorandum AU-217). Texas Research andDevelopment Foundation, Austin, Texas, October 12, 1992.
7.11 Irick, P. and W. O. Hadley. "An Approach to Improvements of Load EquivalenceFactors from SHRP-LTPP Data" (TRDF Technical Memorandum AU-204). TexasResearch and Development Foundation, Austin, Texas, May 3, 1992.
7.12 AASHO Road Test, Report 5, Pavement Research (Highway Research Board SpecialReport 61E. National Academy of Sciences, National Research Council PublicationNumber 954). Washington, D.C., 1962.
243

7.13 Kohn, S. D. Manual for Profile Measurements: Operational Field Guidelines (ReportNo. SHRP-P-378). Strategic Highway Research Program, National Research Council,Washington, D.C., 1994.
7.14 "PASCO Film Interpretation Manual (PASCO-FMA)" (Operational Guide No. SHRP-LTPP-OG-0024). Strategic Highway Research Program, Nati_,nal Research Council,Washington, D.C., May 1990.
7.15 Hadley, W. O., and M. G. Myers. "Rut Depth Estimates De_'eloped from Cross ProfileData" (TRDF Technical Memorandum AU-179). Texas Research and DevelopmentFoundation, Austin, Texas, April I, 1991.
7.16 Hadley, W. O. "Rut Depth Estimates from PASCO Cross-Profile" (TRDF TechnicalMemorandum AU-185). Texas Research and Development Foundation, Austin, Texas,June 28, 1991.
7.17 Rauhut, J. B., and M. I. Darter. Early Analyses of LTPP General Pavement StudiesData. Executive Summary (Report No. SHRP-P-392). Strategic Highway ResearchProgram, National Research Council, Washington, D.C., 1994.
7.18 Killingsworth et al. Early Analyses of LTPP General Pavement Studies Data: DataProcessing and Evaluation (Report No. SHRP-P-684). Strategic Highway ResearchProgram, National Research Council, Washington, D.C., 1994.
7.19 Simpson, A. L., J. B. Rauhut, P. R. Jordahl, et al. Sensitivity Analyses for SelectedPavement Distresses (Report No. SHRP-P-393). Strategic Highway Research Program,National Research Council, Washington, D.C., 1994.
7.20 Daleiden, J. S., J. B. Rauhut, B. Killingsworth, et al. Evaluation of the AASHTO DesignEquations and Recommended Improvements (Report No. SHILP-P-394). StrategicHighway Research Program, National Research Council, Wa,_hington, D.C., 1994.
7.21 Daleiden, J. S., J. B. Rauhut, B. Killingsworth, et al. Early Analyses of Long-TermPavement Performance General Studies Data: Lessons Learned and Recommendations(Report No. SHRP-P-680). Strategic Highway Research Program, National ResearchCouncil, Washington, D.C., 1994.
7.22 Baladi, G. and F. X. McKelvey. Mechanistic Evaluation and Calibration of theAASHTO Design Equations and Mechanistic Analysis of the SHRP Asphalt SurfacePavement Sections (Report No. SHRP-P-678). Strategic Highway Research Program,National Research Council, Washington, D.C., 1994.
7.23 "A Review of the Technical Analysis for the Canadian Long-Term PavementPerformance (C-LTPP) Project." Clayton, Sparks & Associates Ltd. and Decision FocusInc., Draft, August 1990.
244

Section 8Traffic Data Collection and Analysis
Background
The planners of the Strategic Highway Research Program Long-Term Pavement Performance(SHRP-LTPP)project(8.1)identifiedtheneedtoretrievehistoricaltrafficvolumeand axle-
loaddataforeachGeneralPavementStudies(GPS)testlocationbeforebeginningthedatamonitoringphase,aswellastheneedtocollecttrafficandaxle-loaddataateachGPS testlocationduringthedatamonitoringphaseofLTPP. BecausetheAmericanAssociationof
StateHighwayandTransportationOfficials(AASHTO) designsarcbasedon thenumberof18,000-1b.equivalentsingleaxleloads(ESALs)projectedovera pavementlife,itwasconsideredimportantinSHRP-LTPP toevaluatepavementperformanceaccordingtotheactualnumberofESALs accumulatedby a testsectionsinceitwas openedtotrafficinitspresentconfiguration.
The optionsforobtainingthecumulativeannualaxle-loaddata(ESALs)included(I)directtrafficmeasurementsby permanentlyinstalledweigh-in-motion(WIM) equipmentlocatedandoperatingcontinuouslyatthetestlocationand(2)estimatesbasedon a combinationoftraffic
volume,vehicleclassificationdata,andportableWIM measurements.The originalSHRPplanfortrafficdatacollectionatGPS testlocationswas basedon thefirstoptionandinvolved"low-cost"WIM devicesoperatingcontinuouslyateachsite(8.1).
Subsequentlyitwas determinedthat,althoughtheuseofpiezoelectriccable-basedlow-costWIM deviceswas nota viableoptionfortruckweightstudies,thedevicescouldreliablybcusedforvehicleclassificationstudies(8.2).Many statehighwayagencies(SHAs)insistedthatbendingplatesand loadcellsmustbcusedinconjunctionwithWIM equipmenttoobtainvalidweightdata.The highcostofthehigherqualityWIM systemsrequireda changeintheoriginalplanforSHRP.
Traffic Expert Task Group (ETG) Activities
One of the unique features of the traffic program was the role of the Traffic ETG inrecommending and defining actions taken by SHRP in traffic data collection and analysis.This role evolved because the need for traffic loading data for GPS was not sufficientlydefined before SHRP-LTPP began. This became evident early in SHRP-LTPP, and the TrafficETG was established to address traffic loading data issues.
245

To enhance the traffic experience of SHRP-LTPP, the LTPP Program Manager allowed theTraffic ETG to become more directly involved in the traffic data collection program, toprovide direction to the SHRP staff, and to provide general guidance for the activities of theconsultants and Regional Traffic Representatives.
The ETG was instrumental in several decisions that concerned
• SHRP traffic requirements• Traffic data collection requirements• Site-specific data collection• Traffic database needs
• "Truth in data" and data availability concepts• Need for guidelines in traffic variability and precision• Adoption of Federal Highway Administration (FHWA) vehicle classification system• WIM requirements• ESAL calculations
The contributions of the ETG were instrumental in and essential to the development of thepresent SHRP-LTPP traffic program.
Traffic Data Collection Program
A modified traffic data collection program was subsequently developed that recognized that itwould not be possible to install a WIM device at each site, nor would it be possible tooperate WIM equipment continuously at each site (8.2). In this modified plan (8.3) threelevels of traffic data collection were established: (1) a preferred approach that relied oncontinuously operated WIM equipment, (2) a desirable level that substituted automatedvehicle classifiers (AVCs) for WIM and added portable WIM measurements for a week eachquarter of the year, and (3) a minimum response that was similar to the desirable level butreduced the length of time for the portable WIM counts.
The modified plan continues to be the basis for traffic data collection by the SHA for theGPS experiments. The SHAs were more responsive to the desirable option that allowed forthe installation of AVCs at GPS test sites coupled with portable WIM measurements on aquarterly basis. At the end of SHRP-LTPP, more than 60% of the GPS sites will haveincluded the AVC option only, while more than 270 installations will have includedpermanent WIM equipment. This total represents a marked increase over the number of suchinstallations in place across the United States and Canada before SHRP (8.4).
The application of WIM technology by SHRP-LTPP spurred increased attention to traffic datacollection by SHAs. The capability to collect continuous data on traffic volumes, vehicleclasses, and individual truck weights with one device was a major breakthrough. AlthoughWIM technology had been available since the early 1970s, its use had been minimal. Thenewly expanded use of WIM equipment required major changes in the data collection,
246

processing, and summarization procedures used by SHAs. SHRP-LTPP led the way inimplementing these changes and devising new procedures for their use.
The SHRP-LTPP data collection methodology involves a flexible framework designed toprovide the best possible traffic data within the limitations of each SHA. The SHRP trafficdata collection plan requires minimum standards for traffic data collection at each LTPP site,but encourages SHAs to provide more extensive and better quality data collection when fiscaland physical limitations could be overcome (8.3). The plan identified three alternatives fortraffic data collection and allowed each SHA the option of selecting any one of the three.Since the selection could be made independently for each LTPP site, this approach allowedthe SHA the option of defining differing levels of traffic data collection at the various LTPPsites located within a state or province.
The three alternatives for monitoring traffic data are defined as follows:
• Preferred traffic data collection--permanent, year-round WIM equipment installed ateach site and operated continuously
• Desirable traffic data collection--a permanent, year-round site-specific AVC,supplemented by 1 week of WIM measurements for each season of the year at eachstudy site
• Minimum traffic data collectionwa year-round vehicle classifier, counting at least 1full year during each 5-year period, supplemented by one 48-hour weekend and one48-hour weekday WIM session during each season of the year
The SHRP-LTPP plan, therefore, gave SHAs the flexibility in traffic data collection thatwould permit optimal use of their scarce resources. At the same time, the traffic datacollection requirements could provide sufficient information to SHRP researchers fordevelopment of reasonable estimates of traffic loading at each LTPP test section.
Site-Specific versus Site-Related Data Collection
The SHRP-LTPP plan recommended that all traffic data collection take place immediatelyupstream or downstream of the LTPP test sections (8.5). Traffic loading estimates for aparticular section were to be based on traffic data collected at that test location, since trafficloading characteristics can vary considerably between sites.
The necessity for site-specific traffic measurements was substantiated early in SHRP-LTPP,when the Minnesota Highway Department and the North Central regional office of SHRPjoined to conduct an analysis of truck volume and weight data that had been collected at fourpermanent WIM sites in Minnesota over the previous 4 years (8.6). In comparing thevariation of truck volumes with truck weight and ESAL calculations, several conclusions werereached:
247

• The pavtcms for loading (ESALs) varied greatly from volumes for the "eighteen-wheeler" class of trucks (3S2).
• Variation between the loading patterns at each of the four siu._swas significant.
• Low truck volumes on weekends actually resulted in higher equivalent loadingsbecause unusually heavy vehicles ran on weekends.
• Location, direction, time of day, and classification of the highway also significantlyaffect the number of u'ucks, weight of the trucks, and resulting ESALs.
The Minnesota results demonstrated the need for site-specific traffic and weight datacollection equipment. After a series of traffic data collection workshops conducted in allFHWA regions and in Canada, the site-specific approach was accepted and plans to infer orestimate data at a given site from statewide data were eventually a'bandoned.
The location of the traffic data collection equipment was selected to ensure that nointerruption or interference in the traffic stream or flow could develop between the LTPP testsection and the traffic data collection site. If the traffic counting and weighing station wasseparated from the LTPP test location and the truck traffic was expe£ted to vary between thetwo locations, additional traffic data were collected at each site to document the difference intraffic loading between the two sites.
While SHRP-LTPP's traffic data collection requirements provided more realistic traffic datacollection options for the SHAs, they increased the difficulties that future LTPP researcherswill face when they analyze the traffic data because the amount and types of available trafficdata will vary from one LTPP site to another. As a result, analysts will need a method forhandling the differences in the available traffic data. As an aid to future analysts, the trafficdata are assigned both a quantitative measure of variability and reliability and a qualitativedescription of the traffic data residing in the database.
Traffic Data Collection Plans
Because of the variety of options available to the SHAs in installing traffic data collectionequipment and measuring traffic and axle-load data, each SHA was requested to prepare aTraffic Data Collection Plan based on a set of guidelines issued in November 1989 (8.5).Each SHA was advised to submit plans to the SHRP-LTPP regional offices outlining specificplans for collection of traffic data at each GPS test section in the state or province. Theseplans would summarize location, type of equipment, frequency of operation, funds required,persons responsible, and method of transmitting the data. Maps and installation scheduleswere also included, along with other pertinent information.
248

Historical Data
The requirements for reu-ieving and reporting historical data for each GPS test location werespecified in Chapter 4 of the LTPP Data Collection Guide (8.7). This document providedbackground information, an explanation of the historical and monitoring traffic datarequirements, historical data forms, monitoring data formats, and baseline information aboutcollecting and processing of traffic data.
Historical data were initially retrieved from the files for two sites in each SHA and weresubmitted to the regional office for review and verification of the output. After receivingfeedback from the regional office, the SHA collected the historical data for all other GPSsites in the state. Historical Waffic data were received for more than 95% of test locations.These data were an important element in several early analysis studies.
Traffic Data in the LTPP Database
The specific traffic data elements included in the LTPP National Pavement Performance
Database (NPPDB) consist of the Level 1 primary loading estimates from the LTPP CentralTraffic Database (8.8). These Level 1 records represent the "best estimate" of the trafficloads experienced at each LTPP site for each calendar year since the particular LTPP site wasopened to traffic.
The loading estimates are presented as the number of axles by weight range and axle type(i.e., singles, tandems, tridems, and quadrems) to which the LTPP test section was exposedduring a given year. Additionally, the combined ESALs for these traffic data are computedbased on the current AASHTO ESAL formula. The estimates are also based on the pavementstructure identified in the NPPDB and information stored in the two databases. Severalsupporting variables are also included in the traffic data information stored in the NPPDB.
Maintenance of the pavement loadings by axle load and axle group will provide SHRP-LTPPresearchers with the capability to evaluate alternative ESAL computational formulas. On theother hand, the availability of the current AASHTO ESAL values within the NPPDB willprovide researchers with a quick, convenient and consistent traffic load estimate for limited,specific analyses.
The NPPDB and the traffic database contain descriptions of the traffic data collected at eachLTPP site (8.8). These narratives will be helpful to future researchers by defining the trafficdata available in the NPPDB and by identifying the number and type of traffic data used tocalculate the annual ESAL loadings. This information is stored in the Data AvailabilityMavrix for each LTPP site. Table 8.1 is a sample matrix.
249

m
13.ft..-I
o
(U e-
_ oo_
e,,
< _ _ ® ®C C
a o e, _
- -_.,
• . .....
......... _
• :.... ":. • _
250

FHWA Monitoring Standards
One major action taken by the ETG was to recommend the adoption of the FHWA HighwayPavement Management System (HPMS) and Traffic Monitoring Guide (8.9) as basicdocuments for the development of a SHRP-LTPP traffic database. This resulted in theadoption of the FHWA 13-class vehicle classification system and the standard FHWA formatsfor reporting traffic volume, classification, and weight data. This provided a standard thatwas known to all states. With the adoption of the FHWA standards, FHWA committed toprovide funding support, personnel support, and assistance at all levels of the organization inthe development and implementation of the LTPP traffic data collection program.
Role of theRegional Offices
The traffic database is currently housed at the four regional offices. The data are received,entered, checked, summarized, processed, reported, and stored at the regional level (8.8). Theregional representatives work directly with the SHAs in obtaining traffic and load data for theGPS experiments. This includes reviewing and approving data collection plans, verifying theinstallation of traffic data collection equipment at each site, and receiving and entering trafficdata from the SHAs on a monthly basis.
International Traffic Data Requirements
The traffic data requirements for international GPS test locations are expected to be the sameas those established for U.S. and Canadian sites. To facilitate an understanding of theserequirements by the coordinators from the various countries, an International Traffic DataCollection Handbook (8.10) was compiled incorporating the most important technicalmemoranda, reports, and documents. The handbook was initially distributed at theInternational Coordinator's meeting in England in November 1990.
Traffic Data Analysis Studies
Data analysis and special studies were conducted in support of the traffic program. In somecases the results were instrumental in transforming the traffic data collection procedures usedby the various SHAs. Some of the studies are listed below:
• Evaluation of triple and quadruple axles (8.11) definition for LTPP studies
• Data Variability (8.12)--procedures for assessing precision of annual traffic estimates
• Piezoelectric cable for vehicle classification (8.13)---development of AVCspecifications
• WIM data analysis (8.6, 8.14, 8.15)---identification of traffic load trends and patterns
251

• ESAL projections for a construction variability study (8.16 8.17)
• An assessment of the impact of ESALs and other load/enviroLamental factors on loadequivalency factors (LEFs) developed from SHRP-LTPP data (8.17, 8.18, 8.19)
Summary
The LTPP traffic database formulated by SHRP will benefit state and federal highwayagencies for many years to come. The establishment of the LTPP Central Traffic Database atthe Transportation Research Board, in coordination with the NPPDI3, will make both readilyaccessible and usable for research well into the future. At some future date, the relative effectof traffic loading on pavement performance will clearly be known, a process will be availableto collect traffic and loading data on a sampling basis, and a method will be developed toproject the total cumulative ESALs for a highway over a given time fnune in a very accurateand effective manner. Many of the basic objectives of the SHRP-LTPP program will havebeen met when these events occur.
References
8.1 Strategic Highway Research Program Research Plans, Final Report, May 1986.Technical Research Area 2, Long-Term Pavement Performance.
8.2 Elkins, G. E. "Presentation on Traffic Data Requirements." Texas Research andDevelopment Foundation, Austin, Texas, April 30, 1988.
8.3 Elkins G. E. "Background on Traffic Data Considerations for LTPP." TexasResearch and Development Foundation, Austin, Texas, May 6, 1988.
8.4 Traffic Monitoring Guide. U.S. Department of Transportation, Federal HighwayAdministration, Washington, DC, June 1985.
8.5 Hallenbeck, M. "Position Paper for Traffic ETG" (unpublished). WashingtonState Transportation Center (TRAC), Seattle, Washington, July 11, 1988.
8.6 Dahlin, C., P. Harker, and R. Ingberg. "Minnesota WIM Data Analysis Study"(unpublished). Strategic Highway Research Program, National Research Council,Washington, DC, March 1989.
8.7 German, J. L., A. Horosko, M. Hallenbeck, and G. E. Elkins. SHRP-LTPP DataCollection Guide, Chapter 4, "Traffic Data Collection for GPS Sections." April1992.
252

8.8 German, J. L. "Implementation of the National Traffic Database" (TRDFTechnical Memorandum AU-123). Texas Research and Development Foundation,Austin, Texas, April 10, 1990.
8.9 German, J. L. SHRP-LTPP Traffic Data Collection and Analysis (Report No.SHRP-P-386). Strategic Highway Research Program, National Research Council,Washington, DC, 1994.
8.10 German, J. L., ed. SHRP-LTPP International Traffic Data Collection Handbook.Texas Research and Development Foundation, Austin, Texas, September 1991.
8.11 Hajek, J. and J. Hamrick. "ESALs for Triple and Quadruple Axles." Reportprepared for SHRP Expert Task Group on Traffic Data Collection and Analysis.June 1990.
8.12 Wilkinson, J., P. Irick, W. O. Hadley, and J. L. German. "Procedures forAssessing the Precision of Annual Traffic Statistics." SHRP-LTPP. November1991.
8.13 Laylor, H. M. "Pilot Project: Piezo-Electric Automatic Vehicle Classification
System." Oregon Department of Transportation, Salem, Oregon, July 1991.
8.14 Hallenbeck, M. "The SHRP Traffic Database: What It Really Is." Paper preparedfor SHRP Midcourse Assessment Meeting in Denver, CO. Washington StateTransportation Center (TRAC), Seattle, Washington, August 1990.
8.15 Myers, M. and J. L. German, "Preliminary Weigh-in-Motion Data Analysis forSelected SHRP GPS Sites" (Final Report). Texas Research and DevelopmentFoundation, Austin, Texas, July 1992.
8.16 Hadley, W. O. "Construction Variability Studies" (TRDF TechnicalMemorandum AU-219). Texas Research and Development Foundation, Austin,Texas, October 16, 1992.
8.17 Hadley, W. O. SHRP-LTPP Data Analysis Studies: Five-Year Report (Report No.SHRP-P-688). Strategic Highway Research Program, National Research Council,Washington, DC, Forthcoming.
8.18 Hadley, W. O. "Traffic Data Assessment for the SHRP-LTPP Load EquivalenceFactor Improvement Study" (TRDF Technical Memorandum AU-217). TexasResearch and Development Foundation, Austin, Texas, October 12, 1992.
8.19 Hadley, W. O. "Approach for Improving AASHTO Load Equivalence FactorsUsing SHRP-LTPP Data" (TRDF Technical Memorandum AU-218). TexasResearch and Development Foundation, Austin, Texas, October 13, 1992.
253

Section 9International Participation
Introduction
From the beginning, high priority was given to international coordination and cooperation inthe conduct of the Strategic Highway Research Program Long-Term Pavement Performance(SHRP-LTPP) program. During the pre-implementation phase, SHRP contacted forty-fiveindividuals in twelve countries to obtain information about concurrent research similar toSHRP and to solicit suggestions for future cooperation.
Initiation of International Cooperation Activities
SHRP hosted a special reception for international attendees at the annual TransportationResearch Board (TRB) meeting in 1986 and a SHRP International Workshop in May 1986 tofoster future coordination and cooperation between SHRP and the international community.The enthusiasm of the international community for SHRP-LTPP led to the adoption bySHRP's Executive Committee at its meeting in September 1986 of a policy for internationalcooperation.
As a result of these actions, the Swedish Road and Traffic Research Institute (VTI) and TRBheld a joint conference in September 1987 on present and future road research, with specialemphasis on SHRP and highway safety research.
The first SHRP International Technical Workshop was held in Bath, England, on September14, 1988, and involved presentations and discussions concerning implementation of SHRP'sdata collection procedures in countries planning to establish their own parallel andcomplementary General Pavement Studies (GPS) or Specific Pavement Studies (SPS)programs.
International Conferences
In September 1989, TRB and VTI held their second jointly organized conference on SHRPand traffic safety in G/Jteborg, Sweden. A preconference International Long-Term PavementPerformance Workshop was held to demonstrate the levels of participation of overseascountries in the program. A status report on LTPP activities was presented and included the
255

topics of experimental design principles, data collection, information management system, anddata analysis.
During SHRP's Midcourse Assessment Meeting of August 1--3, 1._0, in Denver, Colorado, aworkshop session for international attendees included a brief update, on the midcourse statusof international LTPP participation. Attendees were alerted to some of the areas whereinternational participation or involvement was needed. Several countries expressed an interestin participating with test sites from their construction programs, including rehabilitation ofexisting roadways (SPS-5 or SPS-6) as well as construction of new pavements (SPS-1 orSPS-2).
At the International SHRP/Institution of Civil Engineers Conference, Sharing the Benefits,held September 1990 in London, an international SHRP workshop was held to provide anupdate on international SHRP-related activities and to discuss issues that must be addressedby participating countries that proceed with LTPP studies.
International LTPP experiments were presented by five countries that had committed toestablish LTPP test sections. The discussion that followed these presentations addressedseveral issues, including integrating existing databases, establishing an international database,and developing a European database. Other issues discussed during the workshop wereinternational data handling, data extraction, and condition monitoring. Conformance withInternational Standard ISO 9000 on quality assurance was also recommended.
An LTPP International Information Management System (I-IMS) workshop was held inconjunction with the annual TRB meeting in January 1991. Workshop participants includedcoordinators and representatives from Australia, Canada, Denmark, Japan, and theNetherlands; SHRP-loaned staff from Australia, Sweden, and Venezuela; and representativesfrom the U.S. Federal Highway Administration.
Presentations included updates on the status of the National Information Management System(NIMS), news of the first data release to the public, procedures for requesting data from theNIMS, an update on the status of the traffic database, discussion of quality assurance in theNIMS, and plans for entering data from the I-IMS into the NIMS. A significant outcome ofthe workshop was the conclusion that a plan for unit conversions in the IMS was necessary topermit the first step in an international data transfer process.
A SHRP-LTPP Traffic Data Collection Workshop was held in G6teborg, Sweden, inSeptember 1991 and focused mainly on establishing traffic data collection and processingguidelines for the international participants in LTPP. The full-day workshop stressed the needfor "traffic data compatibility," especially in the determination of equivalent single axle loads(ESALs) that will be needed for pavement-related research.
At the same time, an international conference on SHRP and Traffic Safety on TwoContinents, jointly planned by VTI and TRB, was held in Gtteborg. The program hadparallel sessions, with SHRP information presented in one session and traffic safetyinformation in another. The SHRP session dealt with LTPP in the United States, in Canada,and internationally.
256

In connection with the conference, an I-IMS User Group Meeting was held. Representativesfrom Australia, Austria, Canada, the Netherlands, Finland (Nordic countries), the UnitedKingdom, and the United States were present at the meeting. One major topic discussed wasthe structure of the I-IMS. The data from all I-IMS users will be forwarded to the UnitedStates to be incorporated into the NIMS.
International Data and the LTPP National Information ManagementSystem (NIMS)
A link between the NIMS and the I-IMS is an essential element in completing thedevelopment of the NIMS. The international participants in LTPP expressed an increasinginterest in storing the data from their test sites in the NIMS and acquiring the data from theNIMS. This link would enable researchers worldwide to share and use the data in theirresearch.
Data Flow
At present the data for the international participants will be stored not at the NIMS, but in aseparate database. The structure of the NIMS was not altered during SHRP-LTPP, and datafrom the United States and Canada continue to be entered in American Customary (AC) orfoot-pound-second (FPS) units. Researchers who request all the data available in the databasewould receive the North American data in AC units and the international data in Syst_meInternationale (SI) units. Conversion of existing NIMS data to SI units is a future workactivity of the FHWA-LTPP program.
Types of Modifications
The three major modifications necessary for use of the IMS by other countries involve
• Units of measure• Measurement devices• Test methods
Modifications to some tables will be required when converting the IMS units. To modify theIMS to suit a given country, it will be important to review the Data Collection Guide, IMSschema, and IMS data dictionary to identify tables that require unit conversions. In somecases, new tables will be necessary to accommodate different measurement devices or testmethods. In other cases, codes may simply be added to tables to indicate a unique testmethod. New tables must be created and added to the I-IMS by the individual country.
257

International Participants
Several countries have recognized the importance of SHRP and its potential benefits andhave established or proposed complementary or supplementary SI IRP sections. Thecountries include Australia, Austria, Canada, France, India, Japan, the Netherlands, theNordic countries (Denmark, Finland, Norway, and Sweden), Poland, Switzerland, and theUnited Kingdom.
Level of Participation
The international community has embraced SHRP-LTPP at different levels. Somecountries, such as the Netherlands, have been involved in SHRP-LTPP almost from thebeginning; other countries, such as Australia and Poland, are just now getting their LTPPprograms under way.
In addition, the level of involvement in SHRP-LTPP (first 5 years) varied from country tocountry (see Table 9.1). The Netherlands (264 sites), India (113 sites), Poland (100 sites),and Canada (65 sites) have projected significant participation in the number ofsupplementary and complementary LTPP sections. Note that the sixty-five sections listedfor Canada are a part of their CSHRP program and do not include the Canadian sectionsidentified with SHRP-LTPP.
The international LTPP sites are composed almost totally of flexible pavement sections(504 sites, or 89%). Australia (2 sections), India (39 sections), and the United Kingdom(21 sections) account for the 62 rigid pavement sections. It is important to note that thetotal of 666 international sites (including the 100 proposed by Poland) almost matches thenumber of GPS sites (770) included in SHRP-LTPP. The international effort thusrepresents a significant enhancement to SHRP-LTPP.
Data Collection Activities
The data collection measures and approaches adopted by the international agencies arenoteworthy when consideration is given to merging the international community's LTPPresults with those of SHRP-LTPP. Differences in data types and fbrm are expected becauseof the specific equipment adopted SHRP (e.g., PASCO Distress Interpretation, LawProfilometer, Dynatest FWD) to conduct data collection. In general, the internationalcountries attempted to match the SHRP data collection program (see Table 9.2) withinbudgetary and practical limitations.
The materials testing and deflection programs of the international cotmtries generallymatched those of the SHRP program. The French program, however, conducted no tests onsubgrade materials; in this instance the properties of the subgrade materials will be obtainedfrom construction records.
258

Table 9.1. International LTPP Sites
Number GPS SPS Flexible RigidCounu'y of Sites Sites Sites Pavements Pavements
Australia 9 9 0 7 2Austria 12 12 0 12 0Canada 65 LINK UNK 65 0France UNK LINK UNK UNK LINKIndia 113 UNK UNK 74 39Japan 28 28 0 28 0Netherlands 264 144 120 264 0Nordic 38 38 0 38 0Poland (110") LINK LINK UNK LINKSwitzerland 16 UNK UNK 16 0United Kingdom 21 6 15 0 21
566 237 135 504 62(666*)
* PROPOSED
259

. r_
o _ _ _
",,=1
,¢ 0
0
E _N
0
° i:__, _ _ _ _ ,_ _ _ _ ,,
_ _ . .=_r_ _ _ Z m
26O

For deflection testing, most countries use failing weight deflectometers (FWDs) only. Theexceptions include Canada, which conducts companion benkelman beam (BB) and FWDdeflection studies, and India, which currently conducts BB deflection studies but will add anFWD in the future. Most FWDs used in the international LTPP program are manufactured byDynatest, although Japan uses a Kuab FWD. In two countries (Japan and the UnitedKingdom) a single load level is used to conduct the deflection program. In addition, FWDsensor locations used in the international programs may differ from the spacings specified inSHRP-LTPP.
The method for developing the longitudinal and transverse profile in the international programdiffers significantly (Table 9.2) from the PASCO method used in SHRP-LTPP. In mostinstances the longitudinal profde information is developed at 0.3-m (l-ft) intervals, comparedto the 0.15-m 6-in.) intervals in the SHRP program. The transverse profile is obtained bymethods ranging from a manual profdometer to an ARAN device. In one country (India) thecross-profile apparently will not be determined; rather, the rut depth will be determineddirectly with a rut depth gauge.
Distress in the international LTPP sections will be defined in manual/visual distress surveys.Austria and the Netherlands will back up the manual distress information with photos andvideos, respectively; France will obtain the distress information principally from photos.
Traffic volumes and loads will be obtained by a variety of techniques (Table 9.2) includingautomated vehicle classifiers (AVCs) or weigh-in-motion (WIM) equipment, piezoelectriccables and mats, and manual counts. Most of the countries will use manual countinginformation to develop their traffic information.
261

Section 10
Expected Results, Products, and Benefits
Introduction
To focus on the expected results, products, and benefits of SHRP-LTPP, it is appropriate toreview the initial goals and objectives of the program. The specific objectives developedby the Advisory Committee (10.1) were
• Evaluation of existing design methods• Development of improved design methodologies and strategies for the rehabilitation
of existing pavements
• Development of improved design equations for new and reconstructed pavements• Determination of the effects on pavement distress and performance of (1) loading,
(2) environment, (3) materials properties and variability, (4) construction quality, and(5) maintenance levels
• Determination of the effects of specific design features on pavement performance• Establishment of a national long-term pavement database to support SHRP
objectives and future needs
The first 5 years of LTPP have been focused on laying the groundwork for theaccomplishment of these goals. Pavement test sections for the General Pavement Studies(GPS) and Specific Pavement Studies (SPS) programs have been established, andstandardized monitoring activities have been initiated. Most of the tools for achieving theobjectives of SHRP-LTPP are in place.
Most of the goals cannot be fully achieved until SHRP-LTPP has run its course
(approximately 2010). However, early data analysis studies conducted during SHRP-LTPPhave begun to make great strides in providing useful predictive performance equations fromthe data collected thus far. The following is a brief outline of the expected results,products, and benefits that have reached fruition over the past 5 years. Readers who wishto gain a greater understanding of the status and progress of SHRP-LTPP after the first 5years are advised to refer to the various SHRP Five-Year Reports.
Initial Results
Results from SHRP-LTPP (i.e., the past 5 years of LTPP) cannot be expressed merely interms of the specific objectives outlined above. The information and data collected for the
263

GPS and SPS test sections and entered into the National Pavemen Performance Database
(NPPDB) represent one step of a continuing process to attain the goals of the program.Products from each area of LTPP may well enhance or fulfill one or more program goals.Many products will be derived from the initial 5 years of these studies; however, the truerewards will only come when long-term performance relationships are established. TheGPS test sites will no doubt provide the performance baseline against which the products ofother SHRP research will be measured (10.2).
The establishment, identification, and monitoring of the GPS test sections are majoraccomplishments of the first 5 years of LTPP. These baseline stud.ies will provide theinitial evaluation of existing design methods as a part of the SHRP Data Analysis contract.
The development of the SPS program is well under way, although some sections have notyet been identified and constructed at this point. Each SPS experiment has been designedto answer specific questions concerning pavement performance (10.1):
• What are the proper design and construction procedures for pavement rehabilitationand overlays to provide economical renewed pavement life'?
• What are the effects of various types and levels of pavement maintenance onpavement life and performance7
• What are the effects of climatic and environmental variables on pavement life andperformance?
• What are the relative effects and interactions of load and environmental (climatic)variables on pavement deterioration, performance, and service life?
• What are the effects of alternative drainage designs on pavement performance andservice life (10.1)?
The SPS experiments will provide most, if not all, of the answers to these questions. Somewill be answered in the short term (for example, maintenance practices); others (forexample, climatic effects) will occupy the remaining 15 years of I_.TPP before sufficientconclusions can be drawn.
A principal by-product of the development of GPS and SPS is the completion of theNPPDB. This database will contain information on the approximately 777 GPS LTPP testsections and 84 SPS test projects. The information in the NPPDB will extend the benefitsof LTPP for decades ahead and will allow future researchers to pursue and answerimportant questions about pavement maintenance, management, rehabilitation, and design.
Along with the development of this database, the development of the National InformationManagement System (NIMS) to allow access to the data in the database has been achieved.A detailed and extensive quality assurance and quality control (QA/QC) program wasimplemented for the NIMS to ensure the quality of the various data elements residing in thedatabase through appropriate validation and verification actions.
264

The traffic issues considered and traffic monitoring activities pursued during SHRP-LTPPcould themselves be considered products of the program. The dialogue and cooperationdeveloped among the traffic/highway groups of the states and provinces included withinSHRP-LTPP have led to the development of standard specifications, methods, and protocolsfor all phases of traffic monitoring, including weigh-in-motion (WIM) devices, automatedtraffic classification, and data interpretation techniques. More definitive traffic-relatedproducts are anticipated in future LTPP activities as more states and provinces become moreinvolved in traffic monitoring activities and comprehensive traffic volume and vehicularloading data are obtained.
The collection of SHRP-LTPP techniques developed in materials characterization, visualdistress, profile, deflection, and instrumentation will lead to the adoption of more standardand fundamental pavement evaluation diagnostic techniques. The SHRP-LTPP standards,specifications, and protocols, when considered as companion documents to the NPPDB data,offer a great opportunity for national and international standardization.
Analysis of the NPPDB data will yield improved pavement design equations, improved designand analysis techniques, distress-specific performance models, construction variability, factorsimportant in the initiation of rutting, and a technique for reevaluating load equivalencyfactors. These initial efforts offer a baseline for launching future research efforts.
Finally, a product of SHRP-LTPP is the national and international focus generated by theinterest in long-term pavement performance. This focus opened the door to widespreadcooperative studies and research efforts. The NPPDB data, similar information gathered inCanadian SHRP, and other international efforts will foster the development of a variety ofstandardized specifications, techniques, and protocols.
Summary
The products or results gained from the capture and analysis of these data are expected to begleaned from equations that describe the relationships among various data elements in theNPPDB. These equations may be used in pavement management systems to predict thedeterioration of pavements and to select rehabilitation or repair strategies. They may bemodified into design equations or transformed into homographs for design of pavements oroverlays (10.1). The dependent variables in these equations will generally be major distressor performance measures, and the independent variables will be the data elements whosevariations have significant effects on the dependent variables. Among these elements arematerials characteristics, environmental data, traffic data, and pavement structure data.
Implicitly, these developments will yield the answers to such questions as "What is the costof deferred maintenance and the ultimate effect on the life of the highway?" or "What is theload-carrying capacity of a pavement when the design life is reached?" This information inturn could, and will, lead to improved cost allocation analysis and more accurate pavementneeds estimatesj among other things.
265

In summary, over its first 5 years, LTPP has produced the following usable results:
1. Standardized data collection procedures2. Establislunent of the NPPDB to realize the goals of the program3. Improved understanding of pavements in general
These results and accomplishments must be carried on for at least the next 15 years to reapall the benefits of the building blocks established over the first 5 years of SHRP. Throughthe experience of the research teams currently in place and the cooperation of all participatingagencies, SHRP-LTPP has provided the direction necessary for achieving all the goalsoriginally set forth by the Pavement Performance Advisory Committee and the SHRPExecutive Committee.
References
10.1 Strategic Highway Research Program Research Plans, Final Report. TransportationResearch Board, National Research Council, Washington, D.C., May, 1986.
10.2 Hawks, N. F. "Future of LTPP." White paper prepared for the AASHTO Task Forceon the Future of LTPP. Strategic Highway Research Program, National ResearchCouncil, Washington, D.C., July 18, 1989.
266

SELECT BIBLIOGRAPHY
MISCELLANEOUS REPORTS AND MANUALS
A Review of the Technical Analysis for the Canadian Long-Term Pavement
Performance (C-LTPP) Project. Clayton, Sparks and Associates Ltd. and
Decision Focus Incorporated. Draft. August 1990.
"American's Highway, Accelerating the Search for Innovation." Special Report
2020, Strategic Transportation Research Study: Highways, pp. 93-94,
Transportation Research Board, National Research Council, Washington,
D.C., 1984.
AASHTO Pavement Design Guide (1986), Appendix D.
Benson, K., H. Castedo, and D. Goulias. "Distress Identification Manual for
the Long-Term Pavement Performance (LTPP) Studies." Operational Guide No.
SHRP-LTPP-OG-002, October 1990.
Benson, K., H. Castedo, et. al. "Manual for Field Distress Survey of
Pavements with Asphalt Concrete Surfaces I, II, III." Operational Guide
No. SHRP-LTPP-OG-008, June 1989.
Brent Rauhut Engineering Inc. and ERES Consultants, Inc. Data Analysis Work
Plan, Lon_-Term Pavement Performance Studies, SHRP Projects PO2OA.
September 1990.
Brent Rauhut Engineering, Inc. and ERES Consultants, Inc. "Technical
Research Area 2, Long-Term Pavement Performance." prepared for the
Strategic Highway Research ProGram's Research Plans p. TRA2-14. January
1986.
Data Analysis A Revised Research Plan SHRP Project P-O2OB. Michigan
State University. September, 1990.
Database Structure Reference Manual, Long-Term Pavement Performance
Information Management System. January 1990.
"Discussion of Initial SHRP Database Design." April 1989.
267

EARTHINFO, Inc. "DRAFT Doctunents for SHRP-LTPP Envlr_,nmental Database."
September 5, 1991.
"Environmental Data Collected For LTPP Study." July 15. 1989.
Gardner, M., and Rauhut, J., "Material Sampling and Testing Guide for Long-
Term Pavement Performance Studies, Draft. "Brent Rauhut Engineering, Inc.
October, 1987.
Hadley, W.O. and J.L. Groeger, "An Introduction to thai S}LRP-LTPP Asphalt
Concrete Resilient Modulus Testing Program", paper No. 920898,
Transportation Research Board, 71st Annual Meeting. January, 1992.
Hadley, W.O. and J.L. Croeger, "Tile SHRP-LTPP Asphalt Concrete Resilient
Modulus Pilot Study." A Paper Prepared for Presentation at the ASCE
Materials Specialty Conference, Texas Research and Development Foundation.
August, 1992.
Hadley, W.O., W.R. Hudson, and T.W. Kennedy, "A Method of Estimating Tensile
Properties of Materials Tested in Indirect Tension." Research Report 98-
2, Center for Highway Research, the University of Texas. September, 1970.
Hondros, G., "The Evaluation of Poisson's Ratio and the Modulus of
Materials of a Low Tensile Resistance by the Brazilian (Indirect Tensile)
Test with Particular Reference to Concrete." Australian Journal of Applied
Science, Volume I0, No.3.
"LTPP IMS Data Quality Assurance Checks." Long-Term Pavement Performance
Information Management System, Draft. May 1992.
NIMS Users Manual, Long-Term Pavement Performance Information Management
System. March 1990.
Operations and Quality Assurance Manual, Long-Term Pavement Performance
Informational Management System. April 1990.
"Operations Manual" for Roadrecon Pavement Condition Monitoring Methods and
Equipment, PASCO USA. January 1989.
268

Paterson, William D.O. "Road Deterioration and Maintenance Effects: Models
for Planning and Management." the John Hopkins University Press. December
1987.
Pelzner, Adrian, "SHRP-LTPP Pavement Materials Characterization, SHRP-LTPP
Interim Report (Unpublished)." Strategic Highway Research Program. April,
1990.
PROGRAMMER'S REFERENCE MANUAL, Long-Term Pavement Performance Information
Management System. July 1989.
"Procedures for Manipulating SIlRP LTPP Traffic Data." June 1989.
RIMS Users Manual. Long-Term Pavement Performance Information Management
System. January 1990.
Strategic Highway Research Program. "A Video Guide for Obtaining SHRP-LTPP
Pavement Material Samples." (VHS Videocassette). May, 1989.
Strategic Highway Research Program. "Data Collection Guide for Long-Term
Pavement Performance Studies." Draft. Revised January 17, 1990.
Strategic Highway Research Program. "Framework for Traffic Data Collection
at GPS Test Locations." January 1989.
Strategic Highway Research Program. "Guidelines for Maintenance of General
Pavement Studies (GPS) Test Sections." Operational Memorandum SHRP-LTPP-
OM-O01. July 1988.
Strategic Highway Research Program. "IMS Researchers Guide." January, 1991.
Strategic Highway Research Program. "Long-Term Pavement Performance
Information Management Researchers Guide." SHRP-NRC. July 1991.
Strategic Highway Research Program. "PASCO Film Interpretation Manual
(PASCO-FMA)." Operational Guide No. SHRP-LTPP-OG-0024. May 1990.
"Strategic Highway Research Program, Research Plans, Final Report." pp.
TRA2-6. Transportation Research Board. National Research Council.
Washington, D.C.. May 1986.
269

Strategic Highway Research Program. "SHRP LTPP Development of Specific
Pavement Studies." September 1988.
Strategic Highway Research Program. "SHRP LTPP Guide for Field Materials
Sampling, Testing, and Handling, Version 1.0 (A guide for Drilling and
Sampling)." January 20, 1991.
Strategic Highway Research Program. "SHRP LTPP Guide for Field Materials
Sampling, Testing, and Handling, Version 1.0." Operational Guide No. SHRP-
LTPP-OG-006. May 1990.
Strategic Highway Research Program. "SHRP LTPP Guidelines for Signing and
Marking of General Pavement Studies' (GPS) Test Sections (SHRP-LTPP-OM-
002)." July 1988.
Strategic Highway Research Program. "SHRP-LTPP Interim Guide for Laboratory
Materials Handling and Testing (PCC, Bituminous Materials, Aggregates and
Soils)." Operational Guide No. SHRP-LTPP-OG-004. November 1989.
Strategic Highway Research Program. "SHRP-LTPPManual for FWDTesting (SHRP-
LTPP-OG-002)." Operational Guide No. SHRP-LTPP-OG-007. January 1989.
Strategic Highway Research Program. nSHRP-LTPP Manual for Profile
Measurements." Operational Field Guidelines Version 1.0. _ Operational
Guide No. SHRP-LTPP-OG-005. December 1989.
Strategic Highway Research Program. "SHRP-LTPP Traffic Database Design. _
June 1989.
Strategic Highway Research Program. "SI_P Operational Guidelines on Test
Pits." (SHRP-LTPP-OM-004). January 1989 (Revised March 17, 1989.
Strategic Highway Research Program. "SHRP Program Announcement for Fourth
Quarter of FY '88." June, 1988.
Strategic Highway Research Program. "Skid Data Collection for SHRP Test
Sections." May 22, 1989.
270

Strategic Highway Research Program. "Specific Pavement Studies Materials
Sampling and Testing Requirements for Experiment SPS-I: Strategic Study
of Structural Factors for Flexible Pavements." SHRP-LTPP-OM-021. February
1991.
Strategic Highway Research Program. "Specific Pavement Studies Data
Collection Guidelines for Experiment SPS-I: Rehabilitation of Jointed
Portland Cement Concrete Pavements." Operational Memorandum No, SHRP-
LTPP-0M-023. December 1991.
Strategic Highway Research Program. "Specific Pavement Studies Data
Collection Guidelines for Experiment SPS-I: Study of Structural Factors
for Flexible Pavements," Operational Memorandum No, SHRP-LTPP-0M-026.
December 1991.
Strategic Highway Research Program. "Specific Pavement Studies (SPS-I)
Strategic Study of Structural Factors for Flexible Pavements: Experimental
Design and Research Plan." February 1990.
Strategic Highway Research Program. "Specific Pavement Studies (SPS-I)
Strategic Study of Structural Factors for Flexible Pavements: Guidelines
for Nomination and Evaluation of Candidate Projects." SHRP-LTPP-OM-008.
February 1990.
Strategic Highway Research Program. "Specific Pavement Studies (SPS-I)
Strategic Study of Structural Factors for Flexible Pavements: Construction
Guidelines." February 1990.
Strategic Highway Research Program. "Specific Pavement Studies Materials
Sampling and Testing Requirements for Experiment SPS-2: Strategic Study
of Structural Factors for Rigid Pavements." SHRP-LTPP-OM-022, April 1991.
Strategic Highway Research Program. "Specific Pavement Studies Data
Collection Guidelines for Experiment (SPS-2) Strategic Study of Structural
Factors for Rigid Pavements." Operational Memorandum No. SHRP-LTPP-OM-
028. February 1992.
Strategic Highway Research Program. "Specific Pavement Studies (SPS-2)
Strategic Study of Structural Factors for Rigid Pavements: Construction
Guidelines." April 1990.
271

Strategic Highway Research Program. "Specific Pavemert Studies (SPS-2)
Strategic Study of Structural Factors for Rigid Pavem_nts: Experimental
Design and Research Plan." April 1990.
Strategic Highway Research Program. "Specific Pavement Studies (SPS-2)
Strategic Study of Structural Factors for Rigid Pavements: Guidelines for
Nomination and Evaluation of Candidate Projects." SHRP-LTPP-OM-O09. April
1990.
Strategic Highway Research Program. "Specific Pavement Studies Data
Collection Guidelines for Experiments SPS-5: Rehabilitation of Hot Mix
Asphalt Concrete Pavements." Operational Memorandum No. SIIRP-LTPP-OM-015.
October 1990.
Strategic Highway Research Program. "Specific Pavement Studies Materials
Sampling and Testing Requirements for Experiment SPS-5: Rehabilitation of
Asphalt Concrete Pavements." SIIRP-LTPP-OM-OI4. October 1990.
Strategic Highway Research Program. "Specific Pavement Studies (SPS-5)
Rehabilitation of Asphalt Concrete Pavements: Experimental Design and
Implementation Plan." April 1989.
Strategic Highway Research Program. "Specific Pavement Studies (SPS-5)
Rehabilitation of Asphalt Concrete Pavements: Construction Guidelines."
SHRP-LTPP-OM-012. June 1990.
Strategic Highway Research Program. "Specific Pavement Studies (SPS-5)
Rehabilitation of Asphalt Concrete Pavements: Guidelines for Nomination
and Evaluation of Candidate Projects." SHRP-LTPP-OM-006. November 1989.
Strategic Highway Research Program. "Specific Pavement Studies Materials
Sampling and Testing Requirements for Experiment SPS-6, Rehabilitation of
Jointed Portland Cement Concrete Pavements." January 1991.
Strategic Highway Research Program. "Specific Pavement Studies Data
Collection Guidelines for Experiment SPS-6, Rehabilitation of Jointed
Portland Cement Concrete Pavements." Operational Memorandum No. SHRP-
LTPP-OM-023. May 1991.
272

Strategic Highway Research Program. "Specific Pavement Studies (SPS-6)
Rehabilitation of Jointed Portland Cement Concrete Pavements: Experimental
Design and Research Plan." March 20, 1989.
Strategic Highway Research Program. "Specific Pavement Studies (SPS-6)
Rehabilitation of Jointed Portland Cement Concrete Pavements: Guidelines
for Nomination and Evaluation of Candidate Projects." SHRP-LTPP-OM-007.November 1989.
Strategic Highway Research Program. "Specific Pavement Studies (SPS-6)
Rehabilitation of Jointed Portland Cement Concrete Pavements: Construction
Guidelines." SHRP-LTPP°OM-OI3. July 1990.
Strategic Highway Research Program. "Specific Pavement Studies (SPS-7)
Bonded Portland Cement Concrete Overlays: Experimental Design and Research
Plan." February 1990.
Strategic Highway Research Program. "Specific Pavement Studies (SPS-7)
Bonded Portland Cement Concrete Overlays: Guidelines for Nomination and
Evaluation of Candidate Projects." SHRP-LTPP-OM-OII. June 1990.
Strategic Highway Research Program. "Specific Pavement Studies Materials
Sampling and Testing Requirements for Experiment SPS-7, Bonded Portland
Cement Concrete Overlays." SF_P-LTPP-OM-020. January 1991.
Strategic Highway Research Program. "Specific Pavement Studies Data
Collection Guidelines for Experiment SPS-7, Bonded Portland Cement
Concrete Overlays." Operational Memorandum No. SHRP-LTPP-OM-024. July1991.
Strategic Highway Research Program. "Specific Pavement Studies (SPS-7)
Bonded Portland Cement Concrete Overlays: Construction Guidelines."February, 1990.
Strategic Highway Research Program. "Specific Pavement Studies (SPS-8)
Environmental Factors: Experimental Design and Research Plan." February1992.
273

Strategic Highway Research Program. "Specific Pavement Studies (SPS-8)
Environmental Factors: Construction Guidelines." February 1992.
Strategic Highway Research Program. "Specific Pavement Studies (SPS-8)
Environmental Factors: Data Collection Guidelines." February 1992.
Strategic Highway Research Program. "Specific Pavement Studies: Experimental
Design and Participation Requirements." November 1989.
Strategic Highway Research Program. "Technical Provisions and Fee Schedules
for Field Sampling and Field Testing." May 6, 1988.
Strategic Highway Research Program. "Technical Provisions and Fee Schedules
for Laboratory Testing of Portland Cement Concrete Pavement Materials."
May 6, 1988.
Strategic Highway Research Program. "Technical Provisions and Fee Schedules
for Laboratory Testing of Soils and Bituminous Materials." May 6, 1988.
Texas Research and Development Foundation. "Final Development of General
Pavement Studies Sampling Plan." Prepared for the Strategic Highway
Research Program by the June 1988.
Texas Research and Development Foundation. "Guidelines for Initial State
Visits Section Selection and Section Verification." Prepared for the
Strategic Highway Research Program's Long-Term Pavement Performance. July
6, 1988.
Texas Research and Development Foundation. "Recruitment Guidelines for
Additional GPS Candidate Projects." Prepared for the Strategic Highway
Research Program's Long-Term Pavement Performance_ October 1988.
Texas Research and Development Foundation. "Report on the Evolution and
Development of CPS." Prepared for the Strategic Highway Research Program's
Long-Term Pavement Performance. December 1990.
Texas Research and Development Foundation. "SHRP Field Operations Guidelines
for Dipstick Measurements." Prepared for the Strategic Highway Research
Program's Long-Term Pavement Performance. July 1989,
274

Texas Research and Development Foundation. _SHRP Traffic Data Collection and
Analysis Expert Task Group Meeting Notebook. _ Prepared for the Strategic
Highway Research Program's Long-Term Pavement Performance. May 1992.
"The AASHO Road Test Report 5, Pavement Research. _ Highway Research Board
Special Report 61E, NAS, NRC, 1962.
"Traffic Monitoring Guide." U.S. Department of Transportation, Federal
Highway A_ninistration. June, 1985.
Welch, William J. "Algorithms for the Construction of Experimental Designs."
Version 1.6.1. University of Waterloo.
MATERIALS DIRECTIVES
Strategic Highway Research Program. "Bulk Sample Handling and Testing
Requirements for Unbound Materials." SHRP-LTPP Materials Directive No. 7.
May 26, 1989.
Strategic Highway Research Program. "Change in GPS Experiment No. 5 Sampling
Plans. _ SHRP-LTPP Materials Directive No. 4. April 26, 1989.
Strategic Highway Research Program. "Field Material Sampling Layout Plans
for GPS-6 and GPS-7 Pavements." SHRP-LTPP Materials Directive No. 13.
August 21, 1989.
Strategic Highway Research Program. "Information and Forms for SHRP
Laboratory Material Testing Contractors." SHRP-LTPP Materials Directive
No. 3. March 23, 1989.
Strategic Highway Research Program. _Laboratory Identification Code
Numbering Scheme." SHRP-LTPP Materials Directive No. 23. December 3, 1990.
Strategic Highway Research Program. "Laboratory Sample Tracking Tables. _
SHRP-LTPP Materials Directive No. 12. August 2, 1989.
Strategic Highway Research Program. "Materials Testing Quarterly Reporting
Requirements." SHRP-LTPP Materials Directive No. I0. June 30, 1989.
275

Strategic Highway Research Program. "National Verifi_:ation of Nuclear
Moisture Density Equipment Used by SHRY Drilling and Sampling
Contractors." SHRP-LTPP Materials Directive No. 15. O_tober 5, 1989.
Strategic Highway Research Program. "Obtaining 12 Inch (ores for Use in A-
001 Testing." SIIRP-LTPP Materials Directive No. 8. Ma_ 24, 1989.
Strategic Highway Research Program. "Obtaining AC and PfC Cores for Use in
the H-210, H-202, H-203 and H-204 Contracts from the North Central and
North Atlantic Regions." SHRP-LTPP Materials Directix'e No. ii. July 26,
1989.
Strategic Highway Research Program. "Reduction in LTPP Sampling and
Testing." SHRP-LTPP Materials Directive No. I. March I, i[989.
Strategic Highway Research Program. "Reduction in LTPP Sampling and
Testing." SHRP-LTPP Materials Directive No. 2. March 14, 1989.
Strategic Highway Research Program. "Resilient Modulus Testing Protocols."
SHRP-LTPP Materials Directive No. 14. September 26, 1989.
Strategic Highway Research Program. "Revised Field Data Collection Forms and
Guidelines for Bulk Sample Retrieval from BA..-type Boreholes." SHRP-LTPP
Materials Directive No. 16. February 5, 1990.
Strategic Highway Research Program. "Revised Laboratory Data Sheets LO5A and
L05B. Summary of Pavement Layers." SHRP-LTPP Materials Directive No. 30.
May 19, 1992.
Strategic Highway Research Program. "Revised SHRP-LTPP Guide for Laboratory
Material Handling and Testing, Revised February, 1.991." SHRP-LTPP
Materials Directive No. 25. March 22, 1990.
Strategic Highway Research Program. "Revised SHRP Protocol P04." SHRP-LTPP
Materials Directive No. 24. December 3, 1990.
Strategic Highway Research Program. "Revised SHRP Protocols P04 and P42."
SHRP-LTPP Materials Directive No. 18. March 29, 1990.
276

Strategic Highway Research Program. "Revised SHRP Protocol P43. " SHRP-LTPP
Materials Directive No. 19. April 19, 1990.
Strategic Highway Research Program. "Revised SHRP Protocols P47 and P52."
SHRP-LTPP Materials Directive No. 17. March 20, 1990.
Strategic Highway Research Program. "Revised Table C.2, Version 2.0 of the
SHRP-LTPP Guide for Field Materials Sampling, Handling and Testing. May,
1990." SHRP-LTPP Materials Directive No. 21, June 5, 1990.
Strategic Highway Research Program. "Revised Version of SHRP Protocols PI4
and P51." SIIRP-LTPP Materials Directive No. 22. June 19, 1990.
Strategic Highway Research Program. "Revised Version of Appendix D (Pages
i-Ii) of the SHRP-LTPP Guide for Laboratory Materials Handling and
Testing." SHRP-LTPP Materials Directive No. 27. October 30, 1991.
Strategic Highway Research Program. "Revised Version of SHRP Protocols P47
(GPS) and Protocol P47 (SPS)." SHRP-LTPP Materials Directive No. 26.
August 12, 1991.
Strategic Highway Research Program. "Revisions to the SHRP-LTPP Guide for
Laboratory Materials Handling and Testing." SHRP-LTPP Materials Directive
No. 20. May 24, 1990.
Strategic Highway Research Program. "SIIRP Protocols for SPS Laboratory
Materials Testing and Related Revisions to the SHRP-LTPP Guide for
Laboratory Materials Handling and Testing." SHRP-LTPP Materials Directive
No. 28. November 5, 1991.
Strategic Highway Research Program. "SHRP Protocols for SPS Laboratory
Materials Testing and Related Revisions to the SHRP-LTPP Guide for
Laboratory Materials Handling and Testing." SHRP-LTPP Materials Directive
No. 29. January 23, 1992.
Strategic Highway Research Program. "Testing Requirements for Layers Within
AC Cores." SHRP-LTPP Materials Directive No. 5. May 4, 1989.
277

Strategic Highway Research Program. "Testing Requirements for Treated Base
and Subbase Materials and Treated Subgrade. N S_P-LTPP Katerials Directive
No. 9. June 13, 1989.
Strategic Highway Research Program. "Transmittal of Protocols P41, P42, P47,
PSI, and P52." SHRP-LTPP Materials Directive No. 6. May 16, 1989.
REM NOTES
Hadley, W.O. "SHRP Rem Notes Issue No. 1 Resilient Modulus Testing for
Asphalt Concrete." Strategic Highway Research Program. April, 1990.
Hadley, W. O. "SHRP Rem Notes Issue No. 3 - Alignment and Measurement Issues
Associated with SHRP Protocol P07." Strategic Highway Research Program.
June, 1990.
Hadley, W. O. "SHRP Rem Notes Issue No. 4 - Alignment and Measurement Issues
Associated with SHRP Protocol P07, contlnued. N Strategic Highway Research
Program. July, 1990.
Hadley, W.O., "SHRP Rem Notes Issue No. 6 - S_P Protocol P46
Familiarization Testing." Strategic Highway Research Program. November,
1990.
Pelzner A., and Groeger, J. "SHRP Rem Notes Issue No. 7 - Observation of
SHRP Laboratories and Revisions to the SIIRP Laboratory Materials Testing
Guide." Strategic Highway Research Program. April, 1991.
Steele, Garland. "SHRP Rem Notes Issue No. 2 - SHRP Proficiency Testing. N
Strategic Highway Research Program. May, 1990.
Steele, Garland. "SHRP Rem Notes Issue No. 5 - SHRP Proficiency Sample
Testing Programs." Strategic Highway Research Program. August, 1990.
278

TECHNICAL MEMORANDA
NOTE: All Technical Memoranda listed below were prepared for the
Strategic Highway Research Program's Long-Term Pavement Performance
project - unless otherwise stated.
Anderson, V. "A Short Discussion of Algorithms for the Construction of
Experimental Designs (ACED)." TRDF Technical Memorandum VA-l. February 8,
1988.
Anderson, V. "Analysis of GPS Data." TRDF Technical Memorandum AU-15. March
18, 1988.
Anderson, V. "Analysis of the Material Testing Sampling Design." TRDF
Technical Memorandum AU-108. January 31, 1990.
Anderson, V. "An Analysis of Variance Method to Estimate ESAL's for a
Year." TRDF Technical Memorandum AU-199. January 20, 1992.
Anderson, V. "Crucial Analyses for SPS-I." TRDF Technical Memorandum AU-
162. September I0, 1990.
Anderson, V. "Error Variation for GPS and SPS." TRDF Technical Memorandum
AU-171. October 25, 1990.
Anderson, V. "A Few Analyses of LTPP Data from the North Atlantic Region. _
TRDF Technical Memorandum AU-211. September 15, 1992.
Anderson, V. "A Few Analyses of LTPP Data from the Southern Region."
TRDF Technical Memorandum AU-210 (Revised). August 14, 1992.
Anderson, V. "Fractional Factorials for Designs that have Classification
and Treatment Factors in the Same Experiment." TRDF Technical Memorandum
AU-9. February 17, 1988.
Anderson, V. "GPS (1-5) Simulated data Analyses for the Initial
Recruitment." TRDF Technical Memorandum AU-49. April 7, 1989.
Anderson, V. "Method to Compare Predictability of Y called "closeness'."
TRDF Technical Memorandum AU-28. September 16, 1988.
279

Anderson, V. "Mr (Calculated Resilient Modulus) Analysi:1 of Variance (ANOVA)
for Five Sections." TRDF Technical Memorandum AU-20:_. March 17, 1992.
Anderson, V. "One Method to Estimate Construction Var|ability on Pavement
Distress." TRDF Technical Memorandum AU-201. February 28, 1992.
Anderson, V. "Philosophy of Sampling (Allocating Cbservations)." TRDF
Technical Memorandum AU-17. March 28, 1988.
Anderson, V. "Possible Influence of Unequal Frequencies on Two Factor
Interactions in GPS-5, 4, 3, 2." TRDF Technical Memorandum AU-151. August
2, 1990.
Anderson, V. "A Recapitulation of the Design of GPS and Regression Analy-
ses." TRDF Technical Memorandum AU-178. March I, 1991.
Anderson, V. "Rut Depth Analyses for Six Section." TRDF Technical
Memorandum AU-206. May 15, 1992.
Anderson, V. "Selecting Sections for CPS (P-001)." TRDF Technical
Memorandum AU-3. January 6, 1988.
Anderson, V. "Some Essential Data Enhancement Techniques." TRDF Technical
Memorand_n AU-II7. March 22, 1990.
Anderson, V. "SPS Designs." TRDF Technical Memorandum AU-14. March 16,
1988.
Anderson, V. "Statistical Design (Split Plot) and Inference Space for SPS
(Rationale for using at least 2 error terms)." TRDF Technical Memorandum
AU-173. December 3, 1991.
Anderson, V. "Statistical Design (Completely Randomized) and Inference
Space for GPS (Rational for using residual mean square for the estimate
of the error variance in regression analyses)." TRDF Technical Memorandum
AU-172. November 21, 1990.
Anderson, V. "Suggested Verification Procedure in South Carolina as a GPS
Pilot Study." TRDF Technical Memorandum AU-13. March 15, 1988.
Anderson, V. "Three factor Interactions (3 f.i.) Confounded with 4 f.i. and
Higher From I/4th replicate of 28. ''TRDF Technical Memorandum AU-19. April
17, 1988.
280

Anderson, V. "Trial Analyses for GPS 1-5 Using Simulated Data." TRDF
Technical Memorandum TW-2. September 19, 1988.
Anderson, V. and R. High. "Sampling Within Sections." TRDF Technical
Memorandum AU-4. January 29, 1988.
Anderson, V. and R. High. "Value of Fractional Factorials for the SPS-I and
SPS-2 Experimental Designs." TRDF Technical Memorandum AU-56. March 14,1989.
Benson, K. "Collection of Skid Measurements for SPS Test Sections." TRDF
Technical Memorandum AU-96. December 12, 1989.
Benson K. "Existing AC Overlay of PCC Pavements." TRDF Technical
Memorandum AU-47. February 9, 1989.
Benson K. "Extension of Tech Memo AU-23, Surface Distresses for LTPP Test
Sections." TRDF Technical Memorandum AU-25. September 14, 1988.
Benson, K. "Florida Limerock Sections." TRDF Technical Memorandum AU-43.
January 19, 1989.
Benson, K. "GPS New AC Overlay Studies (GPS-6B/7B)." TRDF Technical Memor-
andum AU-50. February 14, 1989.
Benson K. "GPS Unbonded PCC Overlay of PCC Study." TRDF Technical
Memorandum AU-51. February 15, 1989.
Benson K. "Guidelines for Routine Monitoring Measurements." TRDF Technical
Memorandum AU-93. December 6, 1989.
Benson, K. "Magnetic Pavement Marking System (DRAFT)." TRDF Technical
Memorandum AU-33. January 9, 1989.
Benson, K. "Quality Control Plan for Rehabilitation Data Collection." TRDF
Technical Memorandum AU-80. September 26, 1989.
Benson, K. "Recommended Certification Procedures for the Manual Distress
Surveys." TRDF Technical Memorandum AU-157. August 23, 1990.
Benson, K. "Recommended Quality Control of the Manual Distress Survey
Data." TRDF Technical Memorandum AU-158. August 15, 1990.
281

Benson K. "Recommended System of Inter-Reglon Quality _md Consistency for
Distress Data." TRDF Technical Memorandum AU-71. Aug_Ist 6, 1989.
Benson K. "Rehabilitation Sheets 1-64." TRDF Technical Memorandum AU-II5.
March 16, 1990.
Benson K. "Site Verification Recommendations." TRDF _echnical Memorandum
AU-10. February 16, 1988.
Benson K. "Update of Tech Memo AU-22, Surface Distresses for LTPP Pavement
Test Sections." TRDF Technical Memorandum AU-23. August 15, 1988.
Benson K. and R. High. "Existing AC Overlay of PCC Pavements." TRDF Techn-
ical Memorandum AU-46. January 31, ].989.
Benson K. and E. Pensock. "Quality Control Plan for Skid Data." TRDF
Technical Memorandum AU-75. October 24, 1989.
Benson, K. and H. Roper. "Review of PASCO's January 1989 Operation Manual."
TRDF Technical Memorandum AU-48. February 7, 1989.
Bertrand, Carl and C. Claros. "Class I Rod Profiling Techniques." TRDF
Technical Memorandum UT-38. March 30, 1990.
Castedo, H. "Consideration of Data Collection Needs for Evaluating Existing
Pavement Design Methods (Revision of the Data Collection Guide for
LTPP)." TRDF Technical Memorandum UT-4. February 17, 1988.
Castedo, H. "Environmental Data for LTPP." TRDF Technical Memorandum UT-6.
April 29, 1988.
Castedo, H. "Evaluation and Comments of Proposed AC Hot Mix Recycling (SPS-
3) and JCP Restoration (SPS-4) Experiments (Refer to Tech Memo No. PI-
03)." TRDF Technical Memorandum UT-5. April 6, 1988.
Castedo, H. "List of "Available" Computer Programs for Pavement Design,
Condition Survey and Pavement Structures in General." TRDF Technical
Memorandum UT-2. February 16, 1988.
Castedo, H. "Literature on Pavement Design Methods." TRDF Technical
Memorandum UT-3. February 19, 1988.
282

Castedo, H. "Long-Term PASCO Film Storage at TRDF." TRDF Technical Memor-
andum UT-17. June 29, 1989.
Castedo, H. "P-O01 Project." TRDF Technical Memorandum UT-I. December 23,
1987.
Castedo, H. "Recommendations for the Implementation of the Environmental
Data Collection to be Used in LTPP. (Refer to TMs No. UT-06 and 07)."
TRDF Technical Memorandum UT-8. May 6, 1988.
Castedo, H. "Sources of Information and References for Environmental Data
to be Used in LTPP (Refer to TM no. UT-06)." TRDF Technical Memorandum
UT-7. May 4, 1988.
Castedo, H. "Status Report on: Surface Distress Manual PASCO Film Data
Reduction." TRDF Technical Memorandum UT-9. July 7, 1988.
Castedo, H. and K. Benson. "Recommended Distresses to be Collected on LTPP
Test Sections." TRDF Technical Memorandum AU-26. September 14, 1988.
Castedo, H., K. Benson and L. Moser. "Surface Distresses for LTPP Pavement
Test Sections." TRDF Technical Memorandum AU-22. July 21, 1988.
Castedo, H., J. Semrau and K. Benson. "Summary and Review of Pavement
Condition Survey Manuals from Various States and Provinces." TRDF
Technical Memorandum AU-24. August 19, 1988.
Claros, G. "Additional Colm,ents Regarding the PADIAS-SHRP Manual." TRDF
Technical Memorandum UT-36. March 19, 1990.
Claros, G. "Comments to the PADIAS-SHRP Manual Revision." TRDF Technical
Memorandum UT-35. March 9, 1990.
Claros, G. "Comments to the Procedure for Testing Synthetic Samples." TRDF
Technical Memorand_n UT-34. February 26, 1990.
Claros, G. "Proficiency and Calibration Tests for Task 3." TRDF Technical
Memorand_n UT-33. February 22, 1990.
Claros, G. "Protocols for SPS Expe,_Iments." TRDF Technical Memorandum UT-
46. May 23, 1990.
283

Claros, G. "Task 2, Protocol P-07." TRDF Technical Memorandum UT-28.
January 22, 1990.
Claros, G. and H. deSolminihac. "Comments to Tech Memo AU-101." TRDF
Technical Memorandum UT-29. January 25, 1990.
Claros, G. and H. deSolminihac. "Preliminary Ana],ysis of the SHRP
Profilometer Workshop." TRDF Technical Memorandum UT-31. February 15,
1990.
Copeland, C. "SHRP Regional IMS Computer Equipment Configuration. " TRDF
Technical Memorandum AU-I03. January 26, 1990.
Copeland, C. and J. German. "Traffic Data Tracking Sys_em. n TRDF Technical
Memorandum AU-I05. January 31, 1990.
Copeland, C. and J. German. "Automated NTDB Traffic Data Edit." TRDF
Technical Memorandum AU-106. January 31, 1990.
Coplantz, J. "Alternatives for Revision of GPS Experiment 2." TRDF
Technical Memorandum AU-6. February I, 1988.
Coplantz, J. "Investigation of Quality Control Procedures for Use of
Nuclear Moisture/Density Gauges." TRDF Technical Memorandum AU-II.
February 18, 1988.
Coplantz, J. "Proposed Revision of GPS Experiment 2 to be Presented to the
ETG on May 9th and 10th." TRDF Technical Memorandum AU-18. April 19,
1988.
Coplantz, J. and P. Irick. "Recommendations on Approach to GPS Experiments
6, 7, and 9." TRDF Technical Memorandum AU-8. February i0, 1988.
deSolminihac, H. "Acceptance Criteria for the PASCO Films and Results of
the First Film Revision." TRDF Technical Memorandum UT-52. June 25, 1990.
deSolminihac, H. "Certification Procedures for Manual Condition Survey
Personnel." TRDF Technical Memorandl_ UT-49. June 4. 1990.
deSolminihac, H. "Certification Procedures for the P_)IAS Operator." TRDF
Technical Memorandum UT-45. June 27, 1990.
284

deSolminihac, H. "Manual Procedure for Faulting Measurement." TRDF
Technical Memorandum UT-55. July 27, 1990.
deSolminihac, H. "Organization of the Distress Identification Manual for
PASCO Films." TRDF Technical Memorandum UT-30, January 25, 1990.
deSolminihac, H. "Preliminary Proposition for the Quality Assurance Plan of
the Manual Condition Survey." TRDF Technical Memorandum UT-32. February
20, 1990.
deSolminihac, H. "Quality Assurance Plan for Film Interpretation." TRDF
Technical Memorandum UT-47. June 27, 1990.
deSolminihac, H. "Quality Assurance Plan for the Manual Condition Survey."
TRDF Technical Memorandum UT-50. June 27. 1990.
deSolminlhac, H. and G. Claros. "Statistical Analysis of the February 1990
SHRP Profilometer Workshop." TRDF Technical Memorandum UT-39. March 26,
1990.
Elkins G. "Additions to Traffic Presentation on Review of Continuously
Collected Data." TRDF Technical Memorandum AU-63. May i, 1989.
Elkins G. "Acceptance Reco_nendation on SPS-6 Project in Texas." TRDF
Technical Memorandum EC-48. April 19, 1990.
Elkins G. "Data Collection and Storage Consideration for SPS Sections."
TRDF Technical Memorandum EC-44. February 5, 1990.
Elkins G. "Executive Summary of LTPP Technical Overview Workshop." TRDF
Technical Memorandum EC-16. May 14, 1989.
Elkins G. "Manual measurement of transverse profile using the Dipstick."
TRDF Technical Memorandum EC-39. January 15, 1990.
Elkins G. "Material Sampling Plan for SPS-5 Manitoba Project." TRDF
Technical Memorandum EC-19. June 27, 1989.
Elkins G. "Nominated SPS-6 Project on US-31." TRDF Technical Memorandum
EC-68. August i0, 1990.
Elkins G. "Notes to Reviewers of Preliminary SPS-I Construction
Guidelines." TRDF Technical Memorand_n EC-66. August 7, 1990.
285

Elkins, G "Pavement Condition Index for LTPP." TRDF _echnical Memorandum
AU-69. June 15, 1989.
Elkins G "Policy for Pavement Maintenance on GPS Sections." Texas
Research and Development Memorandum T-O01. May 26, 1988.
Elkins G "Potential Modification to SPS 1 Design." TRDF Technical Memor-
andum EC-37. January 4, 1990.
Elkins G "Recommendation on Montana's Request to Omit the Control Section
on their SPS-5 Project." TRDF Technical Memorandum EC-59. June 20, 1990.
Elkins G "Recommendation on Nominated SPS-2 Site on 1-80, Iowa." TRDF
Technical Memorandum EC-70. August i0, 1990.
Elkins G "Recolmnendation or, Nominated SPS-5 project from Texas, US-175."
TRDF Technical Memorandum EC-64. August 8, 1990.
Elkins G "Recommendation on Nominated SPS-7 Project from Minnesota on 1-
94." TRDF Technical Memorandum EC-65. August 8, 1990.
Elkins G "Recommendation on SPS-5 Project in Florida." TRDF Technical
Memo1"andum EC-54. May 23, 1990.
Elkins O "Recommendations on Arizona SPS-I Project." TRDF Technical
Memorandum EC-57. May 30, 1990.
Elkins G "Recommendations on Nominated SPS-5 Project in Maryland." TRDF
Technical Memorandum EC-52. June 13, 1990.
Elkins G. "Recommendations on Organization to Interpret Distress
Photographs." TRDF Technical Memorandum AU-44. January 27, 1989.
Elkins G. "Recommendations on SPS-I project in California." TRDF Technical
Memorandum EC-56. May 30, 1990.
Elkins G. "Recommended Design and Construction Details for Manual Rut
Depth Gauge." TRDF Technical Memorandum EC-14. May ii, 1989.
Elkins G. "Recruitment Plan for SPS Test Sections." TRDF Technical
Memorandum EC-31. September 25, 1989.
286

Elklns G. "Review & Recommendations on nominated SPS-5 Project on 1-75 in
TRDF Technical Memorandum EC-60. June 25, 1990.
Elklns G. "Review of Nominated SPS 5 & 6 Projects in Connecticut." TRDF
Technical Memorandum EC-47. February 19, 1990.
Elklns G. "Review of Nominated SPS 6 Project in Pennsylvania." TRDF
Technical Memorandum EC-41. January 19, 1990.
Elklns G. "Review of Nomination Form for SPS-7 on US-67 in Missouri." TRDF
Technical Memorandum EC-67. August I0, 1990.
Elklns G. "Review of SPS-6 Nomination Forms." TRDF Technical Memorandum
EC-26. August 9, 1989.
Elklns G. "Review of SPS-6 Nomination from Ohio." TRDF Technical
Memorandum EC-63. July 27, 1990.
Elklns G. "Revised Survival Estimates for Revised SPS-I Test Sections
Structures." TRDF Technical Memorandum EC-34. December 29, 1989.
Elkins G. "Site Specific Environmental Data Collection." TRDF Technical
Memorandum EC-58. May 31, 1990.
Elkins, G. "SPS-8 Strawman Experiment Design." TRDF Technical Memorandum
EC-51. June 13, 1990.
Elkins G. "SPS Recruitment Plan and Schedule." TRDF Technical Memorandum
EC-32. November 13, 1989.
Elkins G. "SPS Test Section Numbering Scheme." TRDF Technical Memorandum
EC-29. September 7, 1989.
Elkins G. "Status of Data Base and Available LTPP Data." TRDF Technical
Memorandum EC-50. February 26, 1990.
Elkins G. "Survival Estimates for SPS-I Test Sections." TRDF Technical
Memorandum EC-33. December 19, 1989.
Elkins G. "Traffic Data Collection Needs for Specific Pavement Studies
Test Sections." TRDF Technical Memorandum AU-72. September 21, 1989.
287

Elkins, G. "Use of SPS 3, 4, 5, and 6 Data in P-0_0 Analysis." TRDF
Technical Memorandtun EC-49. May Ii, 1990.
Elkins, G. "Work Items and Development Topics for SPS _.:xperiments." TRDF
Technical Memorandum EC-17. May 13, 1989.
Elkins, G. and K. Benson. "REVISED - Guidelines for BefcJ_e and After Over-
lay and Seal Coat Monitoring Measurements (Update of the May 13, 1989
version)." TRDF Technical Memorandum EC-15. November ].0, 1989.
Elkins, G. and C. Copeland. "Traffic Data Summary Statistics in the SHRP
NPDB." TRDF Technical Memorand_n EC-4]. January 30, 1990.
Elkins, G. and J. German. "Draft Material for Traffic Executive Summary
Report." TRDF Technical Memorandum AU-40. December 30, 1988.
Elkins, G. and J. Groeger. "Recommended Materials Sampling Plan for SPS-6
Site in Iowa." TRDF Technical Memorandum EC-21. June 30, 1989.
Elkins, G. and J. Groeger. "Review of SPS-5 Nomination Forms." TRDF
Technical Memorandum, EC-28. August 21, 1989.
Elkins, G., R. Haas and P. Irick. "Draft Report on Further Development of
SPS-5." TRDF Technical Memorand_n EC-10. January 24, 1989.
Elkins, G. and P. Stephanos. "Comparison of Rut Depths from Dipstick and
PASCO Transverse Profile Measurements." TRDF Technical Memorandum EC-42.
January 30, 1990.
German, J. "Algorithms for the Estimation of Traffic Variability." TRDF
Technical Memorandt_n AU-176. January 24, 1991.
German, J. "Computer Capability at Regional Level." TRDF Technical
Memorandum AU-122. March 28, 1990.
Cot,nan, J. and W. O. Hadley "D_.termiuation of Cumulative Loading Estimates
from Historical Data." TRDF Technical Memorandum AU-175. January 4, 1991.
German, J. "Final Draft of Data Collection Guide Chapter 3: Traffic Data
Collection." TRDF Technical Memorandum AU-52. August 9, 1989.
German, J. "Implementation of the National Traffic Data Base." TRDF
Technical Memorand_ AU-123. March 29, 1990.
288

German J. "Incorporating FHWA Truck Weight Data into GPS Traffic
Database. " TRDF Technical Memorandum AU-177. February 15, 1991.
German J. "Procedures for Assessing the Precision of Annual Traffic
Estimates." TRDF Technical Memorandum AU-193. October 29, 1991.
German J. "Site Related Code for Traffic Data. N TRDF Technical Memorandum
AU-134. June i, 1990.
German J. "Standards for Profile Measurements at WIM Locations. NTRDF
Technical Memorandum AU-192. October 25, 1991.
German J. "Traffic Data Collection Plan Guidelines." TRDF Technical
Memorandum AU-88. November 16, 1989.
German J. "Traffic Data Collection Requirements for SPS-8." TRDF Technical
Memorandum AU-161. August 31, 1990.
German, J. "WIM Data Analyses for the SHRP LTPP Traffic ETG. _ TRDF
Technical Memorandum AU-205. May 8, 1992.
German J. and W. Cunagin. "Measures of Traffic Data Variability. _ TRDF
Technical Memorandum AU-128. April 30, 1990.
German, J. and E. Pensock. "Selection Criteria for Regional Weigh-in-Motion
Sites." TRDF Technical Memorandum AU-147. June 29, 1990.
Gibson, S. "Additional Revisions to the PADIAS Distress Analysis System. _
TRDF Technical Memorandum AU-143. June 25, 1990.
Gibson, S. "PASCO Film Acceptance Review." TRDF Technical Memorandum AU-
165. August 31, 1990.
Gibson, S. "PASCO Film Acceptance Review." TRDF Technical Memorandum AU-
148. July 13, 1990.
Gibson, S. "PASCO Film Acceptance Review." TRDF Technical Memorandum AU
150. July 16, 1990.
289

Gibson, S. "Recommended Certification Criteria for PASCO [,_[AInterpretation
Technician." TRDF Technical Memorandum AU-149. July 13, 1990.
Gibson, S., H. Roper and W. O. Hadley. "Pilot Study for PASCO Distress
Interpretatlon." TRDF Technical Memorandum AU-164. September i0, 1990.
Goulias, D. "Anticipated SHRP-LTPP General Revisions of AASHTO Pavement
Design Guide." TRDF Technical Memorandum UT-41. April 2, 1990.
Goulias, D. "Conversion of Asphalt Pavement Field Distress Data Collected
During the Preliminary "Before Overlay or Seal Coat Application"
Condition Surveys to the Descriptions Included in the "Distress
Identification Manual for the LTPP Studies." TRDF Technical Memorandum
UT-22. September 25, 1989.
Goulias, D. "Conversion of Rigid Pavement Field Distress Data Collected
from the Preliminary Before Overlay or Seal Coat Application" Condition
Surveys to the Descriptions included in the "Distress Identification
Manual for the LTPP Studies." TRDF Technical Memorandum UT-23. September
25, 1989.
Goulias, D. "Evaluation of the Input Parameters of the 1986 AASHTO Design
Equation for Rigid Pavements from the LTPP Data Base." TRDF Technical
Memorandum UT-48. May 29, 1990.
Goulias, D. "Evaluation of the Input Parameters of the 1986 AASHTO Design
Equation for Flexible Pavements from the LTPP Data Base." TRDF Technical
Memorandum UT-27. January 30, 1990.
Goulias, D. "Evaluation of Input Variables of Existing Pavement Design
Equations from LTPP Data." TRDF Technical Memorandum UT-26. November 6,
1989.
Goulias, D. "Input/Output Variables at the 1986 AASHTO Design Guide for
Flexible Pavements and their Evaluation from the LTPP Data Collection
Set." TRDF Technical Memorandum UT-15. June 19, 1989.
Goulias, D. "Pavement condition Indices Based on Distress Data and Other
Pavement Condition Measurements." TRDF Technical Memorandum UT-IO. June
5, 1989.
290

Goullas, D. "Possible Improvements to Chapters 2 and 3 of Part II of the
1986 AASHTO Design Guide from the SHRP/LTPP Study." TRDF Technical
Memorandum UT-37. March 16, 1990.
Goulias, D. "Procedures for evaluating the ESAL's (of non-overlayed
sections) from the traffic data of the LTPP test sections." TRDF
Technical Memorandum "Status of "INV PCC STRENGTH Portland Concrete
Layers Strength Data .... " TRDF Technical Memorandum UT-56. June 13,
1990.
Goulias, D. "Flowchart of distress data collection and monitoring for the
LTPP studies." TRDF Technical Memorandum UT-21. September II, 1989.
Goullas, D. "Input/Output Variables at the 1986 AASHTO Design Guide for
Flexible Pavements and their Evaluation from the LTPP Data Collection
Set." TRDF Technical Memorandum UT-15. June 19, 1989.
Goulias, D. "Modeling Approach for Developing Pavement Performance
Prediction Models." TRDF Technical Memorandum UT-25. November 3, 1989.
Goulias, D. "Pavement condition Indices Based on Distress Data and Other
Pavement Condition Measurements." TRDF Technical Memorandum UT-10. June
5, 1989.
Goulias, D. "Possible Improvements to Chapters 2 and 3 of Part II of the
1986 AASHTO Design Guide from the SHRP/LTPP Study." TRDF Technical
Memorandum UT-37. March 16, 1990.
Goulias, D. "Procedures for evaluating the ESAL's (of non-overlayed
sections) from the traffic data of the LTPP test sections." TRDF
Technical Memorandum "Status of "INV PCC STRENGTH Portland Concrete
Layers Strength Data .... " TRDF Technical Memorandum UT-56. June 13,
1990.
Goulias, D. "Proposed Procedures for Rating LTPP Test-Sections Prior to
Placement of Overlays and Seal Coats for Classifying the Sections in the
"Good" or "Bad" Category of the GPS 6B and 7B Factorial Analysis." TRDF
Technical Memorandum UT-24. October 13, 1989.
Goulias, D. "Recommendations for Distress Measurements on the SPS-5 & 6
Sections." TRDF Technical Memorandum UT-42. April 19, 1990.
291

Coullas, D. "Recommended Pavement Condition Indices bas4d on Distress Data
for use in the LTPP Test Sections." TRDF Technical Mem,,)randum UT-II. June
5, 1989.
Goulias, D. "Review and Comparison of Techniques for Developing Pavement
Performance Prediction Models." TRDF Technical Memor_,ndum UT-20, 1989.
Goulias. "Status of "INV_GENERAL Geometric, Drainage, and other General
Information Requiring the Construction Number (Data Sheets i, 2, & 3)
.... " TRDF Technical Memorandum UT-51. June 8, 1990.
Goulias, D. "Status of 'IN-V_IAYER Layer Descriptions (Data Sheet: Inventory
3)" and "INV_AGE of Pavement Data (Data Sheets: Inventory 4). " TRDF
Technical Memorandum UT-53. June 12, 1990.
Goulias, D. "Status of "INV_MAJOR_IMP Major Improvement: Data (Data Sheet:
Inventory 4)" and INV_PCC_STEEL Portland Concrete Imyers Reinforcing
Steel (Data Sheets: Inventory 7)." TRDF Technical Memorandum UT-54. June
14, 1990.
Goulias, D. "Use of Markov Chains in Developing Pavement Performance
Prediction Models." TRDF Technical Memorandum UT-19. August 18, 1989.
Goulias, D. "Use of Statistical Concepts in Developing Probabillstic
Performance Prediction Models." TRDF Technical Memorandum UT-18. July 17,
1989.
Goulias, D. and H. Castedo. "Pavement Condition Rating Procedure for LTPP
Asphalt Test Sections (Before Overlay or Seal Coat Application." TRDF
Technical Memorandum UT-14. June 22, 1989.
Goulias, D. and H. Castedo. "Preliminary Rating of LTPP Asphalt Test
Sections." TRDF Technical Memorandum UT-12. June 8, 1989.
Goulias, D. and H. Castedo. "Preliminary Rating of LTPP Portland Cement
Concrete Test Sections." TRDF Technical Memorandum UT-13. June 14, 1989.
Goulias, D. and H. Castedo. "Pre-Overlay Pavement Condition Rating
Procedure for LTPP Portland Cement Concrete." TRDF Technical Memorandum
UT-16. June 26, 1989.
292

Goulias, D. and H. deSolminihac. NPreliminary Recommendations for Distress
Measurements on the SPS 5 & 6 Sections." TRDF Technical Memorandum UT-
40. March 26, 1990.
Groeger, J. "Comparative Laboratory Testing Costs." TRDF Technical
Memorandum EC-40. January 18, 1990.
Groeger, J. "Materials Sampling & Testing Laboratory Identification Code
Numbering Scheme." TRDF Technical Memorandum EC-62. July 24, 1990.
Groeger, J. "Proof Testing of P07 M r Test System with an Aluminum Specimen. n
TRDF Resilient Modulus Technical Memorandum AURES-3. May 12, 1992.
Groeger, J. "Reco_nendations for the Revision of SI_P Protocol P51." TRDF
Technical Memorandum EC-46. April 19, 1990.
Groeger, J. "Section 4 of the SIiRP-LTPP Field Drilling & Sampling Guide
Quality Control & Quality Assurance." TRDF Technical Memorandum EC-45.
April 16, 1990.
Groeger, J. "SPS Field Sampling & Lab Testing Protocols. n TRDF Technical
Memorandum EC-61. June 21, 1990.
Groeger, J. "S_nmaries of ETG Comments and Possible Cost Savings from
Elimination of Selected Laboratory Material Tests. n TRDF Technical
Memorandum EC-II. February i, 1989.
Croeger, J. and C. Elkins. "Arizona Drilling, Sampling and Testing Plan for
SPS-6 Project." TRDF Technical Memorandum EC-38. January 22, 1990.
Croeger, J. and G. Elkins. "California and Arizona Drilling, Sampling, and
Testing Plan for SPS-5 Projects." TRDF Technical Memorandum EC-35.
December 29, 1989.
Groeger, J.and G. Elkins. "Comments on Proposed Sampling Plan for SPS-5
Westbound Trunk Highway 2 West of Bemidji, MN." TRDF Technical Memorandum
EC-55. May 31, 1990.
Groeger, J. and W. O. Hadley. "Field Drilling and Sampling of GPS-6B and
GPS-7B Pavements." TRDF Technical Memorandum AU-212. September 23, 1992.
Haas, R. "Design for SPS-I (Particularly the Thin-thin Section Combina-
tion)." TRDF Technical Memorandum _I-2. December 23, 1989.
293

Haas, R. "Potential Benefits from LTPP Models Incorpor, ting Environmental
Factors and Environment-Load Interactions. M TRDF Technical Memorandum RH-
03. July 21, 1989.
Haas, R., T. White, W. Uddin and W. R. Hudson. "PoterLtial Benefits from
LTPP." TRDF Technical Memorandum AU-74. October 15, ].989.
Hadley, W. O. "An Approach to Improvements of Load Equiw_.lence Factors from
SHRP LTPP Data." TRDF Technical Memorandum AU-190. Oc:tober 15, 1991.
Hadley, W. O. "Classification of Pavement Types (Revised)." TRDF Technical
Memorandum AU-166. November 5, 1990.
Hadley, W.O. "Equivalent Thickness for GPS-LTPP Overlay Sections
(Revised)." TRDF Technical Memorandum AU-169. November 5, 1990.
Hadley. W.O. "Fingerprinting Comparisons Between Round Robin laboratories,
Southwestern Laboratories and Arizona State University." TRDF Resilient
Modulus Technical Memorandum AURES-I. April 23, 1992.
Hadley, W.O. "General Review of Computer Printouts/Results." TRDF Technical
Memorandum AU-194. December 3, 1991.
Hadley, W. O. "General Review of Computer Printout/Results - Second
Report." TRDF Technical Memorandum AU-196. January 2, 1992.
Hadley, W. O. "Initial Report General Review of Computer Printouts/
Results - Protocol P46 - Law Engineering." TRDF Technical Memorandum AU-
198. January 13, 1992.
Hadley, W. O. "Initial Statistical Analysis of the February 1990 SIIRP
Profilometer Workshop Results." TRDF Technical Memorandum AU-131. May 4,
1990.
Hadley. W.O. "Instantaneous Deformation Data Extraction Procedure for P07
Resilient Modulus Test." TRDF Resilient Modulus Technical Memorandum
AURES-II. July 31, 1992.
294

Hadley, W. O. "Load Equivalency Factor (LEF) Estimates for CPS-LTPP Rigid
Pavements Based on the SHRP LTPP IMS Inventory Data (Revised)." TRDF
Technical Memorandum AU-168. November 26, 1990.
Hadley, W. O. "Logical Review and Acceptable Range Values of LTPP
Maintenance Data." (DRAFT)." TRDF Technical Memorandum AU-107. January
29, 1990.
Hadley, W.O. "North Central Region Modulus Testing." TRDF Resilient
Modulus Technical Memorandum A_ES-9. July 2, 1992.
Hadley, W.O. "P07 Proof Testing with Aluminum Specimen." TRDF Resilient
Modulus Technical Memorandum AURES-7. May 29, 1992.
Hadley, W. O. "Pilot Studies of Effects of Materials and Construction
Variabilities on Pavement and Performance." TRDF Technical Memorandum AU-
203. April 6, 1992.
Hadley, W. O. "Possible Revisions to the Resilient Modulus Test Procedures
(P-07)." TRDF Technical Memorandum AU-II0. January 12, 1990.
Hadley, W.O. "Preliminary Evaluation of the "Fingerprinting" Testing of
the Synthetic Specimens." TRDF Resilient Modulus Technical Memorandum
AURES-4. May 12, 1992.
Hadley, W. O. "Proposed Decision Criteria for Establishing Representative
Thickness of a Flexible Pavement with Variable Structural Sections." TRDF
Technical Memorandum AU-159. September 29, 1990.
Hadley, W. O. "Proposed Method for Measurement of PCC Slab Faulting." TRDF
Technical Memorandum AU-141. June 21, 1990.
Hadley, W. O. "Quality Assurance Checks on FWD Data." TRDF Technical
Memorandum AU-207. May 18, 1992.
Hadley, W. O. "Reco_nended PC Concrete Pilot Studies." TRDF Technical
Memorandum AU-190a. September 30, 1991.
Hadley, W. O. "REM Notes." TRDF Technical Memorandum AU-121. March 28,1990.
295

Hadley, W. O. "Resilient Modulus Testing." TRDF TechnLeal Memorandum AU-
112, March 7, 1990.
Hadley, W.O. "Review of Law Engineering Mr Test Da_a for Round Robin
Synthetic Samples." TRDF Resilient Modulus Technical Memorandum AURES-8,
June 22, 1992.
Hadley, W.O. "Review of Initial Braun Mr "Fingerprint:ing" of Test System
with Synthetic Specimens." TRDF Resilient Modulus Technical Memorandum
AURES-5. May 15, 1992.
Hadley, W. O. "Revision of SHRP Protocol P51." TRDF Technical Memorandum
AU-II4. March 15, 1990.
Hadley, W. O. "Rut Depth Estimates from PASCO Cross Profile." TRDF
Technical Memorandum AU-185. June 28, 1991.
Hadley, W. O. "Technical Review of Initial Statistical Analysis & Analysis
of Results & Reconunendations for Future Analyses: Feb. 1990 SHRP
Profilometer Workshop." TRDF Technical Memorandum AU-132. May 7, 1990.
Hadley, W.O. and J.L. Groeger. "Interim Results SHRP Resilient Modulus
Pilot Study." TRDF Resilient Modulus Technical Memorandum AURES-2. June
15, 1992.
Hadley, W.O. and J.L. Groeger. "Revised Modification of SHRP Diametral
Load Guide Device." TRDF Resilient MOdulus Technical Memorandum AUI_ES-6
(Revised). June 30, 1992.
Hadley, W.O. and S. Heinberg. "Review of Results from the ITVIEW Software
Package." TRDF Resilient Modulus Technical Memorand_n AURES-IO. July 15,1992.
Hadley, W. O. and P. Irick. "An Approach to Improvements of Load
Equivalence Factors from SHRP LTPP Data." TRDF Technical Memorandum AU-
204. May 7, 1992.
296

Hadley, W. O., E. Pensock, and D. Goulias. "Flexible Pavement Load
Equivalency Factors, LEFs, Based on Structural Number Estimates Using the
SHRP-LTPP IMS Inventory Data." TRDF Technical Memorandum AU-167. November
26, 1990.
High, R. "Algorithm for Cell Numbers of Factorial Designs." TRDF Technical
Memorandt_ AU-189. September 3, 1991.
High, R. "Analysis of Pavement Condition Measurements with Zero Response."
TRDF Technical Memorandum AU-187. August 21, 1991.
High, R. "Analysis of Type I Base Course Aggregates Test Data." TRDF
Technical Memorand_n AU-208. July 7, 1992.
High, R. "Analysis of Type II Cohesive Subgrade Soil Test Data." TRDF
Technical Memorandum AU-209. July 7, 1992.
High, R. "Censored Regression Analysis Applied to the AASHO Road Test
Equation for Rigid Pavement." TRDF Technical Memorandum AU-II3. March 15,
1990.
High, R. "Data Analysis Plan for LTPP Studies. _ TRDF Technical Memorandum
AU-36. March 29, 1989.
High, R. "Dipstick Data Analysis." TRDF Technical Memorandum AU-94,
December I, 1989.
High, R. "Effectiveness Computations Using Prediction Variances." TRDF
Technical Memorandum AU-183. June 17, 1991.
High, R. "The Effectiveness of the GPS Sampling Designs for Predictions
from Linear Regression Relationships." TRDF Technical Memorandum AU-60.
March 29, 1989.
lligh, R. "Evolution of the Nulnber of Test Sections for the LTPP." TRDF
Technical Memor_ndt_ AU-31. November 9, 1988.
High, R. "Examp.le of Preliminary GPS Simulated Data Analyses. M TRDF
Technical Memorandt_ AU-34, prepared for SHRP. January 3, 1989.
297

High, R. "Expected Types of Improvements for LTP? Pavement Design
Equations." TRDF Technical Memorandum AU-62. May i, ]989.
High, R. "Experimental Plan for the Comparison of SHRP P[ofilometers." TRDF
Technical Memorandum AU-IO0. January 26, 1990.
High, R. "Frequency Distribution of Layer Thicknesses by Layer Descriptions
for GPS Candidate Projects." TRDF Technical Memorandcm_ AU-2. December 21,
1987.
lligh, R. "Frequency Distribution of Layer Thicknesses Material Type Codes
for CPS Candidate Projects." TRDF Technical Memorandum AU-I. December 21,
1987.
High, R. "Guidelines for the Classification of GPS Test Sections as
Released or Out-of-Study." TRDF Technical Memorandum AU-188. August 26,
1991.
High, R. "Initial GPS Project Selections." TRDF Technical Memorandum
AU-12. March 2, 1988.
High, R. "LTPP Quality Control & Assurance Procedures. n TRDF Technical
Memorandum AU-146. June 29, 1990.
High, R. "LTPP Section Reference Guide." TRDF Technical Memorandum AU-145,
June 29, 1990.
High, R. "Materials Testing Sampling Designs." TRDF Technical Memorandum
AU-95. December 28, 1989.
High, R. "Notes on Environmental Data Collection. _ TRDF Technical
Memorandum RH-I. April I, 1989.
High, R. "Proposed Modifications to GPS Experimental-Design Number i: AC on
Granular Base." TRDF Technical Meil_orand_n AU-5. February 2, 1988.
High, R. "Qua] Itv Control & Assurance Procedures for LTPP Data." TRDF
Technical Memorandum AU-IIg. March 23, 1990.
298
High, R. "Quality Control Proc_e._slng of LTPP Data. " TRDF Technical
Memorandum AU-160. August 3, 1990.
High, R. "SPS-2 Experimental Design." TRDF Technical Memorandum AU-90,
November 17, 1989.
High, R. "Statistical Analyses of IRI from SHRP Profilometers." TRDF
Technical Memorandum AU-66. June I, 1989.
High, R. "Statistical Software for VAX Computer." TRDF Technical Memorandum
AU-125. March 30, 1990.
High, R. "Status of General Pavement Studies." TRDF Technical Memorandum
AU-37. December 22, 1988.
High, R. "Strategic pavement Design Initiatives for SPS-I and SPS-2." TRDF
Technical Memorandum AU-35. February i0, 1989.
High, R. "Variance Component Estimates of Resilient Modulus Tests for Type
II Soils." TRDF Technical Memorandum AU-184. June 17, 1991.
High, R. "Variance Component Estimates of Resilient Modulus Tests for Type
I Materials." TRDF Technical Memorandum AU-186. August 21, 1991.
High, R. "Variance Components and Bias Estimation for SHRP Moisture Content
Proficiency Sample Program." TRDF Technical Memorandum AU-181. June 12,
1991.
High, R. and V. Anderson. "A Note on Centering Data." TRDF Technical
Memorandum AU-144. June 26, 1990.
High, R. and W.O. Hadley. "Variance Component Analysis of SHRP Portland
Cement Concrete Core Proficiency Sample Program." TRDF Technical
Memorandum AU-127. May 21, 1990.
High, R., P. frick and V. Anderson. "Data Analysis Plan to Meet LTPP
Objectives." TRDF Technical Memorandt_ AU-68. July 13, 1989.
Hudson, W.R. "Evaluation of PRORUT." TRDF Technical Memorandum AU-39,
January I, 1989.
299

Hudson, W. R. "GPS Test Site Status as of i February 1989." TRDF Technical
Memorandum AU-38. February 29, 1989.
Hudson, W.R. and P. Irick. "Draft Report on Further Development of SPS-6."
TRDF Technical Memorandum AU-45. January 24, 1989.
Irick, P. "AASHTO Design Guide Modifications." TRDF Technical Memorandum
AU-120. March 26, 1990.
Irick, P. "Data simulation and Trial Analyses for GPS E>:perimental Designs
(DRAFT)." TRDF Technical Memorandum PI-4. April 27, 1988.
Irick, P. "GPS Section Length and Sampling Plans for In,,entory Data." TRDF
Technical Memorandum PI-2. February 20, 1988.
Irick, P. "Rationale for Further Development and Implementation of
Experimental Designs for SHRP LTPP Studies." TRDF Technical Memorandum
PI-I. January 6, 1988.
Irick, P. "SPS Experimental Design Development and Implementation." TRDF
Technical Memorandum PI-3. February 20, 1988.
frick, P and R. High. "Evaluation and Calibration of Pavement Design
Equations." TRDF Technical Memorandum AU-89. December 29, 1989.
Irick, P. and R. High. "Expected Economic Benefits from Increased Precision
in LTPP Prediction Equations." TRDF Technical Memorandum AU-79. September
29, 1989.
Irick, P. and R. High. "LTPP Data Base Gaps & Biases." TRDF Technical
Memorand_n AU-136. June ii, 1990.
Linder, S. "PASCO Film Data Reduction Possibilities." TRDF Technical
Memorandum AU-7. February 2, 1988.
Myers, M. "Rehabilitation Intra-Module Checks." TRDF Technical Memorandum
AU-174. January 2, 1991.
Moser, L. "Surface Distress." TRDF Technical Memorandum AU-20. June 21,
1988.
300

Moser, L. "TRDF Staff (DRAFT)." TRDF Technical Memorandum AU-21. June 22,
1988.
Myers, M. "Identification of GPS Sites where FHWA Traffic Data can be used
to Calculate Site Specific." TRDF Technical Memorandum AU-180. May 13,
1991.
Myers, M. "Literature Search for Pertinent Past Research on Deriving Load
Equivalency Factors." TRDF Technical Memorandum AU-200. February 13,
1992.
Myers, M. and J. German. "Definition of Truck for SHRP." TRDF Technical
Memorandum AU-182. June 12, 1991.
Myers, M. and J. Cerman, "Research Plan for Studying WIM Data From Selected
SHRP GPS Sites." TRDF Technical Memorandum AU-197. January 7, 1992.
Myers, M. and W. O. Hadley. "Rut Depth Estimates Developed." TRDF Technical
Memorandum AU-179. April i, 1991.
Pensock, E. "Historical Traffic Data Profile." TRDF Technical Memorandum
AU-87. November 16, 1989.
Pensock, E. "Logical Review of LTPP Maintenance Data." TRDF Technical
Memorandum AU-84. September 27, 1989.
Pensock, E. "LTPP International Test Section Numbering." TRDF Technical
Memorandum AU-163. September I0, 1990.
Pensock, E. "Maintenance Construction Data Guidelines for SPS-5." TRDF
Technical Memorandum AU-II8. March 22, 1990.
Pensock, E. "Maintenance Data Collection Quality Control and Quality
Assurance." TRDF Technical Memorand_ AU-70. June 30, 1989.
Pensock, E. "Proposed LTPP Data collection Guide Revisions." TRDF Technical
Memorandum AU-129. May i, 1990.
Pensock, E. "Rehabilitation Construction Data for SPS-5." TRDF Technical
Memorandum AU-124. March 30, 1990.
Pensock, E. "Review of Proposed Australian CPS Projects." TRDF Technical
Memorandum AU-III. March 1990.
301

Pensock, E. "Summary of LTPP Projects." TRDF Technical Memorandum AU-65,
June 29, 1989.
Rabinow, S., M. Witczak and W. Uddin. "FWD Test S4_quence and Data
Collection Recommendation." TRDF Technical Memorandum _C-6. May 5, 1988.
Roper, H. "Dipstick Data Handling Plan." TRDF Technical _emorandum AU-153,
August 13, 1990.
Roper, H. "Dipstick Evaluation." TRDF Technical MemorandL=a AU-57. March 22,
1989.
Roper, H. "Evaluation Plan for the Datalogger Mode of Dipstick." TRDF
Technical Memorandum AU-64. May 15, 1989.
Roper, H. "Evaluation Plan for the Manual Mode of Dipstick." TRDF Technical
Memorandum AU-59. April 6, 1989.
Roper, H. "Evaluation Report Using the Manual Mode of Dipstick." TRDF
Technical Memorandum AU-61. May 15, 1989.
Roper, H. "FHWA Profilometer Data Analysis." TRDF Technical Memorandum AU-
77. October 29, 1989.
Roper, H. "Guidelines of Profile Data Processing." TRDF Technical
Memorandum AU-98. December 31, 1989.
Roper, H. "Initial Evaluation of the Pre-Processor for Profile Data
Processing." TRDF Technical Memorandum AU-156. August 14, 1990.
Roper, H. "Initial Review of the PADIAS Distress Analysis System." TRDF
Technical Memorandum AU-130. May 2, 1990.
Roper, H. "Measurement Error Associated with GPS Test Section Data." TRDF
Technical Memorandum AU-I37. June 13, 1990.
Roper, H. "PASCO Rut Depth Data for HIOI Contractor." TRDF Technical
Memorandum AU-152. August Ii, 1990.
Roper, H. "PASCO Distress Interpretation Procedure." TRDF Technical
Memorandum AU-154. August 13, 1990.
302

Roper, H. "Personnel/Operator Requirements for the SHRP KJ Law
Profilometers." TRDF Technical Memorandum AU-54. February 28, 1989.
Roper, H. "Plan for Evaluation and Acceptance of the KJ Law Profilometer."
TRDF Technical Memorandum AU-53. February 28, 1989.
Roper, H. "Preliminary Profilometer Data Analysis." TRDF Technical
Memorandum AU-67. May 3, 1989.
Roper, H. "Profile Data Collection Quality Control and Quality Assurance."
TRDF Technical Memorandum AU-82. September 29, 1989.
Roper, H. "Profile Field Q.C. Procedure." TRDF Technical Memorandum AU-83,
October 6, 1989.
Roper, H. "Profile Quality Assurance Software." TRDF Technical Memorandum
AU-138. June 15, 1990.
Roper, H. "Profile Q.C. Procedures for Data Collection Assurance." TRDF
Technical Memorandum AU-85. October 7, 1989.
Roper, H. "Profilometer Test Plan." TRDF Technical Memorandum AU-101,
January 29, 1990.
Roper, H. "Recommendations to Interpret PASCO Distress Photographs." TRDF
Technical Memorandum AU-73. September 19, 1989.
Roper, H. "Recommendations for Modification of the FHWA Profilometer." TRDF
Technical Memorandum AU-55. March 15, 1989.
Roper, H. "Recommendations for Profllometers for SPS 5 & 6." TRDF Technical
Memorandum AU-II6. March 21, 1990.
Roper, H. "Recommendations on the Specifications for the Purchase of
Dipstick." TRDF Technical Memorand_n AU-76. October 29, 1989.
Roper, H. "Recommended Acceptance Test Plan for the SHRP-LTPP Dipsticks."
TRDF Technical Memorand_un AU-86. November 9, 1989.
Roper, H. "Recommended Acceptance Testing Plan for the Southern Region
SHRP-LTPP Dipstick." TRDF Technical Memorandum AU-133. May 15, 1990.
303

Roper, H. "Recommended Plan for Completion of PASCO Din:tress ID Manual."
TRDF Technical Memorandum AU-78. September 13, 1989.
Roper, H. "Review of the Revisions to PADIAS Distress Analysis System."
TRDF Technical Memorandum AU-135. June 5, 1990
Roper, H. "Rod and Leve]. Survey Procedures for Profi]ometer Acceptance
Testing." TRDF Technical Memorandum AU-58. March 27, 1989.
Roper, H. "Rod and Level Survey Procedures for Profilometer Testing." TRDF
Technical Memorandum AU-I02. January 22, 1990.
Roper, H. "Rut Depth Quality Control Recommendations.." TRDF Technical
Memorandum AU-155. August 13, 1990.
Roper, H. "SHRP-LTPP Dipstick Acceptance Testing." TRDF Technical
Memorandum AU-92. November 22, 1989.
Roper, H. "SHRP-LTPP Dipstick Acceptance Testing for Southern Region." TRDF
Technical Memorandum AU-142. June 22, 1990.
Roper, H. "Simplifying Profile Measurements on SPS Sections." TRDF
Technical Memorandum AU-97. December 19, 1989.
Roper, H. "Simulated Data Analysis GPS (Simple Case)." TRDF Technical
Memorandum AU-16. March 28,1988.
Roper, H. "Specifications for Interpretation of Distress from PASCO
Photographs." TRDF Technical Memorandum AU-42. February 23, 1989.
Smith, H. "Field Sampling and Testing." TRDF Technical Memorandum EC-3,
January 20, 1988.
Smith, H. "State Implementation of LTPP Results." TRDF Technical Memorandum
EC-I. January 6, 1988.
Smith, H. "Suggested Revisions of GPS Experiment i and 2." TRDF Technical
Memorandum EC-4. March 4, 1988.
Smith, H. "Visits with SHRP State Coordinators and LTPP Contacts." TRDF
Technical Memorandum EC-2. January 20, 1988.
304

Stephanos, P. "Appendixes of Data and Figures for Comparison of Rut Depth
from Dipstick and PASCO Measurements." TRDF Technical Measurements EC-
47a. February 19, 1990.
Stephanos, P. and G. Elklns. "Model Construction Specification for Crack
and Seat and Break and Seat Operations on SHI_ SPS-6 Test Sections." TRDF
Technical Memorandum EC-36. January 40, 1990.
Uddin, W. "Analysis of SHRP FWD Acceptance Tests Data." TRDF Technical
Memorandum EC-8. June 21,1988.
Uddin, W. "Harold Von Quintus' Memo of 13 June 1989, Confusion with Layer ,
Numbers." TRDF Technical Memorandum EC-22. July 5, 1989.
Uddin, W. "Material Sampling and Testing Data" Chapter for the LTPP Data
Collection Guide." TRDF Technical Memorandum EC-29a. September 25, 1989.
Uddin, W. "Pavement Temperature Measurement Procedure." TRDF Technical
Memorandum EC-9. July 15, 1988.
Uddin, W. "Quality Control and Quality Assurance of LTPP Field Material
Sampling, Handling, and Laboratory Material Testing Activities." TRDF
Technical Memorandum EC-23. July 5, 1989.
Uddin, W. "Reduction of Bulk Sample to Test Sample Sizes." TRDF Technical
Memorandum EC-18. June 6, 1989.
Uddin, W. "Remote Pavement Temperature Gradient Data Collection During FW-D
Testing." TRDF Technical Memorandum EC-12. March 15, 1989.
Uddin, W. "Resilient Modulus Testing of Unbound Granular Base and Subbase
Materials and Subgrade Soils Protocol P46." TRDF Technical Memorandum
EC-13. May i0, 1989.
Uddin, W. "Response to Tony's Memo (Dated June 28, 1989) to Waheed
Materials Testing." TRDF Technical Memorandum EC-27. August 9, 1989.
Uddin, W. "Review of Nominated SPS-7 Project on 1-35, Iowa." TRDF Technical
Memorandum EC-69. August I0, 1990.
Uddin, W. "Sensor Configuration for Falling Weight Deflectometers." TRDF
Technical Memorandum EC-5. March 16, 1988.
305

Uddin, W. "Summarizing Resource Materials Used in Version 1.0 of the LTPP
Laboratory Material Testing Guide." TRDF Technical Memorandum EC-30.
September 22, 1989.
Uddin, W. "Testing of Asphaltic Concrete Layers, Harold Von Quintus' Memo
of 29 August 1989." TRDF Technical Memorandum EC-31a. September 25, 1989.
Uddin, W. and J. Groeger. "Consideration of Treated Subgrade Soll in the
LTPP Field Material Sampling, Handling and Laboratory Material Testing
Programs." TRDF Technical Memorandum EC-24. August i, 1989.
Uddin, W. and J. Groeger. "Laboratory Sample Tracking Tables for the GPS
Sampling and Testing Program." TRDF Technical Memorand1_m EC-25. August i,
1989.
Uddin, W., M. Witczak, and S. Rabinow. "Acceptance Testlng of SHRP-FWDs.=
TRDF Technical Memorandum EC-7. May i0, 1988.
Uddin, W. and D. Wagner. "Pavement Temperature Measurement for FWD (Final
Revision of Tech Memo No. EC-09)." TRDF Technical Memorandum AU-27.
September 8, 1988.
Wagner, D. "PRORUT Evaluation Trip Report to Purdue University West
Lafayette, Indiana." TRDF Technical Memorandum AU-32. December 2, 1988.
Wagner, D. "Suggested Acceptance Tests and Operations Manual Procedures for
PASCO." TRDF Technical Memorandum AU-29. October 20, 1988.
Wagner, D. and L. Moser. "Interpretation of PASCO Distress Photos." TRDF
Technical Memorandum AU-30. October 25, 1988.
White, T. "Digitallzing Pavement Photo Logs." TRDF Technical Memorandum TW-
2. July 30, 1989.
White, T. "SHRP Products." TRDF Technical Memorandum TW-I. July 23, 1989.
306

IMS ME$SACES
Copeland, C. "Comments Table Review and Usage Recommendations for Regions."
IMS Message Number TRDF-58. May 3, 1991.
Copeland, C. and W.O. Hadley. "COMMENTS Table Usage Recommendations for
Regions." IMS Message Number TRDF-64. May 16, 1991.
Copeland, C. "Concerns with Newly Revised Climatic Data to be Stored in
NIMS." TRDF-125. May 29, 1992.
Copeland, C. "EXPERIMENT_SECTION Table Changes." TRDF-133. August 17, 1992.
Copeland, C. "EXPERIMENT_SECTION Table Changes." TRDF-132. August 17, 1992.
Copeland, C. "LXPERIMENT_SECTION Table Changes." TRDF-131. August 17, 1992.
Copeland, C. "EXPERIMENT_SECTION Table Changes." TRDF-130. August 17, 1992.
Copeland, C. "IMS QA/QC Check for STEEL LAP LENGTH and Cross-Profile Data
Status." IMS Message Number TRDF-68. June 3, 1991.
Copeland, C. "INIT_B Check Revision and Other QA/QC Concerns." IMS Message
Number TRDF-98. November 26, 1991.
Copeland, C. and W.O. Hadley. "INIT_B Check Correction and Revision and
INV E Check Clarification." IMS Message Number TR/)F-63. May 16, 1991.
Copeland, C. "Recommended Procedures for Dealing with Inventory Data QA
Checks." IMS Message Number TRDF-67. May 29, 1991.
Copeland, C. "Review of Data Checking Reports and IMS Procedures." IMS
Message Number TRDF-52. April Ii, 1991.
Copeland, C. "Traffic Software Version 3.1(b)." TRDF-120. May 5, 1992.
Copeland, C. "Traffic Table Modifications and Historical Traffic QA/QC
Checks." TRDF-II9 (Revised). June 12, 1992.
307

Copeland, C. and W.O. Hadley. "Use of Information from tLe COMMENTS Table."
IMS Message TRDF-86. September 12, 1991.
German, J.L. "Basic Framework for Traffic Data and SHRP IMS Data." IMS
Message TI£DF-17. March 20, 1989.
Groeger, J.L. "Additional Test Data on Concrete Samples", IMS Message
Number TRDF-II7. May 5, 1992.
Groeger, J.L. "(a) Algorithm for Automating Completior of Gradation Data
(b) Algorithm for Automating Completion of Atterberg Limits Data." IMS
Message Number TRDF-109. February 17, 1992.
Groeger, J.L. "Algorithm for Updating Table TST_L06." [MS Message Number
TRDF-80. July 31, 1991.
Groeger, J.L. "Algorithm for Populating L05A with Existing REF_LAYER IMS
Data, Revised QA/QC Checks for TST_L05A and TST L05B, Other Revised QA/QC
Checks." TRDF-125a. May 29, 1992.
Croeger, J.L. "Documentation of: Declsio,_s Reached Concerning the Materials
Module of the IMS." IMS Message Number TRDF-69. June I0, 1991.
Groeger, J.L. "Material C Checks for NIMS Data Release." IMS Message Number
TRDF-75. June 25, 1991.
Groeger, J.L. "NA Region Laboratory Test Data." IMS Message Number TRDF-
83. August 15, 1991.
Groeger, J.L. "Review and Refinements to the MATL_* and TST_* NIMS QA/QC."
IMS Message Number TRDF-100. December 19, 1991.
Groeger, J.L. "Review of Maintenance Data for 3rd IMS Release for the North
Atlantic Region." IMS Message Number TRDF-105. February 7, 1992.
Groeger, J.L. "Review of Maintenance Data for 3rd IMS Release for the
North Central Region." IMS Message Number TRDF-I06. February 7, 1992.
Groeger, J.L. "Review of Maintenance Data for 3rd IMS Release for the
Southern Region." IMS Message Number TRDF-I07. February 7, 1992.
308

Groeger, J.L. "Review of Maintenance Data for 3rd IMS Release for the
Western Region." IMS Message Number TRDF-108. February 7, 1992.
Groeger, J.L. "Review of the MATL_E QA/QC Report for the Southern Region."
IMS Message Number TRDF-IIS, Report i. May 5, 1992
Groeger, J.I.. "SIIRP Section 19891125 Data Entry of Layer "3" and "3AW. "
IMS Message Number TRDF-IIO. Ma_'ch 11, 1992.
Hadley, W.O. "Cross Reference of Data collections Guide Sheets with IMS
Schema." IMS Message N_unber TRDF-78. June 28, 1991.
Hadley, W.O. "Enhanced and Augmented Data Dependency Checks Based on
Initial IMS Level I Release Review." IMS Message Number TRDF-49. February
21, 1991.
Hadley, W.O. "IMS Intra Checks." IMS Message N_nber TRDF-62. May 15, 1991.
Hadley, W.O. "IMS Intra Checks Maintenance, IMS Message Number TRDF-55,
April 26, 1991.
Hadley, W.O. "IMS Intra Checks REHABILITATION." IMS Message Number TRDF-
57. April 29, 1991.
Hadley, W.O. "IMS Intra Checks SKID." IMS Message Number TRDF-56. April 26,
1991.
Hadley, W.O. "IMS Level I QA/QC Checks for Distress (Manual)." IMS Message
Number TRDF-III (Revised). May 29, 1992.
Hadley, W.O. "IMS Level i QA/QC Checks for Distress (PADIAS)." IMS Message
Number TRDF-II4. March 19, 1992.
Hadley, W.O. "IMS Level 2-F Check - Intermodal." IMS Message Number TRDF-
134. September 29, 1992.
Hadley, W.O. "IMS Level 2: G Check Experiment and Cell Verification."
IMS Message Number TRDF-88. September 23, 1991.
309

Hadley, W.O. "Intra Checks for FWD." IMS Message Number.' TRDF-72. June 6,
1991.
Hadley, W.O. "Intra Checks - Materials Testing Data Module." IMS Message
Number TRDF-65. May 22, 1991.
Hadley, W.O. "Intra-Module Checks RUT." IMS Message Number TRDF-73. June
6, 1991.
Hadley, W.O. "Inventory Data Checks." IMS Message Numb_.1: TRDF-61. May 15,
1991.
Hadley, W.O. "PCS-Law Comment on QA Checks for Man_.al Distress. " IMS
Message NLunber TRDF-129. August 14, 1992.
Hadley, W.O. "Range Checks for Deflection (FWD) Data." ][MS Message Number
TRDF-77 (Revised). June 25, 1991.
Hadley, W.O. "Results of the Review of the SHRP Sections which did not
Achieve 'E' or 'Section Release' Status during the Second IMS Level I
Release." IMS Message Number TRDF-91o September 30, 1991.
Hadley, W.O. "Revisions to Range Checks for Deflection (FWI)) Data." IMS
Message Number TRDF-96. November 20, 1991.
Hadley, W.O. "Second IMS Level Release, Data Dependency Tables." IMS
Message Number TRDF-81. September 18, 1991.
Hadley, W.O. "Second IMS Level Release, Data Dependence Tables, Part 2."
IMS Message Number TRDF-82. September 18, 1991.
Hadley, W.O. "Second IMS Data Release QA/QC S,,mmary Report Corrections on
Data Dependency Tables." IMS Message Number TRDF-87 (Revised). September
19, 1992.
Hadley, W.O. "Section Release (Level i) Definitions." IMS Message Number
TRDF-41. November 26, 1990.
Hadley, W.O. "SN and D Calculation Program SAIC-73 and AU-167." IMS
Message Number TRDF-76 (Revised). June 25, 1991.
310

Hadley, W.O. "Subsurface Layer Designation: Impact on Base Layer Assign-
ment." IMS Message Number TRDF-92. October 4, 1991.
Hadley, W.O. and C. Copeland. "Data Dependence Checks for Material Data
Module." IMS Message Number TRDF-51. April 8, 1991.
Hadley, W.O. and C. Copeland. "Enhanced Range, Critical Element and Intra
Module Checks for Inventory Data - Basic on Initial IMS Level 1 Release
Review." IMS Message Number TRDF-48. February 21, 1991.
Hadley, W.O. and C. Copeland. "Third Data Release QA/QC Summary Report
WRCO." IMS Message Number TRDF-104. February 3, 1992.
Hadley, W.O. and C. Copeland. "Third Data Release QA/QC Summary Report -
SRCO." IMS Message Number TRDF-103. February 3, 1992.
Hadley, W.O. and C. Copeland. "Third Data Release QA/QC Summary Report
NCRCO." IMS Message Number TRDF-102. February 3, 1992.
Hadley, W.O. and C. Copeland. "Third Data Release QA/QC Summary Report
NARCO." IMS Message Number TRDF-101. February 3, 1992.
Hadley, W.O., C. Copeland, and M. Myers. "Friction and Deflection Intra-
Module Checks." IMS Message Number TRDF-42. December 12, 1990.
Hadley, W.O. and C. Copeland. "Initial Inventory Status Report on NIMS
Database Based on January 1991 Level I Release, Region i." TRDF-43.
January 31, 1991.
Hadley, W.O. and C. Copeland. "Initial Inventory Status Report on NIMS
Database Based on January 1991 Level I Release, Region 2." IMS Message
Number TRDF-44. January 31, 1991.
Hadley, W.O. and C. Copeland. "Initial Inventory Status Report on NIMS
Database Based on January 1991 Level I Release, Region 3." IMS Message
Number TRDF-45. January 31, 1991.
Hadley, W.O. and C. Copeland. "Initial Inventory Status Report on NIMS
Database Based on January 1991 Level I Release, Region 4." IMS Message
Number TRDF-46. January 31, 1991.
311

Hadley, W.O. and C. Copeland. "Intra Checks for Rut." ]MS Message Number
TRDF-70. June 5, 1991.
Hadley, W.O. and C. Copeland. "Inventory IMS Checks." IMS Message Number
TRDF-50. April 8, 1991.
Hadley, W.O. and C. Copeland, "Recommended Code Value Additions to Cell
Section Link Table (NIMS)." IMS Message Number TRD_.47. February 21,
1991.
Hadley, W.O. and C. Copeland. "Your Fax of August II, 1.992 Concerning
Climatic Data QA/QC." IMS Message N_ber TROF-128. Au,gust 14, 1992.
Hadley, W.O. and J.L. Groeger. "IMS Intra Checks on AASHT(>_SOIL._CLASS." IMS
Message Number TRDF-60. May 16, 1991.
Hadley, W.0 and J.L. Groeger. "Proposed Revisions to the Resilient Modulus
IMS Table and Revised Level C-E QA/QC Checks for the Mr Program. _ IMS
Message Number TRDF-135. September 30, 1992.
Hadley, W.0. and M. Myers. "Revisions to Level I Section Release QA/QC
Checks for the Profile Module." November 20, 1991 and "Level i - Section
Release QA/QC Checks for the Profile Module." IMS Message Number TRDF-
95. October 25, 1991.
Hadley, W.O., C. Copeland, R. High, and H. Roper. "LTPP Data Availability
Policy Recommendations." IMS Message Number TRDF-40 (Revised). October
25, 1990.
Hadley, W.O., C. Copeland, and M. Myers. "Revisions and Additions to
Message number TRDF-42 Friction and Deflection Intra-Module Checks. " IMS
Message Number TRDF-71. June 6, 1991.
,1 ° °
Hadley, W.O., J.L. Groeger, and M. Myers, Addltlonal Intrachecks
Materials Testing Data Module." IMS Message Number TRDF-66. May 23, 1991.
Hammet, N. "Backup Procedures for IMS Machine." IMS Message Number TRJ)F-
22. June 2, 1989.
Hammer, N. "Distress Data sheets 1-9." IMS Message Number TRDF-18. March
28, 1989.
312

Hammer, N. "Draft AQ Plan and Data Quality Indicator (DQI) Flag." IMS
Message Number TRDF-25. July i0, 1989.
Hammer, N. "IMS Error Recovery." IMS Message Number TRDF-31. October 18,1989.
Hammer, N. "IMS Pre-release Meeting, Middle of July." IMS Message Number
TRDF-23. June 29, 1989.
Hammet, N. "IMS Processing of Distress Data." IMS Message Number TRDF-29,
September 7, 1989.
Hammet, N. "IMS Traffic Data." IMS Message Number TRDF-28. August 29, 1989.
Hammet, N. "LTPP IMS Development SAIC P-016 Quarterly Report: Comments."
IMS Message Number TRDF-33. October 24, 1989.
Hammet, N. "Materials Testing Resolution of Layer No's." IMS Message
Number TRDF-26. July 25, 1989.
Hammet, N. "Task 14 (IMS) Bi-Weekly Status." IMS Message Number TRDF-20,
May 24, 1989.
Hedfi, A., W.O. Hadley, J.L. Groeger, S. Heinberg. "QA/QC Checks for SHILP
Environmental Data." IMS Message number TRDF-121 (Revision). July 31, 1992.
High, R. "Comments on IMS Printer Reports and Data Access." IMS Message
Number TRDF-34. November 5, 1989.
High, R. "Co_nents on Printed Reports of the Information Management
System." IMS Message Number TRDF-38. June 26, 1990.
High, R. "Descriptive Codes for GPS Special Case Sections." IMS Message
Number TRDF-16. March 17, 1989.
High, R. "History of Experiment and Cell Assignments for GPS Sections."
IMS Message Number TRDF-37. June 21, 1990.
High, R. "Interface of IMS with Data Analysis." IMS Message Number TRDF-
30. September 15, 1989.
High, R. "Interface of IMS with Data Analysis & Reporting." IMS MessageNumber TRDF-21. June 1989.
313

High, R. "Interface of [MS with Data Analysis & Repo: ring. _ IMS Message
Number TRDF-21. June 1989.
High, R. "Revisions to the EXP_SECT.LIS Table." IMS M;ssage Number TRDF-
79. July 29, 1991
High, R. "SHRP LTPP Data Processing, Security and Availability Plan." IMS
Message Number TRDF-35. December 6, 1989.
High, R. and W.O. Hadley. "IMS Level 2 Statistical (glality Control and
Assurance Procedures." IMS Message Number TRDF-134a. September ii, 1992.
Moser, L. "Availability of Revised DCG Forms during October i, 1988
December 31, 1988." IMS Message Number TRDF-14. November 7, 1988.
Moser, L. "Comments on SAIC October 21/88 memo (SAIC #ll) Recommending a
386 IBM PC Compatible with DOS for RIMS." IMS Message Number TRDF-12.
October 25, 1988.
Moser L. "Comments on SAIC #13, "Cut-off Dates for Final LTPP Data
Specifications." IMS Message Number TRDF-13. October 25, 1988.
Moser L. "Disk Space Estimates for Regional Data Collection Item." IMS
Message N_nber TRDF-4. August 4, 1988.
Moser L. "Feasibility of PC-DOS for RIMS." IMS Message Number TRDF-II.
October 21, 1988.
Moser L. "Hardware for Regions Response to SAIC-14." IMS Message Number
TRDF-15. November 8, 1988.
Moser L. "Inventory Data Structure on CTT Implementation Plan." IMS
Message Number TRDF-6. September 30, 1988.
Moser L. "Monitoring Data-Material Testing Data and IMS Design." IMS
Message N_nber TRDF-10. October 13, 1988.
Moser L. "My Con_ents on the IMS Comprehensive Work Plan." IMS Message
Number TRDF°3. August 19, 1988.
314

Moser, L. "NIMS Test Suite Sample Queries." IMS Message Number TRDF-7,
October 6, 1988.
Moser, L. "Response to SAIC #9 Inventory Design." IMS Message Number
TRDF-8. October 7, 1988.
Moser, L. "Responses to Message #SAIC-9 Questions." IMS Message Number
TRDF-5. September 22, 1988.
Moser, L. "Review of SAIC Revised Schedule and Work Plan Outline." IMS
Message Number TRDF-2. July 5, 1988.
Moser, L. "SAIC Approach and Thlnking on Software/Hardware Evaluation." IMS
Message Number TRDF-I. July 5, 1988.
Pensock, Ed. "Incomplete IMS Sections Task 6 and Misc. Other." IMS
Message Number TRDF-36. February 20, 1990.
Uddln, W. "Materials Testing Information for IMS." IMS Message Number TRDF-
19. March 30, 1989.
315

¸Committee ¸
Willi_ J. ;_, _ MamhmlIt Thomps_WJ. Ma_nw_), i_. Un_rs_ of lU.Anois
K_me_ R. WardlawConsultant
Marcus WilliamsH.B.Zac_y C',_.y
Jarn_ L, Brown L'misomsPm_mem Consultant
John P. Hallin
Albert J. Bush, Ill Federal Highway AdministrationU£4EWaterwaysExperimentSta_on
Th_-_dom R. Fmxagut
Robert L. Cl_r Federal Highway Adm_islrationColorado Department of Higlrav_s
• Frank R. McCullaghRon_d Collins Transportation Research Board
Georgia _nt of _rtattonLouis M. Papet
Guy Dol_ Federal Highway AdministrationMJrdstdre des Transport3 du Qudbec
Charles E. DouganConnecticut _nt of Transportation
McRaney Ful_South Carolina Departmentof Highways and Public Transportation
Marlin L KnutsonAmerican Concrete Pavement AssoCiation
Hans Jorgen Ertman LarsenDan_h Road Institute, Road Directorate
Kenneth H. McGhee
Consultant Civil Engineer
Raymond K. Moore
University of Kansas
Richard D. MorganNational Asphalt Pavement Association
William R. MoyerPennsylvania Department of Transportation
David E. Newcomb
University of Minnesota
Charles A. PryorNational Stone Association
Cesar A. V. QueirozThe World Bank
Rolands L. RizenbergsKentucky Transportation Cabinet
Gary K. RobinsonArizona Department of Transportation
Frederic R. Ross
Wisconsin Department of Transportation
Ted M. Scott
American Trucking Association