State Transportation Statistics 2015
142
State Transportation Statistics 2015 Bureau of Transportation Statistics State Transportation Statistics 2015
-
Upload
khangminh22 -
Category
Documents
-
view
0 -
download
0
Transcript of State Transportation Statistics 2015

Sta
te
Tr
an
sp
or
tatio
n S
tatis
tics
20
15
Printed on paper containing recycled post consumer waste paper.Bureau of Transportation Statistics
State Transportation Statistics 2015

State Transportation Statistics 2015
Bureau of Transportation Statistics


U.S. Department of Transportation
Anthony Foxx Secretary of Transportation
Victor Mendez Deputy Secretary of Transportation
Gregory Winfree Assistant Secretary for Research and Technology
Bureau of Transportation Statistics
Patricia Hu Director
Rolf Schmitt Deputy Director
Michael SprungDirector, Office of Transportation Analysis
Project ManagersMindy Liu Long X. Nguyen
ContributorsAnt-quanique DancyWilliam MooreAlpha Wingfield
Acknowledgements
To obtain State Transportation Statistics 2015 and other BTS publications:
Internet: www.bts.govMail: U.S. Department of Transportation Bureau of Transportation Statistics ATTN: Product Orders 1200 New Jersey Avenue, SE Washington, DC 20590
Your comments on State Transportation Statistics reports are welcome.
BTS Information ServiceE-mail: [email protected]: 202-366-DATA (3282)
Photo credits by chapter:1. iStockphoto.com2. BTS stock photo3. BTS stock photo4. William Moore5. BTS stock photo 6. BTS stock photo7. BTS stock photo

The Bureau of Transportation Statistics (BTS) presents State Transportation Statistics 2015, a statistical profile of transportation in the 50 States and the District of Columbia. This is the 13th annual edition of State Transportation Statistics, a companion document to National Transportation Statistics (NTS), which is updated quarterly on the BTS website.
Like the previous editions, this document presents transportation information from BTS and other Federal Government agencies and national sources. A picture of each State’s transportation infrastructure, freight movement and passenger travel, system safety, vehicles, transportation-related economy and finance, energy usage, and the environment is presented in table form. Tables have been updated with the most recently available data.
Included in this State Transportation Statistics 2015 report is a brief description of the data sources used and a glossary of terms. Also contained in this publication is a summary table that displays the approximate timing of future data releases and contact information for each State’s department of transportation.
This report is available free of charge and can be downloaded from our website at www.bts.gov. A State Transportation Facts and Figures application also featured on the BTS website uses selected data from this report to present State-by-State comparisons and rankings.
About State Transportation Statistics 2015
Quality Assurance Statement
The Bureau of Transportation Statistics (BTS) provides high quality information to serve government, industry, and the public in a manner that promotes public understanding. Standards and policies are used to ensure and maximize the quality, objectivity, utility and integrity of its information. BTS reviews quality issues on a regular basis and adjusts its programs and processes to ensure continuous quality improvement.
NoticeThis document is disseminated under the sponsorship of the Department of Transportation in the interest of information exchange. The United States Government assumes no liability for its contents or use thereof.

Table of Contents
Chapter 1 Infrastructure1-1 Public Road Length, Miles by Functional System: 2013 ...............................................................................1 1-2 Public Road Length, Miles by Ownership: 2013 ...........................................................................................2 1-3 Toll Roads, Toll Bridges and Tunnels, and Toll Ferry Routes: 2012 ..............................................................3 1-4 Road Condition: 2013 ...................................................................................................................................4 1-5 Number of Road Bridges by Functional System: 2014 ................................................................................5 1-6 Number of Road Bridges by Owner: 2014 ....................................................................................................6 1-7 Road Bridge Condition: 2014 ........................................................................................................................7 1-8 Motor Bus Transit Route Mileage: 2013 ...................................................................................................... 8 1-9 Characteristics of Rail Transit by Transit Authority: 2013 .............................................................................9 1-10 Public and Private Airports, Heliports, and Seaplane Bases: 2013 ............................................................10 1-11 Top 50 Commercial Service Airport Enplanements by Air Carrier Category: 2013 ..................................... 11 1-12 Airport Enplanements by State and Air Carrier Category: 2013 .................................................................12 1-13 Number of Freight Railroads by Class: 2012 .............................................................................................13 1-14 Miles of Freight Railroad Operated by Class of Railroad: 2012 .................................................................14 1-15 Top 50 Water Ports by Tonnage: 2012 and 2013 ........................................................................................15 1-16 Inland Waterway Mileage: 2013 ..................................................................................................................161-17 Number of Metropolitan Planning Organizations: 2015 ..............................................................................17
Chapter 2 Safety 2-1 Highway Traffic Fatalities and Fatality Rates: 2013 ....................................................................................20 2-2 Passenger Car and Light Truck Occupants Killed and Restraint Use: 2013 .............................................. 21 2-3 Large Truck Involvement in Fatal Crashes: 2013 .......................................................................................22 2-4 Key Provisions of Safety Belt Use Laws: 2012 ...........................................................................................23 2-5 Helmet Use Laws: 2015 ..............................................................................................................................26 2-6 Safety Belt Use: 2000, 2005, 2010, 2013, 2014 ........................................................................................27 2-7 Pedestrian Fatalities Involving Motor Vehicles: 2013 .................................................................................28 2-8 Fatalities in Motor Vehicle Crashes Involving High Blood Alcohol Concentration: 2012 and 2013 .......................................................................................................................................29 2-9 Maximum Posted Speed Limits by Type of Road: 2015 .............................................................................30 2-10 Rail Accidents/Incidents: 2013 ....................................................................................................................31 2-11 Highway-Rail Grade Crossing Incidents: 2013 ...........................................................................................32 2-12 Highway-Rail Grade Crossings by Type: 2013 ...........................................................................................33 2-13 Warning Devices at Public Highway-Rail Grade Crossings: 2013 ..............................................................34 2-14 Train Accident/Incident Fatalities, Including at Highway-Rail Crossings, by Category of Person Killed: 2013 ............................................................................................................35 2-15 Train Accident/Incident Injuries, Including at Highway-Rail Crossings, by Category of Person Injured: 2013 ..........................................................................................................36 2-16 Transit Incidents, Fatalities, Injuries, and Property Damage, All Transit Modes: 2012 ............................... 37 2-17 Recreational Boating Accidents: 2014 ........................................................................................................382-18 Alcohol Involvement in Recreational Boating Accidents: 2014 ...................................................................392-19 Hazardous Materials Incidents: 2013 and 2014 .........................................................................................40 2-20 Hazardous Materials Incidents by Mode: 2013 and 2014 ...........................................................................41 2-21 Natural Gas Distribution Pipeline Incidents: 2013 and 2014 ......................................................................42 2-22 Natural Gas Transmission Pipeline Incidents: 2013 and 2014 ...................................................................43 2-23 Hazardous Liquid Pipeline Incidents: 2013 and 2014 .................................................................................44 2-24 State Laws on Distracted Driving: June 2015 .............................................................................................45

2-25 Bus Involvement in Fatal Crashes: 2013 ....................................................................................................46 2-26 Bicyclist Fatalities Involving Motor Vehicles: 2013 ......................................................................................47
Chapter 3 Freight Transportation 3-1 Freight Shipments by State of Origin: 2012 ................................................................................................50 3-2 Hazardous Material Shipments by Selected State of Origin: 2012 .............................................................51 3-3 Hazardous Material Shipments by Selected State of Destination: 2012 ....................................................52 3-4 Rail Shipments: 2012 ..................................................................................................................................53 3-5 Waterborne Shipments: 2012 and 2013 .....................................................................................................54 3-6 Top 50 U.S. Ports by Port Calls and Vessel Type: 2013 .............................................................................55 3-7 Top 30 U.S. Containership Ports: 2013 ......................................................................................................56 3-8 Scheduled and Nonscheduled Air Freight and Mail Enplaned: 2013 ..........................................................57 3-9 Top 50 Airports by Landed Weight of All-Cargo Operations: 2008–2013 ...................................................58 3-10 U.S. Surface Merchandise Trade with Canada and Mexico: 2014 .............................................................59 3-11 U.S. Surface Merchandise Imports from Canada and Mexico: 2014 ..........................................................60 3-12 Incoming Truck Crossings, U.S.-Canadian Border: 2009–2014 .................................................................61 3-13 Incoming Truck Container (Loaded) Crossings, U.S.-Canadian Border, 2008–2013 ................................. 61 3-14 Incoming Truck Container (Empty) Crossings, U.S.-Canadian Border: 2009–2014 ................................... 61 3-15 Incoming Train Crossings, U.S.-Canadian Border: 2009–2014 ..................................................................62 3-16 Incoming Rail Container (Loaded) Crossings, U.S.-Canadian Border: 2009–2014 .................................... 62 3-17 Incoming Rail Container (Empty) Crossings, U.S.-Canadian Border: 2009–2014 ..................................... 62 3-18 Incoming Truck Crossings, U.S.-Mexican Border: 2009–2014 ...................................................................63 3-19 Incoming Truck Container (Loaded) Crossings, U.S.-Mexican Border: 2009–2014 ................................... 63 3-20 Incoming Truck Container (Empty) Crossings, U.S.-Mexican Border: 2009–2014 ..................................... 63 3-21 Incoming Train Crossings, U.S.-Mexican Border: 2009–2014 ....................................................................64 3-22 Incoming Rail Container (Loaded) Crossings, U.S.-Mexican Border: 2009–2014 ...................................... 64 3-23 Incoming Rail Container (Empty) Crossings, U.S.-Mexican Border: 2009–2014 ....................................... 64 3-24 Top 50 U.S. Foreign Trade Freight Gateways: 2013 ..................................................................................65
Chapter 4 Passenger Travel 4-1 Commuting to Work: 2013 ..........................................................................................................................68 4-2 Licensed Drivers: 2013 ...............................................................................................................................69 4-3 Transit Ridership in the 50 Largest Urbanized Areas: 2012 and 2013 .......................................................70 4-4 Urban Transit Ridership by State and Transit Mode: 2013 .........................................................................71 4-5 Top 50 Amtrak Stations by Number of Passengers1: Fiscal Years 2013 and 2014 .................................... 724-6 Top 50 Airports by Passengers Enplaned on Large U.S. Carriers: 2003, 2012, 2013 ................................ 73 4-7 Major Airports by On-Time Arrival Performance: 2013 and 2014 ...............................................................74 4-8 Top 15 Cruise Ship Ports by Port of Departure: 2010 and 2011 .................................................................75 4-9 Incoming Personal Vehicle Crossings, U.S.-Canadian Border: 2009–2014 ............................................... 76 4-10 Incoming Passengers in Personal Vehicles, U.S.-Canadian Border: 2009–2014 ...................................... 76 4-11 Incoming Train Passengers, U.S.-Canadian Border: 2009–2014 ...............................................................76 4-12 Incoming Bus Crossings, U.S.-Canadian Border: 2009–2014 ....................................................................77 4-13 Incoming Passengers on Buses, U.S.-Canadian Border: 2009–2014 ........................................................77 4-14 Incoming Pedestrians, U.S.-Canadian Border: 2009–2014 ........................................................................77 4-15 Incoming Personal Vehicle Crossings, U.S.-Mexican Border: 2009–2014 .................................................78 4-16 Incoming Passengers in Personal Vehicles, U.S.-Mexican Border: 2009–2014 ........................................ 78 4-17 Incoming Train Passengers, U.S.-Mexican Border: 2009–2014 .................................................................78 4-18 Incoming Bus Crossings, U.S.-Mexican Border: 2009–2014 ......................................................................79 4-19 Incoming Passengers on Buses, U.S.-Mexican Border: 2009–2014 ..........................................................79

4-20 Incoming Pedestrians, U.S.-Mexican Border: 2009–2014 ..........................................................................79 4-21 Overseas Visitors to the United States by Destination State and Territory: 2003, 2008, 2012, and 2013 ..................................................................................................................80 4-22 Overseas Visitors to the United States by Destination City: 2003, 2008, 2012, and 2013 ..................................................................................................................81
Chapter 5 Registered Vehicles and Vehicle-Miles Traveled 5-1 Motor-Vehicle Registrations: 2013 ..............................................................................................................84 5-2 Trailer and Semi-Trailer Registrations: 2012 ..............................................................................................85 5-3 Highway Vehicle-Miles Traveled (VMT): 2008, 2013 ..................................................................................86 5-4 Highway, Demographic, and Geographic Characteristics of 30 Largest Urbanized Areas: 2013 ............... 87 5-5 Highway Congestion in the 50 Largest Urban Areas: 2014 ........................................................................88 5-6 Recreational Boat Registrations by Propulsion Type: 2014 ........................................................................89 5-7 General Aviation and Air Taxi Aircraft and Hours Flown: 2013 ....................................................................90 5-8 Active Aviation Pilots and Flight Instructors: 2014 ......................................................................................91
Chapter 6 Economy and Finance 6-1 Transportation and Warehousing Establishments and Employment: 2013 ................................................ 94 6-2 Air Transportation Establishments and Employment: 2013 ........................................................................95 6-3 Water Transportation Establishments and Employment: 2013 ...................................................................96 6-4 Truck Transportation Establishments and Employment: 2013 ....................................................................97 6-5 Transit and Ground Passenger Transportation Establishments and Employment: 2013 ........................... 98 6-6 Pipeline Transportation Establishments and Employment: 2013 ................................................................99 6-7 Freight Railroad Employment, Retirement, and Wages: 2012 ..................................................................100 6-8 Transportation Expenditures by State and Local Governments: 2012 .....................................................101 6-9 Transportation Revenues Collected by State and Local Governments: 2012 .......................................... 102 6-10 Federal and State Funding of Public Transit: 2008, 2010, and 2012 ........................................................103 6-11 Average Motor Gasoline Prices Excluding Taxes, All Grades: 2008–2010 ...............................................104 6-12 State Motor-Fuel Tax Rates: 2013 ............................................................................................................105
Chapter 7 Energy and Environment 7-1 Transportation Energy Consumption by Energy Source: 2013 ................................................................108 7-2 Energy Consumption by End-Use Sector: 2013 .......................................................................................109 7-3 Transportation Energy Consumption per Capita: 2013 ............................................................................ 110 7-4 Motor-Fuel Use: 2013 ................................................................................................................................111 7-5 Alternative Fuel Vehicle Fleet by Fuel Type: 2013 .................................................................................... 112 7-6 Alternative Fuel Stations by Fuel Type: 2013 ........................................................................................... 113 7-7 Air Pollution in the 50 Largest Metropolitan Areas: 2009–2014 ................................................................ 114
Appendices Appendix A - Information on Data Sources ........................................................................................................ 117Appendix B - Data Sources and Availability ......................................................................................................125 Appendix C - State DOT Contact Information ...................................................................................................127Appendix D - Glossary .......................................................................................................................................128


Chapter 1Infrastructure


1
State Interstate
Other principal and minor arterials1
Major and minor collectors Local Total
Alabama 1,002 9,716 22,386 68,733 101,837Alaska 1,081 1,571 3,300 9,727 15,680Arizona 1,168 6,021 8,072 51,178 66,441Arkansas 656 7,441 21,061 72,499 101,656California 2,451 30,002 32,223 110,313 174,989Colorado 952 9,259 16,245 62,109 88,565Connecticut 346 3,004 3,206 14,918 21,474Delaware 41 680 1,039 4,633 6,393District of Columbia 12 286 157 1,047 1,501Florida 1,495 13,590 14,560 92,442 122,088Georgia 1,247 14,329 23,037 90,006 128,620Hawaii 55 824 752 2,800 4,430Idaho 612 4,249 10,611 32,611 48,082Illinois 2,185 14,771 22,169 106,583 145,708Indiana 1,188 8,758 22,523 65,084 97,553Iowa 782 9,778 31,629 72,240 114,429Kansas 874 9,688 33,698 96,427 140,687Kentucky 801 6,169 16,562 56,066 79,598Louisiana 926 5,685 9,972 44,844 61,427Maine 367 2,199 5,914 14,401 22,882Maryland 481 4,110 5,059 22,772 32,422Massachusetts 575 6,768 4,550 24,478 36,370Michigan 1,244 15,008 24,458 81,431 122,141Minnesota 914 13,686 30,408 93,759 138,767Mississippi 700 7,740 15,892 50,784 75,116Missouri 1,379 10,487 25,109 94,925 131,900Montana 1,192 6,088 16,245 51,408 74,933Nebraska 482 8,144 20,772 64,371 93,770Nevada 596 3,471 5,612 30,460 40,139New Hampshire 225 1,745 2,642 11,485 16,098New Jersey 431 6,391 4,437 28,034 39,293New Mexico 1,000 4,963 9,188 55,620 70,772New York 1,724 14,601 20,737 77,666 114,728North Carolina 1,255 10,018 17,351 77,579 106,202North Dakota 571 5,941 11,929 68,637 87,078Ohio 1,574 11,253 22,869 87,602 123,297Oklahoma 933 8,417 25,490 78,100 112,940Oregon 730 7,112 18,589 44,798 71,228Pennsylvania 1,857 13,762 19,847 84,470 119,936Rhode Island 70 914 887 4,235 6,106South Carolina 851 7,233 15,089 43,059 66,232South Dakota 679 6,430 19,004 56,446 82,558Tennessee 1,104 9,305 17,994 67,132 95,536Texas 3,415 33,280 65,154 211,378 313,228Utah 937 3,772 8,162 33,384 46,254Vermont 320 1,320 3,119 9,506 14,266Virginia 1,119 8,764 14,394 50,472 74,748Washington 764 8,412 17,292 55,980 82,448West Virginia 555 3,498 8,635 26,063 38,750Wisconsin 743 12,910 23,501 77,990 115,145Wyoming 914 3,671 10,279 14,161 29,024United States, total 47,575 417,232 803,807 2,846,848 4,115,462U.S. total (incl. Puerto Rico)2 47,857 418,966 805,541 2,859,789 4,132,1531Includes other freeways and expressways.2Data for Puerto Rico are for 2010.
Table 1-1: Public Road Length, Miles by Functional System: 2013
NOTE: The difference in total miles between tables 1-1 and 1-2 results from the Federal Highway Administration's expansion of sampledata to derive estimates of road length by different variables. FHWA considers the length totals in this table to be the control totals should a single value be required.
SOURCE: U.S. Department of Transportation, Federal Highway Administration, Highway Statistics , HM-20, available at www.fhwa.dot.gov/policyinformation/statistics.cfm as of June 2015.
Table 1-1: Public Road Length, Miles by Functional System: 2013
1Includes other freeways and expressways. 2Data for Puerto Rico are for 2010. NOTE: The difference in total miles between tables 1-1 and 1-2 results from the Federal Highway Administration’s expansion of sample data to derive estimates of road length by different variables. FHWA considers the length totals in this table to be the con-trol totals should a single value be required. SOURCE: U.S. Department of Transportation, Federal Highway Administration, Highway Statistics, HM-20, available at www.fhwa.dot.gov/policyinformation/statistics.cfm as of June 2015.

2
StateState highway
agency County
Town,township,municipal
Otherjurisdiction1
Federalagency2 Total
Alabama 10,902 62,519 26,777 169 1,471 101,837Alaska 5,591 3,626 1,802 2,349 2,311 15,680Arizona 6,800 17,864 22,657 4,620 14,500 66,441Arkansas 16,411 65,931 16,673 0 2,642 101,656California 15,104 65,306 76,129 3,432 15,018 174,989Colorado 9,061 55,995 16,110 851 6,548 88,565Connecticut 3,720 0 17,339 359 56 21,474Delaware 5,386 0 806 78 122 6,393District of Columbia 1,374 0 0 28 99 1,501Florida 12,099 70,095 37,579 87 2,228 122,088Georgia 17,926 87,542 19,359 166 3,626 128,620Hawaii 948 3,285 0 68 130 4,430Idaho 4,982 15,600 6,235 13,782 7,483 48,082Illinois 15,986 16,488 112,238 751 245 145,708Indiana 11,175 66,097 19,006 0 1,275 97,553Iowa 8,883 89,823 14,965 621 138 114,429Kansas 10,298 113,346 15,866 238 938 140,687Kentucky 27,620 39,841 10,637 547 952 79,598Louisiana 16,689 32,708 11,330 35 665 61,427Maine 8,378 364 13,682 320 138 22,882Maryland 5,158 21,346 4,794 290 833 32,422Massachusetts 3,018 0 32,587 640 101 36,370Michigan 9,664 89,444 21,198 61 1,773 122,141Minnesota 11,811 46,532 76,181 1,715 2,529 138,767Mississippi 10,899 51,891 11,258 649 420 75,116Missouri 33,887 73,383 23,166 5 1,459 131,900Montana 11,006 42,562 4,807 4,239 12,320 74,933Nebraska 9,948 61,186 22,283 120 232 93,770Nevada 5,318 26,355 4,820 373 3,272 40,139New Hampshire 3,921 0 11,964 104 108 16,098New Jersey 2,341 6,650 28,733 1,011 558 39,293New Mexico 12,034 39,348 6,269 189 12,932 70,772New York 15,034 20,233 77,299 1,458 705 114,728North Carolina 79,546 0 22,435 906 3,315 106,202North Dakota 7,378 10,156 67,979 19 1,546 87,078Ohio 19,226 29,102 73,064 1,136 770 123,297Oklahoma 12,265 78,411 21,147 1,105 13 112,940Oregon 7,661 32,949 10,922 677 19,019 71,228Pennsylvania 39,787 293 77,694 1,341 821 119,936Rhode Island 1,103 0 4,874 35 93 6,106South Carolina 41,396 20,329 2,366 191 1,950 66,232South Dakota 7,767 35,266 35,469 1,626 2,431 82,558Tennessee 13,899 57,906 22,195 344 1,192 95,536Texas 80,323 146,826 84,707 167 1,205 313,228Utah 5,869 24,238 11,098 516 4,534 46,254Vermont 2,628 0 11,463 50 125 14,266Virginia 58,411 1,721 11,752 63 2,801 74,748Washington 7,054 39,232 18,672 8,743 8,747 82,448West Virginia 34,407 0 3,227 282 834 38,750Wisconsin 11,766 20,764 81,771 136 709 115,145Wyoming 6,751 14,620 2,431 1,036 4,185 29,024United States, total 780,609 1,797,172 1,327,813 57,727 152,115 4,115,462U.S. total (incl. Puerto Rico)3 785,191 1,797,172 1,339,879 57,728 152,145 4,132,1531Includes state park, State toll, other state agency, other local agency and other roadways not identified by ownership.2Roadways in Federal parks, forests, and reservations that are not part of the State and local highway systems.3Data for Puerto Rico are for 2009.
Table 1-2: Public Road Length, Miles by Ownership: 2013
NOTE: The difference in total miles between tables 1-1 and 1-2 results from the Federal Highway Administration's (FHWA) expansion ofsample data to derive estimates of road length by different variables. FHWA considers the length totals in table 1-1 to be the control totals should a single value be required.
SOURCE: U.S. Department of Transportation, Federal Highway Administration, Highway Statistics, HM-10, available at www.fhwa.dot.gov/policyinformation/statistics.cfm as of June 2015.
Table 1-2: Public Road Length, Miles by Ownership: 2013
1Includes state park, state toll, other state agency, other local agency and other roadways not identified by ownership. 2Roadways in Federal parks, forests, and reservations that are not part of the state and local highway systems. 3Data for Puerto Rico are for 2009. NOTE: The difference in total miles between tables 1-1 and 1-2 results from the Federal Highway Administration’s (FHWA) expansion of sample data to derive estimates of road length by different variables. FHWA considers the length totals in table 1-1 to be the control totals should a single value be required. SOURCE: U.S. Department of Transportation, Federal Highway Administration, Highway Statistics, HM-10, available at www.fhwa.dot.gov/policyinformation/statistics.cfm as of June 2015.

3
Table 1-3: Toll Roads, Toll Bridges and Tunnels, and Toll Ferry Routes: 2012
State Toll road mileage1Number of toll
bridges2Number of toll
tunnels2Number of toll ferry
routes2,3
Alabama 3.1 3 0 2Alaska 0.0 0 1 16Arizona 0.0 0 0 0Arkansas 0.0 0 0 0California 134.8 8 0 1Colorado 84.0 0 0 0Connecticut 0.0 0 0 6Delaware 46.7 1 0 1District of Columbia 0.0 0 0 0Florida 427.9 14 0 0Georgia 6.2 0 0 0Hawaii 0.0 0 0 0Idaho 0.0 0 0 0Illinois 374.5 4 0 5Indiana 157.0 2 0 0Iowa 0.0 5 0 1Kansas 236.0 0 0 0Kentucky 0.0 0 0 3Louisiana 1.5 4 0 0Maine 108.2 0 0 15Maryland 27.6 5 2 2Massachusetts 138.2 1 2 2Michigan 0.0 7 1 12Minnesota 27.0 1 0 0Mississippi 0.0 0 0 0Missouri 0.0 1 0 7Montana 0.0 0 0 0Nebraska 0.0 4 0 0Nevada 6.4 0 0 0New Hampshire 127.0 0 0 0New Jersey 335.0 26 2 1New Mexico 0.0 0 0 0New York 511.4 28 4 10North Carolina 9.2 0 0 4North Dakota 0.0 1 0 0Ohio 241.2 2 0 6Oklahoma 595.1 0 0 0Oregon 0.0 2 0 5Pennsylvania 596.7 15 0 2Rhode Island 0.0 1 0 3South Carolina 23.5 0 0 0South Dakota 0.0 0 0 0Tennessee 0.0 0 0 3Texas 497.8 27 1 1Utah 1.0 0 0 1Vermont 11.9 0 0 4Virginia 57.1 5 2 1Washington 14.5 4 0 19West Virginia 86.8 2 0 1Wisconsin 0.0 0 0 4Wyoming 0.0 0 0 0United States, total 4,887.2 140 13 115U.S. total (incl. Puerto Rico) 5,433.8 141 13 1201Length includes approaches and connecting links which were financed as an integral part of the toll project. The length of tollbridges includes approach sections which may be used toll free by local residents.2Multiple structures at a single facility are counted as one bridge or tunnel. Does not include bridges or tunnels that are part of roadway segments reported under Toll road mileage.3Excludes ferries providing exclusive service for passengers or freight as opposed to vehicles.
NOTE: Totals reflect crossings between states as one facility or ferry route, including 33 bridges, 2 tunnels, and 28 ferry routes. Data as of January 1, 2013.
SOURCE: U.S. Department of Transportation, Federal Highway Administration, Office of Highway Policy Information Toll Facilities in the United States, table T-1, available at www.fhwa.dot.gov/policyinformation/tollpage as of June 2014.
Table 1-3: Toll Roads, Toll Bridges and Tunnels, and Toll Ferry Routes: 2012
1Length includes approaches and connecting links which were financed as an integral part of the toll project. The length of toll bridges includes approach sections which may be used toll free by local residents. 2Multiple structures at a single facility are counted as one bridge or tunnel. Does not include bridges or tunnels that are part of roadway segments reported under Toll road mileage. 3Excludes ferries providing exclusive service for passengers or freight as opposed to vehicles.
NOTE: Totals reflect crossings between states as one facility or ferry route, including 33 bridges, 2 tunnels, and 28 ferry routes. Data as of January 1, 2013. SOURCE: U.S. Department of Transportation, Federal Highway Administration, Office of Highway Policy Information, Toll Facilities in the United States, table T-1, available at www.fhwa.dot.gov/policyinformation/tollpage as of June 2014.

4
Table 1-4: Road Condition: 2013(Miles)
StateNot
Reported <60 60-94 95-170 171-220 >220 >3.9 3.5-3.9 2.6-3.4 2.1-2.5 <=2.0Alabama 0 4,376 9,227 8,024 1,361 1,110 1 4 55 63 67Alaska 74 361 1,003 1,290 419 487 0 0 0 0 0Arizona 1,045 2,213 2,463 2,305 396 240 562 0 447 0 226Arkansas 233 968 4,381 7,718 2,292 1,009 6 26 3,869 0 0California 1,999 965 6,624 21,086 9,798 9,374 751 790 1,893 421 392Colorado 271 1,125 4,542 7,002 1,876 1,556 52 23 11 2 0Connecticut 0 196 806 2,532 1,117 1,474 0 0 0 0 0Delaware 0 92 637 532 135 113 0 0 0 0 0District of Columbia 1 0 1 22 32 395 0 0 2 0 1Florida 628 3,967 5,683 2,612 498 346 822 1,015 2,769 241 186Georgia 233 4,103 12,111 9,608 1,691 1,871 0 0 0 0 0Hawaii 3 60 147 646 285 363 0 0 0 0 0Idaho 212 804 1,773 1,253 149 126 1,206 896 1,923 858 596Illinois 0 2,634 9,636 12,304 3,226 3,141 0 0 0 0 0Indiana 261 4,306 6,470 7,411 1,849 1,973 0 0 0 0 0Iowa 3,174 1,283 1,853 1,858 427 412 0 0 0 0 0Kansas 0 4,449 6,806 3,181 799 713 125 2,048 4,986 598 563Kentucky 128 1,858 3,857 5,678 717 410 0 0 0 0 0Louisiana 150 1,030 3,868 4,683 1,516 1,658 0 1 6 0 7Maine 0 368 1,229 3,011 1,083 625 4 0 0 0 0Maryland 10 773 1,652 1,961 600 804 0 0 0 0 0Massachusetts 27 423 874 1,979 720 686 0 0 6,278 0 0Michigan 74 3,373 3,755 2,599 637 574 3,761 2,214 6,366 5,107 5,962Minnesota 225 5,460 6,929 6,689 1,244 943 0 0 0 0 0Mississippi 6 2,365 4,893 8,790 2,857 2,467 0 0 0 0 0Missouri 769 2,504 6,190 11,478 3,638 1,462 0 0 0 0 0Montana 6 1,822 4,860 4,361 699 401 0 0 0 0 0Nebraska 115 2,799 3,254 4,282 428 84 0 0 0 0 0Nevada 370 1,383 1,278 1,328 82 68 0 19 58 2 2New Hampshire 4 720 867 938 366 534 0 0 17 0 0New Jersey 52 433 847 2,766 1,573 2,272 678 283 1,512 92 25New Mexico 501 1,975 1,798 2,998 1,176 1,121 0 0 0 0 0New York 57 905 6,565 11,990 3,382 4,294 4 7 32 13 2North Carolina 426 1,941 7,587 7,853 1,297 835 155 5 11 6 0North Dakota 0 1,745 2,495 1,287 171 134 1,246 3,993 1,176 1,040 115Ohio 12 1,826 7,459 7,384 1,521 1,075 0 0 0 0 0Oklahoma 35 1,837 6,338 12,014 3,694 5,028 0 0 0 0 0Oregon 139 1,312 3,071 3,093 575 316 2,633 2,307 3,002 385 203Pennsylvania 229 1,337 5,825 11,483 3,131 2,372 0 0 0 0 0Rhode Island 4 39 99 560 216 249 113 86 163 119 67South Carolina 0 2,006 5,649 10,765 1,789 746 0 0 0 0 0South Dakota 26 1,639 4,152 3,514 347 73 377 75 3,701 216 727Tennessee 69 4,200 4,536 4,178 567 373 0 0 0 0 0Texas 737 4,832 10,761 9,795 1,256 1,104 1,943 1,961 6,803 1,830 1,782Utah 68 664 1,936 3,873 1,023 424 0 51 457 8 3Vermont 7 485 916 1,172 403 426 0 0 0 0 0Virginia 43 796 4,726 9,211 2,279 1,575 525 450 919 154 92Washington 0 879 3,289 8,977 3,576 2,885 0 0 0 0 0West Virginia 63 88 1,600 5,402 1,291 1,649 19 24 127 120 11Wisconsin 0 3,863 5,986 8,956 3,301 3,168 0 0 0 0 0Wyoming 39 1,216 3,031 2,274 360 233 0 0 0 0 0United States, total 12,527 90,793 206,333 276,698 73,890 65,776 14,986 16,276 46,580 11,272 11,033U.S. total (incl. Puerto Rico) 12,558 90,793 206,369 277,266 74,625 66,850 15,206 16,509 47,078 11,326 11,033
International Roughness Index (IRI) Present Serviceability Rating (PSR)
NOTES: Data may not sum to totals. Road condition ratings are reported using the International Roughness Index (IRI) and the Present Serviceability Rating (PSR). States are required to report to the Federal Highway Administration (FHWA) IRI data for the Interstates, other principal arterials, rural minor arterials, and the National Highway System regardless of functional system. The IRI is also recommended by FHWA for measuring all other functional classifications because the IRI uses a more standardized and objective measurement methodology. Some States elect to report PSR for some sections of rural major collectors, urban minor arterials, and urban collectors. Pavement rating data are not reported for local or rural minor collector functional systems.
According to the pavement condition criteria used in the Highway Performance Monitoring System, an IRI rating less than 95 or a PSR rating greater than or equal to 3.5 indicates "good" ride quality. An IRI rating of less than or equal to 170 or a PSR rating for greater than or equal to 2.5 indicates "acceptable" ride quality. For further information, refer to the U.S. Department of Tansportation, Federal Highway Administration, 2013 Status of the Nation's Highways, Bridges, and Transit: Conditions and Performance Report, Exhibit 3-1, available at www.fhwa.dot.gov/policy/2013cpr as of June 2015.
SOURCE: U.S. Department of Transportation, Federal Highway Administration, Highway Statistics, HM-63 and HM-64, available at www.fhwa.dot.gov/policyinformation/statistics.cfm as of June 2015.
Table 1-4: Road Condition: 2013 (Miles)
NOTES: Data may not sum to totals. Road condition ratings are reported using the International Roughness Index (IRI) and the Present Serviceability Rating (PSR). States are required to report to the Federal Highway Administration (FHWA) IRI data for the Interstates, other principal arterials, rural minor arterials, and the National Highway System regardless of functional system. The IRI is also recommended by FHWA for measuring all other functional classifications because the IRI uses a more standardized and objective measurement methodology. Some States elect to report PSR for some sections of rural major collectors, urban minor arteri-als, and urban collectors. Pavement rating data are not reported for local or rural minor collector functional systems. According to the pavement condition criteria used in the Highway Performance Monitoring System, an IRI rating less than 95 or a PSR rating greater than or equal to 3.5 indicates “good” ride quality. An IRI rating of less than or equal to 170 or a PSR rating for greater than or equal to 2.5 indicates “acceptable” ride quality. For further information, refer to the U.S. Department of Tansportation, Federal Highway Administration, 2013 Status of the Nation’s Highways, Bridges, and Transit: Conditions and Performance Report, Exhibit 3-1, available at www.fhwa.dot.gov/policy/2013cpr as of June 2015. SOURCE: U.S. Department of Transportation, Federal Highway Administration, Highway Statistics, HM-63 and HM-64, available at www.fhwa.dot.gov/policyinformation/statistics.cfm as of June 2015.

5
Table 1-5: Number of Road Bridges by Functional System: 2014
State Interstate
Otherfreeways and expressways
Otherarterials Collector Local Interstate
Otherarterials Collector Local
Alabama 558 86 926 291 1,013 690 2,633 5,517 4,374Alaska 41 0 106 43 50 146 170 298 690Arizona 313 377 1,344 426 573 1,240 1,660 1,438 664Arkansas 352 163 761 157 463 467 2,372 5,020 3,051California 2,612 3,071 4,979 1,354 1,773 1,203 2,860 3,376 4,178Colorado 562 401 974 343 511 553 1,295 1,773 2,256Connecticut 740 560 808 434 534 83 225 327 507Delaware 91 28 189 81 65 0 102 114 195District of Columbia 68 26 95 16 46 0 1 1 0Florida 1,225 1,178 2,329 1,035 1,191 616 1,675 1,379 1,509Georgia 575 212 2,053 613 1,347 422 2,346 3,818 3,409Hawaii 184 89 137 70 103 27 258 159 110Idaho 113 0 339 106 98 279 544 998 1,954Illinois 1,417 178 2,756 1,070 1,339 875 2,314 4,475 12,164Indiana 723 262 1,337 582 827 892 1,600 5,135 7,661Iowa 340 0 1,164 349 508 371 2,272 7,342 11,954Kansas 490 454 1,012 416 556 549 2,633 8,280 10,695Kentucky 416 133 646 271 405 373 1,647 4,432 5,871Louisiana 868 157 1,102 313 900 551 2,043 2,824 4,224Maine 113 19 139 102 81 173 325 719 748Maryland 701 424 782 296 699 185 373 837 1,008Massachusetts 897 454 1,645 525 565 90 190 335 440Michigan 827 316 1,508 470 576 387 1,222 2,623 3,143Minnesota 420 225 935 284 360 291 1,683 3,193 5,570Mississippi 298 109 611 287 393 482 2,789 4,734 7,388Missouri 899 1,077 816 655 1,107 463 2,321 5,037 12,010Montana 84 0 98 32 66 747 1,003 1,079 2,142Nebraska 119 52 365 90 147 212 2,177 3,576 8,636Nevada 219 90 300 220 277 319 151 173 149New Hampshire 141 55 250 104 179 223 271 425 819New Jersey 983 774 2,057 652 973 77 189 299 605New Mexico 279 1 440 143 116 600 1,014 844 514New York 1,658 1,123 2,619 1,087 1,384 651 1,428 3,258 4,248North Carolina 741 540 1,569 600 1,565 448 1,639 3,562 7,453North Dakota 59 0 141 21 33 147 607 893 2,528Ohio 1,356 776 1,985 993 1,377 854 2,302 6,809 10,534Oklahoma 502 420 1,043 568 665 604 2,587 7,198 9,560Oregon 307 69 761 351 195 361 1,206 2,289 2,513Pennsylvania 1,365 826 3,018 1,302 1,487 1,074 2,514 4,067 7,038Rhode Island 132 117 270 84 53 11 24 45 30South Carolina 353 80 813 534 557 376 1,264 2,675 2,686South Dakota 117 6 160 51 66 338 972 1,319 2,843Tennessee 719 317 1,871 436 969 706 2,786 5,353 6,920Texas 3,223 4,068 6,343 2,533 4,778 2,273 8,249 11,214 10,256Utah 411 41 345 94 275 436 348 463 601Vermont 57 2 92 42 32 256 374 696 1,194Virginia 1,007 435 1,540 518 879 671 1,544 2,654 4,552Washington 649 481 965 236 285 294 899 2,059 2,252West Virginia 252 71 342 133 278 403 766 1,989 2,953Wisconsin 515 360 1,238 204 546 610 2,262 2,546 5,828Wyoming 160 6 119 48 45 765 514 533 937United States, total 31,251 20,709 58,237 21,665 33,310 24,864 74,643 140,202 203,564U.S. total (incl. Puerto Rico) 31,496 20,821 58,612 21,834 33,529 25,057 74,870 140,535 203,995
Urban Rural
NOTE: Some discrepancies exist between the total number of bridges reported in tables 1-5, 1-6, and 1-7 because of bridges not identified in one or more of the categories and other anomalies.
SOURCE: U.S. Department of Transportation, Federal Highway Administration, Office of Bridge Technology, National Bridge Inventory, FunctionalClassification of Bridges by Highway System, available at www.fhwa.dot.gov/bridge/nbi.cfm as of July 2015.
Table 1-5: Number of Road Bridges by Functional System: 2014
NOTE: Some discrepancies exist between the total number of bridges reported in tables 1-5, 1-6, and 1-7 because of bridges not identified in one or more of the categories and other anomalies. SOURCE: U.S. Department of Transportation, Federal Highway Administration, Office of Bridge Technology, National Bridge Inventory, Functional Classification of Bridges by Highway System, available at www.fhwa.dot.gov/bridge/nbi.cfm as of July 2015.

6
Table 1-6: Number of Road Bridges by Owner: 2014
State Federal
Statehighwayagency
State toll authority
Other state agency
Localhighwayagency
Local toll authority
Other local agency
Private(includingrailroad) Total
Alabama 167 5,734 0 9 10,115 0 2 30 16,057Alaska 560 809 0 4 149 0 3 1 1,526Arizona 438 4,741 0 19 2,826 0 1 6 8,031Arkansas 186 7,271 0 41 5,305 0 0 2 12,805California 816 12,347 0 79 11,998 5 54 16 25,315Colorado 294 3,444 0 0 4,787 121 6 14 8,666Connecticut 7 2,814 0 0 1,246 0 0 4 4,071Delaware 5 831 0 0 11 16 0 0 863District of Columbia 36 213 0 1 2 0 1 0 253Florida 150 5,480 1,149 44 5,069 9 46 65 12,012Georgia 175 6,652 0 1 7,902 0 1 46 14,777Hawaii 36 729 0 1 369 0 0 2 1,137Idaho 717 1,325 0 13 1,716 0 655 1 4,427Illinois 41 7,766 454 2 18,171 0 8 93 26,535Indiana 64 5,484 332 61 13,044 1 12 19 19,017Iowa 34 4,103 0 17 20,136 1 0 2 24,293Kansas 115 5,031 363 1 19,535 0 0 1 25,046Kentucky 98 9,005 0 7 5,045 0 2 32 14,189Louisiana 265 7,769 0 17 4,872 5 26 5 12,959Maine 19 1,971 166 8 230 0 1 24 2,419Maryland 93 2,553 313 36 2,289 0 1 4 5,289Massachusetts 19 3,460 8 83 1,565 1 1 0 5,137Michigan 89 4,441 4 27 6,480 0 20 3 11,064Minnesota 88 3,616 0 7 9,136 0 3 34 12,884Mississippi 462 5,775 0 1 10,833 0 0 17 17,088Missouri 64 10,344 0 1 13,878 1 67 20 24,375Montana 803 2,478 0 0 1,970 0 0 0 5,251Nebraska 82 3,512 0 35 11,599 0 99 46 15,373Nevada 40 1,069 0 2 728 0 47 10 1,896New Hampshire 71 1,300 163 1 923 1 1 3 2,463New Jersey 34 2,370 1,145 215 2,675 31 2 18 6,490New Mexico 234 2,975 0 2 736 0 1 3 3,951New York 49 7,487 774 94 8,542 172 109 105 17,332North Carolina 394 16,861 22 3 815 0 0 2 18,097North Dakota 80 1,129 0 2 3,199 0 4 10 4,424Ohio 11 10,361 462 0 16,075 0 4 59 26,972Oklahoma 128 6,791 766 10 15,431 0 4 2 23,132Oregon 1,186 2,718 0 18 4,033 2 48 6 8,011Pennsylvania 67 15,153 777 9 6,147 46 6 225 22,430Rhode Island 2 586 14 3 146 0 1 1 753South Carolina 69 8,467 0 1 780 0 0 19 9,336South Dakota 122 1,797 0 20 3,933 0 0 0 5,872Tennessee 353 8,265 0 6 11,406 0 2 3 20,035Texas 179 34,002 298 19 17,755 524 85 36 52,898Utah 177 1,808 0 2 1,027 0 0 0 3,014Vermont 26 1,087 0 0 1,626 0 0 6 2,745Virginia 357 11,911 12 5 1,404 62 0 49 13,800Washington 779 3,277 1 4 4,032 3 8 3 8,107West Virginia 49 6,890 99 3 103 0 10 9 7,163Wisconsin 117 5,200 0 0 8,776 0 0 16 14,109Wyoming 319 1,955 0 3 844 0 0 3 3,124United States, total 10,766 283,157 7,322 937 301,414 1,001 1,341 1,075 607,013U.S. total (incl. Puerto Rico) 12,385 283,176 7,322 1,278 301,414 1,002 1,341 1,075 607,014NOTES: Some discrepancies exist between the total number of bridges reported in tables 1-5, 1-6, and 1-7 because of bridges not identified in one or more of the categories and other anomalies. Other state agency includes state parks, forests, reservations, and other state agencies. Local highway agency includes county, town or township, and city or municipal highway agencies. Other local agency includes local parks, forests, reservations, and other local agencies. Private includes highway bridges owned by railroads and other private entities. Details for each state may not add to totals because totals include bridges for which ownership is unknown.
SOURCE: U.S. Department of Transportation, Federal Highway Administration, Office of Bridge Technology, National Bridge Inventory, HighwayBridge by Owner, available at www.fhwa.dot.gov/bridge/nbi.cfm as of June 2015.
Table 1-6: Number of Road Bridges by Owner: 2014
NOTES: Some discrepancies exist between the total number of bridges reported in tables 1-5, 1-6, and 1-7 because of bridges not identified in one or more of the categories and other anomalies. Other state agency includes state parks, forests, reservations, and other state agencies. Local highway agency includes county, town or township, and city or municipal highway agencies. Other local agency includes local parks, forests, reservations, and other local agencies. Private includes highway bridges owned by railroads and other private entities. Details for each state may not add to totals because totals include bridges for which ownership is unknown. SOURCE: U.S. Department of Transportation, Federal Highway Administration, Office of Bridge Technology, National Bridge Inven-tory, Highway Bridge by Owner, available at www.fhwa.dot.gov/bridge/nbi.cfm as of June 2015.

7
Table 1-7: Road Bridge Condition: 2014
State All bridges Structurally
deficientFunctionally
obsoleteStructurally
deficientFunctionally
obsoleteAlabama 16,057 1,388 2,144 8.6 13.4Alaska 1,526 153 198 10.0 13.0Arizona 8,031 256 684 3.2 8.5Arkansas 12,805 861 1,994 6.7 15.6California 25,315 2,501 4,306 9.9 17.0Colorado 8,666 529 859 6.1 9.9Connecticut 4,071 373 975 9.2 23.9Delaware 863 48 123 5.6 14.3District of Columbia 253 14 164 5.5 64.8Florida 12,012 243 1,760 2.0 14.7Georgia 14,777 785 1,623 5.3 11.0Hawaii 1,137 61 422 5.4 37.1Idaho 4,427 405 471 9.1 10.6Illinois 26,535 2,216 1,971 8.4 7.4Indiana 19,017 1,902 2,201 10.0 11.6Iowa 24,293 5,022 1,183 20.7 4.9Kansas 25,046 2,416 1,813 9.6 7.2Kentucky 14,189 1,191 3,253 8.4 22.9Louisiana 12,959 1,837 1,944 14.2 15.0Maine 2,419 364 432 15.0 17.9Maryland 5,289 317 1,104 6.0 20.9Massachusetts 5,137 459 2,224 8.9 43.3Michigan 11,064 1,295 1,754 11.7 15.9Minnesota 12,884 830 363 6.4 2.8Mississippi 17,088 2,275 1,290 13.3 7.5Missouri 24,375 3,310 3,145 13.6 12.9Montana 5,251 400 514 7.6 9.8Nebraska 15,373 2,653 986 17.3 6.4Nevada 1,896 34 215 1.8 11.3New Hampshire 2,463 324 451 13.2 18.3New Jersey 6,490 595 1,673 9.2 25.8New Mexico 3,951 284 359 7.2 9.1New York 17,332 2,012 4,733 11.6 27.3North Carolina 18,097 2,199 3,135 12.2 17.3North Dakota 4,424 701 243 15.8 5.5Ohio 26,972 2,080 4,452 7.7 16.5Oklahoma 23,132 4,216 1,575 18.2 6.8Oregon 8,011 439 1,419 5.5 17.7Pennsylvania 22,430 5,049 4,388 22.5 19.6Rhode Island 753 174 255 23.1 33.9South Carolina 9,336 1,031 891 11.0 9.5South Dakota 5,872 1,174 238 20.0 4.1Tennessee 20,035 1,083 2,863 5.4 14.3Texas 52,898 1,127 8,867 2.1 16.8Utah 3,014 102 317 3.4 10.5Vermont 2,745 206 676 7.5 24.6Virginia 13,800 1,120 2,454 8.1 17.8Washington 8,107 382 1,711 4.7 21.1West Virginia 7,163 960 1,541 13.4 21.5Wisconsin 14,109 1,212 759 8.6 5.4Wyoming 3,124 422 284 13.5 9.1United States, total 607,013 61,030 83,399 10.1 13.7U.S. total (incl. Puerto Rico) 607,014 61,331 83,483 10.1 13.8
Percent of all bridges
NOTES: Some discrepancies exist between the total number of bridges reported in tables 1-5, 1-6, and 1-7 because of bridges not identified in one or more of the categories and other anomalies. Definitions of the terms Structurally Deficient and Functionally Obsolete can be found in the Federal Highway Administration 2013 Conditions and Performance Report at http://www.fhwa.dot.gov/policy/2013cpr/.
SOURCE: U.S. Department of Transportation, Federal Highway Administration, Office of Bridge Technology, National Bridge Inventory, Functional Classification of Bridges by Highway System, available at www.fhwa.dot.gov/bridge/nbi.cfm as of June 2015.
Table 1-7: Road Bridge Condition: 2014
NOTES: Some discrepancies exist between the total number of bridges reported in tables 1-5, 1-6, and 1-7 because of bridges not identi-fied in one or more of the categories and other anomalies. Definitions of the terms Structurally Deficient and Functionally Obsolete can be found in the Federal Highway Administration 2013 Conditions and Performance Report at http://www.fhwa.dot.gov/policy/2013cpr/. SOURCE: U.S. Department of Transportation, Federal Highway Administration, Office of Bridge Technology, National Bridge Inventory, Func-tional Classification of Bridges by Highway System, available at www.fhwa.dot.gov/bridge/nbi.cfm as of June 2015.
8
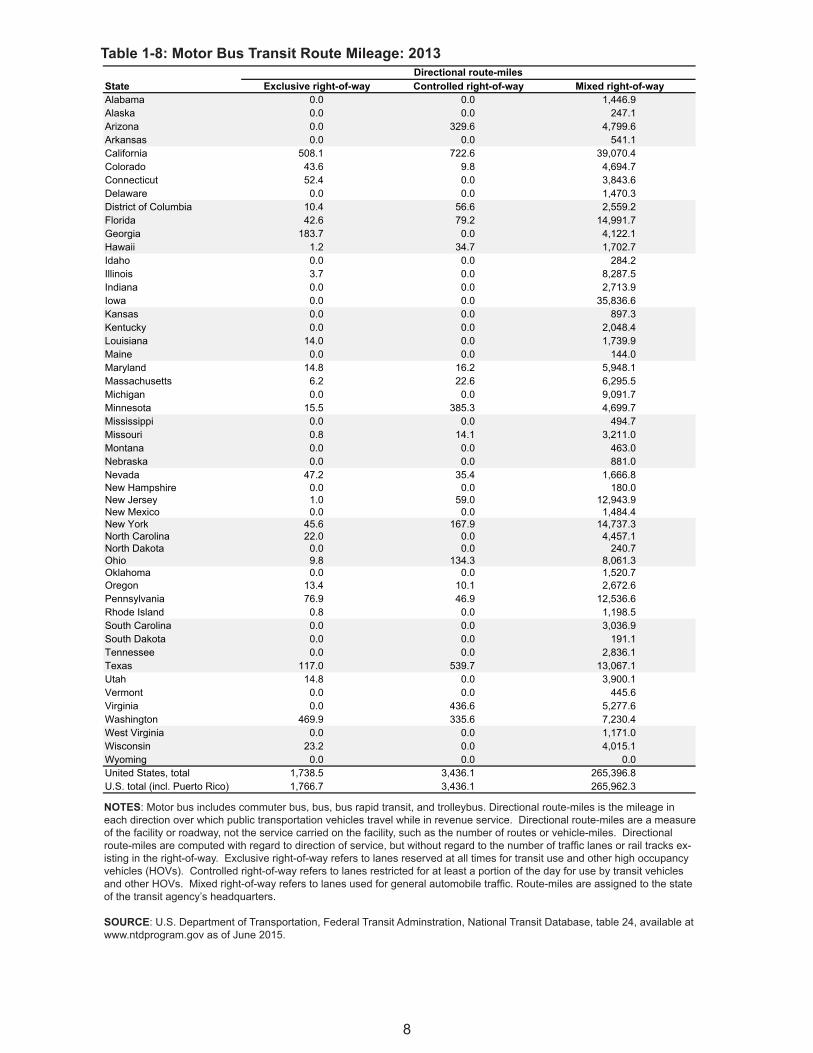
Table 1-8: Motor Bus Transit Route Mileage: 2013
State Exclusive right-of-way Controlled right-of-way Mixed right-of-wayAlabama 0.0 0.0 1,446.9Alaska 0.0 0.0 247.1Arizona 0.0 329.6 4,799.6Arkansas 0.0 0.0 541.1California 508.1 722.6 39,070.4Colorado 43.6 9.8 4,694.7Connecticut 52.4 0.0 3,843.6Delaware 0.0 0.0 1,470.3District of Columbia 10.4 56.6 2,559.2Florida 42.6 79.2 14,991.7Georgia 183.7 0.0 4,122.1Hawaii 1.2 34.7 1,702.7Idaho 0.0 0.0 284.2Illinois 3.7 0.0 8,287.5Indiana 0.0 0.0 2,713.9Iowa 0.0 0.0 35,836.6Kansas 0.0 0.0 897.3Kentucky 0.0 0.0 2,048.4Louisiana 14.0 0.0 1,739.9Maine 0.0 0.0 144.0Maryland 14.8 16.2 5,948.1Massachusetts 6.2 22.6 6,295.5Michigan 0.0 0.0 9,091.7Minnesota 15.5 385.3 4,699.7Mississippi 0.0 0.0 494.7Missouri 0.8 14.1 3,211.0Montana 0.0 0.0 463.0Nebraska 0.0 0.0 881.0Nevada 47.2 35.4 1,666.8New Hampshire 0.0 0.0 180.0New Jersey 1.0 59.0 12,943.9New Mexico 0.0 0.0 1,484.4New York 45.6 167.9 14,737.3North Carolina 22.0 0.0 4,457.1North Dakota 0.0 0.0 240.7Ohio 9.8 134.3 8,061.3Oklahoma 0.0 0.0 1,520.7Oregon 13.4 10.1 2,672.6Pennsylvania 76.9 46.9 12,536.6Rhode Island 0.8 0.0 1,198.5South Carolina 0.0 0.0 3,036.9South Dakota 0.0 0.0 191.1Tennessee 0.0 0.0 2,836.1Texas 117.0 539.7 13,067.1Utah 14.8 0.0 3,900.1Vermont 0.0 0.0 445.6Virginia 0.0 436.6 5,277.6Washington 469.9 335.6 7,230.4West Virginia 0.0 0.0 1,171.0 Wisconsin 23.2 0.0 4,015.1Wyoming 0.0 0.0 0.0United States, total 1,738.5 3,436.1 265,396.8U.S. total (incl. Puerto Rico) 1,766.7 3,436.1 265,962.3
Directional route-miles
NOTES: Motor bus includes commuter bus, bus, bus rapid transit, and trolleybus. Directional route-miles is the mileage in each direction over which public transportation vehicles travel while in revenue service. Directional route-miles are a measure of thefacility or roadway, not the service carried on the facility, such as the number of routes or vehicle-miles. Directional route-miles are computed with regard to direction of service, but without regard to the number of traffic lanes or rail tracks existing in the right-of-way. Exclusive right-of-way refers to lanes reserved at all times for transit use and other high occupancy vehicles (HOVs).Controlled right-of-way refers to lanes restricted for at least a portion of the day for use by transit vehicles and other HOVs. Mixed right-of-way refers to lanes used for general automobile traffic. Route-miles are assigned to the state of the transit agency'sheadquarters.
SOURCE: U.S. Department of Transportation, Federal Transit Adminstration, National Transit Database, table 24, available at www.ntdprogram.gov as of June 2015.
Table 1-8: Motor Bus Transit Route Mileage: 2013
NOTES: Motor bus includes commuter bus, bus, bus rapid transit, and trolleybus. Directional route-miles is the mileage in each direction over which public transportation vehicles travel while in revenue service. Directional route-miles are a measure of the facility or roadway, not the service carried on the facility, such as the number of routes or vehicle-miles. Directional route-miles are computed with regard to direction of service, but without regard to the number of traffic lanes or rail tracks ex-isting in the right-of-way. Exclusive right-of-way refers to lanes reserved at all times for transit use and other high occupancy vehicles (HOVs). Controlled right-of-way refers to lanes restricted for at least a portion of the day for use by transit vehicles and other HOVs. Mixed right-of-way refers to lanes used for general automobile traffic. Route-miles are assigned to the state of the transit agency’s headquarters.
SOURCE: U.S. Department of Transportation, Federal Transit Adminstration, National Transit Database, table 24, available at www.ntdprogram.gov as of June 2015.

9
Table 1-9: Characteristics of Rail Transit by Transit Authority: 2013
Rail transit mode/transit agencyPrimary city served States served
Directionalroute-miles
Number of crossings
Number of stations1
Number of ADA accessiblestations2
Heavy rail, total 11 17 1,601.4 27 1028 534Metropolitan Atlanta Rapid Transit Authority Atlanta GA 96.1 0 38 38Maryland Transit Administration Baltimore MD 29.4 0 14 14Massachusetts Bay Transportation Authority Boston MA, NH, RI 76.3 0 53 49Chicago Transit Authority Chicago IL, IN 207.8 25 145 97The Greater Cleveland Regional Transit Authority Cleveland OH 38.1 0 18 15Los Angeles County Metropolitan Transportation Authority Los Angeles CA 31.9 0 16 16Miami-Dade Transit Miami FL 49.8 0 23 23MTA New York City Transit New York NY, NJ, CT 487.5 0 468 96Port Authority Trans-Hudson Corporation New York NY, NJ, CT 28.6 2 13 7Staten Island Rapid Transit Operating Authority New York NY, NJ, CT 28.6 0 22 4Port Authority Transit Corporation Philadelphia PA, NJ, DE, MD 31.5 0 13 7Southeastern Pennsylvania Transportation Authority Philadelphia PA 74.9 0 75 38San Francisco Bay Area Rapid Transit District San Francisco CA 209.0 0 44 44Washington Metropolitan Area Transit Authority Washington DC, MD, VA 211.8 0 86 86Light rail, total 29 25 1,789.4 3,628 925 825Capital Metropolitan Transportation Authority Austin TX 64.2 79 9 9Maryland Transit Administration Baltimore MD 57.6 52 33 33Massachusetts Bay Transportation Authority Boston MA, NH, RI 51.0 65 74 36Niagara Frontier Transportation Authority Buffalo NY 12.4 8 14 14Charlotte Area Transit System Charlotte NC 18.6 19 19 19The Greater Cleveland Regional Transit Authority Cleveland OH 30.4 22 34 10Dallas Area Rapid Transit Dallas TX 171.4 162 61 61Denver Regional Transportation District Denver CO 94.2 57 46 46Metropolitan Transit Authority of Harris County Houston TX 14.8 68 16 16Kenosha Transit Kenosha WI 1.9 19 2 1Central Arkansas Transit Authority Little Rock AR 3.8 24 0 0Los Angeles County Metropolitan Transportation Authority Los Angeles CA 136.3 152 66 66Memphis Area Transit Authority Memphis TN, MS, AR 10.0 62 7 7Metro Transit Minneapolis MN 24.7 50 19 19New Orleans Regional Transit Authority New Orleans LA 26.9 247 10 10New Jersey Transit Corporation Newark NJ 116.2 120 55 61Hampton Roads Transit Norfolk VA 14.8 22 11 11Southeastern Pennsylvania Transportation Authority Philadelphia PA 82.9 695 45 2Valley Metro Rail, Inc. Phoenix AZ 39.2 140 33 33Port Authority of Allegheny County Pittsburgh PA 49.6 44 26 26City of Portland Portland OR 14.78 191 2 2Tri-County Metropolitan Transportation District of Oregon Portland OR, WA 133.5 214 37 37Sacramento Regional Transit District Sacramento CA 76.1 133 38 38Utah Transit Authority Salt Lake City UT 93.9 144 56 56North County Transit District San Diego CA 44.0 41 15 15San Diego Metropolitan Transit System San Diego CA 108.4 96 53 53San Francisco Municipal Railway San Francisco CA 83.1 417 9 9Santa Clara Valley Transportation Authority San Jose CA 81.0 168 65 65Central Puget Sound Regional Transit Authority Seattle WA 34.4 51 13 13King County Department of Transportation Seattle WA 2.7 18 11 11Bi-State Development Agency St. Louis MO, IL 91.1 25 37 37Hillsborough Area Regional Transit Authority Tampa FL 5.4 23 9 9Commuter rail, total3 19 23 8,733.9 3,450 1,247 841Rio Metro Regional Transit District Albuquerque NM 193.1 86 13 13Alaska Railroad Corporation Anchorage AK 959.9 133 10 10Maryland Transit Administration Baltimore MD 400.4 40 42 24Massachusetts Bay Transportation Authority Boston MA, NH, RI 776.1 258 137 100Northern New England Passenger Rail Authority Boston MA, ME, NH 287.6 103 12 12Northeast Illinois Regional Commuter Railroad Corporation Chicago IL, WI 975.4 571 241 173Northern Indiana Commuter Transportation District Chicago IL, IN 179.8 117 20 13Dallas Area Rapid Transit Dallas TX 72.3 44 10 10Denton County Transportation Authority Dallas TX 42.6 43 5 5Connecticut Department of Transportation Hartford CT 101.2 3 9 8Southern California Regional Rail Authority Los Angeles CA 777.8 423 55 55South Florida Regional Transportation Authority Miami FL 142.2 73 18 18Metro Transit Minneapolis MN 77.9 36 7 7Regional Transportation Authority Nashville TN 62.8 35 6 6Metro-North Commuter Railroad Company New York NY, NJ, CT 545.7 158 112 46MTA Long Island Rail Road New York NY, NJ, CT 638.2 343 124 103New Jersey Transit Corporation New York NY, NJ, CT 1,001.8 330 164 77Pennsylvania Department of Transportation Philadelphia PA 144.4 4 12 5Southeastern Pennsylvania Transportation Authority Philadelphia PA 446.9 283 154 66Utah Transit Authority Salt Lake City UT 174.5 65 16 16North County Transit District San Diego CA 82.2 34 8 8Peninsula Corridor Joint Powers Board San Francisco CA 153.7 55 32 26Altamont Commuter Express San Jose CA 172.0 127 10 10Central Puget Sound Regional Transit Authority Seattle WA 163.8 66 12 12Virginia Railway Express Washington DC, VA, MD 161.5 20 18 18United States, total 38 34 12,124.7 7,105 3,200 2,2001Many light rail lines have numerous stops in the street that do not meet the definition of a station.2Additional stations may be wheelchair accessible but do not comply with other provisions of the Americans with Disabilities Act.3Excludes commuter-type services operated independently by Amtrak or another intercity rail provider.
KEY: U = data are unavailable, ADA = Americans with Disabilities Act of 1990, MTA = Metropolitan Transportation Authority.
NOTES: Beginning in 2012, National Transit Database data are reported according to revised modal classifications. Light rail includes systems classified as light rail, hybrid rail, and street car rail. This table does not include other transit rail systems such as cable car, inclined plane, and monorail/automated guideway. For definition of Directional route-miles see table 1-8. Heavy rail, light rail, and commuter rail are defined in the glossary. For more information on individual transit agencies, see Annual National Transit Profilesavailable at www.ntdprogram.gov/ntdprogram/data.htm. For more information on footnotes, see the National Transit Database Glossary available at www.ntdprogram.gov/ntdprogram/Glossary.htm.
SOURCE: U.S. Department of Transportation, Federal Transit Adminstration, National Transit Database, table 21 and 23, available at www.ntdprogram.gov as of July 2015.
Table 1-9: Characteristics of Rail Transit by Transit Authority: 2013
1Many light rail lines have numerous stops in the street that do not meet the definition of a station. 2Additional stations may be wheelchair accessible but do not comply with other provisions of the Americans with Dis-abilities Act. 3Excludes commuter-type services operated independently by Amtrak or another intercity rail provider. KEY: U = data are unavailable, ADA = Americans with Disabilities Act of 1990, MTA = Metropolitan Transportation Authority. NOTES: Beginning in 2012, National Transit Database data are reported according to revised modal classifications. Light rail includes systems classified as light rail, hybrid rail, and street car rail. This table does not include other transit rail systems such as cable car, inclined plane, and monorail/automated guideway. For definition of Directional route-miles see table 1-8. Heavy rail, light rail, and commuter rail are defined in the glossary. For more information on individual transit agencies, see Annual National Transit Profiles available at www.ntdprogram.gov/ntdprogram/data.htm. For more information on footnotes, see the National Transit Database Glossary available at www.ntdprogram.gov/ntdprogram/Glossary.htm. SOURCE: U.S. Department of Transportation, Federal Transit Adminstration, National Transit Database, table 21 and 23, available at www.ntdprogram.gov as of July 2015.
10
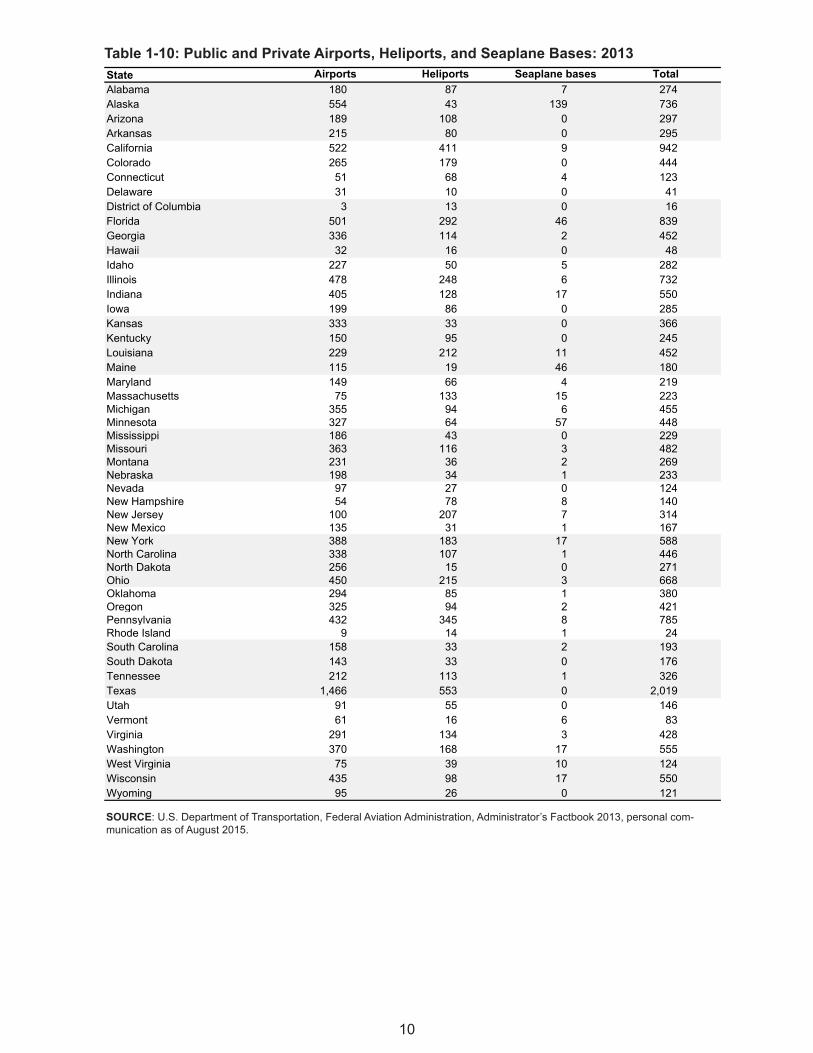
Table 1-10: Public and Private Airports, Heliports, and Seaplane Bases: 2013State Airports Heliports Seaplane bases TotalAlabama 180 87 7 274Alaska 554 43 139 736Arizona 189 108 0 297Arkansas 215 80 0 295California 522 411 9 942Colorado 265 179 0 444Connecticut 51 68 4 123Delaware 31 10 0 41District of Columbia 3 13 0 16Florida 501 292 46 839Georgia 336 114 2 452Hawaii 32 16 0 48Idaho 227 50 5 282Illinois 478 248 6 732Indiana 405 128 17 550Iowa 199 86 0 285Kansas 333 33 0 366Kentucky 150 95 0 245Louisiana 229 212 11 452Maine 115 19 46 180Maryland 149 66 4 219Massachusetts 75 133 15 223Michigan 355 94 6 455Minnesota 327 64 57 448Mississippi 186 43 0 229Missouri 363 116 3 482Montana 231 36 2 269Nebraska 198 34 1 233Nevada 97 27 0 124New Hampshire 54 78 8 140New Jersey 100 207 7 314New Mexico 135 31 1 167New York 388 183 17 588North Carolina 338 107 1 446North Dakota 256 15 0 271Ohio 450 215 3 668Oklahoma 294 85 1 380Oregon 325 94 2 421Pennsylvania 432 345 8 785Rhode Island 9 14 1 24South Carolina 158 33 2 193South Dakota 143 33 0 176Tennessee 212 113 1 326Texas 1,466 553 0 2,019Utah 91 55 0 146Vermont 61 16 6 83Virginia 291 134 3 428Washington 370 168 17 555West Virginia 75 39 10 124Wisconsin 435 98 17 550Wyoming 95 26 0 121SOURCE: U.S. Department of Transportation, Federal Aviation Administration, Administrator's Factbook 2013, personal communication as of August 2015.
Table 1-10: Public and Private Airports, Heliports, and Seaplane Bases: 2013
SOURCE: U.S. Department of Transportation, Federal Aviation Administration, Administrator’s Factbook 2013, personal com-munication as of August 2015.

11
Table 1-11: Top 50 Commercial Service Airport Enplanements by Air Carrier Category: 2013(For airports with scheduled service and 2,500 or more passengers enplaned)
Airport RankLarge certificated
air carriers
Commuter and small certificated
air carriersForeign
air carriersTotal
enplanementsAtlanta, GA: Hartsfield-Jackson Atlanta International 1 44,637,041 33,550 632,736 45,303,327Los Angeles, CA: Los Angeles International 2 25,847,206 12,263 6,580,509 32,439,978Chicago, IL: Chicago O'Hare International 3 29,503,162 486,465 2,332,500 32,322,127Dallas/Fort Worth, TX: Dallas/Fort Worth International 4 28,488,499 185 546,871 29,035,555Denver, CO: Denver International 5 24,994,870 189,374 311,796 25,496,040New York, NY: John F. Kennedy International 6 17,035,122 2,998 8,024,920 25,063,040San Francisco, CA: San Francisco International 7 18,853,016 102 2,848,334 21,701,452Charlotte, NC: Charlotte Douglas International 8 20,512,874 728,234 100,306 21,341,414Las Vegas, NV: McCarran International 9 18,469,206 10,245 1,429,067 19,908,518Phoenix, AZ: Phoenix Sky Harbor International 10 19,145,992 10,430 367,438 19,523,860Miami, FL: Miami International 11 15,298,878 142,853 4,013,136 19,454,867Houston, TX: George Bush Intercontinental/Houston 12 17,783,534 161,200 1,011,744 18,956,478Newark, NJ: Newark Liberty International 13 15,544,481 333,982 1,672,379 17,550,842Orlando, FL: Orlando International 14 15,223,612 54,679 1,657,823 16,936,114Seattle, WA: Seattle/Tacoma International 15 15,944,363 0 710,751 16,655,114Minneapolis, MN: Minneapolis-St Paul International 16 16,169,638 28,655 78,846 16,277,139Detroit, MI: Detroit Metro Wayne County 17 15,506,511 1,183 176,339 15,684,033Boston, MA: Logan International 18 13,105,579 151,754 1,517,139 14,774,472Philadelphia, PA: Philadelphia International 19 13,657,147 851,608 217,006 14,725,761New York, NY: LaGuardia 20 12,798,018 22,762 550,372 13,371,152Fort Lauderdale, FL: Fort Lauderdale-Hollywood International 21 10,570,528 123,363 813,372 11,507,263Baltimore, MD: Baltimore/Washington International Thurgood Marshall 22 10,901,703 60,770 90,262 11,052,735Washington, DC: Washington Dulles International 23 8,188,462 551,554 1,832,273 10,572,289Chicago, IL: Chicago Midway International 24 9,726,146 397 180,255 9,906,798Washington, DC: Ronald Reagan Washington National 25 9,700,202 47,911 89,431 9,837,544Salt Lake City, UT: Salt Lake City International 26 9,663,086 2,695 0 9,665,781Honolulu, HI: Honolulu International 27 8,094,186 41,387 1,360,751 9,496,324San Diego, CA: San Diego International 28 8,647,344 14,597 211,844 8,873,785Tampa, FL: Tampa International 29 7,913,976 122,274 230,465 8,266,715Portland, OR: Portland International 30 7,392,879 7,985 50,926 7,451,790St. Louis, MO: Lambert-St. Louis International 31 5,890,929 302,096 18,180 6,211,205Houston, TX: William P Hobby 32 5,371,409 411 57 5,371,877Nashville, TN: Nashville International 33 5,015,741 6,859 25,940 5,048,540Austin, TX: Austin - Bergstrom International 34 4,896,963 1,683 223 4,898,869Kansas City, MO: Kansas City International 35 4,811,901 8,394 14,916 4,835,211Oakland, CA: Metropolitan Oakland International 36 4,680,383 12,561 77,863 4,770,807New Orleans, LA: Louis Armstrong New Orleans International 37 4,552,542 1,043 21,444 4,575,029Santa Ana, CA: John Wayne Airport-Orange County 38 4,424,669 3 113,722 4,538,394Raleigh/Durham, NC: Raleigh-Durham International 39 4,414,850 33,000 31,246 4,479,096Cleveland, OH: Cleveland-Hopkins International 40 3,971,751 383,840 19,048 4,374,639San Jose, CA: Norman Y. Mineta San Jose International 41 4,233,840 398 74,430 4,308,668Sacramento, CA: Sacramento International 42 4,202,283 40 52,228 4,254,551San Juan, PR: Luis Munoz Marin International 43 3,826,532 172,982 116,988 4,116,502Dallas, TX: Dallas Love Field 44 4,012,459 6,935 1,048 4,020,442San Antonio, TX: San Antonio International 45 3,816,978 7,979 179,448 4,004,405Pittsburgh, PA: Pittsburgh International 46 3,671,268 114,994 24,964 3,811,226Fort Myers, FL: Southwest Florida International 47 3,619,737 18,192 150,298 3,788,227Indianapolis, IN: Indianapolis International 48 3,494,238 10,145 17,309 3,521,692Milwaukee, WI: General Mitchell International 49 3,201,178 1,636 10,904 3,213,718Columbus, OH: Port Columbus International 50 3,018,378 24,663 19,009 3,062,050Top 50 Airports, total 574,445,290 5,303,309 40,608,856 620,357,455United States, total (including U.S. territories) 684,668,326 11,698,417 42,148,518 738,515,261NOTES: Ranked by total enplaned passengers on air carriers of all types, including foreign air carriers. In previous years, the source of the data for this table was the FAA which includes information on Air Taxi operators. The current table uses data from the Office of Airline Information, which does not collect data on Air Taxi operators. Air carrier enplanements may not add to total enplanements because totals include enplanements for which carrier type is unknown.
SOURCE: U.S. Department of Transportation, Bureau of Transportation Statistics, TranStats Database, T-100 Market (All Carriers), available at www.transtats.bts.gov as of July 2015.
Table 1-11: Top 50 Commercial Service Airport Enplanements by Air Carrier Category: 2013 (For airports with scheduled service and 2,500 or more passengers enplaned)
NOTES: Ranked by total enplaned passengers on air carriers of all types, including foreign air carriers. In previous years, the source of the data for this table was the FAA which includes information on Air Taxi operators. The current table uses data from the Office of Airline Informa-tion, which does not collect data on Air Taxi operators. Air carrier enplanements may not add to total enplanements because totals include enplanements for which carrier type is unknown. SOURCE: U.S. Department of Transportation, Bureau of Transportation Statistics, TranStats Database, T-100 Market (All Carriers), available at www.transtats.bts.gov as of July 2015.

12
Table 1-12: Airport Enplanements by State and Air Carrier Category: 2013
StateLarge
certificated air carriersCommuter and small
certificated air carriersForeign
air carriersTotal
enplanementsAlabama 2,333,955 2,625 5 2,336,585Alaska 3,032,642 1,414,218 39,413 4,486,273Arizona 21,683,896 222,665 367,485 22,274,046Arkansas 1,727,416 17,927 0 1,745,343California 78,820,748 67,014 10,177,638 89,065,400Colorado 26,626,656 215,686 311,968 27,154,310Connecticut 2,560,335 137,993 20,170 2,718,498Delaware 52,570 182 0 52,752District of Columbia1 0 0 0 0Florida 62,744,528 666,285 7,120,541 70,531,354Georgia 45,822,965 67,850 632,783 46,523,598Hawaii 14,166,182 206,408 1,561,056 15,933,646Idaho 1,623,264 160 40 1,623,464Illinois 40,363,316 545,233 2,512,780 43,421,329Indiana 4,288,325 13,464 17,309 4,319,098Iowa 1,669,377 19,810 0 1,689,187Kansas 828,926 24,579 0 853,505Kentucky 4,964,237 42,328 14,061 5,020,626Louisiana 5,788,011 32,841 21,444 5,842,296Maine 1,067,404 45,114 570 1,113,088Maryland 10,914,012 124,333 90,380 11,128,725Massachusetts 13,180,375 437,312 1,517,188 15,134,875Michigan 17,777,179 85,030 179,541 18,041,750Minnesota 16,514,874 30,844 78,887 16,624,605Mississippi 1,039,695 20,645 0 1,060,340Missouri 11,239,567 366,102 33,932 11,639,601Montana 1,622,920 31,781 23 1,654,724Nebraska 2,168,564 37,608 27 2,206,199Nevada 20,197,639 114,554 1,429,082 21,741,275New Hampshire 1,184,018 18,600 31 1,202,649New Jersey 16,222,447 347,485 1,672,878 18,242,810New Mexico 2,582,109 30,976 0 2,613,085New York 37,360,154 653,399 8,589,400 46,602,953North Carolina 26,915,046 977,898 131,562 28,024,506North Dakota 1,121,226 23,754 0 1,144,980Ohio 9,145,558 499,464 38,195 9,683,217Oklahoma 3,106,473 57,985 59 3,164,517Oregon 8,393,973 16,597 51,032 8,461,602Pennsylvania 18,418,987 1,456,718 246,555 20,122,260Rhode Island 1,863,274 41,591 418 1,905,283South Carolina 3,544,246 227,946 7,849 3,780,041South Dakota 762,129 20,085 0 782,214Tennessee 8,528,051 146,603 25,940 8,700,594Texas 68,851,777 255,760 1,743,988 70,851,525Utah 9,828,852 20,197 5 9,849,054Vermont 590,570 18,531 1,929 611,030Virginia 21,478,785 1,065,180 1,923,759 24,467,724Washington 18,464,910 27,373 711,077 19,203,360West Virginia 260,899 127,946 9 388,854Wisconsin 4,815,440 1,964 10,911 4,828,315Wyoming 490,880 41,294 25 532,199United States, total (excl. U.S. territories) 678,749,382 11,067,937 41,281,945 731,099,264United States, total (incl. U.S. territories) 684,668,326 11,698,417 42,148,518 738,515,2611Reagan National is legally and geographically a part of Virginia.
NOTE: Enplanements consist of all persons boarding a flight other than crew and passengers who boarded at an earlier stop. In previous years the source of the data for this table was the FAA, which provides information on Air Taxi operators. The current table uses data from the Office of Airline Information, which does not collect data on Air Taxi operators. General aviation passengers are also excluded from the data. Air carrier enplanements may not add to total enplanements because totals include enplanements for which carrier type is unknown.
SOURCE: U.S. Department of Transportation, Bureau of Transportation Statistics, TranStats Database, T-100 Market (All Carriers), available at www.transtats.bts.gov as of July 2015.
Table 1-12: Airport Enplanements by State and Air Carrier Category: 2013
1Reagan National is legally and geographically a part of Virginia.
NOTE: Enplanements consist of all persons boarding a flight other than crew and passengers who boarded at an earlier stop. In previous years the source of the data for this table was the FAA, which provides information on Air Taxi operators. The current table uses data from the Office of Airline Information, which does not collect data on Air Taxi operators. General aviation passengers are also excluded from the data. Air carrier enplanements may not add to total enplanements because totals include enplanements for which carrier type is unknown. SOURCE: U.S. Department of Transportation, Bureau of Transportation Statistics, TranStats Database, T-100 Market (All Carriers), available at www.transtats.bts.gov as of July 2015.

13
Table 1-13: Number of Freight Railroads by Class: 2012
State Class I Regional LinehaulSwitching and
terminal Canadian1 TotalAlabama 5 1 17 3 0 26Alaska 0 1 0 0 0 1Arizona 2 0 4 3 0 9Arkansas 3 0 16 5 0 24California 2 0 14 8 0 24Colorado 2 3 6 3 0 14Connecticut 1 3 4 0 0 8Delaware 2 0 2 3 0 7District of Columbia 2 0 0 1 0 3Florida 2 2 9 1 0 14Georgia 2 0 21 1 0 24Hawaii 0 0 0 0 0 0Idaho 2 1 7 2 0 12Illinois 7 3 13 17 0 40Indiana 5 1 22 13 0 41Iowa 5 1 5 3 0 14Kansas 4 3 4 2 0 13Kentucky 5 1 7 0 0 13Louisiana 6 0 9 3 0 18Maine 0 2 5 1 0 8Maryland 2 1 4 2 0 9Massachusetts 1 3 5 3 0 12Michigan 4 0 13 9 1 27Minnesota 4 1 9 3 1 18Mississippi 5 1 18 3 0 27Missouri 6 0 4 7 0 17Montana 2 2 4 0 0 8Nebraska 3 1 5 3 0 12Nevada 2 0 0 0 0 2New Hampshire 0 2 7 0 0 9New Jersey 3 1 7 6 0 17New Mexico 2 0 3 1 0 6New York 3 4 23 8 1 39North Carolina 2 0 14 7 0 23North Dakota 2 2 4 0 0 8Ohio 4 1 14 15 0 34Oklahoma 3 0 12 4 0 19Oregon 2 1 11 4 0 18Pennsylvania 4 3 29 21 0 57Rhode Island 0 1 0 0 0 1South Carolina 2 0 9 4 0 15South Dakota 2 1 4 2 0 9Tennessee 6 0 14 5 0 25Texas 3 0 25 21 0 49Utah 2 0 2 3 0 7Vermont 0 3 5 0 0 8Virginia 2 0 6 1 0 9Washington 2 1 15 6 0 24West Virginia 2 0 5 1 0 8Wisconsin 4 1 3 0 0 8Wyoming 3 0 0 1 0 4United States, total 7 21 356 190 1 5751Refers to non-Class I, Canadian-owned lines.
Local
NOTES: According to the Association of American Railroads, a Class I railroad in 2012 is a railroad with operating revenues of at least$$452.7 million. A Regional railroad is a non-Class I, line-haul, freight railroad operating 350 or more miles of road or with revenues of at least $40 million or both. A Local railroad is a railroad which is neither a Class I nor a Regional railroad, and is engaged primarily in line-haul service. A Switching and terminal railroad is a non-Class I railroad engaged primarily in switching and/or terminal services for other railroads. States do not sum to totals; totals count railroads that operate in multiple states only once.
SOURCE: Association of American Railroads, Railroad Ten-Year Trends , available at www.aar.org/StatisticsAndPublications as of August 2015.
Table 1-13: Number of Freight Railroads by Class: 2012
1Refers to non-Class I, Canadian-owned lines.
NOTES: According to the Association of American Railroads, a Class I railroad in 2012 is a railroad with operating revenues of at least $$452.7 million. A Regional railroad is a non-Class I, line-haul, freight railroad operating 350 or more miles of road or with revenues of at least $40 million or both. A Local railroad is a railroad which is neither a Class I nor a Regional railroad, and is engaged primarily in line-haul service. A Switching and terminal railroad is a non-Class I railroad engaged primarily in switching and/or terminal services for other railroads. States do not sum to totals; totals count railroads that operate in multiple states only once. SOURCE: Association of American Railroads, Railroad Ten-Year Trends, available at www.aar.org/StatisticsAndPublications as of August 2015.

14
Table 1-14: Miles of Freight Railroad Operated by Class of Railroad: 20121
State Class I Regional LinehaulSwitching and
terminal Canadian2 Total3
Alabama 2,255 236 635 68 0 3,194Alaska 0 506 0 0 0 506Arizona 1,235 0 259 149 0 1,643Arkansas 1,677 0 895 126 0 2,698California 3,919 0 999 377 0 5,295Colorado 2,018 198 368 78 0 2,662Connecticut 6 210 148 0 0 364Delaware 183 0 47 20 0 250District of Columbia 15 0 0 5 0 20Florida 1,693 431 774 2 0 2,900Georgia 3,251 0 1,384 18 0 4,653Hawaii 0 0 0 0 0 0Idaho 962 33 481 147 0 1,623Illinois 5,851 148 649 338 0 6,986Indiana 2,510 304 1,076 185 0 4,075Iowa 3,189 364 271 45 0 3,869Kansas 2,816 1,429 367 243 0 4,855Kentucky 2,117 270 221 0 0 2,608Louisiana 2,354 0 515 58 0 2,927Maine 0 621 493 2 0 1,116Maryland 557 0 172 29 0 758Massachusetts 261 529 159 24 0 973Michigan 1,557 0 1,751 233 1 3,542Minnesota 3,625 3 651 127 44 4,450Mississippi 1,614 8 716 114 0 2,452Missouri 3,399 0 419 139 0 3,957Montana 2,061 865 274 0 0 3,200Nebraska 2,567 324 469 15 0 3,375Nevada 1,192 0 0 0 0 1,192New Hampshire 0 174 170 0 0 344New Jersey 189 91 176 525 0 981New Mexico 1,431 0 96 310 0 1,837New York 1,758 328 1,231 128 2 3,447North Carolina 2,335 0 709 214 0 3,258North Dakota 2,182 766 382 0 0 3,330Ohio 3,240 433 1,265 350 0 5,288Oklahoma 2,009 0 968 296 0 3,273Oregon 1,103 321 843 129 0 2,396Pennsylvania 2,428 772 1,374 577 0 5,151Rhode Island 0 19 0 0 0 19South Carolina 1,948 0 266 97 0 2,311South Dakota 1,494 74 98 87 0 1,753Tennessee 1,836 0 751 62 0 2,649Texas 8,369 0 1,236 864 0 10,469Utah 1,249 0 59 35 0 1,343Vermont 0 224 366 0 0 590Virginia 2,773 0 438 4 0 3,215Washington 1,735 0 1,272 185 0 3,192West Virginia 1,855 0 365 6 0 2,226Wisconsin 2,595 674 180 0 0 3,449Wyoming 1,851 0 0 9 0 1,860United States, total 95,264 10,355 26,438 6,420 47 138,524
2Refers to non-Class I, Canadian-owned lines.3Excludes 656 miles of track owned by Amtrak.
Local
1Miles operated under trackage rights provided by another (owning) railroad are excluded. Miles of railroad operated is synonymous with route-miles (so that a mile of single track is counted the same as a mile of double track). Sidings, turnouts, yard switching mileage, and mileage not operated are excluded. Year-to-year changes in miles operated are due to both changes in track mileage and changes in the number of railroads with rights for the same track.
NOTES: According to the Association of American Railroads, a Class I railroad in 2012 is a railroad with operating revenues of at least $452.7 million. A Regional railroad is a non-Class I, line-haul, freight railroad operating 350 or more miles of road or with revenues of at least $40 million or both. A Local railroad is a railroad which is neither a Class I nor a Regional railroad, and is engaged primarily in line-haul service. A Switching and terminal railroad is a non-Class I railroad engaged primarily in switching and/or terminal services for other railroads. This table is not comparable to past versions of this table.
SOURCE: Association of American Railroads, Railroad Ten-Year Trends , available at www.aar.org/StatisticsAndPublications as of July 2015.
Table 1-14: Miles of Freight Railroad Operated by Class of Railroad: 20121
1Miles operated under trackage rights provided by another (owning) railroad are excluded. Miles of railroad operated is synonymous with route-miles (so that a mile of single track is counted the same as a mile of double track). Sidings, turnouts, yard switching mileage, and mileage not operated are excluded. Year-to-year changes in miles operated are due to both changes in track mileage and changes in the number of railroads with rights for the same track. 2Refers to non-Class I, Canadian-owned lines. 3Excludes 656 miles of track owned by Amtrak.
NOTES: According to the Association of American Railroads, a Class I railroad in 2012 is a railroad with operating revenues of at least $452.7 million. A Regional railroad is a non-Class I, line-haul, freight railroad operating 350 or more miles of road or with revenues of at least $40 million or both. A Local railroad is a railroad which is neither a Class I nor a Regional railroad, and is en-gaged primarily in line-haul service. A Switching and terminal railroad is a non-Class I railroad engaged primarily in switching and/or terminal services for other railroads. This table is not comparable to past versions of this table. SOURCE: Association of American Railroads, Railroad Ten-Year Trends, available at www.aar.org/StatisticsAndPublications as of July 2015.

15
Table 1-15: Top 50 Water Ports by Tonnage: 2012 and 2013
Port Rank Total Foreign Domestic Rank Total Foreign DomesticSouth Louisiana, LA, Port of 1 252.1 119.3 132.7 1 238.6 111.7 126.9Houston, TX 2 238.2 162.4 75.7 2 229.2 159.6 69.7New York, NY and NJ 3 132.0 87.0 45.1 3 123.3 76.6 46.7Beaumont, TX 5 78.5 49.7 28.8 4 94.4 61.0 33.4Long Beach, CA 6 77.4 65.8 11.6 5 84.5 73.7 10.8New Orleans, LA 4 79.3 36.5 42.9 6 77.2 34.0 43.2Corpus Christi, TX 7 69.0 45.7 23.3 7 76.2 44.2 31.9Baton Rouge, LA 9 60.0 23.3 36.7 8 63.9 25.1 38.7Los Angeles, CA 8 61.8 54.9 7.0 9 57.9 52.0 5.9Plaquemines, LA, Port of 10 58.3 24.6 33.6 10 56.9 23.1 33.8Lake Charles, LA 13 54.4 31.3 23.1 11 56.6 31.1 25.5Mobile, AL 12 54.9 29.8 25.1 12 54.0 30.7 23.3Texas City, TX 11 56.7 36.0 20.8 13 49.7 30.4 19.3Norfolk Harbor, VA 15 46.2 40.5 5.8 14 48.9 42.3 6.6Huntington - Tristate 14 52.9 0.0 52.9 15 46.8 0.0 46.8Baltimore, MD 16 42.1 36.8 5.3 16 36.6 30.0 6.6Duluth-Superior, MN and WI 19 34.7 7.8 26.9 17 36.5 7.7 28.7Port Arthur, TX 23 30.6 19.9 10.7 18 34.7 25.2 9.5St. Louis, MO and IL 18 35.0 0.0 35.0 19 33.6 0.0 33.6Pittsburgh, PA 17 35.2 0.0 35.2 20 32.7 0.0 32.7Pascagoula, MS 21 33.8 24.8 9.0 21 32.4 24.1 8.3Tampa, FL 22 31.7 10.1 21.6 22 32.4 10.7 21.7Savannah, GA 20 34.1 31.9 2.2 23 32.0 30.2 1.8Newport News, VA 24 30.5 29.2 1.3 24 29.8 29.0 0.8Valdez, AK 26 27.9 0.0 27.9 25 28.2 0.0 28.2Philadelphia, PA 25 28.5 16.5 12.0 26 26.0 14.9 11.2Richmond, CA 30 22.6 12.7 9.9 27 23.5 14.1 9.4Portland, OR 27 25.5 17.2 8.3 28 23.4 15.0 8.4Tacoma, WA 28 24.9 19.0 5.9 29 22.9 18.4 4.5Port Everglades, FL 32 21.1 11.1 10.0 30 21.7 11.8 9.9Seattle, WA 29 23.7 18.4 5.3 31 20.6 14.8 5.7Freeport, TX 31 22.1 16.5 5.6 32 19.7 12.5 7.2Oakland, CA 34 18.7 16.4 2.3 33 19.3 16.5 2.8Paulsboro, NJ 35 17.4 11.5 5.8 34 19.1 12.0 7.1Charleston, SC 33 19.1 17.0 2.1 35 18.5 16.5 2.0Boston, MA 37 16.3 11.6 4.7 36 17.1 11.4 5.7Two Harbors, MN 38 16.2 0.8 15.4 37 16.7 0.1 16.6Jacksonville, FL 39 15.4 9.2 6.2 38 16.5 9.7 6.7Chicago, IL 36 17.1 1.5 15.6 39 15.4 1.6 13.9Honolulu, HI 40 14.3 1.0 13.4 40 14.3 1.4 12.9Memphis, TN 41 13.6 0.0 13.6 41 14.2 0.0 14.2Longview, WA 45 12.2 10.5 1.7 42 13.7 11.2 2.5Detroit, MI 43 12.9 2.6 10.3 43 13.0 2.3 10.7Indiana Harbor, IN 42 13.2 0.3 12.9 44 12.4 0.3 12.1Portland, ME 44 12.8 11.8 1.0 45 12.0 11.1 0.9Marcus Hook, PA 79 4.3 1.6 2.7 46 11.9 5.6 6.3Cincinnati, OH 51 11.1 0.0 11.1 47 11.7 0.0 11.7Cleveland, OH 50 11.3 1.4 9.9 48 11.5 1.5 9.9Galveston, TX 47 11.6 4.8 6.9 49 11.4 4.3 7.1Albany, NY 60 7.5 0.8 6.7 50 11.0 1.0 10.0United States, total water ports 2,465.3 1,317.9 1,147.5 2,462.7 1,291.1 1,171.6NOTE: Top 50 water ports are not additive due to shared tonnage between ports.
2012 2013Millions of short tons Millions of short tons
SOURCE: U.S. Army Corps of Engineers, Navigation Data Center, Waterborne Commerce Statistics Center, Principal Ports of the United States, available at www.navigationdatacenter.us/data/datappor.htm as of June 2015.
Table 1-15: Top 50 Water Ports by Tonnage: 2012 and 2013
NOTE: Top 50 water ports are not additive due to shared tonnage between ports. SOURCE: U.S. Army Corps of Engineers, Navigation Data Center, Waterborne Commerce Statistics Center, Principal Ports of the United States, available at www.navigationdatacenter.us/data/datappor.htm as of June 2015.

16
Table 1-16: Inland Waterway Mileage: 2013(Includes only the 39 states and the District of Columbia with inland waterways)State Miles1
Alabama 1,270Alaska 5,500Arkansas 1,860California 290Connecticut 120Delaware 100District of Columbia 10Florida 1,540Georgia 720Idaho 110Illinois 1,100Indiana 350Iowa 490Kansas 120Kentucky 1,590Louisiana 2,820Maine 70Maryland 530Massachusetts 90Minnesota 260Mississippi 870Missouri 1,030Nebraska 320New Hampshire 10New Jersey 360New York 390North Carolina 1,150Ohio 440Oklahoma 150Oregon 680Pennsylvania 260Rhode Island 40South Carolina 480South Dakota 80Tennessee 950Texas 830Virginia 670Washington 1,060West Virginia 680Wisconsin 230United States, total2 25,0001Mileages are rounded to the nearest 10 miles.2States do not add to total due to waterways on state boundaries.
NOTES: The waterway mileages were determined by the following methodology: Length of channels included were those channels (Corps projects and nonprojects) with a controlling draft of 9 feet or greater, and had commercial cargo traffic reported for CY98 of CY99, and were not offshore (i.e., channels in coastal areas included only the miles from the entrance channel inward). Channels within major bays are included (e.g., Chesapeake Bay, San Francisco Bay, Puget Sound, Long Island Sound, major sounds and straits in southeastern Alaska). Channels in the Great Lakes are not included, but waterways connecting lakes and the St. Lawrence Seaway inside the United States are included.
SOURCE: U.S. Army Corps of Engineers, Waterborne Commerce Statistics Center, National Waterway Network, personal communication as of July 2015.
Table 1-16: Inland Waterway Mileage: 2013 (Includes only the 39 states and the District of Columbia with inland waterways)
1Mileages are rounded to the nearest 10 miles.2States do not add to total due to waterways on state boundaries.
NOTES: The waterway mileages were determined by the following methodology: Length of channels included were those channels (Corps projects and nonprojects) with a controlling draft of 9 feet or greater, and had commercial cargo traffic reported for CY98 of CY99, and were not offshore (i.e., channels in coastal areas included only the miles from the entrance channel inward). Channels within major bays are included (e.g., Chesapeake Bay, San Francisco Bay, Puget Sound, Long Island Sound, major sounds and straits in southeastern Alaska). Channels in the Great Lakes are not included, but waterways connecting lakes and the St. Lawrence Seaway inside the United States are included.
SOURCE: U.S. Army Corps of Engineers, Waterborne Commerce Statistics Center, Na-tional Waterway Network, personal communication as of July 2015.

17
Table 1-17: Number of Metropolitan Planning Organizations: 2015Table 1-17: Number of Metropolitan Planning Organizations: 2015State Total Multi-state Intra-stateAlabama 14 2 12Alaska 2 0 2Arizona 8 1 7Arkansas 8 2 6California 19 2 17Colorado 5 0 5Connecticut 8 0 8Delaware 3 2 1District of Columbia 2 2 0Florida 27 1 26Georgia 16 3 13Hawaii 2 0 2Idaho 5 1 4Illinois 15 4 11Indiana 14 3 11Iowa 9 4 5Kansas 5 1 4Kentucky 9 4 5Louisiana 9 0 9Maine 4 0 4Maryland 7 5 2Massachusetts 10 0 10Michigan 13 0 13Minnesota 8 4 4Mississippi 4 1 3Missouri 8 2 6Montana 3 0 3Nebraska 4 2 2Nevada 4 1 3New Hampshire 4 0 4New Jersey 3 1 2New Mexico 5 1 4New York 14 0 14North Carolina 18 0 18North Dakota 3 2 1Ohio 17 5 12Oklahoma 4 1 3Oregon 9 1 8Pennsylvania 20 2 18Rhode Island 1 0 1South Carolina 11 1 10South Dakota 3 1 2Tennessee 11 5 6Texas 25 2 23Utah 4 0 4Vermont 1 0 1Virginia 15 3 12Washington 12 2 10West Virginia 8 5 3Wisconsin 14 4 10Wyoming 2 0 2United States, total 405 39 366U.S. total (incl. Puerto Rico) 408 39 369NOTE: The boundaries of multi-state metropolitan planning organizations (MPOs) cross state lines.
SOURCE: U.S. Department of Transportation, Federal Highway Administration and Federal Transit Administration, Transportation Planning Capacity Building, Metropolitan Planning Organization Database, available at www.planning.dot.gov/mpo.asp as of October 2015.
NOTES: The boundaries of multi-state metropolitan planning organizations (MPOs) cross state lines.
SOURCE: U.S. Department of Transportation, Federal Highway Administration and Federal Transit Administration, Transportation Planning Capacity Building, Metropolitan Planning Organization Database, available at www.planning.dot.gov/mpo.asp as of October 2015.


Chapter 2Safety
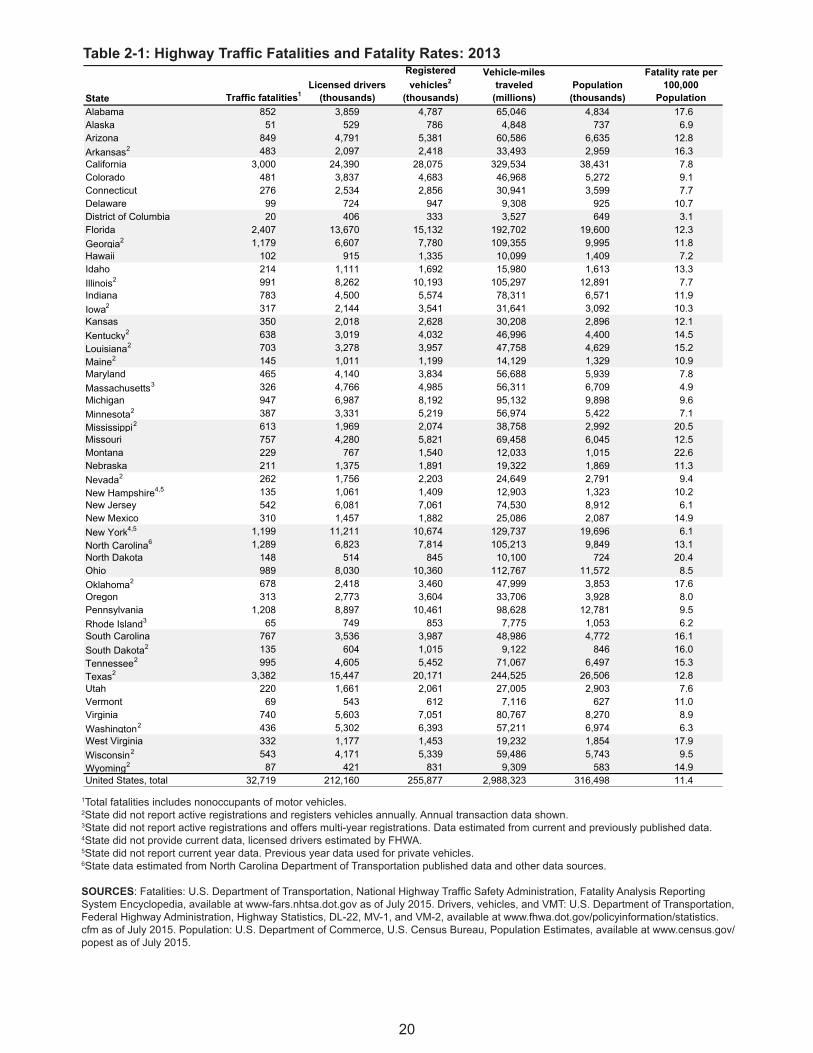
20
Table 2-1: Highway Traffic Fatalities and Fatality Rates: 2013
State Traffic fatalities1Licensed drivers
(thousands)
Registeredvehicles2
(thousands)
Vehicle-milestraveled
(millions)Population
(thousands)
Fatality rate per 100,000
PopulationAlabama 852 3,859 4,787 65,046 4,834 17.6Alaska 51 529 786 4,848 737 6.9Arizona 849 4,791 5,381 60,586 6,635 12.8Arkansas2 483 2,097 2,418 33,493 2,959 16.3California 3,000 24,390 28,075 329,534 38,431 7.8Colorado 481 3,837 4,683 46,968 5,272 9.1Connecticut 276 2,534 2,856 30,941 3,599 7.7Delaware 99 724 947 9,308 925 10.7District of Columbia 20 406 333 3,527 649 3.1Florida 2,407 13,670 15,132 192,702 19,600 12.3Georgia2 1,179 6,607 7,780 109,355 9,995 11.8Hawaii 102 915 1,335 10,099 1,409 7.2Idaho 214 1,111 1,692 15,980 1,613 13.3Illinois2 991 8,262 10,193 105,297 12,891 7.7Indiana 783 4,500 5,574 78,311 6,571 11.9Iowa2 317 2,144 3,541 31,641 3,092 10.3Kansas 350 2,018 2,628 30,208 2,896 12.1Kentucky2 638 3,019 4,032 46,996 4,400 14.5Louisiana2 703 3,278 3,957 47,758 4,629 15.2Maine2 145 1,011 1,199 14,129 1,329 10.9Maryland 465 4,140 3,834 56,688 5,939 7.8Massachusetts3 326 4,766 4,985 56,311 6,709 4.9Michigan 947 6,987 8,192 95,132 9,898 9.6Minnesota2 387 3,331 5,219 56,974 5,422 7.1Mississippi2 613 1,969 2,074 38,758 2,992 20.5Missouri 757 4,280 5,821 69,458 6,045 12.5Montana 229 767 1,540 12,033 1,015 22.6Nebraska 211 1,375 1,891 19,322 1,869 11.3Nevada2 262 1,756 2,203 24,649 2,791 9.4New Hampshire4,5 135 1,061 1,409 12,903 1,323 10.2New Jersey 542 6,081 7,061 74,530 8,912 6.1New Mexico 310 1,457 1,882 25,086 2,087 14.9New York4,5 1,199 11,211 10,674 129,737 19,696 6.1North Carolina6 1,289 6,823 7,814 105,213 9,849 13.1North Dakota 148 514 845 10,100 724 20.4Ohio 989 8,030 10,360 112,767 11,572 8.5Oklahoma2 678 2,418 3,460 47,999 3,853 17.6Oregon 313 2,773 3,604 33,706 3,928 8.0Pennsylvania 1,208 8,897 10,461 98,628 12,781 9.5Rhode Island3 65 749 853 7,775 1,053 6.2South Carolina 767 3,536 3,987 48,986 4,772 16.1South Dakota2 135 604 1,015 9,122 846 16.0Tennessee2 995 4,605 5,452 71,067 6,497 15.3Texas2 3,382 15,447 20,171 244,525 26,506 12.8Utah 220 1,661 2,061 27,005 2,903 7.6Vermont 69 543 612 7,116 627 11.0Virginia 740 5,603 7,051 80,767 8,270 8.9Washington2 436 5,302 6,393 57,211 6,974 6.3West Virginia 332 1,177 1,453 19,232 1,854 17.9Wisconsin2 543 4,171 5,339 59,486 5,743 9.5Wyoming2 87 421 831 9,309 583 14.9United States, total 32,719 212,160 255,877 2,988,323 316,498 11.41Total fatalities includes nonoccupants of motor vehicles.2State did not report active registrations and registers vehicles annually. Annual transaction data shown.3State did not report active registrations and offers multi-year registrations. Data estimated from current and previously published data.4State did not provide current data, licensed drivers estimated by FHWA.5State did not report current year data. Previous year data used for private vehicles.6State data estimated from North Carolina Department of Transportation published data and other data sources.
SOURCES: Fatalities: U.S. Department of Transportation, National Highway Traffic Safety Administration, Fatality Analysis Reporting SystemEncyclopedia, available at www-fars.nhtsa.dot.gov as of July 2015. Drivers, vehicles, and VMT: U.S. Department of Transportation, Federal Highway Administration, Highway Statistics, DL-22, MV-1, and VM-2, available at www.fhwa.dot.gov/policyinformation/statistics.cfm as of July 2015. Population: U.S. Department of Commerce, U.S. Census Bureau, Population Estimates, available at www.census.gov/popest as of July 2015.
Table 2-1: Highway Traffic Fatalities and Fatality Rates: 2013
1Total fatalities includes nonoccupants of motor vehicles.2State did not report active registrations and registers vehicles annually. Annual transaction data shown.3State did not report active registrations and offers multi-year registrations. Data estimated from current and previously published data.4State did not provide current data, licensed drivers estimated by FHWA.5State did not report current year data. Previous year data used for private vehicles.6State data estimated from North Carolina Department of Transportation published data and other data sources. SOURCES: Fatalities: U.S. Department of Transportation, National Highway Traffic Safety Administration, Fatality Analysis Reporting System Encyclopedia, available at www-fars.nhtsa.dot.gov as of July 2015. Drivers, vehicles, and VMT: U.S. Department of Transportation, Federal Highway Administration, Highway Statistics, DL-22, MV-1, and VM-2, available at www.fhwa.dot.gov/policyinformation/statistics.cfm as of July 2015. Population: U.S. Department of Commerce, U.S. Census Bureau, Population Estimates, available at www.census.gov/popest as of July 2015.
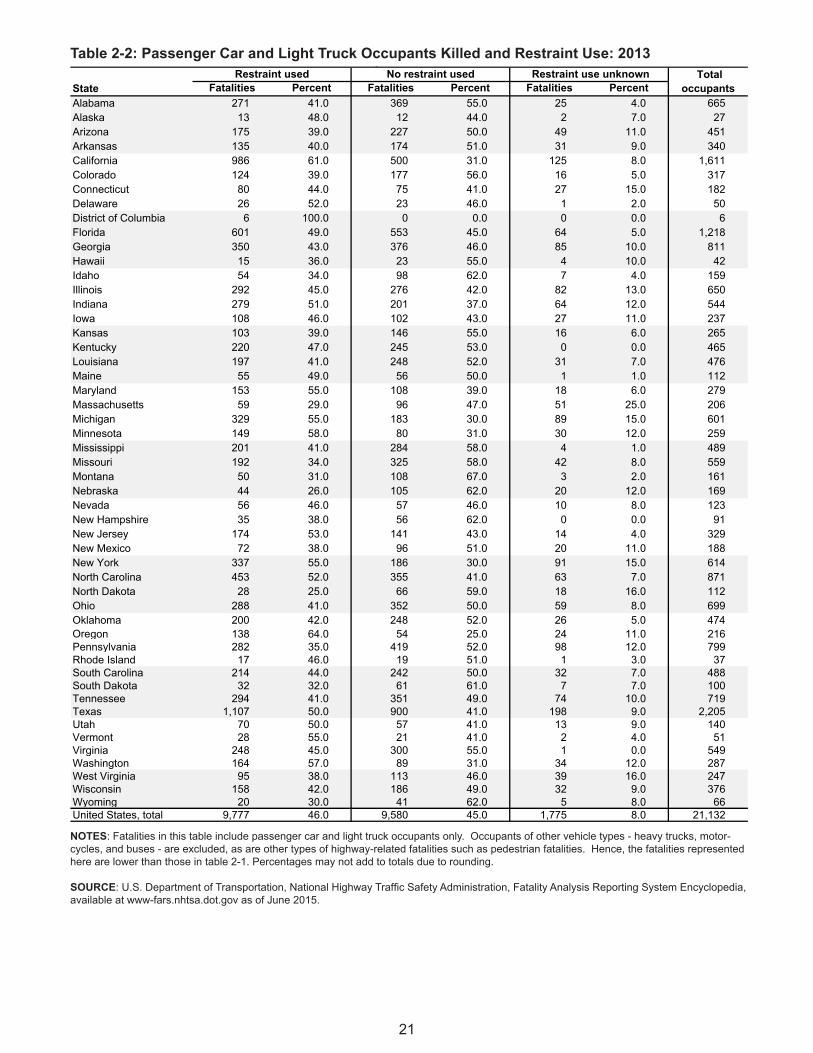
21
Table 2-2: Passenger Car and Light Truck Occupants Killed and Restraint Use: 2013
State Fatalities Percent Fatalities Percent Fatalities PercentAlabama 271 41.0 369 55.0 25 4.0 665Alaska 13 48.0 12 44.0 2 7.0 27Arizona 175 39.0 227 50.0 49 11.0 451Arkansas 135 40.0 174 51.0 31 9.0 340California 986 61.0 500 31.0 125 8.0 1,611Colorado 124 39.0 177 56.0 16 5.0 317Connecticut 80 44.0 75 41.0 27 15.0 182Delaware 26 52.0 23 46.0 1 2.0 50District of Columbia 6 100.0 0 0.0 0 0.0 6Florida 601 49.0 553 45.0 64 5.0 1,218Georgia 350 43.0 376 46.0 85 10.0 811Hawaii 15 36.0 23 55.0 4 10.0 42Idaho 54 34.0 98 62.0 7 4.0 159Illinois 292 45.0 276 42.0 82 13.0 650Indiana 279 51.0 201 37.0 64 12.0 544Iowa 108 46.0 102 43.0 27 11.0 237Kansas 103 39.0 146 55.0 16 6.0 265Kentucky 220 47.0 245 53.0 0 0.0 465Louisiana 197 41.0 248 52.0 31 7.0 476Maine 55 49.0 56 50.0 1 1.0 112Maryland 153 55.0 108 39.0 18 6.0 279Massachusetts 59 29.0 96 47.0 51 25.0 206Michigan 329 55.0 183 30.0 89 15.0 601Minnesota 149 58.0 80 31.0 30 12.0 259Mississippi 201 41.0 284 58.0 4 1.0 489Missouri 192 34.0 325 58.0 42 8.0 559Montana 50 31.0 108 67.0 3 2.0 161Nebraska 44 26.0 105 62.0 20 12.0 169Nevada 56 46.0 57 46.0 10 8.0 123New Hampshire 35 38.0 56 62.0 0 0.0 91New Jersey 174 53.0 141 43.0 14 4.0 329New Mexico 72 38.0 96 51.0 20 11.0 188New York 337 55.0 186 30.0 91 15.0 614North Carolina 453 52.0 355 41.0 63 7.0 871North Dakota 28 25.0 66 59.0 18 16.0 112Ohio 288 41.0 352 50.0 59 8.0 699Oklahoma 200 42.0 248 52.0 26 5.0 474Oregon 138 64.0 54 25.0 24 11.0 216Pennsylvania 282 35.0 419 52.0 98 12.0 799Rhode Island 17 46.0 19 51.0 1 3.0 37South Carolina 214 44.0 242 50.0 32 7.0 488South Dakota 32 32.0 61 61.0 7 7.0 100Tennessee 294 41.0 351 49.0 74 10.0 719Texas 1,107 50.0 900 41.0 198 9.0 2,205Utah 70 50.0 57 41.0 13 9.0 140Vermont 28 55.0 21 41.0 2 4.0 51Virginia 248 45.0 300 55.0 1 0.0 549Washington 164 57.0 89 31.0 34 12.0 287West Virginia 95 38.0 113 46.0 39 16.0 247Wisconsin 158 42.0 186 49.0 32 9.0 376Wyoming 20 30.0 41 62.0 5 8.0 66United States, total 9,777 46.0 9,580 45.0 1,775 8.0 21,132
SOURCE: U.S. Department of Transportation, National Highway Traffic Safety Administration, Fatality Analysis Reporting System Encyclopedia, available at www-fars.nhtsa.dot.gov as of June 2015.
Restraint used No restraint used Restraint use unknown Total occupants
NOTES: Fatalities in this table include passenger car and light truck occupants only. Occupants of other vehicle types - heavy trucks,motorcycles, and buses - are excluded, as are other types of highway-related fatalities such as pedestrian fatalities. Hence, the fatalities represented here are lower than those in table 2-1. Percentages may not add to totals due to rounding.
Table 2-2: Passenger Car and Light Truck Occupants Killed and Restraint Use: 2013
NOTES: Fatalities in this table include passenger car and light truck occupants only. Occupants of other vehicle types - heavy trucks, motor-cycles, and buses - are excluded, as are other types of highway-related fatalities such as pedestrian fatalities. Hence, the fatalities represented here are lower than those in table 2-1. Percentages may not add to totals due to rounding. SOURCE: U.S. Department of Transportation, National Highway Traffic Safety Administration, Fatality Analysis Reporting System Encyclopedia, available at www-fars.nhtsa.dot.gov as of June 2015.

22
Table 2-3: Large Truck Involvement in Fatal Crashes: 2013
State NumberPercent of state total Number
Percent of state total
Alabama 785 1,116 25 3.2 107 2.7Alaska 44 67 2 4.5 4 0.1Arizona 659 1,173 11 1.7 69 1.8Arkansas 430 638 16 3.7 86 2.2California 2,121 4,125 33 1.6 249 6.4Colorado 417 630 11 2.6 51 1.3Connecticut 237 375 2 0.8 19 0.5Delaware 73 150 2 2.7 10 0.3District of Columbia 10 31 1 10.0 3 0.1Florida 1,755 3,358 25 1.4 187 4.8Georgia 970 1,636 26 2.7 157 4.0Hawaii 75 123 3 4.0 7 0.2Idaho 197 277 6 3.0 32 0.8Illinois 833 1,353 17 2.0 136 3.5Indiana 687 1,093 16 2.3 115 2.9Iowa 294 434 10 3.4 59 1.5Kansas 318 473 12 3.8 66 1.7Kentucky 577 880 10 1.7 71 1.8Louisiana 590 969 13 2.2 74 1.9Maine 130 189 0 0.0 16 0.4Maryland 348 648 5 1.4 61 1.6Massachusetts 250 417 4 1.6 29 0.7Michigan 769 1,363 7 0.9 88 2.3Minnesota 346 563 10 2.9 74 1.9Mississippi 554 781 17 3.1 57 1.5Missouri 677 1,002 19 2.8 77 2.0Montana 204 266 2 1.0 19 0.5Nebraska 197 279 6 3.0 27 0.7Nevada 186 372 4 2.2 24 0.6New Hampshire 118 168 1 0.8 11 0.3New Jersey 396 750 9 2.3 64 1.6New Mexico 255 389 16 6.3 55 1.4New York 816 1,579 16 2.0 114 2.9North Carolina 1,093 1,756 16 1.5 125 3.2North Dakota 145 215 20 13.8 64 1.6Ohio 876 1,485 27 3.1 151 3.9Oklahoma 604 972 29 4.8 116 3.0Oregon 258 421 5 1.9 34 0.9Pennsylvania 1,040 1,694 31 3.0 170 4.4Rhode Island 48 83 0 0.0 5 0.1South Carolina 651 1,030 10 1.5 67 1.7South Dakota 126 184 2 1.6 18 0.5Tennessee 901 1,400 19 2.1 121 3.1Texas 2,837 4,651 111 3.9 493 12.6Utah 183 289 5 2.7 21 0.5Vermont 64 89 1 1.6 7 0.2Virginia 654 1,001 24 3.7 100 2.6Washington 374 593 5 1.3 38 1.0West Virginia 302 431 9 3.0 48 1.2Wisconsin 494 801 13 2.6 85 2.2Wyoming 83 106 7 8.4 25 0.6United States, total 27,051 44,868 691 2.6 3,906 8.7SOURCE: U.S. Department of Transportation, National Highway Traffic Safety Administration, Fatality Analysis Reporting System Encyclopedia, available at www-fars.nhtsa.dot.gov as of July 2015.
Total occupant fatalities in all motor vehicle
crashes
Total vehicles involved in all
fatal motor vehicle crashes
Large trucksOccupant fatalities Involved in fatal crashes
Table 2-3: Large Truck Involvement in Fatal Crashes: 2013
SOURCE: U.S. Department of Transportation, National Highway Traffic Safety Administration, Fatality Analysis Reporting System Encyclopedia, available at www-fars.nhtsa.dot.gov as of July 2015.

23
Table 2-4: Key Provisions of Safety Belt Use Laws: 2012Table 2-4: Key Provisions of Safety Belt Use Laws: 2012
State Effective1 Enforcement2 Seats4 Ages5 ExemptionsAlabama 7/18/1991 Primary Not more than $25 Front All Medical reasons, model year <1965, rural mail carriers/
newspaper delivery vehicles, vehicles operating in reverse.
Alaska 9/12/1990 Primary Not more than $15 All 16 years and older School buses, emergency vehicles, mail or newspaper delivery vehicles, non-highway vehicles (generally, off-road or snowmobiles).
Arizona 1/1/1991 Secondary Not more than $10 All
Front
5-15 years
5 years and older
Designed for >10 passengers, model year <1972, rural mail carriers, medical reasons.
Arkansas 7/15/1991 Primary Not more than $25 Front All Model year < 1972. Not required when an emergency exists that threatens the life of a child or person operating a motor vehicle. Any child who is physically unable because of a medical condition (as certified by a physician) is exempted.
California 1/1/1986 Primary Not more than $20 All 16 years and older Medical reasons, emergency vehicles, rural postal service vehicles, newspaper delivery vehicles, recycling vehicles, taxis.
Colorado 7/1/1987 Secondary $65 Front All Ambulence crew, peace officer, medical reasons, passenger buses, school buses, postal service vehicles, delivery and pickup service vehicles.
Connecticut 1/1/1986 Primary $504 Front All Medical reasons, emergency vehicles other than fire-fighting apparatus, postal service vehicles, newspaper delivery vehicles.
Delaware 1/1/1992 Primary $25 All 16 years and older Medical reasons, postal service vehicles, tractors, off-highway vehicles, electric personal assistive mobility devices.
District of Columbia 12/12/1985 Primary $50 All 16 years and older Vehicles manufactured before July 1, 1966; medical reasons; all seat belts occupied;seating for >8 people, taxis (6pm-6am).
Florida 7/1/1986 Primary $30 All
Front
6-17 years
6 years and older
Medical reasons; newspaper delivery vehicles; solid waste/ recyclable collection service vehicles working designated routes; persons traveling in the living quarters of a recreational vehicle or a space within a truck body primarily intended for merchandise or property; school buses; buses that transport for compensation; farm tractors or implements of husbandry; trucks >26,000 lb.
Georgia 9/1/1988 Primary Not more than $15 All
Front
8-17 years
18 years and older
Pickups, vehicles designed for >10 passengers, off-road vehicles, vehicles used for frequent stops (all seats), rural postal vehicles, newspaper delivery vehicles, emergency vehicles, driver in reverse, taxis, public transit vehicles.
Hawaii 12/16/1985 Primary $45 All
Front
8-17 years
15 years and older
Bus or school bus >10,000 lb, emergency vehicles, taxicabs. DOT may establish additional exemptions.
Idaho 7/1/1986 Secondary $10 All 7 years and older Vehicles >8,000 lb, mail carriers, implements of husbandry, motorcycles.
Illinois 1/1/1988 Primary Not more than $25 All
Front
18 years and under if driver is under 19 years
16 years and older
Motorcycles, vehicles that stop frequently for medical reasons, rural letter carriers, model year <1965.
Indiana 7/1/1987 Primary Not more than $25 All All Medical reasons, vehicles that stop frequently, farm vehicles, RVs, postal vehicles, non-drivers in parades, public utility vehicles, towing recovery vehicles, occupant other than operator of vehicle used by a public utility in an emergency.
Iowa 7/1/1986 Primary $50 All
Front
17 years and under
18 years and older
Delivery vehicles that do not exceed 25 mph between stops, bus passengers, medical reasons, model year <1965, emergency vehicles, motorcycles, rural letter carriers.
Kansas 7/1/1986 Primary7 $106 All
Front
14-17 years
18 years and older
Designed for >10 people, truck >12,000 lb, off-road vehicles, postal vehicles, vehicles delivering newspapers.
Kentucky 7/15/1994 Primary Not more than $25 All All Designed for >10 people, farm trucks registered for agricultural use only and with gross weight 2,000 lb or greater, motorcycles.
Louisiana 7/1/1986 Primary $25 All 13 years and older Vehicles with gross weight >10,000 lb, utility vehicles traveling <20 mph, model year <1981, postal vehicles, farm vehicles, persons delivering newspapers.
Maine 12/26/1995 Primary $50 All All Medical reasons, rural mail carriers, persons delivering newspapers, postal vehicles, passengers riding in taxi or limousine for hire.
Maryland 7/1/1986 Primary Not more than $26 All
Front
15 years and under
16 years and older
“Historical” vehicles, for-hire vehicles, motorcycles, trucks, buses, vehicles delivering mail, vehicles built before June 1, 1964.
Massachusetts 2/1/1994 Secondary $258 All All Buses, trucks 18,000 lb or more, taxis, utility vehicles, model year <1966, postal vehicles, farm vehicles, authorized emergency vehicles, side-facing seat in car owned for antique collecting.
Base fine3Seat belt required
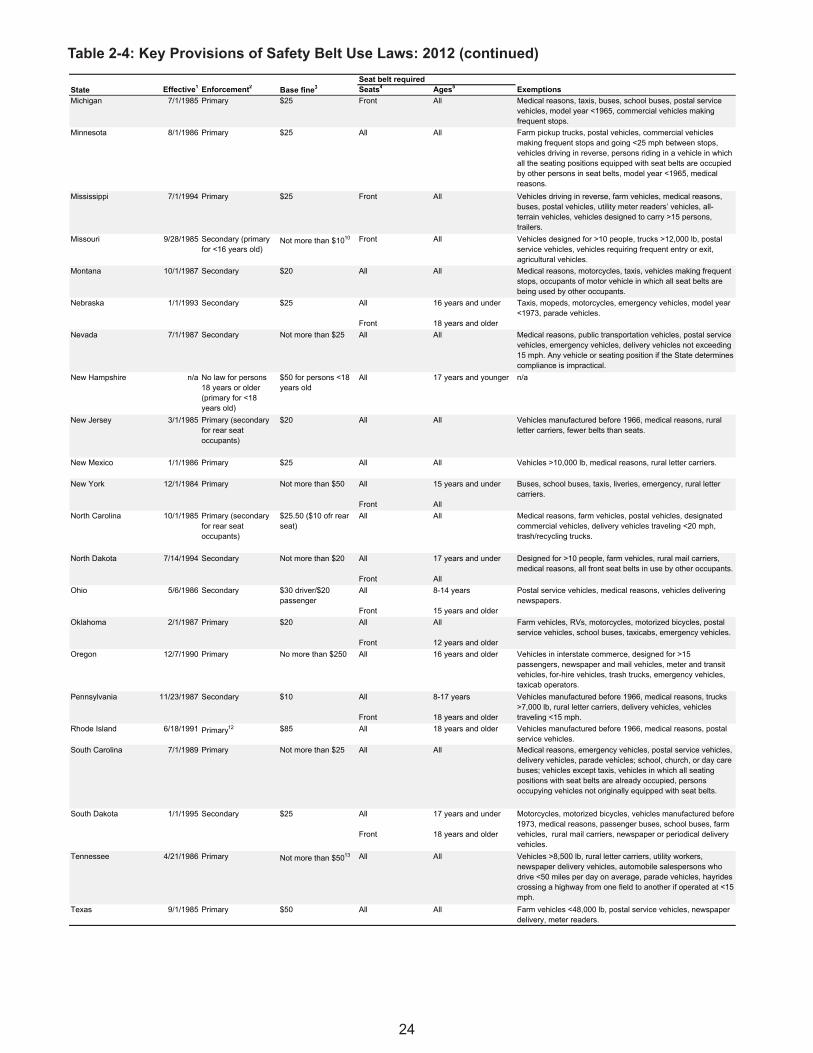
24
Table 2-4: Key Provisions of Safety Belt Use Laws: 2012 (continued)Table 2-4: Key Provisions of Safety Belt Use Laws: 2012
State Effective1 Enforcement2 Seats4 Ages5 ExemptionsBase fine3Seat belt required
Michigan 7/1/1985 Primary $25 Front All Medical reasons, taxis, buses, school buses, postal service vehicles, model year <1965, commercial vehicles making frequent stops.
Minnesota 8/1/1986 Primary $25 All All Farm pickup trucks, postal vehicles, commercial vehicles making frequent stops and going <25 mph between stops, vehicles driving in reverse, persons riding in a vehicle in which all the seating positions equipped with seat belts are occupied by other persons in seat belts, model year <1965, medical reasons.
Mississippi 7/1/1994 Primary $25 Front All Vehicles driving in reverse, farm vehicles, medical reasons, buses, postal vehicles, utility meter readers’ vehicles, all-terrain vehicles, vehicles designed to carry >15 persons, trailers.
Missouri 9/28/1985 Secondary (primary for <16 years old)
Not more than $1010 Front All Vehicles designed for >10 people, trucks >12,000 lb, postal service vehicles, vehicles requiring frequent entry or exit, agricultural vehicles.
Montana 10/1/1987 Secondary $20 All All Medical reasons, motorcycles, taxis, vehicles making frequent stops, occupants of motor vehicle in which all seat belts are being used by other occupants.
Nebraska 1/1/1993 Secondary $25 All
Front
16 years and under
18 years and older
Taxis, mopeds, motorcycles, emergency vehicles, model year <1973, parade vehicles.
Nevada 7/1/1987 Secondary Not more than $25 All All Medical reasons, public transportation vehicles, postal service vehicles, emergency vehicles, delivery vehicles not exceeding 15 mph. Any vehicle or seating position if the State determines compliance is impractical.
New Hampshire n/a No law for persons 18 years or older (primary for <18 years old)
$50 for persons <18 years old
All 17 years and younger n/a
New Jersey 3/1/1985 Primary (secondary for rear seat occupants)
$20 All All Vehicles manufactured before 1966, medical reasons, rural letter carriers, fewer belts than seats.
New Mexico 1/1/1986 Primary $25 All All Vehicles >10,000 lb, medical reasons, rural letter carriers.
New York 12/1/1984 Primary Not more than $50 All
Front
15 years and under
All
Buses, school buses, taxis, liveries, emergency, rural letter carriers.
North Carolina 10/1/1985 Primary (secondary for rear seat occupants)
$25.50 ($10 ofr rear seat)
All All Medical reasons, farm vehicles, postal vehicles, designated commercial vehicles, delivery vehicles traveling <20 mph, trash/recycling trucks.
North Dakota 7/14/1994 Secondary Not more than $20 All
Front
17 years and under
All
Designed for >10 people, farm vehicles, rural mail carriers, medical reasons, all front seat belts in use by other occupants.
Ohio 5/6/1986 Secondary $30 driver/$20 passenger
All
Front
8-14 years
15 years and older
Postal service vehicles, medical reasons, vehicles delivering newspapers.
Oklahoma 2/1/1987 Primary $20 All
Front
All
12 years and older
Farm vehicles, RVs, motorcycles, motorized bicycles, postal service vehicles, school buses, taxicabs, emergency vehicles.
Oregon 12/7/1990 Primary No more than $250 All 16 years and older Vehicles in interstate commerce, designed for >15 passengers, newspaper and mail vehicles, meter and transit vehicles, for-hire vehicles, trash trucks, emergency vehicles, taxicab operators.
Pennsylvania 11/23/1987 Secondary $10 All
Front
8-17 years
18 years and older
Vehicles manufactured before 1966, medical reasons, trucks >7,000 lb, rural letter carriers, delivery vehicles, vehicles traveling <15 mph.
Rhode Island 6/18/1991 Primary12 $85 All 18 years and older Vehicles manufactured before 1966, medical reasons, postal service vehicles.
South Carolina 7/1/1989 Primary Not more than $25 All All Medical reasons, emergency vehicles, postal service vehicles, delivery vehicles, parade vehicles; school, church, or day care buses; vehicles except taxis, vehicles in which all seating positions with seat belts are already occupied, persons occupying vehicles not originally equipped with seat belts.
South Dakota 1/1/1995 Secondary $25 All
Front
17 years and under
18 years and older
Motorcycles, motorized bicycles, vehicles manufactured before 1973, medical reasons, passenger buses, school buses, farm vehicles, rural mail carriers, newspaper or periodical delivery vehicles.
Tennessee 4/21/1986 Primary Not more than $5013 All All Vehicles >8,500 lb, rural letter carriers, utility workers, newspaper delivery vehicles, automobile salespersons who drive <50 miles per day on average, parade vehicles, hayrides crossing a highway from one field to another if operated at <15 mph.
Texas 9/1/1985 Primary $50 All All Farm vehicles <48,000 lb, postal service vehicles, newspaper delivery, meter readers.

25
Table 2-4: Key Provisions of Safety Belt Use Laws: 2012 (continued)
1Effective date of first belt law in the state. 2Primary enforcement enables police officers to stop vehicles and write citations whenever they observe a violation of the seat belt law. Secondary enforcement allows police officers to write a citation for seat belt infractions only after stopping a vehicle for some other traffic infraction. 3Additional processing and surcharge fees are likely to apply. 4The word “All” used in this category means everyone must be restrained. For children, that may be in a CR 5May include rear-facing CRs, forward-facing CRs, and booster seats. 6If a driver under 18 years old commits a violation, he/she is subject to a higher fine of $75. 7Secondary enforcement for other seating positions. 8The fine is $60 for violators 14-17 years old. 9Louisiana HB 197 was signed by the Governor on May 29, 2012, to expand the seat belt requirement for all seating positions to include SUVs. 10Drivers in Massachusetts may be fined $25 for violating the belt law themselves and $25 for each unrestrained passenger 12-16 years old. 11The fine is $50 for violators 8-15 years old. 12Rhode Island’s primary seat belt law includes a sunset provision that will revert the law to secondary enforcement on June 30, 2013. 13In lieu of a court appearance, a first offender may pay a fine of $10; for a second or subsequent offense, the fine is $20. 14Upgraded to primary enforcement on May 23, 2013, effective July 9, 2013. 15Penalty not less than $30 or more than $75 for a violation involving children <4 years old and not less than $10 or more than $25 for children 4–8 years old. 16Not less than $10 for passenger or more than $25 for driver.
KEY: n/a = not applicable
NOTES: For the most current provisions of state seat belt laws, see the Insurance Institute for Highway Safety’s Safety Belt Use Laws, available at /iihs.org/laws/SafetyBeltUse.aspx. For more information on child restraint laws, see Traffic Safety Facts Annual Report, available at www-nrd.nhtsa.dot.gov/Cats.
SOURCES: Effective Dates: Insurance Institute for Highway Safety, Highway Loss Data Institute, Safety Belt Use Laws, available at www.iihs.org/iihs/topics/t/safety-belts/topicoverview as of June 2015. Enforcement, Base fine, Seat belt required and Exemptions: U.S. Department of Transportation, National Highway Traffic Safety Administration, Traffic Safety Facts 2012, table 8, available at www-nrd.nhtsa.dot.gov/Cats as of June 2015.
Table 2-4: Key Provisions of Safety Belt Use Laws: 2012
State Effective1 Enforcement2 Seats4 Ages5 ExemptionsBase fine3Seat belt required
Utah 4/28/1986 Secondary (primary for drivers and occupants 18 years and younger)
Not more than $45 All All Vehicles manufactured before 1966, medical reasons, all seats occupied or person is riding in a seating position not equipped with seat belts.
Vermont 1/1/1994 Secondary (primary for drivers and occupants 17 years and younger)
$25 All All Buses, taxis, rural mail carriers, delivery vehicles traveling <15 mph, emergency vehicles, farm tractors, vehicles ordered by emergency personnel to evacuate persons from stricken area.
Virginia 1/1/1988 Secondary (primary for passengers 17 years and younger in all seats)
$25 All
Front
17 years and under
18 years and older
Medical reasons, trucks >10,000 lb, school buses, motor homes, taxis, police vehicles enforcing parking or transporting prisoners, law enforcement officers when seat belts are impractical, rural mail carriers, newspaper delivery vehicles, utility meter readers, commercial vehicles making frequent stops.
Washington 6/11/1986 Primary $124 All All Medical reasons, vehicles designed for >10 people; when all designated seating positions are occupied; vehicles exempted by State regulation, including farm construction or commercial vehicles making frequent stops.
West Virginia 9/1/1993 Secondary Not more than $25 All
Front
8-17 years
All
Motorcycles, vehicles designed for >10 people, vehicles manufactured before 1967, medical reasons, rural mail carriers, trailers. All seat belts in use and vehicle contains more passengers than total number of seat belts or other safety devices installed in compliance with Federal motor vehicle safety standards.
Wisconsin 12/1/1987 Primary $10 All All Emergency vehicles in which compliance could endanger passngers; taxis, farm trucks engaged in farming, rural mail carriers, land surveyors.
Wyoming 6/8/1989 Secondary Not more than $2516 All All Medical reasons, postal vehicles; excess passengers exempted if all seats occupied.
14Upgraded to primary enforcement on May 23, 2013, effective July 9, 2013. 15Penalty not less than $30 or more than $75 for a violation involving children <4 years old and not less than $10 or more than $25 for children 4–8 years old
KEY: n/a = not applicable
SOURCES: Effective Dates: Insurance Institute for Highway Safety, Highway Loss Data Institute, Safety Belt Use Laws, available at www.iihs.org/iihs/topics/t/safety-belts/topicoverview as of June 2015. Enforcement, Base fine, Seat belt required and Exemptions: U.S. Department of Transportation, National Highway Traffic Safety Administration, Traffic Safety Facts 2012, table 8, available at www-nrd.nhtsa.dot.gov/Cats as of June 2015.
NOTES: For the most current provisions of state seat belt laws, see the Insurance Institute for Highway Safety's Safety Belt Use Laws, available at /iihs.org/laws/SafetyBeltUse.aspx. For more information on child restraint laws, see Traffic Safety Facts Annual Report, available at www-nrd.nhtsa.dot.gov/Cats.
4The word “All” used in this category means everyone must be restrained. For children, that may be in a CR
1Effective date of first belt law in the state.2Primary enforcement enables police officers to stop vehicles and write citations whenever they observe a violation of the seat belt law. Secondary enforcement allows police officers to write a citation for seat belt infractions only after stopping a vehicle for some other traffic infraction.3Additional processing and surcharge fees are likely to apply
16Not less than $10 for passenger or more than $25 for driver.
13In lieu of a court appearance, a first offender may pay a fine of $10; for a second or subsequent offense, the fine is $20.
12Rhode Island’s primary seat belt law includes a sunset provision that will revert the law to secondary enforcement on June 30, 2013
11The fine is $50 for violators 8-15 years old.
10Drivers in Massachusetts may be fined $25 for violating the belt law themselves and $25 for each unrestrained passenger 12-16 years old
9Louisiana HB 197 was signed by the Governor on May 29, 2012, to expand the seat belt requirement for all seating positions to include SUVs
8The fine is $60 for violators 14-17 years old.
7Secondary enforcement for other seating positions.
6If a driver under 18 years old commits a violation, he/she is subject to a higher fine of $75.
5May include rear-facing CRs, forward-facing CRs, and booster seats.

26
Table 2-5: Helmet Use Laws: 2015State Motorcycle riders covered by helmet law Bicycle riders covered by helmet lawAlabama all riders 15 and youngerAlaska 17 and younger1 no lawArizona 17 and younger no lawArkansas 20 and younger no lawCalifornia all riders 17 and youngerColorado 17 and younger and passengers 17 and younger no lawConnecticut 17 and younger 15 and youngerDelaware 18 and younger2 17 and youngerDistrict of Columbia all riders 15 and youngerFlorida 20 and younger3 15 and youngerGeorgia all riders 15 and youngerHawaii 17 and younger 15 and youngerIdaho 17 and younger no lawIllinois no law no lawIndiana 17 and younger no lawIowa no law no lawKansas 17 and younger no lawKentucky 20 and younger4 no lawLouisiana all riders 11 and youngerMaine 17 and younger5 15 and youngerMaryland all riders 15 and youngerMassachusetts all riders 1-16 (riding with children younger than 1 prohibited)Michigan 20 and younger6 no lawMinnesota 17 and younger7 no lawMississippi all riders no lawMissouri all riders no lawMontana 17 and younger no lawNebraska all riders no lawNevada all riders no lawNew Hampshire no law 15 and youngerNew Jersey all riders 16 and youngerNew Mexico 17 and younger 17 and youngerNew York all riders 1-13 (riding with children younger than 1 prohibited)North Carolina all riders 15 and youngerNorth Dakota 17 and younger8 no lawOhio 17 and younger9 no lawOklahoma 17 and younger no lawOregon all riders 15 and youngerPennsylvania 20 and younger10 11 and youngerRhode Island 20 and younger11 15 and youngerSouth Carolina 20 and younger no lawSouth Dakota 17 and younger no lawTennessee all riders 15 and youngerTexas 20 and younger12 no lawUtah 17 and younger no lawVermont all riders no lawVirginia all riders no lawWashington all riders no lawWest Virginia all riders 14 and youngerWisconsin 17 and younger13 no lawWyoming 17 and younger no law
6In Michigan, the law requires that all riders younger than 21 wear helmets, without exception. Those 21 and older may ride without helmets only if they carry additional insurance and have passed a motorcycle safety course or have had their motorcycle endorsement for at least two years. Motorcycle passengers who want to exercise this option also must be 21 or older and carry additional insurance.
1Alaska's motorcycle helmet use law covers passengers of all ages, operators younger than 18, and operators with instructional permits.2In Delaware, every motorcycle operator or rider age 19 and older must carry an approved helmet.3In Florida, the law requires that all riders younger than 21 years wear helmets, without exception. Those 21 years and older may ride without helmets only if they can show proof that they are covered by a medical insurance policy.4In Kentucky, the law requires that all riders younger than 21 years wear helmets, without exception. Those 21 and older may ride without helmets only if they can show proof that they are covered by a medical insurance policy. Motorcycle helmet laws in Kentucky also cover operators with instructional/learner's permits.5Motorcycle helmet laws in Maine cover operators with instructional/learner's permits and operators in their first year of licensure. Maine's motorcycle helmet use law also covers passengers 17 and younger and passengers riding with operators who are required to wear a helmet.
13Motorcycle helmet laws in Wisconsin cover operators with instructional/learner's permits.
SOURCE: Insurance Institute for Highway Safety, Highway Loss Data Institute, Motorcycle and bicycle helmet use laws, available at www.iihs.org/iihs/topics#statelaws as of June 2015.
7Motorcycle helmet laws in Minnesota cover operators with instructional/learner's permits.8North Dakota's motorcycle helmet use law covers all passengers traveling with operators who are covered by the law.9Ohio's motorcycle helmet use law covers all operators during the first year of licensure and all passengers of operators who are covered by the law.10Pennsylvania's motorcycle helmet use law covers all operators during the first two years of licensure unless the operator has completed the safety course approved by PennDOT or the Motorcycle Safety Foundation.11Rhode Island's motorcycle helmet use law covers all passengers (regardless of age) and all operators during the first year of licensure (regardless of age).12Texas exempts riders 21 or older if they can either show proof of successfully completing a motorcycle operator training and safety course or can show proof of having a medical insurance policy. A peace officer may not stop or detain a person who is the operator of or a passenger on a motorcycle for the sole purpose of determining whether the person has successfully completed the motorcycle operator training and safety course or is covered by a health insurance plan.
Table 2-5: Helmet Use Laws: 2015
1Alaska’s motorcycle helmet use law covers passengers of all ages, operators younger than 18, and operators with instructional permits.2In Delaware, every motorcycle operator or rider age 19 and older must carry an approved helmet. 3In Florida, the law requires that all riders younger than 21 years wear helmets, without exception. Those 21 years and older may ride with-out helmets only if they can show proof that they are covered by a medical insurance policy. 4In Kentucky, the law requires that all riders younger than 21 years wear helmets, without exception. Those 21 and older may ride without helmets only if they can show proof that they are covered by a medical insurance policy. Motorcycle helmet laws in Kentucky also cover operators with instructional/learner’s permits. 5Motorcycle helmet laws in Maine cover operators with instructional/learner’s permits and operators in their first year of licensure. Maine’s motorcycle helmet use law also covers passengers 17 and younger and passengers riding with operators who are required to wear a helmet. 6In Michigan, the law requires that all riders younger than 21 wear helmets, without exception. Those 21 and older may ride without helmets only if they carry additional insurance and have passed a motorcycle safety course or have had their motorcycle endorsement for at least two years. Motorcycle passengers who want to exercise this option also must be 21 or older and carry additional insurance. 7Motorcycle helmet laws in Minnesota cover operators with instructional/learner’s permits. 8North Dakota’s motorcycle helmet use law covers all passengers traveling with operators who are covered by the law. 9Ohio’s motorcycle helmet use law covers all operators during the first year of licensure and all passengers of operators who are covered by the law.10Pennsylvania’s motorcycle helmet use law covers all operators during the first two years of licensure unless the operator has completed the safety course approved by PennDOT or the Motorcycle Safety Foundation. 11Rhode Island’s motorcycle helmet use law covers all passengers (regardless of age) and all operators during the first year of licensure (regardless of age). 12Texas exempts riders 21 or older if they can either show proof of successfully completing a motorcycle operator training and safety course or can show proof of having a medical insurance policy. A peace officer may not stop or detain a person who is the operator of or a passen-ger on a motorcycle for the sole purpose of determining whether the person has successfully completed the motorcycle operator training and safety course or is covered by a health insurance plan. 13Motorcycle helmet laws in Wisconsin cover operators with instructional/learner’s permits.
SOURCE: Insurance Institute for Highway Safety, Highway Loss Data Institute, Motorcycle and bicycle helmet use laws, available at www.iihs.org/iihs/topics#statelaws as of June 2015.
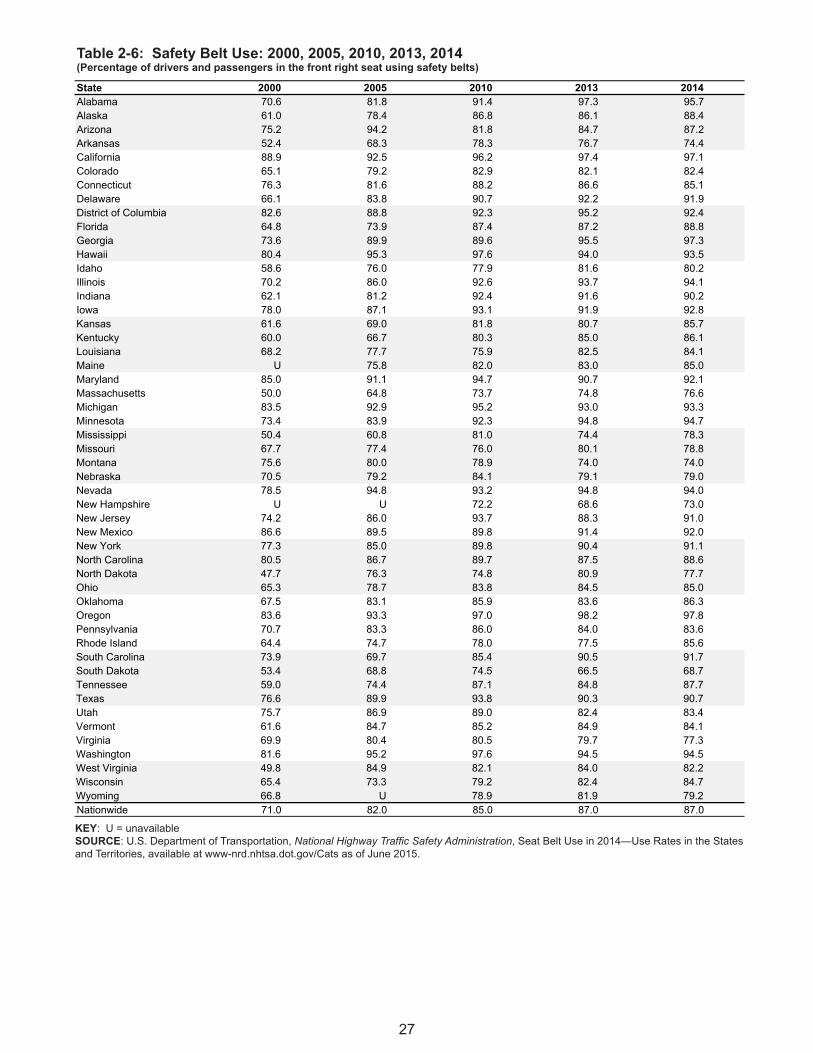
27
Table 2-6: Safety Belt Use: 2000, 2005, 2010, 2013, 2014(Percentage of drivers and passengers in the front right seat using safety belts)State 2000 2005 2010 2013 2014Alabama 70.6 81.8 91.4 97.3 95.7Alaska 61.0 78.4 86.8 86.1 88.4Arizona 75.2 94.2 81.8 84.7 87.2Arkansas 52.4 68.3 78.3 76.7 74.4California 88.9 92.5 96.2 97.4 97.1Colorado 65.1 79.2 82.9 82.1 82.4Connecticut 76.3 81.6 88.2 86.6 85.1Delaware 66.1 83.8 90.7 92.2 91.9District of Columbia 82.6 88.8 92.3 95.2 92.4Florida 64.8 73.9 87.4 87.2 88.8Georgia 73.6 89.9 89.6 95.5 97.3Hawaii 80.4 95.3 97.6 94.0 93.5Idaho 58.6 76.0 77.9 81.6 80.2Illinois 70.2 86.0 92.6 93.7 94.1Indiana 62.1 81.2 92.4 91.6 90.2Iowa 78.0 87.1 93.1 91.9 92.8Kansas 61.6 69.0 81.8 80.7 85.7Kentucky 60.0 66.7 80.3 85.0 86.1Louisiana 68.2 77.7 75.9 82.5 84.1Maine U 75.8 82.0 83.0 85.0Maryland 85.0 91.1 94.7 90.7 92.1Massachusetts 50.0 64.8 73.7 74.8 76.6Michigan 83.5 92.9 95.2 93.0 93.3Minnesota 73.4 83.9 92.3 94.8 94.7Mississippi 50.4 60.8 81.0 74.4 78.3Missouri 67.7 77.4 76.0 80.1 78.8Montana 75.6 80.0 78.9 74.0 74.0Nebraska 70.5 79.2 84.1 79.1 79.0Nevada 78.5 94.8 93.2 94.8 94.0New Hampshire U U 72.2 68.6 73.0New Jersey 74.2 86.0 93.7 88.3 91.0New Mexico 86.6 89.5 89.8 91.4 92.0New York 77.3 85.0 89.8 90.4 91.1North Carolina 80.5 86.7 89.7 87.5 88.6North Dakota 47.7 76.3 74.8 80.9 77.7Ohio 65.3 78.7 83.8 84.5 85.0Oklahoma 67.5 83.1 85.9 83.6 86.3Oregon 83.6 93.3 97.0 98.2 97.8Pennsylvania 70.7 83.3 86.0 84.0 83.6Rhode Island 64.4 74.7 78.0 77.5 85.6South Carolina 73.9 69.7 85.4 90.5 91.7South Dakota 53.4 68.8 74.5 66.5 68.7Tennessee 59.0 74.4 87.1 84.8 87.7Texas 76.6 89.9 93.8 90.3 90.7Utah 75.7 86.9 89.0 82.4 83.4Vermont 61.6 84.7 85.2 84.9 84.1Virginia 69.9 80.4 80.5 79.7 77.3Washington 81.6 95.2 97.6 94.5 94.5West Virginia 49.8 84.9 82.1 84.0 82.2Wisconsin 65.4 73.3 79.2 82.4 84.7Wyoming 66.8 U 78.9 81.9 79.2Nationwide 71.0 82.0 85.0 87.0 87.0KEY: U = unavailable
SOURCE: U.S. Department of Transportation, National Highway Traffic Safety Administration, Seat Belt Use in 2014—Use Rates in the Statesand Territories, available at www-nrd.nhtsa.dot.gov/Cats as of June 2015.
Table 2-6: Safety Belt Use: 2000, 2005, 2010, 2013, 2014 (Percentage of drivers and passengers in the front right seat using safety belts)
KEY: U = unavailable SOURCE: U.S. Department of Transportation, National Highway Traffic Safety Administration, Seat Belt Use in 2014—Use Rates in the States and Territories, available at www-nrd.nhtsa.dot.gov/Cats as of June 2015.

28
Table 2-7: Pedestrian Fatalities Involving Motor Vehicles: 2013
StateTotal traffic
fatalities Pedestrians killedPedestrian fatalities as percent of total
Population(thousands)
Pedestrian fatality rate per 100,000
populationAlabama 852 59 6.9 4,834 1.2Alaska 51 6 11.8 737 0.8Arizona 849 151 17.8 6,635 2.3Arkansas 483 45 9.3 2,959 1.5California 3,000 701 23.4 38,431 1.8Colorado 481 50 10.4 5,272 0.9Connecticut 276 36 13.0 3,599 1.0Delaware 99 25 25.3 925 2.7District of Columbia 20 9 45.0 649 1.4Florida 2,407 501 20.8 19,600 2.6Georgia 1,179 176 14.9 9,995 1.8Hawaii 102 23 22.5 1,409 1.6Idaho 214 14 6.5 1,613 0.9Illinois 991 125 12.6 12,891 1.0Indiana 783 77 9.8 6,571 1.2Iowa 317 20 6.3 3,092 0.6Kansas 350 25 7.1 2,896 0.9Kentucky 638 55 8.6 4,400 1.3Louisiana 703 97 13.8 4,629 2.1Maine 145 11 7.6 1,329 0.8Maryland 465 108 23.2 5,939 1.8Massachusetts 326 68 20.9 6,709 1.0Michigan 947 148 15.6 9,898 1.5Minnesota 387 32 8.3 5,422 0.6Mississippi 613 53 8.6 2,992 1.8Missouri 757 73 9.6 6,045 1.2Montana 229 24 10.5 1,015 2.4Nebraska 211 12 5.7 1,869 0.6Nevada 262 65 24.8 2,791 2.3New Hampshire 135 12 8.9 1,323 0.9New Jersey 542 129 23.8 8,912 1.4New Mexico 310 49 15.8 2,087 2.3New York 1,199 335 27.9 19,696 1.7North Carolina 1,289 173 13.4 9,849 1.8North Dakota 148 1 0.7 724 0.1Ohio 989 85 8.6 11,572 0.7Oklahoma 678 58 8.6 3,853 1.5Oregon 313 48 15.3 3,928 1.2Pennsylvania 1,208 147 12.2 12,781 1.2Rhode Island 65 14 21.5 1,053 1.3South Carolina 767 100 13.0 4,772 2.1South Dakota 135 9 6.7 846 1.1Tennessee 995 80 8.0 6,497 1.2Texas 3,382 480 14.2 26,506 1.8Utah 220 28 12.7 2,903 1.0Vermont 69 5 7.2 627 0.8Virginia 740 75 10.1 8,270 0.9Washington 436 49 11.2 6,974 0.7West Virginia 332 28 8.4 1,854 1.5Wisconsin 543 37 6.8 5,743 0.6Wyoming 87 4 4.6 583 0.7United States, total 32,719 4,735 14.5 316,498 1.5NOTE: Details may not add to totals due to rounding.
SOURCE: Fatalities: U.S. Department of Transportation, National Highway Traffic Safety Administration, Fatality Analysis Reporting System Encyclopedia, available at www-fars.nhtsa.dot.gov as of June 2015. Population: U.S. Department of Commerce, U.S. Census Bureau, Population Estimates, available at www.census.gov/popest as of June 2015.
Table 2-7: Pedestrian Fatalities Involving Motor Vehicles: 2013
NOTE: Details may not add to totals due to rounding.
SOURCE: Fatalities: U.S. Department of Transportation, National Highway Traffic Safety Administration, Fatality Analysis Reporting System Encyclopedia, available at www-fars.nhtsa.dot.gov as of June 2015. Population: U.S. Department of Commerce, U.S. Census Bureau, Popu-lation Estimates, available at www.census.gov/popest as of June 2015.

29
Table 2-8: Fatalities in Motor Vehicle Crashes Involving High Blood Alcohol Concentration: 2012 and 2013(BAC ≥ 0.08 grams per deciliter)
State Total fatalities
Fatalitiesinvolving high blood alcohol Percent Total fatalities
Fatalitiesinvolving high blood alcohol Percent
Alabama 865 257 29.7 852 260 31.0Alaska 59 15 25.4 51 15 30.0Arizona 825 227 27.5 849 219 26.0Arkansas 552 143 25.9 483 123 25.0California 2,857 802 28.1 3,000 867 29.0Colorado 472 133 28.2 481 142 30.0Connecticut 236 85 36.0 276 114 41.0Delaware 114 34 29.8 99 38 39.0District of Columbia 15 4 26.7 20 6 31.0Florida 2,424 697 28.8 2,407 676 28.0Georgia 1,192 301 25.3 1,179 297 25.0Hawaii 126 51 40.5 102 33 33.0Idaho 184 54 29.3 214 58 27.0Illinois 956 321 33.6 991 322 32.0Indiana 779 228 29.3 783 198 25.0Iowa 365 92 25.2 317 103 32.0Kansas 405 98 24.2 350 102 29.0Kentucky 746 168 22.5 638 167 26.0Louisiana 722 241 33.4 703 234 33.0Maine 164 49 29.9 145 42 29.0Maryland 505 160 31.7 465 141 30.0Massachusetts 349 123 35.2 326 118 36.0Michigan 938 259 27.6 947 255 27.0Minnesota 395 114 28.9 387 95 25.0Mississippi 582 179 30.8 613 210 34.0Missouri 826 280 33.9 757 248 33.0Montana 205 89 43.4 229 92 40.0Nebraska 212 74 34.9 211 60 28.0Nevada 258 82 31.8 262 79 30.0New Hampshire 108 32 29.6 135 46 34.0New Jersey 589 164 27.8 542 146 27.0New Mexico 365 97 26.6 310 93 30.0New York 1,168 344 29.5 1,199 364 30.0North Carolina 1,292 402 31.1 1,289 371 29.0North Dakota 170 72 42.4 148 62 42.0Ohio 1,123 385 34.3 989 271 27.0Oklahoma 708 205 29.0 678 170 25.0Oregon 336 86 25.6 313 105 33.0Pennsylvania 1,310 408 31.1 1,208 368 30.0Rhode Island 64 24 37.5 65 24 38.0South Carolina 863 358 41.5 767 335 44.0South Dakota 133 45 33.8 135 41 31.0Tennessee 1,014 295 29.1 995 277 28.0Texas 3,398 1,296 38.1 3,382 1,337 40.0Utah 217 34 15.7 220 38 17.0Vermont 77 23 29.9 69 18 27.0Virginia 777 211 27.2 740 254 34.0Washington 444 145 32.7 436 149 34.0West Virginia 339 95 28.0 332 91 27.0Wisconsin 615 200 32.5 543 178 33.0Wyoming 123 40 32.5 87 25 29.0United States, total 33,561 10,322 30.8 32,719 10,076 31.0
2012 2013
NOTE: National Highway Traffic Safety Administration estimates the proportion of fatalities with a high Blood Alcohol Concentration for cases in which alcohol test results are unknown. The sum of individual state fatalities with a high BAC may therefore not add to the U.S. total due to rounding of these estimates.
SOURCE: U.S. Department of Transportation, National Highway Traffic Safety Administration, Traffic Safety Fact Sheet, Alcohol-Impaired Driving, available at www-nrd.nhtsa.dot.gov/Cats as of June 2015.
Table 2-8: Fatalities in Motor Vehicle Crashes Involving High Blood Alcohol Concentration: 2012 and 2013 (BAC ≥ 0.08 grams per deciliter)
NOTE: National Highway Traffic Safety Administration estimates the proportion of fatalities with a high Blood Alcohol Concentration for cases in which alcohol test results are unknown. The sum of individual state fatalities with a high BAC may therefore not add to the U.S. total due to rounding of these estimates. SOURCE: U.S. Department of Transportation, National Highway Traffic Safety Administration, Traffic Safety Fact Sheet, Alcohol-Impaired Driv-ing, available at www-nrd.nhtsa.dot.gov/Cats as of June 2015.

30
Table 2-9: Maximum Posted Speed Limits by Type of Road: 2015(Speed limit in miles per hour)
State Rural Urban Other roadsAlabama 70 65 65 65Alaska 65 55 65 55Arizona 75 65 65 65; trucks: 65Arkansas 70; trucks: 65 651 651 651
California 70; trucks: 55 65; trucks: 55 70; trucks: 55 65; trucks: 55Colorado 75 65 65 65Connecticut 65 55 65 55Delaware 65 55 65 55District of Columbia n/a 55 n/a 25Florida 70 65 70 65Georgia 70 70 65 65Hawaii 602 602 552 452
Idaho 75; 80 on specified segments of road3;trucks: 70
75; 80 on specified segments of road3;trucks: 65
70 70
Illinois 704 55 65 55Indiana 70; trucks: 65 55 60 55Iowa 70 55 70 65Kansas 75 75 75 65Kentucky 65; 70 on specified segments of road5 65 65 55Louisiana 75 70 70 65Maine 75 75 75 60Maryland 70 (effective, October 1, 2015) 70 (effective, October 1, 2015) 70 (effective, October 1, 2015 55Massachusetts 65 65 65 55Michigan 70 (trucks 60); <70 (trucks 55) 65 70 55Minnesota 70 65 65 60Mississippi 70 70 70 65Missouri 70 60 70 65Montana 80 (effective, October 1, 2015); trucks: 65 65 day: 70; night: 65 day: 70; night: 65Nebraska 75 65 65 60Nevada 80 (effective, October 1, 2015) 65 70 70New Hampshire 65; 70 on specified segments of road6 65 55 55New Jersey 65 55 65 55New Mexico 75 75 65 55New York 65 65 65 55North Carolina 70 70 70 55North Dakota 75 75 70 65Ohio 70 65 70 55Oklahoma 75 70 70 70Oregon 65; trucks: 55 55 55 55Pennsylvania 70 70 70 55Rhode Island 65 55 55 55South Carolina 70 70 60 55South Dakota 80 807 70 70Tennessee 70 70 70 65Texas
75; 80 or 85 on specified segment of road8 75 75 75
Utah 75; 80 on specified segments of road9 65 75 65Vermont 65 55 50 50Virginia 70 70 65 55Washington 70; 75 on specified segments of
road10(effective August 2015); trucks: 6060 60 60
West Virginia 70 55 65 55Wisconsin 70 70 70 55Wyoming 75; 80 on specified segments of road11 75; 80 on specified segments of road11 70 70
8Sections of I-10 and I-20 in West Texas and sections of Highway 45 in Travis County have a speed limit for passenger cars and light trucks of 80 mph. Speed limits of up to 85 mph may be established if the highway is originally constructed and designed to accommodate the higher speed and it has been determined by an engineering study to 9In Utah, the speed limit may be increased beyond 75 mph on any freeway or limited access highway on the basis of an engineering and traffic investigation. The highest posted limit in Utah is currently 80mph.
NOTES: Interstates are divided into urban and rural sections based primarily on population size and population density. Many roads, particularly urban interstates, often have a lower posted speed limit than the maximum allowable shown in this table.
SOURCE: Insurance Institute for Highway Safety, Highway Loss Data Institute, Maximum posted speed limits, available at www.iihs.org/iihs/topics/t/speed/topicoverview as of June 2015.
Interstate Other limited-access roads
4The Illinois law allows Cook, DuPage, Kane, Lake, Madison, McHenry, St. Clair and Will Counties to opt-out by adopting an ordinance that sets a lower maximum speed limit, empowering counties to make adjustments based on their own local needs. These counties have a maximum large truck speed limit of 60 mph outside of urban 5In Kentucky, the speed limit may be increased to 70 mph on specific segments of highway on the basis of an engineering and traffic investigation.62013 New Hampshire House Bill 146 raised the speed limit from 65 to 70 mph on the portion of I-93 from mile marker 45 to the Vermont border.7The Transportation Commission may establish a maximum speed limit of less than 80 upon any highway or portion of highway under the jurisdiction of the Department of Transportation, and any portion of highway under the jurisdiction of a state or federal agency.
11In Wyoming, the speed limit may be increased to 80 mph on specific segments of highway on the basis of an engineering and traffic investigation.
10In Washington State, maximum speed limits on highways or portions of highways may be posted as high as 75 mph if based on a traffic and engineering study, effective August 2015.
3In Idaho, the speed limit may be increased to 80 mph on specific segments of highway on the basis of an engineering and traffic investigation.
2In Hawaii, the maximum speed limit is established by county ordinance or by the director of transportation.
1In Arkansas, the speed limit may be raised on particular two-lane or four-lane highways to 65 mph if based on traffic and engineering studies.
Table 2-9: Maximum Posted Speed Limits by Type of Road: 2015 (Speed limit in miles per hour)
1In Arkansas, the speed limit may be raised on particular two-lane or four-lane highways to 65 mph if based on traffic and engineering studies.2In Hawaii, the maximum speed limit is established by county ordinance or by the director of transportation. 3In Idaho, the speed limit may be increased to 80 mph on specific segments of highway on the basis of an engineering and traffic investigation.4The Illinois law allows Cook, DuPage, Kane, Lake, Madison, McHenry, St. Clair and Will Counties to opt-out by adopting an ordinance that sets a lower maximum speed limit, empowering counties to make adjustments based on their own local needs. These counties have a maxi-mum large truck speed limit of 60 mph outside of urban districts and 55 mph inside urban districts. 5In Kentucky, the speed limit may be increased to 70 mph on specific segments of highway on the basis of an engineering and traffic investigation.62013 New Hampshire House Bill 146 raised the speed limit from 65 to 70 mph on the portion of I-93 from mile marker 45 to the Vermont border.7The Transportation Commission may establish a maximum speed limit of less than 80 upon any highway or portion of highway under the jurisdiction of the Department of Transportation, and any portion of highway under the jurisdiction of a state or federal agency. 8Sections of I-10 and I-20 in West Texas and sections of Highway 45 in Travis County have a speed limit for passenger cars and light trucks of 80 mph. Speed limits of up to 85 mph may be established if the highway is originally constructed and designed to accommodate the higher speed and it has been determined by an engineering study to be reasonable and safe. State Highway 130 (portions toll) has a posted limit of 85 mph. 9In Utah, the speed limit may be increased beyond 75 mph on any freeway or limited access highway on the basis of an engineering and traffic investigation. The highest posted limit in Utah is currently 80mph. 10In Washington State, maximum speed limits on highways or portions of highways may be posted as high as 75 mph if based on a traffic and engineering study, effective August 2015. 11In Wyoming, the speed limit may be increased to 80 mph on specific segments of highway on the basis of an engineering and traffic investigation.
NOTES:Interstates are divided into urban and rural sections based primarily on population size and population density. Many roads, particu-larly urban interstates, often have a lower posted speed limit than the maximum allowable shown in this table.
SOURCE: Insurance Institute for Highway Safety, Highway Loss Data Institute, Maximum posted speed limits, available at www.iihs.org/iihs/topics/t/speed/topicoverview as of June 2015.

31
Table 2-10: Rail Accidents/Incidents: 2013(Includes freight railroad, Amtrak, and commuter rail operations)State Accidents/Incidents Fatalities InjuriesAlabama 202 18 109Alaska 41 0 39Arizona 104 7 69Arkansas 139 10 82California 806 108 585Colorado 113 7 77Connecticut 128 4 247Delaware 62 0 53District of Columbia 136 0 135Florida 318 34 221Georgia 276 28 201Hawaii 0 0 0Idaho 66 6 29Illinois 984 35 727Indiana 301 31 185Iowa 163 13 96Kansas 197 8 110Kentucky 134 14 74Louisiana 248 13 145Maine 33 1 19Maryland 147 10 124Massachusetts 204 7 177Michigan 189 9 116Minnesota 237 11 158Mississippi 105 9 82Missouri 221 9 158Montana 104 2 70Nebraska 202 3 127Nevada 37 3 23New Hampshire 4 0 3New Jersey 779 21 739New Mexico 96 17 48New York 1,293 30 1310North Carolina 215 25 151North Dakota 110 5 83Ohio 284 31 157Oklahoma 167 15 79Oregon 126 7 89Pennsylvania 635 23 527Rhode Island 34 0 32South Carolina 112 15 97South Dakota 37 1 20Tennessee 198 7 108Texas 777 52 449Utah 79 8 45Vermont 26 2 21Virginia 216 10 160Washington 188 15 137West Virginia 105 13 89Wisconsin 166 6 111Wyoming 54 1 27United States, total 11,598 704 8,720NOTE: Data are preliminary. Accidents/Incidents includes all events reportable to the U.S. Department of Transportation, Federal Railroad Administration under applicable regulations. These include: train accidents, reported on Form F 6180.54, comprised ofcollisions, derailments, and other events involving the operation of on-track equipment and causing reportable damage above an established threshold ($9,200 for 2010, per 49 CFR 225.19); highway-rail grade crossing incidents, reported on Form F 6180.57, involvingimpact between railroad on-track equipment and highway users at crossings; and other incidents, reported on Form F 6180.55a, involvingall other reportable incidents or exposures that cause a fatality or injury to any person, or an occupational illness to a railroad employee.
SOURCE: U.S. Department of Transportation, Federal Railroad Administration, Office of Safety Analysis, available at safetydata.fra.dot.gov/OfficeofSafety as of July 2015.
Table 2-10: Rail Accidents/Incidents: 2013 (Includes freight railroad, Amtrak, and commuter rail operations)
NOTE: Data are preliminary. Accidents/Incidents includes all events reportable to the U.S. Department of Transportation, Federal Railroad Administration under applicable regulations. These include: train accidents, reported on Form F 6180.54, comprised of collisions, derail-ments, and other events involving the operation of on-track equipment and causing reportable damage above an established threshold ($9,200 for 2010, per 49 CFR 225.19); highway-rail grade crossing incidents, reported on Form F 6180.57, involving impact between rail-road on-track equipment and highway users at crossings; and other incidents, reported on Form F 6180.55a, involving all other reportable incidents or exposures that cause a fatality or injury to any person, or an occupational illness to a railroad employee. SOURCE: U.S. Department of Transportation, Federal Railroad Administration, Office of Safety Analysis, available at safetydata.fra.dot.gov/OfficeofSafety as of July 2015.

32
Table 2-11: Highway-Rail Grade Crossing Incidents: 2013(Includes freight railroad, Amtrak, and commuter rail operations)
StateNumber of grade
crossings Incidents Fatalities InjuriesAlabama 4,550 85 5 45Alaska 282 0 0 0Arizona 1,157 23 0 8Arkansas 3,983 37 5 18California 9,297 146 37 76Colorado 2,781 15 3 5Connecticut 635 2 0 1Delaware 393 7 0 1District of Columbia 36 0 0 0Florida 5,065 65 8 19Georgia 7,549 96 13 65Hawaii 8 0 0 0Idaho 2,359 25 4 7Illinois 11,955 126 13 40Indiana 7,634 93 15 36Iowa 6,910 49 5 25Kansas 7,873 46 3 12Kentucky 4,649 49 6 22Louisiana 5,015 72 6 31Maine 1,668 3 0 1Maryland 1,278 11 2 14Massachusetts 1,434 16 1 7Michigan 7,149 61 3 26Minnesota 6,801 53 6 34Mississippi 4,306 43 3 34Missouri 5,735 53 2 31Montana 3,109 13 1 6Nebraska 4,976 41 2 23Nevada 542 4 1 1New Hampshire 584 0 0 0New Jersey 2,133 41 6 38New Mexico 1,236 12 4 4New York 5,368 35 7 11North Carolina 7,125 56 7 29North Dakota 4,723 27 3 18Ohio 8,533 71 8 25Oklahoma 5,036 42 8 13Oregon 3,953 15 2 3Pennsylvania 6,118 60 3 22Rhode Island 144 0 0 0South Carolina 3,928 44 5 21South Dakota 2,927 13 1 5Tennessee 4,619 62 2 25Texas 13,857 225 19 95Utah 1,257 17 4 5Vermont 881 4 0 2Virginia 4,451 33 1 9Washington 4,801 24 3 7West Virginia 3,356 19 2 28Wisconsin 6,387 60 2 22Wyoming 1,085 4 1 2United States, total 211,631 2,098 232 972NOTES: Data are preliminary. Any impact, regardless of severity, between railroad on-track equipment and any user of a public or privatecrossing site must be reported to the U.S. Department of Transportation, Federal Railroad Administration on Form F 6180.57. The crossing site includes sidewalks and pathways at, or associated with, the crossing. Counts of Fatalities and Injuries include motor vehicle occupants, people not in vehicles or the trains, as well as people on the train or railroad equipment.
SOURCE: U.S. Department of Transportation, Federal Railroad Administration, Office of Safety Analysis, available at safetydata.fra.dot.gov/OfficeofSafety as of July 2015.
Table 2-11: Highway-Rail Grade Crossing Incidents: 2013 (Includes freight railroad, Amtrak, and commuter rail operations)
NOTES: Data are preliminary. Any impact, regardless of severity, between railroad on-track equipment and any user of a public or private crossing site must be reported to the U.S. Department of Transportation, Federal Railroad Administration on Form F 6180.57. The crossing site includes sidewalks and pathways at, or associated with, the crossing. Counts of Fatalities and Injuries include motor vehicle occupants, people not in vehicles or the trains, as well as people on the train or railroad equipment.
SOURCE: U.S. Department of Transportation, Federal Railroad Administration, Office of Safety Analysis, available at safetydata.fra.dot.gov/OfficeofSafety as of July 2015.

33
Table 2-12: Highway-Rail Grade Crossings by Type: 2013(Includes freight railroad, Amtrak, and commuter rail operations)
State Total (number) Public, motor vehicle Private, motor vehicle PedestrianAlabama 4,550 61.3 38.0 0.7Alaska 282 63.5 34.4 2.1Arizona 1,157 63.1 36.6 0.3Arkansas 3,983 67.9 31.9 0.2California 9,297 63.0 35.1 1.9Colorado 2,781 61.0 37.7 1.3Connecticut 635 57.0 41.6 1.4Delaware 393 68.7 30.8 0.5District of Columbia 36 13.9 58.3 27.8Florida 5,065 74.5 24.4 1.1Georgia 7,549 68.2 31.1 0.7Hawaii 8 100.0 0.0 0.0Idaho 2,359 54.0 45.6 0.4Illinois 11,955 65.0 32.0 3.0Indiana 7,634 74.6 24.5 0.9Iowa 6,910 62.7 36.7 0.6Kansas 7,873 65.5 34.2 0.3Kentucky 4,649 48.8 50.1 1.1Louisiana 5,015 54.2 45.1 0.7Maine 1,668 49.4 49.9 0.7Maryland 1,278 49.1 49.1 1.7Massachusetts 1,434 58.0 39.7 2.3Michigan 7,149 67.6 31.1 1.3Minnesota 6,801 64.1 35.0 0.9Mississippi 4,306 51.2 48.3 0.5Missouri 5,735 60.1 39.1 0.9Montana 3,109 44.6 55.0 0.4Nebraska 4,976 60.5 39.2 0.2Nevada 542 53.5 45.6 0.9New Hampshire 584 55.5 40.8 3.8New Jersey 2,133 70.6 26.1 3.3New Mexico 1,236 58.3 39.8 1.9New York 5,368 49.9 48.8 1.3North Carolina 7,125 55.6 43.4 1.0North Dakota 4,723 73.6 26.0 0.4Ohio 8,533 66.8 32.4 0.8Oklahoma 5,036 73.9 25.9 0.3Oregon 3,953 45.1 53.6 1.2Pennsylvania 6,118 56.7 41.7 1.5Rhode Island 144 46.5 35.4 18.1South Carolina 3,928 67.0 32.0 1.0South Dakota 2,927 63.9 35.9 0.2Tennessee 4,619 59.7 39.6 0.7Texas 13,857 66.0 33.8 0.2Utah 1,257 54.4 45.3 0.3Vermont 881 42.2 55.5 2.3Virginia 4,451 42.5 56.7 0.9Washington 4,801 49.2 49.8 1.0West Virginia 3,356 41.7 56.9 1.4Wisconsin 6,387 62.9 35.7 1.5Wyoming 1,085 35.0 65.0 0.0United States, total 211,631 58.5 40.4 2.0NOTE: Data are preliminary.
Percent of total
SOURCE: U.S. Department of Transportation, Federal Railroad Administration, Railroad Safety Statistics Preliminary Annual Report, table9-2, available at safetydata.fra.dot.gov/OfficeofSafety/publicsite/Prelim.aspx as of July 2015.
Table 2-12: Highway-Rail Grade Crossings by Type: 2013 (Includes freight railroad, Amtrak, and commuter rail operations)
NOTE: Data are preliminary. SOURCE: U.S. Department of Transportation, Federal Railroad Administration, Railroad Safety Statistics Preliminary Annual Report, table 9-2, available at safetydata.fra.dot.gov/OfficeofSafety/publicsite/Prelim.aspx as of July 2015.

34
Table 2-13: Warning Devices at Public Highway-Rail Grade Crossings: 2013
StateTotal
(number)Crossbucks Gates
Flashinglights Stop signs Unknown
Specialwarning
HWTS,WW, bells Other
Alabama 2,791 25.9 29.2 18.0 23.6 1.5 0.4 1.0 0.3Alaska 179 26.3 43.0 4.5 19.0 2.2 2.8 0.0 2.2Arizona 730 10.4 2.1 57.7 1.4 1.0 0.4 6.6 20.5Arkansas 2,705 53.3 16.6 13.9 8.0 3.7 1.6 2.8 0.0California 5,853 27.0 52.1 12.1 3.3 1.6 0.4 2.7 0.2Colorado 1,697 46.7 29.0 10.0 9.1 1.9 1.2 1.8 0.4Connecticut 362 6.4 29.0 39.2 12.2 2.2 7.7 1.7 0.0Delaware 270 8.1 26.7 57.0 0.4 0.7 5.9 0.4 0.4District of Columbia 5 0.0 0.0 40.0 20.0 0.0 40.0 0.0 0.0Florida 3,774 14.9 65.6 10.6 5.1 0.9 1.6 0.3 0.1Georgia 5,149 21.2 40.1 4.8 22.3 1.9 2.2 6.6 0.3Hawaii 8 75.0 0.0 0.0 12.5 0.0 0.0 0.0 12.5Idaho 1,273 30.8 13.4 13.6 41.2 0.7 0.1 0.2 0.0Illinois 7,768 28.8 43.4 22.0 1.0 1.1 0.8 1.4 0.1Indiana 5,693 21.7 36.7 20.3 16.7 1.1 0.1 2.7 0.2Iowa 4,331 47.1 23.2 18.3 9.8 0.5 0.4 0.4 0.0Kansas 5,153 57.7 29.1 6.7 3.6 1.0 0.7 1.1 0.1Kentucky 2,269 40.0 21.1 29.4 2.2 3.9 1.6 0.5 0.0Louisiana 2,717 35.7 35.8 15.1 9.2 3.1 0.6 0.2 0.2Maine 824 31.8 12.6 46.1 1.3 0.1 6.8 0.6 0.0Maryland 628 29.6 21.2 33.3 5.6 4.1 3.5 2.2 0.5Massachusetts 832 13.2 41.0 32.1 1.3 3.4 6.5 1.6 0.4Michigan 4,831 19.5 23.4 24.5 28.4 1.6 1.1 1.4 0.1Minnesota 4,362 34.5 28.2 7.7 27.9 0.6 0.3 0.1 0.2Mississippi 2,206 33.4 22.4 18.4 18.3 2.4 1.1 1.2 2.5Missouri 3,444 45.0 29.6 16.9 3.2 2.7 1.4 1.0 0.1Montana 1,388 57.3 22.2 11.6 5.3 1.3 0.4 0.1 1.7Nebraska 3,012 61.0 22.8 5.9 7.7 2.0 0.3 0.2 0.0Nevada 290 30.7 45.9 6.9 13.8 1.0 0.7 0.3 0.7New Hampshire 324 27.8 10.2 33.6 15.4 3.4 6.2 0.3 0.3New Jersey 1,505 15.1 33.0 38.4 1.2 3.8 6.6 1.3 0.0New Mexico 720 41.0 39.6 9.2 4.3 1.4 0.0 0.0 0.1New York 2,676 16.4 65.4 9.3 1.3 1.6 3.2 2.1 0.3North Carolina 3,961 23.0 55.9 10.1 3.4 2.5 1.9 0.7 0.4North Dakota 3,478 79.2 16.7 0.0 1.7 1.7 0.5 0.0 0.0Ohio 5,703 31.5 50.1 13.6 2.1 0.4 0.5 1.5 0.0Oklahoma 3,720 54.0 25.5 12.2 5.3 1.1 1.2 0.4 0.0Oregon 1,784 28.9 41.6 3.4 20.9 1.7 1.5 0.6 0.8Pennsylvania 3,470 28.2 27.9 29.1 4.8 1.7 4.8 2.2 0.4Rhode Island 67 6.0 23.9 22.4 0.0 9.0 13.4 25.4 0.0South Carolina 2,632 15.6 43.8 11.8 24.5 0.0 1.9 2.1 0.1South Dakota 1,871 76.9 4.4 12.3 2.9 3.4 0.0 0.1 0.1Tennessee 2,759 37.9 30.4 20.7 5.4 1.7 2.8 0.8 0.1Texas 9,150 31.1 48.7 8.3 3.7 1.3 0.5 4.7 0.1Utah 684 22.2 36.7 12.9 18.7 1.9 4.1 1.6 0.1Vermont 372 27.7 12.1 44.4 6.2 0.5 7.8 0.3 0.0Virginia 1,890 15.1 64.4 15.1 2.2 0.8 0.3 1.1 0.2Washington 2,363 46.8 26.6 12.7 3.8 7.9 0.9 1.1 0.2West Virginia 1,400 40.6 17.2 32.9 2.6 4.9 0.6 0.5 0.4Wisconsin 4,016 34.4 22.5 22.9 18.0 0.8 0.3 0.7 0.2Wyoming 380 27.9 54.7 12.4 2.4 0.5 0.3 0.8 0.0United States, total 129,469 34.5 35.3 15.4 9.3 1.7 1.3 1.7 0.3KEY: HWTS = highway traffic signals; WW = wigwags.
Percent of total
SOURCE: U.S. Department of Transportation, Federal Railroad Administration, Railroad Safety Statistics Preliminary Annual Report, table 9-4, available at safetydata.fra.dot.gov/OfficeofSafety/publicsite/Prelim.aspx as of July 2015.
Table 2-13: Warning Devices at Public Highway-Rail Grade Crossings: 2013
KEY: HWTS = highway traffic signals; WW = wigwags. SOURCE: U.S. Department of Transportation, Federal Railroad Administration, Railroad Safety Statistics Preliminary Annual Report, table 9-4, available at safetydata.fra.dot.gov/OfficeofSafety/publicsite/Prelim.aspx as of July 2015.
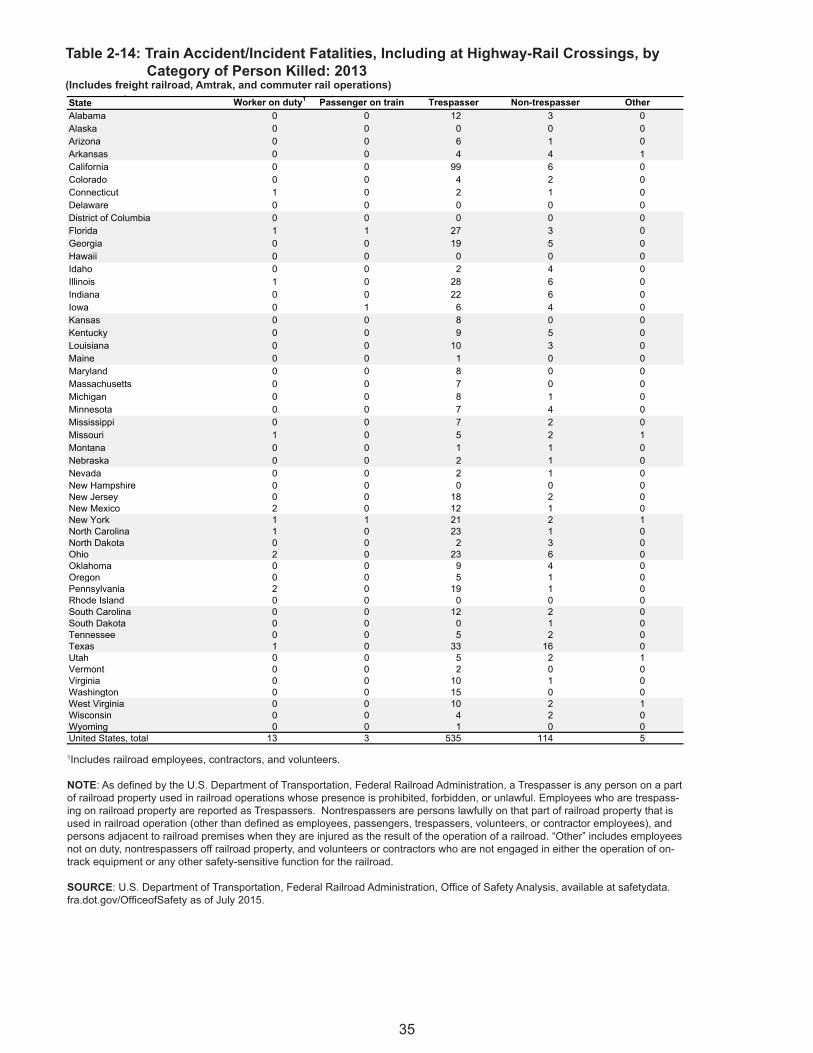
35
Table 2-14: Train Accident/Incident Fatalities, Including at Highway-Rail Crossings, by Category of Person Killed: 2013(Includes freight railroad, Amtrak, and commuter rail operations)State Worker on duty1 Passenger on train Trespasser Non-trespasser OtherAlabama 0 0 12 3 0Alaska 0 0 0 0 0Arizona 0 0 6 1 0Arkansas 0 0 4 4 1California 0 0 99 6 0Colorado 0 0 4 2 0Connecticut 1 0 2 1 0Delaware 0 0 0 0 0District of Columbia 0 0 0 0 0Florida 1 1 27 3 0Georgia 0 0 19 5 0Hawaii 0 0 0 0 0Idaho 0 0 2 4 0Illinois 1 0 28 6 0Indiana 0 0 22 6 0Iowa 0 1 6 4 0Kansas 0 0 8 0 0Kentucky 0 0 9 5 0Louisiana 0 0 10 3 0Maine 0 0 1 0 0Maryland 0 0 8 0 0Massachusetts 0 0 7 0 0Michigan 0 0 8 1 0Minnesota 0 0 7 4 0Mississippi 0 0 7 2 0Missouri 1 0 5 2 1Montana 0 0 1 1 0Nebraska 0 0 2 1 0Nevada 0 0 2 1 0New Hampshire 0 0 0 0 0New Jersey 0 0 18 2 0New Mexico 2 0 12 1 0New York 1 1 21 2 1North Carolina 1 0 23 1 0North Dakota 0 0 2 3 0Ohio 2 0 23 6 0Oklahoma 0 0 9 4 0Oregon 0 0 5 1 0Pennsylvania 2 0 19 1 0Rhode Island 0 0 0 0 0South Carolina 0 0 12 2 0South Dakota 0 0 0 1 0Tennessee 0 0 5 2 0Texas 1 0 33 16 0Utah 0 0 5 2 1Vermont 0 0 2 0 0Virginia 0 0 10 1 0Washington 0 0 15 0 0West Virginia 0 0 10 2 1Wisconsin 0 0 4 2 0Wyoming 0 0 1 0 0United States, total 13 3 535 114 51Includes railroad employees, contractors, and volunteers.
NOTE: As defined by the U.S. Department of Transportation, Federal Railroad Administration, a Trespasser is any person on a part of railroadproperty used in railroad operations whose presence is prohibited, forbidden, or unlawful. Employees who are trespassing on railroad property are reported as Trespassers. Nontrespassers are persons lawfully on that part of railroad property that is used in railroad operation (other than defined as employees, passengers, trespassers, volunteers, or contractor employees), and persons adjacent to railroad premises when they are injured as the result of the operation of a railroad. "Other" includes employees not on duty, nontrespassers off railroad property, and volunteers or contractors who are not engaged in either the operation of on-track equipment or any other safety-sensitive function for the railroad.
SOURCE: U.S. Department of Transportation, Federal Railroad Administration, Office of Safety Analysis, available at safetydata.fra.dot.gov/OfficeofSafety as of July 2015.
Table 2-14: Train Accident/Incident Fatalities, Including at Highway-Rail Crossings, by Category of Person Killed: 2013 (Includes freight railroad, Amtrak, and commuter rail operations)
1Includes railroad employees, contractors, and volunteers.
NOTE: As defined by the U.S. Department of Transportation, Federal Railroad Administration, a Trespasser is any person on a part of railroad property used in railroad operations whose presence is prohibited, forbidden, or unlawful. Employees who are trespass-ing on railroad property are reported as Trespassers. Nontrespassers are persons lawfully on that part of railroad property that is used in railroad operation (other than defined as employees, passengers, trespassers, volunteers, or contractor employees), and persons adjacent to railroad premises when they are injured as the result of the operation of a railroad. “Other” includes employees not on duty, nontrespassers off railroad property, and volunteers or contractors who are not engaged in either the operation of on-track equipment or any other safety-sensitive function for the railroad.
SOURCE: U.S. Department of Transportation, Federal Railroad Administration, Office of Safety Analysis, available at safetydata.fra.dot.gov/OfficeofSafety as of July 2015.

36
Table 2-15: Train Accident/Incident Injuries, Including at Highway-Rail Crossings, by Category of Person Injured: 2013(Includes freight railroad, Amtrak, and commuter rail operations)State Worker on duty1 Passenger on train Trespasser Non-trespasser OtherAlabama 49 4 19 26 2Alaska 36 1 0 0 0Arizona 32 12 12 7 1Arkansas 49 3 4 8 2California 206 137 67 72 19Colorado 51 12 0 7 3Connecticut 82 19 2 6 2Delaware 40 5 1 4 1District of Columbia 80 30 0 19 0Florida 68 52 23 36 11Georgia 76 8 33 28 13Hawaii 0 0 0 0 0Idaho 20 0 2 5 0Illinois 351 129 46 101 44Indiana 108 5 27 14 2Iowa 50 6 4 18 5Kansas 78 1 2 17 1Kentucky 32 1 8 13 9Louisiana 69 6 12 24 4Maine 13 3 2 1 0Maryland 57 28 7 17 1Massachusetts 108 34 9 16 2Michigan 62 17 6 25 0Minnesota 95 7 7 19 3Mississippi 22 19 5 8 0Missouri 77 16 10 25 5Montana 51 9 2 3 1Nebraska 86 3 5 19 2Nevada 8 6 6 2 0New Hampshire 3 0 0 0 0New Jersey 292 238 16 128 9New Mexico 26 8 6 2 0New York 549 265 24 333 22North Carolina 53 35 18 23 7North Dakota 48 7 4 12 2Ohio 80 7 23 9 8Oklahoma 43 1 18 9 2Oregon 46 15 6 10 6Pennsylvania 314 56 28 75 11Rhode Island 18 9 0 3 0South Carolina 20 15 13 17 2South Dakota 14 0 0 5 0Tennessee 52 2 17 18 3Texas 194 29 63 62 19Utah 18 6 5 2 1Vermont 0 0 2 0 0Virginia 66 47 12 10 6Washington 76 20 10 8 6West Virginia 39 3 9 3 2Wisconsin 69 5 5 18 5Wyoming 24 0 0 2 0United States, total 4,100 1,341 600 1,289 2441Includes railroad employee, contractor, and volunteer.
NOTES: As defined by the U.S. Department of Transportation, Federal Railroad Administration, a Trespasser is any person on a part of railroad property used in railroad operations whose presence is prohibited, forbidden, or unlawful. Employees who are trespassing on railroad property are reported as Trespassers.Nontrespassers are persons lawfully on that part of railroad property that is used in railroad operation (other than defined as employees, passengers, trespassers, volunteers, or contractor employees), and persons adjacent to railroad premises when they are injured as the result of the operation of a railroad."Other" includes employees not on duty, nontrespassers off railroad property, and volunteers or contractors who are not engaged in either the operation of on-track equipment or any other safety-sensitive function for the railroad.
SOURCE: U.S. Department of Transportation, Federal Railroad Administration, Office of Safety Analysis, available at safetydata.fra.dot.gov/OfficeofSafety as of July 2015.
Table 2-15: Train Accident/Incident Injuries, Including at Highway-Rail Crossings, by Category of Person Injured: 2013 (Includes freight railroad, Amtrak, and commuter rail operations)
1Includes railroad employee, contractor, and volunteer.
NOTES: As defined by the U.S. Department of Transportation, Federal Railroad Administration, a Trespasser is any person on a part of railroad property used in railroad operations whose presence is prohibited, forbidden, or unlawful. Employees who are trespassing on railroad property are reported as Trespassers. Nontrespassers are persons lawfully on that part of railroad property that is used in railroad operation (other than defined as employees, passengers, trespassers, volunteers, or contractor employees), and persons adjacent to railroad premises when they are injured as the result of the operation of a railroad. “Other” includes employees not on duty, nontrespassers off railroad property, and volunteers or contractors who are not engaged in either the operation of on-track equipment or any other safety-sensitive function for the railroad.
SOURCE: U.S. Department of Transportation, Federal Railroad Administration, Office of Safety Analysis, available at safetydata.fra.dot.gov/OfficeofSafety as of July 2015.

37
Table 2-16: Transit Incidents, Fatalities, Injuries, and Property Damage, All Transit Modes: 2012
StateNumber of incidents Fatalities Injuries
Number of incidents Fatalities Injuries
Alabama 7 0 9 11 0 13 107Alaska 6 1 7 57 0 54 48Arizona 56 1 75 83 2 82 668Arkansas 5 0 10 10 0 11 34California 498 36 842 2,190 24 2,195 6,064Colorado 70 2 106 102 4 100 485Connecticut 63 0 155 98 1 111 658Delaware 35 0 92 52 0 52 407District of Columbia 167 1 294 608 8 581 426Florida 357 11 787 714 8 709 2,668Georgia 117 1 260 380 2 352 566Hawaii 23 4 28 104 0 104 265Idaho 0 0 0 1 0 1 0Illinois 365 11 762 1,360 19 1,277 3,555Indiana 51 1 96 74 1 75 645Iowa 10 0 15 10 0 6 164Kansas 0 0 0 5 0 7 0Kentucky 47 0 140 32 2 29 255Louisiana 51 0 159 75 0 74 444Maine 0 0 0 0 0 0 0Maryland 183 3 401 283 1 285 1,265Massachusetts 99 5 184 781 11 633 952Michigan 75 1 146 146 1 139 768Minnesota 55 1 74 110 0 115 419Mississippi 3 0 20 12 0 12 120Missouri 85 5 238 218 0 216 1,127Montana 0 0 0 7 0 7 0Nebraska 1 0 2 5 0 4 72Nevada 50 4 100 96 0 95 609New Hampshire 2 0 2 9 0 11 10New Jersey 75 8 147 599 2 563 460,842New Mexico 9 0 12 21 0 21 16New York 548 50 958 7,564 42 6,685 423,554North Carolina 83 1 245 106 0 143 1,472North Dakota 0 0 0 1 0 1 15Ohio 117 6 262 212 1 207 1,173Oklahoma 6 0 16 9 1 7 116Oregon 47 0 70 153 1 169 557Pennsylvania 123 8 246 758 11 721 2,627Rhode Island 21 0 35 33 0 30 477South Carolina 18 0 71 11 0 9 149South Dakota 1 0 7 0 0 0 6Tennessee 29 0 62 60 0 55 257Texas 317 16 588 542 8 517 3,482Utah 49 3 56 34 4 24 2,160Vermont 1 0 1 2 0 2 6Virginia 60 0 137 67 2 66 566Washington 100 3 124 247 0 239 908West Virginia 11 0 17 3 0 5 317Wisconsin 46 2 68 124 0 123 251Wyoming 0 0 0 0 0 0 0United States, total (excluding Puerto Rico)1 4,142 185 8,126 18,179 156 16,937 921,752United States, total (including Puerto Rico)1 4,145 186 8,128 18,223 156 16,980 925,752
Collision Non-collision Total property damage ($ thousands)
NOTES: Collision includes at-grade crossings excluding suicides. Noncollision includes: 1) derailments; 2) personal casualties in parking facilities, inside vehicles, on right of way, boarding/alighting, and in station/bus stops; 3) evacuations for life safety; and 4) nonarson fires. For an incident to be reportable it must involve a transit vehicle or occur on transit property and either: 1) result in a fatality, injury or transit property damage greater than $25,000; 2) involve a nonarson fire; 3) involve a mainline derailment; or 4) involve an evacuation due to life safety 5) involve an act of God 6) involve a Hazardous Material Spill. Data are compiled from Federal Transit Administration's National Transit Database and Federal Railroad Administration's Rail Accident/Incident Reporting System.
SOURCE: U.S. Department of Transportation, Federal Transit Adminstration, personal communication as of August 2015.
1Increase in property damage due to Hurricane Sandy
Table 2-16: Transit Incidents, Fatalities, Injuries, and Property Damage, All Transit Modes: 2012
1Increase in property damage due to Hurricane Sandy.
NOTES: Collision includes at-grade crossings excluding suicides. Noncollision includes: 1) derailments; 2) personal casualties in parking facilities, inside vehicles, on right of way, boarding/alighting, and in station/bus stops; 3) evacuations for life safety; and 4) nonarson fires. For an incident to be reportable it must involve a transit vehicle or occur on transit property and either: 1) result in a fatality, injury or transit property damage greater than $25,000; 2) involve a nonarson fire; 3) involve a mainline derailment; or 4) involve an evacuation due to life safety 5) involve an act of God 6) involve a Hazardous Material Spill. Data are compiled from Federal Transit Administration’s National Transit Database and Federal Railroad Administration’s Rail Accident/Incident Reporting System.
SOURCE: U.S. Department of Transportation, Federal Transit Adminstration, personal communication as of August 2015.

38
Table 2-17: Recreational Boating Accidents: 2014
State Total FatalNonfatal
injuryPropertydamage Killed Injured
Alabama 71 12 35 24 13 53Alaska 18 10 3 5 11 4Arizona 87 7 42 38 7 66Arkansas 54 7 22 25 8 33California 379 29 175 175 38 256Colorado 57 12 30 15 12 37Connecticut 40 5 17 18 5 27Delaware 15 1 5 9 1 7District of Columbia 2 0 1 1 0 1Florida 581 62 202 317 70 327Georgia 92 12 47 33 13 81Hawaii 9 3 3 3 3 3Idaho 43 10 15 18 10 17Illinois 84 17 38 29 22 63Indiana 40 9 14 17 9 25Iowa 33 6 14 13 7 15Kansas 17 6 7 4 6 12Kentucky 46 8 24 14 9 38Louisiana 113 18 60 35 18 114Maine 35 5 14 16 5 14Maryland 130 10 83 37 12 96Massachusetts 82 5 31 46 6 56Michigan 97 18 42 37 19 51Minnesota 50 14 29 7 14 38Mississippi 25 2 11 12 3 16Missouri 142 13 79 50 14 101Montana 14 3 9 2 3 15Nebraska 26 1 18 7 1 20Nevada 47 7 22 18 11 32New Hampshire 44 1 19 24 1 27New Jersey 111 3 41 67 3 77New Mexico 13 0 11 2 0 13New York 175 27 67 81 27 105North Carolina 124 22 68 34 26 92North Dakota 11 4 2 5 5 4Ohio 100 15 33 52 22 43Oklahoma 50 6 35 9 6 51Oregon 61 7 17 37 7 27Pennsylvania 66 20 23 23 21 39Rhode Island 40 3 8 29 3 21South Carolina 124 13 59 52 14 92South Dakota 8 1 2 5 1 3Tennessee 111 13 50 48 14 69Texas 167 34 74 59 39 119Utah 80 5 35 40 5 44Vermont 5 1 4 0 1 9Virginia 60 15 27 18 17 40Washington 122 22 44 56 22 67West Virginia 102 9 56 37 9 85Wisconsin 24 3 8 13 3 13Wyoming 11 4 4 3 4 8United States, total (excluding territories) 4,038 540 1,779 1,719 600 2,666United States, total (including territories)1 4,064 548 1,785 1,731 610 2,678
SOURCE: U.S. Department of Homeland Security, U.S. Coast Guard, Boating Statistics 2014 , table 30, available at www.uscgboating.org/statistics/accident_statistics.aspx as of June 2015.
Number of accidents Number of persons
1Includes accidents in Guam, Puerto Rico, the Virgin Islands, American Samoa, Northern Mariana Islands, and those occurring offshore.
NOTES: An accident is listed under one category only, with Fatal being the highest priority, followed by Nonfatal injury, followed by Property damage. For example, if two vessels are in an accident resulting in a Fatality and a Nonfatal injury, the accident is counted as a fatal accident involving two vessels.Data in this table do not include: 1) accidents involving only slight injury not requiring medical treatment beyond first-aid; 2) accidents involving property damage of less than $2,000; 3) accidents not caused or contributed to by a vessel, its equipment, or its appendages; 4) accidents where a person died or was injured from natural causes while aboard a vessel; 5) accidents in which the boat was used solely as a platform for other activities, such as swimming or skin diving. Such cases are not included because the victims freely left the safety of a boat. However, the data do include accidents involving people in the water who are struck by their boat or another boat; and 6) accidents involving damage, injury, or death on a docked or moored boat resulting from storms, unusual tidal, sea, or swell conditions, or when a vessel got underway in those conditions in an attempt to rescue persons put in peril.
Table 2-17: Recreational Boating Accidents: 2014
1 Includes accidents in Guam, Puerto Rico, the Virgin Islands, American Samoa, Northern Mariana Islands, and those occur-ring offshore.
NOTES: An accident is listed under one category only, with Fatal being the highest priority, followed by Nonfatal injury, fol-lowed by Property damage. For example, if two vessels are in an accident resulting in a Fatality and a Nonfatal injury, the accident is counted as a fatal accident involving two vessels. Data in this table do not include: 1) accidents involving only slight injury not requiring medical treatment beyond first-aid; 2) accidents involving property damage of less than $2,000; 3) accidents not caused or contributed to by a vessel, its equip-ment, or its appendages; 4) accidents where a person died or was injured from natural causes while aboard a vessel; 5) accidents in which the boat was used solely as a platform for other activities, such as swimming or skin diving. Such cases are not included because the victims freely left the safety of a boat. However, the data do include accidents involving people in the water who are struck by their boat or another boat; and 6) accidents involving damage, injury, or death on a docked or moored boat resulting from storms, unusual tidal, sea, or swell conditions, or when a vessel got underway in those conditions in an attempt to rescue persons put in peril.
SOURCE: U.S. Department of Homeland Security, U.S. Coast Guard, Boating Statistics 2014, table 30, available at www.uscgboating.org/statistics/accident_statistics.aspx as of June 2015.

39
Table 2-18: Alcohol Involvement in Recreational Boating Accidents: 2014
StateTotal number of
accidents Percent of state total Persons killedAlabama 71 7 9.9 5Alaska 18 3 16.7 3Arizona 87 7 8.0 1Arkansas 54 7 13.0 2California 379 14 3.7 5Colorado 57 2 3.5 0Connecticut 40 2 5.0 1Delaware 15 2 13.3 0District of Columbia 2 0 0.0 0Florida 581 30 5.2 12Georgia 92 7 7.6 2Hawaii 9 0 0.0 0Idaho 43 4 9.3 2Illinois 84 17 20.2 8Indiana 40 10 25.0 5Iowa 33 6 18.2 2Kansas 17 1 5.9 0Kentucky 46 11 23.9 5Louisiana 113 20 17.7 6Maine 35 5 14.3 2Maryland 130 7 5.4 1Massachusetts 82 5 6.1 0Michigan 97 8 8.2 4Minnesota 50 8 16.0 4Mississippi 25 2 8.0 2Missouri 142 16 11.3 5Montana 14 3 21.4 2Nebraska 26 1 3.8 0Nevada 47 6 12.8 2New Hampshire 44 2 4.5 0New Jersey 111 2 1.8 0New Mexico 13 1 7.7 0New York 175 13 7.4 7North Carolina 124 13 10.5 5North Dakota 11 5 45.5 3Ohio 100 7 7.0 6Oklahoma 50 5 10.0 2Oregon 61 4 6.6 1Pennsylvania 66 10 15.2 6Rhode Island 40 2 5.0 1South Carolina 124 7 5.6 3South Dakota 8 3 37.5 1Tennessee 111 6 5.4 2Texas 167 17 10.2 5Utah 80 2 2.5 1Vermont 5 1 20.0 1Virginia 60 6 10.0 3Washington 122 9 7.4 4West Virginia 102 5 4.9 1Wisconsin 24 12 50.0 3Wyoming 11 2 18.2 1United States, total (excluding territories) 4,038 345 8.5 137United States, total (including territories)1 4,064 345 8.5 137
Total number of accidents
Accidents with alcohol as a contributing factor
1Includes accidents in Guam, Puerto Rico, the Virgin Islands, American Samoa, Northern Mariana Islands, and those occurring offshore.
NOTE: Data are based on alcohol use by a boat’s occupants resulting directly or indirectly in an accident.
SOURCE: U.S. Department of Homeland Security, U.S. Coast Guard, Boating Statistics 2014 , table 8 and 30, available at www.uscgboating.org/statistics/accident_statistics.aspx as of June 2015.
Table 2-18: Alcohol Involvement in Recreational Boating Accidents: 2014
1Includes accidents in Guam, Puerto Rico, the Virgin Islands, American Samoa, Northern Mariana Islands, and those occurring offshore. NOTE: Data are based on alcohol use by a boat’s occupants resulting directly or indirectly in an accident. SOURCE: U.S. Department of Homeland Security, U.S. Coast Guard, Boating Statistics 2014, table 8 and 30, available at www.uscgboating.org/statistics/accident_statistics.aspx as of June 2015.

40
Table 2-19: Hazardous Materials Incidents: 2013 and 2014(Not including pipelines or bulk, nonpackaged water incidents)
State Incidents Deaths Total Major Minor Incidents Deaths Total Major MinorAlabama 209 0 1 0 1 6,322 200 0 0 0 0 1,770Alaska 168 0 0 0 0 150 175 0 0 0 0 30Arizona 300 0 2 0 2 248 291 0 1 0 1 269Arkansas 170 0 3 1 2 1,008 161 0 0 0 0 2,420California 1,427 1 11 0 11 2,446 1,454 0 22 4 18 2,574Colorado 341 0 1 0 1 2,666 371 0 10 0 10 3,153Connecticut 165 0 1 0 1 423 215 0 2 0 2 178Delaware 11 0 0 0 0 17 0 0 0 0 32District of Columbia 2 0 0 0 0 1 0 1 0 1Florida 661 1 19 8 11 3,157 712 0 4 1 3 11,055Georgia 580 4 6 1 5 1,343 611 0 6 0 6 1,186Hawaii 9 0 0 0 0 113 11 0 0 0 0 2Idaho 32 0 0 0 0 468 33 0 1 0 1 292Illinois 1,281 1 4 0 4 1,502 1,336 0 5 0 5 1,693Indiana 473 0 3 1 2 1,466 568 0 1 0 1 501Iowa 163 0 1 0 1 1,098 162 0 4 1 3 349Kansas 318 0 0 0 0 1,074 303 0 1 0 1 306Kentucky 405 0 0 0 0 1,218 437 0 15 0 15 993Louisiana 299 0 7 0 7 4,450 321 3 1 0 1 2,330Maine 27 0 0 0 0 70 24 0 0 0 0 272Maryland 222 0 0 0 0 11,044 260 0 0 0 0 129Massachusetts 231 0 0 0 0 1,038 230 0 1 0 1 1,631Michigan 315 0 2 0 2 323 395 0 5 0 5 1,710Minnesota 249 1 9 2 7 2,079 253 0 1 1 0 722Mississippi 101 0 4 0 4 391 140 0 0 0 0 3,464Missouri 353 0 3 0 3 1,349 392 1 3 0 3 975Montana 51 0 0 0 0 1,875 76 0 1 1 0 584Nebraska 59 0 7 0 7 331 59 1 2 0 2 51Nevada 115 0 5 0 5 108 123 0 0 0 0 45New Hampshire 41 0 0 0 0 13 40 0 2 0 2 222New Jersey 427 0 5 0 5 313 372 0 3 0 3 502New Mexico 85 0 0 0 0 343 75 0 0 0 0 565New York 507 0 13 3 10 1,316 491 1 8 0 8 2,704North Carolina 366 0 2 1 1 1,647 386 0 4 0 4 1,284North Dakota 54 0 0 0 0 3,706 71 0 1 1 0 754Ohio 988 0 7 2 5 12,213 1,021 0 6 0 6 2,657Oklahoma 183 0 2 0 2 1,666 256 1 2 1 1 1,707Oregon 299 0 0 0 0 388 310 0 2 0 2 1,038Pennsylvania 819 0 6 4 2 2,221 881 0 6 2 4 7,152Rhode Island 29 0 0 0 0 43 47 0 0 0 0 13South Carolina 121 0 1 1 0 988 194 0 4 0 4 589South Dakota 15 0 0 0 0 76 19 0 1 0 1 84Tennessee 756 0 0 0 0 1,217 831 0 2 0 2 2,363Texas 1,475 1 32 5 27 6,822 1,806 1 18 1 17 8,612Utah 291 0 5 0 5 927 260 0 1 0 1 532Vermont 16 0 0 0 0 631 7 0 0 0 0 1,785Virginia 201 2 2 1 1 1,655 225 0 8 0 8 2,812Washington 194 0 4 2 2 700 217 0 0 0 0 2,981West Virginia 55 0 0 0 0 2,016 58 0 0 0 0 732Wisconsin 296 0 0 0 0 490 324 0 1 0 1 261Wyoming 29 0 2 0 2 177 38 1 0 0 0 3,290United States, total1 15,984 11 170 32 138 87,328 17,260 9 156 13 143 81,3571Total excludes Incidents occurring in a U.S. territory or foreign country.
NOTES: Data for 2013 are revised. Hazardous material incident locations are often listed as the terminals or sorting centers where they are discovered. Therefore, states with this type of facility may show a disproportionate number of incidents. Hazardous materials transportation incidents required to be reported are defined in the Code of Federal Regulations (CFR), 49 CFR Part 171.15, 171.16 (Form F 5800.1). Incident means any of the following events: (1) a Fatality or Major injury caused by the release of a hazardous material; (2) the evacuation of 25 or more persons as a result of release of a hazardous material or exposure to fire; (3) a release or exposure to fire which results in the closure of a major transportation artery; (4) the alteration of an aircraft flight plan or operation; (5) the release of radioactive materials from Type B packaging; (6) the release of over 11.9 gallons or 88.2 pounds of a severe marine pollutant; or (7) the release of a bulk quantity (over 119 gallons or 882 pounds) of a hazardous material. Hazardous materials Deaths and Injuries are caused by the hazardous material in commerce. Hazardous materials incident data are subject to revision and correction by the Office of Hazardous Materials Safety.
SOURCE: U.S. Department of Transportation, Pipeline and Hazardous Materials Safety Administration, Office of Hazardous Materials Safety,Hazmat Intelligence Portal, Yearly Incident Summary Reports , available at www.phmsa.dot.gov/hazmat/library/data-stats/incidents as of June 2015.
2013 2014Injuries Damages
($1,000)Injuries Damages
($1,000)
Table 2-19: Hazardous Materials Incidents: 2013 and 2014 (Not including pipelines or bulk, nonpackaged water incidents)
1Total excludes Incidents occurring in a U.S. territory or foreign country. NOTES: Data for 2013 are revised. Hazardous material incident locations are often listed as the terminals or sorting centers where they are discovered. Therefore, states with this type of facility may show a disproportionate number of incidents. Hazardous materials transporta-tion incidents required to be reported are defined in the Code of Federal Regulations (CFR), 49 CFR Part 171.15, 171.16 (Form F 5800.1). Incident means any of the following events: (1) a Fatality or Major injury caused by the release of a hazardous material; (2) the evacuation of 25 or more persons as a result of release of a hazardous material or exposure to fire; (3) a release or exposure to fire which results in the closure of a major transportation artery; (4) the alteration of an aircraft flight plan or operation; (5) the release of radioactive materials from Type B packaging; (6) the release of over 11.9 gallons or 88.2 pounds of a severe marine pollutant; or (7) the release of a bulk quantity (over 119 gallons or 882 pounds) of a hazardous material. Hazardous materials Deaths and Injuries are caused by the hazardous material in commerce. Hazardous materials incident data are subject to revision and correction by the Office of Hazardous Materials Safety. SOURCE: U.S. Department of Transportation, Pipeline and Hazardous Materials Safety Administration, Office of Hazardous Materials Safety, Hazmat Intelligence Portal, Yearly Incident Summary Reports, available at www.phmsa.dot.gov/hazmat/library/data-stats/incidents as of June 2015.

41
Table 2-20: Hazardous Materials Incidents by Mode: 2013 and 2014(Not including pipelines or bulk, nonpackaged water incidents)
State Highway Rail Air Water2 Highway Rail Air Water2
Alabama 191 17 1 0 209 183 15 2 0 200Alaska 3 0 143 22 168 2 16 156 17 191Arizona 272 8 20 0 300 268 19 7 0 294Arkansas 141 23 5 1 170 141 126 1 0 268California 1,186 110 128 3 1,427 1,224 11 104 0 1,339Colorado 317 10 14 0 340 351 0 9 0 360Connecticut 157 0 8 0 165 210 0 5 0 215Delaware 11 0 0 0 11 15 1 1 0 17District of Columbia 2 0 0 0 2 1 0 0 0 1Florida 581 10 52 18 660 630 12 51 19 712Georgia 553 11 15 1 580 580 21 9 1 611Hawaii 3 0 5 1 9 5 0 6 0 11Idaho 28 0 4 0 32 24 2 7 0 33Illinois 1,212 35 34 0 1,281 1,256 40 40 0 1,336Indiana 423 15 35 0 472 510 15 43 0 568Iowa 154 7 2 0 162 156 4 2 0 162Kansas 292 15 11 0 318 289 6 8 0 303Kentucky 212 9 185 0 406 263 8 166 0 437Louisiana 252 41 5 1 299 291 28 2 0 321Maine 25 0 2 0 27 22 1 1 0 24Maryland 200 6 16 0 222 249 6 5 0 260Massachusetts 203 3 25 0 231 209 1 20 0 230Michigan 278 7 30 0 315 358 14 23 0 395Minnesota 228 14 7 0 249 240 7 6 0 253Mississippi 93 7 1 0 101 125 14 1 0 140Missouri 326 14 13 0 353 367 11 14 0 392Montana 41 6 4 0 51 66 8 2 0 76Nebraska 55 4 0 0 59 50 6 3 0 59Nevada 96 6 13 0 115 96 15 12 0 123New Hampshire 38 0 3 0 41 35 0 5 0 40New Jersey 359 11 51 6 427 328 9 34 1 372New Mexico 70 14 1 0 85 69 4 2 0 75New York 462 7 38 0 505 432 33 26 0 491North Carolina 334 9 23 0 366 372 8 6 0 386North Dakota 39 11 4 0 53 60 6 5 0 71Ohio 939 20 29 0 988 973 22 26 0 1,021Oklahoma 171 5 7 0 182 249 2 5 0 256Oregon 258 18 23 0 299 268 30 12 0 310Pennsylvania 760 38 20 1 816 812 34 34 0 880Rhode Island 29 0 0 0 29 43 0 4 0 47South Carolina 112 0 9 0 121 185 8 1 0 194South Dakota 14 0 1 0 15 16 1 2 0 19Tennessee 459 16 279 2 756 554 20 257 0 831Texas 1,341 67 66 1 1,473 1,667 71 65 0 1,803Utah 277 6 8 0 291 244 12 4 0 260Vermont 15 0 1 0 16 7 0 0 0 7Virginia 177 19 5 0 201 215 2 8 0 225Washington 152 14 23 5 193 169 26 21 1 217West Virginia 38 13 4 0 55 53 5 0 0 58Wisconsin 278 12 6 0 296 310 7 7 0 324Wyoming 21 7 1 0 29 33 5 0 0 38United States, total1 13,878 665 1,380 62 15,971 15,275 712 1,230 39 17,2561Total excludes Incidents occurring in a U.S. territory or foreign country.2Includes only packaged shipments (i.e., nonbulk shipments).
NOTES: Data for 2013 are revised. Hazardous materials Incident data are subject to revision and correction by the Office of HazardousMaterials Safety. Hazardous materials transportation Incidents required to be reported are defined in the Code of Federal Regulations(CFR), 49 CFR Part 171.15, 171.16 (Form F 5800.1). Incident means any of the following events: (1) a fatality or major injury caused by the release of a hazardous material; (2) the evacuation of 25 or more persons as a result of release of a hazardous material or exposure to fire; (3) a release or exposure to fire which results in the closure of a major transportation artery; (4) the alteration of an aircraft flight plan or operation; (5) the release of radioactive materials from Type B packaging; (6) the release of over 11.9 gallons or 88.2 pounds of a severe marine pollutant; or (7) the release of a bulk quantity (over 119 gallons or 882 pounds) of a hazardous material.
SOURCE: U.S. Department of Transportation, Pipeline and Hazardous Materials Safety Administration, Office of Hazardous Materials Safety, Hazmat Intelligence Portal, Yearly Incident Summary Reports , available at www.phmsa.dot.gov/hazmat/library/data-stats/incidents as of June 2015.
2013 2014Mode
TotalMode
Total
Table 2-20: Hazardous Materials Incidents by Mode: 2013 and 2014 (Not including pipelines or bulk, nonpackaged water incidents)
1Total excludes Incidents occurring in a U.S. territory or foreign country. 2 Includes only packaged shipments (i.e., nonbulk shipments). NOTES: Data for 2013 are revised. Hazardous materials Incident data are subject to revision and correction by the Office of Hazardous Materials Safety. Hazardous materials transportation Incidents required to be reported are defined in the Code of Federal Regulations (CFR), 49 CFR Part 171.15, 171.16 (Form F 5800.1). Incident means any of the following events: (1) a fatality or major injury caused by the release of a hazardous material; (2) the evacuation of 25 or more persons as a result of release of a hazardous material or exposure to fire; (3) a release or exposure to fire which results in the closure of a major transportation artery; (4) the alteration of an aircraft flight plan or operation; (5) the release of radioactive materials from Type B packaging; (6) the release of over 11.9 gallons or 88.2 pounds of a severe marine pollutant; or (7) the release of a bulk quantity (over 119 gallons or 882 pounds) of a hazardous material. SOURCE: U.S. Department of Transportation, Pipeline and Hazardous Materials Safety Administration, Office of Hazardous Materials Safety, Hazmat Intelligence Portal, Yearly Incident Summary Reports, available at www.phmsa.dot.gov/hazmat/library/data-stats/incidents as of June 2015.

42
Table 2-21: Natural Gas Distribution Pipeline Incidents: 2013 and 2014
StateNumber of incidents
Number of fatalities
Number of injuries
Damages($1,000)
Number of incidents
Number of fatalities
Number of injuries
Damages($1,000)
Alabama 2 1 4 554 0 0 0 0Alaska 0 0 0 0 1 0 0 301Arizona 3 0 3 13 3 0 1 220Arkansas 0 0 0 0 1 0 1 51California 14 0 0 3,491 18 2 2 18,684Colorado 3 0 3 969 1 0 0 133Connecticut 2 0 0 938 0 0 0 0Delaware 0 0 0 0 1 0 0 303District of Columbia 0 0 0 0 0 0 0 0Florida 1 0 0 128 1 0 0 3,021Georgia 4 0 0 686 0 0 0 0Hawaii 2 0 0 210 0 0 0 0Idaho 0 0 0 0 0 0 0 0Illinois 3 0 0 585 5 0 1 11,030Indiana 2 0 0 110 5 1 1 463Iowa 0 0 0 0 1 0 0 0Kansas 2 0 0 353 2 0 1 53Kentucky 2 1 1 391 2 0 0 5,101Louisiana 1 0 0 75 2 1 1 7Maine 0 0 0 0 0 0 0 0Maryland 1 0 1 0 1 1 2 70Massachusetts 4 0 0 955 2 0 0 81Michigan 4 3 1 1,315 12 0 9 1,394Minnesota 3 0 0 25 2 0 0 191Mississippi 0 0 0 0 2 0 0 207Missouri 1 1 4 0 5 0 0 1,663Montana 0 0 0 0 2 0 2 281Nebraska 3 0 1 192 1 0 0 44Nevada 2 0 0 140 3 0 0 210New Hampshire 0 0 0 0 0 0 0 0New Jersey 2 0 0 1,072 2 1 10 21,379New Mexico 0 0 0 0 1 0 0 55New York 16 0 12 3,086 10 8 51 3,840North Carolina 0 0 0 0 0 0 0 0North Dakota 0 0 0 0 0 0 0 0Ohio 4 0 1 148 4 0 0 1,725Oklahoma 2 0 1 273 1 1 0 2Oregon 0 0 0 0 0 0 0 0Pennsylvania 4 0 0 522 4 1 1 1,017Rhode Island 1 0 0 29 0 0 0 0South Carolina 0 0 0 0 0 0 0 0South Dakota 0 0 0 0 0 0 0 0Tennessee 2 0 0 557 2 1 2 268Texas 10 1 4 639 9 1 3 1,673Utah 1 0 0 102 0 0 0 0Vermont 0 0 0 0 0 0 0 0Virginia 1 0 0 1 4 0 6 1,024Washington 2 0 0 223 2 0 0 102West Virginia 3 2 3 169 0 0 0 0Wisconsin 0 0 0 0 1 0 0 141Wyoming 0 0 0 0 0 0 0 0United States, total 107 9 39 17,949 113 18 94 74,734
Historical totals may change as the Office of Pipeline Safety receives supplemental information on incidents.
SOURCE: U.S. Department of Transportation, Pipeline and Hazardous Materials Safety Administration, Office of Pipeline Safety, Incident Statistics, available at www.phmsa.dot.gov/pipeline/library/data-stats as of July 2015.
2013 2014
NOTES: Data for 2013 are revised. Incidents are reported on Form RSPA F 7100.1. Incident means any of the following events:I. An event that involves a release of gas from a pipeline or a liquefied natural gas (LNG) facility and a) a death or personal injury necessitating in-patient hospitalization or b) estimated property damage, including cost of gas lost, of the operator or others, or both, of $50,000 or more.II. An event that results in an emergency shutdown of an LNG facility.III. An event that is significant, in the judgment of the operator, even though it did not meet the criteria of I or II.
Table 2-21: Natural Gas Distribution Pipeline Incidents: 2013 and 2014
NOTES: Data for 2013 are revised. Incidents are reported on Form RSPA F 7100.1. Incident means any of the following events: I. An event that involves a release of gas from a pipeline or a liquefied natural gas (LNG) facility and a) a death or personal injury necessitating in-patient hospitalization or b) estimated property damage, including cost of gas lost, of the operator or others, or both, of $50,000 or more. II. An event that results in an emergency shutdown of an LNG facility. III. An event that is significant, in the judgment of the operator, even though it did not meet the criteria of I or II. Historical totals may change as the Office of Pipeline Safety receives supplemental information on incidents.
SOURCE: U.S. Department of Transportation, Pipeline and Hazardous Materials Safety Administration, Office of Pipeline Safety, Incident Statistics, available at www.phmsa.dot.gov/pipeline/library/data-stats as of July 2015.

43
StateNumber of incidents
Number of fatalities
Number of injuries
Damages($1,000)
Number of incidents
Number of fatalities
Number of injuries
Damages($1,000)
Alabama 1 0 0 171 2 0 0 810Alaska 0 0 0 0 0 0 0 0Arizona 0 0 0 0 1 0 0 132Arkansas 1 0 0 2 4 0 0 810California 6 0 0 2,324 13 0 0 10,345Colorado 3 0 0 234 0 0 0 0Connecticut 0 0 0 0 0 0 0 0Delaware 0 0 0 0 0 0 0 0District of Columbia 0 0 0 0 0 0 0 0Florida 1 0 0 147 1 0 0 1,494Georgia 2 0 0 123 3 0 0 101Hawaii 0 0 0 0 0 0 0 0Idaho 0 0 0 0 1 0 0 559Illinois 1 0 0 59 1 0 0 46Indiana 0 0 0 0 3 0 0 171Iowa 3 0 0 770 4 0 0 650Kansas 3 0 0 2,123 3 0 0 1,209Kentucky 0 0 0 0 5 0 1 3,317Louisiana 20 0 2 15,666 10 0 0 3,904Maine 0 0 0 0 0 0 0 0Maryland 0 0 0 0 0 0 0 0Massachusetts 0 0 0 0 0 0 0 0Michigan 2 0 0 184 9 0 0 8,683Minnesota 2 0 0 208 4 0 0 1,121Mississippi 7 0 0 1,270 6 0 0 696Missouri 2 0 0 2,017 2 0 0 859Montana 0 0 0 0 0 0 0 0Nebraska 2 0 0 518 1 0 0 3,404Nevada 0 0 0 0 1 0 0 126New Hampshire 0 0 0 0 0 0 0 0New Jersey 1 0 0 0 1 0 0 207New Mexico 2 0 0 121 0 0 0 0New York 4 0 0 894 2 0 0 72North Carolina 1 0 0 606 2 0 0 858North Dakota 5 0 0 519 2 0 0 226Ohio 1 0 0 1,501 3 0 0 544Oklahoma 8 0 0 3,507 7 0 0 951Oregon 0 0 0 0 0 0 0 0Pennsylvania 2 0 0 564 2 0 0 358Rhode Island 0 0 0 0 0 0 0 0South Carolina 0 0 0 0 1 0 0 111South Dakota 0 0 0 0 0 0 0 0Tennessee 1 0 0 97 1 0 0 64Texas 10 0 0 8,909 21 1 0 3,080Utah 1 0 0 177 0 0 0 0Vermont 0 0 0 0 0 0 0 0Virginia 0 0 0 0 0 0 0 0Washington 2 0 0 795 0 0 0 0West Virginia 0 0 0 0 5 0 0 178Wisconsin 1 0 0 230 1 0 0 297Wyoming 1 0 0 257 1 0 0 523United States, total1 111 0 2 50,940 141 1 1 55,888
II. An event that results in an emergency shutdown of an LNG facility.III. An event that is significant, in the judgment of the operator, even though it did not meet the criteria of I or II.Historical totals may change as the Office of Pipeline Safety receives supplemental information on incidents.
SOURCE: U.S. Department of Transportation, Pipeline and Hazardous Materials Safety Administration, Office of Pipeline Safety, Incident Statistics, available at www.phmsa.dot.gov/pipeline/library/data-stats as of July 2015.
Table 2-22: Natural Gas Transmission Pipeline Incidents: 2013 and 20142013 2014
1Incidents that have an "unknown" location are included in the U.S. total (15 Incidents causing $6,945,051 in property damage for 2013; and 18 incidents causing $9,981,646 in property damage for 2014).
NOTES: Data for 2013 are revised. Incidents are reported on Form RSPA F 7100.2. Incident means any of the following events:I. An event that involves a release of gas from a pipeline or a liquefied natural gas (LNG) facility and a) a death or personal injury necessitating in-
Table 2-22: Natural Gas Transmission Pipeline Incidents: 2013 and 2014
1Incidents that have an “unknown” location are included in the U.S. total (15 Incidents causing $6,945,051 in property damage for 2013; and 18 incidents causing $9,981,646 in property damage for 2014).
NOTES: Data for 2013 are revised. Incidents are reported on Form RSPA F 7100.2. Incident means any of the following events: I. An event that involves a release of gas from a pipeline or a liquefied natural gas (LNG) facility and a) a death or personal injury necessitating in-patient hospitalization or b) estimated property damage, including cost of gas lost, of the operator or others, or both, of $50,000 or more. II. An event that results in an emergency shutdown of an LNG facility. III. An event that is significant, in the judgment of the operator, even though it did not meet the criteria of I or II. Historical totals may change as the Office of Pipeline Safety receives supplemental information on incidents. SOURCE: U.S. Department of Transportation, Pipeline and Hazardous Materials Safety Administration, Office of Pipeline Safety, Incident Statistics, available at www.phmsa.dot.gov/pipeline/library/data-stats as of July 2015.
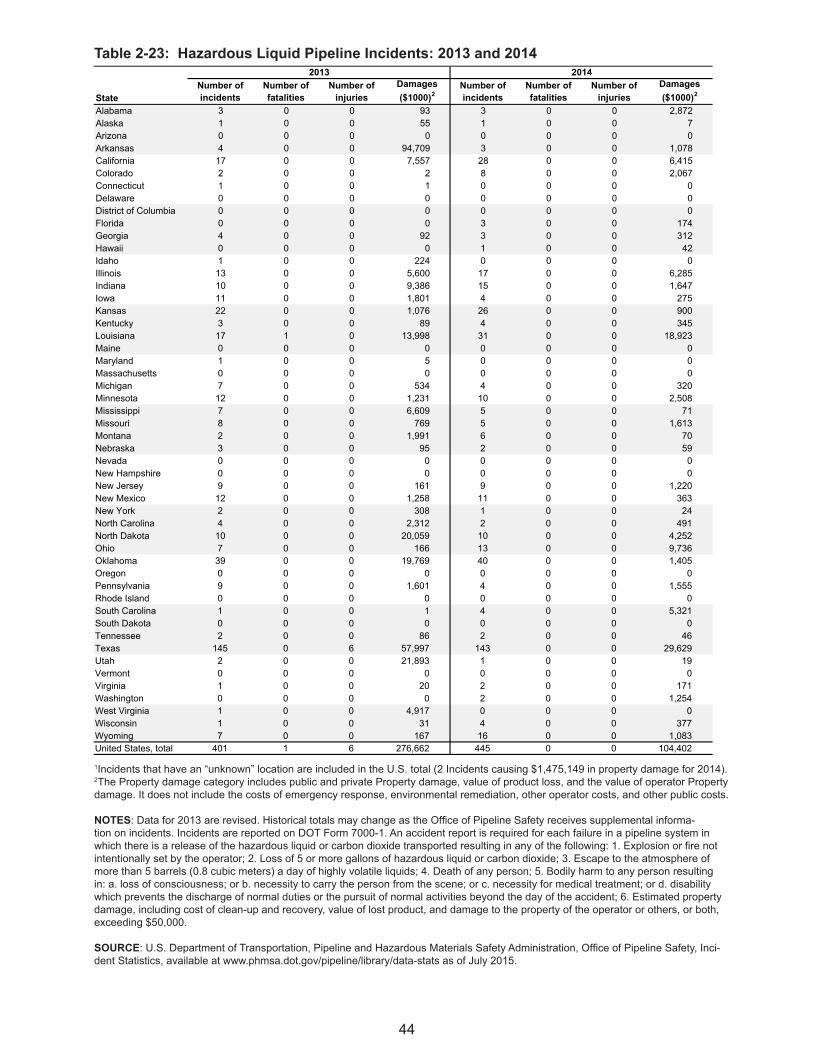
44
Table 2-23: Hazardous Liquid Pipeline Incidents: 2013 and 2014
StateNumber of incidents
Number of fatalities
Number of injuries
Damages($1000)2
Number of incidents
Number of fatalities
Number of injuries
Damages($1000)2
Alabama 3 0 0 93 3 0 0 2,872Alaska 1 0 0 55 1 0 0 7Arizona 0 0 0 0 0 0 0 0Arkansas 4 0 0 94,709 3 0 0 1,078California 17 0 0 7,557 28 0 0 6,415Colorado 2 0 0 2 8 0 0 2,067Connecticut 1 0 0 1 0 0 0 0Delaware 0 0 0 0 0 0 0 0District of Columbia 0 0 0 0 0 0 0 0Florida 0 0 0 0 3 0 0 174Georgia 4 0 0 92 3 0 0 312Hawaii 0 0 0 0 1 0 0 42Idaho 1 0 0 224 0 0 0 0Illinois 13 0 0 5,600 17 0 0 6,285Indiana 10 0 0 9,386 15 0 0 1,647Iowa 11 0 0 1,801 4 0 0 275Kansas 22 0 0 1,076 26 0 0 900Kentucky 3 0 0 89 4 0 0 345Louisiana 17 1 0 13,998 31 0 0 18,923Maine 0 0 0 0 0 0 0 0Maryland 1 0 0 5 0 0 0 0Massachusetts 0 0 0 0 0 0 0 0Michigan 7 0 0 534 4 0 0 320Minnesota 12 0 0 1,231 10 0 0 2,508Mississippi 7 0 0 6,609 5 0 0 71Missouri 8 0 0 769 5 0 0 1,613Montana 2 0 0 1,991 6 0 0 70Nebraska 3 0 0 95 2 0 0 59Nevada 0 0 0 0 0 0 0 0New Hampshire 0 0 0 0 0 0 0 0New Jersey 9 0 0 161 9 0 0 1,220New Mexico 12 0 0 1,258 11 0 0 363New York 2 0 0 308 1 0 0 24North Carolina 4 0 0 2,312 2 0 0 491North Dakota 10 0 0 20,059 10 0 0 4,252Ohio 7 0 0 166 13 0 0 9,736Oklahoma 39 0 0 19,769 40 0 0 1,405Oregon 0 0 0 0 0 0 0 0Pennsylvania 9 0 0 1,601 4 0 0 1,555Rhode Island 0 0 0 0 0 0 0 0South Carolina 1 0 0 1 4 0 0 5,321South Dakota 0 0 0 0 0 0 0 0Tennessee 2 0 0 86 2 0 0 46Texas 145 0 6 57,997 143 0 0 29,629Utah 2 0 0 21,893 1 0 0 19Vermont 0 0 0 0 0 0 0 0Virginia 1 0 0 20 2 0 0 171Washington 0 0 0 0 2 0 0 1,254West Virginia 1 0 0 4,917 0 0 0 0Wisconsin 1 0 0 31 4 0 0 377Wyoming 7 0 0 167 16 0 0 1,083United States, total 401 1 6 276,662 445 0 0 104,402
SOURCE: U.S. Department of Transportation, Pipeline and Hazardous Materials Safety Administration, Office of Pipeline Safety, Incident Statistics, available at www.phmsa.dot.gov/pipeline/library/data-stats as of July 2015.
2013 2014
2The Property damage category includes public and private Property damage, value of product loss, and the value of operator Property damage. It does not include the costs of emergency response, environmental remediation, other operator costs, and other public costs.
NOTES: Data for 2013 are revised. Historical totals may change as the Office of Pipeline Safety receives supplemental information on incidents.Incidents are reported on DOT Form 7000-1. An accident report is required for each failure in a pipeline system in which there is a release of the hazardous liquid or carbon dioxide transported resulting in any of the following: 1. Explosion or fire not intentionally set by the operator; 2. Loss of 5 or more gallons of hazardous liquid or carbon dioxide; 3. Escape to the atmosphere of more than 5 barrels (0.8 cubic meters) a day of highly volatile liquids; 4. Death of any person; 5. Bodily harm to any person resulting in: a. loss of consciousness; or b. necessity to carry the person from the scene; or c. necessity for medical treatment; or d. disability which prevents the discharge of normal duties or the pursuit of normal activities beyond the day of the accident; 6. Estimated property damage, including cost of clean-up and recovery, value of lost product, and damage to the property of the operator or others, or both, exceeding $50,000.
1Incidents that have an "unknown" location are included in the U.S. total (2 Incidents causing $1,475,149 in property damage for 2014).
Table 2-23: Hazardous Liquid Pipeline Incidents: 2013 and 2014
1Incidents that have an “unknown” location are included in the U.S. total (2 Incidents causing $1,475,149 in property damage for 2014).2The Property damage category includes public and private Property damage, value of product loss, and the value of operator Property damage. It does not include the costs of emergency response, environmental remediation, other operator costs, and other public costs. NOTES: Data for 2013 are revised. Historical totals may change as the Office of Pipeline Safety receives supplemental informa-tion on incidents. Incidents are reported on DOT Form 7000-1. An accident report is required for each failure in a pipeline system in which there is a release of the hazardous liquid or carbon dioxide transported resulting in any of the following: 1. Explosion or fire not intentionally set by the operator; 2. Loss of 5 or more gallons of hazardous liquid or carbon dioxide; 3. Escape to the atmosphere of more than 5 barrels (0.8 cubic meters) a day of highly volatile liquids; 4. Death of any person; 5. Bodily harm to any person resulting in: a. loss of consciousness; or b. necessity to carry the person from the scene; or c. necessity for medical treatment; or d. disability which prevents the discharge of normal duties or the pursuit of normal activities beyond the day of the accident; 6. Estimated property damage, including cost of clean-up and recovery, value of lost product, and damage to the property of the operator or others, or both, exceeding $50,000.
SOURCE: U.S. Department of Transportation, Pipeline and Hazardous Materials Safety Administration, Office of Pipeline Safety, Inci-dent Statistics, available at www.phmsa.dot.gov/pipeline/library/data-stats as of July 2015.
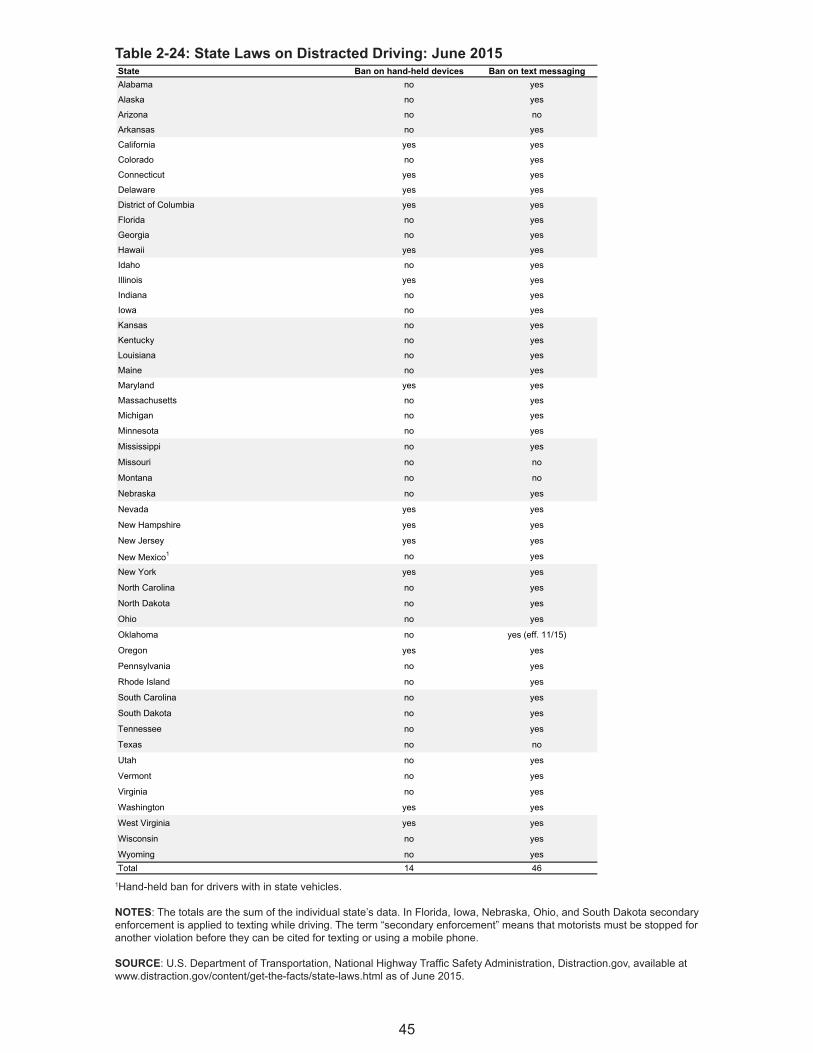
45
Table 2-24: State Laws on Distracted Driving: June 2015State Ban on hand-held devices Ban on text messagingAlabama no yes
Alaska no yes
Arizona no no
Arkansas no yes
California yes yes
Colorado no yes
Connecticut yes yes
Delaware yes yes
District of Columbia yes yes
Florida no yes
Georgia no yes
Hawaii yes yes
Idaho no yes
Illinois yes yes
Indiana no yes
Iowa no yes
Kansas no yes
Kentucky no yes
Louisiana no yes
Maine no yes
Maryland yes yes
Massachusetts no yes
Michigan no yes
Minnesota no yes
Mississippi no yes
Missouri no no
Montana no no
Nebraska no yes
Nevada yes yes
New Hampshire yes yes
New Jersey yes yes
New Mexico1 no yes
New York yes yes
North Carolina no yes
North Dakota no yes
Ohio no yes
Oklahoma no yes (eff. 11/15)
Oregon yes yes
Pennsylvania no yes
Rhode Island no yes
South Carolina no yes
South Dakota no yes
Tennessee no yes
Texas no no
Utah no yes
Vermont no yes
Virginia no yes
Washington yes yes
West Virginia yes yes
Wisconsin no yes
Wyoming no yesTotal 14 461Hand-held ban for drivers with in state vehicles.
NOTES: The totals are the sum of the individual state's data. In Florida, Iowa, Nebraska, Ohio, and South Dakota secondary enforcement is applied to texting while driving. The term "secondary enforcement" means that motorists must be stopped for another violation before they can be cited for texting or using a mobile phone.
SOURCE: U.S. Department of Transportation, National Highway Traffic Safety Administration, Distraction.gov, available at www.distraction.gov/content/get-the-facts/state-laws.html as of June 2015.
Table 2-24: State Laws on Distracted Driving: June 2015
1Hand-held ban for drivers with in state vehicles.
NOTES: The totals are the sum of the individual state’s data. In Florida, Iowa, Nebraska, Ohio, and South Dakota secondary enforcement is applied to texting while driving. The term “secondary enforcement” means that motorists must be stopped for another violation before they can be cited for texting or using a mobile phone.
SOURCE: U.S. Department of Transportation, National Highway Traffic Safety Administration, Distraction.gov, available at www.distraction.gov/content/get-the-facts/state-laws.html as of June 2015.

46
Table 2-25: Bus Involvement in Fatal Crashes: 2013
State BusesAll
vehicles
Buses as percentage of
all vehicles Buses All vehicles
Bus fatatlities as percentage of all fatalities
Alabama 7 1,116 0.6 9 852 1.1Alaska 0 67 0.0 0 51 0.0Arizona 3 1,173 0.3 3 849 0.4Arkansas 1 638 0.2 1 483 0.2California 27 4,125 0.7 27 3,000 0.9Colorado 5 630 0.8 5 481 1.0Connecticut 2 375 0.5 2 276 0.7Delaware 2 150 1.3 3 99 3.0District of Columbia 0 31 0.0 0 20 0.0Florida 29 3,358 0.9 30 2,407 1.2Georgia 11 1,636 0.7 11 1,179 0.9Hawaii 1 123 0.8 1 102 1.0Idaho 1 277 0.4 1 214 0.5Illinois 9 1,353 0.7 9 991 0.9Indiana 4 1,093 0.4 6 783 0.8Iowa 4 434 0.9 6 317 1.9Kansas 1 473 0.2 1 350 0.3Kentucky 1 880 0.1 1 638 0.2Louisiana 5 969 0.5 5 703 0.7Maine 3 189 1.6 3 145 2.1Maryland 7 648 1.1 7 465 1.5Massachusetts 5 417 1.2 5 326 1.5Michigan 4 1,363 0.3 4 947 0.4Minnesota 6 563 1.1 6 387 1.6Mississippi 3 781 0.4 3 613 0.5Missouri 3 1,002 0.3 4 757 0.5Montana 1 266 0.4 1 229 0.4Nebraska 1 279 0.4 1 211 0.5Nevada 6 372 1.6 6 262 2.3New Hampshire 0 168 0.0 0 135 0.0New Jersey 11 750 1.5 11 542 2.0New Mexico 2 389 0.5 2 310 0.6New York 26 1,579 1.6 28 1,199 2.3North Carolina 7 1,756 0.4 7 1,289 0.5North Dakota 1 215 0.5 1 148 0.7Ohio 5 1,485 0.3 5 989 0.5Oklahoma 5 972 0.5 5 678 0.7Oregon 2 421 0.5 2 313 0.6Pennsylvania 19 1,694 1.1 22 1,208 1.8Rhode Island 0 83 0.0 0 65 0.0South Carolina 7 1,030 0.7 9 767 1.2South Dakota 1 184 0.5 1 135 0.7Tennessee 6 1,400 0.4 14 995 1.4Texas 18 4,651 0.4 22 3,382 0.7Utah 2 289 0.7 2 220 0.9Vermont 2 89 2.2 2 69 2.9Virginia 6 1,001 0.6 6 740 0.8Washington 2 593 0.3 3 436 0.7West Virginia 2 431 0.5 2 332 0.6Wisconsin 4 801 0.5 5 543 0.9Wyoming 0 106 0.0 0 87 0.0United States, total 280 44,868 0.6 310 32,719 0.9
SOURCES: Fatal crashes: U.S. Department of Transportation, National Highway Traffic Safety Administration, Fatality Analysis Reporting System Encyclopedia, available at www-fars.nhtsa.dot.gov as of July 2015.
Number of vehicles involved in fatal crahes Number of fatalities
NOTES: Fatal bus crashes involve school buses, cross country/inter-city buses, transit buses, van-based bus with gross vehicle weightrating greater than 10,000 lbs. and other/unknown bus types.
Table 2-25: Bus Involvement in Fatal Crashes: 2013
NOTES: Fatal bus crashes involve school buses, cross country/inter-city buses, transit buses, van-based bus with gross vehicle weight rating greater than 10,000 lbs. and other/unknown bus types.
SOURCES: Fatal crashes: U.S. Department of Transportation, National Highway Traffic Safety Administration, Fatality Analysis Reporting System Encyclopedia, available at www-fars.nhtsa.dot.gov as of July 2015.

47
Table 2-26: Bicyclist Fatalities Involving Motor Vehicles: 2013
State Total traffic fatalities Bicyclists killedBicylist fatalities as
percent of totalPopulation(thousands)
Bicyclist fatality rate per 100,000 population
Alabama 852 6 0.7 4,834 0.12Alaska 51 1 2.0 737 0.14Arizona 849 31 3.7 6,635 0.47Arkansas 483 4 0.8 2,959 0.14California 3,000 141 4.7 38,431 0.37Colorado 481 12 2.5 5,272 0.23Connecticut 276 3 1.1 3,599 0.08Delaware 99 1 1.0 925 0.11District of Columbia 20 1 5.0 649 0.15Florida 2,407 133 5.5 19,600 0.68Georgia 1,179 28 2.4 9,995 0.28Hawaii 102 2 2.0 1,409 0.14Idaho 214 3 1.4 1,613 0.19Illinois 991 30 3.0 12,891 0.23Indiana 783 14 1.8 6,571 0.21Iowa 317 3 0.9 3,092 0.10Kansas 350 6 1.7 2,896 0.21Kentucky 638 3 0.5 4,400 0.07Louisiana 703 14 2.0 4,629 0.30Maine 145 4 2.8 1,329 0.30Maryland 465 6 1.3 5,939 0.10Massachusetts 326 6 1.8 6,709 0.09Michigan 947 27 2.9 9,898 0.27Minnesota 387 6 1.6 5,422 0.11Mississippi 613 6 1.0 2,992 0.20Missouri 757 4 0.5 6,045 0.07Montana 229 1 0.4 1,015 0.10Nebraska 211 0 0.0 1,869 0.00Nevada 262 7 2.7 2,791 0.25New Hampshire 135 4 3.0 1,323 0.30New Jersey 542 14 2.6 8,912 0.16New Mexico 310 4 1.3 2,087 0.19New York 1,199 40 3.3 19,696 0.20North Carolina 1,289 22 1.7 9,849 0.22North Dakota 148 1 0.7 724 0.14Ohio 989 19 1.9 11,572 0.16Oklahoma 678 13 1.9 3,853 0.34Oregon 313 3 1.0 3,928 0.08Pennsylvania 1,208 11 0.9 12,781 0.09Rhode Island 65 3 4.6 1,053 0.28South Carolina 767 15 2.0 4,772 0.31South Dakota 135 0 0.0 846 0.00Tennessee 995 8 0.8 6,497 0.12Texas 3,382 48 1.4 26,506 0.18Utah 220 6 2.7 2,903 0.21Vermont 69 0 0.0 627 0.00Virginia 740 8 1.1 8,270 0.10Washington 436 11 2.5 6,974 0.16West Virginia 332 0 0.0 1,854 0.00Wisconsin 543 10 1.8 5,743 0.17Wyoming 87 0 0.0 583 0.00United States, total 32,719 743 2.3 316,498 0.23NOTE: Details may not add to totals due to rounding.
SOURCE: Fatalities: U.S. Department of Transportation, National Highway Traffic Safety Administration, Fatality Analysis Reporting SystemEncyclopedia, available at www-fars.nhtsa.dot.gov as of June 2015. Population: U.S. Department of Commerce, U.S. Census Bureau,Population Estimates, Vintage 2009 and 2012, available at www.census.gov/popest as of June 2015.
Table 2-26: Bicyclist Fatalities Involving Motor Vehicles: 2013
NOTE: Details may not add to totals due to rounding.
SOURCE: Fatalities: U.S. Department of Transportation, National Highway Traffic Safety Administration, Fatality Analysis Reporting System En-cyclopedia, available at www-fars.nhtsa.dot.gov as of June 2015. Population: U.S. Department of Commerce, U.S. Census Bureau, Population Estimates, Vintage 2009 and 2012, available at www.census.gov/popest as of June 2015.


Chapter 3Freight Transportation

50
Table 3-1: Freight Shipments by State of Origin: 2012State Value ($ millions) Tons (thousands) Ton-miles (millions)Alabama 214,750 191,500 51,227Alaska 19,848 23,958 3,108Arizona 147,147 117,119 16,298Arkansas 114,095 121,430 30,478California 1,476,407 718,345 171,432Colorado 158,800 169,335 50,450Connecticut 271,125 179,846 32,455Delaware 42,768 25,537 2,786District of Columbia 2,509 3,049 SFlorida 440,516 414,015 61,698Georgia 395,725 272,760 62,439Hawaii 22,156 25,730 SIdaho 41,405 44,001 24,417Illinois 825,191 606,874 149,574Indiana 393,998 324,668 66,176Iowa 195,992 263,357 85,170Kansas 218,973 193,929 70,888Kentucky 268,530 285,812 88,294Louisiana 349,658 438,166 138,352Maine 38,545 44,888 9,628Maryland 162,416 101,222 12,042Massachusetts 235,932 109,368 13,472Michigan 427,177 258,965 61,455Minnesota 270,394 291,694 101,362Mississippi 140,334 119,048 24,662Missouri 242,404 197,077 47,770Montana 30,561 90,511 73,468Nebraska 109,147 146,474 66,851Nevada 69,591 40,254 10,176New Hampshire 42,805 26,554 3,474New Jersey 450,795 219,863 35,599New Mexico 48,793 48,681 7,472New York 545,050 317,630 42,457North Carolina 385,732 220,669 47,304North Dakota 45,743 88,071 31,915Ohio 587,929 449,851 81,668Oklahoma 169,262 217,905 51,251Oregon 147,065 106,742 31,974Pennsylvania 550,644 418,478 76,704Rhode Island 45,575 26,719 1,882South Carolina 159,760 99,936 26,526South Dakota 58,621 70,357 27,891Tennessee 329,399 187,514 48,264Texas 1,897,658 1,686,264 243,743Utah 108,593 89,129 29,911Vermont 24,980 17,862 3,324Virginia 238,576 173,461 30,082Washington 296,901 183,138 46,771West Virginia 54,759 174,741 56,674Wisconsin 311,937 234,984 53,485Wyoming 25,470 421,925 461,804United States, total 13,852,143 11,299,409 2,969,506KEY: S = Estimate does not meet publication standards.
NOTE: Details may not add to total due to rounding. Ton-miles estimates are based on estimated distances traveled along a modeled transportation network. Value-of-shipments estimates have not been adjusted for price changes. For more information, visit www.census.gov/econ/cfs.
SOURCE: U.S. Department of Transportation, Bureau of Transportation Statistics and U.S. Department of Commerce, U.S. Census Bureau, Commodity Flow Survey, Freight Shipments by State of Origin, available at www.bts.gov/publications/commodity_flow_surveyas of July 2015.
Table 3-1: Freight Shipments by State of Origin: 2012
KEY: S = Estimate does not meet publication standards.
NOTE: Details may not add to total due to rounding. Ton-miles estimates are based on estimated distances traveled along a modeled transportation network. Value-of-shipments estimates have not been adjusted for price changes. For more information, visit www.census.gov/econ/cfs.
SOURCE: U.S. Department of Transportation, Bureau of Transportation Statistics and U.S. Department of Commerce, U.S. Census Bu-reau, Commodity Flow Survey, United States, table 14, Shipment Characteristics by Origin State for the United States: 2012, available at www.bts.gov/publications/commodity_flow_survey as of July 2015.

51
Table 3-2: Hazardous Material Shipments by Selected State of Origin: 2012(Ranked by tons)State Value ($ millions) Tons (thousands) Ton-miles (millions)Texas 802,054 911,558 86,339Louisiana 185,958 228,855 50,821California 155,608 161,487 15,608Illinois 136,261 153,609 25,466Connecticut 95,097 100,006 3,219Florida 70,884 70,889 6,405Ohio 55,777 58,051 5,572New Jersey 61,025 56,241 2,401Oklahoma 46,039 54,561 6,353New York 46,688 50,714 3,277Washington 41,895 50,681 2,636Pennsylvania 44,756 49,486 6,214Indiana 40,530 46,514 2,805Wisconsin 33,804 36,144 3,540Massachusetts S S SGeorgia 33,686 34,770 2,958Michigan 32,378 34,322 3,334Kentucky 34,352 32,984 3,939Tennessee 28,807 29,212 3,304Kansas 25,159 26,423 2,561United States, total 2,334,425 2,580,153 307,524
KEY: S = Estimate does not meet publication standards because of high sampling variability or poor response quality.
SOURCE: U.S. Department of Transportation, Bureau of Transportation Statistics and U.S. Department of Commerce, U.S. Census Bureau, Commodity Flow Survey, Hazardous Material Shipments by Selected State of Origin, available at www.bts.gov/publications/commodity_flow_survey as of July 2015.
NOTES: Selected states shown had the highest estimated weight without considering sampling variability and are shown in descending order. Since an “All other states” line is not shown, estimates do not add to total. Ton-miles estimates are based on estimated distances traveled along a modeled transportation network. Value-of-shipments estimates have not been adjusted for price changes. For moreinformation, visit www.census.gov/econ/cfs.
Table 3-2: Hazardous Material Shipments by Selected State of Origin: 2012(Ranked by tons)
KEY: S = Estimate does not meet publication standards because of high sampling variability or poor response quality.
NOTES: Selected states shown had the highest estimated weight without considering sampling variability and are shown in descending order. Since an “All other states” line is not shown, estimates do not add to total. Ton-miles estimates are based on estimated distances traveled along a modeled transportation network. Value-of-shipments estimates have not been adjusted for price changes. For more information, visit www.census.gov/econ/cfs.
SOURCE: U.S. Department of Transportation, Bureau of Transportation Statistics and U.S. Department of Commerce, U.S. Census Bureau, Commodity Flow Survey, Hazardous Materials, table 5a, Hazardous Material Shipment Characteristics by Selected State of Origin, available at www.bts.gov/publications/commodity_flow_survey as of July 2015.

52
Table 3-3: Hazardous Material Shipments by Selected State of Destination: 2012(Ranked by tons)State Value ($ millions) Tons (thousands) Ton-miles (millions)Texas 804,751 919,634 64,672California 157,704 164,829 32,530Louisiana 126,128 153,886 10,417Illinois 109,044 120,213 15,468Connecticut 83,387 90,375 2,493Florida 83,421 86,552 21,187New Jersey 55,362 61,416 8,317Ohio 58,051 60,834 8,365Indiana 50,039 54,921 3,402New York 54,866 54,116 8,788Oklahoma 46,200 52,325 4,216Washington 44,511 51,888 4,215Pennsylvania 44,623 50,549 7,793Massachusetts 45,765 44,176 1,976Michigan 37,948 40,026 6,082Georgia 36,623 37,916 6,290Minnesota 28,419 33,476 3,163Tennessee 28,971 31,829 8,896North Carolina 30,888 31,565 SMississippi 26,270 30,182 3,389United States, total 2,334,425 2,580,153 307,524
KEY: S = Estimate does not meet publication standards because of high sampling variability or poor response quality.
SOURCE: U.S. Department of Transportation, Bureau of Transportation Statistics and U.S. Department of Commerce, U.S. Census Bureau, Commodity Flow Survey, Hazardous Material Shipments by Selected State of Destination, available at www.bts.gov/publications/commodity_flow_survey as of July 2015.
NOTES: Selected states shown had the highest estimated weight without considering sampling variability and are shown in descending order. Since an “All other states” line is not shown, estimates do not add to total. Ton-miles estimates are based on estimated distances traveled along a modeled transportation network. Value-of-shipments estimates have not been adjusted for price changes. For moreinformation, visit www.census.gov/econ/cfs.
Table 3-3: Hazardous Material Shipments by Selected State of Destination: 2012(Ranked by tons)
KEY: S = Estimate does not meet publication standards because of high sampling variability or poor response quality.
NOTES: Selected states shown had the highest estimated weight without considering sampling variability and are shown in descending order. Since an “All other states” line is not shown, estimates do not add to total. Ton-miles estimates are based on estimated distances trav-eled along a modeled transportation network. Value-of-shipments estimates have not been adjusted for price changes. For more informa-tion, visit www.census.gov/econ/cfs.
SOURCE: U.S. Department of Transportation, Bureau of Transportation Statistics and U.S. Department of Commerce, U.S. Census Bureau, Commodity Flow Survey, Hazardous Materials, table 5b, Hazardous Material Shipment Characteristics by Selected State of Destination, available at www.bts.gov/publications/commodity_flow_survey as of July 2015.

53
Table 3-4: Rail Shipments: 2012
StateAll commodities
(thousands of tons)Top commodity by weight
All commodities (thousands of tons)
Top commodity by weight
Alabama 51,082 Coal 38,161 CoalAlaska 5,561 Stone, sand, gravel 5,561 Stone, sand, gravelArizona 26,052 Coal 3,281 Stone, sand, limeArkansas 27,429 Coal 14,493 Stone, sand, gravelCalifornia 98,903 Intermodal 59,066 IntermodalColorado 29,703 Coal 30,647 CoalConnecticut 1,324 Primary metal prod. 1,271 Waste & scrapDelaware 4,442 Stone, sand, gravel 842 Coke & metal productsDistrict of Columbia 17 All traffic 37 All trafficFlorida 66,677 Phospate rock 43,721 Phospate rockGeorgia 67,689 Coal 31,841 Stone, sand, gravelHawaii NA NA NA NAIdaho 7,380 Chemicals 7,081 Food productsIllinois 157,810 Coal 115,899 IntermodalIndiana 56,517 Coal 54,154 CoalIowa 35,389 Coal 46,269 Food productsKansas 23,383 Coal 17,913 Farm productsKentucky 36,761 Coal 59,158 CoalLouisiana 44,592 Coal 29,344 ChemicalsMaine 2,573 Ground minerals 2,126 Pulp & paperMaryland 35,538 Coal 5,815 Waste & scrapMassachusetts 6,671 Intermodal 2,829 Empty containersMichigan 32,653 Coal 21,874 Motor veh. & partsMinnesota 70,254 Metallic ores 90,337 Metallic oresMississippi 13,579 Coal & metallic ores 7,699 ChemicalsMissouri 68,908 Coal 16,716 Food productsMontana 4,771 Prod. of petr. refining 38,320 Coal & cokeNebraska 23,323 Coal 27,027 Farm productsNevada 5,060 Coal 2,075 Concrete & gypsum prod.New Hampshire 780 Coal & cement 321 Stone, sand, gravelNew Jersey 23,625 Chemicals 11,789 IntermodalNew Mexico 3,772 Food products 12,068 CoalNew York 20,575 Chemicals 7,439 Waste & scrapNorth Carolina 47,903 Coal 10,362 ChemicalsNorth Dakota 22,003 Farm products 49,480 Farm productsOhio 77,297 Coal 66,191 CoalOklahoma 34,810 Coal 18,299 Stone, sand, gravelOregon 19,304 Chemicals 10,187 Lumber & woodPennsylvania 54,495 Coal 51,550 CoalRhode Island 836 Chemicals 49 All trafficSouth Carolina 27,757 Coal 12,114 ChemicalsSouth Dakota 4,813 Coal & cement 14,276 Farm productsTennessee 26,558 Chemicals 15,695 IntermodalTexas 206,591 Coal 92,892 ChemicalsUtah 10,752 Coal & cement 15,775 CoalVermont 1,552 Salt & ground miner. 659 Ground mineralsVirginia 77,551 Coal 32,231 CoalWashington 48,340 Farm products 21,892 IntermodalWest Virginia 14,281 Coal 92,328 CoalWisconsin 57,490 Coal 20,625 Stone, sand, gravelWyoming 15,755 Coal 434,299 CoalUnited States, total 1,800,883 Coal 1,764,078 Coal
Rail shipments terminating in state Rail shipments originating in state
KEY: NA = not applicable.
NOTE: The top commodity is based on the 38 two-digit Standard Transportation Commodity Code groupings and is determined by the tonnage either originating or terminating in the state (including intrastate shipments.) Commodity tonnage data are rounded estimates based on the Carload Waybill Sample. Individual state shipments may not add to total.
SOURCE: Association of American Railroads, Railroad Ten-Year Trends , available at www.aar.org/StatisticsAndPublications as of July 2015.
Table 3-4: Rail Shipments: 2012
KEY: NA = not applicable.
NOTE: The top commodity is based on the 38 two-digit Standard Transportation Commodity Code groupings and is determined by the tonnage either originating or terminating in the state (including intrastate shipments.) Commodity tonnage data are rounded estimates based on the Carload Waybill Sample. Individual state shipments may not add to total.
SOURCE: Association of American Railroads, Railroad Ten-Year Trends, available at www.aar.org/StatisticsAndPublications as of July 2015.

54
Table 3-5: Waterborne Shipments: 2012 and 2013(Thousands of short tons)
State Domestic Foreign Domestic Foreign Domestic Foreign Domestic ForeignAlabama 16,073 13,542 13,308 10,104 16,512 69,539 13,929 14,169 12,493 10,624 18,178 69,394Alaska 3,776 3,142 1,763 28,103 4,258 41,041 5,398 3,171 1,044 28,246 3,740 41,599Arkansas 1,932 6,918 0 7,580 0 16,430 2,035 6,697 0 8,676 0 17,409California 12,505 16,310 120,470 5,662 65,889 220,836 12,746 15,400 124,222 5,061 68,745 226,174Connecticut 730 6,884 2,027 472 532 10,645 694 7,544 2,417 371 341 11,368Delaware 124 4,059 6,991 3,372 1,249 15,794 190 4,002 4,983 3,096 1,665 13,936District of Columbia 0 113 0 0 0 113 0 128 0 0 0 128Florida 876 39,987 28,017 4,695 18,510 91,501 615 38,495 30,274 6,530 18,013 93,925Georgia 1,125 903 16,646 234 17,971 36,879 690 1,027 14,500 138 18,863 35,216Hawaii 10,367 4,172 8,521 1,469 403 24,932 9,574 4,222 7,804 1,133 447 23,180Idaho 0 0 0 867 0 868 0 0 0 825 0 825Illinois 7,441 17,063 1,352 80,424 116 106,399 5,786 16,239 1,475 68,424 91 92,015Indiana 2,288 46,265 1,443 18,211 116 68,322 1,930 43,215 1,033 18,722 21 64,922Iowa 125 3,372 0 6,829 0 10,327 53 3,257 0 4,552 0 7,861Kansas 0 0 0 346 0 346 0 0 0 391 0 391Kentucky 20,657 25,357 0 48,674 0 94,688 25,608 23,828 0 50,887 0 100,232Louisiana 51,561 136,948 92,973 86,780 142,523 510,788 54,212 134,938 91,850 86,737 133,340 501,077Maine 109 1,136 13,179 168 536 15,127 130 1,156 12,322 87 382 14,078Maryland 1,015 3,712 12,892 3,656 23,993 45,268 3,421 3,194 10,765 3,919 19,370 40,669Massachusetts 381 5,028 10,206 223 1,459 17,298 274 6,488 10,482 180 1,442 18,866Michigan 9,853 18,948 3,960 19,859 4,927 57,547 9,364 19,979 3,471 19,950 5,459 58,222Minnesota 1,204 6,560 314 31,296 3,499 42,872 1,286 7,194 316 30,441 2,230 41,466Mississippi 467 7,727 18,469 13,806 8,122 48,592 296 8,991 17,520 13,360 8,416 48,582Missouri 4,253 5,853 0 23,960 0 34,066 3,883 6,197 0 26,899 0 36,979Nebraska 0 10 0 12 0 22 0 6 0 3 0 9New Hampshire 0 492 1,654 9 264 2,419 6 499 2,004 12 158 2,679New Jersey 9,554 10,119 74,657 33,954 24,401 152,685 6,423 11,641 69,166 36,718 22,043 145,991New York 5,179 13,279 9,507 8,325 2,585 38,875 4,710 14,414 7,362 10,233 1,988 38,706North Carolina 1,385 1,612 5,314 160 2,557 11,028 1,688 1,731 5,155 180 2,878 11,632Ohio 10,820 49,682 6,531 18,621 4,915 90,569 10,812 54,048 5,466 17,102 6,321 93,749Oklahoma 6 2,632 0 3,478 0 6,116 3 2,905 0 3,869 0 6,777Oregon 2,904 5,842 3,745 2,261 16,004 30,758 2,938 5,621 3,976 3,873 13,851 30,259Pennsylvania 8,947 29,488 20,424 9,734 1,838 70,431 5,900 30,751 21,757 12,900 2,237 73,546Puerto Rico 1,398 3,681 13,351 1,324 253 19,424 1,100 3,309 13,058 945 441 18,853Rhode Island 112 2,721 3,795 363 575 7,567 140 2,526 5,194 531 681 9,072South Carolina 456 1,629 10,614 403 6,437 19,539 332 1,700 9,610 360 6,914 18,916Tennessee 1,656 25,378 0 7,042 0 34,076 1,808 25,508 0 7,439 0 34,755Texas 75,043 26,494 218,616 37,957 127,774 485,884 76,260 23,489 201,524 45,605 145,781 492,659Vermont 0 0 0 0 0 0 0 0 0 0 0 0Virginia 2,650 3,080 9,205 3,765 61,121 79,821 2,784 3,525 9,996 3,549 63,980 83,834Washington 9,257 18,906 23,857 11,396 52,182 115,598 9,548 19,996 22,157 10,826 49,685 112,212West Virginia 11,822 15,420 0 37,742 0 64,984 12,180 14,576 0 35,873 0 62,629Wisconsin 171 6,571 1,305 18,880 4,706 31,634 15 7,018 2,341 18,893 5,958 34,225United States, total 288,507 596,369 804,514 596,369 617,381 2,306,770 288,781 602,371 758,743 602,371 624,883 2,274,778NOTES: U.S. and state totals exclude duplication. U.S. total includes data for Guam, the Virgin Islands, the Pacific Islands, other territories, and transshipments, which are not individually provided in the table.
SOURCE: U.S. Army Corps of Engineers, Navigation Data Center, Waterborne Commerce Statistics Center, Waterborne Commerce of the United States 2012 and 2013, Part 5 National Summaries , Table 4-1, available at www.navigationdatacenter.us/wcsc as of July 2015.
2012 2013
IntrastateTerminating in state Originating in state
Total IntrastateTerminating in state Originating in state
Total
Table 3-5: Waterborne Shipments: 2012 and 2013 (Thousands of short tons)
NOTES: U.S. and state totals exclude duplication. U.S. total includes data for Guam, the Virgin Islands, the Pacific Islands, other territories, and transshipments, which are not individually provided in the table. SOURCE: U.S. Army Corps of Engineers, Navigation Data Center, Waterborne Commerce Statistics Center, Waterborne Commerce of the United States 2012 and 2013, Part 5 National Summaries, Table 4-1, available at www.navigationdatacenter.us/wcsc as of July 2015.

55
Table 3-6: Top 50 U.S. Ports by Port Calls and Vessel Type1: 2013(Capacity in thousands of dwt tons)
Port Calls Capacity Calls Capacity Calls Capacity Calls Capacity Calls CapacityHouston, TX 1 8,321 331,539 4,977 225,256 803 36,894 722 34,078 1,819 35,312Sabine-Neches Waterway, TX 2 7,462 431,098 5,111 356,464 1,016 46,558 0 0 1,335 28,076New Orleans, LA 3 6,605 337,589 2,371 143,971 2,633 148,940 385 18,825 1,216 25,852New York/New Jersey, NY 4 5,508 284,870 2,478 127,892 217 11,245 2,252 133,382 561 12,351South Louisiana, LA 5 4,098 231,160 2,050 123,877 1,726 99,945 0 0 322 7,339San Francisco Bay Area, CA 6 3,953 38,252 1,259 0 755 38,252 1,635 0 304 0Philadelphia/Delaware River Ports, P 7 2,602 69,972 914 56,410 223 7,137 383 0 1,082 6,425Savannah, GA 8 2,566 133,587 321 11,517 202 7,438 1,739 106,299 304 8,333Hampton Roads, VA 9 2,176 143,713 99 3,311 734 64,340 1,134 71,211 209 4,850Port Everglades, FL 10 2,001 51,588 386 17,933 56 1,591 1,170 28,942 389 3,123Long Beach, CA 11 1,962 159,070 618 72,872 249 14,514 877 66,172 218 5,512Los Angeles, CA 12 1,925 114,320 250 11,954 91 4,598 1,430 93,924 154 3,844Baltimore, MD 13 1,498 70,125 91 2,735 323 28,845 298 19,779 786 18,766Miami, FL 14 1,492 31,043 23 1,432 0 0 1,026 28,168 443 1,444Jacksonville, FL 15 1,431 43,286 125 5,550 95 5,489 472 19,067 739 13,178Corpus Christi, TX 16 1,415 79,679 946 61,944 286 15,152 0 0 183 2,584Columbia River, OR 17 1,392 44,684 81 0 942 44,684 86 0 283 0Charleston, SC 18 1,296 64,626 93 3,973 67 3,386 833 50,909 303 6,358Texas City, TX 19 1,077 54,197 1,040 52,483 32 1,585 0 0 5 129San Juan, PR 20 1,074 22,919 199 7,107 33 1,313 433 9,799 409 4,700Mobile, AL 21 986 46,698 130 5,251 350 23,868 163 10,358 343 7,221Tacoma, WA 22 873 41,493 12 935 90 5,321 483 29,140 288 6,096Tampa, FL 23 834 28,618 259 9,305 316 12,800 38 1,829 221 4,684Lake Charles, LA 24 807 48,916 557 40,315 121 6,257 0 0 129 2,345Seattle, WA 25 669 38,949 20 896 54 2,685 512 33,483 83 1,884Greater Baton Rouge, LA 26 616 29,427 449 22,937 120 5,787 0 0 47 703Galveston, TX 27 547 14,217 123 4,797 107 3,739 0 0 317 5,682Boston, MA 28 522 24,015 258 10,584 34 2,065 137 8,192 93 3,175Pascagoula, MS 29 514 34,297 385 29,152 61 3,855 0 0 68 1,290Freeport, TX 30 505 19,638 312 15,383 10 573 115 1,856 68 1,825Brunswick, GA 31 489 10,782 3 116 52 1,834 0 0 434 8,832Wilmington, NC, NC 32 452 16,962 132 4,704 47 2,749 172 7,126 101 2,383Honolulu, HI 33 447 13,386 76 3,096 5 246 303 9,155 63 890Wilmington, DE, DE 34 344 8,359 7 593 43 1,526 97 3,100 197 3,140Cherry Point Refinery, WA 35 304 35,952 286 34,960 13 728 0 0 5 263Apra Harbor, GU 36 302 6,933 72 2,128 13 616 126 3,147 91 1,042Port Hueneme, CA 37 299 5,285 10 445 0 0 45 1,268 244 3,572San Diego, CA 38 279 5,374 7 335 5 248 47 619 220 4,172Dutch Harbor, AK 39 272 6,889 11 230 0 0 124 5,924 137 736El Segundo Offshore Oil Terminal, C 40 272 27,904 272 27,904 0 0 0 0 0 0Valdez, AK 41 267 32,720 266 32,719 0 0 0 0 1 1Portland, ME 42 255 15,489 198 14,392 4 187 10 82 43 828Point Comfort, TX 43 235 10,660 87 2,559 117 7,262 0 0 31 839Louisiana Offshore Oil Port, LA 44 220 46,749 220 46,749 0 0 0 0 0 0March Point, WA 45 209 19,335 209 19,335 0 0 0 0 0 0Providence, RI 46 192 7,680 136 5,549 33 1,726 0 0 23 406Palm Beach, FL 47 187 1,459 5 134 0 0 23 211 159 1,114Anchorage, AK 48 185 4,189 3 170 5 188 84 1,755 93 2,077Port Manatee, FL 49 167 4,315 9 501 58 2,432 0 0 100 1,382Kalaeloa (Barbers Point), HI 50 152 10,349 123 8,682 25 1,593 0 0 4 73Top 50 ports total 72,256 3,354,357 28,069 1,631,537 12,166 670,189 17,354 797,802 14,667 254,830U.S. ports total5 74,188 3,418,774 28,679 1,657,892 12,648 693,076 17,540 801,170 15,321 266,636Top 50 ports as percent of U.S. total 97.4 98.1 97.9 98.4 96.2 96.7 98.9 99.6 95.7 95.6
SOURCE: U.S. Department of Transportation, Maritime Administration, Vessel Calls at U.S. Ports by Vessel Type, available at http://www.marad.dot.gov/resources/data-statistics as of July 2015.
1Excludes calls by vessels under 10,000 dwt.2Capacity is calculated as the sum for all calling vessels of Calls multiplied by Capacity in dwt.3Includes petroleum and chemical Tankers.4Includes roll-on/roll-off, gas carrier, general cargo, and combination carriers.5Includes Puerto Rico.
KEY: dwt = deadweight.
Rank
Vessel type and total capacity2
Tanker3 Dry-bulk ContainershipOther general
cargo4Total
Table 3-6: Top 50 U.S. Ports by Port Calls and Vessel Type1: 2013 (Capacity in thousands of dwt tons)
1Excludes calls by vessels under 10,000 dwt. 2Capacity is calculated as the sum for all calling vessels of calls multiplied by capacity in dwt. 3Includes petroleum and chemical tankers. 4Includes roll-on/roll-off, gas carrier, general cargo, and combination carriers. 5Includes Puerto Rico.
KEY: dwt = deadweight.
SOURCE: U.S. Department of Transportation, Maritime Administration, Vessel Calls at U.S. Ports by Vessel Type, available at http://www.marad.dot.gov/resources/data-statistics as of July 2015.

56
Table 3-7: Top 30 U.S. Containership Ports: 2013(Thousands of TEUs)Port Rank Total Export Import Los Angeles, CA 1 5,662 1,737 3,925Long Beach, CA 2 4,963 1,518 3,445New York, NY 3 4,197 1410 2,788Savannah, GA 4 2,363 1218 1146Norfolk, VA 5 1,834 934 900Oakland, CA 6 1,608 836 772Houston, TX 7 1,572 917 655Charleston, SC 8 1,292 626 666Tacoma, WA 9 1,263 530 733Seattle, WA 10 999 454 545Jacksonville, FL 11 753 513 240Miami, FL 12 711 360 352Port Everglades, FL 13 695 386 309Baltimore, MD 14 536 202 334New Orleans, LA 15 301 220 81Philadelphia, PA 16 281 94 187Wilmington, NC 17 220 114 106Wilmington, DE 18 194 27 167San Juan, PR 19 185 22 162Gulfport, MS 20 171 74 97Mobile, AL 21 170 101 69Boston, MA 22 161 64 97West Palm Beach, FL 23 153 124 29Portland, OR 24 144 71 73Freeport, TX 25 74 27 47Chester, PA 26 67 25 42Honolulu, HI 27 60 40 20Port Hueneme, CA 28 54 4 49Pensauken, NJ 29 53 38 15San Diego, CA 30 51 2 48Top 30 ports, total 30,786 12,687 18,099United States, all ports1 30,926 12,748 18,178Top 30 ports as percent of U.S. total 99.5 99.5 99.61Includes Puerto Rico.
KEY: TEUs = twenty-foot equivalent units.
SOURCE: U.S. Department of Transportation, Maritime Administration, U.S. Waterborne Foreign Container Trade by U.S. Custom Ports, available at www.marad.dot.gov/library_landing_page/data_and_statistics/Data_and_Statistics.htm as of July 2015.
Table 3-7: Top 30 U.S. Containership Ports: 2013 (Thousands of TEUs)
1Includes Puerto Rico.
KEY: TEU = twenty-foot equivalent unit.
SOURCE: U.S. Department of Transportation, Maritime Administration, U.S. Waterborne Foreign Container Trade by U.S. Custom Ports, avail-able at www.marad.dot.gov/library_landing_page/data_and_statistics/Data_and_Statistics.htm as of July 2015.

57
Table 3-8: Scheduled and Nonscheduled Air Freight and Mail Enplaned: 2013(Short tons)
State Scheduled Nonscheduled Scheduled NonscheduledAlabama 22,062 39,916 12 0Alaska 520,051 278,305 91,472 570Arizona 148,769 1,978 12,468 0Arkansas 9,137 114 167 0California 1,682,268 108,476 69,873 134Colorado 110,562 5,569 6,720 0Connecticut 51,097 1,613 3,991 0Delaware 0 514 0 0District of Columbia 0 0 0 0Florida 903,708 176,725 26,631 0Georgia 290,000 6,808 27,372 0Hawaii 221,125 49,624 21,401 1,850Idaho 21,057 114 58 0Illinois 629,829 56,097 32,608 0Indiana 555,854 1,183 2,091 0Iowa 54,407 15 3,911 0Kansas 10,518 4,069 0 0Kentucky 1,370,694 172,484 38,025 0Louisiana 40,084 194 170 0Maine 5,033 3 0 0Maryland 50,515 898 3,067 0Massachusetts 124,459 1,739 5,427 0Michigan 127,005 1,780 10,345 0Minnesota 104,996 3,876 11,962 0Mississippi 3,342 40 3 0Missouri 97,524 1,539 2,947 0Montana 24,436 3 126 0Nebraska 33,718 60 1,089 0Nevada 84,557 274 1,732 4New Hampshire 42,623 199 255 0New Jersey 310,086 4,704 20,742 9,498New Mexico 41,640 59 285 0New York 603,751 33,202 19,938 13,058North Carolina 130,207 1,286 12,659 0North Dakota 12,532 247 3 0Ohio 94,462 7,630 1,868 0Oklahoma 43,829 215 0 0Oregon 97,465 2,181 3,035 39Pennsylvania 288,339 1,048 16,561 0Rhode Island 5,113 28 1 0South Carolina 47,993 5,793 117 0South Dakota 27,938 2 28 0Tennessee 2,335,611 1,352 3,324 1,983Texas 756,042 37,189 27,481 0Utah 86,375 2,459 10,431 0Vermont 2,165 0 0 0Virginia 162,850 1,238 5,916 0Washington 235,757 9,514 10,931 54West Virginia 2,765 25 1 0Wisconsin 56,800 156 1,293 0Wyoming 7,614 0 0 0United States, total (including U.S. territories) 12,771,658 1,025,424 510,721 27,356
Freight Mail
NOTE: Shipments by foreign carriers, destined for foreign airports and intrastate shipments are included.
SOURCE: U.S. Department of Transportation, Bureau of Transportation Statistics, TranStats Database, T-100 Market (All Carriers), available at www.transtats.bts.gov as of July 2015.
Table 3-8: Scheduled and Nonscheduled Air Freight and Mail Enplaned: 2013 (Short tons)
NOTE: Shipments by foreign carriers, destined for foreign airports and intrastate shipments are included. SOURCE: U.S. Department of Transportation, Bureau of Transportation Statistics, TranStats Database, T-100 Market (All Carriers), available at www.transtats.bts.gov as of July 2015.

58
Table 3-9: Top 50 Airports by Landed Weight of All-Cargo Operations: 2008–2013(In thousand short tons)
2008 2009 2010 2011 2012 2013Memphis International (MEM) 1 9,750 9,464 9,772 10,152 10,492 10,946Ted Stevens Anchorage International (ANC) 2 8,976 7,762 9,732 8,887 8,261 7,991Louisville International-Standiford Field (SDF) 3 5,223 5,139 5,319 5,491 5,548 5,632Miami International (MIA) 4 2,103 1,750 2,448 2,184 2,278 3,432Indianapolis International (IND) 5 3,494 3,176 3,453 3,317 3,574 3,424Chicago O'Hare International (ORD) 6 2,564 2,288 2,359 2,407 2,470 2,634Los Angeles International (LAX) 7 2,876 1,884 1,977 2,022 2,102 2,100John F Kennedy International (JFK) 8 104 564 1,216 1,410 1,594 1,711Cincinnati/Northern Kentucky International (CVG) 9 2,222 1,591 1,962 1,972 1,747 1,686Dallas/Fort Worth International (DFW) 10 1,614 1,436 1,516 1,532 1,544 1,531Newark Liberty International (EWR) 11 1,742 1,341 1,324 1,340 1,323 1,362Metropolitan Oakland International (OAK) 12 1,727 1,464 1,489 1,525 1,427 1,267Ontario International (ONT) 13 1,350 1,168 1,121 1,157 1,181 1,186Hartsfield - Jackson Atlanta International (ATL) 14 1,167 1,278 1,314 1,328 1,014 1,094Honolulu International (HNL) 15 1,032 1,021 1,062 1,057 988 1,058Philadelphia International (PHL) 16 1,264 1,132 994 975 942 942George Bush Intercontinental/Houston (IAH) 17 754 784 763 808 788 852Phoenix Sky Harbor International (PHX) 18 747 803 697 679 645 693Seattle-Tacoma International (SEA) 19 675 610 607 620 650 688Denver International (DEN) 20 625 624 619 605 602 630San Francisco International (SFO) 21 775 747 652 622 599 596Portland International (PDX) 22 656 545 531 567 581 569Salt Lake City International (SLC) 23 521 449 424 428 438 467Minneapolis-St Paul International/Wold-Chamberlain (MSP) 24 492 418 409 403 390 433Luis Munoz Marin International (SJU) 25 431 543 441 434 425 424Rafael Hernandez (BQN) 26 710 564 459 444 411 396Chicago/Rockford International (RFD) 27 433 382 365 375 364 387San Antonio International (SAT) 28 418 447 453 455 396 380Boeing Field/King County International (BFI) 29 412 336 337 374 405 369General Edward Lawrence Logan International (BOS) 30 562 474 512 484 438 366Bradley International (BDL) 31 322 255 257 333 411 358Orlando International (MCO) 32 425 391 398 403 363 349Rickenbacker International (LCK) 33 365 323 342 327 347 348San Diego International (SAN) 34 354 292 276 301 333 341Detroit Metropolitan Wayne County (DTW) 35 333 319 315 325 341 339Fort Worth Alliance (AFW) 36 449 299 350 449 317 318Piedmont Triad International (GSO) 37 232 279 306 304 303 303Albuquerque International Sunport (ABQ) 38 315 290 299 297 284 284El Paso International (ELP) 39 227 166 249 261 260 257Manchester (MHT) 40 228 235 236 242 244 247Baltimore/Washington International Thurgood Marshall (BWI) 41 294 228 216 212 214 244Washington Dulles International (IAD) 42 279 187 248 245 222 243Laredo International (LRD) 43 224 196 264 267 277 240Fort Lauderdale/Hollywood International (FLL) 44 285 215 225 223 233 239General Mitchell International (MKE) 45 252 219 220 217 220 227Spokane International (GEG) 46 336 251 238 213 224 223Reno/Tahoe International (RNO) 47 296 199 199 208 210 221Huntsville International-Carl T Jones Field (HSV) 48 234 168 175 186 219 214Des Moines International (DSM) 49 213 223 186 192 175 214Kansas City International (MCI) 50 298 240 217 213 216 208Top 50 airports, total1 62,092 55,727 59,873 59,663 59,098 60,663United States, all airports2 71,147 63,191 67,530 67,194 66,356 68,655Top 50 airports as percent of U.S. total 87.27 88.19 88.66 88.79 89.06 88.36
SOURCE: U.S. Department of Transportation, Federal Aviation Administration, Passenger Boarding and All-Cargo Data, available at www.faa.gov/airports/planning_capacity/passenger_allcargo_stats as of July 2015.
Airport Rank in 2013
Landed weight
1The sum of the top 50 airports in earlier years will not be equal to the total since some of the top 50 airports in earlier years are not in the top 50 list in 2013.2Includes Puerto Rico and Guam.
Table 3-9: Top 50 Airports by Landed Weight of All-Cargo Operations: 2008–2013 (In thousand short tons)
1The sum of the top 50 airports in earlier years will not be equal to the total since some of the top 50 airports in earlier years are not in the top 50 list in 2013. 2Includes Puerto Rico and Guam.
SOURCE: U.S. Department of Transportation, Federal Aviation Administration, Passenger Boarding and All-Cargo Data, available at www.faa.gov/airports/planning_capacity/passenger_allcargo_stats as of July 2015.

59
Table 3-10: U.S. Surface Merchandise Trade with Canada and Mexico: 2014(Millions of current dollars)
State Canada Mexico Canada MexicoAlabama 4,183 1,499 2,151 1,499Alaska 188 5 298 18Arizona 1,417 8,238 905 7,171Arkansas 1,409 665 861 600California 14,932 22,133 24,449 38,207Colorado 1,390 951 4,142 1,692Connecticut 1,415 1,167 1,310 2,318Delaware 569 86 1,603 59District of Columbia 5 4 46 7Florida 3,363 1,298 2,483 2,847Georgia 6,059 2,620 4,111 4,860Hawaii 5 1 42 5Idaho 1,324 242 852 97Illinois 20,238 7,358 38,983 12,247Indiana 11,701 4,774 7,927 4,820Iowa 4,494 2,006 3,245 1,704Kansas 2,293 1,497 1,411 924Kentucky 7,163 1,999 3,629 5,313Louisiana 2,124 1,523 1,531 358Maine 1,372 50 1,638 57Maryland 1,503 347 1,611 1,429Massachusetts 3,034 2,139 6,792 3,127Michigan 24,553 10,664 47,685 41,302Minnesota 4,930 1,960 12,777 2,082Mississippi 1,717 1,020 1,248 1,177Missouri 4,191 2,300 3,105 3,242Montana 538 80 5,522 46Nebraska 2,119 1,314 1,101 271Nevada 896 233 703 384New Hampshire 515 404 894 548New Jersey 6,075 2,408 5,049 3,227New Mexico 168 1,469 175 484New York 13,015 2,296 17,315 2,934North Carolina 6,453 2,702 3,272 4,278North Dakota 3,977 311 2,545 145Ohio 19,715 5,511 15,168 7,317Oklahoma 1,751 576 6,357 1,016Oregon 2,927 280 2,463 472Pennsylvania 11,041 3,419 11,138 3,041Rhode Island 468 168 359 208South Carolina 3,373 1,731 2,635 2,799South Dakota 683 336 471 71Tennessee 8,720 4,477 5,282 6,021Texas 19,038 85,139 14,661 67,060Utah 1,168 649 1,494 2,250Vermont 1,592 125 2,940 44Virginia 2,990 1,108 1,641 666Washington 6,567 1,201 14,147 713West Virginia 1,775 159 1,058 240Wisconsin 7,373 2,713 4,388 2,488Wyoming 723 29 1,628 28United States, total1 249,944 195,408 297,303 243,936
Exports to Imports from
1United States total includes trade in which the state is unknown.
NOTE: Surface merchandise trade comprises all shipments of goods between the U.S. and Canada or Mexico by surface modes of transport (other than air or maritime vessel).
SOURCE: U.S. Department of Transportation, Bureau of Transportation Statistics, Transborder Freight Data available at transborder.bts.gov/programs/international/transborder as of July 2015.
Table 3-10: U.S. Surface Merchandise Trade with Canada and Mexico: 2014 (Millions of current dollars)
1United States total includes trade in which the state is unknown.
NOTE: Surface merchandise trade comprises all shipments of goods between the U.S. and Canada or Mexico by surface modes of trans-port (other than air or maritime vessel).
SOURCE: U.S. Department of Transportation, Bureau of Transportation Statistics, Transborder Freight Data, available at transborder.bts.gov/programs/international/transborder as of July 2015.

60
Table 3-11: U.S. Surface Merchandise Imports from Canada and Mexico: 2014(Short Tons)
StateTotal
(short tons)Truck
(percent)Rail
(percent)Other1
(percent)Total
(short tons)Truck
(percent)Rail
(percent)Other1
(percent)Alabama 2,095,981 14.3 85.7 Z 292,848 87.9 12.1 <0.05Alaska 116,027 85.8 14.1 0.1 6,511 20.5 79.5 ZArizona 618,888 29.2 70.7 0.1 4,048,823 83.4 15.3 1.3Arkansas 562,114 29.9 70.1 <0.05 114,958 94.4 5.6 <0.05California 7,787,906 28.5 71.4 0.1 8,012,181 85.7 11.5 2.7Colorado 6,539,586 4.1 8.7 87.2 174,456 89.0 11.0 <0.05Connecticut 828,088 68.7 31.1 0.1 338,682 51.5 48.4 <0.05Delaware 3,225,844 2.5 91.2 6.4 16,082 90.8 9.2 ZDistrict of Columbia 9,401 97.8 2.2 Z 8,389 100.0 0.0 ZFlorida 1,701,687 31.0 69.0 0.1 610,036 74.1 25.8 <0.05Georgia 2,257,043 31.9 68.0 <0.05 1,171,752 89.2 10.8 ZHawaii 36,507 99.8 0.1 0.1 2,826 100.0 0.0 ZIdaho 1,878,297 25.6 74.4 <0.05 36,495 92.3 7.7 ZIllinois 71,574,177 3.7 6.8 89.5 4,997,040 38.5 61.4 0.1Indiana 6,306,719 31.5 68.5 <0.05 767,003 82.4 17.6 ZIowa 2,956,674 22.2 77.8 Z 254,383 97.9 2.1 ZKansas 911,384 25.8 66.1 8.2 95,597 77.9 22.1 <0.05Kentucky 1,936,680 45.4 54.6 <0.05 838,459 75.1 24.8 0.1Louisiana 2,065,599 4.8 95.2 <0.05 217,679 23.4 76.6 <0.05Maine 3,342,324 37.2 21.6 41.2 15,095 99.7 0.3 ZMaryland 1,280,718 35.3 64.1 0.6 155,659 77.4 22.5 0.1Massachusetts 2,971,809 56.6 43.4 <0.05 221,903 93.2 6.8 <0.05Michigan 22,198,405 38.5 16.6 44.9 5,708,628 36.1 63.9 <0.05Minnesota 23,208,863 7.3 17.1 75.6 356,736 92.3 7.7 ZMississippi 1,194,425 12.3 85.8 1.9 387,755 57.2 42.8 ZMissouri 2,445,147 24.1 35.0 40.9 718,625 82.2 17.8 ZMontana 10,567,106 13.1 3.6 83.3 8,240 60.3 0.0 39.7Nebraska 948,149 35.5 63.9 0.6 50,602 98.9 1.1 ZNevada 547,733 34.0 65.9 <0.05 141,274 99.7 0.3 ZNew Hampshire 772,863 66.0 34.0 Z 26,451 100.0 0.0 ZNew Jersey 3,549,441 45.0 54.7 0.2 576,776 84.4 15.3 0.3New Mexico 570,920 5.2 94.8 Z 363,366 81.6 17.7 0.6New York 9,556,738 71.1 23.8 5.2 491,910 91.7 8.3 <0.05North Carolina 2,422,742 30.1 69.9 <0.05 650,436 95.3 4.7 <0.05North Dakota 4,271,094 63.6 36.3 0.1 15,099 81.1 18.9 ZOhio 16,494,347 23.2 18.7 58.1 1,126,851 75.3 20.9 3.9Oklahoma 11,658,574 1.3 3.5 95.2 251,191 99.2 0.8 <0.05Oregon 5,055,076 17.7 82.3 <0.05 133,915 90.7 9.3 ZPennsylvania 9,021,730 41.9 33.7 24.4 779,736 65.3 34.2 0.5Rhode Island 269,484 56.7 43.3 Z 18,742 99.5 0.5 ZSouth Carolina 1,709,278 31.5 68.0 0.5 407,898 75.2 4.1 20.7South Dakota 473,781 56.2 43.8 <0.05 22,022 60.0 40.0 ZTennessee 2,825,456 30.1 69.9 0.1 830,491 87.8 6.1 6.1Texas 12,288,801 14.2 43.1 42.6 18,243,650 82.7 15.0 2.3Utah 862,793 45.2 54.7 <0.05 136,144 94.8 5.2 <0.05Vermont 1,725,439 74.5 25.5 Z 4,659 97.8 2.2 ZVirginia 1,245,348 41.9 55.0 3.1 100,475 81.6 18.4 0.1Washington 14,279,588 21.2 23.9 54.9 153,704 74.0 26.0 ZWest Virginia 747,691 26.3 73.7 Z 160,532 13.6 86.4 <0.05Wisconsin 4,940,644 24.7 72.2 3.1 636,356 87.8 12.2 <0.05Wyoming 2,470,753 2.9 17.9 79.2 6,901 98.9 1.1 ZUnited States, total2 289,348,903 20.6 28.4 50.9 54,909,985 73.8 24.6 1.6
SOURCE: U.S. Department of Transportation, Bureau of Transportation Statistics, Transborder Freight Data available at transborder.bts.gov/programs/international/transborder as of July 2015.
Imports from Canada Imports from Mexico
1Includes pipeline, mail, imports into Foreign Trade Zones, and other imports by modes not elsewhere classified.2The sum of states may not add to U.S. totals, because the totals include imports to unknown destinations.
KEY: Z = No activity.
NOTES: For "Other" category of Imports from Canada, approximately 90.0 percent of the weight arrives by pipeline. For the category "Other"Imports from Mexico, approximately 66.6 percent of the weight is via pipeline, and approximately 32.1 percent of the weight arrives by Foreign Trade Zones.
Table 3-11: U.S. Surface Merchandise Imports from Canada and Mexico: 2014 (Short tons)
1Includes pipeline, mail, imports into Foreign Trade Zones, and other imports by modes not elsewhere classified. 2The sum of states may not add to U.S. totals, because the totals include imports to unknown destinations. KEY: Z = No activity.
NOTES: For “Other” category of Imports from Canada, approximately 90.0 percent of the weight arrives by pipeline. For the cat-egory “Other” Imports from Mexico, approximately 66.6 percent of the weight is via pipeline, and approximately 32.1 percent of the weight arrives by Foreign Trade Zones.
SOURCE: U.S. Department of Transportation, Bureau of Transportation Statistics, Transborder Freight Data, available at transbor-der.bts.gov/programs/international/transborder as of July 2015.

61
Table 3-12: Incoming Truck Crossings, U.S.-Canadian Border: 2009—20142009 2010 2011 2012 2013 2014
Alaska 9,484 5,944 5,699 5,275 4,843 10,117Idaho 58,390 63,927 64,992 69,633 69,125 71,408Maine 335,671 344,612 334,310 328,974 321,728 305,326Michigan 1,867,706 2,165,079 2,189,895 2,274,224 2,303,991 2,371,352Minnesota 67,452 73,928 75,298 69,712 66,396 62,929Montana 144,911 155,016 165,818 175,770 176,583 183,828New York 1,398,201 1,451,605 1,463,269 1,474,122 1,476,360 1,514,443North Dakota 363,076 380,838 386,711 412,873 396,412 422,452Vermont 216,463 217,404 205,843 207,317 212,291 219,548Washington 559,279 586,052 598,540 605,607 620,929 640,808United States, total 5,020,633 5,444,405 5,490,375 5,623,507 5,648,658 5,802,211NOTES: Truck crossings do not represent the number of unique vehicles and include both loaded and unloaded trucks. Crossings do not includeprivately owned pickup trucks. The data for incoming trucks exceeds the data for truck containers loaded and unloaded (empty) because some incoming trucks do not carry a container. The states listed in the table comprise all states with truck entries at U.S.–Canada border.
SOURCE: U.S. Department of Transportation, Bureau of Transportation Statistics, North American Border Crossing/Entry Data available attransborder.bts.gov/programs/international/transborder/TBDR_BC/TBDR_BC_Index.html as of June 2015.
Table 3-12: Incoming Truck Crossings, U.S.-Canadian Border: 2009–2014
NOTES: Truck crossings do not represent the number of unique vehicles and include both loaded and unloaded trucks. Crossings do not include privately owned pickup trucks. The data for incoming trucks exceeds the data for truck containers loaded and unloaded (empty) because some incoming trucks do not carry a container. The states listed in the table comprise all states with truck entries at U.S.–Canada border. SOURCE: U.S. Department of Transportation, Bureau of Transportation Statistics, North American Border Crossing/Entry Data, available at transborder.bts.gov/programs/international/transborder/TBDR_BC/TBDR_BC_Index.html as of June 2015.
Table 3-13: Incoming Truck Container (Loaded) Crossings, U.S.-Canadian Border: 2009—20142009 2010 2011 2012 2013 2014
Alaska 7,059 10,141 10,469 9,920 9,449 8,694Idaho 49,723 49,573 46,726 48,556 44,768 53,133Maine 189,200 199,200 176,215 183,831 180,242 172,495Michigan 1,541,803 1,805,476 1,734,025 1,732,268 1,771,063 1,809,462Minnesota 38,300 40,189 40,575 35,160 35,440 36,059Montana 119,215 112,774 127,790 129,789 108,649 182,095New York 1,118,436 1,144,885 1,091,610 1,100,864 1,094,797 1,211,479North Dakota 262,108 273,137 259,135 277,270 279,550 312,787Vermont 195,304 169,036 163,909 162,117 164,661 138,672Washington 376,156 367,020 398,462 388,999 394,632 302,351United States, total 3,897,304 4,171,431 4,048,916 4,068,774 4,083,251 4,227,227NOTES: Truck crossings do not represent the number of unique vehicles and include both loaded and unloaded trucks. Crossings do not includeprivately owned pickup trucks. The data for incoming trucks exceeds the data for truck containers loaded and unloaded (empty) because some incoming trucks do not carry a container. The states listed in the table comprise all states with truck entries at U.S.–Canada border.
SOURCE: U.S. Department of Transportation, Bureau of Transportation Statistics, North American Border Crossing/Entry Data available attransborder.bts.gov/programs/international/transborder/TBDR_BC/TBDR_BC_Index.html as of June 2015.
Table 3-13: Incoming Truck Container (Loaded) Crossings, U.S.-Canadian Border: 2009–2014
NOTES: Truck crossings do not represent the number of unique vehicles and include both loaded and unloaded trucks. Crossings do not in-clude privately owned pickup trucks. The data for incoming trucks exceeds the data for truck containers loaded and unloaded (empty) because some incoming trucks do not carry a container. The states listed in the table comprise all states with truck entries at U.S.–Canada border. SOURCE: U.S. Department of Transportation, Bureau of Transportation Statistics, North American Border Crossing/Entry Data, available at transborder.bts.gov/programs/international/transborder/TBDR_BC/TBDR_BC_Index.html as of June 2015.
Table 3-14: Incoming Truck Container (Unloaded) Crossings, U.S.-Canadian Border: 2009—20142009 2010 2011 2012 2013 2014
Alaska 1,044 4,579 4,356 3,856 3,770 3,882Idaho 8,510 8,755 12,788 16,633 21,634 22,570Maine 131,192 144,724 133,641 141,840 98,972 99,883Michigan 280,601 288,006 274,300 388,933 509,246 477,666Minnesota 29,320 35,226 37,381 36,699 31,623 27,194Montana 23,092 26,071 35,776 44,047 43,575 35,183New York 277,995 308,783 315,926 321,025 323,218 310,682North Dakota 102,566 111,243 132,504 139,638 120,910 113,272Vermont 40,867 48,576 40,927 41,455 39,084 28,557Washington 161,951 163,753 175,823 172,773 181,333 126,971United States, total 1,057,138 1,139,716 1,163,422 1,306,899 1,373,365 1,245,860NOTES: Truck crossings do not represent the number of unique vehicles and include both loaded and unloaded trucks. Crossings do not includeprivately owned pickup trucks. The data for incoming trucks exceeds the data for truck containers loaded and unloaded (empty) because some incoming trucks do not carry a container. The states listed in the table comprise all states with truck entries at U.S.–Canada border.
SOURCE: U.S. Department of Transportation, Bureau of Transportation Statistics, North American Border Crossing/Entry Data available attransborder.bts.gov/programs/international/transborder/TBDR_BC/TBDR_BC_Index.html as of June 2015.
Table 3-14: Incoming Truck Container (Empty) Crossings, U.S.-Canadian Border: 2009–2014
NOTES: Truck crossings do not represent the number of unique vehicles and include both loaded and unloaded trucks. Crossings do not include privately owned pickup trucks. The data for incoming trucks exceeds the data for truck containers loaded and unloaded (empty) because some incoming trucks do not carry a container. The states listed in the table comprise all states with truck entries at U.S.–Canada border. SOURCE: U.S. Department of Transportation, Bureau of Transportation Statistics, North American Border Crossing/Entry Data, available at transborder.bts.gov/programs/international/transborder/TBDR_BC/TBDR_BC_Index.html as of June 2015.

62
Table 3-15: Incoming Train Crossings, U.S.-Canadian Border: 2009—20142009 2010 2011 2012 2013 2014
Alaska 318 300 295 273 0 277Idaho 967 1,205 1,233 1,188 1,267 1,389Maine 743 726 593 923 981 998Michigan 5,490 6,268 6,485 6,682 7,060 6,616Minnesota 6,556 6,744 7,101 7,406 8,031 7,629Montana 344 373 380 442 444 351New York 4,042 3,984 4,023 4,238 4,455 4,556North Dakota 2,887 3,311 3,048 3,509 3,085 3,199Vermont 767 803 793 787 735 649Washington 1,920 2,409 2,716 3,076 3,028 2,979United States, total 24,034 26,123 26,667 28,524 29,086 28,643NOTE: The states listed in the table comprise all states with rail crossings at the U.S.–Canada border.
SOURCE: U.S. Department of Transportation, Bureau of Transportation Statistics, North American Border Crossing/Entry Data available attransborder.bts.gov/programs/international/transborder/TBDR_BC/TBDR_BC_Index.html as of June 2015.
Table 3-15: Incoming Train Crossings, U.S.-Canadian Border: 2009–2014
NOTE: The states listed in the table comprise all states with rail crossings at the U.S.–Canada border. SOURCE: U.S. Department of Transportation, Bureau of Transportation Statistics, North American Border Crossing/Entry Data, available at transborder.bts.gov/programs/international/transborder/TBDR_BC/TBDR_BC_Index.html as of June 2015.
Table 3-16: Incoming Rail Container (Full) Crossings, U.S.-Canadian Border: 2009—20142009 2010 2011 2012 2013 2014
Alaska NA NA NA NA NA NAIdaho 68,792 89,365 89,989 88,508 99,890 119,017Maine 12,513 15,783 14,639 21,274 17,840 12,683Michigan 325,594 385,873 401,959 401,374 406,646 383,480Minnesota 224,202 267,534 302,829 382,975 420,956 472,546Montana 14,405 16,985 13,725 14,700 14,469 8,373New York 127,635 151,185 164,089 168,291 193,633 201,723North Dakota 164,274 200,168 203,848 254,306 271,676 273,357Vermont 24,665 25,004 25,964 26,337 26,491 22,993Washington 60,852 57,143 70,485 74,077 82,560 80,676United States, total 1,022,932 1,209,040 1,287,527 1,431,842 1,534,161 1,574,848KEY: NA = not applicable.
NOTE: The states listed in the table comprise all states with rail crossings at the U.S.–Canada border.
SOURCE: U.S. Department of Transportation, Bureau of Transportation Statistics, North American Border Crossing/Entry Data available attransborder.bts.gov/programs/international/transborder/TBDR_BC/TBDR_BC_Index.html as of June 2015.
Table 3-16: Incoming Rail Container (Loaded) Crossings, U.S.-Canadian Border: 2009–2014
KEY: NA = not applicable.
NOTE: The states listed in the table comprise all states with rail crossings at the U.S.–Canada border. SOURCE: U.S. Department of Transportation, Bureau of Transportation Statistics, North American Border Crossing/Entry Data, available at transborder.bts.gov/programs/international/transborder/TBDR_BC/TBDR_BC_Index.html as of June 2015.
Table 3-17: Incoming Rail Container (Empty) Crossings, U.S.-Canadian Border: 2009—20142009 2010 2011 2012 2013 2014
Alaska NA NA NA NA NA NAIdaho 6,338 8,153 9,266 8,799 7,590 8,443Maine 12,005 13,670 14,816 27,948 26,752 14,334Michigan 223,346 219,110 235,493 247,419 278,926 294,016Minnesota 70,969 80,552 91,799 117,189 140,282 141,598Montana 10,712 10,201 13,414 24,122 22,747 11,517New York 49,459 45,577 48,654 48,322 44,259 56,615North Dakota 107,998 122,251 106,968 127,611 109,575 132,729Vermont 8,792 9,177 8,149 7,303 10,475 7,805Washington 40,865 84,528 110,290 106,632 111,135 112,948United States, total 530,484 593,219 638,849 715,345 751,741 780,005KEY: NA = not applicable.
NOTE: The states listed in the table comprise all states with rail crossings at the U.S.–Canada border.
SOURCE: U.S. Department of Transportation, Bureau of Transportation Statistics, North American Border Crossing/Entry Data available attransborder.bts.gov/programs/international/transborder/TBDR_BC/TBDR_BC_Index.html as of June 2015.
Table 3-17: Incoming Rail Container (Empty) Crossings, U.S.-Canadian Border: 2009–2014
KEY: NA = not applicable. NOTE: The states listed in the table comprise all states with rail crossings at the U.S.–Canada border. SOURCE: U.S. Department of Transportation, Bureau of Transportation Statistics, North American Border Crossing/Entry Data, available at transborder.bts.gov/programs/international/transborder/TBDR_BC/TBDR_BC_Index.html as of June 2015.

63
Table 3-18: Incoming Truck Crossings, U.S.-Mexican Border: 2009–20142009 2010 2011 2012 2013 2014
Arizona 343,761 372,719 354,573 377,903 381,568 380,751California 1,026,642 1,088,707 1,110,151 1,144,877 1,143,338 1,187,675New Mexico 66,181 87,290 80,620 91,675 92,924 101,520Texas 2,854,881 3,194,209 3,323,032 3,489,468 3,577,037 3,744,622United States, total 4,291,465 4,742,925 4,868,376 5,103,923 5,194,867 5,414,568NOTES: Truck crossings do not represent the number of unique vehicles and include both loaded and unloaded trucks. Crossings do not include privately owned pickup trucks. The data for incoming trucks exceeds the data for truck containers loaded and unloaded (empty)because some incoming trucks do not carry a container. The states listed in the table comprise all states with truck entries at U.S.–Mexico border.
SOURCE: U.S. Department of Transportation, Bureau of Transportation Statistics, North American Border Crossing/Entry Data available attransborder.bts.gov/programs/international/transborder/TBDR_BC/TBDR_BC_Index.html as of June 2015.
Table 3-18: Incoming Truck Crossings, U.S.-Mexican Border: 2009–2014
NOTES: Truck crossings do not represent the number of unique vehicles and include both loaded and unloaded trucks. Crossings do not in-clude privately owned pickup trucks. The data for incoming trucks exceeds the data for truck containers loaded and unloaded (empty) because some incoming trucks do not carry a container. The states listed in the table comprise all states with truck entries at U.S.–Mexico border. SOURCE: U.S. Department of Transportation, Bureau of Transportation Statistics, North American Border Crossing/Entry Data, available at transborder.bts.gov/programs/international/transborder/TBDR_BC/TBDR_BC_Index.html as of June 2015.
Table 3-19: Incoming Truck Container (Loaded) Crossings, U.S.-Mexican Border: 2009–20142009 2010 2011 2012 2013 2014
Arizona 264,579 290,773 272,641 286,742 288,249 294,686California 620,758 677,959 700,750 734,214 740,345 815,257New Mexico 46,243 56,625 57,813 55,144 67,912 67,729Texas 1,797,123 2,148,778 2,245,799 2,383,492 2,402,516 2,601,672United States, total 2,728,703 3,174,135 3,277,003 3,459,592 3,499,022 3,779,344NOTES: Truck crossings do not represent the number of unique vehicles and include both loaded and unloaded trucks. Crossings do not include privately owned pickup trucks. The data for incoming trucks exceeds the data for truck containers loaded and unloaded (empty)because some incoming trucks do not carry a container. The states listed in the table comprise all states with truck entries at U.S.–Mexico border.
SOURCE: U.S. Department of Transportation, Bureau of Transportation Statistics, North American Border Crossing/Entry Data available attransborder.bts.gov/programs/international/transborder/TBDR_BC/TBDR_BC_Index.html as of June 2015.
Table 3-19: Incoming Truck Container (Loaded) Crossings, U.S.-Mexican Border: 2009–2014
NOTES: Truck crossings do not represent the number of unique vehicles and include both loaded and unloaded trucks. Crossings do not in-clude privately owned pickup trucks. The data for incoming trucks exceeds the data for truck containers loaded and unloaded (empty) because some incoming trucks do not carry a container. The states listed in the table comprise all states with truck entries at U.S.–Mexico border. SOURCE: U.S. Department of Transportation, Bureau of Transportation Statistics, North American Border Crossing/Entry Data, available at transborder.bts.gov/programs/international/transborder/TBDR_BC/TBDR_BC_Index.html as of June 2015.
Table 3-20: Incoming Truck Container (Unloaded) Crossings, U.S.-Mexican Border: 2009–20142009 2010 2011 2012 2013 2014
Arizona 80,732 84,826 87,021 92,096 91,408 87,197California 398,773 410,314 408,855 427,693 382,724 373,282New Mexico 19,819 27,809 22,345 24,228 22,658 31,888Texas 1,050,714 1,012,053 1,002,716 1,079,517 1,035,971 1,042,072United States, total 1,550,038 1,535,002 1,520,937 1,623,534 1,532,761 1,534,439NOTES: Truck crossings do not represent the number of unique vehicles and include both loaded and unloaded trucks. Crossings do not include privately owned pickup trucks. The data for incoming trucks exceeds the data for truck containers loaded and unloaded (empty)because some incoming trucks do not carry a container. The states listed in the table comprise all states with truck entries at U.S.–Mexico border.
SOURCE: U.S. Department of Transportation, Bureau of Transportation Statistics, North American Border Crossing/Entry Data available attransborder.bts.gov/programs/international/transborder/TBDR_BC/TBDR_BC_Index.html as of June 2015.
Table 3-20: Incoming Truck Container (Empty) Crossings, U.S.-Mexican Border: 2009–2014
NOTES: Truck crossings do not represent the number of unique vehicles and include both loaded and unloaded trucks. Crossings do not in-clude privately owned pickup trucks. The data for incoming trucks exceeds the data for truck containers loaded and unloaded (empty) because some incoming trucks do not carry a container. The states listed in the table comprise all states with truck entries at U.S.–Mexico border. SOURCE: U.S. Department of Transportation, Bureau of Transportation Statistics, North American Border Crossing/Entry Data, available at transborder.bts.gov/programs/international/transborder/TBDR_BC/TBDR_BC_Index.html as of June 2015.
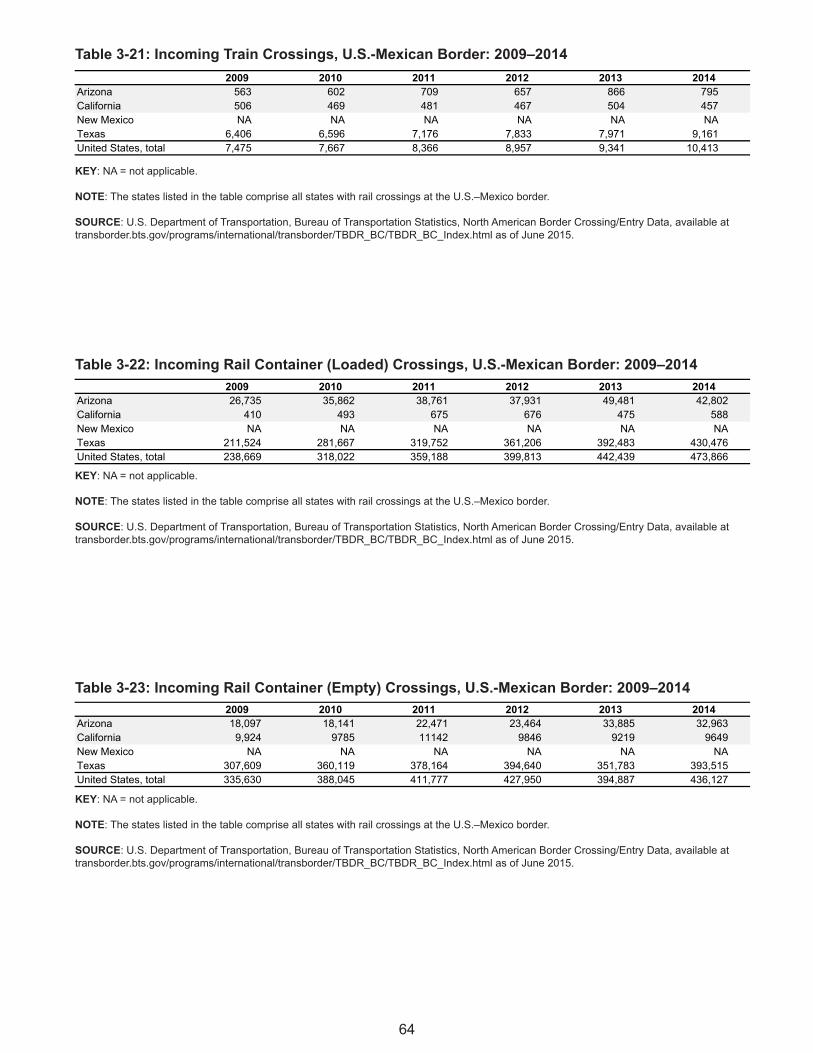
64
Table 3-21: Incoming Train Crossings, U.S.-Mexican Border: 2009–20142009 2010 2011 2012 2013 2014
Arizona 563 602 709 657 866 795California 506 469 481 467 504 457New Mexico NA NA NA NA NA NATexas 6,406 6,596 7,176 7,833 7,971 9,161United States, total 7,475 7,667 8,366 8,957 9,341 10,413KEY: NA = not applicable.
SOURCE: U.S. Department of Transportation, Bureau of Transportation Statistics, North American Border Crossing/Entry Data available attransborder.bts.gov/programs/international/transborder/TBDR_BC/TBDR_BC_Index.html as of June 2015.
NOTE: The states listed in the table comprise all states with rail crossings at the U.S.–Mexico border.
Table 3-21: Incoming Train Crossings, U.S.-Mexican Border: 2009–2014
KEY: NA = not applicable.
NOTE: The states listed in the table comprise all states with rail crossings at the U.S.–Mexico border. SOURCE: U.S. Department of Transportation, Bureau of Transportation Statistics, North American Border Crossing/Entry Data, available at transborder.bts.gov/programs/international/transborder/TBDR_BC/TBDR_BC_Index.html as of June 2015.
Table 3-22: Incoming Rail Container (Full) Crossings, U.S.-Mexican Border: 2009–20142009 2010 2011 2012 2013 2014
Arizona 26,735 35,862 38,761 37,931 49,481 42,802California 410 493 675 676 475 588New Mexico NA NA NA NA NA NATexas 211,524 281,667 319,752 361,206 392,483 430,476United States, total 238,669 318,022 359,188 399,813 442,439 473,866KEY: NA = not applicable.
NOTE: The states listed in the table comprise all states with rail crossings at the U.S.–Mexico border.
SOURCE: U.S. Department of Transportation, Bureau of Transportation Statistics, North American Border Crossing/Entry Data available attransborder.bts.gov/programs/international/transborder/TBDR_BC/TBDR_BC_Index.html as of June 2015.
Table 3-22: Incoming Rail Container (Loaded) Crossings, U.S.-Mexican Border: 2009–2014
KEY: NA = not applicable.
NOTE: The states listed in the table comprise all states with rail crossings at the U.S.–Mexico border. SOURCE: U.S. Department of Transportation, Bureau of Transportation Statistics, North American Border Crossing/Entry Data, available at transborder.bts.gov/programs/international/transborder/TBDR_BC/TBDR_BC_Index.html as of June 2015.
Table 3-23: Incoming Rail Container (Empty) Crossings, U.S.-Mexican Border: 2009–20142009 2010 2011 2012 2013 2014
Arizona 18,097 18,141 22,471 23,464 33,885 32,963California 9,924 9785 11142 9846 9219 9649New Mexico NA NA NA NA NA NATexas 307,609 360,119 378,164 394,640 351,783 393,515United States, total 335,630 388,045 411,777 427,950 394,887 436,127KEY: NA = not applicable.
NOTE: The states listed in the table comprise all states with rail crossings at the U.S.–Mexico border.
SOURCE: U.S. Department of Transportation, Bureau of Transportation Statistics, North American Border Crossing/Entry Data available attransborder.bts.gov/programs/international/transborder/TBDR_BC/TBDR_BC_Index.html as of June 2015.
Table 3-23: Incoming Rail Container (Empty) Crossings, U.S.-Mexican Border: 2009–2014
KEY: NA = not applicable.
NOTE: The states listed in the table comprise all states with rail crossings at the U.S.–Mexico border. SOURCE: U.S. Department of Transportation, Bureau of Transportation Statistics, North American Border Crossing/Entry Data, available at transborder.bts.gov/programs/international/transborder/TBDR_BC/TBDR_BC_Index.html as of June 2015.

65
Table 3-24: Top 50 U.S. Foreign Trade Freight Gateways: 2013(Ranked by value of shipments in billions of dollars)Gateway1 Mode Rank Exports Imports TotalLos Angeles, CA Water 1 42.6 170.2 212.9New York, NY Water 2 52.4 149.5 201.9John F. Kennedy International Airport, NY Air 3 96.4 93.4 189.7Long Beach, CA Water 4 37.3 143.6 180.9Laredo, TX Land 5 82.4 91.6 174.0Houston, TX Water 6 93.1 74.4 167.5Detroit, MI Land 7 64.0 58.9 122.9Chicago, IL Air 8 38.9 83.3 122.2Los Angeles International Airport, CA Air 9 41.8 45.8 87.6Port Huron, MI Land 10 40.2 41.6 81.8Buffalo-Niagara Falls, NY Land 11 43.4 37.5 80.9Norfolk, VA Water 12 33.8 37.5 71.3Savannah, GA Water 13 27.8 43.3 71.1New Orleans, LA Air 14 26.3 41.9 68.2Miami International Airport, FL Air 15 39.6 27.8 67.4Charleston, SC Water 16 24.4 40.7 65.2El Paso, TX Land 17 30.3 34.0 64.2Baltimore, MD Water 18 20.9 31.8 52.7San Francisco International Airport, CA Air 19 28.1 23.0 51.1Tacoma, WA Water 20 11.6 39.4 51.0Dallas-Fort Worth, TX Air 21 17.4 32.6 50.0Oakland, CA Water 22 19.9 27.5 47.4Cleveland, OH Air 23 25.7 18.1 43.8Anchorage, AK Air 24 9.5 31.5 41.0New Orleans, LA Water 25 24.0 15.3 39.3Otay Mesa, CA Land 26 13.1 22.9 36.0Atlanta, GA Air 27 12.8 21.9 34.7Beaumont, TX Water 28 6.6 25.9 32.6Nogales, AZ Land 29 10.3 17.4 27.7Hidalgo, TX Land 30 10.7 16.6 27.3Seattle, WA Water 31 7.4 19.6 27.0Pembina, ND Land 32 17.0 9.9 26.9Miami, FL Water 33 11.1 14.7 25.8Corpus Christi, TX Water 34 10.9 14.7 25.6Morgan City, LA Water 35 2.1 22.1 24.2Port Everglades, FL Water 36 13.5 10.4 23.9Jacksonville, FL Water 37 12.3 11.2 23.5Gramercy, LA Water 38 14.5 8.1 22.6Champlain-Rouses Point, NY Land 39 9.3 12.5 21.9Texas City, TX Water 40 9.6 12.0 21.7Eagle Pass, TX Land 41 7.1 14.3 21.4Blaine, WA Land 42 13.0 8.0 21.0Philadelphia, PA Water 43 2.8 17.0 19.8Portal, ND Land 44 12.3 7.1 19.4Lake Charles, LA Water 45 5.8 13.4 19.2Brunswick, GA Water 46 5.0 14.2 19.2Port Arthur, TX Water 47 7.9 10.7 18.6Santa Teresa, NM Land 48 8.3 10.2 18.6Sweetgrass, MT Land 49 9.9 7.3 17.2Houston Intercontinental Airport, TX Air 50 9.5 7.6 17.1Total top 50 gateways 1,214.6 1,784.0 2,998.61Gateway is any port, airport, or border crossing that provides access for the import or export of goods.
NOTES: All data: Trade levels reflect the mode of transportation as a shipment enters or exits at a border port. Flows through individual ports are based on reported data collected from U.S. trade documents. Trade does not include low-value shipments. (Ingeneral, these are imports valued at less than $1,250 and exports that are valued at less than $2,500). Air: Data for all air gatewaysinclude a low level (generally less than 2%-3% of the total value) of small user-fee airports located in the same region. Air gatewaysnot identified by airport name (e.g., Chicago, IL, and others) include major airport(s) in that geographic area in addition to smallregional airports. In addition, due to U.S. Census Bureau confidentiality regulations, data for courier operations are included in the airport totals for JFK International Airport, Chicago, Los Angeles, Miami, New Orleans, Anchorage, and Cleveland.
SOURCES: Air-U.S. Department of Commerce, U.S. Census Bureau, Foreign Trade Division, USA Trade Online, available at www.usatradeonline.gov as of November 2014. Land-U.S. Department of Transportation, Research and Innovative Technology Administration, Bureau of Transportation Statistics, Transborder Freight Data available at transborder.bts.gov/programs/international/transborder as of March 2015. Water-U.S. Army Corps of Engineers, Navigation Data Center, personal communication as of March 2015.
Table 3-24: Top 50 U.S. Foreign Trade Freight Gateways: 2013 (Ranked by value of shipments in billions of dollars)
1Gateway is any port, airport, or border crossing that provides access for the import or export of goods. NOTES: All data: Trade levels reflect the mode of transportation as a shipment enters or exits at a border port. Flows through individual ports are based on reported data collected from U.S. trade documents. Trade does not include low-value shipments. (In general, these are imports valued at less than $1,250 and exports that are valued at less than $2,500). Air: Data for all air gateways include a low level (generally less than 2%-3% of the total value) of small user-fee airports located in the same region. Air gateways not identified by airport name (e.g., Chicago, IL, and others) include major airport(s) in that geographic area in addition to small regional airports. In addition, due to U.S. Census Bureau confidentiality regulations, data for courier operations are included in the airport totals for JFK International Airport, Chicago, Los Angeles, Miami, New Orleans, Anchorage, and Cleveland.
SOURCES: Air-U.S. Department of Commerce, U.S. Census Bureau, Foreign Trade Division, USA Trade Online, avail-able at www.usatradeonline.gov as of November 2014. Land-U.S. Department of Transportation, Bureau of Transportation Statistics, Transborder Freight Data available at transborder.bts.gov/programs/international/transborder as of March 2015. Water-U.S. Army Corps of Engineers, Navigation Data Center, personal communication as of March 2015.


Chapter 4Passenger Travel

68
Table 4-1: Commuting to Work: 2013
State
Car, truck, or van–
drove alone
Car, truck, or van–
carpooled
Publictransportation
(excludingtaxicab) Walked
Taxicab,motorcycle,
bicycle or other means
Worked at home
Alabama 1,983,610 86.4 8.5 0.5 1.0 1.0 2.5 23.6Alaska 357,776 66.7 13.0 1.8 8.8 5.4 4.3 18.4Arizona 2,754,451 76.3 11.0 2.4 2.1 2.8 5.5 23.4Arkansas 1,223,214 83.4 10.1 0.5 1.7 1.5 2.8 20.8California 16,745,843 73.2 10.9 5.3 2.7 2.6 5.2 26.4Colorado 2,577,184 74.7 9.7 3.3 2.9 2.5 6.9 22.9Connecticut 1,736,156 77.9 8.3 5.1 3.1 1.2 4.3 24.4Delaware 423,542 80.3 9.1 3.5 2.1 1.2 3.7 24.5District of Columbia 330,087 32.3 5.3 38.5 13.6 5.9 4.4 28.6Florida 8,353,263 79.6 9.4 2.1 1.5 2.2 5.1 24.8Georgia 4,291,263 79.6 10.3 2.1 1.5 1.7 4.9 25.7Hawaii 672,446 67.6 13.5 6.1 4.2 4.2 4.4 25.6Idaho 696,905 78.8 9.6 0.7 3.1 2.3 5.5 19.0Illinois 5,973,263 73.6 8.3 9.1 3.1 1.6 4.2 26.9Indiana 2,974,599 83.0 8.8 1.2 2.0 1.7 3.3 22.4Iowa 1,547,508 80.9 8.6 1.1 3.7 1.6 4.2 18.1Kansas 1,389,013 82.4 9.1 0.5 2.5 1.5 4.0 18.4Kentucky 1,866,676 82.8 9.6 1.1 2.3 1.2 3.2 21.9Louisiana 1,984,437 82.6 9.6 1.3 1.7 2.3 2.4 24.6Maine 629,171 77.4 10.6 0.7 3.9 1.6 5.7 22.0Maryland 2,946,590 74.0 9.0 9.1 2.4 1.2 4.2 31.1Massachusetts 3,326,313 71.8 7.4 9.9 4.8 1.7 4.4 27.3Michigan 4,274,964 82.4 8.8 1.5 2.2 1.3 3.8 23.1Minnesota 2,773,626 78.4 8.6 3.6 2.9 1.6 4.9 21.9Mississippi 1,181,081 84.0 10.3 0.4 1.5 1.7 1.9 23.2Missouri 2,773,780 81.7 9.2 1.6 2.0 1.4 4.1 22.3Montana 475,287 75.1 10.1 0.7 5.3 2.8 6.0 16.9Nebraska 954,452 81.5 9.3 0.8 2.7 1.3 4.4 17.3Nevada 1,246,513 78.4 10.5 3.4 2.2 1.9 3.6 22.8New Hampshire 677,618 81.2 8.1 1.0 3.1 1.1 5.4 25.4New Jersey 4,166,286 72.0 8.0 11.1 2.9 2.0 4.0 29.7New Mexico 865,357 79.2 10.5 1.1 2.3 2.6 4.4 20.5New York 9,024,559 52.8 6.9 27.9 6.4 2.0 4.0 30.8North Carolina 4,348,669 81.1 10.0 1.1 1.9 1.3 4.5 22.8North Dakota 387,697 79.0 10.1 0.4 4.5 1.6 4.4 17.1Ohio 5,241,598 83.6 7.8 1.7 2.2 1.2 3.5 22.4Oklahoma 1,703,568 83.4 9.7 0.5 1.7 1.4 3.4 20.6Oregon 1,745,718 71.6 10.3 4.3 4.0 3.5 6.3 21.4Pennsylvania 5,867,765 76.8 8.3 5.6 3.9 1.5 3.9 25.0Rhode Island 505,361 80.3 8.0 2.7 4.1 1.8 3.1 23.2South Carolina 2,064,944 82.9 9.0 0.7 2.5 1.6 3.3 22.9South Dakota 427,117 79.7 9.2 0.3 4.2 1.4 5.2 16.1Tennessee 2,837,090 83.9 9.2 0.7 1.4 1.3 3.5 23.7Texas 11,939,372 80.2 10.7 1.6 1.6 1.8 4.1 24.4Utah 1,307,408 76.0 11.8 2.3 2.6 2.1 5.1 20.1Vermont 314,505 75.4 9.7 1.2 5.3 1.6 6.8 21.0Virginia 4,018,400 77.4 9.4 4.4 2.5 1.8 4.5 26.4Washington 3,204,510 72.7 10.1 6.3 3.5 2.2 5.3 24.6West Virginia 738,848 81.5 10.8 0.7 2.8 1.2 3.1 25.0Wisconsin 2,822,070 80.5 8.2 2.0 3.5 1.7 4.1 21.2Wyoming 290,906 77.1 10.8 1.5 4.6 2.3 3.7 16.9United States, total 142,962,379 76.4 9.4 5.2 2.8 1.9 4.4 24.7
Number of workers
Percent
Mean travel time to work
(minutes)
NOTES: Data for workers age 16 years and over, based on state of residence.
SOURCE: U.S. Department of Commerce, U.S. Census Bureau, 2013 American Community Survey 1-Year Estimates , available at www.census.gov/acs as of August 2015.
Table 4-1: Commuting to Work: 2013
NOTES: Data for workers age 16 years and over, based on state of residence. SOURCE: U.S. Department of Commerce, U.S. Census Bureau, 2013 American Community Survey 1-Year Estimates, available at www.cen-sus.gov/acs as of August 2015.

69
Table 4-2: Licensed Drivers: 2013
StateNumber of
licensed drivers1
Licensed drivers per registered
vehicleResident
population
Driving age population (16
and over)
Drivers per 1,000 total resident
population
Drivers per 1,000 driving age population
Alabama 3,859,403 0.81 4,833,722 3,848,576 798 1,003Alaska 528,873 0.69 735,132 567,372 719 932Arizona 4,791,450 0.90 6,626,624 5,189,383 723 923Arkansas 2,097,201 0.89 2,959,373 2,328,418 709 901California 24,390,236 0.89 38,332,521 30,218,651 636 807Colorado 3,837,488 0.83 5,268,367 4,162,832 728 922Connecticut 2,534,090 0.90 3,596,080 2,908,694 705 871Delaware 723,657 0.77 925,749 744,154 782 972District of Columbia 405,555 1.30 646,449 545,368 627 744Florida 13,670,441 0.92 19,552,860 15,996,284 699 855Georgia 6,607,016 0.86 9,992,167 7,775,850 661 850Hawaii 915,033 0.70 1,404,054 1,128,884 652 811Idaho 1,111,485 0.66 1,612,136 1,230,965 689 903Illinois 8,261,582 0.82 12,882,135 10,208,958 641 809Indiana 4,500,403 0.81 6,570,902 5,164,988 685 871Iowa 2,143,665 0.61 3,090,416 2,447,740 694 876Kansas 2,017,759 0.78 2,893,957 2,248,518 697 897Kentucky 3,019,283 0.76 4,395,295 3,493,897 687 864Louisiana 3,278,143 0.85 4,625,470 3,633,574 709 902Maine 1,011,385 0.85 1,328,302 1,099,524 761 920Maryland 4,140,105 1.10 5,928,814 4,737,568 698 874Massachusetts 4,765,586 0.97 6,692,824 5,466,929 712 872Michigan 6,986,587 0.86 9,895,622 7,922,631 706 882Minnesota 3,330,725 0.64 5,420,380 4,283,605 614 778Mississippi 1,968,907 0.96 2,991,207 2,334,928 658 843Missouri 4,280,438 0.74 6,044,171 4,804,108 708 891Montana 766,716 0.50 1,015,165 816,492 755 939Nebraska 1,374,529 0.75 1,868,516 1,453,480 736 946Nevada 1,756,095 0.81 2,790,136 2,202,901 629 797New Hampshire 1,061,433 0.76 1,323,459 1,087,125 802 976New Jersey 6,081,386 0.87 8,899,339 7,115,472 683 855New Mexico 1,456,500 0.79 2,085,287 1,632,983 698 892New York2 11,210,783 1.07 19,651,127 15,907,539 570 705North Carolina 6,822,902 0.88 9,848,060 7,812,833 693 873North Dakota 513,838 0.62 723,393 577,967 710 889Ohio 8,030,421 0.79 11,570,808 9,230,566 694 870Oklahoma 2,418,307 0.71 3,850,568 3,004,270 628 805Oregon 2,773,373 0.78 3,930,065 3,170,882 706 875Pennsylvania 8,896,590 0.86 12,773,801 10,381,760 696 857Rhode Island 749,232 0.90 1,051,511 863,702 713 867South Carolina 3,536,404 0.91 4,774,839 3,813,523 741 927South Dakota 603,643 0.61 844,877 659,321 714 916Tennessee 4,605,100 0.87 6,495,978 5,171,538 709 890Texas 15,447,273 0.79 26,448,193 20,165,608 584 766Utah 1,661,219 0.81 2,900,872 2,095,086 573 793Vermont 543,057 0.90 626,630 519,298 867 1,046Virginia 5,602,765 0.81 8,260,405 6,602,567 678 849Washington 5,301,630 0.84 6,971,406 5,553,636 760 955West Virginia 1,177,136 0.83 1,854,304 1,516,395 635 776Wisconsin 4,171,427 0.80 5,742,713 4,585,087 726 910Wyoming 421,473 0.51 582,658 459,841 723 917United States, total 212,159,728 0.84 316,128,839 250,892,271 671 8461Includes restricted drivers and graduated driver licenses.2State did not provide current data, estimated by FHWA.
SOURCE: U.S. Department of Transportation, Federal Highway Administration, Highway Statistics, DL-1C, available at www.fhwa.dot.gov/policyinformation/statistics.cfm as of June 2015.
Table 4-2: Licensed Drivers: 2013
1Includes restricted drivers and graduated driver licenses. 2State did not provide current data, estimated by FHWA.
SOURCE: U.S. Department of Transportation, Federal Highway Administration, Highway Statistics, DL-1C, available at www.fhwa.dot.gov/policyin-formation/statistics.cfm as of June 2015.

70
Table 4-3: Transit Ridership in the 50 Largest Urbanized Areas: 2012 and 2013
2013 2012Motorbus
Heavyrail
Lightrail
Commuterrail Other
Motorbus
Heavyrail
Lightrail
Commuterrail Other
New York-Newark, NY-NJ-CT 18,351,295 1 4,299,316 4,178,127 27.7 63.6 0.4 6.1 0.9 28.8 63.6 0.5 6.2 0.9Los Angeles-Long Beach-Anaheim, CA 12,150,996 2 681,565 679,932 77.9 7.3 9.3 2.0 1.8 80.1 7.2 8.9 2.1 1.8Chicago, IL-IN 8,608,208 3 648,055 664,108 51.6 35.4 0.0 11.9 1.1 52.4 34.8 0.0 11.7 1.1Miami, FL 5,502,379 4 171,635 168,182 77.3 12.4 0.0 2.4 7.9 78.3 11.4 0.0 2.4 7.8Philadelphia, PA-NJ-DE-MD 5,441,567 5 380,981 371,544 51.2 29.3 0.0 9.9 2.4 50.2 29.7 7.8 9.9 2.4Dallas-Fort Worth-Arlington, TX 5,121,892 6 80,648 80,607 56.4 0.0 36.5 2.6 3.9 57.6 0.0 35.4 2.7 4.2Houston, TX 4,944,332 7 84,791 82,223 71.8 0.0 13.4 0.0 5.2 80.9 0.0 13.8 0.0 5.2Washington, DC-VA-MD 4,586,770 8 473,403 479,674 40.0 57.8 0.0 1.0 0.5 40.3 58.2 0.0 1.0 0.5Atlanta, GA 4,515,419 9 140,132 139,959 46.8 49.7 0.0 0.0 1.4 48.3 50.4 0.0 0.0 1.3Boston, MA-NH-RI 4,181,019 10 403,160 408,893 30.2 41.8 17.4 8.7 1.8 30.3 40.7 18.3 8.8 1.9Detroit, MI 3,734,090 11 45,838 46,479 88.1 0.0 0.0 0.0 11.9 90.5 0.0 0.0 0.0 9.5Phoenix-Mesa, AZ 3,629,114 12 76,807 75,431 78.6 0.0 18.6 0.0 2.8 78.6 0.0 18.6 0.0 2.8San Francisco-Oakland, CA 3,281,212 13 449,674 440,217 38.8 28.1 10.1 3.6 17.5 39.0 28.0 11.8 3.1 18.1Seattle, WA 3,059,393 14 201,644 196,621 57.7 0.0 4.8 1.5 25.6 67.3 0.0 5.3 1.4 25.9San Diego, CA 2,956,746 15 154,010 102,031 54.0 0.0 41.3 1.1 2.2 62.6 0.0 33.0 1.6 2.8Minneapolis-St. Paul, MN-WI 2,650,890 16 95,088 94,674 85.9 0.0 10.7 0.8 2.5 85.8 0.0 11.1 0.7 2.4Tampa-St. Petersburg, FL 2,441,770 17 30,945 30,511 96.2 0.0 0.0 0.0 2.5 96.6 0.0 1.0 0.0 2.4Denver-Aurora, CO 2,374,203 18 101,684 98,716 75.1 0.0 23.4 0.0 1.5 77.7 0.0 20.9 0.0 1.4Baltimore, MD 2,203,663 19 108,096 107,991 63.8 14.1 8.0 8.4 1.9 67.6 14.3 8.2 8.1 1.9St. Louis, MO-IL 2,150,706 20 49,900 50,287 64.0 0.0 34.2 0.0 1.8 64.1 0.0 34.1 0.0 1.9Riverside-San Bernardino, CA 1,932,666 21 25,790 25,566 94.2 0.0 0.0 0.0 4.4 95.9 0.0 0.0 0.0 4.1Las Vegas-Henderson, NV 1,886,011 22 65,874 65,867 84.9 0.0 0.0 0.0 8.4 91.7 0.0 0.0 0.0 8.3Portland, OR-WA 1,849,898 23 111,675 113,365 57.7 0.0 35.1 0.0 1.3 59.1 0.0 39.7 0.0 1.2Cleveland, OH 1,780,673 24 50,067 49,115 69.3 12.8 5.8 0.0 2.0 79.5 12.7 5.8 0.0 2.0San Antonio, TX 1,758,210 25 46,963 47,508 96.9 0.0 0.0 0.0 3.1 96.9 0.0 0.0 0.0 3.1Pittsburgh, PA 1,733,853 26 65,462 67,410 83.4 0.0 12.3 0.0 3.2 83.5 0.0 11.5 0.0 5.0Sacramento, CA 1,723,634 27 31,867 31,087 53.2 0.0 42.4 0.0 2.1 54.7 0.0 43.7 0.0 1.6San Jose, CA 1,664,496 28 44,221 43,741 74.1 0.0 24.3 0.0 1.7 74.3 0.0 24.0 0.0 1.7Cincinnati, OH-KY-IN 1,624,827 29 21,067 21,445 97.9 0.0 0.0 0.0 1.9 98.2 0.0 0.0 0.0 1.8Kansas City, MO-KS 1,519,417 30 17,010 17,189 86.1 0.0 0.0 0.0 3.5 96.3 0.0 0.0 0.0 3.7Orlando, FL 1,510,516 31 29,853 29,531 93.8 0.0 0.0 0.0 3.4 96.5 0.0 0.0 0.0 3.5Indianapolis, IN 1,487,483 32 10,527 10,243 97.4 0.0 0.0 0.0 2.6 97.4 0.0 0.0 0.0 2.6Virginia Beach, VA 1,439,666 33 18,811 18,839 86.2 0.0 9.4 0.0 4.4 86.5 0.0 8.8 0.0 4.7Milwaukee, WI 1,376,476 34 128,516 47,497 66.4 0.0 0.0 0.0 0.5 98.4 0.0 0.0 0.0 1.6Columbus, OH 1,368,035 35 18,917 18,692 97.8 0.0 0.0 0.0 2.2 98.6 0.0 0.0 0.0 1.4Austin, TX 1,362,416 36 36,402 36,275 93.7 0.0 0.0 0.0 2.3 96.1 0.0 1.6 0.0 2.3Charlotte, NC-SC 1,249,442 37 29,046 28,610 80.2 0.0 16.9 0.0 2.9 80.9 0.0 17.4 0.0 1.7Providence, RI-MA 1,190,956 38 21,660 21,349 95.2 0.0 0.0 0.0 4.3 95.6 0.0 0.0 0.0 4.4Jacksonville, FL 1,065,219 39 12,678 12,549 88.5 0.0 0.0 0.0 11.5 89.4 0.0 0.0 0.0 10.6Memphis, TN-MS-AR 1,060,061 40 10,460 10,267 83.6 0.0 0.0 0.0 2.4 83.0 0.0 14.5 0.0 2.4Salt Lake City-West Valley City, UT 1,021,243 41 44,281 42,347 42.7 0.0 42.9 8.6 4.0 49.7 0.0 41.4 4.4 4.4Louisville/Jefferson County, KY-IN 972,546 42 17,089 17,162 95.9 0.0 0.0 0.0 4.1 96.0 0.0 0.0 0.0 4.0Nashville-Davidson, TN 969,587 43 10,545 10,500 90.0 0.0 0.0 2.4 6.1 91.3 0.0 0.0 2.5 6.2Richmond, VA 953,556 44 9,369 9,458 91.9 0.0 0.0 0.0 8.1 92.7 0.0 0.0 0.0 7.3Buffalo, NY 935,906 45 29,750 29,937 78.2 0.0 21.2 0.0 0.6 77.8 0.0 21.6 0.0 0.6Hartford, CT 924,859 46 18,784 17,724 87.3 0.0 0.0 4.6 5.9 90.4 0.0 0.0 3.5 6.1Bridgeport-Stamford, CT-NY 923,311 47 12,130 12,115 96.5 0.0 0.0 0.0 3.5 97.2 0.0 0.0 0.0 2.8New Orleans, LA 899,703 48 27,191 27,349 55.6 0.0 0.0 0.0 12.6 64.0 0.0 26.4 0.0 9.5Raleigh, NC 884,891 49 10,008 6,929 95.5 0.0 0.0 0.0 4.5 93.7 0.0 0.0 0.0 6.3Oklahoma City, OK 861,505 50 2,912 2,943 97.8 0.0 0.0 0.0 2.2 97.8 0.0 0.0 0.0 2.2Top 50 urbanized area, total 141,816,726 9,656,298 9,388,820 45.4 39.4 5.1 4.9 2.9 46.9 39.7 5.5 5.0 3.0United States, urbanized area total1 209,569,050 10,574,238 10,214,018 49.2 36.1 4.6 4.5 3.2 50.7 36.5 5.0 4.6 3.2Top 50 as percent of U.S. total 67.7 91.3 91.9 84.3 99.7 100.0 99.5 84.4 85.0 100.0 99.9 99.4 85.51Excludes territories (Puerto Rico and Virgin Islands)
NOTES: This table includes data from urban transit agencies that are required to report information to the federal government because they applied for or are direct beneficiaries of urbanized area formula grants (49 USC 5307). Beginning in 2012, data include estimated industry totals for agencies with a Small Systems Waiver in place and Rural reporters. Details may not add to totals due to rounding. Other includes autmoated guideway, cable car, demand response, ferry boat, inclined plane, monorail, trolley bus, and van pool.
SOURCE: U.S. Department of Transportation, Federal Transit Adminstration, National Transit Database, Monthly Database, available at www.ntdprogram.gov as of July 2015.
Urbanized areaPopulation
(2010)Rank by
population
Annual unlinked passenger trips
(thousands) Percent in 2013 Percent in 2012
Table 4-3: Transit Ridership in the 50 Largest Urbanized Areas: 2012 and 2013
1Excludes territories (Puerto Rico and Virgin Islands) NOTES: This table includes data from urban transit agencies that are required to report information to the federal government because they applied for or are direct beneficiaries of urbanized area formula grants (49 USC 5307). Beginning in 2012, data include estimated industry totals for agencies with a Small Systems Waiver in place and Rural reporters. Details may not add to totals due to rounding. Other includes autmoated guideway, cable car, demand response, ferry boat, inclined plane, monorail, trolley bus, and van pool. SOURCE: U.S. Department of Transportation, Federal Transit Adminstration, National Transit Database, Monthly Database, available at www.ntdprogram.gov as of July 2015.

71
Table 4-4: Urban Transit Ridership by State and Transit Mode: 2013
State Motor bus Heavy rail Light rail Commuter rail OtherAlabama 14 7,514 84.8 0.0 0.0 0.0 15.2Alaska 4 5,079 87.9 0.0 0.0 0.0 9.1Arizona 16 100,261 82.9 0.0 14.2 0.0 2.8Arkansas 7 5,862 95.8 0.0 1.6 0.0 2.6California 102 1,434,266 65.2 12.3 12.1 2.3 7.0Colorado 10 109,704 76.5 0.0 21.7 0.0 1.9Connecticut 18 44,809 93.0 0.0 0.0 1.9 4.2Delaware 1 11,195 91.0 0.0 0.0 0.0 9.0District of Columbia 2 413,652 33.3 66.2 0.0 0.0 0.5Florida 34 285,579 83.9 7.4 0.1 1.5 6.8Georgia 20 161,115 53.1 43.2 0.0 0.0 1.8Hawaii 2 73,078 97.8 0.0 0.0 0.0 2.0Idaho 6 2,677 90.1 0.0 0.0 0.0 9.9Illinois 18 674,192 53.9 34.0 0.0 10.9 1.2Indiana 24 34,656 86.1 0.0 0.0 10.4 3.3Iowa 13 22,724 95.6 0.0 0.0 0.0 4.4Kansas 9 7,459 88.6 0.0 0.0 0.0 9.1Kentucky 11 27,075 95.5 0.0 0.0 0.0 4.3Louisiana 15 38,411 67.8 0.0 22.5 0.0 9.7Maine 10 5,445 62.4 0.0 0.0 10.2 27.4Maryland 14 143,586 72.3 10.6 6.0 6.3 1.9Massachusetts 16 424,702 33.2 39.7 16.5 8.3 2.1Michigan 23 98,694 91.9 0.0 0.0 0.0 7.9Minnesota 8 103,567 86.8 0.0 9.8 0.8 2.5Mississippi 3 1,981 86.3 0.0 0.0 0.0 13.7Missouri 10 68,235 70.7 0.0 25.0 0.0 2.0Montana 4 2,466 95.6 0.0 0.0 0.0 4.4Nebraska 3 6,594 96.6 0.0 0.0 0.0 3.4Nevada 4 74,479 86.1 0.0 0.0 0.0 7.9New Hampshire 7 3,865 67.4 0.0 0.0 0.0 1.6New Jersey 33 391,480 46.4 20.7 5.4 20.5 2.2New Mexico 5 16,426 90.5 0.0 0.0 6.6 2.6New York 47 3,966,731 26.4 67.1 0.2 4.6 0.8North Carolina 40 73,295 87.7 0.0 6.7 0.0 5.6North Dakota 4 2,509 87.0 0.0 0.0 0.0 13.0Ohio 30 112,620 82.1 5.7 2.6 0.0 5.0Oklahoma 5 7,831 95.5 0.0 0.0 0.0 3.7Oregon 12 124,644 59.7 0.0 34.8 0.0 1.9Pennsylvania 27 461,149 58.8 21.9 7.7 8.2 2.9Rhode Island 1 20,483 96.6 0.0 0.0 0.0 3.4South Carolina 13 11,469 93.3 0.0 0.0 0.0 5.1South Dakota 2 1,554 85.4 0.0 0.0 0.0 14.6Tennessee 17 31,473 86.5 0.0 4.7 0.8 7.5Texas 45 290,399 76.9 0.0 14.7 0.7 4.3Utah 3 46,769 45.7 0.0 40.6 8.2 3.9Vermont 1 2,740 91.1 0.0 0.0 0.0 2.0Virginia 22 73,559 83.8 0.0 2.4 6.2 3.1Washington 22 243,626 62.6 0.0 4.7 1.2 23.1West Virginia 8 8,525 71.0 0.0 0.0 0.0 29.0Wisconsin 21 70,584 96.7 0.0 0.1 0.0 2.6Wyoming 2 487 84.4 0.0 0.0 0.0 15.6United States, total1 788 10,351,277 49.1 36.8 5.0 4.6 3.2
SOURCE: U.S. Department of Transportation, Federal Transit Adminstration, National Transit Database, table 19, available at www.ntdprogram.gov as of July 2015.
Number of agenciesreporting
Annual unlinked passenger trips
(thousands)
Percent
1Excludes territories (Puerto Rico and Virgin Islands)
NOTES: This table includes data from urban transit agencies that are required to report information to the federal government because they applied for or are direct beneficiaries of urbanized area formula grants (49 USC 5307). Beginning in 2012, data include estimated industry totals for agencies with a Small Systems Waiver in place and Rural reporters. Data are assigned to the state of a transit agency's mailing address. Details may not add to totals due to rounding. Light rail includes light rail, street car, and hybrid rail modes. Motorbus includes motorbus, commuter bus, and bus rapid transit. Other includes automated guideway, cable car, demand response, ferry boat, inclined plane, monorail, trolley bus, and van pool.
Table 4-4: Urban Transit Ridership by State and Transit Mode: 2013
1Excludes territories (Puerto Rico and Virgin Islands)
NOTES: This table includes data from urban transit agencies that are required to report information to the federal government be-cause they applied for or are direct beneficiaries of urbanized area formula grants (49 USC 5307). Beginning in 2012, data include estimated industry totals for agencies with a Small Systems Waiver in place and Rural reporters. Data are assigned to the state of a transit agency’s mailing address. Details may not add to totals due to rounding. Light rail includes light rail, street car, and hybrid rail modes. Motorbus includes motorbus, commuter bus, and bus rapid transit. Other includes automated guideway, cable car, demand response, ferry boat, inclined plane, monorail, trolley bus, and van pool. SOURCE: U.S. Department of Transportation, Federal Transit Adminstration, National Transit Database, table 19, available at www.ntdprogram.gov as of July 2015.

72
Table 4-5: Top 50 Amtrak Stations by Number of Passengers1: Fiscal Years 2013 and 2014
Station Rank Number of passengers Rank Number of passengersNew York City (Penn Station), DC 1 9,556,424 1 10,024,474Washington, DC 2 5,033,392 2 5,028,928Philadelphia 30th Street, PA 3 4,125,503 3 4,083,704Chicago, IL 4 3,522,388 4 3,377,259Los Angeles, CA 5 1,643,706 5 1,551,090Boston-South Station, MA 6 1,434,148 6 1,491,095Baltimore, MD 8 1,065,576 7 1,032,527Sacramento, CA 7 1,132,750 8 1,022,322Albany-Rensselaer, NY 9 764,898 9 781,597New Haven, CT 10 745,530 10 714,146Wilmington, DE 11 738,313 11 704,523San Diego, CA 13 686,953 12 700,107BWI Thurgood Marshall Airport, MD 12 710,513 13 692,268Newark, NJ 15 656,822 14 677,175Providence, RI 14 660,267 15 665,670Seattle, WA 17 640,054 16 626,623Milwaukee, WI 18 617,153 17 596,415Portland, OR 16 652,455 18 585,828Emeryville, CA 19 598,859 19 578,386Boston-Back Bay, MA 23 540,770 20 566,892Lancaster, PA 20 578,731 21 529,409Bakersfield, CA 22 546,439 22 521,423Harrisburg, PA 21 571,940 23 498,995Boston-North Station, MA 24 475,447 24 433,060Trenton, NJ 28 425,075 25 419,477Oceanside, CA 34 384,786 26 412,711Irvine, CA 29 425,041 27 406,451Stamford, CT 33 388,733 28 401,414Fresno, CA 32 399,141 29 389,543Solana Beach, CA 26 428,841 30 384,547Metropark, NJ 35 383,353 31 381,178Martinez, CA 25 473,836 32 359,755Richmond - Staples Mill, VA 37 372,592 33 358,615Davis, CA 30 424,114 34 358,350St. Louis, MO 36 378,146 35 350,866Fullerton, CA 40 313,949 36 336,265Santa Barbara, CA 39 322,410 37 319,245Oakland, CA 31 405,627 38 303,431Stockton (San Joaquin St.), CA 41 295,344 39 292,818Sanford (Auto Train Station), FL 43 265,274 40 274,445Lorton (Auto Train), VA 44 265,274 41 274,445Bloomington/Normal, IL 45 263,235 42 261,631Anaheim, CA 38 342,284 43 254,066Richmond, CA 37 372,592 44 241,962San Juan Capistrano, CA 47 242,722 45 226,515Hanford, CA 48 225,708 46 220,144San Jose, CA 46 258,776 47 210,297New Orleans, LA 49 212,426 48 201,476San Diego-Old Town, CA 76 135,749 49 196,795Springfield, IL 51 202,095 50 194,762Top 50 stations, total 46,490,906 45,515,120United States, all stations 62,841,683 61,557,072Top 50 stations as percent of U.S. total 74.0 73.9
Fiscal Year 2013 Fiscal Year 2014
1Includes the number of boarding and alighting passengers (on & off the train).
NOTES: Amtrak's fiscal year ends on September 30. Ranking is based on the 2014 data. The total for the top 50 stations in 2013 is notthe sum of stations in this table since some of the 2013 top 50 stations are not in the top 50 list in 2014.
SOURCE: National Passenger Railroad Corporation (Amtrak) available at http://www.amtrak.com/servlet/ContentServer?c=Page&pagename=am%2FLayout&cid=1246041980432 as of June 2015.
Table 4-5: Top 50 Amtrak Stations by Number of Passengers1: Fiscal Years 2013 and 2014
1Includes the number of boarding and alighting passengers (on & off the train).
NOTES: Amtrak’s fiscal year ends on September 30. Ranking is based on the 2014 data. The total for the top 50 stations in 2013 is not the sum of stations in this table since some of the 2013 top 50 stations are not in the top 50 list in 2014.
SOURCE: National Passenger Railroad Corporation (Amtrak) available at http://www.amtrak.com/servlet/ContentServer?c=Page&pagename=am%2FLayout&cid=1246041980432 as of June 2015.

73
Table 4-6: Top 50 Airports by Passengers Enplaned on Large U.S. Carriers: 2003, 2012, 2013
2003 2012 2013Atlanta, GA (Hartsfield-Jackson Atlanta International) 1 38,256,038 45,192,870 44,675,318Chicago, IL (Chicago O'Hare International) 2 30,835,241 29,983,544 29,991,861Dallas/Fort Worth, TX (Dallas/Fort Worth International) 3 24,724,519 27,555,896 28,490,680Los Angeles, CA (Los Angeles International) 4 20,939,293 24,982,954 25,859,720Denver, CO (Denver International) 5 17,744,834 25,511,455 25,184,634Charlotte, NC (Charlotte Douglas International) 6 11,414,356 19,928,299 21,241,895Phoenix, AZ (Phoenix Sky Harbor International) 7 18,030,517 19,221,241 19,156,769San Francisco, CA (San Francisco International) 8 12,231,791 18,567,216 18,853,118Las Vegas, NV (McCarran International) 9 16,898,813 18,467,290 18,480,027Houston, TX (George Bush Intercontinental/Houston) 10 15,692,910 18,155,248 17,945,713New York, NY (John F. Kennedy International) 11 10,821,004 17,107,144 17,038,558Minneapolis, MN (Minneapolis-St Paul International) 12 16,047,432 15,892,286 16,200,673Seattle, WA (Seattle/Tacoma International) 13 12,799,019 15,460,449 15,979,235Newark, NJ (Newark Liberty International) 14 13,154,602 15,370,482 15,879,280Detroit, MI (Detroit Metro Wayne County) 15 15,603,940 15,424,226 15,507,719Miami, FL (Miami International) 16 11,288,952 15,316,047 15,442,379Orlando, FL (Orlando International) 17 12,579,440 15,594,968 15,278,563Philadelphia, PA (Philadelphia International) 18 11,511,273 14,362,474 14,508,927Boston, MA (Logan International) 19 9,897,699 12,857,791 13,257,406New York, NY (LaGuardia) 20 11,049,194 12,313,701 12,820,980Baltimore, MD (Baltimore/Washington International Thurgood Marshall 21 9,548,075 11,096,463 11,040,598Fort Lauderdale, FL (Fort Lauderdale-Hollywood International) 22 8,276,957 10,644,055 10,693,964Washington, DC (Washington Dulles International) 23 6,733,062 9,359,654 9,748,489Chicago, IL (Chicago Midway International) 24 8,680,635 9,264,895 9,726,623Salt Lake City, UT (Salt Lake City International) 25 8,932,998 9,579,427 9,666,707Washington, DC (Ronald Reagan Washington National) 26 6,956,596 9,137,164 8,740,399San Diego, CA (San Diego International) 27 7,466,727 8,479,221 8,662,314Honolulu, HI (Honolulu International) 28 7,658,719 7,961,154 8,138,354Tampa, FL (Tampa International) 29 7,475,654 8,005,320 8,036,590Portland, OR (Portland International) 30 5,963,210 7,076,710 7,400,965St. Louis, MO (Lambert-St. Louis International) 31 9,931,995 6,178,781 6,193,661Houston, TX (William P Hobby) 32 3,703,830 5,040,709 5,371,820Nashville, TN (Nashville International) 33 3,927,389 4,777,315 5,022,777Austin, TX (Austin - Bergstrom International) 34 3,165,554 4,605,401 4,898,886Kansas City, MO (Kansas City International) 35 4,825,282 4,856,267 4,820,972Oakland, CA (Metropolitan Oakland International) 36 6,520,138 4,851,495 4,692,991New Orleans, LA (Louis Armstrong New Orleans International) 37 4,589,037 4,273,944 4,554,142Raleigh/Durham, NC (Raleigh-Durham International) 38 3,885,536 4,458,715 4,448,169Santa Ana, CA (John Wayne Airport-Orange County) 39 4,265,963 4,300,976 4,424,745Cleveland, OH (Cleveland-Hopkins International) 40 4,989,325 4,327,344 4,355,885San Jose, CA (Norman Y. Mineta San Jose International) 41 5,041,304 4,028,860 4,235,676Sacramento, CA (Sacramento International) 42 4,367,111 4,326,178 4,202,425Dallas, TX (Dallas Love Field) 43 2,796,140 3,900,854 4,019,531San Juan, PR (Luis Munoz Marin International) 44 4,619,347 4,073,344 4,000,152San Antonio, TX (San Antonio International) 45 3,066,242 3,863,661 3,825,514Pittsburgh, PA (Pittsburgh International) 46 7,035,578 3,868,672 3,786,479Fort Myers, FL (Southwest Florida International) 47 2,815,861 3,507,186 3,637,929Indianapolis, IN (Indianapolis International) 48 3,662,734 3,570,149 3,517,235Milwaukee, WI (General Mitchell International) 49 3,083,674 3,698,097 3,203,231Columbus, OH (Port Columbus International) 50 3,033,475 3,087,239 3,043,372Top 50 airports, total1 508,751,314 573,729,606 579,904,050United States, all airports 656,709,814 692,369,957 696,930,821Top 50 as percent of all enplanements 77.5 82.9 83.2
SOURCE: U.S. Department of Transportation, Bureau of Transportation Statistics, TranStats Database, T3: U.S. Air Carrier Airport Activity Statistics, available at www.transtats.bts.gov as of July 2015.
Airport Rank in 2013Number of enplanements
1The total for the top 50 airports will not sum from the individual airports because some top 50 airports in 2012 were not in the top 50 in the earlier years.
NOTES: Data for 2013 are revised. Rank order by total enplaned passengers on large certificated U.S. air carriers (Majors, Nationals, Large Regionals, and Medium Regionals), scheduled and nonscheduled operations, at all airports served within the 50 states, the District of Columbia, and other U.S. areas designated by the Federal Aviation Administration. Large certificated air carriers hold Certificates of Public Convenience and Necessity issued by the U.S. Department of Transportation authorizing the performance of air transportation. Large certificated air carriers operate at least one aircraft with seating capacity of more than 60 seats or a maximum payload capacity of more than 18,000 pounds. Data for commuter, small-certificated and foreign-flag air carriers are not included.
Table 4-6: Top 50 Airports by Passengers Enplaned on Large U.S. Carriers: 2003, 2012, 2013
1The total for the top 50 airports will not sum from the individual airports because some top 50 airports in 2012 were not in the top 50 in the earlier years.
NOTES: Data for 2013 are revised. Rank order by total enplaned passengers on large certificated U.S. air carriers (Majors, Nationals, Large Regionals, and Medium Regionals), scheduled and nonscheduled operations, at all airports served within the 50 states, the District of Colum-bia, and other U.S. areas designated by the Federal Aviation Administration. Large certificated air carriers hold Certificates of Public Conve-nience and Necessity issued by the U.S. Department of Transportation authorizing the performance of air transportation. Large certificated air carriers operate at least one aircraft with seating capacity of more than 60 seats or a maximum payload capacity of more than 18,000 pounds. Data for commuter, small-certificated and foreign-flag air carriers are not included.
SOURCE: U.S. Department of Transportation, Bureau of Transportation Statistics, TranStats Database, T3: U.S. Air Carrier Airport Activity Statistics, available at www.transtats.bts.gov as of July 2015.
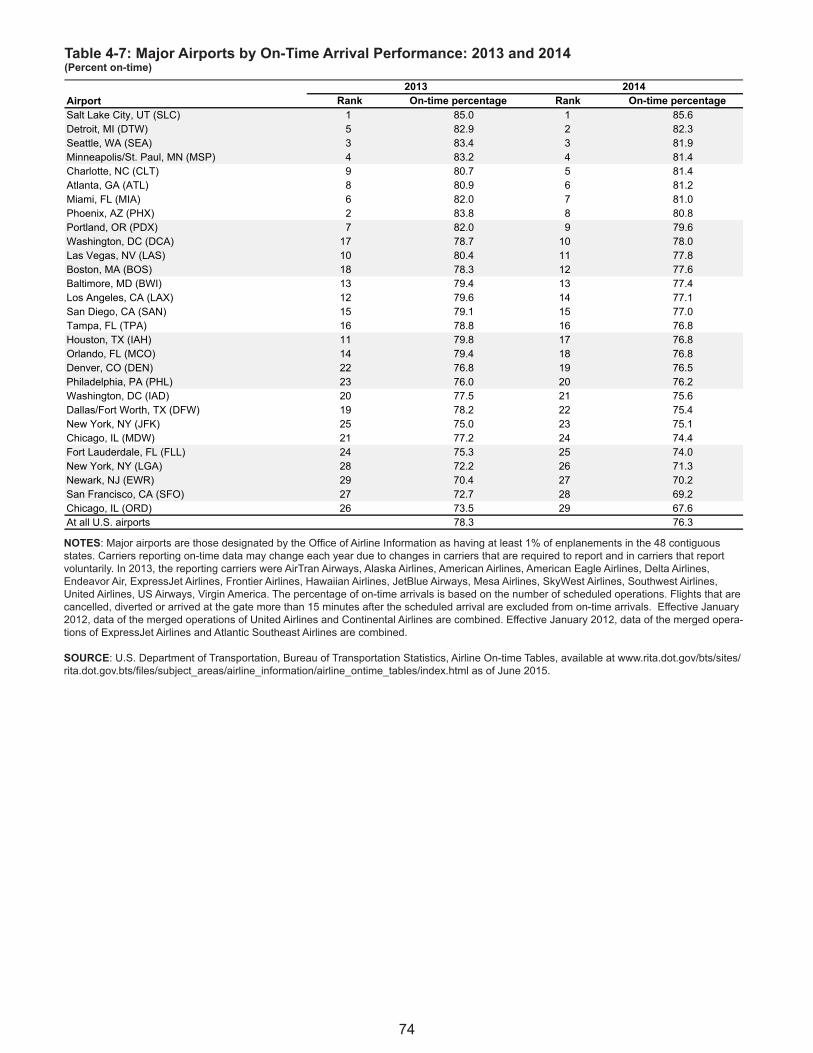
74
Table 4-7: Major Airports by On-Time Arrival Performance: 2013 and 2014(Percent on-time)
Airport Rank On-time percentage Rank On-time percentageSalt Lake City, UT (SLC) 1 85.0 1 85.6Detroit, MI (DTW) 5 82.9 2 82.3Seattle, WA (SEA) 3 83.4 3 81.9Minneapolis/St. Paul, MN (MSP) 4 83.2 4 81.4Charlotte, NC (CLT) 9 80.7 5 81.4Atlanta, GA (ATL) 8 80.9 6 81.2Miami, FL (MIA) 6 82.0 7 81.0Phoenix, AZ (PHX) 2 83.8 8 80.8Portland, OR (PDX) 7 82.0 9 79.6Washington, DC (DCA) 17 78.7 10 78.0Las Vegas, NV (LAS) 10 80.4 11 77.8Boston, MA (BOS) 18 78.3 12 77.6Baltimore, MD (BWI) 13 79.4 13 77.4Los Angeles, CA (LAX) 12 79.6 14 77.1San Diego, CA (SAN) 15 79.1 15 77.0Tampa, FL (TPA) 16 78.8 16 76.8Houston, TX (IAH) 11 79.8 17 76.8Orlando, FL (MCO) 14 79.4 18 76.8Denver, CO (DEN) 22 76.8 19 76.5Philadelphia, PA (PHL) 23 76.0 20 76.2Washington, DC (IAD) 20 77.5 21 75.6Dallas/Fort Worth, TX (DFW) 19 78.2 22 75.4New York, NY (JFK) 25 75.0 23 75.1Chicago, IL (MDW) 21 77.2 24 74.4Fort Lauderdale, FL (FLL) 24 75.3 25 74.0New York, NY (LGA) 28 72.2 26 71.3Newark, NJ (EWR) 29 70.4 27 70.2San Francisco, CA (SFO) 27 72.7 28 69.2Chicago, IL (ORD) 26 73.5 29 67.6At all U.S. airports 78.3 76.3
2013 2014
NOTES: Major airports are those designated by the Office of Airline Information as having at least 1% of enplanements in the 48 contiguous states. Carriers reporting on-time data may change each year due to changes in carriers that are required to report and in carriers that report voluntarily. In 2013, the reporting carriers were AirTran Airways, Alaska Airlines, American Airlines, American Eagle Airlines, Delta Airlines, Endeavor Air, ExpressJet Airlines, Frontier Airlines, Hawaiian Airlines, JetBlue Airways, Mesa Airlines, SkyWest Airlines, Southwest Airlines, United Airlines, US Airways, Virgin America. The percentage of on-time arrivals is based on the number of scheduled operations. Flights that are cancelled, diverted or arrived at the gate more than 15 minutes after the scheduled arrival are excluded from on-time arrivals. Effective January 2012, data of the merged operations of United Airlines and Continental Airlines are combined. Effective January 2012, data of the merged operations of ExpressJet Airlines and Atlantic Southeast Airlines are combined.
SOURCE: U.S. Department of Transportation, Research and Innovative Technology Administration, Bureau of Transportation Statistics, Airline On-time Tables, available at www.rita.dot.gov/bts/sites/rita.dot.gov.bts/files/subject_areas/airline_information/airline_ontime_tables/index.html as of June 2015.
Table 4-7: Major Airports by On-Time Arrival Performance: 2013 and 2014 (Percent on-time)
NOTES: Major airports are those designated by the Office of Airline Information as having at least 1% of enplanements in the 48 contiguous states. Carriers reporting on-time data may change each year due to changes in carriers that are required to report and in carriers that report voluntarily. In 2013, the reporting carriers were AirTran Airways, Alaska Airlines, American Airlines, American Eagle Airlines, Delta Airlines, Endeavor Air, ExpressJet Airlines, Frontier Airlines, Hawaiian Airlines, JetBlue Airways, Mesa Airlines, SkyWest Airlines, Southwest Airlines, United Airlines, US Airways, Virgin America. The percentage of on-time arrivals is based on the number of scheduled operations. Flights that are cancelled, diverted or arrived at the gate more than 15 minutes after the scheduled arrival are excluded from on-time arrivals. Effective January 2012, data of the merged operations of United Airlines and Continental Airlines are combined. Effective January 2012, data of the merged opera-tions of ExpressJet Airlines and Atlantic Southeast Airlines are combined. SOURCE: U.S. Department of Transportation, Bureau of Transportation Statistics, Airline On-time Tables, available at www.rita.dot.gov/bts/sites/rita.dot.gov.bts/files/subject_areas/airline_information/airline_ontime_tables/index.html as of June 2015.

75
Table 4-8: Top 15 Cruise Ship Ports by Port of Departure: 2010 and 2011
Port Rank Passengers(thousands) Cruises Rank
Passengers(thousands) Cruises
Miami, FL 1 2,151 779 1 1,970 731Fort Lauderdale, FL 2 1,759 649 2 1,826 611Port Canaveral, FL 3 1,299 448 3 1,496 485New York, NY 4 562 219 4 612 242San Juan, PR 5 522 227 5 522 222Galveston, TX 7 440 152 6 462 149Tampa, FL 8 425 192 7 458 199Seattle, WA 6 469 217 8 439 183Long Beach, CA 9 414 150 9 405 144New Orleans, LA 11 261 89 10 373 136Los Angeles, CA 10 378 140 11 311 130Baltimore, MD 13 215 90 12 254 104Cape Liberty, NJ 14 198 67 13 217 73Jacksonville, FL 16 172 71 14 190 77Charleston, SC 18 117 49 15 165 68All other ports1 700 348 706 390Top 15 ports, total1 9,516 3,618 9,702 3,554Total U.S. ports 10,216 3,966 10,409 3,944Top 15 as percent of total1 93.2 91.2 93.2 90.1
SOURCE: U.S. Department of Transportation, Maritime Administration, Cruise Summary Tables, available at www.marad.dot.gov/library_landing_page/data_and_statistics/Data_and_Statistics.htm as of June 2013.
2010 2011
1Data for 2010 are based on the top 15 cruise ship ports in that year.
NOTES: Cruise passenger statistics for this table are based on the passenger data provided by 20 major cruise lines that offered NorthAmerican cruises with a U.S. port of call. Details may not add to totals due to rounding.
Table 4-8: Top 15 Cruise Ship Ports by Port of Departure: 2010 and 2011
1Data for 2010 are based on the top 15 cruise ship ports in that year.
NOTES: Cruise passenger statistics for this table are based on the passenger data provided by 20 major cruise lines that offered North American cruises with a U.S. port of call. Details may not add to totals due to rounding. SOURCE: U.S. Department of Transportation, Maritime Administration, Cruise Summary Tables, available at www.marad.dot.gov/library_landing_page/data_and_statistics/Data_and_Statistics.htm as of June 2013.

76
Table 4-9: Incoming Personal Vehicle Crossings, U.S.-Canadian Border: 2009-2014State 2009 2010 2011 2012 2013 2014Alaska 97,832 97,879 92,911 91,014 90,780 89,997Idaho 244,118 262,244 286,310 270,114 278,175 279,732Maine 2,747,309 3,051,111 3,194,976 3,208,951 3,098,861 2,874,542Michigan 6,439,995 6,565,627 6,966,265 7,133,003 7,170,429 6,944,792Minnesota 1,036,727 1,192,351 1,284,589 1,287,040 1,259,588 1,238,024Montana 555,911 659,358 696,532 737,724 763,866 759,832New York 8,253,468 8,581,980 9,072,685 9,386,897 9,175,000 8,689,968North Dakota 638,750 761,960 760,514 853,493 846,334 841,472Vermont 1,249,939 1,334,432 1,447,109 1,532,179 1,563,982 1,608,154Washington 5,442,781 6,377,325 7,793,878 8,583,221 9,586,373 8,653,223United States, total 26,706,830 28,884,267 31,595,769 33,083,636 33,833,388 31,979,736NOTE: Details may not add to totals due to rounding.
SOURCE: U.S. Department of Transportation, Bureau of Transportation Statistics, North American Border Crossing/Entry Data available attransborder.bts.gov/programs/international/transborder/TBDR_BC/TBDR_BC_Index.html as of June 2015
Table 4-9: Incoming Personal Vehicle Crossings, U.S.-Canadian Border: 2009 –2014
SOURCE: U.S. Department of Transportation, Bureau of Transportation Statistics, North American Border Crossing/Entry Data, available at transborder.bts.gov/programs/international/transborder/TBDR_BC/TBDR_BC_Index.html as of June 2015
Table 4-10: Incoming Passengers in Personal Vehicles, U.S.-Canadian Border: 2009-2014State 2009 2010 2011 2012 2013 2014Alaska 205,504 207,433 213,009 229,786 229,863 214,766Idaho 457,231 534,176 518,557 515,368 527,659 512,404Maine 4,530,838 4,991,191 4,844,899 4,939,243 4,754,379 4,510,849Michigan 12,012,710 12,251,134 12,732,327 13,103,922 13,189,897 12,659,396Minnesota 2,068,739 2,302,687 2,031,845 2,046,631 1,991,269 1,946,510Montana 1,147,465 1,314,802 1,219,337 1,300,642 1,365,943 1,353,302New York 18,050,422 18,208,480 19,215,414 19,936,696 19,465,181 18,301,361North Dakota 1,288,031 1,560,246 1,602,572 1,720,789 1,670,263 1,591,154Vermont 2,704,002 2,622,861 2,586,654 2,738,342 2,832,460 2,731,851Washington 11,063,399 12,795,860 14,227,082 15,476,759 16,320,145 15,842,599United States, total 53,528,341 56,788,870 59,191,696 62,008,178 62,347,059 59,664,192NOTE: Details may not add to totals due to rounding.
SOURCE: U.S. Department of Transportation, Bureau of Transportation Statistics, North American Border Crossing/Entry Data available attransborder.bts.gov/programs/international/transborder/TBDR_BC/TBDR_BC_Index.html as of June 2015.
Table 4-10: Incoming Passengers in Personal Vehicles, U.S.-Canadian Border: 2009– 2014
SOURCE: U.S. Department of Transportation, Bureau of Transportation Statistics, North American Border Crossing/Entry Data, available at transborder.bts.gov/programs/international/transborder/TBDR_BC/TBDR_BC_Index.html as of June 2015.
Table 4-11: Incoming Train Passengers, U.S.-Canadian Border: 2009-2014State 2009 2010 2011 2012 2013 2014Alaska 64,751 71,970 73,307 74,844 81,526 81,393Idaho 1,987 2,410 2,466 2,376 2,718 2,775Maine 1,476 1,403 1,006 1,775 1,870 1,928Michigan 13,214 16,084 17,367 18,078 19,062 17,579Minnesota 13,283 13,916 14,434 15,767 13,390 16,538Montana 2,064 2,238 2,280 2,651 2,664 2,106New York 65,685 73,985 79,787 77,801 74,433 73,561North Dakota 7,658 8,691 7,772 8,878 8,099 8,307Vermont 1,639 1,633 1,641 1,613 1,491 1,273Washington 46,076 62,206 76,670 65,265 74,224 77,693United States, total 217,833 254,536 276,730 269,048 279,477 283,153NOTE: Details may not add to totals due to rounding.
SOURCE: U.S. Department of Transportation, Bureau of Transportation Statistics, North American Border Crossing/Entry Data available attransborder.bts.gov/programs/international/transborder/TBDR_BC/TBDR_BC_Index.html as of June 2015.
Table 4-11: Incoming Train Passengers, U.S.-Canadian Border: 2009– 2014
SOURCE: U.S. Department of Transportation, Bureau of Transportation Statistics, North American Border Crossing/Entry Data, available at transborder.bts.gov/programs/international/transborder/TBDR_BC/TBDR_BC_Index.html as of June 2015.

77
Table 4-12: Incoming Bus Crossings, U.S.-Canadian Border: 2009-2014State 2009 2010 2011 2012 2013 2014Alaska 11,015 10,830 11,102 12,197 12,543 13,002Idaho 204 205 216 152 168 87Maine 1,415 1,464 1,215 1,021 903 837Michigan 36,843 35,928 34,635 29,633 30,017 27,966Minnesota 2,661 2,628 2,647 2,463 2,137 2,082Montana 630 684 646 843 597 381New York 40,386 39,148 39,051 37,302 36,274 35,495North Dakota 1,947 1,977 1,760 1,631 1,627 1,663Vermont 3,577 5,215 5,440 5,260 5,282 5,520Washington 17,677 17,985 17,220 17,519 16,604 16,716United States, total 116,355 116,064 113,932 108,021 106,152 103,749NOTE: Details may not add to totals due to rounding.
SOURCE: U.S. Department of Transportation, Bureau of Transportation Statistics, North American Border Crossing/Entry Data available attransborder.bts.gov/programs/international/transborder/TBDR_BC/TBDR_BC_Index.html as of June 2015.
Table 4-12: Incoming Bus Crossings, U.S.-Canadian Border: 2009 –2014
SOURCE: U.S. Department of Transportation, Bureau of Transportation Statistics, North American Border Crossing/Entry Data, available at transborder.bts.gov/programs/international/transborder/TBDR_BC/TBDR_BC_Index.html as of June 2015.
Table 4-13: Incoming Passengers on Buses, U.S.-Canadian Border: 2009-2014State 2009 2010 2011 2012 2013 2014Alaska 170,065 157,102 158,466 168,851 164,685 189,989Idaho 6,763 7,849 7,750 5,510 6,540 4,728Maine 34,674 38,505 39,353 35,204 30,006 28,827Michigan 415,144 364,721 344,371 388,623 445,974 379,061Minnesota 47,332 43,613 45,824 38,937 37,789 35,085Montana 14,801 17,847 19,066 21,342 10,757 15,404New York 1,258,049 1,214,441 1,223,422 1,193,677 1,104,610 1,032,034North Dakota 57,707 58,529 56,461 52,740 51,989 48,147Vermont 107,886 159,213 178,357 164,776 164,082 165,109Washington 390,996 389,406 379,359 365,948 359,512 345,398United States, total 2,503,417 2,451,226 2,452,429 2,435,608 2,375,944 2,243,782SOURCE: U.S. Department of Transportation, Bureau of Transportation Statistics, North American Border Crossing/Entry Data available attransborder.bts.gov/programs/international/transborder/TBDR_BC/TBDR_BC_Index.html as of June 2015.
Table 4-13: Incoming Passengers on Buses, U.S.-Canadian Border: 2009– 2014
SOURCE: U.S. Department of Transportation, Bureau of Transportation Statistics, North American Border Crossing/Entry Data, available at transborder.bts.gov/programs/international/transborder/TBDR_BC/TBDR_BC_Index.html as of June 2015.
Table 4-14: Incoming Pedestrians, U.S.-Canadian Border: 2009-2014State 2009 2010 2011 2012 2013 2014Alaska 2,836 2,745 2,781 2,486 2,640 2,066Idaho 437 1,560 2,570 2,443 2,617 2,916Maine 24,569 15,194 17,208 23,032 26,845 27,872Michigan 16,529 17,302 20,913 16,214 0 0Minnesota 15,788 22,198 18,849 16,506 14,710 15,946Montana 5,048 3,073 3,588 5,145 5,391 4,355New York 246,766 262,172 285,129 293,405 283,492 277,104North Dakota 3,545 3,534 2,597 2,933 3,943 4,490Vermont 3,632 2,897 4,063 4,282 4,996 5,626Washington 60,752 64,428 48,987 60,535 72,460 83,230United States, total 379,902 395,103 406,685 426,981 417,094 423,605
SOURCE: U.S. Department of Transportation, Bureau of Transportation Statistics, North American Border Crossing/Entry Data available attransborder.bts.gov/programs/international/transborder/TBDR_BC/TBDR_BC_Index.html as of June 2015.
NOTE: Incoming pedestrians for Michigan were participants in the annual Detroit Marathon and were not counted in 2013 and 2014.
Table 4-14: Incoming Pedestrians, U.S.-Canadian Border: 2009– 2014
NOTE: Incoming pedestrians for Michigan were participants in the annual Detroit Marathon and were not counted in 2013 and 2014.
SOURCE: U.S. Department of Transportation, Bureau of Transportation Statistics, North American Border Crossing/Entry Data, available at transborder.bts.gov/programs/international/transborder/TBDR_BC/TBDR_BC_Index.html as of June 2015.

78
Table 4-15: Incoming Personal Vehicle Crossings, U.S.-Mexican Border: 2009—2014State 2009 2010 2011 2012 2013 2014Arizona 7,387,953 6,650,691 6,713,284 7,472,683 8,172,192 8,518,851California 26,536,413 25,259,609 24,678,930 25,104,487 26,033,552 27,593,261New Mexico 795,249 785,757 704,848 661,277 757,794 821,490Texas 35,585,141 31,348,795 29,083,206 29,464,056 31,584,131 32,690,091United States, total 70,304,756 64,044,852 61,180,268 62,702,503 66,547,669 69,623,693NOTE: Details may not add to totals due to rounding.
SOURCE: U.S. Department of Transportation, Bureau of Transportation Statistics, North American Border Crossing/Entry Data available attransborder.bts.gov/programs/international/transborder/TBDR_BC/TBDR_BC_Index.html as of June 2015.
Table 4-15: Incoming Personal Vehicle Crossings, U.S.-Mexican Border: 2009–2014
SOURCE: U.S. Department of Transportation, Bureau of Transportation Statistics, North American Border Crossing/Entry Data, available at transborder.bts.gov/programs/international/transborder/TBDR_BC/TBDR_BC_Index.html as of June 2015.
Table 4-16: Incoming Passengers in Personal Vehicles, U.S.-Mexican Border: 2009—2014State 2009 2010 2011 2012 2013 2014Arizona 17,579,271 14,726,256 12,879,043 14,015,636 15,462,699 16,367,308California 48,911,130 45,611,407 43,567,956 44,095,817 46,084,882 49,326,532New Mexico 2,253,766 2,056,321 1,430,089 1,446,681 1,557,628 1,712,213Texas 72,272,826 63,355,537 53,084,820 55,491,451 59,019,742 61,837,785United States, total 141,016,993 125,749,521 110,961,908 115,049,585 122,124,951 129,243,838NOTE: Details may not add to totals due to rounding.
SOURCE: U.S. Department of Transportation, Bureau of Transportation Statistics, North American Border Crossing/Entry Data available attransborder.bts.gov/programs/international/transborder/TBDR_BC/TBDR_BC_Index.html as of June 2015.
Table 4-16: Incoming Passengers in Personal Vehicles, U.S.-Mexican Border: 2009–2014
SOURCE: U.S. Department of Transportation, Bureau of Transportation Statistics, North American Border Crossing/Entry Data, available at transborder.bts.gov/programs/international/transborder/TBDR_BC/TBDR_BC_Index.html as of June 2015.
Table 4-17: Incoming Train Passengers, U.S.-Mexican Border: 2009—2014State 2009 2010 2011 2012 2013 2014Arizona 2,252 2,408 2,836 2,628 3,466 3,180California 1,935 875 787 691 733 1,572New Mexico U U U U U UTexas1 U U U U U 6,903United States, total 4,187 3,283 3,623 3,319 4,199 11,6551Customs and Border Protection has not provided data on train passengers and crew entering the United States in Texas since 2009.
KEY: U = data are unavailable.
SOURCE: U.S. Department of Transportation, Bureau of Transportation Statistics, North American Border Crossing/Entry Data available attransborder.bts.gov/programs/international/transborder/TBDR_BC/TBDR_BC_Index.html as of June 2015.
Table 4-17: Incoming Train Passengers, U.S.-Mexican Border: 2009–2014
1Customs and Border Protection has not provided data on train passengers and crew entering the United States in Texas between 2009 and 2013. KEY: U = data are unavailable.
SOURCE: U.S. Department of Transportation, Bureau of Transportation Statistics, North American Border Crossing/Entry Data, available at transborder.bts.gov/programs/international/transborder/TBDR_BC/TBDR_BC_Index.html as of June 2015.

79
Table 4-18: Incoming Bus Crossings, U.S.-Mexican Border: 2009—2014State 2009 2010 2011 2012 2013 2014Arizona 14,035 12,624 11,586 10,557 11,294 12,236California 109,718 107,305 98,924 108,667 105,000 101,415New Mexico 2,590 2,073 1,762 1,651 1,512 1,624Texas 102,111 96,752 96,052 91,336 92,394 98,505United States, total 228,454 218,754 208,324 212,211 210,200 213,780NOTE: Details may not add to totals due to rounding.
SOURCE: U.S. Department of Transportation, Bureau of Transportation Statistics, North American Border Crossing/Entry Data available attransborder.bts.gov/programs/international/transborder/TBDR_BC/TBDR_BC_Index.html as of June 2015.
Table 4-18: Incoming Bus Crossings, U.S.-Mexican Border: 2009–2014
SOURCE: U.S. Department of Transportation, Bureau of Transportation Statistics, North American Border Crossing/Entry Data, available at transborder.bts.gov/programs/international/transborder/TBDR_BC/TBDR_BC_Index.html as of June 2015.
Table 4-19: Incoming Passengers on Buses, U.S.-Mexican Border: 2009—2014State 2009 2010 2011 2012 2013 2014Arizona 194,159 185,071 178,395 182,114 182,845 185,376California 644,907 753,801 726,541 841,614 796,173 794,812New Mexico 33,530 26,641 20,785 19,797 18,080 19,057Texas 1,556,594 1,714,194 1,794,382 1,823,112 1,825,858 1,783,650United States, total 2,429,190 2,679,707 2,720,103 2,866,637 2,822,956 2,782,895NOTE: Details may not add to totals due to rounding.
SOURCE: U.S. Department of Transportation, Bureau of Transportation Statistics, North American Border Crossing/Entry Data available attransborder.bts.gov/programs/international/transborder/TBDR_BC/TBDR_BC_Index.html as of June 2015.
Table 4-19: Incoming Passengers on Buses, U.S.-Mexican Border: 2009–2014
SOURCE: U.S. Department of Transportation, Bureau of Transportation Statistics, North American Border Crossing/Entry Data, available at transborder.bts.gov/programs/international/transborder/TBDR_BC/TBDR_BC_Index.html as of June 2015.
Table 4-20: Incoming Pedestrians, U.S.-Mexican Border: 2009—2014State 2009 2010 2011 2012 2013 2014Arizona 8,066,921 7,648,107 7,440,332 7,048,474 7,154,131 6,310,951California 14,124,387 14,740,276 16,859,463 18,140,671 17,729,194 17,762,847New Mexico 276,090 370,988 357,675 368,717 445,498 442,904Texas 18,847,287 17,155,610 15,363,746 15,583,778 15,870,112 16,706,590United States, total 41,314,685 39,914,981 40,021,216 41,141,640 41,198,935 41,223,292NOTE: Details may not add to totals due to rounding.
SOURCE: U.S. Department of Transportation, Bureau of Transportation Statistics, North American Border Crossing/Entry Data available attransborder.bts.gov/programs/international/transborder/TBDR_BC/TBDR_BC_Index.html as of June 2015.
Table 4-20: Incoming Pedestrians, U.S.-Mexican Border: 2009–2014
SOURCE: U.S. Department of Transportation, Bureau of Transportation Statistics, North American Border Crossing/Entry Data, available at transborder.bts.gov/programs/international/transborder/TBDR_BC/TBDR_BC_Index.html as of June 2015.

80
Table 4-21: Overseas Visitors to the United States by Destination State and Territory1: 2003, 2008, 2012, and 2013
State RankVisitors
(thousands)Percent of U.S. total Rank
Visitors(thousands)
Percent of U.S. total Rank
Visitors(thousands)
Percent of U.S. total Rank
Visitors(thousands)
Percent of U.S. total
New York 1 4,200 23.3 1 8,413 33.2 1 9,315 31.3 1 9,804 30.6Florida 1 4,200 23.3 3 5,246 20.7 2 6,577 22.1 2 7,209 22.5California 3 3,984 22.1 2 5,296 20.9 3 6,012 20.2 3 6,472 20.2Hawaii 4 1,947 10.8 5 1,825 7.2 4 2,827 9.5 4 3,172 9.9Nevada 5 1,370 7.6 4 2,103 8.3 5 2,768 9.3 5 2,915 9.1Texas 7 829 4.6 9 1,090 4.3 6 1,339 4.5 6 1,570 4.9Guam 6 847 4.7 8 1,191 4.7 7 1,399 4.7 7 1,474 4.6Illinois 7 829 4.6 6 1,419 5.6 8 1,399 4.7 8 1,442 4.5Massachusetts 7 829 4.6 7 1,267 5.0 9 1,339 4.5 9 1,378 4.3Pennsylvania 11 613 3.4 11 1,014 4.0 10 952 3.2 10 993 3.1New Jersey 10 685 3.8 10 1,039 4.1 11 863 2.9 11 929 2.9Arizona 12 487 2.7 12 710 2.8 12 804 2.7 12 833 2.6Georgia 13 451 2.5 13 634 2.5 13 744 2.5 13 705 2.2Washington 14 342 1.9 14 456 1.8 14 446 1.5 14 513 1.6Utah 18 252 1.4 15 380 1.5 15 476 1.6 15 481 1.5North Carolina 18 252 1.4 17 355 1.4 16 387 1.3 16 384 1.2Colorado 17 288 1.6 15 380 1.5 17 446 1.5 17 384 1.2Ohio 16 324 1.8 20 304 1.2 18 357 1.2 18 352 1.1Virginia 21 234 1.3 18 329 1.3 19 387 1.3 19 352 1.1Louisiana 22 216 1.2 U U U 21 298 1.0 20 352 1.1Maryland 23 198 1.1 21 253 1.0 20 298 1.0 21 320 1.0Connecticut 18 252 1.4 18 329 1.3 22 268 0.9 U U UMichigan 14 361 2.0 U U U U U U U U UTennessee 24 162 0.9 U U U U U U U U UMinnesota 29 90 0.5 U U U U U U U U UOregon 24 162 0.9 U U U U U U U U USouth Carolina 26 144 0.8 U U U U U U U U UIndiana 26 144 0.8 U U U U U U U U UNew Hampshire 29 90 0.5 U U U U U U U U UWisconsin 28 108 0.6 U U U U U U U U UKentucky 34 72 0.4 U U U U U U U U UMissouri 29 90 0.5 U U U U U U U U UNew Mexico 29 90 0.5 U U U U U U U U UAlabama 29 72 0.4 U U U U U U U U URhode Island 34 72 0.4 U U U U U U U U UUnited States, total2 18,026 25,341 29,761 32,038
KEY: U = data are unavailable.
NOTES: A visitor may visit more than one state. Percent of U.S. total represents the percent of overseas visitors visiting the state. These columns, therefore, do not sum to 100.Some states are not shown due to low sampling size of overseas visitors. The Office of Travel and Tourism Industries instituted a new policy for data quality in 2006. As a result, data is published for fewer states in subsequent years. The District of Columbia is included, together with the rest of its metropolitan area, in table 4-22.
SOURCE: U.S. Department of Commerce, International Trade Administration, Office of Travel and Tourism Industries, Overseas Visitors Estimates for U.S. States, July 2015.
2003 2008 2012 2013
1International travelers to the United States from Canada and Mexico are not included2Includes U.S. territories.
Table 4-21: Overseas Visitors to the United States by Destination State and Territory1: 2003, 2008, 2012, and 2013
1International travelers to the United States from Canada and Mexico are not included. 2Includes U.S. territories. KEY: U = data are unavailable. NOTES: A visitor may visit more than one state. Percent of U.S. total represents the percent of overseas visitors visiting the state. These columns, therefore, do not sum to 100. Some states are not shown due to low sampling size of overseas visitors. The Office of Travel and Tourism Industries instituted a new policy for data quality in 2006. As a result, data is published for fewer states in subsequent years. The District of Columbia is included, together with the rest of its metropolitan area, in table 4-22. SOURCE: U.S. Department of Commerce, International Trade Administration, Office of Travel and Tourism Industries, Overseas Visitors Estimates for U.S. States, July 2015.
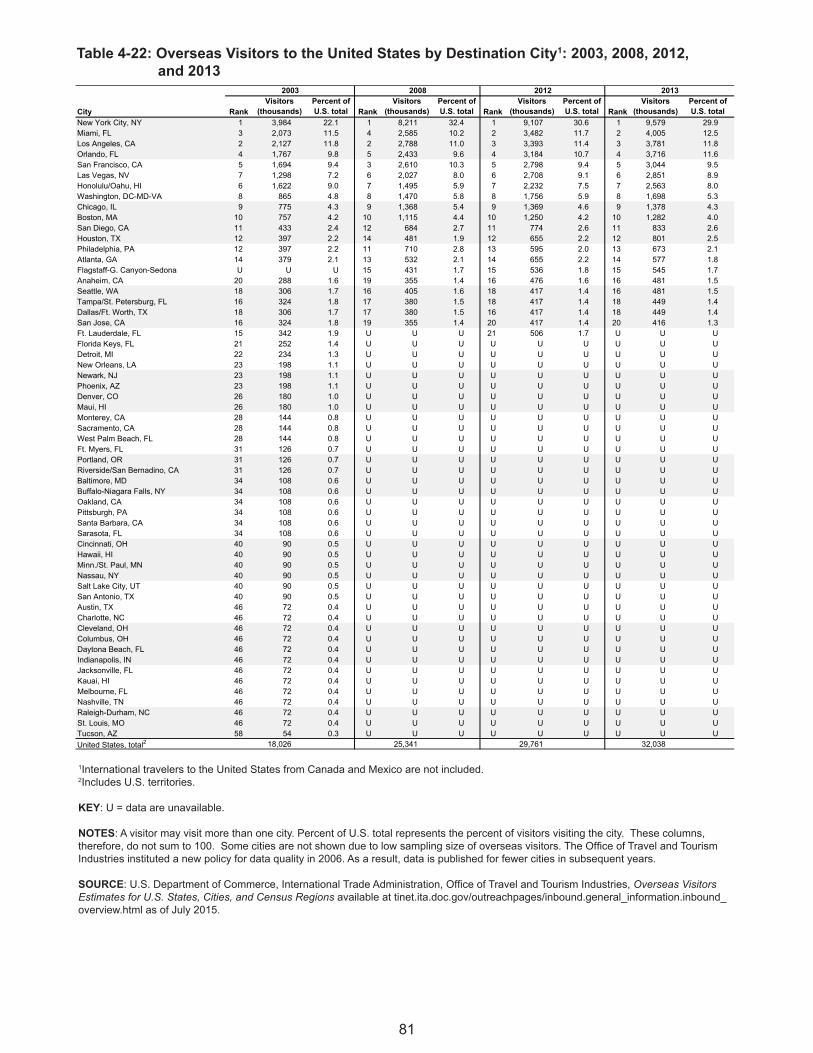
81
Table 4-22: Overseas Visitors to the United States by Destination City1: 2003, 2008, 2012, and 2013
City RankVisitors
(thousands)Percent of U.S. total Rank
Visitors(thousands)
Percent of U.S. total Rank
Visitors(thousands)
Percent of U.S. total Rank
Visitors(thousands)
Percent of U.S. total
New York City, NY 1 3,984 22.1 1 8,211 32.4 1 9,107 30.6 1 9,579 29.9Miami, FL 3 2,073 11.5 4 2,585 10.2 2 3,482 11.7 2 4,005 12.5Los Angeles, CA 2 2,127 11.8 2 2,788 11.0 3 3,393 11.4 3 3,781 11.8Orlando, FL 4 1,767 9.8 5 2,433 9.6 4 3,184 10.7 4 3,716 11.6San Francisco, CA 5 1,694 9.4 3 2,610 10.3 5 2,798 9.4 5 3,044 9.5Las Vegas, NV 7 1,298 7.2 6 2,027 8.0 6 2,708 9.1 6 2,851 8.9Honolulu/Oahu, HI 6 1,622 9.0 7 1,495 5.9 7 2,232 7.5 7 2,563 8.0Washington, DC-MD-VA 8 865 4.8 8 1,470 5.8 8 1,756 5.9 8 1,698 5.3Chicago, IL 9 775 4.3 9 1,368 5.4 9 1,369 4.6 9 1,378 4.3Boston, MA 10 757 4.2 10 1,115 4.4 10 1,250 4.2 10 1,282 4.0San Diego, CA 11 433 2.4 12 684 2.7 11 774 2.6 11 833 2.6Houston, TX 12 397 2.2 14 481 1.9 12 655 2.2 12 801 2.5Philadelphia, PA 12 397 2.2 11 710 2.8 13 595 2.0 13 673 2.1Atlanta, GA 14 379 2.1 13 532 2.1 14 655 2.2 14 577 1.8Flagstaff-G. Canyon-Sedona U U U 15 431 1.7 15 536 1.8 15 545 1.7Anaheim, CA 20 288 1.6 19 355 1.4 16 476 1.6 16 481 1.5Seattle, WA 18 306 1.7 16 405 1.6 18 417 1.4 16 481 1.5Tampa/St. Petersburg, FL 16 324 1.8 17 380 1.5 18 417 1.4 18 449 1.4Dallas/Ft. Worth, TX 18 306 1.7 17 380 1.5 16 417 1.4 18 449 1.4San Jose, CA 16 324 1.8 19 355 1.4 20 417 1.4 20 416 1.3Ft. Lauderdale, FL 15 342 1.9 U U U 21 506 1.7 U U UFlorida Keys, FL 21 252 1.4 U U U U U U U U UDetroit, MI 22 234 1.3 U U U U U U U U UNew Orleans, LA 23 198 1.1 U U U U U U U U UNewark, NJ 23 198 1.1 U U U U U U U U UPhoenix, AZ 23 198 1.1 U U U U U U U U UDenver, CO 26 180 1.0 U U U U U U U U UMaui, HI 26 180 1.0 U U U U U U U U UMonterey, CA 28 144 0.8 U U U U U U U U USacramento, CA 28 144 0.8 U U U U U U U U UWest Palm Beach, FL 28 144 0.8 U U U U U U U U UFt. Myers, FL 31 126 0.7 U U U U U U U U UPortland, OR 31 126 0.7 U U U U U U U U URiverside/San Bernadino, CA 31 126 0.7 U U U U U U U U UBaltimore, MD 34 108 0.6 U U U U U U U U UBuffalo-Niagara Falls, NY 34 108 0.6 U U U U U U U U UOakland, CA 34 108 0.6 U U U U U U U U UPittsburgh, PA 34 108 0.6 U U U U U U U U USanta Barbara, CA 34 108 0.6 U U U U U U U U USarasota, FL 34 108 0.6 U U U U U U U U UCincinnati, OH 40 90 0.5 U U U U U U U U UHawaii, HI 40 90 0.5 U U U U U U U U UMinn./St. Paul, MN 40 90 0.5 U U U U U U U U UNassau, NY 40 90 0.5 U U U U U U U U USalt Lake City, UT 40 90 0.5 U U U U U U U U USan Antonio, TX 40 90 0.5 U U U U U U U U UAustin, TX 46 72 0.4 U U U U U U U U UCharlotte, NC 46 72 0.4 U U U U U U U U UCleveland, OH 46 72 0.4 U U U U U U U U UColumbus, OH 46 72 0.4 U U U U U U U U UDaytona Beach, FL 46 72 0.4 U U U U U U U U UIndianapolis, IN 46 72 0.4 U U U U U U U U UJacksonville, FL 46 72 0.4 U U U U U U U U UKauai, HI 46 72 0.4 U U U U U U U U UMelbourne, FL 46 72 0.4 U U U U U U U U UNashville, TN 46 72 0.4 U U U U U U U U URaleigh-Durham, NC 46 72 0.4 U U U U U U U U USt. Louis, MO 46 72 0.4 U U U U U U U U UTucson, AZ 58 54 0.3 U U U U U U U U UUnited States, total2 18,026 25,341 29,761 32,038
KEY: U = data are unavailable.
NOTES: A visitor may visit more than one city. Percent of U.S. total represents the percent of visitors visiting the city. These columns, therefore, do not sum to 100. Some cities are not shown due to low sampling size of overseas visitors. The Office of Travel and Tourism Industries instituted a new policy for data quality in 2006. As a result, data is published for fewer cities in subsequent years.
SOURCE: U.S. Department of Commerce, International Trade Administration, Office of Travel and Tourism Industries, Overseas Visitors Estimates for U.S. States, Cities, and Census Regions available at tinet.ita.doc.gov/outreachpages/inbound.general_information.inbound_overview.html as of July 2015.
2003 2008 2012 2013
1International travelers to the United States from Canada and Mexico are not included.2Includes U.S. territories.
Table 4-22: Overseas Visitors to the United States by Destination City1: 2003, 2008, 2012, and 2013
1International travelers to the United States from Canada and Mexico are not included. 2Includes U.S. territories. KEY: U = data are unavailable. NOTES: A visitor may visit more than one city. Percent of U.S. total represents the percent of visitors visiting the city. These columns, therefore, do not sum to 100. Some cities are not shown due to low sampling size of overseas visitors. The Office of Travel and Tourism Industries instituted a new policy for data quality in 2006. As a result, data is published for fewer cities in subsequent years. SOURCE: U.S. Department of Commerce, International Trade Administration, Office of Travel and Tourism Industries, Overseas Visitors Estimates for U.S. States, Cities, and Census Regions available at tinet.ita.doc.gov/outreachpages/inbound.general_information.inbound_overview.html as of July 2015.

Chapter 5Registered Vehicles and Vehicle-Miles Traveled

84
Table 5-1: Motor-Vehicle Registrations: 2013(Thousands)
StateAuto-
mobilesMotor-cycles2 Buses Trucks
Trucktractors Pickups Vans
Sportutilities Other light3
Alabama 2,057 117 1 2,566 36 1,153 265 973 3Alaska 197 32 2 538 5 228 55 208 0Arizona 2,235 188 16 2,874 44 1,033 371 1,131 4Arkansas3 822 74 1 1,454 39 691 132 509 1California 13,598 785 34 13,038 263 4,122 1,890 5,902 10Colorado 1,800 184 8 2,637 30 865 269 1,316 3Connecticut 1,458 91 4 1,253 7 287 191 691 1Delaware 447 30 3 461 3 131 75 231 0District of Columbia 204 4 3 101 0 11 21 66 0Florida 7,310 543 25 6,985 67 2,103 1,104 3,354 3Georgia3 3,405 199 10 4,066 63 1,498 516 1,754 3Hawaii 557 40 2 712 3 279 108 303 0Idaho 594 65 3 1,020 22 473 103 351 1Illinois3 4,750 352 4 4,959 142 1,218 928 2,400 2Indiana 2,257 219 9 3,074 227 1,027 484 1,120 1Iowa3 1,356 183 4 1,957 70 795 288 674 1Kansas 1,017 99 3 1,473 46 613 192 510 1Kentucky3 1,699 110 2 2,177 29 929 281 811 2Louisiana3 1,466 113 22 2,269 32 1,098 186 839 1Maine3 482 63 1 639 8 257 76 255 0Maryland 1,893 99 6 1,773 11 444 303 890 1Massachusetts4 2,483 125 8 2,311 13 521 358 1,292 0Michigan 3,562 267 3 4,283 66 1,285 764 1,966 1Minnesota3 2,191 237 5 2,732 67 906 460 1,124 2Mississippi3 868 28 2 1,159 29 561 107 401 1Missouri 2,462 185 3 3,116 67 1,210 452 1,196 2Montana 442 171 4 916 24 437 88 282 1Nebraska 704 56 2 1,082 58 423 135 385 1Nevada3 968 71 1 1,138 8 404 126 539 1New Hampshire5 620 74 2 702 4 232 91 332 0New Jersey4 3,604 152 14 3,214 40 558 595 1,820 1New Mexico 705 65 1 1,077 14 507 101 386 1New York5 5,120 345 15 5,020 38 1,014 928 2,731 2North Carolina6 3,463 195 12 4,061 61 1,490 563 1,712 2North Dakota 249 36 1 542 36 234 52 163 0Ohio 4,806 402 17 4,993 98 1,547 881 2,162 2Oklahoma3 1,359 127 1 1,939 67 804 213 690 1Oregon 1,505 90 1 1,968 24 771 268 774 3Pennsylvania 4,764 400 52 5,124 67 1,425 806 2,484 2Rhode Island4 452 32 0 353 2 91 58 182 0South Carolina 1,709 113 5 2,063 20 783 264 892 1South Dakota3 326 86 0 578 25 248 67 185 0Tennessee3 2,248 164 2 2,895 41 1,178 361 1,145 2Texas3 7,810 440 18 11,393 239 4,700 1,069 4,749 4Utah 869 65 4 1,105 27 403 135 444 1Vermont 256 29 1 318 4 119 33 139 0Virginia 3,226 189 7 3,495 32 1,118 536 1,630 2Washington3 2,772 227 12 3,308 41 1,220 455 1,366 5West Virginia 516 57 1 839 8 362 83 335 1Wisconsin3 2,240 323 1 2,679 63 869 470 1,111 1Wyoming3 227 31 1 567 10 282 40 188 1United States, total 112,128 8,375 361 130,998 2,443 44,958 18,395 57,091 76
5State did not report current year data. Previous year data shown for private vehicles.6State data estimated from North Carolina Department of Transportation published data and other data sources.
SOURCE: U.S. Department of Transportation, Federal Highway Administration, Highway Statistics , MV-1 and MV-9, available at www.fhwa.dot.gov/policyinformation/statistics.cfm as of June 2015.
Private and commercial Partial classification of trucks1
1Data estimated by FHWA from state reported data and other sources. Farm trucks data are as reported bystates.2Many states do not maintain records on publicly owned motorcycles. Total may not represent an accurate count of the total number of publicly-owned motorcycles.3State did not report active registrations and registers vehicles annually. Annual transaction data shown.4State data estimated from Department of Motor Vehicles published data.
Table 5-1: Motor-Vehicle Registrations: 2013 (Thousands)
1Data estimated by FHWA from state reported data and other sources. Farm trucks data are as reported by states. 2Many states do not maintain records on publicly owned motorcycles. Total may not represent an accurate count of the total number of publicly-owned motorcycles. 3State did not report active registrations and registers vehicles annually. Annual transaction data shown. 4State data estimated from Department of Motor Vehicles published data. 5State did not report current year data. Previous year data shown for private vehicles. 6State data estimated from North Carolina Department of Transportation published data and other data sources.
SOURCE: U.S. Department of Transportation, Federal Highway Administration, Highway Statistics, MV-1 and MV-9, available at www.fhwa.dot.gov/policyinformation/statistics.cfm as of June 2015.

85
Table 5-2: Trailer and Semi-Trailer Registrations: 20121
Publicly owned
State Commercial trailers2Light farm trailers,
car trailers, etc. House trailers3 Total
State, county, municipal
governmentAlabama 66,267 242,849 51,649 360,765 U 360,765Alaska 11,489 115,934 U 127,423 2,315 129,738Arizona 766,697 U 90,236 856,933 53 856,986Arkansas 92,899 35,229 7,700 135,828 U 135,828California 1,000,747 954,211 330,696 2,285,654 68,286 2,353,940Colorado 7,181 478,720 97,410 583,311 7,237 590,548Connecticut 34,165 U 153,460 187,625 U 187,625Delaware 18,628 60,895 56,100 135,623 U 135,623District of Columbia 870 U U 870 U 870Florida 57,208 1,519,616 1 1,576,825 1,070 1,577,895Georgia4 U U U 1,058,038 U 1,058,038Hawaii4 U U U 28,958 1,694 30,652Idaho 42,505 336,048 72,376 450,929 578 451,507Illinois 297,154 501,446 89,989 888,589 U 888,589Indiana 236,267 401,015 U 637,282 U 637,282Iowa 254,677 434,035 87,759 776,471 3,670 780,141Kansas 10,790 144,109 19,550 174,449 U 174,449Kentucky 277,710 16,926 27,845 322,481 U 322,481Louisiana 184,692 109,377 17,467 311,536 842 312,378Maine 111,006 193,544 U 304,550 U 304,550Maryland 871,889 U U 871,889 U 871,889Massachusetts 22,855 242,086 U 264,941 223 265,164Michigan 369,869 U 288,974 658,843 U 658,843Minnesota 242,098 43,395 119,901 405,394 U 405,394Mississippi 30,174 65,253 9,619 105,046 340 105,386Missouri4 U U U 985,159 U 985,159Montana 30,461 445,733 68,745 544,939 221 545,160Nebraska 205,396 170,037 U 375,433 6,835 382,268Nevada 7,031 164,724 34,943 206,698 U 206,698New Hampshire5 U U U 171,735 U 171,735New Jersey 3,640 264,353 22,103 290,096 U 290,096New Mexico 35,946 208,912 56,950 301,808 U 301,808New York6 141,211 202,234 11,130 354,575 903 355,478North Carolina 923,989 U 19,638 943,627 20,535 964,162North Dakota 109,378 U 23,510 132,888 137 133,025Ohio 250,775 524,734 94,591 870,100 842 870,942Oklahoma 139,001 84,845 5,525 229,371 U 229,371Oregon 753 135,515 84,505 220,773 U 220,773Pennsylvania 1,110,355 U U 1,110,355 14,836 1,125,191Rhode Island 6,301 45,402 5,387 57,090 1,240 58,330South Carolina 124,425 39,726 5 164,156 3,934 168,090South Dakota 6,343 205,278 694 212,315 4,120 216,435Tennessee 1,390,266 U 13 1,390,279 U 1,390,279Texas 863,216 1,220,141 207,876 2,291,233 57,306 2,348,539Utah 152,692 10,212 67,821 230,725 2,950 233,675Vermont 94,360 U U 94,360 U 94,360Virginia 308,970 507,557 38,313 854,840 618 855,458Washington 59,738 638,082 U 697,820 U 697,820West Virginia 174,199 123,530 U 297,729 7,269 304,998Wisconsin 428,507 2,266 72,439 503,212 5,194 508,406Wyoming 126,483 161,090 37,877 325,450 169 325,619United States, total7 11,701,273 11,049,059 2,372,797 27,367,019 213,417 27,580,436
5State did not file a 2012 report, 2011 data used.6State did not file a 2012 report, data estimated by FHWA from website report.7As data has been estimated, or not included in some cases, totals should be considered estitmates at best.
KEY: U = data are unavailable.
SOURCE: U.S. Department of Transportation, Federal Highway Administration, Highway Statistics , MV-11, available at www.fhwa.dot.gov/policyinformation/statistics.cfm as of August 2015.
Private and commercial
Total
1The completeness of data on trailer registrations varies greatly. Data are reported to the extent available from State reports.2This column includes all commercial type vehicles and semiltrailers that are in a private or for-hire use.3Mobile homes and house trailers are shown in this column for States that require them to be registered and are able to separate them from other trailers. In States where this classification is not available, house trailers are included with light car trailers.4State indicated data by type was not available.
Table 5-2: Trailer and Semi-Trailer Registrations: 20121
1The completeness of data on trailer registrations varies greatly. Data are reported to the extent available from State reports. 2This column includes all commercial type vehicles and semiltrailers that are in a private or for-hire use. 3Mobile homes and house trailers are shown in this column for States that require them to be registered and are able to separate them from other trailers. In States where this classification is not available, house trailers are included with light car trailers. 4State indicated data by type was not available. 5State did not file a 2012 report, 2011 data used. 6State did not file a 2012 report, data estimated by FHWA from website report. 7As data has been estimated, or not included in some cases, totals should be considered estitmates at best. KEY: U = data are unavailable.
SOURCE: U.S. Department of Transportation, Federal Highway Administration, Highway Statistics, MV-11, available at www.fhwa.dot.gov/policy-information/statistics.cfm as of August 2015.

86
Table 5-3: Highway Vehicle-Miles Traveled (VMT): 2008, 2013
StateTotal VMT1
(millions)EstimatedPopulation VMT per capita
Total VMT2
(millions)EstimatedPopulation VMT per capita
Alabama 59,303 4,661,900 12,721 65,046 4,833,996 13,456Alaska 4,865 686,293 7,089 4,848 737,259 6,576Arizona 61,628 6,500,180 9,481 60,586 6,634,997 9,131Arkansas 33,163 2,855,390 11,614 33,493 2,958,765 11,320California 327,286 36,756,666 8,904 329,534 38,431,393 8,575Colorado 47,860 4,939,456 9,689 46,968 5,272,086 8,909Connecticut 31,737 3,501,252 9,064 30,941 3,599,341 8,596Delaware 8,976 873,092 10,281 9,308 925,240 10,060District of Columbia 3,611 591,833 6,101 3,527 649,111 5,434Florida 198,616 18,328,340 10,837 192,702 19,600,311 9,832Georgia 109,057 9,685,744 11,260 109,355 9,994,759 10,941Hawaii 10,278 1,288,198 7,979 10,099 1,408,987 7,168Idaho 15,251 1,523,816 10,008 15,980 1,612,843 9,908Illinois 106,079 12,901,563 8,222 105,297 12,890,552 8,169Indiana 70,973 6,376,792 11,130 78,311 6,570,713 11,918Iowa 30,713 3,002,555 10,229 31,641 3,092,341 10,232Kansas 29,727 2,802,134 10,609 30,208 2,895,801 10,432Kentucky 47,534 4,269,245 11,134 46,996 4,399,583 10,682Louisiana 45,091 4,410,796 10,223 47,758 4,629,284 10,316Maine 14,559 1,316,456 11,059 14,129 1,328,702 10,634Maryland 55,023 5,633,597 9,767 56,688 5,938,737 9,545Massachusetts 54,505 6,497,967 8,388 56,311 6,708,874 8,394Michigan 101,825 10,003,422 10,179 95,132 9,898,193 9,611Minnesota3 57,995 5,220,393 11,109 56,974 5,422,060 10,508Mississippi 43,711 2,938,618 14,875 38,758 2,992,206 12,953Missouri 68,273 5,911,605 11,549 69,458 6,044,917 11,490Montana 10,812 967,440 11,176 12,033 1,014,864 11,856Nebraska 19,170 1,783,432 10,749 19,322 1,868,969 10,338Nevada 20,780 2,600,167 7,992 24,649 2,791,494 8,830New Hampshire 13,040 1,315,809 9,910 12,903 1,322,616 9,756New Jersey 73,629 8,682,661 8,480 74,530 8,911,502 8,363New Mexico 26,279 1,984,356 13,243 25,086 2,086,895 12,021New York 134,085 19,490,297 6,880 129,737 19,695,680 6,587North Carolina 101,712 9,222,414 11,029 105,213 9,848,917 10,683North Dakota 7,820 641,481 12,191 10,100 723,857 13,953Ohio 108,302 11,485,910 9,429 112,767 11,572,005 9,745Oklahoma 48,499 3,642,361 13,315 47,999 3,853,118 12,457Oregon 33,468 3,790,060 8,830 33,706 3,928,068 8,581Pennsylvania 107,848 12,448,279 8,664 98,628 12,781,296 7,717Rhode Island 8,187 1,050,788 7,791 7,775 1,053,354 7,381South Carolina 49,597 4,479,800 11,071 48,986 4,771,929 10,266South Dakota 8,986 804,194 11,174 9,122 845,510 10,789Tennessee 69,469 6,214,888 11,178 71,067 6,497,269 10,938Texas4 235,382 24,326,974 9,676 244,525 26,505,637 9,225Utah 25,974 2,736,424 9,492 27,005 2,902,787 9,303Vermont 7,312 621,270 11,769 7,116 626,855 11,352Virginia 82,278 7,769,089 10,590 80,767 8,270,345 9,766Washington 55,558 6,549,224 8,483 57,211 6,973,742 8,204West Virginia 20,774 1,814,468 11,449 19,232 1,853,595 10,376Wisconsin 57,462 5,627,967 10,210 59,486 5,742,953 10,358Wyoming 9,447 532,668 17,735 9,309 583,223 15,961United States, total 2,973,509 304,059,724 9,779 2,988,323 316,497,531 9,442
NOTES: Population estimates are for July 1st of given year.
SOURCES: VMT: U.S. Department of Transportation, Federal Highway Administration, Highway Statistics , VM-2, available at www.fhwa.dot.gov/policyinformation/statistics.cfm as of July 2015. Population: U.S. Department of Commerce, U.S. Census Bureau,Population Estimates, available at www.census.gov/popest as of July 2015.
2008 2013
1Travel for all systems are FHWA estimates based on State provided HPMS data.2Travel for the rural minor collector and rural/urban local functional systems is estimated by the States based on a model or other means and provided to the FHWA on a summary basis. Travel for all other systems are estimated from State-provided data in the HighwayPerformance Monitoring System.32008 Data excludes 788 miles of Federal agency owned roads.42008 State has revised their adjusted urbanized area boundaries and/or functional classifications.
Table 5-3: Highway Vehicle-Miles Traveled (VMT): 2008, 2013
1Travel for all systems are FHWA estimates based on State provided HPMS data. 2Travel for the rural minor collector and rural/urban local functional systems is estimated by the States based on a model or other means and provided to the FHWA on a summary basis. Travel for all other systems are estimated from State-provided data in the Highway Performance Monitoring System. 32008 Data excludes 788 miles of Federal agency owned roads. 42008 State has revised their adjusted urbanized area boundaries and/or functional classifications.
NOTES: Population estimates are for July 1st of given year.
SOURCES: VMT: U.S. Department of Transportation, Federal Highway Administration, Highway Statistics, VM-2, available at www.fhwa.dot.gov/policyinformation/statistics.cfm as of July 2015. Population: U.S. Department of Commerce, U.S. Census Bureau, Population Estimates, available at www.census.gov/popest as of July 2015.

87
Table 5-4: Highway, Demographic, and Geographic Characteristics of 30 Largest Urbanized Areas: 2013
Federal-aid urbanized area1 State(s)
Estimatedpopulation
(thousands)
Net land area (square
miles)Persons per square mile
Totalroadway
miles
Miles of roadway per
thousandpersons
Total DVMT (thousands)
Total DVMT per capita
Totalestimated
freeway lane miles2
Averagedaily traffic per freeway
lane mileNew York-Newark NY, NJ, CT 17,800 4,868 3,657 44,675 2.5 120,723 16.6 7,437 16,233Los Angeles-Long Beach-Santa Ana CA 11,789 1,971 5,981 25,207 2.1 119,806 22.3 5,246 22,837Chicago IL, IN 8,308 3,535 2,350 31,162 3.8 56,433 21.6 3,123 18,067Philadelphia PA, NJ, DE, MD 5,149 2,401 2,145 20,377 4.0 35,794 19.8 2,565 13,957Miami FL 4,919 1,499 3,282 15,569 3.2 41,175 25.5 2,256 18,250Dallas-Fort Worth-Arlington TX 4,146 2,375 1,746 22,223 5.4 64,670 30.5 3,880 16,667Boston MA, NH, RI 4,032 2,430 1,659 17,578 4.4 41,470 23.9 2,603 15,930Washington DC, VA, MD 3,934 1,279 3,076 12,620 3.2 37,786 25.2 2,113 17,886Detroit MI 3,903 1,603 2,435 15,342 3.9 32,689 23.5 2,049 15,957Houston TX 3,823 1,824 2,096 17,256 4.5 51,518 27.8 3,137 16,425Atlanta GA 3,500 3,649 959 25,046 7.2 49,469 41.2 2,881 17,174San Francisco-Oakland CA 2,996 1,054 2,842 7,688 2.6 27,612 19.9 1,475 18,722Phoenix-Mesa AZ 2,907 1,614 1,801 11,929 4.1 29,401 28.0 1,992 14,758Seattle WA 2,712 1,199 2,262 11,719 4.3 28,553 24.8 1,730 16,503San Diego CA 2,674 984 2,718 5,964 2.2 39,540 26.5 2,115 18,692Minneapolis-St. Paul MN - WI 2,651 1,593 1,664 13,389 5.1 29,550 26.0 1,863 15,857St. Louis MO, IL 2,078 1,476 1,408 11,892 5.7 30,557 32.3 2,467 12,388Baltimore MD 2,076 683 3,040 7,558 3.6 28,327 26.8 1,637 17,309Tampa-St. Petersburg FL 2,062 1,072 1,924 9,695 4.7 14,318 29.8 903 15,858Denver-Aurora CO 1,985 814 2,438 8,505 4.3 21,242 25.3 1,280 16,597Cleveland OH 1,787 855 2,090 7,389 4.1 17,868 23.1 1,539 11,607Pittsburgh PA 1,753 1,215 1,443 9,478 5.4 8,820 18.8 1,263 6,985Portland OR, WA 1,583 591 2,679 7,202 4.5 13,536 22.1 795 17,026San Jose CA 1,538 353 4,358 3,869 2.5 27,039 31.4 1,338 20,204Riverside-San Bernardino CA 1,507 747 2,017 5,286 3.5 32,744 37.2 1,525 21,476Cincinnati OH, KY, IN 1,503 910 1,652 7,106 4.7 18,070 30.7 1,260 14,337Virginia Beach VA 1,394 1,409 990 6,761 4.8 13,003 25.6 907 14,337Sacramento CA 1,393 446 3,124 5,245 3.8 15,607 27.8 872 17,901Kansas City MO, KS 1,362 1,202 1,133 9,836 7.2 22,187 33.4 2,098 10,574San Antonio TX 1,328 574 2,313 6,436 4.8 21,185 29.6 1,249 16,9551A "Federal-Aid Urbanized Area" is an area with 50,000 or more persons that at a minimum encompasses the land area delineated as the urbanized area by the Bureau of the Census. Areas are in sort by population. Some areas may be missing, unreported, or included in other areas.2Lane miles estimated by the Federal Highway Administration (FHWA).
KEY: DVMT = daily vehicle-miles of travel.
NOTE: Ratios are based on unrounded numbers.
SOURCE: U.S. Department of Transportation, Federal Highway Administration, Highway Statistics , HM-72, available at www.fhwa.dot.gov/policyinformation/statistics.cfm as of June 2015.
Table 5-4: Highway, Demographic, and Geographic Characteristics of 30 Largest Urbanized Areas: 2013
1A “Federal-Aid Urbanized Area” is an area with 50,000 or more persons that at a minimum encompasses the land area delineated as the urban-ized area by the Bureau of the Census. Areas are in sort by population. Some areas may be missing, unreported, or included in other areas. 2Lane miles estimated by the Federal Highway Administration (FHWA).
KEY: DVMT = daily vehicle-miles of travel.
NOTE: Ratios are based on unrounded numbers.
SOURCE: U.S. Department of Transportation, Federal Highway Administration, Highway Statistics, HM-72, available at www.fhwa.dot.gov/policy-information/statistics.cfm as of June 2015.

88
Table 5-5: Highway Congestion in the 50 Largest Urban Areas: 2014
Urban area RankPopulation(thousands)
Hours of delay (thousands)
Hours of delay per commuter
Cost of congestion($ millions)
Cost of congestion per commuter ($)
Washington DC-VA-MD 1 4,920 204,375 82 4,560 1,834Los Angeles-Long Beach-Anaheim CA 2 12,635 622,509 80 13,318 1,711San Francisco-Oakland CA 3 3,480 146,013 78 3,143 1,675New York-Newark NY-NJ-CT 4 19,040 628,241 74 14,712 1,739San Jose CA 5 1,950 104,559 67 2,230 1,422Boston MA-NH-RI 6 4,440 153,994 64 3,363 1,388Seattle WA 7 3,325 139,842 63 3,294 1,491Chicago IL-IN 8 8,700 302,609 61 7,222 1,445Houston TX 8 5,000 203,173 61 4,924 1,490Riverside-San Bernardino CA 10 2,020 99,058 59 2,201 1,316Dallas-Fort Worth-Arlington TX 11 5,485 186,535 53 4,202 1,185Miami FL 12 5,860 195,946 52 4,444 1,169Detroit MI 12 3,825 155,358 52 3,514 1,183Atlanta GA 12 4,500 148,666 52 3,214 1,130Portland OR-WA 12 1,990 72,341 52 1,763 1,273Austin TX 12 1,500 51,116 52 1,140 1,159Phoenix-Mesa AZ 17 3,925 155,730 51 3,641 1,201Denver-Aurora CO 19 2,615 91,479 49 2,061 1,101Oklahoma City OK 19 1,000 45,652 49 1,030 1,110Bridgeport-Stamford CT-NY 19 955 37,119 49 898 1,174Philadelphia PA-NJ-DE-MD 22 5,560 157,183 48 3,669 1,112Minneapolis-St. Paul MN-WI 23 2,815 99,710 47 2,196 1,035Baltimore MD 23 2,600 87,620 47 2,075 1,115Las Vegas-Henderson NV 27 1,975 63,693 46 1,375 984Orlando FL 27 1,615 52,723 46 1,207 1,044Virginia Beach VA 29 1,460 48,274 45 1,020 953New Orleans LA 29 975 39,159 45 1,014 1,161Nashville-Davidson TN 29 1,200 38,977 45 1,013 1,168San Antonio TX 33 1,935 64,328 44 1,462 1,002St. Louis MO-IL 35 2,200 69,350 43 1,637 1,020San Juan PR 35 2,055 60,301 43 1,605 1,150Sacramento CA 35 1,810 60,220 43 1,334 958Indianapolis IN 35 1,555 46,435 43 1,142 1,060Memphis TN-MS-AR 35 1,085 37,824 43 939 1,080Providence RI-MA 35 1,180 37,809 43 846 951Louisville-Jefferson County KY-IN 35 1,110 35,622 43 860 1,048Charlotte NC-SC 35 1,200 34,153 43 770 963San Diego CA 43 3,090 79,412 42 1,658 887Tampa-St. Petersburg FL 45 2,540 71,628 41 1,589 907Cincinnati OH-KY-IN 45 1,640 48,485 41 1,159 989Columbus OH 45 1,455 40,025 41 921 933Buffalo NY 49 945 26,851 40 620 918Kansas City MO-KS 51 1,600 45,570 39 1,085 933Pittsburgh PA 51 1,765 44,758 39 1,030 889Cleveland OH 55 1,765 45,051 38 1,046 887Milwaukee WI 55 1,410 37,659 38 984 987Jacksonville FL 55 1,085 29,680 38 659 842Salt Lake City-West Valley City UT 66 1,100 26,925 37 779 1,059Richmond VA 77 1,000 26,104 34 558 729Raleigh NC 77 965 23,128 34 504 734
SOURCE: Texas A&M University, Texas Transportation Institute, Urban Mobility Report 2015 , available at mobility.tamu.edu/ums as of August 2015.
NOTES: Ranked by annual hours of delay per commuter. TTI's methodology changes periodically. When changes do occur, the methods are appliedto all years, resulting in changes possibly over the entire period of data available. Consequently, the most recently published figures may not be comparable to those in past editions.
Table 5-5: Highway Congestion in the 50 Largest Urban Areas: 2014
NOTES: Ranked by annual hours of delay per commuter. TTI’s methodology changes periodically. When changes do occur, the methods are ap-plied to all years, resulting in changes possibly over the entire period of data available. Consequently, the most recently published figures may not be comparable to those in past editions.
SOURCE: Texas A&M University, Texas Transportation Institute, Urban Mobility Report 2015, available at mobility.tamu.edu/ums as of August 2015.

89
Table 5-6: Recreational Boat Registrations by Propulsion Type: 2014State Powered1 Nonpowered2 Other3 TotalAlabama 259,000 1,960 1,966 262,926Alaska 49,390 448 285 50,123Arizona 124,380 0 45 124,425Arkansas 180,629 573 25,081 206,283California 675,250 29,534 23,895 728,679Colorado 78,926 3,226 1,531 83,683Connecticut 99,250 305 103 99,658Delaware 57,272 0 2,065 59,337District of Columbia 1,529 339 95 1,963Florida 825,019 20,918 27,570 873,507Georgia 308,572 3,259 9,909 321,740Hawaii 11,522 386 125 12,033Idaho 83,419 650 2,201 86,270Illinois 232,849 36,380 5,677 274,906Indiana 210,930 733 803 212,466Iowa 179,561 37,708 4,670 221,939Kansas 78,514 2,628 874 82,016Kentucky 160,296 0 14,062 174,358Louisiana 307,059 0 0 307,059Maine 105,550 0 778 106,328Maryland 171,801 294 6,478 178,573Massachusetts 124,507 0 11,243 135,750Michigan 737,372 48,969 3,117 789,458Minnesota 598,195 197,283 13,814 809,292Mississippi 132,812 594 0 133,406Missouri 291,771 2,174 64 294,009Montana 46,374 297 756 47,427Nebraska 82,915 1 3,862 86,778Nevada 42,700 220 1,276 44,196New Hampshire 88,869 3,389 0 92,258New Jersey 149,529 3,360 0 152,889New Mexico 33,610 964 73 34,647New York 450,761 9 1,092 451,862North Carolina 375,192 1,763 3,715 380,670North Dakota 52,576 651 333 53,560Ohio 303,511 156,148 119 459,778Oklahoma 214,468 0 0 214,468Oregon 157,558 0 5,800 163,358Pennsylvania 283,321 19,150 19,724 322,195Rhode Island 34,772 50 1,469 36,291South Carolina 436,917 22,927 2,836 462,680South Dakota 52,967 3,925 317 57,209Tennessee 255,595 1,267 0 256,862Texas 556,554 3,010 7,333 566,897Utah 65,920 884 0 66,804Vermont 27,861 0 0 27,861Virginia 231,824 308 4,389 236,521Washington 226,662 0 0 226,662West Virginia 48,139 0 0 48,139Wisconsin 601,514 19,555 6,283 627,352Wyoming 26,279 614 224 27,117United States, total4 10,960,861 627,056 216,085 11,804,002
SOURCE: U.S. Department of Homeland Security, U.S. Coast Guard, Office of Boating Safety, personal communication in July 2015.
1Powered boats include traditional power boats, sailboats with auxiliary engines and personal watercraft (such as jet-skis).2Nonpowered boats include row boats, sail boats, canoes and kayaks.3Other boats are those not included elsewhere.4U.S. totals include Guam, Puerto Rico, the Virgin Islands, American Samoa, and the Northern Mariana Islands.
NOTES: Data are derived from reports of states and other jurisdictions with varying registration categories. The U.S. totals do not include sailboards, which are registered in some states.
Table 5-6: Recreational Boat Registrations by Propulsion Type: 2014
1Powered boats include traditional power boats, sailboats with auxiliary engines and personal watercraft (such as jet-skis).2Nonpowered boats include row boats, sail boats, canoes and kayaks. 3Other boats are those not included elsewhere. 4U.S. totals include Guam, Puerto Rico, the Virgin Islands, American Samoa, and the Northern Mariana Islands.
NOTES: Data are derived from reports of states and other jurisdictions with varying registration categories. The U.S. totals do not include sailboards, which are registered in some states.
SOURCE: U.S. Department of Homeland Security, U.S. Coast Guard, Office of Boating Safety, personal communication in July 2015.

90
Table 5-7: General Aviation and Air Taxi Aircraft and Hours Flown: 2013(Excludes commuter aircraft)
State Active aircraftHours flown (thousands)
Alabama 3,635 244Alaska 8,161 675Arizona 7,470 718Arkansas 3,750 328California 26,141 2,331Colorado 6,819 611Connecticut 1,681 175Delaware 2,081 349District of Columbia 52 13Florida 18,162 1,868Georgia 7,198 571Hawaii 700 141Idaho 3,731 322Illinois 7,021 530Indiana 4,489 359Iowa 4,056 236Kansas 4,806 378Kentucky 2,197 142Louisiana 4,177 757Maine 1,606 80Maryland 2,983 245Massachusetts 2,944 218Michigan 6,965 410Minnesota 6,308 437Mississippi 2,672 243Missouri 4,855 328Montana 2,968 211Nebraska 2,750 194Nevada 3,153 323New Hampshire 1,645 103New Jersey 3,508 434New Mexico 3,629 137New York 6,989 477North Carolina 7,175 559North Dakota 2,053 275Ohio 6,830 537Oklahoma 5,476 862Oregon 6,535 569Pennsylvania 7,144 510Rhode Island 415 43South Carolina 2,855 186South Dakota 1,834 167Tennessee 4,478 411Texas 22,851 2,243Utah 2,511 284Vermont 666 22Virginia 6,446 499Washington 9,507 513West Virginia 1,031 66Wisconsin 7,046 318Wyoming 1,466 156United States, total (excluding territories) 265,621 22,807United States, total (including territories) 265,989 22,876
NOTES: These data are derived from a sample survey of general aviation and air taxi aircraft. The estimates are subject to sampling and nonsampling error. Beginning in 2007, the survey asked the state in which the aircraft was primarily flown rather than where the aircraft was based. Columns may not add to totals due to rounding procedures.
SOURCE: U.S. Department of Transportation, Federal Aviation Administration, General Aviation and Part 135 Activity Surveys, available at www.faa.gov/data_research/aviation_data_statistics/general_aviation as of July 2015.
Table 5-7: General Aviation and Air Taxi Aircraft and Hours Flown: 2013 (Excludes commuter aircraft)
NOTES: These data are derived from a sample survey of general aviation and air taxi aircraft. The estimates are subject to sampling and nonsampling error. Beginning in 2007, the survey asked the state in which the aircraft was primarily flown rather than where the aircraft was based. Columns may not add to totals due to rounding procedures.
SOURCE: U.S. Department of Transportation, Federal Aviation Administration, General Aviation and Part 135 Activity Surveys, available at www.faa.gov/data_research/aviation_data_statistics/general_aviation as of July 2015.

91
Table 5-8: Active Aviation Pilots and Flight Instructors: 20141
State Private CommercialAirline
transportAlabama 7,260 1,500 2,377 1,930 1,390 63 1,469Alaska 8,032 1,144 2,877 1,772 2,187 52 1,374Arizona 18,029 3,738 5,070 3,579 5,509 133 3,763Arkansas 4,957 1,082 1,777 1,146 881 71 746California 59,213 12,234 23,092 11,570 11,925 392 9,587Colorado 17,382 2,861 5,138 3,184 6,089 110 3,615Connecticut 5,023 866 1,889 821 1,422 25 847Delaware 1,343 337 383 211 403 9 256District of Columbia 572 152 222 92 98 8 82Florida 52,967 12,501 13,437 9,786 16,770 473 9,592Georgia 18,131 2,964 4,959 2,704 7,359 145 3,267Hawaii 3,134 624 633 707 1,158 12 661Idaho 4,850 919 1,869 1,043 948 71 840Illinois 16,307 3,034 5,568 2,712 4,744 249 3,349Indiana 9,558 1,805 3,612 1,720 2,229 192 1,662Iowa 5,154 990 2,293 1,062 719 90 834Kansas 6,866 1,333 2,748 1,411 1,301 73 1,414Kentucky 5,629 1,003 1,598 875 2,096 57 1,060Louisiana 5,650 1,215 1,857 1,320 1,196 62 898Maine 2,415 420 921 487 541 46 387Maryland 7,664 1,902 2,461 1,372 1,847 82 1,361Massachusetts 7,784 1,728 3,088 1,345 1,564 59 1,227Michigan 13,672 2,445 5,292 2,516 3,216 203 2,446Minnesota 12,172 1,929 4,240 2,089 3,821 93 2,547Mississippi 4,108 1,034 1,246 854 943 31 640Missouri 8,986 1,751 3,232 1,692 2,180 131 1,642Montana 3,681 671 1,449 916 613 32 661Nebraska 3,550 824 1,389 713 595 29 496Nevada 6,841 1,126 1,921 1,334 2,413 47 1,389New Hampshire 3,632 514 1,117 603 1,357 41 704New Jersey 8,787 1,819 3,059 1,507 2,363 39 1,615New Mexico 4,527 908 1,728 1,127 701 63 638New York 15,949 4,069 5,771 2,910 3,056 143 2,617North Carolina 13,935 2,529 4,678 2,356 4,238 134 2,456North Dakota 3,535 794 1,128 1,313 288 12 492Ohio 15,137 2,815 5,487 2,568 4,002 265 2,975Oklahoma 7,825 2,074 2,756 1,475 1,472 48 1,287Oregon 8,573 1,587 3,485 1,989 1,436 76 1,581Pennsylvania 15,187 2,889 5,336 2,610 4,154 198 2,726Rhode Island 975 215 363 161 229 7 153South Carolina 6,498 1,154 2,196 1,203 1,883 62 1,091South Dakota 2,234 408 878 516 381 51 422Tennessee 11,540 1,971 3,312 1,959 4,201 97 2,118Texas 49,614 9,951 14,514 8,534 16,265 350 8,728Utah 7,998 1,727 2,371 1,525 2,317 58 1,584Vermont 1,221 203 523 246 238 11 171Virginia 14,126 2,739 4,271 2,757 4,216 143 2,732Washington 18,665 3,358 6,052 3,330 5,744 181 3,518West Virginia 1,756 426 666 332 296 36 274Wisconsin 9,073 1,604 3,768 1,430 2,043 228 1,579Wyoming 1,852 374 790 366 304 18 288United States, total 543,569 108,260 180,887 101,780 147,341 5,301 97,861
2Includes pilots with an airplane only certificate and those with an airplane and a helicopter and/or glider certificate3Includes helicopter, glider, and recreational pilots. Does not include pilots holding an airplane certificate. A recreationalpilot may fly no more than one passenger in a light, single engine aircraft with no more than four seats during good weather and daylight hours and, unless authorized, no more than 50 miles from the home airport.4Not included in total. A flight instructor must hold a flight instructor certificate in addition to a pilot certificate.
NOTE: Excludes U.S. military personnel holding civilian certificates who are stationed in a foreign country and pilots in U.S. territories.
SOURCE: U.S. Department of Transportation, Federal Aviation Administration, U.S. Civil Airmen Statistics, available at www.faa.gov/data_research/aviation_data_statistics/civil_airmen_statistics as of June 2015.
1An active pilot is a person who holds a pilot certificate and a valid medical certificate issued within the last 25 months
Total Students
Airplane pilots2
Misc.3Flight
instructor4
Table 5-8: Active Aviation Pilots and Flight Instructors: 20141
1An active pilot is a person who holds a pilot certificate and a valid medical certificate issued within the last 25 months. 2Includes pilots with an airplane only certificate and those with an airplane and a helicopter and/or glider certificate. 3Includes helicopter, glider, and recreational pilots. Does not include pilots holding an airplane certificate. A recreation-al pilot may fly no more than one passenger in a light, single engine aircraft with no more than four seats during good weather and daylight hours and, unless authorized, no more than 50 miles from the home airport. 4Not included in total. A flight instructor must hold a flight instructor certificate in addition to a pilot certificate. NOTE: Excludes U.S. military personnel holding civilian certificates who are stationed in a foreign country and pilots in U.S. territories.
SOURCE: U.S. Department of Transportation, Federal Aviation Administration, U.S. Civil Airmen Statistics, available at www.faa.gov/data_research/aviation_data_statistics/civil_airmen_statistics as of June 2015.


Chapter 6Economy and Finance

94
Table 6-1: Transportation and Warehousing Establishments and Employment: 2013
State Number of establishments Number of paid employeesAnnual payroll ($ thousands)
Alabama 2,845 58,471 2,490,950Alaska 1,084 19,097 1,345,399Arizona 3,161 81,274 3,693,380Arkansas 2,364 49,665 2,159,077California 21,397 445,742 20,797,494Colorado 3,457 63,219 3,086,311Connecticut 1,611 40,491 1,729,350Delaware 637 11,804 486,891District of Columbia 157 2,845 141,502Florida 13,517 209,498 9,223,123Georgia 6,102 164,898 7,549,952Hawaii 851 27,868 1,239,320Idaho 1,735 16,858 610,622Illinois 13,636 225,959 10,274,004Indiana 5,082 122,587 4,753,813Iowa 3,485 55,443 2,129,910Kansas 2,492 49,763 2,006,261Kentucky 2,826 83,574 3,998,594Louisiana 3,830 69,766 3,876,909Maine 1,195 14,649 574,154Maryland 3,393 64,301 2,747,431Massachusetts 3,553 77,211 3,371,837Michigan 5,734 100,454 4,720,501Minnesota 4,620 77,561 3,271,392Mississippi 2,030 33,202 1,356,791Missouri 4,479 81,996 3,291,794Montana 1,434 12,387 501,434Nebraska 2,293 27,758 1,164,097Nevada 1,403 46,119 1,789,598New Hampshire 804 12,309 465,939New Jersey 7,171 158,946 7,746,426New Mexico 1,389 17,620 748,953New York 12,364 233,149 10,107,169North Carolina 5,407 107,649 4,507,539North Dakota 1,683 18,846 1,100,936Ohio 7,000 158,169 6,928,667Oklahoma 2,685 46,789 2,341,925Oregon 2,940 50,836 2,215,373Pennsylvania 8,227 206,938 8,240,126Rhode Island 609 10,103 376,680South Carolina 2,472 52,756 2,144,466South Dakota 1,185 9,686 381,443Tennessee 3,988 125,010 5,403,271Texas 17,501 390,221 20,622,776Utah 2,205 47,856 2,124,148Vermont 489 6,266 222,453Virginia 4,801 95,463 4,307,669Washington 4,883 86,375 4,453,992West Virginia 1,205 13,857 592,686Wisconsin 5,171 93,997 3,747,073Wyoming 965 9,935 495,120United States, total 215,547 4,287,236 193,656,721
SOURCE: U.S. Department of Commerce , U.S. Census Bureau, County Business Patterns, available at www.census.gov/econ/cbp as of June 2015.
NOTES: The Transportation and Warehousing sector, North American Industrial Classification System (NAICS) 48, includes industries providing transportation of passengers and cargo, warehousing and storage for goods, scenic and sightseeing transportation, and support activities related to modes of transportation. Establishments in these industries use transportation equipment or transportation related facilities as a productive asset. The type of equipment depends on the mode of transportation. The industries included are: airtransportation, water transportation, truck transportation, transit and ground passenger transportation, pipeline transportation, scenic and sightseeing transportation, support activities for transportation, postal service, couriers and messengers, and warehousing and storage.These data do not include government, railroad transportation (NAICS 482), or self-employed persons.
Table 6-1: Transportation and Warehousing Establishments and Employment: 2013
NOTES: The Transportation and Warehousing sector, North American Industrial Classification System (NAICS) 48, includes industries providing transportation of passengers and cargo, warehousing and storage for goods, scenic and sightseeing transportation, and sup-port activities related to modes of transportation. Establishments in these industries use transportation equipment or transportation related facilities as a productive asset. The type of equipment depends on the mode of transportation. The industries included are: air transporta-tion, water transportation, truck transportation, transit and ground passenger transportation, pipeline transportation, scenic and sightseeing transportation, support activities for transportation, postal service, couriers and messengers, and warehousing and storage. These data do not include government, railroad transportation (NAICS 482), or self-employed persons.
SOURCE: U.S. Department of Commerce, U.S. Census Bureau, County Business Patterns, available at www.census.gov/econ/cbp as of June 2015.

95
Table 6-2: Air Transportation Establishments and Employment: 2013
State Number of establishments Number of paid employeesAnnual payroll ($ thousands)
Alabama 45 629 33,508Alaska 196 5,773 315,963Arizona 110 W WArkansas 39 423 16,825California 552 44,075 2,880,699Colorado 103 15,614 907,706Connecticut 42 1,400 83,677Delaware 26 190 11,352District of Columbia 15 W WFlorida 533 22,099 1,266,728Georgia 125 30,665 2,008,440Hawaii 62 8,377 473,553Idaho 49 1,082 47,841Illinois 187 W WIndiana 71 W 126,704Iowa 31 278 8,842Kansas 34 406 16,300Kentucky 49 4,191 247,294Louisiana 103 4,654 277,909Maine 20 184 5,458Maryland 40 W WMassachusetts 87 7,683 410,361Michigan 106 12,545 888,907Minnesota 57 W WMississippi 39 285 10,160Missouri 62 W WMontana 64 779 33,929Nebraska 30 577 31,424Nevada 58 W WNew Hampshire 25 W WNew Jersey 101 14,846 1,281,137New Mexico 38 611 31,855New York 332 32,918 2,084,308North Carolina 101 W WNorth Dakota 16 135 4,174Ohio 102 10,906 877,901Oklahoma 49 W WOregon 80 5,242 333,669Pennsylvania 124 W WRhode Island 10 W WSouth Carolina 47 998 40,655South Dakota 25 163 6,038Tennessee 69 4,299 227,449Texas 449 W WUtah 39 7,910 410,861Vermont 7 91 3,053Virginia 125 W WWashington 106 11,431 823,326West Virginia 9 W 1,886Wisconsin 51 1,381 51,099Wyoming 24 W WUnited States, total1 4,864 418,936 26,921,123
SOURCE: U.S. Department of Commerce , U.S. Census Bureau, County Business Patterns, available at www.census.gov/econ/cbp as of June 2015.
NOTES: The Air Transportation subsector (NAICS 481) includes industries providing air transportation of passengers and/or cargo usingaircraft, such as airplanes and helicopters. These data do not include scenic and sightseeing air transportation (NAICS 4879, part),support activities for air transportation (NAICS 4881), or air courier services (NAICS 4921, part).
KEY: W = data withheld to avoid disclosure.
1Values for states not reported individually are included in U.S. totals.
Table 6-2: Air Transportation Establishments and Employment: 2013
1Values for states not reported individually are included in U.S. totals.
KEY: W = data withheld to avoid disclosure.
NOTES: The Air Transportation subsector (NAICS 481) includes industries providing air transportation of passengers and/or cargo using aircraft, such as airplanes and helicopters. These data do not include scenic and sightseeing air transportation (NAICS 4879, part), sup-port activities for air transportation (NAICS 4881), or air courier services (NAICS 4921, part).
SOURCE: U.S. Department of Commerce, U.S. Census Bureau, County Business Patterns, available at www.census.gov/econ/cbp as of June 2015.

96
Table 6-3: Water Transportation Establishments and Employment: 2013
State Number of establishments Number of paid employeesAnnual payroll ($ thousands)
Alabama 22 920 62,337Alaska 78 W 98,156Arizona 4 W WArkansas 2 W WCalifornia 98 5,522 429,882Colorado 2 W WConnecticut 29 966 85,969Delaware 8 55 4,060District of Columbia W W WFlorida 214 14,667 939,639Georgia 15 W 7,475Hawaii 10 W WIdaho 1 W WIllinois 44 1,283 83,102Indiana 8 W WIowa 4 W WKansas 1 W WKentucky 23 2,234 139,188Louisiana 263 11,958 948,669Maine 12 52 2,102Maryland 28 183 12,525Massachusetts 36 445 45,441Michigan 38 468 39,640Minnesota 11 W WMississippi 16 1,104 75,697Missouri 11 504 29,451Montana W W WNebraska W W WNevada 3 W WNew Hampshire 1 W WNew Jersey 63 887 62,710New Mexico 5 W WNew York 125 2,361 191,651North Carolina 30 W WNorth Dakota W W WOhio 18 W WOklahoma 1 W WOregon 16 W WPennsylvania 34 1,176 60,852Rhode Island 7 77 3,591South Carolina 13 W WSouth Dakota W W WTennessee 13 2,439 158,654Texas 119 4,986 427,694Utah 4 W WVermont 4 W WVirginia 33 1,319 104,135Washington 79 5,585 346,877West Virginia 4 W WWisconsin 5 W 3,888Wyoming 1 W WUnited States, total1 1,556 66,672 4,737,874
SOURCE: U.S. Department of Commerce , U.S. Census Bureau, County Business Patterns, available at www.census.gov/econ/cbp as of June 2015.
NOTES: The Water Transportation subsector (NAICS 483) includes industries providing water transportation of passengers and cargo usingwater craft, such as ships, barges, and boats. The subsector is composed of two industry groups: one for deep sea, coastal, and Great Lakes; and one for inland water transportation. This split typically reflects the difference in equipment used. These data do not include scenic and sightseeing water transportation services (NAICS 4872) and support activities for water transportation (NAICS 4883).
KEY: W = data withheld to avoid disclosure.
1Values for states not reported individually are included in U.S. totals.
Table 6-3: Water Transportation Establishments and Employment: 2013
1Values for states not reported individually are included in U.S. totals.
KEY: W = data withheld to avoid disclosure.
NOTES: The Water Transportation subsector (NAICS 483) includes industries providing water transportation of passengers and cargo using water craft, such as ships, barges, and boats. The subsector is composed of two industry groups: one for deep sea, coastal, and Great Lakes; and one for inland water transportation. This split typically reflects the difference in equipment used. These data do not include scenic and sightseeing water transportation services (NAICS 4872) and support activities for water transportation (NAICS 4883).
SOURCE: U.S. Department of Commerce, U.S. Census Bureau, County Business Patterns, available at www.census.gov/econ/cbp as of June 2015.

97
Table 6-4: Truck Transportation Establishments and Employment: 2013
State Number of establishments Number of paid employeesAnnual payroll ($ thousands)
Alabama 1,692 25,591 1,000,439Alaska 228 3,071 169,662Arizona 1,397 22,134 866,289Arkansas 1,503 31,703 1,438,892California 9,304 105,264 4,655,923Colorado 1,911 19,875 937,482Connecticut 571 5,717 293,298Delaware 231 3,086 123,526District of Columbia 14 106 4,789Florida 5,244 45,730 1,860,840Georgia 3,133 48,472 2,042,001Hawaii 195 3,325 134,010Idaho 1,223 9,811 371,260Illinois 8,801 68,952 3,176,110Indiana 3,353 53,874 2,298,505Iowa 2,612 36,065 1,361,041Kansas 1,569 19,325 842,120Kentucky 1,656 21,151 883,363Louisiana 1,653 17,928 750,524Maine 699 5,428 211,147Maryland 1,447 15,479 678,264Massachusetts 1,353 15,763 749,918Michigan 3,407 42,509 1,963,534Minnesota 2,866 26,402 1,172,656Mississippi 1,234 13,771 557,601Missouri 2,714 37,296 1,548,015Montana 909 6,348 286,224Nebraska 1,716 14,624 614,711Nevada 558 6,287 284,980New Hampshire 396 3,449 147,365New Jersey 3,259 38,200 1,815,635New Mexico 753 7,606 374,207New York 4,501 39,800 1,734,713North Carolina 3,014 40,340 1,687,003North Dakota 1,327 13,887 874,076Ohio 4,110 59,256 2,680,696Oklahoma 1,725 20,021 912,162Oregon 1,560 18,316 770,317Pennsylvania 4,428 60,941 2,799,016Rhode Island 277 2,663 126,949South Carolina 1,213 17,269 740,298South Dakota 859 4,952 208,026Tennessee 1,963 48,710 2,243,234Texas 8,639 130,575 6,123,275Utah 1,435 21,185 1,016,095Vermont 297 2,918 108,990Virginia 2,554 29,254 1,228,829Washington 2,438 22,925 1,016,832West Virginia 794 6,262 252,846Wisconsin 3,458 48,066 2,162,852Wyoming 656 4,952 254,515United States, total 112,849 1,366,634 60,555,055
SOURCE: U.S. Department of Commerce , U.S. Census Bureau, County Business Patterns, available at www.census.gov/econ/cbp as of June 2015.
NOTES: The Truck Transportation subsector (NAICS 484) includes industries providing over-the-road transportation of cargo using motorvehicles, such as trucks and tractor trailers. The subsector is divided into two industry groups for general freight trucking and specialized freight trucking. This distinction reflects differences in equipment used, type of load carried, scheduling, terminal, and other networking services. These data do not include support activities for road transportation (NAICS 4884), freight transportation arrangement services (NAICS 4885, part), the Postal Service (NAICS 491), or courier services (NAICS 492, part).
Table 6-4: Truck Transportation Establishments and Employment: 2013
NOTES: The Truck Transportation subsector (NAICS 484) includes industries providing over-the-road transportation of cargo using motor ve-hicles, such as trucks and tractor trailers. The subsector is divided into two industry groups for general freight trucking and specialized freight trucking. This distinction reflects differences in equipment used, type of load carried, scheduling, terminal, and other networking services. These data do not include support activities for road transportation (NAICS 4884), freight transportation arrangement services (NAICS 4885, part), the Postal Service (NAICS 491), or courier services (NAICS 492, part).
SOURCE: U.S. Department of Commerce, U.S. Census Bureau, County Business Patterns, available at www.census.gov/econ/cbp as of June 2015.

98
Table 6-5: Transit and Ground Passenger Transportation Establishments and Employment: 2013
State Number of establishments Number of paid employeesAnnual payroll ($ thousands)
Alabama 95 1,677 31,776Alaska 74 1,633 36,683Arizona 266 9,132 238,928Arkansas 61 1,083 21032California 2,083 43,539 1,257,956Colorado 219 4,944 142,502Connecticut 383 14,009 383,207Delaware 135 1,894 29396District of Columbia 45 1,119 38,291Florida 1043 13,248 342,405Georgia 332 5,187 128,732Hawaii 111 4,526 162,884Idaho 81 1,803 30,327Illinois 1104 26,994 550,168Indiana 236 11,457 169,245Iowa 104 1,707 45,146Kansas 144 8,302 132,248Kentucky 110 1,984 43,596Louisiana 180 3,812 103,655Maine 92 1,458 26,385Maryland 703 11,340 280,892Massachusetts 807 23,457 718,763Michigan 349 7,003 155,992Minnesota 503 14,383 295,800Mississippi 82 1,828 34,120Missouri 301 9,010 172,062Montana 89 1,319 19,674Nebraska 70 1,842 28,045Nevada 149 15,577 385,585New Hampshire 122 3,689 73,897New Jersey 1,038 29,055 694,391New Mexico 131 3,691 67,300New York 2,976 73,467 2,188,905North Carolina 296 4,551 103,498North Dakota 66 1,038 20419Ohio 400 9,829 182,182Oklahoma 92 1,433 26384Oregon 249 4,937 96,300Pennsylvania 1,140 35,200 642,005Rhode Island 99 2,948 56,923South Carolina 148 1,632 38,433South Dakota 86 1,148 21,095Tennessee 276 4,803 136,872Texas 716 19,091 503,392Utah 80 1,581 27,416Vermont 61 1,439 28,584Virginia 426 8,523 258,332Washington 288 5,576 159,583West Virginia 42 400 5,952Wisconsin 492 13,832 243,014Wyoming 23 267 6676United States, total1 19,198 473,397 11,587,048
SOURCE: U.S. Department of Commerce , U.S. Census Bureau, County Business Patterns, available at www.census.gov/econ/cbp as of June 2015.
NOTES: The Transit and Ground Passenger Transportation subsector (NAICS 485) includes industries providing a variety of passenger transportation activities, such as urban transit systems; chartered bus, school bus, and interurban bus transportation; and taxis. These activities are distinguished based primarily on such production process factors as vehicle types, routes, and schedules. These data do not include scenic and sightseeing transportation (NAICS 4871, part), support activities for road transportation (NAICS 4884), orarrangement for car pools and vanpools (NAICS 4889, part).
KEY: W = data withheld to avoid disclosure.
1Values for states not reported individually are included in U.S. totals.
Table 6-5: Transit and Ground Passenger Transportation Establishments and Employment: 2013
1Values for states not reported individually are included in U.S. totals.
KEY: W = data withheld to avoid disclosure.
NOTES: The Transit and Ground Passenger Transportation subsector (NAICS 485) includes industries providing a variety of passen-ger transportation activities, such as urban transit systems; chartered bus, school bus, and interurban bus transportation; and taxis. These activities are distinguished based primarily on such production process factors as vehicle types, routes, and schedules. These data do not include scenic and sightseeing transportation (NAICS 4871, part), support activities for road transportation (NAICS 4884), or arrangement for car pools and vanpools (NAICS 4889, part).
SOURCE: U.S. Department of Commerce, U.S. Census Bureau, County Business Patterns, available at www.census.gov/econ/cbp as of June 2015.

99
Table 6-6: Pipeline Transportation Establishments and Employment: 2013
State Number of establishments Number of paid employeesAnnual payroll ($ thousands)
Alabama 69 W 97,520Alaska 16 1,456 267,975Arizona 50 W WArkansas 60 W WCalifornia 106 W WColorado 102 W WConnecticut 15 164 19,255Delaware 2 W WDistrict of Columbia 7 W WFlorida 53 W WGeorgia 66 W WHawaii 1 W WIdaho 5 W 6,876Illinois 124 W WIndiana 64 538 50,929Iowa 59 442 38,090Kansas 143 1,716 162,111Kentucky 60 954 83,197Louisiana 335 W 314,489Maine 13 W 7,307Maryland 14 W 9,786Massachusetts 30 343 39,208Michigan 82 606 61,020Minnesota 71 645 61,447Mississippi 118 W 90,501Missouri 66 W 29,221Montana 30 252 23,218Nebraska 57 698 65,061Nevada 7 W 6,210New Hampshire 11 36 3,851New Jersey 40 333 34,797New Mexico 88 925 85,905New York 76 W 143,492North Carolina 33 284 25,251North Dakota 46 684 60,361Ohio 87 W WOklahoma 167 2,300 230,693Oregon 13 131 13,716Pennsylvania 147 1,987 172,273Rhode Island 3 W WSouth Carolina 20 172 16,019South Dakota 16 122 11,972Tennessee 77 W WTexas 812 18,182 2,624,906Utah 21 W WVermont 3 W WVirginia 58 W 32,213Washington 28 331 32,942West Virginia 80 W WWisconsin 50 W 39,833Wyoming 90 839 77,380United States, total1 3,791 52,021 6,070,358
SOURCE: U.S. Department of Commerce , U.S. Census Bureau, County Business Patterns, available at www.census.gov/econ/cbp as of June 2015.
NOTES: The Pipeline Transportation subsector (NAICS 486) includes industries using transmission pipelines to transport products, such as crude oil, natural gas, refined petroleum products, and slurry. Industry groups are determined based on the products transported (i.e., crude oil, natural gas, and other). Gas industry data include the storage of natural gas because the storage is usually done by the pipelineestablishment and because a pipeline is inherently a network in which all the nodes are interdependent. These data do not include activities classified under the Utilities sector, such as natural gas distribution (NAICS 2212) or water and air distribution and collection (NAICS 2213).
KEY: W = data withheld to avoid disclosure.
1Values for states not reported individually are included in U.S. totals.
Table 6-6: Pipeline Transportation Establishments and Employment: 2013
1Values for states not reported individually are included in U.S. totals.
KEY: W = data withheld to avoid disclosure.
NOTES: The Pipeline Transportation subsector (NAICS 486) includes industries using transmission pipelines to transport products, such as crude oil, natural gas, refined petroleum products, and slurry. Industry groups are determined based on the products transported (i.e., crude oil, natural gas, and other). Gas industry data include the storage of natural gas because the storage is usually done by the pipeline establishment and because a pipeline is inherently a network in which all the nodes are interdependent. These data do not include activities classified under the Utilities sector, such as natural gas distribution (NAICS 2212) or water and air distribution and collection (NAICS 2213). SOURCE: U.S. Department of Commerce, U.S. Census Bureau, County Business Patterns, available at www.census.gov/econ/cbp as of June 2015.

100
Table 6-7: Freight Railroad Employment, Retirement, and Wages: 20121
State Number of employees Wages ($ millions)Number of retirement
beneficiariesRetirement payments
($ millions)Alabama 3,711 387 9,232 189Alaska 525 48 229 5Arizona 2,854 322 9,148 188Arkansas 3,390 365 9,749 200California 8,877 997 26,826 550Colorado 2,973 337 7,735 159Connecticut 117 11 2,562 53Delaware 196 20 1,973 40District of Columbia 12 1 418 9Florida 4,981 529 28,642 587Georgia 7,178 748 16,309 334Hawaii 0 0 174 4Idaho 1,390 151 4,423 91Illinois 13,152 1,482 32,710 671Indiana 6,223 659 15,227 312Iowa 3,746 411 8,874 182Kansas 5,427 626 13,575 278Kentucky 4,195 446 14,340 294Louisiana 3,083 339 7,178 147Maine 650 65 2,574 53Maryland 1,535 165 8,438 173Massachusetts 823 75 3,664 75Michigan 3,194 350 13,615 279Minnesota 4,566 517 14,518 298Mississippi 1,833 211 5,780 118Missouri 7,333 832 18,593 381Montana 2,805 321 5,629 115Nebraska 12,010 1,364 12,781 262Nevada 676 75 3,236 66New Hampshire 242 20 834 17New Jersey 1,132 118 8,469 174New Mexico 1,671 196 4,242 87New York 3,487 361 20,897 428North Carolina 2,434 252 9,923 203North Dakota 2,026 213 2,904 60Ohio 7,619 791 24,606 504Oklahoma 1,991 225 4,991 102Oregon 2,026 220 7,747 159Pennsylvania 7,056 718 32,481 666Rhode Island 61 6 517 11South Carolina 1,749 184 6,649 136South Dakota 869 102 1,473 30Tennessee 4,274 463 11,945 245Texas 16,826 1,908 33,307 683Utah 1,659 179 5,032 103Vermont 172 14 744 15Virginia 5,737 593 16,767 344Washington 3,967 463 10,634 218West Virginia 2,861 303 8,174 168Wisconsin 3,128 358 9,118 187Wyoming 2,822 323 3,114 64United States, total 181,264 19,861 522,720 10,716
NOTE: Wages are estimated by multiplying average wage by number of employees in each state. For Class I railroads, average wages areestimated based on aggregate data which incorporates fringe benefits, assumed to be 37.5 percent of wages.
1Includes Class I, Regional, Switching and Terminal, and Local freight railroads.
SOURCE: Association of American Railroads, Railroad Ten-Year Trends , available at www.aar.org/StatisticsAndPublications as of July 2015.
Table 6-7: Freight Railroad Employment, Retirement, and Wages: 20121
1Includes Class I, Regional, Switching and Terminal, and Local freight railroads.
NOTE: Wages are estimated by multiplying average wage by number of employees in each state. For Class I railroads, average wages are esti-mated based on aggregate data which incorporates fringe benefits, assumed to be 37.5 percent of wages.
SOURCE: Association of American Railroads, Railroad Ten-Year Trends, available at www.aar.org/StatisticsAndPublications as of July 2015.

101
Table 6-8: Transportation Expenditures by State and Local Governments: 2012(Millions of current dollars)State Total Highway Transit Air WaterAlabama 2,649 2,265 77 185 123Alaska 1,813 1,285 60 362 106Arizona 3,595 2,343 670 582 ZArkansas 1,583 1,444 28 108 4California 32,312 17,080 10,452 3,519 1,261Colorado 3,543 2,410 581 550 2Connecticut 2,517 1,742 716 57 2Delaware 898 724 136 7 32District of Columbia 2,832 548 2,284 Z ZFlorida 12,221 8,110 1,696 1,961 454Georgia 4,887 3,110 792 727 259Hawaii 1,593 605 647 284 58Idaho 951 881 17 51 2Illinois 12,226 7,250 3,757 1,202 16Indiana 3,209 2,842 185 166 17Iowa 2,626 2,405 113 109 <0.5Kansas 1,928 1,810 47 71 ZKentucky 2,903 2,577 143 163 19Louisiana 3,619 2,766 222 289 342Maine 999 893 16 69 21Maryland 6,728 5,123 1,259 246 99Massachusetts 5,718 2,627 2,449 557 85Michigan 4,432 3,350 612 464 5Minnesota 4,225 3,638 184 368 36Mississippi 1,933 1,738 16 107 72Missouri 3,760 2,962 449 342 7Montana 1,161 1,058 35 67 1Nebraska 1,375 1,229 40 106 ZNevada 2,698 1,686 361 651 ZNew Hampshire 824 750 15 59 <0.5New Jersey 6,730 4,246 2,401 67 16New Mexico 1,266 1,044 135 87 ZNew York 32,310 10,368 19,762 1,767 413North Carolina 4,919 3,955 562 372 31North Dakota 1,363 1,296 13 54 ZOhio 6,613 5,409 736 449 20Oklahoma 2,550 2,330 72 138 11Oregon 3,086 1,878 821 225 162Pennsylvania 11,914 8,894 2,403 435 182Rhode Island 647 441 150 53 3South Carolina 1,985 1,585 91 160 148South Dakota 1,016 949 10 58 ZTennessee 3,138 2,489 254 384 11Texas 16,030 11,348 2,783 1,528 371Utah 2,696 1,962 624 111 ZVermont 733 678 24 31 ZVirginia 6,545 4,248 523 1,378 396Washington 7,528 4,153 2,432 447 496West Virginia 1,412 1,301 50 60 1Wisconsin 4,499 3,874 363 247 15Wyoming 823 761 3 59 ZUnited States, total 249,562 160,459 62,270 21,533 5,300KEY: Z = Data not available, no activity, value of zero, or value too small to report.
NOTES: Data are for fiscal year 2012. Most state government fiscal years end on June 30, except for four states with other ending dates: Alabama and Michigan (September 30), New York (March 31), and Texas (August 31). Not all agencies of a government necessarily have a fiscal period that coincides with the central organization. Totals for an individual government, in those instances, are the summation of finances for all agencies with a fiscal period ending between July 1, 2011, and June 30, 2012. Details may not add to totals due to rounding and values that are too small to report.
SOURCE: U.S. Department of Commerce, U.S. Census Bureau, State and Local Government Finance, available at www.census.gov/govs/local as of July 2015.
Table 6-8: Transportation Expenditures by State and Local Governments: 2012 (Millions of current dollars)
KEY: Z = Data not available, no activity, value of zero, or value too small to report.
NOTES: Data are for fiscal year 2012. Most state government fiscal years end on June 30, except for four states with other ending dates: Alabama and Michigan (September 30), New York (March 31), and Texas (August 31). Not all agencies of a government necessarily have a fiscal period that coincides with the central organization. Totals for an individual government, in those instances, are the summation of finances for all agencies with a fiscal period ending between July 1, 2011, and June 30, 2012. Details may not add to totals due to round-ing and values that are too small to report.
SOURCE: U.S. Department of Commerce, U.S. Census Bureau, State and Local Government Finance, available at www.census.gov/govs/local as of July 2015.

102
(Millions of current dollars)State Total Highway1 Transit Air WaterAlabama 1,118 868 6 99 145Alaska 371 190 7 115 58Arizona 1,661 1,099 116 446 ZArkansas 705 630 3 68 3California 16,188 10,176 1,987 2,737 1,289Colorado 2,232 1,301 140 791 ZConnecticut 859 758 54 46 1Delaware 510 453 17 6 34District of Columbia 997 93 904 Z ZFlorida 8,495 5,887 303 1,915 390Georgia 2,532 1,368 174 707 284Hawaii 1,064 530 59 380 94Idaho 442 407 3 30 2Illinois 5,948 3,904 907 1,118 19Indiana 1,452 1,215 46 180 11Iowa 1,103 1,012 25 66 <0.5Kansas 786 739 6 41 ZKentucky 1,309 1,057 22 209 20Louisiana 1,089 767 27 137 158Maine 511 469 3 35 3Maryland 2,186 1,752 168 211 55Massachusetts 2,881 1,589 604 605 83Michigan 2,616 2,070 85 458 2Minnesota 1,983 1,617 21 334 11Mississippi 648 562 1 51 33Missouri 1,470 1,044 73 351 3Montana 417 382 3 31 1Nebraska 634 567 6 61 ZNevada 1,031 553 78 400 ZNew Hampshire 444 400 4 39 ZNew Jersey 3,733 2,707 986 20 19New Mexico 462 365 15 82 ZNew York 15,415 6,799 5,640 2,690 287North Carolina 3,057 2,543 74 408 32North Dakota 362 339 4 19 ZOhio 3,275 2,834 131 280 30Oklahoma 1,466 1,358 13 86 8Oregon 1,603 1,159 126 242 76Pennsylvania 5,309 4,179 599 520 11Rhode Island 288 196 33 56 3South Carolina 1,091 831 17 112 132South Dakota 240 226 2 12 ZTennessee 1,600 1,272 38 286 4Texas 8,868 6,631 292 1,575 369Utah 813 574 47 192 ZVermont 205 182 5 18 ZVirginia 2,951 1,660 116 875 299Washington 3,411 2,039 417 527 428West Virginia 545 499 11 34 ZWisconsin 1,923 1,676 84 153 10Wyoming 184 162 1 22 ZUnited States, total 120,481 81,692 14,505 19,876 4,408
Table 6-9: Transportation Revenues Collected by State and Local Governments: 2012
1Highway revenues include state and local government receipts from motor fuel taxes and motor vehicle license taxes, regular and toll highway charges, and receipts from parking facilities.
KEY: Z = Data not available, no activity, value of zero, or value too small to report.
NOTES: Data are for fiscal year 2012. Most state government fiscal years end on June 30, except for four states with other ending dates:Alabama and Michigan (September 30), New York (March 31), and Texas (August 31). Not all agencies of a government necessarily have a fiscal period that coincides with the central organization. Totals for an individual government, in those instances, are the summation of finances for all agencies with a fiscal period ending between July 1, 2011, and June 30, 2012. Details may not add to totals due to rounding and values that are too small to report.
SOURCE: U.S. Department of Commerce, U.S. Census Bureau, State and Local Government Finance, available at www.census.gov/govs/local as of July 2015.
Table 6-9: Transportation Revenues Collected by State and Local Governments: 2012 (Millions of current dollars)
1Highway revenues include state and local government receipts from motor fuel taxes and motor vehicle license taxes, regular and toll highway charges, and receipts from parking facilities.
KEY: Z = Data not available, no activity, value of zero, or value too small to report.
NOTES: Data are for fiscal year 2012. Most state government fiscal years end on June 30, except for four states with other ending dates: Alabama and Michigan (September 30), New York (March 31), and Texas (August 31). Not all agencies of a government neces-sarily have a fiscal period that coincides with the central organization. Totals for an individual government, in those instances, are the summation of finances for all agencies with a fiscal period ending between July 1, 2011, and June 30, 2012. Details may not add to totals due to rounding and values that are too small to report.
SOURCE: U.S. Department of Commerce, U.S. Census Bureau, State and Local Government Finance, available at www.census.gov/govs/local as of July 2015.

103
Table 6-10: Federal and State Funding of Public Transit: 2008, 2010, and 2012(Thousands of dollars)
State Federal State Federal State Federal StateAlabama 62,505 0 46,559 0 44,278 0Alaska 77,703 86,815 71,954 98,132 62,886 179,978Arizona 186,106 11,780 169,253 0 142,128 0Arkansas 27,933 3,790 26,364 4,023 26,459 3,477California 1,191,982 2,299,579 1,298,998 1,731,333 1,514,724 1,849,194Colorado 189,078 23,048 260,467 12,673 254,446 12,350Connecticut 151,637 267,500 143,886 307,342 182,299 453,476Delaware 17,894 86,233 24,168 81,526 15,343 82,731District of Columbia 193,160 272,724 283,671 322,038 194,810 484,166Florida 336,576 146,339 386,206 184,516 397,708 217,310Georgia 162,810 6,141 184,225 2,173 174,445 2,920Hawaii 60,973 0 77,183 0 259,158 0Idaho 20,869 312 17,354 312 19,350 312Illinois 548,007 519,300 570,978 589,000 509,332 814,448Indiana 99,438 55,733 85,528 54,671 86,504 56,019Iowa 40,623 13,281 50,744 10,889 38,947 12,899Kansas 33,260 5,762 28,802 6,000 28,193 6,000Kentucky 51,200 3,502 70,868 1,412 53,881 1,490Louisiana 62,519 5,963 67,274 4,955 61,216 4,955Maine 14,076 1,528 16,035 530 24,227 530Maryland 190,310 844,417 191,192 889,306 231,827 1,086,510Massachusetts 316,215 1,182,785 395,390 1,376,366 352,288 1,245,381Michigan 150,255 200,087 146,171 198,430 183,572 240,437Minnesota 155,980 249,253 116,589 270,639 195,772 309,427Mississippi 35,066 1,600 25,431 1,600 23,609 1,600Missouri 97,413 6,922 104,648 6,247 86,501 2,994Montana 14,702 415 16,154 447 15,313 319Nebraska 22,892 2,900 28,917 3,000 24,190 2,900Nevada 52,793 0 49,385 0 45,022 107New Hampshire 14,303 4,474 11,865 494 12,176 244New Jersey 547,740 NR 685,717 1,157,687 523,244 918,027New Mexico 30,838 9,297 35,541 18,417 35,203 6,665New York 1,586,021 3,015,442 1,730,895 4,352,345 1,701,170 4,465,884North Carolina 120,309 73,466 116,176 74,948 108,102 73,575North Dakota 11,922 2,900 13,680 3,150 13,729 3,152Ohio 179,053 15,817 192,156 10,839 173,313 7,300Oklahoma 35,102 5,750 42,784 6,083 38,604 5,750Oregon 165,425 39,921 166,601 108,055 177,176 32,670Pennsylvania 409,290 1,145,567 424,423 1,225,108 406,059 1,091,936Rhode Island 49,321 47,338 28,083 53,538 27,473 53,073South Carolina 38,523 6,400 43,764 6,000 39,667 6,000South Dakota 14,456 770 11,417 770 14,562 770Tennessee 74,495 41,537 79,788 35,927 77,207 44,499Texas 487,289 28,741 642,570 28,741 687,160 30,341Utah 161,499 0 264,753 0 289,747 0Vermont 10,671 5,899 18,817 6,328 5,914 6,843Virginia 197,361 228,966 117,945 189,478 192,256 239,203Washington 289,569 39,752 365,506 57,212 345,601 52,776West Virginia 27,875 3,023 23,382 2,833 18,859 2,786Wisconsin 81,038 125,180 84,708 132,066 69,540 117,852Wyoming 8,023 2,496 8,090 2,496 9,233 2,522United States, total 9,104,100 11,140,442 10,063,053 13,630,074 10,214,424 14,233,797
2008 2010 2012
KEY: NR = not reported.
SOURCE: American Association of State Highway and Transportation Officials, Survey of State Funding for Public Transportation 2014 , as of July 2015.
Table 6-10: Federal and State Funding of Public Transit: 2008, 2010, and 2012 (Thousands of current dollars)
KEY: NR = not reported.
SOURCE: American Association of State Highway and Transportation Officials, Survey of State Funding for Public Transportation 2014, as of July 2015.

104
Table 6-11: Average Motor Gasoline Prices Excluding Taxes, All Grades: 2008-2010(Cents per gallon excluding taxes)State 2008 2009 2010Alabama 276.7 182.8 225.2Alaska 339.1 260.9 311.7Arizona 278.0 190.0 234.7Arkansas 270.3 176.0 224.7California 290.6 212.2 252.7Colorado 276.6 185.2 224.6Connecticut 280.4 194.4 241.5Delaware 275.5 187.4 231.2District of Columbia 280.8 NA 239.6Florida 276.2 186.0 228.4Georgia 279.3 185.0 227.4Hawaii 317.1 235.0 290.1Idaho 281.9 189.8 242.7Illinois 279.2 191.4 234.7Indiana 273.4 186.5 226.7Iowa 272.3 187.9 228.5Kansas 267.6 181.3 223.3Kentucky 276.2 188.2 229.6Louisiana 277.0 185.4 225.2Maine 284.8 198.4 236.0Maryland 280.8 188.3 231.5Massachusetts 282.0 196.9 235.8Michigan 273.8 187.9 228.2Minnesota 270.0 187.7 231.6Mississippi 272.6 184.0 226.0Missouri 267.5 182.5 224.3Montana 280.4 190.9 238.6Nebraska 266.8 185.8 229.5Nevada 282.9 200.0 240.3New Hampshire 280.9 194.0 237.5New Jersey 281.7 192.2 235.0New Mexico 281.9 195.3 236.2New York 282.8 191.7 234.4North Carolina 274.3 181.9 223.7North Dakota 278.2 197.1 242.2Ohio 269.5 185.3 225.9Oklahoma 268.5 182.1 224.8Oregon 292.4 205.7 245.8Pennsylvania 274.2 188.0 229.7Rhode Island 272.9 189.6 232.9South Carolina 276.2 181.7 223.3South Dakota 274.1 191.3 234.6Tennessee 273.6 181.1 223.8Texas 271.3 182.5 223.4Utah 277.8 190.4 241.5Vermont 292.5 198.9 242.2Virginia 275.4 186.6 229.1Washington 285.6 201.2 241.6West Virginia 282.5 192.7 235.4Wisconsin 273.9 188.5 229.2Wyoming 283.9 187.3 234.3United States, average 277.2 189.3 231.6
SOURCE: U.S. Department of Energy, Energy Information Administration, Gasoline Prices by Formulation , Grade, Sales Type available at www.eia.gov/dnav/pet/pet_pri_allmg_a_epm0_pta_dpgal_a.htm as of June 2013.
NOTE: Data includes sales to end users through retail outlets as well as all direct sales to end users that were not made through company-operated retail outlets (e.g., sales to agricultural customers, commercial sales, and industrial sales).
KEY: NA = Not available.
Table 6-11: Average Motor Gasoline Prices Excluding Taxes, All Grades: 2008-2010 (Cents per gallon excluding taxes)
KEY: NA = Not available. NOTE: Data includes sales to end users through retail outlets as well as all direct sales to end users that were not made through company-operated retail outlets (e.g., sales to agricultural customers, commercial sales, and industrial sales). SOURCE: U.S. Department of Energy, Energy Information Administration, Gasoline Prices by Formulation, Grade, Sales Type available at www.eia.gov/dnav/pet/pet_pri_allmg_a_epm0_pta_dpgal_a.htm as of June 2013.
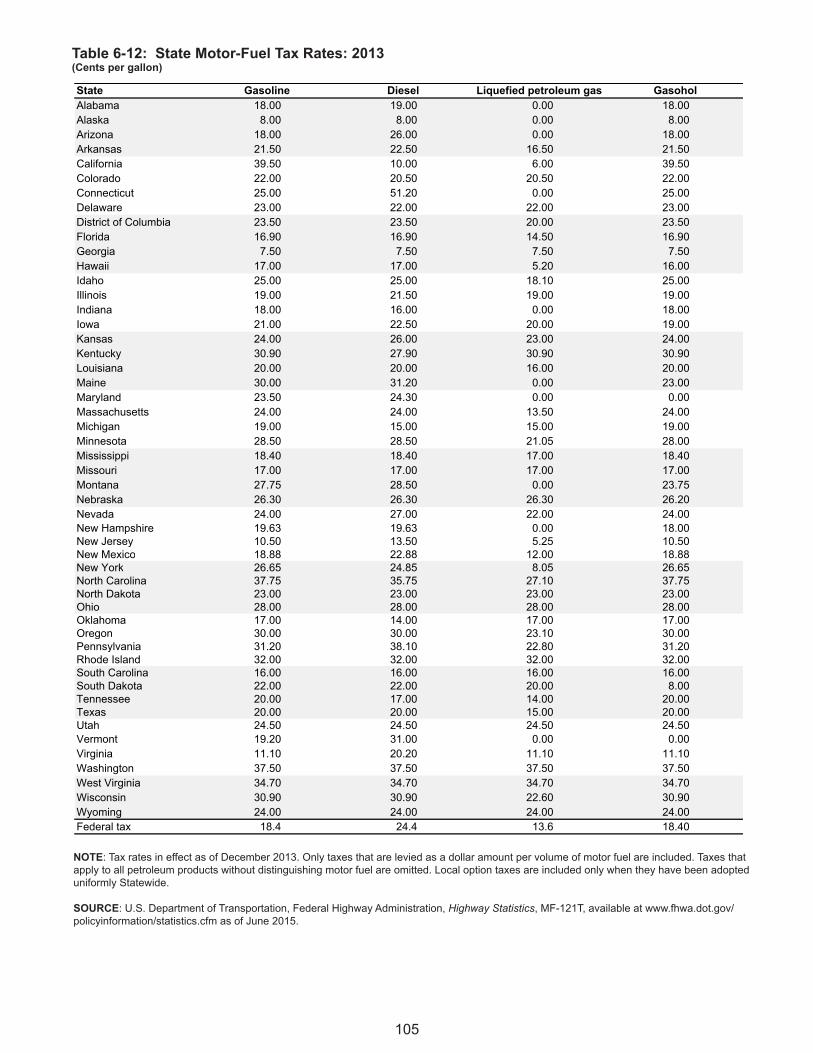
105
Table 6-12: State Motor-Fuel Tax Rates: 2013(Cents per gallon)State Gasoline Diesel Liquefied petroleum gas GasoholAlabama 18.00 19.00 0.00 18.00Alaska 8.00 8.00 0.00 8.00Arizona 18.00 26.00 0.00 18.00Arkansas 21.50 22.50 16.50 21.50California 39.50 10.00 6.00 39.50Colorado 22.00 20.50 20.50 22.00Connecticut 25.00 51.20 0.00 25.00Delaware 23.00 22.00 22.00 23.00District of Columbia 23.50 23.50 20.00 23.50Florida 16.90 16.90 14.50 16.90Georgia 7.50 7.50 7.50 7.50Hawaii 17.00 17.00 5.20 16.00Idaho 25.00 25.00 18.10 25.00Illinois 19.00 21.50 19.00 19.00Indiana 18.00 16.00 0.00 18.00Iowa 21.00 22.50 20.00 19.00Kansas 24.00 26.00 23.00 24.00Kentucky 30.90 27.90 30.90 30.90Louisiana 20.00 20.00 16.00 20.00Maine 30.00 31.20 0.00 23.00Maryland 23.50 24.30 0.00 0.00Massachusetts 24.00 24.00 13.50 24.00Michigan 19.00 15.00 15.00 19.00Minnesota 28.50 28.50 21.05 28.00Mississippi 18.40 18.40 17.00 18.40Missouri 17.00 17.00 17.00 17.00Montana 27.75 28.50 0.00 23.75Nebraska 26.30 26.30 26.30 26.20Nevada 24.00 27.00 22.00 24.00New Hampshire 19.63 19.63 0.00 18.00New Jersey 10.50 13.50 5.25 10.50New Mexico 18.88 22.88 12.00 18.88New York 26.65 24.85 8.05 26.65North Carolina 37.75 35.75 27.10 37.75North Dakota 23.00 23.00 23.00 23.00Ohio 28.00 28.00 28.00 28.00Oklahoma 17.00 14.00 17.00 17.00Oregon 30.00 30.00 23.10 30.00Pennsylvania 31.20 38.10 22.80 31.20Rhode Island 32.00 32.00 32.00 32.00South Carolina 16.00 16.00 16.00 16.00South Dakota 22.00 22.00 20.00 8.00Tennessee 20.00 17.00 14.00 20.00Texas 20.00 20.00 15.00 20.00Utah 24.50 24.50 24.50 24.50Vermont 19.20 31.00 0.00 0.00Virginia 11.10 20.20 11.10 11.10Washington 37.50 37.50 37.50 37.50West Virginia 34.70 34.70 34.70 34.70Wisconsin 30.90 30.90 22.60 30.90Wyoming 24.00 24.00 24.00 24.00Federal tax 18.4 24.4 13.6 18.40NOTE: Tax rates in effect as of December 2013. Only taxes that are levied as a dollar amount per volume of motor fuel are included. Taxes that apply to all petroleum products without distinguishing motor fuel are omitted. Local option taxes are included only when they have been adopted uniformly Statewide.
SOURCE: U.S. Department of Transportation, Federal Highway Administration, Highway Statistics , MF-121T, available at www.fhwa.dot.gov/policyinformation/statistics.cfm as of June 2015.
Table 6-12: State Motor-Fuel Tax Rates: 2013 (Cents per gallon)
NOTE: Tax rates in effect as of December 2013. Only taxes that are levied as a dollar amount per volume of motor fuel are included. Taxes that apply to all petroleum products without distinguishing motor fuel are omitted. Local option taxes are included only when they have been adopted uniformly Statewide.
SOURCE: U.S. Department of Transportation, Federal Highway Administration, Highway Statistics, MF-121T, available at www.fhwa.dot.gov/policyinformation/statistics.cfm as of June 2015.


Chapter 7Energy and Environment

108
Table 7-1: Transportation Energy Consumption by Energy Source: 2013(Trillion Btu)
Distillate fuel (diesel) Jet fuel
Motorgasoline2,4 Residual fuel Other3 Total petroleum
Alabama 22.7 117.3 13.2 308.2 5.0 3.0 446.8 21.7 0.0 469.5 0.0 469.5Alaska 0.9 32.0 107.3 31.3 0.0 1.2 171.9 1.7 0.0 172.8 0.0 172.8Arizona 14.9 106.6 21.0 314.0 0.0 3.3 444.9 19.9 0.0 459.8 0.0 459.8Arkansas 11.8 91.2 6.0 164.5 0.0 2.8 264.5 11.6 <0.05 276.3 <0.05 276.3California 27.9 438.1 563.1 1,727.1 124.1 19.6 2,872.0 121.7 2.9 2,902.8 5.1 2,907.8Colorado 10.2 80.4 53.5 254.5 0.0 2.8 391.3 14.8 0.2 401.7 0.5 402.2Connecticut 4.5 38.3 10.8 171.0 0.0 1.6 221.6 12.1 0.6 226.8 1.2 228.0Delaware 1.0 8.1 0.7 51.0 0.5 0.6 60.9 3.6 0.0 62.0 0.0 62.0District of Columbia 2.5 2.0 0.0 11.5 0.0 0.2 13.7 0.8 1.1 17.3 2.4 19.8Florida 12.8 225.2 180.2 981.8 57.4 7.7 1,452.3 64.5 0.3 1,465.4 0.6 1,466.0Georgia 9.3 181.0 22.6 576.5 26.9 5.2 812.3 37.9 0.5 822.2 1.0 823.2Hawaii <0.05 17.7 64.2 53.3 5.5 0.4 141.2 3.0 0.0 141.2 0.0 141.2Idaho 6.2 41.4 4.3 81.6 0.0 1.0 128.4 4.8 0.0 134.6 0.0 134.6Illinois 27.8 219.2 137.6 548.9 0.1 10.6 916.3 38.7 2.0 946.1 4.3 950.4Indiana 7.8 205.4 46.7 354.0 0.6 5.2 611.9 25.0 0.1 619.8 0.2 620.0Iowa 11.8 95.8 6.1 182.6 0.0 3.4 288.0 11.9 0.0 299.7 0.0 299.7Kansas 23.9 97.4 10.1 152.4 0.0 3.5 263.4 8.3 0.0 287.3 0.0 287.3Kentucky 7.8 127.3 48.5 253.2 0.0 3.4 432.4 17.8 0.0 440.2 0.0 440.2Louisiana 41.5 150.7 123.6 269.3 70.8 4.2 618.6 19.0 <0.05 660.1 0.1 660.2Maine 0.9 28.4 6.3 87.5 4.1 0.8 127.1 5.8 0.0 128.0 0.0 128.0Maryland 7.7 67.8 11.1 335.0 1.2 2.0 417.2 23.5 1.8 426.7 4.2 430.9Massachusetts 5.5 80.5 35.7 326.7 1.2 2.8 447.0 23.0 1.2 453.8 2.4 456.2Michigan 19.8 133.7 22.1 546.7 1.5 9.3 713.2 38.5 <0.05 733.1 <0.05 733.1Minnesota 12.1 103.3 33.1 294.2 0.5 4.9 435.9 24.6 0.1 448.1 0.1 448.2Mississippi 25.5 88.5 56.6 191.3 4.3 1.9 342.6 13.5 0.0 368.1 0.0 368.1Missouri 5.8 145.7 18.6 365.4 0.0 6.6 536.3 21.2 0.1 542.2 0.2 542.3Montana 7.0 44.8 5.0 60.1 0.0 1.2 111.1 3.5 0.0 118.1 0.0 118.1Nebraska 7.2 79.6 6.1 99.9 0.0 2.3 187.9 5.4 0.0 195.1 0.0 195.1Nevada 5.8 43.0 26.9 130.9 0.0 1.0 201.7 7.3 <0.05 207.6 <0.05 207.6New Hampshire 0.1 12.9 1.9 83.9 <0.05 0.5 99.3 5.8 0.0 99.4 0.0 99.4New Jersey 7.1 119.1 204.6 473.9 34.8 4.4 836.8 33.4 1.0 845.0 2.1 847.1New Mexico 9.3 72.7 6.2 111.6 0.0 1.6 192.1 7.1 0.0 201.5 0.0 201.5New York 27.3 152.4 154.8 635.1 39.6 6.2 988.1 43.5 9.8 1,025.1 17.6 1,042.8North Carolina 4.2 142.8 57.4 511.0 0.0 5.0 716.3 33.6 <0.05 720.5 0.1 720.5North Dakota 17.4 61.8 6.6 52.8 0.0 1.1 122.2 3.7 0.0 139.6 0.0 139.6Ohio 11.1 236.5 75.2 588.2 0.0 9.0 908.7 41.5 0.2 920.0 0.3 920.3Oklahoma 44.5 140.5 44.0 220.2 0.0 4.8 409.4 11.9 0.0 453.9 0.0 453.9Oregon 4.3 89.9 25.9 173.4 3.8 3.7 296.8 9.7 0.1 301.2 0.1 301.3Pennsylvania 43.0 215.9 41.5 592.8 6.3 8.0 864.7 40.0 2.8 910.4 5.6 916.0Rhode Island 1.5 8.9 3.9 43.2 <0.05 0.4 56.5 3.0 0.1 58.1 0.1 58.3South Carolina 2.6 107.4 11.6 319.5 9.7 2.0 450.3 21.0 0.0 452.9 0.0 452.9South Dakota 7.1 31.5 3.8 51.8 0.0 1.2 88.3 3.6 0.0 95.4 0.0 95.4Tennessee 8.2 144.3 63.6 375.0 0.3 4.8 588.0 26.4 <0.05 596.2 <0.05 596.2Texas 304.9 749.2 386.7 1,498.4 118.3 15.4 2,767.9 93.6 0.2 3,073.1 0.4 3,073.5Utah 14.5 68.1 36.3 129.0 0.0 1.4 234.9 7.5 0.2 249.6 0.4 250.0Vermont 0.1 9.8 1.3 37.7 0.0 0.3 49.1 2.5 0.0 49.2 0.0 49.2Virginia 9.1 148.6 100.1 465.9 4.1 3.4 722.2 31.9 0.7 732.0 1.4 733.4Washington 11.1 106.6 89.7 321.0 60.2 4.4 581.8 17.9 <0.05 592.9 <0.05 593.0West Virginia 31.9 41.3 1.2 94.3 0.0 1.5 138.3 6.2 <0.05 170.1 <0.05 170.2Wisconsin 3.0 105.4 8.9 290.5 0.0 4.5 409.2 20.3 0.0 412.2 0.0 412.2Wyoming 16.0 53.8 2.3 41.0 0.0 0.8 98.0 2.4 0.0 114.0 0.0 114.0United States, total 921.3 5,909.6 2,968.6 16,034.9 581.2 197.3 25,691.4 1,071.6 26.0 26,638.7 50.7 26,689.4
5Incurred in the generation, transmission, and distribution of electricity plus plant use and unaccounted for electrical system energy losses.
KEY: Btu = British thermal unit
NOTE: Totals may not equal sum of components due to independent rounding.
SOURCE: U.S. Department of Energy, Energy Information Administration, State Energy Data System , Consumption Estimates, available at www.eia.gov/state/seds as of July 2015.
Electrical system energy losses5 Total4
1Transportation use of natural gas is gas consumed in the operation of pipelines, primarily in compressors, and gas consumed as vehicle fuel.2Includes ethanol blended into motor gasoline.3"Other" is the sum of aviation gasoline, liquefied petroleum gas (LPG), and lubricants.4Ethanol blended into motor gasoline is included in motor gasoline, but is also shown separately to display the use of renewable energy by the transportation sector. It is counted only once in the total.
State Natural gas1
Petroleum
Ethanol4 Electricity Net energy4
Table 7-1: Transportation Energy Consumption by Energy Source: 2013 (Trillion Btu)
1Transportation use of natural gas is gas consumed in the operation of pipelines, primarily in compressors, and gas consumed as vehicle fuel. 2Includes ethanol blended into motor gasoline. 3”Other” is the sum of aviation gasoline, liquefied petroleum gas (LPG), and lubricants. 4Ethanol blended into motor gasoline is included in motor gasoline, but is also shown separately to display the use of renewable energy by the transportation sector. It is counted only once in the total. 5Incurred in the generation, transmission, and distribution of electricity plus plant use and unaccounted for electrical system energy losses.
KEY: Btu = British thermal unit NOTE: Totals may not equal sum of components due to independent rounding. SOURCE: U.S. Department of Energy, Energy Information Administration, State Energy Data System, Consumption Estimates, available at www.eia.gov/state/seds as of July 2015.

109
Table 7-2: Energy Consumption by End-Use Sector: 2013(Trillion Btu)
Trillion Btu Percent Trillion Btu Percent Trillion Btu Percent Trillion Btu PercentAlabama 1,931.4 469.5 24.3 358.5 18.6 256.8 13.3 846.5 43.8Alaska 609.0 172.8 28.4 48.9 8.0 63.0 10.3 324.3 53.3Arizona 1,414.8 459.8 32.5 398.1 28.1 346.2 24.5 210.7 14.9Arkansas 1,093.0 276.3 25.3 241.3 22.1 176.6 16.2 398.8 36.5California 7,684.1 2,907.8 37.8 1,480.0 19.3 1,483.8 19.3 1,812.4 23.6Colorado 1,471.8 402.2 27.3 367.1 24.9 285.6 19.4 417.0 28.3Connecticut 748.1 228.0 30.5 249.1 33.3 189.2 25.3 81.9 10.9Delaware 274.5 62.0 22.6 65.4 23.8 56.6 20.6 90.5 33.0District of Columbia 170.9 19.8 11.6 37.0 21.7 111.3 65.1 2.9 1.7Florida 4,077.9 1,466.0 35.9 1,168.3 28.6 968.2 23.7 475.4 11.7Georgia 2,795.4 823.2 29.4 688.1 24.6 530.8 19.0 753.3 26.9Hawaii 277.1 141.2 51.0 35.7 12.9 39.0 14.1 61.2 22.1Idaho 529.5 134.6 25.4 127.3 24.0 88.1 16.6 179.6 33.9Illinois 4,011.5 950.4 23.7 1,011.9 25.2 804.4 20.1 1,244.7 31.0Indiana 2,900.0 620.0 21.4 569.6 19.6 385.0 13.3 1,325.5 45.7Iowa 1,516.5 299.7 19.8 253.7 16.7 215.7 14.2 747.3 49.3Kansas 1,163.1 287.3 24.7 236.1 20.3 210.1 18.1 429.5 36.9Kentucky 1,822.7 440.2 24.2 385.2 21.1 284.4 15.6 712.9 39.1Louisiana 3,835.0 660.2 17.2 343.6 9.0 269.1 7.0 2,562.0 66.8Maine 407.1 128.0 31.4 85.6 21.0 58.9 14.5 134.6 33.1Maryland 1,403.8 430.9 30.7 431.5 30.7 424.6 30.2 116.8 8.3Massachusetts 1,442.6 456.2 31.6 452.6 31.4 290.9 20.2 242.8 16.8Michigan 2,843.2 733.1 25.8 773.6 27.2 600.7 21.1 735.8 25.9Minnesota 1,859.8 448.2 24.1 417.3 22.4 358.0 19.2 636.3 34.2Mississippi 1,141.8 368.1 32.2 211.2 18.5 160.3 14.0 402.2 35.2Missouri 1,857.0 542.3 29.2 538.3 29.0 411.2 22.1 365.2 19.7Montana 401.2 118.1 29.4 85.2 21.2 76.9 19.2 121.0 30.2Nebraska 871.8 195.1 22.4 163.8 18.8 140.4 16.1 372.5 42.7Nevada 657.1 207.6 31.6 162.1 24.7 121.3 18.5 166.1 25.3New Hampshire 302.8 99.4 32.8 92.8 30.6 70.4 23.2 40.1 13.2New Jersey 2,314.5 847.1 36.6 599.4 25.9 600.7 26.0 267.3 11.5New Mexico 688.5 201.5 29.3 123.9 18.0 125.8 18.3 237.4 34.5New York 3,625.3 1,042.8 28.8 1,072.1 29.6 1,134.2 31.3 376.3 10.4North Carolina 2,524.1 720.5 28.5 692.1 27.4 555.8 22.0 555.7 22.0North Dakota 588.6 139.6 23.7 73.4 12.5 85.4 14.5 290.1 49.3Ohio 3,745.4 920.3 24.6 914.3 24.4 694.9 18.6 1,216.0 32.5Oklahoma 1,622.8 453.9 28.0 323.0 19.9 258.1 15.9 587.8 36.2Oregon 996.7 301.3 30.2 258.1 25.9 190.9 19.2 246.4 24.7Pennsylvania 3,795.0 916.0 24.1 930.0 24.5 630.8 16.6 1,318.2 34.7Rhode Island 193.6 58.3 30.1 66.2 34.2 49.0 25.3 20.0 10.3South Carolina 1,591.4 452.9 28.5 351.6 22.1 259.5 16.3 527.4 33.1South Dakota 390.4 95.4 24.4 73.5 18.8 65.2 16.7 156.3 40.0Tennessee 2,135.9 596.2 27.9 531.9 24.9 428.0 20.0 579.8 27.1Texas 12,944.1 3,073.5 23.7 1,685.9 13.0 1,609.9 12.4 6,574.8 50.8Utah 830.6 250.0 30.1 175.3 21.1 163.5 19.7 241.8 29.1Vermont 133.6 49.2 36.8 42.7 32.0 26.0 19.5 15.8 11.8Virginia 2,410.7 733.4 30.4 626.6 26.0 612.1 25.4 438.6 18.2Washington 2,039.3 593.0 29.1 494.9 24.3 382.8 18.8 568.6 27.9West Virginia 737.8 170.2 23.1 174.1 23.6 112.3 15.2 281.2 38.1Wisconsin 1,804.0 412.2 22.8 445.1 24.7 369.1 20.5 577.6 32.0Wyoming 535.5 114.0 21.3 49.2 9.2 63.1 11.8 309.2 57.7United States, total 97,144.7 26,689.4 27.5 21,182.0 21.8 17,894.3 18.4 31,378.9 32.31U.S. total energy and U.S. industrial sector include 4.0 trillion Btu of net imports of coal coke that is not allocated to the States.2End-use sector data include electricity sales and associated electrical system energy losses.
KEY: Btu = British thermal unit.
NOTE: Totals may not equal sum of components due to rounding.
SOURCE: U.S. Department of Energy, Energy Information Administration, State Energy Data System , Consumption Estimates, available at www.eia.gov/state/seds as of July 2015.
StateTotal energy consumed1
End-use sectors2
Transportation Residential Commercial Industrial
Table 7-2: Energy Consumption by End-Use Sector: 2013 (Trillion Btu)
1U.S. total energy and U.S. industrial sector include 4.0 trillion Btu of net imports of coal coke that is not allocated to the States. 2End-use sector data include electricity sales and associated electrical system energy losses.
KEY: Btu = British thermal unit.
NOTE: Totals may not equal sum of components due to rounding. SOURCE: U.S. Department of Energy, Energy Information Administration, State Energy Data System, Consumption Estimates, avail-able at www.eia.gov/state/seds as of July 2015.

110
Table 7-3: Transportation Energy Consumption per Capita: 2013
StateTotal
(trillion Btu)Per capita
(million Btu)Total
(trillion Btu)Per capita
(million Btu)Alabama 4,834.0 446.8 92.4 97.1 98.2Alaska 737.3 171.9 233.2 234.4 243.3Arizona 6,635.0 444.9 67.1 69.3 71.9Arkansas 2,958.8 264.5 89.4 93.4 94.8California 38,431.4 2,872.0 74.7 75.7 78.1Colorado 5,272.1 391.3 74.2 76.3 80.0Connecticut 3,599.3 221.6 61.6 63.3 63.8Delaware 925.2 60.9 65.8 67.0 69.0District of Columbia 649.1 13.7 21.1 30.5 32.9Florida 19,600.3 1,452.3 74.1 74.8 78.0Georgia 9,994.8 812.3 81.3 82.4 85.0Hawaii 1,409.0 141.2 100.2 100.2 103.8Idaho 1,612.8 128.4 79.6 83.5 85.9Illinois 12,890.6 916.3 71.1 73.7 74.1Indiana 6,570.7 611.9 93.1 94.4 95.6Iowa 3,092.3 288.0 93.1 96.9 98.4Kansas 2,895.8 263.4 91.0 99.2 100.7Kentucky 4,399.6 432.4 98.3 100.1 101.4Louisiana 4,629.3 618.6 133.6 142.6 145.6Maine 1,328.7 127.1 95.7 96.3 96.4Maryland 5,938.7 417.2 70.3 72.6 74.6Massachusetts 6,708.9 447.0 66.6 68.0 69.7Michigan 9,898.2 713.2 72.1 74.1 74.2Minnesota 5,422.1 435.9 80.4 82.7 84.5Mississippi 2,992.2 342.6 114.5 123.0 124.1Missouri 6,044.9 536.3 88.7 89.7 90.6Montana 1,014.9 111.1 109.5 116.4 119.4Nebraska 1,869.0 187.9 100.5 104.4 106.8Nevada 2,791.5 201.7 72.3 74.4 76.9New Hampshire 1,322.6 99.3 75.1 75.2 75.5New Jersey 8,911.5 836.8 93.9 95.1 96.4New Mexico 2,086.9 192.1 92.1 96.6 97.9New York 19,695.7 988.1 50.2 52.9 53.8North Carolina 9,848.9 716.3 72.7 73.2 75.6North Dakota 723.9 122.2 168.8 192.9 207.6Ohio 11,572.0 908.7 78.5 79.5 79.8Oklahoma 3,853.1 409.4 106.3 117.8 121.0Oregon 3,928.1 296.8 75.6 76.7 78.6Pennsylvania 12,781.3 864.7 67.7 71.7 72.1Rhode Island 1,053.4 56.5 53.6 55.3 55.4South Carolina 4,771.9 450.3 94.4 94.9 97.9South Dakota 845.5 88.3 104.4 112.8 117.2Tennessee 6,497.3 588.0 90.5 91.8 93.9Texas 26,505.6 2,767.9 104.4 116.0 122.2Utah 2,902.8 234.9 80.9 86.1 90.5Vermont 626.9 49.1 78.3 78.5 78.6Virginia 8,270.3 722.2 87.3 88.7 91.7Washington 6,973.7 581.8 83.4 85.0 88.2West Virginia 1,853.6 138.3 74.6 91.8 91.9Wisconsin 5,743.0 409.2 71.3 71.8 72.5Wyoming 583.2 98.0 168.0 195.5 202.3United States 316,497.5 25,691.4 81.2 84.3 86.4
SOURCE: Population: U.S. Department of Commerce, U.S. Census Bureau, Population Estimates, available at www.census.gov/popest as of July 2015. Consumption: U.S. Department of Energy, Energy Information Administration, State Energy Data System , Consumption Estimates, available at www.eia.gov/state/seds as of July 2015.
Population(thousands)
Petroleum All energy sources
KEY: Btu = British thermal unit
NOTE: Totals may not equal sum of components due to rounding.
Table 7-3: Transportation Energy Consumption per Capita: 2013
KEY: Btu = British thermal unit
NOTE: Totals may not equal sum of components due to rounding.
SOURCE: Population: U.S. Department of Commerce, U.S. Census Bureau, Population Estimates, available at www.census.gov/popest as of July 2015. Consumption: U.S. Department of Energy, Energy Information Administration, State Energy Data System, Consumption Estimates, available at www.eia.gov/state/seds as of July 2015.

111
Table 7-4: Motor-Fuel Use: 2013(Millions of gallons)
Private and commercial Public use
Private and commercial Public use
Private and commercial
Private and commercial Public use
Combinedtotal
Alabama 2,481 39 49 2 737 3,267 41 3,308 684Alaska 244 8 27 <0.5 133 404 8 412 559Arizona 2,539 39 66 2 717 3,322 41 3,363 507Arkansas 1,315 27 53 1 598 1,966 28 1,995 674California 13,977 225 340 11 2,859 17,176 236 17,413 453Colorado 2,058 38 46 2 566 2,669 39 2,709 514Connecticut 1,377 21 38 1 270 1,685 22 1,707 474Delaware 401 7 22 <0.5 61 485 7 492 532District of Columbia 88 6 2 <0.5 16 107 7 113 175Florida 7,851 104 286 5 1,416 9,553 109 9,661 493Georgia 4,674 63 87 3 1,249 6,010 66 6,076 608Hawaii 427 11 9 1 53 490 11 501 356Idaho 653 14 36 1 263 952 15 967 599Illinois 4,410 94 119 5 1,490 6,019 99 6,118 475Indiana 2,854 52 100 3 1,240 4,194 54 4,248 647Iowa 1,464 31 146 2 665 2,275 33 2,308 746Kansas 1,225 29 29 1 488 1,742 31 1,773 612Kentucky 2,037 37 47 2 742 2,826 39 2,865 651Louisiana 2,154 37 86 2 680 2,920 39 2,959 639Maine 705 10 20 1 201 927 11 938 706Maryland 2,714 31 56 1 488 3,258 32 3,290 554Massachusetts 2,644 38 58 2 504 3,206 40 3,246 484Michigan 4,386 70 122 3 911 5,419 73 5,492 555Minnesota 2,343 47 128 2 662 3,133 49 3,182 587Mississippi 1,537 28 45 1 551 2,133 29 2,162 723Missouri 2,943 50 52 2 960 3,956 52 4,008 663Montana 481 11 19 1 265 765 11 776 765Nebraska 801 19 31 1 430 1,262 20 1,282 686Nevada 1,060 15 20 1 318 1,398 16 1,414 507New Hampshire 675 10 19 <0.5 92 786 11 796 602New Jersey 3,829 54 80 3 790 4,699 57 4,756 534New Mexico 901 18 21 1 507 1,429 19 1,448 694New York 5,079 109 155 5 1,351 6,586 115 6,701 340North Carolina 4,117 61 128 3 983 5,228 64 5,292 537North Dakota 424 9 17 <0.5 395 836 9 845 1,167Ohio 4,730 86 115 4 1,504 6,348 90 6,438 556Oklahoma 1,763 35 71 2 871 2,705 37 2,742 712Oregon 1,392 28 54 1 523 1,968 29 1,998 509Pennsylvania 4,789 79 122 4 1,548 6,459 83 6,542 512Rhode Island 344 8 10 <0.5 60 413 9 422 401South Carolina 2,570 27 66 1 769 3,405 29 3,434 720South Dakota 415 10 18 1 218 651 11 661 782Tennessee 3,026 48 64 2 886 3,976 51 4,026 620Texas 12,151 172 343 8 4,741 17,236 180 17,416 657Utah 1,036 22 27 1 479 1,541 23 1,564 539Vermont 303 6 7 <0.5 60 371 6 377 601Virginia 3,765 56 73 3 1,005 4,843 59 4,902 593Washington 2,584 41 87 2 656 3,326 43 3,369 483West Virginia 757 17 14 1 287 1,058 18 1,076 581Wisconsin 2,323 47 75 2 728 3,126 49 3,175 553Wyoming 327 7 30 <0.5 369 726 7 733 1,257United States 126,665 2,153 3,736 106 38,352 168,753 2,260 173,493 548NOTES: Consumption based on reports from state motor fuel tax agencies. Gasohol is included with gasoline. Public use and nonhighway use were estimated by the Federal Highway Administration. Estimates may not be comparable to data for prior years due to revised estimation procedures.The term motor fuel applies to gasoline and all other fuels, including special fuels, coming under the purview of the state motor-fuel tax laws. Special fuels include diesel fuel and, to the extent they can be quantified, liquefied petroleum gases such as propane. Gasohol, a blend of gasoline and fuel alcohol, is included with gasoline.
SOURCE: Motor-fuel use: U.S. Department of Transportation, Federal Highway Administration, Highway Statistics, MF-21, available at www.fhwa.dot.gov/policyinformation/statistics.cfm as of July 2015. Population: U.S. Department of Commerce, U.S. Census Bureau, Population Estimates,available at www.census.gov/popest as of July 2015.
State
Gasoline Special fuel (mainly diesel) Total use Total
GallonsPer Capita
Highway use Nonhighway use
Table 7-4: Motor-Fuel Use: 2013 (Millions of gallons)
NOTES: Consumption based on reports from state motor fuel tax agencies. Gasohol is included with gasoline. Public use and nonhighway use were estimated by the Federal Highway Administration. Estimates may not be comparable to data for prior years due to revised estimation procedures.The term motor fuel applies to gasoline and all other fuels, including special fuels, coming under the purview of the state motor-fuel tax laws. Special fuels include diesel fuel and, to the extent they can be quantified, liquefied petroleum gases such as propane. Gasohol, a blend of gasoline and fuel alcohol, is included with gasoline.
SOURCE: Motor-fuel use: U.S. Department of Transportation, Federal Highway Administration, Highway Statistics, MF-21, available at www.fhwa.dot.gov/policyinformation/statistics.cfm as of July 2015. Population: U.S. Department of Commerce, U.S. Census Bureau, Population Estimates,available at www.census.gov/popest as of July 2015.

112
Table 7-5: Alternative Fuel Vehicle Fleet by Fuel Type: 2013(Number of vehicles)
StateCompressedNatural Gas Electricity1 Ethanol (E85)2 Hydrogen
Liquified Natural Gas
LiquifiedPetroleum Gas Total
Alabama 345 76 4,573 0 0 169 5,163Alaska 35 18 1,148 0 0 9 1,210Arizona 710 451 8,902 0 0 349 10,412Arkansas 85 18 1,447 0 0 65 1,615California 8,922 3,078 27,766 26 428 1,455 41,675Colorado 224 52 7,103 0 0 206 7,585Connecticut 36 22 2,417 0 2 36 2,513Delaware 3 4 1,868 0 0 7 1,882District of Columbia 696 88 4,810 0 0 0 5,594Florida 205 350 13,904 0 0 260 14,719Georgia 765 372 10,982 0 0 390 12,509Hawaii 0 179 2,557 3 1 17 2,757Idaho 58 18 2,738 0 0 17 2,831Illinois 258 41 13,630 0 0 131 14,060Indiana 38 44 4,156 0 0 214 4,452Iowa 0 12 3,809 0 0 32 3,853Kansas 37 78 2,843 0 0 47 3,005Kentucky 6 53 5,235 0 1 52 5,347Louisiana 54 147 5,426 0 0 42 5,669Maine 2 23 1,058 0 0 44 1,127Maryland 256 163 8,955 0 0 20 9,394Massachusetts 793 82 2,576 0 0 31 3,482Michigan 139 144 10,373 0 0 220 10,876Minnesota 23 36 7,743 0 4 78 7,884Mississippi 16 73 3,625 0 2 248 3,964Missouri 47 90 8,389 0 0 275 8,801Montana 4 10 1,760 0 0 40 1,814Nebraska 174 0 2,585 0 0 28 2,787Nevada 286 50 3,043 0 0 84 3,463New Hampshire 39 13 572 0 0 50 674New Jersey 630 6 8,786 0 2 60 9,484New Mexico 144 9 5,801 0 0 99 6,053New York 3,385 632 8,639 0 0 98 12,754North Carolina 278 208 12,766 0 1 373 13,626North Dakota 1 1 1,677 0 0 8 1,687Ohio 353 71 9,528 0 0 133 10,085Oklahoma 859 26 3,228 0 0 221 4,334Oregon 302 107 4,803 0 0 19 5,231Pennsylvania 319 67 8,361 0 0 70 8,817Rhode Island 230 28 1,023 0 0 0 1,281South Carolina 49 85 8,781 1 0 148 9,064South Dakota 1 4 3,030 0 0 53 3,088Tennessee 128 97 8,893 0 0 89 9,207Texas 1,497 278 29,312 0 58 1,034 32,179Utah 490 12 3,639 0 0 48 4,189Vermont 15 12 889 0 0 6 922Virginia 237 299 11,188 0 0 103 11,827Washington 271 235 7,278 0 0 58 7,842West Virginia 24 26 808 0 0 10 868Wisconsin 23 29 4,864 0 0 141 5,057Wyoming 67 1 1,328 0 0 14 1,410United States, total 23,559 8,018 320,615 30 499 7,401 360,122
SOURCE: U.S. Department of Energy, Energy Information Administration, Renewable & Alternative Fuels, Alternative Vehicle Fuel Data, available at www.eia.gov/renewable/afv as of October 2015.
2Includes only those E85 vehicles believed to be used as alternative-fuels vehicles (AFVs), primarily fleet-operated vehicles; excludes other vehicles with E85-fueling capability.
1Excludes gasoline-electric hybrids.
NOTE: The aternative fuel vehicle (AFV) fleet includes vehicles in use by four user groups: federal government, state government, transit agencies, and fuel providers.
Table 7-5: Alternative Fuel Vehicle Fleet by Fuel Type: 2013(Number of vehicles)
1Excludes gasoline-electric hybrids.2Includes only those E85 vehicles believed to be used as alternative-fuels vehicles (AFVs), primarily fleet-operated vehicles; excludes other vehicles with E85-fueling capability.
NOTE: The aternative fuel vehicle (AFV) fleet includes vehicles in use by four user groups: federal government, state government, transit agen-cies, and fuel providers. SOURCE: U.S. Department of Energy, Energy Information Administration, Renewable & Alternative Fuels, Alternative Vehicle Fuel Data, available at www.eia.gov/renewable/afv as of October 2015.

113
Table 7-6: Alternative Fuel Stations by Fuel Type: 2013
StateCompressednatural gas 85% Ethanol
Liquefiedpetroleum
gas Electric1 Biodiesel HydrogenLiquefied
natural gas Total2
Alabama 21 29 113 50 10 0 2 225Alaska 1 0 7 0 2 0 0 10Arizona 32 31 62 710 79 1 6 921Arkansas 8 30 39 38 5 0 0 120California 258 88 233 5,176 84 21 43 5,903Colorado 36 85 52 256 19 1 0 449Connecticut 16 1 15 217 2 2 1 254Delaware 1 1 4 20 1 0 0 27District of Columbia 2 3 0 62 7 0 0 74Florida 33 54 65 996 17 0 0 1,165Georgia 25 61 57 370 25 0 1 539Hawaii 1 3 3 351 9 3 0 370Idaho 8 9 25 13 6 0 5 66Illinois 40 218 102 527 11 1 0 899Indiana 20 169 174 183 7 0 1 554Iowa 4 186 21 87 7 0 0 305Kansas 6 28 36 109 7 0 0 186Kentucky 4 55 47 45 4 0 0 155Louisiana 20 4 34 53 2 0 1 114Maine 1 1 12 24 3 0 0 41Maryland 9 25 17 553 9 0 0 613Massachusetts 23 8 17 546 12 1 0 607Michigan 19 163 73 721 19 4 0 999Minnesota 11 336 33 235 11 0 0 626Mississippi 5 1 125 37 4 0 0 172Missouri 12 106 64 146 4 1 0 333Montana 2 4 45 2 6 0 0 59Nebraska 9 75 22 28 3 0 0 137Nevada 7 20 39 107 6 1 2 182New Hampshire 3 0 10 40 5 0 0 58New Jersey 29 5 10 219 5 0 0 268New Mexico 11 13 45 33 8 0 0 110New York 111 81 63 693 38 9 0 995North Carolina 36 22 97 524 135 0 0 814North Dakota 1 58 18 4 3 0 0 84Ohio 25 97 66 175 19 1 2 385Oklahoma 94 27 149 32 5 0 0 307Oregon 14 8 34 915 24 0 0 995Pennsylvania 51 33 73 263 7 2 0 429Rhode Island 6 1 6 143 7 0 0 163South Carolina 10 82 44 218 60 2 1 417South Dakota 0 87 17 13 2 0 0 119Tennessee 9 52 102 866 44 0 0 1,073Texas 62 81 458 1,599 20 1 10 2,231Utah 88 3 27 72 3 0 7 200Vermont 3 1 3 51 2 0 0 60Virginia 20 19 58 370 12 1 0 480Washington 24 24 68 1,325 33 1 1 1,476West Virginia 3 4 12 42 2 0 0 63Wisconsin 45 115 54 211 4 0 1 430Wyoming 11 9 17 2 13 0 0 52United States, total 1,290 2,616 2,967 19,472 832 53 84 27,314
2Total number of fuel types available at stations. Stations are counted once for each type of fuel available.
1Does not include residential electric charging infrastructure.
SOURCE: U.S. Department of Energy, Office of Energy Efficiency and Renewable Energy, Alternative Fuels Data Center, Alternative Fueling Stations, available at http://www.afdc.energy.gov/ as of July 2015.
NOTE: Counts as of December 2013.
Table 7-6: Alternative Fuel Stations by Fuel Type: 2013
1Does not include residential electric charging infrastructure. 2Total number of fuel types available at stations. Stations are counted once for each type of fuel available.
NOTE: Counts as of December 2013.
SOURCE: U.S. Department of Energy, Office of Energy Efficiency and Renewable Energy, Alternative Fuels Data Center, Alternative Fueling Stations, available at http://www.afdc.energy.gov/ as of July 2015.

114
Table 7-7: Air Pollution in the 50 Largest Metropolitan Areas: 2009–2014(Number of days with AQI value greater than 100)
Metropolitan area 2009 2010 2011 2012 2013 2014Atlanta-Sandy Springs-Marietta, GA 18 29 46 19 3 10Austin-Round Rock, TX 5 3 7 4 1 0Baltimore-Towson, MD 15 36 25 20 5 4Birmingham-Hoover, AL 5 15 23 10 1 3Boston-Cambridge-Quincy, MA-NH 5 5 3 6 5 0Buffalo-Niagara Falls, NY 2 3 2 8 1 0Charlotte-Concord-Gastonia, NC-SC 4 15 18 11 0 0Chicago-Naperville-Joliet, IL-IN-WI 34 38 27 47 12 16Cincinnati-Middletown, OH-KY-IN 11 30 47 43 11 10Cleveland-Elyria-Mentor, OH 63 74 75 59 13 15Columbus, OH 1 8 11 14 2 1Dallas-Fort Worth-Arlington, TX 34 18 40 36 33 14Denver-Aurora, CO 8 17 21 26 23 11Detroit-Warren-Livonia, MI 12 27 20 38 7 12Hartford-West Hartford-East Hartford, CT 3 9 8 16 11 8Houston-Sugar Land-Baytown, TX 31 35 38 34 19 7Indianapolis-Carmel, IN 20 20 31 29 11 30Jacksonville, FL 4 18 19 5 2 3Kansas City, MO-KS 46 25 53 72 42 53Las Vegas-Paradise, NV 8 11 25 29 16 7Los Angeles-Long Beach-Anaheim, CA 112 85 105 106 80 90Louisville/Jefferson County, KY-IN 35 55 36 45 18 31Memphis, TN-MS-AR 4 14 22 20 2 2Miami-Fort Lauderdale-Pompano Beach, FL 2 4 9 2 3 3Milwaukee-Waukesha-West Allis, WI 7 9 5 26 0 3Minneapolis-St. Paul-Bloomington, MN-WI 8 9 2 5 2 1Nashville-Davidson--Murfreesboro--Franklin, TN 1 10 13 23 1 2New Orleans-Metairie-Kenner, LA 95 68 89 44 25 11New York-Northern New Jersey-Long Island, NY-NJ-PA 26 41 29 22 15 11Oklahoma City, OK 5 3 27 23 3 0Orlando-Kissimmee, FL 1 2 8 1 0 1Philadelphia-Camden-Wilmington, PA-NJ-DE-MD 15 38 20 27 11 15Phoenix-Mesa-Scottsdale, AZ 67 44 121 94 87 107Pittsburgh, PA 69 82 54 59 18 18Portland-Vancouver-Beaverton, OR-WA 15 2 17 2 16 1Providence-New Bedford-Fall River, RI-MA 2 16 11 14 9 1Raleigh-Cary, NC 0 3 7 5 0 0Richmond, VA 1 11 12 12 1 1Riverside-San Bernardino-Ontario, CA 145 139 151 153 130 140Sacramento--Roseville--Arden-Arcade, CA 46 24 60 51 35 35Salt Lake City, UT 30 21 22 11 45 17San Antonio-New Braunfels, TX 3 4 12 8 10 3San Diego-Carlsbad-San Marcos, CA 30 19 13 22 19 18San Francisco-Oakland-Hayward, CA 14 10 8 5 7 7San Jose-Sunnyvale-Santa Clara, CA 9 10 4 4 8 5Seattle-Tacoma-Bellevue, WA 21 1 13 9 8 6St. Louis, MO-IL 93 87 78 97 35 9Tampa-St. Petersburg-Clearwater, FL 18 12 14 13 3 1Virginia Beach-Norfolk-Newport News, VA-NC 0 8 11 4 0 0Washington-Arlington-Alexandria, DC-VA-MD-WV 7 34 21 24 5 4
AQI days > 100
KEY: AQI = Air Quality Index
NOTES: Historical data are reviesd. Air Quality Index (AQI) is an indicator of overall air quality and takes into account all of the criteria air pollutants measured within a geographic area. Although AQI includes all available pollutant measurements, areas may have monitoringstations for some, but not all, pollutants. An AQI value greater than 100 is considered unhealthy. Metropolitan area rank is based on 2010 U.S. Census population.
SOURCE: U.S. Environmental Protection Agency, AirData, available at www.epa.gov/airquality/airdata as of July 2015.
Table 7-7: Air Pollution in the 50 Largest Metropolitan Areas: 2009–2014 (Number of days with AQI value greater than 100)
KEY: AQI = Air Quality Index
NOTES: Historical data are reviesd. Air Quality Index (AQI) is an indicator of overall air quality and takes into account all of the criteria air pol-lutants measured within a geographic area. Although AQI includes all available pollutant measurements, areas may have monitoring stations for some, but not all, pollutants. An AQI value greater than 100 is considered unhealthy. Metropolitan area rank is based on 2010 U.S. Census population.
SOURCE: U.S. Environmental Protection Agency, AirData, available at www.epa.gov/airquality/airdata as of July 2015.

AppendicesA Information on Data SourcesB Data Sources and AvailabilityC State DOT Contact InformationD Glossary


117
Appendix A: Information on Data Sources
Airline freight and passenger dataThe U.S. Department of Transportation’s (USDOT), Bureau of Transportation Statistics (BTS) collects and compiles data on the volume of revenue passengers, freight, and mail traffic handled and reported by the nation’s large certificated air carriers. These carriers hold Certificates of Public Convenience and Necessity (CPCN) issued by the USDOT authorizing the performance of air transportation. Large certificated air carriers operate aircraft with seating capacity of more than 60 seats or a maximum payload capacity of more than 18,000 pounds or conduct international operations. Data for commuters, intrastate, nonscheduled air taxi operators, and foreign flag air carriers are not included.
Additional information:
Contact: USDOT, Bureau of Transportation Statistics, Office of Airline Information
Internet: www.bts.gov
Border-crossing/entry dataU.S. Customs and Border Protection personnel collect passenger and vehicle border-crossing/entry data at land ports of entry and provide BTS with aggregate monthly information. These numbers reflect all entries, and it is not possible to divide these data into separate entries for same-day and overnight travel or by country of residence for the traveler. Additionally, for border-crossing figures, the total number of people is not the number of unique individuals, but rather indicates the number of border crossings. Multiple crossings by the same individual count as multiple border crossings.
Additional information:
Contact: USDOT, Bureau of Transportation Statistics
Internet: www.bts.gov
Commodity Flow SurveyThe Commodity Flow Survey (CFS) provides data on the movement of freight by type of commodity shipped and by mode of transport. In 2012, approximately 102,000 domestic establishments were randomly selected from a universe of approximately 716,000 engaged in mining, manufacturing, wholesale trade, warehouses and managing offices of multi-establishment companies, and some selected activities in retail and services based on the 2007 NAICS classification system. The survey excluded establishments classified as farms, forestry, fisheries, governments, construction, transportation, foreign establishments, and most services and retail trade establishments. The sample for the 2012 CFS was selected using a stratified three-stage design in which the first-stage sampling units were establishments, the second-stage sampling units were groups of four 1-week periods (reporting weeks) within the survey year, and the third-stage sampling units were shipments. This produced a total sample of approximately 4.5 million shipments. Due to industrywide reporting problems, shipments by oil and gas extraction establishments were excluded from data tabulations.
For each sampled 2012 CFS shipment, zip code of origin and destination, 5-digit Standard Classification of Transported Goods (SCTG) code, weight, value, and modes of transport were provided. Information on whether the shipment was a hazardous material or an export was also obtained. The miles traveled by each shipment was determined using the shipment information reported by the respondents, and a software tool, called GeoMiler, that has been developed by the Bureau of Transportation Statistics (BTS) for estimating freight travel. Distance was used to compute ton-mileage by mode of transport. The 2012 CFS also provides nationwide geographic coverage and in-state and selected substate areas.
Additional information:
Contact: USDOT, Bureau of Transportation Statistics
Print source: USDOT, Bureau of Transportation Statistics and U.S. Department of Commerce (USDOC), U.S.
118
Census Bureau, 2012 Commodity Flow Survey (Washington, DC: 2015).
Internet: www.bts.gov and www.census.gov/
Commuting dataCommuting data are from the American Community Survey (ACS), a nationwide Census Bureau survey designed to replace the long form in the decennial census. Instead of collecting data every ten years, the data collection occurs continuously. The ACS uses a series of monthly samples to produce annually updated data. This survey has an annual sample of three million housing units and will provide estimates of demographic, housing, social, and economic characteristics every year for states, cities, counties, metropolitan areas, and other geographic areas. Data products based on twelve-month periods are already available for geographic areas of 65,000 and greater population. Data products based on thirty-six-month periods are available starting in 2005–2007 for geographic areas of 20,000 and greater population. Data products based on sixty-month periods are available as of 2005–2009 for all geographic areas. Once the data products based on sample periods of more than twelve months are released for the first time, they will be released annually thereafter.
Additional information:
Contact: USDOC, U.S. Census Bureau
Internet: www.census.gov/
Gas and hazardous liquid pipeline dataFatality and injury data for natural gas pipelines and hazardous liquid pipelines are based on reports filed with the USDOT, Pipeline and Hazardous Materials Safety Administration, Office of Pipeline Safety under 49 CFR 191 and 49 CFR 195. Accidents must be reported as soon as possible, but no later than 30 days after discovery. Undetected releases are a possible source of error; even if subsequently detected and reported, it may not be possible to accurately reconstruct the accident. Property damage figures are estimates.
Gas pipeline incidents involve: 1) releases of gas from a pipeline or liquefied natural gas (LNG) or gas from an LNG facility that results in a) death or personal injury necessitating in-patient hospitalization, or b) estimated property damage, including cost of gas lost, of the operator or others, or both, of $50,000 or more; 2) an event that results in an emergency shutdown of an LNG facility; or 3) an event that is significant, in the judgment of the operator, even though it did not meet the criteria of 1) or 2).
For hazardous liquid pipelines, an accident report is required for each failure in a pipeline system in which there is a release of the hazardous liquid or carbon dioxide transported resulting in any of the following: 1) explosion or fire not intentionally set by the operator; 2) loss of 50 or more gallons of hazardous liquid or carbon dioxide; 3) release to the atmosphere of more than 5 barrels (0.8 cubic meters) per day of highly volatile liquids; 4) death of any person; 5) bodily harm to any person resulting in one or more of the following: a) loss of consciousness, b) an individual being carried from the scene, c) medical treatment, or d) disability that prevents the discharge of normal duties or the pursuit of normal activities beyond the day of the accident; or 6) estimated property damage, including cost of cleanup and recovery, value of lost product, and damage to the property of the operator or others, or both, exceeding $50,000.
Additional information:
Contact: USDOT, Pipeline and Hazardous Materials Safety Administration, Office of Pipeline Safety
Internet: http://phmsa.dot.gov/pipeline
Government transportation revenue and expenditure dataThe U.S. Department of Commerce, U.S. Census Bureau conducts an Annual Survey of Government Finances. Alternatively, every five years, in years ending in a ‘2’or ‘7’, a Census of Governments, including a finance portion, is conducted. The survey coverage includes all state and local governments in the United States. For both the census and annual survey, the finance detail data encompass revenue, expenditure, debt, and assets. These data are the primary source of state and local government data used by BTS to produce Government Transportation Financial Statistics.

119
The data collection for the annual survey by the U.S. Census Bureau uses two methods: mail canvas and central collection from state sources. Data for local governments include counties, municipal, townships, special districts, and school districts. Data for state governments are compiled from state government audits, budgets, and other financial reports into the classification categories used for reporting by the Census Bureau.
Reporting of government finances by the Census Bureau involves presentation of data in uniform categories. While often similar to, or identical to, the classification used by the state or local government, there could be instances in which a significant difference exists between the name used by a state for a financial item and the final category to which it is assigned by the Census Bureau.
Like financial transactions are combined. The financial categories for revenue involve grouping of items by source. Revenue items of the same kind are merged. Financial transactions for expenditures are classified both by function and by object category. Debt items are classified by term (short and long term), as well as by type of debt and, to a limited extent, by purpose. Assets also are put into uniform categories, grouped by type of holding, with holdings for insurance trust systems grouped separately from general government.
The share of government sector financial totals contributed by a state government or by local governments differs materially from one state to another. Users can review the Government Finance and Employment Classification Manual for additional information regarding the financial categories. The financial amounts in the tables and files are statistical in nature and do not represent accounting statements or conditions.
The local government statistics are developed from a sample survey. Therefore, the local totals, as well as state and local aggregates, are considered estimated amounts subject to sampling error. State government finance data are not subject to sampling. Consequently, state-local aggregates for individual states are more reliable (on a relative standard error basis) than the local government estimates they include.
Additional information:
Contact: USDOC, U.S. Census Bureau, Finance Branch; or USDOT, Bureau of Transportation Statistics.
Internet: http://www.census.gov and www.bts.gov
Hazardous materials incidents dataIncidents resulting in certain unintentional releases of hazardous materials must be reported under 49 CFR 171.16. Each carrier must submit a report to the USDOT, Pipeline and Hazardous Materials Safety Administration (PHMSA) within 30 days of the incident, including information on the mode of transportation involved, results of the incident, and a narrative description of the accident. These reports are generally made available on PHMSA’s incident database within 90 days of receipt.
Fatalities and injuries are counted only if directly caused by a hazardous material. For example, a truck operator killed by impact forces during a motor vehicle crash would not be counted as a hazardous-material fatality. PHMSA contacts the submitting carrier by telephone to verify all reported fatalities.
Although PHMSA acknowledges there is some level of underreporting, it believes the underreporting is mostly limited to small, nonserious incidents. The reporting requirements were extended to intrastate highway carriers on Oct. 1, 1998. Property damage figures are estimates determined by the carrier prior to the 30-day reporting deadline and are generally not subsequently updated. Property damage figures, therefore, may underestimate actual damages.
Additional information:
Contact: USDOT, Pipeline and Hazardous Materials Safety Administration, Office of Hazardous Materials Planning and Analysis
Internet: http://phmsa.dot.gov/hazmat
Highway mileage, condition, usage, driver license, and highway vehicle registration dataData on roadway mileage, condition, and use are extracted from the Highway Performance Monitoring System (HPMS), which uses a stratified simple random sample of highway links (small sections of roadway) selected from state inventory files. The HPMS sample was designed as a fixed sample to minimize data-collection costs, but

120
adjustments to maintain adequate representation are carried out periodically. The HPMS also consists of universe reporting (a complete census) for the Interstate and the National Highway System, and tabular summary reporting of limited information.
Data are collected independently by the states, metropolitan planning organizations (MPOs), and other local jurisdictions. Many of the geometric data items (e.g., number of lanes) change slowly, while other data items (e.g., traffic volumes) are more dynamic over time. The U.S. Department of Transportation, Federal Highway Administration (FHWA) provides guidelines for data collection in the HPMS Field Manual, which the states follow to varying extents, depending on factors such as staff, resources, state perspective, uses of the data, and state/MPO/local needs for the data. State Departments of Transportation (DOTs) report HPMS data annually to FHWA.
HPMS data are subject to sampling and nonsampling error. Nonsampling error is the major concern with these data. For some of the most variable and important data items, such as traffic, guidelines for measurement and data collection have been produced. States have the option of using the guidelines or using their own procedures. Many data items are difficult and costly to collect and are reported as estimates not based on direct measurement. The data are collected and reported by many entities within the responsible organizations.
States provide vehicle registration data to FHWA. Vehicle registration data are shown on a calendar year basis. Efforts are made to exclude transfers, re-registrations, and any other factors that could result in duplication in the vehicle counts. Registration practices for commercial vehicles differ greatly among the states. Some states register a tractor-semitrailer combination as a single unit; others register the tractor and the semitrailer separately. Some states register buses with trucks or automobiles, while many states do not report house and light utility trailers separately from commercial trailers or semitrailers. Some states do not require registration of car or light utility trailers. In some instances, FHWA has supplemented the data supplied by the states with information obtained from other sources.
States also provide driver licensing data to FHWA. Although efforts are made to minimize license duplication, drivers who move from one state to another are sometimes counted in both states until the license from the previous state of residence expires. Problems with the data also arise because: 1) some individuals obtain their drivers licenses in states other than those of legal residence; 2) some individuals fraudulently obtain multiple licenses; 3) not all individuals who drive are licensed; and 4) the purging of expired licenses or licenses from deceased individuals is not performed on a continual basis.
Additional information:
Contact: USDOT, Federal Highway Administration, Office of Highway Policy Information
Print source: USDOT, Federal Highway Administration, Highway Statistics (Washington, DC: Annual Issues).
Internet: http://www.fhwa.dot.gov/policyinformation/statistics.cfm
Highway safety dataFatalities: Highway fatality data are extracted from the Fatality Analysis Reporting System (FARS), which is compiled by USDOT National Highway Traffic Safety Administration (NHTSA). Data are gathered from a census of police accident reports (PARs), state vehicle registration files, state drivers licensing files, state highway department data, vital statistics, death certificates, coroner/medical examiner reports, hospital medical reports, and emergency medical service reports. A separate form is completed for each fatal crash. Blood alcohol concentration (BAC) is estimated when not known. Statistical procedures used for unknown data in the FARS can be found in the NHTSA report, A Method for Estimating Posterior BAC Distributions for Persons Involved in Fatal Traffic Accidents, DOT HS 807 094 (Washington, DC: July 1986).
Data are collected from relevant state agencies and electronically submitted for inclusion in the FARs database on a continuous basis. Cross-verification of PARs with death certificates helps prevent undercounting. Moreover, when data are entered, they are checked automatically for acceptable range values and consistency, enabling quick corrections when necessary. Several programs continually monitor the data for completeness and accuracy. Periodically, sample cases are analyzed for accuracy and consistency.
FARS data do not include motor vehicle fatalities on nonpublic roads. These are thought to account for about 2 percent or fewer of the total motor vehicle fatalities per year.
Injuries and crashes: NHTSA’s General Estimates System (GES) data are a nationally representative sample of police-reported crashes that contributed to an injury or fatality or resulted in property damage and involved at least

121
one motor vehicle traveling on a traffic way. GES data collectors randomly sample PARs and forward copies to a central contractor for coding into a standard GES system format. Documents such as police diagrams or supporting text provided by the officers might be further reviewed to complete a data entry.
Additional information:
Contact: USDOT, National Highway Traffic Safety Administration, National Center for Statistics and Analysis
Print source: USDOT, National Highway Traffic Safety Administration, Traffic Safety Facts (Washington, DC: Annual Issues).
Internet: http://www.nhtsa.gov
International visitors dataData on international visitors to the United States are based on international arrivals by air to the United States (excluding those from Canada and Mexico). Information is derived from the U.S. Department of Homeland Security Customs and Border Protection’s Visitor Arrivals Program (I-94) and the U.S. Department of Commerce, Tourism Industries Office’s Survey of International Air Travelers. The survey obtains data on overseas travel patterns, characteristics, and spending patterns of international travelers to and from the United States. Between 69,000 and 95,000 travelers are surveyed each year. The survey results are weighted so that they represent the international travel populations of U.S. residents and nonresidents based on U.S. Customs and Border Protection’s data.
Additional information:
Contact: U.S. Department of Commerce (USDOC), International Trade Administration, Tourism Industries Office
Print source: USDOC, International Trade Administration, Office of Travel and Tourism Industries, Overseas Visitors to Select U.S. States and Territories (Washington, DC: Annual Issues); and USDOC, International Trade Administration, Office of Travel and Tourism Industries, Overseas Visitors to Select U.S. Cities/Hawaiian Islands (Washington, DC: Annual Issues).
Internet: http://tinet.ita.doc.gov
Railroad industry and shipments dataThe Association of American Railroads (AAR) database aggregates data from several sources and covers the freight railroad industry and movement of freight, both nationally and statewide. The state-level data include commerce, employment, and financial contributions.
The primary source of data for Class I railroads is Schedule 702 of the R-1 Annual Report to the Surface Transportation Board (STB) by individual carriers (100 percent reporting) and the Carload Waybill Sample. The primary source of data for non-Class I railroads is AAR’s Profiles of U.S. Railroads from statistics supplied annually by nearly all operating U.S. freight railroads. Some of the data are estimated based on more aggregated, national figures.
The STB defines Class I railroads as having operating revenues at or above a threshold indexed to a base of $250 million (1991) and adjusted annually in concert with changes in the Railroad Freight Rate Index published by the Bureau of Labor Statistics. In 2013, the STB Class I threshold was annual operating revenue of $467.0 million. Declassification from Class I status occurs when a railroad falls below the applicable threshold for three consecutive years. Although few in number, Class I railroads account for over 90 percent of the industry’s revenue.
AAR determines the number of non-Class I railroads through an annual survey sent to each U.S. freight railroad.
Historical reliability may vary due to changes in the railroad industry, including bankruptcies, mergers, and declassification by STB. Small data errors may also have occurred because of independent rounding in this series by AAR.
Additional information:
Contact: AAR, Policy and Economics Department
Internet: http://www.aar.org

122
Railroad safety dataRailroads are required to file a report for each accident or incident to the Federal Railroad Administration (FRA). These include: 1) train accidents, reported on Form F 6180.54, comprised of collisions, derailments, and other events involving the operation of on-track equipment and causing reportable damage above an established threshold ($9,900 for 2013); 2) highway-rail grade crossing incidents, reported on Form F 6180.57, involving an impact between railroad on-track equipment and highway users at crossings; and 3) other incidents, reported on Form F 6180.55a, involving all other reportable incidents or exposures that cause a fatality or injury to any person or an occupational illness to a railroad employee.
Railroads are required by FRA regulations to use the current FRA Guide for Preparing Accident/Incident Reports when preparing reports.
The Systems Support Division of FRA maintains the Railroad Accident/Incident Reporting System (RAIRS), consisting of four databases: rail equipment, injury/illness, grade-crossing accidents, and railroad summary (freight and passenger). These databases include information on all railroad accidents, grade-crossing accidents, railroad employee casualties, and any other injuries on railroad property, and provide the basis for accident analyses and assessment as well as annual reports. The databases are updated monthly from information submitted by the railroads.
Additional information:
Contact: USDOT, Federal Railroad Administration, Office of Safety
Print publication: USDOT, Federal Railroad Administration, Railroad Safety Statistics (Washington, DC: Annual Issues).
Internet: http://www.fra.dot.gov
Recreational boating safety and registration dataThe U.S. Coast Guard, of the U.S. Department of Homeland Security, collects data on recreational boating accidents from two sources: 1) Boating Accident Report (BAR) data forwarded to the Coast Guard by jurisdictions with an approved boat numbering and casualty reporting system, and 2) reports of Coast Guard investigations of fatal boating accidents that occurred on waters under federal jurisdiction. Recreational Boating Accident Investigation data are used if submitted to the Coast Guard and are relied on as much as possible to provide accident statistics. In the absence of investigations, information is collected from reports filed by boat operators.
Boat operators are required to file a BAR if an accident results in 1) loss of life, 2) personal injury that requires medical treatment beyond first aid, 3) damage to the vessel and other property exceeding $2,000, or complete loss of the vessel, or 4) disappearance of a person from the vessel under circumstances that indicate death or injury.
Boat operators are required to report their accidents to authorities in the state where the accident occurred. States with approved boat numbering systems furnish the Coast Guard with BAR data. The minimum reporting requirements are set by federal regulation, but states are allowed to have stricter requirements. The Coast Guard reports recreational boating safety data in their report Boating Statistics, which covers accidents meeting the federal minimum reporting requirements.
The data in Boating Statistics cover boating accidents reported on waters of joint federal and state jurisdiction and exclusive state jurisdiction.
The Coast Guard believes nearly all fatal accidents and most boating accidents that result in serious injury (i.e., hospital admission) are included in Boating Statistics. A smaller percentage of nonfatal accidents are reported because of reporting thresholds, ignorance of the law, and difficulties enforcing the law. Federal law does not require the reporting of accidents on private waters where states have no jurisdiction. Reports of accidents on such waters are included when received by the Coast Guard if they satisfy the other requirements of inclusion. Accidents excluded are those in which the boat was used as a platform for other activities (e.g., swimming), and those in which a person dies of natural causes aboard a boat. However, the data do include accidents involving people in the water who are struck by their boat or another boat.
Additional information:
Contact: U.S. Department of Homeland Security (USDHS), U.S. Coast Guard, Office of Boating Safety

123
Print source: USDHS, U.S. Coast Guard, Office of Boating Safety, Boating Statistics (Washington, DC: Annual Issues).
Internet: http://www.uscgboating.org
Transborder freight dataThe TransBorder Freight Data is extracted from the Census Bureau’s Foreign Trade Statistics Program and made available by the Bureau of Transportation Statistics. Import and export data are extracted from administrative records required by the Departments of Commerce and Treasury. This dataset incorporates all shipments entering or exiting the United States by modes of transport to and from Canada or Mexico. Prior to January 1997, this dataset also included transhipments in its detailed tables (i.e., shipments entering or exiting the United States by way of U.S. Customs ports on the northern or southern borders, even when the actual origin or final destination of the goods was other than Canada or Mexico).
Users should be aware that the trade data fields (e.g., value and commodity classification) are typically more rigorously reviewed than transportation data fields (i.e., mode of transportation and port of entry/exit). Also, although this dataset provides information for individual Customs districts and ports on the northern and southern borders, filing procedures for trade documents do not always correspond to the port where goods physically crossed the border. This is because the filer of information may choose to file trade documents at one port, while shipments actually enter or exit at another port.
Import data are generally more accurate than export data primarily because Customs uses import documents for enforcement purposes, while it performs no similar function for exports.
Additional information:
Contact: USDOT, Bureau of Transportation Statistics
Internet: http://www.bts.gov
Transit operating, financial, and safety dataTransit data are from the National Transit Database (NTD) produced by the USDOT, Federal Transit Administration (FTA). Data are collected from transit agencies that receive Urbanized Area Formula Program funds. Transit operators that do not report to FTA are those that do not receive federal funding, typically private, small, and rural operators. FTA reviews and validates information submitted by individual transit agencies. Reliability may vary because some transit agencies cannot obtain accurate information or may interpret certain data definitions differently than intended.
In 2013, 849 agencies submitted data to the NTD. Of that, 536 agencies submitted full reports, 282 agencies submitted small systems waivers for agencies that operate 30 or fewer vehicles across all modes and types of service, 5 agencies submitted reporting separately, and 26 received a waiver from detailed reporting. In total, 786 agencies are included in the NTD database. Data are collected on a range of variables including capital and operating funding, transit service supplied and consumed, and transit safety and security. Transit operators must report fatalities, injuries, accidents, incidents, and property damage in excess of $25,000.
Additional information:
Contact: USDOT, Federal Transit Administration
Print source: USDOT, Federal Transit Administration, Data Tables (Washington, DC: Annual Issues); and USDOT, Federal Transit Administration, National Transit Database Reporting Manual (Washington, DC: Annual Issues).
Internet: http://www.ntdprogram.gov/ntdprogram/
Transportation establishment, employees, and payroll dataData on employees, establishments, and payroll are taken from County Business Patterns, a database of employment in the United States using the North American Industry Classification System (NAICS). Data are collected annually. Data are extracted from the Business Register, the Census Bureau’s file of all known single and multi-establishment companies. The Annual Company Organization Survey and quinquennial Economic Censuses provide individual establishment data for multi-location firms. Data for single-location firms are obtained from various

124
programs conducted by the Census Bureau, such as the Economic Censuses, the Annual Survey of Manufacturer, and Current Business Surveys. They are also obtained from administrative records of the Internal Revenue Service, the Social Security Administration, and the Bureau of Labor Statistics.
Additional information:
Contact: USDOC, U.S. Census Bureau, Economic Planning and Coordination Division
Internet: http://www.census.gov/econ/cbp/index.html
Waterborne shipments dataThe U.S. Army Corps of Engineers’ (Corps) Navigation Data Center (NDC) collects data on waterborne commodity and vessel movements, domestic commercial vessel characteristics, port and waterway facilities, and navigation dredging projects.
The NDC’s databases contain information on physical characteristics, infrastructure, and commodities for principal facilities on the U.S. coast, Great Lakes, and inland ports. The data consist of listings of port area’s waterfront facilities, including information on berthing, cranes, transit sheds, grain elevators, marine repair plants, fleeting areas, and docking and storage facilities.
All vessel operators of record report their domestic waterborne traffic movements to the Corps via ENG Forms 3925 and 3925b. Cargo movements are reported according to points of loading and unloading. Excluded cargo movements are: 1) cargo carried on general ferries, 2) coal and petroleum products loaded from shore facilities directly into vessels for fuel use, 3) military cargo moved in U.S. Department of Defense vessels, and 4) cargo weighing less than 100 tons moved on government equipment. The Corps calculates ton-miles by multiplying the cargo’s tonnage by the distance between points of loading and unloading.
An annual survey of companies that operate inland waterway vessels is the principal source of data for inland nonself-propelled, self-propelled, flag passenger, and cargo vessels. More than 3,000 surveys are sent to these companies, and response rates are typically above 90 percent.
Additional information:
Contact: U.S. Army Corps of Engineers, Waterborne Commerce Statistics Center
Print source: U.S. Army Corps of Engineers, Waterborne Commerce of the United States (New Orleans, LA: Annual Issues).
Internet: http://www.navigationdatacenter.us/data/datawcus.htm

125
Appendix B: Data Sources and Availability
Publication/database Source Website Tables Update available (approx.)
Air Carrier Activity Information System (ACAIS)
U.S. DOT, Federal Aviation Administration, Office of Airports
http://www.faa.gov/airports/planning_capacity/passenger_allcargo_stats/passenger/
3-9 4th quarter
Air Carrier Statistics U.S. DOT, Bureau of Transportation Statistics, Office of Airline Information
http://www.transtats.bts.gov/ 1-11, 1-12, 3-8, 4-6, 4-7 3rd quarter
AirData U.S. EPA http://www.epa.gov/airdata/ 7-7 4th quarterAirport Facilities Data U.S. DOT, Federal Aviation
Administration, Office of Aeronautical Information Services
http://www.faa.gov/airports/airport_safety/ 1-10 Bimonthly
Alcohol-Impaired Driving U.S. DOT, National Highway Traffic Safety Administration
http://www-nrd.nhtsa.dot.gov/CMSWeb/index.aspx
2-8 4th quarter
Alternative Fueling Stations U.S. DOE, Office of Energy Efficiency and Renewable Energy, Alternative Fuels and Advanced Vehicles Data Center
http://www.afdc.energy.gov/ 7-6 Monthly
Alternatives to Traditional Transportation Fuels
U.S. DOE, Energy Information Administration, Office of Energy Consumption and Efficiency Statistics
http://www.eia.gov/renewable/ 7-5 4th quarter
American Community Survey U.S. Census Bureau http://www.census.gov/programs-surveys/acs/
4-1 4th quarter
Boating Registration U.S. Coast Guard, Office of Auxiliary and Boating Safety
http://www.uscgboating.org/ 5-6 2nd quarter
Boating Statistics U.S. Coast Guard, Office of Auxiliary and Boating Safety
http://www.uscgboating.org 2-17, 2-18 2nd quarter
Border Crossing/Entry Data U.S. DOT, Bureau of Transportation Statistics
http://www.bts.gov/programs/international 3-12, 3-13, 3-14, 3-15, 3-16, 3-17, 3-18, 3-19, 3-20, 3-21, 3-22, 3-23, 4-9, 4-10, 4-11, 4-12, 4-13, 4-14, 4-15, 4-16, 4-17, 4-18, 4-19, 4-20
2nd quarter
Commodity Flow Survey U.S. DOT, Bureau of Transportation Statistics
http://www.bts.gov/publications/commodity_flow_survey/
3-1, 3-2, 3-3 2012 (quinquennial)
County Business Patterns U.S. Census Bureau http://www.census.gov/econ/cbp/index.html 6-1, 6-2, 6-3, 6-4, 6-5, 6-6 2nd quarter
Cruise Passenger Statistics U.S. DOT, Maritime Administration http://www.marad.dot.gov/resources/data-statistics/
4-8 2nd quarter
Fatality Analysis Reporting System Encyclopedia
U.S. DOT, National Highway Traffic Safety Administration
http://www-fars.nhtsa.dot.gov/Main/index.aspx
2-1, 2-2, 2-3, 2-7, 2-25, 2-26 4th quarter
Gasoline Prices by Formulation, Grade, Sales Type
U.S. DOE, Energy Information Administration
http://www.eia.gov/dnav/pet/pet_pri_allmg_a_epm0_pta_dpgal_a.htm
6-11 4th quarter
General Aviation and Part 135 Activity Surveys
U.S. DOT, Federal Aviation Administration
http://www.faa.gov/data_research/aviation_data_statistics/general_aviation/
5-7 1st quarter
Hazmat Summary by State U.S. DOT, PHMSA, Office of Hazardous Material Safety
http://www.phmsa.dot.gov/hazmat/library/data-stats/incidents
2-19, 2-20 Monthly
Highway Statistics U.S. DOT, Federal Highway Administration
http://www.fhwa.dot.gov/policyinformation/statistics.cfm
1-1, 1-2, 1-4, 2-1, 4-2, 5-1, 5-2, 5-3, 5-4, 6-12, 7-4
1st quarter
Maritime Statistics U.S. DOT, Maritime Administration http://www.marad.dot.gov/resources/data-statistics/
3-6, 3-7 3rd quarter
Maximum Posted Speed Limits for Passenger Vehicles
Insurance Institute for Highway Safety, Highway Loss Data Institute
http://www.iihs.org/iihs/topics/laws/speedlimits?topicName=speed
2-9 Monthly
Motorcycle and Bicycle Helmet Laws
Insurance Institute for Highway Safety, Highway Loss Data Institute
http://www.iihs.org/iihs/topics#statelaws 2-5 Monthly
National Bridge Inventory U.S. DOT, Federal Highway Administration, Office of Bridge Technology
http://www.fhwa.dot.gov/bridge/nbi.cfm 1-5, 1-6, 1-7 4th quarter
National Transit Database U.S. DOT, Federal Transit Administration
http://www.ntdprogram.gov 1-8, 1-9, 2-16, 4-3, 4-4 3rd quarter
Overseas Visitors to Selected U.S. States and Territories and Overseas Visitors to Select U.S. Cities/Hawaiian Islands
U.S. Dept. of Commerce, International Trade Administration, Office of Travel & Tourism Industries
http://travel.trade.gov/ 4-21, 4-22 2nd quarter
Pipeline Statistics U.S. DOT, PHMSA, Office of Pipeline Safety
http://www.phmsa.dot.gov/pipeline 2-21, 2-22, 2-23 2nd quarter
Population Estimates U.S. Department of Commerce, U.S. Census Bureau
http://www.census.gov/popest/index.html 2-1, 2-7, 2-26, 5-3, 7-3, 7-4 2nd quarter
Office of Safety Analysis U.S. DOT, Federal Railroad Administration, Office of Safety Analysis
http://safetydata.fra.dot.gov/OfficeofSafety 2-10, 2-11, 2-12, 2-13, 2-14, 2-15
4th quarter
Railroads and States Association of American Railroads http://www.aar.org 1-13, 1-14, 3-4, 6-7 2nd quarterSafety Belt Use U.S. DOT, National Highway Traffic
Safety Administration http://www-nrd.nhtsa.dot.gov/CMSWeb/index.aspx
2-6 3rd quarter
Safety Belt Use Laws Insurance Institute for Highway Safety, Highway Loss Data Institute
http://www.iihs.org/iihs/topics/laws/safetybeltuse
2-4 Monthly
Appendix B: Data Sources and Availability

126
KEY: PHMSA = Pipeline and Hazardous Materials Safety Administration; MARAD = Maritime Administration; U.S. DOE = U.S. Department of Energy; U.S. DOT = U.S. Department of Transportation; U.S. EPA = U.S. Environmental Protection Agency.
Appendix B: Data Sources and Availability (continued)
Publication/database Source Website Tables Update available (approx.)
Appendix B: Data Sources and Availability
State and Local Government Finances
U.S. Department of Commerce, U.S. Census Bureau
https://www.census.gov/govs/local/ 6-8, 6-9 3rd quarter
State Energy Data System U.S. Dept. of Energy, Energy Information Administration
http://www.eia.gov/state/seds/seds-data-complete.cfm#consumption
7-1, 7-2, 7-3 2nd quarter
State Fact Sheets National Passenger Railroad Corporation (Amtrak), News & Media
http://www.amtrak.com/servlet/ContentServer?c=Page&pagename=am%2FLayout&cid=1246041980432
4-5 Annual
State Laws U.S. DOT, National Highway Traffic Safety Administration
http://www.distraction.gov/ 2-24 Regular
Survey of State Funding for Pub American Association of State Highway and Transportation Officials
http://scopt.transportation.org/Pages/MTAPPublications.aspx
6-10 2nd quarter
Toll Facilities in the United States: Bridges-Roads-Tunnels-Ferries
U.S. DOT, Federal Highway Administration
http://www.fhwa.dot.gov/ohim/tollpage.htm 1-3 no historical information
Transborder Surface Freight Data
U.S. DOT, Bureau of Transportation Statistics
http://www.bts.gov/programs/international/transborder/
3-10, 3-11, 3-24 1st quarter
U.S. Civil Airmen Statistics U.S. DOT, Federal Aviation Administration
http://www.faa.gov/data_research/aviation_data_statistics/civil_airmen_statistics/
5-8 3rd quarter
Urban Mobility Report Texas Transportation Institute http://mobility.tamu.edu/ums/ 5-5 3rd quarterUSA Trade Online U.S. Department of Commerce, U.S.
Census Bureauhttps://usatrade.census.gov/ 3-24 Regular
Waterborne Commerce in the United States
U.S. Army Corps of Engineers, Navigation Data Center
http://www.navigationdatacenter.us/ 1-15, 1-16, 3-5, 3-24 4th quarter
KEY: PHMSA = Pipeline and Hazardous Materials Safety Administration; MARAD = Maritime Administration; U.S. DOE = U.S. Department of Energy; U.S. DOT = U.S. Department of Transportation; U.S. EPA = U.S. Environmental Protection Agency.

127
State Agency Website address Alabama Alabama Department of Transportation www.dot.state.al.usAlaska Alaska Department of Transportation and Public Facilities www.dot.state.ak.usArizona Arizona Department of Transportation www.azdot.govArkansas Arkansas State Highway and Transportation Department www.arkansashighways.comCalifornia California Department of Transportation www.dot.ca.govColorado Colorado Department of Transportation www.codot.govConnecticut Connecticut Department of Transportation www.ct.gov/dotDelaware Delaware Department of Transportation www.deldot.govDistrict of Columbia District Department of Transportation www.ddot.dc.govFlorida Florida Department of Transportation www.dot.state.fl.usGeorgia Georgia Department of Transportation www.dot.ga.govHawaii State of Hawaii Department of Transportation hidot.hawaii.govIdaho Idaho Transportation Department www.itd.idaho.govIllinois Illinois Department of Transportation www.idot.illinois.govIndiana Indiana Department of Transportation www.in.gov/indotIowa Iowa Department of Transportation www.iowadot.govKansas Kansas Department of Transportation www.ksdot.orgKentucky Kentucky Transportation Cabinet www.transportation.ky.govLouisiana Louisiana Department of Transportation and Development wwwsp.dotd.la.govMaine Maine Department of Transportation www.maine.gov/mdotMaryland Maryland Department of Transportation www.mdot.maryland.govMassachusetts Massachusetts Department of Transportation www.massdot.state.ma.usMichigan Michigan Department of Transportation www.michigan.gov/mdotMinnesota Minnesota Department of Transportation www.dot.state.mn.us Mississippi Mississippi Department of Transportation mdot.ms.govMissouri Missouri Department of Transportation www.modot.orgMontana Montana Department of Transportation www.mdt.mt.govNebraska Nebraska Department of Roads roads.nebraska.govNevada Nevada Department of Transportation www.nevadadot.comNew Hampshire New Hampshire Department of Transportation www.nh.gov/dotNew Jersey New Jersey Department of Transportation www.state.nj.us/transportationNew Mexico New Mexico Department of Transportation www.dot.state.nm.usNew York New York State Department of Transportation www.dot.ny.govNorth Carolina North Carolina Department of Transportation www.ncdot.orgNorth Dakota North Dakota Department of Transportation www.dot.nd.govOhio Ohio Department of Transportation www.dot.state.oh.usOklahoma Oklahoma Department of Transportation www.okladot.state.ok.usOregon Oregon Department of Transportation www.oregon.gov/odotPennsylvania Pennsylvania Department of Transportation www.dot.state.pa.usRhode Island Rhode Island Department of Transportation www.dot.ri.govSouth Carolina South Carolina Department of Transportation www.dot.state.sc.usSouth Dakota South Dakota Department of Transportation www.sddot.comTennessee Tennessee Department of Transportation www.tn.gov/tdotTexas Texas Department of Transportation www.txdot.govUtah Utah Department of Transportation www.udot.utah.govVermont Vermont Agency of Transportation vtrans.vermont.govVirginia Virginia Department of Transportation www.virginiadot.orgWashington Washington State Department of Transporation www.wsdot.wa.govWest Virginia West Virginia Department of Tranportation www.transportation.wv.govWisconsin Wisconsin Department of Transportation wisconsindot.govWyoming Wyoming Department of Transportation www.dot.state.wy.usUnited States U.S. Department of Transportation www.transportation.gov
Appendix C: State Departments of TransportationAppendix C: State Departments of Transportation
128
Appendix D: GlossaryAir taxi: For-hire passenger or cargo aircraft operations in accordance with Federal Aviation Regulations (FAR) Part 135. An air taxi operates on an on-demand basis and does not meet the flight schedule qualifications of a commuter air carrier.
British thermal unit (Btu): The amount of energy required to raise the temperature of 1 pound of water 1 degree Fahrenheit (F) at or near 39.2 degrees F and 1 atmosphere of pressure.
Bus rapid transit: Fixed-route bus systems that either operate their routes predominantly on fixed-guideways (other than on highway high occupancy vehicle or shoulder lanes, such as for commuter bus service) or that operate routes of high-frequency service with the following elements: Substantial transit stations, traffic signal priority or pre-emption, low-floor vehicles or level-platform boarding, and separate branding of the service. High-frequency service is defined as 10-minute peak and 15-minute off-peak headways for at least 14 hours of service operations per day. This mode may include portions of service that are fixed-guideway and non-fixed guideway.
Certificated airport: An airport holding an operating certificate issued by the Federal Aviation Administration in accordance with Code of Federal Regulations (CFR) Title 14, Chapter 1, Part 139 allowing it to serve scheduled or nonscheduled air carrier aircraft designed for more than 30 passengers.
Class I (rail): As defined by the Surface Transportation Board in 2013, a Class I Railroad is a railroad with operating revenues of at least $467.0 million.
Commuter bus: Fixed-route bus systems that are primarily connecting outlying areas with a central city through bus service that operates with at least five miles of continuous closed-door service. This service typically operates using motorcoaches and usually features peak scheduling, multiple-trip tickets, and multiple stops in outlying areas with limited stops in the central city.
Commuter rail: A transit mode that is an electric or diesel propelled railway for urban passenger train service consisting of local short distance travel operating between a central city and adjacent suburbs. Service must be operated on a regular basis by or under contract with a transit operator for the purpose of transporting passengers within urbanized areas (UZAs), or between urbanized areas and outlying
areas. Such rail service, using either locomotive hauled or self-propelled railroad passenger cars, is generally characterized by multi-trip tickets, specific station to station fares, railroad employment practices, and usually only one or two stations in the central business district. It does not include: heavy rail rapid transit or light rail / streetcar transit service. Intercity rail service is excluded, except for that portion of such service that is operated by or under contract with a public transit agency for predominantly commuter services.
Container: A box-like device used to store, protect, and handle a number of packages or items as a unit of transit that can be interchanged between trucks, trains, and ships without rehandling the contents. State Transportation
Controlled right-of-way: Lanes restricted for at least a portion of the day for use by transit vehicles and other high occupancy vehicles (HOVs).
Demand response: A transit mode comprised of passenger cars, vans or small buses operating in response to calls from passengers or their agents to the transit operator, who then dispatches a vehicle to pick up the passengers and transport them to their destinations. Service is usually provided using cars, vans, or buses with fewer than 25 seats.
Directional route-miles: The mileage in each direction over which public transportation vehicles travel while in revenue service. Directional route-miles are a measure of the facility or roadway, not the service carried on the facility such as the number of routes or vehicle-miles. Directional route-miles are computed with regard to direction of service, but without regard to the number of traffic lanes or rail tracks existing in the right-of-way.
Dry-bulk carrier (water): A ship with specialized holds for carrying dry cargo such as coal, grain, and iron ore in unpackaged bulk form.
Enplanements: The total number of revenue passengers boarding aircraft.
Exclusive right-of-way: Lanes reserved at all times for transit use and other high occupancy vehicles (HOVs).
Ferryboat (transit): Vessels for carrying passengers and / or vehicles over a body of water. The vessels are generally diesel powered conventional ferry vessels. They may also be hovercraft, hydrofoil and other high-speed vessels. The vessel is limited in its use to the carriage of deck passengers or vehicles or both, oper-ates on a short run on a frequent schedule between two points over the most direct water routes other

129
than in ocean or coastwise service, and is offered as a public service of a type normally attributed to a bridge or tunnel.
Full containership: Ships equipped with permanent container cells, with little or no space for other types of cargo.
General aviation: Civil aviation activity except that of air carriers operated in accordance with Federal Aviation Regulation (FAR) Parts 121, 123, 127, and 135. The types of aircraft used in general aviation range from corporate multi-engine jet aircraft piloted by professional crews to amateur-built single engine piston acrobatic planes, balloons, and dirigibles.
Heavy rail: A transit mode that is an electric railway with the capacity for a heavy volume of traffic. It is characterized by high speed and rapid acceleration passenger rail cars operating singly or in multi-car trains on fixed rails, separate rights-of-way from which all other vehicular and foot traffic are excluded, sophisticated signaling, and high platform loading. Also known as "subway", "elevated (railway)", or "metropolitan railway (metro)".
Hybrid rail: Rail System Primarily operating routes on the National system of railroads, but not operating with the characteristics of commuter rail. This service typically operates light rail-type vehicles as diesel multiple-unit trains. These trains do not meet Federal Railroad Administration standards, and so must operate with temporal separation from freight rail traffic.
Light rail: A transit mode that typically is an electric railway with a light volume traffic capacity compared to heavy rail. It is characterized by passenger rail cars operating singly (or in short, usually two car, trains) on fixed rails in shared or exclusive right-of-way, low or high platform loading, and vehicle power drawn from an overhead electric line via a trolley or a pantograph.
Local railroad: A railroad which is neither a Class I nor a Regional Railroad, and is engaged primarily in line-haul services.
Major arterial highway: A major highway used primarily for through traffic.
Metric ton: 2,205 pounds (2,000 pounds divided by 0.907).
Minor arterial: In rural areas, roads linking cities and larger towns. In urban areas, roads distributing trips to small geographic areas but not penetrating identifiable neighborhoods.
Minor collector highway: In rural areas, routes that serve intracounty rather than statewide travel. In urban areas, streets that provide direct access to neighborhoods and arterials.
Mixed right-of-way: Lanes used for general automobile traffic.
Motorbus: A transit mode comprised of rubber-tired passenger vehicles operating on fixed routes and schedules over roadways. Vehicles are powered by diesel, gasoline, battery, or alternative fuel engines contained within the vehicle.
Natural gas distribution pipeline: Smaller than transmission pipelines and maintained by companies that distribute natural gas locally (intrastate). Distribution pipeline systems are analogous to networks of lesser roads and residential streets that people travel after getting off the freeway.
Natural gas transmission pipeline: Analogous to a major freeway, it is the main interstate transportation route for moving large amounts of natural gas from the source of production to points of distribution. Transmission pipelines are designed to move large amounts of natural gas from areas where the gas is extracted and stored to the local distribution companies that provide natural gas to homes and businesses.
Principal arterial highway: Major streets or highways, many of multilane or freeway design, serving high-volume traffic corridor movements that connect major generators of travel.
Regional railroad: A non-Class I, line-haul railroad operating 350 or more miles of road or with revenues of at least $40 million or both.
Short ton: 2,000 pounds.
Streetcar rail: This mode is for rail transit systems operating entire routes predominantly on streets in mixed-traffic. This service typically operates with single-car trains powered by overhead catenaries and with frequent stops.
Switching and terminal railroad: A non-Class I Railroad engaged primarily in switching and/or terminal services for other railroads
Tanker: An oceangoing ship designed to haul liquid bulk cargo in world trade.
Ton-mile: The movement of one ton of cargo the distance of one statute mile.

130
Trackage rights: The authority of one railroad to use the tracks of another railroad for a fee.
Trolley bus: A transit mode comprised of electric rubber-tired passenger vehicles, manually steered and operating singly on city streets. Vehicles are propelled by a motor drawing current through overhead wires via trolleys, from a central power source not onboard the vehicle.
Unlinked passenger trips: The number of passengers boarding public transportation vehicles. A passenger is counted each time he or she boards a vehicle even if the boarding is part of the same journey from origin to destination.
Vanpool: A transit mode comprised of vans, small buses and other vehicles operating as a ride sharing arrangement, providing transportation to a group of individuals traveling directly between their homes and a regular destination within the same geographical area. The vehicles shall have a minimum seating capacity of seven persons, including the driver.
Vehicle-miles traveled (highway): Miles of travel by all types of motor vehicles as determined by the states on the basis of actual traffic counts and established estimating procedures.
Wigwag (railroad): An early 20th century railroad grade crossing signal that uses a pendulum like motion to signal the approach of a train.

Sta
te
Tr
an
sp
or
tatio
n S
tatis
tics
20
15
Printed on paper containing recycled post consumer waste paper.Bureau of Transportation Statistics
State Transportation Statistics 2015