2015 Tabor City Comprehensive Transportation Plan
136
2015 Tabor City Comprehensive Transportation Plan
-
Upload
khangminh22 -
Category
Documents
-
view
1 -
download
0
Transcript of 2015 Tabor City Comprehensive Transportation Plan

2015 Tabor City Comprehensive Transportation Plan


2015 Tabor City Comprehensive Transportation Plan
Prepared by: Suzette Morales, EI, Project Engineer Scott Walston, PE, Triangle Planning Group Supervisor
Transportation Planning Branch N.C. Department of Transportation In Cooperation with: Tabor City
Columbus County Cape Fear Area Rural Planning Organization
Published: June 2015
Scott Walston, PE Triangle Planning Group Supervisor


Table of Contents
Executive Summary .......................................................................................i
Chapter 1: Analysis of the Existing and Future Transportation System
1.1 Analysis Methodology and Data Requirements ........................................1-1
a) Roadway System Analysis .................................................................1-1
i. Traffic Crash Assessment .........................................................1-3 ii. Bridge Deficiency Assessment .................................................1-3
b) Public Transportation and Rail ...........................................................1-11
i. Public Transportation ................................................................1-11 ii. Rail ...........................................................................................1-12
c) Bicycles and Pedestrians ...................................................................1-12
d) Land Use ............................................................................................1-13
1.2 Consideration of the Natural and Human Environment .............................1-14
1.3 Public Involvement ....................................................................................1-15
Chapter 2: Recommendations
2.1 Implementation .........................................................................................2-1 2.2 Problem Statements .................................................................................2-2
a) Highway .............................................................................................2-3 b) Public Transportation and Rail ...........................................................2-14 c) Bicycle ................................................................................................2-15 d) Pedestrian ..........................................................................................2-17 e) Multi-Use Path ....................................................................................2-20
Appendices
Appendix A: Resources and Contacts ....................................................................A-1 Appendix B: Comprehensive Transportation Plan Definitions ................................B-1 Appendix C: CTP Inventory and Recommendations ..............................................C-1 Appendix D: Typical Cross-Sections ......................................................................D-1 Appendix E: Level of Service Definitions ................................................................E-1 Appendix F: Bridge Deficiency Assessment ...........................................................F-1 Appendix G: Socio-Economic Data Forecasting Methodology ................................G-1 Appendix H: Public Involvement .............................................................................H-1 Appendix I: Tabor City Special Traffic Counts .......................................................I-1

List of Figures
Figure 1: Comprehensive Transportation Plan .......................................................iii Figure 2: 2012 Volumes and Capacity Deficiencies ...............................................1-5 Figure 3: 2040 Volumes and Capacity Deficiencies ...............................................1-7 Figure 4: High Frequency Crash Locations ............................................................1-9 Figure 5: Zoning Jurisdictions .................................................................................1-17 Figure 6: Environmental Features Map- Primary ....................................................1-19 Figure 7: Environmental Features Map 2- Primary .................................................1-21 Figure 8: Environmental Features Map 3- Secondary ............................................1-23 Figure 9: Environmental Features Map 4- 100-Year Flood ....................................1-25 Figure 10: US 701 BYP and US 701 BUS (Hickman Road) Merge .........................2-11 Figure 11: “Typical” Highway Cross Sections .........................................................D-2 Figure 12: Level of Service Illustrations ..................................................................E-2 Figure 13: Traffic Analysis Zones, External Stations, AADT Locations ...................G-13 Figure 14: Tabor City, Planning Area, Township, 2010 Census Boundaries ...........G-15 Figure 15: Tabor City Labor Day Holiday Traffic Counts - Friday ............................I-2 Figure 16: Tabor City Labor Day Holiday Traffic Counts - Saturday .......................I-2 Figure 17: Tabor City Labor Day Holiday Traffic Counts - Monday .........................I-3 Figure 18: Tabor City Summer Traffic Counts - Tuesday ........................................I-3 Figure 19: Tabor City Summer Traffic Counts - Friday ............................................I-4 Figure 20: Tabor City Summer Traffic Counts - Saturday .......................................I-4
List of Tables
Table 1: Environmental Features ...........................................................................1-15 Table 2: US 701 Volumes and Capacity (R-5013) .................................................2-4 Table 3: US 701 Labor Day Weekend Traffic Volume vs AADT and Capacity ........2-5 Table 4: CTP Inventory and Recommendations ......................................................C-3 Table 5: Base Year (2012) Parameters ...................................................................G-4 Table 6: Through Trip Table Base Year (2012) .......................................................G-5 Table 7: External-Internal Trip Table Base Year (2012) ..........................................G-5 Table 8: Internal-External Trip Table Base Year (2012) ..........................................G-6 Table 9: Internal-Internal Trip Table Base Year (2012) ...........................................G-6 Table 10: Historical Socioeconomic Data ................................................................G-8 Table 11: Planning Area Growth Projections ...........................................................G-8 Table 12: Zone Distribution of Socioeconomic Data ...............................................G-9 Table 13: Cordon Station Travel .............................................................................G-9 Table 14: Through Trip Table Design Year (2040) ..................................................G-10 Table 15: External-Internal Trip Table Design Year (2040) .....................................G-10 Table 16: Internal-External Trip Table Design Year (2040) .....................................G-10 Table 17: Internal-Internal Trip Table for Design Year (2040) .................................G-11

i
Executive Summary
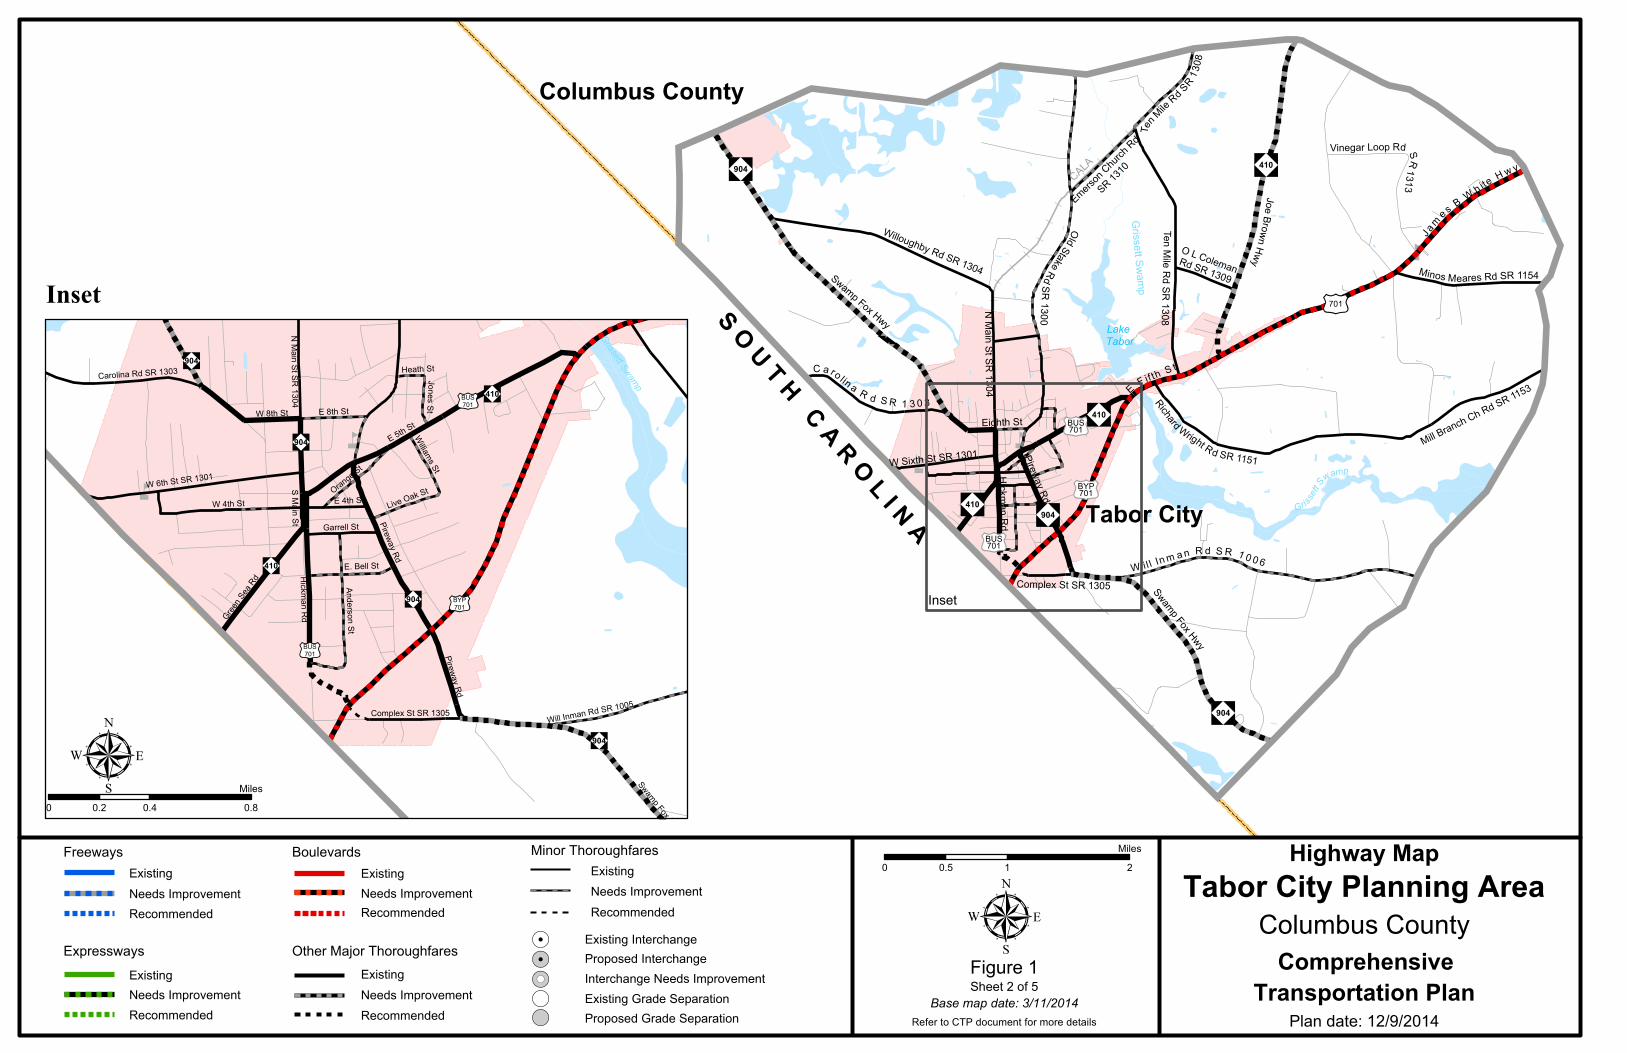
In August of 2013, the Transportation Planning Branch of the North Carolina Department of Transportation (NCDOT) and the town of Tabor City initiated a study to cooperatively develop the Tabor City Comprehensive Transportation Plan (CTP), which includes the town of Tabor City and adjacent areas within Columbus County. This is a long range multi-modal transportation plan that covers transportation needs through 2040. Modes of transportation evaluated as part of this plan include: highway, public transportation and rail, bicycle, and pedestrian. This plan does not cover routine maintenance or minor operations issues. Refer to Appendix A for contact information on these types of issues. Findings of this CTP study were based on an analysis of the transportation system, environmental screening and public input, which are detailed in Chapter 1. Figure 1 shows the CTP maps, which were mutually adopted by NCDOT in 2015. Descriptive information and definitions for designations depicted on the CTP maps can be found in Appendix B. Implementation of the plan is the responsibility of the Columbus County, Tabor City, and NCDOT. Refer to Chapter 2 for information on the implementation process. This report documents the recommendations for improvements that are included in the Tabor City CTP. The major recommendations for improvements are listed below. More detailed information about these and other recommendations can be found in Chapter 2. US 701: Widen US 701 to four lane boulevard from the South Carolina state line to
the eastern planning boundary with intersection improvements as warranted along the corridor.
NC 410: Widen NC 410 to standard cross section from US 701 to the northern planning boundary. Realignment of NC 410 to a "T" intersection with US 701 is also recommended.
US 701 Bypass & Complex Street (SR 1305) Intersection: Realign Complex Street (SR 1305) to a “T” intersection.
US 701 Business (Hickman Road) Relocation: Relocate US 701 Business from Sandwall Drive to the US 701 Bypass north of realigned Complex Street (SR 1305).

ii
This page intentionally left blank.

Notes:
n
n
n
Ten Mile Rd SR 1308
Will Inman Rd SR 1006
JoeBrownHwy
OldStakeRdSR1300
James B White Hwy
Swamp Fox Hwy
Willoughby Rd SR 1304
Swamp Fox Hwy
Hickman Rd
Minos Meares Rd SR 1154
Mill Branch Ch Rd SR 1153
Richard Wright Rd SR 1151
Carolina Rd SR 1303
Vinegar Loop Rd SR1313
N Main St SR 1304
Pireway Rd
E F if th S t
Complex St SR 1305
Emerson
Church R
d
SR 1310
O L ColemanRd SR 1309
Eighth St
W Sixth St SR 1301
Ten
Mile Rd SR13
08
"$410"$904
"$410
"$904
£¤701
£¤BYP701
£¤BUS701"$410
£¤BUS701
"$904
GrissettSwamp
Lake Tabor
Grissett
Swamp
Tabor City Planning Area
ComprehensiveTransportation Plan
North Carolina
Adopted by:
Transportation Planning BranchDate: 2/3/2015
Columbus County
Recommended by:
Endorsed by:Cape Fear Area RPO
Sheet 1 of 5
0 1 20.5Miles
Base map date: 3/11/2014
µRefer to CTP document for more details
Highway MapPublic Transportation and Rail MapBicycle MapPedestrian Map
Sheet 4Sheet 5
Sheet 3Sheet 2Sheet 1 Adoption Sheet
Date: 1/23/2015
Legend
RailroadRivers and Streams
Roadsn Schools
Planning Area Boundary
Municipal BoundaryWater Bodies
County Boundary Figure 1S O U T H C A R O L I N A Tabor City
Columbus County
Plan date: 12/9/2014
NCDOT
Tabor CityDate: 12/9/2014Columbus CountyDate: 1/5/2015Date: 4/2/2015
Revised Highway Map to reflect improvement to SR 1300 (Stake Road)

iv
Back of Figure
n
n
n
"$410"$904
"$410
"$904
£¤701
£¤BYP701
£¤BUS701"$410
£¤BUS701
"$904
Ten Mile Rd SR 1308
W i l l In m a n R d S R 1 0 0 6
JoeBrownHwy
OldStakeRdSR1300
J am e s B W h ite H w y
Swamp Fox Hwy
Willoughby Rd SR 1304
Swamp Fox Hwy
Hickman Rd
Minos Meares Rd SR 1154
Mill Branch Ch Rd SR 1153
Richard Wright Rd SR 1151
C a ro lin a R d S R 1 3 0 3
Vinegar Loop Rd SR1313
N Main St SR 1304 E F if th S t
Complex St SR 1305
Emerson
Church R
d
SR 1310
Eighth St
O L ColemanRd SR 1309
W Sixth St SR 1301 Pireway Rd
Ten
Mile Rd SR 1308
Lake Tabor
Grissett
Swamp
CALA
Grissett Swamp
Tabor City
S O U T H C A R O L I N A
Columbus County
Sheet 2 of 5
0 1 20.5Miles
Base map date: 3/11/2014
µRefer to CTP document for more details
Figure 1
Highway MapTabor City Planning Area
ComprehensiveTransportation Plan
Columbus County
Plan date: 12/9/2014
ExistingNeeds ImprovementRecommended
Freeways
ExistingNeeds ImprovementRecommended
Expressways
Boulevards
Other Major Thoroughfares
Minor ThoroughfaresExistingNeeds ImprovementRecommended
ExistingNeeds ImprovementRecommended
ExistingNeeds ImprovementRecommended
Proposed Grade Separation!(Existing Grade Separation!(
Existing InterchangeProposed Interchange
!.!.
Interchange Needs Improvement!(!(
n
n
E 5th St
Will Inman Rd SR 1005
Stake Rd
N Main St SR 1304
Carolina Rd SR 1303
W 6th St SR 1301
Pireway Rd
W 4th St
Hickman Rd
Jones St
Anderson St
E. Bell St
Green S
ea Rd
Orange St
E 8th St
Complex St SR 1305
Garrell St
E 4th St
W 8th St
Live Oak St
Williams St
S Main St
Heath St
Swamp Fox Hwy
Pireway Rd
"$904
"$904
"$904
"$410
"$904
"$410
"$904
"$904
"$904£¤701
£¤BUS701
£¤BUS701
£¤BYP701
Grissett Swamp
µ0 0.4 0.80.2
Miles
Inset
Inset

vi
Back of Figure
n
nn
Ten Mile Rd SR 1308
Will Inman Rd SR 1006
JoeBrownHwy
OldStakeRdSR1300
James B White Hwy
Swamp Fox Hwy
Willoughby Rd SR 1304
Swamp Fox Hwy
Hickman Rd
Minos Meares Rd SR 1154
Mill Branch Ch Rd SR 1153
Richard Wright Rd SR 1151
Carolina Rd SR 1303
Vinegar Loop Rd SR1313
N Main St SR 1304
Pireway Rd
E F if th S t
Complex St SR 1305
Emerson
Church R
d
SR 1310
O L ColemanRd SR 1309
Eighth St
W Sixth St SR 1301
Ten
Mile Rd SR 1308
"$410"$904
"$410
"$904
£¤701
£¤BYP701
£¤BUS701"$410
£¤BUS701
"$904
GrissettSwamp
Lake Tabor
Grissett
Swamp
Tabor City
Columbus County
S O U T H C A R O L I N A
High Speed Rail CorridorExistingRecommended
ActiveInactive
Rail Corridor
Recommended
Park and Ride Lot
""P RecommendedExisting"P
ExistingRecommended
Rail Stops%
,,,
Intermodal Connector# Existing
Recommended***
Existing Grade SeparationProposed Grade Separation
!(
!(
Recommended
ExistingOperational Strategies
Needs ImprovementRecommended
ExistingBus Routes
Needs Improvement
Recommended
ExistingFixed Guideway
Needs Improvement Sheet 3 of 5
0 1 20.5Miles
Base map date: 3/11/2014
µRefer to CTP document for more details
Figure 1
Public Transportation and Rail MapTabor City Planning Area
ComprehensiveTransportation Plan
Columbus County
Plan date: 5/21/2014

viii
Back of Figure
On-Road Off RoadExistingNeeds Improvement
ExistingNeeds ImprovementRecommended
Multi-Use PathsExistingNeeds ImprovementRecommendedRecommended
Bicycle MapTabor City Planning Area
ComprehensiveTransportation Plan
Columbus County
Plan date: 7/2/2014Sheet 4 of 5
Base map date: 3/11/2014Refer to CTP document for more details
Figure 1n Schools[k Parks
n
n
"$410
"$904
"$410
£¤BYP701
£¤BUS701"$410
£¤BUS701
"$904
Will Inman Rd SR 1006
E Fifth St US 701
Coleman Rd SR 1175
US 70
1 BYP
Swamp Fox HWY E NC 904
W Sixth St SR 1301
Fipps Ln
Fowler Ave
W Third St
Barr y S t
N Main St SR 1304
Carolina Rd SR 1303
Pireway Rd
Bogg
y Hill R
d SR
1307
Wildlife Club Rd
Reece St
Burns St
School St SR 1302
Queen St
New Life Church Rd SR 1128
Canal St SR 1367
E Bell St Steven St
O L Coleman Rd SR 1309
W Fourth St Worth St
Fair Bluff Rd NC 904
April Dr
Willow Dr
Howard S t
Alton St
Seals St
Avon St
Rogers Cir
Jesse St
Roscoe Coleman Rd SR 1152
N Wa
ll St
US 701 B
YP
Sanders St
Garrell St
Ridge Dr
Anderson St
McArthur St
N Lewis St
Nesmith St
Prince S t
Brown St NC 904
Sykes St
New Warehouse Rd SR 1306
Ray St
Grainger St
Wright St
Live Oak St
Shay St
Complex St SR 1305
S Lewis St SR 1301
Gore St
Jones St
Gwen
& Du
sty Ln
Britt St
Zeb Lewis Dr
P D R
anch
Dr
S and w a l l Ave
Floyd St
W Fifth St
Lynwood Norris St
Watering St Carter St
Perkin St
Lake Tabor Dr
Orange St
Tabor Industrial Park SR 1377
Fowler St
Catelyn Vlg Magnolia St
Jarvis St
Mallard St
Evans Point Dr
Watts Lew
is Dr
Woodrow St
Miriam Ln
Forest Ave
Hickman Rd
Green S
ea Rd
E Fourth St
Grissett Swamp
Grissett Swamp
Insetn
nn
"$410"$904
"$410
"$904
£¤701
£¤BYP701
£¤BUS701"$410
£¤BUS701
"$904
Ten Mile Rd SR 1308
Will Inman Rd SR 1006
JoeBrownHwy
OldStakeRdSR1300
James B White Hwy
Swamp Fox Hwy
Willoughby Rd SR 1304
Swamp Fox Hwy
Hickman Rd
Minos Meares Rd SR 1154
Mill Branch Ch Rd SR 1153
Richard Wright Rd SR 1151
Carolina Rd SR 1303
Vinegar Loop Rd SR1313
N Main St SR 1304
Pireway Rd
E F if th S t
Complex St SR 1305
Emerson
Church R
d
SR 1310
O L ColemanRd SR 1309
Eighth St
W Sixth St SR 1301
Ten
Mile Rd SR13
08
GrissettSwamp
Lake Tabor
Grissett
Swamp
Tabor City
Columbus County
0 1 20.5Miles
µS O U T H C A R O L I N A
0 0.45 0.90.225Miles
Inset

x�
�
Back of Figure

Sidewalks Off RoadExistingNeeds Improvement
ExistingNeeds ImprovementRecommended
Multi-Use PathsExistingNeeds ImprovementRecommendedRecommended
Pedestrian MapTabor City Planning Area
ComprehensiveTransportation Plan
Columbus County
Plan date: 7/2/2014Sheet 5 of 5
Base map date: 3/11/2014Refer to CTP document for more details
Figure 1n Schools[k Parks
n
n
"$410
"$904
"$410
£¤BYP701
£¤BUS701"$410
£¤BUS701
"$904
Will Inman Rd SR 1006
E Fifth St US 701
Coleman Rd SR 1175
US 70
1 BYP
Swamp Fox HWY E NC 904
W Sixth St SR 1301
Fowler Ave
W Third St
Barry S t
N Main St SR 1304
Carolina Rd SR 1303
Pireway Rd
Wildlife Club Rd
Reece St
Burns St
School St SR 1302
Queen St
New Life Church Rd SR 1128
C anal St SR 1367
E Bell St Steven St
W Fourth St Worth St
Fair Bluff Rd NC 904
Willow Dr
Howard S t
Alton St
Seals St
Avon St
Rogers Cir
Jesse St
Roscoe Coleman Rd SR 1152
N Wa
ll St
US 701 B
YP
Sanders St
Garrell St
Ridge Dr
Anderson St
McArthur St
N Lewis St
Nesmith St
Prince S t
Brown St NC 904
Sykes St
New Warehouse Rd SR 1306
Ray St
Grainger St
Wright St
Live Oak St
Shay St
Complex St SR 1305
S Lewis St SR 1301
Gore St
Jones St
Gwen
& Du
sty Ln
Britt St
Zeb Lewis Dr
P D R
anch
Dr
S and w a ll Ave
Floyd St
W Fifth St
Lynwood Norris St
Watering St Carter St
Perkin St
Lake Tabor Dr
Orange St
Tabor Industrial Park SR 1377
Fowler St
Catelyn Vlg Magnolia St
Jarvis St
Mallard St
Evans Point Dr
Watts Lew
is Dr
Woodrow St
Miriam Ln
Forest Ave
Hickman Rd
Green S
ea Rd
E Fourth St
Grissett Swamp
Insetn
nn
"$410
"$904
"$410
"$904
£¤701
£¤BYP701
£¤BUS701"$
410
£¤BUS701 "$904
Ten Mile Rd SR 1308
Will Inman Rd SR 1006
JoeBrownHwy
OldStakeRdSR1300
James B White Hwy
Swamp Fox Hwy
Willoughby Rd SR 1304
Swamp Fox Hwy
Hickman Rd
Minos Meares Rd SR 1154
Mill Branch Ch Rd SR 1153
Richard Wright Rd SR 1151
Carolina Rd SR 1303
Vinegar Loop Rd SR1313
N Main St SR 1304
Pireway Rd
E F if th S t
Complex St SR 1305
Emerson
Church R
d
SR 1310
O L ColemanRd SR 1309
Eighth St
W Sixth St SR 1301
Ten
Mile Rd SR13
08
GrissettSwamp
Lake Tabor
Grissett
Swamp
Tabor City
Columbus County
0 1 20.5Miles
µS O U T H C A R O L I N A
0 0.45 0.90.225Miles
Inset

xii�
�
Back of Figure

1-1
1. Analysis of the Existing and Future Transportation System
A Comprehensive Transportation Plan (CTP) is developed to ensure that the transportation system will meet the needs of the region for the planning period. The CTP serves as an official guide to providing a well-coordinated, efficient, and economical transportation system for the future of the region. This document should be utilized by the local officials to ensure that planned transportation facilities reflect the needs of the public, while minimizing the disruption to local residents, businesses and environmental resources. In order to develop a CTP, the following are considered:
Analysis of the transportation system, including any local and statewide initiatives;
Impacts to the natural and human environment, including natural resources, historic resources, homes, and businesses;
Public input, including community vision and goals and objectives.
1.1 Analysis Methodology and Data Requirements
Reliable forecasts of future travel patterns must be estimated in order to analyze the ability of the transportation system to meet future travel demand. These forecasts depend on careful analysis of the character and intensity of existing and future land use and travel patterns. An analysis of the transportation system looks at both current and future travel patterns and identifies existing and anticipated deficiencies. This is usually accomplished through a capacity deficiency analysis, a traffic crash analysis, and a system deficiency analysis. This information, along with population growth, economic development potential, and land use trends, is used to determine the potential impacts on the future transportation system. Roadway System Analysis
An important stage in the development of a CTP is the analysis of the existing transportation system and its ability to serve the area’s travel demand. Emphasis is placed not only on detecting the existing deficiencies, but also on understanding the causes of these deficiencies. Roadway deficiencies may result from inadequacies in pavement widths, intersection geometry, or intersection controls. System deficiencies may result from missing travel links, bypass routes, loop facilities, or radial routes; or improvements needed to meet statewide initiatives. One of those statewide initiatives is the Strategic Transportation Corridors (STC)1 adopted by the Board of Transportation on March 4, 2015.
1 For more information on the STC, go to:
https://connect.ncdot.gov/projects/planning/Pages/NCTransportationNetwork.aspx

1-2
The STC is an initiative to protect and maximize the mobility and connectivity on a critical set of transportation corridors throughout North Carolina, while promoting environmental stewardship through maximizing the use of existing facilities to the extent possible, and fostering economic prosperity through the quick and efficient movement of people and goods. The primary purpose of the STC is to provide a network of core multimodal transportation corridors that move most of North Carolina’s freight and people, link critical centers of economic activity to international air and sea ports, and support interstate commerce. The primary goal to support this purpose is to create a greater consensus towards the development of a genuine vision for each corridor. Individual CTPs shall establish a vision for each corridor that preserves the inter-regional, long-
distance travel needs into and through the study region. In the development of this plan, travel demand was projected from 2012 to 2040 using a Hand Allocation travel demand model. Travel demand models are developed to replicate travel patterns on the existing transportation system as well as to estimate travel patterns for 2040. In addition, local land use plans and growth expectations were used to develop future growth rates and patterns. The established future growth rates were endorsed by the Tabor City Town Council (12/10/2013). Refer to Appendix G for more detailed information on growth expectations and the socio-economic data forecasting methodology. Existing and future travel demand is compared to existing roadway capacities. Capacity deficiencies occur when the traffic volume of a roadway exceeds the roadway’s capacity. Roadways are considered near capacity when the traffic volume is at least eighty percent of the capacity. Refer to Figure 2 and Figure 3 for existing and future capacity deficiencies respectively. The 2040 traffic volume in Figure 3 is an estimate of the traffic volume in 2040 with only existing plus committed projects assumed to be in place, where committed is defined as projects programmed for construction in the 2012 – 2020 Transportation Improvement Program2 (TIP). Capacity is the maximum number of vehicles which have a “reasonable expectation” of passing over a given section of roadway, during a given time period under prevailing roadway and traffic conditions. Many factors contribute to the capacity of a roadway including the following:
Geometry of the road (including number of lanes), horizontal and vertical alignment, and proximity of perceived obstructions to safe travel along the road;
Typical users of the road, such as commuters, recreational travelers, and truck traffic;
Access control, including streets and driveways, or lack thereof, along the roadway;
2 For more information on the TIP, go to: https://connect.ncdot.gov/projects/planning/Pages/default.aspx

1-3
Development along the road, including residential, commercial, agricultural, and industrial developments;
Number of traffic signals along the route;
Peaking characteristics of the traffic on the road;
Characteristics of side-roads feeding into the road; and
Directional split of traffic or the percentages of vehicles traveling in each direction along a road at any given time.
The relationship of travel demand compared to the roadway capacity determines the level of service (LOS) of a roadway. Six levels of service identify the range of possible conditions. Designations range from LOS A, which represents the best operating conditions, to LOS F, which represents the worst operating conditions. LOS D indicates “practical capacity” of a roadway, or the capacity at which the public begins to experience delay. The practical capacity for each roadway was developed based on the 2000 Highway Capacity Manual using the Transportation Planning Branch’s LOS D Standards for Systems Level Planning. Recommended improvements and overall design of the transportation plan were based upon achieving a minimum LOS D on existing facilities and a LOS C for new facilities. Refer to Appendix E for detailed information on LOS. Traffic Crash Assessment
Traffic crashes are often used as an indicator for locating congestion and roadway problems. Crash patterns obtained from an analysis of crash data can lead to the identification of improvements that will reduce the number of crashes. The Traffic Safety Unit of NCDOT’s Transportation Mobility and Safety Division identifies high frequency crashes at intersections and along roadway sections during a five year period. The high frequency crash locations examined during the development of the Tabor City CTP occurred between January 1, 2007 and December 31, 2011. During this period, a total of four intersections and eight roadway sections were identified as having a high frequency of crashes as illustrated in Figure 4. Contact information for the Transportation Mobility and Safety Division can be found in Appendix A. The NCDOT is actively involved with investigating and improving many of these locations. To request a more detailed analysis for any of these locations, or other intersections of concern, contact the Division Traffic Engineer (see Appendix A). Bridge Deficiency Assessment
Bridges are a vital element of a highway system. First, they represent the highest unit investment of all elements of the system. Second, any inadequacy or deficiency in a bridge reduces the value of the total investment. Third, a bridge presents the greatest opportunity of all potential highway failures for disruption of community welfare. Finally, and most importantly, a bridge represents the greatest opportunity of all highway

1-4
failures for loss of life. For these reasons, it is imperative that bridges be constructed to the same design standards as the system of which they are a part. The NCDOT Structures Management Unit inspects all bridges in North Carolina at least once every two years. Bridges having the highest priority are replaced as federal and state funds become available. No deficient bridges were identified on roads evaluated as part of the CTP.

2012 Volumes (AADT)2012 Capacity
µ0 0.9 1.80.45
Miles
RoadsModel Network RoadsNear Capacity (0.80-0.99)Over Capacity (1.00+)Municipal Boundary
Rivers & StreamsCounty BoundaryRailroad
Extraterritorial JurisdictionPlanning Area Boundary
Tabor City
########
Figure 2
n
nn
Willoughby Rd SR 1304
Will Inman Rd SR 1006
Richard Wright Rd S R 1151
Minor Meares Rd SR 1154
Vinegar Loop RdSR1313
N Main St SR 1304
O L ColemanRd SR 1309
Mill Branch CH Rd SR 1153Carolina Rd SR 1303
OldStakeRdSR1300
JoeBrownHwy
Ten Mile Rd SR 13
08Ten Mile Rd SR 1308Swamp Fox Hwy
Swamp Fox Hwy
55014200
19009900
21014200
12009900
35014200
52014200
280011000
120014700
820017200
510011000
820015800
450015800
360011000
140012600
250011000
420012600
290015300
1200015800
350014000
250012600
180015300
90014200
87014200
430015800
550015800
63014200
43014700
230015300
120014200
130014000
1200015800
670015800
"$410
"$904
"$410
£¤701
"$904
"$904
"$410
£¤BUS701
£¤701
£¤BUS701
£¤BYP701
GrissettSwamp
Lake Tabor
Grissett
Swamp
S O U T H C A R O L I N A Tabor City
Columbus County
2012Volumes & Capacity
DeficienciesTabor City
Planning AreaComprehensize
Transportation Plan

1-6�
�
Back of Figure

n
n
n
Willoughby Rd SR 1304
Will Inman Rd SR 1006
Richard Wright Rd S R 1151
Minor Meares Rd SR 1154
Vinegar Loop RdSR1313
N Main St SR 1304
O L ColemanRd SR 1309
Mill Branch CH Rd SR 1153Carolina Rd SR 1303
OldStakeRdSR1300
JoeBrownHwy
Ten Mile Rd SR 13
08
Ten Mile Rd SR 1308Swamp Fox Hwy
Swamp Fox Hwy
9809900
37009900
57014200
62014200
290014200
530011000
240014700
660011000
870015800
360014000
7000110002200
12600
220011000
660012600
360015300
2000017200
2300015800
620012600
2500015800
46014200
82014200
300015300
73014700
2670015800
160014200
170012600
310015300
120014200
110014200
890015800
940015800
1200015800
"$410
"$904
"$410
£¤701
"$904
"$904
"$410
£¤BUS701
£¤701
£¤BUS701
£¤BYP701
GrissettSwamp
Lake Tabor
Grissett
Swamp
2040Volumes & Capacity
DeficienciesTabor City
Planning Area
2040 Volumes (AADT)2012 Capacity
µ
ComprehensizeTransportation Plan
RoadsModel Network RoadsNear Capacity (0.80-0.99)Over Capacity (1.00+)Municipal Boundary
Rivers & StreamsCounty BoundaryRailroad
Extraterritorial JurisdictionPlanning Area Boundary
########
Figure 3
0 1 20.5Miles
S O U T H C A R O L I N A Tabor City
Columbus County

1-8�
�
Back of Figure

n
n
n
Ten Mile Rd SR 1308
Will Inman Rd SR 1006
JoeBrownHwy
OldStakeRdSR1300
James B White Hwy
Swamp Fox Hwy
Willoughby Rd SR 1304
Swamp Fox Hwy
Hickman Rd
Minos Meares Rd SR 1154
Mill Branch Ch Rd SR 1153
Richard Wright Rd SR 1151
Carolina Rd SR 1303
Vinegar Loop Rd SR1313
N Main St SR 1304
Pireway Rd
E F if th S t
Complex St SR 1305
Emerson
Church R
d
SR 1310
O L ColemanRd SR 1309
Eighth St
W Sixth St SR 1301
Ten
Mile Rd SR13
08
!(
!(
!(
!(
"$410"$904
"$410
"$904
£¤701
£¤BYP701
£¤BUS701"$410
£¤BUS701
"$904
GrissettSwamp
Lake Tabor
Grissett
Swamp
CALA
Figure 4
µ0 1 20.5
Miles
S O U T H C A R O L I N A Tabor City
Columbus County
Crash Intersections$+ 50 and above#* 40 to 49") 30 to 39(! 20 to 29!( 10 to 19!( 4 to 9
Crash Sections50 and above40 to 4930 to 3920 to 2910 to 194 to 9Roads
n Schoolso Airports
RailroadsRivers and StreamsWater BodiesMunicipal BoundariesCounty Boundary
High FrequencyCrash Locations
Tabor CityPlanning Area
ComprehensizeTransportation Plan
January 1, 2007 toDecember 31, 2011

1-10�
�
Back of Figure

1-11
Public Transportation and Rail
Public transportation and rail are vital modes of transportation that give alternatives for transporting people and goods from one place to another. Public Transportation
North Carolina's public transportation systems serve more than 50 million passengers each year. Five categories define North Carolina's public transportation system: community, regional community, urban, regional urban and intercity.
Community Transportation - Local transportation efforts formerly centered on assisting clients of human service agencies. Today, the vast majority of rural systems serve the general public as well as those clients.
Regional Community Transportation - Regional community transportation systems are composed of two or more contiguous counties providing coordinated / consolidated service. Although such systems are not new, is encouraging single-county systems to consider mergers to form more regional systems.
Urban Transportation – There are currently nineteen urban transit systems operating in North Carolina, from locations such as Asheville and Hendersonville in the west to Jacksonville and Wilmington in the east. In addition, small urban systems provide service in three areas of the state. Consolidated urban-community transportation exists in five areas of the state. In those systems, one transportation system provides both urban and rural transportation within the county.
Regional Urban Transportation - Regional urban transit systems currently operate in three areas of the state. These systems connect multiple municipalities and counties.
Intercity Transportation - Intercity bus service is one of a few remaining examples of privately owned and operated public transportation in North Carolina. Intercity buses serve many cities and towns throughout the state and provide connections to locations in neighboring states and throughout the United States and Canada. Greyhound/Carolina Trailways operates in North Carolina. However, community, urban and regional transportation systems are providing increasing intercity service in North Carolina.
There are no existing or planned fixed public transportation routes for the Tabor City planning area. Columbus County does have a, non-fixed route, state and federally funded General Public Transportation System. It provides predominantly healthcare-related transportation, but also serves general users needing transportation to work or shopping. The transit system serves county residents weekdays from 6:00 am to 6:00 pm at varying fares. The system logs approximately 7500 miles per month serving residents of the Tabor City area.

1-12
Rail
Today North Carolina has 3,684 miles of railroad tracks throughout the state. There are two types of trains that operate in the state, passenger trains and freight trains. Intercity passenger service is provided by a partnership between NCDOT and Amtrak. Amtrak currently operates six passenger services daily in or through North Carolina serving 16 cities across the state. Five of the services are interstate (Crescent, Palmetto, Silver Meteor, Silver Star, and Carolinian passenger trains) and one service (Piedmont passenger train) operates exclusively within North Carolina. In addition to the six passenger services mentioned, Amtrak also operates its Auto Train service which passes through North Carolina but does not make any stops. Amtrak ridership demand has been on a rise in the state. In 2010 ridership was 840,000 and increased to 893,000 passengers in 2011. The North Carolina Department of Transportation sponsors two passenger trains, the Carolinian and Piedmont. The Carolinian runs between Charlotte and New York City, while the Piedmont train carries passengers from Raleigh to Charlotte and back every day. Combined, the Carolinian and Piedmont carry more than 200,000 passengers each year. There are two major freight railroad companies that operate in North Carolina, CSX Transportation and Norfolk Southern Corporation. Also, there are more than 20 smaller freight railroads, known as shortlines. There are no active rail facilities for the Tabor City planning Area. There is an inactive railroad which was last used by Carolina Southern Railroad for freight services. It is the town of Tabor City’s desire to promote the reactivation of the railroad facility. An inventory of existing and planned rail facilities for the planning area is presented on Sheet 3 of Figure 1. All recommendations for rail were coordinated with the local governments and the NCDOT Rail Division. Refer to Appendix A for contact information for the Rail Division. Bicycles & Pedestrians
Bicyclists and pedestrians are a growing part of the transportation system in North Carolina. Many communities are working to improve mobility for both cyclists and pedestrians. NCDOT’s Bicycle Policy, updated in 1991, clarifies responsibilities regarding the provision of bicycle facilities along the 77,000-mile state-maintained highway system. The policy details guidelines for planning, design, construction, maintenance, and operations pertaining to bicycle facilities and accommodations. All bicycle improvements undertaken by NCDOT are based upon this policy. The 2000 NCDOT Pedestrian Policy Guidelines specifies that NCDOT will participate with localities in the construction of sidewalks as incidental features of highway

1-13
improvement projects. At the request of a locality, state funds for a sidewalk are made available if matched by the requesting locality, using a sliding scale based on population. NCDOT’s administrative guidelines, adopted in 1994, ensure that greenways and greenway crossings are considered during the highway planning process. This policy was incorporated so that critical corridors which have been adopted by localities for future greenways will not be severed by highway construction. Inventories of existing and planned bicycle and pedestrian facilities for the planning area are presented on Sheets 4 and 5 of Figure 1. There are no regional or statewide bicycle facilities that go through the Tabor City planning area. All recommendations for bicycle and pedestrian facilities were coordinated with the town of Tabor City and the NCDOT Transportation Planning Branch. Land Use
G.S. §136-66.2 requires that local areas have a current (less than five years old) land development plan prior to adoption of the CTP. For this CTP, the 1990 town of Tabor City Zoning map (refer to Figure 5) was used to meet this requirement. Though the plan is more than 5 years old, the town of Tabor City designates this land use plan as current and uses this land use plan in making zoning decisions. Land use refers to the physical patterns of activities and functions within an area. Traffic demand in a given area is, in part, attributed to adjacent land use. For example, a large shopping center typically generates higher traffic volumes than a residential area. The spatial distribution of different types of land uses is a predominant determinant of when, where, and to what extent traffic congestion occurs. The travel demand between different land uses and the resulting impact on traffic conditions varies depending on the size, type, intensity, and spatial separation of development. Additionally, traffic volumes have different peaks based on the time of day and the day of the week. For transportation planning purposes, land use is divided into the following categories:
Residential: Land devoted to the housing of people, with the exception of hotels and motels which are considered commercial.
Commercial: Land devoted to retail trade including consumer and business services and their offices; this may be further stratified into retail and special retail classifications. Special retail would include high-traffic establishments, such as fast food restaurants and service stations; all other commercial establishments would be considered retail.
Industrial: Land devoted to the manufacturing, storage, warehousing, and transportation of products.
Public: Land devoted to social, religious, educational, cultural, and political activities; this would include the office and service employment establishments.

1-14
Agricultural: Land devoted to the use of buildings or structures for the raising of non-domestic animals and/or growing of plants for food and other production.
Mixed Use: Land devoted to a combination of any of the categories above.
Anticipated future land development is, in general, a logical extension of the present spatial land use distribution. Locations and types of expected growth within the planning area help to determine the location and type of proposed transportation improvements. Heavy manufacturing is the main type of land use that exists along US 701 Bypass, though commercial businesses are on the increase on this route, particularly at the US 701/NC 904 intersection. US 701 Business, which travels through the center of the town, contains the central business district which contains restaurants, retail, and offices. In general, the areas outside of the central business district but within the municipal limits are residential. Areas within the Tabor City planning area but outside the municipal limits are considered rural and the land use is a mix of residential and agriculture. The highest population/housing growth rates projected by the town are generally in the southeast and northeast areas. The highest employment growth rate areas are located along US 701 Bypass and in downtown Tabor City. For detailed information on how land use and growth projections were developed for and applied in the CTP, refer to Appendix G.
1.2 Consideration of Natural and Human Environment
Environmental features are a key consideration in the transportation planning process. Section 102 of the National Environmental Policy Act3 (NEPA) requires consideration of impacts on wetlands, wildlife, water quality, historic properties, and public lands. While a full NEPA evaluation was not conducted as part of the CTP, every effort was made to minimize potential impacts to these features utilizing the best available data. Any potential impacts to these resources were identified as a part of the project recommendations in Chapter 2 of this report. Prior to implementing transportation recommendations of the CTP, a more detailed environmental study would need to be completed in cooperation with the appropriate environmental resource agencies. A full listing of environmental features that are typically examined as a part of a CTP study is shown in the following tables. Environmental features occurring within the Tabor City Planning Area are shown in Figures 6, 7, 8, and 9 are shown in bold text in Table 1.
3 For more information on NEPA, go to: http://ceq.hss.doe.gov/.

1-15
Table 1 – Environmental Features
100-Year Flood
24k Hydro Lines
303D Streams
Airport Boundaries
Anadromous Fish Spawning Areas
APNEP - Submerged Aquatic Vegetation
Beach and Waterfront Access
Benthic Habitat
Bicycle Routes
Boating Access
Churches and Cemeteries
Colleges and Universities (Points)
Conservation Tax Credit Properties
Critical Habitat for Threatened and Endangered Species
Emergency Operation Centers
Fish Nursery Areas
Hazard Substance Disposal Sites (points & polygons)
Hazardous Waste Facilities
High Quality Waters and Outstanding Resource Water Management
Historic Resources – National Register and Determined Eligible (points and polygons)
Hospitals
Hydrography - 1:24,000-scale (polygons)
Landscape Habitat Indicator Guilds (LHIGs)Managed Areas
National Wetlands Inventory (polygons)
Natural Heritage Element Occurrences
NC-CREWS: N.C. Coastal Region Evaluation of Wetland Significance
NCDOT Maintained Mitigation Sites
Railroads (1:24,000)
Recreation Projects - Land and Water Conservation Fund
Regional Trails
Sanitary Sewer Systems - Treatment Plants
Schools (Public & Non-Public)
Significant Natural Heritage Areas
State Natural and Scenic Rivers
State Parks
Target Local Watersheds - EEP
Trout Streams (DWQ)
Trout Waters WRC (arcs & polygons)
Unique Wetlands
Water Distribution Systems – Tanks & Treatment Plants
Water Supply Watersheds
Archaeological sites were also considered but are not mapped due to restrictions associated with the sensitivity of the data.
1.3 Public Involvement
Public involvement is a key element in the transportation planning process. Adequate documentation of this process is essential for a seamless transfer of information from systems planning to project planning and design. The study was initiated in July of 2013 and a with a meeting held with representatives from the town of Tabor City, Cape Fear Area Rural Planning Organization (RPO), NCDOT Division 6 engineers, and the NCDOT Transportation Planning Branch. A

1-16
meeting was held with the Tabor City Town Council in August 2013 to formally initiate the study, provide an overview of the transportation planning process, and to gather input on area transportation needs. Throughout the course of the study, the NCDOT Transportation Planning Branch cooperatively worked with the Tabor City Planning Area Steering Committee, which included a representative from the town of Tabor City, Columbus county staff, the Cape Fear Area RPO and others. The committee provided information on current local plans, developed transportation vision and goals, discussed population and employment projections, and developed proposed CTP recommendations. Refer to Appendix H for detailed information on the vision statement, the goals and objectives survey and a listing of committee members. The public involvement process included holding one public drop-in session in the town of Tabor City to present the proposed CTP to the public and solicit comments. The meeting was held on October 14, 2014 at The Ritz Center in the downtown area. The public drop-in session was publicized in the local newspaper and was held from 4:00 PM – 6:00 PM. There were no formal comments submitted during the session. A public hearing was held on September 9, 2014 during the Tabor City Town Council meeting. The purpose of the meeting was to discuss the plan recommendations. A second public hearing took place on October 14, 2014. The CTP was adopted during this meeting. A public hearing was held on September 15, 2014 during the Columbus County Commissioners meeting. The purpose of this meeting was to present and discuss the plan recommendations. Another public hearing took place on November 3, 2014. The CTP was adopted during this meeting. The Cape Fear Area RPO endorsed the CTP on October 11, 2014 contingent on the town of Tabor City’s October 14, 2014 adoption. The North Carolina Department of Transportation mutually adopted the Tabor City CTP on December 4, 2014. The Tabor City CTP Maps were later revised to reflect a highway improvement on Stake Road (SR 1300). The amended Tabor City CTP Maps were adopted on December 9, 2014 by the town of Tabor City, January 5, 2015 by Columbus County and the North Carolina Department of Transportation on April 2, 2015. The amended Tabor City CTP Maps were endorsed by the Cape Fear Area RPO on January 23, 2015.

Zoning Jurisdictions
FIGURE 5
Tabor City Planning Area
January 1990
LM-W Light Manufacturing - Wholesale
HS-B Highway Services - Business
NC Neighborhood Commercial
CB-O Central Business - Office
MH-P Mobile Home Park
HM-W Heavy Manufacturing - Wholesale MED (MH)
Medium Densiy Residential (w/mobile homes)
MED Medium Density Residential
MOD Moderate Density Residential
Light Density Residential - AgriculturalLD-A
SFD Single Family Dwelling Residential
Open SpaceOS
�

1-18�
�
Back of Figure

Ten Mile Rd SR 1308
Will Inman Rd SR 1006
JoeBrownHwy
OldStakeRdSR1300
James B White Hwy
Swamp Fox Hwy
Willoughby Rd SR 1304
Swamp Fox Hwy
Hickman Rd
Minos Meares Rd SR 1154
Mill Branch Ch Rd SR 1153
Richard Wright Rd SR 1151
Carolina Rd SR 1303
Vinegar Loop Rd SR1313
N Main St SR 1304
Pireway Rd
E F if th S t
Complex St SR 1305
Emerson
Church R
d
SR 1310
O L ColemanRd SR 1309
Eighth St
W Sixth St SR 1301
Ten
Mile Rd SR13
08
"$410"$904
"$410
"$904
£¤701
£¤BYP701
£¤BUS701"$410
£¤BUS701
"$904
0 1 20.5Miles
µ
Primary EnvironmentalFeatures Map
Figure 6
S O U T H C A R O L I N A Tabor City
Columbus County Tabor CityPlanning Area
ComprehensiveTransportation Plan
Planning Area BoundaryNational Wetland InventoryNC-CREWSCounty BoundaryRoadsRailroadsMunicipal Boundaries

1-20�
�
Back of Figure

Ten Mile Rd SR 1308
Will Inman Rd SR 1006
JoeBrownHwy
OldStakeRdSR1300
James B White Hwy
Swamp Fox Hwy
Willoughby Rd SR 1304
Swamp Fox Hwy
Hickman Rd
Minos Meares Rd SR 1154
Mill Branch Ch Rd SR 1153
Richard Wright Rd SR 1151
Carolina Rd SR 1303
Vinegar Loop Rd SR1313
N Main St SR 1304
Pireway Rd
E F if th S t
Complex St SR 1305
Emerson
Church R
d
SR 1310
O L ColemanRd SR 1309
Eighth St
W Sixth St SR 1301
Ten
Mile Rd SR13
08
"$410"$904
"$410
"$904
£¤701
£¤BYP701
£¤BUS701"$410
£¤BUS701
"$904
0 1 20.5Miles
µFigure 7
S O U T H C A R O L I N A Tabor City
Columbus County
Primary EnvironmentalFeatures Map
Tabor CityPlanning Area
ComprehensiveTransportation Plan
Planning Area Boundaryn Schools
24k Hydro LinesHydrography AreasLandscape Habitat Indicator GuildsSignificant Natural Heritage Areas
RoadsRailroadsMunicipal Boundaries
County Boundary

1-22�
�
Back of Figure
!R
UT
UT
UT
!(
`
`
`
`
`
`
`
`
Ten Mile Rd SR 1308
Will Inman Rd SR 1006
JoeBrownHwy
OldStakeRdSR1300
James B White Hwy
Swamp Fox Hwy
Willoughby Rd SR 1304
Swamp Fox Hwy
Hickman Rd
Minos Meares Rd SR 1154
Mill Branch Ch Rd SR 1153
Richard Wright Rd SR 1151
Carolina Rd SR 1303
Vinegar Loop Rd SR1313
N Main St SR 1304
Pireway Rd
E F if th S t
Complex St SR 1305
Emerson
Church R
d
SR 1310
O L ColemanRd SR 1309
Eighth St
W Sixth St SR 1301
Ten
Mile Rd SR13
08
"$410"$904
"$410
£¤701
Will Inman Rd SR 1006
Old S
take R
d SR
1300
James B White HWY S US 701
Willoughby Rd SR 1304
Richard Wright Rd SR 1151
Coleman Rd SR 1175
Hickm
an R
d US 7
01
Stake
Rd S
R 13
00
Dusty Ln
Mill Branch Ch Rd SR 1153
Westwood Dr
Spivey Ward Dr
Seals St
Lester Watts Rd SR 1129
Anderson St
Mills
Dr
Avon St
W Third St
Williams St
µFigure 8
S O U T H C A R O L I N A Tabor City
Columbus County
Secondary EnvironmentalFeatures Map
Tabor CityPlanning Area
ComprehensiveTransportation Plan
` Hazardous Substance Disposal Sites
!( Sewer Treatment Plants
UT Water Distribution Tanks
!R Water Pumping Stations
Columbus_CountyAll RoadsRailroad
Planning Area Boundary
0 1 20.5Miles
Municipal
Natural Heritage Element Occurence

1-24�
�
Back of Figure

Ten Mile Rd SR 1308
Will Inman Rd SR 1006
JoeBrownHwy
OldStakeRdSR1300
James B White Hwy
Swamp Fox Hwy
Willoughby Rd SR 1304
Swamp Fox Hwy
Hickman Rd
Minos Meares Rd SR 1154
Mill Branch Ch Rd SR 1153
Richard Wright Rd SR 1151
Carolina Rd SR 1303
Vinegar Loop Rd SR1313
N Main St SR 1304
Pireway Rd
E F if th S t
Complex St SR 1305
Emerson
Church R
d
SR 1310
O L ColemanRd SR 1309
Eighth St
W Sixth St SR 1301
Ten
Mile Rd SR13
08
"$410"$904
"$410
"$904
£¤701
£¤BYP701
£¤BUS701"$410
£¤BUS701
"$904
µFigure 9
S O U T H C A R O L I N A Tabor City
Columbus County
Environmental Features 100-Year Flood Map
Tabor CityPlanning Area
ComprehensiveTransportation Plan
Extraterritorial Jurisdiction100-Year Flood ZoneMunicipal BoundariesRailroadsRoadsCounty BoundaryPlanning Area Boundary
0 1 20.5Miles

1-26�
�
Back of Figure

2-1
2. Recommendations
This chapter presents recommendations for each mode of transportation in the 2014 Tabor City CTP as shown in Figure 1. More detailed information on each recommendation is tabulated in Appendix C. NCDOT adopted a "Complete Streets1" policy in July 2009. The policy directs the Department to consider and incorporate several modes of transportation when building new projects or making improvements to existing infrastructure. Under this policy, the Department will collaborate with cities, towns and communities during the planning and design phases of projects. Together, they will decide how to provide the transportation options needed to serve the community and complement the context of the area. The benefits of this approach include:
making it easier for travelers to get where they need to go; encouraging the use of alternative forms of transportation; building more sustainable communities; increasing connectivity between neighborhoods, streets, and transit systems; improving safety for pedestrians, cyclists, and motorists.
Complete streets are streets designed to be safe and comfortable for all users, including pedestrians, bicyclists, transit riders, motorists and individuals of all ages and capabilities. These streets generally include sidewalks, appropriate bicycle facilities, transit stops, right-sized street widths, context-based traffic speeds, and are well-integrated with surrounding land uses. The complete street policy and concepts were utilized in the development of the CTP. The CTP proposes projects that include multi-modal project recommendations as documented in the problem statements within this chapter. Refer to Appendix C for recommended cross sections for all project proposals and Appendix D for more detailed information on the typical cross sections.
2.1 Implementation
The CTP is based on the projected growth and mobility for the planning area. It is possible that actual growth patterns will differ from those logically anticipated. As a result, it may be necessary to accelerate or delay the implementation of some recommendations found within this plan. Some portions of the plan may require revisions in order to accommodate unexpected changes in development. Therefore, any changes made to one element of the CTP should be consistent with the other elements. Initiative for implementing the CTP rests predominately with the policy boards and citizens of the Tabor City and/or Columbus County. As transportation needs throughout the state exceed available funding, it is imperative that the local planning area aggressively pursue funding for priority projects. Projects should be prioritized locally
1 For more information on Complete Streets, go to: http://www.completestreetsnc.org/

2-2
and submitted to the Cape Fear Area RPO for prioritization and submittal to NCDOT. Refer to Appendix A for contact information on prioritization and funding. Local governments may use the CTP to guide development and protect corridors for the recommended projects. It is critical that NCDOT and local governments coordinate on relevant land development reviews and all transportation projects to ensure proper implementation of the CTP. Local governments and NCDOT share the responsibility for access management and the planning, design and construction of the recommended projects. Prior to implementing projects from the CTP, additional analysis will be necessary to meet the National Environmental Policy Act (NEPA) or the North Carolina (or State) Environmental Policy Act2 (SEPA). This CTP may be used to provide information in the NEPA/SEPA process.
2.2 Problem Statements
The following pages contain problem statements for each recommendation, organized by CTP modal element. The information provided in the problem statement is intended to help support decisions made in the NEPA/SEPA process. A full, minimum or reference problem statement is presented for each recommendation, with full problem statements occurring first in each section. Full problem statements are denoted by a gray shaded box containing project information. Minimum problem statements are more concise and less detailed than full problem statements, but include all known or readily available information. Reference problem statements are developed for TIP projects where the purpose and need for the project has already been established.
2 For more information on SEPA, go to: http://www.doa.nc.gov/clearing/faq.aspx.

2-3
HIGHWAY
US 701/US 701 Bypass Proposed Improvements from South Local ID: COLU0001-H Carolina State Line to 0.4 Miles north of Spivey Ward Drive Last Updated: 7/18/2014
Identified Problem Presently, US 701 is mostly approaching capacity from Richard Wright Road (SR 1151) to the South Carolina state line. The US 701 facility experiences peak congestion and is over capacity during summer periods in the Tabor City planning area. Based on 2040 traffic projections, US 701 will exceed capacity from Vinegar Loop Road (SR 1313) to the South Carolina state line. The primary purpose of improving US 701 is to relieve present and future congestion on the existing facility such that a minimum Level of Service (LOS) D can be achieved.
Justification of Need
US 701 is currently a two to five lane major thoroughfare in North Carolina. There is a short section in Clinton, NC that is a four lane expressway. US 701 extends from just south of Smithfield in Johnston County and continues south through Tabor City in Columbus County and ends in Georgetown, South Carolina. US 701 is a regionally tiered route in the NC Multimodal Investment Network (NCMIN).
COLU0001-H

2-4
For the US 701 section in Columbus County, it is a major north-south corridor. US 701 connects to US 74/ US 76, an east-west corridor that leads to the municipalities of Laurinburg, Chadbourn, and Whiteville, to the west, and to the metropolitan area of Wilmington, 65 miles to the east. In Tabor City, US 701 is also known as US 701 Bypass from the US 701 & US 701 Business/NC 410 (East 5th Street) intersection to the South Carolina border. The US 701 corridor is also significant because it is used by many vacationers en route to Myrtle Beach, South Carolina.
Based on LOS D, by 2040, US 701 is projected to be over capacity for a majority of the Tabor City planning area; from the South Carolina state line to Vinegar Loop Road (SR 1313). Currently, it is near capacity between Richard Wright Road (SR 1511) and the US 701 BUS/NC 410 (East 5th Street) section and between NC 904 (Pireway Road) and the South Carolina state line.
Local knowledge, historical population data, housing and employment trends, and a Hand Allocation model were used to determine the traffic projections (See Appendix G for a more detailed explanation). Table 2 shows, in vehicles per day (vpd), the comparisons between the 2012 Average Annual Daily Traffic (AADT), the projected 2040 AADT, and the existing capacity of the facility at LOS D. Although the study began in 2013, the 2012 AADT were the most recent counts available.
Table 2 – US 701/US 701 Bypass Volumes and Capacity
Section (From - To) Capacity
2012 AADT
Projected 2040 AADT
Tabor City planning boundary – Vinegar Loop Road (SR 1313) 15,800 6,700 9,400
Vinegar Loop Road (SR 1313) – Tabor City town limits 15,800 6,700 12,000
Tabor City town limits – NC 410 15,800 6,700 12,000
NC 410 - Richard Wright Rd (SR 1151) 17,200 12,000 25,000
Richard Wright Road (SR 1151) – US 701 Business/NC 410 (East 5th Street) 15,800 12,000 25,000
US 701 Business/NC 410 (East 5th Street) – NC 904 (Pireway Road) 17,200 8,200 20,000
NC 904 (Pireway Road) – South Carolina state line 15,800 8,800 20,000
Community Vision and Problem History
Vehicular traffic is expected to increase through the 2040 planning period. According to the census, the town of Tabor City’s population is growing. The population has increased from 2,330 in 1990 to 2,511 in 2010 (The 2010 census population numbers including prison population at the Tabor City correctional institution is 3,970). The town predicts that the population will grow linearly, at an annual rate of 1% and will, therefore, have an estimated population of 3,214 within the town limits by the year 2040. The population is expected to increase for the entire planning area, from 4,511 in 2010 to 5,774 by the year 2040. The increase in vehicular traffic in Tabor City will be mostly due to through traffic as drivers head to and from Myrtle Beach, South Carolina and other destinations south. The town has observed that with the increased use of global

2-5
positioning systems (GPS) since the early 2000s, the town has seen an increase in vehicular traffic. The town of Tabor City has a vision and several goals and objectives that it would like to achieve. These can be found in the Tabor City Comprehensive Transportation Plan in Appendix H and the 2010 Land Use and Development Plan for Tabor City North Carolina. A majority of their goals would be met with the conversion of US 701 to a four lane boulevard. The vision of Tabor City is to develop a safe, reliable and efficient multi-modal transportation infrastructure that is compatible with land use plans and environmental protection that will also recognize the natural beauty, quality of life, agricultural economy and pro-business climate that the town of Tabor City has to offer. The town has goals of relieving congestion and at the same encouraging more business along the US 701 corridor highway business district. Seasonal traffic is the main type of traffic that is causing the most congestion for the town. A traffic count study was conducted during the 2013 Labor Day holiday weekend to compare to the most recent (2012) AADT counts. From Table 3, the ratio of volume to capacity (V/C) is greater than 1 for most of the sections of US 701 from NC 410 to the South Carolina state line. It can be concluded that during summer holidays and many weekends, the facility is over capacity. Additional traffic counts were taken during a regular summer (non-holiday) week (June 2, 2014 – June 9, 2014). Appendix I provides a more detailed explanation of the traffic counts taken. The results show that the weekday non-holiday summer traffic is comparable to the 2012 AADT; however, during regular non-holiday summer weekends, US 701 Bypass is still over capacity. To note, the projected 2040 AADT is greater than the 2012 summer holiday traffic.
Table 3 – US 701 Labor Day Weekend Traffic Volume vs AADT and Capacity
The town has mentioned that there are key intersections along the corridor which make it difficult for people to traverse through the area during this time period. Those intersections are: US 701 & NC 410 (See COLU0002-H) US 701 & US 701 Business/NC 410 (East 5th Street) US 701 Bypass & NC 904 (Pireway Road)
Section (From – To) Capacity 2012 AADT
2012 AADT V/C
2013 Highest Labor Day Holiday counts
2013 Labor Day V/C
NC 410 – Richard Wright Road (SR 1151) 17,200 12,000 0.70 19,100 1.11
Richard Wright Road (SR 1151) – US 701 Business/NC 410 (East 5th Street)
15,800 12,000 0.76 17,400 1.10
US 701 Business/NC 410 (East 5th Street) – NC 904 (Pireway Road)
17,200 8,200 0.48 12,700 0.74
NC 904 (Pireway Road) – South Carolina state line
15,800 8,800 0.56 17,400 1.10

2-6
The US 701 & NC 410 intersection is a three-legged unsignalized intersection. It is an especially difficult intersection at peak periods because drivers are unable to make left turns. The town has noted that during peak summer traffic, local law enforcement has had to direct traffic at the US 701 & NC 410 intersection. In general, signals impede the smooth flow of traffic along the major leg of an intersection. This occurs at the US 701 & US 701 Business/NC 410 and at the US 701 Bypass & NC 904 (Pireway Road) intersection which are both two-phase signalized intersections. Generally, the traffic signal causes delays to those traveling along US 701 and the US 701 Bypass. The signal stops the flow of traffic on the US 701 Bypass so that those on NC 904 (Pireway Road) can complete their movements through the intersection. In addition, because the traffic signal has a permissive only left-turn phasing, drivers are having difficulty making left turns from US 701 Bypass to NC 904 (Pireway Road) during peak periods. With the completion of new businesses in 2013 near the US 701 Bypass & NC 904 (Pireway Road) intersection, there is more intersection volume. There are significant issues during the summer along the US 701 corridor from NC 410 to the South Carolina state line. There is a need for continuous flow of vehicles along the corridor. At the same time, there is a need for intersection improvements to allow drivers to easily get on or off US 701. Improvements of these three intersections in conjunction with the widening of US 701 will allow for better flow of traffic for the area. There is a need for cooperation with the South Carolina Department of Transportation so that widening improvements made in North Carolina continue into South Carolina to meet highway SC-9, which is a four lane boulevard. CTP Project Proposal
Project Description and Overview
The proposed project (COLU0001-H) is to widen US 701’s existing two lane and three lane facility to a four lane boulevard. The project begins at US 701 Bypass at the South Carolina state line, goes through the Tabor City planning area, and continues north to US 74/US 76 in Whiteville. The facility upgrade would help in providing smooth flowing traffic for through vehicles on US 701 and increase overall capacity. The facility’s current capacity in the Tabor City planning area ranges from 15,800 vpd to 17,200 vpd. The new capacity of the facility will be 43,900 vpd with the conversion to a four lane boulevard. Project Segmentation It is recommended that the proposed project be segmented into multiple smaller projects in order to better reach the ultimate goal of completing the project. Listed below are the following segments listed by location: US 701 Bypass from the South Carolina state line to NC 904 (Pireway Road) – Upgrade from a two lane facility to a four lane boulevard

2-7
US 701 Bypass/US 701 from NC 904 (Pireway Road) to NC 410 – Upgrade from a three lane facility to a four lane boulevard. US 701 from NC 410 to the Tabor City planning boundary – Upgrade from a two lane facility to a four lane boulevard. US 701/NC 410 & US 701 Business/NC 410 (East 5th Street) – Intersection improvement. US 701 Bypass & NC 904 – Intersection improvement. Natural & Human Environmental Context
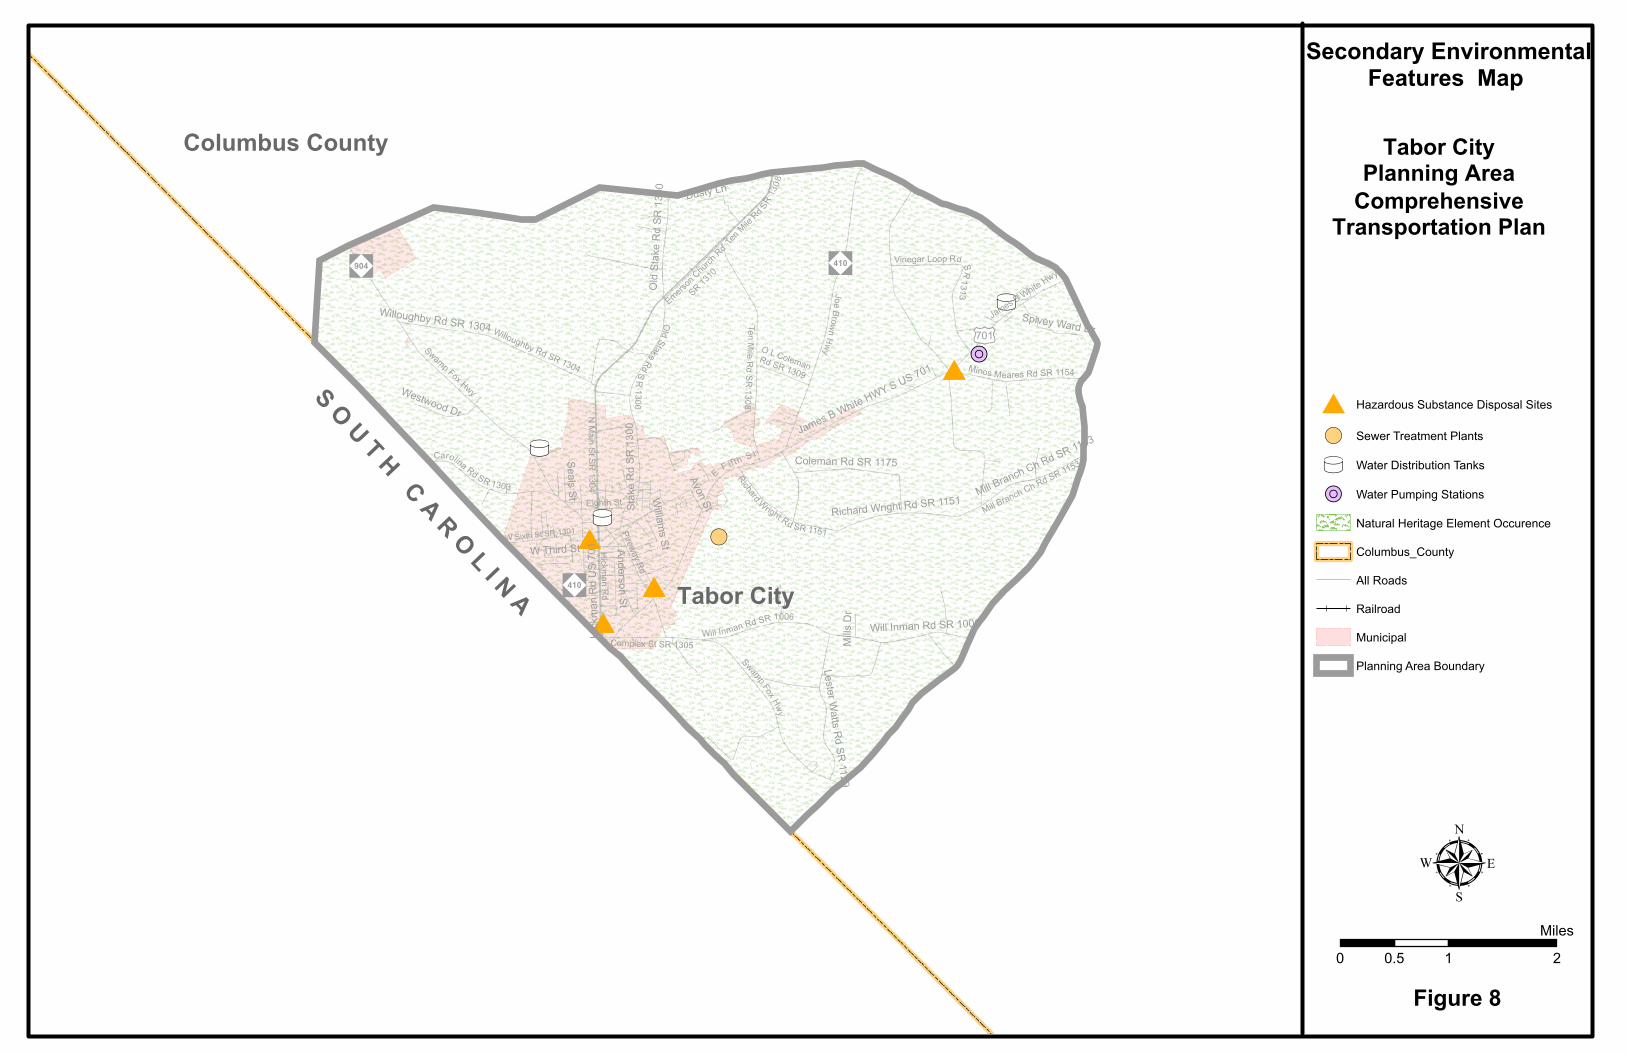
Since the upgrade of the roadway is predominantly on the existing right-of-way (ROW), the natural environmental impact would be minimal. The exception would be the section of US 701/NC 410 between Richard Wright Road (SR 1151) and US 701 Business/NC 410 (East 5th Street). The culvert over Grissett Swamp could be upgraded to match the new width of the road. According to the Natural Heritage Program of the North Carolina Department of Environment and Natural Resources (NCDENR)3, the Tabor City planning area is designated as a natural heritage element occurrence (Figure 8) for a rare animal species which was last seen before 2006. Since less than 5% of the mapped area is occupied by the element, the estimation of the viability of the element in the Tabor City planning area is uncertain. There would be minimal to no human environment impacts along NC 410 and a majority of the US 701 corridor in the Tabor City planning area because the ROW needed for the upgrade is already acquired. The exception to this would be the section of US 701/NC 410 between Richard Wright Road (SR 1151) and US 701 Business/NC 410 (East 5th
Street) where the current ROW is 125 feet instead of the 150 feet which is the minimum necessary for the new cross section. Property would likely need to be acquired to obtain the necessary ROW.
Relationship to Land Use Plans
The land use along the US 701 Bypass is zoned as a highway service business district, created to provide for effective use of land situated in relationship to major highways so efficient grouping of activities can be developed to service the traveling public. The interest of the town of Tabor City is the promotion of new business along the highway service business district which will encourage travelers to stop en route to their destinations. 3 For more information on the Natural Heritage Program by NCDENR go to: http://portal.ncdenr.org/web/nhp/element-
occurrences
2-8
Linkages to Other Plans and Proposed Project History
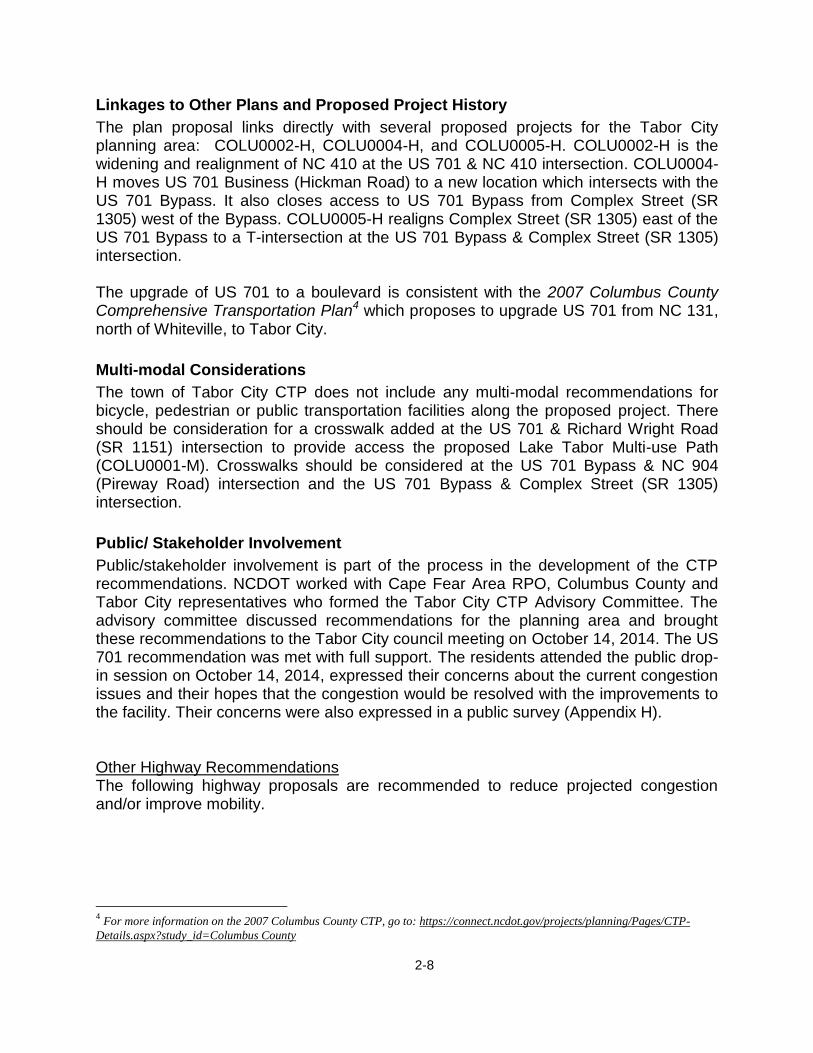
The plan proposal links directly with several proposed projects for the Tabor City planning area: COLU0002-H, COLU0004-H, and COLU0005-H. COLU0002-H is the widening and realignment of NC 410 at the US 701 & NC 410 intersection. COLU0004-H moves US 701 Business (Hickman Road) to a new location which intersects with the US 701 Bypass. It also closes access to US 701 Bypass from Complex Street (SR 1305) west of the Bypass. COLU0005-H realigns Complex Street (SR 1305) east of the US 701 Bypass to a T-intersection at the US 701 Bypass & Complex Street (SR 1305) intersection. The upgrade of US 701 to a boulevard is consistent with the 2007 Columbus County Comprehensive Transportation Plan4 which proposes to upgrade US 701 from NC 131, north of Whiteville, to Tabor City.
Multi-modal Considerations
The town of Tabor City CTP does not include any multi-modal recommendations for bicycle, pedestrian or public transportation facilities along the proposed project. There should be consideration for a crosswalk added at the US 701 & Richard Wright Road (SR 1151) intersection to provide access the proposed Lake Tabor Multi-use Path (COLU0001-M). Crosswalks should be considered at the US 701 Bypass & NC 904 (Pireway Road) intersection and the US 701 Bypass & Complex Street (SR 1305) intersection.
Public/ Stakeholder Involvement
Public/stakeholder involvement is part of the process in the development of the CTP recommendations. NCDOT worked with Cape Fear Area RPO, Columbus County and Tabor City representatives who formed the Tabor City CTP Advisory Committee. The advisory committee discussed recommendations for the planning area and brought these recommendations to the Tabor City council meeting on October 14, 2014. The US 701 recommendation was met with full support. The residents attended the public drop-in session on October 14, 2014, expressed their concerns about the current congestion issues and their hopes that the congestion would be resolved with the improvements to the facility. Their concerns were also expressed in a public survey (Appendix H). Other Highway Recommendations The following highway proposals are recommended to reduce projected congestion and/or improve mobility.
4 For more information on the 2007 Columbus County CTP, go to: https://connect.ncdot.gov/projects/planning/Pages/CTP-
Details.aspx?study_id=Columbus County

2-9
NC 410 Realignment, Local ID: COL0002-H
NC 410 is a north-south, two lane major thoroughfare in Columbus County. The route originates north, in the town of Dublin in Bladen County and continues south through Bladenboro and Chadbourn and then to Tabor City. The route joins then splits with US 701 in Tabor City and then ends when it reunites with US 701 in South Carolina 21 miles later. The section of NC 410 in the Tabor City planning area is significant because it is used by many vacationers en route to Myrtle Beach, South Carolina. NC 410 is a regionally tiered route in the NC Multimodal Investment Network (NCMIN). The CTP project proposal (COLU0002-H) recommends realigning NC 410 from just north of Ridge Drive to the US 701 & NC 410 intersection. It is proposed to improve this segment of NC 410 to a T-intersection in order to improve the sight distance.
The US 701 & NC 410 intersection is a three-legged unsignalized intersection. It is an especially difficult intersection at peak periods because drivers are unable to make left turns. The town has noted that during peak summer traffic, local law enforcement has had to direct traffic at the US 701/NC 410 intersection. In addition, at the US 701 & NC 410 intersection, there were a total of 11 reported crashes between January 2007 and December 2011. NC 410 & US 701 meet at a skewed angle. According to the FHWA’s report, NCHRP Report 500 / Volume 5: A Guide for Addressing Unsignalized Intersection Collisions, roadways that intersect at skewed angles may experience one or more of the following problems:

2-10
Vehicles may have a longer distance to traverse while crossing or turning onto the intersecting roadway, resulting in an increased time of exposure to the cross-street traffic.
Older drivers may find it more difficult to turn their heads, necks, or upper bodies for an adequate line of sight down an acute-angle approach.
The driver’s sight angle for convenient observation of opposing traffic and pedestrian crossings is decreased.
Drivers may have more difficulty aligning their vehicles as they enter the cross street to make a right or left turn.
Drivers making right turns around an acute-angle radius may encroach on lanes intended for oncoming traffic from the right.
The larger intersection area may confuse drivers or cause them to deviate from the intended path.
Through-roadway drivers making left turns across an obtuse angle may attempt to maintain a higher than normal turning speed and cut across the oncoming traffic lane on the intersecting street.
The vehicle body may obstruct the line of sight of drivers with an acute-angle approach to their right.
US 701 Business (Hickman Road) Realignment, Local ID: COL0003-H
US 701 Business in Tabor City begins at the US 701 Bypass & US 701 Business/NC 410 intersection where it is known as East 5th Street. The route continues left onto
COLU0003-H

2-11
Hickman Road and through the Tabor City central business district and then to the South Carolina state line. It rejoins US 701 Bypass 0.3 miles south of the state line as a three-legged Y intersection with has merges, yields, and stops. The CTP project proposal (COL0003-H) recommends relocating the portion of US 701 Business (Hickman Road) from Sandwall Road to the South Carolina state line. The road would be relocated to meet with the US 701 Bypass just north of Complex Street. It is currently a two lane major thoroughfare. The relocated facility would be a two lane major thoroughfare. Included in the project proposal is to convert the remaining US 701 Business (Hickman Street) to a local road that dead ends at the South Carolina border. The remaining portion of Complex Street (SR 1305), west of the US 701 Bypass, would also be converted to a local road. Access to the US 701 Bypass from the west side of Complex Street (SR 1305) would be eliminated. As previously mentioned, US 701 Business (Hickman Road) would remain intact as a local road and would have bicycle (COLU0002-B) and sidewalk (COLU0002-P) access and Complex Street (SR 1305) would have bicycle (COLU0014-B) and sidewalk (COLU0012-P) access. This section of US 701 Business (Hickman Road) has a 2012 AADT of 3,200 vpd and is forecasted to reach an AADT of 5,600 vpd by the year 2040. The capacity of the facility is 11,000 vpd. Though the road has not reached capacity, the town has observed that many non-resident drivers become confused when driving through and near the intersection because of the way US 701 Business (Hickman Road) merges with US 701 Bypass just south of the border (Figure 10).
Figure 10: US 701 BYP and US 701 BUS (Hickman Road) Merge
2-12
In addition, several reported and non-reported accidents have occurred in the area. More details about the crashes can be found in the Complex Street realignment project (COLU0004-H). The relocation would improve mobility and safety in the southern portion of the Tabor City planning area. Complex Street (SR 1305) Realignment (eastern side of Complex Street (SR 1305) at the intersection of US 701 Bypass and Complex Street (SR 1305)), Local ID: COLU0004-H Complex Street (SR 1305) is a minor thoroughfare that connects motorists to US 701 Bypass and US 701 Business (Hickman Road). The CTP project proposal (COLU0004-H) recommends realigning the existing intersection in order to improve the sight distance. Complex Street (SR 1305) and US 701 Bypass intersect at a skewed angle. According to the FHWA’s report, NCHRP Report 500 / Volume 5: A Guide for Addressing Unsignalized Intersection Collisions, roadways that intersect at skewed angles may experience one or more of the following problems:
Vehicles may have a longer distance to traverse while crossing or turning onto the intersecting roadway, resulting in an increased time of exposure to the cross-street traffic.
Older drivers may find it more difficult to turn their heads, necks, or upper bodies for an adequate line of sight down an acute-angle approach.
The driver’s sight angle for convenient observation of opposing traffic and pedestrian crossings is decreased.
Drivers may have more difficulty aligning their vehicles as they enter the cross street to make a right or left turn.
Drivers making right turns around an acute-angle radius may encroach on lanes intended for oncoming traffic from the right.
The larger intersection area may confuse drivers or cause them to deviate from the intended path.
Through-roadway drivers making left turns across an obtuse angle may attempt to maintain a higher than normal turning speed and cut across the oncoming traffic lane on the intersecting street.
The vehicle body may obstruct the line of sight of drivers with an acute-angle approach to their right.
The town has safety concerns at and near the US 701 Bypass & Complex Street (SR 1305) intersection. Of particular concern is the northern sight distance on Complex Street (SR 1305). The other concern is the nearby, US 701 Bypass and US 701 Business merge just south of the state line. The North Carolina Department of Transportation’s (NCDOT) Transportation, Mobility & Safety (TMS) Division has records of seventeen crashes at the US 701 Bypass & Complex Street (SR 1305) intersection from 2007 to 2011. According to the Tabor City Fire Department incident reports, an additional seven crashes have occurred at the intersection between 2012 and 2013. To note, the Tabor City Fire Department also takes calls in South Carolina near the border. The crashes, though they may have an effect on traffic in North Carolina, are not

2-13
reported to TMS. The entire southern portion of the town of Tabor City is of concern because of the merging of US 701 Bypass and US 701 Business (Hickman Road) just south of the border. The primary purpose of improving the intersection is to minimize the problems that can occur with having a skewed angle intersection. The improvement may aid in the reduction of crashes that occur in the area. The project proposes the realignment of Complex Street (SR 1305), at the intersection of US 701 Bypass and Complex Street (SR1305), just north of the existing intersection.
Minor Improvements
The following facilities are not projected to exceed Level of Service (D) by 2040 but are considered narrow roads that are recommended to be upgraded to 2A typical cross-section standards (See Appendix D). These facilities were recommended for modernization in the 2007 Columbus County Comprehensive Transportation Plan.
NC 410, Local ID: COLU0005-H: NC 410 from US 701 to the northern Tabor City planning boundary.
NC 904, Local ID: COLU0006-H: NC 904 from Carolina Road (SR 1303) to the northeastern Tabor City planning boundary and NC 904 from Complex Street (SR 1305) to the southeastern Tabor City planning boundary
Emerson Church Road (SR 1310), Local ID: COLU0011-H: Emerson Church Road (SR 1310) from Old Stake Road (SR 1300) to Ten Mile Road (SR 1308).
Old Stake Road (SR 1300), Local ID: COLU0015-H: Old Stake Road (SR 1300) from Canal Street (SR 1367) to Emerson Church Road (SR 1310).
Ten Mile Road (SR 1308), Local ID: COLU0017-H: Ten Mile Road (SR 1308) from Emerson Church Road (SR 1310 to the northern Tabor City planning boundary.
Will Inman Road (SR 1006), Local ID: COLU0018-H: Will Inman Road (SR 1006) from NC 904 to the eastern Tabor City planning boundary.
Minor Improvements- Planned Bond Referendum
The following facilities are not projected to exceed Level of Service (D) by 2040 but are curb and gutter improvements that are proposed by the town of Tabor City for better mobility and for modernization as growth occurs. These facilities are planned to be improved through a local bond referendum.

2-14
West Fourth Street, Local ID: COLU0007-H: West Fourth Street from Lewis Street to Bay Street.
East Eighth Street, Local ID: COLU0008-H: Eight Street from Stake Road (SR 1300) to North Main Street (SR 1304).
Anderson Street, Local ID: COLU0009-H: Anderson Street from Garrell Street to US 701 Business (Hickman Road).
Bell Street, Local ID: COLU0010-H: Bell Street from NC 904 (Pireway Road) to US 701 Business (Hickman Road).
Heath Street, Local ID: COLU0012-H: Heath Street from Jones Street to Stake Road (SR 1300).
Jones Street, Local ID: COLU0013-H: Jones Street from US 701 Business/NC 410 (East 5th Street) to Heath Street.
Live Oak Street, Local ID: COLU0014-H: Live Oak Street from NC 904 (Pireway Road) to Williams Street.
Orange Street, Local ID: COLU0016-H: Orange Street from US 701 Business/NC 410 (East 5th Street) to East 4th Street.
Stake Road (SR 1300), Local ID: COLU0020-H: Stake Road (SR 1300) from US 701 Business/NC 410 (East 5th Street) to East 8th Street.
Williams Street, Local ID: COLU0019-H: Williams Street from US 701 Business/NC 410 (East 5th Street) to Live Oak Street.
PUBLIC TRANSPORTATION & RAIL
A public transportation and rail assessment was completed during the development of the CTP. There are no recommended improvements associated with the public transportation mode in the Tabor City planning area. As for the railroad, it is currently owned by Carolina Southern Railroad (CALA) which is a member of the Carolina Rails system with connections that run from Whiteville, North Carolina to Mullins, South Carolina and also from Chadbourn, North Carolina, through Tabor City, North Carolina and on to Conway, South Carolina. The railroad is currently inactive. The rail line which runs through Tabor City once carried goods to and from several businesses in the town. The future of the CALA railroad line is uncertain. The rail line is important to the town of Tabor City as it can further the town’s vision of economic growth. The town of Tabor City would like to see the railroad line reactivated.

2-15
BICYCLE According to the WalkBikeNC North Carolina Statewide Pedestrian and Bike Plan, bicycling has been part of transportation in North Carolina for more than 100 years. Bicyclists helped champion North Carolina’s “Good Roads” movement in the early 1900’s. Formal planning for bicycle accommodation in North Carolina began with passage of the Bicycle and Bikeway Act in 1974. The Tabor City CTP will help continue bicycling as an alternative form or transportation. During the development of the CTP, the bicycle facilities listed below were identified as recommended bicycle routes by the Tabor City CTP Steering Committee. The recommended bicycle map includes several improvements needed to provide adequate, safe, and desirable facilities for use by bicyclists. The bicycle facilities provide connectivity and access to key places in and around Tabor City such as schools, park and recreation facilities, retail, grocery, and others. In accordance with American Association of State Highway and Transportation Officials (AASHTO), roadways identified as bicycle routes should incorporate the following standards as roadway improvements are made and funding is available:
Curb & gutter sections require at minimum 5 foot bike lanes or 14 foot wide shoulder lanes.
Shoulder sections require a minimum of 4 foot paved shoulder.
All bridges along the roadways where bike facilities are recommended shall be equipped with 54 inch railings.
It should be noted that the recommended improvements to on-road facilities can include several potential solutions. The improvements can be as minor as installing “Share-the-Road” signs and pavement markings to more major projects such as constructing wide shoulders or bicycle lanes. The following is the list of facilities identified for on-road bicycle improvements. Some recommendations are concurrent with highway and/or pedestrian projects. Refer to CTP mapping (Figure 1, Sheet 4) and Appendix C for more information.
US 701 Business/NC 410 (East 5th Street), Local ID: COLU0001-B Add bicycle lanes accommodations on both sides of US 701 Business/NC 410 (East 5th Street) from US 701 Bypass to US 701 Business (Hickman Road).
US 701 Business (Hickman Road), Local ID: COLU0002-B Add “Share the Road” bicycle accommodations on US 701 Business (Hickman Road) from US 701 Business/NC 410 (East 5th Street) NC 410 (Green Sea Road) and add bicycle lane from NC 410 (Green Sea Road) to the South Carolina state line.
NC 410 (Green Sea Road), Local ID: COLU0003-B Add bicycle lane accommodations on NC 410 (Green Sea Road) from US 701 Business (Hickman Road) to the South Carolina state line.

2-16
NC 904 (West 8th Street), Local ID: COLU0004-B Add bicycle lane accommodations on NC 904 (West 8th Street) from Stake Road (SR 1300) (North Main Street) to NC 904 (Fair Bluff Road).
NC 904 (Fair Bluff Road), Local ID: COLU0005-B Add bicycle lane accommodations on NC 904 (Fair Bluff Road) from NC 904 (West 8th Street) to Carolina Road (SR 1303).
NC 904 (North Main Street), Local ID: COLU0006-B Add bicycle lane accommodations on NC 904 (North Main Street) from US 701 Business/NC 410 (East 5th Street) to NC 904 (West 8th Street).
NC 904 (Pireway Road), Local ID: COLU0007-B Add bicycle lane accommodations on NC 904 (Pireway Road) from US 701 Business/NC 410/NC 904 (East 5th Street) to Complex Street (SR 1305).
East 4th Street, Local ID: COLU0008-B Add “Share the Road” bicycle accommodations on East 4th Street from NC 904 (Pireway Road) to West 6th Street (SR 1301).
West 6th Street (SR 1301), Local ID: COLU0009-B Add “Share the Road” bicycle accommodations on West 6th Street (SR 1301) from NC 904 (North Main Street) to the South Carolina state line.
East 8th Street, Local ID: COLU00010-B Add “Share the Road” bicycle accommodations on East 8th Street from Stake Road (SR 1300) to North Main Street (SR 1304).
East Bell Street, Local ID: COLU00011-B Add “Share the Road” bicycle accommodations on Bell Street from US 701 Business (Hickman Road) to NC 904 (Pireway Road).
Canal Street (SR 1367), Local ID: COLU00012-B Add “Share the Road” bicycle accommodations on Canal Street (SR 1367) from Stake Road (SR 1300) to loop Lakeside Drive and Miriam Lane.
Carolina Road (SR 1303), Local ID: COLU0013-B Add paved shoulder bicycle accommodations on Carolina Road (SR 1303) from NC 904 (Fair Bluff Road) to School Street (SR 1302).
Complex Street (SR 1305), Local ID: COLU0014-B Add paved shoulder bicycle accommodations on Complex Street (SR 1305) from NC 904 (Pireway Road) to US 701 Business (Hickman Road).

2-17
Lynwood Norris Road, Local ID: COLU0015-B Add “Share the Road” bicycle accommodations on Lynwood Norris Road from US 701 Business/NC 410 (East 5th Street) to the end of the road.
North Main Street (SR 1304), Local ID: COLU0016-B Add paved shoulder bicycle accommodations on North Main Street (SR 1304) from NC 904 (North Main Street) to New Warehouse Road (SR 1306).
New Warehouse Road (SR 1306), Local ID: COLU0017-B Add paved shoulder bicycle accommodations on New Warehouse Road (SR 1306) from Old Stake Road (SR 1300) to Willoughby Road (SR 1304).
Old Stake Road (SR 1300), Local ID: COLU0018-B Add paved shoulders bicycle accommodations on Stake Road (SR 1300) from New Warehouse Road (SR 1306) to Canal Street (SR 1367).
Richard Wright Road (SR 1151), Local ID: COLU0019-B Add paved shoulders bicycle accommodations on Richard Wright Road (SR 1151) which will provide access from the Yogi Bear's Jellystone Park to US 701 and meet the Lake Tabor Multiuse Path (COLU0001-M).
School Street (SR 1302), Local ID: COLU0020-B Add paved shoulder bicycle accommodations on School Street (SR 1302) from Carolina Road (SR 1303) to West 6th Street (SR 1301).
Stake Road (SR 1300), Local ID: COLU0021-B Add bicycle accommodations from Canal Street (SR 1367), to Carter Street, add “Share the Road” bicycle accommodations from Carter Street to US 701 Business/NC 410 (East 5th Street).
PEDESTRIAN
In the Statewide Bicycle and Pedestrian Plan5, it states that North Carolinas vision for walking and biking. “North Carolina is a place that incorporates walking and bicycling into daily life, promoting safe access to destinations, physical activity opportunities for improved health, increased mobility for better transportation efficiency, retention and attraction of economic development, and resource conservation for better environmental stewardship of our state.” The recommended projects in the Tabor City CTP pedestrian map identifies pedestrian improvements such as new sidewalks, improving existing sidewalk facilities by either adding a sidewalk to the other side or filling in gaps. The recommended projects will aid in meeting North Carolina’s vision for pedestrians.
5 For more information on the Statewide Bicycle and Pedestrian Plan, visit http://www.ncdot.gov/bikeped/planning/walkbikenc/

2-18
The following is the list of facilities identified for sidewalk improvements. Some recommendations are concurrent with highway and/or bicycle projects. Refer to CTP mapping (Figure 1, Sheet 5) and Appendix C for more information.
US 701 Business (Hickman Road), Local ID: COLU0001-P Add sidewalk on the eastern side of US 701 Business (Hickman Road) from Forest Road to Complex Street (SR 1305).
US 701 Business/NC 410/NC 904 (East 5th Street), Local ID: COLU0002-P Add sidewalks to both sides of US 701 Business/NC 410/NC 904 (East 5th Street) from Stake Road (SR 1300) to Lynwood Norris Road. Some sections have sidewalk existing on at least one side of the facility. Add crosswalks at major intersections and update for ADA compliance.
NC 410 (Green Sea Road), Local ID: COLU0003-P Add sidewalks on both sides of NC 410 (Green Sea Road) from South Main Street to the South Carolina state line. Some sections are existing on at least one side of the facility. Fill in sidewalk gaps.
NC 904 (North Main Street), Local ID: COLU0004-P Add sidewalk to west side of NC 904 (North Main Street) from 7th Street to NC 904 (8th Street).
NC 904 (Pireway Road), Local ID: COLU0005-P Add sidewalks on both sides of NC 904 (Pireway Road) from US 701 Business/NC 410/NC 904 (East 5th Street) to Floyd Street, filling in gaps. Some sections have sidewalk existing on at least one side of the facility. Add sidewalks on both sides of NC 904 (Pireway Road) from Floyd Street to Complex Street (SR 1305). Add crosswalks at major intersections and check/update for ADA compliance.
West 4th Street, Local ID: COLU0006-P Add sidewalk on both sides of West 4th Street from NC 410 (South Main Street) to Bay Street. Some sections have sidewalk existing on at least one side of the facility.
West 6th Street (SR 1301), Local ID: COLU0007-P Add sidewalks on both sides of West 6th Street (SR 1301) from NC 904 (North Main Street) to School Road (SR 1302). Sidewalks exist on either side of the facility.
East 8th Street, Local ID: COLU0008-P Add sidewalks on both sides of East 8th Street from Stake Road (SR 1300) to North Main Street (SR 1304).

2-19
Anderson Street, Local ID: COLU0009-P Add sidewalks on both sides of Anderson Street from Garrell Street to Sandwall Drive.
Bay Street, Local ID: COLU0010-P Add sidewalks on both sides of Bay Street from West 6th Street to West 4th Street.
East Bell Street, Local ID: COLU0011-P Add sidewalks on both sides of East Bell Street from US 701 Business (Hickman Road) to NC 904 (Pireway Road).
Complex Street (SR 1305), Local ID: COLU0012-P Add sidewalks on both sides of Complex Street (SR 1305) from NC 904 (Pireway Road) to US 701 Business (Hickman Road). There is existing sidewalk on one side of the road from Essie Mae Court and Evans Point Drive. Add crosswalks at major intersections, at Essie Mae Court, and at Evans Point Drive.
Garrell Street, Local ID: COLU0013-P Add sidewalks on the north side of Garrell Street from US 701 Business (Hickman Street) to NC 904 (Pireway Road).
Heath Street, Local ID: COLU0014-P Add sidewalks on both sides of Heath Street from Jones Street to Stake Road (SR 1300).
Jones Street, Local ID: COLU0015-P Add sidewalks on both sides of Jones Street from US 701 Business/NC 410 (East 5th Street) to Heath Street.
Live Oak Street, Local ID: COLU0016-P Add sidewalks on both sides of Live Oak Street from Williams Street to NC 904 (Pireway Road).
Lynwood Norris Street, Local ID: COLU0017-P Add sidewalk on Lynwood Norris Street from US 701 Business/NC 410 (East 5th Street) to the end of the road.
Sandwall Drive, Local ID: COLU0018-P Add sidewalks on both sides of Sandwall Drive from Anderson Street to US 701 Business (Hickman Road).
Stake Road (SR 1300), Local ID: COLU0019 -P Add sidewalks on both sides of Stake Road (SR 1300) from US 701 Business/NC 410 (East 5th Street) to Barry Street. There is existing sidewalk on

2-20
the west side of Stake Road (SR 1300) from US 701 Business/NC 410 (East 5th Street) to Carter Street.
Williams Street, Local ID: COLU0020-P Add sidewalks on both sides of Williams Street from US 701 Business/NC 410 (East 5th Street) to Live Oak Street. There is existing sidewalk on the west side of Williams Street from US 701 Business/NC 410 (East 5th Street) to Britt Street.
MULTI-USE PATH
The NCDOT envisions that all citizens of North Carolina and visitors to the state should be able to walk and bicycle safely and conveniently to their desired destinations with reasonable access to roadways. Increased bicycle and pedestrian safety and connectivity are needed within the town of Tabor City. On-road bicycle facilities serve a specific purpose, as do sidewalks, but multi-use paths offer a unique combination of the two. They cater to both modes of transportation, while typically offering an off-road, safer, more recreational experience. The purpose of the recommended multi-use path in Tabor City is to provide an adequate, safe, and desirable facility that both pedestrians and bicyclists can use for local connectivity within the planning area. Below is the identified multi-use path recommended by the town of Tabor City. Refer to either the Bicycle CTP map (Figure 1, sheet 4) or the Pedestrian CTP map (Figure 1, Sheet 5), and Appendix C for more information.
Lake Tabor Multi-Use Path, Local ID: COLU001-M Provide a multi-use path from Richard Wright Road (SR 1151) to Lynwood Norris Street. The proposed path will allow residents and visitors access to Lake Tabor. The Lake Tabor Multi-Use Path (COLU001-M) connects to the Richard Wright (SR 1151) bicycle path (COLU0019-B) and the Lynwood Norris Street bicycle “Share the Road” path (COLU0014-B) and pedestrian sidewalk (COLU0017-P).


A-1
Appendix A Resources and Contacts
Local Planning Organization
Cape Fear Area Rural Planning Organization (http://www.capefearcog.org/) Contact the RPO for information on long-range multi-modal planning services.
1480 Harbour Drive Wilmington, NC 28401 (910) 395-4553
North Carolina Department of Transportation
Customer Service Office
Contact information for other units within the NCDOT that are not listed in this appendix is available by calling the Customer Service Office or by visiting the NCDOT directory:
1-877-DOT-4YOU (1-877-368-4968) http://www.ncdot.gov/contact/ Secretary of Transportation (http://www.ncdot.org/about/leadership/secretary.html)
1501 Mail Service Center Raleigh, NC 27699-1501 (919) 707-2800 Board of Transportation (http://www.ncdot.gov/about/board/)
1501 Mail Service Center Raleigh, NC 27699-1501 (919) 707-2820 Highway Division 6 (https://apps.dot.state.nc.us/dot/directory/authenticated/ToC.aspx)
558 Gillespie Street Fayetteville, NC 28301 (910) 486-1493
Contact the Highway Division with questions concerning NCDOT activities within each Division.
Contact the following NCDOT divisions and units1 for:
Transportation Planning Branch (TPB)
Information on long-range multi-modal planning services.
1554 Mail Service Center Raleigh, NC 27699 (919) 707-0900
Strategic Planning Office
Information concerning prioritization of transportation projects.
1501 Mail Service Center Raleigh, NC 27699 (919) 707-4740
Project Development & Environmental Analysis (PDEA)
Information on environmental studies for projects that are included in the TIP.
1548 Mail Service Center Raleigh, NC 27699 (919) 707-6000
State Asset Management Unit
Information regarding the status for unpaved roads to be paved, additions and deletions of roads to the State maintained system and the Industrial Access Funds program.
1535 Mail Service Center Raleigh, NC 27699 (919) 707-2500
1 Unit websites are hyperlinked and can also be accessed at https://connect.ncdot.gov/Pages/default.aspx.
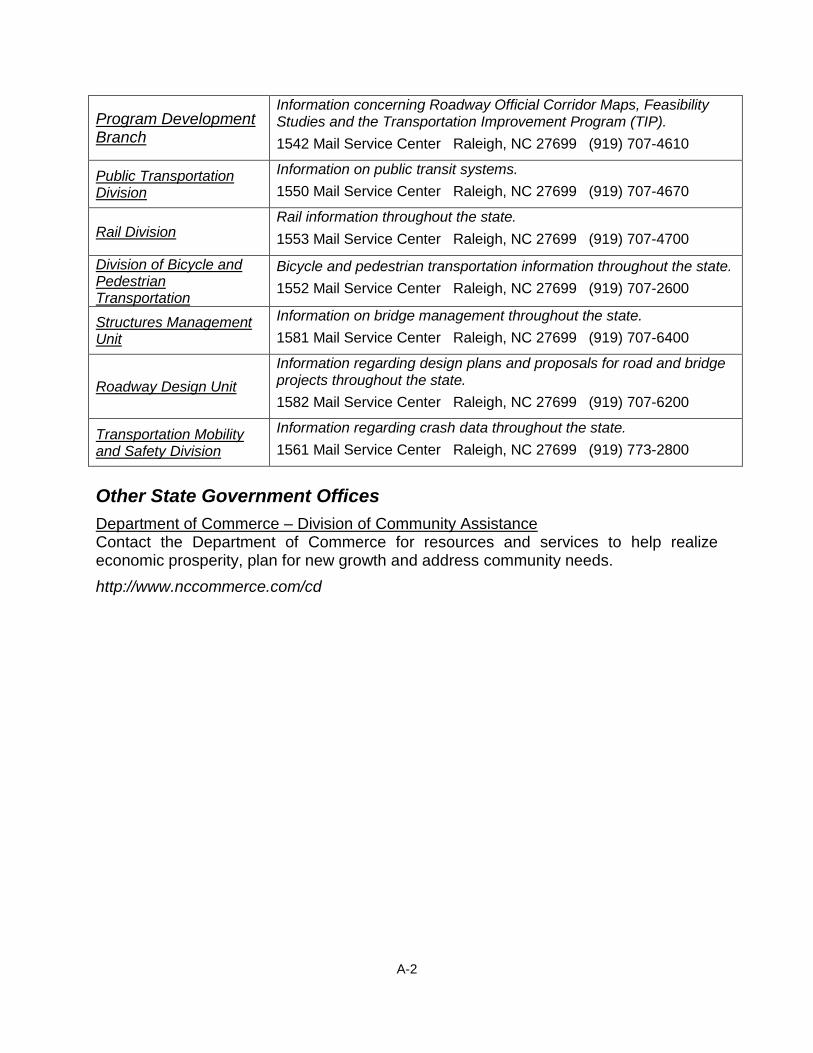
A-2
Program Development Branch
Information concerning Roadway Official Corridor Maps, Feasibility Studies and the Transportation Improvement Program (TIP).
1542 Mail Service Center Raleigh, NC 27699 (919) 707-4610
Public Transportation Division
Information on public transit systems.
1550 Mail Service Center Raleigh, NC 27699 (919) 707-4670
Rail Division Rail information throughout the state.
1553 Mail Service Center Raleigh, NC 27699 (919) 707-4700
Division of Bicycle and Pedestrian Transportation
Bicycle and pedestrian transportation information throughout the state.
1552 Mail Service Center Raleigh, NC 27699 (919) 707-2600
Structures Management Unit
Information on bridge management throughout the state.
1581 Mail Service Center Raleigh, NC 27699 (919) 707-6400
Roadway Design Unit
Information regarding design plans and proposals for road and bridge projects throughout the state.
1582 Mail Service Center Raleigh, NC 27699 (919) 707-6200
Transportation Mobility and Safety Division
Information regarding crash data throughout the state.
1561 Mail Service Center Raleigh, NC 27699 (919) 773-2800
Other State Government Offices
Department of Commerce – Division of Community Assistance Contact the Department of Commerce for resources and services to help realize economic prosperity, plan for new growth and address community needs.
http://www.nccommerce.com/cd

Revised: October 4, 2012B-1
Appendix B Comprehensive Transportation Plan Definitions
This appendix contains descriptive information and definitions for the designations depicted on the CTP maps shown in Figure 1.
Highway Map The “NCDOT Facility Type –Control of Access Definitions” document provides a visual depiction of facility types for the following CTP classification. Facility Type Definitions
� Freeways � Functional purpose – high mobility, high volume, high speed � Posted speed – 55 mph or greater � Cross section – minimum four lanes with continuous median � Multi-modal elements – High Occupancy Vehicles (HOV)/High Occupancy
Transit (HOT) lanes, busways, truck lanes, park-and-ride facilities at/near interchanges, adjacent shared use paths (separate from roadway and outside ROW)
� Type of access control – full control of access � Access management – interchange spacing (urban – one mile; non-urban – three
miles); at interchanges on the intersecting roadway, full control of access for 1,000ft or for 350ft plus 650ft island or median; use of frontage roads, rear service roads
� Intersecting facilities – interchange or grade separation (no signals or at-grade intersections)
� Driveways – not allowed � Expressways
� Functional purpose – high mobility, high volume, medium-high speed � Posted speed – 45 to 60 mph � Cross section – minimum four lanes with median � Multi-modal elements – HOV lanes, busways, very wide paved shoulders (rural),
shared use paths (separate from roadway but within ROW) � Type of access control – limited or partial control of access; � Access management – minimum interchange/intersection spacing 2,000ft;
median breaks only at intersections with minor roadways or to permit U-turns; use of frontage roads, rear service roads; driveways limited in location and number; use of acceleration/deceleration or right turning lanes
� Intersecting facilities – interchange; at-grade intersection for minor roadways; right-in/right-out and/or left-over or grade separation (no signalization for through traffic)
� Driveways – right-in/right-out only; direct driveway access via service roads or other alternate connections

Revised: October 4, 2012B-2
� Boulevards � Functional purpose – moderate mobility; moderate access, moderate volume,
medium speed � Posted speed – 30 to 55 mph � Cross section – two or more lanes with median (median breaks allowed for U-
turns per current NCDOT Driveway Manual � Multi-modal elements – bus stops, bike lanes (urban) or wide paved shoulders
(rural), sidewalks (urban - local government option) � Type of access control – limited control of access, partial control of access, or no
control of access � Access management – two lane facilities may have medians with crossovers,
medians with turning pockets or turning lanes; use of acceleration/deceleration or right turning lanes is optional; for abutting properties, use of shared driveways, internal out parcel access and cross-connectivity between adjacent properties is strongly encouraged
� Intersecting facilities – at grade intersections and driveways; interchanges at special locations with high volumes
� Driveways – primarily right-in/right-out, some right-in/right-out in combination with median leftovers; major driveways may be full movement when access is not possible using an alternate roadway
� Other Major Thoroughfares
� Functional purpose – balanced mobility and access, moderate volume, low to medium speed
� Posted speed – 25 to 55 mph � Cross section – four or more lanes without median (US and NC routes may have
less than four lanes) � Multi-modal elements – bus stops, bike lanes/wide outer lane (urban) or wide
paved shoulder (rural), sidewalks (urban) � Type of access control – no control of access � Access management – continuous left turn lanes; for abutting properties, use of
shared driveways, internal out parcel access and cross-connectivity between adjacent properties is strongly encouraged
� Intersecting facilities – intersections and driveways � Driveways – full movement on two lane roadway with center turn lane as
permitted by the current NCDOT Driveway Manual � Minor Thoroughfares
� Functional purpose – balanced mobility and access, moderate volume, low to medium speed
� Posted speed – 25 to 55 mph � Cross section – ultimately three lanes (no more than one lane per direction) or
less without median � Multi-modal elements – bus stops, bike lanes/wide outer lane (urban) or wide
paved shoulder (rural), sidewalks (urban) � ROW – no control of access
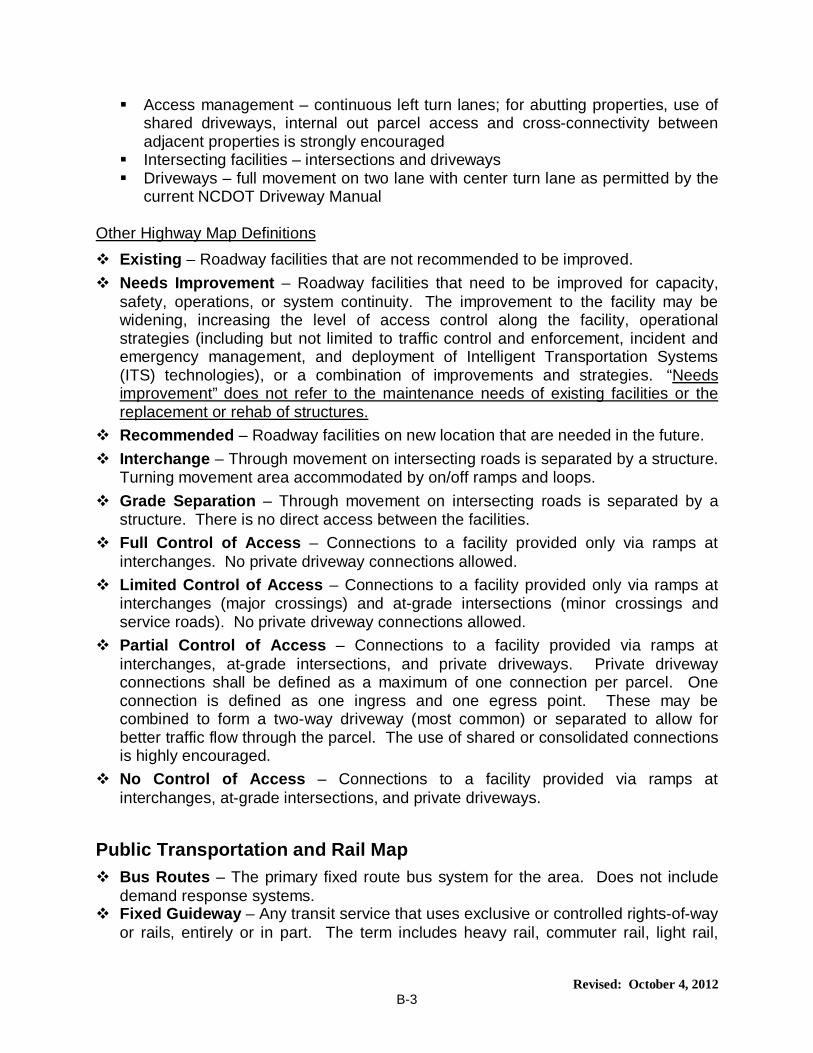
Revised: October 4, 2012B-3
� Access management – continuous left turn lanes; for abutting properties, use of shared driveways, internal out parcel access and cross-connectivity between adjacent properties is strongly encouraged
� Intersecting facilities – intersections and driveways � Driveways – full movement on two lane with center turn lane as permitted by the
current NCDOT Driveway Manual
Other Highway Map Definitions
� Existing – Roadway facilities that are not recommended to be improved.
� Needs Improvement – Roadway facilities that need to be improved for capacity, safety, operations, or system continuity. The improvement to the facility may be widening, increasing the level of access control along the facility, operational strategies (including but not limited to traffic control and enforcement, incident and emergency management, and deployment of Intelligent Transportation Systems (ITS) technologies), or a combination of improvements and strategies. “Needs improvement” does not refer to the maintenance needs of existing facilities or the replacement or rehab of structures.
� Recommended – Roadway facilities on new location that are needed in the future.
� Interchange – Through movement on intersecting roads is separated by a structure. Turning movement area accommodated by on/off ramps and loops.
� Grade Separation – Through movement on intersecting roads is separated by a structure. There is no direct access between the facilities.
� Full Control of Access – Connections to a facility provided only via ramps at interchanges. No private driveway connections allowed.
� Limited Control of Access – Connections to a facility provided only via ramps at interchanges (major crossings) and at-grade intersections (minor crossings and service roads). No private driveway connections allowed.
� Partial Control of Access – Connections to a facility provided via ramps at interchanges, at-grade intersections, and private driveways. Private driveway connections shall be defined as a maximum of one connection per parcel. One connection is defined as one ingress and one egress point. These may be combined to form a two-way driveway (most common) or separated to allow for better traffic flow through the parcel. The use of shared or consolidated connections is highly encouraged.
� No Control of Access – Connections to a facility provided via ramps at interchanges, at-grade intersections, and private driveways.
Public Transportation and Rail Map � Bus Routes – The primary fixed route bus system for the area. Does not include
demand response systems. � Fixed Guideway – Any transit service that uses exclusive or controlled rights-of-way
or rails, entirely or in part. The term includes heavy rail, commuter rail, light rail,
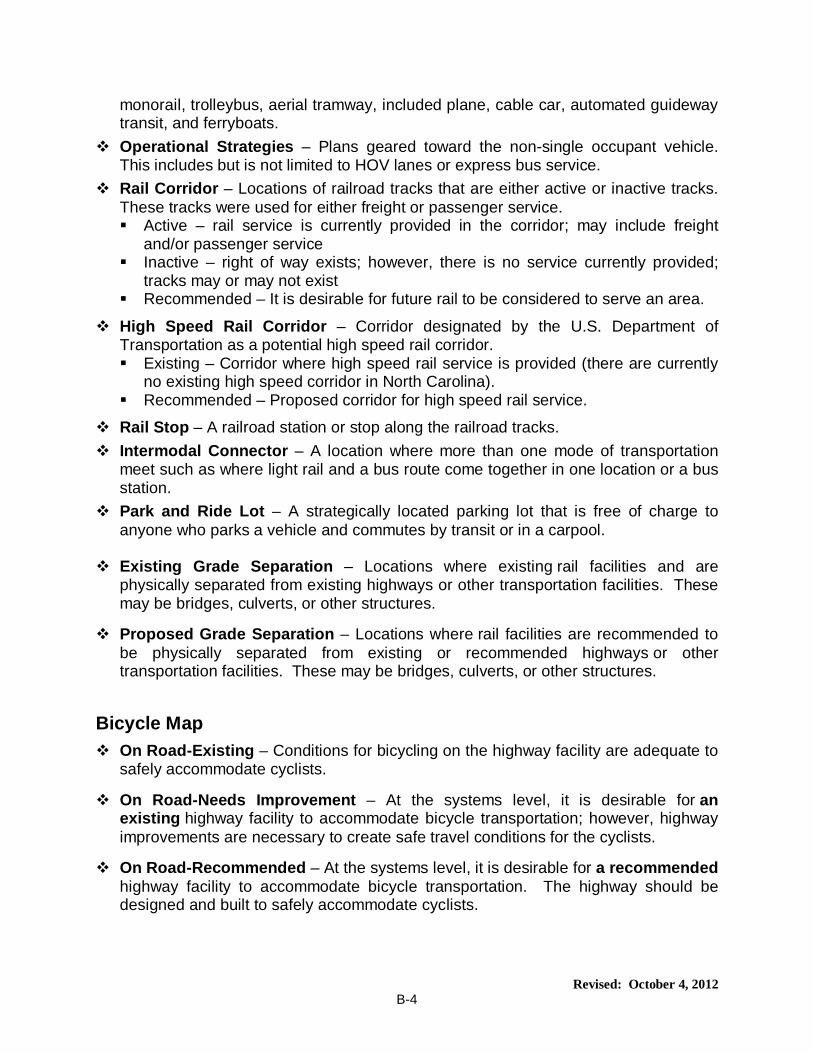
Revised: October 4, 2012B-4
monorail, trolleybus, aerial tramway, included plane, cable car, automated guideway transit, and ferryboats.
� Operational Strategies – Plans geared toward the non-single occupant vehicle. This includes but is not limited to HOV lanes or express bus service.
� Rail Corridor – Locations of railroad tracks that are either active or inactive tracks. These tracks were used for either freight or passenger service. � Active – rail service is currently provided in the corridor; may include freight
and/or passenger service � Inactive – right of way exists; however, there is no service currently provided;
tracks may or may not exist � Recommended – It is desirable for future rail to be considered to serve an area.
� High Speed Rail Corridor – Corridor designated by the U.S. Department of Transportation as a potential high speed rail corridor. � Existing – Corridor where high speed rail service is provided (there are currently
no existing high speed corridor in North Carolina). � Recommended – Proposed corridor for high speed rail service.
� Rail Stop – A railroad station or stop along the railroad tracks.
� Intermodal Connector – A location where more than one mode of transportation meet such as where light rail and a bus route come together in one location or a bus station.
� Park and Ride Lot – A strategically located parking lot that is free of charge to anyone who parks a vehicle and commutes by transit or in a carpool.
� Existing Grade Separation – Locations where existing rail facilities and are physically separated from existing highways or other transportation facilities. These may be bridges, culverts, or other structures.
� Proposed Grade Separation – Locations where rail facilities are recommended to be physically separated from existing or recommended highways or other transportation facilities. These may be bridges, culverts, or other structures.
Bicycle Map � On Road-Existing – Conditions for bicycling on the highway facility are adequate to
safely accommodate cyclists.
� On Road-Needs Improvement – At the systems level, it is desirable for an existing highway facility to accommodate bicycle transportation; however, highway improvements are necessary to create safe travel conditions for the cyclists.
� On Road-Recommended – At the systems level, it is desirable for a recommended highway facility to accommodate bicycle transportation. The highway should be designed and built to safely accommodate cyclists.

Revised: October 4, 2012B-5
� Off Road-Existing – A facility that accommodates only bicycle transportation and is physically separated from a highway facility either within the right-of-way or within an independent right-of-way.
� Off Road-Needs Improvement – A facility that accommodates only bicycle transportation and is physically separated from a highway facility either within the right-of-way or within an independent right-of-way that will not adequately serve future bicycle needs. Improvements may include but are not limited to, widening, paving (not re-paving or other maintenance activities), and improved horizontal or vertical alignment.
� Off Road-Recommended – A facility needed to accommodate only bicycle transportation and is physically separated from a highway facility either within the right-of-way or within an independent right-of-way.
� Multi-use Path-Existing – An existing facility physically separated from motor vehicle traffic that is either within the highway right-of-way or on an independent right-of-way that serves bicycle and pedestrian traffic. Sidewalks should not be designated as a multi-use path.
� Multi-use Path-Needs Improvement – An existing facility physically separated from motor vehicle traffic that is either within the highway right-of-way or on an independent right-of-way that serves bicycle and pedestrian traffic that will not adequately serve future needs. Improvements may include but are not limited to, widening, paving (not re-paving or other maintenance activities), and improved horizontal or vertical alignment. Sidewalks should not be designated as a multi-use path.
� Multi-use Path-Recommended – A facility physically separated from motor vehicle traffic that is either within the highway right-of-way or on an independent right-of-way that is needed to serve bicycle and pedestrian traffic. Sidewalks should not be designated as a multi-use path.
� Existing Grade Separation – Locations where existing “Off Road” facilities and “Multi-use Paths” are physically separated from existing highways, railroads, or other transportation facilities. These may be bridges, culverts, or other structures.
� Proposed Grade Separation – Locations where “Off Road” facilities and “Multi-use Paths” are recommended to be physically separated from existing or recommended highways, railroads, or other transportation facilities. These may be bridges, culverts, or other structures.
Pedestrian Map � Sidewalk-Existing – Paved paths (including but not limited to concrete, asphalt,
brick, stone, or wood) on both sides of a highway facility and within the highway right-of-way that are adequate to safely accommodate pedestrian traffic.
� Sidewalk-Needs Improvement – Improvements are needed to provide paved paths on both sides of a highway facility. The highway facility may or may not need

Revised: October 4, 2012B-6
improvements. Improvements do not include re-paving or other maintenance activities but may include: filling in gaps, widening sidewalks, or meeting ADA (Americans with Disabilities Act) requirements.
� Sidewalk-Recommended – At the systems level, it is desirable for a recommended highway facility to accommodate pedestrian transportation or to add sidewalks on an existing facility where no sidewalks currently exist. The highway should be designed and built to safely accommodate pedestrian traffic.
� Off Road-Existing – A facility that accommodates only pedestrian traffic and is physically separated from a highway facility usually within an independent right-of-way.
� Off Road-Needs Improvement – A facility that accommodates only pedestrian traffic and is physically separated from a highway facility usually within an independent right-of-way that will not adequately serve future pedestrian needs. Improvements may include but are not limited to, widening, paving (not re-paving or other maintenance activities), improved horizontal or vertical alignment, and meeting ADA requirements.
� Off Road-Recommended – A facility needed to accommodate only pedestrian traffic and is physically separated from a highway facility usually within an independent right-of-way.
� Multi-use Path-Existing – An existing facility physically separated from motor vehicle traffic that is either within the highway right-of-way or on an independent right-of-way that serves bicycle and pedestrian traffic. Sidewalks should not be designated as a multi-use path.
� Multi-use Path-Needs Improvement – An existing facility physically separated from motor vehicle traffic that is either within the highway right-of-way or on an independent right-of-way that serves bicycle and pedestrian traffic that will not adequately serve future needs. Improvements may include but are not limited to, widening, paving (not re-paving or other maintenance activities), and improved horizontal or vertical alignment. Sidewalks should not be designated as a multi-use path.
� Multi-use Path-Recommended – A facility physically separated from motor vehicle traffic that is either within the highway right-of-way or on an independent right-of-way that is needed to serve bicycle and pedestrian traffic. Sidewalks should not be designated as a multi-use path.
� Existing Grade Separation – Locations where existing “Off Road” facilities and “Multi-use Paths” are physically separated from existing highways, railroads, or other transportation facilities. These may be bridges, culverts, or other structures.
� Proposed Grade Separation – Locations where “Off Road” facilities and “Multi-use Paths” are recommended to be physically separated from existing or recommended highways, railroads, or other transportation facilities. These may be bridges, culverts, or other structures.

C-1
Appendix C CTP Inventory and Recommendations
Assumptions/ Notes:
Local ID: This Local ID is the same as the one used for the Prioritization Project Submittal Tool. If a TIP project number exists it is listed as the ID. Otherwise, the following system is used to create a code for each recommended improvement: the first 4 letters of the county name is combined with a 4 digit unique numerical code followed by ‘-H’ for highway, ‘-T’ for public transportation, ‘-R’ for rail, ‘-B’ for bicycle, ‘-M’ for multi-use paths, or ‘-P’ for pedestrian modes. If a different code is used along a route it indicates separate projects will probably be requested. Also, upper case alphabetic characters (i.e. ‘A’, ‘B’, or ‘C’) are included after the numeric portion of the code if it is anticipated that project segmentation or phasing will be recommended.
Jurisdiction: Jurisdictions listed are based on municipal limits, county boundaries, and MPO Metropolitan Planning Area Boundaries (MAB), as applicable.
Existing Cross-Section: Listed under ‘Total Width (ft)’ is the approximate width of the roadway from edge of pavement to edge of pavement and under ‘Lane Width (ft)’ is the approximate width of a single lane based on centerline/ edge line markings. Listed under ‘Lanes’ is the total number of lanes, with ‘D’ if the facility is divided, and ‘OW’ if it is a one-way facility.
Existing ROW: The estimated existing right-of-way is based on NCDOT GIS Roadway Characteristic layer in conjunction with current aerial photography. These right-of-way amounts are approximate and may vary.
Existing and Proposed Capacity: The estimated capacities are given in vehicles per day (vpd) based on LOS D for existing facilities and LOS C for new facilities. These capacity estimates were developed based on the 2000 Highway Capacity Manual using the Transportation Planning Branch’s LOS D Standards for Systems Level Planning, as documented in Chapter 1.
Existing and Proposed Volumes, given in vehicles per day (vpd), are estimates only based on a systems-level analysis. The ‘2040 Volume E+C’ is an estimate of the volume in 2040 with only existing plus committed projects assumed to be in place, where committed is defined as projects programmed for construction in the 2012 - 2020 Transportation Improvement Program (TIP). The ‘2040 Volume with CTP’ is an estimate of the volume in 2040 with all proposed CTP improvements assumed to be in place. The ’2040 Volume with CTP’ is shown in bold if it exceeds the proposed capacity, indicating an unmet need. For additional information about the assumptions and techniques used to develop the AADT volume estimates, refer to Chapter 1.
Proposed Cross-section: The CTP recommended cross-sections are listed by code; for depiction of the cross-section, refer to Appendix D. An entry of ‘ADQ’ indicates the existing facility is adequate and there are no improvements recommended for the given mode as part of the CTP.

C-2
CTP Classification: The CTP classification is listed, as shown on the adopted CTP Maps (see Figure 1). Abbreviations are F= freeway, E= expressway, B= boulevard, Maj= other major thoroughfare, Min= minor thoroughfare.
Tier: Tiers are defined as part of the North Carolina Multimodal Investment Network (NCMIN). Abbreviations are Sta= statewide tier, Reg= regional tier, Sub= subregional tier.
Proposals for Other Modes: If there is an improvement recommended for another mode of transportation that relates to the given recommendation, it is indicated by an alphabetic code (H= highway, T= public transportation, R= rail, B= bicycle, P= pedestrian, and M= multi-use path).

CO
LU
0001-H
US
701 B
yp
South
Caro
lina
Lin
e
0.2
Mile
South
NC
904
Tow
n o
f T
abor
City
0.8
24
212
150
55
15800
8800
20000
20000
43900
4E
150
Maj
Reg
CO
LU
0001-H
US
701 B
yp
0.2
Mile
South
NC
904
0.1
Mile
South
US
701 B
us/N
C
410 (
E. 5th
St.)
Tow
n o
f T
abor
City
1.2
36
312
150
55
17200
8200
20000
20000
43900
4E
150
Maj
Reg
CO
LU
0001-H
US
701/N
C 4
10
(E. 5th
St.)
0.1
Mile
South
US
701 B
us/N
C 4
10
(E. 5th
St.)
.1 M
ile S
outh
Ric
hard
Wright
Rd. (S
R 1
151)
Tow
n o
f T
abor
City
0.1
24
212
150
55
15800
12000
25000
25000
43900
4E
150
Maj
Reg
CO
LU
0001-H
US
701/N
C 4
10
(E. 5th
St.)
.1 M
ile S
outh
Ric
hard
Wright
Rd. (S
R 1
151)
0.2
Mile
South
NC
410 (
Joe B
row
n
Hw
y)
Tow
n o
f T
abor
City
0.3
36
312
125
55
17200
12000
25000
25000
43900
4E
150
Maj
Reg
CO
LU
0001-H
US
701/N
C 4
10
(E. 5th
St.)
0.2
Mile
South
NC
410 (
Joe B
row
n
Hw
y)
NC
410 (
Joe
Bro
wn H
wy)
Tow
n o
f T
abor
City
0.2
36
312
150
55
15800
6700
19000
19000
43900
4E
150
Maj
Reg
CO
LU
0001-H
US
701/N
C 4
10
(E. 5th
St.)
NC
410 (
Joe
Bro
wn H
wy)
0.2
Mile
Nort
h N
C
410 (
Joe B
row
n
Hw
y)
Tow
n o
f T
abor
City
0.2
36
312
150
55
15800
6700
19000
19000
43900
4E
150
Maj
Reg
CO
LU
0001-H
US
701 (
Jam
es
B. W
hite H
wy)
0.2
Mile
Nort
h N
C
410 (
Joe B
row
n
Hw
y)
Tabor
City T
ow
n
Lim
it
Tow
n o
f T
abor
City
0.7
24
212
150
55
15800
6700
19000
19000
43900
4E
150
Maj
Reg
CO
LU
0001-H
US
701 (
Jam
es
B. W
hite H
wy)
Tabor
City T
ow
n
Lim
it
Ric
hard
Wright
Rd. (S
R 1
151)
Colu
mbus
County
0.9
24
212
150
55
15800
6700
19000
19000
43900
4E
150
Maj
Reg
CO
LU
0001-H
US
701 (
Jam
es
B. W
hite H
wy)
Ric
hard
Wright
Rd. (S
R 1
151)
Vin
egar
Loop R
d.
(SR
1313)
Colu
mbus
County
0.4
36
212
150
55
15800
6700
19000
19000
43900
4E
150
Maj
Reg
CO
LU
0001-H
US
701 (
Jam
es
B. W
hite H
wy)
Vin
egar
Loop R
d.
(SR
1313)
Butler
Rd. (S
R
1155)
Colu
mbus
County
1.3
24
212
150
55
15800
6700
9400
9400
43900
4E
150
Maj
Reg
CO
LU
0003-H
US
701 B
us.
Relo
cation
US
701 B
yp
Sandw
all
St.
Tow
n o
f T
abor
City
0.2
--
--
--
--
5600
11000
2C
60
Maj
Reg
US
701 B
us.
(Hic
km
an R
d)
Sandw
all
St.
NC
410 (
Sea
Gre
en R
d.)
Tow
n o
f T
abor
City
0.6
40
220
60
20
11000
3600
7000
7000
11000
2E
60
Maj
Reg
B P
US
701 B
us. (E
.
5th
St.)
NC
410 (
Sea
Gre
en R
d.)
US
701 B
us./N
C
410/N
C 9
04 (
E.
5th
St.)
Tow
n o
f T
abor
City
0.2
24
212
50
20
11000
4800
7600
7600
11000
AD
Q1
60
Maj
Reg
B P
US
701 B
us. (E
.
5th
St.)
US
701 B
us./N
C
410 (
Hic
km
an
Rd.)
NC
904 (
Pirew
ay
Rd.)
Tow
n o
f T
abor
City
0.2
24
212
50
20
11000
3500
7800
7800
11000
2E
60
Maj
Reg
B P
US
701 B
us. (E
.
5th
St.)
US
701 B
us./N
C
410 (
E. 5th
St.)
0.1
Mile
East
Ora
nge S
t.
Tow
n o
f T
abor
City
0.2
24
212
50
20
11000
5100
6600
6600
11000
2E
60
Maj
Reg
B P
Tab
le 5
: C
TP
In
ve
nto
ry a
nd
Rec
om
men
dati
on
s
HIG
HW
AY
2040
Volu
me
E+
C
2040
Volu
me
with
CT
PF
acili
tyJurisdic
tion
Local ID
Tie
r
2040 P
rop
osed
Syste
m
Speed
Lim
it
(mph)
Exis
ting
Capacity
(vpd
2012
(2011)
Volu
me
Pro
posed
Capacity
(vpd)
Section
Fro
mT
o
Proposals for
Other Modes
Dis
t.
(mi)
Total Width (ft)
Lanes
Lane Width (ft)
CT
P
Cla
ssifi-
cation
2012 E
xis
tin
g S
yste
m
Cro
ss-
Section
RO
W
(ft)
RO
W
(ft)
C-3

HIG
HW
AY
2040
Volu
me
E+
C
2040
Volu
me
with
CT
PF
acili
tyJurisdic
tion
Local ID
Tie
r
2040 P
rop
osed
Syste
m
Speed
Lim
it
(mph)
Exis
ting
Capacity
(vpd
2012
(2011)
Volu
me
Pro
posed
Capacity
(vpd)
Section
Fro
mT
o
Proposals for
Other Modes
Dis
t.
(mi)
Total Width (ft)
Lanes
Lane Width (ft)
CT
P
Cla
ssifi-
cation
2012 E
xis
tin
g S
yste
m
Cro
ss-
Section
RO
W
(ft)
RO
W
(ft)
US
701 B
us. (E
.
5th
St.)
Ora
nge S
t.Jessie
St.
Tow
n o
f T
abor
City
0.3
36
312
100
35
14000
5100
6600
6600
14000
3C
100
Maj
Reg
B P
US
701 B
us. (E
.
5th
St.)
Jessie
St.
US
701
Tow
n o
f T
abor
City
0.5
36
312
100
35
14000
5600
8600
8600
14000
3C
100
Maj
Reg
B P
NC
410 (
Gre
en
Sea R
d.)
South
Caro
lina
Lin
e
S. Lew
is S
t. (
SR
1301)
Tow
n o
f T
abor
City
0.3
36
312
60
35
14000
1400
2200
2200
14000
3C
60
Maj
Reg
B P
NC
410 (
Gre
en
Sea R
d.)
S. Lew
is S
t. (
SR
1301)
US
701 B
us./N
C
410 (
Hic
km
an
Rd.)
and N
C 4
10
(S. M
ain
St.)3
Tow
n o
f T
abor
City
0.2
24
212
60
35
12600
1400
1700
1700
12600
2E
60
Maj
Reg
B P
NC
410 (
S. M
ain
St.)
NC
410 (
Gre
en
Sea R
d.)
NC
904 (
N. M
ain
St.)
Tow
n o
f T
abor
City
0.1
12
1 O
W3
12
40
20
5500
N/A
N/A
N/A
5500
AD
Q40
Maj
Reg
NC
410 (E
. 5th
St.)
NC
904 (
N. M
ain
St.)
US
701 B
us./N
C
410 (
Hic
km
an
Rd.)
Tow
n o
f T
abor
City
0.1
24
212
50
20
11000
3500
7800
7800
11000
2E
60
Maj
Reg
B P
NC
410
(Hic
km
an R
d.)
US
701 B
us./N
C
410 (
Hic
km
an
Rd.)
US
701 B
us./N
C
410/N
C 9
04 (
E.
5th
St.)
NC
410 (E
. 5th
St.)
US
701 B
us./N
C
410/N
C 9
04 (
E.
5th
St.)
NC
904 (
Pirew
ay
Rd.)
NC
410 (E
. 5th
St.)
NC
904 (
Pirew
ay
Rd)
Ora
nge S
t.
NC
410 (E
. 5th
St.)
Ora
nge S
t.Jessie
St.
NC
410 (E
. 5th
St.)
Jessie
St.
US
701/N
C 4
10
(E. 5th
St)
NC
410 (
Jam
es
B. W
hite H
wy)
US
701/N
C 4
10
.1 M
ile S
outh
Ric
hard
Wright
Rd. (S
R 1
151)
NC
410 (
Jam
es
B. W
hite H
wy)
.1 M
ile S
outh
Ric
hard
Wright
Rd. (S
R 1
151)
NC
410 (
Joe
Bro
wn H
wy)
CO
LU
0002-H
NC
410 (
Joe
Bro
wn H
wy)
Realig
nm
ent
NC
410 (
Joe
Bro
wn H
wy)
Tabor
City T
ow
n
Lim
it
Tow
n o
f T
abor
City
0.3
24
212
100
55
15800
4500
8700
8700
15800
2A
60
Maj
Reg
CO
LU
0005-H
NC
410 (
Joe
Bro
wn H
wy)
Tabor
City T
ow
n
Lim
it
Nort
hern
pla
nnin
g
boundary
Tow
n o
f T
abor
City
2.4
24
212
100
55
15800
4500
8900
8900
15800
2A
60
Maj
Reg
Concurr
ent w
ith U
S 7
01
Concurr
ent w
ith U
S 7
01 B
us.
Concurr
ent w
ith U
S 7
01 B
us. /N
C 9
04
Concurr
ent w
ith U
S 7
01 B
us.
Concurr
ent w
ith U
S 7
01 B
us.
Concurr
ent w
ith U
S 7
01 B
us.
Concurr
ent w
ith U
S 7
01
C-4

HIG
HW
AY
2040
Volu
me
E+
C
2040
Volu
me
with
CT
PF
acili
tyJurisdic
tion
Local ID
Tie
r
2040 P
rop
osed
Syste
m
Speed
Lim
it
(mph)
Exis
ting
Capacity
(vpd
2012
(2011)
Volu
me
Pro
posed
Capacity
(vpd)
Section
Fro
mT
o
Proposals for
Other Modes
Dis
t.
(mi)
Total Width (ft)
Lanes
Lane Width (ft)
CT
P
Cla
ssifi-
cation
2012 E
xis
tin
g S
yste
m
Cro
ss-
Section
RO
W
(ft)
RO
W
(ft)
CO
LU
0006-H
NC
904 (
Sw
am
p
Fox H
wy)
0.1
Mile
N.
Mccrim
mon E
xd.
(SR
1126)
Com
ple
x S
t. (
SR
1305)
Colu
mbus
County
2.2
22
211
60
55
15300
2900
3600
3600
15800
2A
60
Maj
Reg
NC
904 (
Pirew
ay
Rd.)
Com
ple
x S
t. (
SR
1305)
Tabor
City T
ow
n
Lim
it
Colu
mbus
County
0.2
36
312
60
35
14000
4200
6600
6600
14000
3C
60
Maj
Reg
B P
NC
904 (
Pirew
ay
Rd.)
Tabor
City T
ow
n
Lim
itU
S 7
01
Tow
n o
f T
abor
City
0.2
36
312
60
35
14000
3500
4900
4900
14000
3C
60
Maj
Reg
B P
NC
904 (
Pirew
ay
Rd.)
US
701
US
701 B
us./N
C
410 (
E. 5th
St.)
Tow
n o
f T
abor
City
0.7
32
216
60
35
12600
2500
6200
6200
12600
2E
60
Maj
Reg
B P
NC
904 (
E. 5th
St.)
US
701 B
us./N
C
410 (
E. 5th
St.)
US
701 B
us./N
C
410/N
C 9
04
(Hic
km
an R
d.)
NC
904 (
E. 5th
St.)
US
701 B
us./N
C
410/N
C 9
04
(Hic
km
an R
d.)
Main
St.
Tow
n o
f T
abor
City
0.1
24
212
40
20
11000
1200
2200
2200
11000
AD
Q40
Maj
Reg
NC
904 (
N. M
ain
St.)
Main
St.
NC
904 (
W. 8th
St.)
Tow
n o
f T
abor
City
0.3
40
220
40
35
12600
1200
2200
2200
12600
AD
Q2
40
Maj
Reg
B
NC
904 (
W. 8th
St.)
NC
904 (
W. 8th
St.)
NC
904 (
Fair B
luff
Rd.)
Tow
n o
f T
abor
City
0.2
34
217
60
35
11100
2500
4400
4400
11100
AD
Q2
60
Maj
Reg
B
NC
904 (
Fair
Blu
ff R
d.)
NC
904 (
Fair B
luff
Rd.)
Caro
lina R
d. (S
R
1303)
Tow
n o
f T
abor
City
0.2
34
217
60
35
12200
2500
4400
4400
12200
AD
Q1
60
Maj
Reg
B
CO
LU
0006-H
NC
904 (
Fair
Blu
ff R
d.)
Caro
lina R
d. (S
R
1303)
Tabor
City T
ow
n
Lim
it
Tow
n o
f T
abor
City
0.4
22
211
60
35
12200
2500
4400
4400
12200
2A
60
Maj
Reg
B
CO
LU
0006-H
NC
904 (
Sw
am
p
Fox H
wy)
Tabor
City T
ow
n
Lim
it
0.2
Mile
N. P
rison
Entr
ance
Colu
mbus
County
2.7
22
211
60
55
15300
1800
3100
3100
15800
2A
60
Maj
Reg
E. 4th
St.
US
701 B
us./N
C
410 (
Hic
km
an
Rd.)
Nort
hern
pla
nnin
g
boundary
Tow
n o
f T
abor
City
0.2
18
29
40
20
9000
N/A
N/A
N/A
9000
AD
Q4
40
Min
-
E. 4th
St.
NC
410 (
S. M
ain
St)
S. Lew
is S
t. (
SR
1301)
Tow
n o
f T
abor
City
0.1
18
29
40
20
9000
N/A
N/A
N/A
9000
AD
Q4
40
Min
-B
P
CO
LU
0007-H
E. 4th
St.
S. Lew
is S
t (S
R
1301)
Bay S
t.T
ow
n o
f T
abor
City
0.1
18
29
40
20
9000
N/A
N/A
N/A
9000
AD
Q4
40
Min
-B
P
E. 4th
St.
Bay S
t.W
. 6th
St. (
SR
1301)
Tow
n o
f T
abor
City
0.4
18
29
40
20
9000
N/A
N/A
N/A
9000
AD
Q4
40
Min
-B
P
W. 6th
St.
NC
410 (
S. M
ain
St.)
N. Lew
is S
t.T
ow
n o
f T
abor
City
0.1
18
29
60
35
9900
200
250
250
9900
AD
Q4
60
Min
Sub
B P
W. 6th
St. (
SR
1301)
N. Lew
is S
t.
South
Caro
lina
Lin
e
Tow
n o
f T
abor
City
0.8
18
29
60
35
9900
200
250
250
9900
AD
Q4
60
Min
Sub
B P
Concurr
ent w
ith U
S 7
01 B
us./N
C 4
10
C-5
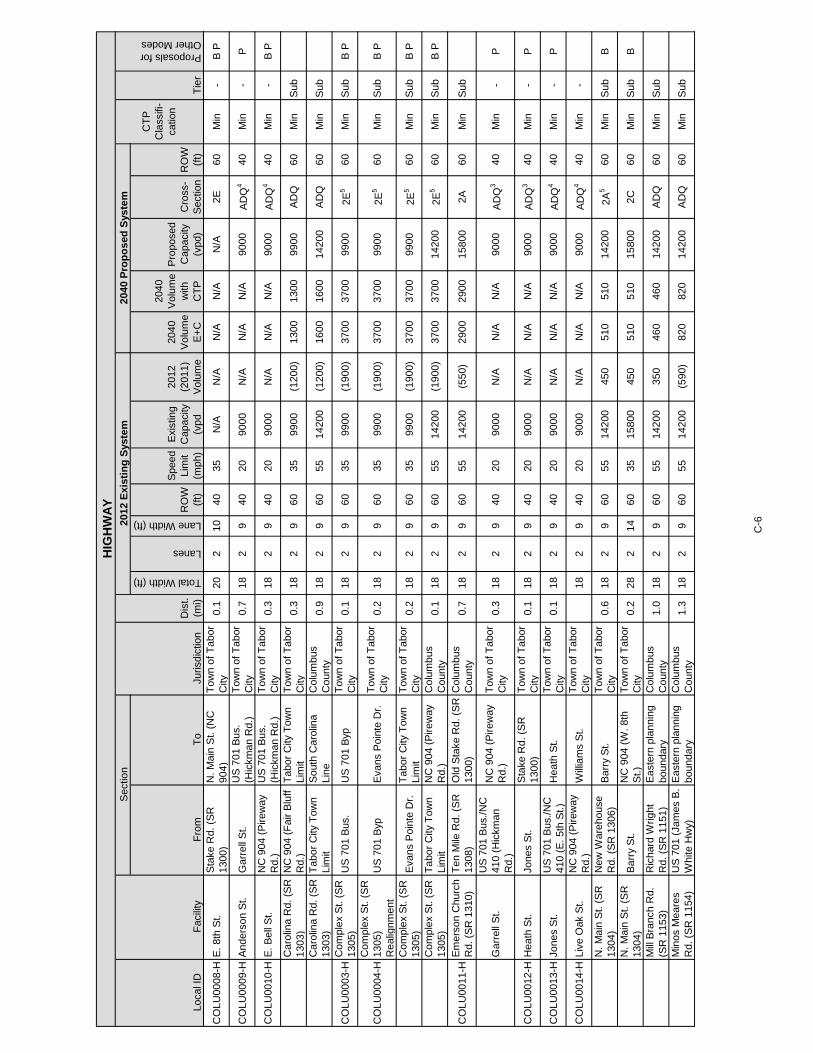
HIG
HW
AY
2040
Volu
me
E+
C
2040
Volu
me
with
CT
PF
acili
tyJurisdic
tion
Local ID
Tie
r
2040 P
rop
osed
Syste
m
Speed
Lim
it
(mph)
Exis
ting
Capacity
(vpd
2012
(2011)
Volu
me
Pro
posed
Capacity
(vpd)
Section
Fro
mT
o
Proposals for
Other Modes
Dis
t.
(mi)
Total Width (ft)
Lanes
Lane Width (ft)
CT
P
Cla
ssifi-
cation
2012 E
xis
tin
g S
yste
m
Cro
ss-
Section
RO
W
(ft)
RO
W
(ft)
CO
LU
0008-H
E. 8th
St.
Sta
ke R
d. (S
R
1300)
N. M
ain
St. (
NC
904)
Tow
n o
f T
abor
City
0.1
20
210
40
35
N/A
N/A
N/A
N/A
N/A
2E
60
Min
-B
P
CO
LU
0009-H
Anders
on S
t.G
arr
ell
St.
US
701 B
us.
(Hic
km
an R
d.)
Tow
n o
f T
abor
City
0.7
18
29
40
20
9000
N/A
N/A
N/A
9000
AD
Q4
40
Min
-P
CO
LU
0010-H
E. B
ell
St.
NC
904 (
Pirew
ay
Rd.)
US
701 B
us.
(Hic
km
an R
d.)
Tow
n o
f T
abor
City
0.3
18
29
40
20
9000
N/A
N/A
N/A
9000
AD
Q4
40
Min
-B
P
Caro
lina R
d. (S
R
1303)
NC
904 (
Fair B
luff
Rd.)
Tabor
City T
ow
n
Lim
it
Tow
n o
f T
abor
City
0.3
18
29
60
35
9900
(1200)
1300
1300
9900
AD
Q60
Min
Sub
Caro
lina R
d. (S
R
1303)
Tabor
City T
ow
n
Lim
it
South
Caro
lina
Lin
e
Colu
mbus
County
0.9
18
29
60
55
14200
(1200)
1600
1600
14200
AD
Q60
Min
Sub
CO
LU
0003-H
Com
ple
x S
t. (
SR
1305)
US
701 B
us.
US
701 B
yp
Tow
n o
f T
abor
City
0.1
18
29
60
35
9900
(1900)
3700
3700
9900
2E
560
Min
Sub
B P
CO
LU
0004-H
Com
ple
x S
t. (
SR
1305)
Realig
nm
ent
US
701 B
yp
Evans P
oin
te D
r.T
ow
n o
f T
abor
City
0.2
18
29
60
35
9900
(1900)
3700
3700
9900
2E
560
Min
Sub
B P
Com
ple
x S
t. (
SR
1305)
Evans P
oin
te D
r.T
abor
City T
ow
n
Lim
it
Tow
n o
f T
abor
City
0.2
18
29
60
35
9900
(1900)
3700
3700
9900
2E
560
Min
Sub
B P
Com
ple
x S
t. (
SR
1305)
Tabor
City T
ow
n
Lim
it
NC
904 (
Pirew
ay
Rd.)
Colu
mbus
County
0.1
18
29
60
55
14200
(1900)
3700
3700
14200
2E
560
Min
Sub
B P
CO
LU
0011-H
Em
ers
on C
hurc
h
Rd. (S
R 1
310)
Ten M
ile R
d. (S
R
1308)
Old
Sta
ke R
d. (S
R
1300)
Colu
mbus
County
0.7
18
29
60
55
14200
(550)
2900
2900
15800
2A
60
Min
Sub
Garr
ell
St.
US
701 B
us./N
C
410 (
Hic
km
an
Rd.)
NC
904 (
Pirew
ay
Rd.)
Tow
n o
f T
abor
City
0.3
18
29
40
20
9000
N/A
N/A
N/A
9000
AD
Q3
40
Min
-P
CO
LU
0012-H
Heath
St.
Jones S
t.S
take R
d. (S
R
1300)
Tow
n o
f T
abor
City
0.1
18
29
40
20
9000
N/A
N/A
N/A
9000
AD
Q3
40
Min
-P
CO
LU
0013-H
Jones S
t.U
S 7
01 B
us./N
C
410 (
E. 5th
St.)
Heath
St.
Tow
n o
f T
abor
City
0.1
18
29
40
20
9000
N/A
N/A
N/A
9000
AD
Q4
40
Min
-P
CO
LU
0014-H
Liv
e O
ak S
t.N
C 9
04 (
Pirew
ay
Rd.)
Will
iam
s S
t.T
ow
n o
f T
abor
City
18
29
40
20
9000
N/A
N/A
N/A
9000
AD
Q4
40
Min
-
N. M
ain
St. (
SR
1304)
New
Ware
house
Rd. (S
R 1
306)
Barr
y S
t.T
ow
n o
f T
abor
City
0.6
18
29
60
55
14200
450
510
510
14200
2A
560
Min
Sub
B
N. M
ain
St. (
SR
1304)
Barr
y S
t.N
C 9
04 (
W. 8th
St.)
Tow
n o
f T
abor
City
0.2
28
214
60
35
15800
450
510
510
15800
2C
60
Min
Sub
B
Mill
Bra
nch R
d.
(SR
1153)
Ric
hard
Wright
Rd. (S
R 1
151)
Easte
rn p
lannin
g
boundary
Colu
mbus
County
1.0
18
29
60
55
14200
350
460
460
14200
AD
Q60
Min
Sub
Min
os M
eare
s
Rd. (S
R 1
154)
US
701 (
Jam
es B
.
White H
wy)
Easte
rn p
lannin
g
boundary
Colu
mbus
County
1.3
18
29
60
55
14200
(590)
820
820
14200
AD
Q60
Min
Sub
C-6

HIG
HW
AY
2040
Volu
me
E+
C
2040
Volu
me
with
CT
PF
acili
tyJurisdic
tion
Local ID
Tie
r
2040 P
rop
osed
Syste
m
Speed
Lim
it
(mph)
Exis
ting
Capacity
(vpd
2012
(2011)
Volu
me
Pro
posed
Capacity
(vpd)
Section
Fro
mT
o
Proposals for
Other Modes
Dis
t.
(mi)
Total Width (ft)
Lanes
Lane Width (ft)
CT
P
Cla
ssifi-
cation
2012 E
xis
tin
g S
yste
m
Cro
ss-
Section
RO
W
(ft)
RO
W
(ft)
New
Ware
house
Rd. (S
R 1
306)
Old
Sta
ke R
d. (S
R
1300)
Will
oughby R
d.
(SR
1305)
Tow
n o
f T
abor
City
0.3
18
29
60
55
14200
(410)
1000
1000
14200
AD
Q60
Min
Sub
O L
Cole
man R
d.
(SR
1309)
NC
904 (
Joe
Bro
wn H
wy)
Ten M
ile R
d. (S
R
1308)
Colu
mbus
County
0.5
18
29
60
55
AD
QM
inS
ub
CO
LU
0015-H
Old
Sta
ke R
d.
(SR
1300)
Canal S
t.T
abor
City T
ow
n
Lim
it
Tow
n o
f T
abor
City
0.2
18
29
60
55
14200
(2800)
5300
5300
15800
2A
60
Min
Sub
CO
LU
0015-H
Old
Sta
ke R
d.
(SR
1300)
Tabor
City T
ow
n
Lim
it
Nort
hern
pla
nnin
g
boundary
Colu
mbus
County
2.0
18
29
60
55
14200
940
1200
1200
15800
2A
60
Min
Sub
CO
LU
0016-H
Ora
nge S
t.U
S 7
01 B
us./N
C
410 (
E. 5th
St)
NC
904 (
Pirew
ay
Rd.)
Tow
n o
f T
abor
City
0.1
18
29
40
20
9000
N/A
N/A
N/A
9000
AD
Q4
40
Min
-
CO
LU
0016-H
Ora
nge S
t.N
C 9
04 (
Pirew
ay
Rd.)
Wall
St.
Tow
n o
f T
abor
City
0.1
18
29
40
20
9000
N/A
N/A
N/A
9000
AD
Q4
40
Min
-P
CO
LU
0016-H
Ora
nge S
t.W
all
St.
E. 4th
St.
Tow
n o
f T
abor
City
0.1
18
29
40
20
9000
N/A
N/A
N/A
9000
AD
Q40
Min
-
Ric
hard
Wright
Rd. (S
R 1
151)
US
701/N
C 4
10
(E. 5th
St.)
Tabor
City T
ow
n
Lim
it
Tow
n o
f T
abor
City
0.1
18
29
60
55
14200
(520)
620
620
14200
2A
560
Min
Sub
B
Ric
hard
Wright
Rd. (S
R 1
151)
Tabor
City T
ow
n
Lim
it
Mill
Bra
nch R
d.
(SR
1153)
Colu
mbus
County
2.4
18
29
60
55
14200
370
620
620
14200
2A
560
Min
Sub
B
CO
LU
0020-H
Sta
ke R
d. (S
R
1300)
US
701 B
us./N
C
410 (
E. 5th
St.)
E. 8th
St.
Tow
n o
f T
abor
City
0.2
32
216
60
35
11000
(2800)
5300
5300
10600
2E
60
Min
Sub
B P
Sta
ke R
d. (S
R
1300)
E. 8th
St.
Canal S
t.T
ow
n o
f T
abor
City
0.8
32
216
60
35
11000
(2800)
5300
5300
10600
2E
60
Min
Sub
B P
Ten M
ile R
d. (S
R
1308)
US
701 (
Jam
es B
.
White H
wy)
Tabor
City T
ow
n
Lim
it
Tow
n o
f T
abor
City
0.5
18
29
60
55
14200
(580)
690
690
14200
2A
60
Min
Sub
Ten M
ile R
d. (S
R
1308)
Tabor
City T
ow
n
Lim
it
Em
ers
on C
hurc
h
Rd. (S
R 1
310)
Colu
mbus
County
1.6
18
29
60
55
14200
(580)
690
690
14200
AD
Q60
Min
Sub
CO
LU
0017-H
Ten M
ile R
d. (S
R
1308)
Em
ers
on C
hurc
h
Rd. (S
R 1
310)
Nort
hern
pla
nnin
g
boundary
Colu
mbus
County
0.8
18
29
60
55
14200
(870)
1100
1100
15800
2A
60
Min
Sub
CO
LU
0018-H
Will
Inm
an R
d.
(SR
1006)
NC
904 (
Sw
am
p
Fox H
wy)
Easte
rn p
lannin
g
boundary
Colu
mbus
County
2.5
20
210
60
55
14700
1200
2400
2400
15800
2A
60
Min
Sub
CO
LU
0019-H
Will
iam
s. S
tU
S 7
01 B
US
/NC
410 (
E. 5th
Str
eet)
Liv
e O
ak S
t.T
ow
n o
f T
abor
City
0.3
18
29
40
20
9000
N/A
N/A
N/A
9000
AD
Q4
40
Min
-P
Will
oughby R
d.
(SR
1304)
NC
904 (
Sw
am
p
Fox H
wy)
Tabor
City T
ow
n
Lim
it
Colu
mbus
County
2.2
18
29
60
55
14200
(210)
570
570
14200
AD
Q60
Min
Sub
C-7

HIG
HW
AY
2040
Volu
me
E+
C
2040
Volu
me
with
CT
PF
acili
tyJurisdic
tion
Local ID
Tie
r
2040 P
rop
osed
Syste
m
Speed
Lim
it
(mph)
Exis
ting
Capacity
(vpd
2012
(2011)
Volu
me
Pro
posed
Capacity
(vpd)
Section
Fro
mT
o
Proposals for
Other Modes
Dis
t.
(mi)
Total Width (ft)
Lanes
Lane Width (ft)
CT
P
Cla
ssifi-
cation
2012 E
xis
tin
g S
yste
m
Cro
ss-
Section
RO
W
(ft)
RO
W
(ft)
Will
oughby R
d.
(SR
1304)
Tabor
City T
ow
n
Lim
it
New
Ware
house
Rd. (S
R 1
306)
Tow
n o
f T
abor
City
0.1
18
29
60
55
14200
(210)
570
570
14200
AD
Q60
Min
Sub
Footn
ote
s:
(1)
share
the r
oad b
ike u
tiliz
ed, N
C 4
10 n
ort
hbound is a
lso U
S 7
01 B
us. w
hic
h is tw
o w
ay.
(2)
Adequate
RO
W, only
str
ippin
g n
eeded for
bik
e lanes s
ince s
idew
alk
s a
re n
ot re
com
mended
(3)
NC
410 is o
ne w
ay s
outh
bound w
ith o
n s
treet park
ing o
n b
oth
sid
es
(4)
Adequate
RO
W for
type o
f b
icycle
and/o
r pedestr
ian r
ecom
mendation
(5)
adequate
lane w
idth
, add 4
' paved s
hould
er
to a
ccom
modate
bic
ycle
lanes
C-8

Sp
ee
d
Lim
itR
OW
Tra
ins
RO
WT
rain
s
(mp
h)
(mi)
(ft)
pe
r d
ay
(ft)
pe
r d
ay
Mo
de
s
CO
LU
00
01
-R
CA
LA
- W
hite
vill
e N
ort
h
Ca
rolin
a to
Mu
llin
s S
ou
th
Ca
rolin
a
No
rth
ern
Ta
bo
r C
ity p
lan
nin
g b
ou
nd
ary
-
So
uth
Ca
rolin
a s
tate
lin
eIn
de
p.
-5
.8In
active
80
+/-
0-
--
-
Pro
po
se
d S
yste
m
Lo
ca
l ID
Fa
cili
ty/ R
ou
teS
ectio
n (
Fro
m -
To
)
RA
IL
Oth
er
Typ
eT
yp
eC
lass
Dis
tan
ce
Exis
tin
g S
yste
m
C-9
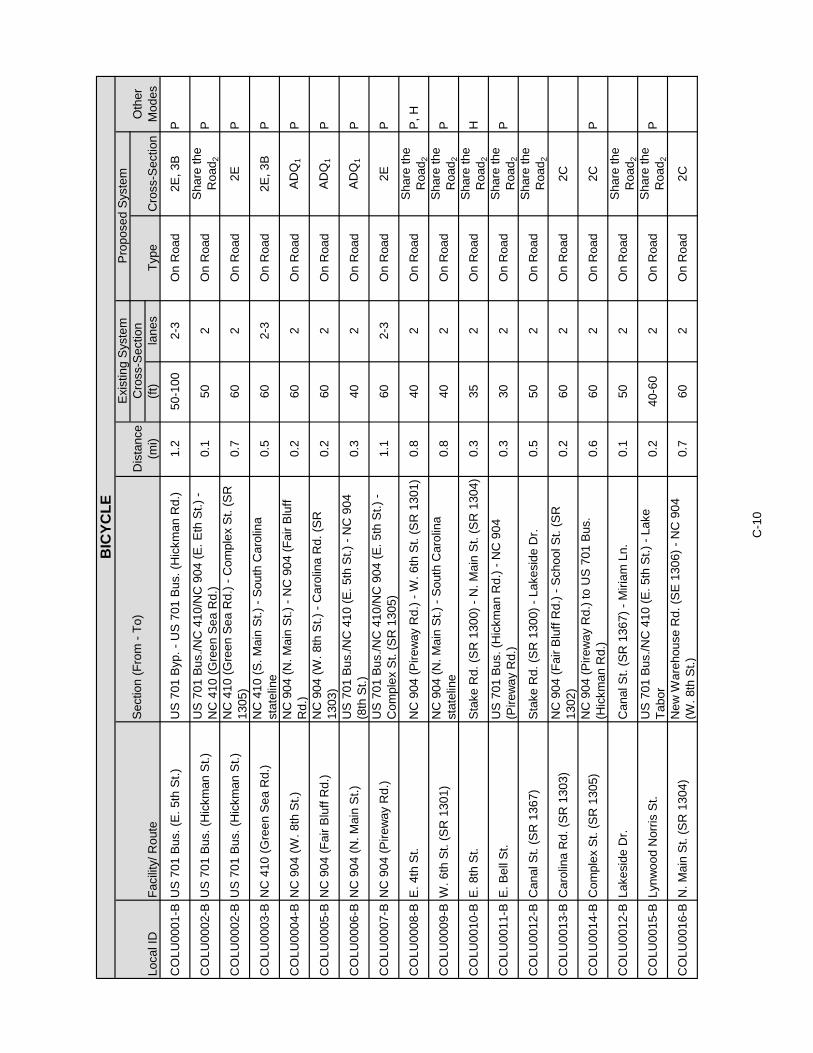
Dis
tance
(mi)
(ft)
lanes
Type
CO
LU
0001-B
US
701 B
us. (E
. 5th
St.)
US
701 B
yp. -
US
701 B
us. (H
ickm
an R
d.)
1.2
50-1
00
2-3
On R
oad
2E
, 3B
P
CO
LU
0002-B
US
701 B
us. (H
ickm
an S
t.)
US
701 B
us./N
C 4
10/N
C 9
04 (
E. E
th S
t.)
-
NC
410 (
Gre
en S
ea R
d.)
0.1
50
2O
n R
oad
Share
the
Road
2P
CO
LU
0002-B
US
701 B
us. (H
ickm
an S
t.)
NC
410 (
Gre
en S
ea R
d.)
- C
om
ple
x S
t. (
SR
1305)
0.7
60
2O
n R
oad
2E
P
CO
LU
0003-B
NC
410 (
Gre
en S
ea R
d.)
NC
410 (
S. M
ain
St.)
- S
outh
Caro
lina
sta
telin
e0.5
60
2-3
On R
oad
2E
, 3B
P
CO
LU
0004-B
NC
904 (
W. 8th
St.)
NC
904 (
N. M
ain
St.)
- N
C 9
04 (
Fair B
luff
Rd.)
0.2
60
2O
n R
oad
AD
Q1
P
CO
LU
0005-B
NC
904 (
Fair B
luff
Rd.)
NC
904 (
W. 8th
St.)
- C
aro
lina R
d. (S
R
1303)
0.2
60
2O
n R
oad
AD
Q1
P
CO
LU
0006-B
NC
904 (
N. M
ain
St.)
US
701 B
us./N
C 4
10 (
E. 5th
St.)
- N
C 9
04
(8th
St.)
0.3
40
2O
n R
oad
AD
Q1
P
CO
LU
0007-B
NC
904 (
Pirew
ay R
d.)
US
701 B
us./N
C 4
10/N
C 9
04 (
E. 5th
St.)
-
Com
ple
x S
t. (
SR
1305)
1.1
60
2-3
On R
oad
2E
P
CO
LU
0008-B
E. 4th
St.
NC
904 (
Pirew
ay R
d.)
- W
. 6th
St. (
SR
1301)
0.8
40
2O
n R
oad
Share
the
Road
2P
, H
CO
LU
0009-B
W. 6th
St. (
SR
1301)
NC
904 (
N. M
ain
St.)
- S
outh
Caro
lina
sta
telin
e0.8
40
2O
n R
oad
Share
the
Road
2P
CO
LU
0010-B
E. 8th
St.
Sta
ke R
d. (S
R 1
300)
- N
. M
ain
St. (
SR
1304)
0.3
35
2O
n R
oad
Share
the
Road
2H
CO
LU
0011-B
E. B
ell
St.
US
701 B
us. (H
ickm
an R
d.)
- N
C 9
04
(Pirew
ay R
d.)
0.3
30
2O
n R
oad
Share
the
Road
2P
CO
LU
0012-B
Canal S
t. (
SR
1367)
Sta
ke R
d. (S
R 1
300)
- Lakesid
e D
r.0.5
50
2O
n R
oad
Share
the
Road
2
CO
LU
0013-B
Caro
lina R
d. (S
R 1
303)
NC
904 (
Fair B
luff
Rd.)
- S
chool S
t. (
SR
1302)
0.2
60
2O
n R
oad
2C
CO
LU
0014-B
Com
ple
x S
t. (
SR
1305)
NC
904 (
Pirew
ay R
d.)
to U
S 7
01 B
us.
(Hic
km
an R
d.)
0.6
60
2O
n R
oad
2C
P
CO
LU
0012-B
Lakesid
e D
r.C
anal S
t. (
SR
1367)
- M
iria
m L
n.
0.1
50
2O
n R
oad
Share
the
Road
2
CO
LU
0015-B
Lynw
ood N
orr
is S
t.U
S 7
01 B
us./N
C 4
10 (
E. 5th
St.)
- Lake
Tabor
0.2
40-6
02
On R
oad
Share
the
Road
2P
CO
LU
0016-B
N. M
ain
St. (
SR
1304)
New
Ware
house R
d. (S
E 1
306)
- N
C 9
04
(W. 8th
St.)
0.7
60
2O
n R
oad
2C
Cro
ss-S
ection
BIC
YC
LE
Local ID
Facili
ty/ R
oute
Section (
Fro
m -
To)
Exis
ting S
yste
mP
roposed S
yste
m
Oth
er
Modes
Cro
ss-S
ection
C-1
0

Dis
tance
(mi)
(ft)
lanes
Type
Cro
ss-S
ection
BIC
YC
LE
Local ID
Facili
ty/ R
oute
Section (
Fro
m -
To)
Exis
ting S
yste
mP
roposed S
yste
m
Oth
er
Modes
Cro
ss-S
ection
CO
LU
0012-B
Miria
m L
n.
Canal S
t. (
SR
1367)
- Lakesid
e D
r.0.1
50
2O
n R
oad
Share
the
Road
2
CO
LU
0017-B
New
Ware
house R
d. (S
R 1
306)
Old
Sta
ke R
d. (S
R 1
300)
- N
. M
ain
St. (
SR
1304)
0.4
60
2O
n R
oad
2C
CO
LU
0018-B
Old
Sta
ke R
d. (S
R 1
300)
Canal S
t. (
SR
1367)
- N
ew
Ware
house R
d.
(SR
1306)
0.1
60
2O
n R
oad
2C
CO
LU
0019-B
Ric
hard
Wright R
d. (S
R 1
151)
US
701/N
C 4
10 (
E. 5th
St.)
- 0.3
Mile
W.
Rosecoe C
ole
man R
d. (S
R 1
152)
0.4
40
2O
n R
oad
2C
CO
LU
0020-B
School S
t. (
SR
1302)
Caro
lina R
d. (S
R 1
303)
to W
. 6th
St. (
SR
1301)
0.4
40
2O
n R
oad
2C
CO
LU
0021-B
Sta
ke R
d. (S
R 1
300)
US
701 B
us./N
C 4
10/N
C 9
04 (
E. E
th S
t.)
-
Canal S
t. (
SR
1367)
0.9
60
2O
n R
oad
2E
, A
DQ
1P
(1)
RO
W is a
dequate
, only
str
ippin
g is n
eeded
(2)
Share
the r
oad s
ignage is a
dequate
C-1
1

Oth
er
Dis
tance
(mi)
Type
Sid
e o
f
Str
eet
Type
Sid
e o
f S
treet
Modes
CO
LU
0001-P
US
701 B
us./N
C 4
10/N
C 9
04
(E. 5th
St.)
Sta
ke R
d. (S
R 1
300)
- C
art
er
St.
0.1
Sid
ew
alk
Both
Sid
ew
alk
Both
, fill
gaps
B
CO
LU
0001-P
US
701 B
us./N
C 4
10/N
C 9
04
(E. 5th
St.)
Cart
er
St. -
How
ard
St.
0.1
----
Sid
ew
alk
Both
B
CO
LU
0001-P
US
701 B
us./N
C 4
10/N
C 9
04
(E. 5th
St.)
How
ard
St. -
Will
iam
s S
t.0.1
Sid
ew
alk
South
Sid
ew
alk
Nort
hB
CO
LU
0001-P
US
701 B
us./N
C 4
10/N
C 9
04
(E. 5th
St.)
Will
iam
s S
t. -
Jones S
t.0.1
----
Sid
ew
alk
Both
B
CO
LU
0001-P
US
701 B
us./N
C 4
10/N
C 9
04
(E. 5th
St.)
Jesse S
t. -
Lynw
ood N
orr
is R
d.
0.5
----
Sid
ew
alk
Both
B
CO
LU
0002-P
US
701 B
us. (H
ickm
an R
d.)
Fore
st R
d. -
Com
ple
x S
t. (
SR
1305)
0.9
----
Sid
ew
alk
Both
B
CO
LU
0003-P
NC
410 (
Gre
en S
ea R
d.)
NC
410 (
S. M
ain
St.)
- S
outh
Caro
lina
sta
telin
e0.5
Sid
ew
alk
West
Sid
ew
alk
Both
, fill
gaps
B
CO
LU
0004-P
NC
904 (
N. M
ain
St.)
7th
St. to N
C 9
04 (
8th
St.)
0.1
Sid
ew
alk
East
Sid
ew
alk
West
B
CO
LU
0005-P
NC
904 (
Pirew
ay R
d.)
US
701 B
us./N
C 4
10/N
C 9
04 (
E. 5th
St.)
-
Garr
ell
St.
0.3
Sid
ew
alk
East
Sid
ew
alk
West
B
CO
LU
0005-P
NC
904 (
Pirew
ay R
d.)
Garr
ell
St. -
E. B
ell
St.
0.2
----
Sid
ew
alk
Both
B
CO
LU
0005-P
NC
904 (
Pirew
ay R
d.)
E. B
ell
St. -
Flo
yd S
t.0.1
Sid
ew
alk
West
Sid
ew
alk
Both
, fill
gaps
B
CO
LU
0005-P
NC
904 (
Pirew
ay R
d.)
Flo
yd S
t. -
Com
ple
x S
t. (
SR
1305)
0.4
----
Sid
ew
alk
Both
B
CO
LU
0006-H
W. 4th
St.
S. M
ain
St. -
Bay S
t.0.2
Sid
ew
alk
Both
Sid
ew
alk
Both
B
CO
LU
0007-P
W. 6th
St. (
SR
1301)
NC
904 (
N. M
ain
St.)
- R
eece S
t.0.6
Sid
ew
alk
Nort
hS
idew
alk
South
B
CO
LU
0007-P
W. 6th
St. (
SR
1301)
Reece S
t. -
W. 4th
St.
0.1
Sid
ew
alk
South
Sid
ew
alk
Nort
hB
CO
LU
0008-P
E. 8th
St.
Sta
ke R
d. (S
R 1
300)
- N
. M
ain
St. (
SR
1304)
0.3
----
Sid
ew
alk
Both
B, H
CO
LU
0009-P
Anders
on S
t.G
arr
ell
St. -
Sandw
all
Dr.
0.6
----
Sid
ew
alk
Both
H
CO
LU
0010-P
Bay S
t.W
. 4th
St. to W
. 6th
St. (
SR
1301)
0.1
----
Sid
ew
alk
Both
PE
DE
ST
RIA
N
Local ID
Facili
ty/ R
oute
Section (
Fro
m -
To)
Exis
ting S
yste
mP
roposed S
yste
m
C-1
2

Oth
er
Dis
tance
(mi)
Type
Sid
e o
f
Str
eet
Type
Sid
e o
f S
treet
Modes
PE
DE
ST
RIA
N
Local ID
Facili
ty/ R
oute
Section (
Fro
m -
To)
Exis
ting S
yste
mP
roposed S
yste
m
CO
LU
0011-P
E. B
ell
St.
US
701 B
us. (H
ickm
an R
d.)
- N
C 9
04
(Pirew
ay R
d.)
0.3
----
Sid
ew
alk
Both
B, H
CO
LU
0012-P
Com
ple
x S
t. (
SR
1305)
NC
904 (
Pirew
ay R
d.)
- U
S 7
01 B
us.
(Hic
km
an R
d.)
0.6
----
Sid
ew
alk
Both
B
CO
LU
0013-P
Garr
ell
St.
US
701 B
us. (H
ickm
an R
d.)
- N
C 9
04
(Pirew
ay R
d.)
0.3
Sid
ew
alk
South
Sid
ew
alk
Nort
h
CO
LU
0014-P
Heath
St.
Jones S
t. -
Sta
ke R
d. (S
R 1
300)
0.1
----
Sid
ew
alk
Both
H
CO
LU
0015-P
Jones S
t.U
S 7
01 B
us./N
C 4
10 (
E. 5th
St.)
- H
eath
St.
0.2
----
Sid
ew
alk
Both
H
CO
LU
0016-P
Liv
e O
ak S
t.W
illia
ms S
t. -
NC
904 (
Pirew
ay R
d.)
0.3
----
Sid
ew
alk
Both
H
CO
LU
0017-P
Lynw
ood N
orr
is S
t.U
S 7
01 B
us./N
C 4
10 (
E. 5th
St.)
- D
ead e
nd
0.2
----
Sid
ew
alk
East
B
CO
LU
0018-P
Sandw
all
Dr.
A
nders
on S
t. -
US
701 B
us. (H
ickm
an R
d.)
0.2
----
Sid
ew
alk
Both
CO
LU
0019-P
Sta
ke R
d. (S
R 1
300)
US
701 B
us./N
C 4
10/N
C 9
04 (
E. 5th
St.)
-
Cart
er
St.
0.1
Sid
ew
alk
West
Sid
ew
alk
East
B
CO
LU
0019-P
Sta
ke R
d. (S
R 1
300)
Cart
er
St. -
McC
ullu
m S
t.0.2
----
Sid
ew
alk
Both
B
CO
LU
0020-P
Will
iam
s S
t.U
S 7
01 B
us./N
C 4
10/N
C 9
04 (
E. 5th
St.)
-
Liv
e O
ak S
t.0.2
----
Sid
ew
alk
Both
H
Oth
er
Dis
tance
(mi)
Sid
e o
f
Str
eet
Cro
ss-
Section
Sid
e o
f S
treet
Cro
ss-S
ection
Modes
CO
LU
0001-M
Lake T
abor
Path
Ric
hard
Wright R
d. (S
R 1
151)
- Lynw
ood
Norr
is S
t.0.3
----
To b
e
dete
rmin
ed
To b
e
dete
rmin
ed
--
MU
LT
I-U
SE
PA
TH
Local ID
Facili
ty/ R
oute
Section (
Fro
m -
To)
Exis
ting S
yste
mP
roposed S
yste
m
C-1
3

C-14
This page intentionally left blank.

D-1
Appendix D Typical Cross Sections
Cross section requirements for roadways vary according to the capacity and level of service to be provided. Universal standards in the design of roadways are not practical. Each roadway section must be individually analyzed and its cross section determined based on the volume and type of projected traffic, existing capacity, desired level of service, and available right-of-way. These cross sections are typical for facilities on new location and where right-of-way constraints are not critical. For widening projects and urban projects with limited right-of-way, special cross sections should be developed that meet the needs of the project. The comprehensive planning and design "typical" highway cross sections, as depicted on the following pages, were updated on May 5, 2014 in response to the Strategic Transportation Investments1 (STI) law (House Bill 817) and are also consistent with SPOTOn!ine (used for project prioritization2), NCDOT's GIS-based web application for providing automated, near real-time prioritization scores and project costs. This guidance establishes design elements that emphasize safety, mobility, complete streets3, and accessibility for multiple modes of travel. These "typical" highway cross sections should be used as guidelines for comprehensive transportation planning, project planning and project design activities. The specific and final cross section details and right of way limits for projects will be established through the preparation of the National Environmental Policy Act4 (NEPA) documentation and through final design preparation. On all existing and proposed roadways delineated on the CTP, adequate right-of-way should be protected or acquired for the recommended cross sections. In addition to cross section and right-of-way recommendations for improvements, Appendix C may recommend ultimate needed right-of-way for the following situations: roadways which may require widening after the current planning period, roadways which are borderline adequate and accelerated traffic growth could
render them deficient, roadways where an urban curb and gutter cross section may be locally desirable
because of urban development or redevelopment, and roadways which may need to accommodate an additional transportation mode.
1 For more information on STI, go to: http://www.ncdot.gov/strategictransportationinvestments/. 2 For more information on prioritization, go to: https://connect.ncdot.gov/projects/planning/Pages/StrategicPrioritization.aspx. 3 For more information on Complete Streets, go to: http://www.completestreetsnc.org/. 4 For more information on NEPA, go to: http://ceq.hss.doe.gov/.

POSTED SPEED 55 MPH
12'12'
5'P.S.
8'
5'P.S.
8'
60’ MIN. RIGHT OF WAY
2 LANE UNDIVIDED WITH PAVED SHOULDERS
2A
2 LANES UNDIVIDED
2B
POSTED SPEED 45 MPH OR LESS
11'11'
4'P.S.
8'
4'P.S.
8'
60’ MIN. .RIGHT OF WAY
2 LANE UNDIVIDED WITH PAVED SHOULDERS
2C
POSTED SPEED 25 - 35 MPH
50’ MIN. RIGHT OF WAY
10' 10'
4'P.S.
4'P.S.
6'6'
“TYPICAL” HIGHWAY CROSS SECTIONS
EWThomas
Typewritten Text
FIGURE 14
ewthomas
Typewritten Text
D-2
EWThomas
Typewritten Text
Revised 05/05/2014

2 LANE UNDIVIDED WITH PAVED SHOULDERS AND SIDEWALKS
2D
90' MIN. RIGHT OF WAY
CLEAR ZONE24' MIN.
CLEAR ZONE24' MIN.
4' P.S4' P.S
11'11' 8'8'
POSTED SPEED 25-45 MPH
5'
SIDEWALK SIDEWALKMIN.
MIN.MIN.
MIN. 5'2' 5' 5' 2'
2 LANE UNDIVIDED WITH CURB & GUTTER, BIKE LANES, AND SIDEWALKS
2EBIKELANE
BIKELANE
11' 5' 2' 10'
5'
11'5'2'10'
5'
SIDEWALKSIDEWALK
POSTED SPEED 25-45 MPH
60' MIN. RIGHT OF WAY
MIN. MIN.MIN.MIN.
MIN. MIN.
4'-6'4'-6' 6''6''
2 LANE UNDIVIDED WITH PAVED SHOULDERS AND SIDEWALKSIN CAMA COUNTIES
2F
20' MIN.CLEAR ZONE
20' MIN.CLEAR ZONE
SIDEWALKSIDEWALK
5'2' 11'11'
POSTED SPEED 25-45 MPH
5' 2'4' P.S.
MIN.
MIN.MIN.
MIN. 4' P.S.
80’ MIN. RIGHT OF WAY
“TYPICAL” HIGHWAY CROSS SECTIONS
EWThomas
Typewritten Text
Revised 05/05/2014
ewthomas
Typewritten Text
D-3

2 LANE DIVIDED (23’ RAISED MEDIAN) WITH CURB & GUTTER AND SIDEWALKS
2I
POSTED SPEED 25-45 MPH
MIN. MIN.MIN.MIN.
MIN. MIN.
SIDEWALK SIDEWALK
23'MEDIAN 12'10'
5'
12'2'
5' 4'-6'
2' 10'
85' MIN. RIGHT OF WAY
4'-6' 6''6''
2 LANE UNDIVIDED WITH CURB & GUTTER, PARKING ONE SIDE, BIKE LANES, AND SIDEWALKS
2H
POSTED SPEED 25-45 MPH
11' 10'
5'
11'2'10'
5' 4'-6'
MIN. MIN.
4'-6'
MIN.MIN.
MIN.MIN.SIDEWALK SIDEWALKPARKING
5'8' 2'5'
75' MIN. RIGHT OF WAY
BIKELANE
BIKELANE
6''6''
2 LANE UNDIVIDED WITH CURB & GUTTER, PARKING BOTH SIDES, BIKE LANES, AND SIDEWALKS
2G
POSTED SPEED 25-45 MPH
11' 10'
5'
11'2'10'
5'
MIN.MIN. MIN. MIN.
4'-6'
MIN.MIN.
SIDEWALKSIDEWALK PARKING PARKING
5'8' 2'8'5'
85' MIN. RIGHT OF WAY
BIKELANE
BIKELANE
SCHOOL BUS
4'-6' 6''6''
“TYPICAL” HIGHWAY CROSS SECTIONS
EWThomas
Typewritten Text
Revised 05/05/2014
ewthomas
Typewritten Text
D-4

2 LANE DIVIDED (17’-6” RAISED MEDIAN) WITH CURB & GUTTER, BIKE LANES, AND SIDEWALKS
2L
POSTED SPEED 25-45 MPH
MIN. MIN.MIN.MIN.
MIN. MIN.
SIDEWALK SIDEWALK
17'-6''MEDIAN 11'
BIKELANE
BIKELANE
10'
5'
11'5'2'
5' 4'-6'
5' 2' 10'
80' MIN. RIGHT OF WAY
4'-6' 6''6''
2 LANE DIVIDED (17’-6” RAISED MEDIAN) WITH CURB & GUTTER AND SIDEWALKS
2K
POSTED SPEED 25-45 MPH
MIN. MIN.MIN.MIN.
MIN. MIN.
SIDEWALK SIDEWALK
17'-6''MEDIAN 12'10'
5'
12'2'
5' 4'-6'
2' 10'
80' MIN. RIGHT OF WAY
4'-6' 6''6''
2 LANE DIVIDED (23’ RAISED MEDIAN) WITH CURB & GUTTER,BIKE LANES, AND SIDEWALKS
2J
POSTED SPEED 25-45 MPH
MIN. MIN.MIN.MIN.
MIN. MIN.
SIDEWALK SIDEWALK
23'MEDIAN 11'
BIKELANE
BIKELANE
10'
5'
11'5'2'
5' 4'-6'
5' 2' 10'
90' MIN. RIGHT OF WAY
4'-6' 6''6''
“TYPICAL” HIGHWAY CROSS SECTIONS
EWThomas
Typewritten Text
Revised 05/05/2014
ewthomas
Typewritten Text
D-5

2 LANE WITH TWO WAY LEFT TURN LANE, CURB & GUTTER,BIKE LANES, AND SIDEWALKS
3C
POSTED SPEED 25-45 MPH
11' 11' 2' 10'MIN.MIN.
5'
MIN. MIN.
5'
BIKELANE
5'
BIKELANE
MIN.MIN.
11'2'10'
5' 4'-6'
SIDEWALKSIDEWALK
80' MIN. RIGHT OF WAY
4'-6' 6''6''
2 LANE WITH TWO WAY LEFT TURN LANE, CURB & GUTTER,AND SIDEWALKS
3B
POSTED SPEED 25-45 MPH
12' 12' 2' 10'MIN.MIN.
5'
MIN. MIN.MIN.MIN.
12'2'10'
5' 4'-6'
SIDEWALKSIDEWALK
80' MIN. RIGHT OF WAY
4'-6' 6''6''
2 LANE WITH TWO WAY LEFT TURN LANE, AND PAVED SHOULDERS POSTED SPEED 25-55 MPH
8'11' 11'
5' 5'
P.S. P.S. 11'
80’ MIN. RIGHT OF WAY
8'
3A
“TYPICAL” HIGHWAY CROSS SECTIONS
EWThomas
Typewritten Text
Revised 05/05/2014
ewthomas
Typewritten Text
D-6

4 LANE DIVIDED (23’ RAISED MEDIAN) WITH CURB & GUTTER,WIDE OUTSIDE LANES, AND SIDEWALKS
4C
POSTED SPEED 35-45 MPH
23' MEDIAN 12' 14'SIDEWALK SIDEWALK
10'
5'
MIN. MIN.MIN.MIN.
12'14'2'
5'
2' 10'MIN.MIN.
110’ MIN. RIGHT OF WAY
4'-6' 6''4'-6'6''
4 LANE DIVIDED (23’ RAISED MEDIAN) WITH PAVED SHOULDERSAND SIDEWALKS
4B 12' 12'23' MEDIAN12'12'
130’ MIN. RIGHT OF WAY
24' MIN.CLEAR ZONE
5'MIN.
SIDEWALK
2' MIN.5'
8'
4'P.S.
8'
4'P.S.
24' MIN.CLEAR ZONE
5'MIN.
SIDEWALK
2' MIN. 5'
POSTED SPEED 35-55 MPH
4 LANE DIVIDED (46’ DEPRESSED MEDIAN) WITH PAVED SHOULDERS
4A4'
P.S.
12' 12' 12'46' MIN. MEDIAN12'
6'
6:1 6:1
12'12'
6'
4'P.S.
180’ MIN. RIGHT OF WAY (LIMITED CONTROL OF ACCESS)300’ MIN. RIGHT OF WAY (FULL CONTROL OF ACCESS)
4’-10' P.S. 4’ -10' P.S.
POSTED SPEED 45-70 MPH
“TYPICAL” HIGHWAY CROSS SECTIONS
EWThomas
Typewritten Text
Revised 05/05/2014
ewthomas
Typewritten Text
D-7

4 LANE DIVIDED (17’-6” RAISED MEDIAN) WITH CURB & GUTTER, WIDE OUTSIDE LANES AND SIDEWALKS
4F
POSTED SPEED 35-45 MPH
17'-6'' MEDIAN 12' 14'SIDEWALK SIDEWALK
10'
5'
MIN. MIN.MIN.MIN.
12'14'2'
5'
2' 10'MIN.MIN.
100' MIN. RIGHT OF WAY
4'-6' 6''4'-6'6''
4 LANE DIVIDED (17’-6” RAISED MEDIAN) WITH PAVED SHOULDERS AND SIDEWALKS
4E 12' 12'17'-6'' MEDIAN12'12' 8'
4'P.S.
8'
4'P.S.
130' MIN. RIGHT OF WAY
POSTED SPEED 35-55 MPH
24' MIN.CLEAR ZONE
5'MIN.
SIDEWALK
2' MIN.5'
24' MIN.CLEAR ZONE
5'MIN.
SIDEWALK
2' MIN. 5'
4 LANE DIVIDED (23’ RAISED MEDIAN) WITH CURB & GUTTER,BIKE LANES AND SIDEWALKS
POSTED SPEED 35-45 MPH
110’ MIN. RIGHT OF WAY
BIKELANE
BIKELANE
23' MEDIAN 11' 11'SIDEWALK SIDEWALK
10'
5'
11'11'5'2'
5'
MIN.MIN.
MIN.
MIN. MIN.
MIN.5' 2' 10'
4'-6' 6''6'' 4'-6'
4D
“TYPICAL” HIGHWAY CROSS SECTIONS
EWThomas
Typewritten Text
Revised 05/05/2014
ewthomas
Typewritten Text
D-8

4 LANE WITH TWO WAY LEFT TURN LANE, CURB & GUTTER,AND SIDEWALKS
5A
POSTED SPEED 35-45 MPH
12' 12' 12' 2' 10'
5'
12'12'2'10'
5'
MIN.MIN.
MIN.
MIN. MIN.
MIN.
SIDEWALKSIDEWALK
100' MIN. RIGHT OF WAY
4'-6' 6''6''
4 LANE DIVIDED (17’-6” RAISED MEDIAN) WITH CURB & GUTTER, BIKE LANES, AND SIDEWALKS
4G
POSTED SPEED 35-45 MPH
110’ MIN. RIGHT OF WAY
BIKELANE
BIKELANE
17'-6'' MEDIAN 11' 11'SIDEWALK SIDEWALK
10'
5'
11'11'5'2'
5'
MIN.MIN.
MIN.
MIN. MIN.
MIN.5' 2' 10'
4'-6' 6''6'' 4'-6'
“TYPICAL” HIGHWAY CROSS SECTIONS
EWThomas
Typewritten Text
Revised 05/05/2014
ewthomas
Typewritten Text
D-9
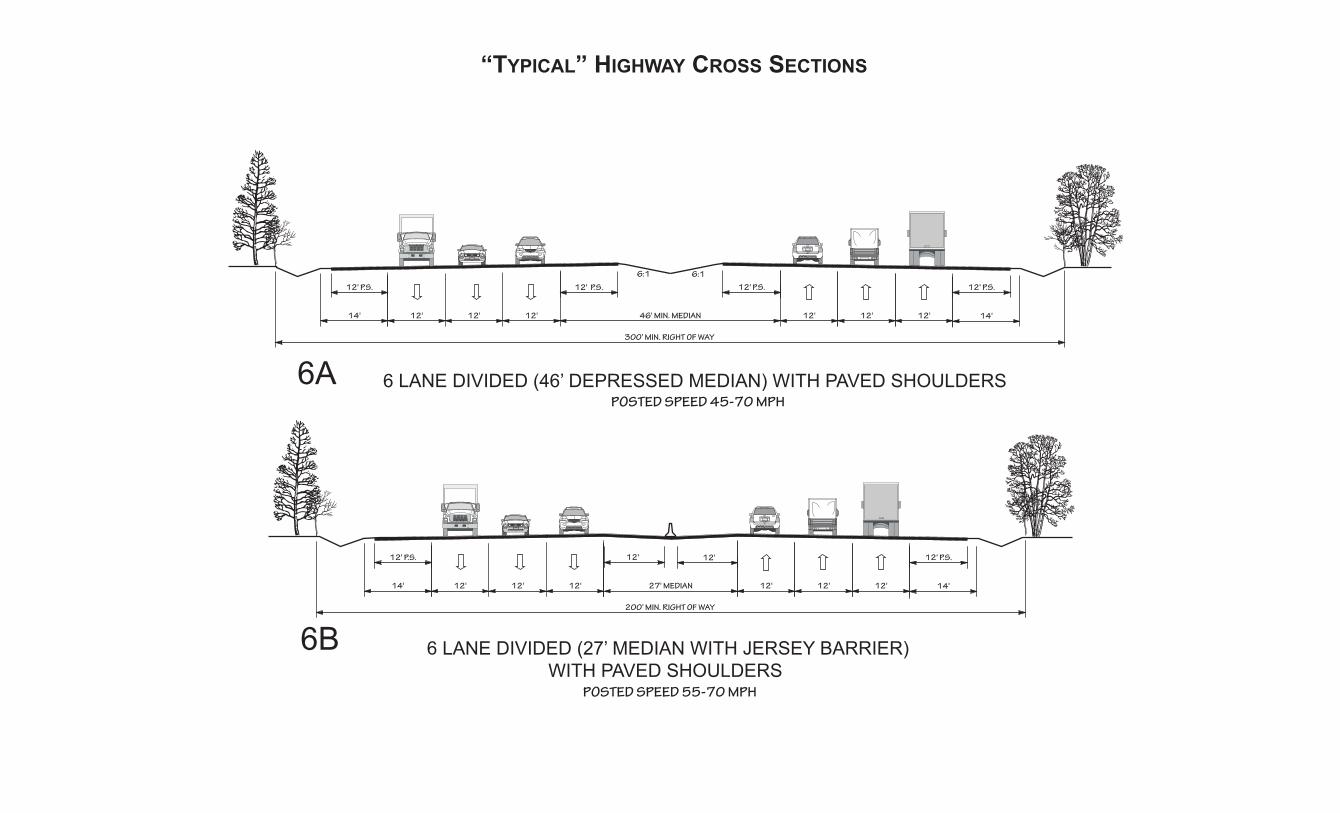
12' 12' 12'46' MIN. MEDIAN
6:16:1
12'12'12'
300’ MIN. RIGHT OF WAY
12' P.S.
14'
12' P.S.12' P.S.12' P.S.
14'
6 LANE DIVIDED (46’ DEPRESSED MEDIAN) WITH PAVED SHOULDERS 6APOSTED SPEED 45-70 MPH
6 LANE DIVIDED (27’ MEDIAN WITH JERSEY BARRIER) WITH PAVED SHOULDERS
6B
12' 12' 12'27' MEDIAN12'12'12'
200’ MIN. RIGHT OF WAY
14'
12' P.S.12' P.S.
14'
POSTED SPEED 55-70 MPH
12'12'
“TYPICAL” HIGHWAY CROSS SECTIONS
EWThomas
Typewritten Text
Revised 05/05/2014
ewthomas
Typewritten Text
D-10

6 LANE FREEWAY (4 GENERAL PURPOSE LANES, 2 MANAGED LANES, AND 27’ MEDIAN WITH JERSEY BARRIER) WITH PAVED SHOULDERS 6D
27' MEDIAN12'12'12'
200’ MIN. RIGHT OF WAY
12' P.S.
14'
12'12'
4' 12' 4' 12' 12' 14'
12' P.S.
POSTED SPEED 55-70 MPH
6 LANE FREEWAY (27’ MEDIAN WITH JERSEY BARRIER) WITH PAVED SHOULDERSAND 2 LANE ONE-WAY SERVICE ROADS EACH SIDE
6C
12' 12'27' MEDIAN12'12'
300' MIN. RIGHT OF WAY
12'12'
12' P.S.12' P.S.
12' 12' 8'
12' P.S. 8' P.S.
23'12' 12'
8' P.S. 12' P.S.
23'8'
POSTED SPEED 55-70 MPH
“TYPICAL” HIGHWAY CROSS SECTIONS
EWThomas
Typewritten Text
Revised 05/05/2014
ewthomas
Typewritten Text
D-11

6 LANE DIVIDED (17’-6” RAISED MEDIAN) WITH CURB & GUTTER, WIDE OUTSIDE LANES, AND SIDEWALKS
6FPOSTED SPEED 35-45 MPH
17'-6'' MEDIAN 12' 14'SIDEWALK SIDEWALK
10'
5'
MIN. MIN.MIN.MIN.
12'14'2'
5'
2' 10'MIN.MIN.
130’ MIN. RIGHT OF WAY
4'-6' 6''4'-6'6''
12'12'
6 LANE DIVIDED (23’ RAISED MEDIAN) WITH CURB & GUTTER, WIDE OUTSIDE LANES, AND SIDEWALKS
6EPOSTED SPEED 35-45 MPH
23' MEDIAN 12' 14'SIDEWALK SIDEWALK
10'
5'
MIN. MIN.MIN.MIN.
12'14'2'
5'
2' 10'MIN.MIN.
150’ MIN. RIGHT OF WAY
4'-6' 6''4'-6'6''
12'12'
“TYPICAL” HIGHWAY CROSS SECTIONS
EWThomas
Typewritten Text
Revised 05/05/2014
ewthomas
Typewritten Text
D-12

M A
M B
5' 5'
40' MIN. ADDITIONAL RIGHT OF WAY
5'5'
2' 3'2'3'
MULTI - USE PATH ADJACENT TO RIGHT OF WAY OR SEPARATE PATHWAY
4' P.S
R/W
12'TRAVEL
LANE
8'
CLEAR ZONE
RIGHT OF WAY LIMITFOR HIGHWAY
R/WMINIMUMRIGHT OF WAY LIMITFOR PLACEMENTOF 5’ SIDEWALK
2'BIKELANE
5'11'-12'TRAVEL
LANE
5'9.5' 5'
25'
ADDITIONAL R/W MAY BE REQUIRED
'5'-6'
MULTI - USE PATH ADJACENT TO CURB AND GUTTER
2'2'
“TYPICAL” HIGHWAY CROSS SECTIONS
EWThomas
Typewritten Text
Revised 05/05/2014
ewthomas
Typewritten Text
D-13

D-14
This page intentionally left blank.

E-1
Appendix E Level of Service Definitions
The relationship of travel demand compared to the roadway capacity determines the level of service (LOS) of a roadway. Six levels of service identify the range of possible conditions. Designations range from LOS A, which represents the best operating conditions, to LOS F, which represents the worst operating conditions. Design requirements for roadways vary according to the desired capacity and level of service. LOS D indicates “practical capacity” of a roadway, or the capacity at which the public begins to express dissatisfaction. Recommended improvements and overall design of the transportation plan were based upon achieving a minimum LOS D on existing facilities and a LOS C on new facilities. The six levels of service are described below and illustrated in Figure 15. � LOS A: Describes free-flow operations. Free Flow Speed (FFS) prevails and
vehicles are almost completely unimpeded in their ability to maneuver within the traffic stream. The effects of incidents or point breakdowns are easily absorbed.
� LOS B: Represents reasonably free-flow operations, and FFS is maintained. The ability to maneuver within the traffic stream is only slightly restricted, and the general level of physical and psychological comfort provided to drivers is still high. The effects of minor incidents and point breakdowns are still easily absorbed.
� LOS C: Provides for flow with speeds near the FFS. Freedom to maneuver within the traffic stream is noticeably restricted, and lane changes require more care and vigilance on the part of the driver. Minor incidents may still be absorbed, but the local deterioration in service quality will be significant. Queues may be expected to form behind any significant blockages.
� LOS D: The level at which speeds begin to decline with increasing flows, with density increasing more quickly. Freedom to maneuver within the traffic stream is seriously limited and drivers experience reduced physical and psychological comfort levels. Even minor incidents can be expected to create queuing, because the traffic stream has little space to absorb disruptions.
� LOS E: Describes operation at capacity. Operations at this level are highly volatile because there are virtually no usable gaps within the traffic stream, leaving little room to maneuver within the traffic stream. Any disruption to the traffic stream, such as vehicles entering from a ramp or a vehicle changing lanes, can establish a disruption wave that propagates throughout the upstream traffic flow. At capacity, the traffic stream has no ability to dissipate even the most minor disruption, and any incident can be expected to produce a serious breakdown and substantial queuing. The physical and psychological comfort afforded to drivers is poor.
� LOS F: Describes breakdown, or unstable flow. Such conditions exist within queues forming behind bottlenecks.

E-2
Figure 12 - Level of Service Illustrations
Source: 2010 Highway Capacity Manual, Exhibit 11-4
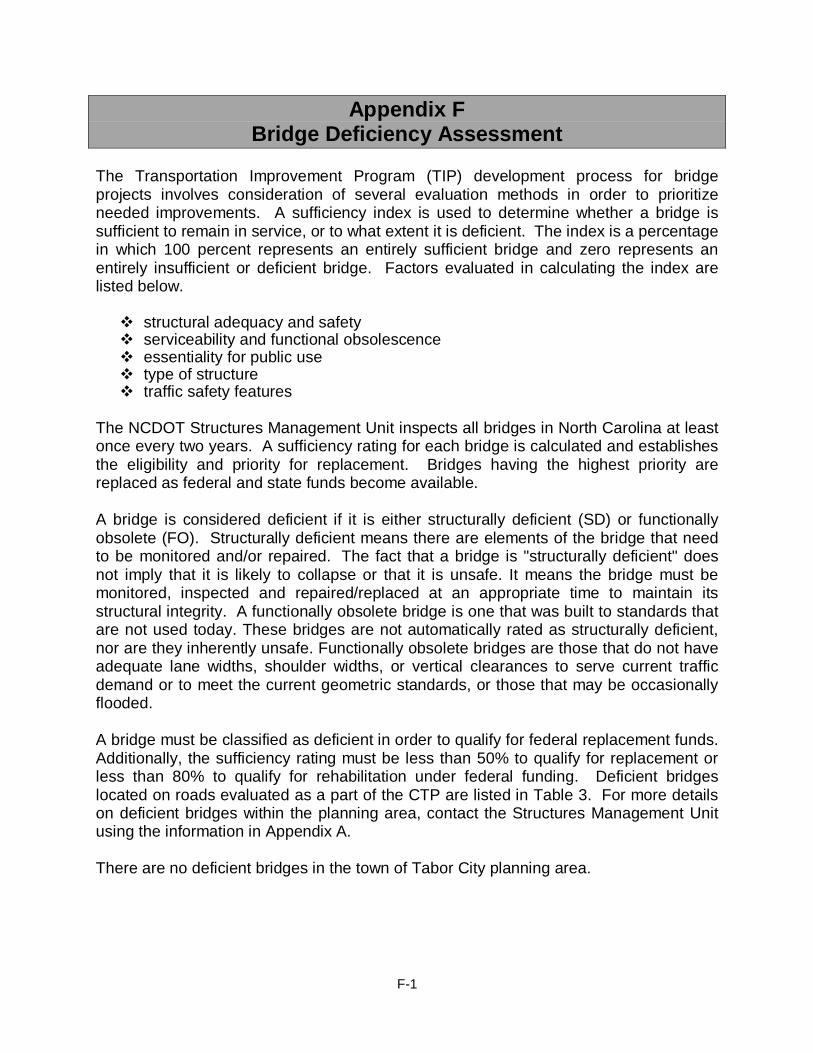
F-1
Appendix F Bridge Deficiency Assessment
The Transportation Improvement Program (TIP) development process for bridge projects involves consideration of several evaluation methods in order to prioritize needed improvements. A sufficiency index is used to determine whether a bridge is sufficient to remain in service, or to what extent it is deficient. The index is a percentage in which 100 percent represents an entirely sufficient bridge and zero represents an entirely insufficient or deficient bridge. Factors evaluated in calculating the index are listed below.
� structural adequacy and safety � serviceability and functional obsolescence � essentiality for public use � type of structure � traffic safety features
The NCDOT Structures Management Unit inspects all bridges in North Carolina at least once every two years. A sufficiency rating for each bridge is calculated and establishes the eligibility and priority for replacement. Bridges having the highest priority are replaced as federal and state funds become available. A bridge is considered deficient if it is either structurally deficient (SD) or functionally obsolete (FO). Structurally deficient means there are elements of the bridge that need to be monitored and/or repaired. The fact that a bridge is "structurally deficient" does not imply that it is likely to collapse or that it is unsafe. It means the bridge must be monitored, inspected and repaired/replaced at an appropriate time to maintain its structural integrity. A functionally obsolete bridge is one that was built to standards that are not used today. These bridges are not automatically rated as structurally deficient, nor are they inherently unsafe. Functionally obsolete bridges are those that do not have adequate lane widths, shoulder widths, or vertical clearances to serve current traffic demand or to meet the current geometric standards, or those that may be occasionally flooded. A bridge must be classified as deficient in order to qualify for federal replacement funds. Additionally, the sufficiency rating must be less than 50% to qualify for replacement or less than 80% to qualify for rehabilitation under federal funding. Deficient bridges located on roads evaluated as a part of the CTP are listed in Table 3. For more details on deficient bridges within the planning area, contact the Structures Management Unit using the information in Appendix A. There are no deficient bridges in the town of Tabor City planning area.

F-2
This page intentionally left blank.

G-1
Appendix G Socio-Economic Data Forecasting Methodology
In the development of the town of Tabor City CTP, existing and anticipated deficiencies were determined through an analysis of the transportation system looking at both current and future travel patterns. The analysis was completed using a Hand Allocation Model. A defined study area and projection of socioeconomic data to the design year (2040) were necessary information to create the model. The data can be used to evaluate various issues on the transportation roadway network and evaluate alternative solutions. The Study Area The study area includes the town of Tabor City and some additional areas outside of the municipal boundary. The study area is divided into 10 zones (Figure 13). An area was chosen as a zone based on similarities in land use. In each zone, a centroid was placed. It is not necessarily the exact center of the zone, but rather the center of activity for that zone. Some zones (zone one and zone six) have two centroids. Zone six is dynamically subzoned, meaning one centroid represents employment and the other centroid represents housing. The purpose of dynamic subzoning is to allow different access points onto the transportation network by having one set of centroid connectors for employment, and one second set of centroid connectors for households” (A Recommended Approach to Delineating Traffic Analysis Zones in Florida, FDOT). For zone one, the majority of the zone is residential with very few employments. Because access is limited, it has two centroids. The 2012 socioeconomic data collected in each zone includes employment and dwelling unit/housing counts via windshield survey. Future socioeconomic projections were based on the present data, past trends, and collaborations with the NCDOT Transportation Planning Branch, Tabor City CTP Steering Committee members and the town of Tabor City council.
Base Year (2012) Network
The goal of the model is to replicate the current traffic conditions of the roadway network. By being able to represent the existing street system, a model of the future system is possible. Generally, all the major arterials and some of the major collector streets, which provide access to major land use areas, need to be represented. Speed and distance are the major factors that define the minimum time path when traveling from zone to zone. The model uses minimum time paths as the basis for assigning traffic to streets. The roadway capacity is also important. The volume/capacity ratio (v/c) is an indicator of present and future congestion. Key factors in determining roadway capacity are speed limits, geometrics, and area type. The Level of Service D Standards for Systems Level Planning, derived from the 2005 North

G-2
Carolina Level of Service (NCLOS) Version 2.1 Program was used in determining the capacities. Data Requirements – Traffic Counts In order to create and calibrate a traffic model for the study area, traffic counts are needed for the chosen roadway system. The traffic counts are taken inside the modeled area and at external stations. The 2012 traffic counts taken by and published by the NCDOT Traffic Survey Unit were used for calibrating the data. Once the traffic is loaded onto the roadway, it is compared to the traffic counts in the Tabor City planning area. Figure 13 shows the location of the Average Annual Daily Traffic (AADT) stations. Traffic counts are collected annually for major routes and every other year for other routes. Therefore, the AADTs may come from 2011 or 2012 counts. Data Requirements – Socioeconomic Data The socioeconomic data consists of population, dwelling unit counts and employment estimates. The housing counts are used in the model as trip generators while employment is used as trip attractors. The planning area population number was checked against the population of the town of Tabor City, the South Williams Township and the 2010 census blocks, because the planning area population data lies between those numbers. Figure 14 is a map with reflects the location of the planning area in comparison to the South Williams township and the Tabor City municipal limits. The population number used for the model does not include the prison population. The prison population is immobile so they do not have an effect on the roadway network. The NCDOT Transportation Planning Branch conducted a windshield survey in August 2013 for dwelling units and employment estimates. The dwelling unit/housing counts were compared to the 2010 US Census block data. The number of employees for each business was estimated, with the exception of larger employers which were contacted for an exact employee count. Houses built and businesses opened after 2012 were not included in the base year data as the trips to and from these developments would not be reflected in the 2012 AADT. Table 11 provides a summary of the window survey results. See the “Design Year (2040) Network” section below for more information. Commercial Vehicles Commercial vehicles have different trip rate characteristics than privately owned vehicles. Due to the size of the study area, commercial vehicle data was not collected. Trip Generation Trip generation is the process by which external station traffic volumes, housing data, and employment data are used to generate traffic volumes that duplicate the traffic

G-3
volumes on the street network. There are three types of trips that are determined using the data: through trips, external<->internal trips, and internal trips. Through trips are trips that begin and end outside the planning area but pass through the planning area en route to a destination. External<->Internal trips are trips that are either entering or exiting the study area. With internal trips, both their origin and destination are inside the planning area. Through Trips The through trip table for this study was developed using the SYNTH computer program developed by J. T. McDonnell, P.E. It was based on Technical Report # 3: Synthesized Through Trip Table for Small Urban Areas, by David G. Modlin, Jr., Ph.D., P.E. This method of deriving through trips is based upon the Fratar balancing method, which balances the trip interchanges at the external stations. Table 13 presents a summary of the through travel at the external stations. External<->Internal Trips Table 13 also includes the summary of the external->internal and internal->external trips combined. With the 2012 AADT at the external stations and the now established through trips, the external<->internal trip volumes can be computed. It is determined by subtracting the total through trips at each station from the total volume at that station. External<->Internal Trips = AADT – Total Through Trips Where, AADT = Annual Daily Traffic Internal-Internal Trips Internal trips are generated by those living in the planning area. The percent of internal<->internal trips depend on the data from external<->internal trips, housing and employment. From these we get the dwelling unit trip rates and can estimate commercial vehicle rates. For this model, residents generate internal trips and travel to/are attracted to zones with employment and other activities. In addition, the number of trips that a dwelling unit takes per day depends, not only on the employment but also on the population type. . The average percent of internal<->internal trips is between 80% to 90% of the total trips while the average trips per day in dwelling unit is eight for a small urban area. The model was initially tested with these values but was later adjusted. The section on model calibration provides an explanation to the adjustment. The town of Tabor City is somewhat of a bedroom community. Therefore, 65% was used for the internal<->internal trips and the trip rates were reduced to seven trips per day. In addition, 12% is the percentage assigned to commercial vehicle trips. Table 5 is the summary of the input data used to determine the internal trips for the model. The

G-4
calculations were done using an excel spreadsheet called the “Travel Allocation Model (General Version).” It was developed based on the NCDOT Technical Report 11: Allocation Type Approach to Estimation Travel for Small Urban Areas.
Table 5: Base Year (2012) Parameters
Base Year
Planning Area /Township (Population) 100.00%
Persons/DU 2.39
DU Vehicle Trip Rate 7.00
Percentage of CV Trips (%) 12.00%
Percentage of I-I Trips (%) 65.00%
Percentage of Secondary Trips (%) 30.00%
Persons per du = DU / planning area population DU trips = (planning area population / persons per du)*(trip rate) CV trips = (percent commercial vehicles)*(du trips) Internal – Internal trips = (DU trips + CV trips)*(percent internal-internal trips) Internal –> External trips = (DU trips + CV trips) - (internal-internal trips) External –> Internal trips = (ADT – thru trips) – (internal-external trips) NHB-NR = (external<->internal trips)*(percent NHB) Total Internal Trips = (internal-internal trips) + (NHB) Where, AADT = Annual Daily Traffic DU = Dwelling Unit CV = Commercial Vehicles ADT = Average Daily Traffic NHB = Non-Home Based NR – Non Residential Trip Distribution Once the number of trips per TAZ is determined, the trips still need to be distributed from external station to external station, from each zone to the external stations, from the external stations to the zones, and from zone to zone. Trips are distributed based on the attractiveness factor that each zone has. The more attractive a zone is, then the higher the percentage of trips that would travel to that zone. The total number of trips that occur internally in a zone is determined by multiplying their zonal attractiveness factor to the total number of internal trips. Through Trip Distribution The distribution of trips (Table 6) from one external station to another external station is determined using the SYNTH computer program.
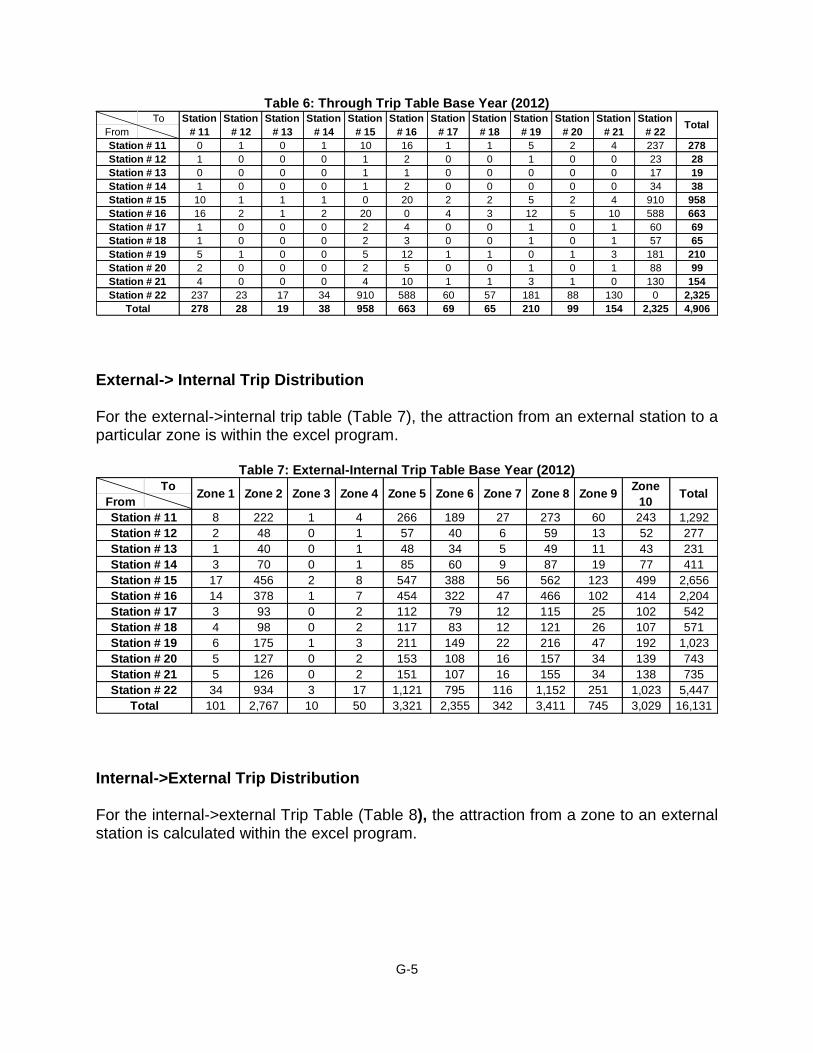
G-5
Table 6: Through Trip Table Base Year (2012) To
From
0 1 0 1 10 16 1 1 5 2 4 237 278
1 0 0 0 1 2 0 0 1 0 0 23 28
0 0 0 0 1 1 0 0 0 0 0 17 19
1 0 0 0 1 2 0 0 0 0 0 34 38
10 1 1 1 0 20 2 2 5 2 4 910 958
16 2 1 2 20 0 4 3 12 5 10 588 663
1 0 0 0 2 4 0 0 1 0 1 60 69
1 0 0 0 2 3 0 0 1 0 1 57 65
5 1 0 0 5 12 1 1 0 1 3 181 210
2 0 0 0 2 5 0 0 1 0 1 88 99
4 0 0 0 4 10 1 1 3 1 0 130 154
237 23 17 34 910 588 60 57 181 88 130 0 2,325
278 28 19 38 958 663 69 65 210 99 154 2,325 4,906
Station # 15
Station # 16
Station # 17
Station # 22
Station # 11
Station # 12
Station # 13
Total
Station # 18
Station # 19
Station # 20
Station # 21
Station
# 15
Station
# 16
Station
# 17Total
Station
# 18
Station
# 11
Station
# 12
Station
# 13
Station
# 14
Station
# 19
Station
# 20
Station
# 21
Station
# 22
Station # 14
External-> Internal Trip Distribution For the external->internal trip table (Table 7), the attraction from an external station to a particular zone is within the excel program.
Table 7: External-Internal Trip Table Base Year (2012)
To
From
8 222 1 4 266 189 27 273 60 243 1,292
2 48 0 1 57 40 6 59 13 52 277
1 40 0 1 48 34 5 49 11 43 231
3 70 0 1 85 60 9 87 19 77 411
17 456 2 8 547 388 56 562 123 499 2,656
14 378 1 7 454 322 47 466 102 414 2,204
3 93 0 2 112 79 12 115 25 102 542
4 98 0 2 117 83 12 121 26 107 571
6 175 1 3 211 149 22 216 47 192 1,023
5 127 0 2 153 108 16 157 34 139 743
5 126 0 2 151 107 16 155 34 138 735
34 934 3 17 1,121 795 116 1,152 251 1,023 5,447
101 2,767 10 50 3,321 2,355 342 3,411 745 3,029 16,131
Station # 21
Station # 22
Total
Total
Station # 19
Station # 20
Zone 7 Zone 8 Zone 9Zone
10
Station # 15
Station # 16
Station # 17
Station # 18
Zone 5 Zone 6
Station # 11
Station # 12
Station # 13
Station # 14
Zone 1 Zone 2 Zone 3 Zone 4
Internal->External Trip Distribution For the internal->external Trip Table (Table 8), the attraction from a zone to an external station is calculated within the excel program.

G-6
Table 8: Internal-External Trip Table Base Year (2012) To
From
43 9 8 14 89 74 18 19 34 25 25 182 540
60 13 11 19 124 103 25 27 48 35 34 254 753
8 2 1 2 16 13 3 3 6 4 4 32 94
46 10 8 15 95 79 19 20 37 27 26 195 578
123 26 22 39 253 210 52 54 98 71 70 519 1,538
53 11 9 17 109 90 22 23 42 30 30 223 659
35 7 6 11 72 60 15 15 28 20 20 147 436
2 0 0 0 3 3 1 1 1 1 1 6 19
44 9 8 14 89 74 18 19 34 25 25 183 543
38 8 7 12 79 65 16 17 30 22 22 161 477
452 97 81 143 928 770 190 199 357 259 257 1,903 5,637
Zone 6
Zone 7
Zone 8
Zone 2
Zone 3
Zone 4
Station
# 22Total
Total
Zone 10
Station
# 19
Station
# 20
Station
# 21
Zone 1
Station
# 13
Station
# 14
Station
# 15
Station
# 18
Station
# 16
Station
# 17
Station
# 11
Station
#12
Zone 9
Zone 5
Internal->Internal Trip Distribution For the internal->internal Trip Table (Table 9), the attraction from a zone to another zone is calculated within the excel program.
Table 9: Internal-Internal Trip Table Base Year (2012)
To
From
9 252 1 5 302 214 31 310 68 275 1,466
13 351 1 6 421 299 43 433 94 384 2,046
2 44 0 1 53 37 5 54 12 48 256
10 269 1 5 323 229 33 332 72 294 1,568
26 717 3 13 860 610 89 883 193 784 4,177
11 307 1 6 368 261 38 379 83 336 1,790
7 203 1 4 244 173 25 251 55 222 1,185
0 9 0 0 11 7 1 11 2 10 51
9 253 1 5 304 215 31 312 68 277 1,475
8 222 1 4 267 189 27 274 60 243 1,296
95 2,626 10 48 3,151 2,235 325 3,237 707 2,874 15,308
Zone 10
Zone 6
Zone 5
Total
Zone 6
Zone 1
Zone 2
Zone 7
Zone 8
Zone 9
Zone 3
Zone 4
Zone
10TotalZone 9Zone 1 Zone 2 Zone 3 Zone 4 Zone 7 Zone 8Zone 5
Mode Choice As there is very limited public bus access and no trains for public use in the town of Tabor City, the only mode used in this model is private motor vehicles. Trip Assignment A trip is assigned by selecting the route/path taken between the origin and destination. In the hand allocation model, the project engineer choses the path of each trip based on several factors: the perceived ease of access and speed limits. By correctly assigning the trips, the current traffic conditions can be mimicked and the future trips routes can be predicted. Model Calibration and Validation After each trip is assigned, the model has to be iteratively calibrated to make sure that it matches the existing traffic behavior. The model is calibrated by matching the modeled

G-7
traffic volumes to the base year observed AADT. When 80% or higher of the traffic count locations are calibrated with the modeled volumes, then the model is calibrated. The model calibration is valid when model volumes are within +/- 10% or +/- 1000 (whichever is greater) of the observed traffic volumes for the particular location in question . For the town of Tabor City, multiple iterations took place. There were too many total trips taking place in the model compared to the base year AADT counts. Changes made to the model involved lowering the trip rates from eight to seven trips per day for each dwelling unit and lowering the percentage of internal trips from 80% to 65%. Some trips were not included to the model at all. Sidney-Cherry Grove Rd (SR 1314)/Butler Rd (SR 1155)/Peacock Rd (SR 1005) is a road that circulates around the outside of the town and is just outside the planning area. The road acts like a bypass around the town. Some of the external stations are connected to this road. For some of the through trips, especially for external stations that were next to each or near each other, they were routed using the “bypass” instead of traveling through the town. In addition, the network roads initially chosen inside the planning area had to be updated to include additional local roads that travelers often take as alternatives through and around the town to avoid main roads and traffic signals. No AADT counts had ever been taken on those local roads but it was confirmed by the Tabor City CTP Steering Committee that these roads are used by the residents as alternative routes.
Design Year (2040) Network The model is used to project traffic volumes and patterns for the design year of 2040. The base year data is modified to reflect assumed conditions in the design year. The future population, housing, and employment numbers are used in the same manner as the base year socioeconomic data to generate trips productions and attractions. The first step in the projection process is the gathering of historical socioeconomic data from the census. Table 10 provides the historic socioeconomic trends for the town of Tabor City, the South Williams Township population, and the county. As previously mentioned the 2010 population numbers do not include the prison population. Those numbers would significantly affected projects which are based on historical data. The linear annual growth rate values are from the socioeconomic historical trends and the expected land use for the Tabor City planning area. On December 10, 2013, the town of Tabor City council approved the growth rates listed in Table 11. Using the approved growth rates, the socioeconomic data is linearly projected to 2040 from the 2012 population, housing, and employment estimates.

G-8
Table 10: Historical Socioeconomic Data
Area Year Population Dwelling Units Person/Dwelling Unit Employment
Tabor City
1960 2,338 - - -
1970 2,400 - - -
1980 2,710 - - -
1990 2,320 1,026 2.26 854
2000 2,509 1,116 2.25 830
2010 2,511 1,239 2.03 1,000*
South Williams
Township
1960 4,828 - - -
1970 4,895 - - -
1980 5,241 - - -
1990 4,972 2,526 1.97
2000 5,507 2,348 2.35 1,866
2010 5,565 2,526 2.20 1,967
Columbus County
1960 48,973 13,475 3.63 -
1970 46,937 14,973 3.13 -
1980 51,037 19,059 2.68 -
1990 49,587 20,513 2.42 20,022
2000 54,749 24,060 2.28 20,551
2010 58,098 26,042 2.23 22,083*
* (American Community Survey 2006-2010) estimate
Table 11: Planning Area Growth Projections
Population Dwelling Units Employment
Growth Rate (%) 1.00 1.35 0.85
2012 4,511 1,796 1,603
2040 5,774 2,512 2,302
Control Totals - 716 699
The difference between the 2012 and 2040 numbers for housing and employment are defined as control totals. Any houses built or businesses opened after 2012 are added to the control totals. The control totals for dwelling units and employment are assigned by the steering committee distributed to the zones where growth is anticipated (Table 12). The base year AADT is then projected to the design year of 2040. The AADT is projected at each external station. Using historical AADT counts, the AADT was linearly projected to the base year to obtain the past growth rate at each station. The growth rates were used to project the external station AADTs to the design year. The projected AADTs are used to project (and distribute) through trips and project external trips using the SYNTH computer program. Table 13 is the result of those projections.

G-9
Table 12: Zone Distribution of Socioeconomic Data
Base Year (2012) Design Year (2040)
Zone Housing Employment Housing Employment
1 172 10 322 10
2 240 275 458 387
3 30 1 30 1
4 184 5 184 5
5 490 330 640 330
6 210 234 210 234
7 139 34 337 34
8 6 339 6 602
9 173 74 173 336
10 152 301 152 363
Table 13: Cordon Station Travel
Station Number
Station Location
BASE YEAR (2012) DESIGN YEAR (2040)
Total ADT
Through Trip-Ends
Ext-Int Trips
Total ADT
Through Trip-Ends
Ext-Int Trips
11 NC 904 (East) 2,300 556 1,744 3,000 724 2,276
12 Will Inman Rd (SR-1006) 430 56 374 730 98 632
13 Mill Branch Church Rd (SR-1153) 350 38 312 460 50 410
14 Minor Meares Rd (SR-1154) 630 76 554 820 100 720
15 US 701 (North) 5,500 1,916 3,584 9,400 3,270 6,130
16 NC 410 (North) 4,300 1,326 2,974 8,900 2,752 6,148
17 Emerson Church Rd (SR-1310) 870 138 732 1,100 176 924
18 Old Stake Rd (SR 1300) 900 130 770 1,200 176 1,024
19 NC 904 (West) 1,800 420 1,380 3,100 728 2,372
20 Carolina Rd (SR-1303) 1,200 198 1,002 1,600 270 1,330
21 NC 410 (South) 1,300 308 992 1,700 400 1,300
22 US 701 (South) 12,000 4,650 7,350 26,700 8,348 18,352
Total 31,580 9,812 21,768 58,710 17,092 41,618
Following projection of through and external<->internal trips is the internal<->internal trip projection and secondary trips projections. The method used to obtain the trips for the base year is used for the design year. The parameters remain the same except the number of persons per dwelling unit has decreased from 2.39 to 2.22. This is because the population and the number of dwelling units have increased over the design year. As with the base model, the Travel Allocation Model excel spreadsheet is used distribute the trips to the respective zones for through trips, external->internal trips, internal->external trips, and internal<->internal trips (See Tables 14, 15, 16, and 17 respectively). The trips were assigned to the same routes/paths that were originally in the base year.
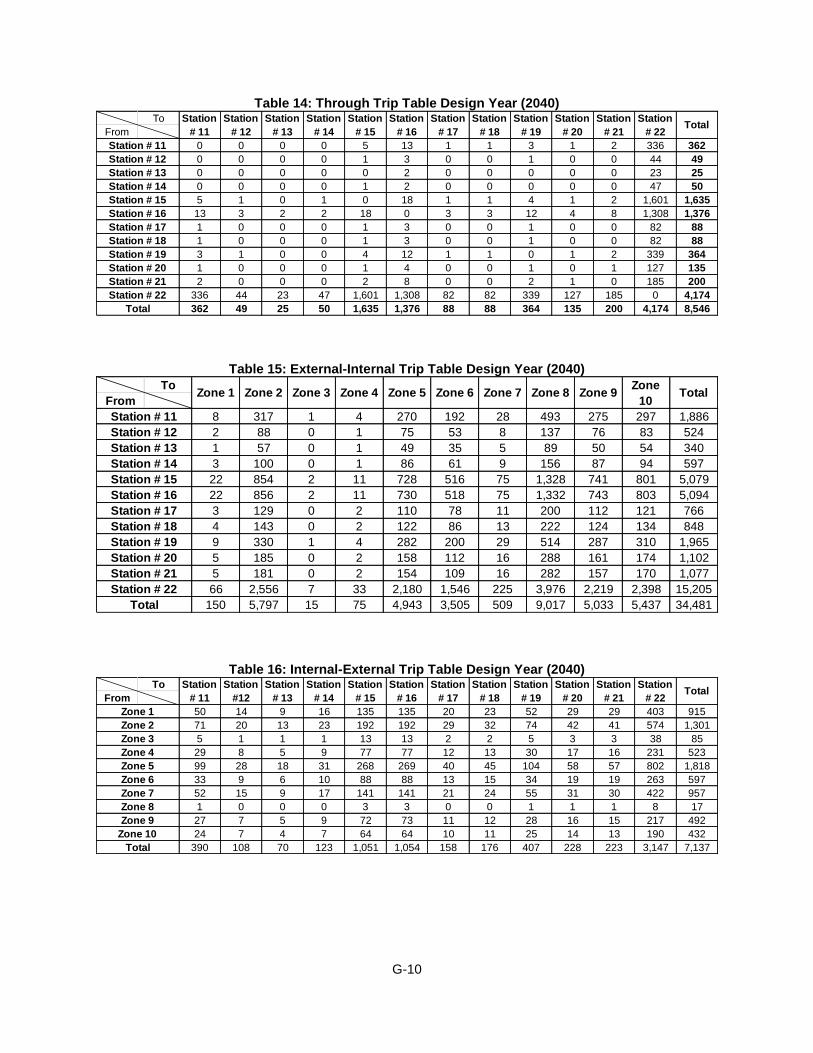
G-10
Table 14: Through Trip Table Design Year (2040) To
From
0 0 0 0 5 13 1 1 3 1 2 336 362
0 0 0 0 1 3 0 0 1 0 0 44 49
0 0 0 0 0 2 0 0 0 0 0 23 25
0 0 0 0 1 2 0 0 0 0 0 47 50
5 1 0 1 0 18 1 1 4 1 2 1,601 1,635
13 3 2 2 18 0 3 3 12 4 8 1,308 1,376
1 0 0 0 1 3 0 0 1 0 0 82 88
1 0 0 0 1 3 0 0 1 0 0 82 88
3 1 0 0 4 12 1 1 0 1 2 339 364
1 0 0 0 1 4 0 0 1 0 1 127 135
2 0 0 0 2 8 0 0 2 1 0 185 200
336 44 23 47 1,601 1,308 82 82 339 127 185 0 4,174
362 49 25 50 1,635 1,376 88 88 364 135 200 4,174 8,546
Station # 11
Station # 12
Station # 13
Station
# 12
Station
# 11
Station
# 20
Station
# 21
Station
# 22
Station
# 13
Station
# 14
Station
# 15
Station
# 16
Station
# 17
Station
# 18
Station
# 19
Station # 14
Station # 18
Station # 19
Station # 15
Station # 16
Station # 17
Total
Total
Station # 20
Station # 21
Station # 22
Table 15: External-Internal Trip Table Design Year (2040)
To
From
8 317 1 4 270 192 28 493 275 297 1,886
2 88 0 1 75 53 8 137 76 83 524
1 57 0 1 49 35 5 89 50 54 340
3 100 0 1 86 61 9 156 87 94 597
22 854 2 11 728 516 75 1,328 741 801 5,079
22 856 2 11 730 518 75 1,332 743 803 5,094
3 129 0 2 110 78 11 200 112 121 766
4 143 0 2 122 86 13 222 124 134 848
9 330 1 4 282 200 29 514 287 310 1,965
5 185 0 2 158 112 16 288 161 174 1,102
5 181 0 2 154 109 16 282 157 170 1,077
66 2,556 7 33 2,180 1,546 225 3,976 2,219 2,398 15,205
150 5,797 15 75 4,943 3,505 509 9,017 5,033 5,437 34,481
Zone
10TotalZone 8
Station # 20
Station # 21
Station # 22
Total
Station # 16
Station # 17
Station # 18
Station # 19
Station # 12
Station # 13
Station # 14
Station # 15
Station # 11
Zone 5 Zone 6 Zone 7Zone 1 Zone 2 Zone 3 Zone 4 Zone 9
Table 16: Internal-External Trip Table Design Year (2040) To
From
50 14 9 16 135 135 20 23 52 29 29 403 915
71 20 13 23 192 192 29 32 74 42 41 574 1,301
5 1 1 1 13 13 2 2 5 3 3 38 85
29 8 5 9 77 77 12 13 30 17 16 231 523
99 28 18 31 268 269 40 45 104 58 57 802 1,818
33 9 6 10 88 88 13 15 34 19 19 263 597
52 15 9 17 141 141 21 24 55 31 30 422 957
1 0 0 0 3 3 0 0 1 1 1 8 17
27 7 5 9 72 73 11 12 28 16 15 217 492
24 7 4 7 64 64 10 11 25 14 13 190 432
390 108 70 123 1,051 1,054 158 176 407 228 223 3,147 7,137
Zone 9
Station
# 20
Station
# 21
Station
# 18
Station
# 19
Zone 1
Zone 2
Zone 3
Zone 4
Total
Zone 5
Zone 6
Zone 7
Zone 8
Zone 10
TotalStation
# 11
Station
#12
Station
# 13
Station
# 14
Station
# 15
Station
# 16
Station
# 17
Station
# 22

G-11
Table 17: Internal-Internal Trip Table for Design Year (2040)
To
From
13 509 1 7 434 307 45 791 442 477 3,025
19 723 2 9 617 437 64 1,125 628 678 4,303
1 47 0 1 40 29 4 74 41 44 282
8 291 1 4 248 176 26 452 252 273 1,729
26 1,011 3 13 862 611 89 1,572 878 948 6,012
9 332 1 4 283 201 29 516 288 311 1,973
14 532 1 7 454 322 47 828 462 499 3,166
0 9 0 0 8 6 1 15 8 9 56
7 273 1 4 233 165 24 425 237 256 1,625
6 240 1 3 205 145 21 373 208 225 1,428
103 3,967 10 51 3,383 2,399 349 6,171 3,445 3,721 23,599Total
Zone 6
Zone 7
Zone 8
Zone 9
Zone 10
Zone 5
Zone 9Zone
10Zone 7 Zone 8Zone 4 Zone 5 Zone 6
Zone 2
Zone 3
Zone 4
Total
Zone 1
Zone 1 Zone 2 Zone 3

G-12
This page intentionally left blank.

!(
!(
!(
!(
!(
!(
!(
!(
!(
!(
!(
!(
!(
!(
!(
!(
!(
!(
!(!(
!(
!(
!(
!(
!(
!(
!(
!(
!(
!(
!(
!(
!(
!(
!(
!(
!(
!(
!(
!(
!(
!(
!(
!(
!(
!(!(!(
!(
!(
Willoughby Rd SR 1304
Will Inman Rd SR 1006
Richard Wright Rd S R 1151
Minor Meares Rd SR 1154
Vinegar Loop RdSR1313
N Main St SR 1304
O L ColemanRd SR 1309
Mill Branch CH Rd SR 1153Carolina Rd SR 1303
OldStakeRdSR1300
JoeBrownHwyTe
n Mile Rd SR 1308
Ten Mile Rd SR 1308Swamp Fox Hwy
Swamp Fox Hwy
"$410
"$904
"$410
£¤701
"$904
"$904
"$410
£¤BUS701
£¤701
£¤BUS701
£¤BYP701
Traffic Analysis Zones, External Stations, AADT Locations
Tabor CityPlanning Area
ComprehensiveTransportation Plan
S O U T H C A R O L I N A
Columbus County
µ0 1 20.5
Miles
Figure 13
17
8
2
345
6
109
Planning Area Boundary
Municipal BoundaryMunicipal ETJ
Model Network Roads!( AADT Station
11
12
13
14
15
161718
19
20
21
22
!( External Station#
Zone Boundary

G-14
Back of Figure

Tabor City, Planning Area,Townships &
2010 Census Block Boundaries2010 Census Blocks
Municipal Boundary
Township Boundary
Planning Area Boundary
Lake Tabor
South Williams Township
Inset
µ0 0.5 10.25
Miles
µ0 2 41
Miles
Figure 14
S O U T H C A R O L I N A
Columbus County
Williams Township
South Williams Township
ComprehensiveTransportation Plan
Plan date: 5/21/2014

G-16
Back of Figure

H-1
Appendix H Public Involvement
This appendix documents the public involvement process and includes a listing of steering committee members, the goals and objectives survey results, and public meetings held throughout the development of the CTP.
List of CTP Steering Committee Members
At the start of a CTP study, a committee is formed that is comprised of individuals who represent the various needs, issues and populations of the community. These representatives are responsible for capturing the transportation needs of the community relative to all modes of transportation and for guiding the development of the CTP. A listing of steering committee members for the Tabor City CTP is given below.
Al Leonard, Tabor City Manager Dianne Nobles Ward, Tabor City Promotions Donald James, Tabor City Public Works Don Eggert, Cape Fear Area RPO Allen Serkin, Cape Fear Area RPO Drew Cox, NCDOT District 3 Engineer Joe Bailey, NCDOT Division 6 Planning Engineer Scott Walston, NCDOT TPB Suzette Morales, NCDOT TPB
CTP Vision, Goals, Objectives and MOEs
The CTP vision, goals and objectives are developed as part of the public involvement process and help identify how the people within an area would like to develop the transportation system (all modes). The CTP committee develops the draft vision, goals, objectives, and MOEs which are further refined with input from citizens via the CTP Goals & Objectives (G&O) survey. These products become the official guide for the CTP being developed. The vision statement, goals and objectives reflect what is important for the area and defines any local preferences concerning the transportation system and community assets. The vision statement is the framework for the area’s strategic planning. Goals and objectives document how the area plans to fulfill its vision. The goals break down the vision statement into themes, while the objectives document how the area plans to make progress towards achieving each goal. MOEs are established to enable the area to track the progress of each objective.
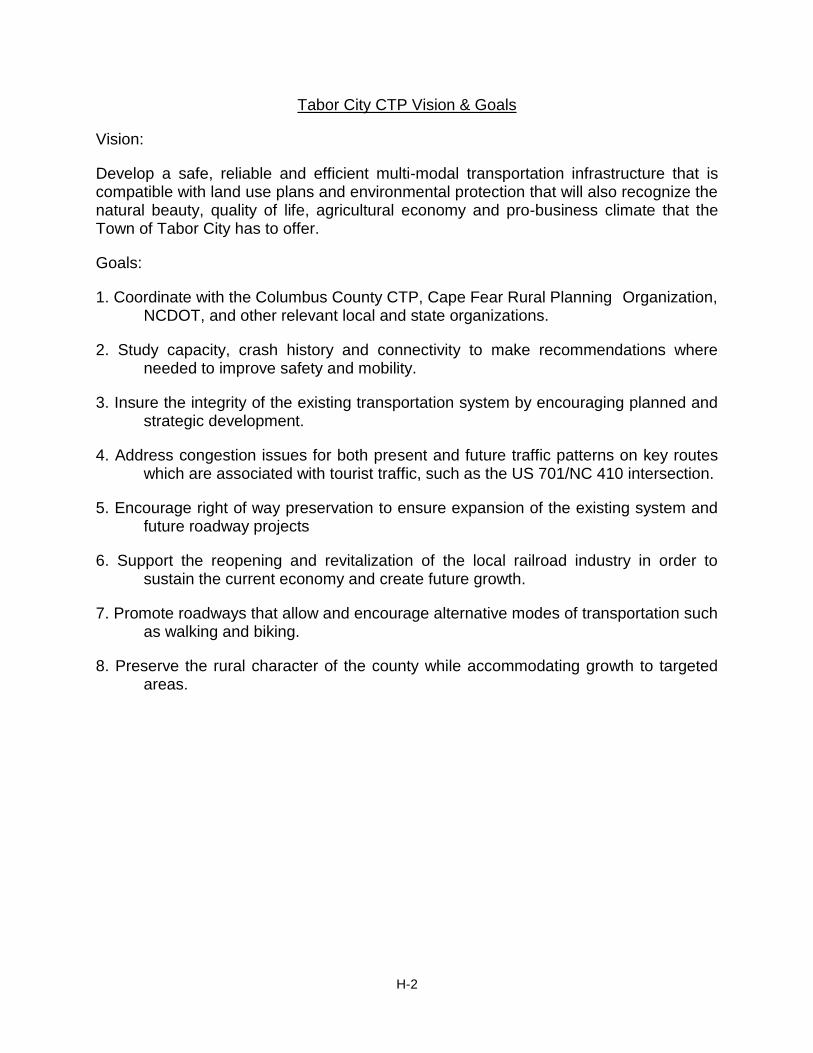
H-2
Tabor City CTP Vision & Goals
Vision:
Develop a safe, reliable and efficient multi-modal transportation infrastructure that is compatible with land use plans and environmental protection that will also recognize the natural beauty, quality of life, agricultural economy and pro-business climate that the Town of Tabor City has to offer.
Goals:
1. Coordinate with the Columbus County CTP, Cape Fear Rural Planning Organization, NCDOT, and other relevant local and state organizations.
2. Study capacity, crash history and connectivity to make recommendations where needed to improve safety and mobility.
3. Insure the integrity of the existing transportation system by encouraging planned and strategic development.
4. Address congestion issues for both present and future traffic patterns on key routes which are associated with tourist traffic, such as the US 701/NC 410 intersection.
5. Encourage right of way preservation to ensure expansion of the existing system and future roadway projects
6. Support the reopening and revitalization of the local railroad industry in order to sustain the current economy and create future growth.
7. Promote roadways that allow and encourage alternative modes of transportation such as walking and biking.
8. Preserve the rural character of the county while accommodating growth to targeted areas.

H-3
Tabor City Community Goals
These goals below were taken from the 2010 Land Use and Development Plan for Tabor City, North Carolina. The bullet points below each goal are notes on ways that the CTP could include recommendations that support the land use plan.
1. Improve the visual quality of the town
Cars, homes, property in general will sell better if they are cleaned up and look their best. People have a greater sense of pride about something if it is neat and clean. They are proud of it. For that reason, the Town of Tabor City needs to have a general facelift. That includes beautification of street corners, especially entrances, and maybe some gardens in strategic spots that will give a fresh new look. Building and store fronts could use some façade improvements, and any abandoned or junked equipment and vehicles should be removed. Implementation Strategies:
A. Provide funding and support for the work of the Tabor City Beautification and Appearance Committee, including a program of public recognition for homes and businesses that contribute to an improved community appearance.
B. Beautify the entrances to the community with new welcome signs and
attractive landscaping. The Town can prepare selected street corners for plantings and then initiate a beautification committee to plant them. This will require a partnership with the town and citizens and a commitment by the town to keep the areas watered. Businesses and civic organizations should be encouraged to adopt a corner.
C. Develop a network of bikeways and pedestrian walkways for the use and enjoyment of residents and visitors to Tabor City.
D. Acquire and develop new park facilities for the enjoyment for residence and visitors.
E. Improve the appearance of abandoned buildings and unoccupied
areas in order to give Tabor City a fresh face to advertise to potential incoming business. The NC Rural Economic Development Center has Building and Facade Grants, as do other grant sources. The Town should utilize the Cape Fear Council of Governments, DCA, or other available resource planners to assist in the procurement of funds to assist property owners with improvements. Dilapidated buildings may be targeted for removal by developing a Building Standards Ordinance.

H-4
F. Target clean up of junk and nuisance conditions throughout the town, through courteous requests and through, where necessary, code enforcement actions.
G. Target historically significant structures for Landmark designation and
consideration of a Historic District with appropriate signage.
H. The Town should establish the standard and set a good example for land owners, throughout the community by landscaping, beautification, and maintenance of all municipal properties, especially maintenance facilities.
I. Develop and implement a uniform standard for street lighting
throughout Town.
J. Coordinate with Civic groups to create memorial gardens at municipal properties and parks (Boy Scouts of America, Rotary, Kiwanis, Ruritan, Civitan, etc.).
Cooperate with NCDOT to improve landscaping features
Complete bicycle and pedestrian plans in the CTP to reach key town destinations
Maintenance of historic appearance 2. Establish Tabor City has a wholesome, family-oriented community for
residents and for visitors.
The total quality of life for residents in town can be enhanced by establishing standards that promote safety, community, and progress for all citizens regardless of their socio-economic situation. Community spirit evolves from family oriented neighborhoods that are clean, safe, and convenient to schools, essential services, shopping, and recreational amenities. Establishing a community that is welcoming to residents and visitors of all ages can create a sustainable community that can support itself during difficult economic times. Implementation Strategies:
A. Promote an active, vibrant, interactive non-segregated community centered facilities where residents can cross paths and meet their neighbors as they go about their lives within Tabor City. The Town of Tabor City can create public spaces in which the community can gather and enjoy recreational opportunities. Creating parks or similar spaces in which to gather, exercise, play and compete. Tabor City should seek over time to create more public places and social gathering places which ought to be scattered in various neighborhoods throughout the town.

H-5
B. Develop a network of bikeways and pedestrian walkways for the use and enjoyment of residents and visitors to Tabor City.
C. Ensure that any new intensive development locates in a compact and
distinct manner and close to areas of existing development which is, or are scheduled to be, provided with public water, sewerage, and other urban services.
D. Discourage and/or prohibit activities that are inconsistent with a
wholesome, family-oriented community atmosphere through innovative public safety programs implemented by the Tabor City Police Department, such as a gang task force, neighborhood organizations to effect crime watch, etc. are examples. Encourage the Police Department to interact with the citizens and work with them to achieve mutual result of taking back the bad neighborhoods from criminal elements.
E. Preserve, wherever possible, the town’s historical properties,
structures, records and traditions. (See section 1-C above).
F. Enhance existing recreational opportunities through sports, activities, etc. that include all ages and all citizens.
Ensure that new facilities are compatible with the Tabor City Land Use Plan
Complete bicycle and pedestrian plans in the CTP to reach key town destinations
Maintenance of historic appearance
3. Support policies that would stimulate jobs for citizens and sustainable
growth that will provide sound economic protection in the future and encourage quality development, in order to establish and maintain a sustainable tax base to support an enhanced quality of life for its citizens
The Town believes that protection and support for existing business and implementation of business friendly regulatory codes that establish a climate that is favorable for small business entrepreneurship will result in sustainable economic growth and attract of larger business interests.
Implementation Strategies:
A. Support ongoing economic development efforts of Tabor City, Columbus County, Southeastern Economic Partnership, and the State Department of Commerce with complimentary land use regulation that promotes the availability of business services for residents and visitors.
B. Support existing industry and encourage new commercial opportunities
that will provide higher paying employment.

H-6
C. Tabor City is served by US Highway 701 and NC Highways 904 and 410. As traffic on these highways continues to increase, so does the potential for new businesses. Long range planning should identify Policy Recommendation that will encourage growth along these corridors and current zoning should reflect zoning designations that accommodate that growth with reasonable and logical regulation.
D. Embrace sustainable development and controlled growth using
existing policy tools (City Zoning Ordinances, Sub-division Ordinances and Code Enforcement).
E. Create a Technical Review Committee to assist planning staff with plan
reviews for new, large developments. Committee should be composed of members from police/fire/emergency management, public works, building inspections, and others as needed.
F. Insure that any new intensive development locates in a compact and
distinct manner close to areas of existing development which is, or are scheduled to be, provided with public water, sewage, and other urban services.
G. Ensure Tabor City’s public infrastructure is capable of serving future
growth and development.
H. Update the FEMA FIRM maps and develop a Flood Management Plan for Tabor City.
I. Seek grants assistance through EDA, NC Commerce, NC Rural
Economic Development Center, The Golden Leaf Foundation, and others to support policy implementation goals.
J. Incorporate the policy goals established by the NC STEP process into
this plan to encourage full implementation and coordination of efforts.
K. Commit to annual review and update of the Land Use Plan.
Seek enhanced transportation improvements that will support expanded industrial needs by participation in the Regional Transportation Planning process and through direct advocacy to NCDOT.
Ensure zoning designations and subsequent permitted uses are in place along targeted properties that are suitable for commercial development along the US HWY 701 and NC Route 410 Corridors.
Provide related infrastructure to the above sites

H-7
Goals and Objectives Survey
A G&O survey is a public involvement technique used to help identify an area’s perception of transportation-related issues, identify concerns that should be addressed during the development of a CTP, and to help develop a vision for the community. The G&O survey is most appropriately implemented at the beginning of the transportation planning study. In addition to determining up front what is important to the citizens of the planning area, initiating the G&O survey early in the planning process allows the survey to serve as an introduction to the transportation planning process. The survey usually includes a brief introduction explaining what a transportation plan is and how the area can benefit from having one. The survey also includes a wide variety of questions that is tailored to each area as appropriate. A summary of the Tabor City G & O survey is given below. Vehicle & Household Summary

H-8
Other Modes of Transportation Summary
Town Concerns/Issues Summary

H-9
Additional Survey Comments Summary Areas with the most congested Traffic are:
1. US 701 Bypass/NC 904 Intersection 2. US 701/NC 410 Intersection 3. US 701 during the summer 4. US 701 & Richard Wright Road intersection
Roads in and around Tabor City that need sidewalks are:
1. Pireway Road, Bell Street, Live Oak Street, Williams Street 2. Stake Road, US 701 Bus. 3. Railroad Street, 8th Street 4. Areas were seniors live, areas where one side of the street already has
sidewalks 5. East 5th Street 6. 6th Street 7. Elizabeth Street 8. All of downtown Tabor City
Roads in the area needing improved connectivity are:
1. Elizabeth Street & NC 410 2. US 701 Bypass & NC 904 3. US 701 North at NC 410 heading to Chadbourn 4. NC 904 through town, reroute NC 904
Additional Comments are:
1. More jobs in Tabor City, more shops and restaurants open in the evening 2. Pedestrian access 3. US 701 Bus., US 701 Bypass, Complex Street (SR 1305) difficult turning
movements, overall dangerous near state line 4. Lack of sight at downtown intersections because due to parked vehicles 5. Signalization at the intersections of US 701 & NC 410, US 701 Bus. & Ten
Mile Road, US 701 Bypass & NC 904 (Pireway Road) 6. Grocery and other stores located on outskirts of town instead of downtown,
residents need to walk to read them, downtown preservation 7. Downtown congestion
Public Meetings
The public involvement process included holding a public drop-session in Tabor City in order to present the proposed Comprehensive Transportation Plan to the public and to solicit comments. Below is a brief summary of the public meeting.

H-10
Public Drop-in Session Date: Tuesday, October 14, 2014 Time: 4:00 PM – 7:00 PM Location: The Ritz Center 213 US 701 Business (Hickman Road)
Tabor City, NC Purpose: Present draft recommendations and solicit comments Attendance: 16 (excluding NCDOT staff and steering committee members) Public Input: No comment forms were submitted during the session

I-1
Appendix I Tabor City Special Traffic Counts
Currently, seasonal traffic is the primary cause of congestion for the town of Tabor City. US 701 in the town of Tabor City is a major north-south route that is used by vacationers as they head to Myrtle Beach, South Carolina and other locations south. The Tabor City steering committee had concerns that the 2012 Annual Average Daily Traffic (AADT) counts did not reflect the summer congestion that occurs there. The town believed that US 701 is over capacity during certain times in summer. The town observed that US 701 southbound is particularly congested at the beginning of the weekend as people head towards the beach. The northbound portion of the route becomes congested at the end of the weekend as vacationers head home. The town requested that traffic counts be completed in order to compare the AADT to summer traffic volumes. A traffic count study was conducted during the 2013 Labor Day holiday weekend. Additional traffic counts were taken in 2014. The 2014 counts were completed in order to find out what traffic volumes are during a regular weekday in the summer and what traffic volumes are like during a non-holiday weekend. The 2014 counts took place from Monday, June 2, 2014 to Monday, June 9, 2014. Due to limited equipment, only two locations along US 701 could be counted during Labor Day. The result (Figures 15, 16, and 17) of the study shows that when the counts are compared to the 2012 AADT, the traffic either doubles or nearly doubles on the US 701 just north of the South Carolina border. The volume also increases by 3,000 to 5,000 vehicles at the location south of Richard Wright Road (SR 1151). The capacity for both sections of the road is 15,800, meaning that the facility is over capacity. Additionally, the facility had about a 65-35 directional split at the beginning of the weekend with most of the traffic travelling southbound. There was a 25-75 directional split at the end of the weekend with a majority of the traffic traveling northbound. Because the Tabor City CTP began towards the end of summer, a non-holiday summer count had to be conducted in 2014. More locations counts were chosen for the new counts. The goal was to compare summer weekday counts to the AADT and to compare summer non-holiday weekend days to the AADT and the previous Labor Day Holiday counts. Figures 18, 19, and 20 are the results of the traffic volume counts. The result of the counts shows that the weekday counts are very similar (and in some cases the same), to the AADT. Just like the Labor Day counts, though the location of the count along US 701 is different, the volume on US 701 has doubled during the weekend. The figures show that a majority of the traffic is coming from NC 410 and US 701, just north of the Tabor City town limits. The two routes join and carry the combined traffic along US 701 and into South Carolina. Most of the weekend volumes are from NC 410. US 701 traffic volumes remain steady throughout the week.

I-2
The conclusion of the Tabor City traffic summer traffic count study for US 701 is that weekday traffic is comparable to the 2012 AADT volumes. The facility is over capacity during summer weekends as vacationers head to and from beach.
Figure 15: Tabor City Labor Day Holiday Traffic Counts – Friday 8/30/13
Figure 16: Tabor City Labor Day Holiday Traffic Counts – Saturday 8/31/13

I-3
Figure 17: Tabor City Labor Day Holiday Traffic Counts – Monday 6/2/14
Figure 18: Tabor City Summer Traffic Counts- Tuesday 6/3/14

I-4
Figure 19: Tabor City Summer Traffic Counts- Friday 6/6/14
Figure 20: Tabor City Summer Traffic Counts- Saturday 6/7/14