The cuticle proteins of Drosophila melanogaster: Stage specificity
Upload
khangminh22Category
view
1download
0
Host tissue specificity of selected South African isolates of
Rift Valley fever virus
by
Moabi Rachel Maluleke
Submitted in partial fulfilment of the requirements for the degree
Philosophiae Doctor
in the Faculty of Veterinary Science
University of Pretoria
Pretoria

II
DECLARATION
I, Moabi Rachel Maluleke, declare that the thesis, which I hereby submit for the
degree, Philosophiae Doctor at the University of Pretoria, is my own work and has
been submitted by me for the degree at this tertiary institution.
Signature ………………………. Date ………………………

III
ACKNOWLEDGEMENTS
A word of special acknowledgement and appreciation to the following people and institution
for their contribution to the successful completion of this study:
The Almighty God, CREATOR of all the opportunities for giving me the strength and
wisdom I needed to make this study a success.
Dr Ben Mans and Professor Estelle Venter, my promoters for their excellent guidance,
patience and everlasting support during my studies. You were so amazing and this
thesis would not have been possible without you. I thank you.
Dr Phelix Majiwa, who conceived the project and supervised part of the work.
Dr Antoinette van Schalkwyk, for always listening and assisting me with some
techniques.
Mr John Putterill, Dr Sonja Maree and Dr Eudri Venter for assistance with microscopy
techniques.
Agricultural Research Council – Onderstepoort Veterinary Research for allowing me
to do research in the laboratories.
Meat Industry Trust, University of Pretoria and Joy Liebenberg grant for financial
assistance.
My husband, John and daughters Dorothy, Tenyiko and Nkhensani for their moral
support, encouragement, believing in me and always praying for me.
Finally, to my family, friends and colleagues at ARC-OVR for their moral support.

IV
SUMMARY
Host tissue specificity of selected South African isolates of Rift
Valley fever virus
By
Moabi Rachel Maluleke
Promoter: Dr B.J. Mans
Agricultural Research Council
Onderstepoort Veterinary Research
Co-promoter: Prof E.H. Venter
Department of Veterinary Tropical Diseases
Faculty of Veterinary Science
University of Pretoria
College of Public Health Medical and Veterinary Sciences
James Cook University
Australia
For the degree PhD
Rift Valley fever (RVF), is a mosquito-borne viral disease affecting humans and some species
of ruminants including sheep, cattle, goats, buffalos and to a lesser extent wild animals. It is a
re-emerging disease responsible for major losses in livestock production, with negative
impacts on livelihoods of both commercial and resource- poor farmers in sub-Saharan African
and some countries in the Middle East. It remains a threat to both endemic and non-endemic
countries where competent mosquito vectors exist.
V
The RVF virus (RVFV) causes the disease and though only a single serotype exists,
differences in virulence and pathogenicity of the virus have been observed in a wide range of
affected mammalian host species. This necessitates the need for a detailed genetic
characterization of various isolates of the virus and whether the causal factors for host tissue
tropism can be explained.
Therefore, the aims of this study were to obtain comprehensive information on the genetic
composition of the RVFVs circulating in South Africa between 2008 and 2010 and to
differentiate these isolates based on cell infectivity and genomic parameters.
In the first chapter the status of some published literature on the disease as well as the virus
are reviewed. Viral characteristics, replication, assembly and release of the viral particle from
the cell as well as virus-host receptors documented are also mentioned in this chapter.
Chapter two focused on the genetic composition of RVFVs that caused outbreaks during 2008-
2010 in South Africa. Complete genome sequence analysis of isolates from different hosts
and tissues collected at discrete foci of outbreaks were analysed and compared with virus
sequences from earlier outbreaks in South Africa and from other countries. Phylogenetic
analysis indicated that viruses that caused outbreaks during 2008-2010 were most probably
reassortants, resulting from exchange of portions of the genome of different isolates,
particularly of Segment M. In addition, the analysis indicated that the viruses were not
introduced from outside the country but mutated in time and caused the outbreaks when the
environmental conditions became favourable. Although no clear association between the virus
genotype and phenotype has been established, various amino acid substitutions have been
implicated for changes in the phenotype.
The third chapter describes the characterization of isolates derived from different hosts (bovine
and ovine), but from the same tissue (liver). The isolates from bovine liver presented a different
growth phenotype in a cell culture-based system as well as some amino acid substitutions
when compared with isolates from ovine livers. Although the codon usage patterns of the six
isolates were the same, they differed with those of their hosts. Further investigation of the
coding regions of the genome, molecular modelling of glycoproteins and codon usage bias
failed to explain the phenotypic changes.
The fourth chapter focused on an attempt to identify RVFV glycoprotein receptors using the
yeast two-hybrid (Y2H) system. Baby hamster kidney cells were chosen as host cells in the
laboratory because hamsters are known to be highly susceptible to RVFV. The complexity of
the cDNA library constructed from BHK cells were assessed by random sequencing of 100
clones and revealed that 51 clones were genes from mRNA from the Syrian/Golden hamster
using BLAST. The constructed library can also be used to study other animal pathogens
VI
such as bluetongue virus and African horse sickness virus. The constructed bait plasmids did
not show any autoactivation or toxicity in yeast, thus making them suitable to be used in the
Y2H system. Twelve unique clones (4 clones using transformants of the glycoprotein Gn and
8 clones using transformants of glycoprotein Gc) were screened from the cDNA library.
Identification and further characterization of the clones is necessary.
Sampling of the isolates that caused the 2008-2010 outbreaks in South Africa and full genome
sequencing indicated that the isolates were genetically distinct, grouping in different clades,
namely C and H. Reassortment have been identified in some of these isolates, particularly in
their M segments. The majority of isolates that emerged in the outbreaks accumulated
mutations over time while circulating in South Africa. The impact of these mutations on the
pathogenicity of RVFV should be further investigated. Sequencing should be done on clinical
samples directly to have a better idea of the phenotype and the effect of amino acid
substitutions. Different phenotypes observed between cattle and sheep in tissue culture
systems should be further investigated including investigation of different phenotypes in vivo
using small experimental animals. The study has laid a foundation in understanding the
pathogenicity of RVFV and necessitates the importance of understanding molecular
mechanisms of the virus.
VII
PUBLICATIONS AND CONFERENCE CONTRIBUTIONS
Publication:
Moabi R. Maluleke, Maanda Phosiwa, Antoinette van Schalkwyk, George Michuki, Baratang
A. Lubisi, Phemelo S. Kegakilwe, Steve J. Kemp , Phelix A.O. Majiwa. A comparative
genome analysis of Rift Valley fever virus isolates from foci of the disease outbreak in
South Africa in 2008-2010. Plos Negl Trop Dis. 2019 Mar 21;13(3):e0006576
Conference contributions:
Poster presentations:
Interregional Conference on Rift Valley fever in the Middle East and Horn of Africa, 21 - 23
April 2015, Djibouti City, Djibouti
Title: Comparative genome sequence analysis of RVF virus isolates from 2008-2010
outbreaks in South Africa
M.R Maluleke, M. Phosiwa, B.A Lubisi, G. Michuki, P.S Kegakilwe, S.J Kemp and P.A.O
Majiwa
11th Annual Sequencing, Finishing and Analysis in the Future (SFAF) conference, 1st - 3rd
June 2016, Santa Fe, NM, USA
Title: Genome sequence of Rift Valley fever virus isolates from the 2008-2010 disease
outbreaks in South Africa
M.R Maluleke, A. Lubisi, G. Michuki, M. Phosiwa, P.S Kegakilwe, Steve J. Kemp and Phelix
A.O. Majiwa
University of Pretoria, Faculty of Veterinary Science, Faculty day 23th August 2018, SA
Title: Screening of host proteins that interact with Rift Valley fever virus glycoproteins using
yeast two hybrid system
M.R Maluleke, E.H Venter and B. Mans
Oral presentation:
University of Pretoria, One Health Symposium, 27 November 2018, University of Pretoria, SA
Title: A comparative genome analysis of Rift Valley fever virus from foci of disease outbreak
in South Africa in 2008-2010
VIII
M.R Maluleke, M. Phosiwa, B.A Lubisi, G. Michuki, P.S Kegakilwe, S.J Kemp and P.A.O
Majiwa

IX
LIST OF FIGURES
Figure Title Page
Figure 1.1 Map of South Africa showing the nine provinces. Map adapted from
www.globalsecurity.org. The provinces indicated by stars experienced
outbreaks in 2008; those indicated by rectangles experienced outbreaks in
2009; those indicated by triangles experienced outbreaks in 2010 and those
provinces indicated by circles experienced outbreaks in 2011. The town
Kakamas is indicated by a red dot.
6
Figure 1.2 Summary of animal and human cases reported during RVF outbreaks
experienced in South Africa during the period 2008 to 2011 (National
Institute for Communicable Diseases, 2012; Pienaar and Thompson, 2013).
7
Figure 1.3 The electron microscopic photo and schematic diagram of RVFV indicating
all major components of the virus (Pepin et al., 2010). Indicated are the L,
M and S segmented genome and the genes coded for, namely, the envelope
glycoproteins Gn and Gc, polymerase, non-structural protein NSm, non-
structural protein NSs and the nucleocapsid (N).
22
Figure 1.4 Replication cycle of phleboviruses (Spiegel et al., 2016). Host cell factors:
DC-SIGN, HS, NMMHC-IIA responsible for attachment of phleboviruses are
shown on the outside of a cell. The CavME, CIE and RNaseK are
responsible for internalization of different phleboviruses. A: cellular
attachment, B: Late endosomes, C: Fusion of viral and endosomal
membranes, D: Translation of glycoproteins Gn and Gc, E: Folding of Gn
and Gc, F: Transportation of Gn and Gc into the Golgi Apparatus, G:
Release of new viral particles.
25
Figure 2.1 Livestock cases of Rift Valley fever in South Africa for 2008, 2009, 2010 and
2011 (Métras et al., 2012). Provinces are NC: Northern Cape, WC: Western
Cape, EC: Eastern Cape, FS: Free State, NW: North West, KN: KwaZulu-
Natal, MP: Mpumalanga, GT: Gauteng, LP: Limpopo. The light grey shaded
areas are Swaziland and Lesotho (no data).
36
X
Figure 2.2 Photograph of a representative agarose gel in which SISPA products of
RVFV were resolved. Lanes contain products as follows: Lane 1: M03/10,
Lane 2: M15/10, Lane 3: M06/10, Lane 4: M19/10, Lane 5: M21/10, Lane 6:
M22/10, Lane 7: M23/10, Lane 8: M25/10, Lane 9: M26/10, Lane 10: M33/10
Lane 11: no DNA. Lanes labeled M contain DNA size markers, with
corresponding sizes of some indicated in kilobasepairs (kb).
40
Figure 2.3A Maximum likelihood tree of the S segment. The tree was generated using
the maximum likelihood algorithm using MEGA 6. The designation of the
clades follows Grobbelaar et al. (2011). The lineages containing RVFV
isolates from South Africa are presented in green.
46
Figure 2.3B Maximum likelihood tree of the M segment. The tree was generated using
the maximum likelihood algorithm using MEGA 6. The designation of the
clades follows Grobbelaar et al. (2011). The lineages containing RVFV
isolates from South Africa are presented in green. The two specific re-
assortants are indicated in red.
47
Figure 2.3C Maximum likelihood tree of the L segment. The tree was generated using
the maximum likelihood algorithm using MEGA 6. The designation of the
clades follows Grobbelaar et al. (2011). The lineages containing RVFV
isolates from South Africa are presented in green.
48
Figure 2.4 Welling antigenicity plots of segment M for the isolates M33_RSA_10 in
blue, ZH501-Egy-77 in black and M37_RSA_08 in green. Differences in
amino acids between these three samples are indicated on top of the
antigenicity plots with each isolate represented in its assigned colour. A
graphical representation of the Non-structural protein (NSm) and
glycoproteins (Gn) and (Gc) regions separate the antigenicity plots from the
graph depicting the proportion of substitutions per amino acid position.
These proportions are representative of the 23 sequences generated during
this study as well as the previously published data indicated in Table 2.3.
50
XI
Figure 3.1 The structures of the envelope glycoproteins Gn and Gc. A) A reconstruction
of RVFV at pH 7.4 (Amroun et al., 2017). The blue rings represent individual
capsomers formed by the six Gn/Gc heterodimers. B) the Gn/Gc capsomer
viewed from the side. C) The Gn/Gc capsomer viewed from above. Red
circled indicate the position of E276 in Gn. D) A ribbon representation of Gn
in the capsomer. Indicated are E276 as a space-filled residue.
58
Figure 3.2 Maximum likelihood tree of the M segment (subset of Figure 2.3B). The six
isolates used in this study are indicated with green circle and their origins
are indicated in brackets next to their names.
65
Figure 3.3 Cellular morphology of BHK cells examined using light microscopy: A:
Uninfected cells. B: BHK cells 24 hours of post infection with RVFV. C: BHK
cells 48 hours post infection with RVFV. D: BHK cells 72 hours of post
infection with RVFV. Bar = 50µm.
66
Figure 3.4 Morphology of RVF viral particles revealed by negative stain transmission
electron microscopy. A) Measured diameter of the viral particles ranging
from 71.34 to 82.91nm. B) The roughly spherical shape viral particle is
shown. C) Pleomorphic viral particles are shown. D) Different morphologies
of viral particles are shown.
67
Figure 3.5 Electron micrographs showing BHK cells in the course of infection with
RVFV at different time intervals (MOI of 0.1 in panels B, C and D). Electron
micrograph A shows a section of an uninfected cell. Electron micrograph B
shows a section of a cell infected with RVFV after 8 minutes. Electron
micrograph C shows a section of a cell infected with RVFV after 16 minutes
of incubation with the virus. Electron micrograph D shows a section of a cell
infected with RVFV after 24 minutes of incubation with the virus. Each dot
represents a viral particle. Bar in A = 1.0µm while bars in B, C and D =
200.0nm.
68
Figure 3.6 Multi-step growth curve of selected RVFV isolates. A: Growth curves of
RVFV isolates from bovine livers. B: Growth curves of isolates from ovine
livers. Cells were infected with RVFV isolates at MOI of 0.1 and samples
collected at different time intervals. Infectious viral particles were
determined using a plaque assay. Mean values are indicated by points.
69
XII
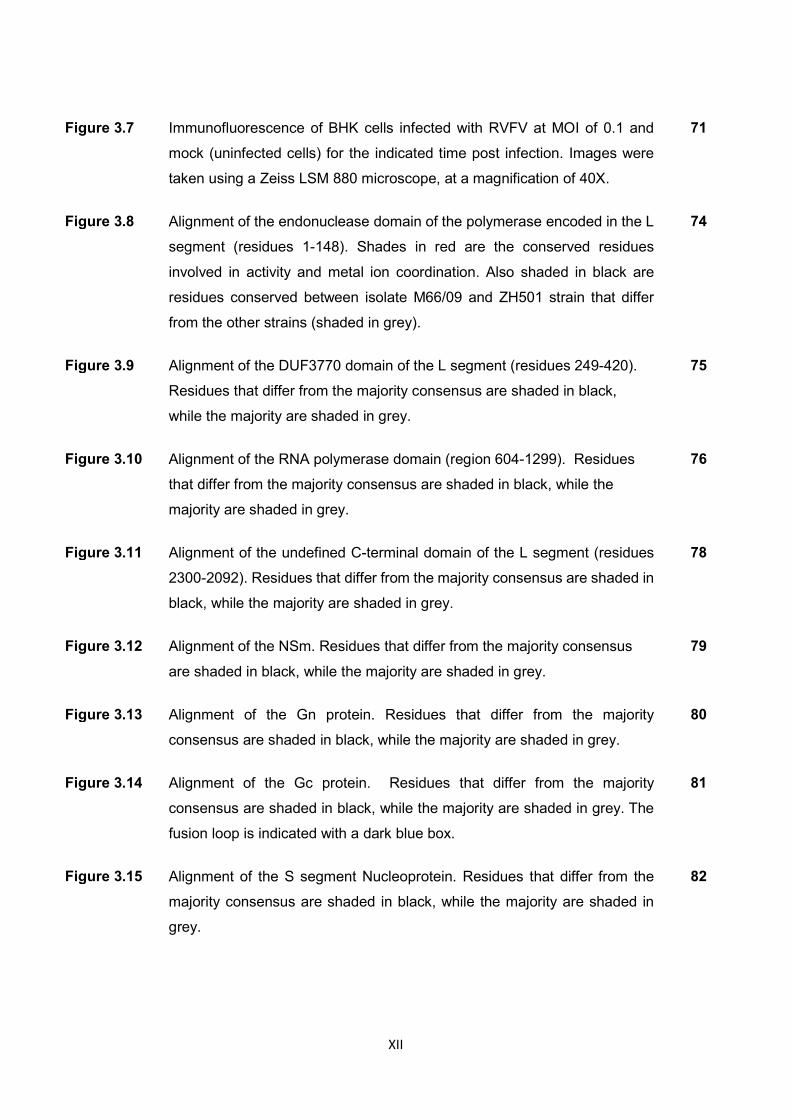
Figure 3.7 Immunofluorescence of BHK cells infected with RVFV at MOI of 0.1 and
mock (uninfected cells) for the indicated time post infection. Images were
taken using a Zeiss LSM 880 microscope, at a magnification of 40X.
71
Figure 3.8 Alignment of the endonuclease domain of the polymerase encoded in the L
segment (residues 1-148). Shades in red are the conserved residues
involved in activity and metal ion coordination. Also shaded in black are
residues conserved between isolate M66/09 and ZH501 strain that differ
from the other strains (shaded in grey).
74
Figure 3.9 Alignment of the DUF3770 domain of the L segment (residues 249-420).
Residues that differ from the majority consensus are shaded in black,
while the majority are shaded in grey.
75
Figure 3.10 Alignment of the RNA polymerase domain (region 604-1299). Residues
that differ from the majority consensus are shaded in black, while the
majority are shaded in grey.
76
Figure 3.11 Alignment of the undefined C-terminal domain of the L segment (residues
2300-2092). Residues that differ from the majority consensus are shaded in
black, while the majority are shaded in grey.
78
Figure 3.12 Alignment of the NSm. Residues that differ from the majority consensus
are shaded in black, while the majority are shaded in grey.
79
Figure 3.13 Alignment of the Gn protein. Residues that differ from the majority
consensus are shaded in black, while the majority are shaded in grey.
80
Figure 3.14 Alignment of the Gc protein. Residues that differ from the majority
consensus are shaded in black, while the majority are shaded in grey. The
fusion loop is indicated with a dark blue box.
81
Figure 3.15 Alignment of the S segment Nucleoprotein. Residues that differ from the
majority consensus are shaded in black, while the majority are shaded in
grey.
82
XIII
Figure 3.16 Alignment of the S segment Nonstructural protein. Residues that differ from
the majority consensus are shaded in black, while the majority are shaded
in grey.
83
Figure 3.17 Welling antigenicity plots of the six isolates for the M segment. Differences
in amino acids between these isolates are indicated on top of the plots. The
lines show the positions where major amino changes are observed.
84
Figure 3.18A and B
The three-dimensional structure models of RVFV Gn protein. Figure A
shows the modelled Gn protein structure of six isolates: M21/10, M33/10,
M66/09, M127/09, M260/09 and M247/09 superimposed with a mean
RMSD of 0.02. Figure B shows Gn protein structures of the six isolates
superimposed with the template c5y0yA with a mean RMSD of 0.065.
85
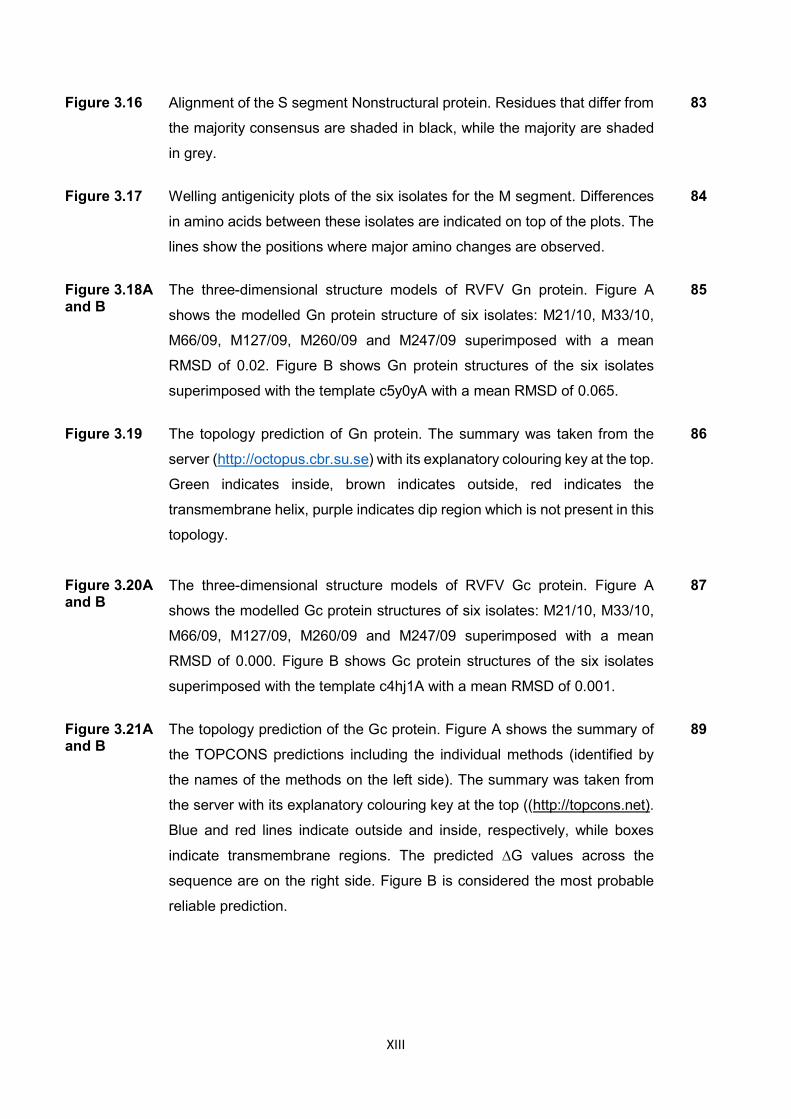
Figure 3.19 The topology prediction of Gn protein. The summary was taken from the
server (http://octopus.cbr.su.se) with its explanatory colouring key at the top.
Green indicates inside, brown indicates outside, red indicates the
transmembrane helix, purple indicates dip region which is not present in this
topology.
86
Figure 3.20A and B
The three-dimensional structure models of RVFV Gc protein. Figure A
shows the modelled Gc protein structures of six isolates: M21/10, M33/10,
M66/09, M127/09, M260/09 and M247/09 superimposed with a mean
RMSD of 0.000. Figure B shows Gc protein structures of the six isolates
superimposed with the template c4hj1A with a mean RMSD of 0.001.
87
Figure 3.21A and B
The topology prediction of the Gc protein. Figure A shows the summary of
the TOPCONS predictions including the individual methods (identified by
the names of the methods on the left side). The summary was taken from
the server with its explanatory colouring key at the top ((http://topcons.net).
Blue and red lines indicate outside and inside, respectively, while boxes
indicate transmembrane regions. The predicted ∆G values across the
sequence are on the right side. Figure B is considered the most probable
reliable prediction.
89

XIV
Figure 3.21C Predicted topology of the transmembrane helix of the sequence of the Gc
glycoprotein. The extracellular and cytoplasmic sides of the membrane and
the beginning and the end of the transmembrane helix are indicated. The
numbers indicate the residues indexes.
90
Figure 3.21D The topology prediction of Gc protein. The summary was taken from the
server (http://octopus.cbr.su.se) with its explanatory colouring key at the top.
Green indicates inside, brown indicates outside, red indicates the
transmembrane helix, purple indicates dip region which is not present in this
topology.
90
Figure 4.1 The classical yeast two-hybrid system (Brückner et al., 2009). A: The protein
of interest known as bait (X) is fused to the DNA binding domain (DBD) to
form DBD-X. The unknown protein known as prey (Y) is fused to the
activation domain (AD) to form AD-Y. B: The DBD-X binds to the upstream
activation sequence (UAS) of the promoter. The interaction between the two
complexes recruits the AD and reconstitutes a functional transcription factor,
leading to further recruitment of RNA polymerase II and subsequent
transcription of a reporter gene.
100
Figure 4.2 Denaturing formaldehyde gel electrophoresis of total RNA and mRNA
extracted from BHK cells. Lane M: Transcript RNA Marker (SIGMA); Lane
1: Total RNA; Lane 2: mRNA.
107
Figure 4.3 Analysis of ds cDNA from BHK cells on 1% agarose gels. (A) Unpurified ds
cDNA and (B) purified ds cDNA; Lane M, O’GeneRuler 1kb DNA ladder Plus
(Thermo Fisher Scientific); Lane 1: ds cDNA.
108
Figure 4.4 Insert check PCR of randomly selected colonies from BHK cDNA library.
One hundred colonies were randomly selected from SD/-Leu plates and
amplified by PCR using Matchmaker Insert PCR Mix 2. The PCR products
were analysed by 1% agarose gel electrophoresis to determine the size
fragment. Lanes 1-100: Recombinant individual colonies; Lane M:
O´GeneRuler 1kb Plus DNA ladder (Thermo Fisher Scientific).
110
Figure 4.5 Pie chart showing sizes of the inserts. The majority of sizes were from 200-
500 bp.
111
XV
Figure 4.6 Ectodormains of genes encoding RVF viral Gc and Gn amplification. PCR-
amplified portions of Segment M which encode viral glycoproteins Gc and
Gn, loaded in lanes 1 and 2, respectively. Lane 3 is PCR products of a
negative control. Lane M: O’GeneRuler 1 kb DNA ladder Plus (Thermo
Fisher Scientific) with sizes shown in basepairs (bp).
114
Figure 4.7 Confirmation of recombinants pGBKT7-Gn (A) and pGBKT7-Gc (B) by
digestion with EcoR1 and Sal1. Lane M: Molecular marker; Lane 1:
Undigested plasmid recombinants; Lane 2: plasmid recombinants digested
with EcoR1; Lane 3: Plasmid recombinants digested with Sal1; Lane 4:
Plasmid recombinants digested with both EcoR1 and Sal1.
114
Figure 4.8 Western blotting analysis of total protein extracts of Y2HGold containing the
plasmids pGBKT7-Gn (A) and pGBKT7-Gc (B). Proteins were separated on
SDS PAGE (4-12%), and later probed with c-myc tag antibody. Lane M:
PageRuler Plus Prestained protein Ladder (Thermo Fischer Scientific);
Lane 1: Y2H yeast cells; Lane 2: Empty vector pGBKT7; Lane 3: Lysates;
Lane 4: Flow-through; Lane 5: Washes; Lane 6: Eluate 1; Lanes 7: Eluate
2; Lane 8: p53 (positive control indicated by an arrow).
115
Figure 4.9 Confirmation analysis of Gn and Gc proteins of RVFV. Proteins were
separated on SDS PAGE (4-12%), and later probed with positive serum
from sheep infected with RVFV. Lane M: PageRuler Plus Prestained protein
ladder (Thermo Fisher Scientific); Lane 1: BHK cells; Lane 2: BHK cells
infected with virus; Lane 3: Gn protein; Lane 4: Gc protein.
116
Figure 4.10 Determination of the autoactivation and toxicity activities of pGBKT7-Gn and
pGBKT7-Gc bait plasmids in yeast. The bait plasmids were used to
transform Y2HGold cells and grown on plates containing different media.
The empty plasmid pGBKT7 was included as a control. SDO = synthetic
dropout media; SDO/X = synthetic dropout media with X-alpha
galactosidase; SDO/X/A = synthetic media with X-alpha galactosidase and
Aureobasidin A antibiotic.
117
Figure 4.11 Blue colonies obtained after the co-transformation. A: Transformants of
pGBKT7-Gn and cDNA in a prey plasmid streaked twice on QDO/X/A plates.
118
XVI
B: Transformants of pGBKT7-Gc and cDNA in a prey plasmid streaked twice
on QDO/X/A plates. QDO/X/A = SD/-Ade/His/-Leu/-Trp/X-α-alpha/AbA.
XVII
LIST OF TABLES
Table Title Page
Table 2.1 List of RVFV isolates analysed in the study 41
Table 2.2 Bayesian coalescent estimations of RVFV isolates 42
Table 2.3 A list of previously published genome sequences of RVFV 42
Table 3.1 Virus isolates used in the study 61
Table 3.2 Amino acids substitutions of field isolates as compared to those
of the reference strain ZH501
73
Table 3.3 The relative synonymous codon usage (RSCU) patterns of
RVFV and its hosts
92
Table 3.4 Codon usage pattern observed for RVFV glycoproteins and its
relationship to potential hosts
94
Table 4.1 Primer sequences used in this study 105
Table 4.2 Parameters/measures of the quality of the cDNA library from
BHK cells
109
Table 4.3 Putative genes identified in cDNA clones of BHK cells 111
XVIII
LIST OF ABBREVIATIONS
A Aureobasidin A
ARC-OVR Agricultural Research Council - Onderstepoort Veterinary Research
BHK Baby Hamster Kidney
CPE Cytopathic effect
DDO Double dropout media
DMEM Dulbecco Modified Eagle media
EC Eastern Cape
ELISA Enzyme linked immunosorbent assay
FAO Food and Agricultural Organization
FBS Fetal bovine serum
FS Free State
GA Glutaraldehyde
GP Gauteng Province
KZN KwaZulu-Natal
LB Luria broth
LP Limpopo Province
MEGA Molecular Evolutionary Genetics Analysis
MOI Multiplicity of infection
MP Mpumalanga Province
NC Northern Cape
NGS Next Generation Sequencing
NP/N Nucleoprotein/Nucleocapsid
NSm Non-structural protein of M segment
NSs Non-structural protein of S segment
OIE World Organisation for Animal Health
PBS Phosphate buffered saline
PFU Plaque forming units
Phyre2 Protein Homology/analogy Recognition Engine V 2.0
QDO Quadruple dropout media
RPM Ramp per minute
RVF Rift Valley fever
RVFV Rift Valley fever virus
SD Minimal, synthetic defined medium for yeast

XIX
SDS PAGE Sodium dodecyl sulphate polyacrylamide gel electrophoresis
SEM Scanning electron microscope
SISPA Sequence independent single primer amplification
TBST Tris buffered saline, with Tween 20
TEM Transmission electron microscope
tRNA Transfer RNA
X X-alpha galactosidase
Y2H Yeast two-hybrid
YPDA Yeast peptone dextrose adenine
XX
Table of Contents
Declaration II
Acknowledgements III
Summary IV
Publications and conference contributions VII
List of figures IX
List of tables XVII
List of abbreviations XVIII
CHAPTER 1: LITERATURE REVIEW ................................................................................... 1
1.1 INTRODUCTION ......................................................................................................... 1
1.2 SOCIO-ECONOMIC IMPORTANCE OF RVF .............................................................. 2
1.3 GEOGRAPHICAL DISTRIBUTION OF RIFT VALLEY FEVER .................................... 3
1.3.1 RVF outbreaks in South Africa .............................................................................. 4
1.4 RISK FACTORS ASSOCIATED WITH THE SPREAD OF RVF ................................... 8
1.4.1 Water borne risk factors ........................................................................................ 8
1.4.2 The role of wildlife and subclinically infected animals, in the epidemiology of the disease .......................................................................................................................... 9
1.4.3 Risk factors during outbreaks ................................................................................ 9
1.5 CONTROL OF RIFT VALLEY FEVER ....................................................................... 10
1.5.1 Vaccination of animals ........................................................................................ 10
1.5.2 Surveillance and Prevention ................................................................................ 11
1.5.3 Diagnostic methods ............................................................................................. 12
1.6 PREDICTION OF RVF DISEASE OUTBREAKS AND CLIMATE MODELS ............... 15
1.7 HOST RANGE ........................................................................................................... 15
1.8 CLINICAL FEATURES OF THE DISEASE ................................................................ 17
1.8.1 Animals (sheep and cattle) .................................................................................. 17
1.8.2 Humans .............................................................................................................. 18
1.9 TRANSMISSION OF THE VIRUS .............................................................................. 18
1.10 SURVIVAL OF RVFV .............................................................................................. 20
1.11 AETIOLOGY ............................................................................................................ 21
1.11.1 Structure of the virus ......................................................................................... 21
1.11.2 Molecular biology of the virus ............................................................................ 23
1.11.3 Replication of the virus ...................................................................................... 24

XXI
Attachment and entry ................................................................................................... 24
Replication in the infected cell ...................................................................................... 27
Assembly and release of the viral particle from the cell ................................................ 27
1.12 VIRUS-RECEPTOR-HOST INTERACTIONS .......................................................... 27
1.13 JUSTIFICATION ...................................................................................................... 31
1.14 THE STUDY OBJECTIVE........................................................................................ 32
CHAPTER 2: A COMPARATIVE GENOME ANALYSIS OF RIFT VALLEY FEVER VIRUS ISOLATES FROM FOCI OF THE DISEASE OUTBREAKS IN SOUTH AFRICA IN 2008-2010 .................................................................................................................................... 33
2.1 INTRODUCTION ....................................................................................................... 33
2.2 MATERIALS AND METHODS ................................................................................... 37
2.2.1 Viruses, cells and media ..................................................................................... 37
2.2.2 RNA isolation and PCR ....................................................................................... 37
2.2.3 cDNA synthesis and Sequence Independent Single Primer Amplification ........... 38
2.2.4 Construction of cDNA libraries ............................................................................ 38
2.2.5 Genome sequence accession numbers .............................................................. 38
2.2.6 Bioinformatic analyses of the sequence data ...................................................... 39
2.3 RESULTS .................................................................................................................. 39
2.4 DISCUSSION ............................................................................................................ 51
CHAPTER 3: COMPARISON AND CHARACTERISATION OF SELECTED SOUTH AFRICAN ISOLATES OF RIFT VALLEY FEVER VIRUS .................................................... 55
3.1 INTRODUCTION ....................................................................................................... 55
3.2 MATERIALS AND METHODS ................................................................................... 59
3.2.1 Determination of viral concentration .................................................................... 59
3.2.2 Confirmation of the viral particle .......................................................................... 60
3.2.3 Attachment of virus to host cells using electron microscopy (cell embedding) ..... 60
3.2.4 Viral growth curves .............................................................................................. 61
3.2.5 Immunofluorescence assay ................................................................................. 62
3.2.6 Nucleotides and amino acid sequence alignment ................................................ 62
3.2.7 Protein structure prediction ................................................................................. 63
3.2.8 Determination of codon usage bias ..................................................................... 63
3.3 RESULTS .................................................................................................................. 64
3.3.1 Selection of strains for further characterization .................................................... 64
3.3.2 Baby hamster kidney cells infected with RVFV .................................................... 65
3.3.3 Confirmation of RVFV particle using TEM and PCR ............................................ 66
3.3.4 Attachment of M66/09 isolate on BHK cells ......................................................... 67
3.3.5 Viral growth curves .............................................................................................. 68
3.3.6 Status of infection as visualized by immunofluorescence .................................... 70
XXII
3.3.7 Amino acid sequence alignment .......................................................................... 71
3.3.8 Protein structure modelling .................................................................................. 85
3.3.9 Relationship between codon usage patterns of RVFV and their hosts ................. 90
3.4 DISCUSSION ............................................................................................................ 95
CHAPTER 4: THE USE OF A YEAST TWO-HYBRID SYSTEM TO IDENTIFY THE RECEPTORS OF RVFV GLYCOPROTEINS ON HOST CELLS ......................................... 99
4.1 INTRODUCTION ....................................................................................................... 99
4.2 MATERIALS AND METHODS ................................................................................. 101
4.2.1 Preparation of the prey (Construction of cDNA library from BHK cells) .............. 101
4.2.2 Construction of the bait plasmids ...................................................................... 103
4.2.3 Protein analysis and bait expression in yeast cells ............................................ 105
4.2.4 Autoactivation and toxicity tests of bait plasmids ............................................... 106
4.2.5 Yeast two-hybrid screen using co-transformation of bait and prey plasmids ...... 106
4.3 RESULTS ................................................................................................................ 107
4.3.1 Isolation and analysis of total RNA and mRNA from BHK cells ......................... 107
4.3.2 Construction and evaluation of cDNA ................................................................ 108
4.3.3 Nucleotide sequence analysis ........................................................................... 111
4.3.4 Construction of bait plasmids (pGBKT7-Gn and pGBKT7-Gc) ........................... 113
4.3.5 Expression of Gn and Gc .................................................................................. 115
4.3.6 Autoactivation and toxicity tests of the bait plasmids ......................................... 116
4.3.7 Yeast two-hybrid screening ............................................................................... 117
4.4 DISCUSSION .......................................................................................................... 118
CHAPTER 5: GENERAL DISCUSSION AND CONCLUSION ........................................... 122
CHAPTER 6: REFERENCES ............................................................................................ 127
APPENDICES ................................................................................................................... 156
APPROVALS……………………………………………………………………………………….158

1
CHAPTER 1: LITERATURE REVIEW
1.1 INTRODUCTION
Rift Valley fever (RVF) is an acute mosquito-borne viral disease affecting humans and a wide
diversity of animals including sheep, cattle, goats and some species of wild animals (Daubney
et al., 1931; Swanepoel and Coetzer, 2004; Ikegami and Makino, 2011). The disease was first
identified and characterized in 1931 when it killed thousands of sheep on a farm in the Rift
Valley in Kenya (Daubney et al., 1931). Rift Valley fever is a notifiable disease in terms of the
South African Animal Disease Act (Act 35 of 1984) (Habjan et al., 2009), as well as in Europe
and the United States of America (USA); it is classified as a potential biological weapon
(Bouloy and Weber, 2010), a Category A Priority pathogen and a high–consequence pathogen
(OIE, 2019). The increasing number of human deaths caused by RVF virus (RVFV) in eastern
Africa and the ability of the RVFV to cross national and geographic borders makes this virus
a high-risk pathogen of importance (Shope et al., 1982; Bird et al., 2008).
The occurrence of RVF epidemics is associated with heavy rainfall and flooding conditions,
which provides an excellent environment for mosquito breeding (Anyamba et al., 2010). During
these periods, Aedes mosquitoes multiply rapidly, transmit and amplify RVFV in animals
(Linthicum et al., 1999). Human infection may be through mosquito bites but mostly is through
direct contact with infectious aerosols. Rift Valley fever is characterised by high numbers of
abortions and mortality among new-born animals. Clinical signs vary between animal species
and animal age. Small ruminants (sheep and cattle) show clinical signs, whereas other
animals such as dogs, adult cats and some monkeys may become viraemic without severe
disease. The disease is more severe in young animals, such as lambs and calves, with
mortality rates ranging from 90-100% (Swanepoel and Coetzer, 2004).
Rift Valley fever outbreaks cause large economic losses resulting from trade cessation of
livestock and livestock-related products (Dautu et al., 2012). The disease is also of economic
concern because of the cost associated with monitoring the introduction of disease in
unaffected areas (Kasye et al., 2016). In humans, RVF outbreaks in the last few decades have
worsened, affecting their social and economic impacts (Baba et al., 2016). For RVF survivors,
neurological and visual complications are likely to be lifelong, including loss in disability-
adjusted life (Baba et al., 2016).

2
Although there is no specific treatment for RVF, vaccination of livestock against RVF
represents the most sustainable strategy to prevent and control its spread. Currently, there
are two types of vaccines available and commonly used in endemic countries: the live
attenuated vaccine, Clone 13, and a formalin-inactivated vaccine (Barnard and Botha, 1977;
Alhaj, 2016). There is major improvement reported towards the novel vaccines development
and the achievements have resulted in teamwork between human and veterinary research
groups: a “One Health” approach to fight RVF, a major zoonotic threat (Faburay et al., 2017).
It is unclear why RVFV infection causes differ in different hosts and result in different
outcomes. Pregnant ruminants are subjected to a high rate of abortion, while new-born
animals, such as lambs, usually die (Ikegami and Makino, 2011). The susceptibility to RVFV
differs between hosts and in the affected hosts certain tissues/organs are targeted. For
example, in adult sheep and cattle the most affected organs are liver and spleen, while in
pregnant animals the virus targets the placenta. The mechanism of interaction between RVFV
and the receptor molecules on the surface of the host cells that facilitates viral attachment and
entry is unknown. Therefore, this work will focus on the interaction between virus and
receptors with specific attention devoted to the isolates from South Africa.
1.2 SOCIO-ECONOMIC IMPORTANCE OF RVF
Rift Valley fever has a great impact on both livestock and humans. Loss of livestock, especially
young animals, is associated with huge economic loss threatening the lives of both people
and animals. In many African countries (e.g. Kenya, Somalia and Tanzania) livestock is an
important source of livelihood, valuable goods and services. It provides products such as milk,
meat, manure, transport and wool, which lead to financial benefits (Sindato et al., 2011). The
disease has a direct and indirect impact on both livestock-keepers and non-livestock keepers.
Livestock-keepers lose their livestock through death and abortions. Loss of animals in this
manner could result in production losses lasting for several years. Benefits provided by
livestock, such as transport and food, are also lost during a disease outbreak. Sheep and
cattle that survive abortions often suffer from infertility, which leads to a decrease in animal
products (Shope et al., 1982). Loss of livestock, especially young animals, is a great disruption
on herd dynamics that could result in production losses lasting for several years (Kasye et al.,
2016).
3
Communities experience psychological stress and trauma due to the loss of family members
to the disease, the possibility of contracting the disease or fear of death or losing animals
(Peyre et al., 2015). In some communities, which depend on animals as a source of income,
the presence of the disease also changes their lifestyle; i.e. meat consumption has to be
reduced due to the high risk of infection and even transport becomes a challenge due to the
fear of coming into contact with sick animals. This again leads to competition for alternative
protein sources such as fish, chicken, pork and vegetables to replace meat (Chengula et al.,
2013).
In some African countries, such as Tanzania where people’s houses are next to animal kraals,
family members might also contract the disease while taking care of their animals (Sindato et
al., 2011), or when slaughtering sick animals (Anyangu et al., 2010). This will not only lead to
a decrease in economic activities among these people and loss of income, but will also
increase medical expenses (Anyangu et al., 2010).
Livestock trade drops due to animal deaths and strict export policies on animals and animal
products will be impeded in countries affected by the disease. These conditions influence both
internal and external markets, resulting in closure of some businesses. In countries in the Horn
of Africa (Somalia, Ethiopia and Kenya), which are actively involved in livestock trading,
livestock bans have a great impact, including adverse effects on public treasury, foreign
exchange rates and prices of imported goods (Sindato et al., 2011). A demand for livestock
during religious feasts such as Ramadan and Feast of Sacrifices in these countries drops
during outbreaks, which also affects economic activities (Kasye et al., 2016).
Outbreaks also cause great financial loss due to costs associated with the control of the
disease where sample collection and animal vaccination are involved. Funding is also needed
for training of personnel and campaigns to raise public awareness (Narrod et al., 2012).
1.3 GEOGRAPHICAL DISTRIBUTION OF RIFT VALLEY FEVER
Rift Valley fever has the capacity to cross borders and emerge in areas where it had never
been reported before or re-emerge after long periods where it had once occurred. Since the
time the disease was first reported in Kenya numerous outbreaks of RVF have been reported
in sub-Saharan countries moving through the Rift Valley from Kenya to Tanzania, Somalia,
Sudan, Zambia and Zimbabwe (Abd EI-Rahim et al., 1999; Gerrard and Nichol, 2007;
Chevalier et al., 2010). In 1973, the disease spread through the Nile Valley to the White Nile
into Sudan and in 1977, spread north of the Sahara Desert outside East Africa into Egypt
4
(Himeidan et al., 2014). This resulted in a major epidemic with more than 200 000 clinical
cases and about 600 human deaths reported (Meegan, 1979; Imam et al., 1979). Epidemics
are now more frequently experienced in Africa and the Middle East. The largest outbreak
recorded was in sub-Saharan Africa in the Garissa District of Kenya in 1997 with human
infections estimated at 27 500 (Woods et al., 2002).
In West Africa, Senegal and Mauritania the disease was first recorded in 1974 and 1987,
respectively (Zeller et al., 1997). The disease spread from continental Africa to Madagascar
in 1991 and was reported in Saudi Arabia and Yemen in 2000 (Ahmad, 2000; Sissoko et al.,
2009). This was the second outbreak outside East Africa and the first time the disease was
detected outside Africa (Swanepoel and Coetzer, 2004). It raised concerns that the disease
might spread further into Asia and more West into Europe (Ahmed et al., 2011; WHO, 2010).
In some African countries (such as Angola, Nigeria, Cameroon and Ethiopia), no RVF
outbreaks have been reported, but virus isolation or serological evidence of the disease has
been reported (LeBreton et al., 2006; Davies, 2010; Liu et al., 2016). This indicates endemic
circulation of the virus with mild or subclinical manifestation (Fafetine et al., 2013).
1.3.1 RVF outbreaks in South Africa
Records indicate that RVF outbreaks were first reported in South Africa in 1951 in three
different areas: Western (North West Province), Southern (Gauteng Province) and South-
Western Transvaal (Free State Province) (Gear et al., 1955). The outbreak started in
December 1950 and continued until April 1951. At first, the disease was not known, reported
as a strange and unusual disease and only recognized when people became ill soon after
contact with tissues of infected sheep and cattle. This epidemic resulted in over 100 000
deaths and 500 000 abortions among sheep (Gear et al., 1955).
Disease outbreaks then occurred in 1955 in the Orange Free State (Free State Province) with
several farmers, farm labourers and a woman working in the kitchen getting sick after handling
meat (Alexander, 1951; Gear et al., 1955). During this outbreak, young lambs were dying,
ewes were either aborting or dying and cattle were becoming sick with a small number
aborting. This outbreak was followed by several outbreaks, which occurred in successive
years (1955-1956, 1956-57, 1969-1970), affecting both animals (especially sheep and cattle)
and humans (Pienaar and Thompson, 2013).
5
The second major epidemic occurred in 1974/75 in the farming districts of the Orange Free
State (Free State Province) and the Cape Province (Eastern Cape Province). This outbreak
lasted for three years. Human cases were more severe, with many deaths reported during this
period (McIntosh et al., 1980a).
In 2008, four provinces (Mpumalanga, North West, Gauteng and Limpopo) reported the
disease outbreaks among cattle, goats, sheep and buffaloes (Figure 1.1 and Figure 1.2). The
outbreak started close to the Kruger National Park, Mpumalanga Province in January 2008
after heavy rainfall and continued until August of the same year. The most affected animals
were cattle. During this period, 18 laboratory cases of humans were reported and these were
people who had close contact with infected animals. It was concluded that the disease
outbreak resulted from re-emergence of the virus from reservoir hosts such as wild animals
(Grobbelaar et al., 2011).
The 2009 outbreak in South Africa started in February and continued until May 2009 with many
cases reported in KwaZulu-Natal, Eastern Cape and Mpumalanga provinces (Figure 1.1). The
most affected species during this outbreak were cattle and sheep. Reports of abortion and
sudden deaths, mostly in new-born and young animals, were recorded. Towards the end of
that year (October to November), an outbreak was reported again, this time starting in the
Northern Cape Province (in an area called Kakamas) (Figure 1.1) near the border of Namibia
and continued towards the interior regions of the country (Kegakilwe, 2010; Glancey et al.,
2015). No confirmed human cases were reported during this period. However, this second
outbreak in 2009 was unusual; the outbreak did not follow any heavy rainfall (Kegakilwe,
2010). It occurred in the Northern Cape Province, next to the Gariep (Orange River) and was
associated with irrigation of land (Kegakilwe, 2010).
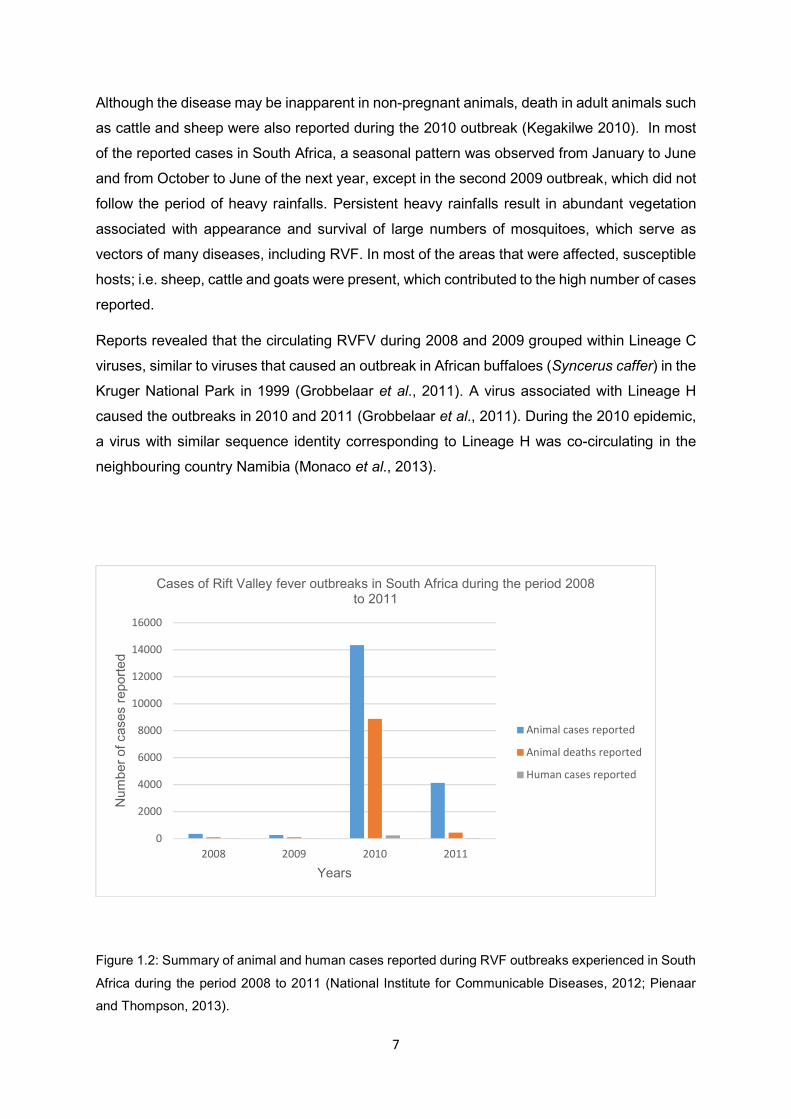
The third major epidemic experienced in South Africa was in 2010 with 14 342 animal cases
reported and 8 877 animal deaths confirmed by laboratory tests (National Institute for
Communicable Diseases, 2012). The disease outbreak appeared to have started in the Free
State Province in February 2010. The outbreak continued (until June) and other provinces
were then also affected. High abortion rates in ewes and death of new-born lambs were
recorded in the Free States and in the Northern Cape Provinces (Figure 1.1). This was the
first time that RVF outbreaks were experienced during winter in South Africa (Pienaar and
Thompson, 2013). The most affected animals during the outbreaks were sheep, cattle and
goats and to a lesser extent buffaloes. During this period, some cases were reported in
neighbouring countries; Namibia and Botswana. No outbreak was reported in KwaZulu-Natal
Province in 2010 (Glancey et al., 2015).
6
Figure 1.1: Map of South Africa showing the nine provinces. Map adapted from www.globalsecurity.org.
The provinces indicated by stars experienced outbreaks in 2008; those indicated by rectangles
experienced outbreaks in 2009; those indicated by triangles experienced outbreaks in 2010 and those
provinces indicated by circles experienced outbreaks in 2011. The town Kakamas is indicated by a red
dot.
A small outbreak of RVF was experienced in November 2010 in the Eastern Cape Province
and continued to the Western and Northern Cape provinces until June 2011. Most RVF cases
in animals were diagnosed at the Agricultural Research Council-Onderstepoort Veterinary
Research (ARC-OVR) (Archer et al., 2011). During this period, 242 laboratory-confirmed
human cases with 26 deaths were reported (National Institute for Communicable Diseases,
2012) as illustrated in Figure 1.2. In addition to livestock infections, camels (Camelus
dromedaries), waterbucks (Kobus ellipsiprymnus) and other wildlife species were also infected
during this outbreak in South Africa (Glancey et al., 2015). The 2008 and 2009 outbreaks were
relatively small compared to those of 2010 and 2011.
7
Although the disease may be inapparent in non-pregnant animals, death in adult animals such
as cattle and sheep were also reported during the 2010 outbreak (Kegakilwe 2010). In most
of the reported cases in South Africa, a seasonal pattern was observed from January to June
and from October to June of the next year, except in the second 2009 outbreak, which did not
follow the period of heavy rainfalls. Persistent heavy rainfalls result in abundant vegetation
associated with appearance and survival of large numbers of mosquitoes, which serve as
vectors of many diseases, including RVF. In most of the areas that were affected, susceptible
hosts; i.e. sheep, cattle and goats were present, which contributed to the high number of cases
reported.
Reports revealed that the circulating RVFV during 2008 and 2009 grouped within Lineage C
viruses, similar to viruses that caused an outbreak in African buffaloes (Syncerus caffer) in the
Kruger National Park in 1999 (Grobbelaar et al., 2011). A virus associated with Lineage H
caused the outbreaks in 2010 and 2011 (Grobbelaar et al., 2011). During the 2010 epidemic,
a virus with similar sequence identity corresponding to Lineage H was co-circulating in the
neighbouring country Namibia (Monaco et al., 2013).
Figure 1.2: Summary of animal and human cases reported during RVF outbreaks experienced in South
Africa during the period 2008 to 2011 (National Institute for Communicable Diseases, 2012; Pienaar
and Thompson, 2013).
0
2000
4000
6000
8000
10000
12000
14000
16000
2008 2009 2010 2011
Nu
mb
er o
f ca
ses
repo
rte
d
Years
Cases of Rift Valley fever outbreaks in South Africa during the period 2008 to 2011
Animal cases reported
Animal deaths reported
Human cases reported
8
1.4 RISK FACTORS ASSOCIATED WITH THE SPREAD OF RVF
1.4.1 Water borne risk factors
Rift Valley fever occurrence typically follows periods of unusually widespread and heavy
rainfall. Heavy rainfall is associated with flooding and increase in the vegetation cover that
favours high vector density and vector amplification (Linthicum et al., 1985). During dry
seasons, dambo areas (low-lying areas of soil often located near rivers) dry out and leave
cracked surfaces that fill up with water during rainy seasons (Chevalier et al., 2011). These
areas are habitats of mosquito vectors. Above normal and persistent rainfall cause the dambo
areas to flood, and this increases the hatching of infected mosquito eggs that were lying
dormant in the soil. These infected eggs produce new generations of infected mosquito
females that transmit RVFV to nearby livestock and wildlife animals (Linthicum et al., 1985).
Large shallow wetlands that are created by floods are also suitable for mosquito breeding.
Furthermore, the construction of dams also provides breeding sites for mosquito vectors, while
the presence of susceptible breeds along the systems, serve as amplifying hosts (Jupp et al.,
2002; Pepin et al., 2010).
During heavy rainfall, dams flood and increase the spread of the disease (Barnard and Botha,
1977; Gerdes, 2004), as was experienced during the construction of the Aswan dam in Egypt
in 1977 (Meegan, 1979). The outbreak in Sudan originated in the White Nile State, where the
Nile River (with a wide basin) floods annually during rainy seasons (Himeidan et al., 2014).
The second outbreak experienced in South Africa in 2009 was associated with irrigation
systems along the Orange River at the border of Namibia; while the outbreaks in Madagascar
in 2008-2009 were also associated with water systems used as resources for irrigation
(Nicolas et al., 2013; Métras et al., 2015).
Environmental factors, such as the type of soil, is also associated with outbreaks of RVF.
During heavy rainfall, clay and loam soil retain water for long periods of time, which renders
this condition suitable for breeding and survival of mosquito vectors (Himeidan et al., 2014;
Baba et al., 2016).
Furthermore, infected mosquito eggs can survive for several years in the soil. Once the
conditions are favourable (during rainy seasons), they hatch and give rise to new generations
of infected mosquitoes, which start a new outbreak (Linthicum et al., 1985; Chevalier et al.,
2011).
9
1.4.2 The role of wildlife and subclinically infected animals, in the
epidemiology of the disease
Studies have shown that many wild animals [including black rhino (Diceros bicornis), African
buffalo, kudu (Tragelaphus strepsiceros), impala (Aepyceros melampus), African elephant
(Loxodonta) and waterbuck] are seropositive for neutralizing antibodies specific to RVFV
during inter-epidemic periods (Evans et al., 2008; LaBeaud et al., 2011; Fafetine et al., 2013).
This is an indication that these animals serve as RVFV reservoirs that may undergo mild or
asymptomatic infections or maintain the virus at low levels (Olive et al., 2012). In another
study, high levels of RVFV antibodies were reported in black rhinos, buffalos, impala and
waterbucks from different species of wildlife collected from Kenya during the 1999-2005 inter-
epidemic periods (Evans et al., 2008). Circulation of RVFV among wild ruminants, especially
African buffaloes and some small ruminants, may lead to dead-end infections (Olive et al.,
2012).
1.4.3 Risk factors during outbreaks
Movement of infected animals during an outbreak is a major risk factor for translocation of
RVF. Outbreaks in Saudi Arabia and Yemen in 2000 were thought to have been the result of
importation of animals from the Horn of Africa, which is similar to the outbreaks in Egypt in
1977 (Gad et al., 1987). Importation of wild animals from infected areas can also be a possible
means of introduction of the disease to an unaffected area (Olive et al., 2012). During an
outbreak, the consumption of raw milk and meat that is not properly cooked may result in the
spread of the disease to humans (Anyangu et al., 2010).
Human cases reported in the first outbreaks in South Africa, were due to contact with sick
animals or animal materials (Gear et al., 1955). This is also a major problem in some rural
areas as most cattle, sheep, goats and camels stay close to their owners, and if they are
infected, their owners may get infected from their saliva, nasal discharges and other materials
(Seufi and Galal, 2010). Likewise, caring for animals during birth and coming into contact with
the aborted animal foetus have become a major risk factor during outbreaks. Aborted animal
foetuses contain high quantities of virus; thus, they need to be handled with extreme care (with
personal protective equipment) to prevent the risk of infection from blood splash and aerosols,
and should be destroyed by buried or burnt their carcasses (Anyangu et al., 2010).
10
1.5 CONTROL OF RIFT VALLEY FEVER
1.5.1 Vaccination of animals
Vaccination of livestock has been and continues to be the most effective method of protecting
livestock against diseases. There are two types of vaccines used for the control of RVF: live
attenuated and inactivated vaccines. The most commonly used live RVF vaccine; is the
Smithburn. The Smithburn strain was isolated from mosquitoes in Uganda and has been used
throughout Africa and the Middle East (Ikegami and Makino, 2009; Dungu et al., 2013).
Although it provides lifelong immunity and is relatively cheap (less than 60 USD per 100ml),
the Smithburn vaccine causes abortions in ewes, cattle and goats and malformations in the
foetus of vaccinated and pregnant animals (Botros et al., 2006, Dungu et al., 2013).
Furthermore, the Smithburn vaccine has poor antibody responses in vaccinated cattle
(Barnard and Botha, 1977). Therefore, its use is not recommended in countries where RVFV
has not been introduced (Ikegami and Makino, 2009). The attenuated MP-12 vaccine,
obtained from a virulent Egyptian strain ZH548, did not cause abortions in ewes after 90-110
days of gestation and was reported to be non-pathogenic (Morrill et al., 1987). However, more
recently this vaccine was shown to cause abortions and teratogenesis (in new-born lambs)
during early stages of pregnancy in ewes during animal trials in South Africa (Hunter and
Bouloy, 2001). A developed recombinant candidate vaccine derived from MP-12, referred to
as arMP-12∆NSm21/384 that has shown to be safe and efficacious in sheep in Canada, has
been tested in goats from Tanzania wherein it elicited neutralising antibodies (Nyundo et al.,
2019).
A new vaccine called RVFV Clone 13 was registered in South Africa in 2008. The vaccine is
based on a virus isolated from a human case of RVF in the Central African Republic, which
has a large deletion (about 70%) of nucleotides in the NSs gene (Muller et al., 1995).
Subsequently, the safety and efficacy of the vaccine was evaluated in both sheep and cattle,
and neither abortion nor teratogenic effects in offspring were observed (Dungu et al., 2010,
von Teichman et al., 2011). The Clone 13 vaccine was used to control the disease during the
2009 – 2010 RVF outbreaks in South Africa, Namibia, Botswana and other countries
(Kortekaas et al., 2011).
A licenced formalin-inactivated vaccine, which is a derivative of the Smithburn vaccine, is
biologically safe and poses no risk of reversion to virulence. However, it has poor immunity in
cattle and requires multiple inoculations and regular boosters in order to maintain effective
11
immunity (Barnard and Botha, 1977; Morrill et al., 1991; Hunter et al., 2002). This annual
revaccination prevents its use in endemic areas (Alhaj, 2016).
Viral vectors such as lumpy skin disease virus, alphavirus, baculovirus and virus-like particles
remain promising approaches to control RVF (Wallace et al., 2006; Liu et al., 2008; Heise et
al., 2009). The vaccine construct, ChAdOx1 RVF, is based on a replication-deficient simian
adenovirus vector (ChAdOx1) encoding the RVFV Gn and Gc glycoproteins, is still undergoing
further developments in livestock trials and humans (Stedman et al., 2019). This candidate
vaccine has shown to be safe to use in cattle, camels, pregnant sheep and goats (Warimwe
et al., 2016; Stedman et al., 2019). Animal vaccination during the time of an outbreak should
be done cautiously, avoiding the reuse of needles that can increase the spread of the disease
(FAO, 2002).
Currently, there is no safe vaccine available for human use however, TSI-GSD 200, a formalin-
inactivated vaccine derived from RVFV vaccine NDBR-103 (Randall et al., 1962), is a safe
vaccine candidate for human use (Pittman et al., 1999; Faburay et al., 2017). The drawback
of this vaccine is that it is expensive and difficult to produce. In addition, for maximum
immunity, follow-up booster administrations are required (Bouloy and Flick, 2009; Ikegami and
Makino, 2009). The MP-12 as a human vaccine, is still under development. Clinical trials in
humans demonstrated that its use induces neutralizing antibodies with a single dose for at
least several years (n=5). Although a single dose of MP-12 has proved to elicit long term
immunity in humans, further assessment of its safety in healthy, immunosuppressed human
individuals, pregnant women and children is still required (Ikegami, 2017).
1.5.2 Surveillance and Prevention
The occurrence of RVF is unpredictable; therefore, surveillance to monitor circulation of the
virus should be encouraged even in unaffected areas. Surveillance may be done 2 to 4 times
a year and any suspicious illness should be reported and investigated. In some cases, where
the level of circulating virus in animals is low and cannot be detected, regular reporting of the
disease (passive surveillance) is not easy. Therefore, it is advisable that surveillance is
focused on vectors and serology of susceptible ruminants (Corso et al., 2008). In high risk
areas, laboratories are required to provide information of the disease to authorities. This type
of surveillance (active) will provide an estimation of the disease frequency and will help in
restraining the outbreaks of RVF by using vaccines or put other control measures in place
(Lichoti et al., 2014).
12
Public and farmer awareness/education programmes and campaigns educating people on the
nature of the disease, consequences and description of benefits arising from disease
prevention should be implemented. Adoption of appropriate protective measures when
engaging in activities such as slaughtering and butchering should be emphasized and possible
contact with mosquitoes and sick animals should be avoided. Consumption and handling of
uncooked or undercooked animal products such as milk and meat should be avoided (Seufi
and Galal, 2010). Clothes with long sleeves should be worn, and insect repellents be applied
to prevent contracting RVF through the bite of mosquitoes (Schulz, 1951; Centres for Disease
Control and Prevention, 2000).
Since mosquitoes are the most common way that RVF can spreads, eradication of their
breeding sites will reduce the spread of the disease (Kasye et al., 2016). Since these sites are
known to be on or near edges of a river, dams and other waterways, managing these sites by
using insecticides will destroy mosquito eggs lying dormant, kill larvae and some adult
mosquitoes (Lernout et al., 2013).
Movement of humans or animals can introduce the disease into areas that were previously
free from the disease. Therefore, during disease outbreaks, these movements should be
controlled to prevent infected animals from moving to unaffected areas (Chevalier et al., 2010).
Outbreaks of RVF in Saudi Arabia and Egypt were caused by the importation of animals from
Kenya and Sudan, respectively (Hassan et al., 2011; Kamal, 2011). The recent RVF outbreak
in Mayotte was the result of illegal animal movements, the presence of susceptible animals
and favourable environment for mosquito vectors (WHO, 2019).
1.5.3 Diagnostic methods
Laboratory diagnosis of RVF is based on many techniques. Appropriate samples for laboratory
diagnosis include liver, spleen, brain, aborted foetuses, serum or blood (OIE, 2019). The
following sections discuss the various laboratory diagnostic procedures or approaches
commonly used.
Virus isolation
Virus isolation can be done from specimens such as liver, spleen, kidney and blood (in
heparin). Various cell cultures including African green monkey kidney [Vero, (CCL-81, ATCC)],
baby hamster kidney [BHK-21 (CCL-10, ATCC)], chicken embryo reticulum [CRL, (CRL-
12203, ATCC)] and AP61 mosquito cells (CVCL-2362, ATCC), are used for in vitro RVFV
isolation (OIE, 2019). Cells infected with the virus show clear cytopathic effect (CPE) after 2-
13
5 days post infection. Although the method is sensitive and specific, further tests confirming
the presence of the virus are required. Virus isolation also involves use of live virus, therefore
requires an adequate biosafety facility.
Histopathology and immunohistochemistry
Diagnosis of RVF can be done from liver samples collected from dead animals or aborted
foetus. Examination of infected liver samples using microscopy may indicate characteristic
RVF liver lesions (Coetzer, 1982; Odendaal et al., 2019). The RVF viral antigens have aslo
been identified in infected tissue samples using the antibodies against RVFV (Dodd et al.,
2014; Wichgers Schereur et al., 2016).
Electron microscopy
Electron microscopy can be used to confirm and characterize the morphology of the virus. The
microscopic technique is reliable and the process can take at least 24 hours upon receipt of
the sample; but it is expensive and highly skilled personnel are required (Goldsmith and Miller,
2009).
Serological methods
Enzyme-linked immunosorbent assays (ELISA) and serum neutralization tests (SNT) are the
most reliable and most often used serological methods to detect antibodies against RVFV in
serum (Nicklasson et al., 1984; Zaki et al., 2006). The SNT is highly specific and can be
applied to blood from any species. Although regarded as the gold standard and prescribed for
international trade (OIE, 2019), the virus neutralization test (VNT) method is laborious,
expensive and involves use of live virus requiring a biosafety facility (Pepin et al., 2010).
There are different types of ELISA for RVF, including indirect IgG (Paweska et al., 2003), Ig-
sandwich and IgM capture ELISA (Paweska et al., 2005). The advantages of these methods
are that they are rapid, specific, sensitive and inexpensive. Besides the fact that the sandwich
ELISA for antigen detection (sAg-ELISA) is safe, it is suitable for use with large numbers of
samples and therefore useful for surveillance and diagnosis in endemic areas (Jansen van
Vuren and Paweska, 2009). Furthermore, the various approaches of ELISAs that are
developed have the potential to replace traditional diagnostic methods that pose health risks
(Pepin et al., 2010).
Classical methods such as haemagglutination inhibition (HAI), complement fixation test,
immunofluorescence (IF) and agar gel immune diffusion (AGID) have also been used (OIE,
2019). Disadvantages of these techniques include cross-reactions between RVF viruses and
other phleboviruses such as sandfly fever sicilian virus (Pepin et al., 2010), and pose health
14
threats to laboratory personnel (McIntosh et al., 1980a). Furthermore, the methods are less
sensitive and time-consuming (Kendall et al., 1999).
Molecular methods
There are two types of molecular techniques used to detect viral genomes in specimens:
nucleic acid probes for hybridization and amplification methods. Hybridization processes that
required labelled DNA/RNA segments serving as probes, or involving dot blot assays, are not
in general use anymore (Cobo, 2012).
Highly sensitive PCR methods for detecting viral nucleic acid in tissues and blood samples
have been reported. The methods include quantitative real-time PCR (RT-PCR) (Garcia et al.,
2001; Sall et al., 2002) and conventional reverse transcriptase PCR (Drosten et al., 2002; Bird
et al., 2007). Another method, called reverse transcription loop-mediated isothermal
amplification (RT-LAMP), has been developed and validated for RVFV RNA amplification
(Peyrefitte et al., 2008). The latter technique is efficient, fast and inexpensive (Le Roux et al.,
2009). A quantitative reverse transcribed PCR (qRT- PCR) is also used to detect and quantify
the amount of viral RNA present in a sample (Njenga et al., 2009).
Sequencing provides detailed information about the origin of a pathogen. Genetic information
on viruses can be obtained through nucleotide sequencing that can be done using Sanger
sequencing and Next Generation Sequencing (NGS). Platforms, including NGS, 454/Roche
and Illumina/Solexa, which are broadly applied to metagenomics, are still used, even though
Sanger sequencing, with its low error rate, long read length and large insert size, is still
considered the gold standard for sequencing (Thomas et al., 2012; Mokili et al., 2012; Smits
and Osterhaus, 2013). Sequencing generates genetic data that provide insights into disease
pathogenesis and therapeutic strategies (Boyd, 2013). The challenges faced with sequencing
as a diagnostic tool includes expensive equipment, processing and interpretation of results by
trained personnel and storage of the amount of data generated. The use of NGS technologies
as a routine application requires a further decrease in costs and run times (Prachayangprecha
et al., 2014).
A new prototype called RVF lateral flow test (LFT) or immune-chromatographic strip was
developed and evaluated for rapid detection of RVF in the field at the site of a suspected
outbreak (Cȇtre-Sossah et al., 2019). It uses monoclonal antibodies against the nucleoprotein
of RVFV to bind antigens captured by immobilized membrane and form a red band indicating
the presence of RVFV. This RVF LFT is a promising diagnostic tool that is rapid, inexpensive
and simpler to use and it provides immediate results which are visible to the naked eye (Cȇtre-
Sossah et al., 2019).

15
1.6 PREDICTION OF RVF DISEASE OUTBREAKS AND CLIMATE MODELS
Rift Valley fever outbreaks in East Africa have been associated with periods of heavy rainfall.
Most of these outbreaks are associated with El Nino Southern Oscillation (ENSO), which
warms the eastern Pacific and western Indian oceans. This causes a change in ocean
temperatures, which is accompanied by changes in rainfall patterns (Anyamba et al., 2002).
Heavy rainfall boosts food supplies, elevates rodent populations and creates appropriate
conditions for mosquito breeding and propagation, thereby fascilitating increased spread of
diseases. Prediction models used to predict RVF outbreaks are based on several satellite-
derived measurements (Linthicum et al., 1999). These include normalized difference
vegetation index (NDVI), Sea Surface Temperatures (SST), Southern Oscillation Index (SOI)
and rainfall (Linthicum et al., 1999, Anyamba et al., 2009, Anyamba et al., 2010). Through the
use of Normalized Difference Vegetation Index (NDVI) measurement, the conditions suitable
for the earliest stages in RVF outbreaks have been detected in East Africa (Linthicum et al.,
1999) and this rainfall indicator was shown to correlate with RVF outbreaks in identified
regions (Nderitu et al., 2011). The NDVI data is available the same day and provides
confirmation of predicted rainfall events with sea surface temperatures (Linthicum et al., 1999).
The model used to predict the occurrence of RVF may be efficient in the Horn and East Africa,
but needs to be adjusted for other countries such as Madagascar and Zambia. Reported
cases of RVF in Madagascar in 2008 and 2009 were in areas that fall outside the endemic
RVF areas predicted by the model (Anyamba et al., 2002; Andriamandimby et al., 2010).
Regular and consistent heavy rainfalls lead to regular and consistent low-level activity of RVF.
Because the methods are based on elevated RVF activity, in countries that receive regular
and consistent rainfalls, the detection of anomalous vegetation conditions using these models
may be problematic (Anyamba et al., 2002). Methods that use NDVI were unable to predict
areas in South Africa that would be affected by RVF in 2010 and 2011. This might suggest
that the difference in environmental and RVF dynamics between eastern and southern Africa
also exist within South Africa (Glancey et al., 2015).
1.7 HOST RANGE
Although the RVFV infects many animal species including humans, it has been noted that not
all animals are equally susceptible to infections. Daubney et al. (1931) reported that RVF is
more prevalent in livestock species, such as sheep, cattle and goats, with sheep being more

16
susceptible than cattle or goats. This susceptibility has been seen in naturally infected sheep
and proven in experimentally infected sheep (Daubney et al., 1931; Easterday, 1965).
Furthermore, during outbreaks of RVF in South Africa in 1951, both sheep and cattle aborted
(Gear et al., 1955; Easterday, 1965). Again, young animals such as lambs, calves and new–
born kids are most susceptible to the disease, with the mortality rate being very high (100%)
in lambs as compared to calves and kids. However, calves usually die within 24 hours of
infection (Gerdes, 2004).
Experimentally inoculated pigs did not show any clinical signs, but antibodies against RVFV
were detected in sera of pigs, suggesting that pigs may act as reservoir hosts for RVFV
(Daubney et al., 1931; Easterday, 1965, Youssef, 2009). Davies and Karstad (1981) noticed
that during outbreaks of the disease when sheep and cattle abort, camels also abort without
showing any clinical signs. Antibodies have also been detected in camels from Kenya (Scott,
1963). Other animal species that include monkeys, domestic cats (Felis catus) and dogs
(Carnivora) have demonstrated susceptibility to RVFV by subcutaneous, intraperitoneal and
respiratory routes during experimental infections (Findlay, 1932; Davies et al., 1972). Rift
Valley fever viruses have also been isolated from mosquitoes in an area where a dead buffalo
and a sick buffalo calf were observed (Smithburn et al., 1948). However, birds, amphibians
and reptiles are not susceptible to the virus (Ikegami and Makino, 2011).
The host range of RVF has also been tested by experimental inoculation of different species.
Among the species inoculated gerbil (Meriones unguiculatus), rhesus monkeys (Macaca
mulatta) and baboons (Papio anubis) have proven to be highly susceptible to RVF (Easterday,
1965; Ikegami and Makino, 2011). Hamsters are the most susceptible rodents with a mortality
rate of about 100% (Easterday and Murphy, 1963). A high mortality rate among rats was also
reported during the first outbreak of RVF in Kenya (Daubney and Hudson, 1933).
Rift Valley fever virus has the capacity to infect and cause severe disease in humans
(Hoogstraal et al., 1979; Easterday, 1965; Meegan, 1981). During the first outbreak in Kenya
and in South Africa, every person engaged in herding sheep on the affected farms had been
ill for some days and complained of fever and severe muscular pains (Daubney and Hudson,
1933; Gear et al., 1955).

17
1.8 CLINICAL FEATURES OF THE DISEASE
1.8.1 Animals (sheep and cattle)
Although the disease signs are non-specific, there are specific signs to look for during or after
heavy prolonged rainfalls; these include sudden abortion in pregnant animals and dying of
lambs and kids together with disease in humans. Clinical signs vary depending on the age
and the health conditions of the animal. Sheep, cattle and goats are less susceptible than
new-born lambs, calves and kids (Swanepoel and Coetzer, 2004). Lambs and kids usually
develop high fevers of 40-42oC (Easterday, 1965) and may be too weak to suckle or to stand.
New-borns usually die within 36-40 hours after the onset of symptoms (Daubney et al., 1931).
Clinical signs in calves are the same as in lambs with occurrence of fever, weakness and
bloody diarrhoea with death occuring two to three days after infection (Coetzer, 1977;
Swanepoel, 1981). A small proportion of lambs and calves may develop jaundice. In pregnant
animals, abortion is the first sign of the disease and this may occur at any stage of pregnancy
because of infection of the foetus (Swanepoel and Coetzer, 2004). Abortion rate in sheep
range between 35-40% and pregnant ewes that aborted may die because of secondary
complications (Coetzer, 1977). The abortion rate seems higher compared to that in cattle (20-
30%). During the South African outbreak in 1951, most sheep were found dead in the morning
with no signs of illness observed the previous day (Gear et al., 1955). Infected cattle may
develop staring coats, refuses to eat and have a decreased in milk production (Daubney et
al., 1931).
The organs that show the greatest damage in infected animals such as sheep are the liver
and spleen with the liver being the most damaged organ (Daubney et al., 1931; Coetzer 1977;
Swanepoel and Coetzer, 2004). Liver lesions are the most common characteristics in affected
animals and these lesions depend on animal age and susceptibility of the animal (Findlay,
1932). Lesions are more severe in young animals than in older animals. In young lambs,
naturally or experimentally infected, liver lesions are constant (Easterday and Murphy, 1963).
The lesions extend throughout the liver in such a way that the organ loses its shape and
becomes congested (Daubney et al., 1931; Gear et al., 1955; Easterday, 1965). In severe
cases, liver necrosis may affect most of the tissue. The necrotic foci start as small white spots
of up to 1 mm in diameter and are distributed evenly throughout the whole organ (Daubney et
al., 1931; Coetzer, 1982; Odendaal et al., 2019). The affected area may turn yellowish. In adult
sheep the liver lesion is different from that of the lamb in that it has red mottled appearance
and the necrotic foci are well-defined and easily recognizable (Daubney et al., 1931).
18
1.8.2 Humans
The virus causes different disease symptoms in humans. Some people may not show any
signs at first while others may have fever as the first sign. The time from infection to visible
symptoms varies from 2-6 days (Ikegami and Makino, 2011). At the start of illness, affected
people experience fever, physical weakness, back pain and dizziness. Patients experienced
the same symptoms during the South African outbreak in 1953 (Gear et al., 1955). Headache,
backache and muscular pains were also experienced as clinical symptoms of RVF. In some
cases fatigue, loss of appetite, vomiting, neck stiffness and bodily unease accompany these
symptoms. Although most infected people recover within 4 to 7 days, some patients take
weeks to recover (Easterday, 1965) and a small percentage (8-10%) may develop
complications including haemorrhagic fever, neurological disorder and loss of vision (Ikegami
and Makino, 2011; Pepin, 2010). In less than 1% of the patients, death may occur within 3-6
days after the development of haemorrhagic fever. Although the fatality rate of the
haemorrhagic fever varies between epidemics, the overall documented fatalities have been
less than 1%. Mild disease in humans can be resolved spontaneously within 2 weeks with
neither complications nor death (WHO, 2010).
1.9 TRANSMISSION OF THE VIRUS
Rift Valley fever virus is primarily transmitted by a broad range of mosquito species belonging
to the genera Aedes, Anopheles, Culex, Eretmapoites, Mansonia and Coquillettidia with the
main vectors Aedes (Aedimorphus) vexans arabiensis and Culex poicilipes (Diptera:
Culicidae) (Smithburn et al., 1948; Steyn and Schulz, 1955; Davies, 1975; McIntosh et al.,
1980b; Logan et al., 1991). Sand flies (Phlebotominae) could also serve as vectors for RVFV
(Hock et al., 1984; Turell and Perkins, 1990).
Infected female mosquitoes of Aedes species transfer the virus directly to their offspring
through eggs and when eggs hatch, they produce a new generation of infected mosquitoes
(Linthicum et al., 1985). Infected eggs can survive for long periods in dry conditions and hatch
after showers. Transmission of the disease from animal to animal can occur by vertical
transmission from pregnant animals to their foetus and by mechanical transmission from
repeated use of contaminated needles during herd vaccination. The virus can also be spread
by aerosols and enter the skin through abrasions (FAO, 2002).
19
Humans can become infected through the bite of infected mosquitoes. However, this happens
rarely and the majority of infections are through direct contact with infected body fluids, blood,
tissues or products of aborted animals and during the slaughter of infected animals (Njenga
et al., 2009). The virus can also infect humans by entering through wounds or broken skin
(Gear et al., 1955) and inhalation of aerosols produced through slaughtering of infected
animals (Bouloy and Flick, 2009). People at risk are farmers, shepherds, abattoir workers,
veterinarians and families who shelter animals (Bouloy and Flick, 2009). Laboratory
staff/technicians are at risk of infection by inhalation of aerosols from samples to be tested.
During outbreaks, ingestion of raw milk and meat that has not been properly cooked also
contributes to infection (Sissoko et al., 2009; Anyangu et al., 2010).
Although no human-to-human infection has been reported, vertical transmission is possible in
pregnant women (Adam and Karsany, 2008). Studies have found that pregnant women
infected with RVFV were significantly associated with miscarriages (Baudin et al., 2016). In
another case, a pregnant woman who was ill, delivered a child that was IgM positive for RVFV.
The infant developed severe haemorrhagic symptoms that led to the child’s death within days
of admission (Arishi et al., 2006).
Rift Valley fever virus may be carried from one country to another by movement of infected
hosts (domestic animals) or infected vectors (mosquitoes) resulting in the disease establishing
itself in areas previously free from the virus (Chevalier et al., 2010). The RVF virus can also
be introduced directly to ruminants or to wild animals and persist at low levels in the
environment for a very long period after the epizootic/epidemic has ended. The virus will then
emerge at a later stage when conditions are favourable to cause outbreaks (Linthicum et al.,
1985; Fafetine et al., 2013).
The detection of RVF viral RNA in infected human urine and semen may reveal another mode
of transmission of the disease, which is through sexual contact but this still needs to be proven
(Hanecke et al., 2016). Insemination by bulls vaccinated with attenuated vaccines may pose
danger to inseminated cows as the virus has been detected in semen three weeks after
vaccination. Transmission of RVFV through semen has not been proven (Kamal, 2011).
Findings of the studies by Evans et al. (2007) and Lichoti et al. (2014) in Kenya and East Africa
respectively suggested the presence of RVFV cycling during inter-epidemic periods (IEPs)
involving continuous but low-level infection of livestock, wildlife and humans. The maintained
virus is transmitted by mosquito vectors in ecosystems that are characterised by certain soil
types vertisols, solonerts and nitisols and low annual rainfall during non-El-Nino climatic
seasons (Njenga and Bett, 2019).
20
1.10 SURVIVAL OF RVFV
In the environment
Aedes mcintoshi infected with RVFV lay drought resistant eggs. The virus persists in these
eggs for some years during dry conditions and as soon as the conditions become favourable
(i.e. during heavy rainfalls), the eggs hatch and newly infected mosquitoes appear. The virus
can survive in mosquito eggs laid in soil for 5-15 years (Linthicum et al., 1999; Baba et al.,
2016).
In wildlife
Antibodies against RVFV have been detected in wild animals (Evans et al., 2008). Studies
have indicated that RVFV has been circulating among apparently healthy ruminants, wildlife
and humans in Mayotte for several years (Lernout et al., 2013). The virus has also been
detected in blood of healthy and naturally infected camels in Egypt and Sudan (Imam et al.,
1979). Detection of RVF antibodies in areas where the disease has never been reported
(Easterday, 1965) is a confirmation that the virus can circulate at a very low level without
clinical signs being observed in infected animals (Lichoti et al., 2014; OIE, 2019). Antibodies
against RVFV have been detected in buffalo sera collected during inter-epidemic periods in
the Kruger National Park and Hluhluwe-iMfolozi Park providing evidence that RVFV
transmission occurs in African buffaloes (Fafetine et al., 2013; Fagbo et al., 2014).
In animal products and by-products
Blood of infected animals have a high concentration of virus, but as soon as the animal is
slaughtered, the virus concentration decreases (Pepin et al., 2010). The drop in pH (to less
than 6.8) during meat processing rapidly destroys the virus (Gerdes, 2004; Ahmed et al.,
2011). The virus is susceptible to acidic environments but can survive for up to 3 months in
dried blood (FAO, 2001). Persistence of the virus in dead animal skins, wool, bones, faeces
and urine has not been demonstrated except when these products have been contaminated
with blood (OIE, 2019; Pepin et al., 2010).
Low concentrations of virus have been detected in milk (but inactivated by pasteurization) and
in body fluids of domestic animals during the epidemic in Saudi Arabia (Easterday, 1965; AI-
Hazmi et al., 2003; Sissoko et al., 2009).
The virus can be destroyed by strong sunlight, lipid solvents and disinfectant solution
containing sodium hypochlorite, chloroform, ether or formalin and acetic acid but can be
maintained for many years when stored in temperatures below 0oC (FAO, 2001).
21
1.11 AETIOLOGY
1.11.1 Structure of the virus
Rift Valley fever virus belongs to the order Bunyavirales. Viruses in this order are grouped into
twelve different families: Fimoviridae, Arenaviridae, Cruliviridae, Hantaviridae, Nairoviridae,
Peribunyaviridae, Phasmaviridae, Phenuiviridae, Mypoviridae, Leishbuviridae,
Wupedeviridae and Tospoviridae (Abudurexiti et al., 2019). Several viruses of the family
Phenuiviridae, including RVFV, comprise major pathogens producing mild to severe diseases
in humans, animals and sometimes in both. The genus Phlebovirus consists of different
species including Rift Valley fever phlebovirus (e.g. RVFV), Sandfly fever Naples phlebovirus
(e.g. Toscana virus), Punta Toro phlebovirus (e.g. Punta Toro virus) and Uukuniemi
phlebovirus (e.g. Uukuniemi virus) (Abudurexiti et al., 2019).
Electron microscopic images of RVFV show a pleomorphic or spherical appearance, with a
diameter of 80 to 120 nm (Elliot, 1990; Liu et al., 2008; Pepin et al., 2010). The viral particle is
composed of a lipid bilayer and anchored glycoproteins Gn (also termed G2 and Gc (also
termed G1) (Bouloy and Weber, 2010) which, when examined under the electron microscope,
form spike-like projections facing outwards (Figure 1.3). The spikes are about 9 nm long and
embedded in a 7 nm lipid bilayer (Freiberg et al., 2008). Like in many other viruses, low pH
treatment changes viral surface projections from a tall (10-18 nm) to a flat (8 nm) appearance
(Ellis et al., 1988; Ӧverby et al., 2008). When RVF virions were examined by cryoelectron
microscopy, the viral envelope showed 720 heterodimers of Gn (54 kDa) and Gc (56 kDa)
forming 110 cylinder-shaped hexamers and 12 pentamers according to a T=12 icosahedral
lattice (Freiberg et al., 2008).
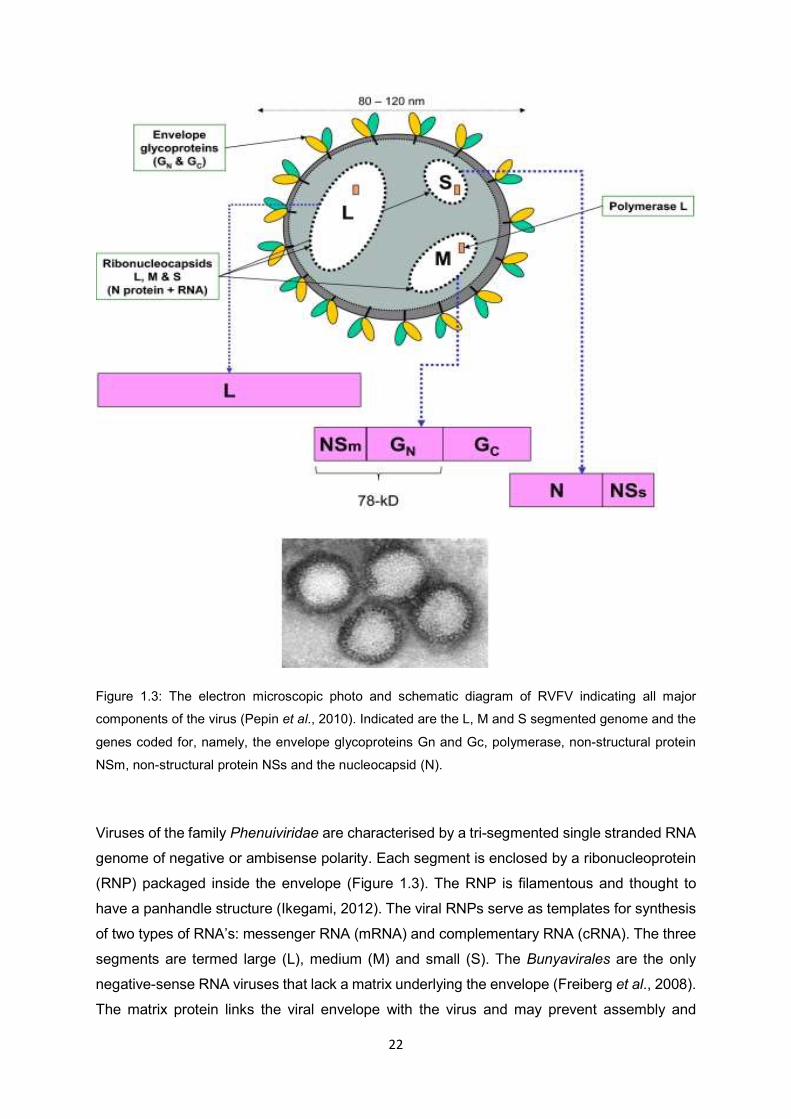
22
Figure 1.3: The electron microscopic photo and schematic diagram of RVFV indicating all major
components of the virus (Pepin et al., 2010). Indicated are the L, M and S segmented genome and the
genes coded for, namely, the envelope glycoproteins Gn and Gc, polymerase, non-structural protein
NSm, non-structural protein NSs and the nucleocapsid (N).
Viruses of the family Phenuiviridae are characterised by a tri-segmented single stranded RNA
genome of negative or ambisense polarity. Each segment is enclosed by a ribonucleoprotein
(RNP) packaged inside the envelope (Figure 1.3). The RNP is filamentous and thought to
have a panhandle structure (Ikegami, 2012). The viral RNPs serve as templates for synthesis
of two types of RNA’s: messenger RNA (mRNA) and complementary RNA (cRNA). The three
segments are termed large (L), medium (M) and small (S). The Bunyavirales are the only
negative-sense RNA viruses that lack a matrix underlying the envelope (Freiberg et al., 2008).
The matrix protein links the viral envelope with the virus and may prevent assembly and

23
stabilization of the virus (Elliot, 1990). In Phlebovirus, the Gn cytoplasmic tail function in place
of the matrix protein. It initiates the budding process and packaging of RNP into the virus
particles while the viral release is facilitated by the genomic RNA and the nucleocapsid
(Ӧverby et al., 2008; Piper et al., 2011).
1.11.2 Molecular biology of the virus
Large (L) segment- polymerase protein (6.4kb)
The L segment, which is approximately 6.4 kb in length, encodes the viral RNA-dependent
RNA polymerase (L-protein: 2087 amino acids) using the negative polarity. The polymerase
protein synthesizes two types of RNAs: mRNA and complementary RNA (cRNA) (Muller et
al., 1994). The cRNA is the full-length copy of the genome RNA. The protein is packaged
together with the genomic RNA segments inside the viral particle and is responsible for viral
transcription and replication (Liu et al., 2008).
Medium (M) segment – non-structural proteins and glycoproteins (3.8kb)
The M segment has an approximate length of 3.8 kb. This segment encodes five proteins: two
non-structural proteins (the 78 kDa also called NSm1 and the 14 kDa named NSm2), two
structural envelope glycoproteins (Gn, encoded by the amino-terminal of the protein and Gc,
encoded by the carboxy-terminal sequences), and the NSm-Gn polyprotein starting from the
nucleotide 135-2090 (Kakach et al., 1988; Kreher et al., 2014). The five proteins are encoded
in a single open reading frame using the negative polarity (Suzich et al., 1990; Gerrard and
Nichol, 2007). The entire mRNA has five-in frame (AUG) initiation codons, upstream of the Gn
and the Gc sequences (Bouloy and Flick, 2009). The first AUG codon initiates the synthesis
of a 78 kDa protein which is dispensable for virus replication (Won et al., 2006). The 78 kDa
consists of pre-Gn and Gn regions. The NSm proteins are not essential for viral multiplication,
packaging and assembly in cell culture, but play an accessory role in the maintenance of
RVFV in nature (Gerrard et al., 2007). The second AUG codon produces the NSm protein,
which is probably involved in pathogenesis (Bird et al., 2007). It suppresses virus-induced
apoptosis in the infected cell (Pepin et al., 2010).
Translation from the 3th and 4th codons results in a single precursor polyprotein which is co-
translationally cleaved by host proteases. Cleavage occurs when the polyprotein enters the
secretory system of the host cell to give rise to mature Gn and Gc glycoproteins (Collett et al.,
1985, Gerrard and Nichol, 2007). The length of both Gn and Gc are the same in all RVFV
isolates; and the N-glycosylation sites are also conserved in all the 33 isolates analysed by

24
Bird et al. (2007). The glycoproteins play an important role in penetration of the virus during
infection (Whitehouse, 2004). They mediate entry of the virus through the unidentified receptor
on the host cell (Pepin et al., 2010) and this entry is activated by low pH predicted to employ
a class II fusion mechanism (Rönkä et al., 1995; Garry and Garry, 2004; Filone et al., 2006).
Small (S) segment – nucleocapsid/nucleoprotein and non-structural protein (1.6kb)
The S segment is approximately 1.6 kb in length and encodes two proteins: the nucleocapsid
protein (NP) in the genomic sense and the non-structural (NSs) protein in the anti-genomic
sense (Bird et al., 2007; Bouloy and Weber, 2010). NSs is a major virulence factor of RVFV.
The functions of the NSs (non-structural protein encoded by the S segment) include
counteracting the host cell interferon response (Bouloy et al., 2001; Pepin et al., 2010). Non-
structural proteins of the S segment form filamentous structure in the nucleus of infected cells
and are highly conserved (Swanepoel and Blackburn, 1977). NSs is also not essential for
virus replication hence the name accessory protein. An intergenic sequence of 82 nucleotides
consisting of unique poly C or poly G tracts divides the NSs and NP (Giorgi et al., 1991). The
NP protein has a role in the assembly process. It encapsulates the copy RNA to form
ribonucleocapsid and is required for transcription and RNA replication (Ikegami et al., 2007).
1.11.3 Replication of the virus
Attachment and entry
The virus uses a host receptor for attachment and entry into their hosts. Cell surface receptors
provide functions essential for productive infection. They are used to activate specific
signalling pathways facilitating viral entry (Grove and Marsh, 2011).
Viral glycoproteins (Gn and Gc) which are the most exposed components of the virus are
responsible for virus attachment and penetration of the host cell (Överby et al., 2008; Lozach
et al., 2010). Both processes (attachment and entry) happen when the viral envelope fuses
with the cellular membrane to deliver the genome segments into the cytoplasm. Bunyaviruses
use many receptors to target and infect many tissues of different species. A few possible
receptors documented are summarized in Figure 1.4 (Spiegel et al., 2016). These are dendritic
cells (DC) specific intercellular adhesion molecule 3-grabbing Nonitegrin (SIGN), nonmuscule
myosin heavy chain 11A (NMHC-11A) and a ribonuclease kappa (RNASEK). Once the virus
attaches to a receptor molecule, the virion is internalized by endocytosis. It has been
suggested that after endocytosis the acidic environment of endosomal compartments
activates virus fusion (Garry and Garry, 2004). Exposure of the viral particle to acidic pH
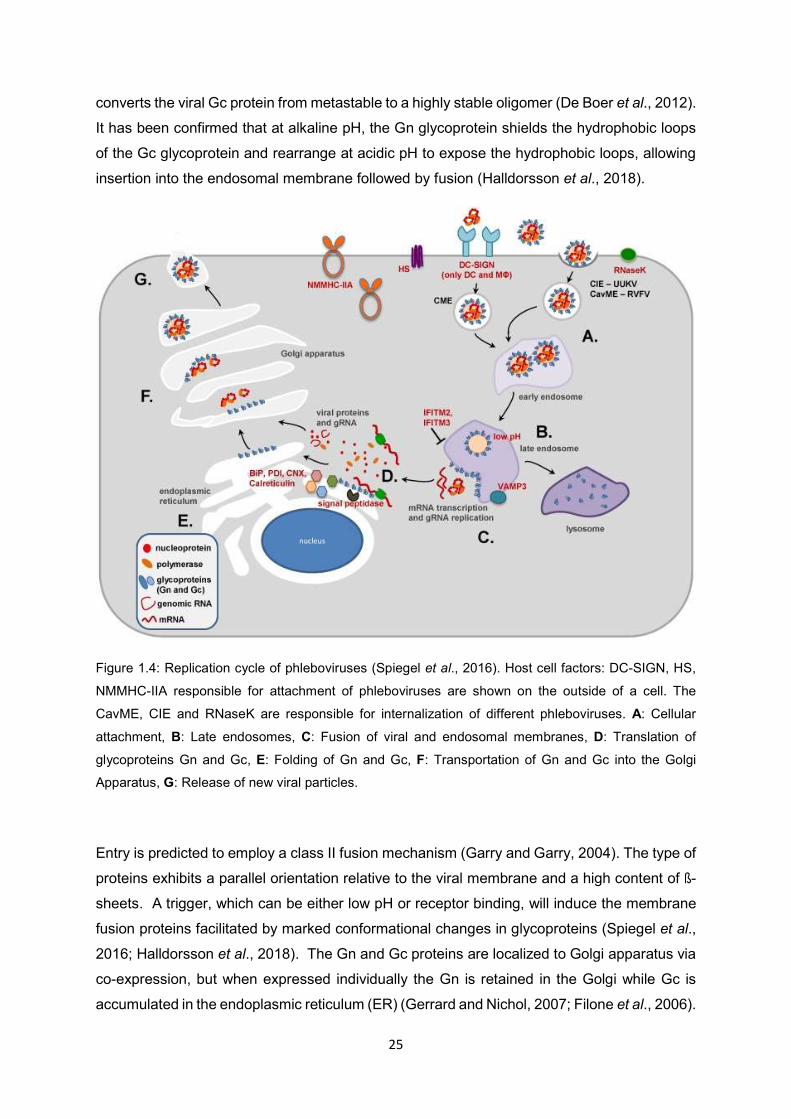
25
converts the viral Gc protein from metastable to a highly stable oligomer (De Boer et al., 2012).
It has been confirmed that at alkaline pH, the Gn glycoprotein shields the hydrophobic loops
of the Gc glycoprotein and rearrange at acidic pH to expose the hydrophobic loops, allowing
insertion into the endosomal membrane followed by fusion (Halldorsson et al., 2018).
Figure 1.4: Replication cycle of phleboviruses (Spiegel et al., 2016). Host cell factors: DC-SIGN, HS,
NMMHC-IIA responsible for attachment of phleboviruses are shown on the outside of a cell. The
CavME, CIE and RNaseK are responsible for internalization of different phleboviruses. A: Cellular
attachment, B: Late endosomes, C: Fusion of viral and endosomal membranes, D: Translation of
glycoproteins Gn and Gc, E: Folding of Gn and Gc, F: Transportation of Gn and Gc into the Golgi
Apparatus, G: Release of new viral particles.
Entry is predicted to employ a class II fusion mechanism (Garry and Garry, 2004). The type of
proteins exhibits a parallel orientation relative to the viral membrane and a high content of ß-
sheets. A trigger, which can be either low pH or receptor binding, will induce the membrane
fusion proteins facilitated by marked conformational changes in glycoproteins (Spiegel et al.,
2016; Halldorsson et al., 2018). The Gn and Gc proteins are localized to Golgi apparatus via
co-expression, but when expressed individually the Gn is retained in the Golgi while Gc is
accumulated in the endoplasmic reticulum (ER) (Gerrard and Nichol, 2007; Filone et al., 2006).

26
Experiments have shown that when glycoproteins are overexpressed using an alphavirus
replicon vector, they become localised in the cell membrane where they induce cell-cell fusion
(Filone et al., 2006).
Heparan sulphate, a sulphated polysaccharide, which is present in mammalian cells and in
the extracellular matrix (Liu and Thorp, 2002; Parish, 2006; Sarrazin et al., 2011), has been
proven to facilitate RVF viral entry into the cell (De Boer et al., 2012). Many viruses may target
a sugar moiety that covers all eukaryotic cells as part of their strategy to infect cells. However,
dendritic cells (DC) which are present in the dermis are among the first cells to encounter the
incoming viruses (Lozach et al., 2010). These dermal DC express DC-specific intercellular
adhesion molecule 3-grabbing Nonitegrin (DC-SIGN), a C-type lectin that captures and
presents foreign antigens (Van Kooyk, 2008; Léger et al., 2016; Spiegel et al., 2016). Lozach
and co-workers (2011) reported virus binding and internalization of different phleboviruses
(UUKV, RVFV, Punta Toro virus and Toscana virus) using DC-SIGN-expressing cell systems
and concluded that DC-SIGN is an authentic receptor required by RVFV for both attachment
and endocytosis. It has been proposed that these phlebovirses use another C-type lectin DC-
SIGN related protein L-SIGN, as attachment to infect cells expressing the lectin ectopically
(Léger et al., 2016). Although the two lectins share 77% amino acid identity, they are
expressed on different cell types with DC-SIGN expressed on dendritic cells, certain tissue
macrophages and platelets, whereas L-SIGN is expressed on the endothelial cells of liver and
lymph node sinuses (Soilleux et al., 2000; Phoenix et al., 2016; Spiegel et al., 2016). Another
critical factor, nonmuscule myosin heavy chain 11A (NMHC-11A), has been shown to
contribute to severe fever with thrombocytopenia syndrome virus (SFTSV) (another member
of Bunyavirales) infection and the recombinant Gn is capable of binding this factor. This
indicates that Gn is more likely a receptor-binding protein for SFTSV (Sun et al., 2014; Wu et
al., 2017).
Not all cell lines susceptible to phlebovirus infection express the DC-SIGN, thus indicating that
these cells have other receptors used for entry (Spiegel et al., 2016). In addition to the
statement above, bunyaviruses also infect a large number of tissues that do not express the
lectin (Léger et al., 2016).
A mechanism independent of clathrin coats called clathrin-independent endocytosis is
involved in the uptake of UUKV virion, a phlebovirus related to RVFV and the process takes
minutes to occur (Lozach et al., 2010). Research has also shown that RVFV entry depends
on caveolin-1-mediated endocytosis (CavME) (Harmon et al., 2012) and a ribonuclease kappa
(RNASEK), which is required for the initial stages of internalization of diverse pH-dependent
viruses (Hackett et al., 2015).

27
Replication in the infected cell
After fusion of viral and endosomal membranes, the three segments are released into the
cytoplasm. Transcription and replication occur in the cytoplasm of infected cells and follows
mechanisms similar to those of viruses with negative single stranded RNA genomes (Elliot,
1990; Pepin et al., 2010). The ribonucleoproteins (RNPs) are templates for the synthesis of
the two types of RNAs (mRNA and genomic RNA), (Gauliard et al., 2006; Bouloy and Weber,
2010). The cRNA of the S segment associated with incoming virions serves as template for
the synthesis of NSs mRNA and is expressed immediately after the virus has entered the cell
(Schmaljohn and Hooper, 2001). During replication, nucleocapsid (N) monomers enclose the
viral genome and antigenome thereby protecting the viral RNA from degradation and
preventing the formation of double stranded RNA intermediate; a process that is proposed to
occur in the 5’ to 3’ direction (Raymond et al., 2012; Ellenbecker et al., 2014). Replication
process starts around 1 to 2 hours after infection and the process increases the amount of
viral mRNA and proteins. Reports indicate that in other bunyaviruses, RNP assemble into
virions by interacting with the cytoplasmic regions of the envelope glycoproteins at the Golgi
apparatus and this process is probably also happening during RVFV replication (Rusu et al.,
2012; Ferron et al., 2011). Although glycoproteins are expressed as a precursor polypeptide,
this polypeptide is co-translationally cleaved prior to maturation of the glycoproteins
(Wasmoen et al., 1988).
Assembly and release of the viral particle from the cell
The assembly process is initiated by recruitment of RdRp and encapsidated genome as a
complex to the Golgi apparatus (Piper et al., 2011). Viral particle assembly takes place in the
Golgi complex. The N protein interact with the Gn cytoplasmic tail and this interaction occurs
during budding thus triggering the release of the virion (Spiegel et al., 2016). Mature virus
particles are released to the plasma membrane where they are released through the process
of exocytosis (Spiegel et al., 2016).
1.12 VIRUS-RECEPTOR-HOST INTERACTIONS
All viruses must enter cells to initiate their replication. Understanding how pathogens attach to
host cells is of particular interest in studying infectious diseases. Pathogen proteins target
different host receptors involved in molecular trafficking to the cell membrane, uptake of

28
nutrients and other metabolites (Hackett et al., 2015). Characterization of host-pathogen
protein-protein interactions helps in understanding pathogen-pathogen interaction. In addition,
the identification of these proteins is important to understand how pathogens evade the
immune system of the host, their replication and how they persist within the organism (Huo et
al., 2015; Nicod et al., 2017).
There are few methods used to study these proteins:
(a) Co-immunoprecipitation
This method uses the same technique as immunoprecipitation except that during co-
immunoprecipitation an antibody against the known protein, usually called the bait is used to
target that protein in the entire cell lysate. The antibody forms an immune complex with its
target protein in the cell lysate and with several washes, bound proteins can be eluted and
analysed using Western blot and mass spectrometry (MS). The disadvantage of this technique
is that the specific immune-precipitated protein/s may be part of large complexes that will
require fractionation, followed by mass spectrometry to analyse their components and to
obtain antibodies of high specificity and avidity can be difficult (Xing et al., 2016; Avila et al.,
2015; Miernyk and Thelen, 2008). Furthermore, the interacting proteins may be lost during
stringent wash processes while non-stringent conditions might involve binding of more
proteins that are not true positives (Phizicky and Fields, 1995; Klockenbusch and Kast, 2010).
(b) Pull-down assay
The approach used in this assay is the same as the one used in co-immunoprecipitation
except that in the pull-down assay, a known protein fused to a tag is used to trap the interacting
protein in the cell lysate. The tagged protein is captured on an immobilized affinity resin by a
chemical specific for the tag. When the cell lysate containing putative prey proteins is
incubated with the resin, the resin traps the bait-prey complex. After several washes to remove
the unbound proteins, the complex is eluted and analysed by western blotting. The assay is
useful for both confirming protein-protein interaction identified using other techniques or to
identify an unknown protein interacting with the known protein (Berggard et al., 2007).
(c) Cross-linking
Another approach for determining protein-protein interaction is by applying a cross-linker
between proteins and side chains of amino acids in a chemical reaction (Hoffman et al., 2015).
This assay stabilises protein-protein interactions including very weak and transient
interactions in the presence of cross-linkers. The cross-linker is usually a molecule with two
29
reactive groups on either sides separated by a spacer (Lum and Cristea, 2016). The shortest
cross-linker that is used is formaldehyde with 2.3-2.7Å (Klockenbusch and Kast, 2010).
Formaldehyde, a simple, inexpensive cross-linker has been widely used to freeze the native
state of tissues and cells because of its high permeability towards cell membranes (Miernyk
and Thelen, 2008). Cross-linked proteins can be identified by mass spectrometry, which will
further reveal the peptide involved in the receptor interaction. The use of higher formaldehyde
concentrations (1%) may lead to a maximum number of captured proteins (Rappsilber, 2011;
Holding, 2015).
(d) Far-western blot
A molecular biological method derived from the technique of western blotting called far-
western is used to detect protein-protein interaction in vitro (Wu et al., 2007). The method is
specifically used to detect the interaction between protein of interest and unknown protein
immobilized on a solid membrane such as nitrocellulose. In far-western blotting, cell lysate
containing unknown (prey) proteins are separated on SDS PAGE, transferred to a membrane
and probed with a purified labelled known (bait) protein, no antibody is used. If there is an
interaction between the proteins, a protein complex will form and be detected directly (Wu et
al., 2007). Far-western blotting involves proteins that have denatured and have been allowed
to renature; allowing proteins to recover their secondary and tertiary structures (Machida and
Mayer, 2009). Unlike other assays, far-western blotting detects direct binding and if binding
involves a multiple protein, far-western blotting will allow the examination of interacting
proteins that form complexes between them (Walsh et al., 2012; Wu et al., 2007). The assay
can be used to either detect or confirm the interaction following pull-down or
immunoprecipitation assays (Wu et al., 2007).
(e) Fluorescence (Förster) Resonance Energy Transfer and Bioluminescence
Resonance Energy Transfer
Interacting molecules can transfer energy between each other by non-radiative dipole-dipole
interactions and if the acceptor is itself fluorescent, the process is called Fluorescence
(Förster) Resonance Energy Transfer (FRET) (Corry et al., 2005). If the reaction is
bioluminescent, it is called Bioluminescence Resonance Energy Transfer (BRET). Both FRET
and BRET can detect the proximity of fluorescently labelled molecules (Xu et al., 1999). The
techniques allow characterization of spatial organization and quantification of the interactions
in living cells (Auerbach et al., 2003). The two techniques are related except that during FRET
two fluorophores are used, one that absorbs exogenous excitation (the donor) and passes
energy to the other fluorophore (the acceptor). In BRET, the donor is a luciferase and in the
30
presence of a substrate it generates its own luminescence emission (Sun et al., 2016). The
disadvantage of the two techniques is that they require specialized equipment and expertise;
in addition, BRET requires the use of expensive luciferase (Xie et al., 2011).
(f) Yeast Two-Hybrid system
Another powerful tool used, is the yeast two-hybrid (Y2H) system (Fields and Song, 1989).
The Y2H system requires construction of two hybrids: a DNA binding domain fused to the
protein of interest (bait) and a transcription activation domain fused to an unknown protein
(prey). The two hybrids are expressed in a cell containing two or more reporter genes and if
bait protein and prey protein interact, this allows association of the DNA binding and activation
domains. This interaction results in expression of inducible reporter genes indicated by colour
change on plates with selective media (Phizicky and Fields, 1995; Causier and Davies, 2002).
The availability of bait protein clones and prey libraries can make Y2H system a relatively easy
and quick method for binding proteins (Mendez-Rios and Uetz, 2010).
The Y2H system allows protein interactions to take place inside a living yeast cell. This method
uses random libraries that can be made from either genomes or cDNA’s to identify the
unknown interacting protein. A genomic library is digested randomly, size selected, and the
resulting fragments are ligated in a prey vector. A cDNA library is made through reverse
transcription of mRNA collected from specific cell types or tissues (Rajapola and Uetz, 2011).
Nowadays, many human and tissue specific cDNA libraries are commercially available making
the system more advantageous. When compared with array screening, random libraries can
find more interactions because they include fragments that may interact while full-length
proteins may not (Koegl and Uetz, 2008). The method can be used to screen complex libraries
for interacting prey proteins using a bait protein. The interacting prey proteins are then
identified by sequencing. Because of the above advantages, Y2H was chosen as the method
for identifying protein-protein interactions in this study.
31
1.13 JUSTIFICATION
Rift Valley fever outbreaks are usually cyclical, occurring every 5-10 years in Africa. Although
only one serotype has been identified, differences in virulence and pathogenicity of the virus
have been observed. Rift Valley fever infects only certain animal species (e.g. young sheep)
and probably infects some animal species without the occurrence of recognizable symptoms
or clinical signs (e.g. domestic pigs) (Daubney et al., 1931; Youssef, 2009). In an infected
animal, the virus preferentially localizes to certain tissues, especially the liver, spleen and in
pregnant animals, the placenta (Swanepoel, 1981). The virus causes greater levels of damage
in these tissues leading to morbidity and in many instances causing death of the infected
animals (Swanepoel and Coetzer, 2004).
Problem statement
Although RVFV has only one serotype, differences in virulence and pathogenicity of the virus
have been observed. The casual factors of host/tissue tropism still need to be elucidated.
The overall aim of the research described herein, was to investigate potential genetic and
infection characteristics, as well as receptor preferences, that may lead to understanding
differences in virulence and pathogenicity between isolates. The studies utilized RVFV
isolates from recent outbreaks in South Africa that were isolated from different hosts and
tissues for genomic sequencing (Chapter 2). From these characterized isolates, the focus was
on selected field isolates from different hosts, but from the same tissue wherein, they were
compared based on growth curves, immunofluorescences and predicted protein structures.
Bioinformatic analysis of protein coding genes were performed to identify possible causes of
tropism (Chapter 3). The final study attempted to identify receptor molecules in BHK cells
using the Y2H system to differentiate potential tropism (Chapter 4).
32
1.14 THE STUDY OBJECTIVE
The main objective of the study was to characterise and understand the causal factors of host
tropism and its mechanism during RVFV infection.
1.14.1 Specific aims
CHAPTER 2: A comparative genome analysis of Rift Valley fever virus isolates from foci
of the disease outbreaks in South Africa in 2008-2010
1. Analysis of the complete genome sequences of RVFV collected over time from animal
samples at distinct foci of the outbreak, with emphasis on isolates from 2008 to 2010
outbreaks.
2. Identification of the reassortment of these isolates.
3. Determination of phylogenetic relationship of SA isolates in relation to previously
published genomes.
4. Selection of isolates for further characterization.
CHAPTER 3: Differentiation of virus isolates based on cell infectivity and genomic
parameters that could affect this
1. Determination of the time taken by RVFV to attach to host cells, during the cause of
infection.
2. Comparison and characterization of selected isolates based on the following:
(a) Sequence alignments (both nucleotides and amino acids)
(b) Status of RVFV infection in BHK cells
(c) Codon usage bias
(d) Molecular modelling
CHAPTER 4: Identification of potential host receptors using the yeast two-hybrid
system
1. Construction and evaluation of cDNA library (as prey for yeast two hybrid screening)
from BHK cells
2. Construction of bait plasmids in yeast
3. Expression, autoactivation and toxicity test on baits constructed
4. Yeast two-hybrid screening using the constructed prey and baits

33
CHAPTER 2: A COMPARATIVE GENOME ANALYSIS OF RIFT VALLEY FEVER VIRUS ISOLATES FROM FOCI OF THE DISEASE OUTBREAKS IN SOUTH AFRICA IN 2008-2010
Data/part of this chapter has been published: PloS Neglected Tropical Diseases 2019 March
21;13(3):e0006576 (Maluleke et al., 2019)
2.1 INTRODUCTION
Rift Valley fever is a mosquito-borne viral disease, which affects humans, sheep, cattle, goats
and buffaloes. The causative agent, RVFV belongs to the genus Phlebovirus in the family
Phenuiviridae of the order Bunyavirales (Abudurexiti et al., 2019). The disease is
characterized in livestock by an acute hepatitis, abortion storms and high mortality rates
particularly in young animals. In humans, it manifests as febrile illness, resulting in retinal
degeneration, severe encephalitis, haemorrhage and fatal hepatitis. Protection of animals
from the disease is through vaccination. However, there is currently no approved vaccine for
use in humans. The transmission of RVFV can be prevented by avoiding contact with infected
tissue and animals or by eliminating the mosquito vectors (Anyangu et al., 2010).
The RVF virus has been isolated in Africa from more than 30 mosquito species belonging to
at least six genera (Aedes, Culex, Anopheles, Eretmapoites, Mansonia and Coquillettidia). In
several mosquito species isolations were performed on both the insects as well as their eggs,
suggesting alternative modes of transmission (Linthicum et al., 1985; Turell et al., 1996). Eggs
from floodwater mosquitoes can remain viable for many years, hatching under conducive
climatic conditions associated with periods of high rainfall (Linthicum et al., 1985). The virus
has been isolated from unfed mosquitoes reared from eggs obtained during inter-epidemic
periods in Kenya (Linthicum et al., 1985) confirming the previous speculation by Alexander
(1957) in South Africa. This contributed to the cyclic outbreaks of RVF, which is enhanced by
changing climate and intensive farming systems creating conditions favorable to mosquito
breeding (Anyamba et al., 2009).
The disease is endemic in eastern and southern Africa, although outbreaks have been
reported in Egypt, Saudi Arabia, Yemen, Madagascar and Mauritania (Shoemaker et al., 2002;
Morvan et al., 1992). Since no significant antigenic differences have been demonstrated
among isolates from different geographic locations, only one serotype of RVFV is recognized.
Despite the single serotype, differences in virulence have been observed, necessitating the
34
need for subsequent genetic characterization of the various isolates (Muller et al., 1995; Bird
et al., 2007).
The genome of RVFV consists of three-segmented, single-stranded negative- and ambi-sense
RNAs with a total size of 12 kb. The L (Large) segment encodes the RNA viral polymerase.
The M (Medium) segment encodes a single precursor protein, which is cleaved to produce the
envelope glycoproteins Gn and Gc; and two non-structural 78 kDa protein and NSm protein.
The glycoproteins, which are located on the outer surface of the virus trigger the host humoral
immune response, which produces neutralizing antibodies (Pepin et al., 2010).
In contrast, the ambisense S (small) segment encodes the nonstructural protein NSs in the
antigenomic sense and the nucleocapsid protein N in the genomic sense (Muller et al., 1995;
Sall et al., 1997; Liu et al., 2008; Bouloy and Weber, 2010). Due to its segmented genome,
recombination through reassortment has been described as an essential contributor to RVFV
evolutionary dynamics (Freire et al., 2015). The RVFV genome is characterized by low genetic
diversity (~5%) resulting in the inability to statistically detect intragenic recombination events
(Bird et al., 2007; Grobbelaar et al., 2011). Similar to other arboviruses, all the genes of RVFV
are under purifying selection and evolved at distinct rates by accumulating mutations through
substitutions at 1.9 x 10⁻⁴ to 2.5 x 10⁻⁴ substitutions per site per year (Freire et al., 2015; Bird
et al., 2007). The previously estimated time to most recent common ancestor (TMRCA) were
estimated to be approximately 124 to 133 years ago coinciding with the importation of highly
susceptible European cattle and sheep breeds into Africa (Bird et al., 2007).
Despite the high percentage of sequence identity, partial M segment sequences of RVFV
isolated over 60 years from various countries have been grouped into 15 lineages (Grobbelaar
et al., 2011). Congruence of the phylogenetic trees constructed for the three partial genome
segments indicated the presence of reassortment, with special emphasis on a 2010 isolate
from a human patient in South Africa. This patient was potentially exposed to co-infection with
the live animal vaccine that clustered with viruses from Lineage H. Lineage H contains mainly
isolates from the 2009-2010 outbreaks in South Africa (Grobbelaar et al., 2011).
The first occurrence of the disease in South Africa occurred in the summer of 1950-1951 in
animals and was subsequently diagnosed in humans in 1951 (Alexander, 1951; Schulz, 1951).
Three major outbreaks of RVF occurred in South Africa namely in 1950-1951, 1974-1976 and
recently in 2008-2011. Smaller outbreaks and individual cases of which some were not
laboratory confirmed also occurred. Most of these small outbreaks occurred in the eastern
part of the country (KwaZulu-Natal, Mpumalanga and Gauteng provinces) (Pienaar and
Thompson, 2013). Outbreaks of RVF usually follow weather conditions, which favour an
increase in mosquito populations. Such outbreaks are normally cyclical, occurring once every

35
30 or so years. However, this is not always the case. For example, recent outbreaks of the
disease in South Africa have occurred with increasing frequency and rather unexpectedly: in
2008 (in Mpumalanga, Limpopo and Gauteng provinces), 2009 (in KwaZulu-Natal,
Mpumalanga and Northern Cape provinces) and 2010 (in Eastern Cape, Northern Cape,
Western Cape, North West, Free State and Mpumalanga provinces) (Figure 2.1). As of August
2010, there were 232 recorded human cases, with 26 confirmed deaths.

36
Figure 2.1: Livestock cases of Rift Valley fever in South Africa for 2008, 2009, 2010 and 2011 (Métras
et al., 2012). Provinces are NC: Northern Cape, WC: Western Cape, EC: Eastern Cape, FS: Free State,
NW: North West, KN: KwaZulu-Natal, MP: Mpumalanga, GT: Gauteng, LP: Limpopo. The light grey
shaded areas are Swaziland and Lesotho (no data).
The aim of this work was to obtain comprehensive information on the genetic composition of
the RVFVs circulating in South Africa. This work detailed the source of the outbreaks by
comparing genomes of samples collected from these outbreaks and samples collected over
37
time from animals at distinct foci of outbreaks. Comparisons also included samples from earlier
outbreaks in South Africa and from other countries with the aim to identify reassortment.
2.2 MATERIALS AND METHODS
2.2.1 Viruses, cells and media
All the outbreak samples used in the study were brought to the Agricultural Research Council-
Onderstepoort Veterinary Research (ARC-OVR) to be tested for the presence of RVFV using
PCR. The samples that tested positive for the presence of RVFV nucleic acid using real-time
PCR (modified from Drosten et al., 2002) were confirmed by virus isolation using the method
described by Digoutte et al. (1989). Thereafter the virus materials were propagated either in
Vero or in BHK cells and stored at -80°C.
Baby hamster kidney (BHK-21) and Vero cells used throughout the study were a kind donation
from Virology Division at ARC-OVR. For optimization of the growth of RVFV in the laboratory,
different media; i.e. DMEM/F12, MEM and RPMI supplemented with different concentrations
of fetal bovine serum (FBS) and a 1% mixture of penicillin (10 000 U/ml), streptomycin (10 000
U/ml) and amphotericin B (25 µg/ml) were used. Cells were grown at 37°C, 5% CO2 in a
humidified incubator. Confluent cells were infected with different concentrations of the M35/74
(also called the challenge strain of RVFV), an isolate of RVFV previously isolated from a liver
of sheep in South Africa. Subsequently, the viruses were isolated in BHK-21 cells grown in
DMEM/F12 supplemented with 5% FBS and 1% penicillin, streptomycin and amphotericin B.
2.2.2 RNA isolation and PCR
After 3 days of infection, the cells were pelleted by centrifugation at 2 500 rpm in an Eppendorf
Centrifuge 5810R (Eppendorf, Germany) for 5 minutes and supernatant recovered and filtered
through a 0.2 µm filter to remove all the cells and contaminants. In order to remove possible
host nucleic acid contamination from the viral particles in the supernatant, the cell culture
supernatant was treated with 100U DNase I and 4 µg RNase at 37°C for 2 hours. Viral RNA
was then extracted using TRIZOL LS reagent (Invitrogen, USA) according to the procedure
provided by the supplier. The RNA was precipitated, washed and diluted with 20 µl of RNase
free water. The concentration of RNA was determined using the Nanodrop ND-1000 (Thermo
Fisher Scientific).

38
2.2.3 cDNA synthesis and Sequence Independent Single Primer Amplification
The sequence independent single primer amplification (SISPA) method was performed
according to Djikeng et al. (2008). A total of 170-200 ng RNA extracted as described above,
was used to synthesize cDNA. Briefly, RNA was added to a mixture of 10 mM dNTP and 20
pmol/µl of the randomly-tagged primer FR26RV-N (5’-GCC GGA GCT CTG CAG ATA TCN
NNN NN-3’) and incubated at 65°C for 5 minutes, then placed on watery ice for another 5
minutes. A volume of 10 µl of cDNA mix (prepared using SuperscriptTM 111 First Strand
Synthesis System for RT-PCR, Invitrogen) was added to the RNA mix prepared above. The
mix was incubated at 25°C for 10 minutes followed by 50 minutes incubation at 50°C. The
reaction was terminated by incubation at 85°C for 20 minutes and the unreacted RNA removed
by addition of RNase H and incubation at 37°C for 20 minutes. A second strand was
synthesized using Klenow exo-DNA polymerase in the presence of a random tagged and a
virus specific 5’ end oligo primer FR20RV (5’-GCCGGAGCTCTGCAGATATC-3’). The double
stranded DNA was amplified with FR20RV primer using Accuprime Taq DNA polymerase High
Fidelity (Invitrogen). The following PCR protocol was used: 94°C for 2 minutes, 35 cycles of
94°C for 30 seconds, 55°C for 30 seconds and 68°C for 1 minute with the final extension of
68°C for 10 minutes. The PCR products were analyzed on a 1% agarose gel and purified by
the MinElute PCR Purification kit (Qiagen).
2.2.4 Construction of cDNA libraries
The SISPA products ranging in size from 0.2 kb to 1.5 kb were recovered from agarose gels
and used in the preparation of a library for sequencing following procedures described by the
manufacturer (Roche Applied Science). Sequencing was done using the Genome Sequencer
454 platform (GSFLX; 454 Life Sciences, Roche Applied Science; http://www.454.com).
SISPA products from at least two random isolates were also sequenced on the Illumina
platform (http://www.illumina.com).
2.2.5 Genome sequence accession numbers
The nucleotide sequences of all the segments of the RVF isolates analyzed in the current
study have been deposited in GenBank with accession numbers indicated in Table 2.1.
39
2.2.6 Bioinformatic analyses of the sequence data
The sequence data obtained was processed and assembled into contigs using the Roche/454
Newbler software set to default values (454 Life Sciences Corporation, Software Release: 2.8
— 20120726_1306) and then further subjected to analyses using a combination of
bioinformatics software. The nucleotide sequences were aligned using the Clustal W module
within the Molecular Evolutionary Genetics Analysis (MEGA 6); set to optimum parameters for
each sequence type (Thompson et al., 1994; Tamura et al., 2011). The best fitting nucleotide
substitution model (General Time Reversible; GTR) was determined for each genome
segment using MEGA 6 and this was applied to subsequent analysis. The criteria for selecting
the best fitting nucleotide substitution was based on the lowest Bayesian information criterion
(BIC). The sequence alignments were used in MEGA 6 to calculate the mean pairwise
distances as well as to derive phylogenetic trees using Maximum likelihood under 1000
bootstrap iterations (Hall, 2013). Evidence of intragenic recombination events were analysed
using different methods available from RDP3 (Heath et al., 2006). Rates of molecular evolution
for individual genome segments were estimated using Bayesian Markov Chain Monte Carlo
implemented in the BEAUTI, BEAST, Tracer and FigTree packages (Drummond et al., 2012).
The substitution rates were estimated using both strict and relaxed uncorrelated lognormal
molecular clock under the GTR model with gamma distribution (T4). The general Bayesian
skyline coalescent prior was used and the MCMC allowed to run for a sufficient number of
generations with sampling every 1000 states, to ensure convergence of all parameters
(Drummond et al., 2012).
The two glycoproteins Gn starts from amino acid 154 and terminates at amino acid 691, while
the Gc starts at amino acid residue 692 and ends at amino acid residue 1197. The amino acid
sequences of the glycoproteins encoded by the M segment of different RVFV isolates obtained
from the 2008-2010 outbreaks were compared with previously published sequences of
isolates are illustrated in Table 2.2.
2.3 RESULTS
This study focused on RVF viruses isolated from diagnostic outbreak samples submitted to
the ARC-OVR for testing. The identification of the isolates, hosts, tissue sources and the
nearest towns where the samples were collected are outlined in Table 2.1. The year in which
the samples were collected is attached to the virus identification number.

40
The complete genome sequences of 23 isolates were determined by using the SISPA method
followed by NGS technologies. A representative profile of SISPA products (smear ranging
between 200 bp and 1 500 bp) obtained from the virus isolates is indicated in Figure 2.2. The
23 isolates represent four of the 15 reported outbreaks in 2008, three of the 19 outbreaks
reported in 2009 and six of the 484 outbreaks in 2010 (Table 2.1) (Pienaar and Thompson,
2013). In addition, the complete genome sequence of isolate M48/08 from Madagascar as
well as historical samples M57/74, M1975Bov and M1955 isolated respectively from South
African outbreaks in 1955, 1974 and 1975 were elucidated (Table 2.1). Isolates M247/09 and
M260/09 were sequenced using both 454 Platform and Illumina Platform (indicated by I), in
order to evaluate the efficiency of SISPA using these NGS technologies. The sequencing
results indicated that either of these NGS technologies could be utilized together with SISPA
to produce complete genome sequences of RVFV isolates.
Figure 2.2: Photograph of a representative agarose gel in which SISPA products of RVFVs were
resolved. Lanes contain products as follows: Lane 1: M03/10, Lane 2: M15/10, Lane 3: M06/10, Lane
4: M19/10, Lane 5: M21/10, Lane 6: M22/10, Lane 7: M23/10, Lane 8: M25/10, Lane 9: M26/10, Lane
10: M33/10, Lane 11: no DNA. Lane labeled M contain DNA size markers, with corresponding sizes of
some indicated in kilobasepairs (kb).
The assembled NGS data of all the RVFV isolates generated complete sequence data for
Segments S, M and L for each of the viruses and were subsequently deposited in GenBank
with accession numbers indicated in Table 2.1. Alignments were generated for each of the
three segments using the available sequence data from GenBank as previously indicated.
0.1kb 0.2kb
0.5kb
1.5kb
M 1 2 3 4 5 6 7 8 9 10 11 M
41
These alignments included full genome sequences from 120 – 140 isolates depending on the
segment and were used to evaluate the evolutionary dynamics of each segment. Virus
diversity was low for each of the segments, with percentage sequence identity differences less
than 5% between isolates for Segment S and Segment L and less than 6% in Segment M.
Table 2.I. List of RVFV isolates analyzed in the study
Isolate #/year
GenBank Accession number Host
Tissue source
Nearest town (Province) L segment M
segment S segment
M48/08 KX944866 KX944843 KX944820 Bovine Liver Madagascar M47/08 KX944865 KX944842 KX944819 Bovine Liver Warmbad – Bela-Bela,
(LP) M39/08 KX944864 KX944841 KX944818 Buffalo
calf Whole foetus
Nelspruit – Mbombela, (MP)
M37/08 KX944863 KX944840 KX944817 Buffalo calf
Whole foetus
Hoedspruit (LP)
M85/08 KX944871 KX944848 KX944825 Bovine Calf
Carcase Irene (GP)
M84/08 KX944870 KX944847 KX944824 Bovine Serum Irene (GP) M80/08/2 KX944869 KX944846 KX944823 Bovine Serum Irene (GP) M66/09 KX944868 KX944845 KX944822 bovine liver Modderfontein (GP) M260/09 KX944860 KX944837 KX944814 Bovine Foetus
organ Upington (NC)
M259/09 KX944859 KX944836 KX944812 Bovine Serum Upington (NC) M247/09 KX944857 KX944834 KX944811 Ovine Liver, lung Upington (NC) M127/09 KX944851 KX944828 KX944804 Bovine Serum,
fresh liver Cascade (KZN)
M33/10 KX944862 KX944839 KX944816 Ovine Liver Middelburg (EC) M29/10 KX944861 KX944838 KX944815 Bovine Serum Pretoria – Tshwane, (GP) M25/10 KX944858 KX944835 KX944813 Ovine Organs Bultfontein (FS) M12/10 KX944850 KX944827 KX944805 Ovine Serum Bultfontein (FS) M19/10 KX944853 KX944830 KX944809 Ovine Liver, Lung,
Brain and spleen
Helderfontein (FS)
M16/10 KX944852 KX944829 KX944806 Ovine Organs Bultfontein (FS) M06/10 KX944849 KX944826 KX944803 Bovine Serum Sterkfontein (EC) M21/10 KX944856 KX944833 KX944810 Ovine Liver Bloemfontein – Mangaung,
(FS) M57/74 KX944867 KX944844 KX944821 N/A N/A N/A M1975Bov KX944855 KX944832 KX944808 Bovine N/A N/A M1955 KX944854 KX944831 KX944807 N/A N/A N/A
N/A = Unknown
In order to determine the influence of substitution rate on biological function, the effect of
differential selection pressures was estimated by calculating the rate of nonsynonymous (dN)
to synonymous (dS) substitutions. All the coding regions were estimated to be under purifying
selection pressure (dN/dS <1) (Table 2.2).
42
The estimated molecular evolutionary rates were as follows: for the L segment, 3.08 x 10⁻⁴
[95% highest posterior density (HPD) interval, 2.2 x 10⁻⁴ – 3.9 x 10⁻⁴] nucleotide
substitutions/site/year; for the M segment, 3.64 x 10⁻⁴ (95% HPD interval, 2.8 x 10⁻⁴ – 4.5 x 10-
4) nucleotide substitutions/site/year and for the S segment, 4.17 x 10⁻⁴ (95% HPD interval, 3.1
x 10-4 – 5.3 x 10⁻⁴) nucleotide substitutions/site/year (Table 2.2).
Table 2.2. Bayesian coalescent estimations of RVFV isolates
Segment
TMRA (Years) [95% HPD Interval]
Substitution rate (Substitutions / site / year) [95% HPD Interval]
Mean dN/dS
Segment L 131.5 [83.3 – 140.5] 3.08 x 10⁻⁴ [ 2.2 x 10⁻⁴ – 3.9 x 10⁻⁴] 0.045 [Log(L) = -19920.8] Segment M 112 [86.3 -140.1] 3.64 x 10⁻⁴ [2.8 x 10⁻⁴ – 4.5 x 10⁻⁴] 0.081 [Log(L) = -12337.7] Segment S 100.9 [ 74.4 – 141.1] 4.17 x 10⁻⁴ [3.1 x 10⁻⁴ – 5.3 x 10⁻⁴] NS: 0.18 [Log(L) = -3206.7]
NP: 0.058 [Log(L) = -2756.2] TMRA = time to most recent common ancestor; HPD = highest posterior density; dN =
nonsynonymous nucleotide substitution site; dS = synonymous nucleotide substitution site.
The phylogenetic relationships of the 23 RVFV sequences were assessed in relationship to
50 previously published sequences (Table 2.3) using maximum likelihood trees (Figures 2.3A-
C).
Table 2.3. A list of previously published genome sequences of RVFV
Isolate/Name Country of origin
Year of isolation Segment L Segment M Segment S
T1: mosquito which fed on hamster infected with ZH-501 Egypt 1977
DQ375407 Egy Sha T1 77
DQ380201 Egy T1 ZH-501 77
DQ380150 Egy T1 ZH-501 77
ZH-1776 Egypt 1978 DQ375411 Egy Gha ZH-1776 78
DQ380203 Egy Gha ZH-1776 78
DQ380153 Egy Gha ZH-1776 78
ZM-657 Egypt 1978 DQ375409 Egy Sha ZM-657 78
DQ380204 Egy Sha ZM-657 78
DQ380146 Egy Sha ZM-657 78
ZS-6365 Egypt 1979 DQ375410 Egy Cha ZS-6365 79
DQ380205 Egy Gha ZS-6365 79
DQ380145 Egy Gha ZS-6365 79
ZH-548 Egypt 1977 DQ375403 Egy Sha ZH-548 77
DQ380206 Egy Sha ZH-548 77
DQ380151 Egy Sha ZH-548 77
ZC-3349 Egypt 1978 DQ375412 Egy Asy ZC-3349 78
DQ380207 Egy Asy ZC-3349 78
DQ380152 Egy Asy ZC-3349 78
763/70 Zimbabwe 1970 DQ375426 Zim Sal 763 70
DQ380188 Zim Sal 763 70
DQ380174 Zim Sal 763 70
2373/74 Zimbabwe 1974 DQ375432 Zim Sal 2373 74
DQ380194 Zim Sal 2373 74
DQ380159 Zim Sal 2373 74
2250/74 Zimbabwe 1974 DQ375413 Zim Bea 2250 74
DQ380209 Zim Bea 2250 74
DQ380143 Zim Bea 2250 74
1260/78 Zimbabwe 1978 DQ375418 Zim Sal 1260 78
DQ380214 Zim Sal 1260 78
DQ380164 Zim Sal 1260 78
43
1853/78 Zimbabwe 1978 DQ375424 Zim Sin 1853 78
DQ380220 Zim Sin 1853 78
DQ380168 Zim Sin 1853 78
2269/74 Zimbabwe 1974 DQ375434 Zim Sin 2269 74
DQ380222 Zim Sin 2269 74
DQ380173 Zim Sin 2269 74
MgH824 Madagascar 1979 DQ375414 Mad MgH824 79
DQ380210 Mad MgH824 79
DQ380144 Mad MgH824 79
200803166 Madagascar 1991 JF311372 Mad Ant 200803166 91
JF311381 Mad Ant 200803166 91
JF311390 Mad Ant 200803166 91
200803167 Madagascar 1991 JF311373 Mad Ant 200803167 91
JF311382 Mad Ant 200803167 91
JF311391 Mad Ant 200803167 91
200803168 Madagascar 2008 JF311374 Mad Mia 200803168 08
JF311383 Mad Mia 200803168 08
JF311392 Mad Mia 200803168 08
200803169 Madagascar 2008 JF311375 Mad Ant 200803169 08
JF311384 Mad Ant 200803169 08
JF311393 Mad Ant 200803169 08
OS-9 Mauritania 1987 DQ375397 Mau OS-9 87
DQ380183 Mau OS-9 87
DQ380179 Mau OS-9 87
OS-8 Mauritania 1987 DQ375395 Mau OS-8 87
DQ380185 Mau OS-8 87
DQ380177 Mau OS-8 87
OS-1 Mauritania 1987 DQ375398 Mau OS-1 87
DQ380186 Mau OS-1 87
DQ380180 Mau OS-1 87
Hv-B375
Central African Republic 1985
DQ375422 CAR Mba Hv-B375 85
DQ380218 CAR Aba Hv-B375 85
DQ380161 CAR Hv-B375 85
CAR-R1622
Central African Republic 1985
DQ375423 CAR Ban R1622 85
DQ380219 CAR Ban R1622 85
DQ380160 CAR R1622 85
73HB1230
Central African Republic 1973
DQ375425 CAR 73HB1230 73
DQ380221 CAR 73HB1230 73
DQ380172 CAR 73HB1230 73
Zinga
Central African Republic 1969
DQ375419 CAR Zinga 69
DQ380217 CAR Zinga 69
DQ380167 CAR Zinga 69
Kenya 56 (IB8) Kenya 1965 DQ375427 Ken-IB8 56
DQ380190 Ken-IB8 65
DQ380176 Ken 56-IB8 65
Kenya 57 (Rintoul) Kenya 1951
DQ375431 Ken Rintoul 57
DQ380192 Ken Rintoul-57 51
DQ380155 Ken Rintoul-57 51
Kenya 9800523 Kenya 1998 DQ375400 Ken 9800523 98
DQ380196 Ken 9800523 98
DQ380169 Ken 9800523 98
Kenya 83 (21445) Kenya 1983
DQ375402 Ken Rui 21445 83
DQ380198 Ken Rui 21445 83
DQ380171 Ken Rui 21445 83
2007004194 Kenya 2007 EU574004 Ken Kia 2007004194 07
EU574031 Ken Kia 2007004194 07
EU574057 Ken Kia 2007004194 07
2007004193 Kenya 2007
EU574005 Ken Nai 2007004193 07
EU574032 Ken Nai 2007004193 07
EU574058 Ken Nai 2007004193 07
2007003644 Kenya 2007
EU574006 Ken Bar 2007003644 07
EU574033 Ken Bar 2007003644 07
EU574059 Ken Bar 2007003644 07
2007002060 Kenya 2007
EU574013 Ken Nai 2007002060 07
EU574039 Ken Nai 2007002060 07
EU574066 Ken Nai 2007002060 07
2007001564 Kenya 2007
EU574017 Ken Mur 2007001564 07
EU574044 Ken Mur 2007001564 07
EU574072 Ken Mur 2007001564 07
2007001292 Kenya 2007
EU574019 Ken Mer 2007001292 07
EU574046 Ken Meru 2007001292 07
EU574074 Ken Mer 2007001292 07
Saudi 2000-10911 Saudi Arabia 2000
DQ375401 SA 10911 00
DQ380197 Saudi 10911 00
DQ380170 Saudi 10911 00
SA01-1322 Saudi Arabia 2001 KX096941 SA 1322 01
KX096942 Saudi 1322 01
KX096943 Saudi 1322 01
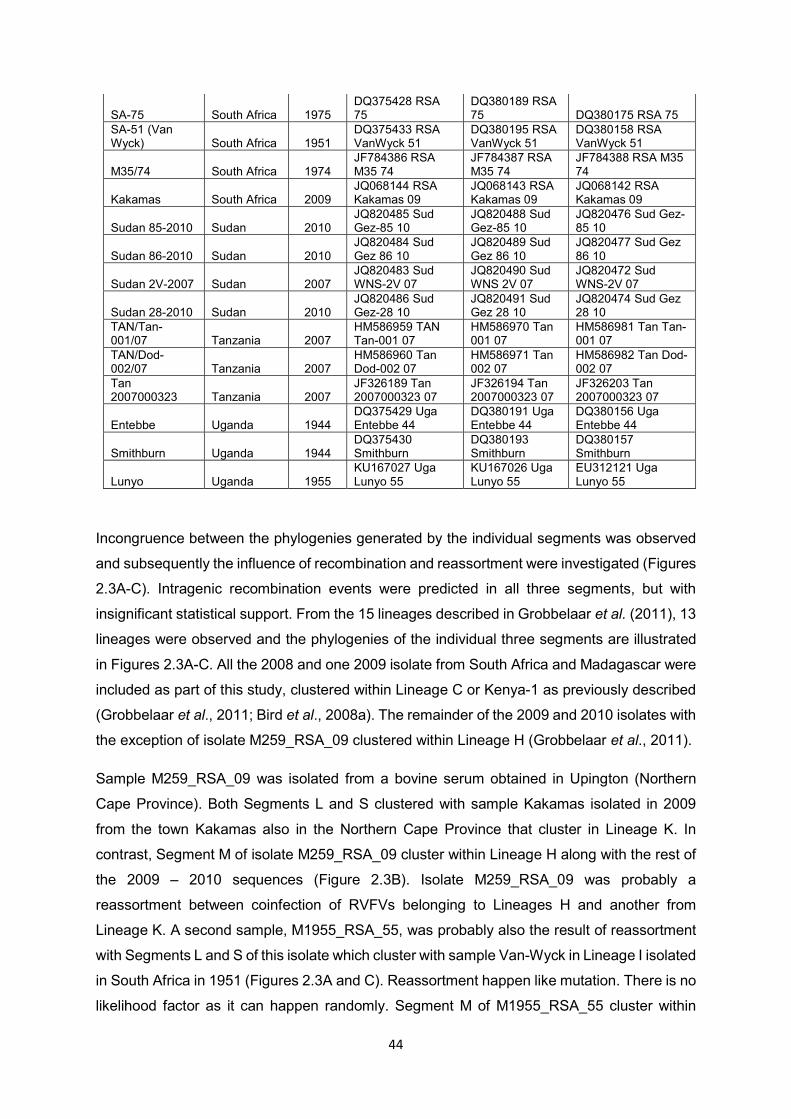
44
SA-75 South Africa 1975 DQ375428 RSA 75
DQ380189 RSA 75 DQ380175 RSA 75
SA-51 (Van Wyck) South Africa 1951
DQ375433 RSA VanWyck 51
DQ380195 RSA VanWyck 51
DQ380158 RSA VanWyck 51
M35/74 South Africa 1974 JF784386 RSA M35 74
JF784387 RSA M35 74
JF784388 RSA M35 74
Kakamas South Africa 2009 JQ068144 RSA Kakamas 09
JQ068143 RSA Kakamas 09
JQ068142 RSA Kakamas 09
Sudan 85-2010 Sudan 2010 JQ820485 Sud Gez-85 10
JQ820488 Sud Gez-85 10
JQ820476 Sud Gez-85 10
Sudan 86-2010 Sudan 2010 JQ820484 Sud Gez 86 10
JQ820489 Sud Gez 86 10
JQ820477 Sud Gez 86 10
Sudan 2V-2007 Sudan 2007 JQ820483 Sud WNS-2V 07
JQ820490 Sud WNS 2V 07
JQ820472 Sud WNS-2V 07
Sudan 28-2010 Sudan 2010 JQ820486 Sud Gez-28 10
JQ820491 Sud Gez 28 10
JQ820474 Sud Gez 28 10
TAN/Tan-001/07 Tanzania 2007
HM586959 TAN Tan-001 07
HM586970 Tan 001 07
HM586981 Tan Tan-001 07
TAN/Dod-002/07 Tanzania 2007
HM586960 Tan Dod-002 07
HM586971 Tan 002 07
HM586982 Tan Dod-002 07
Tan 2007000323 Tanzania 2007
JF326189 Tan 2007000323 07
JF326194 Tan 2007000323 07
JF326203 Tan 2007000323 07
Entebbe Uganda 1944 DQ375429 Uga Entebbe 44
DQ380191 Uga Entebbe 44
DQ380156 Uga Entebbe 44
Smithburn Uganda 1944 DQ375430 Smithburn
DQ380193 Smithburn
DQ380157 Smithburn
Lunyo Uganda 1955 KU167027 Uga Lunyo 55
KU167026 Uga Lunyo 55
EU312121 Uga Lunyo 55
Incongruence between the phylogenies generated by the individual segments was observed
and subsequently the influence of recombination and reassortment were investigated (Figures
2.3A-C). Intragenic recombination events were predicted in all three segments, but with
insignificant statistical support. From the 15 lineages described in Grobbelaar et al. (2011), 13
lineages were observed and the phylogenies of the individual three segments are illustrated
in Figures 2.3A-C. All the 2008 and one 2009 isolate from South Africa and Madagascar were
included as part of this study, clustered within Lineage C or Kenya-1 as previously described
(Grobbelaar et al., 2011; Bird et al., 2008a). The remainder of the 2009 and 2010 isolates with
the exception of isolate M259_RSA_09 clustered within Lineage H (Grobbelaar et al., 2011).
Sample M259_RSA_09 was isolated from a bovine serum obtained in Upington (Northern
Cape Province). Both Segments L and S clustered with sample Kakamas isolated in 2009
from the town Kakamas also in the Northern Cape Province that cluster in Lineage K. In
contrast, Segment M of isolate M259_RSA_09 cluster within Lineage H along with the rest of
the 2009 – 2010 sequences (Figure 2.3B). Isolate M259_RSA_09 was probably a
reassortment between coinfection of RVFVs belonging to Lineages H and another from
Lineage K. A second sample, M1955_RSA_55, was probably also the result of reassortment
with Segments L and S of this isolate which cluster with sample Van-Wyck in Lineage I isolated
in South Africa in 1951 (Figures 2.3A and C). Reassortment happen like mutation. There is no
likelihood factor as it can happen randomly. Segment M of M1955_RSA_55 cluster within

45
Lineage L along with isolates from South Africa, obtained during the 1974 and 1975 outbreaks
(Figure 2.3B). Since both these reassortment events pertained to Segment M, which encode
two glycoproteins (Gn and Gc), this segment was subjected to additional analysis in this study.

46
Figure 2.3A: Maximum likelihood tree of the S segment. The tree was generated using the maximum likelihood algorithm using MEGA 6. The designation of the clades follows Grobbelaar et al. (2011). The lineages containing RVFV isolates from South Africa are presented in green.
47
Figure 2.3B: Maximum likelihood tree of the M segment. The tree was generated using the maximum likelihood algorithm using MEGA 6. The designation of the clades follows Grobbelaar et al. (2011). The lineages containing RVFV isolates from South Africa are presented in green. The two specific reassortants are indicated in red.

48
Figure 2.3C: Maximum likelihood tree of the L segment. The tree was generated using the maximum likelihood algorithm using MEGA 6. The designation of the clades follows Grobbelaar et al. (2011). The lineages containing RVFV isolates from South Africa are presented in green.
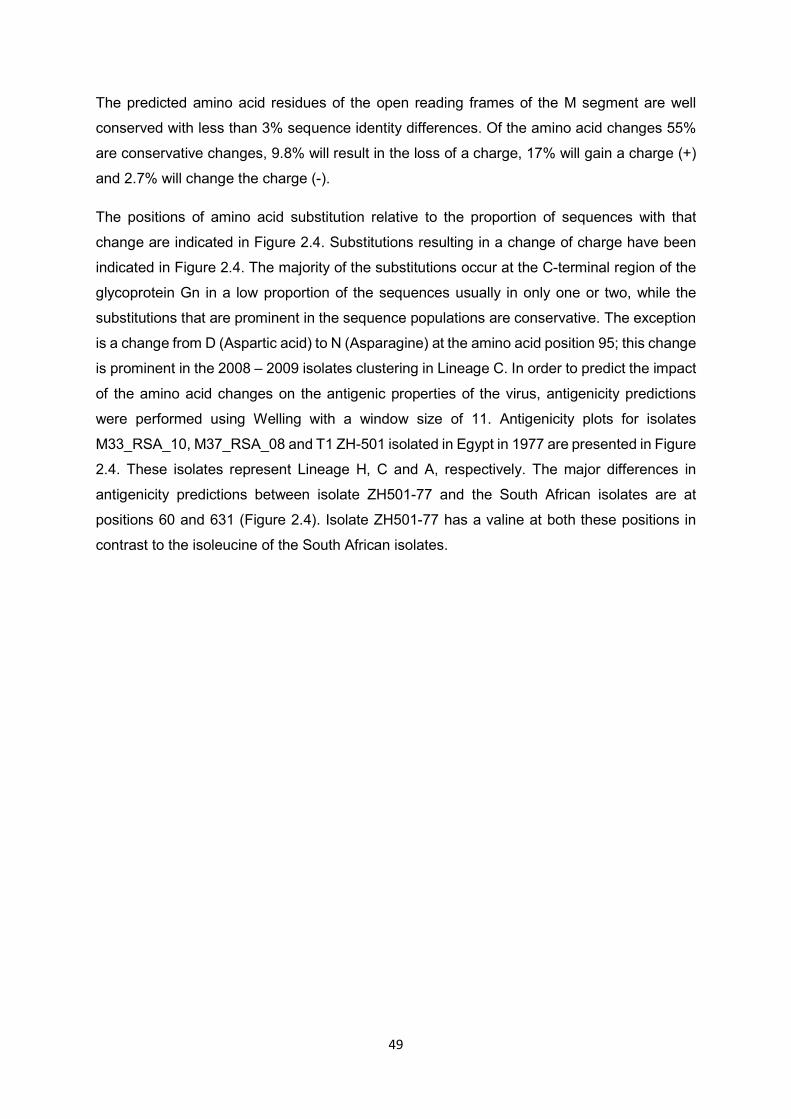
49
The predicted amino acid residues of the open reading frames of the M segment are well
conserved with less than 3% sequence identity differences. Of the amino acid changes 55%
are conservative changes, 9.8% will result in the loss of a charge, 17% will gain a charge (+)
and 2.7% will change the charge (-).
The positions of amino acid substitution relative to the proportion of sequences with that
change are indicated in Figure 2.4. Substitutions resulting in a change of charge have been
indicated in Figure 2.4. The majority of the substitutions occur at the C-terminal region of the
glycoprotein Gn in a low proportion of the sequences usually in only one or two, while the
substitutions that are prominent in the sequence populations are conservative. The exception
is a change from D (Aspartic acid) to N (Asparagine) at the amino acid position 95; this change
is prominent in the 2008 – 2009 isolates clustering in Lineage C. In order to predict the impact
of the amino acid changes on the antigenic properties of the virus, antigenicity predictions
were performed using Welling with a window size of 11. Antigenicity plots for isolates
M33_RSA_10, M37_RSA_08 and T1 ZH-501 isolated in Egypt in 1977 are presented in Figure
2.4. These isolates represent Lineage H, C and A, respectively. The major differences in
antigenicity predictions between isolate ZH501-77 and the South African isolates are at
positions 60 and 631 (Figure 2.4). Isolate ZH501-77 has a valine at both these positions in
contrast to the isoleucine of the South African isolates.
50
Figure 2.4: Welling antigenicity plots of Segment M for the isolates M33_RSA_10 in blue, ZH501-Egy-77 in black and M37_RSA_08 in green. Differences in
amino acids between these three samples are indicated on top of the antigenicity plots with each isolate represented in its assigned colour. A graphical
representation of the non-structural protein (NSm) and glycoproteins (Gn) and (Gc) regions separate the antigenicity plots from the graph depicting the
proportion of substitutions per amino acid position. These proportions are representative of the 23 sequences generated during this study as well as the
previously published data indicated in Table 2.3.

51
2.4 DISCUSSION
South Africa experienced three major outbreaks of RVF, the first in 1950-1951, the second
and largest in 1974-1976 and in a period spanning 2008-2011. In this study, selected viruses
from this last outbreak were sequenced and compared to sequence data obtained from
GenBank.
In 2008 a total of 15 outbreaks were reported, these were all localized to a small region in
Gauteng, Limpopo, North West and Mpumalanga provinces (Pienaar and Thompson, 2013).
Sequence analysis of all three segments from representative isolates of the 2008 (n=7)
outbreaks cluster in Lineage C among isolates from the 2007 outbreak in Kenya, known as
Lineage Kenya-1 (Bird et al., 2007). In contrast to the localized outbreak of 2008 in Gauteng
Province (Figure 2.1), 19 outbreaks were reported in 2009. One was in Mpumalanga, one in
Gauteng, while the rest were either in KwaZulu-Natal and the Eastern Cape provinces or along
the Orange River in the Northern Cape Province (Pienaar and Thompson, 2013). Similarly, to
the isolates from 2008, the 2009 isolates (n=5) from Gauteng clustered in Lineage C within
Lineage Kenya-1. This 2009 Gauteng outbreak appears to be a continuum from the 2008 RVF
outbreak viruses prevalent in that region.
Isolates from outbreaks of 2009 from both the geographically distinct KwaZulu-Natal and
Northern Cape provinces clustered in the same lineage, Lineage H. This includes a Segment
M reassortment of sample M259_RSA_09, where both Segment L and Segment S cluster with
another 2009 isolate from Kakamas in Lineage K. It is therefore possible that the majority of
outbreaks occurring in 2009 in the two regions, originated from a single source.
In 2010 a total of 484 outbreaks were reported in all provinces of South Africa except KwaZulu-
Natal. The initial report came from two towns, Bultfontein and Brandfort in the Free State
Province and subsequently spread to the rest of the country (Pienaar and Thompson, 2013).
Similar to the 2009 outbreaks from KwaZulu-Natal and the Northern Cape provinces, all the
2010 isolates (n=8) clustered in Lineage H. The eight isolates from the 2010 outbreak
analyzed in this study are not statistical representatives of the 14 342 cases reported in that
year; but support speculations that the 2010 outbreak was a continuum from the 2009
outbreaks in KwaZulu-Natal and Northern Cape provinces (Grobbelaar et al., 2011).
This study contributed full genome sequence analysis of RVFV viruses, isolate M57_RSA_74
isolated during the 1974 outbreak and isolate M1955_RSA_55 isolated from one of the 28
outbreaks during 1955 (Pienaar and Thompson, 2013). The period between 1973 and 1976
52
marked the largest RVF epidemic with mortality rates of 95% reported (Swanepoel and
Coetzer, 2004). Outbreaks were reported in every province of South Africa and the human
cases were severe with the most deaths ever reported (Pienaar and Thompson, 2013).
Lineage L contains an isolate 763 from Zimbabwe isolated in 1970 and isolate IB8 from Kenya
isolated in 1956 along with the 1973-1976 South African isolates (n=4). The segment M
reassortment of isolate M1955_RSA_55, indicated that multiple RVFV lineages co-circulate
during outbreaks and that viruses could re-emerge decades later. Evidence of reassortment
within the 2006-2007 Kenya outbreaks supports the conclusion of multiple virus lineages
circulating during a single outbreak (Bird et al., 2008a).
The evolutionary dynamics of RVFV are characterized by slow substitutions rates under strong
purifying or negative selection with the major genomic diversity resulting from reassortment.
Bayesian coalescent estimations of RVF viral genomes indicated that segments evolve at a
mean rate between 3.9 x10⁻⁴ and 4.17 x10⁻⁴ substitutions per site per year regardless of the
molecular model used. This is in accordance with previous Bayesian estimations (Bird et al.,
2008a; Grobbelaar et al., 2011). The lack of statistical support could be due to the low genetic
diversity between the sequences (Prosada et al., 2002). Since recombination through
reassortment has been described in the segmented RVFV genome, this was further described
by Grobbelaar et al. (2011). Similarly, the estimated TMRCA supports previous estimations of
between 1880 and 1890 (Bird et al., 2008b; Grobbelaar et al., 2011). Similar evolutionary
dynamics have been described in other arboviruses such as bluetongue virus and epizootic
haemorrhagic disease virus due to the enforced replication of the virus in both insect vector
and mammalian hosts (Wilson et al., 2015). The majority of reassortment events described
in RVFV involves the exchange of Segment M and this was also the case for the current study
(Bird et al., 2008a; Grobbelaar et al., 2011).
Although RVFV is generally known to be antigenically homogenous, various strains of the
virus exhibit differences in virulence, evident upon infection of the mammalian host. A few or
some of these differences may be attributable to the individual or host population; others are
inherent to the virus. Differences in cytopathic effect and lethality of RVFV isolates have been
observed during the experimental infection of BHK cells (Moutailler et al., 2011), mice (Morrill
et al., 2010), sheep (Faburay et al., 2016) and cattle (Wilson et al., 2016).
Significant differences in mammalian pathogenesis, especially associated with the severity of
the disease in humans have been observed. The latter have increased since the 1977
outbreak in Egypt to devastating effects during the 2006 - 2008 outbreaks in East Africa
53
(Baba et al., 2016). A clear association between RVFV genotype and lethal phenotype has
not been established, but various amino acid substitutions have been identified to contribute
to this (Bird et al., 2007). The most prominent substitution in the glycoproteins are I595V,
R605K, I631V, V659A located in Gn and S1059T within Gc (Bird et al., 2007). Another
variation was identified in ZH501, isolate from a human in Egypt during an outbreak in 1977,
resulted in the change of amino acid from glycine to glutamic acid at position 277. The virus
with the glutamic acid was shown to be more virulent in mice, compared to the one with glycine
in the same position (Morrill et al., 2010). The majority of RVFV analysed in this study had
glutamine at position 277, with the exception of the wild type isolate 763/70 from a foetus
aborted during an outbreak of the disease in Zimbabwe in 1970 (Bird et al., 2007). This study
identified additional substitutions when compared to the lethal isolate ZH501-77 from Egypt
and isolates belonging to Lineage H from 2010 in South Africa. The substitutions include
V602I, D987E and T1131I. A previous study indicated that virus ZH501-77, is associated with
increase virulence, lethal to rats and was therefore included in this analysis as comparison
between isolates from Lineage H and C (Bird et al., 2007). The impact of each of these
substitutions on the pathogenicity of RVFV should be investigated through reverse genetics.
In order to evaluate the efficiency and reliability of the sequence data generated by different
NGS platforms, two isolates (M260/09 and M247/09) were subjected to both 454 sequencing
from Roche as well as Miseq technology from Illumina. The data generated by both technology
platforms were comparative and produced identical sequences. The dataset analyzed in this
study might however not be representative of the RVFVs circulating during the outbreak. This
is due to the viruses being isolated on cell culture prior to genome determination. The dataset
might have a bias towards isolates favoured by the cell culture system. A different picture of
viruses and their quasispecies might emerge if the analyses included viruses sequenced
directly from clinical/positive cases. This is currently unattainable within this study.
Phylogenies done for the three genome segments of RVFV indicated the presence of five
lineages in South Africa as assigned by Grobbelaar et al. (2011). This study indicated that the
viruses from 1951 and 1955 (Lineage I) persisted in the field and may have contributed to the
outbreaks of 1974 and 1975 (Lineage L). The viruses analyzed from the 2008 outbreak and
one 2009 isolate from Gauteng, cluster within Lineage C. The latter predominantly contains
isolates from Kenya, Tanzania as well as Madagascar during their 2007-2008 outbreaks. The
2009-2010 viruses from South Africa seem to have descended from an unknown ancestor,
with their closest relative been a partial sequence obtained from a virus from Namibia in 2004
(Grobbelaar et al., 2011). Lineage H presents a clear indication that new strains could evolve
due to nucleotide substitution, albeit the slow substitution rate. It is possible that these viruses

54
are not introduced from elsewhere, but rather mutate in time and caused outbreaks when
suitable conditions prevailed.
The most notable isolate analyzed in this study is M259_RSA_09 originating from Upington in
the Northern Cape Province. The RVF outbreak in the Orange River region of the Northern
Cape Province appears to have been due primarily to irrigation used in vineyards and
orchards, since this is a winter-rainfall area. Similar to isolate SA184/10, isolated from a person
injected with Smithburn neurotropic strain (SNS) vaccine while vaccinating sheep,
M259_RSA_09 clusters with Lineage H when analyzing Segment M, but in Lineage K when
segments L and S are evaluated (Grobbelaar et al., 2011). Its closest association in Lineage
K is the virus Kakamas, isolated in 2009 from cattle in the Northern Cape Province. Lineage
K contains the sequence for Smithburn (SNS) vaccine as well as isolates Entebbe isolated in
Uganda in 1844, from which the SNS vaccine was derived (Swanepoel and Coetzer, 2004).
Considering that isolate SA184/10 had a direct association with the SNS vaccine, the genetic
distance between M259_RSA_09 and the SNS vaccine is significant to warrant a renewed
attempt to determine the sequence of the current SNS vaccine commercially available.

55
CHAPTER 3: COMPARISON AND CHARACTERISATION OF
SELECTED SOUTH AFRICAN ISOLATES OF RIFT VALLEY FEVER
VIRUS
3.1 INTRODUCTION
Rift Valley fever, an emerging zoonotic disease, associated with heavy and prolonged rainfall
is endemic to African countries (Anyamba et al., 2009; Davies, 2010). The outbreaks are
associated with high rates of abortion and high mortality in young animals. In addition to the
substantial socioeconomic effects caused by the outbreaks, human health is also at risk
(Archer et al., 2013). Since the last reported large outbreak in South Africa in 1974 and 1976,
another large outbreak occurred from 2008 to 2011.
Infected mosquitoes transmit the RVF virus which is classified in the genus Phlebovirus
(Anyamba et al., 2009). The virus has a tri-segmented, negative single stranded RNA genome.
Viruses with RNA genomes adapt to changing environmental conditions due to lack of
proofreading activity resulting in the possibility of high mutation rates as compared to viruses
with DNA genome (Elena and Sanjuán, 2005). Mutations in any of the trinucleotide can result
in amino acid change that may affect the function of the protein or in a stop codon resulting in
a truncated protein. Mutations can arise from substitution, insertion, deletion or frameshift.
A single amino acid residue in a protein can be encoded by more than one codon called
synonymous codons (Behura and Severson, 2013). The corresponding tRNAs of these
codons may differ in their relative abundance in cells and even with the speed, which they are
recognized by the ribosome (Butt et al., 2016). During the coding of a protein, the usage of
the synonymous codons is unequal and this process is called synonymous codon usage bias
(SCUB) or codon usage bias (CUB) (Baker et al., 2015; Song et al., 2017; Belalov and
Lukashev, 2013). The codon usage patterns vary within and among genomes (Behura and
Severson, 2013).
While RVFV shows low genetic diversity (Bird et al., 2007; Grobbelaar et al., 2011), phenotypic
differences between isolates has been observed including cytopathic effect, host specificity
and cell culture phenotypes (Moussa et al., 1982; Morrill et al., 2010; Moutailler et al., 2011;
Wilson et al., 2016). These phenotypic differences must be related to biological processes
such as receptor recognition during invasion, replication and assembly of the viral capsid or
final budding from infected cells. These phenotypic differences may also have a genetic origin
56
allowing potential discovery of the causal factors by comparative genomics. To allow for
thorough analysis, a detailed knowledge of the proteins encoded by the viral genome is
necessary.
The RNA polymerase encoded by the L segment is a polypeptide of 2087 amino acids and
possesses three defined domains as classified by the Conserved Domain Database
(Marchler- Bauer et al., 2015). The N-terminal domain (52-248) is an endonuclease (L-Protein
N pfam15518) found in several of Bunyavirus polymerases. The endonuclease functions in
mRNA transcription, by cleaving the 5’ end capped host mRNA and transferring these capped
oligonucleotides of 12-18 nucleotides to the mRNA, a process called cap-snatching (Reguera
et al., 2010; Amroun et al., 2017; Holm et al., 2018). The nuclease activity is a divalent metal
ion-dependent and several residues (identified in the La Crosse orthobunyavirus) are
important in the active site functioning to sequester the metal ion; notably His34, Asp52,
Asp79, Asp92 and Lys108 (Reguera et al., 2010). These residues are also conserved in the
RVFV endonuclease. This is followed by a domain of unknown function (DUF3770, pfam
12603) (249-420) that is associated with the polymerase domain (Bunya RdRp, pfam04196)
from 604-1299. The polymerase RdRp domain has a right hand-like structure with finger, palm
and thumb subdomains. It is responsible for both transcription and replication (Amroun et al.,
2017). The C-terminal region from 1299-2087 has not yet been classified.
The M segment encodes the non-structural protein NSm and the envelope glycoproteins Gn
and Gc. The NSm has an apoptotic function (Won et al., 2007) and several potential binding
partners including cleavage and polyadenylation specificity factor subunit 2 (Cpsf2), the
peptidyl-prolyl cis-trans isomerase (cyclophilin) like 2 protein (Ppil2) and the synaptosome-
associated protein of 25 kDa (SNAP-25) which have been identified using a yeast two-hybrid
system (Engdahl et al., 2012). The NSm and the 78 kDa proteins are dispensable for virus
maturation, replication and infection in cell culture (Won et al., 2006; Gerrard and Nichol,
2007). However, a virus that lacked NSm was attenuated in mice with reduced titres in murine
macrophages (Kreher et al., 2014). The 78 kDa protein did not have an effect on viral infection
in mice but was important for propagation in mosquitoes (Kreher et al., 2014). The Gn and Gc
form heterodimers in the viral envelope (Huiskonen et al., 2009), with surface protrusions
called “spikes” that are important for cell tropism and virus entry into mammalian host cells
(Amroun et al., 2017) (Figure 3.1A). The Gn forms a larger part of the protruding capsomer,
while Gc forms the capsomer base (Rusu et al., 2012) (Figure 3.1B). The Gn interacts with
cell surface receptors allowing viral uptake into the cell, while shielding Gc to prevent
premature fusion (Halldorsson et al., 2016). After attachment, Gc facilitates membrane fusion
and release of genomic contents from the endosomal compartments into the cytoplasm
(Spiegel et al., 2016). The Gn and Gc are also important for packaging of the viral genome by
57
interaction via the intracellular regions and directly with the ribonucleoprotein (Huiskonen et
al., 2009). The Gn possesses a C-terminal region followed by a type 1 transmembrane region,
a stem region and a head region (Wu et al., 2017; Halldorsson et al., 2016). The head region
is composed of three domains, an N-terminal α-helical domain A, a small globular B domain
and a C-terminal B-ribbon domain (Wu et al., 2017; Halldorsson et al., 2016). The C-terminal
B-ribbon domain dimerizes with the Gc protein to form heterodimers (Halldorsson et al., 2016).
In Gn, a single nucleotide difference that results in a substitution of E276G resulted in
attenuation of a highly virulent strain to one that showed low viremia titers, did not replicate
efficiently, and had low virulence (Morrill et al., 2010). The Gn and Gc glycoproteins form
higher order pentamers and hexamers ring-shaped assemblies (Amroun et al., 2017).
Glutamic acid 276 is in the N-terminal domain at the top of the Gn ring with the side chain
projecting towards the centre of the ring (Figure 3.1C and 3.1D). It probably interacts with the
host receptor by binding to specific residues forming ionic bonds indicating the important role
that receptor recognition may have on virulence, viremia and rate of replication.
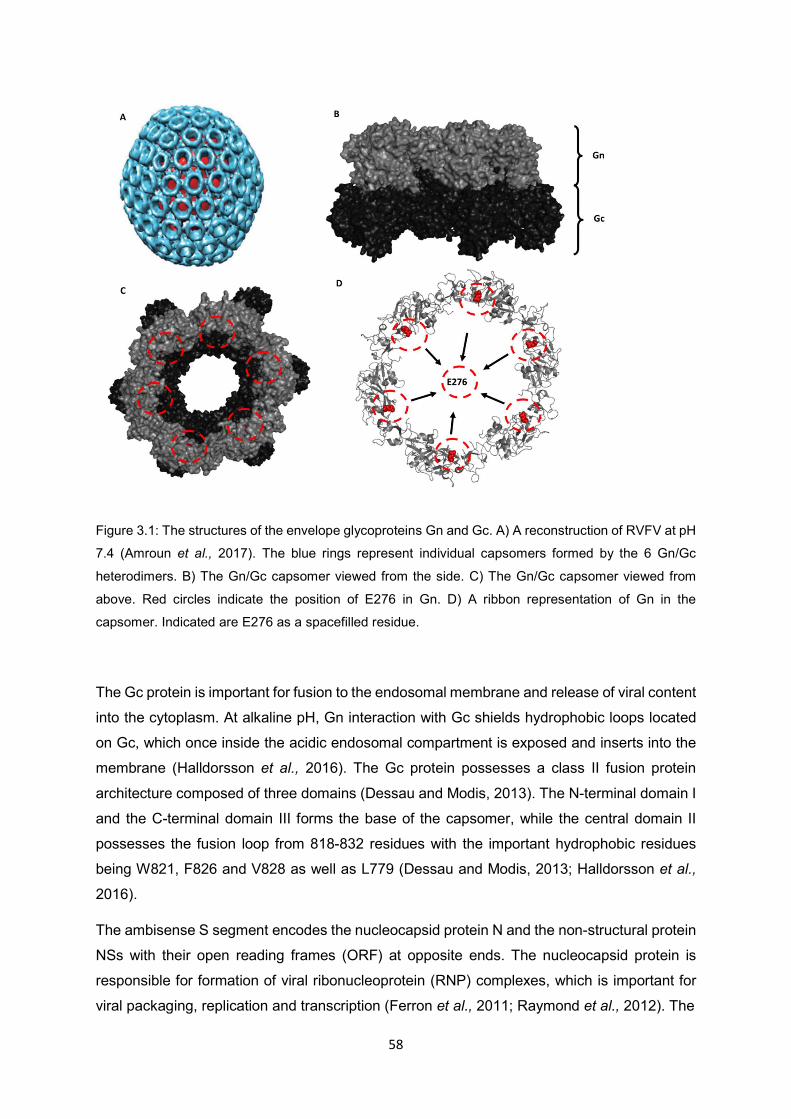
58
Figure 3.1: The structures of the envelope glycoproteins Gn and Gc. A) A reconstruction of RVFV at pH
7.4 (Amroun et al., 2017). The blue rings represent individual capsomers formed by the 6 Gn/Gc
heterodimers. B) The Gn/Gc capsomer viewed from the side. C) The Gn/Gc capsomer viewed from
above. Red circles indicate the position of E276 in Gn. D) A ribbon representation of Gn in the
capsomer. Indicated are E276 as a spacefilled residue.
The Gc protein is important for fusion to the endosomal membrane and release of viral content
into the cytoplasm. At alkaline pH, Gn interaction with Gc shields hydrophobic loops located
on Gc, which once inside the acidic endosomal compartment is exposed and inserts into the
membrane (Halldorsson et al., 2016). The Gc protein possesses a class II fusion protein
architecture composed of three domains (Dessau and Modis, 2013). The N-terminal domain I
and the C-terminal domain III forms the base of the capsomer, while the central domain II
possesses the fusion loop from 818-832 residues with the important hydrophobic residues
being W821, F826 and V828 as well as L779 (Dessau and Modis, 2013; Halldorsson et al.,
2016).
The ambisense S segment encodes the nucleocapsid protein N and the non-structural protein
NSs with their open reading frames (ORF) at opposite ends. The nucleocapsid protein is
responsible for formation of viral ribonucleoprotein (RNP) complexes, which is important for
viral packaging, replication and transcription (Ferron et al., 2011; Raymond et al., 2012). The
59
NSs protein is a major virulence factor that hijacks the host cell and shut down defense
mechanisms. It activates the cullin 1Skp1-Fbox E3 ligase complex to degrade the p62 of the
transcription factor IIH complex and RNA-dependent protein kinase R proteins and facilitate
ubiquitin transfer (Terasaki et al., 2016). The C-terminal possesses a motif that resembles the
ΩXaV motif found in nucleotide excision repair (NER) factors and transcription factors known
to interact with p62 (Cyr et al., 2015). It also affects cohesion and segregation of chromatin
DNA and activation of the interferon-ß promoter. NSs also induces DNA damage, causes cell
cycle arrest, activates p53 resulting in apoptosis (Ly and Ikegami, 2016).
The study aims to characterize and compare the six wild-type isolates of RVFV isolated from
livers of bovine and ovine in South Africa from 2008 to 2010 based on their sequence
alignment (both nucleotide and amino acid), cytopathic effect on mammalian cells, protein
structures, and codon usage bias. The results will help in understanding the behaviour of
isolates from different species. Resulting information on the codon usage bias patterns can
provide significant insight on molecular evolution of genes and reveal host-pathogen
coevolution and adaptation of pathogens to specific hosts (Wang et al., 2017; Behura and
Severson, 2013; Belalov and Lukashev, 2013).
3.2 MATERIALS AND METHODS
3.2.1 Determination of viral concentration
Vero cells were seeded in 12-well plates at a density of 0.2 x 10⁵ cells/well and incubated
overnight at 37°C with 5% CO2. For infection, the virus was serially diluted using 10-fold dilution
in DMEM F/12 media supplemented with 2% FBS and 1% mixture of penicillin (10 000 U/ml),
streptomycin (10 000 U/ml) and amphotericin B (25 µg/ml). A volume of 250 µl of each dilution
was added to each well containing the Vero cell monolayer. Plates were incubated at 37°C on
a rocker for 1 hour to allow virus to attach to cells. At the end of incubation, 1 ml of primary
overlay [1% agarose (Merck) plus 10% DMEM F/12)] was added to each well and the plates
returned to the incubator for 3 days. On the fourth day, a secondary overlay (primary overlay
plus 1% neutral red) was added to the wells and plates returned to the incubator. After 24
hours, plaques were counted and viral titers were calculated. Viral titers were expressed as
plaque forming units per millilitres (PFU/ml), calculated as number of plaques per well/ (dilution
X inoculum).
60
3.2.2 Confirmation of the viral particle
Baby hamster kidney (BHK) cells infected with virus (M66/09) were harvested after 72 hours
and virus was concentrated using sucrose density centrifugation. After ultra-centrifugation for
1 hour at 21 000 rpm in a Sorval Super T21 centrifuge, the viral pellet was suspended with
100 µl cold PBS and split into two tubes of equal volume. The first tube was prepared for
quality purpose using transmission electron microscope (TEM). A drop of purified virus was
mixed with a drop of stain in a ceramic plate well and formvar carbon coated grid floated on
top of the mixture for 30 seconds. Excess fluid was blotted with paper towel. Samples were
examined in a Philips CM10 (TEM) at 80 kV using negative staining with 3% phosphotungstic
acid (PTA) (Sigma-Aldrich). A negative control sample containing uninfected cells was also
included. The second tube was used to infect BHK cells for isolation of viral RNA to confirm
the presence of viral particles. Viral RNA was isolated from the second tube using the modified
method of Drosten et al. (2002) and RNA was then used in a reverse transcriptase PCR. The
PCR primers used were RVF1-F (5’ – TGT CAC ACT GCT CTC AGT GCC – 3’) and RVF2-R
(5’ - GGA GCT TGC CTG AAT CTG TTG – 3’). The PCR conditions were as follows: 37°C for
30 minutes, 94°C for 2 minutes, followed by 35 cycles at 94°C for 30 seconds, 65°C for 30
seconds and 72°C for 30 seconds. The final extension was done at 72°C for 7 minutes.
3.2.3 Attachment of virus to host cells using electron microscopy (cell embedding)
The rate at which RVFV attaches and enters cells was investigated using TEM. The BHK cells
were grown in three T75 flasks using DMEM/F12 (Gibco, Life Technology) supplemented with
5% FBS (Gibco, Life Technology) and 1% mixture of penicillin (10 000 U/ml), streptomycin
(10 000 U/ml) and amphotericin B (25 µg/ml) (LONZA, BioWhitaker) as described in section
3.2.1. The cells were grown for 48 hours at 37°C, 5% CO2 in a humidified incubator. An hour
before fixation, the media was removed from the flasks. Monolayers were washed once with
serum-free media and returned to the incubator. After 1 hour, media was discarded and cells
were infected with the virus at a multiplicity of infection (MOI) of 0.1. After 8, 16, and 24 minute
intervals, the virus suspension was removed and monolayers were washed three times with
pre-warmed phosphate buffered saline solution (PBS). After the final wash, the fixation
solution consisting of equal volumes of pre-warmed PBS and glutaraldehyde (GA) [2.5% GA
in 0.2 M sodium cacodylate buffer pH 7.35 (Sigma-Aldrich)] was added to the infected cells
and agitated gently on a rocker platform at room temperature. After 30 minutes, the solution
was removed, replaced with second fixation solution (PBS and 2.5% GA) and flasks were

61
returned to the rocker for 90 minutes. The fixation solution was removed and replaced with 10
ml of 0.2 M Na-cacodylate buffer (pH=7.35), cells were harvested by scraping the flask with a
cell scraper, transferred to a 15 ml tube and centrifuged at 1 000 rpm in an Eppendorf
Centrifuge 5810R for 15 minutes. The cells were post-fixed with 1% osmium tetroxide (Sigma-
Aldrich) in 100 mM phosphate buffer for 1-2 hours at 4°C. Cells were dehydrated through an
ascending ethanol series: 50, 70, 90, 95 and 3 x 100% ethanol for 10 minutes each. This step
was followed by resin infiltration with an intermediate transition step of 50:50, 100% ethanol:
acetate or propylene oxide and a final rinse of either 100% acetone or propylene oxide. Cells
were embedded into agar silicone moulds (Agar Scientific, UK) and filled with fresh resin.
Moulds were placed in an oven at 60°C for 36 hours prior to sectioning with ultramicrotome to
obtain thin sections (0.6 µm). The ultra-thin sections were stained with saturated uranyl
acetate (Sigma-Aldrich) solution and examined using a JEOL 1400-Plus transmission electron
microscope, operated at 80 kV.
3.2.4 Viral growth curves
To compare the growth rate of the isolates in cell culture, six isolates of RVFV (from South
Africa) that were analysed in the previous chapter were selected (Chapter 2, Table 2.1).
Isolates from the same tissue but different hosts were selected to include three from the liver
of bovine and three from the liver of a sheep/ovine (Table 3.1). BHK cells grown in 12-well
plates were infected with virus isolates using an MOI of 0.1. Samples were collected at time
intervals (0 minutes, 30 minutes, 6 hours, 24 hours, 48 hours and 72 hours post infection). A
standard plaque assay was performed on Vero cells (Section 3.2.1) to calculate viral titers.
Experiments were done in duplicate.
Table 3.1. Virus isolates used in the study
Virus ID Passage
number
Year
isolated
Organ Species Town/Province of origin
M66/09 3BHK/1Vero 2009 Liver Bovine Modderfontein (GP)
M127/09 1Vero/3BHK 2009 Liver Bovine Cascade (KZN)
M260/09 2Vero/3BHK 2009 Liver Bovine Upington (NC)
M21/10 4BHK 2010 Liver Ovine Bloemfontein (FS)
M33/10 4BHK 2010 Liver Ovine Middelburg (EC)
M247/09 1Vero/3BHK 2009 Liver Ovine Upington (NC)
(These isolates were discussed in more detail in Chapter 1)
62
3.2.5 Immunofluorescence assay
To visualise cells infected with RVFV isolates from the same tissue but from different species,
an immunofluorescence assay was performed. BHK cells were grown in plates on coverslips
until they were 70-90% confluent. Cell monolayers were infected with RVFV isolates at an
MOI of 0.1. Plates were incubated at 37°C and coverslips removed from the plates at different
time intervals (10 minutes, 30 minutes, 1 hour, 24 hours and 48 hours) post infection.
Immediately after collection, cells were fixed with 150 µl of 3% formaldehyde for 30 minutes
at room temperature. At the end of the incubation, formaldehyde was removed, followed by
three washes with PBS at intervals of 5 minutes. Coverslips were dried and kept at 4°C until
used. Primary antibody used was RVFV positive serum collected from sheep infected with
RVFV (kind donation from Dr David Wallace, ARC-OVR). The primary antibody was diluted
with 2% skim milk (in PBS), added to coverslips and incubated for 30 minutes at room
temperature in the dark. This was followed by three washes with PBS and one wash with
water. The secondary antibody anti-sheep IgG (whole molecule)-FITC antibody produced in
rabbit was mixed with Evans Blue (1%) in a ratio 1:1. The mixture was further diluted to 1:100
with 2% milk before adding to the coverslips. Incubation with secondary conjugate was done
for 30 minutes at room temperature. At the end of the incubation, coverslips were washed
twice with PBS and once with water. Coverslips were air-dried and mounted upside-down
(using 0.16 M sodium carbonate buffer and glycerol) on microscopic slides.
Immunofluorescence confocal microscopy images were captured using Zeiss LSM 880
microscope. Coverslips with cells that were not infected with virus were included as negative
controls.
3.2.6 Nucleotides and amino acid sequence alignment
The nucleotide and amino acid sequences of all the three segments of the six isolates and
sequences of the segments of the strain ZH501 were aligned using CLC Genomics
Workbench Version 7.5.1. The alignment parameters used were as follows: gap open cost =
10, gap extension cost = 1.0, end gap cost = as any other and the alignment mode was very
accurate (slow). The nucleotide sequence accession numbers of the different samples have
been discussed in the previous chapter (Section 2.3 and Table 2.1).
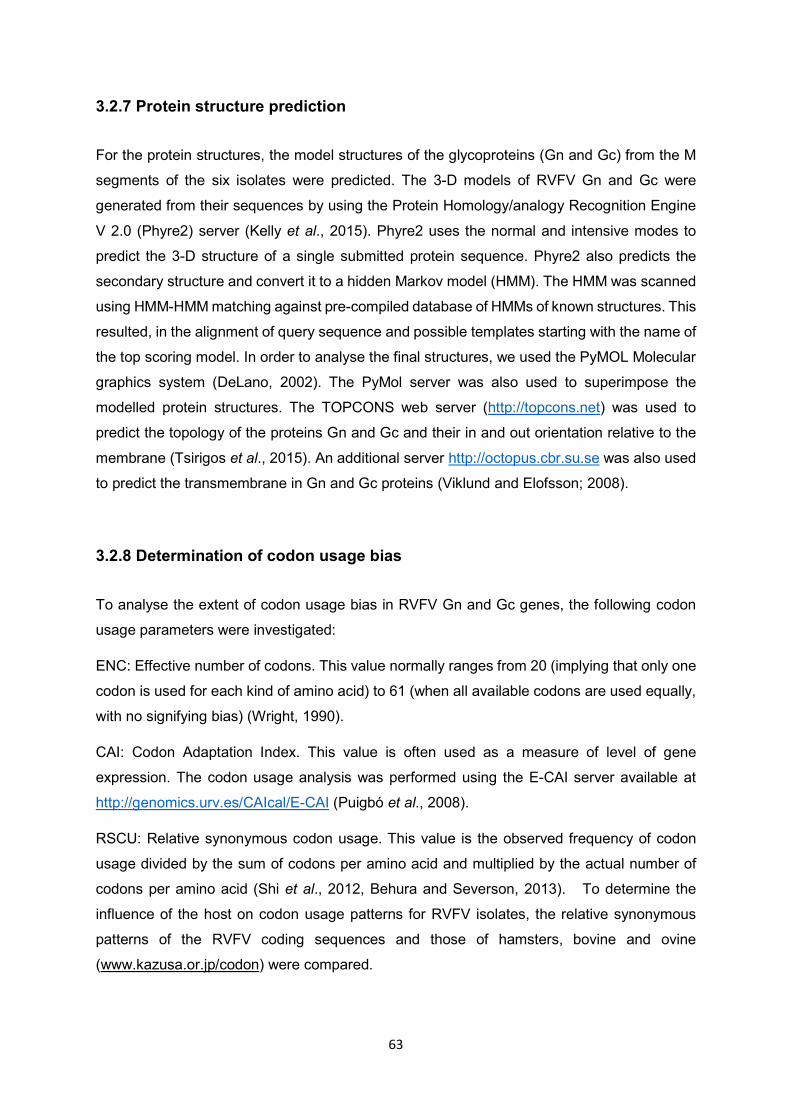
63
3.2.7 Protein structure prediction
For the protein structures, the model structures of the glycoproteins (Gn and Gc) from the M
segments of the six isolates were predicted. The 3-D models of RVFV Gn and Gc were
generated from their sequences by using the Protein Homology/analogy Recognition Engine
V 2.0 (Phyre2) server (Kelly et al., 2015). Phyre2 uses the normal and intensive modes to
predict the 3-D structure of a single submitted protein sequence. Phyre2 also predicts the
secondary structure and convert it to a hidden Markov model (HMM). The HMM was scanned
using HMM-HMM matching against pre-compiled database of HMMs of known structures. This
resulted, in the alignment of query sequence and possible templates starting with the name of
the top scoring model. In order to analyse the final structures, we used the PyMOL Molecular
graphics system (DeLano, 2002). The PyMol server was also used to superimpose the
modelled protein structures. The TOPCONS web server (http://topcons.net) was used to
predict the topology of the proteins Gn and Gc and their in and out orientation relative to the
membrane (Tsirigos et al., 2015). An additional server http://octopus.cbr.su.se was also used
to predict the transmembrane in Gn and Gc proteins (Viklund and Elofsson; 2008).
3.2.8 Determination of codon usage bias
To analyse the extent of codon usage bias in RVFV Gn and Gc genes, the following codon
usage parameters were investigated:
ENC: Effective number of codons. This value normally ranges from 20 (implying that only one
codon is used for each kind of amino acid) to 61 (when all available codons are used equally,
with no signifying bias) (Wright, 1990).
CAI: Codon Adaptation Index. This value is often used as a measure of level of gene
expression. The codon usage analysis was performed using the E-CAI server available at
http://genomics.urv.es/CAIcal/E-CAI (Puigbó et al., 2008).
RSCU: Relative synonymous codon usage. This value is the observed frequency of codon
usage divided by the sum of codons per amino acid and multiplied by the actual number of
codons per amino acid (Shi et al., 2012, Behura and Severson, 2013). To determine the
influence of the host on codon usage patterns for RVFV isolates, the relative synonymous
patterns of the RVFV coding sequences and those of hamsters, bovine and ovine
(www.kazusa.or.jp/codon) were compared.
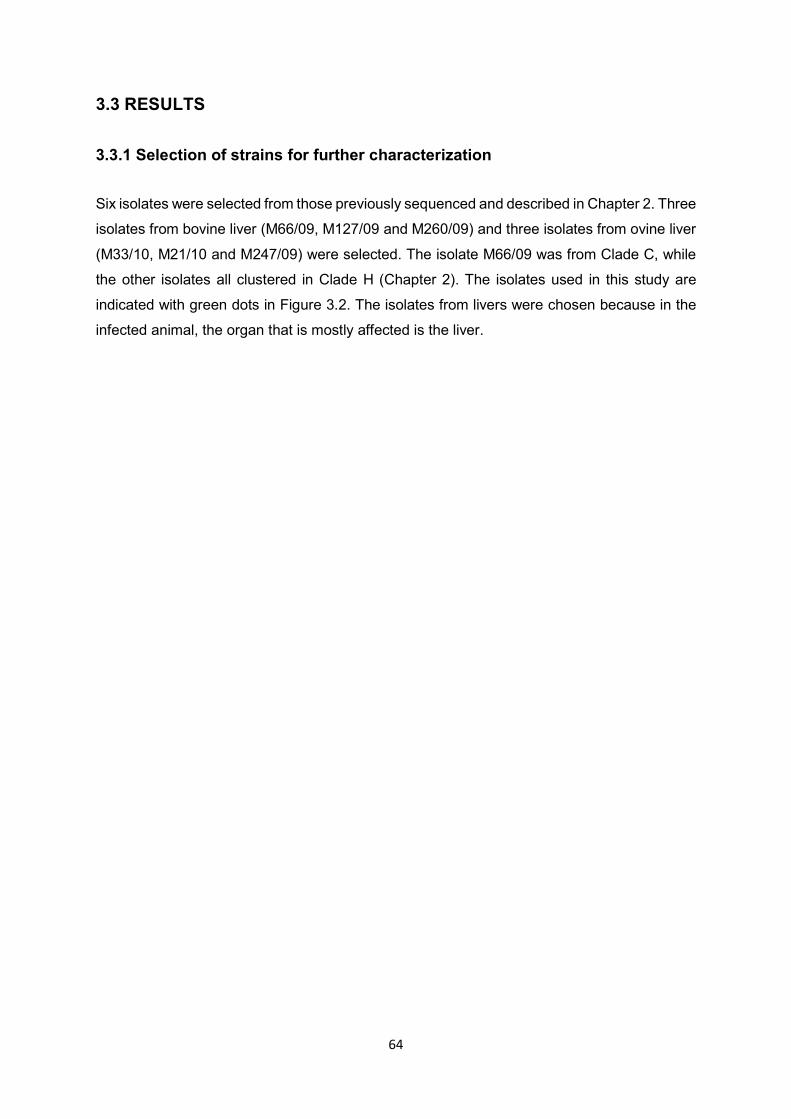
64
3.3 RESULTS
3.3.1 Selection of strains for further characterization
Six isolates were selected from those previously sequenced and described in Chapter 2. Three
isolates from bovine liver (M66/09, M127/09 and M260/09) and three isolates from ovine liver
(M33/10, M21/10 and M247/09) were selected. The isolate M66/09 was from Clade C, while
the other isolates all clustered in Clade H (Chapter 2). The isolates used in this study are
indicated with green dots in Figure 3.2. The isolates from livers were chosen because in the
infected animal, the organ that is mostly affected is the liver.

65
Figure 3.2: Maximum likelihood tree of the M segment (subset of Figure 2.3B). The six isolates used in
this study are indicated with green circle and their origins are indicated in brackets next to their names.
3.3.2 Baby hamster kidney cells infected with RVFV
The morphological changes caused by RVFV on BHK cells are shown in Figure 3.3. The CPE
in all the isolates used were 90-100% after 3 days of infection with RVFV (Figure 3.3). Results
from one isolate (M66/09) are shown in Figure 3.3.
M48 Mad 08 JF311383 Mad Mia 08 M37 RSA MP 08 M39 RSA MP 08
EU574039 Ken Nai 07 EU574033 Ken Bar 07 EU574032 Ken Nai 07
HM586971 Tan 002 07 M66 RSA GP 09 (Bovine)
M80 RSA-2 08 M47 RSA LP 08 M84 RSA GP 08 M85 RSA GP 08 JF311384 Mad Ant 08 EU574074 Ken Mer 07
RSA 2008 - 2009
JQ820488 Sud Gez 85 10 Kenya-2, 2007
JF311381 Mad Ant 91 JF311382 Mad Ant 91
Saudi Arabia 2000 and 2001
C
DQ380198 Ken Rui 21445 83D DQ380221 CAR73HB1230 73
Egypt 1977 and Vaccine MP-12 (A) M127 RSA KZN 09 (Bovine)
M19 RSA FS 10 M260 RSA NC 09 (Bovine)
M33 RSA EC 10 (Ovine) M29 RSA GP 10 M12 RSA GP 10 M16 RSA FS 10 M25 RSA FS 10
M247 RSA NC 09 (Ovine) M06 RSA EC 10
M21 RSA FS 10 (Ovine)Reassortment M259 RSA NC 09
RSA 2009 - 2010 (H)
67
99
64
80
61
62
96
99
99
99
84
99
99
99
70
99
70
62
95
65
57
99
69
0,005
66
Figure 3.3: Cellular morphology of BHK cells examined using light microscopy: A: Uninfected cells. B:
BHK cells 24 hours of post infection with RVFV. C: BHK cells 48 hours post infection with RVFV. D:
BHK cells 72 hours of post infection with RVFV. Bar = 50µm
3.3.3 Confirmation of RVFV particle using TEM and PCR
In order to confirm the morphology of RVFV particle, TEM was used to visualize the virus in
solution using isolate (M66/09). The TEM images showed different shapes of the viral
particles; spherical, roughly and pleomorphic (Figure 3.4A-D). The diameter of the particles
measured ranged from 70 nm to 90 nm (Figure 3.4A). No distortion or broken particles were
observed. The morphology and size of viral particles observed were similar to previously
reports for wild-type RVFV (Freidberg et al., 2008; Gerrard and Nichol, 2007; Martin et al.,
1985).
A B
67
Figure 3.4: Morphology of RVFV particles revealed by negative stain transmission electron microscopy.
A) Measured diameter of the viral particles ranging from 71.34 to 82.91 nm. B) The roughly spherical
shape viral particle is shown. C) Pleomorphic viral particles are shown. D) Different morphologies of
viral particles are shown.
PCR results confirmed that the viral particles were RVFV by amplification of a small portion of
the M segment (330 bp) (data not shown).
3.3.4 Attachment of M66/09 isolate on BHK cells
The rate at which virus isolates attached to cells was determined using TEM to examine
infection at specific time points (0, 8, 16 and 24). An uninfected BHK cell with nucleus is shown
in Figure 3.5A. At 8 minutes post infection, the virus was already inside the cell. After 16
minutes of infection, viral particles were seen inside the cell. Longer incubation of the infected
cells resulted in more viral particles infecting the cell (Figure 3.5B-D).

68
Figure 3.5: Electron micrographs showing BHK cells in the course of infection with RVFV at different
time intervals (MOI of 0.1 in panels B, C and D). Electron micrograph A shows a section of an uninfected
cell. Electron micrograph B shows a section of a cell infected with RVFV after 8 minutes. Electron
micrograph C shows a section of a cell infected with RVFV after 16 minutes of incubation with the virus.
Electron micrograph D shows a section of a cell infected with RVFV after 24 minutes of incubation with
the virus. Each dot represents a viral particle. Bar in A = 1.0 µm while bars in B, C and D = 200.0nm.
3.3.5 Viral growth curves
The growth curves of RVF viruses isolated from different hosts were determined using cell
culture. There were differences between the kinetic growth curves of isolates from bovine
livers compared to isolates from ovine livers. Isolate M66/09 (from bovine) had the highest
growth rate after 42 hours compared to the other bovine isolates followed by M127/09. The
growth curve of isolate M260/09 showed some increase after 24 hours but rising slower than
that of M66/09. Even after 42 hours, the growth rate increased very slow as compared to the
others (Figure 3.6A). Kinetic growth curves of isolates from ovine livers are indicated in Figure
3.6B. Growth curves of the two isolates M21/10 and M247/09 seem to be rising at the same
rate slower than the growth curve of isolate M33/10. At 72 hours the growth curves of the three
isolates seemed to be the same. The titre of both M66/09 and M127/09 was ~107 PFU/ml,
while those for the other isolates were less than 107 PFU/ml. Previous reports indicate that
A
C D
B
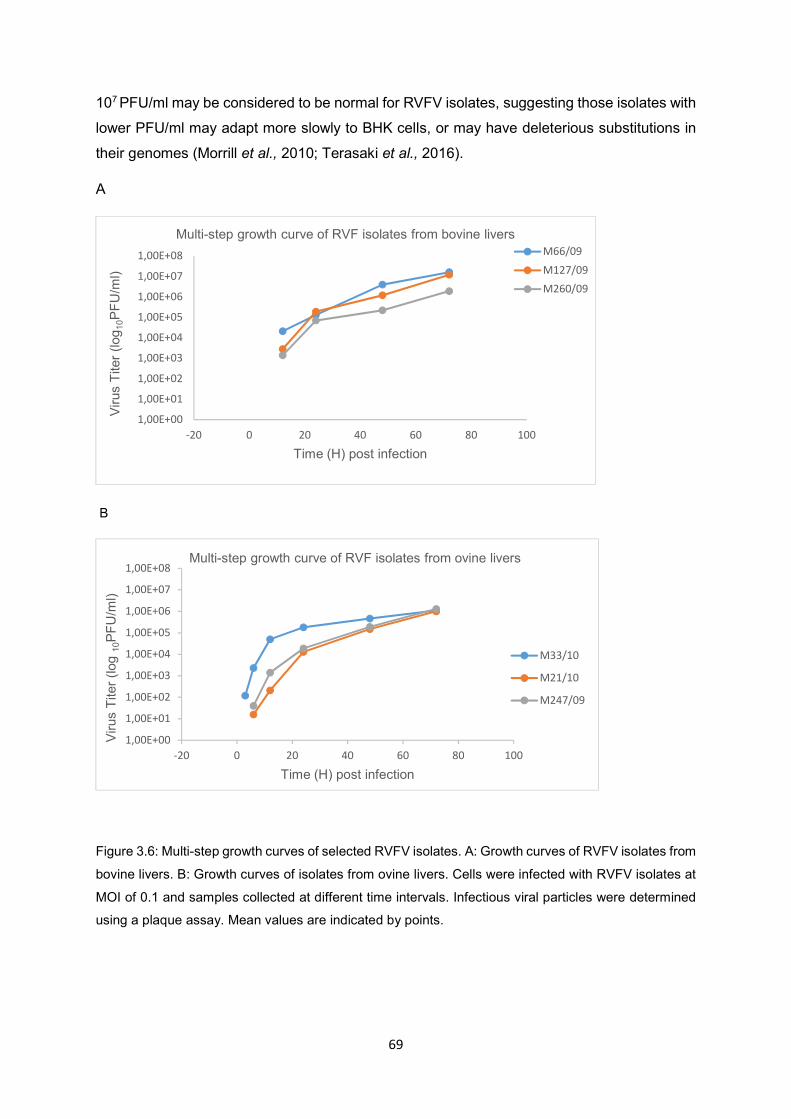
69
107 PFU/ml may be considered to be normal for RVFV isolates, suggesting those isolates with
lower PFU/ml may adapt more slowly to BHK cells, or may have deleterious substitutions in
their genomes (Morrill et al., 2010; Terasaki et al., 2016).
A
B
Figure 3.6: Multi-step growth curves of selected RVFV isolates. A: Growth curves of RVFV isolates from
bovine livers. B: Growth curves of isolates from ovine livers. Cells were infected with RVFV isolates at
MOI of 0.1 and samples collected at different time intervals. Infectious viral particles were determined
using a plaque assay. Mean values are indicated by points.
1,00E+00
1,00E+01
1,00E+02
1,00E+03
1,00E+04
1,00E+05
1,00E+06
1,00E+07
1,00E+08
-20 0 20 40 60 80 100
Vir
us T
iter
(log 1
0PF
U/m
l)
Time (H) post infection
Multi-step growth curve of RVF isolates from bovine liversM66/09
M127/09
M260/09
1,00E+00
1,00E+01
1,00E+02
1,00E+03
1,00E+04
1,00E+05
1,00E+06
1,00E+07
1,00E+08
-20 0 20 40 60 80 100
Vir
us T
iter
(log
10P
FU
/ml)
Time (H) post infection
Multi-step growth curve of RVF isolates from ovine livers
M33/10
M21/10
M247/09

70
3.3.6 Status of infection as visualized by immunofluorescence
The status of BHK cells infected with different isolates from different species was visualized
by using an immunofluorescence assay. No fluorescence resembling any viral particle was
seen in the negative control/mock-infected cells (Figure 3.7). Green fluorescence foci
corresponding to viral particles were clearly visible by the confocal microscopy after 10
minutes of infection in the cells infected with some of the isolates. More viral particles were
seen in cells infected with isolates M66/09, M127/09, M260/09 and M247/09. After 24 hours
post infection, more viral particles were observed in cells infected with isolates M66/09,
M127/09 and M260/09. At 48 hours post infection with these isolates, the majority of the cells
were destroyed (Figure 3.7). An interesting point is that all these isolates were from bovine
livers. Cells infected with M33/10 were also destroyed after this time, but to a lesser extent.
Cells infected with the isolates M21/10, M247/09 were still visible, and their morphology still
intact at 48 hours post infection. Samples collected at 72 hours post infection, did not show
any cells, therefore no images are presented.
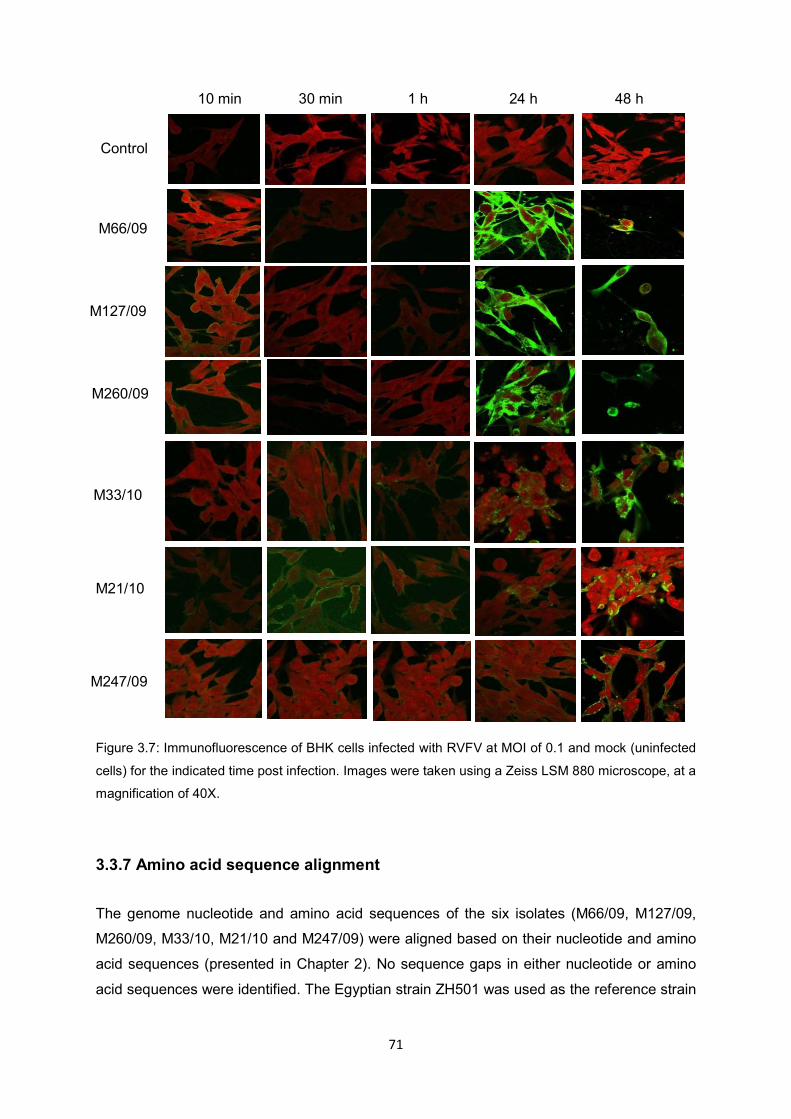
71
Figure 3.7: Immunofluorescence of BHK cells infected with RVFV at MOI of 0.1 and mock (uninfected
cells) for the indicated time post infection. Images were taken using a Zeiss LSM 880 microscope, at a
magnification of 40X.
3.3.7 Amino acid sequence alignment
The genome nucleotide and amino acid sequences of the six isolates (M66/09, M127/09,
M260/09, M33/10, M21/10 and M247/09) were aligned based on their nucleotide and amino
acid sequences (presented in Chapter 2). No sequence gaps in either nucleotide or amino
acid sequences were identified. The Egyptian strain ZH501 was used as the reference strain
Control
M66/09
M127/09
M260/09
M33/10
M21/10
M247/09
10 min 30 min 1 h 24 h 48 h
72
for comparing the amino acid sequences. The six isolates had many amino acid substitutions
in both the L and M segments as compared to the reference strain (Table 3.2). The L segment
of the six field isolates had 14 amino acid substitutions that differ from the reference strain (i.e.
F23Y, V59I, M120T, E177D, S270N, N277D, N278S, D305A, V349I, A663T, G1123S, V1760I,
H1852Y and R1922K). In addition to these substitutions, the M66/09 isolate had 10 unique
amino acid substitutions (A288V, R249K, V302I, D435N, P440L, D446N, R947K, S1667L,
R1926K and T2001A) while M260/09 and M21/10 both had one amino acid substitution (S6Q
and T1683A, respectively). The M segment of the six isolates had seven amino acid
substitutions that differ from ZH501 strain: one in the NSm (I9T), three in the Gn (V450I, I479V,
and V507A) and three in the Gc (D297E, S369T and T441I). In addition to these substitutions,
isolate M127/09 had two amino acid substitutions (I9S and Y74H), isolate M66/09 had five
amino acid substitutions (D95N, D181N, V437I, I443T and I264V), isolates M21/10 and M247
both had one amino acid substitution (M114V and A280T, respectively) while isolate M260/09
had only two amino acid substitutions (C304L and V305C). Only one amino acid substitution
(G159E) from the field isolates differ from that of ZH501 strain in the NP. The NSs of the field
isolates had five amino acid substitutions that differ from the reference strain (F23I, A167V,
V217A, I242V and E251D). In addition, the M66/09 isolate had four unique amino acid
substitutions (K24R, K108R, K202R and E253G) (Table 3.2).
73
Table 3.2. Amino acids substitutions of field isolates as compared to those of the
reference strain ZH501
Segment Amino acid substitutions that differ from ZH501
in all of the isolates
Amino acid substitutions unique to
each isolate
L
F23Y, V59I, M120T, E177D, S270N, N277D,
N278S, D305A, V349I, A663T, G1123S, V1760I,
H1852Y, R1922K
S6Q (M260/09), A288V (M66/09),
R249K (M66/09), V302I (M66/09),
D435N (M66/09), P440L (M66/09),
D446N (M66/09), R947K (M66/09),
S1667L (M66/09), T1683A (M21/10),
R1926K (M66/09), T2001A (M66/09)
M
NSm I9T I9S (M127/09), Y74H (M127/09),
D95N (M66/09)
Gn V450I, I479V, V507A M114V (M21/10), D181N (M66/09),
A280T (M247/09), C304L (M260/09),
V305C (M260/09), V437I (M66/09),
I443T (M66/09)
Gc D297E, S369T, T441I I264V (M66/09)
S
NP G159E None
NSs F23I, A167V, V217A, I242V,E251D K24R (M66/09), K108R (M66/09),
K202R (M66/09, E253G (M66/09)
Substitutions are indicated compared to the reference strain ZH501 with the first amino acid
(IUPAC) referring to the ZH501 strain, the number is the position and the second amino acid
indicate the substitution in the field strain.
The L segment
Given that the L segment shows the largest number of differences between M66/09 and the
other isolates, an analysis of the differences is presented below. Alignment of the
endonuclease domain (residues 1-248) show that all the active site residues are conserved
among all six isolates (Figure 3.8), as well as the Egyptian ZH501 isolate recently
characterized (Holm et al., 2018). Isolate M66/09 and ZH501 share two residues that differ
from those observed in the 5 isolates. Since all isolates are infective and not functional
knockout strains, it is not surprising that all active site residues are conserved. However,
substitutions around the active site (M120T) may lead to sterical hindrance that may impact

74
the rate of replication or transcription and the substitution. The E177D substitution on the other
hand is located distantly from the active site residues and would be considered conserved.
Figure 3.8: Alignment of the endonuclease domain of the polymerase encoded in the L segment
(residues 1-148). Shades in red are the conserved residues involved in activity and metal ion
coordination. Also shaded in black are residues conserved between isolate M66/09 and ZH501 strain
that differ from the other strains (shaded in grey).
For the DUF3770 domain (residues 249-420), M66/09 showed no consistent differences
beyond a S270N substitution also shared with strain ZH501 (Figure 3.9).
ZH501 : M66_09 : M127_09 : M33_10 : M260_09 : M247_09 : M21_10 :
MDSILSKQLVDKTGFVRVPIKHFDCTMLTLALPTFDVSKMVDRITIDFNLDDIQGASEVGSTLLPSMSIDVEDMANFVHDFTFGMDSILSKQLVDKTGFVRVPIKHYDCTMLTLALPTFDVSKMVDRITIDFNLDDIQGASEIGSTLLPSMSIDVEDMANFVHDFTFGMDSILSKQLVDKTGFVRVPIKHYDCTMLTLALPTFDVSKMVDRITIDFNLDDIQGASEIGSTLLPSMSIDVEDMANFVHDFTFGMDSILSKQLVDKTGFVRVPIKHYDCTMLTLALPTFDVSKMVDRITIDFNLDDIQGASEIGSTLLPSMSIDVEDMANFVHDFTFGMDSILQKQLVDKTGFVRVPIKHYDCTMLTLALPTFDVSKMVDRITIDFNLDDIQGASEIGSTLLPSMSIDVEDMANFVHDFTFGMDSILSKQLVDKTGFVRVPIKHYDCTMLTLALPTFDVSKMVDRITIDFNLDDIQGASEIGSTLLPSMSIDVEDMANFVHDFTFGMDSILSKQLVDKTGFVRVPIKHYDCTMLTLALPTFDVSKMVDRITIDFNLDDIQGASEIGSTLLPSMSIDVEDMANFVHDFTFG
ZH501 : M66_09 : M127_09 : M33_10 : M260_09 : M247_09 : M21_10 :
HLADKTDRLLMREFPMMNDGFDHLSPDMIIKTTSGMYNIVEFTTFRGDERGAFQAAMTKLAKYEVPCENRSQGRTVVLYVVSAYHLADKTDRLLMREFPMMNDGFDHLSPDMIIKTTSGMYNIVEFTTFRGDERGAFQAAMTKLAKYEVPCENRSQGRTVVLYVVSAYHLADKTDRLLMREFPMMNDGFDHLSPDMIIKTTSGTYNIVEFTTFRGDERGAFQAAMTKLAKYEVPCENRSQGRTVVLYVVSAYHLADKTDRLLMREFPMMNDGFDHLSPDMIIKTTSGTYNIVEFTTFRGDERGAFQAAMTKLAKYEVPCENRSQGRTVVLYVVSAYHLADKTDRLLMREFPMMNDGFDHLSPDMIIKTTSGTYNIVEFTTFRGDERGAFQAAMTKLAKYEVPCENRSQGRTVVLYVVSAYHLADKTDRLLMREFPMMNDGFDHLSPDMIIKTTSGTYNIVEFTTFRGDERGAFQAAMTKLAKYEVPCENRSQGRTVVLYVVSAYHLADKTDRLLMREFPMMNDGFDHLSPDMIIKTTSGTYNIVEFTTFRGDERGAFQAAMTKLAKYEVPCENRSQGRTVVLYVVSAY
ZH501 : M66_09 : M127_09 : M33_10 : M260_09 : M247_09 : M21_10 :
RHGVWSNLELEDSEAEEMVYRYRLALSVMDELRTLFPELSSTDEELGKTERELLAMVSSIQINWSVTESVFPPFSREMFDRHGVWSNLELEDSEAEEMVYRYRLALSVMDELRTLFPELSSTDEELGKTERELLAMVSSIQINWSVTESVFPPFSREMFDRHGVWSNLDLEDSEAEEMVYRYRLALSVMDELRTLFPELSSTDEELGKTERELLAMVSSIQINWSVTESVFPPFSREMFDRHGVWSNLDLEDSEAEEMVYRYRLALSVMDELRTLFPELSSTDEELGKTERELLAMVSSIQINWSVTESVFPPFSREMFDRHGVWSNLDLEDSEAEEMVYRYRLALSVMDELRTLFPELSSTDEELGKTERELLAMVSSIQINWSVTESVFPPFSREMFDRHGVWSNLDLEDSEAEEMVYRYRLALSVMDELRTLFPELSSTDEELGKTERELLAMVSSIQINWSVTESVFPPFSREMFDRHGVWSNLDLEDSEAEEMVYRYRLALSVMDELRTLFPELSSTDEELGKTERELLAMVSSIQINWSVTESVFPPFSREMFD
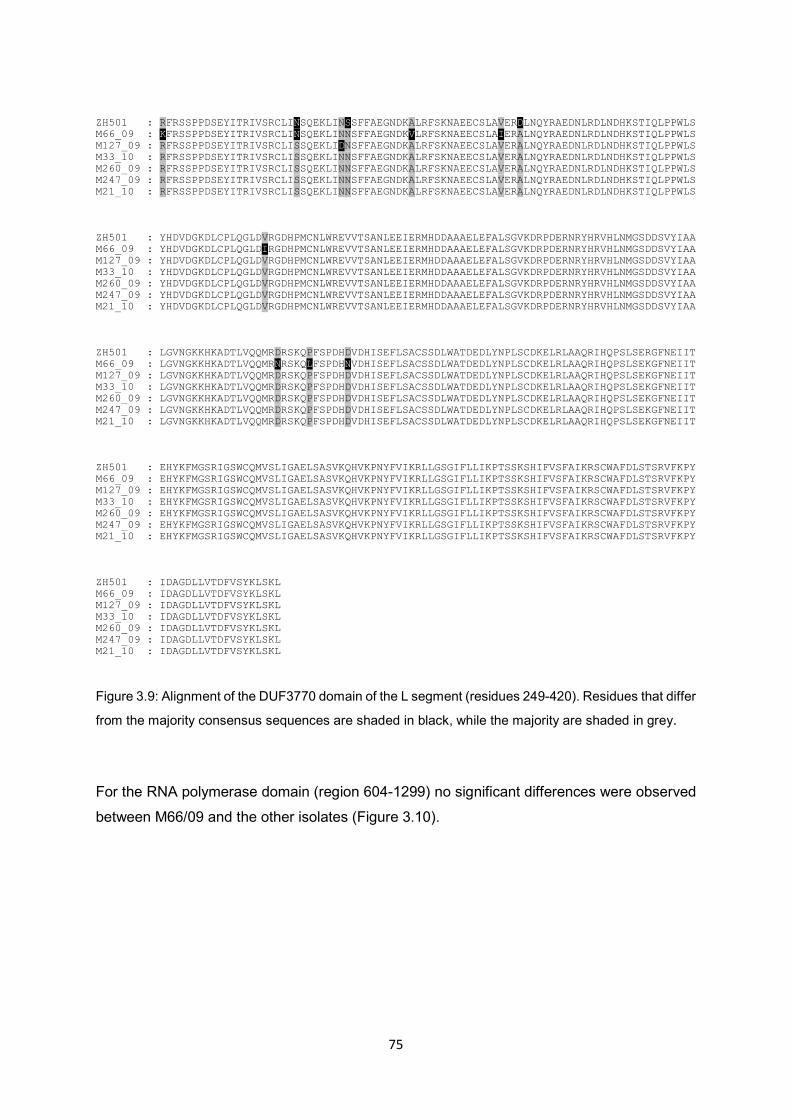
75
Figure 3.9: Alignment of the DUF3770 domain of the L segment (residues 249-420). Residues that differ
from the majority consensus sequences are shaded in black, while the majority are shaded in grey.
For the RNA polymerase domain (region 604-1299) no significant differences were observed
between M66/09 and the other isolates (Figure 3.10).
ZH501 : M66_09 : M127_09 : M33_10 : M260_09 : M247_09 : M21_10 :
RFRSSPPDSEYITRIVSRCLINSQEKLINSSFFAEGNDKALRFSKNAEECSLAVERDLNQYRAEDNLRDLNDHKSTIQLPPWLSKFRSSPPDSEYITRIVSRCLINSQEKLINNSFFAEGNDKVLRFSKNAEECSLAIERALNQYRAEDNLRDLNDHKSTIQLPPWLSRFRSSPPDSEYITRIVSRCLISSQEKLIDNSFFAEGNDKALRFSKNAEECSLAVERALNQYRAEDNLRDLNDHKSTIQLPPWLSRFRSSPPDSEYITRIVSRCLISSQEKLINNSFFAEGNDKALRFSKNAEECSLAVERALNQYRAEDNLRDLNDHKSTIQLPPWLSRFRSSPPDSEYITRIVSRCLISSQEKLINNSFFAEGNDKALRFSKNAEECSLAVERALNQYRAEDNLRDLNDHKSTIQLPPWLSRFRSSPPDSEYITRIVSRCLISSQEKLINNSFFAEGNDKALRFSKNAEECSLAVERALNQYRAEDNLRDLNDHKSTIQLPPWLSRFRSSPPDSEYITRIVSRCLISSQEKLINNSFFAEGNDKALRFSKNAEECSLAVERALNQYRAEDNLRDLNDHKSTIQLPPWLS
ZH501 : M66_09 : M127_09 : M33_10 : M260_09 : M247_09 : M21_10 :
YHDVDGKDLCPLQGLDVRGDHPMCNLWREVVTSANLEEIERMHDDAAAELEFALSGVKDRPDERNRYHRVHLNMGSDDSVYIAAYHDVDGKDLCPLQGLDIRGDHPMCNLWREVVTSANLEEIERMHDDAAAELEFALSGVKDRPDERNRYHRVHLNMGSDDSVYIAAYHDVDGKDLCPLQGLDVRGDHPMCNLWREVVTSANLEEIERMHDDAAAELEFALSGVKDRPDERNRYHRVHLNMGSDDSVYIAAYHDVDGKDLCPLQGLDVRGDHPMCNLWREVVTSANLEEIERMHDDAAAELEFALSGVKDRPDERNRYHRVHLNMGSDDSVYIAAYHDVDGKDLCPLQGLDVRGDHPMCNLWREVVTSANLEEIERMHDDAAAELEFALSGVKDRPDERNRYHRVHLNMGSDDSVYIAAYHDVDGKDLCPLQGLDVRGDHPMCNLWREVVTSANLEEIERMHDDAAAELEFALSGVKDRPDERNRYHRVHLNMGSDDSVYIAAYHDVDGKDLCPLQGLDVRGDHPMCNLWREVVTSANLEEIERMHDDAAAELEFALSGVKDRPDERNRYHRVHLNMGSDDSVYIAA
ZH501 : M66_09 : M127_09 : M33_10 : M260_09 : M247_09 : M21_10 :
LGVNGKKHKADTLVQQMRDRSKQPFSPDHDVDHISEFLSACSSDLWATDEDLYNPLSCDKELRLAAQRIHQPSLSERGFNEIITLGVNGKKHKADTLVQQMRNRSKQLFSPDHNVDHISEFLSACSSDLWATDEDLYNPLSCDKELRLAAQRIHQPSLSEKGFNEIITLGVNGKKHKADTLVQQMRDRSKQPFSPDHDVDHISEFLSACSSDLWATDEDLYNPLSCDKELRLAAQRIHQPSLSEKGFNEIITLGVNGKKHKADTLVQQMRDRSKQPFSPDHDVDHISEFLSACSSDLWATDEDLYNPLSCDKELRLAAQRIHQPSLSEKGFNEIITLGVNGKKHKADTLVQQMRDRSKQPFSPDHDVDHISEFLSACSSDLWATDEDLYNPLSCDKELRLAAQRIHQPSLSEKGFNEIITLGVNGKKHKADTLVQQMRDRSKQPFSPDHDVDHISEFLSACSSDLWATDEDLYNPLSCDKELRLAAQRIHQPSLSEKGFNEIITLGVNGKKHKADTLVQQMRDRSKQPFSPDHDVDHISEFLSACSSDLWATDEDLYNPLSCDKELRLAAQRIHQPSLSEKGFNEIIT
ZH501 : M66_09 : M127_09 : M33_10 : M260_09 : M247_09 : M21_10 :
EHYKFMGSRIGSWCQMVSLIGAELSASVKQHVKPNYFVIKRLLGSGIFLLIKPTSSKSHIFVSFAIKRSCWAFDLSTSRVFKPYEHYKFMGSRIGSWCQMVSLIGAELSASVKQHVKPNYFVIKRLLGSGIFLLIKPTSSKSHIFVSFAIKRSCWAFDLSTSRVFKPYEHYKFMGSRIGSWCQMVSLIGAELSASVKQHVKPNYFVIKRLLGSGIFLLIKPTSSKSHIFVSFAIKRSCWAFDLSTSRVFKPYEHYKFMGSRIGSWCQMVSLIGAELSASVKQHVKPNYFVIKRLLGSGIFLLIKPTSSKSHIFVSFAIKRSCWAFDLSTSRVFKPYEHYKFMGSRIGSWCQMVSLIGAELSASVKQHVKPNYFVIKRLLGSGIFLLIKPTSSKSHIFVSFAIKRSCWAFDLSTSRVFKPYEHYKFMGSRIGSWCQMVSLIGAELSASVKQHVKPNYFVIKRLLGSGIFLLIKPTSSKSHIFVSFAIKRSCWAFDLSTSRVFKPYEHYKFMGSRIGSWCQMVSLIGAELSASVKQHVKPNYFVIKRLLGSGIFLLIKPTSSKSHIFVSFAIKRSCWAFDLSTSRVFKPY
ZH501 : M66_09 : M127_09 : M33_10 : M260_09 : M247_09 : M21_10 :
IDAGDLLVTDFVSYKLSKLIDAGDLLVTDFVSYKLSKLIDAGDLLVTDFVSYKLSKLIDAGDLLVTDFVSYKLSKLIDAGDLLVTDFVSYKLSKLIDAGDLLVTDFVSYKLSKLIDAGDLLVTDFVSYKLSKL

76
Figure 3.10: Alignment of the RNA polymerase domain (region 604-1299). Residues that differ from
the majority consensus are shaded in black, while the majority are shaded in grey.
ZH501 : M66_09 : M127_09 : M33_10 : M260_09 : M247_09 : M21_10 :
TNLCKCVSLMESSFSFWAEAFGIPSWNFVGDLFRSSDSAAMDASYMGKLSLLTLLEDKAATEELQTIARYIIMEGFVSPPEIPKTNLCKCVSLMESSFSFWAEAFGIPSWNFVGDLFRSSDSAAMDASYMGKLSLLTLLEDKATTEELQTIARYIIMEGFVSPPEIPKTNLCKCVSLMESSFSFWAEAFGIPSWNFVGDLFRSSDSAAMDASYMGKLSLLTLLEDKATTEELQTIARYIIMEGFVSPPEIPKTNLCKCVSLMESSFSFWAEAFGIPSWNFVGDLFRSSDSAAMDASYMGKLSLLTLLEDKATTEELQTIARYIIMEGFVSPPEIPKTNLCKCVSLMESSFSFWAEAFGIPSWNFVGDLFRSSDSAAMDASYMGKLSLLTLLEDKATTEELQTIARYIIMEGFVSPPEIPKTNLCKCVSLMESSFSFWAEAFGIPSWNFVGDLFRSSDSAAMDASYMGKLSLLTLLEDKATTEELQTIARYIIMEGFVSPPEIPKTNLCKCVSLMESSFSFWAEAFGIPSWNFVGDLFRSSDSAAMDASYMGKLSLLTLLEDKATTEELQTIARYIIMEGFVSPPEIPK
ZH501 : M66_09 : M127_09 : M33_10 : M260_09 : M247_09 : M21_10 :
PHKMTSKFPKVLRSELQVYLLNCLCRTIQRIAGEPFILKKKDGSISWGGMFNPFSGRPLLDMQPLISCCYNGYFKNKEEETEPSPHKMTSKFPKVLRSELQVYLLNCLCRTIQRIAGEPFILKKKDGSISWGGMFNPFSGRPLLDMQPLISCCYNGYFKNKEEETEPSPHKMTSKFPKVLRSELQVYLLNCLCRTIQRIAGEPFILKKKDGSISWGGMFNPFSGRPLLDMQPLISCCYNGYFKNKEEETEPSPHKMTSKFPKVLRSELQVYLLNCLCRTIQRIAGEPFILKKKDGSISWGGMFNPFSGRPLLDMQPLISCCYNGYFKNKEEETEPSPHKMTSKFPKVLRSELQVYLLNCLCRTIQRIAGEPFILKKKDGSISWGGMFNPFSGRPLLDMQPLISCCYNGYFKNKEEETEPSPHKMTSKFPKVLRSELQVYLLNCLCRTIQRIAGEPFILKKKDGSISWGGMFNPFSGRPLLDMQPLISCCYNGYFKNKEEETEPSPHKMTSKFPKVLRSELQVYLLNCLCRTIQRIAGEPFILKKKDGSISWGGMFNPFSGRPLLDMQPLISCCYNGYFKNKEEETEPS
ZH501 : M66_09 : M127_09 : M33_10 : M260_09 : M247_09 : M21_10 :
SLSGMYKKIIELEHLRPQSDAFLGYKDPELPRMHEFSVSYLKEACNHAKLVLRSLYGQNFMEQIDNQIIRELSGLTLERLATLKSLSGMYKKIIELEHLRPQSDAFLGYKDPELPRMHEFSVSYLKEACNHAKLVLRSLYGQNFMEQIDNQIIRELSGLTLERLATLKSLSGMYKKIIELEHLRPQSDAFLGYKDPELPRMHEFSVSYLKEACNHAKLVLRSLYGQNFMEQIDNQIIRELSGLTLERLATLKSLSGMYKKIIELEHLRPQSDAFLGYKDPELPRMHEFSVSYLKEACNHAKLVLRSLYGQNFMEQIDNQIIRELSGLTLERLATLKSLSGMYKKIIELEHLRPQSDAFLGYKDPELPRMHEFSVSYLKEACNHAKLVLRSLYGQNFMEQIDNQIIRELSGLTLERLATLKSLSGMYKKIIELEHLRPQSDAFLGYKDPELPRMHEFSVSYLKEACNHAKLVLRSLYGQNFMEQIDNQIIRELSGLTLERLATLKSLSGMYKKIIELEHLRPQSDAFLGYKDPELPRMHEFSVSYLKEACNHAKLVLRSLYGQNFMEQIDNQIIRELSGLTLERLATLK
ZH501 : M66_09 : M127_09 : M33_10 : M260_09 : M247_09 : M21_10 :
ATSNFNENWYVYKDVADKNYTRDKLLVKMSKYASEGKSLAIQKFEDCMRQIESQGCMHICLFKKQQHGGLREIYVMGAEERIVQATSNFNENWYVYKDVADKNYTRDKLLVKMSKYASEGKSLAIQKFEDCMRQIESQGCMHICLFKKQQHGGLREIYVMGAEERIVQATSNFNENWYVYKDVADKNYTRDKLLVKMSKYASEGKSLAIQKFEDCMRQIESQGCMHICLFKKQQHGGLREIYVMGAEERIVQATSNFNENWYVYKDVADKNYTRDKLLVKMSKYASEGKSLAIQKFEDCMRQIESQGCMHICLFKKQQHGGLREIYVMGAEERIVQATSNFNENWYVYKDVADKNYTRDKLLVKMSKYASEGKSLAIQKFEDCMRQIESQGCMHICLFKKQQHGGLREIYVMGAEERIVQATSNFNENWYVYKDVADKNYTRDKLLVKMSKYASEGKSLAIQKFEDCMRQIESQGCMHICLFKKQQHGGLREIYVMGAEERIVQATSNFNENWYVYKDVADKNYTRDKLLVKMSKYASEGKSLAIQKFEDCMRQIESQGCMHICLFKKQQHGGLREIYVMGAEERIVQ
ZH501 : M66_09 : M127_09 : M33_10 : M260_09 : M247_09 : M21_10 :
SVVETIARSIGKFFASDTLCNPPNKVKIPETHGIRARKQCKGPVWTCATSDDARKWNQGHFVTKFALMLCEFTSPKWWPLIIRGSVVETIAKSIGKFFASDTLCNPPNKVKIPETHGIRARKQCKGPVWTCATSDDARKWNQGHFVTKFALMLCEFTSPKWWPLIIRGSVVETIARSIGKFFASDTLCNPPNKVKIPETHGIRARKQCKGPVWTCATSDDARKWNQGHFVTKFALMLCEFTSPKWWPLIIRGSVVETIARSIGKFFASDTLCNPPNKVKIPETHGIRARKQCKGPVWTCATSDDARKWNQGHFVTKFALMLCEFTSPKWWPLIIRGSVVETIARSIGKFFASDTLCNPPNKVKIPETHGIRARKQCKGPVWTCATSDDARKWNQGHFVTKFALMLCEFTSPKWWPLIIRGSVVETIARSIGKFFASDTLCNPPNKVKIPETHGIRARKQCKGPVWTCATSDDARKWNQGHFVTKFALMLCEFTSPKWWPLIIRGSVVETIARSIGKFFASDTLCNPPNKVKIPETHGIRARKQCKGPVWTCATSDDARKWNQGHFVTKFALMLCEFTSPKWWPLIIRG
ZH501 : M66_09 : M127_09 : M33_10 : M260_09 : M247_09 : M21_10 :
CSMFTRKRMMMNLNYLKILDGHRELDIRDDFVMDLFKAYHGEAEVPWAFKGKTYLETTTGMMQGILHYTSSLLHTIHQEYIRSLCSMFTRKRMMMNLNYLKILDGHRELDIRDDFVMDLFKAYHGEAEVPWAFKGKTYLETTTGMMQGILHYTSSLLHTIHQEYIRSLCSMFTRKRMMMNLNYLKILDGHRELDIRDDFVMDLFKAYHGEAEVPWAFKGKTYLETTTGMMQGILHYTSSLLHTIHQEYIRSLCSMFTRKRMMMNLNYLKILDGHRELDIRDDFVMDLFKAYHGEAEVPWAFKGKTYLETTTGMMQGILHYTSSLLHTIHQEYIRSLCSMFTRKRMMMNLNYLKILDGHRELDIRDDFVMDLFKAYHGEAEVPWAFKGKTYLETTTGMMQGILHYTSSLLHTIHQEYIRSLCSMFTRKRMMMNLNYLKILDGHRELDIRDDFVMDLFKAYHGEAEVPWAFKGKTYLETTTGMMQGILHYTSSLLHTIHQEYIRSLCSMFTRKRMMMNLNYLKILDGHRELDIRDDFVMDLFKAYHGEAEVPWAFKGKTYLETTTGMMQGILHYTSSLLHTIHQEYIRSL
ZH501 : M66_09 : M127_09 : M33_10 : M260_09 : M247_09 : M21_10 :
SFKIFNLKVAPEMSKGLVCDMMQGSDDSSMLISFPADDEKVLTRCKVAAAICFRMKKELGVYLAIYPSEKSTANTDFVMEYNSESFKIFNLKVAPEMSKSLVCDMMQGSDDSSMLISFPADDEKVLTRCKVAAAICFRMKKELGVYLAIYPSEKSTANTDFVMEYNSESFKIFNLKVAPEMSKSLVCDMMQGSDDSSMLISFPADDEKVLTRCKVAAAICFRMKKELGVYLAIYPSEKSTANTDFVMEYNSESFKIFNLKVAPEMSKSLVCDMMQGSDDSSMLISFPADDEKVLTRCKVAAAICFRMKKELGVYLAIYPSEKSTANTDFVMEYNSESFKIFNLKVAPEMSKSLVCDMMQGSDDSSMLISFPADDEKVLTRCKVAAAICFRMKKELGVYLAIYPSEKSTANTDFVMEYNSESFKIFNLKVAPEMSKSLVCDMMQGSDDSSMLISFPADDEKVLTRCKVAAAICFRMKKELGVYLAIYPSEKSTANTDFVMEYNSESFKIFNLKVAPEMSKSLVCDMMQGSDDSSMLISFPADDEKVLTRCKVAAAICFRMKKELGVYLAIYPSEKSTANTDFVMEYNSE
ZH501 : M66_09 : M127_09 : M33_10 : M260_09 : M247_09 : M21_10 :
FYFHTQHVRPTIRWIAACCSLPEVETLVARQEEASNLMTSVTEGGGSFSLAAMIQQAQCTLHYMLMGMGVSELFLEYKKAVLKWFYFHTQHVRPTIRWIAACCSLPEVETLVARQEEASNLMTSVTEGGGSFSLAAMIQQAQCTLHYMLMGMGVSELFLEYKKAVLKWFYFHTQHVRPTIRWIAACCSLPEVETLVARQEEASNLMTSVTEGGGSFSLAAMIQQAQCTLHYMLMGMGVSELFLEYKKAVLKWFYFHTQHVRPTIRWIAACCSLPEVETLVARQEEASNLMTSVTEGGGSFSLAAMIQQAQCTLHYMLMGMGVSELFLEYKKAVLKWFYFHTQHVRPTIRWIAACCSLPEVETLVARQEEASNLMTSVTEGGGSFSLAAMIQQAQCTLHYMLMGMGVSELFLEYKKAVLKWFYFHTQHVRPTIRWIAACCSLPEVETLVARQEEASNLMTSVTEGGGSFSLAAMIQQAQCTLHYMLMGMGVSELFLEYKKAVLKWFYFHTQHVRPTIRWIAACCSLPEVETLVARQEEASNLMTSVTEGGGSFSLAAMIQQAQCTLHYMLMGMGVSELFLEYKKAVLKW
ZH501 : M66_09 : M127_09 : M33_10 : M260_09 : M247_09 : M21_10 :
NDPGLGFFLLDNPYACGLGGFRFNNDPGLGFFLLDNPYACGLGGFRFNNDPGLGFFLLDNPYACGLGGFRFNNDPGLGFFLLDNPYACGLGGFRFNNDPGLGFFLLDNPYACGLGGFRFNNDPGLGFFLLDNPYACGLGGFRFNNDPGLGFFLLDNPYACGLGGFRFN
77
The undefined C-terminal domain of the L-segment (region 1300-2092) shows only one
potential substitution of interest namely Y1852H, in M66/09 and strain ZH501(Figure 3.11).

78
Figure 3.11: Alignment of the undefined C-terminal domain of the L segment (residues 2300-2092).
Residues that differ from the majority consensus are shaded in black, while the majority are shaded in
grey.
ZH501 : M66_09 : M127_09 : M33_10 : M260_09 : M247_09 : M21_10 :
LFKAITRTDLQKLYAFFMKKVKGSAARDWADEDVTIPETCSVSPGGALILSSSLKWGSRKKFQKLRDRLNIPENWIELINENPELFKAITRTDLQKLYAFFMKKVKGSAARDWADEDITIPETCSVSPGGALILSSSLKWGSRKKFQKLRDRLNIPENWIELINENPELFKAITRTDLQKLYAFFMKKVKGSAARDWADEDVTIPETCSVSPGGALILSSSLKWGSRKKFQKLRDRLNIPENWIELINENPELFKAITRTDLQKLYAFFMKKVKGSAARDWADEDVTIPETCSVSPGGALILSSSLKWGSRKKFQKLRDRLNIPENWIELINENPELFKAITRTDLQKLYAFFMKKVKGSAARDWADEDVTIPETCSVSPGGALILSSSLKWGSRKKFQKLRDRLNIPENWIELINENPELFKAITRTDLQKLYAFFMKKVKGSAARDWADEDVTIPETCSVSPGGALILSSSLKWGSRKKFQKLRDRLNIPENWIELINENPELFKAITRTDLQKLYAFFMKKVKGSAARDWADEDVTIPETCSVSPGGALILSSSLKWGSRKKFQKLRDRLNIPENWIELINENPE
ZH501 : M66_09 : M127_09 : M33_10 : M260_09 : M247_09 : M21_10 :
VLYRAPRTGPEILLRIAEKVHSPGVVSSLSSGNAVCKVMASAVYFLSATIFEDTGRPEFNFLEDSKYSLLQKMAAYSGFHGFNDVLYRAPRTGPEILLRIAEKVHSPGVVSSLSSGNAVCKVMASAVYFLSATIFEDTGRPEFNFLEDSKYSLLQKMAAYSGFHGFNDVLYRAPRTGPEILLRIAEKVHSPGVVSSLSSGNAVCKVMASAVYFLSATIFEDTGRPEFNFLEDSKYSLLQKMAAYSGFHGFNDVLYRAPRTGPEILLRIAEKVHSPGVVSSLSSGNAVCKVMASAVYFLSATIFEDTGRPEFNFLEDSKYSLLQKMAAYSGFHGFNDVLYRAPRTGPEILLRIAEKVHSPGVVSSLSSGNAVCKVMASAVYFLSATIFEDTGRPEFNFLEDSKYSLLQKMAAYSGFHGFNDVLYRAPRTGPEILLRIAEKVHSPGVVSSLSSGNAVCKVMASAVYFLSATIFEDTGRPEFNFLEDSKYSLLQKMAAYSGFHGFNDVLYRAPRTGPEILLRIAEKVHSPGVVSSLSSGNAVCKVMASAVYFLSATIFEDTGRPEFNFLEDSKYSLLQKMAAYSGFHGFND
ZH501 : M66_09 : M127_09 : M33_10 : M260_09 : M247_09 : M21_10 :
MEPEDILFLFPNIEELESLDSIVYNKGEIDIIPRVNIRDATQTRVTIFNEQKTLRTSPEKLVSDKWFGTQKSRIGKTTFLAEWEMEPEDILFLFPNIEELESLDSIVYNKGEIDIIPRVNIRDATQTRVTIFNEQKTLRTSPEKLVSDKWFGTQKSRIGKTTFLAEWEMEPEDILFLFPNIEELESLDSIVYNKGEIDIIPRVNIRDATQTRVTIFNEQKTLRTSPEKLVSDKWFGTQKSRIGKTTFLAEWEMEPEDILFLFPNIEELESLDSIVYNKGEIDIIPRVNIRDATQTRVTIFNEQKTLRTSPEKLVSDKWFGTQKSRIGKTTFLAEWEMEPEDILFLFPNIEELESLDSIVYNKGEIDIIPRVNIRDATQTRVTIFNEQKTLRTSPEKLVSDKWFGTQKSRIGKTTFLAEWEMEPEDILFLFPNIEELESLDSIVYNKGEIDIIPRVNIRDATQTRVTIFNEQKTLRTSPEKLVSDKWFGTQKSRIGKTTFLAEWEMEPEDILFLFPNIEELESLDSIVYNKGEIDIIPRVNIRDATQTRVTIFNEQKTLRTSPEKLVSDKWFGTQKSRIGKTTFLAEWE
ZH501 : M66_09 : M127_09 : M33_10 : M260_09 : M247_09 : M21_10 :
KLKKIVKWLEDTPEATLAHTPLNNHIQVRNFFARMESKPRTVRITGAPVKKRSGVSKIAMVIRDNFSRMGHLRGVEDLAGFTRSKLKKIVKWLEDTPEATLAHTPLNNHIQVRNFFARMESKPRTVRITGAPVKKRSGVSKIAMVIRDNFSRMGHLRGVEDLAGFTRSKLKKIVKWLEDTPEATLAHTPLNNHIQVRNFFARMESKPRTVRITGAPVKKRSGVSKIAMVIRDNFSRMGHLRGVEDLAGFTRSKLKKIVKWLEDTPEATLAHTPLNNHIQVRNFFARMESKPRTVRITGAPVKKRSGVSKIAMVIRDNFSRMGHLRGVEDLAGFTRSKLKKIVKWLEDTPEATLAHTPLNNHIQVRNFFARMESKPRTVRITGAPVKKRSGVSKIAMVIRDNFSRMGHLRGVEDLAGFTRSKLKKIVKWLEDTPEATLAHTPLNNHIQVRNFFARMESKPRTVRITGAPVKKRSGVSKIAMVIRDNFSRMGHLRGVEDLAGFTRSKLKKIVKWLEDTPEATLAHTPLNNHIQVRNFFARMESKPRTVRITGAPVKKRSGVSKIAMVIRDNFSRMGHLRGVEDLAGFTRS
ZH501 : M66_09 : M127_09 : M33_10 : M260_09 : M247_09 : M21_10 :
VSAEILKHFLFCILQGPYSESYKLQLIYRVLSSVSNVEIKESDGKTKTNLIGILQRFLDGDHVVPIIEEMGAGTVGGFIKRQQSVSAEILKHFLFCILQGPYSESYKLQLIYRVLSLVSNVEIKESDGKTKTNLIGILQRFLDGDHVVPIIEEMGAGTVGGFIKRQQSVSAEILKHFLFCILQGPYSESYKLQLIYRVLSSVSNVEIKESDGKTKTNLIGILQRFLDGDHVVPIIEEMGAGTVGGFIKRQQSVSAEILKHFLFCILQGPYSESYKLQLIYRVLSSVSNVEIKESDGKTKTNLIGILQRFLDGDHVVPIIEEMGAGTVGGFIKRQQSVSAEILKHFLFCILQGPYSESYKLQLIYRVLSSVSNVEIKESDGKTKTNLIGILQRFLDGDHVVPIIEEMGAGTVGGFIKRQQSVSAEILKHFLFCILQGPYSESYKLQLIYRVLSSVSNVEIKESDGKTKTNLIGILQRFLDGDHVVPIIEEMGAGTVGGFIKRQQSVSAEILKHFLFCILQGPYSESYKLQLIYRVLSSVSNVEIKESDGKTKANLIGILQRFLDGDHVVPIIEEMGAGTVGGFIKRQQS
ZH501 : M66_09 : M127_09 : M33_10 : M260_09 : M247_09 : M21_10 :
KVVQNKVVYYGVGIWRGFMDGYQVHLEIENDIGQPPRLRNVTTNCQSSPWDLSIPIRQWAEDMGVTNNQDYSSKSSRGARYWMHKVVQNKVVYYGVGIWRGFMDGYQVHLEIENDIGQPPRLRNVTTNCQSSPWDLSIPIRQWAEDMGVTNNQDYSSKSSRGARYWMHKVVQNKVVYYGVGIWRGFMDGYQVHLEIENDIGQPPRLRNITTNCQSSPWDLSIPIRQWAEDMGVTNNQDYSSKSSRGARYWMHKVVQNKVVYYGVGIWRGFMDGYQVHLEIENDIGQPPRLRNITTNCQSSPWDLSIPIRQWAEDMGVTNNQDYSSKSSRGARYWMHKVVQNKVVYYGVGIWRGFMDGYQVHLEIENDIGQPPRLRNITTNCQSSPWDLSIPIRQWAEDMGVTNNQDYSSKSSRGARYWMHKVVQNKVVYYGVGIWRGFMDGYQVHLEIENDIGQPPRLRNITTNCQSSPWDLSIPIRQWAEDMGVTNNQDYSSKSSRGARYWMHKVVQNKVVYYGVGIWRGFMDGYQVHLEIENDIGQPPRLRNITTNCQSSPWDLSIPIRQWAEDMGVTNNQDYSSKSSRGARYWMH
ZH501 : M66_09 : M127_09 : M33_10 : M260_09 : M247_09 : M21_10 :
SFRMQGPSKPFGCPVYIIKGDMSDVIRLRKEEVEMKVRGSTLNLYTKHHSHQDLHILSYTASDNDLSPGIFKSISDEGVAQALQSFRMQGPSKPFGCPVYIIKGDMSDVIRLRKEEVEMKVRGSTLNLYTKHHSHQDLHILSYTASDNDLSPGIFKSISDEGVAQALQSFRMQGPSKPFGCPVYIIKGDMSDVIRLRKEEVEMKVRGSTLNLYTKHYSHQDLHILSYTASDNDLSPGIFKSISDEGVAQALQSFRMQGPSKPFGCPVYIIKGDMSDVIRLRKEEVEMKVRGSTLNLYTKHYSHQDLHILSYTASDNDLSPGIFKSISDEGVAQALQSFRMQGPSKPFGCPVYIIKGDMSDVIRLRKEEVEMKVRGSTLNLYTKHYSHQDLHILSYTASDNDLSPGIFKSISDEGVAQALQSFRMQGPSKPFGCPVYIIKGDMSDVIRLRKEEVEMKVRGSTLNLYTKHYSHQDLHILSYTASDNDLSPGIFKSISDEGVAQALQSFRMQGPSKPFGCPVYIIKGDMSDVIRLRKEEVEMKVRGSTLNLYTKHYSHQDLHILSYTASDNDLSPGIFKSISDEGVAQALQ
ZH501 : M66_09 : M127_09 : M33_10 : M260_09 : M247_09 : M21_10 :
LFEREPSNCWVRCESVAPKFISAILEICEGKRQIRGINRTRLSEIVRICSESSLRSKVGSMFSFVANVEEAHDVDYDALMDLMILFEREPSNCWVRCESVAPKFISAILEICEGKRQIKGINRTRLSEIVRICSESSLRSKVGSMFSFVANVEEAHDVDYDALMDLMILFEREPSNCWVRCESVAPKFISAILEICEGKRQIKGINKTRLSEIVRICSESSLRSKVGSMFSFVANVEEAHDVDYDALMDLMILFEREPSNCWVRCESVAPKFISAILEICEGKRQIKGINKTRLSEIVRICSESSLRSKVGSMFSFVANVEEAHDVDYDALMDLMILFEREPSNCWVRCESVAPKFISAILEICEGKRQIKGINKTRLSEIVRICSESSLRSKVGSMFSFVANVEEAHDVDYDALMDLMILFEREPSNCWVRCESVAPKFISAILEICEGKRQIKGINKTRLSEIVRICSESSLRSKVGSMFSFVANVEEAHDVDYDALMDLMILFEREPSNCWVRCESVAPKFISAILEICEGKRQIKGINKTRLSEIVRICSESSLRSKVGSMFSFVANVEEAHDVDYDALMDLMI
ZH501 : M66_09 : M127_09 : M33_10 : M260_09 : M247_09 : M21_10 :
EDAKNNAFSHVVDCIELDVSGPYEMESFDTSDVNLFGPAHYKDISSLSMIAHPLMDKFVDYAISKMGRASVRKVLETGRCSSKDEDAKNNAFSHVVNCIELDVSGPYEMESFDASDVNLFGPAHYKDISSLSMIAHPLMDKFVDYAISKMGRASVRKVLETGRCSSKDEDAKNNAFSHVVNCIELDVSGPYEMESFDTSDVNLFGPAHYKDISSLSMIAHPLMDKFVDYAISKMGRASVRKVLETGRCSSKDEDAKNNAFSHVVNCIELDVSGPYEMESFDTSDVNLFGPAHYKDISSLSMIAHPLMDKFVDYAISKMGRASVRKVLETGRCSSKDEDAKNNAFSHVVNCIELDVSGPYEMESFDTSDVNLFGPAHYKDISSLSMIAHPLMDKFVDYAISKMGRASVRKVLETGRCSSKDEDAKNNAFSHVVNCIELDVSGPYEMESFDTSDVNLFGPAHYKDISSLSMIAHPLMDKFVDYAISKMGRASVRKVLETGRCSSKDEDAKNNAFSHVVNCIELDVSGPYEMESFDTSDVNLFGPAHYKDISSLSMIAHPLMDKFVDYAISKMGRASVRKVLETGRCSSKD
ZH501 : M66_09 : M127_09 : M33_10 : M260_09 : M247_09 : M21_10 :
YDLSKVLFRTLQRPEESIRIDDLELYEETDVADDMLGYDLSKVLFRTLQRPEESIRIDDLELYEETDVADDMLGYDLSKVLFRTLQRPEESIRIDDLELYEETDVADDMLGYDLSKVLFRTLQRPEESIRIDDLELYEETDVADDMLGYDLSKVLFRTLQRPEESIRIDDLELYEETDVADDMLGYDLSKVLFRTLQRPEESIRIDDLELYEETDVADDMLGYDLSKVLFRTLQRPEESIRIDDLELYEETDVADDMLG
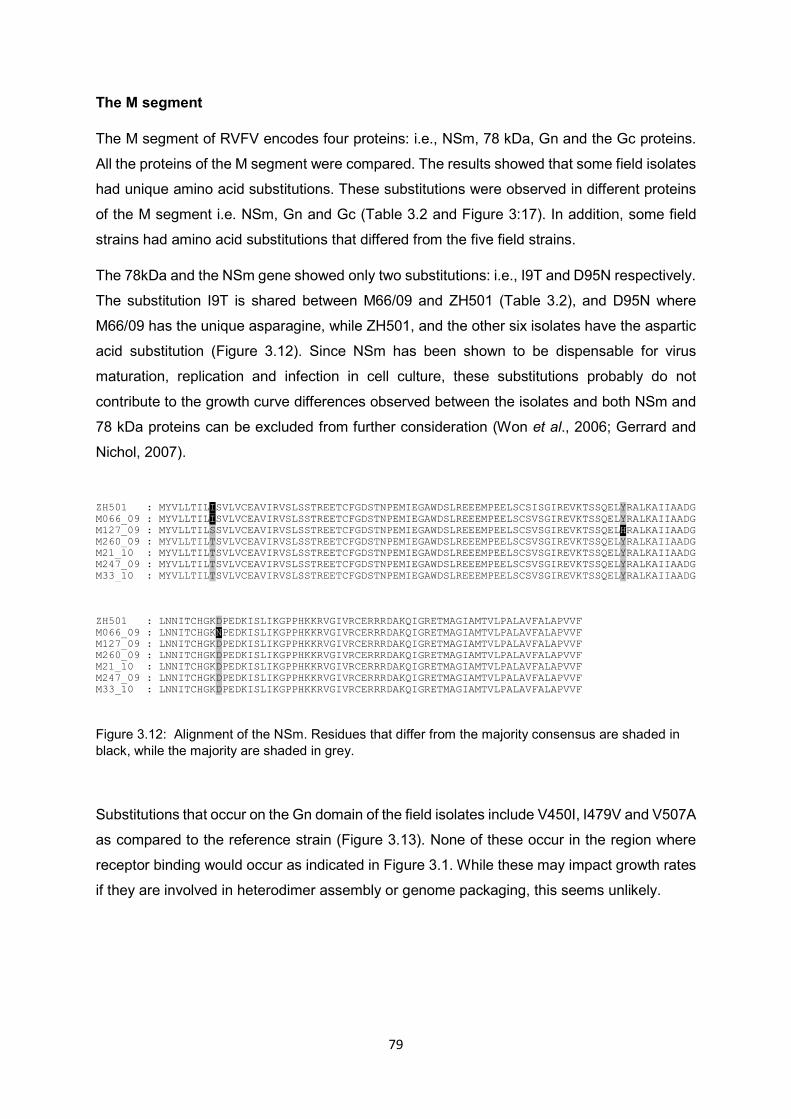
79
The M segment
The M segment of RVFV encodes four proteins: i.e., NSm, 78 kDa, Gn and the Gc proteins.
All the proteins of the M segment were compared. The results showed that some field isolates
had unique amino acid substitutions. These substitutions were observed in different proteins
of the M segment i.e. NSm, Gn and Gc (Table 3.2 and Figure 3:17). In addition, some field
strains had amino acid substitutions that differed from the five field strains.
The 78kDa and the NSm gene showed only two substitutions: i.e., I9T and D95N respectively.
The substitution I9T is shared between M66/09 and ZH501 (Table 3.2), and D95N where
M66/09 has the unique asparagine, while ZH501, and the other six isolates have the aspartic
acid substitution (Figure 3.12). Since NSm has been shown to be dispensable for virus
maturation, replication and infection in cell culture, these substitutions probably do not
contribute to the growth curve differences observed between the isolates and both NSm and
78 kDa proteins can be excluded from further consideration (Won et al., 2006; Gerrard and
Nichol, 2007).
Figure 3.12: Alignment of the NSm. Residues that differ from the majority consensus are shaded in black, while the majority are shaded in grey.
Substitutions that occur on the Gn domain of the field isolates include V450I, I479V and V507A
as compared to the reference strain (Figure 3.13). None of these occur in the region where
receptor binding would occur as indicated in Figure 3.1. While these may impact growth rates
if they are involved in heterodimer assembly or genome packaging, this seems unlikely.
ZH501 : M066_09 : M127_09 : M260_09 : M21_10 : M247_09 : M33_10 :
MYVLLTILISVLVCEAVIRVSLSSTREETCFGDSTNPEMIEGAWDSLREEEMPEELSCSISGIREVKTSSQELYRALKAIIAADGMYVLLTILISVLVCEAVIRVSLSSTREETCFGDSTNPEMIEGAWDSLREEEMPEELSCSVSGIREVKTSSQELYRALKAIIAADGMYVLLTILSSVLVCEAVIRVSLSSTREETCFGDSTNPEMIEGAWDSLREEEMPEELSCSVSGIREVKTSSQELHRALKAIIAADGMYVLLTILTSVLVCEAVIRVSLSSTREETCFGDSTNPEMIEGAWDSLREEEMPEELSCSVSGIREVKTSSQELYRALKAIIAADGMYVLLTILTSVLVCEAVIRVSLSSTREETCFGDSTNPEMIEGAWDSLREEEMPEELSCSVSGIREVKTSSQELYRALKAIIAADGMYVLLTILTSVLVCEAVIRVSLSSTREETCFGDSTNPEMIEGAWDSLREEEMPEELSCSVSGIREVKTSSQELYRALKAIIAADGMYVLLTILTSVLVCEAVIRVSLSSTREETCFGDSTNPEMIEGAWDSLREEEMPEELSCSVSGIREVKTSSQELYRALKAIIAADG
ZH501 : M066_09 : M127_09 : M260_09 : M21_10 : M247_09 : M33_10 :
LNNITCHGKDPEDKISLIKGPPHKKRVGIVRCERRRDAKQIGRETMAGIAMTVLPALAVFALAPVVFLNNITCHGKNPEDKISLIKGPPHKKRVGIVRCERRRDAKQIGRETMAGIAMTVLPALAVFALAPVVFLNNITCHGKDPEDKISLIKGPPHKKRVGIVRCERRRDAKQIGRETMAGIAMTVLPALAVFALAPVVFLNNITCHGKDPEDKISLIKGPPHKKRVGIVRCERRRDAKQIGRETMAGIAMTVLPALAVFALAPVVFLNNITCHGKDPEDKISLIKGPPHKKRVGIVRCERRRDAKQIGRETMAGIAMTVLPALAVFALAPVVFLNNITCHGKDPEDKISLIKGPPHKKRVGIVRCERRRDAKQIGRETMAGIAMTVLPALAVFALAPVVFLNNITCHGKDPEDKISLIKGPPHKKRVGIVRCERRRDAKQIGRETMAGIAMTVLPALAVFALAPVVF
80
Figure 3.13: Alignment of the Gn protein. Residues that differ from the majority consensus are shaded
in black, while the majority are shaded in grey.
ZH501 : M066_09 : M127_09 : M260_09 : M21_10 : M247_09 : M33_10 :
AEDPHLRNRPGKGHNYIDGMTQEDATCKPVTYAGACSSFDVLLEKGKFPLFQSYAHHRTLLEAVHDTIIAKADPPSCDLQSAHGAEDPHLRNRPGKGHNYIDGMTQEDATCKPVTYAGACSSFDVLLEKGKFPLFQSYAHHRTLLEAVHDTIIAKADPPSCDLQSAHGAEDPHLRNRPGKGHNYIDGMTQEDATCKPVTYAGACSSFDVLLEKGKFPLFQSYAHHRTLLEAVHDTIIAKADPPSCDLQSAHGAEDPHLRNRPGKGHNYIDGMTQEDATCKPVTYAGACSSFDVLLEKGKFPLFQSYAHHRTLLEAVHDTIIAKADPPSCDLQSAHGAEDPHLRNRPGKGHNYIDGMTQEDATCKPVTYAGACSSFDVLLEKGKFPLFQSYAHHRTLLEAVHDTIIAKADPPSCDLQSAHGAEDPHLRNRPGKGHNYIDGMTQEDATCKPVTYAGACSSFDVLLEKGKFPLFQSYAHHRTLLEAVHDTIIAKADPPSCDLQSAHGAEDPHLRNRPGKGHNYIDGMTQEDATCKPVTYAGACSSFDVLLEKGKFPLFQSYAHHRTLLEAVHDTIIAKADPPSCDLQSAHG
ZH501 : M066_09 : M127_09 : M260_09 : M21_10 : M247_09 : M33_10 :
NPCMKEKLVMKTHCPNDYQSAHYLNNDGKMASVKCPPKYELTEDCNFCRQMTGASLKKGSYPLQDLFCQSSEDDGSKLKTKMKGNPCMKEKLVMKTHCPNDYQSAHYLNNDGKMASVKCPPKYELTEDCNFCRQMTGASLKKGSYPLQDLFCQSSEDDGSKLKTKMKGNPCMKEKLVMKTHCPNDYQSAHYLNNDGKMASVKCPPKYELTEDCNFCRQMTGASLKKGSYPLQDLFCQSSEDDGSKLKTKMKGNPCMKEKLVMKTHCPNDYQSAHYLNNDGKMASVKCPPKYELTEDCNFCRQMTGASLKKGSYPLQDLFCQSSEDDGSKLKTKMKGNPCMKEKLVMKTHCPNDYQSAHYLNNDGKVASVKCPPKYELTEDCNFCRQMTGASLKKGSYPLQDLFCQSSEDDGSKLKTKMKGNPCMKEKLVMKTHCPNDYQSAHYLNNDGKMASVKCPPKYELTEDCNFCRQMTGASLKKGSYPLQDLFCQSSEDDGSKLKTKMKGNPCMKEKLVMKTHCPNDYQSAHYLNNDGKMASVKCPPKYELTEDCNFCRQMTGASLKKGSYPLQDLFCQSSEDDGSKLKTKMKG
ZH501 : M066_09 : M127_09 : M260_09 : M21_10 : M247_09 : M33_10 :
VCEVGVQALKKCDGQLSTAHEVVPFAVFKNSKKVYLDKLDLKTEENLLPDSFVCFEHKGQYKGTMDSGQTKRELKSFDISQCPKVCEVGVQALKKCNGQLSTAHEVVPFAVFKNSKKVYLDKLDLKTEENLLPDSFVCFEHKGQYKGTMDSGQTKRELKSFDISQCPKVCEVGVQALKKCDGQLSTAHEVVPFAVFKNSKKVYLDKLDLKTEENLLPDSFVCFEHKGQYKGTMDSGQTKRELKSFDISQCPKVCEVGVQALKKCDGQLSTAHEVVPFAVFKNSKKVYLDKLDLKTEENLLPDSFVCFEHKGQYKGTMDSGQTKRELKSFDISQCPKVCEVGVQALKKCDGQLSTAHEVVPFAVFKNSKKVYLDKLDLKTEENLLPDSFVCFEHKGQYKGTMDSGQTKRELKSFDISQCPKVCEVGVQALKKCDGQLSTAHEVVPFAVFKNSKKVYLDKLDLKTEENLLPDSFVCFEHKGQYKGTMDSGQTKRELKSFDISQCPKVCEVGVQALKKCDGQLSTAHEVVPFAVFKNSKKVYLDKLDLKTEENLLPDSFVCFEHKGQYKGTMDSGQTKRELKSFDISQCPK
ZH501 : M066_09 : M127_09 : M260_09 : M21_10 : M247_09 : M33_10 :
IGGHGSKKCTGDAAFCSAYECTAQYANAYCSHANGSGIVQIQVSGVWKKPLCVGYERVVVKRELSAKPIQRVEPCTTCITKCEPIGGHGSKKCTGDAAFCSAYECTAQYANAYCSHANGSGIVQIQVSGVWKKPLCVGYERVVVKRELSAKPIQRVEPCTTCITKCEPIGGHGSKKCTGDAAFCSAYECTAQYANAYCSHANGSGIVQIQVSGVWKKPLCVGYERVVVKRELSAKPIQRVEPCTTCITKCEPIGGHGSKKCTGDAAFCSAYECTAQYANAYCSHANGSGIVQIQVSGVWKKPLLCGYERVVVKRELSAKPIQRVEPCTTCITKCEPIGGHGSKKCTGDAAFCSAYECTAQYANAYCSHANGSGIVQIQVSGVWKKPLCVGYERVVVKRELSAKPIQRVEPCTTCITKCEPIGGHGSKKCTGDAAFCSAYECTAQYANTYCSHANGSGIVQIQVSGVWKKPLCVGYERVVVKRELSAKPIQRVEPCTTCITKCEPIGGHGSKKCTGDAAFCSAYECTAQYANAYCSHANGSGIVQIQVSGVWKKPLCVGYERVVVKRELSAKPIQRVEPCTTCITKCEP
ZH501 : M066_09 : M127_09 : M260_09 : M21_10 : M247_09 : M33_10 :
HGLVVRSTGFKISSAVACASGVCVTGSQSPSTEITLKYPGISQSSGGDIGVHMAHDDQSVSSKIVAHCPPQDPCLVHGCIVCAHHGLVVRSTGFKISSAVACASGVCVTGSQSPSTEITLKYPGISQSSGGDIGVHMAHDDQSVSSKIVAHCPPQDPCLVHGCIVCAHHGLVVRSTGFKISSAVACASGVCVTGSQSPSTEITLKYPGISQSSGGDIGVHMAHDDQSVSSKIVAHCPPQDPCLVHGCIVCAHHGLVVRSTGFKISSAVACASGVCVTGSQSPSTEITLKYPGISQSSGGDIGVHMAHDDQSVSSKIVAHCPPQDPCLVHGCIVCAHHGLVVRSTGFKISSAVACASGVCVTGSQSPSTEITLKYPGISQSSGGDIGVHMAHDDQSVSSKIVAHCPPQDPCLVHGCIVCAHHGLVVRSTGFKISSAVACASGVCVTGSQSPSTEITLKYPGISQSSGGDIGVHMAHDDQSVSSKIVAHCPPQDPCLVHGCIVCAHHGLVVRSTGFKISSAVACASGVCVTGSQSPSTEITLKYPGISQSSGGDIGVHMAHDDQSVSSKIVAHCPPQDPCLVHGCIVCAH
ZH501 : M066_09 : M127_09 : M260_09 : M21_10 : M247_09 : M33_10 :
GLINYQCHTALSAFVVVFVFSSIAIICLAVLYRVLKCLKIAPRKVLNPLMWITAFIRWIYKKMVARVADNINQVNREIGWMEGGGLINYQCHTALSAFVVIFVFSSTAIICLAVLYRVLKCLKIAPRKVLNPLMWITAFIRWVYKKMVARVADNINQVNREIGWMEGGGLINYQCHTALSAFVVVFVFSSIAIICLAILYRVLKCLKIAPRKVLNPLMWITAFIRWVYKKMVARVADNINQVNREIGWMEGGGLINYQCHTALSAFVVVFVFSSIAIICLAILYRVLKCLKIAPRKVLNPLMWITAFIRWVYKKMVARVADNINQVNREIGWMEGGGLINYQCHTALSAFVVVFVFSSIAIICLAILYRVLKCLKIAPRKVLNPLMWITAFIRWVYKKMVARVADNINQVNREIGWMEGGGLINYQCHTALSAFVVVFVFSSIAIICLAILYRVLKCLKIAPRKVLNPLMWITAFIRWVYKKMVARVADNINQVNREIGWMEGGGLINYQCHTALSAFVVVFVFSSIAIICLAILYRVLKCLKIAPRKVLNPLMWITAFIRWVYKKMVARVADNINQVNREIGWMEGG
ZH501 : M066_09 : M127_09 : M260_09 : M21_10 : M247_09 : M33_10 :
QLVLGNPAPIPRHAPIPRYSTYLMLLLIVSYASAQLALGNPAPIPRHAPIPRYSTYLMLLLIVSYASAQLVLGNPAPIPRHAPIPRYSTYLMLLLIVSYASAQLVLGNPAPIPRHAPIPRYSTYLMLLLIVSYASAQLVLGNPAPIPRHAPIPRYSTYLMLLLIVSYASAQLVLGNPAPIPRHAPIPRYSTYLMLLLIVSYASAQLVLGNPAPIPRHAPIPRYSTYLMLLLIVSYASA
81
Substitutions that occur on the Gc domain of the field isolates include D297E, S369T and
T441I as compared to ZH501 strain (Figure 3.14). These positions do not impact fusion loop
function but occur in domain III. These substitutions are not expected to play a major role in
virus entry or host receptor interaction.
Figure 3.14: Alignment of the Gc protein. Residues that differ from the majority consensus are shaded
in black, while the majority are shaded in grey. The fusion loop is indicated with a dark blue box.
ZH501 : M066_09 : M127_09 : M260_09 : M21_10 : M247_09 : M33_10 :
CSELIQASSRITTCSTEGVNTKCRLSGTALIRAGSVGAEACLMLKGVKEDQTKFLKIKTVSSELSCREGQSYWTGSFSPKCLSSCSELIQASSRITTCSTEGVNTKCRLSGTALIRAGSVGAEACLMLKGVKEDQTKFLKIKTVSSELSCREGQSYWTGSFSPKCLSSCSELIQASSRITTCSTEGVNTKCRLSGTALIRAGSVGAEACLMLKGVKEDQTKFLKIKTVSSELSCREGQSYWTGSFSPKCLSSCSELIQASSRITTCSTEGVNTKCRLSGTALIRAGSVGAEACLMLKGVKEDQTKFLKIKTVSSELSCREGQSYWTGSFSPKCLSSCSELIQASSRITTCSTEGVNTKCRLSGTALIRAGSVGAEACLMLKGVKEDQTKFLKIKTVSSELSCREGQSYWTGSFSPKCLSSCSELIQASSRITTCSTEGVNTKCRLSGTALIRAGSVGAEACLMLKGVKEDQTKFLKIKTVSSELSCREGQSYWTGSFSPKCLSSCSELIQASSRITTCSTEGVNTKCRLSGTALIRAGSVGAEACLMLKGVKEDQTKFLKIKTVSSELSCREGQSYWTGSFSPKCLSS
ZH501 : M066_09 : M127_09 : M260_09 : M21_10 : M247_09 : M33_10 :
RRCHLVGECHVNRCLSWRDNETSAEFSFVGESTTMRENKCFEQCGGWGCGCFNVNPSCLFVHTYLQSVRKEALRVFNCIDWVHKRRCHLVGECHVNRCLSWRDNETSAEFSFVGESTTMRENKCFEQCGGWGCGCFNVNPSCLFVHTYLQSVRKEALRVFNCIDWVHKRRCHLVGECHVNRCLSWRDNETSAEFSFVGESTTMRENKCFEQCGGWGCGCFNVNPSCLFVHTYLQSVRKEALRVFNCIDWVHKRRCHLVGECHVNRCLSWRDNETSAEFSFVGESTTMRENKCFEQCGGWGCGCFNVNPSCLFVHTYLQSVRKEALRVFNCIDWVHKRRCHLVGECHVNRCLSWRDNETSAEFSFVGESTTMRENKCFEQCGGWGCGCFNVNPSCLFVHTYLQSVRKEALRVFNCIDWVHKRRCHLVGECHVNRCLSWRDNETSAEFSFVGESTTMRENKCFEQCGGWGCGCFNVNPSCLFVHTYLQSVRKEALRVFNCIDWVHKRRCHLVGECHVNRCLSWRDNETSAEFSFVGESTTMRENKCFEQCGGWGCGCFNVNPSCLFVHTYLQSVRKEALRVFNCIDWVHK
ZH501 : M066_09 : M127_09 : M260_09 : M21_10 : M247_09 : M33_10 :
LTLEITDFDGSVSTIDLGASSSRFTNWGSVSLSLDAEGISGSNSFSFIESPGKGYAIVDEPFSEIPRQGFLGEIRCNSESSVLSLTLEITDFDGSVSTIDLGASSSRFTNWGSVSLSLDAEGISGSNSFSFIESPGKGYAIVDEPFSEIPRQGFLGEIRCNSESSVLSLTLEITDFDGSVSTIDLGASSSRFTNWGSVSLSLDAEGISGSNSFSFIESPGKGYAIVDEPFSEIPRQGFLGEIRCNSESSVLSLTLEITDFDGSVSTIDLGASSSRFTNWGSVSLSLDAEGISGSNSFSFIESPGKGYAIVDEPFSEIPRQGFLGEIRCNSESSVLSLTLEITDFDGSVSTIDLGASSSRFTNWGSVSLSLDAEGISGSNSFSFIESPGKGYAIVDEPFSEIPRQGFLGEIRCNSESSVLSLTLEITDFDGSVSTIDLGASSSRFTNWGSVSLSLDAEGISGSNSFSFIESPGKGYAIVDEPFSEIPRQGFLGEIRCNSESSVLSLTLEITDFDGSVSTIDLGASSSRFTNWGSVSLSLDAEGISGSNSFSFIESPGKGYAIVDEPFSEIPRQGFLGEIRCNSESSVLS
ZH501 : M066_09 : M127_09 : M260_09 : M21_10 : M247_09 : M33_10 :
AHESCLRAPNLISYKPMIDQLECTTNLIDPFVVFERGSLPQTRNDKTFAASKGNRGVQAFSKGSVQADLTLMFDNFEVDFVGAAAHESCLRAPNLVSYKPMIDQLECTTNLIDPFVVFERGSLPQTRNDKTFAASKGNRGVQAFSKGSVQADLTLMFDNFEVDFVGAAAHESCLRAPNLISYKPMIDQLECTTNLIDPFVVFERGSLPQTRNEKTFAASKGNRGVQAFSKGSVQADLTLMFDNFEVDFVGAAAHESCLRAPNLISYKPMIDQLECTTNLIDPFVVFERGSLPQTRNEKTFAASKGNRGVQAFSKGSVQADLTLMFDNFEVDFVGAAAHESCLRAPNLISYKPMIDQLECTTNLIDPFVVFERGSLPQTRNEKTFAASKGNRGVQAFSKGSVQADLTLMFDNFEVDFVGAAAHESCLRAPNLISYKPMIDQLECTTNLIDPFVVFERGSLPQTRNEKTFAASKGNRGVQAFSKGSVQADLTLMFDNFEVDFVGAAAHESCLRAPNLISYKPMIDQLECTTNLIDPFVVFERGSLPQTRNEKTFAASKGNRGVQAFSKGSVQADLTLMFDNFEVDFVGAA
ZH501 : M066_09 : M127_09 : M260_09 : M21_10 : M247_09 : M33_10 :
VSCDAAFLNLTGCYSCNAGARVCLSITSTGTGSLSAHNKDGSLHIVLPSENGTKDQCQILHFTVPEVEEEFMYSCDGDERPLLVVSCDAAFLNLTGCYSCNAGARVCLSITSTGTGTLSAHNKDGSLHIVLPSENGTKDQCQILHFTVPEVEEEFMYSCDGDERPLLVVSCDAAFLNLTGCYSCNAGARVCLSITSTGTGTLSAHNKDGSLHIVLPSENGTKDQCQILHFTVPEVEEEFMYSCDGDERPLLVVSCDAAFLNLTGCYSCNAGARVCLSITSTGTGTLSAHNKDGSLHIVLPSENGTKDQCQILHFTVPEVEEEFMYSCDGDERPLLVVSCDAAFLNLTGCYSCNAGARVCLSITSTGTGTLSAHNKDGSLHIVLPSENGTKDQCQILHFTVPEVEEEFMYSCDGDERPLLVVSCDAAFLNLTGCYSCNAGARVCLSITSTGTGTLSAHNKDGSLHIVLPSENGTKDQCQILHFTVPEVEEEFMYSCDGDERPLLVVSCDAAFLNLTGCYSCNAGARVCLSITSTGTGTLSAHNKDGSLHIVLPSENGTKDQCQILHFTVPEVEEEFMYSCDGDERPLLV
ZH501 : M066_09 : M127_09 : M260_09 : M21_10 : M247_09 : M33_10 :
KGTLIAIDPFDDRREAGGESTVVNPKSGSWNFFDWFSGLMSWFGGPLKTILLICLYVALSIGLFFLLIYLGRTGLSKMWLAATKKGTLIAIDPFDDRREAGGESTVVNPKSGSWNFFDWFSGLMSWFGGPLKTILLICLYVALSIGLFFLLIYLGRTGLSKMWLAATKKGTLIAIDPFDDRREAGGESIVVNPKSGSWNFFDWFSGLMSWFGGPLKTILLICLYVALSIGLFFLLIYLGRTGLSKMWLAATKKGTLIAIDPFDDRREAGGESIVVNPKSGSWNFFDWFSGLMSWFGGPLKTILLICLYVALSIGLFFLLIYLGRTGLSKMWLAATKKGTLIAIDPFDDRREAGGESIVVNPKSGSWNFFDWFSGLMSWFGGPLKTILLICLYVALSIGLFFLLIYLGRTGLSKMWLAATKKGTLIAIDPFDDRREAGGESIVVNPKSGSWNFFDWFSGLMSWFGGPLKTILLICLYVALSIGLFFLLIYLGRTGLSKMWLAATKKGTLIAIDPFDDRREAGGESIVVNPKSGSWNFFDWFSGLMSWFGGPLKTILLICLYVALSIGLFFLLIYLGRTGLSKMWLAATK
ZH501 : M066_09 : M127_09 : M260_09 : M21_10 : M247_09 : M33_10 :
KASKASKASKASKASKASKAS
82
The S segment
The S segment encodes two proteins in opposite directions; the nucleoprotein (NP) and the
non-structural protein (NSs). Only one amino acid substitution (G159E) was found in the NP
of all the six field isolates when compared to the ZH501 reference strain (Figure 3.15).
Figure 3.15: Alignment of the S segment nucleoprotein. Residues that differ from the majority
consensus are shaded in black, while the majority are shaded in grey.
The NSs of the field isolates had five amino acid substitutions (F23I, A167V, V217A, I242V
and E251D) as compared to the reference strain. In addition to these substitutions, M66/09
had four other substitutions (K24R, K108R, K202R and E253G) (Figure 3.16). All substitutions
are conserved and all isolates possess the essential motifs identified for NSs functions. The
substitutions in the S segment would not seem to be adequate to explain the differences
observed in the growth curves. The majority of the substitutions are not linked to any active
site residues. They may affect functions through steric hindrance or long-distance interactions,
but no clear linkage could be found.
ZH501 : M066 : M260 : M247 : M127 : M21 : M33 :
MDNYQELAIQFAAQAVDRNEIEQWVREFAYQGFDARRVIELLKQYGGADWEKDAKKMIVLALTRGNKPRRMMMKMSKEGKATVEALMDNYQELAIQFAAQAVDRNEIEQWVREFAYQGFDARRVIELLKQYGGADWEKDAKKMIVLALTRGNKPRRMMMKMSKEGKATVEALMDNYQELAIQFAAQAVDRNEIEQWVREFAYQGFDARRVIELLKQYGGADWEKDAKKMIVLALTRGNKPRRMMMKMSKEGKATVEALMDNYQELAIQFAAQAVDRNEIEQWVREFAYQGFDARRVIELLKQYGGADWEKDAKKMIVLALTRGNKPRRMMMKMSKEGKATVEALMDNYQELAIQFAAQAVDRNEIEQWVREFAYQGFDARRVIELLKQYGGADWEKDAKKMIVLALTRGNKPRRMMMKMSKEGKATVEALMDNYQELAIQFAAQAVDRNEIEQWVREFAYQGFDARRVIELLKQYGGADWEKDAKKMIVLALTRGNKPRRMMMKMSKEGKATVEALMDNYQELAIQFAAQAVDRNEIEQWVREFAYQGFDARRVIELLKQYGGADWEKDAKKMIVLALTRGNKPRRMMMKMSKEGKATVEAL
ZH501 : M066 : M260 : M247 : M127 : M21 : M33 :
INKYKLKEGNPSRDELTLSRVAAALAGWTCQALVVLSEWLPVTGTTMDGLSPAYPRHMMHPSFAGMVDPSLPGDYLRAILDAHSLYINKYKLKEGNPSRDELTLSRVAAALAGWTCQALVVLSEWLPVTGTTMDGLSPAYPRHMMHPSFAGMVDPSLPEDYLRAILDAHSLYINKYKLKEGNPSRDELTLSRVAAALAGWTCQALVVLSEWLPVTGTTMDGLSPAYPRHMMHPSFAGMVDPSLPEDYLRAILDAHSLYINKYKLKEGNPSRDELTLSRVAAALAGWTCQALVVLSEWLPVTGTTMDGLSPAYPRHMMHPSFAGMVDPSLPEDYLRAILDAHSLYINKYKLKEGNPSRDELTLSRVAAALAGWTCQALVVLSEWLPVTGTTMDGLSPAYPRHMMHPSFAGMVDPSLPEDYLRAILDAHSLYINKYKLKEGNPSRDELTLSRVAAALAGWTCQALVVLSEWLPVTGTTMDGLSPAYPRHMMHPSFAGMVDPSLPEDYLRAILDAHSLYINKYKLKEGNPSRDELTLSRVAAALAGWTCQALVVLSEWLPVTGTTMDGLSPAYPRHMMHPSFAGMVDPSLPEDYLRAILDAHSLY
ZH501 : M066 : M260 : M247 : M127 : M21 : M33 :
LLQFSRVINPNLRGRTKEEVAATFTQPMNAAVNSNFISHEKRREFLKAFGLVDSNGKPSAAVMAAAQAYKTAALLQFSRVINPNLRGRTKEEVAATFTQPMNAAVNSNFISHEKRREFLKAFGLVDSNGKPSAAVMAAAQAYKTAALLQFSRVINPNLRGRTKEEVAATFTQPMNAAVNSNFISHEKRREFLKAFGLVDSNGKPSAAVMAAAQAYKTAALLQFSRVINPNLRGRTKEEVAATFTQPMNAAVNSNFISHEKRREFLKAFGLVDSNGKPSAAVMAAAQAYKTAALLQFSRVINPNLRGRTKEEVAATFTQPMNAAVNSNFISHEKRREFLKAFGLVDSNGKPSAAVMAAAQAYKTAALLQFSRVINPNLRGRTKEEVAATFTQPMNAAVNSNFISHEKRREFLKAFGLVDSNGKPSAAVMAAAQAYKTAALLQFSRVINPNLRGRTKEEVAATFTQPMNAAVNSNFISHEKRREFLKAFGLVDSNGKPSAAVMAAAQAYKTAA
83
Figure 3.16: Alignment of the S segment non-structural protein. Residues that differ from the majority
consensus are shaded in black, while the majority are shaded in grey.
ZH501 : M066 : M127 : M247 : M260 : M21 : M33 :
MDYFPVISVDLQSGRRVVSVEYFRGDGPPRIPYSMVGPCCVFLMHHRPSHEVRLRFSDFYNVGEFPYRVGLGDFASNVAPPPAKPFMDYFPVISVDLQSGRRVVSVEYIKGDGPPRIPYSMVGPCCVFLMHHRPSHEVRLRFSDFYNVGEFPYRVGLGDFASNVAPPPAKPFMDYFPVISVDLQSGRRVVSVEYIRGDGPPRIPYSMVGPCCVFLMHHRPSHEVRLRFSDFYNVGEFPYRVGLGDFASNVAPPPAKPFMDYFPVISVDLQSGRRVVSVEYIRGDGPPRIPYSMVGPCCVFLMHHRPSHEVRLRFSDFYNVGEFPYRVGLGDFASNVAPPPAKPFMDYFPVISVDLQSGRRVVSVEYIRGDGPPRIPYSMVGPCCVFLMHHRPSHEVRLRFSDFYNVGEFPYRVGLGDFASNVAPPPAKPFMDYFPVISVDLQSGRRVVSVEYIRGDGPPRIPYSMVGPCCVFLMHHRPSHEVRLRFSDFYNVGEFPYRVGLGDFASNVAPPPAKPFMDYFPVISVDLQSGRRVVSVEYIRGDGPPRIPYSMVGPCCVFLMHHRPSHEVRLRFSDFYNVGEFPYRVGLGDFASNVAPPPAKPF
ZH501 : M066 : M127 : M247 : M260 : M21 : M33 :
QRLIDLIGHMTLSDFTRFPNLKEAISWPLGEPSLAFFDLSSTRVHRNDDIRRDQIATLAMRSCKITNDLEDSFVGLHRMIATEAILQRLIDLIGHMTLSDFTRFPNLREAISWPLGEPSLAFFDLSSTRVHRNDDIRRDQIATLAMRSCKITNDLEDSFVGLHRMIVTEAILQRLIDLIGHMTLSDFTRFPNLKEAISWPLGEPSLAFFDLSSTRVHRNDDIRRDQIATLAMRSCKITNDLEDSFVGLHRMIVTEAILQRLIDLIGHMTLSDFTRFPNLKEAISWPLGEPSLAFFDLSSTRVHRNDDIRRDQIATLAMRSCKITNDLEDSFVGLHRMIVTEAILQRLIDLIGHMTLSDFTRFPNLKEAISWPLGEPSLAFFDLSSTRVHRNDDIRRDQIATLAMRSCKITNDLEDSFVGLHRMIVTEAILQRLIDLIGHMTLSDFTRFPNLKEAISWPLGEPSLAFFDLSSTRVHRNDDIRRDQIATLAMRSCKITNDLEDSFVGLHRMIVTEAILQRLIDLIGHMTLSDFTRFPNLKEAISWPLGEPSLAFFDLSSTRVHRNDDIRRDQIATLAMRSCKITNDLEDSFVGLHRMIVTEAIL
ZH501 : M066 : M127 : M247 : M260 : M21 : M33 :
RGIDLCLLPGFDLMYEVAHVQCVRLLQAAKEDISNAVVPNSALIVLMEESLMLRSSLPSMMGRNNWIPVIPPIPDVEMESEEESDDRGIDLCLLPGFDLMYEVAHVQCVRLLQAAREDISNAVVPNSALIALMEESLMLRSSLPSMMGRNNWIPVVPPIPDVEMESGEESDDRGIDLCLLPGFDLMYEVAHVQCVRLLQAAKEDISNAVVPNSALIALMEESLMLRSSLPSMMGRNNWIPVVPPIPDVEMDSEEESDDRGIDLCLLPGFDLMYEVAHVQCVRLLQAAKEDISNAVVPNSALIALMEESLMLRSSLPSMMGRNNWIPVVPPIPDVEMDSEEESDDRGIDLCLLPGFDLMYEVAHVQCVRLLQAAKEDISNAVVPNSALIALMEESLMLRSSLPSMMGRNNWIPVVPPIPDVEMDSEEESDDRGIDLCLLPGFDLMYEVAHVQCVRLLQAAKEDISNAVVPNSALIALMEESLMLRSSLPSMMGRNNWIPVVPPIPDVEMDSEEESDDRGIDLCLLPGFDLMYEVAHVQCVRLLQAAKEDISNAVVPNSALIALMEESLMLRSSLPSMMGRNNWIPVVPPIPDVEMDSEEESDD
ZH501 : M066 : M127 : M247 : M260 : M21 : M33 :
DGFVEVDDGFVEVDDGFVEVDDGFVEVDDGFVEVDDGFVEVDDGFVEVD
84
Figure 3.17: Welling antigenicity plots of the six isolates for the M segment. Differences in amino acids between these isolates are indicated on top of the
plots. The lines show the positions where major amino acid changes are observed.
9: I
= S
< T
74
: H <
Y
95
: N <
D
333:
N <
D
432:
T <
A
45
4: L
< C
455:
C <
V
58
9: I
< V
59
5: T
< I
602:
V <
I
65
9: A
< V
954
: V <
I
987:
D <
E
11
31: T
< I
-0,2
-0,15
-0,1
-0,05
0
0,05
0,1
0,15
1 29 54 79 104
129
154
179
204
229
254
279
304
329
354
379
404
429
454
479
504
529
554
579
604
629
654
679
704
729
754
779
804
829
854
879
904
929
954
979
1004
1029
1054
1079
1104
1129
1154
1179
1204
1229
1254
1279
M66/09 M127/09 M260/09 M21/10 M33/10 M247/09
0
0,05
0,1
0,15
0,2
0,25
0,3
0,35
1 25 49 73 97 121
145
169
193
217
241
265
289
313
337
361
385
409
433
457
481
505
529
553
577
601
625
649
673
697
721
745
769
793
817
841
865
889
913
937
961
985
1009
1033
1057
1081
1105
1129
1153
1177
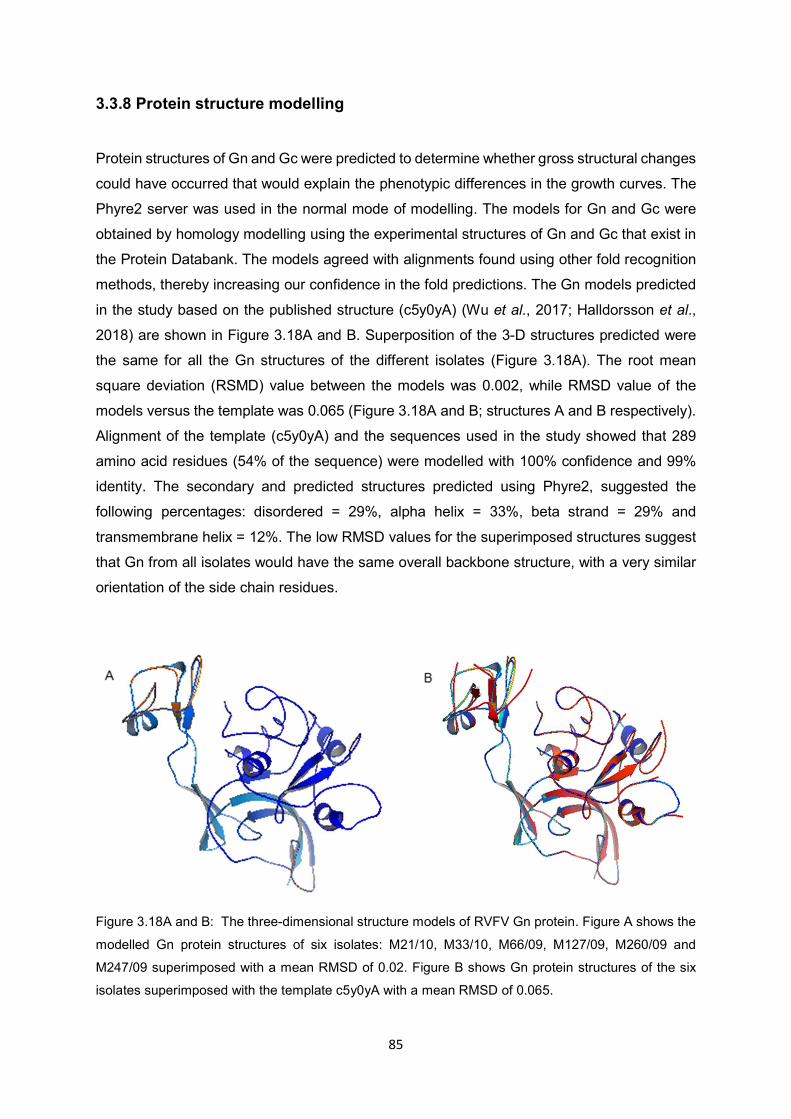
85
3.3.8 Protein structure modelling
Protein structures of Gn and Gc were predicted to determine whether gross structural changes
could have occurred that would explain the phenotypic differences in the growth curves. The
Phyre2 server was used in the normal mode of modelling. The models for Gn and Gc were
obtained by homology modelling using the experimental structures of Gn and Gc that exist in
the Protein Databank. The models agreed with alignments found using other fold recognition
methods, thereby increasing our confidence in the fold predictions. The Gn models predicted
in the study based on the published structure (c5y0yA) (Wu et al., 2017; Halldorsson et al.,
2018) are shown in Figure 3.18A and B. Superposition of the 3-D structures predicted were
the same for all the Gn structures of the different isolates (Figure 3.18A). The root mean
square deviation (RSMD) value between the models was 0.002, while RMSD value of the
models versus the template was 0.065 (Figure 3.18A and B; structures A and B respectively).
Alignment of the template (c5y0yA) and the sequences used in the study showed that 289
amino acid residues (54% of the sequence) were modelled with 100% confidence and 99%
identity. The secondary and predicted structures predicted using Phyre2, suggested the
following percentages: disordered = 29%, alpha helix = 33%, beta strand = 29% and
transmembrane helix = 12%. The low RMSD values for the superimposed structures suggest
that Gn from all isolates would have the same overall backbone structure, with a very similar
orientation of the side chain residues.
Figure 3.18A and B: The three-dimensional structure models of RVFV Gn protein. Figure A shows the
modelled Gn protein structures of six isolates: M21/10, M33/10, M66/09, M127/09, M260/09 and
M247/09 superimposed with a mean RMSD of 0.02. Figure B shows Gn protein structures of the six
isolates superimposed with the template c5y0yA with a mean RMSD of 0.065.
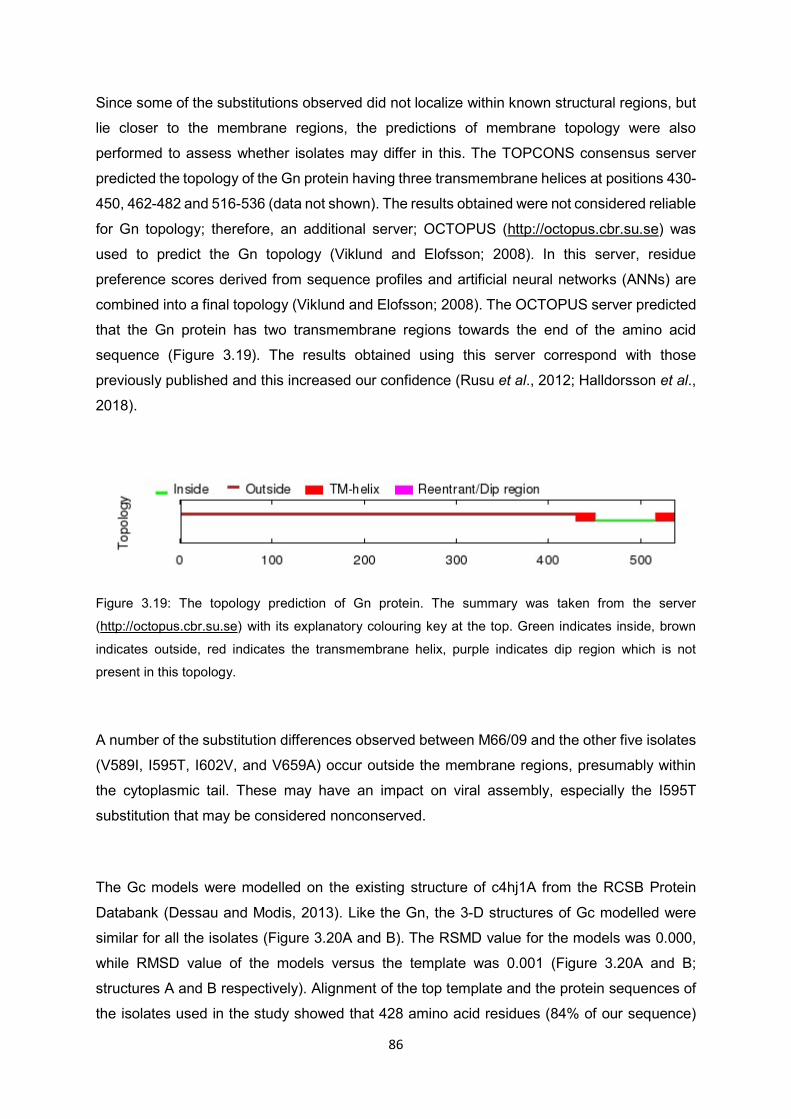
86
Since some of the substitutions observed did not localize within known structural regions, but
lie closer to the membrane regions, the predictions of membrane topology were also
performed to assess whether isolates may differ in this. The TOPCONS consensus server
predicted the topology of the Gn protein having three transmembrane helices at positions 430-
450, 462-482 and 516-536 (data not shown). The results obtained were not considered reliable
for Gn topology; therefore, an additional server; OCTOPUS (http://octopus.cbr.su.se) was
used to predict the Gn topology (Viklund and Elofsson; 2008). In this server, residue
preference scores derived from sequence profiles and artificial neural networks (ANNs) are
combined into a final topology (Viklund and Elofsson; 2008). The OCTOPUS server predicted
that the Gn protein has two transmembrane regions towards the end of the amino acid
sequence (Figure 3.19). The results obtained using this server correspond with those
previously published and this increased our confidence (Rusu et al., 2012; Halldorsson et al.,
2018).
Figure 3.19: The topology prediction of Gn protein. The summary was taken from the server
(http://octopus.cbr.su.se) with its explanatory colouring key at the top. Green indicates inside, brown
indicates outside, red indicates the transmembrane helix, purple indicates dip region which is not
present in this topology.
A number of the substitution differences observed between M66/09 and the other five isolates
(V589I, I595T, I602V, and V659A) occur outside the membrane regions, presumably within
the cytoplasmic tail. These may have an impact on viral assembly, especially the I595T
substitution that may be considered nonconserved.
The Gc models were modelled on the existing structure of c4hj1A from the RCSB Protein
Databank (Dessau and Modis, 2013). Like the Gn, the 3-D structures of Gc modelled were
similar for all the isolates (Figure 3.20A and B). The RSMD value for the models was 0.000,
while RMSD value of the models versus the template was 0.001 (Figure 3.20A and B;
structures A and B respectively). Alignment of the top template and the protein sequences of
the isolates used in the study showed that 428 amino acid residues (84% of our sequence)
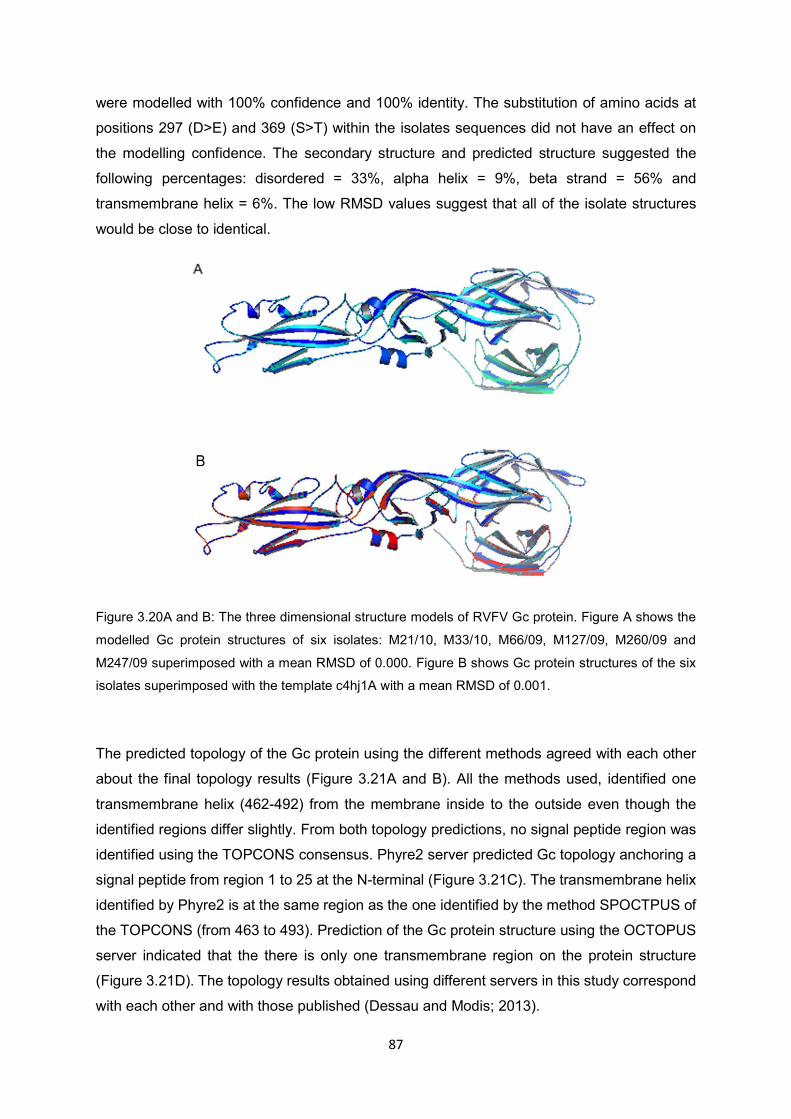
87
were modelled with 100% confidence and 100% identity. The substitution of amino acids at
positions 297 (D>E) and 369 (S>T) within the isolates sequences did not have an effect on
the modelling confidence. The secondary structure and predicted structure suggested the
following percentages: disordered = 33%, alpha helix = 9%, beta strand = 56% and
transmembrane helix = 6%. The low RMSD values suggest that all of the isolate structures
would be close to identical.
Figure 3.20A and B: The three dimensional structure models of RVFV Gc protein. Figure A shows the
modelled Gc protein structures of six isolates: M21/10, M33/10, M66/09, M127/09, M260/09 and
M247/09 superimposed with a mean RMSD of 0.000. Figure B shows Gc protein structures of the six
isolates superimposed with the template c4hj1A with a mean RMSD of 0.001.
The predicted topology of the Gc protein using the different methods agreed with each other
about the final topology results (Figure 3.21A and B). All the methods used, identified one
transmembrane helix (462-492) from the membrane inside to the outside even though the
identified regions differ slightly. From both topology predictions, no signal peptide region was
identified using the TOPCONS consensus. Phyre2 server predicted Gc topology anchoring a
signal peptide from region 1 to 25 at the N-terminal (Figure 3.21C). The transmembrane helix
identified by Phyre2 is at the same region as the one identified by the method SPOCTPUS of
the TOPCONS (from 463 to 493). Prediction of the Gc protein structure using the OCTOPUS
server indicated that the there is only one transmembrane region on the protein structure
(Figure 3.21D). The topology results obtained using different servers in this study correspond
with each other and with those published (Dessau and Modis; 2013).
88
All substitution differences between M66/09 and the other five isolates occur on the external
domain and not in the cytoplasmic tail as predicted by the topology server. Beyond the
potential amino acid differences in the cytoplasmic tails, structural modelling did not suggest
that the three-dimensional structures would differ significantly. Since these are static models,
they may not reveal substitutions that have a destabilizing effect on the structures.
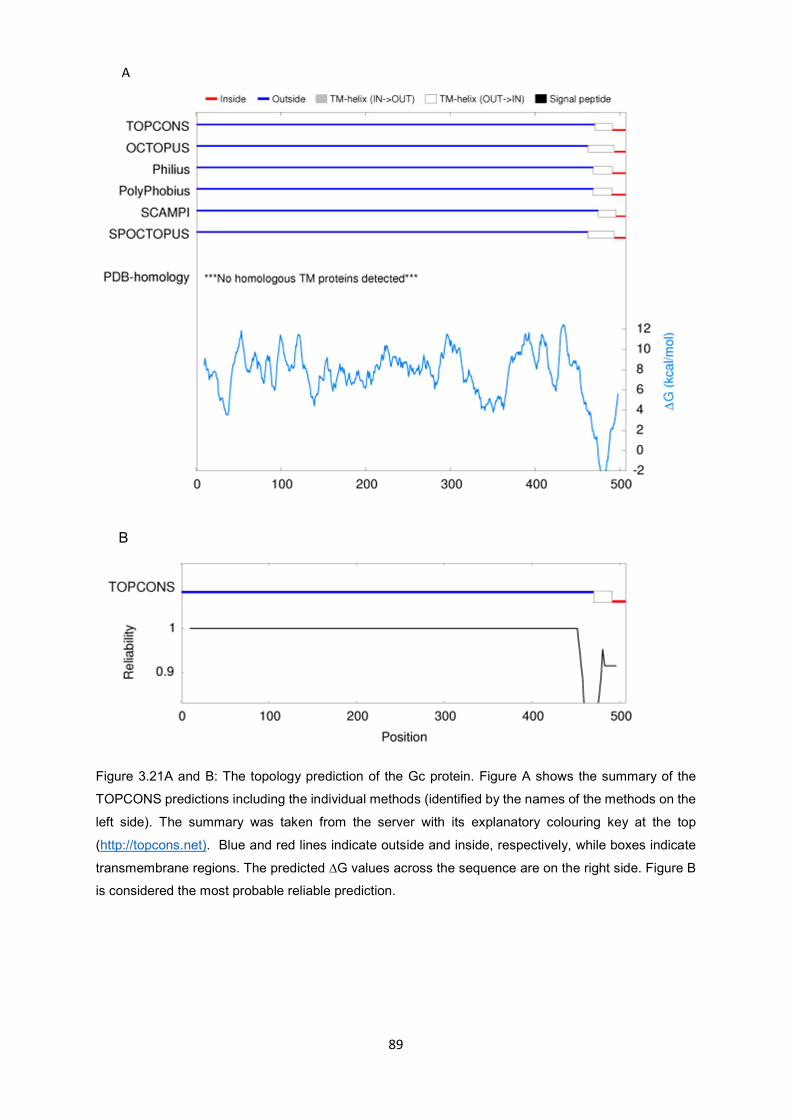
89
Figure 3.21A and B: The topology prediction of the Gc protein. Figure A shows the summary of the
TOPCONS predictions including the individual methods (identified by the names of the methods on the
left side). The summary was taken from the server with its explanatory colouring key at the top
(http://topcons.net). Blue and red lines indicate outside and inside, respectively, while boxes indicate
transmembrane regions. The predicted ∆G values across the sequence are on the right side. Figure B
is considered the most probable reliable prediction.
BA
AA
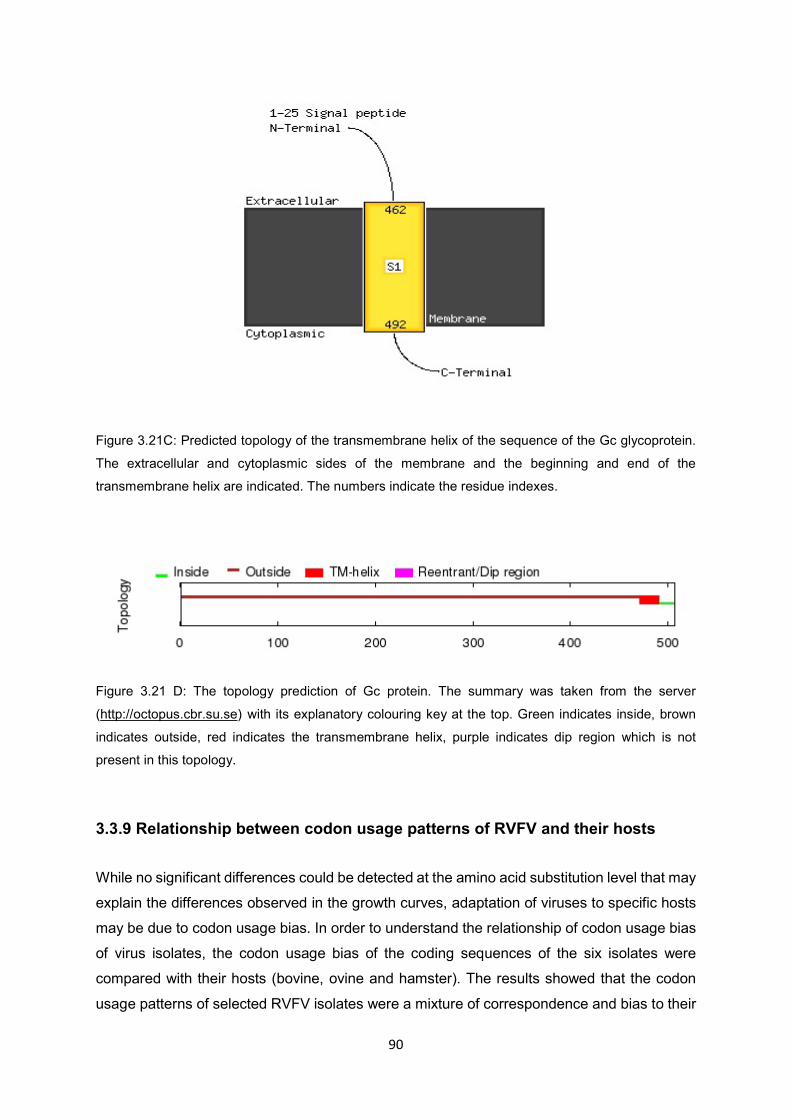
90
Figure 3.21C: Predicted topology of the transmembrane helix of the sequence of the Gc glycoprotein.
The extracellular and cytoplasmic sides of the membrane and the beginning and end of the
transmembrane helix are indicated. The numbers indicate the residue indexes.
Figure 3.21 D: The topology prediction of Gc protein. The summary was taken from the server
(http://octopus.cbr.su.se) with its explanatory colouring key at the top. Green indicates inside, brown
indicates outside, red indicates the transmembrane helix, purple indicates dip region which is not
present in this topology.
3.3.9 Relationship between codon usage patterns of RVFV and their hosts
While no significant differences could be detected at the amino acid substitution level that may
explain the differences observed in the growth curves, adaptation of viruses to specific hosts
may be due to codon usage bias. In order to understand the relationship of codon usage bias
of virus isolates, the codon usage bias of the coding sequences of the six isolates were
compared with their hosts (bovine, ovine and hamster). The results showed that the codon
usage patterns of selected RVFV isolates were a mixture of correspondence and bias to their

91
hosts; which means that some codon usage patterns of the isolates correspond with those of
the hosts (15.3%), while others were not corresponding (49%) (Table 3.3). All host codon
preferences were similar between bovine, ovine and hamster, except for CAU (His) that
showed a much higher prevalence in sheep. However, no difference for codon usage for this
codon was observed between the isolates. The preferred codons for 9 out of the 38 were
common for selected RVFV and its hosts. These included CUG (Leu), GUG (Val), AGC (Ser),
ACC (Thr), CAG (Gln), AAC (Asn), UGC (Cys), CGC (Arg) and GGC (Gly). All common
preferred codons between isolates and their hosts were G/C-ended (three ending with G and
six ending with C). All the preferred codons were the same for all isolates. Codons that differed
in usage between virus and host, included UUU (Phe) preferred by the isolates and UUC (Phe)
preferred by the hosts. The same is seen for CCG (Pro) preferred by the isolates, while CCU,
CCC and CCA (Pro) are preferred by the hosts. Similarly, GCG (Ala) is preferred by the
isolates, while GCU and GCC (Ala) are preferred by the hosts.
Isolates also preferred UAU (Tyr), while the hosts preferred UAC (Tyr). Isolates preferred CAU
(His) and AAA (Lys), while hosts preferred CAC (His) and AAG (Lys). Isolates also preferred
GAU (Asp) and GAA (Glu), while hosts preferred GAC (Asp) and GAG (Glu). While no clear
codon bias differences on preferences is evident between isolates and their respective hosts,
it may still be possible that the subtle differences that exist between isolates could impact on
translation efficiency in the host.
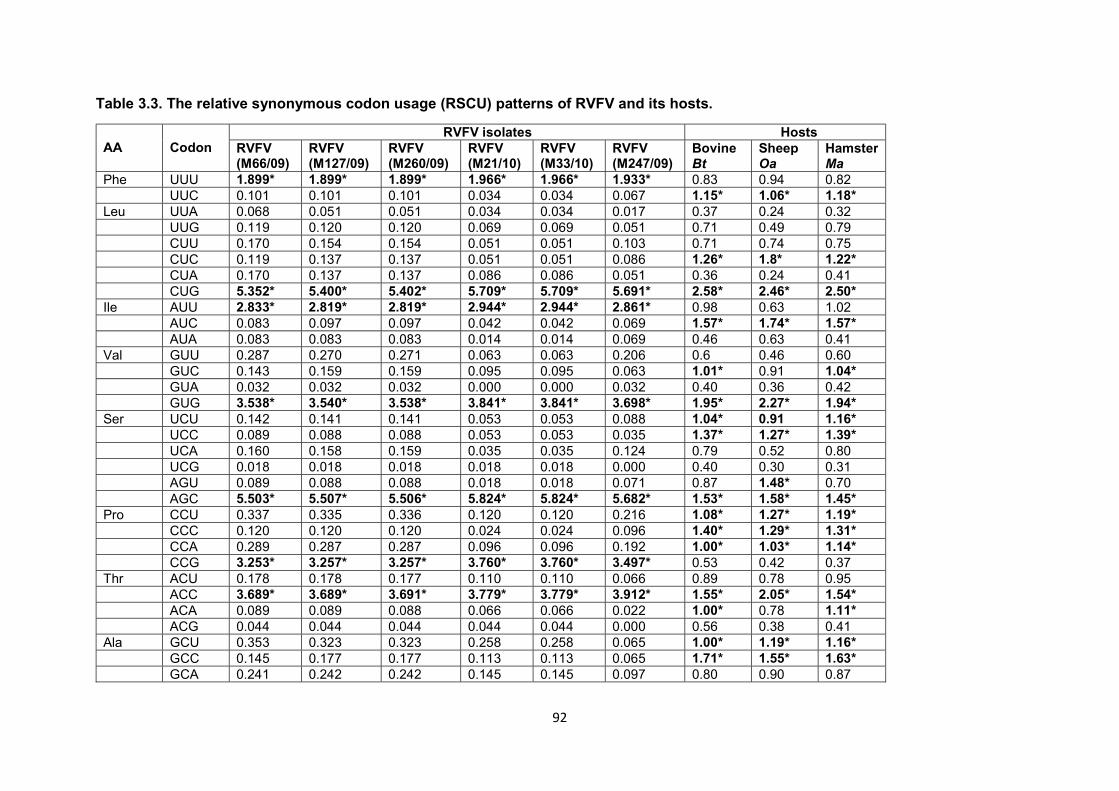
92
Table 3.3. The relative synonymous codon usage (RSCU) patterns of RVFV and its hosts.
AA
Codon
RVFV isolates Hosts RVFV (M66/09)
RVFV (M127/09)
RVFV (M260/09)
RVFV (M21/10)
RVFV (M33/10)
RVFV (M247/09)
Bovine Bt
Sheep Oa
Hamster Ma
Phe UUU 1.899* 1.899* 1.899* 1.966* 1.966* 1.933* 0.83 0.94 0.82 UUC 0.101 0.101 0.101 0.034 0.034 0.067 1.15* 1.06* 1.18* Leu UUA 0.068 0.051 0.051 0.034 0.034 0.017 0.37 0.24 0.32 UUG 0.119 0.120 0.120 0.069 0.069 0.051 0.71 0.49 0.79 CUU 0.170 0.154 0.154 0.051 0.051 0.103 0.71 0.74 0.75 CUC 0.119 0.137 0.137 0.051 0.051 0.086 1.26* 1.8* 1.22* CUA 0.170 0.137 0.137 0.086 0.086 0.051 0.36 0.24 0.41 CUG 5.352* 5.400* 5.402* 5.709* 5.709* 5.691* 2.58* 2.46* 2.50* Ile AUU 2.833* 2.819* 2.819* 2.944* 2.944* 2.861* 0.98 0.63 1.02 AUC 0.083 0.097 0.097 0.042 0.042 0.069 1.57* 1.74* 1.57* AUA 0.083 0.083 0.083 0.014 0.014 0.069 0.46 0.63 0.41 Val GUU 0.287 0.270 0.271 0.063 0.063 0.206 0.6 0.46 0.60 GUC 0.143 0.159 0.159 0.095 0.095 0.063 1.01* 0.91 1.04* GUA 0.032 0.032 0.032 0.000 0.000 0.032 0.40 0.36 0.42 GUG 3.538* 3.540* 3.538* 3.841* 3.841* 3.698* 1.95* 2.27* 1.94* Ser UCU 0.142 0.141 0.141 0.053 0.053 0.088 1.04* 0.91 1.16* UCC 0.089 0.088 0.088 0.053 0.053 0.035 1.37* 1.27* 1.39* UCA 0.160 0.158 0.159 0.035 0.035 0.124 0.79 0.52 0.80 UCG 0.018 0.018 0.018 0.018 0.018 0.000 0.40 0.30 0.31 AGU 0.089 0.088 0.088 0.018 0.018 0.071 0.87 1.48* 0.70 AGC 5.503* 5.507* 5.506* 5.824* 5.824* 5.682* 1.53* 1.58* 1.45* Pro CCU 0.337 0.335 0.336 0.120 0.120 0.216 1.08* 1.27* 1.19* CCC 0.120 0.120 0.120 0.024 0.024 0.096 1.40* 1.29* 1.31* CCA 0.289 0.287 0.287 0.096 0.096 0.192 1.00* 1.03* 1.14* CCG 3.253* 3.257* 3.257* 3.760* 3.760* 3.497* 0.53 0.42 0.37 Thr ACU 0.178 0.178 0.177 0.110 0.110 0.066 0.89 0.78 0.95 ACC 3.689* 3.689* 3.691* 3.779* 3.779* 3.912* 1.55* 2.05* 1.54* ACA 0.089 0.089 0.088 0.066 0.066 0.022 1.00* 0.78 1.11* ACG 0.044 0.044 0.044 0.044 0.044 0.000 0.56 0.38 0.41 Ala GCU 0.353 0.323 0.323 0.258 0.258 0.065 1.00* 1.19* 1.16* GCC 0.145 0.177 0.177 0.113 0.113 0.065 1.71* 1.55* 1.63* GCA 0.241 0.242 0.242 0.145 0.145 0.097 0.80 0.90 0.87

93
GCG 3.258* 3.258* 3.258* 3.484* 3.484* 3.773* 0.48 0.37 0.35 Tyr UAU 1.891* 1.909* 1.910* 1.964* 1.964* 1.946* 0.79 0.72 0.84 UAC 0.109 0.091 0.090 0.036 0.036 0.054 1.21* 1.28* 1.17* His CAU 1.848* 1.870* 1.868* 1.956* 1.956* 1.912* 0.76 2.15* 0.80 CAC 0.152 0.130 0.132 0.044 0.044 0.088 1.25* 0.92 1.20* Gln CAA 0.052 0.069 0.069 0.052 0.052 0.017 0.46 0.57 0.47 CAG 1.948* 1.931* 1.931* 1.948* 1.948* 1.983* 1.54* 1.43* 1.53* Asn AAU 0.138 0.144 0.143 0.071 0.071 0.071 0.81 0.49 0.82 AAC 1.862* 1.856* 1.857* 1.929* 1.929* 1.929* 1.18* 1.51* 1.19* Lys AAA 1.870* 1.870* 0.870 1.887* 1.887* 1.983* 0.79 0.68 0.72 AAG 0.130 0.130 0.130 0.113 0.113 0.017 1.22* 1.32* 1.28* Asp GAU 1.876* 1.888* 1.888* 1.944* 1.944* 1.944* 0.84 0.66 0.82 GAC 0.124 0.112 0.112 0.056 0.056 0.056 1.16* 1.34* 1.18* Glu GAA 1.839* 1.823* 1.823* 1.919* 1.919* 1.903* 0.78 0.75 0.78 GAG 0.161 0.177 0.177 0.081 0.081 0.097 1.22* 1.25* 1.22* Cys UGU 0.055 0.055 0.055 0.000 0.000 0.055 0.85 0.72 0.85 UGC 1.945* 1.945* 1.942* 2.000* 2.000* 1.945* 1.15* 1.28* 1.15* Arg CGU 0.149 0.149 0.149 0.059 0.059 0.089 0.49 0.82 0.56 CGC 4.990* 5.020* 5.020* 5.554* 5.554* 5.465* 1.18* 1.15* 1.08* CGA 0.149 0.149 0.149 0.089 0.089 0.059 0.68 0.88 0.72 CGG 0.119 0.089 0.089 0.089 0.089 0.000 1.32* 0.87 1.12* AGA 0.297 0.238 0.238 0.089 0.089 0.149 1.13* 1.13* 1.26* AGG 0.297 0.356 0.356 0.119 0.119 0.238 1.21* 1.16* 1.27* Gly GGU 0.086 0.069 0.069 0.034 0.034 0.034 0.63 0.92 0.71 GGC 3.657* 3.672* 3.672* 3.862* 3.862* 3.810* 1.43* 1.33* 1.30* GGA 0.086 0.086 0.086 0.000 0.000 0.086 0.95 1.05* 1.02* GGG 0.172 0.172 0.172 0.103 0.103 0.069 0.98 0.71 0.98
Abbreviations: AA – amino acid; Bt – Bos Taurus; Oa - Ovies aries; Ma – Mesocricetus auratus. The preferred codons (RSCU>1) are shown in
bold and a star.
94
The codon adaptation index (CAI) and the estimated codon adaptation index (CAI) values of
all ORFs for all segments were calculated (with the E-CAI server) using the codon usage
tables for hamster, bovine and ovine and the normalised CAI values were obtained for each
segment (Table 3.4). A score for each ORF was calculated using the CAI, which indicates the
level of gene expression. The CAI values from 0.75 to 1.0 indicate a high gene expression
whereas the CAI value less than 0.75 indicates low gene expression. The CAI values of all
the ORFs of the 3 segments of the isolates ranged from 0.671 to 0.735 in relation to hamster,
while in relation to bovine/ovine, the CAI value of genes of isolates from bovine were higher
(ranging from 0.720 to 0.762) than those of isolates from ovine (ranging from 0.687 to 0.716).
The calculated normalized CAI value of genes of isolates from bovine were close to 1 and
higher than those of ovine (Table 3.4), indicating codon usage adaptation towards the host.
Table 3.4. Codon usage pattern observed for RVFV glycoproteins and its relationship to potential hosts
Isolate Hamster (Mesocricetus auratus) Bovine (Bos taurus) M66/09
Protein (ORF)
Length CAI eCAI CAI/eCAI CAI eCAI CAI/eCAI
L 6276 0.733 0.762 0.962 0.757 0.760 0.996 M 3591 0.735 0.762 0.965 0.762 0.760 1.002 S 1530 0.687 0.762 0.902 0.721 0.760 0.949
M127/09
L 6276 0.733 0.762 0.962 0.757 0.760 0.996 M 3591 0.734 0.762 0.963 0.762 0.760 1.000 S 1530 0.687 0.762 0.902 0.720 0.760 0.947
M260/09
L 6276 0.733 0.762 0.962 0.757 0.760 0.997 M 3591 0.734 0.762 0.963 0.762 0.760 1.000 S 1530 0.687 0.762 0.902 0.720 0.760 0.947
M21/10
Hamster (Mesocricetus auratus) Ovine (Ovis aries) L 6276 0.731 0.762 0.959 0.703 0.745 0.943 M 3591 0.734 0.762 0.963 0.715 0.745 0.960 S 1530 0.671 0.762 0.881 0.688 0.745 0.923
M33/10
L 6276 0.733 0.762 0.962 0.704 0.745 0.945 M 3591 0.734 0.762 0.963 0.715 0.745 0.961 S 1530 0.671 0.762 0.881 0.687 0.745 0.922
M247/09
L 6276 0.733 0.762 0.962 0.704 0.745 0.945 M 3591 0.735 0.762 0.965 0.716 0.745 0.961 S 1530 0.671 0.762 0.881 0.687 0.745 0.922
Codon usage tables of hamster, bovine and ovine were used as reference set for the codon adaptation index (CAI) computation. p< 0.05. eCAI = expected CAI value. The eCAI values were calculated using Markov method of the E-CAI server. Normalised CAI values (defined as the quotient between the CAI and its expected value).
95
The ENC value and gene expression are inversely correlated with each other: lower ENC
value indicates a higher codon usage and a higher gene expression (Aravind et al., 2014).
The ENC value for all the genes of the segments was 20 implying that only one codon was
used for each amino acid.
3.4 DISCUSSION
From the reported outbreaks in 2008-2010 in South Africa, a number of RVFV strains have
been isolated. Chapter 1 revealed that the isolated and sequenced strains, were not
introduced from outside South Africa, but mutated over time and caused outbreaks when
suitable conditions prevailed. Those isolates were related to isolates from previous studies
indicating an ancient origin. In this chapter, six isolates, three from bovine liver and three from
ovine liver were selected. These isolates were characterised and compared based on a
number of criteria.
Amino acid comparisons between the six RVFV isolates and the ZH501 strain revealed a
number of substitutions in the field isolates. When the amino acid sequence of isolate M66/09
was compared to those of ZH501 strain, the two were closely related and shared some of the
changes. The growth curve of this isolate differs dramatically from any of the other isolates
tested or used in this study. Cells infected with isolate M66/09 showed CPE at 8 hours post
infection and the virus lysed all the cells within 48 hours of infection. Previous nucleotide
sequence analysis indicated that isolate M66/09 grouped in Clade C while the other isolates
used in the study grouped in Clade H (Chapter 2; Maluleke et al., 2019). The growth curves
of isolates from bovine livers reached higher levels when compared to those of isolates from
ovine livers. The same pattern was observed when using the immunofluorescent localization
in this study. Cells infected with isolates from bovine livers were destroyed within 48 hours of
infection and after 72 hours, all cells were lysed by the virus. It is well known that sheep are
generally more susceptible to infection by RVFV than cattle in outbreaks and lambs are highly
susceptible while calves are moderately susceptible. The rate at which these isolates adapted
to a BHK cell culture environment differs. It is possible that the isolates from bovine livers were
more fit and therefor adapted very fast. On the other hand, isolates from ovine livers might
have difficulties in adapting to the new environment, thereby resulting in slow growth curves.
Due to the fact that corresponding tRNA of the different codons of the same amino acid differ
in abundance in the cell and in the speed by which they are recognized by the ribosomes,
their usage during protein translation is unequal (Burns et al., 2006; Hersberg and Petrov,
2008; Behura and Severson, 2013). In the study, the codon usage patterns of the selected

96
RVFV isolates and their hosts were computed and compared. The preferred RSCU values for
the selected isolates were greater than 1, indicating that the corresponding codons were more
frequently used than expected. The nine preferred codons ended with either G or C showing
strong usage bias for the identified amino acids. Therefore, assumptions were made that
codons ending with G and C at the third position were preferred by RVFV. Results obtained
in this study showed that the codon usage pattern of all the six isolates were similar but
revealed a mixture of correspondence and bias to their hosts. The mixture might reveal the
influence by selection pressures by their hosts. This might have caused the fitness of the virus
to adjust among its dynamic range of hosts (Butt et al., 2014). Both the coincident and
antagonistic codon usage between virus isolates and their hosts are important as the
coincident codon usage enables the corresponding amino acids to be translated efficiently,
whereas the antagonistic usage may allow viral proteins to be folded properly but may result
in decreased translation efficiency (Butt et al., 2014). A mixed codon preference has also been
detected in Chikungunya, Zika and Marburg viruses, both exploiting the same hosts and
vectors (Nasrullah et al., 2015; Butt et al., 2016). Codon usage patterns in RVFV are
undergoing evolutionary processes, reflecting a dynamic process of mutation selection to
adapt its codon usage to different environments and hosts (Butt et al., 2016).
The phenomenon in which the synonymous codons are chosen within and between the
genomes is termed codon usage bias. Several factors that could influence codon usage
patterns including mutation and selection pressures, natural selection, secondary protein
structure, natural and translational selection were identified by this phenomenon (Song et al.,
2017; Nasrullah et al., 2015; Butt et al., 2016; Behura and Severson, 2013; Lauring et al.,
2012). In the study, the codon usage bias and the gene expression as indicated by ENC value
among the different isolates is similar and show little bias. The low codon usage bias has also
been observed among other RNA viruses (Butt et al., 2016). The CAI value is useful for
predicting the expression level of a gene and adaptation of viral genes to their hosts. Values
approaching 1 indicates a strong codon usage and a higher gene expression (Aravind et al.,
2014). In the study, CAI values of genes encoded by L and M vary from 0.704-0.734 relative
to hamster and ovine, and from 0.734-0.757 relative to hamster and bovine. These values are
higher than the genes encoded by S segment, indicating that there is a good variation in codon
usage pattern among the different genes of RVFV. The normalized CAI values of isolates from
bovine were closer to 1. Values closer to 1 also indicate codon usage adaptation towards their
hosts.
Studies have indicated that some RNA viruses accumulate significant genotypic diversity and
access greater phenotypic diversity in relation to few mutational steps (Lauring et al., 2012).
In this study, M66/09 had significant genotypic diversity as compared to other isolates.

97
Although M66/09 isolate grouped in a different clade (Clade C), its divergence time from the
ancestor is the same (52.88 years) as the other isolates used. The growth curve pattern of
isolate M66/09 gave about 107 pfu/ml which may be regarded as normal for RVFV growth
(Morrill et al, 2010). All three segments of this isolate showed diversity, with the L segment
having the most amino acid substitutions. The genetic diversity may have contributed to the
phenotype observed in the kinetic growth curves. However, the current analysis could not
definitively identify specific residues that could have impacted on the growth curve phenotype
and would need more detailed and empirical analysis to confirm which residues play a role in
this.
The study also aimed to confirm that the structural parameters of glycoproteins have not been
affected by the substitutions observed. Molecular modelling of these protein sequences
revealed that the models predicted were based on known structural templates, thus increasing
the confidence in the work. For both protein models, superposition of the models indicated no
deviation from the expected fold. The RMSD values between the models predicted and the
template models ranged from 0.000 to 0.065. While the modelled structures show that the
three-dimensional structure would be conserved, it cannot be excluded that a single point
mutation cannot affect the growth curves. This has been observed for the isolate where a
single substitution of E276G in the Gn resulted in attenuation of a highly virulent strain to one
that showed low viraemia titers, did not replicate efficiently, and had low virulence (Morrill et
al., 2010).
The study used the TOPCONS and the OCTOPUS web servers to predict transmembrane
topology of both the Gn and Gc proteins. The TOPCONS server combines a number of
topology predictions into one consensus prediction and quantifies the reliability of the
predictions, based on the level of agreement between the methods, both on the protein level
and the level of individual transmembrane (TM) regions (Bernsel et al., 2009; Tsirigos et al.,
2015). When prediction methods are different, they may disagree with the results, resulting in
uncertainty about the correct topology. Thus a combination of individual topology predictions
into one consensus prediction is advantageous. In the study, the TOPCONS consensus
predicted three transmembrane regions [430-450, 516-536 (2 TM helix, out in) and 462-482
(TM helix, out in)]. The results obtained for for Gn protein using TOPCONS server were
considered not reliable for Gn hence an additional server OCTOPUS was used. The
OCTOPUS results were more reliable and corresponded with those previously published
(Rusu et al., 2012; Halldorsson et al., 2018). For the Gc protein, the results from the three
servers used correspond with each other. It should be noted that this section focused on
transmembrane proteins because they play major roles in cellular recognition, signal
transduction and transportation of substances through membranes. These proteins are targets
98
for a large fraction of drugs, thus pose a great pharmaceutical interest (von Heijne, 2007;
Bakheet and Doig, 2009). It also showed that a number of the substitutions for Gn occur in the
cytoplasmic tail and these may influence both Gn-Gc cytoplasmic tail interactions and
interaction with the ribonucleoprotein during viral assembly (Huiskonen et al., 2009).
In conclusion, RVFV infects its host target cell through surface contact followed by
internalization in a time-dependent manner. The longer the host cell is exposed to the virus,
the higher the titres of primary infection. Even though various amino acid substitutions were
identified, none of them could be associated with the different growth kinetic phenotypes
observed in the different strains. The structure modelling also did not identify any definitive
signatures associated with Gn or Gc function. While some codon usage bias exists, this also
could not be linked conclusively with the growth phenotype. All bioinformatic analyses suggest
that these proteins should be functional, and that the growth phenotype may depend on a
combination of multiple substitutions and subtle differences in codon bias.
99
CHAPTER 4: THE USE OF A YEAST TWO-HYBRID SYSTEM TO
IDENTIFY THE RECEPTORS OF RVFV GLYCOPROTEINS ON HOST
CELLS
4.1 INTRODUCTION
The previous chapters identified genetic diversity in various RVFV strains which could be
associated with a growth phenotype where some strains grew much slower than the others in
BHK cell culture. Comparative bioinformatics analysis of substitutions, structure and codon
bias between the strains could not conclusively identify the molecular correlates responsible
for the different growth phenotypes. As a starting point for future investigation into RVFV
growth phenotypes, it was decided to investigate virus attachment and entry first and develop
a system that would enable physical characterization of RVFV attachment protein biology. The
yeast two-hybrid (Y2H) system was investigated as a tool to identify host glycoprotein
receptors.
The network of interactions between proteins expressed in a cell can be determined using
proteomics-based strategies (Causier and Davies, 2002). The formation of cellular structures
and many biological processes such as signal transduction involve interaction between
proteins. Protein-protein interactions contribute to many diseases and may be exploited in the
development of potential therapeutic strategies. Many techniques have been developed to
study protein-protein interactions from biochemical approaches including
immunoprecipitation, affinity chromatography and affinity blotting to molecular genetic
approaches such as the Y2H system (van Criekinge and Beyaert, 1999). The use of bacterial
hosts for protein expression may result in insufficient or complete lack of proper protein folding
and/or postrtranslational modification. The biochemical in vitro handling of these expressed
protein extracts, such as during immunoprecipitation, affinity purification and blotting, can
negatively affect proteins. In addition, the production and purification of antibodies required in
these biochemical approaches are expensive (van Criekinge and Beyaert, 1999; Phizicky and
Fields, 1995).
The Y2H system, also known as interaction trapping, enables the identification of interacting
proteins in living yeast cells (Fields and Song, 1989). The technology can be used to discover
novel binding proteins and to confirm an interaction between two proteins (Wong et al., 2017).
It has been applied in many systems such as binary interaction mapping, posttranslational
modifications in the Arabidopsis genus of plants, in host-parasite interactions, and in drug
100
discoveries (Pires and Boxem, 2018; Lai and Lau, 2017; Liu et al., 2017; Wang et al., 2014;
Arabidopsis Interactome Mapping Consortium, 2011; Hamdi and Colas, 2012). The system
involves two hybrid proteins, the “bait” which is usually the known protein and the “prey”, the
unknown protein. The bait protein is fused to the Gal4 DNA binding domain (DBD) whereas
the prey protein is fused to the Gal4 activation domain (AD). The two domains are
independently non-functional as a transcription factor (Stephens and Bangting, 2000). When
the two proteins are expressed in an appropriate yeast strain, they interact, and the reporter
genes are activated (Figure 4.1). The activation of the reporter genes is usually identified by
growth on selective growth media or colour change (Brückner et al., 2009; Van Criekinge and
Beyaert, 1999; Causier and Davies, 2002; Koegl and Uetz, 2008).
Figure 4.1: The classical yeast two-hybrid system (Brückner et al., 2009). A: The protein of interest known as bait
(X) is fused to the DNA binding domain (DBD) to form DBD-X. The unknown protein known as prey (Y) is fused to
the activation domain (AD) to form AD-Y. B: The DBD-X binds to the upstream activation sequence (UAS) of the
promoter. The interaction between the two complexes recruits the AD and reconstitutes a functional transcription
factor, leading to further recruitment of RNA polymerase II and subsequent transcription of a reporter gene.
101
Since its first report, the system has been modified in numerous ways not only for protein-
protein interactions but also for DNA-protein interaction (yeast one hybrid system) and RNA-
protein interaction (yeast three hybrid system) (Causier and Davies, 2002; Reece-Hoyes and
Walhout, 2012; Hook et al., 2005).
Besides its many advantages over biochemical methods in terms of convenience and
sensitivity, the Y2H system still has some drawbacks. False positives, which are often
generated in two hybrid libraries, requires the use of two or more reporter genes in the assay
to be eliminated, proteins that are not stably expressed or toxic when expressed in yeast cells
may also prove difficult (Causier and Davies, 2002; Van Criekinge and Beyaert, 1999).
In this study the Y2H system was used to search for proteins that interact with glycoproteins
of RVFV. The glycoproteins are synthesized as a precursor polyprotein that is cleaved in the
endoplasmic reticulum to generate Gn and Gc (Colett et al., 1985; Suzich et al., 1990). These
glycoproteins mediate the first step in virus replication, namely viral entry into the host cell by
attachment and cell fusion (Överby et al., 2008, Spiegel et al., 2016). Since these proteins are
mostly exposed, they are recognized by the immune system and induce the production of
neutralizing antibodies, thereby playing a major protective role against the virus in the host
(Pepin et al., 2010). Although there are many candidate receptors that might play a role in the
attachment of viruses belonging to the order Bunyavirales, receptor molecules for RVFV has
not yet been identified (Spiegel et al., 2016; Lozach et al., 2011; Lozach et al., 2010; Yamauchi
and Helenius, 2013; Simon et al., 2009). It is not clear whether the Gn or Gc alone, or both
simultaneously or consecutively, interact with the cell surface molecules. However, based on
X-ray crystallography and reconstruction of the Gn/Gc complex it would seem as if the host
receptor would interact via Gn (Halldorsson et al., 2018).
In this chapter, the construction and characterization of a cDNA library from BHK cells using
the switching mechanism at the 5’ end of the RNA transcript (SMARTTM) are described (Zhu
et al., 2001). The ectodomains of Gn and Gc from wild-type RVFV isolated from samples of
animals infected with RVFV were also prepared. The Y2H system was used to search for
proteins which interact with ectodomains of Gn and Gc from the prepared cDNA library.
4.2 MATERIALS AND METHODS
4.2.1 Preparation of the prey (Construction of cDNA library from BHK cells)
Yeast strains and mammalian cells

102
The yeast strains of S. cerevisiae, Y2HGold and Y187 used in this study were obtained from
Clontech (USA). The Y2HGold strain was used as the bait strain while Y187 strain was used
as a prey strain. The Y2HGold has four reporter genes: AURI coding for inositol phosphoryl
ceramide synthase enzyme, HIS3 coding for histidine, ADE2 coding for adenine and MEL1
coding for α-galactosidase and ß-galactosidase enzymes.
The BHK cells were selected for the construction of the cDNA library because this cell line has
previously shown to be very susceptible to RVFV (Scharton et al., 2015). Cells were
maintained in DMEM/F12 supplemented with 5% FBS and 1% mixture of penicillin (10 000
U/ml), streptomycin (10 000 U/ml) and amphotericin B (25 µg/ml).
RNA extraction from BHK cells
The BHK cells were grown in a T75 flask at 37°C in an atmosphere of 5% CO2 until confluent.
The cell monolayers were washed once with PBS and total RNA extracted from BHK cells
using RNeasy Mini kit according to the manufacturer’s protocol (Qiagen). Purification of
mRNA from total RNA was carried out using GenElute mRNA Miniprep kit as per the
manufacturer’s protocol (SIGMA ALDRICH). The quantity and integrity of both RNA and
mRNA were evaluated using a Nanodrop spectrophotometer (Thermo Fisher Scientific) and
1% denaturing formaldehyde agarose gels respectively. The absorbance ratios of the RNA at
A260/280 and A260/230 nm were 2.0 and 1.9, respectively.
cDNA synthesis
Single stranded cDNA was synthesized using Make Your Own Mate and Plate Library System.
Briefly, 2 µl (0.4 µg) of mRNA was reverse transcribed using SMART 111 (5’ -
AAGCAGTGGTATCAACGCAGAGTGGCCATTATGGCCGGG - 3’) and CDS 111 primers (5’
- ATTCTAGAGGCCGAGGCGGCCGACATG-d(T)30VN - 3’ and SMART Moloney Murine
Leukemia Virus (MMLV) Reverse Transcriptase as per the manufacturer’s protocol (Clontech,
USA). The double stranded (ds) cDNA was amplified by long distance PCR using 2 µl of single
strands cDNA product and the Advantage 2 PCR kit (Clontech, USA). The reaction parameters
used were 95°C for 30 seconds, followed by 22 cycles of 95°C for 10 seconds (extension time
increased by 5 seconds with each cycle), 68°C for 6 minutes and final extension at 68°C for 5
minutes. At the end of PCR, the product was analysed on 1% agarose gel to check the quality
of ds cDNA. In order to remove low molecular weight cDNA and unincorporated nucleotides,
the PCR products were size fractionated using CHROMA-SPIN TE 400 columns (Invitrogen).
The cDNA was precipitated using sodium acetate and ethanol. The purified ds cDNA was
analysed using a Nanodrop spectrophotometer and 1% agarose gels.

103
Construction and evaluation of the cDNA library
The purified ds cDNA (3 µg) and 3 µg of Sma1-linearized pGADT7-Rec vector were co-
transformed into freshly prepared competent Y187 yeast cells using a lithium acetate method
according to the protocol in Yeastmaker Yeast Transformation System 2 (Clontech, USA).
Transformed yeast cells were diluted with 0.9% (w/v) NaCl solution and 100 µl of 10-1, 10-2,
10-3 and 10-4 were cultured on synthetically defined medium lacking leucine (SD/Leu) plates
(in duplicate) and incubated at 30°C for 4 days. The purpose of diluting the yeast cells was to
calculate the various parameters of the transformed library. Colonies were randomly selected
to identify the size of the inserts and the recombination rate of the library. The selected
colonies were subjected to PCR using the Matchmaker InsertCheck PCR Mix 2 (Clontech)
and the product analysed on 1% agarose gel. Plasmid DNA were extracted from these
colonies using Easy Yeast Plasmid Isolation kit (Clontech), then amplified in competent
bacterial cells (DH5α) by transformation and plated on LB-ampicillin agar plates. Bacterial
plasmid DNA was extracted from transformants using the QuickLyse Miniprep Kit (Qiagen,
South Africa). The extracted plasmid DNA was sequenced. The remaining transformed
mixture of yeast was spread on SD/Leu plates (in duplicate) and incubated at 30°C for 4 days.
Transformants were then harvested, pooled in freezing media [yeast extract, peptone and
dextrose medium supplemented with adenine hemisulphate (YPDA) plus 25% glycerol] and
stored at -80°C in 1 ml aliquots.
4.2.2 Construction of the bait plasmids
The viral strain (M66/09) used in the study was isolated from diagnostic sample brought to
ARC-OVR to be tested for the presence of RVFV. This sample tested positive using PCR and
was confirmed by virus isolation as mentioned in Section 2.2.1.
Baby hamster kidney and Escherichia coli (DH5α) cells were obtained from the Virology and
Biotechnology laboratories, ARC-OVR, respectively.
Viral RNA extraction
Baby hamster kidney cells were maintained as described in Section 3.2.1. The maintenance
media was removed and replaced with 1 ml of RVFV stored in cell culture. The flask was
incubated at 37°C on a rocker for 1 hour to enable attachment. At the end of incubation, the
unattached virus and debris were removed and replaced with fresh DMEM/F12 supplemented
with 2% FBS and 1% mixture of penicillin (10 000U/ml), streptomycin (10 000U/ml) and
104
amphotericin B (25 µg/ml) before a further incubation. The virus was harvested after 3 days
by centrifugation at 2 500 rpm in an Eppendorf Centrifuge 5810R for 5 minutes. The
supernatant was collected and the cell pellet containing cells was discarded. The supernatant
was aliquoted and stored at -80°C until needed.
Viral RNA was extracted from 250 µl of a 1 ml aliquot using Trizol Reagent according to the
manufacture’s protocol (Invitrogen). The RNA was dissolved with 10 µl of distilled H20. The
quantity of RNA was determined using the Nanodrop spectrophotometer. A concentration of
100 ng of RNA was used to prepare cDNA using SuperScript TM III Reverse Transcriptase
according to the manufacturer’s protocol (Invitrogen). The primers used are listed in Table 4.1.
A simple modular architecture research tool (SMART) Genomic program was used to identify
the glycoprotein transmembrane regions and the signal peptides (Letunic et al., 2014). PCR
primers for both Gn and Gc, excluding transmembrane regions were designed (Appendix A,
Figure S1). The forward primers contained restriction sites of EcoR1 whereas the reverse
primers contained restriction sites for Sal1. Phusion High-Fidelity PCR Master Mix with GC
Buffer (Thermo Fisher Scientific, USA) was used for amplification. For both Gn and Gc the
two step PCR protocol used was the same and as follows: 98°C for 30 seconds, 35 cycles at
98°C for 10 seconds, 72°C for 45 seconds and final extension of 72°C for 10 minutes. The
PCR products were analysed on a 1% agarose gel, purified using QIAquick Gel Extraction kit
(Qiagen, South Africa) and digested with both EcoR1 and Sal1. After digestion, purification
was done using MinElute PCR Purification kit (Qiagen, South Africa) and 100 ng of the purified
products were ligated with an EcoR1/Sal1 digested, purified yeast shuttle vector (pGBKT7)
using T4 DNA ligase. The ligated mixtures were transformed in E. coli cells (DH5α) by heat
shock method and the transformed mixture was plated on LB plates containing 50 µg/ml of
kanamycin (Sambrook et al., 1989). Plates were incubated at 37°C overnight. A colony PCR
using the insert specific primers (Table 4.1), restriction enzyme digestion analysis and DNA
sequencing using pGBKT7 vector specific primers (Table 4.1) confirmed the presence of the
inserts.
105
Table 4.1. Primer sequences used in this study
Name Primer sequence
mGnGcF 5’-CATGGAGGCCGAATTCGAAGACCCCCATCTCAGAAACAGAC -3’
GnR2 5’-GACGTCGACTCAATGGTGATGGTGATGGTGCCCGGAACCACTGAGAGCAGTGTGACA-3’
mGcF 5’-CATGGAGGCCGAATTCTGTTCAGAACTGATTCAGGCAAGC-3’
GcR2 5’-GACGTCGACTCAATGGTGATGGTGATGGTGCCCGGAACCTTTAAGCGGCCCTCCAAA-3’
T7 Sequencing primer
5’-AATACGACTCACTATAGGG-3’
3’ DNA-BD Sequencing primer
5’-TTTTCGTTTTSSSSCCTAAGAGTC-3’
Bold sequence: EcoR1 restriction site, underlined sequence: Sal1 restriction site
4.2.3 Protein analysis and bait expression in yeast cells
The recombinants pGBKT7-Gn and pGBKT7-Gc plasmids were transformed into freshly
prepared yeast competent cells Y2H according to the protocol described in YeastmakerTM
Yeast Transformation System 2 user manual (Clontech). A volume of 100 µl of both a 1/10
and 1/100 dilution of the transformed mixtures were plated on medium lacking tryptophan
(SD/-Trp) and incubated at 30°C for 4 days. This medium was selected because the vector
pGBKT7 had a selectable TRP1 marker. An overnight culture was prepared from colonies
using 5 ml of SD/-Trp media and used to inoculate 50 ml of fresh YPDA media. The culture
was incubated at 30°C with shaking at 250 rpm until an optical density reading of 0.4-0.6 at
OD600 was reached. The culture was centrifuged at 1 000 x g in Eppendorf Centrifuge 5810R
for 5 minutes at 4°C and the supernatant discarded. The pellet was dissolved in 1 ml of protein
extraction buffer containing Y-Per reagent (Thermo Fisher Scientific), lysozyme (25 U/µl),
benzonase (50 mg/ml) and protease inhibitor cocktail tablets (cØmplete, EDTA free) (Roche).
The mixer was allowed to shake for 30 minutes at room temperature and then centrifuged for
30 minutes at 13 000 rpm (Eppendorf Centrifuge 5415). The supernatant was collected and
15 µl loaded on an SDS PAGE gel (4-12% Bis Tris plus).
Purification of proteins was done using Pierce anti-c-myc agarose according to the
manufacturer’s instructions (Thermo Fisher Scientific, USA). Extracted and purified proteins
were loaded on 4-12% SDS PAGE gels and transferred onto PVDF membrane using the
iBlot® 7-minute blotting System (Invitrogen). The membrane was blocked for 1 hour with
Membrane Blocking Buffer (Invitrogen) and incubated with primary antibody (c-myc tag
antibody) (diluted to 1: 1000) for 1 hour. Following three washes for 10 minutes with Tris
106
buffered saline (TBS) and Tween 20 (TBST), and one wash with TBS, the membrane was
incubated with goat anti-mouse IgG (H+L) secondary antibody, horseradish peroxidase (HRP)
conjugate for 1 hour followed by four washes with TBST. Transferred proteins were visualized
using chromogenic substrate 3,3’,5,5’ Tetramethyl Benzidine (Thermo Fisher Scientific).
Confirmation of proteins was done by probing the membrane with serum from sheep infected
with RVFV (strain 35/74) (kind donation from Virology Section, ARC-OVR).
4.2.4 Autoactivation and toxicity tests of bait plasmids
The first step for Y2H screening is to confirm that the selected bait does not autonomously
activate the reporter genes in the absence of a prey protein. In order to test autoactivation
activity of the baits, pGBKT7-Gn, pGBKT7-Gc and empty pGBKT7 plasmids were transformed
into Y2HGold competent cells. Transformants were grown on plates containing minimal yeast
medium without tryptophan (SD/-Trp), or SD/-Trp supplemented with 40 µg/ml of X-α-Gal
(SD/-Trp/X) or SD/-Trp supplemented with both X-α-Gal and 125 ng/ml of Aureobasidin A
(SD/-Trp/X/A) and incubated for 3-5 days at 30°C. Activation of the reporter genes would be
indicated by blue colonies on SD/-Trp/X/A plates, allowing expression of the reporter genes,
while the absence of colonies on these plates would indicate non-autoactivation of the bait.
White colonies appearing on SD/-Trp and SD/-Trp/X plates would indicate non-autoactivation
of the reporter genes by the bait. For toxicity testing, the colony colour and size of Y2H
transformed with bait plasmids were compared with those of Y2H cells transformed with the
empty vector pGBKT7. If the bait is toxic, colonies containing bait plasmids will be smaller than
those containing empty vector pGBKT7 and their colour will also differ. The bait can only be
used in Y2H screening if it lacks autoactivation and does not show toxicity.
4.2.5 Yeast two-hybrid screen using co-transformation of bait and prey plasmids
The interaction between BHK cells and glycoproteins was identified using the Matchmaker
Gold Yeast Two-Hybrid System according to the manufacturer’s protocol (Clontech, USA).
Briefly, the Y187 cells harbouring the mate and plate cDNA library cloned into pGADT7-Rec
vector were co-transformed with the Y2HGold cells transformed with Gn and Gc for 24 hours
at 30°C. The mated culture was spread on SD/-Leu/-Trp/X-α-Gal/AbA (DDO/X/A) plates and
incubated at 30°C for 4-5 days. The presence of blue colonies on these plates will be an
indication of the interaction between the bait and the prey. In order to increase the chance of
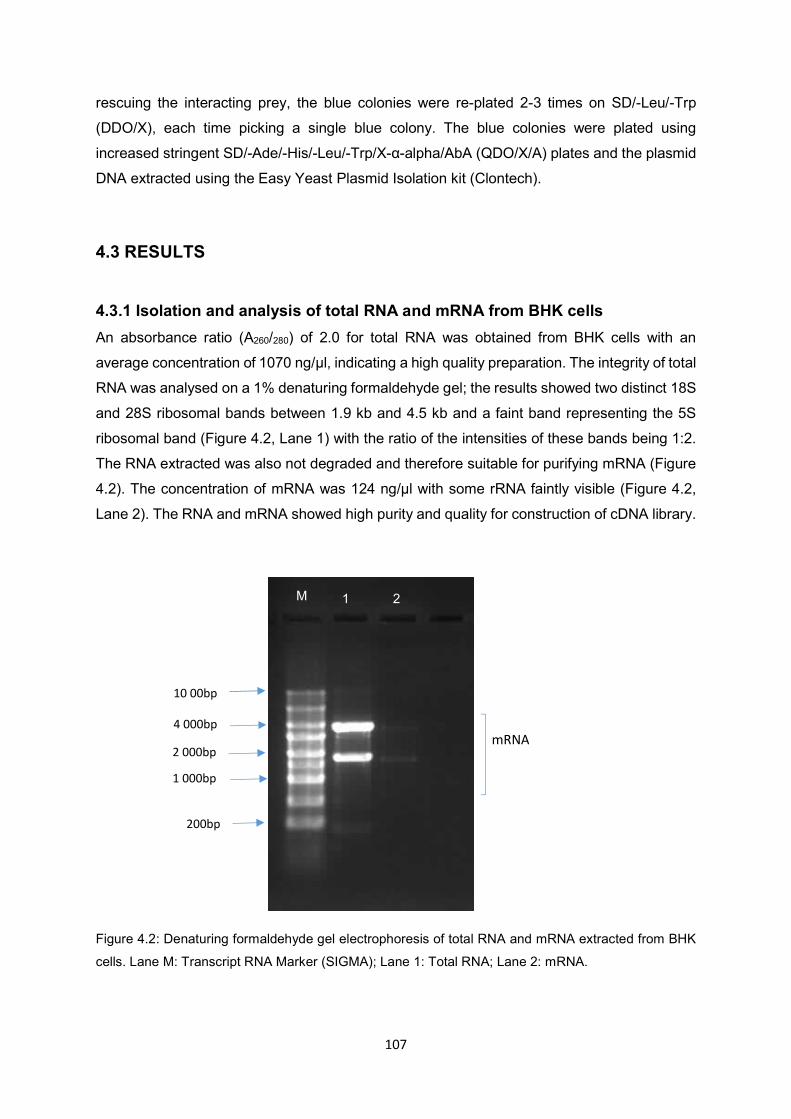
107
rescuing the interacting prey, the blue colonies were re-plated 2-3 times on SD/-Leu/-Trp
(DDO/X), each time picking a single blue colony. The blue colonies were plated using
increased stringent SD/-Ade/-His/-Leu/-Trp/X-α-alpha/AbA (QDO/X/A) plates and the plasmid
DNA extracted using the Easy Yeast Plasmid Isolation kit (Clontech).
4.3 RESULTS
4.3.1 Isolation and analysis of total RNA and mRNA from BHK cells
An absorbance ratio (A260/280) of 2.0 for total RNA was obtained from BHK cells with an
average concentration of 1070 ng/µl, indicating a high quality preparation. The integrity of total
RNA was analysed on a 1% denaturing formaldehyde gel; the results showed two distinct 18S
and 28S ribosomal bands between 1.9 kb and 4.5 kb and a faint band representing the 5S
ribosomal band (Figure 4.2, Lane 1) with the ratio of the intensities of these bands being 1:2.
The RNA extracted was also not degraded and therefore suitable for purifying mRNA (Figure
4.2). The concentration of mRNA was 124 ng/µl with some rRNA faintly visible (Figure 4.2,
Lane 2). The RNA and mRNA showed high purity and quality for construction of cDNA library.
Figure 4.2: Denaturing formaldehyde gel electrophoresis of total RNA and mRNA extracted from BHK
cells. Lane M: Transcript RNA Marker (SIGMA); Lane 1: Total RNA; Lane 2: mRNA.
M 1 2
200bp
10 00bp
4 000bp
2 000bp
1 000bp
mRNA

108
Double stranded cDNA synthesis
A volume of 2 µl of single stranded DNA was amplified by LD-PCR and 5 µl of the product was
analysed on a 1% agarose gel. The results showed a smear ranging from 100 bp to 2 500 bp
in size before purification (Figure 4.3A, Lane 1). After purification using CHROMA-SPIN TE
400 columns, fragments with smaller sizes were eliminated (Figure 4.3B, Lane 1).
A B
Figure 4.3: Analysis of ds cDNA from BHK cells on 1% agarose gels. (A) Unpurified ds cDNA and (B)
purified ds cDNA. Lane M: O’GeneRuler 1 kb DNA ladder Plus (Thermo Fisher Scientific); Lane 1: ds
cDNA.
4.3.2 Construction and evaluation of cDNA
A yeast two-hybrid cDNA library was constructed from BHK cells using the pGADT7-Rec
vector in the Y187 strain. The parameters of the constructed cDNA library are described in
Table 4.1. In order to identify the size of the inserts, 100 colonies were randomly picked and
amplified using Matchmaker InsertCheck PCR Mix 2 and analysed on 1% agarose gels (Figure
4.4). Eighty-eight clones appeared as single bands. Six clones contained more than one band
(lanes 29, 58, 63, 67, 77 and 80) indicating that a single clone possesses several plasmids,
with the same origin of replication and transformed into one yeast cell. Results showed that
most of the insert sizes ranged from 200-500 bp (Figure 4.5) while small fragments of cDNA
of less than 200 bp were removed from the library. The following formulas were used:
M M 1 1
500bp
500bp
1 500bp 1 500bp
3 000bp 3 000bp

109
Total independent clones = number of cfu/ml on SD/-Leu x resuspension volume (15 ml)
= 146 cfu/0.1 ml/0.01 x 15 ml
= 2.2 x 10⁶ clones
Transformation Efficiency = cfu x suspension volume (ml) x dilution factor) / volume plated
(ml) x amount of DNA (µg).
= 60 cfu x 1 000/0.1 x 6 µl of 3 µg pGADT7-Rec
= 3.0 x 10⁴ µg pGADT7-Rec
Library concentration = no. of colonies / plating volume (ml) x dilution factor
= 32 cfu/0.1 x 103 ml
= 32 x 104 cells/ml
CFU = colony forming units.
Table 4.2. Parameters/measures of the quality of the cDNA library from BHK cells
Parameter BHK cDNA library
Total independent clones 2.2 x 10⁶ clones
Transformation efficiency 3.0 x 10⁴ µg of GADT7-Rec
Minimum length 200 bp
Maximum length 2 500 bp
Library concentration 32 x 104 cells/ml
110
Figure 4.4: Insert check PCR of randomly selected colonies from BHK cDNA library. One hundred
colonies were randomly selected from SD/-Leu plates and amplified by PCR using Matchmaker
InsertCheck PCR Mix 2. The PCR products were analysed by 1% agarose gel electrophoresis to
determine the size fragment. Lanes 1-100: Recombinant individual colonies; Lane M: O’GeneRuler 1
kb Plus DNA ladder (Thermo Fisher Scientific).
M 20 21 22 23 24 25 26 27 28 29 30 31 32 33 34 35 36 37 38
M 39 40 41 42 43 44 45 46 47 48 49 50 51 52 53 54 55 56 57
M 58 59 60 61 62 63 64 65 66 67 68 69 70 71 72 73 74
M 75 76 77 78 79 80 81 82 83 84 85 86 87 88 93 94 95 96 97
M 62 65 68 69 89 90 91 92 98 99 100
500bp
500bp
500bp
500bp
1500bp
1500bp
1500bp
1500bp
1500bp
1500bp
M 1 2 3 4 5 6 7 8 9 10 11 12 13 14 15 16 17 18 19
500bp
500bp

111
Figure 4.5: Pie chart showing sizes of the inserts. The majority of sizes were from 200-500 bp.
4.3.3 Nucleotide sequence analysis
Most of the plasmid DNA extracted from yeast colonies (from BHK cDNA library) could not be
transformed in bacteria; and those that could be transformed, could not be sequenced.
Therefore, sequencing was done on PCR products (n=100) of colonies using a T7 sequencing
primer. The cDNA sequences were analysed using BLAST software. The genes identified
from the cDNA library are outlined in Table 4.3. The five clones that contained more than one
band (Figure 4.4) could not be sequenced. Thirty-seven clones contained yeast vector
sequences and were not included in the analysis.
Table 4.3. Putative genes identified in cDNA clones of BHK cells
Colony number
Accession (E-value)
Organism Lowest E-value
Description Identity (%)
Y2 NM_001281566 Mesocricetus auratus
0 HtrA serine peptidase 1 (Htra1), mRNA, complete cds
99
Y3 XM_005080422 Mesocricetus auratus
0 Procollagen C-endopeptidase enhancer (Pcolce), mRNA
100
Y5 XM_013126271 Mesocricetus auratus
4.90E-31
Ribonuclease A family member 4 (Rnase4), transcript variant X2, mRNA
94
Y6 XM_021229702 Mesocricetus auratus
3.08E-65
Replication factor C subunit 1 (Rfc1), mRNA
100
Y7 XM_005080701 Mesocricetus auratus
8.84E-47
Transmembrane p24 trafficking protein 3 (Tmed3), mRNA
100
Y9 XM_005084892 Mesocricetus auratus
7.76E-16
Ribosomal protein L10a (Rpl10a), mRNA
100
Y10 XM_005084892 Mesocricetus auratus
7.76E-16
Ribosomal protein L10a (Rpl10a), mRNA
Y11 XM_005088283 Mesocricetus auratus
0 L-lactate dehydrogenase A chain (LOC101835564), mRNA
100
Chart showing the sizes of randomly selected clones
200-500bp
500-700bp
700-1000bp
1000-2500bp
54 36
8 2
112
Y12 XM_005085713
Mesocricetus auratus
0 TIMP metallopeptidase inhibitor 1 (Timp1), transcript variant X2, mRNA
99
Y13 XM_005067560 Mesocricetus auratus
0 Trafficking protein particle complex 1 (Trappc1), mRNA
99
Y18 XM_005086220 Mesocricetus auratus
2.89E-40
Ribosomal protein S16 (Rps16), mRNA
100
Y19 XM_005081314
Mesocricetus auratus
7.76E-16
NADH:ubiquinone oxidoreductase subunit A7 (Ndufa7), mRNA
100
Y20 XR_002383032 Mesocricetus auratus
3.09E-27
Uncharacterized LOC110341154 (LOC110341154), ncRNA
100
Y21 XM_005081664 Mesocricetus auratus
7.16E-24
Adenylate cyclase 9 (Adcy9), transcript variant X2, mRNA
100
Y22 XM_005066012 Mesocricetus auratus
8.16E-36
Triosephosphate isomerase 1 (Tpi1), mRNA
100
Y25 XM_005085725
Mesocricetus auratus
0 NADH:ubiquinone oxidoreductase subunit B11 (Ndufb11), mRNA
99
Y33 XM_021232574 Mesocricetus auratus
0 Enolase 1 (Eno1), mRNA 98
Y39 XM_005070576
Mesocricetus auratus
1.02E-22
Eukaryotic translation elongation factor 1 beta 2 (Eef1b2), mRNA
100
Y41 XR_002383032 Mesocricetus auratus
4.65E-27
Uncharacterized LOC110341154 (LOC110341154), ncRNA
100
Y42 XM_013118624 Mesocricetus auratus
0 Ribosomal protein L5 (Rpl5), transcript variant X2, mRNA
98
Y43 XM_005069906 Mesocricetus auratus
1.17E-15
Mitochondrial ribosomal protein L38 (Mrpl38), mRNA
100
Y44 XM_005087924 Mesocricetus auratus
0 Quinoid dihydropteridine reductase (Qdpr), mRNA
98
Y46 XM_013124303
Mesocricetus auratus
2.11E-31
Cyclin dependent kinase inhibitor 1A (Cdkn1a), transcript variant X2, mRNA
100
Y48 XM_005075916 Mesocricetus auratus
0 Ribosomal protein L23 (Rpl23), mRNA
99
Y49 XM_005088093 Mesocricetus auratus
8.36E-138
Ribosomal protein S11 (Rps11), mRNA
100
Y51 XM_007635938 Cricetulus griseus
4.06E-110
Actin gamma 1 (Actg1), transcript variant X3, mRNA
96
Y53 AH001828 Mesocricetus auratus
4.35E-40
Desmin gene, complete cds 100
Y56 XM_021229013 Mesocricetus auratus
0 Adenine phosphoribosyltransferase (Aprt), mRNA
98
Y59 XM_021235691
Mesocricetus auratus
1.53E-88
Serum amyloid A-3 protein-like (LOC101833293), transcript variant X1, mRNA
100
Y61 XM_005088093 Mesocricetus auratus
0 Ribosomal protein S11 (Rps11), mRNA
99
Y62 XM_021232924 Mesocricetus auratus
0 MICAL like 2 (Micall2), transcript variant X5, mRNA
98
Y64 XM_021232924 Mesocricetus auratus
0 MICAL like 2 (Micall2), transcript variant X5, mRNA
98
Y66 XM_005080762
Mesocricetus auratus
1.34E-95
Phosphoribosyl pyrophosphate amidotransferase (Ppat), mRNA
100
Y69 XM_005084365 Mesocricetus auratus
0 Cell division cycle associated 8 (Cdca8), mRNA
99
Y70 EU660218 Mesocricetus auratus
7.45E-23
Mitochondrion, complete genome 100
113
Y73 XM_005080434
Mesocricetus auratus
0 Minichromosome maintenance complex component 7 (Mcm7), mRNA
100
Y76 XM_005085713
Mesocricetus auratus
0 TIMP metallopeptidase inhibitor 1 (Timp1), transcript variant X2, mRNA
100
Y78 XM_005066966 Mesocricetus auratus
1.90E-44
Galectin 1 (Lgals1), mRNA 100
Y79 XM_005066966 Mesocricetus auratus
1.90E44 Galectin 1 (Lgals1), mRNA 100
Y81 XM_005084620 Mesocricetus auratus
1.46E-77
Reactive oxygen species modulator 1 (Romo1), mRNA
100
Y82 XM_005070347 Mesocricetus auratus
6.61E-82
Ribosomal protein S27a (Rps27a), mRNA
98
Y84 XM_021234483
Mesocricetus auratus
0 Tribbles pseudokinase 1 (Trib1), transcript variant X3, mRNA
100
Y85 XM_021234483
Mesocricetus auratus
0 Tribbles pseudokinase 1 (Trib1), transcript variant X3, mRNA
100
Y87 XM_005086049
Mesocricetus auratus
2.46E-106
TBC1 domain family member 20 (Tbc1d20), mRNA
100
Y88 XM_005079735
Mesocricetus auratus
0 Nascent polypeptide-associated complex subunit alpha (LOC101829818), mRNA
100
Y94 XM_005086723 Mesocricetus auratus
8.08E-24
Ribosomal protein S5 (Rps5), mRNA
100
Y95 XM_005086723 Mesocricetus auratus
8.08E-24
Ribosomal protein S5 (Rps5), mRNA
100
Y97 XM_005066966
Mesocricetus auratus
7.52E-132
Galectin 1 (Lgals1), mRNA
100
Y98 XM_013126271
Mesocricetus auratus
5.79E-108
Ribonuclease A family member 4 (Rnase4), transcript variant X2, mRNA
99
Y99 XM_021235281
Mesocricetus auratus
2.02E-164
Non-SMC condensin I complex subunit D2 (Ncapd2), mRNA
99
Y100 XM_007628245 Cricetulus griseus
3.17E-21
Acylphosphatase 2 (Acyp2), transcript variant X1, mRNA
100
4.3.4 Construction of bait plasmids (pGBKT7-Gn and pGBKT7-Gc)
PCR amplification successfully amplified fragments of Gn and Gc from wild-type RVFV isolate
M66/09. The amplified sizes were approximately 1 600 bp and 1 500 bp for Gn and Gc
respectively (Figure 4.6). The PCR products were digested with restriction enzymes EcoR1
and Sal1 and then cloned into the pGBKT7 vector. The successful construction of pGBKT7-
Gn and pGBKT7-Gc was confirmed by colony PCR, restriction digestion and sequencing
(Figure 4.7). The sequencing of products showed 100% across the entire gene length for both
Gn and Gc.

114
Figure 4.6: Ectodomains of genes encoding RVF viral Gc and Gn amplification. PCR-amplified portions
of Segment M which encode viral glycoproteins Gc and Gn, loaded in Lane 1 and 2, respectively. Lane
3 is PCR products of a negative control. Lane M: O’GeneRuler 1 kb DNA ladder Plus (Thermo Fisher
Scientific) with sizes shown in basepairs (bp).
Figure 4.7: Confirmation of recombinants pGBKT7-Gn (A) and pGBKT7-Gc (B) by digestion with EcoR1
and Sal1. Lane M: Molecular marker; Lane 1: Undigested plasmid recombinants; Lane 2: plasmid
recombinants digested with EcoR1; Lane 3: Plasmid recombinants digested with Sal1; Lane 4: Plasmid
recombinants digested with both EcoR1 and Sal1.
5 000bp
1 500bp
500bp
500bp
1 500bp
5 000bp
M M M 1 1 2 3 4 2 3 4 A B
5 000bp
1 500bp
500bp
1 2 3 M

115
4.3.5 Expression of Gn and Gc
The expression of the fusion proteins was confirmed before Y2H screening. Total proteins of
baits pGBKT7-Gn and pGBKT7-Gc plasmids transformed in Y2H were extracted using Y-Per
Yeast Protein Extraction Reagent (Thermo Fisher Scientific). Purification of the proteins was
done using the c-myc agarose (Thermo Fisher Scientific). Proteins were detected by western
blot using c-myc epitope tag antibody and goat anti-mouse IgG (H+L) secondary antibody,
HRP conjugate. The molecular weight of Gn fusion protein detected was approximately 30
kDa, while that of Gc fusion detected was also approximately 30 kDa (Figures 4.8A and B,
respectively). The sizes of the molecular weight detected by western blots were lower than
their estimated sizes (Gn = 48.4 kDa, Gc = 52.2 kDa). Expression of Gn and Gc was proved
in yeast cells. A positive control, pGBKT7-53 vector expressing a 57 kDa protein was also
included and the size detected was lower than expected. A very faint band was observed
around the 36 kDa region (Figure 4.8B, Lane 8 indicated by an arrow). Confirmation that these
were RVFV derived proteins was confirmed using the blots with positive serum as indicated
in Material and Methods (Section 4.2.3).
Figure 4.8: Western blotting analysis of total protein extracts of Y2HGold containing the plasmids
pGBKT7-Gn (A) and pGBKT7-Gc (B). Proteins were separated on SDS PAGE (4-12%), and later
probed with c-myc tag antibody. Lane M: PageRuler Plus Prestained protein Ladder (Thermo Fisher
Scientific); Lane 1: Y2H yeast cells; Lane 2: Empty vector pGBKT7; Lane 3: Lysates; Lane 4: Flow-
through; Lane 5: Washes; Lane 6: Eluate 1; Lane 7: Eluate 2; Lane 8: p53 (positive control indicated by
an arrow).
250
75
36
17
kDa M 1 2 3 4 5 6 7 8 M 1 2 3 4 5 6 7 8
36
75
250
17
kDa A B
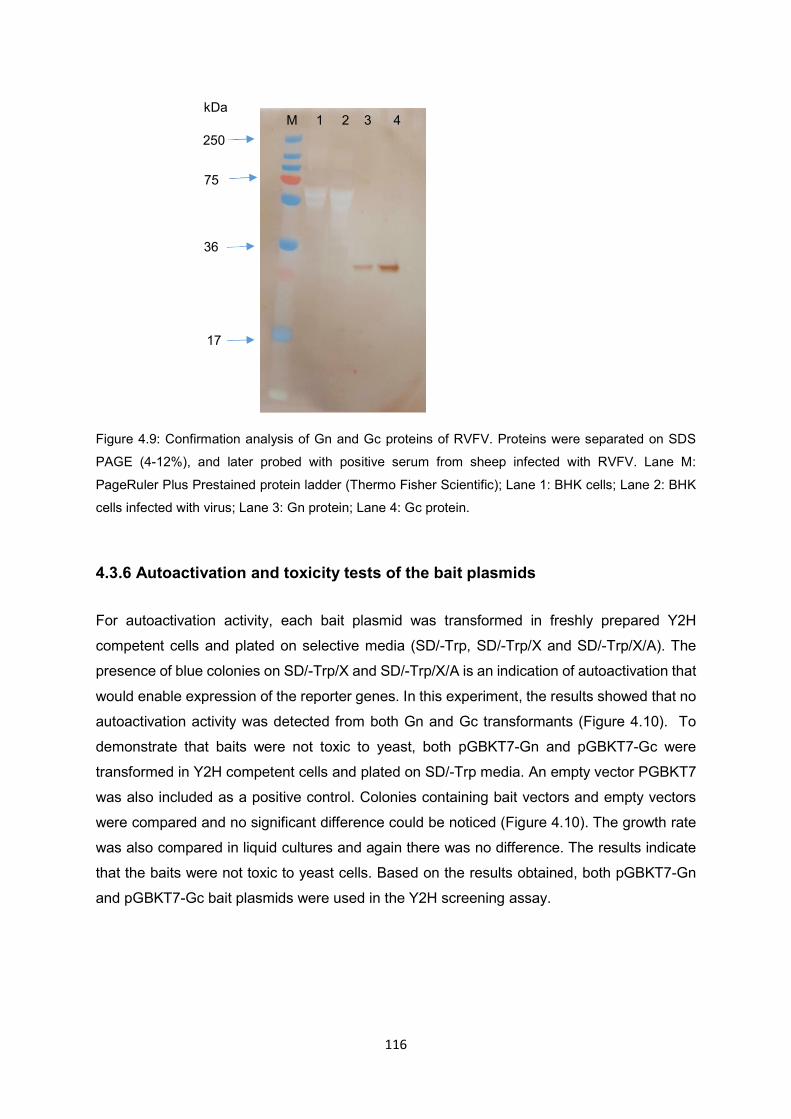
116
Figure 4.9: Confirmation analysis of Gn and Gc proteins of RVFV. Proteins were separated on SDS
PAGE (4-12%), and later probed with positive serum from sheep infected with RVFV. Lane M:
PageRuler Plus Prestained protein ladder (Thermo Fisher Scientific); Lane 1: BHK cells; Lane 2: BHK
cells infected with virus; Lane 3: Gn protein; Lane 4: Gc protein.
4.3.6 Autoactivation and toxicity tests of the bait plasmids
For autoactivation activity, each bait plasmid was transformed in freshly prepared Y2H
competent cells and plated on selective media (SD/-Trp, SD/-Trp/X and SD/-Trp/X/A). The
presence of blue colonies on SD/-Trp/X and SD/-Trp/X/A is an indication of autoactivation that
would enable expression of the reporter genes. In this experiment, the results showed that no
autoactivation activity was detected from both Gn and Gc transformants (Figure 4.10). To
demonstrate that baits were not toxic to yeast, both pGBKT7-Gn and pGBKT7-Gc were
transformed in Y2H competent cells and plated on SD/-Trp media. An empty vector PGBKT7
was also included as a positive control. Colonies containing bait vectors and empty vectors
were compared and no significant difference could be noticed (Figure 4.10). The growth rate
was also compared in liquid cultures and again there was no difference. The results indicate
that the baits were not toxic to yeast cells. Based on the results obtained, both pGBKT7-Gn
and pGBKT7-Gc bait plasmids were used in the Y2H screening assay.
M 1 2 3 4 250
75
36
17
kDa
117
Figure 4.10: Determination of the autoactivation and toxicity activities of pGBKT7-Gn and pGBKT7-Gc
bait plasmids in yeast. The bait plasmids were used to transform Y2HGold cells and grown on plates
containing different media. The empty plasmid pGBKT7 was included as a control. SDO = synthetic
dropout media; SDO/X = synthetic dropout media with X-alpha galactosidase; SDO/X/A = synthetic
dropout media with X-alpha galactosidase and Aureobasidin A antibiotic.
4.3.7 Yeast two-hybrid screening
A total of 32 blue colonies were obtained after the co-transformation of pGBKT7-Gn and cDNA
in a prey plasmid, while with the co-transformation of pGBKT7-Gc with prey plasmid 40 blue
colonies were obtained. Streaking of these colonies 2 to 3 times on plates using increased
stringency of SD/-Ade/His/-Leu/-Trp/X-α-alpha/AbA (QDO/X/A) reduced the number to 4 for
pGBKT7-Gn and to 8 for pGBKT7-Gc (Figure 4.11). Plasmids DNA were extracted from these
colonies and attempts to amplify them in bacteria failed. Sequencing of these plasmid DNA’s
also did not yield any results.
pGBKT7-Gn
pGBKT7-Gc
pGBKT7
SDO SDO/X SDO/X/A

118
Figure 4.11: Blue colonies obtained after the co-transformation. A: Transformants of pGBKT7-Gn and
cDNA in a prey plasmid streaked twice on QDO/X/A plates. B: Transformants of pGBKT7-Gc and cDNA
in a prey plasmid streaked twice on QDO/X/A plates. ODO/X/A = SD/-Ade/His/-Leu/-Trp/X-α-alpha/AbA.
4.4 DISCUSSION
From previous outbreaks, it is clear that different RVFVs isolates circulate in different endemic
areas and these viruses infect different host species i.e. cattle, sheep and goats. In addition,
wildlife can be infected by RVFV. In an infected animal, the virus preferentially localizes to
certain tissues, especially the liver, spleen and in pregnant animals, the placenta (Swanepoel,
1981). The outcome of these infections is also different in the different host species. The
replication of the virus in these host species might depend on host receptor sites. It is well
known that the viral glycoproteins mediate host cell attachment and are involved in viral entry
into the cell (De Boer et al., 2012; Kakach et al., 1998). It possible that more than one receptor
site is present in the host species. It is important to understand the interaction between the
virus glycoproteins and the host cell proteins following attachment.
Characterising host pathogen protein-protein interactions help in understanding the
mechanism underlying pathogen infection and broadens the understanding of molecular
functions of pathogen and host proteins. Different methods have been developed and used
for studying protein-protein interaction. Those methods include affinity purification, co-
immunoprecipitation, pull-down assay and cross-linking assay. Some of these methods are
coupled with mass spectrometry (MS) to identify the interacting partner using proteomic
analysis.
The identity of specific host receptors, targeted during RVFV infection, are still not clear. In
order to understand and identify the host receptors, Y2H system was used in the study to
119
search for BHK cell proteins that interact with viral glycoproteins Gn and Gc. For the Y2H
assay, a high-quality cDNA library which expresses host proteins, is required for screening of
interactions between host and virus proteins. Many cDNA libraries have been constructed
from plants, animals and microorganisms and genes related to biological processes have been
determined (Lee et al., 2012; Ma et al., 2011; Zhao et al., 2009). To date, an interaction
between a mouse embryonic cDNA library and RVFV NSm protein was studied using Y2H
system (Engdahl et al., 2012). In this study, cDNA library from BHK cell line was constructed
and characterised before it could be screened for interaction with RVFV glycoproteins. A
comprehensive screen for positive interactions needs a library with high complexity as
possible to maximize the chances of finding relevant prey proteins (Gao et al., 2015). A good
quality cDNA library has been identified by three aspects 1) The total independent clones/
capacity of more than 1.7 X 10⁵ clones, which will ensure that the low abundance mRNAs is
present in the library. 2) High transformation efficiency and 3) the average length of inserted
cDNA (>1.0 kb). The average length will ensure the integrity of cDNA (Li et al., 2009; Al-
Taweel et al., 2011; Liu et al., 2013). In this study, the total number of independent clones
obtained was 2.2 X 10⁶ and the transformation efficiency was 3.0 X 10⁴ colonies/µg of GADT7-
Rec. This means that the two aspects of the good quality library were achieved. The number
of cycles used in the study was 22. It was believed that this number is small enough to
minimise the chances of amplification of smaller cDNA fragments that might not have been
removed during CHROMA-SPIN fractionation. In this study, the cDNA inserts ranged from 200
bp to 2 500 bp, with a large number of inserts harbouring sizes of 200-500 bp. Only 100
colonies were randomly picked up and amplified. It was possible that the number of clones
amplified was too small to represent the average length of the cDNA size. Although some of
the genes identified in the cDNA library were not full-length sequences, they were identified
as from hamsters. The library parameters calculated indicate that the cDNA library constructed
was suitable to be used as prey in Y2H system for identifying RVFV-interacting host partners.
The constructed cDNA would be a useful tool for studying RVFV host interactions. In addition,
the BHK cell line is susceptible to bluetongue virus, African horse sickness virus, bovine
ephemeral fever and epizootic haemorrhagic disease virus; therefore, the constructed libraries
could also be useful to study host virus protein interactions for these animal pathogens (OIE,
2019; McLaughlin et al., 2003; Wang et al., 2001; Laviada et al., 1993).
It was postulated that the ectodomains of Gn and Gc that lack the transmembrane regions,
would be the relevant baits to be used to screen the cDNA library. Because the aim of the
study was to find proteins that interact with a membrane-bound protein, only the selected
domains were used as baits (Kuo et al., 1997). Two bait plasmids pGBKT7-Gn and pGBKT7-
Gc were constructed and tested for protein expression in yeast cells by western blotting.
120
Confirmation of the proteins was done using positive serum against RVFV and fusion
constructs were confirmed to be in-frame with their fusion partners by sequencing using the
T7 primer (Causier and Davies, 2002). Before the Y2H screen, plasmids were tested for
autoactivation activity and toxicity. It was found that both baits did not have any autoactivation
activities, were also not toxic and were suitable for use as baits for the Y2H screen.
In this study, screening of cDNA library using the ectodomains pGBKT7-Gn and pGBKT7-Gc
yielded 4 blue colonies (using pGBKT7-Gn) and 8 blue colonies (using pGBKT7-Gc).
Rescuing of the plasmid DNA in bacteria was unsuccessful. Neither PCR amplification of the
blue colonies nor sequencing of the plasmid DNA from yeast was successful. Many factors
could have contributed to the failure of rescuing the yeast DNA in bacteria. 1) Although plasmid
DNA was extracted using the kit, it is possible that contaminants were not all removed and
they prevented the bacteria to take up the yeast DNA. 2) The increased concentration (from 1
to 20 ng) of yeast DNA might not have been enough. 3) The size of the genes in the plasmids
might be too big. 4) The open reading frame of the DNA might not had fused in frame with the
GAL4 AD sequence. These factors should be looked upon in the future study.
The proteins that were fused to the DNA binding domain; pGBKT7-Gn and pGBKT7-Gc did
not possess transcription activation domains that might activate the reporter genes (Causier
and Davies, 2002). These proteins were tested for autoactivation and toxicity prior to testing
for protein-protein interaction. There are many reasons that might have contributed to the
negative results. Firstly, the proteins of RVFV are integral proteins. These types of signalling
molecules including receptor tyrosine kinase, G protein-coupled receptor, membrane bound
phosphatase and transporters that are hydrophobic in nature (Stephens and Banting, 2000;
Iyer et al., 2005). This hydrophobicity property makes them difficult to be studied using the
Y2H system. Truncation of the hydrophobic domains might be necessary, but this might be
difficult if it involves the unknown protein. In order to solve this problem, a modified Y2H system
called split ubiquitin Y2H was developed and might have been suitable for the study (Stagljar
et al., 1998). The above system uses an ubiquitin amino acid protein that can be split into two
moieties referred to as Nub1 (N-terminal fragment) and Cub (Carboxy-terminal fragment). The
two fragments allow the bait to be fused to the Cub fragment, which is linked to the artificial
transcription factor, while the prey is fused to the Nub fragment containing an isoleucine 13 to
glycine mutation that prevents re-association of the two fragments. An interaction between the
two proteins; bait and prey in a yeast host will reconstitute an active ubiquitin molecule,
resulting in the proteolytic cleavage of a reporter protein from one of the ubiquitin domains
(Snider and Stagljar, 2016). This will allow the transcription factor to enter the nucleus of the
yeast and to activate the reporter system (Snider and Stagljar, 2016; Snider et al., 2010;
Causier and Davies, 2002; Paumi et al., 2007). The use of split-ubiquitin systems in the

121
analysis of protein-protein interactions involving different kinds of membranes has been
successful (Hooker et al., 2007).
Secondly, these proteins might be unstable when expressed in yeast cells and require
plasmids with modified promoters to drive a low level of expression (Causier and Davies,
2002). The initial Y2H system relied on proteins that were localised to the yeast cell nucleus,
but the current two hybrid vectors, encode nuclear localization signals thereby targeting non-
nuclear proteins into the nucleus (Causier and Davies, 2002). Some proteins such as cyclins
and homeobox gene products are toxic when expressed and targeted to the yeast nucleus.
Thirdly, in the Y2H system, it is possible that both proteins, although able to interact, are never
in close proximity to each other within the cell because of time/space constraints (Van
Criekinge and Bayaert, 1999). The fact that Gn/Gc forms a stable capsomer complex
consisting of at least six Gn/Gc units that assemble into a full virion may support the notion
that single expression glycoproteins may be unstable or may assemble into capsomers that
would prevent entry into the nucleus. However, none of the above problems address the fact
that blue colonies were obtained.
In conclusion, a quality cDNA library was constructed and characterized from a RVFV
susceptible BHK cell line. Evaluation of the library for various parameters demonstrated it to
be suitable for usage as prey for studying RVFV-host protein interactions. The library
constructed will lay a solid foundation for finding relevant genes that are important for viral
attachment during infection and to investigate their mechanisms. Expression of the
ectodomains of Gn and Gc in yeast cells was successful and the baits constructed were
suitable for Y2H screening. The putative clones found in the study using Y2H screening need
to be identified and characterized fully. The molecular interactions of pathogenesis related
proteins involved during RVFV infection is not very clear. Identification and characterization of
these proteins are of importance both in understanding the molecular mechanisms of RVFV
glycoproteins and the improvement of the development of glycoprotein-targeted therapeutics
against RVFV.

122
CHAPTER 5: GENERAL DISCUSSION AND CONCLUSION
The RVF outbreaks of 2008-2010 affected a large number of animals that included cattle and
sheep. A disproportionately large number of sheep were affected during this outbreak, raising
the question of whether host tropism was observed due to the difference of RVFV genotypes.
Sampling of the outbreak isolates and full genome sequencing indicated that the isolates were
genetically distinct, grouping in two different clades, notably Clades C and H. Isolates in Clade
C were from major outbreaks in different countries including Zimbabwe (1978), Madagascar
(1991), eastern Africa (1997-1998), Saudi Arabia (2000-2001), Kenya (2007) and South Africa
while those in Clade H were from South Africa (2009-2010) and Namibia (2004) (Grobbelaar
et al., 2011).
Rift Valley fever virus has a segmented genome that allows reassortment as an essential
contributor to its evolutionary dynamics (Freire et al., 2015). In this study, two reassortants
were identified. Evidence of reassortment was also seen in the viruses that caused the 2006-
2007 outbreaks in Kenya where multiple virus lineages circulated during a single outbreak
(Bird et al., 2008). The exchange of genetic material between different lineages through
superinfection is possible (Bird et al., 2008) and this was also noticed in the current study.
Reassortment can be due to transportation of one strain to a locality where another strain is
circulating (Sall et al., 1999). Studies have shown that RVFV isolates from different
geographical localities appear to have base substitutions varying from 0 to 9.6% in the M
segment, indicating reassortment as a common trait in RVFV natural history (Sall et al., 1997).
When kinetic growth curves are produced, viruses are removed from their original environment
and given a new host system. During that process, many changes involving viral entry into the
host, replication in the host and shedding from the host might occur. A virus with genetic
variants showing faster replication and higher viral loads is believed to produce more severe
disease and a higher mortality rate (Wargo and Kurath, 2011). Growth curves in cell culture
might not represent virulence in the field because the virus might have mutated to adapt to the
new environment. Arbovirus populations need to adapt to the host environments and interact
with the host resources including binding host proteins, folding RNA into functional secondary
structures so that replication can occur efficiently (Sexton and Ebel, 2019). These processes
may vary in different hosts. Alternating replication in vertebrates and arthropods imposed by
arboviruses results from the presence of different evolutionary pressures, allowing the viral
genomes to evolve rapidly when novel conditions arise (Ciota and Kramer, 2010; Moser et al.,
2018; Sexton and Ebel, 2019). Future studies need to assess the virulence of the slow and
fast-growing strains in animal trials to confirm association of growth phenotype and virulence.

123
Recombinants of RVFV can be rescued by developing efficient and reproducible reverse
genetics systems. Through reverse genetic systems, manipulation of RNA molecules through
its complementary DNA has been possible and this enhances the study on the biology of the
virus at the phenotypic level (Kanai et al., 2017). Both T7 and Pol I dependent systems can
be utilized for minigenome assays to characterize the viral proteins mediating transcription
during RVFV infection (Bouloy and Flick, 2009). It has been shown that these systems in
combination with T7 or Pol I driven expression plasmids of the corresponding Bunyavirus
nucleoprotein N and the polymerase L enable the constitution of ribonucleoprotein templates
(Bouloy and Flick, 2009; Flick and Bouloy, 2005; Flick et al., 2003). The latter falls outside the
scope of this current study but should be an integral part of the future work.
Infectious viruses need to use host cellular components to synthesise their proteins and to
replicate. Codon usage bias in the virus and in its host can affect the viral replication. Too
much deviation of the viral codon usage from that of the host will inhibit or slow down the viral
protein synthesis because of the inability of the corresponding tRNA. Therefore, codon usage
bias of a virus and its host must coevolve for the virus to use the host machinery more
efficiently and to replicate faster (Burns et al., 2006; Goñi et al., 2012). Codon usage bias did
not yield a clear answer that may explain the phenotype, but codon usage bias cannot be
excluded since codon usage bias at specific regions of the genome does exist even if this is
not predominant. Although complete genome sequences of RVFVs are available, codon
usage bias in many of these genome sequences have not been thoroughly addressed. Further
studies are needed to address this in order to provide understanding of the evolution and gene
expression in RVFV.
The fact that viruses have different hosts, implies that their adaptation to these hosts differ
(Butt et al., 2016). Most viruses have high variability at nucleotide levels. For the same virus,
multiple strains may exist and at each replication, new mutations are expected to appear, so
that the virus can escape the host immune system and survive (Lucas et al., 2001).
The inability to identify any defined characteristics that could explain the phenotypic
differences observed between the RVFV isolates led to the consideration that identification of
host receptors, followed by subsequent characterization of receptor interaction may shed light
on the role that the glycoproteins may play in the phenotype. To this end, the Y2H system was
investigated as a means to identify the receptors for Gn and Gc. The Y2H system involves
detection of interacting proteins in living yeast cells and this has made it a powerful novel tool
used in protein-protein interactions (Brückner et al., 2009).
The use of yeast is advantageous since yeast is closer to higher eukaryotes than in vitro
experiments or those systems based on bacterial hosts (Van Criekinge and Beyaert, 1999).
124
Although there are many Y2H-based techniques available, they all rely on a similar principle,
which is the modular structure of the protein reporting the interaction (Brückner et al., 2009).
Most of the Y2H systems require translocation of interacting proteins into the nucleus. This
makes it difficult for the membrane-associated proteins, integral membrane proteins and
cytosolic proteins (Sugita et al., 1996). Although truncated versions of these proteins are
possible to use in the system, misfolding of the protein remains an obstacle. For extracellular
proteins, such as receptors and ligands, which participate in a multitude of physiological
processes, a system called screening for interactions between extracellular protein (SCINEX-
P) was developed (Urech et al., 2003).
The cDNA library needed in the Y2H system is crucial. The library should be of good
representation because only one out of six fused cDNAs will be in the correct frame (Van
Criekinge and Beyaert, 1999). The cDNA libraries are usually generated in the activation
domain plasmids and should be directionally cloned into the vector. This will ensure that one
in three of the cDNAs will be in frame with the fusion partner (Causier and Davies, 2002; Gao
et al., 2015; Mahajan et al., 2015). In this study, the SMART technique, a novel method for
constructing cDNA libraries was used. The technique increases the lengths of cDNA clones
and high-quality cDNA library by employing MMLV reverse transcriptase (Gao et al., 2015).
The technique also adds a distinct Sma1 site to each end during transcription which allowed
directional cloning in a Sma1 digested vector.
Mapping of interaction networks that occur during protein-protein networks is of crucial
importance for the systems in biology. In this study, the Y2H system was chosen because it
is an in vivo method and proteins needed posttranslational modifications to carry out their
functions; so, it was believed that the proteins would be in their physiological environment and
fold properly to interact. Methods that could be suitable rather than the use of Y2H include
surface plasmon resonance (SPR) which is a biophysical technology involving injection of
purified cellular extracts onto a sensor chip covered with immobilized binding partner that
could be eluted and identified by mass spectrophotometer (Brüchner et al., 2009), BRET and
FRET-based methods, but these techniques use expensive equipment (Xing et al., 2016; Rao
et al., 2014).
The interaction between viruses and their new environments involve manipulation of
resources. In a virulent relationship, many aspects of cellular metabolism and developments
are changed (Agudelo-Romero et al., 2008). The changes that occur in the virus genome are
important to adapt to the new environment. These changes might differ within isolates of the
same strain and results in different growth phenotypes (Agudelo-Romero et al., 2008).
125
The current study had a number of weaknesses that should be improved in future studies. The
criteria used to select the isolates for comparisons limited some possibilities. The genome
sequencing and phylogenetic analysis linked with host information, allowed the selection of
isolates with distinct genetic background and potential host preferences. The selection of the
isolates for comparison was based on isolates obtained from liver samples and majority of the
viruses were from Clade H, with one exception from Clade C. After the growth curve
experiments, more members of Clade C could have been selected to test whether all members
show the fast-growing phenotype. Since growth phenotypes are known phenomena in RVFV,
selection of a diverse range of isolates could have helped because the primary aim was
investigation of the growth phenomenon as it gives insight into the correlation of the viral cycle.
This could have also helped in identifying the amino acid substitutions that are responsible for
the slow growing phenotype. The study was unable to obtain sequences from the blue
colonies. More time to repeat the experiment might have help to identify the problem.
While reassortment was detected in a small number of isolates, it would seem as if the majority
of strains that emerged in the outbreaks accumulated over time while circulating in South
Africa. Studies have described various amino acid substitutions in the glycoproteins that might
contribute to the association between RVFV genotypes and lethal phenotypes (Bird et al.,
2007). Among the variation identified is the change from glycine to glutamic acid at position
277 of the Gn gene in the strain ZH501 from a human sample during an outbreak in Egypt in
1977 (Morrill et al., 2010). The majority of the South African isolates analysed in the study also
had glutamic acid at this position and some additional amino acid substitutions when
compared to ZH501 strain. This study relates only on the impact of amino acid substitution at
position 277. Further investigation on the impact of other amino acid substitutions is required
to broaden the knowledge about virus pathogenicity.
The study could have been diverted resources to cell infection biology after amino acid
substitution analysis because during viral attachment and entry, many of the capsid
substitutions may affect the stability of the virus. Therefore, heating the virus and testing for
differences in infection rate would have indicated whether the phenotype was capsid
associated or not. Determination of the rate of transcription and replication using quantitative
PCR and rates of translation using ELISA might have also indicated whether the L segment is
responsible for the phenotype observed or not. These are additional approaches that can be
considered in future studies.
Despite the weaknesses identified, the study did produce significant results. Complete
genome sequences of South African isolates of RVFV that caused the disease outbreaks from
2008 to 2010 were determined. Comparison of growth rates indicates different phenotypes for

126
cattle- and sheep-derived strains. Comparative sequence analysis linked with functional
information identified possible amino acid substitutions that may be responsible for the
phenotypes, but this needs to be confirmed. In this study, the ectodomains of Gn and Gc were
successfully expressed in yeast cells. The expressed proteins can be used to improve
diagnostic tests for RVFV. The cDNA BHK library generated in this study will be a significant
resource for animal disease research that can be used to study host-virus protein interactions
for many other animal diseases such as African horse sickness, bovine ephemeral fever,
epizootic haemorrhagic and bluetongue.

127
CHAPTER 6: REFERENCES
Abd EI-Rahim IHA, EI-Hakam U., Hussein M (1999) An epizootic of Rift Valley fever in Egypt
in 1997. Revue Scientifique et Technique De L’Office International Des Epizooties 18:741-
748.
Abudurexiti A, Adkins S, Alioto D, Alkhovsky SV, Avšič-Županc T, Ballinger MJ, Bente DA,
Beer M, Bergeron É, Blair CD, Briese T, Buchmeier MJ, Burt FJ, Calisher CH, Cháng C,
Charrel RN, Choi IR, Clegg JCS, De la Torre JC, De Lamballerie X, Dèng F, Serio FD, Digiaro
M, Drebot MA, Duàn X, Ebihara H, Elbeaino T, Ergünay K, Fulhorst CF, Garrison AR, Gão
GF, Gonzalez JPJ, Groschup MH,Günther S, Haenni AL, Hall RA, Hepojoki J, Hewson R, Hú
Z, Hughes HR, Jonson MG, Junglen S, Klempa B, Klingström J, Kòu C, Laenen L, Lambert
AJ, Langevin SA, Liu D, Lukashevick IS, Luò T, Lǚ C, Maes P, De Souza WM, Marklewitz M,
Martelli GP, Matsuno K, Mielke-Ehret N, Minutolo M, Mirazimi A, Moming A, Mühlbach HP,
Naidu R, Navarro B, Nunes MRT, Palacios G, Papa A, Pauvolid-Corrêa A, Paweska JT, Qiáo
J, Radoshitzky SR, Resende RO, Romanowski V, Sall AA, Salvato MS, Sasaya T, Shěn S,Shi
X, Shirako Y, Simmonds P, Sironi M, Song JW, Spengler JR, Stenglein MD, Sü Z, Sūn S,
Táng S, Turina M, Wáng B, Wáng C, Wáng H, Wáng J, Wèi T, Whitfield AE, Zerbini FM, Zhāng
J, Zhāng L, Zhāng Y, Zhang YZ, Zhāng Y, Zhou X, Zhū L, Kuhn JH (2019) Taxonomy of the
order Bunyavirales: update 2019. Archives of Virology 164:1949-1965.
Adam I, Karsany MS (2008) Case report: Rift Valley fever with vertical transmission in a
pregnant Sudanese woman. Journal of Medical Virology 80:929.
Agudelo-Romero P, Carbonell P, Perez-Amador MA, Elena SF (2008) Virus adaptation by
manipulation of host’s gene expression. PLoS One 3:e2397.
Ahmad K (2000) More details from Rift Valley fever in Saudi Arabia and Yemen. Lancet
356:1422.
Ahmed O, EI Mamy O, Baba MO, Barry Y, Isselmou K, Dia ML, Hampate B, Diallo MY, EI
Kory MOB, Diop M, Lo MM, Thiongane Y, Bengoumi M, Puech L, Plee L, Claes F, de La
Rocque S, Doumbia B ((2011) Unexpected Rift Valley fever outbreak, Northern Mauritania.
Emerging Infectious Diseases www.cdc.gov/eid 17:1894-1896.
Alexander RA (1957) Discussion on both Rift Valley fever (R.V.F.) and Wesselsbron Virus
Disease (W.V.D.). In Proceedings of the IVth Annual Meeting of the Inter African Advisory
Committee on Epizootic Disease. Interafrican Bureau for Epizootic Diseases 29.
128
Alexander RA (1951) Rift Valley fever in the Union. Journal of South African Veterinary
Medical Association 22:105.
Alhaj M (2016) Safety and efficacy profile of commercial veterinary vaccines against Rift Valley
fever: A review study. Journal of Immunology Research 7346294.
AI-Hazmi M, Ayoola EA, Abdurahman M, Banzal S, Ashraf J, EI-Bushra A, Hazmi A, Abdullah
M, Abbo H, Elamin A, AI-Sammani EI-T, Gadour M, Menon C, Hamza M, Rahim I, Hafez M,
Jambavalikar M, Arishi H, Aqeel A (2003) Epidemic Rift Valley fever in Saudi Arabia: A clinical
study of severe illness in humans. Clinical Infectious Disease 36:245-252.
Al-Taweel K, Fernando WGD, Brûlé-Babel AL (2011) Construction and characterization of a
cDNA library from wheat infected with Fusarium graminearum Fg 2. International Journal of
Molecular Sciences 12:613-626.
Amroun A, Priet S, de Lamballerie X, Quérat G (2017) Bunyaviridae RdRps: structure, motifs,
and RNA synthesis machinery. Critical Reviews in Microbiology 43:753-778.
Andriamandimby SF, Randrianarivo-Solofoniaina AE, Jeanmaire E.M, Ravololomanana L,
Razafimanantsoa LT, Rakotojoelinandrasana T, Razainirina J., Hoffmann J, Ravalohery J-P,
Rafisandratantsoa J-T, Rollin PE, Reynes J-MK (2010) Rift Valley fever during rainy seasons,
Madagascar, 2008 and 2009. Emerging Infectious Diseases www.cdc.gov/eid 6:963-970.
Anyamba A, Linthicum KJ, Small J, Britch SC, Park E, de La Rocque S, Formentyc P,
Hightower AW, Breiman RF, Chretien JP, Tucker CJ, Schnatel DC, Sang R, Haagsma K,
Latham M, Lewandowski HB, Magda SO, Mohamed MA, Nguku PM, Reynes JM, Swanepoel
R (2010) Prediction, assessment of the Rift Valley fever activity in east and southern Africa
2006-2008 and possible vector control strategies. American Journal of Tropical Medicine and
Hygiene 83:43-51.
Anyamba A, Chretien JP, Small J, Tucker CJ, Formenty P, Richardson JH, Britch SC,
Schnabel DC, Erickson RL, Linthicum KJ (2009) Prediction of Rift Valley fever outbreak.
Proceedings of the National Academy of Sciences of the United States of America 106:955-
959.
Anyamba A, Linthicum KJ, Mahoney R, Tucker CJ, Kelley PW (2002) Mapping potential risk
of Rift Valley fever outbreaks in African Savannas using vegetation index time series data.
Photogrammetric Engineering and Remote Sensing 68:137-145.
Anyangu AS, Gould LH, Sharif SK, Nguku PM, Omolo JO, Mutonga D, Rao CY, Lederman
ER, Schnabel D, Paweska JT, Katz M, Hightower A, Njenga MK, Feikin DR, Breiman RF,

129
(2010) Risk factors for severe Rift Valley fever infection in Kenya. American Journal of Tropical
Medicine and Hygiene 83:14-21.
Arabidopsis Interactome Mapping Consortium (2011) Evidence for network evolution in an
Arabidopsis Interactome map. Science 333:601-607.
Aravind S, Kamble NM, Gaikwad SS, Khulape SA, Dey S, Dhama K, Mohan CM (2014)
Bioinformatics study involving characterization of synonymous codon usage bias in the duck
enteritis virus glycoprotein D (gD) gene. Asian Journal of Animal and Veterinary Advances
9:229-242.
Archer BN, Thomas J, Weyer J, Cengimbo A, Landoh DE, Jacobs C, Ntuli S, Modise M,
Mathonsi M, Mashishi MS, Leman PA, Le roux C, Jansen van Vuren, Kemp A, Paweska JT,
Blumberg L (2013) Epidemiologic investigations into outbreaks of Rift Valley fever in humans,
South Africa, 2008-2011. Emerging Infectious Diseases 19:1918-1925.
Archer BN, Weyer J, Paweska J, Nkosi D, Leman P, Tint KS, Blumberg L (2011) Outbreak of
Rift Valley fever affecting veterinarians and farmers in South Africa, 2008. South African
Medical Journal 101:263-266.
Arishi HM, Aqeel AY, Al Hazmi MM (2006) Vertical transmission of fatal Rift Valley fever in a
newborn. Annals of Tropical Paediatrics 26:251-253.
Auerbach D, Fetchko M, Stagljar I (2003) Proteomics approaches for generating
comprehensive protein interaction maps. Targets 2:85-92.
Avila JR, Lee JS, Torii KU (2015) Co-Immunoprecipitation of membrane-bound receptors.
Arabidopsis Book 13:e0180.
Baba M, Masiga DK, Sang R, Villinger J (2016) Has Rift Valley fever virus evolved with
increasing in human populations in East Africa? Emerging Microbes and Infections 5:e58.
Baker SF, Nogales A, Martinez-Sobrido L (2015) Downregulating viral gene expression: codon
usage bias manipulation for the generation of novel influenza A virus vaccines. Future Virology
10:715-730.
Bakheet TM, Doig AJ (2009) Properties and identification of human protein drug targets.
Bioinformatics 25:451-457.
Barnard BJ, Botha MJ (1977) An inactivated Rift Valley fever vaccine. Journal of South African
Veterinary Association 48:45-48.
130
Baudin M, Jumaa AM, Jomma HJE, Karsany MS, Bucht G, Naslund J, Ahlm C, Evander M,
Mohamed N (2016) Association of Rift Valley fever virus infection with miscarriage in
Sudanese women: a cross-sectional study. Lancet Glob Health 4:e864-e874.
Behura SK, Severson DW (2013) Codon usage bias: causative factors, quantification methods
and genome-wide patterns: with emphasis on insects genomes. Biological Reviews 88:94-61.
Belalov IS, Lukashev AN (2013) Cause and implications of codon usage bias in RNA viruses.
PLoS One 8:e56642.
Berggard T, Linse S, James P (2007) Methods for the detection and analysis of protein-protein
interactions. Proteomics 7:2833-2842.
Bernsel A, Viklund H, Hennerdal A, Elofsson A (2009) TOPCONS: consensus prediction of
membrane protein topology. Nuclei Acids Research 37:W465-W468.
Bird BH, Albarino CG, Hartman AL, Erickson BR, Ksiazek TG, Nichol ST (2008a) Rift Valley
fever lacking NSs and NSm genes is highly attenuated, confers protective immunity from
virulent virus challenge, and allows for differential identification of infected and vaccinated
animals. Journal of Virology 82:2681-2691.
Bird BH, Githinji JW, Macharia JM, Kasiiti JL, Muriithi RM, Gacheru SG, Musaa JO, Towner
JS, Reeder SA, Oliver JB, Stevens TL, Erickson BR, Morgan LT, Khristova ML, Hartman AL,
Comer JA, Rollin PE, Ksiazek TG, Nichol ST (2008b) Multiple virus lineages sharing recent
common ancestry were associated with a large Rift Valley fever outbreak among livestock in
Kenya during 2006-2007. Journal of Virology 82:11152-11166.
Bird BH, Khristova ML, Rollin PE, Ksiazek TG, Nichol ST (2007) Complete genome analysis
of 33 ecologically and biologically diverse Rift Valley fever virus strains reveals widespread
virus movement and low genetic diversity due to recent common ancestry. Journal of Virology
81:2805-2816.
Botros B, Omar A, Elian K, Mohamed G, Soliman A, Salib A., Salman D, Saad M, Earhart K
(2006) Adverse response of non-indigenous cattle of European breeds to live attenuated
Smithburn Rift Valley fever vaccine. Journal of Medical Virology 78:787-791.
Bouloy M, Weber F (2010) Molecular Biology of Rift Valley fever virus. The Open Virology
Journal 4:8-14.
Bouloy M, Flick R (2009) Reverse genetics technology for Rift Valley fever virus: Current and
future applications for development of therapeutics and vaccines. Antiviral Research 84:101-
118.
131
Bouloy M, Janzen C, Vialat P, Khun H, Pavlovic J, Huerre M, Haller O (2001) Genetic evidence
for an interferon-antagonistic function of Rift Valley fever virus non-structural protein NSs.
Journal of Virology 75:1371-1377.
Boyd S (2013) Diagnostic applications of High-Throughput DNA sequencing. Annual Review
of Pathology: Mechanisms of Disease 8:381-410.
Brückner A, Polge c, Lentze N, Auerbach, Schlattner U (2009) Yeast two-hybrid, a powerful
tool for systems biology. International Journal of Molecular Sciences 10:2763-2788.
Burns CC, Shaw J Campagnoli R, Jorba J, Vincent A, Quay J, Kew O (2006) Modulation of
Poliovirus replicative fitness in Hela cells by deoptimization of synonymous codon usage in
the capsid region. Journal of Virology 80:3259-3275.
Butt AM, Nasrullah I, Qamar R, Tong Y (2016) Evolution of codon usage in Zika virus genomes
in host and vector specific. Emerging Microbes and Infections 5:e107.
Butt AM, Nasrullah I, Tong Y (2014) Genome-wide analysis of codon usage and influencing
factors in Chikungunya viruses. PLoS One 9:e90905.
Causier B, Davies B (2002) Analysing protein-protein interactions with the yeast two-hybrid
system. Plant Molecular Biology 50:855-870.
Centres for Disease Control and Prevention (2000) Update: Outbreak of Rift Valley fever-
Saudi Arabia. August – November (2000) MMWR Morbidity and Mortality Weekly Report
49:905-908.
Cȇtre-Sossah C, Pédarrieu A, Juremalm M, Jansen van Vuren, Brun A, Mamy ABO, Héraud
JM, Filippone C, Ravalohery JP, Chaabihi H, Albina E, Dommergues L, Paweska J, Cardinale
E (2019) Development and validation of a pen side test for Rift Valley fever. PLoS Neglected
Tropical Disease 13:e0007700.
Chengula AA, Mdegela RH, Kasanga CJ (2013) Socio-economic impact of Rift Valley fever to
pastoralists and agro pastoralists in Arusha, Manyara and Morogoro regions in Tanzania.
Springer Plus 2:1-14.
Chevalier V, Rakotondrafara T, Jourdan M, Heraud JM, Andriamanivo HR, Durand B,
Ravaomanana J Rollin PE, Rakotondravao R (2011) An unexpected recurrent transmission of
Rift Valley fever virus in cattle in a temperate and mountainous area of Madagascar. PloS
Neglected Tropical Diseases 5:e1423.
132
Chevalier V, Pepin M, Plee L, Lancelot R (2010) Rift Valley fever – a threat for Europe?
European Surveillance 15:1-11.
Ciota AT, Kramer LD (2010) Insights into arbovirus evolution and adaptation from
experimental studies. Viruses 2:2594-2617.
Cobo F (2012) Application of molecular diagnostic techniques for viral testing. The Open
Virology Journal 6:104-114.
Codon usage database: www.kazusa.or.jp/codon.
Coetzer JAW (1982) The pathology of Rift Valley fever.11. Lesions occurring in field cases in
adult cattle, calves and aborted foetuses. Onderstepoort Journal of Veterinary Research 49:
11-17.
Coetzer JAW (1977) The pathology of Rift Valley fever. 1. Lesions occurring in natural cases
in new-born lambs. Onderstepoort Journal of Veterinary Research 44:205-212.
Collett MS, Purchio AF, Keegan K, Frazier S, Hays W, Anderson DK (1985) Complete
nucleotide sequence of the M RNA segment of Rift Valley fever virus. Virology 144:228-45.
Corso B, Pinto J, Beltrẚn-Alcrudo D, De Simone L and Lubroth J (2008) Rift Valley fever
outbreaks in Madagascar and potential risks to neighbouring countries. FAO Empress Watch
Emergency Prevention Systems 1-5.
Corry B, Jayatilaka D, Rigby P (2005) A flexible approach to the calculation of resonance
energy transfer efficiency between multiple donors and acceptors in complex geometries.
Biophysical Journal 89:3822-3836.
Cyr N, de la Fuente C, Lecoq L, Guendel I, Chabot PR, Kehn-Hall K, Omichinski JG (2015) A
ΩXaV motif in the Rift Valley fever virus NSs protein is essential for degrading p62, forming
nuclear filaments and virulence. Proceedings of the National Academy of Sciences of the
United States of America 112:6021-6026.
Daubney R, Hudson JR (1933) Rift Valley fever. East African Medical Journal 10:2-19.
Daubney R, Hudson JR, Garnham (1931) Enzootic hepatitis or Rift Valley fever. An
undescribed virus disease of sheep, cattle and man from East Africa. Journal of Pathology
and Bacteriology 34:545-579.
Dautu G, Sindato C, Mweene AS, Samui KL, Roy P, Noad R, Paweska JZ, Majiwa PAO,
Musoke AJ (2012) Rift valley fever: Real or perceived threat for Zambia? Onderstepoort
Journal of Veterinary Research 79:466.
133
Davies FG (2010) The historical and recent impact of Rift Valley fever in Africa. American
Journal of Tropical Medicine and Hygiene 83:73-74.
Davies FG, Karstad L (1981) Experimental infection of the African buffalo with the virus of Rift
Valley fever. Tropical Animal Health and Production 13:185-188.
Davies FG (1975) Observations on the epidemiology of Rift Valley fever in Kenya. Journal of
Hygiene 75:219-230.
Davies FG, Clausen B, Lund LJ (1972) The pathogenicity of Rift Valley fever virus for the
baboon. Transactions of the Royal Society of Tropical Medicine and Hygiene 66:363-365.
De Boer SM, Kortekaas J, de Haan CAM, Rottier PJM, Moormann RJM, Bosch BJ (2012)
Heparin sulphate facilitates Rift Valley fever virus entry into the cell. Journal of Virology
86:13767-13771.
Delano WL (2002) The PyMol Molecular Graphics System. Delano Scientific, San Carlos, CA
USA. http://www.pymol.org.
Dessau M, Modis Y (2013) Crystal structure of glycoprotein C from Rift Valley fever virus.
Proceedings of the National Academy of Sciences of the United States of America 110:1696-
1701.
Digoutte JP, Jouan A, Le Guenno B, Riou O, Philippe B, Meegan J, Ksiazek TG, Peters CJ
(1989) Isolation of the Rift valley fever virus by inoculation into Aedes pseuscutellaris cells:
comparison with other diagnostic methods. Research in Virology 140:31-41.
Djikeng A, Halpin R, Kuzmickas R, Depasse J, Feldblyum J, Sengamalay N, Afonso C, Zhang
X, Anderson NG, Ghedin E, Spiro DJ (2008) Viral genome sequencing by random priming
methods. BioMed Central Genomics 9:5.
Dodd KA, McElroy AK, Jones TL, Zaki SR, Nichol ST, Spiropoulou CF (2014) Rift Valley fever
virus encephalitis is associated with an ineffective systematic immune response and activated
T cell infiltration into the CNS in an immunocompetent mouse model. PLos Neglected Tropical
Diseases 8:e2874.
Drosten C, Göttig S, Schilling S, Asper M, Panning M, Schmitz H, Günther S (2002) Rapid
detection and quantification of RNA of Ebola and Marburg viruses, Lassa virus, Crimean-
Congo hemorrhagic fever virus, Rift Valley fever virus, Dengue virus, and Yellow fever virus
by real-time reverse transcription-PCR. Journal of Clinical Microbiology 40:2323-2330.
Drummond AJ, Suchard MA, Xie D, Rambaut A (2012) Bayesian phylogenetics with BEAUTi
and the BEAST 1.7 Molecular Biology and Evolution 29:1969-1973.

134
Dungu B, Donadeu M, Bouloy M (2013) Vaccination for the control of Rift Valley fever in
Enzootic and Epizootic situations. Vaccines and Diagnostics for Transboundary Animal
Diseases 135:61-72.
Dungu B, Louw I, Lubisi A, Hunter P, von Teichman BF, Bouloy M (2010) Evaluation of the
efficacy and safety of Rift Valley fever clone 13 vaccine in sheep. Vaccine 28:4581-4587.
Easterday BC (1965) Rift Valley fever. Advanced Veterinary Science 10:65-127.
Easterday BC, Murphy LC (1963) Studies on Rift Valley fever in laboratory animals. Cornell
Veterinarian 53:423-433.
Elena S, Sanjuán R (2005) Adaptive value of high mutation tares of RNA viruses: separating
causes from consequences. Journal of Virology 79:11555-11528.
Ellenbecker M Lanchy J-M, Lodmell S (2014) Inhibition of Rift Valley fever virus replication
and perturbation of Nucleocapsid-RNA interactions by suramin. Antimicrobial Agents and
Chemotherapy 58:7405-7415.
Elliot RM (1990) Molecular biology of Bunyaviridae. Journal of General Virology 71:501-522.
Ellis DS, Shirodaria PV, Fleming E, Simpson DL (1988) Morphology and development of Rift
Valley fever virus in Vero cell cultures. Journal of Medical Virology 24:161-174.
Engdahl C, Näslund J, Lindgren L, Ahlm C, Bucht G (2012) The Rift Valley fever virus protein
NSm and putative cellular protein interactions. Virology Journal 9:139.
Evans A, Gakuya F, Paweska JT, Rostal M, Akoolo L, Van Vuuren PJ, Manyibe T, Macharia
JM, Ksiazek TG, Feikin DR, Breiman RF, Njenga MK (2008) Prevalence of antibodies against
Rift Valley fever virus in Kenyan wildlife. Epidemiology Infections 136:1261-1269.
Faburay B, LaBeaud AD, McVey DS, Wilson WC, Richt JA (2017) Current status of Rift Valley
fever vaccine development. Vaccine 5:1-20.
Faburay B, Gaudreault NN, Liu Q, Davis AS, Shivanna V, Sunwoo SY, Lang Y, Morozov I,
Ruder M, Drolet B, Scott McVey D, Ma W, Wilson W, Richt JA (2016) Development of a sheep
challenge model for Rift Valley fever. Virology 489:128-140.
Fafetine J, Neves L, Thompson PN, Paweska JT, Rutten PMG (2013) Serological evidence of
Rift Valley fever virus circulation in sheep and goats in Zambézia, Mozambique. PLoS
Neglected Tropical Diseases 7:e2065.
135
Fagbo S, Coetzer JAW, Venter EH (2014) Seroprevalence of Rift Valley fever and lumpy skin
disease in African buffalo (Syncerus caffer) in the Kruger National Park and Hluhluwe-iMfolozi
Park, South Africa. Journal of the South African Veterinary Association 85:1075.
FAO (2002) Preparation of Rift Valley fever contingency plans. FAO Animal Health Manual.
No.15. Rome. http://www.fao.org/docrep/005/Y4140E/Y4140E00.HTM
FAO (2001) Manual of procedures for disease eradication by stamping out. FAO Animal
Health Manual. No.12. Rome. http://www.fao.org/docrep/004/y0660e/Y0660E01.htm
Ferron F, Li Z, Danek EI, Luo D, Wong Y, Coutard B, Lantez V, Charrel R, Canard B, Walz T,
Lescar J (2011) The hexamer structure of the Rift Valley fever virus nucleoprotein suggests a
mechanism for its assembly into ribonucleoprotein complexes. PLoS Pathogens 7:e1002030.
Fields S, Song OK (1989) A novel genetic system to detect protein-protein interactions. Nature
340:245-246.
Filone CM, Heise M, Doms RW, Bertolotti-Ciarlet A (2006) Development and characterization
of a Rift Valley fever virus cell-cell fusion assay using alphavirus replicon vectors. Virology
356:155-164.
Findlay GM (1932) Rift Valley fever or Zoonotic hepatitis. Transactions of the Royal Society of
Tropical Medicine and Hygiene 25:229-265.
Flick R, Bouloy M (2005) Rift Valley fever virus. Current Molecular Medicine 5:827-834.
Flick K, Hooper JW, Schmaljohn CS, Pettersson RF, Feldmann H, Flick R (2003) Rescue of
Hantaan virus minigenomes. Virology 306:219-224.
Freiberg AN, Sherman MB, Morais MC, Molbrook MR, Watowick SJ (2008) Three-dimensional
organization of Rift valley fever virus revealed by cryoelectron tomography. Journal of Virology
82:10341-10348.
Freire CCM, Lamarino A, Ly Soumare PO, Faye O, Sall AA, Zanotto PMA (2015)
Reassortment and distinct evolutionary dynamics of Rift Valley fever virus genomic segments.
Science Reports 5:11353.
Gad AM, Hassan MM, el Said S, Moussa MI, Wood OL (1987) Rift Valley fever virus
transmission by different Egyptian mosquito species. Transaction of the Royal Society of
Tropical Medicine and Hygiene 81:694-698.
136
Gao JX, Jing J, Yu Y, Chen J (2015) Construction of a high quality yeast two-hybrid library
and its application in identification of interacting proteins with Brn1 in Curvularia lunata. The
Plant Pathology Journal 3:108-114.
Garcia S, Crance JM, Billecocq A, Peinnequin A., Jouan A, Bouloy M, Garin D (2001)
Quantitative real-time PCR detection of Rift Valley fever virus and its application to evaluation
of antiviral compounds. Journal of Clinical Microbiology 39:4456-4461.
Garry CE, Garry RF (2004) Proteomics computational analyses suggest that the carboxyl
terminal glycoproteins of Bunyaviruses are class II viral fusion protein (beta-penetrenes).
Theoretical Biology and Medical Modelling 1:10.
Gauliard N, Billecocq A, Flick R, Bouloy M (2006) Rift Valley fever virus noncoding regions of
L, M and S segments regulate RNA synthesis. Virology 351:170-179.
Gear J, Meillon DB, Roux AFL, Kofsky R (1955) Rift Valley fever in South Africa: A study of
the 1953 outbreak in the Orange Free State, with special reference to the vectors and possible
reservoir hosts. South African Medical Journal 29:514-518.
Gerdes GH (2004) Rift Valley fever. Revue Scientifigue et Technique De L’Office International
Des Epizooties 23:613-623.
Gerrard SR, Bird BH, Albarini CG, Nichol ST (2007) The NSm proteins of Rift Valley fever
virus are responsible for maturation, replication and infection. Virology 359:459-465.
Gerrard SR, Nichol ST (2007) Synthesis, proteolytic processing and complex formation of N-
terminally nested precursor proteins of Rift Valley fever virus glycoproteins. Virology 357:124-
133.
Giorgi C, Accardi L, Nicoletti L, Gro MC, Takehara K, Hilditch C, Morikawa S, Bishop DH
(1991) Sequences and coding strategies of the S RNAs of Toscana and Rift Valley fever
viruses compared to those of Punta Toro, Sicilian Sandfly fever, and Uukuniemi viruses.
Virology 180:738-53.
Glancey MM, Anyamba A, Linthicum KJ (2015) Epidemiologic and environmental risk factors
of Rift Valley in South Africa from 2008 to 2011. Vector-borne and Zoonotic Diseases 15:502-
511.
Goldsmith CS, Miller SE (2009) Modern uses of electron microscopy for detection of viruses.
Clinical Microbiology Reviews 22:552-563.
137
Goñi N, Iriarte A, Comas V, Soñora M, Moreno P, Moratorio G, Musto H, Cristina J (2012)
Pandemic influenza A virus codon usage revisited: biases, adaptation and implications for
vaccine strain development. Virology Journal 9:263.
Grobbelaar AA, Weyer J, Leman PA, Kemp A, Paweska JT, Swanepoel R (2011) Molecular
epidemiology of Rift Valley fever virus. Emerging Infectious Diseases 17:2270-2276.
Grove J, Marsh M (2011) The cell biology of receptor-mediated virus entry. Journal of Cell
Biology 195:1071-1082.
Habjan M., Pichlmair A., Elliot R M, Overby AK., Glatter T, Gstaiger M, Superti-Furga G, Unger
H, Weber F (2009) Ns Protein of Rift Valley fever induces the specific degradation of the
double-stranded RNA-dependent protein kinase. Journal of Virology 83:4365-4375.
Hackett BA, Yasunaga A, Panda D, Tartell MA, Hopkins KC, Hensley SE (2015) RNASEK is
required for internalization of diverse acid-dependent viruses. Proceedings of the National
Academy of Sciences of the United States of America 112:7797-7802.
Halldorsson S, Li S, Li M, Harlos K, Bowden TA, Huiskonen JT (2018) Shielding and activation
of a viral membrane fusion protein. Nature Communications 9:349.
Halldorsson S, Behrens AJ, Harlos K, Huiskonen JT, Elliot RM, Crispin M, Brennan B, Bowden
TA (2016) Structure of phleboviral envelope glycoprotein reveals a consolidated model of
membrane fusion. Proceedings of the National Academy of Sciences of the United States of
America 113:7154-7159.
Hall BG (2013) Building phylogenetic trees from molecular data with MEGA. Molecular Biology
and Evolution 30:1229-35.
Hamdi A, Colas P (2012) Yeast two-hybrid methods and their applications in drug discovery.
Trends in Pharmacological Sciences 33:109-118.
Hanecke F, Leparc-Goffart I, Simon F, Hentzien M, Martinez-Pourcher V, Caumes S, Maquart
M (2016) Rift Valley fever in kidney transplant recipient returning from Mali with viral RNA
detected in semen up to four months from symptom onset, France, autumn 2015.
Eurosurveillance 21:30222.
Harmon B, Schudel BR, Maar D, Kozina C, Ikegami T, Tseng C-TK, Negrete OA (2012) Rift
Valley fever virus strain MP-12 enters mammalian host cells via caveola-mediated
endocytosis. Journal of Virology 86:12954-12970.
Hassan OA, Ahlm C, Sang R, Evander M (2011) The 2007 Rift Valley fever outbreak in Sudan.
PLoS Neglected Tropical Diseases 5:e1229.
138
Heath L, van der Walt E, Varsani A, Martin DP (2006) Recombination patterns in
aphthoviruses mirror those found in other picornaviruses. Journal of Virology 80:11827-11832.
Heise MT, Whitmore A, Thompson J, Parsons M, Grobbelaar AA, Kemp A, Paweska JT,
Madric K, White LJ, Swanepoel R, Burt FJ (2009) An alpha virus replicon-derived candidate
vaccine against Rift Valley fever virus. Epidemiology and Infection 137:1309-1318.
Hershberg R, Petrov DA (2008) Selection on codon bias. Annual Review of Genetics 42:287-
299.
Himeidan YE, Kweka EJ, Mahgoub MM, Rayah EAE, Ouma JO (2014) Recent outbreaks of
Rift Valley fever in East Africa and the Middle East. Frontiers in Public Health 2:169.
Hoch AL, Turell MJ, Bailey CL (1984) Replication of Rift Valley fever virus in the sand fly
Lutzomyia longipalpis. The American Journal of Medicine and Hygiene 33:295-299.
Hoffman EA, Frey BL, Smith LM, Auble DT (2015) Formaldehyde crosslinking: A tool for the
study of chromatin complexes. Journal of Biological Chemistry 290:26404-26411.
Holding AN (2015) XL-MS: Protein cross-linking coupled with mass spectrometry. Methods
89:54-63.
Holm T, Kopicki JD, Busch C, Olschewski S, Rosenthal M, Uetrecht C, Günther S, Reindi S
(2018) Biochemical and structural studies reveal differences and commonalities among cap-
snatching endonucleases from segmented negative-strand RNA viruses. Journal of Biological
Chemistry 293:19686-19698.
Hoogstral H, Meegan JM, Khalil GM, Adham FK (1979) Rift Valley fever epizootic in Egypt
1977-1978. 11. Ecological and entomological studies. Transactions of the Royal Society of
Tropical Medicine and Hygiene 73:624-629.
Hook B, Bernstein D, Zhang B, Wickens M (2005) RNA-protein interactions in the yeast three-
hybrid system: Affinity, sensitivity, and enhanced library screening. RNA 11:227-233.
Hooker BS, Bigelow DJ, Lin, CT (2007) Methods for mapping of interaction networks involving
membrane proteins. Biochemical and Biophysical Research Communications 363:457-461.
https://bioinformatics.org/sms/
http://octopus.cbr.su.se
http://topcons.net
139
Huo T, Liu W, Guo Y, Yang C, Lin J, Rao Z (2015) Prediction of host-pathogen protein
interactions between Mycobacterium tuberculosis and Homo sapiens using sequence motifs.
BioMed Central Bioinformatics 16:100.
Huiskonen JT, Overby AK, Weber F, Grünewald K (2009) Electron cryo-microscopy and
single-particle averaging of Rift Valley fever virus: evidence for GN-GC glycoprotein
heterodimers. Journal of Virology 83:3762-3769.
Hunter P, Erasmus BJ, Vorster JH (2002) Teratogenicity of a mutagenized Rift Valley fever
(MV 12) in sheep. Onderstepoort Journal of Veterinary Research 69:95-98.
Hunter B, Bouloy M (2001) Investigation of C13 RVF mutant as a vaccine strain. In:
Proceedings of 5th International Sheep Veterinary Congress 21-25 Stellenbosch, South Africa.
Ikegami T (2017) Rift Valley fever vaccines: An overview of the safety and efficacy of the live–
attenuated MP-12 vaccine candidate. Expert Review of Vaccines 16:601-611.
Ikegami T (2012) Molecular biology and genetic diversity of Rift Valley fever virus. Antiviral
Research 95:293-310.
Ikegami T, Makino S (2011) The Pathogenesis of Rift Valley fever. Viruses 3:493-519.
Ikegami T, Makino S (2009) Rift Valley fever vaccines. Vaccines 2754:D69-D72.
Ikegami T, Won Peters CJ, Makino S (2007) Characterization of Rift Valley fever virus
transcriptional terminations. Journal of Virology 81:8421-8438.
Imam IZE, EL-Karamany R, Darwish MA (1979) An epidemic of Rift Valley fever in Egypt 2.
Isolation of the virus from animals. Bulletin of the World Health Organization 57:441-443.
Iyer K, Bürke L, Auerbach D, Thaminy M, Dinkel M, Engels K, Stagljar I (2005) Utilizing the
split-ubiquitin membrane yeast two hybrid system to identify protein-protein interactions of
integral membrane proteins. Science’s STKE: Signal Transduction Knowledge Environment
15:13.
Jansen van Vuren P, Paweska JT (2009) Laboratory safe detection of nucleocapsid protein of
Rift Valley fever virus in human and animal specimens by a sandwich ELISA. Journal of
Virological Methods 157:15-24.
Jupp PG, Kemp A, Grobbelaar A, Leman P, Burt FJ, Alahmed AM, Al Mujalli D, Al Khamees
M, Swanepoel R (2002) The 2000 epidemic of Rift Valley fever in Saudi Arabia: mosquito
vector studies. Medical and Veterinary Entomology 16:245-252.

140
Kakach LT, Wasmoen TL, Collet MS (1988) Rift Valley fever virus M Segment: Use of
recombinant vaccinia viruses to study Phlebovirus gene expression. Journal of Virology
62:826-833.
Kamal SA (2011) Observations on Rift Valley fever virus and vaccines in Egypt. Virology
Journal 8:532.
Kanai Y, Komoto S, Kawagishi T, Nouda R, Nagasawa N, Onishi M, Matsuura Y, Taniguchi
K, Kobayashi T (2017) Entirely plasmid-based reverse genetics system for rotaviruses.
Proceedings of the National Academy of Sciences of the United States of America 114:2349-
2354.
Kasye M, Teshome D, Abiye A, Eshetu A (2016) A review on Rift Valley fever on animal,
human health and its impact on livestock marketing. Austin Virology and Retrovirology 3:020.
Kegakilwe PS (2010) An atypical outbreak of Rift Valley fever in the Northern Cape in October
2009. Proceedings of the 9th Annual Congress of the Southern African Society for Veterinary
Epidemiology and Preventive Medicine. 18-20 August 2010. Farm Inn, Republic of South
Africa. ISBN 978-0-620-47979-0.
Kelly LA Mezulis S, Yates CM, Wass MN, Sternberg JE (2015) The Phyre2 web portal for
protein modelling, prediction and analysis. Nature Protocols 10:845-858.
Kendall LV, Steffen EK, Riley LK (1999) Hemagglutination inhibition (HAI) assay. American
Association for Laboratory Animal Science 38:54.
Klockenbusch C, Kast J (2010) Optimization of formaldehyde cross-linking for protein
interaction analysis of non-tagged Integrin B1. Journal of Biomedicine and Biotechnology
2010:927585.
Koegl M, Uetz P (2008) Improving yeast two-hybrid screening systems. Briefings in Functional
Genomics 6:302-312.
Kortekaas J, Zingeser J, de Leeuw P, de la Rocque S, Unger H, Moorman RJM (2011) Rift
Valley fever vaccine development, progress and constraints. Emerging Infectious Diseases
17:e1.
Kreher F, Tamietti C, Gommet C, Guillemot L, Ermonval M, Failloux A-B, Panthier J-J, Bouloy
M, Flamand M (2014) The Rift Valley fever accessory proteins NSm and P78/NSm-GN are
distinct determinants of virus propagation in vertebrate and invertebrate hosts. Emerging
Microbes and Infections 3:e71.
141
Kuo HJ, Maslen CL, Keene DR, Glanville RW (1997) Type VI collagen anchors endothelial
basement membranes by interacting with type IV collagen. Journal of Biological Chemistry
272:26522-26529.
LaBeaud AD, Cross PC, Getz WM, Glinka A, King CH (2011) Rift Valley fever virus infection
in African Buffalo (Syncerus caffer) herds in rural South Africa: Evidence of interepidemic
transmission. American Journal of Tropical Medicine and Hygiene 84:641-646.
Lai MY, Lau YL (2017) Screening and identification of host proteins interacting with
Toxoplasma gondii SAG2 by yeast two-hybrid assay. Parasites and Vectors 10:456.
Lauring AS, Acevedo A, Cooper SB, Andino R (2012) Codon usage determines the mutational
robustness, evolutionary capacity, and virulence of an RNA virus. Cell Host and Microbe
12:623-632.
Laviada MD, Arias M, Sánchez-Vizcaino JM (1993) Characterization of African horse sickness
virus serotype 4-induced polypeptides in Vero cells and their reactivity in western
immunoblotting. Journal of General Virology 74:81-87.
LeBreton M, Umlauf S, Djoko CF, Daszak P, Burke DS, Kwenkam PY, Wolfe ND (2006) Rift
Valley fever in goats, Cameroon. Emerging Infectious Diseases 12:702-703.
Lee LY, Wu FH, Hsu CT, Shen SC, Yeh HY, Liao D, Fang MJ, Liu NT, Yen YC Dokládal L
(2012) Screening a cDNA library for protein-protein interactions directly in planta. Plant Cell
24:1746-1759.
Léger P, Tetard M, Youness B, Cordes N, Rouxel RN, Flamand M, Lozach PY (2016)
Differential use of the C-type lectins L-SIGN and DC-SIGN for Phlebovirus endocytosis. Traffic
17:639-656.
Lernout T, Cardinale E, Jego M, Desprѐs P, Collet L, Zumbo B, Tillard E, Girard S and Filleul
L (2013) Rift Valley fever in humans and animals in Mayotte, an Endemic situation? PLoS One
8:e74192.
Le Roux CA, Kubo T, Grobbelaar AA, Jansen van Vuren P, Weyer J, Nel LH, Swanepoel R,
Morita K, Paweska JT (2009) Development and evaluation of a real-time reverse transcription-
loop-mediated isothermal amplification assay for rapid detection of Rift Valley fever virus in
clinical specimens. Journal of Clinical Microbiology 47:645-651.
Letunic I, Doerks T, Bork P (2014) SMART: recent updates, new developments and status in
2015. Nucleic Acids Research 43:D257-D260.

142
Li YP, Xia RX, Wang H, Li XS, Liu YQ, Wei ZJ, Lu C, Xiang ZH (2009) Construction of a full-
length cDNA library from Chinese oak silkworm pupa and identification of a KK-42-binding
protein gene in relation to pupa-diapause termination. International Journal of Biological
Sciences 5:451-457.
Lichoti JK, Kihara A, Oriko AA, Okutoyi LA, Wauna JO, Tchouassi DP, Tigoi CC, Kemp S,
Sang R Mbabu RM (2014) Detection of Rift Valley fever virus interepidemic activity in some
hotspot areas of Kenya by sentinel animal surveillance, 2009-2012. Veterinary Medicine
International 2014:379010.
Linthicum KJ, Anyamba A, Tucker CJ, Kelley PW, Myers MF, Peters J (1999) Climate and
satellite indicators to forecast Rift Valley fever epidemics in Kenya. Science 285:397-400.
Linthicum KJ, Davies FG, Kairo A (1985) Rift Valley fever virus (family Bunyaviridae, genus
Phlebovirus). Isolation from Diptera collected during an inter-epizootic period in Kenya.
Journal of Hygiene 95:197-209.
Liu Q, Li FC, Elsheika HM, Sun MM, Zhu XQ (2017) Identification of host proteins interacting
with Toxoplasma gondii GRA 15 (TgGRA 15) by yeast two-hybrid system. Parasites and
Vectors 10:1.
Liu W, Sun FJ Tong YG, Zhang SQ, Cao WC (2016) Rift Valley fever virus imported into China
from Angola. The Lancet Infectious Disease 16:1226.
Liu C, Liu D, Guo Y, Lu T, Li X, Zhang M, Ma J, Ma Y, Guan W (2013) Construction of a full-
length enriched cDNA library and preliminary analysis of expressed sequence tags from
Bengal tiger Panthera tigris tigris. International Journal of Molecular Sciences 14:11072-
11083.
Liu L, Celma CCP, Roy P (2008) Rift Valley fever virus structural proteins: expression,
characterization and assembly of recombinant proteins. Virology Journal 5:82.
Liu J, Thorp SC (2002) Cell surface heparin sulphate and its role in assisting viral infection.
Medicinal Research Revision 22:1-25.
Logan TM, Linthicum KJ, Davies FG, Binepal YS, Roberts CR (1991) Isolation of Rift Valley
fever virus from mosquitoes (Diptera: Culcidae) collected during an outbreak in domestic
animals in Kenya. Journal of Medical Entomology 28:293-295.
Lozach PY, Kühbacher A, Meier R, Mancini R, Bitto D, Bouloy M., Helenius A (2011) DC-
SIGN as a receptor for Phleboviruses. Cell Host and Microbe 10:75-88.
143
Lozach PY, Mancini R, Bitto D, Meier R, Oestereich L, Överby AK, Pettersson RF, Helenius,
A. (2010) Entry of bunyaviruses into mammalian cells. Cell Host and Microbe 7:488-499.
Lucas M, Krrer U, Lucas A, Klenerman P (2001) Viral escape mechanisms – escapology
taught by viruses. International Journal of Experimental Pathology 82:269-286.
Lum KK, Cristea IM (2016) Proteomic approaches to uncovering virus-host protein interactions
during the progression of viral infection. Expert Review of Proteomics 13:325-340.
Ly HJ, Ikegami T (2016) Rift Valley fever virus NSs protein functions and the similarity to other
bunyavirus NSs proteins. Virology Journal 13:118.
Ma Y, Ruan Q, Ji Y, Wang N, Li M, Qi Y, He R, Sun Z, Ren G (2011) Novel transcripts of
human cytomegalovirus clinical strain found by cDNA library screening. Genetics and
Molecular Research 10:566-575.
Machida K, Mayer BJ (2009) Detection of protein-protein interactions by far-western blotting.
In protein blotting and detection. Humana Press Volume 536 pages 313-329.
Mahajan S, Sharma GK, Matura R, Subramaniam S, Mohapatra JK, Pattnaik B (2015)
Construction and characterization of yeast two-hybrid cDNA library derived from LFBK cell
line. Biologicals 43:202-208.
Maluleke MR, Phosiwa M, van Schalkwyk A, Michuki G, Lubisi BA, Kegakilwe PS, Kemp SJ,
Majiwa PAO (2019) A comparative genome analysis of Rift Valley fever virus isolates from
foci of the disease outbreak in South Africa in 2008-2010. PloS Neglected Tropical Diseases
13(3):e0006576.
Marchler-Bauer A, Derbyshire MK, Gonzales NR, Lu S, Chitsaz F, Geer LY, Geer RC, He J,
Gwadz M, Hurwitz DI, Lanczycki CJ, Lu F, Marchler GH, Song JS, Thanki N, Wang Z,
Yamashita RA, Zhang D, Zheng C, Bryant SH (2015) CDD: NCBI’s conserved domain
database. Nucleic Acids Research 43:D222-D226.
Martin ML, Lindsey-Regnery H, Sasso DR, McCormick JB, Palmer E (1985) Distinction
between Bunyaviridae genera by surface structure and comparison with Hantaan virus using
negative stain electron microscopy. Archives of Virology 86:17-28.
McIntosh BM, Russel D, Dos Santos I, Gear JHS (1980a) Rift Valley fever in humans in South
Africa. South African Medical Journal 58:803-806.
McIntosh BM, Jupp PG, Dos Santos I, Barnard BJH (1980b) Vector studies on Rift Valley fever
virus in South Africa. South African Medical Journal 58:127-132.

144
McLaughlin BE, DeMaula CD, Wilson WC, Boyce WM, MacLachlan NJ (2003) Replication of
bluetongue virus and epizootic hemorrhagic disease virus in pulmonary artery endothelial cells
obtained from cattle, sheep and deer. American Journal of Veterinary Research 64:860-865.
Meegan JM (1981) Rift Valley fever in Egypt: an overview of epizootics in 1977 and 1978.
Contributions to Epidemiology and Biostatistics 3:100-113.
Meegan JM (1979) The Rift Valley fever epizootic in Egypt 1977-98. 1. Description of the
epizootic and virological studies. Transaction of the Royal Society of Tropical Medicine and
Hygiene 73:618-623.
Mendez-Rios J, Uetz P (2010) Global approaches to study protein-protein interactions among
viruses and hosts. Future Microbiology 5:289-301.
Métras R, Jewel C, Porphyre T, Thompson PN, Pfeiffer DU, Collins LM, White RG (2015) Risk
factors associated with Rift Valley fever epidemics in South Africa in 2008-11. Scientific
Reports 5:9492.
Métras R, Porphyre T, Pfeiffer DU, Kemp A, Thompson PN, Collins LM, White RG (2012)
Exploratory space-time analysis of Rift Valley fever in South Africa in 2008-2011. PloS
Neglected Tropical Diseases 6:e1808.
Miernyk JA, Thelen JJ (2008) Biochemical approaches for discovering protein-protein
interactions. The Plant Journal 53:597-609.
Mokili JL, Rohwer F, Dutilh BE (2012) Metagenomics and future perspectives in virus
discovery. Current Opinion in Virology 2:63-77.
Monaco F, Pinoni C, Cosseddu, GM, Khaiseb S, Calistri P, Molini U, Bishi A, Conte A,
Scacchia M, Lelli R (2013) Rift Valley fever in Namibia, 2010. Emerging Infectious Diseases
19:2025-2027.
Morrill JC, Ikegami T, Yoshikawa-Iwata N, Lokugamage N, Won S, Terasaki K, Zamoto-
Niikura A, Peters CJ, Makino S (2010) Rapid accumulation of virulent Rift Valley fever virus in
mice from an attenuated virus carrying a single nucleotide substitution in the mRNA. PLoS
One 5:e9986.
Morrill JC, Carpenter L, Taylor D, Ramsburg HH, Quance J Peters CJ (1991) Further
evaluation of a mutagen-attenuated Rift Valley fever vaccine in sheep. Vaccine 9:35-41.
145
Morrill JC, Jennings GB, Caplen H, Turell MJ, Johnson AJ, Peters CJ (1987) Pathogenicity
and immunogenicity of a mutagen-attenuated Rift Valley fever virus immunogen in pregnant
ewes. American Journal of Veterinary Research 48:1042-1047.
Morvan J, Lesbordes JL, Rollin PE, Mouden JC, Roux J (1992) First fatal human case of Rift
Valley fever in Madagascar. Transactions of the Royal Society of Tropical Medicine and
Hygiene 86:320.
Moser LA, Boylan BT, Moreira FR, Myers LJ, Svenson EL, Fedorova NB, Pickett BE, Bernard
KA (2018) Growth and adaptation of Zika virus in mammalian and mosquito cells. PloS
Neglected Diseases 12:e0006880.
Moussa MI, Wood OL, Abdel Wahab KS (1982) Reduced pathogenicity associated with a
small plaque variant of the Egyptian strain of Rift Valley fever virus (ZH501). Transactions of
the Royal Society of Tropical Medicine and Hygiene 76:482-486.
Moutailler S, Roche B, Thiberge JM, Caro V, Rougeon F, Failloux AB (2011) Host alternation
is necessary to maintain the genome stability of Rift Valley fever virus. PLoS Neglected
Tropical Diseases 5:e1156.
Muller R, Saluzzo JF, Lopez N, Dreier T, Turell M, Smith J, Bouloy M (1995) Characterization
of clone 13, a naturally attenuated avirulent isolate of Rift Valley fever virus,
which is altered in the small segment. American Journal of Tropical Medicine Hygiene 53:405-
411.
Muller R, Poch O, Delarue M, Bishop DH, Bouloy M (1994) Rift Valley fever L segment:
correction of the sequence and possible functional role of newly identified regions conserved
in RNA-dependent polymerases. Journal of General Virology 75:1345-52.
Narrod C, Zinsstag J, Tiongco M, (2012) A One Health framework for estimating the economic
costs of zoonotic diseases on society. EcoHealth 9:150-162.
National Institute for Communicable Diseases (2012) Communicable Disease Surveillance
Bulletin 10.
Nasrullah I, Butt AM, Tahir S, Idrees M, Tong Y (2015) Genomic analysis of codon usage
shows influence of mutation pressure, natural selection and host features on Marburg virus
evolution. BioMed Central Evolutionary Biology 15:1-15.
Nderitu L, Lee JS, Omolo J, Omulo S, O’Guinn ML, Hightower A, Mosha F, Mohamed M,
Munyua P, Nganga Z, Hiett K, Seal B, Feikin DR, Breiman RF, Njenga MK (2011) Sequential
146
Rift Valley fever outbreaks in eastern Africa caused by multiple lineages of the virus. Journal
of Infectious Disease 203:655-665.
Nicklasson B, Peters CJ, Grandien M, Wood O (1984) Detection of human immunoglobulins
G and M antibodies of Rift Valley fever virus by enzyme-linked immunosorbent assay. Journal
of Clinical Microbiology 19:225-229.
Nicod C, Banaei-Esfahani A, Collins BC (2017) Elucidation of host-pathogen protein-protein
interactions to uncover mechanisms to host cell rewiring. Current Opinions in Microbiology
39:7-15.
Nicolas G, Durand B, Duboz R, Rakotondravao R, Chevalier V (2013) Description and analysis
of the cattle trade network in the Madagascar highlands: potential role in the diffusion of Rift
Valley fever virus. Acta Tropica 126:19-27.
Njenga MK, Bett B (2019) Rift Valley fever virus – How and where virus is maintained during
inter-epidemic periods. Current Clinical Microbiology Reports 6:18-24.
Njenga MK, Paweska J, Wanjala R, Rao CY, Weiner M, Omballa V, Luman ET, Mutonga D,
Sharif S, Panning M, Dorsten C, Feikin DR, Breiman R (2009) Using a field quantitative real-
time PCR test to rapidly identify highly viremic Rift Valley fever cases. Journal of Clinical
Microbiology 47:1166-1171.
Nyundo S, Adamson E, Rowland J, Palermo PM, Matiko M, Bettinger GE, Wambura P, Morrill
JC, Watts D (2019) Safety and immunogenicity of Rift Valley fever MP-12 and arMP-
12∆NSm21/384 vaccine candidates in goats (Capra aegagrus hircus) from Tanzania.
Onderstepoort Journal of Veterinary Research 86:a1683.
Odendaal L, Clift SJ, Fosgate GT, Davis AS (2019) Lesions and cellular tropism of natural Rift
Valley fever virus infection in adult sheep. Veterinary Pathology 56:61-77.
OIE (2019) Manual of diagnostic tests and vaccines for terrestrial animals. World Organisation
for Animal Health, Paris.
Olive M-M, Goodman SM, Reynes J-M (2012) The role of wild mammals in the maintenance
of Rift Valley fever virus. Journal of Wildlife Diseases 48:241-266.
Överby AK, Pettersson RF, Grunewald K, Huiskonen JT (2008) Insights into bunyavirus
architecture from electron cryotomography of Uukuniemi virus. Proceedings of the National
Academy of Sciences of the United States of America 105:2375-2379.
Parish CR (2006) The role of heparin sulphate in inflammation. Nature Reviews Immunology
6:633-643.

147
Paweska JT, Mortimer E, Leman PA, Swanepoel R (2005) An inhibition enzyme-linked
immunosorbent assay for the detection of antibody to Rift Valley fever virus in humans,
domestic and wild ruminants. Journal of Virological Methods 127:10-18.
Paweska JT, Burt FJ, Anthony F, Smith SJ, Grobbelaar AA, Croft JE, Ksiazek TG, Swanepoel
R (2003) IgG-sandwich and IgM-capture enzyme-linked immunosorbent assay for the
detection of antibody to Rift Valley fever virus in domestic ruminants. Journal of Virological
Methods 113:103-112.
Paumi CM, Menndez J, Amoldo A, Engels K, Iyer KR, Thaminy S, Georgiev O, Barral Y,
Michaelis S, Stagljar I (2007) Mapping protein-protein interactions for the yeast ABC
transporter Ycf1p by integrated split-ubiquitin membrane yeast two-hybrid analysis. Molecular
Cell 26:15-25.
Pepin M, Bouloy M, Bird BH, Kemp A, Paweska J (2010) Rift Valley Fever virus
(Bunyavirirdae: Phlebovirus): an update on pathogenesis, molecular epidemiology, vectors,
diagnostics and prevention. Veterinary Research 41:61.
Peyre M, Chevalier V, Abdo-Salem S, Velthuis A, Antoine-Moussiaux N, Thiry E, Roger F
(2015) A systematic scoping study of the socio-economic impact of Rift Valley fever: Research
gaps and needs. Zoonoses and Public Health 62:309-325.
Peyrefitte CN, Boubis L, Coudrier D, Bouloy M, Grndadam M, Tolou HJ, Plumet S (2008) Real-
time reverse-transcription loop-mediated isothermal amplification for rapid detection of Rift
Valley fever virus. Journal of Clinical Microbiology 46:3653-3659.
Phizicky EM, Fields S (1995) Protein-protein interactions: methods for detection and analysis.
Microbiological Revision 59:94-123.
Phoenix I, Nishiyama S, Lokugamage N, Hill TE, Huante MB, Slack OAL, Carpio VH, Freiberg
AN, Ikegami T (2016) N-Glycans on the Rift Valley fever virus envelope glycoproteins Gn and
Gc redundantly support viral infection via DC-SIGN. Viruses 8:149.
Pienaar NJ, Thompson PN (2013) Temporal and spatial history of Rift Valley fever in South
Africa: 1950 to 2011. Onderstepoort Journal of Veterinary Research 80:a384.
Piper ME, Sorenson DR, Gerrard SR (2011) Efficient cellular release of Rift Valley fever virus
requires genomic RNA. PLoS One 3:e18070.
Pires HR, Boxem M (2018) Mapping the polarity Interactome. Journal of Molecular Biology
430:3521-3544.

148
Pittman PR, Liu CT, CannonTL, Makuch RS, Mangaiafico JA, Gibbs PH, Peters CJ (1999)
Immunogenicity of an inactivated Rift Valley fever vaccine in humans: a 12–year experiment.
Vaccine 18:181-189.
Prachayangprecha S, Schapendonk CME, Koopmans MP, Osterhaus ADME, Schürch AC,
Pas SD, van der Eijk AA, Poovorawan Y, Haagmans BL, Smits SL (2014) Exploring the
potential of Next Generation Sequencing in detection of respiratory viruses. Journal of Clinical
Microbiology 52:3722-3730.
Posada D, Crandall KA, Holmes EC (2002) Recombination in evolutionary genomics. Annual
Review of Genetics 36:75-97.
Puigbò P, Bravo I, Garcia-Vallvé S (2008) E-CAI: a novel server to estimate an expected value
of codon adaptation index (eCAI). BioMed Central Bioinformatics 9:65.
Rajagopala SV, Uetz P (2011) Analysis of protein-protein interactions using high-throughput
yeast two-hybrid screens. In: Cagney G, Emili A. (eds) Network Biology. Methods in Molecular
Biology (Methods and Protocols), Volume 781. Humana Press.
Randall R, Gibbs CJ Jr, Aulisio CG, Binn LN, Harrison VR (1962) The development of a
formalin-killed Rift Valley fever virus vaccine for use in man. Journal of Immunology 89:660-
71.
Rao VS, Srinivas K, Sujini GN, Kumar GNS (2014) Protein-protein interaction detection:
Methods and analysis. International Journal of Proteomics: 147648.
Rappsilber J (2011) The beginning of a beautiful friendship: cross-linking/mass spectrometry
and modelling of proteins and multi-protein complexes. Journal of Structural Biology 173: 530-
540.
Raymond DD, Piper ME, Gerrard SR, Skiniotis G, Smith JL (2012) Phleboviruses encapsidate
their genomes by sequestering RNA bases. Proceedings of the National Academy of Sciences
of the United States of America 109:19208-19213.
Reece-Hoyes JS, Walhout AJ (2012) Gene-centered yeast one-hybrid assays. Methods in
Molecular Biology 812:189-208.
Reguera J, Weber F, Cusack S (2010) Bunyaviridae RNA polymerases (L-protein) have an N-
terminal, influenza-like endonuclease domain, essential for viral cap-dependent transcription.
PLoS Pathogens 6:e1001101.
Rönkä H, Hildén P, Von Bonsdorff CH, Kuismanen E (1995) Homodimeric association of the
spike glycoproteins G1 and G2 of Uukuniemi virus. Virology 211:241-250.
149
Rusu M, Bonneau R, Holbrook MR, Watowich SJ, Birmanns S, Wriggers W, Freiberg AN
(2012) An assembly model of Rift Valley fever virus. Frontiers in Microbiology 3:254.
Sall AA, Macondo EA, Sene OK, Diagne M, Sylla R, Mondo M, Girault L, Marrama L, Spiegel
A, Diallo M, Bouloy M, Mathiot C (2002) Use of reverse transcriptase PCR in early diagnosis
of Rift Valley fever. Clinical and Diagnostic Laboratory Immunology 9:713-715.
Sall AA, Zanotto PM De A, Sene OK, Zeller HG, Digoutte JP, Thiongane Y, Bouloy M (1999)
Genetic reassortment of Rift Valley fever virus in nature. Journal of Virology 73:8196-8200.
Sall AA, de Zanotto PM, Zeller HG, Digoutte JP, Thiongane Y, Bouloy M (1997) Variability of
NSs protein among Rift Valley fever virus isolates. Journal of General Virology 78:2853-2858.
Sambrook J, Fritsch EF, Maniatis T (1989) Molecular cloning A laboratory manual 2nd Edition.
1.74-1.81, Harbor Laboratory Press, New York.
Sarrazin S, Lamanna WC, Esko JD (2011) Heparan sulfate proteoglycans. Cold Spring Harbor
Perspectives in Biology 7:a004952.
Scharton D, Van Wettere AJ, Bailey KW, Vest Z, Westover JB, Siddharthan V, Gowen BB
(2015) Rift Valley fever virus infection in Golden Syrian hamsters. PLoS One 10:e0116722.
Schoemaker T, Boulianne C, Vincent MJ, Pezzanite L, AI-Qahtani MM, AI-Mazrou Y, Khan
AS, Rollin PE, Swanepoel R, Ksiazek TG, Nichol ST (2002) Genetic Analysis of viruses
associated with emergence of Rift Valley fever in Saudi Arabia and Yemen, 2000-01.
Emerging Infectious Diseases 8:1415-1420.
Schulz KH (1951) Rift Valley fever in South Africa. Special Report No 5/51. Union Department
of Health, Plaque Research Laboratory, Johannesburg, South Africa, May 1951.
Schmaljohn C, Hooper JW (2001) Bunyaviridae: The viruses and their replication. In D.M
Knipe, PM Howley, DE Griffin, MA Martin, RA Lamb, B Roizman, SE Straus (ed), Fields
Virology, 4th edition, Lippincott, Williams and Wilkins, Philadelphia, Pennsylvania. p1581-
1602.
Scott GR (1963) Pigs and Rift Valley fever. Nature 200:919-920.
Seufi AM, Galal FH (2010) Role of Culex and Anopheles mosquito species as potential vectors
of Rift Valley fever virus in Sudan outbreak, 2007. BioMed Central Infectious Diseases 10:65.
Sexton NR, Ebel GD (2019) Effects of arbovirus multi-host life cycles on dinucleotide and
codon usage patterns. Viruses 11:643.
150
Shi M, Jagger BW, Wise HM, Digard P, Holmes EC, Taubenberger JK (2012) Evolutionary
conservation of the PA-X open reading frame in segment 3 of Influenza A virus. Journal of
Virology 86:12411-12413.
Shope RE, Peters CJ, Davies FG (1982) The spread of Rift Valley fever and approaches to
its control. Bulletin of the World Health Organization 60:299-304.
Simon M, Johansson C, Mirazimi A (2009) Crimean-Congo hemorrhagic fever virus entry and
replication is clathrin-, pH- and cholesterol-dependent. Journal of General Virology 90:210-
215.
Sindato C, Karimuribo E, Mboera LEG (2011) The epidemiology and socio-economic impact
of Rift Valley fever epidemics in Tanzania: a review. Tanzania Journal of Health Research
13:305-318.
Sissoko D, Giry C, Gabrie P, Tarantola A, Pettinelli F, Collet L, D’Ortenzio E, Renault P, Pierre
V (2009) Rift Valley fever, Mayotte, 2007-2008. Emerging Infectious Diseases 15:568-570.
Smithburn KC, Haddow, AJ, Gillett JD (1948) Rift Valley fever: Isolation of the virus from wild
mosquitoes. British Journal of Experimental Pathology 30:107-121.
Smits SL, Osterhaus ADME (2013) Virus discovery: one step beyond. Current Opinion in
Virology 3:e1-e6.
Snider J, Stagljar I (2016) Membrane yeast two-hybrid (MYTH) mapping of full-length
membrane protein interactions. Article in Cold Spring Harbor Protocols Press.
http://cshprotocols.cshlp.org
Snider J, Kittanakom S, Curak J, Stagljar I (2010) Split-ubiquitin based membrane yeast two-
hybrid (MYTH) system: a powerful tool for identifying protein-protein interactions. Journal of
Visualized Experiments 1:1698.
Soilleux EJ, Barten R, Trowsdale J (2000) Cutting edge: DC-SIGN; a related gene, DC-
SIGNR; and CD232 form a cluster on 19p13. Journal of Immunology 165:2937-2942.
Song H, Liu J, Song Q, Zhang Q, Tian P, Nan Z (2017) Comprehensive analysis of codon
usage bias in seven Epichloë species and their peramine-coding genes. Frontiers in
Microbiology 8:1419.
Spiegel M, Plegge T, Pöhlmann S (2016) The role of Phlebovirus glycoproteins in viral entry,
assembly and release. Viruses 8:202.
151
Stagljar I, Korostensky C, Johnsson N, Te Heesen S (1998) A genetic system based on split-
ubiquitin for the analysis of interactions between membrane proteins in vivo. Proceedings of
the National Academy of Sciences of the United States of America 95:5187-5192.
Stedman A, Wright D, Schreur PJW, Clark MHA, Hill AVS, Gilbert SC, Francis MJ, Van Keulen
L, Kortekaas J, Charleston B, Warmwe GM (2019) Safety and efficacy of ChAdOxl RVF
vaccine against Rift Valley fever in pregnant sheep and goats. Vaccines 44.
Stephens DJ, Banting G (2000) The use of yeast two hybrid screens in studies of
protein:protein interactions involved in trafficking. Traffic 1:763-768.
Steyn JJ, Schulz KH (1955) Aedes (Ochlerotatus) caballus Theobald, the South African vector
of Rift Valley fever. South African Medical Journal 29:1114-1120.
Sugita S, Hata Y, Sudhof TC (1996) Distinct Ca(2+)-dependent properties of the first and
second C2-domains of synaptotagmin I. The Journal of Biological Chemistry 271:1262-1265.
Sun S, Yang X, wang Y, Shen X (2016) In vivo analysis of protein-protein interactions with
Bioluminiscence resonance energy transfer (BRET): Progress and prospects. International
Journal of Molecular Sciences 17:1704
Sun Y, Qi Y, Liu C, Gao W, Chen P, Fu L, Peng B, Wang H, Jing Z, Zhong G, Li W (2014)
Nonmuscle myosin heavy chain 11A is a critical factor contributing to the efficiency of early
infection of severe fever with thrombocytopenia syndrome virus. Journal of Virology 88:237-
248.
Suzich JA, Kakach LT, Collett MS (1990) Expression strategy of a Phlebovirus: biogenesis of
proteins from the Rift Valley fever virus M segment. Journal of Virology 64:1549-1555.
Swanepoel R, Coetzer JAW (2004) Rift Valley fever. In Coetzer JAW and Tustin RC (2nd
editions), Infectious diseases of livestock with special reference to Southern Africa. 1037-
1070. Oxford University Press, Cape Town.
Swanepoel R (1981) Observations on Rift Valley fever in Zimbabwe. Contributions to
Epidemiology and Biostatistics 3:383-391.
Swanepoel R, Blackburn NK (1977) Demonstration of nuclear immunofluorescence in Rift
Valley fever infected cells. Journal of General Virology 34:557-561.
Swanepoel R, Coetzer JAW (2004) Rift Valley fever. In Coetzer JAW and Tustin RC. (2nd
editions), Infectious diseases of livestock with special reference to Southern Africa. 1037-
1070, Oxford University Press, Cape Town.
152
Tamura K, Peterson D, Peterson N, Stecher G, Nei M, Kumar S (2011) MEGA5: Molecular
evolutionary genetics analysis using Maximum Likelihood, Evolutionary Distance, and
Maximum Parsimony methods. Molecular Biology and Evolution 28:2731-2739.
Terasaki K, Ramirez SI, Makino S (2016) Mechanistic insight into the host transcription
inhibition function of Rift Valley fever virus NSs and its importance in virulence. PLoS
Neglected Tropical Diseases 10:e0005047.
Thomas T, Gilbert J, Meyer F (2012) Metagenomics – a guide from sampling to data analysis.
Microbial Informatics and Experimentation 2:3.
Thompson JD, Higgins DG, Gibson TJ (1994) CLUSTAL W: improving the sensitivity of
progressive multiple sequence alignment through sequence weighting, position-specific gap
penalties and weight matrix choice. Nucleic Acids Research 22:4673-4680.
Tsirigos KD, Peters C, Shu N, Käll L, Elofsson A (2015) The TOPCONS web server for
consensus prediction of membrane protein topology and signal peptides. Nucleic Acids
Research 43:W401-W407.
Turell MJ, Presley SM, Gad AM, Cope SE, Dohm DJ, Morrill JC, Arthur PP (1996) Vector
competence of Egyptian mosquitoes for Rift Valley fever virus. The American Journal of
Tropical Medicine and Hygiene 54:136-139.
Turell MJ, Perkins PV (1990) Transmission of Rift Valley fever virus by the sand fly,
Phlebotomus duboscqi (Diptera:Psychodidae). The American Journal of Tropical Medicine
and Hygiene 42:185-188.
Urech DM, Lichtlen P, Barberis A (2003) Cell growth selection system to detect extracellular
and transmembrane protein interactions. Biochimica et Biophysica Acta 1622:117-127.
Van Criekinge W, Beyaert R (1999) Yeast two-hybrid: State of Art. Biological Procedures
Online 2(1). www.biologicalprocedures.com.
Van Kooyk Y (2008) C-type lectins on dendritic cells: key modulators for the induction of
immune responses. Biochemical Society Transactions 36:1478-1481.
Viklund H, Elofsson A (2008) OCTOPUS: Improving topology prediction by two-track ANN-
based preference scores and an extended topology grammar. Bioinformatics 24: 1662-1668.
Von Heijne G (2007) The membrane protein universe: what’s out there and why bother?
Journal of Internal Medicine 261:543-557.
153
Von Teichman B, Engelbrecht A, Zulu G, Dungu B, Pardini A, Bouloy M (2011) Safety and
efficacy of Rift Valley fever Smithburn and Clone 13 vaccines in calves. Vaccine 29:5771-
5777.
Wallace DB, Ellis CE, Espach A, Smith SJ, Greyling RR, Viljoen GJ (2006) Protective immune
responses induced by different recombinant vaccine regimes to Rift Valley fever. Vaccine
24:7181-7189.
Walsh BW, Lenhart JS, Schroeder JW, Simmons LA (2012) Far-western blotting as a rapid
and efficient method for detecting interactions between DNA replication and DNA repair
proteins. Methods in Molecular Biology 922:161-168.
Wang H, Liu S, Zhang B, Wei W (2017) Analysis of synonymous codon usage of Zika virus
and its adaptation to hosts. PLoS One 12:e0170128.
Wang Y, Fang R, Yuan Y, Hu M, Zhou Y, Zhao J (2014) Identification of host proteins
interacting with the integrin-like A domain of Toxoplasma gondii micronemal protein MIC2 by
yeast two-hybrid screening. Parasites and Vectors 7:543.
Wang FI, Hsu AM, Huang KJ (2001) Bovine ephemeral fever in Taiwan. Journal of Veterinary
Diagnostic Investigation 13:462-467.
Wargo AR, Kurath G (2011) In vivo fitness associated with high virulence in a vertebrate virus
is a complex trait regulated by host entry, replication and shedding. Journal of Virology
85:3959-3967.
Warimwe GM, Gesharisha J, Carr BV, Otieno S, Otingah K, Wright D, Charleston B, Okoth E,
Elena LG, Lorenzo G, Ayman EB, Alharbi NK, Al-dubaib MA, Brun A, Gilbert SC, Nene V, Hill
AVS (2016) Chimpanzee adenovirus vaccine provides multispecies protection against Rift
Valley fever. Science Report 6:20617.
Wasmoen TL, Kakach LT, Colett MS (1988) Rift Valley fever virus M segment: cellular
localization of M segment-encoded proteins. Virology 166:275-280.
Whitehouse CA, (2004) Crimean-Congo haemorrhagic fever. Antiviral Research 64:145-160.
WHO, 2019 Rift Valley fever – Mayotte (France): Disease outbreak news (13 May 2019).
WHO, 2010. Fact sheet 207.
Wichgers Schereur, van Keulen L, Kant J, Oreshkova N, Moormann RJ, Kortekaas J (2016)
Co-housing of Rift Valley fever virus infected lambs with immunocompetent or
immunosuppressed lambs does not result in virus transmission. Frontiers in Microbiology
7:287.
154
Wilson WC, Davis AS, Gaudreault NN, Faburay B, Trujillo JD, Shivanna V, Sunwoo SY,
Balogh A, Endalew A, Ma W, Drolet BS, Ruder MG, Morozov I, McVey DS, Richt JA (2016)
Experimental infection of calves by two genetically-distinct strains of Rift Valley fever virus.
Viruses 8:E145.
Wilson WC, Gaudreault NN, Jasperson DC, Johnson DJ, Ostlund EN, Chase CL, Ruder MG,
Stallknecht DE (2015) Molecular evolution of American field strains of Bluetongue and
Epizootic haemorrhagic disease viruses. Veterinaria Italiana 51:269-273.
Won S, Ikegami T, Peters CJ, Makino S (2007) NSm protein of Rift Valley fever virus
suppresses virus-induced apoptosis. Journal of Virology 81:13335-13345.
Won S, Ikegami T, Peters CJ, Makino S (2006) NSm and 78-kilodalton proteins of Rift Valley
fever virus are nonessential for viral replication in cell culture. Journal of Virology 80:8274-
8278.
Wong JH, Alfatah M, Sin MF, Sim HM, Verma CS, Lane DP, Arumugam P (2017) A yeast two-
hybrid system for the screening and characterization of small molecule inhibitors of protein-
protein interactions identifies a novel putative Mdm2-binding site in p53. BioMed Central
Biology 15:108.
Woods CW, Karpati AM, Grein T, McCarthy N, Gaturuku P, Muchiri E, Dunster L, Henderson
A, Khan AS, Swanepoel R, Bonmarin I, Martin L, Mann P, Smoak BL, Ryan M, Ksiazek TG,
Arthur RR, Ndikuyeze A, Agata NN, Peters CJ, WHO HFTF (2002) An outbreak of Rift Valley
fever in Northeastern Kenya, 1997-98. Emerging Infectious Diseases 8:138-144.
Wright F (1990) The effective number of codons used in a gene. Gene 87:23-29.
Wu Y, Zhu Y, Gao F, Jiao Y, Oladejo BO, Chai Y, Bi Y, Lu S, Dong M, Zhang C, Huang G,
Wong G, Li N, Zhang Y, Li Y, Feng W-h, Shi Y, Liang M, Zhang R, Qi J, Gao GF (2017)
Structures of phlebovirus glycoprotein Gn and identification of a neutralizing antibody epitope.
Proceedings of the National Academy of Sciences of the United States of America E7564-
E7573.
Wu Y, Li Q, Chen XZ (2007) Detecting protein-protein interactions by far-western blotting.
Nature Protocols 2:3278-3284.
Xie Q, Soutto M, Xu X, Zhang Y, Johnson CH (2011) Bioluminescence resonance energy
transfer (BRET) imaging in plant seedling and mammalian cells. Methods in Molecular Biology
680:3-28.
155
Xing S, Wallmeroth N, Berendzen KW, Grefen C (2016) Techniques for the analysis of protein-
protein interactions in vivo. Plant Physiology 171:727-758.
Xu Y, Piston DW, Johnson CH (1999) A bioluminescence resonance energy transfer (BRET)
system: Application to interacting circadian clock proteins. Proceedings of the National
Academy of Sciences of the United States of America 96:151-156.
Yamauchi Y, Helenius A (2013) Virus entry at a glance. Journal of Cell Science 126:1289-
1295.
Youssef BZ (2009) The potential role of pigs in the enzootic cycle of Rift Valley fever at
Alexandria Governorate, Egypt. Journal of Egypt Public Health Association 84:329-341.
Zaki A, Coudrier D, Yousef AI, Fakeeh M, Bouloy M, Billecocq A (2006) Production of
monoclonal antibodies against Rift Valley fever virus: Application for rapid diagnosis tests
(virus detection and ELISA) in human sera. Journal of Virological Methods 131:34-40.
Zeller HG, Fontenille D, Traore-Laminaza M, Thiongane Y, Digoutte J-P (1997) Enzootic
activity of Rift Valley fever virus in Senegal. The American Journal of Tropical Medicine and
Hygiene 56:265-272.
Zhao WJ, Zhang H, Bo X, Li Y, Fu X (2009) Generation and analysis of expressed sequence
tags from cDNA library of monieza expansa. Molecular and Biochemical Parasitology 164:80-
85.
Zhu YY, Machleder EM, Chenchik A, Li R, Siebert PD (2001) Reverse transcriptase template
switching: A SMARTTM approach for full-length cDNA library construction. BioTechniques
30:892-897.
156
APPENDICES
Appendix A
1 ATGACAGTCCTCCCAGCCTTAGCAGTTTTTGCTTTGGCACCTGTTGTTTTTGCTGAAGAC 61 CCCCATCTCAGAAACAGACCAGGGAAGGGGCACAACTACATTGACGGGATGACTCAGGAG 121 GATGCCACATGCAAACCTGTGACATATGCTGGGGCATGTAGCAGTTTTGATGTCTTGCTT 181 GAAAAGGGAAAATTTCCCCTTTTCCAGTCATATGCTCATCATAGAACTCTACTAGAGGCA 241 GTTCACGACACCATCATTGCAAAGGCTGATCCACCTAGCTGTGACCTTCAGAGTGCTCAT 301 GGGAATCCCTGTATGAAAGAGAAACTTGTGATGAAGACACATTGTCCAAATGACTACCAG 361 TCAGCTCATTACCTCAACAATGACGGGAAAATGGCTTCAGTCAAGTGCCCACCTAAGTAT 421 GAGCTCACTGAGGACTGCAACTTTTGTAGACAGATGACAGGTGCTAGCCTGAAGAAGGGG 481 TCTTATCCTCTCCAAGACTTATTTTGTCAGTCAAGTGAGGATGATGGATCAAAATTGAAA 541 ACAAAAATGAAAGGGGTCTGCGAAGTGGGGGTTCAAGCACTCAAAAAGTGTAATGGCCAA 601 CTCAGCACTGCACATGAGGTTGTGCCCTTTGCAGTGTTTAAAAACTCAAAGAAGGTTTAT 661 CTTGATAAACTTGACCTCAAGACTGAGGAGAATCTGCTACCAGACTCATTTGTCTGCTTC 721 GAGCATAAGGGACAGTATAAAGGAACAATGGACTCTGGTCAGACCAAGAGGGAGCTCAAA 781 AGCTTTGATATCTCTCAGTGCCCCAAGATTGGAGGGCATGGTAGTAAGAAGTGCACTGGG 841 GACGCAGCATTTTGCTCTGCTTATGAATGCACTGCTCAGTATGCCAATGCCTATTGTTCA 901 CATGCTAACGGGTCAGGGATTGTGCAGATTCAAGTATCAGGGGTCTGGAAGAAGCCTTTA 961 TGTGTAGGGTATGAGAGAGTGGTTGTGAAGAGAGAACTCTCTGCCAAACCCATCCAGAGA 1021 GTTGAGCCTTGCACAACTTGTATAACCAAATGTGAGCCTCATGGATTGGTTGTCCGATCA 1081 ACAGGGTTCAAGATATCATCTGCAGTTGCTTGTGCTAGCGGGGTTTGCGTCACAGGGTCG 1141 CAGAGTCCTTCTACTGAGATTACACTCAAGTATCCAGGGATATCCCAGTCCTCTGGGGGG 1201 GACATAGGGGTTCACATGGCACACGATGATCAGTCAGTTAGCTCCAAAATAGTAGCCCAC 1261 TGCCCTCCCCAGGACCCGTGCTTAGTGCATGGCTGCATAGTGTGTGCTCATGGCCTGATA 1321 AATTACCAGTGTCACACTGCTCTCAGTGCCTTTGTTGTCATATTTGTATTCAGTTCTACT 1381 GCAATAATTTGCTTAGCTGTTCTTTATAGGGTGCTCAAGTGCTTAAAGATTGCCCCAAGG 1441 AAAGTCCTGAATCCACTAATGTGGATTACAGCCTTCATCAGATGGGTGTATAAGAAGATG 1501 GTTGCTAGAGTGGCAGACAATATTAATCAAGTGAACAGAGAAATAGGATGGATGGAAGGA 1561 GGTCAGTTGGCTCTAGGGAACCCTGCCCCTATTCCTCGTCATGCCCCAATCCCACGTTAT 1621 AGCACATACCTAATGCTACTATTGATTGTCTCATATGCATCAGCATGTTCAGAACTGATT 1681 CAGGCAAGCTCCAGAATCACCACTTGCTCCACAGAGGGTGTCAACACCAAGTGTAGACTG 1741 TCTGGCACAGCATTGATCAGGGCAGGGTCAGTTGGGGCAGAGGCTTGTTTGATGTTGAAG 1801 GGGGTCAAGGAAGATCAAACCAAGTTCTTAAAGATAAAAACTGTCTCAAGTGAGCTATCG 1861 TGCAGGGAGGGCCAGAGCTATTGGACTGGGTCCTTTAGCCCCAAGTGCCTGAGCTCAAGG 1921 AGATGCCATCTTGTCGGGGAATGTCATGTGAATAGGTGTCTGTCTTGGAGGGACAATGAA 1981 ACTTCAGCAGAGTTTTCATTTGTTGGAGAAAGCACAACCATGCGAGAGAATAAGTGTTTT 2041 GAGCAGTGTGGAGGATGGGGGTGTGGATGTTTCAATGTGAACCCTTCTTGCTTATTTGTG 2101 CACACGTATCTGCAGTCAGTTAGAAAAGAGGCCCTTAGAGTTTTTAACTGTATCGACTGG 2161 GTGCATAAACTCACTCTAGAGATCACAGACTTTGATGGCTCTGTTTCAACAATAGACTTA 2221 GGAGCATCATCTAGCCGTTTCACAAACTGGGGTTCAGTTAGCCTCTCACTGGACGCAGAG 2281 GGCATTTCAGGCTCAAATAGCTTTTCTTTTATTGAGAGCCCAGGCAAAGGGTATGCAATT 2341 GTTGATGAGCCATTCTCAGAGATCCCTCGGCAAGGGTTCTTGGGGGAGATCAGGTGCAAT 2401 TCAGAGTCCTCAGTCCTGAGTGCTCATGAATCATGCCTTAGGGCACCAAACCTTGTCTCG 2461 TACAAGCCCATGATAGATCAATTGGAGTGCACCACAAATCTGATTGATCCCTTTGTTGTC 2521 TTTGAGAGGGGTTCTCTGCCACAGACAAGGAATGACAAAACCTTTGCAGCTTCAAAAGGA 2581 AATAGAGGTGTTCAGGCTTTCTCTAAGGGCTCTGTACAAGCTGATCTGACTCTGATGTTT 2641 GATAATTTTGAGGTGGACTTTGTGGGAGCAGCCGTGTCTTGTGATGCCGCCTTCTTGAAT 2701 TTGACAGGTTGCTATTCTTGCAACGCAGGGGCCAGAGTCTGCCTGTCCATCACATCCACA 2761 GGAACTGGAACTCTCTCTGCCCACAATAAGGACGGGTCTCTGCATATAGTTCTCCCATCA 2821 GAGAACGGGACAAAAGATCAGTGTCAGATACTACATTTTACTGTACCTGAAGTAGAAGAG 2881 GAGTTCATGTACTCTTGTGATGGAGATGAGCGGCCTCTGTTAGTGAAAGGGACCCTGATA
157
2941 GCTATTGACCCATTTGATGATAGACGGGAAGCAGGGGGGGAATCAACAGTTGTGAATCCA 3001 AAATCTGGATCTTGGAATTTCTTTGACTGGTTTTCTGGACTCATGAGTTGGTTTGGAGGG 3061 CCGCTTAAAACTATACTCCTCATTTGCCTGTATGTTGCATTATCAATTGGGCTCTTCTTC 3121 CTCCTTATATATCTTGGAAGAACAGGCCTCTCTAAAATGTGGCTTGCCGCTACTAAGAAG 3181 GCCTCA Figure S1: Sequence of the GnGc nucleotide indicating the regions amplified. Black arrows
indicate the positions where the forward and the reverse primers were designed to amplify the
region of the Gn. Green arrows indicate the positions where the forward and reverse primers
were designed to amplify the region of the Gc.
158
159
160
161
Copyright © 2022 FDOKUMEN