Beta-specificity: The turnover of host species in space and another way to measure host specificity
9
Beta-specificity: The turnover of host species in space and another way to measure host specificity Boris R. Krasnov a, * , David Mouillot b , Georgy I. Shenbrot a , Irina S. Khokhlova c , Robert Poulin d a Mitrani Department of Desert Ecology, Institute for Dryland Environmental Research, Jacob Blaustein Institutes for Desert Research, Ben-Gurion University of the Negev, Sede-Boqer Campus, 84990 Midreshet Ben-Gurion, Israel b UMR CNRS-UM2-IFREMER-IRD 5119 Ecosystèmes Lagunaires, University of Montpellier 2, CC093, FR-34095 Montpellier Cedex 5, France c Wyler Department of Dryland Agriculture, French Associates Institute for Agriculture and Biotechnology of Drylands, Jacob Blaustein Institutes for Desert Research, Ben-Gurion University of the Negev, Sede-Boqer Campus, 84990 Midreshet Ben-Gurion, Israel d Department of Zoology, University of Otago, P.O. Box 56, 9054 Dunedin, New Zealand article info Article history: Received 5 May 2010 Received in revised form 24 June 2010 Accepted 25 June 2010 Keywords: Beta-specificity Fleas Hosts Spatial turnover abstract Host specificity is often measured as the number of host species used by a parasite, or as their phyloge- netic diversity; both of these measures ignore the larger scale component of host use by parasites. A par- asite may exploit very few host species in one locality but these hosts may be substituted for completely different species elsewhere; in contrast, another parasite may exploit many host species in one locality, with the identity of these hosts remaining the same throughout the parasite’s geographical range. To cap- ture these spatial nuances of host specificity, we propose to use an index for host species turnover across localities, or beta-specificity (b SPF ), that is derived from studies of spatial patterns in plant and animal diversity. We apply this index to fleas parasitic on small mammals to show that: (i) it is statistically inde- pendent of traditional or ‘‘local” measures of host specificity as well as of ‘‘global” measures of host spec- ificity, and (ii) it is also independent of the size of the geographical area studied or the sampling effort put into collecting hosts and parasites. Furthermore, the distribution of b SPF values among flea species shows a significant phylogenetic signal, i.e. related flea species have more similar b SPF values than expected by chance. Nevertheless, most possible combinations of either local specificity (alpha-specificity) or global (gamma-specificity) and beta-specificity are observed among flea species, suggesting that adding a spa- tial component to studies of host use reveals a new facet of specificity. The measure presented here pro- vides a new perspective on host specificity on a scale relevant to studies on topics ranging from biogeography to evolution and may underlie the rate and extent of disease transmission and population dynamics. Ó 2010 Australian Society for Parasitology Inc. Published by Elsevier Ltd. All rights reserved. 1. Introduction Host specificity is one of the most fundamental properties of any parasitic species. Highly host-specific parasites exploit a single host species, whereas host-opportunistic parasites use hosts belonging to several different species. Consequently, from an eco- logical perspective, host specificity represents a component of the breadth of a parasite’s ecological niche, i.e. the one reflecting the diversity of resources it uses (Futuyma and Moreno, 1988). From an evolutionary perspective, the host specificity of a parasite is not merely a function of how many host species it can exploit, but also of the identity of these hosts and how closely related they are to each other (Poulin and Mouillot, 2003). Therefore, the spe- cies composition of a parasite’s host spectrum reflects both the position and the breadth of one of the dimensions of its ecological niche within the multi-dimensional ecological space (Hutchinson, 1957). Several methods to measure host specificity in parasites have been suggested (see Poulin, 2007 for review). Some of these meth- ods rely on the number of host species used by a parasite or the rel- ative abundance of the parasite in its different host species (e.g., Rohde, 1994), whereas other methods take into account the phylo- genetic relatedness of a parasite’s host spectrum (Caira et al., 2003; Poulin and Mouillot, 2003, 2005). Importantly, all of these methods estimate host specificity on a local scale; that is, in a particular locality or region where parasites may choose their hosts from the pool of available species. This specificity can be defined as alpha-specificity, similarly to the way species diversity is classi- cally divided across scales into alpha (local), beta (between locali- ties) and gamma (global) components (Whittaker, 1972; Crist and Veech, 2006). The resource specialization of a species depends on two interre- lated factors, namely local resource specialization and the extent to 0020-7519/$36.00 Ó 2010 Australian Society for Parasitology Inc. Published by Elsevier Ltd. All rights reserved. doi:10.1016/j.ijpara.2010.06.001 * Corresponding author. Tel.: +972 8 6596841; fax: +972 8 6596772. E-mail address: [email protected] (B.R. Krasnov). International Journal for Parasitology 41 (2011) 33–41 Contents lists available at ScienceDirect International Journal for Parasitology journal homepage: www.elsevier.com/locate/ijpara
-
Upload
independent -
Category
Documents
-
view
1 -
download
0
Transcript of Beta-specificity: The turnover of host species in space and another way to measure host specificity

International Journal for Parasitology 41 (2011) 33–41
Contents lists available at ScienceDirect
International Journal for Parasitology
journal homepage: www.elsevier .com/locate / i jpara
Beta-specificity: The turnover of host species in space and another way tomeasure host specificity
Boris R. Krasnov a,*, David Mouillot b, Georgy I. Shenbrot a, Irina S. Khokhlova c, Robert Poulin d
a Mitrani Department of Desert Ecology, Institute for Dryland Environmental Research, Jacob Blaustein Institutes for Desert Research, Ben-Gurion University of the Negev,Sede-Boqer Campus, 84990 Midreshet Ben-Gurion, Israelb UMR CNRS-UM2-IFREMER-IRD 5119 Ecosystèmes Lagunaires, University of Montpellier 2, CC093, FR-34095 Montpellier Cedex 5, Francec Wyler Department of Dryland Agriculture, French Associates Institute for Agriculture and Biotechnology of Drylands, Jacob Blaustein Institutes for Desert Research,Ben-Gurion University of the Negev, Sede-Boqer Campus, 84990 Midreshet Ben-Gurion, Israeld Department of Zoology, University of Otago, P.O. Box 56, 9054 Dunedin, New Zealand
a r t i c l e i n f o a b s t r a c t
Article history:Received 5 May 2010Received in revised form 24 June 2010Accepted 25 June 2010
Keywords:Beta-specificityFleasHostsSpatial turnover
0020-7519/$36.00 � 2010 Australian Society for Paradoi:10.1016/j.ijpara.2010.06.001
* Corresponding author. Tel.: +972 8 6596841; fax:E-mail address: [email protected] (B.R. Krasnov).
Host specificity is often measured as the number of host species used by a parasite, or as their phyloge-netic diversity; both of these measures ignore the larger scale component of host use by parasites. A par-asite may exploit very few host species in one locality but these hosts may be substituted for completelydifferent species elsewhere; in contrast, another parasite may exploit many host species in one locality,with the identity of these hosts remaining the same throughout the parasite’s geographical range. To cap-ture these spatial nuances of host specificity, we propose to use an index for host species turnover acrosslocalities, or beta-specificity (bSPF), that is derived from studies of spatial patterns in plant and animaldiversity. We apply this index to fleas parasitic on small mammals to show that: (i) it is statistically inde-pendent of traditional or ‘‘local” measures of host specificity as well as of ‘‘global” measures of host spec-ificity, and (ii) it is also independent of the size of the geographical area studied or the sampling effort putinto collecting hosts and parasites. Furthermore, the distribution of bSPF values among flea species showsa significant phylogenetic signal, i.e. related flea species have more similar bSPF values than expected bychance. Nevertheless, most possible combinations of either local specificity (alpha-specificity) or global(gamma-specificity) and beta-specificity are observed among flea species, suggesting that adding a spa-tial component to studies of host use reveals a new facet of specificity. The measure presented here pro-vides a new perspective on host specificity on a scale relevant to studies on topics ranging frombiogeography to evolution and may underlie the rate and extent of disease transmission and populationdynamics.
� 2010 Australian Society for Parasitology Inc. Published by Elsevier Ltd. All rights reserved.
1. Introduction
Host specificity is one of the most fundamental properties ofany parasitic species. Highly host-specific parasites exploit a singlehost species, whereas host-opportunistic parasites use hostsbelonging to several different species. Consequently, from an eco-logical perspective, host specificity represents a component ofthe breadth of a parasite’s ecological niche, i.e. the one reflectingthe diversity of resources it uses (Futuyma and Moreno, 1988).From an evolutionary perspective, the host specificity of a parasiteis not merely a function of how many host species it can exploit,but also of the identity of these hosts and how closely related theyare to each other (Poulin and Mouillot, 2003). Therefore, the spe-cies composition of a parasite’s host spectrum reflects both theposition and the breadth of one of the dimensions of its ecological
sitology Inc. Published by Elsevier
+972 8 6596772.
niche within the multi-dimensional ecological space (Hutchinson,1957).
Several methods to measure host specificity in parasites havebeen suggested (see Poulin, 2007 for review). Some of these meth-ods rely on the number of host species used by a parasite or the rel-ative abundance of the parasite in its different host species (e.g.,Rohde, 1994), whereas other methods take into account the phylo-genetic relatedness of a parasite’s host spectrum (Caira et al., 2003;Poulin and Mouillot, 2003, 2005). Importantly, all of these methodsestimate host specificity on a local scale; that is, in a particularlocality or region where parasites may choose their hosts fromthe pool of available species. This specificity can be defined asalpha-specificity, similarly to the way species diversity is classi-cally divided across scales into alpha (local), beta (between locali-ties) and gamma (global) components (Whittaker, 1972; Crist andVeech, 2006).
The resource specialization of a species depends on two interre-lated factors, namely local resource specialization and the extent to
Ltd. All rights reserved.

Fig. 1. Hypothetical examples involving four parasite species (P1–P4), threelocations (Site 1–Site 3) and four host species (A–D). Parasite P1 is overall (thatis, both locally and regionally) host-specific because it exploits few host species ineach location and its host spectra in locations where it exploits fewer hosts aresubsets of the host spectrum in the location where it exploits the highest number ofhosts. Parasite P2 is locally host-opportunistic but regionally host-specific becauseit exploits many hosts in each location but, similarly to P1, its poorer local hostspectra are subsets of the richest host spectrum. Parasite P3 is locally host-specificbut regionally host-opportunistic because it exploits a few hosts in each locationand the shifts of its host spectra among locations are random. Parasite P4 is overall ahost opportunist because it exploits many hosts in each location and the shifts of itshost spectra among locations are random. Note that P3 and P4 exploit the samenumbers of hosts across locations.
34 B.R. Krasnov et al. / International Journal for Parasitology 41 (2011) 33–41
which these resources can be substituted in space, i.e. among loca-tions (Hughes, 2000), so that the estimation of resource specializa-tion should be scale-dependent (Devictor et al., 2010). In the caseof parasites, if we are interested not only in the simple estimationof a parasite’s ability to infest either a few or many host species in aparticular location (alpha-specificity), but also in, for example, itspotential to expand its geographic distribution and infest new hostspecies, then host specificity should be measured at both small andlarge scales. The former facet of specificity has been extensivelystudied and quantified, while the latter has been neglected anddeserves both an appropriate definition and measurement tools.
The need to estimate the host specificity of parasites at a regio-nal scale has recently been recognized and addressed by measuringit in fleas parasitic on small mammals at local and global scales, i.e.alpha- and gamma-specificity (Krasnov et al., 2008). Adaptingideas from Fox and Morrow (1981), Gaston et al. (1997) andHughes (2000) to parasites, it was suggested that a parasite mightnot just be either host-specific or host-opportunistic on both localand global scales. Instead, a parasite may be host-specific on a localscale but host-opportunistic on a global scale, or host-opportunis-tic locally but host-specific globally. The former would use locallyfew hosts that are substitutable across locations, so that it shiftshosts from location to location and has a high total number of hostsacross its geographic range. The latter exploits locally many hoststhat cannot be substituted from one location to the next, so the to-tal number of hosts that it uses across its geographic range is rel-atively small. Krasnov et al. (2008) showed that, although themajority of flea species are either scale-invariant host specialistsor scale-invariant host opportunists (alpha- and gamma-specificitypositively correlated), some species, nevertheless, demonstratedscale-dependence in their degree of host specificity, being eitherlocal generalists but global specialists (low alpha-specificity buthigh gamma-specificity), or local specialists but global generalists(high alpha-specificity but low gamma-specificity). Krasnov et al.(2008) measured host specificity as both the number and taxo-nomic diversity of host species used by a parasite, but the actualidentity of host species was not taken into account. Surprisingly,the beta component of specificity has not been introduced yet,although it captures the ability of parasite species to shift theirhost spectrum across locations. In particular, this ability mayunderlie the rate and extent of disease transmission and popula-tion dynamics.
Consequently, a measure of host specificity that mirrors spatialvariation in host species composition is needed. In other words, thepattern of spatial variation in the species composition of the hostspectrum represents another facet of host specificity that has notbeen considered in earlier studies.
Here we evaluated host specificity of parasites across a largespatial scale using deconstruction of the beta-diversity of host spe-cies composition into two components, namely ‘‘pure” spatialturnover and dissimilarity due to nestedness (Baselga, 2010). Theconcept of beta-diversity was originally developed to estimate var-iation in the species composition of assemblages of free-livingorganisms (Whittaker, 1960). Spatial turnover is the replacementof some species by others from locality to locality (e.g., Harrisonet al., 1992), whereas nestedness represents a pattern in whichspecies comprising depauperate assemblages constitute non-ran-dom subsets of the species occurring in successively richer assem-blages (e.g., Patterson and Atmar, 1986). Recently, Baselga (2010)proposed a technique to disentangle the contributions of spatialturnover and nestedness to total beta-diversity based on the factthat these two facets are additive and antithetic (Baselga et al.,2007). We proposed to use the turnover component of beta-diver-sity (that is, beta-diversity free from the effect of nestedness) as anew measure of host specificity (=‘‘beta-specificity”) because it re-flects the ‘‘pure” ability of a parasite to shift hosts from one region
to another independently of any non-random and/or any nestedpattern (Fig. 1). Indeed, nestedness tends to inflate beta-diversity(and thus beta-specificity) but this component does not tell uswhether a parasite is able to shift host composition across scales,only that this parasite infests subsets of hosts that are nested with-in the broader host spectrum in one location. We recognize thatthe dissimilarity in host species composition due to nestedness isimportant to study spatial or temporal variation in the speciescomposition of a parasite’s host spectrum. However, a truly host-specific parasite is expected to demonstrate low turnover of hostspecies composition whatever the degree of dissimilarity due tonestedness. Therefore, beta-specificity is an inverse indicator ofthe degree of host specialization across scales.
We calculated beta-specificity using fleas (Siphonaptera) para-sitic on small Palaearctic mammals as a case study. In addition topresenting the new measure of host specificity, our aims werethreefold. First, we tested whether the pattern of spatial variationin the composition of the host spectra of a flea species follows thatof the assemblage of all available host species. This was done bycomparing ‘‘the pure” turnover component of beta-diversity ofthe host spectra of a flea species with that of the assemblages ofsmall mammalian hosts that are exploited by any flea species.
Second, we studied the phylogenetic dependence of beta-spec-ificity in fleas by testing whether phylogenetically related fleasresemble one another in the degree of their beta-specificity. Thepattern of resemblance among phylogenetically-related species iscommonly known as ‘‘phylogenetic signal” (Blomberg and Garland,2002; Blomberg et al., 2003). The detection and estimation of phy-logenetic signals in any ecological trait (including host specificity)is important because a significant signal necessitates control forthe confounding effect of phylogenetic dependence in further com-parative analyses (Freckleton et al., 2002).
Third, we tested whether beta-specificity is independent ofother measures of host specificity such as the number and

B.R. Krasnov et al. / International Journal for Parasitology 41 (2011) 33–41 35
taxonomic diversity of (i) exploited hosts averaged across locations(that is, alpha-specificity) and (ii) exploited hosts across a flea’sgeographic range (that is, gamma-specificity). The independenceof beta-specificity from these measures would support the useful-ness of this new index. In addition, we asked whether beta-speci-ficity is sensitive to the size of a flea’s geographic range and/orsampling effort (number of examined host individuals). In particu-lar, the effect of sampling effort on the number of recorded hostspecies is one of the main problems associated with use of hostnumber as a measure of specificity (Poulin, 1992) as is the casewith many other diversity measures (Magurran, 2004).
2. Materials and methods
2.1. Flea species and host species
We extracted data from our database compiled from publishedsurveys of fleas parasitic on small mammals (Soricomorpha,Erinaceomorpha, Rodentia and Lagomorpha) across the Palaearctic(60 surveys in 52 regions). These surveys reported the number offleas of each individual species found on a given number of individ-uals of each mammal species. The complete list and geographiclocation of surveys can be found elsewhere (Krasnov et al.,2010a). We selected flea species that were recorded in at least 10regions and host species from which at least three individuals ofa given flea species were collected. This resulted in datasets ofregional host species composition for 21 flea species.
2.2. Beta-specificity
To estimate beta-specificity, we used measures of beta-diversityand its components of spatial turnover and nestedness derived byBaselga (2010). In this context, beta-diversity is considered as ameasure of dissimilarity between sites (see also Koleff et al., 2003).The total amount of beta-diversity may be estimated using a multi-ple-site metric (bSOR) based on the Sørensen dissimilarity measure(Baselga et al., 2007; Baselga, 2010). This measure encompassesboth spatial turnover and differences in species richness (Fig. 1; Ko-leff et al. 2003). It can be calculated using the equation: (1).
bSOR ¼
Pi<j
minðbi;j; bj;iÞ" #
þPi<j
maxðbi;j; bj;iÞ" #
2P
iSi � ST
� �þ
Pi<j
minðbi;j; bj;iÞ" #
þPi<j
maxðbi;j; bj;iÞ" # ð1Þ
where Si is the total number of species in site i, ST is the number of spe-cies in all sites and bi,j and bj,i are the numbers of species occurring insite i only and site j only, respectively, when compared by pairs (Base-lga, 2010). The total amount of beta-diversity can be further parti-tioned into two components, spatial turnover (bSIM) anddissimilarity due to nestedness (bNES). The measure of multi-site spa-tial turnover free from the influence of richness (bSIM) is based on theSimpson dissimilarity index (Lennon et al., 2001; Baselga et al., 2007;Baselga, 2010) and involves construction of multiple-site equivalentsof the matching components of indices (that is, species shared andnot shared by assemblages; see Baselga et al., 2007 for details). Theequation to calculate multiple-site spatial turnover is (2)
bSIM ¼
Pi<j
minðbi;j; bj;iÞ" #
Pi
Si � ST
� �þ
Pi<j
minðbi;j; bj;iÞ" # ð2Þ
where variables are the same as in equation (1) (Baselga 2010). Ifassemblages are composed of equal numbers of species, then their
dissimilarity is due to ‘‘pure” turnover because nestedness is notpossible. Consequently, the total amount of beta-diversity will beequal to the amount of turnover (bSOR = bSIM). The difference be-tween bSOR and bSIM is thus dissimilarity due to nestedness orbNES = bSOR � bSIM (Baselga, 2010). A detailed description of thebehaviors of these indices under various simulated scenarios canbe found in Baselga (2010).
For each flea species, we constructed presence-absence matri-ces in which rows were regions, while columns were either (i)hosts that this flea exploited in a region or (ii) hosts that wereexploited by any flea species in a region. Thus, for each flea, weobtained two matrices that reflected (i) variation in species compo-sition of its host spectrum (realized host spectrum) and (ii) varia-tion in species composition of all hosts that are suitable for fleas(potential host spectrum). Then, we calculated bSOR and bSIM usingthe function ‘‘beta-multi.R” for the R software environment (RDevelopment Core Team, 2009) compiled by Baselga (2010). Fol-lowing Baselga et al. (2007) and to make measures computed forfleas occurring in different numbers of regions comparable witheach other, we calculated bSOR and bSIM for fleas occurring in morethan 10 regions using resampling procedures. For each of thesefleas, we took 100 random samples of 10 host spectra and averagedmetrics across these samples. Initially, we estimated beta-specific-ity (bSPF) for each flea as the spatial turnover component of beta-diversity of hosts used by this flea across locations. In addition,for each flea species, we estimated the spatial turnover componentof beta-diversity of all hosts used by any flea species across loca-tions where this flea occurred (bSIM). However, bSPF might be notonly an intrinsic property of a parasite, but may also be affectedby the beta-diversity of the available hosts. This was not the casein our dataset (see Results), but it may well be the case for otherdatasets. If bSPF of parasites and bSIM of available hosts are related,then positive and negative deviations from the regression linebetween these two metrics would indicate turnover either inexcess of or lower than that expected due to the structure of hostcommunities. Thus, these deviations would reflect properties ofthe parasites themselves that are free from the effects of host com-munities. Consequently, we plotted bSPF against bSIM and visuallyidentified a single species that obviously accounted for the lackof the relationship between these two measures (see Results).We removed this species from the dataset. Then, we substitutedoriginal values of bSPF with their residual deviations from theregression on bSIM (bSPFR) and re-ran all analyses.
2.3. Local host specificity, global host specificity and geographic range
For each of the 21 flea species, we calculated two measures ofalpha- (that is, local) and two measures of gamma- (that is, global)host specificity: (i) the number of mammalian species on whichthe flea species was found, and (ii) an index of specificity, STD
(Poulin and Mouillot, 2003). At a local scale, we took into accountthe number and taxonomic diversity of all host species exploitedby a given flea in a geographic region, while at the global scalewe included all host species exploited by that flea across its entiregeographic range. The index STD is based on the taxonomic or phy-logenetic affinities of the host species and measures the averagetaxonomic distinctness of all host species used by a parasite spe-cies. Thus, this measure emphasises the phylogenetic diversity ofa flea’s host spectrum, providing a different perspective on hostspecificity. The greater the taxonomic distinctness between hostspecies, the higher the value of STD: thus this index is inversely pro-portional to specificity. Details of calculation of STD for fleas arepublished elsewhere (Krasnov et al., 2004a). For each flea species,we calculated STD (i) within each region for all host species andthen averaged the resulting values across regions, and (ii) for all

Table 1Total amount of beta-diversity (bSOR) and its spatial turnover component for the hostspectra of 21 flea species (bSPF) and small mammal communities co-occurring withthese fleas (bSIM).
Flea species Flea host spectrum Small mammal community
bSOR bSPF bSOR bSIM
Amalaraeus penicilliger 0.88 0.78 0.85 0.79Amphipsylla primaris 0.92 0.87 0.86 0.82Amphipsylla rossica 0.88 0.78 0.85 0.82Catallagia dacenkoi 0.87 0.78 0.79 0.64Ceratophyllus indages 0.8 0.57 0.81 0.7Ceratophyllus sciurorum 0.87 0.71 0.76 0.59Citellophilus tesquorum 0.91 0.84 0.85 0.8Corrodopsylla birulai 0.83 0.64 0.80 0.72Ctenophthalmus assimilis 0.81 0.7 0.79 0.73Frontopsylla elata 0.9 0.84 0.85 0.8Hystrichopsylla talpae 0.83 0.65 0.82 0.77Megabothris calcarifer 0.87 0.8 0.80 0.69Megabothris rectangulatus 0.83 0.69 0.82 0.75Megabothris turbidus 0.84 0.71 0.82 0.77Mesopsylla hebes 0.79 0.46 0.83 0.78Neopsylla mana 0.91 0.83 0.85 0.81Neopsylla pleskei 0.92 0.85 0.86 0.82Neopsylla setosa 0.91 0.87 0.84 0.8Oropsylla ilovaiskii 0.9 0.85 0.82 0.78Oropsylla silantiewi 0.89 0.85 0.84 0.78Palaeopsylla soricis 0.83 0.64 0.79 0.73
36 B.R. Krasnov et al. / International Journal for Parasitology 41 (2011) 33–41
host species across all regions. Obviously, all these measures areinverse indicators of host specificity.
For each flea species, we calculated the size of its geographicrange. We estimated the size of the geographic range from a flea’sdistribution map based on published maps (e.g., Traub et al., 1983)and/or various literature sources and museum records usingArcView 9.2 software and a combination of the minimal convexpolygon method (MCP; Fortin et al., 2005) and the GARP algorithm(Stockwell and Peters, 1999) (see details in Krasnov et al., 2008).Geographic range size was log-transformed prior to further analyses.
Across flea species, the mean number of host species per regionand the total number of host species on which a flea was recordeddid not correlate with the mean number of host individuals exam-ined in a region or with the total number of hosts examined in allregions (Pearson’s product-moment correlation r = �0.30 andr = �0.06, respectively, P > 0.20 for both). In contrast, within-regionSTD and STD for the entire host assemblage were positively correlatedwith the number of host species used by flea species within a regionand across regions, respectively (Pearson’s product-moment corre-lations r = 0.81 and 0.62, P < 0.001), indicating that this measurewas influenced by the number of host species in a flea’s repertoire(see Poulin and Mouillot, 2003). In subsequent analyses, values ofSTD were corrected for the number of host species exploited by a fleain a region or across regions by substitution of the original valueswith their residual deviations from the linear regressions of thesevariables in log–log space. Values of host specificity in terms of num-ber of host species exploited were log-transformed prior to analyses.
2.4. Data analyses
Distributions of the variables bSIM, bSPF and bSPFR did notsignificantly deviate from normality (Kolmogorov–Smirnov tests,P > 0.20 for all).
We used Pagel (1999) k to detect phylogenetic signal in bSPF andbSPFR. This method involves maximum likelihood optimization toassess the degree to which a trait exhibits a phylogenetic signal.The measure k is a multiplier of the off-diagonal elements of thevariance/covariance matrix describing tree topology and branchlengths. It ranges from zero to 1 and thus gradually eliminates phy-logenetic structure. A zero value indicates that the evolution of thetrait is independent of phylogeny, while k = 1 indicates a Brownianmotion model of evolution of the trait on a given phylogenetic tree.Under this model, evolutionary changes along branches are ex-pected to have zero values. Their distribution is normal with a var-iance proportional to branch length (Felsenstein, 1985). Wecalculated k using the package ‘‘geiger” implemented in the R soft-ware environment (Harmon et al., 2008). We tested the signifi-cance of any phylogenetic signal by comparison of log-likelihoodobtained from the observed tree topology and log-likelihood ob-tained from a tree without phylogenetic signal (that is, whenk = 0 or a star phylogeny) using log-likelihood ratio tests. The onlyavailable molecular phylogeny of fleas (Whiting et al., 2008) wasused as a source of topological relationships among fleas withbranch length arbitrarily set to an equal length of 1.
Significant phylogenetic signal in bSPF and bSPFR (see Results)necessitated controlling for the confounding effects of phylogenyin subsequent analyses. We tested for the relationships across fleaspecies between bSPF or bSPFR and mean local (alpha-) host specific-ity (number of host species and STD), global (gamma-) host specific-ity (number of host species and STD), geographic range size, andsampling effort (number of host individuals examined). Amongseveral available methods that allow controlling for phylogeny,the method of independent contrasts (Felsenstein, 1985) and Gen-eralized Least-Squares (GLS) analysis (Martins and Hansen, 1997;Pagel, 1997, 1999; Freckleton et al., 2002; Gage and Freckleton,2003) are the most widely used. We applied both of these methods
and found that they produced similar results. Consequently, wepresent here the results of GLS only.
In brief, GLS analysis tests for the relationships between originalcharacter values rather than between contrasts. This method con-trols for the confounding effect of phylogeny by incorporating thephylogenetic autocorrelation of the data in the structure of errors(Martins and Hansen, 1997; Freckleton et al., 2002). The signifi-cance of the regression coefficients between the dependent vari-able and independent variable(s) was tested using maximumlikelihood (Pagel, 1997, 1999). GLS analyses were carried out usingthe package ‘‘ape” (Paradis et al., 2004) implemented in R.
We re-ran the analyses after obtaining values of bSPFR via GLSrather than conventional statistics. These analyses produced thesame results, so we do not report them here. P-values < 0.05 wereconsidered significant.
3. Results
Among the 21 flea species, values of total amount of beta-diver-sity for the host spectra and communities of available host rangedfrom 0.79 to 0.92 and from 0.76 to 0.86, respectively (Table 1). Thespatial turnover component of the total amount of beta-diversity inthe host spectra (that is, bSPF) varied from 0.46 in Mesopsylla hebesto 0.87 in Neopsylla setosa and Amphipsylla primaris, while spatialturnover component of beta-diversity of available hosts (that is,bSIM) varied from 0.59 in Ceratophyllus sciurorum to 0.82 in A. prim-aris, A. rossica and N. pleskei; the rest being due to nestedness.
Across fleas, bSPF did not correlate with bSIM (conventional sta-tistics: Pearson product-moment correlation 0.36, P > 0.05; GLS:coefficient = 0.45 ± 0.37, k = 0.66, t = 1.23, P > 0.20) (Fig. 2A). How-ever, this lack of correlation was obviously due to M. hebes(Fig. 2B). When this flea was omitted from the analyses, correlationbetween bSPF and bSIM became significant (conventional statistics:Pearson product-moment correlation 0.51, P < 0.05; GLS: coeffi-cient = 0.80 ± 0.29, k = �0.16, t = 2.76, P < 0.05).
In both bSPF and bSPFR, a significant phylogenetic signal was de-tected (k = 0.90, log-likelihood ratio = �3.96 and k = 0.79, log-likeli-hood ratio = �3.88, respectively, P < 0.05), i.e. values from relatedflea species tend to be more similar than expected by chance. GLSanalyses detected no relationship between bSPF or bSPFR and either

B.R. Krasnov et al. / International Journal for Parasitology 41 (2011) 33–41 37
of the two traditional measures of host specificity at either scale, thesize of a flea’s geographic range, or host sampling effort. All coeffi-cients of independent variables were non-significant (Table 2).
The distributions of species data points in bivariate space forbSPF against either alpha- (the mean number of hosts exploitedlocally or mean local STD) or gamma-specificity (the total numberof hosts exploited or total STD) are presented in Figs. 3 and 4,respectively. The respective scatterplots of bSPFR showed similari-ties independent of scale. In terms of host number, the majorityof fleas used in our study were either local specialists or local gen-eralists with a high spatial turnover of hosts among locations,whereas only two fleas (M. hebes and C. indages) were locallyhost-specific with concomitantly low bSPF, and no locally host-opportunistic flea was characterized by low bSPF (Fig. 3A). When lo-cal host specificity was evaluated via the taxonomic diversity of
Fig. 2. Relationships between spatial turnover component of beta-diversity of flea hostcommunities co-occurring with these fleas (bSIM) before (A) and after (B) removal of Me
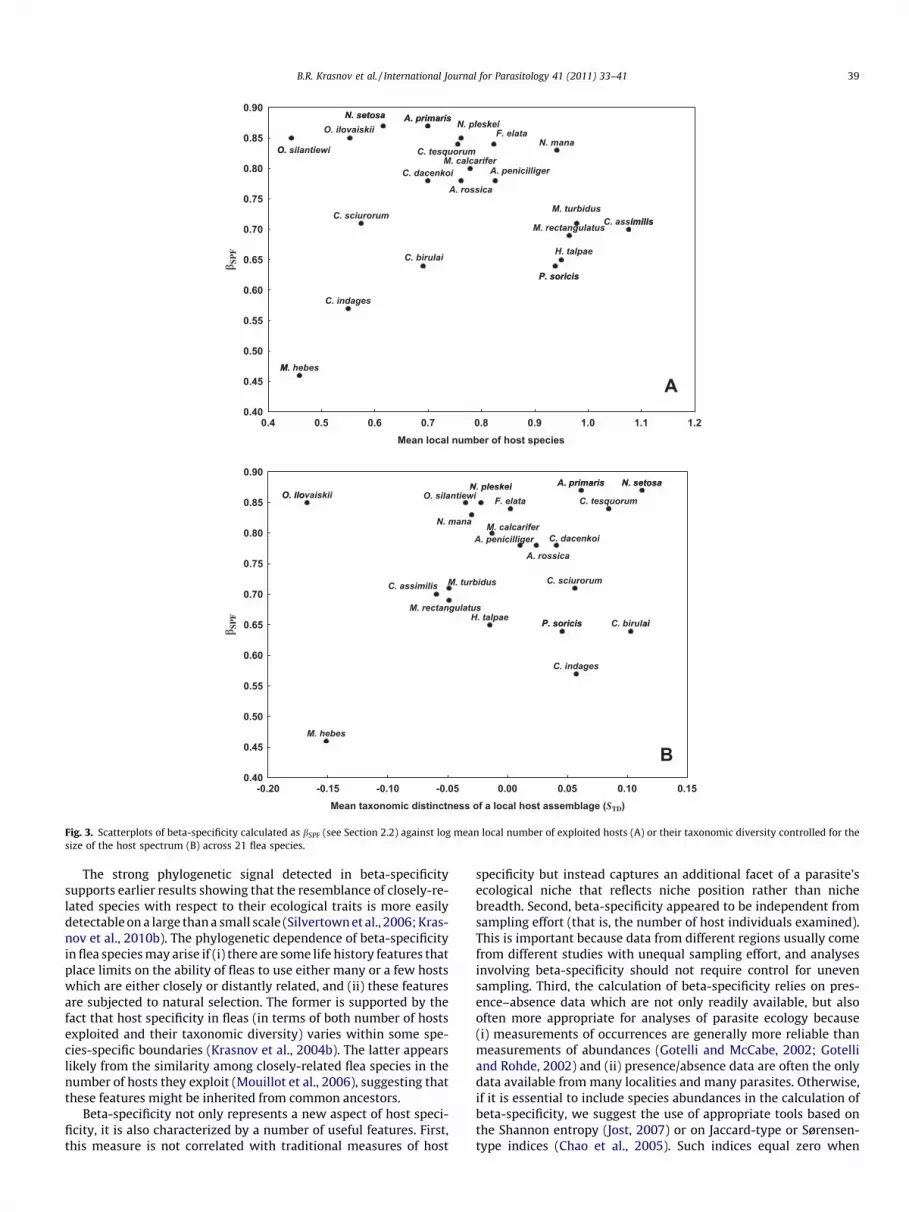
host assemblages, it appeared that the majority of species datapoints were scattered along bSPF but mainly in the right portionof the bivariate space. This means that fleas that exploited localhost spectra of high taxonomic diversity were characterized byeither a high or low turnover of these hosts from one locality toanother (Fig. 3B). In addition, two fleas that predominantly usedtaxonomically-related hosts were characterized by either high(Oropsylla ilovaiskii) or low (M. hebes) bSPF. Fleas with relativelylarge or taxonomically diverse global host spectra (e.g., N. manaand Ctenophthalmus assimilis, respectively) were mainly character-ized by high spatial host turnover (Fig. 4). In contrast, fleas withglobal host spectra of a small size (e.g., Oropsylla silantiewi) and/or low taxonomic diversity (e.g., N. setosa) demonstrated twofoldvariation in their degree of spatial host turnover (e.g., O. silantiewiversus M. hebes) (Fig. 4).
spectra (bSPF) and spatial turnover component of beta-diversity of small mammalsopsylla hebes.

Table 2Summary of generalized least-squares of the relationships between bSPF or bSPFR andalpha-host specificity [a-NHS (number of host species) and a-STD], gamma-hostspecificity [c-NHS (number of host species) and c-STD], geographic range size (GRS),and sampling effort (SEF; number of host individuals examined).
Dependentvariable
Independentvariable
Coefficient ± S.E. t P
bSPF a-NHS �0.34 ± 0.30 �1.13 0.27a-STD 0.48 ± 0.38 1.27 0.22c-NHS 0.14 ± 0.25 0.58 0.57c-STD 0.28 ± 0.20 1.44 0.17GRS �0.17 ± 0.12 �1.44 0.17SEF �0.02 ± 0.06 �0.25 0.80
bSPFR a-NHS �0.39 ± 0.25 �1.60 0.15a-STD 0.09 ± 0.25 0.36 0.72c-NHS 0.03 ± 0.18 0.18 0.85c-STD 0.21 ± 0.14 0.19 0.85GRS �0.12 ± 0.07 �1.99 0.08SEF �0.11 ± 0.06 �2.00 0.09
S.E., standard error.
38 B.R. Krasnov et al. / International Journal for Parasitology 41 (2011) 33–41
4. Discussion
A parasite may differ in the degree of its host specificity consid-ered at different scales. Indeed, a hypothetical parasite may be (i) alocal and regional specialist, (ii) a local and regional generalist, (iii)a local specialist but regional generalist, and (iv) a local generalistbut regional specialist (Gaston et al., 1997; Krasnov et al., 2008).Furthermore, the relationships between the local and regionalspecificity of a parasite may determine the degree of its gamma-specificity, although not always in a straightforward way (seebelow). For example, a local and regional specialist uses a few hostsand/or phylogenetically closely-related hosts locally (high alpha-specificity) whose identities or taxonomic affinities do not changefrom locality to locality (high beta-specificity), so that the numberand/or taxonomic diversity of all host species used by this parasiteacross its entire geographic range are low (high gamma-specificity)and it can be classified as an all-around specialist. A local andregional generalist uses many hosts and/or phylogenetically-dis-tant hosts locally (low alpha-specificity), while the species compo-sition of its host spectra varies substantially among localities (lowbeta-specificity), so its gamma-specificity is obviously low and itcan be categorized as an all-round generalist. Similarly, a local spe-cialist/regional generalist is expected to demonstrate high alpha-specificity and low beta-specificity, whereas a local generalist/re-gional specialist is characterized by low alpha-specificity and highbeta-specificity. In both these cases, gamma-specificity is expectedto be moderate. The comparison of alpha-, beta- and gamma-spec-ificity of fleas used in our study has demonstrated that the majorityof combinations of these traits are observed in nature, albeit withdifferent frequencies of occurrence.
Given that all metrics of host specificity presented here are in-verse indicators of host specificity, the scatter of species points inFig. 3 suggest that all-around generalists (low alpha- and lowbeta-specificity; upper right quadrant of the bivariate space) andlocal specialists/regional generalists (high alpha-specificity andlow beta-specificity; upper left quadrant) were equally repre-sented. For example, C. assimilis not only exploited many hosts lo-cally (on average, 9.7 species belonging to different higher taxa;e.g., in the Altai mountains these hosts belonged to two ordersand four families), but the species composition of its local hostspectra varied greatly among regions, resulting in a high (0.83)spatial turnover of host species. As a result, the total number ofhosts used by this species was high (Fig. 4A), that is, it demon-strated low gamma-specificity. In contrast, O. ilovaiskii exploitedlocally, on average, 2.0 host species only. However, across locations
these hosts belonged to three families and five genera, so that thespatial turnover of host species reached 0.85. High spatial turnoverof only a few hosts resulted in moderate values of gamma-specific-ity for this flea, especially in terms of STD (Fig. 4B). This examplecontradicts the earlier view that the colonization abilities ofspecialist taxa, capable of using only a narrow range of resources,are limited (Krasnov et al., 2008).
Two species from our dataset, namely M. hebes and C. indages,demonstrated low spatial turnover of hosts (0.46 and 0.57, respec-tively).M. hebes behaved as an all-round specialist (high alpha-spec-ificity, high beta-specificity and high gamma-specificity)independently of whether its alpha- and gamma-specificity weremeasured as the number of host species or their taxonomic diversity(Figs. 3 and 4). Similarly to O. ilovaiskii, the local number of hostsexploited by M. hebes was 2.0. However, it was recorded on jerboasin all 10 regions where it occurred, on a hamster or a ground squirrelin one region, and on a gerbil in two regions. In contrast, the assigna-tion of C. indages to either all-round specialists or local generalists/regional specialists depended on whether the size or the taxonomicdiversity of the local host spectra was considered. On the one hand, itexploited 2.6 hosts locally on average (high alpha-specificity;Fig. 3A) but, on the other hand, within any location these hosts oftenbelonged to different subfamilies and sometimes even to differentorders (low alpha-specificity; Fig. 3B). However, the degree of itsbeta- and gamma-specificity was low (Fig. 4). The example ofC. indages suggests two important points, namely (i) assignation ofa parasite to local/regional/global specialists or generalists is notalways straightforward but rather context-dependent, and (ii) thefacet of host specificity captured by beta-specificity differs fromthose obtained from other measures of host specificity.
As defined in this paper, beta-specificity is a derivative of one ofthe components of beta-diversity. In general, beta-diversity is ameasure of the difference in species composition between sites(Koleff et al., 2003) with its turnover component being a conse-quence of processes such as environmental sorting or spatial andhistorical constraints (Nekola and White, 1999; Qian et al., 2005;Baselga, 2010) that result in structured assemblages of speciesalong gradients (Qian et al., 2005). The biological interpretationof beta-specificity is thus that it is the difference between the spe-cies composition of local host spectra due to stochastic losses andacquisitions of hosts. The simplest scenario for the loss of one hostand the acquisition of another host is the dispersal of a parasite toan area where (i) the original host is absent or becomes extinctshortly after dispersal and (ii) the parasite encounters a local hostsuitable for exploitation. This new host may not necessarily be re-lated to the original host. This scenario can be considered as an in-stance of ecological fitting; that is, a situation in which a parasitemainly tracks the resource provided by a host rather than the hostper se (Brooks et al., 2006). In addition, ecological fitting may ex-plain incongruities between parasite and host phylogenies (Brookset al., 2006). High values of bSPF in the majority of fleas coupledwith high values of taxonomic diversity of their local host spectrasuggest that ecological fitting may indeed be a reason behind thespatial turnover of hosts among localities. Furthermore, the valueof beta-specificity may indicate whether ecological fitting hasinfluenced a given flea species and what is the dispersal ability ofthis species. The latter can be important from a medical or veteri-nary point of view as fleas are vectors of many diseases (see Kras-nov, 2008 for review). The main pre-requisite of ecological fitting,that is, tracking by a parasite of the resource rather than the hostper se, applies well to fleas (see Krasnov et al., 2010a for detailedexplanation). Moreover, in the only two studies where the phylog-eny of fleas and that of their hosts were compared, they were foundincongruent and host switches seemed to predominate during thehistory of flea-host associations (Krasnov and Shenbrot, 2002; Luand Wu, 2005).
A. penicilliger
A. primaris
A. rossica
C. dacenkoi
C. indages
C. sciurorum
C. tesquorum
C. birulai
C. assimilis
F. elata
H. talpae
M. calcarifer
M. rectangulatus
M. turbidus
M. hebes
N. mana
N. pleskeiN. setosa
O. ilovaiskii
O. silantiewi
P. soricis
0.4 0.5 0.6 0.7 0.8 0.9 1.0 1.1 1.2Mean local number of host species
0.40
0.45
0.50
0.55
0.60
0.65
0.70
0.75
0.80
0.85
0.90
SPF
A. penicilliger
A. primaris
A. rossica
C. dacenkoi
C. indages
C. sciurorum
C. tesquorum
C. birulai
C. assimilis
F. elata
H. talpae
M. calcarifer
M. rectangulatus
M. turbidus
M. hebes
N. mana
N. pleskeiN. setosa
O. ilovaiskii
O. silantiewi
P. soricis
A
A. penicilliger
A. primaris
A. rossica
C. dacenkoi
C. indages
C. sciurorum
C. tesquorum
C. birulai
C. assimilis
F. elata
H. talpae
M. calcarifer
M. rectangulatus
M. turbidus
M. hebes
N. mana
N. pleskei N. setosaO. ilovaiskii O. silantiewi
P. soricis
-0.20 -0.15 -0.10 -0.05 0.00 0.05 0.10 0.15Mean taxonomic distinctness of a local host assemblage (STD)
0.40
0.45
0.50
0.55
0.60
0.65
0.70
0.75
0.80
0.85
0.90
SPF
A. penicilliger
A. primaris
A. rossica
C. dacenkoi
C. indages
C. sciurorum
C. tesquorum
C. birulai
C. assimilis
F. elata
H. talpae
M. calcarifer
M. rectangulatus
M. turbidus
M. hebes
N. mana
N. pleskei N. setosaO. ilovaiskii O. silantiewi
P. soricis
B
Fig. 3. Scatterplots of beta-specificity calculated as bSPF (see Section 2.2) against log mean local number of exploited hosts (A) or their taxonomic diversity controlled for thesize of the host spectrum (B) across 21 flea species.
B.R. Krasnov et al. / International Journal for Parasitology 41 (2011) 33–41 39
The strong phylogenetic signal detected in beta-specificitysupports earlier results showing that the resemblance of closely-re-lated species with respect to their ecological traits is more easilydetectable on a large than a small scale (Silvertown et al., 2006; Kras-nov et al., 2010b). The phylogenetic dependence of beta-specificityin flea species may arise if (i) there are some life history features thatplace limits on the ability of fleas to use either many or a few hostswhich are either closely or distantly related, and (ii) these featuresare subjected to natural selection. The former is supported by thefact that host specificity in fleas (in terms of both number of hostsexploited and their taxonomic diversity) varies within some spe-cies-specific boundaries (Krasnov et al., 2004b). The latter appearslikely from the similarity among closely-related flea species in thenumber of hosts they exploit (Mouillot et al., 2006), suggesting thatthese features might be inherited from common ancestors.
Beta-specificity not only represents a new aspect of host speci-ficity, it is also characterized by a number of useful features. First,this measure is not correlated with traditional measures of host
specificity but instead captures an additional facet of a parasite’secological niche that reflects niche position rather than nichebreadth. Second, beta-specificity appeared to be independent fromsampling effort (that is, the number of host individuals examined).This is important because data from different regions usually comefrom different studies with unequal sampling effort, and analysesinvolving beta-specificity should not require control for unevensampling. Third, the calculation of beta-specificity relies on pres-ence–absence data which are not only readily available, but alsooften more appropriate for analyses of parasite ecology because(i) measurements of occurrences are generally more reliable thanmeasurements of abundances (Gotelli and McCabe, 2002; Gotelliand Rohde, 2002) and (ii) presence/absence data are often the onlydata available from many localities and many parasites. Otherwise,if it is essential to include species abundances in the calculation ofbeta-specificity, we suggest the use of appropriate tools based onthe Shannon entropy (Jost, 2007) or on Jaccard-type or Sørensen-type indices (Chao et al., 2005). Such indices equal zero when
A. penicilliger
A. primaris
A. rossicaC. dacenkoi
C. indages
C. sciurorum
C. tesquorum
C. birulai
C. assimilis
F. elata
H. talpae
M. calcarifer
M. rectangulatus
M. turbidus
M. hebes
N. manaN. pleskei
N. setosaO. ilovaiskiiO. silantiewi
P. soricis
0.8 0.9 1.0 1.1 1.2 1.3 1.4 1.5 1.6 1.7Total number of host species
0.40
0.45
0.50
0.55
0.60
0.65
0.70
0.75
0.80
0.85
0.90
SPF
A. penicilliger
A. primaris
A. rossicaC. dacenkoi
C. indages
C. sciurorum
C. tesquorum
C. birulai
C. assimilis
F. elata
H. talpae
M. calcarifer
M. rectangulatus
M. turbidus
M. hebes
N. manaN. pleskei
N. setosaO. ilovaiskiiO. silantiewi
P. soricis
A
A. penicilliger
A. primaris
A. rossicaC. dacenkoi
C. indages
C. sciurorum
C. tesquorum
C. birulai
C. assimilis
F. elata
H. talpae
M. calcarifer
M. rectangulatusM. turbidus
M. hebes
N. manaN. pleskei
N. setosaO. ilovaiskiiO. silantiewi
P. soricis
-0.3 -0.2 -0.1 0.0 0.1 0.2 0.3Taxonomic distinctness of a total host assemblage (STD)
0.40
0.45
0.50
0.55
0.60
0.65
0.70
0.75
0.80
0.85
0.90
SPF
A. penicilliger
A. primaris
A. rossicaC. dacenkoi
C. indages
C. sciurorum
C. tesquorum
C. birulai
C. assimilis
F. elata
H. talpae
M. calcarifer
M. rectangulatusM. turbidus
M. hebes
N. manaN. pleskei
N. setosaO. ilovaiskiiO. silantiewi
P. soricis
B
Fig. 4. Scatterplots of beta-specificity calculated as bSPF (see Section 2.2) against log total number of exploited hosts across all regions (A) or their taxonomic diversitycontrolled for the size of the host spectrum (B) across 21 flea species.
40 B.R. Krasnov et al. / International Journal for Parasitology 41 (2011) 33–41
communities share the same species and when species have thesame relative abundances in all communities. In summary,beta-specificity provides a new perspective of host use on a scalerelevant to studies on topics ranging from biogeography to evolu-tion. However, in our study we measured beta-specificity for onlyone type of parasite-host association in only one, albeit large, geo-graphic region. The behavior and applicability of this measureshould be further tested with other parasite and host taxa in othergeographic realms.
Acknowledgements
We thank three anonymous referees for their most helpful com-ments on an earlier version of the manuscript. This study was partlysupported by the Israel Science Foundation (Grant no. 27/08 to B.R.K.and I.S.K.). This is publication no. 684 of the Mitrani Department ofDesert Ecology, Ben-Gurion University of the Negev, Israel.
References
Baselga, A., 2010. Partitioning the turnover and nestedness components of beta-diversity. Global Ecol. Biogeogr. 19, 134–143.
Baselga, A., Jiménez-Valverde, A., Niccolini, G., 2007. A multiple-site similaritymeasure independent of richness. Biol. Lett. 3, 642–645.
Blomberg, S.P., Garland, T., 2002. Tempo and mode in evolution: phylogeneticinertia, adaptation and comparative methods. J. Evol. Biol. 15, 899–910.
Blomberg, S.P., Garland, T., Ives, A.R., 2003. Testing for phylogenetic signal incomparative data: behavioral traits are more labile. Evolution 57, 717–745.
Brooks, D.R., León-Règagnon, V., McLennan, D.A., Zelmer, D., 2006. Ecological fittingas a determinant of the community structure of platyhelminth parasites ofanurans. Ecology 87, S76–S85.
Caira, J.N., Jensen, K., Holsinger, K., 2003. On a new index of host specificity. In:Combes, C., Jordan, J. (Eds.), Taxonomy. ecology, and evolution of metazoanparasites, vol. I (Livre hommage à Louis Euzet). PUP Presses, Perpignan, France,pp. 161–201.
Chao, A., Chazdon, R.L., Colwell, R.K., Tsung-Jen, S., 2005. A new statistical approachfor assessing similarity of species composition with incidence and abundancedata. Ecol. Lett. 8, 148–159.
Crist, T.O., Veech, J.A., 2006. Additive partitioning of rarefaction curves and species-area relationships: unifying alpha-, beta- and gamma-diversity with samplesize and habitat area. Ecol. Lett. 9, 923–932.

B.R. Krasnov et al. / International Journal for Parasitology 41 (2011) 33–41 41
Devictor, V., Clavel, J., Julliard, R., Lavergne, S., Mouillot, D., Thuiller, W., Venail, P.,Villeger, S., Mouquet, N., 2010. Defining and measuring ecologicalspecialization. J. Appl. Ecol. 47, 15–25.
Felsenstein, J., 1985. Phylogenies and the comparative method. Am. Nat. 125, 1–15.Fortin, M.J., Keitt, T.H., Maurer, B.A., Taper, M.L., Kaufman, D.M., Blackburn, T.M.,
2005. Species’ geographic ranges and distributional limits: pattern analysis andstatistical issues. Oikos 108, 7–17.
Fox, L.R., Morrow, P.A., 1981. Specialization: species property or local phenomenon?Science 211, 887–893.
Freckleton, R.P., Harvey, P.H., Pagel, M., 2002. Phylogenetic analysis andcomparative data: a test and review of the evidence. Am. Nat. 160, 712–726.
Futuyma, D.J., Moreno, G., 1988. The evolution of ecological specialization. Ann. Rev.Ecol. Syst. 19, 207–233.
Gage, M.J.G., Freckleton, R.P., 2003. Relative testis size and sperm morphometryacross mammals: no evidence for an association between sperm competitionand sperm length. Proc. Roy. Soc. London B 270, 265–272.
Gaston, K.J., Blackburn, T.M., Lawton, J.H., 1997. Interspecific abundance-range sizerelationships: an appraisal of mechanisms. J. Anim. Ecol. 66, 579–601.
Gotelli, N.J., McCabe, D.J., 2002. Species co-occurrence. a meta-analysis of J.M.Diamond’s assembly rules model. Ecology 83, 2091–2096.
Gotelli, N.J., Rohde, K., 2002. Co-occurrence of ectoparasites of marine fishes: a nullmodel analysis. Ecol. Lett. 5, 86–94.
Harrison, S., Ross, S.J., Lawton, J.H., 1992. Beta–diversity on geographic gradients inBritain. J. Anim. Ecol. 61, 151–158.
Harmon, L.J., Weir, J.T., Brock, C.D., Glor, R.E., Challenger, W., 2008. GEIGER:investigating evolutionary radiations. Bioinformatics 24, 129–131.
Hughes, J.B., 2000. The scale of resource specialization and the distribution andabundance of lycaenid butterflies. Oecologia 123, 375–383.
Hutchinson, G.E., 1957. Concluding remarks Cold Spring Harbor Symp. Quant. Biol.22, 415–427.
Jost, L., 2007. Partitioning diversity into independent alpha and beta components.Ecology 88, 2427–2439.
Koleff, P., Gaston, K.J., Lennon, J.K., 2003. Measuring beta–diversity for presence–absence data. J. Anim. Ecol. 72, 367–382.
Krasnov, B.R., 2008. Functional and Evolutionary Ecology of Fleas: A Model forEcological Parasitology. Cambridge University Press, Cambridge.
Krasnov, B.R., Shenbrot, G.I., 2002. Coevolutionary events in history of association ofjerboas (Rodentia: Dipodidae) and their flea parasites. Israel J. Zool. 48,331–350.
Krasnov, B.R., Poulin, R., Shenbrot, G.I., Mouillot, D., Khokhlova, I.S., 2004a.Ectoparasitic ‘‘jacks-of-all-trades”: relationship between abundance and hostspecificity in fleas (Siphonaptera) parasitic on small mammals. Am. Nat. 164,506–515.
Krasnov, B.R., Mouillot, D., Shenbrot, G.I., Khokhlova, I.S., Poulin, R., 2004b.Geographical variation in host specificity of fleas (Siphonaptera): theinfluence of phylogeny and local environmental conditions. Ecography 27,787–797.
Krasnov, B.R., Mouillot, D., Khokhlova, I.S., Shenbrot, G.I., Poulin, R., 2008. Scale-invariance of niche breadth in haematophagous ectoparasites. Ecography 31,630–635.
Krasnov, B.R., Mouillot, D., Shenbrot, G.I., Khokhlova, I.S., Vinarski, M.V., Korallo-Vinarskaya, N.P., Poulin, R., 2010a. Similarity in ectoparasite faunas of
Palaearctic rodents as a function of host phylogenetic, geographic, orenvironmental distances: which matters the most? Int. J. Parasitol. 40, 807–817.
Krasnov, B.R., Poulin, R., Mouillot, D., 2010b. Scale-dependence of phylogeneticsignal in ecological traits of ectoparasites. Ecography (in press).
Lennon, J.J., Koleff, P., Greenwood, J.J.D., Gaston, K.J., 2001. The geographicalstructure of British bird distributions: diversity, spatial turnover and scale. J.Anim. Ecol. 70, 966–979.
Lu, L., Wu, H., 2005. Morphological phylogeny of Geusibia Jordan, 1932(Siphonaptera: Leptopsyllidae) and the host-parasite relationships with pikas.Syst. Parasitol. 61, 65–78.
Magurran, A.E., 2004. Measuring Biological Diversity. Blackwell Sci, Oxford.Martins, E.P., Hansen, T.F., 1997. Phylogenies and the comparative method: a
general approach to incorporating phylogenetic information into the analysis ofinterspecific data. Am. Nat. 149, 646–667.
Mouillot, D., Krasnov, B.R., Gaston, K., Shenbrot, G.I., Poulin, R., 2006. Conservatismof host specificity in parasites. Ecography 29, 596–602.
Nekola, J.C., White, P.S., 1999. The distance decay of similarity in biogeography andecology. J. Biogeogr. 26, 867–878.
Pagel, M., 1997. Seeking the evolutionary regression coefficient: an analysis of whatcomparative methods measure. J. Theor. Biol. 164, 191–205.
Pagel, M., 1999. Inferring the biological patterns of evolution. Nature 401, 877–884.Paradis, E., Claude, J., Strimmer, K., 2004. APE: analyses of phylogenetics and
evolution in R language. Bioinformatics 20, 289–290.Patterson, B.D., Atmar, W., 1986. Nested subsets and the structure of insular
mammalian faunas and archipelagos. Biol. J. Linn. Soc. 28, 65–82.Poulin, R., 1992. Determinants of host specificity in parasites of freshwater fishes.
Int. J. Parasitol. 22, 753–758.Poulin, R., 2007. Evolutionary Ecology of Parasites, second ed. Princeton University
Press, Princeton.Poulin, R., Mouillot, D., 2003. Parasite specialization from a phylogenetic
perspective: a new index of host specificity. Parasitology 126, 473–480.Poulin, R., Mouillot, D., 2005. Combining phylogenetic and ecological information
into a new index of host specificity. J. Parasitol. 91, 511–514.Qian, H., Ricklefs, R.E., White, P.S., 2005. Beta–diversity of angiosperms in temperate
floras of eastern Asia and eastern North America. Ecol. Lett. 8, 15–22.R Development Core Team, 2009. R: A language and environment for statistical
computing. R Foundation for Statistical Computing, Vienna, Austria. ISBN3-900051-07-0, Available from: http://www.R-project.org.
Rohde, K., 1994. Niche restriction in parasites: proximate and ultimate causes.Parasitology 109, S69–S84.
Silvertown, J., Dodd, M., Gowing, D., Lawson, C., McConway, K., 2006. Phylogeny andthe hierarchical organization of plant diversity. Ecology 87, S39–S49.
Stockwell, D.R.B., Peters, D.P., 1999. The GARP modelling system: problems andsolutions to automated spatial prediction. Int. J. Geogr. Inf. Sys. 13, 143–158.
Traub, R., Rothschild, M., Haddow, J.F., 1983. The Ceratophyllidae. Key to the generaand host relationships. Cambridge University Press, Cambridge.
Whiting, M.F., Whiting, A.S., Hastriter, M.W., Dittmar, K., 2008. A molecularphylogeny of fleas (Insecta: Siphonaptera): origins and host associations.Cladistics 24, 677–707.
Whittaker, R.H., 1960. Vegetation of the Siskiyou Mountains, Oregon and California.Ecol. Monogr. 30, 280–338.
Whittaker, R.H., 1972. Evolution and measurement of species diversity. Taxon 21,213–251.