Hindalco Annual Report 2015-16.indb
200
ASIA’S LARGEST SINGLE LOCATION COPPER SMELTER
-
Upload
khangminh22 -
Category
Documents
-
view
1 -
download
0
Transcript of Hindalco Annual Report 2015-16.indb
ASIA’S LARGEST SINGLELOCATION COPPER SMELTER
Hindalco Industries Limited
Registered Offi ce:Century Bhavan, 3rd Floor,
Dr. Annie Besant Road, Worli, Mumbai - 400 030.
Tel: (91-22) 6662 6666 Fax: (91-22) 2422 7586/2436 2516
E-Mail: [email protected]: www.hindalco.com
CIN No. L27020MH1958PLC011238
HIN
DA
LC
O IN
DU
ST
RIE
S L
IMIT
ED
AN
NU
AL
RE
PO
RT
20
15
-1
6
Cover.indd 1Cover.indd 1 8/17/2016 2:56:43 PM8/17/2016 2:56:43 PM
Hindalco Industries Limited (Indian Limited Liability Company)
Hindalco Corporate Structure Diagram
Par
ent
Firs
t T
ier
Sub
sid
iari
esS
eco
nd T
ier
Sub
sid
iari
es
100% 100% 100%
100%
100%100%100%100% 100% 100%100% 100% 60%97.18%
BirlaResourcesPty. Limited
MaudaEnergy
Ltd.
East CoastBauxiteMining
CompanyPvt. Ltd.
51%
Utkal AluminaTechnical &
GeneralServices Ltd
SuvasHoldingsLimited
100%
100%
100% 100%
LucknowFinance
CompanyLimited
AVMetals
Inc.
NovelisInc.
Australia India Canada Brazil GuineaThe
Nether-lands
Hindalcodo Brasil
Indústria eComércio
de AluminaLtda.
RenukaInvestments& Finance
Limited
UtkalAlumina
InternationalLimited
HindalcoAlmex
AerospaceLimited
TubedCoal
MinesLtd.
Mineralsand
MineralsLimited
Dahej Harbourand
InfrastructureLimited
RenukeshwarInvestments& FinanceLimited
AV Minerals(Netherlands)
NV
HindalcoGuineaSARL
71% 51%
Mr. Aditya Vikram BirlaWe live by his values.
Integrity, Commitment, Passion, Seamlessness and Speed.
Cover.indd 2Cover.indd 2 8/17/2016 2:56:43 PM8/17/2016 2:56:43 PM
i
THE CHAIRMAN’S LETTER TO SHAREHOLDERS
Dear Shareholders,
Global Economy
The global scenario continues to be
trapped in a low growth trajectory,
despite the steep drop in crude oil
and commodity prices. Furthermore, a
barrage of monetary stimulus has driven
down interest rates close to zero in many
of the advanced economies. With the
monetary stimulus option by and large
exhausted, governments are more likely
to turn to fi scal and structural measures
to revive growth.
The IMF projects global growth to inch
up from 3.1% in 2015, to 3.2% in 2016,
and increasing to 3.5% in 2017. Growth
in the advanced economies is projected
at 1.9% in 2016, with US growth pegged
at 2.4%, Europe at 1.5% and Japan at
0.5%. Growth in the emerging markets
in 2016, overall, is projected at 4.1%,
much of it coming from China, India
and the ASEAN region. Growth in Latin
America is expected to be only 0.5%, on
account of a 3.8% decline in growth in
Brazil. No sustained upside is seen in oil
and commodity prices in 2016.
The path ahead for the global economy
remains challenging, with greater
uncertainties thrown in. Concerns
persist about the slowdown in China
and its ability to shift smoothly from
export-led to domestic-led growth.
Fiscal pressures will accentuate in the
oil producing countries, including the
rich Middle-East countries. Financial
markets remain nervous and exchange
rate volatility has been pronounced. This
is reinforced by the impending reversal
of the interest rate cycle in the US.
Hindalco Annual Report 2015-16.indb iHindalco Annual Report 2015-16.indb i 8/17/2016 1:31:14 PM8/17/2016 1:31:14 PM
ii
Hindalco Industries Limited
Indian Economy
Against the backdrop of a muted global economy, India’s economy is an
outperformer. For 2016-17, GDP growth is projected at 7.5%. This would
make it the fastest growing among the large economies. This is particularly
creditable in the context of two successive unfavourable monsoons and
a decline in exports. Recent data indicate a 5.7% year-on-year growth in
eight of the key core sector industries, against 2.3% growth registered last
year.
Infl ationary pressures have been contained. The rise in the consumer price
index averaged 4.9% in 2015-16, down from 5.9% in the previous year. The
wholesale price index declined 2.5% on an averaged basis, compared to a
rise of 2.0% in the previous year. In 2015-16, merchandise exports and imports
each fell over 15% over 2014-15. The trade defi cit in 2015-16 was US$ 118.5
billion, a decline of 14% over the previous year. The current account defi cit
narrowed sharply from US$ 26.1 billion to US$ 22.0 billion, representing
1.4% of GDP. India’s foreign exchange reserves, as at March-end 2016 were
US$ 360.2 billion. The government is also committed to meeting the current
year’s fi scal target of 3.5% of GDP. Overall, the economic fundamentals are
sound.
There have also been positive moves on the policy front, in areas related to
ease of doing business, promoting start-ups, rationalising the tax structure
and administration, and opening up more areas for foreign investment
through the automatic route. The government is substantially stepping up
infrastructure spending.
Having said that, some issues come to the fore. For instance, capital
investment will take time to revive, given stretched corporate balance
sheets, low capacity utilization, (at only 72.5% in the organized industrial
sector), and competition from imports. Slow global output and trade
growth will continue to impact exports. There is also the overhang of non-
performing assets in the banking sector. Much more also needs to be done
to “monsoon-proof” the Indian economy.
The growth in the manufacturing sector has been subdued, including a
decline in the output of capital goods.
Your Company’s Performance
Your Company attained a consolidated revenue of US$ 15 billion
(` 100,042 crore) and PBITDA of US$ 1.5 billion (` 10,007 crore). This was
despite a sharp drop in LME and the decline in aluminium ingot premium
that caused a large adverse metal price lag. Further, the interest and
“Your Company
attained a consolidated
revenue of US$ 15 billion
(` 100,042 crore) and
PBITDA of US$ 1.5 billion
(` 10,007 crore).”
Hindalco Annual Report 2015-16.indb iiHindalco Annual Report 2015-16.indb ii 8/17/2016 1:31:15 PM8/17/2016 1:31:15 PM

iii
THE CHAIRMAN’S LETTER TO SHAREHOLDERS
depreciation charges rose signifi cantly in line with the commissioning of
new facilities. However, higher volumes and a signifi cant reduction in the
cost of production enabled your Company record a robust performance.
The year 2015-16 was indeed a milestone year for your Company. Aluminium
and alumina production at 1.1 million tons and 2.7 million tons respectively
has been the highest ever achieved as were the shipments of fl at rolled
products. Your Company’s three Greenfi eld projects – Mahan Aluminium,
Aditya Aluminium and Utkal Alumina ramped up to their full capacity. Utkal,
in fact, has positioned itself in the lowest decile on the global alumina cost
curve on the back of very effi cient logistics in a remote terrain and robust
operational performance.
Of the 4 coal blocks – two in Chhatisgarh and two in Jharkhand - bagged
by your Company in the auction process, both the Gare Palma mines in
Chhatisgarh have become operational.
Your Company’s Copper business also put in a commendable performance.
Copper production for the year was at a record level of 388 KT. The continued
thrust on value addition led to a higher production of continuous cast rods.
The year also marked the culmination of Novelis’ large scale investment
programme, started four years ago. Novelis’ Aluminium recycling center
in Germany, the world’s largest of its kind, is stabilizing well. Additionally,
it commissioned two new automotive lines in the US and in Europe. In all, the
5 automotive fi nishing lines consolidate Novelis’ leadership in the high
growth Auto segment.
Importantly, Novelis’ auto shipments increased 47% during the year, in line
with the strategic portfolio shift that is underway.
Outlook
The overall outlook for commodity markets continues to be challenging.
The macroeconomic headwinds persist and the uncertain global macros
pose many concerns. However, your Company’s structural positioning
in the markets that it serves has strengthened signifi cantly, following the
completion of its ambitious Greenfi eld investments in India and the ongoing
enrichment of the product portfolio in Novelis.
Our People: Our Pride
Despite yet another challenging year, we have achieved good results.
This has been largely due to deft cost management, a concerted move
towards on-streaming of new capacities, focus on effi ciency improvement,
productivity and customer centricity. Our employees have unfl inchingly
rallied around us. And for this, I would say a big “thank you” to all of them”.
“The year 2015-16 was
indeed a milestone
year for your Company.
Aluminium and alumina
production at 1.1 million
tons and 2.7 million
tons respectively has
been the highest ever
achieved. ”
“Your Company’s
structural positioning
in the markets that it
serves has strengthened
signifi cantly, following
the completion of its
ambitious Greenfi eld
investments in India and
the ongoing enrichment
of the product portfolio
in Novelis. ”
Hindalco Annual Report 2015-16.indb iiiHindalco Annual Report 2015-16.indb iii 8/17/2016 1:31:15 PM8/17/2016 1:31:15 PM
iv
Hindalco Industries Limited
The Aditya Birla Group: In perspective
At the Group level, we have done well both in terms of revenue and earnings.
As a matter of fact, the EBIDTA attained has been the highest ever.
Having worked extensively on the people front for over a decade, I am
happy to state that our leadership processes are now mature. At the
management level we have built quality bench strength.
The Chairman’s Series launched last year for senior leaders in the areas of
business strategy, fi nance and personal leadership saw 150 of our senior
most leaders recourse to these learning interventions.
To create a leadership pipeline to the Business Head roles within the next
couple of years, we have created the Aditya Birla Fellows programme. The
managers who have won this recognition are put in charge of critical Group-
wide projects under my personal oversight. Up until now, we have named
14 managers who have tremendous potential to rise to the stature of
Business Heads, going forward.
A slew of other initiatives have been set afoot to grow leaders from within.
To do so, we have announced a hiring freeze at the middle and senior
management levels for the next 3 years. It paves the way for accelerated
talent growth.
In this context, I am happy to state that our accelerated leadership
programme Cutting Edge, which prepares high potential leaders for P&L
positions across our Group is gaining traction. It was launched last year. Up
until now, 20 of the 35 graduates of this programme have already moved
roles to take on higher responsibilities.
Furthermore, the 250+ youngsters who joined us over 6 years ago as
Group Management Trainees, in our Leadership Associate Programmes
(Lead) and Leadership Programme for Experienced youngsters (Leap), are
shaping well. In the last 2 years nearly a 100 from this slot have moved
across functions and businesses. Additionally, we have 25 mid-career
participants who have joined us in the Group Manufacturing Leadership
Programme. They too are making signifi cant contributions in our
manufacturing business units.
The fi rst batch of 14 participants in “Spring Board”, (a programme designed
specially for high calibre women) graduated commendably to higher roles.
The second batch of 39 women leaders is making good progress on their
way to greater responsibilities. As of now, we have nearly 5,000 women –
14 percent in the managerial cadre.
“The Chairman’s Series
launched last year
for senior leaders in
the areas of business
strategy, fi nance and
personal leadership
saw 150 of our senior
most leaders recourse
to these learning
interventions.”
Hindalco Annual Report 2015-16.indb ivHindalco Annual Report 2015-16.indb iv 8/17/2016 1:31:15 PM8/17/2016 1:31:15 PM
v
THE CHAIRMAN’S LETTER TO SHAREHOLDERS
“Our Group features
among the formidable
Top-5 in the A C Nielsen –
CRI Campus Recruitment
India Index 2015.”
“ The Aditya Birla Group
Leadership Programme
aimed at securing young
talent from the top
tier Business Schools
of India has become
aspirational.”
In the last 3 years, we have had more than 1100 inter-business and over
1000 intra-business transfers of employees across levels.
At Gyanodaya, the Aditya Birla Global Centre for Leadership Learning over
2000 managers enrolled for learning programmes. With a mix of academics
and live case studies, these programmes enable our people to keep abreast
of the developments in their area and stay contemporary. Side by side
the Gyanodaya Virtual Campus hosts more than 500 e-learning modules
in multiple languages. During the year, over 25,000 employees chose to
access these programmes.
The Aditya Birla Group Leadership Programme aimed at securing young
talent from the top tier Business Schools of India has become aspirational.
I am happy to record that our Group’s brand attractiveness has taken a
quantum leap across 35 top B-Schools in India. Our Group features among
the formidable Top-5 in the A C Nielsen – CRI Campus Recruitment India
Index 2015.
In sum
All these moves are a testament to our commitment to accord a World of
Opportunity for our people and they are leveraging it. Our people are fully
aware of what business needs to succeed. They are committed to contribute
their best to our values based, performance driven, meritocratic culture.
We are future ready.
Your sincerely
Kumar Mangalam Birla
Hindalco Annual Report 2015-16.indb vHindalco Annual Report 2015-16.indb v 8/17/2016 1:31:15 PM8/17/2016 1:31:15 PM
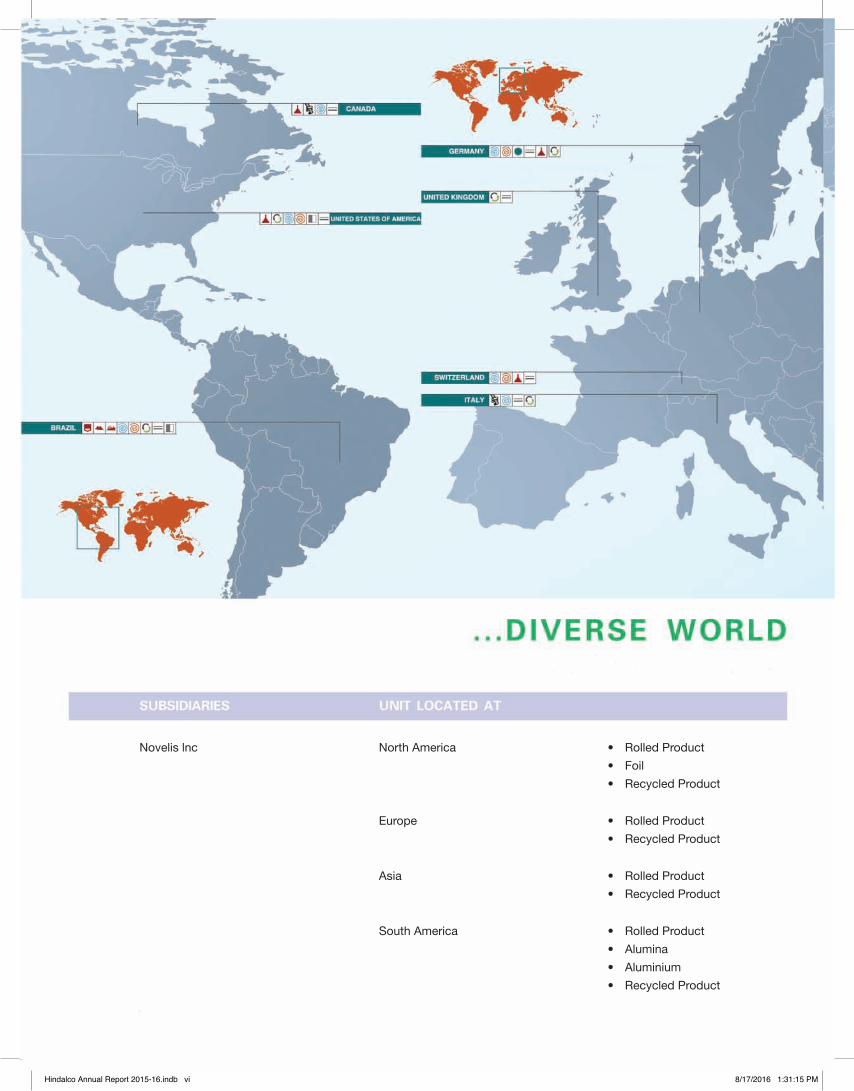
Novelis lnc North America • Rolled Product
• Foil
• Recycled Product
Europe • Rolled Product
• Recycled Product
Asia • Rolled Product
• Recycled Product
South America • Rolled Product
• Alumina
• Aluminium
• Recycled Product
Hindalco Annual Report 2015-16.indb viHindalco Annual Report 2015-16.indb vi 8/17/2016 1:31:15 PM8/17/2016 1:31:15 PM
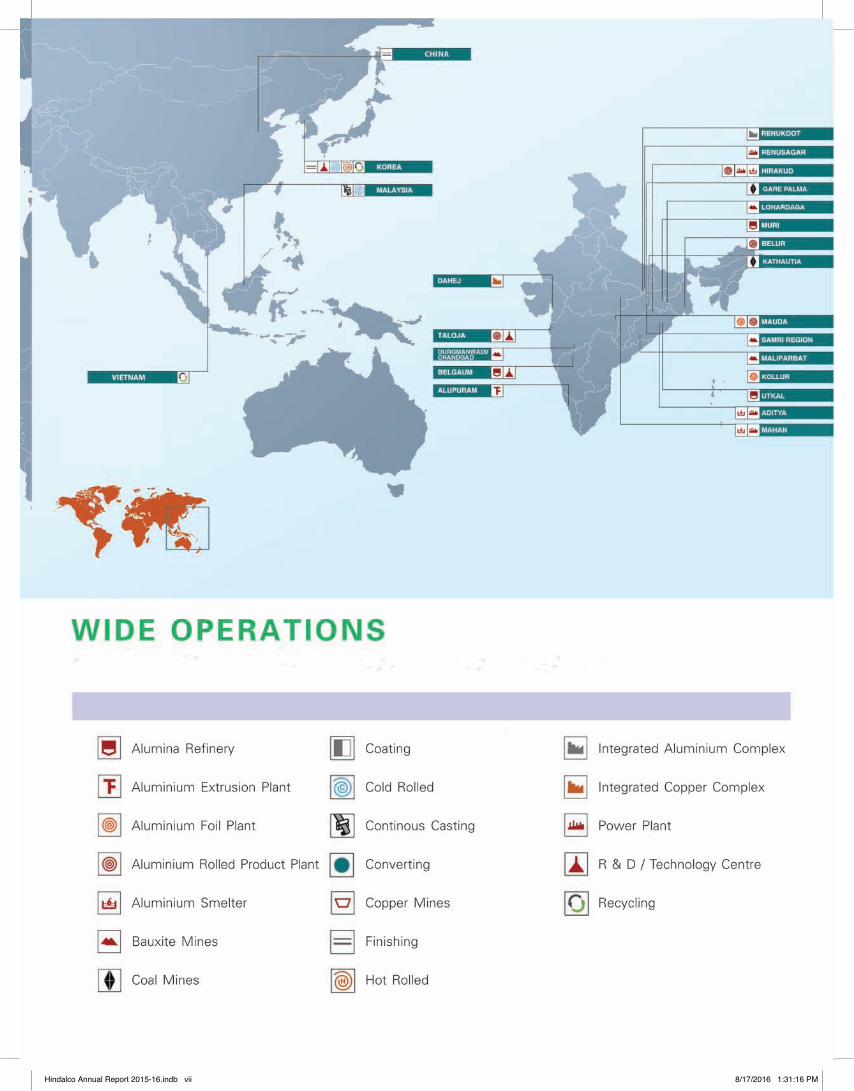
Hindalco Annual Report 2015-16.indb viiHindalco Annual Report 2015-16.indb vii 8/17/2016 1:31:16 PM8/17/2016 1:31:16 PM
viii
OU
R V
AL
UE
S
1 Board of Directors and Key Executives
2 Financial Highlights
4 Management Discussion & Analysis
14 Directors’ Report
46 Sustainability & Business Responsibility Report
50 Corporate Governance Report
61 Shareholder Information
70 Social Report
74 Independent Auditors’ Report
80 Balance Sheet
81 Statement of Profi t and Loss
82 Cash Flow Statement
83 Notes forming part of Financial Statements
133 Consolidated Financial Statements
Table of Contents
Hindalco Annual Report 2015-16.indb viiiHindalco Annual Report 2015-16.indb viii 8/17/2016 1:31:17 PM8/17/2016 1:31:17 PM
1
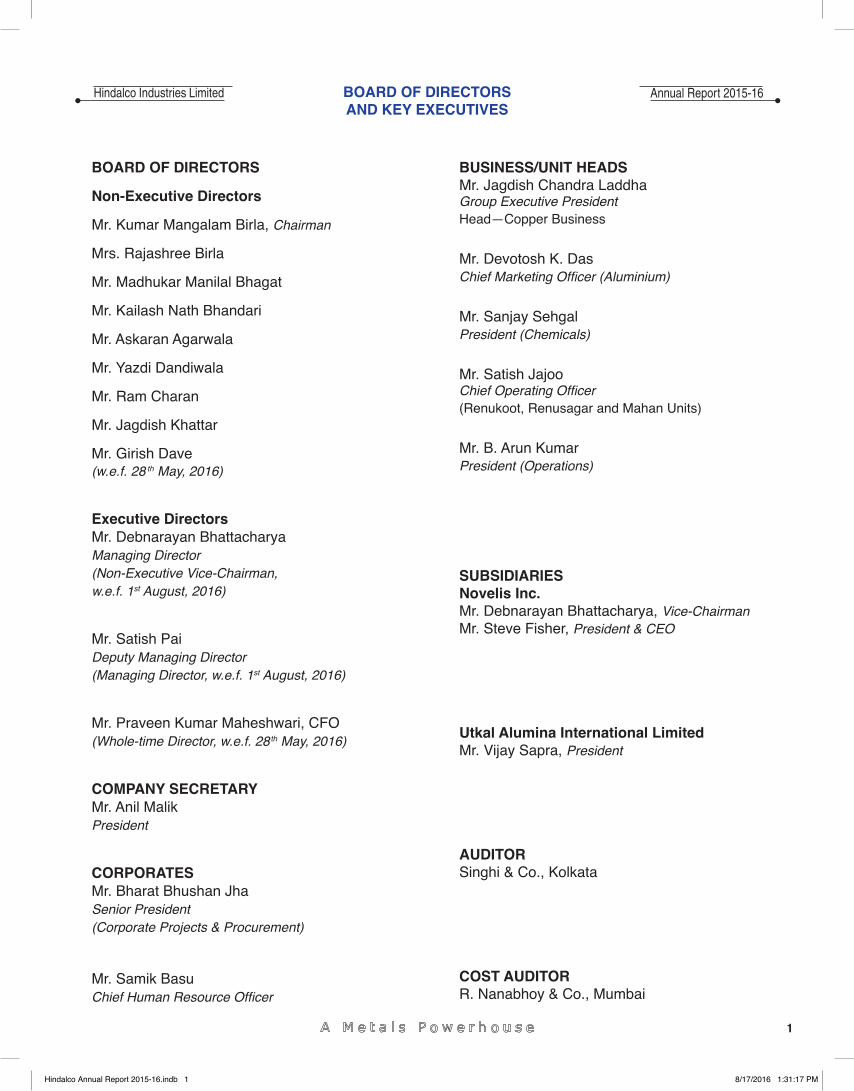
BOARD OF DIRECTORS AND KEY EXECUTIVES
Annual Report 2015-16
BOARD OF DIRECTORS
Non-Executive Directors
Mr. Kumar Mangalam Birla, Chairman
Mrs. Rajashree Birla
Mr. Madhukar Manilal Bhagat
Mr. Kailash Nath Bhandari
Mr. Askaran Agarwala
Mr. Yazdi Dandiwala
Mr. Ram Charan
Mr. Jagdish Khattar
Mr. Girish Dave(w.e.f. 28 th May, 2016)
Executive DirectorsMr. Debnarayan BhattacharyaManaging Director(Non-Executive Vice-Chairman, w.e.f. 1st August, 2016)
Mr. Satish PaiDeputy Managing Director(Managing Director, w.e.f. 1st August, 2016)
Mr. Praveen Kumar Maheshwari, CFO(Whole-time Director, w.e.f. 28 th May, 2016)
COMPANY SECRETARYMr. Anil MalikPresident
CORPORATESMr. Bharat Bhushan JhaSenior President(Corporate Projects & Procurement)
Mr. Samik BasuChief Human Resource Offi cer
BUSINESS/UNIT HEADSMr. Jagdish Chandra LaddhaGroup Executive PresidentHead—Copper Business
Mr. Devotosh K. DasChief Marketing Offi cer (Aluminium)
Mr. Sanjay SehgalPresident (Chemicals)
Mr. Satish JajooChief Operating Offi cer(Renukoot, Renusagar and Mahan Units)
Mr. B. Arun KumarPresident (Operations)
SUBSIDIARIESNovelis Inc.Mr. Debnarayan Bhattacharya, Vice-ChairmanMr. Steve Fisher, President & CEO
Utkal Alumina International LimitedMr. Vijay Sapra, President
AUDITORSinghi & Co., Kolkata
COST AUDITORR. Nanabhoy & Co., Mumbai
Hindalco Industries Limited
Hindalco Annual Report 2015-16.indb 1Hindalco Annual Report 2015-16.indb 1 8/17/2016 1:31:17 PM8/17/2016 1:31:17 PM
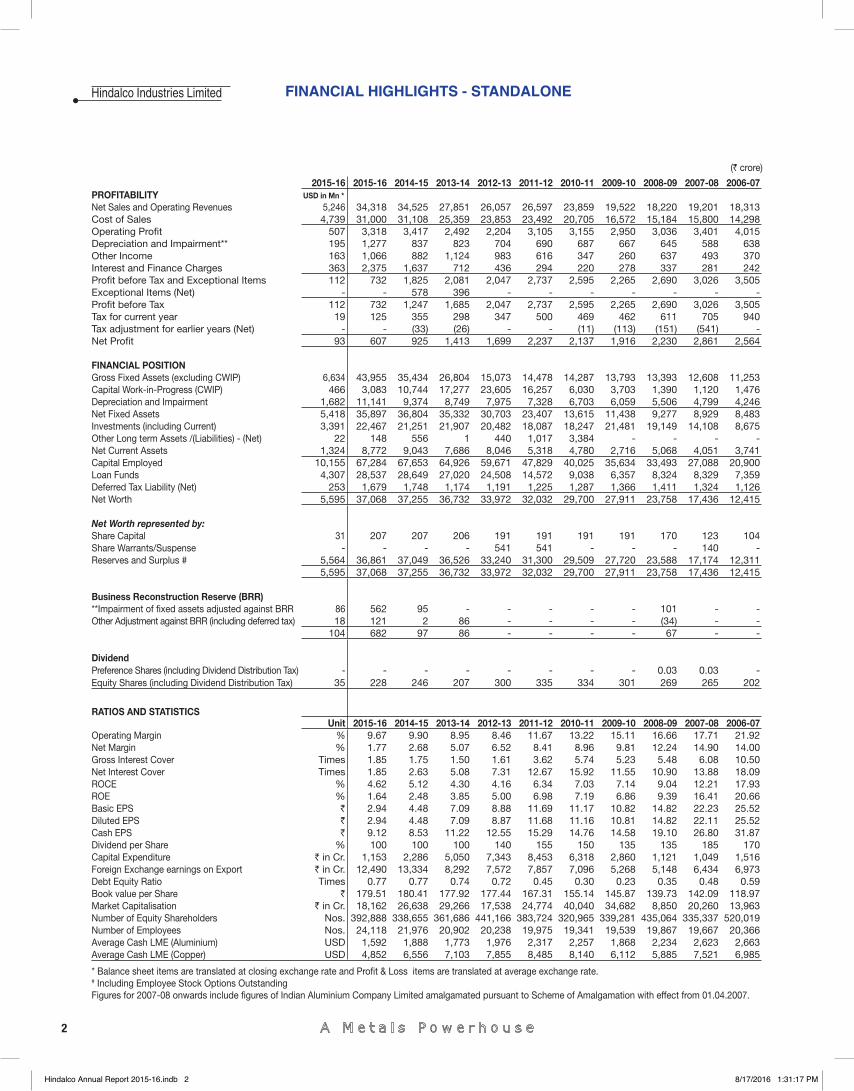
FINANCIAL HIGHLIGHTS - STANDALONE
2
Hindalco Industries Limited
(` crore)
2015-16 2015-16 2014-15 2013-14 2012-13 2011-12 2010-11 2009-10 2008-09 2007-08 2006-07PROFITABILITY USD in Mn *
Net Sales and Operating Revenues 5,246 34,318 34,525 27,851 26,057 26,597 23,859 19,522 18,220 19,201 18,313 Cost of Sales 4,739 31,000 31,108 25,359 23,853 23,492 20,705 16,572 15,184 15,800 14,298 Operating Profi t 507 3,318 3,417 2,492 2,204 3,105 3,155 2,950 3,036 3,401 4,015 Depreciation and Impairment** 195 1,277 837 823 704 690 687 667 645 588 638 Other Income 163 1,066 882 1,124 983 616 347 260 637 493 370 Interest and Finance Charges 363 2,375 1,637 712 436 294 220 278 337 281 242 Profi t before Tax and Exceptional Items 112 732 1,825 2,081 2,047 2,737 2,595 2,265 2,690 3,026 3,505 Exceptional Items (Net) - - 578 396 - - - - - - - Profi t before Tax 112 732 1,247 1,685 2,047 2,737 2,595 2,265 2,690 3,026 3,505 Tax for current year 19 125 355 298 347 500 469 462 611 705 940 Tax adjustment for earlier years (Net) - - (33) (26) - - (11) (113) (151) (541) - Net Profi t 93 607 925 1,413 1,699 2,237 2,137 1,916 2,230 2,861 2,564
FINANCIAL POSITION Gross Fixed Assets (excluding CWIP) 6,634 43,955 35,434 26,804 15,073 14,478 14,287 13,793 13,393 12,608 11,253 Capital Work-in-Progress (CWIP) 466 3,083 10,744 17,277 23,605 16,257 6,030 3,703 1,390 1,120 1,476 Depreciation and Impairment 1,682 11,141 9,374 8,749 7,975 7,328 6,703 6,059 5,506 4,799 4,246 Net Fixed Assets 5,418 35,897 36,804 35,332 30,703 23,407 13,615 11,438 9,277 8,929 8,483 Investments (including Current) 3,391 22,467 21,251 21,907 20,482 18,087 18,247 21,481 19,149 14,108 8,675 Other Long term Assets /(Liabilities) - (Net) 22 148 556 1 440 1,017 3,384 - - - - Net Current Assets 1,324 8,772 9,043 7,686 8,046 5,318 4,780 2,716 5,068 4,051 3,741 Capital Employed 10,155 67,284 67,653 64,926 59,671 47,829 40,025 35,634 33,493 27,088 20,900 Loan Funds 4,307 28,537 28,649 27,020 24,508 14,572 9,038 6,357 8,324 8,329 7,359 Deferred Tax Liability (Net) 253 1,679 1,748 1,174 1,191 1,225 1,287 1,366 1,411 1,324 1,126 Net Worth 5,595 37,068 37,255 36,732 33,972 32,032 29,700 27,911 23,758 17,436 12,415
Net Worth represented by: Share Capital 31 207 207 206 191 191 191 191 170 123 104 Share Warrants/Suspense - - - - 541 541 - - - 140 - Reserves and Surplus # 5,564 36,861 37,049 36,526 33,240 31,300 29,509 27,720 23,588 17,174 12,311
5,595 37,068 37,255 36,732 33,972 32,032 29,700 27,911 23,758 17,436 12,415
Business Reconstruction Reserve (BRR) **Impairment of fi xed assets adjusted against BRR 86 562 95 - - - - - 101 - - Other Adjustment against BRR (including deferred tax) 18 121 2 86 - - - - (34) - -
104 682 97 86 - - - - 67 - -
Dividend Preference Shares (including Dividend Distribution Tax) - - - - - - - - 0.03 0.03 - Equity Shares (including Dividend Distribution Tax) 35 228 246 207 300 335 334 301 269 265 202
RATIOS AND STATISTICS Unit 2015-16 2014-15 2013-14 2012-13 2011-12 2010-11 2009-10 2008-09 2007-08 2006-07
Operating Margin % 9.67 9.90 8.95 8.46 11.67 13.22 15.11 16.66 17.71 21.92 Net Margin % 1.77 2.68 5.07 6.52 8.41 8.96 9.81 12.24 14.90 14.00 Gross Interest Cover Times 1.85 1.75 1.50 1.61 3.62 5.74 5.23 5.48 6.08 10.50 Net Interest Cover Times 1.85 2.63 5.08 7.31 12.67 15.92 11.55 10.90 13.88 18.09 ROCE % 4.62 5.12 4.30 4.16 6.34 7.03 7.14 9.04 12.21 17.93 ROE % 1.64 2.48 3.85 5.00 6.98 7.19 6.86 9.39 16.41 20.66 Basic EPS ` 2.94 4.48 7.09 8.88 11.69 11.17 10.82 14.82 22.23 25.52 Diluted EPS ` 2.94 4.48 7.09 8.87 11.68 11.16 10.81 14.82 22.11 25.52 Cash EPS ` 9.12 8.53 11.22 12.55 15.29 14.76 14.58 19.10 26.80 31.87 Dividend per Share % 100 100 100 140 155 150 135 135 185 170 Capital Expenditure ` in Cr. 1,153 2,286 5,050 7,343 8,453 6,318 2,860 1,121 1,049 1,516 Foreign Exchange earnings on Export ` in Cr. 12,490 13,334 8,292 7,572 7,857 7,096 5,268 5,148 6,434 6,973 Debt Equity Ratio Times 0.77 0.77 0.74 0.72 0.45 0.30 0.23 0.35 0.48 0.59 Book value per Share Rs` 179.51 180.41 177.92 177.44 167.31 155.14 145.87 139.73 142.09 118.97 Market Capitalisation ` in Cr. 18,162 26,638 29,266 17,538 24,774 40,040 34,682 8,850 20,260 13,963 Number of Equity Shareholders Nos. 392,888 338,655 361,686 441,166 383,724 320,965 339,281 435,064 335,337 520,019 Number of Employees Nos. 24,118 21,976 20,902 20,238 19,975 19,341 19,539 19,867 19,667 20,366 Average Cash LME (Aluminium) USD 1,592 1,888 1,773 1,976 2,317 2,257 1,868 2,234 2,623 2,663 Average Cash LME (Copper) USD 4,852 6,556 7,103 7,855 8,485 8,140 6,112 5,885 7,521 6,985
* Balance sheet items are translated at closing exchange rate and Profi t & Loss items are translated at average exchange rate. # Including Employee Stock Options OutstandingFigures for 2007-08 onwards include fi gures of Indian Aluminium Company Limited amalgamated pursuant to Scheme of Amalgamation with effect from 01.04.2007.
Hindalco Annual Report 2015-16.indb 2Hindalco Annual Report 2015-16.indb 2 8/17/2016 1:31:17 PM8/17/2016 1:31:17 PM
FINANCIAL HIGHLIGHTS - CONSOLIDATED
3
Annual Report 2015-16
FINA
NCIA
L HI
GHLI
GHTS
MAN
AGEM
ENT
DISC
USSI
ON
AND
ANAL
YSIS
CORP
ORAT
E GO
VERN
ANCE
RE
PORT
STAN
DALO
NE
FINA
NCIA
L ST
ATEM
ENTS
CONS
OLID
ATED
FI
NANC
IAL
STAT
EMEN
TSSO
CIAL
RE
PORT
DIRE
CTOR
S’RE
PORT
SHAR
EHOL
DER
INFO
RMAT
ION
SUST
AINA
BILI
TY &
BUS
INES
SRE
SPON
SIBI
LITY
REP
ORT
(` crore)
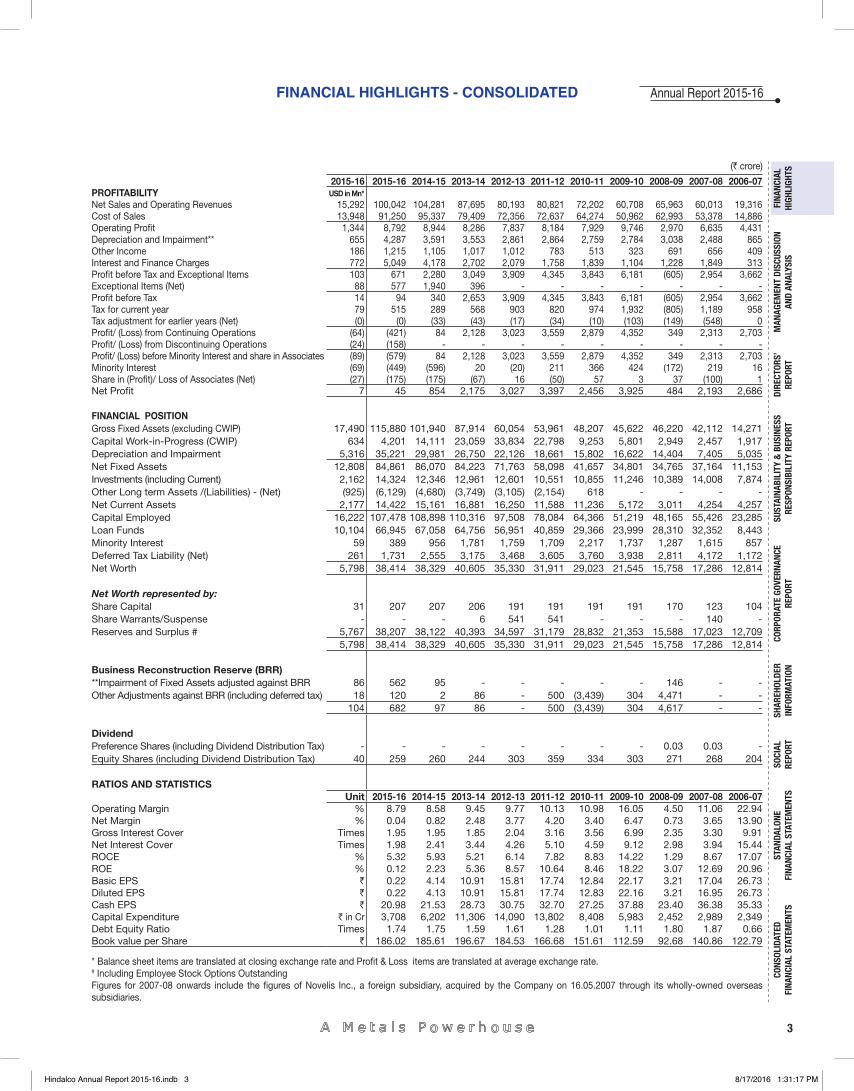
2015-16 2015-16 2014-15 2013-14 2012-13 2011-12 2010-11 2009-10 2008-09 2007-08 2006-07PROFITABILITY USD in Mn*Net Sales and Operating Revenues 15,292 100,042 104,281 87,695 80,193 80,821 72,202 60,708 65,963 60,013 19,316 Cost of Sales 13,948 91,250 95,337 79,409 72,356 72,637 64,274 50,962 62,993 53,378 14,886 Operating Profi t 1,344 8,792 8,944 8,286 7,837 8,184 7,929 9,746 2,970 6,635 4,431 Depreciation and Impairment** 655 4,287 3,591 3,553 2,861 2,864 2,759 2,784 3,038 2,488 865 Other Income 186 1,215 1,105 1,017 1,012 783 513 323 691 656 409 Interest and Finance Charges 772 5,049 4,178 2,702 2,079 1,758 1,839 1,104 1,228 1,849 313 Profi t before Tax and Exceptional Items 103 671 2,280 3,049 3,909 4,345 3,843 6,181 (605) 2,954 3,662 Exceptional Items (Net) 88 577 1,940 396 - - - - - - - Profi t before Tax 14 94 340 2,653 3,909 4,345 3,843 6,181 (605) 2,954 3,662 Tax for current year 79 515 289 568 903 820 974 1,932 (805) 1,189 958 Tax adjustment for earlier years (Net) (0) (0) (33) (43) (17) (34) (10) (103) (149) (548) 0 Profi t/ (Loss) from Continuing Operations (64) (421) 84 2,128 3,023 3,559 2,879 4,352 349 2,313 2,703 Profi t/ (Loss) from Discontinuing Operations (24) (158) - - - - - - - - - Profi t/ (Loss) before Minority Interest and share in Associates (89) (579) 84 2,128 3,023 3,559 2,879 4,352 349 2,313 2,703 Minority Interest (69) (449) (596) 20 (20) 211 366 424 (172) 219 16 Share in (Profi t)/ Loss of Associates (Net) (27) (175) (175) (67) 16 (50) 57 3 37 (100) 1 Net Profi t 7 45 854 2,175 3,027 3,397 2,456 3,925 484 2,193 2,686
FINANCIAL POSITIONGross Fixed Assets (excluding CWIP) 17,490 115,880 101,940 87,914 60,054 53,961 48,207 45,622 46,220 42,112 14,271 Capital Work-in-Progress (CWIP) 634 4,201 14,111 23,059 33,834 22,798 9,253 5,801 2,949 2,457 1,917 Depreciation and Impairment 5,316 35,221 29,981 26,750 22,126 18,661 15,802 16,622 14,404 7,405 5,035 Net Fixed Assets 12,808 84,861 86,070 84,223 71,763 58,098 41,657 34,801 34,765 37,164 11,153 Investments (including Current) 2,162 14,324 12,346 12,961 12,601 10,551 10,855 11,246 10,389 14,008 7,874 Other Long term Assets /(Liabilities) - (Net) (925) (6,129) (4,680) (3,749) (3,105) (2,154) 618 - - - - Net Current Assets 2,177 14,422 15,161 16,881 16,250 11,588 11,236 5,172 3,011 4,254 4,257 Capital Employed 16,222 107,478 108,898 110,316 97,508 78,084 64,366 51,219 48,165 55,426 23,285 Loan Funds 10,104 66,945 67,058 64,756 56,951 40,859 29,366 23,999 28,310 32,352 8,443 Minority Interest 59 389 956 1,781 1,759 1,709 2,217 1,737 1,287 1,615 857 Deferred Tax Liability (Net) 261 1,731 2,555 3,175 3,468 3,605 3,760 3,938 2,811 4,172 1,172 Net Worth 5,798 38,414 38,329 40,605 35,330 31,911 29,023 21,545 15,758 17,286 12,814
Net Worth represented by: Share Capital 31 207 207 206 191 191 191 191 170 123 104 Share Warrants/Suspense - - - 6 541 541 - - - 140 - Reserves and Surplus # 5,767 38,207 38,122 40,393 34,597 31,179 28,832 21,353 15,588 17,023 12,709
5,798 38,414 38,329 40,605 35,330 31,911 29,023 21,545 15,758 17,286 12,814
Business Reconstruction Reserve (BRR) **Impairment of Fixed Assets adjusted against BRR 86 562 95 - - - - - 146 - - Other Adjustments against BRR (including deferred tax) 18 120 2 86 - 500 (3,439) 304 4,471 - -
104 682 97 86 - 500 (3,439) 304 4,617 - -
Dividend Preference Shares (including Dividend Distribution Tax) - - - - - - - - 0.03 0.03 - Equity Shares (including Dividend Distribution Tax) 40 259 260 244 303 359 334 303 271 268 204
RATIOS AND STATISTICS Unit 2015-16 2014-15 2013-14 2012-13 2011-12 2010-11 2009-10 2008-09 2007-08 2006-07
Operating Margin % 8.79 8.58 9.45 9.77 10.13 10.98 16.05 4.50 11.06 22.94 Net Margin % 0.04 0.82 2.48 3.77 4.20 3.40 6.47 0.73 3.65 13.90 Gross Interest Cover Times 1.95 1.95 1.85 2.04 3.16 3.56 6.99 2.35 3.30 9.91 Net Interest Cover Times 1.98 2.41 3.44 4.26 5.10 4.59 9.12 2.98 3.94 15.44 ROCE % 5.32 5.93 5.21 6.14 7.82 8.83 14.22 1.29 8.67 17.07 ROE % 0.12 2.23 5.36 8.57 10.64 8.46 18.22 3.07 12.69 20.96 Basic EPS Rs` 0.22 4.14 10.91 15.81 17.74 12.84 22.17 3.21 17.04 26.73 Diluted EPS Rs` 0.22 4.13 10.91 15.81 17.74 12.83 22.16 3.21 16.95 26.73 Cash EPS Rs` 20.98 21.53 28.73 30.75 32.70 27.25 37.88 23.40 36.38 35.33 Capital Expenditure ` in Cr 3,708 6,202 11,306 14,090 13,802 8,408 5,983 2,452 2,989 2,349 Debt Equity Ratio Times 1.74 1.75 1.59 1.61 1.28 1.01 1.11 1.80 1.87 0.66 Book value per Share Rs` 186.02 185.61 196.67 184.53 166.68 151.61 112.59 92.68 140.86 122.79
* Balance sheet items are translated at closing exchange rate and Profi t & Loss items are translated at average exchange rate. # Including Employee Stock Options Outstanding Figures for 2007-08 onwards include the fi gures of Novelis Inc., a foreign subsidiary, acquired by the Company on 16.05.2007 through its wholly-owned overseas subsidiaries.
Hindalco Annual Report 2015-16.indb 3Hindalco Annual Report 2015-16.indb 3 8/17/2016 1:31:17 PM8/17/2016 1:31:17 PM
4
Hindalco Industries Limited
4
MANAGEMENT DISCUSSION AND ANALYSIS
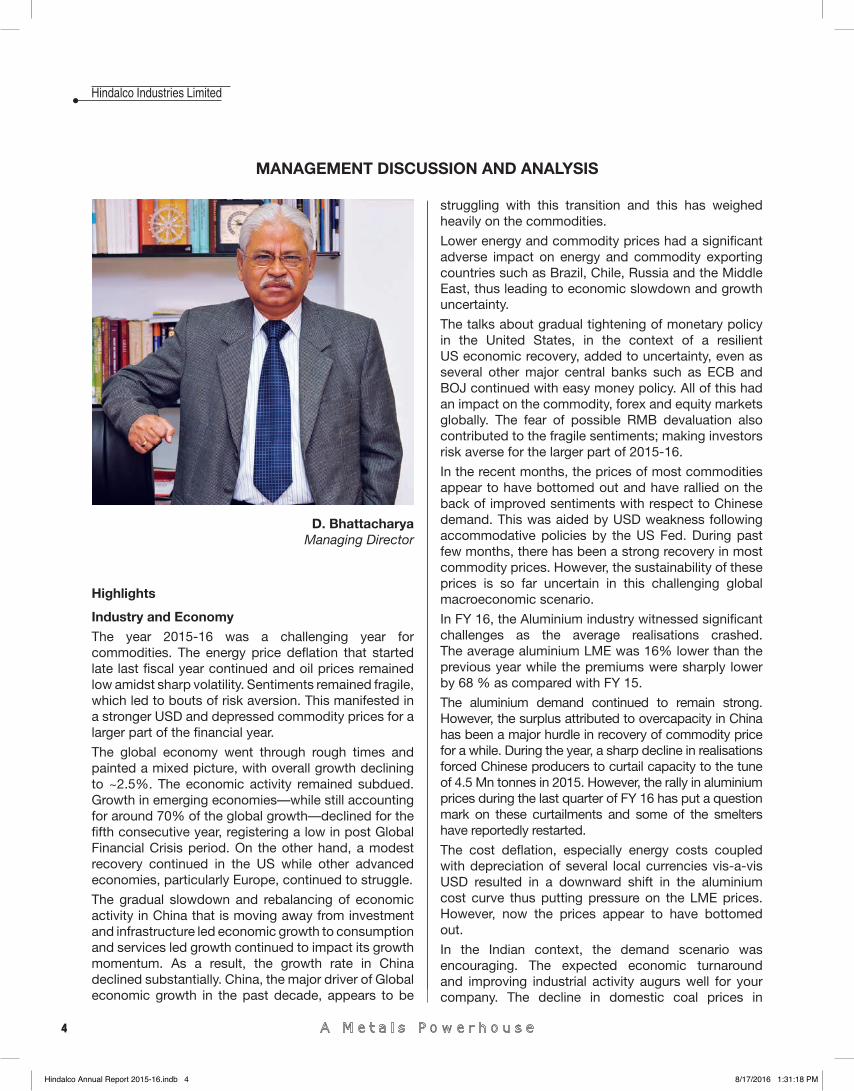
D. BhattacharyaManaging Director
Highlights
Industry and EconomyThe year 2015-16 was a challenging year for commodities. The energy price defl ation that started late last fi scal year continued and oil prices remained low amidst sharp volatility. Sentiments remained fragile, which led to bouts of risk aversion. This manifested in a stronger USD and depressed commodity prices for a larger part of the fi nancial year.
The global economy went through rough times and painted a mixed picture, with overall growth declining to ~2.5%. The economic activity remained subdued. Growth in emerging economies—while still accounting for around 70% of the global growth—declined for the fi fth consecutive year, registering a low in post Global Financial Crisis period. On the other hand, a modest recovery continued in the US while other advanced economies, particularly Europe, continued to struggle.
The gradual slowdown and rebalancing of economic activity in China that is moving away from investment and infrastructure led economic growth to consumption and services led growth continued to impact its growth momentum. As a result, the growth rate in China declined substantially. China, the major driver of Global economic growth in the past decade, appears to be
struggling with this transition and this has weighed heavily on the commodities.
Lower energy and commodity prices had a signifi cant adverse impact on energy and commodity exporting countries such as Brazil, Chile, Russia and the Middle East, thus leading to economic slowdown and growth uncertainty.
The talks about gradual tightening of monetary policy in the United States, in the context of a resilient US economic recovery, added to uncertainty, even as several other major central banks such as ECB and BOJ continued with easy money policy. All of this had an impact on the commodity, forex and equity markets globally. The fear of possible RMB devaluation also contributed to the fragile sentiments; making investors risk averse for the larger part of 2015-16.
In the recent months, the prices of most commodities appear to have bottomed out and have rallied on the back of improved sentiments with respect to Chinese demand. This was aided by USD weakness following accommodative policies by the US Fed. During past few months, there has been a strong recovery in most commodity prices. However, the sustainability of these prices is so far uncertain in this challenging global macroeconomic scenario.
In FY 16, the Aluminium industry witnessed signifi cant challenges as the average realisations crashed. The average aluminium LME was 16% lower than the previous year while the premiums were sharply lower by 68 % as compared with FY 15.
The aluminium demand continued to remain strong. However, the surplus attributed to overcapacity in China has been a major hurdle in recovery of commodity price for a while. During the year, a sharp decline in realisations forced Chinese producers to curtail capacity to the tune of 4.5 Mn tonnes in 2015. However, the rally in aluminium prices during the last quarter of FY 16 has put a question mark on these curtailments and some of the smelters have reportedly restarted.
The cost defl ation, especially energy costs coupled with depreciation of several local currencies vis-a-vis USD resulted in a downward shift in the aluminium cost curve thus putting pressure on the LME prices. However, now the prices appear to have bottomed out.
In the Indian context, the demand scenario was encouraging. The expected economic turnaround and improving industrial activity augurs well for your company. The decline in domestic coal prices in
Hindalco Annual Report 2015-16.indb 4Hindalco Annual Report 2015-16.indb 4 8/17/2016 1:31:18 PM8/17/2016 1:31:18 PM
MANAGEMENT DISCUSSION AND ANALYSIS Annual Report 2015-16
5
FINA
NCIA
L HI
GHLI
GHTS
MAN
AGEM
ENT
DISC
USSI
ON
AND
ANAL
YSIS
CORP
ORAT
E GO
VERN
ANCE
RE
PORT
STAN
DALO
NE
FINA
NCIA
L ST
ATEM
ENTS
CONS
OLID
ATED
FI
NANC
IAL
STAT
EMEN
TSSO
CIAL
RE
PORT
DIRE
CTOR
S’RE
PORT
SHAR
EHOL
DER
INFO
RMAT
ION
SUST
AINA
BILI
TY &
BUS
INES
SRE
SPON
SIBI
LITY
REP
ORT
5
India was a major relief. Depreciation of Indian Rupee also helped your company to some extent. However, imports of aluminium in various forms was a major bane for the Indian producers as imports surged in FY 16.Against this challenging backdrop, your company delivered an exceptional operational performance. The aluminium business delivered highest ever production crossing a Million tonne mark for the fi rst time. The three Greenfi eld projects have now ramped up to their full capacity. The operating effi ciencies are improving following the ramp up of the two world class smelters and Utkal alumina refi nery. This has improved the cost effi ciencies of your company. Your company’s focus on Value added products is also yielding desired results and is set to contribute signifi cantly to the profi tability.The copper business, a strategic component of our portfolio, continued to deliver robust operational and fi nancial performance supporting the results from Indian operations. Your Company registered a consolidated turnover of US $15 billion (`100,042 crore) and PBIDTA of US $1.5 billion (`10,007 crore).
Novelis, your company’s wholly owned subsidiary, also faced signifi cant head winds as it continued to ramp up production from the newly commissioned facilities. A sharp decline in regional premium (that unlike LME cannot be hedged) resulted in a Metal Price Lag (MPL), which impacted its fi nancial performance throughout the year.
Operationally, however, it delivered a strong performance. This strong performance was primarily achieved on the back of sharp focus on product portfolio that resulted in pricing power. Novelis indeed has progressed remarkably well on its strategic path, and auto investments made by it has already started showing the desired results.
Some of the highlights of FY 16 are –• Consolidated Revenues again crossed ` 1 lakh
crore mark despite sharply lower aluminium and copper LME.
• Consolidated PBIDTA at USD 1.5 Bn (` 10,007 crore) in a challenging industry environment and after Metal Price lag (MPL) impact at Novelis.
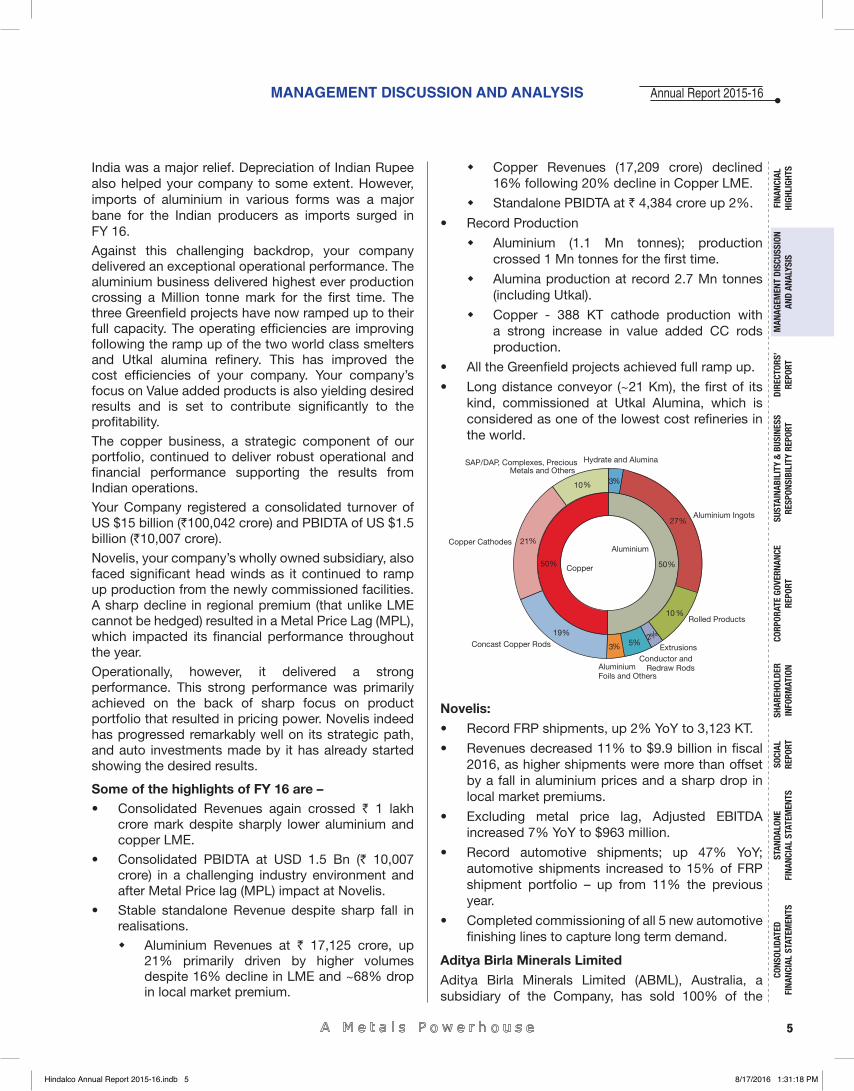
• Stable standalone Revenue despite sharp fall in realisations.� Aluminium Revenues at ` 17,125 crore, up
21% primarily driven by higher volumes despite 16% decline in LME and ~68% drop in local market premium.
� Copper Revenues (17,209 crore) declined 16% following 20% decline in Copper LME.
� Standalone PBIDTA at ` 4,384 crore up 2%.
• Record Production
� Aluminium (1.1 Mn tonnes); production crossed 1 Mn tonnes for the fi rst time.
� Alumina production at record 2.7 Mn tonnes (including Utkal).
� Copper - 388 KT cathode production with a strong increase in value added CC rods production.
• All the Greenfi eld projects achieved full ramp up.
• Long distance conveyor (~21 Km), the fi rst of its kind, commissioned at Utkal Alumina, which is considered as one of the lowest cost refi neries in the world.
Novelis:
• Record FRP shipments, up 2% YoY to 3,123 KT.
• Revenues decreased 11% to $9.9 billion in fi scal 2016, as higher shipments were more than offset by a fall in aluminium prices and a sharp drop in local market premiums.
• Excluding metal price lag, Adjusted EBITDA increased 7% YoY to $963 million.
• Record automotive shipments; up 47% YoY; automotive shipments increased to 15% of FRP shipment portfolio – up from 11% the previous year.
• Completed commissioning of all 5 new automotive fi nishing lines to capture long term demand.
Aditya Birla Minerals Limited
Aditya Birla Minerals Limited (ABML), Australia, a subsidiary of the Company, has sold 100% of the
Hindalco Annual Report 2015-16.indb 5Hindalco Annual Report 2015-16.indb 5 8/17/2016 1:31:18 PM8/17/2016 1:31:18 PM
6
Hindalco Industries Limited
shares in Birla Mt Gordon Pty Ltd to M/s Lighthouse Minerals Holdings Pty Ltd on 27th October, 2015.
Further, Metals X Ltd, a listed company in Australia, made a takeover offer for shares of ABML. As per the offer, the Shareholders of ABML will receive A$ 0.08 per share of ABML in cash and 1 share of Metals X Ltd for every 4.5 shares of ABML. The Company has accepted the said offer on 19th July, 2016 in respect of its entire shareholding of ABML.
Business Performance Review:
Aluminium Business –
Industry Review:
Aluminium is a relatively new metal and has seen widespread applications across both the industrial and consumer sectors. On the industrial side, aluminium is heavily used in electrical power transmission, machinery and equipment, and construction. Housing, in particular, makes heavy use of the lightweight material as a substitute for steel and wood in doors, windows and siding. On the consumer side, aluminium is used in a variety of retail products, including cans, packaging, air conditioners, furniture and vehicles.
Auto makers have long faced regulatory and competitive pressure to make their vehicles both greener and safer. Many of the benefi ts of fuel effi cient engines have been undercut by increases in weight that come with added safety and comfort. But with increasingly stringent fuel economy standards coming around the world, we believe that auto makers will be forced to increase their focus on making cars lighter, accelerating a shift to new materials and here aluminium is the preferred choice. Over the past fi ve years, considerable progress has been made in aluminium-intensive vehicle production.
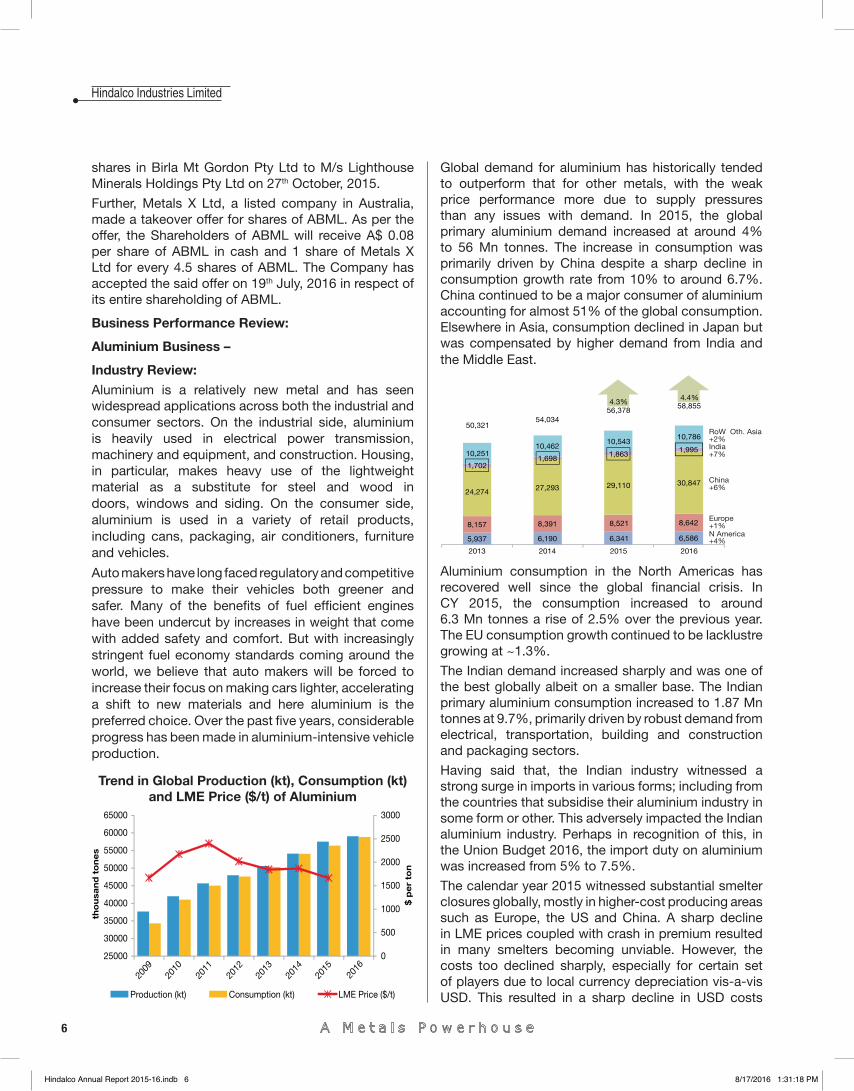
Trend in Global Production (kt), Consumption (kt) and LME Price ($/t) of Aluminium
Global demand for aluminium has historically tended to outperform that for other metals, with the weak price performance more due to supply pressures than any issues with demand. In 2015, the global primary aluminium demand increased at around 4% to 56 Mn tonnes. The increase in consumption was primarily driven by China despite a sharp decline in consumption growth rate from 10% to around 6.7%. China continued to be a major consumer of aluminium accounting for almost 51% of the global consumption. Elsewhere in Asia, consumption declined in Japan but was compensated by higher demand from India and the Middle East.
Aluminium consumption in the North Americas has recovered well since the global fi nancial crisis. In CY 2015, the consumption increased to around 6.3 Mn tonnes a rise of 2.5% over the previous year. The EU consumption growth continued to be lacklustre growing at ~1.3%.
The Indian demand increased sharply and was one of the best globally albeit on a smaller base. The Indian primary aluminium consumption increased to 1.87 Mn tonnes at 9.7%, primarily driven by robust demand from electrical, transportation, building and construction and packaging sectors.
Having said that, the Indian industry witnessed a strong surge in imports in various forms; including from the countries that subsidise their aluminium industry in some form or other. This adversely impacted the Indian aluminium industry. Perhaps in recognition of this, in the Union Budget 2016, the import duty on aluminium was increased from 5% to 7.5%.
The calendar year 2015 witnessed substantial smelter closures globally, mostly in higher-cost producing areas such as Europe, the US and China. A sharp decline in LME prices coupled with crash in premium resulted in many smelters becoming unviable. However, the costs too declined sharply, especially for certain set of players due to local currency depreciation vis-a-vis USD. This resulted in a sharp decline in USD costs
Hindalco Annual Report 2015-16.indb 6Hindalco Annual Report 2015-16.indb 6 8/17/2016 1:31:18 PM8/17/2016 1:31:18 PM
MANAGEMENT DISCUSSION AND ANALYSIS Annual Report 2015-16
7
FINA
NCIA
L HI
GHLI
GHTS
MAN
AGEM
ENT
DISC
USSI
ON
AND
ANAL
YSIS
CORP
ORAT
E GO
VERN
ANCE
RE
PORT
STAN
DALO
NE
FINA
NCIA
L ST
ATEM
ENTS
CONS
OLID
ATED
FI
NANC
IAL
STAT
EMEN
TSSO
CIAL
RE
PORT
DIRE
CTOR
S’RE
PORT
SHAR
EHOL
DER
INFO
RMAT
ION
SUST
AINA
BILI
TY &
BUS
INES
SRE
SPON
SIBI
LITY
REP
ORT
for many smelters. Currency depreciation along with energy defl ation has resulted in a sharp decline in operating costs and hence the Aluminium cost curve has shifted downward.
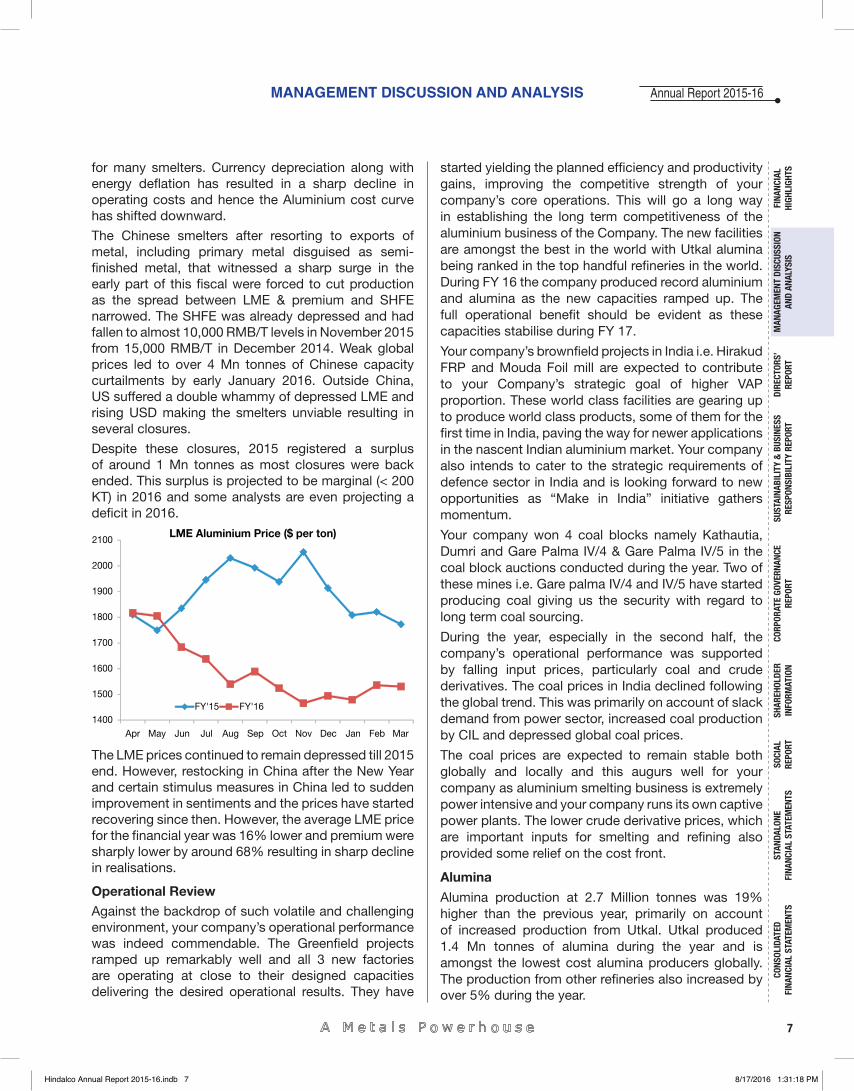
The Chinese smelters after resorting to exports of metal, including primary metal disguised as semi-fi nished metal, that witnessed a sharp surge in the early part of this fi scal were forced to cut production as the spread between LME & premium and SHFE narrowed. The SHFE was already depressed and had fallen to almost 10,000 RMB/T levels in November 2015 from 15,000 RMB/T in December 2014. Weak global prices led to over 4 Mn tonnes of Chinese capacity curtailments by early January 2016. Outside China, US suffered a double whammy of depressed LME and rising USD making the smelters unviable resulting in several closures.
Despite these closures, 2015 registered a surplus of around 1 Mn tonnes as most closures were back ended. This surplus is projected to be marginal (< 200 KT) in 2016 and some analysts are even projecting a defi cit in 2016.
The LME prices continued to remain depressed till 2015 end. However, restocking in China after the New Year and certain stimulus measures in China led to sudden improvement in sentiments and the prices have started recovering since then. However, the average LME price for the fi nancial year was 16% lower and premium were sharply lower by around 68% resulting in sharp decline in realisations.
Operational Review
Against the backdrop of such volatile and challenging environment, your company’s operational performance was indeed commendable. The Greenfi eld projects ramped up remarkably well and all 3 new factories are operating at close to their designed capacities delivering the desired operational results. They have
started yielding the planned effi ciency and productivity gains, improving the competitive strength of your company’s core operations. This will go a long way in establishing the long term competitiveness of the aluminium business of the Company. The new facilities are amongst the best in the world with Utkal alumina being ranked in the top handful refi neries in the world. During FY 16 the company produced record aluminium and alumina as the new capacities ramped up. The full operational benefi t should be evident as these capacities stabilise during FY 17.
Your company’s brownfi eld projects in India i.e. Hirakud FRP and Mouda Foil mill are expected to contribute to your Company’s strategic goal of higher VAP proportion. These world class facilities are gearing up to produce world class products, some of them for the fi rst time in India, paving the way for newer applications in the nascent Indian aluminium market. Your company also intends to cater to the strategic requirements of defence sector in India and is looking forward to new opportunities as “Make in India” initiative gathers momentum.
Your company won 4 coal blocks namely Kathautia, Dumri and Gare Palma IV/4 & Gare Palma IV/5 in the coal block auctions conducted during the year. Two of these mines i.e. Gare palma IV/4 and IV/5 have started producing coal giving us the security with regard to long term coal sourcing.
During the year, especially in the second half, the company’s operational performance was supported by falling input prices, particularly coal and crude derivatives. The coal prices in India declined following the global trend. This was primarily on account of slack demand from power sector, increased coal production by CIL and depressed global coal prices.
The coal prices are expected to remain stable both globally and locally and this augurs well for your company as aluminium smelting business is extremely power intensive and your company runs its own captive power plants. The lower crude derivative prices, which are important inputs for smelting and refi ning also provided some relief on the cost front.
Alumina
Alumina production at 2.7 Million tonnes was 19% higher than the previous year, primarily on account of increased production from Utkal. Utkal produced 1.4 Mn tonnes of alumina during the year and is amongst the lowest cost alumina producers globally. The production from other refi neries also increased by over 5% during the year.
Hindalco Annual Report 2015-16.indb 7Hindalco Annual Report 2015-16.indb 7 8/17/2016 1:31:18 PM8/17/2016 1:31:18 PM
8
Hindalco Industries Limited
Primary Metal
In FY 16, Primary aluminium production increased by 36% to 1.1 Mn tonnes. This increase was primarily on account of higher production from Mahan and Aditya smelters, which together contributed 566 KT to production this year.
Value Added Products (VAP)The value added downstream production including wire rods grew by 12% over last year to 423 KT. This growth was in line with your company’s focussed strategy of value maximisation.
Your company’s wholly owned subsidiary Novelis faced several headwinds during the fi nancial year and yet delivered a creditable performance. Operationally it was a remarkable year for Novelis.
One of the focus areas for Novelis has been the automobile market and today it is geared to produce auto body sheet (Body-in-white or BIW) – the next big driver of aluminium rolling sheets. During the year, the total fl at rolled aluminium product shipments were up 2% to 3.1 Mn tonnes. The proportion of the company’s automotive shipment in its portfolio grew to 15%, up from 11% in the previous year. By the end of fi scal 2016, all fi ve of the company’s recently constructed automotive fi nishing lines were producing and shipping automotive sheet products to the customers. When all of these automotive fi nishing lines are fully utilized, automotive shipments is targeted to grow to approximately 25% of total shipments.
Novelis’ thrust on sustainability and recycled aluminium is unparalleled. Your company has invested signifi cantly in recycling initiatives and has developed high tech recycling capabilities, expanded aluminium scrap buying foot prints globally, widened scope of recycled scrap that can be used and developed close loop recycling systems with end users to improve effi ciencies. Novelis today is well positioned to reap the benefi ts of these initiatives.
Financial ReviewThe turnover of the standalone aluminium domestic business increased by 21% to ` 17,125 crore vis-à-vis ` 14,105 crore in the previous year, despite lower realisations. This was achieved primarily on the back of higher metal volumes. Higher proportion of value added products also contributed to this revenue increase.
The standalone Aluminium EBIT declined 35% to ` 880 crore. The decline was primarily on account of sharp increase in depreciation even as the impact of sharp drop in realisations was partially offset by higher production. The average LME was lower by 16% and
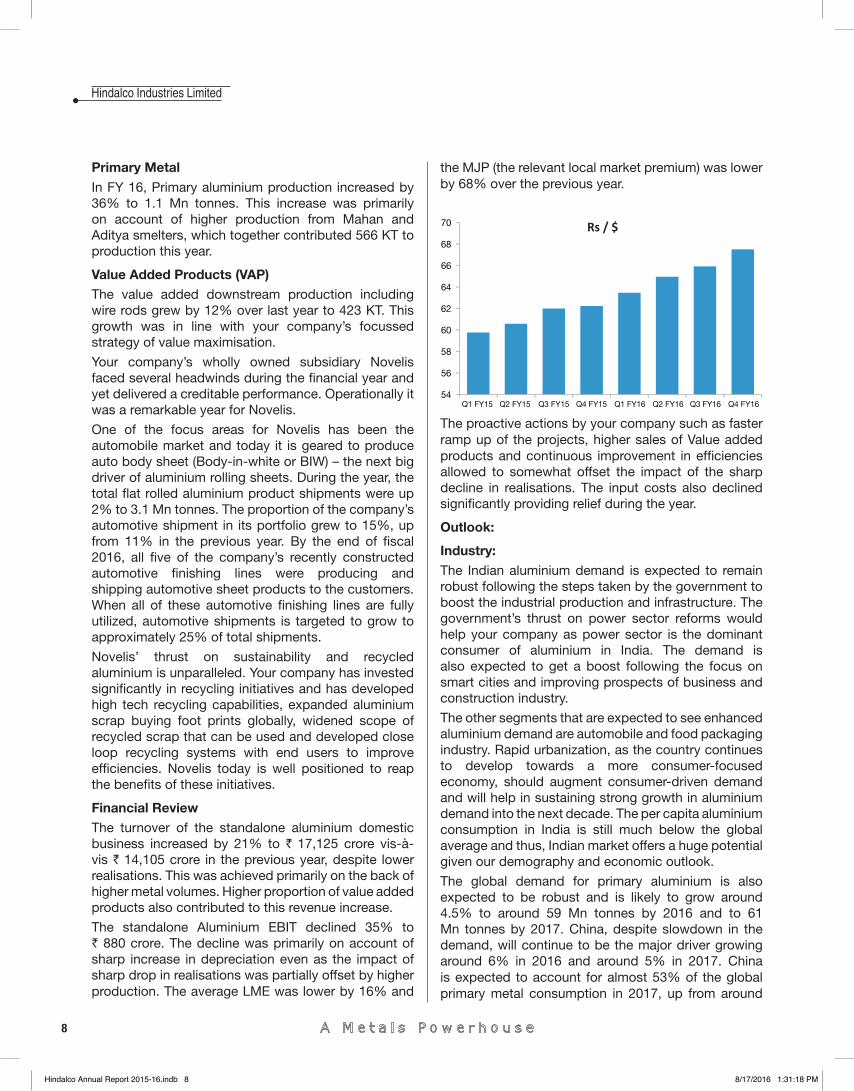
the MJP (the relevant local market premium) was lower by 68% over the previous year.
The proactive actions by your company such as faster ramp up of the projects, higher sales of Value added products and continuous improvement in effi ciencies allowed to somewhat offset the impact of the sharp decline in realisations. The input costs also declined signifi cantly providing relief during the year.
Outlook:
Industry:The Indian aluminium demand is expected to remain robust following the steps taken by the government to boost the industrial production and infrastructure. The government’s thrust on power sector reforms would help your company as power sector is the dominant consumer of aluminium in India. The demand is also expected to get a boost following the focus on smart cities and improving prospects of business and construction industry.
The other segments that are expected to see enhanced aluminium demand are automobile and food packaging industry. Rapid urbanization, as the country continues to develop towards a more consumer-focused economy, should augment consumer-driven demand and will help in sustaining strong growth in aluminium demand into the next decade. The per capita aluminium consumption in India is still much below the global average and thus, Indian market offers a huge potential given our demography and economic outlook.
The global demand for primary aluminium is also expected to be robust and is likely to grow around 4.5% to around 59 Mn tonnes by 2016 and to 61 Mn tonnes by 2017. China, despite slowdown in the demand, will continue to be the major driver growing around 6% in 2016 and around 5% in 2017. China is expected to account for almost 53% of the global primary metal consumption in 2017, up from around
Hindalco Annual Report 2015-16.indb 8Hindalco Annual Report 2015-16.indb 8 8/17/2016 1:31:18 PM8/17/2016 1:31:18 PM
MANAGEMENT DISCUSSION AND ANALYSIS Annual Report 2015-16
9
FINA
NCIA
L HI
GHLI
GHTS
MAN
AGEM
ENT
DISC
USSI
ON
AND
ANAL
YSIS
CORP
ORAT
E GO
VERN
ANCE
RE
PORT
STAN
DALO
NE
FINA
NCIA
L ST
ATEM
ENTS
CONS
OLID
ATED
FI
NANC
IAL
STAT
EMEN
TSSO
CIAL
RE
PORT
DIRE
CTOR
S’RE
PORT
SHAR
EHOL
DER
INFO
RMAT
ION
SUST
AINA
BILI
TY &
BUS
INES
SRE
SPON
SIBI
LITY
REP
ORT
51% in 2014. The aluminium consumption pattern in China is expected to shift from infrastructure and power to packaging and automobile following the Chinese government’s growth balancing efforts with increased thrust on consumer driven growth. Besides, the power sector will continue to see rising aluminium consumption globally as more and more aluminium is expected to replace copper.
The US demand is expected to remain strong growing at a CAGR of 4-5% over the next few years, as the housing recovery gains traction, car sales continue to improve and aluminium demand benefi ts from its new applications, particularly in the automotive sector. Western Europe is expected to grow moderately amidst economic uncertainty. The aluminium demand is expected to grow around 2.5%.
Asia and Middle East are expected to register around 5-6% growth in consumption on a relatively smaller base.
The main issue affl icting the aluminium industry has been the oversupply. In the past, unbridled Chinese capacities have resulted in oversupply and led to high inventories. This has resulted in depressed aluminium prices despite robust demand. During 2015, smelters saw a sharp decline in realisations as both LME and the local market premium dropped signifi cantly. The SHFE aluminium prices too continued to decline. As a result, Chinese smelter capacities to the tune of 4.5 Mn tonnes were closed in 2015. Outside China also, several smelters were shut down, especially in the US as they became unviable.
Although new smelting capacities in the Western and Central China are being added, the pace of Chinese capacity addition has declined. Besides unattractive realisations, the costs are rising for the Chinese players as the bauxite supply is getting constrained and they are now relying on the bauxite from distant places. The bauxite value chain is expected to defi ne the cost structure going forward as energy prices have bottomed out. As a result, Chinese producers are expected to witness cost pressures going forward.
In the Middle East also, new capacity growth is expected to slow down following the sharp decline in oil prices. These are positive signs for the industry besotted with oversupply. Some industry sources predict defi cit in the global markets post 2017. This should result in a price recovery.
During the fi rst quarter of CY 2016 the LME prices recovered partially due to demand pick up from China aided by robust demand in the US. The Chinese restocking after the annual vacation resulted in a
defi cit and hence the LME surged over 10% in a short span. Overall the LME prices appear to have bottomed out and are expected to increase gradually. We are cautiously optimistic on the prices and expect a gradual recovery given the robust demand and slowing supply growth.
Business:The outlook for your company’s aluminium business is encouraging. The Greenfi eld projects have started delivering. The effi ciency gains on account of new age technology are kicking in. The coal availability in the country has improved signifi cantly. We have started mining our own coal from two of the four coal blocks that were won in the auction last year.
The new factories are stabilising and we remain committed to focussing on cost. Our emphasis on value added products continues and the integrated aluminium business model with strong presence across the value chain is expected to deliver strongly as the Indian aluminium demand grows. Your company is uniquely positioned in India as it possesses the capability and feedstock to take advantage of growing alumina chemical markets. The alumina chemicals fi nd diverse applications in several industries such as paints, ceramics, and refractory and fi re retardants.
Novelis is geared to take advantage of changing trends in global aluminium consumption pattern with its premium product portfolio comprising auto, can and high-tech products. It is well on its course to leverage its vantage position as a technology leader and major supplier of automotive sheets globally.
Copper Business -
Industry Review: 2015 was a challenging year for the copper demand. The refi ned copper consumption growth declined sharply from 5.5% in 2013 and 4.6% in 2014 to 1.6% in 2015. The global refi ned copper consumption in CY 2015 was around 22 Mn tonnes. This sharp decline in consumption growth trajectory was primarily on account of slower growth in Chinese demand and de-growth in Japanese consumption. The copper demand growth in China declined from 7.3% to 3 % while Japanese growth rate fell from a healthy 6% to -2%. This was a sharp decline considering that China accounted for almost 46% of global consumption and Japan another 5%. The demand growth in the US and Europe too was lacklustre. The copper demand is facing challenging times as China is moving away from investment led economy to consumer driven economy. The lower growth in grid and property sector in China is hurting the copper demand growth.
Hindalco Annual Report 2015-16.indb 9Hindalco Annual Report 2015-16.indb 9 8/17/2016 1:31:18 PM8/17/2016 1:31:18 PM
10
Hindalco Industries Limited
On the supply side, in 2015, copper mine supply grew at around 3.3% vis-à-vis 2.3% growth in 2014. The supply growth outstripped the demand increase resulting in a surplus. The mine supply increased despite disruptions as some new mines came on stream.
The lower demand and ample availability of concentrate manifested in healthy TC/RC. The co- product prices especially sulphuric acid and fertilisers were also supportive as the local demand was good.
Operational Review
Your company’s copper business continued to deliver robust operational performance supporting the company’s overall cash fl ows. The copper cathode production was at 388 KT, around the same levels as last year. However, in line with your company’s focus on value addition, continuous cast rods production at 157 KT during the year was higher by almost 5% over the previous year. The production of fertiliser too, was higher by 8% as compared with the previous year.
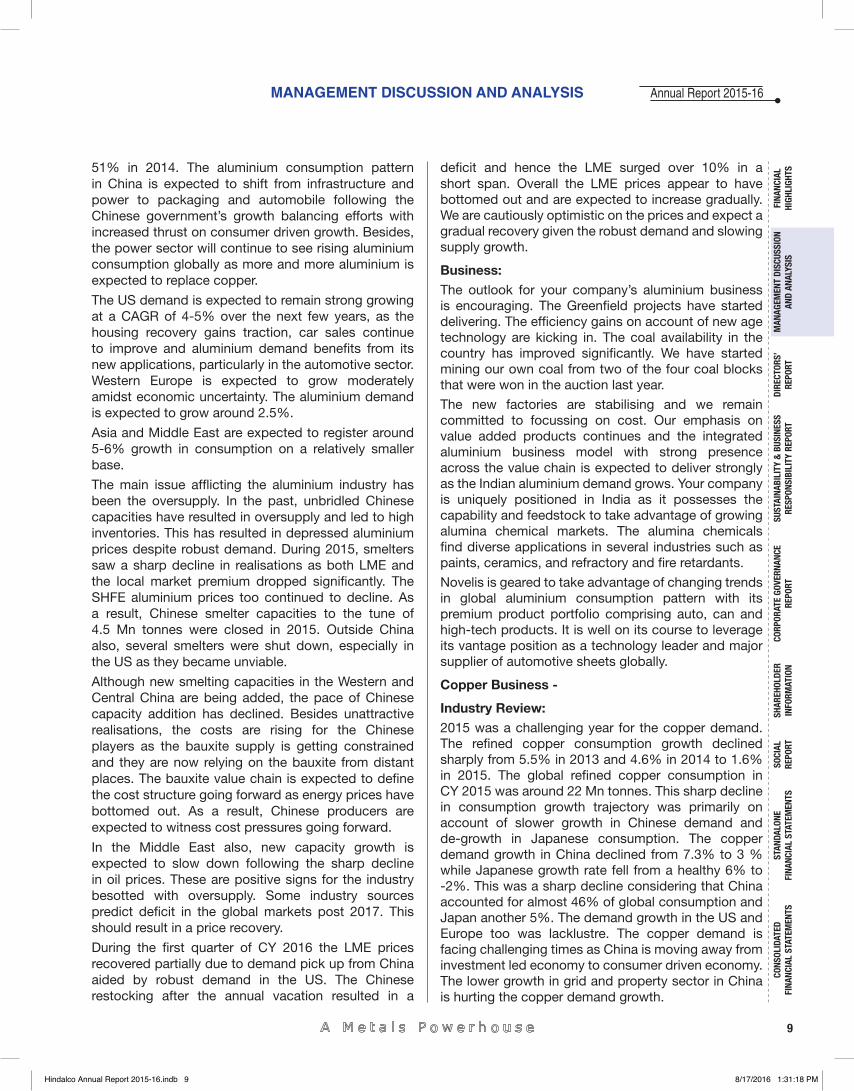
The Copper business revenues for the FY 2016 at ` 17,209 crore were 16% lower than the previous year. This decline was primarily on account of sharp fall in LME prices of copper. The average copper LME in FY 16 was 26% lower as compared with that in FY 15. However, the depreciation of rupee and higher value addition did offset some fall in copper prices.
Your company’s copper business registered an EBIT of ` 1419 crore, a 6% decline as compared with FY 15. This decline was primarily on account of abolition of certain export incentive by the Government.
Outlook:
Industry:
The refi ned copper market is expected to be in marginal surplus for another 2-3 years. The demand growth rate is expected to be low and hence despite a marginal decline in supply growth, a surplus is projected in the coming years. This could keep the copper LME prices depressed.
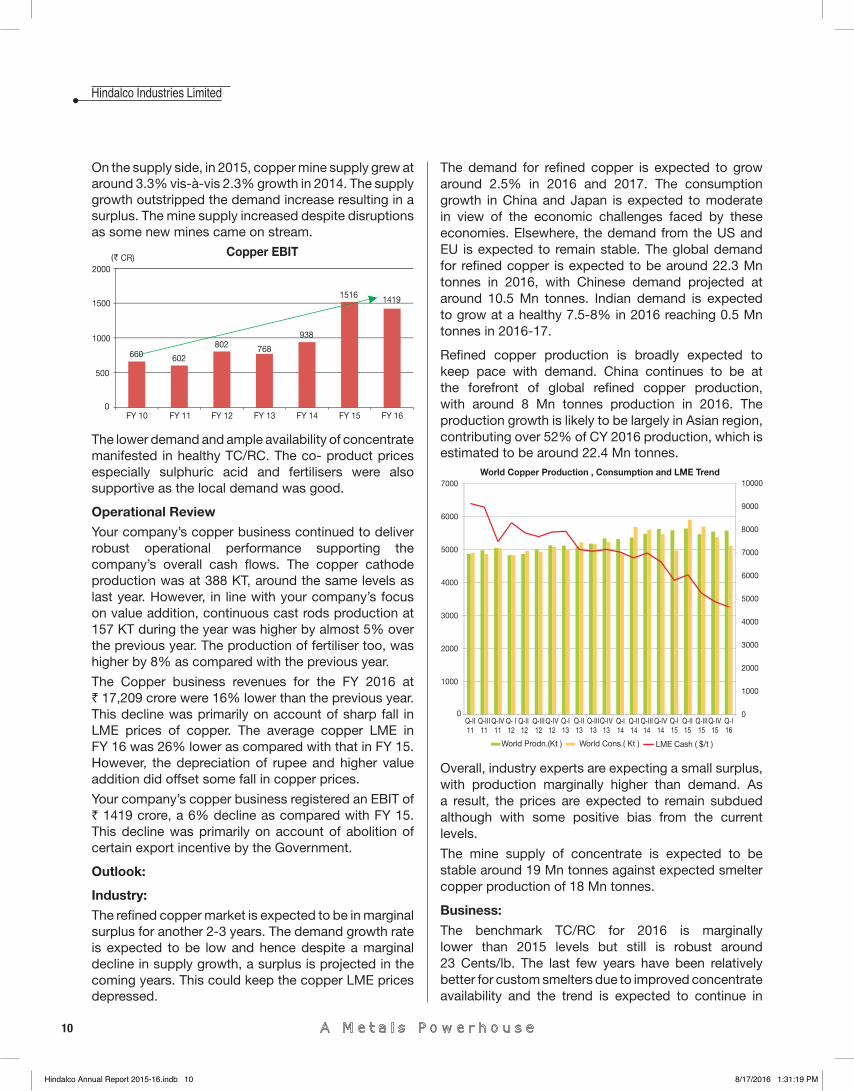
The demand for refi ned copper is expected to grow around 2.5% in 2016 and 2017. The consumption growth in China and Japan is expected to moderate in view of the economic challenges faced by these economies. Elsewhere, the demand from the US and EU is expected to remain stable. The global demand for refi ned copper is expected to be around 22.3 Mn tonnes in 2016, with Chinese demand projected at around 10.5 Mn tonnes. Indian demand is expected to grow at a healthy 7.5-8% in 2016 reaching 0.5 Mn tonnes in 2016-17.
Refi ned copper production is broadly expected to keep pace with demand. China continues to be at the forefront of global refi ned copper production, with around 8 Mn tonnes production in 2016. The production growth is likely to be largely in Asian region, contributing over 52% of CY 2016 production, which is estimated to be around 22.4 Mn tonnes.
Overall, industry experts are expecting a small surplus, with production marginally higher than demand. As a result, the prices are expected to remain subdued although with some positive bias from the current levels.
The mine supply of concentrate is expected to be stable around 19 Mn tonnes against expected smelter copper production of 18 Mn tonnes.
Business:
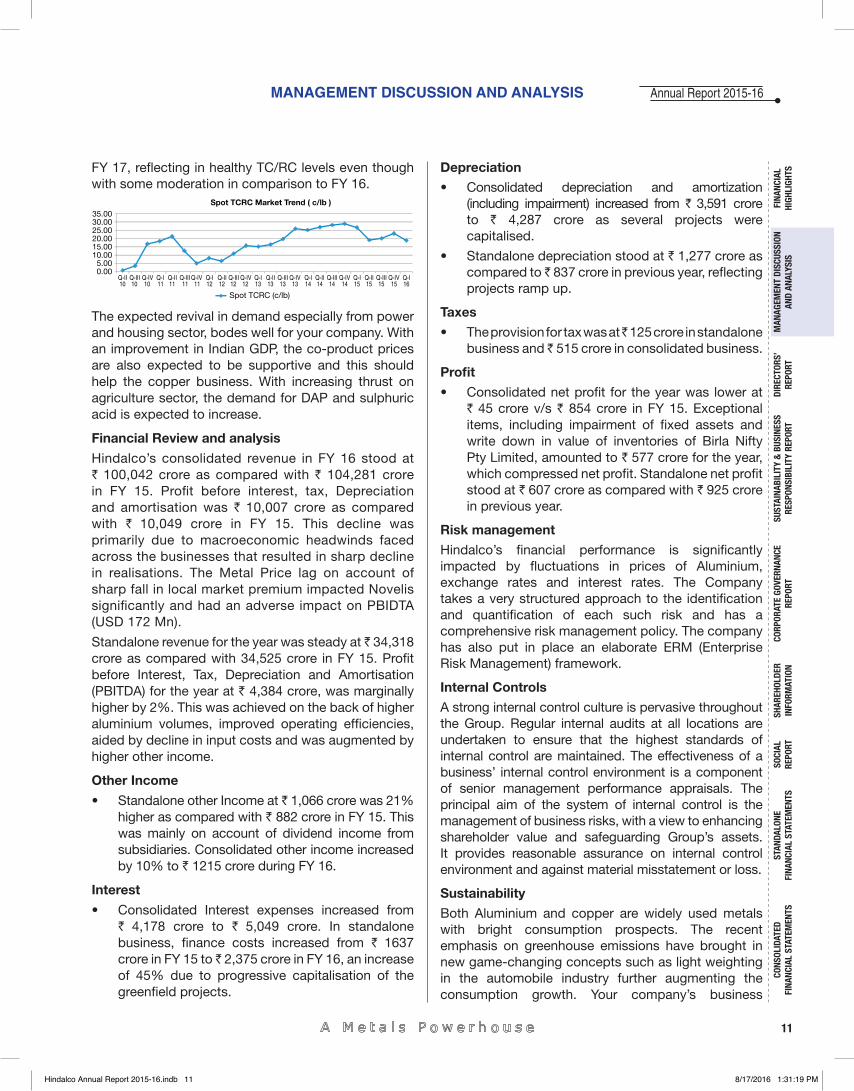
The benchmark TC/RC for 2016 is marginally lower than 2015 levels but still is robust around 23 Cents/lb. The last few years have been relatively better for custom smelters due to improved concentrate availability and the trend is expected to continue in
Hindalco Annual Report 2015-16.indb 10Hindalco Annual Report 2015-16.indb 10 8/17/2016 1:31:19 PM8/17/2016 1:31:19 PM
MANAGEMENT DISCUSSION AND ANALYSIS Annual Report 2015-16
11
FINA
NCIA
L HI
GHLI
GHTS
MAN
AGEM
ENT
DISC
USSI
ON
AND
ANAL
YSIS
CORP
ORAT
E GO
VERN
ANCE
RE
PORT
STAN
DALO
NE
FINA
NCIA
L ST
ATEM
ENTS
CONS
OLID
ATED
FI
NANC
IAL
STAT
EMEN
TSSO
CIAL
RE
PORT
DIRE
CTOR
S’RE
PORT
SHAR
EHOL
DER
INFO
RMAT
ION
SUST
AINA
BILI
TY &
BUS
INES
SRE
SPON
SIBI
LITY
REP
ORT
FY 17, refl ecting in healthy TC/RC levels even though with some moderation in comparison to FY 16.
The expected revival in demand especially from power and housing sector, bodes well for your company. With an improvement in Indian GDP, the co-product prices are also expected to be supportive and this should help the copper business. With increasing thrust on agriculture sector, the demand for DAP and sulphuric acid is expected to increase.
Financial Review and analysis
Hindalco’s consolidated revenue in FY 16 stood at ` 100,042 crore as compared with ` 104,281 crore in FY 15. Profi t before interest, tax, Depreciation and amortisation was ` 10,007 crore as compared with ` 10,049 crore in FY 15. This decline was primarily due to macroeconomic headwinds faced across the businesses that resulted in sharp decline in realisations. The Metal Price lag on account of sharp fall in local market premium impacted Novelis signifi cantly and had an adverse impact on PBIDTA (USD 172 Mn).
Standalone revenue for the year was steady at ̀ 34,318 crore as compared with 34,525 crore in FY 15. Profi t before Interest, Tax, Depreciation and Amortisation (PBITDA) for the year at ` 4,384 crore, was marginally higher by 2%. This was achieved on the back of higher aluminium volumes, improved operating effi ciencies, aided by decline in input costs and was augmented by higher other income.
Other Income
• Standalone other Income at ` 1,066 crore was 21% higher as compared with ` 882 crore in FY 15. This was mainly on account of dividend income from subsidiaries. Consolidated other income increased by 10% to ` 1215 crore during FY 16.
Interest
• Consolidated Interest expenses increased from ` 4,178 crore to ` 5,049 crore. In standalone business, fi nance costs increased from ` 1637 crore in FY 15 to ̀ 2,375 crore in FY 16, an increase of 45% due to progressive capitalisation of the greenfi eld projects.
Depreciation
• Consolidated depreciation and amortization (including impairment) increased from ̀ 3,591 crore to ` 4,287 crore as several projects were capitalised.
• Standalone depreciation stood at ` 1,277 crore as compared to ̀ 837 crore in previous year, refl ecting projects ramp up.
Taxes
• The provision for tax was at ̀ 125 crore in standalone business and ̀ 515 crore in consolidated business.
Profi t
• Consolidated net profi t for the year was lower at ` 45 crore v/s ` 854 crore in FY 15. Exceptional items, including impairment of fi xed assets and write down in value of inventories of Birla Nifty Pty Limited, amounted to ` 577 crore for the year, which compressed net profi t. Standalone net profi t stood at ` 607 crore as compared with ` 925 crore in previous year.
Risk management
Hindalco’s fi nancial performance is signifi cantly impacted by fl uctuations in prices of Aluminium, exchange rates and interest rates. The Company takes a very structured approach to the identifi cation and quantifi cation of each such risk and has a comprehensive risk management policy. The company has also put in place an elaborate ERM (Enterprise Risk Management) framework.
Internal Controls
A strong internal control culture is pervasive throughout the Group. Regular internal audits at all locations are undertaken to ensure that the highest standards of internal control are maintained. The effectiveness of a business’ internal control environment is a component of senior management performance appraisals. The principal aim of the system of internal control is the management of business risks, with a view to enhancing shareholder value and safeguarding Group’s assets. It provides reasonable assurance on internal control environment and against material misstatement or loss.
Sustainability
Both Aluminium and copper are widely used metals with bright consumption prospects. The recent emphasis on greenhouse emissions have brought in new game-changing concepts such as light weighting in the automobile industry further augmenting the consumption growth. Your company’s business
Hindalco Annual Report 2015-16.indb 11Hindalco Annual Report 2015-16.indb 11 8/17/2016 1:31:19 PM8/17/2016 1:31:19 PM
12
Hindalco Industries Limited
portfolio is geared to ride on these changing patterns and today boasts of a de-risked portfolio through a strong accent on conversion businesses.
By virtue of being the only integrated aluminium producer in India, your company also has a strong commitment towards product development. Your company has developed several pioneering applications in the Indian context and Novelis is the global leader in FRP space.
Sustained access and availability of resources is critical to the businesses of your company. Your company follows a holistic approach to address the multi-dimensional facets of resource sustainability throughout the value chain. As it continues to serve the increased demands of the society for sustainable metals, it recognizes the limited availability of resources and impacts of resource extraction.
Your company has identifi ed climate, water, raw material and regulatory risks while considering its future sustainability framework. In this regard, the sustainability efforts comprise energy optimization, water conservation, social forestry, recycling of waste generated and safety amongst others.
Your company’s mining practices, regeneration activities and community engagement are aimed at minimising the environmental impact with a focus on improving socio economic life. Improving operational effi ciencies, adoption of technological advances are important for effi cient use of raw materials. Your company believes that systems and work practices are critical in conserving resources, energy and environment and ensuring and improving health and safety standards.
Aluminium is a 100% recyclable metal and does not degrade in quality on recycling. Your Company’s wholly owned subsidiary Novelis presently uses 50% of input in the form of recycled scrap – a sharp jump from 39% during the last year. Novelis has invested in major recycling initiatives, including advanced equipment and technology to process diversifi ed scrap. The Copper business also has a focused approach on recycled materials.
Your Company continues to maintain its thrust on inclusive growth, stemming from the belief in triple bottom line accounting and trusteeship management concept encompassing economic, environmental and social wellbeing. Your company has carried out several projects aimed at development of neighbouring communities and society. The focus areas are health care, education, sustainable livelihood, infrastructure and social reform.
Safety
As a responsible corporate citizen, your company is dedicated to human health & safety, conservation of natural resources & the environment. Your company’s plants and mines follow the environmental, health and safety management standard that integrates environment and safety responsibilities into everyday business. The focus of these efforts is to make Hindalco the safest company and to go for “zero harm” zero harm to its employees, community & environment. Hence Safety is considered as core value all across Hindalco and initiatives to help achieve the ambition and to be the benchmark within the industry are underway. Extensive work is in progress to ensure risk control in important areas like mining activities, road traffi c management and contractor management. In order to build a sustainable safe work place environment, a common health and safety management system across your company is being implemented. This includes implementation of world class safety standards, organisational safety competency and capability improvement, safety leadership development, a cross auditing activity to enhance sharing experiences and sharing best practices across Hindalco.
Human capital
Aditya Birla Group is one of the preferred employers in the country. It is a name to reckon with in the fi eld of human resources. Since last few years, the Group has been able to establish the world class HR Practices and has been successful in passing the benefi ts of these HR Practices to the last man standing in the organisation. Due to people oriented HR Processes, the Group has been able to attract and retain the best of talent across functions. At Aditya Birla Group, all employees have opportunities to fulfi l their professional and personal aspirations.
In the last few years, for its people practices, the Group has got several accolades from the global agencies like AON Hewitt, Fortune, SHRM etc. The People Oriented Best HR Practices enables the Group to attract and retain the best of available talent.
People are the most valuable resource of your company and it is ensuring that all the HR systems, processes and practices are enabling people to grow professionally and personally. Currently, your company is managing a pool of around 24,100 people in India and around 11,000 people outside India, with well laid down HR Processes like talent management, employee engagement, performance management, rewards and recognition etc. Line and HR Managers are fully equipped and are duly
Hindalco Annual Report 2015-16.indb 12Hindalco Annual Report 2015-16.indb 12 8/17/2016 1:31:19 PM8/17/2016 1:31:19 PM
MANAGEMENT DISCUSSION AND ANALYSIS Annual Report 2015-16
13
FINA
NCIA
L HI
GHLI
GHTS
MAN
AGEM
ENT
DISC
USSI
ON
AND
ANAL
YSIS
CORP
ORAT
E GO
VERN
ANCE
RE
PORT
STAN
DALO
NE
FINA
NCIA
L ST
ATEM
ENTS
CONS
OLID
ATED
FI
NANC
IAL
STAT
EMEN
TSSO
CIAL
RE
PORT
DIRE
CTOR
S’RE
PORT
SHAR
EHOL
DER
INFO
RMAT
ION
SUST
AINA
BILI
TY &
BUS
INES
SRE
SPON
SIBI
LITY
REP
ORT
Cautionary Statement
Statements in this “Management’s Discussion and Analysis” describing the Company’s objectives, projections, estimates, expectations or predictions may be “forward looking statements” within the meaning of applicable securities laws and regulations. Actual results could differ materially from those expressed or implied. Important factors that could make a difference to the Company’s operations include global and Indian demand supply conditions, fi nished goods prices, feedstock availability and prices, cyclical demand and pricing in the Company’s principal markets, changes in the Government regulations, tax regimes, economic developments within India and the countries within which the Company conducts business and other factors such as litigation and labour negotiations. The Company assumes no responsibility to publicly amend, modify or revise any forward looking statements, on the basis of any subsequent development, information or events or otherwise.
supported for the robust implementation of the people practices.
Training and Development
The Learning and Development function is well integrated with the overall HR Function and the Business Objectives. Across locations, your company has full-fl edged learning infrastructure to support its learning objectives. Your company’s strategy aims at equipping all our people across Units with business linked knowledge, technical and behavioural based learning events.
For the leadership development, the company works closely with ‘Gyanodaya- Aditya Birla Group’s Learning University’ that provides relevant and current knowledge and competency based learning opportunities along with e-learning programs.
Summing Up
Over the years and through the slowdown in the global economy after the Global Financial Crisis, your company has successfully demonstrated benefi ts of a de-risked portfolio comprising upstream operations that can participate in commodity cycles and downstream operations focused on value addition that have more steady cashfl ow irrespective of the stage of the commodity cycle. With the full ramp-up of its Greenfi eld and brownfi eld projects, your company has strengthened its assets across the portfolio. The desired scales, product capabilities and effi ciency gains have been delivered, making your company ready to reap opportunities across the markets that it serves.
During FY 16, Utkal Alumina, your company’s 100% subsidiary, has established itself as a world class asset producing alumina at an extremely competitive cost, which in turn is fed primarily to the two new age smelters.
The company crossed 1 Mn tonne aluminium production mark for the fi rst time in its history as the new state-of-the-art facilities ramped up. Signifi cant operating effi ciency gains were achieved during the year and your company has delivered a robust operational performance. The lower input costs following a sharp decline in crude and energy prices
were supportive last year. The coal price decline due to increased production in India helped your company deliver respectable profi ts.
The reported fi nancial performance as anticipated was signifi cantly impacted by higher interest and depreciation charges in the Income Statement as the projects were ramped up during the year.
Even as your company’s operational performance is expected to maintain its momentum next year, the outlook for the commodity prices remains somewhat uncertain. While prices appear to have bottomed out and have improved in the recent months, macroeconomic uncertainty following Brexit clouds the outlook. On the positive side, coal prices are broadly expected to remain soft in the near-term, which is likely to support your company’s performance.
The Indian demand is expected to be strong on the back of improved outlook for Industrial and infrastructure growth. The government’s thrust on power sector spells good news for both aluminium and copper industries. Your Company is sharpening its focus on downstream value added products in India to take advantage of the opportunities.
Aluminium usage in automobiles is rising and is expected to increase internationally. All the fi ve new auto lines of Novelis have been commissioned and the production of automobile sheets is expected to grow substantially over coming years.
Your company has just completed a very ambitious investment program both in India and abroad that has not only increased its capacity but has also improved its competitiveness in terms of cost and product mix & quality. In the coming years, the focus will be on operational excellence and increasing the productivity of new assets. The thrust will be on cash conservation and de-leveraging.
A strong business portfolio comprising de-risked convertor businesses namely copper smelting and Novelis, along with cost competitive aluminium upstream operations, would go a long way in ensuring the long term profi table sustainability of your company and strengthening its balance sheet as and when the macro headwinds ease out.
Hindalco Annual Report 2015-16.indb 13Hindalco Annual Report 2015-16.indb 13 8/17/2016 1:31:19 PM8/17/2016 1:31:19 PM
14
Hindalco Industries Limited
Dear Shareholder,
Your Directors have pleasure in presenting the 57th Annual Report and the audited standalone and consolidated fi nancial statements of your company for the year ended 31st March, 2016.FINANCIAL HIGHLIGHTS
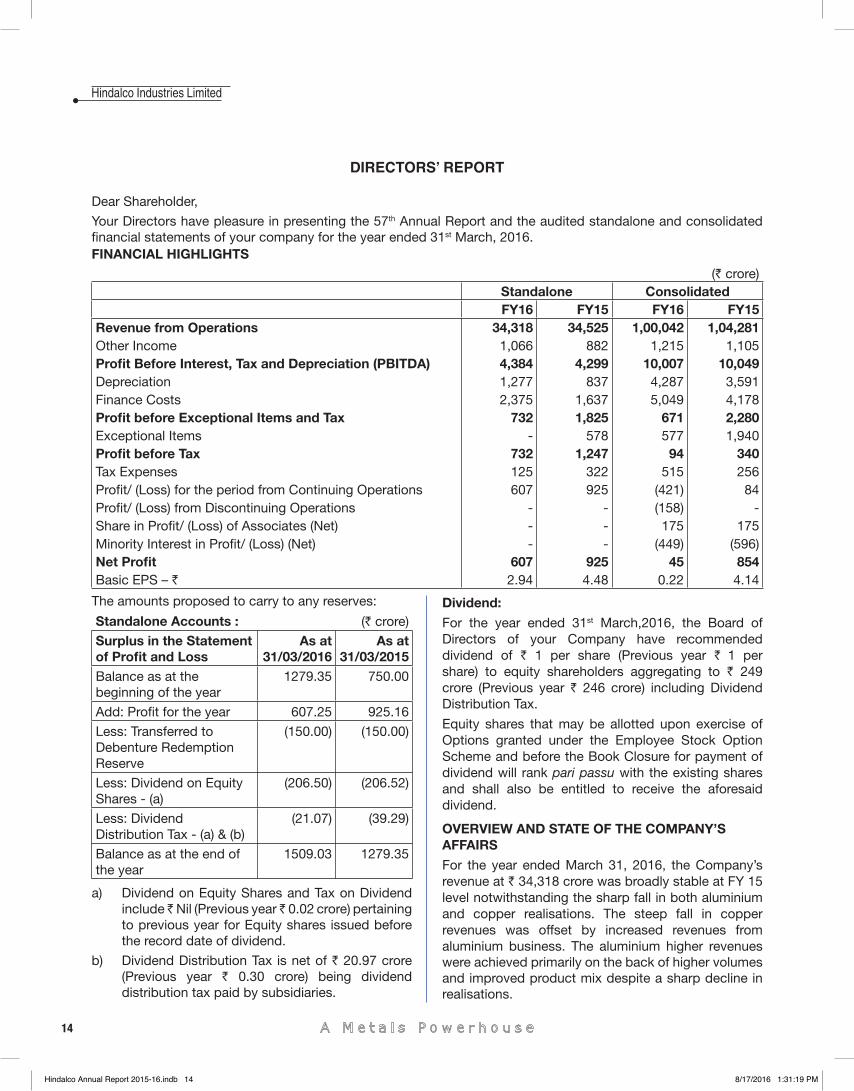
(` crore)Standalone ConsolidatedFY16 FY15 FY16 FY15
Revenue from Operations 34,318 34,525 1,00,042 1,04,281Other Income 1,066 882 1,215 1,105Profi t Before Interest, Tax and Depreciation (PBITDA) 4,384 4,299 10,007 10,049Depreciation 1,277 837 4,287 3,591Finance Costs 2,375 1,637 5,049 4,178Profi t before Exceptional Items and Tax 732 1,825 671 2,280Exceptional Items - 578 577 1,940Profi t before Tax 732 1,247 94 340Tax Expenses 125 322 515 256Profi t/ (Loss) for the period from Continuing Operations 607 925 (421) 84Profi t/ (Loss) from Discontinuing Operations - - (158) -Share in Profi t/ (Loss) of Associates (Net) - - 175 175Minority Interest in Profi t/ (Loss) (Net) - - (449) (596)Net Profi t 607 925 45 854Basic EPS – ` 2.94 4.48 0.22 4.14
The amounts proposed to carry to any reserves:
Standalone Accounts : (` crore)
Surplus in the Statement of Profi t and Loss
As at31/03/2016
As at31/03/2015
Balance as at the beginning of the year
1279.35 750.00
Add: Profi t for the year 607.25 925.16
Less: Transferred to Debenture Redemption Reserve
(150.00) (150.00)
Less: Dividend on Equity Shares - (a)
(206.50) (206.52)
Less: Dividend Distribution Tax - (a) & (b)
(21.07) (39.29)
Balance as at the end of the year
1509.03 1279.35
a) Dividend on Equity Shares and Tax on Dividend include ̀ Nil (Previous year ̀ 0.02 crore) pertaining to previous year for Equity shares issued before the record date of dividend.
b) Dividend Distribution Tax is net of ` 20.97 crore (Previous year ` 0.30 crore) being dividend distribution tax paid by subsidiaries.
Dividend:
For the year ended 31st March,2016, the Board of Directors of your Company have recommended dividend of ` 1 per share (Previous year ` 1 per share) to equity shareholders aggregating to ` 249 crore (Previous year ` 246 crore) including Dividend Distribution Tax.
Equity shares that may be allotted upon exercise of Options granted under the Employee Stock Option Scheme and before the Book Closure for payment of dividend will rank pari passu with the existing shares and shall also be entitled to receive the aforesaid dividend.
OVERVIEW AND STATE OF THE COMPANY’S AFFAIRS
For the year ended March 31, 2016, the Company’s revenue at ` 34,318 crore was broadly stable at FY 15 level notwithstanding the sharp fall in both aluminium and copper realisations. The steep fall in copper revenues was offset by increased revenues from aluminium business. The aluminium higher revenues were achieved primarily on the back of higher volumes and improved product mix despite a sharp decline in realisations.
DIRECTORS’ REPORT
Hindalco Annual Report 2015-16.indb 14Hindalco Annual Report 2015-16.indb 14 8/17/2016 1:31:19 PM8/17/2016 1:31:19 PM
15
DIRECTORS’ REPORT
FINA
NCIA
L HI
GHLI
GHTS
MAN
AGEM
ENT
DISC
USSI
ON
AND
ANAL
YSIS
CORP
ORAT
E GO
VERN
ANCE
RE
PORT
STAN
DALO
NE
FINA
NCIA
L ST
ATEM
ENTS
CONS
OLID
ATED
FI
NANC
IAL
STAT
EMEN
TSSO
CIAL
RE
PORT
DIRE
CTOR
S’RE
PORT
SHAR
EHOL
DER
INFO
RMAT
ION
SUST
AINA
BILI
TY &
BUS
INES
SRE
SPON
SIBI
LITY
REP
ORT
Annual Report 2015-16
Profi t before Interest, Tax, Depreciation and Amortisation (PBITDA) for the year was marginally higher by 2%. This refl ects a robust operational performance in a challenging year, when average realisations were much lower. PBIDTA was also augmented by higher other income.
As anticipated, depreciation and fi nance cost increased by ` 1,178 crore over FY 15 following progressive capitalisation of the projects. The PBT during FY 16 (before exceptional items) was lower by 60% at ` 733 crore. Net profi t for the year at ` 607 crore was lower by 34% as compared with that delivered in FY 15.
Standalone Segmental Results:
(` crore)
FY16 FY15
Aluminium Segment
Net Sales 17,125 14,105
Earnings Before Interest & Tax (EBIT) 880 1,349
Copper Segment
Net Sales 17,209 20,451
Earnings Before Interest & Tax (EBIT) 1,419 1,516
Aluminium business: During FY 16, our primary focus was on ramping up the Greenfi eld projects to their designed capacities and stabilise these operations. This objective was achieved during the year and all plants are now running at their designed capacities.
For the year, Alumina production (including Utkal refi nery) was 2.7 Mn tonnes, an increase of 19% over FY 15. Aluminium production for the year reached a record high. It crossed the 1 Mn tonnes mark for the fi rst time reaching 1.13 Mn tonnes an increase of 36% or almost 300 KT over that produced during the previous fi nancial year. In spite of higher volumes, the EBIT of Aluminium segment declined because of higher depreciation following progressive capitalisation of the projects. The standalone fi nancials do not include Utkal’s fi nancial performance.
Copper Business:Though copper production for the year was steady at 388 KT, Fertiliser production rose by 8%. Our continued thrust on Value addition led to higher production of Continuous cast (CC) rods. The production of CC rods was higher by 5%. Despite all these initiatives for value maximisation, EBIT was 6% lower as compared with that achieved in FY15. This was primarily on account of the abolition of certain export incentive scheme during the year and challenging market conditions.
Consolidated Results:
Consolidated revenue decreased by 4% while profi t before interest, depreciation and taxes was at same level compared to the last year’s corresponding fi gures.
Net profi t was lower at ` 45 crore on back of adverse macroeconomic conditions, higher interest cost, depreciation and loss from discontinuing operations.
Novelis Inc. (A wholly owned subsidiary):
Revenues decreased 11% to $9.9 billion in FY 2016, as higher shipments were more than offset by a 16% decrease in average base aluminium prices and a 58% decrease in local market premiums.
For fi scal year 2016, the company recorded a net loss of $38 million. Excluding tax effected special items, net income was $131 million for the full year.
The rapid decline in local market premiums over the early months of FY 2016 resulted in $172 million in negative metal price lag for the full year, and was primarily responsible for the 12% decrease in EBITDA to $791 million in FY 2016. Excluding the impact of metal price lag in both years, EBITDA was $963 million in FY 2016, up 7% compared to $896 million in FY 2015.
The company more than doubled its free cash fl ow as compared to the prior year, generating $160 million in FY 2016 after investing $370 million in capital expenditure. As of March 31, 2016, the company reported a strong liquidity of $1.2 billion.
Utkal Alumina International Limited (UAIL) (A wholly owned subsidiary):
The alumina refi nery at UAIL produced 1.4 Mn tonne of alumina in FY 16 compared to 1 Mn tonne in FY 15. Of this, 130 KT of alumina was sold outside and the balance was supplied to smelters at Hindalco. The cost of production of alumina at UAIL is comparable to the world benchmark cost of production.
UAIL reported an EBITDA of ` 714 crore. Its net loss stood at ` 93 crore after accounting for interest charge of ` 518 crore and depreciation of ` 289 crore.
Aditya Birla Minerals Limited:
Aditya Birla Minerals Limited (ABML), Australia, a subsidiary of the Company, has sold 100% of the shares in Birla Mt Gordon Pty Ltd to M/s Lighthouse Minerals Holdings Pty Ltd on 27th October, 2015.
Further, Metals X Ltd, a listed company in Australia, made a takeover offer for shares of ABML. As per the offer, the Shareholders of ABML will receive A$ 0.08
Hindalco Annual Report 2015-16.indb 15Hindalco Annual Report 2015-16.indb 15 8/17/2016 1:31:19 PM8/17/2016 1:31:19 PM
16
Hindalco Industries Limited
per share of ABML in cash and 1 share of Metals X Limited for every 4.5 shares of ABML. The Company has accepted the said offer on 19th July, 2016 in respect of its entire shareholding of ABML.
There were no other material changes and commitments affecting the fi nancial position of your Company between end of fi nancial year and the date of report.
Business Reconstruction Reserve:
The Company had formulated a scheme of fi nancial restructuring under Sections 391 to 394 of the Companies Act 1956 (“the Scheme”) between the Company and its equity shareholders approved by the High Court of judicature of Bombay to deal with various costs associated with its organic and inorganic growth plan. Pursuant to this, a separate reserve account titled as Business Reconstruction Reserve (“BRR”) was created during the year 2008-09 by transferring balance standing to the credit of Securities Premium Account of the Company for adjustment of certain expenses as prescribed in the Scheme. Accordingly, the Company had transferred ` 8,647.37 crore from Securities Premium Account to BRR and till 31st March, 2015, ` 250.33 crore and ` 2,165.80 crore have been adjusted against BRR in stand-alone and consolidated accounts respectively. During the year, following expenses has been adjusted with BRR in both accounts:
(a) ` 279.46 crore towards expenses on exited Projects.
(b) Impairment loss of ̀ 367.31 crore (Net of deferred tax ` 194.39 crore).
(c) Provision of ` 35.50 crore towards diminution in value of investments.
Had the Scheme not prescribed aforesaid treatment, the impact on results and Earnings per Share (EPS) would have been as under:
i) Standalone and Consolidated Net Profi t for the year ended 31st March, 2016 lower by ` 682.27 crore.
(ii) Standalone and Consolidated Basic and Diluted EPS for the year ended 31st March, 2016 lower by ` 3.30.
HUMAN RESOURCES
Several innovative people – focused initiatives have been instituted at the Group level, and these are translated into action at all of the Aditya Birla Group Companies. Our basic objective is to ensure
that a robust talent pipeline and a high-performance culture, centred around accountability is in place. We feel this is critical to enable us retain our competitive edge.
RESEARCH AND DEVELOPMENT
Your Company’s Research & Development (R&D) activities are focused on providing innovative, cost-effective and sustainable solutions to support consistent growth of business.
The R&D activities of your Company include process, product and application development, to develop short term as well as long term solutions to the issues faced by nonferrous sector, such as raw material quality, cost effective management of waste generated during processing, recovery of value from byproduct as well as any waste products, developing better understanding of the science of processes, reducing the specifi c energy consumption and carbon footprint etc. Specifi c programs have also been initiated to foster better understanding of the requirement of existing and prospective customers, and to provide a better service through application development, so as to increase your company’s market share in the chosen market space. Technical competencies developed by your company will go a long way in terms of quick absorption of technologies, enabling pushing boundaries of our processes, so as to increase the economic performance and improve our new product/new application pipeline to address the impending market opportunities.
Your Company already operates two Hindalco Innovation Centres (HIC), one HIC-Alumina at Belagavi working on R&D of bauxite, alumina and specialty alumina products, and one HIC-SemiFab located at Taloja, near Mumbai, working in the area of aluminium fabricated products. In addition, your company engages the Aditya Birla Group’s corporate research and development centre, Aditya Birla Science and Technology Company Private Limited (“ABSTCPL”), for conducting R&D in select areas of work through chartered R&D projects. These are based on the domain expertise and R&D facilities available in ABSTCPL. The engagement has resulted into some patent applications, which have been and will be assigned to your company on the grant of the patent. ABSTCPL’s forte of having multi-disciplinary teams of technical experts, scientists and engineers, enables your company to develop building competencies in select areas, as a long term value to business.
Hindalco Annual Report 2015-16.indb 16Hindalco Annual Report 2015-16.indb 16 8/17/2016 1:31:19 PM8/17/2016 1:31:19 PM
17
DIRECTORS’ REPORT
FINA
NCIA
L HI
GHLI
GHTS
MAN
AGEM
ENT
DISC
USSI
ON
AND
ANAL
YSIS
CORP
ORAT
E GO
VERN
ANCE
RE
PORT
STAN
DALO
NE
FINA
NCIA
L ST
ATEM
ENTS
CONS
OLID
ATED
FI
NANC
IAL
STAT
EMEN
TSSO
CIAL
RE
PORT
DIRE
CTOR
S’RE
PORT
SHAR
EHOL
DER
INFO
RMAT
ION
SUST
AINA
BILI
TY &
BUS
INES
SRE
SPON
SIBI
LITY
REP
ORT
Annual Report 2015-16
AWARDS & RECOGNITIONS
Several accolades have been conferred upon your Company, in recognition of its contribution in diverse fi eld. A selective list:
Hindalco Marketing:
Hindalco awarded the Top Exporter - Gold Trophy in the category of large enterprise for outstanding performance in fi nancial year 2013–14. This was the second consecutive year that Hindalco has won the top award in this category. This recognition of excellence in exports, is an award administered by EEPC (formerly Engineering Export Promotion Council), an export promotion council under Union Ministry of Commerce and Industry, Government of India.
The London Metal Exchange in March, 2016 approved Aluminium Ingots & Sows produced at Aditya and Mahan Smelters as good delivery brands against its high grade primary Aluminium contracts.
Aditya Aluminium:
Aditya Aluminium wins Safety Award by the National Safety Council of India - Certifi cate of Appreciation in recognition of appreciable achievement in Occupational Safety and Health.
Belagavi Alumina:
Belagavi Alumina wins the State Safety Award – Unnatha Suraksha Puraskara - by the National Safety Council of Karnataka State for outstanding work in safety performance and management systems in the manufacturing sector category.
Belur Rolling Plant:
Belur Rolling Plant wins First Prize in Industrial Relations category, for the 16th Long Term Settlement signed at a 78 year old unit, which has contributed towards survival and profi tability of the plant, presented by the National HRD Network Eastern Regional Zenith Awards & Recognition Programme held in January 2016.
Birla Copper:
Birla Copper Dahej wins the Greentech Environment Gold Award for 2015, in the Metal & Mining sector, for continual sustainable development approach, presented by the Greentech Foundation, New Delhi.
Birla Copper Dahej awarded the Greentech Gold Safety Award 2015 in the Metal & Mining Sector for outstanding achievement in Safety Management.
Birla Copper Dahej wins the FAI Environmental Protection Award – 2015 constituted by the Fertilizer Association of India for control of pollution.
Gare Palma Coal Mines:
Gare Palma Coal Mines wins First Prize in the HR Best Practices category, for cultural change brought about in the newly acquired mines, presented by the National HRD Network Eastern Regional Zenith Awards & Recognition Programme held in January 2016.
Hirakud:
Hirakud Complex awarded the Greentech Safety Gold Award 2015 in Metal, Mining & CPP Sector category presented by the Greentech Foundation, New Delhi.
Hirakud Power wins the CII Odisha State Award 2015, First Prize, for Best Practices in Environment, Health & Safety.
Utkal Alumina International Limited: (wholly owned subsidiary)
Utkal Alumina awarded the OTV (Odisha Television) CSR Award 2015 in the category of Women’s Empowerment.
Individual:
Mr. D. Bhattacharya, Managing Director Hindalco and Vice Chairman, Novelis, named Global Leader of the Year by CEO India, for his multiple distinctions achieved on the world stage and leading the Aditya Birla Group’s metals business in a highly volatile environment.
CONSOLIDATED FINANCIAL STATEMENTS
The Consolidated Financial Statements for the year ended 31st March, 2016 have been prepared by your Company in accordance with the provisions of the Companies Act, 2013, read with the Companies (Accounts) Rules, 2014, applicable Accounting Standards and the provisions of Securities and Exchange Board of India (Listing Obligations and Disclosure Requirements) Regulations, 2015 “Listing Regulations” and forms part of the full Annual Report.
Consolidated Financial Statements (CFS) were approved by the Board of Directors on 28th May, 2016 which incorporated accounts of Aditya Birla Minerals Limited (ABML), Australia, a subsidiary of the Company, for six months ended 30th September, 2015, as full year accounts of ABML were not available at that time. ABML has subsequently fi nalized its accounts for the year ended 31st March, 2016. Accordingly, the Board of Directors in the meeting held on 21st July, 2016 approved updated CFS based on full year accounts of ABML which is a part of full Annual Report.
Hindalco Annual Report 2015-16.indb 17Hindalco Annual Report 2015-16.indb 17 8/17/2016 1:31:19 PM8/17/2016 1:31:19 PM
18
Hindalco Industries Limited
EMPLOYEE STOCK OPTION SCHEMES
ESOS – 2006:
During the year ended 31st March, 2016, the Company has allotted 3,185 fully paid-up equity share of ` 1/- each (Previous year 373,666) on exercise of options under ESOS 2006 for which the Company has realised ` 0.03 crore (Previous year ` 3.83 crore) as exercise money. The weighted average share price at the exercise date was ̀ 134.70 per share (Previous year ` 168.73 per share).
ESOS – 2013:
During the year ended 31st March, 2016, the Company has allotted 2,193 fully paid-up equity share of ` 1/- each (Previous year 18,848) on exercise of options under ESOS 2013 for which the Company has realised ` 0.03 crore (Previous year ` 0.22 crore) as exercise money. The weighted average share price at the exercise date was ` 114.30 per share (Previous year ` 154.54 per share).
The details of Stock Options and Restricted Stock Units granted under the above mentioned Schemes are available on your Company’s website viz. www.hindalco.com.
A certifi cate from the statutory auditor on the implementation of your Company’s Employees Stock Option Schemes will be placed at the ensuing Annual General Meeting for inspection by the members.
CORPORATE GOVERNANCE
Your Directors reaffi rm their continued commitment to good corporate governance practices. Your Company fully adheres to the standards set out by the Securities and Exchange Board of India for Corporate Governance practices and has implemented all of its stipulations.
The entire report on Corporate Governance forms part of full Annual Report.
ABRIDGED ANNUAL REPORT
In terms of the provision of Section 136(1) of the Companies Act, 2013, Rule 10 of Companies (Accounts of Companies) Rules, 2014 and Regulation 36 of the Listing Regulations, the Board of Directors has decided to circulate the Abridged Annual Report containing salient features of the balance sheet and statement of profit and loss and other documents to the shareholders for the Financial Year 2015-16, under the relevant laws.
The Abridged Annual Report is being circulated to the members excluding the ‘Annual Report
on CSR Activities’, ‘Remuneration Philosophy/Policy’, ‘Secretarial Audit Report’, ‘Extract of Annual Return’, ‘Full Report on Corporate Governance and Shareholders’ Information’.
Members who desire to obtain the full version of the Annual Report may write to the Company Secretary at the registered offi ce. Full version of the Annual Report is also available on the Company’s website www.hindalco.com.
DIRECTORS’ RESPONSIBILITY STATEMENT
As stipulated in Section 134(3)(c) of the Companies Act, 2013 “the Act”, your Directors subscribe to the “Directors’ Responsibility Statement” and confi rm that:
a) in the preparation of the annual accounts, applicable accounting standards have been followed along with proper explanations relating to material departures;
b) the accounting policies selected have been applied consistently and judgments and estimates have been made that are reasonable and prudent so as to give a true and fair view of the state of affairs of the company as at 31st March, 2016 and of the profi t of your company for that period;
c) proper and suffi cient care has been taken for the maintenance of adequate accounting records in accordance with the provisions of the Act for safeguarding the assets of your company and for preventing and detecting fraud and other irregularities;
d) the annual accounts of your Company have been prepared on a going concern basis;
e) your Company had laid down internal fi nancial controls and that such internal fi nancial controls are adequate and were operating effectively;
f) your Company has devised proper system to ensure compliance with the provisions of all applicable laws and that such systems were adequate and operating effectively.
ENERGY, TECHNOLOGY AND FOREIGN EXCHANGE
The information on conservation of Energy, Technology Absorption and Foreign Exchange Earnings and Outgo stipulated under Section 134(3)(m) of the Companies Act, 2013, read with Companies (Accounts) Rules, 2014 is set out in Annexure I to the full and Abridged Annual Report.
Hindalco Annual Report 2015-16.indb 18Hindalco Annual Report 2015-16.indb 18 8/17/2016 1:31:19 PM8/17/2016 1:31:19 PM
19
DIRECTORS’ REPORT
FINA
NCIA
L HI
GHLI
GHTS
MAN
AGEM
ENT
DISC
USSI
ON
AND
ANAL
YSIS
CORP
ORAT
E GO
VERN
ANCE
RE
PORT
STAN
DALO
NE
FINA
NCIA
L ST
ATEM
ENTS
CONS
OLID
ATED
FI
NANC
IAL
STAT
EMEN
TSSO
CIAL
RE
PORT
DIRE
CTOR
S’RE
PORT
SHAR
EHOL
DER
INFO
RMAT
ION
SUST
AINA
BILI
TY &
BUS
INES
SRE
SPON
SIBI
LITY
REP
ORT
Annual Report 2015-16
PARTICULARS OF EMPLOYEESIn accordance with the provisions of Section 197(12) of the Companies Act, 2013 “the Act”, read with the Companies (Appointment and Remuneration of Managerial Personnel) Rules, 2014, the names and other particulars of employees are to be set out in the Directors’ Report, as an addendum thereto. However, in line with the provisions of Section 136(1) of the Act, the Report and Accounts as set out therein, are being sent to all Members of your Company excluding the aforesaid information about the employees. Any Member, who is interested in obtaining these particulars about employees, may write to the Company Secretary at the Registered Offi ce of your Company.
Disclosures pertaining to remuneration and other details as required under section 197(12) read with Companies (Appointment and Remuneration of Managerial Personnel) Rules, 2014 are attached as Annexure II to the full and Abridged Annual Report.
DIRECTORS
Board constitution and changes: Mr. Y.P. Dandiwala (DIN:01055000), was appointed as an Independent Director of the Company for a term of fi ve years which was also approved by the members in the Annual General Meeting held on 16th September, 2015. At the same Annual General Meeting, Mr. Kumar Mangalam Birla and Mr. Satish Pai were reappointed as the Directors of the Company.
Mr. N. J. Jhaveri passed away, hence ceased to be a Director w.e.f. 6th June, 2015.
Mr. D. Bhattacharya (DIN:00033553) will demit the offi ce as the Managing Director w.e.f. the close of business hours of 31st July 2016. He is appointed as the Vice Chairman of the Board.
Mr. Satish Pai (DIN:06646758) is appointed as the Managing Director for a term of 5 years w.e.f. opening hours of 1st August 2016.
Mr. Praveen Kumar Maheshwari (DIN:00174361) is appointed as the Whole-time Director for a term of 5 Years w.e.f. 28th May,2016. He is also the Chief Financial Offi cer of the Company.
Mr. Girish Dave (DIN:00036455) is appointed as an Independent Director for a term of 5 years w.e.f. 28th May, 2016.
These changes are based on recommendation of the Nomination and Remuneration Committee. The Board places on record its deep appreciation for the services rendered by Mr. Bhattacharya as the Managing Director of your Company.
Notices pursuant to Section 160 of the Companies Act, 2013, have been received from members proposing Mr. Praveen Kumar Maheshwari and Mr. Girish Dave as Directors of the Company.
Smt. Rajashree Birla (DIN:00022995) and Mr. D. Bhattacharya (DIN:00033553) will retire from offi ce by rotation at the ensuing Annual General Meeting, and being eligible, offers themselves for reappointment.
The Board recommends the appointment of Mr. Satish Pai, Mr. Praveen Kumar Maheshwari and Mr. Girish Dave and reappointment of Smt. Rajashree Birla and Mr. D. Bhattacharya. Items seeking your approval on the above are included in the Notice convening the Annual General Meeting.
Brief resume of the directors being appointed/reappointed forms part of the notice of the ensuing Annual General Meeting.
All the directors being appointed/reappointed have given required declaration under Companies Act, 2013 and Listing Regulations.
All Independent Directors have given declarations that they meet the criteria of Independence as laid down under Section 149(6) of the Companies Act, 2013 and Listing Regulations.
Policy on appointment and remuneration of Directors and Key Managerial Personnel:The Nomination and Remuneration Committee has formulated the remuneration policy of your company which is attached as Annexure III to the full Annual Report.
Meetings of the Board:The Board of Directors of your Company met 5 times during the year details of which are given in the Corporate Governance Report forming part of the full Annual Report.
Annual Evaluation:Pursuant to the provisions of the Companies Act, 2013 and Listing Regulations, the Directors have carried annual performance evaluation of Board, Independent Directors, Non executive Directors, Executive Directors, Committee and Chairman of the Board.
The evaluation framework focused on various aspects of the Board and Committees such as review, timely information from management etc. Also, the performance of individual directors was divided into Executive, Non Executive and Independent Directors and based on the parameters such as contribution, attendance, decision making, action oriented, external knowledge etc.
Hindalco Annual Report 2015-16.indb 19Hindalco Annual Report 2015-16.indb 19 8/17/2016 1:31:19 PM8/17/2016 1:31:19 PM
20
Hindalco Industries Limited
Board members have evaluated Independent Directors, Non executive Directors, Executive Directors, Committee and Chairman of the Board. The result of evaluation was satisfactory and meets the requirements of the Company. Board fully agreed and rated 100% on its functioning, skill sets and working atmosphere. Independent Directors scored well on expressing their views and in understanding the Company and its requirements. Non-Executive Directors scored well in understanding the Company and its requirement. Executive Directors are action oriented and ensures timely implementation of the Board decisions. Board is completely satisfied with the functioning of various Committees. Board has full faith in the Chairman in leading the Board effectively and ensuring contribution from all its members.
AUDIT COMMITTEE
The Audit Committee comprises of Mr. M.M. Bhagat, Mr. K.N. Bhandari, Mr. Y.P. Dandiwala, Independent Directors of your Company. Mr. D. Bhattacharya: Managing Director, Mr. Satish Pai: Deputy Managing Director and Mr. Praveen Kumar Maheshwari: Chief Financial Offi cer are the permanent invitees. Further details relating to the Audit Committee are provided in the Corporate Governance Report forming part of the full Annual Report.
KEY MANAGERIAL PERSONNEL
In terms of provisions of Section 203 of the Companies Act,2013, Mr. D. Bhattacharya: Managing Director, Mr. Satish Pai: Deputy Managing Director, Mr. Praveen Kumar Maheshwari: Chief Financial Offi cer and Mr. Anil Malik: Company Secretary are the Key Managerial Personnel of your Company.
VIGIL MECHANISM
Your Company has in place a vigil mechanism for directors and employees to report concerns about unethical behaviour, actual or suspected fraud or violation of your Company’s Code of Conduct. Adequate safeguards are provided against victimisation to those who avail of the mechanism or access to the Chairman of the Audit Committee.
The vigil mechanism is available on your Company’s website viz. www.hindalco.com.
AUDITORS
Statutory Auditors:
Pursuant to provisions of Section 139 of the Companies Act, 2013 read with the Companies (Audit
and Auditors) Rules, 2014, M/s Singhi & Co, Chartered Accountants were appointed as Statutory Auditors of the Company from the conclusion of fi fty fi fth Annual General Meeting held on 24th September, 2014, until the conclusion of fi fty-eighth Annual General meeting to be held in the calendar year 2017, subject to ratifi cation of their appointment at every Annual General Meeting.
Resolution seeking your ratifi cation is included in the Notice convening the Annual General Meeting. The observation made in the Auditor’s Report are self explanatory and thereofore, do not call for any further comments under Section 134(3)(f) of the Act.
Cost Auditors:In terms of the provisions of Section 148 of the Act read with the Companies (Cost Records and Audit) Amendment Rules, 2014, the Board of Directors of your Company have on the recommendation of the Audit Committee, appointed M/s. Nanabhoy & Co., Cost Accountants, Mumbai as Cost Auditors, to conduct the cost audit of your Company for the fi nancial year ending 31st March, 2017, at a remuneration as mentioned in the Notice convening the Annual General Meeting. As required under the Act, the remuneration payable to the cost auditor is required to be placed before the Members in a general meeting for their ratifi cation. Accordingly, a resolution seeking Member’s ratifi cation for the remuneration payable to Cost Auditors forms part of the Notice of the ensuing Annual General Meeting.
Secretarial Auditor: Pursuant to provisions of Section 204 of the Companies Act, 2013 read with the Companies (Appointment and Remuneration of Managerial Personnel) Rules, 2014, the Company had appointed BNP & Associates, Company Secretaries, Mumbai as Secretarial Auditor for conducting the Secretarial Audit of your Company for the fi nancial year ended 31st March, 2016. The Report of the Secretarial Auditor is annexed as Annexure IV to the full Annual Report.
The Secretarial Audit Report does not contain any qualifi cation, reservation or adverse remark.
ENVIRONMENT PROTECTION AND POLLUTION CONTROL
Your Company is committed to sustainable development. A detailed report of the Company’s initiatives and commitment to environment conservation is part of Sustainability & Business Responsibility Report forming part of the full and Abridged Annual Report.
Hindalco Annual Report 2015-16.indb 20Hindalco Annual Report 2015-16.indb 20 8/17/2016 1:31:19 PM8/17/2016 1:31:19 PM
21
DIRECTORS’ REPORT
FINA
NCIA
L HI
GHLI
GHTS
MAN
AGEM
ENT
DISC
USSI
ON
AND
ANAL
YSIS
CORP
ORAT
E GO
VERN
ANCE
RE
PORT
STAN
DALO
NE
FINA
NCIA
L ST
ATEM
ENTS
CONS
OLID
ATED
FI
NANC
IAL
STAT
EMEN
TSSO
CIAL
RE
PORT
DIRE
CTOR
S’RE
PORT
SHAR
EHOL
DER
INFO
RMAT
ION
SUST
AINA
BILI
TY &
BUS
INES
SRE
SPON
SIBI
LITY
REP
ORT
Annual Report 2015-16
PARTICULARS OF LOANS, GUARANTEES AND INVESTMENTS:
Details of Loans, Guarantee and Investments covered under the provisions of Section 186 of the Companies Act, 2013 read with Companies (Meetings of Board and its Powers) Rules, 2014 are given in the notes to Financial Statements of the full Annual Report.
CORPORATE SOCIAL RESPONSIBILITY:
In terms of the provisions of Section 135 of the Companies Act, 2013 (“the Act”) read with Companies (Corporate Social Responsibility Policy) Rules, 2014, the Board of Directors of your Company has constituted a Corporate Social Responsibility (“CSR”) Committee which is chaired by Mrs. Rajashree Birla. The other Members of the Committee are Mr. Jagdish Khattar, Independent Director, Mr. A.K. Agarwala, Non Executive Director and Mr. D. Bhattacharya, Managing Director. Dr. Pragnya Ram, Group Executive President, Corporate Communication & CSR is a permanent invitee to the Committee. Your Company also has in place a CSR Policy and the same is available on your Company’s website viz. www.hindalco.com. The Committee recommends to the Board activities to be undertaken during the year.
Your Company is a caring corporate citizen and lays signifi cant emphasis on development of the communities around which it operates. Your Company has identifi ed several projects relating to Social Empowerment & Welfare, Infrastructure Development, Sustainable Livelihood, Health Care and Education during the year and initiated various activities in neighbouring villages around plant locations.
During the Financial Year 2015-16 the Company has spent ̀ 34.15 crore under Section 135 of the Companies Act, 2013 on CSR Activities, which represent 2.20% of average net profi ts of the Company for last three Financial Years.
The Annual Report on CSR activities is attached as Annexure V to the full Annual Report.
RISK MANAGEMENT
Pursuant to the requirement of Listing Regulations, the Company has constituted Risk Management Committee, to review the risk management plan/process of your company.
Risk evaluation and management is an ongoing process within the Organization. Your Company has comprehensive risk management policy which is periodically reviewed by the Risk Management Committee.
CONTRACTS AND ARRANGEMENTS WITH RELATED PARTIES During the fi nancial year, your Company entered into related party transactions which were on arm’s length basis and in the ordinary course of business. There are no material transactions with any related party as defi ned under Section 188 of the Act read with Companies (Meetings of Board and its Powers) Rules, 2014 and Listing Regulations. All related party transactions have been approved by the Audit Committee of your Company.
The policy on Related Party Transactions as approved by the Audit Committee and the Board is available on your Company’s website viz. www.hindalco.com.
EXTRACT OF ANNUAL RETURN:In terms of the provisions of Section 92 (3) of the Companies Act, 2013 (“the Act”) read with the Companies (Management and Administration) Rules, 2014, an extract of the Annual Return of your Company for the fi nancial year ended 31st March, 2016 is given in Annexure VI to the full Annual Report.
BUSINESS RESPONSIBILITY REPORT:As per Listing Regulations, a separate section of Business Responsibility Report forms part of the full and Abridged Annual Report.
INTERNAL CONTROL SYSTEM AND THEIR ADEQUACY: Your Company has an Internal Control System, commensurate with the size, scale and complexity of its operations. The scope and authority of the Internal Audit (IA) function is defi ned by the Audit Committee.
The Internal Audit Department monitors and evaluates the effi cacy and adequacy of internal control system in the Company, its compliance with operating systems, accounting procedures and policies at all locations of the Company.
Based on the report of internal auditors, the process owners undertake corrective action in their respective areas and thereby strengthen the controls. Signifi cant audit observations and corrective actions thereon are presented to the Audit Committee.
INTERNAL FINANCIAL CONTROLYour directors confi rm having laid down internal fi nancial controls and that such internal fi nancial controls are adequate and were operating effectively.
SUBSIDIARY, JOINT VENTURES OR ASSOCIATE COMPANIES:The fi nancial statements of your Company’s subsidiaries and related information have been placed
Hindalco Annual Report 2015-16.indb 21Hindalco Annual Report 2015-16.indb 21 8/17/2016 1:31:19 PM8/17/2016 1:31:19 PM
22
Hindalco Industries Limited
on the website of your Company viz. www.hindalco.com and also available for inspection during business hours at the registered offi ce of your Company. Any Member, who is interested in obtaining a copy of fi nancial statements of your Company’s subsidiaries, may write to the Company Secretary at the Registered Offi ce of your Company.
In accordance with the provisions of the section 129 (3) of the Act, read with the Companies (Accounts) Rules, 2014, a statement on the performance and fi nancial position of each of the subsidiaries, associates and Joint Venture is attached as Annexure VII to the full and Abridged Annual Report.
The names of Companies which have become or ceased to be subsidiaries, Joint Ventures and associates are also provided in the aforesaid statement.
OTHER DISCLOSURES:• Your Company has not issued any shares with
differential voting.
• There was no revision in the fi nancial statements. However the Board of Directors in the meeting held on 21st July, 2016 approved Consolidated Financial Statements (updated) as disclosed in the Directors Report.
• Your Company has not issued any sweat equity shares.
• Mr. D. Bhattacharya and Mr. Satish Pai are directors on the Board of Novelis Inc, wholly owned subsidiary. They are in receipt of annual fee of US$ 1,50,000 and US$ 1,50,000 respectively in the calendar year 2015.
• There was no change in the nature of business.
• During the year under review, your Company has not accepted any fi xed deposits from the public falling under Section 73 of the Act read with the
Companies (Acceptance of Deposits) Rules, 2014. Thus, as on 31st March, 2016, there were no deposits which were unpaid or unclaimed and due for repayment.
• There are no signifi cant and material orders passed by the regulators or courts or tribunals impacting the going concern status and company’s operations in future.
• There were no frauds reported by the Auditors u/s 143(12) of the Companies Act, 2013.
APPRECIATION Your Directors place on record their sincere appreciation for the assistance and guidance provided by the Honorable Ministers, Secretaries and other offi cials of the Ministry of Mines, Ministry of Coal, the Ministry of Chemicals and Fertilizers and various State Governments. Your Directors thank the Financial Institutions and Banks associated with your Company for their support as well.
Your Company’s employees are instrumental in your Company scaling new heights, year after year. Their commitment and contribution is deeply acknowledged.
Your involvement as Shareholders is greatly valued. Your Directors look forward to your continuing support.
For and on behalf of the Board
Kumar Mangalam BirlaMumbai ChairmanDated : 21st July, 2016 (DIN: 00012813)
Hindalco Annual Report 2015-16.indb 22Hindalco Annual Report 2015-16.indb 22 8/17/2016 1:31:19 PM8/17/2016 1:31:19 PM
23
DIRECTORS’ REPORT
FINA
NCIA
L HI
GHLI
GHTS
MAN
AGEM
ENT
DISC
USSI
ON
AND
ANAL
YSIS
CORP
ORAT
E GO
VERN
ANCE
RE
PORT
STAN
DALO
NE
FINA
NCIA
L ST
ATEM
ENTS
CONS
OLID
ATED
FI
NANC
IAL
STAT
EMEN
TSSO
CIAL
RE
PORT
DIRE
CTOR
S’RE
PORT
SHAR
EHOL
DER
INFO
RMAT
ION
SUST
AINA
BILI
TY &
BUS
INES
SRE
SPON
SIBI
LITY
REP
ORT
Annual Report 2015-16
Annexure-I
DISCLOSURE OF PARTICULARS WITH RESPECT TO CONSERVATION OF ENERGY, TECHNOLOGY ABSORPTION AND FOREIGN EXCHANGE EARNINGS AND OUTGO AS PRESCRIBED UNDER RULE 8(3) OF OF THE COMPANIES (ACCOUNTS) RULES, 2014.
A. CONSERVATION OF ENERGY
(a) THE STEPS TAKEN ON CONSERVATION OF ENERGYi. Periodic Energy audit in all units.
ii. Replacement of Metallic Fan blade of Cooling Towers with FRP blades.
iii. Rationalization of motor, pump & fan capacities.
iv. Replacement of ineffi cient pumps & motors with high effi ciency pumps & motors.
v. Reduction in line losses through power factor improvement by capacitor installation.
vi. Installation of translucent roofi ng sheet/sun pipe light to use more natural light.
vii. Replacement of conventional light with energy effi cient LED Light.
viii. Reduction in DC Power consumption in pots by optimizing pot voltage.
ix. Conversion loss reduction in Aluminium Smelter through Rectifi er replacement.
x. Installation of VFD in variable load application.
xi. Combustion effi ciency improvement and loss reduction in Furnaces.
xii. Compressed Air system effi ciency improvement.
xiii. Effi ciency improvement in Boilers through process optimization.
xiv. Auxiliary power reduction through automation.
(b) STEPS TAKEN BY THE COMPANY FOR UTILISING ALTERNATE SOURCES OF ENERGYDuring the year, the following projects are implemented:
i. 1 MW Solar PV Power Plant at Alupuram, Kerala unit.
ii. Roof top Solar PV installation at Belur, WB unit.
iii. Use of biomass as a supplementary fuel in our boilers.
iv. Use of translucent roofi ng sheet/Sun light pipe for more use of Natural light and use of turbo ventilators in place of conventional exhaust fans.
(c) THE CAPITAL INVESTMENT ON ENERGY CONSERVATION EQUIPMENT & PROJECTSThe Capital investment on Energy conservation equipment & projects for the year was ` 86.80 crore.
B. TECHNOLOGY ABSORPTION
(a) Efforts Made Towards Technology Absorption:• Specialty alumina product development for ceramic, polishing and other applications like fi re
retardant fi llers.
• Effi cient use of low grade ores from Lohardaga and Kolhapur regions.
• Research on value added applications of process waste materials like bauxite residue, fl y ash etc.
• Successful demonstration of “Gemini” trial pots at Renukoot operating at higher line current and lower specifi c energy consumption.
• Specifi c oil consumption reduction in anode baking furnace#6 at Renukoot.
• Improved product quality: AA2014 alloy extrusions, AA8021 Alu blister, 6082 T6 and 6061 T6 rods etc.
• Development of process for aerospace grade alloys and marine applications for Hirakud FRP.
• Development of AA5754 plates for tanker applications and AA5083 industrial cylinders for IOCL.
Hindalco Annual Report 2015-16.indb 23Hindalco Annual Report 2015-16.indb 23 8/17/2016 1:31:20 PM8/17/2016 1:31:20 PM
24
Hindalco Industries Limited
• Impact damage of profi led Aluminium roofi ng sheets and design of test methodology for correlation of impact resistance to thickness and material yield properties.
• Development of new methods and tools for Rolling Plant data analysis.
• New process developed for recovery of Copper from refi nery effl uent.
• Design modifi cation in Scrap Melting Furnace at Dahej.
• Design modifi cation in TG-4 at CPP Dahej.
• Number of initiatives implemented towards improving energy effi ciency, cost reductions and emissions.
(b) Benefi ts Derived Like Product Improvement, Cost Reduction, Product Development or Import Substitution:• Reduction in specifi c energy consumption and GHG emissions.
• Improved productivity and capacity utilization.
• Increase in production of value-added products.
• Increased export volume and revenue.
• Increase in market share and profi tability.
• Cost reduction.
• Quality improvement for specifi c products for domestic and overseas market.
• Enhancement in customer satisfaction.
• Improved copper recovery.
• Conservation of natural resources – water, energy and basic raw material.
(c) In case of imported technology (imported during the last three years reckoned from the beginning of the fi nancial year):
Technology Imported for Year of Import
Has technology been fully absorbed
If not fully absorbed, areas where this has not taken place, reason thereof and future plan of action
Pressure Filtration of bauxite residue at Muri
2014-15 Yes NA
Aluminium smelters technology from M/s. Aluminium Pechiney for Aditya and Mahan smelters
2010-13 Yes NA
Aluminum smelting technology from M/s. Kan-nac for Renukoot smelter
2010-14 Almost Test pots trials were successful. Line basis trials planned.
Membrane Bio-reactor Technology for waste water treatment
2013-14 Yes NA
Prayon MK 4 Di-hydrate Process 2014-15 Yes NA
(d) Expenditure incurred on Research and DevelopmentThe Company spent ` 19.44 crore for Research and Development during the fi nancial year 2015-16.
FOREIGN EXCHANGE EARNINGS & OUTGO
a) Activities related to exportsExports during the year were ` 12,489.85 crore.
b) Total Foreign Exchange Used and Earned Foreign Exchange used ` 16,402.49 crore.
Foreign Exchange Earned ` 12,490.68 crore.
Hindalco Annual Report 2015-16.indb 24Hindalco Annual Report 2015-16.indb 24 8/17/2016 1:31:20 PM8/17/2016 1:31:20 PM
25
DIRECTORS’ REPORT
FINA
NCIA
L HI
GHLI
GHTS
MAN
AGEM
ENT
DISC
USSI
ON
AND
ANAL
YSIS
CORP
ORAT
E GO
VERN
ANCE
RE
PORT
STAN
DALO
NE
FINA
NCIA
L ST
ATEM
ENTS
CONS
OLID
ATED
FI
NANC
IAL
STAT
EMEN
TSSO
CIAL
RE
PORT
DIRE
CTOR
S’RE
PORT
SHAR
EHOL
DER
INFO
RMAT
ION
SUST
AINA
BILI
TY &
BUS
INES
SRE
SPON
SIBI
LITY
REP
ORT
Annual Report 2015-16
Annexure-II
Details pertaining to remuneration as required under Section 197(12) of the Companies Act, 2013 read with Rule 5(1) of the Companies (Appointment and Remuneration of Managerial Personnel) Rules, 2014
i. The percentage increase in remuneration of each Director, Chief Financial Offi cer and Company Secretary during the fi nancial year 2015-16, ratio of the remuneration of each Director to the median remuneration of the employees of the Company for the fi nancial year 2015-16 and the comparison of remuneration of each Key Managerial Personnel (KMP) against the performance of the Company are as under:
Sr. No.
Name of Director/KMP and Designation
Remuneration*of Director/KMP
for fi nancial year 2015-16
(` in Lakhs)
% increase inRemuneration
in the Financial Year 2015-16
Ratio ofremuneration of each
Director/ to median remuneration of
employees
Comparison of theRemuneration of
the KMP against the performance of the
Company
1 Kumar Mangalam Birla 173.46 (50.41) 39.9 Not applicable
2 Rajashree Birla 4.27 (32.33) 1.0 Not applicable
3 A.K.Agarwala 5.32 (35.75) 1.2 Not applicable
4 M.M. Bhagat 4.66 (43.24) 1.1 Not applicable
5 Y.P. Dandiwala ** 2.27 N.A. 0.5 Not applicable
6 K.N. Bhandari 5.31 (44.69) 1.2 Not applicable
7 Jagdish Khattar 2.87 (45.95) 0.7 Not applicable
8 Ram Charan 1.85 (53.75) 0.4 Not applicable
9 D.Bhattacharya# 1990.00 (7.83) 457.5Profi t before
Interest Tax and Depreciation (PBITDA)
has increased by 1.98% in FY 2015-16
10 Satish Pai 1396.00 14.68 320.9
11 Praveen Kumar Maheshwari^
325.00 6.56 N.A.
12 Anil Malik^ 89.00 5.95 N.A.
* Remuneration includes commission payable to Non Executive Directors for the year ended 31st March, 2016 which is subject to the approval of the members of the Company. Sitting fees paid to Directors is excluded.
** Was appointed as Independent Director w.e.f. 14th August 2015. # Mr. D. Bhattacharya was provided Company accommodation in FY 2014-15. The perquisite value was
` 2.57 crore on this account. In FY 2015-16, he occupied the company accommodation for 2 months and the perquisite value was ` 24 lakhs on this account. If housing perquisite is not considered, the salary of Mr. Bhattacharya is increased by 3.36%.
^ Includes Employer’s Contribution to Provident Fund. Last year’s remuneration is also readjusted to include Employer’s Contribution to Provident Fund.
ii. The median remuneration of employees of the Company during the fi nancial year was ` 4.35 lakhs.
iii In the fi nancial year, there was an increase of 4.5% in the median remuneration of employees.
iv There were 24,118 permanent employees on the rolls of Company as on 31st March, 2016.
v Relationship between average increase in remuneration and company performance: (The Profi t before Interest, Tax and Depreciation (PBITDA) for the fi nancial year ended 31st March, 2016 increased by 1.98% whereas the increase in median remuneration was 4.5%). The average increase in median remuneration was in line with industry benchmark and performance of the Company.
Hindalco Annual Report 2015-16.indb 25Hindalco Annual Report 2015-16.indb 25 8/17/2016 1:31:20 PM8/17/2016 1:31:20 PM
26
Hindalco Industries Limited
vi Comparison of Remuneration of the Key Managerial Personnel(s) against the performance of the Company:The details of the same is provided in point no(i) above.
vii a. Variations in the market capitalisation of the Company : The market capitalisation as on 31st March, 2016 was ` 18,162 crore (` 26,638 crore as on 31st March, 2015).
b. Price Earnings ratio of the Company was 29.90 as at 31st March, 2016 (28.83 as at 31st March, 2015).
c. Percent increase over/ decrease in the market quotations of the shares of the company as compared to the rate at which the company came out with the last public offer in the year – The Company has made Rights Offer in 2008 @ ` 96.00 per share. As on 31st March, 2016, the Company’s shares was quoted at ` 87.95 per share on National Stock Exchange. The Company shares as on 31st March, 2016 were quoted 8.39% less than the Rights offer price.
viii Average percentage increase made in the salaries of employees other than the managerial personnel in the last fi nancial year i.e. 2015-16 was 6.91% whereas the increase in the managerial remuneration for the same fi nancial year was 0.30%.
ix The key parameters for the variable component of remuneration availed by the directors: Based on the Remuneration Philosophy/Policy of the Company approved by Nomination and Remuneration Committee.
x The ratio of the remuneration of the highest paid director to that of the employees who are not directors but receive remuneration in excess of the highest paid director during the year – None of the employees has remuneration more than the highest paid directors.
xi It is hereby affi rmed that the remuneration paid is as per the Remuneration Philosophy/Policy of the Company.
Hindalco Annual Report 2015-16.indb 26Hindalco Annual Report 2015-16.indb 26 8/17/2016 1:31:20 PM8/17/2016 1:31:20 PM
27
DIRECTORS’ REPORT
FINA
NCIA
L HI
GHLI
GHTS
MAN
AGEM
ENT
DISC
USSI
ON
AND
ANAL
YSIS
CORP
ORAT
E GO
VERN
ANCE
RE
PORT
STAN
DALO
NE
FINA
NCIA
L ST
ATEM
ENTS
CONS
OLID
ATED
FI
NANC
IAL
STAT
EMEN
TSSO
CIAL
RE
PORT
DIRE
CTOR
S’RE
PORT
SHAR
EHOL
DER
INFO
RMAT
ION
SUST
AINA
BILI
TY &
BUS
INES
SRE
SPON
SIBI
LITY
REP
ORT
Annual Report 2015-16
Annexure-III
Hindalco Industries Limited (“the Company”) an Aditya Birla Group Company adopts this Executive Remuneration Philosophy/Policy as applicable across Group Companies. This Philosophy/Policy is detailed below:
Aditya Birla Group: Executive Remuneration Philosophy/PolicyAt the Aditya Birla Group, we expect our executive team to foster a culture of growth and entrepreneurial risk-taking. Our Executive Remuneration Philosophy/Policy supports the design of programs that align executive rewards – including incentive programs, retirement benefi t programs, promotion and advancement opportunities – with the long-term success of our stakeholders.
Our business and organizational modelOur Group is a conglomerate and organized in a manner such that there is sharing of resources and infrastructure. This results in uniformity of business processes and systems thereby promoting synergies and exemplary customer experiences.
I. Objectives of the Executive Remuneration ProgramOur executive remuneration program is designed to attract, retain, and reward talented executives who will contribute to our long-term success and thereby build value for our shareholders.
Our executive remuneration program is intended to:
1. Provide for monetary and non-monetary remuneration elements to our executives on a holistic basis
2. Emphasize “Pay for Performance” by aligning incentives with business strategies to reward executives who achieve or exceed Group, business and individual goals.
II. Covered ExecutivesOur Executive Remuneration Philosophy/Policy applies to the following:
1. Directors of the Company
2. Key Managerial Personnel: Chief Executive Offi cer and equivalent (eg: Deputy Managing Director), Chief Financial Offi cer and Company Secretary.
3. Senior Management
III. Business and Talent CompetitorsWe benchmark our executive pay practices and levels against peer companies in similar industries, geographies and of similar size. In addition, we look at secondary reference (internal and external) benchmarks in order to ensure that pay policies and levels across the Group are broadly equitable and support the Group’s global mobility objectives for executive talent. Secondary reference points bring to the table, the executive pay practices and pay levels in other markets and industries, to appreciate the differences in levels and medium of pay and build in as appropriate for decision making.
IV. Executive Pay PositioningWe aim to provide competitive remuneration opportunities to our executives by positioning target total remuneration (including perks and benefi ts, annual incentive pay-outs, long term incentive pay-outs at target performance) and target total cash compensation (including annual incentive pay-outs) at target performance directionally between median and top quartile of the primary talent market. We recognize the size and scope of the role and the market standing, skills and experience of incumbents while positioning our executives.
We use secondary market data only as a reference point for determining the types and amount of remuneration while principally believing that target total remuneration packages should refl ect the typical cost of comparable executive talent available in the sector.
V. Executive Pay-MixOur executive pay-mix aims to strike the appropriate balance between key components: (i) Fixed Cash compensation (Basic Salary + Allowances) (ii) Annual Incentive Plan (iii) Long-Term Incentives (iv) Perks and Benefi ts
Hindalco Annual Report 2015-16.indb 27Hindalco Annual Report 2015-16.indb 27 8/17/2016 1:31:20 PM8/17/2016 1:31:20 PM
28
Hindalco Industries Limited
Annual Incentive Plan:
We tie annual incentive plan pay-outs of our executives to relevant fi nancial and operational metrics achievement and their individual performance. We annually align the fi nancial and operational metrics with priorities/ focus areas for the business.
Long-Term Incentive:
Our Long-term incentive plans incentivize stretch performance, link executive remuneration to sustained long term growth and act as a retention and reward tool.
We use stock options as the primary long-term incentive vehicles for our executives as we believe that they best align executive incentives with stockholder interests.
We grant restricted stock units as a secondary long term incentive vehicles, to motivate and retain our executives.
VI. Performance Goal Setting
We aim to ensure that for both annual incentive plans and long term incentive plans, the target performance goals shall be achievable and realistic.
Threshold performance (the point at which incentive plans are paid out at their minimum, but non-zero, level) shall refl ect a base-line level of performance, refl ecting an estimated 90% probability of achievement.
Target performance is the expected level of performance at the beginning of the performance cycle, taking into account all known relevant facts likely to impact measured performance.
Maximum performance (the point at which the maximum plan payout is made) shall be based on an exceptional level of achievement, refl ecting no more than an estimated 10% probability of achievement.
VII. Executive Benefi ts and Perquisites
Our executives are eligible to participate in our broad-based retirement, health and welfare, and other employee benefi t plans. In addition to these broad-based plans, they are eligible for perquisites and benefi ts plans commensurate with their roles. These benefi ts are designed to encourage long-term careers with the Group.
Other Remuneration Elements
Each of our executives is subject to an employment agreement. Each such agreement generally provides for a total remuneration package for our executives including continuity of service across the Group Companies.
We limit other remuneration elements, for e.g. Change in Control (CIC) agreements, severance agreements, to instances of compelling business need or competitive rationale and generally do not provide for any tax gross-ups for our executives.
Risk and Compliance
We aim to ensure that the Group’s remuneration programs do not encourage excessive risk taking. We review our remuneration programs for factors such as, remuneration mix overly weighted towards annual incentives, uncapped pay-outs, unreasonable goals or thresholds, steep pay-out cliffs at certain performance levels that may encourage short-term decisions to meet pay-out thresholds.
Claw back Clause:
In an incident of restatement of fi nancial statements, due to fraud or non-compliance with any requirement of the Companies Act 2013 and the rules made thereafter, we shall recover from our executives, the remuneration received in excess, of what would be payable to him / her as per restatement of fi nancial statements, pertaining to the relevant performance year.
Implementation
The Group and Business Centre of Expertise teams will assist the Nomination & Remuneration Committee in adopting, interpreting and implementing the Executive Remuneration Philosophy/Policy. These services will be established through “arm’s length”, agreements entered into as needs arise in the normal course of business.
Hindalco Annual Report 2015-16.indb 28Hindalco Annual Report 2015-16.indb 28 8/17/2016 1:31:20 PM8/17/2016 1:31:20 PM
29
DIRECTORS’ REPORT
FINA
NCIA
L HI
GHLI
GHTS
MAN
AGEM
ENT
DISC
USSI
ON
AND
ANAL
YSIS
CORP
ORAT
E GO
VERN
ANCE
RE
PORT
STAN
DALO
NE
FINA
NCIA
L ST
ATEM
ENTS
CONS
OLID
ATED
FI
NANC
IAL
STAT
EMEN
TSSO
CIAL
RE
PORT
DIRE
CTOR
S’RE
PORT
SHAR
EHOL
DER
INFO
RMAT
ION
SUST
AINA
BILI
TY &
BUS
INES
SRE
SPON
SIBI
LITY
REP
ORT
Annual Report 2015-16
Annexure-IVSECRETARIAL AUDIT REPORT
For the fi nancial year ended 31st March, 2016[Pursuant to section 204(1) of the Companies Act, 2013 and Rule No.9 of the Companies
(Appointment and Remuneration of Managerial Personnel) Rules, 2014]
To,
The Members
Hindalco lndustries LimitedCentury Bhavan, 3rd FloorDr. Annie Besant RoadWorli, Mumbai 400025
We have conducted the Secretarial Audit of the compliance of applicable statutory provisions and the adherence to corporate practices by Hindalco Industries Limited (hereinafter called ‘the Company’) for the audit period covering the fi nancial year ended on 31st March, 2016 (‘the audit period’). Secretarial Audit was conducted in a manner that provided us a reasonable basis for evaluating the corporate conducts / statutory compliances and expressing our opinion thereon.
Based on our verifi cation of the Company’s books, papers, minute books, forms and returns fi led and other records maintained by the Company and also the information provided by the Company, its offi cers, agents and authorized representatives during the conduct of Secretarial Audit; we hereby report that in our opinion, the Company has, during the audit period generally complied with the statutory provisions listed hereunder and also that the Company has proper Board-processes and compliance-mechanism in place to the extent, in the manner and subject to the reporting made hereinafter.
We have examined the books, papers, minute books, forms and returns fi led and other records maintained by the Company for the fi nancial year ended on 31st March, 2016 according to the provisions of:
(i) The Companies Act, 2013 (‘the Act’);
(ii) The Securities Contracts (Regulation) Act, 1956 (SCRA) and the Rules made thereunder;
(iii) The Depositories Act, 1996 and the Regulations and Bye-laws framed thereunder;
(iv) Foreign Exchange Management Act, 1999 and the Rules and Regulations made thereunder to the extent of Foreign Direct Investment, Overseas Direct Investment and External Commercial Borrowings;
(v) The following Regulations and Guidelines prescribed under the Securities and Exchange Board of India Act, 1992 (‘SEBI Act’):
(a) Securities and Exchange Board of India (Listing Obligations and Disclosure Requirements) Regulations, 2015;
(b) The Securities and Exchange Board of India (Substantial Acquisition of Shares and Takeovers) Regulations, 2011;
(c) The Securities and Exchange Board of India (Prohibition of Insider Trading) Regulations, 2015;
(d) The Securities and Exchange Board of India (Share Based Employee Benefi ts) Regulations, 2014;
(e) The Securities and Exchange Board of India (Registrars to an Issue and Share Transfer Agents) Regulations, 1993 regarding the Companies Act and dealing with client.
We have also examined compliance with the applicable clauses of the following:
(i) Secretarial Standards issued by The Institute of Company Secretaries of India related to meetings and minutes;
(ii) Listing Agreements entered into by the Company with the Stock Exchanges.
During the period under review, the Company has generally complied with the provisions of the Act, Rules, Regulations, Guidelines, Standards, etc. mentioned above.
Hindalco Annual Report 2015-16.indb 29Hindalco Annual Report 2015-16.indb 29 8/17/2016 1:31:20 PM8/17/2016 1:31:20 PM
30
Hindalco Industries Limited
We have also examined, on test-check basis, the relevant documents and records maintained by the Company according to the following laws applicable specifi cally to the Company:
(i) The Mines Act, 1952;
(ii) The Mines and Minerals (Regulation and Development) Act, 1957.
Based on such examination and having regard to the compliance system prevailing in the Company; the Company has complied with the provisions of the above laws during the audit period.
During the period under review, provisions of the following Regulations prescribed under the Securities and Exchange Board of India Act, 1992 (‘SEBI Act’) were not applicable to the Company:
(i) The Securities and Exchange Board of India (Issue of Capital and Disclosure Requirements) Regulations, 2009;
(ii) The Securities and Exchange Board of India (Issue and Listing of Debt Securities) Regulations, 2008;
(iii) The Securities and Exchange Board of India (Delisting of Equity Shares) Regulations, 2009;
(iv) The Securities and Exchange Board of India (Buyback of Securities) Regulations, 1998;
We further report that -The Board of Directors of the Company is duly constituted with proper balance of Executive Directors, Non-Executive Directors and Independent Directors. The changes in the composition of the Board of Directors that took place during the period under review were carried out in compliance with the provisions of the Act.
Proper notice is given to all Directors to schedule the Board meetings in compliance with the provisions of Section 173(3) of the Companies Act, 2013, agenda and detailed notes on agenda were generally sent at least seven days in advance, and a system exists for seeking and obtaining further information and clarifi cations on the agenda items before the meeting and for meaningful participation at the meeting.
Decisions at the meetings of the Board of Directors of the Company were carried through on the basis of majority. There were no dissenting views by any member of the Board of Directors during the period under review.
We further report that –There are adequate systems and processes in the Company commensurate with the size and operations of the Company to monitor and ensure compliance with applicable laws, rules, regulations and guidelines.
We further report that during the audit period, the Company has:
1. Obtained consent of the Board of Directors to issue Non-Convertible Debentures aggregating up to ` 6,000 Crore on Private Placement basis.
2. Obtained approval from the members in the Annual General Meeting to issue Non-Convertible Debentures aggregating up to ` 6,000 Crore on Private Placement basis.
For BNP & Associates Company Secretaries
[Firm Regn. No. P2014MH037400]
B. Narasimhan Place : Mumbai PartnerDate : 28th May, 2016 FCS 1303 / CP No.10440
Hindalco Annual Report 2015-16.indb 30Hindalco Annual Report 2015-16.indb 30 8/17/2016 1:31:20 PM8/17/2016 1:31:20 PM
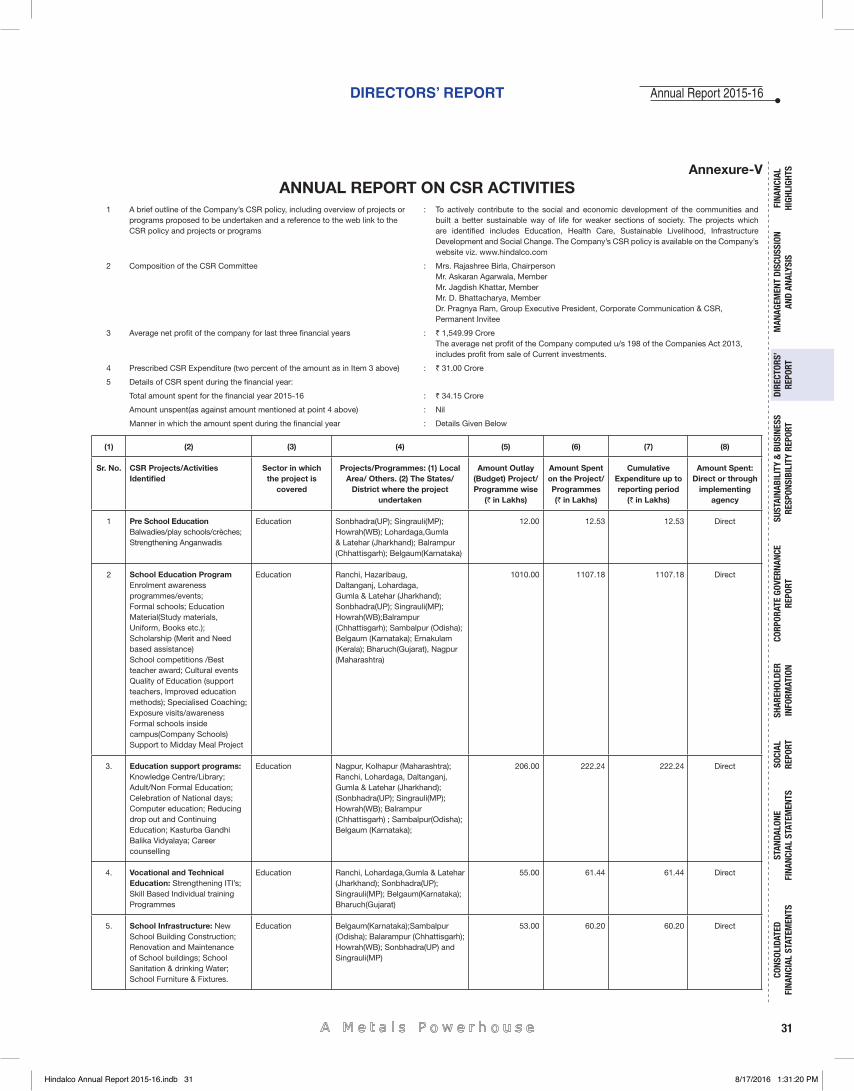
31
DIRECTORS’ REPORT
FINA
NCIA
L HI
GHLI
GHTS
MAN
AGEM
ENT
DISC
USSI
ON
AND
ANAL
YSIS
CORP
ORAT
E GO
VERN
ANCE
RE
PORT
STAN
DALO
NE
FINA
NCIA
L ST
ATEM
ENTS
CONS
OLID
ATED
FI
NANC
IAL
STAT
EMEN
TSSO
CIAL
RE
PORT
DIRE
CTOR
S’RE
PORT
SHAR
EHOL
DER
INFO
RMAT
ION
SUST
AINA
BILI
TY &
BUS
INES
SRE
SPON
SIBI
LITY
REP
ORT
Annual Report 2015-16
Annexure-VANNUAL REPORT ON CSR ACTIVITIES
1 A brief outline of the Company’s CSR policy, including overview of projects or programs proposed to be undertaken and a reference to the web link to the CSR policy and projects or programs
: To actively contribute to the social and economic development of the communities and built a better sustainable way of life for weaker sections of society. The projects which are identifi ed includes Education, Health Care, Sustainable Livelihood, Infrastructure Development and Social Change. The Company’s CSR policy is available on the Company’s website viz. www.hindalco.com
2 Composition of the CSR Committee : Mrs. Rajashree Birla, ChairpersonMr. Askaran Agarwala, MemberMr. Jagdish Khattar, Member Mr. D. Bhattacharya, Member Dr. Pragnya Ram, Group Executive President, Corporate Communication & CSR, Permanent Invitee
3 Average net profi t of the company for last three fi nancial years : ` 1,549.99 CroreThe average net profi t of the Company computed u/s 198 of the Companies Act 2013, includes profi t from sale of Current investments.
4 Prescribed CSR Expenditure (two percent of the amount as in Item 3 above) : ` 31.00 Crore
5 Details of CSR spent during the fi nancial year:
Total amount spent for the fi nancial year 2015-16 : ` 34.15 Crore
Amount unspent(as against amount mentioned at point 4 above) : Nil
Manner in which the amount spent during the fi nancial year : Details Given Below
(1) (2) (3) (4) (5) (6) (7) (8)
Sr. No. CSR Projects/Activities Identifi ed
Sector in which the project is
covered
Projects/Programmes: (1) Local Area/ Others. (2) The States/
District where the project undertaken
Amount Outlay (Budget) Project/ Programme wise
(` in Lakhs)
Amount Spent on the Project/ Programmes (` in Lakhs)
Cumulative Expenditure up to reporting period
(` in Lakhs)
Amount Spent: Direct or through
implementing agency
1 Pre School Education Balwadies/play schools/crèches; Strengthening Anganwadis
Education Sonbhadra(UP); Singrauli(MP); Howrah(WB); Lohardaga,Gumla & Latehar (Jharkhand); Balrampur (Chhattisgarh); Belgaum(Karnataka)
12.00 12.53 12.53 Direct
2 School Education Program Enrolment awareness programmes/events; Formal schools; Education Material(Study materials, Uniform, Books etc.); Scholarship (Merit and Need based assistance)School competitions /Best teacher award; Cultural eventsQuality of Education (support teachers, Improved education methods); Specialised Coaching; Exposure visits/awarenessFormal schools inside campus(Company Schools)Support to Midday Meal Project
Education Ranchi, Hazaribaug, Daltanganj, Lohardaga, Gumla & Latehar (Jharkhand); Sonbhadra(UP); Singrauli(MP); Howrah(WB);Balrampur (Chhattisgarh); Sambalpur (Odisha); Belgaum (Karnataka); Ernakulam (Kerala); Bharuch(Gujarat), Nagpur (Maharashtra)
1010.00 1107.18 1107.18 Direct
3. Education support programs: Knowledge Centre/Library; Adult/Non Formal Education; Celebration of National days; Computer education; Reducing drop out and Continuing Education; Kasturba Gandhi Balika Vidyalaya; Career counselling
Education Nagpur, Kolhapur (Maharashtra); Ranchi, Lohardaga, Daltanganj, Gumla & Latehar (Jharkhand); (Sonbhadra(UP); Singrauli(MP); Howrah(WB); Balrampur (Chhattisgarh) ; Sambalpur(Odisha); Belgaum (Karnataka);
206.00 222.24 222.24 Direct
4. Vocational and Technical Education: Strengthening ITI’s; Skill Based Individual training Programmes
Education Ranchi, Lohardaga,Gumla & Latehar (Jharkhand); Sonbhadra(UP); Singrauli(MP); Belgaum(Karnataka); Bharuch(Gujarat)
55.00 61.44 61.44 Direct
5. School Infrastructure: New School Building Construction; Renovation and Maintenance of School buildings; School Sanitation & drinking Water; School Furniture & Fixtures.
Education Belgaum(Karnataka);Sambalpur(Odisha); Balarampur (Chhattisgarh); Howrah(WB); Sonbhadra(UP) and Singrauli(MP)
53.00 60.20 60.20 Direct
Hindalco Annual Report 2015-16.indb 31Hindalco Annual Report 2015-16.indb 31 8/17/2016 1:31:20 PM8/17/2016 1:31:20 PM
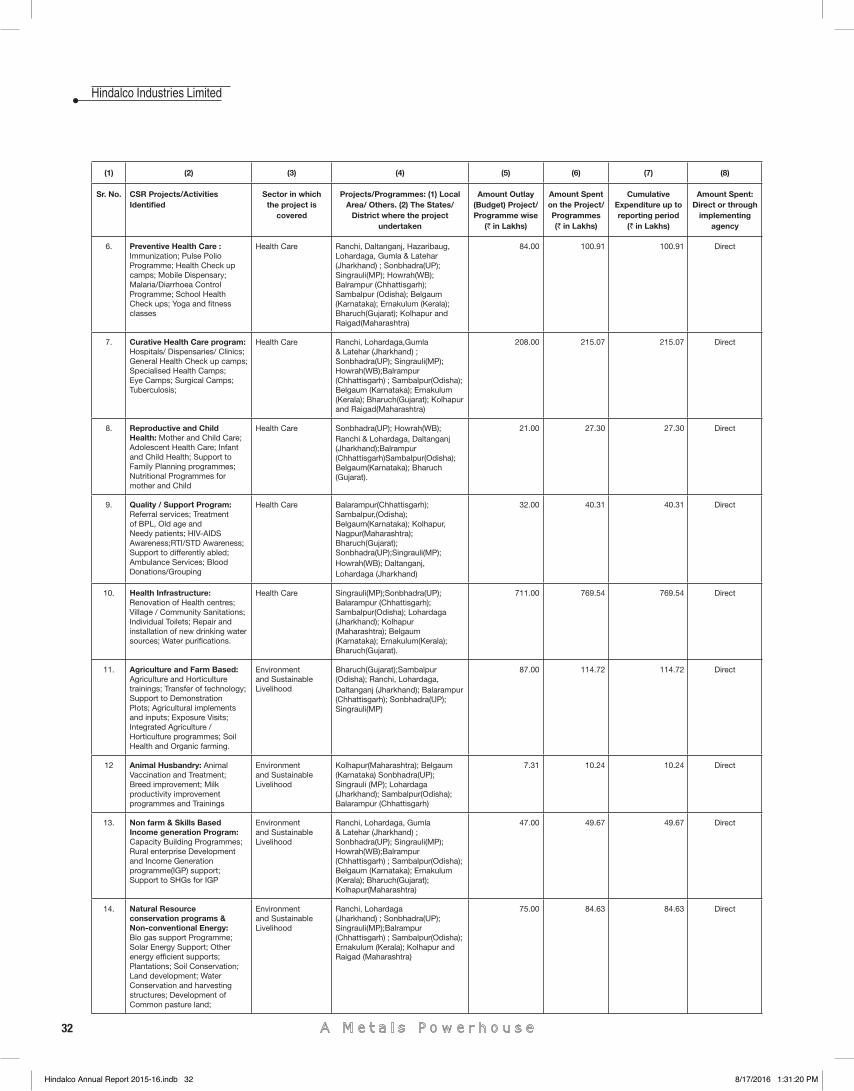
32
Hindalco Industries Limited
(1) (2) (3) (4) (5) (6) (7) (8)
Sr. No. CSR Projects/Activities Identifi ed
Sector in which the project is
covered
Projects/Programmes: (1) Local Area/ Others. (2) The States/
District where the project undertaken
Amount Outlay (Budget) Project/ Programme wise
(` in Lakhs)
Amount Spent on the Project/ Programmes (` in Lakhs)
Cumulative Expenditure up to reporting period
(` in Lakhs)
Amount Spent: Direct or through
implementing agency
6. Preventive Health Care : Immunization; Pulse Polio Programme; Health Check up camps; Mobile Dispensary; Malaria/Diarrhoea Control Programme; School Health Check ups; Yoga and fi tness classes
Health Care Ranchi, Daltanganj, Hazaribaug, Lohardaga, Gumla & Latehar (Jharkhand) ; Sonbhadra(UP); Singrauli(MP); Howrah(WB); Balrampur (Chhattisgarh); Sambalpur (Odisha); Belgaum (Karnataka); Ernakulum (Kerala); Bharuch(Gujarat); Kolhapur and Raigad(Maharashtra)
84.00 100.91 100.91 Direct
7. Curative Health Care program: Hospitals/ Dispensaries/ Clinics; General Health Check up camps; Specialised Health Camps; Eye Camps; Surgical Camps; Tuberculosis;
Health Care Ranchi, Lohardaga,Gumla & Latehar (Jharkhand) ; Sonbhadra(UP); Singrauli(MP); Howrah(WB);Balrampur (Chhattisgarh) ; Sambalpur(Odisha); Belgaum (Karnataka); Ernakulum (Kerala); Bharuch(Gujarat); Kolhapur and Raigad(Maharashtra)
208.00 215.07 215.07 Direct
8. Reproductive and Child Health: Mother and Child Care; Adolescent Health Care; Infant and Child Health; Support to Family Planning programmes; Nutritional Programmes for mother and Child
Health Care Sonbhadra(UP); Howrah(WB); Ranchi & Lohardaga, Daltanganj (Jharkhand);Balrampur (Chhattisgarh)Sambalpur(Odisha); Belgaum(Karnataka); Bharuch (Gujarat).
21.00 27.30 27.30 Direct
9. Quality / Support Program: Referral services; Treatment of BPL, Old age and Needy patients; HIV-AIDS Awareness;RTI/STD Awareness; Support to differently abled; Ambulance Services; Blood Donations/Grouping
Health Care Balarampur(Chhattisgarh); Sambalpur,(Odisha); Belgaum(Karnataka); Kolhapur, Nagpur(Maharashtra); Bharuch(Gujarat); Sonbhadra(UP);Singrauli(MP); Howrah(WB); Daltanganj, Lohardaga (Jharkhand)
32.00 40.31 40.31 Direct
10. Health Infrastructure: Renovation of Health centres; Village / Community Sanitations; Individual Toilets; Repair and installation of new drinking water sources; Water purifi cations.
Health Care Singrauli(MP);Sonbhadra(UP); Balarampur (Chhattisgarh); Sambalpur(Odisha); Lohardaga (Jharkhand); Kolhapur (Maharashtra); Belgaum (Karnataka); Ernakulum(Kerala); Bharuch(Gujarat).
711.00 769.54 769.54 Direct
11. Agriculture and Farm Based: Agriculture and Horticulture trainings; Transfer of technology; Support to Demonstration Plots; Agricultural implements and inputs; Exposure Visits; Integrated Agriculture / Horticulture programmes; Soil Health and Organic farming.
Environment and Sustainable Livelihood
Bharuch(Gujarat);Sambalpur(Odisha); Ranchi, Lohardaga, Daltanganj (Jharkhand); Balarampur (Chhattisgarh); Sonbhadra(UP); Singrauli(MP)
87.00 114.72 114.72 Direct
12 Animal Husbandry: Animal Vaccination and Treatment; Breed improvement; Milk productivity improvement programmes and Trainings
Environment and Sustainable Livelihood
Kolhapur(Maharashtra); Belgaum(Karnataka) Sonbhadra(UP); Singrauli (MP); Lohardaga (Jharkhand); Sambalpur(Odisha); Balarampur (Chhattisgarh)
7.31 10.24 10.24 Direct
13. Non farm & Skills Based Income generation Program: Capacity Building Programmes; Rural enterprise Development and Income Generation programme(IGP) support; Support to SHGs for IGP
Environment and Sustainable Livelihood
Ranchi, Lohardaga, Gumla & Latehar (Jharkhand) ; Sonbhadra(UP); Singrauli(MP); Howrah(WB);Balrampur (Chhattisgarh) ; Sambalpur(Odisha); Belgaum (Karnataka); Ernakulum (Kerala); Bharuch(Gujarat); Kolhapur(Maharashtra)
47.00 49.67 49.67 Direct
14. Natural Resource conservation programs & Non-conventional Energy: Bio gas support Programme; Solar Energy Support; Other energy effi cient supports; Plantations; Soil Conservation; Land development; Water Conservation and harvesting structures; Development of Common pasture land;
Environment and Sustainable Livelihood
Ranchi, Lohardaga(Jharkhand) ; Sonbhadra(UP); Singrauli(MP);Balrampur (Chhattisgarh) ; Sambalpur(Odisha); Ernakulum (Kerala); Kolhapur and Raigad (Maharashtra)
75.00 84.63 84.63 Direct
Hindalco Annual Report 2015-16.indb 32Hindalco Annual Report 2015-16.indb 32 8/17/2016 1:31:20 PM8/17/2016 1:31:20 PM
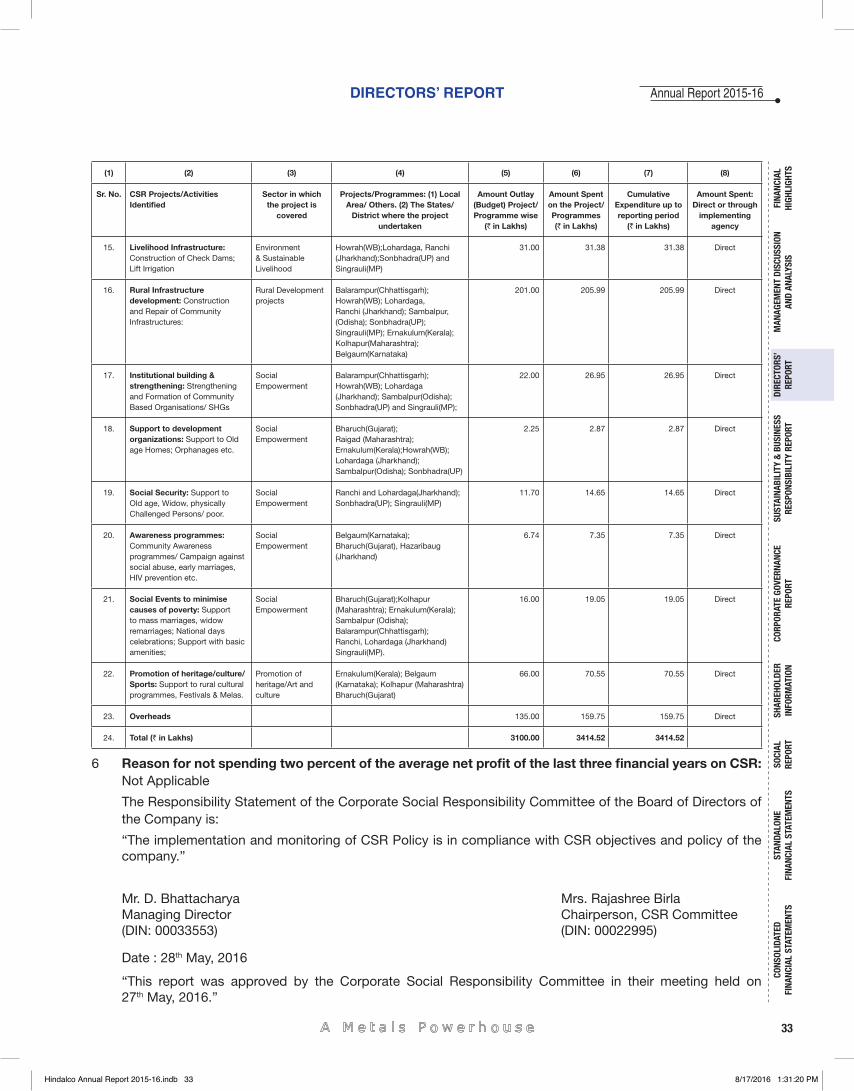
33
DIRECTORS’ REPORT
FINA
NCIA
L HI
GHLI
GHTS
MAN
AGEM
ENT
DISC
USSI
ON
AND
ANAL
YSIS
CORP
ORAT
E GO
VERN
ANCE
RE
PORT
STAN
DALO
NE
FINA
NCIA
L ST
ATEM
ENTS
CONS
OLID
ATED
FI
NANC
IAL
STAT
EMEN
TSSO
CIAL
RE
PORT
DIRE
CTOR
S’RE
PORT
SHAR
EHOL
DER
INFO
RMAT
ION
SUST
AINA
BILI
TY &
BUS
INES
SRE
SPON
SIBI
LITY
REP
ORT
Annual Report 2015-16
(1) (2) (3) (4) (5) (6) (7) (8)
Sr. No. CSR Projects/Activities Identifi ed
Sector in which the project is
covered
Projects/Programmes: (1) Local Area/ Others. (2) The States/
District where the project undertaken
Amount Outlay (Budget) Project/ Programme wise
(` in Lakhs)
Amount Spent on the Project/ Programmes (` in Lakhs)
Cumulative Expenditure up to reporting period
(` in Lakhs)
Amount Spent: Direct or through
implementing agency
15. Livelihood Infrastructure: Construction of Check Dams; Lift Irrigation
Environment & Sustainable Livelihood
Howrah(WB);Lohardaga, Ranchi (Jharkhand);Sonbhadra(UP) and Singrauli(MP)
31.00 31.38 31.38 Direct
16. Rural Infrastructure development: Construction and Repair of Community Infrastructures:
Rural Development projects
Balarampur(Chhattisgarh);Howrah(WB); Lohardaga, Ranchi (Jharkhand); Sambalpur, (Odisha); Sonbhadra(UP); Singrauli(MP); Ernakulum(Kerala); Kolhapur(Maharashtra); Belgaum(Karnataka)
201.00 205.99 205.99 Direct
17. Institutional building & strengthening: Strengthening and Formation of Community Based Organisations/ SHGs
Social Empowerment
Balarampur(Chhattisgarh); Howrah(WB); Lohardaga (Jharkhand); Sambalpur(Odisha); Sonbhadra(UP) and Singrauli(MP);
22.00 26.95 26.95 Direct
18. Support to development organizations: Support to Old age Homes; Orphanages etc.
Social Empowerment
Bharuch(Gujarat); Raigad (Maharashtra); Ernakulum(Kerala);Howrah(WB); Lohardaga (Jharkhand); Sambalpur(Odisha); Sonbhadra(UP)
2.25 2.87 2.87 Direct
19. Social Security: Support to Old age, Widow, physically Challenged Persons/ poor.
Social Empowerment
Ranchi and Lohardaga(Jharkhand); Sonbhadra(UP); Singrauli(MP)
11.70 14.65 14.65 Direct
20. Awareness programmes: Community Awareness programmes/ Campaign against social abuse, early marriages, HIV prevention etc.
Social Empowerment
Belgaum(Karnataka); Bharuch(Gujarat), Hazaribaug (Jharkhand)
6.74 7.35 7.35 Direct
21. Social Events to minimise causes of poverty: Support to mass marriages, widow remarriages; National days celebrations; Support with basic amenities;
Social Empowerment
Bharuch(Gujarat);Kolhapur(Maharashtra); Ernakulum(Kerala); Sambalpur (Odisha); Balarampur(Chhattisgarh); Ranchi, Lohardaga (Jharkhand) Singrauli(MP).
16.00 19.05 19.05 Direct
22. Promotion of heritage/culture/Sports: Support to rural cultural programmes, Festivals & Melas.
Promotion of heritage/Art and culture
Ernakulum(Kerala); Belgaum (Karnataka); Kolhapur (Maharashtra) Bharuch(Gujarat)
66.00 70.55 70.55 Direct
23. Overheads 135.00 159.75 159.75 Direct
24. Total (` in Lakhs) 3100.00 3414.52 3414.52
6 Reason for not spending two percent of the average net profi t of the last three fi nancial years on CSR: Not Applicable
The Responsibility Statement of the Corporate Social Responsibility Committee of the Board of Directors of the Company is:
“The implementation and monitoring of CSR Policy is in compliance with CSR objectives and policy of the company.”
Mr. D. Bhattacharya Mrs. Rajashree BirlaManaging Director Chairperson, CSR Committee(DIN: 00033553) (DIN: 00022995)
Date : 28th May, 2016
“This report was approved by the Corporate Social Responsibility Committee in their meeting held on 27th May, 2016.”
Hindalco Annual Report 2015-16.indb 33Hindalco Annual Report 2015-16.indb 33 8/17/2016 1:31:20 PM8/17/2016 1:31:20 PM
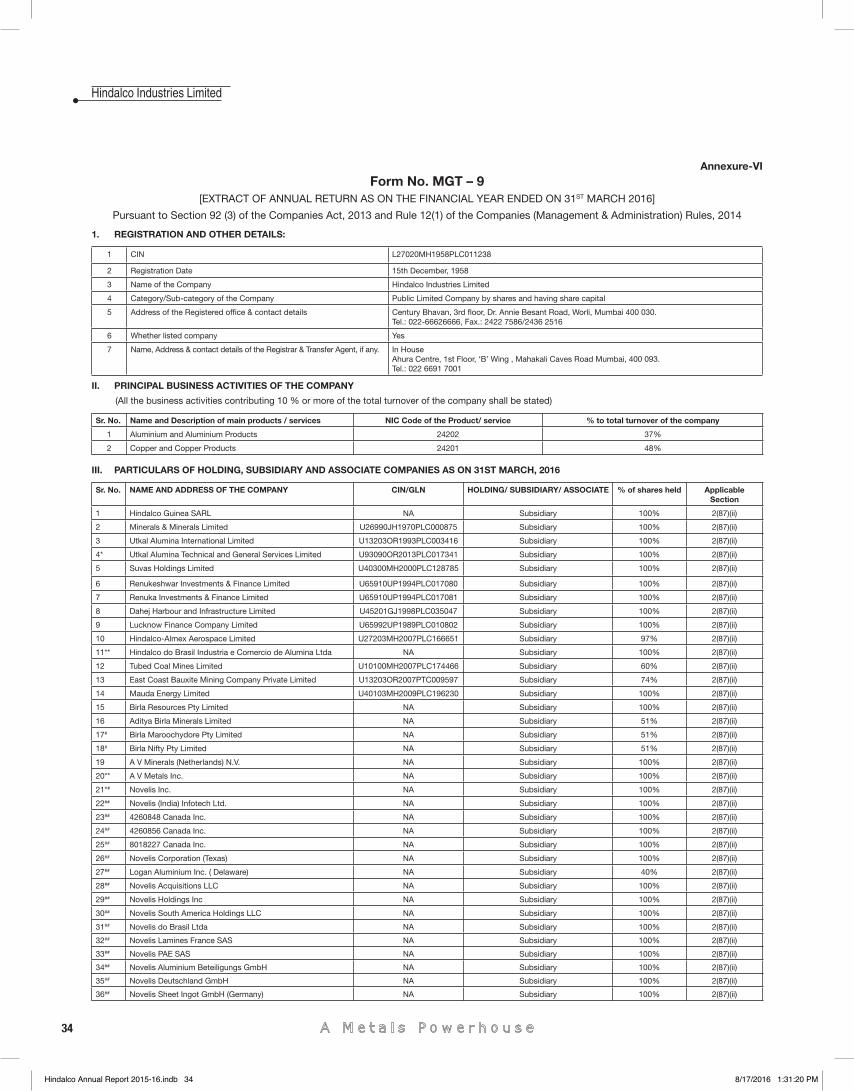
34
Hindalco Industries Limited
Annexure-VI
Form No. MGT – 9[EXTRACT OF ANNUAL RETURN AS ON THE FINANCIAL YEAR ENDED ON 31ST MARCH 2016]
Pursuant to Section 92 (3) of the Companies Act, 2013 and Rule 12(1) of the Companies (Management & Administration) Rules, 2014
1. REGISTRATION AND OTHER DETAILS:
1 CIN L27020MH1958PLC011238
2 Registration Date 15th December, 1958
3 Name of the Company Hindalco Industries Limited
4 Category/Sub-category of the Company Public Limited Company by shares and having share capital
5 Address of the Registered offi ce & contact details Century Bhavan, 3rd fl oor, Dr. Annie Besant Road, Worli, Mumbai 400 030.Tel.: 022-66626666, Fax.: 2422 7586/2436 2516
6 Whether listed company Yes
7 Name, Address & contact details of the Registrar & Transfer Agent, if any. In House Ahura Centre, 1st Floor, ‘B’ Wing , Mahakali Caves Road Mumbai, 400 093.Tel.: 022 6691 7001
II. PRINCIPAL BUSINESS ACTIVITIES OF THE COMPANY
(All the business activities contributing 10 % or more of the total turnover of the company shall be stated)
Sr. No. Name and Description of main products / services NIC Code of the Product/ service % to total turnover of the company
1 Aluminium and Aluminium Products 24202 37%
2 Copper and Copper Products 24201 48%
III. PARTICULARS OF HOLDING, SUBSIDIARY AND ASSOCIATE COMPANIES AS ON 31ST MARCH, 2016
Sr. No. NAME AND ADDRESS OF THE COMPANY CIN/GLN HOLDING/ SUBSIDIARY/ ASSOCIATE % of shares held Applicable Section
1 Hindalco Guinea SARL NA Subsidiary 100% 2(87)(ii)
2 Minerals & Minerals Limited U26990JH1970PLC000875 Subsidiary 100% 2(87)(ii)
3 Utkal Alumina International Limited U13203OR1993PLC003416 Subsidiary 100% 2(87)(ii)
4* Utkal Alumina Technical and General Services Limited U93090OR2013PLC017341 Subsidiary 100% 2(87)(ii)
5 Suvas Holdings Limited U40300MH2000PLC128785 Subsidiary 100% 2(87)(ii)
6 Renukeshwar Investments & Finance Limited U65910UP1994PLC017080 Subsidiary 100% 2(87)(ii)
7 Renuka Investments & Finance Limited U65910UP1994PLC017081 Subsidiary 100% 2(87)(ii)
8 Dahej Harbour and Infrastructure Limited U45201GJ1998PLC035047 Subsidiary 100% 2(87)(ii)
9 Lucknow Finance Company Limited U65992UP1989PLC010802 Subsidiary 100% 2(87)(ii)
10 Hindalco-Almex Aerospace Limited U27203MH2007PLC166651 Subsidiary 97% 2(87)(ii)
11** Hindalco do Brasil Industria e Comercio de Alumina Ltda NA Subsidiary 100% 2(87)(ii)
12 Tubed Coal Mines Limited U10100MH2007PLC174466 Subsidiary 60% 2(87)(ii)
13 East Coast Bauxite Mining Company Private Limited U13203OR2007PTC009597 Subsidiary 74% 2(87)(ii)
14 Mauda Energy Limited U40103MH2009PLC196230 Subsidiary 100% 2(87)(ii)
15 Birla Resources Pty Limited NA Subsidiary 100% 2(87)(ii)
16 Aditya Birla Minerals Limited NA Subsidiary 51% 2(87)(ii)
17# Birla Maroochydore Pty Limited NA Subsidiary 51% 2(87)(ii)
18# Birla Nifty Pty Limited NA Subsidiary 51% 2(87)(ii)
19 A V Minerals (Netherlands) N.V. NA Subsidiary 100% 2(87)(ii)
20** A V Metals Inc. NA Subsidiary 100% 2(87)(ii)
21*# Novelis Inc. NA Subsidiary 100% 2(87)(ii)
22## Novelis (India) Infotech Ltd. NA Subsidiary 100% 2(87)(ii)
23## 4260848 Canada Inc. NA Subsidiary 100% 2(87)(ii)
24## 4260856 Canada Inc. NA Subsidiary 100% 2(87)(ii)
25## 8018227 Canada Inc. NA Subsidiary 100% 2(87)(ii)
26## Novelis Corporation (Texas) NA Subsidiary 100% 2(87)(ii)
27## Logan Aluminium Inc. ( Delaware) NA Subsidiary 40% 2(87)(ii)
28## Novelis Acquisitions LLC NA Subsidiary 100% 2(87)(ii)
29## Novelis Holdings Inc NA Subsidiary 100% 2(87)(ii)
30## Novelis South America Holdings LLC NA Subsidiary 100% 2(87)(ii)
31## Novelis do Brasil Ltda NA Subsidiary 100% 2(87)(ii)
32## Novelis Lamines France SAS NA Subsidiary 100% 2(87)(ii)
33## Novelis PAE SAS NA Subsidiary 100% 2(87)(ii)
34## Novelis Aluminium Beteiligungs GmbH NA Subsidiary 100% 2(87)(ii)
35## Novelis Deutschland GmbH NA Subsidiary 100% 2(87)(ii)
36## Novelis Sheet Ingot GmbH (Germany) NA Subsidiary 100% 2(87)(ii)
Hindalco Annual Report 2015-16.indb 34Hindalco Annual Report 2015-16.indb 34 8/17/2016 1:31:20 PM8/17/2016 1:31:20 PM
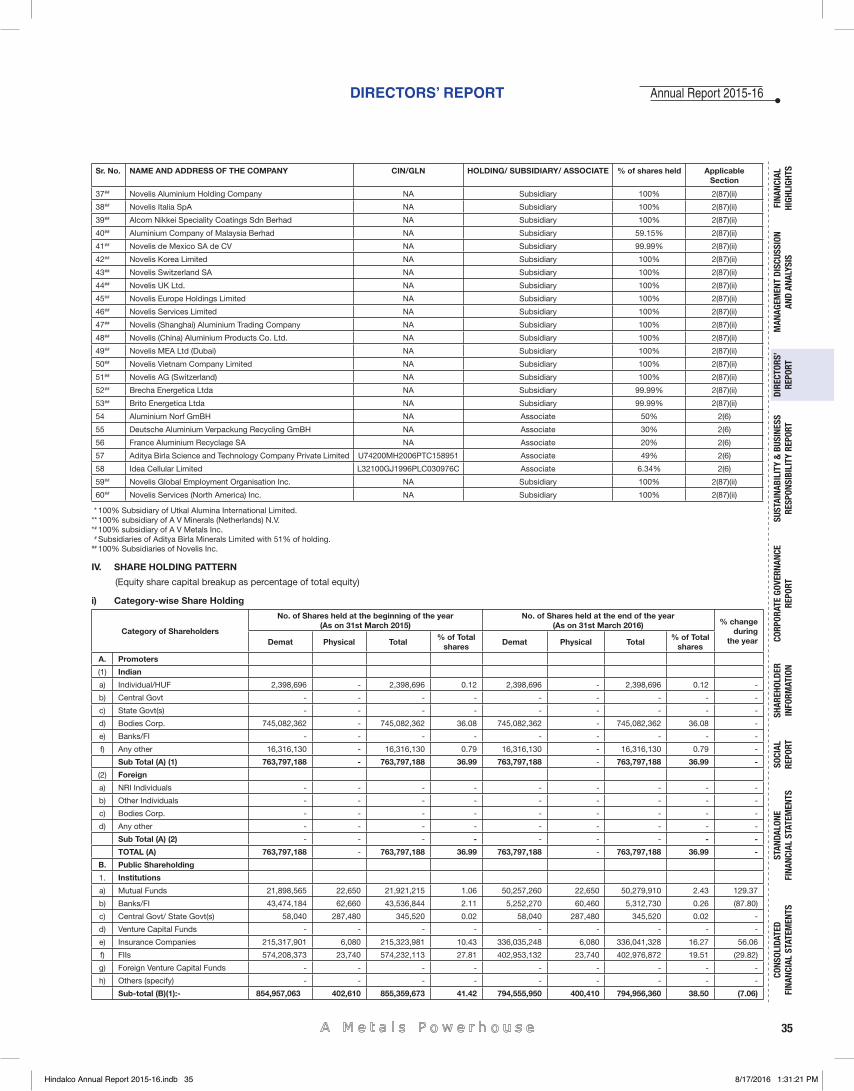
35
DIRECTORS’ REPORT
FINA
NCIA
L HI
GHLI
GHTS
MAN
AGEM
ENT
DISC
USSI
ON
AND
ANAL
YSIS
CORP
ORAT
E GO
VERN
ANCE
RE
PORT
STAN
DALO
NE
FINA
NCIA
L ST
ATEM
ENTS
CONS
OLID
ATED
FI
NANC
IAL
STAT
EMEN
TSSO
CIAL
RE
PORT
DIRE
CTOR
S’RE
PORT
SHAR
EHOL
DER
INFO
RMAT
ION
SUST
AINA
BILI
TY &
BUS
INES
SRE
SPON
SIBI
LITY
REP
ORT
Annual Report 2015-16
Sr. No. NAME AND ADDRESS OF THE COMPANY CIN/GLN HOLDING/ SUBSIDIARY/ ASSOCIATE % of shares held Applicable Section
37## Novelis Aluminium Holding Company NA Subsidiary 100% 2(87)(ii)
38## Novelis Italia SpA NA Subsidiary 100% 2(87)(ii)
39## Alcom Nikkei Speciality Coatings Sdn Berhad NA Subsidiary 100% 2(87)(ii)
40## Aluminium Company of Malaysia Berhad NA Subsidiary 59.15% 2(87)(ii)
41## Novelis de Mexico SA de CV NA Subsidiary 99.99% 2(87)(ii)
42## Novelis Korea Limited NA Subsidiary 100% 2(87)(ii)
43## Novelis Switzerland SA NA Subsidiary 100% 2(87)(ii)
44## Novelis UK Ltd. NA Subsidiary 100% 2(87)(ii)
45## Novelis Europe Holdings Limited NA Subsidiary 100% 2(87)(ii)
46## Novelis Services Limited NA Subsidiary 100% 2(87)(ii)
47## Novelis (Shanghai) Aluminium Trading Company NA Subsidiary 100% 2(87)(ii)
48## Novelis (China) Aluminium Products Co. Ltd. NA Subsidiary 100% 2(87)(ii)
49## Novelis MEA Ltd (Dubai) NA Subsidiary 100% 2(87)(ii)
50## Novelis Vietnam Company Limited NA Subsidiary 100% 2(87)(ii)
51## Novelis AG (Switzerland) NA Subsidiary 100% 2(87)(ii)
52## Brecha Energetica Ltda NA Subsidiary 99.99% 2(87)(ii)
53## Brito Energetica Ltda NA Subsidiary 99.99% 2(87)(ii)
54 Aluminium Norf GmBH NA Associate 50% 2(6)
55 Deutsche Aluminium Verpackung Recycling GmBH NA Associate 30% 2(6)
56 France Aluminium Recyclage SA NA Associate 20% 2(6)
57 Aditya Birla Science and Technology Company Private Limited U74200MH2006PTC158951 Associate 49% 2(6)
58 Idea Cellular Limited L32100GJ1996PLC030976C Associate 6.34% 2(6)
59## Novelis Global Employment Organisation Inc. NA Subsidiary 100% 2(87)(ii)
60## Novelis Services (North America) Inc. NA Subsidiary 100% 2(87)(ii)
* 100% Subsidiary of Utkal Alumina International Limited. ** 100% subsidiary of A V Minerals (Netherlands) N.V. *# 100% subsidiary of A V Metals Inc. # Subsidiaries of Aditya Birla Minerals Limited with 51% of holding. ## 100% Subsidiaries of Novelis Inc.
IV. SHARE HOLDING PATTERN
(Equity share capital breakup as percentage of total equity)
i) Category-wise Share Holding
Category of Shareholders
No. of Shares held at the beginning of the year(As on 31st March 2015)
No. of Shares held at the end of the year(As on 31st March 2016) % change
during the yearDemat Physical Total
% of Total shares
Demat Physical Total % of Total
shares
A. Promoters
(1) Indian
a) Individual/HUF 2,398,696 - 2,398,696 0.12 2,398,696 - 2,398,696 0.12 -
b) Central Govt - - - - - - - - -
c) State Govt(s) - - - - - - - - -
d) Bodies Corp. 745,082,362 - 745,082,362 36.08 745,082,362 - 745,082,362 36.08 -
e) Banks/FI - - - - - - - - -
f) Any other 16,316,130 - 16,316,130 0.79 16,316,130 - 16,316,130 0.79 -
Sub Total (A) (1) 763,797,188 - 763,797,188 36.99 763,797,188 - 763,797,188 36.99 -
(2) Foreign
a) NRI Individuals - - - - - - - - -
b) Other Individuals - - - - - - - - -
c) Bodies Corp. - - - - - - - - -
d) Any other - - - - - - - - -
Sub Total (A) (2) - - - - - - - - -
TOTAL (A) 763,797,188 - 763,797,188 36.99 763,797,188 - 763,797,188 36.99 -
B. Public Shareholding
1. Institutions
a) Mutual Funds 21,898,565 22,650 21,921,215 1.06 50,257,260 22,650 50,279,910 2.43 129.37
b) Banks/FI 43,474,184 62,660 43,536,844 2.11 5,252,270 60,460 5,312,730 0.26 (87.80)
c) Central Govt/ State Govt(s) 58,040 287,480 345,520 0.02 58,040 287,480 345,520 0.02 -
d) Venture Capital Funds - - - - - - - - -
e) Insurance Companies 215,317,901 6,080 215,323,981 10.43 336,035,248 6,080 336,041,328 16.27 56.06
f) FIIs 574,208,373 23,740 574,232,113 27.81 402,953,132 23,740 402,976,872 19.51 (29.82)
g) Foreign Venture Capital Funds - - - - - - - - -
h) Others (specify) - - - - - - - - -
Sub-total (B)(1):- 854,957,063 402,610 855,359,673 41.42 794,555,950 400,410 794,956,360 38.50 (7.06)
Hindalco Annual Report 2015-16.indb 35Hindalco Annual Report 2015-16.indb 35 8/17/2016 1:31:21 PM8/17/2016 1:31:21 PM
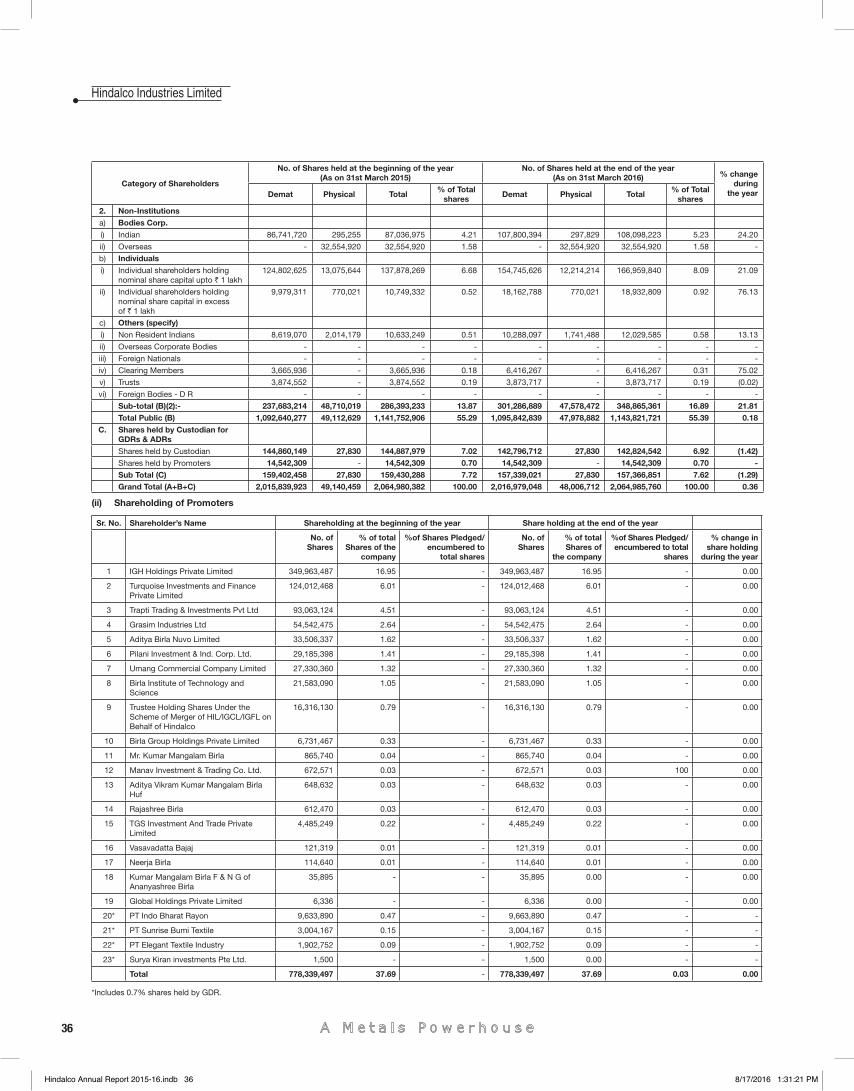
36
Hindalco Industries Limited
Category of Shareholders
No. of Shares held at the beginning of the year(As on 31st March 2015)
No. of Shares held at the end of the year(As on 31st March 2016) % change
during the yearDemat Physical Total
% of Total shares
Demat Physical Total % of Total
shares2. Non-Institutions
a) Bodies Corp.
i) Indian 86,741,720 295,255 87,036,975 4.21 107,800,394 297,829 108,098,223 5.23 24.20
ii) Overseas - 32,554,920 32,554,920 1.58 - 32,554,920 32,554,920 1.58 -
b) Individuals
i) Individual shareholders holding nominal share capital upto ` 1 lakh
124,802,625 13,075,644 137,878,269 6.68 154,745,626 12,214,214 166,959,840 8.09 21.09
ii) Individual shareholders holding nominal share capital in excess of ` 1 lakh
9,979,311 770,021 10,749,332 0.52 18,162,788 770,021 18,932,809 0.92 76.13
c) Others (specify)
i) Non Resident Indians 8,619,070 2,014,179 10,633,249 0.51 10,288,097 1,741,488 12,029,585 0.58 13.13
ii) Overseas Corporate Bodies - - - - - - - - -
iii) Foreign Nationals - - - - - - - - -
iv) Clearing Members 3,665,936 - 3,665,936 0.18 6,416,267 - 6,416,267 0.31 75.02
v) Trusts 3,874,552 - 3,874,552 0.19 3,873,717 - 3,873,717 0.19 (0.02)
vi) Foreign Bodies - D R - - - - - - - - -
Sub-total (B)(2):- 237,683,214 48,710,019 286,393,233 13.87 301,286,889 47,578,472 348,865,361 16.89 21.81Total Public (B) 1,092,640,277 49,112,629 1,141,752,906 55.29 1,095,842,839 47,978,882 1,143,821,721 55.39 0.18
C. Shares held by Custodian for GDRs & ADRsShares held by Custodian 144,860,149 27,830 144,887,979 7.02 142,796,712 27,830 142,824,542 6.92 (1.42)
Shares held by Promoters 14,542,309 - 14,542,309 0.70 14,542,309 - 14,542,309 0.70 -Sub Total (C) 159,402,458 27,830 159,430,288 7.72 157,339,021 27,830 157,366,851 7.62 (1.29)Grand Total (A+B+C) 2,015,839,923 49,140,459 2,064,980,382 100.00 2,016,979,048 48,006,712 2,064,985,760 100.00 0.36
(ii) Shareholding of Promoters
Sr. No. Shareholder’s Name Shareholding at the beginning of the year Share holding at the end of the year
No. of Shares
% of total Shares of the
company
%of Shares Pledged/ encumbered to
total shares
No. of Shares
% of total Shares of
the company
%of Shares Pledged/encumbered to total
shares
% change in share holding
during the year
1 IGH Holdings Private Limited 349,963,487 16.95 - 349,963,487 16.95 - 0.00
2 Turquoise Investments and Finance Private Limited
124,012,468 6.01 - 124,012,468 6.01 - 0.00
3 Trapti Trading & Investments Pvt Ltd 93,063,124 4.51 - 93,063,124 4.51 - 0.00
4 Grasim Industries Ltd 54,542,475 2.64 - 54,542,475 2.64 - 0.00
5 Aditya Birla Nuvo Limited 33,506,337 1.62 - 33,506,337 1.62 - 0.00
6 Pilani Investment & Ind. Corp. Ltd. 29,185,398 1.41 - 29,185,398 1.41 - 0.00
7 Umang Commercial Company Limited 27,330,360 1.32 - 27,330,360 1.32 - 0.00
8 Birla Institute of Technology and Science
21,583,090 1.05 - 21,583,090 1.05 - 0.00
9 Trustee Holding Shares Under the Scheme of Merger of HIL/IGCL/IGFL on Behalf of Hindalco
16,316,130 0.79 - 16,316,130 0.79 - 0.00
10 Birla Group Holdings Private Limited 6,731,467 0.33 - 6,731,467 0.33 - 0.00
11 Mr. Kumar Mangalam Birla 865,740 0.04 - 865,740 0.04 - 0.00
12 Manav Investment & Trading Co. Ltd. 672,571 0.03 - 672,571 0.03 100 0.00
13 Aditya Vikram Kumar Mangalam Birla Huf
648,632 0.03 - 648,632 0.03 - 0.00
14 Rajashree Birla 612,470 0.03 - 612,470 0.03 - 0.00
15 TGS Investment And Trade Private Limited
4,485,249 0.22 - 4,485,249 0.22 - 0.00
16 Vasavadatta Bajaj 121,319 0.01 - 121,319 0.01 - 0.00
17 Neerja Birla 114,640 0.01 - 114,640 0.01 - 0.00
18 Kumar Mangalam Birla F & N G of Ananyashree Birla
35,895 - - 35,895 0.00 - 0.00
19 Global Holdings Private Limited 6,336 - - 6,336 0.00 - 0.00
20* PT Indo Bharat Rayon 9,633,890 0.47 - 9,663,890 0.47 - -
21* PT Sunrise Bumi Textile 3,004,167 0.15 - 3,004,167 0.15 - -
22* PT Elegant Textile Industry 1,902,752 0.09 - 1,902,752 0.09 - -
23* Surya Kiran investments Pte Ltd. 1,500 - - 1,500 0.00 - -
Total 778,339,497 37.69 - 778,339,497 37.69 0.03 0.00
*Includes 0.7% shares held by GDR.
Hindalco Annual Report 2015-16.indb 36Hindalco Annual Report 2015-16.indb 36 8/17/2016 1:31:21 PM8/17/2016 1:31:21 PM
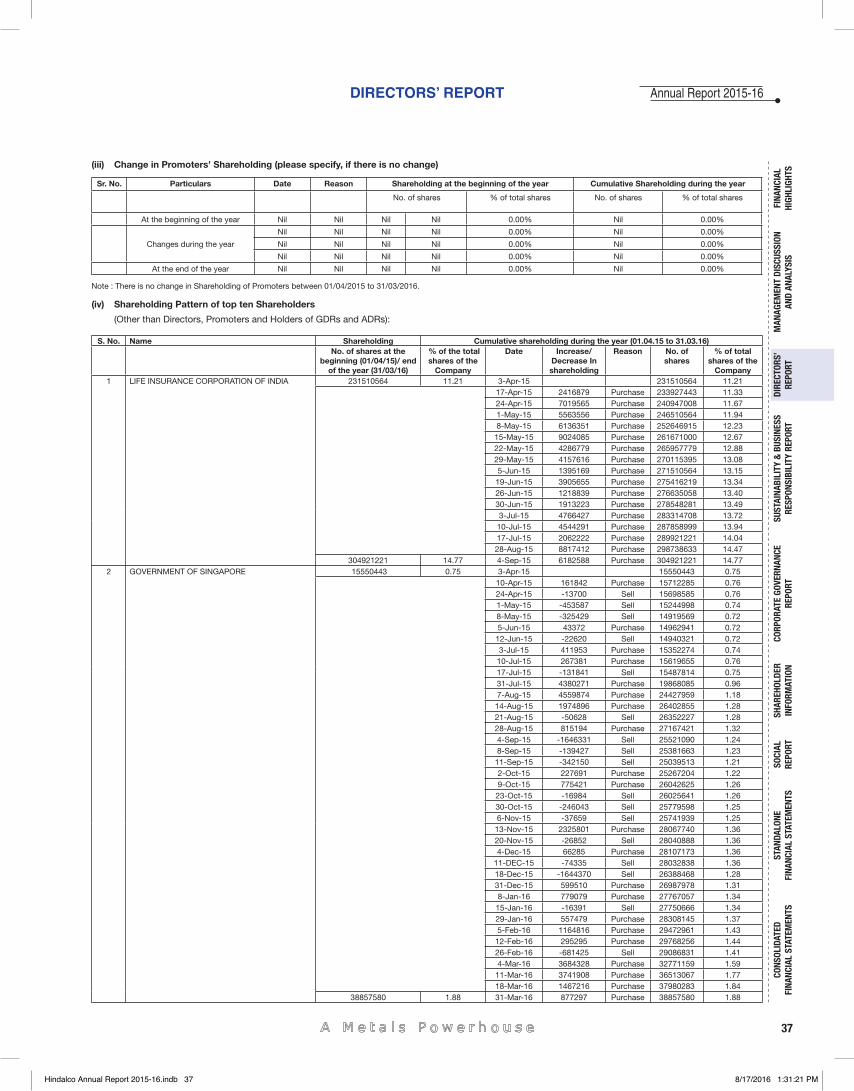
37
DIRECTORS’ REPORT
FINA
NCIA
L HI
GHLI
GHTS
MAN
AGEM
ENT
DISC
USSI
ON
AND
ANAL
YSIS
CORP
ORAT
E GO
VERN
ANCE
RE
PORT
STAN
DALO
NE
FINA
NCIA
L ST
ATEM
ENTS
CONS
OLID
ATED
FI
NANC
IAL
STAT
EMEN
TSSO
CIAL
RE
PORT
DIRE
CTOR
S’RE
PORT
SHAR
EHOL
DER
INFO
RMAT
ION
SUST
AINA
BILI
TY &
BUS
INES
SRE
SPON
SIBI
LITY
REP
ORT
Annual Report 2015-16
(iii) Change in Promoters’ Shareholding (please specify, if there is no change)
Sr. No. Particulars Date Reason Shareholding at the beginning of the year Cumulative Shareholding during the year
No. of shares % of total shares No. of shares % of total shares
At the beginning of the year Nil Nil Nil Nil 0.00% Nil 0.00%
Changes during the year
Nil Nil Nil Nil 0.00% Nil 0.00%
Nil Nil Nil Nil 0.00% Nil 0.00%
Nil Nil Nil Nil 0.00% Nil 0.00%
At the end of the year Nil Nil Nil Nil 0.00% Nil 0.00%
Note : There is no change in Shareholding of Promoters between 01/04/2015 to 31/03/2016.
(iv) Shareholding Pattern of top ten Shareholders
(Other than Directors, Promoters and Holders of GDRs and ADRs):
S. No. Name Shareholding Cumulative shareholding during the year (01.04.15 to 31.03.16)No. of shares at the
beginning (01/04/15)/ end of the year (31/03/16)
% of the total shares of the
Company
Date Increase/Decrease In shareholding
Reason No. of shares
% of total shares of the
Company1 LIFE INSURANCE CORPORATION OF INDIA 231510564 11.21 3-Apr-15 231510564 11.21
17-Apr-15 2416879 Purchase 233927443 11.3324-Apr-15 7019565 Purchase 240947008 11.671-May-15 5563556 Purchase 246510564 11.948-May-15 6136351 Purchase 252646915 12.2315-May-15 9024085 Purchase 261671000 12.6722-May-15 4286779 Purchase 265957779 12.8829-May-15 4157616 Purchase 270115395 13.085-Jun-15 1395169 Purchase 271510564 13.1519-Jun-15 3905655 Purchase 275416219 13.3426-Jun-15 1218839 Purchase 276635058 13.4030-Jun-15 1913223 Purchase 278548281 13.493-Jul-15 4766427 Purchase 283314708 13.7210-Jul-15 4544291 Purchase 287858999 13.9417-Jul-15 2062222 Purchase 289921221 14.0428-Aug-15 8817412 Purchase 298738633 14.47
304921221 14.77 4-Sep-15 6182588 Purchase 304921221 14.772 GOVERNMENT OF SINGAPORE 15550443 0.75 3-Apr-15 15550443 0.75
10-Apr-15 161842 Purchase 15712285 0.7624-Apr-15 -13700 Sell 15698585 0.761-May-15 -453587 Sell 15244998 0.748-May-15 -325429 Sell 14919569 0.725-Jun-15 43372 Purchase 14962941 0.7212-Jun-15 -22620 Sell 14940321 0.723-Jul-15 411953 Purchase 15352274 0.7410-Jul-15 267381 Purchase 15619655 0.7617-Jul-15 -131841 Sell 15487814 0.7531-Jul-15 4380271 Purchase 19868085 0.967-Aug-15 4559874 Purchase 24427959 1.1814-Aug-15 1974896 Purchase 26402855 1.2821-Aug-15 -50628 Sell 26352227 1.2828-Aug-15 815194 Purchase 27167421 1.324-Sep-15 -1646331 Sell 25521090 1.248-Sep-15 -139427 Sell 25381663 1.2311-Sep-15 -342150 Sell 25039513 1.212-Oct-15 227691 Purchase 25267204 1.229-Oct-15 775421 Purchase 26042625 1.2623-Oct-15 -16984 Sell 26025641 1.2630-Oct-15 -246043 Sell 25779598 1.256-Nov-15 -37659 Sell 25741939 1.2513-Nov-15 2325801 Purchase 28067740 1.3620-Nov-15 -26852 Sell 28040888 1.364-Dec-15 66285 Purchase 28107173 1.36
11-DEC-15 -74335 Sell 28032838 1.3618-Dec-15 -1644370 Sell 26388468 1.2831-Dec-15 599510 Purchase 26987978 1.318-Jan-16 779079 Purchase 27767057 1.3415-Jan-16 -16391 Sell 27750666 1.3429-Jan-16 557479 Purchase 28308145 1.375-Feb-16 1164816 Purchase 29472961 1.4312-Feb-16 295295 Purchase 29768256 1.4426-Feb-16 -681425 Sell 29086831 1.414-Mar-16 3684328 Purchase 32771159 1.5911-Mar-16 3741908 Purchase 36513067 1.7718-Mar-16 1467216 Purchase 37980283 1.84
38857580 1.88 31-Mar-16 877297 Purchase 38857580 1.88
Hindalco Annual Report 2015-16.indb 37Hindalco Annual Report 2015-16.indb 37 8/17/2016 1:31:21 PM8/17/2016 1:31:21 PM
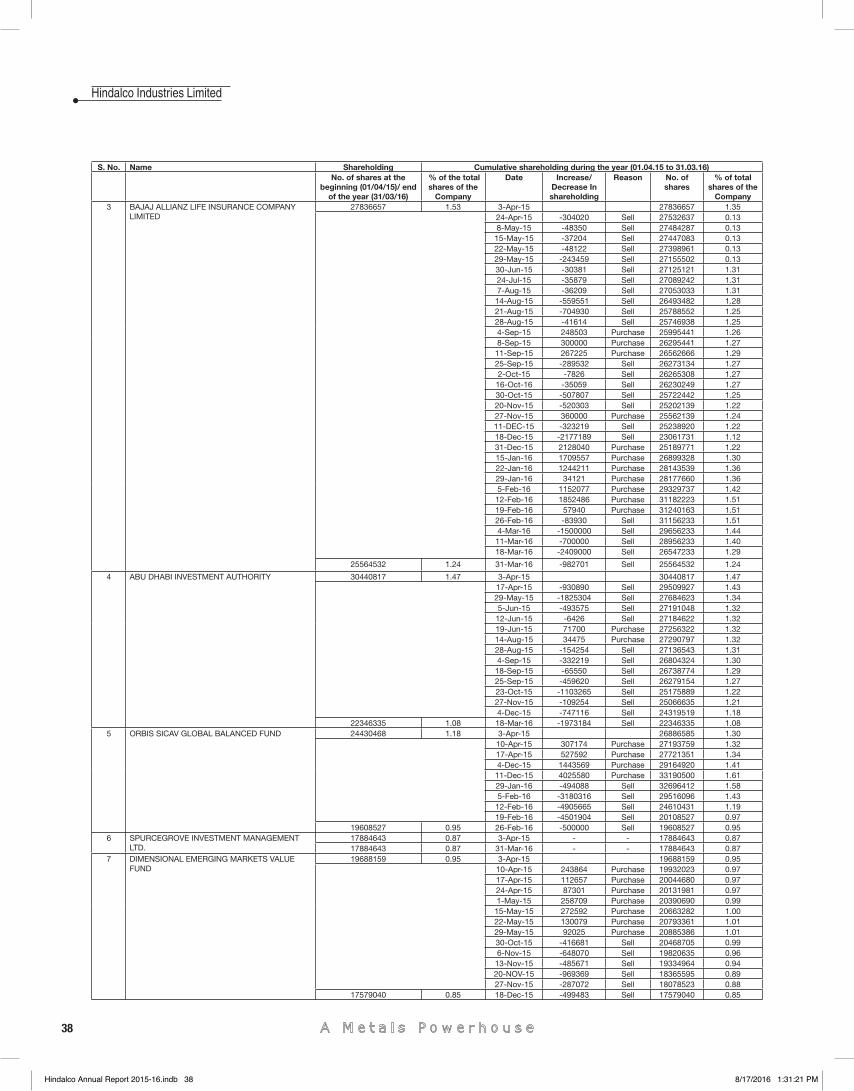
38
Hindalco Industries Limited
S. No. Name Shareholding Cumulative shareholding during the year (01.04.15 to 31.03.16)No. of shares at the
beginning (01/04/15)/ end of the year (31/03/16)
% of the total shares of the
Company
Date Increase/Decrease In shareholding
Reason No. of shares
% of total shares of the
Company3 BAJAJ ALLIANZ LIFE INSURANCE COMPANY
LIMITED27836657 1.53 3-Apr-15 27836657 1.35
24-Apr-15 -304020 Sell 27532637 0.138-May-15 -48350 Sell 27484287 0.1315-May-15 -37204 Sell 27447083 0.1322-May-15 -48122 Sell 27398961 0.1329-May-15 -243459 Sell 27155502 0.1330-Jun-15 -30381 Sell 27125121 1.3124-Jul-15 -35879 Sell 27089242 1.317-Aug-15 -36209 Sell 27053033 1.3114-Aug-15 -559551 Sell 26493482 1.2821-Aug-15 -704930 Sell 25788552 1.2528-Aug-15 -41614 Sell 25746938 1.254-Sep-15 248503 Purchase 25995441 1.268-Sep-15 300000 Purchase 26295441 1.2711-Sep-15 267225 Purchase 26562666 1.2925-Sep-15 -289532 Sell 26273134 1.272-Oct-15 -7826 Sell 26265308 1.2716-Oct-16 -35059 Sell 26230249 1.2730-Oct-15 -507807 Sell 25722442 1.2520-Nov-15 -520303 Sell 25202139 1.2227-Nov-15 360000 Purchase 25562139 1.2411-DEC-15 -323219 Sell 25238920 1.2218-Dec-15 -2177189 Sell 23061731 1.1231-Dec-15 2128040 Purchase 25189771 1.2215-Jan-16 1709557 Purchase 26899328 1.3022-Jan-16 1244211 Purchase 28143539 1.3629-Jan-16 34121 Purchase 28177660 1.365-Feb-16 1152077 Purchase 29329737 1.4212-Feb-16 1852486 Purchase 31182223 1.5119-Feb-16 57940 Purchase 31240163 1.5126-Feb-16 -83930 Sell 31156233 1.514-Mar-16 -1500000 Sell 29656233 1.4411-Mar-16 -700000 Sell 28956233 1.4018-Mar-16 -2409000 Sell 26547233 1.29
25564532 1.24 31-Mar-16 -982701 Sell 25564532 1.24
4 ABU DHABI INVESTMENT AUTHORITY 30440817 1.47 3-Apr-15 30440817 1.4717-Apr-15 -930890 Sell 29509927 1.4329-May-15 -1825304 Sell 27684623 1.345-Jun-15 -493575 Sell 27191048 1.3212-Jun-15 -6426 Sell 27184622 1.3219-Jun-15 71700 Purchase 27256322 1.3214-Aug-15 34475 Purchase 27290797 1.3228-Aug-15 -154254 Sell 27136543 1.314-Sep-15 -332219 Sell 26804324 1.3018-Sep-15 -65550 Sell 26738774 1.2925-Sep-15 -459620 Sell 26279154 1.2723-Oct-15 -1103265 Sell 25175889 1.2227-Nov-15 -109254 Sell 25066635 1.214-Dec-15 -747116 Sell 24319519 1.18
22346335 1.08 18-Mar-16 -1973184 Sell 22346335 1.085 ORBIS SICAV GLOBAL BALANCED FUND 24430468 1.18 3-Apr-15 26886585 1.30
10-Apr-15 307174 Purchase 27193759 1.3217-Apr-15 527592 Purchase 27721351 1.344-Dec-15 1443569 Purchase 29164920 1.4111-Dec-15 4025580 Purchase 33190500 1.6129-Jan-16 -494088 Sell 32696412 1.585-Feb-16 -3180316 Sell 29516096 1.4312-Feb-16 -4905665 Sell 24610431 1.1919-Feb-16 -4501904 Sell 20108527 0.97
19608527 0.95 26-Feb-16 -500000 Sell 19608527 0.956 SPURCEGROVE INVESTMENT MANAGEMENT
LTD.17884643 0.87 3-Apr-15 - - 17884643 0.8717884643 0.87 31-Mar-16 - - 17884643 0.87
7 DIMENSIONAL EMERGING MARKETS VALUE FUND
19688159 0.95 3-Apr-15 19688159 0.9510-Apr-15 243864 Purchase 19932023 0.9717-Apr-15 112657 Purchase 20044680 0.9724-Apr-15 87301 Purchase 20131981 0.971-May-15 258709 Purchase 20390690 0.9915-May-15 272592 Purchase 20663282 1.0022-May-15 130079 Purchase 20793361 1.0129-May-15 92025 Purchase 20885386 1.0130-Oct-15 -416681 Sell 20468705 0.996-Nov-15 -648070 Sell 19820635 0.9613-Nov-15 -485671 Sell 19334964 0.9420-NOV-15 -969369 Sell 18365595 0.8927-Nov-15 -287072 Sell 18078523 0.88
17579040 0.85 18-Dec-15 -499483 Sell 17579040 0.85
Hindalco Annual Report 2015-16.indb 38Hindalco Annual Report 2015-16.indb 38 8/17/2016 1:31:21 PM8/17/2016 1:31:21 PM
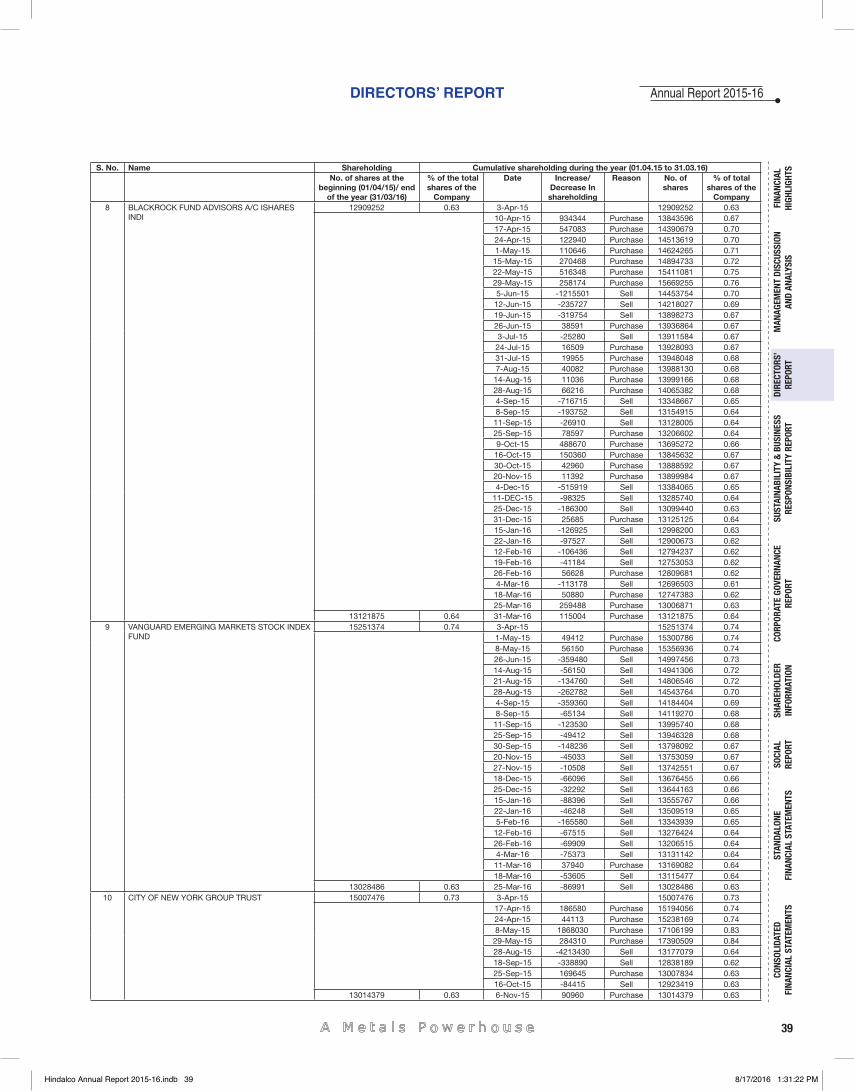
39
DIRECTORS’ REPORT
FINA
NCIA
L HI
GHLI
GHTS
MAN
AGEM
ENT
DISC
USSI
ON
AND
ANAL
YSIS
CORP
ORAT
E GO
VERN
ANCE
RE
PORT
STAN
DALO
NE
FINA
NCIA
L ST
ATEM
ENTS
CONS
OLID
ATED
FI
NANC
IAL
STAT
EMEN
TSSO
CIAL
RE
PORT
DIRE
CTOR
S’RE
PORT
SHAR
EHOL
DER
INFO
RMAT
ION
SUST
AINA
BILI
TY &
BUS
INES
SRE
SPON
SIBI
LITY
REP
ORT
Annual Report 2015-16
S. No. Name Shareholding Cumulative shareholding during the year (01.04.15 to 31.03.16)No. of shares at the
beginning (01/04/15)/ end of the year (31/03/16)
% of the total shares of the
Company
Date Increase/Decrease In shareholding
Reason No. of shares
% of total shares of the
Company8 BLACKROCK FUND ADVISORS A/C ISHARES
INDI12909252 0.63 3-Apr-15 12909252 0.63
10-Apr-15 934344 Purchase 13843596 0.6717-Apr-15 547083 Purchase 14390679 0.7024-Apr-15 122940 Purchase 14513619 0.701-May-15 110646 Purchase 14624265 0.7115-May-15 270468 Purchase 14894733 0.7222-May-15 516348 Purchase 15411081 0.7529-May-15 258174 Purchase 15669255 0.765-Jun-15 -1215501 Sell 14453754 0.7012-Jun-15 -235727 Sell 14218027 0.6919-Jun-15 -319754 Sell 13898273 0.6726-Jun-15 38591 Purchase 13936864 0.673-Jul-15 -25280 Sell 13911584 0.6724-Jul-15 16509 Purchase 13928093 0.6731-Jul-15 19955 Purchase 13948048 0.687-Aug-15 40082 Purchase 13988130 0.6814-Aug-15 11036 Purchase 13999166 0.6828-Aug-15 66216 Purchase 14065382 0.684-Sep-15 -716715 Sell 13348667 0.658-Sep-15 -193752 Sell 13154915 0.6411-Sep-15 -26910 Sell 13128005 0.6425-Sep-15 78597 Purchase 13206602 0.649-Oct-15 488670 Purchase 13695272 0.6616-Oct-15 150360 Purchase 13845632 0.6730-Oct-15 42960 Purchase 13888592 0.6720-Nov-15 11392 Purchase 13899984 0.674-Dec-15 -515919 Sell 13384065 0.65
11-DEC-15 -98325 Sell 13285740 0.6425-Dec-15 -186300 Sell 13099440 0.6331-Dec-15 25685 Purchase 13125125 0.6415-Jan-16 -126925 Sell 12998200 0.6322-Jan-16 -97527 Sell 12900673 0.6212-Feb-16 -106436 Sell 12794237 0.6219-Feb-16 -41184 Sell 12753053 0.6226-Feb-16 56628 Purchase 12809681 0.624-Mar-16 -113178 Sell 12696503 0.6118-Mar-16 50880 Purchase 12747383 0.6225-Mar-16 259488 Purchase 13006871 0.63
13121875 0.64 31-Mar-16 115004 Purchase 13121875 0.649 VANGUARD EMERGING MARKETS STOCK INDEX
FUND15251374 0.74 3-Apr-15 15251374 0.74
1-May-15 49412 Purchase 15300786 0.748-May-15 56150 Purchase 15356936 0.7426-Jun-15 -359480 Sell 14997456 0.7314-Aug-15 -56150 Sell 14941306 0.7221-Aug-15 -134760 Sell 14806546 0.7228-Aug-15 -262782 Sell 14543764 0.704-Sep-15 -359360 Sell 14184404 0.698-Sep-15 -65134 Sell 14119270 0.6811-Sep-15 -123530 Sell 13995740 0.6825-Sep-15 -49412 Sell 13946328 0.6830-Sep-15 -148236 Sell 13798092 0.6720-Nov-15 -45033 Sell 13753059 0.6727-Nov-15 -10508 Sell 13742551 0.6718-Dec-15 -66096 Sell 13676455 0.6625-Dec-15 -32292 Sell 13644163 0.6615-Jan-16 -88396 Sell 13555767 0.6622-Jan-16 -46248 Sell 13509519 0.655-Feb-16 -165580 Sell 13343939 0.6512-Feb-16 -67515 Sell 13276424 0.6426-Feb-16 -69909 Sell 13206515 0.644-Mar-16 -75373 Sell 13131142 0.6411-Mar-16 37940 Purchase 13169082 0.6418-Mar-16 -53605 Sell 13115477 0.64
13028486 0.63 25-Mar-16 -86991 Sell 13028486 0.6310 CITY OF NEW YORK GROUP TRUST 15007476 0.73 3-Apr-15 15007476 0.73
17-Apr-15 186580 Purchase 15194056 0.7424-Apr-15 44113 Purchase 15238169 0.748-May-15 1868030 Purchase 17106199 0.8329-May-15 284310 Purchase 17390509 0.8428-Aug-15 -4213430 Sell 13177079 0.6418-Sep-15 -338890 Sell 12838189 0.6225-Sep-15 169645 Purchase 13007834 0.6316-Oct-15 -84415 Sell 12923419 0.63
13014379 0.63 6-Nov-15 90960 Purchase 13014379 0.63
Hindalco Annual Report 2015-16.indb 39Hindalco Annual Report 2015-16.indb 39 8/17/2016 1:31:22 PM8/17/2016 1:31:22 PM
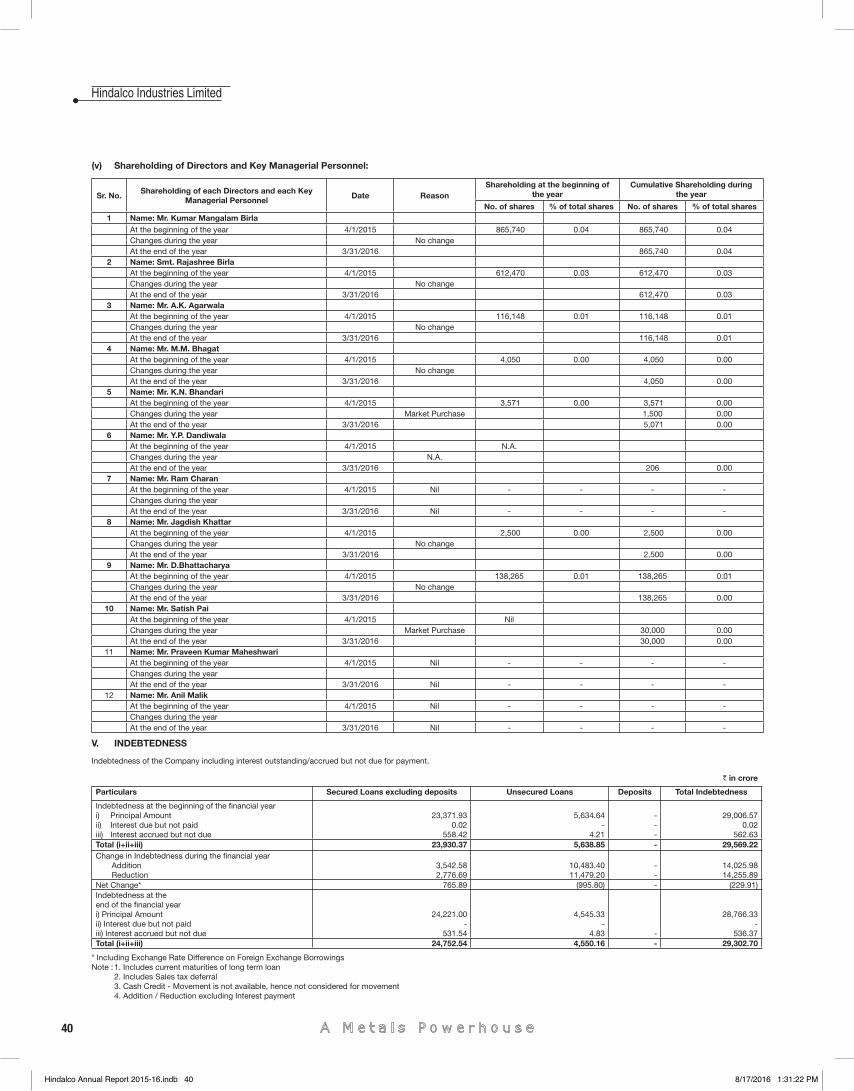
40
Hindalco Industries Limited
(v) Shareholding of Directors and Key Managerial Personnel:
Sr. No.Shareholding of each Directors and each Key
Managerial PersonnelDate Reason
Shareholding at the beginning of the year
Cumulative Shareholding during the year
No. of shares % of total shares No. of shares % of total shares1 Name: Mr. Kumar Mangalam Birla
At the beginning of the year 4/1/2015 865,740 0.04 865,740 0.04 Changes during the year No changeAt the end of the year 3/31/2016 865,740 0.04
2 Name: Smt. Rajashree BirlaAt the beginning of the year 4/1/2015 612,470 0.03 612,470 0.03 Changes during the year No changeAt the end of the year 3/31/2016 612,470 0.03
3 Name: Mr. A.K. AgarwalaAt the beginning of the year 4/1/2015 116,148 0.01 116,148 0.01 Changes during the year No changeAt the end of the year 3/31/2016 116,148 0.01
4 Name: Mr. M.M. BhagatAt the beginning of the year 4/1/2015 4,050 0.00 4,050 0.00 Changes during the year No changeAt the end of the year 3/31/2016 4,050 0.00
5 Name: Mr. K.N. BhandariAt the beginning of the year 4/1/2015 3,571 0.00 3,571 0.00 Changes during the year Market Purchase 1,500 0.00 At the end of the year 3/31/2016 5,071 0.00
6 Name: Mr. Y.P. DandiwalaAt the beginning of the year 4/1/2015 N.A.Changes during the year N.A.At the end of the year 3/31/2016 206 0.00
7 Name: Mr. Ram CharanAt the beginning of the year 4/1/2015 Nil - - - -Changes during the yearAt the end of the year 3/31/2016 Nil - - - -
8 Name: Mr. Jagdish KhattarAt the beginning of the year 4/1/2015 2,500 0.00 2,500 0.00 Changes during the year No changeAt the end of the year 3/31/2016 2,500 0.00
9 Name: Mr. D.BhattacharyaAt the beginning of the year 4/1/2015 138,265 0.01 138,265 0.01 Changes during the year No changeAt the end of the year 3/31/2016 138,265 0.00
10 Name: Mr. Satish PaiAt the beginning of the year 4/1/2015 NilChanges during the year Market Purchase 30,000 0.00 At the end of the year 3/31/2016 30,000 0.00
11 Name: Mr. Praveen Kumar MaheshwariAt the beginning of the year 4/1/2015 Nil - - - -Changes during the yearAt the end of the year 3/31/2016 Nil - - - -
12 Name: Mr. Anil MalikAt the beginning of the year 4/1/2015 Nil - - - -Changes during the yearAt the end of the year 3/31/2016 Nil - - - -
V. INDEBTEDNESS
Indebtedness of the Company including interest outstanding/accrued but not due for payment.
` in crore
Particulars Secured Loans excluding deposits Unsecured Loans Deposits Total Indebtedness
Indebtedness at the beginning of the fi nancial yeari) Principal Amount ii) Interest due but not paid iii) Interest accrued but not due
23,371.930.02
558.42
5,634.64
-4.21
- --
29,006.57
0.02562.63
Total (i+ii+iii) 23,930.37 5,638.85 - 29,569.22Change in Indebtedness during the fi nancial year Addition Reduction
3,542.58 2,776.69
10,483.4011,479.20
--
14,025.9814,255.89
Net Change* 765.89 (995.80) - (229.91)Indebtedness at the end of the fi nancial year i) Principal Amount ii) Interest due but not paid iii) Interest accrued but not due
24,221.00 -
531.54
4,545.33-
4.83 -
28,766.33-
536.37Total (i+ii+iii) 24,752.54 4,550.16 - 29,302.70
* Including Exchange Rate Difference on Foreign Exchange BorrowingsNote : 1. Includes current maturities of long term loan 2. Includes Sales tax deferral 3. Cash Credit - Movement is not available, hence not considered for movement 4. Addition / Reduction excluding Interest payment
Hindalco Annual Report 2015-16.indb 40Hindalco Annual Report 2015-16.indb 40 8/17/2016 1:31:22 PM8/17/2016 1:31:22 PM
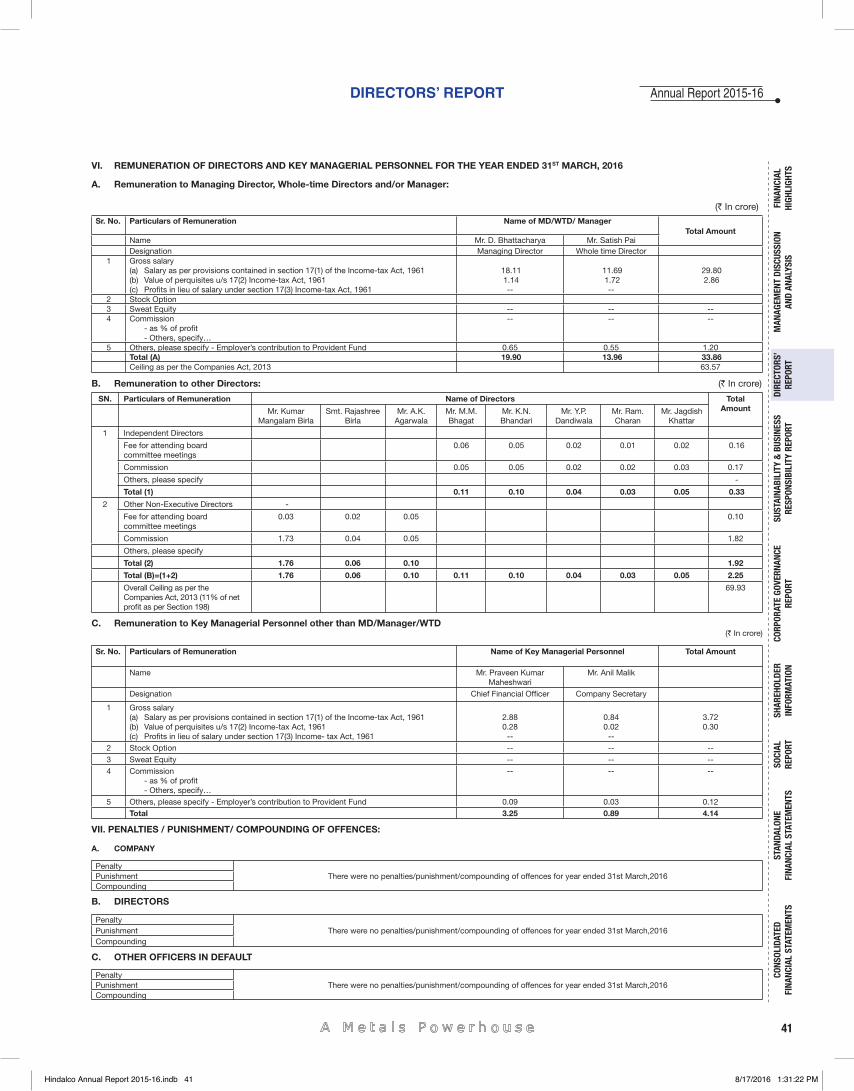
41
DIRECTORS’ REPORT
FINA
NCIA
L HI
GHLI
GHTS
MAN
AGEM
ENT
DISC
USSI
ON
AND
ANAL
YSIS
CORP
ORAT
E GO
VERN
ANCE
RE
PORT
STAN
DALO
NE
FINA
NCIA
L ST
ATEM
ENTS
CONS
OLID
ATED
FI
NANC
IAL
STAT
EMEN
TSSO
CIAL
RE
PORT
DIRE
CTOR
S’RE
PORT
SHAR
EHOL
DER
INFO
RMAT
ION
SUST
AINA
BILI
TY &
BUS
INES
SRE
SPON
SIBI
LITY
REP
ORT
Annual Report 2015-16
VI. REMUNERATION OF DIRECTORS AND KEY MANAGERIAL PERSONNEL FOR THE YEAR ENDED 31ST MARCH, 2016
A. Remuneration to Managing Director, Whole-time Directors and/or Manager:
(` In crore)
Sr. No. Particulars of Remuneration Name of MD/WTD/ Manager Total Amount
Name Mr. D. Bhattacharya Mr. Satish Pai Designation Managing Director Whole time Director
1 Gross salary (a) Salary as per provisions contained in section 17(1) of the Income-tax Act, 1961 (b) Value of perquisites u/s 17(2) Income-tax Act, 1961(c) Profi ts in lieu of salary under section 17(3) Income-tax Act, 1961
18.11 1.14
--
11.69 1.72
--
29.80 2.86
2 Stock Option 3 Sweat Equity -- -- --4 Commission
- as % of profi t - Others, specify…
-- -- --
5 Others, please specify - Employer’s contribution to Provident Fund 0.65 0.55 1.20Total (A) 19.90 13.96 33.86Ceiling as per the Companies Act, 2013 63.57
B. Remuneration to other Directors: (` In crore)
SN. Particulars of Remuneration Name of Directors Total AmountMr. Kumar
Mangalam BirlaSmt. Rajashree
BirlaMr. A.K.
AgarwalaMr. M.M. Bhagat
Mr. K.N. Bhandari
Mr. Y.P. Dandiwala
Mr. Ram. Charan
Mr. Jagdish Khattar
1 Independent Directors
Fee for attending board committee meetings
0.06 0.05 0.02 0.01 0.02 0.16
Commission 0.05 0.05 0.02 0.02 0.03 0.17
Others, please specify -
Total (1) 0.11 0.10 0.04 0.03 0.05 0.33
2 Other Non-Executive Directors -
Fee for attending board committee meetings
0.03 0.02 0.05 0.10
Commission 1.73 0.04 0.05 1.82
Others, please specify
Total (2) 1.76 0.06 0.10 1.92
Total (B)=(1+2) 1.76 0.06 0.10 0.11 0.10 0.04 0.03 0.05 2.25
Overall Ceiling as per the Companies Act, 2013 (11% of net profi t as per Section 198)
69.93
C. Remuneration to Key Managerial Personnel other than MD/Manager/WTD (` In crore)
Sr. No. Particulars of Remuneration Name of Key Managerial Personnel Total Amount
Name Mr. Praveen Kumar Maheshwari
Mr. Anil Malik
Designation Chief Financial Offi cer Company Secretary
1 Gross salary (a) Salary as per provisions contained in section 17(1) of the Income-tax Act, 1961(b) Value of perquisites u/s 17(2) Income-tax Act, 1961(c) Profi ts in lieu of salary under section 17(3) Income- tax Act, 1961
2.880.28
--
0.840.02
--
3.720.30
2 Stock Option -- -- --3 Sweat Equity -- -- --4 Commission
- as % of profi t - Others, specify…
-- -- --
5 Others, please specify - Employer’s contribution to Provident Fund 0.09 0.03 0.12Total 3.25 0.89 4.14
VII. PENALTIES / PUNISHMENT/ COMPOUNDING OF OFFENCES:
A. COMPANY
Penalty There were no penalties/punishment/compounding of offences for year ended 31st March,2016Punishment
Compounding
B. DIRECTORS
Penalty There were no penalties/punishment/compounding of offences for year ended 31st March,2016Punishment
Compounding
C. OTHER OFFICERS IN DEFAULT
Penalty There were no penalties/punishment/compounding of offences for year ended 31st March,2016Punishment
Compounding
Hindalco Annual Report 2015-16.indb 41Hindalco Annual Report 2015-16.indb 41 8/17/2016 1:31:22 PM8/17/2016 1:31:22 PM
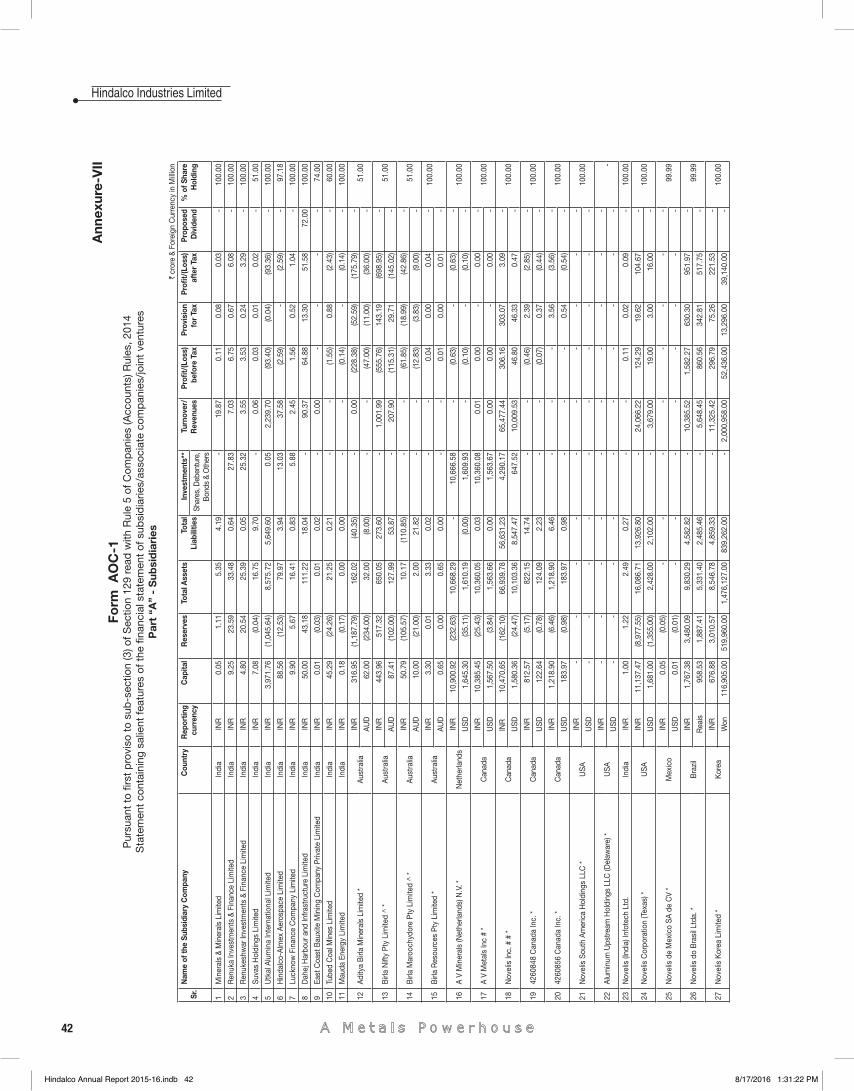
42
Hindalco Industries LimitedA
nnex
ure-
VII
Form
AO
C-1
Pur
suan
t to
fi rs
t p
rovi
so t
o su
b-s
ectio
n (3
) of S
ectio
n 12
9 re
ad w
ith R
ule
5 of
Com
pan
ies
(Acc
ount
s) R
ules
, 201
4S
tate
men
t co
ntai
ning
sal
ient
feat
ures
of t
he fi
nanc
ial s
tate
men
t of
sub
sid
iarie
s/as
soci
ate
com
pan
ies/
join
t ve
ntur
esP
art
“A”
- S
ubsi
dia
ries
` cr
ore
& Fo
reig
n C
urre
ncy
in M
illio
n
Sr
. N
ame
of th
e Su
bsid
iary
Com
pany
Cou
ntry
R
epor
ting
curr
ency
C
apita
l R
eser
ves
Tota
l Ass
ets
Tot
al
Liab
ilitie
s In
vest
men
ts**
T
urno
ver/
R
even
ues
Pro
fi t/(
Loss
) be
fore
Tax
P
rovi
sion
fo
r Ta
x P
rofi t
/(Lo
ss)
afte
r Ta
x P
ropo
sed
Div
iden
d %
of S
hare
H
oldi
ng
Sha
res,
Deb
entu
re,
Bon
ds &
Oth
ers
1 M
iner
als
& M
iner
als
Lim
ited
Indi
a IN
R
0.0
5 1
.11
5.3
5 4
.19
-
19.
87
0.1
1 0
.08
0.0
3 -
1
00.0
0
2 R
enuk
a In
vest
men
ts &
Fin
ance
Lim
ited
Indi
a IN
R
9.2
5 2
3.59
3
3.48
0
.64
27.
83
7.0
3 6
.75
0.6
7 6
.08
-
100
.00
3 R
enuk
eshw
ar In
vest
men
ts &
Fin
ance
Lim
ited
Indi
a IN
R
4.8
0 2
0.54
2
5.39
0
.05
25.
32
3.5
5 3
.53
0.2
4 3
.29
-
100
.00
4 S
uvas
Hol
ding
s Li
mite
d In
dia
INR
7
.08
(0.0
4) 1
6.75
9
.70
-
0.0
6 0
.03
0.0
1 0
.02
-
51.
00
5 U
tkal
Alu
min
a In
tern
atio
nal L
imite
d In
dia
INR
3
,971
.76
(1,0
45.6
4) 8
,575
.72
5,6
49.6
0 0
.05
2,2
39.7
0 (9
3.40
) (0
.04)
(93.
36)
-
100
.00
6 H
inda
lco-
Alm
ex A
eros
pace
Lim
ited
Indi
a IN
R
88.
56
(12.
53)
79.
97
3.9
4 1
3.03
3
7.58
(2
.59)
-
(2.5
9) -
9
7.18
7 L
uckn
ow F
inan
ce C
ompa
ny L
imite
d In
dia
INR
9
.90
5.6
7 1
6.41
0
.83
5.8
8 2
.45
1.5
6 0
.52
1.0
4 -
1
00.0
0
8 D
ahej
Har
bour
and
Infra
stru
ctur
e Li
mite
d In
dia
INR
5
0.00
4
3.18
1
11.2
2 1
8.04
-
9
0.37
6
4.88
1
3.30
5
1.58
7
2.00
1
00.0
0
9 E
ast C
oast
Bau
xite
Min
ing
Com
pany
Priv
ate
Lim
ited
Indi
a IN
R
0.0
1 (0
.03)
0.0
1 0
.02
-
0.0
0 -
-
-
-
7
4.00
10 T
ubed
Coa
l Min
es L
imite
d In
dia
INR
4
5.29
(2
4.26
) 2
1.25
0
.21
-
-
(1.5
5) 0
.88
(2.4
3) -
6
0.00
11 M
auda
Ene
rgy
Lim
ited
Indi
a IN
R
0.1
8 (0
.17)
0.0
0 0
.00
-
-
(0.1
4) -
(0
.14)
-
100
.00
12 A
dity
a B
irla
Min
eral
s Li
mite
d *
Aus
tral
ia
INR
3
16.9
5 (1
,187
.79)
162
.02
(40.
35)
-
0.0
0 (2
28.3
8) (5
2.59
) (1
75.7
9) -
5
1.00
A
UD
6
2.00
(2
34.0
0) 3
2.00
(8
.00)
-
-
(47.
00)
(11.
00)
(36.
00)
-
13 B
irla
Nift
y P
ty L
imite
d ^
* A
ustr
alia
IN
R
443
.96
517
.32
650
.05
273
.60
-
1,0
01.9
9 (5
55.7
6) 1
43.1
9 (6
98.9
5) -
5
1.00
A
UD
8
7.41
(1
02.0
0) 1
27.9
9 5
3.87
-
2
07.9
0 (1
15.3
1) 2
9.71
(1
45.0
2) -
14 B
irla
Mar
ooch
ydor
e P
ty L
imite
d ^
* A
ustr
alia
IN
R
50.
79
(105
.57)
10.
17
(110
.85)
-
-
(61.
85)
(18.
99)
(42.
86)
-
51.
00
AU
D
10.
00
(21.
00)
2.0
0 2
1.82
-
-
(1
2.83
) (3
.83)
(9.0
0) -
15 B
irla
Res
ourc
es P
ty L
imite
d *
Aus
tral
ia
INR
3
.30
0.0
1 3
.33
0.0
2 -
-
0
.04
0.0
0 0
.04
-
100
.00
AU
D
0.6
5 0
.00
0.6
5 0
.00
-
-
0.0
1 0
.00
0.0
1 -
16 A
V M
iner
als
(Net
herla
nds)
N.V
. *
Net
herla
nds
INR
1
0,90
0.92
(2
32.6
3) 1
0,66
8.29
-
1
0,66
6.58
-
(0
.63)
-
(0.6
3) -
1
00.0
0 U
SD
1
,645
.30
(35.
11)
1,6
10.1
9 (0
.00)
1,6
09.9
3 -
(0
.10)
-
(0.1
0) -
17 A
V M
etal
s In
c #
* C
anad
a IN
R
10,
385.
45
(25.
43)
10,
360.
05
0.0
3 1
0,36
0.08
0
.01
0.0
0 -
0
.00
-
100
.00
US
D
1,5
67.5
0 (3
.84)
1,5
63.6
6 0
.00
1,5
63.6
7 0
.00
0.0
0 -
0
.00
-
18 N
ovel
is In
c. #
# *
Can
ada
INR
10,
470.
65
(162
.10)
66,
939.
78
56,
631.
23
4,2
90.1
7 6
5,47
7.44
3
06.1
6 3
03.0
7 3
.09
-
100
.00
US
D
1,5
80.3
6 (2
4.47
) 1
0,10
3.36
8
,547
.47
647
.52
10,
009.
53
46.
80
46.
33
0.4
7 -
19 4
2608
48 C
anad
a In
c. *
Can
ada
INR
8
12.5
7 (5
.17)
822
.15
14.
74
-
-
(0.4
6) 2
.39
(2.8
5) -
1
00.0
0 U
SD
1
22.6
4 (0
.78)
124
.09
2.2
3 -
-
(0
.07)
0.3
7 (0
.44)
-
20 4
2608
56 C
anad
a In
c. *
Can
ada
INR
1
,218
.90
(6.4
6) 1
,218
.90
6.4
6 -
-
-
3
.56
(3.5
6) -
1
00.0
0 U
SD
1
83.9
7 (0
.98)
183
.97
0.9
8 -
-
-
0
.54
(0.5
4) -
21 N
ovel
is S
outh
Am
eric
a H
oldi
ngs
LLC
* U
SA
IN
R
-
-
-
-
-
-
-
-
-
-
100
.00
US
D
-
-
-
-
-
-
-
-
-
-
22 A
lum
inum
Ups
tream
Hol
ding
s LL
C (D
elaw
are)
* U
SA
IN
R
-
-
-
-
-
-
-
-
-
-
- U
SD
-
-
-
-
-
-
-
-
-
-
23 N
ovel
is (I
ndia
) Inf
otec
h Lt
d.
Indi
a IN
R
1.0
0 1
.22
2.4
9 0
.27
-
-
0.1
1 0
.02
0.0
9 -
1
00.0
0
24 N
ovel
is C
orpo
ratio
n (T
exas
) *
US
A
INR
1
1,13
7.47
(8
,977
.55)
16,
086.
71
13,
926.
80
-
24,
066.
22
124
.29
19.
62
104
.67
-
100
.00
US
D
1,6
81.0
0 (1
,355
.00)
2,4
28.0
0 2
,102
.00
-
3,6
79.0
0 1
9.00
3
.00
16.
00
-
25 N
ovel
is d
e M
exic
o S
A d
e C
V *
Mex
ico
INR
0
.05
(0.0
5) -
-
-
-
-
-
-
-
9
9.99
U
SD
0
.01
(0.0
1) -
-
-
-
-
-
-
-
26 N
ovel
is d
o B
rasi
l Ltd
a. *
Bra
zil
INR
1
,767
.38
3,4
80.0
9 9
,830
.29
4,5
82.8
2 -
1
0,38
5.52
1
,582
.27
630
.30
951
.97
-
99.
99
Rea
is
958
.53
1,8
87.4
1 5
,331
.40
2,4
85.4
6 -
5
,648
.45
860
.56
342
.81
517
.75
-
27 N
ovel
is K
orea
Lim
ited
* K
orea
IN
R
676
.88
3,0
10.5
7 8
,546
.78
4,8
59.3
3 -
1
1,32
5.42
2
96.7
9 7
5.26
2
21.5
3 -
1
00.0
0 W
on
116
,905
.00
519
,960
.00
1,4
76,1
27.0
0 8
39,2
62.0
0 -
2
,000
,958
.00
52,
436.
00
13,
296.
00
39,
140.
00
-
Hindalco Annual Report 2015-16.indb 42Hindalco Annual Report 2015-16.indb 42 8/17/2016 1:31:22 PM8/17/2016 1:31:22 PM
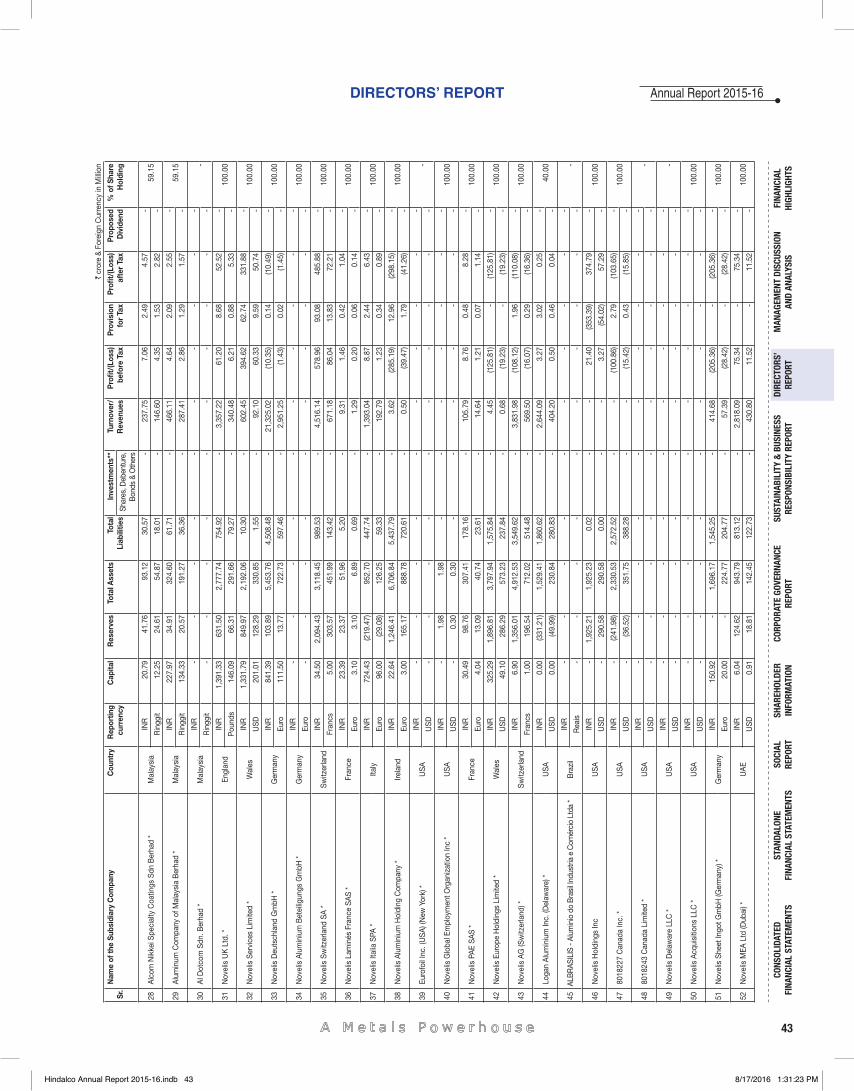
43
DIRECTORS’ REPORT
FINA
NCIA
L HI
GHLI
GHTS
MAN
AGEM
ENT
DISC
USSI
ON
AND
ANAL
YSIS
CORP
ORAT
E GO
VERN
ANCE
RE
PORT
STAN
DALO
NE
FINA
NCIA
L ST
ATEM
ENTS
CONS
OLID
ATED
FI
NANC
IAL
STAT
EMEN
TSSO
CIAL
RE
PORT
DIRE
CTOR
S’RE
PORT
SHAR
EHOL
DER
INFO
RMAT
ION
SUST
AINA
BILI
TY &
BUS
INES
SRE
SPON
SIBI
LITY
REP
ORT
Annual Report 2015-16`
cror
e &
Fore
ign
Cur
renc
y in
Mill
ion
Sr
. N
ame
of th
e Su
bsid
iary
Com
pany
Cou
ntry
R
epor
ting
curr
ency
C
apita
l R
eser
ves
Tota
l Ass
ets
Tot
al
Liab
ilitie
s In
vest
men
ts**
T
urno
ver/
R
even
ues
Pro
fi t/(
Loss
) be
fore
Tax
P
rovi
sion
fo
r Ta
x P
rofi t
/(Lo
ss)
afte
r Ta
x P
ropo
sed
Div
iden
d %
of S
hare
H
oldi
ng
Sha
res,
Deb
entu
re,
Bon
ds &
Oth
ers
28 A
lcom
Nik
kei S
peci
alty
Coa
tings
Sdn
Ber
had
* M
alay
sia
INR
2
0.79
4
1.76
9
3.12
3
0.57
-
2
37.7
5 7
.06
2.4
9 4
.57
-
59.
15
Rin
ggit
12.
25
24.
61
54.
87
18.
01
-
146
.60
4.3
5 1
.53
2.8
2 -
29 A
lum
inum
Com
pany
of M
alay
sia
Ber
had
* M
alay
sia
INR
2
27.9
7 3
4.91
3
24.6
0 6
1.71
-
4
66.1
1 4
.64
2.0
9 2
.55
-
59.
15
Rin
ggit
134
.33
20.
57
191
.27
36.
36
-
287
.41
2.8
6 1
.29
1.5
7 -
30 A
l Dot
com
Sdn
. Ber
had
* M
alay
sia
INR
-
-
-
-
-
-
-
-
-
-
-
Rin
ggit
-
-
-
-
-
-
-
-
-
-
31 N
ovel
is U
K L
td. *
E
ngla
nd
INR
1
,391
.33
631
.50
2,7
77.7
4 7
54.9
2 -
3
,357
.22
61.
20
8.6
8 5
2.52
-
1
00.0
0 P
ound
s 1
46.0
9 6
6.31
2
91.6
6 7
9.27
-
3
40.4
8 6
.21
0.8
8 5
.33
-
32 N
ovel
is S
ervi
ces
Lim
ited
* W
ales
IN
R
1,3
31.7
9 8
49.9
7 2
,192
.06
10.
30
-
602
.45
394
.62
62.
74
331
.88
-
100
.00
US
D
201
.01
128
.29
330
.85
1.5
5 -
9
2.10
6
0.33
9
.59
50.
74
-
33 N
ovel
is D
euts
chla
nd G
mbH
* G
erm
any
INR
8
41.3
9 1
03.8
9 5
,453
.76
4,5
08.4
8 -
2
1,32
5.02
(1
0.35
) 0
.14
(10.
49)
-
100
.00
Eur
o 1
11.5
0 1
3.77
7
22.7
3 5
97.4
6 -
2
,951
.25
(1.4
3) 0
.02
(1.4
5) -
34 N
ovel
is A
lum
iniu
m B
etei
ligun
gs G
mbH
* G
erm
any
INR
-
-
-
-
-
-
-
-
-
-
1
00.0
0 E
uro
-
-
-
-
-
-
-
-
-
-
35 N
ovel
is S
witz
erla
nd S
A *
Sw
itzer
land
IN
R
34.
50
2,0
94.4
3 3
,118
.45
989
.53
-
4,5
16.1
4 5
78.9
6 9
3.08
4
85.8
8 -
1
00.0
0 F
ranc
s 5
.00
303
.57
451
.99
143
.42
-
671
.18
86.
04
13.
83
72.
21
-
36 N
ovel
is L
amin
és F
ranc
e S
AS
* F
ranc
e IN
R
23.
39
23.
37
51.
96
5.2
0 -
9
.31
1.4
6 0
.42
1.0
4 -
1
00.0
0 E
uro
3.1
0 3
.10
6.8
9 0
.69
-
1.2
9 0
.20
0.0
6 0
.14
-
37 N
ovel
is It
alia
SPA
* It
aly
INR
7
24.4
3 (2
19.4
7) 9
52.7
0 4
47.7
4 -
1
,393
.04
8.8
7 2
.44
6.4
3 -
1
00.0
0 E
uro
96.
00
(29.
08)
126
.25
59.
33
-
192
.79
1.2
3 0
.34
0.8
9 -
38 N
ovel
is A
lum
iniu
m H
oldi
ng C
ompa
ny *
Irel
and
INR
2
2.64
1
,246
.41
6,7
06.8
4 5
,437
.79
-
3.6
2 (2
85.1
9) 1
2.96
(2
98.1
5) -
1
00.0
0 E
uro
3.0
0 1
65.1
7 8
88.7
8 7
20.6
1 -
0
.50
(39.
47)
1.7
9 (4
1.26
) -
39 E
urof
oil I
nc. (
US
A) (
New
Yor
k) *
US
A
INR
-
-
-
-
-
-
-
-
-
-
-
US
D
-
-
-
-
-
-
-
-
-
-
40 N
ovel
is G
loba
l Em
ploy
men
t Org
aniz
atio
n In
c *
US
A
INR
-
1
.98
1.9
8 -
-
-
-
-
-
-
1
00.0
0 U
SD
-
0
.30
0.3
0 -
-
-
-
-
-
-
41 N
ovel
is P
AE
SA
S *
Fra
nce
INR
3
0.49
9
8.76
3
07.4
1 1
78.1
6 -
1
05.7
9 8
.76
0.4
8 8
.28
-
100
.00
Eur
o 4
.04
13.
09
40.
74
23.
61
-
14.
64
1.2
1 0
.07
1.1
4 -
42 N
ovel
is E
urop
e H
oldi
ngs
Lim
ited
* W
ales
IN
R
325
.29
1,8
96.8
1 3
,797
.94
1,5
75.8
4 -
4
.45
(125
.81)
-
(125
.81)
-
100
.00
US
D
49.
10
286
.29
573
.23
237
.84
-
0.6
8 (1
9.23
) -
(1
9.23
) -
43 N
ovel
is A
G (S
witz
erla
nd) *
S
witz
erla
nd
INR
6
.90
1,3
56.0
1 4
,912
.53
3,5
49.6
2 -
3
,831
.98
(108
.12)
1.9
6 (1
10.0
8) -
1
00.0
0 F
ranc
s 1
.00
196
.54
712
.02
514
.48
-
569
.50
(16.
07)
0.2
9 (1
6.36
) -
44 L
ogan
Alu
min
ium
Inc.
(Del
awar
e) *
US
A
INR
0
.00
(331
.21)
1,5
29.4
1 1
,860
.62
-
2,6
44.0
9 3
.27
3.0
2 0
.25
-
40.
00
US
D
0.0
0 (4
9.99
) 2
30.8
4 2
80.8
3 -
4
04.2
0 0
.50
0.4
6 0
.04
-
45AL
BR
ASIL
IS -
Alum
inio
do
Bra
sil I
ndus
tria
e C
omér
cio
Ltda
* B
razi
l IN
R
-
-
-
-
-
-
-
-
-
-
- R
eais
-
-
-
-
-
-
-
-
-
-
46 N
ovel
is H
oldi
ngs
Inc
US
A
INR
-
1
,925
.21
1,9
25.2
3 0
.02
-
-
21.
40
(353
.39)
374
.79
-
100
.00
US
D
-
290
.58
290
.58
0.0
0 -
-
3
.27
(54.
02)
57.
29
-
47 8
0182
27 C
anad
a In
c. *
US
A
INR
-
(2
41.9
8) 2
,330
.53
2,5
72.5
2 -
-
(1
00.8
6) 2
.79
(103
.65)
-
100
.00
US
D
-
(36.
52)
351
.75
388
.28
-
-
(15.
42)
0.4
3 (1
5.85
) -
48 8
0182
43 C
anad
a Li
mite
d *
US
A
INR
-
-
-
-
-
-
-
-
-
-
-
US
D
-
-
-
-
-
-
-
-
-
-
49 N
ovel
is D
elaw
are
LLC
* U
SA
IN
R
-
-
-
-
-
-
-
-
-
-
- U
SD
-
-
-
-
-
-
-
-
-
-
50 N
ovel
is A
cqui
sitio
ns L
LC *
US
A
INR
-
-
-
-
-
-
-
-
-
-
1
00.0
0 U
SD
-
-
-
-
-
-
-
-
-
-
51 N
ovel
is S
heet
Ingo
t Gm
bH (G
erm
any)
* G
erm
any
INR
1
50.9
2 -
1
,696
.17
1,5
45.2
5 -
4
14.6
8 (2
05.3
6) -
(2
05.3
6) -
1
00.0
0 E
uro
20.
00
-
224
.77
204
.77
-
57.
39
(28.
42)
-
(28.
42)
-
52 N
ovel
is M
EA L
td (D
ubai
) *
UA
E IN
R
6.0
4 1
24.6
2 9
43.7
9 8
13.1
2 -
2
,818
.09
75.
34
-
75.
34
-
100
.00
US
D
0.9
1 1
8.81
1
42.4
5 1
22.7
3 -
4
30.8
0 1
1.52
-
1
1.52
-
Hindalco Annual Report 2015-16.indb 43Hindalco Annual Report 2015-16.indb 43 8/17/2016 1:31:23 PM8/17/2016 1:31:23 PM
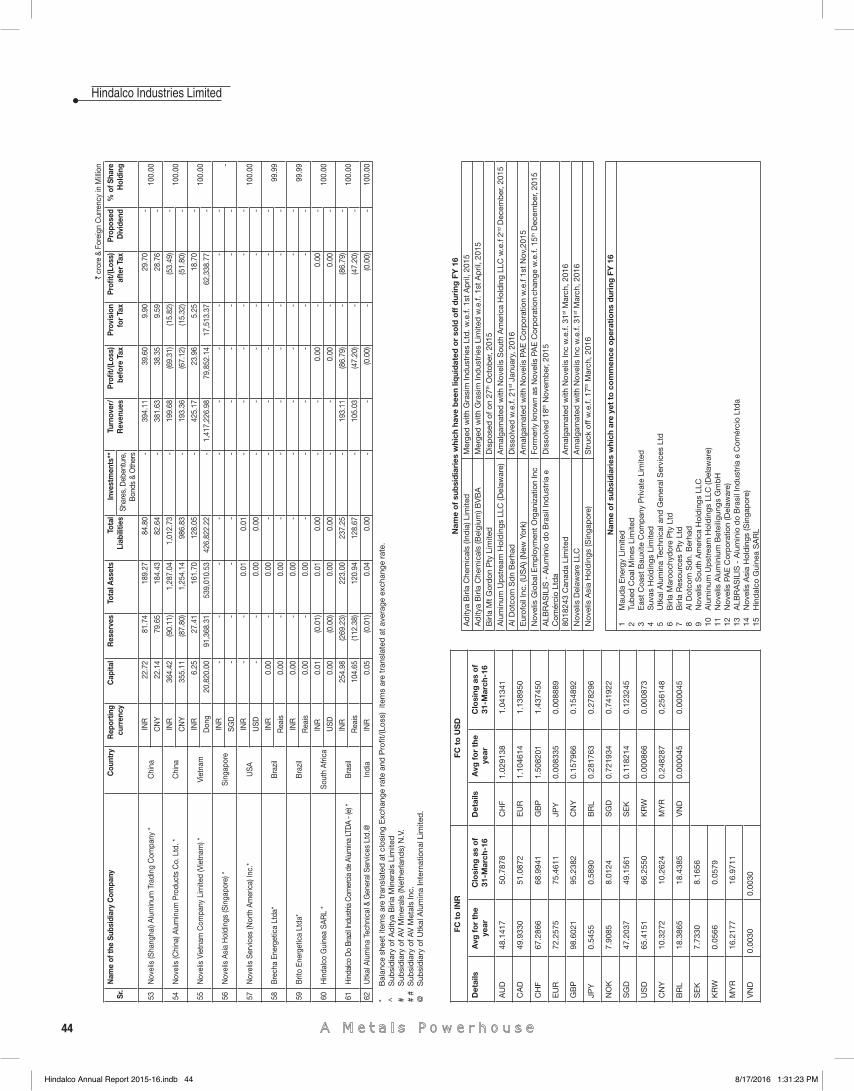
44
Hindalco Industries Limited`
cror
e &
Fore
ign
Cur
renc
y in
Mill
ion
Sr
. N
ame
of th
e Su
bsid
iary
Com
pany
Cou
ntry
R
epor
ting
curr
ency
C
apita
l R
eser
ves
Tota
l Ass
ets
Tot
al
Liab
ilitie
s In
vest
men
ts**
T
urno
ver/
R
even
ues
Pro
fi t/(
Loss
) be
fore
Tax
P
rovi
sion
fo
r Ta
x P
rofi t
/(Lo
ss)
afte
r Ta
x P
ropo
sed
Div
iden
d %
of S
hare
H
oldi
ng
Sha
res,
Deb
entu
re,
Bon
ds &
Oth
ers
53 N
ovel
is (S
hang
hai)
Alu
min
um T
radi
ng C
ompa
ny *
Chi
na
INR
2
2.72
8
1.74
1
89.2
7 8
4.80
-
3
94.1
1 3
9.60
9
.90
29.
70
-
100
.00
CN
Y
22.
14
79.
65
184
.43
82.
64
-
381
.63
38.
35
9.5
9 2
8.76
-
54 N
ovel
is (C
hina
) Alu
min
um P
rodu
cts
Co.
Ltd
. *
Chi
na
INR
3
64.4
2 (9
0.11
) 1
,287
.04
1,0
12.7
3 -
1
99.6
8 (6
9.31
) (1
5.82
) (5
3.49
) -
1
00.0
0 C
NY
3
55.1
1 (8
7.80
) 1
,254
.14
986
.83
-
193
.36
(67.
12)
(15.
32)
(51.
80)
-
55 N
ovel
is V
ietn
am C
ompa
ny L
imite
d (V
ietn
am) *
V
ietn
am
INR
6
.25
27.
41
161
.70
128
.05
-
425
.17
23.
96
5.2
5 1
8.70
-
1
00.0
0 D
ong
20,
820.
00
91,
368.
31
539
,010
.53
426
,822
.22
-
1,4
17,2
26.9
8 7
9,85
2.14
1
7,51
3.37
6
2,33
8.77
-
56 N
ovel
is A
sia
Hol
ding
s (S
inga
pore
) *
Sin
gapo
re
INR
-
-
-
-
-
-
-
-
-
-
-
SG
D
-
-
-
-
-
-
-
-
-
-
57 N
ovel
is S
ervi
ces
(Nor
th A
mer
ica)
Inc.
* U
SA
IN
R
-
-
0.0
1 0
.01
-
-
-
-
-
-
100
.00
US
D
-
-
0.0
0 0
.00
-
-
-
-
-
-
58 B
rech
a En
erge
tica
Ltda
* B
razi
l IN
R
0.0
0 -
0
.00
-
-
-
-
-
-
-
99.
99
Rea
is
0.0
0 -
0
.00
-
-
-
-
-
-
-
59 B
rito
Ener
getic
a Lt
da*
Bra
zil
INR
0
.00
-
0.0
0 -
-
-
-
-
-
-
9
9.99
R
eais
0
.00
-
0.0
0 -
-
-
-
-
-
-
60 H
inda
lco
Gui
nea
SA
RL
* S
outh
Afri
ca
INR
0.0
1 (0
.01)
0.0
1 0
.00
-
-
0.0
0 -
0
.00
-
100
.00
US
D
0.0
0 (0
.00)
0.0
0 0
.00
-
-
0.0
0 -
0
.00
-
61 H
inda
lco
Do
Braz
il Ind
ustri
a C
omer
cia
de A
lum
ina
LTD
A - (
e) *
Bra
sil
INR
254
.98
(269
.23)
223
.00
237
.25
-
193
.11
(86.
79)
-
(86.
79)
-
100
.00
Rea
is
104
.65
(112
.38)
120
.94
128
.67
-
105
.03
(47.
20)
-
(47.
20)
-
62 U
tkal
Alu
min
a Te
chni
cal &
Gen
eral
Ser
vice
s Lt
d.@
In
dia
INR
0.0
5 (0
.01)
0.0
4 0
.00
-
-
(0.0
0) -
(0
.00)
-
100.
00
* B
alan
ce s
heet
item
s ar
e tr
ansl
ated
at
clos
ing
Exc
hang
e ra
te a
nd P
rofi t
/(Lo
ss)
item
s ar
e tr
ansl
ated
at
aver
age
exch
ange
rat
e.
^
S
ubsi
dia
ry o
f Ad
itya
Birl
a M
iner
als
Lim
ited
# S
ubsi
dia
ry o
f AV
Min
eral
s (N
ethe
rland
s) N
.V.
#
# S
ubsi
dia
ry o
f AV
Met
als
Inc.
@
Sub
sid
iary
of U
tkal
Alu
min
a In
tern
atio
nal L
imite
d.
Nam
e o
f su
bsi
dia
ries
whi
ch h
ave
bee
n liq
uid
ated
or
sold
off
dur
ing
FY
16
Ad
itya
Birl
a C
hem
ical
s (In
dia
) Lim
ited
M
erge
d w
ith G
rasi
m In
dus
trie
s Lt
d. w
.e.f.
1st
Ap
ril, 2
015
Ad
itya
Birl
a C
hem
ical
s (B
elgi
um) B
VB
A
Mer
ged
with
Gra
sim
Ind
ustr
ies
Lim
ited
w.e
.f. 1
st A
pril
, 201
5 B
irla
Mt
Gor
don
Pty
Lim
ited
D
isp
osed
of o
n 27
th O
ctob
er, 2
015
Alu
min
um U
pst
ream
Hol
din
gs L
LC (D
elaw
are)
A
mal
gam
ated
with
Nov
elis
Sou
th A
mer
ica
Hol
din
g LL
C w
.e.f
2nd D
ecem
ber
, 201
5 A
l Dot
com
Sd
n B
erha
d
Dis
solv
ed w
.e.f.
21st
Jan
uary
, 201
6 E
urof
oil I
nc. (
US
A) (
New
Yor
k)
Am
alga
mat
ed w
ith N
ovel
is P
AE
Cor
por
atio
n w
.e.f
1st
Nov
,201
5 N
ovel
is G
lob
al E
mp
loym
ent
Org
aniz
atio
n In
c Fo
rmer
ly k
now
n as
Nov
elis
PA
E C
orp
orat
ion c
hang
e w
.e.f.
15th
Dec
emb
er, 2
015
ALB
RA
SIL
IS -
Alu
min
io d
o B
rasi
l Ind
ustr
ia e
C
omér
cio
Ltd
a D
isso
lved
18th
Nov
emb
er, 2
015
8018
243
Can
ada
Lim
ited
A
mal
gam
ated
with
Nov
elis
Inc
w.e
.f. 3
1st M
arch
, 201
6 N
ovel
is D
elaw
are
LLC
A
mal
gam
ated
with
Nov
elis
Inc
w.e
.f. 3
1st M
arch
, 201
6 N
ovel
is A
sia
Hol
din
gs (S
inga
por
e)
Str
uck
off w
.e.f.
17th
Mar
ch, 2
016
Nam
e o
f su
bsi
dia
ries
whi
ch a
re y
et t
o c
om
men
ce o
per
atio
ns d
urin
g F
Y 1
6 1
Mau
da
Ene
rgy
Lim
ited
2
Tub
ed C
oal M
ines
Lim
ited
3
Eas
t C
oast
Bau
xite
Com
pan
y P
rivat
e Li
mite
d
4 S
uvas
Hol
din
gs L
imite
d
5 U
tkal
Alu
min
a Te
chni
cal a
nd G
ener
al S
ervi
ces
Ltd
6
Birl
a M
aroo
chyd
ore
Pty
Ltd
7
Birl
a R
esou
rces
Pty
Ltd
8
Al D
otco
m S
dn.
Ber
had
9
Nov
elis
Sou
th A
mer
ica
Hol
din
gs L
LC
10
Alu
min
um U
pst
ream
Hol
din
gs L
LC (D
elaw
are)
11
N
ovel
is A
lum
iniu
m B
etei
ligun
gs G
mb
H
12
Nov
elis
PA
E C
orp
orat
ion
(Del
awar
e)
13
ALB
RA
SIL
IS -
Alu
min
io d
o B
rasi
l Ind
ustr
ia e
Com
érci
o Lt
da
14
N
ovel
is A
sia
Hol
din
gs (S
inga
por
e)
15
Hin
dal
co G
uine
a S
AR
L
FC t
o IN
RFC
to
US
D
Det
ails
Avg
fo
r th
e ye
arC
losi
ng a
s o
f31
-Mar
ch-1
6D
etai
lsA
vg f
or
the
year
Clo
sing
as
of
31-M
arch
-16
AU
D48
.141
750
.787
8C
HF
1.02
9138
1.04
1341
CA
D49
.933
051
.087
2E
UR
1.10
4614
1.13
8950
CH
F67
.286
668
.994
1G
BP
1.50
8201
1.43
7450
EU
R72
.257
575
.461
1JP
Y0.
0083
350.
0088
89
GB
P98
.602
195
.238
2C
NY
0.15
7966
0.15
4892
JPY
0.54
550.
5890
BR
L0.
2817
630.
2782
96
NO
K7.
9085
8.01
24S
GD
0.72
1934
0.74
1922
SG
D47
.203
749
.156
1S
EK
0.11
8214
0.12
3245
US
D65
.415
166
.255
0K
RW
0.00
0866
0.00
0873
CN
Y10
.327
210
.262
4M
YR
0.24
8287
0.25
6148
BR
L18
.386
518
.438
5V
ND
0.00
0045
0.00
0045
SE
K7.
7330
8.16
56
KR
W0.
0566
0.05
79
MY
R16
.217
716
.971
1
VN
D0.
0030
0.00
30
Hindalco Annual Report 2015-16.indb 44Hindalco Annual Report 2015-16.indb 44 8/17/2016 1:31:23 PM8/17/2016 1:31:23 PM
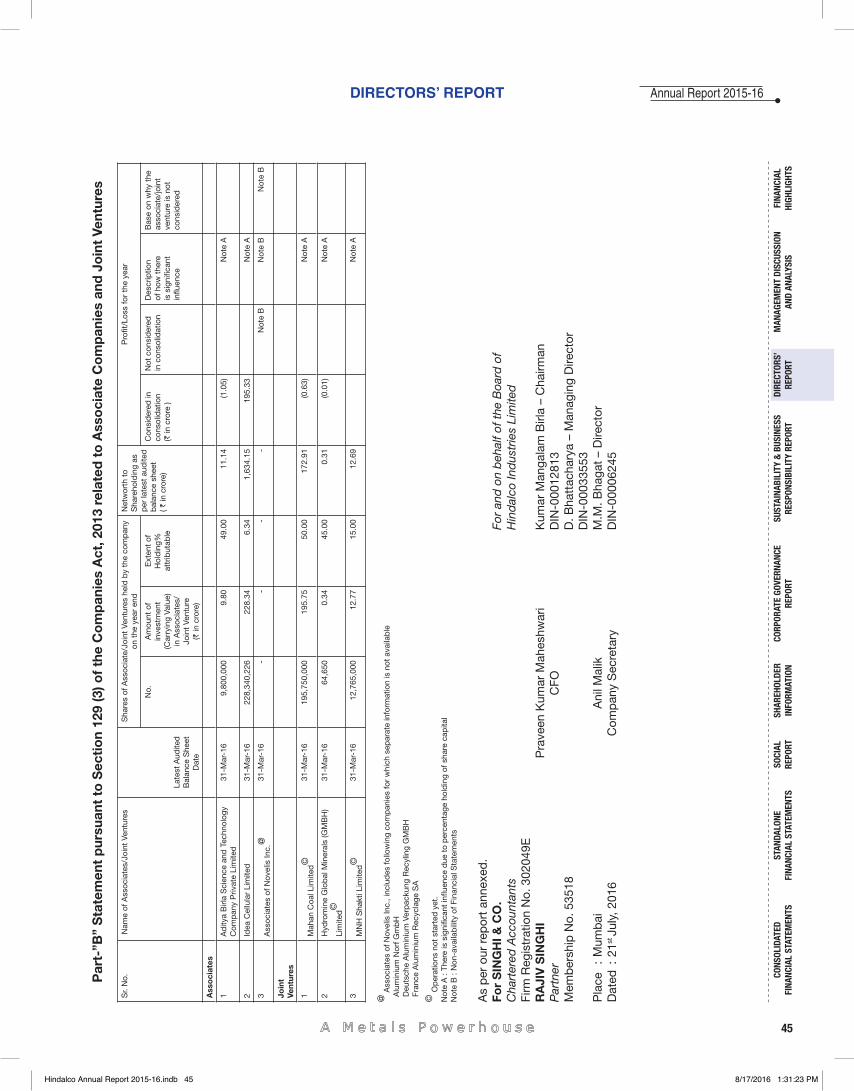
45
DIRECTORS’ REPORT
FINA
NCIA
L HI
GHLI
GHTS
MAN
AGEM
ENT
DISC
USSI
ON
AND
ANAL
YSIS
CORP
ORAT
E GO
VERN
ANCE
RE
PORT
STAN
DALO
NE
FINA
NCIA
L ST
ATEM
ENTS
CONS
OLID
ATED
FI
NANC
IAL
STAT
EMEN
TSSO
CIAL
RE
PORT
DIRE
CTOR
S’RE
PORT
SHAR
EHOL
DER
INFO
RMAT
ION
SUST
AINA
BILI
TY &
BUS
INES
SRE
SPON
SIBI
LITY
REP
ORT
Annual Report 2015-16P
art-
”B”
Sta
tem
ent
pur
suan
t to
Sec
tio
n 12
9 (3
) of
the
Co
mp
anie
s A
ct, 2
013
rela
ted
to
Ass
oci
ate
Co
mp
anie
s an
d J
oin
t Ve
ntur
es
Sr.
No.
Nam
e of
Ass
ocia
tes/
Join
t Ve
ntur
es
Late
st A
udite
d
Bal
ance
She
et
Dat
e
Sha
res
of A
ssoc
iate
/Joi
nt V
entu
res
held
by
the
com
pan
y on
the
yea
r en
dN
etw
orth
to
Sha
reho
ldin
g as
p
er la
test
aud
ited
b
alan
ce s
heet
( `
in c
rore
)
Pro
fi t/L
oss
for
the
year
No.
Am
ount
of
inve
stm
ent
(Car
ryin
g Va
lue)
in
Ass
ocia
tes/
Join
t Ve
ntur
e (`
in c
rore
)
Ext
ent
of
Hol
din
g%
attr
ibut
able
Con
sid
ered
in
cons
olid
atio
n (`
in c
rore
)
Not
con
sid
ered
in
con
solid
atio
nD
escr
iptio
n of
how
the
re
is s
igni
fi can
t in
fl uen
ce
Bas
e on
why
the
as
soci
ate/
join
t ve
ntur
e is
not
co
nsid
ered
Ass
oci
ates
1A
dity
a B
irla
Sci
ence
and
Tec
hnol
ogy
Com
pan
y P
rivat
e Li
mite
d31
-Mar
-16
9,80
0,00
0 9.
8049
.00
11.
14
(1.0
5)N
ote
A
2Id
ea C
ellu
lar
Lim
ited
31-M
ar-1
622
8,34
0,22
6 22
8.34
6.34
1,63
4.15
1
95.3
3 N
ote
A
3A
ssoc
iate
s of
Nov
elis
Inc.
@31
-Mar
-16
--
--
Not
e B
Not
e B
Not
e B
Join
t Ve
ntur
es
1M
ahan
Coa
l Lim
ited©
31-M
ar-1
6 1
95,7
50,0
0019
5.75
50.0
017
2.91
(0.6
3)N
ote
A
2H
ydro
min
e G
lob
al M
iner
als
(GM
BH
)
Lim
ited©
31-M
ar-1
6 6
4,65
0 0.
3445
.00
0.31
(0.0
1)N
ote
A
3M
NH
Sha
kti L
imite
d©
31-M
ar-1
6 1
2,76
5,00
0 12
.77
15.0
012
.69
Not
e A
@ A
ssoc
iate
s of
Nov
elis
Inc.
, inc
lud
es fo
llow
ing
com
pan
ies
for
whi
ch s
epar
ate
info
rmat
ion
is n
ot a
vaila
ble
A
lum
iniu
m N
orf G
mb
H
Deu
tsch
e A
lum
iniu
m V
erp
acku
ng R
ecyl
ing
GM
BH
Fran
ce A
lum
iniu
m R
ecyc
lage
SA
© O
per
atio
ns n
ot s
tart
ed y
et.
Not
e A
: Th
ere
is s
igni
fi can
t in
fl uen
ce d
ue t
o p
erce
ntag
e ho
ldin
g of
sha
re c
apita
l
N
ote
B :
Non
-ava
ilab
ility
of F
inan
cial
Sta
tem
ents
As
per
our
rep
ort
anne
xed
.Fo
r S
ING
HI &
CO
.
For
and
on
beh
alf o
f the
Boa
rd o
fC
hart
ered
Acc
ount
ants
Hin
dal
co In
dus
trie
s Li
mite
dFi
rm R
egis
trat
ion
No.
302
049E
RA
JIV
SIN
GH
I P
rave
en K
umar
Mah
eshw
ari
Kum
ar M
anga
lam
Birl
a –
Cha
irman
Par
tner
C
FO
DIN
-000
1281
3M
emb
ersh
ip N
o. 5
3518
D. B
hatt
acha
rya
– M
anag
ing
Dire
ctor
DIN
-000
3355
3P
lace
:
Mum
bai
A
nil M
alik
M
.M. B
haga
t –
Dire
ctor
Dat
ed :
21st
Jul
y, 2
016
Com
pan
y S
ecre
tary
D
IN-0
0006
245
Hindalco Annual Report 2015-16.indb 45Hindalco Annual Report 2015-16.indb 45 8/17/2016 1:31:23 PM8/17/2016 1:31:23 PM
46
Hindalco Industries Limited
SUSTAINABILITY & BUSINESS RESPONSIBILITY REPORT
At the Aditya Birla Group, we endeavour to become the leading Indian conglomerate for sustainable business practices across our global operations by 2017.To achieve this vision, we are innovating from the traditional sustainability models to one consistent with our vision to build sustainable businesses capable of operating in the world we hope to see emerge in 2030 and 2050. It is in our own interests, to contribute to mitigate our impact in every way we can, and also prepare for further mitigation and potential adaption to planetary changes as we go forward.We began our quest with a question, “If everyone and every business followed the law as written today, is the planet sustainable?” We quickly concluded that around the year 2050, when the Earth’s population reaches an estimated 9 billion, climate change, water scarcity, stress plus pollution and an overload of waste, if left unchecked, would set the planet on a possibly irreversible course to un-sustainability. It is therefore intuitive that laws be tightened over time and imperative that the Aditya Birla Group remain ahead of the curve. Our fi rst step has been to set up a sustainability programme in our current operations, under the heading “Responsible Stewardship”. By doing so, we try to move from merely following local laws to aligning ourselves voluntarily with the international standards set by the global bodies of the International Finance Corporation (IFC), the Organisation for Economic Cooperation and Development (OECD), the International Standards Organisation (ISO), Occupational Health and Safety Advisory Services (OHSAS), the Global Reporting Initiative (GRI) and others. We are working hard to develop and improve our management systems and their performance by making sure that they conform to the Aditya Birla Group’s Sustainability Framework of Policies, Technical Standards, and Guidance Notes by giving our employees the chance to train, learn, understand, and apply improvement techniques to reach higher standards of performance. So far, we have had much success with respect to reductions in energy use, water use, and improvements in safety performance. We are working towards achieving the World Business Council for Sustainable Development’s Water and Sanitation and Hygiene pledge (WASH) to ensure that we provide safe drinking water, sanitation and hygiene in all our operations. Each of these achievements helps reduce and mitigate our impact on the planet and are hence imperative to building a platform for the future.However, if we are to create sustainable business models and systems, “Responsible Stewardship” by itself is not enough and we need other components
to help us with a greater transformation. We need to understand how many laws will need to change in order to support a sustainable world. Our performance will need to be improved further to meet these laws, possibly by redesigning our business models. We call this “Future Proofi ng” our businesses. This has two components; the fi rst, we call “Strategic Stakeholder Engagement” which involves scanning the time horizon for disruptions by discussing the global megatrends with experts in the fi elds of climate, water, human rights, supply chain management, biodiversity transparency and reporting, in order to understand what constraints might be placed on our businesses by 2030 and 2050. By doing so, we are able to build our capability to understand which external changes might heavily infl uence our value chains and business models in the future and what might be expected of our products and brands. For example, the world will need businesses that are able to mitigate and adapt to climate change, with robust and sustainable supply chains that are also impervious to all external forces that will inevitably begin to affect us in the future. The second part of our “Future Proofi ng” programme is to test our current business models and strategies against various scenarios designed to simulate what the world will potentially look like in 2030 and 2050. To achieve these results, sustainable businesses will take time, particularly when we consider some of our complex supply chains. By pushing to be the leader today, we are giving ourselves the best possibility of achieving long term success.It is interesting to note that nowhere are sustainable strategies more important than in the land masses of India, China and South East Asia, because over half the population of the planet lives there. Land mass and natural resources are already feeling the strain, with often cited pollution, biodiversity loss, growing levels of water stress and the need to manage the growth of electricity production decoupled from a country’s carbon footprint. This makes sustainable development not just a business “nice to do” but has also become a central business imperative because, “Businesses cannot survive on a planet that fails”.
Business through Sustainability – the Hindalco WayBoth Aluminium and copper are widely used metals with bright consumption prospects. The recent emphasis on greenhouse emissions have brought in new game changing concepts such as light weighting in the automobile industry further augmenting the consumption growth. Our business is geared to ride on these changing patterns and today boasts of a de-risked portfolio through a strong accent on conversion business.
Hindalco Annual Report 2015-16.indb 46Hindalco Annual Report 2015-16.indb 46 8/17/2016 1:31:23 PM8/17/2016 1:31:23 PM
47
SUSTAINABILITY & BUSINESS RESPONSIBILITY REPORT
FINA
NCIA
L HI
GHLI
GHTS
MAN
AGEM
ENT
DISC
USSI
ON
AND
ANAL
YSIS
CORP
ORAT
E GO
VERN
ANCE
RE
PORT
STAN
DALO
NE
FINA
NCIA
L ST
ATEM
ENTS
CONS
OLID
ATED
FI
NANC
IAL
STAT
EMEN
TSSO
CIAL
RE
PORT
DIRE
CTOR
S’RE
PORT
SHAR
EHOL
DER
INFO
RMAT
ION
SUST
AINA
BILI
TY &
BUS
INES
SRE
SPON
SIBI
LITY
REP
ORT
Annual Report 2015-16
By virtue of being the only integrated aluminium producer in India, we also have a strong commitment towards product development. We have developed several pioneering applications in the Indian context and Novelis is the global leader in FRP space.
Sustained access and availability of resources is critical to our business. Hindalco follows holistic approach to address the multi-dimensional facets of resource sustainability throughout the value chain. As we continue to serve the increased demands of the society for sustainable metals, we recognize the limited availability of resources and impacts of resource extraction. Our strategy is to have a good mix of captive sources as well as long-term sourcing arrangement based on long term cost and sustainability parameters. Our mining practices, regeneration activities and community engagement are aimed at minimizing the environmental impact with a focus on improving socio economic life.
Improving operational effi ciencies, adoption of technological advances are important for effi cient use of raw materials. We believe systems and work practices are critical in conserving resources, energy and environment and ensuring health and safety.
Aluminium is a 100% recyclable metal and does not degrade in quality on recycling. Our wholly owned subsidiary Novelis Inc presently uses 50% of input in the form of recycled scrap a sharp jump from 39% during the last year. It also announced the commercial debut of Evercan™ high recycled-content aluminium beverage can sheet. Novelis has invested in major recycling initiatives, including advanced equipment and technology to process diversifi ed scrap.
Energy Conservation and its effi cient use continue to be one of the focus areas of your company. Your company has an Energy policy supported by a robust Energy Management Organization structure. Energy Audits, Quality Circles, OPEX Committees, Energy Conservation month, suggestion scheme are some among many efforts at plant level towards energy conservation. Through the Suggestion Scheme employees are encouraged, recognized and suitably rewarded to come up with energy savings ideas. All these measures ensure increased participation across the hierarchy.
PAT (Perform Achieve & Trade) scheme has been enacted and launched by the Bureau of Energy Effi ciency (BEE) under the aegis of Ministry of Power, Government of India. Based on the threshold energy consumption norm, fi ve units of the company were under cycle-1 of the scheme. Your Company had made detailed plan and executed number of projects to meet the Target set under cycle-1 of the scheme. The M&V (monitoring & verifi cation) audit were carried out during
2015-16 and the actual overall reduction achieved is higher than the target.
Your company has initiated several projects on “Value from Waste” and “Emission Control through technological innovation”. This has resulted in re-use of Wastes and improvement in quality of emission from our process.
Strengthening of Safety Management System, Involvement of People, Effective Training and Periodic assessment to correct deviations has resulted in improvement of Safety Performance of the company. Our aim is Zero Fatality.
Your company has implemented various initiatives to reduce water consumption. This has resulted in 15 % reduction in Specifi c Water consumption in Aluminium Sector over last year.
We continue to maintain our thrust on inclusive growth as we believe in triple bottom line accounting and trusteeship management concept. We have carried out several projects aimed at development of neighbouring communities and society. Our focus areas are health care, education, sustainable livelihood, infrastructure and social reform.
Business Responsibility Report:
As per Regulation 34 of the SEBI (Listing Obligations and Disclosure Requirements) Regulations,2015 read with SEBI Circular dated 4th November, 2015 issued by Securities and Exchange Board of India, those listed entities which have been submitting sustainability reports to overseas regulatory agencies/stakeholders based on internationally accepted reporting frameworks need not prepare a separate report for the purpose of the National Voluntary Guidelines on Social, Environmental and Economic Responsibility of Business, but only furnish the same to their stakeholders along with the details of the framework under which their Business Responsibility Report has been prepared and a mapping of the principles contained in the aforesaid guidelines to the disclosures made in their sustainability reports.
Hindalco has been publishing its Sustainability Report since FY11 on Global Reporting Initiative (GRI) Framework. The report for 2014-15 titled ‘Business through Sustainability’ has been rated as A+ rating based on Global Reporting Initiatives (GRI G 3.1) standards by an external independent assessing agency.
The Company will also publish its Sustainability Report for FY 2015-16. This will be hosted on our website www.hindalco.com. Any shareholder interested in obtaining a physical copy of the same may write to the Company Secretary at the Registered Offi ce of your Company.
Hindalco Annual Report 2015-16.indb 47Hindalco Annual Report 2015-16.indb 47 8/17/2016 1:31:23 PM8/17/2016 1:31:23 PM
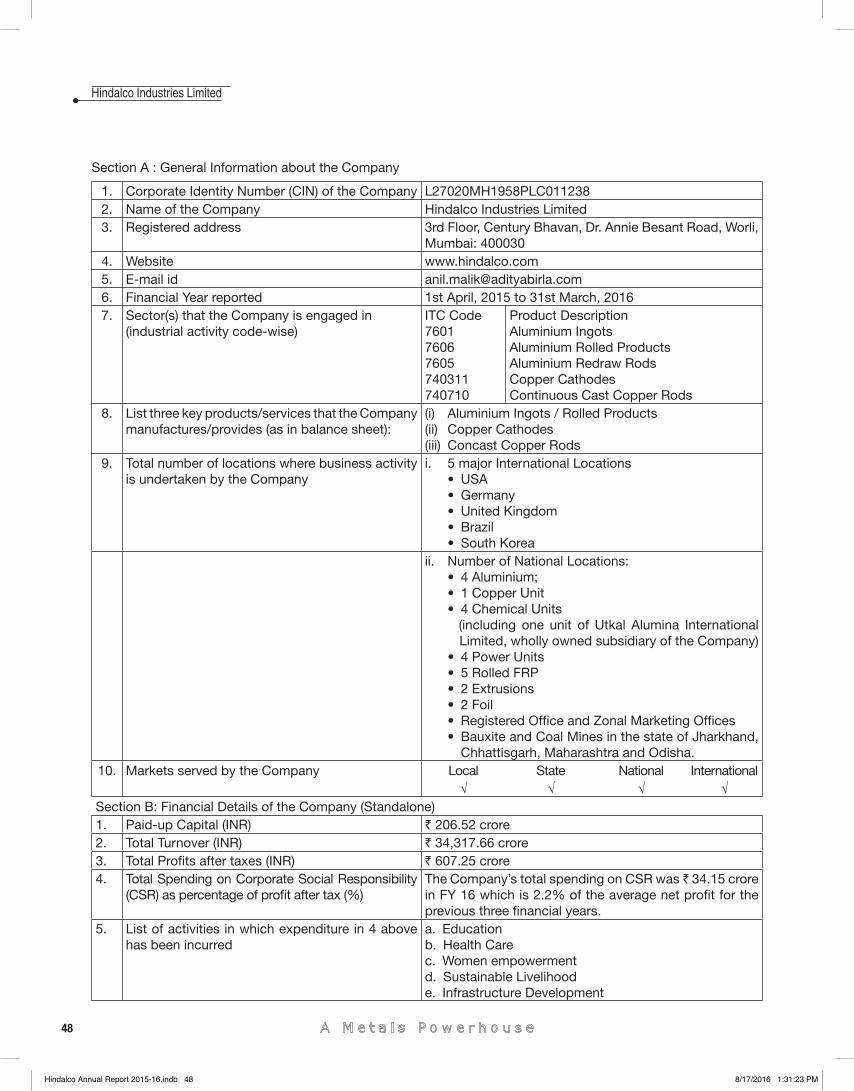
48
Hindalco Industries Limited
Section A : General Information about the Company
1. Corporate Identity Number (CIN) of the Company L27020MH1958PLC0112382. Name of the Company Hindalco Industries Limited3. Registered address 3rd Floor, Century Bhavan, Dr. Annie Besant Road, Worli,
Mumbai: 400030 4. Website www.hindalco.com5. E-mail id [email protected]. Financial Year reported 1st April, 2015 to 31st March, 2016 7. Sector(s) that the Company is engaged in
(industrial activity code-wise)ITC Code760176067605740311740710
Product DescriptionAluminium IngotsAluminium Rolled ProductsAluminium Redraw RodsCopper CathodesContinuous Cast Copper Rods
8. List three key products/services that the Company manufactures/provides (as in balance sheet):
(i) Aluminium Ingots / Rolled Products(ii) Copper Cathodes(iii) Concast Copper Rods
9. Total number of locations where business activity is undertaken by the Company
i. 5 major International Locations • USA • Germany • United Kingdom • Brazil • South Koreaii. Number of National Locations: • 4 Aluminium; • 1 Copper Unit • 4 Chemical Units (including one unit of Utkal Alumina International
Limited, wholly owned subsidiary of the Company) • 4 Power Units • 5 Rolled FRP • 2 Extrusions • 2 Foil
• Registered Offi ce and Zonal Marketing Offi ces • Bauxite and Coal Mines in the state of Jharkhand,
Chhattisgarh, Maharashtra and Odisha.10. Markets served by the Company Local State National International
√ √ √ √Section B: Financial Details of the Company (Standalone)1. Paid-up Capital (INR) ` 206.52 crore2. Total Turnover (INR) ` 34,317.66 crore3. Total Profi ts after taxes (INR) ` 607.25 crore4. Total Spending on Corporate Social Responsibility
(CSR) as percentage of profi t after tax (%) The Company’s total spending on CSR was ̀ 34.15 crore in FY 16 which is 2.2% of the average net profi t for the previous three fi nancial years.
5. List of activities in which expenditure in 4 above has been incurred
a. Education b. Health Carec. Women empowermentd. Sustainable Livelihoode. Infrastructure Development
Hindalco Annual Report 2015-16.indb 48Hindalco Annual Report 2015-16.indb 48 8/17/2016 1:31:23 PM8/17/2016 1:31:23 PM

49
SUSTAINABILITY & BUSINESS RESPONSIBILITY REPORT
FINA
NCIA
L HI
GHLI
GHTS
MAN
AGEM
ENT
DISC
USSI
ON
AND
ANAL
YSIS
CORP
ORAT
E GO
VERN
ANCE
RE
PORT
STAN
DALO
NE
FINA
NCIA
L ST
ATEM
ENTS
CONS
OLID
ATED
FI
NANC
IAL
STAT
EMEN
TSSO
CIAL
RE
PORT
DIRE
CTOR
S’RE
PORT
SHAR
EHOL
DER
INFO
RMAT
ION
SUST
AINA
BILI
TY &
BUS
INES
SRE
SPON
SIBI
LITY
REP
ORT
Annual Report 2015-16
Section C: Other Details 1. Does the Company have any Subsidiary Company/Companies?
Yes, as on 31st March, 2016, the Company has 55(fi fty fi ve) subsidiaries - 13 (thirteen) domestic and 42 (forty two) foreign.
2. Do the Subsidiary Company/Companies participate in the BR Initiatives of the parent company? If yes, then indicate the number of such subsidiary company(s):Hindalco’s Sustainability Report covers the India Operations including Greenfi eld Projects, along with overseas subsidiary Novelis Inc. Further, Novelis Inc., also publishes Sustainability Report based of Global Reporting Initiative (GRI) framework.
3. Do any other entity/entities (e.g. suppliers, distributors etc.) that the Company does business participate in the BR initiatives of the Company? If yes, then indicate the percentage of such entity/entities?At present, suppliers and distributors with whom the Company does business, do not participate in the Business Responsibility initiatives of the Company directly.
Section D: BR Information1. Details of Director/Directors responsible for BR:
a) Details of the Director/Director responsible for implementation of the BR policy/policies
DIN Number 00013496Name Mr. Jagdish KhattarDesignation Independent Director
2. The National Voluntary Guidelines on Social, Environmental and Economic Responsibilities of Business released by the Ministry of Corporate Affairs has adopted nine areas of Business Responsibility. These briefl y are as follows:
P1 Businesses should conduct and govern themselves with Ethics, Transparency and Accountability.
P2 Businesses should provide goods and services that are safe and contribute to sustainability throughout their life cycle.
P3 Businesses should promote the wellbeing of all employees.
P4 Businesses should respect the interests of, and be responsive towards all stakeholders, especially those who are disadvantaged, vulnerable and marginalized.
P5 Businesses should respect and promote human rights.
P6 Business should respect, protect, and make efforts to restore the environment.
P7 Businesses, when engaged in infl uencing public and regulatory policy, should do so in a responsible manner.
P8 Businesses should support inclusive growth and equitable development.
P9 Businesses should engage with and provide value to their customers and consumers in a responsible manner.
The mapping of the these principles to the disclosures will form part of the Sustainability Report 2015-16, which will be available on our website www.hindalco.com.
b) Details of the BR head:Sr. No. Particulars Details1. DIN Number
(if applicable)N.A.
2. Name Mr. Anil Malik3. Designation President & Company Secretary4. Tel: No. 022-666266665. E-mail id [email protected]
Hindalco Annual Report 2015-16.indb 49Hindalco Annual Report 2015-16.indb 49 8/17/2016 1:31:23 PM8/17/2016 1:31:23 PM
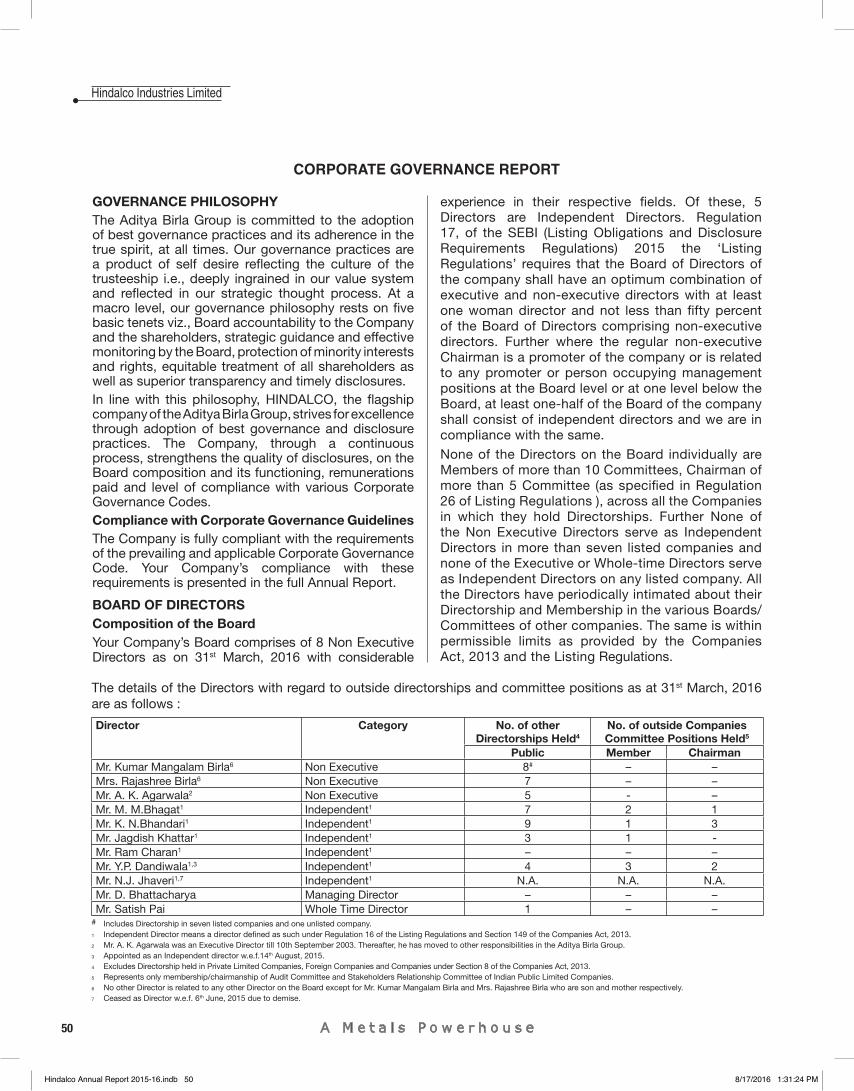
50
Hindalco Industries Limited
GOVERNANCE PHILOSOPHYThe Aditya Birla Group is committed to the adoption of best governance practices and its adherence in the true spirit, at all times. Our governance practices are a product of self desire refl ecting the culture of the trusteeship i.e., deeply ingrained in our value system and refl ected in our strategic thought process. At a macro level, our governance philosophy rests on fi ve basic tenets viz., Board accountability to the Company and the shareholders, strategic guidance and effective monitoring by the Board, protection of minority interests and rights, equitable treatment of all shareholders as well as superior transparency and timely disclosures.In line with this philosophy, HINDALCO, the fl agship company of the Aditya Birla Group, strives for excellence through adoption of best governance and disclosure practices. The Company, through a continuous process, strengthens the quality of disclosures, on the Board composition and its functioning, remunerations paid and level of compliance with various Corporate Governance Codes.Compliance with Corporate Governance Guidelines The Company is fully compliant with the requirements of the prevailing and applicable Corporate Governance Code. Your Company’s compliance with these requirements is presented in the full Annual Report.
BOARD OF DIRECTORSComposition of the Board Your Company’s Board comprises of 8 Non Executive Directors as on 31st March, 2016 with considerable
CORPORATE GOVERNANCE REPORT
experience in their respective fi elds. Of these, 5 Directors are Independent Directors. Regulation 17, of the SEBI (Listing Obligations and Disclosure Requirements Regulations) 2015 the ‘Listing Regulations’ requires that the Board of Directors of the company shall have an optimum combination of executive and non-executive directors with at least one woman director and not less than fi fty percent of the Board of Directors comprising non-executive directors. Further where the regular non-executive Chairman is a promoter of the company or is related to any promoter or person occupying management positions at the Board level or at one level below the Board, at least one-half of the Board of the company shall consist of independent directors and we are in compliance with the same.None of the Directors on the Board individually are Members of more than 10 Committees, Chairman of more than 5 Committee (as specifi ed in Regulation 26 of Listing Regulations ), across all the Companies in which they hold Directorships. Further None of the Non Executive Directors serve as Independent Directors in more than seven listed companies and none of the Executive or Whole-time Directors serve as Independent Directors on any listed company. All the Directors have periodically intimated about their Directorship and Membership in the various Boards/ Committees of other companies. The same is within permissible limits as provided by the Companies Act, 2013 and the Listing Regulations.
The details of the Directors with regard to outside directorships and committee positions as at 31st March, 2016 are as follows :
Director Category No. of other Directorships Held4
No. of outside Companies Committee Positions Held5
Public Member Chairman Mr. Kumar Mangalam Birla6 Non Executive 8# – –Mrs. Rajashree Birla6 Non Executive 7 – –Mr. A. K. Agarwala2 Non Executive 5 - –Mr. M. M.Bhagat1 Independent1 7 2 1Mr. K. N.Bhandari1 Independent1 9 1 3Mr. Jagdish Khattar1 Independent1 3 1 -Mr. Ram Charan1 Independent1 – – –Mr. Y.P. Dandiwala1,3 Independent1 4 3 2Mr. N.J. Jhaveri1,7 Independent1 N.A. N.A. N.A.Mr. D. Bhattacharya Managing Director – – –Mr. Satish Pai Whole Time Director 1 – –
# Includes Directorship in seven listed companies and one unlisted company.1 Independent Director means a director defi ned as such under Regulation 16 of the Listing Regulations and Section 149 of the Companies Act, 2013.2 Mr. A. K. Agarwala was an Executive Director till 10th September 2003. Thereafter, he has moved to other responsibilities in the Aditya Birla Group.3 Appointed as an Independent director w.e.f.14th August, 2015.4 Excludes Directorship held in Private Limited Companies, Foreign Companies and Companies under Section 8 of the Companies Act, 2013.5 Represents only membership/chairmanship of Audit Committee and Stakeholders Relationship Committee of Indian Public Limited Companies.6 No other Director is related to any other Director on the Board except for Mr. Kumar Mangalam Birla and Mrs. Rajashree Birla who are son and mother respectively.7 Ceased as Director w.e.f. 6th June, 2015 due to demise.
Hindalco Annual Report 2015-16.indb 50Hindalco Annual Report 2015-16.indb 50 8/17/2016 1:31:24 PM8/17/2016 1:31:24 PM
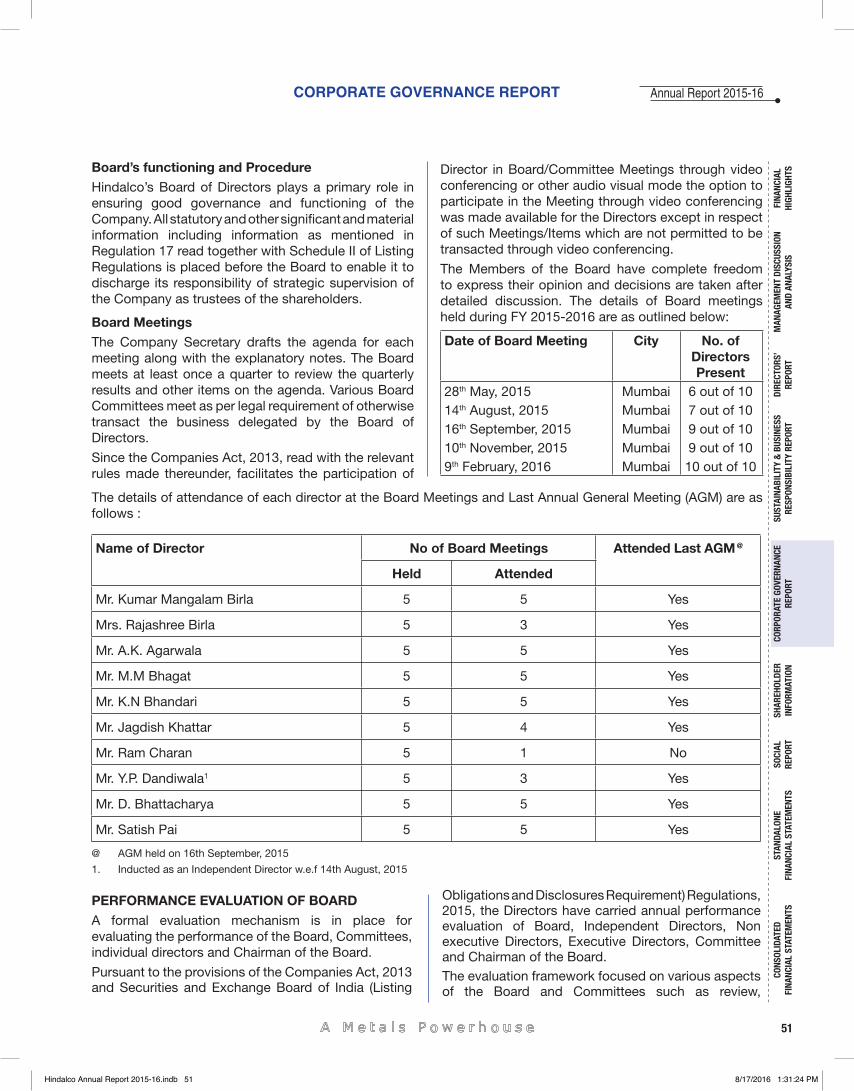
CORPORATE GOVERNANCE REPORT
51
Annual Report 2015-16
FINA
NCIA
L HI
GHLI
GHTS
MAN
AGEM
ENT
DISC
USSI
ON
AND
ANAL
YSIS
CORP
ORAT
E GO
VERN
ANCE
RE
PORT
STAN
DALO
NE
FINA
NCIA
L ST
ATEM
ENTS
CONS
OLID
ATED
FI
NANC
IAL
STAT
EMEN
TSSO
CIAL
RE
PORT
DIRE
CTOR
S’RE
PORT
SHAR
EHOL
DER
INFO
RMAT
ION
SUST
AINA
BILI
TY &
BUS
INES
SRE
SPON
SIBI
LITY
REP
ORT
Board’s functioning and Procedure Hindalco’s Board of Directors plays a primary role in ensuring good governance and functioning of the Company. All statutory and other signifi cant and material information including information as mentioned in Regulation 17 read together with Schedule II of Listing Regulations is placed before the Board to enable it to discharge its responsibility of strategic supervision of the Company as trustees of the shareholders.
Board MeetingsThe Company Secretary drafts the agenda for each meeting along with the explanatory notes. The Board meets at least once a quarter to review the quarterly results and other items on the agenda. Various Board Committees meet as per legal requirement of otherwise transact the business delegated by the Board of Directors.
Since the Companies Act, 2013, read with the relevant rules made thereunder, facilitates the participation of
Director in Board/Committee Meetings through video conferencing or other audio visual mode the option to participate in the Meeting through video conferencing was made available for the Directors except in respect of such Meetings/Items which are not permitted to be transacted through video conferencing.
The Members of the Board have complete freedom to express their opinion and decisions are taken after detailed discussion. The details of Board meetings held during FY 2015-2016 are as outlined below:
Date of Board Meeting City No. of Directors Present
28th May, 2015 Mumbai 6 out of 1014th August, 2015 Mumbai 7 out of 10 16th September, 2015 Mumbai 9 out of 10 10th November, 2015 Mumbai 9 out of 10 9th February, 2016 Mumbai 10 out of 10
The details of attendance of each director at the Board Meetings and Last Annual General Meeting (AGM) are as follows :
Name of Director No of Board Meetings Attended Last AGM @
Held Attended
Mr. Kumar Mangalam Birla 5 5 Yes
Mrs. Rajashree Birla 5 3 Yes
Mr. A.K. Agarwala 5 5 Yes
Mr. M.M Bhagat 5 5 Yes
Mr. K.N Bhandari 5 5 Yes
Mr. Jagdish Khattar 5 4 Yes
Mr. Ram Charan 5 1 No
Mr. Y.P. Dandiwala1 5 3 Yes
Mr. D. Bhattacharya 5 5 Yes
Mr. Satish Pai 5 5 Yes
@ AGM held on 16th September, 2015
1. Inducted as an Independent Director w.e.f 14th August, 2015
PERFORMANCE EVALUATION OF BOARDA formal evaluation mechanism is in place for evaluating the performance of the Board, Committees, individual directors and Chairman of the Board.
Pursuant to the provisions of the Companies Act, 2013 and Securities and Exchange Board of India (Listing
Obligations and Disclosures Requirement) Regulations, 2015, the Directors have carried annual performance evaluation of Board, Independent Directors, Non executive Directors, Executive Directors, Committee and Chairman of the Board. The evaluation framework focused on various aspects of the Board and Committees such as review,
Hindalco Annual Report 2015-16.indb 51Hindalco Annual Report 2015-16.indb 51 8/17/2016 1:31:24 PM8/17/2016 1:31:24 PM
52
Hindalco Industries Limited
timely information from management etc. Also, the performance of individual directors was divided into Executive, Non Executive and Independent Directors and based on the parameters such as contribution, attendance, decision making, action oriented, external knowledge etc. Board members have evaluated Independent Directors, Non executive Directors, Executive Directors, Committee and Chairman of the Board. The result of evaluation was satisfactory and meets the requirements of the Company. Board fully agreed and rated 100% on its functioning, skill sets and working atmosphere. Independent Directors scored well on expressing their views and in understanding the Company and its requirements. Non-Executive Directors scored well in understanding the Company and its requirements and keep themselves current on the areas to be discussed. Executive Directors are action oriented and ensures timely implementation of the Board decisions. Board is completely satisfi ed with the functioning of various Committees. Board has full faith in the Chairman in leading the Board effectively and ensuring contribution from all its members.
INDEPENDENT DIRECTOR’S MEETINGDuring the year under review, the Independent Directors met on 9th February, 2016 without the presence of non independent directors and members of the management interalia to discuss:
• Evaluation of the performance of Non Independent Directors and the Board of Directors as a whole
• Evaluation of the performance of the Chairman, taking into account the views of Executive and Non Executive Directors.
• Evaluation of the quality, content and timelines of fl ow of information between the Management and the Board that is necessary for the Board to effectively and reasonably perform its duties.
FAMILIARISATION PROGRAMME FOR INDEPENDENT DIRECTORSAll new Independent Directors inducted on the Board are given an orientation. Induction and training A letter of appointment together with an induction kit is given to Independent Directors at the time of their appointment setting out their roles, functions, duties and responsibilities. The Directors are familiarised with your Company’s business and its operations. Interactions are held between the Directors and senior management of your Company. Directors are familiarised with the organisational set-up, functioning of various departments, internal control processes and relevant information pertaining to your Company. They are periodically updated on the industry scenario,
changes in regulatory framework and the impact thereof on the working of your Company. The details on the Company’s Familiarisation Programme for Independent Directors can be accessed at:http://hindalco.com/about-us/management-team/board-of-directors.
COMMITTEES OF THE BOARD OF DIRECTORSThe Board has constituted following Committees of Directors to deal with matters and monitor the activities falling within the respective terms of reference:-
AUDIT COMMITTEEConstitution of Audit Committee and its functionsYour Company has an Audit Committee at the Board level which acts as a link between the management, the statutory and the internal auditors and the Board of Directors and oversees the fi nancial reporting process. The Committee is governed by a Charter which is line with the regulatory requirements mandated by the Companies Act, 2013 and the Listing Regulations. The Committee comprises of three Non Executive Directors, all of whom are Independent Directors. Due to the death of Mr. N. J. Jhaveri, member of the Audit Committee, the Committee was reconstituted with the following members:
Mr. M.M Bhagat ChairmanMr. K.N Bhandari MemberMr. Y.P. Dandiwala Member
During the year, the Audit Committee met 4 times i.e on 28th May, 2015, 14th August, 2015, 10th November, 2015 and 9th February, 2016 to deliberate on various matters. The attendance of each Audit Committee members are as follows:
Name of Audit Committee Members
No of meetings Attended
Mr. M.M Bhagat 4Mr. K.N Bhandari 4Mr. Y.P. Dandiwala@ 2
@ Appointed w.e.f. 14th August, 2015
1. The Chairman of the Audit Committee, Mr. M.M. Bhagat was present at the last Annual General Meeting of your Company held on 16th September, 2015.
2. Mr. D. Bhattacharya, Managing Director, Mr. Satish Pai, Deputy Managing Director and Mr. Praveen Kumar Maheshwari, CFO are the permanent invitiees to the Committee.
3. Mr. Anil Malik, Company Secretary, is the Secretary to the Committee.
Hindalco Annual Report 2015-16.indb 52Hindalco Annual Report 2015-16.indb 52 8/17/2016 1:31:24 PM8/17/2016 1:31:24 PM
CORPORATE GOVERNANCE REPORT
53
Annual Report 2015-16
FINA
NCIA
L HI
GHLI
GHTS
MAN
AGEM
ENT
DISC
USSI
ON
AND
ANAL
YSIS
CORP
ORAT
E GO
VERN
ANCE
RE
PORT
STAN
DALO
NE
FINA
NCIA
L ST
ATEM
ENTS
CONS
OLID
ATED
FI
NANC
IAL
STAT
EMEN
TSSO
CIAL
RE
PORT
DIRE
CTOR
S’RE
PORT
SHAR
EHOL
DER
INFO
RMAT
ION
SUST
AINA
BILI
TY &
BUS
INES
SRE
SPON
SIBI
LITY
REP
ORT
Role of Audit Committee:1. Oversight of the listed entity’s fi nancial reporting
process and the disclosure of its fi nancial information to ensure that the fi nancial statement is correct, suffi cient and credible;
2. Recommendation for appointment, remuneration and terms of appointment of auditors of the listed entity;
3. Approval of payment to statutory auditors for any other services rendered by the statutory auditors;
4. Reviewing, with the management, the annual fi nancial statements and auditor’s report thereon before submission to the board for approval, with particular reference to:
a. Matters required to be included in the director’s responsibility statement to be included in the board’s report in terms of clause (c) of sub-section (3) of Section 134 of the Companies Act, 2013;
b. Changes, if any, in accounting policies and practices and reasons for the same;
c. Major accounting entries involving estimates based on the exercise of judgment by management;
d. Signifi cant adjustments made in the fi nancial statements arising out of audit fi ndings;
e. Compliance with listing and other legal requirements relating to fi nancial statements;
f. Disclosure of any related party transactions;
g. Modifi ed opinion(s) in the draft audit report;
5. Reviewing, with the management, the quarterly fi nancial statements before submission to the board for approval;
6. Reviewing, with the management, the statement of uses / application of funds raised through an issue (public issue, rights issue, preferential issue, etc.), the statement of funds utilized for purposes other than those stated in the offer document / prospectus / notice and the report submitted by the monitoring agency monitoring the utilisation of proceeds of a public or rights issue, and making appropriate recommendations to the board to take up steps in this matter;
7. Reviewing and monitoring the auditor’s independence and performance, and effectiveness of audit process;
8. Approval or any subsequent modifi cation of transactions of the listed and effectiveness of audit process;
9. Scrutiny of inter-corporate loans and investments;
10. Valuation of undertakings or assets of the listed entity, wherever it is necessary;
11. Evaluation of internal fi nancial controls and risk management systems;
12. Reviewing, with the management, performance of statutory and internal auditors, adequacy of the internal control systems;
13. Reviewing the adequacy of internal audit function, if any, including the structure of the internal audit department, staffi ng and seniority of the offi cial heading the department, reporting structure coverage and frequency of internal audit;
14. Discussion with internal auditors of any signifi cant fi ndings and follow up there on;
15. Reviewing the fi ndings of any internal investigations by the internal auditors into matters where there is suspected fraud or irregularity or a failure of internal control systems of a material nature and reporting the matter to the board;
16. Discussion with statutory auditors before the audit commences, about the nature and scope of audit as well as post-audit discussion to ascertain any area of concern;
17. To look into the reasons for substantial defaults in the payment to the depositors, debenture holders, shareholders (in case of non-payment of declared dividends) and creditors;
18. To review the functioning of the whistle blower mechanism;
19. Approval of appointment of chief fi nancial offi cer after assessing the qualifi cations, experience and background, etc. of the candidate;
20. Carrying out any other function as is mentioned in the terms of reference of the audit committee.
B. The Audit Committee reviews the following information:
1. Management discussion and analysis of fi nancial condition and results of operations;
2. Statement of signifi cant related party transactions (as defi ned by the audit committee), submitted by management;
3. Management letters / letters of internal control weaknesses issued by the statutory auditors;
4. Internal audit reports relating to internal control weaknesses; and
5. The appointment, removal and terms of remuneration of the chief internal auditor shall be subject to review by the audit committee.
Hindalco Annual Report 2015-16.indb 53Hindalco Annual Report 2015-16.indb 53 8/17/2016 1:31:24 PM8/17/2016 1:31:24 PM
54
Hindalco Industries Limited
6. Statement of deviations:a. Quarterly statement of deviation(s) including
report of monitoring agency, if applicable, submitted to stock exchange(s) in terms of Regulation 32(1) of the Listing Regulations .
b. Annual statement of funds utilized for purposes other than those stated in the offer document/prospectus/notice in terms of Regulation 32(7) of the Listing Regulations .
STAKEHOLDER’S RELATIONSHIP COMMITTEEThe Company has a “Stakeholder’s Relationship Committee” at the Board level to deal with various matters relating to redressal of shareholders and investor grievances, such as transfer and transmission of shares, issue of duplicate shares, non-receipt of dividend/notices/ Annual Reports, etc. In addition, the Committee looks into other issues including status of dematerialisation / rematerialisation of shares and debentures, systems and procedures followed to track investor complaints and suggest measures for improvement from time to time. Due to the demise of Mr. N.J. Jhaveri the Committee was reconstituted with the following members:Mr. K.N. Bhandari – ChairmanMr. M.M Bhagat – MemberMr. A.K Agarwala – Member Mr. Anil Malik, Company Secretary, is the Compliance offi cer and acts as secretary to the Committee.During the year under review, the Committee met four times i.e on 28th May, 2015, 14th August, 2015, 10th November, 2015 and 9th February, 2016 to deliberate on various matters referred above. Details of attendance by Directors for the Committee meetings are as follows:
Name of the Director Held Attended Mr. K.N Bhandari 4 4Mr. M.M Bhagat 4 4Mr. A.K. Agarwala@ 4 2
@ Inducted as a member w.e.f 14th August, 2015
The Company’s shares are traded and delivered in the dematerialised form in all Stock Exchanges. To expedite the transfer in the physical segment, necessary authority has been delegated to certain offi cers, who are authorised to transfer up to 10,000 shares under one transfer deed.
Number of shareholders complaint received so far/number not solved to the satisfaction of shareholders/number of pending complaints
Details of complaints received, disposed off and pending during the year, number of shares transferred
during the year, time taken for affecting these transfers and the number of share transfers pending are furnished in the “Shareholder Information” section of this Annual Report.
NOMINATION AND REMUNERATION COMMIITEE
The Nomination and Remuneration Committee comprises of three Directors of whom two are Independent. Due to the death of Mr. N.J. Jhaveri, member of the Committee, the Nomination and Remuneration Committee was reconstituted with the following members:
Mr. M. M. Bhagat - Chairman
Mr. Kumar Mangalam Birla - Member
Mr. K. N. Bhandari - Member
The terms of reference of the Committee interalia include the following:
• Identify persons who are qualifi ed to become directors and who may be appointed in senior management and recommend to the Board their appointment and removal.
• Formulation of criteria for evaluation of Independent Directors and the Board.
• Carry out evaluation of every director’s performance.
• Formulate the criteria for determining qualifi cations, positive attributes and independence of a director.
• Recommend to the Board a policy, relating to the remuneration for the directors, key managerial personnel and other employees.
• Devise a policy on Board diversity.
The scope and functions of the Committee is in accordance with the provisions of the Companies Act, 2013 and Listing Regulations.
During the year under review, the Committee met twice i.e on 14th August, 2015 and 16th September, 2015 to deliberate on various matters referred above. The details of attendance of the members is as below:
Name of the Director Held Attended Mr. M.M Bhagat 2 2Mr. Kumar Mangalam Birla 2 2Mr. K.N Bhandari @ 2 1
@ Inducted as a member w.e.f 14th August, 2015.
CORPORATE SOCIAL RESPONSIBILITY COMMITTEE (CSR)
The CSR Committee comprises of four Directors of whom two are Non executive, one Independent and one Executive.
Hindalco Annual Report 2015-16.indb 54Hindalco Annual Report 2015-16.indb 54 8/17/2016 1:31:24 PM8/17/2016 1:31:24 PM
CORPORATE GOVERNANCE REPORT
55
Annual Report 2015-16
FINA
NCIA
L HI
GHLI
GHTS
MAN
AGEM
ENT
DISC
USSI
ON
AND
ANAL
YSIS
CORP
ORAT
E GO
VERN
ANCE
RE
PORT
STAN
DALO
NE
FINA
NCIA
L ST
ATEM
ENTS
CONS
OLID
ATED
FI
NANC
IAL
STAT
EMEN
TSSO
CIAL
RE
PORT
DIRE
CTOR
S’RE
PORT
SHAR
EHOL
DER
INFO
RMAT
ION
SUST
AINA
BILI
TY &
BUS
INES
SRE
SPON
SIBI
LITY
REP
ORT
Due to the demise of Mr. N.J. Jhaveri the Committee was reconstituted with the following members:
Mrs. Rajashree Birla – Chairman Mr. A. K. Agarwala – MemberMr. D. Bhattacharya – MemberMr. Jagdish Khattar – Member
Dr. Pragnya Ram, Group Executive President- Corporate Communications and CSR is a permanent invitee to the Committee.
The terms of reference of Corporate Social Responsibility Committee (CSR) broadly comprises of following:
(a) Formulate and Recommend CSR Policy to the Board indicating the activities to be undertaken by the Company as specifi ed in Schedule VII of Companies Act, 2013;
(b) Recommend the amount of expenditure to be incurred on the activities referred to in clause(a);
(c) Provide guidance on various CSR activities to be undertaken by the Company and to monitor its progress.
During the year under review, the Committee met twice i.e on 10th November, 2015 and 9th February, 2016 to deliberate on various matters referred above.The details of attendance of the members is as below:
Name of the Director Held Attended
Mrs. Rajashree Birla 2 2
Mr. A.K.Agarwala 2 2
Mr. D. Bhattacharya 2 2
Mr. Jagdish Khattar@ 2 2@ Inducted as a Member w.e.f. 14th August, 2015
RISK MANAGEMENT COMMITTEE
The Company has a robust risk management framework to identify, monitor and minimise risk.
Your Company has comprehensive risk management policy and it is periodically reviewed by the Board of Directors. The following are the Members of Risk Management Committee:• Mr. A.K. Agarwala - Chairman• Mr. D.Bhattacharya - Member• Mr. Satish Pai - Member• Mr. R.K. Kasliwal - Member• Mr. Anil Mathew - Member
Mr. Anil Malik , Company Secretary acts as Secretary to the Committee.
During the year under review, the Committee met four times i.e on 25th May, 2015 , 13th August, 2015 ,
5th November, 2015 and 6th February, 2016 to deliberate on various matters. Details of attendance by the Committee members are as follows:
Name of the Member Held Attended
Mr. A.K. Agarwala 4 4
Mr. D. Bhattacharya 4 4
Mr. R.K. Kasliwal 4 4
Mr. Satish Pai 4 1
Mr. Anil Mathew 4 4
Non Executive Director’s Compensation and Disclosure
All fees/compensation including sitting fee paid to the Non-Executive directors of the Company are fi xed by Board of Directors within the limits approved by the shareholders. Details of sitting fees/compensation paid including stock Options, if any, to them are given at the respective places in the report.
Remuneration of Directors and Others
Your Company has two Executive Directors, The Board of Directors decides the remuneration of the Managing Director and Whole Time Director.
The Company has a system where all the directors or senior management of the Company are required to disclose all pecuniary relationship or transactions with the Company. No signifi cant material transactions have been made by the Non Executive Directors with the Company during the year.
Besides sitting fees @ ` 50,000/- per meeting of the Board, fee @ ` 25,000/- per meeting of the Audit Committee and ` 20,000/- per meeting for any other Committee thereof, the Company also pays Commission to the Non-Executive Directors.
For FY - 2015-16, the Board has approved payment of ` 2.0 Crores (Previous Year ̀ 4.0 Crores) as Commission to the Non- Executive Directors of the Company pursuant to the authority given by the shareholders at the Annual General Meeting held on 24th September, 2014 to pay Commission not exceeding 1% of the net profi ts of the Company to the Non Executive Directors of the Company. The Amount of Commission payable is determined after assigning weightage to attendance and the type of meeting and other responsibilities.
Executive Director is paid remuneration within the limits envisaged under Schedule V of the Companies Act, 2013. The said remuneration is approved by the Board with in the limits set by the Shareholders of the Company.
Hindalco Annual Report 2015-16.indb 55Hindalco Annual Report 2015-16.indb 55 8/17/2016 1:31:24 PM8/17/2016 1:31:24 PM
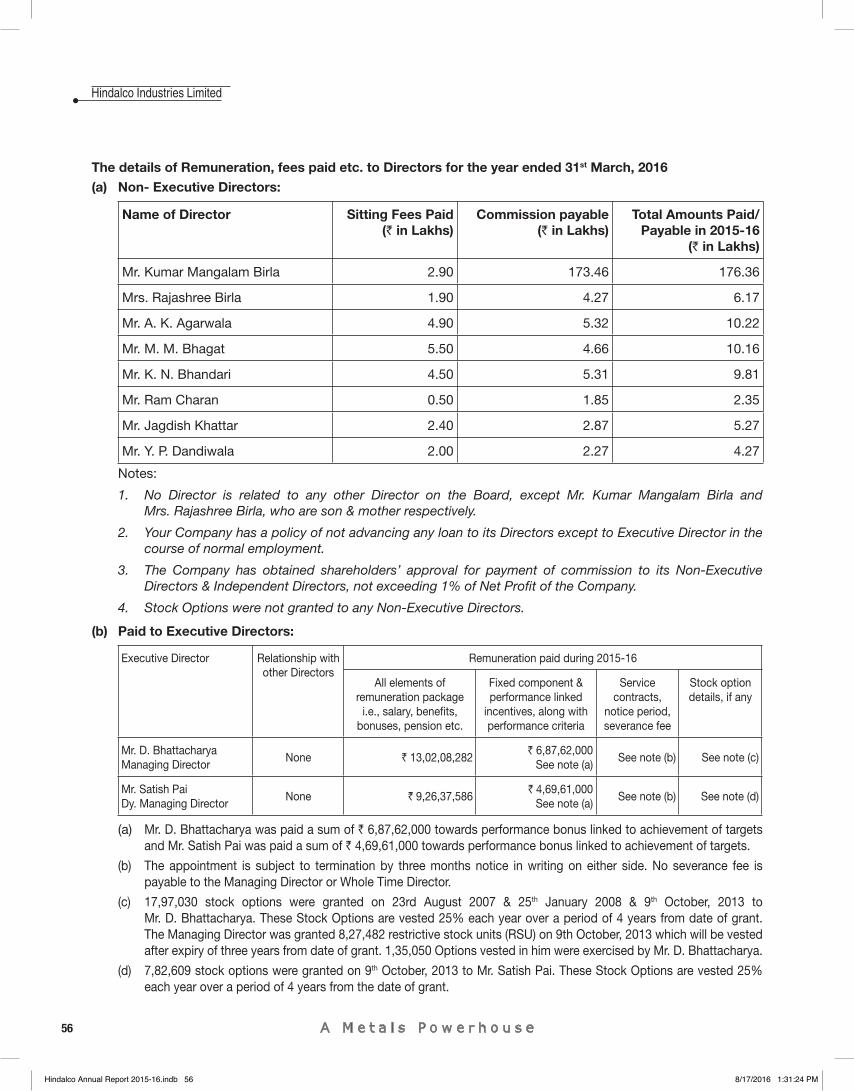
56
Hindalco Industries Limited
The details of Remuneration, fees paid etc. to Directors for the year ended 31st March, 2016(a) Non- Executive Directors:
Name of Director Sitting Fees Paid(` in Lakhs)
Commission payable (` in Lakhs)
Total Amounts Paid/ Payable in 2015-16
(` in Lakhs)
Mr. Kumar Mangalam Birla 2.90 173.46 176.36
Mrs. Rajashree Birla 1.90 4.27 6.17
Mr. A. K. Agarwala 4.90 5.32 10.22
Mr. M. M. Bhagat 5.50 4.66 10.16
Mr. K. N. Bhandari 4.50 5.31 9.81
Mr. Ram Charan 0.50 1.85 2.35
Mr. Jagdish Khattar 2.40 2.87 5.27
Mr. Y. P. Dandiwala 2.00 2.27 4.27
Notes:
1. No Director is related to any other Director on the Board, except Mr. Kumar Mangalam Birla and Mrs. Rajashree Birla, who are son & mother respectively.
2. Your Company has a policy of not advancing any loan to its Directors except to Executive Director in the course of normal employment.
3. The Company has obtained shareholders’ approval for payment of commission to its Non-Executive Directors & Independent Directors, not exceeding 1% of Net Profi t of the Company.
4. Stock Options were not granted to any Non-Executive Directors.
(b) Paid to Executive Directors:
Executive Director Relationship with other Directors
Remuneration paid during 2015-16
All elements of remuneration package
i.e., salary, benefi ts, bonuses, pension etc.
Fixed component & performance linked
incentives, along with performance criteria
Service contracts,
notice period, severance fee
Stock option details, if any
Mr. D. BhattacharyaManaging Director
None ` 13,02,08,282` 6,87,62,000
See note (a)See note (b) See note (c)
Mr. Satish PaiDy. Managing Director
None ` 9,26,37,586` 4,69,61,000
See note (a)See note (b) See note (d)
(a) Mr. D. Bhattacharya was paid a sum of ` 6,87,62,000 towards performance bonus linked to achievement of targets and Mr. Satish Pai was paid a sum of ` 4,69,61,000 towards performance bonus linked to achievement of targets.
(b) The appointment is subject to termination by three months notice in writing on either side. No severance fee is payable to the Managing Director or Whole Time Director.
(c) 17,97,030 stock options were granted on 23rd August 2007 & 25th January 2008 & 9th October, 2013 to Mr. D. Bhattacharya. These Stock Options are vested 25% each year over a period of 4 years from date of grant. The Managing Director was granted 8,27,482 restrictive stock units (RSU) on 9th October, 2013 which will be vested after expiry of three years from date of grant. 1,35,050 Options vested in him were exercised by Mr. D. Bhattacharya.
(d) 7,82,609 stock options were granted on 9th October, 2013 to Mr. Satish Pai. These Stock Options are vested 25% each year over a period of 4 years from the date of grant.
Hindalco Annual Report 2015-16.indb 56Hindalco Annual Report 2015-16.indb 56 8/17/2016 1:31:24 PM8/17/2016 1:31:24 PM
CORPORATE GOVERNANCE REPORT
57
Annual Report 2015-16
FINA
NCIA
L HI
GHLI
GHTS
MAN
AGEM
ENT
DISC
USSI
ON
AND
ANAL
YSIS
CORP
ORAT
E GO
VERN
ANCE
RE
PORT
STAN
DALO
NE
FINA
NCIA
L ST
ATEM
ENTS
CONS
OLID
ATED
FI
NANC
IAL
STAT
EMEN
TSSO
CIAL
RE
PORT
DIRE
CTOR
S’RE
PORT
SHAR
EHOL
DER
INFO
RMAT
ION
SUST
AINA
BILI
TY &
BUS
INES
SRE
SPON
SIBI
LITY
REP
ORT
All Directors have disclosed their shareholding in the Company. None of the Directors are holding any debentures of the Company.
Details of Shareholding of Directors as on March 31st, 2016 are as follows:
NAME OF THE DIRECTORSSHARES
(` 1 paid up)
Mr. Kumar Mangalam Birla 8,65,740
Mrs. Rajashree Birla 6,12,470
Mr. A. K. Agarwala 1,16,148
Mr. M. M. Bhagat 4,050
Mr. K. N. Bhandari 5,071
Mr. Y.P Dandiwala 206
Mr. Ram Charan NIL
Mr. Jagdish Khattar 2,500
Mr. D. Bhattacharya 1,38,265
Mr. Satish Pai 30,000
Code of Conduct The Hindalco Code of Conduct, as adopted by the Board of Directors, is applicable to all Directors Senior Management/employees of the Company. The Code is available on the Company’s website viz: http://www.hindalco.com/investor-centre/code-of-conduct
For the year under review, all Directors, Senior Management personnel of the Company have confi rmed their adherence to the provisions of the said Code.
Declaration as required under Regulation 26(3) of the Listing Regulations
We hereby confi rm that :
All Directors and Senior Management have affi rmed compliance with Code of Conduct for the fi nancial year ended 31st March, 2016.
D. BhattacharyaPlace : Mumbai Managing Director
CODE OF CONDUCT FOR PREVENTION OF INSIDER TRADING
As part of Aditya Birla Group, the Company has a strong legacy of fair, transparent and ethical governance practices. The Company has a Code of Conduct for Prevention of Insider Trading in the Shares and securities of the Company for its Directors , Key Managerial Personnel and Designated employees.
SUBSIDIARY COMPANIES
Your Company does not have any material subsidiary whose net worth exceeds 20% of the consolidated net worth of the holding company in the immediately preceding accounting year or has generated 20% of the consolidated income of the Company during previous fi nancial year.
The company has adopted a policy for determining ‘material’ subsidiaries and the policy can be accessed on your Company’s website viz: www.hindalco.com The Audit Committee reviews the fi nancial statements and investments made by unlisted subsidiary companies once in a year. The minutes of the Board meetings as well as statements of all signifi cant transactions of the unlisted subsidiary companies are placed before the Board for their review.
DISCLOSURES
(A) Related Party Transaction
All the related party transactions are strictly done on arm’s length basis and ordinary course of business. The Company places all the relevant details of a related party transaction, before the Audit Committee from time to time. There was no material related party transaction, which are not in the normal course of the business, entered into by the company during the year. Attention of the Members is drawn to the disclosures of transactions with the related parties set out in Notes on Accounts forming part of the fi nancial statements. The Board of Directors have approved and adopted a policy on Related Party Transactions and the same has been uploaded on the website of the Company at http://www.hindalco.com.
(B) Non Compliances/Strictures/penalties Imposed
No Non Compliance/strictures/penalties have been imposed on the Company by stock exchange(s) or SEBI or any statutory authority on any matters related to capital markets during the last three years .
(C) Disclosure of Accounting Treatment
Your Company has followed all relevant Accounting Standards while preparing the Financial Statements.
The Company had formulated a scheme of fi nancial restructuring under sections 391 to 394 of the Companies Act 1956 (“the Scheme”) between the Company and its equity shareholders approved
Hindalco Annual Report 2015-16.indb 57Hindalco Annual Report 2015-16.indb 57 8/17/2016 1:31:24 PM8/17/2016 1:31:24 PM
58
Hindalco Industries Limited
by the High Court of judicature of Bombay to deal with various costs associated with its organic and inorganic growth plan. Pursuant to this, a separate reserve account titled as Business Reconstruction Reserve (“BRR”) was created during the year 2008-09 by transferring balance standing to the credit of Securities Premium Account of the Company for adjustment of certain expenses as prescribed in the Scheme. Accordingly, the Company had transferred ` 8,647.37 crore from Securities Premium Account to BRR and till 31st March, 2015, ` 250.33 crore and ` 2,165.80 crore have been adjusted against BRR in stand-alone and consolidated accounts respectively. During the year, following expenses has been adjusted with BRR in both accounts:
(a) ` 279.46 crore towards expenses on exited Projects.
(b) Impairment loss of ` 367.31 crore (Net of deferred tax ` 194.39 crore).
(c) Provision of ` 35.50 crore towards diminution in value of investments.
Had the Scheme not prescribed aforesaid treatment, the impact on results and Earnings per Share (EPS) would have been as under:
i) Standalone and Consolidated Net Profi t for the year ended 31st March, 2016 lower by ` 682.27 crore.
(ii) Standalone and Consolidated Basic and Diluted EPS for the year ended 31st March, 2016 lower by ` 3.30.
(D) Risk Management
Risk evaluation and management is an ongoing process within the Organisation. Your Company has comprehensive risk management policy and it is periodically reviewed by the Board of Directors.
(E) Proceeds from public issues, right issues, preferential issues etc:
During the year under review, the Company has not raised any proceeds from public issue, right issue or preferential issue.
(F) Remuneration of Directors
This is included separately in this Section.
(G) Management
Management Discussion and Analysis Report is prepared in accordance with the requirements laid out under Listing Regulations forms part of this Annual Report.
No material transaction has been entered into by the Company with the Promoters, Directors or the Management, their subsidiaries or relatives, etc., that may have a potential confl ict with interests of the Company.
(H) ShareholdersThe Company has provided the details of Directors seeking re-appointment in the Annual General Meeting notice attached with this Annual Report.Quarterly Presentations on the Company results are available on the website of the Company (www.hindalco.com) and the Aditya Birla Group website (www.adityabirla.com).
Whistle Blower PolicyThe Company promotes ethical behaviour in all its business activities and has put in place a mechanism for reporting illegal and unethical behaviour. The Company has a Vigil Mechanism and Whistle Blower Policy under which employees are free to report violations of applicable laws and regulations and Code of Conduct. The whistle blower may send the complaint to the independent reporting mechanism - Ethics Hotline or to the respective Values Standards Committee (VSC), depending on the level at which the violation is perceived to be happening. The whistle blower mechanism is reviewed by the Audit Committee. Employees can also report to the Chairman of the Audit Committee. During the year under review, no employee was denied access to the Audit Committee.
Prevention of Sexual Harassment Your Company has zero tolerance for sexual harassment at workplace and has adopted a Policy on prevention, prohibition and redressal of sexual harassment at workplace in line with the provisions of the Sexual Harassment of Women at Workplace (Prevention, Prohibition and Redressal) Act, 2013 and the Rules thereunder for prevention and redressal of complaints of sexual harassment at workplace. The Company is committed to providing equal opportunities without regard to their race, caste, sex, religion, colour, nationality, disability, etc. All women associates (permanent, temporary, contractual and trainees) as well as any women visiting the Company’s offi ce premises or women service providers are covered under this policy. All employees are treated with dignity with a view to maintain a work environment free of sexual harassment whether physical, verbal or psychological.During Fiscal 2016, the Company has received one complaint on sexual harassment, which has been substantiated and appropriate actions were taken.
Hindalco Annual Report 2015-16.indb 58Hindalco Annual Report 2015-16.indb 58 8/17/2016 1:31:24 PM8/17/2016 1:31:24 PM
CORPORATE GOVERNANCE REPORT
59
Annual Report 2015-16
FINA
NCIA
L HI
GHLI
GHTS
MAN
AGEM
ENT
DISC
USSI
ON
AND
ANAL
YSIS
CORP
ORAT
E GO
VERN
ANCE
RE
PORT
STAN
DALO
NE
FINA
NCIA
L ST
ATEM
ENTS
CONS
OLID
ATED
FI
NANC
IAL
STAT
EMEN
TSSO
CIAL
RE
PORT
DIRE
CTOR
S’RE
PORT
SHAR
EHOL
DER
INFO
RMAT
ION
SUST
AINA
BILI
TY &
BUS
INES
SRE
SPON
SIBI
LITY
REP
ORT
There were no complaints pending for more than 90 days during the year.
CEO/CFO Certifi cation The Managing Director and CFO have certifi ed to the Board that:A. They have reviewed fi nancial statements and the
cash fl ow statement for the year and that to the best of their knowledge and belief:1. these statements do not contain any materially
untrue statement or omit any material fact or contain statements that might be misleading;
2. these statements together present a true and fair view of the company’s affairs and are in compliance with existing accounting standards, applicable laws and regulations.
B. There are, to the best of their knowledge and belief, no transactions entered into by the company during the year which are fraudulent, illegal or violative of the company’s code of conduct.
C. They accept responsibility for establishing and maintaining internal controls for fi nancial reporting and that they have evaluated the effectiveness of internal control systems of the company pertaining to fi nancial reporting and they have disclosed to the auditors and the Audit Committee, defi ciencies in the design or operation of such internal controls, if any, of which they are aware and the steps they have taken or propose to take to rectify these defi ciencies.
D. They have indicated to the auditors and the Audit committee:1. signifi cant changes in internal control over
fi nancial reporting during the year;2. signifi cant changes in accounting policies
during the year and that the same have been disclosed in the notes to the fi nancial statements; and
3. instances of signifi cant fraud of which they have become aware and the involvement therein, if any, of the management or an employee having a signifi cant role in the company’s internal control system over fi nancial reporting.
REPORT ON CORPORATE GOVERNANCE Your Company has complied with Corporate Governance Requirements specifi ed under Regulations 17 to 27 and clause (b) to (i) of sub regulation (2) of Regulation 46 of the Listing Regulations.
COMPLIANCE A certifi cate from the Statutory Auditors confi rming compliance with the conditions of Corporate
Governance as stipulated in Listing Regulations forms part of Annual Report.GENERAL BODY MEETINGSDetails of Annual General Meetings: Location and time, where Annual General Meetings (AGMs) in the last three years were held:-
Year AGM Location Date Time2014-15 AGM Birla Matushri
Sabhagar16th September, 2015
3.00 p.m
2013-14 AGM Ravindra Natya Mandir
24th September, 2014
2.30 p.m
2012-13 AGM Ravindra Natya Mandir
10th September, 2013
2.30 p.m
In the last three years special resolutions were passed by shareholders.
Whether any special resolution passed last year through postal ballot? : No
Person who conducted the postal exercise : Not
ApplicableWhether any special resolution is proposed to be conducted through postal ballot
:No
MEANS OF COMMUNICATION
• Quarterly Results:
Newspaper Cities of PublicationBusiness Standard (English) All editionsNavshakti (Marathi) Mumbai Edition only
• Any website, where displayed:www.hindalco.comwww.adityabirla.com
• Whether the Company Website displays • All offi cial news releases Yes• Presentation made to Institutional
Investors/Analysts YesGeneral Shareholder InformationProvided in the ‘Shareholders Information’ section. Status of compliance of Non mandatory requirement1. The Company maintains a separate offi ce for
the Non-Executive Chairman. All necessary infrastructure and assistance are available to enable him discharge his responsibilities effectively.
2. During the period under review, there is no audit qualifi cation in the fi nancial statement.
3. The post of the Non-Executive Chairman of the Board is separate from that of the Managing Director/CEO.
4. The Company has engaged external internal auditors for aluminium and copper business separately. Their report is placed before the Audit Committee.
Hindalco Annual Report 2015-16.indb 59Hindalco Annual Report 2015-16.indb 59 8/17/2016 1:31:24 PM8/17/2016 1:31:24 PM
60
Hindalco Industries Limited
AUDITORS’ CERTIFICATE ON CORPORATE GOVERNANCE
To the Members of Hindalco Industries Limited
We have examined the compliance of the conditions of Corporate Governance of M/s Hindalco Industries Limited (‘the Company’), for the year ended 31st March, 2016, as stipulated in Clause 49 of the Listing Agreement (‘Listing Agreement’) of the Company with the Stock Exchanges for the period 1st April, 2015 to 30th November, 2015 and as per the relevant provisions of Securities and Exchange Board of India (Listing Obligation and Disclosure Requirements) Regulations, 2015 (‘Listing Regulations’) as referred to in Regulation 15 (2) of the Listing Regulations for the period 1st December, 2015 to 31st March, 2016.
The Compliance of conditions of Corporate Governance is the responsibility of the management. Our examination was limited to procedures and implementation thereof, adopted by the Company for ensuring the compliance of conditions of Corporate Governance. It is neither an audit nor an expression of opinion on the fi nancial statements of the Company.
In our opinion and to the best of our information and according to explanations given to us and the representations made by the Directors and the management, we certify that the Company has complied with the conditions of Corporate Governance as stipulated in the above mentioned Listing Agreement / Regulation as applicable.
We state that such compliance is neither an assurance as the future viability of the Company nor the effi ciency or effectiveness with which the Management has conducted the affairs of the Company.
For SINGHI & CO.
Chartered Accountants
Firm Registration No. 302049E
(RAJIV SINGHI)
Camp: Mumbai Partner
Dated: 28th May, 2016 Membership No. 053518
Hindalco Annual Report 2015-16.indb 60Hindalco Annual Report 2015-16.indb 60 8/17/2016 1:31:24 PM8/17/2016 1:31:24 PM
SHAREHOLDER INFORMATION
61
Annual Report 2015-16
FINA
NCIA
L HI
GHLI
GHTS
MAN
AGEM
ENT
DISC
USSI
ON
AND
ANAL
YSIS
CORP
ORAT
E GO
VERN
ANCE
RE
PORT
STAN
DALO
NE
FINA
NCIA
L ST
ATEM
ENTS
CONS
OLID
ATED
FI
NANC
IAL
STAT
EMEN
TSSO
CIAL
RE
PORT
DIRE
CTOR
S’RE
PORT
SHAR
EHOL
DER
INFO
RMAT
ION
SUST
AINA
BILI
TY &
BUS
INES
SRE
SPON
SIBI
LITY
REP
ORT
1. Annual General Meeting
- Date and Time : 14th September, 2016 at 3.00 p.m.
- Venue : Ravindra Natya Mandir P.L Deshpande Maharashtra Kala Academy, Prabhadevi, Mumbai: 400025
2. Financial Year
- Financial reporting for the quarter ending June 30, 2016 : On or before 14th September, 2016
- Financial reporting for the half year ending September 30, 2016 : On or before 14th December, 2016
- Financial reporting for the quarter ending December 31, 2016 : On or before 14th February, 2017
- Financial reporting for the year ending March 31, 2017 (Audited ) : On or before 30th May, 2017
- Annual General Meeting for the year ended March 31, 2017 : On or before 30th September, 2017
3. Dates of Book Closure : 8th September, 2016 to
14th September, 2016
4. Dividend Payment Date : On or After 14th September, 2016
5. Registered Offi ce : Century Bhavan, 3rd Floor, Dr. Annie Besant Road, Worli, Mumbai - 400 030. Tel: (91-22) 6662 6666 Fax: (91-22) 2422 7586 / 2436 2516 E-Mail: [email protected] Website: www.adityabirla.com CIN No. L27020MH1958PLC011238
6. a. Listing Details:
Equity Shares Global DepositoryReceipts (GDRs)
Non-Convertible Debentures
BSE LimitedPhiroze Jeejeebhoy TowersDalal Street, Mumbai – 400 001.
Societe de la Bourse de LuxembourgSociete Anonyme, RC B6222, B.P.165, L-2011, Luxembourg
National Stock Exchange of India Limited“Exchange Plaza”, Bandra Kurla Complex Bandra (East), Mumbai – 400 051.
National Stock Exchange of India Limited“Exchange Plaza”, Bandra Kurla Complex Bandra (East), Mumbai – 400 051.
Note: Listing fees has been paid to all the Stock Exchanges as per their Schedule.
b. Overseas Depository for GDRs : J.P. Morgan Chase Bank
60 Wall Street, New York, NY 10260
Tel.: 1-302-552 0253
Fax: 1-302-552 0320
Hindalco Annual Report 2015-16.indb 61Hindalco Annual Report 2015-16.indb 61 8/17/2016 1:31:24 PM8/17/2016 1:31:24 PM
62
Hindalco Industries Limited
c. Domestic Custodian of GDRs : Citibank N.A. Custody Services FIFC, 11th Floor, C54 & 55, G Block Bandra Kurla Complex Bandra (East) Mumbai – 400 051 Tel.: 91-22-61756895 Fax: 91-22-26532205
7. ISIN : Fully paid up equity share: ISIN INE038A01020GDR: ISIN US4330641022 CUSIP No. 433064300
8. Details of Debenture issued:
Interest Payment Date
Interest Series Date of allotment
Tenure RecordDate
ISIN No.
25th April Annually 9.55% Series
(2012) – I
25th April, 2012
10 Years 7 days prior to each interest and/
or redemption payment
INE038A07258
27th June Annually 9.55% Series
(2012) – II
27th June, 2012
10 Years 7 days prior to each interest and/
or redemption payment
INE038A07266
2nd August Annually 9.60% Series
(2012) – III
2nd August, 2012
10 Years 7 days prior to each interest and/
or redemption payment
INE038A07274
9. Stock Code:
Stock Code: Scrip Code
Bombay Stock Exchange 500440
National Stock Exchange HINDALCO
Stock Exchange Reuters Bloomberg
Bombay Stock Exchange HALC.BO HNDL IN
National Stock Exchange HALC.NS NHNDL IN
Luxembourg Stock Exchange (GDRs) (GDRs) HDCD LI
Name and Address of Debenture Trustee : IDBI Trusteeship Services Limited
Asian Building, Ground Floor,
17 R. Kamani Marg
Ballard Estate, Mumbai : 400 001
Hindalco Annual Report 2015-16.indb 62Hindalco Annual Report 2015-16.indb 62 8/17/2016 1:31:24 PM8/17/2016 1:31:24 PM
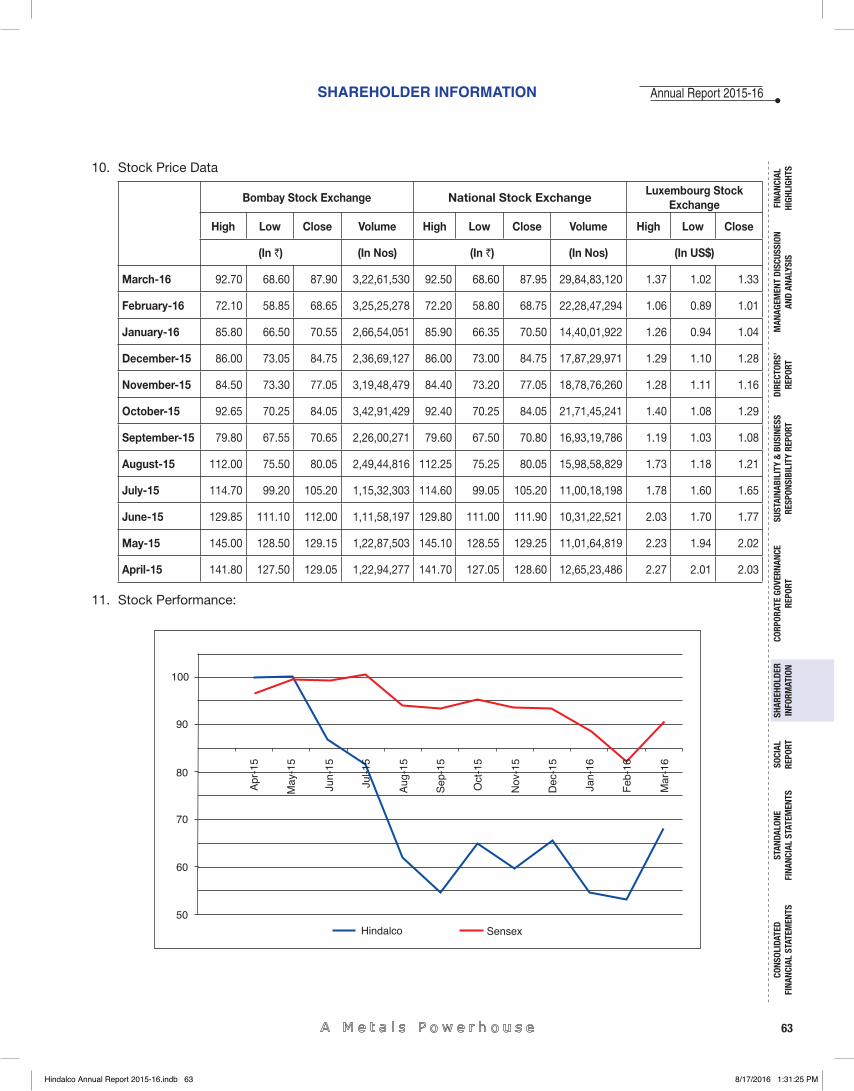
SHAREHOLDER INFORMATION
63
Annual Report 2015-16
FINA
NCIA
L HI
GHLI
GHTS
MAN
AGEM
ENT
DISC
USSI
ON
AND
ANAL
YSIS
CORP
ORAT
E GO
VERN
ANCE
RE
PORT
STAN
DALO
NE
FINA
NCIA
L ST
ATEM
ENTS
CONS
OLID
ATED
FI
NANC
IAL
STAT
EMEN
TSSO
CIAL
RE
PORT
DIRE
CTOR
S’RE
PORT
SHAR
EHOL
DER
INFO
RMAT
ION
SUST
AINA
BILI
TY &
BUS
INES
SRE
SPON
SIBI
LITY
REP
ORT
10. Stock Price Data
Bombay Stock Exchange National Stock ExchangeLuxembourg Stock
Exchange
High Low Close Volume High Low Close Volume High Low Close
(In `) (In Nos) (In `) (In Nos) (In US$)
March-16 92.70 68.60 87.90 3,22,61,530 92.50 68.60 87.95 29,84,83,120 1.37 1.02 1.33
February-16 72.10 58.85 68.65 3,25,25,278 72.20 58.80 68.75 22,28,47,294 1.06 0.89 1.01
January-16 85.80 66.50 70.55 2,66,54,051 85.90 66.35 70.50 14,40,01,922 1.26 0.94 1.04
December-15 86.00 73.05 84.75 2,36,69,127 86.00 73.00 84.75 17,87,29,971 1.29 1.10 1.28
November-15 84.50 73.30 77.05 3,19,48,479 84.40 73.20 77.05 18,78,76,260 1.28 1.11 1.16
October-15 92.65 70.25 84.05 3,42,91,429 92.40 70.25 84.05 21,71,45,241 1.40 1.08 1.29
September-15 79.80 67.55 70.65 2,26,00,271 79.60 67.50 70.80 16,93,19,786 1.19 1.03 1.08
August-15 112.00 75.50 80.05 2,49,44,816 112.25 75.25 80.05 15,98,58,829 1.73 1.18 1.21
July-15 114.70 99.20 105.20 1,15,32,303 114.60 99.05 105.20 11,00,18,198 1.78 1.60 1.65
June-15 129.85 111.10 112.00 1,11,58,197 129.80 111.00 111.90 10,31,22,521 2.03 1.70 1.77
May-15 145.00 128.50 129.15 1,22,87,503 145.10 128.55 129.25 11,01,64,819 2.23 1.94 2.02
April-15 141.80 127.50 129.05 1,22,94,277 141.70 127.05 128.60 12,65,23,486 2.27 2.01 2.03
11. Stock Performance:
Hindalco Annual Report 2015-16.indb 63Hindalco Annual Report 2015-16.indb 63 8/17/2016 1:31:25 PM8/17/2016 1:31:25 PM
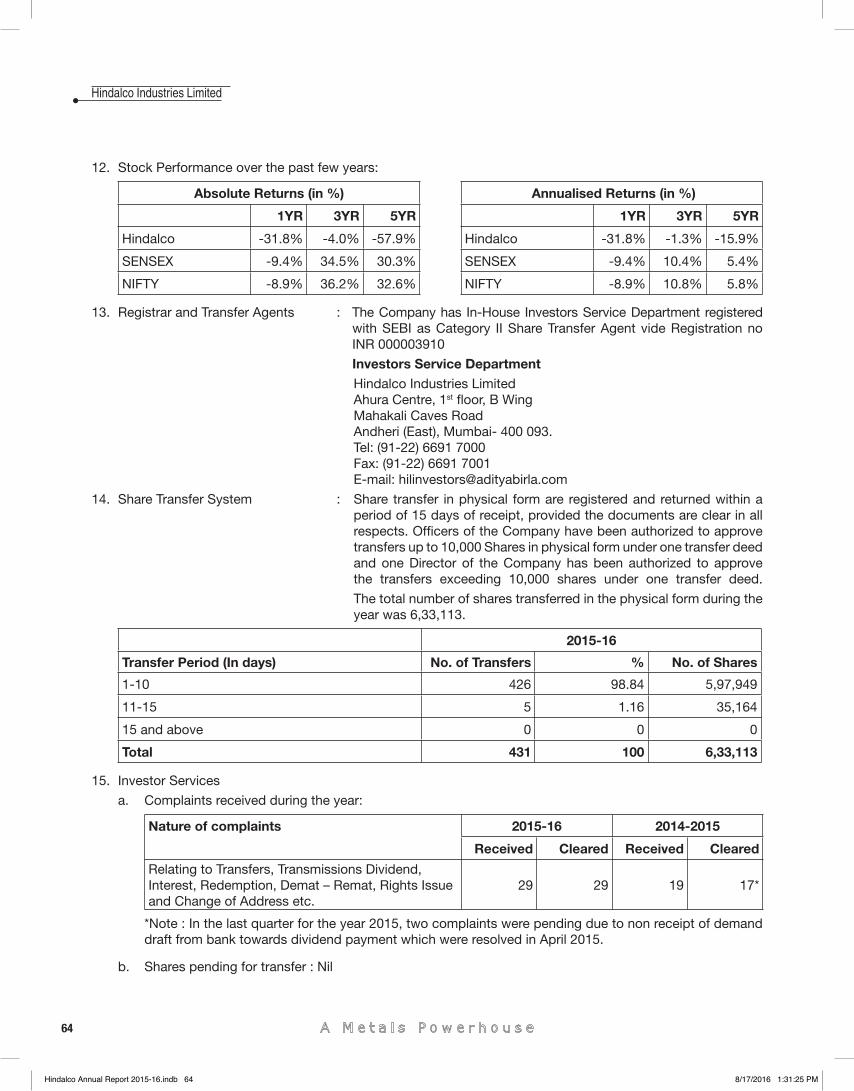
64
Hindalco Industries Limited
12. Stock Performance over the past few years:
Absolute Returns (in %) Annualised Returns (in %)
1YR 3YR 5YR 1YR 3YR 5YR
Hindalco -31.8% -4.0% -57.9% Hindalco -31.8% -1.3% -15.9%
SENSEX -9.4% 34.5% 30.3% SENSEX -9.4% 10.4% 5.4%
NIFTY -8.9% 36.2% 32.6% NIFTY -8.9% 10.8% 5.8%
13. Registrar and Transfer Agents : The Company has In-House Investors Service Department registered with SEBI as Category II Share Transfer Agent vide Registration no INR 000003910
Investors Service Department Hindalco Industries Limited Ahura Centre, 1st fl oor, B Wing Mahakali Caves Road Andheri (East), Mumbai- 400 093. Tel: (91-22) 6691 7000 Fax: (91-22) 6691 7001 E-mail: [email protected]
14. Share Transfer System : Share transfer in physical form are registered and returned within a period of 15 days of receipt, provided the documents are clear in all respects. Offi cers of the Company have been authorized to approve transfers up to 10,000 Shares in physical form under one transfer deed and one Director of the Company has been authorized to approve the transfers exceeding 10,000 shares under one transfer deed.
The total number of shares transferred in the physical form during the year was 6,33,113.
2015-16
Transfer Period (In days) No. of Transfers % No. of Shares
1-10 426 98.84 5,97,949
11-15 5 1.16 35,164
15 and above 0 0 0
Total 431 100 6,33,113
15. Investor Services
a. Complaints received during the year:
Nature of complaints 2015-16 2014-2015
Received Cleared Received Cleared
Relating to Transfers, Transmissions Dividend, Interest, Redemption, Demat – Remat, Rights Issue and Change of Address etc.
29 29 19 17*
*Note : In the last quarter for the year 2015, two complaints were pending due to non receipt of demand draft from bank towards dividend payment which were resolved in April 2015.
b. Shares pending for transfer : Nil
Hindalco Annual Report 2015-16.indb 64Hindalco Annual Report 2015-16.indb 64 8/17/2016 1:31:25 PM8/17/2016 1:31:25 PM
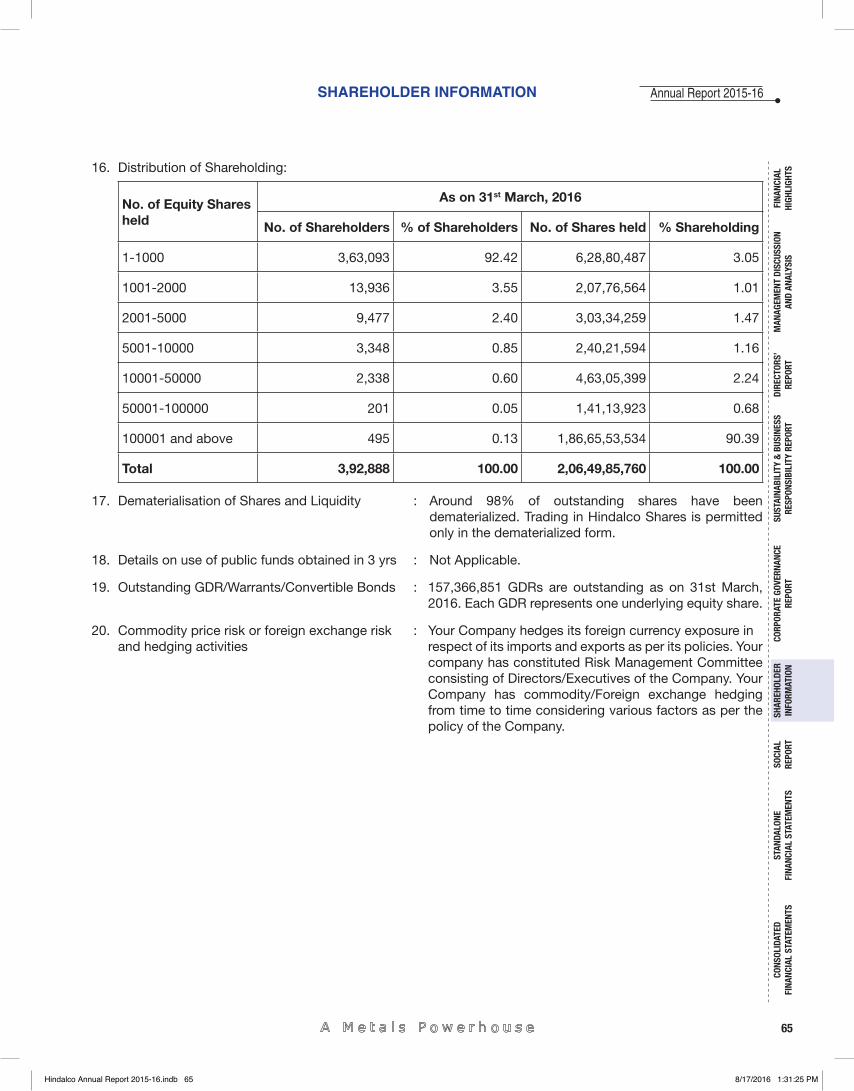
SHAREHOLDER INFORMATION
65
Annual Report 2015-16
FINA
NCIA
L HI
GHLI
GHTS
MAN
AGEM
ENT
DISC
USSI
ON
AND
ANAL
YSIS
CORP
ORAT
E GO
VERN
ANCE
RE
PORT
STAN
DALO
NE
FINA
NCIA
L ST
ATEM
ENTS
CONS
OLID
ATED
FI
NANC
IAL
STAT
EMEN
TSSO
CIAL
RE
PORT
DIRE
CTOR
S’RE
PORT
SHAR
EHOL
DER
INFO
RMAT
ION
SUST
AINA
BILI
TY &
BUS
INES
SRE
SPON
SIBI
LITY
REP
ORT
16. Distribution of Shareholding:
No. of Equity Shares held
As on 31st March, 2016
No. of Shareholders % of Shareholders No. of Shares held % Shareholding
1-1000 3,63,093 92.42 6,28,80,487 3.05
1001-2000 13,936 3.55 2,07,76,564 1.01
2001-5000 9,477 2.40 3,03,34,259 1.47
5001-10000 3,348 0.85 2,40,21,594 1.16
10001-50000 2,338 0.60 4,63,05,399 2.24
50001-100000 201 0.05 1,41,13,923 0.68
100001 and above 495 0.13 1,86,65,53,534 90.39
Total 3,92,888 100.00 2,06,49,85,760 100.00
17. Dematerialisation of Shares and Liquidity : Around 98% of outstanding shares have been dematerialized. Trading in Hindalco Shares is permitted only in the dematerialized form.
18. Details on use of public funds obtained in 3 yrs : Not Applicable.
19. Outstanding GDR/Warrants/Convertible Bonds : 157,366,851 GDRs are outstanding as on 31st March, 2016. Each GDR represents one underlying equity share.
20. Commodity price risk or foreign exchange risk : Your Company hedges its foreign currency exposure in and hedging activities respect of its imports and exports as per its policies. Your
company has constituted Risk Management Committee consisting of Directors/Executives of the Company. Your Company has commodity/Foreign exchange hedging from time to time considering various factors as per the policy of the Company.
Hindalco Annual Report 2015-16.indb 65Hindalco Annual Report 2015-16.indb 65 8/17/2016 1:31:25 PM8/17/2016 1:31:25 PM
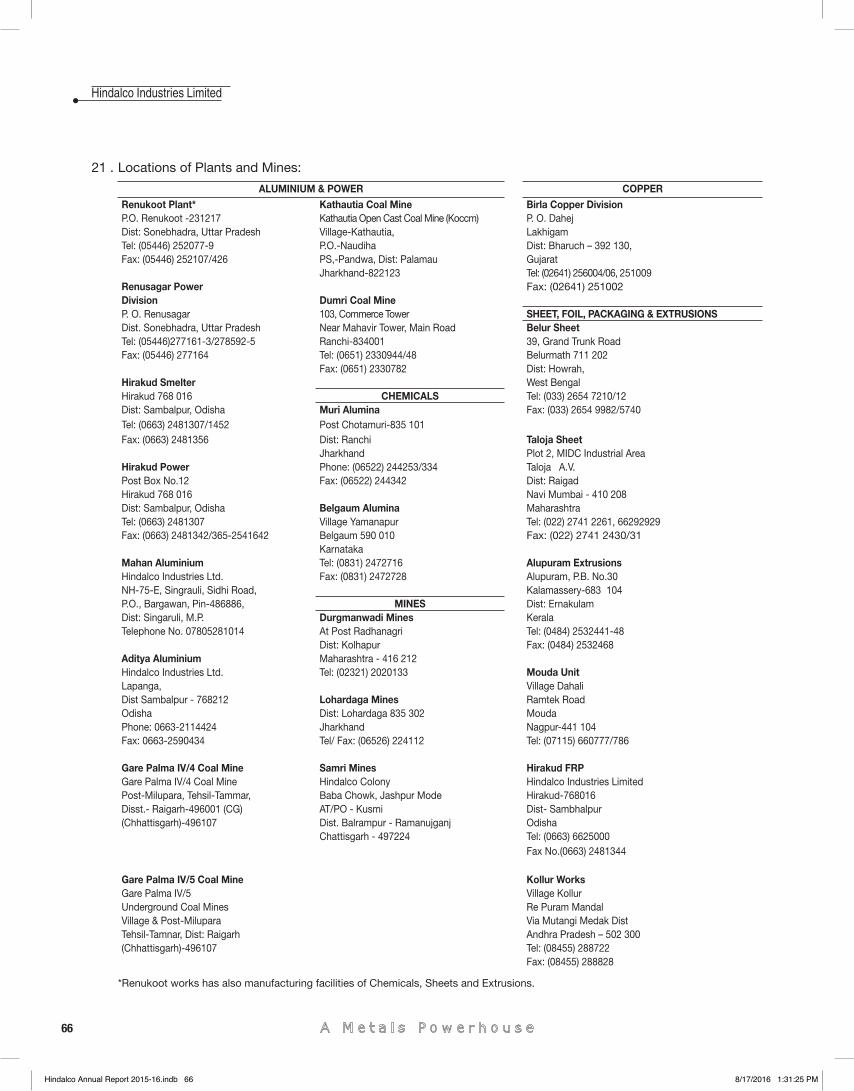
66
Hindalco Industries Limited
21 . Locations of Plants and Mines:
ALUMINIUM & POWER COPPERRenukoot Plant* Kathautia Coal Mine Birla Copper DivisionP.O. Renukoot -231217 Kathautia Open Cast Coal Mine (Koccm) P. O. DahejDist: Sonebhadra, Uttar Pradesh Village-Kathautia, LakhigamTel: (05446) 252077-9 P.O.-Naudiha Dist: Bharuch – 392 130, Fax: (05446) 252107/426 PS,-Pandwa, Dist: Palamau Gujarat
Jharkhand-822123 Tel: (02641) 256004/06, 251009Renusagar Power Fax: (02641) 251002Division Dumri Coal MineP. O. Renusagar 103, Commerce Tower SHEET, FOIL, PACKAGING & EXTRUSIONSDist. Sonebhadra, Uttar Pradesh Near Mahavir Tower, Main Road Belur SheetTel: (05446)277161-3/278592-5 Ranchi-834001 39, Grand Trunk RoadFax: (05446) 277164 Tel: (0651) 2330944/48 Belurmath 711 202
Fax: (0651) 2330782 Dist: Howrah, Hirakud Smelter West BengalHirakud 768 016 CHEMICALS Tel: (033) 2654 7210/12Dist: Sambalpur, Odisha Muri Alumina Fax: (033) 2654 9982/5740Tel: (0663) 2481307/1452 Post Chotamuri-835 101Fax: (0663) 2481356 Dist: Ranchi Taloja Sheet
Jharkhand Plot 2, MIDC Industrial AreaHirakud Power Phone: (06522) 244253/334 Taloja A.V. Post Box No.12 Fax: (06522) 244342 Dist: RaigadHirakud 768 016 Navi Mumbai - 410 208Dist: Sambalpur, Odisha Belgaum Alumina MaharashtraTel: (0663) 2481307 Village Yamanapur Tel: (022) 2741 2261, 66292929Fax: (0663) 2481342/365-2541642 Belgaum 590 010 Fax: (022) 2741 2430/31
KarnatakaMahan Aluminium Tel: (0831) 2472716 Alupuram ExtrusionsHindalco Industries Ltd. Fax: (0831) 2472728 Alupuram, P.B. No.30NH-75-E, Singrauli, Sidhi Road, Kalamassery-683 104P.O., Bargawan, Pin-486886, MINES Dist: ErnakulamDist: Singaruli, M.P. Durgmanwadi Mines KeralaTelephone No. 07805281014 At Post Radhanagri Tel: (0484) 2532441-48
Dist: Kolhapur Fax: (0484) 2532468Aditya Aluminium Maharashtra - 416 212Hindalco Industries Ltd. Tel: (02321) 2020133 Mouda UnitLapanga, Village DahaliDist Sambalpur - 768212 Lohardaga Mines Ramtek Road Odisha Dist: Lohardaga 835 302 MoudaPhone: 0663-2114424 Jharkhand Nagpur-441 104Fax: 0663-2590434 Tel/ Fax: (06526) 224112 Tel: (07115) 660777/786
Gare Palma IV/4 Coal Mine Samri Mines Hirakud FRPGare Palma IV/4 Coal Mine Hindalco Colony Hindalco Industries Limited Post-Milupara, Tehsil-Tammar, Baba Chowk, Jashpur Mode Hirakud-768016Disst.- Raigarh-496001 (CG) AT/PO - Kusmi Dist- Sambhalpur(Chhattisgarh)-496107 Dist. Balrampur - Ramanujganj Odisha
Chattisgarh - 497224 Tel: (0663) 6625000Fax No.(0663) 2481344
Gare Palma IV/5 Coal Mine Kollur WorksGare Palma IV/5 Village KollurUnderground Coal Mines Re Puram Mandal Village & Post-Milupara Via Mutangi Medak DistTehsil-Tamnar, Dist: Raigarh Andhra Pradesh – 502 300(Chhattisgarh)-496107 Tel: (08455) 288722
Fax: (08455) 288828
*Renukoot works has also manufacturing facilities of Chemicals, Sheets and Extrusions.
Hindalco Annual Report 2015-16.indb 66Hindalco Annual Report 2015-16.indb 66 8/17/2016 1:31:25 PM8/17/2016 1:31:25 PM
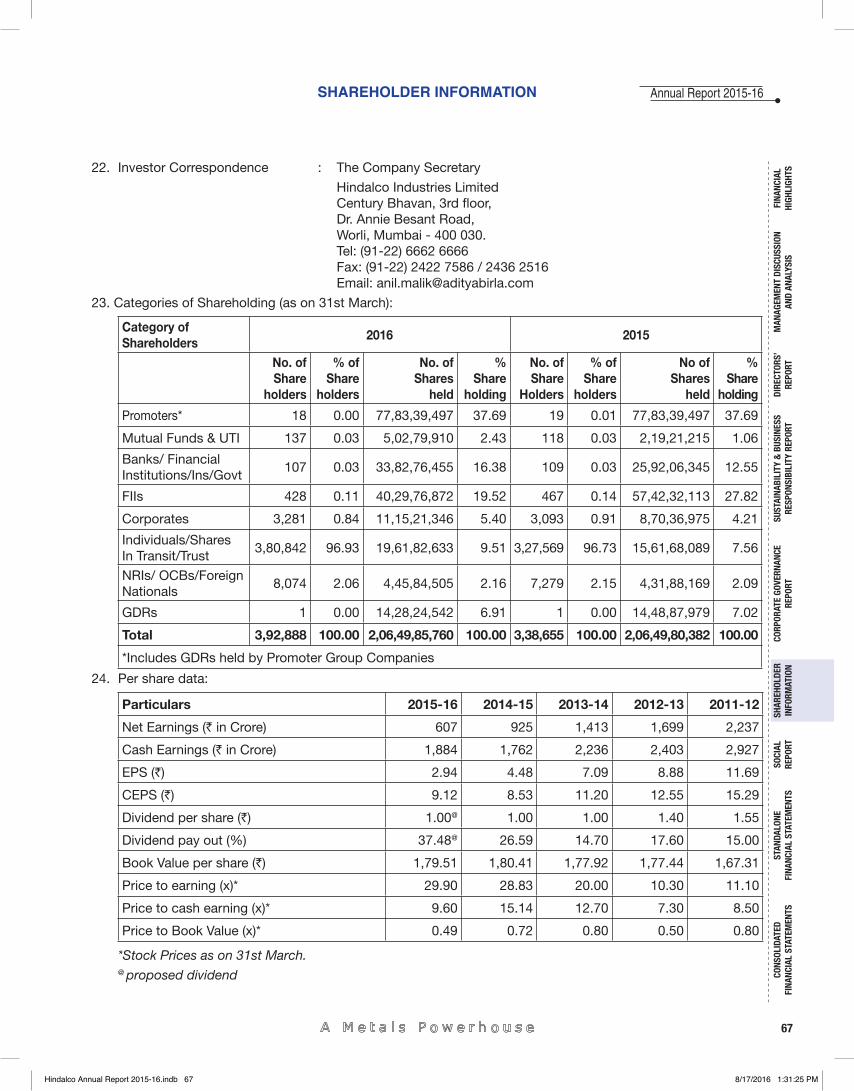
SHAREHOLDER INFORMATION
67
Annual Report 2015-16
FINA
NCIA
L HI
GHLI
GHTS
MAN
AGEM
ENT
DISC
USSI
ON
AND
ANAL
YSIS
CORP
ORAT
E GO
VERN
ANCE
RE
PORT
STAN
DALO
NE
FINA
NCIA
L ST
ATEM
ENTS
CONS
OLID
ATED
FI
NANC
IAL
STAT
EMEN
TSSO
CIAL
RE
PORT
DIRE
CTOR
S’RE
PORT
SHAR
EHOL
DER
INFO
RMAT
ION
SUST
AINA
BILI
TY &
BUS
INES
SRE
SPON
SIBI
LITY
REP
ORT
22. Investor Correspondence : The Company Secretary
Hindalco Industries Limited Century Bhavan, 3rd fl oor, Dr. Annie Besant Road, Worli, Mumbai - 400 030. Tel: (91-22) 6662 6666 Fax: (91-22) 2422 7586 / 2436 2516 Email: [email protected]
23. Categories of Shareholding (as on 31st March):
Category of Shareholders
2016 2015
No. of Share
holders
% of Share
holders
No. of Shares
held
%Share
holding
No. of Share
Holders
% of Share
holders
No of Shares
held
%Share
holding
Promoters* 18 0.00 77,83,39,497 37.69 19 0.01 77,83,39,497 37.69
Mutual Funds & UTI 137 0.03 5,02,79,910 2.43 118 0.03 2,19,21,215 1.06
Banks/ Financial Institutions/Ins/Govt
107 0.03 33,82,76,455 16.38 109 0.03 25,92,06,345 12.55
FIIs 428 0.11 40,29,76,872 19.52 467 0.14 57,42,32,113 27.82
Corporates 3,281 0.84 11,15,21,346 5.40 3,093 0.91 8,70,36,975 4.21
Individuals/Shares In Transit/Trust
3,80,842 96.93 19,61,82,633 9.51 3,27,569 96.73 15,61,68,089 7.56
NRIs/ OCBs/Foreign Nationals
8,074 2.06 4,45,84,505 2.16 7,279 2.15 4,31,88,169 2.09
GDRs 1 0.00 14,28,24,542 6.91 1 0.00 14,48,87,979 7.02
Total 3,92,888 100.00 2,06,49,85,760 100.00 3,38,655 100.00 2,06,49,80,382 100.00
*Includes GDRs held by Promoter Group Companies
24. Per share data:
Particulars 2015-16 2014-15 2013-14 2012-13 2011-12
Net Earnings (` in Crore) 607 925 1,413 1,699 2,237
Cash Earnings (` in Crore) 1,884 1,762 2,236 2,403 2,927
EPS (`) 2.94 4.48 7.09 8.88 11.69
CEPS (`) 9.12 8.53 11.20 12.55 15.29
Dividend per share (`) 1.00@ 1.00 1.00 1.40 1.55
Dividend pay out (%) 37.48@ 26.59 14.70 17.60 15.00
Book Value per share (`) 1,79.51 1,80.41 1,77.92 1,77.44 1,67.31
Price to earning (x)* 29.90 28.83 20.00 10.30 11.10
Price to cash earning (x)* 9.60 15.14 12.70 7.30 8.50
Price to Book Value (x)* 0.49 0.72 0.80 0.50 0.80
*Stock Prices as on 31st March.@ proposed dividend
Hindalco Annual Report 2015-16.indb 67Hindalco Annual Report 2015-16.indb 67 8/17/2016 1:31:25 PM8/17/2016 1:31:25 PM
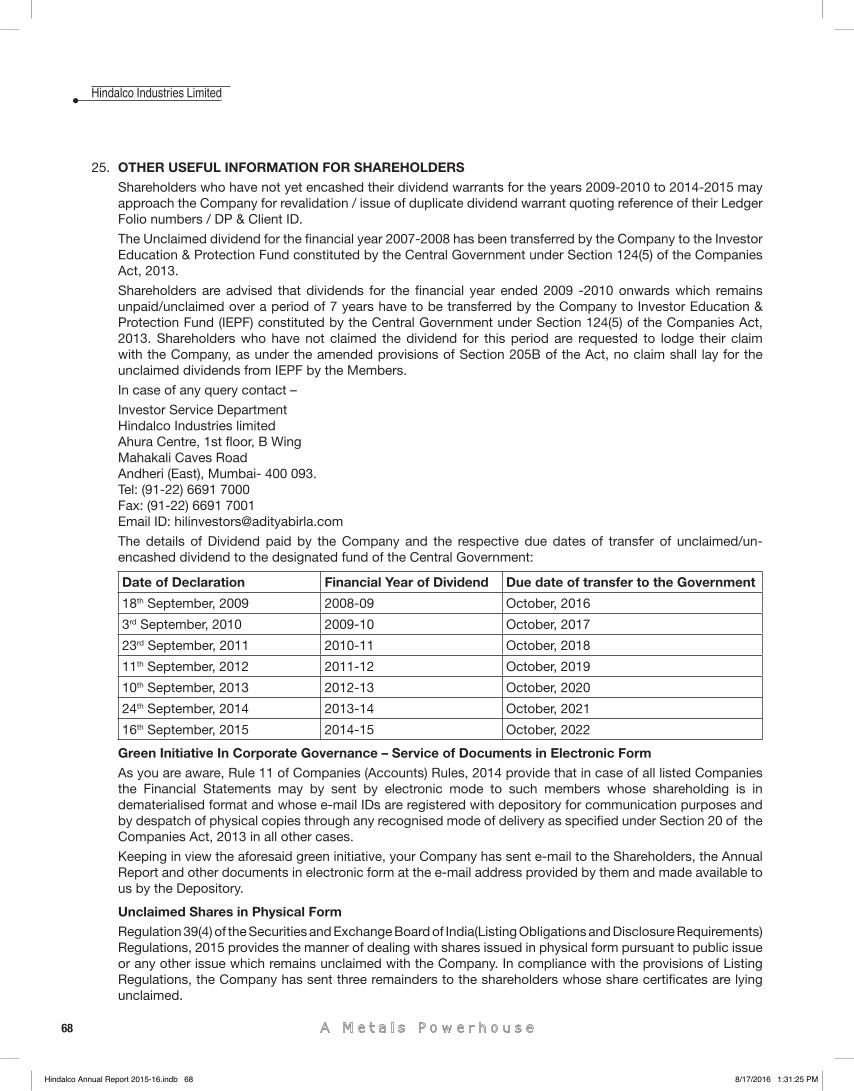
68
Hindalco Industries Limited
25. OTHER USEFUL INFORMATION FOR SHAREHOLDERSShareholders who have not yet encashed their dividend warrants for the years 2009-2010 to 2014-2015 may approach the Company for revalidation / issue of duplicate dividend warrant quoting reference of their Ledger Folio numbers / DP & Client ID.
The Unclaimed dividend for the fi nancial year 2007-2008 has been transferred by the Company to the Investor Education & Protection Fund constituted by the Central Government under Section 124(5) of the Companies Act, 2013.
Shareholders are advised that dividends for the fi nancial year ended 2009 -2010 onwards which remains unpaid/unclaimed over a period of 7 years have to be transferred by the Company to Investor Education & Protection Fund (IEPF) constituted by the Central Government under Section 124(5) of the Companies Act, 2013. Shareholders who have not claimed the dividend for this period are requested to lodge their claim with the Company, as under the amended provisions of Section 205B of the Act, no claim shall lay for the unclaimed dividends from IEPF by the Members.
In case of any query contact –
Investor Service DepartmentHindalco Industries limitedAhura Centre, 1st fl oor, B WingMahakali Caves RoadAndheri (East), Mumbai- 400 093.Tel: (91-22) 6691 7000 Fax: (91-22) 6691 7001Email ID: [email protected]
The details of Dividend paid by the Company and the respective due dates of transfer of unclaimed/un-encashed dividend to the designated fund of the Central Government:
Date of Declaration Financial Year of Dividend Due date of transfer to the Government
18th September, 2009 2008-09 October, 2016
3rd September, 2010 2009-10 October, 2017
23rd September, 2011 2010-11 October, 2018
11th September, 2012 2011-12 October, 2019
10th September, 2013 2012-13 October, 2020
24th September, 2014 2013-14 October, 2021
16th September, 2015 2014-15 October, 2022
Green Initiative In Corporate Governance – Service of Documents in Electronic Form As you are aware, Rule 11 of Companies (Accounts) Rules, 2014 provide that in case of all listed Companies the Financial Statements may by sent by electronic mode to such members whose shareholding is in dematerialised format and whose e-mail IDs are registered with depository for communication purposes and by despatch of physical copies through any recognised mode of delivery as specifi ed under Section 20 of the Companies Act, 2013 in all other cases.
Keeping in view the aforesaid green initiative, your Company has sent e-mail to the Shareholders, the Annual Report and other documents in electronic form at the e-mail address provided by them and made available to us by the Depository.
Unclaimed Shares in Physical Form Regulation 39(4) of the Securities and Exchange Board of India(Listing Obligations and Disclosure Requirements) Regulations, 2015 provides the manner of dealing with shares issued in physical form pursuant to public issue or any other issue which remains unclaimed with the Company. In compliance with the provisions of Listing Regulations, the Company has sent three remainders to the shareholders whose share certifi cates are lying unclaimed.
Hindalco Annual Report 2015-16.indb 68Hindalco Annual Report 2015-16.indb 68 8/17/2016 1:31:25 PM8/17/2016 1:31:25 PM
SHAREHOLDER INFORMATION
69
Annual Report 2015-16
FINA
NCIA
L HI
GHLI
GHTS
MAN
AGEM
ENT
DISC
USSI
ON
AND
ANAL
YSIS
CORP
ORAT
E GO
VERN
ANCE
RE
PORT
STAN
DALO
NE
FINA
NCIA
L ST
ATEM
ENTS
CONS
OLID
ATED
FI
NANC
IAL
STAT
EMEN
TSSO
CIAL
RE
PORT
DIRE
CTOR
S’RE
PORT
SHAR
EHOL
DER
INFO
RMAT
ION
SUST
AINA
BILI
TY &
BUS
INES
SRE
SPON
SIBI
LITY
REP
ORT
Disclosures pursuant to Regulation 39(4) of defi ne are as below:� Aggregate no of shareholders and outstanding shares lying in Unclaimed Suspense account lying as at
1st April, 2015: 4210 shareholders holding 13,09,322 equity shares.� Number of shareholders who approached the issuer for transfer of shares from Unclaimed Suspense
Account during the year. 29 shareholders consisting 12,370 equity shares.� Number of shareholders to whom shares were transferred from Unclaimed Suspense Account during the
year. 29 shareholders consisting 12,370 equity shares.� Aggregate number of shareholders and outstanding shares lying in Unclaimed Suspense Account as at
31st March, 2016. 4,181 shareholders holding 12,96,952 equity shares.
INVESTOR SERVICESi. Equity Shares of the Company are under compulsory demat trading by all investors, with effect from 5th
April, 1999. Considering the advantages of scrip less trading, shareholders are requested to consider dematerialization of their shareholding so as to avoid inconvenience in future.
ii. Shareholders/Benefi cial Owners are requested to quote their Folio No./DP & Client ID Nos., as the case may be, in all correspondence with the Company. All correspondences regarding shares & debentures of the Company should be addressed to the Investor Service Department of the Company at Ahura Centre, 1st Floor, ‘B’ Wing, Mahakali Caves Road, Andheri (East), Mumbai - 400 093 and not to any other offi ce(s) of the Company.
iii. Shareholders holding shares in physical form are requested to notify to the Company, change in their address/Pin Code number and Bank Account details promptly by written request under the signatures of sole / fi rst joint holder. Benefi cial Owners of shares in demat form are requested to send their instructions regarding change of name, change of address, bank details, nomination, power of attorney, etc. directly to their DP.
iv. To prevent fraudulent encashment of dividend warrants, members are requested to provide their Bank Account Details (if not provided earlier) to the Company (if shares are held in physical form) or to DP (if shares are held in demat form), as the case may be, for printing of the same on their dividend warrants.
v. Non-resident members are requested to immediately notify:-• change in their residential status on return to India for permanent settlement;• Particulars of their NRE Bank Account with a bank in India, if not furnished earlier.
vi. In case of loss/misplacement of share certifi cate, investors should immediately lodge a FIR/Complaint with the police and inform to Company along with original or certifi ed copy of FIR/acknowledged copy of the complaint.
vii. For expeditious transfer of shares, shareholders should fi ll in complete and correct particulars in the transfer deed in Form SH4, wherever applicable registration number of Power of Attorney should also be quoted in the transfer deed at the appropriate place.
Further please note that Securities and Exchange Board of India (SEBI), has made it mandatory for the transferors and the transferees to furnish the copy of the PAN Card to the Company for registration of physical transfer of shares.
Investors therefore are requested to furnish the self attested copy of PAN card at the time of sending the physical transfer of shares.
viii. Shareholders are requested to keep record of their specimen signature before lodgment of shares with the Company to obviate possibility of difference in signature at a later date.
ix. Shareholders(s) of the Company who have multiple accounts in identical name(s) or holding more than one Share Certifi cates in the same name under different Ledger Folio(s) are requested to apply for consolidation of such Folio(s) and send the relevant Share Certifi cates to the Company.
x. Shareholders are requested to give us their valuable suggestions for improvement of our investor services.xi. Shareholders are requested to quote their e-mail Ids, Telephone/Fax numbers for prompt reply to their
communication.
Hindalco Annual Report 2015-16.indb 69Hindalco Annual Report 2015-16.indb 69 8/17/2016 1:31:25 PM8/17/2016 1:31:25 PM
70
Hindalco Industries Limited
SOCIAL REPORT
Our focus is on healthcare, education, sustainable livelihood, infrastructure and social reform.
Health Care:
This year we conducted 1,556 rural medical and awareness camps servicing 1,53,825 villagers. Among these feature family welfare camps, health check-ups for ailments such as malaria, fi laria, diarrhoea, diabetes, hepatitis, arthritis, skin diseases, gynaecological disorders and cardiac related issues. Thousands of villagers in the remotest areas also availed of the facilities offered by us through our rural mobile medical van services. Those affl icted with serious ailments were referred to our hospitals.
At our Company’s 10 hospitals, 19 dispensaries/clinics housed at Renukoot, Renusagar, Singrauli, Taloja, Lapanga, Belagavi, Dahej, Muri, Lohardaga, Samri, Alupuram, Kathautia and Durgmanwadi, over 1,46,970 patients were given the necessary medical attention.
Furthermore, our support extended to the Government- run primary health centres, where 1,83,477 patients were cared for. Our Samri Unit provided an incubator to the local Primary Health Centers.
Over 1,230 patients affl icted with chronic ailments were examined and medical advise/treatment given at Renukoot, Renusagar and Singrauli. In surgical camps 148 patients underwent surgeries.
At the Eye camps, conducted by us, 3,570 persons were treated. Of these, 503 patients at Lohardaga, Renukoot, Belagavi, Dahej, Hirakud and Belur were operated for cataract, and intra-ocular lens fi tted for their vision.
For the differently abled, in 10 medical camps organised at Renukoot and Durgmanwadi 2,176 persons were tended. Among them 16 patients underwent polio corrective surgery and can now walk.
At dental check-up camps in Renukoot, Belur, Renusagar, Muri, Dahej, Mouda and Kollur 4,089 persons received treatment.
In Renukoot, Renusagar and Lohardaga, over 365 patients were diagnosed with tuberculosis and registered under the directly observed treatment programme (DOT). They were treated at the 10 designated microscopic centres (DMC). Among these were the Hindalco Family Welfare Centre, the Hindalco-run Arogyam Hospital and the Rajendra Hospital at the Lohardaga mines and the Aditya Birla Rural Technology Park, Muirpur.
At 47 camps in Singrauli, Taloja, Belagavi, Lohardaga, Lapanga, Dahej, Kathauti, Renusagar and Renukoot on STD/RTI and AIDS awareness, 7,186 persons underwent tests and many were given treatment in line with the diagnosis.
In collaboration with the sickling cell of Rotary International, Sambalpur, we conducted 5 sickling detection and counselling camps. These benefi tted 250 patients.
At Muri, 14 ambulances, for use in emergencies, have been allocated. Over 4,140 people have availed of this service.
We held 47 health check-up and blood grouping camps at schools in Samri, Lohardaga, Hirakud, Renukoot, Lapanga, Dahej, Muri, Belur, Kathautia and Belagavi. More than 6,508 school students were examined and taken care of.
“As a nation we have embarked on the journey of social change through inclusive growth. A shared sense of community through shared responsibilities, both by the Government and corporates, is apparent today. We have always been engaged in reaching out to communities through the spirit and culture of giving and caring, the spirit of compassion and service, which has been a legacy passed on from the Birla family, generation after generation. Our CSR activities are focused and strategic. We plough in resources, both fi nancial and manpower where our work truly impacts the lives of the underprivileged. At the Aditya Birla Group level, through our outreach programmes, we pan out to 7.5 million people across 5,000 villages. Of this, Hindalco’s community engagement reaches out to a rural population of nearly 11.19 lakh, spread over 672 villages and 33 urban slums.”
— Mrs. Rajashree BirlaChairperson, Aditya Birla Centre for Community Initiatives and Rural Development
Hindalco Annual Report 2015-16.indb 70Hindalco Annual Report 2015-16.indb 70 8/17/2016 1:31:25 PM8/17/2016 1:31:25 PM
SOCIAL REPORT
71
Annual Report 2015-16
FINA
NCIA
L HI
GHLI
GHTS
MAN
AGEM
ENT
DISC
USSI
ON
AND
ANAL
YSIS
CORP
ORAT
E GO
VERN
ANCE
RE
PORT
STAN
DALO
NE
FINA
NCIA
L ST
ATEM
ENTS
CONS
OLID
ATED
FI
NANC
IAL
STAT
EMEN
TSSO
CIAL
RE
PORT
DIRE
CTOR
S’RE
PORT
SHAR
EHOL
DER
INFO
RMAT
ION
SUST
AINA
BILI
TY &
BUS
INES
SRE
SPON
SIBI
LITY
REP
ORT
At Hirakud and Renukoot 52 malnourished children are being provided nutritional support.
Mother and Child Health Care:In collaboration with the District Health Department, over 2,24,941 children were immunised against polio. Further, more than 19,142 children were immunised against BCG, DPT and hepatitis B across your Company’s units.
More than 1,00,281 expectant mothers and their children leveraged our 23 family welfare centres at Renukoot, Renusagar and Lohardaga to avail the services offered under our Safe Motherhood and Child Survival Programme.
Nearly 12,420 women participated in 372 camps on anti-natal, post-natal care, mass immunisation, nutrition and escort services for institutional delivery. These camps, organised at Renukoot, Samri and Lohardaga, form part of our reproductive and child health care programmes.
Our focused programme on adolescent health care covered 5,376 girls at Kanyashrams, Govt. Girls High Schools and Kasturba Gandhi Balika Vidyalayas.
As a result of our intensive motivational drive towards responsible family raising, 587 villagers opted for planned families at Renukoot, Lohardaga, Samri, Muri and Hirakud.
Safe Drinking Water and Sanitation: This year we installed 89 hand pumps, repaired 901 hand pumps and dug wells. Consequently, more than 77,750 villagers have access to safe drinking water.
In the villages prone to water borne diseases, our Samri Unit provided 25 Life Straw Community Water Filters (recommended by WHO), to Anganwadis, Schools, Health Centres and common public places.
We constructed 111 toilets and repaired 10 school toilets to make them operational. Besides this, we availed of Government schemes and contributed from our own funds as well to build 4,287 toilets. We were able to act as catalysts and motivate 3,148 households to have sanitation facilities, leveraging Government schemes. Thus, we facilitated the construction of 7,546 individual toilets at Dahej, Lohardaga, Singrauli, Belagavi, Renukoot, Muri, Samri, Lapanga, Durgmanwadi and Taloja.
Education:We run 40 Balwadis at Renukoot, Renusagar, Lohardaga, Samri, Durgmanwadi, Belagavi Kathautia and Singrauli. Through these, we have mentored 1,241 students from underprivileged families. We extend support to 75 Anganwadis at Renukoot, Singrauli,
Samri, Belur, Alupuram, Lohardaga Dahej and Kollur where 3,228 children are enrolled.
At our 10 Aditya Birla Public Schools at Renukoot, Renusagar, Dahej and Muri, we have enrolled 7,338 rural students. Additionally, 1,799 students have been enlisted in our 11 Aditya Birla Vidya Mandirs at Renukoot, Lohardaga, Kathautia and Samri.
We foster the cause of the girl child through encouraging and supporting 2,546 girls at the 12 Kasturba Gandhi Balika Vidyalayas (KGBV). This project operates in Renukoot, Belur, Lohardaga, Muri, Samri, Hirakud and Kathautia.
We have tied up with 28 primary schools under the Sarva Siksha Abhiyan (SSA) initiatives at Renukoot, Lohardaga, Dahej, Kathautia and Samri. Over 3,240 students in these schools have received technical support, study materials, school bags and uniforms.
Teacher support was extended to primary schools in Bharuch (Gujarat), Lohardaga, Gumla and Latehar districts of Jharkhand.
Under the ‘Shala Praveshotsav’ programme 14,210 students from Grade 1st to 8th in 73 schools of Bharuch district in Gujarat and 25 Schools of Balrampur district in Chhattisgarh, were given notebooks, practice books, slates, school bags, etc. Additionally, school bags, uniforms, sweaters and educational kits have been provided to over 11,756 students at most of our Units.
To encourage the spirit of excellence, 2,600 students from the rural schools supported by us were awarded scholarships and 100 girl students of class XI were given “Mahan Jyoti scholarship” of ` 1,000 each at Singrauli.
To address the issue of school dropouts, we organised 219 ‘meet the parent’ counselling events at Renukoot, Lohardaga, Singrauli,Samri, Durgmanwadi Belagavi, Lapanga and Dahej. Through this process we managed to bring 607 students back to school. At the same time, we also began coaching classes for students weak in Maths, Science and English to enable them get through the exams.
In Lapanga, Singrauli, Alupuram, Dahej, Lohardaga, Garepalma and Samri mines, where the dropout rate among secondary level girl students is high, we provide bus services to encourage them continue their education.
Furthermore, we organised Science Exhibitions to showcase talent resident at our schools and exposure visits to similar exhibitions as a knowledge gaining platform.
Hindalco Annual Report 2015-16.indb 71Hindalco Annual Report 2015-16.indb 71 8/17/2016 1:31:25 PM8/17/2016 1:31:25 PM
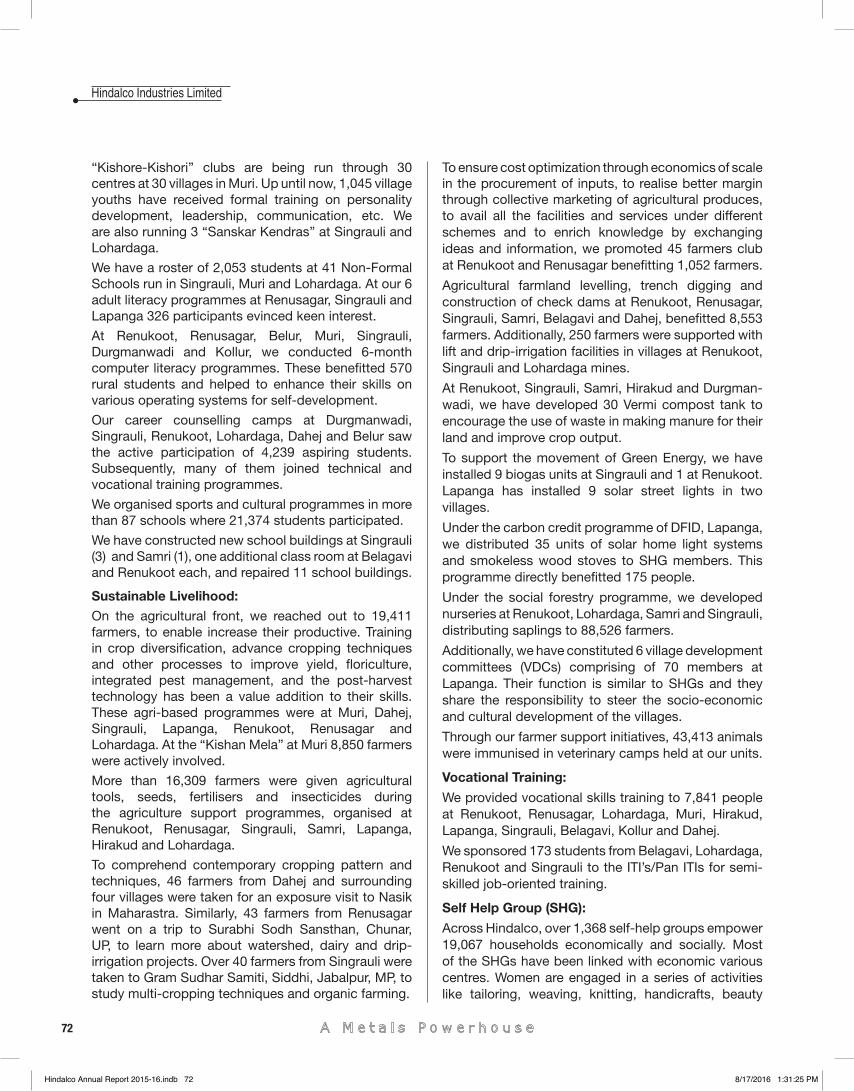
72
Hindalco Industries Limited
“Kishore-Kishori” clubs are being run through 30 centres at 30 villages in Muri. Up until now, 1,045 village youths have received formal training on personality development, leadership, communication, etc. We are also running 3 “Sanskar Kendras” at Singrauli and Lohardaga.
We have a roster of 2,053 students at 41 Non-Formal Schools run in Singrauli, Muri and Lohardaga. At our 6 adult literacy programmes at Renusagar, Singrauli and Lapanga 326 participants evinced keen interest.
At Renukoot, Renusagar, Belur, Muri, Singrauli, Durgmanwadi and Kollur, we conducted 6-month computer literacy programmes. These benefi tted 570 rural students and helped to enhance their skills on various operating systems for self-development.
Our career counselling camps at Durgmanwadi, Singrauli, Renukoot, Lohardaga, Dahej and Belur saw the active participation of 4,239 aspiring students. Subsequently, many of them joined technical and vocational training programmes.
We organised sports and cultural programmes in more than 87 schools where 21,374 students participated.
We have constructed new school buildings at Singrauli (3) and Samri (1), one additional class room at Belagavi and Renukoot each, and repaired 11 school buildings.
Sustainable Livelihood:
On the agricultural front, we reached out to 19,411 farmers, to enable increase their productive. Training in crop diversifi cation, advance cropping techniques and other processes to improve yield, fl oriculture, integrated pest management, and the post-harvest technology has been a value addition to their skills. These agri-based programmes were at Muri, Dahej, Singrauli, Lapanga, Renukoot, Renusagar and Lohardaga. At the “Kishan Mela” at Muri 8,850 farmers were actively involved.
More than 16,309 farmers were given agricultural tools, seeds, fertilisers and insecticides during the agriculture support programmes, organised at Renukoot, Renusagar, Singrauli, Samri, Lapanga, Hirakud and Lohardaga.
To comprehend contemporary cropping pattern and techniques, 46 farmers from Dahej and surrounding four villages were taken for an exposure visit to Nasik in Maharastra. Similarly, 43 farmers from Renusagar went on a trip to Surabhi Sodh Sansthan, Chunar, UP, to learn more about watershed, dairy and drip-irrigation projects. Over 40 farmers from Singrauli were taken to Gram Sudhar Samiti, Siddhi, Jabalpur, MP, to study multi-cropping techniques and organic farming.
To ensure cost optimization through economics of scale in the procurement of inputs, to realise better margin through collective marketing of agricultural produces, to avail all the facilities and services under different schemes and to enrich knowledge by exchanging ideas and information, we promoted 45 farmers club at Renukoot and Renusagar benefi tting 1,052 farmers.
Agricultural farmland levelling, trench digging and construction of check dams at Renukoot, Renusagar, Singrauli, Samri, Belagavi and Dahej, benefi tted 8,553 farmers. Additionally, 250 farmers were supported with lift and drip-irrigation facilities in villages at Renukoot, Singrauli and Lohardaga mines.
At Renukoot, Singrauli, Samri, Hirakud and Durgman-wadi, we have developed 30 Vermi compost tank to encourage the use of waste in making manure for their land and improve crop output.
To support the movement of Green Energy, we have installed 9 biogas units at Singrauli and 1 at Renukoot. Lapanga has installed 9 solar street lights in two villages.
Under the carbon credit programme of DFID, Lapanga, we distributed 35 units of solar home light systems and smokeless wood stoves to SHG members. This programme directly benefi tted 175 people.
Under the social forestry programme, we developed nurseries at Renukoot, Lohardaga, Samri and Singrauli, distributing saplings to 88,526 farmers.
Additionally, we have constituted 6 village development committees (VDCs) comprising of 70 members at Lapanga. Their function is similar to SHGs and they share the responsibility to steer the socio-economic and cultural development of the villages.
Through our farmer support initiatives, 43,413 animals were immunised in veterinary camps held at our units.
Vocational Training:
We provided vocational skills training to 7,841 people at Renukoot, Renusagar, Lohardaga, Muri, Hirakud, Lapanga, Singrauli, Belagavi, Kollur and Dahej.
We sponsored 173 students from Belagavi, Lohardaga, Renukoot and Singrauli to the ITI’s/Pan ITIs for semi-skilled job-oriented training.
Self Help Group (SHG):
Across Hindalco, over 1,368 self-help groups empower 19,067 households economically and socially. Most of the SHGs have been linked with economic various centres. Women are engaged in a series of activities like tailoring, weaving, knitting, handicrafts, beauty
Hindalco Annual Report 2015-16.indb 72Hindalco Annual Report 2015-16.indb 72 8/17/2016 1:31:25 PM8/17/2016 1:31:25 PM
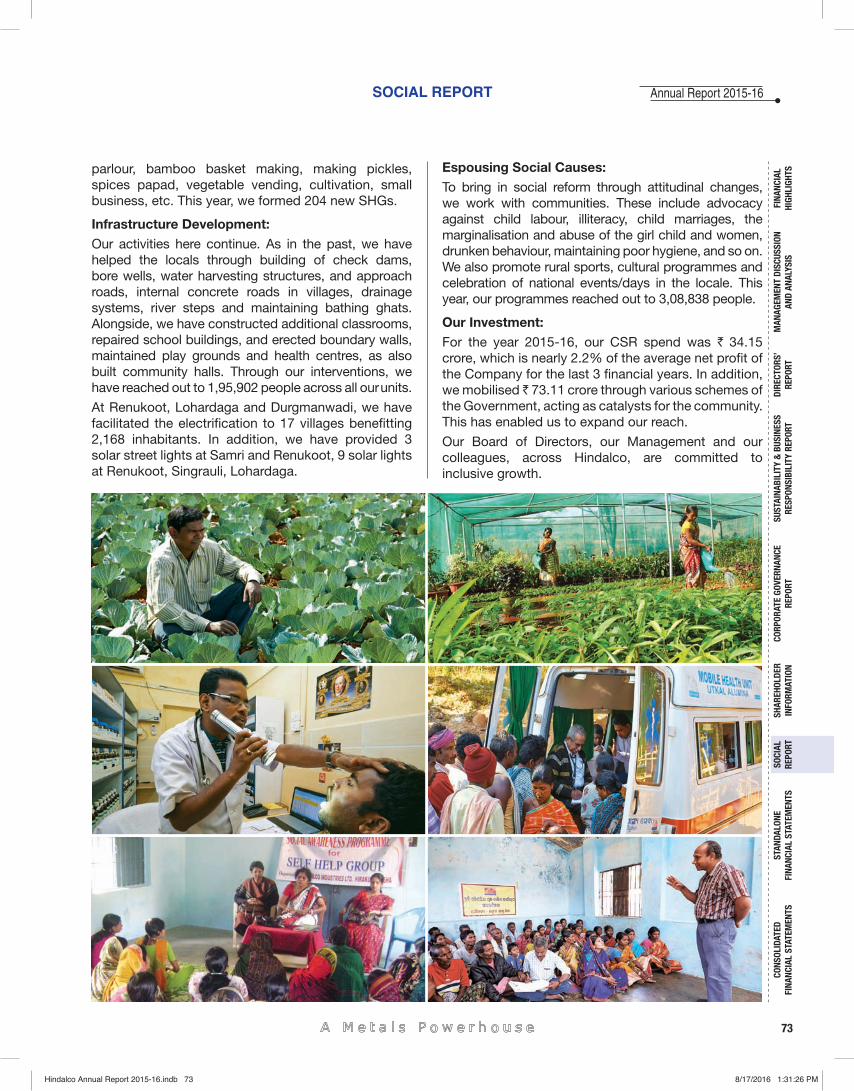
SOCIAL REPORT
73
Annual Report 2015-16
FINA
NCIA
L HI
GHLI
GHTS
MAN
AGEM
ENT
DISC
USSI
ON
AND
ANAL
YSIS
CORP
ORAT
E GO
VERN
ANCE
RE
PORT
STAN
DALO
NE
FINA
NCIA
L ST
ATEM
ENTS
CONS
OLID
ATED
FI
NANC
IAL
STAT
EMEN
TSSO
CIAL
RE
PORT
DIRE
CTOR
S’RE
PORT
SHAR
EHOL
DER
INFO
RMAT
ION
SUST
AINA
BILI
TY &
BUS
INES
SRE
SPON
SIBI
LITY
REP
ORT
parlour, bamboo basket making, making pickles, spices papad, vegetable vending, cultivation, small business, etc. This year, we formed 204 new SHGs.
Infrastructure Development:Our activities here continue. As in the past, we have helped the locals through building of check dams, bore wells, water harvesting structures, and approach roads, internal concrete roads in villages, drainage systems, river steps and maintaining bathing ghats. Alongside, we have constructed additional classrooms, repaired school buildings, and erected boundary walls, maintained play grounds and health centres, as also built community halls. Through our interventions, we have reached out to 1,95,902 people across all our units.
At Renukoot, Lohardaga and Durgmanwadi, we have facilitated the electrifi cation to 17 villages benefi tting 2,168 inhabitants. In addition, we have provided 3 solar street lights at Samri and Renukoot, 9 solar lights at Renukoot, Singrauli, Lohardaga.
Espousing Social Causes:To bring in social reform through attitudinal changes, we work with communities. These include advocacy against child labour, illiteracy, child marriages, the marginalisation and abuse of the girl child and women, drunken behaviour, maintaining poor hygiene, and so on. We also promote rural sports, cultural programmes and celebration of national events/days in the locale. This year, our programmes reached out to 3,08,838 people.
Our Investment: For the year 2015-16, our CSR spend was ` 34.15 crore, which is nearly 2.2% of the average net profi t of the Company for the last 3 fi nancial years. In addition, we mobilised ̀ 73.11 crore through various schemes of the Government, acting as catalysts for the community. This has enabled us to expand our reach.
Our Board of Directors, our Management and our colleagues, across Hindalco, are committed to inclusive growth.
Hindalco Annual Report 2015-16.indb 73Hindalco Annual Report 2015-16.indb 73 8/17/2016 1:31:26 PM8/17/2016 1:31:26 PM
74
Hindalco Industries Limited
INDEPENDENT AUDITORS’ REPORT ON THE STANDALONE FINANCIAL STATEMENTS
TO THE MEMBERS OF HINDALCO INDUSTRIES LIMITEDWe have audited the accompanying standalone fi nancial statements of HINDALCO INDUSTRIES LIMITED (“the Company”), which comprise the Balance Sheet as at 31st March, 2016, the Statement of Profi t and Loss, the Cash Flow Statement for the year then ended, and a summary of the signifi cant accounting policies and other explanatory information.
Management’s Responsibility for the Standalone Financial Statements
The Company’s Board of Directors is responsible for the matters stated in Section 134(5) of the Companies Act, 2013 (“the Act”), with respect to the preparation of these standalone fi nancial statements that give a true and fair view of the fi nancial position, fi nancial performance and cash fl ows of the Company in accordance with the accounting principles generally accepted in India, including the Accounting Standards specifi ed under Section 133 of the Act, read with Rule 7 of the Companies (Accounts) Rules, 2014. This responsibility also includes maintenance of adequate accounting records in accordance with the provisions of the Act for safeguarding the assets of the Company and for preventing and detecting frauds and other irregularities; selection and application of appropriate accounting policies; making judgments and estimates that are reasonable and prudent; and design, implementation and maintenance of adequate internal fi nancial controls, that were operating effectively for ensuring the accuracy and completeness of the accounting records, relevant to the preparation and presentation of the fi nancial statements that give a true and fair view and are free from material misstatement, whether due to fraud or error.
Auditor’s Responsibility
Our responsibility is to express an opinion on these standalone fi nancial statements based on our audit. We have taken into account the provisions of the Act, the accounting and auditing standards and matters which are required to be included in the audit report under the provisions of the Act and the Rules made thereunder.
We conducted our audit in accordance with the Standards on Auditing specifi ed under Section 143(10) of the Act. Those Standards require that we comply with ethical requirements and plan, and perform the audit to obtain reasonable assurance about whether the fi nancial statements are free from material misstatement.
An audit involves performing procedures to obtain audit evidence about the amounts and the disclosures in the fi nancial statements. The procedures selected depend on the auditor’s judgment, including the assessment of the risks of material misstatement of the fi nancial statements, whether due to fraud or error. In making those risk assessments, the auditor considers internal fi nancial control relevant to the Company’s preparation of the fi nancial statements that give a true and fair view in order to design audit procedures that are appropriate in the circumstances. An audit also includes evaluating the appropriateness of the accounting policies used and the reasonableness of the accounting estimates made by the Company’s Directors, as well as evaluating the overall presentation of the fi nancial statements.
We believe that the audit evidence we have obtained is suffi cient and appropriate to provide a basis for our audit opinion on the standalone fi nancial statements.
Opinion
In our opinion and to the best of our information and according to the explanations given to us, the aforesaid standalone fi nancial statements give the information required by the Act in the manner so required and give a true and fair view in conformity with the accounting principles generally accepted in India, of the state of affairs of the Company as at 31st March, 2016, and its profi t and its cash fl ows for the year ended on that date.
Emphasis of Matters
We draw attention to
Note No. 43 of the Financial Statement, explaining that in compliance to the scheme of arrangement under Sections 391 to 394 of the Companies Act, 1956, approved by the Hon’ble Bombay High Court, vide order dated
Hindalco Annual Report 2015-16.indb 74Hindalco Annual Report 2015-16.indb 74 8/17/2016 1:31:28 PM8/17/2016 1:31:28 PM

75
Annual Report 2015-16
FINA
NCIA
L HI
GHLI
GHTS
MAN
AGEM
ENT
DISC
USSI
ON
AND
ANAL
YSIS
CORP
ORAT
E GO
VERN
ANCE
RE
PORT
STAN
DALO
NE
FINA
NCIA
L ST
ATEM
ENTS
CONS
OLID
ATED
FI
NANC
IAL
STAT
EMEN
TSSO
CIAL
RE
PORT
DIRE
CTOR
S’RE
PORT
SHAR
EHOL
DER
INFO
RMAT
ION
SUST
AINA
BILI
TY &
BUS
INES
SRE
SPON
SIBI
LITY
REP
ORT
INDEPENDENT AUDITORS’ REPORT ON THE STANDALONE FINANCIAL STATEMENTS
29th June, 2009, the management of the Company has, during the year, identifi ed and adjusted following against Business Reconstruction Reserve: a. provision for diminution in the carrying value of Investments in one of its Subsidiaries and of a Jointly Controlled
Entity aggregating to ` 35.50 crore,b. impairment loss of ` 561.70 crore (deferred tax of ` 194.39 crore) related to one of its cash generating units,c. expenses of ` 279.46 crore for exited project, against Business Reconstruction Reserve. Had the above impact be considered the reported profi t before tax and profi t after tax of ` 732.61 crore and ` 607.25 crore, respectively, would have been converted in to loss before tax of ` 144.05 crore and loss after tax of ` 75.02 crore. Our report is not qualifi ed in respect of this matter.
Report on Other Legal and Regulatory Requirements1. As required by the Companies (Auditor’s Report) Order, 2016; issued by the Central Government of India in
terms of Sub-section (11) of Section 143 of the Act (“the order”), and on the basis of examination of the books and records of the Company and according to the information and explanations given to us, we give in the Annexure A statement on the matters specifi ed in the paragraph 3 and 4 of the Order.
2. As required by Section 143(3) of the Act, we report that:a) we have sought and obtained all the information and explanations which to the best of our knowledge and
belief, were necessary for the purposes of our audit.b) in our opinion, proper books of account as required by law have been kept by the Company so far as it
appears from our examination of those books; c) the Balance Sheet, the Statement of Profi t and Loss, and the Cash Flow Statement dealt with by this
report are in agreement with the books of account;d) in our opinion, the aforesaid standalone fi nancial statements comply with the applicable Accounting
Standards specifi ed under Section 133 of the Act, read with Rule 7 of the Companies (Accounts) Rules, 2014;
e) on the basis of the written representations received from the directors as on 31st March, 2016, taken on record by the Board of Directors, none of the directors is disqualifi ed as on 31st March, 2016, from being appointed as a director in terms of Section 164(2) of the Act;
f) With respect to the adequacy of the internal fi nancial controls over fi nancial reporting of the Company and the operating effectiveness of such controls, refer to our separate Report in Annexure ‘B’; and
g) With respect to the other Matters to be included in the Auditor’s Report in accordance with Rule 11 of the Companies (Audit and Auditors) Rules, 2014, in our opinion and to the best of our information and according to the explanations given to us:i. the Company has disclosed the impact of pending litigation on its fi nancial position in its fi nancial
statements – Refer Note 50A(a), c(iii) and c(iv) to the fi nancial statements.ii. the Company has long-term contracts including derivative contracts as at 31st March, 2016 for which
there were no material foreseeable losses. iii. there has been no delay in transferring amounts, required to be transferred, to the Investor Education
and Protection Fund by the Company, except ̀ 0.09 crore which are held in abeyance due to pending legal cases.
For SINGHI & CO. Chartered Accountants
Firm Registration No. 302049E
(RAJIV SINGHI)Place : Mumbai PartnerDate : 28th May, 2016 Membership No. 53518
Hindalco Annual Report 2015-16.indb 75Hindalco Annual Report 2015-16.indb 75 8/17/2016 1:31:28 PM8/17/2016 1:31:28 PM
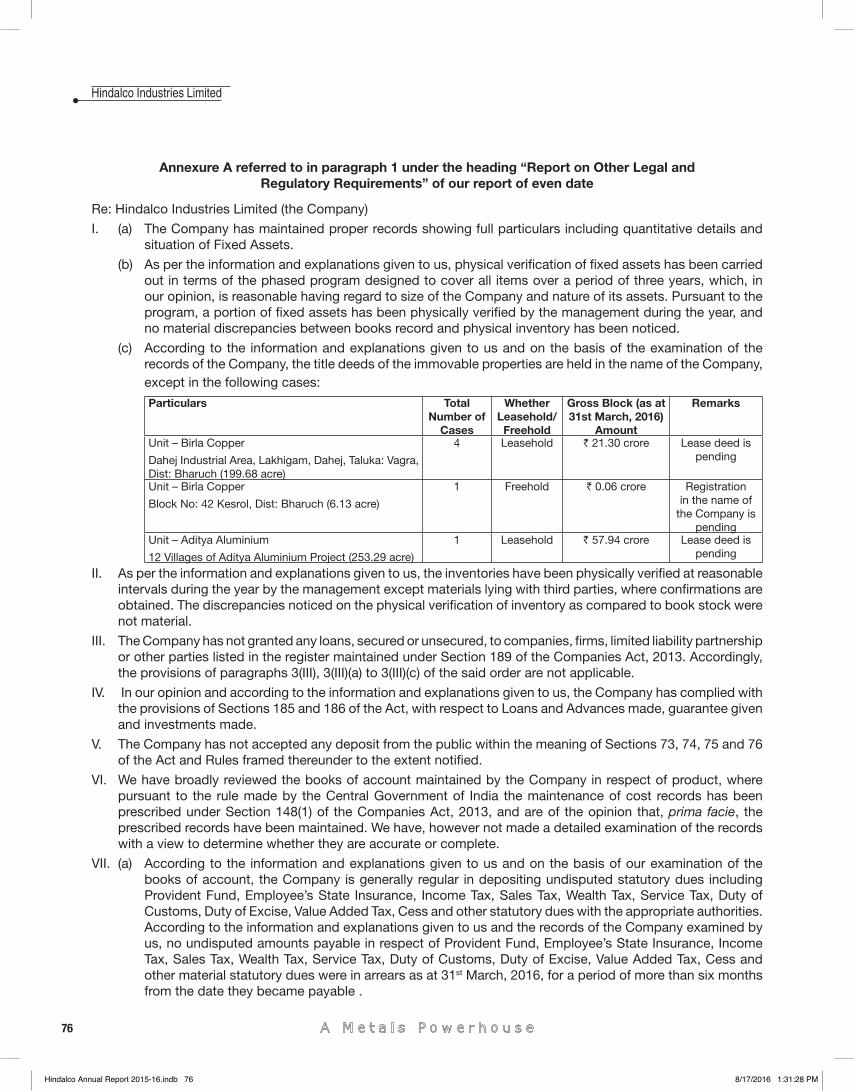
76
Hindalco Industries Limited
Annexure A referred to in paragraph 1 under the heading “Report on Other Legal and Regulatory Requirements” of our report of even date
Re: Hindalco Industries Limited (the Company)
I. (a) The Company has maintained proper records showing full particulars including quantitative details and situation of Fixed Assets.
(b) As per the information and explanations given to us, physical verifi cation of fi xed assets has been carried out in terms of the phased program designed to cover all items over a period of three years, which, in our opinion, is reasonable having regard to size of the Company and nature of its assets. Pursuant to the program, a portion of fi xed assets has been physically verifi ed by the management during the year, and no material discrepancies between books record and physical inventory has been noticed.
(c) According to the information and explanations given to us and on the basis of the examination of the records of the Company, the title deeds of the immovable properties are held in the name of the Company, except in the following cases:
Particulars Total Number of
Cases
Whether Leasehold/ Freehold
Gross Block (as at 31st March, 2016)
Amount
Remarks
Unit – Birla Copper
Dahej Industrial Area, Lakhigam, Dahej, Taluka: Vagra, Dist: Bharuch (199.68 acre)
4 Leasehold ` 21.30 crore Lease deed is pending
Unit – Birla Copper
Block No: 42 Kesrol, Dist: Bharuch (6.13 acre)
1 Freehold ` 0.06 crore Registration in the name of
the Company is pending
Unit – Aditya Aluminium
12 Villages of Aditya Aluminium Project (253.29 acre)
1 Leasehold ` 57.94 crore Lease deed is pending
II. As per the information and explanations given to us, the inventories have been physically verifi ed at reasonable intervals during the year by the management except materials lying with third parties, where confi rmations are obtained. The discrepancies noticed on the physical verifi cation of inventory as compared to book stock were not material.
III. The Company has not granted any loans, secured or unsecured, to companies, fi rms, limited liability partnership or other parties listed in the register maintained under Section 189 of the Companies Act, 2013. Accordingly, the provisions of paragraphs 3(III), 3(III)(a) to 3(III)(c) of the said order are not applicable.
IV. In our opinion and according to the information and explanations given to us, the Company has complied with the provisions of Sections 185 and 186 of the Act, with respect to Loans and Advances made, guarantee given and investments made.
V. The Company has not accepted any deposit from the public within the meaning of Sections 73, 74, 75 and 76 of the Act and Rules framed thereunder to the extent notifi ed.
VI. We have broadly reviewed the books of account maintained by the Company in respect of product, where pursuant to the rule made by the Central Government of India the maintenance of cost records has been prescribed under Section 148(1) of the Companies Act, 2013, and are of the opinion that, prima facie, the prescribed records have been maintained. We have, however not made a detailed examination of the records with a view to determine whether they are accurate or complete.
VII. (a) According to the information and explanations given to us and on the basis of our examination of the books of account, the Company is generally regular in depositing undisputed statutory dues including Provident Fund, Employee’s State Insurance, Income Tax, Sales Tax, Wealth Tax, Service Tax, Duty of Customs, Duty of Excise, Value Added Tax, Cess and other statutory dues with the appropriate authorities. According to the information and explanations given to us and the records of the Company examined by us, no undisputed amounts payable in respect of Provident Fund, Employee’s State Insurance, Income Tax, Sales Tax, Wealth Tax, Service Tax, Duty of Customs, Duty of Excise, Value Added Tax, Cess and other material statutory dues were in arrears as at 31st March, 2016, for a period of more than six months from the date they became payable .
Hindalco Annual Report 2015-16.indb 76Hindalco Annual Report 2015-16.indb 76 8/17/2016 1:31:28 PM8/17/2016 1:31:28 PM
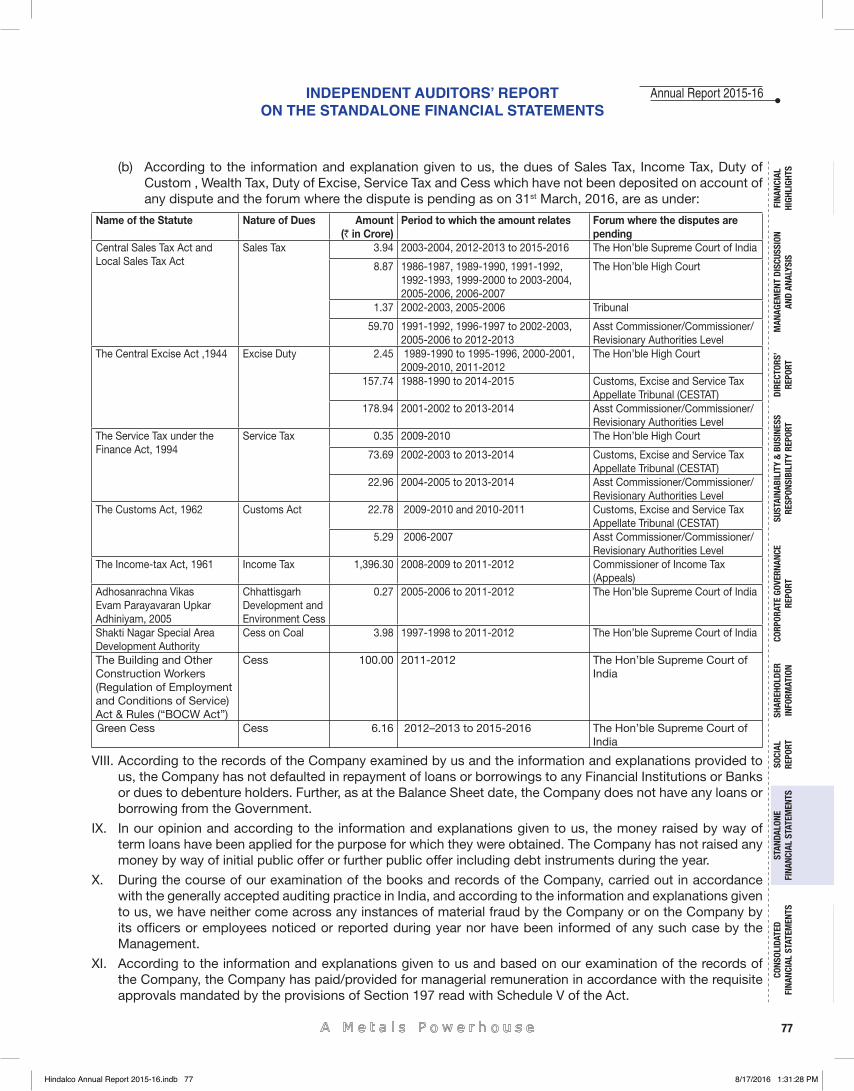
77
Annual Report 2015-16
FINA
NCIA
L HI
GHLI
GHTS
MAN
AGEM
ENT
DISC
USSI
ON
AND
ANAL
YSIS
CORP
ORAT
E GO
VERN
ANCE
RE
PORT
STAN
DALO
NE
FINA
NCIA
L ST
ATEM
ENTS
CONS
OLID
ATED
FI
NANC
IAL
STAT
EMEN
TSSO
CIAL
RE
PORT
DIRE
CTOR
S’RE
PORT
SHAR
EHOL
DER
INFO
RMAT
ION
SUST
AINA
BILI
TY &
BUS
INES
SRE
SPON
SIBI
LITY
REP
ORT
(b) According to the information and explanation given to us, the dues of Sales Tax, Income Tax, Duty of Custom , Wealth Tax, Duty of Excise, Service Tax and Cess which have not been deposited on account of any dispute and the forum where the dispute is pending as on 31st March, 2016, are as under:
Name of the Statute Nature of Dues Amount(` in Crore)
Period to which the amount relates Forum where the disputes are pending
Central Sales Tax Act and Local Sales Tax Act
Sales Tax 3.94 2003-2004, 2012-2013 to 2015-2016 The Hon’ble Supreme Court of India
8.87 1986-1987, 1989-1990, 1991-1992, 1992-1993, 1999-2000 to 2003-2004, 2005-2006, 2006-2007
The Hon’ble High Court
1.37 2002-2003, 2005-2006 Tribunal
59.70 1991-1992, 1996-1997 to 2002-2003, 2005-2006 to 2012-2013
Asst Commissioner/Commissioner/ Revisionary Authorities Level
The Central Excise Act ,1944 Excise Duty 2.45 1989-1990 to 1995-1996, 2000-2001, 2009-2010, 2011-2012
The Hon’ble High Court
157.74 1988-1990 to 2014-2015 Customs, Excise and Service Tax Appellate Tribunal (CESTAT)
178.94 2001-2002 to 2013-2014 Asst Commissioner/Commissioner/ Revisionary Authorities Level
The Service Tax under the Finance Act, 1994
Service Tax 0.35 2009-2010 The Hon’ble High Court
73.69 2002-2003 to 2013-2014 Customs, Excise and Service Tax Appellate Tribunal (CESTAT)
22.96 2004-2005 to 2013-2014 Asst Commissioner/Commissioner/ Revisionary Authorities Level
The Customs Act, 1962 Customs Act 22.78 2009-2010 and 2010-2011 Customs, Excise and Service Tax Appellate Tribunal (CESTAT)
5.29 2006-2007 Asst Commissioner/Commissioner/ Revisionary Authorities Level
The Income-tax Act, 1961 Income Tax 1,396.30 2008-2009 to 2011-2012 Commissioner of Income Tax (Appeals)
Adhosanrachna Vikas Evam Parayavaran Upkar Adhiniyam, 2005
Chhattisgarh Development and Environment Cess
0.27 2005-2006 to 2011-2012 The Hon’ble Supreme Court of India
Shakti Nagar Special Area Development Authority
Cess on Coal 3.98 1997-1998 to 2011-2012 The Hon’ble Supreme Court of India
The Building and Other Construction Workers (Regulation of Employment and Conditions of Service) Act & Rules (“BOCW Act”)
Cess 100.00 2011-2012 The Hon’ble Supreme Court of India
Green Cess Cess 6.16 2012–2013 to 2015-2016 The Hon’ble Supreme Court of India
VIII. According to the records of the Company examined by us and the information and explanations provided to us, the Company has not defaulted in repayment of loans or borrowings to any Financial Institutions or Banks or dues to debenture holders. Further, as at the Balance Sheet date, the Company does not have any loans or borrowing from the Government.
IX. In our opinion and according to the information and explanations given to us, the money raised by way of term loans have been applied for the purpose for which they were obtained. The Company has not raised any money by way of initial public offer or further public offer including debt instruments during the year.
X. During the course of our examination of the books and records of the Company, carried out in accordance with the generally accepted auditing practice in India, and according to the information and explanations given to us, we have neither come across any instances of material fraud by the Company or on the Company by its offi cers or employees noticed or reported during year nor have been informed of any such case by the Management.
XI. According to the information and explanations given to us and based on our examination of the records of the Company, the Company has paid/provided for managerial remuneration in accordance with the requisite approvals mandated by the provisions of Section 197 read with Schedule V of the Act.
INDEPENDENT AUDITORS’ REPORT ON THE STANDALONE FINANCIAL STATEMENTS
Hindalco Annual Report 2015-16.indb 77Hindalco Annual Report 2015-16.indb 77 8/17/2016 1:31:28 PM8/17/2016 1:31:28 PM
78
Hindalco Industries Limited
XII. The Company is not a Nidhi Company. Accordingly, paragraph 3(XII) of the Order is not applicable.
XIII. According to the information and explanations given to us and based on our examination of the records of the Company, transactions with the related parties are in compliance with Sections 177 and 188 of the Act where applicable, and details of such transactions have been disclosed in the fi nancial statements as required under Accounting Standard (AS)-18, Related Party Transactions.
XIV. The Company has not made any preferential allotment or private placement of shares or fully or partly converted debentures during the year. Accordingly, paragraph 3(XIV) of the Order is not applicable to the Company.
XV. According to the information and explanations given to us and based on our examination of the records of the Company, the Company has not entered into non-cash transactions with directors or persons connected with him. Accordingly, paragraph 3(XV) of the Order is not applicable.
XVI. The Company is not required to be registered under Section 45-IA of the Reserve Bank of India Act, 1934. Accordingly, paragraph 3(XVI) of the Order is not applicable to the Company.
For SINGHI & CO. Chartered Accountants
Firm Registration No. 302049E
(RAJIV SINGHI)Place : Mumbai PartnerDate : 28th May, 2016 Membership No. 53518
ANNEXURE - B TO THE INDEPENDENT AUDITOR’S REPORT
Report on the Internal Financial Controls under Clause (i) ofSub-section 3 of Section 143 of the Companies Act, 2013 (“the Act”)
We have audited the internal fi nancial controls over fi nancial reporting of HINDALCO INDUSTRIES LIMITED (“the Company”) as of 31st March, 2016, in conjunction with our audit of the fi nancial statements of the Company for the year ended on that date.
Management’s Responsibility for Internal Financial Controls
The Company’s management is responsible for establishing and maintaining the internal fi nancial controls based on the internal control over fi nancial reporting criteria established by the Company considering the essential components of internal control stated in the Guidance Note on Audit of Internal Financial Controls over Financial Reporting issued by the Institute of Chartered Accountants of India (‘ICAI’). These responsibilities include the design, implementation and maintenance of adequate internal fi nancial controls that were operating effectively for ensuring the orderly and effi cient conduct of its business, including adherence to company’s policies, the safeguarding of its assets, the prevention and detection of frauds and errors, the accuracy and completeness of the accounting records, and the timely preparation of reliable fi nancial information, as required under the Companies Act, 2013.
Auditor’s Responsibility
Our responsibility is to express an opinion on the Company’s internal fi nancial controls over fi nancial reporting based on our audit. We conducted our audit in accordance with the Guidance Note on Audit of Internal Financial Controls over Financial Reporting (the “Guidance Note”) and the Standards on Auditing, issued by the ICAI and deemed to be prescribed under Section 143(10) of the Companies Act, 2013, to the extent applicable to an audit of internal fi nancial controls, both applicable to an audit of Internal Financial Controls and both issued by the Institute of Chartered Accountants of India. Those Standards and the Guidance Note require that we comply with ethical
Hindalco Annual Report 2015-16.indb 78Hindalco Annual Report 2015-16.indb 78 8/17/2016 1:31:28 PM8/17/2016 1:31:28 PM
79
Annual Report 2015-16
FINA
NCIA
L HI
GHLI
GHTS
MAN
AGEM
ENT
DISC
USSI
ON
AND
ANAL
YSIS
CORP
ORAT
E GO
VERN
ANCE
RE
PORT
STAN
DALO
NE
FINA
NCIA
L ST
ATEM
ENTS
CONS
OLID
ATED
FI
NANC
IAL
STAT
EMEN
TSSO
CIAL
RE
PORT
DIRE
CTOR
S’RE
PORT
SHAR
EHOL
DER
INFO
RMAT
ION
SUST
AINA
BILI
TY &
BUS
INES
SRE
SPON
SIBI
LITY
REP
ORT
requirements, and plan and perform the audit to obtain reasonable assurance about whether adequate internal fi nancial controls over fi nancial reporting was established and maintained, and if such controls operated effectively in all material respects.
Our audit involves performing procedures to obtain audit evidence about the adequacy of the internal fi nancial controls system over fi nancial reporting and their operating effectiveness. Our audit of internal fi nancial controls over fi nancial reporting included obtaining an understanding of internal fi nancial controls over fi nancial reporting, assessing the risk that a material weakness exists, and testing and evaluating the design and operating effectiveness of internal control based on the assessed risk. The procedures selected depend on the auditor’s judgment, including the assessment of the risks of material misstatement of the fi nancial statements, whether due to fraud or error.
We believe that the audit evidence we have obtained is suffi cient and appropriate to provide a basis for our audit opinion on the Company’s internal fi nancial controls system over fi nancial reporting.
Meaning of Internal Financial Controls over Financial Reporting
A company’s internal fi nancial control over fi nancial reporting is a process designed to provide reasonable assurance regarding the reliability of fi nancial reporting and the preparation of fi nancial statements for external purposes in accordance with generally accepted accounting principles. A company’s internal fi nancial control over fi nancial reporting includes those policies and procedures that:
(1) pertain to the maintenance of records that, in reasonable detail, accurately and fairly refl ect the transactions and dispositions of the assets of the company;
(2) provide reasonable assurance that transactions are recorded as necessary to permit preparation of fi nancial statements in accordance with generally accepted accounting principles, and that receipts and expenditures of the company are being made only in accordance with the authorizations of management and directors of the company; and
(3) provide reasonable assurance regarding prevention or timely detection of unauthorized acquisition, use, or disposition of the company’s assets that could have a material effect on the fi nancial statements.
Inherent Limitations of Internal Financial Controls over Financial Reporting
Because of the inherent limitations of internal fi nancial controls over fi nancial reporting, including the possibility of collusion or improper management override of controls, material misstatements due to error or fraud may occur and not be detected. Also, projections of any evaluation of the internal fi nancial controls over fi nancial reporting to future periods are subject to the risk that the internal fi nancial control over fi nancial reporting may become inadequate because of changes in conditions, or that the degree of compliance with the policies or procedures may deteriorate.
Opinion
In our opinion, the Company has, in all material respects, an adequate internal fi nancial controls system over fi nancial reporting and such internal fi nancial controls over fi nancial reporting were operating effectively as at31 March, 2016, based on the internal control over fi nancial reporting criteria established by the Company considering the essential components of internal control stated in the Guidance Note on Audit of Internal Financial Controls Over Financial Reporting issued by the Institute of Chartered Accountants of India.
For SINGHI & CO. Chartered Accountants
Firm Registration No. 302049E
(RAJIV SINGHI)Place : Mumbai PartnerDate : 28th May, 2016 Membership No. 53518
INDEPENDENT AUDITORS’ REPORT ON THE STANDALONE FINANCIAL STATEMENTS
Hindalco Annual Report 2015-16.indb 79Hindalco Annual Report 2015-16.indb 79 8/17/2016 1:31:28 PM8/17/2016 1:31:28 PM
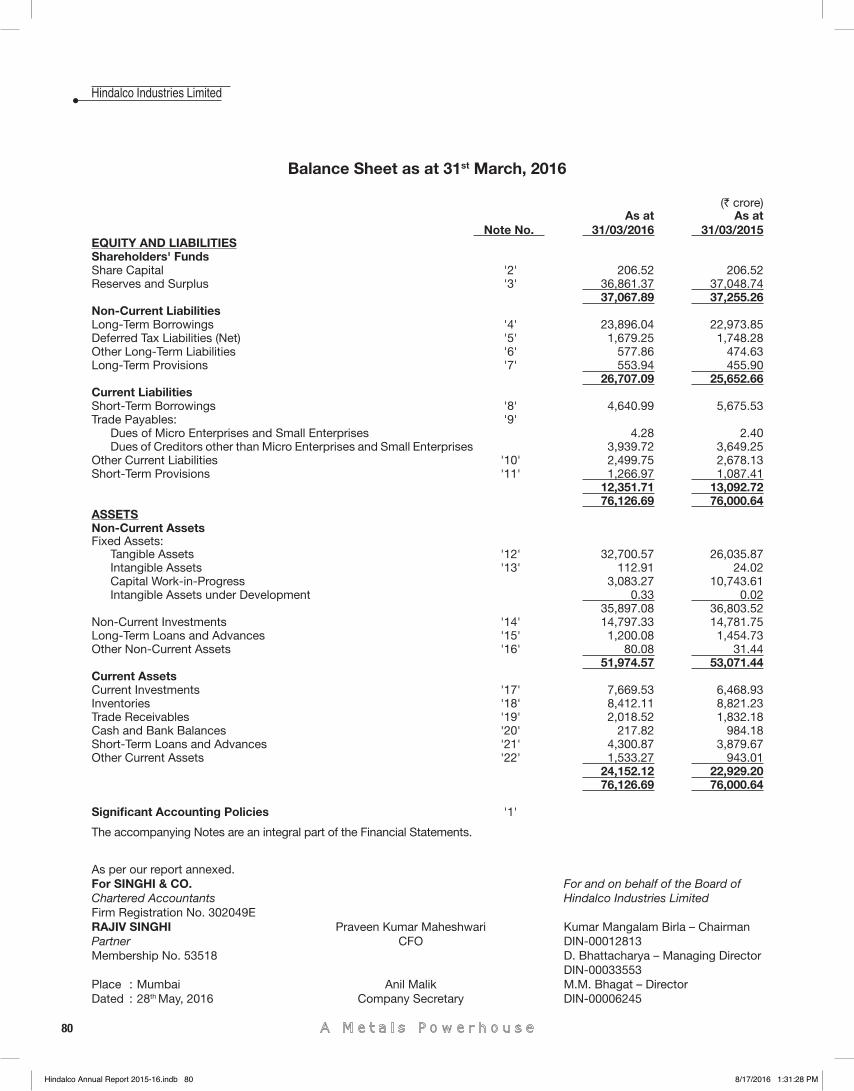
80
Hindalco Industries Limited
Balance Sheet as at 31st March, 2016
(` crore)
Note No. As at
31/03/2016 As at
31/03/2015EQUITY AND LIABILITIESShareholders' FundsShare Capital '2' 206.52 206.52 Reserves and Surplus '3' 36,861.37 37,048.74
37,067.89 37,255.26 Non-Current LiabilitiesLong-Term Borrowings '4' 23,896.04 22,973.85 Deferred Tax Liabilities (Net) '5' 1,679.25 1,748.28 Other Long-Term Liabilities '6' 577.86 474.63 Long-Term Provisions '7' 553.94 455.90
26,707.09 25,652.66 Current LiabilitiesShort-Term Borrowings '8' 4,640.99 5,675.53 Trade Payables: '9'
Dues of Micro Enterprises and Small Enterprises 4.28 2.40 Dues of Creditors other than Micro Enterprises and Small Enterprises 3,939.72 3,649.25
Other Current Liabilities '10' 2,499.75 2,678.13 Short-Term Provisions '11' 1,266.97 1,087.41
12,351.71 13,092.72 76,126.69 76,000.64
ASSETSNon-Current AssetsFixed Assets:
Tangible Assets '12' 32,700.57 26,035.87 Intangible Assets '13' 112.91 24.02 Capital Work-in-Progress 3,083.27 10,743.61 Intangible Assets under Development 0.33 0.02
35,897.08 36,803.52 Non-Current Investments '14' 14,797.33 14,781.75 Long-Term Loans and Advances '15' 1,200.08 1,454.73 Other Non-Current Assets '16' 80.08 31.44
51,974.57 53,071.44 Current Assets Current Investments '17' 7,669.53 6,468.93 Inventories '18' 8,412.11 8,821.23 Trade Receivables '19' 2,018.52 1,832.18 Cash and Bank Balances '20' 217.82 984.18 Short-Term Loans and Advances '21' 4,300.87 3,879.67 Other Current Assets '22' 1,533.27 943.01
24,152.12 22,929.20 76,126.69 76,000.64
Signifi cant Accounting Policies '1'
The accompanying Notes are an integral part of the Financial Statements.
As per our report annexed.For SINGHI & CO. For and on behalf of the Board ofChartered Accountants Hindalco Industries LimitedFirm Registration No. 302049E RAJIV SINGHI Praveen Kumar Maheshwari Kumar Mangalam Birla – ChairmanPartner CFO DIN-00012813Membership No. 53518 D. Bhattacharya – Managing Director DIN-00033553Place : Mumbai Anil Malik M.M. Bhagat – DirectorDated : 28th May, 2016 Company Secretary DIN-00006245
Hindalco Annual Report 2015-16.indb 80Hindalco Annual Report 2015-16.indb 80 8/17/2016 1:31:28 PM8/17/2016 1:31:28 PM
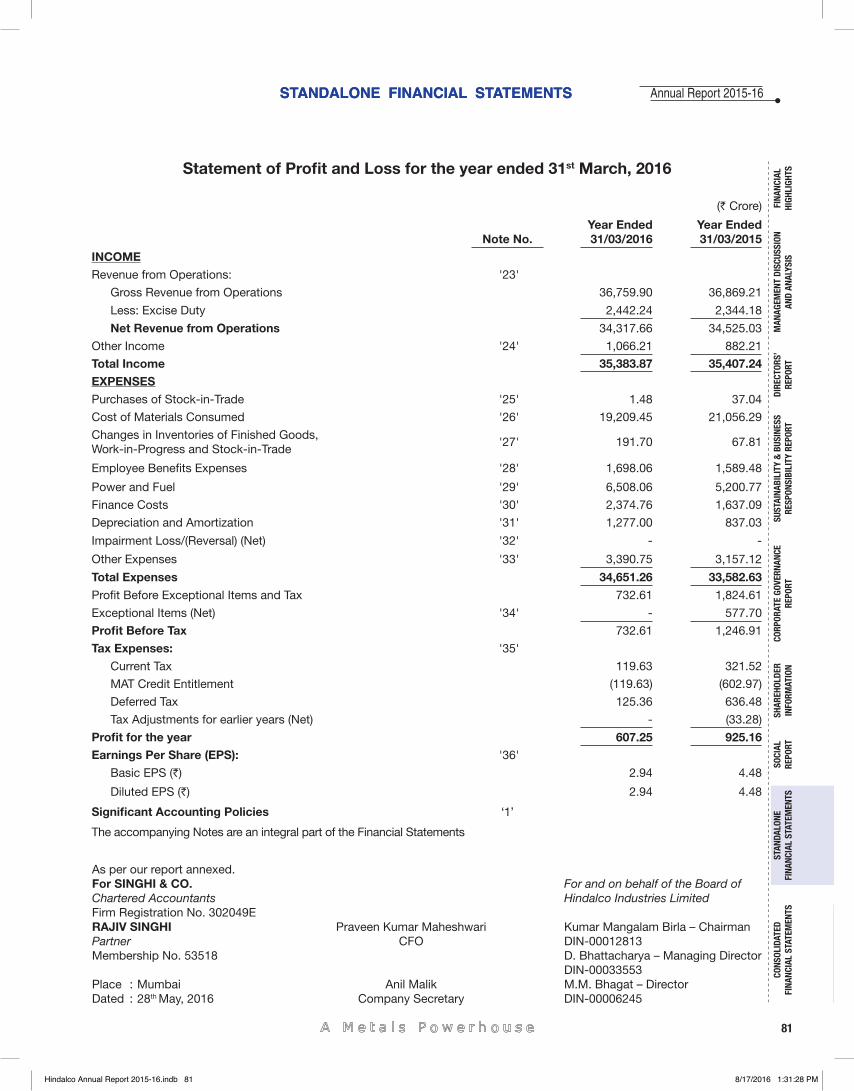
81
Annual Report 2015-16
FINA
NCIA
L HI
GHLI
GHTS
MAN
AGEM
ENT
DISC
USSI
ON
AND
ANAL
YSIS
CORP
ORAT
E GO
VERN
ANCE
RE
PORT
STAN
DALO
NE
FINA
NCIA
L ST
ATEM
ENTS
CONS
OLID
ATED
FI
NANC
IAL
STAT
EMEN
TSSO
CIAL
RE
PORT
DIRE
CTOR
S’RE
PORT
SHAR
EHOL
DER
INFO
RMAT
ION
SUST
AINA
BILI
TY &
BUS
INES
SRE
SPON
SIBI
LITY
REP
ORT
STANDALONE FINANCIAL STATEMENTSSTANDALONE FINANCIAL STATEMENTS
Statement of Profi t and Loss for the year ended 31st March, 2016
(` Crore)
Note No. Year Ended 31/03/2016
Year Ended 31/03/2015
INCOMERevenue from Operations: '23'
Gross Revenue from Operations 36,759.90 36,869.21
Less: Excise Duty 2,442.24 2,344.18
Net Revenue from Operations 34,317.66 34,525.03
Other Income '24' 1,066.21 882.21
Total Income 35,383.87 35,407.24 EXPENSESPurchases of Stock-in-Trade '25' 1.48 37.04
Cost of Materials Consumed '26' 19,209.45 21,056.29
Changes in Inventories of Finished Goods, Work-in-Progress and Stock-in-Trade
'27' 191.70 67.81
Employee Benefi ts Expenses '28' 1,698.06 1,589.48
Power and Fuel '29' 6,508.06 5,200.77
Finance Costs '30' 2,374.76 1,637.09
Depreciation and Amortization '31' 1,277.00 837.03
Impairment Loss/(Reversal) (Net) '32' - -
Other Expenses '33' 3,390.75 3,157.12
Total Expenses 34,651.26 33,582.63
Profi t Before Exceptional Items and Tax 732.61 1,824.61
Exceptional Items (Net) '34' - 577.70
Profi t Before Tax 732.61 1,246.91
Tax Expenses: '35'
Current Tax 119.63 321.52
MAT Credit Entitlement (119.63) (602.97)
Deferred Tax 125.36 636.48
Tax Adjustments for earlier years (Net) - (33.28)
Profi t for the year 607.25 925.16 Earnings Per Share (EPS): '36'
Basic EPS (`) 2.94 4.48
Diluted EPS (`) 2.94 4.48
Signifi cant Accounting Policies ‘1’
The accompanying Notes are an integral part of the Financial Statements
As per our report annexed.For SINGHI & CO. For and on behalf of the Board ofChartered Accountants Hindalco Industries LimitedFirm Registration No. 302049E RAJIV SINGHI Praveen Kumar Maheshwari Kumar Mangalam Birla – ChairmanPartner CFO DIN-00012813Membership No. 53518 D. Bhattacharya – Managing Director DIN-00033553Place : Mumbai Anil Malik M.M. Bhagat – DirectorDated : 28th May, 2016 Company Secretary DIN-00006245
Hindalco Annual Report 2015-16.indb 81Hindalco Annual Report 2015-16.indb 81 8/17/2016 1:31:28 PM8/17/2016 1:31:28 PM
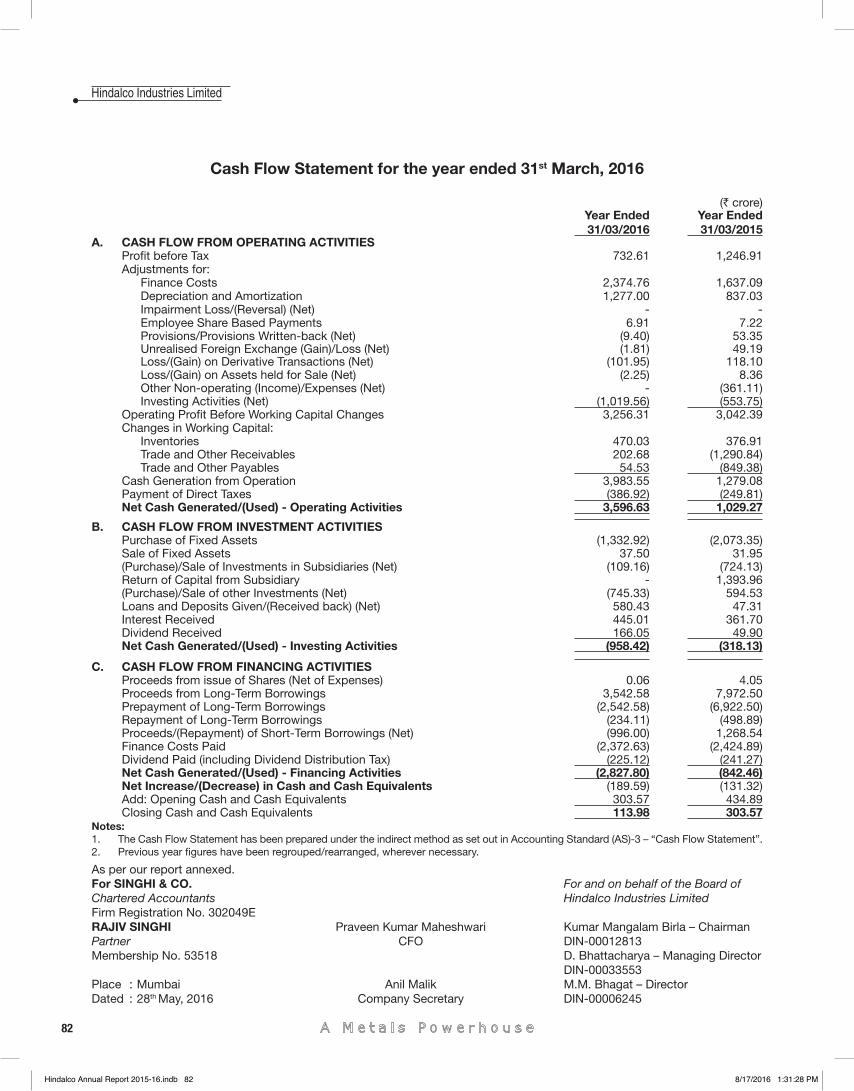
82
Hindalco Industries Limited
Cash Flow Statement for the year ended 31st March, 2016
(` crore)Year Ended 31/03/2016
Year Ended 31/03/2015
A. CASH FLOW FROM OPERATING ACTIVITIESProfi t before Tax 732.61 1,246.91 Adjustments for:
Finance Costs 2,374.76 1,637.09 Depreciation and Amortization 1,277.00 837.03 Impairment Loss/(Reversal) (Net) - - Employee Share Based Payments 6.91 7.22 Provisions/Provisions Written-back (Net) (9.40) 53.35 Unrealised Foreign Exchange (Gain)/Loss (Net) (1.81) 49.19 Loss/(Gain) on Derivative Transactions (Net) (101.95) 118.10 Loss/(Gain) on Assets held for Sale (Net) (2.25) 8.36 Other Non-operating (Income)/Expenses (Net) - (361.11)Investing Activities (Net) (1,019.56) (553.75)
Operating Profi t Before Working Capital Changes 3,256.31 3,042.39 Changes in Working Capital:
Inventories 470.03 376.91 Trade and Other Receivables 202.68 (1,290.84)Trade and Other Payables 54.53 (849.38)
Cash Generation from Operation 3,983.55 1,279.08 Payment of Direct Taxes (386.92) (249.81)Net Cash Generated/(Used) - Operating Activities 3,596.63 1,029.27
B. CASH FLOW FROM INVESTMENT ACTIVITIESPurchase of Fixed Assets (1,332.92) (2,073.35)Sale of Fixed Assets 37.50 31.95 (Purchase)/Sale of Investments in Subsidiaries (Net) (109.16) (724.13)Return of Capital from Subsidiary - 1,393.96 (Purchase)/Sale of other Investments (Net) (745.33) 594.53 Loans and Deposits Given/(Received back) (Net) 580.43 47.31 Interest Received 445.01 361.70 Dividend Received 166.05 49.90 Net Cash Generated/(Used) - Investing Activities (958.42) (318.13)
C. CASH FLOW FROM FINANCING ACTIVITIESProceeds from issue of Shares (Net of Expenses) 0.06 4.05 Proceeds from Long-Term Borrowings 3,542.58 7,972.50 Prepayment of Long-Term Borrowings (2,542.58) (6,922.50)Repayment of Long-Term Borrowings (234.11) (498.89)Proceeds/(Repayment) of Short-Term Borrowings (Net) (996.00) 1,268.54 Finance Costs Paid (2,372.63) (2,424.89)Dividend Paid (including Dividend Distribution Tax) (225.12) (241.27)Net Cash Generated/(Used) - Financing Activities (2,827.80) (842.46)Net Increase/(Decrease) in Cash and Cash Equivalents (189.59) (131.32)Add: Opening Cash and Cash Equivalents 303.57 434.89 Closing Cash and Cash Equivalents 113.98 303.57
Notes: 1. The Cash Flow Statement has been prepared under the indirect method as set out in Accounting Standard (AS)-3 – “Cash Flow Statement”.2. Previous year fi gures have been regrouped/rearranged, wherever necessary.
As per our report annexed.For SINGHI & CO. For and on behalf of the Board ofChartered Accountants Hindalco Industries LimitedFirm Registration No. 302049E RAJIV SINGHI Praveen Kumar Maheshwari Kumar Mangalam Birla – ChairmanPartner CFO DIN-00012813Membership No. 53518 D. Bhattacharya – Managing Director DIN-00033553Place : Mumbai Anil Malik M.M. Bhagat – DirectorDated : 28th May, 2016 Company Secretary DIN-00006245
Hindalco Annual Report 2015-16.indb 82Hindalco Annual Report 2015-16.indb 82 8/17/2016 1:31:28 PM8/17/2016 1:31:28 PM

83
Annual Report 2015-16
FINA
NCIA
L HI
GHLI
GHTS
MAN
AGEM
ENT
DISC
USSI
ON
AND
ANAL
YSIS
CORP
ORAT
E GO
VERN
ANCE
RE
PORT
STAN
DALO
NE
FINA
NCIA
L ST
ATEM
ENTS
CONS
OLID
ATED
FI
NANC
IAL
STAT
EMEN
TSSO
CIAL
RE
PORT
DIRE
CTOR
S’RE
PORT
SHAR
EHOL
DER
INFO
RMAT
ION
SUST
AINA
BILI
TY &
BUS
INES
SRE
SPON
SIBI
LITY
REP
ORT
STANDALONE FINANCIAL STATEMENTS
Notes forming part of the Financial Statements
1. Signifi cant Accounting Policies:
A. Accounting Convention
These fi nancial statements are prepared in accordance with Indian Generally Accepted Accounting Principles
(GAAP) under the historical cost convention on an accrual basis. GAAP comprises mandatory accounting
standards as prescribed under Section 133 of the Companies Act, 2013 (‘Act’), read with Rule 7 of the
Companies (Accounts) Rules, 2014, the provisions of the Act (to the extent notifi ed) and guidelines issued
by the Securities and Exchange Board of India (SEBI). All the assets and liabilities are classifi ed as current or
non-current as per the criteria set out in Schedule III to the Companies Act, 2013.
B. Use of Estimates
The preparation of fi nancial statements require estimates and assumptions to be made that affect the reported
amount of assets and liabilities on the date of the fi nancial statements and the reported amount of revenues
and expenses during the reporting period. Difference between the actual results and estimates are recognized
in the period in which the results are known/materialized.
C. Fixed Assets
(a) Tangible Assets are stated at cost less accumulated depreciation and impairment loss, if any. Cost
comprises of purchase price and any directly attributable cost of bringing the assets to its working
condition and any obligatory decommissioning costs for its intended use.
(b) Intangible Assets are stated at cost less accumulated amortization and impairment loss, if any. Cost
includes any directly attributable expenditure on making the asset ready for its intended use.
(c) Machinery spares, which can be used only in connection with an item of Tangible Asset and whose use is
not of regular nature, are written off over the estimated useful life of the relevant asset.
(d) Certain directly attributable pre-operative expenses during construction period are included under Capital
Work-in-Progress. These expenses are allocated to the cost of Fixed Assets when the same are ready for
intended use.
D. Depreciation and Amortization
(a) Depreciation on Tangible Assets, except leasehold land, has been provided using Straight-Line Method
over the estimated useful life of the assets in a manner prescribed in Part C of Schedule II of the Companies
Act, 2013, which is also in line with management estimated useful life. Leasehold lands are amortized over
the period of lease on straight-line basis.
(b) Intangible Assets, except Mining Rights, are amortized over their estimated useful lives on straight-
line basis. Mining Rights are amortized over the period of lease on straight line basis or on the basis
of production, proportional to mineral resources expected to be ultimately economically recoverable,
whichever is higher.
E. Impairment
An asset is treated as impaired when the carrying cost of the asset exceeds its recoverable value being higher
of value in use and net selling price. Value in use is computed at net present value of cash fl ow expected over
Hindalco Annual Report 2015-16.indb 83Hindalco Annual Report 2015-16.indb 83 8/17/2016 1:31:29 PM8/17/2016 1:31:29 PM
84
Hindalco Industries Limited
the balance useful life of the assets. An impairment loss is recognized as an expense in the Statement of Profi t
and Loss in the year in which an asset is identifi ed as impaired. The impairment loss recognized in the prior
accounting period is reversed if there has been an improvement in recoverable amount.
F. Leases
Lease payments under an operating lease are recognized as expense in the Statement of Profi t and Loss as
per the terms of lease agreement.
G. Investments
(a) Long-term investments are carried at cost after deducting provision, if any, for diminution in value
considered to be other than temporary in nature.
(b) Current investments are stated at lower of cost and fair value.
H. Inventories
(a) Inventories of stores and spare parts are valued at or below cost after providing for cost of obsolescence
and other anticipated losses, wherever considered necessary. Inventory of other items are valued ‘at
Cost or Net Realizable Value, whichever is lower’. Cost is generally determined on weighted-average cost
basis and wherever required, appropriate overheads are taken into account. Net Realizable Value is the
estimated selling price in the ordinary course of business less the estimated cost of completion and the
estimated costs necessary to make the sale. However, materials and other supplies held for use in the
production of inventories are not written down below cost if the fi nished products in which they will be
used are expected to be sold at or above cost.
(b) Fair value hedges are mainly used to hedge the exposure to change in fair value of commodity price risks.
The fair value adjustment remains part of the carrying value of inventory and enters into the determination
of earnings when the inventory is sold.
I. Foreign Currency Transactions
Transactions in foreign currency are recorded at the rate of exchange prevailing on the date of transaction. Year
end balance of foreign currency monetary item is translated at the year end rates. Exchange differences arising
on settlement of monetary items or on reporting of monetary items at rates different from those at which they
were initially recorded during the period or reported in previous fi nancial statements are recognized as income
or expense in the period in which they arise. Foreign currency monetary items, which are used as hedge
instruments or hedged items, are accounted as per accounting policy on derivative fi nancial instruments.
J. Employee Benefi ts
Employee benefi ts of short-term nature are recognized as expense, as and when these accrue. Long-term
employee benefi ts and post-employment benefi ts, whether funded or otherwise, are recognized as expense
based on actuarial valuation at year end using the projected unit credit method. For discounting purpose,
market yield of Government Bonds at the Balance Sheet date is used. Actuarial gains or losses are recognized
immediately in the Statement of Profi t and Loss.
K. Employee Share Based Payments
Equity settled stock options granted to employees pursuant to the Company’s stock option schemes are
accounted for as per the intrinsic value method prescribed by Employee Stock Option Scheme and permitted
Hindalco Annual Report 2015-16.indb 84Hindalco Annual Report 2015-16.indb 84 8/17/2016 1:31:29 PM8/17/2016 1:31:29 PM
85
Annual Report 2015-16
FINA
NCIA
L HI
GHLI
GHTS
MAN
AGEM
ENT
DISC
USSI
ON
AND
ANAL
YSIS
CORP
ORAT
E GO
VERN
ANCE
RE
PORT
STAN
DALO
NE
FINA
NCIA
L ST
ATEM
ENTS
CONS
OLID
ATED
FI
NANC
IAL
STAT
EMEN
TSSO
CIAL
RE
PORT
DIRE
CTOR
S’RE
PORT
SHAR
EHOL
DER
INFO
RMAT
ION
SUST
AINA
BILI
TY &
BUS
INES
SRE
SPON
SIBI
LITY
REP
ORT
STANDALONE FINANCIAL STATEMENTS
by the SEBI guidelines and the Guidance Note on Share Based Payment issued by the Institute of Chartered
Accountants of India (ICAI). The intrinsic value of the option, being excess of market value of the underlying
share at the date of grant of option, over its exercise price is recognized as deferred employee compensation
with a credit to Employee Stock Options Outstanding Account. The deferred employee compensation is
amortized to Statement of Profi t and Loss on straight-line basis over the vesting period of the option. In case
of forfeiture of option, which is not vested, amortised portion is reversed by credit to employee compensation
expense. In a situation where the stock option expires unexercised, the related balance standing to the credit
of the Employees Stock Options Outstanding Account are transferred to the General Reserve.
L. Revenue Recognition
Sales revenue is recognized on transfer of signifi cant risk and rewards of the ownership of the goods to the
buyer and stated at net of trade discount and rebates. Dividend income on investments is accounted for when
the right to receive the payment is established. Export incentive, certain insurance, railway and other claims,
where quantum of accruals cannot be ascertained with reasonable certainty, are accounted on acceptance
basis.
M. Borrowing Costs
Borrowing costs, directly attributable to the acquisition or construction of qualifying assets, are capitalized.
Other borrowing costs are recognized as expenses in the period in which they are incurred. In determining
the amount of borrowing costs eligible for capitalization during a period, any income earned on temporary
investment of those borrowings is deducted from the borrowing costs incurred.
N. Taxation
(a) Provision for current income tax is made in accordance with the Income-tax Act, 1961. Deferred tax assets
and deferred tax liabilities are recognized at substantively enacted tax rates, subject to the consideration
of prudence, on timing difference, being the difference between taxable income and accounting income
that originate in one period and are capable of reversal in one or more subsequent periods.
(b) Minimum Alternative Tax (MAT) is recognized as an asset only when and to the extent there is convincing
evidence that the Company will pay normal Income Tax during the specifi ed period. In the year in which
the MAT credit becomes eligible to be recognized as an asset in accordance with the recommendations
contained in guidance note issued by the ICAI, the said asset is created by way of credit to Statement
of Profi t and Loss and shown as MAT credit entitlement. The Company reviews the same at each
Balance Sheet date and writes down the carrying amount of MAT entitlement to the extent there is no
longer convincing evidence to the effect that Company will pay normal Income Tax during the specifi ed
period.
O. Derivative Financial Instruments
(a) The Company uses derivative fi nancial instruments such as Forwards, Swaps, Options, futures, etc.,
to hedge its risks associated with foreign exchange fl uctuations. Risks associated with fl uctuations in
the price of the products (e.g., Copper, Alumina, Aluminium, Coal and precious metals) are minimized
by undertaking hedging using appropriate derivative instruments. Derivatives embedded in other
fi nancial instruments or other host contracts are treated as separate derivatives when their risks and
characteristics are not closely related to their host contracts. In some cases, the embedded derivatives
may be designated in a hedge relationship. The fair values of all such derivative fi nancial instruments are
Hindalco Annual Report 2015-16.indb 85Hindalco Annual Report 2015-16.indb 85 8/17/2016 1:31:29 PM8/17/2016 1:31:29 PM
86
Hindalco Industries Limited
recognized as assets or liabilities at the Balance Sheet date. All such derivative fi nancial instruments are
used as risk management tools only and not for speculative purposes.
(b) For derivative fi nancial instruments and foreign currency monetary items designated as Cash Flow
hedges, the effective portion of the fair value of the hedge instruments are recognized in Hedging Reserve
and reclassifi ed to ‘Revenue from Operations’, ‘Cost of Materials Consumed’ or ‘Other Expenses’ in the
period in which the Statement of Profi t and Loss is impacted by the hedged items or in the period when
the hedge relationship no longer qualifi es as cash fl ow hedge. In cases where the exposure gives rise
to a non-fi nancial asset, the effective portion is reclassifi ed from Hedging Reserve to the initial carrying
amount of the non-fi nancial asset as a ‘basis adjustment’ and recycled to the Statement of Profi t and
Loss when and the manner in which the respective non-fi nancial asset affects the Statement of Profi t and
Loss in future periods. The ineffective portion of the change in fair value of such instruments is recognized
in the Statement of Profi t and Loss in the period in which they arise. If the hedging relationship ceases
to be effective or it becomes probable that the expected forecast transaction will no longer occur, hedge
accounting is discontinued and the fair value changes arising from the derivative fi nancial instruments are
recognized in ‘Other Expenses’ in the Statement of Profi t and Loss.
(c) For derivative fi nancial instruments designated as Fair Value hedges, the fair value of both the derivative
fi nancial instrument and the hedged item, are recognized in ‘Revenue from Operations’, ‘Cost of Materials
Consumed’ or ‘Other Expenses’ in the Statement of Profi t and Loss till the period the relationship is
found to be effective. If the hedging relationship ceases to be effective or it becomes probable that the
expected transaction will no longer occur, future gains or losses on the derivative fi nancial instruments are
recognized in ‘Other Expenses’ in the Statement of Profi t and Loss.
(d) If no hedging relationship is designated, the fair value of the derivative fi nancial instruments is marked-to-
market through the Statement of Profi t and Loss and included in ‘Other Expenses’.
P. Research and Development
Expenditure incurred during research and development phase is charged to revenue when no intangible asset
arises from such research. Assets procured for research and development activities are generally capitalized.
Q. Government Grants
Government Grants are recognized when there is a reasonable assurance that the same will be received.
Revenue grants are recognized in the Statement of Profi t and Loss. Capital grants relating to specifi c fi xed
assets are reduced from the gross value of the respective fi xed assets. Other capital grants are credited to
Capital Reserve.
R. Provisions, Contingent Liabilities and Contingent Assets
Provision is recognized when there is a present obligation as a result of a past event that probably requires
an outfl ow of resources, and a reliable estimate can be made of the amount of the obligation. Disclosure for
contingent liability is made when there is a possible obligation or a present obligation that may, but probably
will not, require an outfl ow of resources. No provision is recognized, or disclosure for contingent liability is
made, when there is a possible obligation or a present obligation and the likelihood of outfl ow of resources is
remote. Contingent Asset is neither recognized nor disclosed in the fi nancial statements.
Hindalco Annual Report 2015-16.indb 86Hindalco Annual Report 2015-16.indb 86 8/17/2016 1:31:29 PM8/17/2016 1:31:29 PM
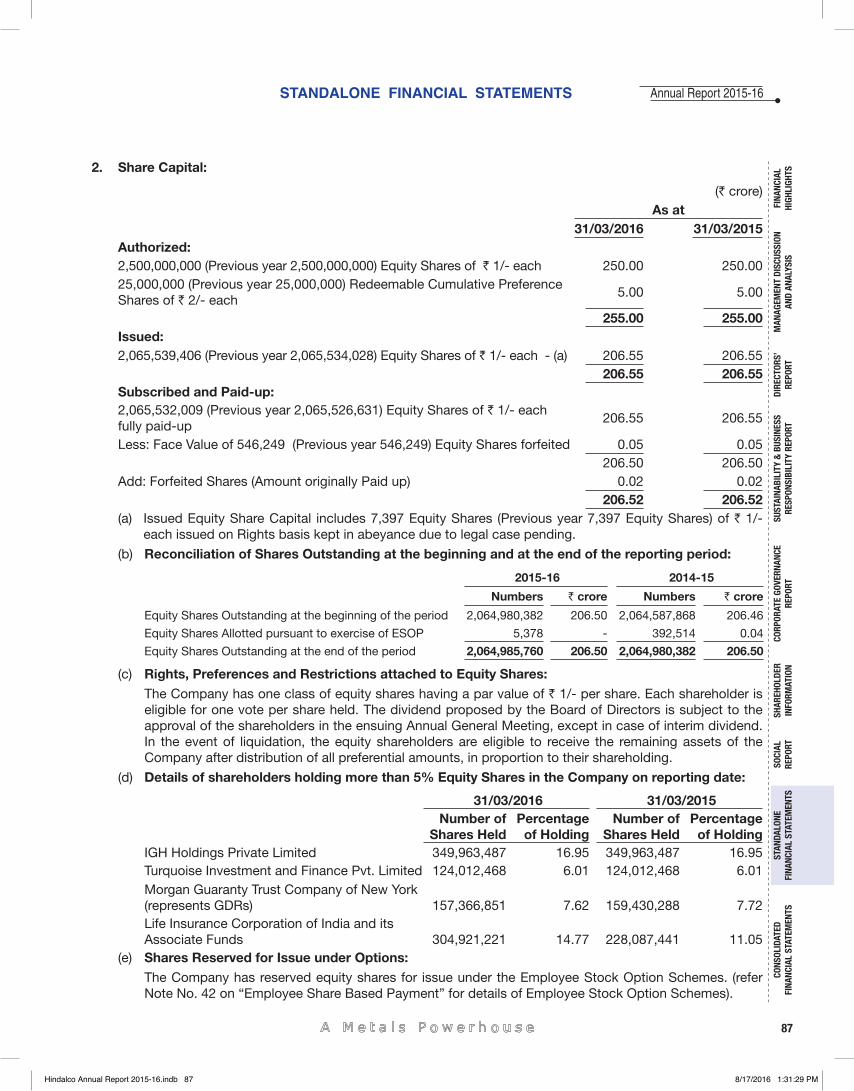
87
Annual Report 2015-16
FINA
NCIA
L HI
GHLI
GHTS
MAN
AGEM
ENT
DISC
USSI
ON
AND
ANAL
YSIS
CORP
ORAT
E GO
VERN
ANCE
RE
PORT
STAN
DALO
NE
FINA
NCIA
L ST
ATEM
ENTS
CONS
OLID
ATED
FI
NANC
IAL
STAT
EMEN
TSSO
CIAL
RE
PORT
DIRE
CTOR
S’RE
PORT
SHAR
EHOL
DER
INFO
RMAT
ION
SUST
AINA
BILI
TY &
BUS
INES
SRE
SPON
SIBI
LITY
REP
ORT
STANDALONE FINANCIAL STATEMENTS
2. Share Capital:
(` crore)As at
31/03/2016 31/03/2015Authorized:2,500,000,000 (Previous year 2,500,000,000) Equity Shares of ` 1/- each 250.00 250.00 25,000,000 (Previous year 25,000,000) Redeemable Cumulative Preference Shares of ` 2/- each
5.00 5.00
255.00 255.00 Issued: 2,065,539,406 (Previous year 2,065,534,028) Equity Shares of ` 1/- each - (a) 206.55 206.55
206.55 206.55 Subscribed and Paid-up: 2,065,532,009 (Previous year 2,065,526,631) Equity Shares of ` 1/- each fully paid-up
206.55 206.55
Less: Face Value of 546,249 (Previous year 546,249) Equity Shares forfeited 0.05 0.05 206.50 206.50
Add: Forfeited Shares (Amount originally Paid up) 0.02 0.02 206.52 206.52
(a) Issued Equity Share Capital includes 7,397 Equity Shares (Previous year 7,397 Equity Shares) of ` 1/- each issued on Rights basis kept in abeyance due to legal case pending.
(b) Reconciliation of Shares Outstanding at the beginning and at the end of the reporting period:
2015-16 2014-15
Numbers ` crore Numbers ` crore
Equity Shares Outstanding at the beginning of the period 2,064,980,382 206.50 2,064,587,868 206.46
Equity Shares Allotted pursuant to exercise of ESOP 5,378 - 392,514 0.04
Equity Shares Outstanding at the end of the period 2,064,985,760 206.50 2,064,980,382 206.50
(c) Rights, Preferences and Restrictions attached to Equity Shares:The Company has one class of equity shares having a par value of ` 1/- per share. Each shareholder is eligible for one vote per share held. The dividend proposed by the Board of Directors is subject to the approval of the shareholders in the ensuing Annual General Meeting, except in case of interim dividend. In the event of liquidation, the equity shareholders are eligible to receive the remaining assets of the Company after distribution of all preferential amounts, in proportion to their shareholding.
(d) Details of shareholders holding more than 5% Equity Shares in the Company on reporting date:
31/03/2016 31/03/2015 Number of
Shares Held Percentage
of Holding Number of
Shares Held Percentage
of Holding IGH Holdings Private Limited 349,963,487 16.95 349,963,487 16.95 Turquoise Investment and Finance Pvt. Limited 124,012,468 6.01 124,012,468 6.01 Morgan Guaranty Trust Company of New York (represents GDRs) 157,366,851 7.62 159,430,288 7.72 Life Insurance Corporation of India and its Associate Funds 304,921,221 14.77 228,087,441 11.05
(e) Shares Reserved for Issue under Options: The Company has reserved equity shares for issue under the Employee Stock Option Schemes. (refer Note No. 42 on “Employee Share Based Payment” for details of Employee Stock Option Schemes).
Hindalco Annual Report 2015-16.indb 87Hindalco Annual Report 2015-16.indb 87 8/17/2016 1:31:29 PM8/17/2016 1:31:29 PM
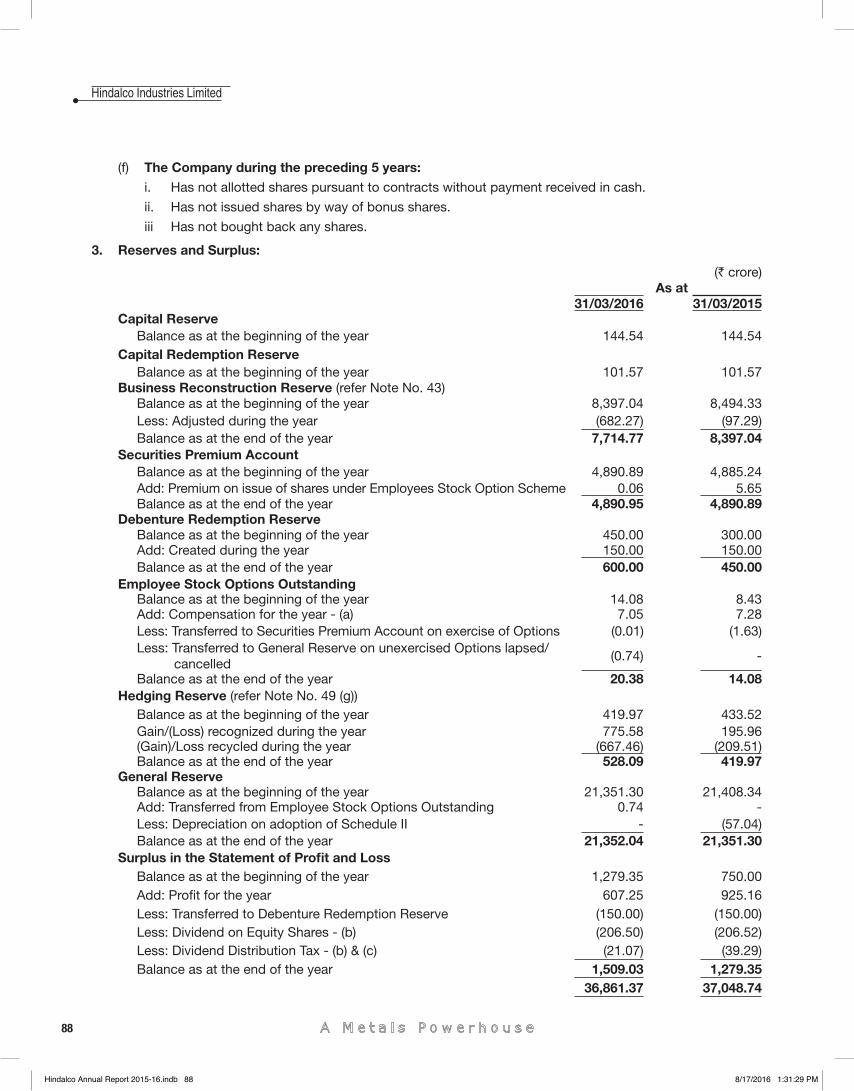
88
Hindalco Industries Limited
(f) The Company during the preceding 5 years:i. Has not allotted shares pursuant to contracts without payment received in cash.
ii. Has not issued shares by way of bonus shares.
iii Has not bought back any shares.
3. Reserves and Surplus:
(` crore)As at
31/03/2016 31/03/2015Capital Reserve
Balance as at the beginning of the year 144.54 144.54 Capital Redemption Reserve
Balance as at the beginning of the year 101.57 101.57 Business Reconstruction Reserve (refer Note No. 43)
Balance as at the beginning of the year 8,397.04 8,494.33 Less: Adjusted during the year (682.27) (97.29)Balance as at the end of the year 7,714.77 8,397.04
Securities Premium AccountBalance as at the beginning of the year 4,890.89 4,885.24 Add: Premium on issue of shares under Employees Stock Option Scheme 0.06 5.65 Balance as at the end of the year 4,890.95 4,890.89
Debenture Redemption ReserveBalance as at the beginning of the year 450.00 300.00 Add: Created during the year 150.00 150.00 Balance as at the end of the year 600.00 450.00
Employee Stock Options OutstandingBalance as at the beginning of the year 14.08 8.43 Add: Compensation for the year - (a) 7.05 7.28 Less: Transferred to Securities Premium Account on exercise of Options (0.01) (1.63)Less: Transferred to General Reserve on unexercised Options lapsed/
cancelled (0.74) -
Balance as at the end of the year 20.38 14.08 Hedging Reserve (refer Note No. 49 (g))
Balance as at the beginning of the year 419.97 433.52 Gain/(Loss) recognized during the year 775.58 195.96 (Gain)/Loss recycled during the year (667.46) (209.51)Balance as at the end of the year 528.09 419.97
General ReserveBalance as at the beginning of the year 21,351.30 21,408.34 Add: Transferred from Employee Stock Options Outstanding 0.74 - Less: Depreciation on adoption of Schedule II - (57.04)Balance as at the end of the year 21,352.04 21,351.30
Surplus in the Statement of Profi t and LossBalance as at the beginning of the year 1,279.35 750.00 Add: Profi t for the year 607.25 925.16 Less: Transferred to Debenture Redemption Reserve (150.00) (150.00)Less: Dividend on Equity Shares - (b) (206.50) (206.52)Less: Dividend Distribution Tax - (b) & (c) (21.07) (39.29)Balance as at the end of the year 1,509.03 1,279.35
36,861.37 37,048.74
Hindalco Annual Report 2015-16.indb 88Hindalco Annual Report 2015-16.indb 88 8/17/2016 1:31:29 PM8/17/2016 1:31:29 PM
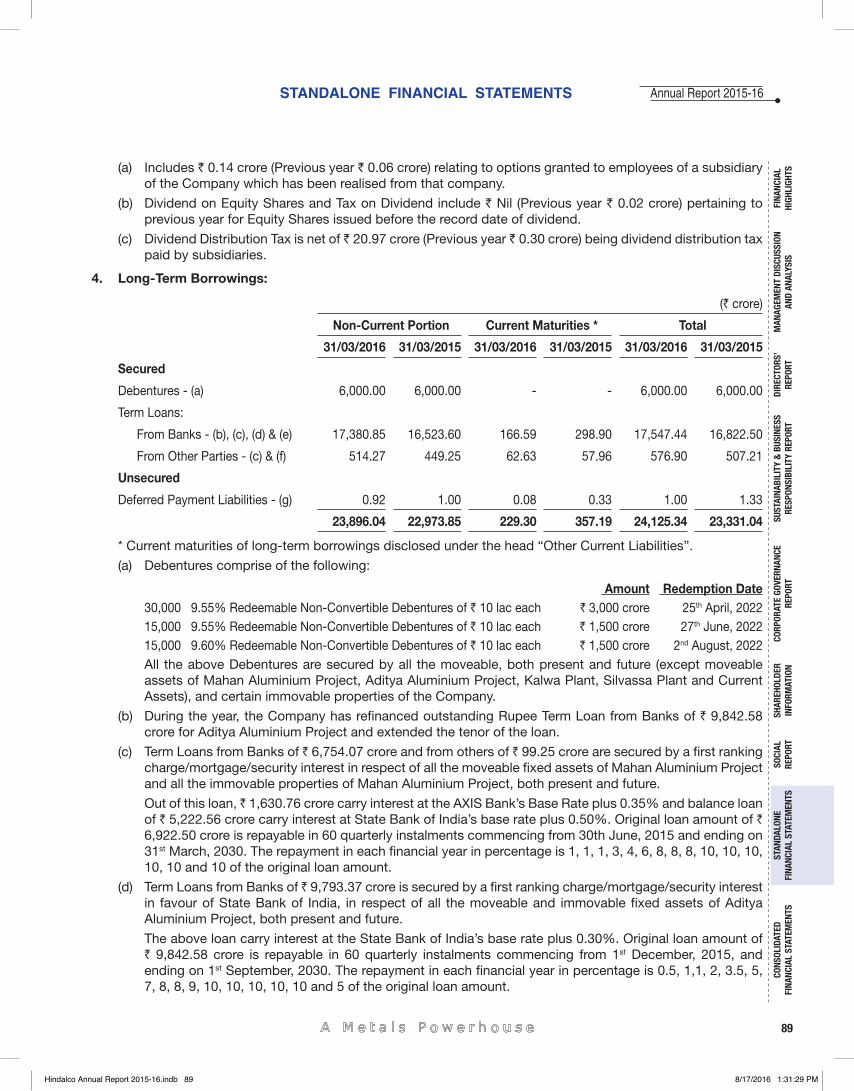
89
Annual Report 2015-16
FINA
NCIA
L HI
GHLI
GHTS
MAN
AGEM
ENT
DISC
USSI
ON
AND
ANAL
YSIS
CORP
ORAT
E GO
VERN
ANCE
RE
PORT
STAN
DALO
NE
FINA
NCIA
L ST
ATEM
ENTS
CONS
OLID
ATED
FI
NANC
IAL
STAT
EMEN
TSSO
CIAL
RE
PORT
DIRE
CTOR
S’RE
PORT
SHAR
EHOL
DER
INFO
RMAT
ION
SUST
AINA
BILI
TY &
BUS
INES
SRE
SPON
SIBI
LITY
REP
ORT
STANDALONE FINANCIAL STATEMENTS
(a) Includes ` 0.14 crore (Previous year ` 0.06 crore) relating to options granted to employees of a subsidiary of the Company which has been realised from that company.
(b) Dividend on Equity Shares and Tax on Dividend include ` Nil (Previous year ` 0.02 crore) pertaining to previous year for Equity Shares issued before the record date of dividend.
(c) Dividend Distribution Tax is net of ̀ 20.97 crore (Previous year ̀ 0.30 crore) being dividend distribution tax paid by subsidiaries.
4. Long-Term Borrowings:
(` crore)
Non-Current Portion Current Maturities * Total
31/03/2016 31/03/2015 31/03/2016 31/03/2015 31/03/2016 31/03/2015
Secured
Debentures - (a) 6,000.00 6,000.00 - - 6,000.00 6,000.00
Term Loans:
From Banks - (b), (c), (d) & (e) 17,380.85 16,523.60 166.59 298.90 17,547.44 16,822.50
From Other Parties - (c) & (f) 514.27 449.25 62.63 57.96 576.90 507.21
Unsecured
Deferred Payment Liabilities - (g) 0.92 1.00 0.08 0.33 1.00 1.33
23,896.04 22,973.85 229.30 357.19 24,125.34 23,331.04
* Current maturities of long-term borrowings disclosed under the head “Other Current Liabilities”.
(a) Debentures comprise of the following:
Amount Redemption Date 30,000 9.55% Redeemable Non-Convertible Debentures of ` 10 lac each ` 3,000 crore 25th April, 202215,000 9.55% Redeemable Non-Convertible Debentures of ` 10 lac each ` 1,500 crore 27th June, 202215,000 9.60% Redeemable Non-Convertible Debentures of ` 10 lac each ` 1,500 crore 2nd August, 2022All the above Debentures are secured by all the moveable, both present and future (except moveable assets of Mahan Aluminium Project, Aditya Aluminium Project, Kalwa Plant, Silvassa Plant and Current Assets), and certain immovable properties of the Company.
(b) During the year, the Company has refi nanced outstanding Rupee Term Loan from Banks of ` 9,842.58 crore for Aditya Aluminium Project and extended the tenor of the loan.
(c) Term Loans from Banks of ` 6,754.07 crore and from others of ` 99.25 crore are secured by a fi rst ranking charge/mortgage/security interest in respect of all the moveable fi xed assets of Mahan Aluminium Project and all the immovable properties of Mahan Aluminium Project, both present and future.
Out of this loan, ̀ 1,630.76 crore carry interest at the AXIS Bank’s Base Rate plus 0.35% and balance loan of ` 5,222.56 crore carry interest at State Bank of India’s base rate plus 0.50%. Original loan amount of ` 6,922.50 crore is repayable in 60 quarterly instalments commencing from 30th June, 2015 and ending on 31st March, 2030. The repayment in each fi nancial year in percentage is 1, 1, 1, 3, 4, 6, 8, 8, 8, 10, 10, 10, 10, 10 and 10 of the original loan amount.
(d) Term Loans from Banks of ` 9,793.37 crore is secured by a fi rst ranking charge/mortgage/security interest in favour of State Bank of India, in respect of all the moveable and immovable fi xed assets of Aditya Aluminium Project, both present and future.
The above loan carry interest at the State Bank of India’s base rate plus 0.30%. Original loan amount of` 9,842.58 crore is repayable in 60 quarterly instalments commencing from 1st December, 2015, and ending on 1st September, 2030. The repayment in each fi nancial year in percentage is 0.5, 1,1, 2, 3.5, 5, 7, 8, 8, 9, 10, 10, 10, 10, 10 and 5 of the original loan amount.
Hindalco Annual Report 2015-16.indb 89Hindalco Annual Report 2015-16.indb 89 8/17/2016 1:31:29 PM8/17/2016 1:31:29 PM
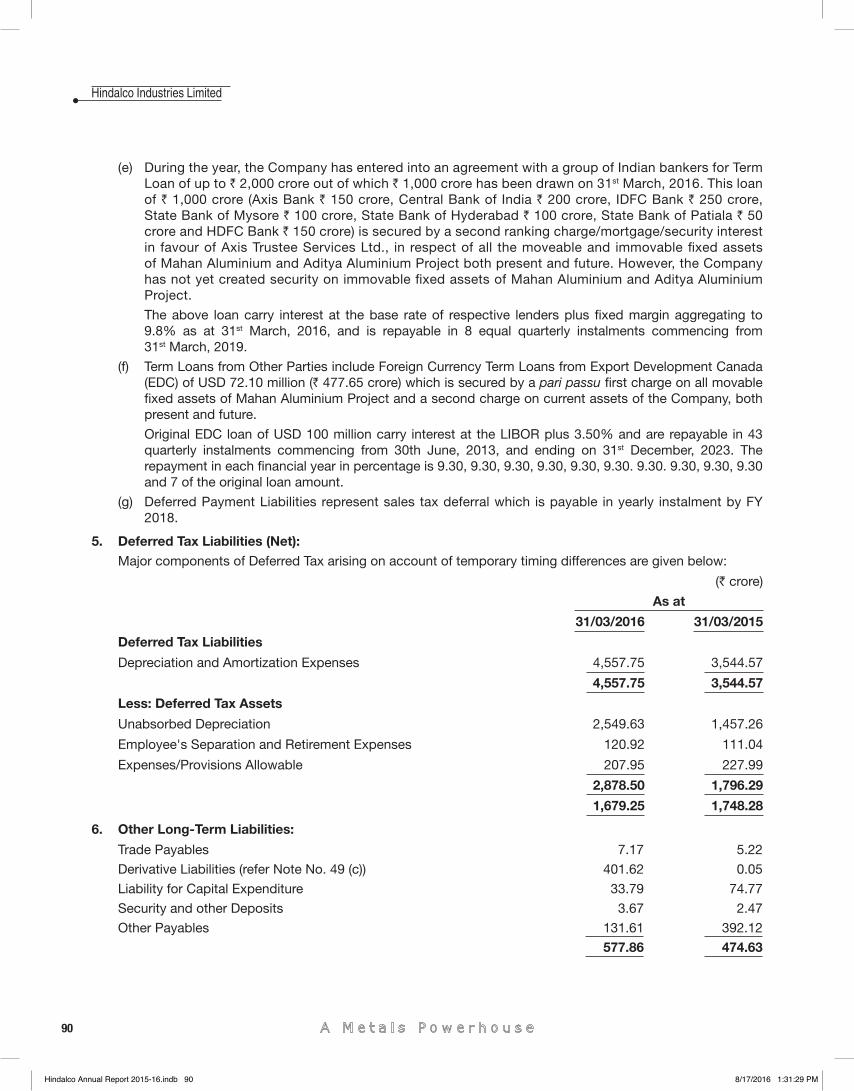
90
Hindalco Industries Limited
(e) During the year, the Company has entered into an agreement with a group of Indian bankers for Term Loan of up to ` 2,000 crore out of which ` 1,000 crore has been drawn on 31st March, 2016. This loan of ` 1,000 crore (Axis Bank ` 150 crore, Central Bank of India ` 200 crore, IDFC Bank ` 250 crore, State Bank of Mysore ` 100 crore, State Bank of Hyderabad ` 100 crore, State Bank of Patiala ` 50 crore and HDFC Bank ` 150 crore) is secured by a second ranking charge/mortgage/security interest in favour of Axis Trustee Services Ltd., in respect of all the moveable and immovable fi xed assets of Mahan Aluminium and Aditya Aluminium Project both present and future. However, the Company has not yet created security on immovable fi xed assets of Mahan Aluminium and Aditya Aluminium Project.
The above loan carry interest at the base rate of respective lenders plus fi xed margin aggregating to 9.8% as at 31st March, 2016, and is repayable in 8 equal quarterly instalments commencing from 31st March, 2019.
(f) Term Loans from Other Parties include Foreign Currency Term Loans from Export Development Canada (EDC) of USD 72.10 million (` 477.65 crore) which is secured by a pari passu fi rst charge on all movable fi xed assets of Mahan Aluminium Project and a second charge on current assets of the Company, both present and future.
Original EDC loan of USD 100 million carry interest at the LIBOR plus 3.50% and are repayable in 43 quarterly instalments commencing from 30th June, 2013, and ending on 31st December, 2023. The repayment in each fi nancial year in percentage is 9.30, 9.30, 9.30, 9.30, 9.30, 9.30. 9.30. 9.30, 9.30, 9.30 and 7 of the original loan amount.
(g) Deferred Payment Liabilities represent sales tax deferral which is payable in yearly instalment by FY 2018.
5. Deferred Tax Liabilities (Net): Major components of Deferred Tax arising on account of temporary timing differences are given below:
(` crore)
As at
31/03/2016 31/03/2015
Deferred Tax Liabilities
Depreciation and Amortization Expenses 4,557.75 3,544.57
4,557.75 3,544.57
Less: Deferred Tax Assets
Unabsorbed Depreciation 2,549.63 1,457.26
Employee's Separation and Retirement Expenses 120.92 111.04
Expenses/Provisions Allowable 207.95 227.99
2,878.50 1,796.29
1,679.25 1,748.28
6. Other Long-Term Liabilities:
Trade Payables 7.17 5.22
Derivative Liabilities (refer Note No. 49 (c)) 401.62 0.05
Liability for Capital Expenditure 33.79 74.77
Security and other Deposits 3.67 2.47
Other Payables 131.61 392.12
577.86 474.63
Hindalco Annual Report 2015-16.indb 90Hindalco Annual Report 2015-16.indb 90 8/17/2016 1:31:29 PM8/17/2016 1:31:29 PM
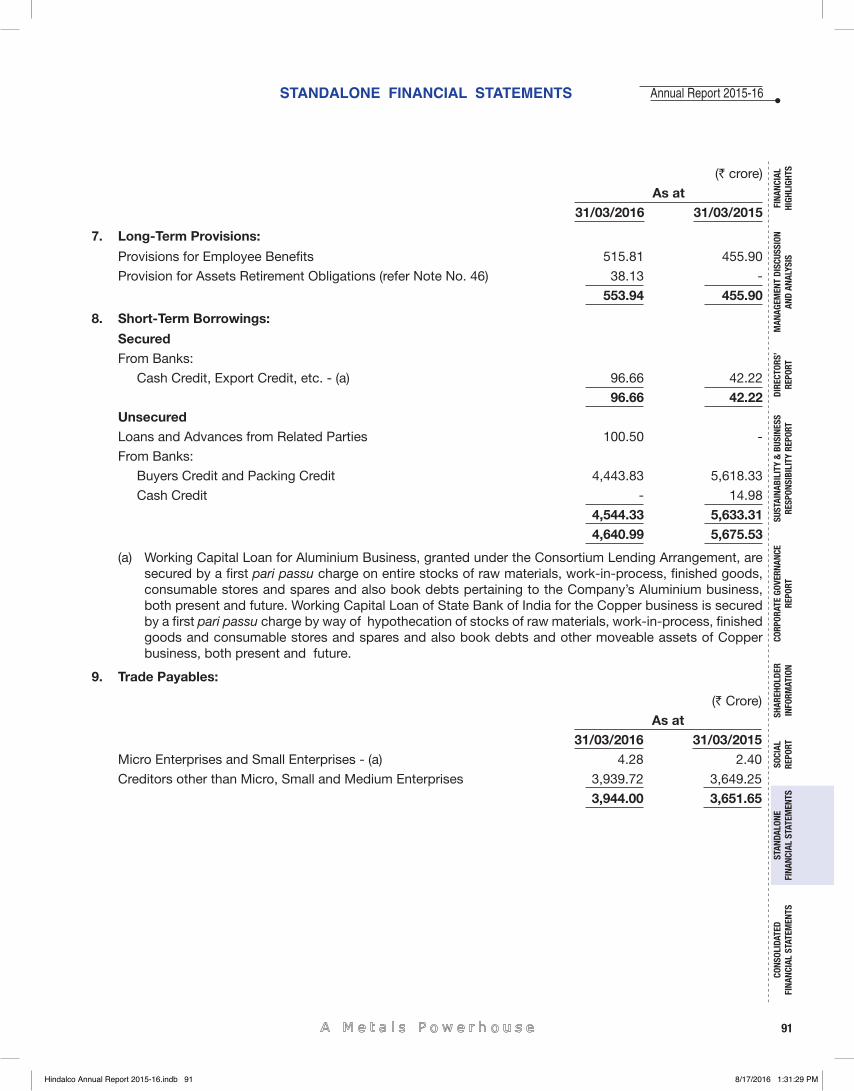
91
Annual Report 2015-16
FINA
NCIA
L HI
GHLI
GHTS
MAN
AGEM
ENT
DISC
USSI
ON
AND
ANAL
YSIS
CORP
ORAT
E GO
VERN
ANCE
RE
PORT
STAN
DALO
NE
FINA
NCIA
L ST
ATEM
ENTS
CONS
OLID
ATED
FI
NANC
IAL
STAT
EMEN
TSSO
CIAL
RE
PORT
DIRE
CTOR
S’RE
PORT
SHAR
EHOL
DER
INFO
RMAT
ION
SUST
AINA
BILI
TY &
BUS
INES
SRE
SPON
SIBI
LITY
REP
ORT
STANDALONE FINANCIAL STATEMENTS
(` crore)
As at31/03/2016 31/03/2015
7. Long-Term Provisions:
Provisions for Employee Benefi ts 515.81 455.90
Provision for Assets Retirement Obligations (refer Note No. 46) 38.13 -
553.94 455.90
8. Short-Term Borrowings:
SecuredFrom Banks:
Cash Credit, Export Credit, etc. - (a) 96.66 42.22
96.66 42.22 UnsecuredLoans and Advances from Related Parties 100.50 -
From Banks:
Buyers Credit and Packing Credit 4,443.83 5,618.33
Cash Credit - 14.98
4,544.33 5,633.31 4,640.99 5,675.53
(a) Working Capital Loan for Aluminium Business, granted under the Consortium Lending Arrangement, are secured by a fi rst pari passu charge on entire stocks of raw materials, work-in-process, fi nished goods, consumable stores and spares and also book debts pertaining to the Company’s Aluminium business, both present and future. Working Capital Loan of State Bank of India for the Copper business is secured by a fi rst pari passu charge by way of hypothecation of stocks of raw materials, work-in-process, fi nished goods and consumable stores and spares and also book debts and other moveable assets of Copper business, both present and future.
9. Trade Payables:
(` Crore)
As at31/03/2016 31/03/2015
Micro Enterprises and Small Enterprises - (a) 4.28 2.40
Creditors other than Micro, Small and Medium Enterprises 3,939.72 3,649.25
3,944.00 3,651.65
Hindalco Annual Report 2015-16.indb 91Hindalco Annual Report 2015-16.indb 91 8/17/2016 1:31:29 PM8/17/2016 1:31:29 PM
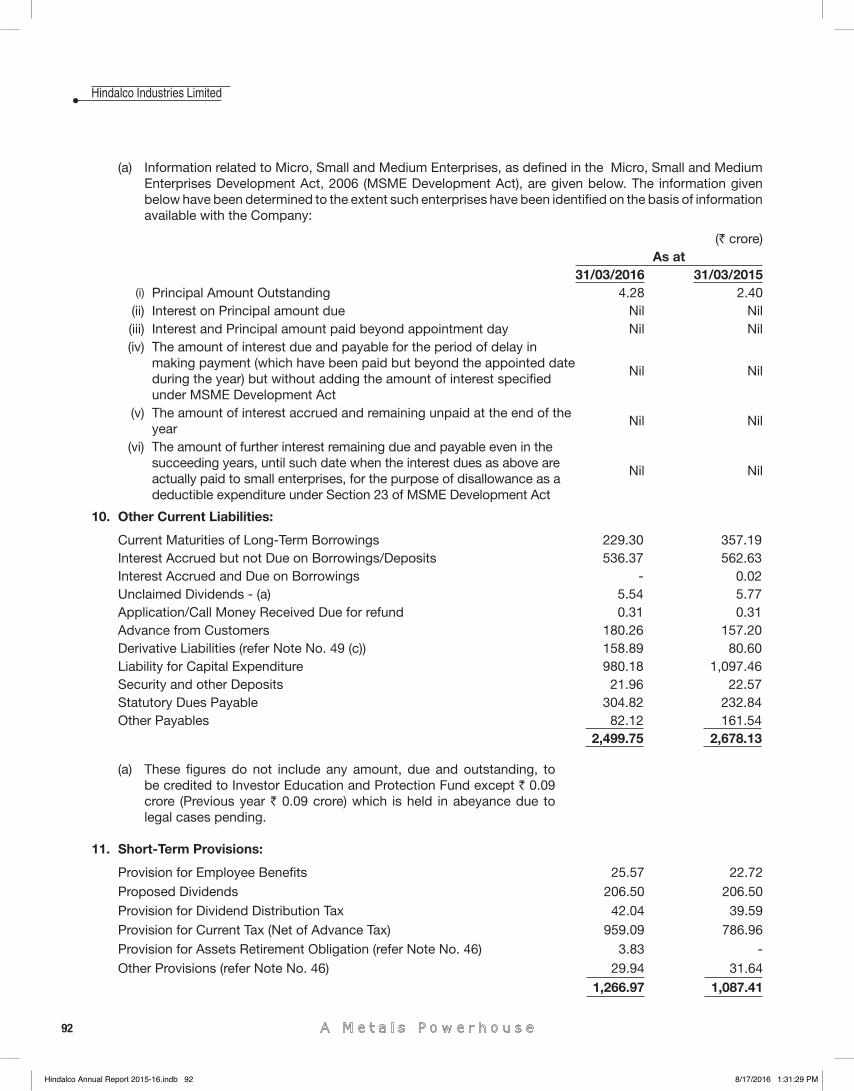
92
Hindalco Industries Limited
(a) Information related to Micro, Small and Medium Enterprises, as defi ned in the Micro, Small and Medium Enterprises Development Act, 2006 (MSME Development Act), are given below. The information given below have been determined to the extent such enterprises have been identifi ed on the basis of information available with the Company:
(` crore)As at
31/03/2016 31/03/2015 (i) Principal Amount Outstanding 4.28 2.40
(ii) Interest on Principal amount due Nil Nil (iii) Interest and Principal amount paid beyond appointment day Nil Nil (iv) The amount of interest due and payable for the period of delay in
making payment (which have been paid but beyond the appointed date during the year) but without adding the amount of interest specifi ed under MSME Development Act
Nil Nil
(v) The amount of interest accrued and remaining unpaid at the end of the year
Nil Nil
(vi) The amount of further interest remaining due and payable even in the succeeding years, until such date when the interest dues as above are actually paid to small enterprises, for the purpose of disallowance as a deductible expenditure under Section 23 of MSME Development Act
Nil Nil
10. Other Current Liabilities:
Current Maturities of Long-Term Borrowings 229.30 357.19 Interest Accrued but not Due on Borrowings/Deposits 536.37 562.63 Interest Accrued and Due on Borrowings - 0.02 Unclaimed Dividends - (a) 5.54 5.77 Application/Call Money Received Due for refund 0.31 0.31 Advance from Customers 180.26 157.20 Derivative Liabilities (refer Note No. 49 (c)) 158.89 80.60 Liability for Capital Expenditure 980.18 1,097.46 Security and other Deposits 21.96 22.57 Statutory Dues Payable 304.82 232.84 Other Payables 82.12 161.54
2,499.75 2,678.13
(a) These fi gures do not include any amount, due and outstanding, to be credited to Investor Education and Protection Fund except ` 0.09 crore (Previous year ` 0.09 crore) which is held in abeyance due to legal cases pending.
11. Short-Term Provisions:
Provision for Employee Benefi ts 25.57 22.72 Proposed Dividends 206.50 206.50 Provision for Dividend Distribution Tax 42.04 39.59 Provision for Current Tax (Net of Advance Tax) 959.09 786.96 Provision for Assets Retirement Obligation (refer Note No. 46) 3.83 - Other Provisions (refer Note No. 46) 29.94 31.64
1,266.97 1,087.41
Hindalco Annual Report 2015-16.indb 92Hindalco Annual Report 2015-16.indb 92 8/17/2016 1:31:29 PM8/17/2016 1:31:29 PM
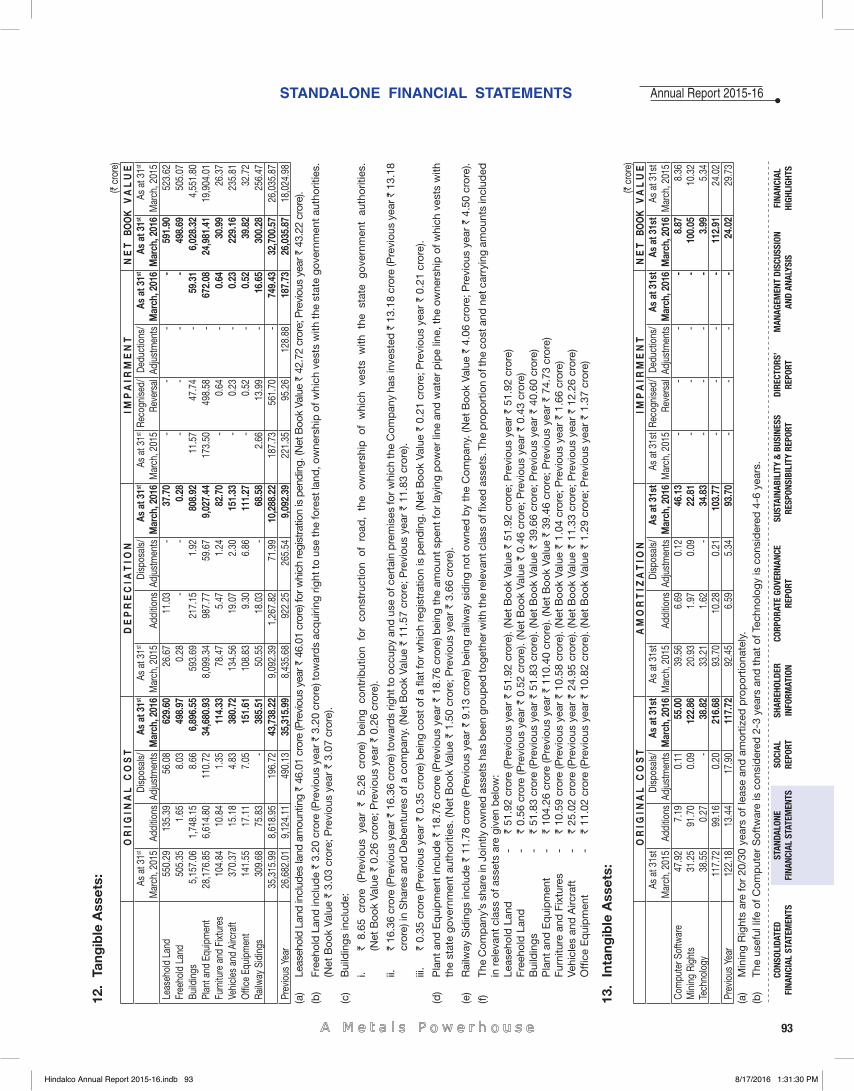
93
Annual Report 2015-16
FINA
NCIA
L HI
GHLI
GHTS
MAN
AGEM
ENT
DISC
USSI
ON
AND
ANAL
YSIS
CORP
ORAT
E GO
VERN
ANCE
RE
PORT
STAN
DALO
NE
FINA
NCIA
L ST
ATEM
ENTS
CONS
OLID
ATED
FI
NANC
IAL
STAT
EMEN
TSSO
CIAL
RE
PORT
DIRE
CTOR
S’RE
PORT
SHAR
EHOL
DER
INFO
RMAT
ION
SUST
AINA
BILI
TY &
BUS
INES
SRE
SPON
SIBI
LITY
REP
ORT
STANDALONE FINANCIAL STATEMENTS12
. Ta
ngib
le A
sset
s:(`
cro
re)
O R
I G
I N
A L
C O
S T
D
E P
R E
C I
A T
I O N
I
M P
A I
R M
E N
T
N E
T
BOO
K V
A L
U E
A
s at
31st
M
arch
, 201
5 A
dditi
ons
Disp
osal
s/
Adju
stm
ents
A
s at
31st
M
arch
, 201
6 A
s at
31st
M
arch
, 201
5 Ad
ditio
ns
Disp
osal
s/
Adju
stm
ents
A
s at
31st
M
arch
, 201
6 A
s at
31st
M
arch
, 201
5Re
cogn
ised/
Re
vers
al D
educ
tions
/ Ad
just
men
ts A
s at
31st
M
arch
, 201
6 A
s at
31st
M
arch
, 201
6 A
s at
31st
M
arch
, 201
5Le
aseh
old
Land
550
.29
135
.39
56.
08
629
.60
26.
67
11.
03
- 3
7.70
-
- -
- 5
91.9
0 5
23.6
2 Fr
eeho
ld L
and
505
.35
1.6
5 8
.03
498
.97
0.2
8 -
- 0
.28
- -
- -
498
.69
505
.07
Build
ings
5,1
57.0
6 1
,748
.15
8.6
6 6
,896
.55
593
.69
217
.15
1.9
2 8
08.9
2 1
1.57
4
7.74
-
59.
31
6,0
28.3
2 4
,551
.80
Plan
t and
Equ
ipm
ent
28,
176.
85
6,6
14.8
0 1
10.7
2 3
4,68
0.93
8
,099
.34
987
.77
59.
67
9,0
27.4
4 1
73.5
0 4
98.5
8 -
672
.08
24,
981.
41
19,
904.
01
Furn
iture
and
Fix
ture
s 1
04.8
4 1
0.84
1
.35
114
.33
78.
47
5.4
7 1
.24
82.
70
- 0
.64
- 0
.64
30.
99
26.
37
Vehi
cles
and
Airc
raft
370
.37
15.
18
4.8
3 3
80.7
2 1
34.5
6 1
9.07
2
.30
151
.33
- 0
.23
- 0
.23
229
.16
235
.81
Offi
ce E
quip
men
t 1
41.5
5 1
7.11
7
.05
151
.61
108
.83
9.3
0 6
.86
111
.27
- 0
.52
- 0
.52
39.
82
32.
72
Railw
ay S
idin
gs 3
09.6
8 7
5.83
-
385
.51
50.
55
18.
03
- 6
8.58
2
.66
13.
99
- 1
6.65
3
00.2
8 2
56.4
7 3
5,31
5.99
8
,618
.95
196
.72
43,
738.
22
9,0
92.3
9 1
,267
.82
71.
99
10,
288.
22
187
.73
561
.70
- 7
49.4
3 3
2,70
0.57
2
6,03
5.87
Pr
evio
us Y
ear
26,
682.
01
9,1
24.1
1 4
90.1
3 3
5,31
5.99
8
,435
.68
922
.25
265
.54
9,0
92.3
9 2
21.3
5 9
5.26
1
28.8
8 1
87.7
3 2
6,03
5.87
1
8,02
4.98
(a
) Le
aseh
old
Land
incl
udes
land
am
ount
ing
` 46
.01
cror
e (P
revi
ous
year
` 4
6.01
cro
re) f
or w
hich
regi
stra
tion
is p
endi
ng. (
Net
Boo
k Va
lue
` 42
.72
cror
e; P
revi
ous
year
` 4
3.22
cro
re).
(b)
Free
hold
Lan
d in
clud
e `
3.20
cro
re (P
revi
ous
year
` 3
.20
cror
e) to
war
ds
acq
uirin
g rig
ht to
use
the
fore
st la
nd, o
wne
rshi
p o
f whi
ch v
ests
with
the
stat
e go
vern
men
t aut
horit
ies.
(N
et B
ook
Valu
e `
3.03
cro
re; P
revi
ous
year
` 3
.07
cror
e).
(c)
Bui
ldin
gs in
clud
e:
i. `
8.65
cro
re (
Pre
viou
s ye
ar `
5.2
6 cr
ore)
bei
ng c
ontr
ibut
ion
for
cons
truc
tion
of r
oad
, th
e ow
ners
hip
of
whi
ch v
ests
with
the
sta
te g
over
nmen
t au
thor
ities
.(N
et B
ook
Valu
e `
0.26
cro
re; P
revi
ous
year
` 0
.26
cror
e).
ii.
` 16
.36
cror
e (P
revi
ous
year
` 1
6.36
cro
re) t
owar
ds
right
to o
ccup
y an
d u
se o
f cer
tain
pre
mis
es fo
r whi
ch th
e C
omp
any
has
inve
sted
` 1
3.18
cro
re (P
revi
ous
year
` 1
3.18
cr
ore)
in S
hare
s an
d D
eben
ture
s of
a c
omp
any.
(Net
Boo
k Va
lue
` 11
.57
cror
e; P
revi
ous
year
` 1
1.83
cro
re).
iii.
` 0.
35 c
rore
(Pre
viou
s ye
ar `
0.3
5 cr
ore)
bei
ng c
ost
of a
fl at
for
whi
ch r
egis
trat
ion
is p
end
ing.
(Net
Boo
k Va
lue
` 0.
21 c
rore
; Pre
viou
s ye
ar `
0.2
1 cr
ore)
.
(d)
Pla
nt a
nd E
qui
pm
ent
incl
ude
` 18
.76
cror
e (P
revi
ous
year
` 1
8.76
cro
re) b
eing
the
am
ount
sp
ent
for
layi
ng p
ower
line
and
wat
er p
ipe
line,
the
ow
ners
hip
of w
hich
ves
ts w
ith
the
stat
e go
vern
men
t au
thor
ities
. (N
et B
ook
Valu
e `
1.50
cro
re; P
revi
ous
year
` 3
.66
cror
e).
(e)
Rai
lway
Sid
ings
incl
ude
` 11
.78
cror
e (P
revi
ous
year
` 9
.13
cror
e) b
eing
rai
lway
sid
ing
not
owne
d b
y th
e C
omp
any.
(Net
Boo
k Va
lue
` 4.
06 c
rore
; Pre
viou
s ye
ar `
4.5
0 cr
ore)
.
(f)
The
Com
pan
y’s
shar
e in
Joi
ntly
ow
ned
ass
ets
has
bee
n gr
oup
ed to
geth
er w
ith th
e re
leva
nt c
lass
of fi
xed
ass
ets.
The
pro
por
tion
of th
e co
st a
nd n
et c
arry
ing
amou
nts
incl
uded
in
rel
evan
t cl
ass
of a
sset
s ar
e gi
ven
bel
ow:
Leas
ehol
d L
and
-
` 51
.92
cror
e (P
revi
ous
year
` 5
1.92
cro
re).
(Net
Boo
k Va
lue
` 51
.92
cror
e; P
revi
ous
year
` 5
1.92
cro
re)
Free
hold
Lan
d
- `
0.56
cro
re (P
revi
ous
year
` 0
.52
cror
e). (
Net
Boo
k Va
lue
` 0.
46 c
rore
; Pre
viou
s ye
ar `
0.4
3 cr
ore)
Bui
ldin
gs
- `
51.8
3 cr
ore
(Pre
viou
s ye
ar `
51.
83 c
rore
). (N
et B
ook
Valu
e `
39.6
6 cr
ore;
Pre
viou
s ye
ar `
40.
60 c
rore
)P
lant
and
Eq
uip
men
t -
` 10
4.26
cro
re (P
revi
ous
year
` 1
10.4
0 cr
ore)
. (N
et B
ook
Valu
e `
39.4
6 cr
ore;
Pre
viou
s ye
ar `
74.
73 c
rore
)Fu
rnitu
re a
nd F
ixtu
res
- `
10.5
9 cr
ore
(Pre
viou
s ye
ar `
10.
58 c
rore
). (N
et B
ook
Valu
e `
1.04
cro
re; P
revi
ous
year
` 1
.66
cror
e)Ve
hicl
es a
nd A
ircra
ft
- `
25.0
2 cr
ore
(Pre
viou
s ye
ar `
24.
95 c
rore
). (N
et B
ook
Valu
e `
11.3
3 cr
ore;
Pre
viou
s ye
ar `
12.
26 c
rore
)O
ffi ce
Eq
uip
men
t -
` 11
.02
cror
e (P
revi
ous
year
` 1
0.82
cro
re).
(Net
Boo
k Va
lue
` 1.
29 c
rore
; Pre
viou
s ye
ar `
1.3
7 cr
ore)
13.
Inta
ngib
le A
sset
s:(`
cro
re)
O R
I G
I N
A L
C O
S T
A
M O
R T
I Z
A T
I O N
I
M P
A I
R M
E N
T
N E
T
BOO
K V
A L
U E
A
s at
31s
t M
arch
, 201
5 A
dditi
ons
Disp
osal
s/
Adju
stm
ents
A
s at
31s
t M
arch
, 201
6 A
s at
31s
t M
arch
, 201
5 Ad
ditio
ns
Disp
osal
s/
Adju
stm
ents
A
s at
31s
t M
arch
, 201
6 A
s at
31s
t M
arch
, 201
5Re
cogn
ised/
Re
vers
al D
educ
tions
/ Ad
just
men
ts A
s at
31s
t M
arch
, 201
6 A
s at
31s
t M
arch
, 201
6 A
s at
31s
t M
arch
, 201
5Co
mpu
ter S
oftw
are
47.
92
7.1
9 0
.11
55.
00
39.
56
6.6
9 0
.12
46.
13
- -
- -
8.8
7 8
.36
Min
ing
Righ
ts 3
1.25
9
1.70
0
.09
122
.86
20.
93
1.9
7 0
.09
22.
81
- -
- -
100
.05
10.
32
Tech
nolo
gy 3
8.55
0
.27
- 3
8.82
3
3.21
1
.62
- 3
4.83
-
- -
- 3
.99
5.3
4 1
17.7
2 9
9.16
0
.20
216
.68
93.
70
10.
28
0.2
1 1
03.7
7 -
- -
- 1
12.9
1 2
4.02
Pr
evio
us Y
ear
122
.18
13.
44
17.
90
117
.72
92.
45
6.5
9 5
.34
93.
70
- -
- -
24.
02
29.
73
(a)
Min
ing
Rig
hts
are
for
20/3
0 ye
ars
of le
ase
and
am
ortiz
ed p
rop
ortio
nate
ly.
(b)
The
usef
ul li
fe o
f Com
put
er S
oftw
are
is c
onsi
der
ed 2
-3 y
ears
and
tha
t of
Tec
hnol
ogy
is c
onsi
der
ed 4
-6 y
ears
.
Hindalco Annual Report 2015-16.indb 93Hindalco Annual Report 2015-16.indb 93 8/17/2016 1:31:30 PM8/17/2016 1:31:30 PM
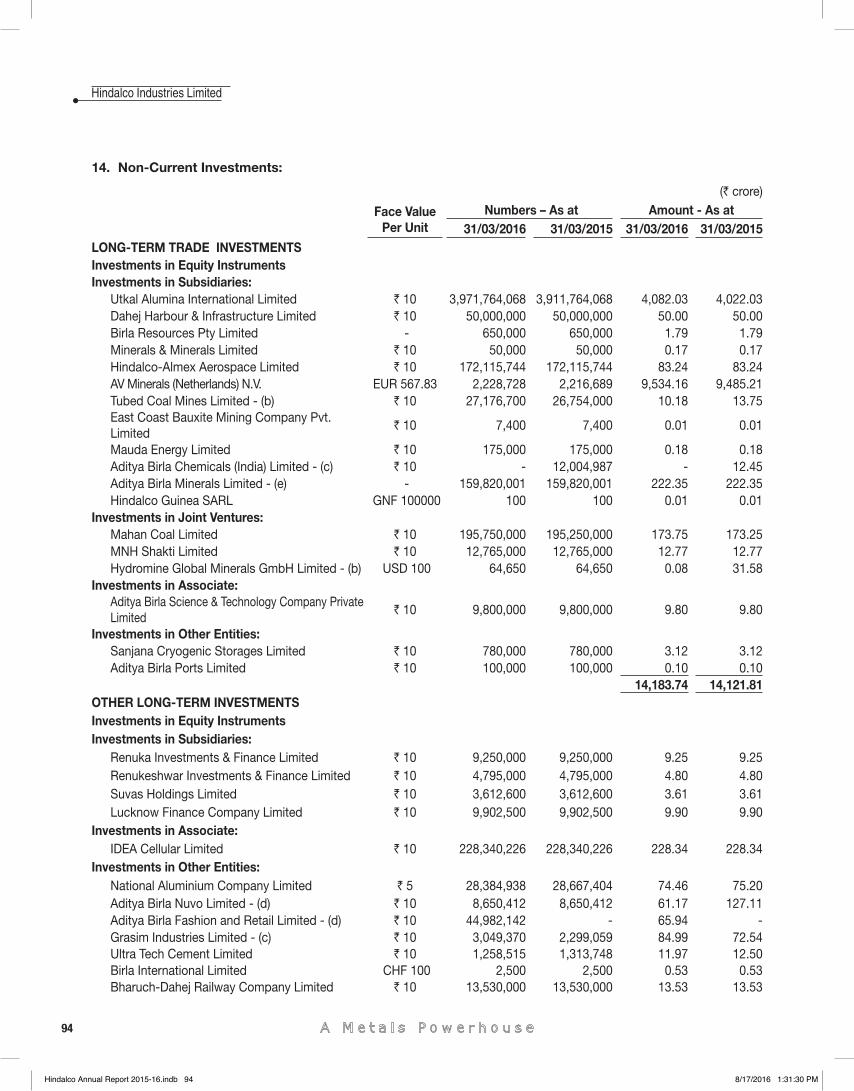
94
Hindalco Industries Limited
14. Non-Current Investments:
(` crore)
Face Value Per Unit
Numbers – As at Amount - As at 31/03/2016 31/03/2015 31/03/2016 31/03/2015
LONG-TERM TRADE INVESTMENTSInvestments in Equity InstrumentsInvestments in Subsidiaries:
Utkal Alumina International Limited ` 10 3,971,764,068 3,911,764,068 4,082.03 4,022.03 Dahej Harbour & Infrastructure Limited ` 10 50,000,000 50,000,000 50.00 50.00 Birla Resources Pty Limited - 650,000 650,000 1.79 1.79 Minerals & Minerals Limited ` 10 50,000 50,000 0.17 0.17 Hindalco-Almex Aerospace Limited ` 10 172,115,744 172,115,744 83.24 83.24 AV Minerals (Netherlands) N.V. EUR 567.83 2,228,728 2,216,689 9,534.16 9,485.21 Tubed Coal Mines Limited - (b) ` 10 27,176,700 26,754,000 10.18 13.75 East Coast Bauxite Mining Company Pvt. Limited
` 10 7,400 7,400 0.01 0.01
Mauda Energy Limited ` 10 175,000 175,000 0.18 0.18 Aditya Birla Chemicals (India) Limited - (c) ` 10 - 12,004,987 - 12.45 Aditya Birla Minerals Limited - (e) - 159,820,001 159,820,001 222.35 222.35 Hindalco Guinea SARL GNF 100000 100 100 0.01 0.01
Investments in Joint Ventures:Mahan Coal Limited ` 10 195,750,000 195,250,000 173.75 173.25 MNH Shakti Limited ` 10 12,765,000 12,765,000 12.77 12.77 Hydromine Global Minerals GmbH Limited - (b) USD 100 64,650 64,650 0.08 31.58
Investments in Associate:Aditya Birla Science & Technology Company Private Limited
` 10 9,800,000 9,800,000 9.80 9.80
Investments in Other Entities:Sanjana Cryogenic Storages Limited ` 10 780,000 780,000 3.12 3.12 Aditya Birla Ports Limited ` 10 100,000 100,000 0.10 0.10
14,183.74 14,121.81 OTHER LONG-TERM INVESTMENTSInvestments in Equity InstrumentsInvestments in Subsidiaries:
Renuka Investments & Finance Limited ` 10 9,250,000 9,250,000 9.25 9.25 Renukeshwar Investments & Finance Limited ` 10 4,795,000 4,795,000 4.80 4.80 Suvas Holdings Limited ` 10 3,612,600 3,612,600 3.61 3.61 Lucknow Finance Company Limited ` 10 9,902,500 9,902,500 9.90 9.90
Investments in Associate:IDEA Cellular Limited ` 10 228,340,226 228,340,226 228.34 228.34
Investments in Other Entities:National Aluminium Company Limited ` 5 28,384,938 28,667,404 74.46 75.20 Aditya Birla Nuvo Limited - (d) ` 10 8,650,412 8,650,412 61.17 127.11 Aditya Birla Fashion and Retail Limited - (d) ` 10 44,982,142 - 65.94 - Grasim Industries Limited - (c) ` 10 3,049,370 2,299,059 84.99 72.54 Ultra Tech Cement Limited ` 10 1,258,515 1,313,748 11.97 12.50 Birla International Limited CHF 100 2,500 2,500 0.53 0.53 Bharuch-Dahej Railway Company Limited ` 10 13,530,000 13,530,000 13.53 13.53
Hindalco Annual Report 2015-16.indb 94Hindalco Annual Report 2015-16.indb 94 8/17/2016 1:31:30 PM8/17/2016 1:31:30 PM
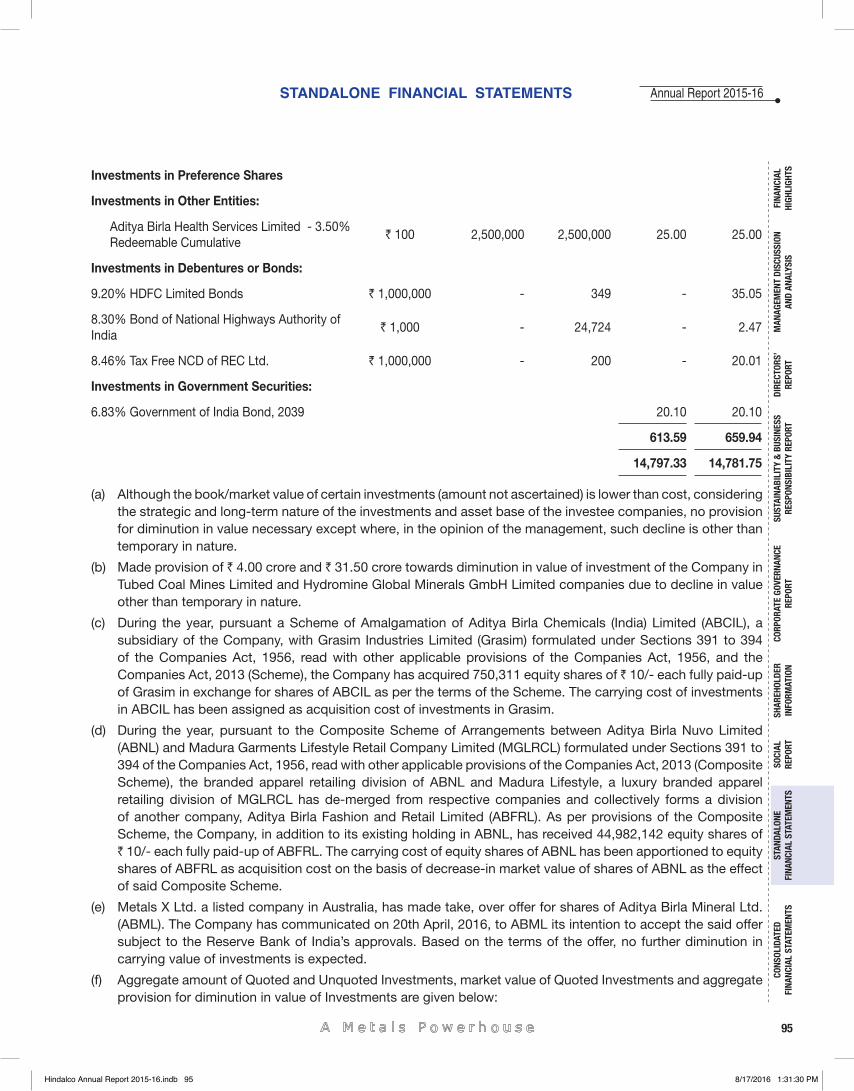
95
Annual Report 2015-16
FINA
NCIA
L HI
GHLI
GHTS
MAN
AGEM
ENT
DISC
USSI
ON
AND
ANAL
YSIS
CORP
ORAT
E GO
VERN
ANCE
RE
PORT
STAN
DALO
NE
FINA
NCIA
L ST
ATEM
ENTS
CONS
OLID
ATED
FI
NANC
IAL
STAT
EMEN
TSSO
CIAL
RE
PORT
DIRE
CTOR
S’RE
PORT
SHAR
EHOL
DER
INFO
RMAT
ION
SUST
AINA
BILI
TY &
BUS
INES
SRE
SPON
SIBI
LITY
REP
ORT
STANDALONE FINANCIAL STATEMENTS
Investments in Preference Shares
Investments in Other Entities:
Aditya Birla Health Services Limited - 3.50% Redeemable Cumulative
` 100 2,500,000 2,500,000 25.00 25.00
Investments in Debentures or Bonds:
9.20% HDFC Limited Bonds ` 1,000,000 - 349 - 35.05
8.30% Bond of National Highways Authority of India
` 1,000 - 24,724 - 2.47
8.46% Tax Free NCD of REC Ltd. ` 1,000,000 - 200 - 20.01
Investments in Government Securities:
6.83% Government of India Bond, 2039 20.10 20.10
613.59 659.94
14,797.33 14,781.75
(a) Although the book/market value of certain investments (amount not ascertained) is lower than cost, considering the strategic and long-term nature of the investments and asset base of the investee companies, no provision for diminution in value necessary except where, in the opinion of the management, such decline is other than temporary in nature.
(b) Made provision of ` 4.00 crore and ` 31.50 crore towards diminution in value of investment of the Company in Tubed Coal Mines Limited and Hydromine Global Minerals GmbH Limited companies due to decline in value other than temporary in nature.
(c) During the year, pursuant a Scheme of Amalgamation of Aditya Birla Chemicals (India) Limited (ABCIL), a subsidiary of the Company, with Grasim Industries Limited (Grasim) formulated under Sections 391 to 394 of the Companies Act, 1956, read with other applicable provisions of the Companies Act, 1956, and the Companies Act, 2013 (Scheme), the Company has acquired 750,311 equity shares of ` 10/- each fully paid-up of Grasim in exchange for shares of ABCIL as per the terms of the Scheme. The carrying cost of investments in ABCIL has been assigned as acquisition cost of investments in Grasim.
(d) During the year, pursuant to the Composite Scheme of Arrangements between Aditya Birla Nuvo Limited (ABNL) and Madura Garments Lifestyle Retail Company Limited (MGLRCL) formulated under Sections 391 to 394 of the Companies Act, 1956, read with other applicable provisions of the Companies Act, 2013 (Composite Scheme), the branded apparel retailing division of ABNL and Madura Lifestyle, a luxury branded apparel retailing division of MGLRCL has de-merged from respective companies and collectively forms a division of another company, Aditya Birla Fashion and Retail Limited (ABFRL). As per provisions of the Composite Scheme, the Company, in addition to its existing holding in ABNL, has received 44,982,142 equity shares of ` 10/- each fully paid-up of ABFRL. The carrying cost of equity shares of ABNL has been apportioned to equity shares of ABFRL as acquisition cost on the basis of decrease-in market value of shares of ABNL as the effect of said Composite Scheme.
(e) Metals X Ltd. a listed company in Australia, has made take, over offer for shares of Aditya Birla Mineral Ltd. (ABML). The Company has communicated on 20th April, 2016, to ABML its intention to accept the said offer subject to the Reserve Bank of India’s approvals. Based on the terms of the offer, no further diminution in carrying value of investments is expected.
(f) Aggregate amount of Quoted and Unquoted Investments, market value of Quoted Investments and aggregate provision for diminution in value of Investments are given below:
Hindalco Annual Report 2015-16.indb 95Hindalco Annual Report 2015-16.indb 95 8/17/2016 1:31:30 PM8/17/2016 1:31:30 PM
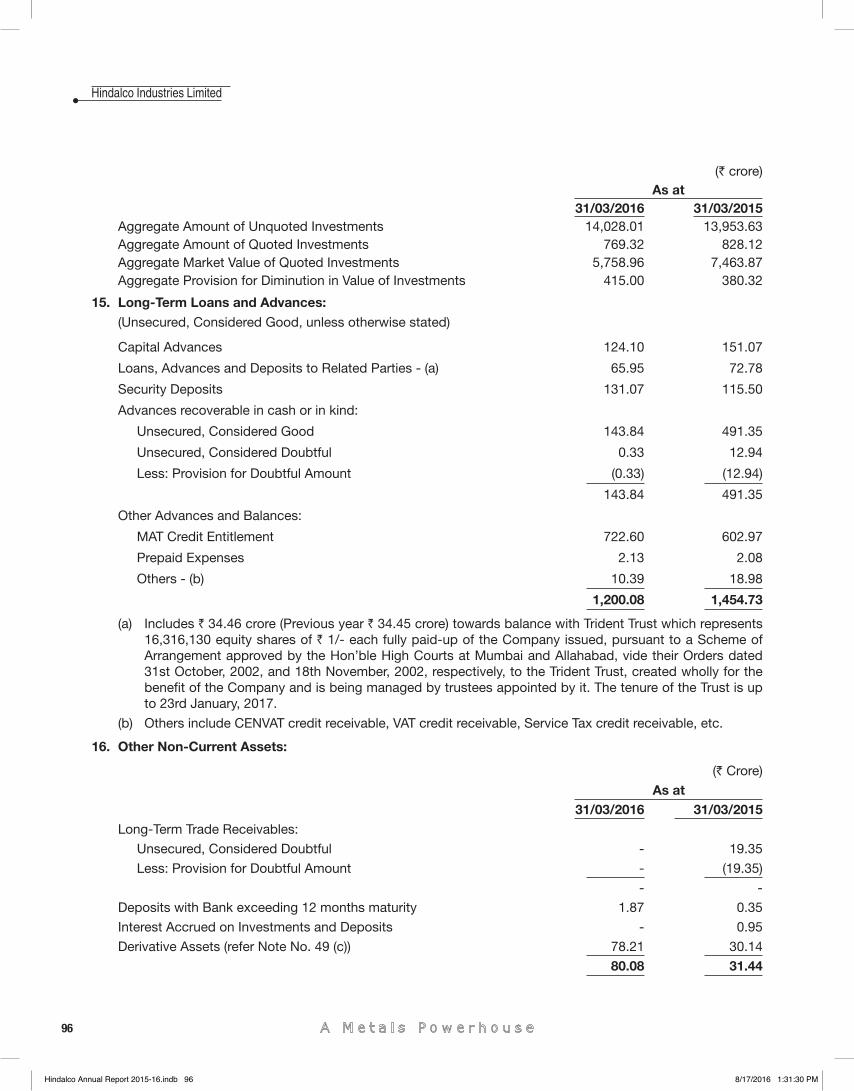
96
Hindalco Industries Limited
(` crore)As at
31/03/2016 31/03/2015Aggregate Amount of Unquoted Investments 14,028.01 13,953.63 Aggregate Amount of Quoted Investments 769.32 828.12 Aggregate Market Value of Quoted Investments 5,758.96 7,463.87 Aggregate Provision for Diminution in Value of Investments 415.00 380.32
15. Long-Term Loans and Advances:(Unsecured, Considered Good, unless otherwise stated)
Capital Advances 124.10 151.07
Loans, Advances and Deposits to Related Parties - (a) 65.95 72.78
Security Deposits 131.07 115.50
Advances recoverable in cash or in kind:
Unsecured, Considered Good 143.84 491.35
Unsecured, Considered Doubtful 0.33 12.94
Less: Provision for Doubtful Amount (0.33) (12.94)
143.84 491.35
Other Advances and Balances:
MAT Credit Entitlement 722.60 602.97
Prepaid Expenses 2.13 2.08
Others - (b) 10.39 18.98
1,200.08 1,454.73
(a) Includes ` 34.46 crore (Previous year ` 34.45 crore) towards balance with Trident Trust which represents 16,316,130 equity shares of ` 1/- each fully paid-up of the Company issued, pursuant to a Scheme of Arrangement approved by the Hon’ble High Courts at Mumbai and Allahabad, vide their Orders dated 31st October, 2002, and 18th November, 2002, respectively, to the Trident Trust, created wholly for the benefi t of the Company and is being managed by trustees appointed by it. The tenure of the Trust is up to 23rd January, 2017.
(b) Others include CENVAT credit receivable, VAT credit receivable, Service Tax credit receivable, etc.
16. Other Non-Current Assets:
(` Crore)
As at31/03/2016 31/03/2015
Long-Term Trade Receivables:
Unsecured, Considered Doubtful - 19.35
Less: Provision for Doubtful Amount - (19.35)
- -
Deposits with Bank exceeding 12 months maturity 1.87 0.35
Interest Accrued on Investments and Deposits - 0.95
Derivative Assets (refer Note No. 49 (c)) 78.21 30.14
80.08 31.44
Hindalco Annual Report 2015-16.indb 96Hindalco Annual Report 2015-16.indb 96 8/17/2016 1:31:30 PM8/17/2016 1:31:30 PM
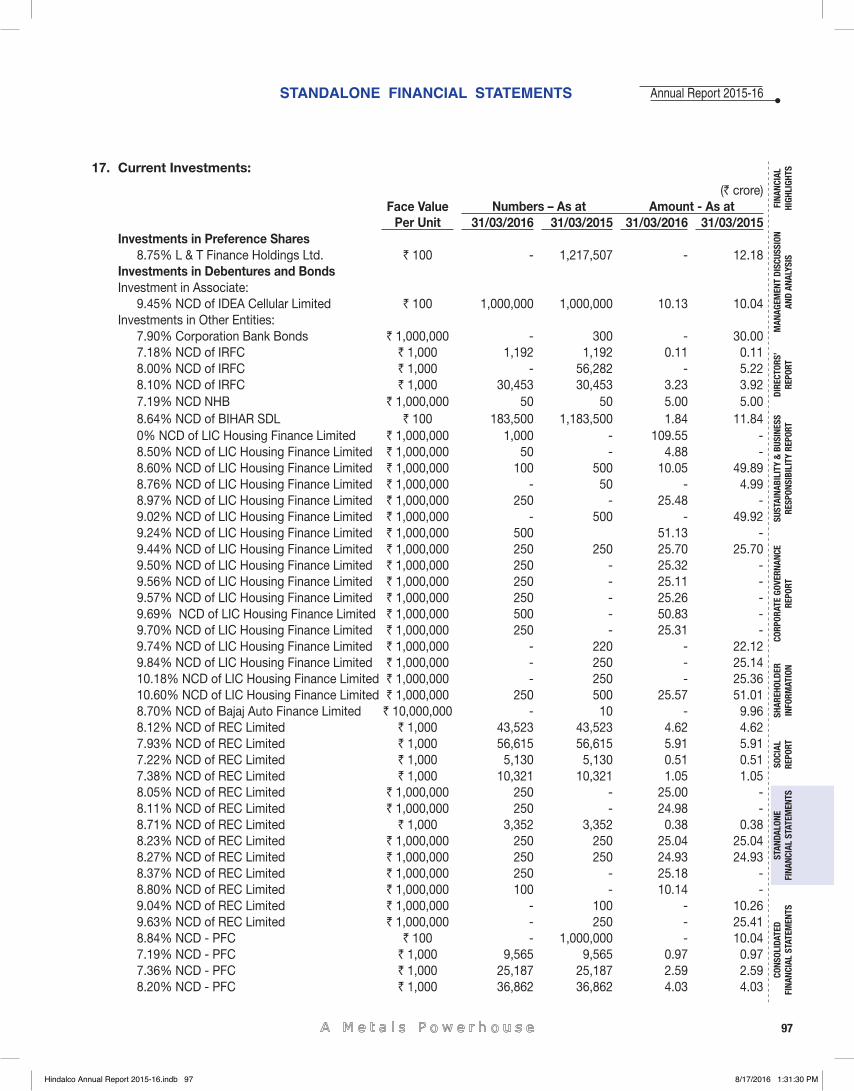
97
Annual Report 2015-16
FINA
NCIA
L HI
GHLI
GHTS
MAN
AGEM
ENT
DISC
USSI
ON
AND
ANAL
YSIS
CORP
ORAT
E GO
VERN
ANCE
RE
PORT
STAN
DALO
NE
FINA
NCIA
L ST
ATEM
ENTS
CONS
OLID
ATED
FI
NANC
IAL
STAT
EMEN
TSSO
CIAL
RE
PORT
DIRE
CTOR
S’RE
PORT
SHAR
EHOL
DER
INFO
RMAT
ION
SUST
AINA
BILI
TY &
BUS
INES
SRE
SPON
SIBI
LITY
REP
ORT
STANDALONE FINANCIAL STATEMENTS
17. Current Investments:
(` crore)Face Value
Per Unit Numbers – As at Amount - As at
31/03/2016 31/03/2015 31/03/2016 31/03/2015 Investments in Preference Shares
8.75% L & T Finance Holdings Ltd. ` 100 - 1,217,507 - 12.18 Investments in Debentures and BondsInvestment in Associate:
9.45% NCD of IDEA Cellular Limited ` 100 1,000,000 1,000,000 10.13 10.04Investments in Other Entities:
7.90% Corporation Bank Bonds ` 1,000,000 - 300 - 30.00 7.18% NCD of IRFC ` 1,000 1,192 1,192 0.11 0.11 8.00% NCD of IRFC ` 1,000 - 56,282 - 5.22 8.10% NCD of IRFC ` 1,000 30,453 30,453 3.23 3.92 7.19% NCD NHB ` 1,000,000 50 50 5.00 5.00 8.64% NCD of BIHAR SDL ` 100 183,500 1,183,500 1.84 11.84 0% NCD of LIC Housing Finance Limited ` 1,000,000 1,000 - 109.55 - 8.50% NCD of LIC Housing Finance Limited ` 1,000,000 50 - 4.88 - 8.60% NCD of LIC Housing Finance Limited ` 1,000,000 100 500 10.05 49.89 8.76% NCD of LIC Housing Finance Limited ` 1,000,000 - 50 - 4.99 8.97% NCD of LIC Housing Finance Limited ` 1,000,000 250 - 25.48 - 9.02% NCD of LIC Housing Finance Limited ` 1,000,000 - 500 - 49.92 9.24% NCD of LIC Housing Finance Limited ` 1,000,000 500 51.13 - 9.44% NCD of LIC Housing Finance Limited ` 1,000,000 250 250 25.70 25.70 9.50% NCD of LIC Housing Finance Limited ` 1,000,000 250 - 25.32 - 9.56% NCD of LIC Housing Finance Limited ` 1,000,000 250 - 25.11 - 9.57% NCD of LIC Housing Finance Limited ` 1,000,000 250 - 25.26 - 9.69% NCD of LIC Housing Finance Limited ` 1,000,000 500 - 50.83 - 9.70% NCD of LIC Housing Finance Limited ` 1,000,000 250 - 25.31 - 9.74% NCD of LIC Housing Finance Limited ` 1,000,000 - 220 - 22.12 9.84% NCD of LIC Housing Finance Limited ` 1,000,000 - 250 - 25.14 10.18% NCD of LIC Housing Finance Limited ` 1,000,000 - 250 - 25.36 10.60% NCD of LIC Housing Finance Limited ` 1,000,000 250 500 25.57 51.01 8.70% NCD of Bajaj Auto Finance Limited ` 10,000,000 - 10 - 9.96 8.12% NCD of REC Limited ` 1,000 43,523 43,523 4.62 4.62 7.93% NCD of REC Limited ` 1,000 56,615 56,615 5.91 5.91 7.22% NCD of REC Limited ` 1,000 5,130 5,130 0.51 0.51 7.38% NCD of REC Limited ` 1,000 10,321 10,321 1.05 1.05 8.05% NCD of REC Limited ` 1,000,000 250 - 25.00 - 8.11% NCD of REC Limited ` 1,000,000 250 - 24.98 - 8.71% NCD of REC Limited ` 1,000 3,352 3,352 0.38 0.38 8.23% NCD of REC Limited ` 1,000,000 250 250 25.04 25.04 8.27% NCD of REC Limited ` 1,000,000 250 250 24.93 24.93 8.37% NCD of REC Limited ` 1,000,000 250 - 25.18 - 8.80% NCD of REC Limited ` 1,000,000 100 - 10.14 - 9.04% NCD of REC Limited ` 1,000,000 - 100 - 10.26 9.63% NCD of REC Limited ` 1,000,000 - 250 - 25.41 8.84% NCD - PFC ` 100 - 1,000,000 - 10.04 7.19% NCD - PFC ` 1,000 9,565 9,565 0.97 0.97 7.36% NCD - PFC ` 1,000 25,187 25,187 2.59 2.59 8.20% NCD - PFC ` 1,000 36,862 36,862 4.03 4.03
Hindalco Annual Report 2015-16.indb 97Hindalco Annual Report 2015-16.indb 97 8/17/2016 1:31:30 PM8/17/2016 1:31:30 PM
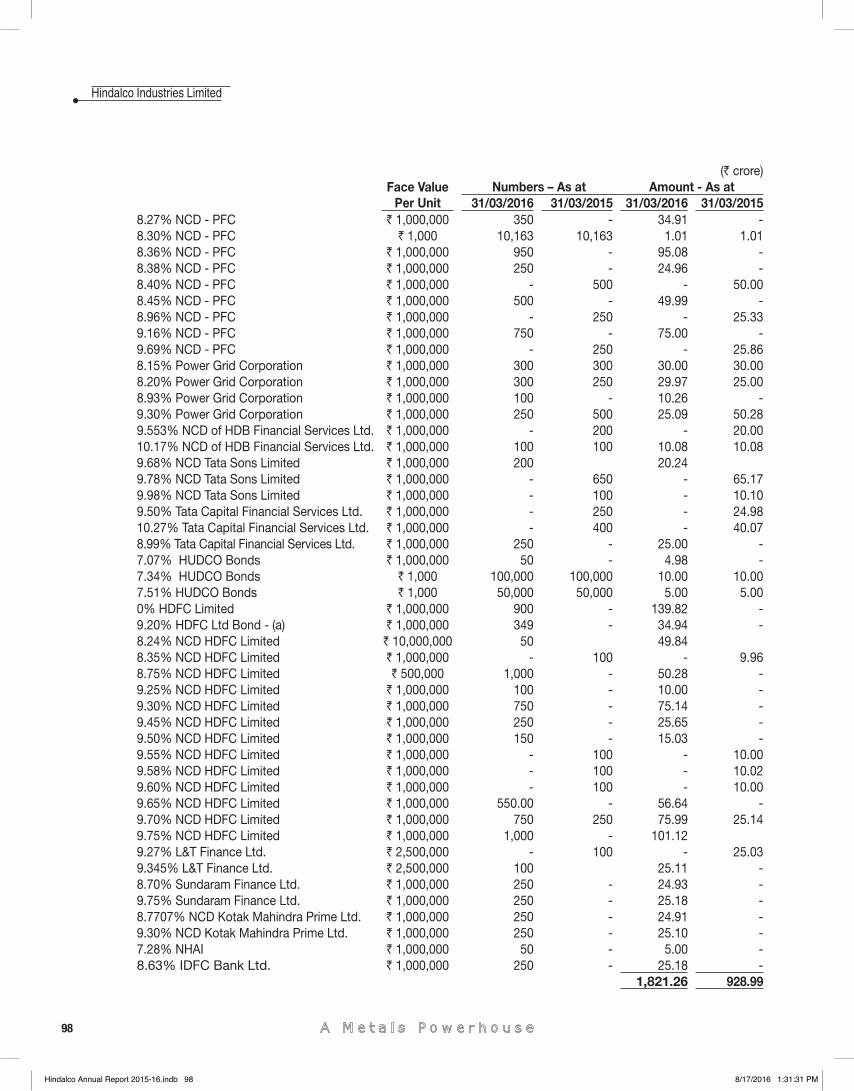
98
Hindalco Industries Limited
(` crore)Face Value
Per Unit Numbers – As at Amount - As at
31/03/2016 31/03/2015 31/03/2016 31/03/2015 8.27% NCD - PFC ` 1,000,000 350 - 34.91 - 8.30% NCD - PFC ` 1,000 10,163 10,163 1.01 1.01 8.36% NCD - PFC ` 1,000,000 950 - 95.08 - 8.38% NCD - PFC ` 1,000,000 250 - 24.96 - 8.40% NCD - PFC ` 1,000,000 - 500 - 50.00 8.45% NCD - PFC ` 1,000,000 500 - 49.99 - 8.96% NCD - PFC ` 1,000,000 - 250 - 25.33 9.16% NCD - PFC ` 1,000,000 750 - 75.00 - 9.69% NCD - PFC ` 1,000,000 - 250 - 25.86 8.15% Power Grid Corporation ` 1,000,000 300 300 30.00 30.00 8.20% Power Grid Corporation ` 1,000,000 300 250 29.97 25.00 8.93% Power Grid Corporation ` 1,000,000 100 - 10.26 - 9.30% Power Grid Corporation ` 1,000,000 250 500 25.09 50.28 9.553% NCD of HDB Financial Services Ltd. ` 1,000,000 - 200 - 20.00 10.17% NCD of HDB Financial Services Ltd. ` 1,000,000 100 100 10.08 10.08 9.68% NCD Tata Sons Limited ` 1,000,000 200 20.24 9.78% NCD Tata Sons Limited ` 1,000,000 - 650 - 65.17 9.98% NCD Tata Sons Limited ` 1,000,000 - 100 - 10.10 9.50% Tata Capital Financial Services Ltd. ` 1,000,000 - 250 - 24.98 10.27% Tata Capital Financial Services Ltd. ` 1,000,000 - 400 - 40.07 8.99% Tata Capital Financial Services Ltd. ` 1,000,000 250 - 25.00 - 7.07% HUDCO Bonds ` 1,000,000 50 - 4.98 - 7.34% HUDCO Bonds ` 1,000 100,000 100,000 10.00 10.00 7.51% HUDCO Bonds ` 1,000 50,000 50,000 5.00 5.00 0% HDFC Limited ` 1,000,000 900 - 139.82 - 9.20% HDFC Ltd Bond - (a) ` 1,000,000 349 - 34.94 - 8.24% NCD HDFC Limited ` 10,000,000 50 49.84 8.35% NCD HDFC Limited ` 1,000,000 - 100 - 9.96 8.75% NCD HDFC Limited ` 500,000 1,000 - 50.28 - 9.25% NCD HDFC Limited ` 1,000,000 100 - 10.00 - 9.30% NCD HDFC Limited ` 1,000,000 750 - 75.14 - 9.45% NCD HDFC Limited ` 1,000,000 250 - 25.65 - 9.50% NCD HDFC Limited ` 1,000,000 150 - 15.03 - 9.55% NCD HDFC Limited ` 1,000,000 - 100 - 10.00 9.58% NCD HDFC Limited ` 1,000,000 - 100 - 10.02 9.60% NCD HDFC Limited ` 1,000,000 - 100 - 10.00 9.65% NCD HDFC Limited ` 1,000,000 550.00 - 56.64 - 9.70% NCD HDFC Limited ` 1,000,000 750 250 75.99 25.14 9.75% NCD HDFC Limited ` 1,000,000 1,000 - 101.12 9.27% L&T Finance Ltd. ` 2,500,000 - 100 - 25.03 9.345% L&T Finance Ltd. ` 2,500,000 100 25.11 - 8.70% Sundaram Finance Ltd. ` 1,000,000 250 - 24.93 - 9.75% Sundaram Finance Ltd. ` 1,000,000 250 - 25.18 - 8.7707% NCD Kotak Mahindra Prime Ltd. ` 1,000,000 250 - 24.91 - 9.30% NCD Kotak Mahindra Prime Ltd. ` 1,000,000 250 - 25.10 - 7.28% NHAI ` 1,000,000 50 - 5.00 - 8.63% IDFC Bank Ltd. ` 1,000,000 250 - 25.18 -
1,821.26 928.99
Hindalco Annual Report 2015-16.indb 98Hindalco Annual Report 2015-16.indb 98 8/17/2016 1:31:31 PM8/17/2016 1:31:31 PM
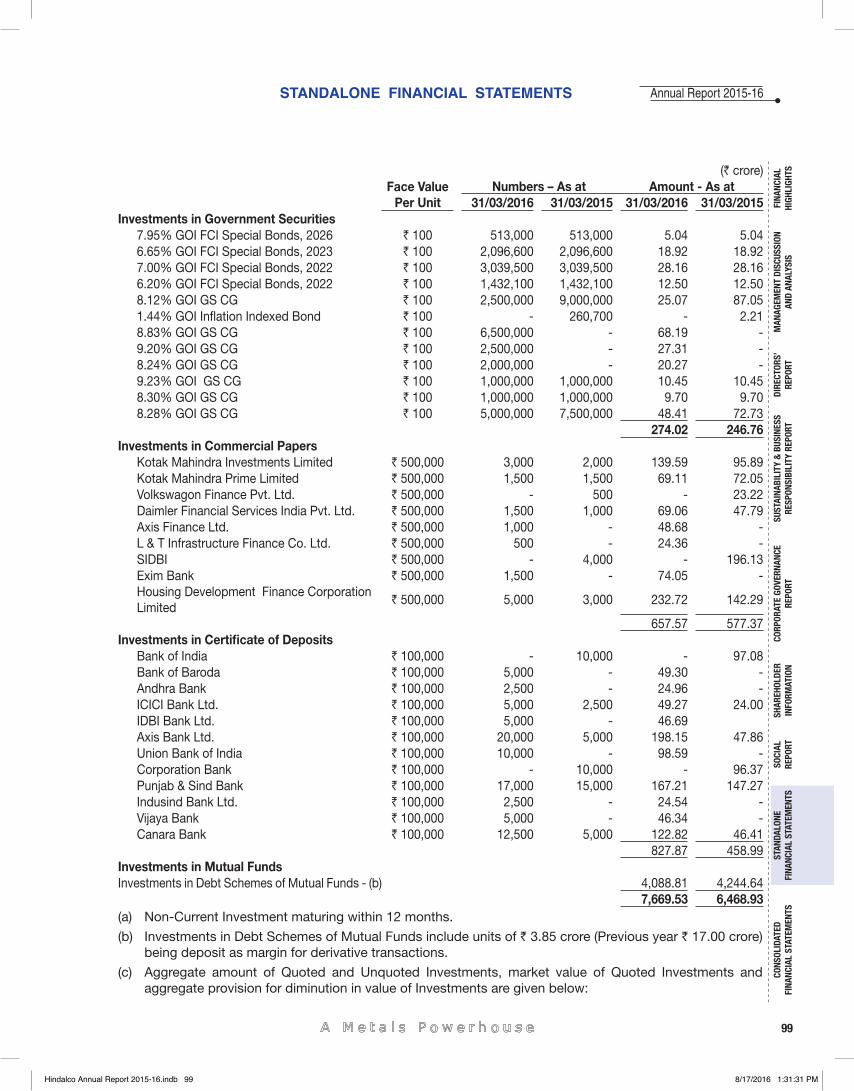
99
Annual Report 2015-16
FINA
NCIA
L HI
GHLI
GHTS
MAN
AGEM
ENT
DISC
USSI
ON
AND
ANAL
YSIS
CORP
ORAT
E GO
VERN
ANCE
RE
PORT
STAN
DALO
NE
FINA
NCIA
L ST
ATEM
ENTS
CONS
OLID
ATED
FI
NANC
IAL
STAT
EMEN
TSSO
CIAL
RE
PORT
DIRE
CTOR
S’RE
PORT
SHAR
EHOL
DER
INFO
RMAT
ION
SUST
AINA
BILI
TY &
BUS
INES
SRE
SPON
SIBI
LITY
REP
ORT
STANDALONE FINANCIAL STATEMENTS
(` crore)Face Value
Per Unit Numbers – As at Amount - As at
31/03/2016 31/03/2015 31/03/2016 31/03/2015 Investments in Government Securities
7.95% GOI FCI Special Bonds, 2026 ` 100 513,000 513,000 5.04 5.04 6.65% GOI FCI Special Bonds, 2023 ` 100 2,096,600 2,096,600 18.92 18.92 7.00% GOI FCI Special Bonds, 2022 ` 100 3,039,500 3,039,500 28.16 28.16 6.20% GOI FCI Special Bonds, 2022 ` 100 1,432,100 1,432,100 12.50 12.50 8.12% GOI GS CG ` 100 2,500,000 9,000,000 25.07 87.05 1.44% GOI Infl ation Indexed Bond ` 100 - 260,700 - 2.21 8.83% GOI GS CG ` 100 6,500,000 - 68.19 - 9.20% GOI GS CG ` 100 2,500,000 - 27.31 - 8.24% GOI GS CG ` 100 2,000,000 - 20.27 - 9.23% GOI GS CG ` 100 1,000,000 1,000,000 10.45 10.45 8.30% GOI GS CG ` 100 1,000,000 1,000,000 9.70 9.70 8.28% GOI GS CG ` 100 5,000,000 7,500,000 48.41 72.73
274.02 246.76 Investments in Commercial Papers
Kotak Mahindra Investments Limited ` 500,000 3,000 2,000 139.59 95.89 Kotak Mahindra Prime Limited ` 500,000 1,500 1,500 69.11 72.05 Volkswagon Finance Pvt. Ltd. ` 500,000 - 500 - 23.22 Daimler Financial Services India Pvt. Ltd. ` 500,000 1,500 1,000 69.06 47.79 Axis Finance Ltd. ` 500,000 1,000 - 48.68 - L & T Infrastructure Finance Co. Ltd. ` 500,000 500 - 24.36 - SIDBI ` 500,000 - 4,000 - 196.13 Exim Bank ` 500,000 1,500 - 74.05 - Housing Development Finance Corporation Limited
` 500,000 5,000 3,000 232.72 142.29
657.57 577.37 Investments in Certifi cate of Deposits
Bank of India ` 100,000 - 10,000 - 97.08 Bank of Baroda ` 100,000 5,000 - 49.30 - Andhra Bank ` 100,000 2,500 - 24.96 - ICICI Bank Ltd. ` 100,000 5,000 2,500 49.27 24.00 IDBI Bank Ltd. ` 100,000 5,000 - 46.69 Axis Bank Ltd. ` 100,000 20,000 5,000 198.15 47.86 Union Bank of India ` 100,000 10,000 - 98.59 - Corporation Bank ` 100,000 - 10,000 - 96.37 Punjab & Sind Bank ` 100,000 17,000 15,000 167.21 147.27 Indusind Bank Ltd. ` 100,000 2,500 - 24.54 - Vijaya Bank ` 100,000 5,000 - 46.34 - Canara Bank ` 100,000 12,500 5,000 122.82 46.41
827.87 458.99 Investments in Mutual FundsInvestments in Debt Schemes of Mutual Funds - (b) 4,088.81 4,244.64
7,669.53 6,468.93 (a) Non-Current Investment maturing within 12 months.
(b) Investments in Debt Schemes of Mutual Funds include units of ` 3.85 crore (Previous year ` 17.00 crore) being deposit as margin for derivative transactions.
(c) Aggregate amount of Quoted and Unquoted Investments, market value of Quoted Investments and aggregate provision for diminution in value of Investments are given below:
Hindalco Annual Report 2015-16.indb 99Hindalco Annual Report 2015-16.indb 99 8/17/2016 1:31:31 PM8/17/2016 1:31:31 PM
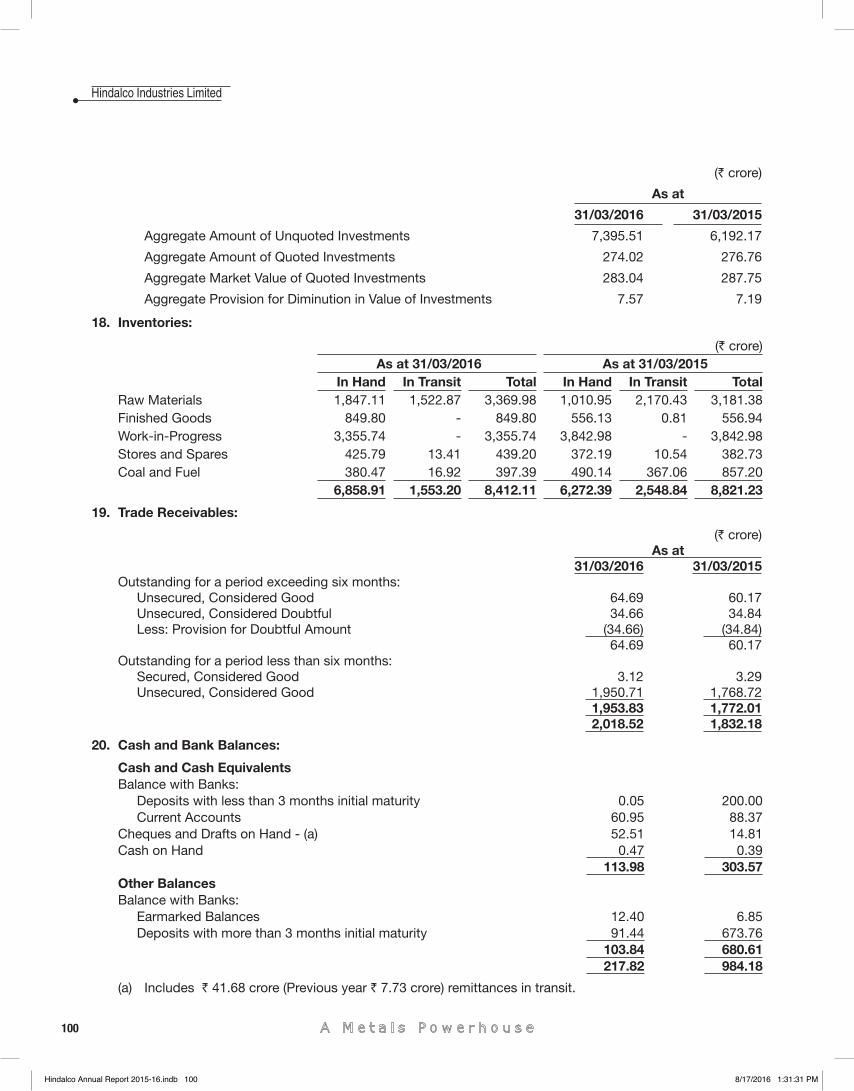
100
Hindalco Industries Limited
(` crore)
As at
31/03/2016 31/03/2015
Aggregate Amount of Unquoted Investments 7,395.51 6,192.17
Aggregate Amount of Quoted Investments 274.02 276.76
Aggregate Market Value of Quoted Investments 283.04 287.75
Aggregate Provision for Diminution in Value of Investments 7.57 7.19
18. Inventories:
(` crore) As at 31/03/2016 As at 31/03/2015
In Hand In Transit Total In Hand In Transit Total Raw Materials 1,847.11 1,522.87 3,369.98 1,010.95 2,170.43 3,181.38 Finished Goods 849.80 - 849.80 556.13 0.81 556.94 Work-in-Progress 3,355.74 - 3,355.74 3,842.98 - 3,842.98 Stores and Spares 425.79 13.41 439.20 372.19 10.54 382.73 Coal and Fuel 380.47 16.92 397.39 490.14 367.06 857.20
6,858.91 1,553.20 8,412.11 6,272.39 2,548.84 8,821.23
19. Trade Receivables:
(` crore)As at
31/03/2016 31/03/2015Outstanding for a period exceeding six months:
Unsecured, Considered Good 64.69 60.17 Unsecured, Considered Doubtful 34.66 34.84 Less: Provision for Doubtful Amount (34.66) (34.84)
64.69 60.17 Outstanding for a period less than six months:
Secured, Considered Good 3.12 3.29 Unsecured, Considered Good 1,950.71 1,768.72
1,953.83 1,772.01 2,018.52 1,832.18
20. Cash and Bank Balances:
Cash and Cash EquivalentsBalance with Banks:
Deposits with less than 3 months initial maturity 0.05 200.00 Current Accounts 60.95 88.37
Cheques and Drafts on Hand - (a) 52.51 14.81 Cash on Hand 0.47 0.39
113.98 303.57 Other BalancesBalance with Banks:
Earmarked Balances 12.40 6.85 Deposits with more than 3 months initial maturity 91.44 673.76
103.84 680.61 217.82 984.18
(a) Includes ` 41.68 crore (Previous year ` 7.73 crore) remittances in transit.
Hindalco Annual Report 2015-16.indb 100Hindalco Annual Report 2015-16.indb 100 8/17/2016 1:31:31 PM8/17/2016 1:31:31 PM
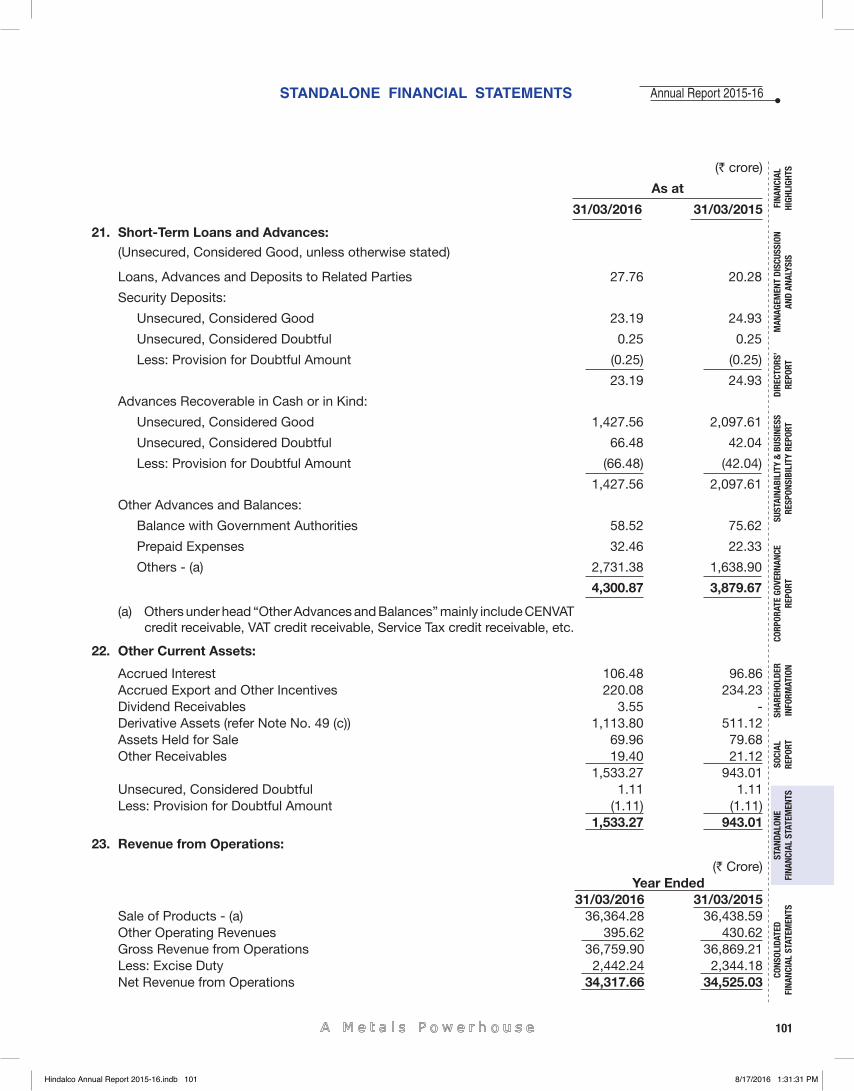
101
Annual Report 2015-16
FINA
NCIA
L HI
GHLI
GHTS
MAN
AGEM
ENT
DISC
USSI
ON
AND
ANAL
YSIS
CORP
ORAT
E GO
VERN
ANCE
RE
PORT
STAN
DALO
NE
FINA
NCIA
L ST
ATEM
ENTS
CONS
OLID
ATED
FI
NANC
IAL
STAT
EMEN
TSSO
CIAL
RE
PORT
DIRE
CTOR
S’RE
PORT
SHAR
EHOL
DER
INFO
RMAT
ION
SUST
AINA
BILI
TY &
BUS
INES
SRE
SPON
SIBI
LITY
REP
ORT
STANDALONE FINANCIAL STATEMENTS
21. Short-Term Loans and Advances:(Unsecured, Considered Good, unless otherwise stated)
Loans, Advances and Deposits to Related Parties 27.76 20.28
Security Deposits:
Unsecured, Considered Good 23.19 24.93
Unsecured, Considered Doubtful 0.25 0.25
Less: Provision for Doubtful Amount (0.25) (0.25)
23.19 24.93
Advances Recoverable in Cash or in Kind:
Unsecured, Considered Good 1,427.56 2,097.61
Unsecured, Considered Doubtful 66.48 42.04
Less: Provision for Doubtful Amount (66.48) (42.04)
1,427.56 2,097.61
Other Advances and Balances:
Balance with Government Authorities 58.52 75.62
Prepaid Expenses 32.46 22.33
Others - (a) 2,731.38 1,638.90
4,300.87 3,879.67
(a) Others under head “Other Advances and Balances” mainly include CENVAT credit receivable, VAT credit receivable, Service Tax credit receivable, etc.
22. Other Current Assets:
Accrued Interest 106.48 96.86 Accrued Export and Other Incentives 220.08 234.23 Dividend Receivables 3.55 - Derivative Assets (refer Note No. 49 (c)) 1,113.80 511.12 Assets Held for Sale 69.96 79.68 Other Receivables 19.40 21.12
1,533.27 943.01 Unsecured, Considered Doubtful 1.11 1.11 Less: Provision for Doubtful Amount (1.11) (1.11)
1,533.27 943.01
23. Revenue from Operations:
(` Crore)Year Ended
31/03/2016 31/03/2015Sale of Products - (a) 36,364.28 36,438.59 Other Operating Revenues 395.62 430.62 Gross Revenue from Operations 36,759.90 36,869.21 Less: Excise Duty 2,442.24 2,344.18 Net Revenue from Operations 34,317.66 34,525.03
(` crore)
As at
31/03/2016 31/03/2015
Hindalco Annual Report 2015-16.indb 101Hindalco Annual Report 2015-16.indb 101 8/17/2016 1:31:31 PM8/17/2016 1:31:31 PM

102
Hindalco Industries Limited
(a) Details of Sale of Products are given below:
Sale of Finished Goods:Aluminium Business:
Alumina 928.66 1,033.39 Aluminium and Aluminium Products 16,885.88 13,600.87 Others 236.39 265.39
Copper Business:Copper and Copper Products - (i) 14,636.77 17,421.80 Precious Metals - (i) 2,136.15 2,710.05 Others - (ii) 1,538.88 1,370.05
36,362.73 36,401.55 Sale of Traded Goods:
Other Materials 1.55 37.04 1.55 37.04
36,364.28 36,438.59 (i) Sales of Copper Products and Precious Metals are accounted for provisionally, pending fi nalization of
price and quantity. Variations are accounted for in the year of settlement. Final price receivable on sale of above products for which quotational price was not fi nalized in previous year, were realigned at year end forward LME/LBMA rate and addition of sales of ` 12.14 crore (Previous year reversal of ` 7.83 crore) was accounted for. During the year, fi nal price was settled at ` 16.24 crore (Previous year settled at ` 7.05 crore) and further addition of sales of ` 4.10 crore (Previous year additional sales of ` 0.78 crore) was taken into account. As on 31st March, 2016, sale of Copper Products/Precious Metals, pending for price fi nalization were realigned at year-end forward LME/LBMA and an addition of sales of ` 5.24 crore (Previous year additional sales ` 12.14 crore) was accounted for. Actual cash fl ow is expected on fi nalization of quotational price and quantity in the subsequent fi nancial year.
(ii) Includes sales of DAP including nutrient-based subsidy of P&K ` 403.91 crore (Previous year ` 372.35 crore).
24. Other Income:
(` crore)Year Ended
31/03/2016 31/03/2015Interest Income:
On Long-Term Investments 8.28 8.84 On Current Investments 170.46 148.34 On Others - (a) 274.94 169.60
Dividend Income:On Long-Term Investments - (b) 154.78 41.46 On Current Investments 14.82 20.44
Gain/(Loss) on Sale of Investments (Net):On Long-Term Investments 17.37 - On Current Investments 379.65 425.16
Adjustments to the carrying amount of Investments (Net):On Long-Term Investments - (c) 0.82 (0.11)On Current Investments (0.38) 16.05
Profi t/(Loss) on Fixed Assets Sold/Discarded (Net) (1.18) (15.25)
(` Crore)As at
31/03/2016 31/03/2015
Hindalco Annual Report 2015-16.indb 102Hindalco Annual Report 2015-16.indb 102 8/17/2016 1:31:31 PM8/17/2016 1:31:31 PM
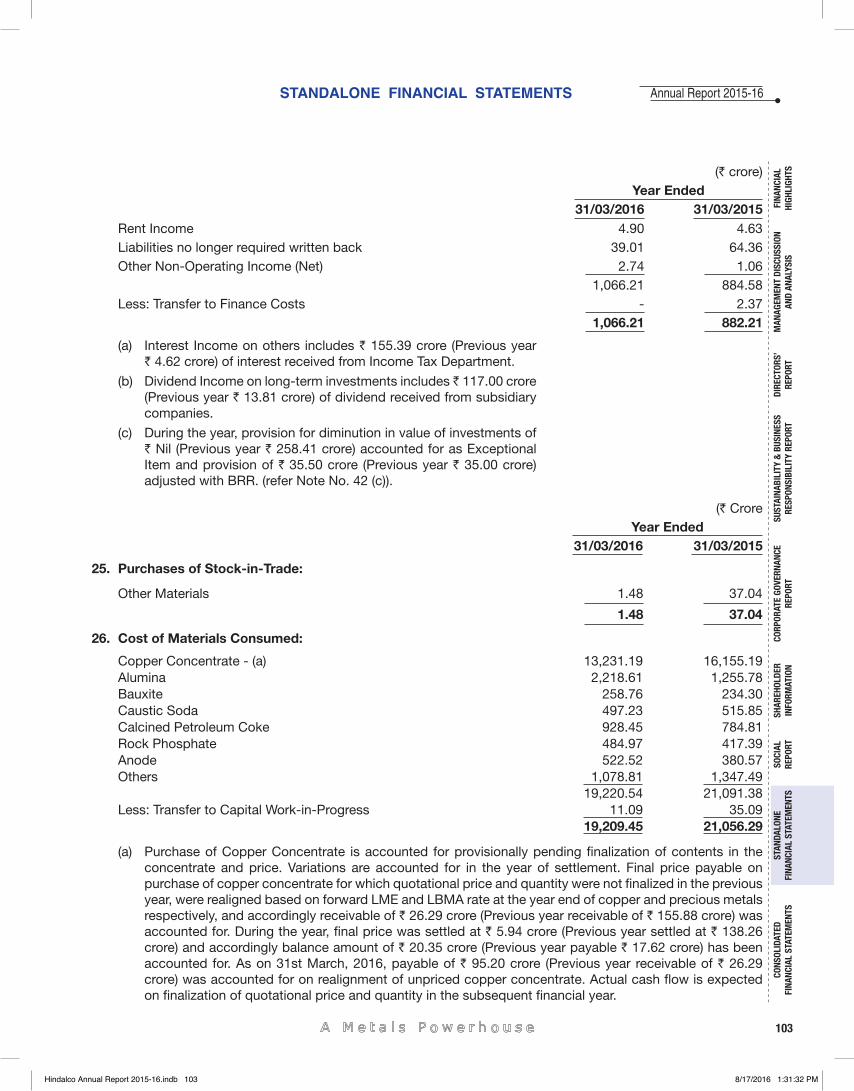
103
Annual Report 2015-16
FINA
NCIA
L HI
GHLI
GHTS
MAN
AGEM
ENT
DISC
USSI
ON
AND
ANAL
YSIS
CORP
ORAT
E GO
VERN
ANCE
RE
PORT
STAN
DALO
NE
FINA
NCIA
L ST
ATEM
ENTS
CONS
OLID
ATED
FI
NANC
IAL
STAT
EMEN
TSSO
CIAL
RE
PORT
DIRE
CTOR
S’RE
PORT
SHAR
EHOL
DER
INFO
RMAT
ION
SUST
AINA
BILI
TY &
BUS
INES
SRE
SPON
SIBI
LITY
REP
ORT
STANDALONE FINANCIAL STATEMENTS
(` crore)Year Ended
31/03/2016 31/03/2015Rent Income 4.90 4.63 Liabilities no longer required written back 39.01 64.36 Other Non-Operating Income (Net) 2.74 1.06
1,066.21 884.58 Less: Transfer to Finance Costs - 2.37
1,066.21 882.21
(a) Interest Income on others includes ` 155.39 crore (Previous year` 4.62 crore) of interest received from Income Tax Department.
(b) Dividend Income on long-term investments includes ̀ 117.00 crore (Previous year ` 13.81 crore) of dividend received from subsidiary companies.
(c) During the year, provision for diminution in value of investments of ` Nil (Previous year ` 258.41 crore) accounted for as Exceptional Item and provision of ` 35.50 crore (Previous year ` 35.00 crore) adjusted with BRR. (refer Note No. 42 (c)).
(` CroreYear Ended
31/03/2016 31/03/2015
25. Purchases of Stock-in-Trade:
Other Materials 1.48 37.04
1.48 37.04
26. Cost of Materials Consumed:
Copper Concentrate - (a) 13,231.19 16,155.19 Alumina 2,218.61 1,255.78 Bauxite 258.76 234.30 Caustic Soda 497.23 515.85 Calcined Petroleum Coke 928.45 784.81 Rock Phosphate 484.97 417.39 Anode 522.52 380.57 Others 1,078.81 1,347.49
19,220.54 21,091.38 Less: Transfer to Capital Work-in-Progress 11.09 35.09
19,209.45 21,056.29
(a) Purchase of Copper Concentrate is accounted for provisionally pending fi nalization of contents in the concentrate and price. Variations are accounted for in the year of settlement. Final price payable on purchase of copper concentrate for which quotational price and quantity were not fi nalized in the previous year, were realigned based on forward LME and LBMA rate at the year end of copper and precious metals respectively, and accordingly receivable of ` 26.29 crore (Previous year receivable of ` 155.88 crore) was accounted for. During the year, fi nal price was settled at ` 5.94 crore (Previous year settled at ` 138.26 crore) and accordingly balance amount of ` 20.35 crore (Previous year payable ` 17.62 crore) has been accounted for. As on 31st March, 2016, payable of ` 95.20 crore (Previous year receivable of ` 26.29 crore) was accounted for on realignment of unpriced copper concentrate. Actual cash fl ow is expected on fi nalization of quotational price and quantity in the subsequent fi nancial year.
Hindalco Annual Report 2015-16.indb 103Hindalco Annual Report 2015-16.indb 103 8/17/2016 1:31:32 PM8/17/2016 1:31:32 PM
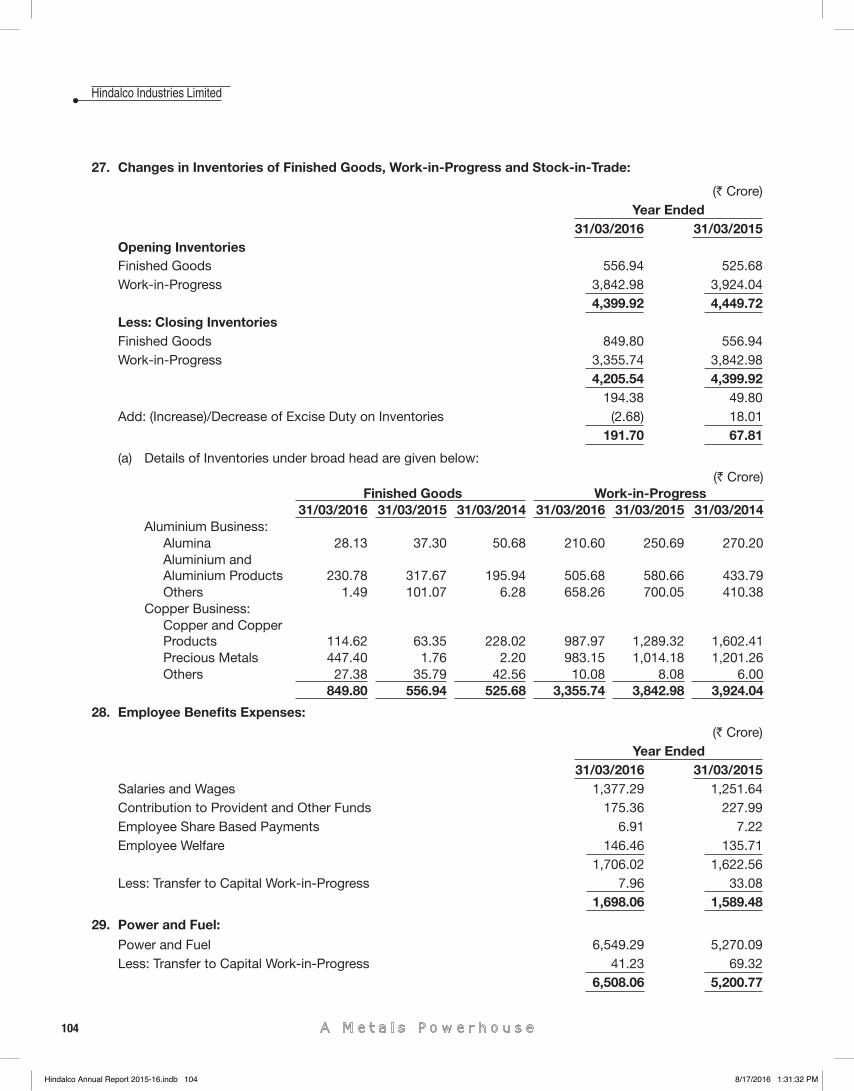
104
Hindalco Industries Limited
27. Changes in Inventories of Finished Goods, Work-in-Progress and Stock-in-Trade:
(` Crore)Year Ended
31/03/2016 31/03/2015Opening Inventories Finished Goods 556.94 525.68 Work-in-Progress 3,842.98 3,924.04
4,399.92 4,449.72 Less: Closing Inventories Finished Goods 849.80 556.94 Work-in-Progress 3,355.74 3,842.98
4,205.54 4,399.92 194.38 49.80
Add: (Increase)/Decrease of Excise Duty on Inventories (2.68) 18.01 191.70 67.81
(a) Details of Inventories under broad head are given below:(` Crore)
Finished Goods Work-in-Progress 31/03/2016 31/03/2015 31/03/2014 31/03/2016 31/03/2015 31/03/2014
Aluminium Business:Alumina 28.13 37.30 50.68 210.60 250.69 270.20 Aluminium and Aluminium Products 230.78 317.67 195.94 505.68 580.66 433.79 Others 1.49 101.07 6.28 658.26 700.05 410.38
Copper Business:Copper and Copper Products 114.62 63.35 228.02 987.97 1,289.32 1,602.41 Precious Metals 447.40 1.76 2.20 983.15 1,014.18 1,201.26 Others 27.38 35.79 42.56 10.08 8.08 6.00
849.80 556.94 525.68 3,355.74 3,842.98 3,924.04
28. Employee Benefi ts Expenses:
(` Crore)Year Ended
31/03/2016 31/03/2015 Salaries and Wages 1,377.29 1,251.64 Contribution to Provident and Other Funds 175.36 227.99 Employee Share Based Payments 6.91 7.22 Employee Welfare 146.46 135.71
1,706.02 1,622.56 Less: Transfer to Capital Work-in-Progress 7.96 33.08
1,698.06 1,589.48
29. Power and Fuel:
Power and Fuel 6,549.29 5,270.09 Less: Transfer to Capital Work-in-Progress 41.23 69.32
6,508.06 5,200.77
Hindalco Annual Report 2015-16.indb 104Hindalco Annual Report 2015-16.indb 104 8/17/2016 1:31:32 PM8/17/2016 1:31:32 PM
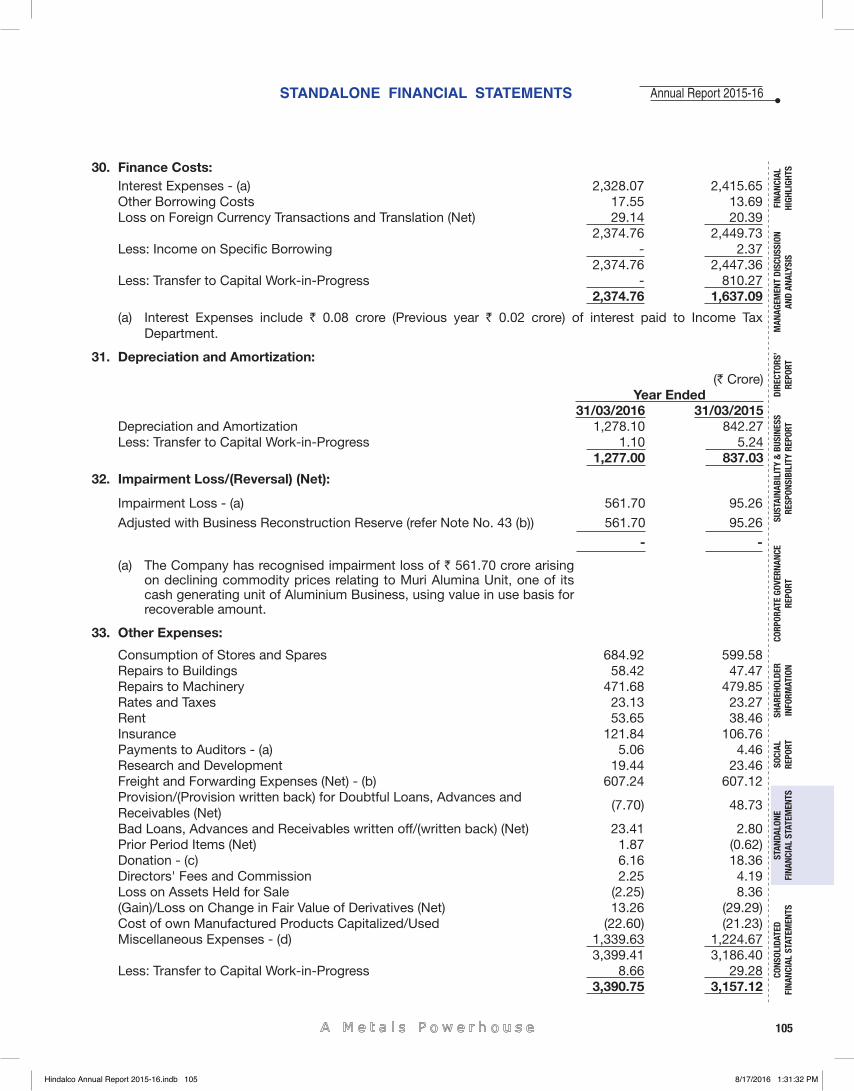
105
Annual Report 2015-16
FINA
NCIA
L HI
GHLI
GHTS
MAN
AGEM
ENT
DISC
USSI
ON
AND
ANAL
YSIS
CORP
ORAT
E GO
VERN
ANCE
RE
PORT
STAN
DALO
NE
FINA
NCIA
L ST
ATEM
ENTS
CONS
OLID
ATED
FI
NANC
IAL
STAT
EMEN
TSSO
CIAL
RE
PORT
DIRE
CTOR
S’RE
PORT
SHAR
EHOL
DER
INFO
RMAT
ION
SUST
AINA
BILI
TY &
BUS
INES
SRE
SPON
SIBI
LITY
REP
ORT
STANDALONE FINANCIAL STATEMENTS
30. Finance Costs:Interest Expenses - (a) 2,328.07 2,415.65 Other Borrowing Costs 17.55 13.69 Loss on Foreign Currency Transactions and Translation (Net) 29.14 20.39
2,374.76 2,449.73 Less: Income on Specifi c Borrowing - 2.37
2,374.76 2,447.36 Less: Transfer to Capital Work-in-Progress - 810.27
2,374.76 1,637.09
(a) Interest Expenses include ` 0.08 crore (Previous year ` 0.02 crore) of interest paid to Income Tax Department.
31. Depreciation and Amortization:
(` Crore)Year Ended
31/03/2016 31/03/2015 Depreciation and Amortization 1,278.10 842.27 Less: Transfer to Capital Work-in-Progress 1.10 5.24
1,277.00 837.03
32. Impairment Loss/(Reversal) (Net):
Impairment Loss - (a) 561.70 95.26
Adjusted with Business Reconstruction Reserve (refer Note No. 43 (b)) 561.70 95.26
- -
(a) The Company has recognised impairment loss of ` 561.70 crore arising on declining commodity prices relating to Muri Alumina Unit, one of its cash generating unit of Aluminium Business, using value in use basis for recoverable amount.
33. Other Expenses:
Consumption of Stores and Spares 684.92 599.58 Repairs to Buildings 58.42 47.47 Repairs to Machinery 471.68 479.85 Rates and Taxes 23.13 23.27 Rent 53.65 38.46 Insurance 121.84 106.76 Payments to Auditors - (a) 5.06 4.46 Research and Development 19.44 23.46 Freight and Forwarding Expenses (Net) - (b) 607.24 607.12 Provision/(Provision written back) for Doubtful Loans, Advances and Receivables (Net)
(7.70) 48.73
Bad Loans, Advances and Receivables written off/(written back) (Net) 23.41 2.80 Prior Period Items (Net) 1.87 (0.62)Donation - (c) 6.16 18.36 Directors' Fees and Commission 2.25 4.19 Loss on Assets Held for Sale (2.25) 8.36 (Gain)/Loss on Change in Fair Value of Derivatives (Net) 13.26 (29.29)Cost of own Manufactured Products Capitalized/Used (22.60) (21.23)Miscellaneous Expenses - (d) 1,339.63 1,224.67
3,399.41 3,186.40 Less: Transfer to Capital Work-in-Progress 8.66 29.28 3,390.75 3,157.12
Hindalco Annual Report 2015-16.indb 105Hindalco Annual Report 2015-16.indb 105 8/17/2016 1:31:32 PM8/17/2016 1:31:32 PM
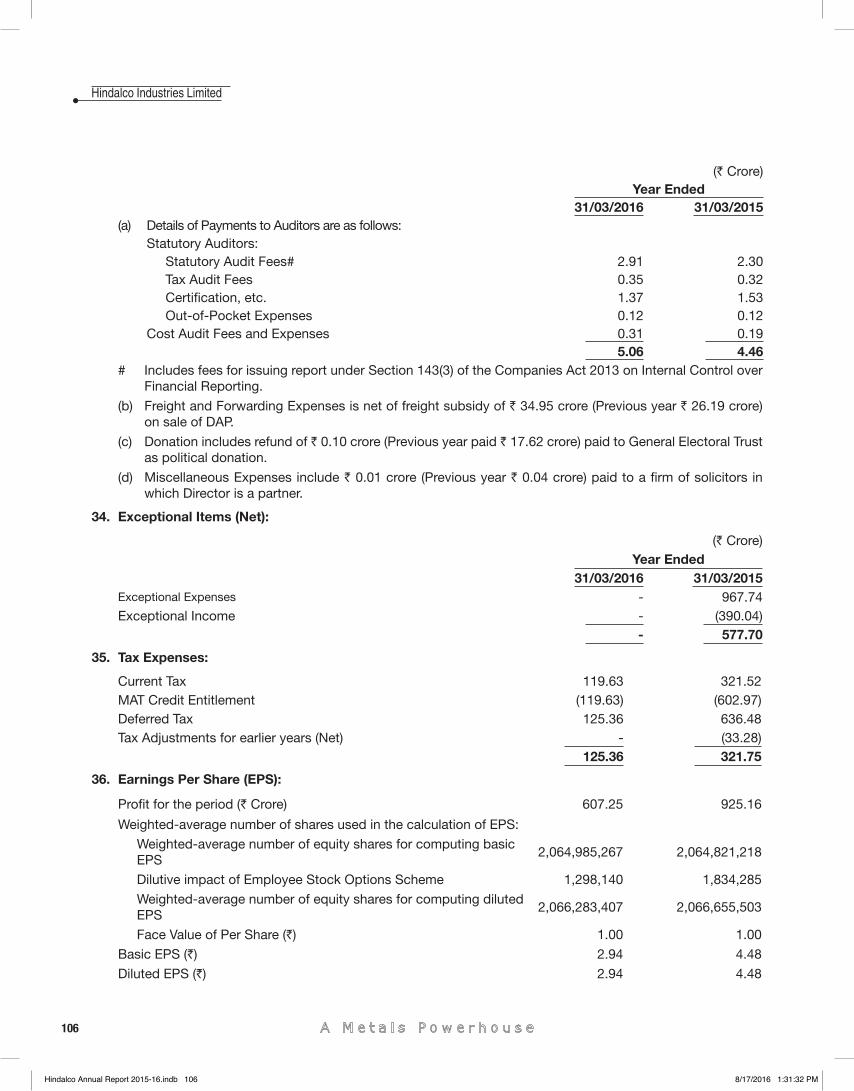
106
Hindalco Industries Limited
(` Crore)Year Ended
31/03/2016 31/03/2015(a) Details of Payments to Auditors are as follows:
Statutory Auditors:Statutory Audit Fees# 2.91 2.30 Tax Audit Fees 0.35 0.32 Certifi cation, etc. 1.37 1.53 Out-of-Pocket Expenses 0.12 0.12
Cost Audit Fees and Expenses 0.31 0.19 5.06 4.46
# Includes fees for issuing report under Section 143(3) of the Companies Act 2013 on Internal Control over Financial Reporting.
(b) Freight and Forwarding Expenses is net of freight subsidy of ` 34.95 crore (Previous year ` 26.19 crore) on sale of DAP.
(c) Donation includes refund of ` 0.10 crore (Previous year paid ` 17.62 crore) paid to General Electoral Trust as political donation.
(d) Miscellaneous Expenses include ` 0.01 crore (Previous year ` 0.04 crore) paid to a fi rm of solicitors in which Director is a partner.
34. Exceptional Items (Net):
(` Crore)Year Ended
31/03/2016 31/03/2015 Exceptional Expenses - 967.74 Exceptional Income - (390.04)
- 577.70
35. Tax Expenses:
Current Tax 119.63 321.52 MAT Credit Entitlement (119.63) (602.97)Deferred Tax 125.36 636.48 Tax Adjustments for earlier years (Net) - (33.28)
125.36 321.75
36. Earnings Per Share (EPS):
Profi t for the period (` Crore) 607.25 925.16
Weighted-average number of shares used in the calculation of EPS:
Weighted-average number of equity shares for computing basic EPS
2,064,985,267 2,064,821,218
Dilutive impact of Employee Stock Options Scheme 1,298,140 1,834,285
Weighted-average number of equity shares for computing diluted EPS
2,066,283,407 2,066,655,503
Face Value of Per Share (`) 1.00 1.00
Basic EPS (`) 2.94 4.48
Diluted EPS (`) 2.94 4.48
Hindalco Annual Report 2015-16.indb 106Hindalco Annual Report 2015-16.indb 106 8/17/2016 1:31:32 PM8/17/2016 1:31:32 PM
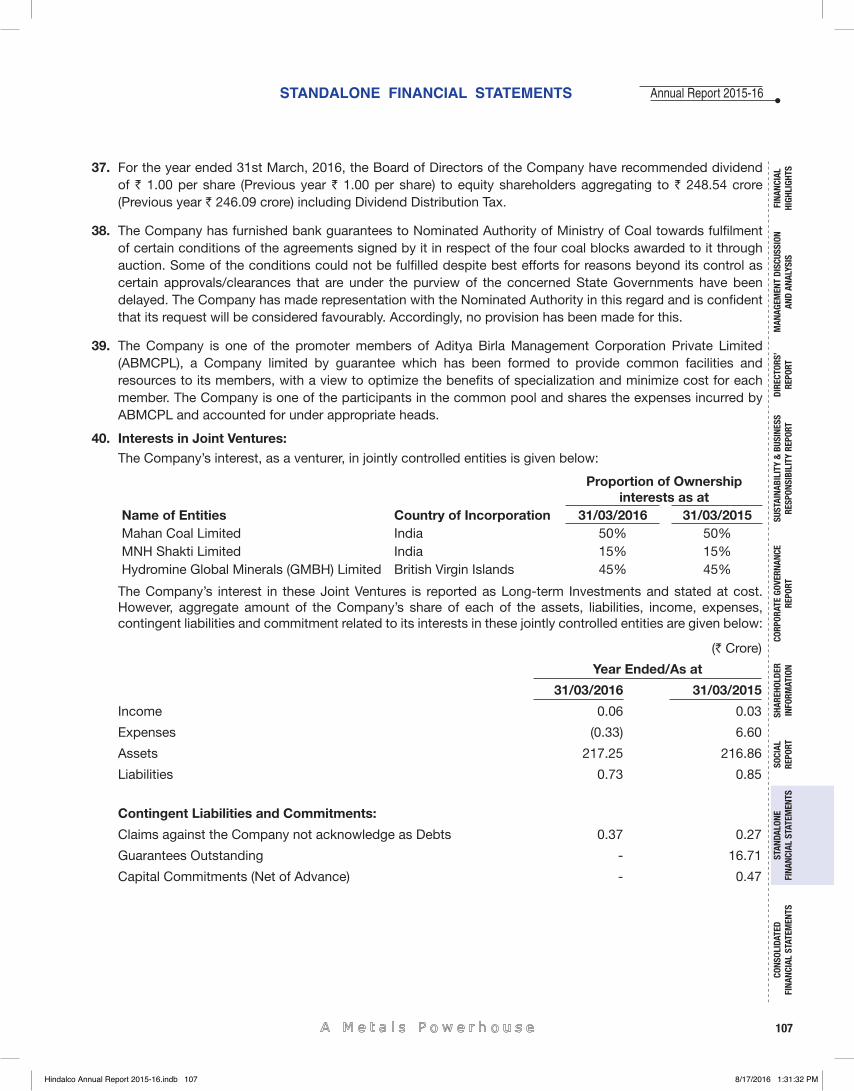
107
Annual Report 2015-16
FINA
NCIA
L HI
GHLI
GHTS
MAN
AGEM
ENT
DISC
USSI
ON
AND
ANAL
YSIS
CORP
ORAT
E GO
VERN
ANCE
RE
PORT
STAN
DALO
NE
FINA
NCIA
L ST
ATEM
ENTS
CONS
OLID
ATED
FI
NANC
IAL
STAT
EMEN
TSSO
CIAL
RE
PORT
DIRE
CTOR
S’RE
PORT
SHAR
EHOL
DER
INFO
RMAT
ION
SUST
AINA
BILI
TY &
BUS
INES
SRE
SPON
SIBI
LITY
REP
ORT
STANDALONE FINANCIAL STATEMENTS
37. For the year ended 31st March, 2016, the Board of Directors of the Company have recommended dividend of ` 1.00 per share (Previous year ` 1.00 per share) to equity shareholders aggregating to ` 248.54 crore (Previous year ` 246.09 crore) including Dividend Distribution Tax.
38. The Company has furnished bank guarantees to Nominated Authority of Ministry of Coal towards fulfi lment of certain conditions of the agreements signed by it in respect of the four coal blocks awarded to it through auction. Some of the conditions could not be fulfi lled despite best efforts for reasons beyond its control as certain approvals/clearances that are under the purview of the concerned State Governments have been delayed. The Company has made representation with the Nominated Authority in this regard and is confi dent that its request will be considered favourably. Accordingly, no provision has been made for this.
39. The Company is one of the promoter members of Aditya Birla Management Corporation Private Limited (ABMCPL), a Company limited by guarantee which has been formed to provide common facilities and resources to its members, with a view to optimize the benefi ts of specialization and minimize cost for each member. The Company is one of the participants in the common pool and shares the expenses incurred by ABMCPL and accounted for under appropriate heads.
40. Interests in Joint Ventures:The Company’s interest, as a venturer, in jointly controlled entities is given below:
Proportion of Ownership interests as at
Name of Entities Country of Incorporation 31/03/2016 31/03/2015Mahan Coal Limited India 50% 50%MNH Shakti Limited India 15% 15%Hydromine Global Minerals (GMBH) Limited British Virgin Islands 45% 45%
The Company’s interest in these Joint Ventures is reported as Long-term Investments and stated at cost. However, aggregate amount of the Company’s share of each of the assets, liabilities, income, expenses, contingent liabilities and commitment related to its interests in these jointly controlled entities are given below:
(` Crore)
Year Ended/As at
31/03/2016 31/03/2015
Income 0.06 0.03
Expenses (0.33) 6.60
Assets 217.25 216.86
Liabilities 0.73 0.85
Contingent Liabilities and Commitments:
Claims against the Company not acknowledge as Debts 0.37 0.27
Guarantees Outstanding - 16.71
Capital Commitments (Net of Advance) - 0.47
Hindalco Annual Report 2015-16.indb 107Hindalco Annual Report 2015-16.indb 107 8/17/2016 1:31:32 PM8/17/2016 1:31:32 PM
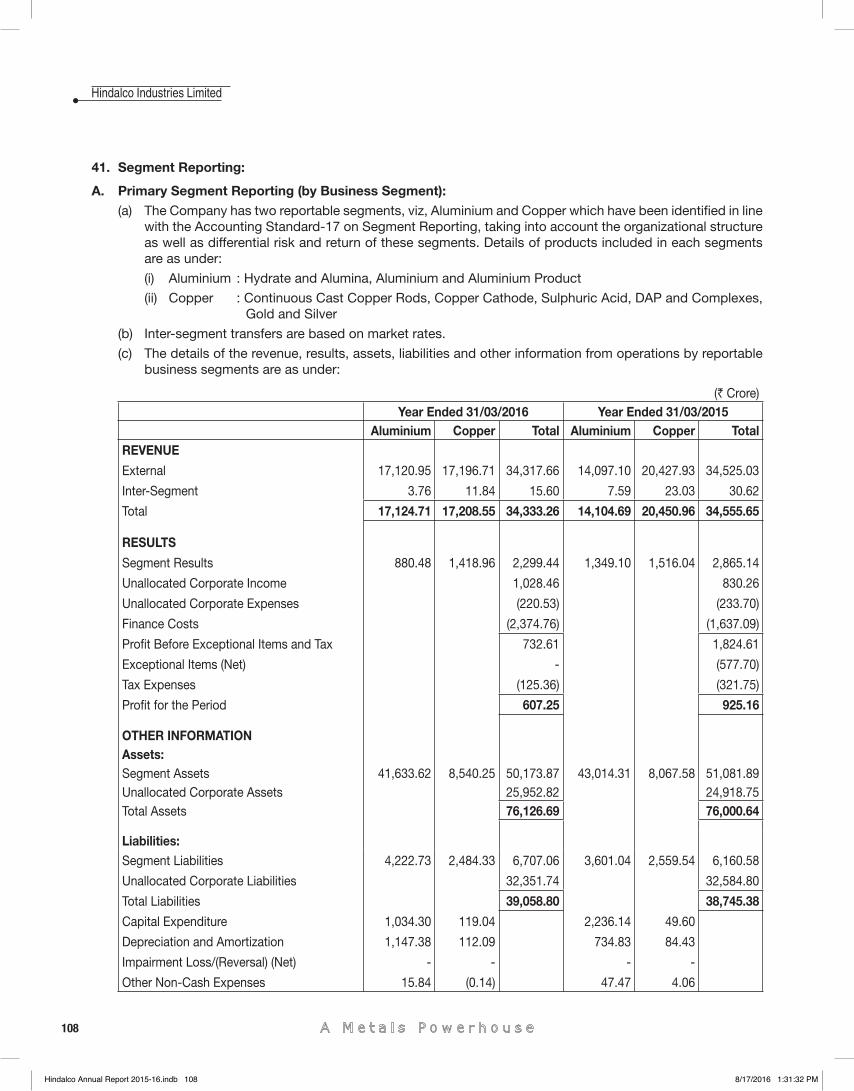
108
Hindalco Industries Limited
41. Segment Reporting:
A. Primary Segment Reporting (by Business Segment):(a) The Company has two reportable segments, viz, Aluminium and Copper which have been identifi ed in line
with the Accounting Standard-17 on Segment Reporting, taking into account the organizational structure as well as differential risk and return of these segments. Details of products included in each segments are as under:
(i) Aluminium : Hydrate and Alumina, Aluminium and Aluminium Product
(ii) Copper : Continuous Cast Copper Rods, Copper Cathode, Sulphuric Acid, DAP and Complexes, Gold and Silver
(b) Inter-segment transfers are based on market rates.
(c) The details of the revenue, results, assets, liabilities and other information from operations by reportable business segments are as under:
(` Crore)Year Ended 31/03/2016 Year Ended 31/03/2015
Aluminium Copper Total Aluminium Copper Total REVENUE
External 17,120.95 17,196.71 34,317.66 14,097.10 20,427.93 34,525.03
Inter-Segment 3.76 11.84 15.60 7.59 23.03 30.62
Total 17,124.71 17,208.55 34,333.26 14,104.69 20,450.96 34,555.65
RESULTS
Segment Results 880.48 1,418.96 2,299.44 1,349.10 1,516.04 2,865.14
Unallocated Corporate Income 1,028.46 830.26
Unallocated Corporate Expenses (220.53) (233.70)
Finance Costs (2,374.76) (1,637.09)
Profi t Before Exceptional Items and Tax 732.61 1,824.61
Exceptional Items (Net) - (577.70)
Tax Expenses (125.36) (321.75)
Profi t for the Period 607.25 925.16
OTHER INFORMATION Assets: Segment Assets 41,633.62 8,540.25 50,173.87 43,014.31 8,067.58 51,081.89 Unallocated Corporate Assets 25,952.82 24,918.75 Total Assets 76,126.69 76,000.64
Liabilities: Segment Liabilities 4,222.73 2,484.33 6,707.06 3,601.04 2,559.54 6,160.58
Unallocated Corporate Liabilities 32,351.74 32,584.80
Total Liabilities 39,058.80 38,745.38
Capital Expenditure 1,034.30 119.04 2,236.14 49.60
Depreciation and Amortization 1,147.38 112.09 734.83 84.43
Impairment Loss/(Reversal) (Net) - - - -
Other Non-Cash Expenses 15.84 (0.14) 47.47 4.06
Hindalco Annual Report 2015-16.indb 108Hindalco Annual Report 2015-16.indb 108 8/17/2016 1:31:32 PM8/17/2016 1:31:32 PM
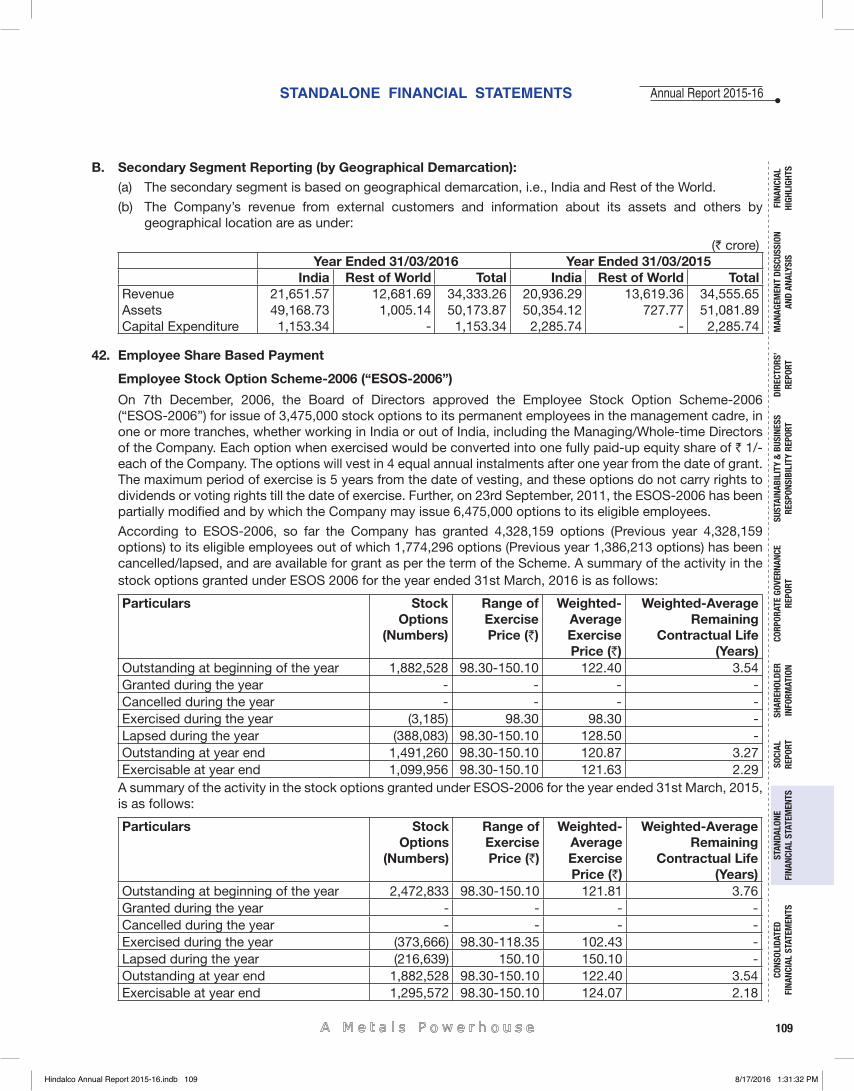
109
Annual Report 2015-16
FINA
NCIA
L HI
GHLI
GHTS
MAN
AGEM
ENT
DISC
USSI
ON
AND
ANAL
YSIS
CORP
ORAT
E GO
VERN
ANCE
RE
PORT
STAN
DALO
NE
FINA
NCIA
L ST
ATEM
ENTS
CONS
OLID
ATED
FI
NANC
IAL
STAT
EMEN
TSSO
CIAL
RE
PORT
DIRE
CTOR
S’RE
PORT
SHAR
EHOL
DER
INFO
RMAT
ION
SUST
AINA
BILI
TY &
BUS
INES
SRE
SPON
SIBI
LITY
REP
ORT
STANDALONE FINANCIAL STATEMENTS
B. Secondary Segment Reporting (by Geographical Demarcation):(a) The secondary segment is based on geographical demarcation, i.e., India and Rest of the World.
(b) The Company’s revenue from external customers and information about its assets and others by geographical location are as under:
(` crore) Year Ended 31/03/2016 Year Ended 31/03/2015
India Rest of World Total India Rest of World Total Revenue 21,651.57 12,681.69 34,333.26 20,936.29 13,619.36 34,555.65 Assets 49,168.73 1,005.14 50,173.87 50,354.12 727.77 51,081.89 Capital Expenditure 1,153.34 - 1,153.34 2,285.74 - 2,285.74
42. Employee Share Based Payment
Employee Stock Option Scheme-2006 (“ESOS-2006”)
On 7th December, 2006, the Board of Directors approved the Employee Stock Option Scheme-2006 (“ESOS-2006”) for issue of 3,475,000 stock options to its permanent employees in the management cadre, in one or more tranches, whether working in India or out of India, including the Managing/Whole-time Directors of the Company. Each option when exercised would be converted into one fully paid-up equity share of ` 1/- each of the Company. The options will vest in 4 equal annual instalments after one year from the date of grant. The maximum period of exercise is 5 years from the date of vesting, and these options do not carry rights to dividends or voting rights till the date of exercise. Further, on 23rd September, 2011, the ESOS-2006 has been partially modifi ed and by which the Company may issue 6,475,000 options to its eligible employees.
According to ESOS-2006, so far the Company has granted 4,328,159 options (Previous year 4,328,159 options) to its eligible employees out of which 1,774,296 options (Previous year 1,386,213 options) has been cancelled/lapsed, and are available for grant as per the term of the Scheme. A summary of the activity in the stock options granted under ESOS 2006 for the year ended 31st March, 2016 is as follows:
Particulars Stock Options
(Numbers)
Range of Exercise Price (`)
Weighted-Average Exercise Price (`)
Weighted-Average Remaining
Contractual Life (Years)
Outstanding at beginning of the year 1,882,528 98.30-150.10 122.40 3.54 Granted during the year - - - - Cancelled during the year - - - - Exercised during the year (3,185) 98.30 98.30 - Lapsed during the year (388,083) 98.30-150.10 128.50 - Outstanding at year end 1,491,260 98.30-150.10 120.87 3.27 Exercisable at year end 1,099,956 98.30-150.10 121.63 2.29
A summary of the activity in the stock options granted under ESOS-2006 for the year ended 31st March, 2015, is as follows:
Particulars Stock Options
(Numbers)
Range of Exercise Price (`)
Weighted-Average Exercise Price (`)
Weighted-Average Remaining
Contractual Life (Years)
Outstanding at beginning of the year 2,472,833 98.30-150.10 121.81 3.76 Granted during the year - - - - Cancelled during the year - - - - Exercised during the year (373,666) 98.30-118.35 102.43 - Lapsed during the year (216,639) 150.10 150.10 - Outstanding at year end 1,882,528 98.30-150.10 122.40 3.54 Exercisable at year end 1,295,572 98.30-150.10 124.07 2.18
Hindalco Annual Report 2015-16.indb 109Hindalco Annual Report 2015-16.indb 109 8/17/2016 1:31:32 PM8/17/2016 1:31:32 PM
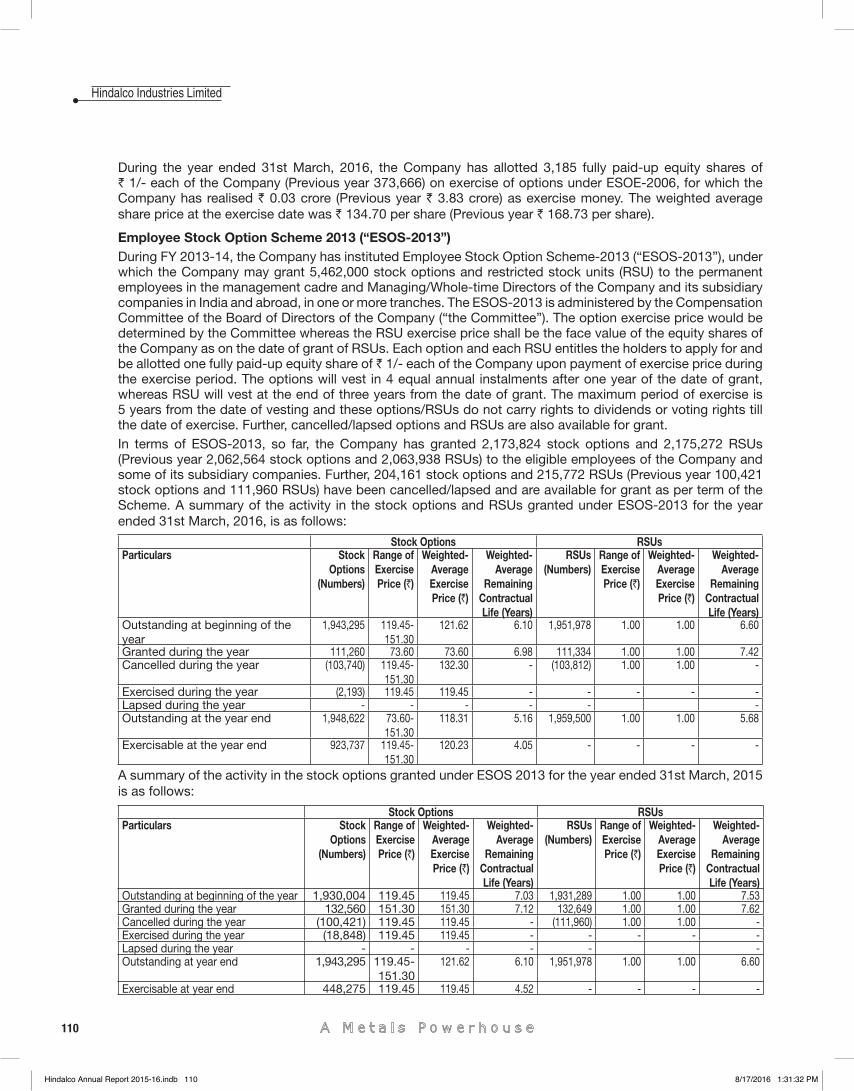
110
Hindalco Industries Limited
During the year ended 31st March, 2016, the Company has allotted 3,185 fully paid-up equity shares of` 1/- each of the Company (Previous year 373,666) on exercise of options under ESOE-2006, for which the Company has realised ` 0.03 crore (Previous year ` 3.83 crore) as exercise money. The weighted average share price at the exercise date was ` 134.70 per share (Previous year ` 168.73 per share).
Employee Stock Option Scheme 2013 (“ESOS-2013”)During FY 2013-14, the Company has instituted Employee Stock Option Scheme-2013 (“ESOS-2013”), under which the Company may grant 5,462,000 stock options and restricted stock units (RSU) to the permanent employees in the management cadre and Managing/Whole-time Directors of the Company and its subsidiary companies in India and abroad, in one or more tranches. The ESOS-2013 is administered by the Compensation Committee of the Board of Directors of the Company (“the Committee”). The option exercise price would be determined by the Committee whereas the RSU exercise price shall be the face value of the equity shares of the Company as on the date of grant of RSUs. Each option and each RSU entitles the holders to apply for and be allotted one fully paid-up equity share of ` 1/- each of the Company upon payment of exercise price during the exercise period. The options will vest in 4 equal annual instalments after one year of the date of grant, whereas RSU will vest at the end of three years from the date of grant. The maximum period of exercise is 5 years from the date of vesting and these options/RSUs do not carry rights to dividends or voting rights till the date of exercise. Further, cancelled/lapsed options and RSUs are also available for grant.In terms of ESOS-2013, so far, the Company has granted 2,173,824 stock options and 2,175,272 RSUs (Previous year 2,062,564 stock options and 2,063,938 RSUs) to the eligible employees of the Company and some of its subsidiary companies. Further, 204,161 stock options and 215,772 RSUs (Previous year 100,421 stock options and 111,960 RSUs) have been cancelled/lapsed and are available for grant as per term of the Scheme. A summary of the activity in the stock options and RSUs granted under ESOS-2013 for the year ended 31st March, 2016, is as follows:
Stock Options RSUsParticulars Stock
Options (Numbers)
Range of Exercise Price (`)
Weighted- Average Exercise Price (`)
Weighted- Average
Remaining Contractual Life (Years)
RSUs (Numbers)
Range of Exercise Price (`)
Weighted- Average Exercise Price (`)
Weighted- Average
Remaining Contractual Life (Years)
Outstanding at beginning of the year
1,943,295 119.45-151.30
121.62 6.10 1,951,978 1.00 1.00 6.60
Granted during the year 111,260 73.60 73.60 6.98 111,334 1.00 1.00 7.42 Cancelled during the year (103,740) 119.45-
151.30 132.30 - (103,812) 1.00 1.00 -
Exercised during the year (2,193) 119.45 119.45 - - - - - Lapsed during the year - - - - - - Outstanding at the year end 1,948,622 73.60-
151.30 118.31 5.16 1,959,500 1.00 1.00 5.68
Exercisable at the year end 923,737 119.45-151.30
120.23 4.05 - - - -
A summary of the activity in the stock options granted under ESOS 2013 for the year ended 31st March, 2015 is as follows:
Stock Options RSUsParticulars Stock
Options (Numbers)
Range of Exercise Price (`)
Weighted- Average Exercise Price (`)
Weighted- Average
Remaining Contractual Life (Years)
RSUs (Numbers)
Range of Exercise Price (`)
Weighted- Average Exercise Price (`)
Weighted- Average
Remaining Contractual Life (Years)
Outstanding at beginning of the year 1,930,004 119.45 119.45 7.03 1,931,289 1.00 1.00 7.53 Granted during the year 132,560 151.30 151.30 7.12 132,649 1.00 1.00 7.62 Cancelled during the year (100,421) 119.45 119.45 - (111,960) 1.00 1.00 - Exercised during the year (18,848) 119.45 119.45 - - - - - Lapsed during the year - - - - - - Outstanding at year end 1,943,295 119.45-
151.30 121.62 6.10 1,951,978 1.00 1.00 6.60
Exercisable at year end 448,275 119.45 119.45 4.52 - - - -
Hindalco Annual Report 2015-16.indb 110Hindalco Annual Report 2015-16.indb 110 8/17/2016 1:31:32 PM8/17/2016 1:31:32 PM

111
Annual Report 2015-16
FINA
NCIA
L HI
GHLI
GHTS
MAN
AGEM
ENT
DISC
USSI
ON
AND
ANAL
YSIS
CORP
ORAT
E GO
VERN
ANCE
RE
PORT
STAN
DALO
NE
FINA
NCIA
L ST
ATEM
ENTS
CONS
OLID
ATED
FI
NANC
IAL
STAT
EMEN
TSSO
CIAL
RE
PORT
DIRE
CTOR
S’RE
PORT
SHAR
EHOL
DER
INFO
RMAT
ION
SUST
AINA
BILI
TY &
BUS
INES
SRE
SPON
SIBI
LITY
REP
ORT
STANDALONE FINANCIAL STATEMENTS
During the year ended 31st March, 2016, the Company has allotted 2,193 fully paid-up equity share of ` 1/- each of the Company (Previous year 18,848) on exercise of options under ESOS-2013 for which the Company has realised ` 0.03 crore (Previous year ` 0.22 crore) as exercise money. The weighted-average share price at the exercise date was ` 114.30 per share (Previous year ` 154.54 per share).
Fair ValuationThe Fair Value of the options used to compute net profi t and earnings per share have been done by an independent valuer using Black and Scholes Model. The details of options granted during the year ended 31st March, 2016, the key assumptions and the Fair Value on the date of grant are as under:
FY 2015-16 FY 2014-15
ESOS-2013 ESOS-2013
Particulars Stock Option RSU Stock Option RSU
Number of Option/RSU granted 111,260 111,334 132,560 132,649
Options/RSUs grant date 26.11.2015 26.11.2015 13.11.2014 13.11.2014
Exercise Price (`) 73.60 1.00 151.30 1.00
Risk-Free Interest Rate 8% 8% 9% 9%
Life of Options granted 7.5 years 8 years 7.5 years 8 years
Expected Volatility 0.4636 0.4759 0.4830 0.4749
Expected Dividend 100% 100% 100% 100%
Weighted-average Fair Value per Option (`) 41.96 68.20 88.52 137.69
The expected volatility was determined based on the historical share price volatility over the past period depending on life of the options granted.
For the year ended 31st March, 2016, the Company determined ` 7.05 crore (Previous year ` 7.28 crore) as amortized compensation cost for stock options granted including ` 0.14 crore (Previous year ` 0.06 crore) expenses relating to options granted to employees of a subsidiary of the Company which has been realised from that company. The Company measures compensation cost for the stock options granted using intrinsic value method. Had the compensation cost been determined in a manner consistent with fair value approach, the Company’s net profi t and earnings per share as reported would have been as under:
(` Crore)
Year Ended
31/03/2016 31/03/2015
Reported Net Profi t for the period 607.25 925.16
Add: Compensation Cost under ESOS as per Intrinsic Value 6.91 7.22
Less: Compensation Cost under ESOS as per Fair Value (9.45) (13.03)
Proforma Net Profi t for the period 604.71 919.35
Basic Earnings Per Share (`)
As Reported 2.94 4.48
Proforma 2.93 4.45
Diluted Earnings Per Share (`)
As Reported 2.94 4.48
Proforma 2.93 4.45
Hindalco Annual Report 2015-16.indb 111Hindalco Annual Report 2015-16.indb 111 8/17/2016 1:31:33 PM8/17/2016 1:31:33 PM
112
Hindalco Industries Limited
43. The Company had formulated a scheme of fi nancial restructuring under Sections 391 to 394 of the Companies Act, 1956 (“the Scheme”), between the Company and its equity shareholders approved by the High Court of Judicature of Bombay to deal with various costs associated with its organic and inorganic growth plan. Pursuant to this, a separate reserve account titled as Business Reconstruction Reserve (“BRR”) was created during the year 2008-09 by transferring balance standing to the credit of Securities Premium Account of the Company, for adjustment of certain expenses as prescribed in the Scheme. Accordingly, the Company had transferred ` 8,647.37 crore from Securities Premium Account to BRR, and till 31st March, 2015, ` 250.33 crore have been adjusted against BRR. During the year, following expenses has been adjusted with BRR:
(a) ` 279.46 crore towards expenses on exited Projects
(b) Impairment loss of ` 367.31 crore (Net of deferred tax ` 194.39 crore)
(c) Provision of ` 35.50 crore towards diminution in value of investments
Had the Scheme not prescribed aforesaid treatment, the impact on results and Earnings Per Share (EPS) would have been as under:
Profi t for the year lower by ` 682.27 crore
Basic EPS lower by ` 3.30
Diluted EPS lower by ` 3.30
44. Directors’ Remuneration: Calculation of Net Profi t for Managerial Remuneration under Section 197 and 198 of the Companies Act, 2013,
given below:
(` Crore)
Year Ended31/03/2016 31/03/2015
Net Profi t for the Year as per the Statement of Profi t and Loss 607.25 925.16
Add: Income/Expenses not to be included:
Executive Directors, Remuneration 33.86 33.76
Other Directors’ Fees and Commission 2.25 4.19
Income Tax Expenses 125.36 321.75
Contribution/(Refund) for Donation to Political Parties (0.10) 17.62
Provisions/(Provisions written back) for Doubtful Loans, Advances and Receivables (Net)
(7.70) 48.73
Unrealized (Gain)/Loss on change in Fair Value of Derivatives recognised in Profi t and Loss (Net)
(101.95) 118.10
Adjustments to the carrying amount of Long-term Investments (Net) (0.82) 0.11
Profi t on Sale of Fixed Assets over original cost (5.05) -
(Gain)/Loss on Sale of Long-term Investments (Net) (17.37) -
Net Profi t as per Section 198 of the Companies Act, 2013 635.73 1,469.42
Remuneration to Executive Directors (shall not exceed 10% of Net Profi t u/s 197) 63.57 146.94
Remuneration to Other Directors (shall not exceed 1% of Net Profi t u/s 197) 6.36 14.69
Hindalco Annual Report 2015-16.indb 112Hindalco Annual Report 2015-16.indb 112 8/17/2016 1:31:33 PM8/17/2016 1:31:33 PM
113
Annual Report 2015-16
FINA
NCIA
L HI
GHLI
GHTS
MAN
AGEM
ENT
DISC
USSI
ON
AND
ANAL
YSIS
CORP
ORAT
E GO
VERN
ANCE
RE
PORT
STAN
DALO
NE
FINA
NCIA
L ST
ATEM
ENTS
CONS
OLID
ATED
FI
NANC
IAL
STAT
EMEN
TSSO
CIAL
RE
PORT
DIRE
CTOR
S’RE
PORT
SHAR
EHOL
DER
INFO
RMAT
ION
SUST
AINA
BILI
TY &
BUS
INES
SRE
SPON
SIBI
LITY
REP
ORT
STANDALONE FINANCIAL STATEMENTS
45. Disclosure as required by Accounting Standard (AS)-15 (Revised) on “Employee Benefi ts”:
A. In respect of Gratuity, a Defi ned Benefi t Scheme (based on actuarial valuation):-
(` crore)Year Ended
31/03/2016 31/03/2015(a) Change in Obligations over the year ended 31 March, 2016
Present value of Defi ned Benefi t Obligations at the beginning of the year 747.85 595.05 Current Service Cost 50.18 38.40 Past Service Cost - - Interest Cost 55.49 52.52 Curtailment Cost/(Credit) - - Settlement Cost/(Credit) - - Plan Amendments 1.01 - Acquisitions Cost 3.22 - Actuarial (Gain) or Loss 10.60 84.84 Benefi ts Paid (22.29) (22.96)Present Value of Defi ned Benefi t Obligations at the end of the year 846.06 747.85
(b) Change in Plan Assets (Reconciliation of Opening and Closing Balances)Fair Value of Plan Assets at the beginning of the year 462.51 388.54 Expected Return on Plan Assets 38.20 39.52 Actuarial Gain or (Loss) (2.92) - Contributions 52.33 57.41 Benefi ts Paid (22.29) (22.96)Fair Value of Plan Assets at the end of the year 527.83 462.51
(c) Reconciliation of Fair Value of Assets and ObligationsFair Value of Plan Assets at the end of the year 527.83 462.51 Present Value of Defi ned Benefi t Obligations at the end of the year (846.06) (747.85)Amount Recognised in the Balance Sheet (318.23) (285.34)
(d) Expenses Recognised during the year Current Service Cost 50.18 38.40 Past Service Cost 1.01 - Interest Cost 55.49 52.52 Curtailment Cost/(Credit) - - Settlement Cost/(Credit) - - Actuarial (Gain) or Loss 13.52 77.78 Expected Return on Plan Assets (38.20) (32.46)
82.00 136.24 (e) Investments Details of Plan Assets:
Insurer Managed Funds 96.35% 96.38%Government Securities 0.00% 0.00%Corporate Bonds 0.00% 0.00%Others 3.65% 3.62%
Hindalco Annual Report 2015-16.indb 113Hindalco Annual Report 2015-16.indb 113 8/17/2016 1:31:33 PM8/17/2016 1:31:33 PM
114
Hindalco Industries Limited
(` crore)Year Ended
31/03/2016 31/03/2015(f) Principal Actuarial Assumptions:
Discount Rate (based on the market yields available on Government Bonds at the accounting date with a term that matches that of the liabilities)
7.50% 7.50%
Expected Rate of Return on Assets 8.00% 8.00%Salary increases taking into account infl ation, seniority, promotion and other relevant factors
8.00% 7.50%
The Company has various schemes (funded/unfunded) for payment of gratuity to all eligible employees calculated at specifi ed number of days (ranging from 15 days to 1 month) of last drawn salary depending upon the tenure of service for each year of completed service, subject to minimum service of fi ve years, payable at the time of separation upon superannuation or on exit otherwise.
B. In respect of Defi ned Contribution Schemes:
(a) As required under Guidance Note on Implementation of Accounting Standard-15 (revised) issued by the ICAI, in respect of exempted Provident Fund, the Company has carried out actuarial valuation to ascertain shortfall in interest, if any, payable to the members of Provident Fund and has made appropriate provision in the books. The Company contributes 12% of salary for all eligible employees towards Provident Fund managed either by approved trusts or by the Central Government and debited to the Statement of Profi t and Loss. In view of typical nature of such Provident Fund Scheme involving defi ned benefi t underpin in respect of interest payable to members as declared by the Employees Provident Fund Organisation, the defi ned benefi t obligation relating to interest shortfall is considered to be Other Long Term Employee Benefi ts. The amount debited to the Statement of Profi t and Loss during the year was ` 88.63 crore (Previous year ` 87.29 crore).
(b) The Company contributes a certain percentage of salary for all eligible employees in the managerial cadre towards Superannuation Funds with option to put certain portion in NPS and/or in Funds managed by approved trusts or by Life Insurance Corporation of India. The amount debited to the Statement of Profi t and Loss during the year was ` 14.80 crore (Previous year ` 13.27 crore).
46. Provisions:The details of other provisions and its movement included in Notes 7 and 11 are as under:
(` crore)
As at 31/3/2015 Additions Utilised
Unused Reversed
As at 31/3/2016
(a) Provision for Claims against the Company 28.39 1.55 - - 29.94
(b) Assets Retirement Obligation - 25.34 - - 25.34
(c) Environment Obligation - 16.62 - - 16.62
(d) Others 3.25 - - 3.25 -
31.64 43.51 - 3.25 71.90
Previous Year 27.02 - - - 31.64
As at31/03/2016 31/03/2015
Non-Current Portion 38.13 - Current Portion 33.77 31.64
Hindalco Annual Report 2015-16.indb 114Hindalco Annual Report 2015-16.indb 114 8/17/2016 1:31:33 PM8/17/2016 1:31:33 PM

115
Annual Report 2015-16
FINA
NCIA
L HI
GHLI
GHTS
MAN
AGEM
ENT
DISC
USSI
ON
AND
ANAL
YSIS
CORP
ORAT
E GO
VERN
ANCE
RE
PORT
STAN
DALO
NE
FINA
NCIA
L ST
ATEM
ENTS
CONS
OLID
ATED
FI
NANC
IAL
STAT
EMEN
TSSO
CIAL
RE
PORT
DIRE
CTOR
S’RE
PORT
SHAR
EHOL
DER
INFO
RMAT
ION
SUST
AINA
BILI
TY &
BUS
INES
SRE
SPON
SIBI
LITY
REP
ORT
STANDALONE FINANCIAL STATEMENTS
Provision for claims against the Company represents the provision for claims of suppliers, contractors, customers, revenue authorities and others, where the Company anticipates probable outfl ow. Asset retirement and environment obligations represent decommissioning and site cleaning costs. The amount of provision is estimated by the Company considering the facts and circumstances of each case for which cash fl ow will be determined on settlement of these matters.
47. Gain or (Loss) on foreign currency transaction and translation has been accounted for under respective head of accounts depending upon the nature of transaction. The details of net gain or (loss) included in various head of accounts are as under:
(` crore)Year Ended
31/03/2016 31/03/2015Revenue from Operations 57.59 131.39 Cost of Materials Consumed (18.19) (78.60)Power and Fuel (2.49) 2.03 Other Expenses (55.95) (11.72)Interest (29.14) (20.39)
(48.18) 22.71
48. Operating Lease:The total of future minimum lease payment commitments under non-cancellable operating lease agreement for a period of twenty years, expiring in 2022, to use railway tracks along with locomotives for transportation of materials are as under:
(` crore)As at
31/03/2016 31/03/2015Not later than one year 0.40 0.40 Later than one year and not later than fi ve years 1.60 1.60 Later than fi ve years 0.47 0.87
49. Derivative Financial Instruments:(a) The Company has adopted Accounting Standard-30, “Financial Instruments: Recognition and
Measurement”, issued by the Institute of Chartered Accountants of India, so far as it relates to derivative accounting.
(b) In the ordinary course of business, the Company is exposed to risks resulting from changes in prices of commodity, exchange rate fl uctuation and interest rate movements. It manages its exposure to these risks through derivative fi nancial instruments. It uses derivative instruments such as forwards, futures, swaps and options to manage these risks. These derivative instruments reduce the impact of both favourable and unfavourable fl uctuations.
The Company’s risk management activities are subject to the management, direction and control of Risk Management Board (RMB). The RMB is composed of three directors including Managing Director, Deputy Managing Director and at least two offi cers, one being the Chief Financial Offi cer. The RMB reports to the Board of Directors on the scope of its activities.
The decision of whether and when to execute derivative fi nancial instruments along with its tenure can vary from period to period depending on market conditions and the relative costs of the instruments. The tenure is always linked to the timing of the underlying exposure, with the connection between the two being regularly monitored. The Company is exposed to losses in the event of non-performance by the counterparties to the derivative contracts. All derivative contracts are executed with counterparties that, in our judgment, are creditworthy. The credit levels are reviewed to ensure that there is no inappropriate concentration of outstanding to any particular counterparty.
Hindalco Annual Report 2015-16.indb 115Hindalco Annual Report 2015-16.indb 115 8/17/2016 1:31:33 PM8/17/2016 1:31:33 PM
116
Hindalco Industries Limited
Commodity Price Risk
Copper and Precious Metals
This business is conducted under a conversion model. The prices of input and output are derived from the same benchmark and/or are linked to each other through a defi ned formula. The objective of risk management is to attempt to use derivatives to match the price fl uctuations arising out of the timing mismatch in pricing the input and output to make the margins immune to the fl uctuations in prices of the input and output.
Aluminium
This business is vertically integrated. The main raw material, viz., bauxite (mostly mined from own mines) and other purchased raw materials do not have any linkage with the output price which is Aluminium LME prices. When the prices of input(s) and output(s) do not follow the above condition, then risk management attempts to use derivatives so as to protect the margins from adverse movements in prices on either side, i.e., from a rise in input cost or from a fall in output price.
Coal and Furnace Oil
Smelting and other associated operations of aluminium require signifi cant amount of power. Such power is mostly supplied through captive power generation units which are coal based. In order to meet the gap between requirement of coal and its availability domestically, sometimes coal is also imported. The domestic prices of coal are not linked to any internationally traded price whereas the imported coal is linked to internationally traded prices. Hence the imported coal price fl uctuates in line with the international prices. To mitigate this risk, coal commodity derivatives are taken. Similarly, Furnace Oil is also an important input for manufacturing alumina which is the input for aluminium production. Furnace oil is sourced mainly from domestic market but the price is linked to international crude price movement. Hence, to mitigate this risk, furnace oil commodity derivatives are taken.
Foreign Currency Exchange Risk
Exchange rate movements, particularly, the United States Dollar (USD) and Euro (EUR) against Indian Rupee (INR), have an impact on our operating results. In addition to the foreign exchange fl ow from exports, the commodity prices in the domestic market are derived based on the landed cost of imports in India where LME prices and USD/INR exchange rate are the main factors. In case of conversion business, the objective is to match the exchange rate of outfl ows and related infl ows through derivative fi nancial instruments. With respect to Aluminium business, where costs are predominantly in INR, the strengthening of INR against USD adversely affects the profi tability of the business and benefi ts when INR depreciates against USD. The Company enters into various foreign exchange contracts to protect profi tability. The Company also enters into various foreign exchange contracts to mitigate the risk arising out of foreign currency exchange rate movement in foreign currency contracts executed with foreign suppliers to procure capital items for its project activities. Also, certain foreign exchange future derivatives are taken for arbitrage between exchange and OTC.
Embedded derivatives
Copper concentrate is purchased on future pricing model based on month’s average LME (in case of copper)/LBMA (in case of gold and silver). Since the value of the concentrate changes with response to change in commodity pricing indices, embedded derivatives (ED) is identifi ed and segregated in the contract. The ED, so segregated, is treated like commodity derivative and qualify for hedge accounting. These derivatives are put into a Fair Value hedge relationship with inventory.
The objective of hedge designation of the embedded commodity derivative is to offset the volatility in the Statement of Profi t and Loss due to change in value of un-priced inventory with response to LME/ LBMA.
Hindalco Annual Report 2015-16.indb 116Hindalco Annual Report 2015-16.indb 116 8/17/2016 1:31:33 PM8/17/2016 1:31:33 PM
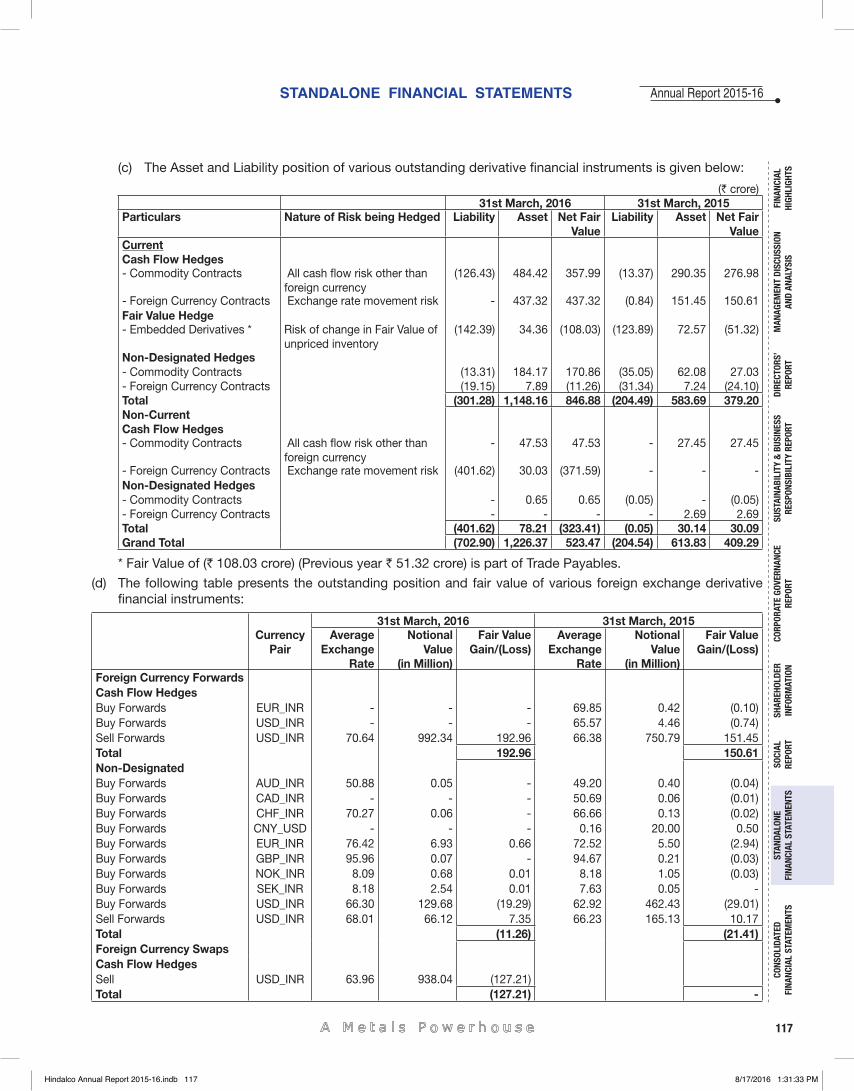
117
Annual Report 2015-16
FINA
NCIA
L HI
GHLI
GHTS
MAN
AGEM
ENT
DISC
USSI
ON
AND
ANAL
YSIS
CORP
ORAT
E GO
VERN
ANCE
RE
PORT
STAN
DALO
NE
FINA
NCIA
L ST
ATEM
ENTS
CONS
OLID
ATED
FI
NANC
IAL
STAT
EMEN
TSSO
CIAL
RE
PORT
DIRE
CTOR
S’RE
PORT
SHAR
EHOL
DER
INFO
RMAT
ION
SUST
AINA
BILI
TY &
BUS
INES
SRE
SPON
SIBI
LITY
REP
ORT
STANDALONE FINANCIAL STATEMENTS
(c) The Asset and Liability position of various outstanding derivative fi nancial instruments is given below:
(` crore)31st March, 2016 31st March, 2015
Particulars Nature of Risk being Hedged Liability Asset Net Fair Value
Liability Asset Net Fair Value
CurrentCash Flow Hedges- Commodity Contracts All cash fl ow risk other than
foreign currency (126.43) 484.42 357.99 (13.37) 290.35 276.98
- Foreign Currency Contracts Exchange rate movement risk - 437.32 437.32 (0.84) 151.45 150.61 Fair Value Hedge- Embedded Derivatives * Risk of change in Fair Value of
unpriced inventory (142.39) 34.36 (108.03) (123.89) 72.57 (51.32)
Non-Designated Hedges- Commodity Contracts (13.31) 184.17 170.86 (35.05) 62.08 27.03 - Foreign Currency Contracts (19.15) 7.89 (11.26) (31.34) 7.24 (24.10)Total (301.28) 1,148.16 846.88 (204.49) 583.69 379.20 Non-CurrentCash Flow Hedges- Commodity Contracts All cash fl ow risk other than
foreign currency - 47.53 47.53 - 27.45 27.45
- Foreign Currency Contracts Exchange rate movement risk (401.62) 30.03 (371.59) - - - Non-Designated Hedges- Commodity Contracts - 0.65 0.65 (0.05) - (0.05)- Foreign Currency Contracts - - - - 2.69 2.69 Total (401.62) 78.21 (323.41) (0.05) 30.14 30.09 Grand Total (702.90) 1,226.37 523.47 (204.54) 613.83 409.29
* Fair Value of (` 108.03 crore) (Previous year ` 51.32 crore) is part of Trade Payables.
(d) The following table presents the outstanding position and fair value of various foreign exchange derivative fi nancial instruments:
31st March, 2016 31st March, 2015Currency
PairAverage
Exchange Rate
Notional Value
(in Million)
Fair Value Gain/(Loss)
Average Exchange
Rate
Notional Value
(in Million)
Fair Value Gain/(Loss)
Foreign Currency ForwardsCash Flow HedgesBuy Forwards EUR_INR - - - 69.85 0.42 (0.10)Buy Forwards USD_INR - - - 65.57 4.46 (0.74)Sell Forwards USD_INR 70.64 992.34 192.96 66.38 750.79 151.45 Total 192.96 150.61 Non-DesignatedBuy Forwards AUD_INR 50.88 0.05 - 49.20 0.40 (0.04)Buy Forwards CAD_INR - - - 50.69 0.06 (0.01)Buy Forwards CHF_INR 70.27 0.06 - 66.66 0.13 (0.02)Buy Forwards CNY_USD - - - 0.16 20.00 0.50 Buy Forwards EUR_INR 76.42 6.93 0.66 72.52 5.50 (2.94)Buy Forwards GBP_INR 95.96 0.07 - 94.67 0.21 (0.03)Buy Forwards NOK_INR 8.09 0.68 0.01 8.18 1.05 (0.03)Buy Forwards SEK_INR 8.18 2.54 0.01 7.63 0.05 - Buy Forwards USD_INR 66.30 129.68 (19.29) 62.92 462.43 (29.01)Sell Forwards USD_INR 68.01 66.12 7.35 66.23 165.13 10.17 Total (11.26) (21.41)Foreign Currency SwapsCash Flow HedgesSell USD_INR 63.96 938.04 (127.21)Total (127.21) -
Hindalco Annual Report 2015-16.indb 117Hindalco Annual Report 2015-16.indb 117 8/17/2016 1:31:33 PM8/17/2016 1:31:33 PM
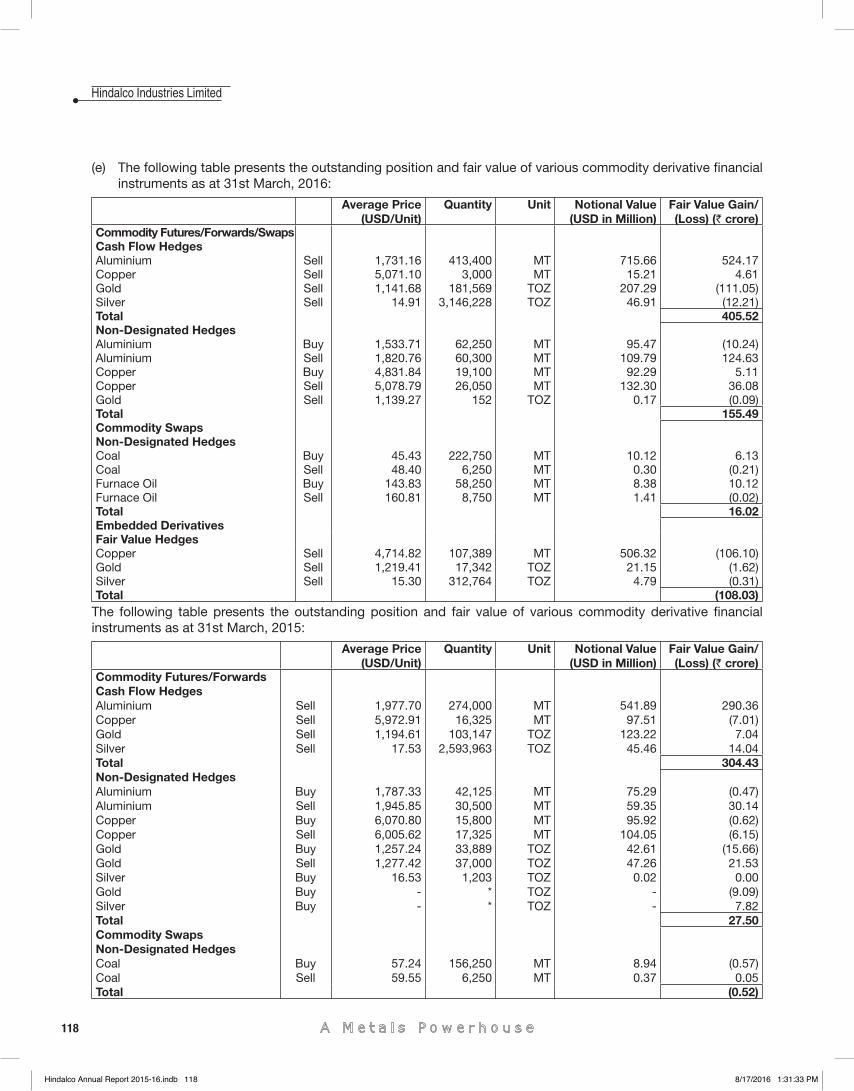
118
Hindalco Industries Limited
(e) The following table presents the outstanding position and fair value of various commodity derivative fi nancial instruments as at 31st March, 2016:
Average Price (USD/Unit)
Quantity Unit Notional Value (USD in Million)
Fair Value Gain/(Loss) (` crore)
Commodity Futures/Forwards/SwapsCash Flow HedgesAluminium Sell 1,731.16 413,400 MT 715.66 524.17 Copper Sell 5,071.10 3,000 MT 15.21 4.61 Gold Sell 1,141.68 181,569 TOZ 207.29 (111.05)Silver Sell 14.91 3,146,228 TOZ 46.91 (12.21)Total 405.52 Non-Designated HedgesAluminium Buy 1,533.71 62,250 MT 95.47 (10.24)Aluminium Sell 1,820.76 60,300 MT 109.79 124.63 Copper Buy 4,831.84 19,100 MT 92.29 5.11 Copper Sell 5,078.79 26,050 MT 132.30 36.08 Gold Sell 1,139.27 152 TOZ 0.17 (0.09)Total 155.49 Commodity SwapsNon-Designated HedgesCoal Buy 45.43 222,750 MT 10.12 6.13 Coal Sell 48.40 6,250 MT 0.30 (0.21)Furnace Oil Buy 143.83 58,250 MT 8.38 10.12 Furnace Oil Sell 160.81 8,750 MT 1.41 (0.02)Total 16.02 Embedded DerivativesFair Value HedgesCopper Sell 4,714.82 107,389 MT 506.32 (106.10)Gold Sell 1,219.41 17,342 TOZ 21.15 (1.62)Silver Sell 15.30 312,764 TOZ 4.79 (0.31)Total (108.03)
The following table presents the outstanding position and fair value of various commodity derivative fi nancial instruments as at 31st March, 2015:
Average Price (USD/Unit)
Quantity Unit Notional Value (USD in Million)
Fair Value Gain/(Loss) (` crore)
Commodity Futures/ForwardsCash Flow HedgesAluminium Sell 1,977.70 274,000 MT 541.89 290.36 Copper Sell 5,972.91 16,325 MT 97.51 (7.01)Gold Sell 1,194.61 103,147 TOZ 123.22 7.04 Silver Sell 17.53 2,593,963 TOZ 45.46 14.04 Total 304.43 Non-Designated HedgesAluminium Buy 1,787.33 42,125 MT 75.29 (0.47)Aluminium Sell 1,945.85 30,500 MT 59.35 30.14 Copper Buy 6,070.80 15,800 MT 95.92 (0.62)Copper Sell 6,005.62 17,325 MT 104.05 (6.15)Gold Buy 1,257.24 33,889 TOZ 42.61 (15.66)Gold Sell 1,277.42 37,000 TOZ 47.26 21.53 Silver Buy 16.53 1,203 TOZ 0.02 0.00 Gold Buy - * TOZ - (9.09)Silver Buy - * TOZ - 7.82 Total 27.50 Commodity SwapsNon-Designated HedgesCoal Buy 57.24 156,250 MT 8.94 (0.57)Coal Sell 59.55 6,250 MT 0.37 0.05 Total (0.52)
Hindalco Annual Report 2015-16.indb 118Hindalco Annual Report 2015-16.indb 118 8/17/2016 1:31:33 PM8/17/2016 1:31:33 PM
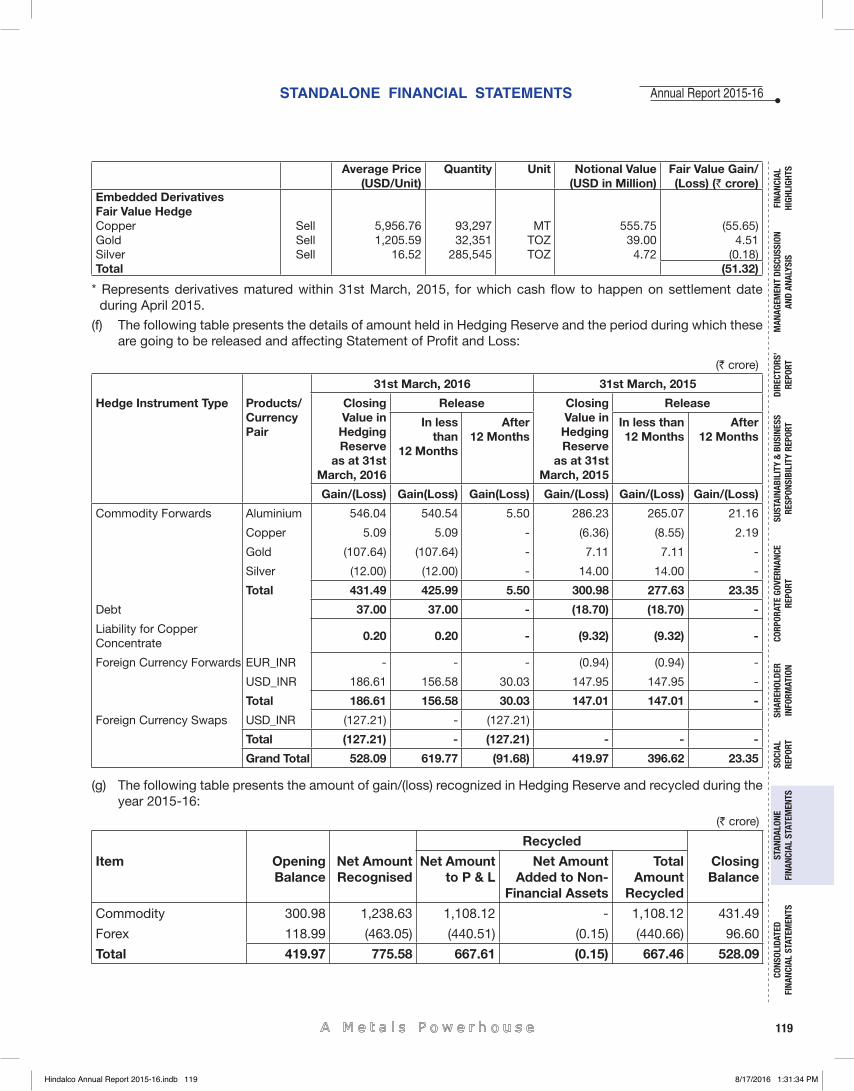
119
Annual Report 2015-16
FINA
NCIA
L HI
GHLI
GHTS
MAN
AGEM
ENT
DISC
USSI
ON
AND
ANAL
YSIS
CORP
ORAT
E GO
VERN
ANCE
RE
PORT
STAN
DALO
NE
FINA
NCIA
L ST
ATEM
ENTS
CONS
OLID
ATED
FI
NANC
IAL
STAT
EMEN
TSSO
CIAL
RE
PORT
DIRE
CTOR
S’RE
PORT
SHAR
EHOL
DER
INFO
RMAT
ION
SUST
AINA
BILI
TY &
BUS
INES
SRE
SPON
SIBI
LITY
REP
ORT
STANDALONE FINANCIAL STATEMENTS
Average Price (USD/Unit)
Quantity Unit Notional Value (USD in Million)
Fair Value Gain/(Loss) (` crore)
Embedded DerivativesFair Value HedgeCopper Sell 5,956.76 93,297 MT 555.75 (55.65)Gold Sell 1,205.59 32,351 TOZ 39.00 4.51 Silver Sell 16.52 285,545 TOZ 4.72 (0.18)Total (51.32)
* Represents derivatives matured within 31st March, 2015, for which cash fl ow to happen on settlement date during April 2015.
(f) The following table presents the details of amount held in Hedging Reserve and the period during which these are going to be released and affecting Statement of Profi t and Loss:
(` crore)
31st March, 2016 31st March, 2015
Hedge Instrument Type Products/Currency Pair
Closing Value in
Hedging Reserve
as at 31st March, 2016
Release Closing Value in
Hedging Reserve
as at 31st March, 2015
Release
In less than
12 Months
After 12 Months
In less than 12 Months
After 12 Months
Gain/(Loss) Gain(Loss) Gain(Loss) Gain/(Loss) Gain/(Loss) Gain/(Loss)
Commodity Forwards Aluminium 546.04 540.54 5.50 286.23 265.07 21.16
Copper 5.09 5.09 - (6.36) (8.55) 2.19
Gold (107.64) (107.64) - 7.11 7.11 -
Silver (12.00) (12.00) - 14.00 14.00 -
Total 431.49 425.99 5.50 300.98 277.63 23.35
Debt 37.00 37.00 - (18.70) (18.70) -
Liability for Copper Concentrate
0.20 0.20 - (9.32) (9.32) -
Foreign Currency Forwards EUR_INR - - - (0.94) (0.94) -
USD_INR 186.61 156.58 30.03 147.95 147.95 -
Total 186.61 156.58 30.03 147.01 147.01 -
Foreign Currency Swaps USD_INR (127.21) - (127.21)
Total (127.21) - (127.21) - - -
Grand Total 528.09 619.77 (91.68) 419.97 396.62 23.35
(g) The following table presents the amount of gain/(loss) recognized in Hedging Reserve and recycled during the year 2015-16:
(` crore)
Recycled
Item Opening Balance
Net Amount Recognised
Net Amount to P & L
Net Amount Added to Non-
Financial Assets
Total Amount
Recycled
Closing Balance
Commodity 300.98 1,238.63 1,108.12 - 1,108.12 431.49
Forex 118.99 (463.05) (440.51) (0.15) (440.66) 96.60
Total 419.97 775.58 667.61 (0.15) 667.46 528.09
Hindalco Annual Report 2015-16.indb 119Hindalco Annual Report 2015-16.indb 119 8/17/2016 1:31:34 PM8/17/2016 1:31:34 PM
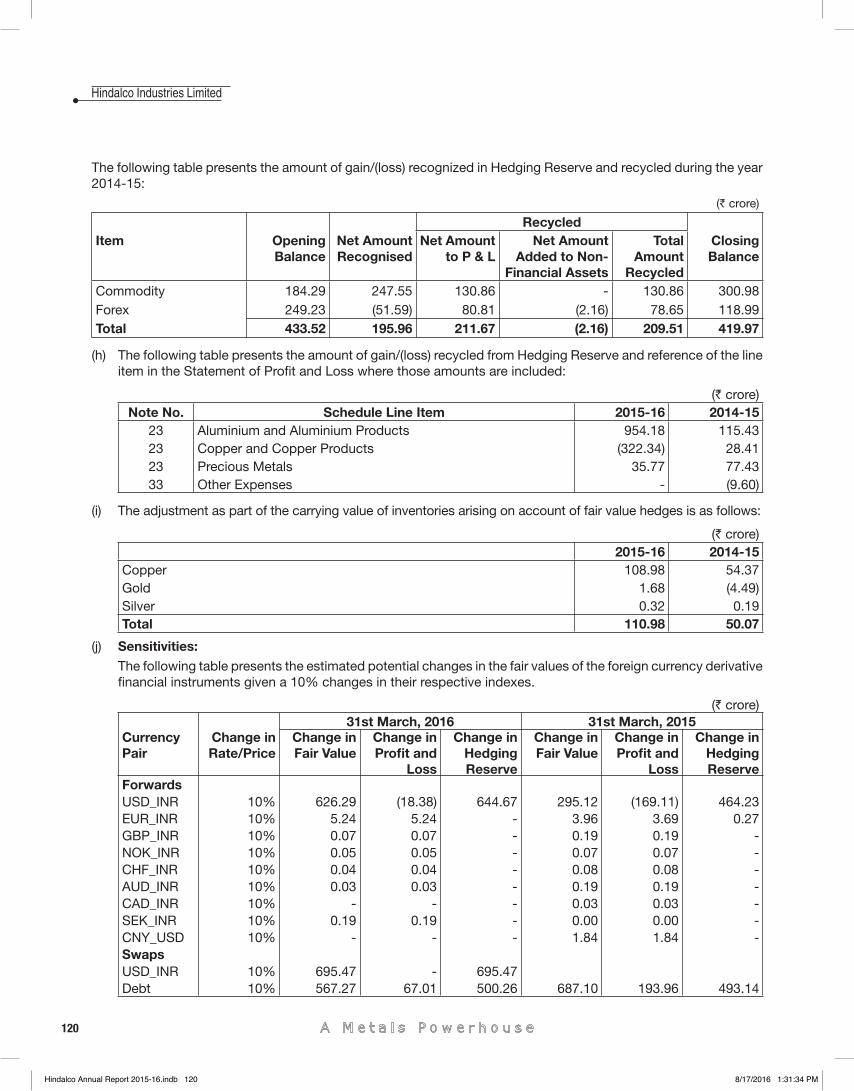
120
Hindalco Industries Limited
The following table presents the amount of gain/(loss) recognized in Hedging Reserve and recycled during the year 2014-15:
(` crore)
RecycledItem Opening
BalanceNet Amount Recognised
Net Amount to P & L
Net Amount Added to Non-
Financial Assets
Total Amount
Recycled
Closing Balance
Commodity 184.29 247.55 130.86 - 130.86 300.98 Forex 249.23 (51.59) 80.81 (2.16) 78.65 118.99 Total 433.52 195.96 211.67 (2.16) 209.51 419.97
(h) The following table presents the amount of gain/(loss) recycled from Hedging Reserve and reference of the line item in the Statement of Profi t and Loss where those amounts are included:
(` crore)Note No. Schedule Line Item 2015-16 2014-15
23 Aluminium and Aluminium Products 954.18 115.43 23 Copper and Copper Products (322.34) 28.41 23 Precious Metals 35.77 77.43 33 Other Expenses - (9.60)
(i) The adjustment as part of the carrying value of inventories arising on account of fair value hedges is as follows:
(` crore)2015-16 2014-15
Copper 108.98 54.37 Gold 1.68 (4.49)Silver 0.32 0.19 Total 110.98 50.07
(j) Sensitivities: The following table presents the estimated potential changes in the fair values of the foreign currency derivative fi nancial instruments given a 10% changes in their respective indexes.
(` crore)31st March, 2016 31st March, 2015
Currency Pair
Change in Rate/Price
Change in Fair Value
Change in Profi t and
Loss
Change in Hedging Reserve
Change in Fair Value
Change in Profi t and
Loss
Change in Hedging Reserve
ForwardsUSD_INR 10% 626.29 (18.38) 644.67 295.12 (169.11) 464.23 EUR_INR 10% 5.24 5.24 - 3.96 3.69 0.27 GBP_INR 10% 0.07 0.07 - 0.19 0.19 - NOK_INR 10% 0.05 0.05 - 0.07 0.07 - CHF_INR 10% 0.04 0.04 - 0.08 0.08 - AUD_INR 10% 0.03 0.03 - 0.19 0.19 - CAD_INR 10% - - - 0.03 0.03 - SEK_INR 10% 0.19 0.19 - 0.00 0.00 - CNY_USD 10% - - - 1.84 1.84 - SwapsUSD_INR 10% 695.47 - 695.47 Debt 10% 567.27 67.01 500.26 687.10 193.96 493.14
Hindalco Annual Report 2015-16.indb 120Hindalco Annual Report 2015-16.indb 120 8/17/2016 1:31:34 PM8/17/2016 1:31:34 PM
121
Annual Report 2015-16
FINA
NCIA
L HI
GHLI
GHTS
MAN
AGEM
ENT
DISC
USSI
ON
AND
ANAL
YSIS
CORP
ORAT
E GO
VERN
ANCE
RE
PORT
STAN
DALO
NE
FINA
NCIA
L ST
ATEM
ENTS
CONS
OLID
ATED
FI
NANC
IAL
STAT
EMEN
TSSO
CIAL
RE
PORT
DIRE
CTOR
S’RE
PORT
SHAR
EHOL
DER
INFO
RMAT
ION
SUST
AINA
BILI
TY &
BUS
INES
SRE
SPON
SIBI
LITY
REP
ORT
STANDALONE FINANCIAL STATEMENTS
The following table presents the estimated potential change in the fair values of the commodity derivative fi nancial instruments, given a 10% change in their respective indexes (LME in case of Aluminium and Copper, LBMA in case of Gold and Silver, Argus McCloskey API 4 in case of Coal and Platts Fuel Oil 180 cst AG in case of Furnace Oil ).
(` crore)31st March, 2016 31st March, 2015
Types of Derivative
Change in Rate/Price
Change in Fair Value
Change in Profi t and
Loss
Change in Hedging Reserve
Change in Fair Value
Change in Profi t and
Loss
Change in Hedging Reserve
Forwards 10% 630.22 22.41 607.80 467.24 (3.01) 470.25
Swaps 10% 12.69 12.69 - 5.28 5.28 -
Embedded Derivatives
10% 363.09 363.09 - 378.50 378.50 -
50. Contingent Liabilities and Commitments:(` crore)
As at 31/03/2016 31/03/2015
A. Contingent Liabilities(a) Claims against the Company not acknowledged as debt:
Following demands are disputed by the Company and are not provided for:(i) Demand of Interest on past dues of the Aluminium Regulation
Account up to 31st December, 1987. - 6.33 * The demand is not payable.
(ii) Retrospective Revision of Water Rates by UP Jal Vidyut Nigam Limited (April 1989 to June 1993 and Jan 2000 to Jan 2001). 4.08 4.08 * Writ petition pending with Lucknow Bench of Allahabad High Court. The demand for arrears stayed vide order dated 11/05/2001.
(iii) Transit Fees levied by Divisional Forest Offi cer, Renukoot, on Coal and Bauxite. 127.39 117.63 * Appeal pending with the Hon’ble High Court of Allahabad, and
payment of transit fee has been stayed. According to the legal opinion received by the Company, the Forest department has no authority to levy such fees. The Company has fi led a transfer application before the Hon’ble Supreme Court. The Hon’ble Supreme Court of India, while issuing notice on our Transfer Petition, stayed the further proceedings of the Company's Writ Petition pending before the Hon’ble Allahabad High Court.
(iv) M.P. Transit Fee on Coal demanded by Northern Coal Fields Limited. 25.15 24.51 * The Company had challenged the demand towards MP Transit
Fee on Coal and fi led Writ Petition before the Hon'ble Jabalpur High Court. The Hon'ble High Court has struck down the levy and also ordered for refund of the amount paid under protest. The State Government has fi led an Appeal before the Hon'ble Supreme Court of India against the said order, and the Hon'ble Supreme Court has stayed the order of the Hon'ble High Court. The Counter Affi davit in the matter has been fi led. The rejoinder has also been fi led by the state. To be listed along with the similar matter before the Supreme Court of India.
Hindalco Annual Report 2015-16.indb 121Hindalco Annual Report 2015-16.indb 121 8/17/2016 1:31:34 PM8/17/2016 1:31:34 PM
122
Hindalco Industries Limited
(` crore)As at
31/03/2016 31/03/2015(v) Imposition of Cess on Coal by Shaktinagar Special Area
Development Authority. 3.98 3.98 *Writ pending before Allahabad High Court, Allahabad. Demand
and levy stayed. However, the Company has moved a transfer petition before the Hon'ble Supreme Court of India for tagging the matter with CA No. 1883 of 06 (ORISED Matter). The matter is tagged with ORISED and to be heard by the Nine Judges Bench of the Hon'ble Supreme Court.
(vi) Demand of Royalty on Vanadium by District Mining Offi cer, Lohardaga. - 7.96 * In view of favourable order of the Jurisdictional High Court
during the year on similar facts.(vii) The demand of Excise Duty on gold. - 155.31
*The Hon'ble Supreme Court has given order in favour of the Company
(viii) Revision of Surface Rent on land by Government of Jharkhand w.e.f. 16th June, 2005. 33.74 29.97 * Matter is in dispute at the Hon’ble Supreme Court.
(ix) Demand made by Nayab Tehsildar Kusmi/Collector under Chhattisgarh as per Adhosanrachna Vikas evam Parayavaran Upkar Adhiniyam, 2005, @ 5% as environment tax on royalty plus 5% as development tax. 8.59 7.37 * The Writ Petition, fi led by the Company before the Hon’ble High
Court of Chhattisgarh at Bilaspur, has been transferred to the Hon’ble Supreme Court and tagged with other Civil Appeals.
(x) Service Tax paid on Goods Transport Agency and Business Auxiliary Services. 11.27 11.27 * Commissioner has confi rmed the demand. Appeal is being fi led
at CESTAT, New Delhi.(xi) MP Transit Fee on Bauxite. 1.30 1.30
Company has fi led Writ Petition before the Hon'ble Jabalpur High Court. The Hon'ble High Court has struck down the levy and also ordered for refund of the amount paid under protest. The State Government has fi led an appeal against the order of the Hon'ble High court.
(xii) Demand for Entry Tax relating to valuation dispute of 2004-05 to 2005-06, for which appeals have been fi led. 28.05 1.18 * Appeal has been fi led with Additional CCT, Sambalpur.
(xiii) CST demand on reopening of assessments for 1999-00 to2003-04. 5.01 5.01 * Appeals have been fi led.
(xiv) Demand of Penalty on excess CENVAT Credit taken. 0.10 0.10 *Appeal pending with the CESTAT, Ahmedabad.
(xv) Demand for Sales Tax u/s 15B for A.Y. 2001-02 and 2002-03. 7.96 7.96 * Appeal is pending with J.C. Appellate Authority, Baroda.
(xvi) Service Tax on insurance policy attributable to Renusagar. 3.97 3.97 * Commissioner has confi rmed the demand. Appeal is pending
before the CESTAT, New Delhi.
Hindalco Annual Report 2015-16.indb 122Hindalco Annual Report 2015-16.indb 122 8/17/2016 1:31:34 PM8/17/2016 1:31:34 PM
123
Annual Report 2015-16
FINA
NCIA
L HI
GHLI
GHTS
MAN
AGEM
ENT
DISC
USSI
ON
AND
ANAL
YSIS
CORP
ORAT
E GO
VERN
ANCE
RE
PORT
STAN
DALO
NE
FINA
NCIA
L ST
ATEM
ENTS
CONS
OLID
ATED
FI
NANC
IAL
STAT
EMEN
TSSO
CIAL
RE
PORT
DIRE
CTOR
S’RE
PORT
SHAR
EHOL
DER
INFO
RMAT
ION
SUST
AINA
BILI
TY &
BUS
INES
SRE
SPON
SIBI
LITY
REP
ORT
STANDALONE FINANCIAL STATEMENTS
(` crore)As at
31/03/2016 31/03/2015(xvii) Disallowance of CENVAT credit. 5.29 5.29
* The matter is pending with CESTAT, Ahmedabad.(xviii) Demand raised on assessment under CST Act and APGST Act
for various years. 5.77 5.89 * Appeals have been fi led with appropriate authorities.
(xix) Demand for Service Tax on Consulting Engineer Services and Scientifi c & Tech Service. 3.84 3.84 * Appeal pending with Commissioner (Appeals), Ahmedabad.
(xx) Alleged Cenvat taken without receipt of Alumina Hydrate inside the factory. 3.46 3.46 * Appeal fi led with CESTAT.
(xxi) Alleged Cenvat availed on the Input Services at captive mines. 36.05 36.05 *Appeal pending with CESTAT.
(xxii) Cenvat of Service Tax Credit availed on Supplementary Invoices. 11.05 11.05 *Pending with appropriate Authority.
(xxiii) Excess rebate has been sanctioned to the extent duty paid by supplementary invoices. 5.08 5.08 *Appeal pending with Commissioner of Customs (Appeals), Mumbai.
(xxiv) Disallowance of CENVAT on input services. 9.62 7.74 *Pending with appropriate Authority.
(xxv) Water Tariff revision demand for previous years. 8.14 10.86 *Matter is pending in the Hon'ble High Court of Karnataka.
(xxvi) Demand for Sales Tax under KVAT Act, 2003, for Tax period2011-2012 and 2012-13. 16.46 16.46 *Appeal pending with Commissioner, Appellate Authority, Bengaluru.
(xxvii) Demand for Sales Tax under MPVAT Act, 2002, for Tax period 2010-11. - 7.64 *Order in favour of the Company.
(xxviii) Demand for Sales Tax under CST Act, 1969, for Tax Period 2009-10. 1.21 1.21 *Appeal pending with Commissioner, Appellate Authority, Bengaluru.
(xxix) U.P. Transit Fee on Coal. 6.50 - *Matter is pending in the Hon'ble High Court of Allahabad.
(xxx) Demand for Sales Tax under MPVAT Act, 2002, for Tax period 2009-10.*Appeal pending with the Commissioner, Appellate Authority,
Indore.1.35 -
(xxxi) Other Contingent Liabilities in respect of Excise, Customs, Sales Tax etc., each being for less than ` 1 crore. 16.66 17.72 * The demands are in dispute at various legal forums.
391.07 520.22 (b) Corporate Guarantees Outstanding 5,075.99 5,270.76
(`5,075.99 crore* (Previous year ` 5,229.70 crore*) given on behalf of subsidiary companies).* Includes ` 5,044.61 crore (Previous year ` 5,181.28 crore) given to
lenders against loan provided to various subsidiaries, amount of loan outstanding as on 31st March, 2016 is ` 4,952.10 crore (Previous year` 4,887.43 crore).
Hindalco Annual Report 2015-16.indb 123Hindalco Annual Report 2015-16.indb 123 8/17/2016 1:31:34 PM8/17/2016 1:31:34 PM
124
Hindalco Industries Limited
(` crore)As at
31/03/2016 31/03/2015(c) Other Money for which the Company is contingently liable:
(i) Bills discounted with Banks. - 0.87 (ii) Customs Duty on Capital Goods and Raw Materials imported
under EPCG Scheme/Advance Licence, against which export obligation is to be fulfi lled (excluding cenvatable portion). 325.81 328.03
(iii) The Company has received a notice dated 24th March, 2007 from Collector (Stamp), Kanpur, Uttar Pradesh, alleging that stamp duty of ` 252.96 crore is payable in view of order dated 18th November, 2002, of the Hon’ble High Court of Allahabad approving the scheme of arrangement for merger of Copper business of Indo Gulf Corporation Limited with the Company. The Company is of the opinion that it has a very strong case as there is no substantive/computation provision for levy/calculation of stamp duty on court order approving the scheme of arrangement under the Companies Act, 1956, within the provisions of Uttar Pradesh Stamp Act, moreover, the properties in question are located in the State of Gujarat and, thus, the Collector (Stamp), Kanpur, has no territorial jurisdiction to make such a demand. It is pertinent to note that the Company in 2003-04 has already paid the stamp duty which has been accepted as per the provisions of the Bombay Stamp Act, 1958, with regard to transfer of shareholding of Indo Gulf Corporation Limited as per the Scheme of Arrangement. Furthermore, the demand made is on an incorrect assumption. The Company’s contention, amongst the various other grounds made, is that the demand is illegal, against the principles of natural justice, incorrect, bad in law and malafi de. The Company has fi led a writ petition before the Hon’ble High Court of Allahabad, inter alia, on the above said grounds, which is pending determination.
(iv) The Company has an agreement with Uttar Pradesh Power Corporation Limited (UPPCL), under which banking of surplus energy with UPPCL is permitted and such banked energy may be drawn as and when required at free of cost. However, UPPCL has raised demand of ` 55.32 crore with retrospective effect from 1.4.2009 on the alleged ground that drawal of energy against the banked energy is not permissible during peak hours. The UPPCL has also included ` 32.15 crore in the bill as late payment surcharge upto 31.3.2016. Thus, the total amount outstanding till 31.3.2016 is ` 87.47 crore. However, if the case is decided against the Company, 107.4 million units valuing ` 22.97 crore will be treated as energy banked with UPPCL and, accordingly the net liability will be ` 64.50 crore. The Company has challenged the demand by fi ling a petition on 27.12.2013 under section 86(i)(f) read with other relevant provisions of Electricity Act, 2003 seeking quashing/setting aside the demand. The matter has been heard on 12.2.2014 and the Hon’ble Uttar Pradesh Electricity Regulatory Commission (UPERC), vide its order dated 24.2.2014, has directed the UPPCL to restrain from taking any coercive action till fi nal order of UPERC. The Company believes that it has a strong case and no provision towards this is required.
(` crore)As at
31/03/2016 31/03/2015
B. Commitments
(a) Estimated amount of contracts remaining to be executed on capital account and not provided for net of advances 235.98 574.76
(b) The Company, along with Aditya Birla Nuvo Limited, Grasim Industries Limited and Birla TMT Holdings Pvt. Limited (the Sponsors), being promoters of Idea Cellular Limited (Idea), has given the following undertakings to the Facility Agent:
Hindalco Annual Report 2015-16.indb 124Hindalco Annual Report 2015-16.indb 124 8/17/2016 1:31:34 PM8/17/2016 1:31:34 PM
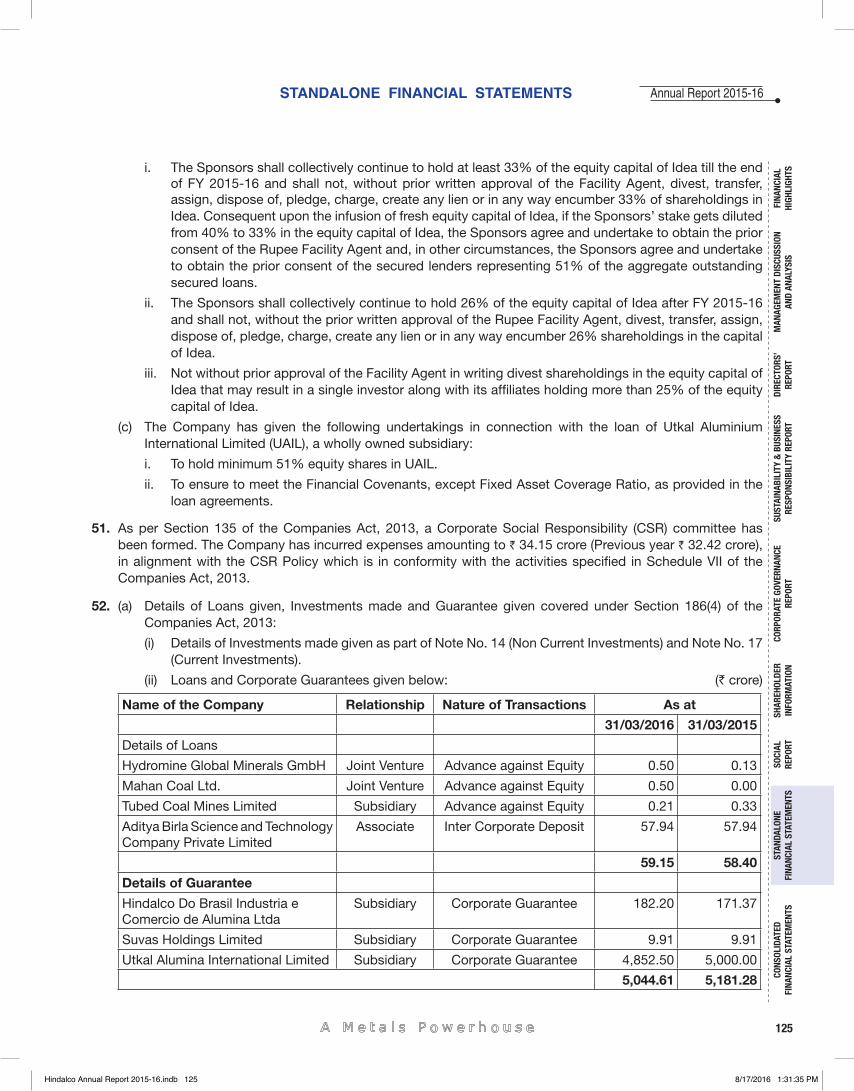
125
Annual Report 2015-16
FINA
NCIA
L HI
GHLI
GHTS
MAN
AGEM
ENT
DISC
USSI
ON
AND
ANAL
YSIS
CORP
ORAT
E GO
VERN
ANCE
RE
PORT
STAN
DALO
NE
FINA
NCIA
L ST
ATEM
ENTS
CONS
OLID
ATED
FI
NANC
IAL
STAT
EMEN
TSSO
CIAL
RE
PORT
DIRE
CTOR
S’RE
PORT
SHAR
EHOL
DER
INFO
RMAT
ION
SUST
AINA
BILI
TY &
BUS
INES
SRE
SPON
SIBI
LITY
REP
ORT
STANDALONE FINANCIAL STATEMENTS
i. The Sponsors shall collectively continue to hold at least 33% of the equity capital of Idea till the end of FY 2015-16 and shall not, without prior written approval of the Facility Agent, divest, transfer, assign, dispose of, pledge, charge, create any lien or in any way encumber 33% of shareholdings in Idea. Consequent upon the infusion of fresh equity capital of Idea, if the Sponsors’ stake gets diluted from 40% to 33% in the equity capital of Idea, the Sponsors agree and undertake to obtain the prior consent of the Rupee Facility Agent and, in other circumstances, the Sponsors agree and undertake to obtain the prior consent of the secured lenders representing 51% of the aggregate outstanding secured loans.
ii. The Sponsors shall collectively continue to hold 26% of the equity capital of Idea after FY 2015-16 and shall not, without the prior written approval of the Rupee Facility Agent, divest, transfer, assign, dispose of, pledge, charge, create any lien or in any way encumber 26% shareholdings in the capital of Idea.
iii. Not without prior approval of the Facility Agent in writing divest shareholdings in the equity capital of Idea that may result in a single investor along with its affi liates holding more than 25% of the equity capital of Idea.
(c) The Company has given the following undertakings in connection with the loan of Utkal Aluminium International Limited (UAIL), a wholly owned subsidiary:
i. To hold minimum 51% equity shares in UAIL.
ii. To ensure to meet the Financial Covenants, except Fixed Asset Coverage Ratio, as provided in the loan agreements.
51. As per Section 135 of the Companies Act, 2013, a Corporate Social Responsibility (CSR) committee has been formed. The Company has incurred expenses amounting to ` 34.15 crore (Previous year ` 32.42 crore), in alignment with the CSR Policy which is in conformity with the activities specifi ed in Schedule VII of the Companies Act, 2013.
52. (a) Details of Loans given, Investments made and Guarantee given covered under Section 186(4) of the Companies Act, 2013:
(i) Details of Investments made given as part of Note No. 14 (Non Current Investments) and Note No. 17 (Current Investments).
(ii) Loans and Corporate Guarantees given below: (` crore)
Name of the Company Relationship Nature of Transactions As at
31/03/2016 31/03/2015
Details of Loans
Hydromine Global Minerals GmbH Joint Venture Advance against Equity 0.50 0.13
Mahan Coal Ltd. Joint Venture Advance against Equity 0.50 0.00
Tubed Coal Mines Limited Subsidiary Advance against Equity 0.21 0.33
Aditya Birla Science and Technology Company Private Limited
Associate Inter Corporate Deposit 57.94 57.94
59.15 58.40
Details of Guarantee
Hindalco Do Brasil Industria e Comercio de Alumina Ltda
Subsidiary Corporate Guarantee 182.20 171.37
Suvas Holdings Limited Subsidiary Corporate Guarantee 9.91 9.91
Utkal Alumina International Limited Subsidiary Corporate Guarantee 4,852.50 5,000.00
5,044.61 5,181.28
Hindalco Annual Report 2015-16.indb 125Hindalco Annual Report 2015-16.indb 125 8/17/2016 1:31:35 PM8/17/2016 1:31:35 PM
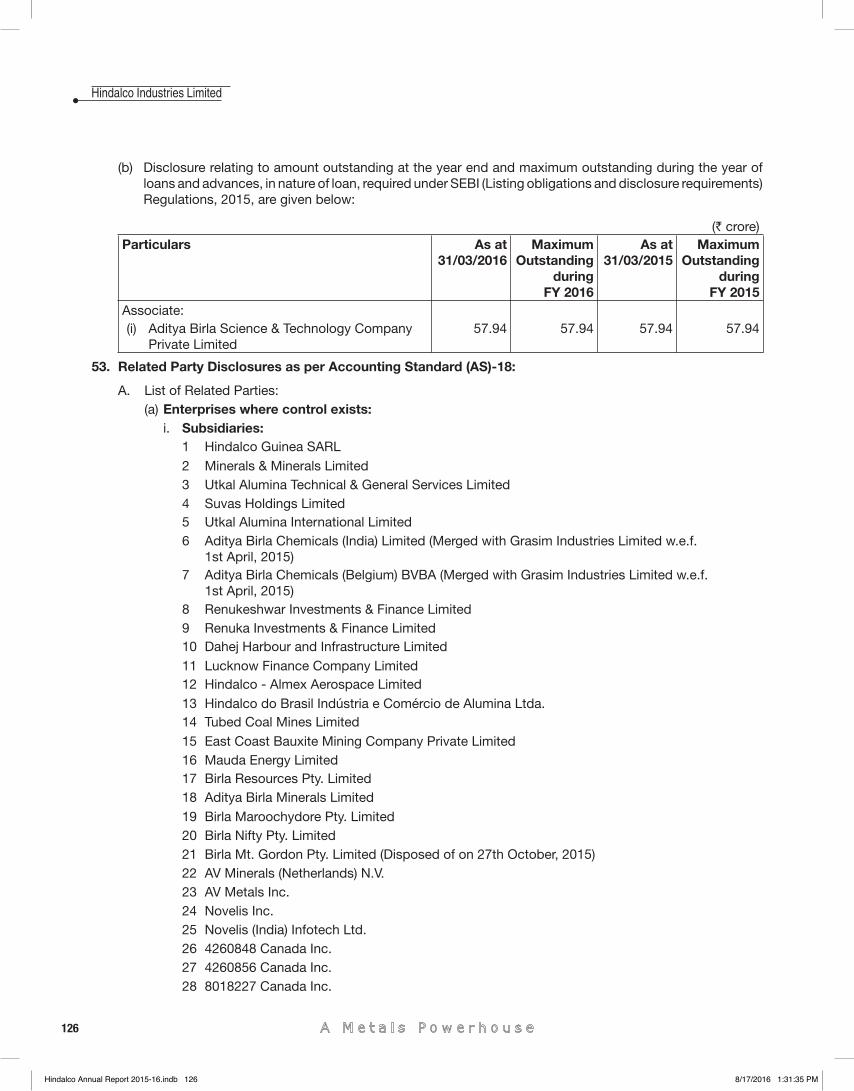
126
Hindalco Industries Limited
(b) Disclosure relating to amount outstanding at the year end and maximum outstanding during the year of loans and advances, in nature of loan, required under SEBI (Listing obligations and disclosure requirements)Regulations, 2015, are given below:
(` crore)Particulars As at
31/03/2016Maximum
Outstanding during
FY 2016
As at 31/03/2015
Maximum Outstanding
during FY 2015
Associate:(i) Aditya Birla Science & Technology Company
Private Limited 57.94 57.94 57.94 57.94
53. Related Party Disclosures as per Accounting Standard (AS)-18:
A. List of Related Parties:(a) Enterprises where control exists:
i. Subsidiaries:1 Hindalco Guinea SARL2 Minerals & Minerals Limited3 Utkal Alumina Technical & General Services Limited4 Suvas Holdings Limited5 Utkal Alumina International Limited 6 Aditya Birla Chemicals (India) Limited (Merged with Grasim Industries Limited w.e.f.
1st April, 2015)7 Aditya Birla Chemicals (Belgium) BVBA (Merged with Grasim Industries Limited w.e.f.
1st April, 2015)8 Renukeshwar Investments & Finance Limited9 Renuka Investments & Finance Limited10 Dahej Harbour and Infrastructure Limited11 Lucknow Finance Company Limited12 Hindalco - Almex Aerospace Limited13 Hindalco do Brasil Indústria e Comércio de Alumina Ltda.14 Tubed Coal Mines Limited15 East Coast Bauxite Mining Company Private Limited16 Mauda Energy Limited 17 Birla Resources Pty. Limited18 Aditya Birla Minerals Limited19 Birla Maroochydore Pty. Limited20 Birla Nifty Pty. Limited21 Birla Mt. Gordon Pty. Limited (Disposed of on 27th October, 2015)22 AV Minerals (Netherlands) N.V.23 AV Metals Inc. 24 Novelis Inc.25 Novelis (India) Infotech Ltd.26 4260848 Canada Inc.27 4260856 Canada Inc.28 8018227 Canada Inc.
Hindalco Annual Report 2015-16.indb 126Hindalco Annual Report 2015-16.indb 126 8/17/2016 1:31:35 PM8/17/2016 1:31:35 PM
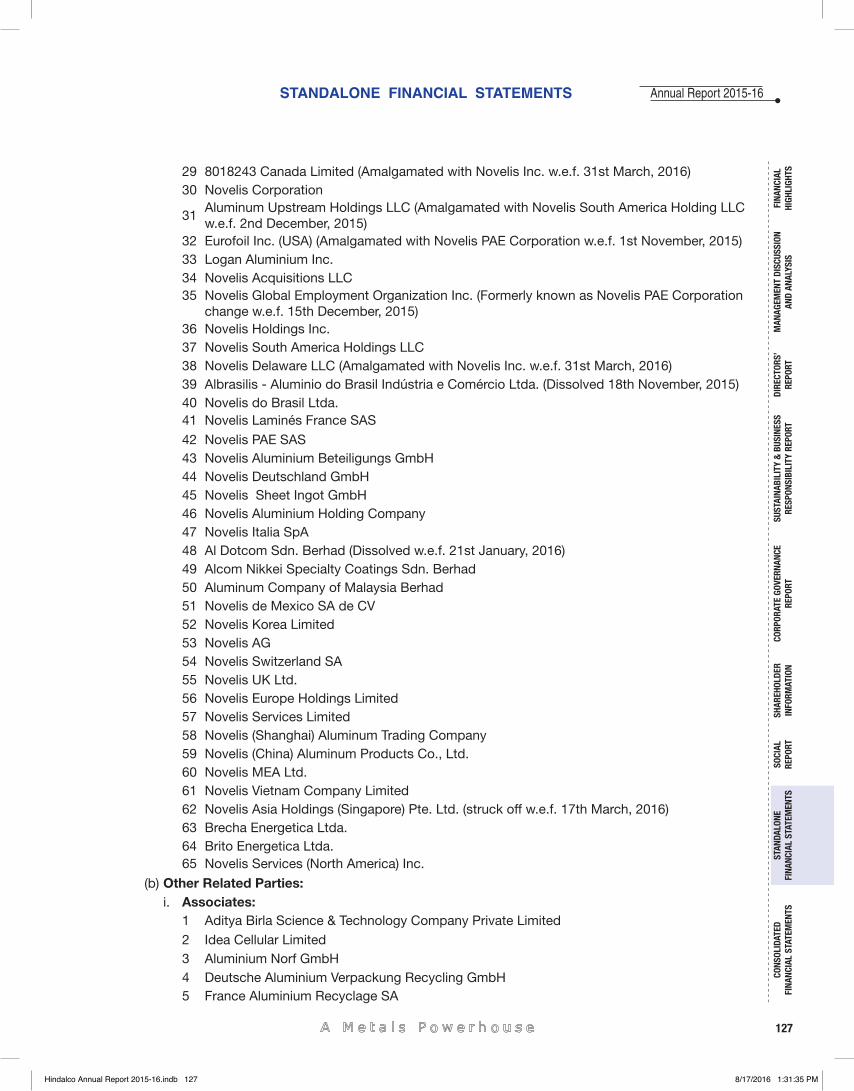
127
Annual Report 2015-16
FINA
NCIA
L HI
GHLI
GHTS
MAN
AGEM
ENT
DISC
USSI
ON
AND
ANAL
YSIS
CORP
ORAT
E GO
VERN
ANCE
RE
PORT
STAN
DALO
NE
FINA
NCIA
L ST
ATEM
ENTS
CONS
OLID
ATED
FI
NANC
IAL
STAT
EMEN
TSSO
CIAL
RE
PORT
DIRE
CTOR
S’RE
PORT
SHAR
EHOL
DER
INFO
RMAT
ION
SUST
AINA
BILI
TY &
BUS
INES
SRE
SPON
SIBI
LITY
REP
ORT
STANDALONE FINANCIAL STATEMENTS
29 8018243 Canada Limited (Amalgamated with Novelis Inc. w.e.f. 31st March, 2016)30 Novelis Corporation
31Aluminum Upstream Holdings LLC (Amalgamated with Novelis South America Holding LLC w.e.f. 2nd December, 2015)
32 Eurofoil Inc. (USA) (Amalgamated with Novelis PAE Corporation w.e.f. 1st November, 2015)33 Logan Aluminium Inc.34 Novelis Acquisitions LLC 35 Novelis Global Employment Organization Inc. (Formerly known as Novelis PAE Corporation
change w.e.f. 15th December, 2015)36 Novelis Holdings Inc.37 Novelis South America Holdings LLC38 Novelis Delaware LLC (Amalgamated with Novelis Inc. w.e.f. 31st March, 2016)39 Albrasilis - Aluminio do Brasil Indústria e Comércio Ltda. (Dissolved 18th November, 2015)40 Novelis do Brasil Ltda.41 Novelis Laminés France SAS
42 Novelis PAE SAS43 Novelis Aluminium Beteiligungs GmbH44 Novelis Deutschland GmbH45 Novelis Sheet Ingot GmbH46 Novelis Aluminium Holding Company47 Novelis Italia SpA48 Al Dotcom Sdn. Berhad (Dissolved w.e.f. 21st January, 2016)49 Alcom Nikkei Specialty Coatings Sdn. Berhad50 Aluminum Company of Malaysia Berhad 51 Novelis de Mexico SA de CV52 Novelis Korea Limited53 Novelis AG54 Novelis Switzerland SA55 Novelis UK Ltd. 56 Novelis Europe Holdings Limited57 Novelis Services Limited58 Novelis (Shanghai) Aluminum Trading Company59 Novelis (China) Aluminum Products Co., Ltd. 60 Novelis MEA Ltd.61 Novelis Vietnam Company Limited62 Novelis Asia Holdings (Singapore) Pte. Ltd. (struck off w.e.f. 17th March, 2016)63 Brecha Energetica Ltda. 64 Brito Energetica Ltda. 65 Novelis Services (North America) Inc.
(b) Other Related Parties:i. Associates:
1 Aditya Birla Science & Technology Company Private Limited2 Idea Cellular Limited3 Aluminium Norf GmbH4 Deutsche Aluminium Verpackung Recycling GmbH5 France Aluminium Recyclage SA
Hindalco Annual Report 2015-16.indb 127Hindalco Annual Report 2015-16.indb 127 8/17/2016 1:31:35 PM8/17/2016 1:31:35 PM
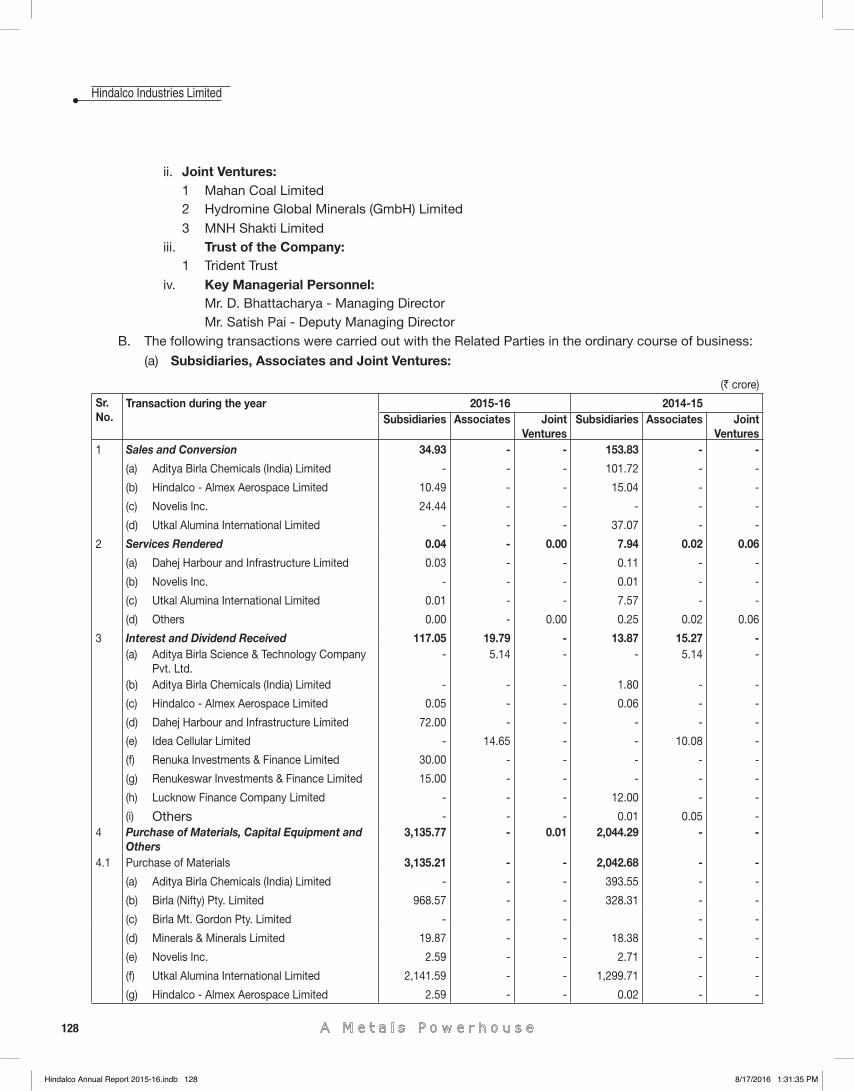
128
Hindalco Industries Limited
ii. Joint Ventures:1 Mahan Coal Limited2 Hydromine Global Minerals (GmbH) Limited3 MNH Shakti Limited
iii. Trust of the Company:1 Trident Trust
iv. Key Managerial Personnel:Mr. D. Bhattacharya - Managing DirectorMr. Satish Pai - Deputy Managing Director
B. The following transactions were carried out with the Related Parties in the ordinary course of business:
(a) Subsidiaries, Associates and Joint Ventures:
(` crore)
Sr. No.
Transaction during the year 2015-16 2014-15 Subsidiaries Associates Joint
VenturesSubsidiaries Associates Joint
Ventures1 Sales and Conversion 34.93 - - 153.83 - -
(a) Aditya Birla Chemicals (India) Limited - - - 101.72 - -
(b) Hindalco - Almex Aerospace Limited 10.49 - - 15.04 - -
(c) Novelis Inc. 24.44 - - - - -
(d) Utkal Alumina International Limited - - - 37.07 - -
2 Services Rendered 0.04 - 0.00 7.94 0.02 0.06
(a) Dahej Harbour and Infrastructure Limited 0.03 - - 0.11 - -
(b) Novelis Inc. - - - 0.01 - -
(c) Utkal Alumina International Limited 0.01 - - 7.57 - -
(d) Others 0.00 - 0.00 0.25 0.02 0.06
3 Interest and Dividend Received 117.05 19.79 - 13.87 15.27 - (a) Aditya Birla Science & Technology Company
Pvt. Ltd. - 5.14 - - 5.14 -
(b) Aditya Birla Chemicals (India) Limited - - - 1.80 - -
(c) Hindalco - Almex Aerospace Limited 0.05 - - 0.06 - -
(d) Dahej Harbour and Infrastructure Limited 72.00 - - - - -
(e) Idea Cellular Limited - 14.65 - - 10.08 -
(f) Renuka Investments & Finance Limited 30.00 - - - - -
(g) Renukeswar Investments & Finance Limited 15.00 - - - - -
(h) Lucknow Finance Company Limited - - - 12.00 - -
(i) Others - - - 0.01 0.05 - 4 Purchase of Materials, Capital Equipment and
Others 3,135.77 - 0.01 2,044.29 - -
4.1 Purchase of Materials 3,135.21 - - 2,042.68 - -
(a) Aditya Birla Chemicals (India) Limited - - - 393.55 - -
(b) Birla (Nifty) Pty. Limited 968.57 - - 328.31 - -
(c) Birla Mt. Gordon Pty. Limited - - - - -
(d) Minerals & Minerals Limited 19.87 - - 18.38 - -
(e) Novelis Inc. 2.59 - - 2.71 - -
(f) Utkal Alumina International Limited 2,141.59 - - 1,299.71 - -
(g) Hindalco - Almex Aerospace Limited 2.59 - - 0.02 - -
Hindalco Annual Report 2015-16.indb 128Hindalco Annual Report 2015-16.indb 128 8/17/2016 1:31:35 PM8/17/2016 1:31:35 PM
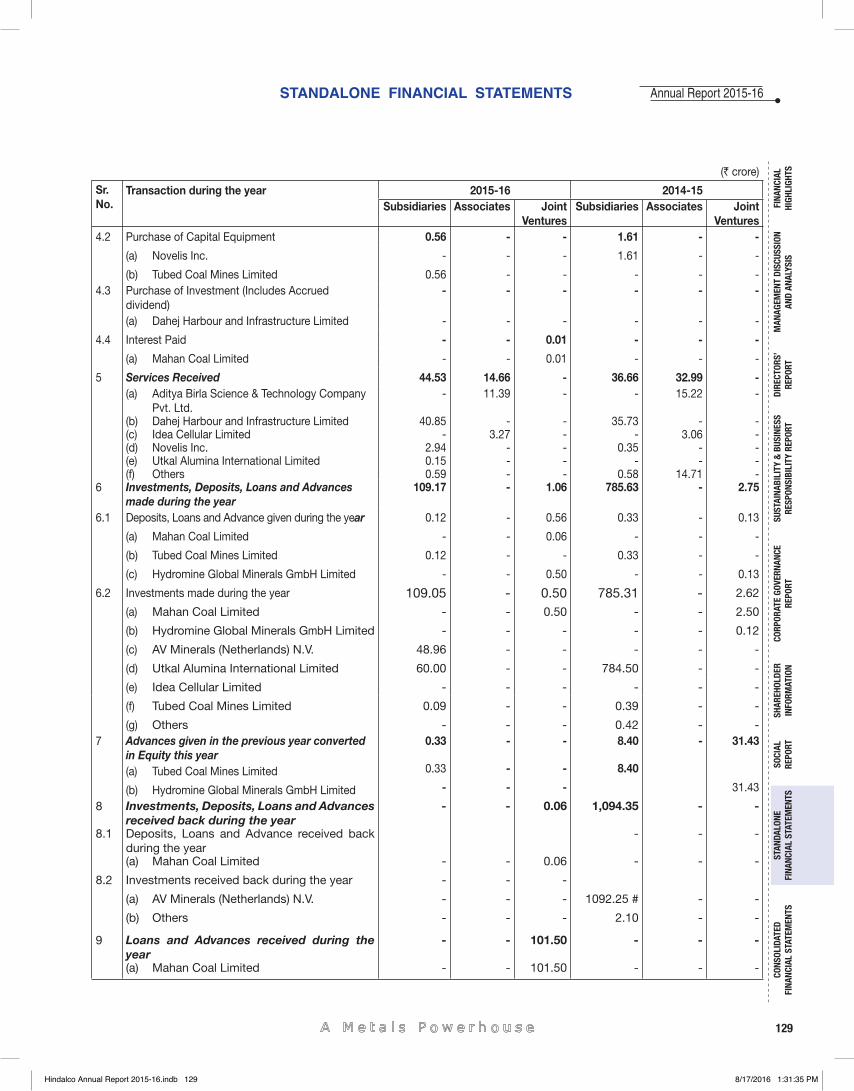
129
Annual Report 2015-16
FINA
NCIA
L HI
GHLI
GHTS
MAN
AGEM
ENT
DISC
USSI
ON
AND
ANAL
YSIS
CORP
ORAT
E GO
VERN
ANCE
RE
PORT
STAN
DALO
NE
FINA
NCIA
L ST
ATEM
ENTS
CONS
OLID
ATED
FI
NANC
IAL
STAT
EMEN
TSSO
CIAL
RE
PORT
DIRE
CTOR
S’RE
PORT
SHAR
EHOL
DER
INFO
RMAT
ION
SUST
AINA
BILI
TY &
BUS
INES
SRE
SPON
SIBI
LITY
REP
ORT
STANDALONE FINANCIAL STATEMENTS
(` crore)
Sr. No.
Transaction during the year 2015-16 2014-15 Subsidiaries Associates Joint
VenturesSubsidiaries Associates Joint
Ventures4.2 Purchase of Capital Equipment 0.56 - - 1.61 - -
(a) Novelis Inc. - - - 1.61 - -
(b) Tubed Coal Mines Limited 0.56 - - - - - 4.3 Purchase of Investment (Includes Accrued
dividend) - - - - - -
(a) Dahej Harbour and Infrastructure Limited - - - - - -
4.4 Interest Paid - - 0.01 - - -
(a) Mahan Coal Limited - - 0.01 - - -
5 Services Received 44.53 14.66 - 36.66 32.99 - (a) Aditya Birla Science & Technology Company
Pvt. Ltd. - 11.39 - - 15.22 -
(b) Dahej Harbour and Infrastructure Limited 40.85 - - 35.73 - - (c) Idea Cellular Limited - 3.27 - - 3.06 - (d) Novelis Inc. 2.94 - - 0.35 - - (e) Utkal Alumina International Limited 0.15 - - - - - (f) Others 0.59 - - 0.58 14.71 -
6 Investments, Deposits, Loans and Advances made during the year
109.17 - 1.06 785.63 - 2.75
6.1 Deposits, Loans and Advance given during the year 0.12 - 0.56 0.33 - 0.13
(a) Mahan Coal Limited - - 0.06 - - -
(b) Tubed Coal Mines Limited 0.12 - - 0.33 - -
(c) Hydromine Global Minerals GmbH Limited - - 0.50 - - 0.13
6.2 Investments made during the year 109.05 - 0.50 785.31 - 2.62
(a) Mahan Coal Limited - - 0.50 - - 2.50
(b) Hydromine Global Minerals GmbH Limited - - - - - 0.12
(c) AV Minerals (Netherlands) N.V. 48.96 - - - - -
(d) Utkal Alumina International Limited 60.00 - - 784.50 - -
(e) Idea Cellular Limited - - - - - -
(f) Tubed Coal Mines Limited 0.09 - - 0.39 - -
(g) Others - - - 0.42 - - 7 Advances given in the previous year converted
in Equity this year 0.33 - - 8.40 - 31.43
(a) Tubed Coal Mines Limited 0.33 - - 8.40
(b) Hydromine Global Minerals GmbH Limited - - - 31.43
8 Investments, Deposits, Loans and Advances received back during the year
- - 0.06 1,094.35 - -
8.1 Deposits, Loans and Advance received back during the year
- - -
(a) Mahan Coal Limited - - 0.06 - - -
8.2 Investments received back during the year - - -
(a) AV Minerals (Netherlands) N.V. - - - 1092.25 # - -
(b) Others - - - 2.10 - -
9 Loans and Advances received during the year
- - 101.50 - - -
(a) Mahan Coal Limited - - 101.50 - - -
Hindalco Annual Report 2015-16.indb 129Hindalco Annual Report 2015-16.indb 129 8/17/2016 1:31:35 PM8/17/2016 1:31:35 PM
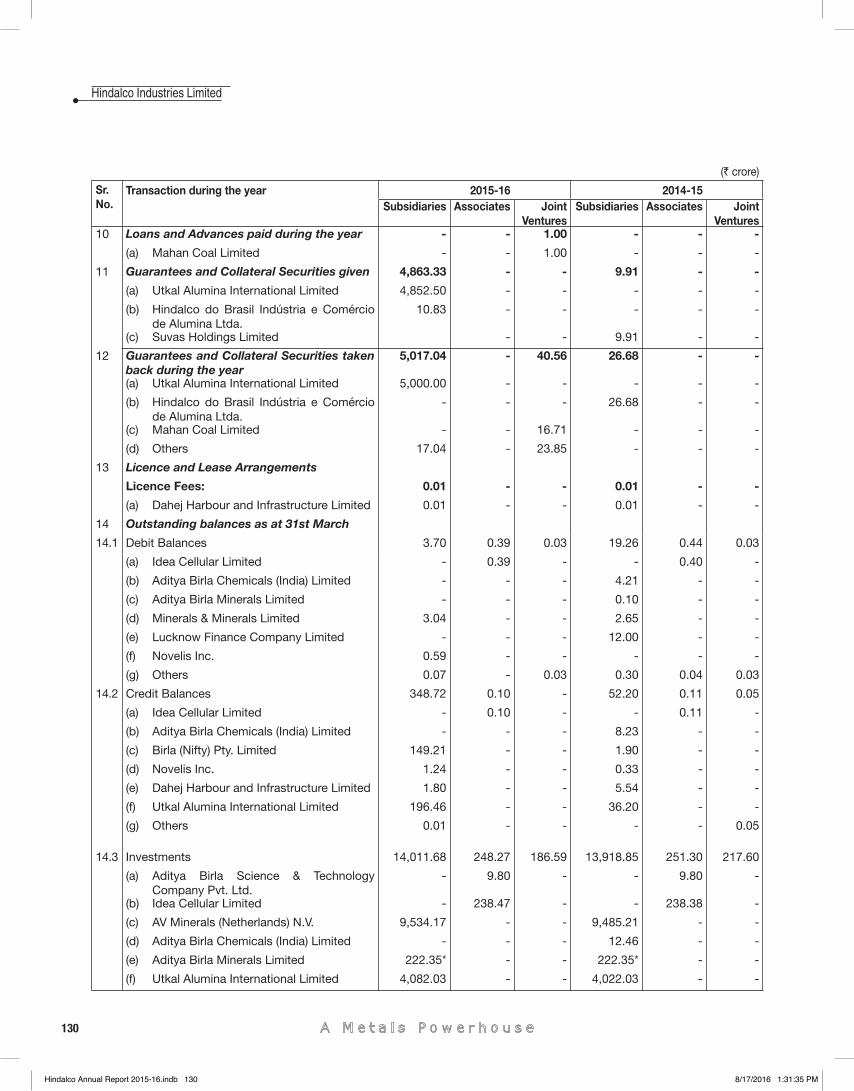
130
Hindalco Industries Limited
(` crore)
Sr. No.
Transaction during the year 2015-16 2014-15 Subsidiaries Associates Joint
VenturesSubsidiaries Associates Joint
Ventures10 Loans and Advances paid during the year - - 1.00 - - -
(a) Mahan Coal Limited - - 1.00 - - -
11 Guarantees and Collateral Securities given 4,863.33 - - 9.91 - -
(a) Utkal Alumina International Limited 4,852.50 - - - - -
(b) Hindalco do Brasil Indústria e Comércio de Alumina Ltda.
10.83 - - - - -
(c) Suvas Holdings Limited - - 9.91 - -
12 Guarantees and Collateral Securities taken back during the year
5,017.04 - 40.56 26.68 - -
(a) Utkal Alumina International Limited 5,000.00 - - - - -
(b) Hindalco do Brasil Indústria e Comércio de Alumina Ltda.
- - - 26.68 - -
(c) Mahan Coal Limited - - 16.71 - - -
(d) Others 17.04 - 23.85 - - -
13 Licence and Lease Arrangements
Licence Fees: 0.01 - - 0.01 - -
(a) Dahej Harbour and Infrastructure Limited 0.01 - - 0.01 - -
14 Outstanding balances as at 31st March
14.1 Debit Balances 3.70 0.39 0.03 19.26 0.44 0.03
(a) Idea Cellular Limited - 0.39 - - 0.40 -
(b) Aditya Birla Chemicals (India) Limited - - - 4.21 - -
(c) Aditya Birla Minerals Limited - - - 0.10 - -
(d) Minerals & Minerals Limited 3.04 - - 2.65 - -
(e) Lucknow Finance Company Limited - - - 12.00 - -
(f) Novelis Inc. 0.59 - - - - -
(g) Others 0.07 - 0.03 0.30 0.04 0.03
14.2 Credit Balances 348.72 0.10 - 52.20 0.11 0.05
(a) Idea Cellular Limited - 0.10 - - 0.11 -
(b) Aditya Birla Chemicals (India) Limited - - - 8.23 - -
(c) Birla (Nifty) Pty. Limited 149.21 - - 1.90 - -
(d) Novelis Inc. 1.24 - - 0.33 - -
(e) Dahej Harbour and Infrastructure Limited 1.80 - - 5.54 - -
(f) Utkal Alumina International Limited 196.46 - - 36.20 - -
(g) Others 0.01 - - - - 0.05
14.3 Investments 14,011.68 248.27 186.59 13,918.85 251.30 217.60
(a) Aditya Birla Science & Technology Company Pvt. Ltd.
- 9.80 - - 9.80 -
(b) Idea Cellular Limited - 238.47 - - 238.38 -
(c) AV Minerals (Netherlands) N.V. 9,534.17 - - 9,485.21 - -
(d) Aditya Birla Chemicals (India) Limited - - - 12.46 - -
(e) Aditya Birla Minerals Limited 222.35* - - 222.35* - -
(f) Utkal Alumina International Limited 4,082.03 - - 4,022.03 - -
Hindalco Annual Report 2015-16.indb 130Hindalco Annual Report 2015-16.indb 130 8/17/2016 1:31:35 PM8/17/2016 1:31:35 PM
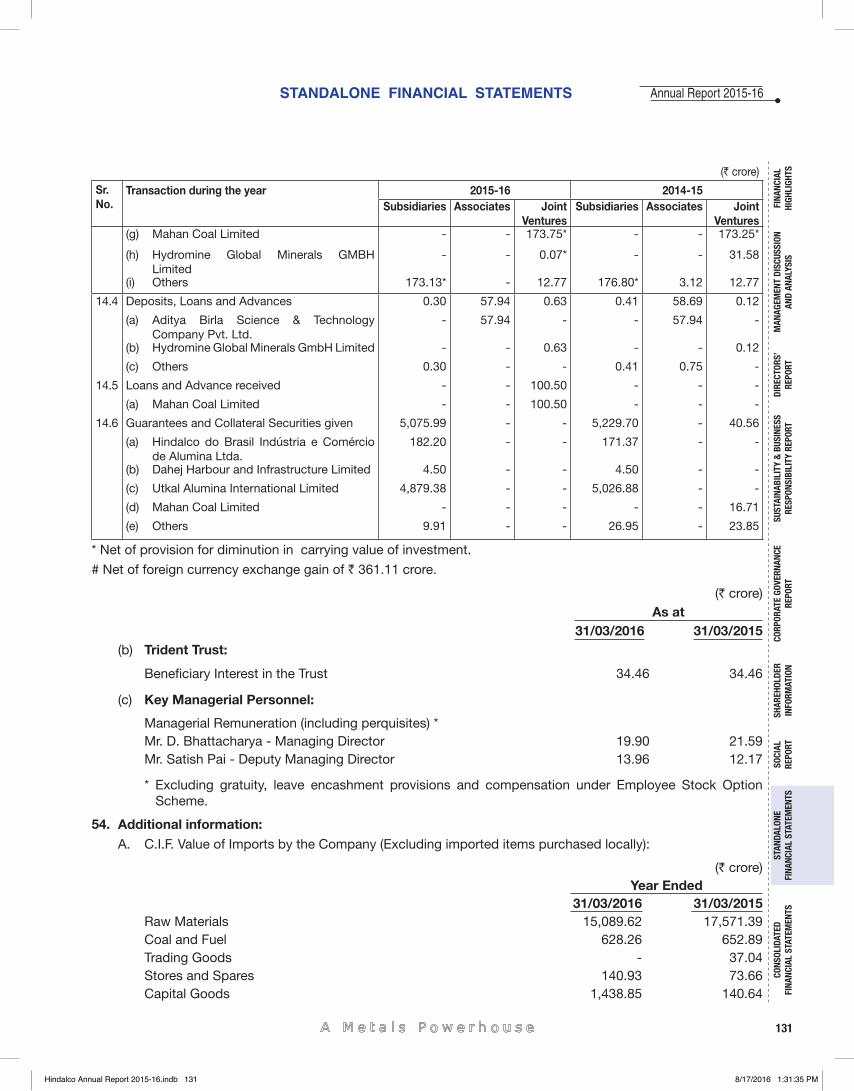
131
Annual Report 2015-16
FINA
NCIA
L HI
GHLI
GHTS
MAN
AGEM
ENT
DISC
USSI
ON
AND
ANAL
YSIS
CORP
ORAT
E GO
VERN
ANCE
RE
PORT
STAN
DALO
NE
FINA
NCIA
L ST
ATEM
ENTS
CONS
OLID
ATED
FI
NANC
IAL
STAT
EMEN
TSSO
CIAL
RE
PORT
DIRE
CTOR
S’RE
PORT
SHAR
EHOL
DER
INFO
RMAT
ION
SUST
AINA
BILI
TY &
BUS
INES
SRE
SPON
SIBI
LITY
REP
ORT
STANDALONE FINANCIAL STATEMENTS
(` crore)
Sr. No.
Transaction during the year 2015-16 2014-15 Subsidiaries Associates Joint
VenturesSubsidiaries Associates Joint
Ventures(g) Mahan Coal Limited - - 173.75* - - 173.25*
(h) Hydromine Global Minerals GMBH Limited
- - 0.07* - - 31.58
(i) Others 173.13* - 12.77 176.80* 3.12 12.77
14.4 Deposits, Loans and Advances 0.30 57.94 0.63 0.41 58.69 0.12
(a) Aditya Birla Science & Technology Company Pvt. Ltd.
- 57.94 - - 57.94 -
(b) Hydromine Global Minerals GmbH Limited - - 0.63 - - 0.12
(c) Others 0.30 - - 0.41 0.75 -
14.5 Loans and Advance received - - 100.50 - - -
(a) Mahan Coal Limited - - 100.50 - - -
14.6 Guarantees and Collateral Securities given 5,075.99 - - 5,229.70 - 40.56
(a) Hindalco do Brasil Indústria e Comércio de Alumina Ltda.
182.20 - - 171.37 - -
(b) Dahej Harbour and Infrastructure Limited 4.50 - - 4.50 - -
(c) Utkal Alumina International Limited 4,879.38 - - 5,026.88 - -
(d) Mahan Coal Limited - - - - - 16.71
(e) Others 9.91 - - 26.95 - 23.85
* Net of provision for diminution in carrying value of investment.
# Net of foreign currency exchange gain of ` 361.11 crore.
(` crore)As at
31/03/2016 31/03/2015(b) Trident Trust:
Benefi ciary Interest in the Trust 34.46 34.46
(c) Key Managerial Personnel:
Managerial Remuneration (including perquisites) *Mr. D. Bhattacharya - Managing Director 19.90 21.59 Mr. Satish Pai - Deputy Managing Director 13.96 12.17
* Excluding gratuity, leave encashment provisions and compensation under Employee Stock Option Scheme.
54. Additional information:A. C.I.F. Value of Imports by the Company (Excluding imported items purchased locally):
(` crore)Year Ended
31/03/2016 31/03/2015Raw Materials 15,089.62 17,571.39 Coal and Fuel 628.26 652.89 Trading Goods - 37.04 Stores and Spares 140.93 73.66 Capital Goods 1,438.85 140.64
Hindalco Annual Report 2015-16.indb 131Hindalco Annual Report 2015-16.indb 131 8/17/2016 1:31:35 PM8/17/2016 1:31:35 PM
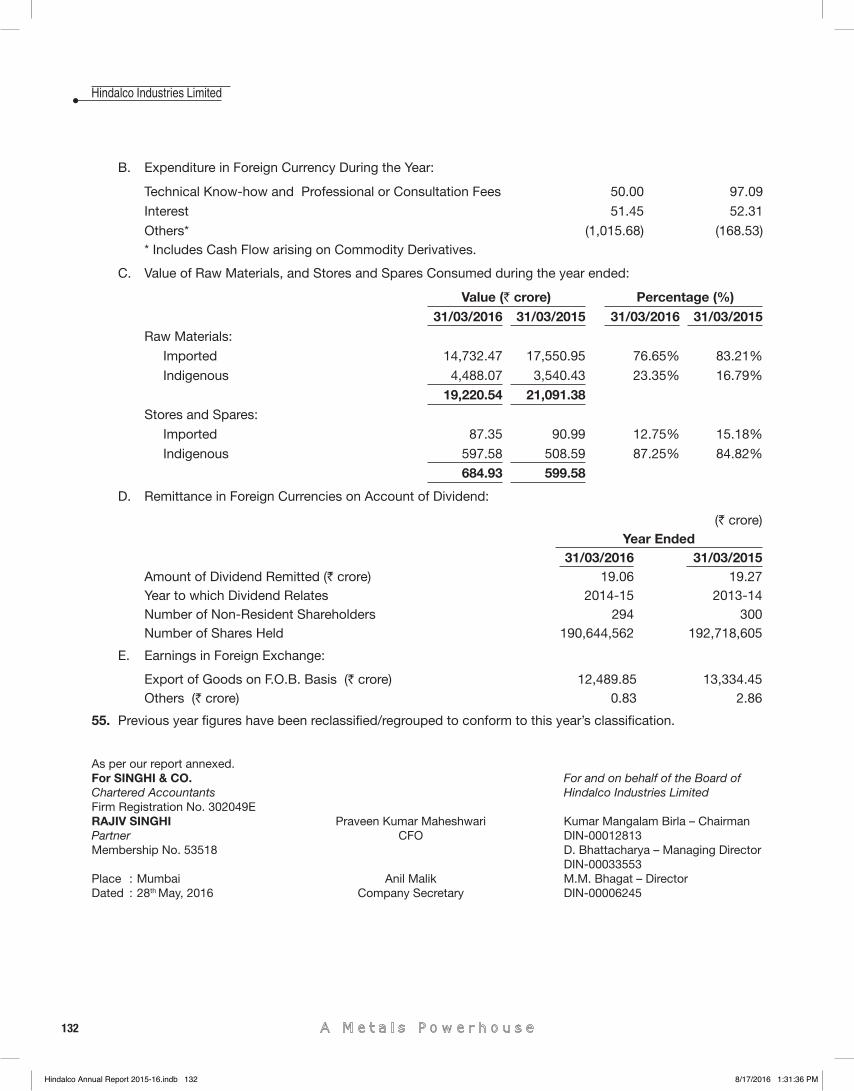
132
Hindalco Industries Limited
B. Expenditure in Foreign Currency During the Year:
Technical Know-how and Professional or Consultation Fees 50.00 97.09
Interest 51.45 52.31
Others* (1,015.68) (168.53)* Includes Cash Flow arising on Commodity Derivatives.
C. Value of Raw Materials, and Stores and Spares Consumed during the year ended:
Value (` crore) Percentage (%) 31/03/2016 31/03/2015 31/03/2016 31/03/2015
Raw Materials:
Imported 14,732.47 17,550.95 76.65% 83.21%
Indigenous 4,488.07 3,540.43 23.35% 16.79%
19,220.54 21,091.38 Stores and Spares:
Imported 87.35 90.99 12.75% 15.18%
Indigenous 597.58 508.59 87.25% 84.82%
684.93 599.58
D. Remittance in Foreign Currencies on Account of Dividend:
(` crore)Year Ended
31/03/2016 31/03/2015Amount of Dividend Remitted (` crore) 19.06 19.27 Year to which Dividend Relates 2014-15 2013-14 Number of Non-Resident Shareholders 294 300 Number of Shares Held 190,644,562 192,718,605
E. Earnings in Foreign Exchange:
Export of Goods on F.O.B. Basis (` crore) 12,489.85 13,334.45 Others (` crore) 0.83 2.86
55. Previous year fi gures have been reclassifi ed/regrouped to conform to this year’s classifi cation.
As per our report annexed.For SINGHI & CO. For and on behalf of the Board ofChartered Accountants Hindalco Industries LimitedFirm Registration No. 302049E RAJIV SINGHI Praveen Kumar Maheshwari Kumar Mangalam Birla – ChairmanPartner CFO DIN-00012813Membership No. 53518 D. Bhattacharya – Managing Director DIN-00033553Place : Mumbai Anil Malik M.M. Bhagat – DirectorDated : 28th May, 2016 Company Secretary DIN-00006245
Hindalco Annual Report 2015-16.indb 132Hindalco Annual Report 2015-16.indb 132 8/17/2016 1:31:36 PM8/17/2016 1:31:36 PM
133
Annual Report 2015-16Annual Report 2015-16
FINA
NCIA
L HI
GHLI
GHTS
MAN
AGEM
ENT
DISC
USSI
ON
AND
ANAL
YSIS
CORP
ORAT
E GO
VERN
ANCE
RE
PORT
STAN
DALO
NE
FINA
NCIA
L ST
ATEM
ENTS
CONS
OLID
ATED
FI
NANC
IAL
STAT
EMEN
TSSO
CIAL
RE
PORT
DIRE
CTOR
S’RE
PORT
SHAR
EHOL
DER
INFO
RMAT
ION
SUST
AINA
BILI
TY &
BUS
INES
SRE
SPON
SIBI
LITY
REP
ORT
INDEPENDENT AUDITORS’ REPORT ON THE CONSOLIDATED FINANCIAL STATEMENTS
To the Members of Hindalco Industries Limited
Report on the Consolidated Financial Statements
This Audit report on consolidated fi nancial statements which, inter-alia, includes full year fi nancial statements of Aditya Birla Minerals Limited (ABML), Australia, supersedes our earlier audit report dated 28th May 2016 issued on consolidated fi nancial statements which was then prepared considering the half yearly consolidated fi nancial statements of ABML.
We have audited the accompanying consolidated fi nancial statements of HINDALCO INDUSTRIES LIMITED (“hereinafter referred to as “the Holding Company”) and its Subsidiaries (the Holding Company and its Subsidiaries together referred to as “the Group”) and its Associates and Jointly Controlled Entities, comprising of the Consolidated Balance Sheet as at 31st March, 2016, the Consolidated Statement of Profi t and Loss and Consolidated Cash Flow Statement for the year then ended and a summary of signifi cant accounting policies and other explanatory information (hereinafter referred to as “the consolidated fi nancial statements”).
Management’s Responsibility for the Consolidated Financial Statements
The Holding Company’s Board of Directors is responsible for the preparation of these consolidated fi nancial statements in terms of the requirements of the Companies Act, 2013 (hereinafter referred to as “the Act”) that give a true and fair view of the consolidated fi nancial position, consolidated fi nancial performance and consolidated cash fl ows of the Group in accordance with the accounting principles generally accepted in India, including the Accounting Standards specifi ed under Section 133 of the Act, read with Rule 7 of the Companies (Accounts) Rules, 2014. The respective Board of Directors of the companies included in the Group are responsible for maintenance of adequate accounting records in accordance with the provisions of the Act for safeguarding the assets of the Group and for preventing and detecting frauds and other irregularities; the selection and application of appropriate accounting policies; making judgments and estimates that are reasonable and prudent; and the design, implementation and maintenance of adequate internal fi nancial controls, that were operating effectively for ensuring the accuracy and completeness of the accounting records, relevant to the preparation and presentation of the fi nancial statements that give a true and fair view and are free from material misstatement, whether due to fraud or error, which have been used for the purpose of preparation of the consolidated fi nancial statements by the Directors of the Holding Company, as aforesaid.
Auditor’s Responsibility
Our responsibility is to express an opinion on these consolidated fi nancial statements based on our audit. While conducting the audit, we have taken into account the provisions of the Act, the accounting and auditing standards and matters which are required to be included in the audit report under the provisions of the Act and the Rules made there under.
We conducted our audit in accordance with the Standards on Auditing specifi ed under Section 143(10) of the Act. Those Standards require, that we comply with ethical requirements and plan and perform the audit to obtain reasonable assurance about whether the consolidated fi nancial statements are free from material misstatement.
An audit involves performing procedures to obtain audit evidence about the amounts and the disclosures in the consolidated fi nancial statements. The procedures selected depend on the auditor’s judgment, including the assessment of the risks of material misstatement of the consolidated fi nancial statements, whether due to fraud or error. In making those risk assessments, the auditor considers internal fi nancial control relevant to the Holding Company’s preparation of the consolidated fi nancial statements that give a true and fair view in order to design audit procedures that are appropriate in the circumstances. An audit also includes evaluating the appropriateness of the accounting policies used and the reasonableness of the accounting estimates made by the Holding Company’s Board of Directors, as well as evaluating the overall presentation of the consolidated fi nancial statements.
We believe that the audit evidence obtained by us and the audit evidence obtained by the other auditor’s in term of their report referred to in sub paragraph 1 and 2 of the other matter paragraph is suffi cient and appropriate to provide a basis for our audit opinion on the consolidated fi nancial statements.
Hindalco Annual Report 2015-16.indb 133Hindalco Annual Report 2015-16.indb 133 8/17/2016 1:31:36 PM8/17/2016 1:31:36 PM
134
Hindalco Industries LimitedHindalco Industries Limited
Opinion
In our opinion and to the best of our information and according to the explanations given to us, the aforesaid consolidated fi nancial statements give the information required by the Act in the manner so required and give a true and fair view in conformity with the accounting principles generally accepted in India, of the consolidated state of affairs of the Group as at 31st March, 2016, and their consolidated profi t and their consolidated cash fl ows for the year ended on that date.
Emphasis of Matters
We draw attention to –
1. Note no. 42 to the consolidated fi nancial statements regarding accounting policy of Novelis Inc., a wholly owned subsidiary, with respect to recognition of actuarial losses(net of deferred tax) relating to pension and other post retirement benefi t plans in the Actuarial Gain/(Loss) Reserve. Had the Group followed the practice of recognition of actuarial gains/ losses on the aforesaid defi ned benefi t plans in the Statement of Profi t and Loss, Employee Benefi ts Expenses would have been higher by ` 253.75 crore (Previous year higher by ` 1,516.50 crore), Tax Expenses (Deferred Tax) would have been lower by ` 93.02 crore (Previous year lower by ` 452.80 crore), Minority Interest credit would have been lower by ` 71.71 crore (Previous year lower by ` 50.28 crore), Actuarial Gain/ (Loss) Reserve would have been ` Nil (Previous year ` Nil) and Foreign Currency Translation Reserve would have been lower by ` 150.74 crore (Previous year lower by ` 68.65 crore).
2. Note no. 49 to the consolidated fi nancial statements explaining that in compliance to scheme of arrangement under section 391 to 394 of the Companies Act, 1956 approved by the Hon’ble Bombay High Court vide order dated 29th June 2009, the management of the Holding Company during the year has identifi ed and adjusted following against Business Reconstruction Reserve:
a. provision for diminution in the carrying value of Investment in one of its Subsidiaries and a Jointly Controlled Entity aggregating to ` 35.50 crore,
b. impairment loss of ` 561.70 crore(deferred tax of ` 194.39 crore) related to one of its cash generating units,
c. expenses of ` 279.46 crore for exited project.
Had the impact of paragraph 1 and 2 be considered, the reported consolidated profi t before tax of ` 559.56 crore and profi t after tax and minority interest of ` 44.81 crore respectively, would have been converted in to consolidated loss before tax of ̀ 642.57 crore and loss after tax and minority interest of ̀ 869.91 crore. Further, consolidated share of minority interest would have been ` 377.29 crore (loss) against reported minority share of ` 449.00 crore (loss).
Our opinion is not qualifi ed in respect of above matters.
Other Matters
1. We did not audit the fi nancial statements/fi nancial information of eleven subsidiaries and one jointly controlled entity, whose fi nancial statements/fi nancial information refl ect total assets of ̀ 8,766.07 crore as at 31st March, 2016, total revenue of ` 2,314.87 crore and net cash fl ow amounting to ` 15.47 crore for the year then ended on that date, as considered in the consolidated fi nancial statements. The consolidated fi nancial statements also include the Group’s share of net profi t of ̀ 180.58 crore for the year ended 31st March 2016, as considered in the consolidated fi nancial statements, in respect of two associates, whose fi nancial statements/fi nancial information have not been audited by us. These fi nancial statements/fi nancial information of subsidiaries, jointly controlled entity and associates have been audited by other auditors whose reports have been furnished to us by the management and our opinion on the consolidated fi nancial statements, in so far as it relates to the amounts and disclosures included in respect of these subsidiaries, jointly controlled entity and associates, is based solely on the report of other auditors.
2. We did not audit the consolidated fi nancial statements/fi nancial statements/fi nancial information of three foreign subsidiaries whose consolidated fi nancial statements/fi nancial statements refl ect total assets of
Hindalco Annual Report 2015-16.indb 134Hindalco Annual Report 2015-16.indb 134 8/17/2016 1:31:36 PM8/17/2016 1:31:36 PM
135
Annual Report 2015-16Annual Report 2015-16
FINA
NCIA
L HI
GHLI
GHTS
MAN
AGEM
ENT
DISC
USSI
ON
AND
ANAL
YSIS
CORP
ORAT
E GO
VERN
ANCE
RE
PORT
STAN
DALO
NE
FINA
NCIA
L ST
ATEM
ENTS
CONS
OLID
ATED
FI
NANC
IAL
STAT
EMEN
TSSO
CIAL
RE
PORT
DIRE
CTOR
S’RE
PORT
SHAR
EHOL
DER
INFO
RMAT
ION
SUST
AINA
BILI
TY &
BUS
INES
SRE
SPON
SIBI
LITY
REP
ORT
` 66,829.65 crore (net) as at 31st March, 2016, total revenue of ` 65,446.49 crore and net cash fl ow amounting to ` 292.34 crore for the year then ended on that date, as considered in the consolidated fi nancial statements. These consolidated fi nancial statements/fi nancial statements/fi nancial information have been prepared by the management of the Holding Company and its subsidiaries in accordance with the generally accepted accounting principles in India and other recognized accounting policies read with point no. 1 under Emphasis of Matter and principles followed by the Holding Company. These fi nancial statements/fi nancial information have been audited by a fi rm of Chartered Accountants and have been included in the consolidated fi nancial statements of the Group on the basis of their Fit-For-Consolidation Report (“FFC”) and our opinion in respect of these foreign subsidiaries are based solely on those FFC reports.
3. We did not audit the consolidated fi nancial statements/fi nancial statements/fi nancial information of two foreign subsidiaries, whose consolidated fi nancial statements/fi nancial statements refl ect total assets of ` 825.56 crore (net) as at 31st March, 2016, total revenue of ` 1,006.13 crore and net cash fl ow amounting to ` 241.99 crore for the year ended on that date, as considered in the consolidated fi nancial statements. These consolidated fi nancial statements/fi nancial statements/fi nancial information are audited as per the local law of the respective countries and have been converted by the Management of the Holding Company into Indian GAAP, and our opinion on the consolidated fi nancial statements in so far as it relates to the amounts included in respect of these subsidiaries, is based solely on such fi nancial statement /fi nancial information which have been converted into Indian GAAP by the management to the extent possible and have been reviewed by us.
4. We did not audit the fi nancial statements/fi nancial information of a foreign subsidiary and a jointly controlled entity, whose fi nancial statements/fi nancial information refl ect total assets of ` 264.35 crore (net) as at 31st March, 2016 (net), total revenue of ` 193.11 crore and net cash fl ow amounting to ` 7.33 crore for the year ended on that date, as considered in the consolidated fi nancial statements. These fi nancial statements/fi nancial information are audited as per the local laws of the respective country and have been converted by the management of respective subsidiary/jointly controlled entity into Indian GAAP and certifi ed by the management of the respective subsidiary/jointly controlled entity and provided to us by the management of the Holding Company. Our opinion on the consolidated fi nancial statement in so far as it relates to amount included in respect of these subsidiary and jointly controlled entity is based solely on Management certifi ed fi nancial statements and fi nancial information.
Our opinion on the consolidated fi nancial statements and our report on Other Legal and Regulatory Requirements below are not qualifi ed in respect of the above matters with respect to our reliance on the work done and the reports of the other auditors and the fi nancial statements/fi nancial information certifi ed by the management.
Report on Other Legal and Regulatory Requirements
As required by Section143 (3) of the Act, we report that:-
(a) We have sought and obtained all the information and explanations which to the best of our knowledge and belief were necessary for the purposes of our audit of the aforesaid consolidated fi nancial statements.
(b) In our opinion, proper books of account as required by law relating to preparation of the aforesaid consolidated fi nancial statements have been kept so far as it appears from our examination of those books.
(c) The Consolidated Balance Sheet, the Consolidated Statement of Profi t and Loss, and the Consolidated Cash Flow Statement dealt with by this Report are in agreement with the relevant books of account maintained for the purpose of preparation of the consolidated fi nancial statements.
(d) In our opinion, the aforesaid consolidated fi nancial statements read with the our observations made in Emphasis of Matter paragraph, comply with the Accounting Standards specifi ed under Section 133 of the Act, read with Rule 7 of the Companies (Accounts) Rules, 2014 and Accounting Standard (AS) - 30 to the extent it relates to Derivative Accounting, as prescribed by Institute of Chartered Accountants of India.
(e) On the basis of the written representations received from the directors of the Holding Company and Subsidiary Companies as on March 31, 2016 taken on record by the Board of Directors of the Holding Company and
INDEPENDENT AUDITORS’ REPORT ON THE CONSOLIDATED FINANCIAL STATEMENTS
Hindalco Annual Report 2015-16.indb 135Hindalco Annual Report 2015-16.indb 135 8/17/2016 1:31:36 PM8/17/2016 1:31:36 PM
136
Hindalco Industries LimitedHindalco Industries Limited
Subsidiary Companies incorporated in India, none of the directors of the Holding Company and Subsidiary Companies incorporated in India is disqualifi ed as on 31st March, 2016 from being appointed as a director in terms of Section 164 (2) of the Act.
(f) With respect to the adequacy of the internal fi nancial controls over fi nancial reporting of the Group and the operating effectiveness of such controls, refer to our separate report in “Annexure A”; and
(g) With respect to the other matters to be included in the Auditor’s Report in accordance with Rule 11 of the Companies (Audit and Auditor’s) Rules, 2014, in our opinion and to the best of our information and according to the explanations given to us:
i. the consolidated fi nancial statements disclose the impact of pending litigation on the consolidated fi nancial position of the Group – Refer note no. 52A(a), 52A(c)(iii) and 52A(c)(iv) to the consolidated fi nancial statements.
ii. the Group has long-term contracts including derivative contracts as at 31st March, 2016 for which there were no material foreseeable losses.
iii. there has been no delay in transferring amounts, required to be transferred, to the Investor Education and Protection Fund by the Holding Company and its Subsidiaries, Associates and Jointly Controlled Entities incorporated in India, except a sum of ` 0.09 crore which are held in abeyance due to pending legal cases.
For SINGHI & CO. Chartered Accountants
Firm Registration No. 302049E
(RAJIV SINGHI)Place : Mumbai PartnerDate : 21st July, 2016 Membership No. 53518
Annexure - A to the Auditor’s Report
Report on the Internal Financial Controls under Clause (i) of Sub-section 3 of Section 143 of the Companies Act, 2013 (“the Act”).
In conjunction with our audit of the consolidated fi nancial statements of the Company as of and for the year ended 31st March, 2016, we have audited the internal fi nancial controls over fi nancial reporting of Hindalco Industries Limited (“the Holding Company”) and its subsidiary companies which are companies incorporated in India, as of that date.
Management’s Responsibility for Internal Financial Controls
The Respective Board of Directors of the Holding Company and its subsidiary companies, which are companies incorporated in India, are responsible for establishing and maintaining internal fi nancial controls based on the internal control over fi nancial reporting criteria established by the Company considering the essential components of internal control stated in the Guidance Note on Audit of Internal Financial Controls over Financial Reporting issued by the Institute of Chartered Accountants of India (“ICAI’). These responsibilities include the design, implementation and maintenance of adequate internal fi nancial controls that were operating effectively for ensuring the orderly and effi cient conduct of its business, including adherence to company’s policies, the safeguarding of its assets, the prevention and detection of frauds and errors, the accuracy and completeness of the accounting records, and the timely preparation of reliable fi nancial information, as required under the Companies Act, 2013.
Auditors’ Responsibility
Our responsibility is to express an opinion on the Company’s internal fi nancial controls over fi nancial reporting based on our audit. We conducted our audit in accordance with the Guidance Note on Audit of Internal Financial
Hindalco Annual Report 2015-16.indb 136Hindalco Annual Report 2015-16.indb 136 8/17/2016 1:31:36 PM8/17/2016 1:31:36 PM

137
Annual Report 2015-16Annual Report 2015-16
FINA
NCIA
L HI
GHLI
GHTS
MAN
AGEM
ENT
DISC
USSI
ON
AND
ANAL
YSIS
CORP
ORAT
E GO
VERN
ANCE
RE
PORT
STAN
DALO
NE
FINA
NCIA
L ST
ATEM
ENTS
CONS
OLID
ATED
FI
NANC
IAL
STAT
EMEN
TSSO
CIAL
RE
PORT
DIRE
CTOR
S’RE
PORT
SHAR
EHOL
DER
INFO
RMAT
ION
SUST
AINA
BILI
TY &
BUS
INES
SRE
SPON
SIBI
LITY
REP
ORT
Controls over Financial Reporting (the “Guidance Note”) issued by ICAI and the Standards on Auditing, issued by ICAI and deemed to be prescribed under Section 143(10) of the Companies Act, 2013, to the extent applicable to an audit of internal fi nancial controls, both issued by the Institute of Chartered Accountants of India. Those Standards and the Guidance Note require that we comply with ethical requirements and plan and perform the audit to obtain reasonable assurance about whether adequate internal fi nancial controls over fi nancial reporting was established and maintained and if such controls operated effectively in all material respects.
Our audit involves performing procedures to obtain audit evidence about the adequacy of the internal fi nancial controls system over fi nancial reporting and their operating effectiveness. Our audit of internal fi nancial controls over fi nancial reporting included obtaining an understanding of internal fi nancial controls over fi nancial reporting, assessing the risk that a material weakness exists, and testing and evaluating the design and operating effectiveness of internal control based on the assessed risk. The procedures selected depend on the auditor’s judgment, including the assessment of the risks of material misstatement of the fi nancial statements, whether due to fraud or error.
We believe that the audit evidence we have obtained is suffi cient and appropriate to provide a basis for our audit opinion on the Company’s internal fi nancial controls system over fi nancial reporting.
Meaning of Internal Financial Controls over Financial Reporting
A Company’s internal fi nancial control over fi nancial reporting is a process designed to provide reasonable assurance regarding the reliability of fi nancial reporting and the preparation of fi nancial statements for external purposes in accordance with generally accepted accounting principles. A Company’s internal fi nancial control over fi nancial reporting includes those policies and procedures that (1) pertain to the maintenance of records that, in reasonable detail, accurately and fairly refl ect the transactions and dispositions of the assets of the Company; (2) provide reasonable assurance that transactions are recorded as necessary to permit preparation of fi nancial statements in accordance with generally accepted accounting principles, and that receipts and expenditures of the Company are being made only in accordance with authorisations of management and directors of the Company; and (3) provide reasonable assurance regarding prevention or timely detection of unauthorised acquisition, use, or disposition of the Company’s assets that could have a material effect on the fi nancial statements.
Inherent Limitations of Internal Financial Controls over Financial Reporting
Because of the inherent limitations of internal fi nancial controls over fi nancial reporting, including the possibility of collusion or improper management override of controls, material misstatements due to error or fraud may occur and not be detected. Also, projections of any evaluation of the internal fi nancial controls over fi nancial reporting to future periods are subject to the risk that the internal fi nancial control over fi nancial reporting may become inadequate because of changes in conditions, or that the degree of compliance with the policies or procedures may deteriorate.
Opinion
In our opinion, the Holding Company and its subsidiary companies, which are companies incorporated in India, have, in all material respects, an adequate internal fi nancial controls system over fi nancial reporting and such internal fi nancial controls over fi nancial reporting were operating effectively as at 31st March 2016, based on the internal control over fi nancial reporting criteria established by the Company considering the essential components of internal control stated in the Guidance Note on Audit of Internal Financial Controls Over Financial Reporting issued by the ICAI.
For SINGHI & CO. Chartered Accountants
Firm Registration No. 302049E
(RAJIV SINGHI)Place : Mumbai PartnerDate : 21st July, 2016 Membership No. 53518
INDEPENDENT AUDITORS’ REPORT ON THE CONSOLIDATED FINANCIAL STATEMENTS
Hindalco Annual Report 2015-16.indb 137Hindalco Annual Report 2015-16.indb 137 8/17/2016 1:31:36 PM8/17/2016 1:31:36 PM
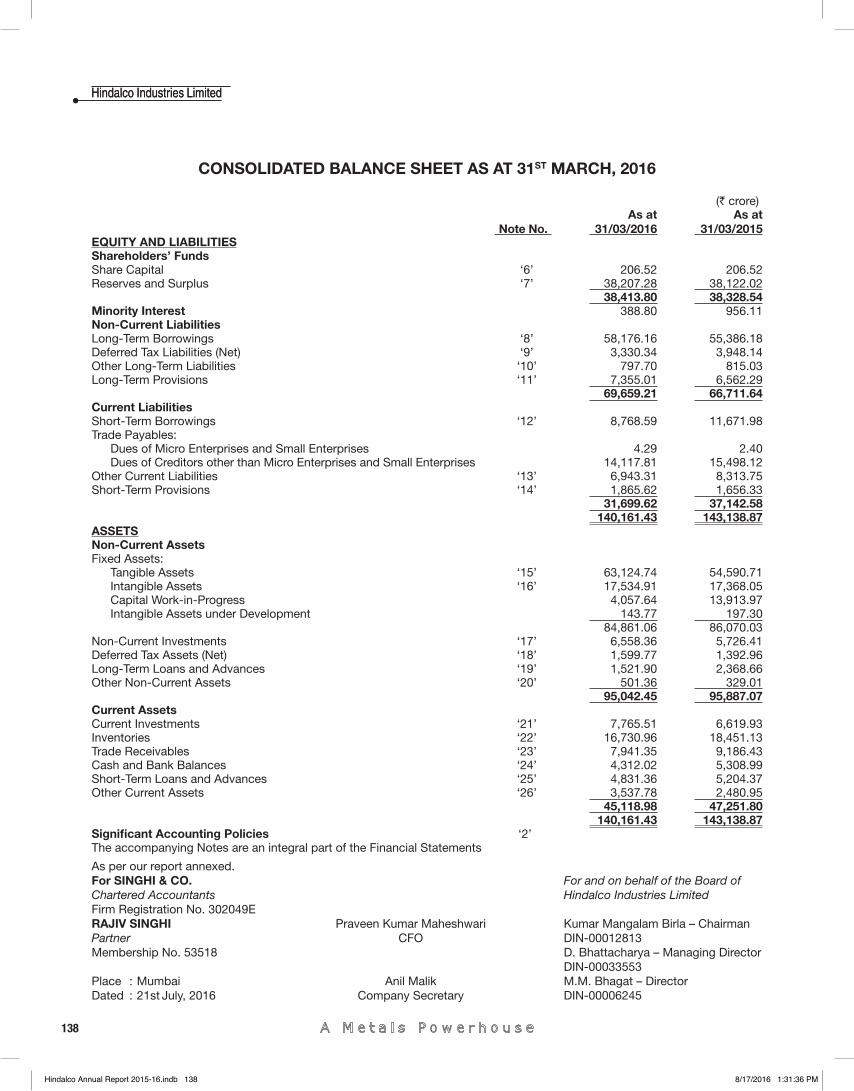
138
Hindalco Industries LimitedHindalco Industries Limited
As per our report annexed.For SINGHI & CO. For and on behalf of the Board ofChartered Accountants Hindalco Industries LimitedFirm Registration No. 302049E RAJIV SINGHI Praveen Kumar Maheshwari Kumar Mangalam Birla – ChairmanPartner CFO DIN-00012813Membership No. 53518 D. Bhattacharya – Managing Director DIN-00033553Place : Mumbai Anil Malik M.M. Bhagat – DirectorDated : 21st July, 2016 Company Secretary DIN-00006245
CONSOLIDATED BALANCE SHEET AS AT 31ST MARCH, 2016
(` crore)
Note No. As at
31/03/2016 As at
31/03/2015EQUITY AND LIABILITIESShareholders’ FundsShare Capital ‘6’ 206.52 206.52 Reserves and Surplus ‘7’ 38,207.28 38,122.02
38,413.80 38,328.54 Minority Interest 388.80 956.11 Non-Current LiabilitiesLong-Term Borrowings ‘8’ 58,176.16 55,386.18 Deferred Tax Liabilities (Net) ‘9’ 3,330.34 3,948.14 Other Long-Term Liabilities ‘10’ 797.70 815.03 Long-Term Provisions ‘11’ 7,355.01 6,562.29
69,659.21 66,711.64 Current LiabilitiesShort-Term Borrowings ‘12’ 8,768.59 11,671.98 Trade Payables:
Dues of Micro Enterprises and Small Enterprises 4.29 2.40 Dues of Creditors other than Micro Enterprises and Small Enterprises 14,117.81 15,498.12
Other Current Liabilities ‘13’ 6,943.31 8,313.75 Short-Term Provisions ‘14’ 1,865.62 1,656.33
31,699.62 37,142.58 140,161.43 143,138.87
ASSETSNon-Current AssetsFixed Assets:
Tangible Assets ‘15’ 63,124.74 54,590.71 Intangible Assets ‘16’ 17,534.91 17,368.05 Capital Work-in-Progress 4,057.64 13,913.97 Intangible Assets under Development 143.77 197.30
84,861.06 86,070.03 Non-Current Investments ‘17’ 6,558.36 5,726.41 Deferred Tax Assets (Net) ‘18’ 1,599.77 1,392.96 Long-Term Loans and Advances ‘19’ 1,521.90 2,368.66 Other Non-Current Assets ‘20’ 501.36 329.01
95,042.45 95,887.07 Current Assets Current Investments ‘21’ 7,765.51 6,619.93 Inventories ‘22’ 16,730.96 18,451.13 Trade Receivables ‘23’ 7,941.35 9,186.43 Cash and Bank Balances ‘24’ 4,312.02 5,308.99 Short-Term Loans and Advances ‘25’ 4,831.36 5,204.37 Other Current Assets ‘26’ 3,537.78 2,480.95
45,118.98 47,251.80 140,161.43 143,138.87
Signifi cant Accounting Policies ‘2’ The accompanying Notes are an integral part of the Financial Statements
Hindalco Annual Report 2015-16.indb 138Hindalco Annual Report 2015-16.indb 138 8/17/2016 1:31:36 PM8/17/2016 1:31:36 PM
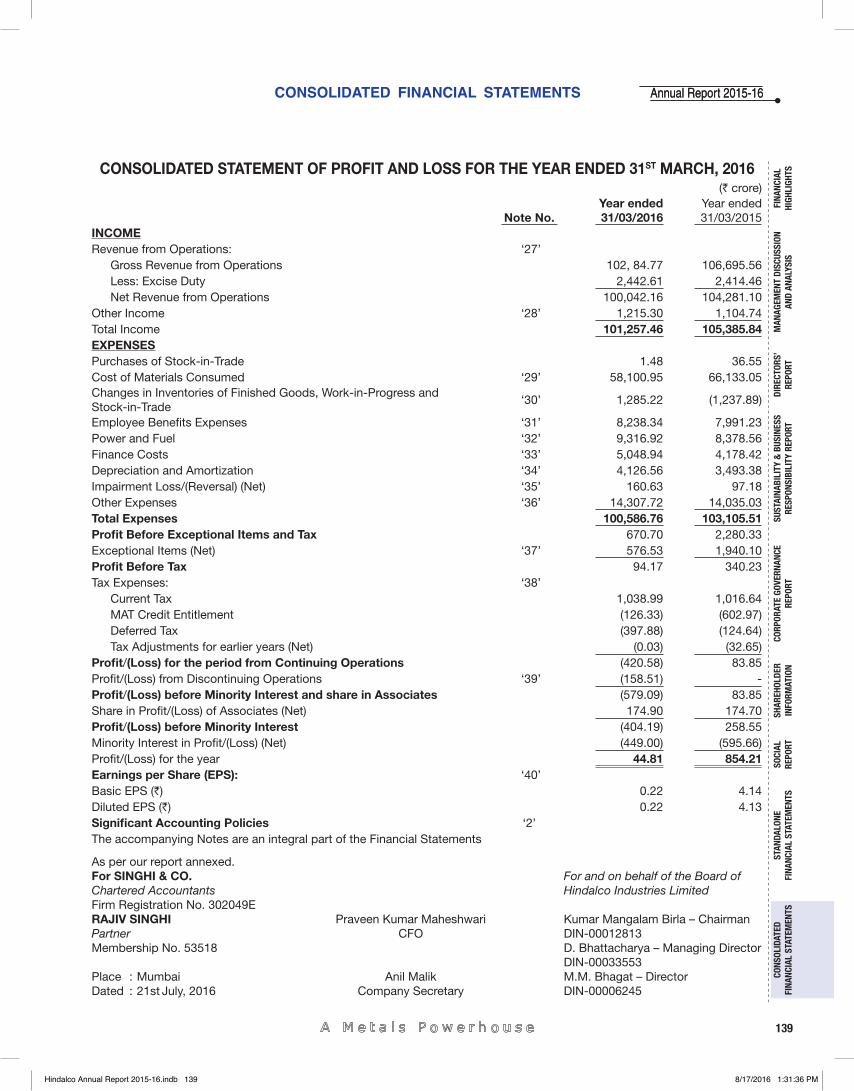
CONSOLIDATED FINANCIAL STATEMENTS
139
Annual Report 2015-16Annual Report 2015-16
FINA
NCIA
L HI
GHLI
GHTS
MAN
AGEM
ENT
DISC
USSI
ON
AND
ANAL
YSIS
CORP
ORAT
E GO
VERN
ANCE
RE
PORT
STAN
DALO
NE
FINA
NCIA
L ST
ATEM
ENTS
CONS
OLID
ATED
FI
NANC
IAL
STAT
EMEN
TSSO
CIAL
RE
PORT
DIRE
CTOR
S’RE
PORT
SHAR
EHOL
DER
INFO
RMAT
ION
SUST
AINA
BILI
TY &
BUS
INES
SRE
SPON
SIBI
LITY
REP
ORT
As per our report annexed.For SINGHI & CO. For and on behalf of the Board ofChartered Accountants Hindalco Industries LimitedFirm Registration No. 302049E RAJIV SINGHI Praveen Kumar Maheshwari Kumar Mangalam Birla – ChairmanPartner CFO DIN-00012813Membership No. 53518 D. Bhattacharya – Managing Director DIN-00033553Place : Mumbai Anil Malik M.M. Bhagat – DirectorDated : 21st July, 2016 Company Secretary DIN-00006245
CONSOLIDATED STATEMENT OF PROFIT AND LOSS FOR THE YEAR ENDED 31ST MARCH, 2016(` crore)
Note No. Year ended31/03/2016
Year ended31/03/2015
INCOMERevenue from Operations: ‘27’
Gross Revenue from Operations 102, 84.77 106,695.56 Less: Excise Duty 2,442.61 2,414.46 Net Revenue from Operations 100,042.16 104,281.10
Other Income ‘28’ 1,215.30 1,104.74 Total Income 101,257.46 105,385.84 EXPENSESPurchases of Stock-in-Trade 1.48 36.55 Cost of Materials Consumed ‘29’ 58,100.95 66,133.05 Changes in Inventories of Finished Goods, Work-in-Progress and Stock-in-Trade
‘30’ 1,285.22 (1,237.89)
Employee Benefi ts Expenses ‘31’ 8,238.34 7,991.23 Power and Fuel ‘32’ 9,316.92 8,378.56 Finance Costs ‘33’ 5,048.94 4,178.42 Depreciation and Amortization ‘34’ 4,126.56 3,493.38 Impairment Loss/(Reversal) (Net) ‘35’ 160.63 97.18 Other Expenses ‘36’ 14,307.72 14,035.03 Total Expenses 100,586.76 103,105.51 Profi t Before Exceptional Items and Tax 670.70 2,280.33 Exceptional Items (Net) ‘37’ 576.53 1,940.10 Profi t Before Tax 94.17 340.23 Tax Expenses: ‘38’
Current Tax 1,038.99 1,016.64 MAT Credit Entitlement (126.33) (602.97)Deferred Tax (397.88) (124.64)Tax Adjustments for earlier years (Net) (0.03) (32.65)
Profi t/(Loss) for the period from Continuing Operations (420.58) 83.85 Profi t/(Loss) from Discontinuing Operations ‘39’ (158.51) - Profi t/(Loss) before Minority Interest and share in Associates (579.09) 83.85 Share in Profi t/(Loss) of Associates (Net) 174.90 174.70 Profi t/(Loss) before Minority Interest (404.19) 258.55 Minority Interest in Profi t/(Loss) (Net) (449.00) (595.66)Profi t/(Loss) for the year 44.81 854.21 Earnings per Share (EPS): ‘40’Basic EPS (`) 0.22 4.14 Diluted EPS (`) 0.22 4.13 Signifi cant Accounting Policies ‘2’The accompanying Notes are an integral part of the Financial Statements
Hindalco Annual Report 2015-16.indb 139Hindalco Annual Report 2015-16.indb 139 8/17/2016 1:31:36 PM8/17/2016 1:31:36 PM
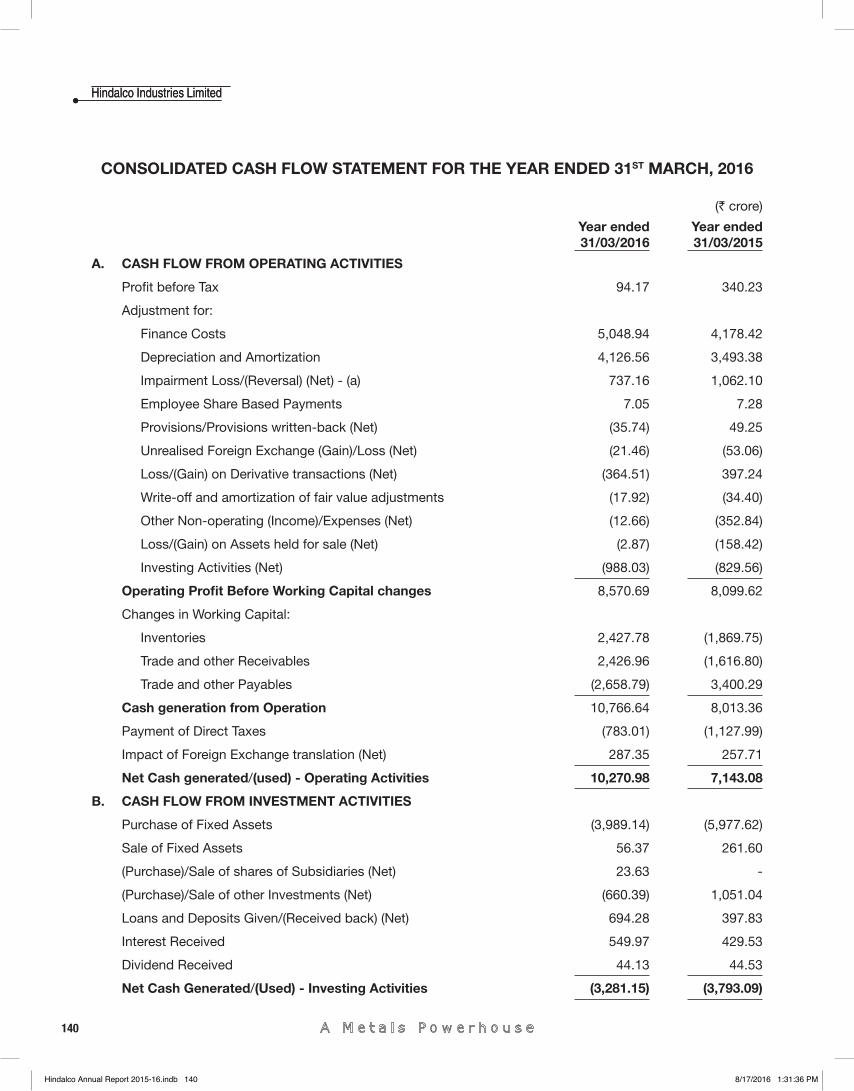
140
Hindalco Industries LimitedHindalco Industries Limited
CONSOLIDATED CASH FLOW STATEMENT FOR THE YEAR ENDED 31ST MARCH, 2016
(` crore)
Year ended31/03/2016
Year ended31/03/2015
A. CASH FLOW FROM OPERATING ACTIVITIES
Profi t before Tax 94.17 340.23
Adjustment for:
Finance Costs 5,048.94 4,178.42
Depreciation and Amortization 4,126.56 3,493.38
Impairment Loss/(Reversal) (Net) - (a) 737.16 1,062.10
Employee Share Based Payments 7.05 7.28
Provisions/Provisions written-back (Net) (35.74) 49.25
Unrealised Foreign Exchange (Gain)/Loss (Net) (21.46) (53.06)
Loss/(Gain) on Derivative transactions (Net) (364.51) 397.24
Write-off and amortization of fair value adjustments (17.92) (34.40)
Other Non-operating (Income)/Expenses (Net) (12.66) (352.84)
Loss/(Gain) on Assets held for sale (Net) (2.87) (158.42)
Investing Activities (Net) (988.03) (829.56)
Operating Profi t Before Working Capital changes 8,570.69 8,099.62
Changes in Working Capital:
Inventories 2,427.78 (1,869.75)
Trade and other Receivables 2,426.96 (1,616.80)
Trade and other Payables (2,658.79) 3,400.29
Cash generation from Operation 10,766.64 8,013.36
Payment of Direct Taxes (783.01) (1,127.99)
Impact of Foreign Exchange translation (Net) 287.35 257.71
Net Cash generated/(used) - Operating Activities 10,270.98 7,143.08
B. CASH FLOW FROM INVESTMENT ACTIVITIES
Purchase of Fixed Assets (3,989.14) (5,977.62)
Sale of Fixed Assets 56.37 261.60
(Purchase)/Sale of shares of Subsidiaries (Net) 23.63 -
(Purchase)/Sale of other Investments (Net) (660.39) 1,051.04
Loans and Deposits Given/(Received back) (Net) 694.28 397.83
Interest Received 549.97 429.53
Dividend Received 44.13 44.53
Net Cash Generated/(Used) - Investing Activities (3,281.15) (3,793.09)
Hindalco Annual Report 2015-16.indb 140Hindalco Annual Report 2015-16.indb 140 8/17/2016 1:31:36 PM8/17/2016 1:31:36 PM
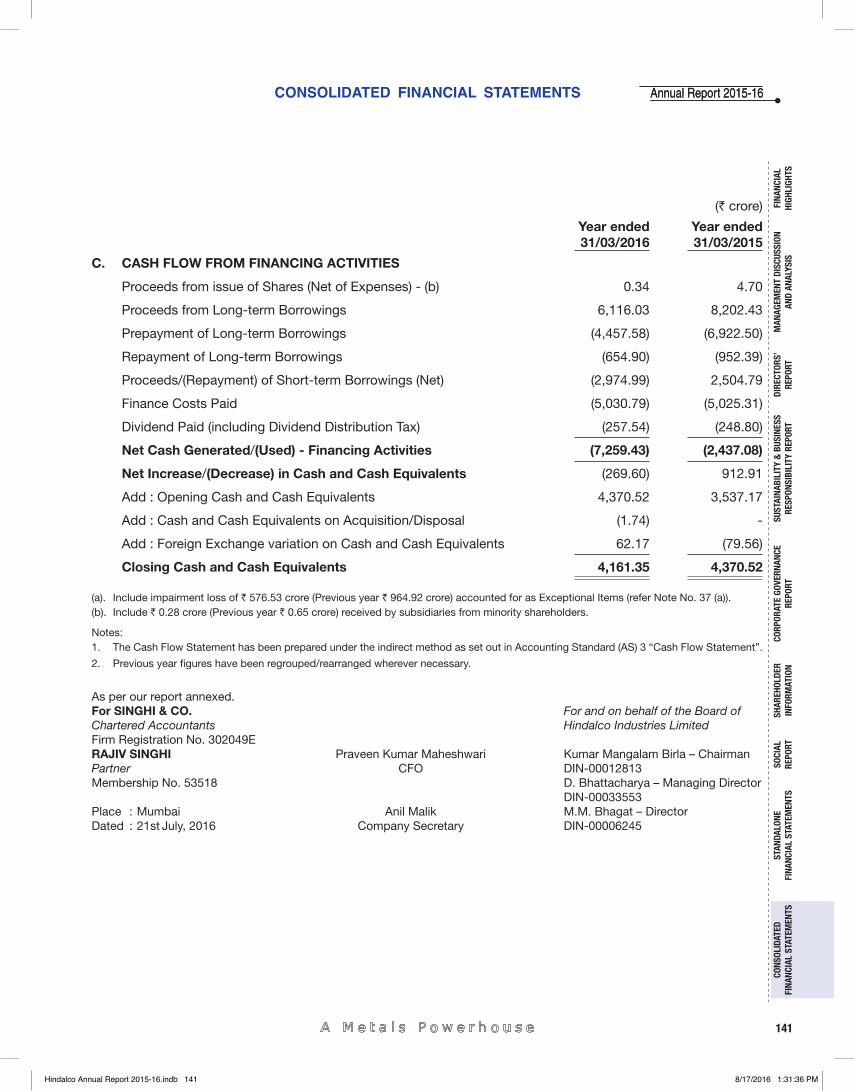
CONSOLIDATED FINANCIAL STATEMENTS
141
Annual Report 2015-16Annual Report 2015-16
FINA
NCIA
L HI
GHLI
GHTS
MAN
AGEM
ENT
DISC
USSI
ON
AND
ANAL
YSIS
CORP
ORAT
E GO
VERN
ANCE
RE
PORT
STAN
DALO
NE
FINA
NCIA
L ST
ATEM
ENTS
CONS
OLID
ATED
FI
NANC
IAL
STAT
EMEN
TSSO
CIAL
RE
PORT
DIRE
CTOR
S’RE
PORT
SHAR
EHOL
DER
INFO
RMAT
ION
SUST
AINA
BILI
TY &
BUS
INES
SRE
SPON
SIBI
LITY
REP
ORT
(` crore)
Year ended31/03/2016
Year ended31/03/2015
C. CASH FLOW FROM FINANCING ACTIVITIES
Proceeds from issue of Shares (Net of Expenses) - (b) 0.34 4.70
Proceeds from Long-term Borrowings 6,116.03 8,202.43
Prepayment of Long-term Borrowings (4,457.58) (6,922.50)
Repayment of Long-term Borrowings (654.90) (952.39)
Proceeds/(Repayment) of Short-term Borrowings (Net) (2,974.99) 2,504.79
Finance Costs Paid (5,030.79) (5,025.31)
Dividend Paid (including Dividend Distribution Tax) (257.54) (248.80)
Net Cash Generated/(Used) - Financing Activities (7,259.43) (2,437.08)
Net Increase/(Decrease) in Cash and Cash Equivalents (269.60) 912.91
Add : Opening Cash and Cash Equivalents 4,370.52 3,537.17
Add : Cash and Cash Equivalents on Acquisition/Disposal (1.74) -
Add : Foreign Exchange variation on Cash and Cash Equivalents 62.17 (79.56)
Closing Cash and Cash Equivalents 4,161.35 4,370.52
(a). Include impairment loss of ` 576.53 crore (Previous year ` 964.92 crore) accounted for as Exceptional Items (refer Note No. 37 (a)). (b). Include ` 0.28 crore (Previous year ` 0.65 crore) received by subsidiaries from minority shareholders.
Notes: 1. The Cash Flow Statement has been prepared under the indirect method as set out in Accounting Standard (AS) 3 “Cash Flow Statement”.
2. Previous year fi gures have been regrouped/rearranged wherever necessary. As per our report annexed.For SINGHI & CO. For and on behalf of the Board ofChartered Accountants Hindalco Industries LimitedFirm Registration No. 302049E RAJIV SINGHI Praveen Kumar Maheshwari Kumar Mangalam Birla – ChairmanPartner CFO DIN-00012813Membership No. 53518 D. Bhattacharya – Managing Director DIN-00033553Place : Mumbai Anil Malik M.M. Bhagat – DirectorDated : 21st July, 2016 Company Secretary DIN-00006245
Hindalco Annual Report 2015-16.indb 141Hindalco Annual Report 2015-16.indb 141 8/17/2016 1:31:36 PM8/17/2016 1:31:36 PM
142
Hindalco Industries LimitedHindalco Industries Limited
NOTES FORMING PART OF THE CONSOLIDATED FINANCIAL STATEMENTS
1. Principles of Consolidation
The Consolidated Financial Statements (CFS) relate to Hindalco Industries Limited (the Company) and its Subsidiaries (the Company and its subsidiaries together referred to as “the Group”) and its interest in Associates and Joint Ventures. The CFS have been prepared in accordance with Accounting Standard 21 on “Consolidated Financial Statements” (AS 21), Accounting Standard 23 on “Accounting for Investments in Associates in Consolidated Financial Statements” (AS 23) and Accounting Standard 27 on “Financial reporting of interests in Joint Ventures” (AS 27) and are prepared on the following basis:
(a). The fi nancial statements of the Company and its Subsidiaries are combined on a line-by-line basis by adding together the book values of like items of assets, liabilities, income and expenses, after fully eliminating inter-group balances and inter-group transactions including unrealized profi ts/losses in period end assets, such as inventories, fi xed assets etc. The difference between the Company’s cost of investments in the Subsidiaries, over its portion of equity at the time of acquisition of shares is recognized in the consolidated fi nancial statements as Goodwill or Capital Reserve on consolidation, as the case may be. Minority Interest’s share in net profi t/loss of consolidated subsidiaries for the year is adjusted against the income of the Group in order to arrive at the net income attributable to equity shareholders of the Company. Minority Interest’s share in net assets of consolidated subsidiaries is presented in the Consolidated Balance Sheet separate from liabilities and the equity of the Company’s shareholders. Minority Interest in the consolidated fi nancial statements is identifi ed and recognized after taking into consideration:
(i). The amount of equity attributable to minorities at the date on which investments in a subsidiary is made.
(ii). The minorities’ share of movement in equity since the date parent-subsidiary relationship came into existence.
(iii). The losses attributable to the minorities are adjusted against the minority interest in the equity of the subsidiary.
(iv). The excess of loss over the minority interest in the equity, is adjusted against General Reserve of the Company.
(b). In case of foreign subsidiaries, being non-integral foreign operations, revenue items are translated at the average rates prevailing during the period. Assets, liabilities and equity are translated at the closing rate. Any exchange difference arising on translation is recognized in the “Foreign Currency Translation Reserve”.
(c). Investments in Associates are accounted for using equity method in accordance with AS 23. For this purpose investments are initially recorded at cost. Any Goodwill/Capital Reserve arising at the time of acquisition are identifi ed and carrying amount of investment are adjusted thereafter for the post acquisition share of profi ts or losses. Adjustment for any change in equity that has not been included in the profi t and loss account are directly made in the carrying amount of investments without routing it through the consolidated profi t and loss account. The corresponding debit/credit are made in the relevant head of the equity interest in the Consolidated Balance Sheet.
(d). Interests in jointly controlled entities, where the Company is a direct venturer, are accounted for using proportionate consolidation in accordance with AS 27. The difference between costs of the Company’s interests in jointly controlled entities over its share of net assets in the jointly controlled entities, at the date on which interest is acquired, is recognized in the CFS as Goodwill or Capital Reserve as the case may be.
(e). The CFS are prepared by using uniform accounting policies for like transactions and other events in similar circumstances and necessary adjustments required for deviations, if any and to the extent possible, are made in the CFS and are presented in the same manner as the Company’s separate fi nancial statements except otherwise stated elsewhere in this schedule.
Hindalco Annual Report 2015-16.indb 142Hindalco Annual Report 2015-16.indb 142 8/17/2016 1:31:37 PM8/17/2016 1:31:37 PM
CONSOLIDATED FINANCIAL STATEMENTS
143
Annual Report 2015-16Annual Report 2015-16
FINA
NCIA
L HI
GHLI
GHTS
MAN
AGEM
ENT
DISC
USSI
ON
AND
ANAL
YSIS
CORP
ORAT
E GO
VERN
ANCE
RE
PORT
STAN
DALO
NE
FINA
NCIA
L ST
ATEM
ENTS
CONS
OLID
ATED
FI
NANC
IAL
STAT
EMEN
TSSO
CIAL
RE
PORT
DIRE
CTOR
S’RE
PORT
SHAR
EHOL
DER
INFO
RMAT
ION
SUST
AINA
BILI
TY &
BUS
INES
SRE
SPON
SIBI
LITY
REP
ORT
NOTES FORMING PART OF THE CONSOLIDATED FINANCIAL STATEMENTS
2. Signifi cant Accounting Policies
A. Accounting Convention
These fi nancial statements are prepared in accordance with Indian Generally Accepted Accounting Principles (GAAP) under the historical cost convention on an accrual basis. GAAP comprises mandatory accounting standards as prescribed under Section 133 of the Companies Act, 2013 (‘Act’) read with Rule 7 of the Companies (Accounts) Rules, 2014, the provisions of the Act (to the extent notifi ed) and guidelines issued by the Securities and Exchange Board of India (SEBI). All the assets and liabilities are classifi ed as current or non-current as per the criteria set out in Schedule III to the Companies Act, 2013.
In the absence of any specifi c guidance being available under generally accepted accounting principles in India on accounting for business combination through purchase of shares (to the extent not covered under Accounting Standard 14 on ‘Accounting for Amalgamations’ and under Accounting Standard 10 on ‘Accounting for Fixed Assets’), the Company has adopted the principles of International Financial Reporting Standards 3 (IFRS 3 - Accounting for Business Combinations), effective from fi nancial year ended 31st March 2008. Accordingly, the aggregate of consideration (purchase price and transaction costs) paid by the acquirer company has been allocated to the assets acquired and liabilities assumed of the acquiree company, at their acquisition-date fair values.
B. Use of Estimates
The preparation of fi nancial statements require estimates and assumptions to be made that affect the reported amount of assets and liabilities on the date of the fi nancial statements and the reported amount of revenues and expenses during the reporting period. Difference between the actual results and estimates are recognized in the period in which the results are known/materialized.
C. Fixed Assets
(a) Tangible Assets are stated at cost less accumulated depreciation and impairment loss, if any. Cost comprises of purchase price and any directly attributable cost of bringing the assets to its working condition and any obligatory decommissioning costs for its intended use.
(b) Intangible Assets are stated at cost less accumulated amortization and impairment loss, if any. Cost includes any directly attributable expenditure on making the asset ready for its intended use.
(c) Machinery spares which can be used only in connection with an item of Tangible Asset and whose use is not of regular nature are written off over the estimated useful life of the relevant asset.
(d) Certain directly attributable pre-operative expenses during construction period are included under Capital Work-in-Progress. These expenses are allocated to the cost of Fixed Assets when the same are ready for intended use.
D. Depreciation and Amortization
(a) Depreciation on Tangible Fixed Assets are provided using Straight Line Method based on estimated useful life or on the basis of depreciation rates prescribed under respective local laws.
(b) Intangible Assets other than Mining Rights and Goodwill on Consolidation are amortized over their estimated useful lives on straight line basis. Mining Rights are amortized over the period of lease on straight line basis or on the basis of production, proportional to mineral resources expected to be ultimately economically recoverable, whichever is higher. Goodwill on Consolidation is subject to impairment testing.
(c) Depreciation on assets acquired under fi nance lease is spread over the lease term.
E. Impairment
An asset is treated as impaired when the carrying cost of the asset exceeds its recoverable value being higher of value in use and net selling price. Value in use is computed at net present value of cash fl ow
Hindalco Annual Report 2015-16.indb 143Hindalco Annual Report 2015-16.indb 143 8/17/2016 1:31:37 PM8/17/2016 1:31:37 PM
144
Hindalco Industries LimitedHindalco Industries Limited
NOTES FORMING PART OF THE CONSOLIDATED FINANCIAL STATEMENTS
expected over the balance useful life of the assets. An impairment loss is recognized as an expense in the Statement of Profi t and Loss in the year in which an asset is identifi ed as impaired. The impairment loss recognized in prior accounting period is reversed if there has been an improvement in recoverable amount except in the case of goodwill on consolidation for which specifi c external event of an exceptional nature that caused impairment loss has actually reversed the effect of that event.
F. Leases
(a) Lease payments under an operating lease are recognized as expense in the profi t and loss account as per terms of lease agreement.
(b) Finance leases prior to 1st April, 2001: Lease rental recognized as expense in the profi t and loss account as per terms of lease agreement.
(c) Finance leases on or after 1st April, 2001: The lower of the fair value of the assets and the present value of the minimum lease rental is recorded as fi xed assets with corresponding amount shown as unsecured Loan. The principal component in the lease rental is adjusted against the lease liability and the interest component is charged to profi t and loss account as interest cost.
G. Investments
(a) Long term investments are carried at cost after deducting provision, if any, for diminution in value considered to be other than temporary in nature.
(b) Current investments are stated at lower of cost and fair value.
H. Inventories
(a) Inventories of stores and spare parts are valued at or below cost after providing for cost of obsolescence and other anticipated losses, wherever considered necessary. Inventory of other items are valued ‘at Cost or Net Realizable Value, whichever is lower’. Cost is generally determined on weighted average cost basis and wherever required, appropriate overheads are taken into account. Net Realizable Value is the estimated selling price in the ordinary course of business less the estimated cost of completion and the estimated costs necessary to make the sale. However, materials and other supplies held for use in the production of inventories are not written down below cost if the fi nished products in which they will be used are expected to be sold at or above cost.
(b) Fair value hedges are mainly used to hedge the exposure to change in fair value of commodity price risks. The fair value adjustment remains part of the carrying value of inventory and enters into the determination of earnings when the inventory is sold.
I. Foreign Currency Transactions
Transactions in foreign currency are recorded at the rate of exchange prevailing on the date of transaction. Year end balance of foreign currency monetary item is translated at the year end rates. Exchange differences arising on settlement of monetary items or on reporting of monetary items at rates different from those at which they were initially recorded during the period or reported in previous fi nancial statements are recognized as income or expense in the period in which they arise. Foreign currency monetary items which are used as hedge instruments or hedged items are accounted as per accounting policy on Derivative Financial Instruments.
J. Employee benefi ts
Employee benefi ts of short term nature are recognized as expense as and when these accrue. Long term employee benefi ts and post employment benefi ts, whether funded or otherwise, are recognized as expense based on actuarial valuation at year end using the projected unit credit method. For discounting purpose, market yield of government bonds at the balance sheet date is used except in case of Novelis Inc. for which such discounting is done on the basis of high quality country-specifi c corporate bond
Hindalco Annual Report 2015-16.indb 144Hindalco Annual Report 2015-16.indb 144 8/17/2016 1:31:37 PM8/17/2016 1:31:37 PM

CONSOLIDATED FINANCIAL STATEMENTS
145
Annual Report 2015-16Annual Report 2015-16
FINA
NCIA
L HI
GHLI
GHTS
MAN
AGEM
ENT
DISC
USSI
ON
AND
ANAL
YSIS
CORP
ORAT
E GO
VERN
ANCE
RE
PORT
STAN
DALO
NE
FINA
NCIA
L ST
ATEM
ENTS
CONS
OLID
ATED
FI
NANC
IAL
STAT
EMEN
TSSO
CIAL
RE
PORT
DIRE
CTOR
S’RE
PORT
SHAR
EHOL
DER
INFO
RMAT
ION
SUST
AINA
BILI
TY &
BUS
INES
SRE
SPON
SIBI
LITY
REP
ORT
NOTES FORMING PART OF THE CONSOLIDATED FINANCIAL STATEMENTS
yield. Actuarial gains or losses are recognized immediately in the Statement of Profi t & Loss except in case of Novelis Inc. for which such gains or losses are accounted directly in Reserves and Surplus as it is not considered practicable to adopt a common accounting policy due to potential volatility caused by periodic changes in the assumptions underlying the computation of the actuarial liabilities.
K. Employee Share Based Payments
Equity settled stock options granted to employees pursuant to the Company’s stock option schemes are accounted for as per the intrinsic value method prescribed by Employee Stock Option Scheme and permitted by the SEBI guidelines and the Guidance Note on Share Based Payment issued by the Institute of Chartered Accountants of India (ICAI). The intrinsic value of the option being excess of market value of the underlying share at the date of grant of option, over its exercise price is recognised as deferred employee compensation with a credit to Employees Stock Options Outstanding Account. The deferred employee compensation is amortized to Statement of Profi t and Loss on straight line basis over the vesting period of the option. In case of forfeiture of option which is not vested, amortised portion is reversed by credit to employee compensation expense. In a situation where the stock option expires unexercised, the related balance standing to the credit of the employees Stock Options Outstanding Account are transferred to the General Reserve.
L. Revenue Recognition
Sales revenue is recognized on transfer of signifi cant risk and rewards of the ownership of the goods to the buyer and stated at net of trade discount and rebates. Dividend income on investments is accounted for when the right to receive the payment is established. Export incentive, certain insurance, railway and other claims where quantum of accruals cannot be ascertained with reasonable certainty, are accounted on acceptance basis.
M. Borrowing Costs
Borrowing costs directly attributable to the acquisition or construction of qualifying assets are capitalized. Other borrowing costs are recognized as expenses in the period in which they are incurred. In determining the amount of borrowing costs eligible for capitalization during a period, any income earned on temporary investment of those borrowings is deducted from the borrowing costs incurred.
N. Taxation
(a) Provision for current income tax is made in accordance with local laws. Deferred tax liabilities and assets are recognized at substantively enacted tax rates, subject to the consideration of prudence, on timing difference.
b) Minimum Alternative Tax (MAT) is recognized as an asset only when and to the extent there is convincing evidence that the Company will pay normal Income Tax during the specifi ed period. In the year in which the MAT credit becomes eligible to be recognized as an asset in accordance with the recommendations contained in guidance note issued by the ICAI, the said asset is created by way of credit to Statement of Profi t and Loss and shown as MAT credit entitlement. The Company reviews the same at each Balance Sheet date and writes down the carrying amount of MAT entitlement to the extent there is no longer convincing evidence to the effect that Company will pay normal Income Tax during the specifi ed period.
O. Derivative Financial Instruments
(a) The Company uses derivative fi nancial instruments such as Forwards, Swaps, Options, Futures etc. to hedge its risks associated with foreign exchange fl uctuations. Risks associated with fl uctuations in the price of the products (Copper, Alumina, Aluminium, Coal and Precious metals) are minimized by undertaking hedging using appropriate derivative instruments. Derivatives embedded in other
Hindalco Annual Report 2015-16.indb 145Hindalco Annual Report 2015-16.indb 145 8/17/2016 1:31:37 PM8/17/2016 1:31:37 PM
146
Hindalco Industries LimitedHindalco Industries Limited
NOTES FORMING PART OF THE CONSOLIDATED FINANCIAL STATEMENTS
fi nancial instruments or other host contracts are treated as separate derivatives when their risks and characteristics are not closely related to their host contracts. In some cases, the embedded derivatives may be designated in a hedge relationship. The fair values of all such derivative fi nancial instruments are recognized as assets or liabilities at the balance sheet date. All such derivative fi nancial instruments are used as risk management tools only and not for speculative purposes.
(b) For derivative fi nancial instruments and foreign currency monetary items designated as Cash Flow hedges, the effective portion of the fair value of the hedge instruments are recognized in Hedging Reserve and reclassifi ed to ‘Revenue from Operations’, ‘Cost of Materials Consumed’ or ‘Other Expenses’ in the period in which the Statement of Profi t and Loss is impacted by the hedged items or in the period when the hedge relationship no longer qualifi es as cash fl ow hedge. In cases where the exposure gives rise to a non-fi nancial asset, the effective portion is reclassifi ed from Hedging Reserve to the initial carrying amount of the non-fi nancial asset as a ‘basis adjustment’ and recycled to the Statement of Profi t and Loss when and the manner in which the respective non-fi nancial asset affects the Statement of Profi t and Loss in future periods. The ineffective portion of the change in fair value of such instruments is recognised in the Statement of Profi t and Loss in the period in which they arise If the hedging relationship ceases to be effective or it becomes probable that the expected forecast transaction will no longer occur, hedge accounting is discontinued and the fair value changes arising from the derivative fi nancial instruments are recognized in Other Expenses in the Statement of Profi t and Loss.
(c) For derivative fi nancial instruments designated as Fair Value hedges, the fair value of both the derivative fi nancial instrument and the hedged item are recognized in ‘Revenue from Operations’, ‘Cost of Materials Consumed’ or ‘Other Expenses’ in the Statement of Profi t and Loss till the period the relationship is found to be effective. If the hedging relationship ceases to be effective or it becomes probable that the expected transaction will no longer occur, future gains or losses on the derivative fi nancial instruments are recognized in ‘Other Expenses’ in the Statement of Profi t and Loss.
(d) If no hedging relationship is designated, the fair value of the derivative fi nancial instruments is marked to market through Statement of Profi t and Loss and included in ‘Other Expenses’.
P. Research and Development
Expenditure incurred during research and development phase is charged to revenue when no intangible asset arises from such research. Assets procured for research and development activities are generally capitalized.
Q. Government Grants
Government Grants are recognized when there is a reasonable assurance that the same will be received. Revenue grants are recognized in the Statement of Profi t and Loss. Capital grants relating to specifi c fi xed assets are reduced from the gross value of the respective fi xed assets. Other capital grants are credited to Capital Reserve.
R. Provisions, Contingent Liabilities and Contingent Assets
Provision is recognized when there is a present obligation as a result of a past event that probably requires an outfl ow of resources and a reliable estimate can be made of the amount of the obligation. Disclosure for contingent liability is made when there is a possible obligation or a present obligation that may, but probably will not, require an outfl ow of resources. No provision is recognized or disclosure for contingent liability is made when there is a possible obligation or a present obligation and the likelihood of outfl ow of resources is remote. Contingent Asset is neither recognized nor disclosed in the fi nancial statements.
Hindalco Annual Report 2015-16.indb 146Hindalco Annual Report 2015-16.indb 146 8/17/2016 1:31:37 PM8/17/2016 1:31:37 PM
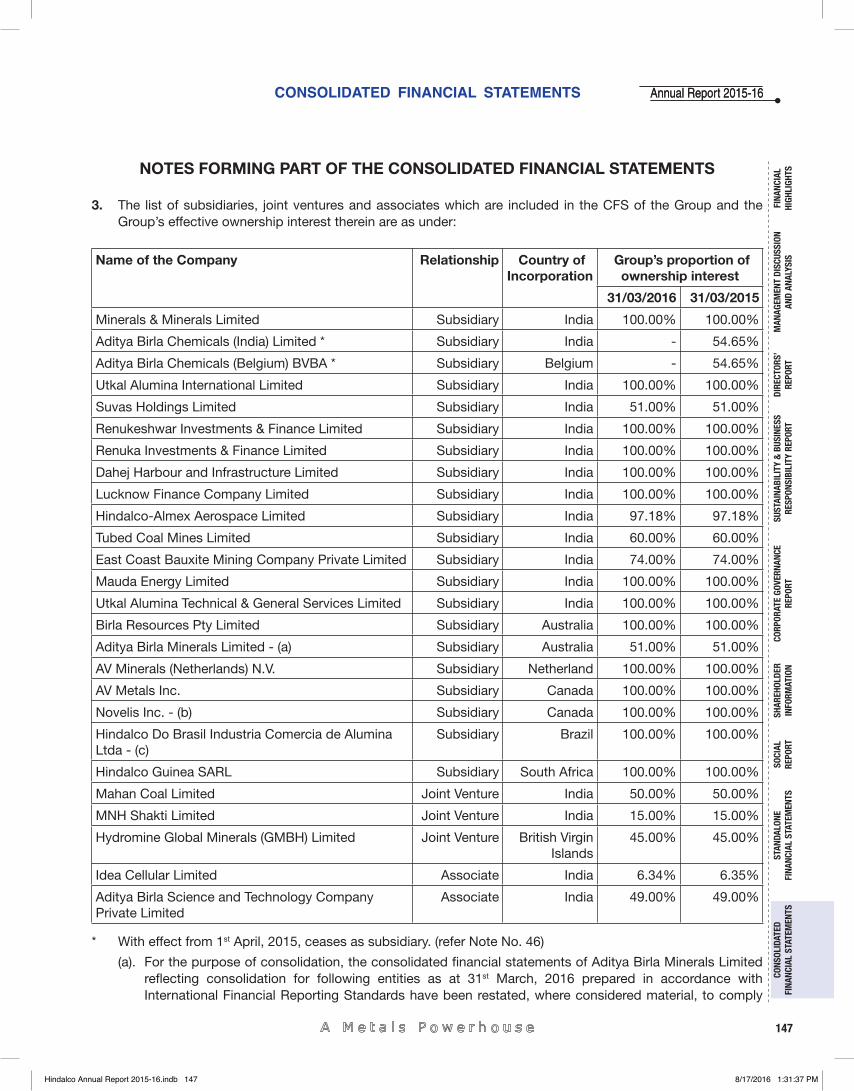
CONSOLIDATED FINANCIAL STATEMENTS
147
Annual Report 2015-16Annual Report 2015-16
FINA
NCIA
L HI
GHLI
GHTS
MAN
AGEM
ENT
DISC
USSI
ON
AND
ANAL
YSIS
CORP
ORAT
E GO
VERN
ANCE
RE
PORT
STAN
DALO
NE
FINA
NCIA
L ST
ATEM
ENTS
CONS
OLID
ATED
FI
NANC
IAL
STAT
EMEN
TSSO
CIAL
RE
PORT
DIRE
CTOR
S’RE
PORT
SHAR
EHOL
DER
INFO
RMAT
ION
SUST
AINA
BILI
TY &
BUS
INES
SRE
SPON
SIBI
LITY
REP
ORT
NOTES FORMING PART OF THE CONSOLIDATED FINANCIAL STATEMENTS
3. The list of subsidiaries, joint ventures and associates which are included in the CFS of the Group and the Group’s effective ownership interest therein are as under:
Name of the Company Relationship
Country of Incorporation
Group’s proportion of ownership interest
31/03/2016 31/03/2015
Minerals & Minerals Limited Subsidiary India 100.00% 100.00%
Aditya Birla Chemicals (India) Limited * Subsidiary India - 54.65%
Aditya Birla Chemicals (Belgium) BVBA * Subsidiary Belgium - 54.65%
Utkal Alumina International Limited Subsidiary India 100.00% 100.00%
Suvas Holdings Limited Subsidiary India 51.00% 51.00%
Renukeshwar Investments & Finance Limited Subsidiary India 100.00% 100.00%
Renuka Investments & Finance Limited Subsidiary India 100.00% 100.00%
Dahej Harbour and Infrastructure Limited Subsidiary India 100.00% 100.00%
Lucknow Finance Company Limited Subsidiary India 100.00% 100.00%
Hindalco-Almex Aerospace Limited Subsidiary India 97.18% 97.18%
Tubed Coal Mines Limited Subsidiary India 60.00% 60.00%
East Coast Bauxite Mining Company Private Limited Subsidiary India 74.00% 74.00%
Mauda Energy Limited Subsidiary India 100.00% 100.00%
Utkal Alumina Technical & General Services Limited Subsidiary India 100.00% 100.00%
Birla Resources Pty Limited Subsidiary Australia 100.00% 100.00%
Aditya Birla Minerals Limited - (a) Subsidiary Australia 51.00% 51.00%
AV Minerals (Netherlands) N.V. Subsidiary Netherland 100.00% 100.00%
AV Metals Inc. Subsidiary Canada 100.00% 100.00%
Novelis Inc. - (b) Subsidiary Canada 100.00% 100.00%
Hindalco Do Brasil Industria Comercia de Alumina Ltda - (c)
Subsidiary Brazil 100.00% 100.00%
Hindalco Guinea SARL Subsidiary South Africa 100.00% 100.00%
Mahan Coal Limited Joint Venture India 50.00% 50.00%
MNH Shakti Limited Joint Venture India 15.00% 15.00%
Hydromine Global Minerals (GMBH) Limited Joint Venture British Virgin Islands
45.00% 45.00%
Idea Cellular Limited Associate India 6.34% 6.35%
Aditya Birla Science and Technology Company Private Limited
Associate India 49.00% 49.00%
* With effect from 1st April, 2015, ceases as subsidiary. (refer Note No. 46)
(a). For the purpose of consolidation, the consolidated fi nancial statements of Aditya Birla Minerals Limited refl ecting consolidation for following entities as at 31st March, 2016 prepared in accordance with International Financial Reporting Standards have been restated, where considered material, to comply
Hindalco Annual Report 2015-16.indb 147Hindalco Annual Report 2015-16.indb 147 8/17/2016 1:31:37 PM8/17/2016 1:31:37 PM
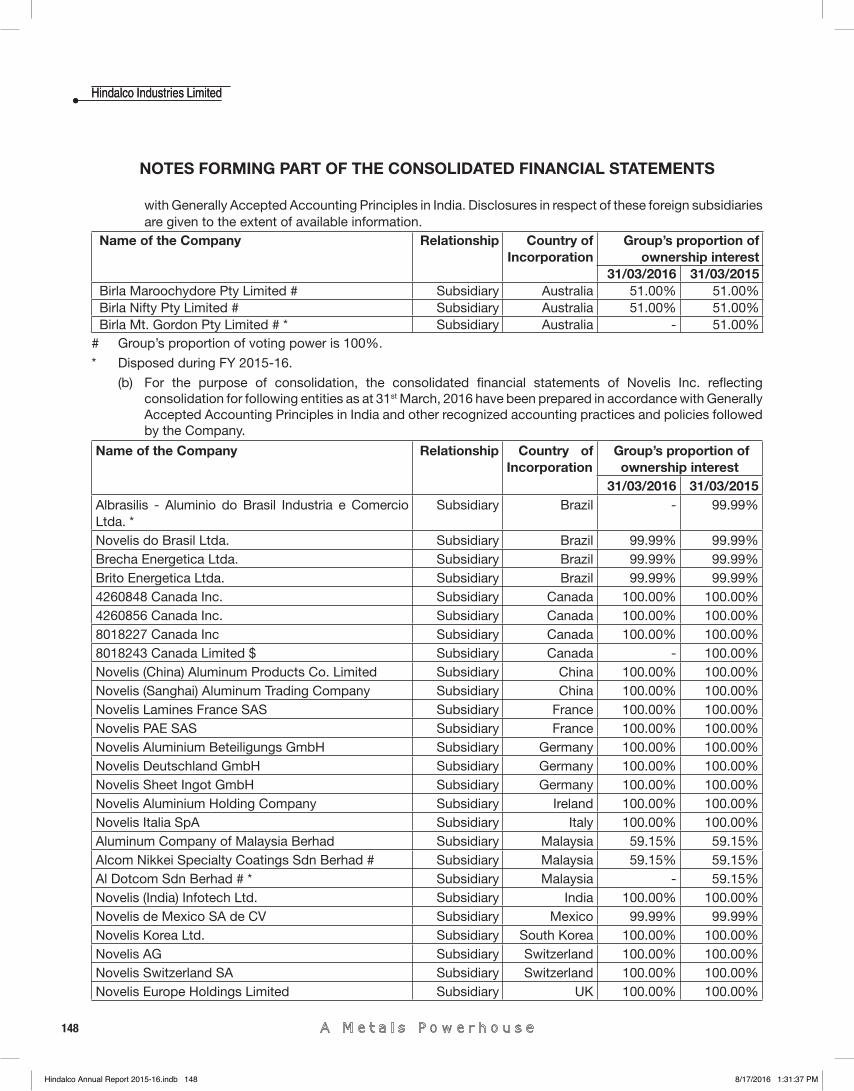
148
Hindalco Industries LimitedHindalco Industries Limited
NOTES FORMING PART OF THE CONSOLIDATED FINANCIAL STATEMENTS
with Generally Accepted Accounting Principles in India. Disclosures in respect of these foreign subsidiaries are given to the extent of available information.
Name of the Company
Relationship
Country of Incorporation
Group’s proportion of ownership interest
31/03/2016 31/03/2015 Birla Maroochydore Pty Limited # Subsidiary Australia 51.00% 51.00% Birla Nifty Pty Limited # Subsidiary Australia 51.00% 51.00% Birla Mt. Gordon Pty Limited # * Subsidiary Australia - 51.00%
# Group’s proportion of voting power is 100%.
* Disposed during FY 2015-16.
(b) For the purpose of consolidation, the consolidated fi nancial statements of Novelis Inc. refl ecting consolidation for following entities as at 31st March, 2016 have been prepared in accordance with Generally Accepted Accounting Principles in India and other recognized accounting practices and policies followed by the Company.
Name of the Company Relationship
Country of Incorporation
Group’s proportion of ownership interest
31/03/2016 31/03/2015Albrasilis - Aluminio do Brasil Industria e Comercio Ltda. *
Subsidiary Brazil - 99.99%
Novelis do Brasil Ltda. Subsidiary Brazil 99.99% 99.99%Brecha Energetica Ltda. Subsidiary Brazil 99.99% 99.99%Brito Energetica Ltda. Subsidiary Brazil 99.99% 99.99%4260848 Canada Inc. Subsidiary Canada 100.00% 100.00%4260856 Canada Inc. Subsidiary Canada 100.00% 100.00%8018227 Canada Inc Subsidiary Canada 100.00% 100.00%8018243 Canada Limited $ Subsidiary Canada - 100.00%Novelis (China) Aluminum Products Co. Limited Subsidiary China 100.00% 100.00%Novelis (Sanghai) Aluminum Trading Company Subsidiary China 100.00% 100.00%Novelis Lamines France SAS Subsidiary France 100.00% 100.00%Novelis PAE SAS Subsidiary France 100.00% 100.00%Novelis Aluminium Beteiligungs GmbH Subsidiary Germany 100.00% 100.00%Novelis Deutschland GmbH Subsidiary Germany 100.00% 100.00%Novelis Sheet Ingot GmbH Subsidiary Germany 100.00% 100.00%Novelis Aluminium Holding Company Subsidiary Ireland 100.00% 100.00%Novelis Italia SpA Subsidiary Italy 100.00% 100.00%Aluminum Company of Malaysia Berhad Subsidiary Malaysia 59.15% 59.15%Alcom Nikkei Specialty Coatings Sdn Berhad # Subsidiary Malaysia 59.15% 59.15%Al Dotcom Sdn Berhad # * Subsidiary Malaysia - 59.15%Novelis (India) Infotech Ltd. Subsidiary India 100.00% 100.00%Novelis de Mexico SA de CV Subsidiary Mexico 99.99% 99.99%Novelis Korea Ltd. Subsidiary South Korea 100.00% 100.00%Novelis AG Subsidiary Switzerland 100.00% 100.00%Novelis Switzerland SA Subsidiary Switzerland 100.00% 100.00%Novelis Europe Holdings Limited Subsidiary UK 100.00% 100.00%
Hindalco Annual Report 2015-16.indb 148Hindalco Annual Report 2015-16.indb 148 8/17/2016 1:31:37 PM8/17/2016 1:31:37 PM
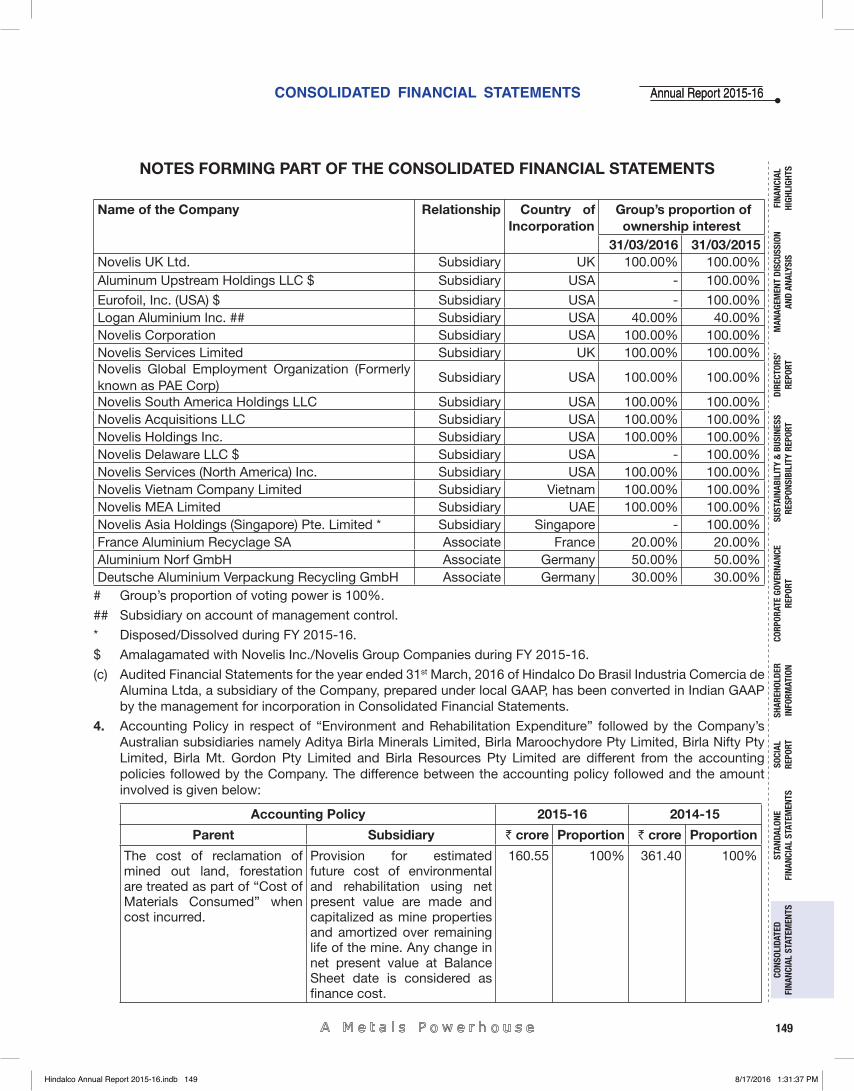
CONSOLIDATED FINANCIAL STATEMENTS
149
Annual Report 2015-16Annual Report 2015-16
FINA
NCIA
L HI
GHLI
GHTS
MAN
AGEM
ENT
DISC
USSI
ON
AND
ANAL
YSIS
CORP
ORAT
E GO
VERN
ANCE
RE
PORT
STAN
DALO
NE
FINA
NCIA
L ST
ATEM
ENTS
CONS
OLID
ATED
FI
NANC
IAL
STAT
EMEN
TSSO
CIAL
RE
PORT
DIRE
CTOR
S’RE
PORT
SHAR
EHOL
DER
INFO
RMAT
ION
SUST
AINA
BILI
TY &
BUS
INES
SRE
SPON
SIBI
LITY
REP
ORT
Name of the Company Relationship
Country of Incorporation
Group’s proportion of ownership interest
31/03/2016 31/03/2015Novelis UK Ltd. Subsidiary UK 100.00% 100.00%Aluminum Upstream Holdings LLC $ Subsidiary USA - 100.00%
Eurofoil, Inc. (USA) $ Subsidiary USA - 100.00%Logan Aluminium Inc. ## Subsidiary USA 40.00% 40.00%Novelis Corporation Subsidiary USA 100.00% 100.00%Novelis Services Limited Subsidiary UK 100.00% 100.00%Novelis Global Employment Organization (Formerly known as PAE Corp)
Subsidiary USA 100.00% 100.00%
Novelis South America Holdings LLC Subsidiary USA 100.00% 100.00%Novelis Acquisitions LLC Subsidiary USA 100.00% 100.00%Novelis Holdings Inc. Subsidiary USA 100.00% 100.00%Novelis Delaware LLC $ Subsidiary USA - 100.00%Novelis Services (North America) Inc. Subsidiary USA 100.00% 100.00%Novelis Vietnam Company Limited Subsidiary Vietnam 100.00% 100.00%Novelis MEA Limited Subsidiary UAE 100.00% 100.00%Novelis Asia Holdings (Singapore) Pte. Limited * Subsidiary Singapore - 100.00%France Aluminium Recyclage SA Associate France 20.00% 20.00%Aluminium Norf GmbH Associate Germany 50.00% 50.00%Deutsche Aluminium Verpackung Recycling GmbH Associate Germany 30.00% 30.00%
# Group’s proportion of voting power is 100%.
## Subsidiary on account of management control.
* Disposed/Dissolved during FY 2015-16.
$ Amalagamated with Novelis Inc./Novelis Group Companies during FY 2015-16.
(c) Audited Financial Statements for the year ended 31st March, 2016 of Hindalco Do Brasil Industria Comercia de Alumina Ltda, a subsidiary of the Company, prepared under local GAAP, has been converted in Indian GAAP by the management for incorporation in Consolidated Financial Statements.
4. Accounting Policy in respect of “Environment and Rehabilitation Expenditure” followed by the Company’s Australian subsidiaries namely Aditya Birla Minerals Limited, Birla Maroochydore Pty Limited, Birla Nifty Pty Limited, Birla Mt. Gordon Pty Limited and Birla Resources Pty Limited are different from the accounting policies followed by the Company. The difference between the accounting policy followed and the amount involved is given below:
Accounting Policy 2015-16 2014-15
Parent Subsidiary ` crore Proportion ` crore Proportion
The cost of reclamation of mined out land, forestation are treated as part of “Cost of Materials Consumed” when cost incurred.
Provision for estimated future cost of environmental and rehabilitation using net present value are made and capitalized as mine properties and amortized over remaining life of the mine. Any change in net present value at Balance Sheet date is considered as fi nance cost.
160.55 100% 361.40 100%
NOTES FORMING PART OF THE CONSOLIDATED FINANCIAL STATEMENTS
Hindalco Annual Report 2015-16.indb 149Hindalco Annual Report 2015-16.indb 149 8/17/2016 1:31:37 PM8/17/2016 1:31:37 PM
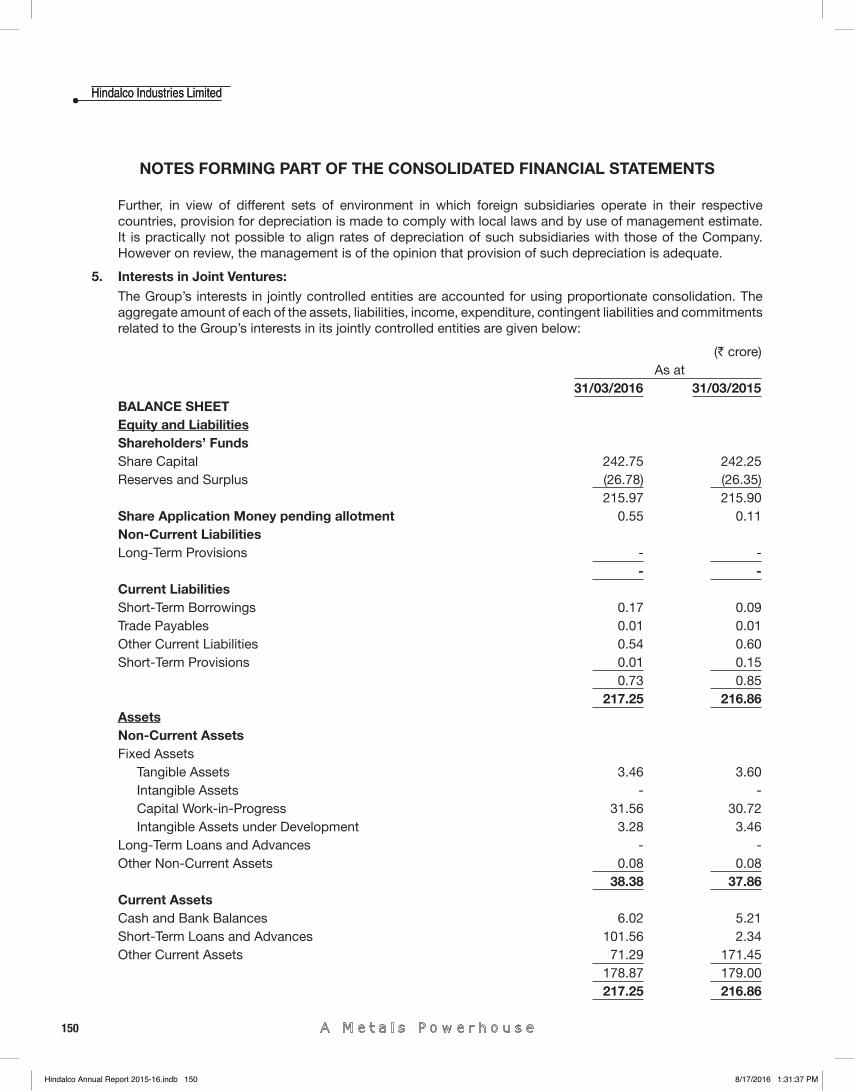
150
Hindalco Industries LimitedHindalco Industries Limited
NOTES FORMING PART OF THE CONSOLIDATED FINANCIAL STATEMENTS
Further, in view of different sets of environment in which foreign subsidiaries operate in their respective countries, provision for depreciation is made to comply with local laws and by use of management estimate. It is practically not possible to align rates of depreciation of such subsidiaries with those of the Company. However on review, the management is of the opinion that provision of such depreciation is adequate.
5. Interests in Joint Ventures:The Group’s interests in jointly controlled entities are accounted for using proportionate consolidation. The aggregate amount of each of the assets, liabilities, income, expenditure, contingent liabilities and commitments related to the Group’s interests in its jointly controlled entities are given below:
(` crore) As at 31/03/2016 31/03/2015BALANCE SHEETEquity and LiabilitiesShareholders’ FundsShare Capital 242.75 242.25 Reserves and Surplus (26.78) (26.35) 215.97 215.90Share Application Money pending allotment 0.55 0.11 Non-Current LiabilitiesLong-Term Provisions - -
- -Current LiabilitiesShort-Term Borrowings 0.17 0.09 Trade Payables 0.01 0.01 Other Current Liabilities 0.54 0.60 Short-Term Provisions 0.01 0.15 0.73 0.85 217.25 216.86AssetsNon-Current AssetsFixed Assets
Tangible Assets 3.46 3.60 Intangible Assets - - Capital Work-in-Progress 31.56 30.72 Intangible Assets under Development 3.28 3.46
Long-Term Loans and Advances - - Other Non-Current Assets 0.08 0.08 38.38 37.86Current Assets Cash and Bank Balances 6.02 5.21 Short-Term Loans and Advances 101.56 2.34 Other Current Assets 71.29 171.45 178.87 179.00 217.25 216.86
Hindalco Annual Report 2015-16.indb 150Hindalco Annual Report 2015-16.indb 150 8/17/2016 1:31:37 PM8/17/2016 1:31:37 PM
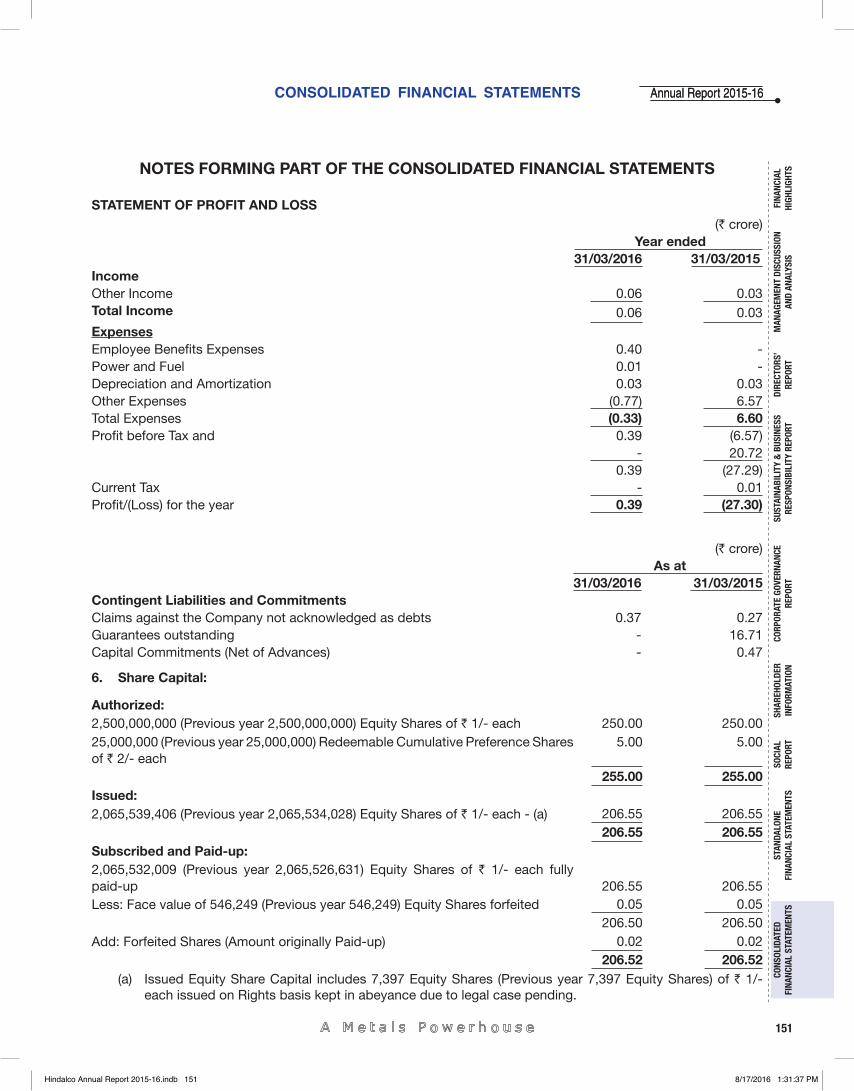
CONSOLIDATED FINANCIAL STATEMENTS
151
Annual Report 2015-16Annual Report 2015-16
FINA
NCIA
L HI
GHLI
GHTS
MAN
AGEM
ENT
DISC
USSI
ON
AND
ANAL
YSIS
CORP
ORAT
E GO
VERN
ANCE
RE
PORT
STAN
DALO
NE
FINA
NCIA
L ST
ATEM
ENTS
CONS
OLID
ATED
FI
NANC
IAL
STAT
EMEN
TSSO
CIAL
RE
PORT
DIRE
CTOR
S’RE
PORT
SHAR
EHOL
DER
INFO
RMAT
ION
SUST
AINA
BILI
TY &
BUS
INES
SRE
SPON
SIBI
LITY
REP
ORT
NOTES FORMING PART OF THE CONSOLIDATED FINANCIAL STATEMENTS
STATEMENT OF PROFIT AND LOSS (` crore)
Year ended 31/03/2016 31/03/2015IncomeOther Income 0.06 0.03 Total Income 0.06 0.03 ExpensesEmployee Benefi ts Expenses 0.40 - Power and Fuel 0.01 - Depreciation and Amortization 0.03 0.03 Other Expenses (0.77) 6.57 Total Expenses (0.33) 6.60 Profi t before Tax and 0.39 (6.57)
- 20.72 0.39 (27.29)
Current Tax - 0.01 Profi t/(Loss) for the year 0.39 (27.30)
(` crore) As at 31/03/2016 31/03/2015Contingent Liabilities and CommitmentsClaims against the Company not acknowledged as debts 0.37 0.27 Guarantees outstanding - 16.71 Capital Commitments (Net of Advances) - 0.47
6. Share Capital:
Authorized:2,500,000,000 (Previous year 2,500,000,000) Equity Shares of ` 1/- each 250.00 250.00 25,000,000 (Previous year 25,000,000) Redeemable Cumulative Preference Shares of ` 2/- each
5.00 5.00
255.00 255.00 Issued: 2,065,539,406 (Previous year 2,065,534,028) Equity Shares of ` 1/- each - (a) 206.55 206.55
206.55 206.55Subscribed and Paid-up: 2,065,532,009 (Previous year 2,065,526,631) Equity Shares of ` 1/- each fully paid-up 206.55 206.55 Less: Face value of 546,249 (Previous year 546,249) Equity Shares forfeited 0.05 0.05
206.50 206.50Add: Forfeited Shares (Amount originally Paid-up) 0.02 0.02
206.52 206.52(a) Issued Equity Share Capital includes 7,397 Equity Shares (Previous year 7,397 Equity Shares) of ` 1/-
each issued on Rights basis kept in abeyance due to legal case pending.
Hindalco Annual Report 2015-16.indb 151Hindalco Annual Report 2015-16.indb 151 8/17/2016 1:31:37 PM8/17/2016 1:31:37 PM
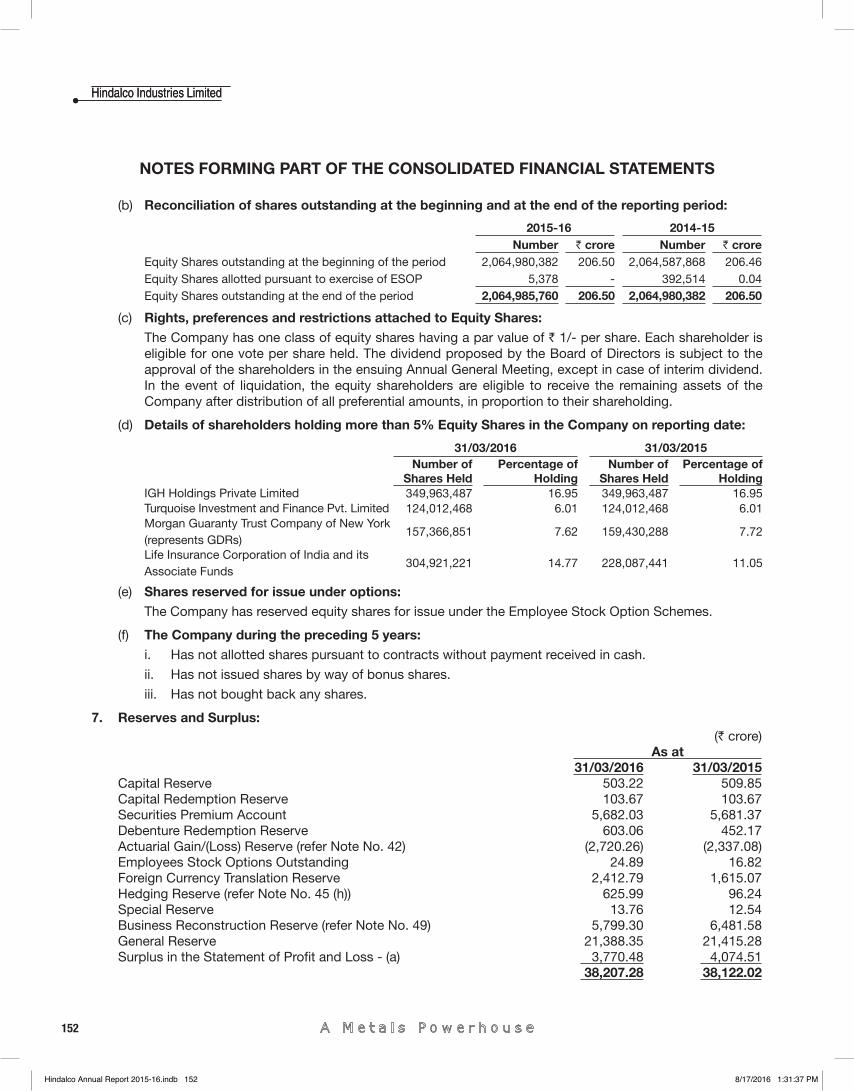
152
Hindalco Industries LimitedHindalco Industries Limited
NOTES FORMING PART OF THE CONSOLIDATED FINANCIAL STATEMENTS
(b) Reconciliation of shares outstanding at the beginning and at the end of the reporting period:
2015-16 2014-15 Number ` crore Number ` crore
Equity Shares outstanding at the beginning of the period 2,064,980,382 206.50 2,064,587,868 206.46 Equity Shares allotted pursuant to exercise of ESOP 5,378 - 392,514 0.04 Equity Shares outstanding at the end of the period 2,064,985,760 206.50 2,064,980,382 206.50
(c) Rights, preferences and restrictions attached to Equity Shares: The Company has one class of equity shares having a par value of ` 1/- per share. Each shareholder is
eligible for one vote per share held. The dividend proposed by the Board of Directors is subject to the approval of the shareholders in the ensuing Annual General Meeting, except in case of interim dividend. In the event of liquidation, the equity shareholders are eligible to receive the remaining assets of the Company after distribution of all preferential amounts, in proportion to their shareholding.
(d) Details of shareholders holding more than 5% Equity Shares in the Company on reporting date:
31/03/2016 31/03/2015 Number of
Shares HeldPercentage of
HoldingNumber of
Shares HeldPercentage of
Holding IGH Holdings Private Limited 349,963,487 16.95 349,963,487 16.95 Turquoise Investment and Finance Pvt. Limited 124,012,468 6.01 124,012,468 6.01 Morgan Guaranty Trust Company of New York (represents GDRs)
157,366,851 7.62 159,430,288 7.72
Life Insurance Corporation of India and its Associate Funds
304,921,221 14.77 228,087,441 11.05
(e) Shares reserved for issue under options: The Company has reserved equity shares for issue under the Employee Stock Option Schemes.
(f) The Company during the preceding 5 years:i. Has not allotted shares pursuant to contracts without payment received in cash.
ii. Has not issued shares by way of bonus shares.
iii. Has not bought back any shares.
7. Reserves and Surplus: (` crore)
As at31/03/2016 31/03/2015
Capital Reserve 503.22 509.85 Capital Redemption Reserve 103.67 103.67 Securities Premium Account 5,682.03 5,681.37 Debenture Redemption Reserve 603.06 452.17 Actuarial Gain/(Loss) Reserve (refer Note No. 42) (2,720.26) (2,337.08)Employees Stock Options Outstanding 24.89 16.82 Foreign Currency Translation Reserve 2,412.79 1,615.07 Hedging Reserve (refer Note No. 45 (h)) 625.99 96.24 Special Reserve 13.76 12.54 Business Reconstruction Reserve (refer Note No. 49) 5,799.30 6,481.58 General Reserve 21,388.35 21,415.28 Surplus in the Statement of Profi t and Loss - (a) 3,770.48 4,074.51
38,207.28 38,122.02
Hindalco Annual Report 2015-16.indb 152Hindalco Annual Report 2015-16.indb 152 8/17/2016 1:31:37 PM8/17/2016 1:31:37 PM
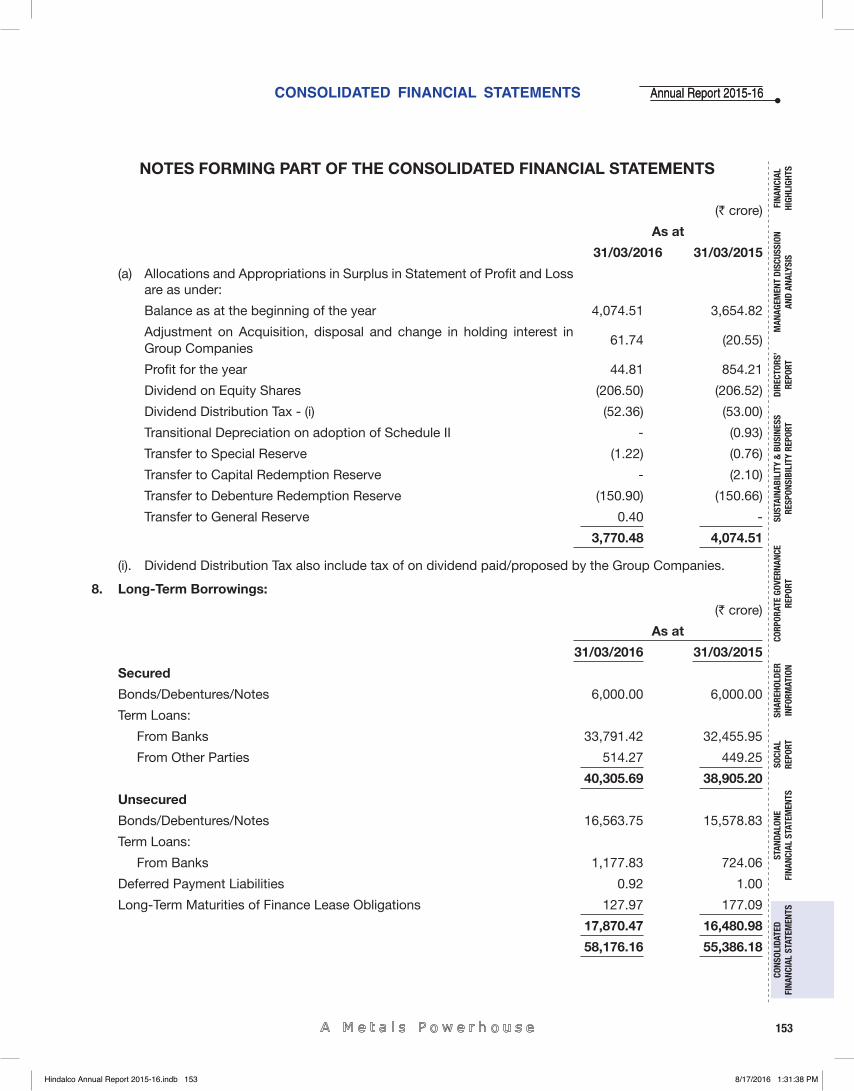
CONSOLIDATED FINANCIAL STATEMENTS
153
Annual Report 2015-16Annual Report 2015-16
FINA
NCIA
L HI
GHLI
GHTS
MAN
AGEM
ENT
DISC
USSI
ON
AND
ANAL
YSIS
CORP
ORAT
E GO
VERN
ANCE
RE
PORT
STAN
DALO
NE
FINA
NCIA
L ST
ATEM
ENTS
CONS
OLID
ATED
FI
NANC
IAL
STAT
EMEN
TSSO
CIAL
RE
PORT
DIRE
CTOR
S’RE
PORT
SHAR
EHOL
DER
INFO
RMAT
ION
SUST
AINA
BILI
TY &
BUS
INES
SRE
SPON
SIBI
LITY
REP
ORT
NOTES FORMING PART OF THE CONSOLIDATED FINANCIAL STATEMENTS
(` crore)
As at
31/03/2016 31/03/2015
(a) Allocations and Appropriations in Surplus in Statement of Profi t and Loss are as under:
Balance as at the beginning of the year 4,074.51 3,654.82
Adjustment on Acquisition, disposal and change in holding interest in Group Companies
61.74 (20.55)
Profi t for the year 44.81 854.21
Dividend on Equity Shares (206.50) (206.52)
Dividend Distribution Tax - (i) (52.36) (53.00)
Transitional Depreciation on adoption of Schedule II - (0.93)
Transfer to Special Reserve (1.22) (0.76)
Transfer to Capital Redemption Reserve - (2.10)
Transfer to Debenture Redemption Reserve (150.90) (150.66)
Transfer to General Reserve 0.40 -
3,770.48 4,074.51
(i). Dividend Distribution Tax also include tax of on dividend paid/proposed by the Group Companies.
8. Long-Term Borrowings:
(` crore)
As at
31/03/2016 31/03/2015
Secured
Bonds/Debentures/Notes 6,000.00 6,000.00
Term Loans:
From Banks 33,791.42 32,455.95
From Other Parties 514.27 449.25
40,305.69 38,905.20
Unsecured
Bonds/Debentures/Notes 16,563.75 15,578.83
Term Loans:
From Banks 1,177.83 724.06
Deferred Payment Liabilities 0.92 1.00
Long-Term Maturities of Finance Lease Obligations 127.97 177.09
17,870.47 16,480.98
58,176.16 55,386.18
Hindalco Annual Report 2015-16.indb 153Hindalco Annual Report 2015-16.indb 153 8/17/2016 1:31:38 PM8/17/2016 1:31:38 PM
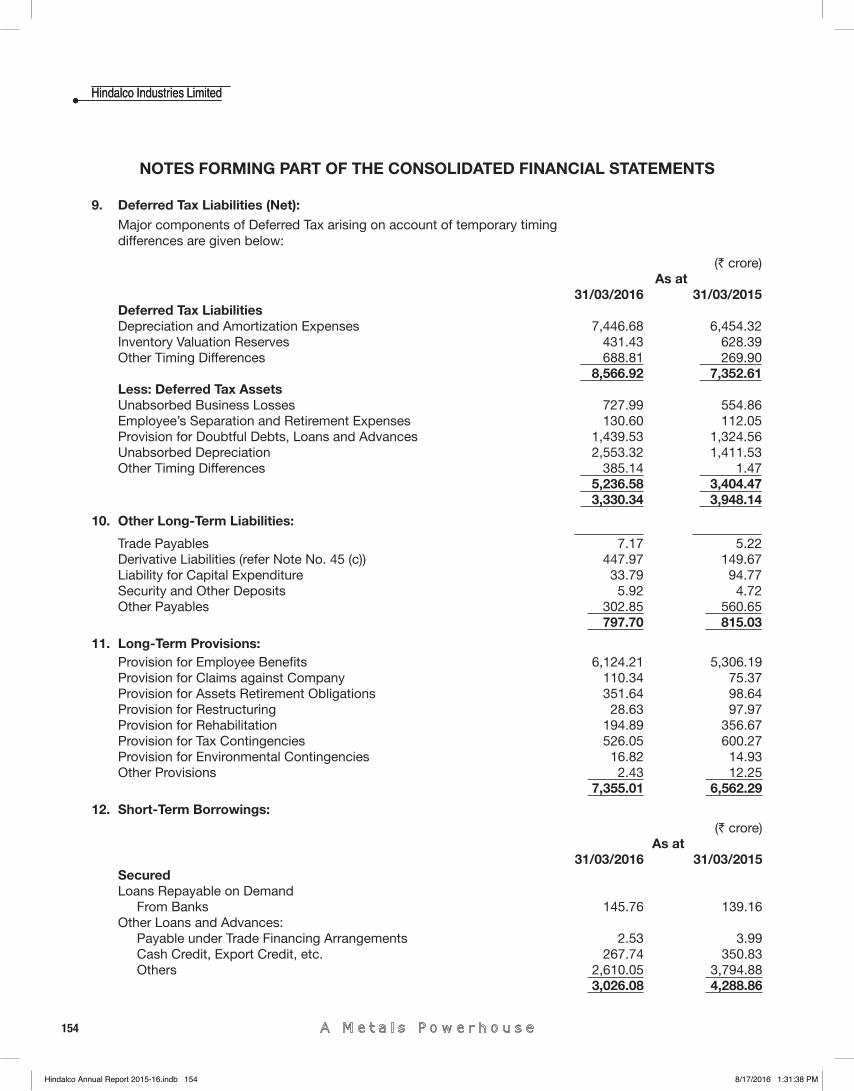
154
Hindalco Industries LimitedHindalco Industries Limited
NOTES FORMING PART OF THE CONSOLIDATED FINANCIAL STATEMENTS
9. Deferred Tax Liabilities (Net): Major components of Deferred Tax arising on account of temporary timing differences are given below:
(` crore)As at
31/03/2016 31/03/2015Deferred Tax LiabilitiesDepreciation and Amortization Expenses 7,446.68 6,454.32 Inventory Valuation Reserves 431.43 628.39 Other Timing Differences 688.81 269.90
8,566.92 7,352.61Less: Deferred Tax AssetsUnabsorbed Business Losses 727.99 554.86 Employee’s Separation and Retirement Expenses 130.60 112.05 Provision for Doubtful Debts, Loans and Advances 1,439.53 1,324.56 Unabsorbed Depreciation 2,553.32 1,411.53 Other Timing Differences 385.14 1.47
5,236.58 3,404.47 3,330.34 3,948.14
10. Other Long-Term Liabilities:
Trade Payables 7.17 5.22Derivative Liabilities (refer Note No. 45 (c)) 447.97 149.67 Liability for Capital Expenditure 33.79 94.77 Security and Other Deposits 5.92 4.72 Other Payables 302.85 560.65
797.70 815.03
11. Long-Term Provisions:Provision for Employee Benefi ts 6,124.21 5,306.19Provision for Claims against Company 110.34 75.37 Provision for Assets Retirement Obligations 351.64 98.64 Provision for Restructuring 28.63 97.97 Provision for Rehabilitation 194.89 356.67 Provision for Tax Contingencies 526.05 600.27 Provision for Environmental Contingencies 16.82 14.93 Other Provisions 2.43 12.25
7,355.01 6,562.29
12. Short-Term Borrowings:(` crore)
As at31/03/2016 31/03/2015
SecuredLoans Repayable on Demand
From Banks 145.76 139.16 Other Loans and Advances:
Payable under Trade Financing Arrangements 2.53 3.99 Cash Credit, Export Credit, etc. 267.74 350.83 Others 2,610.05 3,794.88
3,026.08 4,288.86
Hindalco Annual Report 2015-16.indb 154Hindalco Annual Report 2015-16.indb 154 8/17/2016 1:31:38 PM8/17/2016 1:31:38 PM
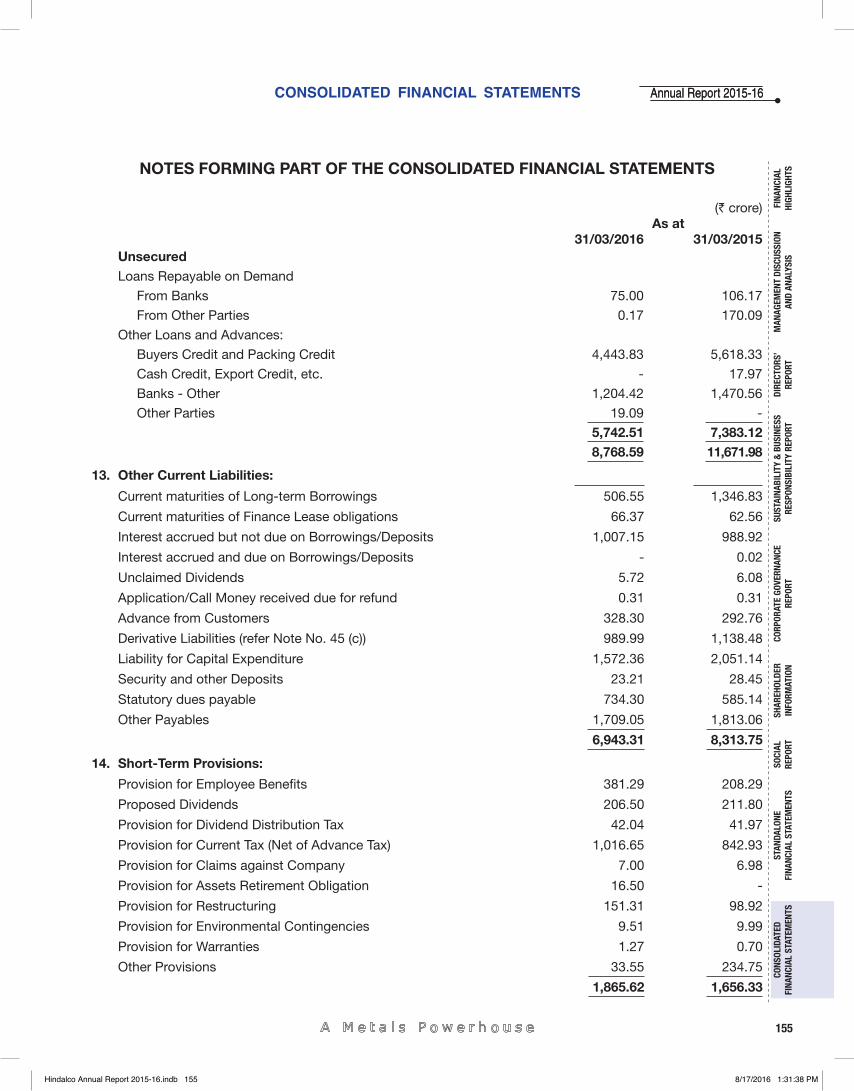
CONSOLIDATED FINANCIAL STATEMENTS
155
Annual Report 2015-16Annual Report 2015-16
FINA
NCIA
L HI
GHLI
GHTS
MAN
AGEM
ENT
DISC
USSI
ON
AND
ANAL
YSIS
CORP
ORAT
E GO
VERN
ANCE
RE
PORT
STAN
DALO
NE
FINA
NCIA
L ST
ATEM
ENTS
CONS
OLID
ATED
FI
NANC
IAL
STAT
EMEN
TSSO
CIAL
RE
PORT
DIRE
CTOR
S’RE
PORT
SHAR
EHOL
DER
INFO
RMAT
ION
SUST
AINA
BILI
TY &
BUS
INES
SRE
SPON
SIBI
LITY
REP
ORT
NOTES FORMING PART OF THE CONSOLIDATED FINANCIAL STATEMENTS
(` crore)As at
31/03/2016 31/03/2015UnsecuredLoans Repayable on Demand
From Banks 75.00 106.17
From Other Parties 0.17 170.09
Other Loans and Advances:
Buyers Credit and Packing Credit 4,443.83 5,618.33
Cash Credit, Export Credit, etc. - 17.97
Banks - Other 1,204.42 1,470.56
Other Parties 19.09 -
5,742.51 7,383.12 8,768.59 11,671.98
13. Other Current Liabilities:
Current maturities of Long-term Borrowings 506.55 1,346.83
Current maturities of Finance Lease obligations 66.37 62.56
Interest accrued but not due on Borrowings/Deposits 1,007.15 988.92
Interest accrued and due on Borrowings/Deposits - 0.02
Unclaimed Dividends 5.72 6.08
Application/Call Money received due for refund 0.31 0.31
Advance from Customers 328.30 292.76
Derivative Liabilities (refer Note No. 45 (c)) 989.99 1,138.48
Liability for Capital Expenditure 1,572.36 2,051.14
Security and other Deposits 23.21 28.45
Statutory dues payable 734.30 585.14
Other Payables 1,709.05 1,813.06
6,943.31 8,313.75
14. Short-Term Provisions:
Provision for Employee Benefi ts 381.29 208.29
Proposed Dividends 206.50 211.80
Provision for Dividend Distribution Tax 42.04 41.97
Provision for Current Tax (Net of Advance Tax) 1,016.65 842.93
Provision for Claims against Company 7.00 6.98
Provision for Assets Retirement Obligation 16.50 -
Provision for Restructuring 151.31 98.92
Provision for Environmental Contingencies 9.51 9.99
Provision for Warranties 1.27 0.70
Other Provisions 33.55 234.75
1,865.62 1,656.33
Hindalco Annual Report 2015-16.indb 155Hindalco Annual Report 2015-16.indb 155 8/17/2016 1:31:38 PM8/17/2016 1:31:38 PM
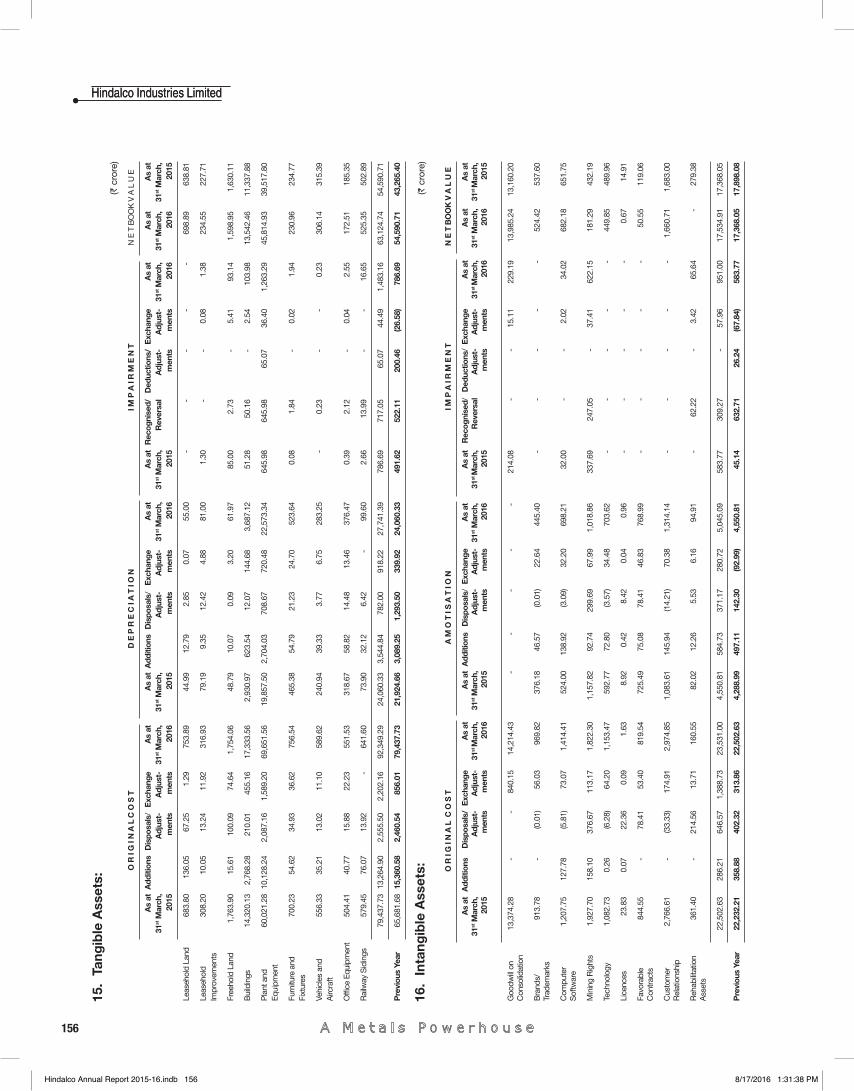
156
Hindalco Industries LimitedHindalco Industries Limited15
. Ta
ngib
le A
sset
s:(`
cro
re)
O R
I G
I N
A L
C O
S T
D E
P R
E C
I A
T I
O N
I M
P A
I R
M E
N T
N E
T B
OO
K V
A L
U E
As
at
31st M
arch
, 20
15
Add
ition
sD
ispo
sals
/A
djus
t-m
ents
Exc
hang
e A
djus
t-m
ents
As
at
31st M
arch
, 20
16
As
at
31st M
arch
, 20
15 A
dditi
ons
Dis
posa
ls/
Adj
ust-
men
ts
Exc
hang
e A
djus
t-m
ents
As
at
31st M
arch
, 20
16
As
at
31st M
arch
, 20
15
Rec
ogni
sed/
Rev
ersa
lD
educ
tions
/A
djus
t-m
ents
Exc
hang
eA
djus
t-m
ents
As
at
31st M
arch
, 20
16
As
at
31st M
arch
, 20
16
As
at
31st M
arch
, 20
15
Leas
ehol
d La
nd 6
83.8
0 1
36.0
5 6
7.25
1
.29
753
.89
44.
99
12.
79
2.8
5 0
.07
55.
00
-
-
-
-
-
698
.89
638
.81
Leas
ehol
d
Impr
ovem
ents
308
.20
10.
05
13.
24
11.
92
316
.93
79.
19
9.3
5 1
2.42
4
.88
81.
00
1.3
0 -
-
0
.08
1.3
8 2
34.5
5 2
27.7
1
Free
hold
Lan
d 1
,763
.90
15.
61
100
.09
74.
64
1,7
54.0
6 4
8.79
1
0.07
0
.09
3.2
0 6
1.97
8
5.00
2
.73
-
5.4
1 9
3.14
1
,598
.95
1,6
30.1
1
Bui
ldin
gs 1
4,32
0.13
2
,768
.28
210
.01
455
.16
17,
333.
56
2,9
30.9
7 6
23.5
4 1
2.07
1
44.6
8 3
,687
.12
51.
28
50.
16
-
2.5
4 1
03.9
8 1
3,54
2.46
1
1,33
7.88
Pla
nt a
nd
Equi
pmen
t 6
0,02
1.28
10
,128
.24
2,0
87.1
6 1
,589
.20
69,
651.
56
19,
857.
50
2,7
04.0
3 7
08.6
7 7
20.4
8 2
2,57
3.34
6
45.9
8 6
45.9
8 6
5.07
3
6.40
1
,263
.29
45,
814.
93
39,
517.
80
Furn
iture
and
Fi
xtur
es 7
00.2
3 5
4.62
3
4.93
3
6.62
7
56.5
4 4
65.3
8 5
4.79
2
1.23
2
4.70
5
23.6
4 0
.08
1.8
4 -
0
.02
1.9
4 2
30.9
6 2
34.7
7
Vehi
cles
and
A
ircra
ft 5
56.3
3 3
5.21
1
3.02
1
1.10
5
89.6
2 2
40.9
4 3
9.33
3
.77
6.7
5 2
83.2
5 -
0
.23
-
-
0.2
3 3
06.1
4 3
15.3
9
Offi
ce E
quip
men
t 5
04.4
1 4
0.77
1
5.88
2
2.23
5
51.5
3 3
18.6
7 5
8.82
1
4.48
1
3.46
3
76.4
7 0
.39
2.1
2 -
0
.04
2.5
5 1
72.5
1 1
85.3
5
Rai
lway
Sid
ings
579
.45
76.
07
13.
92
-
641
.60
73.
90
32.
12
6.4
2 -
9
9.60
2
.66
13.
99
-
-
16.
65
525
.35
502
.89
79,
437.
73
13,2
64.9
0 2
,555
.50
2,2
02.1
6 9
2,34
9.29
2
4,06
0.33
3
,544
.84
782
.00
918
.22
27,
741.
39
786
.69
717
.05
65.
07
44.
49
1,4
83.1
6 6
3,12
4.74
5
4,59
0.71
Pre
viou
s Ye
ar 6
5,68
1.68
15
,360
.58
2,4
60.5
4 8
56.0
1 7
9,43
7.73
2
1,92
4.66
3
,089
.25
1,2
93.5
0 3
39.9
2 2
4,06
0.33
4
91.6
2 5
22.1
1 2
00.4
6 (2
6.58
) 7
86.6
9 5
4,59
0.71
4
3,26
5.40
16.
Inta
ngib
le A
sset
s:
(` c
rore
)
O R
I G
I N
A L
C O
S T
A M
O T
I S
A T
I O
N I
M P
A I
R M
E N
T N
E T
BO
OK
V A
L U
E
As
at
31st M
arch
, 20
15
Add
ition
s D
ispo
sals
/A
djus
t-m
ents
Exc
hang
e A
djus
t-m
ents
As
at
31st
Mar
ch,
2016
As
at31
st M
arch
, 20
15
Add
ition
s D
ispo
sals
/ A
djus
t-m
ents
Exc
hang
eA
djus
t-m
ents
As
at
31st M
arch
, 20
16
As
at
31st
Mar
ch,
2015
Rec
ogni
sed/
Rev
ersa
lD
educ
tions
/A
djus
t-m
ents
Exc
hang
e A
djus
t-m
ents
As
at
31st
Mar
ch,
2016
As
at
31st M
arch
, 20
16
As
at
31st
Mar
ch,
2015
Goo
dwill
on
Con
solid
atio
n 1
3,37
4.28
-
-
8
40.1
5 1
4,21
4.43
-
-
-
-
-
2
14.0
8 -
-
1
5.11
2
29.1
9 1
3,98
5.24
1
3,16
0.20
Bra
nds/
Trad
emar
ks 9
13.7
8 -
(0
.01)
56.
03
969
.82
376
.18
46.
57
(0.0
1) 2
2.64
4
45.4
0 -
-
-
-
-
5
24.4
2 5
37.6
0
Com
pute
r S
oftw
are
1,2
07.7
5 1
27.7
8 (5
.81)
73.
07
1,4
14.4
1 5
24.0
0 1
38.9
2 (3
.09)
32.
20
698
.21
32.
00
-
-
2.0
2 3
4.02
6
82.1
8 6
51.7
5
Min
ing
Rig
hts
1,9
27.7
0 1
58.1
0 3
76.6
7 1
13.1
7 1
,822
.30
1,1
57.8
2 9
2.74
2
99.6
9 6
7.99
1
,018
.86
337
.69
247
.05
-
37.
41
622
.15
181
.29
432
.19
Tech
nolo
gy 1
,082
.73
0.2
6 (6
.28)
64.
20
1,1
53.4
7 5
92.7
7 7
2.80
(3
.57)
34.
48
703
.62
-
-
-
-
-
449
.85
489
.96
Lice
nces
23.
83
0.0
7 2
2.36
0
.09
1.6
3 8
.92
0.4
2 8
.42
0.0
4 0
.96
-
-
-
-
-
0.6
7 1
4.91
Favo
rabl
e C
ontr
acts
844
.55
-
78.
41
53.
40
819
.54
725
.49
75.
08
78.
41
46.
83
768
.99
-
-
-
-
-
50.
55
119
.06
Cus
tom
er
Rel
atio
nshi
p 2
,766
.61
-
(33.
33)
174
.91
2,9
74.8
5 1
,083
.61
145
.94
(14.
21)
70.
38
1,3
14.1
4 -
-
-
-
-
1
,660
.71
1,6
83.0
0
Reh
abilit
atio
n A
sset
s 3
61.4
0 -
2
14.5
6 1
3.71
1
60.5
5 8
2.02
1
2.26
5
.53
6.1
6 9
4.91
-
6
2.22
-
3
.42
65.
64
-
279
.38
22,
502.
63
286
.21
646
.57
1,3
88.7
3 2
3,53
1.00
4
,550
.81
584
.73
371
.17
280
.72
5,0
45.0
9 5
83.7
7 3
09.2
7 -
5
7.96
9
51.0
0 1
7,53
4.91
1
7,36
8.05
Pre
viou
s Ye
ar 2
2,23
2.21
3
58.8
8 4
02.3
2 3
13.8
6 2
2,50
2.63
4
,288
.99
497
.11
142
.30
(92.
99)
4,5
50.8
1 4
5.14
6
32.7
1 2
6.24
(6
7.84
) 5
83.7
7 1
7,36
8.05
1
7,89
8.08
Hindalco Annual Report 2015-16.indb 156Hindalco Annual Report 2015-16.indb 156 8/17/2016 1:31:38 PM8/17/2016 1:31:38 PM
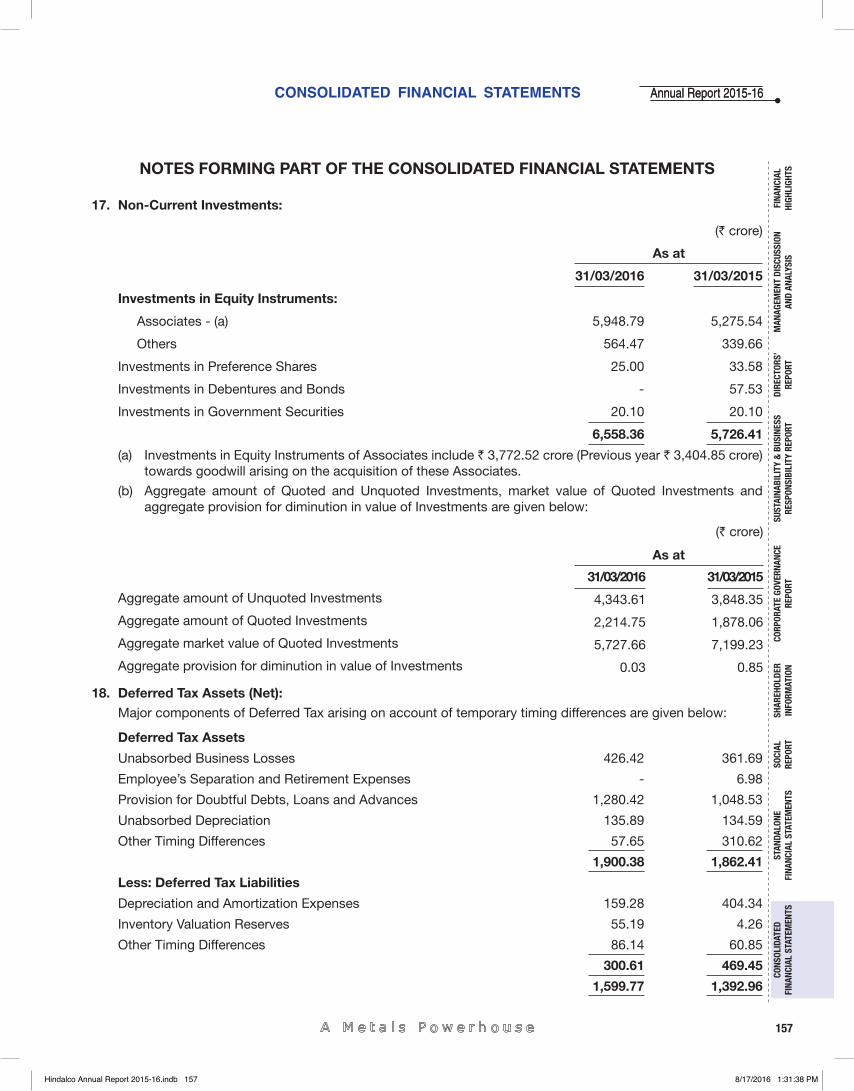
CONSOLIDATED FINANCIAL STATEMENTS
157
Annual Report 2015-16Annual Report 2015-16
FINA
NCIA
L HI
GHLI
GHTS
MAN
AGEM
ENT
DISC
USSI
ON
AND
ANAL
YSIS
CORP
ORAT
E GO
VERN
ANCE
RE
PORT
STAN
DALO
NE
FINA
NCIA
L ST
ATEM
ENTS
CONS
OLID
ATED
FI
NANC
IAL
STAT
EMEN
TSSO
CIAL
RE
PORT
DIRE
CTOR
S’RE
PORT
SHAR
EHOL
DER
INFO
RMAT
ION
SUST
AINA
BILI
TY &
BUS
INES
SRE
SPON
SIBI
LITY
REP
ORT
NOTES FORMING PART OF THE CONSOLIDATED FINANCIAL STATEMENTS
17. Non-Current Investments:
(` crore)
As at
31/03/2016 31/03/2015
Investments in Equity Instruments:
Associates - (a) 5,948.79 5,275.54
Others 564.47 339.66
Investments in Preference Shares 25.00 33.58
Investments in Debentures and Bonds - 57.53
Investments in Government Securities 20.10 20.10
6,558.36 5,726.41
(a) Investments in Equity Instruments of Associates include ` 3,772.52 crore (Previous year ` 3,404.85 crore) towards goodwill arising on the acquisition of these Associates.
(b) Aggregate amount of Quoted and Unquoted Investments, market value of Quoted Investments and aggregate provision for diminution in value of Investments are given below:
(` crore)
As at
31/03/2016 31/03/2015
Aggregate amount of Unquoted Investments 4,343.61 3,848.35
Aggregate amount of Quoted Investments 2,214.75 1,878.06
Aggregate market value of Quoted Investments 5,727.66 7,199.23
Aggregate provision for diminution in value of Investments 0.03 0.85
18. Deferred Tax Assets (Net):Major components of Deferred Tax arising on account of temporary timing differences are given below:
Deferred Tax Assets
Unabsorbed Business Losses 426.42 361.69
Employee’s Separation and Retirement Expenses - 6.98
Provision for Doubtful Debts, Loans and Advances 1,280.42 1,048.53
Unabsorbed Depreciation 135.89 134.59
Other Timing Differences 57.65 310.62
1,900.38 1,862.41
Less: Deferred Tax Liabilities
Depreciation and Amortization Expenses 159.28 404.34
Inventory Valuation Reserves 55.19 4.26
Other Timing Differences 86.14 60.85
300.61 469.45
1,599.77 1,392.96
Hindalco Annual Report 2015-16.indb 157Hindalco Annual Report 2015-16.indb 157 8/17/2016 1:31:38 PM8/17/2016 1:31:38 PM
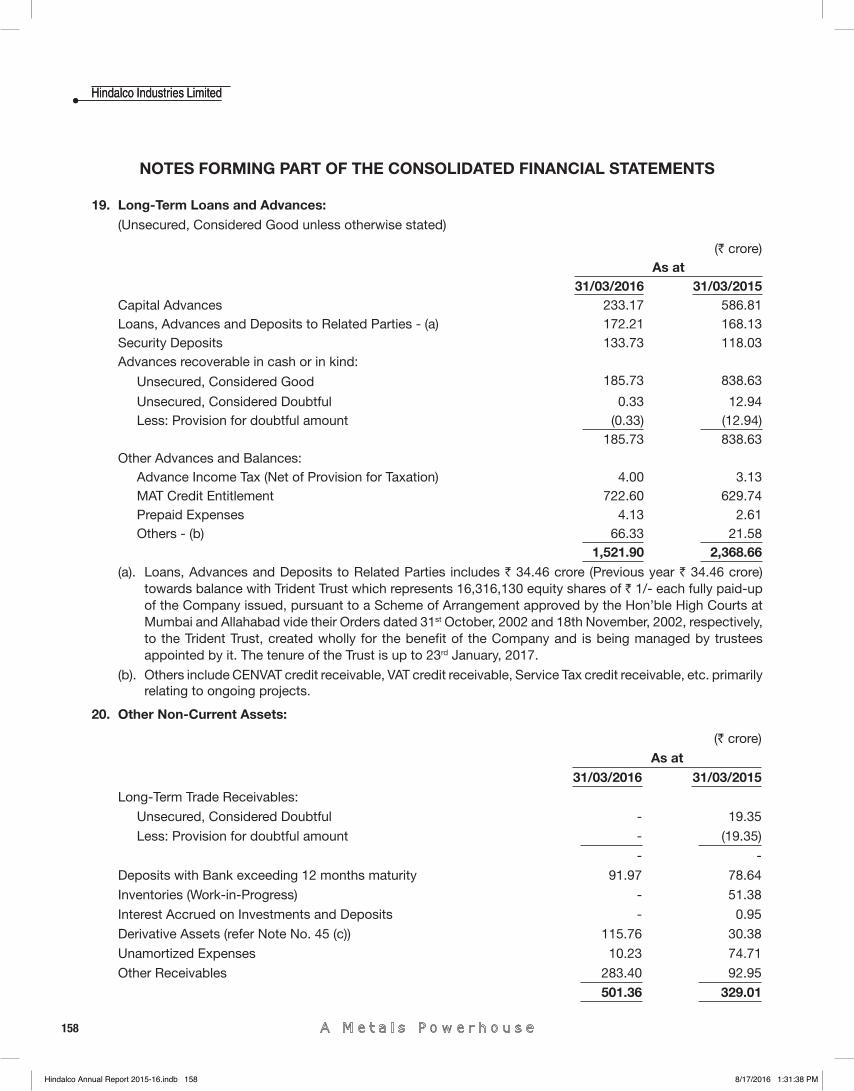
158
Hindalco Industries LimitedHindalco Industries Limited
NOTES FORMING PART OF THE CONSOLIDATED FINANCIAL STATEMENTS
19. Long-Term Loans and Advances: (Unsecured, Considered Good unless otherwise stated)
(` crore)As at
31/03/2016 31/03/2015Capital Advances 233.17 586.81 Loans, Advances and Deposits to Related Parties - (a) 172.21 168.13 Security Deposits 133.73 118.03 Advances recoverable in cash or in kind:
Unsecured, Considered Good 185.73 838.63
Unsecured, Considered Doubtful 0.33 12.94 Less: Provision for doubtful amount (0.33) (12.94)
185.73 838.63 Other Advances and Balances:
Advance Income Tax (Net of Provision for Taxation) 4.00 3.13 MAT Credit Entitlement 722.60 629.74 Prepaid Expenses 4.13 2.61 Others - (b) 66.33 21.58
1,521.90 2,368.66 (a). Loans, Advances and Deposits to Related Parties includes ` 34.46 crore (Previous year ` 34.46 crore)
towards balance with Trident Trust which represents 16,316,130 equity shares of ` 1/- each fully paid-up of the Company issued, pursuant to a Scheme of Arrangement approved by the Hon’ble High Courts at Mumbai and Allahabad vide their Orders dated 31st October, 2002 and 18th November, 2002, respectively, to the Trident Trust, created wholly for the benefi t of the Company and is being managed by trustees appointed by it. The tenure of the Trust is up to 23rd January, 2017.
(b). Others include CENVAT credit receivable, VAT credit receivable, Service Tax credit receivable, etc. primarily relating to ongoing projects.
20. Other Non-Current Assets:
(` crore)
As at31/03/2016 31/03/2015
Long-Term Trade Receivables:
Unsecured, Considered Doubtful - 19.35
Less: Provision for doubtful amount - (19.35)
- -
Deposits with Bank exceeding 12 months maturity 91.97 78.64
Inventories (Work-in-Progress) - 51.38
Interest Accrued on Investments and Deposits - 0.95
Derivative Assets (refer Note No. 45 (c)) 115.76 30.38
Unamortized Expenses 10.23 74.71
Other Receivables 283.40 92.95
501.36 329.01
Hindalco Annual Report 2015-16.indb 158Hindalco Annual Report 2015-16.indb 158 8/17/2016 1:31:38 PM8/17/2016 1:31:38 PM
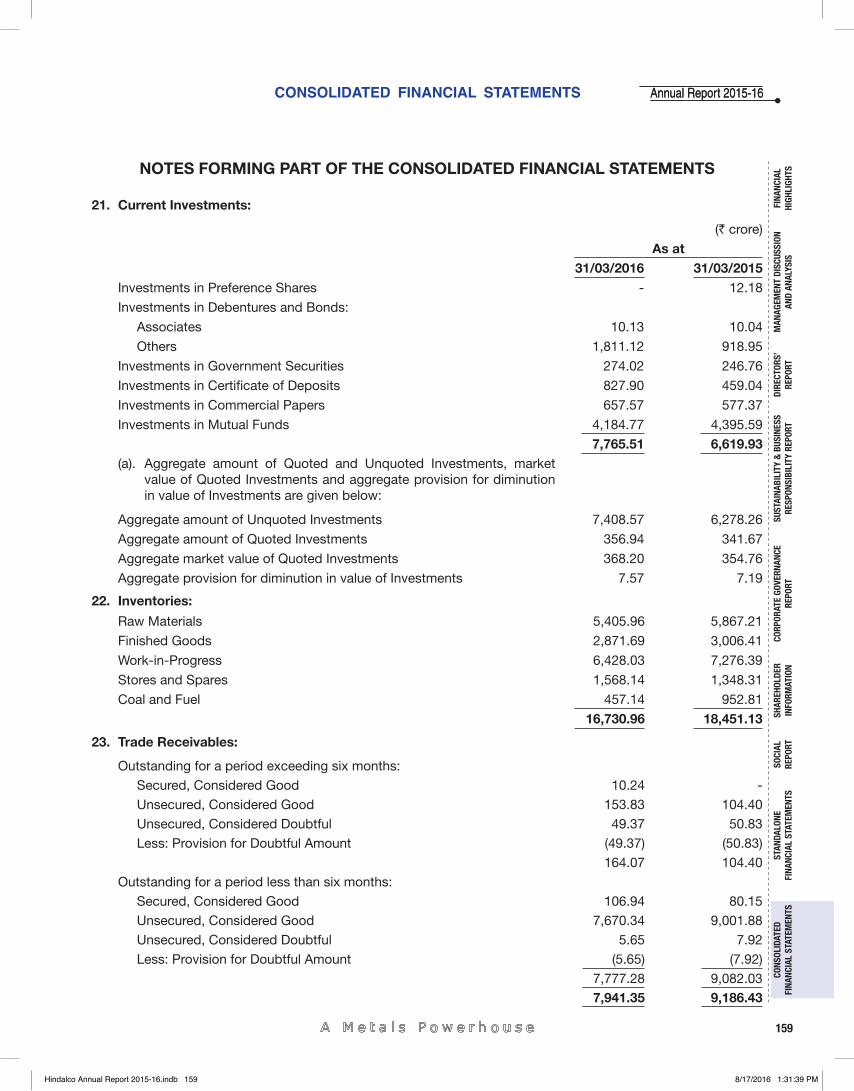
CONSOLIDATED FINANCIAL STATEMENTS
159
Annual Report 2015-16Annual Report 2015-16
FINA
NCIA
L HI
GHLI
GHTS
MAN
AGEM
ENT
DISC
USSI
ON
AND
ANAL
YSIS
CORP
ORAT
E GO
VERN
ANCE
RE
PORT
STAN
DALO
NE
FINA
NCIA
L ST
ATEM
ENTS
CONS
OLID
ATED
FI
NANC
IAL
STAT
EMEN
TSSO
CIAL
RE
PORT
DIRE
CTOR
S’RE
PORT
SHAR
EHOL
DER
INFO
RMAT
ION
SUST
AINA
BILI
TY &
BUS
INES
SRE
SPON
SIBI
LITY
REP
ORT
NOTES FORMING PART OF THE CONSOLIDATED FINANCIAL STATEMENTS
21. Current Investments:
(` crore)
As at31/03/2016 31/03/2015
Investments in Preference Shares - 12.18
Investments in Debentures and Bonds:
Associates 10.13 10.04
Others 1,811.12 918.95
Investments in Government Securities 274.02 246.76
Investments in Certifi cate of Deposits 827.90 459.04
Investments in Commercial Papers 657.57 577.37
Investments in Mutual Funds 4,184.77 4,395.59
7,765.51 6,619.93(a). Aggregate amount of Quoted and Unquoted Investments, market
value of Quoted Investments and aggregate provision for diminution in value of Investments are given below:
Aggregate amount of Unquoted Investments 7,408.57 6,278.26
Aggregate amount of Quoted Investments 356.94 341.67
Aggregate market value of Quoted Investments 368.20 354.76
Aggregate provision for diminution in value of Investments 7.57 7.19
22. Inventories:
Raw Materials 5,405.96 5,867.21
Finished Goods 2,871.69 3,006.41
Work-in-Progress 6,428.03 7,276.39
Stores and Spares 1,568.14 1,348.31
Coal and Fuel 457.14 952.81
16,730.96 18,451.13
23. Trade Receivables:
Outstanding for a period exceeding six months:Secured, Considered Good 10.24 - Unsecured, Considered Good 153.83 104.40 Unsecured, Considered Doubtful 49.37 50.83 Less: Provision for Doubtful Amount (49.37) (50.83)
164.07 104.40 Outstanding for a period less than six months:
Secured, Considered Good 106.94 80.15 Unsecured, Considered Good 7,670.34 9,001.88 Unsecured, Considered Doubtful 5.65 7.92 Less: Provision for Doubtful Amount (5.65) (7.92)
7,777.28 9,082.03 7,941.35 9,186.43
Hindalco Annual Report 2015-16.indb 159Hindalco Annual Report 2015-16.indb 159 8/17/2016 1:31:39 PM8/17/2016 1:31:39 PM
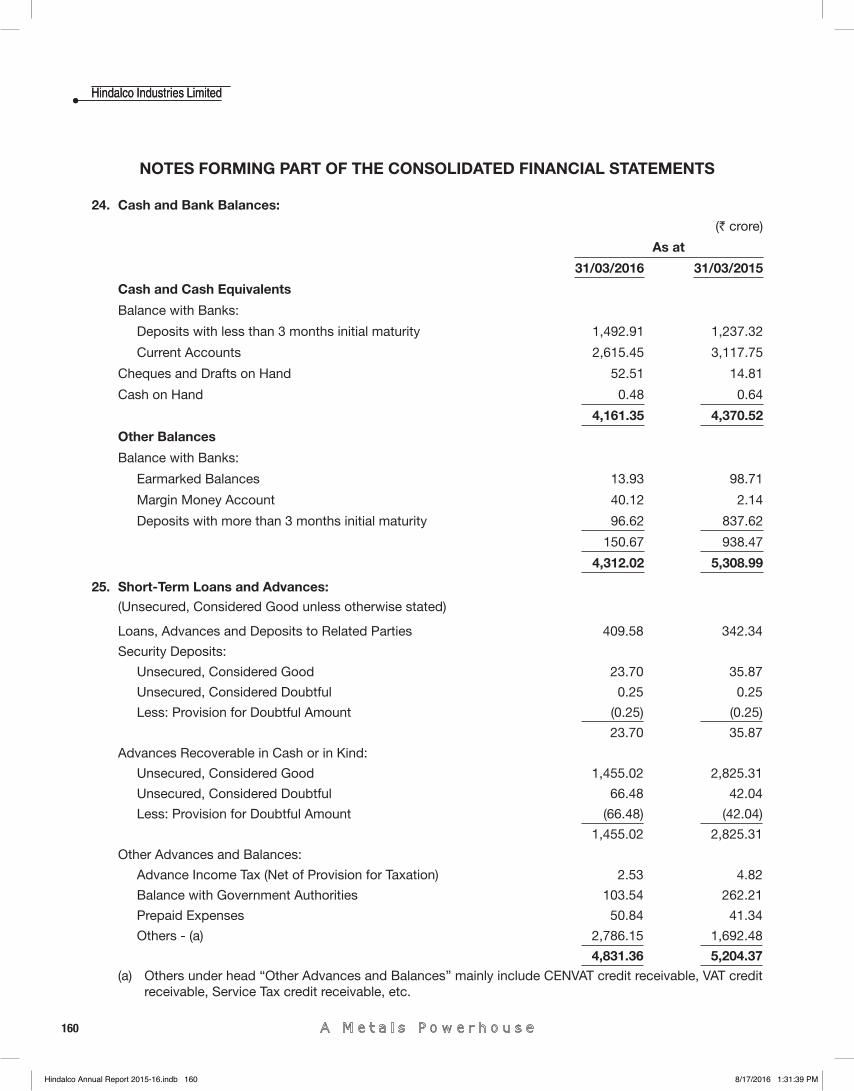
160
Hindalco Industries LimitedHindalco Industries Limited
NOTES FORMING PART OF THE CONSOLIDATED FINANCIAL STATEMENTS
24. Cash and Bank Balances:
(` crore)
As at
31/03/2016 31/03/2015
Cash and Cash Equivalents
Balance with Banks:
Deposits with less than 3 months initial maturity 1,492.91 1,237.32
Current Accounts 2,615.45 3,117.75
Cheques and Drafts on Hand 52.51 14.81
Cash on Hand 0.48 0.64
4,161.35 4,370.52
Other Balances
Balance with Banks:
Earmarked Balances 13.93 98.71
Margin Money Account 40.12 2.14
Deposits with more than 3 months initial maturity 96.62 837.62
150.67 938.47
4,312.02 5,308.99
25. Short-Term Loans and Advances:(Unsecured, Considered Good unless otherwise stated)
Loans, Advances and Deposits to Related Parties 409.58 342.34
Security Deposits:
Unsecured, Considered Good 23.70 35.87
Unsecured, Considered Doubtful 0.25 0.25
Less: Provision for Doubtful Amount (0.25) (0.25)
23.70 35.87
Advances Recoverable in Cash or in Kind:
Unsecured, Considered Good 1,455.02 2,825.31
Unsecured, Considered Doubtful 66.48 42.04
Less: Provision for Doubtful Amount (66.48) (42.04)
1,455.02 2,825.31
Other Advances and Balances:
Advance Income Tax (Net of Provision for Taxation) 2.53 4.82
Balance with Government Authorities 103.54 262.21
Prepaid Expenses 50.84 41.34
Others - (a) 2,786.15 1,692.48
4,831.36 5,204.37(a) Others under head “Other Advances and Balances” mainly include CENVAT credit receivable, VAT credit
receivable, Service Tax credit receivable, etc.
Hindalco Annual Report 2015-16.indb 160Hindalco Annual Report 2015-16.indb 160 8/17/2016 1:31:39 PM8/17/2016 1:31:39 PM
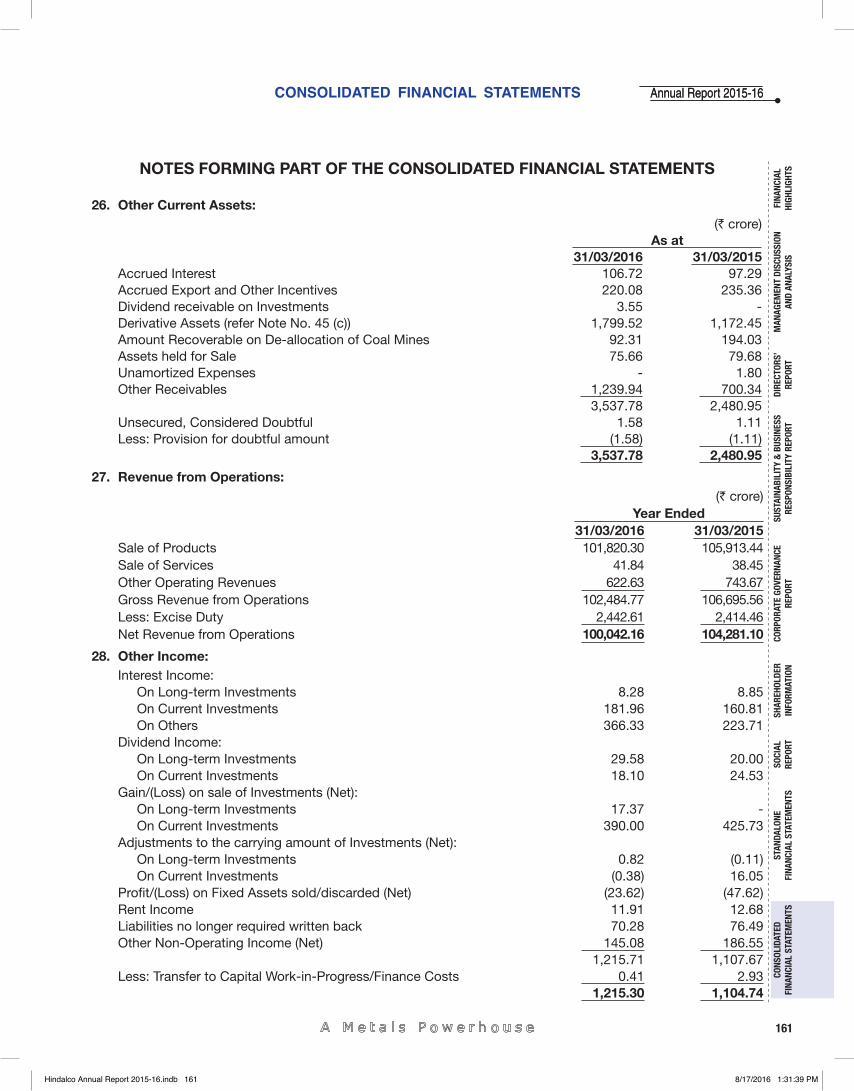
CONSOLIDATED FINANCIAL STATEMENTS
161
Annual Report 2015-16Annual Report 2015-16
FINA
NCIA
L HI
GHLI
GHTS
MAN
AGEM
ENT
DISC
USSI
ON
AND
ANAL
YSIS
CORP
ORAT
E GO
VERN
ANCE
RE
PORT
STAN
DALO
NE
FINA
NCIA
L ST
ATEM
ENTS
CONS
OLID
ATED
FI
NANC
IAL
STAT
EMEN
TSSO
CIAL
RE
PORT
DIRE
CTOR
S’RE
PORT
SHAR
EHOL
DER
INFO
RMAT
ION
SUST
AINA
BILI
TY &
BUS
INES
SRE
SPON
SIBI
LITY
REP
ORT
NOTES FORMING PART OF THE CONSOLIDATED FINANCIAL STATEMENTS
26. Other Current Assets:(` crore)
As at31/03/2016 31/03/2015
Accrued Interest 106.72 97.29 Accrued Export and Other Incentives 220.08 235.36 Dividend receivable on Investments 3.55 - Derivative Assets (refer Note No. 45 (c)) 1,799.52 1,172.45 Amount Recoverable on De-allocation of Coal Mines 92.31 194.03 Assets held for Sale 75.66 79.68 Unamortized Expenses - 1.80 Other Receivables 1,239.94 700.34 3,537.78 2,480.95Unsecured, Considered Doubtful 1.58 1.11 Less: Provision for doubtful amount (1.58) (1.11)
3,537.78 2,480.95
27. Revenue from Operations:(` crore)
Year Ended31/03/2016 31/03/2015
Sale of Products 101,820.30 105,913.44Sale of Services 41.84 38.45 Other Operating Revenues 622.63 743.67 Gross Revenue from Operations 102,484.77 106,695.56 Less: Excise Duty 2,442.61 2,414.46 Net Revenue from Operations 100,042.16 104,281.10
28. Other Income:Interest Income:
On Long-term Investments 8.28 8.85 On Current Investments 181.96 160.81 On Others 366.33 223.71
Dividend Income:On Long-term Investments 29.58 20.00 On Current Investments 18.10 24.53
Gain/(Loss) on sale of Investments (Net):On Long-term Investments 17.37 - On Current Investments 390.00 425.73
Adjustments to the carrying amount of Investments (Net):On Long-term Investments 0.82 (0.11)On Current Investments (0.38) 16.05
Profi t/(Loss) on Fixed Assets sold/discarded (Net) (23.62) (47.62)Rent Income 11.91 12.68 Liabilities no longer required written back 70.28 76.49 Other Non-Operating Income (Net) 145.08 186.55
1,215.71 1,107.67Less: Transfer to Capital Work-in-Progress/Finance Costs 0.41 2.93
1,215.30 1,104.74
Hindalco Annual Report 2015-16.indb 161Hindalco Annual Report 2015-16.indb 161 8/17/2016 1:31:39 PM8/17/2016 1:31:39 PM
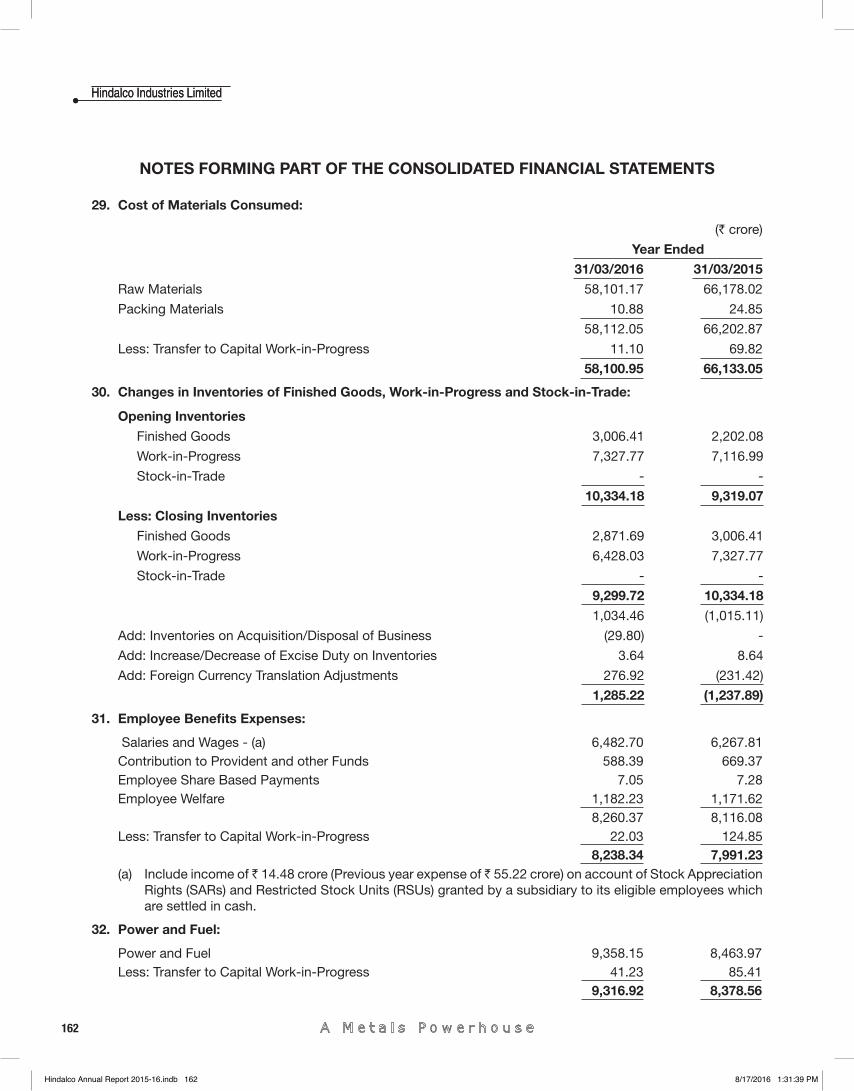
162
Hindalco Industries LimitedHindalco Industries Limited
NOTES FORMING PART OF THE CONSOLIDATED FINANCIAL STATEMENTS
29. Cost of Materials Consumed:
(` crore)
Year Ended
31/03/2016 31/03/2015
Raw Materials 58,101.17 66,178.02
Packing Materials 10.88 24.85
58,112.05 66,202.87
Less: Transfer to Capital Work-in-Progress 11.10 69.82
58,100.95 66,133.05
30. Changes in Inventories of Finished Goods, Work-in-Progress and Stock-in-Trade:
Opening Inventories
Finished Goods 3,006.41 2,202.08
Work-in-Progress 7,327.77 7,116.99
Stock-in-Trade - -
10,334.18 9,319.07
Less: Closing Inventories
Finished Goods 2,871.69 3,006.41
Work-in-Progress 6,428.03 7,327.77
Stock-in-Trade - -
9,299.72 10,334.18
1,034.46 (1,015.11)
Add: Inventories on Acquisition/Disposal of Business (29.80) -
Add: Increase/Decrease of Excise Duty on Inventories 3.64 8.64
Add: Foreign Currency Translation Adjustments 276.92 (231.42)
1,285.22 (1,237.89)
31. Employee Benefi ts Expenses:
Salaries and Wages - (a) 6,482.70 6,267.81Contribution to Provident and other Funds 588.39 669.37 Employee Share Based Payments 7.05 7.28 Employee Welfare 1,182.23 1,171.62 8,260.37 8,116.08Less: Transfer to Capital Work-in-Progress 22.03 124.85
8,238.34 7,991.23(a) Include income of ̀ 14.48 crore (Previous year expense of ̀ 55.22 crore) on account of Stock Appreciation
Rights (SARs) and Restricted Stock Units (RSUs) granted by a subsidiary to its eligible employees which are settled in cash.
32. Power and Fuel:
Power and Fuel 9,358.15 8,463.97Less: Transfer to Capital Work-in-Progress 41.23 85.41
9,316.92 8,378.56
Hindalco Annual Report 2015-16.indb 162Hindalco Annual Report 2015-16.indb 162 8/17/2016 1:31:39 PM8/17/2016 1:31:39 PM
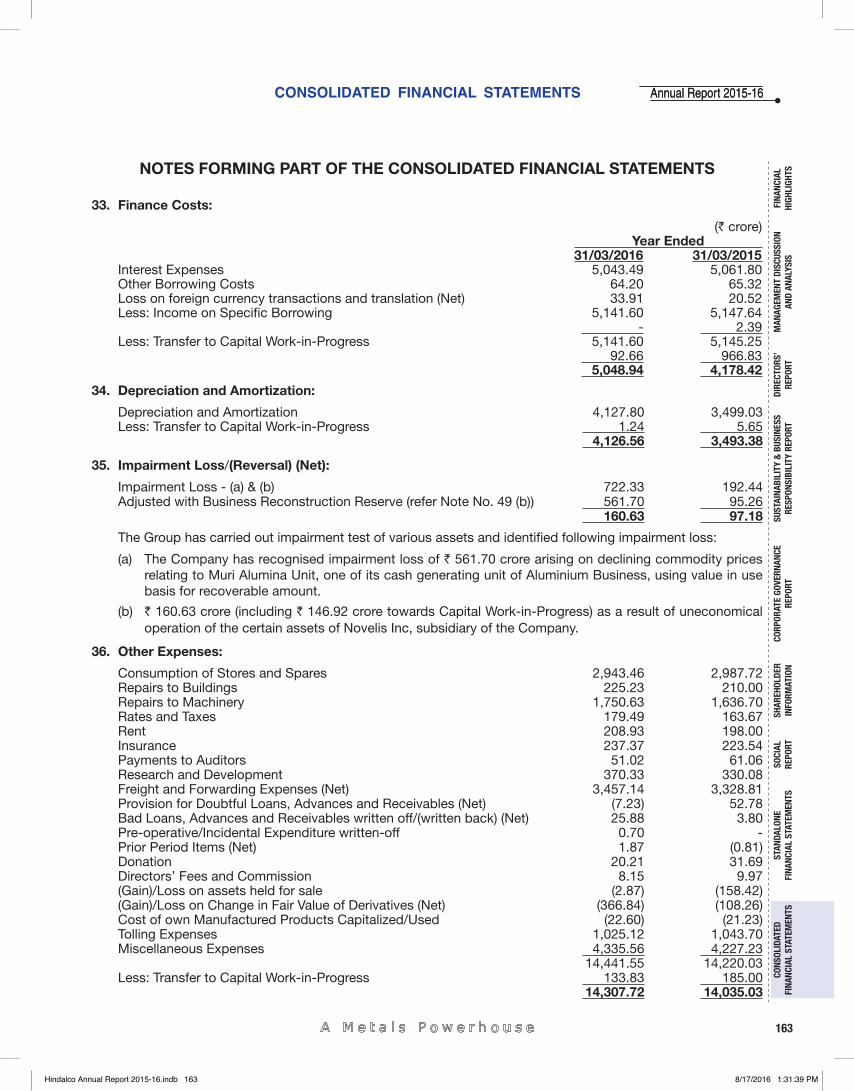
CONSOLIDATED FINANCIAL STATEMENTS
163
Annual Report 2015-16Annual Report 2015-16
FINA
NCIA
L HI
GHLI
GHTS
MAN
AGEM
ENT
DISC
USSI
ON
AND
ANAL
YSIS
CORP
ORAT
E GO
VERN
ANCE
RE
PORT
STAN
DALO
NE
FINA
NCIA
L ST
ATEM
ENTS
CONS
OLID
ATED
FI
NANC
IAL
STAT
EMEN
TSSO
CIAL
RE
PORT
DIRE
CTOR
S’RE
PORT
SHAR
EHOL
DER
INFO
RMAT
ION
SUST
AINA
BILI
TY &
BUS
INES
SRE
SPON
SIBI
LITY
REP
ORT
NOTES FORMING PART OF THE CONSOLIDATED FINANCIAL STATEMENTS
33. Finance Costs:
(` crore)Year Ended
31/03/2016 31/03/2015Interest Expenses 5,043.49 5,061.80Other Borrowing Costs 64.20 65.32 Loss on foreign currency transactions and translation (Net) 33.91 20.52 Less: Income on Specifi c Borrowing 5,141.60 5,147.64 - 2.39 Less: Transfer to Capital Work-in-Progress 5,141.60 5,145.25
92.66 966.83 5,048.94 4,178.42
34. Depreciation and Amortization:
Depreciation and Amortization 4,127.80 3,499.03Less: Transfer to Capital Work-in-Progress 1.24 5.65
4,126.56 3,493.38
35. Impairment Loss/(Reversal) (Net):
Impairment Loss - (a) & (b) 722.33 192.44 Adjusted with Business Reconstruction Reserve (refer Note No. 49 (b)) 561.70 95.26
160.63 97.18
The Group has carried out impairment test of various assets and identifi ed following impairment loss:
(a) The Company has recognised impairment loss of ` 561.70 crore arising on declining commodity prices relating to Muri Alumina Unit, one of its cash generating unit of Aluminium Business, using value in use basis for recoverable amount.
(b) ` 160.63 crore (including ` 146.92 crore towards Capital Work-in-Progress) as a result of uneconomical operation of the certain assets of Novelis Inc, subsidiary of the Company.
36. Other Expenses:
Consumption of Stores and Spares 2,943.46 2,987.72Repairs to Buildings 225.23 210.00 Repairs to Machinery 1,750.63 1,636.70 Rates and Taxes 179.49 163.67 Rent 208.93 198.00 Insurance 237.37 223.54 Payments to Auditors 51.02 61.06 Research and Development 370.33 330.08 Freight and Forwarding Expenses (Net) 3,457.14 3,328.81 Provision for Doubtful Loans, Advances and Receivables (Net) (7.23) 52.78 Bad Loans, Advances and Receivables written off/(written back) (Net) 25.88 3.80 Pre-operative/Incidental Expenditure written-off 0.70 - Prior Period Items (Net) 1.87 (0.81)Donation 20.21 31.69 Directors’ Fees and Commission 8.15 9.97 (Gain)/Loss on assets held for sale (2.87) (158.42)(Gain)/Loss on Change in Fair Value of Derivatives (Net) (366.84) (108.26)Cost of own Manufactured Products Capitalized/Used (22.60) (21.23)Tolling Expenses 1,025.12 1,043.70 Miscellaneous Expenses 4,335.56 4,227.23 14,441.55 14,220.03Less: Transfer to Capital Work-in-Progress 133.83 185.00
14,307.72 14,035.03
Hindalco Annual Report 2015-16.indb 163Hindalco Annual Report 2015-16.indb 163 8/17/2016 1:31:39 PM8/17/2016 1:31:39 PM
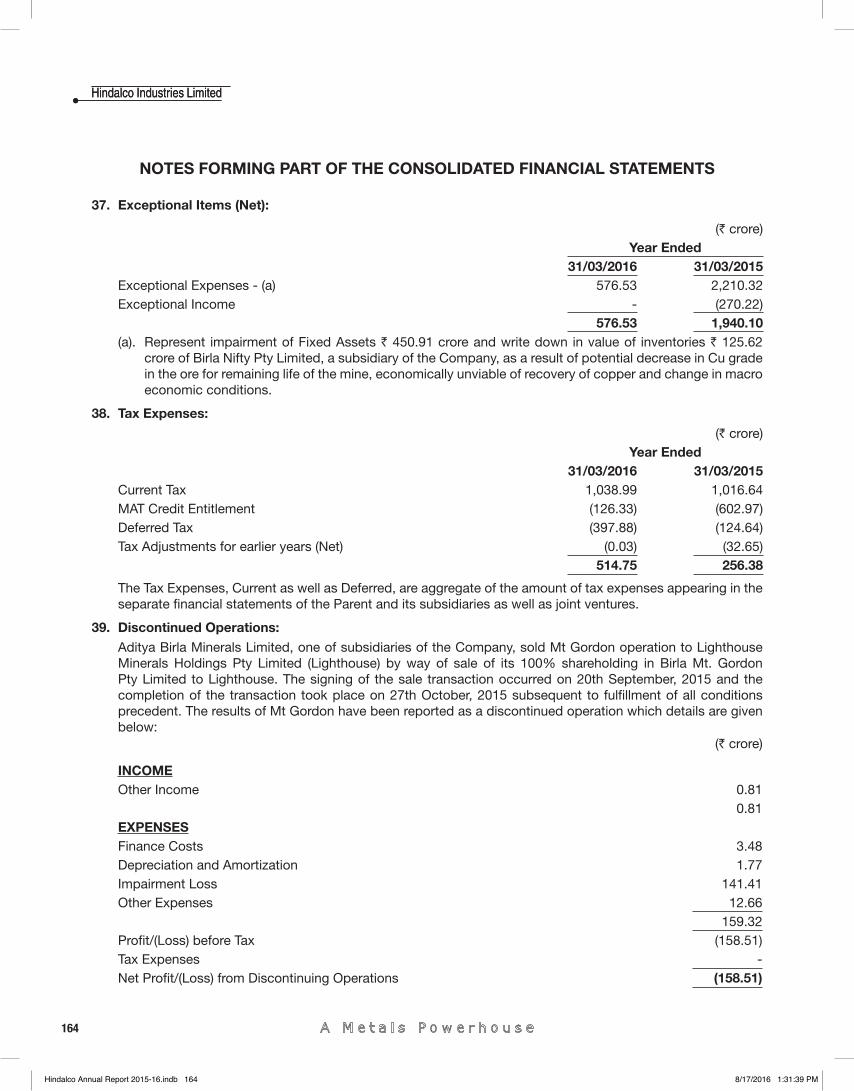
164
Hindalco Industries LimitedHindalco Industries Limited
NOTES FORMING PART OF THE CONSOLIDATED FINANCIAL STATEMENTS
37. Exceptional Items (Net):
(` crore)Year Ended
31/03/2016 31/03/2015Exceptional Expenses - (a) 576.53 2,210.32Exceptional Income - (270.22)
576.53 1,940.10 (a). Represent impairment of Fixed Assets ` 450.91 crore and write down in value of inventories ` 125.62
crore of Birla Nifty Pty Limited, a subsidiary of the Company, as a result of potential decrease in Cu grade in the ore for remaining life of the mine, economically unviable of recovery of copper and change in macro economic conditions.
38. Tax Expenses:
(` crore)Year Ended
31/03/2016 31/03/2015Current Tax 1,038.99 1,016.64MAT Credit Entitlement (126.33) (602.97)Deferred Tax (397.88) (124.64)Tax Adjustments for earlier years (Net) (0.03) (32.65)
514.75 256.38
The Tax Expenses, Current as well as Deferred, are aggregate of the amount of tax expenses appearing in the separate fi nancial statements of the Parent and its subsidiaries as well as joint ventures.
39. Discontinued Operations:Aditya Birla Minerals Limited, one of subsidiaries of the Company, sold Mt Gordon operation to Lighthouse Minerals Holdings Pty Limited (Lighthouse) by way of sale of its 100% shareholding in Birla Mt. Gordon Pty Limited to Lighthouse. The signing of the sale transaction occurred on 20th September, 2015 and the completion of the transaction took place on 27th October, 2015 subsequent to fulfi llment of all conditions precedent. The results of Mt Gordon have been reported as a discontinued operation which details are given below:
(` crore)
INCOMEOther Income 0.81 0.81EXPENSESFinance Costs 3.48 Depreciation and Amortization 1.77 Impairment Loss 141.41 Other Expenses 12.66 159.32Profi t/(Loss) before Tax (158.51)Tax Expenses - Net Profi t/(Loss) from Discontinuing Operations (158.51)
Hindalco Annual Report 2015-16.indb 164Hindalco Annual Report 2015-16.indb 164 8/17/2016 1:31:39 PM8/17/2016 1:31:39 PM

CONSOLIDATED FINANCIAL STATEMENTS
165
Annual Report 2015-16Annual Report 2015-16
FINA
NCIA
L HI
GHLI
GHTS
MAN
AGEM
ENT
DISC
USSI
ON
AND
ANAL
YSIS
CORP
ORAT
E GO
VERN
ANCE
RE
PORT
STAN
DALO
NE
FINA
NCIA
L ST
ATEM
ENTS
CONS
OLID
ATED
FI
NANC
IAL
STAT
EMEN
TSSO
CIAL
RE
PORT
DIRE
CTOR
S’RE
PORT
SHAR
EHOL
DER
INFO
RMAT
ION
SUST
AINA
BILI
TY &
BUS
INES
SRE
SPON
SIBI
LITY
REP
ORT
NOTES FORMING PART OF THE CONSOLIDATED FINANCIAL STATEMENTS
40. Earnings per Share (EPS):
Year Ended
31/03/2016 31/03/2015
Profi t for the period (` crore) 44.81 854.21
Weighted average number of shares used in the calculation of EPS:
Weighted average number of equity shares for computing basic EPS 2,064,985,267 2,064,821,218
Dilutive impact of Employee Stock Options Scheme 1,298,140 1,834,285
Weighted average number of equity shares for computing diluted EPS 2,066,283,407 2,066,655,503
Face value of per share (`) 1.00 1.00
Basic EPS (`) 0.22 4.14
Diluted EPS (`) 0.22 4.13
41. For the year ended 31st March, 2016, the Board of Directors of the Company in the meeting held on 28th May, 2016 have recommended dividend of ` 1.00 per share (Previous year ` 1.00 per share) to equity shareholders aggregating to ` 248.54 crore (Previous year ` 246.09 crore) including Dividend Distribution Tax.
42. In accordance with the accounting policy for accounting of actuarial gains or losses relating to pension and other post retirement employee benefi t plans of Novelis Inc., the Group has recognised actuarial gains/losses (net of deferred tax) in the ‘Actuarial Gain/(Loss) Reserve’ under Reserves and Surplus in its Consolidated Financial Statements. Had the Group followed the practice of recognition of actuarial gains/losses on the aforesaid defi ned benefi t plans in the Statement of Profi t and Loss, Employee Benefi ts Expenses would have been higher by ` 253.75 crore (Previous year higher by ` 1,516.50 crore), Tax Expenses (Deferred Tax) would have been lower by ` 93.02 crore (Previous year lower by ` 452.80 crore), Minority Interest credit would have been lower by ` 71.71 crore (Previous year lower by ` 50.28 crore), Net Profi t for the year would have been lower by ` 232.45 crore (Previous year Profi t lower by ` 1,063.69 crore), Actuarial Gain/(Loss) Reserve would have been ` Nil (Previous year ` Nil) and Foreign Currency Translation Reserve would have been lower by ` 150.74 crore (Previous year lower by ` 68.65 crore).
43. The Company is one of the promoter members of Aditya Birla Management Corporation Private Limited (ABMCPL), a Company limited by guarantee which has been formed to provide common facilities and resources to its members, with a view to optimize the benefi ts of specialization and minimize cost for each member. The Company is one of the participants in the common pool and shares the expenses incurred by ABMCPL and accounted for under appropriate heads.
44. Segment Reporting
A. Primary Segment Reporting (by Business Segment): (a) The Group has three reportable segments viz. Aluminium, Copper and Others which have been
identifi ed in line with the Accounting Standard 17 on Segment Reporting, taking into account the organizational structure as well as differential risk and return of these segments. Details of products included in each segments are as under:
i. Aluminium : Hydrate & Alumina, Aluminium and Aluminium Product
ii. Copper : Continuous Cast Copper Rods, Copper Cathode, Sulphuric Acid, DAP & Complexes, Gold and Silver
iii. Others : Caustic and Others #
(b) Inter-segment transfers are based on market rates.
(c) The details of the revenue, results, assets, liabilities and other information from operations by reportable business segments are follows:
Hindalco Annual Report 2015-16.indb 165Hindalco Annual Report 2015-16.indb 165 8/17/2016 1:31:39 PM8/17/2016 1:31:39 PM
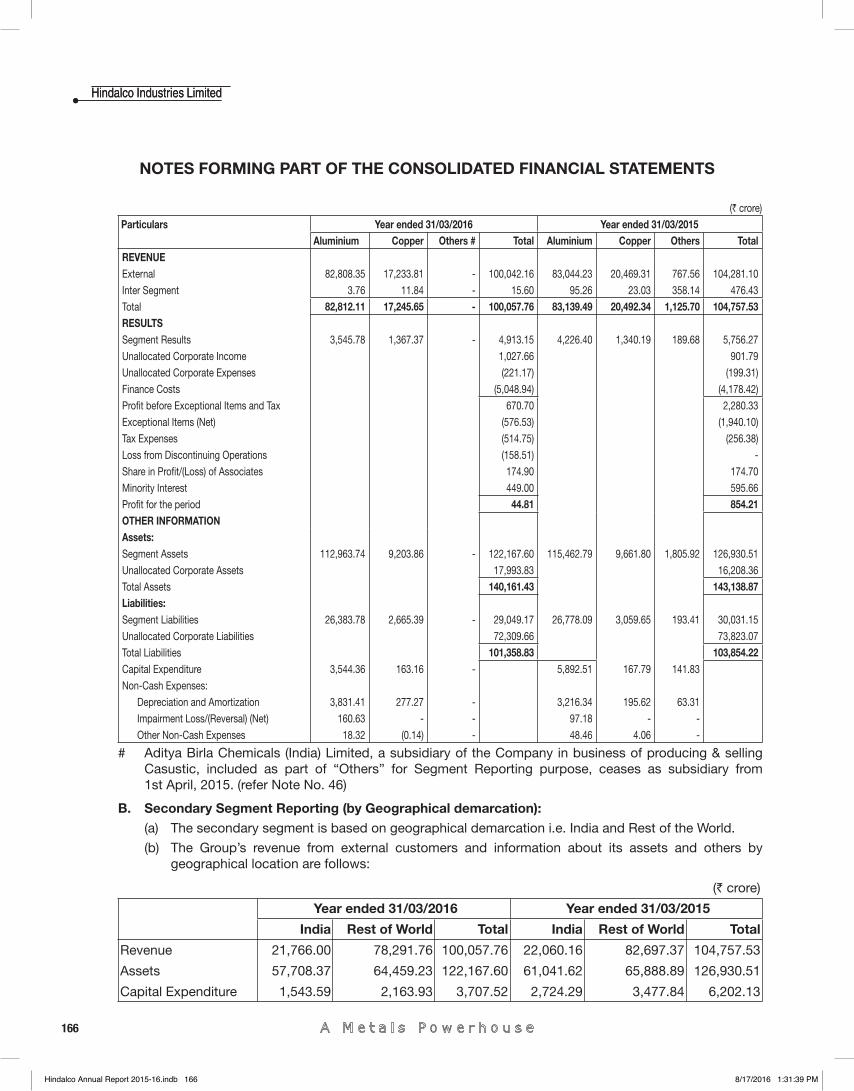
166
Hindalco Industries LimitedHindalco Industries Limited
NOTES FORMING PART OF THE CONSOLIDATED FINANCIAL STATEMENTS
(` crore) Particulars Year ended 31/03/2016 Year ended 31/03/2015
Aluminium Copper Others # Total Aluminium Copper Others Total REVENUEExternal 82,808.35 17,233.81 - 100,042.16 83,044.23 20,469.31 767.56 104,281.10 Inter Segment 3.76 11.84 - 15.60 95.26 23.03 358.14 476.43 Total 82,812.11 17,245.65 - 100,057.76 83,139.49 20,492.34 1,125.70 104,757.53 RESULTS Segment Results 3,545.78 1,367.37 - 4,913.15 4,226.40 1,340.19 189.68 5,756.27 Unallocated Corporate Income 1,027.66 901.79 Unallocated Corporate Expenses (221.17) (199.31)Finance Costs (5,048.94) (4,178.42)Profi t before Exceptional Items and Tax 670.70 2,280.33 Exceptional Items (Net) (576.53) (1,940.10)Tax Expenses (514.75) (256.38)Loss from Discontinuing Operations (158.51) - Share in Profi t/(Loss) of Associates 174.90 174.70 Minority Interest 449.00 595.66 Profi t for the period 44.81 854.21 OTHER INFORMATION Assets: Segment Assets 112,963.74 9,203.86 - 122,167.60 115,462.79 9,661.80 1,805.92 126,930.51 Unallocated Corporate Assets 17,993.83 16,208.36 Total Assets 140,161.43 143,138.87 Liabilities: Segment Liabilities 26,383.78 2,665.39 - 29,049.17 26,778.09 3,059.65 193.41 30,031.15 Unallocated Corporate Liabilities 72,309.66 73,823.07 Total Liabilities 101,358.83 103,854.22 Capital Expenditure 3,544.36 163.16 - 5,892.51 167.79 141.83 Non-Cash Expenses:
Depreciation and Amortization 3,831.41 277.27 - 3,216.34 195.62 63.31 Impairment Loss/(Reversal) (Net) 160.63 - - 97.18 - - Other Non-Cash Expenses 18.32 (0.14) - 48.46 4.06 -
# Aditya Birla Chemicals (India) Limited, a subsidiary of the Company in business of producing & selling Casustic, included as part of “Others” for Segment Reporting purpose, ceases as subsidiary from 1st April, 2015. (refer Note No. 46)
B. Secondary Segment Reporting (by Geographical demarcation): (a) The secondary segment is based on geographical demarcation i.e. India and Rest of the World.
(b) The Group’s revenue from external customers and information about its assets and others by geographical location are follows:
(` crore)
Year ended 31/03/2016 Year ended 31/03/2015
India Rest of World Total India Rest of World Total
Revenue 21,766.00 78,291.76 100,057.76 22,060.16 82,697.37 104,757.53
Assets 57,708.37 64,459.23 122,167.60 61,041.62 65,888.89 126,930.51
Capital Expenditure 1,543.59 2,163.93 3,707.52 2,724.29 3,477.84 6,202.13
Hindalco Annual Report 2015-16.indb 166Hindalco Annual Report 2015-16.indb 166 8/17/2016 1:31:39 PM8/17/2016 1:31:39 PM
CONSOLIDATED FINANCIAL STATEMENTS
167
Annual Report 2015-16Annual Report 2015-16
FINA
NCIA
L HI
GHLI
GHTS
MAN
AGEM
ENT
DISC
USSI
ON
AND
ANAL
YSIS
CORP
ORAT
E GO
VERN
ANCE
RE
PORT
STAN
DALO
NE
FINA
NCIA
L ST
ATEM
ENTS
CONS
OLID
ATED
FI
NANC
IAL
STAT
EMEN
TSSO
CIAL
RE
PORT
DIRE
CTOR
S’RE
PORT
SHAR
EHOL
DER
INFO
RMAT
ION
SUST
AINA
BILI
TY &
BUS
INES
SRE
SPON
SIBI
LITY
REP
ORT
NOTES FORMING PART OF THE CONSOLIDATED FINANCIAL STATEMENTS
45. Derivative Financials Instruments and Risk Management:(a) The Company has adopted Accounting Standard 30, “Financial Instruments: Recognition and
Measurement” issued by The Institute of Chartered Accountants of India so far as it relates to derivative accounting.
(b) In the ordinary course of business, the Company is exposed to risks resulting from changes in prices of commodity, exchange rate fl uctuation and interest rate movements. It manages its exposure to these risks through derivative fi nancial instruments. It uses derivative instruments such as forwards, futures, swaps and options to manage these risks. These derivative fi nancial instruments reduce the impact of both favourable and unfavourable fl uctuations.
The Company’s risk management activities are subject to the management, direction and control of Risk Management Board (RMB). The RMB is composed of three directors including Managing Director, Deputy Managing Director and at least two offi cers one being the Chief Financial Offi cer. The RMB reports to the Board of Directors on the scope of its activities.
The decision of whether and when to execute derivative fi nancial instruments along with its tenure can vary from period to period depending on market conditions and the relative costs of the instruments. The tenure is always linked to the timing of the underlying exposure, with the connection between the two being regularly monitored. The Company is exposed to losses in the event of non-performance by the counterparties to the derivative contracts. All derivative contracts are executed with counterparties that, in our judgment, are creditworthy. The credit levels are reviewed to ensure that there is no inappropriate concentration of outstanding to any particular counterparty.
Commodity Price Risk
Copper and Precious MetalsThis business is conducted under a conversion model. The prices of input and output are derived from the same benchmark and/or are linked to each other through a defi ned formula. The objective of risk management is to attempt to use derivatives to match the price fl uctuations arising out of the timing mismatch in pricing the input and output to make the margins immune to the fl uctuations in prices of the input and output.
Aluminium This business is vertically integrated. The main raw material viz. bauxite (mostly mined from own mines) and other purchased raw materials do not have any linkage with the output price which is Aluminium LME prices. When the prices of input(s) and output(s) do not follow the above condition, then risk management attempts to use derivatives so as to protect the margins from adverse movements in prices on either side, i.e. from a rise in input cost or from a fall in output price.
As a condition of sale, customers often require the Company to enter into fi xed price commitments. These commitments expose the Company to the risk of fl uctuating aluminum prices between the time the order is committed and the time that the material is shipped. The Company may enter into derivative fi nancial instruments to mitigate the risk arising out of the fi xed price commitments. Consequently, the gain or loss resulting from movements in the price of aluminum on these contracts would generally be offset by an equal and opposite impact on the net sales and purchases being hedged.
Coal and Furnace OilSmelting and other associated operations of aluminium require signifi cant amount of power. Such power is mostly supplied through captive power generation units which are coal based. In order to meet the gap between requirement of coal and its availability domestically, sometimes coal is also imported. The domestic prices of coal are not linked to any internationally traded price whereas the imported coal is linked to internationally traded prices. Hence the imported coal price fl uctuates in line with the international prices. To mitigate this risk , coal commodity derivatives are taken. Similarly, Furance oil is
Hindalco Annual Report 2015-16.indb 167Hindalco Annual Report 2015-16.indb 167 8/17/2016 1:31:40 PM8/17/2016 1:31:40 PM
168
Hindalco Industries LimitedHindalco Industries Limited
NOTES FORMING PART OF THE CONSOLIDATED FINANCIAL STATEMENTS
also an important input for manufacturing of alumina which is the input for aluminium production. Furnace oil is sourced mainly from domestic market but the price is linked to international crude price movement. Hence, to mitigate this risk , furnace oil commodity derivatives are taken.
Natural Gas and Diesel FuelThe Company purchases natural gas & diesel fuel on the open market in Europe, Asia and South America which exposes the Company to market price fl uctuations. The Company mitigates the future exposure to natural gas prices through the use of forward purchase contracts.
ElectricityThe Company has entered into an electricity swap in North America to fi x a portion of the cost of electricity requirement in North America.
Foreign Currency Exchange Risk Exchange rate movements, particularly the United States Dollar (USD) and Euro (EUR) against Indian Rupee (INR), have an impact on our operating results. In addition to the foreign exchange fl ow from exports, the commodity prices in the domestic market are derived based on the landed cost of imports in India where LME prices and USD/INR exchange rate are the main factors. In case of conversion business, the objective is to match the exchange rate of outfl ows and related infl ows through derivative fi nancial instruments. With respect to Aluminium business where costs are predominantly in INR, the strengthening of INR against USD adversely affects the profi tability of the business and benefi ts when INR depreciates against USD. The company enters into various foreign exchange contracts to protect profi tability. Also, certain foreign exchange future derivatives are taken for arbitrage purpose between exchange and OTC.
The Company enters into various cross currency swaps to manage the exposure to fl uctuating exchange rate arising from loans given to and net investments made in various European subsidiaries.
The Company also enters into various foreign exchange contracts to mitigate the risk arising out of foreign currency exchange rate movement in foreign currency contracts executed with foreign suppliers to procure capital items for its project activities.
Interest Rate RiskThe Company is exposed to changes in interest rates due to fi nancing, investing and cash management activities. The Company enters into interest rate swap contracts to manage its exposure to changes in the benchmark LIBOR interest rate arising from various fl oating rate debts.
Embedded derivativesCopper concentrate is purchased on future pricing model based on month’s average LME (in case of copper) / LBMA (in case of gold and silver). Since the value of the concentrate changes with response to change in commodity pricing indices, embedded derivatives (ED) is identifi ed and segregated in the contract. The ED so segregated, is treated like commodity derivative and qualify for hedge accounting. These derivatives are put into a Fair Value hedge relationship with inventory.
The objective of hedge designation of the embedded commodity derivative is to offset the volatility in the Statement of Profi t and Loss due to change in value of un-priced inventory with response to LME / LBMA.
Net Investment HedgesFor derivative instruments that are designated as hedges of net investment in foreign operations, gains and losses on derivative instruments are included (net of taxes), to the extent the hedges are effective, in Cumulative Translation Adjustment (CTA). The ineffective portions of hedges of net investments in foreign operations, if any, are recognised as gains or losses and included in ‘Other Expenses’ in the Statement of Profi t and Loss.
Hindalco Annual Report 2015-16.indb 168Hindalco Annual Report 2015-16.indb 168 8/17/2016 1:31:40 PM8/17/2016 1:31:40 PM
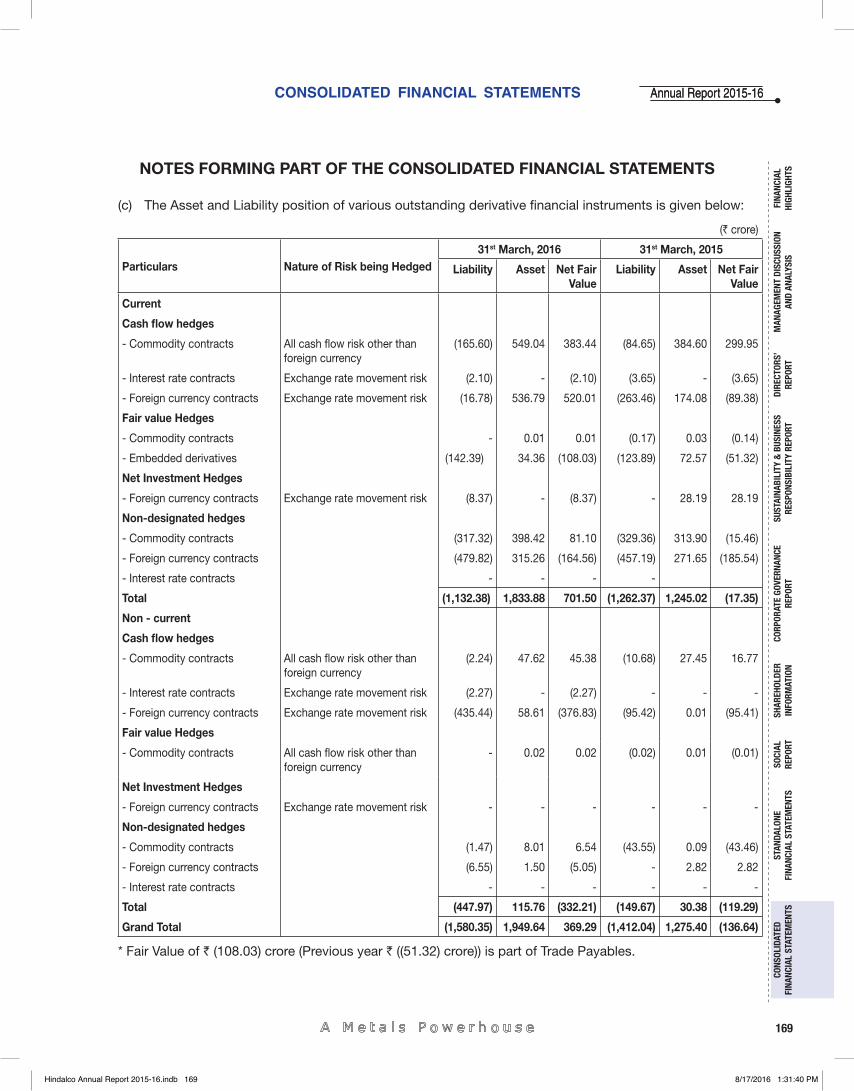
CONSOLIDATED FINANCIAL STATEMENTS
169
Annual Report 2015-16Annual Report 2015-16
FINA
NCIA
L HI
GHLI
GHTS
MAN
AGEM
ENT
DISC
USSI
ON
AND
ANAL
YSIS
CORP
ORAT
E GO
VERN
ANCE
RE
PORT
STAN
DALO
NE
FINA
NCIA
L ST
ATEM
ENTS
CONS
OLID
ATED
FI
NANC
IAL
STAT
EMEN
TSSO
CIAL
RE
PORT
DIRE
CTOR
S’RE
PORT
SHAR
EHOL
DER
INFO
RMAT
ION
SUST
AINA
BILI
TY &
BUS
INES
SRE
SPON
SIBI
LITY
REP
ORT
NOTES FORMING PART OF THE CONSOLIDATED FINANCIAL STATEMENTS
(c) The Asset and Liability position of various outstanding derivative fi nancial instruments is given below:
(` crore)
Particulars Nature of Risk being Hedged31st March, 2016 31st March, 2015
Liability Asset Net Fair Value
Liability Asset Net Fair Value
Current
Cash fl ow hedges
- Commodity contracts All cash fl ow risk other than foreign currency
(165.60) 549.04 383.44 (84.65) 384.60 299.95
- Interest rate contracts Exchange rate movement risk (2.10) - (2.10) (3.65) - (3.65)
- Foreign currency contracts Exchange rate movement risk (16.78) 536.79 520.01 (263.46) 174.08 (89.38)
Fair value Hedges
- Commodity contracts - 0.01 0.01 (0.17) 0.03 (0.14)
- Embedded derivatives (142.39) 34.36 (108.03) (123.89) 72.57 (51.32)
Net Investment Hedges
- Foreign currency contracts Exchange rate movement risk (8.37) - (8.37) - 28.19 28.19
Non-designated hedges
- Commodity contracts (317.32) 398.42 81.10 (329.36) 313.90 (15.46)
- Foreign currency contracts (479.82) 315.26 (164.56) (457.19) 271.65 (185.54)
- Interest rate contracts - - - -
Total (1,132.38) 1,833.88 701.50 (1,262.37) 1,245.02 (17.35)
Non - current
Cash fl ow hedges
- Commodity contracts All cash fl ow risk other than foreign currency
(2.24) 47.62 45.38 (10.68) 27.45 16.77
- Interest rate contracts Exchange rate movement risk (2.27) - (2.27) - - -
- Foreign currency contracts Exchange rate movement risk (435.44) 58.61 (376.83) (95.42) 0.01 (95.41)
Fair value Hedges
- Commodity contracts All cash fl ow risk other than foreign currency
- 0.02 0.02 (0.02) 0.01 (0.01)
Net Investment Hedges
- Foreign currency contracts Exchange rate movement risk - - - - - -
Non-designated hedges
- Commodity contracts (1.47) 8.01 6.54 (43.55) 0.09 (43.46)
- Foreign currency contracts (6.55) 1.50 (5.05) - 2.82 2.82
- Interest rate contracts - - - - - -
Total (447.97) 115.76 (332.21) (149.67) 30.38 (119.29)
Grand Total (1,580.35) 1,949.64 369.29 (1,412.04) 1,275.40 (136.64)
* Fair Value of ` (108.03) crore (Previous year ` ((51.32) crore)) is part of Trade Payables.
Hindalco Annual Report 2015-16.indb 169Hindalco Annual Report 2015-16.indb 169 8/17/2016 1:31:40 PM8/17/2016 1:31:40 PM

170
Hindalco Industries LimitedHindalco Industries Limited
NOTES FORMING PART OF THE CONSOLIDATED FINANCIAL STATEMENTS
(d) The following table presents the outstanding position and fair value of various foreign currency derivative fi nancial instruments:
Currency Pair
31st March, 2016 31st March, 2015Average
exchange rate
NotionalValue
(in Million)
Fair ValueGain/(Loss)
(` crore)
Average exchange
rate
NotionalValue
(in Million)
Fair ValueGain/(Loss)
(` crore)Foreign currency forwardsCash fl ow hedges
Buy CHF_EUR 0.93 101.60 (8.06) 0.95 86.11 6.95 Buy USD_CHF 0.99 1.66 0.44 Buy EUR_INR - - - 69.85 0.42 (0.10)Buy USD_INR - - - 65.57 4.46 (0.74)Buy BRL_USD 0.26 146.17 27.08 0.36 258.92 (287.03)Buy EUR_USD 1.12 20.56 (1.92) 1.27 48.86 (17.12)Buy USD_CAD 1.33 49.96 8.66 1.18 36.65 (18.62)Buy USD_KRW 1,190.48 281.08 51.25 1,098.90 186.61 (19.58)Sell USD_INR 70.64 992.34 192.94 66.38 750.79 151.45
Total 270.39 (184.79)
Net investment hedgeBuy EUR_USD 1.11 36.09 (8.37) 1.32 27.86 28.19
Total (8.37) 28.19Non-Designated
Buy AUD_INR 50.88 0.05 - 49.20 0.44 (0.05)Buy CAD_INR - - - 50.69 0.06 (0.01)Buy CHF_INR 70.27 0.06 - 66.66 0.13 (0.02)Buy EUR_INR 76.42 7.13 0.66 72.52 5.66 (2.96)Buy GBP_INR 95.96 0.07 - 94.67 0.21 (0.03)Buy NOK_INR 8.09 0.68 0.01 8.18 1.05 (0.03)Buy SEK_INR 8.18 2.54 0.01 7.63 0.05 (0.00)Buy USD_INR 66.30 129.68 (19.29) 62.92 462.43 (29.01)Buy GBP_EUR 1.37 41.07 (15.47) 1.38 43.58 0.73 Buy KRW_USD 0.00 164.71 25.88 0.91 179.14 1.79 Buy USD_EUR 0.90 209.90 (33.96) 0.86 232.17 43.30 Buy GBP_USD 1.43 10.36 0.80 1.49 22.21 2.05 Buy USD_CHF 1.00 34.49 (9.20) 0.96 59.58 4.18
Buy CAD_USD - - 0.27 - - - Buy USD_BRL 0.81 208.95 (104.98) 2.94 292.58 (209.75)Buy JPY_USD - - - 0.01 0.83 (0.00)Buy CHF_GBP 0.71 15.09 (2.15) 0.69 1.06 0.60 Buy CHF_EUR 0.93 78.51 (10.36) 0.94 36.10 19.52 Buy EUR_KRW - - - 1,207.70 0.68 (0.04)Buy CNY_USD 0.15 48.83 (5.44) 0.16 39.48 4.90 Buy CNY_EUR 0.14 11.49 0.86 0.14 26.11 (8.53)Buy MYR_USD 0.24 6.13 2.61 0.27 1.23 (1.03)Buy EUR_MYR 4.62 0.01 (0.00) - - - Sell USD_INR 68.01 66.12 7.35 66.23 165.13 10.17 Sell AUD_USD 0.75 18.50 2.85 0.84 31.90 (18.50)
Total (159.55) (182.72)
Hindalco Annual Report 2015-16.indb 170Hindalco Annual Report 2015-16.indb 170 8/17/2016 1:31:40 PM8/17/2016 1:31:40 PM
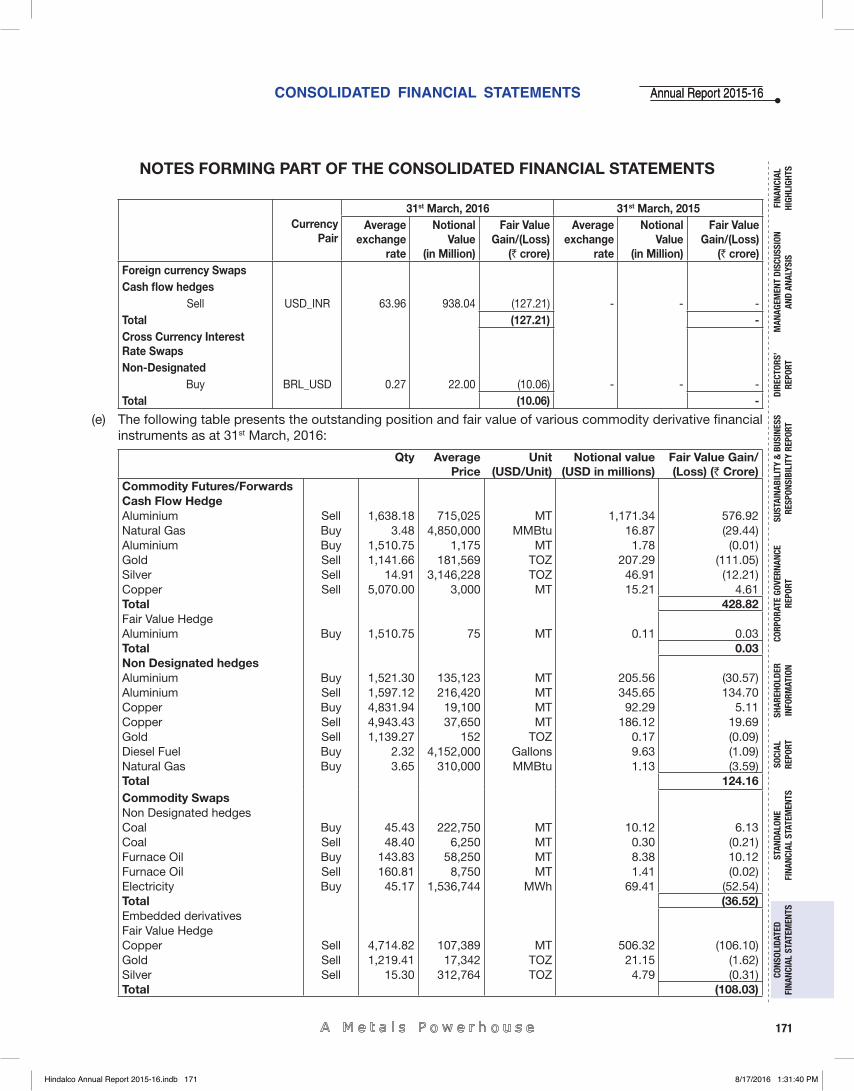
CONSOLIDATED FINANCIAL STATEMENTS
171
Annual Report 2015-16Annual Report 2015-16
FINA
NCIA
L HI
GHLI
GHTS
MAN
AGEM
ENT
DISC
USSI
ON
AND
ANAL
YSIS
CORP
ORAT
E GO
VERN
ANCE
RE
PORT
STAN
DALO
NE
FINA
NCIA
L ST
ATEM
ENTS
CONS
OLID
ATED
FI
NANC
IAL
STAT
EMEN
TSSO
CIAL
RE
PORT
DIRE
CTOR
S’RE
PORT
SHAR
EHOL
DER
INFO
RMAT
ION
SUST
AINA
BILI
TY &
BUS
INES
SRE
SPON
SIBI
LITY
REP
ORT
NOTES FORMING PART OF THE CONSOLIDATED FINANCIAL STATEMENTS
Currency Pair
31st March, 2016 31st March, 2015Average
exchange rate
NotionalValue
(in Million)
Fair ValueGain/(Loss)
(` crore)
Average exchange
rate
NotionalValue
(in Million)
Fair ValueGain/(Loss)
(` crore)Foreign currency SwapsCash fl ow hedges
Sell USD_INR 63.96 938.04 (127.21) - - - Total (127.21) -Cross Currency Interest Rate SwapsNon-Designated
Buy BRL_USD 0.27 22.00 (10.06) - - - Total (10.06) -
(e) The following table presents the outstanding position and fair value of various commodity derivative fi nancial instruments as at 31st March, 2016:
Qty Average Price
Unit(USD/Unit)
Notional value(USD in millions)
Fair Value Gain/(Loss) (` Crore)
Commodity Futures/ForwardsCash Flow HedgeAluminium Sell 1,638.18 715,025 MT 1,171.34 576.92 Natural Gas Buy 3.48 4,850,000 MMBtu 16.87 (29.44)Aluminium Buy 1,510.75 1,175 MT 1.78 (0.01)Gold Sell 1,141.66 181,569 TOZ 207.29 (111.05)Silver Sell 14.91 3,146,228 TOZ 46.91 (12.21)Copper Sell 5,070.00 3,000 MT 15.21 4.61 Total 428.82Fair Value HedgeAluminium Buy 1,510.75 75 MT 0.11 0.03 Total 0.03Non Designated hedgesAluminium Buy 1,521.30 135,123 MT 205.56 (30.57)Aluminium Sell 1,597.12 216,420 MT 345.65 134.70 Copper Buy 4,831.94 19,100 MT 92.29 5.11 Copper Sell 4,943.43 37,650 MT 186.12 19.69 Gold Sell 1,139.27 152 TOZ 0.17 (0.09)Diesel Fuel Buy 2.32 4,152,000 Gallons 9.63 (1.09)Natural Gas Buy 3.65 310,000 MMBtu 1.13 (3.59)Total 124.16Commodity SwapsNon Designated hedgesCoal Buy 45.43 222,750 MT 10.12 6.13 Coal Sell 48.40 6,250 MT 0.30 (0.21)Furnace Oil Buy 143.83 58,250 MT 8.38 10.12 Furnace Oil Sell 160.81 8,750 MT 1.41 (0.02)Electricity Buy 45.17 1,536,744 MWh 69.41 (52.54)Total (36.52)Embedded derivativesFair Value HedgeCopper Sell 4,714.82 107,389 MT 506.32 (106.10)Gold Sell 1,219.41 17,342 TOZ 21.15 (1.62)Silver Sell 15.30 312,764 TOZ 4.79 (0.31)Total (108.03)
Hindalco Annual Report 2015-16.indb 171Hindalco Annual Report 2015-16.indb 171 8/17/2016 1:31:40 PM8/17/2016 1:31:40 PM
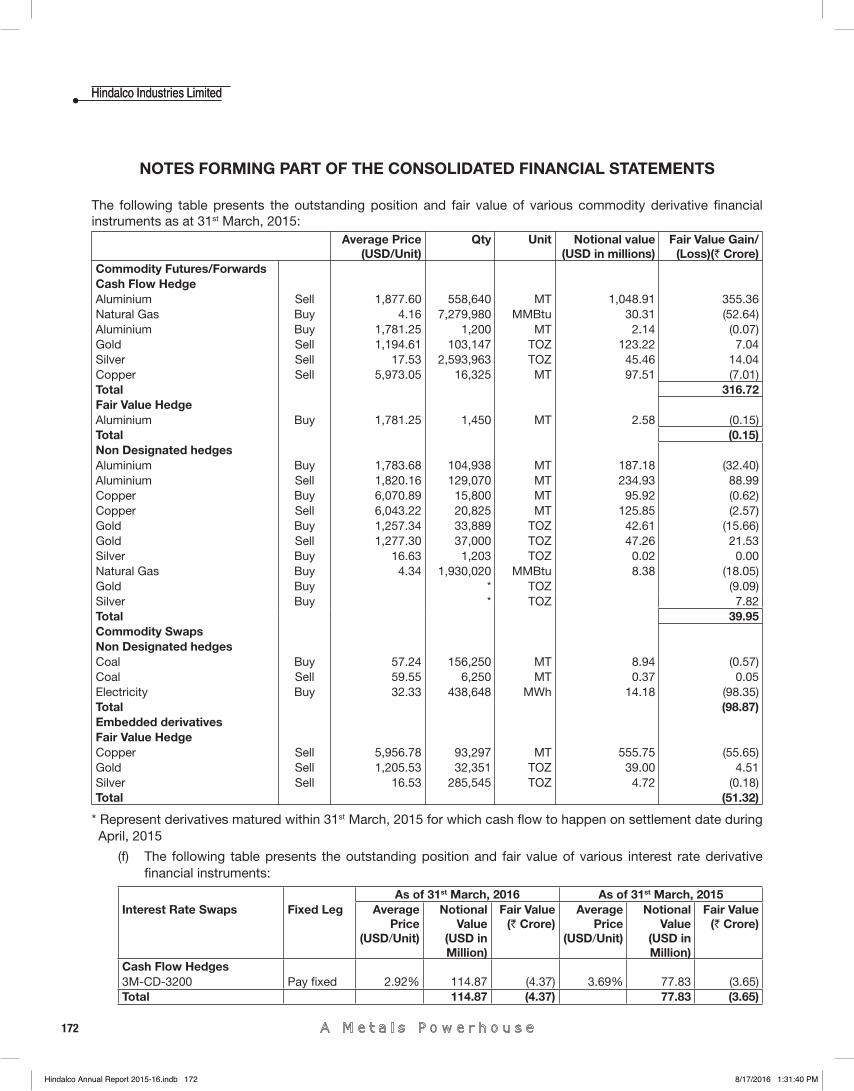
172
Hindalco Industries LimitedHindalco Industries Limited
NOTES FORMING PART OF THE CONSOLIDATED FINANCIAL STATEMENTS
The following table presents the outstanding position and fair value of various commodity derivative fi nancial instruments as at 31st March, 2015:
Average Price(USD/Unit)
Qty Unit Notional value(USD in millions)
Fair Value Gain/(Loss)(` Crore)
Commodity Futures/ForwardsCash Flow HedgeAluminium Sell 1,877.60 558,640 MT 1,048.91 355.36 Natural Gas Buy 4.16 7,279,980 MMBtu 30.31 (52.64)Aluminium Buy 1,781.25 1,200 MT 2.14 (0.07)Gold Sell 1,194.61 103,147 TOZ 123.22 7.04 Silver Sell 17.53 2,593,963 TOZ 45.46 14.04 Copper Sell 5,973.05 16,325 MT 97.51 (7.01)Total 316.72Fair Value HedgeAluminium Buy 1,781.25 1,450 MT 2.58 (0.15)Total (0.15)Non Designated hedgesAluminium Buy 1,783.68 104,938 MT 187.18 (32.40)Aluminium Sell 1,820.16 129,070 MT 234.93 88.99 Copper Buy 6,070.89 15,800 MT 95.92 (0.62)Copper Sell 6,043.22 20,825 MT 125.85 (2.57)Gold Buy 1,257.34 33,889 TOZ 42.61 (15.66)Gold Sell 1,277.30 37,000 TOZ 47.26 21.53 Silver Buy 16.63 1,203 TOZ 0.02 0.00 Natural Gas Buy 4.34 1,930,020 MMBtu 8.38 (18.05)Gold Buy * TOZ (9.09)Silver Buy * TOZ 7.82Total 39.95Commodity SwapsNon Designated hedgesCoal Buy 57.24 156,250 MT 8.94 (0.57)Coal Sell 59.55 6,250 MT 0.37 0.05 Electricity Buy 32.33 438,648 MWh 14.18 (98.35)Total (98.87)Embedded derivativesFair Value HedgeCopper Sell 5,956.78 93,297 MT 555.75 (55.65)Gold Sell 1,205.53 32,351 TOZ 39.00 4.51 Silver Sell 16.53 285,545 TOZ 4.72 (0.18)Total (51.32)
* Represent derivatives matured within 31st March, 2015 for which cash fl ow to happen on settlement date during April, 2015
(f) The following table presents the outstanding position and fair value of various interest rate derivative fi nancial instruments:
As of 31st March, 2016 As of 31st March, 2015Interest Rate Swaps Fixed Leg Average
Price (USD/Unit)
Notional Value
(USD in Million)
Fair Value(` Crore)
Average Price
(USD/Unit)
Notional Value
(USD in Million)
Fair Value(` Crore)
Cash Flow Hedges3M-CD-3200 Pay fi xed 2.92% 114.87 (4.37) 3.69% 77.83 (3.65)Total 114.87 (4.37) 77.83 (3.65)
Hindalco Annual Report 2015-16.indb 172Hindalco Annual Report 2015-16.indb 172 8/17/2016 1:31:40 PM8/17/2016 1:31:40 PM
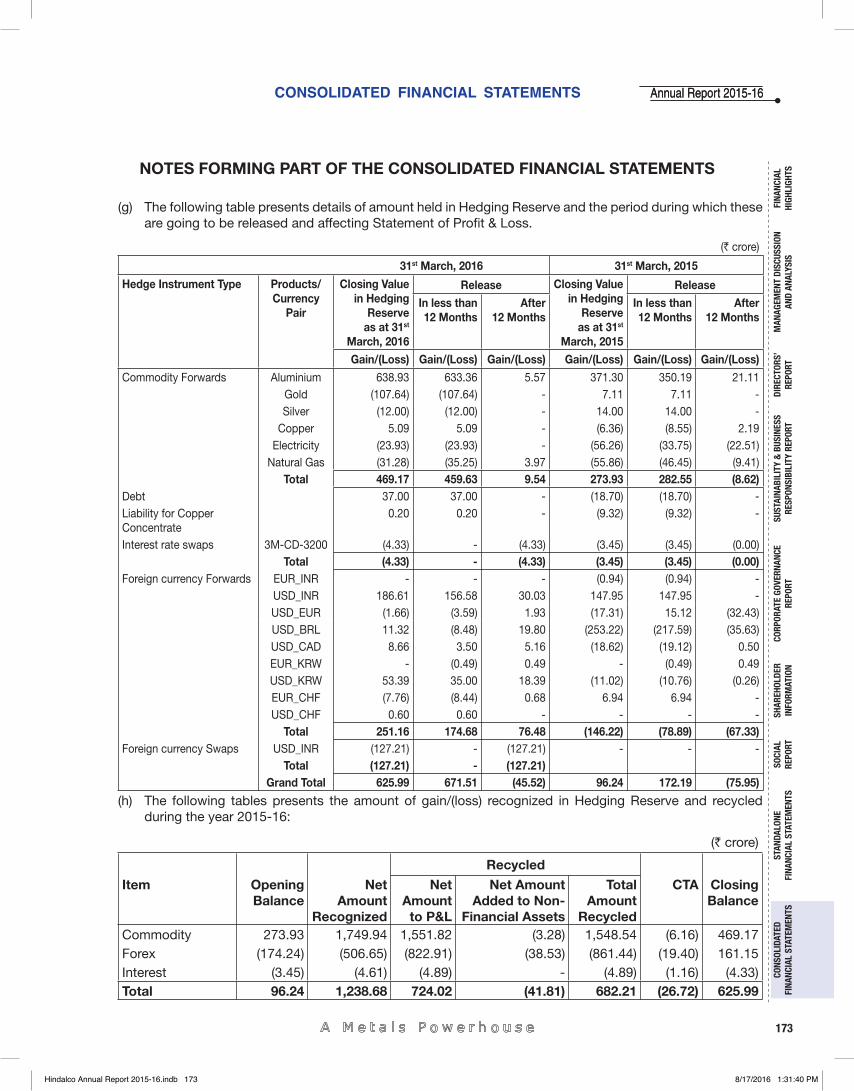
CONSOLIDATED FINANCIAL STATEMENTS
173
Annual Report 2015-16Annual Report 2015-16
FINA
NCIA
L HI
GHLI
GHTS
MAN
AGEM
ENT
DISC
USSI
ON
AND
ANAL
YSIS
CORP
ORAT
E GO
VERN
ANCE
RE
PORT
STAN
DALO
NE
FINA
NCIA
L ST
ATEM
ENTS
CONS
OLID
ATED
FI
NANC
IAL
STAT
EMEN
TSSO
CIAL
RE
PORT
DIRE
CTOR
S’RE
PORT
SHAR
EHOL
DER
INFO
RMAT
ION
SUST
AINA
BILI
TY &
BUS
INES
SRE
SPON
SIBI
LITY
REP
ORT
NOTES FORMING PART OF THE CONSOLIDATED FINANCIAL STATEMENTS
(g) The following table presents details of amount held in Hedging Reserve and the period during which these are going to be released and affecting Statement of Profi t & Loss.
(` crore)
31st March, 2016 31st March, 2015
Hedge Instrument Type Products/Currency
Pair
Closing Value in Hedging
Reserve as at 31st
March, 2016
Release Closing Value in Hedging
Reserve as at 31st
March, 2015
Release
In less than 12 Months
After 12 Months
In less than 12 Months
After 12 Months
Gain/(Loss) Gain/(Loss) Gain/(Loss) Gain/(Loss) Gain/(Loss) Gain/(Loss)
Commodity Forwards Aluminium 638.93 633.36 5.57 371.30 350.19 21.11 Gold (107.64) (107.64) - 7.11 7.11 - Silver (12.00) (12.00) - 14.00 14.00 -
Copper 5.09 5.09 - (6.36) (8.55) 2.19 Electricity (23.93) (23.93) - (56.26) (33.75) (22.51)
Natural Gas (31.28) (35.25) 3.97 (55.86) (46.45) (9.41)Total 469.17 459.63 9.54 273.93 282.55 (8.62)
Debt 37.00 37.00 - (18.70) (18.70) - Liability for Copper Concentrate
0.20 0.20 - (9.32) (9.32) -
Interest rate swaps 3M-CD-3200 (4.33) - (4.33) (3.45) (3.45) (0.00)Total (4.33) - (4.33) (3.45) (3.45) (0.00)
Foreign currency Forwards EUR_INR - - - (0.94) (0.94) - USD_INR 186.61 156.58 30.03 147.95 147.95 - USD_EUR (1.66) (3.59) 1.93 (17.31) 15.12 (32.43)USD_BRL 11.32 (8.48) 19.80 (253.22) (217.59) (35.63)USD_CAD 8.66 3.50 5.16 (18.62) (19.12) 0.50 EUR_KRW - (0.49) 0.49 - (0.49) 0.49 USD_KRW 53.39 35.00 18.39 (11.02) (10.76) (0.26)EUR_CHF (7.76) (8.44) 0.68 6.94 6.94 - USD_CHF 0.60 0.60 - - - -
Total 251.16 174.68 76.48 (146.22) (78.89) (67.33)Foreign currency Swaps USD_INR (127.21) - (127.21) - - -
Total (127.21) - (127.21)Grand Total 625.99 671.51 (45.52) 96.24 172.19 (75.95)
(h) The following tables presents the amount of gain/(loss) recognized in Hedging Reserve and recycled during the year 2015-16:
(` crore)
Recycled
Item Opening Balance
Net Amount
Recognized
Net Amount to P&L
Net Amount Added to Non-
Financial Assets
Total Amount
Recycled
CTA Closing Balance
Commodity 273.93 1,749.94 1,551.82 (3.28) 1,548.54 (6.16) 469.17 Forex (174.24) (506.65) (822.91) (38.53) (861.44) (19.40) 161.15 Interest (3.45) (4.61) (4.89) - (4.89) (1.16) (4.33)Total 96.24 1,238.68 724.02 (41.81) 682.21 (26.72) 625.99
Hindalco Annual Report 2015-16.indb 173Hindalco Annual Report 2015-16.indb 173 8/17/2016 1:31:40 PM8/17/2016 1:31:40 PM
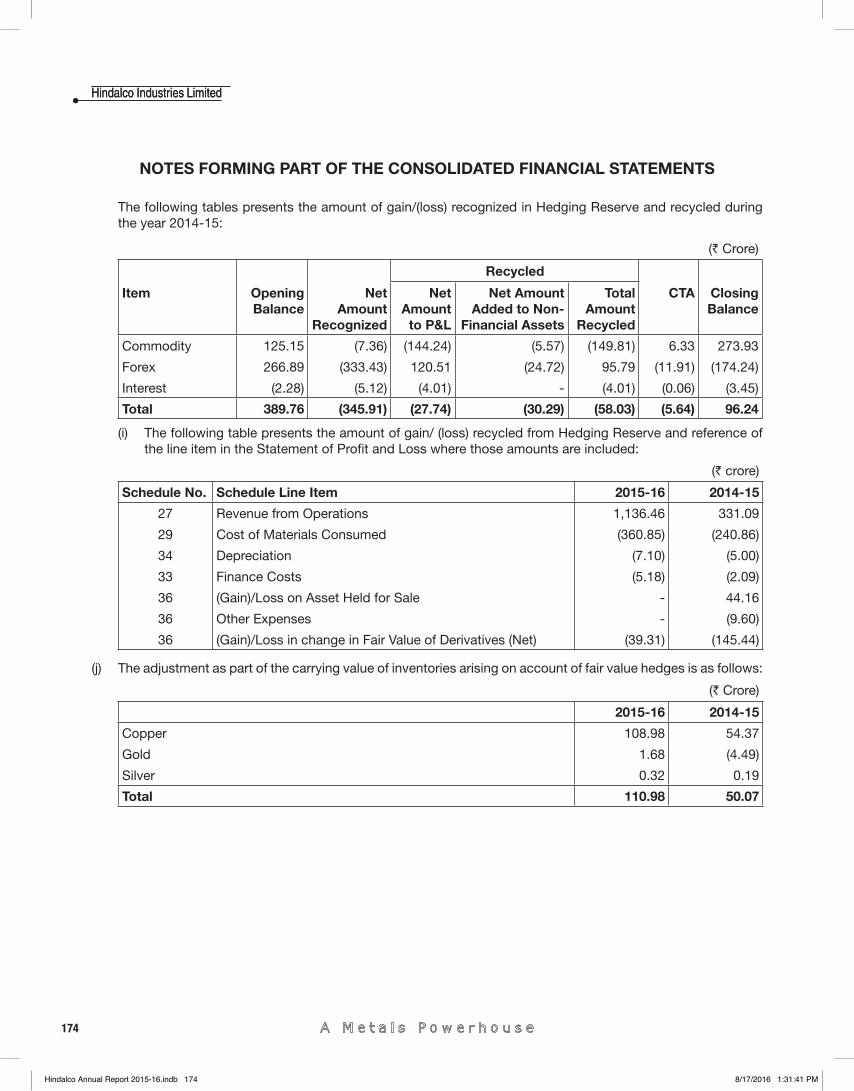
174
Hindalco Industries LimitedHindalco Industries Limited
NOTES FORMING PART OF THE CONSOLIDATED FINANCIAL STATEMENTS
The following tables presents the amount of gain/(loss) recognized in Hedging Reserve and recycled during the year 2014-15:
(` Crore)
Recycled
Item Opening Balance
Net Amount
Recognized
Net Amount to P&L
Net Amount Added to Non-
Financial Assets
Total Amount
Recycled
CTA Closing Balance
Commodity 125.15 (7.36) (144.24) (5.57) (149.81) 6.33 273.93
Forex 266.89 (333.43) 120.51 (24.72) 95.79 (11.91) (174.24)
Interest (2.28) (5.12) (4.01) - (4.01) (0.06) (3.45)
Total 389.76 (345.91) (27.74) (30.29) (58.03) (5.64) 96.24
(i) The following table presents the amount of gain/ (loss) recycled from Hedging Reserve and reference of the line item in the Statement of Profi t and Loss where those amounts are included:
(` crore)
Schedule No. Schedule Line Item 2015-16 2014-15
27 Revenue from Operations 1,136.46 331.09
29 Cost of Materials Consumed (360.85) (240.86)
34 Depreciation (7.10) (5.00)
33 Finance Costs (5.18) (2.09)
36 (Gain)/Loss on Asset Held for Sale - 44.16
36 Other Expenses - (9.60)
36 (Gain)/Loss in change in Fair Value of Derivatives (Net) (39.31) (145.44)
(j) The adjustment as part of the carrying value of inventories arising on account of fair value hedges is as follows:
(` Crore)
2015-16 2014-15
Copper 108.98 54.37
Gold 1.68 (4.49)
Silver 0.32 0.19
Total 110.98 50.07
Hindalco Annual Report 2015-16.indb 174Hindalco Annual Report 2015-16.indb 174 8/17/2016 1:31:41 PM8/17/2016 1:31:41 PM
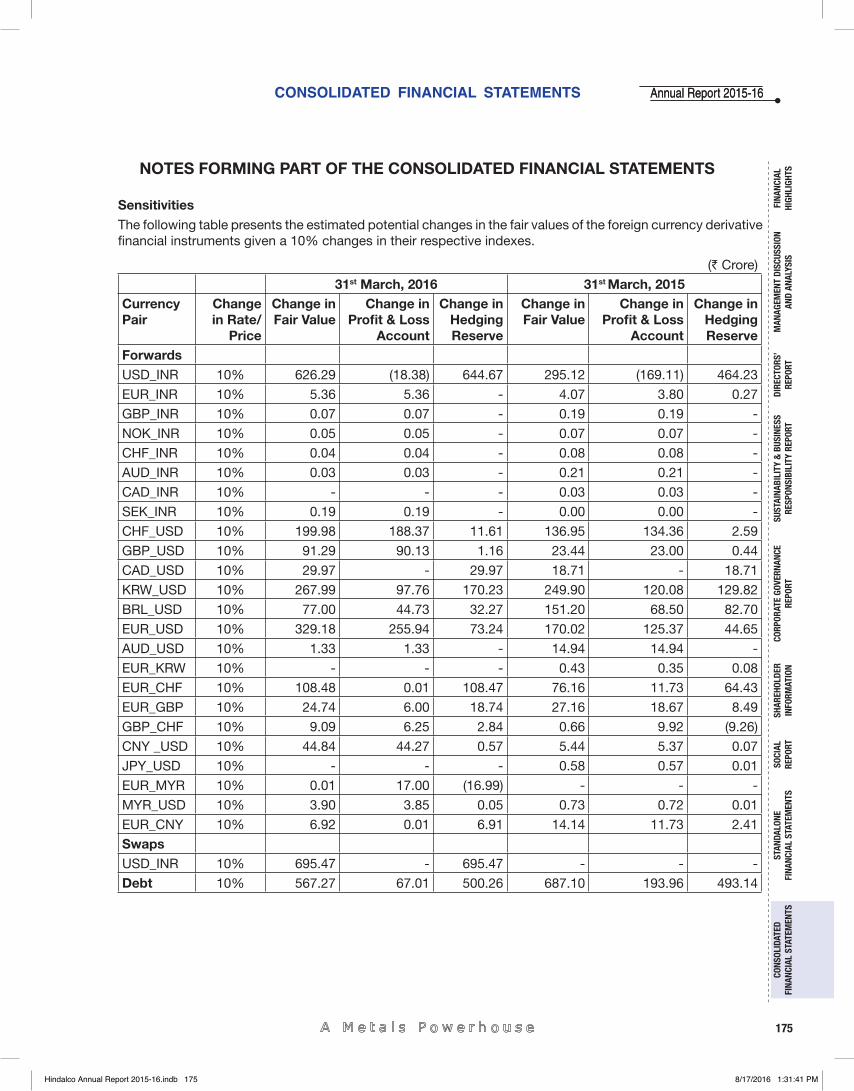
CONSOLIDATED FINANCIAL STATEMENTS
175
Annual Report 2015-16Annual Report 2015-16
FINA
NCIA
L HI
GHLI
GHTS
MAN
AGEM
ENT
DISC
USSI
ON
AND
ANAL
YSIS
CORP
ORAT
E GO
VERN
ANCE
RE
PORT
STAN
DALO
NE
FINA
NCIA
L ST
ATEM
ENTS
CONS
OLID
ATED
FI
NANC
IAL
STAT
EMEN
TSSO
CIAL
RE
PORT
DIRE
CTOR
S’RE
PORT
SHAR
EHOL
DER
INFO
RMAT
ION
SUST
AINA
BILI
TY &
BUS
INES
SRE
SPON
SIBI
LITY
REP
ORT
NOTES FORMING PART OF THE CONSOLIDATED FINANCIAL STATEMENTS
SensitivitiesThe following table presents the estimated potential changes in the fair values of the foreign currency derivative fi nancial instruments given a 10% changes in their respective indexes.
(` Crore)
31st March, 2016 31st March, 2015Currency Pair
Change in Rate/
Price
Change in Fair Value
Change in Profi t & Loss
Account
Change in Hedging Reserve
Change in Fair Value
Change in Profi t & Loss
Account
Change in Hedging Reserve
ForwardsUSD_INR 10% 626.29 (18.38) 644.67 295.12 (169.11) 464.23
EUR_INR 10% 5.36 5.36 - 4.07 3.80 0.27
GBP_INR 10% 0.07 0.07 - 0.19 0.19 -
NOK_INR 10% 0.05 0.05 - 0.07 0.07 -
CHF_INR 10% 0.04 0.04 - 0.08 0.08 -
AUD_INR 10% 0.03 0.03 - 0.21 0.21 -
CAD_INR 10% - - - 0.03 0.03 -
SEK_INR 10% 0.19 0.19 - 0.00 0.00 -
CHF_USD 10% 199.98 188.37 11.61 136.95 134.36 2.59
GBP_USD 10% 91.29 90.13 1.16 23.44 23.00 0.44
CAD_USD 10% 29.97 - 29.97 18.71 - 18.71
KRW_USD 10% 267.99 97.76 170.23 249.90 120.08 129.82
BRL_USD 10% 77.00 44.73 32.27 151.20 68.50 82.70
EUR_USD 10% 329.18 255.94 73.24 170.02 125.37 44.65
AUD_USD 10% 1.33 1.33 - 14.94 14.94 -
EUR_KRW 10% - - - 0.43 0.35 0.08
EUR_CHF 10% 108.48 0.01 108.47 76.16 11.73 64.43
EUR_GBP 10% 24.74 6.00 18.74 27.16 18.67 8.49
GBP_CHF 10% 9.09 6.25 2.84 0.66 9.92 (9.26)
CNY _USD 10% 44.84 44.27 0.57 5.44 5.37 0.07
JPY_USD 10% - - - 0.58 0.57 0.01
EUR_MYR 10% 0.01 17.00 (16.99) - - -
MYR_USD 10% 3.90 3.85 0.05 0.73 0.72 0.01
EUR_CNY 10% 6.92 0.01 6.91 14.14 11.73 2.41
SwapsUSD_INR 10% 695.47 - 695.47 - - -
Debt 10% 567.27 67.01 500.26 687.10 193.96 493.14
Hindalco Annual Report 2015-16.indb 175Hindalco Annual Report 2015-16.indb 175 8/17/2016 1:31:41 PM8/17/2016 1:31:41 PM
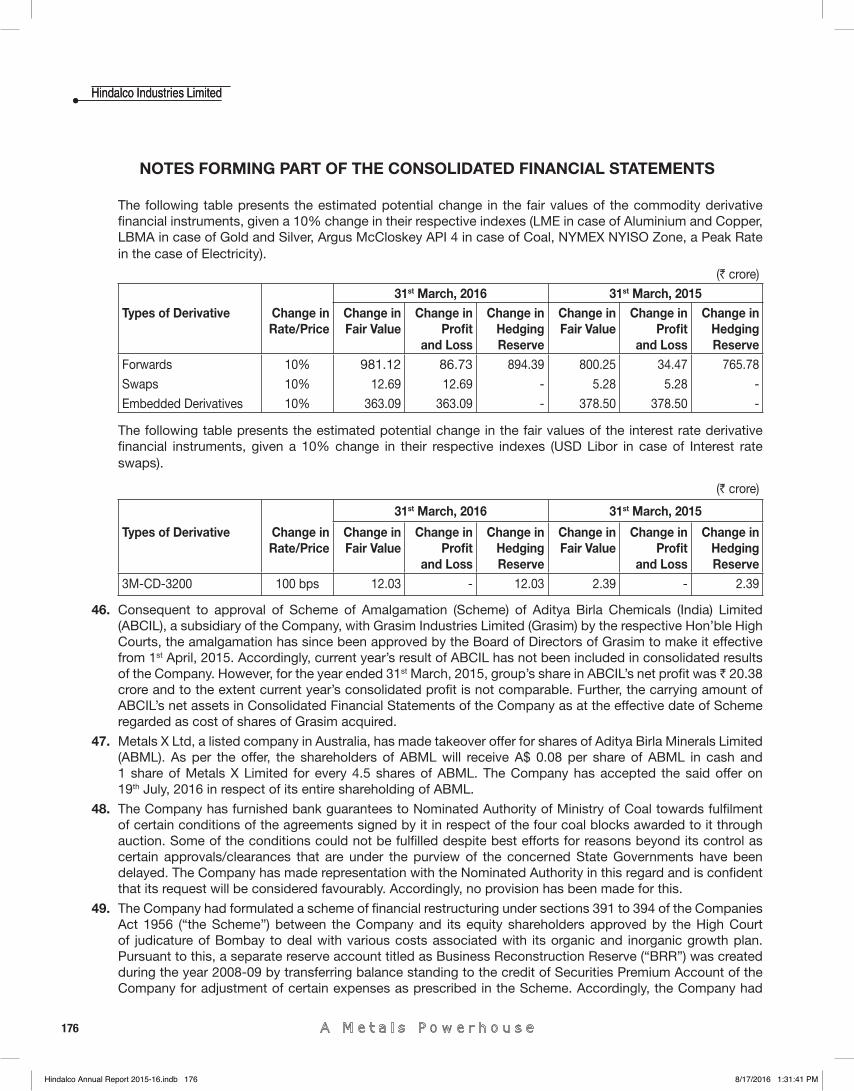
176
Hindalco Industries LimitedHindalco Industries Limited
NOTES FORMING PART OF THE CONSOLIDATED FINANCIAL STATEMENTS
The following table presents the estimated potential change in the fair values of the commodity derivative fi nancial instruments, given a 10% change in their respective indexes (LME in case of Aluminium and Copper, LBMA in case of Gold and Silver, Argus McCloskey API 4 in case of Coal, NYMEX NYISO Zone, a Peak Rate in the case of Electricity).
(` crore)
31st March, 2016 31st March, 2015Types of Derivative Change in
Rate/PriceChange in Fair Value
Change in Profi t
and Loss
Change in Hedging Reserve
Change in Fair Value
Change in Profi t
and Loss
Change in Hedging Reserve
Forwards 10% 981.12 86.73 894.39 800.25 34.47 765.78
Swaps 10% 12.69 12.69 - 5.28 5.28 -
Embedded Derivatives 10% 363.09 363.09 - 378.50 378.50 -
The following table presents the estimated potential change in the fair values of the interest rate derivative fi nancial instruments, given a 10% change in their respective indexes (USD Libor in case of Interest rate swaps).
(` crore)
31st March, 2016 31st March, 2015
Types of Derivative Change in Rate/Price
Change in Fair Value
Change in Profi t
and Loss
Change in Hedging Reserve
Change in Fair Value
Change in Profi t
and Loss
Change in Hedging Reserve
3M-CD-3200 100 bps 12.03 - 12.03 2.39 - 2.39
46. Consequent to approval of Scheme of Amalgamation (Scheme) of Aditya Birla Chemicals (India) Limited (ABCIL), a subsidiary of the Company, with Grasim Industries Limited (Grasim) by the respective Hon’ble High Courts, the amalgamation has since been approved by the Board of Directors of Grasim to make it effective from 1st April, 2015. Accordingly, current year’s result of ABCIL has not been included in consolidated results of the Company. However, for the year ended 31st March, 2015, group’s share in ABCIL’s net profi t was ̀ 20.38 crore and to the extent current year’s consolidated profi t is not comparable. Further, the carrying amount of ABCIL’s net assets in Consolidated Financial Statements of the Company as at the effective date of Scheme regarded as cost of shares of Grasim acquired.
47. Metals X Ltd, a listed company in Australia, has made takeover offer for shares of Aditya Birla Minerals Limited (ABML). As per the offer, the shareholders of ABML will receive A$ 0.08 per share of ABML in cash and 1 share of Metals X Limited for every 4.5 shares of ABML. The Company has accepted the said offer on 19th July, 2016 in respect of its entire shareholding of ABML.
48. The Company has furnished bank guarantees to Nominated Authority of Ministry of Coal towards fulfi lment of certain conditions of the agreements signed by it in respect of the four coal blocks awarded to it through auction. Some of the conditions could not be fulfi lled despite best efforts for reasons beyond its control as certain approvals/clearances that are under the purview of the concerned State Governments have been delayed. The Company has made representation with the Nominated Authority in this regard and is confi dent that its request will be considered favourably. Accordingly, no provision has been made for this.
49. The Company had formulated a scheme of fi nancial restructuring under sections 391 to 394 of the Companies Act 1956 (“the Scheme”) between the Company and its equity shareholders approved by the High Court of judicature of Bombay to deal with various costs associated with its organic and inorganic growth plan. Pursuant to this, a separate reserve account titled as Business Reconstruction Reserve (“BRR”) was created during the year 2008-09 by transferring balance standing to the credit of Securities Premium Account of the Company for adjustment of certain expenses as prescribed in the Scheme. Accordingly, the Company had
Hindalco Annual Report 2015-16.indb 176Hindalco Annual Report 2015-16.indb 176 8/17/2016 1:31:41 PM8/17/2016 1:31:41 PM
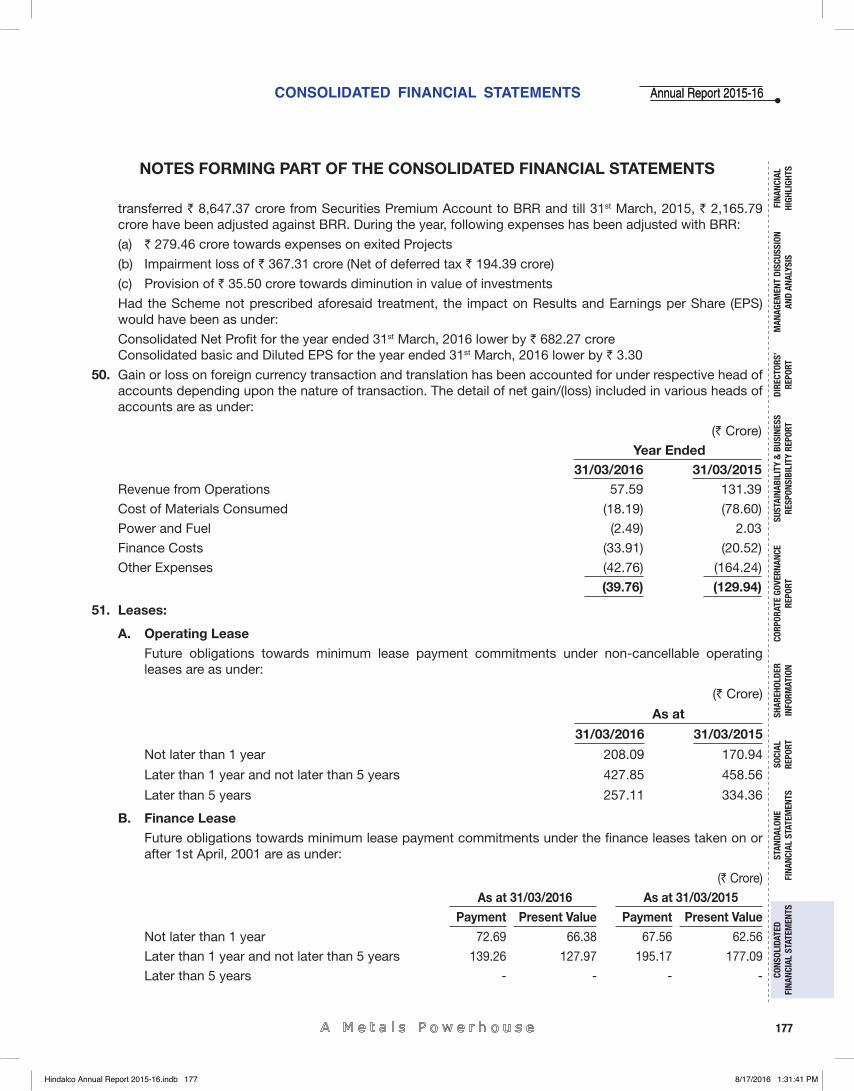
CONSOLIDATED FINANCIAL STATEMENTS
177
Annual Report 2015-16Annual Report 2015-16
FINA
NCIA
L HI
GHLI
GHTS
MAN
AGEM
ENT
DISC
USSI
ON
AND
ANAL
YSIS
CORP
ORAT
E GO
VERN
ANCE
RE
PORT
STAN
DALO
NE
FINA
NCIA
L ST
ATEM
ENTS
CONS
OLID
ATED
FI
NANC
IAL
STAT
EMEN
TSSO
CIAL
RE
PORT
DIRE
CTOR
S’RE
PORT
SHAR
EHOL
DER
INFO
RMAT
ION
SUST
AINA
BILI
TY &
BUS
INES
SRE
SPON
SIBI
LITY
REP
ORT
NOTES FORMING PART OF THE CONSOLIDATED FINANCIAL STATEMENTS
transferred ` 8,647.37 crore from Securities Premium Account to BRR and till 31st March, 2015, ` 2,165.79 crore have been adjusted against BRR. During the year, following expenses has been adjusted with BRR:
(a) ` 279.46 crore towards expenses on exited Projects
(b) Impairment loss of ` 367.31 crore (Net of deferred tax ` 194.39 crore)
(c) Provision of ` 35.50 crore towards diminution in value of investments
Had the Scheme not prescribed aforesaid treatment, the impact on Results and Earnings per Share (EPS) would have been as under:
Consolidated Net Profi t for the year ended 31st March, 2016 lower by ` 682.27 crore Consolidated basic and Diluted EPS for the year ended 31st March, 2016 lower by ` 3.30
50. Gain or loss on foreign currency transaction and translation has been accounted for under respective head of accounts depending upon the nature of transaction. The detail of net gain/(loss) included in various heads of accounts are as under:
(` Crore)
Year Ended31/03/2016 31/03/2015
Revenue from Operations 57.59 131.39
Cost of Materials Consumed (18.19) (78.60)
Power and Fuel (2.49) 2.03
Finance Costs (33.91) (20.52)
Other Expenses (42.76) (164.24)
(39.76) (129.94)
51. Leases:
A. Operating LeaseFuture obligations towards minimum lease payment commitments under non-cancellable operating leases are as under:
(` Crore)
As at
31/03/2016 31/03/2015
Not later than 1 year 208.09 170.94
Later than 1 year and not later than 5 years 427.85 458.56
Later than 5 years 257.11 334.36
B. Finance LeaseFuture obligations towards minimum lease payment commitments under the fi nance leases taken on or after 1st April, 2001 are as under:
(` Crore)
As at 31/03/2016 As at 31/03/2015 Payment Present Value Payment Present Value
Not later than 1 year 72.69 66.38 67.56 62.56
Later than 1 year and not later than 5 years 139.26 127.97 195.17 177.09
Later than 5 years - - - -
Hindalco Annual Report 2015-16.indb 177Hindalco Annual Report 2015-16.indb 177 8/17/2016 1:31:41 PM8/17/2016 1:31:41 PM
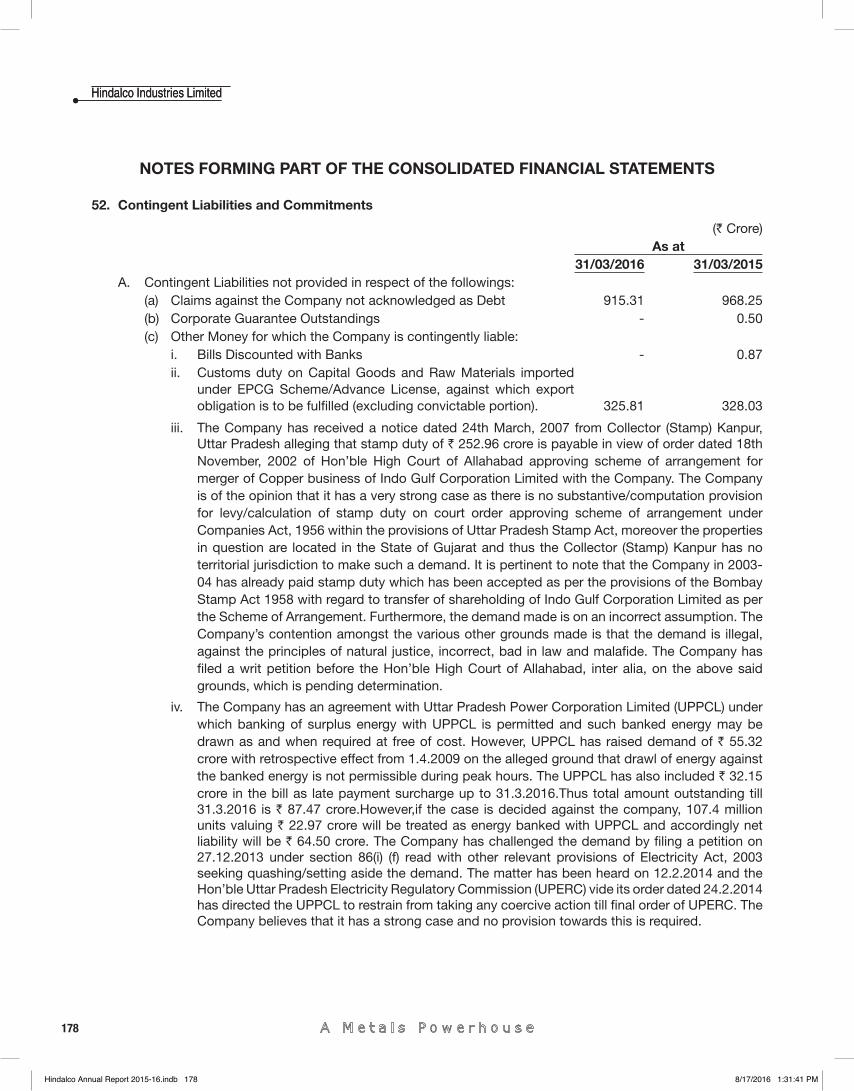
178
Hindalco Industries LimitedHindalco Industries Limited
NOTES FORMING PART OF THE CONSOLIDATED FINANCIAL STATEMENTS
52. Contingent Liabilities and Commitments
(` Crore)As at
31/03/2016 31/03/2015A. Contingent Liabilities not provided in respect of the followings:
(a) Claims against the Company not acknowledged as Debt 915.31 968.25 (b) Corporate Guarantee Outstandings - 0.50 (c) Other Money for which the Company is contingently liable:
i. Bills Discounted with Banks - 0.87 ii. Customs duty on Capital Goods and Raw Materials imported
under EPCG Scheme/Advance License, against which export obligation is to be fulfi lled (excluding convictable portion). 325.81 328.03
iii. The Company has received a notice dated 24th March, 2007 from Collector (Stamp) Kanpur, Uttar Pradesh alleging that stamp duty of ` 252.96 crore is payable in view of order dated 18th November, 2002 of Hon’ble High Court of Allahabad approving scheme of arrangement for merger of Copper business of Indo Gulf Corporation Limited with the Company. The Company is of the opinion that it has a very strong case as there is no substantive/computation provision for levy/calculation of stamp duty on court order approving scheme of arrangement under Companies Act, 1956 within the provisions of Uttar Pradesh Stamp Act, moreover the properties in question are located in the State of Gujarat and thus the Collector (Stamp) Kanpur has no territorial jurisdiction to make such a demand. It is pertinent to note that the Company in 2003-04 has already paid stamp duty which has been accepted as per the provisions of the Bombay Stamp Act 1958 with regard to transfer of shareholding of Indo Gulf Corporation Limited as per the Scheme of Arrangement. Furthermore, the demand made is on an incorrect assumption. The Company’s contention amongst the various other grounds made is that the demand is illegal, against the principles of natural justice, incorrect, bad in law and malafi de. The Company has fi led a writ petition before the Hon’ble High Court of Allahabad, inter alia, on the above said grounds, which is pending determination.
iv. The Company has an agreement with Uttar Pradesh Power Corporation Limited (UPPCL) under which banking of surplus energy with UPPCL is permitted and such banked energy may be drawn as and when required at free of cost. However, UPPCL has raised demand of ` 55.32 crore with retrospective effect from 1.4.2009 on the alleged ground that drawl of energy against the banked energy is not permissible during peak hours. The UPPCL has also included ` 32.15 crore in the bill as late payment surcharge up to 31.3.2016.Thus total amount outstanding till 31.3.2016 is ` 87.47 crore.However,if the case is decided against the company, 107.4 million units valuing ` 22.97 crore will be treated as energy banked with UPPCL and accordingly net liability will be ` 64.50 crore. The Company has challenged the demand by fi ling a petition on 27.12.2013 under section 86(i) (f) read with other relevant provisions of Electricity Act, 2003 seeking quashing/setting aside the demand. The matter has been heard on 12.2.2014 and the Hon’ble Uttar Pradesh Electricity Regulatory Commission (UPERC) vide its order dated 24.2.2014 has directed the UPPCL to restrain from taking any coercive action till fi nal order of UPERC. The Company believes that it has a strong case and no provision towards this is required.
Hindalco Annual Report 2015-16.indb 178Hindalco Annual Report 2015-16.indb 178 8/17/2016 1:31:41 PM8/17/2016 1:31:41 PM
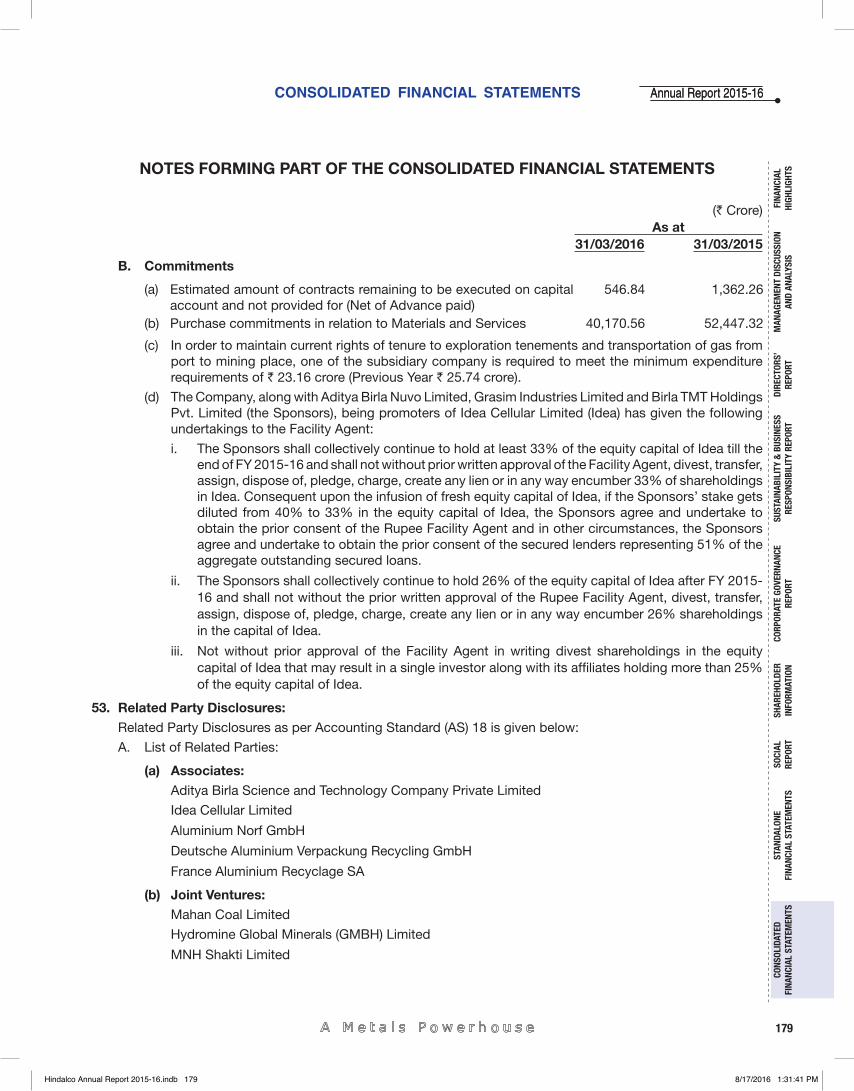
CONSOLIDATED FINANCIAL STATEMENTS
179
Annual Report 2015-16Annual Report 2015-16
FINA
NCIA
L HI
GHLI
GHTS
MAN
AGEM
ENT
DISC
USSI
ON
AND
ANAL
YSIS
CORP
ORAT
E GO
VERN
ANCE
RE
PORT
STAN
DALO
NE
FINA
NCIA
L ST
ATEM
ENTS
CONS
OLID
ATED
FI
NANC
IAL
STAT
EMEN
TSSO
CIAL
RE
PORT
DIRE
CTOR
S’RE
PORT
SHAR
EHOL
DER
INFO
RMAT
ION
SUST
AINA
BILI
TY &
BUS
INES
SRE
SPON
SIBI
LITY
REP
ORT
NOTES FORMING PART OF THE CONSOLIDATED FINANCIAL STATEMENTS
(` Crore)As at
31/03/2016 31/03/2015
B. Commitments
(a) Estimated amount of contracts remaining to be executed on capital account and not provided for (Net of Advance paid)
546.84 1,362.26
(b) Purchase commitments in relation to Materials and Services 40,170.56 52,447.32
(c) In order to maintain current rights of tenure to exploration tenements and transportation of gas from port to mining place, one of the subsidiary company is required to meet the minimum expenditure requirements of ` 23.16 crore (Previous Year ` 25.74 crore).
(d) The Company, along with Aditya Birla Nuvo Limited, Grasim Industries Limited and Birla TMT Holdings Pvt. Limited (the Sponsors), being promoters of Idea Cellular Limited (Idea) has given the following undertakings to the Facility Agent:
i. The Sponsors shall collectively continue to hold at least 33% of the equity capital of Idea till the end of FY 2015-16 and shall not without prior written approval of the Facility Agent, divest, transfer, assign, dispose of, pledge, charge, create any lien or in any way encumber 33% of shareholdings in Idea. Consequent upon the infusion of fresh equity capital of Idea, if the Sponsors’ stake gets diluted from 40% to 33% in the equity capital of Idea, the Sponsors agree and undertake to obtain the prior consent of the Rupee Facility Agent and in other circumstances, the Sponsors agree and undertake to obtain the prior consent of the secured lenders representing 51% of the aggregate outstanding secured loans.
ii. The Sponsors shall collectively continue to hold 26% of the equity capital of Idea after FY 2015-16 and shall not without the prior written approval of the Rupee Facility Agent, divest, transfer, assign, dispose of, pledge, charge, create any lien or in any way encumber 26% shareholdings in the capital of Idea.
iii. Not without prior approval of the Facility Agent in writing divest shareholdings in the equity capital of Idea that may result in a single investor along with its affi liates holding more than 25% of the equity capital of Idea.
53. Related Party Disclosures:Related Party Disclosures as per Accounting Standard (AS) 18 is given below:
A. List of Related Parties:
(a) Associates:Aditya Birla Science and Technology Company Private Limited
Idea Cellular Limited
Aluminium Norf GmbH
Deutsche Aluminium Verpackung Recycling GmbH
France Aluminium Recyclage SA
(b) Joint Ventures:Mahan Coal Limited
Hydromine Global Minerals (GMBH) Limited
MNH Shakti Limited
Hindalco Annual Report 2015-16.indb 179Hindalco Annual Report 2015-16.indb 179 8/17/2016 1:31:41 PM8/17/2016 1:31:41 PM
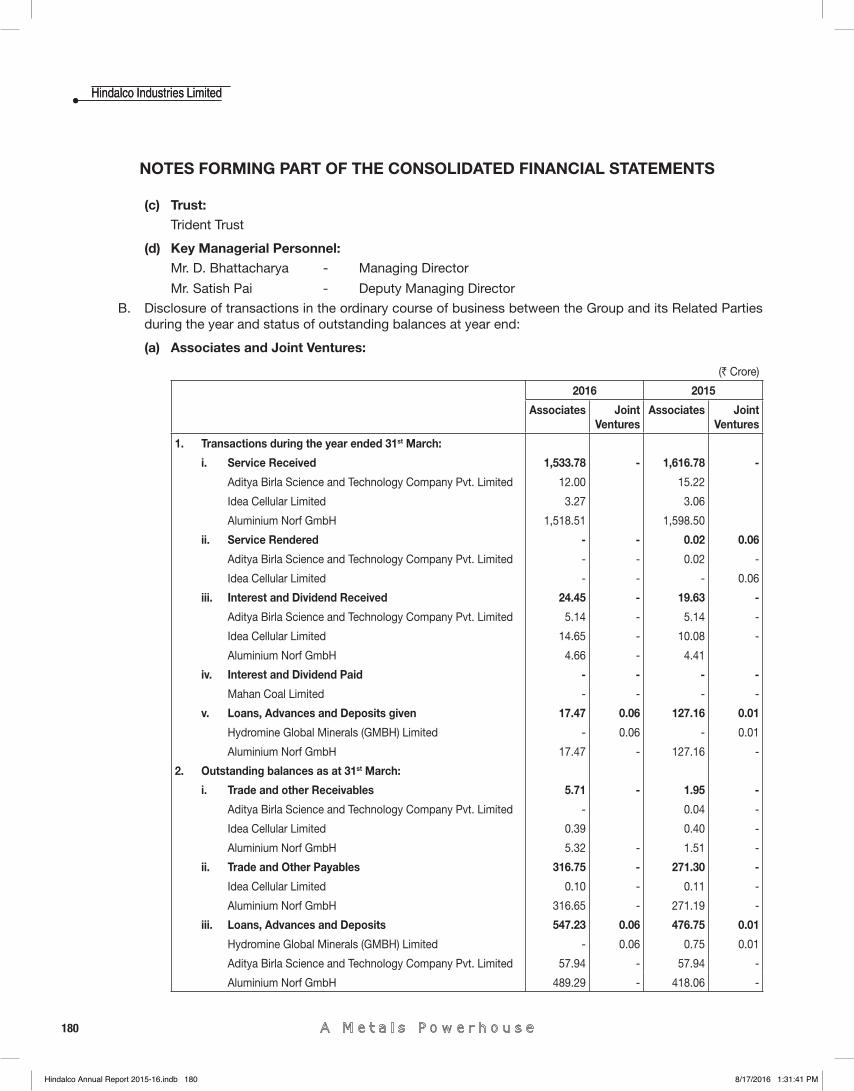
180
Hindalco Industries LimitedHindalco Industries Limited
(c) Trust:Trident Trust
(d) Key Managerial Personnel:Mr. D. Bhattacharya - Managing Director
Mr. Satish Pai - Deputy Managing Director
B. Disclosure of transactions in the ordinary course of business between the Group and its Related Parties during the year and status of outstanding balances at year end:
(a) Associates and Joint Ventures:
(` Crore)
2016 2015
Associates JointVentures
Associates JointVentures
1. Transactions during the year ended 31st March:
i. Service Received 1,533.78 - 1,616.78 -
Aditya Birla Science and Technology Company Pvt. Limited 12.00 15.22
Idea Cellular Limited 3.27 3.06
Aluminium Norf GmbH 1,518.51 1,598.50
ii. Service Rendered - - 0.02 0.06
Aditya Birla Science and Technology Company Pvt. Limited - - 0.02 -
Idea Cellular Limited - - - 0.06
iii. Interest and Dividend Received 24.45 - 19.63 -
Aditya Birla Science and Technology Company Pvt. Limited 5.14 - 5.14 -
Idea Cellular Limited 14.65 - 10.08 -
Aluminium Norf GmbH 4.66 - 4.41
iv. Interest and Dividend Paid - - - -
Mahan Coal Limited - - - -
v. Loans, Advances and Deposits given 17.47 0.06 127.16 0.01
Hydromine Global Minerals (GMBH) Limited - 0.06 - 0.01
Aluminium Norf GmbH 17.47 - 127.16 -
2. Outstanding balances as at 31st March:
i. Trade and other Receivables 5.71 - 1.95 -
Aditya Birla Science and Technology Company Pvt. Limited - 0.04 -
Idea Cellular Limited 0.39 0.40 -
Aluminium Norf GmbH 5.32 - 1.51 -
ii. Trade and Other Payables 316.75 - 271.30 -
Idea Cellular Limited 0.10 - 0.11 -
Aluminium Norf GmbH 316.65 - 271.19 -
iii. Loans, Advances and Deposits 547.23 0.06 476.75 0.01
Hydromine Global Minerals (GMBH) Limited - 0.06 0.75 0.01
Aditya Birla Science and Technology Company Pvt. Limited 57.94 - 57.94 -
Aluminium Norf GmbH 489.29 - 418.06 -
NOTES FORMING PART OF THE CONSOLIDATED FINANCIAL STATEMENTS
Hindalco Annual Report 2015-16.indb 180Hindalco Annual Report 2015-16.indb 180 8/17/2016 1:31:41 PM8/17/2016 1:31:41 PM

CONSOLIDATED FINANCIAL STATEMENTS
181
Annual Report 2015-16Annual Report 2015-16
FINA
NCIA
L HI
GHLI
GHTS
MAN
AGEM
ENT
DISC
USSI
ON
AND
ANAL
YSIS
CORP
ORAT
E GO
VERN
ANCE
RE
PORT
STAN
DALO
NE
FINA
NCIA
L ST
ATEM
ENTS
CONS
OLID
ATED
FI
NANC
IAL
STAT
EMEN
TSSO
CIAL
RE
PORT
DIRE
CTOR
S’RE
PORT
SHAR
EHOL
DER
INFO
RMAT
ION
SUST
AINA
BILI
TY &
BUS
INES
SRE
SPON
SIBI
LITY
REP
ORT
(b) Trust:
(` Crore)As at
31/03/2016As at
31/03/2015Benefi ciary Interest in Trust 34.46 34.46
(c) Key Managerial Personnel:Managerial Remuneration (including perquisites but excluding gratuity, leave encashment provisions and compensation under Employee Stock Options Scheme)
(` Crore)As at
31/03/2016As at
31/03/2015Mr. D. Bhattacharya 20.93 22.56 Mr. Satish Pai 14.95 13.11
54. Additional Information, as required under Schedule III to the Companies Act, 2013, of enterprises consolidated as Subsidiaries, Associates and Joint Ventures.
Name of Entity
Net Assets i.e. total assets minus total liabilities
as at 31st March, 2016
Share in Profi t/(Loss) for the year ended
31st March, 2016As % of
Consolidated Net Assets
Amount (` Crore)
As % of Consolidated Profi t/(Loss)
Amount (` Crore)
A. Parent:Hindalco Industries Limited 96.50% 37,067.89 1355.17% 607.25
B. Subsidiaries:Indian:Minerals & Minerals Limited 0.00% 1.16 0.07% 0.03 Utkal Alumina International Limited 7.62% 2,926.12 -208.35% (93.36)Utkal Alumina Technical & General Services Limited *
0.00% 0.04 0.00% -
Suvas Holdings Limited 0.02% 7.04 0.04% 0.02 Renuka Investments & Finance Limited 0.09% 32.84 13.57% 6.08 Renukeshwar Investments & Finance Limited 0.07% 25.34 7.34% 3.29 Dahej Harbour and Infrastructure Limited 0.24% 93.18 115.11% 51.58 Lucknow Finance Company Limited 0.04% 15.58 2.32% 1.04 Hindalco-Almex Aerospace Limited 0.20% 76.03 -5.78% (2.59)Tubed Coal Mines Limited 0.06% 21.15 -5.42% (2.43)East Coast Bauxite Mining Company Private Limited
0.00% (0.02) 0.00% -
Mauda Energy Limited 0.00% - -0.31% (0.14)Foreign:Birla Resources Pty Limited 0.01% 3.31 0.09% 0.04 Aditya Birla Minerals Limited (Consolidated) 1.24% 478.14 -2045.48% (916.58)AV Minerals (Netherlands) N.V. 27.77% 10,668.29 -1.41% (0.63)AV Metals Inc. * 26.97% 10,360.03 0.00% - Novelis Inc. (Consolidated) * @ 27.20% 10,449.06 -36.33% (16.28)Hindalco Do Brasil Industria Comercia de Alumina Ltda *
-0.04% (14.25) -193.68% (86.79)
Hindalco Guinea SARL 0.00% - 0.00% - Minority Interests in all Subsidiaries # -1.01% (388.80) 1002.01% 449.00
NOTES FORMING PART OF THE CONSOLIDATED FINANCIAL STATEMENTS
Hindalco Annual Report 2015-16.indb 181Hindalco Annual Report 2015-16.indb 181 8/17/2016 1:31:41 PM8/17/2016 1:31:41 PM
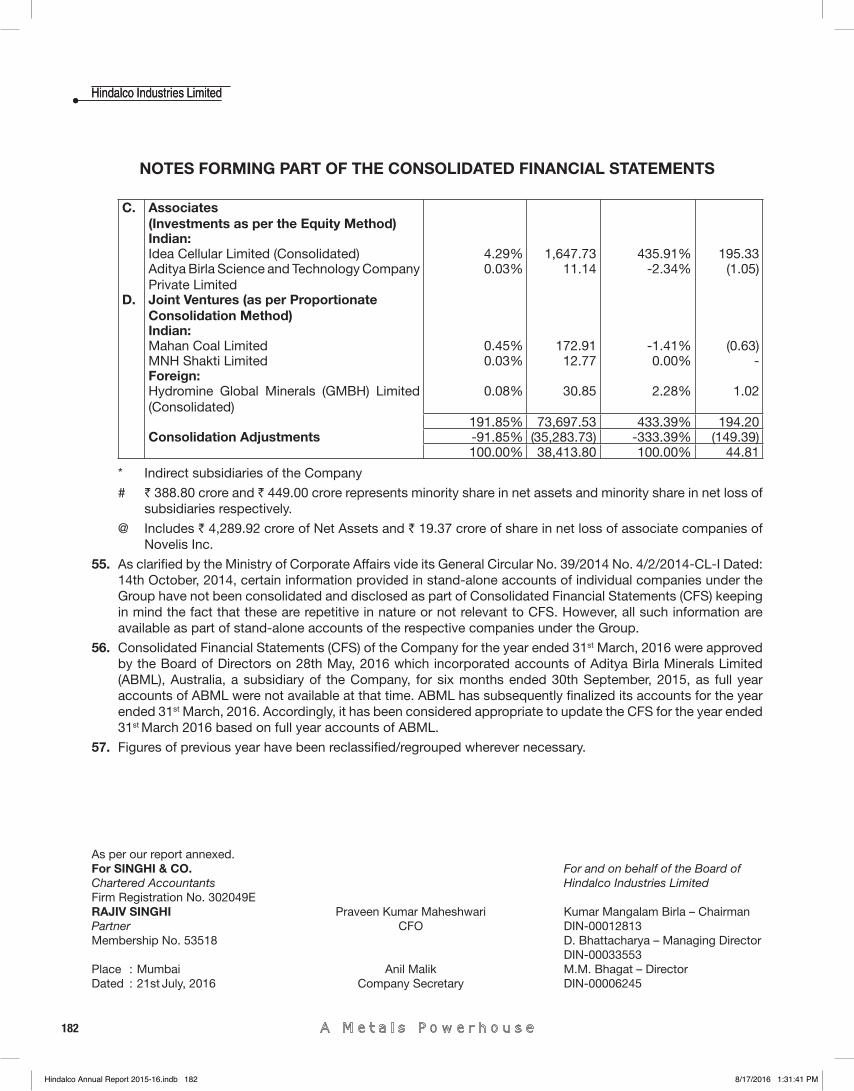
182
Hindalco Industries LimitedHindalco Industries Limited
As per our report annexed.For SINGHI & CO. For and on behalf of the Board ofChartered Accountants Hindalco Industries LimitedFirm Registration No. 302049E RAJIV SINGHI Praveen Kumar Maheshwari Kumar Mangalam Birla – ChairmanPartner CFO DIN-00012813Membership No. 53518 D. Bhattacharya – Managing Director DIN-00033553Place : Mumbai Anil Malik M.M. Bhagat – DirectorDated : 21st July, 2016 Company Secretary DIN-00006245
C. Associates (Investments as per the Equity Method)Indian:Idea Cellular Limited (Consolidated) 4.29% 1,647.73 435.91% 195.33 Aditya Birla Science and Technology Company Private Limited
0.03% 11.14 -2.34% (1.05)
D. Joint Ventures (as per Proportionate Consolidation Method)Indian: Mahan Coal Limited 0.45% 172.91 -1.41% (0.63)MNH Shakti Limited 0.03% 12.77 0.00% - Foreign:Hydromine Global Minerals (GMBH) Limited (Consolidated)
0.08% 30.85 2.28% 1.02
191.85% 73,697.53 433.39% 194.20 Consolidation Adjustments -91.85% (35,283.73) -333.39% (149.39)
100.00% 38,413.80 100.00% 44.81
* Indirect subsidiaries of the Company
# ` 388.80 crore and ` 449.00 crore represents minority share in net assets and minority share in net loss of subsidiaries respectively.
@ Includes ` 4,289.92 crore of Net Assets and ` 19.37 crore of share in net loss of associate companies of Novelis Inc.
55. As clarifi ed by the Ministry of Corporate Affairs vide its General Circular No. 39/2014 No. 4/2/2014-CL-I Dated: 14th October, 2014, certain information provided in stand-alone accounts of individual companies under the Group have not been consolidated and disclosed as part of Consolidated Financial Statements (CFS) keeping in mind the fact that these are repetitive in nature or not relevant to CFS. However, all such information are available as part of stand-alone accounts of the respective companies under the Group.
56. Consolidated Financial Statements (CFS) of the Company for the year ended 31st March, 2016 were approved by the Board of Directors on 28th May, 2016 which incorporated accounts of Aditya Birla Minerals Limited (ABML), Australia, a subsidiary of the Company, for six months ended 30th September, 2015, as full year accounts of ABML were not available at that time. ABML has subsequently fi nalized its accounts for the year ended 31st March, 2016. Accordingly, it has been considered appropriate to update the CFS for the year ended 31st March 2016 based on full year accounts of ABML.
57. Figures of previous year have been reclassifi ed/regrouped wherever necessary.
NOTES FORMING PART OF THE CONSOLIDATED FINANCIAL STATEMENTS
Hindalco Annual Report 2015-16.indb 182Hindalco Annual Report 2015-16.indb 182 8/17/2016 1:31:41 PM8/17/2016 1:31:41 PM
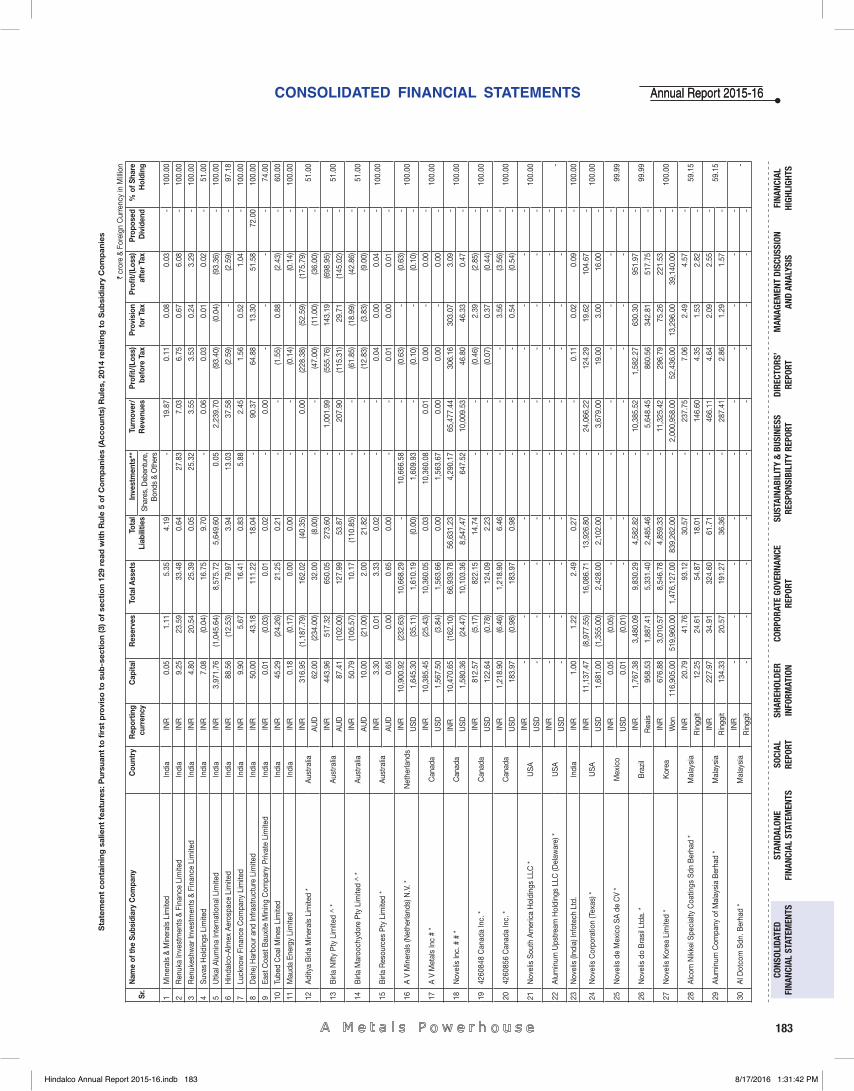
CONSOLIDATED FINANCIAL STATEMENTS
183
Annual Report 2015-16Annual Report 2015-16
FINA
NCIA
L HI
GHLI
GHTS
MAN
AGEM
ENT
DISC
USSI
ON
AND
ANAL
YSIS
CORP
ORAT
E GO
VERN
ANCE
RE
PORT
STAN
DALO
NE
FINA
NCIA
L ST
ATEM
ENTS
CONS
OLID
ATED
FI
NANC
IAL
STAT
EMEN
TSSO
CIAL
RE
PORT
DIRE
CTOR
S’RE
PORT
SHAR
EHOL
DER
INFO
RMAT
ION
SUST
AINA
BILI
TY &
BUS
INES
SRE
SPON
SIBI
LITY
REP
ORT
Sta
tem
ent
cont
aini
ng s
alie
nt f
eatu
res:
Pur
suan
t to
fi rs
t p
rovi
so t
o s
ub-s
ecti
on
(3) o
f se
ctio
n 12
9 re
ad w
ith
Rul
e 5
of
Co
mp
anie
s (A
cco
unts
) Rul
es, 2
014
rela
ting
to
Sub
sid
iary
Co
mp
anie
s
` cr
ore
& Fo
reig
n C
urre
ncy
in M
illio
n
Sr
. N
ame
of th
e Su
bsid
iary
Com
pany
Cou
ntry
R
epor
ting
curr
ency
C
apita
l R
eser
ves
Tota
l Ass
ets
Tot
al
Liab
ilitie
s In
vest
men
ts**
T
urno
ver/
R
even
ues
Pro
fi t/(
Loss
) be
fore
Tax
P
rovi
sion
fo
r Ta
x P
rofi t
/(Lo
ss)
afte
r Ta
x P
ropo
sed
Div
iden
d %
of S
hare
H
oldi
ng
Sha
res,
Deb
entu
re,
Bon
ds &
Oth
ers
1 M
iner
als
& M
iner
als
Lim
ited
Indi
a IN
R
0.0
5 1
.11
5.3
5 4
.19
-
19.
87
0.1
1 0
.08
0.0
3 -
1
00.0
0
2 R
enuk
a In
vest
men
ts &
Fin
ance
Lim
ited
Indi
a IN
R
9.2
5 2
3.59
3
3.48
0
.64
27.
83
7.0
3 6
.75
0.6
7 6
.08
-
100
.00
3 R
enuk
eshw
ar In
vest
men
ts &
Fin
ance
Lim
ited
Indi
a IN
R
4.8
0 2
0.54
2
5.39
0
.05
25.
32
3.5
5 3
.53
0.2
4 3
.29
-
100
.00
4 S
uvas
Hol
ding
s Li
mite
d In
dia
INR
7
.08
(0.0
4) 1
6.75
9
.70
-
0.0
6 0
.03
0.0
1 0
.02
-
51.
00
5 U
tkal
Alu
min
a In
tern
atio
nal L
imite
d In
dia
INR
3
,971
.76
(1,0
45.6
4) 8
,575
.72
5,6
49.6
0 0
.05
2,2
39.7
0 (9
3.40
) (0
.04)
(93.
36)
-
100
.00
6 H
inda
lco-
Alm
ex A
eros
pace
Lim
ited
Indi
a IN
R
88.
56
(12.
53)
79.
97
3.9
4 1
3.03
3
7.58
(2
.59)
-
(2.5
9) -
9
7.18
7 L
uckn
ow F
inan
ce C
ompa
ny L
imite
d In
dia
INR
9
.90
5.6
7 1
6.41
0
.83
5.8
8 2
.45
1.5
6 0
.52
1.0
4 -
1
00.0
0
8 D
ahej
Har
bour
and
Infra
stru
ctur
e Li
mite
d In
dia
INR
5
0.00
4
3.18
1
11.2
2 1
8.04
-
9
0.37
6
4.88
1
3.30
5
1.58
7
2.00
1
00.0
0
9 E
ast C
oast
Bau
xite
Min
ing
Com
pany
Priv
ate
Lim
ited
Indi
a IN
R
0.0
1 (0
.03)
0.0
1 0
.02
-
0.0
0 -
-
-
-
7
4.00
10 T
ubed
Coa
l Min
es L
imite
d In
dia
INR
4
5.29
(2
4.26
) 2
1.25
0
.21
-
-
(1.5
5) 0
.88
(2.4
3) -
6
0.00
11 M
auda
Ene
rgy
Lim
ited
Indi
a IN
R
0.1
8 (0
.17)
0.0
0 0
.00
-
-
(0.1
4) -
(0
.14)
-
100
.00
12 A
dity
a B
irla
Min
eral
s Li
mite
d *
Aus
tral
ia
INR
3
16.9
5 (1
,187
.79)
162
.02
(40.
35)
-
0.0
0 (2
28.3
8) (5
2.59
) (1
75.7
9) -
5
1.00
A
UD
6
2.00
(2
34.0
0) 3
2.00
(8
.00)
-
-
(47.
00)
(11.
00)
(36.
00)
-
13 B
irla
Nift
y P
ty L
imite
d ^
* A
ustr
alia
IN
R
443
.96
517
.32
650
.05
273
.60
-
1,0
01.9
9 (5
55.7
6) 1
43.1
9 (6
98.9
5) -
5
1.00
A
UD
8
7.41
(1
02.0
0) 1
27.9
9 5
3.87
-
2
07.9
0 (1
15.3
1) 2
9.71
(1
45.0
2) -
14 B
irla
Mar
ooch
ydor
e P
ty L
imite
d ^
* A
ustr
alia
IN
R
50.
79
(105
.57)
10.
17
(110
.85)
-
-
(61.
85)
(18.
99)
(42.
86)
-
51.
00
AU
D
10.
00
(21.
00)
2.0
0 2
1.82
-
-
(1
2.83
) (3
.83)
(9.0
0) -
15 B
irla
Res
ourc
es P
ty L
imite
d *
Aus
tral
ia
INR
3
.30
0.0
1 3
.33
0.0
2 -
-
0
.04
0.0
0 0
.04
-
100
.00
AU
D
0.6
5 0
.00
0.6
5 0
.00
-
-
0.0
1 0
.00
0.0
1 -
16 A
V M
iner
als
(Net
herla
nds)
N.V
. *
Net
herla
nds
INR
1
0,90
0.92
(2
32.6
3) 1
0,66
8.29
-
1
0,66
6.58
-
(0
.63)
-
(0.6
3) -
1
00.0
0 U
SD
1
,645
.30
(35.
11)
1,6
10.1
9 (0
.00)
1,6
09.9
3 -
(0
.10)
-
(0.1
0) -
17 A
V M
etal
s In
c #
* C
anad
a IN
R
10,
385.
45
(25.
43)
10,
360.
05
0.0
3 1
0,36
0.08
0
.01
0.0
0 -
0
.00
-
100
.00
US
D
1,5
67.5
0 (3
.84)
1,5
63.6
6 0
.00
1,5
63.6
7 0
.00
0.0
0 -
0
.00
-
18 N
ovel
is In
c. #
# *
Can
ada
INR
10,
470.
65
(162
.10)
66,
939.
78
56,
631.
23
4,2
90.1
7 6
5,47
7.44
3
06.1
6 3
03.0
7 3
.09
-
100
.00
US
D
1,5
80.3
6 (2
4.47
) 1
0,10
3.36
8
,547
.47
647
.52
10,
009.
53
46.
80
46.
33
0.4
7 -
19 4
2608
48 C
anad
a In
c. *
Can
ada
INR
8
12.5
7 (5
.17)
822
.15
14.
74
-
-
(0.4
6) 2
.39
(2.8
5) -
1
00.0
0 U
SD
1
22.6
4 (0
.78)
124
.09
2.2
3 -
-
(0
.07)
0.3
7 (0
.44)
-
20 4
2608
56 C
anad
a In
c. *
Can
ada
INR
1
,218
.90
(6.4
6) 1
,218
.90
6.4
6 -
-
-
3
.56
(3.5
6) -
1
00.0
0 U
SD
1
83.9
7 (0
.98)
183
.97
0.9
8 -
-
-
0
.54
(0.5
4) -
21 N
ovel
is S
outh
Am
eric
a H
oldi
ngs
LLC
* U
SA
IN
R
-
-
-
-
-
-
-
-
-
-
100
.00
US
D
-
-
-
-
-
-
-
-
-
-
22 A
lum
inum
Ups
tream
Hol
ding
s LL
C (D
elaw
are)
* U
SA
IN
R
-
-
-
-
-
-
-
-
-
-
- U
SD
-
-
-
-
-
-
-
-
-
-
23 N
ovel
is (I
ndia
) Inf
otec
h Lt
d.
Indi
a IN
R
1.0
0 1
.22
2.4
9 0
.27
-
-
0.1
1 0
.02
0.0
9 -
1
00.0
0
24 N
ovel
is C
orpo
ratio
n (T
exas
) *
US
A
INR
1
1,13
7.47
(8
,977
.55)
16,
086.
71
13,
926.
80
-
24,
066.
22
124
.29
19.
62
104
.67
-
100
.00
US
D
1,6
81.0
0 (1
,355
.00)
2,4
28.0
0 2
,102
.00
-
3,6
79.0
0 1
9.00
3
.00
16.
00
-
25 N
ovel
is d
e M
exic
o S
A d
e C
V *
Mex
ico
INR
0
.05
(0.0
5) -
-
-
-
-
-
-
-
9
9.99
U
SD
0
.01
(0.0
1) -
-
-
-
-
-
-
-
26 N
ovel
is d
o B
rasi
l Ltd
a. *
Bra
zil
INR
1
,767
.38
3,4
80.0
9 9
,830
.29
4,5
82.8
2 -
1
0,38
5.52
1
,582
.27
630
.30
951
.97
-
99.
99
Rea
is
958
.53
1,8
87.4
1 5
,331
.40
2,4
85.4
6 -
5
,648
.45
860
.56
342
.81
517
.75
-
27 N
ovel
is K
orea
Lim
ited
* K
orea
IN
R
676
.88
3,0
10.5
7 8
,546
.78
4,8
59.3
3 -
1
1,32
5.42
2
96.7
9 7
5.26
2
21.5
3 -
1
00.0
0 W
on
116
,905
.00
519
,960
.00
1,4
76,1
27.0
0 8
39,2
62.0
0 -
2
,000
,958
.00
52,
436.
00
13,
296.
00
39,
140.
00
-
28 A
lcom
Nik
kei S
peci
alty
Coa
tings
Sdn
Ber
had
* M
alay
sia
INR
2
0.79
4
1.76
9
3.12
3
0.57
-
2
37.7
5 7
.06
2.4
9 4
.57
-
59.
15
Rin
ggit
12.
25
24.
61
54.
87
18.
01
-
146
.60
4.3
5 1
.53
2.8
2 -
29 A
lum
inum
Com
pany
of M
alay
sia
Ber
had
* M
alay
sia
INR
2
27.9
7 3
4.91
3
24.6
0 6
1.71
-
4
66.1
1 4
.64
2.0
9 2
.55
-
59.
15
Rin
ggit
134
.33
20.
57
191
.27
36.
36
-
287
.41
2.8
6 1
.29
1.5
7 -
30 A
l Dot
com
Sdn
. Ber
had
* M
alay
sia
INR
-
-
-
-
-
-
-
-
-
-
-
Rin
ggit
-
-
-
-
-
-
-
-
-
-
Hindalco Annual Report 2015-16.indb 183Hindalco Annual Report 2015-16.indb 183 8/17/2016 1:31:42 PM8/17/2016 1:31:42 PM
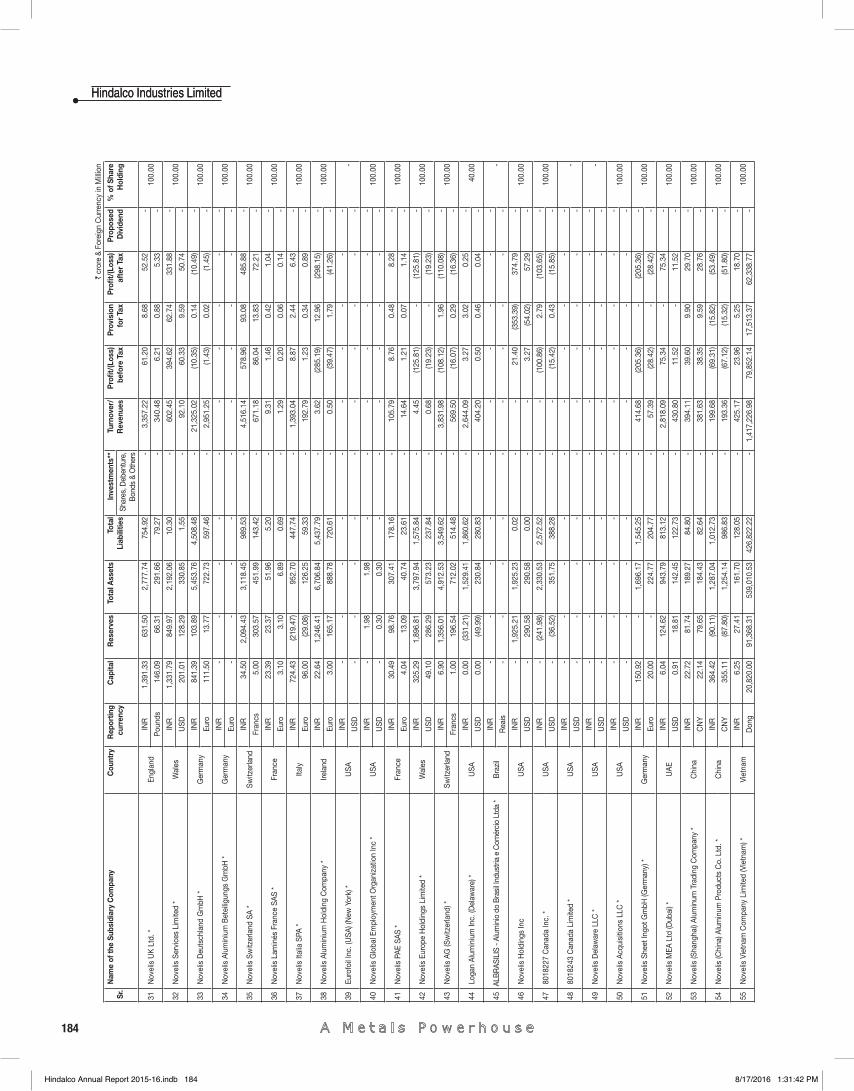
184
Hindalco Industries LimitedHindalco Industries Limited`
cror
e &
Fore
ign
Cur
renc
y in
Mill
ion
Sr
. N
ame
of th
e Su
bsid
iary
Com
pany
Cou
ntry
R
epor
ting
curr
ency
C
apita
l R
eser
ves
Tota
l Ass
ets
Tot
al
Liab
ilitie
s In
vest
men
ts**
T
urno
ver/
R
even
ues
Pro
fi t/(
Loss
) be
fore
Tax
P
rovi
sion
fo
r Ta
x P
rofi t
/(Lo
ss)
afte
r Ta
x P
ropo
sed
Div
iden
d %
of S
hare
H
oldi
ng
Sha
res,
Deb
entu
re,
Bon
ds &
Oth
ers
31 N
ovel
is U
K L
td. *
E
ngla
nd
INR
1
,391
.33
631
.50
2,7
77.7
4 7
54.9
2 -
3
,357
.22
61.
20
8.6
8 5
2.52
-
1
00.0
0 P
ound
s 1
46.0
9 6
6.31
2
91.6
6 7
9.27
-
3
40.4
8 6
.21
0.8
8 5
.33
-
32 N
ovel
is S
ervi
ces
Lim
ited
* W
ales
IN
R
1,3
31.7
9 8
49.9
7 2
,192
.06
10.
30
-
602
.45
394
.62
62.
74
331
.88
-
100
.00
US
D
201
.01
128
.29
330
.85
1.5
5 -
9
2.10
6
0.33
9
.59
50.
74
-
33 N
ovel
is D
euts
chla
nd G
mbH
* G
erm
any
INR
8
41.3
9 1
03.8
9 5
,453
.76
4,5
08.4
8 -
2
1,32
5.02
(1
0.35
) 0
.14
(10.
49)
-
100
.00
Eur
o 1
11.5
0 1
3.77
7
22.7
3 5
97.4
6 -
2
,951
.25
(1.4
3) 0
.02
(1.4
5) -
34 N
ovel
is A
lum
iniu
m B
etei
ligun
gs G
mbH
* G
erm
any
INR
-
-
-
-
-
-
-
-
-
-
1
00.0
0 E
uro
-
-
-
-
-
-
-
-
-
-
35 N
ovel
is S
witz
erla
nd S
A *
Sw
itzer
land
IN
R
34.
50
2,0
94.4
3 3
,118
.45
989
.53
-
4,5
16.1
4 5
78.9
6 9
3.08
4
85.8
8 -
1
00.0
0 F
ranc
s 5
.00
303
.57
451
.99
143
.42
-
671
.18
86.
04
13.
83
72.
21
-
36 N
ovel
is L
amin
és F
ranc
e S
AS
* F
ranc
e IN
R
23.
39
23.
37
51.
96
5.2
0 -
9
.31
1.4
6 0
.42
1.0
4 -
1
00.0
0 E
uro
3.1
0 3
.10
6.8
9 0
.69
-
1.2
9 0
.20
0.0
6 0
.14
-
37 N
ovel
is It
alia
SPA
* It
aly
INR
7
24.4
3 (2
19.4
7) 9
52.7
0 4
47.7
4 -
1
,393
.04
8.8
7 2
.44
6.4
3 -
1
00.0
0 E
uro
96.
00
(29.
08)
126
.25
59.
33
-
192
.79
1.2
3 0
.34
0.8
9 -
38 N
ovel
is A
lum
iniu
m H
oldi
ng C
ompa
ny *
Irel
and
INR
2
2.64
1
,246
.41
6,7
06.8
4 5
,437
.79
-
3.6
2 (2
85.1
9) 1
2.96
(2
98.1
5) -
1
00.0
0 E
uro
3.0
0 1
65.1
7 8
88.7
8 7
20.6
1 -
0
.50
(39.
47)
1.7
9 (4
1.26
) -
39 E
urof
oil I
nc. (
US
A) (
New
Yor
k) *
US
A
INR
-
-
-
-
-
-
-
-
-
-
-
US
D
-
-
-
-
-
-
-
-
-
-
40 N
ovel
is G
loba
l Em
ploy
men
t Org
aniz
atio
n In
c *
US
A
INR
-
1
.98
1.9
8 -
-
-
-
-
-
-
1
00.0
0 U
SD
-
0
.30
0.3
0 -
-
-
-
-
-
-
41 N
ovel
is P
AE
SA
S *
Fra
nce
INR
3
0.49
9
8.76
3
07.4
1 1
78.1
6 -
1
05.7
9 8
.76
0.4
8 8
.28
-
100
.00
Eur
o 4
.04
13.
09
40.
74
23.
61
-
14.
64
1.2
1 0
.07
1.1
4 -
42 N
ovel
is E
urop
e H
oldi
ngs
Lim
ited
* W
ales
IN
R
325
.29
1,8
96.8
1 3
,797
.94
1,5
75.8
4 -
4
.45
(125
.81)
-
(125
.81)
-
100
.00
US
D
49.
10
286
.29
573
.23
237
.84
-
0.6
8 (1
9.23
) -
(1
9.23
) -
43 N
ovel
is A
G (S
witz
erla
nd) *
S
witz
erla
nd
INR
6
.90
1,3
56.0
1 4
,912
.53
3,5
49.6
2 -
3
,831
.98
(108
.12)
1.9
6 (1
10.0
8) -
1
00.0
0 F
ranc
s 1
.00
196
.54
712
.02
514
.48
-
569
.50
(16.
07)
0.2
9 (1
6.36
) -
44 L
ogan
Alu
min
ium
Inc.
(Del
awar
e) *
US
A
INR
0
.00
(331
.21)
1,5
29.4
1 1
,860
.62
-
2,6
44.0
9 3
.27
3.0
2 0
.25
-
40.
00
US
D
0.0
0 (4
9.99
) 2
30.8
4 2
80.8
3 -
4
04.2
0 0
.50
0.4
6 0
.04
-
45AL
BR
ASIL
IS -
Alum
inio
do
Bra
sil I
ndus
tria
e C
omér
cio
Ltda
* B
razi
l IN
R
-
-
-
-
-
-
-
-
-
-
- R
eais
-
-
-
-
-
-
-
-
-
-
46 N
ovel
is H
oldi
ngs
Inc
US
A
INR
-
1
,925
.21
1,9
25.2
3 0
.02
-
-
21.
40
(353
.39)
374
.79
-
100
.00
US
D
-
290
.58
290
.58
0.0
0 -
-
3
.27
(54.
02)
57.
29
-
47 8
0182
27 C
anad
a In
c. *
US
A
INR
-
(2
41.9
8) 2
,330
.53
2,5
72.5
2 -
-
(1
00.8
6) 2
.79
(103
.65)
-
100
.00
US
D
-
(36.
52)
351
.75
388
.28
-
-
(15.
42)
0.4
3 (1
5.85
) -
48 8
0182
43 C
anad
a Li
mite
d *
US
A
INR
-
-
-
-
-
-
-
-
-
-
-
US
D
-
-
-
-
-
-
-
-
-
-
49 N
ovel
is D
elaw
are
LLC
* U
SA
IN
R
-
-
-
-
-
-
-
-
-
-
- U
SD
-
-
-
-
-
-
-
-
-
-
50 N
ovel
is A
cqui
sitio
ns L
LC *
US
A
INR
-
-
-
-
-
-
-
-
-
-
1
00.0
0 U
SD
-
-
-
-
-
-
-
-
-
-
51 N
ovel
is S
heet
Ingo
t Gm
bH (G
erm
any)
* G
erm
any
INR
1
50.9
2 -
1
,696
.17
1,5
45.2
5 -
4
14.6
8 (2
05.3
6) -
(2
05.3
6) -
1
00.0
0 E
uro
20.
00
-
224
.77
204
.77
-
57.
39
(28.
42)
-
(28.
42)
-
52 N
ovel
is M
EA L
td (D
ubai
) *
UA
E IN
R
6.0
4 1
24.6
2 9
43.7
9 8
13.1
2 -
2
,818
.09
75.
34
-
75.
34
-
100
.00
US
D
0.9
1 1
8.81
1
42.4
5 1
22.7
3 -
4
30.8
0 1
1.52
-
1
1.52
-
53 N
ovel
is (S
hang
hai)
Alu
min
um T
radi
ng C
ompa
ny *
Chi
na
INR
2
2.72
8
1.74
1
89.2
7 8
4.80
-
3
94.1
1 3
9.60
9
.90
29.
70
-
100
.00
CN
Y
22.
14
79.
65
184
.43
82.
64
-
381
.63
38.
35
9.5
9 2
8.76
-
54 N
ovel
is (C
hina
) Alu
min
um P
rodu
cts
Co.
Ltd
. *
Chi
na
INR
3
64.4
2 (9
0.11
) 1
,287
.04
1,0
12.7
3 -
1
99.6
8 (6
9.31
) (1
5.82
) (5
3.49
) -
1
00.0
0 C
NY
3
55.1
1 (8
7.80
) 1
,254
.14
986
.83
-
193
.36
(67.
12)
(15.
32)
(51.
80)
-
55 N
ovel
is V
ietn
am C
ompa
ny L
imite
d (V
ietn
am) *
V
ietn
am
INR
6
.25
27.
41
161
.70
128
.05
-
425
.17
23.
96
5.2
5 1
8.70
-
1
00.0
0 D
ong
20,
820.
00
91,
368.
31
539
,010
.53
426
,822
.22
-
1,4
17,2
26.9
8 7
9,85
2.14
1
7,51
3.37
6
2,33
8.77
-
Hindalco Annual Report 2015-16.indb 184Hindalco Annual Report 2015-16.indb 184 8/17/2016 1:31:42 PM8/17/2016 1:31:42 PM
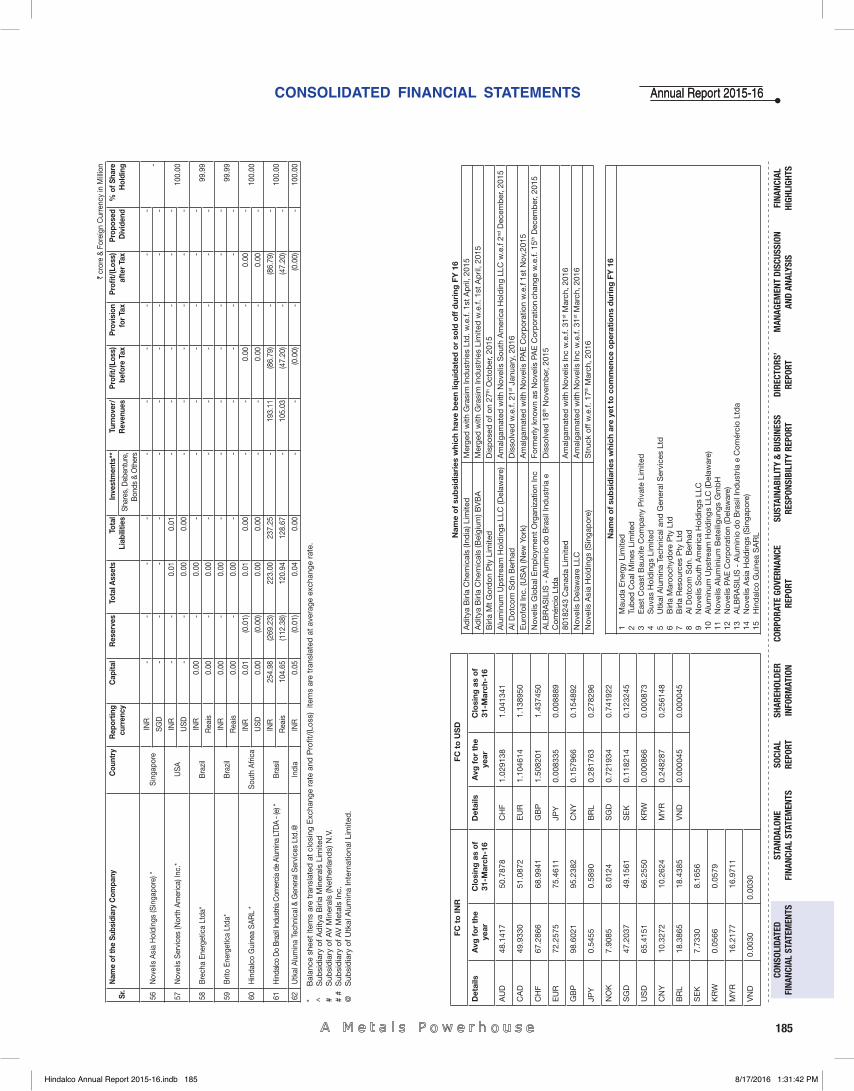
CONSOLIDATED FINANCIAL STATEMENTS
185
Annual Report 2015-16Annual Report 2015-16
FINA
NCIA
L HI
GHLI
GHTS
MAN
AGEM
ENT
DISC
USSI
ON
AND
ANAL
YSIS
CORP
ORAT
E GO
VERN
ANCE
RE
PORT
STAN
DALO
NE
FINA
NCIA
L ST
ATEM
ENTS
CONS
OLID
ATED
FI
NANC
IAL
STAT
EMEN
TSSO
CIAL
RE
PORT
DIRE
CTOR
S’RE
PORT
SHAR
EHOL
DER
INFO
RMAT
ION
SUST
AINA
BILI
TY &
BUS
INES
SRE
SPON
SIBI
LITY
REP
ORT
` cr
ore
& Fo
reig
n C
urre
ncy
in M
illio
n
Sr
. N
ame
of th
e Su
bsid
iary
Com
pany
Cou
ntry
R
epor
ting
curr
ency
C
apita
l R
eser
ves
Tota
l Ass
ets
Tot
al
Liab
ilitie
s In
vest
men
ts**
T
urno
ver/
R
even
ues
Pro
fi t/(
Loss
) be
fore
Tax
P
rovi
sion
fo
r Ta
x P
rofi t
/(Lo
ss)
afte
r Ta
x P
ropo
sed
Div
iden
d %
of S
hare
H
oldi
ng
Sha
res,
Deb
entu
re,
Bon
ds &
Oth
ers
56 N
ovel
is A
sia
Hol
ding
s (S
inga
pore
) *
Sin
gapo
re
INR
-
-
-
-
-
-
-
-
-
-
-
SG
D
-
-
-
-
-
-
-
-
-
-
57 N
ovel
is S
ervi
ces
(Nor
th A
mer
ica)
Inc.
* U
SA
IN
R
-
-
0.0
1 0
.01
-
-
-
-
-
-
100
.00
US
D
-
-
0.0
0 0
.00
-
-
-
-
-
-
58 B
rech
a En
erge
tica
Ltda
* B
razi
l IN
R
0.0
0 -
0
.00
-
-
-
-
-
-
-
99.
99
Rea
is
0.0
0 -
0
.00
-
-
-
-
-
-
-
59 B
rito
Ener
getic
a Lt
da*
Bra
zil
INR
0
.00
-
0.0
0 -
-
-
-
-
-
-
9
9.99
R
eais
0
.00
-
0.0
0 -
-
-
-
-
-
-
60 H
inda
lco
Gui
nea
SA
RL
* S
outh
Afri
ca
INR
0.0
1 (0
.01)
0.0
1 0
.00
-
-
0.0
0 -
0
.00
-
100
.00
US
D
0.0
0 (0
.00)
0.0
0 0
.00
-
-
0.0
0 -
0
.00
-
61 H
inda
lco
Do
Braz
il Ind
ustri
a C
omer
cia
de A
lum
ina
LTD
A - (
e) *
Bra
sil
INR
254
.98
(269
.23)
223
.00
237
.25
-
193
.11
(86.
79)
-
(86.
79)
-
100
.00
Rea
is
104
.65
(112
.38)
120
.94
128
.67
-
105
.03
(47.
20)
-
(47.
20)
-
62 U
tkal
Alu
min
a Te
chni
cal &
Gen
eral
Ser
vice
s Lt
d.@
In
dia
INR
0.0
5 (0
.01)
0.0
4 0
.00
-
-
(0.0
0) -
(0
.00)
-
100.
00
* B
alan
ce s
heet
item
s ar
e tr
ansl
ated
at
clos
ing
Exc
hang
e ra
te a
nd P
rofi t
/(Lo
ss)
item
s ar
e tr
ansl
ated
at
aver
age
exch
ange
rat
e.
^
S
ubsi
dia
ry o
f Ad
itya
Birl
a M
iner
als
Lim
ited
# S
ubsi
dia
ry o
f AV
Min
eral
s (N
ethe
rland
s) N
.V.
#
# S
ubsi
dia
ry o
f AV
Met
als
Inc.
@
Sub
sid
iary
of U
tkal
Alu
min
a In
tern
atio
nal L
imite
d.
Nam
e o
f su
bsi
dia
ries
whi
ch h
ave
bee
n liq
uid
ated
or
sold
off
dur
ing
FY
16
Ad
itya
Birl
a C
hem
ical
s (In
dia
) Lim
ited
M
erge
d w
ith G
rasi
m In
dus
trie
s Lt
d. w
.e.f.
1st
Ap
ril, 2
015
Ad
itya
Birl
a C
hem
ical
s (B
elgi
um) B
VB
A
Mer
ged
with
Gra
sim
Ind
ustr
ies
Lim
ited
w.e
.f. 1
st A
pril
, 201
5 B
irla
Mt
Gor
don
Pty
Lim
ited
D
isp
osed
of o
n 27
th O
ctob
er, 2
015
Alu
min
um U
pst
ream
Hol
din
gs L
LC (D
elaw
are)
A
mal
gam
ated
with
Nov
elis
Sou
th A
mer
ica
Hol
din
g LL
C w
.e.f
2nd D
ecem
ber
, 201
5 A
l Dot
com
Sd
n B
erha
d
Dis
solv
ed w
.e.f.
21st
Jan
uary
, 201
6 E
urof
oil I
nc. (
US
A) (
New
Yor
k)
Am
alga
mat
ed w
ith N
ovel
is P
AE
Cor
por
atio
n w
.e.f
1st
Nov
,201
5 N
ovel
is G
lob
al E
mp
loym
ent
Org
aniz
atio
n In
c Fo
rmer
ly k
now
n as
Nov
elis
PA
E C
orp
orat
ion c
hang
e w
.e.f.
15th
Dec
emb
er, 2
015
ALB
RA
SIL
IS -
Alu
min
io d
o B
rasi
l Ind
ustr
ia e
C
omér
cio
Ltd
a D
isso
lved
18th
Nov
emb
er, 2
015
8018
243
Can
ada
Lim
ited
A
mal
gam
ated
with
Nov
elis
Inc
w.e
.f. 3
1st M
arch
, 201
6 N
ovel
is D
elaw
are
LLC
A
mal
gam
ated
with
Nov
elis
Inc
w.e
.f. 3
1st M
arch
, 201
6 N
ovel
is A
sia
Hol
din
gs (S
inga
por
e)
Str
uck
off w
.e.f.
17th
Mar
ch, 2
016
Nam
e o
f su
bsi
dia
ries
whi
ch a
re y
et t
o c
om
men
ce o
per
atio
ns d
urin
g F
Y 1
6 1
Mau
da
Ene
rgy
Lim
ited
2
Tub
ed C
oal M
ines
Lim
ited
3
Eas
t C
oast
Bau
xite
Com
pan
y P
rivat
e Li
mite
d
4 S
uvas
Hol
din
gs L
imite
d
5 U
tkal
Alu
min
a Te
chni
cal a
nd G
ener
al S
ervi
ces
Ltd
6
Birl
a M
aroo
chyd
ore
Pty
Ltd
7
Birl
a R
esou
rces
Pty
Ltd
8
Al D
otco
m S
dn.
Ber
had
9
Nov
elis
Sou
th A
mer
ica
Hol
din
gs L
LC
10
Alu
min
um U
pst
ream
Hol
din
gs L
LC (D
elaw
are)
11
N
ovel
is A
lum
iniu
m B
etei
ligun
gs G
mb
H
12
Nov
elis
PA
E C
orp
orat
ion
(Del
awar
e)
13
ALB
RA
SIL
IS -
Alu
min
io d
o B
rasi
l Ind
ustr
ia e
Com
érci
o Lt
da
14
N
ovel
is A
sia
Hol
din
gs (S
inga
por
e)
15
Hin
dal
co G
uine
a S
AR
L
FC t
o IN
RFC
to
US
D
Det
ails
Avg
fo
r th
e ye
arC
losi
ng a
s o
f31
-Mar
ch-1
6D
etai
lsA
vg f
or
the
year
Clo
sing
as
of
31-M
arch
-16
AU
D48
.141
750
.787
8C
HF
1.02
9138
1.04
1341
CA
D49
.933
051
.087
2E
UR
1.10
4614
1.13
8950
CH
F67
.286
668
.994
1G
BP
1.50
8201
1.43
7450
EU
R72
.257
575
.461
1JP
Y0.
0083
350.
0088
89
GB
P98
.602
195
.238
2C
NY
0.15
7966
0.15
4892
JPY
0.54
550.
5890
BR
L0.
2817
630.
2782
96
NO
K7.
9085
8.01
24S
GD
0.72
1934
0.74
1922
SG
D47
.203
749
.156
1S
EK
0.11
8214
0.12
3245
US
D65
.415
166
.255
0K
RW
0.00
0866
0.00
0873
CN
Y10
.327
210
.262
4M
YR
0.24
8287
0.25
6148
BR
L18
.386
518
.438
5V
ND
0.00
0045
0.00
0045
SE
K7.
7330
8.16
56
KR
W0.
0566
0.05
79
MY
R16
.217
716
.971
1
VN
D0.
0030
0.00
30
Hindalco Annual Report 2015-16.indb 185Hindalco Annual Report 2015-16.indb 185 8/17/2016 1:31:42 PM8/17/2016 1:31:42 PM
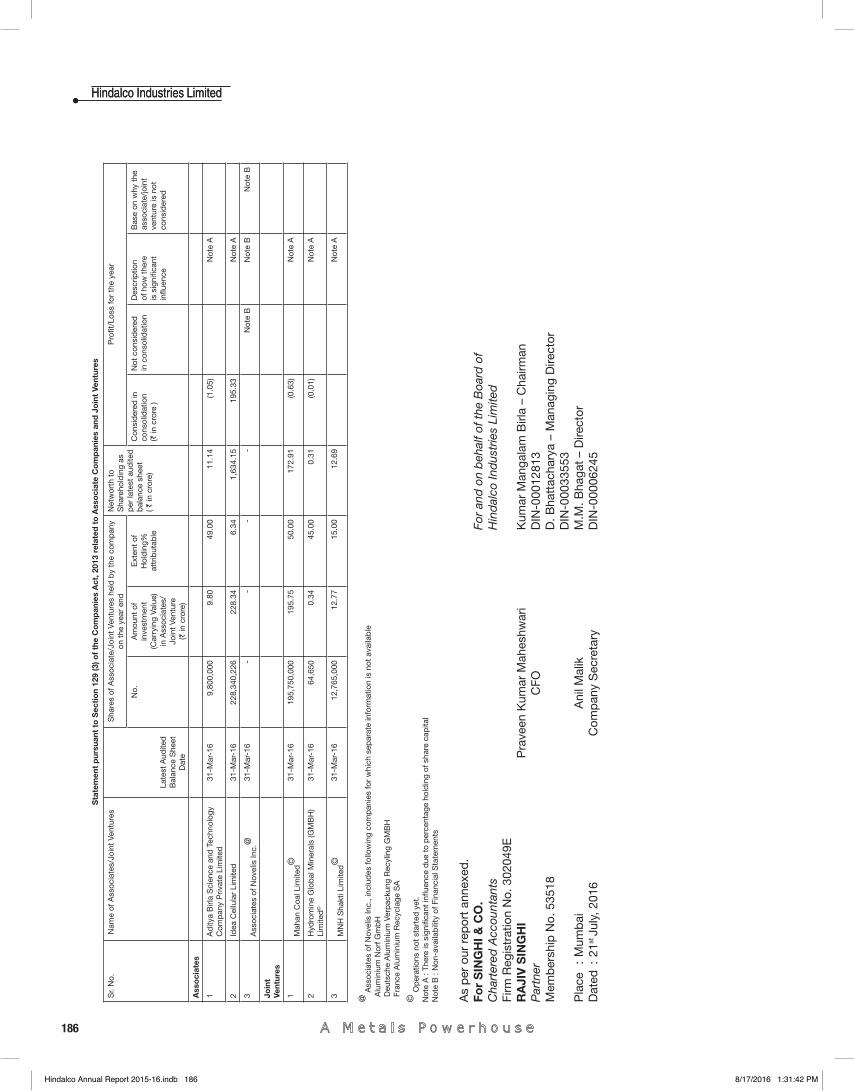
186
Hindalco Industries LimitedHindalco Industries LimitedS
tate
men
t p
ursu
ant
to S
ecti
on
129
(3) o
f th
e C
om
pan
ies
Act
, 201
3 re
late
d t
o A
sso
ciat
e C
om
pan
ies
and
Jo
int
Vent
ures
Sr.
No.
Nam
e of
Ass
ocia
tes/
Join
t Ve
ntur
es
Late
st A
udite
d
Bal
ance
She
et
Dat
e
Sha
res
of A
ssoc
iate
/Joi
nt V
entu
res
held
by
the
com
pan
y on
the
yea
r en
dN
etw
orth
to
Sha
reho
ldin
g as
p
er la
test
aud
ited
b
alan
ce s
heet
( `
in c
rore
)
Pro
fi t/L
oss
for
the
year
No.
Am
ount
of
inve
stm
ent
(Car
ryin
g Va
lue)
in
Ass
ocia
tes/
Join
t Ve
ntur
e (`
in c
rore
)
Ext
ent
of
Hol
din
g%
attr
ibut
able
Con
sid
ered
in
cons
olid
atio
n (`
in c
rore
)
Not
con
sid
ered
in
con
solid
atio
nD
escr
iptio
n of
how
the
re
is s
igni
fi can
t in
fl uen
ce
Bas
e on
why
the
as
soci
ate/
join
t ve
ntur
e is
not
co
nsid
ered
Ass
oci
ates
1A
dity
a B
irla
Sci
ence
and
Tec
hnol
ogy
Com
pan
y P
rivat
e Li
mite
d31
-Mar
-16
9,80
0,00
0 9.
8049
.00
11.
14
(1.0
5)N
ote
A
2Id
ea C
ellu
lar
Lim
ited
31-M
ar-1
622
8,34
0,22
6 22
8.34
6.34
1,63
4.15
1
95.3
3 N
ote
A
3A
ssoc
iate
s of
Nov
elis
Inc.
@31
-Mar
-16
--
--
Not
e B
Not
e B
Not
e B
Join
t Ve
ntur
es
1M
ahan
Coa
l Lim
ited©
31-M
ar-1
6 1
95,7
50,0
0019
5.75
50.0
017
2.91
(0.6
3)N
ote
A
2H
ydro
min
e G
lob
al M
iner
als
(GM
BH
) Li
mite
d©
31-M
ar-1
6 6
4,65
0 0.
3445
.00
0.31
(0.0
1)N
ote
A
3M
NH
Sha
kti L
imite
d©
31-M
ar-1
6 1
2,76
5,00
0 12
.77
15.0
012
.69
Not
e A
@ A
ssoc
iate
s of
Nov
elis
Inc.
, inc
lud
es fo
llow
ing
com
pan
ies
for
whi
ch s
epar
ate
info
rmat
ion
is n
ot a
vaila
ble
A
lum
iniu
m N
orf G
mb
H
Deu
tsch
e A
lum
iniu
m V
erp
acku
ng R
ecyl
ing
GM
BH
Fran
ce A
lum
iniu
m R
ecyc
lage
SA
© O
per
atio
ns n
ot s
tart
ed y
et.
Not
e A
: Th
ere
is s
igni
fi can
t in
fl uen
ce d
ue t
o p
erce
ntag
e ho
ldin
g of
sha
re c
apita
l
N
ote
B :
Non
-ava
ilab
ility
of F
inan
cial
Sta
tem
ents
As
per
our
rep
ort
anne
xed
.Fo
r S
ING
HI &
CO
.
For
and
on
beh
alf o
f the
Boa
rd o
fC
hart
ered
Acc
ount
ants
Hin
dal
co In
dus
trie
s Li
mite
dFi
rm R
egis
trat
ion
No.
302
049E
RA
JIV
SIN
GH
I P
rave
en K
umar
Mah
eshw
ari
Kum
ar M
anga
lam
Birl
a –
Cha
irman
Par
tner
C
FO
DIN
-000
1281
3M
emb
ersh
ip N
o. 5
3518
D. B
hatt
acha
rya
– M
anag
ing
Dire
ctor
DIN
-000
3355
3P
lace
:
Mum
bai
A
nil M
alik
M
.M. B
haga
t –
Dire
ctor
Dat
ed :
21st
Jul
y, 2
016
Com
pan
y S
ecre
tary
D
IN-0
0006
245
Hindalco Annual Report 2015-16.indb 186Hindalco Annual Report 2015-16.indb 186 8/17/2016 1:31:42 PM8/17/2016 1:31:42 PM
187
Annual Report 2015-16
187
Annual Report 2015-16
Notes
Hindalco Annual Report 2015-16.indb 187Hindalco Annual Report 2015-16.indb 187 8/17/2016 1:31:43 PM8/17/2016 1:31:43 PM
11 Hindalco Ltd. AR 2015-16 Consolidated (133-188).indd 18811 Hindalco Ltd. AR 2015-16 Consolidated (133-188).indd 188 8/17/2016 2:44:10 PM8/17/2016 2:44:10 PM
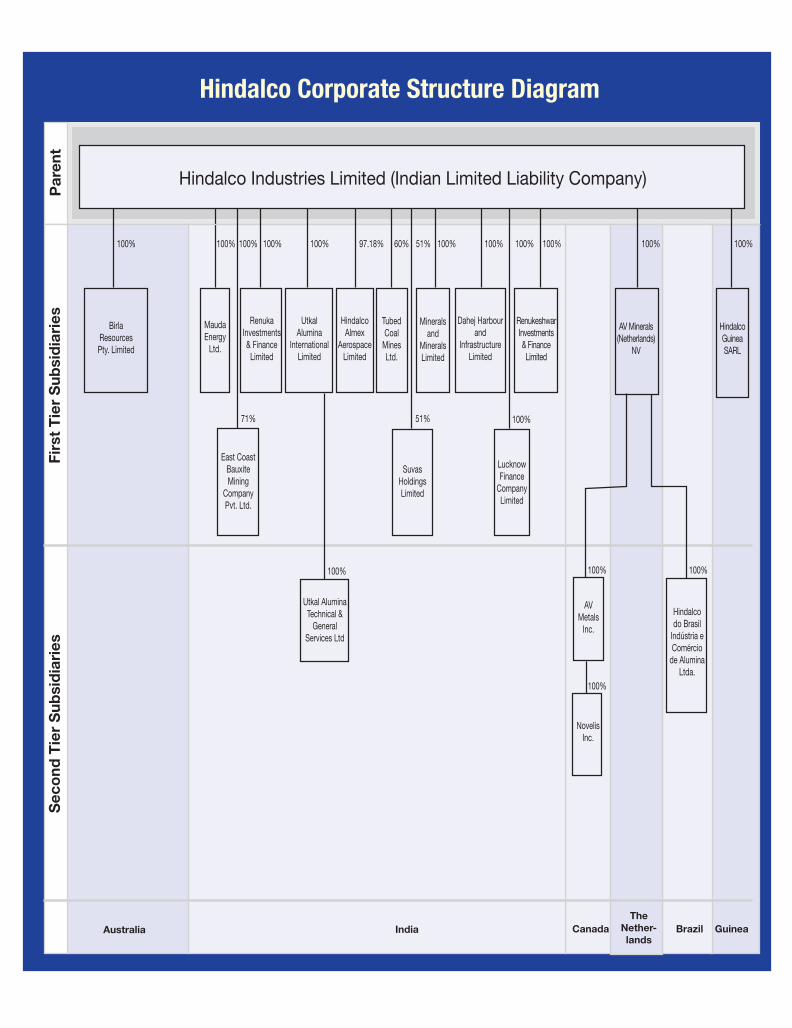
Hindalco Industries Limited (Indian Limited Liability Company)
Hindalco Corporate Structure Diagram
Par
ent
Firs
t T
ier
Sub
sid
iari
esS
eco
nd T
ier
Sub
sid
iari
es
100% 100% 100%
100%
100%100%100%100% 100% 100%100% 100% 60%97.18%
BirlaResourcesPty. Limited
MaudaEnergy
Ltd.
East CoastBauxiteMining
CompanyPvt. Ltd.
51%
Utkal AluminaTechnical &
GeneralServices Ltd
SuvasHoldingsLimited
100%
100%
100% 100%
LucknowFinance
CompanyLimited
AVMetals
Inc.
NovelisInc.
Australia India Canada Brazil GuineaThe
Nether-lands
Hindalcodo Brasil
Indústria eComércio
de AluminaLtda.
RenukaInvestments& Finance
Limited
UtkalAlumina
InternationalLimited
HindalcoAlmex
AerospaceLimited
TubedCoal
MinesLtd.
Mineralsand
MineralsLimited
Dahej Harbourand
InfrastructureLimited
RenukeshwarInvestments& FinanceLimited
AV Minerals(Netherlands)
NV
HindalcoGuineaSARL
71% 51%
Mr. Aditya Vikram BirlaWe live by his values.
Integrity, Commitment, Passion, Seamlessness and Speed.
Cover.indd 2Cover.indd 2 8/17/2016 2:56:43 PM8/17/2016 2:56:43 PM

ASIA’S LARGEST SINGLELOCATION COPPER SMELTER
Hindalco Industries Limited
Registered Offi ce:Century Bhavan, 3rd Floor,
Dr. Annie Besant Road, Worli, Mumbai - 400 030.
Tel: (91-22) 6662 6666 Fax: (91-22) 2422 7586/2436 2516
E-Mail: [email protected]: www.hindalco.com
CIN No. L27020MH1958PLC011238
HIN
DA
LC
O IN
DU
ST
RIE
S L
IMIT
ED
AN
NU
AL
RE
PO
RT
20
15
-1
6
Cover.indd 1Cover.indd 1 8/17/2016 2:56:43 PM8/17/2016 2:56:43 PM