BOD New 04-05 - HINDALCO
122
H I N D A L C O I N D U S T R I E S L I M I T E D
-
Upload
khangminh22 -
Category
Documents
-
view
1 -
download
0
Transcript of BOD New 04-05 - HINDALCO

H I N D A L C O I N D U S T R I E S L I M I T E D

(1)
ALUMINIUM BUSINESSMr. Sashi K. Maudgal, Chief Marketing OfficerMr. Shankar Ray, Joint President (Chemicals & International Trade)Mr. Sumit Banerjee, Joint President (Foil & Wheel)Mr. S. M. Bhatia, Chief Operating Officer – Demerged Indal UnitsMr. Amit Basu, Joint President (HR) – Demerged Indal Units
Renukoot UnitMr. Ratan K. Shah, Chief Officer – OperationsMr. R.P. Shah, Chief Manufacturing OfficerMr. Rahul Mohnot, Jt. Executive President (F & C)Mr. Ajey Srivastava, Joint President (Fabrication)Mr. S.C. Tandon, Joint President (Reduction)Mr. J. Bhowmik, Joint President (Renusagar Power)
Aditya AluminiumMr. S. N. Bontha, CEO
Utkal AluminaMr. S. Marar, CEO
COPPER BUSINESSMr. P.Balakrishnan, Executive PresidentMr. A.K. Saxena, Joint Executive President(Manufacturing)Mr. P.S. Ghose, Joint Executive President(Projects)Mr. J.P. Paliwal, Joint Executive President(Commercial)Mr. B.M. Sharma, Joint Executive President(Marketing)Mr. Sanjay Loyalka, CEO, Copper Mines(Australia)
CORPORATEMr. S. Talukdar, Deputy CFOMr. Kim Freeman, COO (Mining)Mr. Pratik Roy, Chief People OfficerMr. Barry Marshall, Head-Risk Management & Business Development
BOARD OF DIRECTORSMr. Kumar Mangalam BirlaChairmanMrs. Rajashree BirlaMr. C.M. ManiarMr. E.B.DesaiMr. S.S. KothariMr. M.M.BhagatMr. K.N.BhandariMr. A.K. AgarwalaMr. D. BhattacharyaManaging Director
KEY EXECUTIVESCHIEF FINANCIAL OFFICERMr. R.K. KasliwalGroup Executive President
COMPANY SECRETARYMr. Anil Malik
AUDITORSSinghi & Co., Kolkata
COST AUDITORSR. Nanabhoy & Co., MumbaiMani & Co., Kolkata
INDEPENDENTAUDITORS (US GAAP)KPMG, Mumbai
H I N D A L C O I N D U S T R I E S L I M I T E D
(2)
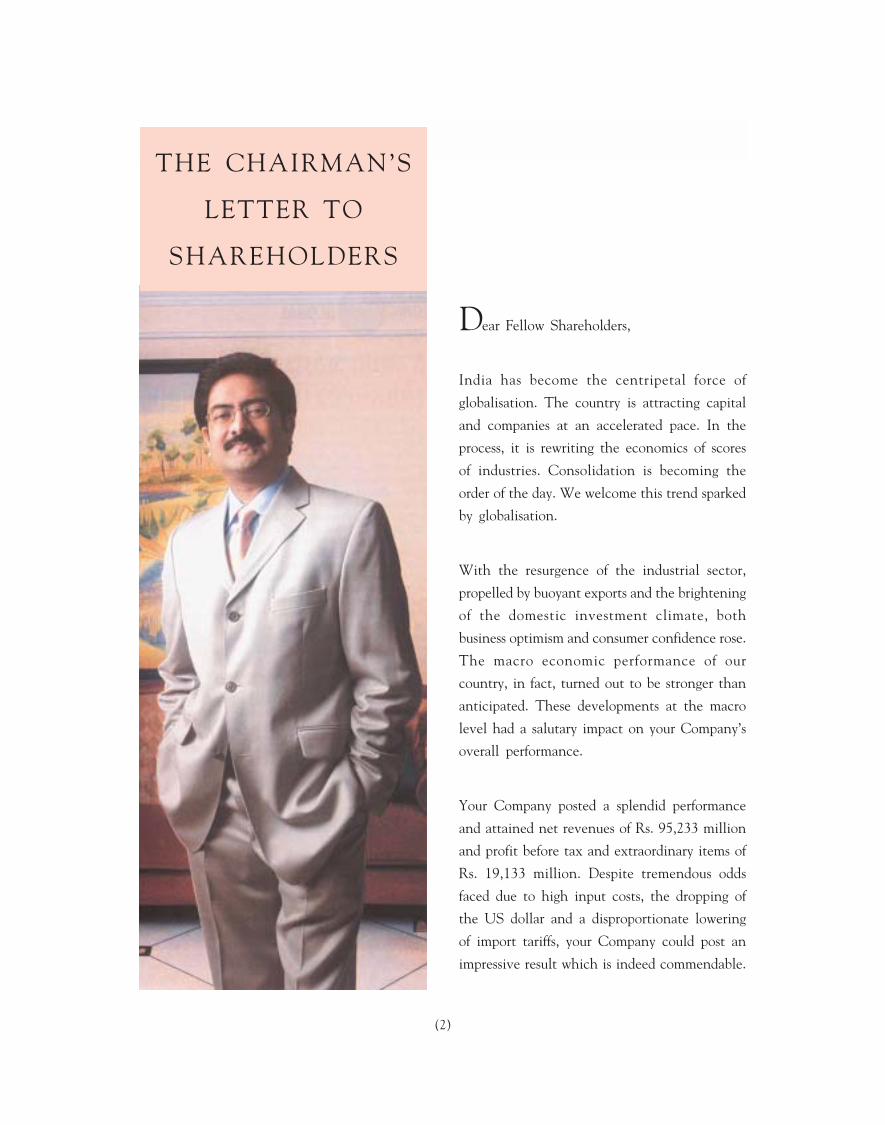
Dear Fellow Shareholders,
India has become the centripetal force of
globalisation. The country is attracting capital
and companies at an accelerated pace. In the
process, it is rewriting the economics of scores
of industries. Consolidation is becoming the
order of the day. We welcome this trend sparked
by globalisation.
With the resurgence of the industrial sector,
propelled by buoyant exports and the brightening
of the domestic investment climate, both
business optimism and consumer confidence rose.
The macro economic performance of our
country, in fact, turned out to be stronger than
anticipated. These developments at the macro
level had a salutary impact on your Company’s
overall performance.
Your Company posted a splendid performance
and attained net revenues of Rs. 95,233 million
and profit before tax and extraordinary items of
Rs. 19,133 million. Despite tremendous odds
faced due to high input costs, the dropping of
the US dollar and a disproportionate lowering
of import tariffs, your Company could post an
impressive result which is indeed commendable.
THE CHAIRMAN’S
LETTER TO
SHAREHOLDERS

(3)
To take Hindalco’s strategic stake in Indal to its logical conclusion, all of the businesses of that
Company have been merged into Hindalco, with the exception of its foil business at Kollur.
To retain its edge, your Company has opted for further brownfield expansions and is exploring
greenfield ventures as well. The Alumina capacity at your Company’s Muri plant is being raised from
110,000 tpa to 500,000 tpa. Likewise, a plan for enhancement of capacity at Belgaum is under
evaluation. Our intent is to elevate the capacity significantly from 350,000 tpa to 650,000 tpa and to
ramp up high value special alumina from 91,000 tpa to 167,000 tpa. Concurrent to the Alumina
Expansion, your Company is also augmenting its smelter and captive power generation capacity at
Hirakud. The metal capacity is being enhanced from 65,000 tpa
to 146,000 tpa, while the power generation capacity is to increase
from 67.5 MW to 317.5 MW.
We have entered into MoUs with the Government of Orissa
and Jharkhand to set up a world-class aluminium complex and a
greenfield aluminium smelter respectively. These mark a
milestone in our goal of making Hindalco a global non-ferrous
metals powerhouse. Both these projects are subject to receiving
the necessary approvals, land and other infrastructural support
from the Governments of Orissa and Jharkhand. Once
commissioned, these projects will position Hindalco in the league
of the top ten global players.
Doubling the copper smelter capacity from 250,000 tpa to
500,000 tpa catapults your Company’s plant - Birla Copper to
become the world’s largest single location world-scale copper
smelter. Importantly, it brings us closer to our goal of being
among the “Top 15%” global, cost efficient copper makers.
Ramping up of Birla Copper’s capacity from 100,000 tpa in 1998 to 500,000 tpa which is a five-fold
leap in 7 years, is indeed a commendable feat. It also enables us to sweat our assets optimally,
enabling us to leverage the Dahej jetty and infrastructural facilities to the maximum.
“Doubling the copper smelter
capacity from 250,000 tpa to
500,000 tpa catapults your
Company’s plant - Birla Copper to
become the world’s largest single
location world-scale copper smelter.
Importantly, it brings us closer
to our goal of being among the
“Top 15%” global, cost efficient
copper makers.”

(4)
I would also like to share with you that in the Copper business too our aspiration is to be a world-
class, globally competitive, integrated copper player. To do so, apart from the Nifty and Mt. Gordon
mines, which we have acquired in the last three years, we are exploring getting new mines in the
South-East Asian and the Australian region. Nifty and Mt. Gordon will eventually contribute
20 per cent of our copper concentrate requirement at Dahej.
Unrelenting sweating of the assets, a tight rein on costs, extremely prudent financial management,
the leadership position that its aluminium and copper businesses enjoy and above all, its strong
fundamentals, in my view, have a collective propitious impact on your Company’s future. This is
notwithstanding, the challenges that both the businesses will continue to face.
Globally the demand for aluminium grew by 10 per cent last year on the back of strong demand from
China. In 2005, we peg growth at a moderate 4 to 5 per cent due to the softening demand growth in
the US, Western Europe and China.
For us in India, the tidings are good. Indian domestic
consumption was up by 9.5 per cent in the year under
review, driven by a double digit growth in aluminium forms
of castings, extrusions and wire rods used in the
transportation, building and electrical sectors. The
continued growth in the Indian economy is expected to
heighten activities in these sectors. Collectively they
account for over 65 per cent of the total aluminium usage.
With our GDP growth slated to be around 7 per cent for
the ensuing year, we expect the domestic aluminium
demand to grow at sustained levels of 8 per cent.
In so far as it relates to copper, global copper consumption
in 2005 is estimated to grow at a moderate 2.4 per cent
after a growth of 8.8 per cent in 2004. China would
continue to be the main driver with a consumption growth
of 9.5 per cent. Given the increased availability of Copper Concentrate the demand/supply situation
will equalize after experiencing a huge demand/supply gap of approximately 800,000 tonnes in 2004.
“Unrelenting sweating of the assets,
a tight rein on costs, extremely
prudent financial management, the
leadership position that its
aluminium and copper businesses
enjoy and above all, its strong
fundamentals, in my view, have a
collective propitious impact on your
Company’s future.”

(5)
In India the user segments such as winding wire, power cables, the transformer industry and continued
increased export of down stream products supporting higher Deemed Export sales will help the
copper sector chug along. Regrettably, the industry is greatly disadvantaged as non-value added
imports from Sri Lanka under the FTA continue to adversely impact the domestic sales.
A large number of Smelters are taking their annual maintenance shutdown during the first quarter of
the financial year 2006. No major new Smelters other than those already in the pipeline are reported
to come on stream. In a scenario of high copper and gold prices, mines would continue to produce
more. The market would therefore remain in surplus, and hence the annual Tc/Rc for 2006 is
expected to further improve in favour of the Smelters.
We continue to look forward to a period of high growth both in revenues and earnings.
I would like to take this opportunity to place on record, your Board and my personal appreciation of
the dedication and uncompromising commitment of an overwhelming majority of your Company’s
employees. They have enabled us build a culture of meritocracy.
Aditya Birla Group – In Perspective
I am pleased to share that much of the consolidation that we
had embarked upon is now behind us. Going forward, our accent
is on accelerated growth as we stand at an inflection point. In
each of our major businesses, scaling up of capacities and services
will be necessary. Our road-map includes exploring further
acquisitions and leveraging upon both greenfield and brownfield
opportunities. Our plans are well under way.
The completion of the acquisition of UltraTech Cement (the
erstwhile Cement business of Larsen & Toubro), has positioned
Grasim Industries as the 8th largest Cement player in the world.
By the turn of the decade, significant additional capacities will
also be added.
“Our road-map includes
exploring further acquisitions
and leveraging upon both
greenfield and brownfield
opportunities. Our plans are
well under way.”
(6)
As a step up to fortify our Pulp operations in the Viscose Staple Fibre business, we have signed a
Framework Agreement with the Province of New Brunswick for the acquisition of St. Anne Nackawic
Pulp Mill, in partnership again with Tembec. To become self-sufficient in pulp, we are exploring the
setting up of Greenfield pulp plants globally. This strategy is consistent with our game-plan of
reinforcing our competitive edge in the Cellulosic man-made fibre sector through setting up fully
integrated operations virtually from the “Forest to the Fabric” stage.
Our Carbon Black Plant in Egypt has become the largest
producer in the world. In China, at the Liaoning Carbon
Black Plant, we are scaling up the capacity significantly.
Today, we are the fourth largest Carbon Black player in
the world, and we hope to rise in the rank.
In essence, our vision as a Group is to be a premium
global conglomerate with a clear focus on each business.
Our focus is both top-line and bottom-line growth and
not growth for the mere sake of growth.
Focus on People
Being essentially a meritocracy and a people’s organization, our attention in the people area remains
unwavering. We are enhancing the quality and the pace of the institutionalization of our systems and
processes. These now embrace the entire life cycle of the employees’ engagement with the organization.
Several new initiatives have been taken towards the well-being of our employees, particularly in the
area of healthcare, education of their children and other critical aspects that can have a significant
bearing on his or her performance.
“Our vision as a Group is to be a
premium global conglomerate with a
clear focus on each business. Our
focus is both top-line and bottom-line
growth and not growth for the mere
sake of growth.”

(7)
Our focus on managerial capabilities is getting much sharper. We are proactively addressing the need
to build a robust leadership pipeline. International firms have been enlisted by us to assess the talent
and the potential in our Group to meet our future growth
aspirations. I have also impressed upon our management
teams that it is our collective responsibility to spot talent,
track it and help spawn leaders.
Let me reiterate, our aspiration is to hone capabilities
not for an Indian manager who is posted overseas, but for
a world-class manager who simply happens to be an
Indian.
Finally, I believe few organizations can take pride in the
quality of competence, passion and commitment that we
find here. We have the organizational will, discipline and
people power to achieve our stretched ambition.
Best regards,
Yours sincerely,
Kumar Mangalam Birla
Date: 30th April, 2005
“Our focus on managerial
capabilities is getting much sharper.
We are proactively addressing the
need to build a robust leadership
pipeline. International firms have
been enlisted by us to assess the
talent and the potential in our
Group to meet our future growth
aspirations. I have also impressed
upon our management teams that
it is our collective responsibility
to spot talent, track it and
help spawn leaders.”

(8)
(Rs. in Millon)
2004-05*** 2003-04 2002-03** 2001-02 2000-01 1999-00 1998-99 1997-98 1996-97 1995-96 1986
PROFITABILITY MnUS$*
Gross Sales &Operating Revenues 2,396 104,804 68,199 55,024 26,595 25,836 23,076 20,131 16,707 13,083 14,222 3,218
Net Sales &Operating Revenues 2,177 95,233 62,084 49,856 23,314 22,754 20,312 17,670 14,733 11,571 12,518 2,483
Operating Profit 520 22,766 15,003 12,972 10,060 10,622 9,450 7,916 6,156 4,425 5,700 251
Other Income 62 2,700 2,400 1,662 1,989 1,221 1,337 1,305 1,176 1,592 1,675 18
Interest Charges 39 1,700 1,772 1,365 456 619 597 836 723 489 616 78
Depreciation 106 4,633 3,175 2,642 1,543 1,424 1,353 1,246 776 423 348 126
Profit before Tax &Extraordinary Items 437 19,133 12,456 10,627 10,050 9,801 8,837 7,138 5,832 5,105 6,411 34
Current Tax 130 5,705 2,606 2,520 2,570 3,020 2,485 1,470 870 1,202 2,400 -
Deferred Tax 1 43# 1,461 653 620 - - - - - - -
Net Profit beforeExtraordinary items 306 13,385 8,389 7,455 6,860 6,781 6,352 5,668 4,962 3,903 4,011 34
Net Profit 304 13,294 8,389 5,821 6,860 6,781 6,124 5,668 4,962 3,903 4,011 34
Dividend Payout(Including Dividend tax) 48 2,120 1,721 1,408 1,005 985 691 532 430 369 298 20
Retained Profit 255 11,174 6,668 4,413 5,855 5,796 5,433 5,135 4,532 3,534 3,714 14
Foreign ExchangeEarnings on Exports 595 26,052 12,951 10,283 3,374 3,763 3,123 1,655 1,702 1,566 1,054 1
BALANCE SHEET
Gross Fixed Assets(including CWIP andRevaluation)**** 2,308 100,958 71,262 64,704 63,168 56,365 53,450 52,055 36,205 30,812 25,046 3,784
Net Fixed Assets(excluding Revaluation) 1,583 69,265 52,079 48,634 26,951 21,520 20,009 19,950 18,929 14,202 8,845 806
Investments 846 37,021 33,772 26,484 19,853 19,175 11,328 10,628 10,012 7,144 9,455 224
Net Current Assets 448 19,582 18,325 19,233 13,032 10,241 12,409 8,851 6,282 7,059 6,339 399
Capital Employed 2,877 125,869 104,176 94,351 59,836 50,936 43,746 39,429 35,223 28,405 24,640 1,429
Loan Fund 869 38,000 25,646 23,950 9,577 7,147 5,754 6,870 7,799 5,513 5,282 827
Deferred Tax Liability 258 11,297 9,951 8,490 4,443 - - - - - - -
Net Worth 1,750 76,572 68,579 61,911 45,816 43,789 37,992 32,559 27,424 22,892 19,357 602
Net Worth represented by :-
Share Capital 21 928 925 925 745 745 745 745 745 745 496 184
Reserves & Surplus(Excluding Revaluation Reserves ) ***** 1,729 75,644 67,654 60,986 45,071 43,044 37,247 31,814 26,679 22,147 18,861 418
1,750 76,572 68,579 61,911 45,816 43,789 37,992 32,559 27,424 22,892 19,357 602
Book Value per share(US$ / Rs.) 19 825.30 741.59 669.24 615.26 588.00 510.19 437.24 368.27 307.41 389.92 44.97
Capital Expenditure 336 14,689 6,690 10,373 7,009 2,995 1,474 2,311 5,549 5,786 2,937 336
Market Capitalisation(at year end share price) 2,743 120,023 112,556 49,428 57,338 57,447 54,740 34,701 49,892 67,876 39,050 1,165
* 1 US$= Rs. 43.7500
** Figures for 2002-03 onwards include figures relating to the copper business acquired from Indo Gulf Corporation Ltd with effect from 01.04.2002.
*** Figures for 2004-05 include figures relating to the Aluminium business after the merger of demerged undertakings of Indal with effect from 01.04.2004.
**** Fixed assets of Aluminium Business have been reinstated at its original cost in 2002-03.
***** Net of Miscellaneous Expenditure.
# Net of Provision for Deferred Tax Liability for earlier years written back.
F I N A N C I A L H I G H L I G H T S

(9)
F I N A N C I A L H I G H L I G H T S(Rs. in Millon)
2004-05** 2003-04 2002-03* 2001-02 2000-01 1999-00 1998-99 1997-98 1996-97 1995-96 1986
RATIOS & STATISTICS
Operating Margin % 23.90 24.17 26.02 43.15 46.68 46.53 44.80 41.78 38.24 45.54 10.12
Gross Margin % 24.96 25.18 26.62 49.73 49.33 50.17 47.45 44.86 47.77 54.00 7.71
Net Margin % 13.96 13.51 11.68 29.42 29.80 30.15 32.08 33.68 33.73 32.05 1.38
Interest Cover(EBITDA/Interest) Times 14.98 9.82 10.72 26.43 19.14 18.08 11.02 10.13 12.31 11.98 3.06
Gross Interest Cover(EBITDA/Gross Interest) Times 12.47 8.77 7.51 13.50 14.92 17.76 10.70 7.23 8.63 11.98 3.06
Pre-tax Interest Cover (EBIT/Interest) Times 12.26 8.03 8.79 23.04 16.84 15.81 9.53 9.06 11.44 11.41 1.44
ROACE % 17.45 14.33 13.57 18.97 22.01 22.68 21.36 20.61 21.09 32.02 9.68
ROAE*** % 17.88 15.10 15.05 16.70 16.58 18.01 18.90 19.72 18.48 23.44 6.05
Net Sales / Total Assets Times 0.76 0.60 0.53 0.39 0.45 0.46 0.45 0.42 0.41 0.51 1.74
Debts Equity Ratio Times 0.47 0.36 0.37 0.20 0.16 0.14 0.20 0.27 0.21 0.22 1.21
Debt Equity ( net of cash& cash equivalents) Times 0.07 0.14 0.20 - 0.00 - 0.09 0.20 0.14 0.10 0.90
Debts Capitalisation Ratio Times 0.30 0.25 0.25 0.16 0.14 0.13 0.17 0.21 0.17 0.18 0.58
DPS Rs 20.00 16.50 13.50 13.50 12.00 8.00 6.50 5.25 4.50 6.00 1.50
EPS Rs 143.28 90.71 62.92 92.12 91.06 82.23 76.11 66.64 52.50 80.79 2.56
CEPS Rs 193.21 125.04 91.49 112.85 110.18 100.41 92.85 77.06 58.18 87.81 12.00
No. of Equity Shareholders No 117,721 117,124 153,606 35,955 37,925 39,769 38,780 37,294 37,656 38,577 20,638
No. of Employees No 19,687 13,675 13,752 12,955 12,892 12,964 12,968 12,445 11,935 11,388 8,143
Average Cash LME(Aluminium) US$/MT 1,779 1,496 1,354 1,395 1,533 1,473 1,291 1,566 1,505 1,723 1,450
Average Cash LME(Copper) US$/MT 3,000 2,046 1,586 - - - - - - - -
PRODUCTION
Calcined Alumina MT 1,159,664 591,297 501,270 494,724 476,700 453,305 421,486 361,520 333,223 341,031 194,576
Aluminium Metal MT 409,068 323,184 266,837 261,338 251,492 248,930 240,926 200,304 166,272 175,398 123,425
Wire Rods MT 62,392 58,233 50,789 52,203 43,946 49,018 51,197 45,482 42,704 45,865 30,443
Rolled Products MT 175,734 77,069 73,171 70,113 62,811 58,690 44,668 34,193 18,302 31,378 26,498
Extruded Products MT 28,551 18,194 18,973 16,250 18,602 14,959 11,995 12,389 11,798 12,589 9,064
Foil MT 26,177 18,560 19,235 17,209 12,756 7,537 1,551 26 - - -
Wheel Pcs 107,279 99,091 56,117 22,889 23,058 5,451 - - - - -
Copper CathodesProduced MT 217,138 186,611 185,159 - - - - - - - -
Continuous CastCopper Rods MT 88,298 91,380 76,766 - - - - - - - -
DAP and Complexes MT 286,264 231,903 315,785 - - - - - - - -
Gold Kgs 5,155 6,908 5,451 - - - - - - - -
Silver Kgs 36,595 31,513 30,500 - - - - - - - -
* Figures for 2002-03 onwards include figures relating to the Copper business acquired from Indo Gulf Corporation Limited with effect from 01.04.2002.** Figures for 2004-05 onwards include figures relating to the Aluminium business after the merger of demerged undertakings of Indal with effect from 01.04.2004.* ** ROAE is based on profit before extraordinary items.
(10)
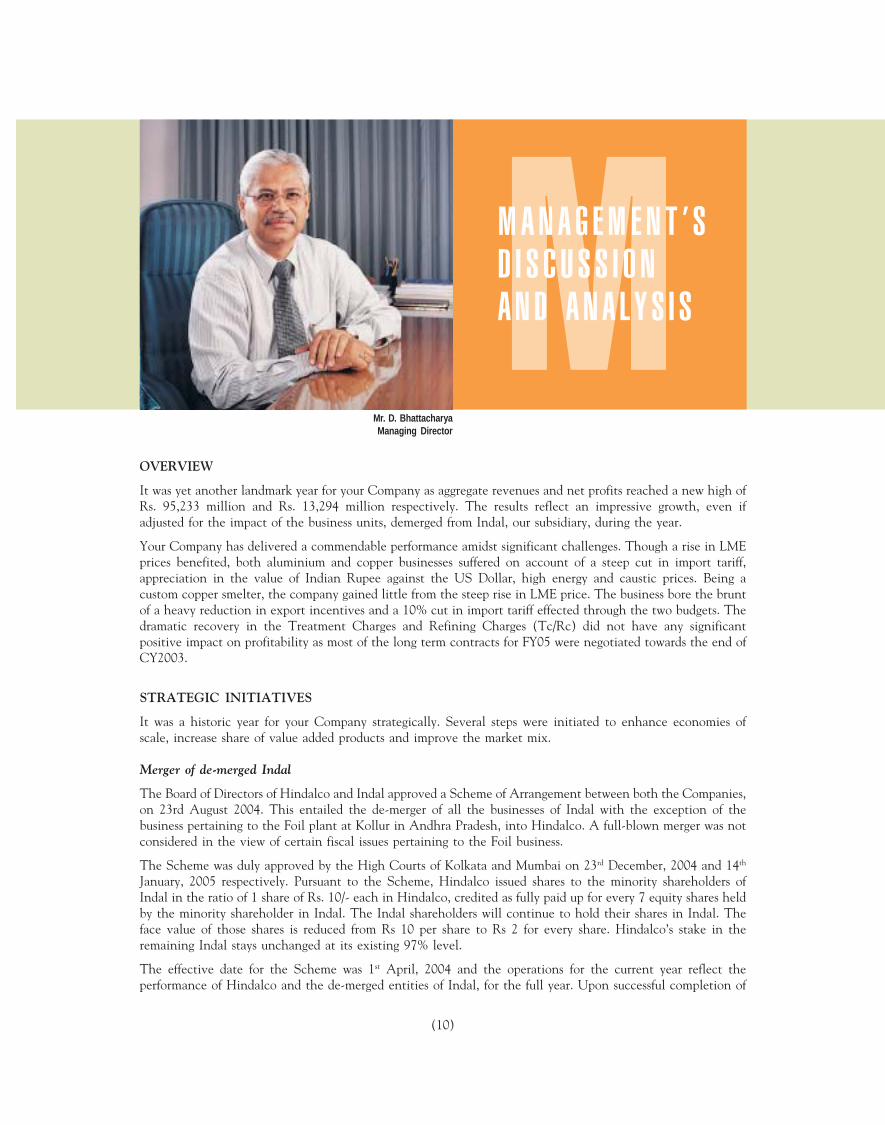
OVERVIEW
It was yet another landmark year for your Company as aggregate revenues and net profits reached a new high ofRs. 95,233 million and Rs. 13,294 million respectively. The results reflect an impressive growth, even ifadjusted for the impact of the business units, demerged from Indal, our subsidiary, during the year.
Your Company has delivered a commendable performance amidst significant challenges. Though a rise in LMEprices benefited, both aluminium and copper businesses suffered on account of a steep cut in import tariff,appreciation in the value of Indian Rupee against the US Dollar, high energy and caustic prices. Being acustom copper smelter, the company gained little from the steep rise in LME price. The business bore the bruntof a heavy reduction in export incentives and a 10% cut in import tariff effected through the two budgets. Thedramatic recovery in the Treatment Charges and Refining Charges (Tc/Rc) did not have any significantpositive impact on profitability as most of the long term contracts for FY05 were negotiated towards the end ofCY2003.
STRATEGIC INITIATIVES
It was a historic year for your Company strategically. Several steps were initiated to enhance economies ofscale, increase share of value added products and improve the market mix.
Merger of de-merged Indal
The Board of Directors of Hindalco and Indal approved a Scheme of Arrangement between both the Companies,on 23rd August 2004. This entailed the de-merger of all the businesses of Indal with the exception of thebusiness pertaining to the Foil plant at Kollur in Andhra Pradesh, into Hindalco. A full-blown merger was notconsidered in the view of certain fiscal issues pertaining to the Foil business.
The Scheme was duly approved by the High Courts of Kolkata and Mumbai on 23rd December, 2004 and 14th
January, 2005 respectively. Pursuant to the Scheme, Hindalco issued shares to the minority shareholders ofIndal in the ratio of 1 share of Rs. 10/- each in Hindalco, credited as fully paid up for every 7 equity shares heldby the minority shareholder in Indal. The Indal shareholders will continue to hold their shares in Indal. Theface value of those shares is reduced from Rs 10 per share to Rs 2 for every share. Hindalco’s stake in theremaining Indal stays unchanged at its existing 97% level.
The effective date for the Scheme was 1st April, 2004 and the operations for the current year reflect theperformance of Hindalco and the de-merged entities of Indal, for the full year. Upon successful completion of
MM A N A G E M E N T ’ S
D I S C U S S I O N
A N D A N A L Y S I S
Mr. D. BhattacharyaManaging Director

(11)
the scheme, your Company has also re-organised its production as well as sales and marketing divisions towardsensuring seamlessness in operations and tighter control over costs. We are confident that this value accretivemove will yield desired results from the current fiscal onwards.
Brownfield expansion in Copper
Your Company has successfully stabilized the smelter capacity of 250,000 tpa, expansion of which was completedtowards the end of FY04. The capacity ramp-up has been satisfactory.
Towards attaining global size, scale and competitiveness and to reap benefits of the significant deficit in theAsian markets, your Company pursued yet another expansion of the copper smelter to 500,000 tpa. The projectimplementation is nearing completion and in fact significantly ahead of planned timelines. Commissioningtrials have begun in April 2005 and the commercial production is likely to start soon.
On successful stabilisation of the expanded smelter, your Company will be amongst the Top-10 global producersof copper and will also be the largest custom smelter in a single location anywhere in the World. Moreimportantly, it will also enable your Company to fully exploit the infrastructure potential at Dahej and move tothe coveted position of being amongst Top-15% of lowest cost copper producers in the World.
Significant growth plans initiated
Simultaneously, towards realizing the vision of attaining global size and scale and further improving costcompetitiveness, your Company pursued several growth projects in alumina and aluminium. These includelow cost brownfield expansion of alumina capacities at Muri and Belguam as well as smelting capacity atHirakud, which is already under implementation. In addition, your Company is also implementing a 1 - 1.5million tpa greenfield alumina plant in Orissa through Utkal Alumina, a joint venture with Alcan. Yourcompany holds 55% equity stake in the joint venture.
Apart from these, your Company is also exploring opportunities for further growth in alumina and aluminium.Towards this end, your Company has signed a Memorandum of Understanding each with the Governments ofJharkhand and Orissa, details of which are outlined elsewhere in this report. On their successful completionthese projects will catapult your company into the league of “Global Top-10” and further strengthen its costcompetitiveness in the global aluminium industry.
Aluminium Cash Price on LME
1500
1600
1700
1800
1900
2000
2100
Mar
-05
Dec-0
4
Sep-0
4
Jun-
04
Apr-0
4
AI Cash
US$/MT

(12)
BUSINESS PERFORMANCE REVIEW
Your Company delivered top notch performance with the highest ever net profit of Rs. 13,294 million on arecord breaking turnover of Rs. 95,233 million. The Aluminium business accounted for 55% of the totalrevenues and 77% of Earnings before Interest & Tax, while the balance came from the Copper business.
Aluminium Copper Unallocable Total
Rs. Mn Share Rs. Mn Share Rs. Mn Rs. Mn
Net Sales & Operating Revenue 52,521 55% 42,712 45% - 95,233
PBIT 15,957 77% 2,538 12% 2,338 20,833
Capital Employed 55,129 44% 37,813 30% 33,021 125,963
ROCE (%) 29% 7% 17%
PBIT Margins (%) 30% 6% 22%
ALUMINIUM BUSINESS
It was an eventful year for the Aluminium business due to the following reasons:
• Production scaled new heights with alumina volumes nearing 1.16 million tonnes and primary metalcrossing the 400,000 tonne mark.
• Business income rose to record level of Rs. 52,521 Million. In fact it was up by 17.5% on a comparablebasis even after excluding results of the newly merged Indal.
• The PBDIT margins reached 42%, the highest level in last 5 years.
• Aluminium exports of your Company crossed the Rs. 10,000 million mark to reach Rs. 10,890 million
Your Company recorded the highest production across all products. The sales volumes crossed previous highs,except in primary metal as more metal was used in-house for value added products. Realisations too registeredincrease in all the product categories. The highlight of the year’s performance was the contribution of valueadded products (VAP) to sales. At 198,615 MT, the VAP constituted 47% of metal sales tonnage and 54% ofmetal revenues.
The Aluminium Gallery : A conceptpromoting the customer products to helpgrow the market. The Gallery at CenturyBhavan, Mumbai showcases a range ofarchitectural system.

(13)
Operational Review
Product-wise break-up of sales
Products Net Sales (Rs. Million) Sales Volume (MT)
FY05 FY04 FY05 FY04
Hydrate and Alumina (StandardMetallurgical & Specials) 5,696 - 322,828 -
Aluminium Ingots/Billets 14,375 13,653 158,518 170,319
Rolled Products 16,380 5,852 144,158 58,175
Extruded Products 3,379 1,927 ..28,453 18,352
Conductor Redraw Rods 5,908 4,991 62,841 58,778
Aluminium Foils 4,543 2,574 26,004 18,818
Aluminium Wheels 198 186 111,045 (Pcs) 105,975 (Pcs)
Note: This year’s results include performance of demerged Indal and hence are not comparable with those of last year.
Alumina
Total Alumina production stood at 1,159,664 MT while sales aggregated to 322,828 MT with balance captivelyconsumed for metal production. Revenues from third party sale of Alumina were Rs. 5,696 Million reflectingan average realisation of Rs. 17,643/MT, which is 46% higher than last year when the business was owned byIndal.
Primary Metal
The primary metal production was at 409,068 MT, pegging the capacity utilisation level at 90% compared to94% last year. However, excluding the Alupuram smelter which had been de-energised temporarily, the utilisationworks out to 100%. The sales tonnage at 158,518 MT was 7% less compared to last year, as a substantial partwas used for manufacturing value added products. Total revenues from primary metal sales rose by 5% on theback of improved pricing conditions. This is reflected in average metal realisation which grew 13% from Rs.80,162/MT to Rs. 90,682/MT. The realisations were higher on account of the strong LME prices.
Freshwrapp - Aluminium Kitchen Foil
(14)
During the year, the average LME price increased by 19% from $1,496/MT to $1,779/MT. However, this risedid not translate into an equivalent change in domestic prices due to the appreciation in the value of INRagainst the US$ and reduction in effective import tariff to 15% in January 2004 before being cut to 10%effective from March’05.
Redraw Rods
Your company produced 62,392 MT of Redraw Rods up by 7% over that of 58,233 MT in the previous year.The stable demand from electrical sector ensured good off-take and helped increase the total sales tonnage by7% to 62,841 MT. Revenues surged 18%; realisations increased by as much as 11% to Rs. 94,015/MT from Rs.84,906/MT during the previous year.
Value Added Products (VAP)
Your company has been striving to improve share of value added products, which now accounts for nearly 50%of aggregate metal sales. A well structured plan has been put into place to carry forward the strategy to expandthis market further. Already, considerable progress has been made through:
• Refinement and Institutionalization of Key Account Management practices.
• Identification of potential markets to substitute imports by customers.
• Setting up of a large distribution network covering the entire country and plans to further improve thedepth of coverage are on the anvil.
• De-risking of the distribution chain through channel financing.
• The Aluminium Gallery to showcase new products and applications in aluminium.
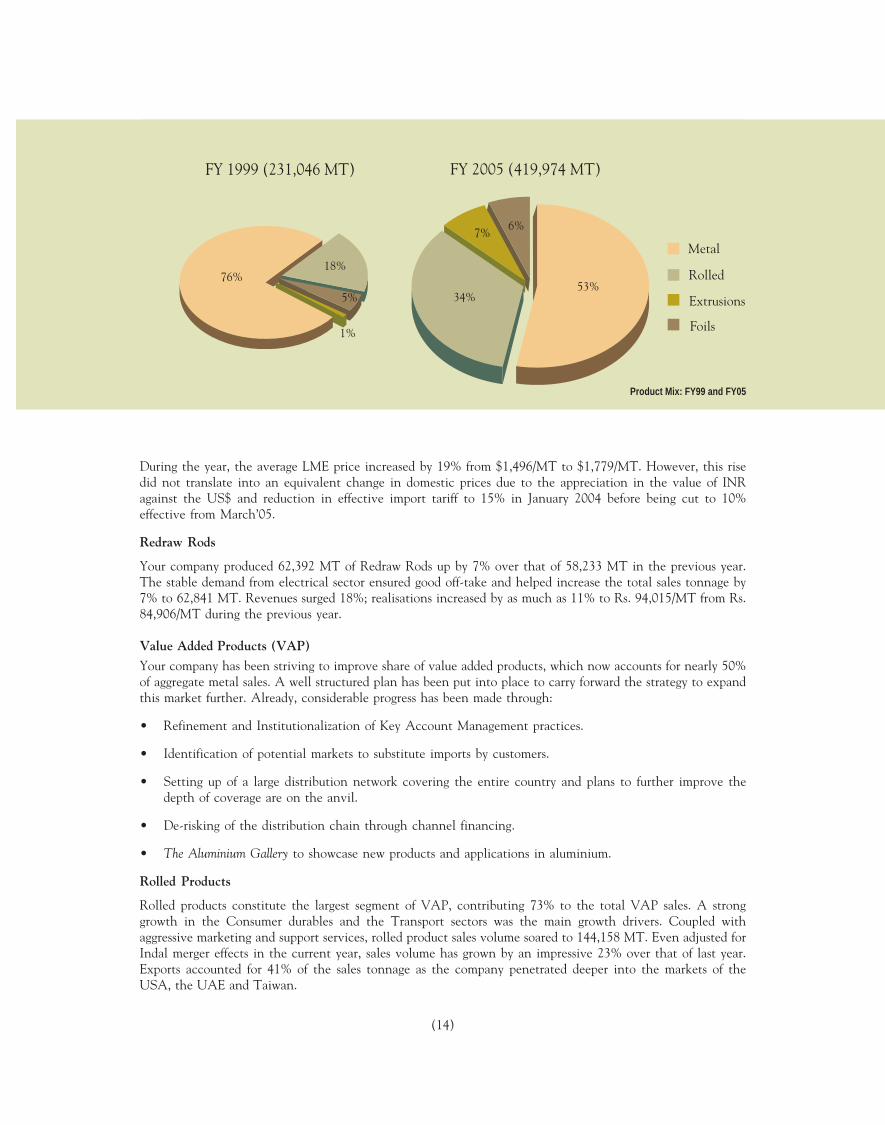
Rolled Products
Rolled products constitute the largest segment of VAP, contributing 73% to the total VAP sales. A stronggrowth in the Consumer durables and the Transport sectors was the main growth drivers. Coupled withaggressive marketing and support services, rolled product sales volume soared to 144,158 MT. Even adjusted forIndal merger effects in the current year, sales volume has grown by an impressive 23% over that of last year.Exports accounted for 41% of the sales tonnage as the company penetrated deeper into the markets of theUSA, the UAE and Taiwan.
Product Mix: FY99 and FY05
76%18%
5%
1%
53%34%
7%6%
Metal
Rolled
Extrusions
Foils
FY 2005 (419,974 MT)FY 1999 (231,046 MT)

(15)
The realisations grew by 15%, outperforming the trend in domestic metal prices, due to higher mark-up andricher product mix. As a result, the revenues from rolled products jumped to Rs. 16,380 million constituting37% of total metal sales.
Foils
Foils business is the second largest VAP segment accounting for 10% of total metal products sales. Aggregatesales volume climbed up to 26,004 MT garnering Rs. 4,543 million in revenues. The sales tonnage has risen by11% as compared to last year, even if adjusted of Indal merger effects. Meanwhile, average realisation moved up28% from Rs. 136,787/MT to Rs. 174,700/MT in FY05, reflecting 93% higher realisation over the ingot pricesas compared to 71% in the previous fiscal. The higher premium reflects the significant improvement in productmix and deeper penetration into the profitable niche segments of the end-user sectors.
Extrusions
The total production of extruded products stood at 28,551 MT and excluding the demerged Indal’s production,the output rose by 23%. Sales volume clocked 28,453 MT due to a high demand from construction andautomobiles sectors. Improved product range and development of new applications like Shuttering Systems,Auto Components and Aluminium Truck & Bus bodies also helped. Notably, this was achieved despite industrialunrest at the Alupuram plant, leading to a production loss for 5 months. The problem has since been resolvedand the plant is currently operating at full capacity. Average realisation improved by 13% YoY and pushed thesegment revenues to a new high of Rs. 3,379 million.
Wheels
Wheels business operates in a highly competitive environment with four major players and imports as majorsupply source. Your company increased its volumes by 5% and revenues by 6% to Rs.198 million in FY05. Theslow growth in realisation primarily reflects competitive pressures in the market as well as our consciousstrategy to widen product range, with a bias towards smaller cars in the popular segment. The latter move wasa conscious effort towards expanding the alloy wheels market for long term benefits.
Pricing & Profitability
LME prices started the year at $1,723/MT then declined to $1,575/MT in May before trending up to the 10year high of $2,032/MT in March and subsequently closed the year at $1,973/MT. This historically high levelwas accompanied by huge stock depletion on LME warehouses with aluminium inventories touching a mereone week of consumption at the year end.
Golden Foil Packaging

(16)
Supported by the LME and high demand for VAP, your Company realised better prices across all the VAPsegments, despite the appreciating rupee and fall in import tariffs. Higher share of VAP and a richer productmix resulted in higher premiums over metal.
Continuous efforts to improve efficiency, control over costs and higher volumes led to an all time high EBIT ofRs. 15,957 million. Business operating margins were maintained at 37% in FY05. This is commendable consideringthe sharp increases in cost of key inputs such as caustic soda, auxiliary chemicals as well as energy costs duringthe year.
Aluminium Outlook
Global Industry Outlook
The global aluminium industry witnessed a healthy growth of over 10% in CY04. Though the pace of growthmay not be similar to previous year, primary consumption is expected to remain firm on the back of a stronggrowth in China and South East Asia and a modest growth in the US and Latin America.
The US consumption is expected to grow, albeit at a slower pace as compared to a double-digit growthwitnessed in CY04. With the aerospace market recovering and the truck trailer market growing strong, expertsforecast the automotive sector consumption of the metal to be encouraging this year as well. The demand fromthe construction, machinery and electrical sectors will gain from an upturn in the investment spending. Theend-use sector will thus be able to sustain the demand.
With demand from Europe and Japan slowing down for the year, world primary aluminium demand is expectedto grow by 4-5% in 2005.
Asia continues to be the strongest engine for the growth in aluminium consumption world over, growing byalmost 13% in the last 3 years. While China remains the fastest growing region, the consumption growth in theSouth East Asian region is impressive. South Korea, Taiwan and Thailand will continue to remain strongconsumers of aluminium, the South East Asian region is expected to grow by a healthy 5.6% in 2005. Asia isexpected to witness 7-8% demand growth for 2005.
Aluminium production in Asia too has witnessed good growth in the recent times with production in theregion growing by a huge 23% in 2004. Notwithstanding, aluminium supplies continue to lag behind thedemand, resulting in a supply deficit of 4.2 million metric tons in 2004. During this period, China witnessed amarginal surplus and the rest of Asia witnessed a deficit of 4.8 million metric tons. Given the expectations of
Aluminium Chequered Sheets: Flooring & Panelling ApplicationsClosure Stock

(17)
continued strong growth in China and other Asian markets, the demand supply gap is expected to widen and isestimated to reach a high of 5.9 million metric tons by 2009.
Reflecting the positive outlook, industry experts forecast LME prices to remain firm and move in a range boundmanner in a band of $1,700 – 1,900 levels over the next 12-18 months.
Domestic Industry Outlook
The domestic sector outlook remains impressive, both in the immediate and long term. The market that hasgrown in excess of 10% last year is poised to grow at a healthy pace going forward as well, driven by robustdemand from the end-use segments.
The electrical sector has been the largest consumer of aluminium, accounting for 44% of the aluminiumconsumption. The demand from the sector has been growing at a healthy 10% during the year on the back ofreforms in the sector. The recent government initiatives (SEB restructuring, the New Electricity Act and thruston Transmission & Distribution) have created an environment for rising investments in the power sector. Thegovernment has set a capacity addition target of around 100,000 MW in the 10th plan (FY02-07) and the 11th
plan (FY07-12). This coupled with the favourable policy changes that allow power sales by captive producers tothird parties have created yet another opportunity for increasing private sector participation. We believe thatthe contribution from this segment will grow in the future as well.
The automotive sector is the second largest user of domestic aluminium. Consumption from the automotivesegment has grown by 17% driven by the demand in the automobiles sector and a significant increase in theintensity of aluminium consumption. The automobiles sector growth, having clocked 16% in FY05, is expectedto remain in double digits during the year boosted by demand for both 2-wheelers and passenger cars. Importantly,India is fast emerging as a global hub for automobiles as well as auto components, which is likely to fueldemand further.
The building and construction sector is also poised to grow further. The current housing shortage is estimatedto be around 19 million and industry experts forecast at least 7-8 million houses to be added every year. Theimproving affordability on the back of lower interest rates, stable real estate prices and continued fiscalincentives is driving the growth. This coupled with growing acceptance of aluminium for construction andincreasing standardisation of extruded products for construction would increase the sector’s confidence in usingaluminium products. With the Government now considering to allow 100% FDI in the retail sector there willbe a surge in retail malls with newer designs that will improve the usage of aluminium in construction. Thesector has been growing with a CAGR of over 9% in the past two years and we expect the growth to continueeven further.
Premium Quality Aluminium circlesfor pressure cookers and deep
drawing applications

(18)
Overall, we expect domestic aluminium consumption to grow by 7-8% in FY06.
Domestic prices continue to track the landed cost of imports and hence will follow LME trends, outlook forwhich remains positive. However the domestic premiums have fallen on account of the duty cuts in theprevious budget. The appreciation of the Rupee will also play a significant role in determination of thedomestic prices.
Business Outlook for Hindalco
The strong deficit in the neighbouring regions offers significant opportunity for India. Your Company is wellpositioned to capitalise on the emerging opportunity due to significant competitive strengths, acquired over theyears. Your Company is the domestic market leader and amongst the lowest cost producers globally. It benefitsfrom its fully integrated operations, superior operating efficiencies and cost effective access to abundant qualitybauxite in India. The changing power scenario in the country and the opening up of coal mining for captiveconsumers will add further strength going forward.
Aggressive growth plans
Towards capitalising on the emerging opportunities, your Company has chalked out an ambitious growth planthat is aimed at catapulting your company into the league of Top-10 producers of alumina and aluminium inthe World.
Keeping in mind the ongoing value shift in alumina, favourable demand-supply conditions in the growingmarkets of Asia and the significant advantages available for Indian producers, your company has decided topursue aggressive growth starting with Alumina. Towards this end, as mentioned earlier, we have embarked ontwo large brownfield expansions and a Greenfield joint venture with Alcan.
• First, we are expanding the refinery capacity at Muri from 110,000 tpa to 450,000 tpa. The project workhas already been initiated and is likely to be commissioned by FY07.
• The second expansion is planned at Belgaum, where the refinery capacity is being hiked up from 350,000tpa to 650,000 tpa. The project is currently under evaluation and if found attractive, is expected to becommissioned in 24 months from the zero date.
• To further strengthen our hold on the domestic market and embark on value added exports in the future,we also plan to de-bottleneck the Special Alumina capacity at Belguam.
Everlast Curvomatic SheetsAluva Bus Terminus

(19)
Simultaneous to these cost-effective brownfield expansions, your Company is also embarking on a greenfieldAlumina plant through Utkal Alumina - a 55% held joint venture with Alcan. Utkal will set up a 1.0 – 1.5 Mntpa alumina plant. The mining leases for over 195 million tonnes of bauxite in Orissa are in place, the landacquisition is completed and the shareholder agreement with Alcan has also been signed. Work on the projecthas already been initiated. The project is likely to be commissioned in 36 months from the zero date.
Metal growth: The next logical step
Simultaneous to aggressive growth plans in Alumina, towards reaping benefits of attractive metal opportunitiesin Asia and to further improve cost competitiveness, we are also pursuing opportunities in aluminium as well.
Towards this end, your Company is pursuing a low cost brownfield expansion of the metal capacity at itsHirakud smelter. The smelter capacity is being raised from 65,000 tpa to 146,000 tpa in two phases. Simultaneousefforts are on to modernise the Smelter by converting it from the Soderberg technology to a more efficientPre-bake technology. The power generation capacity is being hiked to 317.5 MW to complement the smelterexpansions.
MoUs with the Jharkhand and the Orissa Governments
Simultaneous to brownfield smelter expansion, your Company is pursuing a few Greenfield opportunities aswell. Towards this end, your Company has signed Memorandums of Understanding (MoUs) with the StateGovernments of Jharkhand and Orissa:
• In the State of Orissa, your Company proposes to setup an integrated greenfield aluminium project, with acapacity to produce a million tpa of alumina and 260,000 metric tpa of aluminium upon completion. Thiswill be supported by a 650 MW dedicated power plant, backed by dedicated coal mines. We have signed aMoU with the Government of Orissa for land, water, bauxite and coal mines, grid power back-up and othernecessary approvals/clearances required for the project.
• In the State of Jharkhand, we are considering the implementation of a greenfield smelter with 325,000 tpacapacity, backed by a 750 MW dedicated power with coal mines.
You may please note that these projects are still at the planning stage and their future is contingent upon athorough evaluation, coal and bauxite linkages falling into place.
On successful completion of the proposed expansions, post critical evaluation of their viability, your Company’ssmelting capacity will cross the 1-million mark over the next 5-6 years and place us amongst the league of
Hindalco Extrusions:Where Ideas Take Shape
(20)
“Global Top-10” in aluminium. This will also help reduce production costs significantly; thereby furtherstrengthening our competitive position in the aluminium industry, both domestic as well as global.
COPPER BUSINESS
It was an extremely challenging year for the copper business. The sharp rise in LME had a limited impact oncurrent operations, as it was largely a pass through for custom smelters like us. We continued to suffer onaccount of Tc/Rc that hit a new low in July 2004 before witnessing a sharp recovery during the second half.Since our contracts had already been negotiated for the CY2004, the impact of the recovery was not evidentuntil the fourth quarter as the benefit was contained to that period of the year.
Additionally, the copper business suffered on account of the accelerated pace of tariff changes as it was cuttwice to reach the level of 10% in Feb’05 from the 20% level prevailing during the previous fiscal. Thedifficulties got exacerbated due to heavy reduction in export incentives, INR appreciation against the USD,and rise in input costs.
Operational Review
Products Net Sales (Rs. Million) Sales Volume (MT)
FY05 FY04 FY05 FY04
CC Rods 14,774 11,266 87,924 91,537
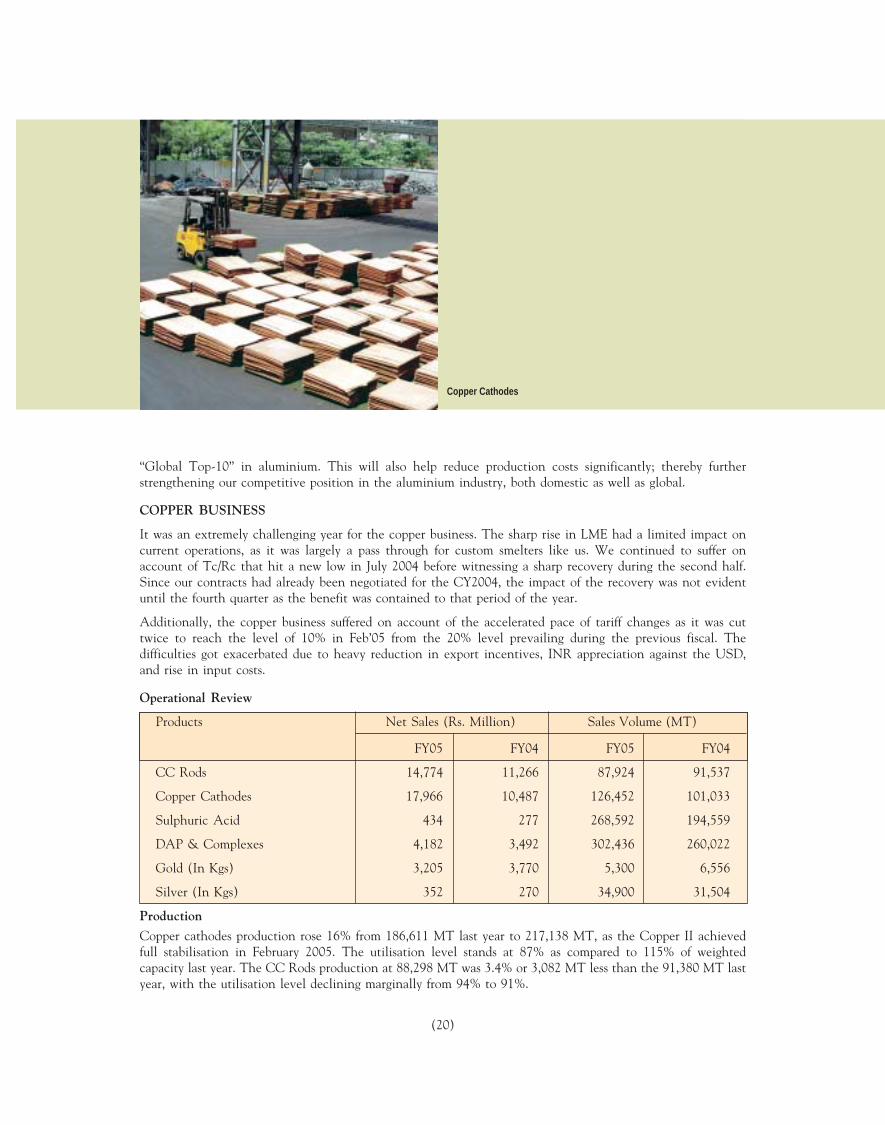
Copper Cathodes 17,966 10,487 126,452 101,033
Sulphuric Acid 434 277 268,592 194,559
DAP & Complexes 4,182 3,492 302,436 260,022
Gold (In Kgs) 3,205 3,770 5,300 6,556
Silver (In Kgs) 352 270 34,900 31,504
Production
Copper cathodes production rose 16% from 186,611 MT last year to 217,138 MT, as the Copper II achievedfull stabilisation in February 2005. The utilisation level stands at 87% as compared to 115% of weightedcapacity last year. The CC Rods production at 88,298 MT was 3.4% or 3,082 MT less than the 91,380 MT lastyear, with the utilisation level declining marginally from 94% to 91%.
Copper Cathodes

(21)
Sales
Copper revenues soared by 33% to Rs. 42,712 Million from Rs. 32,126 Million. Aggregate sales tonnage rose to214,376 MT a rise of 11% over 192,570 MT. With increasing penetration into the high deficit South East Asiaand Far Eastern markets, total export rose 16% to 112,001 MT making your Company the largest copperexporter in the country.
The volumes for copper cathodes are 25% up at 126,452 MT while that for CC Rods fell marginally by 4%.Domestic sales of CC Rods increased by 12% Y-o-Y and copper cathodes exports by 37% Y-o-Y. Your companymaintained its leadership position in the domestic market by raising its market share from 39% last year to 41%during the year under review.
To extract value from large quantities of by-products generated, your Company launched its fertilizer brandBirla Balwan. The exercise has already started showing results as DAP sales crossed 300,000 MT with a 16%increase and revenues by 20% to Rs. 4,182 Million.
The inverted duty structure for Gold and Silver makes their production an uneconomical proposition. Therefore,your company consciously scouts for concentrate with low gold content. In line with lower production, Goldrevenues were 15% lower at Rs 3,205 Million and quantity sold declined by 19% from 6,556 Kgs to 5,300 Kgs.
Pricing & Profitability
The rise in LME copper prices, led to higher revenues. However, as you are perhaps aware, the copper price onLME is largely pass-through in nature and does not contribute much to the bottomline. Therefore, the highLME prices have not brought any benefit to the company. The major factors affecting profitability are theTc/Rc, premium on value added products, domestic market premium, regional premium net of freight costs andvalue extracted from by-products.
As discussed earlier, the Tc/Rc for CY 2004 were contracted at a time when they were at historic lows. In fact,the higher LME copper prices increased the working capital requirement for your Company resulting inincreased interest and financial charges. The import tariff was brought down from 25% to 20% in January 2004,then further to 15% in July 2004 before being cut to 10% in February 2005. The export incentive was alsoreduced to Rs. 6,500/MT in November 2004. These fiscal changes reduced the domestic market premium andexport benefits earlier available to the company.
Overall profitability was constrained as EBIT declined from Rs. 3,097 Million in 2003-04 to Rs. 2,538 Million,as a fallout of the difficult business conditions as outlined above.
Copper Refinery at Dahej

(22)
Copper Outlook
Global Industry Outlook
The global copper industry witnessed a demand growth of over 8.5% in 2004, the strongest since the 1980s.The growth was backed by rising consumption from China and better industrial production in the US, Europeand the Asian region. The copper production growth in 2004 was lower at 5.7% and led to a deficit for theyear. Though demand growth is expected to slowdown in the rest of the world, strong consumption in Asiawould keep global demand growing at 3-4% for 2005.
Led by China, Asia may witness the strongest growth in copper consumption even in 2005. Demand fromChina is slated to grow in double digits during 2005 mainly due to the need for large investments in thecountry’s power sector. The sector, estimated to account for half of China’s total copper demand, is stillunderinvested and the Chinese government’s growth plans for the sector will ensure continued strong demandfor copper. Demand from the rest of Asia also remained firm in 2004 with the region emerging as a hub forconsumer durables and electronic components (key copper consumers). Consumption in 2005 is likely to slowdown as exports of these products fall. As a result experts feel that overall Asian demand growth too may slowdown to 5-6% for 2005 from 10% in 2004.
Production in the region too has been growing steadily with a growth of 10% during 2004. With supplies stilllagging demand and lack of additional smelting capacities in the region, experts forecast a deficit of around 2 –2.5 million tonnes in the Asian region. This provides an enormous opportunity to Indian producers for tappingthe export potential in the coming years, given the locational advantage they command over the westernproducers.
Outlook for copper prices and Tc/Rc
As stated earlier, the strong growth in demand, lagging supplies and subsequent fall in inventories have led tobuoyant LME prices with FY05 seeing copper prices touching a 15-year high of $3,453/MT towards the yearend. The average LME for the year was around $3,000/MT. With demand growth cooling off in the current yearand supplies likely to grow on expectations of the new smelter being commissioned in the year, experts feel thathigh copper prices may not be sustainable. For custom copper smelters, Tc/Rc outlook however is more critical,being the key determinant of sustainable profitability.
2400
2600
2800
3000
3200
3400
3600
Mar
-05
Dec-0
4
Sep-0
4
Jun-
04
Apr-0
4
Cu Cash
US$/MT
Copper Cash Price on LME
(23)
Tc/Rc rates have risen sharply after remaining weak throughout CY 2003 and hitting new lows in the first halfof CY 2004. From a low of US¢2-3/lb in July 2004, the spot rates have shot up to US¢25-30/lb by December2004 and have remained firm since then. Meanwhile, benchmark rates in the contract markets (as indicated byJapanese negotiated rates) have shot up from US¢10-12/lb in 2004 to US¢18-20/lb levels during the currentnegotiating season.
With most large mines increasing production to capture the high LME prices, experts forecast a surplus ofaround 500,000 MT of copper-in-concentrate and resultant high Tc/Rc rates for smelters. With increasedproduction from mines likely to continue in the coming year and most smelters having planned shutdowns formaintenance during the first half of 2005, there is the possibility of a surplus for copper in concentrate in 2005,leading to high Tc/Rc for the year.
Domestic Industry Outlook
Domestic demand outlook remains stable. The Jelly Filled Telecom Cables (JFTC), the largest copper consumingsegment, is likely to witness steady growth, after having recovered from a sharp fall in recent years. Coupledwith continuing strong growth in other key user segments such as winding wires, power cables and the transfersector, domestic demand is expected to grow by around 4-5% annually over the next few years. The continuingthreat of non-value added imports from Sri Lanka under FTA pose a significant challenge for domestic copperproducers.
The outlook for domestic copper producers remains optimistic given widening demand-supply gap in Asia,which provides an opportunity for direct exports. Deemed exports should also rise on the back of better outlookfor downstream product exports and strong competitive advantage enjoyed by the producers in India.
Business Outlook for Hindalco
Your Company is a domestic market leader with a 41% market share. Towards benefiting from growthopportunities, it has drawn a three pronged strategy:
• The first leg of the strategy focuses on sweating existing assets to attain global cost competitiveness.Simultaneous to its focus on stabilising Copper II operations (i.e., smelter expansion to 250,000 tpa), yourcompany is concentrating on a speedy ramp up of Copper III (i.e., smelter expansion to 500,000 tpa).Improved efficiencies and economies of scale will take your Company to the league of the “Top-15%”global producers in terms of cost.
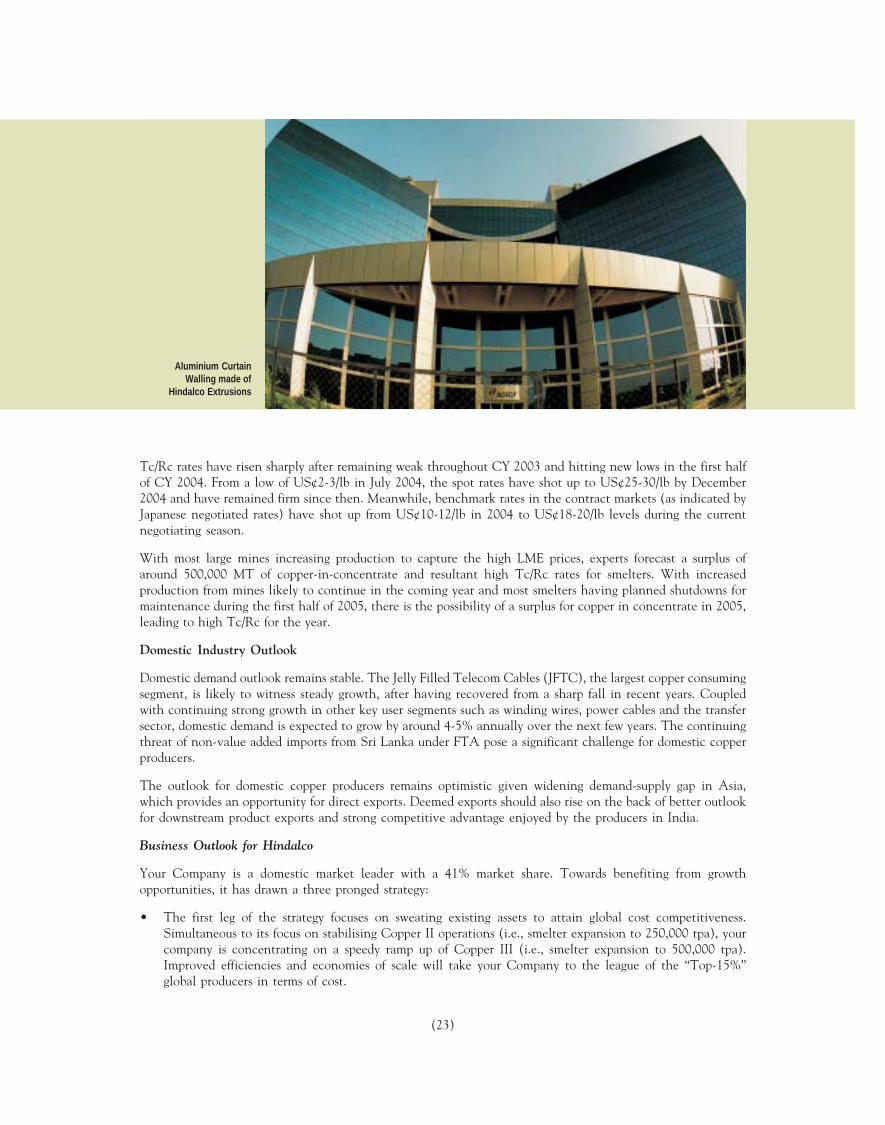
Aluminium CurtainWalling made of
Hindalco Extrusions

(24)
• Second, your company will strive to leverage benefits of concentrate supplies from captive mines to furtherimprove business profitability in the future. The Mt. Gordon mines in Australia has commenced supplieslast year and the Nifty Mines in Australia is expected to go onstream in 2005. The benefits of captivesupplies that are expected to account for 20% of expanded requirements will compliment the gains arisingout of cyclical improvement in the Tc/Rc markets.
• Finally, we will focus on further strengthening the presence in the Copper mining sector. While tappingthe copper value chain optimally, we strive to achieve a fair balance between captive and merchant sourcesfor concentrate requirements in the future.
Your Company will continue to benefit from its strategic strengths arising from its location on the coast,superior operating efficiencies and the benefits of low cost brownfield expansions, completed recently. Thevalue contribution from by-products and the captive jetty at Dahej will add further strength. More importantly,with the improved outlook for Tc/Rc as well as the increased volumes the business is poised to improve inprofitability.
FINANCIAL REVIEW & ANALYSIS
Highlights (in Rs. Million)
FY05 FY04Net Sales & Operating Revenues 95,233 62,084Other Income 2,700 2,400Total Revenues 97,933 64,484Total Expenditure 72,467 47,081Operating Profit 22,766 15,003Interest 1,700 1,772Depreciation 4,633 3,175Profit before Extraordinary Items and Tax 19,133 12,456Provision for Current Tax 5,705 2,606Provision for Deferred Tax 759 1,461Provision for Deferred Tax for earlier years written back (716) -Profit before Extraordinary Items 13,385 8,389Extraordinary Items 91 -Net Profit after Extraordinary Items 13,294 8,389Operating Margins 24% 24%
Note: This year’s results include performance of demerged Indal and hence are not comparable with those of last year.
Tata Motors, Pune - A Testimonyof the Durability of EverlastAluminium Roofing

(25)
Total Operating Revenues
Net Sales & Operating Revenues increased to Rs. 95,233 Million from Rs. 62,084 Million last year. As thecurrent year’s revenues include those of demerged Indal, it is therefore not comparable with last year’s revenues.Operating margins were flat at 24% as the gains in aluminium business were offset by constraints in the copperbusiness.
Other Income
Other Income rose by 12.5% to Rs. 2,700 Million, partly on account of inclusion of Indal, but mainly becauseof interest on income tax refund and higher income from current investments.
Interest
Total interest expenses declined by 4% from Rs. 1,772 Million in the previous year to Rs. 1,700 Million onaccount of repayment of debenture and foreign currency loans. Your Company also capitalized about Rs. 342Million of interest along with capital expenses.
Depreciation
There has been a 46% increase in depreciation charges, mainly due to inclusion of Indal’s assets and full yeardepreciation on Copper II plant at Dahej. Average depreciation rate for the year under review stands at 8% ascompared to 7.7% last year.
Taxes
The total effective tax rate at 34% remained almost the same as last year’s 33%, even though deferred tax ratedeclined to 4% from 12%. This was due to increase in effective current tax rate, from 21% to 30% in FY05, onaccount of lower tax depreciation and removal of export benefits under the Income Tax Act, 1962. Reversal ofthe deferred tax on account of decrease in income tax rate has resulted in a net addition of Rs. 716 Million tothe bottomline of the Company as extraordinary items.
Extraordinary Items
Your Company had to incur expenses amounting to Rs. 91 million for carrying out the scheme of amalgamationof demerged business of Indal with itself.
Net Profit
The net profit before extraordinary items for the year 2004-05 crossed the Rs. 10 billion mark at Rs. 13.29billion. The earnings per share rose by 58% to Rs. 143 per share, while the cash earnings per share at Rs. 193is higher by 55% as compared to Rs. 125 last year.
Everlast Colour Coated Roofing:Industrial and Residential
Applications

(26)
Cash Flow Analysis (In Rs. Million)
Cash Flow Highlights – FY05 Amount %
SOURCES OF CASHCash from operations 17,609 65.0%Non-operating income 2,061 7.6%Net debt Inflows 7,427 27.4%Total 27,097 100.0%APPLICATION OF CASHNet capital expenditure 11,205 43.8%Investment in subsidiaries 588 2.3%Other Treasury investments (Net) 10,358 40.4%Interest charges and lease rentals 1,740 6.8%Dividend payout – FY04 1,725 6.7%Total 25,616 100.0%Increase / (Decrease) in Cash and Cash Equivalents 1,481
Sources of Cash
Income from operations
Strong aluminium and copper prices combined with a better product and market mix significantly improvedthe realisations. As a result, the year ended with a sizeable Rs. 17,609 million in cash generated from operations.Your company’s cash flows remain strong.
Non-operating income
Your company manages a large treasury surplus, giving due considerations to safety, liquidity and returns in thatorder. It turned in a cash inflow of Rs. 2,061 million, constituting just about 8% of aggregate cash flows.
Net debt inflows
To finance its on going expansion projects, your company tied up a 10 year loan facility for Rs. 49,500 million,out of which the first tranche of Rs. 4,950 million was drawn down in March 2005. Your Company also raisedRs. 3,500 million through two Secured Redeemable Non-Convertible Debenture issues and draw down of
Mr. S.K. Maudgal, CMO andMr. R.K. Kasliwal, CFO receivingthe IMC Ramakrishna BajajNational Quality Award 2004 fromHon’ble Governor of MaharashtraMr. S.M. Krishna

(27)
US$ 50 million from a facility contracted last year. Total debt inflows added to Rs. 15,933 million whileoutflows amounted to Rs. 8,506 million resulting in net debt inflows of Rs. 7,427 million.
Application of Cash
Capital Expenditure
Your Company made investments to the tune of Rs. 11,205 million towards expansions and efficiencyimprovement projects. Of this, over Rs. 10,118 million crores was spent on expansion projects and the balancefor efficiency projects and normal activities.
Investment in Subsidiaries
Your Company has made net investments of Rs. 588 million in subsidiary companies. A sum of Rs. 981 millionwas invested in equity Shares of Birla Minerals Resources Pty Limited, towards providing finance for thedevelopment of the mines. A sum of Rs. 281 million was received from subsidiaries as repayment of loan. Thebalance is accounted for by the cash and cash equivalents of the demerged Indal net of expenditure on themerger.
Other Investments
Net investment has gone up by Rs. 10,358 million primarily in the form of bonds and units of debt schemes ofdomestic mutual funds.
Interest
Interest and Finance charges amounted to Rs. 1,700 million during the year, while the total payment towardsthese charges was Rs. 1,740 million.
Dividend
Your Board has recommended a dividend of Rs. 20 per share, which if approved, would entail an outflow of Rs.2,120 million including the dividend tax of Rs. 264 million. During the year, your company paid Rs. 1,725million towards dividend and dividend tax, which includes Rs. 1,721 million towards dividend (incl. dividendtax) for FY04 and the balance for earlier years.
The Award certificate and citation
(28)
Consolidated Financials
The consolidated financial result of Hindalco along with that of its subsidiaries and joint ventures is impressive.It reflects the robust performance of the company as shown below.
(In Rs. Million)
Consolidated Highlights FY05 FY04
Net Sales & Operating Revenues 101,055 82,233
Operating Profit 24,306 19,555
Profit before Extraordinary Items 12,978 9,945
Net Profit after Extraordinary Items 12,848 9,935
EPS (before Extraordinary Items) in Rs. 139.9 107.5
EPS (after Extraordinary Items) in Rs. 138.5 107.4
Net Worth 76,514 70,308
RISK MANAGEMENT
Your company is in the commodity business and therefore its revenues and consequently the profitability areexposed to the volatility and cyclicality of commodity prices. Moreover, its revenues are directly and indirectlylinked with exchange rate of US$ / Indian Rupee. Your company also assumes interest rate risk in course of itsbusiness.
A well established commodity risk management policy and foreign exchange management policy is in place toprovide a framework for management of price-risk exposures in these areas. The policy stipulates hedgingobjectives, risk management authority structure, limits & controls and reporting requirements.
Your Company has a Risk Management Board (RMB), authorized by the board of directors, to oversee variousrisk management aspects of your Company, strategies for various exposures and compliances with the policies.The members of the RMB are nominated by the board of directors. Formation of price-view and variousoperational decisions making are done in committees, namely, Price Management Committee for Commoditiesand Exchange Management Committee for exchange rate risk. These committees report to Risk ManagementBoard.
Commodity Price Risk Management
The Company gets reference from quotations of London Metal Exchange (LME) for its prices in domestic andinternational markets. Consequently, the changes in the prices of alumina, aluminium, copper, gold and silversignificantly impact the revenues of your Company. In accordance with its risk management policy, Companyendeavours to reduce exposure to commodity price-risk movements by entering into hedging contracts. Theprincipal objectives of the activity are to reduce volatility of future cash flows and to increase visibility of futurerevenues.
Company’s commodity hedging activities can be divided into following:
- Timing mismatch risk: This is the price risk arising due to timing mismatch of purchases of copper concentrate,which is priced based on copper, gold and silver content and sale of copper products, gold and silver. Weuse various spread risk management tools to hedge this risk.
- Absolute price risk: We have price risk on metals that we produce. We use various derivative tools forhedging this risk from time to time.
The prevailing regulations do not permit hedging price-risk of domestic sales of Aluminium. Your company hasapplied to the RBI for approval in this behalf and is expecting a positive response from the regulator. Anotherkey risk arises from the fluctuations in Treatment Charges and Refining Charges (Tc/Rc) in the Copper
(29)
business, as these are negotiated annually. Your company addresses this problem through judicious use of longterm and short term concentrate contracts in the global markets. Acquiring own mines has been a strategicmove towards hedging this risk.
Foreign Exchange Risk
Your company is exposed to foreign exchange risk due to imports of raw materials, capital goods and exports offinished goods. However, since Company’s revenues (both export and domestic) are linked with US$/IndianRupee exchange rate, any volatility in the exchange rate may significantly impact your Company’s profitability.
In order to hedge the risk, your company uses various tools such as foreign currency borrowings, currencyforward and option contracts in accordance with its foreign exchange risk management policy.
Interest Rate Risk
Your company borrows money from the market to fund its working capital and expansion plans. These borrowingsare exposed to interest rate risk. While most of the long-term borrowings are at fixed rate, the short-termborrowings are exposed to interest rate changes every time new loans are drawn. Your company uses a combinationof interest rate and cross currency swaps to manage the interest rate risk from time to time.
Internal Control System
Strong internal controls and an effective MIS system define roles and responsibilities of people across variouslevels of the organisation, enabling checks and controls and tight monitoring on a continuous basis. Allmanagement decisions are supported by well-defined and integrated MIS reports.
These checks, controls and monitoring systems are periodically evaluated for their effectiveness by themanagement along with the internal auditors. A system has been put in place for reviewing the implementationof the improvement measures. This is a continuous process that provides for improvement in the internalcontrol systems.
The management and the auditors, internal and statutory, have detailed discussions from time to time toidentify key focus areas and to help the auditors prepare an effective audit plan.
CONCLUSIONYour company has delivered record performance amidst challenging business environment characterized byappreciating rupee, steep cut in import tariff and withdrawal of export incentives.
Going forward, your Company is cautiously confident of delivering superior operating performance on the backof improving cost competitiveness driven by expansion benefits, favourable demand conditions in the domesticand regional markets, firm LME prices and improved outlook for Tc/Rc for the copper business.
Towards heightening growth momentum to realise its vision of being a global sized, globally competitive metalproducer, your Company has chalked out expansions in alumina and aggressive growth plans in aluminium.Our efforts will be supported by robust current operations, a strong balance sheet and locational advantagesthat provide us access to good quality bauxite and coal as well as freight advantage. We are confident of successof these efforts in transforming your Company to the league of “Global Top-10” in both the metals and deliversuperior value to stakeholders even in the future.
CAUTIONARY STATEMENTStatements in this “Management’s Discussion and Analysis” describing the Company’s objectives, projections, estimates,expectations or predictions may be “forward looking statements” within the meaning of applicable securities laws andregulations. Actual results could differ materially from those expressed or implied. Important factors that could make adifference to the Company’s operations include global and Indian demand supply conditions, finished goods prices,feedstock availability and prices, cyclical demand and pricing in the Company’s principal markets, changes in theGovernment regulations, tax regimes, economic developments within India and the countries within which the Companyconducts business and other factors such as litigation and labour negotiations.

(30)
R E P O R T O N C O R P O R A T E G O V E R N A N C E
Governance Philosophy
The Aditya Birla Group is committed to the adoption of best governance practices and its adherence in thetrue spirit, at all times. Our governance practices are a product of self desire and reflect the culture oftrusteeship that is deeply ingrained in our value system and reflected in the strategic thought process. At amacro level, our governance philosophy rests on five basic tenets viz., Board accountability to the Companyand shareholders, strategic guidance and effective monitoring by the Board, protection of minority interests andrights, equitable treatment of all shareholders as well as superior transparency and timely disclosure.
In line with this philosophy, Hindalco Industries Limited, a flagship of the Aditya Birla Group, has beenstriving for excellence through adoption of best governance and disclosure practices. During the year, theCompany has further strengthened the quality of disclosures on the Board Composition and its functioning,remuneration paid and level of compliance with various Corporate Governance Codes.
Compliance with Corporate Governance Codes
Your company is fully compliant with the recommendations of the prevailing and applicable corporate governancecodes and is committed to ensuring full compliance with any proposals for modifications, well ahead of theirimplementation timelines. Your company’s compliance with requirements are presented in the subsequentsections of the report.
I. BOARD OF DIRECTORS
• Composition of the Board
Director Executive/Non- Executive/ No of Outside Outside CommitteeIndependent1 Directorships Held5 Positions Held6
Public Private Member Chairman
Mr. Kumar Mangalam Birla Non Executive 12 10 1 -
Mrs. Rajashree Birla Non Executive 6 10 - -
Mr. A. K. Agarwala Non Executive2 6 - 2 1
Mr. E. B. Desai Non Executive 6 2 1 5
Mr. S. S. Kothari Non Executive - 1 - -
Mr. C. M. Maniar Independent 13 7 7 1
Mr. M. M. Bhagat Independent 3 - 1 -
Mr. K. N. Bhandari Independent3 4 - 1 -
Mr D. Bhattacharya Managing Director 5 - 1 -
1 Independent Director means a director defined as such under Clause 49 of the Listing Agreement.
2 Employee of another company of the Aditya Birla Group.
3 Nominee of General Insurance Corporation of India (GIC) (An Investor).
4 Mr. T. K. Sethi who was an independent director on the Board of the Company left for heavenly abode on 25th
August, 2004.
5 Excluding Directorships in private Companies, foreign companies and companies under Section 25 of theCompanies Act, 1956.
6 Only the three Committees viz. the Audit Committee, the Remuneration Committee and the Shareholders’ /Investor Grievance Committees are considered.

(31)
• Details of Board Meetings and Attendance
Date of Board Meeting City No. of Directors Present
26th April, 2004 Mumbai 9 out of 10
31st July, 2004 Mumbai 9 out of 10
23rd August, 2004 Mumbai 9 out of 10
29th October, 2004 Mumbai 9 out of 9
29th January, 2005 Mumbai 8 out of 9
31st March, 2005 Mumbai 7 out of 9
• Details of Remuneration to Board of Directors
All decisions related to the remunerations of the Directors, both executive and non-executive are decidedby the Board of Directors of the Company. Details of the actual remunerations paid to the Executive andNon-Executive directors for the period under review are as follows:
A. Non-Executive Directors
Name of Director TotalSitting* Commission Payments No. of Board Attended
Fees Paid payable Paid/Payable Meetings Last AGM@
in 2004-05
(In Rs.) (Rs in Mn.) (Rs in Mn.) Held Attended
Mr. Kumar Mangalam Birla 25,000 11.18 11.20 6 5 Yes
Mrs. Rajashree Birla 25,000 0.37 0.40 6 5 Yes
Mr. E. B. Desai 90,000 0.76 0.85 6 6 Yes
Mr. S. S. Kothari 25,000 0.37 0.40 6 5 No
Mr. T. K. Sethi 10,000 0.11 0.12 6 1 Yes
Mr. C. M. Maniar 80,000 0.65 0.73 6 5 Yes
Mr. M. M. Bhagat 60,000 0.60 0.66 6 6 Yes
Mr. K. N. Bhandari^ 30,000 0.45 0.48 6 6 Yes
Mr. A. K. Agarwala 60,000 0.51 0.57 6 6 Yes
Mr. D. Bhattacharya - - - 6 6 Yes
@ Annual General Meeting Held on 31st July, 2004 at Birla Matushri Sabhagar, Mumbai* Sitting fees paid at the rate of Rs. 5,000 per meeting of the Board and Board Committees^ Commission paid to General Insurance Corporation, as director is a nominee of GIC
Note:
1. No Director is related to any other Director on the Board, except for Mr. Kumar Mangalam Birla and Mrs.Rajashree Birla, who are son and mother respectively.
2. Your Company has a policy of not advancing any loans to its Directors except to Executive Directors in the courseof normal employment.
3. In the AGM for the year 2003-04, the Company had obtained shareholders’ approval for payment of commissionon profits to its Non-Executive Directors and Independent Directors, not exceeding 1% of the profits of theCompany.

(32)
B. Executive Director
Executive Director Relationship Business Remuneration paid during 2004-05
with other relationship All elements of Fixed component & Service contracts, Stock optionDirectors with the remuneration package performance linked notice period, details, if any
Company, if any i.e, salary, benefits, incentives, alongwith severance feebonuses, pension etc. performance criteria
Mr. D. - Managing
Bhattacharya Director Rs. 2,58,18,082.00 See note (a) See note (b) See note (c)
a) Mr. D. Bhattacharya was paid a sum of Rs. 48,65,519.00 towards performance bonus linked to achievementof targets.
b) The appointment is subject to termination by three months notice in writing on either side. The appointment isfor a period of 5 years w.e.f. 2nd October 2003. No severance fees is payable to the Managing Director.
c) The Company does not have any scheme for grant of stock options to its Directors or Employees.
II. BOARD COMMITTEES
• Audit CommitteeYour Company has an Audit Committee at the Board level with the powers and the role that are inaccordance with Section 292A of the Companies Act, 1956 and Clause 49 II (C) and (D) of the ListingAgreement. The Committee acts as a link between the management, the statutory, cost and internalauditors and the Board of Directors and oversees the financial reporting process. The Audit Committeenow comprises of two Independent Directors and the position of one Independent Director is vacant dueto death, as per details mentioned hereunder:❑ Mr. M. M. Bhagat, Chairman❑ Mr. T. K. Sethi, Member*❑ Mr. C. M. Maniar, Member❑ Mr. E. B. Desai, MemberDuring the year, the Audit Committee met 6 times to deliberate on various matters and the details of theattendance by the Committee members are as follows:
Name of Director No. of MeetingsHeld Attended
Mr. M. M. Bhagat 6 6Mr. T. K. Sethi* 6 1Mr. C. M. Maniar 6 5Mr. E. B. Desai 6 6
* Mr. T. K. Sethi attended one Audit Committee Meeting, which was held on 31.07.2004.1. The Chairman of the Audit Committee was present at the Annual General Meeting of your Company held on
31st July, 2004.2. Mr. D. Bhattacharya, Managing Director and Mr. R. K. Kasliwal, Group Executive President & C.F.O. are
permanent invitees of the Audit Committee and the Statutory, Internal as well as the Cost Auditors of theCompany are also invited to the Audit Committee Meetings.
3. Mr. Anil Malik, Company Secretary, acted as Secretary to the Committee.
• Shareholders Committee
Your Company has an “Investor Grievance Committee” at the Board level to look into issues relating to shareholders,including transfer and transmission of shares, issue of duplicate shares, non-receipt of dividend, Annual Report,etc.
The composition of the Committee is as follows:
❑ Mr. E.B. Desai - Chairman
❑ Mr. C.M. Maniar - Member
(33)
The shares of the Company are traded on the stock exchanges only in the dematerialised form and areautomatically transferred on delivery in the dematerialised form. As of 31st March, 2005 more than 83% ofCompany’s shares are in the dematerialised form. In addition, to expedite the transfer of shares in thephysical segment, Officers of the Company have been authorised to approve transfers of up to 5,000 sharesand / or debentures under one transfer deed.
Keeping this in mind, during the year under review, the Committee met once and was attended by boththe Directors.
Mr. Anil Malik, Company Secretary, acts as Secretary to the Committee.
- Name and designation of compliance officer:
Mr. Anil Malik, Company Secretary has been appointed as the Compliance Officer of the Company.
- The details of shareholders complaints are shown in the shareholder information.
III. OTHER DISCLOSURES
• Details of related party transactions
There are no material pecuniary transactions with related parties that require separate disclosure. Acomprehensive list of related party transactions as required by the Accounting Standard (AS) 18 asissued by the Institute of Chartered Accountants of India, forms part of the Note No. 31 of Part B ofSchedule 23 to the Accounts in the Annual Report.
• Pecuniary relationship or transactions of the Non-Executive Directors
There is no material transaction with any Non-Executive as well as Independent Director of theCompany that requires a separate disclosure.
• Details on the use of proceeds from public issues, rights issues, preferential issues etc.
No funds have been raised through issue of equity or debt in the form of public or rights or preferentialissues during the year under review.
• Details of information on appointment of new directors
A brief resume, nature of expertise in specific functional areas, names of companies in which theperson already holds directorships and memberships of committees of the Board and his shareholdingin the Company forms part of the Notice of General Meeting, annexed to this Annual Report.
• Details of non-compliance, penalties, strictures imposed on the company by Stock Exchange orSEBI or any statutory authority, on any matter related to capital markets, during the last three years.
Pursuant to the SEBI Order dated February 18, 2005, the Company has made an Open Offer to acquireupto 20% Equity shares of Bihar Caustic & Chemicals Limited under the provisions of the SEBI(Substantial Acquistions of Shares & Takeovers) Regulations, 1997.
• Means of communication:
- Half-yearly report sent to each household of shareholders Yes
- Quarterly results:
❑ Which newspapers normally published in The Financial Express – All editions.Business Standard – All editions.Tarun Bharat (Mumbai) – Mumbai.
❑ Any website, where displayed www.adityabirla.com
❑ Whether it also displays official news releases Yes
- Presentations made to investors/analysts: Are theyavailable on the company website Yes
- Whether MD&A forms part of the Annual Report Yes
- Whether Corporate Governance report forms Part ofthe Annual Report Yes

(34)
• General Body Meetings❑ Current AGM: Date, time and venue
The ensuing Annual General Meeting shall be held on Tuesday, the 12th July, 2005 at 3:30 P.M. atBirla Matushri Sabhagar, 19, Marine Lines, Mumbai – 400 020.
❑ Location and time, where last three AGMs held:
Year Location Date Time
2003-04 Birla Matushri Sabhagar 31st July 2004 3:30 p.m.
2002-03 Birla Matushri Sabhagar 31st July 2003 3:30 p.m.
2001-02 Birla Matushri Sabhagar 31st July 2002 3:30 p.m.
• Postal Ballot
❑ Whether special resolutions were put through postal ballot last year No
❑ Details of voting pattern. N.A.
❑ Person who conducted the postal ballot exercise N.A.
❑ Are proposed to be conducted through postal ballot N.A.
❑ Procedure for postal ballot N.A.
NON-MANDATORY RECOMMENDATIONS
• Chairman’s office: A non-executive Chairman should be entitled to maintain a Chairman’soffice at the company’s expense and also allowed reimbursement of expenses incurred inperformance of his duties.
Your Company has a separate office for the Chairman with necessary infrastructure facilities todischarge his duties and responsibilities effectively.
• Shareholders’ Rights: The half-yearly declaration of financial performance including summaryof the significant events in last six-months, should be sent to each household of shareholders.
“Performance Update” consisting of financial and operational performance is being sent to theshareholders since 2000-01 and this practice has continued this year as well.
Postal Ballot: For shareholders who are unable to attend the meetings, there should be arequirement, which will enable them to vote by postal ballot for key decisions.
Your Company has not carried any resolutions through a postal ballot in the past and will adhereto all applicable laws in spirit in such an event in the future.

(35)
S H A R E H O L D E R I N F O R M A T I O N
1. Annual General Meeting
- Date and Time : 12th July, 2005 – 3:30 p.m.
- Venue : Birla Matushri Sabhagar19, Marine Lines,Mumbai-400 020.
2. Financial Calendar
- Financial reporting for the quarter ending June 30, 2005 : End July 2005
- Financial reporting for the half year ending September 30, 2005 : End October 2005
- Financial reporting for the quarter ending December 31, 2005 : End January 2006
- Financial reporting for the year ending March 31, 2006 : End April 2006
- Annual General Meeting for the year ended March 31, 2006 : End July 2006
3. Dates of Book Closure : 01st July, 2005 – 12th July, 2005(Both days inclusive)
4. Dividend Payment Date : On or after 12th July 2005
5. Registered Office : Century Bhavan, 3rd Floor,Dr. Annie Besant Road,Worli, Mumbai - 400 025.Tel: (91-22) 5662 6666Fax: (91-22) 2422 7586 / 2436 2516E-Mail: [email protected]
Website: www.adityabirla.com
6 (a) Listing Details:
Equity Shares Global Depository Receipts (GDRs) Non-Convertible Debentures
The Stock Exchange, Mumbai Societe de la Bourse de Luxembourg National Stock Exchange ofPhiroze Jeejeebhoy Towers Societe Anonyme, RC B6222, India LimitedDalal Street, Mumbai - 400 023 B.P.165, L-2011, Luxembourg “Exchange Plaza”,
Bandra Kurla ComplexBandra (East),Mumbai 400 051.
National Stock Exchange ofIndia Limited“Exchange Plaza”,Bandra Kurla ComplexBandra (East), Mumbai 400 051.
Note: Listing fees for the Financial year 2005-06 have been paid to the respective Stock Exchanges in India. Listing feesfor the GDRs has been paid to Societe de la Bourse de Luxembourg for the calendar year 2005.
During the year Calcutta Stock Exchange Association Limited has delisted Company’s shares pursuant to the applicationfor voluntary delisting made to them.
6 (b) Overseas Depository for GDRs : J.P. Morgan Chase Bank60 Wall Street,New York, NY 10260Tel.: 1-302-552 0253Fax: 1-302-552 0320

(36)
S H A R E H O L D E R I N F O R M A T I O N
6 (c) Domestic Custodian of GDRs : Citibank N.A.Custody Services,77 Ramnord House,Dr. Annie Besant Road,Worli, Mumbai – 400 018Tel.: (91-22) 24975301Fax: (91-22) 24937620
7. Stock Code: Reuters Bloomberg
Bombay Stock Exchange HALC.BO HNDL INNational Stock Exchange HALC.NS NHNDL INLuxembourg Stock Exchange (GDRs) HALCq.L HDCD LI
8. Stock Price Data
Bombay Stock Exchange National Stock Exchange Luxembourg Stock ExchangeHigh Low Close Av. Vol. High Low Close Av. Vol. High Low Close
(In Rs.) (In Nos.) (In Rs.) (In Nos.) (In US$)
Apr-04 1374.0 1101.0 1114.7 35763.6 1374.0 1101.2 1114.5 111008.1 32.8 25.5 25.5
May-04 1153.5 725.0 904.5 100858.1 1154.0 720.0 905.6 256971.3 25.9 18.0 20.1
Jun-04 1025.4 905.0 998.0 29017.7 1030.0 901.1 996.9 109334.2 22.3 20.3 21.9
Jul-04 1150.0 1000.0 1101.2 40412.3 1270.0 990.0 1101.8 139846.5 24.7 22.1 23.7
Aug-04 1193.9 1016.0 1178.8 46236.1 1189.9 1016.0 1178.5 153672.3 25.7 22.3 25.7
Sep-04 1354.8 1168.0 1347.8 49029.4 1370.0 1162.0 1356.2 146131.0 29.3 25.3 29.1
Oct-04 1409.5 1173.6 1187.1 48766.3 1408.0 1174.0 1187.2 154955.4 30.3 25.6 25.8
Nov-04 1315.0 1186.0 1307.4 33156.6 1324.0 1170.1 1308.6 131279.3 29.1 26.8 29.1
Dec-04 1472.8 1247.0 1426.8 60465.5 1474.9 1249.0 1422.7 170659.5 33.2 28.3 32.9
Jan-05 1487.0 1220.0 1300.5 59953.6 1499.7 1218.1 1301.0 192473.2 32.5 28.3 29.6
Feb-05 1418.0 1302.1 1394.6 63619.8 1424.7 1305.3 1393.2 168887.4 32.5 30.1 32.5
Mar-05 1465.0 1265.1 1293.7 42445.7 1465.0 1267.0 1295.6 124433.4 34.5 29.4 30.0
9. Stock Performance
50
70
90
110
130
HindalcoSensex
Mar-05Feb-05Jan-05Dec-04Nov-04Oct-04Sep-04Aug-04Jul-04Jun-04May-04
Stock Performance (Indexed)
April-04

(37)
10. Stock Performance over the past few years:
Absolute Returns (in %) Annualised Returns (in %)
1 Year 3 Years 5 Years 1 Year 3 Years 5 Years
Hindalco 6.3 68.0 76.0 6.3 18.9 12.0
BSE Sensex 16.1 87.1 29.8 16.1 23.2 5.4
NSE Nifty 14.9 80.2 33.2 14.9 21.7 5.9
11. Registrar and Transfer Agents : In house Share TransferRegistered with SEBI as category II Share Transfer Agentvide Registration no INR 000003910Investor Service DepartmentHindalco Industries LimitedAhura Centre, 1st floor, B Wing, Mahakali Caves Road,Andheri (East), Mumbai- 400 093.Tel: (91-22) 5691 7000 /11/ 19 Fax: (91-22) 5691 7001E-mail: [email protected]
12. Share Transfer System : Share transfer in physical form are registered and returned within a period of 15days of receipt, if the documents are clear in all respects. Officers of the Companyhave been authorized to approve transfers upto 1,000 Shares in physical formunder one transfer deed and one Director of the Company has been authorizedto approve the transfers exceeding 1,000 shares under one transfer deed.The total number of shares transferred in the physical form during the year was925,274 (previous year 192,640). Transfer of shares in the physical segment issignificantly lower since more than 83 % of the outstanding capital is in thedematerialized form and dealing in the Company’s shares are permitted only indematerialized form on all Stock Exchanges.
2004-05 2003-04
Transfer period No. of No. of % No. of No. of %(in days) Transfers Shares Transfers Shares
1-10 1,809 894,836 76.6 1,103 24,465 12.711-15 388 22,309 16.4 965 35,446 18.416-20 65 3,511 2.8 221 41,996 21.821-30 99 4,618 4.2 1,736 90,733 47.1
Total 2,361 925,274 100.0 4,025 192,640 100.0
13. Investor Services :a) Complaints received during the year
Nature of complaints during 2004-2005 Opening Received Cleared Pending
Relating to Transfers, Transmissions,Dividend, Interest, Redemption, Demat - Rematand Change of Address etc. 1 31 31 1
Nature of complaints during 2003-2004 Opening Received Cleared Pending
Relating to Transfers, Transmissions,Dividend, Interest, Redemption, Demat - Rematand Change of Address etc. 2 21 22 1

(38)
b) Legal proceedings on share transfer issues, if any : Nil
c) Shares pending for transfer : Nil
14. Distribution of Shareholding as on 31st March:
2005 2004
No. of No. of % of No. of % No. of % of No. of %equity Share share Shares share share share Shares shareShares held Holders holders held holding holders holders held holding
1-100 100,775 85.7 2,268,992 2.5 99,379 84.9 2,249,515 2.4
101-200 6,327 5.4 946,386 1.0 6,562 5.6 983,296 1.1
201-500 6,130 5.2 1,991,387 2.2 6,454 5.5 2,101,723 2.3
501-1000 2,510 2.1 1,775,290 1.9 2,656 2.3 1,887,077 2.0
1001-5000 1,556 1.3 3,021,319 3.3 1,668 1.4 3,229,393 3.5
5001-10000 136 0.1 957,703 1.0 143 0.1 991,080 1.1
10001 and above 287 0.2 81,813,720 88.1 262 0.2 81,033,191 87.6
Total 117,721 100.0 92,774,797 100.0 117,124 100.0 92,475,275 100.0
15. Categories of Shareholding as on 31st March:
2005 2004
Category No. of % of No. of % No. of No. of % Share Share Shares share share Shares share
Holders Holders held holding holders held holding
Promoters 59 0.05 24,068,057 25.9 31 22,534,236 24.4Mutual Funds & UTI 42 0.04 5,718,264 6.2 132 7,391,737 8.0Banks, Financial Institutions 233 0.20 10,097,594 10.9 103 11,233,347 12.2FIIs 194 0.16 21,091,621 22.7 187 17,600,633 19.0Corporates 1,804 1.53 2,343,062 2.5 2,165 3,361,138 3.6Individuals 110,591 93.94 9,542,543 10.3 110,523 9,920,824 10.7NRIs/ OCBs 4,795 4.08 3,999,270 4.3 3,982 4,355,734 4.7GDRs 3 0.0 15,914,386 17.2 1 16,077,626 17.4Total 117,721 100.0 92,774,797 100.0 117,124 92,475,275 100.0
16. Dematerialisation of : Over 83% of outstanding shares (including 17.15% ofShares and Liquidity outstanding capital in the form of Global Depository Receipts) have
been dematerialized. Trading in Hindalco Shares is permitted only in thedematerialized form from 5th April, 1999 as per notification issued by TheSecurities and Exchange Board of India.
17. Details on use of public : Not Applicablefunds obtained in 3 years
18. Outstanding GDR/Warrants : Outstanding number of GDRs as on 31st March, 2005 are/Convertible Bonds 15,914,386 (Previous year 16,077,626). Each GDRs represent one
underlying equity share. There are no warrants / convertible bondsoutstanding at the year end.

(39)
19. Plant Locations:
ALUMINIUM BUSINESS
Integrated Aluminium Plant (Smelter, Alumina Refinery, Sheets, Extrusions, Wire Rods)
RenukootP.O. Renukoot - 231 217Dist.: Sonbhadra, Uttar Pradesh.Tel : (05446) 252077-9Fax: (05446) 252107
Smelters Alumina Refineries
Hirakud Alupuram Muri BelgaumHirakud 768 016 Alupuram P.B. No. 30 Post Chotamuri - 835 101 Village YamanapurDist.: Sambalpur Kalamassery 683 104 Dist.: Ranchi, Jharkhand Belgaum 590 010Orissa Dist.: Ernakulam, Kerala Phone: (06522) 222233 KarnatakaTel: (0663) 2481307 Tel: (0484) 2532441 Fax: (06522) 222231 Tel: (0831) 2472716Fax: (0663) 2481356 Fax: (0484) 2532468 Fax: (0831) 2472728
Captive Power Plants Coal Mines
Renusagar Hirakud TalabiraP. O. Renusagar Post Box No. 12 Talabira-1, Coal ProjectDist.: Sonbhadra, Hirakud 768 016 Qrs. No. A6/1, Saraswati Vihar,Uttar Pradesh. Dist.: Sambalpur, Orissa P.O. Sankarma, Dist.: SambalpurTel : (05446) 272502-5 Tel: (0663) 2481408 OrissaFax: (05446) 272382 Fax: (0663) 2481342 Tel: (0663) 2540426
Bauxite Mines
Chandgad Durgmanwadi Lohardaga
Post: Chandgad 416509 Post: Radhanagri, Dist.: Kolhapur Dist.: Lohardaga 835 302Dist.: Kolhapur Maharashtra - 416 212 JharkhandMaharashtra Tel: (02321) 237108 Tel/ Fax: (06526) 224049Tel/Fax: (02320) 224142 Fax: (02321) 237478
Sheet Plants Foil Plants
Belur Taloja Kalwa Silvassa39, Grand Trunk Road Plot 2, MIDC Industrial Area Thane Belapur Road Village Khutli, Khanvel,Belurmath 711 202 Taloja A.V., Dist.: Raigad Kalwa, Thane 400 605 Silvassa-396 230Dist.: Howrah Navi Mumbai - 410 208 Maharashtra Dadra & Nagar HaveliWest Bengal Maharashtra Tel: (022) 25347151 Tel: (0260) 2677021-4Tel: (033) 2654 7210 Tel: (022) 2741 2261 Fax: (022) 25348798 Fax: (0260) 2677025Fax: (033) 2654 9982 Fax: (022) 2741 2430
Extrusions Plant Wheel PlantAlupuram SilvassaAlupuram, P.B. No. 30 Village Khutli, Khanvel,Kalamassery - 683 104 Silvassa-396 230Dist.: Ernakulam, Kerala Dadra & Nagar HaveliTel: (0484) 2544713 Tel: (0260) 2677021 - 4Fax: (0484) 2532468 Fax: (0260) 2677025
COPPER BUSINESSBirla CopperP.O. Dahej, LakhigamDist.: Bharuch – 392 130, GujaratTel: (02641) 256004-06, 251009Fax: (02641) 251002-3

(40)
20. Investor Correspondence : The Company SecretaryHindalco Industries LimitedCentury Bhavan, 3rd floor, Dr. Annie Besant Road,Worli, Mumbai - 400 025.Tel: (91-22) 5662 6666Fax: (91-22) 2422 7586 / 2436 2516Email: [email protected]
21. Per share data :
2004-05 2003-04 2002-03 2001-02 2000-01
Net Earnings (Rs. mn) 13,294 8,389 5,821 6,860 6,781
Cash Earnings (Rs. mn) 17,927 11,564 8,463 8,403 8,205
EPS (Rs) 143.3 90.7 62.9 92.1 91.1
CEPS (Rs) 193.2 125.0 91.5 112.9 110.2
Dividend per share (Rs) 20.0@ 16.5 13.5 13.5 12.0
Dividend pay out (%) 16.7@ 20.5 24.2 14.7 13.2
Book Value per share (Rs) 825.3 741.6 669.2 615.3 588.0
Price to earning (x) * 9.04 13.46 8.50 8.38 8.47
Price to cash earning (x)* 6.71 9.76 5.84 6.84 7.00
Price to Book Value (x)* 1.57 1.65 0.80 1.25 1.31
*Stock Prices as on 31st March.
@ Proposed
22. OTHER USEFUL INFORMATION FOR SHAREHOLDERS
Shareholders who have not yet encashed their dividend warrants for the financial years 1997-98 to 2004-2005 may approach the Company for revalidation / issue of duplicate dividend warrant quoting referenceof their Ledger Folio numbers / DP & Client ID.22.1 In terms of Section 205A of the Companies Act 1956, unclaimed equity dividend for the financial
year(s) up to 1994-95 has been transferred to the General Revenue Account of the CentralGovernment. Shareholders who have so far not claimed or collected their dividend for the saidfinancial year(s), may claim the same from the Registrar of Companies - Maharashtra by submittingan application in the prescribed form.
22.2 The Unclaimed dividend for the financial year 1996-97 amounting to Rs.1,022,578 has beentransferred by the Company to the Investor Education & Protection Fund constituted by theCentral Government under Section 205A & 205C of the Companies Act, 1956.
22.3 Shareholders are advised that dividends for the financial year ended 1997-98 onwards which remainsunpaid/unclaimed over a period of 7 years have to be transferred by the Company to InvestorEducation & Protection Fund (IEPF) constituted by the Central Government under Section 205A& 205C of the Companies Act, 1956. Shareholders who have not claimed the dividend for thisperiod are requested to lodge their claim with the Company, as under the amended provisions ofSection 205B of the Act, no claim shall lie for the unclaimed dividends from IEPF by the Members.The dividend for the FY 1997-98 would be transferred to IEPF in the month of August 2005. Theindividual intimation letter to those shareholders who have not claimed the dividend are beingsent by the Company.
Upon effectiveness of the Scheme of Arrangement under the Companies Act, 1956 between Indo GulfCorporation Limited (IGCL), Hindalco Industries Limited (Hindalco) and Indo Gulf Fertilisers Limited

(41)
(IGFL), all unpaid dividend amounts of the then IGCL for FY 1997-98 to FY 2001-02 have been takenover by the Company. Members who have not yet encashed their dividend warrant for the above years mayapproach the Company for issue of demand draft(s) in lieu thereof.
As required under the Companies Unpaid Dividend (Transfer to General Revenue Account of the CentralGovernment) Rules 1978, the then IGCL has transferred all unclaimed dividend upto FY 1994-95 to theGeneral Revenue Account of the Central Government. Members who have so far not claimed or collectedtheir dividend for the said financial year(s), may claim the same from the Registrar of Companies, UttarPradesh & Uttaranchal, Westcott Building, The Mall, Kanpur-208 001 (U.P.) by submitting an applicationin the prescribed form.
The Unclaimed dividend for the financial year 1996-97 of erstwhile IGCL amounting to Rs. 2,519,588.36has been transferred by the Company to the Investor Education & Protection Fund constituted by theCentral Government under Section 205A & 205C of the Companies Act, 1956.
Members are advised that dividends of IGCL for FY 1997-98 to FY 2001-2002 that remains unpaid/unclaimed over a period of 7 years have to be transferred to the Investor Education & Protection Fund(IEPF) constituted by the Central Government under Sec. 205A & 205C of the Companies Act, 1956.Members who have not claimed the dividend for these years are requested to lodge their claim, as under theamended provisions of Sec. 205B of the Act, no claim shall lie for the unclaimed dividends from IEPF bythem. Further, the unpaid dividend amount of FY 1997-98 is due for transfer to the IEPF by end 2005.Those members whose dividend for the said years is unpaid may please immediately approach the Company.
22.4 Shareholders are requested to provide particulars of their bank account details for availing ‘ElectronicClearing Service’ (ECS) facility. Further, ECS facility is also available to the beneficial owners ofshares in demat form. Those desirous of availing the facility may provide their mandate to theCompany in writing.
22.5 Dematerialisation requests duly completed in all respects are normally processed within 10 daysfrom the date of their receipt at Registered Office / Investor Service Department.
23. INVESTOR SERVICES
23.1 Equity Shares of the Company are under compulsory demat trading by all investors, with effectfrom 31st May, 1999. Considering the advantages of scripless trading, shareholders are requested toconsider dematerialisation of their shareholding so as to avoid inconvenience in future.
23.2 Shareholders/Beneficial Owners are requested to quote their Folio No./DP & Client ID Nos., as thecase may be, in all correspondence with the Company. All correspondences regarding shares &debentures of the Company should be addressed to the Share Department of the Company atAhura Centre, 1st Floor, ‘B’ Wing, Mahakali Caves Road, Andheri (East), Mumbai - 400 093 andnot to any other office(s) of the Company.
23.3 Beneficial Owners of shares in demat form are advised that in terms of the regulations of NSDL &CDSL, their Bank Account details, as furnished to the Depository Participants (DP), will beprinted on their dividend warrants. The Company will not entertain requests for change of suchbank details printed on their dividend warrants.
23.4 Shareholders holding shares in physical form are requested to notify to the Company, change intheir address/Pin Code number and Bank Account details promptly by written request under thesignatures of sole / all joint holder(s). Beneficial Owners of shares in demat form are requested tosend their instructions regarding change of name, change of address, bank details, nomination,power of attorney, etc. directly to their DP.
23.5 To prevent fraudulent encashment of dividend warrants, members are requested to provide theirBank Account Details (if not provided earlier) to the Company (if shares are held in physical form)or to DP (if shares are held in demat form), as the case may be, for printing of the same on theirdividend warrants.

(42)
23.6 Non-resident members are requested to immediately notify:-
o change in their residential status on return to India for permanent settlement;
o particulars of their NRE Bank Account with a Bank in India, if not furnished earlier.
23.7 In case of loss/misplacement of shares, investors should immediately lodge a FIR/Complaint withthe police and inform to the Company along with original or certified copy of FIR/acknowledgedcopy of the complaint.
23.8 For expeditious transfer of shares, shareholders should fill in complete and correct particulars in thetransfer deed. Wherever applicable, registration number of Power of Attorney should also be quotedin the transfer deed at the appropriate place.
23.9 Shareholders are requested to keep record of their specimen signature before lodgement of shareswith the Company to obviate possibility of difference in signature at a later date.
23.10 Shareholders(s) of the Company who have multiple accounts in identical name(s) or holding morethan one Share Certificates in the same name under different Ledger Folio(s) are requested to applyfor consolidation of such Folio(s) and send the relevant Share Certificates to the Company.
23.11 Section 109A of the Companies Act, 1956 extends nomination facility to individuals holdingshares in physical form in companies. Shareholders, in particular those holding shares in singlename, may avail of the above facility by furnishing the particulars of their nominations in theprescribed Nomination Form to the Company.
23.12 Shareholders are requested to give us their valuable suggestions for improvement of our investorservices.
23.13 Shareholders are requested to quote their E-mail Ids, Telephone/Fax numbers for prompt reply totheir communication(s).

(43)
24. INFORMATION FOR DEBENTURE HOLDERS.
The following are the outstanding Debentures of the Company:
Interest Frequency % of ISIN No. Date of Face NamePayment of Interest Interest & Maturity Value & Address of DebentureDate payment Series No. per Deb. (in Rs.) Trustees
8th Jan. Annually 6.20% Series (XIV) INE038A07175 8-Jan-2008 5 Lacs
14th Jan. Annually 5.95% Series INE038A07183 14-Jan-2008 5 Lacs(XV)
15th Jan. Annually 7.95% Series 2002 INE038A07084 15-Jul-2009 1 Crore(I) Put/Call Option
15-Jul-200723rd Feb. & Semi-Annually 6.95% Series 2002 INE038A07092 23-Aug-07 1 Crore23rd Aug. (II) Put/Call Option
23-Aug-05
23rd Feb. & Semi-Annually 7.20% Series 2002 INE038A07100 23-Aug-09 1 Crore23rd Aug. (III) Put/Call Option
23-Aug-0723rd Feb. & Semi-Annually 6.95% Series 2002 INE038A07126 23-Aug-07 1 Crore23rd Aug. (V) Put/Call Option
23-Aug-0523rd Feb. & Semi-Annually 7.20% Series 2002 INE038A07134 23-Aug-09 1 Crore23rd Aug. (VI) Put/Call Option
23-Aug-0728th Feb. & Semi-Annually 7.20% Series 2002 INE038A07118 28-Aug-07 1 Crore28th Aug. (IV)
28th Feb. & Semi-Annually 7.20% INE038A07142 28-Aug-07 1 Crore28th Aug. Series 2002 (VII)31st Mar. Annually 9.75% INE038A07068 02-Jul-08 1 Crore
Series 2001 Put/Call Option(II) 02-Jul-06
31st Mar. Annually 6.40% Series 2002 INE038A07159 29-Nov-09 1 Crore(VIII) Put/Call Option
29-Nov-0731st Mar. & Semi Annually 12.75% Series VI INE022A07047 Redeemable in 5 5 lacs IDBI Trusteeship Services30th Sept and 7054 equal installments Ltd., 10th Floor,
at the end of Nariman Bhavan,5th, 6th, 7th, 8th 227, Vinay K. Shah Marg.,& 9th yrs from Nariman Point,date of allotment Mumbai – 400 021.starting from4.12.02 &12.12.02
23rd April Annually 8.70% Series INE022A07120 23-Apr-2007 5 Lacs (“SBI”)(XII)
14th June* Annually 9.95% INE038A07233 14-Jun-06 1 Crore Bank of Maharashtra#
1st July Annually 11.22% INE038A07050 12-Jan-08 1 Crore (“SBI”)Series 2001 Put/Call Option
12-Jan-0619th July Annually 8.10% INE038A07167 19-Jul-09 5 Lacs (“SBI”)
Series (XIII) Put/Call Option19-Jul-07
31st Aug. Annually 9% Series 2001 INE038A07076 17-Sep-08 1 Crore (“SBI”)(III) Put/Call Option
17-Sep-066th Sept. Annually 6.5% INE038A07209 06-Sep-09 10 Lacs (“SBI”)
(Series 2004 - I)9th Sept.* Annual 6.39% INE038A07225 15-Sep-09 1 Crore # Bank of Maharashtra,
1501, Shivaji Nagar,Lok Mangal,
20th Nov.* Annual 6.6% INE038A07241 20-Nov-07 1,000 Pune – 411 005.
* These Debentures were issued by Indian Aluminium Company Limited and transferred to the Company pursuant to the Scheme of Arrangement.
25. Investor Correspondence : The Company SecretaryHindalco Industries LimitedCentury Bhavan, 3rd floor, Dr. Annie Besant Road,Worli, Mumbai - 400 025.Tel: (91-22) 5662 6666Fax: (91-22) 2422 7586 / 2436 2516Email: [email protected]
State Bank of India,New Issues &Securities ServiceDivision, Mumbai MainBranch, MumbaiSamacharMarg, Fort,Mumbai – 400 023.(“SBI”)

(44)
E N V I R O N M E N T R E P O R T
As a business house, we are totally committed to sustainable development. Hence, building eco-efficiency in allof our operations and conserving natural resources comes to us naturally. Your Company has a well-drawn outenvironmental management strategy in place. Environment concerns are textured into all manufacturingprocesses and business decisions. We subscribe to the United Nations Global Compact.
All the company’s installations i.e., mines, power plants, the integrated Aluminium complex, Wheel & FoilsDivision, de-merged undertakings of its subsidiary Indal and Copper complex continue to do excellent work inEnvironment Management and are ISO – 14001 certified and most are also OHSAS – 18001 certified.
Your Company places top priority on conserving valuable natural resources. Environment management forsustainable growth is embedded from the design stage of every unit. For instance, your Company’s Coppercomplex in Dahej has adopted Best Available Technology for all its operations to preserve the green and cleanenvironment around it.
Your Company’s alumina refineries are equipped with high efficiency Electrostatic Precipitators and Bag filtersto arrest alumina particles escaping into the atmosphere. The advanced hi-tech Dry Scrubbing Systems installedin the Pot Lines of Aluminium Smelter at Renukoot not only ensure maximum fluorine recovery and minimumfluoride emission but also restrict the alumina escaping to the atmosphere. Such state-of-the-art pollutioncontrol equipments ensure cleaner operations at all the units.
In its quest to make your Company a zero effluent discharge company, State-of-art industrial effluent treatmentsystems are operated in all units in such a manner that all the treated effluent is recycled for reuse in process.
The solid wastes generated are used in Red Mud Plantation as a soil conditioner at Renukoot and as landfill oflow-lying areas at other locations. The Belgaum Alumina Refinery, after undertaking a scientific study, successfullyrehabilitated 5 hectares of abandoned red mud dump by promoting soil growth through specific vegetation. Thesuccess is being replicated at the Muri Alumina Refinery as well.
Lush Green Copper Complex and Township at Dahej

(45)
Your Company’s units have taken up unique projects on experimental basis jointly with local entrepreneurs forconverting hazardous waste into useful products. Once successful, this will be a first of its kind effort in theAluminium industry in India.
To achieve its goal of a clean environment, your Company operates latest fuel efficient Calciners in theAlumina refineries and meets its steam requirements by running highly efficient large capacity Boilers with Co-generation facilities. Microprocessor based controls in the smelter and baking furnaces also help save energy.
These steps have resulted in saving in fuel consumption, conservation of valuable natural resources andeffective pollution control.
Your company is fully committed to the Charter of “Corporate Responsibility for Environment Protection”declared by the Ministry of Environment & Forests.
A well equipped Environment Management Cell is operative with qualified personnel to oversee environmentalactivities and is supported by full fledged sophisticated control laboratories set up to help and constantlymonitor the quality of air emissions and water effluents.
The Company spent nearly Rs. 1,771 million on pollution control equipment during the year and has plans forsubstantial spending of Rs. 2,924 million within a span of 3 years.
Many accolades have been conferred on your Company for its singular contribution to environment conservationand safety. A selective list is given below.
• Your Company’s Renukoot plant bagged several awards including the CII National Award for Excellence inEnergy Management-2004; National Energy Conservation Award (1st Prize) 2004 in Aluminium Sector,Ministry of Power, Government of India; Green Tech Gold Award 2003-04 to Renusagar Power by GreentechFoundation, New Delhi for Organisational Health & Safety; and the 4th Annual Greentech Safety Gold

(46)
Award for the year 2004-05 in Metallurgy Sector. Renukoot plant was declared as the Best Safety PerformingPlant in the world by the International Aluminium Institute for the year 2004.
• Hirakud Smelter was named the winner of the National Energy Conservation Excellence Award 2004 forthe second consecutive year, while the Power Plant received the Shrestha Puraskar Award for 2003 fromthe National Safety Council, the CII – Exim Bank Award for its strong commitment to excel, and theNational Energy Award-2003 by the Ministry of Labour and Employment.
• Belgaum and Muri Alumina Refineries won the Greentech Safety Gold Award 2003-04 by GreentechFoundation, New Delhi, for Organizational Health and Safety.
• The Belur Sheet Plant won the National Energy Conservation Award (2nd Prize) 2004 and the CII EnergyConservation Award 2004 as well as the National Award for Excellence in Water Management for 2004,from the CII-Sohrabji Godrej Green Business Centre.
• Durgmanwadi Mines bagged the Greentech Safety Silver Award 2003-04. Our Mines have also been recognisedby Indian Bureau of Mines, Government of India for Afforestation, Plantation, Waste Dump Management, TopSoil Management, Reclamation and Rehabilitation, Dust Suppression Arrangement, Publicity and Propagandaand Overall Performance.
Apart from these measures, educating and sensitizing our employees, contractors and customers on the importanceof sustainable development is a process in continuum.
As our country is often faced with drought and severe water shortage, your Company has begun uniquerainwater harvesting projects in areas near our plant locations. These efforts are a part of our EnvironmentManagement Systems and evolve out of our commitment to ensure quality of life for the communities inproximity to our plants.
Our Board and our colleagues across our plants are fully committed to sustainable development. We are allnature lovers. The green cover in and around our plants, with tens of thousands of trees swaying, is a reflectionof our passionate respect for the environment.

(47)
S O C I A L R E P O R T
Even as we in India have made a mark on the globe as a reservoir of intellectual capital, as a nation we aregrappling with quality of life challenges. More so in the hinterland where poverty continues to stalk nearly 26crores of our rural populace. From independence to date we have come a long way and we have to go long wayas well. Regrettably our human development index is at an abysmally low - 127.For over several decades, your company has been engaged in community work, concentrating largely in therural areas close to your company’s plants. The scope of our community projects extend across the villagesaround our plants at Renukoot (UP), Hirakud (Orissa), Muri, Lohardaga (Jharkhand), Belgaum (Karnataka),Alupuram (Kerala), Kalwa, Taloja, Durgmanwadi (Maharashtra), Belur (West Bengal) and Silvassa (Dadra &Nagar Haveli). Your company’s social projects are carried out under the umbrella of the “Aditya Birla Centrefor Community Initiatives and Rural Development”, under the leadership of Mrs Rajashree Birla, your Director.The Centre provides the strategic direction for the Group’s community work, ensuring performance managementand measurement of the impact of its initiatives as well.In working with the communities, we gauge what are their real needs. What we discovered is that people’s firstneed is to have potable water, second - agriculture and ways of sustainable livelihood, third - health carefacilities, fourth - education and fifth - infrastructural facilities. These are our areas of focus, within which wehave prioritized education and water projects.For the year 2004-05, we have made significant progress as indicated.
Health Care• Conducted 638 medical camps at which nearly 60,000 villagers were medically examined and those who
were afflicted, were treated for their ailments.• Hundreds of villagers were checked for their eye sight of which 871 senior citizens were provided with intra
ocular lenses.• 1,812 patients diagnosed with tuberculosis were treated.• Malaria and TB detection /prevention camps benefitted around 1,200 persons including 500 inmates of the
Sambalpur Jail in Orissa.• 221 patients were treated for leprosy.• 22 physically challenged persons were provided artificial limbs while 39 persons underwent reconstructive
surgery.• 13,528 patients were treated in the out-patients departments.
Mrs. Rajashree Birla inaugurating The Aditya Birla Rural Technology Park, Muirpur

(48)
Mother and Child Care• Immunized 74,202 children against polio.• 6 family planning camps organized in which 2,402 women and 38 men participated.• Pre and post-natal care was provided to 15,342 women.• 7,123 women were treated for sexually transmitted diseases and reproductive tract infections.
Education• Merit Scholarships earned by 167 students.• Support provided to 135 underprivileged students.• Over 7,000 children benefited from balwadis, coaching centres and evening classes organized by your
Company.• Training programmes organized for 806 teachers.• Education material distributed to 6,230 students.• Around 1,200 adults are benefitting through a Literacy Drive where trained union representatives of your
Company have volunteered as teachers.• Career guidance programmes to local schools have helped advise 250 students and several youth have been
sponsored to ITI vocational training courses.
Sustainable livelihood• The Aditya Birla Technology Park continues to bring in transformation in the villages:
o More than 72 programmes conducted on repair and maintenance of diesel pump sets, electric andelectronic goods, hand pumps as well as on bee keeping, making ropes, tailoring and knitting.
o 312 rural youth were trained for self employment.o Training in crop diversification, floriculture demonstration, integrated pest management and post
harvest technology has provided agricultural support to more than 500 farmers.• Watershed Development projects ensure optimum use of land and water resources. The projects include
installation of hydel towers, erection of check dams, water channels and digging of wells.
Patient being attended to and a stitching training programme in progress at The Aditya Birla Rural Technology Park

(49)
Women Self-Help Groups
• Micro credit savings and social security through insurance schemes have encouraged financial independence.
• 228 Self Help Groups have enabled the empowerment of women through training and income generation.
Social Welfare
• 15 couples were united at a mass marriage programme.
• 12 widow remarriages were organised.
Infrastructure
• On going community support in the form of better roads, potable water systems, bio-gas plants, constructionof dry toilets, water storage tanks, bore wells, tube wells and animal sheds.
• Panchayat and school buildings and community halls have undergone repair and maintenance work.
Of the 71 villages that we have committed for conversion into model villages, 49 have already been transformed.
Your Company treats its social projects with the same seriousness as its business projects. Your company has aone year plan and a three year rolling plan, with milestones, timelines and measurement mechanisms. At theplant level the head of the plant is responsible for the CSR activities. He and his team constantly apprise theCentre and the Business Director of the progress made.
In a sense CSR at your Company is very much on the radar of the top management. Our Board and all of ouremployees are fully committed to the Corporate Social Responsibility programme. In our own small way, we areendeavouring to build a better and sustainable way of life for the weaker sections of the society, making adifference actually. In doing so, our endeavour is also to raise our country’s human development index.
Mother & Child Care camp at Yamanapur village near Belgaum Skills training to Self Help Group members in bamboo craft at Jharkhand

(50)
D I R E C T O R S ’ R E P O R T T O T H E S H A R E H O L D E R S
Dear Shareholders,
Your Directors take pleasure in presenting the 46th Annual Report along with the audited annual accounts forthe year ended 31st March, 2005.
STRATEGIC INITIATIVES
Copper Brownfield Expansion Completed
As you are aware, your Company had undertaken yet another expansion of the copper smelter to raise thecapacity from 250,000 tpa to 500,000 tpa. Your Directors are pleased to inform you that the commissioning trialsat the new plant have already begun and the commercial production is likely to start soon.
Acquisition through Indal demerger
Pursuant to a Scheme of Arrangement under sections 391-394 of the Companies Act, 1956, all the businessundertakings (other than the aluminium foil unit at Kollur) of the Indian Aluminium Company, Limited(Indal), a subsidiary of your Company, has been transferred to and vested in the Company as a going concernwith effect from 1st April, 2004.
The Company has issued 299,522 equity shares to the shareholders of Indal in the ratio of one equity share of Rs.10 each for every seven equity shares of Rs. 2 each held by such shareholders in Indal and consequently theissued and paid up Share Capital of the Company has increased by Rs. 3 million.
This marks a logical conclusion of the acquisition process. It will strengthen the aluminium business and ensureoptimum realization of potential synergies.
Further growth plans underway in Aluminium
Your company is pursuing various growth opportunities in Aluminium.
Brownfield Expansions
As part of a well carved out strategy, your Company is pursuing brownfield expansions in Alumina and SpecialAlumina at Muri (Jharkhand) and Belgaum (Karnataka). Your Company is also augmenting the smelter andcaptive power generation capacity at Hirakud.
These facilities will be completed in a phased manner within the next three years and besides raising capacity,will pare production costs significantly.
Greenfield Opportunities
Utkal Alumina
Your Company’s joint venture with Alcan to set up a 1.0-1.5 million tpa alumina refinery in Orissa is in anadvanced stage of take-off. Your company holds a 55% stake in the project. On completion, in about 36 monthsfrom the date of commencement, it will emerge as one of the lowest cost producers of alumina in the world.
New Projects
The company has entered into MoUs with the respective governments for setting up of greenfield alumina andaluminium facilities in Orissa and Jharkhand.
OPERATIONAL PERFORMANCE
Your company has reported a stellar performance for the year under review.
The aluminium business continued to deliver strong performance quarter after quarter. Strong demand, firmprices and an enriched product mix led to higher realisations. The stabilization of the brownfield expansiondelivered higher volumes and brought in improved operational efficiencies, bolstering profitability.
The performance of your copper division has been satisfactory despite Tc/Rc (Treatment Charges / RefiningCharges) margins continuing to be at historical lows. Higher production and greater operating efficiencies havelargely mitigated the impact of a steep reduction of import tariffs and rupee appreciation.
The Chairman’s letter to shareholders and the Management’s Discussion & Analysis, a part of this AnnualReport provide the strategic direction and a more detailed analysis on the performance of individual businessesand their outlook.

(51)
Rs. in MillionFinancial Results for the year ended 31.03.2005 31.03.2004
Net Sales 95,233 62,084Profit before Extraordinary Items and Tax 19,133 12,456Extraordinary Items (91) -Profit Before Tax 19,042 12,456Provision for Current Tax 5,705 2,606Provision for Deferred Tax 759 1,461Provision for Deferred Tax for Earlier Years written back 716 -Net Profit 13,294 8,389
AppropriationsTransfer to Debenture Redemption Reserve 960 921Proposed Dividend 1,856 1,526Tax on Proposed Dividend 264 195Transfer to General Reserve 10,614 6,472
DIVIDENDYour Directors recommend a dividend of Rs. 20 per share for the current year. This will entail a dividend payoutratio of 16% and a payment (including dividend tax) of Rs. 2,120 million as compared to Rs. 1,721 million inthe previous year.
FINANCINGYour Company raised Rs. 3,500 million by way of Secured Redeemable Non-Convertible Debentures for generalcorporate purposes. Your Company also raised US$ 50 million through External Commercial Borrowing (ECB)route.
Your Company has also tied up a 10-year secured rupee term loan facility amounting to Rs. 4.95 billion priced ata spread of 65 basis points over the 5 year Sovereign for its expansion projects. The first tranche of Rs. 4,950million was drawn down on 30th March, 2005.
CONSOLIDATED FINANCIAL STATEMENTS
In accordance with Accounting Standards 21 and 27 issued by the Institute of Chartered Accountants of India,your Company is presenting its consolidated financial statements. These consolidated Financial Statements formpart of the Annual Report.
CORPORATE GOVERNANCE
The Securities and Exchange Board of India (SEBI) has prescribed certain corporate governance standards. YourDirectors reaffirm their commitment to these standards and this annual report carries a section on CorporateGovernance.
ENVIRONMENTAL PROTECTION AND POLLUTION CONTROL
Your Company firmly believes in maintaining high standards of corporate environmental conduct and isunequivocally committed to Environment protection. This, being the cornerstone of the Company’s workphilosophy, all its business decisions are integrated with the environmental dimensions. This has not onlyenhanced the Company’s image amongst its stakeholders but has also resulted in keeping its cost of productiondown in harmony with nature and achieving sustainable development.
A separate chapter in this report deals at length with your Company’s initiatives and commitment to sustainabledevelopment.
HUMAN RESOURCE DEVELOPMENT & INDUSTRIAL RELATIONS
You are perhaps aware about your Company’s continuous efforts to nurture talent and develop leaders, for it is itspeople who shall carry the flag in the future.
Keeping in line with its approach of identifying and building business synergies, your Company has established aBusiness HR function.

(52)
In order to set the foundation of realizing its business aspirations, your Company has defined and laid down aprocess of identifying and developing talent of different hues and shades. Aptly called, “Talent Management”,this will help your company in building Leadership at every responsibility level. Further, in line with theglobalised nature of its business your Company has inducted strategic talent from an international talent pool.
We believe your Company will achieve its global-scale plans through solid fundamentals of high quality talentwhich has been carefully selected, developed, nurtured and deeply anchored in its values.
Your Company is proud of its harmonious industrial relations track record. A bipartite wage agreement for 3years was signed between the management and registered trade unions w.e.f. 1st April, 2005 at Renukoot,Renusagar and Silvassa.
AWARDS & RECOGNITIONS
Your company received a number of awards and recognitions for its best practices. The following are noteworthyamongst them –
1. Certificate of Merit for the IMC Ramakrishna Bajaj National Quality Award 2004 in Manufacturingcategory.
2. International Aluminium Institute declared Renukoot plant as Best Safety Performing Plant in the worldfor the year 2004.
3. Joint Award Winner of Rajiv Gandhi National Quality Award 2003 in Large-Scale Manufacturingcategory. The award is instituted by Bureau of Indian Standards, Ministry of Consumer Affairs,Government of India.
4. National Energy conservation Award 2004 in Aluminium Sector, Ministry of Power, Government ofIndia – Excellence award to Hirakud and 1st Prize to Renukoot.
5. CII National Award for Excellence in Energy Management – 2004.6. CIOL-Dataquest Award for Best Performance in the Pioneer Category for 2004-05 for the efforts in
deploying and using information technology for strategic benefits.7. Green Tech Gold Award 2003-04 by Greentech Foundation, New Delhi for exemplary Organizational
Health & Safety.
SUBSIDIARY COMPANIESDahej Harbour and Infrastructure Limited (DHIL) has recorded an impressive performance this year. Its totalincome is up by 23% to Rs. 564 million as compared to Rs. 460 million last year. Net profit at Rs. 258 millionsoared by 103% vis-à-vis Rs. 127 million in the preceding year.Indian Aluminium Company, Limited (Indal), after Scheme of Arrangement, has posted a turnover of Rs. 665million and a marginal loss of Rs. 15 million.Bihar Caustic and Chemicals Limited (BCCL) has reported a stellar performance. Net sales have increased by16% to Rs. 1,080 million, vis-a-vis Rs. 934 million last year. Net profit has tripled to Rs. 265 million as againstRs. 86 million in the preceding year.In line with the Securities and Exchange Board of India (SEBI) requirement, your Company has made a publicannouncement and filed a letter of offer with SEBI to acquire an additional 20% equity capital of BCCL. Earlieryour Company had raised its stake in BCCL from 20% to 54.57% through participation in the rights offer madeby BCCL in May 2003 which as per SEBI has resulted in change of right to control the management.The Central Government has granted an exemption to your Company under Section 212(8) of the CompaniesAct, 1956 from attaching a copy of the Balance Sheet, Profit & Loss Account, Report of the Board of Directorsand the Report of the Auditors of all the Subsidiary Companies, which will not be attached with the financialstatements of your Company. These documents can be requested for by any member, investor of the Company/subsidiary company. Further, in line with the Listing Agreement and in accordance with the AccountingStandards 21 and 27, Consolidated Financial Statements, being prepared by the Company include financialinformation of its subsidiaries.
PARTICULARS AS PER SECTION 217 OF THE COMPANIES ACT, 1956The particulars of employees, as required under Section 217 (2A) of the Companies Act, 1956 are given as anAnnexure to this report.

(53)
A separate statement attached to this report, which forms a part of the report, provides you with additionalinformation relating to the conservation of Energy, Technology Absorption and Foreign Exchange Earnings andOutgo as required under Section 217(1)(e) of the Companies Act, 1956.DIRECTORSIn accordance with Article 146 of the Articles of Association of the Company, Mr. S.S. Kothari andMr. M.M. Bhagat retire from office by rotation, and being eligible, offer themselves for reappointment.Your Directors place on record their appreciation and gratitude to Late Mr. Tej Kumar Sethi, a member of theBoard who expired on August 25, 2004. Mr. Sethi, a director on the Company’s Board since September 17, 1974and a member of the Audit Committee, had rendered valuable services and had contributed significantly to thegrowth of the Company.DIRECTORS’ RESPONSIBILITY STATEMENTYour Directors affirm that the audited accounts containing financial statements for the financial year 2004-05are in full conformity with the requirements of the Companies Act, 1956. They believe that the financialstatements reflect fairly, the form and substance of transactions carried out during the year and reasonablypresent the Company’s financial condition and results of operations. These statements are audited by thestatutory auditors M/s. Singhi & Co.Your Directors further confirm that:
(i) In the presentation of the Annual Accounts, applicable Accounting Standards have been followed.(ii) That the accounting policies are consistently applied and reasonable, prudent judgement and estimates
are made so as to give a true and fair view of the state of affairs of the Company at the end of thefinancial year.
(iii) That the Directors had taken proper and sufficient care for the maintenance of adequate accountingrecords in accordance with the provisions of the Act for safeguarding the assets of the Company andfor preventing and detecting fraud and other irregularities.
(iv) That the Directors had prepared the Annual Accounts on a going concern basis.Your Company’s internal auditors have conducted periodic audits to provide reasonable assurance that establishedpolicies and procedures have been followed.AUDITORS’ REPORTThe observations made in the Auditors’ Report are dealt with separately in the Notes to the Profit & LossAccount and the Balance Sheet in Schedule 23 of the Accounts. These are self-explanatory and do not call forany further comments.AUDITORSM/s. Singhi & Co., Chartered Accountants and Auditors of the Company, retire, and being eligible, offerthemselves for appointment.APPRECIATIONYour Directors place on record their sincere appreciation for the assistance and guidance provided by theHonourable Ministers, Secretaries and other officials of the Ministry of Mines, Ministry of Coal, the Ministry ofChemicals and Fertilizers and various State Governments. Your Directors thank the Financial Institutions andBanks associated with your Company for their support as well.Your Company’s employees are instrumental in your Company scaling new heights, year after year. The commitmentand contribution of your Company’s employees is invaluable.Your involvement as Shareholders is greatly valued. Your Directors look forward to your continuing support.
For and on behalf of the Board
Mumbai ChairmanDated the 30th Day of April, 2005

(54)
Statement of particulars under the Companies (Disclosure of particulars in the Report of the Board of Directors)Rules, 1988
A. CONSERVATION OF ENERGY
Energy Conservation continues to be a focus area for your Company. During 2004-05, your Company hasrevisited the “Energy Policy” and revised it to underscore its commitment to energy conservation. Effortsin this direction are focused through a Central Energy Cell for each of the businesses, whose mandate is toinitiate, facilitate and sustain our thrust on energy conservation. These initiatives include consistentefforts to identify potential energy saving opportunities in all our operations, endeavours to optimizeprocess parameters and to modernize & upgrade technology & plant equipment, with the objective ofincreasing Energy Productivity. Your Company’s success in Energy Conservation has been consistentlyrecognized over the last 10 years. Different units of your Company’s Aluminium Business have beenrecently awarded the Excellence Award, the First Prize and the Second Prize in the “National Awards forEnergy Conservation” instituted by the Ministry of Power, Government of India for the year 2004.
(a) ENERGY CONSERVATION MEASURES TAKEN
GENERAL MEASURES
i. Regular auditing of Steam, Furnaces & Compressed air to minimize losses.
ii. Changes in insulation techniques to reduce heat losses.
iii. Reduction in power consumption by Variable Frequency Drives.
iv. Minimize idle running hours of the equipment through Limit Switches, Timers & PLC etc.
v. Regular monitoring & benchmarking of energy intensive equipments.
vi. Change of Lubes in Gear Boxes to save power.
vii. Installation of capacitor banks to improve power factor.
ALUMINIUM BUSINESS
1. ALUMINA PLANT
i. Modification of Evaporation # 2.
ii. Optimization of slurry de-silicating temperature.
iii. Compressed air pressure optimization and air line modification.
iv. Evaporation No.3 piping modification.
v. Enhanced ball mill throughput to reduce specific power.
A N N E X U R E ‘ A ’ T O T H E D I R E C T O R S ’ R E P O R T
The Hon’ble Prime Minister of India, Dr. Manmohan Singh and Hon’ble Ministerfor Power, Mr. P M Sayeed presenting the National Energy Conservation ExcellenceAward 2004 - being received by Mr. Rabindra Misra for Hirakud Smelter - PowerComplex.

(55)
2. SMELTER PLANT
i. Current efficiency improvement by change of anode covering material.
ii. Reduction of melting and fuel consumption by modification in Slab Casting.
iii. Installation of high efficiency heat exchanger in Pot lines’ rectifier units.
iv. Optimization of DSS fan’s load.
v. Implemented better condensate management system in Pitch melting.
3. FABRICATION PLANT
i. Revamped annealing furnaces.
ii. Implemented software programs to stop idle running of motors.
iii. Optimized set up time of various equipment for reduction of specific energy consumption.
4. FOIL DIVISION
i. Use of natural ventilation fans instead of electrically driven exhaust fans.
ii. Commissioned automatic charging system in melting furnace.
iii. Oven # 2 heaters modification to save power.
iv. Modification of Sprue drill machines & Leak testing machines to save power.
v. Load management of transformer to save power.
5. POWER PLANT
Renusagar Power Division
i. Revamped Tubular Air Preheater & ESP for energy saving.
ii. Ash discharge line of long distance ash disposal modified for power saving.
iii. CW pump impeller replacement for power saving.
iv. Modification of Cooling Tower Fans.
v. Improvement in sealing arrangement of CW pump of TG No. 5.
vi. Replacement of Drift Eliminator in Cooling Tower No. 5 to save water
Co-Generation Power Unit
i. Replacement of Boiler Tubes to avoid break-downs.
ii. Replacement of Coal feeder to reduce running hours.
iii. Installation of heat exchanger in new DM Plant to save steam.
6. DEMERGED UNDERTAKINGS OF INDAL
i. Periodic Energy audit by external agencies like CII and TERI and implementation of theirsuggestions.
ii. Improved awareness through certification course of Energy Manager/Auditor for key plantengineers by BEE – Ministry of Power.
iii. Improved energy efficiency by reducing pot voltage through better control.
iv. Increased use of Coal gas in remelting and preheating process instead of oil and electricity.
v. Improved foil annealing power productivity.
COPPER BUSINESS
i. Reduced bus bar voltage drop in refinery bus bars of commercial rectifiers.
ii. Elimination of pumping through system modification to save power.
iii. Elimination of ash conveying compressor through appropriate modification in CPP.
A N N E X U R E ‘ A ’ T O T H E D I R E C T O R S ’ R E P O R T ( C o n t d . )

(56)
(b) ADITIONAL INVESTMENT AND PROPOSALS BEING IMPLEMENTEDALUMINIUM BUSINESS
1. ALUMINA PLANTi. Modification of Evaporation units to increase steam economy.
ii. Chemical cleaning facility for PSH for steam saving.
iii. Two stage heating in ISH of Digestion unit III to save steam.
iv. Installation of De-Superheaters to optimise steam efficiency.
2. SMELTER PLANTi. Modification of anode stub to reduce energy.
ii. Modification of Aluminium Fluoride feeding system to improve current efficiency.
iii. Use of molten pitch in place of solid pitch for steam saving.
iv. Advance process control of pots for better energy efficiency.
v. Waste heat recovery system in Pig Casting to reduce fuel oil consumption.
3. FABRICATION PLANTi. Revamping of Annealing Furnaces for efficiency improvement.
ii. Modification of soaking pits to reduce specific energy.
iii. Replacement of Billet heater in Press # 3.
4. FOIL DIVISIONi. Switched to Transfer Ladle from electrically heated crucibles for metal transfer.
ii. Installation of Recuperator in the melting furnaces to recover waste heat.
iii. Modification in lining of Caster crucible by providing suitable heater.
iv. Modification of heat treatment basket for optimum utilization of furnace volume.
5. POWER PLANTRenusagar Power Divisioni. Revamping of Boilers # 1, 3 & 4 and ESP to improve efficiency.
ii. Upgradation of Turbo Generators # 3 & 4 to improve energy efficiency.
iii. Auto Secondary Air Damper Control system in Boiler # 8 to improve Boiler efficiency.
iv. Improvement of sealing arrangement of CW pump to reduce power consumption.
v. Replacement of Condensate Pump in Unit # 4 to reduce power.
vi. Replacement of Heaters of Unit No. 1 & 4 to improve rankine efficiency
vii. Replacement of Condenser Tubes of Unit No. 1
viii. Installation of better designed Drift Eliminator in Cooling Tower # 7.
Co-generation Power Unit
Ultra Filtration Unit in D. M. Plant for improving energy efficiency of Turbine.
6. DEMERGED UNDERTAKINGS OF INDALi. Plan to change Smelter Technology from Soderberg to Pre-bake for better energy efficiency.
ii. Plan to change Technology in Alumina Refinery at Muri to reduce energy consumption.
COPPER BUSINESSi. To connect 16MVAR, 11KV capacitor bank at MRS.
ii. To replace old pumps with energy efficient pumps.
iii. Implementation of CTC recommendation after energy audit after a techno economicalfeasibility study.
A N N E X U R E ‘ A ’ T O T H E D I R E C T O R S ’ R E P O R T ( C o n t d . )

(57)
(c) IMPACT OF MEASURES IN (a) AND (b) ABOVE
The various energy conservation measures undertaken by your Company have yielded encouragingresults in most of the production centers. Efforts continue to optimize energy productivity throughongoing and planned measures.
(d) TOTAL ENERGY CONSUMPTION AND ENERGY CONSUMPTION PER TON OFPRODUCTION (As per Form “A” below)
FORM A
A. Power & Fuel Consumption 2004-05 2003-04
1 Electricity
a) Purchased from SEBsUnits (KWh in thousands) 963,479 86,247Total Amount (In Rs. mn) (excluding 2,685 387
Minimum Demand Charges)
Rate/Unit (Rs.) 2.79 4.49
b) Own Generation
1 Through Steam Turbine/GeneratorUnits (KWh in thousands) 6,559,847 5,778,429Cost/Unit (Rs.) (Coal & Fuel only) 1.09 1.01
2 Through Diesel GeneratorUnits (KWh in thousands) 21,910 3,015Cost/Unit (Rs.) 7.80 6.76
3 Adjusted out of Banked Energy
Units (KWh in thousands) - 1,909
2 Steam Coal (for Generation of Steam)Quantity (Tonnes) 6,828,625 6,172,765Total Amount (In Rs. mn) 7,367 6,168Average Rate (Rs.) 1,079 999
3 Furnace Oil (Fuel Oil, L.D. Oil, HSD Oil)
Quantity (KL) 213,744 86,514
Total Amount (In Rs. mn) 2,652 976
Average Rate (Rs.) 12,410 11,276
4 Steam (Purchased)
Quantity (Tonnes) 294,348 258,751
Total Amount (In Rs. mn) 52 46
Average Rate (Rs.) 176 177
B Consumption per Unit of Production (per MT) Unit
1 Aluminium Metal (including Alumina)
Electricity KWh 16,078 16,240
Furnace Oil Litres 227 201
Steam Coal MT 1.32 1.41
A N N E X U R E ‘ A ’ T O T H E D I R E C T O R S ’ R E P O R T ( C o n t d . )

(58)
2 Redraw Rods (including Alloy Rods)
Electricity KWh 65 67
Furnace Oil Litres 39 42
3 Fabricated Products (Rolled & Extrusion)
Electricity KWh 1,004 1,105
Furnace Oil Litres 71 69
4 Aluminium Foil
Electricity KWh 1,122 905
5 Aluminium Wheel
Electricity KWh 49 53
6 Copper Cathodes
Electricity KWh 1,846 1,542
Furnace Oil Litres 43 40
Propane Kg 14 8
Naptha Kg 66 34
7 Copper Rods
Electricity KWh 60 64
Propane Kg 36 39
8 Di Ammonium Phospate (DAP/NPK)
Electricity KWh 138 132
Furnace Oil Litres 5.35 6.00
B. TECHNICAL ABSORPTION
FORM B
Research & Development (R&D)
A. Aluminium Business
1. Specific areas in which R&D has been carried out
• New product development.
• Improvement in energy conservation.
• Optimization of process parameters and process up-gradation.
• Environmental protection and sustainable development.
• Indigenous development of spares and components.
2. Benefits derived as a result of the above R&D
• New market for aluminium applications.
• Reduction in specific energy consumption.
• Improved solid waste minimisation & reutilization.
• Enhanced process management.
• Development of products for strategic applications.
A N N E X U R E ‘ A ’ T O T H E D I R E C T O R S ’ R E P O R T ( C o n t d . )

(59)
3. Future plan of action
• Study through a strategic alliance with external bodies for improvement in process.
• Participation in inter laboratory comparisons for proficiency testing.
• Reduction in process and product defect.
• Applying Computational Fluid Dynamics (CFD) Model for process improvement.
• To work for new applications of aluminium alloys in Transport, Building & Construction, Packagingand Consumer Durable Sectors.
B. Demerged undertakings of Indal
1. Specific area in which R&D has been carried out
Development of:
• New products of speciality alumina and application research for its use.
• Processes for high boehmitic bauxites.
• Product development of High Security Registration Plates for vehicles.
• Heat treatment process for inter-granular corrosion resistant sheet products & 2 alloy clad brazingstock.
• Establish the suitability of Aluminium use in LPG bottling.
• Optimisation of Process parameters.
2. Benefits derived as a result of above R&D
• Improved power productivity at smelter.
• Reduction in aluminium fluoride consumption.
• Improvement in the specific DC energy consumption at smelter.
• Reduced fuel oil consumption for the production of Soderberg paste.
• Continuous casting of 3000 series alloy introduced.
• Introduced improved heat recovery.
• New products and applications developed for the use of speciality aluminas and hydrates whichenabled the Company to maintain its leading position in the field.
• New application market developed for heat treated inter-granular corrosion resistant sheet products.
• New applications for Aluminium Composite Panels, Brazed Auto HVAC and High Security RegistrationPlates.
• Received order from Indian Railways.
• Taloja R&D Centre got NABL accreditation in the field of Oil & Lubricants.
3. Future plan of action
• Adoption of pre-bake smelting technology for the potlines.
• Development of alumina chemicals and continued thrust on application research.
• Development of three alloy clad brazing stock for Auto Radiators.
•· Pursue efforts to introduce aluminium for LPG cylinders.
A N N E X U R E ‘ A ’ T O T H E D I R E C T O R S ’ R E P O R T ( C o n t d . )

(60)
C. Copper Business
1. Specific area in which R&D has been carried out
• Heat and mass balance was done for Concentrate Dryer in Mitsubishi Copper Smelter.
• Modifications carried out based on CFD simulation, in Captive Power Plant-III Economiser-I inlet.
• Process parameters optimised.
• Use of treated effluent water.
• Recycling acidic leachate.
• Study carried out for upgrading phosphoric acid plant process to Central Prayon Process.
• Control of air ingression in Off Gas Handling system in Ausmelt Plant.
• Proposed a Reaction Off Gas scrubber with new design for the PAP.
• Microstructure and grain size for CC rod.
2. Benefits derived as a result of above R&D
• Using nitrogen in dryer to minimize chances of fire.
• Improvement in flue gas flow distribution to reduce tube erosion.
• Reduction in vibration in support structure and noise level.
• Reduction in fresh water consumption.
• To reduce P2O5 loss in phosphor-gypsum.
• Generate Hydrofluosilisic acid for use in AlF3 plant.
• Actions identified to improve efficiency and reduce Naphtha consumption.
• Helped in understanding inclusion of various impurities in CC rod.
3. Future plan of Action
• Application of Computational Fluid Dynamics modelling for process improvement in Ausmelt plant.
• New technology for removal of bismuth impurity from copper refinery electrolyte.
Expenditure on R & D:
(Rs in Million)
2004-05 2003-04
a. Capital 21.67 19.64
b. Recurring 70.75 21.22
c. Total (a + b) 92.42 40.86
d. Total R & D Expenditure as % of Total Turnover 0.10% 0.07%
Technology Absorption, Adaptation and Innovation
i. Efforts in brief
Imported technologies have been fully absorbed and the plant operation stabilized.
ii. Benefits derived
• Advancement of basic skill and knowledge.
• Reduction in specific consumption of power / utilities.
• Plant availability / capacity utilization has increased.
• Environmental protection measures have yielded excellent results.
A N N E X U R E ‘ A ’ T O T H E D I R E C T O R S ’ R E P O R T ( C o n t d . )

(61)
iii. Details of technology imported in the past 5 years
Technology imported for Year of Has technology If not fully absorbed, areasImport been fully where this has not taken place,
absorbed reason thereof and futureplan of action
ALUMINIUMBaking Furnace technology for carbon plant 2000-01 Yes N.A.
Pitch fume treatment technology 2000-01 Yes N.A.
COPPERPyro-metallurgy process forPrecious Metallurgy Process 2000-01 Yes N.A.
Incro double reactortechnology for Di-ammonium phosphate 2000-01 Yes N.A.
Ausmelt technology for Smelter – II 2002-03 Yes N.A.
Mitsubishi Technology for Smelter – III 2003-04 Under N.AImplementation
C. FOREIGN EXCHANGE EARNINGS & OUTGO
a) Activities related to Exports
The company has taken successful initiatives to increase exports during the year to Rs 26,051.71 million.
b) Total Foreign Exchange used and earned
Foreign exchange used Rs 39,093.04 million
Foreign exchange earned Rs 26,073.77 million
A N N E X U R E ‘ A ’ T O T H E D I R E C T O R S ’ R E P O R T ( C o n t d . )
Auditors’ Certificate on Corporate GovernanceTo the Members of Hindalco Industries LimitedWe have examined the compliance of the conditions of Corporate Governance by Hindalco Industries Limitedfor the year ended 31st March 2005 as stipulated in clause 49 of the Listing Agreement of the said Companywith Stock Exchanges in India.The Compliance of conditions of Corporate Governance is the responsibility of the management. Our examinationwas limited to the procedures and implementation thereof, adopted by the Company for ensuring the complianceof the conditions of Corporate Governance. It is neither an audit nor an expression of the opinion on thefinancial statements of the company.In our opinion and to the best of our information and explanations given to us, we may certify that theCompany has complied with the conditions of Corporate Governance as stipulated in the above mentionedListing Agreement.We state that in respect of investor grievances received during the year ended 31st March, 2005, one investorgrievance is pending against the Company as on 31st March, 2005 as per the records maintained by theCompany and presented to the Investors’/shareholders’ Grievance Committee.
We further state that such compliance is neither an assurance as to the future viability of the Company nor theefficiency or effectiveness with which the management has conducted the affairs of the Company.
For SINGHI & COChartered Accountants
RAJIV SINGHIPartner
30th April 2005 Membership No. : 53518

(62)
STA
TEM
ENT
OF
PAR
TIC
ULA
RS
OF
EMPL
OYE
ES P
UR
SUA
NT
TO
TH
E PR
OV
ISIO
NS
OF
SEC
TIO
N 2
17 (
2A)
OF
TH
E C
OM
PAN
IES
AC
T, 1
956
AN
D F
OR
MIN
G P
AR
T O
F T
HE
DIR
ECT
OR
S’ R
EPO
RT
FO
R T
HE
YEA
R E
ND
ED 3
1ST
MA
RC
H, 2
005
SNN
ame
Des
igna
tion
Qua
lific
atio
nA
geD
ate
ofEx
perie
nce
Gro
ssPr
evio
us E
mpl
oym
ent
—(Y
ears
) J
oini
ng(Y
ears
) R
emun
erat
ion
Des
igna
tion,
Exp
erie
nce
1R
.K.
Kas
liwal
Gro
up E
xecu
tive
Pres
iden
t &
B.C
om,
FCA
6004
.12.
1967
376,
520,
801
—C
hief
Fin
anci
al O
ffice
r2
S. T
aluk
dar
Dep
uty
Chi
ef F
inan
cial
Offi
cer
AC
A53
01.1
0.19
8626
2,58
7,48
4T
he G
EC o
f Ind
ia L
td.
Alu
min
ium
Bus
ines
s
3R
atan
K. S
hah
Chi
ef O
ffice
r O
pera
tions
– R
enuk
oot
B.T
ech
(Che
m.E
ngg.
),51
18.0
8.20
0327
5,18
1,74
1Pr
esid
ent,
Vik
ram
Isp
at (
A u
nit
ofM
.S.
(Che
m.E
ngg.
)G
rasim
Ind
ustr
ies
Ltd.
) (3
½)
4S.
K. M
audg
alC
hief
Mar
ketin
g O
ffice
rB.
Tec
h (C
hem
.Eng
g.),
5114
.02.
2001
264,
897,
161
Exec
utiv
e D
irect
or (
Mar
ketin
g &
P.G
. Dip
lom
aSa
les)
Cea
t Lt
d. (
2½)
(Mar
ketin
g &
Fin
ance
)5
R.P
. Sha
hEx
ecut
ive
Pres
iden
t &
Chi
efB.
Tec
h (C
hem
.Eng
g.)
5830
.12.
1969
343,
208,
220
—M
anuf
actu
ring
Offi
cer
6P.
K. P
anda
Join
t Pr
esid
ent
– H
uman
Res
ourc
esM
.A. (
P.M
. & L
.W.)
, L.L
.B.
4912
.07.
1999
252,
818,
169
Gra
sim I
ndus
trie
s,V
ice
Pres
iden
t (H
R),
(2)
7S.
C. T
ando
nJo
int
Pres
iden
t –
Red
uctio
n (R
enuk
oot)
B.Sc
. (M
et.
Engg
.)59
27.0
9.19
6738
2,53
3,06
4—
8A
jey
Sriv
asta
vaJo
int
Pres
iden
t –
Fabr
icat
ion
(Ren
ukoo
t)B.
E. H
ons.
(P),
MIE
(In
dia)
5807
.12.
1969
352,
580,
164
—
Cop
per
Bus
ines
s
9P.
Bal
akris
hnan
Exec
utiv
e Pr
esid
ent
B.E.
, PG
DM
5611
.06.
2000
3453
,39,
698
Kirl
oska
r El
ectr
ic C
o. L
td.,
Exec
utiv
e D
irect
or,(
2)10
A.K
. Sa
xena
Join
t Ex
ecut
ive
Pres
iden
tB.
E. (
Tec
h.)–
Met
allu
rgy
4501
.07.
2003
2426
,37,
708
Ispa
t M
etal
lics
(Ind
ia)
Ltd.
,V
ice
Pres
iden
t, (5
)11
P.S.
Gho
seJo
int
Exec
utiv
e Pr
esid
ent
(Pro
ject
s)B.
E.–M
ech.
, M
.TEC
H54
06.1
1.20
0328
24,6
0,88
9St
erlit
e In
dust
ries
Ltd.
,V
ice
Pres
iden
t, (2
)
Empl
oyed
for
par
t of
the
yea
rA
lum
iniu
m B
usin
ess
12G
.S.
Khu
rana
Sr. E
xecu
tive
Pres
iden
tB.
Sc.,
B.E.
(Mec
h.)
6016
.12.
1986
383,
643,
836
Plan
t M
anag
er, S
hree
Ram
Fer
tilize
r&
Che
mic
als
Ltd.
(10
).13
J. Bh
owm
ikJo
int
Pres
iden
t (R
enus
agar
Pow
er)
B.E.
(Mec
h.),
M. T
ech.
4931
.01.
2005
2651
1,34
1G
ener
al M
anag
er, N
TPC
(26
).(T
herm
al E
ngg.
), M
.B.A
.(F
inan
ce)
14S.
M.
Bhat
iaC
hief
Ope
ratin
g O
ffice
r –
Dem
erge
d In
dal
Uni
tsB.
Sc.,
Engg
. (M
ech)
5101
.09.
2004
292,
417,
819
Jinda
l Iro
n &
Ste
el C
o. L
td.
15M
. G
eorg
eEx
ecut
ive
Pres
iden
t –
Met
al, P
ower
& E
xtru
sion
B.T
ech
(Met
.)58
01.0
8.19
6935
2,65
5,90
5—
16C
.B.
Agr
awal
Seni
or J
oint
Pre
siden
t –
B.E.
(M
ech.
)58
01.0
9.20
0035
1,57
6,16
3—
Cor
pora
te A
ffairs
& P
lann
ing
17M
. H
arih
aran
Seni
or V
ice
Pres
iden
t –
Qua
lity
& W
CM
B.Sc
., En
gg.
(Met
.),
5815
.09.
1969
351,
549,
454
—D
iplo
ma
in C
hem
.18
T.B
. Joh
nJo
int
Pres
iden
t –
Cor
pora
te A
ffairs
Dip
lom
a in
Che
m. T
ech.
5821
.07.
1969
372,
239,
388
Com
inco
Bin
ani
Zinc
Ltd
.19
V.K
. Soo
dSe
nior
Joi
nt P
resid
ent
– Fo
il &
Pac
kagi
ngB.
E. (
Che
m.)
5330
.03.
1994
321,
364,
029
Nat
iona
l A
lum
iniu
m C
o. L
td.
20S.
Sub
ram
ania
nSe
nior
Vic
e Pr
esid
ent
– Pr
ojec
tsB.
E. (
Mec
h.)
5801
.09.
1970
342,
262,
021
—21
Dr.
S.K
. Tam
otia
Pres
iden
t &
Chi
ef E
xecu
tive
offic
er –
B.E.
(H
ons)
Civ
il, M
.E.
6527
.06.
2000
4112
,512
,194
—In
dal
Uni
ts(S
oil M
ech
& F
ound
atio
nEn
gg.)
, D. E
ngg.
(H
ons)
22Sh
ri S.
N. B
onth
aC
EO, A
dity
a A
lum
iniu
m P
roje
ctB.
E. (
Elec
t.), P
.G.
5528
.02.
2005
3339
3,00
5Ex
ecut
ive
Dire
ctor
(Pr
ojec
ts),
Dip
lom
a in
Man
agem
ent
Nee
la c
hal
Ispa
t N
igam
Ltd
.
Cop
per
Bus
ines
s
23K
.P. S
harm
aV
ice
Pres
iden
t –
Com
mer
cial
&B.
E.–C
hem
, M
E–C
hem
5625
.05.
1984
3128
,92,
916
Proj
ects
& D
evel
opm
ent
Indi
a Lt
d.,
Log
istic
s (D
ahej
)A
ssist
ant
Chi
ef E
ngg.
, (8)
Not
es1
Nat
ure
of E
mpl
oym
ent:
All
appo
intm
ents
are
non
–con
trac
tual
. Oth
er t
erm
s an
d co
nditi
ons
as p
er C
ompa
ny’s
Rul
es/S
chem
e.2
Rem
uner
atio
n as
sho
wn
abov
e in
clud
es S
alar
y, A
llow
ance
, Ex–
grat
ia, C
ontr
ibut
ion
to P
rovi
dent
Fun
d an
d Su
pera
nnua
tion
Sche
me
and
othe
r pe
rqui
sitie
s.3
Non
e of
the
Em
ploy
ees
nam
ed a
bove
is a
rel
ativ
e of
any
Dire
ctor
of t
he C
ompa
ny.
A N N E X U R E ‘ A ’ T O T H E D I R E C T O R S ’ R E P O R T ( C o n t d . )

(63)
C O M P L I A N C E C E R T I F I C A T E
This to confirm that in respect of financial year 2004-05 :–
1. The Company has kept and maintained all registers and records as required under the provisions of the Actand the Rules made thereunder and the entries therein have been duly recorded.
2. The Company has duly filed the forms, returns and documents with the Registrar of Companies, Maharashtraand other authorities as required under the Act and Rules made thereunder.
3. All the requirements relating to the meetings of Directors, Committee of Directors and Shareholders as wellas relating to the minutes of the proceedings thereat have been complied with.
4. The Board of Directors of the Company is duly constituted.
5. The Directors of the Company have made all the required disclosures under Section 299 and 274(1)(g) ofthe Act. The Company has also complied with the requirements in pursuance of the disclosure made by itsDirectors.
6. The issue of capital and securities is in conformity with the requirement of the Act. The issues of sharecertificate and the transfer and transmission thereof have been registered properly.
7. The Company has obtained all the necessary approvals of Directors, Shareholders and other authorities asrequired under the Act.
8. The Company has complied with all the provisions of the listing agreements with The Stock Exchange,Mumbai and National Stock Exchange of India Limited.
9. The Company has transferred the dividend declared on July 31st, 2004 to separate dividend account and allthe unpaid / unclaimed dividend accounts have been reconciled.
10. During the year under review, the Company has transferred to Investor Education and Protection Fund,dividend amounting to Rs. 35,42,166 and Rs. 19,86,265 towards principal amount of debentures and interestaccrued thereon that have not been claimed by the shareholders/debentureholders for the financial year1996-97 in accordance with the provisions of the Act.
11. The Company has framed an insider trading code on the lines of model code prescribed under the SEBI(Prohibition of Insider Trading) Regulations, 1992 as amended and the same has been implemented duringthe year under review. The Company Secretary acts as the Compliance Officer.
12. The Company has complied with the disclosure requirements of SEBI (Substantial Acquisition of Sharesand Takeovers) Regulations, 1997 and SEBI (Prohibition of Insider Trading) Regulations, 1992.
13. The Company is registered with the Securities and Exchange Board of India (SEBI) as Share Transfer Agent– Category II and has connectivity with National Securities Depository Limited (NSDL) and CentralDepository Services (India) Limited (CDSL). The Company has complied with SEBI (Registrars to an Issueand Share Transfer Agents) Regulations, 1993.
Anil Malik30th April, 2005 Company Secretary

(64)
We have audited the attached Balance Sheet of HINDALCO INDUSTRIES LIMTIED as at 31st March, 2005and also the Profit and Loss Account and the Cash Flow Statement for the year ended on that date, in which,are incorporated all the assets and liabilities of the demerged business undertakings (other than the aluminumfoil business at Kollur, Andhra Pradesh), of Indian Aluminium Company Ltd effective from 1st April, 2004 interms of the Scheme of Arrangement approved by respective High Courts, annexed thereto. These financialstatements are the responsibility of the Company’s management. Our responsibility is to express an opinion onthese financial statements based on our Audit.
We conducted our audit in accordance with auditing standards generally accepted in India. Those standardsrequire that we plan and perform the audit to obtain reasonable assurance about whether the financial statementsare free of material misstatement. An audit includes examining, on a test basis, evidence supporting theamounts and disclosures in the financial statements. An audit also includes assessing the accounting principlesused and significant estimates made by management, as well as evaluating the overall financial statementpresentation. We believe that our audit provides a reasonable basis for our opinion.
As required by the Companies (Auditor’s report) Order, 2003 (as amended) issued by the Central Governmentin terms of sub-section (4A) of section 227 of the Companies act, 1956, we enclose as Annexure, a statementon the matters specified in the paragraphs 4 and 5 of the said order.
Further to our comments in the Annexure referred above, we report that:
1) We have obtained all the information and explanations, which to the best of our knowledge and beliefwere necessary for the purpose of our audit;
2) In our opinion, proper books of account as required by law have been kept by the Company so far asappears from our examination of those books;
3) The Balance Sheet, Profit & Loss Account and Cash Flow Statement dealt with by this report are inagreement with the books of account;
4) In our opinion, the Balance Sheet, Profit and Loss Account and Cash Flow Statement dealt with by thisreport comply with the accounting standards referred to in sub-section (3C) of Section 211 of the CompaniesAct, 1956;
5) On the basis of the written representations received from the directors and taken on record by the Board ofDirectors, we report that none of the Directors is disqualified as on 31st March, 2005 from being appointedas a Director in terms of clause (g) of sub-section (1) of section 274 of the Companies Act, 1956;
6) In our opinion and to the best of our information and according to the explanations given to us, the saidaccounts read with the notes in Schedule 23 give the information required by the Companies Act, 1956(as amended) in the manner so required and give a true and fair view in conformity with the accountingprinciples generally accepted in India;
(a) In the case of the Balance Sheet, of the state of affairs of the Company as at 31st March, 2005;
(b) In the case of the Profit & Loss Account, of the Profit for the year ended on that date; and
(c) In the case of Cash Flow Statement, of the Cash Flows for the year ended on that date.
Camp : Mumbai For SINGHI & CO.Dated : The 30th day of April, 2005 Chartered Accountants
RAJIV SINGHI1-B, Old Post Office Street, PartnerKolkata-700 001 Membership No. 53518
A U D I T O R S ’ R E P O R T T O T H E S H A R E H O L D E R S

(65)
I (a) The Company has maintained proper records showing full particulars including quantitative detailsand situation of Fixed Assets.
(b) Fixed Assets have been physically verified by the management periodically in a phased manner andno material discrepancies have been noticed on physical verification as confirmed by the management.
(c) No substantial part of Fixed Assets has been disposed off during the year, which has bearing on thegoing concern assumption.
II (a) Physical verification of Inventory (except stocks lying with third parties , confirmation for which hasbeen obtained and in transit) have been conducted at reasonable intervals during the year by themanagement.
(b) In our opinion, the procedures of physical verification of Inventory followed by the management arereasonable and adequate in relation to the size of the Company and nature of its business.
(c) The Company has maintained proper records of inventory. No material discrepancies were noticedon physical verification.
III. (a) The Company has neither granted nor taken any loans, secured or unsecured to and from companies,firms or other parties covered in the register maintained under Section 301 of the Companies Act,1956. Accordingly, clause 4(III)(b) to (d) of the Order are not applicable.
(b) The Company has not taken any loans, secured or unsecured to and from companies, firms or otherparties covered in the register maintained under Section 301 of the Companies Act, 1956. Accordingly,clause 4(III)(f) to (g) of the Order are not applicable.
IV. On the basis of checks carried out during the course of audit and as per explanations given to us, we areof the opinion that there are adequate internal control procedures commensurate with the size of theCompany and the nature of its business; for the purchase of inventory and fixed assets and for the sale ofgoods and services. During the course of our audit, no major weakness has been noticed in the internalcontrol.
V. In our opinion and according to the information and explanations given to us, there are no contracts andarrangements referred to in section 301 of the Companies Act 1956 , particulars of which need to beentered into a register maintained under Section 301 of the Act. Accordingly, clause 4(V)(b) of theOrder is not applicable.
VI. The Directives issued by the Reserve Bank of India and the provisions of sections 58A and 58AA or anyother relevant provisions of the Companies Act, 1956 and the rules framed there-under have beencomplied with in respect of deposits accepted from the public. We have been informed that, no order hasbeen passed by Company Law Board or National Company Law Tribunal or Reserve Bank of India or anyother Court or Tribunal in this regard.
VII. The Company has an Internal Audit System, which in our opinion is commensurate with the size andnature of the business.
VIII The Company has maintained proper cost records as prescribed by Central Government under section209 (1) (d) of the Companies Act, 1956 for the products of the Company but no detailed examination ofsuch records has been carried out by us.
A N N E X U R E T O T H E A U D I T O R S ’ R E P O R T

(66)
IX (a) According to the information and explanations given to us and on the basis of our examination ofthe books of accounts, the Company is regular in depositing undisputed statutory dues includingProvident Fund, Investor Education and Protection Fund, Employees’ State Insurance, Income Tax,Sales Tax, Wealth Tax, Custom Duty, Excise Duty, Cess and other statutory dues with the appropriateauthorities.
(b) According to the information and explanations given to us, the dues of Sales Tax, Income Tax,Customs Duty, Wealth Tax, Excise Duty, Cess and Service Tax which have not been deposited onaccount of any dispute and the forum where the dispute is pending are as under:
Name of the Nature of dues Amount Forum where dispute is pendingstatute (Rs.in million)
Gujarat Sales Demand on Provisional Assessment 212.26 Gujarat High Court, Ahmedabad
Tax Act, 1969 Demand under section 15B 16.36 Gujarat Sales Tax Tribunal, Ahmedabad
Demand under section 15B 2.10 Jurisdictional Commissioner of Appeal,Vadodara
Customs Demand of Custom Duty on 2.87 Commissioner of Customs, SuratAct, 1962 Copper Concentrate
Central Excise Demand of Excise duty on the power 145.94 Delhi High Court, DelhiAct, 1944 generated by the Company’s captive
power plant
Demand of excise duty on Sale of 0.90 Customs, Excise & Service Taxold & used Capital Goods Appellate Tribunal, New Delhi
Modvat Credit disallowed on Short 3.80 Customs, Excise & Service Taxreceipt of Inputs & Raw Materials Appellate Tribunal, New Delhi
Demand of Duty on repacking 2.60 Customs, Excise & Service Taxcharges & financial charges Appellate Tribunal, New Delhi
Demand of duty on sale of Gold 1553.06 Customs, Excise and Service TaxAppellate Tribunal, West Zone, Mumbai
4.63 Commissioner of CentralExcise (Appeals), Vadodara
Demand of duty on sale of Silver 0.20 Customs, Excise and Service TaxAppellate Tribunal, West Zone, Mumbai
Service Tax on Consulting Fee 0.69 Customs, Excise and Service TaxAppellate Tribunal, West Zone, Mumbai
Indian Demand by Dy. Commissioner Latehar 0.90 Petition pending with RanchiStamp Act High Court
Income Tax Demands pertaining to erstwhile Indo 133.95 Assessment Order received, appeal beforeAct, 1961 Gulf Corporation Ltd. CIT(A) shall be filed.
X The Company does not have any accumulated losses and has not incurred cash losses in the currentfinancial year and in the immediately preceding financial year.
XI The Company has not defaulted in repayment of dues to Financial Institutions or Banks or Debentureholders.
XII According to the information and explanations given to us, the Company has not granted any loans oradvances on the basis of security by way of pledge of Shares, Debentures and other Securities.
(67)
XIII The Company is not a chit fund or a nidhi/mutual benefit fund/ society.
XIV The Company is not in the business of dealing or trading in shares. The Company has maintained properrecords of transactions and contracts in respect of Shares, Securities, Debentures and other Investmentand timely entries have been made therein. The Shares, Securities, Debentures and other Securities havebeen held by the Company, in its own name except to the extent of exemption, granted under section 49of the Companies Act, 1956.
XV In our opinion and according to the information and explanations given to us, the terms and conditionson which the Company has given guarantees for loans taken by its Subsidiaries and Joint Ventures fromBanks and Financial Institutions are not prima facie prejudicial to the interest of the Company.
XVI Based on information and explanations given to us by the management, term loans were applied for thepurpose for which the loans were obtained.
XVII On the basis of our overall examination of the Cash Flow Statement, the funds raised on short-termbasis have not been used for long term investment.
XVIII During the year under Audit, the Company has not made any preferential allotment of shares to partiesor companies covered in the register maintained under section 301 of the Companies Act, 1956.
XIX On the basis of records made available to us, the Company has created Securities and charge in respectof Debenture issued/ outstanding during the year.
XX The Company has not raised any money by way of Public Issue during the year.
XXI Based upon the audit procedures performed and on the basis of information and explanations providedby the management, we report that no fraud, on or by the Company has been noticed or reported duringthe year.
Camp : Mumbai For SINGHI & CO.Dated : The 30th day of April, 2005 Chartered Accountants
RAJIV SINGHI1-B, Old Post Office Street, PartnerKolkata-700 001 Membership No. 53518

(68)
B A L A N C E S H E E T A S A T 3 1 S T M A R C H , 2 0 0 5
(Rs. in Million)As at 31st As at 31st
Schedule March, 2005 March, 2004SOURCES OF FUNDSSHAREHOLDERS’ FUNDSShare Capital ‘1’ 927.77 924.77Reserves and Surplus ‘2’ 75,738.01 67,654.23
76,665.78 68,579.00
LOAN FUNDSSecured Loans ‘3’ 29,523.38 17,259.35Unsecured Loans ‘4’ 8,476.59 8,386.55
37,999.97 25,645.90DEFERRED TAX LIABILITY (NET) 11,296.98 9,951.35
TOTAL 125,962.73 104,176.25
APPLICATION OF FUNDSFIXED ASSETSGross Block ‘5’ 87,727.93 66,584.94Less : Depreciation 30,693.37 19,182.79Less : Impairment 999.27 —
Net Block 56,035.29 47,402.15Capital Work-in-Progress 13,229.81 4,676.66
69,265.10 52,078.81INVESTMENTS ‘6’ 37,021.45 33,772.05CURRENT ASSETS, LOANS AND ADVANCESInventories ‘7’ 23,745.18 11,913.43Sundry Debtors ‘8’ 7,873.67 5,611.13Cash and Bank Balances ‘9’ 4,009.69 2,279.02Other Current Assets ‘10’ 422.22 236.42Loans and Advances ‘11’ 8,713.49 8,822.57
44,764.25 28,862.57Less :CURRENT LIABILITIES AND PROVISIONSLiabilities ‘12’ 16,782.95 8,963.95Provisions ‘13’ 8,398.98 1,573.23
25,181.93 10,537.18
NET CURRENT ASSETS 19,582.32 18,325.39MISCELLANEOUS EXPENDITURE ‘14’ 93.86 —(to the extent not written off or adjusted)
TOTAL 125,962.73 104,176.25
Significant Accounting Policies & Notes on Accounts ‘23’
As per our report annexed.For SINGHI & CO. Chairman: KUMAR MANGALAM BIRLAChartered Accountants
Directors: RAJASHREE BIRLARAJIV SINGHI D. BHATTACHARYA C. M. MANIARPartner Managing Director E. B. DESAIMembership No. 53518 S. S. KOTHARI
R. K. KASLIWAL M. M. BHAGATCamp: Mumbai ANIL MALIK Group Executive K. N. BHANDARIDated: The 30th day of April, 2005 Company Secretary President & C.F.O. A. K. AGARWALA

(69)
P R O F I T & L O S S A C C O U N T F O R T H E Y E A R E N D E D 3 1 S T M A R C H , 2 0 0 5
(Rs. in Million)For the year For the year
ended 31st ended 31stSchedule March, 2005 March, 2004
INCOME
Gross Sales and Operating Revenues ‘15’ 104,804.19 68,198.57Less: Excise Duty 9,571.68 6,115.05
Net Sales and Operating Revenues 95,232.51 62,083.52Other Income ‘16’ 2,700.45 2,400.05
97,932.96 64,483.57
EXPENDITURERaw Materials Consumed ‘17’ 46,223.65 31,008.78Goods Purchased 171.34 —Manufacturing and Operating Expenses ‘18’ 20,112.38 11,988.57Payments to and Provision for Employees ‘19’ 4,126.34 2,370.56Selling, Distribution, Administration and Other Overheads ‘20’ 4,390.74 2,732.27(Increase)/ Decrease in Stocks ‘21’ (2,556.48) (1,019.36)Interest and Finance Charges ‘22’ 1,699.56 1,771.54Depreciation 4,632.57 3,174.52
78,800.10 52,026.88
PROFIT BEFORE EXTRAORDINARY ITEM AND TAX 19,132.86 12,456.69Extraordinary Item (Refer Note No. 18 in Schedule ‘23’) 91.03 —
PROFIT BEFORE TAX 19,041.83 12,456.69Provision for Current Tax 5,705.00 2,606.40Provision for Deferred Tax 758.86 1,461.00Provision for Deferred Tax for earlier years written back (715.60) —
NET PROFIT 13,293.57 8,389.29Balance brought forward from Previous year 550.00 550.00Transfer from Debenture Redemption Reserve 400.00 725.00
BALANCE AVAILABLE FOR APPROPRIATIONS 14,243.57 9,664.29
APPROPRIATIONSDebenture Redemption Reserve 960.00 920.70Proposed Dividend on Equity Shares 1,855.61 1,525.84Tax on Dividend Proposed/Paid 264.16 195.50Transfer to General Reserve 10,613.80 6,472.25Balance Carried to Balance Sheet 550.00 550.00
14,243.57 9,664.29
Basic and Diluted Earnings per Share (in Rupees) 143.29 90.71Significant Accounting Policies & Notes on Accounts ‘23’
As per our report annexed.For SINGHI & CO. Chairman: KUMAR MANGALAM BIRLAChartered Accountants
Directors: RAJASHREE BIRLARAJIV SINGHI D. BHATTACHARYA C. M. MANIARPartner Managing Director E. B. DESAIMembership No. 53518 S. S. KOTHARI
R. K. KASLIWAL M. M. BHAGATCamp: Mumbai ANIL MALIK Group Executive K. N. BHANDARIDated: The 30th day of April, 2005 Company Secretary President & C.F.O. A. K. AGARWALA

(70)
S C H E D U L E S
(Rs. in Million)As at 31st As at 31st
March, 2005 March, 2004SCHEDULE ‘1’SHARE CAPITALAUTHORISED1450,00,000 Equity Shares of Rs.10/- each. 1,450.00 1,450.00
5,00,000 14% Free of Company’s tax but subject to deduction oftaxes at source at the prescribed rates, RedeemableCumulative Preference Shares of Rs. 100/- each 50.00 50.00
1,500.00 1,500.00ISSUED, SUBSCRIBED AND PAID-UP
927,80,847 Equity Shares of Rs.10/- each fully paid-up 927.81 924.816,050 Less: Face value of Shares forfeited 0.06 0.06
927.75 924.75Add: Forfeited Shares Account (Amount Paid-up) 0.03 0.03
927.78 924.78Less: Calls-in-Arrears 0.01 0.01
927.77 924.77Note:1. Issued, Subscribed and paid-up Equity Share Capital includes:
(i) 4,91,76,677 Equity Shares of Rs. 10/- each fully paid-up allotted as fully paid-upBonus Shares by capitalisation of General Reserve and Capital Redemption Reserve.
(ii) 6,00,000 Equity Shares of Rs. 10/- each fully paid-up issued pursuant to a contractfor consideration other than cash.
(iii) 1,87,67,835 Equity Shares allotted to the share holders of erstwhile Indo GulfCorporation Limited (since amalgamated) pursuant to the Scheme of Arrangementwithout payment being received in cash.
(iv) 2,99,522 Equity Shares allotted to the share holders of Indian Aluminium CompanyLimited pursuant to the Scheme of Arrangement without payment being receivedin cash.
SCHEDULE ‘2’RESERVES AND SURPLUSCAPITAL RESERVE
As per last Balance Sheet — —Add: Created as per Scheme of Arrangement 4.00 —
4.00 —CAPITAL REDEMPTION RESERVE
As per last Balance Sheet 1,007.59 1,007.59
SECURITIES PREMIUM ACCOUNTAs per last Balance Sheet 11,393.91 11,393.91Less: Adjusted as per Scheme of Arrangement (Refer Note No. 5 in Schedule ‘23’) 2,102.74 —
9,291.17 11,393.91DEBENTURE REDEMPTION RESERVE
As per last Balance Sheet 3,400.02 3,204.32Add: Created as per scheme of Arrangement 111.85 —Add: Created during the year 960.00 920.70
4,471.87 4,125.02Less: Transferred to Profit and Loss Account on Redemption of Debentures 400.00 725.00
4,071.87 3,400.02GENERAL RESERVE
As per last Balance Sheet 51,302.71 44,830.46Less: Provision for Impairment 1,103.13 —
50,199.58 44,830.46Add: Transfer from Profit and Loss Account 10,613.80 6,472.25
60,813.38 51,302.71PROFIT AND LOSS ACCOUNT BALANCE 550.00 550.00
75,738.01 67,654.23

(71)
S C H E D U L E S
SCHEDULE ‘3’ (Rs. in Million)SECURED LOANS As at 31st As at 31st
March, 2005 March, 2004A. Secured Redeemable Non-Convertible Debentures
2,000 13.20% NCD of Rs 5 lac each redeemable in three instalmentson 9th September, 2002 (Redeemed), 9th September, 2003(Redeemed) and 9th September, 2004 (Redeemed) — 300.00
150 11.22% NCD of Rs. 1 crore each redeemable on 12th January, 2008(Put/call option on 12th January, 2006) 1,500.00 1,500.00
200 9.75% NCD of Rs. 1 crore each redeemable on 2nd July, 2008(Put/ call option on 2nd July, 2006) 2,000.00 2,000.00
50 9.00% NCD of Rs. 1 crore each redeemable on 17th September,2008 (Put/call option on 17th September, 2006) 500.00 500.00
60 7.95% NCD of Rs. 1 crore each redeemable on 15th July, 2009(Put/ call option on 15th July, 2007) 600.00 600.00
25 6.95% NCD of Rs. 1 crore each redeemable on 23rd August, 2007(Put/call option on 23rd August, 2005) 250.00 250.00
75 7.20% NCD of Rs. 1 crore each redeemable on 23rd August, 2007(Rs. 500.00 million) & 23rd August, 2009 (Rs. 250.00 million)(Put/call option on 23rd August, 2007 for Rs. 250.00 million only) 750.00 750.00
105 6.40% NCD of Rs. 1 crore each redeemable on 29th November, 2009(Put/call option on 29th November, 2007) 1,050.00 1,050.00
All the above debentures are secure by first charge on immovable properties ofaluminium plant situate at Renukoot, both present and future, ranking pari-passu save and except, some of the Workers’ Quarters and on fixed assets bothpresent and future ranking pari-passu of the Aluminium plant situate at Renukoot.
50 9.95% NCD of Rs. 1 crore each redeemable on 14th June, 2006 500.00 —486,804 6.60% NCD of Rs. 1 thousand each redeemable on 20th
November, 2007 486.80 —100 6.39% NCD of Rs. 1 crore each redeemable on 15th September, 2009 1,000.00 —
The 9.95% and 6.60% debentures are secured by first charge on immovableproperties of Belur units situate in the State of West Bengal, both present andfuture, ranking pari-passu and fixed assets of the Belur Unit both present anffuture (save and except book debt) and 6.39% debentures are secured/to besecured by first charge on immovable properties of Hirakud Smelter and powerplant, both present and future ranking pari-passu and a fixed assets of Hirakudsmelter and power plant both present and future.
3,000 12.75% NCD of Rs. 5 lac each redeemable in five equalinstalments of Rs. 26.50 crore each on 4th December, 2002(Redeemed), 4th December, 2003 (Redeemed), 4th December, 2004(Redeemed), 4th December, 2005 and 4th December, 2006 andRs. 3.50 crore on 12th December, 2002 (Redeemed), 12th December,2003 (Redeemed), 12th December, 2004 (Redeemed), 12th December,2005 and 12th December, 2006 600.00 900.00
500 10.00% NCD of Rs. 5 Lac each redeemable on 1st June, 2004(Redeemed) — 250.00
500 9.70% NCD of Rs. 5 Lac each redeemable on 6th June, 2004(Redeemed) — 250.00
4,000 8.70% NCD of Rs. 5 Lac each redeemable on 23rdApril, 2007 2,000.00 2,000.00
2,000 8.10% NCD of Rs. 5 Lac each redeemable on 19th July, 2009(Put/call option on 19th July, 2007) 1,000.00 1,000.00
1,000 6.20% NCD of Rs. 5 lac each redeemable on 8th January, 2008 500.00 500.001,000 5.95% NCD of Rs. 5 Lac each redeemable on 14th January, 2008 500.00 500.002,500 6.50% NCD of Rs. 10 Lac each redeemable on 6th September, 2009 2,500.00 —
These debentures are secured/to be secured by first charge on immovable propertyof Copper Plant situate at Dahej both present and future ranking pari-passu withexisting charge holders and a fixed assets present and future ranking pari-passuof the Copper plant at Dahej. Further 12.75% debentures are secured on movableproperties subject to charge created/to be created in favour of the Bankers forsecuring Working Capital facilities.
Carried over . . . 15,736.80 12,350.00

(72)
SCHEDULE ‘3’ (Contd.) (Rs. in Million)SECURED LOANS (Contd.) As at 31st As at 31st
March, 2005 March, 2004
Brought Forward . . . 15,736.80 12,350.00
S C H E D U L E S
B. Term Loans from Government of Uttar Pradesh under SubsidisedHousing Scheme for Industrial Workers 0.73 0.92Secured by hypothecation of Workers’ Quarters (repayable within one yearRs. 0.19 million)
C. Loans from Scheduled Banks - Cash Credit and Export Credit Accounts 1,775.65 645.69Secured by hypothecation of stocks of Raw Materials, Consumable Stores,Spares, Work-in-Progress and Finished Products of other than its CopperDivision, movable assets and book debts of its Copper Division, both presentand future. Further secured/to be secured by way of joint equitable mortgageof the immovable assets, on second charge basis, of the Copper Division,ranking pari-passu with other Lenders/Institutions.
D. Rupee Term Loans from Schedule Banks 4,963.38 —The loan is secured/to be secured by first charge on all immovable propertiesof the Company both present and future ranking pari passu and hypothecationon all the assets both present and future of the Company ranking pari passu.(repayable within one year Rs. 13.38 million)
E. Rupee Term Loans from Financial Institutions 113.32 171.51Rupee Term loans from Financial Institutions are secured by joint andequitable mortgage/hypothecation of all properties (save & except book debts)of the Copper Division of the Company, both present & future, ranking pari-passu inter-se, subject to prior charges created in favour of the Company’sBankers on specified movables assets for securing the borrowings for theworking capital facilities and Hirakud Power assets (repayable within oneyear Rs. 66.99 million).
F. Foreign Currency Term Loans from Banks 6,639.08 2,692.27Foreign Currency Loan of USD 48 million from Banks, ranking pari-passu andare secured by hypothecation on Unit No.8 of power plant at Renusagar. USD40 million loan is secrured by first charge on specific assets and USD 12.5million loan is secured by tangible movable properties including movable plant& machinery and or equipments both present and future located at factories,godowns and premises at Taloja and Kalwa; and JPY loan equivalent to USD100 million are secured by first charge on immovable properties of the Copperdivision situate at Dahej ranking pari-passu and hypothecation of fixed assetsboth present and future of Copper division at Dahej ranking pari-passu(repayable within one year US $ 32.00 million)
G. Foreign Currency Term Loans from Financial Institutions 294.42 1,398.96Foreign Currency loan from a Financial Institution is guaranteed by a bankguarantee and such guarantee is secured by hypothecation of all plant &machinery both present & future pertaining to the Copper Division. This isfurther secured by joint equitable mortgage, on first charge basis, of allimmovable properties of the Copper Division at Dahej both present & future.(repayable within one year US $ 2.24 million)
29,523.38 17,259.35
SCHEDULE ‘4’UNSECURED LOANSEmployees’ and other Deposits 268.25 313.30Rupee Loans from Banks 55.02 -Foreign Currency Loans from Banks 3,420.31 693.53Foreign Currency Loans from Financial Institutions 1,484.11 1,979.76Buyers’ Credit 3,248.90 5,399.96
8,476.59 8,386.55
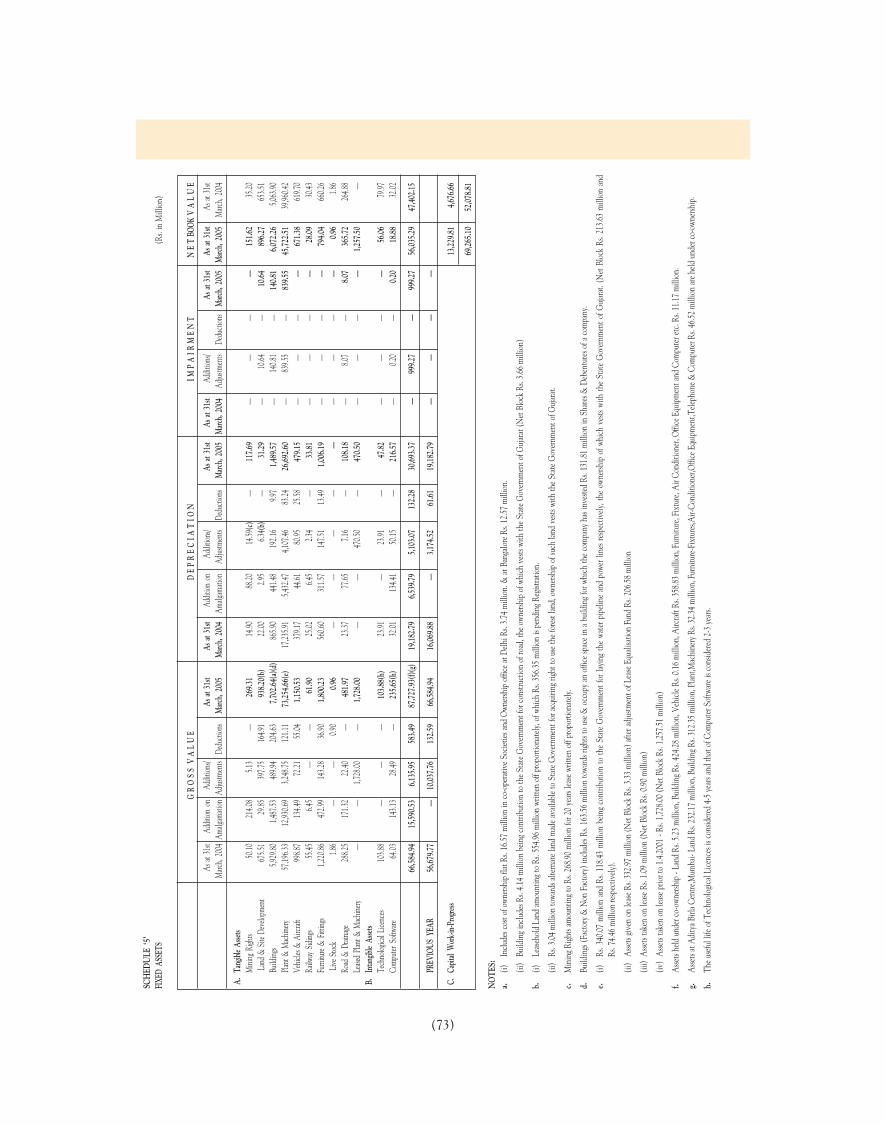
(73)
SCH
EDU
LE ‘5
’FI
XED
ASSE
TS(R
s. in
Mill
ion)
G R
O S
S V
A L
U E
D E
P R
E C
I A T
I O
NI M
P A
I R
M E
N T
N E
T BO
OK V
A L
U E
As at
31st
Addit
ion o
nAd
dition
s/As
at 3
1st
As at
31s
tAd
dition
on
Addit
ions/
As at
31s
tAs
at 3
1st
Addit
ions/
As at
31s
tAs
at 3
1st
As at
31st
Marc
h, 20
04Am
algam
ation
Adjus
tmen
tsDe
ducti
ons
Marc
h, 20
05M
arch,
2004
Amalg
amati
onAd
justm
ents
Dedu
ction
sM
arch,
2005
Marc
h, 20
04Ad
justm
ents
Dedu
ction
sM
arch,
2005
Marc
h, 20
05M
arch,
2004
A.Ta
ngibl
e Asse
tsM
ining
Righ
ts50
.1021
4.08
5.13
—26
9.31
14.90
88.20
14.59
(c)—
117.6
9—
——
—15
1.62
35.20
Lan
d &
Site D
evelo
pmen
t67
5.51
29.85
397.7
516
4.91
938.2
0(b)
22.00
2.95
6.34(
b)—
31.29
—10
.64—
10.64
896.2
765
3.51
Build
ings
5,929
.801,4
87.53
489.9
420
4.63
7,702
.64(a)
(d)
865.9
044
1.48
192.1
69.9
71,4
89.57
—14
0.81
—14
0.81
6,072
.265,0
63.90
Plant
& M
achin
ery57
,196.3
312
,930.6
93,2
48.75
121.1
173
,254.6
6(e)
17,23
5.91
5,432
.474,1
07.46
83.24
26,69
2.60
—83
9.55
—83
9.55
45,72
2.51
39,96
0.42
Vehic
les &
Airc
raft
998.8
713
4.49
72.21
55.04
1,150
.5337
9.17
44.61
80.95
25.58
479.1
5—
——
—67
1.38
619.7
0Ra
ilway
Sidi
ngs
55.45
6.45
——
61.90
25.02
6.45
2.34
—33
.81—
——
—28
.0930
.43Fu
rnitu
re &
Fittin
gs1,2
20.86
472.9
914
3.28
36.90
1,800
.2356
0.60
311.5
714
7.51
13.49
1,006
.19—
——
—79
4.04
660.2
6 L
ive S
tock
1.86
——
0.90
0.96
——
——
——
——
—0.9
61.8
6Ro
ad &
Drai
nage
288.2
517
1.32
22.40
—48
1.97
23.37
77.65
7.16
—10
8.18
—8.0
7—
8.07
365.7
226
4.88
Lease
d Pla
nt &
Mac
hinery
——
1,728
.00—
1,728
.00—
—47
0.50
—47
0.50
——
——
1,257
.50—
B.In
tangib
le As
sets
Tech
nolog
ical L
icenc
es10
3.88
——
—10
3.88(
h)23
.91—
23.91
—47
.82—
——
—56
.0679
.97Co
mpute
r Soft
ware
64.03
143.1
328
.49—
235.6
5(h)
32.01
134.4
150
.15—
216.5
7—
0.20
—0.2
018
.8832
.02
66,58
4.94
15,59
0.53
6,135
.9558
3.49
87,72
7.93(
f)(g)
19,18
2.79
6,539
.795,1
03.07
132.2
830
,693.3
7—
999.2
7—
999.2
756
,035.2
947
,402.1
5
PREV
IOUS
YEA
R56
,679.7
7—
10,03
7.76
132.5
966
,584.9
416
,069.8
8—
3,174
.5261
.6119
,182.7
9—
——
—
C.Ca
pital
Wor
k-in-
Prog
ress
13,22
9.81
4,676
.66
69,26
5.10
52,07
8.81
NO
TES:
a.(i)
Inclu
des c
ost o
f own
ersh
ip fl
at R
s. 16
.57
mill
ion
in co
-ope
rativ
e Soc
ieties
and
Own
ersh
ip o
ffice
at D
elhi R
s. 3.
74 m
illio
n. &
at B
anga
lore
Rs.
12.5
7 m
illio
n.
(ii)
Build
ing i
nclu
des R
s. 4.
14 m
illio
n be
ing c
ontri
butio
n to
the S
tate
Gov
ernm
ent f
or co
nstru
ctio
n of
road
, the
own
ersh
ip o
f whi
ch v
ests
with
the S
tate
Gov
ernm
ent o
f Guj
arat
(Net
Blo
ck R
s. 3.
66 m
illio
n)
b.(i)
Leas
ehol
d La
nd am
ount
ing t
o Rs
. 554
.96
mill
ion
writt
en o
ff pr
opor
tiona
tely,
of w
hich
Rs.
356.
35 m
illio
n is
pend
ing R
egist
ratio
n.
(ii)
Rs. 3
.04
mill
ion
towa
rds a
ltern
ate l
and
mad
e ava
ilabl
e to
Stat
e Gov
ernm
ent f
or ac
quiri
ng ri
ght t
o us
e the
fore
st lan
d, o
wner
ship
of s
uch
land
vests
with
the S
tate
Gov
ernm
ent o
f Guj
arat
.
c.M
inin
g Righ
ts am
ount
ing t
o Rs
. 268
.90
mill
ion
for 2
0 ye
ars l
ease
writ
ten
off p
ropo
rtion
ately
.
d.Bu
ildin
gs (F
acto
ry &
Non
Fac
tory
) inc
lude
s Rs.
163.
56 m
illio
n to
ward
s righ
ts to
use
& o
ccup
y an
offic
e spa
ce in
a bu
ildin
g for
whi
ch th
e com
pany
has
inve
sted
Rs. 1
31.8
1 m
illio
n in
Sha
res &
Deb
entu
res o
f a co
mpa
ny.
e.(i)
Rs. 3
40.0
7 m
illio
n an
d Rs
. 118
.43
mill
ion
bein
g co
ntrib
utio
n to
the
Stat
e G
over
nmen
t for
layin
g th
e wa
ter p
ipeli
ne a
nd p
ower
line
s res
pect
ively
, the
own
ersh
ip o
f whi
ch v
ests
with
the
Stat
e G
over
nmen
t of G
ujar
at. (
Net
Blo
ck R
s. 21
3.63
mill
ion
and
Rs. 7
4.46
mill
ion
resp
ectiv
ely).
(ii)
Asse
ts giv
en o
n lea
se R
s. 33
2.97
mill
ion
(Net
Blo
ck R
s. 3.
33 m
illio
n) af
ter a
djus
tmen
t of L
ease
Equ
alisa
tion
Fund
Rs.
206.
58 m
illio
n
(iii)
Asse
ts ta
ken
on le
ase R
s. 1.
09 m
illio
n (N
et B
lock
Rs.
0.90
mill
ion)
(iv)
Asse
ts ta
ken
on le
ase p
rior t
o 1.
4.20
01 -
Rs. 1
,728
.00
(Net
Blo
ck R
s. 1,
257.
51 m
illio
n)
f.A
ssets
held
und
er co
-own
ersh
ip -
Land
Rs.
5.23
mill
ion,
Bui
ldin
g Rs.
424.
28 m
illio
n, V
ehicl
e Rs.
0.16
mill
ion,
Airc
raft
Rs. 3
58.8
3 m
illio
n, F
urni
ture
, Fix
ture
, Air
Cond
ition
er, O
ffice
Equ
ipm
ent a
nd C
ompu
ter e
tc. R
s. 11
.17
mill
ion.
g.A
ssets
at A
dity
a Birl
a Cen
tre,M
umba
i- La
nd R
s. 23
2.17
mill
ion,
Bui
ldin
g Rs.
312.
35 m
illio
n, P
lant,M
achi
nery
Rs.
32.3
4 m
illio
n, F
urni
ture
-Fix
ture
s,Air-
Cond
ition
er,O
ffice
Equ
ipm
ent,T
eleph
one &
Com
pute
r Rs.
46.5
2 m
illio
n ar
e held
und
er co
-own
ersh
ip.
h.Th
e use
ful l
ife o
f Tec
hnol
ogica
l Lice
nces
is co
nsid
ered
4-5
year
s and
that
of C
ompu
ter S
oftw
are i
s con
sider
ed 2
-3 ye
ars.

(74)
S C H E D U L E S
(Rs. in Million)Face Value Total As at 31st As at 31st
SCHEDULE ‘6’ (Rupees) Nos. March, 2005 March, 2004INVESTMENTSA. LONG TERM INVESTMENTS
1. UNQUOTEDa. Trade
i. Shares in Subsidiary Companies-Fully paid-upEquity Shares of Dahej Harber &Infrastructure Limited 10 50,000,000 500.00 500.00Equity Shares of Utkal Alumina InternationalLimited (acquired pursuant to the Scheme ofArrangement) 10 56,638,612 406.74 —
b. Other than Tradei. Government Securities
Indira Vikas Patra (Amount Rs. 200.00)(*Amount Rs. 200.00) (Lodged as security deposit)National Plan Savings Certificates(Amount Rs. 1000.00) (*Amount Rs. 1000.00)(Lodged as security deposit)National Defence Certificates (Amount Rs. 200.00)(*Amount Rs. 200.00) (Lodged as security deposit)National Saving Certificates (includesRs. 0.06 million lodged as security deposit) 0.37 0.39
ii. Shares in Subsidiary Companies- Fully paid-upEquity Shares of Minerals & Minerals Limited(including 606 shares held jointly with nominees) 10 50,000 1.66 1.66Equity Shares of Renuka Investments &Finance Limited (including 10 shares heldjointly with nominees) 10 9,250,000 92.50 92.50
15% Redeemable Cumulative PreferenceShares of Renuka Investments &Finance Limited 100 150 0.02 0.02
Equity Shares of Renukeshwar Investments &Finance Limited (including 10 shares heldjointly with nominees) 10 4,795,000 47.95 47.95
15% Redeemable Cumulative PreferenceShares of Renukeshwar Investments &Finance Limited 100 150 0.02 0.02Equity Shares of Lucknow FinanceCompany Limited 10 12,002,500 120.03 120.03Equity Shares of Indal Exports Limited(acquired pursuant to the Scheme ofArrangement) 10 140,000 1.40 —Equity Shares of Birla MineralsResources Pty Limited (30,000,000 EquityShares purchased during the year) AUD 1 143,820,001 4,269.89 3,288.95Equity Shares of Birla ResourcesPty Limited AUD 1 650,000 17.89 17.89
Carried Over …. 5,458.47 4,069.41

(75)
S C H E D U L E S
(Rs. in Million)Face Value Total As at 31st As at 31st
SCHEDULE ‘6’ (Contd.) (Rupees) Nos. March, 2005 March, 2004INVESTMENTS (Contd.)
Brought Forward … 5,458.47 4,069.41
Equity Shares of Suvas Holdings Limited(acquired pursuant to the Scheme ofArrangement) 10 188,700 1.89 —
Equity Shares of Indian AluminiumCompany Limited (reduced investmentby Rs. 11,882.79 million refer Note No. 5in Schedule ‘23’) 2 69,160,477 138.32 12,021.11
iii. Other Shares, Debentures and Bonds-Fully paid-up
Equity Shares of Gwalior Properties &Estates Limited (sold during the year) — — 74.26
Equity Shares of Seshasayee Properties Pvt.Limited (sold during the year) — — 76.54
Equity Shares of Turquoise Investments &Finance Limited (sold during the year) — — 189.65
Equity Shares of Trapti Trading & InvestmentsPvt. Limited (sold during the year) — — 192.54
Ordinary Shares of BirlaInternational Limited CHF 100 2,500 5.29 5.29
Equity Shares of Ganesh KrupaCo-operative Housing Society Limited(Amount Rs. 1,000.00) 50 20
Equity Shares of Ivory Tower PremisesCo-operative Housing Society Limited(Amount Rs. 250.00) 50 5
Equity Shares of Udyog Services Limited(Amount Rs. 200.00) (*Amount Rs. 200.00) —
Equity Shares of IDEA Cellular Limited 10 228,340,226 2,283.40 2,283.40
Equity Shares of Sanjana Cryogenic Limited 10 780,000 31.20 31.20
3.50% Redeemable Cumulative PreferenceShares of Aditya Birla Health Services Limited(purchased during the year) 100 2,000,000 200.00 —
2. QUOTED
a. Trade
i. Shares in Subsidiary Companies-Fully paid-up
Equity Shares of Bihar Caustic &Chemicals Limited 10 11,987,287 122.26 122.26
ii. Other Shares, Debentures and Bonds-Fully paid-up
Equity Shares of Tanfac Industries Limited 10 995,652 9.96 9.96
Carried Over …. 8,250.79 19,075.62

(76)
S C H E D U L E S
(Rs. in Million)Face Value Total As at 31st As at 31st
SCHEDULE ‘6’ (Contd.) (Rupees) Nos. March, 2005 March, 2004INVESTMENTS (Contd.)
Brought Forward … 8,250.79 19,075.62
b. Other than Tradei. Government Securities
11.40% GOI Stock 2008(Refer Note No. 6 in Schedule ‘23’) 50,000,000 1 61.71 61.71
ii. Other Shares, Debentures and Bonds-Fully paid-upEquity Shares of Century Enka Limited(sold during the year) — — 7.50Equity Shares of National AluminiumCompany Limited (463,433 Equity Sharessold during the year) 10 8,378,644 873.35 921.65Equity Shares of Indian Rayon &Industries Limited 10 7,663,535 488.47 488.47Equity Shares of Grasim Industries Limited 10 2,299,059 850.40 850.40Equity Shares of State Bank of India(acquired pursuant to the Scheme ofArrangement) 10 500 0.05 —Equity Shares of SBI Home Finance(acquired pursuant to the Scheme ofArrangement) 10 150,000 0.83 —Equity Shares of HDFC Bank Limited(acquired pursuant to the Scheme ofArrangement) 10 1,000 0.01 —Equity Shares of ICICI Bank Limited(acquired pursuant to the Scheme ofArrangement) (Amount Rs 4000.00) 10 400 — —6.75% Tax Free US 64 Bonds of Unit Trust ofIndia (Refer Note No. 6 in Schedule ‘23’) 100 140,200 14.02 14.02
iii. Units of Mutual FundsUnits of Mutual Funds (acquired pursuant tothe Scheme of Arrangement) 2,000,000 13.10 —
B. CURRENT INVESTMENTS1. UNQUOTED
a. Other than Tradei. Units of Mutual Funds
Units of Debt Schemes of various MutualFunds # (including acquired pursuant to the Schemeof Arrangement) 2,552,395,149.823 26,468.72 12,352.68
37,021.45 33,772.05
Aggregate Book Value:Unquoted 8,118.57 6,922.29Quoted 2,421.06 14,497.08Units of Mutual Funds 26,481.82 12,352.68
37,021.45 33,772.05
Aggregate Market Value/ Repurchase Price:Quoted 8,025.92 16,963.73Units of Mutual Funds 26,723.86 11,241.57
34,749.78 28,205.30
* Represent figures for Previous Year.# During the year the company has purchased and sold 5,223,142,691.325 units of Debt Scheme of various Mutual Funds.

(77)
S C H E D U L E S
(Rs. in Million)As at 31st As at 31st
March, 2005 March, 2004SCHEDULE ‘7’INVENTORIES (As valued and certified by the Management)(including in transit)
Stores, Spare-parts etc. 1,708.42 1,305.69
Coal and Fuel 643.36 580.20
Raw Materials 10,492.77 3,188.98
Work-in-Progress 9,086.64 5,707.48
Finished Goods 1,621.05 990.87
Excise Duty on Stocks 192.94 140.21
23,745.18 11,913.43
SCHEDULE ‘8’SUNDRY DEBTORS(Unsecured Considered Good, except otherwise stated)
Over six months (including Rs. 94.70 million doubtful) 255.95 247.67
Others (including Rs. 2,402.71 million secured) 7,712.42 5,382.53
7,968.37 5,630.20Less: Provision for doubtful debts 94.70 19.07
7,873.67 5,611.13
SCHEDULE ‘9’CASH AND BANK BALANCESCash Balance on hand 3.78 1.48Cheques and Drafts in hand 275.36 307.31Balance with Scheduled Banks:
In Current Accounts 694.19 408.52In E.E.F.C. Account 0.56 0.55In Deposit Account 2,973.53 1,508.78In Escrow Account 7.84 0.31In Unpaid Dividends Account 50.34 47.07In Unpaid Debentures Account — 1.27In Account of Nominees for sale proceeds of Fractional Coupons of Shares 3.73 3.73
Balance with Non-Scheduled Banks:In Current Accounts with Municipal Co-operative Bank Limited, Mumbai(maximum balance held at any time during the year Rs. 0.58 million) 0.36 —
4,009.69 2,279.02
SCHEDULE ‘10’OTHER CURRENT ASSETSAccrued Interest
On Investments 1.18 0.82On Inter Corporate Deposits and Deposit in Banks 31.23 53.62On Others (including Rs. 0.44 million from Subsidiary Companies) 12.04 28.01
Accrued Exports Incentives 377.77 153.97
422.22 236.42

(78)
S C H E D U L E S
(Rs. in Million)As at 31st As at 31st
March, 2005 March, 2004SCHEDULE ‘11’LOANS AND ADVANCES(Unsecured Considered Good, unless otherwise stated)Advance and Loan to Subsidiary Companies 212.27 555.65Loan to Employees 201.77 13.86Inter Corporate Deposits 631.47 853.66Advances recoverable in cash or in kind or for value to be receivedand/or to be adjusted (including doubtful/under litigation Rs. 31.19 million) 2,611.97 2,008.84
Prepaid Expenses 214.67 1,270.09
Balance with Customs, Port Trusts, Excise etc. 11.51 0.02
Security and other Deposits (including Rs. 12.21 million Receipts of Deposits inBank/Post Office Savings Bank Pass book lodged with Government Departments) 770.64 445.17
Excise, Customs and other Claims Receivable 3,714.67 3,330.76
Trident Trust (Refer Note No. 8 (iv) in Schedule ‘23’) 344.52 344.52
8,713.49 8,822.57
SCHEDULE ‘12’CURRENT LIABILITIESSundry Creditors (including Rs. 10.06 million outstanding dues of SSI undertakings) 14,573.87 7,600.26Customers’ Credit Balances and Advances against orders 407.18 332.50Subsidiary Companies 279.84 104.47Security Deposits Refundable 123.09 70.05Investor Education and Protection Fund shall be credited by the following:
Unpaid Dividends 50.34 47.07Unpaid matured Debentures 0.21 2.20Unpaid matured Fixed Deposits 0.97 —Unpaid Interest on above 0.90 —
Unclaimed amount of Fractional Coupons of Shares 3.73 3.73Interest accrued but not due on Debentures, Loans and Deposits 715.37 557.31Other Liabilities 627.45 246.36
16,782.95 8,963.95
SCHEDULE ‘13’PROVISIONSProposed Dividends 1,855.61 1,525.84Tax on Proposed Dividends 260.25 195.50Provision for Income Tax (Net) (Refer Note No. 2(III) in Schedule ‘23’) 6,117.24 (219.72)Post-retiral benefits 78.68 16.88Others (including Rs. 54.73 million refer Note No. 2 (II) in Schedule ‘23’) 87.20 54.73
8,398.98 1,573.23
SCHEDULE ‘14’MISCELLANEOUS EXPENDITURECompensation under Voluntary Retirement Scheme(Rs. 77.98 million transferred pursuant to the Scheme of Arrangement,Rs. 76.57 million paid and Rs. 60.69 million charged to Profit and Loss Accountduring the year) 93.86 —
93.86 —

(79)
S C H E D U L E S
(Rs. in Million)For the year For the year
Tonnes Tonnes ended 31st ended 31st2004-05 2003-04 March, 2005 March, 2004
SCHEDULE ‘15’
GROSS SALES AND OPERATING REVENUES
A. Sales
Aluminium:
Hydrate and Alumina (Standard Metallurgical &Specials) 322,828 — 5,695.54 —
Aluminium Ingots/Billets 158,518 170,319 14,374.77 13,653.06
Rolled Products 144,158 58,175 16,380.02 5,851.71
Extruded Products 28,453 18,352 3,379.28 1,927.05
Conductor Redraw Rods 62,841 58,778 5,908.00 4,990.58
Aluminium Foils 26,004 18,818 4,542.90 2,574.05
Aluminium Wheels Pcs. 111,045 Pcs. 105,975 197.75 185.70
Conversion Charges 2,502 — 93.93 —
Trade Sales 10 — 2.10 —
Miscellaneous 1,111.09 392.67
51,685.38 29,574.82
Copper:
Continuous Cast Copper Rods 87,924 91,537 14,773.56 11,265.92
Copper Cathodes 126,452 101,033 17,965.50 10,486.75
Sulphuric Acid 268,592 194,559 434.41 277.32
DAP & Complexes 302,436 260,022 4,181.69 3,492.46
Gold 5.300 6.556 3,205.26 3,770.24
Silver 34.900 31.504 352.18 269.90
Trade Sales 14,250 — 168.85 —
Miscellaneous 226.82 76.44
41,308.27 29,639.03
Net Sales 92,993.65 59,213.85
Excise Duty 9,571.68 6,115.05
Gross Sales 102,565.33 65,328.90
B. Operating Revenues
Exports Incentives 1,851.67 2,561.06
Miscellaneous Receipts and Claims (Net) 387.19 308.61
2,238.86 2,869.67
104,804.19 68,198.57
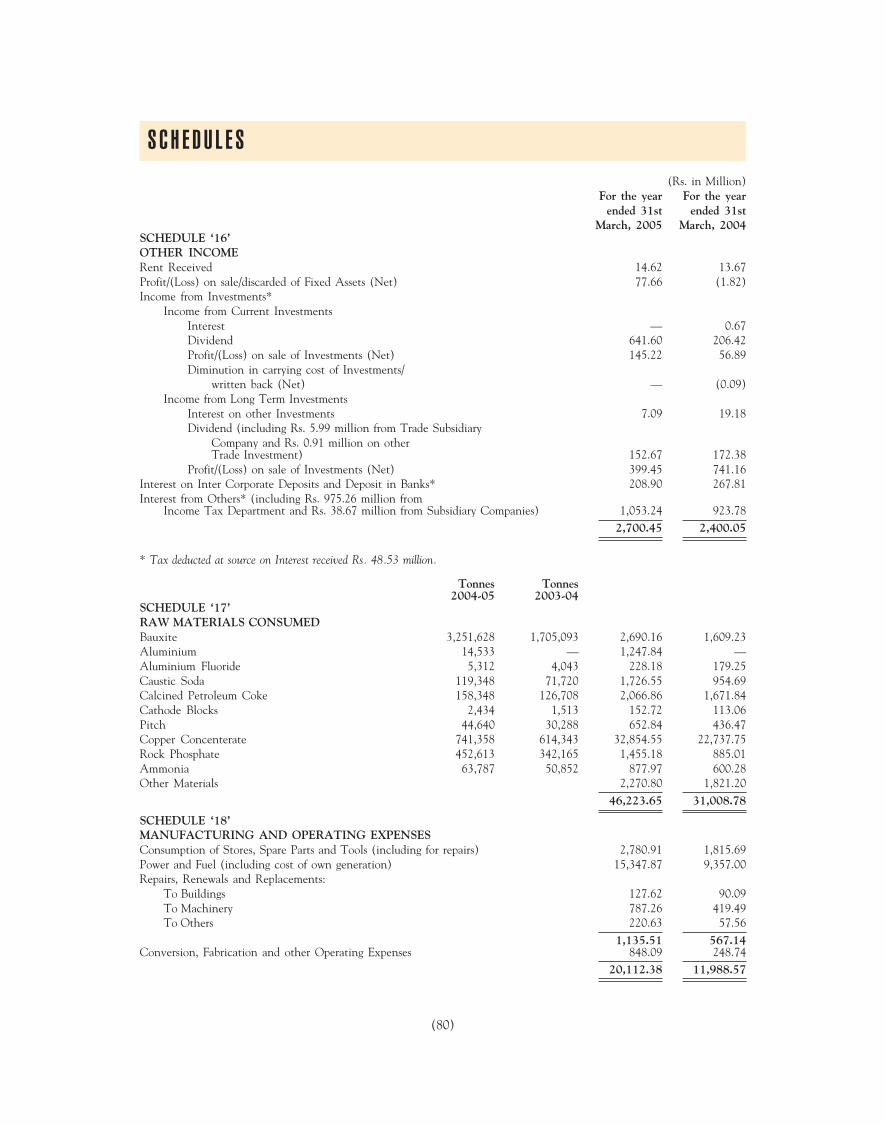
(80)
S C H E D U L E S
(Rs. in Million)For the year For the year
ended 31st ended 31stMarch, 2005 March, 2004
SCHEDULE ‘16’OTHER INCOMERent Received 14.62 13.67Profit/(Loss) on sale/discarded of Fixed Assets (Net) 77.66 (1.82)Income from Investments*
Income from Current InvestmentsInterest — 0.67Dividend 641.60 206.42Profit/(Loss) on sale of Investments (Net) 145.22 56.89Diminution in carrying cost of Investments/
written back (Net) — (0.09)Income from Long Term Investments
Interest on other Investments 7.09 19.18Dividend (including Rs. 5.99 million from Trade Subsidiary
Company and Rs. 0.91 million on otherTrade Investment) 152.67 172.38
Profit/(Loss) on sale of Investments (Net) 399.45 741.16Interest on Inter Corporate Deposits and Deposit in Banks* 208.90 267.81Interest from Others* (including Rs. 975.26 million from
Income Tax Department and Rs. 38.67 million from Subsidiary Companies) 1,053.24 923.782,700.45 2,400.05
* Tax deducted at source on Interest received Rs. 48.53 million.
Tonnes Tonnes2004-05 2003-04
SCHEDULE ‘17’RAW MATERIALS CONSUMEDBauxite 3,251,628 1,705,093 2,690.16 1,609.23Aluminium 14,533 — 1,247.84 —Aluminium Fluoride 5,312 4,043 228.18 179.25Caustic Soda 119,348 71,720 1,726.55 954.69Calcined Petroleum Coke 158,348 126,708 2,066.86 1,671.84Cathode Blocks 2,434 1,513 152.72 113.06Pitch 44,640 30,288 652.84 436.47Copper Concenterate 741,358 614,343 32,854.55 22,737.75Rock Phosphate 452,613 342,165 1,455.18 885.01Ammonia 63,787 50,852 877.97 600.28Other Materials 2,270.80 1,821.20
46,223.65 31,008.78
SCHEDULE ‘18’MANUFACTURING AND OPERATING EXPENSESConsumption of Stores, Spare Parts and Tools (including for repairs) 2,780.91 1,815.69Power and Fuel (including cost of own generation) 15,347.87 9,357.00Repairs, Renewals and Replacements:
To Buildings 127.62 90.09To Machinery 787.26 419.49To Others 220.63 57.56
1,135.51 567.14Conversion, Fabrication and other Operating Expenses 848.09 248.74
20,112.38 11,988.57

(81)
S C H E D U L E S
(Rs. in Million)For the year For the year
ended 31st ended 31stMarch, 2005 March, 2004
SCHEDULE ‘19’PAYMENTS TO AND PROVISIONS FOR EMPLOYEESSalaries, Wages, Bonus, Ex-gratia and Pension (including for repairs) 3,070.98 1,712.34Employees Welfare Expenses 510.84 351.46Provision/Contribution to Employees’ Gratuity Fund 208.18 114.65Contribution to Provident and other Funds 336.34 192.11
4,126.34 2,370.56
SCHEDULE ‘20’SELLING, DISTRIBUTION, ADMINISTRATION ANDOTHER OVERHEADSRates and Taxes (Net) 32.66 25.75Rent 123.11 54.14Insurance 364.99 335.25Miscellaneous Expenses (including Rs. 0.53 million Law Charges to a Firm of
Solicitors in which a Director is a partner) 948.66 628.00Travelling & Conveyance 313.07 208.44Donation (including Rs. 64.00 million contribution to General Electoral Trust for
political purposes) 135.34 44.26Auditors’ Remuneration 8.48 6.33Cost Audit Fee and Expenses 0.65 0.35Research and Development Expenses 21.92 21.22Royalty 41.17 10.77Discount on Sales 103.31 26.83Commission on Sales 282.16 137.23Freight, Forwarding and Handling Charges (Net) 2,003.00 1,261.02Provision for doubtful debts/(written back) (Net) 31.96 4.79Bad Debts written off 3.75 —Miscellaneous Expenditure written off 60.69 —Directors’ Fees 0.41 0.34Directors’ Commission 15.00 15.00Liability no longer required written back (99.59) (47.45)
4,390.74 2,732.27
SCHEDULE ‘21’(INCREASE)/DECREASE IN STOCKSClosing Stocks:
Work-in-Progress 9,086.64 5,707.48Finished Goods 1,621.05 990.87
10,707.69 6,698.35Less: Opening Stocks:
Work-in-Progress 5,707.48 4,442.19Finished Goods 990.87 1,236.80
Stock transferred pursuant to the scheme of Arrangement:Work-in-Progress 1,005.74 —Finished Goods 447.12 —
8,151.21 5,678.99
(2,556.48) (1,019.36)

(82)
(Rs. in Million)For the year For the year
ended 31st ended 31stMarch, 2005 March, 2004
SCHEDULE ‘22’INTEREST AND FINANCE CHARGESInterest on Debentures and other Fixed Loans 1,582.19 1,467.32Interest on Others (including Rs. 0.07 million to Income Tax Dept.) 459.72 397.43Finance Lease Charges — 97.25Other Finance Charges — 21.89
2,041.91 1,983.89Less: Interest Capitalised 342.35 212.35
1,699.56 1,771.54
SCHEDULE ‘23’
SIGNIFICANT ACCOUNTING POLICIES & NOTES ON ACCOUNTS
A SIGNIFICANT ACCOUNTING POLICIES
1 FIXED ASSETS
Fixed Assets are stated at cost. Cost includes borrowing costs and other related overheads incurred during theperiod of construction.
2. INTANGIBLE ASSETS
Intangible assets are stated at cost. Cost includes any directly attributable expenditure on making the asset readyfor its intended use.
3. DEPRECIATION AND AMORTISATION
(a) Depreciation on Fixed Assets has been provided for on Straight Line Method at the rates and mannerprescribed under Schedule XIV to the Companies Act, 1956, as amended.
(b) Leasehold land / mining rights are amortised over the period of lease.
(c) Assets where ownership vests with the Government Authorities are amortised at the rates of depreciationspecified in schedule XIV to the Companies Act, 1956.
(d) Intangible assets are amortised over their estimated useful life.
4. IMPAIRMENT
Impairment loss is recognized wherever the carrying amount of an asset is in excess of its recoverable amountand the same is recognized as an expense in the statement of profit and loss and carrying amount of the asset isreduced to its recoverable amount.
Reversal of impairment losses recognized in prior years is recorded when there is an indication that the impairmentlosses recognized for the asset no longer exist or have decreased
5. LEASES
(a) Assets taken on finance lease (including that prior to 1st April 2001) are capitalised and finance charges arecharged to statement of profit and loss on accrual basis.
(b) Lease payments under an operating lease recognised as expense in the statement of profit and loss as perterms of lease agreement.
6. INVESTMENTS
(a) Long term Investments are carried at cost after deducting provision, in cases where the fall in market valuehas been considered of permanent nature.
(b) Current investments are stated at lower of cost and fair value.
7. INVENTORIES
(a) Inventories of stores and spare parts are valued at or below cost after providing for cost of obsolescence andother anticipated losses, wherever considered necessary.
S C H E D U L E S
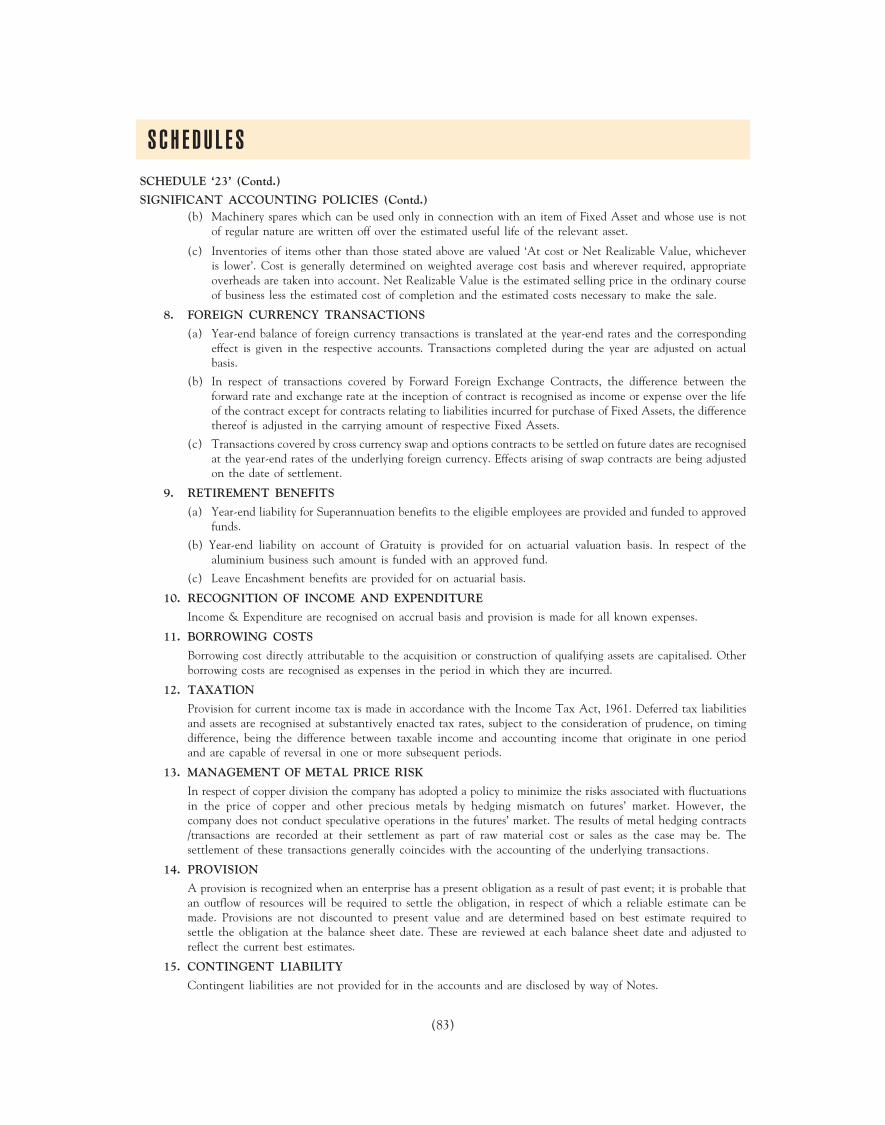
(83)
(b) Machinery spares which can be used only in connection with an item of Fixed Asset and whose use is notof regular nature are written off over the estimated useful life of the relevant asset.
(c) Inventories of items other than those stated above are valued ‘At cost or Net Realizable Value, whicheveris lower’. Cost is generally determined on weighted average cost basis and wherever required, appropriateoverheads are taken into account. Net Realizable Value is the estimated selling price in the ordinary courseof business less the estimated cost of completion and the estimated costs necessary to make the sale.
8. FOREIGN CURRENCY TRANSACTIONS
(a) Year-end balance of foreign currency transactions is translated at the year-end rates and the correspondingeffect is given in the respective accounts. Transactions completed during the year are adjusted on actualbasis.
(b) In respect of transactions covered by Forward Foreign Exchange Contracts, the difference between theforward rate and exchange rate at the inception of contract is recognised as income or expense over the lifeof the contract except for contracts relating to liabilities incurred for purchase of Fixed Assets, the differencethereof is adjusted in the carrying amount of respective Fixed Assets.
(c) Transactions covered by cross currency swap and options contracts to be settled on future dates are recognisedat the year-end rates of the underlying foreign currency. Effects arising of swap contracts are being adjustedon the date of settlement.
9. RETIREMENT BENEFITS
(a) Year-end liability for Superannuation benefits to the eligible employees are provided and funded to approvedfunds.
(b) Year-end liability on account of Gratuity is provided for on actuarial valuation basis. In respect of thealuminium business such amount is funded with an approved fund.
(c) Leave Encashment benefits are provided for on actuarial basis.
10. RECOGNITION OF INCOME AND EXPENDITURE
Income & Expenditure are recognised on accrual basis and provision is made for all known expenses.
11. BORROWING COSTS
Borrowing cost directly attributable to the acquisition or construction of qualifying assets are capitalised. Otherborrowing costs are recognised as expenses in the period in which they are incurred.
12. TAXATION
Provision for current income tax is made in accordance with the Income Tax Act, 1961. Deferred tax liabilitiesand assets are recognised at substantively enacted tax rates, subject to the consideration of prudence, on timingdifference, being the difference between taxable income and accounting income that originate in one periodand are capable of reversal in one or more subsequent periods.
13. MANAGEMENT OF METAL PRICE RISK
In respect of copper division the company has adopted a policy to minimize the risks associated with fluctuationsin the price of copper and other precious metals by hedging mismatch on futures’ market. However, thecompany does not conduct speculative operations in the futures’ market. The results of metal hedging contracts/transactions are recorded at their settlement as part of raw material cost or sales as the case may be. Thesettlement of these transactions generally coincides with the accounting of the underlying transactions.
14. PROVISION
A provision is recognized when an enterprise has a present obligation as a result of past event; it is probable thatan outflow of resources will be required to settle the obligation, in respect of which a reliable estimate can bemade. Provisions are not discounted to present value and are determined based on best estimate required tosettle the obligation at the balance sheet date. These are reviewed at each balance sheet date and adjusted toreflect the current best estimates.
15. CONTINGENT LIABILITY
Contingent liabilities are not provided for in the accounts and are disclosed by way of Notes.
S C H E D U L E S
SCHEDULE ‘23’ (Contd.)
SIGNIFICANT ACCOUNTING POLICIES (Contd.)

(84)
S C H E D U L E S
(Rs. in Million)
As at 31st As at 31stMarch, 2005 March, 2004
SCHEDULE ‘23’ (Contd.)
B. NOTES ON ACCOUNTS
1. Capital Commitments outstanding (Advance/Deposit paid Rs 3,097.48 million) 9,654.80 6,733.67
2. (I) Contingent Liabilities not provided for in respect of:
(a) Claims/Disputed liabilities not acknowledged as debt:Following demands are disputed by the Company and are not provided for:i) Demand notice by Asstt. Collector Central Excise Mirzapur for 91.21 91.21
excise duty on power generated by company’s captive power plant,Renusagar Power Co. Ltd (Since amalgamated).* Writ petition pending with Delhi High Court, Delhi. Earlier demandraised was quashed by Delhi High Court. The amount has beensequestered in the Aluminium Regulation account. According to theterms of settlement dated 5.12.83 between the Central Govt. and theCompany, this amount will be reimbursed to the Company in the eventthe case is decided against the Company.
ii) Demand of interest on past dues of the Aluminium Regulation 63.29 29.04account upto 31.12.1987.* The demand is in dispute with Controller of Aluminium RegulationAccount.
iii) Retrospective Revision of Water Rates by UP Jal Vidyut Nigam 40.80 40.80Limited (April 1989 to June 1993 & Jan 2000 to Jan 2001)* Writ petition pending with Lucknow Bench of Allahabad High Court.The demand stayed vide order dated 11.5.2001.
iv) Transit fees levied by Divisional Forest officer, Renukoot on coal 52.05 37.73and bauxite.* Appeal pending with Allahabad High Court and payment of transit feehas been stayed. According to legal opinion received by the Company, theforest department has no authority to levy such fee.
v) M.P Transit Fee on Coal demanded by Nothern Coal Fields Limited. 112.48 82.67* Writ petition pending with Jabalpur High Court. The Company haspaid Rs 105.90 million to NCL under protest subject to the finalconclusion of the writ petition.
vi) Withholding Tax on payment of fees on GDR issue. 91.56 91.56* Appeal pending before Income Tax Appellate Tribunal, Mumbai.Demand adjusted against refund due to the Company.
vii) Imposition of Cess on Coal by Shaktinagar Special Area 31.40 10.11Development Authority.* Appeal pending before Allahabad High Court, Allahabad. Demand andlevy stayed. According to legal opinion received by the Company, thestate has no power to tax the mineral since this field is covered underMines and Minerals Development and Regulation Act.
viii) Demand of Royalty on Vanadium by District Mining officer, Lohardaga. 12.90 12.90* Appeal pending with Allahabad High Court, Allahabad. The demandstayed on certain conditions which has been fulfilled by the Company.
ix) The demand of Excise Duty on gold. 1,557.70 1,557.70* Appeal pending with Customs, Excise and Service tax AppellateTribunal, West Zone, Mumbai.
x) The Demand for Custom Duty on Engg, Fees. — 113.70* Appeal with Customs, Excise and Service tax Appellate Tribunal, WestZone, Mumbai decided in favour of Company.
xi) Demand for non-payment of sales tax on leased assets. 212.26 218.90* Writ petition admitted and stay granted by High Court, Ahemdabad
xii) Arbitration proceeding with IFFCO for claim of short supply of — 45.09Phosphoric Acid.* Matter settled.
xiii) Other Contingent Liabilities in respect of Excise, Customs, Sales Tax etc. 84.85 37.84 each being for less than 10 millions.* The demands are in dispute at various legal forums.
* Status indicating uncertainties

(85)
(Rs. in Million)
As at 31st As at 31stMarch, 2005 March, 2004
SCHEDULE ‘23’ (Contd.)
B. NOTES ON ACCOUNTS (Contd.)
(b) i). Bills discounted with Banks. 468.14 586.39
ii). Guarantees outstanding (includes corporate guarantees ofRs. 11,399.76 given on behalf of subsidiary companies). 12,595.15 5,966.86
iii). Letters of Credit Outstanding. 684.17 8,851.09
iv). Bank Guarantees & Bonds. 249.54 505.55
(c) The Company has received supplementary bills on account ofrevision in rate of power for Main Supply from the UPSEB forthe period 15th May, 1976 to 30th June, 1980 and the sameremains unprovided for as disputed by the Company. 50.10 50.10
(d) In terms of the Scheme of Arrangement between the Company, the erstwhile Indo Gulf Corporation Ltd.(IGCL) and Indo Gulf Fertilisers Limited approved by the Hon’ble High Courts at Allahabad and Mumbaivide their orders dated 18th November 2002 and 31st October 2002 respectively, the company may beliable to pay a portion of disputed demands of Income Tax of Rs. 133.95 million pertaining to IGCL.
(e) 228,340,226 Equity Shares of Rs.10/- each fully paid up in IDEA Cellular Ltd. are held by the Company asinvestment. Out of the above 115,187,999 shares of Rs. 10/- each have been pledged for securing financialassistance granted by the lenders to that company.
2. (II) Provisions:
For Excise duty on electricity (Additions and Deductions duringthe year — Nil) 54.73 54.73
2. (III) Balance in provision for income tax account is after netting-off the payment made and refunds receivedsince the appeals filed by the Company and the Department are pending before appellate authorities.
2. (IV) The Company has given undertakings to various Financial Institutions for non-disposal of shares held inBihar Caustic & Chemicals Ltd., Tanfac Industries Ltd. and 57,085,060 shares of Rs 10/ each of IDEACellular Ltd. till the Institutional loans are repaid in full.
3. (a) The company has export obligations of Rs. 7,501.33 million (USD 171.46 million) against the ImportLicences taken for import of capital goods under Export Promotion Capital Goods Scheme.
(b) The company has export obligation of Rs. 2,592.25 millions (USD 59.25 million) against the AdvanceLicence.
4. (a) The exchange rate difference (gain) amounting to Rs. 0.06 million (net) in connection with acquiring fixedassets has been adjusted in the carrying amount of the relevant fixed assets.
(b) Exchange gain/loss amounting to Rs. 104.18 million (Net loss) (Previous year gain of Rs. 652.55 million)have been accounted for under respective heads of account, viz. Sales & conversion charges loss ofRs. 56.04 million (Previous year gain of Rs. 181.13 million), Raw Material consumed gain of Rs.0.73million (Previous year gain of Rs. 466.96 million), Manufacturing expenses (loss) Rs. 0.04 million (Previousyear gain of Rs. 0.16 million) and Selling, Distribution, Administration and Other expenses gain of Rs. 1.04million (Previous year gain of Rs. 4.30 million)and Interest (loss) 49.87 million(previous Year Rs Nil)
(c) Exchange difference of Rs 27.28 million in respect of unexpired period of forward cover contracts will berecognized in the profit and loss account in subsequent year.
(d) The Company has entered into cross currency swap and options transactions in respect of borrowing/repayable/payable, which will be settled on future date. Since the fluctuations and resultant effect in theintervening period in respect of these transactions cannot be fairly estimated, the effect of these transactionswill be accounted for in the year in which the contracted settlements takes place.
S C H E D U L E S

(86)
5. Pursuant to a Scheme of Arrangement u/s. 391 to 394 of the Companies Act, 1956 (the Scheme) which hasbeen approved by Hon’ble Bombay High Court and Kolkata High Court on 14th January, 2004 and 23rd December2004, respectively, all the business undertakings (other than the aluminum foil business at Kollur, AndhraPradesh), herein after referred to as demerged undertaking, of Indian Aluminium Company Ltd (Indal) has beentransferred to the Company with effect from the appointed date i.e. 1st April, 2004 on going concern basis.Demerged undertaking is engaged inter alia in conducting and carrying on the business of mining, manufactureand sale of hydrate and alumina, alumina chemicals, aluminium, aluminium products including aluminiumsheets, extrusions and foil and generation of electricity.a) In terms of the Scheme, all the assets and liabilities of the demerged undertaking have been transferred and
stand vested with the Company with effect from the appointed date at their book value. Further, in terms ofthe Scheme, all the business activities of the demerged undertaking of Indal carried out on or after theappointed date are deemed to have been carried out by Indal on behalf of the Company on a going concernbasis. The Scheme has accordingly been given effect to in these accounts and operational result for the yearof the demerged undertaking of Indal have been incorporated in the Company’s accounts.
b) In consideration of the above, the Company has issued 299,522 equity shares in the ratio of one equityshare of Rs.10/ each for every seven equity shares to the shareholders of Indal and consequently the issuedand paid up Share Capital of the Company has increased by Rs. 3 million. In addition to the above thevalue of investments in Indal has been reduced by Rs 11,882.79 million
c) As required in terms of schemei) The assets and liabilities of the demerged undertaking of Indal as on 1st April 2004 have been taken
over at the respective book value.ii) Amount of Rs. 111.85 million and Rs.4 million credited to Debenture Redemption Reserve and
Capital Reserve, respectively.iii) Rs. 2,102.74 million, being the amount representing deficit of net assets of the demerged undertaking
over the aggregate of (1) the paid up value of equity shares issued and allotted (2) investment in Indalas reducded in (b) above and the amount credited to reserves as given in (ii) above, has been debitedto Securities Premium Account.
6. The Company has earmarked 11.40% GOI, Stock 2008 of the face value of Rs. 50 million, book value beingRs. 61.71 million, 140,200 6.75% Tax Free US 64 Bonds of Unit Trust Of India of the face value Rs.100/- eachcost being Rs. 14.02 million in compliance with the provisions of Rule 3A of the Companies (Acceptance ofDepos-its) Rules, 1975 (as amended).
7. As per the Accounting Standard (AS) 28 - Impairment of Assets, which came into effect from 1st April 2004, theCompany carried the impairment test as of 1st April 2004 and provided for the impairment loss where recoverableamount was lower than amount carried in the accounts by adjusting the same (net of deferred taxes of Rs. 336.29million) against opening balance of revenue reserves as per the transitional provisions. Details are given below:
A) Aluminium
Nature of Asset Events/Circumstances Impairment Loss Basis ofAmount Recoverable
(Rs. in Million) Amount
Certain assets of Low return on Investments due to 164.00 Value In useFoil units severe competition in the market place
120.20 Net Selling Price
Certain assets of Inadequate return on InvestmentWheel Unit due to low demand 330.95 Net Selling Price
Certain assets of Inadequate return on Investment 143.39 Value In useSmelters mainly due to high cost of operation
146.43 Net Selling Price
Certain assets ofOther Units Erosion in value 194.58 Net selling Price
SCHEDULE ‘23’ (Contd.)
B. NOTES ON ACCOUNTS (Contd.)
S C H E D U L E S

(87)
B) Copper
Nature of Asset Events/Circumstances Impairment Loss Basis ofAmount Recoverable
(Rs. in Million) Amount
Certain Assets of Higher carrying value than Value in Use 339.87 Value in UseCopper Unit
For arriving at Value in Use discount rate of 9.5% has been used. Net Selling Price has been determinedbased on valuation report from external agencies.
As at 31st As at 31stMarch, 2005 March, 2004
8. Loan and Advances includes -
(i) (a) Due from a firm of Solicitors & Advocates in which one of theDirectors is a partner. — 0.13(Maximum balance during the year Rs. 0.13 million)
(b) Due from Officers (Maximum balance during the yearRs. 0.07 million) 0 .07 0.23
(c) Payments made to Rosa Power Supply Co. Ltd. Rs. 20.99 million (maximum balance Rs. 20.99 million),Bina Power Supply Co. Ltd. Rs. 391.44 million (maximum balance Rs. 491.44 million) and BirlaTelecom Ltd. Rs. 1.47 million (maximum balance Rs. 1.47 million) to be adjusted against the value ofthe Equity Shares to be issued by such companies in the event the relative projects are implementedafter receipt of all regulatory approvals.
(ii) To Subsidiary Companies:As on Maximum amount
31.03.2005 outstanding duringthe year
Renukeshwar Investments & Finance Limited — 8.24
Renuka Investments & Finance Limited — 54.03
Bihar Caustic & Chemicals Ltd. 122.90 122.90
Lucknow Finance Company Limited(without interest) 54.85* 59.85
Utkal Alumina International Limited 34.44 201.28
Dahej Harbour and Infrastructure Limited — 330.00
Indal Export Ltd 0.08 0.08
*with no repayment schedule
(iii) Inter Corporate Deposits:
(a) Inter Corporate Deposit aggregating to Rs. 160.76 million (maximum balance Rs. 160.76 million)made to Aditya Birla Power Company Ltd. (formally Birla Project Development Corporation Ltd.) oninterest pursuant to MOU entered into with the company for development of new projects.
(b) Inter Corporate Deposit aggregating to Rs. 200.71 million (maximum balance Rs.200.71 million)made to Aditya Birla Management Corporation Ltd. (ABMCL) bearing interest.
(c) The company is one of the promoter member of ABMCL, a company limited by guarantee which hasbeen formed to provide a common pool of facilities and resources to its members, with a view tooptimise the benefits of specialisation and minimise cost for each member. The company has participatedin the common pool and has shared the expenses incurred by ABMCL and accounted for these underappropriate heads.
S C H E D U L E S
SCHEDULE ‘23’ (Contd.)
B. NOTES ON ACCOUNTS (Contd.)

(88)
(iv) Balances with Trident Trust representing 16,31,613 equity shares of the Company issued pursuant to theScheme of Arrangement approved by the Hon’ble High Courts at Mumbai and Allahabad vide their Orderdated 31st October, 2002 and 18th November, 2002, respectively, to the Trident Trust, which is createdwholly for the benefit of the Company and is being managed by trustees appointed by it
9. Although the Market value of certain quoted investments (as reflected in Schedule “6”) and the book value ofcertain unquoted investments (amount not ascertained) is lower than cost, considering the strategic and longterm nature of the investments and assets base of the investee companies, in the opinion of the managementsuch decline is temporary in nature and accordingly no provision is necessary for the same.
10. The Name of the Small Scale Industries to whom the Company owes any sum together with interest outstandingfor more than thirty days are as follows :
Ecko Cabels Pvt. Ltd, Electro Service India, Finishing Furnace Systems India P.Ltd, Forech India Ltd, Furnace &Foundry Equipment Co.,Grip Engineers P.Ltd,Jagdamba Saw Mill, Kay International, M.J.Patel & Co.Ltd.,S.R.Steels, Saha & Co., Sharad Refractories P.Ltd., Beekay Industries, Insha Plastic Industries, Delta ElectrotradeControl Pvt Ltd., Rewa Gases Private Limited, Universal Oil Seals Manufacturing Company Pvt. Ltd, TextileInland agencies, Universal Sheet Metal,Saini industries, Zealot Engg Works, Cast Polymers,Jay Wood Ind,Libraflex, Radix sensors.These outstandings are in normal course of business and the information regarding small scale undertakings havebeen determined to the extent such parties have been identified on the basis of information available with thecompany.
11. Purchase of copper concentrate is accounted for provisionally pending finalisation of content in the concentrate,price, and custom duty. Variations are accounted for in the year of settlement.
12. A part of electricity supplied by the company, which has been treated by UPPCL as sale, has been accounted foron the basis of provisional rates. The effect of variation in the rate will be accounted for in the year in whichrates are finalised by UPPCL.
13. Insurance claims under various policies / other claims are not accounted for, as the amounts are still unascertainedpending the completion of assessment/ settlement of the claims.
14. a) Future obligations towards lease rentals under the lease agreements taken prior to 1st April 2001.(Rs. in Million)
Period Lease Payment Present Value
Not later than one year 68.05 64.92Later than one year and not Later than five years 21.60 20.09
b) Future obligations towards lease rentals under the lease agreements taken on or after 1st April 2001.(Rs. in Million)
Period Lease Payment Present Value
Not later than one year 0.29 0.27Later than one year and not Later than five years 0.24 0.21
c) In Line with Accounting Standard – 19 “Leases” on April 1, 2004 the company has capitalized as on 1st
April 2004 assets taken on finance lease in earlier years at their respective cost amounting Rs. 1,728 milliontogether with their respective accumulated depreciation of Rs. 470.50 million.
d) The total of future minimum lease payment commitments under non-cancellable operating lease agreementfor a period of twenty years to use railway tracks along with locomotives for transportation of its materials.are as under:
(Rs. in Million)Period As at 31st March, 2005Not later than one year 4.00Later than one year and not Later than five years 16.00Later than five years 48.67The above amounts are exclusive of taxes and duties. During the year the company has charged Rs 4.00million (P.Y- Rs 4.00 million) as rent in respect of this lease.
S C H E D U L E S
SCHEDULE ‘23’ (Contd.)
B. NOTES ON ACCOUNTS (Contd.)

(89)
15. Sale of Di-Ammonium Phosphate (DAP) and other complex fertilizers are covered under the concessionalschemes for decontrolled fertilizers of the Government of India. Pending declaration of final rate of concessionfor the quarter ended 31st March 2005 the claim for concession under the scheme for that period has beenaccounted for provisionally based on final rates declared for the preceding quarter.
16. Sales include own manufactured items capitalised / used Rs. 221.75 million at cost (inclusive of excise duty).
17. Rs. 0.07 million has been paid as pension to a Director of the company who was the President of the companybefore his appointment as Director.
18. Extraordinary items represent 91.03 million on account of expenses incurred on demerger as per note no.5.
(Rs. in Million)As at 31st As at 31st
March, 2005 March, 200419. The following are included under other heads of expenses in the
Profit & Loss Account:Consumption of stores and spare parts 367.91 466.52Power and Fuel 338.87 73.15Repairs to buildings 27.03 25.38Repairs to machinery 352.32 199.43Repairs to others 91.49 116.46Salaries, wages & bonus etc. 758.41 662.82Contribution to provident and other funds 79.05 67.17Workmen and staff welfare expenses 153.92 137.11Royalty 173.06 48.20Insurance 18.30 4.81Rent 2.27 0.81Rates & Taxes 5.97 0.85Research and Development 48.83 —
20. Capital work- in- progress includes: -Pre-operative expenses pending allocation:Raw Materials Consumed 0.87 109.99Stores, Spare Parts & Tools Consumed 0.30 22.29Power & Fuel 37.92 309.29Salary, Wages, Bonus, Ex-Gratia, Pension and Provisions 52.95 —Raw Water Charges and Cess — 0.46Insurance 21.21 8.05Rates & Taxes — 0.45Supervision Fees 16.61 20.04Misc expenses 29.41 —
159.27 470.57Less: —Pre-operative IncomeWIP — 109.99Power Generation 12.44 22.41Sulphuric Acid Sales — 1.23
Pre-operative expenses (Net) 146.83 336.94Add: Brought Forward from Previous Year 36.67 5.30
Sub Total 183.50 342.24Less: Allocated to Fixed Assets 5.09 342.24
Balance 178.41 —
S C H E D U L E S
SCHEDULE ‘23’ (Contd.)
B. NOTES ON ACCOUNTS (Contd.)

(90)
21. Auditors Remunerationa) Statutory Auditors
Audit Fees 5.00 3.35Certification/Company law/Other matters 2.70 1.79Tax Audit Fees 0.61 0.59Expenses 0.17 0.60
b) Cost AuditorsAudit Fees 0.40 0.21Other matters 0.11 —Expenses 0.14 0.14
22. Expenses include following payments to Managing DirectorMr. Debu Bhattacharya – Managing DirectorSalary 7.59 3.53Contribution to Provident Fund & Superannuation Fund 2.05 0.95Special Allowance 3.82 1.58Performance Linked Pay 4.87 —Perquisites 5.17 —Leave Travel Assistance 2.32 —
Mr A.K. Agarwala – Whole Time Director (up to 10th Sept 2003)Salary — 2.08Contribution to Provident Fund & Superannuation Fund — 0.56Special Allowance — 2.41Performance Linked Pay — 0.77Leave Salary — 3.51One Time Variable Pay — 0.73Leave Travel Assistance — 0.39
23. Computation of Other Directors CommissionComputation of net profit in accordance with section 198 and309(5) of the Companies Act, 1956Computation of Other Directors CommissionProfit before non-recurring items and tax as per Profit and Loss Account 19,132.86 12,456.69Add: Directors remuneration:
Directors’ remuneration including cost/estimated value of benefits 40.82 31.51Directors’ fees 0.41 0.34Doubtful debts provision/(write back)-net 31.96 4.79Loss on sale of Fixed Assets (net) — 1.82
19,206.05 12,495.15Less: Profit on sale of Fixed Assets (net) 77.66 —
Profit on sale of Investments (net) 544.67 798.05
Net Profit for the year 18,583.72 11,697.10
Other Directors Commission –1% of the above profit 185.84 116.97Restricted to maximum amount payable 15.00 15.00
24. Remittance of dividend on equity shares/GDRs in foreign currencyNo. Of Non-Resident Shareholders 685 663No. Of Shares held 16,303,283 14,214,011Dividend (Rs. in Million) 269.00 191.89
(Rs. in Million)As at 31st As at 31st
March, 2005 March, 2004
SCHEDULE ‘23’ (Contd.)
B. NOTES ON ACCOUNTS (Contd.)
S C H E D U L E S

(91)
S C H E D U L E S
SCHEDULE ‘23’ (Contd.)
B. NOTES ON ACCOUNTS (Contd.)25. Deferred Tax
Major components of Deferred Tax arising on account of temporary timing differences along with their movementas at 31st March 2005 are:Particulars As at 31st As at 31st
March, 2005 March, 2004Deferred Tax Assets (A)— Brought forward long term Capital Losses — 36.58Deferred Tax Liability (B)— Depreciation 10,450.26 8,809.71— Others 846.72 1,178.22Net Deferred Tax Liabilities (B-A) 11,296.98 9,951.35
26. Disclosure in respect of jointly controlled entities in which the company is a joint venturer, in compliance withAS-27 on Financial Reporting of Interest in Joint Ventures:
(Rs. in Million)Particulars Tanfac Industries Limited IDEA Cellular Ltd
(Unaudited) (Unaudited)Country of incorporation India IndiaPercentage of Share in Joint Venture 9.98% 10.11%Assets 97.83 4,234.85Liabilities 62.73 3,180.91Income 87.92 1,659.06Expenditure 87.87 1,632.73Capital Commitments (net of advance) 0.04 102.18Contingent Liabilities 16.46 238.40
27. Additional information pursuant to paragraphs 3 and 4 of Part II of Schedule VI to the Companies Act, 1956(As amended)
(a) Particulars in respect of Goods manufactured: - (Rs. in Million)Class of goods Installed Actual Stock of Goods Produced
Capacity Production Opening ClosingQty. Qty. Qty. Qty. 01.04.04 01.04.03 31.03.05 31.03.04
2004-05 2003-04 2004-05 2003-04 Qty. Value Qty. Value Qty. Value Qty. ValueTonnes Tonnes Tonnes Tonnes Tonnes Tonnes Tonnes Tonnes
Aluminium Metal 455,000 345,000 409,068 323,184 2,605 140.43 4,262 213.30 1,839 107.09 2,318 116.17Rolled Products 170,000 80,000 175,734(#) 77,069 6,428 473.57 4,060 260.05 4,678 353.50 3,363 214.11Extruded Products 21,700 13,700 28,551(@) 18,194 846 62.63 790 51.65 944 76.13 632 43.15Conductor RedrawRods 50,000 40,000 62,392 58,233 698 36.08 1,243 64.16 249 13.52 698 36.08Aluminium Foil 11,000 5,000 26,177(i) 18,560 854 111.63 938 101.08 700 83.61 680 68.98
Aluminium Wheel 300,000 300,000 107,279 99,091 12,343 16.63 19,227 30.53 8,577 8.81 12,343 16.63Pcs Pcs Pcs Pcs Pcs Pcs Pcs Pcs
Hydrate & Alumina 1,145,000 — 1,159,664 — 10,923 90.53 — — 27,407 278.98 — —Electricity 809.2MW 741.7MW 6,468MU 5,883MU — — — — — — — —Electricity(Co-generation) 145.4MW 104.4MW 878MU 627MU — — — — — — — —Continuous CastCopper Rods (CCR) 97,200 97,200 88,298 91,380 168 21.27 325 26.39 542 80.15 168 21.27Copper cathodes 250,000 250,000 128,923 101,179 146 15.51 1 0.05 2,617 370.17 146 15.51Sulphuric Acid 735,000 735,000 261,882 203,737 14,995 7.37 5,817 2.98 8,285 8.30 14,995 7.37Phosphonic Acid 180,000 180,000 — — — — 540 6.68 — — — —DAP & complexes 400,000 400,000 286,264 231,903 22,615 241.20 50,734 474.82 6,443 76.86 22,615 241.20Gold 7.5 7.5 5.156 6.908 0.361 210.32 0.009 5.11 0.216 130.50 0.361 210.32Silver 75 75 36.595 31.513 0.009 0.08 — — 1.703 18.30 0.009 0.08Others 10.74 15.13TOTAL 1,437.99 1,236.80 1,621.05 990.87
The Installed Capacity is as certified by the Management and license capacity is not given as licensing is not applicable.# Includes 4,887 MT (Previous year Nil) being production out of customers’ material and 28,439 MT (Previous year 19,591 MT) transferred for captive
consumption.@ Includes 1952 MT (Previous year 151 MT) converted from outside party.
Opening Stock on 01-04-2004 includes Rs. 447.12 millions of stock transferred under the scheme of arrangementAlumina includes 8,20,352 MT transferred for own consumption/ further processing.
(i) Includes 327 MT (previous year Nil ) being production out of customers material / own consumption/ further processing.Production of Copper cathodes, Sulphuric acid and Phosphoric acid are net of 88,215 MT,401,434 MT and 133,735 MT (Previous year 85,431 MT,323,969 MT, 100,476 MT) respectively which have been captively consumed /to be consumed.

(92)
S C H E D U L E S
SCHEDULE ‘23’ (Contd.)
B. NOTES ON ACCOUNTS (Contd.)
b) Value of following materials consumed for power generation is included in Power & Fuel Charges: -
2004-05 2003-04
Particulars Quantity Value Quantity ValueTonnes (Rs. in Million) Tonnes (Rs. in Million)
Coal 6,455,014 6,755.52 5,896,007 5,827.63
Naphta 4,905 95.62 3,401 50.85
Fuel Oil/L.D.O 5,466 131.89 5,419 103.23
(c) CIF value of imports (Excluding goods in transit and imported items purchased locally)
(Rs. in Million)
Particulars 2004-05 2003-04
i) Raw materials 35,492.32 23,218.56
ii) Coal 594.61 425.75
iii) Components & Spare parts 359.18 412.49
iv) Capital Goods 2,123.24 546.91
(d) Value of raw materials, stores and spares consumed
(Rs in Million)
2004-05 2003-04
Particulars Consumption % Of Total Consumption % Of TotalConsumption Consumption
(1) Value of Raw MaterialsConsumed:
Total Consumption 46,223.65 31,008.78
Imported 36,907.04 79.84 24,592.23 79.31
Indigenous 9,316.61 20.16 6,416.55 20.69
(2) Value of Stores and
Spares Consumed:
Total Consumption 2,780.91 1,815.69
Imported 374.70 13.47 387.12 21.32
Indigenous 2,406.21 86.53 1,428.57 78.68
(3) Value of Coal Consumed
Total Consumption 7,181.89 6,167.51
Imported 778.97 10.85 440.97 7.15
Indigenous 6,402.92 89.15 5,726.54 92.85

(93)
SCHEDULE ‘23’ (Contd.)
B. NOTES ON ACCOUNTS (Contd.)
(e) Particulars in respect of Purchase (Rs. in Million)
Particulars 2004-05 2003-04
Quantity (M.T.) Value Quantity (M.T.) Value
Ammonia 14,250 166.71 Nil Nil
Casserol 26.68 4.63 Nil Nil
(f) Expenditure in Foreign Currency (Paid or Provided):-(Rs. in Million)
As at 31 st As at 31 stMarch, 2005 March, 2004
Technical know-how & Professional Fee 130.26 242.48
Foreign Travelling 16.38 15.13
Commission 104.30 27.53
Interest 259.92 225.07
Others 12.83 7.35
(g) Earning in Foreign Exchange: -
Export of goods on FOB basis 26,051.71 12,950.97
Others 22.06 —
28. Earnings Per Share
Particulars As at 31st As at 31stMarch, 2005 March, 2004
Profits after taxation (Rs. in Million) 13,293.57 8,389.29
Weighted average number of shares outstanding:
Total number of shares outstanding at the beginning of the year 92,481,325 92,481,325
Weighted average number of shares issued pursuant toscheme of arrangement 299,522 —
Weighted average number of shares outstanding during the year 92,780,847 92,481,325
Basic and Diluted Earnings per share in Rupees 143.29 90.71(Face Value Rs. 10/- per share)
29. a) Pursuant to Scheme of Arrangement, the demerged undertaking of Indian Aluminium Company Ltd (Indal)has been transferred to the company with effect from 1st April 2004, therefore the figures for the currentyear are not comparable with those of the previous year.
b) Figures of the previous year have been regrouped/ rearranged wherever found necessary.
S C H E D U L E S

(94)
SCHEDULE ‘23’ (Contd.)
B. NOTES ON ACCOUNTS (Contd.)
30. Segment Reporting
(i) Segment-wise Revenue, Results and Other Information(Rs. in Million)
As at 31st March, 2005 As at 31st March, 2004
Particulars Aluminium Copper Total Aluminium Copper Total
REVENUEExternal Sales 52,520.90 42,711.61 95,232.51 29,957.76 32,125.76 62,083.52
Inter Segment Sales — — — — — —
52,520.90 42,711.61 95,232.51 29,957.76 32,125.76 62,083.52
Less: Inter Segment Sales — — — — — —
Total Revenue 52,520.90 42,711.61 95,232.51 29,957.76 32,125.76 62,083.52
RESULTSSegment/OperatingResults 15,957.41 2,538.00 18,495.41 8,905.94 3,097.00 12,002.94
Un-allocable Income(Net of Expenses) 2,337.01 2,225.29
Interest Expenses (1,699.56) (1,771.54)
Non RecurringExpenses (91.03) —
Provision for Tax(including Deferred Tax) (5,748.26) (4,067.40)
Net Profit 13,293.57 8,389.29
OTHER INFORMATIONSegment Assets 60,073.08 47,935.18 108,008.26 43,833.57 32,806.97 76,640.54
Un-allocable Assets 43,136.40 38,072.89
Total Assets 151,144.66 114,713.43
Segment Liabilities 4,944.08 10,121.80 15,065.88 3,172.07 5,185.22 8,357.29
UnallocableLiabilities & Provisions 10,116.05 2,179.89
Total Liabilities 25,181.93 10,537.18
Depreciation 3,482.25 1,138.66 4,620.91 2,263.12 910.92 3,174.04
Un-allocableDepreciation 11.66 0.48
Total Depreciation 4,632.57 3,174.52
Capital Expenditureincluding CWIP 4,980.49 5,990.14 10,970.63 3,486.88 3,203.40 6,690.28
(ii) The secondary segment is based on geographical demarcation i.e. India and Rest of the World. The secondary segmental revenue are as under:
(Rs. in Million)
2004-05 2003-04
India 68,773.21 49,132.55
Rest of the World 26,459.30 12,950.97
S C H E D U L E S
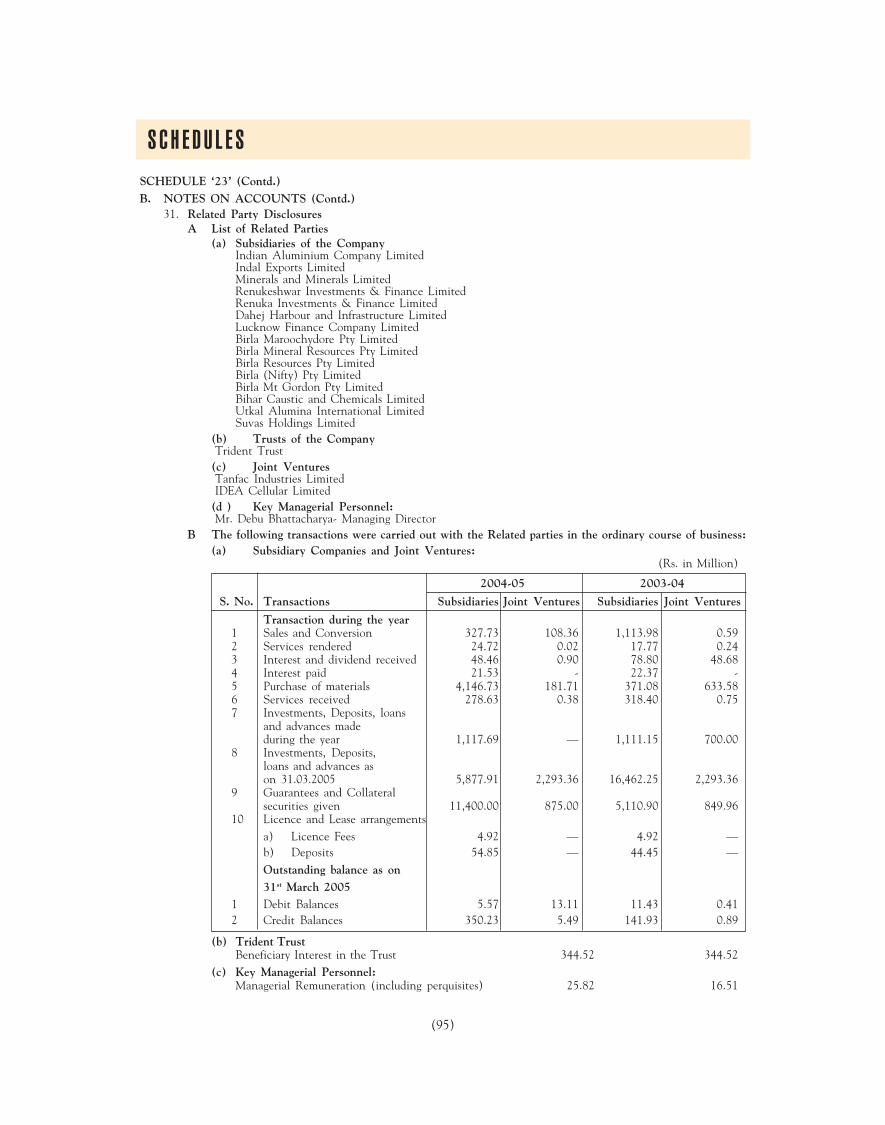
(95)
SCHEDULE ‘23’ (Contd.)B. NOTES ON ACCOUNTS (Contd.)
31. Related Party DisclosuresA List of Related Parties
(a) Subsidiaries of the CompanyIndian Aluminium Company LimitedIndal Exports LimitedMinerals and Minerals LimitedRenukeshwar Investments & Finance LimitedRenuka Investments & Finance LimitedDahej Harbour and Infrastructure LimitedLucknow Finance Company LimitedBirla Maroochydore Pty LimitedBirla Mineral Resources Pty LimitedBirla Resources Pty LimitedBirla (Nifty) Pty LimitedBirla Mt Gordon Pty LimitedBihar Caustic and Chemicals LimitedUtkal Alumina International LimitedSuvas Holdings Limited
(b) Trusts of the CompanyTrident Trust
(c) Joint VenturesTanfac Industries LimitedIDEA Cellular Limited
(d ) Key Managerial Personnel:Mr. Debu Bhattacharya- Managing Director
B The following transactions were carried out with the Related parties in the ordinary course of business:(a) Subsidiary Companies and Joint Ventures:
(Rs. in Million)
2004-05 2003-04
S. No. Transactions Subsidiaries Joint Ventures Subsidiaries Joint Ventures
Transaction during the year1 Sales and Conversion 327.73 108.36 1,113.98 0.592 Services rendered 24.72 0.02 17.77 0.243 Interest and dividend received 48.46 0.90 78.80 48.684 Interest paid 21.53 - 22.37 -5 Purchase of materials 4,146.73 181.71 371.08 633.586 Services received 278.63 0.38 318.40 0.757 Investments, Deposits, loans
and advances madeduring the year 1,117.69 — 1,111.15 700.00
8 Investments, Deposits,loans and advances ason 31.03.2005 5,877.91 2,293.36 16,462.25 2,293.36
9 Guarantees and Collateralsecurities given 11,400.00 875.00 5,110.90 849.96
10 Licence and Lease arrangementsa) Licence Fees 4.92 — 4.92 —b) Deposits 54.85 — 44.45 —Outstanding balance as on31st March 2005
1 Debit Balances 5.57 13.11 11.43 0.412 Credit Balances 350.23 5.49 141.93 0.89
(b) Trident TrustBeneficiary Interest in the Trust 344.52 344.52
(c) Key Managerial Personnel:Managerial Remuneration (including perquisites) 25.82 16.51
S C H E D U L E S

(96)
32. Balance Sheet Abstract and Company’s General Business Profile
I. REGISTRATION DETAILSRegistration No. 1 1 - 1 1 2 3 8 State Code 1 1Balance Sheet 3 1 0 3 0 5
Date Month Year
II. CAPITAL RAISED DURING THE YEAR (Amount in Rs. Million)Public/Euro Issue Right Issue
N I L N I LBonus Issue Private Placement
N I L 3 . 0 0III. POSITION OF MOBILISATION AND DEPLOYMENT OF FUNDS (Amount in Rs. Million)
Total Liabilities Total Assets1 5 1 1 4 4 . 6 6 1 5 1 1 4 4 . 6 6
Sources of Funds:Paid-up Capital Reserves & Surplus
9 2 7 . 7 7 7 5 7 3 8 . 0 1Secured Loans Unsecured Loans
2 9 5 2 3 . 3 8 8 4 7 6 . 5 9Application of Funds:
Net Fixed Assets Investments6 9 2 6 5 . 1 0 3 7 0 2 1 . 4 5Net Current Assets Misc. Expenditure
1 9 5 8 2 . 3 2 9 3 . 8 6Accumulated Losses
N I LIV. PERFORMANCE OF THE COMPANY (Amount in Rs. Million)
Turnover Total Expenditure1 0 7 5 0 4 . 6 4 8 8 3 7 1 . 7 8Profit/Loss Before Tax & Profit/Loss After Tax &
Extraordinary Item Extraordinary Item+ 1 9 1 3 2 . 8 6 + 1 3 2 9 3 . 5 7
EPS (In Rs.) Dividend %*1 4 3 . 2 9 2 0 0
*ProposedV. GENERIC NAMES OF FIVE PRINCIPAL PRODUCTS/SERVICES OF COMPANY
Item Code No. (ITC Code) 7 6 0 1Product Description A L U M I N I U M I N G O T SItem Code No. (ITC Code) 7 6 0 6Product Description A L U M I N I U M R O L L E D P R O D U C T SItem Code No. (ITC Code) 7 6 0 5Product Description A L U M I N I U M R E D R A W R O D SItem Code No. (ITC Code) 7 4 0 3 1 1Product Description C O P P E R C A T H O D E SItem Code No. (ITC Code) 7 4 0 7 1 0Product Description C O N T I N U O U S C A S T C O P P E R R O D S
SCHEDULE ‘23’(Cont’d)
NOTES ON ACCOUNTS (Cont’d)
As per our report annexed.For SINGHI & CO. Chairman: KUMAR MANGALAM BIRLAChartered Accountants
Directors: RAJASHREE BIRLARAJIV SINGHI D. BHATTACHARYA C. M. MANIARPartner Managing Director E. B. DESAIMembership No. 53518 S. S. KOTHARI
R. K. KASLIWAL M. M. BHAGATCamp: Mumbai ANIL MALIK Group Executive K. N. BHANDARIDated: The 30th day of April, 2005 Company Secretary President & C.F.O. A. K. AGARWALA
S C H E D U L E S

(97)
(Rs. in Million)Year ended Year ended
March 31, 2005 March 31, 2004 $A. CASH FLOW FROM OPERATING ACTIVITIES
Net profit before tax and extraordinary items 19,132.86 12,456.69Adjustment for :Depreciation 4,632.57 3,174.52Investment activities (2,706.71) (2,091.28)Lease Rent Paid — 97.25Foreign Exchange Loss 41.51Provisions/Misc. expenditure w/off 95.18Interest charged 1,732.85 3,795.40 1,514.52 2,695.01
Operating profit before working capital changes 22,928.26 15,151.70Changes in working Capital:Trade and other receivables (1,774.76) (2,462.76)Inventories (9,377.40) (1,891.21)Trade payable 5,273.79 (5,878.37) 1,920.23 (2,433.74)
Cash generated from operation 17,049.89 12,717.96Direct taxes paid 636.01 (1,589.23)Payment of compensation under voluntary retirement scheme (76.57) —
NET CASH GENERATED FROM OPERATIONS 17,609.33 11,128.73
B. CASH FLOW FROM INVESTMENT ACTIVITIESPurchase of Fixed Assets (11,733.39) (7,030.31)Sale of Fixed Assets 528.15 69.16Purchase of shares of Subsidiaries (982.58) (906.58)Acquisition of Business* 113.70 —Purchase of Investments(net) (10,357.22) (5,583.52)Loan repayment received from Subsidiaries (Net) 280.96 474.67Interest received 1,255.79 937.99Dividend received 794.27 378.80Lease rent received 10.82 —
NET CASH USED IN INVESTMENT ACTIVITIES (20,089.50) (11,659.79)
C. CASH FLOW FROM FINANCING ACTIVITIESShare call money received 0.01 0.13Proceeds from long term borrowings (net) 8,146.22 (2,233.54)Proceeds from short term borrowings (net) (719.44) 4,280.95Interest paid (1,740.32) (1,539.69)Lease Rent Paid — (97.25)Dividend paid (1,725.25) (1,408.34)
NET CASH FROM FINANCING ACTIVITIES 3,961.22 (997.74)
NET INCREASE IN CASH ANDCASH EQUIVALENTS 1,481.05 (1,528.80)CASH & CASH EQUIVALENTS-OPENING BALANCE 2,916.75 4,445.55CASH & CASH EQUIVALENTS-CLOSING BALANCE 4,397.80 2,916.75* Expense incurred on merger of “Amalgamating Business”, net of its opening cash & cash equivalent has been shown in
Acquisition of Business.$ Due to inclusion of demerged undertakings of Indian Aluminium Company, Ltd. current year figures are not comparable with
those of the previous year.Notes:1 Cash and cash equivalent includes cash and bank balances and Deposits with Companies and interest accrued thereon.2 Figures for the previous year have been regrouped / rearrranged wherever found necessary.3 Interest charged excludes and Purchase of Fixed Assets includes interest capitalised Rs 342.35 Million (Rs. 212.35 Million)
As per our report annexed.For SINGHI & CO. Chairman: KUMAR MANGALAM BIRLAChartered Accountants
Directors: RAJASHREE BIRLARAJIV SINGHI D. BHATTACHARYA C. M. MANIARPartner Managing Director E. B. DESAIMembership No. 53518 S. S. KOTHARI
R. K. KASLIWAL M. M. BHAGATCamp: Mumbai ANIL MALIK Group Executive K. N. BHANDARIDated: The 30th day of April, 2005 Company Secretary President & C.F.O. A. K. AGARWALA
C A S H F L O W S T A T E M E N T F O R T H E Y E A R E N D E D M A R C H 3 1 , 2 0 0 5
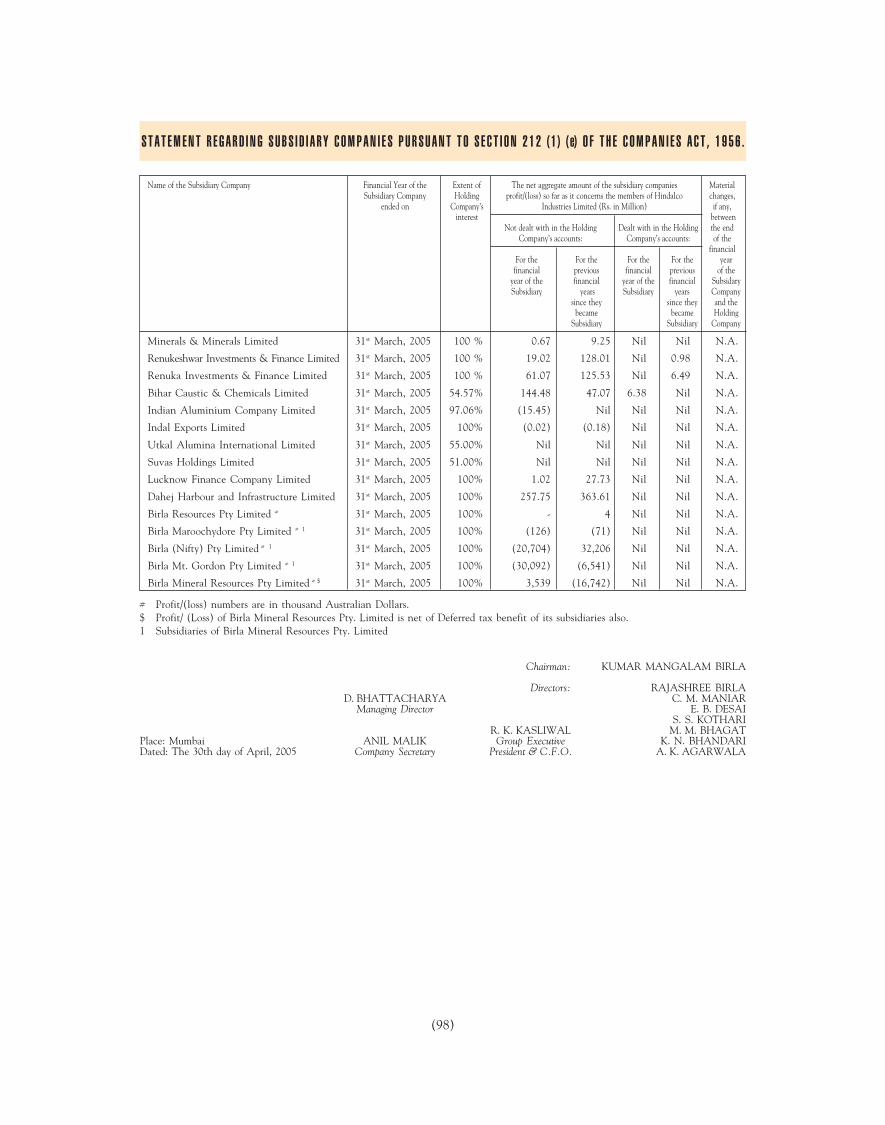
(98)
Name of the Subsidiary Company Financial Year of the Extent of The net aggregate amount of the subsidiary companies MaterialSubsidiary Company Holding profit/(loss) so far as it concerns the members of Hindalco changes,
ended on Company’s Industries Limited (Rs. in Million) if any,interest between
Not dealt with in the Holding Dealt with in the Holding the endCompany’s accounts: Company’s accounts: of the
financialFor the For the For the For the year
financial previous financial previous of theyear of the financial year of the financial SubsidarySubsidiary years Subsidiary years Company
since they since they and thebecame became Holding
Subsidiary Subsidiary Company
Minerals & Minerals Limited 31st March, 2005 100 % 0.67 9.25 Nil Nil N.A.
Renukeshwar Investments & Finance Limited 31st March, 2005 100 % 19.02 128.01 Nil 0.98 N.A.
Renuka Investments & Finance Limited 31st March, 2005 100 % 61.07 125.53 Nil 6.49 N.A.
Bihar Caustic & Chemicals Limited 31st March, 2005 54.57% 144.48 47.07 6.38 Nil N.A.
Indian Aluminium Company Limited 31st March, 2005 97.06% (15.45) Nil Nil Nil N.A.
Indal Exports Limited 31st March, 2005 100% (0.02) (0.18) Nil Nil N.A.
Utkal Alumina International Limited 31st March, 2005 55.00% Nil Nil Nil Nil N.A.
Suvas Holdings Limited 31st March, 2005 51.00% Nil Nil Nil Nil N.A.
Lucknow Finance Company Limited 31st March, 2005 100% 1.02 27.73 Nil Nil N.A.
Dahej Harbour and Infrastructure Limited 31st March, 2005 100% 257.75 363.61 Nil Nil N.A.
Birla Resources Pty Limited # 31st March, 2005 100% - 4 Nil Nil N.A.
Birla Maroochydore Pty Limited # 1 31st March, 2005 100% (126) (71) Nil Nil N.A.
Birla (Nifty) Pty Limited # 1 31st March, 2005 100% (20,704) 32,206 Nil Nil N.A.
Birla Mt. Gordon Pty Limited # 1 31st March, 2005 100% (30,092) (6,541) Nil Nil N.A.
Birla Mineral Resources Pty Limited # $ 31st March, 2005 100% 3,539 (16,742) Nil Nil N.A.
# Profit/(loss) numbers are in thousand Australian Dollars.$ Profit/ (Loss) of Birla Mineral Resources Pty. Limited is net of Deferred tax benefit of its subsidiaries also.1 Subsidiaries of Birla Mineral Resources Pty. Limited
Chairman: KUMAR MANGALAM BIRLA
Directors: RAJASHREE BIRLAD. BHATTACHARYA C. M. MANIAR
Managing Director E. B. DESAIS. S. KOTHARI
R. K. KASLIWAL M. M. BHAGATPlace: Mumbai ANIL MALIK Group Executive K. N. BHANDARIDated: The 30th day of April, 2005 Company Secretary President & C.F.O. A. K. AGARWALA
S T A T E M E N T R E G A R D I N G S U B S I D I A R Y C O M P A N I E S P U R S U A N T T O S E C T I O N 2 1 2 ( 1 ) ( e) O F T H E C O M P A N I E S A C T , 1 9 5 6 .
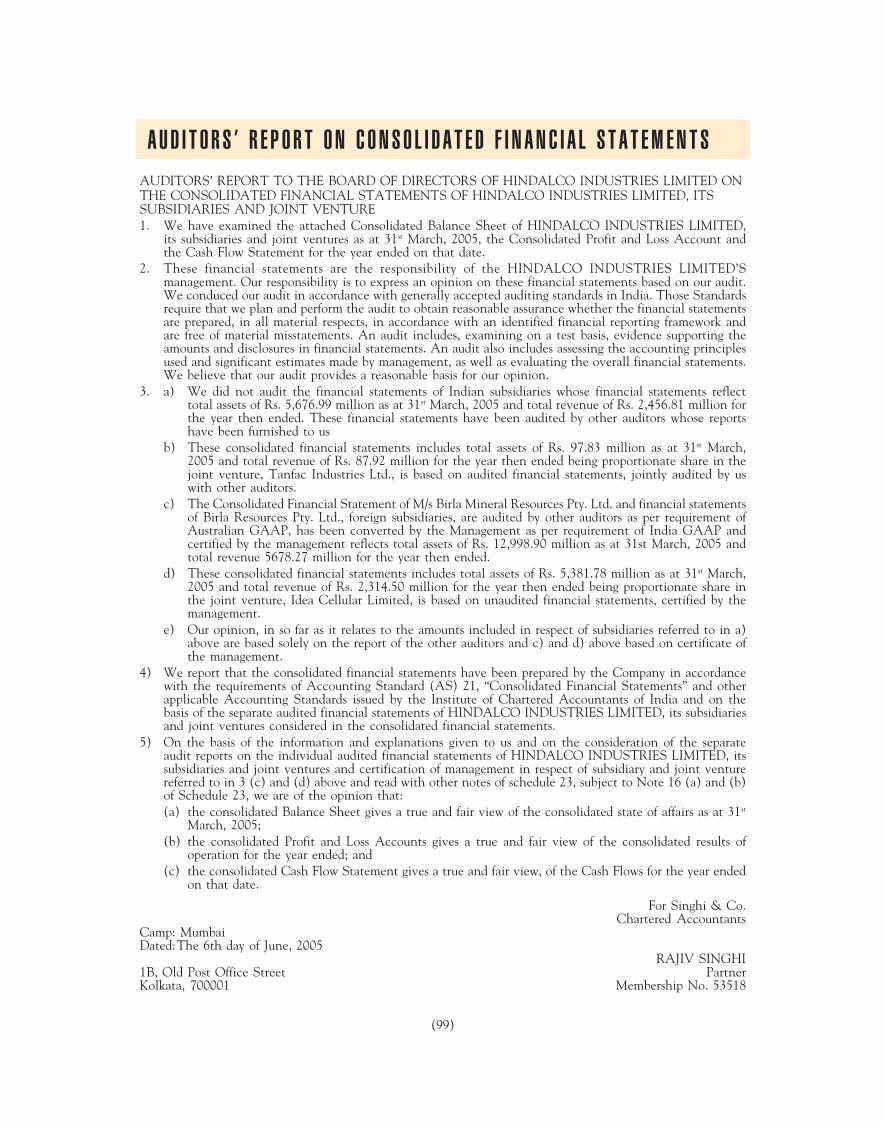
(99)
AUDITORS’ REPORT TO THE BOARD OF DIRECTORS OF HINDALCO INDUSTRIES LIMITED ONTHE CONSOLIDATED FINANCIAL STATEMENTS OF HINDALCO INDUSTRIES LIMITED, ITSSUBSIDIARIES AND JOINT VENTURE1. We have examined the attached Consolidated Balance Sheet of HINDALCO INDUSTRIES LIMITED,
its subsidiaries and joint ventures as at 31st March, 2005, the Consolidated Profit and Loss Account andthe Cash Flow Statement for the year ended on that date.
2. These financial statements are the responsibility of the HINDALCO INDUSTRIES LIMITED’Smanagement. Our responsibility is to express an opinion on these financial statements based on our audit.We conduced our audit in accordance with generally accepted auditing standards in India. Those Standardsrequire that we plan and perform the audit to obtain reasonable assurance whether the financial statementsare prepared, in all material respects, in accordance with an identified financial reporting framework andare free of material misstatements. An audit includes, examining on a test basis, evidence supporting theamounts and disclosures in financial statements. An audit also includes assessing the accounting principlesused and significant estimates made by management, as well as evaluating the overall financial statements.We believe that our audit provides a reasonable basis for our opinion.
3. a) We did not audit the financial statements of Indian subsidiaries whose financial statements reflecttotal assets of Rs. 5,676.99 million as at 31st March, 2005 and total revenue of Rs. 2,456.81 million forthe year then ended. These financial statements have been audited by other auditors whose reportshave been furnished to us
b) These consolidated financial statements includes total assets of Rs. 97.83 million as at 31st March,2005 and total revenue of Rs. 87.92 million for the year then ended being proportionate share in thejoint venture, Tanfac Industries Ltd., is based on audited financial statements, jointly audited by uswith other auditors.
c) The Consolidated Financial Statement of M/s Birla Mineral Resources Pty. Ltd. and financial statementsof Birla Resources Pty. Ltd., foreign subsidiaries, are audited by other auditors as per requirement ofAustralian GAAP, has been converted by the Management as per requirement of India GAAP andcertified by the management reflects total assets of Rs. 12,998.90 million as at 31st March, 2005 andtotal revenue 5678.27 million for the year then ended.
d) These consolidated financial statements includes total assets of Rs. 5,381.78 million as at 31st March,2005 and total revenue of Rs. 2,314.50 million for the year then ended being proportionate share inthe joint venture, Idea Cellular Limited, is based on unaudited financial statements, certified by themanagement.
e) Our opinion, in so far as it relates to the amounts included in respect of subsidiaries referred to in a)above are based solely on the report of the other auditors and c) and d) above based on certificate ofthe management.
4) We report that the consolidated financial statements have been prepared by the Company in accordancewith the requirements of Accounting Standard (AS) 21, “Consolidated Financial Statements” and otherapplicable Accounting Standards issued by the Institute of Chartered Accountants of India and on thebasis of the separate audited financial statements of HINDALCO INDUSTRIES LIMITED, its subsidiariesand joint ventures considered in the consolidated financial statements.
5) On the basis of the information and explanations given to us and on the consideration of the separateaudit reports on the individual audited financial statements of HINDALCO INDUSTRIES LIMITED, itssubsidiaries and joint ventures and certification of management in respect of subsidiary and joint venturereferred to in 3 (c) and (d) above and read with other notes of schedule 23, subject to Note 16 (a) and (b)of Schedule 23, we are of the opinion that:(a) the consolidated Balance Sheet gives a true and fair view of the consolidated state of affairs as at 31st
March, 2005;(b) the consolidated Profit and Loss Accounts gives a true and fair view of the consolidated results of
operation for the year ended; and(c) the consolidated Cash Flow Statement gives a true and fair view, of the Cash Flows for the year ended
on that date.
For Singhi & Co.Chartered Accountants
Camp: MumbaiDated:The 6th day of June, 2005
RAJIV SINGHI1B, Old Post Office Street PartnerKolkata, 700001 Membership No. 53518
A U D I T O R S ’ R E P O R T O N C O N S O L I D A T E D F I N A N C I A L S T A T E M E N T S

(100)
C O N S O L I D A T E D B A L A N C E S H E E T A S A T 3 1 S T M A R C H , 2 0 0 5
(Rs. in Million)Share in Consolidated Consolidated
SOURCES OF FUNDS Schedule Joint Ventures 31st March, 2005 31st March, 2004SHAREHOLDERS’ FUNDSShare Capital ‘1’ 2,781.46 1,415.87 1,412.87Reserves and Surplus ‘2’ (1,814.80) 75,233.46 69,089.54
966.66 76,649.33 70,502.41LOAN FUNDSSecured Loans ‘3’ 2,294.72 32,310.15 24,385.11Unsecured Loans ‘4’ 1,466.29 16,998.00 12,851.50
3,761.01 49,308.15 37,236.61
MINORITY INTEREST — 857.73 932.11DEFERRED TAX LIABILITY (NET) 6.99 11,342.46 11,952.61
TOTAL 4,734.66 138,157.67 120,623.74
APPLICATION OF FUNDSFIXED ASSETSGross Block ‘5’ 7,216.69 109,531.67 102,585.10Less : Depreciation 2,447.57 38,065.60 30,412.75Less : Impairment — 999.27 —
Net Block 4,769.12 70,466.80 72,172.35Capital Work-in-Progress 97.11 16,386.94 7,115.58
4,866.23 86,853.74 79,287.93INVESTMENTS ‘6’ 0.92 29,558.53 18,655.71CURRENT ASSETS, LOANS AND ADVANCESInventories ‘7’ 50.61 26,970.41 17,033.69Sundry Debtors ‘8’ 224.76 8,404.44 7,517.35Cash and Bank Balances ‘9’ 175.43 4,730.47 2,831.20Other Current Assets ‘10’ 0.22 427.04 443.56Loans and Advances ‘11’ 141.34 8,988.85 9,778.72
592.36 49,521.21 37,604.52Less :CURRENT LIABILITIES AND PROVISIONSLiabilities ‘12’ 734.97 19,111.60 12,952.85Provisions ‘13’ (10.12) 8,799.23 2,166.42
724.85 27,910.83 15,119.27
NET CURRENT ASSETS (132.49) 21,610.38 22,485.25MISCELLANEOUS EXPENDITURE ‘14’ — 135.02 194.85(to the extent not written off or adjusted)
TOTAL 4,734.66 138,157.67 120,623.74
Notes on Accounts ‘23’
As per our report annexed.For SINGHI & CO.Chartered Accountants
RAJIV SINGHIPartner D. BHATTACHARYAMembership No. 53518 Managing Director
R. K. KASLIWAL Directors: M. M. BHAGATCamp: Mumbai ANIL MALIK Group Executive E. B. DESAIDated: The 6th day of June, 2005 Company Secretary President & C.F.O. C. M. MANIAR

(101)
(Rs. in Million)Share in Consolidated Consolidated
INCOME Schedule Joint Ventures 31st March, 2005 31st March, 2004Gross Sales and Operating Revenues ‘15’ 2,399.32 110,723.72 89,977.21Less: Excise Duty 8.84 9,669.08 7,744.50
Net Sales and Operating Revenues 2,390.48 101,054.64 82,232.71Other Income ‘16’ 5.85 2,778.83 2,795.21
2,396.33 103,833.47 85,027.92
EXPENDITURERaw Materials Consumed ‘17’ 45.42 43,461.86 36,054.17Goods Purchased 10.88 182.22 8.42Manufacturing and Operating Expenses ‘18’ 861.59 24,965.24 20,293.47Payments to and Provision for Employees ‘19’ 146.44 5,051.26 4,598.62Selling, Distribution, Administration andOther Overheads ‘20’ 480.28 6,109.45 4,911.28(Increase)/ Decrease in Stocks ‘21’ 7.62 (3,021.03) (3,188.54)Interest and Finance Charges ‘22’ 318.09 2,159.12 2,345.64Depreciation 449.25 6,324.93 5,140.34
2,319.57 85,233.05 70,163.40
PROFIT BEFORE EXTRAORDINARY ITEM AND TAX 76.76 18,600.42 14,864.52Extraordinary Item — 130.55 10.04
PROFIT BEFORE TAX 76.76 18,469.87 14,854.48Provision for Current Tax — 5,418.81 3,233.51Provision for Deferred Tax 0.02 809.04 1,637.73Provision for Taxation for earlier years written back (Net) — (715.94) 8.70
NET PROFIT BEFORE MINORITY INTEREST 76.74 12,957.96 9,974.54Minority Interest — 110.11 39.70
NET PROFIT 76.74 12,847.85 9,934.84Balance brought forward from Previous year (2,020.21) 3,777.93 2,371.31Adjusted pursuant to the Scheme of Arrangement — (4,488.22) —Transfer from Debenture Redemption Reserve — 416.67 645.00
BALANCE AVAILABLE FOR APPROPRIATIONS (1,943.47) 12,554.23 12,951.15
APPROPRIATIONSDebenture Redemption Reserve — 960.00 970.70Special Reserve — 38.28 1.70Proposed Dividend on Equity Shares 0.50 1,864.11 1,531.15Tax on Dividend Proposed/Paid 0.07 266.88 197.11Transfer to General Reserve (3.10) 10,617.48 6,472.56Balance Carried to Balance Sheet (1,940.94) (1,192.52) 3,777.93
(1,943.47) 12,554.23 12,951.15
Basic and Diluted Earnings per Share (in Rupees) 138.48 107.43
Notes on Accounts ‘23’
CONSOLIDATED PROFIT & LOSS ACCOUNT FOR THE YEAR ENDED 31ST MARCH, 2005
As per our report annexed.For SINGHI & CO.Chartered Accountants
RAJIV SINGHIPartner D. BHATTACHARYAMembership No. 53518 Managing Director
R. K. KASLIWAL Directors: M. M. BHAGATCamp: Mumbai ANIL MALIK Group Executive E. B. DESAIDated: The 6th day of June, 2005 Company Secretary President & C.F.O. C. M. MANIAR

(102)
S C H E D U L E S T O C O N S O L I D A T E D F I N A N C I A L S T A T E M E N T S
(Rs. in Million)Share in Consolidated Consolidated
SCHEDULE ‘1’ Joint Ventures 31st March, 2005 31st March, 2004
SHARE CAPITAL
EQUITY SHARE CAPITAL
927,80,847 Equity Shares of Rs.10/- each fully paid-up 2,293.36 927.81 924.81
6,050 Less: Face value of Shares forfeited — 0.06 0.06
2,293.36 927.75 924.75
Add: Forfeited Shares Account (Amount Paid-up) — 0.03 0.03
2,293.36 927.78 924.78
Less: Calls-in-Arrears — 0.01 0.01
2,293.36 927.77 924.77
PREFERENCE SHARE CAPITAL
483 11% Redeemable Cumulative Non-ConvertiblePreference Shares of Rs. 10 million each of IdeaCellular Limited 488.10 488.10 488.10
2,781.46 1,415.87 1,412.87
SCHEDULE ‘2 ‘
RESERVES AND SURPLUS
Capital Reserve 0.30 376.99 419.68
Capital Redemption Reserve — 1,011.59 1,011.59
Special Reserve — 45.39 7.11
Securities Premium Account 0.02 9,291.37 13,010.15
Debenture Redemption Reserve — 4,162.20 3,625.02
Foreign Currency Translation Reserve — 708.25 —
General Reserve 125.82 61,214.71 54,771.12
Profit & Loss Account Balance (1,940.94) (1,192.52) 3,777.93
(1,814.80) 75,617.98 76,622.60Less: Minority Share — 171.97 462.69Less: Goodwill/Capital Reserve — 212.55 7,070.37
(1,814.80) 75,233.46 69,089.54

(103)
S C H E D U L E S T O C O N S O L I D A T E D F I N A N C I A L S T A T E M E N T S
(Rs. in Million)Share in Consolidated Consolidated
Joint Ventures 31st March, 2005 31st March, 2004
SCHEDULE ‘3’
SECURED LOANS
Secured Redeemable Non-Convertible Debentures — 15,833.33 13,516.67
Term Loans from Govt. of UP underSubsidised Housing Scheme forIndustrial Workers — 0.73 0.92
Loans from Scheduled Banks - Cash Credit andExport Credit Accounts 21.95 1,822.36 1,860.14
Rupee Term Loans from Schedule Banks 915.50 5,878.88 1,093.67
Rupee Term Loans from Financial Institutions 1,253.51 1,737.59 851.32
Foreign Currency Term Loans from Banks 103.76 6,742.84 5,659.15
Foreign Currency Term Loans from Financial Institutions — 294.42 1,398.96
Interest Free Excise Loan from Government of India — — 4.28
2,294.72 32,310.15 24,385.11
SCHEDULE ‘4’
UNSECURED LOANS
Employees’ and other Deposits — 268.25 313.30
Rupee Loans from Banks 1,212.70 1,271.10 863.45
Rupee Loans from Financial Institutions 75.79 75.79 20.07
Foreign Currency Loans from Banks — 10,346.31 728.89
Foreign Currency Loans from Financial Institutions — 1,484.11 5,414.26
Buyers’ Credit — 3,248.90 5,399.96
Loan from Promoters — 26.63 95.74
Interest Free Power Loan from Government of Bihar — 7.31 7.31
Sales Tax Deferral 0.21 8.19 8.52
Loan from Others 177.59 261.41 —
1,466.29 16,998.00 12,851.50

(104)
SC
HE
DU
LE
‘5’
FI
XE
D A
SSE
TS
(Rs.
in
Mill
ion)
GR
OSS
BL
OC
KD
EP
RE
CIA
TIO
NIM
PA
IRM
EN
TN
ET
BL
OC
K
As
at 3
1st
Mar
ch,
2005
As
at 3
1st
Mar
ch,
2005
As
at 3
1st
Mar
ch,
2005
As
at 3
1st
Mar
ch,
2005
Shar
e in
As
at 3
1st
Shar
e in
As
at 3
1st
Shar
e in
As
at 3
1st
Shar
e in
As
at 3
1st
Des
crip
tion
Join
tM
arch
, 20
04Jo
int
Mar
ch,
2004
Join
tM
arch
, 20
04Jo
int
Mar
ch,
2004
Ven
ture
sC
onso
lidat
ed C
onso
lidat
edV
entu
res
Con
solid
ated
Con
solid
ated
Ven
ture
sC
onso
lidat
ed C
onso
lidat
edV
entu
res
Con
solid
ated
Con
solid
ated
A.
Tan
gibl
e A
sset
sM
inin
g R
ight
s—
5,65
7.53
4,13
6.60
—2,
826.
911,
730.
24—
——
—2,
830.
622,
406.
36La
nd &
Site
Dev
elop
men
t20
.72
1,16
4.38
838.
8510
.59
52.0
031
.27
—10
.64
—10
.13
1,10
1.74
807.
58Bu
ildin
gs51
.15
8,18
1.21
7,88
2.62
13.4
01,
574.
631,
382.
05—
140.
81—
37.7
56,
465.
776,
500.
57Pl
ant
& M
achi
nery
4,00
5.52
84,0
64.9
077
,922
.91
1,60
5.04
30,3
79.8
325
,075
.46
—83
9.55
—2,
400.
4852
,845
.52
52,8
47.4
5V
ehic
les
& A
ircra
ft17
.03
1,29
1.67
1,59
2.33
10.0
851
1.66
592.
46—
——
6.95
780.
0199
9.87
Rai
lway
Sid
ings
—13
6.19
138.
76—
44.7
441
.03
——
——
91.4
597
.73
Furn
iture
& F
ittin
gs87
.68
1,92
3.51
1,59
2.43
59.8
81,
083.
5775
2.03
——
—27
.80
839.
9484
0.40
Live
Sto
ck—
0.95
1.85
——
——
——
—0.
951.
85R
oad
& D
rain
age
0.69
482.
6745
7.07
0.22
108.
4299
.15
—8.
07—
0.47
366.
1835
7.92
Leas
ed P
lant
& M
achi
nery
—1,
728.
00—
—47
0.50
——
——
—1,
257.
50—
B.
Inta
ngib
le A
sset
sG
oodw
ill1,
191.
572,
717.
466,
213.
65—
——
——
—1,
191.
572,
717.
466,
213.
65T
echn
olog
ical
Lic
ence
s1,
804.
781,
908.
661,
573.
2372
0.91
768.
7452
6.79
——
—1,
083.
871,
139.
921,
046.
44C
ompu
ter
Softw
are
37.5
527
4.54
234.
8027
.45
244.
6018
2.27
—0.
20—
10.1
029
.74
52.5
3
Tot
al7,
216.
6910
9,53
1.67
102,
585.
102,
447.
5738
,065
.60
30,4
12.7
5—
999.
27—
4,76
9.12
70,4
66.8
072
,172
.35
S C H E D U L E S T O C O N S O L I D A T E D F I N A N C I A L S T A T E M E N T S

(105)
S C H E D U L E S T O C O N S O L I D A T E D F I N A N C I A L S T A T E M E N T S
SCHEDULE ‘6’INVESTMENTS
(Rs. in Million)Share in Consolidated Consolidated
Joint Ventures 31st March, 2005 31st March, 2004
A. LONG TERM INVESTMENTS1. UNQUOTED
a. Other than Tradei. Government Securities — 0.37 0.44ii. Shares, Debentures and Bonds— Fully paid-up 0.17 237.05 806.57iii. Units of Mutual Funds 0.75 5.75 —
2. QUOTEDa. Other than Trade
i. Government Securities — 61.71 61.71ii. Shares, Debentures and Bonds- Fully paid-up — 2,606.45 2,683.10iii. Units of Mutual Funds — 13.10 —
B. CURRENT INVESTMENTS1. UNQUOTED
a. Other than Tradei. Units of Mutual Funds — 26,634.10 15,103.89
0.92 29,558.53 18,655.71
SCHEDULE ‘7’INVENTORIES(including in transit)Stores, Spare-parts etc. 16.32 2,045.85 1,920.04Coal and Fuel — 641.93 609.67Raw Materials 26.10 10,406.49 3,631.35Work-in-Progress 1.23 11,818.99 8,967.94Finished Goods 6.69 1,862.21 1,692.23Excise Duty on Stocks 0.27 194.94 212.46
50.61 26,970.41 17,033.69
SCHEDULE ‘8’SUNDRY DEBTORSOver six months 186.09 473.93 511.69Others 206.98 8,212.26 7,217.51
393.07 8,686.19 7,729.20Less: Provision for doubtful debts 168.31 281.75 211.85
224.76 8,404.44 7,517.35
SCHEDULE ‘9’CASH AND BANK BALANCESCash Balance on hand — 4.45 4.20Cheques and Drafts in hand 5.17 289.33 337.78Balance with Scheduled Banks:
In Current Accounts 144.91 951.52 674.26In E.E.F.C. Account — 0.56 1.05In Deposit Account 25.13 3,283.36 1,686.74In Escrow Account — 7.84 0.31In Unpaid Dividends Account 0.22 59.69 57.45In Unpaid Debentures Account — — 1.27In Account of Nominees for sale proceeds of
Fractional Coupons of Shares — 3.73 3.73Balance with Non-Scheduled Banks — 0.36 0.43Balance with Foreign Banks — 129.63 63.98
175.43 4,730.47 2,831.20

(106)
S C H E D U L E S T O C O N S O L I D A T E D F I N A N C I A L S T A T E M E N T S
(Rs. in Million)Share in Consolidated Consolidated
Joint Ventures 31st March, 2005 31st March, 2004
SCHEDULE ‘10’OTHER CURRENT ASSETSAccrued Interest
On Investments — 1.18 1.03On Inter Corporate Deposits and Deposit in Banks — 32.33 54.73On Others 0.22 12.26 28.01
Accrued Exports Incentives — 381.27 359.79
0.22 427.04 443.56
SCHEDULE ‘11’LOANS AND ADVANCESLoan to Employees — 209.68 296.17Inter Corporate Deposits — 631.47 1,015.39Advances recoverable in cash or in kind or for value to be receivedand/or to be adjusted 120.27 2,873.41 2,217.00Prepaid Expenses 0.23 267.42 1,416.46Balance with Customs, Port Trusts, Excise etc. 7.68 21.50 0.02Security and other Deposits 11.30 915.00 1,122.32Excise, Customs and other Claims Receivable 1.86 3,725.85 3,366.84Trident Trust (Refer Note No. 8 in Schdule ‘23’) — 344.52 344.52
141.34 8,988.85 9,778.72
SCHEDULE ‘12’CURRENT LIABILITIESSundry Creditors 313.42 16,666.36 9,912.11Customers’ Credit Balances and Advances against orders 139.46 553.33 512.62Security Deposits Refundable 76.79 257.31 169.34Investor Education and Protection Fund shall be
credited by the following:Unpaid Dividends 0.22 59.69 57.45Unpaid matured Debentures — 0.21 2.20Unpaid application money due for refund — — 0.01Unpaid matured Fixed Deposits — 0.97 0.86Unpaid Interest on above — 0.90 0.90
Unclaimed amount of Fractional Coupons of Shares — 3.73 3.73Interest accrued but not due on Debentures, Loans and Deposits 20.01 737.75 640.26Other Liabilities 185.07 831.35 1,653.37
734.97 19,111.60 12,952.85
SCHEDULE ‘13’PROVISIONSProposed Dividends 0.50 1,864.11 1,531.15Tax on Proposed Dividends 0.07 262.94 197.11Provision for Income Tax (Net) (Refer Note No. 4(IV)in Schedule ‘23’) (10.69) 6,204.66 (172.95)Post-retiral benefits — 102.56 251.83Others — 364.96 359.28
(10.12) 8,799.23 2,166.42

(107)
S C H E D U L E S T O C O N S O L I D A T E D F I N A N C I A L S T A T E M E N T S
SCHEDULE ‘14’MISCELLANEOUS EXPENDITURECompensation under Voluntary Retirement Scheme — 101.42 78.00Others — 33.60 116.85
— 135.02 194.85
SCHEDULE ‘15’GROSS SALES AND OPERATING REVENUESA. Sales
Net Sales 93.30 96,257.40 77,513.86Excise Duty 8.84 9,669.08 7,744.50
Gross Sales 102.14 105,926.48 85,258.36B. Operating Revenues
Exports Incentives 2.24 1,857.81 2,852.89Service Revenues 2,287.83 2,520.79 1,508.96Miscellaneous Receipts and Claims (Net) 7.11 418.64 357.00
2,297.18 4,797.24 4,718.85
2,399.32 110,723.72 89,977.21
SCHEDULE ‘16’OTHER INCOMERent Received — 25.35 29.80Profit/(Loss) on sale/discarded of Fixed Assets (Net) (0.10) 88.68 (9.43)Income from InvestmentsIncome from Current InvestmentsInterest — — 0.67Dividend — 643.09 411.21Profit/(Loss) on sale of Investments (Net) 0.27 145.74 9.57Diminution in carrying cost of Investments/written back (Net) — — (0.09)Income from Long Term InvestmentsInterest on other Investments — 7.54 20.06Dividend — 190.38 225.31Profit/(Loss) on sale of Investments (Net) — 433.15 968.56Interest on Inter Corporate Deposits and Deposit in Banks 0.05 121.86 275.35Interest from Others 5.63 1,123.04 864.20
5.85 2,778.83 2,795.21
SCHEDULE ‘17’RAW MATERIALS CONSUMEDRaw Materials Consumed 45.42 43,461.86 36,054.17
45.42 43,461.86 36,054.17
(Rs. in Million)Share in Consolidated Consolidated
Joint Ventures 31st March, 2005 31st March, 2004
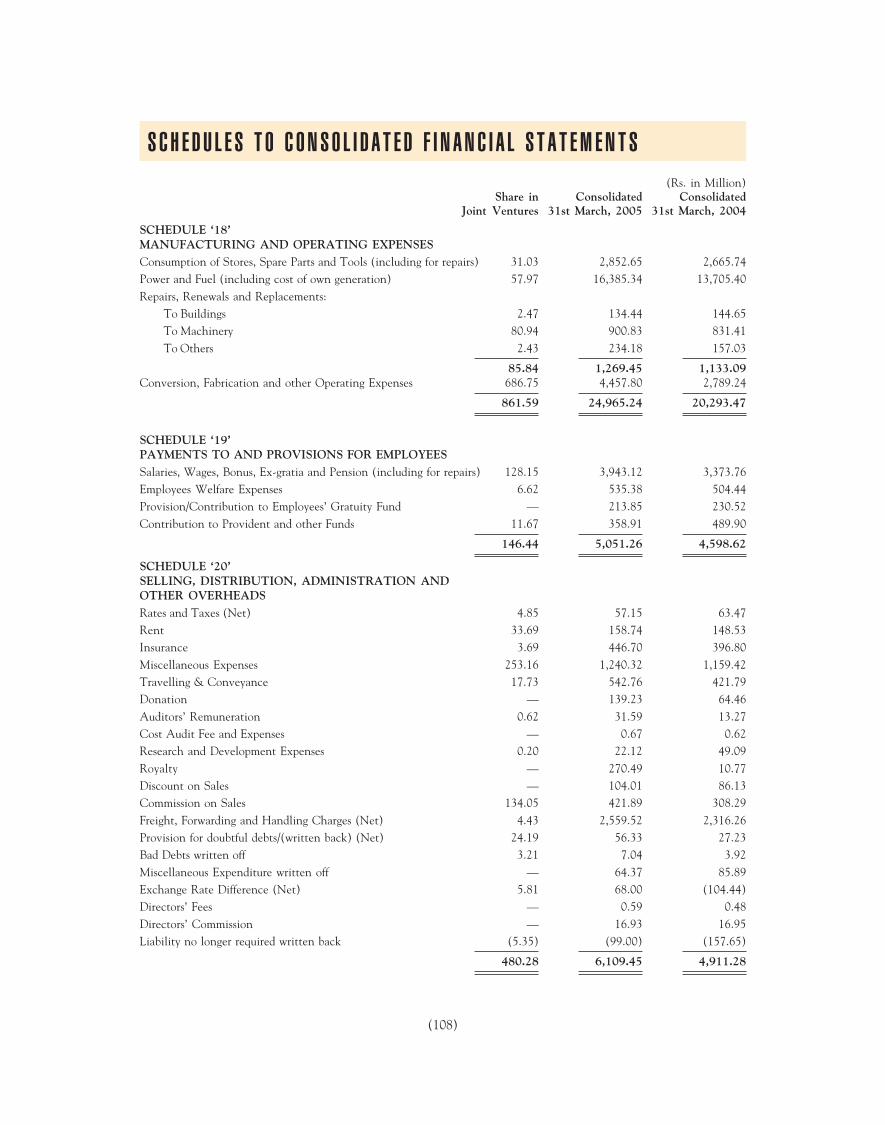
(108)
SCHEDULE ‘18’MANUFACTURING AND OPERATING EXPENSESConsumption of Stores, Spare Parts and Tools (including for repairs) 31.03 2,852.65 2,665.74Power and Fuel (including cost of own generation) 57.97 16,385.34 13,705.40Repairs, Renewals and Replacements:
To Buildings 2.47 134.44 144.65To Machinery 80.94 900.83 831.41To Others 2.43 234.18 157.03
85.84 1,269.45 1,133.09Conversion, Fabrication and other Operating Expenses 686.75 4,457.80 2,789.24
861.59 24,965.24 20,293.47
SCHEDULE ‘19’PAYMENTS TO AND PROVISIONS FOR EMPLOYEESSalaries, Wages, Bonus, Ex-gratia and Pension (including for repairs) 128.15 3,943.12 3,373.76Employees Welfare Expenses 6.62 535.38 504.44Provision/Contribution to Employees’ Gratuity Fund — 213.85 230.52Contribution to Provident and other Funds 11.67 358.91 489.90
146.44 5,051.26 4,598.62
SCHEDULE ‘20’SELLING, DISTRIBUTION, ADMINISTRATION ANDOTHER OVERHEADSRates and Taxes (Net) 4.85 57.15 63.47Rent 33.69 158.74 148.53Insurance 3.69 446.70 396.80Miscellaneous Expenses 253.16 1,240.32 1,159.42Travelling & Conveyance 17.73 542.76 421.79Donation — 139.23 64.46Auditors’ Remuneration 0.62 31.59 13.27Cost Audit Fee and Expenses — 0.67 0.62Research and Development Expenses 0.20 22.12 49.09Royalty — 270.49 10.77Discount on Sales — 104.01 86.13Commission on Sales 134.05 421.89 308.29Freight, Forwarding and Handling Charges (Net) 4.43 2,559.52 2,316.26Provision for doubtful debts/(written back) (Net) 24.19 56.33 27.23Bad Debts written off 3.21 7.04 3.92Miscellaneous Expenditure written off — 64.37 85.89Exchange Rate Difference (Net) 5.81 68.00 (104.44)Directors’ Fees — 0.59 0.48Directors’ Commission — 16.93 16.95Liability no longer required written back (5.35) (99.00) (157.65)
480.28 6,109.45 4,911.28
S C H E D U L E S T O C O N S O L I D A T E D F I N A N C I A L S T A T E M E N T S
(Rs. in Million)Share in Consolidated Consolidated
Joint Ventures 31st March, 2005 31st March, 2004

(109)
SCHEDULE ‘21’(INCREASE)/DECREASE IN STOCKSClosing Stocks:Work-in-Progress 1.23 11,818.99 8,967.94Finished Goods 6.69 1,862.21 1,692.23
7.92 13,681.20 10,660.17Less: Opening Stocks:Work-in-Progress 0.73 8,967.94 5,671.68Finished Goods 14.81 1,692.23 1,799.95
15.54 10,660.17 7,471.63
7.62 (3,021.03) (3,188.54)
SCHEDULE ‘22’INTEREST AND FINANCE CHARGESInterest on Debentures and other Fixed Loans 302.60 2,086.51 1,986.70Interest on Others 4.95 515.09 429.11Finance Lease Charges — — 97.25Other Finance Charges 10.54 21.82 86.63
318.09 2,623.42 2,599.69Less: Interest Capitalised — 464.30 254.05
318.09 2,159.12 2,345.64
S C H E D U L E S T O C O N S O L I D A T E D F I N A N C I A L S T A T E M E N T S
(Rs. in Million)Share in Consolidated Consolidated
Joint Ventures 31st March, 2005 31st March, 2004
SCHEDULE ‘23’
NOTES ON ACCOUNTS
1. PRINCIPLES OF CONSOLIDATION
(a) The financial statements have been prepared to comply in all material aspects with applicable accounting principlesin India, and the Accounting Standards issued by the Institute of Chartered Accountants of India (ICAI).
(b) CONSOLIDATED FINANCIAL STATEMENTS relates to Hindalco Industries Limited, the Company and itsSubsidiaries and Joint ventures (the Group).The Consolidated Financial Statements are in conformity with theAS -21 and AS - 27 issued by ICAI and are prepared on the following:
(i) The financial statements of the Company and its Subsidiaries and interest in Joint ventures have beencombined on a line by line basis by adding together the book values of like items of assets, liabilities, incomeand expenses, after fully eliminating inter-company balances and transactions including profits in year endinventories.
(ii) The consolidated financial statements are prepared by adopting uniform accounting policies for like transactionsand other events in similar circumstances and are presented to the extent possible, in the same manner as theCompany’s separate financial statements except otherwise stated elsewhere in this schedule.
(iii) The excess of cost to the Company of its investments in the subsidiaries over it’s portion of equity ofsubsidiaries at the dates they become subsidiaries is recognised in the financial statements as goodwill.
(iv) The excess of Company’s portion of equity of the subsidiaries over the cost to the Company of its investmentsat the dates they become subsidiaries is recognised in the financial statements as capital reserve.
(v) Minority Interests in the consolidated financial statements is identified and recognised after taking intoconsideration:
— The amount of equity attributable to minorities at the date on which investments in a subsidiary ismade.
— The minorities’ share of movement in equity since the date parent- subsidiary relationship came intoexistence.

(110)
S C H E D U L E S T O C O N S O L I D A T E D F I N A N C I A L S T A T E M E N T S
— The losses attributable to the minorities are adjusted against the minority interest in the equity of thesubsidiary.
— The excess of loss over the minority interest in the equity, is adjusted against General Reserve of theCompany.
(c) Accounting Policies and Notes on Accounts of the Company and all the subsidiaries are set out in theirrespective financial statements.
2. (a) The Consolidated Financial Statements comprise the financial statements of Hindalco Industries Limited and itssubsidiaries and its interest in Joint Ventures as on March 31, 2005, which are as under:
Name of the company Extent of Company’s interest Country of Incorporation
Subsidiaries:
Indian Aluminium Company, Limited 97.06% India
Utkal Alumina International Limited ** 55.00% India
Suvas Holdings Limited ** 51.00% India
Indal Exports Limited 100.00% India
Bihar Caustic and Chemicals Limited 54.57% India
Minerals and Minerals Limited 100.00% India
Renukeshwar Investments & Finance Limited 100.00% India
Renuka Investments & Finance Limited 100.00% India
Dahej Harbour and Infrastructure Limited 100.00% India
Lucknow Finance Company Limited 100.00% India
Birla Maroochydore Pty Limited* 100.00% Australia
Birla Mineral Resources Pty Limited 100.00% Australia
Birla Resources Pty Limited 100.00% Australia
Birla (Nifty) Pty Limited* 100.00% Australia
Birla Mt Gordon Pty Limited* 100.00% Australia
Joint Ventures:
Tanfac Industries Limited 9.98% India
IDEA Cellular Limited 10.11% India
Financial year of all subsidiaries and joint ventures ended on 31st March, 2005
* Subsidiaries of Birla Mineral Resources Pty Limited.
** Have not yet commenced commercial production.
(b) For the purpose of consolidation, the Consolidated Financial Statements of Birla Mineral Resources Pty Limitedwhich reflects the consolidation of Birla (Nifty) Pty Limited, Birla Mt Gordon Pty Limited and Birla MaroochydorePty Limited as at 31st March, 2005 has been prepared. In order to consolidate the audited consolidated financialstatements of Birla Mineral Resources Pty Limited, where considered material, been restated to comply withGenerally Accepted Accounting Principles in India.
(c) In accordance with the requirement of Accounting Standard – 11 (Revised) –”The effects of changes in foreignexchange rates”, operations of foreign subsidiaries have been considered as non-integral operations and accordinglytheir financial statements have been converted in Indian Rupees at following exchange rates:
(i) Revenue and Expenses: At the average exchange rate during the period.
(ii) Current Assets and Current Liabilities: Exchange rate prevailing at the end of the period.
(iii) Fixed Assets: Exchange Rate prevailing at the end of the period.
The resultant translation exchange difference has been transferred to foreign currency translation reserve.
SCHEDULE ‘23’ (Contd.)
NOTES ON ACCOUNTS (Contd.)

(111)
S C H E D U L E S T O C O N S O L I D A T E D F I N A N C I A L S T A T E M E N T S
(Rs. in Million)
As at 31st As at 31stMarch, 2005 March, 2004
3. Capital Commitments outstanding (Advance/Deposit paid Rs. 3,201.96 million) 12,414.98 10,845.94
Joint Ventures (net of advances) 145.31 137.94
4 (I) Contingent Liabilities not provided for in respect of:
(a) Claims/Disputed liabilities not acknowledged as debt
The following demands which are disputed are not provided for
The Company and Subsidiaries:
Income Tax 108.28 95.19
Excise/Custom /Sales Tax 1,920.56 1,987.70
Others 1,106.34 1,048.72
Joint Ventures:
Income Tax 3.12 1.88
Excise/Custom /Sales Tax 102.07 14.51
Others 42.77 25.63
(b) i) Bills discounted with Banks 468.14 586.39ii) Guarantees outstanding 2,770.39 5,966.86
Joint Ventures 40.02 59.12iii) Letters of Credit Outstanding. 684.17 8,851.09
Joint Ventures 12.84 26.67iv) Bank Guarantees & Bonds 877.19 1,930.69
Joint Ventures 132.53 5.57
(c) The Company has received supplementary bills on account of revision in rate ofpower for Main Supply from the UPSEB for the period 15.5.1976 to 30.6.1980and the same remains unprovided for as disputed by the Company 50.10 50.10
(d) In terms of the Scheme of Arrangement between the Company, the erstwhile Indo Gulf Corporation Ltd (IGCL)and Indo Gulf Fertilisers Limited approved by the Hon’ble High Courts at Allahabad and Mumbai vide theirorders dated 18th November 2002 and 31st October 2002 respectively, the company may be liable to pay aportion of disputed demands of Income Tax of Rs.133.95 million pertaining to IGCL.
(II) 228,340,226 Equity Shares of Rs.10/- each fully paid up in IDEA Cellular Ltd. are held by the Company asinvestment. Out of the above 115,187,999 shares of Rs. 10/- each have been pledged for securing financialassistance granted by the lenders to that company.
(III) The Company has given undertakings to various Financial Institutions for non-disposal of shares held in TanfacIndustries Ltd. and 57,085,060 shares of Rs 10/- each of IDEA Cellular Ltd. till the Institutional loans are repaid infull.
(IV) Balance in provision for income tax account is after netting-off the payment made and refunds receivedsince the appeals filed by the Company and the Department are pending before appellate authorities.
5 a) The company has export obligations of Rs. 7,501.33 million (USD 171.46 million) against the Import Licencestaken for import of capital goods under Export Promotion Capital Goods Scheme.
b) The company has export obligation of Rs. 2,592.25 millions (USD 59.25 million) against the Advance Licence.
6. Pursuant to a Scheme of Arrangement u/s. 391 to 394 of the Companies Act, 1956 (the Scheme) which has beenapproved by Hon’ble Bombay High Court and Kolkata High Court on 14th January, 2004 and 23rd December 2004,respectively, all the business undertakings (other than the aluminum foil business at Kollur, Andhra Pradesh), herein
SCHEDULE ‘23’ (Contd.)
NOTES ON ACCOUNTS (Contd.)

(112)
S C H E D U L E S T O C O N S O L I D A T E D F I N A N C I A L S T A T E M E N T S
after referred to as demerged undertaking, of Indian Aluminium Company, Ltd (Indal) has been transferred to theCompany with effect from the appointed date i.e. 1st April, 2004 on going concern basis.
Demerged undertaking is engaged inter alia in conducting and carrying on the business of mining, manufacture and saleof hydrate and alumina, alumina chemicals, aluminium, aluminium products including aluminium sheets, extrusionsand foil and generation of electricity.
a) In terms of the Scheme, all the assets and liabilities of the demerged undertaking have been transferred and standvested with the Company with effect from the appointed date at their book value. Further, in terms of theScheme, all the business activities of the demerged undertaking of Indal carried out on or after the appointed dateare deemed to have been carried out by Indal on behalf of the Company on a going concern basis. The Schemehas accordingly been given effect to in these accounts and operational result for the year of the demergedundertaking of Indal have been incorporated in the Company’s accounts.
b) In consideration of the above, the Company has issued 299,522 equity shares in the ratio of one equity share ofRs.10/- each for every seven equity shares to other shareholders of Indal and consequently the issued and paid upShare Capital of the Company has increased by Rs. 3.00 million. In addition to the above the value of Company’sinvestments in Indal has been reduced by Rs. 11,882.79 million
c) As per the requirements of scheme
i) The assets and liabilities of the demerged undertaking of Indal as on 1st April, 2004 have been taken over atthe respective book value.
ii) Amount of Rs. 111.85 million and Rs. 4.00 million credited to Debenture Redemption Reserve and CapitalReserve, respectively.
iii) Rs. 2,102.74 million, being the amount representing deficit of net assets of the demerged undertaking overthe aggregate of (1) the paid up value of equity shares issued and allotted (2) investment in Indal as reducedin (b) above and the amount credited to reserves as given in (ii) above, has been debited to SecuritiesPremium Account.
7. As per the Accounting Standard (AS) 28 - Impairment of Assets, which came into effect from 1st April 04, theCompany carried the impairment test as on 1st April 2004 and provided for the impairment loss where recoverableamount was lower than amount carried in the accounts by adjusting the same (net of deferred taxes of Rs. 336.29million) against opening balance of revenue reserves as per the transitional provisions. Details are given below :
A) Aluminum
Nature of Asset Events/Circumstances Impairment Loss Basis ofAmount Recoverable
(Rs. in Million) Amount
Certain assets of Low return on Investments due to 164.00 Value in useFoil units severe competition in the market place
120.20 Net Selling Price
Certain assets of Inadequate return on InvestmentWheel Unit due to low demand 330.95 Net Selling Price
Certain assets of Smelters Inadequate return on Investment mainly 143.39 Value in usedue to high cost of operation
146.43 Net Selling Price
Certain assets ofOther Units Erosion in value 194.58 Net selling Price
SCHEDULE ‘23’ (Contd.)
NOTES ON ACCOUNTS (Contd.)

(113)
S C H E D U L E S T O C O N S O L I D A T E D F I N A N C I A L S T A T E M E N T S
B) Copper
Nature of Asset Events/Circumstances Impairment Loss Basis ofAmount Recoverable
(Rs. in Million) Amount
Certain Assets of Higher carrying value than Value in Use 339.87 Value in UseCopper Unit
For arriving at Value in Use discount rate of 9.5% has been used. Net Selling Price has been determined based onvaluation report from external agencies
8. Balances with Trident Trust representing 1,631,613 equity shares of the Company issued pursuant to the Scheme ofArrangement approved by the Hon’ble High Courts at Mumbai and Allahabad vide their Order dated 31st October,2002 and 18th November, 2002, respectively, to the Trident Trust, which is created wholly for the benefit of theCompany and is being managed by trustees appointed by it
9 Although the Market value of certain quoted investments (as reflected in Schedule “6”) and the book value of certainunquoted investments (amount not ascertained) is lower than cost, considering the strategic and long term nature ofthe investments and assets base of the investee companies, in the opinion of the management such decline is temporaryin nature and accordingly no provision is necessary for the same.
10. Purchase of copper concentrate is accounted for provisionally pending finalisation of content in the concentrate, price,and custom duty. Variations are accounted for in the year of settlement.
11. A part of electricity supplied by the company, which has been treated by UPPCL as sale, has been accounted for on thebasis of provisional rates. The effect of variation in the rate will be accounted for in the year in which rates are finalisedby UPPCL
12. a) Future obligations towards lease rentals under the lease agreements taken prior to 1st April 2001:
(Rs. in Million)
Period Lease Payment Present Value
Not later than one year 68.05 64.92
Later than one year and not Later than five years 21.60 20.09
b) Future obligations towards lease rentals under the lease agreements taken or after 1st April 2001:
(Rs. in Million)
Period Lease Payment Present Value
Not later than one year 3.50 3.32
Later than one year and not later than five years 21.02 15.15
Later than Five years 3.82 2.23
c) In Line with Accounting Standard – 19 “Leases”, on April 1, 2004 the Company has capitalized assets taken onfinance lease in earlier years at their respective cost amounting Rs. 1,728.00 million together with their respectiveaccumulated depreciation of Rs. 470.50 million.
d) The total future mininmum lease payment commitments under non-cancellable operating lease agreement for aperiod of twenty years to use railway tracks along with locomotives for transportation of its materials, are as under:
(Rs. in Million)
As at 31stPeriod March, 2005
Not later than one year 4.00
Later than one year and not Later than five years 16.00
Later than five years 48.67
SCHEDULE ‘23’ (Contd.)
NOTES ON ACCOUNTS (Contd.)

(114)
e) Future minimum lease payment commitments for operating lease under the lease agreements for the followingperiod:
(Rs. in Million)
As at 31stPeriod March, 2005
Not Later than one year 8.52
Later than one year but not later than five years 11.08
13. Sale of Di-Ammonium Phosphate (DAP) and other complex fertilisers are covered under the concessional schemes fordecontrolled fertilisers of the Government of India.Pending declaration of final rate of concession for the quarter ended31st March 2005 the claim for concession under the scheme for that period has been accounted for provisionally basedon final rates declared for the preceding quarter.
14. Extraordinary items of Rs.130.55 million represents expenses of Rs.91.03 million incurred on demerger as per note no.6and disputed claim of Rs.39.52 million of earlier years accounted by one of the subsidiary.
15. Deferred Tax
Major components of Deferred Tax arising on account of temporary timing differences along with their movement as atMarch 31, 2005 are: (Rs. in Million)
As at 31st March, 2005 As at 31st March, 2004
Company Companyand its Joint and its Joint
Particulars subsidiaries Ventures Consolidated subsidiaries Ventures Consolidated
Deferred Tax Assets (A)
Brought forward long termCapital Losses 0.01 — 0.01 36.58 0.13 36.71
Others 303.96 — 303.96 — — —
Deferred Tax Liability (B)
Depreciation 10,867.99 7.14 10,875.13 10,975.40 7.27 10,982.67
Others 771.45 (0.15) 771.30 1,006.82 (0.17) 1,006.65
Net Deferred Tax Liability (A-B) 11,335.47 6.99 11,342.46 11,945.64 6.97 11,952.61
16. a) Capital work-in-progress include Rs. 3.40 million being tax paid on behalf of Ex-CEO and Whole Time Directorof a subsidiary company on his remuneration for the period from 1st July, 2000 to 31st January, 2002 in accordancewith Section 10 (5B) of the Income-tax Act, 1961. The subsidiary has been legally advised that provisions ofSection 10 (5B) of the Income-Tax Act, 1961 has an overriding effect on the provisions of Section 200 of theCompanies Act, 1956 and accordingly it believes that the Central Government’s approval is not required for thepurpose.
b) Appointment and payment of remuneration Rs. 1.33 million to Manager and CEO of a subsidiary company isawaiting the approval of Central Government.
17. Exchange gain / loss amounting to Rs. 33.83 million (Net gain) (Previous year gain of Rs. 652.55 million) have beenaccounted for under respective heads of account, viz. Sales & conversion charges gain of Rs. 19.69 million (Previousyear gain of Rs. 181.13 million), Raw Material consumed gain of Rs. 0.73 million (Previous year gain of Rs. 466.96million), Manufacturing expenses (gain) Rs. 10.59 million (Previous year gain of Rs. 0.16 million), Selling, Distribution,Administration and Other expenses gain of Rs. 1.04 million (Previous year gain of Rs. 4.30 million) and Interest (gain)1.78 million (previous Year Rs Nil).
SCHEDULE ‘23’ (Contd.)
NOTES ON ACCOUNTS (Contd.)
S C H E D U L E S T O C O N S O L I D A T E D F I N A N C I A L S T A T E M E N T S

(115)
18. In view of different sets of environment in which subsidiaries namely Birla Mineral Resources Pty Limited, Birla (Nifty)Pty Limited, Birla Mt Gordon Pty Limited, Birla Resources Pty Limited and Birla Maroochydore Pty Limited areoperating, Accounting policies followed in respect of following items by them are different from the accounting policiesmentioned in Schedule 23 of the Financial statements of the Company.
(Rs in Million)
Particulars Accounting Policies Amount ProportionCompany Subsidiaries 2004-05 2003-04 2004-05 2003-04
Fixed Assets Carried at historical cost Carried at the fair value 6,670.66 5,372.43 9.47% 7.44%Assets taken on In respect of assets taken Assets taken on finance NIL 22.85 NIL 0.03%Finance Lease on finance lease prior to lease have been treated as
1st April 2001, the element part of the fixed assetsof lease rental applicable to recording them initially atthe cost of assets has been fair value and depreciatingcharged to the profit and it over its useful life.loss account over theestimated life of the assetsand financing cost has beenallocated over the life of thelease on an appropriate basis.
Depreciation & Depreciation is charged on Depreciation rates used 1,049.26 785.20 16.59% 15.28%Amortisation the basis of rates and (ranging from 10% - 50%)
manner specified for each for each class of assets areclass of assets in Schedule determined by the remainingXIV of the Companies expected life of mine. TheAct, 1956., as amended. carrying cost of the mine
properties itself is amortisedon the basis of productionoutput basis.
Gain / Loss relating Exchange differences Exchange differences Nil 22.57 Nil 21.61%to exchange relating to amounts payable relating to amounts payabledifferences and receivable in foreign and receivable in foreign
currencies are accounted for currencies are accounted foras exchange gains or losses as exchange gains or lossesin the profit and loss in the statement ofaccount, except for amount financial performance.relating to liabilities incurredfor purchase of fixed assets,the difference thereof isadjusted in the carryingamount of the fixed assets.
Environment & The Cost of reclamation of A provision for environ- 265.19 246.24 100% 100%rehabilitation mined out land, mental and rehabilitationexpenditure Afforestation etc is treated costs are made for the total
as part of raw materials cost. estimated future costs ofenvironmental andrehabilitation work requiredto be performed for eachoperation and area ofinterest and a correspondingamount is capitalised tomine properties, which isamortised over the life ofthe operation.
Expenses Mining cost are classified Expenses relating to mining 2,911.70 1,837.60 65.16% 65.88%under raw material and processing except powerconsumption and production & fuel, rates and taxes,overhead are classified insurance, traveling expenses,functionally and disclosed royalty, freight andunder primary heads of forwarding are not classifiedaccounts functionally and are shown
under conversion,fabrication and otheroperating expenses
SCHEDULE ‘23’ (Contd.)
NOTES ON ACCOUNTS (Contd.)
S C H E D U L E S T O C O N S O L I D A T E D F I N A N C I A L S T A T E M E N T S

(116)
Investments Long term Investments are Investments in controlled — — — —stated at cost after entities are carried in thededucting provisions, if any, financial statements at thein cases where the fall in lower of cost andmarket value has been recoverable amount.considered of permanent Dividends and distributionsnature. Current investments are brought to account inare stated at lower of cost the profit and loss accountand fair value. when they are declared by
the controlled entities.Recognition of Forward rate agreement and Forward rate agreement and 539.79 Nil 100% NilHedging gain / loss options are not marked-to options are marked to spot
spot at year end. at year end and the same isrecognized as deferred gain/loss in financial statements.
19. SEGMENT REPORTING
Based on the guiding principles given in the Accounting Standard on Segmental Reporting (AS-17) issued by the“Institute of Chartered Accountants of India” the financial information about the primary business segments is as under:Financial information about the primary business segments is presented in the table given below: -
(Rs. in Million)
2004-05 2003-04
Particulars Aluminium Copper Others Consolidated Aluminium Copper Others Consolidated
REVENUEExternal Sales 53,209.56 45,469.72 2,375.36 101,054.64 45,014.04 35,846.29 1,372.38 82,232.71Inter Segment Sales 8.91 — 15.01 23.92 7.23 — 11.77 19.00
53,218.47 45,469.72 2,390.37 101,078.56 45,021.27 35,846.29 1,384.15 82,251.71Less: Inter Segment Sales (8.91) — (15.01) (23.92) (7.23) — (11.77) (19.00)Total Revenue 53,209.56 45,469.72 2,375.36 101,054.64 45,014.04 35,846.29 1,372.38 82,232.71RESULTSSegment/Operating Results 16,192.69 1,741.30 481.21 18,415.20 10,921.27 3,667.37 357.90 14,946.54Un-allocable Income(Net of Expenses) 2,344.34 2,263.62Interest Expenses (2,159.12) (2,345.64)Non Recurring Income/Expenses (Net) (130.55) (10.04)Provision for Tax(including Deferred Tax) (5,511.91) (4,879.94)
Net Profit 12,957.96 9,974.54
OTHER INFORMATIONSegment Assets 63,100.43 61,408.49 6,116.48 130,625.40 60,751.21 42,524.55 4,439.28 107,715.04Un-allocable Assets 35,443.10 28,027.97
Total Assets 166,068.50 135,743.01
Segment Liabilities 5,253.76 11,633.03 778.20 17,664.99 5,230.89 6,797.67 596.28 12,624.84Un-allocable Liabilities 10,245.84 2,494.43
Total Liabilities 27,910.83 15,119.27
Depreciation 3,599.96 2,260.58 452.73 6,313.27 3,035.30 1,768.73 313.90 5,117.93Un-allocable Depreciation 11.66 22.41
Total Depreciation 6,324.93 5,140.34
Capital Eexpeditureincluding CWIP 5,327.95 9,714.12 604.74 15,646.81 5,545.65 5,822.11 402.03 11,769.79
SCHEDULE ‘23’ (Contd.)
NOTES ON ACCOUNTS (Contd.) (Rs in Million)
Particulars Accounting Policies Amount Proportion
Company Subsidiaries 2004-05 2003-04 2004-05 2003-04
S C H E D U L E S T O C O N S O L I D A T E D F I N A N C I A L S T A T E M E N T S

(117)
Note : During the year the Company has re-identified primary business segment to reflect more appropriate presentation inline with reorganization of some subsidiaries and accordingly previous years figures have been regrouped to make themcomparable with current year.
20. Related Party DisclosuresA List of Related Parties
(a) Trusts of the CompanyTrident Trust
(b) Joint VenturesTanfac Industries LimitedIDEA Cellular Limited
(c) Key Managerial Personnel:Mr. Debu Bhattacharya- Managing Director
B The following transactions were carried out with the Related parties in the ordinary course of business:
(a) Joint Ventures:(Rs. in Million)
2004-05 2003-04
S. No. Transactions Joint Ventures Joint Ventures
Transaction during the year1 Sales and Conversion 97.54 77.632 Services rendered 0.02 0.333 Interest and dividend received 0.81 42.694 Purchase of materials 163.57 433.555 Services received 0.35 0.786 Investments, Deposits, loans and advances
made during the year — 700.007 Guarantees and Collateral securities given 875.00 849.96
Outstanding balance as on 31.03.2005
1 Debit Balances 11.80 15.01
2 Credit Balances 4.94 0.80
(b) Trident TrustBeneficiary Interest in the Trust 344.52 344.52
(c) Key Managerial Personnel:Managerial Remuneration (including perquisites) 25.82 26.61
21. Figures of the previous year have been regrouped/ rearranged wherever found necessary
SCHEDULE ‘23’ (Contd.)
NOTES ON ACCOUNTS (Contd.)
S C H E D U L E S T O C O N S O L I D A T E D F I N A N C I A L S T A T E M E N T S
As per our report annexed.For SINGHI & CO.Chartered Accountants
RAJIV SINGHIPartner D. BHATTACHARYAMembership No. 53518 Managing Director
R. K. KASLIWAL Directors: M. M. BHAGATCamp: Mumbai ANIL MALIK Group Executive E. B. DESAIDated: The 6th day of June, 2005 Company Secretary President & C.F.O. C. M. MANIAR

(118)
C A S H F L O W S T A T E M E N T F O R T H E Y E A R E N D E D M A R C H 3 1 , 2 0 0 5
(Rs. in Million)
Year ended Year endedMarch 31, 2005 March 31, 2004
A. CASH FLOW FROM OPERATING ACTIVITIES
Net profit before tax and extraordinary items 18,600.42 14,864.52
Adjustment for :
Depreciation 6,223.14 5,028.03
Amortisation of Intangible Asset 101.79 112.31
Foreign Exchange Loss/(Gain) 41.51 (120.21)
Investment activities (2,797.46) (2,535.62)
Preliminary/Deferred expenses 696.04 85.89
Provisions 127.73 112.74
Interest & Finance Charges charged 2,208.47 6,601.22 2,185.87 4,869.01
Operating profit before working capital changes 25,201.64 19,733.53
Changes in working Capital:
Trade and other receivables (1,973.29) (2,981.94)
Inventories (9,925.91) (2,501.81)
Trade payable 5,541.14 (6,358.06) 2,915.37 (2,568.38)
Cash generated from operation 18,843.58 17,165.15
Direct taxes paid 580.04 (2,025.32)
Payment of VRS (80.66) -
Cash flow before extraordinary items 19,342.96 15,139.83
Extraordinary items - (10.04)
Increase in deferred revenue expenditure (9.01) (70.84)
NET CASH FROM OPERATING ACTIVITIES 19,333.95 15,058.95
B. CASH FLOW FROM INVESTMENT ACTIVITIES
Goodwill on acquisition (739.98) -
Purchase of Fixed Assets (17,801.74) (12,210.71)
Sale of Fixed Assets 685.14 91.54
Purchase of shares of subsidiaries - (49.86)
Acquisition of Business/Subsidiary (91.03) (35.86)
Purchase of Investments (Net) (10,369.51) (6,123.90)
Interest received 1,234.43 984.58
Dividend received 833.47 636.52
Lease Rent received 10.82 -
Cash flow before extraordinary items (26,238.40) (16,707.69)Extraordinary items (39.52) -
NET CASH USED IN INVESTMENT ACTIVITIES (26,277.92) (16,707.69)

(119)
C. CASH FLOW FROM FINANCING ACTIVITIES
Proceeds from issue of Equity Share 97.14 103.68
Share call money Received 0.01 -
Advance received against share capital - 0.13
Proceeds form Rights Issue (Net of Expenses) 0.17 -
Proceeds from long term borrowings (net) 12,304.38 (90.77)
Proceeds from Short term borrowings (net) (54.62) 3,984.97
Interest & Finance Charges paid (2,189.53) (2,257.75)
Dividend paid (1,733.11) (1,410.17)
NET CASH USED IN FINANCING ACTIVITIES 8,424.44 330.09
NET INCREASE IN CASH AND CASH EQUIVALENTS 1,480.47 (1,318.65)
CASH & CASH EQUIVALENTS-OPENING BALANCE 3,631.94 4,950.59
CASH & CASH EQUIVALENTS-CLOSING BALANCE 5,112.41 3,631.94
Notes:
1 Cash and cash equivalent includes cash and bank balances and Deposits with Companies and interest accrued thereon.
2 Amount invested in subsidiary, net of its cash and cash equivalents on the acquisition date has been shown in Acquisition ofsubsidiary.
3 Interest charged excludes and Purchase of Fixed Assets includes Rs. 464.30 million interest capitalised during the year.
4 Figures for the previous year have been regrouped / rearranged wherever found necessary.
As per our report annexed.For SINGHI & CO.Chartered Accountants
RAJIV SINGHIPartner D. BHATTACHARYAMembership No. 53518 Managing Director
R. K. KASLIWAL Directors: M. M. BHAGATCamp: Mumbai ANIL MALIK Group Executive E. B. DESAIDated: The 6th day of June, 2005 Company Secretary President & C.F.O. C. M. MANIAR
(Rs. in Million)
Year ended Year endedMarch 31, 2005 March 31, 2004
C A S H F L O W S T A T E M E N T F O R T H E Y E A R E N D E D M A R C H 3 1 , 2 0 0 5 ( C o n t d . )

(120)
FIN
AN
CIA
L I
NFO
RM
AT
ION
RE
LA
TIN
G T
O S
UB
SID
IAR
Y C
OM
PA
NIE
S(R
s. i
n M
illio
n)
Det
ails
of
Inve
stm
ent
*
Tot
alT
otal
Lon
g T
erm
Inv
estm
ent
Cur
rent
Inv
estm
ent
Pro
fit
Pro
visi
onP
rofi
tP
ropo
sed
Cap
ital
Res
erve
sA
sset
sL
iabi
litie
sQ
uote
dU
nquo
ted
Quo
ted
Unq
uote
dT
urno
ver
befo
re T
axfo
r T
axat
ion
afte
r T
axD
ivid
end
1M
iner
als
&M
iner
als
Lim
ited
0.50
9.92
12.5
512
.55
--
--
27.3
10.
880.
320.
67-
2B
ihar
Cau
stic
& C
hem
ical
s L
imit
ed23
3.86
619.
221,
919.
901,
919.
90-
--
-1,
248.
2829
6.97
32.4
526
4.75
18.7
1
3R
enuk
a In
vest
men
t &
Fin
ance
Lim
ited
92.5
218
6.61
282.
0328
2.03
197.
460.
19-
-65
.78
61.9
60.
8961
.07
-
4R
enuk
eshw
ar I
nves
tmen
t &
Fin
ance
Lim
ited
47.9
714
7.03
195.
0119
5.01
190.
190.
19-
-19
.46
19.0
2-
19.0
2-
5D
ahej
Har
ber
& I
nfra
stru
ctur
e L
imit
ed50
0.00
621.
361,
506.
071,
506.
07-
--
152.
4756
4.24
336.
9579
.20
257.
75-
6L
uckn
ow F
inan
ce C
ompa
ny L
imit
ed12
0.03
28.7
522
5.14
225.
140.
01-
-12
.91
10.7
72.
321.
301.
02-
7B
irla
Min
eral
s R
esou
rces
Pty
Lim
ited
4,85
9.39
446.
115,
049.
455,
049.
45-
--
--
(823
.63)
(943
.22)
119.
55-
8B
irla
Mar
ooch
ydor
e P
ty L
imit
ed33
7.88
(6.6
6)35
7.92
357.
92-
--
--
(4.2
7)-
(4.2
7)-
9B
irla
(N
ifty
) P
ty L
imit
ed2,
412.
9357
4.92
9,08
9.16
9,08
9.16
--
--
1,70
3.95
(123
.36)
576.
18(6
99.5
3)-
10B
irla
Mt
Gor
don
Pty
Lim
ited
810.
91(1
,237
.73)
2,69
4.72
2,69
4.72
--
--
2,88
1.85
(1,0
16.7
4)-
(1,0
16.7
4)-
11B
irla
Res
ourc
es P
ty L
td.
21.9
60.
0727
.17
27.1
7-
--
--
--
--
12In
dian
Alu
min
ium
Com
pany
Ltd
.14
2.51
26.2
942
2.58
422.
58-
--
-75
8.67
(25.
63)
(10.
18)
(15.
45)
-
13In
dal
Exp
orts
Lim
ited
1.40
3.73
5.24
5.24
-5.
00-
--
(0.0
1)0.
01(0
.02)
-
14U
tkal
Alu
min
a In
tern
atio
nal
Lim
ited
**
1,02
9.79
-1,
104.
721,
104.
72-
--
--
--
--
15Su
vas
Hol
ding
s L
imit
ed *
*3.
70-
3.75
3.75
--
--
--
--
-
*E
xclu
ding
Inv
estm
ent
in S
ubsi
diar
ies.
**N
o P
rofi
t &
Los
s A
ccou
nt p
repa
red
sinc
e th
e co
mpa
ny i
s in
pre
-ope
rati
ve s
tage
.
Prominent Aditya Birla Group of Companies / JVs in IndiaThe Aditya Birla Group enjoys a leadership position in all the sectors in which it operates
I. HINDALCO INDUSTRIES & ITS ASSOCIATES
Hindalco Industries Limited : Aluminium, Copper
Subsidiaries
• Indian Aluminium Company, Limited : Aluminium
• Bihar Caustic and Chemicals Limited : Caustic Soda, Liquid Chlorine, Hydrochloric Acid
• Birla Mineral Resources Pty Limited : Copper mining
Joint Ventures
• Tanfac Industries Limited : Fluorine products
• Idea Cellular Limited : Telecom
II. OTHERS
• Grasim Industries Limited & its Subsidiaries : Viscose Staple Fibre, Cement, Sponge Iron,
- Ultra Tech Cement Limited : Cement
- Shree Digvijay Cement Company Limited : Cement
• Indian Rayon and Industries Limited & : Viscose Filament Yarn, Branded Apparels,its Subsidiaries Carbon Black, Textiles
- Birla Sun Life Insurance Company Limited : Life Insurance
- PSI Data Systems Limited & its Subsidiary : Software Services
- TransWorks Information Services Limited & : Business Process Outsourcingits subsidiary
• Indo Gulf Fertilisers Limited : Fertilisers
• Birla Global Finance Limited & its JVs/Associates : Financial Services
- Birla Sun Life Asset Management Company Limited : Investment / Mutual Fund
- Birla Sun Life Distribution Company Limited : Investment Advisory
- Birla Sun Life Trustee Company Limited : Trustee of Birla Mutual Fund
- Birla Insurance Advisory Services Limited : Non-life Insurance Advisory Services
• Essel Mining & Industries Limited : Iron and Manganese Ore Mining,Noble Ferro Alloys, Nitrogen production
Prin
ted
at In
fom
edia
Indi
a Lt
d.