highway research board
396
-
Upload
khangminh22 -
Category
Documents
-
view
1 -
download
0
Transcript of highway research board

HIGHWAY RESEARCH BOARD 1952
R. H. BALDOCK, Chairman W. H. RooT, Vice Chairman
FRED BURGGRAF, Director
Executive Committee
THOMAS H. MACDONALD, Commissioner, Bureau of Public Roads
HAL H. HALE, Executive Secretary, American Association of State Highway Officials
Louis JORDAN, Executive Secretary, Division of Engineering and Industrial Research, National Research Council
R. H. BALDOCK, State Highway Engineer, Oregon State Highway Commission.
W. H. ROOT, Maintenance Engineer, Iowa State Highway CommissiOn
H. P. BIGLER, Former Executive Vice President, Connors Steel Company
PYKE JOHNSON, President, Automotive Safety Foundation
G. DONALD KENNEDY, Consulting Engineer and Assistant to President, Portland Cement Association
BURTON W. MARSH, Director, Safety and Traffic Engineering Department, American Automobile Association
R. A. MOYER, Research Engineer, Institute of Transportation and Traffic Engineering, University of California
F. V. REAGEL, Engineer of Materials, Missouri State Highway Department
Editorial Staff
FRED BURGGRAF W. N. CAREY, JR. W. J. MILLER
2101 Constitution Avenue, Washington 25, D. C.
The opinions and conclusions expressed in this publication are those of the authors and not necessarily those of the Highway Research Board.

J .2952
::::4 .
Bridge Eng. --
Consi. Eng.
.Ma1 Eng. -
J//W Lug. - C/if. Loc. Lug. I1I_... IS....
?J'rr,ffic Lug. I-. -I
1anuing Survey
Fivalace Officer
Legal Advisor
Equip. Sup'visor
DIsC.
Frost Action, in Soils
HIGHWAY RESEARCH BOARD
Spccial Ittport No. 2
Y .
Washington, D.C.
DEPARTMENT OF SOILS INVESTIGATIONS
Harold Allen, Chairman Principal Highway Engineer
Bureau of Public Roads
COMMITTEE ON FROST HEAVE AND FROST ACTION IN SOIL
K. B. Woods, Chairman
Charles W. Allen, Research Engineer, Ohio Department of Highways
Earl F. Bennett, Tar Products Division, Koppers Company
Ellis Danner, Assistant Professor of Civil Engineering, University of Illinois
L. E. Gregg, Associate Director of Research, Highway Materials Laboratory, Kentucky
Frank B. Hennion, Office, Chief of Engineers, Department of the Army
Miles S. Kersten, Associate Professor, University of Minnesota
J. E. Lawrence, 90 Lothrop Street, Beverly, Massachusetts
R. F. Legget, Division of Building Research, National Research Council, Ottawa, Canada
0. L. Lund, Soils Engineer, Nebraska Department of Roads and Irrigation
A. E. Matthews, Assistant Engineer of Soils, Testing and Research Division, Michigan State Highway Department
George W. McAlpin, Jr., Director, Bureau of Soil Mechanics, New York Department of Public Works
Lloyd H. Morgan, Soils Engineer, Washington Department of Highways
Frank R. Olmstead, Bureau of Public Roads
Paul Otis, Materials and Research Engineer, New Hampshire State Highway Department
James R. Schuyler, Principal Soils Engineer, New Jersey State Highway Department
T. E. Shelburne, Director of Research, Virginia Department of Highway, University of Virginia
H. R. Smith, Solvay Sales Division, Allied Chemical and DyeCorporation
J. H. Swanberg, Engineer of Materials and Research, University of Minnesota
John Walter, Assistant Highway Engineer, Department of Highways, Toronto, Canada
iv
FOREWORD
Professor K. B. Woods, Associate Director, Joint Highway Research Project, Purdue University
The Symposium on Frost Heave and Frost Action in Soil is devoted to presentation and discussion of papers dealing with a variety of subject matter. Because of the wide diversity and the large number of papers, the symposium committee was divided into sub-units, each administered by a sub-committee as follows: Climate and Distribution of Soil, L. E. Gregg, chairman; Soil Temperature and Thermal Properties of Soils, R. F. Legget, chairman; Soil Moisture and Moisture Movements, Miles S. Kersten, chairman; Basic Data Pertaining to Frost Action, George W. McAlpin, Jr. , chairman; Frost Action and Spring Break-up, I. H. Swanberg, chairman; Remedies and Treat- ments, T. E. Shelburne, chairman; and Needed Research, F. R. Olmstead, chairman. Each paper was reviewed by the sub-committees before they were accepted by the en-tire committee. The papers were prepared by well-known authorities. The cooperation of Harold Allen, chairman of the Department of Soils, and the entire staff of the High-way Research Board, particularly Fred Burggraf, A. W. Johnson, and the late R. W. Crum, deserves special mention.
In April 1944 the Highway Research Board appointed a small committee to study the use of calcium chloride in minimizing frost action in highway subgrades and bases. This committee, under the chairmanship of F. C. Lang had meetings in Columbus, Detroit, Chicago, and Washington. Other members included A. G. Cochran, J. E. Lawrence, A. E. Matthews, Frank R. Olmstead, and K. B. Woods.
In 1945 after the untimely death of F. C. Lang, K. B. Woods was made acting chairman of the committee. Meetings were held in Oklahoma City in 1945, Washington in 1946, and Swampscott, Massachusetts in 1947. At this latter meeting the commit-tee was reorganized and the scope was changed to include Frost Heave and Frost Action in Soil. The membership in the committee was increased considerably with 19 mem-bers being listed at the present time.
The committee has had annual meetings at Ely, Minnesota in 1948; Gaylord, Mich-igan in 1949; and Albany, New York in 1950. In addition the committee meets at the time of the annual meeting of the Highway Research Board.
At the Ely meeting it became apparent that a bibliography and a review of the exiht-ing literature was essential for the proper functioning of the committee. With recom-mendation of the committee and the Department of Soils, the Highway Research Board assigned the engineer of soils and foundations, A. W. Johnson, part time to the project. An annotated bibliography was prepared by Johnson and published as Highway Research Board Bibliography No. 3, Frost Action in Soils, Annotated 1948.
After the release of this bibliography, Johnson continued his work with the develop-ment of a comprehensive review of the litereature on frost heave and frost action in soil. This manuscript will be an outstanding contribution of special interest to prac-ticing highway engineers and those interested in developing research projects covering frost action in soil. This manuscript is being published and should be released about the same time as this symposium.
The Sub-committee on Climate and Distribution of Soil submitted three papers. The paper relating soil profiles to climate makes brief mention of the five soil-forming factors, but the authors have concentrated their efforts in discussing the climatic var-iable. The paper on climatic aspects of frost heave discusses climatic and other en-vironmental factors affecting ground-heat loss. The author discusses climatic and geographical data from the standpoint of distribution of frost heave elements in pre-dicting the timing and severity of frost heave forces.
The group of papers on Soil Temperature and Thermal Properties of Soils, appro-priately enough, is initiated by a review of the literature on soil temperatures which includes an excellent bibliography. The paper on field measurements of soil tempera-tures in Indiana reports data collected under asphaltic pavements covering the period

1938-1950. The paper on thermal conductivity and diffusivity of soils presents a method which can be used for measuring these thermal properties while the paper on thermal conductivity probe presents a different technique.
The importance of soil moisture and moisture mOvement with respect to frost heave and frost action in soil is illustrated by the large group of important papers developed by the sub-committee on Soil Moisture and Moisture Movements. Several of these papers deal with methods of measuring moisture content and include discussions of plaster-of-paris electrical-resistance method, the nylon electrical-resistance method, and the measurement of soil moisture density by neutron and gamma-ray scattering. One paper discusses soil moisture and temperature measurements by means of a heat-diffusion moisture cell. Three papers in this section are devoted to the actual measure-ment of moisture content of airport and highway subgrades including both rigid and flexible pavements, while one paper discusses capillary moisture.
The Sub-committee on Basic Data Pertaining to Frost Action presented a group of eight papers covering a wide range of subject matter. The paper on heat transfer and temperature distribution in soils covers a laboratory study of transient heat, while the paper on thermal properties of soils is directed toward a discussion of the several variables, including temperatures, density, soil moisture content, texture, mineral composition, and soil structure. The paper on clay-mineral composition analyzes the data and concepts that have come out of recent clay-mineral researches pertinent to frost action and frost heaving. Two papers are included in this group on solifluction, slump, and instability of slopes; and one paper deals with a method of calculating the depth of thaw in frozen ground. The laboratoi y study of frost action in soils includes data from tests being performed for the purpose of improving design and evaluation criteria for roads and highway and airfield pavements constructed on soils subject to seasonal freezing and thawing. One paper on permafrost includes identification of various types by means of aerial photographs.
The papers on Frost Action and Spring Break-up include a great deal of information on extent of frost-heave damage to roads and airfields. The paper covering damage to New Hampshire highways is a sampling from the New England states, while the northern Middle West is covered by a paper on the frost problem in Michigan. The paper from Colorado covers information of interest to those in the northern plains and in the Colo-rado plateaus. One paper is included on frost damage to roads in Great Britain. Two papers are included on load-carrying capacity, one on roads and one on airfields. One laboratory study of frost action in soils from New Jersey is included.
An important addition to the symposium is the group of papers on Remedies and Treatments. The subject of calcium chloride treatment of subgrades and bases was covered in one review paper, while the design practice for controlling the effects of frost action is covered in a paper from Michigan. A paper on remedies and treatments for the frost problem in Nebraska includes detailed data on soil characteristics, moisture content, and design practices for that state. Similarly, the design practices for the Connecticut Highway Department are included in the paper from the New England states. The problem of frost action in New York is discussed in another paper which covers a description of types of problems encountered in that area. This group also includes a discussion of frost heaving as a problem of the Norwegian railways. The Sub-committee on Remedies and Treatments sent out questionnaires to secure pertinent information concerning the frost action problem throughout the country. The results of this questionnaire are included as a separate paper.
Two papers are included in this group on Needed Research. The committee sent out a questionnaire, and an analysis of the data collected is included in one paper. The second paper covers an analysis of needed research pertaining to frost action and re-lated phenomena.
The Committee on Frost Heave and Frost Action in Soil has set out to collect data pertaining to the problem. It is felt that this endpoint has been achieved through the publication on a review of the literature by A. W. Johnson and this Symposium on Frost Heave and Frost Action in Soil. The next task of the committee will include the collec-tion of ideas for research projects and the soliciting of papers for presentation at annual meetings. vi

CONTENTS
FOREWORD
K. 'B. Woods, Chairman, Committee on Frost Heave and Frost Action in Soils, Highway Research Board
CLIMATE AND DISTRIBUTION OF SOIL
Major Soil Profiles and Their Relationship with Climate - A. C. Orvedal, 3. Kubota, and H. M. Smith 1
Climate Aspects of Frost Heave and Related Ground Frost Phenomena - P. A. Siple ' 10 -
SOIL TEMPERATURE AND THERMAL PROPERTIES OF SOILS
Soil Temperature, A Review of the Literature - C. B. Crawford 17
Field Measurements of Soil Temperature in Indiana - E. I. Yoder and C.. R. Lowrie 41
An Absolute Method of Determining Thermal Conductivity and Diffusivity' . of Soils - A. D. Misener . . 51
The Thermal Conductivity Probe - F. C. Hooper 57
Discussion of Soil Temperature - H. H. Miller . 60
SOIL MOISTURE AND MOISTURE MOVEMENTS . .
Methods for Measuring the Moisture Content of Soils Under Field Conditions - G. J. Bouyoucos . 64
The Measurement of Soil Moisture and Temperature by Heat-Diffusion Moisture Cell - W. M. Aldous and W. L. Lawton 74
The Measurement of Soil Moisture and Density by Neutron and Gamma- Ray Scattering - D. J. Belcher . 98
Water in Highway Subgrades and Foundations - F. N. 'Hveem 110
Soil Moisture Under Concrete Pavement of an Airport - T. B. Ruse 114
Distribution of Capillary Moisture at Equilibrium in, Stratified Soil - M. C. Spangler and Wei Te Pien 120
Moisture Conditions Under Flexible Airfield Pavements - J. F. Redus ' and C. R. Foster 126
BASIC DATA PERTAINING TO FROST ACTION
Heat Transfer and Temperature Distribution in Soils for Transient Heat Flow Due to Cylindrical Sources and Sinks - Y. S. Touloukian, J. D. Bottorf, and Thor Harsen
Thermal Properties of Soils - Miles S. Kersten
Relation of Frost Action to the Clay Mineral Composition of Soil Materials - R. E. Grim
A Theory of Ice-Blocked Drainage as a Principal Factor in Frost Heave, Slump, and Solifluction - P. A. Siple
Soil Instability on Slopes in Regions of Perennially Frozen Ground - R. -S. Sigafoos and D. M. Hopkins
Calculation of Depth of Thaw in Frozen Ground - Harry Carlson
Interpretation of Permafrost Features from Airphotographs - R. E. Frost
Cold Room Studies of Frost Action in Soils - J. F. Haley and C. W. Kaplar
147 -
161
167 -
172
176
192
223
246
FROST ACTION AND SPRING BREAKUP
The Nature and Extent of Damage to New Hampshire Highways from Frost Action - P. S. Otis
Frost Action and Spring Breakup in-Colorado - R. E. Livingston
Frost Action in Michigan - 0. L. Stokstad
Frost Damage to Roads in Great Britain - D. Croney
Load-Carrying Capacity of Roads Affected by Frost Action - T. B. Lawrence
Frost-Action Studies of Thirty Soils in New Jersey - F. C. Rogers and H. C. Nikola
Investigation of the Effect of Frost Action on Pavement Supporting Capacity - K. A. Linnell and J. F. Haley
REMEDIES AND TREATMENTS
Calcium Chloride Treatment of Frost Action - H. R. Smith
Controlling the Effects of Frost Action in Michigan - 0. L. Stokstad
Remedies and Treatments for the Frost Problem in Nebraska - 0. L. Lund -
- viii
268
275
278
- 281
284
287
295
326-
3301
334

Remedies and Treatments by the Connecticut Highway Department - Philip Keene 341
The Influence of Frost on Highway Foundations - E. I. Fuller 345
The Norwegian State Railways' Measures Against Frost Heaving - Sv. Skaven-Haug 348
Results of a Questionnaire on Remedies and Treatments - T. E. Shelburne 357
NEEDED RESEARCH PERTAINING TO FROST ACTION
Results of a Questionnaire on Needed Research - Frank Olmstead 373
Needed Research Pertaining to Frost Action and Related Phenomena - A. W. Iohnson 380
DISCUSSION ON THE FROST SYMPOSIUM
Miles S. Kersten, Associate Professor, University of Minnesota 384
ix

CLIMATE AND DISTRIBUTION OF SOIL
MAJOR SOIL PROFILES AND THEIR RELATIONSHIP WITH CLIMATE
A. C. Orvedal, J. Kubota, and Howard M. Smith, Soil Scientists, Division of. Soil Survey; Bureau of Plant Industry, Soils, and Agricultural Engineering; Agricultural Research Administration,
U. S. Department of Agriculture
When pedologists and engineers talk about soil, they have somewhat different concepts in mind. Soil to the engineer, as a rule, includes any and all unconsolidated earthy ma-terials, at the surface and at great depths as well. Soil to the pedologist, however, in-cludes only that surface portion of the earthy material that has been influenced by ped-ological soil-forming factors. These factors are climate, living organisms, relief (slope), age, and parent material. All work together in producing the soil. Climate and living organisms are dynamic factors. They act on parent material to form soil as pedologists know it. Climate and organisms must have time to exert their influence, hence the factor, age; and the significance of all these is conditioned by relief, or slope of the land.
The depth to which climate and organisms exert their combined effects on the earthy materials is the soil profile (Fig. 1). This soil profile may be just a few inches deep, or it may be many feet deep. It consists of two or more layers, technically called horizons, that usually differ from each other in several characteristics, e. g. , color, texture, struc-ture, pH, and content of organic matter. Below it, in most places, lies parent material - the geologically weathered earthy material (related to the profile) yet unaltered by the combined dynamic forces of climate and organisms. Below the parent material may be other strata of geologically weathered earthy material - totally unrelated to the soil above it - or solid beadrock.
We shall confine our remarks to the soil profile. In doing so, we realize that only part of the material that the engineer considers as soil is being discussed; but the pedological soil profile, after all, is the part that expresses relationships with climate.
If we consider for a moment the proposition that the soil at any given place is the function of a particular combination of the five factors of soil formation, we can readily see that there must be many, many kinds of soil profiles in the world. It is also evident that per-fect correlations between soil profiles and any one of these factors, including climate, does not occur. This explains why there is considerable overlap of climatic limits with-in which a general kind of soil profile is developed.
Climate affects soil formation through the moisture and energy it contributes to an environment (10). It influences genesis directly through temperature (including insola-tion) and precipitation; but perhaps more important is its indirect effects exerted through vegetation and microorganisms, which collectively form the second dynamic factor of soil formation.
Many broad relationships are recognized regarding the influence of different climatic conditions on soil characteristics (6, 10). For example, one important relationship is the increase, within limits, of soil organic matter with increase in precipitation and decrease in temperature. But important as these relationships are, even with a knowl-edge of all of them, we are unable to visualize or predict positively from these alone what soils will occur where. For in addition, we need to know what effects the other four factors of soil formation have had in combination. To learn this, many soil profiles in widely different environments had to be examined in situ.
Only after a great number of such examinations has it become possible for soil sci-entists to generalize with any degree of reliability regarding the kinds of soil profiles that occur under various sets of environmental conditions. By this procedure it has been learned that over broad areas of the world with like climates soil profiles tend to have certain similarities (manifest in the number, thickness, and sequence of soil horizons and in the physical and chemical properties) which reflect the prolonged in-fluence of climate. In general, these manifestations tend to override or show through

the many variations in the profiles caused by the influence of the other factors of the environment. Broad generalizations, therefore, can now be made about relationships between climate and soil profiles.
Major Soil Profiles
In order to get some points fixed in our mind about the relationship of soil profiles with climate, we have selected five for discussion, one from each of five broad groups 1/ of soils of the world associated with different climates. The classificational level may be likened to that of races of people; for like these, each is composed of individuals with a common heritage but differing wiçiely in lesser characteristics. The profiles may be likened to individuals selected as representative of each of the numan races, e. g., one to represent the white race, another the negroid.
We must also keep in mind that the pro- files we have selected are not the product of climate alone but the product of all five HORIZON
factors working together. The profiles are, however, ones in which the effects of climate
- f are considered to be strongly expressed and SOIL TO
to be representative of soils over extensive fli-. , B PEDOLOGISTS
portions of the world. i f:i SOIL PROFiLE
lilt!! LJf.
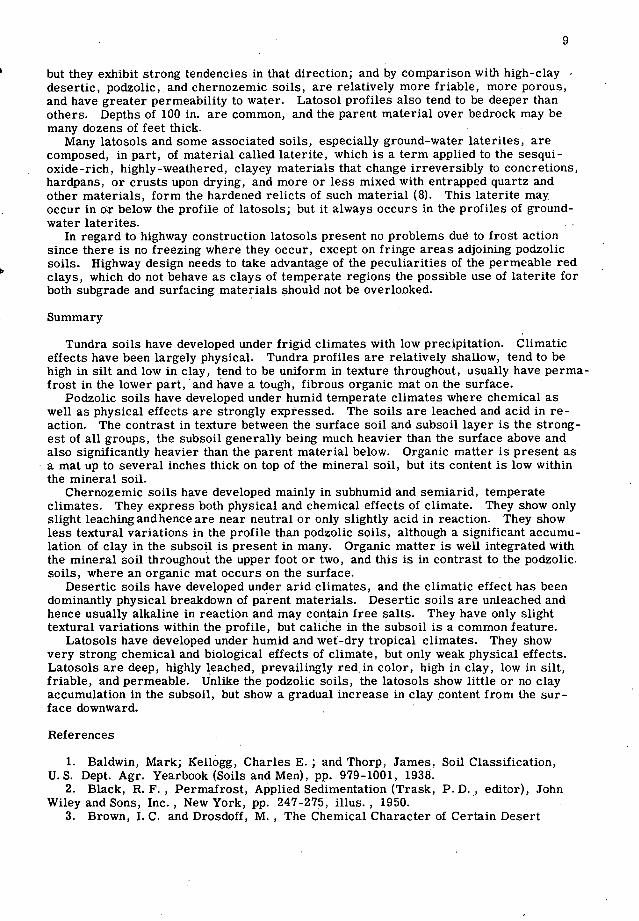
Tundra Soils - These have developed c SOIL TO
mainly under the frigid climate of the polar T
H-r ) ' ENGINEERS regions (Fig. 4) where precipitation is low. (Where precipitation is higher and more
L [ -- snow falls than melts, permanent snowflelds I ' - - '- -. 'UNCONSOLIDATED
occur.) A good example of frigid climate EARTHY
under whichTundra soils occur is that of the !J MATERIAL
Arctic coastal plain of northern Alaska. Here, average annual temperature is between •• . I 10 and.15 F., with monthly averages above 1 freezing only three months of the year /,/ ,/ BEDROCK
(highest 40 F.); and average annual pre- cipitation is about 5 in. (13). These soils Figure 1. Comparison of Pedologists' Versus occur elsewhere, however, under con- Engineers' Concept of Soil siderably higher precipitation and temper- atures, e. g., the Aleutian Islands; but there are no Tundra soils where. summer temper-atures are high or where the climate is mild enough to support more than a hardy vegetation consisting mainly of low-growing shrubs, mosses, and sedges.
Tundra soils, especially in the more severe frigid climate, are restricted mainly to smooth topography. On rough topography rubbly soils only a few inches deep over bed-rock are dominant. - Tundra soils occupy only part of the total area where they form the climactic type.
Permafrost is côn-imon in or immediately below Tundra soil profiles, but there are exceptions, such as on the Aleutian Islands, where permafrost is absent.
The following is condensed from a description of aTundra soil profile (near Bethel, western Alaska) by Kellogg and Nygard (9): 2/ -
/ With few exceptions, these grots correspond to the zonal suborders of the natural soils classification (1, 12).
See also Figure 2.

12
24
PERMAFROST
36
48
24
H LIME ZONE
36 ç
48 -,
TUNDRA PODZOLIC CHERNOZEMIC DESERTIC LATOSOL
Figure 2. Representative Profiles of Tundra, Podzolic, Chernozemic, Desertic, and Latosol Groups of Soils - Depth is expressed in inches.
A0 3/ 3-0 in. 4/ Tough, fibrous, peaty organic mat with many roots of sedges and grasses.
Al 0-4 in. Mucky silt loam, rich in humus and particles of peat. Very friable. Reddish brown. (Wet and cold on August 12.)
B-G 4-15 in. Very fine sandy loam. Compact in place, but easily friable when removed. Grayish-brown. (Wet and cold on August 12.) Below this depth, the soil was frozen.
Tundra soils express mainly physical effects of climate. The alternate freezing and thawing has produced physical breakdown of soil particles, but only to the grain-size of silt and very fine sand (2, 9). Hence, the clay content of Tundra soils is low.
Another effect of frigid climate is the formation of a peaty mat on top of the mineral soil. This forms in spite of the small annual additions provided by plants because the rate of decomposition is even slower than the rate of formation. This mat in many places attains a thickness between 6 and 12 in. (9), considerably thicker than in the profile just described. Most of the organic matter remains in a raw state. That which gives the upper part of the mineral soil a mucky character is probably due to grinding action resulting from freezing and thawing and not from decomposition.
Little or no leaching has occurred in Tundra soils nor do they appear to have consist-ent textural differences within the profile. Variations in texture may occur somewhat erratically, probably due to shifting of materials by frost action.
Associated with Tundra soils are several characteristic surface features. Ponds and lakes are innumerable. Mounds, several inches to a few feet high produce a hummocky microrelief. Soil polygons, soil blisters, and other phenomena resulting from frost action are common (2, 9).
Tundra soils present manifold problems to the highway engineer. They are prevail-ingly wet (low precipitation notwithstanding), and because of permafrost, adequate drain-age is difficult if not impossible to provide. Where permafrost is close to the surface, as is common in most areas of Tundra soils, frost action, including solifluction, assumes gigantic proportions (2). Any disturbance of the soil, even a very minor one, upsets the delicate thermal equilibrium established over the years, and the ultimate result is
J Eqlanation of horizon designations appear in many publications including the 1938 Yearbook of Agriculture (9) and the Soil Survey Manual (7).
The zero line for soil measurements is the top of the mineral soil. Hence, the designation 3 to 0 means that the organic mat above the mineral soil is 3 inches thick.
4
quite likely to spell failure for conventional highway structures.
Podzolic Soils - Moving from the frigid to the temperate regions, we get a corre-sponding gradation from the Tundra to the Podzolic group of soils. These are our forested soils covering extensive parts of the world (Fig. 4). In most places the winters are characterized by snow, and freezing of the ground; the summers are warm with a reasonably good distribution of rainfall. Average annual precipitation, however, varies from about 15 to 50 in. - enough to produce much leaching.
Coniferous or deciduous trees, or mixtures of the two, with varying amounts of shrubs and other low-growing plants form the native vegetation. Leaves and twigs
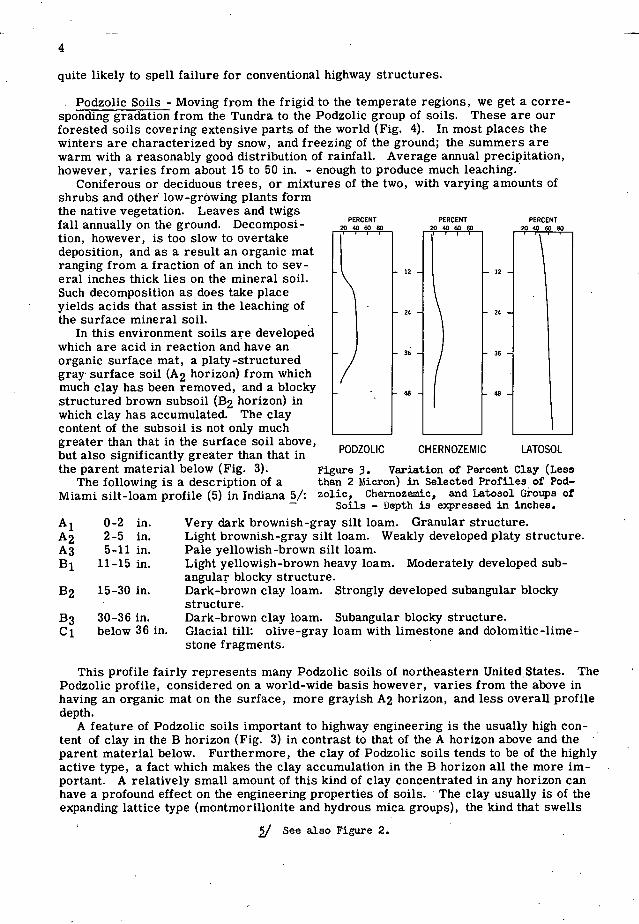
PERCENT fall annually on the ground. Decomposi- 40 PC0NT P
20 0RC 0NT
tion, however, is too slow to overtake deposition, and as a result an organic mat ranging from a fraction of an inch to sev-
12 12 eral inches thick lies on the mineral soil. Such decomposition as does take place yields acids that assist in the leaching of
24 24 the surface mineral soil.
In this environment soils are developed which are acid in reaction and have an
35 organic surface mat, a platy -structured gray surface soil (A2 horizon) from which much clay has been removed, and a blocky structured brown subsoil (B2 horizon) in which clay has accumulated. The clay content of the subsoil is not only much greater than that in the surface soil above, but also significantly greater than that in PODZOLIC CHERNOZEMIC LATOSOL
the parent material below (Fig. 3). Figure 3. Variation of Percent Clay (Less The following is a description of a than 2 Micron) in Selected Profiles of Pod-
Miami silt-loam profile (5) in Indiana 5/: zolic, Chernozemic, and Latosol Groups of O1J.5 - uepn is expresseu in irlcnee.
Al 0-2 in. Very dark brownish-gray silt loam. Granular structure. A2 2-5 in. Light brownish-gray silt loam. Weakly developed platy structure. A3 5-11 in. Pale yellowish-brown silt loam. B1 11-15 in. Light yellowish-brown heavy loam. Moderately developed sub-
angular blocky structure. B2 15-30 in. Dark-brown clay loam. Strongly developed subangular blocky
structure. B3 30-36 in. Dark-brown clay loam. Subangular blocky structure. Cl below 36 in. Glacial till: olive-gray loam with limestone and dolomitic-lime-
stone fragments.
This profile fairly represents many Podzolic soils of northeastern UnitedStates. The Podzolic profile, considered on a world-wide basis however, varies from the above in having an organic mat on the surface, more grayish A2 horizon, and less overall profile depth.
A feature of Podzolic soils important to highway engineering is the usually high con-tent of clay in the B horizon (Fig. 3) in contrast to that of the A horizon above and the parent material below. Furthermore, the clay of Podzolic soils tends to be of the highly active type, a fact which makes the clay accumulation in the B horizon all the more im-portant. A relatively small amount of this kind of clay concentrated in any horizon can have a profound effect on the engineering properties of soils. The clay usually is of the expanding lattice type (montmorillonite and hydrous mica groups), the kind that swells
/ See also Figure 2.

upon wetting and shrinks upon drying. It is highly plastic when wet and hard when dry and is highly subject to frost action. In humid regions where soils become wet many times during the year and usually freeze in winter this kind of clay, in high concentra-tions, poses difficult problems indeed for highway engineers.
Chernozemic Soils - These are the grassland soils of our Great Plains and similar areas elsewhere (Fig. 4). They occur in subhumid to semiarid temperate, continental type of climate which is characterized by hot summers and, in many places, cold win-ters. Precipitation at corresponding latitudes is lower for Chernozemic than for Pod-zolic soils; it ranges from approximately 12 to 35 inches annually, with much of it occurring in late spring and summer. Chernozemic soils, however, are much less leached than Podzolic soils. Generally some freezing occurs in winter.
These soils support grasses which return organic matter annually not only as leaves and stems above the soil but also as fibrous roots within the soil. Organic matter accumulation, as a result, is considerable and continues until equilibrium between addition and decomposition is attained. A 5- to 8-percent level of organic matter in the surface soil is representative where the soil remains undisturbed by cultivation.
Unlike the Podzolic soils previously described where the organic matter occurs mainly as a mat on the surface and is poorly integrated with the mineral soil, the or-ganic matter in the Chernozemic soils is well integrated with the mineral components to a depth of 1 to 3 feet. The high organic matter content, which gradually decreases with depth, gives the Chernozemic soils their black and dark brown colors.
A somewhat less noticeable but yet evident profile characteristic of many, though not all, Chernozemic soils is the presence of a subsoil somewhat heavier in texture than the surface layer above and the parent material below. Unlike the Podzolic soils, however, Chernozemic soils have no bleached or light-colored horizon of removal (A2). In or below the subsoil can be found frequently a layer of calcium carbonate deposited as concretions or surficial coating on the soil particles.
The following description obtained in Nebraska illustrates the major horizon features of a Chernozemic soil profile: 6/, 7/
All 0-1-1/2 in. Very dark grayish-brown silt loam. Mulch-like. Al2 1-1/2-12 in. Dark grayish-brown silt loam. Crumb or granular structure. 1521 12-15 in. Grayish-brown silt loam. B22 15-30 in. Grayish-brown silty-clay loam. Ill-defined prismatic structure. B23 30-40 in. Grayish-brown silty-clay loam. Ill-defined blocky structure. B24 40-50 in. Yellowish-brown silt loam. Lime carbonate deposits occur as
concretions, aggregates, or film-like surface coating. Cl below 50 in. Loess; yellowish-brown calcareous-silt loam.
This description and the clay distribution curve (Fig. 3) show textural differences in the soil profile. Although clay concentration in the B horizon is less than in Podzolic soils, it is high enough to warrant consideration by highway engineers. Since the clays of Chernozemic soils, like those of Podzolic soils, are likely to be of the active type, small variations in clay content may cause big variations in behavior, including frost action.
Chernozemic soils, as a rule, have a relatively well developed granular and prismatic structure. If worked while wet, however, the soil aggregates readily disintegrate, caus-ing the soil to become puddled, which is evidenced by slipperiness or stickiness, depend-ing upon the moisture content. If the soil is severely disturbed after drying, the aggre-gates become pulverized and the soil loose and powdery.
Condensed and slightly revised from the Division of Soil Survey, Bureau of Plant ing, U.S. Department of Agriculture.
standard description of the Holdredge series, Industry, Soils, and Agricultural igineer—
See also Figure 2.

/ I /
OAO&O XHtIMflC SOL "A,
.',
/ -
. /
Figure 4. Broad Schexratic Soil Map of the /orld
Variations from the representative soil profile presented occur particularly in the directions of the Desertic and Podzolic soils. The semiarid climactic members gen-erally have lighter colored surface horizons, have lime accumulations nearer the surface, and have only little or no clay accumulation in the subsoil. In contrast, the subhumid temperate members are deeper, may have greater clay accumulation in the B horizon, and are deeper to the zone of lime accumulation, which is also less conspicuous.
Included in this group are the dark-colored soils of the alternately wet-dry tropics (Fig. 4), which support a savanna type of vegetation. These soils are comparable in color, but differ markedly in behavior. They are dominantly heavy clays which crack deeply upon drying and puddle readily upon wetting.
Desertic Soils - In the desert regions of the world (Fig. 4), soils with strongly ex-pressed genetic profile horizons are less extant than soils with weakly expressed hori-zons, soils with unrelated ones, or soils with no horizon differentiation at all. This is because the processes of physical weathering under desert climates are dominant over chemical and biological ones. The unconsolidated earthy materials thus produced ordinarily do not attain much depth in situ over the parent rocks. More commonly, thE deeper accumulations of these have been transported from the place of origin by water or wind. These deposits are sorted or stratified with regard to particle size and their dry surface-layers are altered more or less constantly by fresh additions of materials or by shifting about in the wind. Wind action piles up vast seas of unstable sand dunes in many places.

It is only on relatively small portions of basins and plains, where deep earthy mate- rials have been left undisturbed sufficiently long, that pedogenic soil horizons are strongly expressed. An example of Desertic soil profile, such as one can expect to find in these places, is that of Fruita very-fine sandy loam, a soil that may be observed on the alluvial fan benches north of Fruita in Mesa County, Colorado. It is described as follows: 8/, 9/
All 0-1/4 in. Very-pale, brown, slightly-hard vesicular-crust of fine sandy loam.
Al2 1/4-2 in. Very-pale, brown, loose-granular fine sandy loam. A3, 2-8 in. Light-brown, very-fine., sandy loam with blocky structure. B21 8-15 in. Light-brown calcareous loam with coarse, blocky structure.
Very friable when moist. B22 15-20 in. Pale-brown calcareous loam, slight amount of segregated lime
in thin veins or small white mottlings. Slightly hard when dry and very friable when moist.
Bca 20-40 in. Pale-brown calcareous loam with 20 to 70 percent segregated lime in mottlings and 2- to 10-inch splotches; lime segregation decreases in lower part.
C l 40-72 in. Pale-brown calcareous loam; hard and massive when dry; friable when moist.
D below, 72 in. Bedrock at varying depths below 72 inches.
Salient features of this profile considered characteristic of desertic soils (3, 4, 11) are: (a) The thin surface crust (Aj1, above); in places this crust may be coveredor embedded with a dense concentration of small pebbles coated with a dark-colored "desert varnish" - a thin film composed of oxide of iron and manganese together with a slight amount of organic matter; the pebbly crust is often referred to as "desert pave-ment." (b) A slight increase in the clay content of the B21 and B22 horizons; the clay of desertic soils is, commonly of the expanding type and sticky when wet. (c) The seg-regated lime in the Bca horizon; in many desertic soils, hardpans or crusts of indurat-ed lime carbonate, gypsum, and other salts occur erratically in this horizon and perhaps even in lower horizons; these may be only a few inches or several feet thick but, in places, may consist of several thin layers separated by earthy material; lime crusts are frequently referred to as "caliche" in this county. (d) A very low content of or-_ ganic matter through the profile; ordinarily this amounts to less than 0. 5 percent, but,, it may be as much as 1. 0 percent or slightly more in the upper part of horizon A, in-dicated by the light colors in the example profile and substantiated by laboratory data.
The climatic factors of precipitation, temperature, and wind in the desert vary. greatly in extremes from those of more humid regions. Low precipitation (usually less than a 10-in, annual average) is responsible for greatly slowed chemical action and low biologic activity in the soil, including the slow and sparse vegetative growth. Thus only small amounts.of organic matter are produced, and little of this is decomposed and in-corporated with the, soil. Most of the organic matter left on the surface by plants is rapidly desiccated in. the dry, hot air and blown away by the wind.
Wind is a significant factor in the formation.of,the thin surface crust (All above)'in-eluding the pebbly "desert pavement." It packs the soil surface and sweeps it free of loose and movable, small soil particles. Pebbles too heavy to be blown away accumulate and form the "desert. pavement." . .
Movement of solubles and fines from the surface to lower soil horizons is slight in desertic soils because of low precipitation. The clay enrichment in the B21 and B22 is
/ Condensed and slightly revised from standard series description of Division of Soil Survey,, dureau of Plant Industry, Soils, and Agricultural' ngineeri,ng, U.S. iiepart—nent of Agriculture.
See also Figure 2.

thought to be largely a result of hydrolysis in place of the clay minerals rather than of removal from horizons above. Some of the lime concentration in the Bca horizon may have leached from overlying horizons; but another possible source is from the ground waters below. Charged ground water may rise by capillärity or hydrostatic pressure into the lower part of the soil where it evaporates and deposits the salts.
Probably the feature of these soils of greatest significance to the engineer is the presence of the hardpans or crusts of lime carbonate and other salts in the Bca horizon. Although they occur erratically in desertic soil profiles, they are of great usefulness for road and airfield surfacing.
Latosols 10/ - Latosols. form the dominant soils in the humid and subhumid tropical parts of the world (Fig. 4) where the average annual temperature is in the neighborhood of 70 to 80 F. with little or no seasonal variation and no freezing and the average annual rainfall ranges between 30 and 80 in. or even more. Their vegetative cover is either forest or savanna.
Latosols reflect profound effects of climate as expressed through intense chemical and biological activity. Results of physical activity are minor, almost insignificant, when compared to those of chemical and biological. The change in chemical composi-tion during the formation of latosols has been so great that their present composition shows practically no similarity to the rocks from which the parent material originated. Latosols have low silica-sesquioxide (oxides of aluminum and iron) ratios in the clay fraction, have low activities of the clay, relatively low base-exchange capacities, a relatively-high degree of aggregate stability, and a red color or reddish shades of, other
colors (8). A profile description by Kellogg (8) of an earthy rod latosol (one of several kinds of
latosols) in Belgian Congo, Africa, where average annual rainfall is about 56 in. follows: !/
Al 0-4-1/2 in. Dark, reddish-brown, granular, clay loam to fine sandy clay, held firmly by grass roots. (Nearly black when wet.)
A30 4-1/2-10 in. Dark, reddish-brown, friable, granular-clay loam to clay, held by grass roots.
A31 10-21 in. Dark, red-clay loam to clay, easily friable to fine granular. A32 2 1-32 in. Like the above but only slightly lighter in color. B2 32-42 in. Red, friable-clay loam to clay. C 42-80 in. Red, very softly granular, mellow clay loam to clay.
Analyses of samples from this profile show a gradual increase in clay from 45 per-cent at the surface to 60 percent in the lowest layer (Fig. 3). Silt content is between 9 and 10 percent throughout, and the sand content decreases with depth.
High-clay and low-silt content are characteristic of many latosols Sand content of these soils varies, apparently depending upon the relative amount of quartz in the parent material. Base-exchange capacity is low in comparison with soils of corresponding clay contents in temperate regions and isan indication of low activity of the clay. Mineral-ogically, latosols are high in kaolinite and oxides of iron and aluminum.
Extreme friability, granular structure, and high porosity are outstanding physical characteristics of earthy red latosols; These soils, in spite of the fact that they may consist of 45 to 60 percent or more of clay, have permeability to water approaching that of sand. The structure is stable and persists even alter heavy rains, but it prob-ably will be destroyed, at least temporarily, by working with heavy machinery when wet. -
All latosols of the tropics are not as friable and porous as the profile we described,
/ Soils formerly called lateritic, red lateritic, red barns, etc., are now termed latosols (8).
See also ?igure 2.
but they exhibit strong tendencies in that direction; and by comparison with high-clay desertic, podzolic,. and chernozemic soils, are relatively more friable, more porous, and have greater permeability to water. Latosol profiles also tend to be deeper than others. Depths of 100 in. are common, and the parent material over bedrock may be many dozens of feet thick.
Many latosols and some associated soils, especially ground-water laterites, are composed, in part, of material called laterite, which is a term applied to the sesqui-oxide-rich, highly-weathered, clayey materials that change irreversibly to concretions, hardpans, or crusts upon drying, and more or less mixed with entrapped quartz and other materials, form the hardened relicts of such material (8). This laterite may occur in or below the profile of latosols; but it always occurs in the profiles of ground-water laterites.
In regard to highway construction latosols present no problems due to frost action since there is no freezing where they occur, except on fringe areas adjoining podzolic soils. Highway design needs to take advantage of the peculiarities of the permeable red clays, which do not behave as clays of temperate regions the possible use of laterite for both subgrade and surfacing materials should not be overlooked.
Summary
Tundra soils have developed under frigid climates with low precipitation. Climatic effects have been largely physical. Tundra profiles are relatively shallow, tend to be high in silt and low in clay, tend to be uniform in texture throughout, usually have perma-frost in the lower part, and have a tough, fibrous organic mat on the surface.
Pod2olic soils have developed under humid temperate climates where chemical as well as physical effects are strongly expressed. The soils are leached and acid in re-action. The contrast in texture between the surface soil and subsoil layer is the strong-est of all groups, the subsoil generally being much heavier than the surface above and also significantly heavier than the parent material below. Organic matter is present as a mat up to several inches thick on top of the mineral soil, but its content is low within the mineral soil.
Chernozemic soils have developed mainly in subhumid and semiarid, temperate climates. They express both physical and chemical effects of climate. They show only slight leaching and hence are near neutral or only slightly acid in reaction. They show less textural variations in the profile than podzolic soils, although a significant accumu-lation of clay in the subsoil is present in many. Organic matter is well integrated with the mineral soil throughout the upper foot or two, and this is in contrast to the podzolic. soils, where an organic mat occurs on the surface.
Desertic soils have developed under arid climates, and the climatic effect has been dominantly physical breakdown of parent materials. Desertic soils are unleached and hence usually alkaline in reaction and may contain free salts. They have only slight textural variations within the profile, but caliche in the subsoil is a common feature.
Latosols have developed under humid and wet-dry tropical climates. They show very strong chemical and biological effects of climate, but only weak physical effects. Latosols are deep, highly leached, prevailingly red, in color, high in clay, low in silt, friable, and permeable. Unlike the podzolic soils, the latosols show little or no clay accumulation in the subsoil, but show a gradual increase in clay content from the sur-face downward.
References
Baldwin, Mark; Kellogg, Charles E.; and Thorp, James, Soil Classification, U. S. Dept. Agr. Yearbook (Soils and Men), pp. 979-1001, 1938.
Black, R. F., Permafrost, Applied Sedimentation (Trask, P. D., editor), John Wiley and Sons, Inc. , New York, pp. 247-275, illus. , 1950.
Brown, I. C. and Drosdoff, M., The Chemical Character of Certain Desert

10
Soils in Relation to Their Genesis and Morphology, Soil Sci. Soc. Amer. Proc. , Vol. 3, pp. 269-273, illus. , 1938.
Brown, I. C. and Drosdoff, M., Chemical and Physical Properties of Soils and Their Colloids Developed from Granitic Materials in the Mojave Desert, Jour. Agr. Research, Vol. 61, No. 5, pp. 335-352, illus. , 1940.
Brown, I. C. and Thorp, James, Morphology and Composition of Some Soils of the Miami Family and the Miami Catena, U. S. Dept. Agr. Tech. Bull. 834, 55 pp., 1942.
Jenny, Hans, Factors of Soil Formation, Mc-Graw-Hill Book Co., Inc., New York, 281 pp. , illus., 1941.
Kellogg, Charles E., Soil Survey Manual, U. S. Dept. Agr. Misc. Pub. 274, 1936 pp., illus. , 1937.
Kellogg, Charles E. and Davol, Fidelia D., An Exploratory Study of Soil Groups in the Belgian Congo, Inst. Nat. L'Etude Agron, Congo Beige Pub. (INEAC), Sci. ser. 46 2 73 pp., illus. , maps, 1949.
Kellogg, Charles E. and Nygard, Iver J. (in press), Exploratory Study of the Principal Soil Groups of Alaska, U. S. Dept. Agr. Monograph 7, illus.
Muckenhirn, R. J.; Whiteside, E. P.; Templin, E. H.; Chandler, R. F., Jr.; and Alexander, L. T. , Soil Classification and the Genetic Factors of Soil Formation, Soil Sci. , Vol. 67, No. 2, pp. 93-106, 1949.
Nikiforoff, Constantin C., General Trends of the Desert Type of Soil Formation, Soil Sci. , Vol. 43, No. 2, pp. 105-131, illus. , 1937.
Thorp, James and Smith, Guy D., Higher Categories of Soil Classification: Order, Suborder, and Great Soil Groups, Soil Sci., Vol. 67, No. 2, pp. 117-126, 1949.
United States Weather Bureau, Climatic Atlas for Alaska, Weather Information Branch, Headquarters Army Air Forces, Rept 444, 229 pp. , illus, 1943.
CLIMATIC ASPECTS OF FROST HEAVE AND RELATED GROUND FROST PHENOMENA
Dr. Paul A. Siple, Military Geographer and Chief, Environmental Research Section, Department of the Army
Synopsis
Frost heave is a freezing-ground phenomenon created by the compound-ing and sequencial influences of several climatic and other environmental factors causing ground heat loss. The most important of these factors are: radiation, convection, conduction, evaporation, vegetation and snow cover, soil type, and accumulation of soil water in the "vernal active zone." (Spring freeze-thaw zone above winter frozen sub-soil.)
By the use of climatic and geographic data, already available, it is pos-sible to map the distribution of frost-heave elements and to predict the tim-ing and severity of heave forces for areas through which highways are pro-jected.
An index using the percentage of the total annual hourly frequency of temperatures below 30 F. , the temperature difference between the freez-ing point and the temperature of the minimum 1 percent frequency level, and an adjustment for surface insulation cover appears to provide a means of predicting probable average maximum depths of winter frost penetration. Similar indices may be possible for the determination of probable time and force of heave by consideration of soil type, precipitation, and accumulation of soil moisture to depths favoring frost heave.
An understanding of the climatic mechanism of frost heave makes it pos-sible to establish positive control measures to protect highways and other structures. Such control measures include drainage and insulation tech-niques heretofore commonly neglected. Highways are generally good

11
thermal conductors, especially when cleared of insulating snow cover; hence frost penetration beneath them will be abnormally deep as compared to adjoining surfaces. Solar heat absorbed by highways in daytime and intensive outward radiation at night intensifies the freeze-thaw action of the vernal active zone. Sub-highway insulation would lessen the depth of winter freeze as well as lessen the diurnal activity in the vernal active zone. Frost heave results from the freezing expansion of excessive water accumulating in the zone above the upper horizon of the winter frozen ground. Highways form dams and troughs beneath them in respect to con-tours of up1)er and lower surfaces of the frozen sub-soil. Drainage may be controlled either by lateral blocking on up-hill sides of slopes or by means of by-passes below the frost line. In flat country vertical sumps to absorptive soils below the level of winter frost penetration should e-liminate soil water accumulation and consequent frost heave below pave-ments.
Radiation
The lowering of incoming solar energy due to seasonal and latitudinal variations is evident. During long, winter nights more radiated heat escapes than can get away on shorter, summer nights. And conversely, solar heat builds up faster in the longer daytime in summer than it can lose by radiation during the short nights. Of course, the sun shines through a greater thickness of atmosphere in winter than in summer, due to differences in elevation of the sun. On a very cold winter night in a locality like Minneapolis, Minnesota, average net loss of radiation is about .07 cal. per sq. cm. per mm. This is sufficient in itself to account for freezing about 3 in. of surface water.
Many factors influence the exact rate of heat loss. Emissivity of the surface, bare, dark ground and rocks will radiate more heat, for example, than snow. Warmer sur-faces will lose more heat in a given time than colder ones. Cloud cover reradiates heat back so that surface temperatures will not fall as rapidly as under clear conditions, be-cause the clouds are warmer than the clear sky. High humidity in the air inhibits the rate of heat loss. Dew or frost condensation of the surface radiating heat gives up its heat of condensation and fusion tending to cancel off the heat being removed from the surface itself. Air motion tends to mix the air at the surface and thereby cancel some of the extreme effects of radiation.
Frost heave occurs most often in spring after the advent of a cold wave, or after a cold, calm night of radiant cooling. The spring occurrence is due to a moisture build up through fall and winter and to the fact that frost penetration has reached its maxi-mum depth. In the spring the solar heat balance is rapidly shifting to the positive or incoming side. By about mid-March, heat received is equivalent to mid-September solar heat, which is still recognized as respectably warm. The frost ground thaws on the surface during the day and ref reezes at night by the combined action of heat radia-tion from above and absorption from below. The freeze-thaw action tends to give rise to accumulation of water and ice bands in the soil above the impermeable layers of frozen soil that do not temporarily thaw by the spring freeze-thaw action, and in due time give rise to frost heave of serious proportions.
Conduction and Convection
Loss of heat from the ground by means of conduction is strictly the flow of heat by direct contact of one surface with another. However, from a practical standpoint, it is difficult to separate the intimate relationship of outgoing radiation from that of conduc-tion into the air. The incoming radiation supplying heat to the surface tends to blend itself with the functions of conduction back into the air or down into the ground. The ground itself is a storehouse for heat, and at a level some 30 ft. or so below the sur-face in normal ground, temperature tends to become isothermal, i. e. , it maintains a constant temperature which is, for all practical purposes, the same as the mean or

12
average annual temperature for the area. This value is usually provided by the Weather Bureau statistics and is frequent-ly calculated as the mean between the av-erage temperature of the warmest months and the average temperature of the coldest month or the simple average of all the months. It also closely approximates the mean of the highest and lowest tempera-tures. In some areas of the country where winter cold extends well into fall and spring, the ground temperature is likely to be lower than would be indicated by the average of extreme temperatures, and the reverse is true for areas with ex- Figure 1. Approximate Distribution of tremely long summers. Deep Ground Isothermal Temperatures Based
When winter sets in, ground tempera- on Mean Annual Temperatures Degrees Fahr- tures have built up to. their maximum. enheit. At levels 15 to 30 ft. below the The surface heat of the ground is rapidly surface, temperatures as shown remain
reduced, however, due to the insulating constant and relatively unaffected byvariations in atmospheric temperatures
effect of the ground itself. The remnant throughout the year. At levels above the temperatures of summer still remain isothermal zone stored heat from the pre- apparent in the ground to the extent that vious summer tends to inhibit the cooling at certain intermediate levels between the and freezing of the ground. surface and the deep isothermal layer, ground temperatures are higher in winter than in summer due to this lag effect. This produces an apparent temperature anomaly. The thermal conduction factor of the soil determines the rate at which the heat will be dissipated from the ground. In a soil of high insulating value or low thermal conductivity the surface will cool rapidly by radia-tion and conduction with a sharp rise in temperature a few feet below the surface in early winter. The frost line at the surface gradually penetrates this soil as the heat is conducted upward. In high conductive materials where the conduction of heat is more rapid, the thermal gradient is less steep and frost penetration consequently is more rapid. Thermal capacity of materials also plays an important part as to the total amount of heat stored in the summertime and gradually given up in winter.
It is clear from the foregoing, that throughout the early winter a supply of heat is ----j- being constantly conducted upward towards
NA the surface, and therefore, the surface layers are being warmed both from the top and the bottom on sunny days.
Changes of temperature in winter are principally caused by the migration of great air masses varying widely in temperature. The coldest air masses arrive in the United States from the northwest and are frequently accompanied by clear weather, admitting solar heat to the ground surface in the day-time and creating conditions for excessive radiant cooling throughout the longer winter nights (which is in excess as noted under
Figtue 2. Estimated Approximate Ground radiation and therefore negative in its net Temperatures Degrees Fahrenheit Six to heat exchange). Air masses aided by radi- Eight Feet Deep at Start of Fall Cooling ation determine the temperature of the air Period. At this level, well above the isothermal zone, temperatures which rep- figuring in conduction heat losses from the resent stored heat from the previous sum- ground. These air masses frequently have mer tend to inhibit the cooling and freez- extremely low temperatures, well below
ing of the ground. zero in the northern United States, but
13
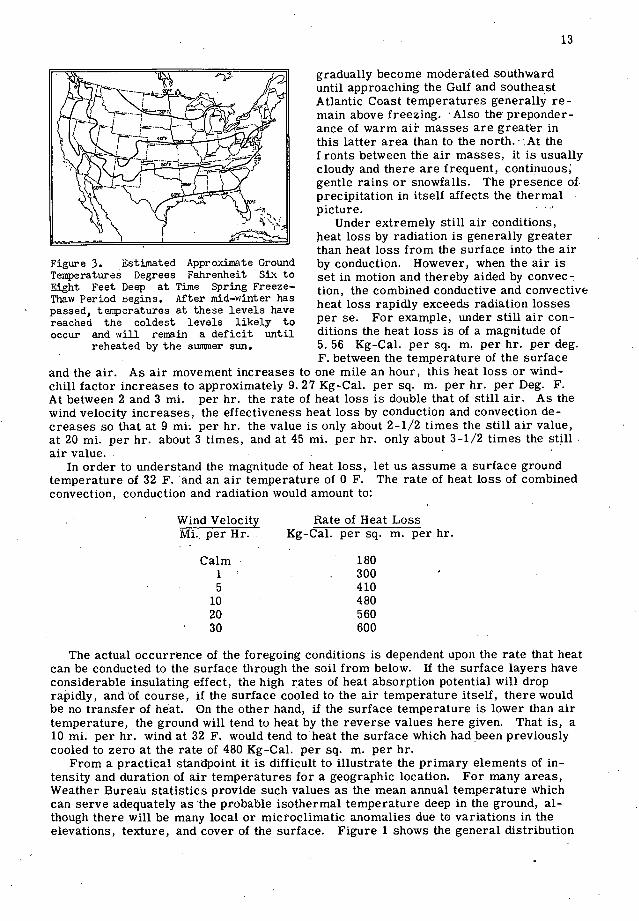
gradually become moderated southward until approaching the Gulf and southeast Atlantic Coast temperatures generally re-main above freezing. Also the preponder-ance of warm aiF masses are greater in this latter area than to the north. At the
- -
L_••J
I ronts between the air masses, it is usually cloudy and there are frequent, continuous, gentle rains or snowfalls. The presence precipitation in itself affects the thermal of. picture.
"-'.. Under extremely still air conditions, heat loss by radiation is generally greater than heat loss from the surface into the air
Figure 3. Estimated Approximate Ground by conduction. However, when the air is Temperatures Degrees Fahrenheit SIX to set in motion and thereby aided by convec- Eight Feet Deep at Time Spring Freeze-. tion, the combined conductive and convective Thaw Period negins. After mid—winter has heat loss rapidily exceeds radiation losses passed, temperatures at these levels have reached the coldest levels likely to per se. For example, under still air con-
occur and will remain a deficit until ditions the heat loss is of a magnitude of reheated by the suiiuner sun. 5. 56 Kg-Cal. per sq. m. per hr. per deg.
F. between the temperature of the surface and the air. As air movement increases to one mile an hour, this heat loss or wind-chill factor increases to approximately 9. 27 Kg-Cal. per sq. m. per hr. per Deg. F. At between 2 and 3 mi. per hr. the rate of heat loss is double that of still air. As the wind velocity increases, the effectiveness heat loss by conduction and convection de-creases so that at 9 mh per hr. the value is only about 2-1/2 times the still air value, at 20 mi. per hr. about 3 times, and at 45 mi. per hr. only about 3-1/2 times the still air value.
In order to understand the magnitude of heat loss, let us assume a surface ground temperature of 32 F. and an air temperature of 0 F. The rate of heat loss of combined convection, conduction and radiation would amount to:
Wind Velocity Rate of Heat Loss Mi.. per Hr. Kg-Cal. per sq. m. per hr.
Calm 180 1 300 5 410 10 480 20 560 30 600
The actual occurrence of the foregoing conditions is dependent upon the rate that heat can be conducted to the surface through the soil from below. If the surface layers have considerable insulating effect, the high rates of heat absorption potential will drop rapidly, and of course, if the surface cooled to the air temperature itself, there would be no transfer of heat. On the other hand, if the surface temperature is lower than air temperature, the ground will tend to heat by the reverse values here given. That is, a 10 mi. per hr. wind at 32 F. would tend to'heat the surface which had been previously cooled to zero at the rate of 480 Kg-Cal. per sq. m. per hr.
From a practical standpoint it is difficult to illustrate the primary elements of in-tensity and duration of air temperatures for a geographic location. For many areas, Weather Bureau statistics provide such values as the mean annual temperature which can serve adequately as the probable isothermal temperature deep in the ground, al-though there will be many local or microclimatic anomalies due to variations in the elevations, texture, and cover of the surface. Figure 1 shows the general distribution

14
of this average annual or deep ground tem- perature value over the United States.
The Weather Bureau statistics covering mean monthly temperatures and mean monthly extremes and absolute extremes are available but their direct application to our problem has many deficiencies. The maps show a more important aspect based on this data as to the probable tem- perature of the ground at 6 to 8 ft., which is taken as the average between the annual mean temperature or deep ground con- stant temperature and the average tem- perature of the month.
At this level, well above the isothermal Figure 4. Approximate Average Depth of zone, temperatures which represent stored Frost Penetration in Feet and Inches. heat from the previous summer tend to (Modified after Climate and Man, Agricul— inhibit the cooling and freezing of the ture Year Book 1941, p. 747). The values
ground (Fig. 2). shown here are reasonable estimates of the depth to which frost is likely to
After mid-winter has passed tempera- penetrate. Local conditions, however, tures at these levels have reached the such as valleys, hills, vegetation cover, coldest levels likely to occur and will re- ground mantle, solar and wind exposure, main a deficit until reheated by the sum- etc., create wide variations. mer sun (Fig. 3).
Figure 4 has data collected unofficially and published in the Agricultural Year Book, 1941, entitled "Climate and the Man," which shows the average depth of frost penetra-tion. It can be seen that there is a great relationship between the 6-to 8-ft. level tem-peratures and frost penetration.
From recent statistical work on temperature frequencies, it has been possible to produce two interesting additional maps that further supply important elements of our frost heave problem. This frequency data is based upon the number of hours in the course of a year that temperature occurs at each degree. It has been observed that the probable and more practical extremes can be more safely calculated by establishing the 1 percent value. That is, Figure 5 shows the minimum temperature recommended for
design wherein only about 88 hr. on an average year will have temperatures lower than the minimum here shown. In some areas absolute extreme temperatures may run to more than 20 deg. lower than this value but will be of such short duration that deep effects will be unlikely. This map can
WF
In Figure 6 is another treatment of the frequency data which shows the duration of
therefore be considered as illustrative of intensity of cold.
cold. Here, for convenience, I have used the occurence of temperature of below +30 F., instead of 32 F. Although the data for
Figure 5. Intensity of Winter Cold (Mm- both these maps was based upon the rela- imum Design Tinperatures Degrees Fahren- t ively few stations available, it at least heit). Not more than about 1 percent hr. gives a clear indication of the period of of the year have temperatures lower than time over which frost actions are probable. shown here, althoujh absolute extremes Here the duration is expressed in percent have been 20 F. or lower. The intensity of cold taken together with the duration of hours of the year and cannot be taken as of sub-freezing temperatures form princi- concurrent but rather as values spread pal factors in estimating the depth of over periods of time. It would be valuable
frost penetration, to study the frequency of temperatures for

15
more minute relations to the frost heave problem and would give us encouragement that observations of intensity and duration, correlated with depth of frost penetration, can eventually provide a clear concept of the physical phenomena involved.
Figure 7 shows a graph plot of data for about 40 stations using statistics from Fig-ures 4, 5, and 6. There appears to be a direct relation between the plot of intensity and duration of winter temperatures and that of the depth of frost penetration.
Moisture Problems Figure 6. Duration of the Ereezing Peri- od. Percent Hours of the Year that the Frost heave is dependent upon the pres- Temperature Falls below 30 F. Because of ence of water in substantial accumulation the character of data available for this
near the surface. The study of frost heave map it proved more convenient to use 30 instead of 32 F., and although the per- has progressed to the point that we are fully centages would be higher at 32 than shown aware that moisture accumulation to create here, they would be of the same relative serious frost heave damage occurs generally
distribution, where there is an appreciable amount of free water present. There are four principal
ways by which this water can accumulate. The first is by transportation, that is, where the land is on a slope, water may flow under gravity or pressure from a higher eleva-tion or across the surface or through the sub-soil. This water may bring with it varying temperatures from that of the ground.
The second method of water accumulation is by direct precipitation or in the form of rain or melted snow. Where the land is on a slope, some of this water may drain off over the surface or through the sub-soil but in flat areas, it is likely to remain on the surface and in the sub-soil. Evaporation during the winter period is extremely low, and through gravity the water will tend to sink into the soil until it meets an obstruction. Where the ground has been frozen, higher temperatures of spring and solar heat may thaw the top soil, thus permitting the water to penetrate to the upper horizon of the sub-frozen soil. Here it will be blocked by the frozen ground which has become impenetra-ble. The soil becomes saturated and, due to periodic if not diurnal freezing, begins to work the soil and deform it if there is space for a considerable amount of water. This gives rise to the dangerous lenses which, upon freezing, are known to contribute heavily to the actual frost heave.
The third method of water accumulation has been discussed by Benkelman and Olmstead, and others, as a phenomenon related to capillary action of water brought up from below.
It is the theory of the writer, however, that the full mechanism of water brought up from below is not to be understood only by capillary action. Benkelman and
20
Olmstead, 1932, demonstrated that no ice bands tended to form when their sam- ples were frozen at a constant rate. Band- ing did occur when the temperature was vripd Thit is the 1ent the surface
Ch?Iflt©.,.S.G(
=N " .. ......
- -- - ...---.,-.. J - 50 40 30 to 0 .10 .20
temperature constant and heated the bot- torn of their sample tubes to tempera- Figure 7. Frost Penetration as Compared tures a little above freezing. to Plotting of Duration and Intensity of
Apparently these workers overlooked Winter Temperatures.
16
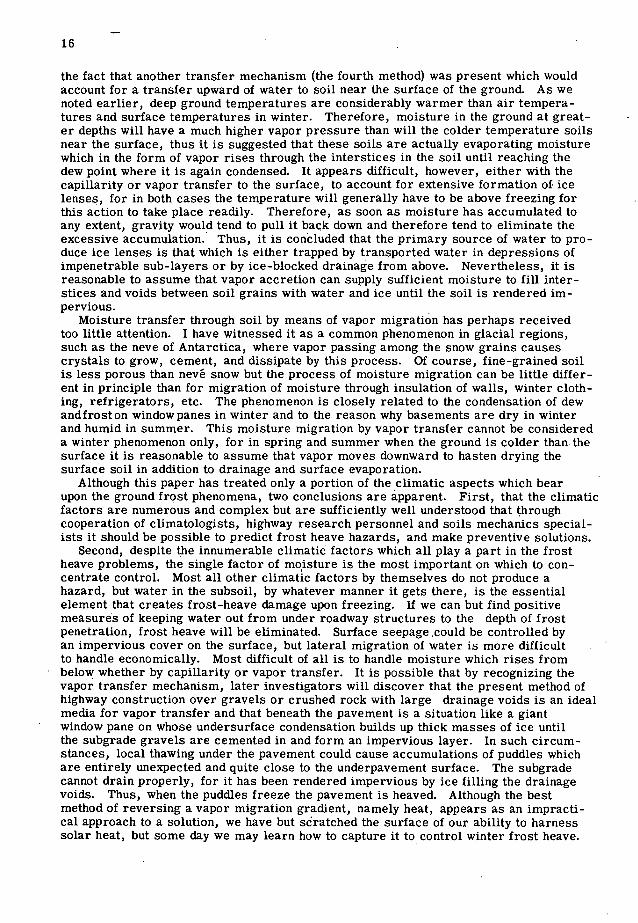
the fact that another transfer mechanism (the fourth method) was present which would account for a transfer upward of water to soil near the surface of the ground. As we noted earlier, deep ground temperatures are considerably warmer than air tempera-tures and surface temperatures in winter. Therefore, moisture in the ground at great-er depths will have a much higher vapor pressure than will the colder temperature soils near the surface, thus it is suggested that these soils are actually evaporating moisture which in the form of vapor rises through the interstices in the soil until reaching the dew point where it is again condensed. It appears difficult, however, either with the capillarity or vapor transfer to the surface, to account for extensive formation of ice lenses, for in both cases the temperature will generally have to be above freezing for this action to take place readily. Therefore, as soon as moisture has accumulated to any extent, gravity would tend to pull it back down and therefore tend to eliminate the excessive accumulation. Thus, it is concluded that the primary source of water to pro-duce ice lenses is that which is either trapped by transported water in depressions of impenetrable sub-layers or by ice-blocked drainage from above. Nevertheless, it is reasonable to assume that vapor accretion can supply sufficient moisture to fill inter-stices and voids between soil grains with water and ice until the soil is rendered im-pervious.
Moisture transfer through soil by means of vapor migration has perhaps received too little attention. I have witnessed it as a common phenomenon in glacial regions, such as the neve of Antarctica, where vapor passing among the snow grains causes crystals to grow, cement, and dissipate by this process. Of course, fine-grained soil is less porous than nevé snow but the process of moisture migration can be little differ-ent in principle than for migration of moisture through insulation of walls, winter cloth-ing, refrigerators, etc. The phenomenon is closely related to the condensation of dew andfroston windowpanes in winter and to the reason why basements are dry in winter and humid in summer. This moisture migration by vapor transfer cannot be considered a winter phenomenon only, for in spring and summer when the ground is colder than the surface it is reasonable to assume that vapor moves downward to hasten drying the surface soil in addition to drainage and surface evaporation.
Although this paper has treated only a portion of the climatic aspects which bear upon the ground frost phenomena, two conclusions are apparent. First, that the climatic factors are numerous and complex but are sufficiently well understood that through cooperation of climatologists, highway research personnel and soils mechanics special-ists it should be possible to predict frost heave hazards, and make preventive solutions.
Second, despite the innumerable climatic factors which all play a part in the frost heave problems, the single factor of moisture is the most important on which to con-centrate control. Most all other climatic factors by themselves do not produce a hazard, but water in the subsoil, by whatever manner it gets there, is the essential element that creates frost-heave damage upon freezing. If we can but find positive measures of keeping water out from under roadway structures to the depth of frost penetration, frost heave will be eliminated. Surface seepage could be controlled by an impervious cover on the surface, but lateral migration of water is more difficult to handle economically. Most difficult of all is to handle moisture which rises from below whether by capillarity or vapor transfer. It is possible that by recognizing the vapor transfer mechanism, later investigators will discover that the present method of highway construction over gravels or crushed rock with large drainage voids is an ideal media for vapor transfer and that beneath the pavement is a situation like a giant window pane on whose undersurface condensation builds up thick masses of ice until the subgrade gravels are cemented in and form an impervious layer. In such circum-stances, local thawing under the pavement could cause accumulations of puddles which are entirely unexpected and quite close to the underpavement surface. The subgrade cannot drain properly, for it has been rendered impervious by ice filling the drainage voids. Thus, when the puddies freeze the pavement is heaved. Although the best method of reversing a vapor migration gradient, namely heat, appears as an impracti-cal approach to a solution, we have but sratched the surface of our ability to harness solar heat, but some thy we may learn how to capture it to control winter frost heave.

17
SOIL TEMPERATURE AND
THERMAL PROPERTIES OF SOILS
SOIL TEMPERATURES, A REVIEW OF PUBLISHED RECORDS
Carl B. Crawford, Junior Research Officer Division of Building Research, National Research Council of Canada
Frost action in soil results from a critical change in temperature at some depth below the surface. Any study of frost action therefore must be closely linked with a detailed study of the variation of temperature in soil at increasing depth below the surface and throughout the cycle of the year. This basic characteristic of soil in place might appear at first sight to be a relatively simple matter. Due, however, to the many variable fac-tors involved, not the least of which is the character of the soil in question, the problem is actually most complex.
The Division of Building Research of the National Research Council of Canada has em-barked upon a long-term study of soil temperature variations in view of their economic importance in many fields of engineering. An earlier paper by Legget and Peckover (56) reviews some of the detailed problems involved in the study of soil temperature varia-tions and outlines work which is at present in progress in Canada. The present paper marks the completion of the initital stage of this project and is now contributed, since it presents in review a brief record of previous considerations of many of the factors dealt with in this symposium.
The usual research project of this kind starts with an extensive review of the literature in order to establish what is already known and proven. On this basis, an experimental program is carefully built. up, avoiding the pitfalls exposed by previous investigators and steering the shortest path to the goal which has been set. In the present instance, the customary procedure was at first reversed, and some field experiments were started before past work was reviewe.d in detail. This was necessary because the time cycle of the experiments involved is one full year, and a delay in commencing field work would have meant much loss of time. It is therefore hoped that in addition to providing the necessary background for Canadian experimental work this paper may be a guide to the fund of information on soil temperatures which is available in scientific literature.
This paper contains references only to publications in English. Indirect references are made to some of the available papers on the subject published in Germany and Scandinavia, but time did not permit these being studied. About 200 papers in Englinh appear to exist, which deal with the subject to some degree. About 80 of the more im-portant of these papers were carefully read, studied, and abstracted. Fifty-seven of the papers were found to be of direct interest, and the following record is essetnially a summary of the information and records which they contain. The bibliography of A. W. Johnson of the Highway Research Board was of great assistance in the lông quest for relevant papers.
In each section of the paper, an effort has been made to give an accurate review of the more important aspects of the work of various investigators. These reviews have been put in chronological order under each subject for the sake of uniformity. It might be expected that this procedure would bring into prominence the studies of some early scientist who had managed to look into the problem thoroughly enough to discuss many of the factors involved. This is indeed the case, and it will be found that almost every section of the paper starts with a review of the work of Dr. G. J. Bouyoucos of Michigan State College, who from 1913-1922 stated most of the problems encountered in the study of soil temperatures, and analyzed many of them. Most of the important references since that time refer to his pioneer work, which is still an essential starting point for current studies.
18
Historical Note NEM
It is not surorisin that scientists of the TEMPOR2TWC 005 V04090 PTH9 890-42)AT DFFO0T
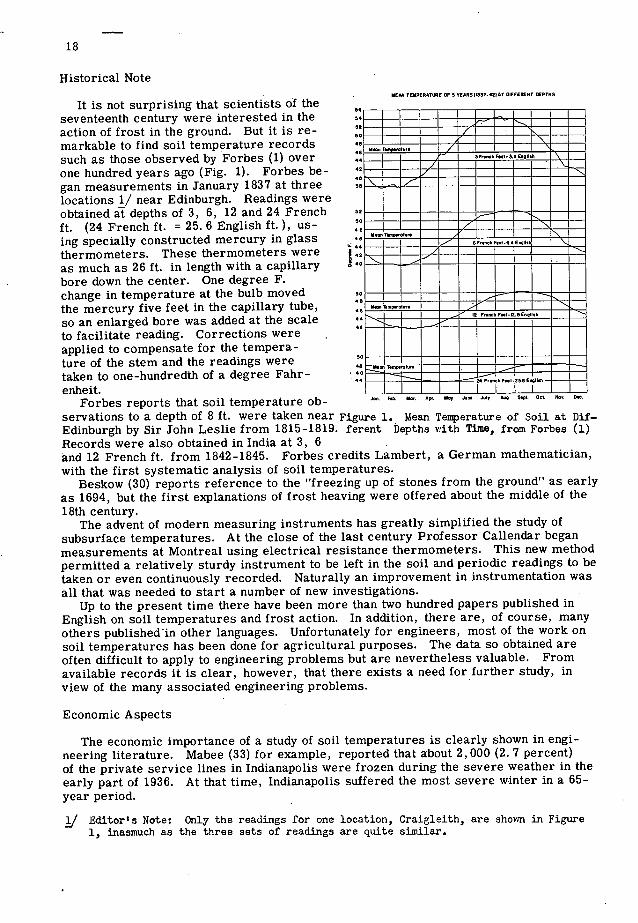
seventeenth century were interested in the action of frost in the ground. But it is re- markable to find soil temperature records such as those observed by Forbes (1) over one hundred years ago (Fig. 1). Forbes be- gan measurements in January 1837 at three locations 1/ near Edinburgh. Readings were obtained at depths of 3, 6, 12 and 24 French 52
ft. (24 French ft. = 25. 6 English ft.), us- ing specially constructed mercury in glass 46
thermometers. These thermometers were as much as 26 ft. in length with a capillary 40
bore down the center. One degree F. change in temperature at the bulb moved 50
48
the mercury five feet in the capillary tube, 40
so an enlarged bore was added at the scale 44
42
to facilitate reading. Corrections were applied to compensate for the tempera- ture of the stem and the readings were taken to one-hundredth of a degree Fahr- 44
enheit.
--------- ---------'-- kF iuluuuuuuiiu -----r----- .--------- liiIIIIuiIII ------—— uuiuuuIuuuII —-- -..--
Forbes reports that soil temperature ob- "' 900.
servations to a depth of 8 ft. were taken near Figure 1. Mean Temperature of Soil at Dif—Edinburgh by Sir John Leslie from 1815-1819. ferent Depths with Time, from Forbes (1) Records were also obtained in India at 3, 6 and 12 French ft. from 1842-1845. Forbes credits Lambert, a German mathematician, with the first systematic analysis of soil temperatures.
Beskow (30) reports reference to the "freezing up of stones from the ground" as early as 1694, but the first explanations of frost heaving were offered about the middle of the 18th century.
The advent of modern measuring instruments has greatly simplified the study of subsurface temperatures. At the close of the last century Professor Callendar began measurements at Montreal using electrical resistance thermometers. This new method permitted a relatively sturdy instrument to be left in the soil and periodic readings to be taken or even continuously recorded. Naturally an improvement in instrumentation was all that was needed to start a number of new investigations.
Up to the present time there have been more than two hundred papers published in English on soil temperatures and frost action. In addition, there are, of course, many others publishedin other languages. Unfortunately for engineers, most of the work on soil temperatures has been done for agricultural purposes. The data so obtained are often difficult to apply to engineering problems but are nevertheless valuable. From available records it is clear, however, that there exists a need for further study, in view of the many associated engineering problems.
Economic Aspects
The economic importance of a study of soil temperatures is clearly shown in engi-neering literature. Mabee (33) for example, reported that about 2,000 (2.7 percent) of the private service lines in Indianapolis were frozen during the severe weather in the early part of 1936. At that time, Indianapolis suffered the most severe winter in a 65-year period.
/ Editor's Note: Only the readings for one location, Craigleith, are shown in Figure 1, inasmuch as the three sets of readings are quite similar.

19
The necessity of soil temperature data for an analysis of flat-slab construction is indicated in a report of the National Bureau of Standards (69).
Hieronymus (48) and Shanklin (17) have pointed out the necessity of soil-temperature observations in order to evaluate the ability of soil to dissipate heat generated by losses from power cables. Economical calbe design is dependent on a knowledge of the earth's temperature at various seasons and depths and a knowledge of soil heat capacity.
Aigren (55) considered observations essential to the study of heat-pump operation, the perimeter and ground-slab loss for floor-panel heating systems and the ground losses and floor-slab temperatures of basementless houses.
In addition to the above references, a publication by Legget and Peckover (56) lists important associated problems: cold storage plants, vegetable storage, city snow clearance, permafrost conditions, and of course, highway and airport construction.
Some Factors Affecting Soil Temperatures
In a review of literature such as this, it is necessary to consider the various factors which may affect the temperature of the soil and to treat individually the most import-ant of these factors. This has been done as far as possible, but in many cases there is a natural overaip from one section to another.
Bouyoucos (8, 12), in his thorough and systematic review, divided the factors affect-ing soil temperatures into two broad classes, intrinsic and external. The intrinsic factors he denoted as specific heat, specific gravity, thermal conductivity, radiation, absorption, moisture content, organic content, texture and structure, concentration of salts in solution, evaporation, nature of surface, and topographic position. The ex-ternal factors are meteorological elements such as air temperature, sunshine, baro-metric pressure, wind velocity, dew point, relative humidity, and precipitation. Some of these factors tend to heat the soil and others tend to cool it.
These factors are related to soils in varying degree. Peat, for example, has a black color, low heat conductivity, and a high water-holding capacity. These prop-erties are reversed in sand. Thus these factors usually compensate to, a surprising degree and result in very similar temperature variations in various soils. Differences do occur, however, when factors are unbalanced. According to Bouyoucos, the in-trinsic factors which most often become unbalanced and cause temperature differences are: (1) Latent heat of fusion of ice, (2) Latent heat of evaporation of water, (3) Ground surface cover, (4) Ground surface color, and (5) Topographic position. The first four of these variables are discussed in other sections in some detail. The fifth may conveniently be dealt with here.
The effects of topographic position are readily apparent. Bouyoucos (12) observed temperatures in various degrees of exposure over a small area. He found that from March to September at 3-in, depth, the temperature on a south slope was about 2 F. higher than that on a north slope, and temperatures on the top of a hill were 5 or 6 F. higher than at a lower elevation on a river bank. From October and through the winter all positions had about the same temperature. Atkinson and Bay (37) indicated that there will probably be a greater frost penetration on north exposures than on south.
Bouyoucos found that it was impossible to analyze the interrelation of minor meteor-ological factors. 'The only factors which can be closely correlated with soil tempera-ture are air temperature and summer sunshine. Air temperature has the most impor-tant influence since many other factors tend to cancel out. During the winter months (until March) the average, air temperature is lower than the soil temperature at depth. The reverse is true for the rest of the year. The greatest difference is usually in January, the least in December and March.
Absorption of solar energy from the sun is another important factor that has a perceptible influence on soil temperatures. It causes the maximum surface temper-ature of the soil to be higher during the day than the maximum air temperature im-mediately above it. Bayer (52) has stated that the temperature of the soil is primarily dependent on radiant energy received from the sun. All other sources of heat are relatively unimportant. The heat absorbed in the soil from the sun's radiation is in

20
turn dependent on the latitude of the location and slope of the ground. He adds that in warm weather vegetative cover protects the soil from direct rays from the sun, re-ducing the maximum temperature. On the other hand, during the cold season, it acts as an insulating blanket reducing the heat loss from the soil. Bayer also noted that large bodies of water tend to stabilize soil temperature due to the high specific heat of water, acting as a heat reservoir which offers great resistance to temperature changes.
Franklin (14) pointed out that a low relative humidity will lower the soil temperature a great deal due to rapid evaporation, particularly when accompanied by high winds. He observed that fluctuations in air temperature are normally followed by fluctuations in soil temperature. However, a frozen layer at the surface will damp out these fluctuations since the bottom of the frozen layer maintains its temperature at the freezing point.
Effect of Rainfall and Melting Snow
There appears to be some disagreement regarding the influence of rainfall and melting snow on soil temperatures. Callendar (4) regarded rainfall and percolation to be one of the greatest single factors influencing soil temperatures. He observed in Montreal that a heavy rainfall on November 3 caused a rapid decrease in temperature in sandy soil. The drop was checked on November 10 by a 4-in, snowfall. A severe frost on November 19 froze the soil to a depth of 4 in. The fall of temperature near the surface was accelerated on November 23 by a rainfall percolating through the half-frozen soil. The most remarkable sudden fall of temperature began on December 12 and was caused by a rainfall which melted 2 or 3 in. of snow and percolated rapidly through the dry and partially frozen soil. This type of fall in temperature differs en-tirely in character from that due to thermal diffusion in being very rapid and nearly simultaneous at all depths.
After this a fortnight of dry, cold weather froze the ground to 13 in. and was followed by a 1-ft. snowfall on December 27, which remained until April 11. The protective cover of snow was found to be very significant in reducing further frost penetration. Heavy rains accompanied by melting snow then caused a sudden fall in temperature at the lower depths. Although the water could not easily penetrate the frozen soil, it found its way to the lower strata by devious means. Final thawing of the soil took place at a depth of 10 in. on April 19. This allowed full-scale penetration of water, which again caused a sudden drop in the lower temperatures. Callendar drew special attention to the insulating effect of snow and the effect of heavy rainfall in diffusing heat and equalizing temperature in porous soils at different depths.
Rainfall was found to raise the value of thermal diffusivity considerably. For in-stance, during the interval of the measurements described, April 21 to 23, 1/2-in, of rainfall occurred and the diffusivity was raised to 0. 011, although the average annual value is about 0. 004 for this soil. This increase in the value was assumed to be due to percolation. On the basis of a three-year record, Callendar and McLeod (6) found that the diffusivity of the soil during February, when the ground was so frozen that there was practically no percolation, had a value of about 1/3 the annual average. It was concluded that the February value represented the diffusivity due to pure thermal con-duction and that more than half the average value is therefore due to the effect of percolation.
Bouyoucos (8), whose views differ from Callendar's, suggested that the importance of rainfall had been over-estimated. He has stated that although rain is commonly con-sidered a warming agent, his records reveal that spring rain lowers the soil tempera-ture not only by eliminating sunshine but by subsequent evaporation of the rain.
Franklin (14) considered rain a great equalizer of temperature between the surface soil and that at depth, due to percolation. In sand, due to rapid percolation of rain, the subsurface temperature will change very rapidly during a rainfall and afterwards re-turn to normal. These changes take place with decreasing rapidity in loam and in clay.
Keen and Russell (16) felt that rainfall not only cooled the soil in summer due to lower temperature but also prevented warming of the soil due to associated cloudiness.
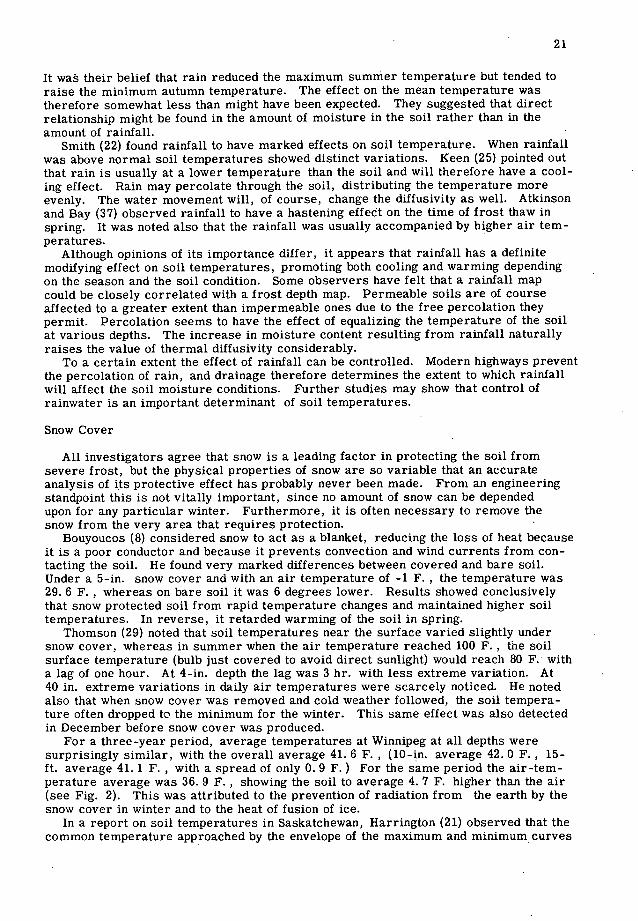
21
It wa their belief that rain reduced the maximum summer temperature but tended to raise the minimum autumn temperature. The effect on the mean temperature was therefore somewhat less than might have been expected. They suggested that direct relationship might be found in the amount of moisture in the soil rather than in the amount of rainfall.
Smith (22) found rainfall to have marked effects on soil temperature. When rainfall was above normal soil temperatures showed distinct variations. Keen (25) pointed out that rain is usually at a lower temperature than the soil and will therefore have a cool-ing effect. Rain may percolate through the soil, distributing the temperature more evenly. The water movement will, of course, change the diffusivity as well. Atkinson and Bay (37) observed rainfall to have a hastening effect on the time of frost thaw in spring. It was noted also that the rainfall was usually accompanied by higher air tem-peratures.
em- peratureS.
Although opinions of its importance differ, it appears that rainfall has a definite modifying effect on soil temperatures, promoting both cooling and warming depending on the season and the soil condition. Some observers have felt that a rainfall map could be closely correlated with a frost depth map. Permeable soils are of course affected to a greater extent than impermeable ones due to the free percolation they permit. Percolation seems to have the effect of equalizing the temperature of the soil at various depths. The increase in moisture content resulting from rainfall naturally raises the value of thermal diffusivity considerably.
To a certain extent the effect of rainfall can be controlled. Modern highways prevent the percolation of rain, and drainage therefore determines the extent to which rainfall will affect the soil moisture conditions. Further studies may show that control of rainwater is an important determinant of soil temperatures.
Snow Cover
All investigators agree that snow is a leading factor in protecting the soil from severe frost, but the physical properties of snow are so variable that an accurate analysis of its protective effect has probably never been made. From an engineering standpoint this is not vitally important, since no amount of snow can be depended upon for any particular winter. Furthermore, it is often necessary to remove the snow from the very area that requires protection.
Bouyoucos (8) considered snow to act as a blanket, reducing the loss of heat because it is a poor conductor and because it prevents convection and wind currents from con-tacting the soil. He found very marked differences between covered and bare soil. Under a 5-in, snow cover and with an air temperature of -1 F. , the temperature was 29. 6 F., whereas on bare soil it was 6 degrees lower. Results showed conclusively that snow protected soil from rapid temperature changes and maintained higher soil temperatures. In reverse, it retarded warming of the soil in spring.
Thomson (29) noted that soil temperatures near the surface varied slightly under snow cover, whereas in summer when the air temperature reached 100 F. , the soil surface temperature (bulb just covered to avoid direct sunlight) would reach 80 F. with a lag of one hour. At 4-in, depth the lag was 3 hr. with less extreme variation. At 40 in. extreme variations in daily air temperatures were scarcely noticed. He noted also that when snow cover was removed and cold weather followed, the soil tempera-ture often dropped to the minimum for the winter. This same effect was also detected in December before snow cover was produced.
For a three-year period, average temperatures at Winnipeg at all depths were surprisingly similar, with the overall average 41. 6 F. , (10-in, average 42. 0 F. , 15-ft. average 41. 1 F., with a spread of only 0. 9 F.) For the same period the air-tem-perature average was 36. 9 F. , showing the soil to average 4. 7 F. higher than the air (see Fig. 2). This was attributed to the prevention of radiation from the earth by the snow cover in winter and to the heat of fusion of ice.
In a report on soil temperatures in Saskatchewan, Harrington (21) observed that the common temperature approached by the envelope of the maximum and minimum curves
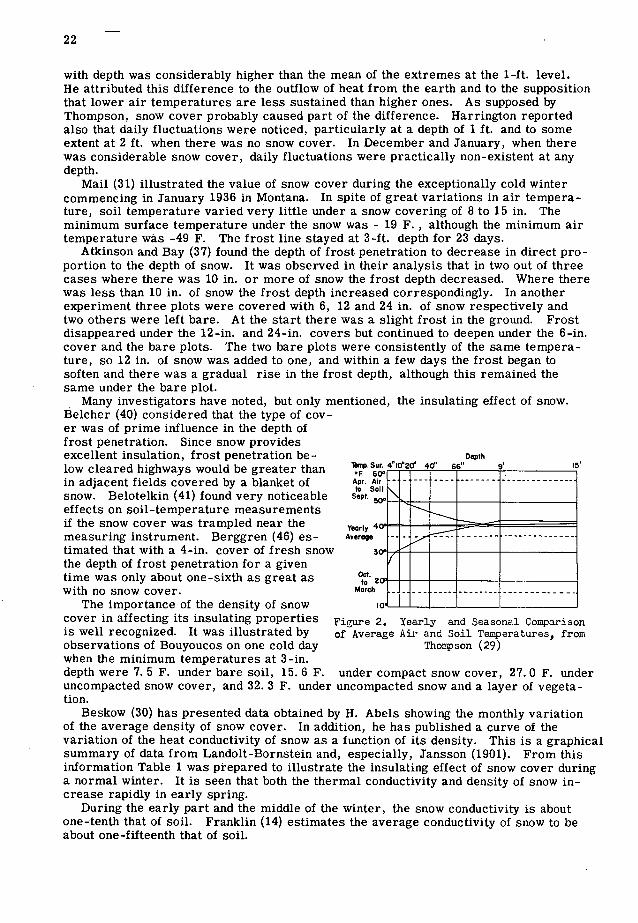
22
with depth was considerably higher than the mean of the extremes at the 1-ft. level. He attributed this difference to the outflow of heat from the earth and to the supposition that lower air temperatures are less sustained than higher ones. As supposed by Thompson, snow cover probably caused part of the difference. Harrington reported also that daily fluctuations were noticed, particularly at a depth of 1 ft. and to some extent at 2 ft. when there was no snow cover. In December and January, when there was considerable snow cover, daily fluctuations were practically non-existent at any depth.
Mail (31) illustrated the value of snow cover during the exceptionally cold winter commencing in January 1936 in Montana. In spite of great variations in air tempera-ture, soil temperature varied very little under a snow covering of 8 to 15 in. The minimum surface temperature under the snow was - 19 F. , although the minimum air temperature was -49 F. The frost line stayed at 3-ft. depth for 23 days.
Atkinson and Bay (37) found the depth of frost penetration to decrease in direct pro-portion to the depth of snow. It was observed in their analysis that in two out of three cases where there was 10 in. or more of snow the frost depth decreased. Where there was less than 10 in. of snow the frost depth increased correspondingly. In another experiment three plots were covered with 6, 12 and 24 in. of snow respectively and two others were left bare. At the start there was a slight frost in the ground. Frost disappeared under the 12-in, and 24-in, covers but continued to deepen under the 6-in. cover and the bare plots. The two bare plots were consistently of the same tempera-ture, so 12 in. of snow was added to one, and within a few days the frost began to soften and there was a gradual rise in the frost depth, although this remained the same under the bare plot.
Many investigators have noted, but only mentioned, the insulating effect of snow. Beicher (40) considered that the type of cov- er was of prime influence in the depth of frost penetration. Since snow provides excellent insulation, frost penetration be- Depth
1nftSur. 4Id'd' 4d' ' a 15' low cieareu nignways woula oe greater than OF 6 in adjacent fields covered by a blanket of Apr. 5Aii
snow. Belotelkin (41) found very noticeable Sept.
effects on soil -temperature measurements if the snow cover was trampled near the Yearly 4 measuring instrument. Berggren (46) es- Average
timated that with a 4-in, cover of fresh snow the depth of frost penetration for a given time was only about one-sixth as great as to
with no snow cover. March
The imoortance of the density of snow
RAN
NON
cover in affecting its insulating properties Figure 2. Yearly and Seasonal Comparison is well recognized. It was illustrated by of Average Air and Soil Temperatures, from observations of Bouyoucos on one cold day Thompson (29) when the minimum temperatures at 3-in. depth were 7. 5 F. under bare soil, 15. 6 F. under compact snow cover, 27.0 F. under uncompacted snow cover, and 32. 3 F. under uncompacted snow and a layer of vegeta-tion.
Beskow (30) has presented data obtained by H. Abels showing the monthly variation of the average density of snow cover. In addition, he has published a curve of the variation of the heat conductivity of snow as a function of its density. This is a graphical summary of data from Landolt-Bornstein and, especially, Jansson (1901). From this information Table 1 was prepared to illustrate the insulating effect of snow cover during a normal winter. It is seen that both the thermal conductivity and density of snow in-crease rapidly in early spring.
During the early part and the middle of the winter, the snow conductivity is about one-tenth that of soil. Franklin (14) estimates the average conductivity of snow to be about one-fifteenth that of soil.

23
TABLE 1
Variation of the Average Density and Thermal Conductivity of Snow Cover
Month Nov. Dec. Jan. Feb. Mar. Apr.
A.Terage-Density of. Snow Cover .139 .182 .193 .189 .233 .279
Lhe rmal Conductivity* .00029 .00033 .00037 .00035 .00045 .00057
I' Cal./cm./sec./°Q.
TABLE 2
Moisture Content of Soil with Different Amounts of Organic Matter ()
5 inch depth
Organic Content
1.81% 2.011. 3.32% 5.47% 6.95% Peat
April 3 16.96 12.95 21,80 26.90 32.53 256 , 5
July 27 . 2.08 3.69 6,78 12.83 17.42 236,4
by. 4 2.46 5.85 8.63 14.46 21.8 247,8
The protective effect of snow in reducing frost penetration and soil -temperature fluctuations has been realized for many years. Unfortunately, as previously pointed out, it is an unreliable protection and may have to be removed. Nevertheless, in some engineering work the insulating effect of snow cover should be considered for the sake of economy. It is clear that the density of snow will have a considerable effect on its protective qualities. Even so, one foot of snow cover will normally provide as much protection against frost penetration as several feet of soil. Snow cover on roads is, of course, much more dense than the above figures would indicate.
Surface Cover
From the literature studied it appears that Bouyoucos has been the only person to study systematically the effect of surface cover on subsurface soil temperature. In his initial paper (8) and a subsequent one (12) he emphasized the importance of color and type of cover. Although these observations were taken for agricultural purposes their importance in an engineering analysis is readily apparent.
It was observed that heat penetrated more rapidly into uncultivated than cultivated soil and most slowly into sod-covered soil. The greater moisture content of the latter two undoubtedly had some retarding effect. In an experiment using surface covers of white quartz sand and black (dyed) quartz sand, it was found that heat from the sun was

24
transmitted both horizontally and vertically but in greater amounts vertically. This was attributed to increased moisture content with depth. The soil with the black sur-face had a higher temperature at 5 in. than the white covered soil had at 3 in.
In order to find the effect of color on radiation and absorption, Bouyoucos used these same two quartz sand. He found color to have little or no effect on radiation (less than two percent difference on all colors) but quite an appreciable effect on absorption. He found black sand to average about 11 F. warmer just below the surface than white sand after a day's sunshine (maximum temperatures 105. 7 to 94. 3 F. and 99. 7 to 89. 1 F. respecitvely). In addition, he found that a dry surface radiates considerably less than a moist surface (7 to 9 percent less for mineral soils, 15 percent less.for peat). He then found that dry soils radiate quite differently according to type (peat 20 percent less than sand). From these observations Bouyoucos concluded that: (1) Radiation is in-dependent of color; (2) In the dry state, sand is the best radiator, followed in order by gravel, clay, loam and peat; (3) Water exhibits the greatest radiating power with all soils, when well moistened, radiating equally; and (4) The different rates of cooling and warming of soils depend on their moisture content and hence on their specific heat.
Bouyoucos mixed natural sand with various amounts or organic matter. The natural sand contained 1. 8 percent organic matter and the mixtures ranged up to 6. 9 percent organic matter. He then had soil samples with various shades of color and various moisture holding properties. He placed these samples in the field along with a similar sample of peat. The moisture content of the samples increased in proportion to organic content. In July and November the 8. 95 percent soil contained about nine times as much water as the 1. 8 percent soil and the peat about 120 times as much. (See Table 2). Nevertheless, the temperature of the dark sand was somewhat higher than that of the uncolored, natural soil whose reflection was great and whose moisture content was small. The temperature of the peat would have been higher but for its great moisture content.
In order to investigate the temperature under field conditions of the most common types of soil, viz, gravel, sand, loam, clay, and peat, Bouyoucos (8) placed these soils in the field in the same manner as for his investigation of organic content. In his first year of study, Bouyoucos covered the soil samples with a thin layer of white sand. In his second year the sand was removed. In the third year the soil was again covered and in the fourth year the cover was removed. He found that without the covering only the sand and gravel attained higher average temperatures in the summer. This illustrated that soils of high moisture content are kept somewhat cooler in spite of dark color) due to increased evaportation when not covered. With the sand cover all soils maintained about the same average temperature. Results of the first and third years of study were in close agreement, as were the results of the second and fourth years. He believed that it was the inequality in the amount of evaporation, therefore, that caused the various types of soil to have different degrees of temperature when the sand cover was removed.
The effect of surface conditions was also noted by Belcher (40) who stated that the color and type of road surface undoubtedly influenced the trend of frost in the subgrade, especially in the early spring when the initial thawing commences. Many investigators have written of the insulating effect of vegetation. Algren (55) observed average tem-perature in September at 1-ft. depth under barren ground to be 7. 6 F. higher than under sodded ground. The difference at 16 ft. was still 3. 6 F. In winter the reverse was true. Soil temperatures below barren ground were more readily affected by variations in air temperatures.
Smith (20) found that frost occurred sooner in marshes when they were poorly drained or covered with'vegetation, because the soil could not heat up during the day. At the same time it was stated that vegetation inhibited radiation, and in a forest the mean annual temperature was observed to be 2. 7 F. warmer than outside, and the mean daily range in the forest was 7. 3 F. less than outside. Belotelkin (40) also observed forest litter to be very effective in delaying frost penetration. Atkinson and Bay (37) found that frost penetrated twice as deeply in an open pasture area as in a protected woodlot area, although snow cover was the same in both cases.

25
T.BLE 3
Soil Specific Gravity
V V
V Specific Heat
Equal'Weight Equal Volume
Sand 2.664 1929 .5093
Gravel 2.707 V V
.2045 .5533
Clay 2.762 .2059 ,5686
Peat 1.755 .2525 4397
Those surface factors chiefly influencing the radiation and adsorption of heat, and hence soil temperatures, are found to be cultivation, moisture content, color of the soil, and presence of vegetation. Cultivation seems to damp out small variations in soil temperature. Moisture content of the soil is fairly important, and dry soils are gen-erally warmer than moist soils, since they radiate and evaporate less. Sands are the coolest of the dry soils, due to their great radiation. V
Color and vegetation are both very important in influencing soil temperatures, the latter when present either as surface vegetation or forest cover. V It is noteworthy that both of these factors are controllable to a certain extent, and their importance is worth remembering in such possible engineering applications as hastening frost retreat or increasing heat storage for heat-pump operation. I V
Soil Moisture Content V V V V
The effect of soil-moisture content is probably the most important and yet the least understood intrinsic factor involved in soil temperature variation. A change in the amount of water present in the soil will alter almost all its intrinsic properties.
It seems appropriate to describe in some detail the experiment conducted by Bouyoucos using soils with varying amounts of organic matter. Organic matter in a soil alters its color and water holding properties, and it was the intention to study the extent to which these two properties would oppose each other. With increasing organic content the soil color darkens and the water-holding capacity increases. The test was prepared by placing wooden boxes 3-by 3-by 3-ft. in a trench' 3-ft. wide and 3-ft. deep. Sand with various amounts of organic matter was placed in each box, and one box was filled with peat. Table 2 shows the amount of organic matter in each sample as found by the igni-tion method. The natural soil contained 1. 8 percent organic matter and it was covered with a thin layer of white-quartz sand to give maximum reflection. The variation of percentage moisture content with season of the year for these soils is shown in Table 2. The striking effect of organic content on moisture content is readily seen in this table.
At depths of 5 and 18 in. , the soil with 3. 3 percent organic content had the highest temperature in spring and summer, followed in order by the soils containing 2. 0, 5. 5, 6. 95, and 1. 8 percent organic matter and peat. With the exception of the 1. 8 percent soil, the temperature in the fall was practically the same for all soils. In winter the 1. 8 percent soil had the lowest temperature, peat had the highest, the others were in-termediate or at about the same temperature. On a yearly average the 1. 8 percent soil and the peat were of about equal temperature but less than that of others, which them-selves were about equal. 'Throughout all seasons the soil with 3. 3 organic matter had the largest amplitude of temperature, followed in order by the 2. 0, 5. 5, 6. 95, and 1. 8

26
TABLE 4
Effect of Moisture on Soil Temperature
Soil Weight of percent Specific heat Iise of Temp0 Rise of a cu. ft. Moisture by of dry soils Temp0 of (lb.) equal weight by 100 heat moist soils
Units by 100 heat Units
Sand 102.7 16,96 .1915 .011170°C. .005876°C,
Gravel 109.2 10,45 .2045 .009854 .006520
Clay 76.35 29.16 .2059 .013990 .005790
Loam 72.93 40.7 .2154 .014010 .004848
peat 36.76 256.5 02525 .023740 .002127
percent soils and the peat. Four years of observations showed that soils either white and with low moisture
content or black with high moisture content had a lower average temperature during the spring and summer than soils with these properties in medium proportions. From these observations it would appear that both surface color and moisture content have considerable influence on soil temperature. From the point of view of color the peat should absorb the greatest amount of heat and the natural soil the least. On the other hand, the natural soil has a low specific heat and should therefore change temperature more readily. Notice that the 3. 3 percent soil became warmest in summer and had the greatest yearly amplitude. This is probably caused by the most favorable balance be-tween surface color and specific heat due to moisture content. The effect of moisture content on temperature changes in the soil is discussed in more detail later in this section and in the section on Thermal Conductivity and Diffusivity.
Bouyoucos (8) gives the specific-heat properties of soils shown in Table 3. This table shows significant properties of the soils. It is seen that peat has the lowest specific heat by volume and yet the highest specific heat by weight. It is the specific heat by volume that is important when considering soil temperature variation with depth.
Moisture content has a great effect on the specific heat of soil in place, since water has a specific heat approximately five times as great as dry soil. As shown by Table 4, dry peat will heat or cool about twice as readily as sand or gravel, with equal ap-plication of heat. In its natural wet condition it will heat or cool only about one-third as readily. Hence it is seen that the moisture content will overshadow in importance density and specific heat of dry soil to a great degree.
Although sand and gravel have a higher specific heat by volume than peat and thus will heat or cool more slowly in the dry condition, Bouyoucos deduced that when field moisture content is considered, the sand and gravel will cool or heat three times as rapidly as peat (Table 4). For this reason the sand and gravel would be expected to warm more rapidly in the spring and cool more rapidly in the fall. This is true in the spring because the air temperature has a daily upward trend and the sand and gravel warm up early, but the peat, having the greatest heat capacity, warms up slowly and finally reaches the temperature of the sand and gravel. In the fall the trend of air temperature is downward on the average but the fluctuations are great. On certain days the temperature falls very low and the sand and gravel cool most. Next thy the

27
temperature may rise considerably and the sand and gravel will heat most. These alternate cold and warm days tend to keep the sand and gravel as warm as the other soils. If, however, there were a sudden continual drop in air temperature the sand and gravel would cool faster than the other soils. The other soils referred to are clay, loam, and peat.
Keen (25) points out that dry soil has a low conductivity due to poor contacts between the grains and hence the temperature falls off rapidly with depth. Moisture improves the grain-to-grain contact and the conductivity increases; but the specific heat also in-creases, so the actual rise in temperature is small. Moreover, the vaporization of water will slow the warming up, since the latent heat of water is about 500 calories per gram. The latent heat may even cool the soil. The greatest temperature rise from a given application of heat occurs between the extremes of wet and dry soil where the con-ductivity increases more rapidly than the specific heat.
Smith (27) attributes variation in temperature lag at depth from year to year to variation in moisture content. Belotelkin (41) observed that frost penetrates deeper and remains longer in poorly drained soils than in better-drained soils. Fine-textured soils resemble, in their influence on soil-freezing, poorly-drained soils; coarse-textured soils resemble better-drained soils.
Smith (44) states that a factor which is far more important than the variation of mechanical composition, or particle arrangement, is the moisture content of the soil. He observes that although the influences of moisture content can be sorted out and dealt with in order without difficulty, they are so interdependent that in field conditions the total effect is very complex.
Water has such an important influence on soil temperature that reference to soil moisture content is made in almost every section of this paper. It appears that soil moisture influences the radiation, evaporation, specific heat, thermal conductivity and diffusivity, and heat capacity of the soil. Organic content and density control soil moisture content, to a certain extent, and therefore have considerable influence on this important property. Moisture content is by far the most important intrinsic factor affecting soil temperatures. This conclusion is suggested by review of the published records of many investigations. Legget and Peckover (56), following Winterkorn, have suggested that the mechanism of water-vapor movement in soil is possibly the main determinant of soil temperature variation.
Moisture Migration
The effect of temperature on moisture movement in soils was studied by Bouyoucos about 35 years ago. He deduced that moisture movement was directly related to the changes in viscosity and surface tension of water with temperature (Table 5). Notice that the decrease in viscosity is considerably greater than the decrease in surface tension as the temperature rises. It was believed that as the temperature increased the reduced surface tension permitted the water to be drawn to regions of higher sur-face tension. The reduced viscosity would also have aided the process.
In order to measure moisture migration Bouyoucos (9) used brass tubes 8-in, long filled with soil of unifbrm moisture content. One end of each tube was placed in a cold bath and the other in a warm bath. This was done with the tubes both horizontally and vertically. Both arrangements gave essentially the same results, illustrating that the effect of gravity is negligible.
According to the laws of surface tension and viscosity the amount of water moved should be independent of the moisture content, provided that the soil mass exerts no influence upon the water. Since the soil does exert an adhesiveforce, the thermal transfer of moisture would be expected to increase continually with a rise in moisture content. This did not happen. Rather the thermal transfer of moisture increased with increasing moisture content to a certain point and then began to decrease. Bouyoucos termed the soil moisture content which allowed the greatest amount of water movement from warm to cold, the "thermal critical moisture content.
Bouyoucos also studied vapor movement in the soil. He found that when a moist,

28
TABLE 5
Variation of Surface Tension and Viscosity with Teniperaturej
Temperature. Surface Tension Viscosity
000. 100.001. 100.00%
10 97.96 73.32
20 94.32 56.70
30 91.62 45.12
40 88.46 36.96
50 85.52 30017
warm column of soil was separated by an air space from a dry, cold column of soil, the percentage of moisutre movement across the air space was insignificant, indicating that little moisture will move in the'form of vapor.
In a recent and extensive investigation of moisture movement in soils, Smith (47) questions the procedure of Bouyoucos in measuring thermal transfer of moisture. He points out that soil in the warm and the cold cylinders are at the, temperature of'their respective baths and that a temperature gradient occurs only across the partition be-tween the two baths. There is little transfer of moisture outside the region of the par-tition, and since Bouyoucos' results are referred to the soil over the whole cylinder, the magnitude of the effect is, therefore, considerably masked.
Smith's experiments were conducted on a relatively thin soil specimen with the tem-perature gradient produced across the small dimension. Samples for moisture-ëontent analysis were taken from the cold and the hot faces of the soil. The results obtained by Smith were similar to those of Bouyoucos, but the moisture transfer was much greater.
The physical condition of the soil, undisturbed or fragmented, was found to influence greatly the amount of moisture migration under small -temperature gradients. When the structure was granular, from the A-horizon, fragmentation moderately increased the moisture transfer. When the structure was blocky (cube-shaped grains with low poros-ity), from the B-horizon, fragmentation increased the moisture transfer up to seven times.. In the C-horizon fragmentation doubled the moisture movement.
The same apparatus used to measure moisture migration was employed to measure vapor movement and subsequent condensation in the soil. Smith agreed with Bouyoucos that a negligible amount of moisture was transferred by vapor movement.
Capillary action and vapor movement were found to be individually incapable of pro-ducing moisture transfer along' a temperature gradient. Smith explains that moisture in soil is distributed in minute capillary bodies.
Franklin (14) claims that water vapor diffuses downward by day, when the surface is hot and upwards at night, when the surface is cold. The vapor which rises at night is trapped in vegetation and condensed, liberating latent heat, which partially balances the outgoing radiation.
Only two investigators, Bouyoucos and Smith, have made a detailed study of moisture migration, although many have noticed the phenomenon. Moisture movement is re-garded as a particular nuisance in the laboratory study of thermal properties, but it has a most important influence on the heat transfer, in soil in the field. Any transfer of water in the soil will not only carry heat but will alter the thermal properties by its movement.

29
Soil Density
Practically all observers of soil temperature fail to record any effect of density. The significance of density on frost penetration in one instance was reported by Legget and Peckover (56). It was noted that most inv.estigators measured soil temperatures in undisturbed ground, whereas for practical engineering purposes data for disturbed soil is usually required. For this reason a comparative study was begun at Toronto, On-tario, taking temperature measurements in both disturbed and undisturbed soil. The degree of compaction normally employed in trench backfill was used to obtain the dis-turbed condition.
Results obtained from this installation were so striking that it was thought some factor other than density was influencing the temperatures. Nevertheless, it did appear that density was an important factor since frost penetration was much greater in dis-turbed soil than in undisturbed soil. Further experiments are being conducted under various conditions in an attempt to establish the true effect of density;
Winn and Rutledge (38) found soil density to have a great effect on frost heaving. They found heaving to be greatest at a certain critical density and to decrease rapidly at lower or higher densities. This was attributed to a favorable combination of per-meability and capillarity.
Soil temperatures would be affected to some extent by this critical density due to the latent heat of water. It may be that density control could result in moisture control and consequently temperature regulation. Density certainly seems to be one of the few con-trollable factors which can affect soil temperatures.
Thermal Conductivity and Diffusivity
The thermal conductivity of a soil is the quantity of heat which will pass through a unit area of unit thickness in unit time under a unit temperature gradient. It is usually expressed in British thermal units transmitted per hour through one square foot of soil one inch thick per degree Fahrenheit difference between the two surfaces, or in calories per second per square centimeter per centimeter thickness per degree Centigrade be-tween the two suraces. The thermal diffusivity of a soil is the thermal conductivity divided by the specific heat times the density. The specific heat is the heat required to raise unit weight of the soil one degree. Thermal diffusivity may be expressed as the thermal conductivity divided by the volumetric heat capacity. The volumetric heat capacity is equal to the density times the specific heat of the soil.
The thermal properties of soils have been under study for a great many years. In 1846 Forbes (1) noticed that the rate of increase in temperature with depth varied ac-cording to the type of material. The rate of increase was greatest in porphyritic trap rock, followed in order by pure sand and sandstone. This is also the order of increase in their conductive powers. Hence, he attributed the various rates of increase in tem-perature with depth to differences in conductivity and consequent differences in the rate of heat conduction from the interior of the earth.
In 1860 Thompson (2) calculated the soil diffusivity using the amplitude of tempera-ture variations at depth. He further calculated the conductivity using a value of specific heat (presumably with soil in the dry state). Everett (3) also determined diffusivity and conductivity using methods similar to those of Thompson.
Callendar (4) calculated the thermal diffusivity of the soil in place using the temper-ature gradient with depth to. determine the heat absorbed by the soil between various depths. This process was equivalent to a graphical integration of the differential equa-tion for heat flow. The changes in the thermal diffusivity of the soil throughout the year could be traced in this manner. In a later paper Callendar and McLeod (5) pre-sented additional calculations.
Some of the most comprehensive early work on the thermal properties of soils was published by Patten (7) in 1909. He expalined that the conductivity of soil is increased by the addition of waterS, due to the better thermal contact between soil grains produced by the moisture film. If the water content is still further increased, the temperature of

the soil will rise more slowly, in spite of better conductivity, due to the high specific heat of water, which is almost five times that of dry soil. (See Figs. 3 and 4). Beyond a certai•n value the moisture content becomes the predominating factor and the conductivity of the mixture gradually falls to the value for water.
With increasing moisture content, the con 3.003
ductivity increases for the reason already - given. The diffusivity, which measures the rate at which the temperature rises under a .002
unit temperature gradient, increases to a maximum and then diminishes. The increase .001
is due to an increase in the conductivity and -
ftific
30
U
8 4.,
8 5 .7 .6 - -5 5 .4
the specific volume. At nigner moisture con- 0 5 10 15 20
tents the volumetric heat capacity increases Percent of Water on Wet Weight
and the specific volume decreases. Both Figure 3. Effect of Moisture Content on changes tend to decrease the thermal diffu- Volume and Thermal Behavior of a Coarse sivity. Between the extremes of dry and wet Quartz Powder, From Patton (7) soil is a range of moisture contents wherein the volumetric heat capacity of the moist material increases less rapidly than the con-uctivity. Within this range is obtained maximum conduction of heat and the greatest temperature rise for a given application of heat.
In 1913 Bouyoucos (8) attempted to measure thermal conductivity of soil by the hot-plate method, but he was troubled with moisture migration in the sample. In the field he found relative values of conductivity by observing the time for heat to penetrate soils which had a similar layer of sand on- their surfaces.
He also noticed variations in the temperatures of different soils during the summer (when no surface sand was present), but this difference almost disappeared by mid-September. From then until December the soils cooled at about the same rate. He be-lieved that this even rate of cooling and equal average temperature in the fall and winter months (even when covered with sand or not covered) indicated there are no intrinsic factors which predominate and cause variations in these different soils.
Bouyoucos and McCool (18) state four principal factors may be responsible for the difference in frost occurrence between organic and mineral soils. These are differences in color, temperature of the air at various elevations, specific heat by volume of the soil, and heat conductivity.
Color of the surface has already been discussed under the section on surface effects. Muck and peat, under field conditions, possess a much greater specific heat than mineral soils, due to large moisture content. It would be expected, therefore, that organic soils should have less frost penetration, but the opposite was found to be true. The heat con-ductivity of mineral soils is much greater than that for organic soil. Bouyoucos deduc-ed from his experimental results that this is the factor responsible for the difference in frost occurrence between mineral and organic soils.
Shanklin (17) experimented with the thermal conductivity of soils in order to study the heat distribution around buried electrical cables. He found the conductivity to increase with moisture content, and he noticed moisture migration. In discussion it was pointed out that a knowledge of the soil heat capacity is important since cables are hot for a relatively short period during the day.
Keen (25) discussed the theory of heat flow in a conducting material. He based his analysis on the common equation for heat flow applied to flow through the soil. At the same time he took into account the migration of moisture from a warm to a cold area. The shift of water alters the thermalconductivity and the volumetric heat capacity of the soil, and these, in turn, influence the rate and amount of heat movement. There-fore, since the conductivity and heat capacity are not constant, the simple theory does not apply exactly. -

Beskow (30) points out that conductivity of ice is three or four times greater than that of water. However, the conductivity of a frozen soil is not greatly increased over that of un- .005 frozen soil, because ice banding decreases the contacts of the soil particles. Therefore, the conductivity of moist (non-saturated) soils is increased only slightly. For coarse soils the increase in conductivity is not normally greater than 20 percent. For clays the con- ductivity of frozen soil is seldom greater , than that for unfrozen soil. g
Using a hot-plate apparatus, Smith and U) Byers (34) found the thermal conductivity of•
003 dry soils to depend greatly on the organic . content and texture. Sandy soils are the best conductors, clay soils medium conductors, and highly organic soils are poor conductors. The conductivity of the actual dry-soil mate- rial was found to be practically constant for .002 all soils, but the conductivity varied with porosity. The least heat transfer occurred with the greatest porosity. In the above anal- ysis all the samples were similarly treated by rolling, sieving, and oven-drying. .00I
Smith (44) concluded that the ability of a dry soil to transmit heat depends on the char- acter of the solids that form th framework
1
0
.:i
I --I--- al.
31
0 0 0 C U U)'
"S
4 U,
S.-
3
0 E
11 I-C 0. 0. ---------------------------------..--.-
of the soil and of the liquids and gases that Percent of Water on Wet Wei ht fill the voids throughout the framework. 'A -
formula was evolved which yields the effec.- Figure 4. Effect of Moisture Content on tive conductivity of a dry soil, provided the Volume and Thermal Behavior of a Fine porosity of the soil and the heat conductivity Sandy Loam, From Patten (7) of the soil particles are known and the effect of structure can be evaluated.
Shannon and Wells (51) found thermal conductivity to depend primarily on water con-tent and whether the soil was frozen or unfrozen. The conductivity, frozen or unfrozen, approached a common value as the water content approached zero. Thermal conductivity increased with increasing moisture content. At high moisture contents the conductivity of frozen material was generally about 50 percent greater than for unfrozen material. Thermal conductivity was found to increase with increases in unit weight of the material.
Kersten (53), in this recent extensive analysis of the thermal properties of soil, found the conductivity to vary in the following manner:
(1) When the soil is unfrozen, it increases with an increase in mean temperature. (2) When the soil is frozen:
with a low moisture content there is very little change with temperature; with greater moisture contents it increases with a decrease in mean tempera-
ture. (3) As the soil changes from unfrozen to frozen:
for dry soils there is no change; at low moisture contents it decreases; at high moisture contents it increases.
(4) When the soil is at a constant moisture content the conductivity increases with an increase in dry density. The rate of increase is fairly constant and independent of the moisture content.
(5) At constant dry density it increases with an increase in moisture content. (6) At a given density and moisture content it varies, in general, with the texture of

32
the soil. It is high for gravels and sand, lower for sandy loam, lowest for silt and clay. (7) The conductivity differs appreciably for different soil minerals. Moisture migration has always been a problem when one attempts to measure thermal
conductivity of soil. Smith (36) in his initial work on the conductivity of moist soils found moisture migration to be a great problem. Griffiths (45) experienced the same trouble in testing building materials. Recently Allcut (54) was similarly troubled with moisture migration in his conductivity testing.
The British Electrical and Allied Industries Research Association (32) has advanced a method of measuring thermal resistivity of the soil in place, employing a heating sphere. Resistivitymay be converted to its reciprocal, conductivity. Very recently Dr. Misener has successfully experimented at London, Ontario , with a heating sphere method of measuring soil conductivity in place. At the present time, Hooper and Lepper (57), of the University of Toronto, are experimenting with a heated probe for measuring conductivity. These modern methods appear to be the answer to the problems of measur-ing thermal conductivity of soil, since the experimental time is reduced to a few minutes and therefore moisture migration does not take place.
Much attention has been given to the study of thermal properties of soils. It now seems that the new methods of measuring thermal properties of soils in situ will add much valuable information to the general study. The thermal diffusivity is, of course, the intrinsic factor controlling soil temperature, and it in turn is controlled largely by the moisture content. Therefore, it is evident that quick, easy determinations of thermal diffusivity of soil in situ are valuable. Moreover, by following changes in diffusivity, changes in moisture content can be calculated.
Freezing Temperature of Soils
It is known that most soils freeze at temperatures somewhat lower than 32 F., but there appears to be some doubt as to the exact causes of this lowering of the freezing point. The fact that the temperature is below freezing in a soil does not mean the soil is frozen. It was observed by Bouyoucos (15) that soils could withstand considerable supercooling before freezing. The degree of cooling which soils and artificial materials could withstand without freezing when they were kept perfectly still and with the water content at about the saturation point was: Sand, loam, and clay: 7. 6 F. below normal freezing point; Peat, muck: 9 F. below normal freezing point; Water, silica, carbon black, gelatin, agar: 10. 8 F. below normal freezing point.
Since the water freezes at about the same degree of super-cooling as the artificial materials, it would appear the water controls the degree of super-cooling and the mate-rials have no effect on it. It was found that clays do not have a greater super-cooling than sands.
Bouyoucos (8) reports that Ulrich in 1897 found the temperature of soil freezing was generally lowered by the addition of salts. This lowering increased with the salt con-centration. Ulrich observed that when the soil water froze the temperature rose im-mediately to 32 F. , remained there for a time and then gradually fell. Some salts re-tarded this fall of temperature while others hastened it.
In his own analysis, Bouyoucos found that salt concentration lowered the freezing point considerably. Bouyoucos points out that as a treated soil freezes, the remaining liquid becomes more concentrated, and therefore lowers the freezing point further. The reverse is true during thawing. Bouyoucos also studied the effect of salt solution on soil temperatures during the summer. He observed that salt-treated soils became as much as 7 or 8 F. warmer than untreated soils. This appeared to be due to a de-creased amountof evaporation from the treated soil due to an increase in surface ten-sion and a lowering of vapor tension. After a time the untreated soil became dry due to evaporation, and the soil treated with salt solution was still moist. Then the salt-treat-ed soil became cooler than the reference soil, since evaporation was continuing.
Beskow (30) believes that lowering of the freezing point is not due to dissolved salts alone. He has shown that particle size has a direct bearing on the lowering of freezing point. This is caused by the attraction of the water molecules to the soil particles.
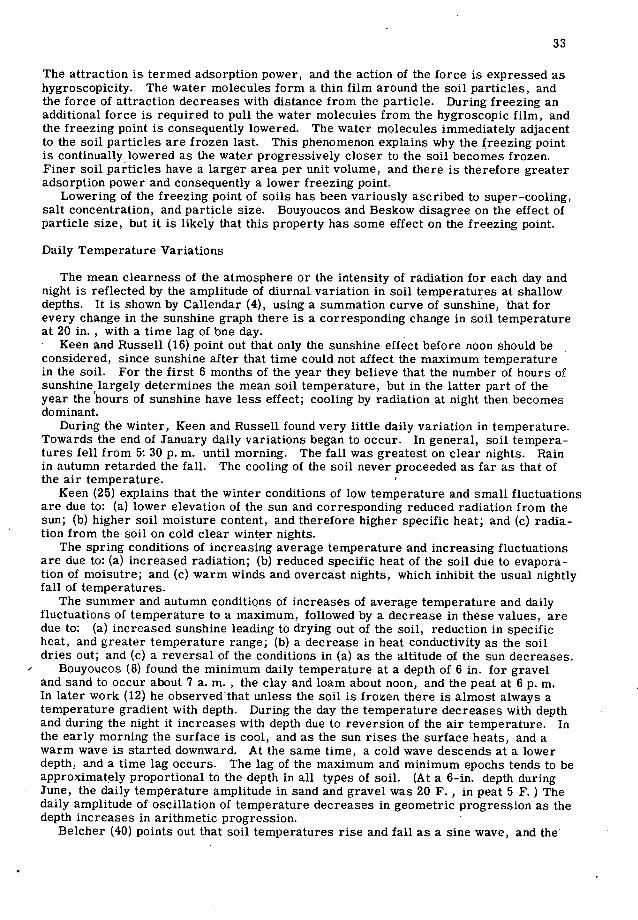
33
The attraction is termed adsorption power, and the action of the force is expressed as hygroscopicity. The water molecules form a thin film around the soil particles, and the force of attraction decreases with distance from the particle. During freezing an additional force is required to pull the water molecules from the hygroscopic film, and the freezing point is consequently lowered. The water molecules immediately adjacent to the soil particles are frozen last. This phenomenon explains why the freezing point is continually, lowered as the water progressively closer to the soil becomes frozen. Finer soil particles have a larger area per unit volume, and there is therefore greater adsorption power and consequently a lower freezing point.
Lowering of the freezing point of soils has been variously ascribed to super-cooling, salt concentration, and particle size. Bouyoucos and Beskow disagree on the effect of particle size, but it is likely that this property has some effect on the freezing point.
Daily Temperature Variations
The mean clearness of the atmosphere or the intensity of radiation for each day and night is reflected by the amplitude of diurnal variation in soil temperatures at shallow depths. It is shown by Callendar (4), using a summation curve of sunshine, that for every change in the sunshine graph there is a corresponding change in soil temperature at 20 in. , with a time lag of bne day.
Keen and Russell (16) point out that only the sunshine effect before noon should be considered, since sunshine after that time could not affect the maximum temperature in the soil. For the first 6 months of the year they believe that the number of hours of sunshine largely determines the mean soil temperature, but in the latter part of the year the hours of sunshine have less effect; cooling by radiation at night then becomes dominant.
During the winter, Keen and Russell found very little daily variation in temperature. Towards the end of January daily variations began to occur. In general, soil tempera-tures fell from 5: 30 p. m. until morning. The fall was greatest on clear nights. Rain in autumn retarded the fall. The cooling of the soil never proceeded as far as that of the air temperature.
Keen (25) explains that the winter conditions of low temperature and smailfiuctuations are due to: (a) lower elevation of the sun and corresponding reduced radiation from the sun; (b) higher soil moisture content, and therefore higher specific heat; and (c) radia-tion from the soil on cold clear winter nights.
The spring conditions of increasing average temperature and increasing fluctuations are due to: (a) increased radiation; (b) reduced specific heat of the soil due to evapora-tion of moisutre; and (c) warm winds and overcast nights, which inhibit the usual nightly fall of temperatures.
The summer and autumn conditions of increases of average temperature and daily fluctuations of temperature to a maximum, followed by a decrease in these values, are due to: (a) increased sunshine leading to drying out of the soil, reduction in specific heat, and greater temperature range; (b) a decrease in heat conductivity as the soil dries out; and (c) a reversal of the conditions in (a) as the altitude of the sun decreases.
Bouyoucos (8) found the minimum daily temperature at a depth of 6 in. for gravel and sand to occur about 7 a. m. , the clay and loam about noon, and the peat at 6 p. m. In later work (12) he observedthat unless the soil is frozen there is almost always a temperature gradient with depth. During the day the temperature decreases with depth and during the night it increases with depth due to reversion of the air temperature. In the early morning the surface is cool, and as the sun rises the surface heats, and a warm wave is started downward. At the same time, a cold wave descends at a lower depth, and a time lag occurs. The lag of the maximum and minimum epochs tends to be approximately proportional to the depth in all types of soil. (At a 6-in, depth during June, the daily temperature amplitude in sand and gravel was 20 F., in peat 5 F.) The daily amplitude of oscillation of temperature decreases in geometric progression as the depth increases in arithmetic progression.
Belcher (40) points out that soil temperatures rise and fall as a sine wave, and the

34
amplitude of the wave varies inversely with depth. The diurnal temperature variation is not generally noticed below two or three feet. In his investigation of surface soil temperatures, Smith (20) developed a special thermometer. Using the instrument, which he considered to be more accurate than an ordinary thermometer, he found several interesting features in the surface temperatures. Just before sunrise the sur-face soil was generally cooler than the air 1/2-in, above it. Peat was seldom more than 1. 5 F. colder, but mineral soil was often as much as 4. 5 F. lower than the air above it. When the air temperature was near freezing no great differences were noted. On calm spring nights, especially when the humidity was high, the surface of mineral soils was as much as 5. 1 cooler than air.
Diurnal changes in temperature were observed to a depth of 12 in. Maximum tem-perature at a depth of 12 in. occurred about three hours later than the maximum sur-face temperature. The minimum at 12 in. occurred five hours later than the minimum surface temperature. In a subsequent publication Smith (27) points out that air changes in volume by 1/491 of its original volume for every degree Fahrenheit change in tem-perature. For this reason, air is inhaled and exhaled by the soil due to diurnal and seasonal temperature changes. This air coming from the atmosphere would tend to equalize soil and air temperatures.
The amplitudes and depths of daily temperature variations are, of course, largely determined by geographical location and local weather conditions. Sunshine, rainfall, and air temperature variation would be expected to have the greatest effect. In general, daily temperature variations do not occur below a depth of 2 ft.
Temperature Inversion with Depth
The temperature inversion due to temperature lag with depth is familiar to all who have studied soil temperatures. More than 100 years ago, Forbes (1) demonstrated • temperature overturn at depths of 3, 6, 12, and 24 ft. (See Fig. 1). Forbes ob-served a decrease in temperature range and a retarding of maximum and minimum temperatures with increase in depth below the surface. Owing to these differences, the temperature curves systematically lag as the depth increases. In trap rock and sand, the range at a depth of 24 ft. was found to be 1/10 that at 3 ft. and the maximum temperature was retarded five months. In sandstone the range at 24 ft. was 1/5 that at 3 ft. and the maximum was retarded only three months. These observations illustrate the appreciable influence of the increased conductivity of sandstone. Theoretically, the annual range ought to decrease in geometric progression as depth increases uniformly. This was shown to be true by Forbes' Observations, and it was calculated that the annual range would be reduced to . 01 C. in trap at 57. 3 French ft. , in sand at 66. 6 French ft. and sandstone at 98. 9 French ft.
At Winnipeg, Manitoba, Thomson (29) observed (Fig. 5) that the lowest temperature in the upper 20 in. was reached on March 13, at 40 in. on March 20th, at 66 in. on March 27, at 9 ft. on May 8 (a lag of three months), at 15 ft. on July 3 (a lag of 6 months). The highest temperature at 9 ft. occurred early in October, and at 15 ft. about December 15. The temperature range at 9 ft. was 14 F. , at 15 ft. was 4 F. and at 20 ft. he presumed that no variation would occur (although the extreme air tem-perature range is 140 F. in this region).
On the average, Thomson found that temperature overturn in soil at Winnipeg began at the end of March in the upper depths and was completed to a depth of. 15 ft. by the beginning of July, (a period of 14 weeks). The fall overturn began at the end of Octo-ber and was completed to 15 ft. before the end of December (a period of 17 weeks).
Bliss, Moore, and Bream (43) observed that temperature overturn in Southern California occurred regularly in the fall and spring to a depth of 7. 5 ft. In the fall, September or October, it was characterized by gradual temperature changes taking from 5 to 7 weeks, while in the spring temperature overturn began in March or April and lasted 7 to 16 weeks.
Hieronymous (48) found no apparent response to seasonal variation of air tempera-ture at a depth of 24 ft. in silt loam. He found time lag at various depths to vary with

35
the kind of soil at different locations and at Jort Fetx MaE Apr. May J1110 July Aug Sept. Oct. Nov D.c
different depths at a given location. - - -- I - - - At Minneapolis, Aigren (55) observed a 6 - - - - - - -
three -week lag behind air temperatures at a , j - - depth of one ft. under bare ground. Varia- (V/ 66
tion at one ft. was 48 degrees, from 75 de- grees , to 27 degrees F. At 16 ft. the varia- 40 - tion was 8 degrees, from 54 degrees to 46 1— - - - - degrees F. At the 16-ft. depth the maximum
24' temperature occurred in November (lag of SU
V ---
three months), minimum pccurred in April.
He deduced that the annual variation at a depth Figure 5. Soil Temperature with Time at depth of 28 ft. would be 2 F. , with an aver- Various Depths, From Thompson (29) age temperature of 50 F. at this depth.
Smith (22) found the temperature lag to vary from 1/2 hour at 1/2-in, depth to 80 hours at the 36-in, depth. In a subsequent publication (27) he found the annual average soil temperatures, at depths ranging from 6 in. to 12 ft. , to be from 65 to 67 F. The annual mean air temperature was 58. 8 F.
Smith (27) reported that McClatchie in Arizona estimated constant temperature at 50 ft. He found the annual range at 5 ft. to be 20 to 25 F. , at 10 ft. to be 15 to 20 F. at 15 ft. to be 10 to 15 F. From his own observations Smith (25) found an annual r.nge of 27 F. at a depth of 4 ft.., 22 F. at 5 ft. , 18 F. at 6 ft. , 14 F. at 8 ft. , 12 F. at 10 ft., 9 F. at 12 ft., in a soil varying from sandy loam to coarse and fine sand. The minimum at 12 ft. occurred 16 weeks later than the minimum at one ft, and the maxi-mum at 12 ft. occurred 15 weeks later than the maximum at one ft. The maximum and minimum at depths ranging from one ft. to 12 ft. was practically a straight line function of the depth.
At Montreal, Callendar and McLeod (5) found annual temperature ranges of 34 F. at 20 in. , 26 F. at 40 in. , 19 F. at 66 in., and 11 F. at 108 in. in a turf-covered area of loose sand. Bouyoucos (8) found that the greatest seasonal amplitude occurred in the summerwith autumn, spring, and winter coming next in order. The yearly aver-age temperature was practically the same for all soils at depths of 6, 12, and 18 in. On a yearly basis, sand had the greatest range, followed in order by gravel, clay, loam, and peat.
Lauchli (10) found temperature amplitude to decrease with depth. In Georgia, he observed a constant temperature of about 61. 5 F. at a depth of 45 ft. Rambaut (11) at Oxford, England, observed a range of 9. 5 F. at a depth of 10 ft. in gravelly soil with grass cover. On an annual average Keen and Russell (16) found the warming of the soil to be much more rapid than the cooling. The soil warms rapidly in the spring, probably due to drying and increased sunshine. Cooling in the winter is retarded due to increased moisture, and radiation on clear fall nights probably accounts for most of the cooling effect.
In comparing Saskatcheqan and Kansas soil temperatures, Harrington (21) noticed that the annual temperature variation at the 6-ft. depth was 21. 5 F. for Saskatchewan and 28. 5 for Kansas, whereas at the one-ft. level the ranges were 67. 5 F. and. 52 F. respectively. This apparent inconsistency is explained by the fact that in Saskatchewan the air temperature varies between greater extremes, as indicated by the one-ft. curves, whereas the general swings indicated by the 6-ft. curves, which are unaffected by daily weather fluctuations, indicate a substantially greater uniformity in mean temperature.
Bliss, Moore, and Bream (43) found the mean weekly air temperature in summer to be considerably higher than the soil temperature at a depth of one ft. This agrees with Harrington (21) but disagrees with Kimbal, Rhunke, and Glover (28) and Smith (22).
The above observations clearly illustrate the wide variations of temperature with depth. Geographical location is certainly a prominent factor influencing temperatures at depths of several feet. Thermal conductivity and moisture content also must have an appreciable effect. It is certain that temperatures at depths within the scope of most engineering work vary throughout the year, and there seems to be no way of estimating

36
closely either the variation or the average without field data obtained in the general area concerned. In temperate climates there is little variation at a depth of 25 ft. , and the average temperature is reasonably close to 50 F.
Frost Penetration and Retreat
To most engineers the understanding of frost action is the most important aspect of soil temperatures. A great deal of work has been done in this field, but in this paper frost action will be dealt with only in its relation to soil temperatures.
Thomson (29) noted that frost penetration begins early in November at Winnipeg. In the spring the frost begins to retreat at the surface and at its lower level at about the same time. The last frost -in the soil is found at about a depth of 4 ft. late in April or early in May. In a severe winter frost penetrated about 20 in. a month to a depth of about 7 ft.
Beskow (30) describes the frost line as an isotherm that has a very large resistance to movement due to the large amount of heat absorbed or extracted during freezing or thawing of the soil water. Thus, great temperature variations in the surface soil are absorbed at the frost line as it slowly penetrates.
According to Keen (25), if the temperature begins to fall below freezing at the lower frost line, more ice is formed and the temperature returns to freezing, due to the evolution of latent heat. The net result, therefore, is a slow increase in the depth of frozen soil. Lang (42) noticed that when the air temperature became warmer at various times during the winter, the soil thawed at the bottom.
Harrington (21) reports frost penetration to a depth of 6 ft. in Saskatchewan. It was believed that the depth reached by the •frost line is largely controlled by such factors as the depth of snow, character and amount of vegetation, kind and texture of soil, and severity and duration of the winter. Since the 8-ft. depth reachesits minimum tem-perature in April or May, the danger to water pipes at this depth is greatest in the spring. This conclusion is borne out by experience.
In 1930 Sourwine (24) attempted an analysis of frost occurrence on a broad scale using available meteorological records to predict average frost penetration over vari-ous areas of the United States. Considerations of modifying effects on ground tempera-tures due to type of soil, density, moisture content, topography, or surface cover were neglected. Rather, the intensity, duration, and frequency of low air-temperature oc-currence over a period of years was chosen as a criterion for analysis. The determined values were subject to modification according to local conditions.
The depth of frost penetration may be approximated by a correlation between the accumulated degree-days of temperature below a given point and actual measurement of the frozen layers. This relation was first noticed by Casagrande (26) in 1931. Belcher (40) realized from a study of the rate of change of temperature and the temper-ature penetration curves that there may be some correlation between the more rapid accumulation of temperature below freezing, producing a greater depth of penetration per time -temperature unit. At Winnipeg the average number of degree-days per in. of penetration is 48 at depths of 10, 20, 40, and 65 in.
Shannon (49) considers the main factors influencing frost penetration to be the mag-nitude and duration of below-freezing air temperatures, the thermal properties of the soil, the surface cover, and the temperature conditions within the soil at the start and during freezing. The summation of the magnitude and duration of air temperatures is termed the freezing index. Thermal properties of soil vary with type, moisture con-tent, density, and whether frozen or unfrozen. Naturally, frost will penetrate deeper if the soil temperature is near freezing when freezing begins. The depth of frost pen-etration can be related to the freezing index and Shannon's study presents a comparison. Freezing index frequently can be calculated from available meteorological records and a probability curve plotted.. From the probable freezing index, the depth of frost can be estimated. Moisture and cover conditions vary from year to year and will alter empirical deductiors using the freezing index.
A theoretical treatment is given to the "freeze" penetration into soil by Berggren

37
(46). It is difficult to apply Berggren's analysis in practice, since thermal character-istics and temperature conditions of the soil must be known. Nevertheless, some in-teresting conclusions may be drawn. Firstly, for a fixed sub-freezing temperature suddenly applied at the surface, the depth of soil frozen increases with the square root of time. Departure of the initial temperature -distribution from uniformity has little effect on.the rate of penetration, because the soil heat-capacity is ordinarily small, relative to the latent heat of fusion. The frost layer increases at a smaller rate for wetter soils, because of greater heat of fusion and despite greater thermal conductivity. Secondly, in the frozen zone and for an equal distance beyond the temperature distribu-tion may, for practical purposes, be considered linear (though having different slopes in each zone). Shannon's computations indicate that Berggren's formula yields frost penetrations that are about 50 percent too great.
In the study of frost penetration Fuller (39) observed that air temperatures penetrate gravel more rapidly than clay. At Portland, Maine, frost penetrated to 45 in. in gravel and remained there from February 27 until March 7, when the ground began to thaw at the bottom. In clay, frost penetrated to a depth of 48 in. The frost penetrated much more rapidly into the gravel at the commencement of freezing, but at the beginning of January the frost line in clay overtook the frost line in gravel. Frost depth had a close relationship to the cumulative degree-days of below-freezing air temperature. It took about half as long for the frost to leave the ground as it did to penetrate to the low point. A similar observation was made by Keen and Russell (16). A chart was prepared which could be used to estimate changes in the frost line using degree-days of below-freezing air temperature.
Highland (19) made a survey of observed frost penetration under streets in American and Canadian cities and towns. In addition, he obtained a record of the depth at which water mains are placed in these areas. In 1938 the maximum frost penetration record-ed in 100 cities was published in "Heating and Ventilating" (35) together with a frost penetration map of the United States.
A five-year program investigating temperature variations in concrete pavement and the underlying subgrade has been reported by Swanberg (50). Frost penetration was correlated to degree-days of freezing air temperatures. Cycles of freezing and thawing at various depths were noted.
Shannon and Wells (51) state that from the point of view of thermal conductivity, it would seem that frost penetration would be greater in wet soil than in dry soil. This was not found to be the case however. A change in moisture content from 5 to 10 percent will increase the sum of the volumetric heat and the latent heat by about 100 percent and will increase the conductivity only about 20 percent. Thus the depth of frost penetration will generally be greatest in a given soil at zero moisture content and will become less with increasing moisture content.
Frost penetration and retreat is an important engineering problem. The depth of frost penetration is of vital importance to waterworks departments in northern latitudes. In recent years several attempts to forecast the depth of frost penetration have been made with reasonable success. The methods employed by Fuller (39) and Shannon (49), both based on the criterion of "freezing index," appear to be the most notable. Once again moisture content is the complicating factor. No method has yet been advanced which would take into account soil moisture in frost predictions, although it is probably next to air temperature in importance.
Conclusion
This review shows clearly that a wealth of information is available in published records on even such a specialized subject as soil-temperature variations. Corre-spondingly, the survey of the available published information shows evident gaps in the overall picture of soil-temperature phenomena and points the way quite clearly to a number of relevant questions still unanswered. All the records of soil-temperature variation with depth which have been examined follow the pattern which would be ex-pected from the basic physics of the problem, having regard to the internal heat of the
38
earth on the one hand and the variations in air temperature and solar radiation on the other. Variations in soil temperature close to ground surface, however, show them-selves to be susceptible to a number of other factors, some of which are controllable. Study of these factors is one direction in which more research is needed with reference to frost action.
Dominating all intrinsic factors which affect soil-temperature variation is the mois-ture content of the soil. As studies of this matter have progressed, it has become clear that the water present in soil affects internal heat flow in a much more complex manner than its presence might ordinarily suggest. The full implications of the dynamics of moisture-vapor movement in relation to soil temperatures have still to be investigated, and this fact directs attention to the significant omission from almost all records of any reference to the position of the ground-water table at the experimental site. Of equal significance is the almost complete neglect of the density or state of compaction of the soils in which records have been taken. Much study and experimentation will be nec-essary before the true role of these factors can be evaluated. Enough is now known, however, to render possible the suggestion that upon these two factors in particular depends to a large extent the full understanding of frost action in soil.
Bibliography
Forbes, James D., "Account of Some Experiments on the Temperature of the Earth at Different Depths, and in Different Soils, near Edinburgh," Transactions, Royal Society of Edinburgh, Vol. XVI, 1846.
Thompson, W. "On the Reduction of Underground Temperatures," Transactions, Royal Society of Edinburgh, Vol. 22, p. 410, 1860.
Everett, J. D., "On a Method of Reducing Observations of Underground Tem-peratures," Transactions, Royal Society of Edinburgh, Vol. XX, p. 430, 1860.
Callendar, H. L., "Preliminary Results of Observations of Soil Temperatures with Electrical Resistance Thermometers Made at the McDonald Physics Building, McGill University, Montreal," Transactions, Royal Society of Canada, Second Series, Vol. I, Sec. 3, pp. 63-84, May 1895.
Callendar, H. L. and McLeod, C. H., "Observations of Soil Temperatures with Electrical Resistance Thermometers," Proceedings and Transactions, Royal Society of Canada, Second Series, Vol. II, Sec. 3, pp. 109-126, May, 1896.
Callendar, H. L., "Observations of Soil Temperatures with Electrical Resist-ance Thermometers," Transactions, Royal Society of Canada, Second Series, Vol. III, pp. 31-49, 1897-98.
Patten, H. E., "Heat Transference in Soils," US Dept. of Agriculture, Bureau of Soils, Bulletin No. 59, 54 pp. , 1909.
Bouyoucos, G. J., "An Investigation of Soil Temperatures and Some of the Factors Influencing It," Michigan Agricultural College, Exp. Sta., Technical Bulletin No. 17, 196 pp., February, 1913.
Bouyoucos, G. J., "Effects of Temperature on Movement of Water Vapor and Capillary Moisture in Soils," Journal of Agricultural Research, Vol. V, No. 4, pp 141-172, October, 1915.
Lauchli, E., "Ground Temperature Variations Decrease with Depth," Engi-neering News, Vol. LXXIV, No. 11, pp. 510-511, September, 1915.
Rambaut, A. A., "Results of Meteorological Observations," Also, "Underground Temperatures in Twelve Years,1898-1910," Radcliffe Observations, Radcliffe Observ-atory, Oxford, Vol. LI, Oxford University Press, London, pp. 103-215, 1916.
Bouyoucos, G. J., "Soil Temperature," Michigan Agricultural College, Exp. Sta., Technical Bulletin No. 26, 133 pp., January, 1916.
Bouyoucos, G. J. and McCool, M. M., "Further Studies on the Freezing Point Lowering of Soils," Michigan Agricultural College, Exp. Sta. , Technical Bulletin No. 31, 51 pp. , Novembe,, 1916.
.14. Franklin, T. B., "The Effect of Weather Changes on Soil Temperatures," Proceedings of Royal Society of Edinburgh, Vol. XL, pp. 56-79, 1919.

39
Bouyoucos, G. J., "Degree of Temperature to Which Soils Can be Cooled Without Freezing," Journal of Agricultural Research, Vol. XX, No. 4, pp. 267-269, November, 1920.
Keen, B. A. and Russell, E. J., "The Factors Determining Soil Temperature," Journal of Agricultural Science, Part 3, Vol. XI, pp. 211-239, July, 1921.
Shanklin, G. B., "The Effects of Moisture on the Thermal Conductivity of Soils," Transactions, American Institute of Electrical Engineers, Vol. XLI, pp. 94-101, 1922.
Bouyoucos, G. J. and McCool, M. M., "A Study of the Causes of Frost Occur-rence in Muck Soils," Soil Science, Vol. XIV, pp. 383-389, November, 1922.
Highland, S. G., "Study of Year-Round Soil Temperatures," Journal American Water Works Association, Vol. XVI, No. 3, pp. 342-354, September, 1926.
Smith, A., "A Contribution to the Study of Interrelations Between the Temper-atures of the Soil and of the Atmosphere and a New Type of Thermometer for Such Study," Soil Science, Vol. XXII, No. 6, pp. 447-457, December, 1926.
Harrington, E. L., "Soil Temperatures in Saskatchewan," Soil Science, Vol. XXV, No. 3, pp. 183-194, March, 1928.
Smith, A., "Daily and Seasonal Air and Soil Temperatures at Davis, California," Hilgardia, Vol. 4, No. 3, pp. 77-112, May, 1929.
Smith, A., "Comparisons of Daytime and Nighttime Soil and Air Temperatures," Hilgardia, Vol. IV, No. 10, pp. 241-272, December, 1929.
Sourwine, J. A., "A Method of Analysis of Data on Frost Occurrence for Use in Highway Design," Public Roads, Vol. XI, No. 3, pp. 51-60, May, 1930.
Keen, B. A. , "Soil Temperatures," The Physical Properties of Soil, Ch. 9, Longmans, Green and Co., London, pp. 295-333, 1931.
Casagrande, A., "Discussion on Frost Heaving," Proceedings, Highway Re-search Board, Part I, Vol. XI, pp. 168-172, 1931.
Smith, A., "Seasonal Subsoil Temperature Variations," Journal of Agricultural Research, VoL XLIV, No. 5, pp. 421-428, March, 1932.
Kimball, D. A., Rhunke, G. M., and Glover, M. P., "A Comparison of Tem-peratures in Air and at Various Depths in a Light Sandy Soil in Southern Ontario Scientific Agriculture, Canada, Vol. XIV, No. 7, pp. 353-359, March, 1934.
Thomson, W. A., "Soil Temperatures at Winnipeg, Manitoba," Scientific Agriculture, Canada, Vol. XV, No. 4, pp. 209-217, December, 1934.
Beskow, G. , "Tjalbildningen och Tjallyftninger" (Soil Freezing and Frost Heav-ing; with Special Reference to Highways and Railroads). Statens Vaginstitut, Meddelande 48, Sveriges Geologiska, Undersokning, Ser. C., No. 375, Stockholm, 242 pp. , 1935.
Mail, G. A., "Soil Temperatures at Bozman, Montana, During Subzero Weather," Science, Vol. LXXXIII, No. 2163, p. 574, June, 1936.
"Directions for the Determination of Thermal Resistivity of the Ground," Technical Report Ref. F/S5, The British Electrical and Allied Industries Research Association, 15 Savoy St. , London, W. C. 2.
Mabee, W. C. , "Lessons from the Winter of 1935-36," Journal, American Water Works Association, Vol. XXIX, No. 1, pp. 7-8, January, 1937.
Smith, W. 0. and Byers, H. G., "The Thermal Conductivity of Dry Soils of Certain of the Great Soil Groups," Proceedings, Soil Science Society of America, Vol. III, pp. 13-19, 1938.
"Frost Penetration in Ground," Heating and Ventilating, Vol. XXXV, No. 6, pp. 53-56, June, 1938.
Smith, W. 0., "Thermal Conductivities in Moist Soils," Proceedings, Soil Science Society of America, Vol. IV, pp. 32-40, 1939.
Atkinson, H. B. and Bay, C. E., "Some Factors Affecting Frost Penetration," Transactions, American Geophysical Union, Part 3, pp. 935-947, 1940.
Winn, H. F. and Rutledge, P. C., "Frost Action in Highway Bases and Sub-grades," Purdue University Engineering Bulletin, Vol. XXIV, No. 2, (Research Ser. No. 73, Highway Research Bulletin No. 4,)104 pp., May, 1940.
Fuller, H. U. "Studies of Frost Penetration," Journal, New England Water Wprks Association, Vol. LIV, No. 3, pp. 275-281, September, 1940.
40
Beicher, D. J., "Subgrade Soil Temperatures," Proceedings, Purdue Con-ference on Soil Mechanics and its Applications, Purdue University, Symposium on Frost Action, pp. 474-482, September, 1940.
Belotelkin, D. T., "Soil Freezing and Forest Cover," Transactions, American Geophysical Union, Part I, pp. 173-175. 1941.
Lang, F. C., "Temperature and Moisture Variations in Concrete Pavements," Proceedings, Highway Research Board, Vol. XXI, pp. 260-271, 1941.
Bliss, D. E., Moore, D. C. and Bream, C. E., "Air and Soil Temperatures in a California Date Garden," Soil Science, Vol. LIII, pp. 55-64, 1941.
Smith, W. 0., "The Thermal Conductivity of Dry Soil," Soil Science, Vol. LIII, No. 6, pp. 435-459, June, 1942.
Griffiths, E., "The Measurement of the Thermal Conductivity of Materials used in Building Construction," Inst. Heat. Vent. Engi. J. , Vol. X, No. 112, pp. 106-138, 1942.
Berggren, W. P., "Prediction of Temperature Distribution in Frozen Soils," Transactions, American Geophysical Union, Part 3, pp. 71-77, 1943.
Smith, W. 0., "Thermal Transfer of Moisture in Soils," Transactions, Amer-ican Geophysical Union, 1943.
Hieronymus, G., "Earth Ambient Temperatures for Cable Loading Limits," Electrical World, Vol. CXXII, No. 24, pp. 92-93, December, 1944.
Shannon, W. L., "Prediction of Frost Penetration," Journal, New England Water Works Association, Vol. LIX, No. 4, pp. 356-363, December, 1945.
Swanberg, J. H., "Temperature Variations in a Concrete Pavement and the Underlying Subgrade," Proceedings, Highway Research Board, Vol. XXV, pp. 169-180, 1945.
Shannon, W. L. and Wells, W. A., "Tests for Thermal Diffusivity of Granular Materials," Proceedings, American Society for Testing Materials, Vol. XLVII, pp. 1044-1055, 1947.
Bayer, L. D. "Soil Physics," Chapter 8, John Wiley and Sons, N. Y., pp. 288-310, 1948.
Kersten, M. S. , "Thermal Properties of Soils," University of Minnesota, Institute of Technology Bulletin No. 28, 221 pp., June, 1949.
Alicut, E. A., "Thermal Conductivity Tests and Results," School of Engi-neering Research, Faculty of Applied Science and Engineering, University of Toronto, Bulletin No. 182, 1949.
Aigren, A. B., "Ground Temperatures as Affected by Weather Conditions," Heating, Piping and Air Conditioning, pp. 111-116, June, 1949.
Legget, R. F. and Peckover, F. L., "Soil Temperature Studies - A First Progress Report," Highway Research Board, December, 1949.
Hooper, F. C. and Lepper, F. R., "Transient Heat Flow Apparatus for the Determination of Thermal Conductivities," Presented at the Semi-Annual Meeting of the American Society of Heating and Ventilating Engineers, June, 1950.
Ingersoll, L. R. and Koepp, 0. A., "Thermal Diffusivity and Conductivity of Some Soil Materials," Physical Review, Vol. V, No. 12, pp. 92-93, July, 1924.
Wintermeyer, A. M.., "Percentage of Water Freezable in Soils," Public Roads, Vol. V, No. 12, pp. 5-8, February, 1925.
British Electrical and Allied Industries Research Association, "Supplement to Report, Reference F/T12, on the Heating of Buried Cables," British Electrical and Allied Industries Research Association, Tech. Report. , Reference F/T15, 1925.
Johnston, W. A., "Frozen Ground in the Glaciated Parts of Northern Canada," Transactions, Royal Society of Canada, Third Ser., Vol. XXIV, Sec. 3, pp. 31-40, 1930.
Dockstader, E. A., "Effect of Freezing and Thawing of Soil Under Foundations of Cold Storage Warehouse," Proceedings, International Conference on Soil Mechanics and Foundation Engineering, Harvard University, Vol. II, pp. 171-173, June, 1936.
MackintosI, A., "Progress Report of an Investigation of Frost Action in Soils," Proceedings, International Conference on Soil Mechanics and Foundation Engineering,

41
Harvard University, Vol. II, pp. 260-262, rune, 1936. Fuller, H. U., "Frost Penetration as Affected by Weather and Snow Conditions,"
Journal, New England Water Works Association, Vol. L, No. 3, pp. 299-301, September, 1936.
Ruedy, R., "Soil Temperatures in Canada," National Research Council of Can-ada," Ottawa, NRC 685, 11 pp., 1937.
Arndt, W. J., "Temperature Changes and Duration of High and Low Temper-atures in a Concrete Pavement," Proceedings, Highway Research Board, Vol. XXIII; pp. 273-279, 1943.
Shannon, W. L., "Frost Investigations at Dow Field, Bangor, Maine," Proceed-ings, Highway Research Board, Vol. XXIV, pp. 71-86, 1944.
Cooling, L. F. and Ward, W. H., "Damage to Cold Stores Due to Frost Heaving," Journal, Institute of Refrigeration, Proc., pp. 41, 37-58, 1944-45.
Dill, Robinson and Robinson, "Measurements of Heat Losses from Slab Floors," Report BMS 103, Bldg. , Materials and Structures, National Bureau of Standards, March, 1945.
White, R. G., "Installations for Noting the Water and Thermal Relationships in Soil," Agricultural Engineering, Vol. XXXVII, pp. 21-25, 1946.
Bouyoucos, G. J., "A New Electrical Resistance Thermometer for Soils," Soil Science, Vol. LXIII, No. 4, pp. 291, 298, April 1947, Highway Research Board, Abstracts, No. 141, p. 4.
Beskow, G., "Scandinavian Soil Frost Research of the Past Decade," Proceed-ings, 27th Annual Meeting, Highway Research Board, December, 1947.
Johnson, A. W., "Frost Action in Highway Subgrades and Bases," Parts 1 and 2, Engineering and Contract Record, Vol. LX, No. 11, pp. 66-68, 70-83, November,. 1947. Vol. LXI, No. 4, pp. 74-76, April, 1948.
Coleman, J. D., "Soil Thermodynamics and Road Engineering," Nature, Vol. CLXIII, No. 4134, pp. 143-145,.January, 1949.
Misener, A. D., "Temperature Gradients in the Canadian Shield," Can. Mining and Metallurgical Bulletin, Vol. XLII, No. 446, pp. 280-287, June, 1949.
Langbein, W. B., "Computing Soil Temperatures," Transactions, American Geophysical Union, Vol. XXX, No. 4, pp. 543-547, August, 1949.
SOME FIELD MEASUREMENTS OF SOIL TEMPERATURES IN INDIANA
E. J. Yoder, Research Engineer, and C. R. Lowrie, Jr., Research Assistant Joint Highway Research Project, Purdue University
Synopsis
This report covers the results of field measurements of soil tempera-tures made under an asphaltic- pavement. -Temperature gauges which actu-ated automatic recording instruments were installed at various depths below the pavement.
The progression of heat waves through the soil, the depth of 32 F: (mean temperature), and the depth of minimum temperatures of 32 F. have been plotted against time. During the winter months measurements were made manually of depth of frost penetration, depth of show cover, ground water fluctuations, and moisture content of the soils.
No definite conclusions have been drawn from the data other than veri-fication of several important facts brought out by previous investigators. It is indicated, however, that more attention should be directed towards considering minimum daily temperatures in a study of this type. Since this type of research is of necessity a long range study, the accumulation of data over a period of years is desirable in order to better correlate the factors affecting soil temperature.

42
One of the problems remaining largely unanswered in soils engineering is that con-cerning the rate of heat transfer in natural soil strata and its effect on the soil structure. This is particularly true with regard to frost action and other problems associated with roads built in areas subjected to extended periods of freezing weather. The criteria governing the design of engineering structures are that they have sufficient strength to enable the structure to support the loads put upon it and are durable, i. e. , able to with-stand loads over a period of time.
It is necessary to design for the worst conditions likely to occur. In areas subjected to freezing temperatures frost action is one of the major factors to be considered. Much work has been done in the laboratory and the field on frost action and its effects on road stability. Laboratory studies by Winn (1) have shown the mechanics of frost action. Further studies in the field have indicated the unfavorable conditions conducive to severe spring breakup (2) (3).
The effects of frost cannot be fully understood until some knowledge is gained re-garding heat transfer in natural soils and seasonal variations of soil temperatures. The agriculturalist has been interested for many years in soil temperatures, primarily from the standpoint of plant growth. Studies of this type have been reported by Radcliffe (4), Bouyoucos (5), and others. In recent years engineers have turned their interest to soil temperatures primarily from the standpoint of predicting depth of frost penetration.
It is obvious depth of frost penetration depends to a very large extent on type of cover. From this standpoint the data presented in this paper are incomplete in that only soil temperatures measured under a bituminous surface are presented. Also, a large portion of the data were obtained during the comparatively mild winter months of 1949-1950.
Factors Affecting Soil Temperature
Foremost among the factors affecting soil temperature is source and amount of heat given to the soil. The primary source of heat is the radiation of the sun; heat trans-ferred to the soil by conduction is comparatively less. Latitude of the location has an important bearing on amount of heat absorbed per unit area of surface. Other factors, e. g., dust and water vapor in the atmosphere, also affect the quantities of heat absorbed by the soil.
The movement of heat into or out of a soil depends upon the difference in temperature between the surface and the atmosphere. Heat flows from a warmer object to cooler surroundings. For a given soil condition, soil temperatures depend upon daily and seasonal fluctuations in air temperature and upon the amount of radiant heat reaching the surface from the sun.
Freezing of soil in nature depends upon the duration of low air temperatures to a large extent. It is customary to measure time and temperature by degree-days. One degree-day below freezing represents one day with a mean temperature of 31 F. Cas-agrande (6) found a good correlation between an accumulative plot of degree-days, depth of frost penetration; and pavement heave due to frost. The Corps of Engineers has made use of degree-days in predicting the depth of frost penetration (7).
The effect of type of cover, both in regard to quantity and color, has been known for some time. Bayer (8) brings out that frost penetration is deeper and its disappearance slower under bare ground than under grass cover, since grass acts as an insulating layer to the soil. Bayer states that there is "ample evidence that soils in forests with a good surface litter freeze only to a rather shallow depth during the coldest winter."
Schubler and Woliny (8) studied the effect of soil color on temperature. These studies brought out that the temperature of soil under dark objects is higher than the natural soil while that under white objects is lower. Wollny also observed that dark soils are warmer during the warmer seasons and greater fluctuations in temperature occur under dark soils. He further states that the effect of color is less pronounced with depth.
The effect of snow cover has been known for many years, both from the standpoint of the farmer and engineer. Farmers are aware of the beneficial effect of snow cover on winter grains. All data show that unless the air temperatures falls very low, the

43
depth of freezing in soils under a cover of snow is quite limited. The engineer is concerned with the freezing of soils under and adjacent to highways.
In 1944 and 1945 the Corps of Engineers made a very extensive frost investigation to determine means of predicting depth of frost penetration (7). Later a report was made covering a study of the transfer of heat through pavements (9). The later report stated that a correction factor should be applied to the degree-day values used in the prediction procedures - the magnitude of this correction was recommended as 0. 75 for asphalt and 0. 90 for portland-cement concrete.
Heat transferred from the air to the soil must pass through the pavement. This causes a time lag between changes in air temperature and the corresponding changes in pavement temperatures (as verified by the Army investigation and by data taken at Purdue.) Thus, the temperature of the surface cover must be considered in a study of soil temperatures.
The physical characteristics of the soil itself determine to a large extent its ability to conduct and to absorb heat. A study of the thermal conductivity of soils was made in 1909 by Patten (10). Further studies were made by the Corps of Engineers, both by the New England divisions (11) and by Kersten at the University of Minnesota (12). These studies indicated that the rate of heat 'transfer depends on soil density, moisture, and texture. Kersten found that the coefficient of thermal conductivity was greater for fro-zen soils than for unfrozen soils. He also found that at constant moisture contents in-creases in density resulted in increases in thermal conductivity; likewise, for constant density, increases in moisture result in increases in thermal conductivity.
The specific heat of a material is defined as the quantity of heat (calories) required to raise the temperature of one gram of the material one degree centigrade. The specific heat of water is 1. 0, while that of ice is 0. 5. In contrast, the specific heat of dry soil as determined by Long and also by Ulrich is approximately 0. 25 (8). It can be seen there-fore, that the heat capacity of soil is affected by the quantity of moisture in the soil.
Purpose of Soil Temperature Studies at Purdue
In May of 1938 a program was initiated at Purdue by the Joint Highway Research Project to make a study of frost action in soils to clarify some of the factors affecting frost damage to the highway system of Indiana. These initial studies were directed toward a laboratory study of the mechanics of frost action (1). Further, a great amount of work was done in connection with spring break-up (2). In order to better correlate the field and laboratory studies, soil temperature gauges were installed at the Joint Highway Research Project test-road. These data were first reported by Beicher in 1940.
It was the purpose of this study to accumulate seasonal data of soil temperatures in an attempt to find a correlation between these temperatures and rate and depth of frost penetration.
Concurrently with these studies, a laboratory investigation was made of the mechanics of soil freezing and the effect of freezing and near-freezing temperatures on soil strength. A study was also made on the effect of temperature on soil moisture and in turn the ef-fect of soil moisture on stability.
Description of Field Temperature Gauge Installations - The soil temperature gauges were installed under a flexible pavement composed of 1-in, bituminous material on top of 6 in. of stabilized gravel. The subgrade was a silty clay of Wisconsin Drift age. A layer of sand-clay was encountered below a depth of 40 in. at this particular site. (The cross-section of the pavement is shown in Fig. 1). Figure 2 shows the grain-size dis-tribution curves for the various soil layers.
The gauges were initially installed at the surface of the pavement, and at 3-1/2, 7, 12, 18, and 24 in. They were automatic recording three-pen instruments. These temperature gauges were actuated by pressure variations in capillary tubes produced by changing temperatures. The gauges were installed at the edge of the pavement, each gauge extended into the pavement and subgrade approximately 12 in.
In the fall of 1949 these gauges were taken up and new gauges installed in their place,

44
except that they were placed at depths of 3-1/2, 7, 12, 18, 24, and 42 in. , measured from the surface of the bituminous pavement. These gauges were similar to those previously, used except they were two-pen type. Figure 3 shows the gauge lead-in cables installed in the ground.
Air temperatures, precipitation, and bar- ometric pressures were measured concur- 8
rently with soil temperatures. All the 8IUMINOUS SURFACE
gauges were automatic and recorded values
'
EAPROX.
continuously, making it necessary to change : MP GRAL the chart on the instruments only once each j0
0 0 0 0
' week. These automatic gauges proved quite , satisfactory.
During the winter months measurements were also made manually of depth of frost penetration, depth of snow cover, ground water fluctuations, and moisture content of
SILTY CLAY
soils as well as any other information that might be pertinent.
Soil Temperature Measurements - As was previously mentioned, the soil temper-ature gauges were first installed in 1940. Up until the fall of 1949, the records con- SAND CLAY - cerning ground water fluctuations, moisture L.L. 23
content, snow cover, and depth of frost P.L.- 6
penetration are incomplete. In addition some Figure 1. Cross Section Joint Highway Re-difficulty was encountered in the clock mech- search Project Test Road Showing Depth of anism of the gauges. Therefore, the data Thermometer Bulbs
for these years are incomplete, and for periods are entirely lacking. Nevertheless, the data shows some interesting facts.
Figure 4 shows the average results for the winter months of the 3-year period, 1943-1946. On this graph is plotted air and soil temperatures based on weekly mean values, and the accumulated degree-days below 32 F. It will be noted that although the air temperature fell well below 32 F. during the third week in December, the soil temperatures did not fall appreciably below 32 F. Also, the temperature immediately below the base course did not reach 32 F. until a week after temperatures of 32 F. were recorded at 3-1/2 in.
It can be further noticed that, in general, the temperature of the pavement was higher than that of the air. It is to be remembered that this pavement was of asphaltic type; being black in color it would tend to have somewhat higher temperatures than the
iiiiii 111111H11111111111111111Ul1111H1 Ulilill Iiii!iffli!!IIIOSIIIIHIIUllIIIIII uIuIIHIIuIIh;uImIIIHlII•IIllIHI
iiIillii•liIIIhIhIIO•ii!IIUUIUlHi uuiuiiii•iunuoiuuuiiuuum 1111111
UlUIlHIIIIIIIHIIIIIflIIIIIlHI
. 1111111 • •IIIIIIIIRIIIIIllIUIIIIflllIIiill!IRii!!III
IIIIHIIIIIIIllIUIIIIIIOSillPI#!!IIlI •IIIIIIII•lIUIIII•lIIIIIIIUUIIIII!IIIIIIlI
Figure 2. Grain Size Distribution Curves

45
air, due to absorption of heat from the sun's rays; in contrast, the average air tempera- ture was somewhat higher than the pavement - in the spring of the year. This demonstiafe that in the interl)retatiOn of soil temperatures --'-; due consideration should be given to surface - temperatures, since these are the tempera- tures affecting soil temperatures at greater depths.
The Corps of Engineers recommends a factor of 0. 75 be applied to degree-day values used in formulas for predicting depth of frost penetration beneath asphaltic pave- ments (8) For this paiticular 3-year aver- age the r itin of maximum degree-days based on pavement temperature to that based on 'iii temperature was approximately 0 55
The curves of Figure 4 illustrate how heat progressed through the soil. This is illustrated by noting that during the later days of December and the early purl of " ranuary temperatures at 3-1/2 in. increased Figure 3. Close-Up of Soil Temperature slightly, as did the air and surface temper- Gauge Lead-In Cable atures. However, during this period the temperatures at 7, 12, 18, and 24 in. continued to decrease. The temperatures at 24 in. reached a minimum a short time after maximum degree-days were recorded.
Heat transfer is further illustrated in Figure 5. Here it can be seen that, for the 5-week period shown, a warm layer existed at 12 in. with a cooler layer at 18 in. ,then a warmer layer again at 24 in.
This is further illustrated in Figure 6. Here is shown penetration of 32 F. both daily mean and minimum plotted against time for the winter of 1945-1946. These curves indicate that the rate of decrease in soil temperature during the fall and winter is much slower than the rate of increase in the spring. For example, the temperature at the surface was 32 F. degrees (based on mean values) in the early part of December; then the soil temperatures were gradually lowered until a mean temperature of 32 F. was recorded at 18 in. depth in the later part of February. This time coincides approx-imately with the time maximum degree-days were recorded. However, the ground soon warmed up as air temperatures rose. That the ground thawed from the bottom as well as the top is illustrated by the slight break in the curve at 3-1/2 and 7 in. during the thawing period.
These curves also indicate the need for considering the daily minimum temperature, as well as the daily mean. It will be noted that a minimum temperature of 32 F. was recorded at 3-1/2 and 7 in. before a mean value of 32 F. was recorded and, also the minimum temperatures progressed deeper and left the soil later than the mean values. The portion of the curve on the right indicates that daily fluctuations in temperatures may cause the soil to freeze during parts of the day and to thaw again the same day. There is ample evidence showing that many times this is the case, i. e. , the soil may freeze at night and thaw during the day although the daily mean temperatures no longer dropped to 32 F. This daily temperature fluctuation also affects moisture conditions.
Figure 7 shows the data obtained during the winter of 1949-1950. These data show trends similar to those shown in Figure 4. The data obtained during this winter are unique in that Indiana experienced a mild, wet winter. Consequently, temperatures below 32 F. were recorded only for short periods of time, ahd the soil did not freeze to any appreciable depth. This was, however, fortunate in that some very interesting points regarding ground freezing were indicated.
The temperature gauge at 3-1/2 in. registered below-freezing temperatures for only short periods of time. In the early weeks of December, air temperatures fell

46
below freezing. However, freezing temperatures penetrated the ground only to a depth of a little more than 7 in. Figure 8 shows penetration of 32 F. as well as depth of frost. It will be noted that, although freezing temperatures existed at depths of 3-1/2 and 7 in. , the ground did not freeze until the middle of January.
During the freezing period in January freezing did occur, although some surface thawing occurred during each day. Of particular note is the unfrozen layer immedi-ately above a frozen layer as shown.
That minimum temperature as well as mean temperatures should be considered in a study of this type is further indicated by the curves on the extreme right. During this period the mean temperatures did not reach 32 F. However, daily minimum temperatures went below 32 F. with the result that the ground alternately froze and thawed with daily temperature fluctuations.
To help correlate soil temperatures with depth of frost penetration, laboratory
Lu Cr X
>u40
-
20
DO u-i ow
5
freeziqj and - - - -
iii•UI•U•IU•IIIlUl• IUmUIIUIUR•i5tNU POP
iIEdU••UUUUU•IUIUNUUU !•U•lUIUIUU•l•IUUUU is•u..•u. mulTi liiiiiiiiu u•uu••iuu•uaiui••uu
i••iuuilM.11N _afl
,uu.mumuau.uuuu•iu !u•uiuu•iiUiE•UiUUU
uuuu•auu•u•uu.•uiu..a uuUU••lUUuUU•uIUUi
'ade.
TIME-MONTHS
Figure 4. Three—Year Average Air and Soil Temperature - West Lafayette, Indiana 1943—I6

C
1
I
2
47
TABLE 1
MOISTURE CONTENT IN PERCENT OF DRY WEIGHT
Date 0
Depth, inches
2 3 4 5 6 7 3% 7% 12 18 24 42
12-27-49 12.7 20.2 22.0 21.5 20.2 291 1-4-50 13.0 22.0 24.0 1-9-50 12.4 19.8 25.0 24.6 27.2 26.3
1-10-50 11.3 14.4 1-16-50 10.4* . 7.7 17.5* 17.1* 20.3* 18.2 23.1. 1-16-50 10.9 22.1 22.1 20.2 20.0 23.8 1-17-50 9.2* 8.9
1-17-50 10.2 . 9.5 1-19-50 17.1 9.3 7.8 7•3t 6.9* 77*
1-19-50 20.2 17.9 11.3 10.7 9.1 8.9 1-23-50 11.3 21.0 24.0 25.0 23.1 25.0
1-30-50 . 15.6 21.5 21.9 21.1 19.5 21.1 2-16-50 . 12.5 23.2 23.0 23.0 22.2 25.3 2-27-50 12.314.0 14.1* 7.3 6.7 6.7 3-3-50 10.0 7.8 8.9 8.2 7.4 8.9
4-10-50 7.9 8.1 7.4 7.4 7.6 7.9 20.0 5_2_50 0 . 14.4 21.5 22.4 21.4 21.4 27.9 5-8-50 9.8 21.4 18.8 19.9 19.1 21.6 6-12-50 6.8 12.2 14.0 18.2 16.2 18.9
* Moisture contents taken at the center line of the pavement. All other determinations were made at the edge.
.j WEEKIX MEAN EINO,
-- ---- JAN.23,1944 JAM. 30. ige. - - FEB. 6.1944 FEB.13 .1944
N, .. .... .................. -- FEB.20, 1944
-- --<.: - ---
zz g4 E5 EB 50 SE
3
4 i 59 40 4Z 44 4
T!NPENATUE - DEGREES ( FAHRENhEIT)
Figure 5. Variation of Soil Temperature with Depth


49
Figure 9. Temperature vs. Time
In these tests undisturbed samples were brought into the laboratory and frozen, their temperature being reduced to -18 F. The samples were then allowed to thaw slowly at room temperature. The temperatures of the soils were measured periodically throughout the thawing period. The samples were again moistened and refrozen, tem-perature measurements being made during the freezing period (see Fig. 9). The flat portions of the curves represent the latent heats of fusion for the soil-water mixtures during the freezing and thawing. The freezing range for the base course material was indicated to be between 30 and 31 F. , while that of the subgrade was 31 F.
Bouyoucos (14), in a series of laboratory experiments to determine the freezing point of soils, found the degree of super-cooling required for freezing of soils was approximately 6 degrees. He also found that unless the soils were vigorously stirred they remained almost indefinitely at 32 F. without freezing. The actual freezing point of soils depends on several factors, including the amount of soluble salts in the water and degree of disturbance. It appears that in the interpretation of soil temperatures from the standpoint of the highway engineer, these factors should be considered.
Mean temperatures of 32 F. were registered at 3-1/2 in. , although minimum tem-peratures registered at 3-1/2 in. during the early periods of December were only 31 F. (Fig. 8). No frost (other than surface freezing)was noticed during this period. Con-versely, during the freezing period in January minimum temperature recorded at 3-1/2 in. was 29 F. , and frozen ground to a depth of 3-1/2 in. was noted. The same applies throughout the winter; unless minimum temperatures reached at least 29 F. for a period of time no freezing was noted.
Throughout most of the winter the moisture content of the base material immediately under the pavement was extremely high (Table 1). This was true even though no ice crystal segregation was noticed.
These high-moisture contents were probably due, in part, to condensation and move-ment of moisture in the form of vapor. This was indicated in several instances, upon removal of the surface material from the road. It was noticed that a very thin layer of frost existed on the under side of the pavement material, much as frost accumulates on refrigerator coils from condensation. This phenomenon warrants further study in regard to softening of the material immediately under a pavement due to high moisture content.
Future Studies
The soil -temperature l)rogram of the Joint Highway Research Project will be ex-panded in future years. It is hoped that several thermocouples may be installed under several other pavements for periodic checks. These pavements will be of various types,

50
including concrete, bituminous concrete, and gravel surfaces. Gauges will also be installed under grass cover. Moisture cells will also be installed to determine fluc-tuations in moisture content with temperature.
Bibliography
Winn, H. F. , "Frost Action in Stabilized Soil Mixtures," Proceedings, Highway Research Board, Vol. 18, Part I, 1938.
Woods, K. B. and Shelburne, T. E., "Report • No. 1 on 1943 Survey Secondary Roads (Spring Break-Up)," Joint Highway Research Project, April 1943. (Unpublished)
Shelburne, T. E. and Waner, A. W., "Analysis of Spring Break-Up Data in Virginia," Bulletin No. 20, Highway Research Board, September, 1949.
Radcliffe Observatory, "Radcliffe Observations," London, England, 1915. Bouyoucos, G. J., "An Investigation of Soil Temperatures and Some of the Fac-
tors Influencing It," Michigan Agricultural College Experiment Station, Technical Bul-letin No. 17, February, 1913.
Casagrande, Arthur, "Discussion of Frost Heaving," Proceedings, Highway Re-search Board, Vol. II, 1931.
"Report on Frost Investigation 1944-1945," War Department, Corps of Engineers, New England Division, Boston, Massachusetts, April, 1947.
Bayer, L. D., Soil Physics, Chapt. VIII, "Soil Temperatures," John Wiley and Sons, 1940.
"Frost Investigations. 1949-1950, Report of Pavement Surface Temperature Trans-fer Study," War Department, Corps of Engineers, New England Division, Boston, Mass-achusetts, June 1950.
Patten, H. E., "Heat Transference in Soils," US Department of Agriculture, Bureau of Soils, Bulletin No. 59; 1909.
"Frost Investigation 1944-1945, Report on Laboratory Tests on Frost Penetra-tion and Thermal Conductivity of Cohesionless Soils," War Department, Corps of Engineers, New England Division, Boston, Massachusetts, 1945.
Kersten, M. S., "The Thermal Conductivity of Soils," Proceedings, Highway Research Board, Vol. 28, pp. 391-409, 1948.
Belcher, D. J., "Subgrade Soil Temperatures," Proceedings, Purdue Conference on Soil Mechanics and Its Applications, 1940.
Bouyoucos, G.J. , "Degree of Temperature to Which Soils Can Be Cooled With-out Freezing," Journal Agriculture Research, Vol. 20, 1920-21.
Bouyoucos, G. J., "Soil Temperature," Michigan Agricultural College, Experi-ment Station, Technical Bulletin No. 26, January, 1916.
Callendar, W. H. and McLeod, C. H., "Observations of Soil Temperatures with Electrical Resistance Thermometers," Transactions, Royal Society of Canada, Vol. 2, Section 3, pp. 109-126, 1896.
Highland, S. G., "Study of Year-Round Soil Temperatures," Journal American Waterworks Association, Vol. 16, No. 13, pp. 342-354, September, 1926.
Legget, R. F. and Peckover, F. L. , "Soil Temperature Studies - A Progress Report," paper presented at 29th Annual Meeting, Highway Research Board, December, 1949.
Sourwine, J. A., "A Method of Analysis of Data on Frost Occurrence for Use in Highway Design," Public Roads, Vol. 11, No. 3, 1930.

51
AN ABSOLUTE METHOD OF DETERMINING THERMAL CONDUCTIVITY AND DIFFUSIVITY OF SOILS
Dr. A. D. Misener, Department of Physics, University of Western Ontario
Synopsis
The most common methods for measurement of thermal conductivity of poor conductors, e. g. , earth or insulating materials, are based on the fact that the sample is in a steady-state condition. For poor conductors this re-quires a long period before the heat flow through the sample becomes steady. During this period the heat source must be held constant. Prolonged heating aggravates such undesirable processes as moisture migration and changes in structure. Furthermore, the necessity of removing samples for measure-ment from their normal situation introduces uncertainties and experimental difficulties.
These methods have two more fundamental defects. First, steady-state measurements will give no information on thermal diffusivity, a constant equal in importance to conductivity in many heat-transfer problems. Sec-ond, the actual experimental devices, hot-plates, divided bars, etc., are calibrated by using materials of presumably known conductivity to either establish quantity heat flow or determine instrumental constants, such as contact resistance with the sample.
The method described here uses measurements during heating or cooling, which may be taken rapidly and will give both thermal conductivity and dif-fusivity. The mathematics are rigorous and therefore the effect of assump-tions made in the theory can be calculated. With heat sources of appropriate shape and dimensions, the measurements may be made absolute, i. e. , they are independent of the particular measuring device and are not affected by the thermal properties of the materials used to construct the source. The limits within which this condition is fulfilled can be calculated accurately. The method is applicable to a variety of different forms of apparatus. When a suitable form has been selected and a particular apparatus built, the necessary calculations may be made once and presented as graphs from which the desired results are read off as rapidly as readings are taken. A general description of the method will be followed by two particular applica-tions, a spherical heater buried in the material and a linear heater or probe inserted into the material.
A heater, usually electric, is surrounded by the material whose thermal constants are to be measured. A temperature measuring device, usually a thermocouple or re-sistancethermometer, attached to the surface of this heater indicates the change in its tempeiature while a constant, measured, energy output is maintained. The temperature rise at two selected intervals is recorded. These intervals are pre -determined to min-imize the effects of certain assumptions made in applying the theory to the particular instrument and are controlled by such factors as physical dimensions, power output, and the temperature rise considered as allowable without affecting the material under investigation.
Using tables of the appropriate functions involving the dimensions of the apparatus and the selected time intervals, a graph is constructed showing the relation between the ratio of the two temperature differences and the thermal diffusivity. If the graph is constructed to cover the range of diffusivities encountered in the type of material being tested, the diffusivity is read directly from the graph as soon as the temperature dif-ferences have been recorded and their ratio calculated. Entering another graph at the value of the diffusivity and using the measured power output and the temperature rise at either of the selected intervals, a single multiplication gives the value of the thermal conductivity. Once the graphs have been constructed, they are used with a particular

52
apparatus and will give rapid results over a -- -
reasonable range of the thermal constants. This simple method will give results ac-
curate to within 3 percent. A slightly more complicated method of calculation, using the same basic principle, can be used to reduce this error, which arises in the application of the theory to actual apparatus.
The physical shape and dimensions of the heater determine the type of function used in u constructing the graphs. The cases of a spherical heater treated as a point source and a cylindrical heater of small diameter treat-ed as a linear source are discussed below. Other cases, such as a cylindrical heater treated as a cylindrical source, may be dealt with by the same method, but calculations required are more complicated and improve-ment in accuracy attained is of doubtful value in view of the inhomogenieties usually en-countered in the substance being measured.
It should be stressed that no novelty is ' r .5 to 2 14
claimed for the heat conduction equations = used. These are to be found in the standard Figure 1. Values of Function U(q) for texts on the subject (Carlslawand Jager, Heat q = r/J up to 1.4 Conduction in Soils; Ingersoll, Zobel, and Ingersoll, Heat Conduction, McGraw-Hill, 1948). They involve no mathematical approx- imations affecting the accuracy of their application to cases studied. The magnitude of the errors introduced in applying the idealized theory to actual conditions can be evaluated.
Application to Spherical Heaters
Aluminum spheres 4 in. in diameter were fitted with small, centrally-located, re-sistance heaters and with copper constantan thermocouples soldered to their surface. These were buried to a depth of 5 ft. in the ground and allowed to attain temperature equilibrium with their surroundings. This was indicated by the constancy of the thermo-couple readings over a period of 48 hours. Energy was then supplied to the heaters at a constant rate of about 25 watts and the temperature of the surface of the heater recorded every few minutes. From the graph of temperature versus time, the temperature rise after heating intervals of 1 hr. and 2 hr. were recorded. 1/ The magnitude of the tem-perature rise was of the order of 30 to 40 degrees F.
This case may be considered as an approximation to that of a point source of heat immersed in an infinite homogeneous medium. The limits of validity of this approxi-mation will be discussed later.
The temperature rise in time t at a distance r from a point source of heat immersed in an infinite homogeneous medium is given by the expression
T= 4 [1+j2T exp(-x2)dx] (1)
where T is the temperature rise above the initial uniform temperature Q' is the rate of heat energy output of the source K is the thermal conductivity of the medium cL is the thermal diffusivity of the medium
= (thermal conductivity) (specific heat) (density)
/ The continuous reading of temperature was done to provide a check for certain aspects of the theory. For satisfactory calculations of conductivity and diffusivity, read— ings taken at 1 hr. and 2 hr. from the start of heating would be sufficient.
IkSexEx2
OE

53
For convenience, equation (1) is written in 81
the form
T=*U(f) (2)
whereQf -
B =--- 4irr
T L '78
and Ti is a function the numerical value of which has been tabulated in the texts for dii .76 - ferent values of the argument. For conven- ience, a graph of the function U for'välues of '74 the argument from 0 to 1. 4 is given in Figure 1.
' 2 Considering the temperature at the surface
of the spherical source (r = rs) and two spe- cific time 'intervals b and t2 we obtain: .70
T1 = BU ( 2j) (3)
and - B .. .05 020 .015 030 '035 '040.045 T2 =j-U 2J_.
(4) ,' L7IFFU'IVITY, o(f.ph.'UNITS)
and, by division ' r Figure 2. Values of Ratio T1/T2 T1 U(2)
S '(5) T2 U(.2 rs S
By assigning particular values to a. which cover the expected rang, the magnitude of the right-hand side of equation (5) may be computed at a number of points and a graph drawn between a. and the ratio S
'7
IS /
Figure 2 is this graph for the case discussed here. In use, Figure 2 is considered as showing the variation of T1/T2 witha. Once the temperature rise after 1 hr, (T ) and the temperature rise after 2, hr. (T2) have been observed, their ratio is computed and the value of for the material surrounding the heater is read from Figure 2.
To determine the value of the thermal con- ductivity K, Figure 3 is used. This gives the variation of
S I U (-h) with a
'015 '020 025 '050 -035 '040 '045 and of U (-a-) with a 2/. PFFUSIVITY, o (f.p.h. UNITS) 21i -
Figure 3. Values of Function U(r/2) Using the value of cx determined above, the for the Particular Heater Used for corresponding magnitudes of the two functions
Range of uiffusivities are read from the graphs. These magnitudes,
This graph requires no new computation but is simply a replotting of the values al—ready calculated for Figure 2.
7 .7.
------7
-----7-- r
-;:--- T / rs
U -t'
- CONPJTIOt1S:
r0 = o.i7ft. -
I-
- /
'6
4
/
L
/ /
/ 5
/
CURVE. I r -057 ft., t hr.
CURVE. fl r, •0'167ft.,t,.2hr.

54
together with the observed values of T1, T2 , and B, are substituted in equations (3) and (4) to obtain two values of K. The agreement of these two values affords a good internal check on the accuracy of the calculations.
As an illustration of the method, we consider the results of a particular test with a spherical heater for which the graphs were calculated. The observed values were Ti =30 F., T2 = 38 F. with B = 40. 2 Btu. perhr. -ft.
The ratio T1/T2 = 0. 790; thus, from Figure 2, cx. = 0. 0320 f. p. h. units r5
From Figure 3 U(2/ 1 ) = . 502
and
and B/Ti = 1. 340, B/T2 - 1.058
Substituting in equations (3) and (4):
K = 1.340 x .502 = .671 f.p.h. units K = 1.058x.634 = .670f.p.h. units
Application to Cylindrical Heaters
Stainless-steel or brass tubes 3/16 in. in diameter and 10-in, long were fitted with axial resistance heaters and thermocouples at the middle of their surface.' The ends were closed and these probes inserted into various samples of insulating material. An adequate sample was roughly a foot or foot-and-a-half cubed. For measurement of the thermal properties of the ground more robust probes 1-1/2 in. in diameter and three feet long were used.
This case may be considered as an approximation to that of a line source of heat in an infinite homogeneous medium. The rise of temperature (T) at a radial distance (r) from such an ideal source is given by
T=——I(rn) (6) 2 irK
where Q' is the rate of heat energy output of the source K is the thermal conductivity of the medium
(a I(rn)=) 3exp(-x2)dx
rn 1
cx is the thermal diffusivity of the medium t is the time from start of heating
If Ti and T2 are the increases in temperature after intervals of t1 and t2 respectively, we may proceed as in the previous application and form the ratio
T11(rn1) (7)
T2 1(m 2)
Values of the function I (r n) are to be found in tables so we can calculate the right hand side of equation (7) for selected values of cL and plot the results as Figure 4a. Using the same calculations we also plot Figure 4b, 4c showing the variation of I (r n1) and of I (r n,) with cx. The values for the particular calculation used here are r = 3/32" = '. 82 x 10 3ft. , t1 = 4 mm. = 0. 0667 hr. and t2 = 10 mm. = 0. 167 hr.
The method of using these graphs is entirely similar to that described in the case of the spherical source. As an illustration we consider the results of a particular test on a sample of silica aerogel. Theobserved-vaiues were T1 = 61 F, T2 = 80 F, with
= 3. 29 Btu. per hr.

55
The ratio T1/T2 = 0. 762; thus from Figure 4a, = 0. 0073 (f. p. h. units) From Figures 4b and 4c,. I (r ni) = 1. 44 and I (r n2) = 1. 90. Substitution of these together with Q' and the appropriate values of T in equation (6)
gives the two values of K = 0. 0123 (f. p. h. units) for T1 and I (r ni)
and K = 0. 0124 (f. p. h. units) for T2 and I (r n2).
Errors Introduced by the Assumptions
There are no assumptions in the mathematical development of equations (1) and (6) which limit them to restricted ranges of application. They should hold for all values of r, , t, Q', etc. This mathematical rigor is not present in some other methods of de- termining thermal constants by using heated probes.
In applying the rigorous theory to the actual conditions certain assumptions have been made. Because the theory is rigorous, the magnitude of the errors introduced by the assumptions can be calculated. The most serious assumption is that a finite heater (a sphere or cylinder) of different thermal properties from the surrounding medium may be treated as an ideal source (point or line). This assumption will undoubtedly introduce a large error at the start of the heating when the output of the heating element is largely used in raising the temperature of the heater itself. The error will be small after a longer period of heating when the heat flowing into the surrounding medium will be very nearly equal to the output of the heater, very little being used to raise the temperature of the source. The problem is to determine the period after which this error will have been reduced to allowable limits. This may be done as follows (the case of a cylindrical source is taken for illustration):
Consider a cylindrical shell in the medium just outside the probe. When the heat flow through this shell is the same for the actual probe (radius = r) as it is for an ideal line source, then the probe is producing all effects in the medium as if it were a true line source. The theory of the ideal line source which gives equation (6) may be extended to show that such a source of strength Q' is equivalent to a cylindrical source (radius = r) of strength Q = Q' exp (-r2 n2). For the probe described above, after 4 mm. , Q = 0. 98 Q'. In other words, at 4 mm. the probe was giving results within 2 percent of those which would be given by the true line source assumed in the theory. Similar reasoning may be applied to the point source case.
-3,4
.32
-30
28
26
24
i r '22
-20
- I '6
'4
2
-0
85-
84-
83 -
92-
-81
80-
1. 79.
78-
.77
'76 -
'75 -
'74-
73 015 .020
PIFFUSIVITY o (f.p.h. UNITS)
Figure 4. Values of Function 1(m) for the Particular Linear Heater Range of Diffusivities
Described for a
••••uiiuuuuu
NNEEMMMEMMEM
popm
no
_ r41...

56
-- IO'I .1 k._._L ....... equauon, ij or ku), a sconu iieaiiig eurve ftdeal) can be calculated. A comparison of the agreement between these two curves quickly shows whether or not the selected intervals for measurement have been chosen to give a sufficiently good approximation to the ideal conditions assumed. Such a com-parison for the case of the spherical heater is shown in Figure 5. The selected intervals of 1 hr. and 2 hr. are well within the range
(HouRs) of good agreement between the two curves. Figure 5. Comparison Between Observed Once such a check has been made, the se- and Theoretical Heating Curves from a lected intervals may be used for any other
Spherical Source substances which do not differ too greatly in thermal properties.
The theory is developed for a medium infinite in extent which is obviously not the case in practice. However we can calculate the thermal effects (temperature rise, heat flow, etc.) at any point in the ideal infinite medium for any-period of heating. When these effects are negligible at the distances corresponding to the actual physical bound-aries of the substance being studied, the behavior of interior points is the same as if the substance were infinite in extent. With substances of low conductivity and with the short heating periods used in this method, this requirement is satisfied by quite small samples. The validity of this assumption may be proved experimentally as well. In the case of the spherical heaters buried in the ground, a thermocouple was placed 2 ft. from the heater. This thermocouple gave no indication of a temperature change greater than 0. 05 deg. F. during the 3-hr. heating period. In a continuous run for 72 hr. the temperature rise at 2 ft. was only 2. 0 F. It is therefore safe to assume that the surface at a distance of 5 ft. does not affect the temperature rise at the heater during a short heating period of a few hours.
The assumption that the medium is homogeneous is required by the theory but is most certainly not the case in practice. However, the results obtained must be inter-preted as those for a homogeneous medium which would show the same average thermal properties as the actual substance used. This places no restriction on the usefulness of the method, since it is precisely the result desired in heat transfer considerations. In effect, the measurements give the average thermal constants for a limited region sur-rounding the heater. Averages for larger samples must be obtained by measurements at a number of locations.
Discussion
The particular. merit of the method is that it provides a rapid and absolute measure-ment of both thermal conductivity and thermal diffusivity. The degree of error of the results may be assigned a mathematically rigorous upper limit without knowledge of the thermal properties of the apparatus used. For extremely accurate work this error may be reduced by more detailed calculations than those given here, but the simple method is apparently accurate to within 2 or 3 percent which compares favorably with other methods.
The construction of the graphs used is not particularly laborious and once obtained they are used for the life of the particular heater. The size and shape of heater is a matter of choice, influenced to a large extent by the type of material tested, the degree
The time interval after which the ideal and the actual sources give sufficiently close agreement may be determined by another method which will have more appeal to those who prefer experimentally determined limits of error. If a complete heating curve has been obtained (not just two readings at selected times), this may be plotted. It repre-sents the behavior of the actual source. By using the two selected values and the above theory (ideal source behavior) values of the thermal constants are calculated. By sub-
stituting these values in the appropriate
TEMP. RISf.,
T. (r)

57
of accuracy desired, and the time available for an individual measurement. Wide variations are possible in the suitable application of the method. For instance,
if it is desirable to have a very small increase of temperature, say 8 to 10 F.-. rather than the 40 to 50 F. used in the applications above, this may be done with no loss of accuracy provided the sensitivity of the temperature measuring equipment is suitably increased. If very rapid readings are desired, a heater design which gives a rapid approximation to the ideal case can be used. If a value which is representative of a large volume of the sample is desired, a heater which has a low output and which can be operated for a long period without giving excessive temperature increases- is used.
The general method, here illustrated by the point source and the line source, can be extended to other types of sources if desired. Because of its flexibility and the rapidity with which results may be obtained, it is being further developed for studies of thermal properties of poor conductors. - -
THE THERMAL CONDUCTIVITY PROBE
F. C. Hooper, Lecturer in Mechanical Engineering, University of Toronto
Interest in the thermal properties of soils has recently increased because of the in-troduction of the ground-coil heat pump, and through an awakening to the necessity for an accurate understanding- of heat flow in soil freezing and associated problems. How-ever, the determination of thermal conductivity and of thermal diffusivity, the two thermal properties of principal interest, is complicated in the case of natural soils by two factors peculiar to. this material. First, soils normally occur in a moist condition and are subject to large seasonal and locational variations in their moisture content. Second, soils have a definite structure which, once disturbed, is difficult to restore. These factors cause test methods adequate for the testing of manufactured bulk mate-rials to be unsatisfactory when applied to soils.
The difficultires associated with obtaining structurally undisturbed soil samples of suitable size and shape for laboratory apparatus are ipparent. The difficultires arising from the presence of, moisture .require- some explanation. - - - -
When a temperature difference exists between two points in a moist soil, avapor-pressure difference will also exist. Water will tend to vaporize in the warmer position, flow or diffuse to the cooler position where the vapor pressure is lower, and condense in the cooler position. Thus, a migration of moisture will occur which will not only continuously alter the distribution of the moisture within the soil by-drying the warmer position and wetting the cooler position but will-also account for a separate mechanism of heat transmission by virtue of the latent heat carried by the vapor. Any apparatus depending upon a steady-state heat-flow principle will not be able to yielda result until a moisture equilibrium has been established,- at which time the specimen-will not be uniformly wetted and the moisture migration mechanism of heat -transmission will not be operative.
To overcome -these and other difficulties, the thermal conductivity probe has been developed at Toronto. Because the new instrument is portable, it can be carried.to the site and no disturbance of the soil is involved. By utilizing a transient heat-flow prin-ciple, the tests are accomplished in a few minutes, before the moisture migration :has significantly disturbed the Original distribution, while at the same time including this mechanism as a contributing factor in the measured properties. - - - - -
The Instrument - - - - - - - -
The thermal conductivity probe is detailed in Figure 1 and the measuring circuit in Figure 2. The probe itself consists of an aluminum tubeapproximately -18 in., in length. Inside of the tube is stretched an axial constantan resistance wire which serves as a constant strength heat source. Near the center of the tube length in contact-with the. inner wall are the hot junctions of several thermocouples arrañgedin series with ex-ternal cold junctions. The tube: is closed by a steel tip at the: -lower end and the, wiring

THERMOCOUPLE JUNCTIONS
_-3II6° ALUMINUM TUBE OVERALL LENGTH 1.56 FT
HEATER 0.98 OHMS PER FOOT
IIIIIhiSTEEL TIP
Figure 1. Detail of Probe.
carried out through a seal at the upper end. The necessary potentiometer, battery
and controls are conveniently mounted in a suitcase to make the whole portable.
Principle of Operation
When the probe is immersed in a homo-geneous material and a current allowed to flow through the heater, the heat flow ap-proximateS thatlrom a line heat source. It can be shown (1) that the temperature rise 6e , in the period between times t1 and t2 after the start of the current, will be given by
Q t2
t8= -loge j-. (1)
where Q is the heat input per unit length and k ig the thermal conductivity.
When a correction factor is applied to compensate for the finite dimensions of the probe, an expression for thermal conduc-tivity
1a c k
= et2.-t, •(2)
58
SERIES THERMOCOUPLE LEADS
.4::~COPPER POWER LEADS
1JTALUMINUM SLEEVE
is obtained.. Here i is the current in the heater, C is an instrument constant, and 9 (th-t1) is the temperature risd in the selected time interval after the start of the
test. Times t1 and t2 are preselected in conjunction with the instrument constant.
The Technique of Measurement
To make a determination, the probe is thrust into the soil for its full length. In sandy or other easily penetrated soils this can be done by hand. In harder soils a steel rod of diameter similar to that of the probe is first driven to make a passage for the probe.
A few minutes are allowed to permit the instrument to come to intitial temperature equilibrium with its surroundings. A constant current is then allowed to pass through the heater, and the current and the temperature at the two times t1 and t2, (typical values are 3 and 7 minutes), is measured.
The thermal conductivity is then determined directly from these observations using equation (2).
Accuracy. and Results
Because the method of use described here is an approximation made for the sake of convenience in measurement, and because the mathematics involve some approximations, the result is not exact. It is probably not more than 5 percent in error and, at least in some materials, much higher accuracy is indicated. The results are highly reproducible among themselves and smooth curves of thermal Figure 2. Control Circuit.

59
conductivity plotted against moisture content are obtained. A typical test curve is shown in Figure 3.
While the instrument is especially suited to field work with moist soils, dry soils and similar-materials can be tested by the probe.
Some precautions should be observed where possible. The probe should be in an isothermal position in the soil, which strict-
_______________ ly speaking is usually a horizontal position, since the temperature tends to vary with depth. In, compressible material the probe would be most reliable if a hollow tube were used to cut the path and withdraw the core
Figure 3. Typical Test Curve, rather than a solid rod. In a moist mate- rial successive readings should not be made
without repositioning the probe since local drying would result. In any case, the tem-perature must be allowed to return to the initial value which requires a lengthy wait between tests.
The probe should be satisfactory in frozen soils if the temperature is not allowed to pass the freezing point during a test. The change in moisture content during the test due to moisture migration has been found to be small. In one 6-minute test with an overall temperature rise of 30 F. the moisture content within a radius of 1/4 in. of the probe changed only from 10. 0 percent to 9. 8 percent on the dry basis.
A method of calculation which permits the derivation of the thermal diffàsivity from the same observations has been developed (2). Because of sufficient investigation of its reliability has not so far been possible, it is not presented here. It does, however, show promise of future usefulness.
The probe is not yet commercially available.
Acknowledgments
The work was initiated with the financial assistance of the National Research Council at Ottawa. Much of the basic technique was adapted from the work of Dr. van der Held of the University of Utrecht. (3)
Bibliography
Hooper, F. C., and Lepper, F. R., Transient Heat Flow Apparatus for the Determination of Thermal Conductivities, ASHVE, Journal Section, Heating, Piping and Air Conditioning, August, 1950.
Author's closure to discussion of above paper, ASHVE, Transactions, 1950. van der Held, E. F. M., and van Drunen, F. G., A Method of Measuring the
Thermal Conductivity of Liquids, Physica (The Hague), October, 1950.
• --------- -------- -

60
DISCUSSION OF SOIL TEMPERATURES
Field Measurements of Soil Temperatures
Herman H. Miller, Head, Dowflake Technical Service, The Dow Chemical Company, Midland, Michigan
During the past several years the subject of frost action in soil has been a major topic of discussion with highway engineers of the northern part of the United States and foreign countries. Millions of dollars in damage annually is caused to highways by the
action of frost. Buildings in certain areas are also vulnerable. Numerous theories have been advanced as to moisture and frost movement in soils and efforts made
- - to prevent the detrimefltal damage from such movement Laboxatory and field investigations have definitely proven that soils treated with calcium chloride, either liquid or solid, resisted greatly any frost action
I !.) which tended to cause heaving or detrimental
.. expansion. Such treatments were usually made without much knowledge of frost pen-etration. Since the problems of frost action, frost penetration, and moisture movement
__________________ in soils is common to the installation of underground pipe lines, foundations, and highway construction, it seemed advisable to proceed with a study of soil temperature as one phase of the problem.
This progress report covers the results of field measurements of soil temperature
Figure 1. Cross Section of the 1avement. made under a 3-in, flexible asphalt carry-
The leads from the thermocouple are at- ing an average of 534 vehicles per day. The tached to an underground cable leading to project began December 4, 1949, and ended
the recording thermometer. December 31, 1950. Thermocouples were installed at 6, 12, 18, 30, 42, 54 and 66 in.
TABLE 1 RAINFALL, INCHES
MIDLAND, MICHIGAN AREA :.::::::::..:.....
December, 1949 3 80 ----- I - January 1950 3 53
------------- ________ -- —
February, 1950 3 21 : •::..:. March, 1950 2. 48
May
= 1 August, 1950 1
nL October, 1950 1 43 I.. November, 1950 1 87 I
TOTAL 33.91 Figure 2. Average High and Low Tempera-
Average rainfall per year since 1887 is ture for iach Month During the Year Plot- 26. 03 inches per year. ted From the ibctreme Daily Temperatures.
Figure 3. Average Temperature Per Month of Thermocouple 7 at 6 in. and lat 12 in.
Figure 5. Average Temperature Per Month of Thermocouple 4 at 42 in., 5 at 54 in.,
and 6 at 66 in.
61
" A/ £
Figure 4. Average Temperature Per Month
Figure 6 Fxtrerne Temperature Reached of Thermocouole2-at 18 in. and 3 at 30 in. During the Year.
.2.fJ -i 4q ri DEC. 5C D.& 3C DEC EC DC EC DEC. .50 2E0 .50.
Figure 7. Average Lonth1y .emperature for Thermocouples 1-6.

___
I,

63
below the surface of the pavement and one at atmospheric exposure. These thermo-couples were attached to an automatic Leeds and Northrup 8-point recording thermom-eter placed in a heated room of a building about 40 feet from the road. The chart's ranges were from -25 F. to 125 F. , 40 yards long, recording 8 times per hour, chang-ed at 35-day intervals. In this study no consideration was given to ground water or moisture content of the soil. However, a precipitation record was kept.
The results to date seem to verify the findings reported at the 1951 meeting of the Highway Research Board by Mr. R. F. Legget, National Research Council, Ottawa, Canada, and Professor L. D Yoder, Purdue University. No definite conclusion has been drawn as it is indicated that this study should continue for several months before concise conclusions can be drawn.

64
SOIL MOISTURE AND MOISTURE MOVEMENTS
METHODS FOR MEASURING THE MOISTURE CONTENT OF SOILS UNDER FIELD CONDITIONS
Professor G. J. BOuyoucos, Department of Soil Science Michigan State College, East Lansing, Michigan
Up to about a decade or so ago there were no suitable methods for measuring the moisture content of soils under field conditions, in spite of the fact that the need for such methods has always been very great in such fields as agronomy, irrigation, drainage, hydrology, and highway engineering. The standard method in general use was the gravemetric method of sampling and oven drying. In the last several years, however, a very intensive effort has been made to discover and develop appropriate and reliable soil-moisture determining methods for field use. As a result of this re-search, several methods have been evolved. The most important of these methods are:
The plaster-of-paris-block electrical resistance method of Bouyoucos and Mick (5) and the nylon electrical-resistance method of Bouyoucos (7);
The fiberglas electrical-resistance method of Colman (12); The electrothermal conductance methods of Shaw and Bayer, (49) and of 3ohnstone
(25); The electrocapacitance method of Fletcher (17), and of Anderson and Edelfsen (4); The tensiometer method of Richards (34, 35) and others; and The sorption-plug gravemetric method of Davis and Slater (14).
These various methods have been studied and compared by numerous investigators. None has been found to be perfect. The general consensus if that the plaster -of -paris-block electrical resistance method is the most satisfactory, particularly for agronomic purposes. This view finds general confirmation in the statement by Kelly and others (27), that the plaster-of-paris-block method "is the most practical instrument avail-able at the present time for measuring moisture changes at tensions above one atmos-phere in soils not containing large amounts of salts."
Of the six methods of soil moisture determination mentioned, this paper will confine its further discussion to those first mentioned plaster-of-paris and nylon electrical-resistance elements.
Plaster -of -Paris Electrical-Resistance Method
Theplaster-of-paris -block method had its inception in 1939. It was the first time that the principle of electrical resistance was utilized successfully in measuring soil moisture content. This was accomplished by imbedding electrodes inside a plaster -of -paris block and establishing a constant environment around the electrodes, thereby minimiz-ing or eliminating the effects of soil factors, such as texture, structure, degree of com-paction, salt content, and electrical lines of force. Previous investigators (19, 32, 55) who had tried to employ electrical resistance to measure soil moisture failed be-cause they used bare electrodes. Such bare-electrode units have been found completely unsuccessful for soil moisture determination (6).
The plaster -of -paris block (Fig. 1) is made of a special type of plaster of paris us-ing a definite ratio of powder to water. Inside the block are imbedded two electrodes attached to wire leads. When this block is placed in the soil it acts as though it had become part of the soil. It absorbs moisture from the soil, and gives it up to the soil very readily, so that its moisture content is in constant equilibrium with the moisture content of the soil. The electrical resistance of the block varies with its moisture content and that, in turn, varies with the moisture content of the soil in which it is buried. Thus, by calibration, the moisture content of the soil is determined by meas-

65
uring the electrical resistance of the block. The calibration curve and a typical performance curve yielded by this method are
shown in Figure 2. The calibration curve shows the effective relationship between per-centage of moisture in the soil and electrical resistance of the block. The curve is similar to that resulting when moisture tension is plotted against moisture percent,
gradual at first and then steep in its rise, i. e. hyperbolic.
This method does not measure the total
eT moisture content of the soil but does meas- sure that portion which is available to the plants. This portion ranges from field capacity to the wilting point, or from a soil moisture tension of less than 1 atmosphere to above 15 atmospheres. The method be-comes extremely sensitive to moisture changes at the drier region but very in-sensitive above field capacity. On the other hand, all well-drained soils tend to not hold water above field capacity. Figure 3 shows the actual performance of the method under field conditions. It reveals the daily elec-trical resistance of the plaster -of -paris blocks as the moisture content of the field soil fluctuates due to evaporation, water absorption by the plants, rainfall, etc.
Resistance-Measuring Instruments
The electrical resistance of the plaster-of-paris blocks is best measured by a moisture bridge specially developed for
Figure 1. The Plaster of Paris Block, this purpose and based upon the Wheatstone bridge principle (Fig. 4). This instrument,
as now manufactured, combines rugged, compact construction with a high degree of sensitivity. It is a completely self-contained unit designed to measure resistances in circuits containing appreciable capacitance, such as is encountered in installations where the units may be connected by up to 200 ft. of commercial multiple-strand, rub-ber-coated copper wires. The instrument will operate at temperatures considerably below freezing. Ordinary bridges do not generally have sufficient range for this work.
Headphones, making use of the sound characteristics of the necessary oscillating Current, are the most useful type of null indicator. In conjunction with the present circuit design a great contrast in tone volume, which rapidly fades to a minimum level within an extremely narrow range, contributes to the ease of adjusting the instrument. For prolonged operation sponge-rubber cushions over the phones have been found to be helpful by reducing the interference of extraneous sounds, adding to the comfort of the operator.
To avoid the influence of capacitance factors present in field circuits, a large con-denser has been included which assists greatly in obtaining a good null balance within the bridge. The instrument is powered by dry-cell batteries feeding through a 2,000-cycle electronic oscillator. The extremely wide range of sensitivity is obtained by inserting two series of standardized resistances in opposite arms of the bridge; the proper combination is selected by means of multiplier switches, and the final null point is obtained by adjusting a logarithmic potentiometric rheostat filled with a 6-inch graduated dial in a matter of seconds. Null points are reduced to the width of not more than two turns of the rheostat coil, which permits finer adjustment than can be con-veniently interpolated from the graduations.
Compared with the general purpose conductivity bridges standard in most research

U 0 -J 10
66
laourawrles, uns sp d. eiL uL1ue has several advantages: It is self-contained and port-able, the power unit is rugged enough to with-stand shocks encountered in field work, and a sharp null point is obtainable as a result of including the variable condenser in one of the bridge arms. Compared with the special bridge originally designed for this work, the newer modification has a much wider range: 5,000,000 ohms as against 100,000 ohms for the old model. The oscillator has also been improved, the new model having a much higher power output at a frequency of 2, 000 cycles. The high power output produces a loud signal that facilitates adjustment be-cause of its great contrast with the null balance, which is, under most conditions, marked by total silence.
The bridge described above furnishes I 5 to Is 20 25 the most accurate means available for meas-
U) P.RMANENT M013TUR uring resistance and, therefore, soil mois- WILTING EQUIVALENT ture content. Bridges with the "magic eye"
tr PER CENT WATER IN TNE SOIL principle have proven entirely unsatisfactory Figure 2. Typical Performance and Calibra- under field conditions.
tion Curve of the Paris diock Metod. There has also been developed an alter- nating-current-impedance meter (8) as a
direct-reading meter to be used with the plaster-of-paris block (Fig. 5). This meter is portable, is powered by dry batteries, and employs a vacuum tube and a rectifier. It is calibrated to read directly in percentage of available moisture content in the soil (Fig. 6), having a range from field capacity to the wilting point or from a soil moisture tension of less than 1 to more than 15 at- mospheres. The percentage refers to and - - - is based upon the original total amount of available moisture in each soil. This meter is accurate with wire leads on the plaster -of -paris block up to about 10 ft. •-. .. in length; beyond this length the meter
readings become inaccurate due to capac- itance effects introduced by the leads.
Advantages of the Plaster-of-Paris Method
1. The plaster -of -paris block pos- esses the most favorable combination of pore-size distribution and buffer action of any material thus far investigated. Its pore-size distribution is such as to enable the block to measure moisture from less than I to more than 15 atmospheres of soil moisture tension. At the same time, the solubility factor of 2200-2400 ppm. of the gypsum is of sufficient magnitude to act as a buffer and minimize inter-ference from variations in salt content in different soils but not such a high mag-nitude as to reduce the resistance sensi-tivity of the block to moisture changes.
Figure 3. The Special Soil Loisture Wheatstone Bridge
---.---,---- l:.-1...-. 1 0 N
U)
o 100 0 0 0

67
2. It has been found that at any given electrical resistance different soils hold water with approximately the same force, or the soil moisture potential is approximately the same for all soils. This being the case, the percentage of water existing between field capacity and the wilting point can be directly determined in all soils without calibrating the method for each individual soil (Fig. 6). For example, when the block resistance
•
HITT1 I
i lh1 I
1,I I T I I jqlI :...
1 T
... . ....
..
I 1\. ' ..
Ige F~Az hig-
ls111 13 1S
Tdoparetwe .f fs ..t1 13 Yo
Oat.
Figure 4. iJaily Electrical Resistance of Brookston Clay Loam at iifferent Depths, Un-cropped and Under Oats and te1ative Amount of Available ;ater at Any Given Resistance
Heading and Total Soil Moisture Content at Six Inches.
registers 2, 800 ohms, the soil contains 50 percent of the total amount that existed be-tween field capacity and the wilting point. The ability of the method to make this direct measurement in all soils without calibration is of high importance and can be of great value to the agronomist as well as to the highway engineer.
The plaster -of -paris blocks are very dependable in their performance. When mechanically sound, they always tell a true story.
The blocks lend themselves for successful use with long-wire leads up to 200 ft., or even longer.
The method is inexpensive.

Figure 5. Alternating Current Impedance Moisture Meter.
placed in intimate contact or too close to the concrete slab. Therefore, blocks should be at least 5 in. below a concrete slab.
The Nylon Electrical-Resistance Method
68
Disadvantages of the Plaster-of-Paris Method
On well-drained soils the plaster -of -paris blocks have lasted for as long as 7 years. However, in constant wet conditions, the blocks do not last for more than 1 or 2 years, especially if submerged in the ground-water table for any considerable length of time. This is perhaps the greatest weakness of the plaster-of-paris blocks.
The blocks are not sensitive to changes in moisture content from saturation to field capacity. However, as previously stated, well-drained soils usually do not hold
water above field capacity for any length of -. time.
Althouzh the elaster -of -paris blocks possess a buffer action of considerable magnitude, their readings are affected by excessively high salt content of the soil. Experiments seem to indicate that a salt concentration of above 5, 000 ppm. may affect the resistance readings. The elec-trical resistance of the blocks under con-crete pavements may be influenced by the excessive salt content of the concrete if
RESISTANCE IN OHMS 3
0 0
N -cc rn
rn°
0
CD
z
'1
I—
P1
0 (p -1 C In,.
0
'uusuii i urn An intensive and extensive research has been conducted to develop a moisture measuring unit superior to the plaster-of- Figure 6. Percent Available ater in Soil. paris block, especially in respect to dur- ability and range of moisture determination. This research had in mind the hydrologist and the highway engineer, who are especially interested in measuring the entire range of soil moisture content. The materials examined have been numerous, including fire-processed clay, cement and concrete mixtures, cement and plaster-of-paris mixtures, hydrocal, and hydrostones, rubber foam, asbestos, fiberglas, nylon, etc. Of all the materials examined, the nylon fabric proved to be the most satisfactory, and was found, in some ways, to be superior to plaster of paris.
:ii UM 1160 mom ::ioII1ov:uIll
IUhIiIIiPr11 •U11H1 IHI JflIIIIV uuIII-.uhIIll dIIIIUIII
Vol dl iiUiiliIlU
ui' H1U111111 11111111 OIRUUI ..IniIi, .
1
ON
11111 uu 11110
I_ IU
0
C

Figure 7. The Nylon .ectrical Resiance Unit.
69
Principle of the Nylon Unit
The moisture -measuring unit composed of nylon fabric was made on the same princi-ple as the plaster -of-paris block, insofar as the electrodes are imbedded in the block in a constant environment. The nylon unit, as finally perfected and embodying the prin-ciple of the plaster -of -paris block, is shown in Figure 6. It consists of two pieces of fine stainless steel, acting as electrodes, to which are soldered wire leads. The soldered joints are covered with a long-lasting coating. The electrodes are separated or wrapped by three single pieces of nylon fabric. The whole assemblage is then placed in a perforated stainless steel case and subjected to a uniform and controlled high pressure. While the center of the unit is held under constant high pressure, . the edges of the unit are mechanically ' ' I united to hold the enclosed assemblage \ permanently in intimate contact. The en-veloping case has 0. 2-in. square holes, 1/4-in, center straight, and is 64 percent open. The holes cover the entire surface oil - -:- -
of the case thus affording the absorbent extcnsive exposure to the soil '.
Like the plaster-of-paiis block the
BROORSTON CLAY DECATUR CLAY HONEOVE CLAY 4FT-MJCH 3UBSOIL.TENN. LOAMNY
5 1
INGP A CENT-
I I - ORYINOCYCLES -
- I.crN
THI0 - - - 4 - .nELo CAPACITY
rc E3
5 1 3TANDI OWA
— I,
x
VINA LOAM.CALJF PUTNAM
LOAM.MO. SILT ML SPINE SANDY
LOAM.TEX
vwc
N _
_ _ — NS O 0 20 40 0 20 40 20 40
PER CENT SOIL MOISTURE
nylon unit absorbs moisture from the soil and gives it up to the soil very readily. When the nylon unit is buried in the soil,
_________ its moisture content tends to achieve and maintain equilibrium with that of the soil. The electrical resistance of the unit varies with its moisture content and is an index of moisture in the soil.
Figure 8. Typical Performance and Call- Like the plaster -of -paris blocks, the bration Curves of the Nylon Unit, nylon units provide a continuous measure
of field-moisture variation. The units may be imbedded in the soil at the desired depth and left there permanently. Soil moisture is determined by measuring the electrical resistance of the unit. Resistances are then translated into moisture percentages by means of previously determined calibration curves. Figure 7 shows typical performance and calibration curves of the nylon unit.
The construction of the nylon units is somewhat difficult and complicated. The pres-sure applied to bring the electrodes and the nylon fabric into intimate contact must be of a controlled magnitude. If too much pressure is applied, the fabric is liable to be crushed or cut and electrical short circuits encouraged. If the pressure is not suffi-cient, the contact between electrodes and fabric will be poor, and the unit will give an
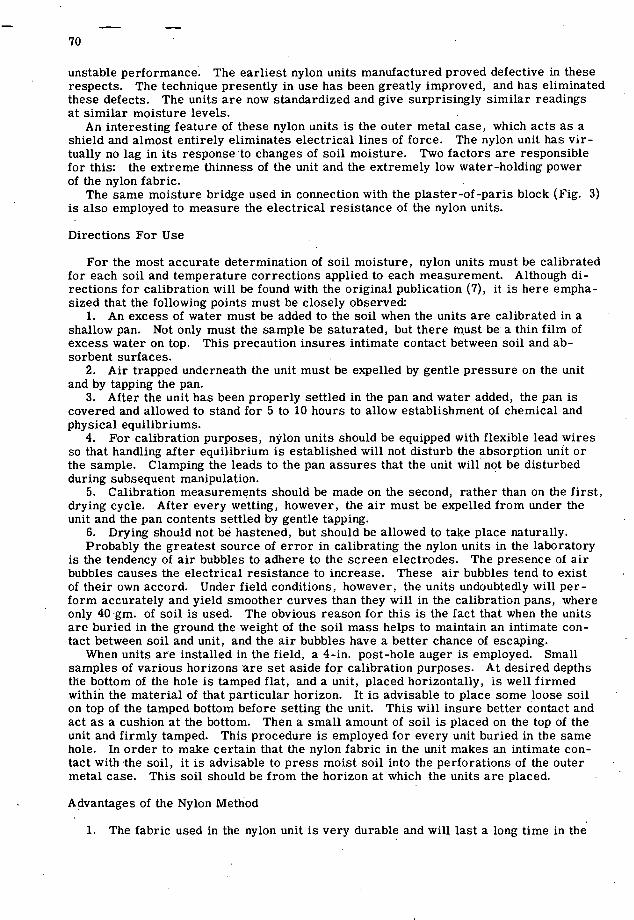
70
unstable performance. The earliest nylon units manufactured proved defective in these respects. The technique presently in use has been greatly improved, and has eliminated these defects. The units are now standardized and give surprisingly similar readings at similar moisture levels.
An interesting feature of these nylon units is the outer metal case, which acts as a shield and almost entirely eliminates electrical lines of force. The nylon unit has vir-tually no lag in its response to changes of soil moisture. Two factors are responsible for this: the extreme thinness of the unit and the extremely low water-holding power of the nylon fabric.
The same moisture bridge used in connection with the plaster -of -paris block (Fig. 3) is also employed to measure the electrical resistance of the nylon units.
Directions For Use
For the most accurate determination of soil moisture, nylon units must be calibrated for each soil and temperature corrections applied to each measurement. Although di-rections for calibration will be found with the original publication (7), it is here empha-sized that the following points must be closely observed:
An excess of water must be added to the soil when the units are calibrated in a shallow pan. Not only must the sample be saturated, but there must be a thin film of excess water on top. This precaution insures intimate contact between soil and ab-sorbent surfaces.
Air trapped underneath the unit must be expelled by gentle pressure on the unit and by tapping the pan.
After the unit has been properly settled in the pan and water added, the pan is covered and allowed to stand for 5 to 10 hours to allow establishment of chemical and physical equilibriums.
For calibration purposes, nylon units should be equipped with flexible lead wires so that handling after equilibrium is established will not disturb the absorption unit or the sample. Clamping the leads to the pan assures that the unit will not be disturbed during subsequent manipulation.
Calibration measurements should be made on the second, rather than on the first, drying cycle. After every wetting, however, the air must be expelled from under the unit and the pan contents settled by gentle tapping.
Drying should not be hastened, but should be allowed to take place naturally. Probably the greatest source of error in calibrating the nylon units in the laboratory
is the tendency of air bubbles to adhere to the screen electrodes. The presence of air bubbles causes the electrical resistance to increase. These air bubbles tend to exist of their own accord. Under field conditions, however, the units undoubtedly will per-form accurately and yield smoother curves than they will in the calibration pans, where only 40 gm. of soil is used. The obvious reason for this is the fact that when the units are buried in the ground the weight of the soil mass helps to maintain an intimate con-tact between soil and unit, and the. air bubbles have a better chance of escaping.
When units are installed in the field, a 4-in, post-hole auger is employed. Small samples of various horizons are set aside for calibration purposes. At desired depths the bottom of the hole is tamped flat, and a unit, placed horizontally, is well firmed within the material of that particular horizon. It in advisable to place some loose soil on top of the tamped bottom before setting the unit. This will insure better contact and act as a cushion at the bottom. Then a small amount of soil is placed on the top of the unit and firmly tamped. This procedure is employed for every unit buried in the same hole. In order to make certain that the nylon fabric in the unit makes an intimate con-tact with the soil, it is advisable to press moist soil into the perforations of the outer metal case. This soil should be from the horizon at which the units are placed.
Advantages of the Nylon Method
1. The fabric used in the nylon unit is very durable and will last a long time in the

71
soil, a minimum of more than 5 years, even in very wet conditions. The unit has an extraordinarily wide range, capable of measuring the moisture
content of soils from saturation to almost air dryness. It is highly responsive and sensitive to changes in moisture content, especially
at the higher levels of water content where a sensitive method is most needed. It lends itself easily and conveniently to calibration. Although nylon has no buffer action, it is less sensitive to variations of salt con-
tent in the soil than such materials as fiberglas, where there is a definite chemical reaction or ion exchange.
Because of its high sensitivity, any physical changes in the soil which tend to alter the soil moisture relationship will be reflected by the unit. For example, a soil in normal condition at field capacity appears well drained; yet, when it is tapped and its macrosize pores are destroyed, free water appears at the surface and the soil appears saturated. The nylon method indicates this condition very readily.
The outer metal case of the unit acts as a shield and almost entirely eliminates electrical lines of force.
Although the nylon method is rather new and has not been tested as long and as widely as the plaster-of-paris method, and consequently no very definite claims can be made for it at present, nevertheless, from all evidence thus far obtained it is in-dicated that the method, when properly used, is a good, reliable, highly -sensitive method for measuring soil moisture content from saturation to almost air dryness.
Disadvantages of the Nylon Method
I. The nylon is an inert fabric and has no buffer action. The unit, therefore, is sensitive to salt content. However, this lack of buffering action may not be a serious handicap since each soil is calibrated and the calibration takes into account the physical and chemical charaëtëristics and salt content. In placing units under concrete pave-ments, it is advisable to place the units at least 3 in. below the concrete slab so the salts from the concrete will have the minimum effect upon the units.
In calibrating the unit in the soil pan there is a tendency for air bubbles to ad-here to the screen electrodes and to the nylon fabric at the saturation range and prevent an exact duplication of results. However, with care these air bubbles can be made to exit. Furthermore, when the units are buried in the ground, the weight of the soil mass helps to maintain an intimate contact between soil and unit and prevents the forma-tion of air bubbles.
The wrapping of fabric around the screen electrodes makes the contact artificial and imperfect. However, by using only one thickness of wrapping the contacts are greatly improved.
The outer metal case of the fabric unit tends to interfere with a perfect contact between soil and unit. This interference may be especially serious at the bottom of the unit as it is placed upon the soil. This interference, however, can be almost entirely eliminated by placing the unit upon loose soil and pressing it down, and also by press-ing moist soil into the perforations of the metal case.
The method must be calibrated for each individual soil. However, there is a possibility of developing a technique similar to that used in the plaster-of-paris method whereby the method may not need such individual calibrations.
Conclusion .
The plaster-of-paris and nylon electrical-resistance methods have been found to be the most satisfactory means now available for measuring soil moisture content under field conditions. Neither one is perfect, but if properly used they will give very valu-able results. These methods give a much more representative picture of actual soil moisture conditions than can be obtained by sampling procedures. A comparable meas-urement cannot, in fact, be obtained by sampling because of the difficulty in procuring constant, representative samples where soils are heterogeneous and not uniform in

72
texture. For highway engineers interested in determining total water content over a wide range and by a more or less permanent method, the nylon is definitely superior to the plaster-of-paris method. On the other hand, the plaster-of-paris method has the distinct advantage of possessing considerable buffer action, and can measure the range of moisture content from less than ,1 atmosphere to more than 15 atmospheres tension in practically all soils without calibrating the method for each individual soil. The nylon unit, however, possess great promise, especially in view of the recent improve-ments it has undergone. These improvements include (a) a stanthrdized technique of manufacturing it; and (b) the use of stainless steel in place of the monel electrodes and case. This latter change is of vital importance because stainless steel does not corrode in the soil, while monel metal corrodes badly in many soils, and the corrosion products tend to destroy the insulating property of the nylon fabric.
Bibliography
Allyn, R. B. and Work, R. A., The Availameter and its Use in Soil Moisture Control: I. The Instrument and its Use, Soil Sci. , 51: 307-321, 1941.
Anderson, A B. C. and Edlefsen, N. E., Laboratory Study of the Response of 2 and 4-Electrodes Plaster of Paris Blocks as Soil Moisture Content Indicators, Soil Sci. , 53: 413-428, 1942.
Anderson, A. B. C. and Edlefsen, N. E., The Electrical Capacity of the 2-Elec-trode Plaster of Paris Blocks as an Indicator of Soil Moisture Content. Soil Sci. , 54: 35-46, 1942.
Anderson, A. B. C., A Method of Determining Soil Moisture Content Based on the Variation of the Electrical Capacitance of Soil, at a Low Frequency, with Moisture Content, Soil Sci., 56: 29-41, 1943.
Bouyoucos, G. 3., and Mick, A. H., An Electrical Method for the Continuous Measurement of Soil Moisture Under Field Conditions, Mich. Agr. Exp. Sta. Tech. Bul. 172: 1-38, 1940.
Bouyoucos, G. J. and.Mick, A. H., A Fabric Absorption Unit for Continuous Measurement of Soil Moisture in the Field, Soil Sci. , 66, No. 3, 2 17-232, 1948.
Bouyoucos, G. 3., A Nylon Electrical Resistance Unit for Making Continuous Measurement of Soil Moisture in the Field, Soil Sci. 67, No. 4, 319-330, 1949.
Bouyoucos, G. 3., A Practical Soil Moisture Meter as a Scientific Guide to Irrigation Practices, Agron. Journ. 42, No. 2, 104-107, 1950.
Briggs, L. 3., Electrical Instruments for Determining the Moisture, Tempera-ture, and Soluble Salt Content of Soil, USDA Bul. 15, 1899.
Buckingham, E. , Studies on the Movement of Soil Moisture, USDA Bur. Soils Bul. 38, 1907. .
Cashen, G. H., Measurement of the Electrical Capacity and Conductivity of Soil Blocks, Jour. Agr. Sci. , 22; 145-164, 1932.
Colman, E. A., The Place of Electrical Soil Moisture Meters in Hydrologic Re-search, AGU Trans. , 27: 847-853.
Cummings, R. W.. and Chandler, R. F., Jr., A Field Comparison of the Elec-trothermal and Gypsum Block Electrical Resistance Methods with the Tensiometer Method for Estimating Soil Moisture in Situ, Soil Sci. Soc. Amer. Proc. , 5: 80-85, 1941.
Davis, Wendell E. and Slater, C. S., A Direct Weighing Method for Sequent Measurements of Soil Moisture Under Field Conditions, Jour. Amer. Soc. Agron. 34: 285-286, 1942.
Edlefsen, N. E. , A Review of Results of Dielectric Methods for Measuring Moisture Present in Materials, Agr. Engin., 14: 243-244, 1933.
Edlefsen, N. E. and Anderson, A. B. C., The Four-Electrode Resistance Method for Measuring Soil Moisture Content Under Field Conditions, Soil Sci. , 51: 367-376, 1941.
Edlefsen, N. E. and Smith, W. 0., The Determination of Moisture in Undisturbed Soil, Soil Sci. Soc. Amer. Proc., 8: 11-115, 1943.

73
Fletcher, J. E. , A Dielectric Method of Measuring Soil Moisture, Soil Sci. Soc. Amer. Proc. , 4: 84-88, 1940.
Gardner, F. D., The Electrical Method of Moisture Determination in Soil: Re-suits and Modificiations in 1897, USDA Bul. 12, 1898.
Gardner, W.,A Capillary Transmission Constant and Methods of Determining it Experimentally, Soil Sci. , 10: 103-126, 1920.
Gardner, W., The Capillary Potential and its Relation to Soil Moisture Constants, Soil Sci. , 10: 357-359, 1920.
Haise, H. R. and Kelley, Omer J., The Relation of Electrical and Heat Con-ductivity to Moisture Tension in Plaster of Paris Blocks, Soil Sci. , 61: 4 11-422, 1946.
Heck, A. F. , A Soil Hygrometer for Irrigated Cane Lands of Hawaii, Jour. Amer. Soc. Agron. , 26: 274-278, 1934.
Hunter, Albert S. and Kelley, Omer J., Changes in the Construction of Soil• Moisture Tensiometers for Field Use, Soil Sci. , 61: 215-218, 1946.
Johnston, C. N., Water-Permeable Jacketed Thermal Radiators as Indicators of Field Capacity and Permanent Wilting Percentage in Soils, Soil Sci. , 54: 123-126, 1942.
Kelley, Omer J., A Rapid Method of Calibrating Various Instruments for Méas-uring Soil Moisture In Situ, Soil Sci. , 58: 433-440, 1944.'
Kelley, Omer 'J., Hunter, ,A. S., Haise, H. R., and Hobbs, C. H', A Cbmpari-son of Methods of Measuring Soil Moisture Under Field Conditions, Jour. 'Amer. Soc. Agron. , 38: 9, September, 1946.
Knoblauch, H. C., Richards, S. J. and Lint, H. C., 'Soil Moisture Tension Under Various Conservation Practices, II, Soil Sci. Soc. Amer. Proc. , 4: 433-437, 1940.
Knoblauch, H. C., Richards, S. J. and Lint, H. C. , Soil Moisture Tension Under Various Conservation Practices, II, Soil Sci. Soc. Amer. Proc. , 6: 480-483, 1942.
Livingston, B. E. and Koketsu, R., The Water-Supplying Power of the Soil as Related to the Wilting of Plants, Soil Sci. , 9: 469-485, 1920.
Magistad, 0. C. and Breazeale, J. F., Plant and Soil Relations at and Below the Wilting Percentage, Ariz. Agr. Exp. Sta. Tech. Bul. 25, 1929.
McCorkle, W. H., Determination of Soil Moisture by the Method of Multiple Electrodes, Tex. Agr. Exp. Sta. Bul. 426, 1931.
Pulling, H. E. and'Livingston, B. E., The Water-Supplying Power of the Soil as Indicated by Osmoters, Carnegie Inst. Was. , Pub.' 204: 49-84, 1915.
Richards, L.A., The Usefulness of Capillary Potential to Soil' Moisture and Plant Investigations, Jour. Agr. Res. , 37: 719-742, 1928.
Richards, L.A. and Gardner, W., Tensiometers for Measuring the Capillary Tension of Soil Water, Jour. Amer. Soc. Agron. , 28: 3 52-358, 1936.
Richards, L. A.', Russell, M. B. andNeal, 0. R., Further Developments on Apparatus for Field Moisture Studies, Soil Sci. Soc. Amer. Proc , 2: 55-64, 1938.
Richards, L. A., Neal; 0. R. and Russell, M. G., Observations on Moisture Conditions in Lysimeters, II, Soil Sci. Soc. Amer. Proc. , 4: 55-59, 1940.
Richards, L. A., A Pressure Membrane Extraction Apparatus for Soil Solution, Soil Sci. , 51: 377-386, 1941. '
Richards, L. A., Moisture Studies Under Citrus Using Tensiometers, Amer. Soc. Hort. Sci. Proc. , 39: 73-79, 1941. '
Soil Moisture Tensiometer Materials and Construction, Soil Sci.', 53: '241-248, 1942.
Richards, L.A. and Fireman, Milton, Pressure-'Late Apparatus for Measur-ing Moisture Sorbtion and Transmission by Soils, Soil Sci., 56: 395-404, 1943.
Richards, L.A. and Weaver, L. R., The Sorbtion Block Soil Moisture Meter and Hysteresis Effects Related to its Operation, Jour. Amer. Soc. Agron. , '35: 1002-1011, 1943.
Richards, L.A. and Weaver, L. R.", The' Relation Between the Fifteen A'tmos-phere Percentage andthe Permanent Wilting Percentage, Soil Sci.', 56: 331-339, 1943.

74
Richards, L. A. and Weaver, L. R., Moisture Retention by Some Irrigated Soils as Related to Soil Moisture Tension, Jour. Agr. Res. , 69: 215-235, 1944.
Richards, S. J., Soil Moisture Content Calculations from Capillary Tension Records, Soil Sci. Soc. Amer. Proc. , 3: 57-64, 1939.
Rogers, W. S., A Soil Moisture MeterDepending on the Capillary Pull of the Soil, Jour. Agr. Sci., 25: 326-343, 1935.
Russell, M. B..,. The Utility of the Energy Concept of Soil Moisture, Soil Sci..Soc. Amer. Proc., 7: 90-94, 1943.
Russell,• M. B., Davis,. F. E. and Bair, R. A., The Use of Tensiometers for Following Soil Moisture Conditions Under Corn, Jour. Amer. Soc. Agron., 32: 922- 930, 1940. '
Shaw, B. T. and Bayer, L. D., Heat Conductivity as an Index of Soil Moisture, Jour. Amer. Soc. Agron. , 31: 886-891, 1939.
Shaw, B. T. and Bayer, L. D., An Electrothermal Method for Following Moisture Changes of the Soil In Situ, Soil Sci. Soc., Amer. Proc.., 4:, 78-83, 1940.
Slater, C. S.., A Modified Resistance Block 'for Soil Moisture Measurement, Jour. Amer. Soc. Agron., 34: 284-285, 1942.
Staebner, F. E. , A Soil Moisture Meter, Agr. Engin. , 20: 317-318, 1939. Veihmeyer, F. J., Edlefsen, N. E. and Hendrickson, A. H., Use of Tensio-
meters in Measuring Availability of. Water to Plants, Plant Physiol. , 18: 66-78, 1943. Veihmeyer, F. J. and Hendrickson, A.H., The Moisture Equivalent as a
Measure of the Field Capacity of Soils, Soil Sci. , 32: 181-193, .1931. Whitney, M., Gardner, F. D. and Briggs, L. J., An Electrical Method of
Determining the Moisture Content of Arable Soil, USDA Bul. 6, 1897.
THE MEASUREMENT OF SOIL MOISTURE AND TEMPERATURE BY HEAT DIFFUSION TYPE MOISTURE CELL
William M. Aldous, Chief, and Warren L. Lawton, Soils and Surfacing Branch, Airport Division, Civil Aeronautics Administration
Synopsis
Procedure and materials employed in the development of soil moisture-temperature measuring equipment are described. The various stages of development are outlined briefly. Results obtained with the several types of cells investigated are presented.
The performance characteristics of the cell in its present state of de-velopment have been investigated through the medium of laboratory-cal-ibration test and soil-moisture determinations. The performance of the present cell is unsatisfactory when in soil at moisture content above 15 percent by dry weight and is quite variable unless positive contact with ambient soil is initially established and maintained during readings. Future improvement in design to increase operating efficiency and sim-plify fabrication is briefly outlined.
The significance of soil moisture as a medium for altering or modifying the struc-tural value of foundation and paving subgrade soils is well recognized. The influence of temperature gradient on the migration of moisture vertically and laterally in the soil is generally less well understood. Facilities for observing and measuring both temperature and moisture content in existing subgrade soils under paving concurrently with weather observations are urgently needed. Such factual information obtained and compiled for various soil types over an extensive period of time and related to climatic environment, types of paving, and other pertinent physical features would be extremely useful in determining the range of moisture content to be expected. Determination of soil bearing value, shear strength and other structural properties required for rational design could thus be predicated upon definitely observed moisture content. As the

75
supporting power of the subgrade soil directly influences the type, thickness, and char-acter of superimposed paving provided to support the designed wheel load, the impor-tance of authentic information on soil moisture under service conditions is obvious.
In addition to providing a means for the determination of moisture content in connec-tion with soil bearing value, installations of cells under paving, spaced vertically at selected distances throughout the soil column, may be used to depict the directional movement of soil water together with its fluctuations and concentrations in response to temperature variations. Using this installation, the need for subdrainage in a given location can be established or the effect of existing drainage systems can be eval- uated.
Investigation made preliminary to the inception of this project indicated that 0 moisture -measuring devices had been 0 developed for use, principally in the ag- ricultural field. Their operation was based upon measuring the electrical re-
/ sistance developed in the soil, which I I
varies with the amount of moisture pres- TYPE I-A THERMISTOR
ent. Reports by others investigating the application of this type of cell to subgrade- 7 MM
GLASS moisture measurement indicated that cell TUBE accuracy was markedly affected by slight i LONG
changes in the chemical composition of the soil and that its greatest efficiency occurred at the lower range of soil mois-ture content. No provision had been made for obtaining soil temperature readings I /2"
concurrently with moisture determination. The evolution of the moisture cell de-
scribed herein is the result of extensive study and experimentation over the past three years. As originally conceived, soil moisture content may be determined
1/4 by the measurement of temperature dif- ference resulting from the diffusion of heat from a regulated constant source LHEATER CoIL NO.37
O RESISTANCE WIRE 70 OHMS
HYDROCAL PLASTER
01
ALUMINUM TUBE
COIL NO. 40 COPPER WIRE 7 OHMS
- I AND
TIUC IN MINUTES
Figure 1. Figures 2 and 2A.
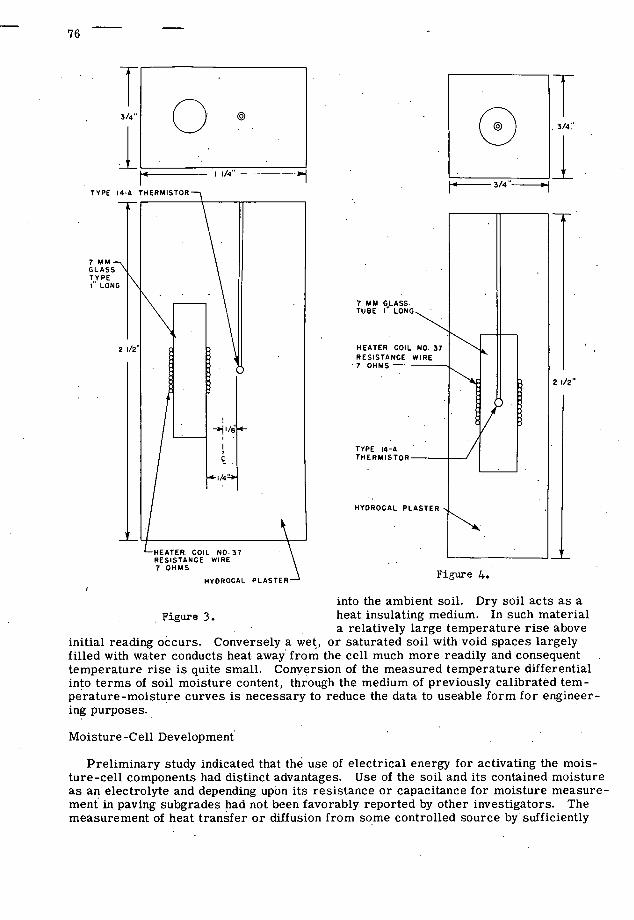
I' 3/4
7 MM GL rUDE I
HEATER RESISTAI 7 OHMS
TYPE 4-THE RN IS
H YD R 0 C A
r
0 TYPE 14-A THERMISTOR
7 MM- GLASS TYPE I" LONG
1/4
HEATER COIL NO.37 RESISTANCE WIRE 7 OHMS
HYDROCAL PLASTER Figure 4.
76
into the ambient soil. Dry soil acts as a Figure 3. heat insulating medium. In such material
a relatively large temperature rise above initial reading occurs. Conversely a wet, or saturated soil with void spaces largely filled with water conducts heat away from the cell much more readily and consequent temperature rise is quite small. Conversion of the measured temperature differential into terms of soil moisture content, through the medium of previously calibrated tem-perature-moisture curves is necessary to reduce the data to useable form for engineer-ing purposes.
Moisture-Cell Development
Preliminary study indicated that the use of electrical energy for activating the mois-ture-cell components had distinct advantages. Use of the soil and its contained moisture as an electrolyte and depending upon its resistance or capacitance for moisture measure-ment in paving subgrades had not been favorably reported by other investigators. The measurement of heat transfer or diffusion from some controlled source by sufficiently

7 MM GL TUBE I
HEATER RESISTAI 7 OHMS
TH ER MO
HYDROC
Figure 5. Figure.6.
2 /2'
77
accurate equipment appeared to be the method least affected by variable soil composition and electrolyte.
The thermistor element employed in this cell as a means of measuring existing soil temperature and temperature rise in the body of the cell after the heating coil has been energized is a standard product of the Western Electric Company and has been used ex-tensively in other commercial and scientific work. It is a selected combination of at least two metallic oxides which, when properly combined, compressed, and sintered, becomes a temperature-measuring instrument of extremesensitivity. Its peculiar a-bility to change its electrical resistance with temperature over a range of 0 to 3000 ohms is a highly advantageous attribute. The uniformity and reproducibility of its per-formance is essential in order to obtain minor temperature variations which accompany very slight changes in the moisture content of the ambient soil. It might be well to add further that the potential of the thermistor has not been fully developed in connection with its application to moisture measurement, and present indications are that it will become an increasingly useful medium in future moisture-cell development.
Figure 1 indicates the type and character of the initial cell. A wire coil was used for heat source. Its change in resistance was correlated with temperature. This type was abandoned due to insulation difficulty, heat control, and variable heat dissipation.
1/4 1W 2 LON( CELLNI A L UM IN I CELLN COPPER
TYPE 14 THERMI
HEATER NO.37
2 1/2 RESISTA WIRE 7
HYDROCAL PLASTER

TYPE 14-A THERMISTOR7
78
Figures from 2 to 13 inclusive* are sketches of cells constructed during the pro-gressive stages of development when a moisture conducting medium (hydrocal plaster) was employed as a bedding material and a protective cover for the electrical elements. Figure 2A indicates graphically the time-temperature rise relationship of cells in this series.
The use of the plaster block was also considered advantageous due to the relatively constant properties of the material itself. Its particle size, chemical composition, and affinity, for water could be readily determined. The'dry density, volume of voids, ther-mal conductivity, specific heat, and physical dimensions of the fabricated block appear- ed.to offer a material of uniform quality ' V
which would have only one'variable,
3/4
.1 1/4 D ALUMI TUBE I' LON
-- HEATEI 1 /4 DIAMETER COIL N ALUM I NUM RESIST TUBE WIRE 3/8' LONG -
_________1 7L____
7 OHM
HEATER COIL
NO. 37 I 1/8" RESISTANCE WIRE 7 OHMS
HYDROCAL . . HYDRO PLASTER- - . PLAST
Figure 8.
namely, moisture content. If block and Figure 9.' soil moisture varied directly, or in some ratio, the block's constant and reproducible characteristics offered a more de-sirable medium in which to measure moisture than the soil itself. This type of block material failed to follow soil moisture closely or rapidly. For that reason, its use was limited only to this transition period in which it served its best purpose in the de-termination of the best type of thermistor and the most efficient relative location of the heater coil and thermistor. Of the cells tested in this series, the best performance was obtained from the one illustrated in Figure 13.
As it was then believed that a uniform material of known density, void space, and heat conductivity would be preferable to the natural soil as the medium for the passage of heat generated in the cell, arrangements were made with the Norton Company, Worcester, Massachusetts, for the design and fabrication of Alundum porous blocks for this purpose. A mixture was selected which, when molded, compressed, and fired,
*Figure 7 is not shown.

IfLJEr
5/IS ALUMINIJ TUBE 5/16 LO
HEATER NO. 37 RE $15 TAI WIRE 7 OHMS
HYDROCA PLASTER
TYPE 14- -
1/4" DIAN ALUMINU TUBE I
1. L
I LONG
HEATER NO.40 ADVANCE WIRE 16
HYDROCAI PLASTER
HEATER C NO.40 ADVANCE 16 OHMS (NO COIL SUPPORT
NY DRO CAL PLASTER
Figure :13.
79
Figure 11,
Figure 10.
HEATER ONE TUR T HE RN IS NO 44 RE SI STAN WIRE 16
MY DR OC PLASTER
Figure 12.
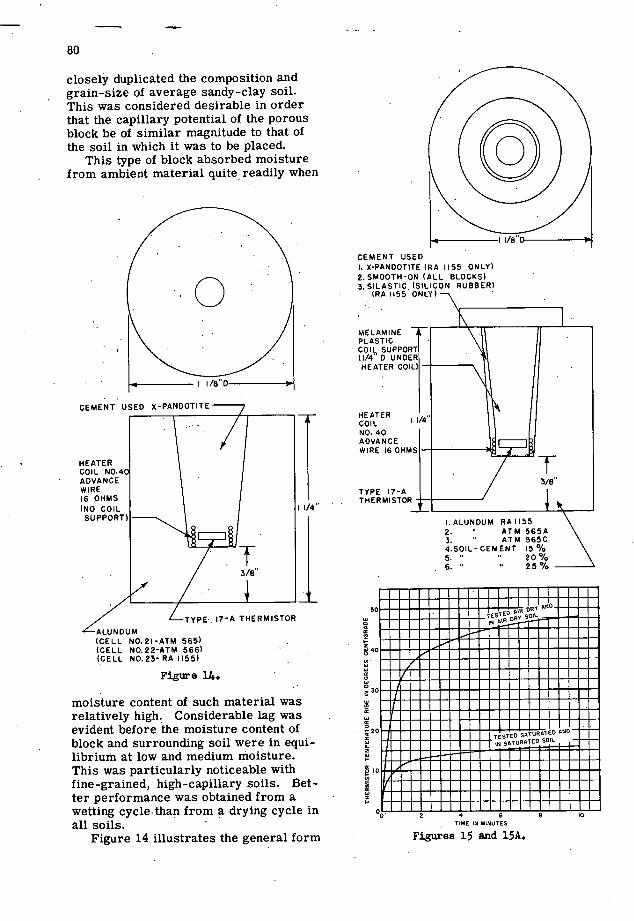
80
closely duplicated the composition and grain-size of average sandy-clay soil. This was considered desirable in order that the capillary potential of the porous block be of similar magnitude to that of the soil in which it was to be placed.
This type of block absorbed moisture from ambient material quite readily when
CEMENT USED X-PANDOTITE
HEATER COIL NO.41 ADVANCE WIRE 16 OHMS (NO COIL I /4 SUPPORT)
3/8
/ /..
Il-A THERMISTOR
A LU N 0 U N (CELL NO.21-ATM 565) (CELL NO.22-ATM 566) (CELL NO. 23- RA 1155)
Figure 14.
moisture content of such material was relatively high. Considerable lag was evident before the moisture content of block and surrounding soil were in equi-librium at low and medium moisture. This was particularly noticeable with fine -grained, high -capillary soils. Bet-ter performance was obtained from a wetting cycle.than from a drying cycle in all soils.
Figure 14 illustrates the general form
191 CEMENT USED I.X-PANDOTITE(RA 1155 ONLY) 2. SMOOTH-ON (ALL BLOCKS) 3.SILASTIC. (SILICON RUBBER)
(RA 1155 ONLY)-
MEL AM INE PLASTIC COIL SUPPORT (1/4" D UNDER HEATER COIL) -
HEATER COIL 11/4
NO. 40 ADVANCE WIRE 16 OHMS -
T 3/8"
TYPE Il-A THERMISTOR
I.ALUNDUM RAII55 ATM 565A ATM 565C
4.SOIL - CEMENT 15% 20% 25%
II tESTED SATURATED AND IN SATURAD.StLtL
L 10
TIME IN MINUTES
Figures 15 and 15A.
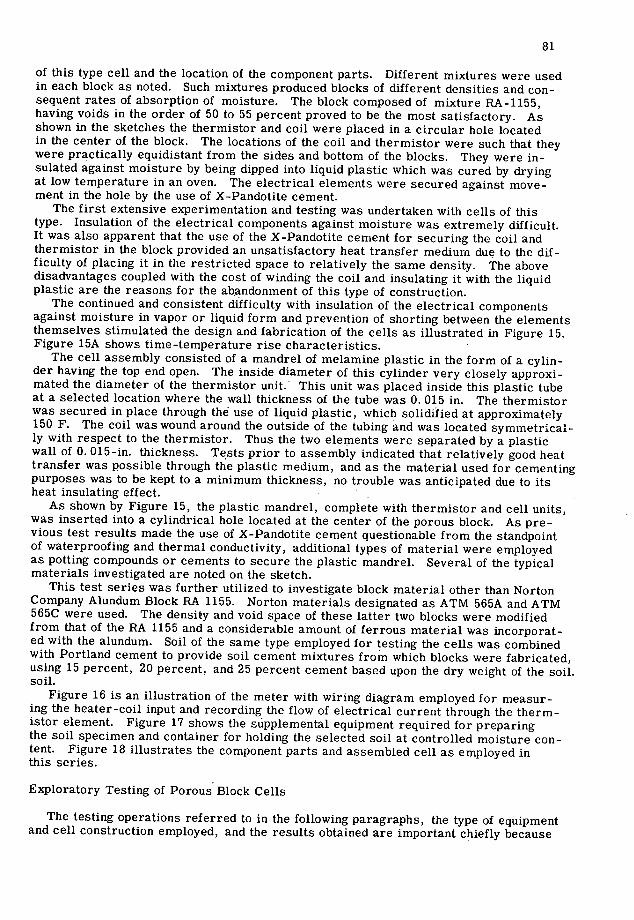
81
of this type cell and the location of the component parts. Different mixtures were used in each block as noted. Such mixtures produced blocks of different densities and con-sequent rates of absorption of moisture. The block composed of mixture RA-1155, having voids in the order of 50 to 55 percent proved to be the most satisfactory. As shown in the sketches the thermistor and coil were placed in a circular hole located in the center of the block. The locations of the coil and thermistor were such that they were practically equidistant from the sides and bottom of the blocks. They were in-sulated against moisture by being dipped into liquid plastic which was cured by drying at low temperature in an oven. The electrical elements were secured against move-ment in the hole by the use of X-Pandotite cement.
The first extensive experimentation and testing was undertaken with cells of this type. Insulation of the electrical components against moisture was extremely difficult. It was also apparent that the use of the X-Pandotite cement for securing the coil and thermistor in the block provided an unsatisfactory heat transfer medium due to the dif-ficulty of placing it in the restricted space to relatively the same density. The above disadvantages coupled with the cost of winding the coil and insulating it with the liquid plastic are the reasons for the abandonment of this type of construction.
The continued and consistent difficulty with insulation of the electrical components against moisture in vapor or liquid form and prevention of shorting between the elements themselves stimulated the design and fabrication of the cells as illustrated in Figure 15. Figure 15A shows time-temperature rise characteristics.
The cell assembly consisted of a mandrel of melamine plastic in the form of a cylin-der having the top end open. The inside diameter of this cylinder very closely approxi-mated the diameter of the thermistor unit. This unit was placed inside this plastic tube at a selected location where the wall thickness of the tube was 0. 015 in. The thermistor was secured in place through the use of liquid plastic, which solidified at approximately 150 F. The coil was wound around the outside of the tubing and was located symmetrical-ly with respect to the thermistor. Thus the two elements were separated by a plastic wall of 0. 015-in, thickness. Tests prior to assembly indicated that relatively good heat transfer was possible through the plastic medium, and as the material used for cementing purposes was to be kept to a minimum thickness, no trouble was anticipated due to its heat insulating effect.
As shown by Figure 15, the plastic mandrel, complete with thermistor and cell units, was inserted into a cylindrical hole located at the center of the porous block. As pre-vious test results made the use of X-Pandotite cement questionable from the standpoint of waterproofing and thermal conductivity, additional types of material were employed as potting compounds or cements to secure the plastic mandrel. Several of the typical materials investigated are noted on the sketch.
This test series was further utilized to investigate block material other than Norton Company Alundum Block RA 1155. Norton materials designated as ATM 565A and ATM 565C were used. The density and void space of these latter two blocks were modified from that of the RA 1155 and a considerable amount of ferrous material was mcorporat-ed with the alundum. Soil of the same type employed for testing the cells was combined with Portland cement to provide soil cement mixtures from which blocks were fabricated, using 15 percent, 20 percent, and 25 percent cement based upon the dry weight of the soil. soil.
Figure 16 is an illustration of the meter with wiring diagram employed for measur-ing the heater-coil input and recording the flow of electrical current through the therm-istor element. Figure 17 shows the supplemental equipment required for preparing the soil specimen and container for holding the selected soil at controlled moisture con-tent. Figure 18 illustrates the component parts and assembled cell as employed in this series.
Exploratory Testing of Porous Block Cells
The testing operations referred to in the following paragraphs, the type of equipment and cell construction employed, and the results obtained are important chiefly because

- - --- :.; t---c
-
çI r •i.;- - - -

83
of the influence they exercised upon subsequent investigations. The performance of these cells under test conditions emphasized the need for ex-
tensive improvement in electrical insulation and further indicated that such insulation must have high thermal conductivity. Variation in density and structure of the potting and cementing material employed to - secure the electrical elements in place and provide insulation against moisture was found to be the cause of unfavorable and erratic cell performance. The random occurrence of air voids in the media surrounding the therm-
SOIL SI'ECIUG N ASSEMBLy
SDECIMLN MOLD
D CAN COVER
ALUMINUM RING OIMENT CAN
Fi'ure 17. Asseithled :oisturc Cell.
ister and heating coil adversely affected the reliability and reproducibility of results. Test data indicated that the moisture content of the ambient block material, while
quite readily measurable by the heat diffusion method, was too frejuently dissimilar to that of the soil in which it was placed. As tests progressed and results were studied, it became apparent that comparable capillary potential between the block and the sur-rounding soil was necessary to facilitate interchange of moisture. To provide this necessary attribute the blocks would need void space closely identical with the various types of soil in which they were to be placed. From a practical standpoint this would be untenable.

TYPE 17-A THERMISTOR1
/
I /8 HEATER COIL NO.39 ADVANCE WIRE 16 OHMS -
MELAMINE PLASTIC COIL SUPPORT (1/4 D UNDER COl
SMOOTH-ON
84
LEAD *AES
/ COIL-Tfl(RUISIOR
ROLL CAP SUBASSOMRLV
I 1 POROUS RIOCU
3
PLASTIC MATdORCL
HEATIRU COIL
Figure 19.
Development of Direct -Contact Moisture Cells
In order to remedy the deficiencies in the initial cells as demonstrated by pre-
-- vious tests, the development of a direct- contact moisture cell was initiated. The
POROUS BLOCT porous block was replaced by a protective - coating material having good thermal con-
ductivity and waterproofing properties and Figure 18. which would be capable of establishing in-
timate contact with the electrical elements to the extent that detrimental air voids or spaces adjacent to the heater coil or thei'-mister could be eliminated.
Direct-Type Metal Encased Cell
The decision to concentrate on the direct-contact moisture cell entailed a consider-able amount of special investigation relative to thermistor dimensions and character-istics and electrical resistance properties. It was necessary to obtain added informa-tion with respect to the heater-coil requirements, e. g. . type of winding, wire-size applicable, and thermal conductivity of available insulating material. Extraneous air voids occurring within the cell structure proved troublesome and to overcome this dif-ficulty, a study was made on the adaptability of various inert fillers. The diameter, wall thickness, and heat conductance of the mandrel was investigated, and heat con-centration areas within the cell were investigated in an effort to eliminate them. The moisture resistance of the several surface coatings for covering electrical components was explored. During such investigation, the special applications of conventional equipment and its calibration were of special significance with respect to test results. Complete coverage of these essential tests and pertinent detail is presented in Appendix

85
Figure 19 illustrates the first direct-type cell fabricated. The electrical elements were encasedand supported by one of the melamine plastic mandrels. The protective covering employed was a metallic cement having the trade name of "Smooth-on." It has been used as heat conducting material in many industrial applications and was gen-erally considered as a satisfactory waterproofing medium. Tests indicated that it would not fulfill our requirements and the coating of the cells with this material was discontinued.
Figure 20 indicates the initial direct-contact cell employing a thin-wall copper cup to cover the heater coil and thermistor.- Figure 20A illustrates its time versus tern-peraturé rise characteristics. In this assembly,, bakelite discs were cemented on both ends of the thermistor. The diameter of these discs equalled the diameter of the ther-mistor plus double the thickness of the..insulated wire used for winding the heater coil and greatly facilitated winding of the coil directly on the thermistor. The insulating effect provided by the bakelite discs. tended to channel the flow of heat between heating coil and center of thermistor. The circular rubber plug was provided with four sepa-rate holes through'which the heater coil and thermistor lead-in wires were passed. The copper cup had an-inside diameter. ade-.. quate to just permit a slip fit over the e- lectrical element assethbly, *änd all small air voids were to be filled with .Formvar insulating plastic. With this design it . appeared that previous difficulty caused by infiltration of moisture had been over- I I
NEOPRENE RUBBER-7 TE 16-A
BAKELITE DISKS THERMISTOR
HEATER COIL
NO.37ADVANCE.
WIRE TRIPPLE 5/8' FORP.1VAR
COATED I6OHMS-
NIOPP ER O.OI'IHICK
BAKELITE DISK 'AND COIL SUPPORT-
TYPE 16-A THERMISTOR
COPPER TU8E-'-
HEATER COIL NO.37, ADVANCE WIRE 16 OHMS
COIL SUPPORT DRILLED TO PERMIT FREE. MOVEMENT OF LIQUID
BAKELITE ,
RUBBER DIAPHRAM
EXPANSION
LIUID FILLED CHAMBER
/ONE CELL USED INTERTEEN AROCHLOR
TIME IN MINUTES
FIGURE 20*
TIME IN MINUTES
FIGURE 214 -
Figures 20 and 20A. Figures 21 and 21A.
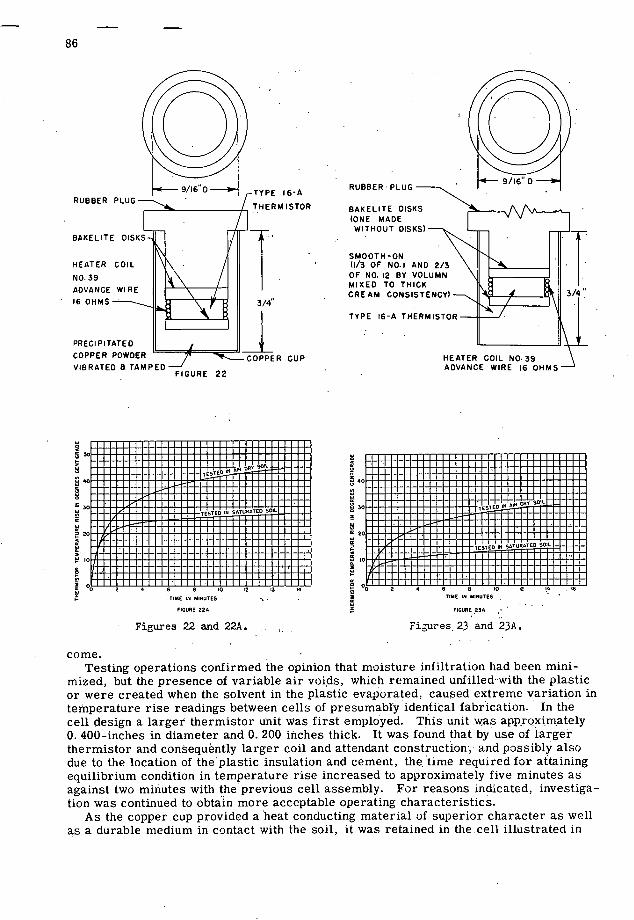
86
RUBBER PLUG
BAKELITE DISKS
HEATER COIL
NO.39
ADVANCE WIRE
16 OHMS---
PRECIPITATED I! COPPER POWDER
VIBRATED & TAMPED FIGURE 22
rTE 16-A
THERM ISTOR
I 3/4" I
-COPPER CUP
RUBBER PLUG
BAKELITE DISKS (ONE MADE WITHOUT DISKS)
SMOOT H-ON (1/3 OF NO.1 AND 2/3 OF NO. 12 BY VOLUMN MIXED TO THICK CREAM CONSISTENCY)-
TYPE 16-A THERMISTOR
HEATER COIL NO.39 ADVANCE WIRE 16 OHMS
TIME IN MINUTES . . I TIME IN MINUTES
FIGURE 22U FIGURE --
Figures 22 and 22A. ., Fiures23 and 23A.
come. Testing operations confirmed the opinion that moisture infiltration had been mini-
mized, but the presence of variable air voids, which remained unfilled-with the plastic or were created when the solvent in the plastic evaporated, caused extreme variation in temperature rise readings between cells of presumably identical fabrication. In the cell design a larger thermistor unit was first employed. This unit was appxoxim.ately 0. 400-inches in diameter and 0. 200 inches thick. It was found that by use of larger thermistor and consequently larger coil and attendant construction,- and possibly also due to the location of theplastic insulation and cement, the, time required for attaining equilibrium condition in temperature rise increased to approximately five minutes as against two minutes with the previous cell assembly. For reasons indicated, investiga-tion was continued to obtain more acceptable operating characteristics.
As the copper cup provided a 'heat conducting material of superior character as well as a durable medium in contact with the soil, it was retained in the.cell illustrated in

CAST WOODS N -TYPE MI7-A THERSTOR
HEATER COIL
NO.33 CUPRON WIRE 16 OHMS—
TYPES OF SUPPORTS
280O.D.X /4 I.D.COPPER
87
Figure 21. - Time versus temperature rise characteristics are shown on Figure 21A. The basis for design and use of liquid heat-transfer media was to provide for the elim-ination of detrimental air bubbles and provide a constant contact material. It may be noted that the thin-wall, perforated plastic mandrel projects from the upper plastic disc This provided a circular tube upon which the heater coil could be wound, and it was so located as to make the heater coil equidistant-from the copper tube and the thermistor. At normal room temperature the liquid filled the cell; when heated, its expansion wasprovided for by averythin, rubber diaphragm. The liquids used were electrical transformer fluids, specially selected for their ability to transmit heat. The time required for heat transmission through the liquid proved to be excessive and the difficulty of providing for its expansion eliminated this design from further consid- eration. '-
Figure 22 illustrates a cell of the same type shown in Figure 21 with the exception that finely-ground copper powder was used as heat-conducting material. Figure 22A demonstrates the detrimental effect of this combination in that a very narrow spread
- ITFt. IA COPPER PRONGED
COIL SUPPORT_ THERMISTO
—J HEATER 1. 0.5 COIL NO.35
A D VAN CE
WIRE 16 OHMS
CAST WOODS
METAL THEN TURNED TO 0.579"
TIME IN MINUTES
Fipires 24 and 24P.
-, - TINE IN MINUTES
Figures 25 and 25A.

88
was obtained between dry and saturated soil conditions. This powder was well vibrated and tamped when placed and apparently provided a continuous metal phase between the outer copper shell and the electrical elements. The infinitely large number of air voids present in finely dispersed material detrimentally affected heat transfer and in-dicated that air spaces, even when present in one of the best heat conducting materials, were sufficient to seriously affect its thermal conductance. This cell consequently re-ceived no further consideration.
Figure 23 illustrates a cell of similar construction using Smooth-on as the heat transfer medium. Figure 23A illustrates time-temperature rise performance. Smooth-on is a relatively well-known metallic cement consisting largely of minute iron particles, graphite, and a paste vehicle. From available literature, it has previously been em-ployed as a heat conductor in various industrial installations. Its performance in this
LRUBBER MOuNrINO
BLOCK
HE UT NO COIL
I LEAD HIRES
THERMISTOR ASS(URLCD MOISTURE METAL COVERED
CEll. CELL
Figure 26.
respect was very unsatisfactory and therefore its further use was not considered. Figure 24 is a line sketch showing the essential component parts and their arrange-
ment employed in the fabrication of the direct cell having its electrical components encased in Wood's metal. This first cell was equipped with the large thermistor unit, which had a thickness of 0. 170-inch and a diameter of approximately 0. 400-inch. It may be noted that a thin-wall-tube copper mandrel was used upon which the wire coil was wound and into which the thermistor unit was placed. The thermistor itself was insulated electrically by repeated immersion in Formvar diluted with solvent to 10 percent solids. From 8 to 12 dips and subsequent baking I)eriods were required. The coil wire was insulated by Ceroc-Teflon application and after its winding was coated with Formvar. The prepared assembly was centered in a mold and liquid Wood's metal heated to approximately 120 C. was poured to the depth indicated on the sketch. As past experience had indicated the importance of eliminating air bubbles to insure constant heat conductance, the lower portion of the copper mandrel upon which the heater coil was wound was slotted, thus providing six prongs to support the coil and grasp the thermistor, leaving adequate space between each prong for the hot metal to flow in and around the thermistor and heating coil. Originally the thickness of the
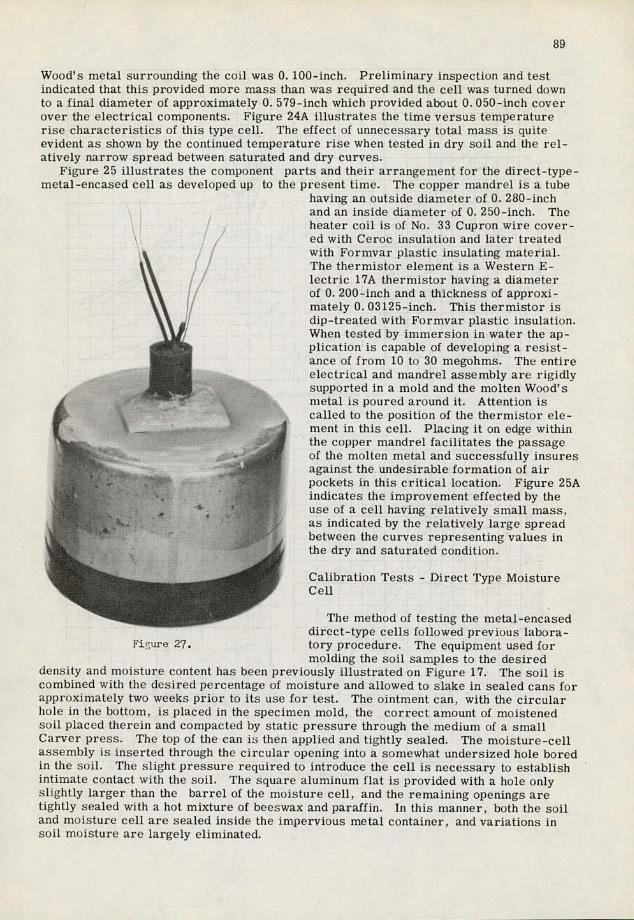
89
Wood's metal surrounding the coil was 0. 100-inch. Preliminary inspection and test indicated that this provided more mass than was required and the cell was turned down to a final diameter of approximately 0. 579-inch which provided about 0. 050-inch cover over the electrical components. Figure 24A illustrates the time versus temperature rise characteristics of this type cell. The effect of unnecessary total mass is quite evident as shown by the continued temperature rise when tested in dry soil and the rel-atively narrow spread between saturated and dry curves.
Figure 25 illustrates the component parts and their arrangement for the direct-type- metal -encased cell as developed up to the present time. The copper mandrel is a tube
having an outside diameter of 0. 280-inch and an inside diameter of 0. 250-inch. The heater coil is of No. 33 Cupron wire cover-ed with Ceroc insulation and later treated with Formvar plastic insulating material. The thermistor element is a Western E-lectric 17A thermistor having a diameter of 0. 200-inch and a thickness of approxi-mately 0. 03125-inch. This thermistor is dip-treated with Formvar plastic insulation. When tested by immersion in water the ap-plication is capable of developing a resist-
______ ance of from 10 to 30 megohms. The entire electrical and mandrel assembly are rigidly supported in a mold and the molten Wood's metal is poured around it. Attention is called to the position of the thermistor dc-ment in this cell. Placing it on edge within the copper mandrel facilitates the passage
- of the molten metal and successfully insures against the undesirable formation of air
lop pockets in this critical location. Figure 25A indicates the improvement effected by the use of a cell having relatively small mass. as indicated by the relatively large spread between the curves representing values in
, the dry and saturated condition.
Calibration Tests - Direct Type Moisture Cell
The method of testing the metal-encased direct-type cells followed previous labora-
I?irure 27. tory procedure. The equipment used for molding the soil samples to the desired
density and moisture content has been previously illustrated on Figure 17. The soil is combined with the desired percentage of moisture and allowed to slake in sealed cans for approximately two weeks prior to its use for test. The ointment can, with the circular hole in the bottom
`is placed in the specimen mold, the correct amount of moistened
soil placed therein and compacted by static pressure through the medium of a small Carver press. The to!) of the can is then applied and tightly sealed. The moisture-cell assembly is inserted through the circular opening into a somewhat undersized hole bored in the soil. The slight pressure required to introduce the cell is necessary to establish intimate contact with the soil. The square aluminum flat is provided with a hole only slightly larger than the barrel of the moisture cell, and the remaining openings are tightly sealed with a hot mixture of beeswax and paraffin. In this manner, both the soil and moisture cell are sealed inside the impervious metal container, and variations in soil moisture are largely eliminated.


Characteristics of Soil Specimens Used in Moisture Cell Calibration
91
Cell Ti Clay Soil Ambient Temperature at 350 and 700
% Moisture Wet Density ]'y Density 5.0 106.20 -101.14 7.43 108.58 101.07
12.13 114.07 101.73 15.40 116.38 100.85 17.48 118.62 101.06 20.29 121.80 101.26 22.99 122.87 99.90
Cell T2 Clay Sol 0 Ambient Temperature at 35 and 70
541 106.39 100.93 6.51 109.01 102.35
12.18 113.94 101.57 15.84 116.38 100.47 17.57 119.37 101.53 20.52 121.87 101.12 22.47 122.80 100.27
Cell T3 Clay Soil mbient Temperature at 350 and 70 5.05 107.08 101.93 7.52 108.51 100.92
12.59 113.82 101.09 15.48 116.19 100.61 17.84 118.93 100.92 21.00 121.18 100.15' 22.88 123.43 100.45
Cell T4 70$ Sand-30$ Clay Soil Ambient Temperature at 350 and 700 Moisture Wet Density Dry Density 5.23 115.50 109.176 7.63 117.94 109.58
11.46 123.18 110.51 13.88 126.55 111.24 14.46 125.55 109.69 17.18 125.55 107.14 17.65 128.04 108.83
Cell T5 - 70$ Sand-301% Cla0y Soil mbiènt Temperature at 35 and 70
5.19 115.7 110.04 7.58 117.87 109.56
11.55 123.99 111.15 14.25 - 126.55 110.77 14.45 124.68 108.94 17.70 127.80 108.58 19.78 126.73 105.80
Cell T6 - 70$ Sand-30% Clay Soil Ambient Temperature at 350 and 700
5.49 115.63 109.61 7.33 118.25 110.17
11.45 122.99 110.35 14.20 126.61 110.87 18.03 126.67 107.32 18.32 127.86 108.06
The picture of the moisture cell appearing on Figure 17 was the initial plastic man-drel-porous block assembly initially reported. The exploded view of the first of this series, and as assembled, is shown on Figure 26. View of the assembled container, as used in test, is shown on Figure 27.
In order to compare cell performance under different temperature conditions, each cell of a given series was exposed to ambient temperatures of 35 and 70 F. One soil was a silty clay, while the other was a mixture of 70 percent fine sand and 30 percent silty clay. By this arrangement it was possible to differentiate between the effect of temperature and soil-particle, size upon the performance of the cell. The results ob-tained are illustrated graphically in Figures 28 to 33. The relationship between tem-perature rise as recorded by the thermistor element and the concurrent soil moisture content has been determined for'various heating periods of the electrical coil, ranging from 1/2 to 5 mm. In all cases, it may be noted that a minimum period of 2 mm. is required to develop a satisfactory slope of the curves to permit ready location of the intercept defining temperature rise and moisture content relationships. More positive definition is possible when the 5-mm. curve is employed.
Based upon test 'results, the cell, performance cannot be considered satisfactory. While a perfectly smooth alignment cannot be expected, the presence of sharp breaks or relatively level position of the line between points of different moisture is undesir-able and is believed to indicate poor contact between the exterior of the cell and the adjacent soil. The importance of positive contact has been long recognized and was fully intended to be attained. When an air spac.e intervenes between the moisture cell and the ambient soil, especially when the soil moisture is relatively low, a heat in-sulating effect is,produced which results in abnormally high temperature rise. As an illustration, cell Ti, clay soil, 70 F. ambient temperature, indicates a relatively high

32
30
30
28
28
26
26
24
24
22
° 20
20 z
18
18
16
16
'4
14
- 2
12
tO
10
8
6
4 6 8 0 12 - 4 16 18 20 22 24 44
6 8 10 12 14 16 8 20 22 SOIL MOISTURE - PERCENT BY WEIGHT OF DRY SOIL
Figure 30.
92
32
30
28
26
24
0 22
2O
z
5 18
16
14
12
to
6
SOIL MOISTURE - PER CENT BY WEIGHT OF DRY SOIL
Figure 31.
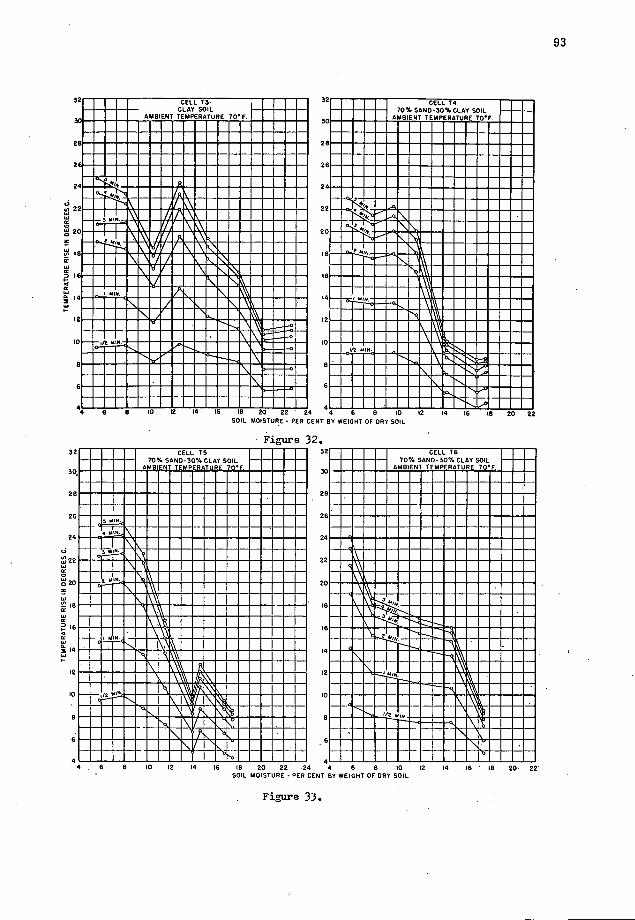
93
CELL YS CLAY SOIL
CELL T4 I "I I f - 11 70%SAND-30%CLAY SOIL
SOIL MOISTURE - PER CENT BY WEIGHT OF DRY SOIL
Fire 32. MI .1I -
SOIL
i.a.uuuuu•uuuuuu•uu MEMMEMEMEMMEMEMS
uuuiruuuuuu•u
N•MEEMMINIELIMMER
III•U••J!4UUU•UU
MKOMMMEN
MEMMEMMEMEMMEMEME mommoommommommoom • UUURURR•UUUUU MMMMEMEMEMIMMEMMEME u••u•uiu••au•• MMUMMERIMMEAMMOMMEM EMSEEMEMMEMMEMEMEM
MENUMMEMEMMEM
MEN MEMSEEM M MisiM.- MEWMEMEMEMEMEMEMEM
MOVE WIRENVEMMEMME
urnuuauiiu•u ,....••.a. '.... ••w•u.•i...•
MIMEan
MESIZZIMENEMME SIMMNNUMEME
- uu•uuu.u•u•u• 4 • N b IU IC 14 lb IN DO 22 24 46 B 10 IS 14 H. • IN 20 22
SOIL MOISTURE - PERCENT BY WEIGHT OF DRY SOIL
Figure 33.

94
DAKELITEMOUNTING
B LOCK
HEATING COIL
LEAD WIRES
ASSEMBLED MOISTURE METAL COVERED
CELL CEL
THERMISTOR L
Figure 34.
temperature rise in soil having 5 percent and again at 17. 9 percent moisture. From past observations both of the values of temperature rise for such moisture content should be lower, which would have produced better alignment between respective points. Curves representing the performance of cell Ti for 35 F. , obtained using the same soil sample, produce the same relative position of the plotted points, and appear to further confirm the opinion that the internal components of the cell are functioning in practically an identical manner irrespective of the ambient temperatures.
An examination of the cell shown in Figure 26, as assembled and used in the tests under discussion, indicates the cause of the difficulty. The active portion of the cell which projects below the beveled bottom of the rubber mount is essentially a right cylinder with a flat base, the top of which extends into the rubber mounting piece to allow the upper disc to I it into a groove molded in the rubber container. It is possible. when the metal encased portion of the cell is inserted into the prepared undersized hole in the soil, that the soil scraped from the sides of the prepared opening in the soil builds up on the bottom edges of the metal cylinder and Prevents complete seating or con-tact of the bottom of the cylinder with the underlying soil, or that it has not been possible to seat the assembly properly and eliminate air space at the point where the walls of the cylinder and the base of the rubber mount occur. The presence of undesirable air space at either or both points would minimize heat transfer and thus account for abnormal temperature rise.
A solution to this difficulty, which appears feasible, is the elimination of the rubber mount, with its overhanging section, to facilitate soil contact at the top of the cell and the use of greater side taper between top and bottom to produce more favorable embed-ment in the soil. The cell, as revised, is illustrated in Figure 34. Due to limited time it has not been possible to include the data obtained as the result of testing the modified cell as illustrated in Figure 34.

95
APPENDIX
TECHNICAL DATA RELATIVE TO COMPONENT PARTS OF DIRECT CONTACT TYPE MOISTURE CELLS
The subject matter covered in this appendix is information relative to the component parts of the direct-contact moisture cell.
To facilitate cell operation heat generated in the cell must be rapidly transmitted to surroundinTg' material. It is further essential that the coil wire be insulated electrically from other material or elements with which it is in contact. The most efficient type of insulation for this purpose would be one having good electrical insulating properties cOmbined with good heat conductance. In our investigation coils were fabricated.from identical wire covered with various types of insulating material. These coils were wound over thermistors and energized for short periods of time and the time rate of change of temperature (-f) as detected by the thermistors was recorded for each of the insulat-ing materials. The one showing the most acceptable performance characteristics was selected for our purpose. The data as obtained by tests are reproduced herewith; Exam-ination shows that the material tested falls into the following order with respect to. heat conductance: - -
1. Ceroc No. 200 - 2. Triple Formvar.
Formvar . . Poule Silk -.
The nomenclature employed in the formation of the tabular data which 'fbllow is set forth below:
Nomenclature for Data: -
t - Time in seconds r - The Resistance of the thermistor as read on the Brown Electron
Instrument in Millivolts (R x E)- A R5 - The change of resistance in Millivolts in five seconds•
A R15 - The, change of resistance in Millivolts in fifteen seconds. Av. A R5 - The average change of resistance in Millivolts in five seconds
Av. A R15 - The average change of resistance in Millivolts in fifteen seconds
Values that were recorded using Brown Electronic Instrument.

96
Amount of Heat Transferred
Triple Formvar #37 ' V
V RUn 1 Run 2 V . V V V
Ave. Ave.
t see AR AR5 .R15 AR 6R5 4R15 AR AR5 'Rl5 ,A.R5 a R15
: .46 .42 V .32
V
V
1.50 ( V l.48(' ' V. 1.54 (
- 1.51
5 1.96 ( 1.90 ( 1.86 ( V V
10 3.14 ( 3.74 .3.10 ( 3.48 3.00 ' ( 3.58 . 3.56 V 1.06 ( • V V 'V .80( ., .90 .( .
15' , 4.20 V ' 3.90 V, , 3.90 V . .64L. ' .86( V8(
20 4.84 ('V .70 476 ' (1.90 8 VV (200 1.90 .56 ( .63 ( - .62 ( .60
25 5.40 ( 5.39 ( V 5.140
.50 ( .41' ( V V .50 ( .47 30 5.90 5.80 .. 5.90
1.10 ' 1.12 . ' 1.10 1.11 45 7.00 V 6.92 6.92 7.00 '
.74 ' .76' ' ' .72 V
.. .74 60 7.74 7.68 " 77
,
'V Glass #37 V •
'
Rn 1 ' '• Run '2 V; , ' ,
, Run 3 Ave. 'Ave.
t seó A R. & R5 A, R15 A R A R5 A R15 ,A R R5 A.R15 A R5 A R15
0 .27 ' .39, .24, V V
1.49 ( 1.40 ( 1.36 ( 1.42 5 1.76 ( 1.70 ( 1.6o
1.14 ( 1.10 ( 1.30 ( 1.18 10 2.90 ( 3.53 2.80 (3.52 2.90 ( 3.66 3.57
1.10 ( ' 1.02 ( 1.00 ( 1.04 15 3.80 3.82 • 3.90
.8 ( .8( .76( .79 20 4.60 ( 4.64 ( . 4.66 (
.68 ( 1.96 .7 ( 1.98 .72 ( 2.04 1.99 25 5.28 . ( 5.50 ( 5.38
.48( ( ,56( 30 5.76 5.80 ( 5.94
1.12 1.10 .98 1.10 45 6.88 6.90 6.92
.80 .80 .76 .79 60 7.68 7.66 7.68

Run3 Ave. Ave.
AR AR5 iiRI5 AR5 tR15
.80 1.62 ( 1.57
2.42 1.18 ( 1.21
3.60 ( 3.78 3.69 .98 ( .90
4.58 .82( .83
5.40 ( 1.87 1.89 .60 .6].
6.00 ( .45( .55
6.45 1.05 1.05
7.50 .64 .68
8.14
Run3 Ave. Ave.
AR A.R5 R15 6R5 6R15
.64 1.48 ( 1.38
2.12 1.12
3.30 ( 3.56 .90( .98
4.20 .80 ( .78
5.00 .60 ( 1.80 .62 1.80
5.60 .40' (. /0
6.00 1.02 1.05
7.02 .76 .76
7.78
Amount of Heat Transferred (Cont'd)
97
t
0
5
10
15
20
25
30
45
60
t
0
4
JO
15
20
25
30
4;
60
1onhiva
Run]. Run2
AR AR5 6R15 AR 6R5 6R15
.77 .60
1.53 ( 1.60
2.30 ( 2.20
1.34 ( 1.10
3.64 ( 3.69 3.30 (3.60
.82( .90(
4./6 4.20
.78( .88(
5.24 ( 1.82 5.08 (1.98
.66( .58(
5.80 ( 5.66
.68 ( .52
6.28 6.18
1.08 1.02
7.36 7.20
.66 .74
8.02 7.94
Double Silkj
Run]. Run2
&a 6R5 AR15 AR AR5 AR15
.63 6.00.
1.37 ( 1.30( 2.00
- 1.10 ( 1.08(
3.10 ( 3.43 2.98 ( 3.39
4.06 3.99
.72 ( .83(
4.78 ( 4.82
.60 ( 1.74 .66( 1.87
5.38 ( 5.48
.2 (' .38(
5.80 5.86
1.10 1.04
6.90 6.90
.76 .76
7.64 7.64

98
Amount of Heat Transferred (Cont'd)
Ceroc #317
Runi Run2 Run3
t R AR5' AR15 AR aR]-5 - 6R15 a R a R15 6 R15
0 •. •'" ..:.
5 1.60 . 1.00 . 2.20 2.00 1.90
16 3.60 3.70 4.20 ' .
1.50 ' 1.50 •' 1.40 -
15 5.10 5.20 5.60 1.18 ( 1.00 (
( .•( . •,
20 6.20 '(2.60 6.38 ( 2.48 6.60 " " ( 2.38.
25 7.10 '- ( 7.14 ' ( 7.40 '
.60 ( . 54( S •, 5 (
30 7.70 ' • 7.68 7.98 1.26 1.32 1.12
45 8.96 9.00 . 9.10 .64 .74 .70
60 9.70 9.71 9.80
THE MEASUREMENT OF SOIL MOISTURE AND DENSITY BY NEUTRON AND GAMMA-RAY SCATTERING
Donald J. Beicher, School of Engineering, Cornell University, Ithaca, New York
Over a span of approximately '50 years the, records and literature on the subject of soils contain descriptions of various apparatus developed'for determining soil moisture. The lack of knowledge in the field of soil moisture can be attributed to a lack of ade-quate means of measurement rather than a lack of interest. Because of the limitations of moisture measuring devices little is known, in a definite sense, of the movement of moisture in soils. This is particularly true in unsaturated soils. The movement of moisture through soil by percolation, by capillary action, and by vapor transfer is little known except by analogy and inference. When in the frozen state, the soil con-ditions defy study.
An essential to the satisfactory study of values and trends in soil moisture is the need for continuing observations of the same soil throughout its seasonal cyclic changes. Destructive smpling with an auger introduces many uncertainties in most soil forma- tions because ther heterogeneous nature. This type of an investigation, although simple, is exp ensive and also lacks continuity, especially over critical periods of rapid rise and fall of theground-water table. To date, the problem of installing measuring devices withoutniaterially altering the adjacent soil conditionshas been met with but limited success. •'' . -
Most of these early instrument methods have been related to the variations in elec-trical resistance offered by soils in varying degrees of saturation. In general, these have presented overwhelming difficulties, particularly in the calibration of the equip-

99
ment at its installation site. A number of improvements over the direct measurement method have been developed. These, in general, substitute for the direct (electrode) contact with the soil, blocks of material that absorb and give up moisture in a way re-lated to the changes in the moisture of the surrounding soil. The electrodes embedded in these blocks are used to measure the resistance of the material in the block and the variations in the moisture content. This arrangement simplifies the calibration of the installation and also insures uniform contact between the electrodes and the measured media.
The ever-present need for information on soil moisture characteristics has been enlarged by the need for more accurate information in subgrade soil moisture as a means of providing better design information for pavements. With the recent availa-bility of radioactive materials, the problem of determining soil moisture was reviewed in the light of the ability of some of these materials to react indirectly, although with great sensitivity, to moisture. The interest of the Civil Aeronautics Administration and staff members of the Engineering College of Cornell University combined to study the possibilities of using nuclear materials to measure soil moisture contents. In prin-ciple, the neutron method of counting hydrogen nuclei seemed to hold considerable promise. Among the favorable characteristics was the fact that the neutrons would de-tect the presence of water regardless of state so that whether the water was in a form of liquid, vapor, or solid,meant that it would be possible to make observations at any time of the year.
Secondly, it appeared that there would be equal sensitivity over the entire range of moisture, and third, that it does not depend upon the in,stallation of electrodes at various depths in the soil column. The neutrons that have the ability to count the hydrogen nuclei contained in water particles readily penetrate stainless steel and aluminum metals so that the simplicity of the installation seemed a desirable attribute. The fact that the measurements could be made by lowering a small unit into a water-tight stainless-steel tube indicated that a low-cost installation could be made, especially with reference to the infinite variation in the number of levels at which moisture determinations could be made. It also largely removed the question of selecting a representative site since the tubes could be installed and withdrawn almost at will and in great numbers, if necessary. Finally, measurements can be made in short-time intervals of the order of one-quarter hour or less, thus recording relatively rapid changes in moisture content.
One of the requisites of a soil -moisture -measuring device is that it be adaptable in all types of soil, ranging from clays through silts, sands and gravels, as well as in stratified and heterogeneous deposits, such as glacial drift containing material sizes ranging from clay to boulders. The problem of inhomogeneities is not confined to that of grain sizes but it also includes variations in density of the soil, the presence of or-ganic matter, such as vegetation and inorganic salts of magnesium, potassiu, and other metals. The latter is particularly important in the dry areas west of the Mississippi River. The organic materials are often associated with low, level ground, that is, at the same time, topographically favorable to engineering installations. The alkali soils of the west, containing the inorganic salts, are also concentrated in those areas that are predominantly level.
Destructive sampling has introduced one of the chief uncertainties into field studies. The use of an auger of 2-in, diameter may well change the drainage properties of the surrounding soil throughout a 2-ft. radius of influence. Further sampling at a later date must avoid this influence. In doing so, variations in the soil may introduce sig-nificant errors. This problem becomes magnified many times when sampling beneath pavements.
Representative sites for sampling are important. When an auger boring is made or a resistance unit installed, it is desirable to know what application these observations will have beyond the immediate site. In many instances, particularly in auger sampl-ing, ignorance of surrounding subsurface inequalities gives false values to the data obtained.
Under some conditions it is impossible to obtain satisfactory moisture samples by the auger method. Where water can drain freely down the test hole from seepage planes,

100
these difficulties will occur. It has also been virtually impossible to obtain samples for studies of water in the form of vapor or ice in soil.
The ideal condition for making soil moisture studies exists when non-destructive testing can be used, when moisture in the soil itself can be measured, and when the soil is undisturbed and free from unnatural influences.
The advantages of the nuclear method closely parallel the ideal described. The simple tube, placed vertically in the soil column, introduces a minimum of change in environment. Since the tube is placed in a drilled hole of slightly smaller diameter, the intimate contact between the outer tube wall and soil eliminates any unnatural tend-ency for vertical drainage downward along the tube wall. The tube provides access to the soil at any practical depth to which it is driven and an unlimited opportunity for making measurements of the same soil at any period of the year. Inexpensive to install, it can be withdrawn or abandoned without appreciable loss of time or investment.
On the basis of the need for a solution to the problem and the promise inherent in the nuclear method, an exploratory and development contract was arranged between the Civil Aeronautics Administration, Airport Development Division, and the College of Engineering at Cornell University. As the work under this contract progressed, many useful applications of the laws governing radioactivity could be seen. Of these, one of the most important was the relationship between the extent of gamma-ray penetration in soil and its in-place density. The relationship between soil moisture and density and its importance in soils engineering encouraged an investigation of this unknown quantity.
Physical Basis of the Neutron Method
The physical phenomena that form the basis of the new method for the determination of moisture content and density of soils are the scattering of neutrons or gamma rays and the loss in their energy during this process . It is well known that the interaction be-tween neutrons and othermaterials is, with the exception of a few specific substances, very weak. These neutrons, therefore, can travel for a long time before they are de-stroyed. However, during their lifetime they collide with the nuclei of the material through which they travel and are scattered in all directions. At the same time, in each collision or scattering process they lose some of their energy. The scattering is par-ticularly strong and the loss of energy marked if the neutrons collide with hydrogen atoms. Fast neutrons differentiate between hydrogen nuclei and most other kinds be-cause they are much alike in mass. Neutrons may be compared to ping-pong balls. When thrown with force against a bowling ball (average atom) the ping-pong ball re-bounds at high speed without much affecting the massive bowling ball. But when thrown against another ping-pong ball (hydrogen atom) the second ball is set in motion while the first rebounds with a greatly reduced velocity, thus becoming a "slow" neutron. There-fore, if we have a source of fast neutrons, and if these neutrons travel away from the source, they will be scattered by the material surrounding the source and a great num-ber will return to the source or to its immediate vicinity. Those neutrons which have been scattered by hydrogen atoms will have lost most of their energy and return as slow neutrons. The more hydrogen atoms present, the more slow neutrons will return to the vicinity of the source. Thus, in counting the number of slow neutrons at or near to the source, one obtains a measure of the number of hydrogen atoms present. It is also a fact that this scattering and slowing down process is practically independent of whether or not the hydrogen is bound chemically. In particular, it is independent of whether water, which contains two hydrogen atoms per molecule, is in the vapor, liquid, or solid state.
Such a device for measuring the moisture content consists, then, of a source of fast neutrons, e. g., a mixture of radium and beryllium or polonium and beryllium, a de-tector for slow neutrons, rigidly placed near the source, e. g. , a silver or rhodium foil or a boron counter; and an electronic device for counting and, if desired, record-ing the number of slow neutrons reaching the detector per second. Such an assembly of source and detector can be lowered into a small diameter (1-in.) metal tube placed in the soil and can be connected by a cable to the counting mechanism, which is placed

101
above the soil surface. To measure density of soil the scattering properties of gamma rays can be used. If
gamma rays emitted by a source, e. g. , radium, pass through a material, these rays are scattered as a consequence of their interaction with the atoms of the material. The stronger the scattering, the greater the number of electrons are contained in an atom. The number of electrons is proportional to the density of the substance; a heavy sub-stance scatters more than a light one. Here again, the method is to measure the gamma rays scattered back from the material to the vicinity of the source. In the case of gamma-ray scattering, the theory of the effect has not been as well studied and the phe-nomenon is very complex.
This apparatus for the determination of the density, then, consists of a gamma-ray source, e. g. , a weak radium preparation; and a detector for gamma rays, e. g., a Geiger counter mounted at a well-defined distance from the source, and shielded from
the source by lead in order to prevent di-rect gamma rays from the source reaching the detector. This assembly is mounted so that it can be lowered in a metal tube con-nected by a cable to an electronic-count-rate meter.
Since the theoretical consideration of scattering of neutrons and of gamma rays under these conditions presents a difficult problem, counting rates cannot yet be cal-
Moisture Determinations. The center foil Figure 1. Photograph of Assembly Used culated in advance for a specific arrange- holder has been partially pulled out so ment. Therefore, it is necessary to obtain as to make visible the neutron source and a calibration curve to relate the readings
its support, with the actual moisture content or with the density.
The laboratory experiments and the field tests have been made with the simple arrangements described above. Where this method is given special ap- plication in the field or laboratory, ad- justments in instrumentation would be necessary. Since the art of detecting and measuring neutrons, gamma rays, etc. , is advancing rapidly, developments in this field will be of help in the consturc- Figure 2. Photograph of Assembly Used in tion of future instruments. The results Density i)eterminations. obtained with the equipment, as developed so far (May 1950) are sufficiently significant to permit a judgment of the usefulness, minimum accuracy, and the Possibilities of this new method.
Experimental Laboratory Procedure
A program of laboratory experiments was set up to determine if the number of low energy neutrons scattered back from the soil mass surrounding the neutron source could effectively be used as a measure of soil moisture.
Studies were made in soil masses of various sizes in order to correlate the laboratory measurements, involving limited volumes, with field observations where an infinite soil mass prevails. Studies with glacial drift were made on samples built up in 55-gallon drums so that stones of various sizes could be placed at a series of known locations.
The moisture content of the soil mass was determined by taking several, usually four, samples from different positions in a drum and then weighing and drying them in the standard manner. The density of the soil was determined from the net weight of the filled drum and its volume.
A measure of the number of slow neutrons was obtained by placing one or more small

102
0OU"150 1121 .. KOISSVEI OONTENT
- rws for Ib Su,pL.o - - - Corve for Ioftoite lldtua Silt SoapI. S.t*r.504 5n4
- Ol.oi.l Drift 17, • _ __
'7 0 15 20 is 30
NOI8W ! (Lb.. of V.t.r per Co. Pt.) Figure 3. Counting Rate versus Moisture Content.
cylinders (7/8-in, diameter by 1-by 0.003-in, wall) of rhodium-metal foil (subsequently changed to silver, resulting in a decreased time of measurement and less cost) within the soil mass and subsequently measuring the degree of radioactivity induced in the foil by its selective capture of slow neutrons. This method is simple, dependable, and re-quires a minimum of expensive equipment.
An assembly consisting of a neutron source and suitable holders for the foils was in-serted into the aluminum tube and lowered to the desired position. After the foil de-tector had reached "radioactive equilibrium" the foils in its holder were rapidly with-drawn and slipped over a Geiger counter mounted inside a lead shield provided to reduce background counts. 1/ The degree of activity of the foil, proportioned to the slow neutron intensity at the place where the foil had been exposed, was determined from the rate at which beta rays from the foil cause the counter to count. The counting rate, in counts per minute, properly corrected for background counts, was then plotted for successive experiments as a function of the soil moisture and a calibration curve for the soil was thus obtained.
In order to obtain precise results, the time interval between removal of the detector foil from the proximity of the source and the time at which counting of the foil activity is started must be determined by stop-watch technique, and be held constant to about + 1/2 second.
The special equipment employed was a neutron source, a Thyrode 1B85 Geiger counter
/ ctraneous radiation from contamination; cosmic rays, etc., cause a certain number of residual counts.
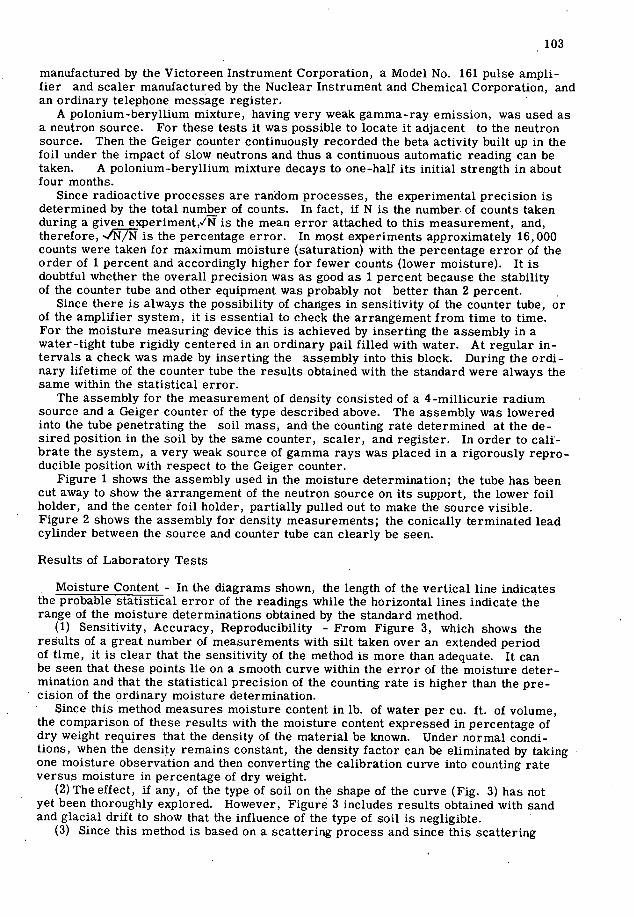
103
manufactured by the Victoreen Instrument Corporation, a Model No. 161 pulse ampli-fier and scaler manufactured by the Nuclear Instrument and Chemical Corporation, and an ordinary telephone message register.
A polonium-beryllium mixture, having very weak gamma-ray emission, was used as a neutron source. For these tests it was possible to locate it adjacent to the neutron source. Then the Geiger counter continuously recorded the beta activity built up in the foil under the impact of slow neutrons and thus a continuous automatic reading can be taken. A polonium-beryllium mixture decays to one-half its initial strength in about four months.
Since radioactive processes are random processes, the experimental precision is determined by the total number of counts. In fact, if N is the number of counts taken during a given experiment,IN is the mean error attached to this measurement, and, therefore, is the percentage error. In most experiments approximately 16, 000 counts were taken for maximum moisture (saturation) with the percentage error of the order of 1 percent and accordingly higher for fewer counts (lower moisture). It is doubtful whether the overall precision was as good as 1 percent because the stability of the counter tube and other equipment was probably not better than 2 percent.
Since there is always the possibility of changes in sensitivity of the counter tube, or of the amplifier system, it is essential to check the arrangement from time to time. For the moisture measuring device this is achieved by inserting the assembly in a water-tight tube rigidly centered in an ordinary pail filled with water. At regular in-tervals a check was made by inserting the assembly into this block. During the ordi-nary lifetime of the counter tube the results obtained with the standard were always the same within the statistical error.
The assembly for the measurement of density consisted of a 4-millicurie radium source and a Geiger counter of the type described above. The assembly was lowered into the tube penetrating the soil mass, and the counting rate determined at the de-sired position in the soil by the same counter, scaler, and register. In order to cali-brate the system, a very weak source of gamma rays was placed in a rigorously repro-ducible position with respect to the Geiger counter.
Figure 1 shows the assembly used in the moisture determination; the tube has been cut away to show the arrangement of the neutron source on its support, the lower foil holder, and the center foil holder, partially pulled out to make the source visible. Figure 2 shows the assembly for density measurements; the conically terminated lead cylinder between the source and counter tube can clearly be seen.
Results of Laboratory Tests
Moisture Content - In the diagrams shown, the length of the vertical line indic4tes the probable statistical error of the readings while the horizontal lines indicate the range of the moisture determinations obtained by the standard method.
(1) Sensitivity, Accuracy, Reproducibility - From Figure 3, which shows the results of a great number of measurements with silt taken over an extended period of time, it is clear that the sensitivity of the method is more than adequate. It can be seen that these points lie on a smooth curve within the error of the moisture deter-mination and that the statistical precision of the counting rate is higher than the pre-cision of the ordinary moisture determination.
Since this method measures moisture content in lb. of water per cu. ft. of volume, the comparison of these results with the moisture content expressed in percentage of dry weight requires that the density of the material be known. Under normal condi-tions, when the density remains constant, the density factor can be eliminated by taking one moisture observation and then converting the calibration curve into counting rate versus moisture in percentage of dry weight.
The effect, if any, of the type of soil on the shape of the curve (Fig. 3) has not yet been thoroughly explored. However, Figure 3 includes results obtained with sand and glacial drift to show that the influence of the type of soil is negligible.
Since this method is based on a scattering process and since this scattering

104
takes place over some reasonable volume, the results given by this method will rep-resent an average moisture content over a more or less extended volume. It is im-portant to investigate the order of magnitude of the effective volume. For low moisture contents the volume over which an average is taken is greater than that for higher mois-ture contents. Experiments in drums of different sizes have shown that for a moisture content higher than 13 lb. water per cu. ft. any increase of size beyond a 17-in, diameter does not increase the number of counts, but for low moisture contents the number of counts increases slightly if a bigger drum is used. In order to compare laboratory results directly with field tests in which the soil-medium is infinitely extended, a cor-rection to the curve, Figure 3, must be applied. Though the laboratory measurements are not quite precise.for this purpose, a corrected calibration curve can be drawn and is seen in Figure 3 as a broken line. This, then, would be the calibration curve that holds for field tests. The calibration curve and the correction for the extended soil-medi-um will change with changes in the geometric arrangement, of source and detector, and the
i UBJ
10 8 6 4 60oo Ito. $000 DI$?AJcI yI lUll Ufl$ PU WI?l
(lach..)
ILl 18.2 20. IJDIC1 NOISlUfl
Figure 4. Cross Section and Moisture.Curve Showing Influence of kooks in Glacial Drift Soil.

105
-
cajriyo I An yr I X98ITr OF s u.s
pozr so. BOLL AND
_ci IOISIURB
8II.T, or 6 SILT, DRY SIX.?.DRY SILT. bY I 582053
aID. DRY SAID. LOW I xssu SILT, sui soxs 7 s & st DRY
.9. SILT, 8I TIM 10. SIb?. HIGH OISWRZ 6 U. GI.IAL Dli 2. 81?URI 9
to
80 90 100 ItO .126 15. 140
053812! (Lbs. psi ft. Pt.)
Figure 5. Counting Rate versus et Density of Soils.
wall thickness and material of the tube. The curye given in the figure is obtained with the detector foil centered around the source and with an aluminum tube of 1/32-in, wall thickness.
A further point of importance is the influence of inhomogeneities; rocks, for example. Several curves were run with glacial drift in a 55-gallon drum in which rocks of well-defined size and shape wereplac'ed at known positions near the tube. Figure 4 shows the variations of the counting rate as the measuring device was moved up or down. The location and size of the rocks is also indicated. Since this method gives an average of moisture content over moderately large volumes, it can be ex-pected that the influence of inhomogeneities is small; in fact, it can be seen from Figure 4 that, though some fluctuations are present, the indicated moisture is still within 1. 25 lb. (1 percent dry weight) of the average.
It can be expected that in certain parts of the country a considerable amount of salt will be present in the soil. Chlorine, one of the main constituents of the inorganic salts which may be present, shows a strong interaction with neutrons; it "captures" them, and thus reduces the number of neutrons that can reach the detector. If chlorine is present the use of the normal calibration curve (Fig. 3) will result in an incorrect (low) moisture determination. The effect of the salt is relatively small and since the amount added in these experiments is much higher than can be reasonably expected in the field, it can be assumed that the-presence of salts will not influence appreciably the
10000
9000
5000
1000

106
0
NoIS?Vfl AID DSIff LOGS - PI2LD TIlT 101.1
t
3
.7
8
IZi4II5totZ 110 - - Ito IO
MOISTUBg COTZ!? DXII81VT (Lb.. of Water per Cu. tt. of Soil) (Lbs. per Cu. 7t.)
Figure 6. Moisture and Density Logs - Field Test Hole.
precision of the measurements. If more salt is present than in saline soils, a new calibration curve should be made.
Another factor that may alter the calibration curve is the presence of organic matter in the soil. Organic matter contains hydrogen (in the form of hydrocarbons for instance) and since the new method cannot distinguish between hydrogen in water or in any other chemical compound, an, excessively-high counting rate may be-observ---- - ed. Measurements of a sample of a high ground-water soil with a highly developed organic top soil containing about 75 percent moisture gave a reading that fell on the calibration curve, thus showing that the influence of organic matter, to the extent present in this soil sample, at least, was negligible.
Some preliminary experiments were made with the objective of investigating the ability of this method to differentiate between different moisture contents occurring in relatively thin horizontal strata. - By means of a particular arrangement of source and detector, it was possible to measure accurately the moisture content of a layer of 4 to
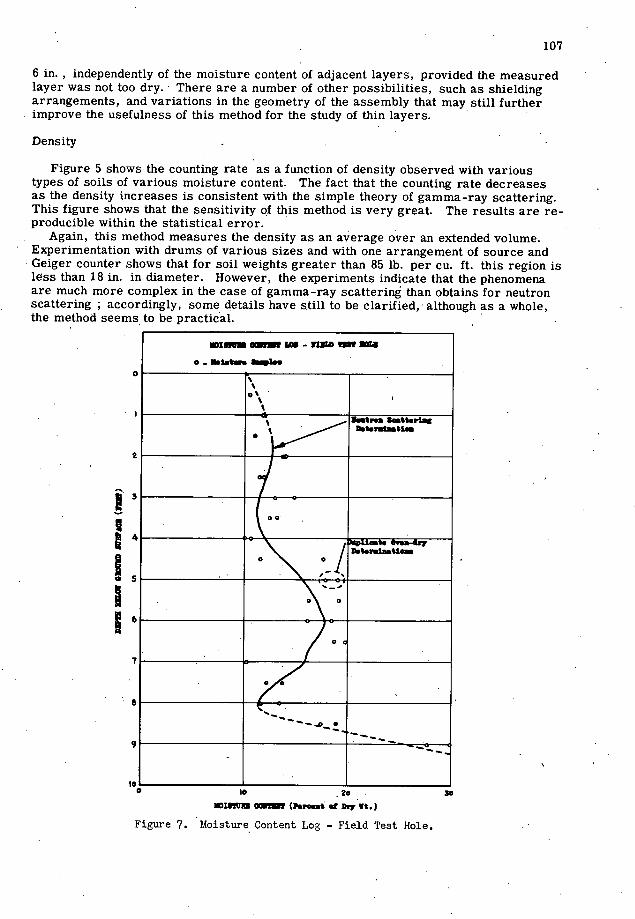
107
6 in., independently of the moisture content of adjacent layers, provided the measured layer was not too dry.' There are a number of other possibilities, such as shielding arrangements, and variations in the geometry of the assembly that may still further improve the usefulness of this method for the study of thin layers.
Density
Figure 5 shows the counting rate as a function of density observed with various types of soils of various moisture content. The fact that the counting rate decreases as the density increases is consistent with the simple theory of gamma-ray scattering. This figure shows that the sensitivity of this method is very great. The results are re-producible within the statistical error.
Again, this method measures the density as an average over an extended volume. Experimentation with drums of various sizes and with one arrangement of source and Geiger counter shows that for soil weights greater than 85 lb. per cu. ft. this region is lnss than 18 in. in diameter. However, the experiments indicate that the phenomena are much more complex in the case of gamma-ray scattering than obtains for neutron scattering ; accordingly, some details have still to be clarified, ' although as a whole, the method seems, to be practical.
- VIM t
ir,* $cstt.Ilig
0
00
/ o\oJ
Ucst. 0vsa-4p n.t.J.Itt
0 0
0
0 0
S... - -_,0---
ROZITUII (Psros.t' of Dr7 Vt.)
Figure 7. Moisture Content Log - Field Test Hole.
101 1
0 10 20 30
108
Field Tests
Two sets oftests were made to check the performance of the new device under field conditions. In the first test the manually-operated laboratory equipment was used to explore the profile of a soil to 9 ft. below the surface. In the second test, exploring a soil-layer 4 ft. thick, automatic equipment especially designed for this purpose was used, and the counts were telemetered from the field station to the laboratory where the results were automatically recorded.
Tests with Manually-Operated Laboratory Equipment
For this test a place was selected approximately 100 ft. from the building where the laboratory tests were performed. Excavation at the site subsequent to the measurements showed that the soil consisted of a 4-ft. layer of gravelly loam underlain by medium sand with occasional minor strata of sandy clay approximately 1 in. thick, which turned at about 8 ft. into clean sand down to the water table at 9 to 9. 5 ft. A 9-ft. stainless steel tubing, 1-in, inner diameter, 1. 25-in, outside diameter 2/, was provided on one end with a solid point. A hole was drilled with an auger down to approximately 6 ft. The steel pipe was inserted into this hole and then driven down for the remaining 3 ft. In the drilling, the auger struck rocks in the upper horizon resulting in a loose fit between the outside of the steel pipe and the soil. This space was filled with sand as well as possi-ble. While drilling the hole, soil samples were taken at regular intervals for weighing and drying. For the moisture determination the assembly used in the laboratory test was lowered into the hole and observations were made at different predetermined posi-tions. In the most complete run, measurements were taken every 6 in. After each ex-posure of 1/2 hr. the foil was withdrawn and quickly carried to the counting device in the laboratory. Care was taken that always exactly the same time (60 seconds) elapsed between the withdrawal of the foil and the beginning of the counting. For the density measurements the count-rate meter was placed near the hole and the density -measur-ing assembly (Fig. 2) directly connected by a coaxial cable, so that readings were taken on the spot. Several runs were taken on different days.
The observations expressed in counts per minute were transformed by means of the laboratory calibration curves into values of moisture content in lb. water per cu. ft. of soil and into soil density in lb. per cu. ft. These results, plotted as a function of the distance below the surface, are shown in Figure 6 for measurements made on one par-ticular day. Other runs, made within one or two days during which there was little probability for a change in moisture, gave practially identical results.
In order to judge the reliability of this method, it was necessary to compare the results with moisture and density determinations made by standard methods. For this purpose, a hole, 4 ft. by 3 ft. by 9 ft., was excavated. As the hole was excavated, one or two samples of approximately 75 grams were taken every 6 in. for the moisture determination. In order to determine the density, a steel tube, 8 in. long and 3 in. in inner diameter, was pressed to its full length into the undisturbed wall, at a given depth, and then carefully taken out without disturbing the soil contained in the tube. The weight of the soil withdrawn, divided by the volume of the tube, was taken as the soil density in that region. The unit weights thus obtained at four different depths were, in general, lower than those obtained with the new device, the maximum difference being 10 lb. per cu. ft. This is ascribed to the fact that the volume used in the direct method is too small for obtaining a good average, particularly in the lueations where stones are present.
The moisture content, expressed in terms of lb. of water per unit weight in Figure 6 has been transformed into units of moisture content expressed as a percentage of dry weight by means of the density values taken from the density curve of Figure 6. This more conventional curve is shown in Figure 7 where the smooth curve represents values determined by the neutron device; the symbols represent moisture as given by
/ Tubes of different wall thicknesses may yield different calibration curves.
109
the standard technique. This figure demonstrated that, within the spread of values ob-tained by sampling, good agreement is obtained. It is not clear whether the "smooth" aspect of the curve from the nuclear device, as compared to the variation of the stand-ard measurements, is due to inherent difficulties of the drying and weighing method, or it is a result of the. fact that the nuclear device reads an average moisture over a radius of perhaps 6 in.
Radiation Hazard
Government regulations for the handling and shippmg of polonium-beryllium sources do not require any special safety measures. The gamma-ray source used in the density measurements was much too weak a source to require special handling. Nevertheless, the personnel on this project were warned not to carry either of these sources unshielded in the pocket or otherwise in close contact with the body.
Summary and Critical Evaluation of Laboratory and Field Tests
Moisture Determination - The neutron-scattering method proves to be a reliable method for determining, without disturbing the soil mass, the moisture content. The precision 1 lb. water per cu. ft. or better, corresponding to about ± one percent moisture content.
The method lends itself to practical measurements in the field without giving rise to any essential difficulties.
The results obtained are averages over a radius of approximately from 6 in. fOr high to 15 in. for low moisture contents, a fact that should be kept in mind in analyzing the readings obtained by this device.
The method permits exploration of the profile by simple movement of the measuring device inside a tube.
Difrent soils seem to have the. same calibration curve although this fact has still to be thoroughly established. The calibration curve obtained by laboratory experiments can be used for measurements in the field.
Inhomogeneities, such as ordinary rocks in glacial drift, do not introduce serious disturbances.
Addition of salts or humus in quantities encountered under normal conditions will not alter the calibration curve.
With the present equipment variations of moisture occurring within a time interval as short as 1/2 hour can be detected.
By using a polonium-beryllium source, readings can be continuously and automatically recorded and telemetered from the test site to.a central station.
Density Determination
The gamma-ray scattering method proves to be a reliable method for determining density without disturbing the soil mass, at least if care is taken that the placing of the tube does not disturb the soil mass near the tube. This sensitivity to soil disturbances near the tube can be minimized by changing the geometric arrangement of the source-detector assembly.
The precision, at present, is t 2 lb. per cu. ft. The readings represent averages over a radius of less than 9 in. The method lends itself to the continuous exploration of profiles by moving the meas-
uring device inside a tube penetrating the soil. The readings may be telemetered and automatically recorded.
The calibration curve is independent of the type of soil. Small inhomogeneities, such as rocks, do not seriously disturb measurements, pro-
vided they do not occur in the immediate proximity of the tube. There is hope that this shortening can be overcome.

110
Summarizing, it can be said that both methods have proven themselves in laboratory and field tests and promise to become satisfactory and very useful tools for the meas-urement and continuous recordings of moisture content and density of soils.
Field and Laboratory Applications
The progress in research leading to improvements, refinements and special applica-tions is rapid. In two months' time major alterations have been made to produce a greater accuracy and a reduced time of measurement. In that same period the problem of radiation hazard has been virtually eliminated by the use of the polonium-beryllium as a source rather than radium.
These improvements and experimental application to various problems has shown that the existing apparatus is suitable for locating seepage zones as they are found in land-slides, dams and in drainage investigations. Special adaptations have shown that moisture control in concrete aggregates can be exercised in batching plants and the density obtain-ed by compaction quickly determinedin the course of the work.
WATER IN HIGHWAY SUBGRADES AND FOUNDATIONS
F. N. Hveem, Materials and Research Engineer, California Division of Highways
The structural integrity and endurance of almost every engineering work is jeop-ardized by the action of water. The permanence of relatively perishable materials, if protected from moisture, is illustrated by the ancient buildings, manuscripts, fabrics, and even cereal grains preserved fOr thousands of years in Egypt, which of course, is noted for the dryness of its climate. The rapid deterioration of all things in a warm, humid climate points the contrast.
In its simplest form then, one of the major problems confronting the civil engineer is the necessity for guarding against or combating the deleterious effects arising from the action of water upon the materials of construction. Everyone is aware of the more spectacular attacks of water, such as the destructive wave action along the shores of oceans and lakes and the washing out of bridge piers or damage to embankments by rivers during flood. The necessity for providing waterproof roofs and protective coatings on most buildings and structures is common knowledge. Engineers have also recognized that water has an adverse effect upon the ability of soils to serve as foundations for dams, buildings, and even pavements for highways and air fields.
A great deal has been written on the subject of bearing or supporting power of soils, and it may be significant to note that this particular field of engineering is generally classed under the heading of "soils mechanics." When a mixture of sand and gravel is mixed with a liquid such as asphalt for the purpose of producing a pavement, such mixtures are invariably referred to as bituminous mixtures or asphaltic pavements, even though the amount of asphalt present commonly does not exceed 5 or 6 percent by weight of the total mass. When considering the properties of soils or granular base materials, however, engineers rarely mention that they are dealing with a water-soil combination even though the water. content commonly ranges between 5 and 30 percent of the weight of soil.
Narrowing our attention to the special problems surrounding the construction of adequate bases and foundations for pavements, we are forced to conclude that the fundamental relationships depend almost entirely upon the effects of water upon the particular soils in place. The long history of pavement failures due to foundation troubles and inadequate soil support casts no particular credit upon the engineering profession, and when such failures continue to reoccur, it is evident that there is a lack of understanding and probably insufficient knowledge of the mechanism by which water is introduced into the soil and of its effects when present. The fact that water is responsible for most of the troubles has, of course, not been entirely overlooked, because texts on highway engineering have stressed the importance of drainage, and for a great many years it has been the practice to provide drainage structures, road-

111
side ditches, and numerous varieties of -u 0ENSTV- LBS PER Cu FT . PASSBG 4 WO underdrains utilizing tile, perforated pipe,
or trenches filled with gravel in an endeavor to drain out the objectionable water. Fail-
I 33 ures have persisted in spite of these attempts, 2
and a few engineers have come to realize 34
- that it is often impossible to remove or re- 2 I duce the thoisture content by the method of
u i simple drainage. PERCERT M0STURE
A few years ago, a Highway Research Figure 1. Shows an example of compara- Board committee, headed by Dr. Hans F. tively uniform moisture distribution under Winterkorn, was formed to study the prob-
a pavement that had been down for 13 years lem of non-gravitational water. However, I at the time the samples were taken. The soil is a very uniform sand-micaceous am not aware that this committee has ever and the moisture content of approximate- taken any definite action on the problem. Dr. ly 7 percent represents 44 percent of Winterkorn also wrote a paper entitled "Cli-
saturation, mate and Highways" which was presented at the June 1944 Meeting of the American Geo-
physical Union (Section of Meteorology). Briefly, Dr. Winterkorn directed attention to a number of facts and factors, some derived from theoretical studies and laboratory in-vestigations and others based upon direct observation of field installations, all of which seemed to indicate that a principal source of moisture accumulation in the soil is through the condensation of vapor in the soil atmosphere. Briefly, the pores in the soil are filled with air, and presumably the air is forced in or out of these pores with every change in barometric pressure and temperature.
Other investigators have shown that most engineering materials are pervious to the passage of water in the vapor phase. This includes asphalt films of substantial thick-ness, most Portland cement concrete, wood, brick, etc. Certainly the more porous structure of soils offers little or no obstacle to the passage of water in the vapor phase. The bulk of literature and instruction dealing with soils for engineering purposes leaves the impression that water can enter only by two very similar means or mechanisms: by percolating downward through the soil from rainfall and melting snow and by the so-called capillary movement by which water is drawn through the pores by a sort of wick action. There is no doubt that water does move by such means. However, there is an increasing amount of evidence that water accumulates beneath pavements under con-ditions that seem to rule out either direct percolation or capillary action. If engineers are to devise corrective or preventive measures, it is essential that the exact mechanism and path of entrance be known. Unfortunately, there is little in the way of comprehen-sive data on this subject. Today, there is only a limited amount of recognition that the moisture problem is more complex than hitherto believed, and most of the data is limit-ed to investigations of existing pavements which show varying amounts of moisture in the underlying soil. I know of no corn- prehensive studies intended to establish -u the rates at which the moisture accumu- DEOSOV-LRS P7 5 R0SSOS U000.
lates. A few years ago Dr. Miles S. Kersten'
presented a "Report of Survey of Subgrade Moisture Conditions Under Existing Pave- IS
ments." This paper was published in the Proceedings of the Highway Research 0
Board in 1944. About the same year, the Materials and Research Department of Figure 2. A number of samples were drilled the California Division of Highways was where the moisture content was greatest in
i • the upper layer, while the composition of
assigned the problem of nvestigatmg the the soil is virtually identical throughout causes for failures and distress often the depth sampled. This is typical of this accompanied by mud-pumping at the joints type of moisture distribution. This pave- in Portland cement concrete pavements. ment had been in place for 13 years.

112
DENSITY-LOS PE5 %PASSI050200
01
::
UI
PERCENT MOISTURE
Figure 3 • Illustrates the moisture dis-tribution in reverse of Figure 2. In this case, the moisture content increases con-sistently with increasing depth below the surface. The soils are very heavy silty clay type containing more than 50 percent passing No. 200. The pavement was II years
old when the samples were taken.
in seeking the causes for these difficulties, a number of pavements were selected rep-resenting all degrees of performance at the joints. Holes were cut through the pave-ments by means of a core drill and the under-lying soil sampled in 6-in, layers to a depth of 24 in. The degree of compaction, or density in terms of weight per cu. ft., was determined at least for the first two layers encountered. Samples were taken and placed in sealed containers for determination of moisture content. The soils were tested,
analyzed, and classified, using all of the methods and techniques common to an engineering soils laboratory. It may be mentioned in passing that there appears to be little if any correlation between these test results or classification schemes and the actual performance of the pave-ment.
For the purposes of this presentation, results were studied in order to deter-mine whether there was any relationship or trend between the moisture content and the nature of the soil. A large number of factors were compared, such as the Atter-berg limits, the Highway Research Board classification, etc. , but there was little if any evidence of relationship between these values and the amount of moisture found in the soil.
The illustrations show the range of moisture distribution in the various lay-ers.
O
MATERIAL N FRIALMATERI AT
A.
; ] SANDY MATERIAL SR
RLUCO ADORE To
I DENSITY. RN LOSPERCUET
PERCENT MOISTURE
Figure 5. This figure is included to show the marked differences in the moisture content where each layer of the soil is of a different type composition. This par-ticular boring was taken in a location where, the first 6-in, layer beneath the pavement consists of alight-weight porous, granular material, presumably of volcanic tufa. The second layer represents an old road surface composed of an oil mixed sur-face on a crushed rock base. The third is a layer of sandy 'material imported as a subbase under the original bituminous sur-face, and the final layer is a local black
adobe soil.
It is obvious that the presence or absence of moisture in the soil is a matter of prima-ry importance to men engaged in several different professional activities. The ag-ricultural expert or agronomist is largely concerned if the soils become too dry to support plant life. The highway engineer has reason for concern when the soils ac cumulate enough moisture to become lubri-cated and hence lose ability to support pave-ments subjected to heavy loading.
It is evident that the construction of tight, impervious pavements does not prevent moisture from entering and accumulating in the soil beneath the pavement. It is evident that the construction of asphaltic membranes
* PASSED MOOD
000 ON
' OR
S IR4
PERCENT MOISTURE
Figure 4. Represents a boring taken through the pavement into sandy, silty soil where the moisture distribution is somewhat erratic. No definite pat-tern evident. The pavement had been
down 15 years.

ward from the surface or by capillary action from below seems to be inadequate to ex-plain the amount of moisture that has been found beneath pavements in a great many cases. This leaves as a remaining possi-bility the movement of moisture in the vapor phase through the pores of the soil and the condensation of vapor, due to either changes in temperature or in pressure. It has been pointed out that soils will hold more mois-ture by adsorption when temperatures are low and will yield up this adsorbed moisture in the form of free water when temperatures rise. Direct observation of roadway perform-ance seems to lend ample support to this theoretical concept. So far as California
.0
DEGREE OF SATURATION
Figure S. This chart shows the relative number of samples representing the various degrees of saturation. While the average of all samples taken corresponds to amois-ture content of approximately 79 percent saturation, it is evident that a relatively high percentage have approached or reached
saturation.
or the presence of an old pavement be-neath a layer of gravel or soil does not prevent the intermediate layer from be-coming saturated. A layer of soil placed as a "sandwich" between two layer of rel-atively impervious pavement usually ac-cumulates more moisture and reaches a higher degree of saturation than if placed directly on the ground. The assumption that water enters the soil by soaking down-
2c
IF .. .
50 00 ITO 200 250
___ O__
25 so /S IRA DEGREE OF SATURATION
Figure 6. This chart illustrates the de-gree of saturation compared to the age of the pavement. These points seem to mdi-. cate that the rate at which moisture accu-mulates may be quite slow. While the data are far from being conclusive because all pavement samples were at least 5 years old when samples were taken, it is undoubtedly true that in some cases interlying soils may have been saturated at the time of construction. Nevertheless, there appears to be a trend indicating that it may re-ctuire a period of more than 10 years for
complete saturation to develop.
113
SURFACE AREA-So FT PER CR
Figure 7. illustrates the relationship between the calculated surface area of the soil particles and the amount of moisture. This relationship apparently represents the only discernible trend between charac-teristics of the soil and the moisture present. While the relationships indicated are not sharp or precise, it is also true that the values shown for surface area e-quivalents are only rough approximations and may be considerably in error for the finely divided clays or soils containing an appreciable amount of colloidal sizes. The indication that there iss one relation-ship between particle surface area and the moisture content may lend support to the theory that moisture accumulates largely as a result of condensation from water
vapor.
experience is concerned, we lack con-vincing or direct proof to establish the path by which moisture enters the sub-grade soil.
Admitting that moisture can enter through porous pavements or leaky sur-faces, and recognizing that moisture can migrate upward by capillary action to produce saturation when the water-table is near the surface, there remains the strong probability that moisture also ac - cumulates as a result of water vapor mov-ing freely through the pores in the soil and condensing upon the soil particles when subjected to a drop in temperature.

114
Variation in temperature would be most marked near the surface of the ground or at the underside of the pavement, and when sufficient water has accumulated, it would migrate downward by drainage or by capillary action. It is not clear, however, whether the water vapor characteristically migrates upward from a submerged water-table (which may be many feet below the surface) or whether it is carried in by the movement of air from the outside atmosphere, or both.
A proven answer to these questions will clarify the problem of designing preventive or corrective methods and should enable the highway engineer to proceed with much greater intelligence or assurance than is possible at the present time.
The charts illustrate some of the relationships between the characteristics of the soil and the amount of moisture found in the soil immediately beneath Portland cement concrete pavements in California.
As a part of the investigation, holes were bored in the concrete pavement using an 8-in, diamond bit, and samples of the underlying subgrade soil were taken for .a depth of 24 in.
Separate samples were secured for each 6 in. beneath the pavement and the density in place of the first two layers was determined by the sand volume method whenever possible.
Figures 1 to 5, inclusive, illustrate the typical types of moisture distribution. Fig-ures 1 to 4 represent borings where the soil was of the same character for the entire depth. Figures 6, 7, and 8 show other soil moisture relationships.
SOIL MOISTURE UNDER THE CONCRETE PAVEMENT OF AN AIRPORT
T. B. Ruse, Norwegian Institute of Technology, Trondheim, Norway
During the spring of 1949 samples were taken of the earth layers under and adjacent to the concrete pavement of an 80 m. (262 ft.) wide runway and a 15-rn. (49-ft.) taxi drive. The airport is situated on a slightly inclined river deposit. The results of the sieve analyses are given in Figure 3. The size of particles varies greatly, but the material consists chiefly of sandy silt and silty sand-gravel. The great variation in particle-size can be explained by the river having changed its course during times past.
During the occupation of Norway by Germany, German geologists made investigations of the soil of this airport. The results show that there are radical variations in the soil also at other locations on this site. It is not possible to define the soil by definite strata.
The concrete pavement is about 15 cm (6 in. thick, laid during 1940-42). It is, at present, impossible to ascertain the exact date. The pavement is in good condition and the joints filled with asphalt. It is therefore assumed that no appreciable seepage of surface water into the ground can occur. The pavement is poured directly on the sub- grade without any base-course.
The samples are taken along an expansion joint across the pavement of the runway and taxi drive. The location of the test holes will appear from Figures 1 and 2. The test holes of the runway are labeled A0 to A9. From each hole are taken 4 or 5 samples at a difference in elevation of about 0. 25 m (10 in.). The samples are numbered from the top. For the taxi drive the test holes are labeled similarly B1 to B6. The test hole elevations are tied in to arbitrary bench marks different for the two profiles. They show proper relations for each profile but there is no relation between the two.
According to observations made by the Germans the ground-water level is assumed to be about 2. 0 in (6. 55 ft.) beneath the surface of profile A and about 9. 0 m (29. 5 ft.) for profile B. There seems to be some uncertainty with regard to. the ground-water level at profile B, but it is certain that it could not possibly be higher than 5 - 7 m (16 - 23 ft.) beneath the surface.
Profile A is located 11. 0 m (36 ft.) from the end of the pavement. Profile B is far from the end.
Under the assumption that the pavement is waterproof there can be no surface water seeping through to the ground underneath.
The soil beneath the pavement can therefore receive moisture only in one of the

Aft
_
/111
_______
/ 2/'l/
I 7Th
—q—
115
Figure 1. The figure sho,s the location where the test holes A0- A were taken. The curves indicate the initial water content of the saji,les.
following ways: By capillary action from the earth masses lying outside the pavement having
absorbed precipitation. By capillary action from the ground water, the assumption being that the cap-
illary head of the earth is equal to or greater than the distance to the ground water. By condensation on the under side of the pavement. The vapor must have orig-
inated in the deeper strata under a temperature higher than that of the pavement. Con-densation will consequently only occur under certain weather conditions.
By water from melting ice in soil sensitive to frost. Considerable quantities of moisture are often developed in this manner.
Water from condensation will usually assert itself by higher moisture content in samples taken immediately underneath the concrete pavement.
In Figures 1 and 2 are curves showing the initial water content of the top samples. A curve showing the average water content of all samples is also drawn. In profile A the water content of the top samples are, in general, higher than the average. This is particularly the case for the right-hand portion.
As can be seen in Table I; the material in the right-hand portion is generally more fine-grained than to the left. This is presumably the principal reason for the higher water content. The same relations are also found in samples taken from deeper strata where condensation-water hardly could occur. In Figure 2 are similary shown the same relations for profile B. Table II is compiled with the same symbols as those used in Table I.
In Table II, 133. 1 showing the highest water content can also be seen to contain the most fine -grained material. In this case it is assumed that condensation-water has played no part whatever.
Water from melting ice in frost-sensitive soil can cause a complete soaking of the

9.10 In. . £i.p 4n' -k--
ce/47Jn/o/M'
C .$4W7/,
awvy .fl'.'a'1 eoA.v/ e/.o/? C9
ew fI ,f.s/4e/e.
.•
.
. I
116
TABLE I
Ratio Silt + Fine Sand:• Sand = a, the Water Content /3 and Permeability Given for Top Samples of All Test Holes in Profile A
a /3 A1 . 1 0.41 4.28 To 15.4 . 10 A2 . 1 0.73 9.50 % 11. 1 . 10 A3 . 1 0.73 7. 10 % 5.7 10 A4 . 1 .0.67 .8. 85.% 3 . 10 A5 . 1 2.05 13.83 % 3. 59 . 10 - A6 . 1 0.35 12.60 % 93. 5 . 10 A7 . 1 3.20 16.52 % 1.36 . 10 A8 . 1 1.13 8.35 % 3.60 . 10
TABLE H
a /3 IL
B2 . 1 0.35 3.23 % 121. . 10
B3 . 1 2.22 6. 88 % 14.3 . 10'
134 . 1 0.04 3.19 % 1784 . 10
1 0.35 5.08% 47
Figwe 2. The figure shows the location where the test ho1s BJ - B6 were taken. The curves indicate the initial water content of the samples.
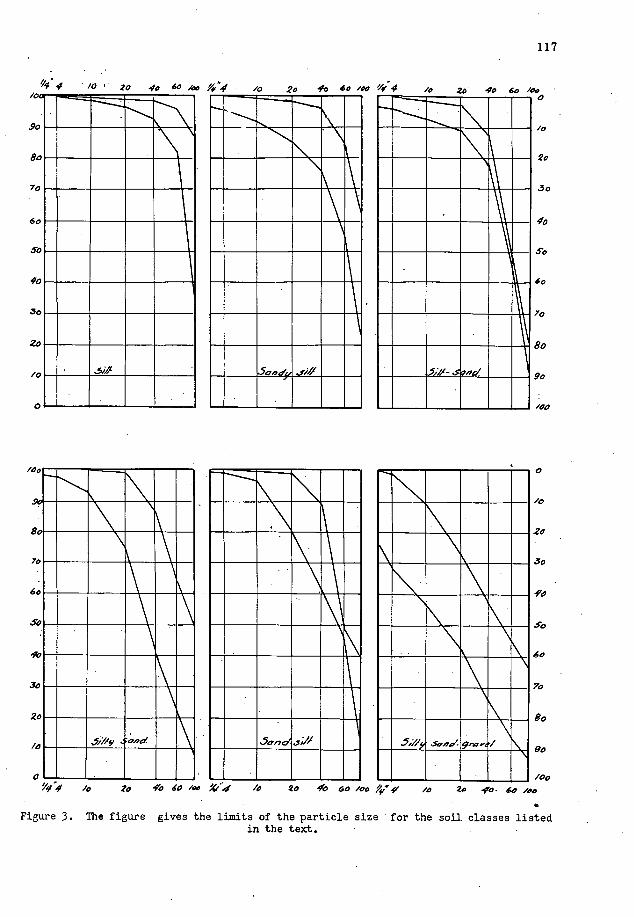
0
/0
2o
30
Ia
so
'0
0
80
90
/00
117
4 /0 20 40 0 /60 /0 2o 16 do /00 44
/0 20 40 60 /00
'o ZO 40 60 /00 5Q4 /0 go Ia 60 /00 5fi /0 20 .90. 60 ,.o S
Figure 3. The figure gives the limits of the particle size for the soil classes listed in the text.
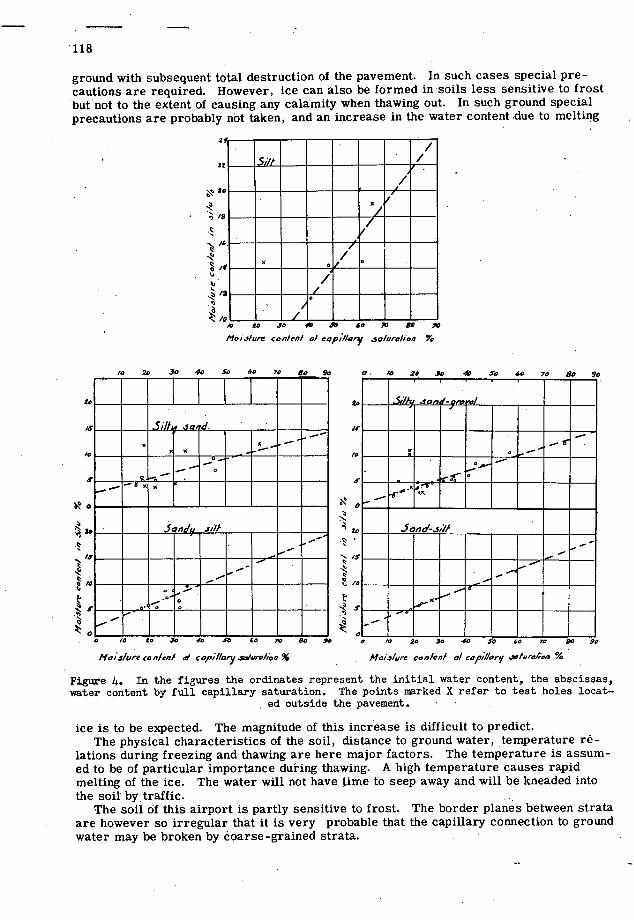
ground with subsequent total destruction of the pavement. In such cases special pre-cautions are required. However, ice can also be formed in soils less sensitive to frost butnot to the extent of causing any calamity when thawing out.. In such ground special precautions are probably not taken, and an increase in the water content due to melting
fl
/ - / - - UUUWI RU UUiNURR UUURIUUU
RURUUUU RU
UUUURRR UUURUUUU
..U.UUU I.UU.UUU
UURRUUU RU
UUUUUUU UUUUUU UUUUUUU R1UUUUUUU
118
- .0 10 30 40 ib 00 IV Sc $9
Mo,.,/ure con/en.' S capillary .so/uF-c/iw %
/o 20 30 40 So 69 79 So a, o. /6 , .,, Q
I'fo,j/ure co n/en.' S ciIioey .$94#-o/io % Mo/519r9 Con/CO.' ci cap/i/cry .ioiu'ohoa %
Figure 4. In the figures the ordinates represent the initial water content, the abscissas, water content by full capillary saturation. The points marked X refer to test holes locat—
ed outside the pavement. -
ice is to be expected. The magnitude of this increase is difficult to predict. The physical characteristics of the soil, thstance to ground water, temperature rë-
lations during freezing and thawing are here major factors. The temperature is assum-ed to be of particular importance during thawing. A high temperature causes rapid melting of the ice. The water will not have time to seep away and will be kneaded into the soil by traffic.
The soil of this airport is partly sensitive to frost. The border planes between strata are however so irregular that it is very probable that the capillary connection to ground water may be broken by áoarse-grained strata.
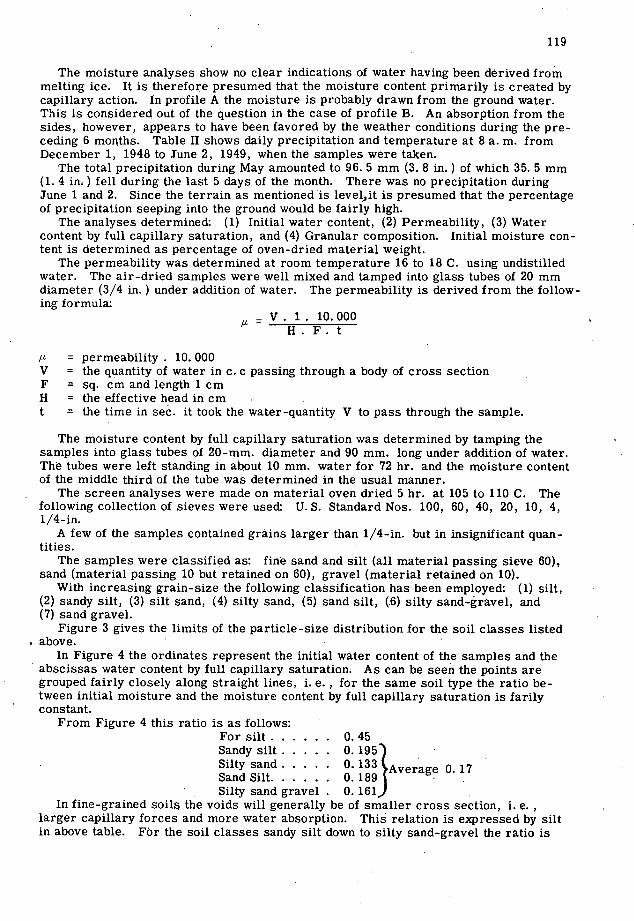
119
The moisture analyses show no clear indications of water having been derived from melting ice. It is therefore presumed that the moisture content primarily is created by capillary action. In profile A the moisture is probably drawn from the ground water. This is considered out of the question in the case of profile B. An absorption from the sides, however, appears to have been favored by the weather conditions during the pre-ceding 6 months. Table II shows daily precipitation and temperature at 8 a. m. from December 1, 1948 to June 2, 1949, when the samples were taken.
The total precipitation during May amounted to 96. 5 mm (3. 8 in.) of which 35. 5 mm (1. 4 in.) fell during the last 5 days of the month. There was no precipitation during June 1 and 2. Since the terrain as mentioned is level,it is presumed that the percentage of precipitation seeping into the ground would be fairly high.
The analyses determined: (1) Initial water content, (2) Permeability, (3) Water content by full capillary saturation, and (4) Granular composition. Initial moisture con-tent is determined as percentage of oven-dried material weight.
The permeability was determined at room temperature 16 to 18 C. using undistilled water. The air-dried samples were well mixed and tamped into glass tubes of 20 mm diameter (3/4 in.) under addition of water. The permeability is derived from the follow-ing formula:
= V. 1. 10.000 H.F.t
= permeability • 10. 000 V = the quantity of water in c. c passing through a body of cross section F = sq. cm and length 1 cm H = the effective head in cm t = the time in sec. it took the water-quantity V to pass through the sample.
The moisture content by full capillary saturation was determined by tamping the samples into glass tubes of 20-mm. diameter and 90 mm. long under addition of water. The tubes were left standing in about 10 mm. water for 72 hr. and the moisture content of the middle third of the tube was determined in the usual manner.
The screen analyses were made on material oven dried 5 hr. at 105 to 110 C. The following collection of sieves were used: U. S. Standard Nos. 100, 60, 40, 20, 10, 4, 1/4-in.
A few of the samples contained grains larger than 1/4-in, but in insignificant quan-tities.
The samples were classified as: fine sand and silt (all material passing sieve 60), sand (material passing 10 but retained on 60), gravel (material retained on 10).
With increasing grain-size the following classification has been employed: (1) silt, (2) sandy silt, (3) silt sand, (4) silty sand, (5) sand silt, (.6) silty sand-gravel, and (7) sand gravel.
Figure 3 gives the limits of the particle-size distribution for the soil classes listed above.
In Figure 4 the ordinates represent the initial water content of the samples and the abscissas water content by full capillary saturation. As can be seen the points are grouped fairly closely along straight lines, i. e. , for the same soil type the ratio be-tween initial moisture and the moisture content by full capillary saturation is farily constant.
From Figure 4 this ratio is as follows: For silt ...... 0. 45 Sandy silt ..... 0. 195) . Silty sand ..... 0. 133 1'Average 0.17 Sand Silt . . . . . . 0.189 . Silty sand gravel 0. 161
In fine-grained soils the voids will generally be of smaller cross section, i. e. larger capillary forces and more water absorption. This relation is expressed by silt in above table. For the soil classes sandy silt down to silty sand-gravel the ratio is

120
fairly constant. This indicates that the pore sizes for the different classifications in this case must be of approximately the same order.
In Figure 4 the points belonging to samples from test holes A0, A9, B1, and B6 are marked X. These test holes are located outside the pavement subject to entirely dif-ferent conditions with regard to water absorption. This explains why the points marked X fall outside the straight lines established by the samples taken from underneath the pavement.
Conclusion
In this case the moisture analyses show that the water content of the ground beneath the concrete pavement is considerably less than what corresponds to full capillary sat-uration and, of course, even more so if compared to water content by èomplete sub-mergence.
In districts with weather conditions like those in this country the results indicate the justification of determining the bearing capacity of the ground for a moisture content corresponding to a certain percentage of that with full capillary saturation.
However, the investigation is far too limited to permit drawing of specific conclu-sions particularly with regard to what percentage of the capillary saturation could be used in estimating the bearing value of different classes of soil.
DISTRIBUTION OF CAPILLARY MOISTURE AT EQUILIBRIUM IN STRATIFIED SOIL
M. G. Spangler, Research Professor of Civil Engineering, Iowa State College, and Wei Te Pien, Shanghai, China, Former Graduate Student, Iowa State College
The rise and retention of capillary moisture in the soil above a free-water table are phenomena of considerable importance in highway engineering, since they influence, to a very great extent, the moisture content and therefore the bearing capacity of highway. pavement subgrades. The movement of capillary water upward from a free-water table is also of prime importance. during the growth of ice lenses, which result in frost heave and subsequent frost boil conditions.
It has been pointed out previously (2, 3) that the free-energy concept of soil mois-ture provides a valuable tool for the study of capillary water movements in soil sub-grades and that the terminal accumulated moisture content in a subgrade beneath an im-pervious pavement is a function of the capillary potential of the soil. All of the sorption curves (capillary potential versus moisture content) presented in conjunction with the previous discussions were for completely homogeneous soils. Since highway subgrades are frequently non-homogeneous, it is of interest to study the character of the sorption curves of stratified soils. This paper presents a discussion of the theoretical aspects of free energy applied to stratified soil and a comparison of the equilibrium moisture content at various elevations above a free water surface in two experimental stratified soil columns with the theoretical moisture distribution.
The free energy of a system may be defined as the work performed to change it from one state to another. This work may, in general, be separated into two parts; the work of expansion due to changes in temperature and pressure and mechanical work. Accord-ing to Edlefsen and Anderson, an incremental change in free energy may be represented by the equation (1, p. 85):
dl = -sdT + vdP-dwm. (1)
in which dl = change in free energy s = entropy of the system dT = change in temperature v = specific volume . dP = change in pressure dWm = change in mechanical work

121
Under isothermal and isobaric conditions, dT and dP are equal to zero and equation (1) becomes
'df=dWm (2)
In the field of soil moisture,: the datum for measuring the change in energy is usually taken as free, pure water. Therefore the difference between the 'absolute free energy of free, pure water and that of the moisture at any point in a soil represents the specific free energy, or simply the free energy. of the soil moisture. In other words, the free energy, A f, of, soil moisture is the energy (aside from the work of expansion against at-mospheric pressure) required to change it from free, pure water to the state in which it exists in the soil. '
When the temperature and pressure on the soil water remain constant, the free en-ergy is analogous to a mechanical or hydraulic potential. This potential is called cap-illary potential or pressure potential. It is this limited concept of free energy which is usually employed in studies of unsaturated soil moisture movements in the liquid phase, although there is little doubt that-the more general concept will need to be employed be-fore complete understanding of problems in this field can be achieved. This would seem to be particularly true in problems of unsaturated moisture flow associated with frost heave and frost boils.
The free energy of unsaturated soil moisture is equal to the sum of several compon-ents of free energies. Thus
Af = tfp .+Afo +Aff+Afg (3) in which
A f = free energy due to hydrostatic pressure A ?o = free energy due to osmotic'pressure A ff = free energy due to adsorptive force field A fg = free energy due to gravitational force field '
In the case of a highway subgrade, the moisture content which may have significant effects upon its stability is great enough that the influence of the adsorptive force fields around the soil particles is probably negligible. Also,, osmotic pressure will not be important in subgrade moisture studies except possibly in regions of high soil alkaline content. Therefore, equation (3) may be written
AfAfp+Afg ' ' (4)
When the moisture in a soil column comes into equilibrium with a water table below under isothermal and isobaric conditions, Af is constant and has the same value at all points. Hence '
AfAfp +Afg c (5)
Then
dh dh '(6) and
Af = -xgh ' , (7)
in which ' h = the height of a point above a free water surface
= the density of pure water g = the gravitational constant
Thus it is shown that the free energy, i. e. , the capillary potential or pressure po-tential of soil moisture under isothermal and isobaric conditions, is dependent only on the height above-a free-water surface and is independent of texture or grain size, state

122
6 - - - - of packing or density, wetting angle, etc.
-J However, the moisture content of soil at —r -r - - - a given height is dependent upon all these
± J - - - factors. Therefore the moisture in dli- 10C _
I - ferent kinds of soil at the same height - - above a water table must adjust itself so that the capillary potential is a constant
- H - - value corresponding to that height.
70 From the above considerations it is con-
- _ - eluded that when the capillary moisture in - a stratified soil is in equilibrium with a H - - \- - -
- - - - - water table, that is, when there is no tend- ency for upward or downward movement of the capillary water, the moisture content
S just above and just below the interface be- tween the two soil strata may be consider-
- L 2
SORP - ably different, depending upon differences - - in character of the two soils. In other words, the theory indicates that the mois- ture content of a stratified soil undergoes
- -' 15 20 -- , 30 --—i - a marked and abrupt change at the inter- MoIsuRC CONTENT-%DRV WI. face between strata. It may abruptly in-
Figure 1. crease or decrease depending upon the relative character of the soils involved.
If the sorption characteristics, that is, the relationship between moisture content and capillary potential of the soils are known, the requirement shown by equation (7) indicates that the variation in moisture content upward from a water table will be in ac- cordance with a composite curve consisting of segments of the sorption curves of the soils involved. For example in Figure 1, let curves x, y, and z represent the moisture-capillary potential relationships - - of three soils X, Y, and Z in stratified - 'I°' - arrangement as shown at the right of the :00 diagram. When capillary moisture in / this stratified soil is in equilibrium, the - / broken curve 1-2-3-4-5-6 represents the 7 - I distribution of capillary moisture through- / out the vertical column. This broken °" curve is made up of segments of the soil sorption curves within the vertical dis- - tances corresponding to the thicknesses / of the various strata.
In order to verify the above theory, - - two columns of stratified soils were plac- ed in 4.9-cm. diameter glass tubes and / the lower ends of the tubes were immers- -± - -- - ed in a vessel of water which was open / OF
to the atmosphere. After a period of time WE.rTING liL 3C
sufficient for the establishment of quasi- / equilibrium had elapsed, the moisture a - contents of the soils were determined at points about 5 cm. apart throughout the I C - - height of the columns. These moisture contents were plotted against height and -_ WATE I. SURFACE _ - compared with the sorption curves obtain- -
0 20 40 60 80 00
ed for the soils by means of a soil tensi- -e TIME - DAYS
ometer (3).. Figure 2.

123
TABLE 1
Property Glacial Till Loess
Location Story Co., Iowa Grundy Co., Iowa
Textural classification Clay loam Silt loam
BPR classification A-6 (5) A-ti (8)
Mechanical analysis
gravel 6.7%
coarse sand 12.1% 0.5%
finesand 30.2% 18.5%
silt 31.7% 71.5%
clay (5 micron) 19.3% 9.5%
colloids (1 micron) 0.2% 0.5%
Specific gravity 2.69 2.72
Liquid limit 23.4 28.1
Plastic limit 15.4 23.0
Plasticity index 8.0 5.1
Shrinkage limit 12.8 15.5
Proctor density 121.I pcf. 113.3 pcf.
Optimum moisture content 12.0% 13.5%
One soil used in the tests was a glacial till taken from the C horizon of a Lindley loam deposit near Ames, Story County, Iowa. The sample was taken from a road cut and at an elevation about 12 to 14 ft. below the original ground surface. The other soil was a bess material taken from the B horizon of a Tama silt loam deposit in Grundy County, Iowa. It was taken from the roadside at an elevation about 18 in. below the surface. The properties of these soils are shown in Table 1.
These soils were placed in the glass tubes in three layers and in a different arrange-ment of layers in each tube. In tube A, the bottom layer consisted of 63. 5 cm. of bess; the middle layer, 30. 5 cm. of glacial till; and the top layer of 21. 5 cm. of bess. In tube B, the bottom layer consisted of 64 cm. of glacial till; the middle layer, 31 cm. of bess; and the top layer of. 20. 3 cm. of glacial till. The bottom of the soil filled tubes extended 8 cm. below the water surface in the vessel. The soils were air dried and pulverized to pass a No. 10 sieve and then were carefully placed in the tubes in an at-tempt to maintain uniform density of each of the soils throughout the depth of the layers. The bess soil layers as placed, had a dry density of 93 pcf. and the glacial till 107 pcf. These densities were arbitrarily chosen, but they approximately represent the natural densities at which the soils existed in nature. The bottoms of the tubes were covered with 200-mesh screen held in place by perforated brass plates clamped to the tubes. . . .
After the tubes were filled with soil,. the lower.ends were immersed in water con-tamed in a bucket. The level .of the water surface was maintained constant throughout

--
1 MEASURED 'I MOISTURE
I— CONTENT
-------
Iii I I I 13
_!L ' 0 iii
I\ I
..L1 .i
; _J1 I
_,,.,_ 0 I- 115
WATER
I
0
SURFACE
- height. In addition, moisture determina- tions were made at points about 0. 5 cm. above and below the planes of contact of the different soil strata. No positive
- evidence is available to show that the capillary moisture had reached static equilibrium at the time these moisture determinations were made, but in view of the long time which the columns were in contact with water and the short length of columns, the investigators feel rea-sonably certain that quasi-equilibrium had been established.
During the period while the soil col-umns were standing in contact with water, the capillary potential of the two soils was measured at several different mois-ture contents by means of a soil tensi-ometer. These measurements were made with the soils compacted in brass Proctor density molds to the same densities at
- which they were placed in the stratified
124
the tests. The tops of the tubes remained 450
open during the early days of the test, while the wetting front was rising, and 400
for a period of several weeks after the wetting front reached the top of the soil 350
column. Later the top of the soil columns were sealed over with paraffin to prevent . 300
evaporation, though asmall hole was left in the seal in order to maintain atmos- 250
pheric pressure in the soil air. The soil filled tubes were mounted rigidly to a con- Z 200
crete wall in a basement room during the tests. The temperature in the room was not thermostatically controlled, although the range and rate. of temperature change
100
was relatively small. Therefore it cannot be said that the tests were conducted under isothermal conditions, although the devia-
50
tion from that ideal was not very great. The rate 01 rise of tne wetting front in 0 5 10 15 20 25 30 35
each soil column was observed by noting MOISTURE CONTENT% DRY WT.
its position daily. These rates are shown Figure 3. graphically in Figure 2. It may be noted that the rate of rise in the upper layers of soil was greatly influenced by the character of the soil layer in contact with the water table. It took the wetting front in tube B, which had a glacial till layer at the bottom, nearly three times as long to reach the top of the column as compared with tube A with bess at the bottom. This result was qualitatively anticipated from the textural character of the two soils.
After the soil columns had been in contact with the free-water surface for a period of approximately 24 weeks, the moisture content of the soils was determined at ooints about 5 cm. apart throughout th
IC,
lOG
SC
eir
60
I Ui I-
5°
> g 40 C
I- I 2 30 IL) I
20
IC
0 1015 20 25 30 35 cuiumns 111 Llie giass LUU. ine sorpLion
MOISTURE CONTENT- % DRY WI. - curves resulting from these capillary po- Figure 4. tential measurements are shown in Figure
MEAJURED
-J A
S
MOISTURE CONTENT
-
—1—
C, >1 Z tX
I
- _ ZI o o
A-
,-
'C I —
C —
I - A-
'C I ------- 0 A-
\2 ' -±7 k-
ttL 'C ---- -— P
"TER URFACE
illary potential and moisture content, ex- cept the lower terminal points. In these cases the moisture content at saturation was computed from the soil densities and
- specific gravities. Since it is known that the capillary potential of a soil is zero when it is saturated, the end points of the curves were thus established.
Having obtained the sorption curves for the two types of soil used to make up the
- stratified columns in the.tubes, it was possible .to construct theoretical curves for soil moisture versus height above the water surface. These theoretical curves consist of segments of the soil sorption curves corresponding to the thickness of the soil layers in the experimental col- umns. They are shown in Figure 4 for column A and in Figure 5 for column B. The actual measured values of moisture content at various heights throughout the columns are plotted on these diagrams to
125
3. All the points shown on these curves rønrncc,nf actual n,a.a ai,raA values of r - 110
100
90
so C,
70
1)
60 0
50
40
C, > 0
30
C I-
a
20
IC
C' lO IS 20 25 30 35 show the degree of coincidence between
MOISTURE CONTENT% DRY WT.. - the theoretical and actual moisture con-
Figure 5. tents. The theoretical and actual values are
in reasonably good agreement throughout the height of the soil columns when it is considered that close control of temperature was not exercised during the experiments. It is especially noteworthy that the abrupt changes in moisture content at the interfaces between the various soil strata which are indicated by theoretical considerations were fully developed in the experimental soil columns.
This study indicates that the usual assumption that subgrade soil moisture decreases as height above a water table increases may not always be true, if the soil is stratified. As an example, in Figure 5 it is shown that the moisture content at the water table in the experimental soil column B was something over 21 percent in the glacial till. But in the bess strata extending from 56 cm. to 87 cm. above the water table, the moisture content ranged from 24 to 25 percent.
Bibliography
-
Edlefson, N. E. and Anderson, ALfred B. C., Thermodynamics of Soil Moisture, Hilgardia, Vol. 15, No. 2, February, 1943.
Russell, M. B. and Spangler, M. G., The Energy Concept of Soil Moisture and the Mechanics of Unsaturated Flow, Proceedings of the Highway Research Board, Vol. 21, p. 435, 1941.
Spangler, M. G., Some Problems in Subgrade Mositure Control, Proceedings of the Highway Research Board, Vol. 25, p. 434, 1945.
Pien, Wei Te, Distribution of Capillary Moisture at Equilibrium in Stratified Soils, Unpublished Thesis, Library, Iowa State College, Ames, Iowa, 1949.

126
MOISTURE CONDITIONS UNDER FLEXIBLE AIRFIELD PAVEMENTS
I. F. Redus, rr., Engineer, and C. R. Foster, Chief, Flexible Pavement Branch, Soils Division, Waterways
Experiment Station, Vicksburg, Mississippi
Synopsis
One of the major problems of designing flexible pavements is the prepara-tion of laboratory samples to meet a future prototype condition. This requires primarily the adjustment of the laboratory -prepared samples to an anticipat-ed maximum expected to occur at some future time, although it is recognized that factors other than moisture content will influence the future strength of the soil.
The problem of preparing samples in the laboratory to meet a future an-ticipated maximum moisture condition has been difficult because the mois-ture conditions that occur under pavements have not been known. The Corps of Engineers recognized this lack of information and in 1944 established a study of field moisture content under flexible airfield pavements. Sites were selected in New Mexico, Texas, and the Mississippi Valley which are repre-sentative of rainfall regions of less than 15 in. , 15 to 35 in. , and more than 35 in., respectively. Moisture readings have been made by direct sampling.
In addition to the moisture observations at the selected locations, a con-siderable volume of information is available on the asphalt stability test sec.-tion at the Waterways Experiment Station to show the changes that occur in the subgrade over a period of time. Also, data from this test section show that a condition similar to saturation can be produced by compaction under traffic when the densification reaches the point where the voids are practi-cally filled with water.
One of the major problems encountered by the Corps of Engineers in the CBR de-sign procedure has been the development of laboratory procedures for preparing sam-ples to meet a future prototype condition. Primarily, this requires the adjustment of the soil sample to a moisture content anticipated as maximum at some future time. It is recognized that other factors, such as thixotropic set, molding moisture content, method of compaction, and density changes, also will influence the future strength of a soil, but the moisture that is accumulated in many cases has a very great influence.
At present the laboratory specimens for CBR design tests are soaked for a period of 4 days prior to testing. If it could be established that the soil moisture content at a given location always would be less than that obtained in the 4-day soaking procedure, a substantial saving could be made in the thickness of base and pavement. The ac-cumulation of moisture under pavements, therefore, is a point of vital interest.
The Corps of Engineers has long recognized this lack of positive information, and in 1944 established a study of the accumulation of moisture under airfield pavements. Sites were selected in New Mexico, Texas, and the Mississippi Valley in rainfall regions of less than 15, 15 to 35, and more than 35 in. annual precipitation. Th fol-lowing table lists the sites and respective rainfall regions:
Site Kirtland Air Force Base Santa Fe Municipal Airport Clovis Air Force Base Lubbock Municipal Airport Goodfellow Air Force Base Bergstrom Air Force Base Keesler Air Force Base Memphis Municipal Airport
Nearest Town Albuquerque, N. Mex. Santa Fe, N. Mex. Clovis, N. Mex. Lubbock, Texas San Angelo, Texas Austin, Texas Biloxi, Mississippi Memphis, Tennessee
Rainfall Region Less than 15 in.
ti
15 to 35 in. 'I.
More than 35 in.
127
The sites in each region also were selected to give a range of subgrade materials, and test locations were designated at the center of the runway, between the edge and the center, at the edge, and out on the shoulder at each site. In addition, tests were to be made on locations near an artificial crack cut in the pavement. Figure 1 is a typical plan of the test locations. Bouyoucos moisture cells were installed at the three fields in the low rainfall zone, which were the first fields tested. Moisture values obtained by direct sampling as a check showed that the moisture blocks were not giving satis-factory values and subsequently direct sampling has been used at all sites. All moisture values presented in this paper were determined by direct sampling.
Initial observations were made at the fields in New Mexico in October 1945, and sub-sequent samplings were accomplished in January, September, and December 1946; February and June 1947; November 1948; November 1949; and April 1950. Initial ob-servations were made at the fields in Texas and in the Mississippi Valley in June 1947, with subsequent samplings being accomplished in November 1948, November 1949, and April 1950. In-place density and CBR values were obtained at the time of initial sampl-ing in addition to the moisture contents, and beginning in November 1949, these values have been obtained at each sampling. The sampling was not as frequent as desired be-cause of lack of funds. These circumstances and the relatively short period covered by the readings limit the information that can be obtained from the investigation at the present time. Tables 1 through 8 present the moisture contents, densities, CBR values, and percent saturation obtained to date, together with information on the base and sub-grade materials. The data obtained at Kirtland, Santa Fe, and Clovis Fields (Tables 1, 2, and 3) in October 1945 were procured in connection with the installation of some moisture cells, and the testing program differed slightly from that of the remaining fields. Because of this difference in testing program, data are not available for some of the test locations at these three fields. Also, the data for these three fields for 1946 and 1947, which appear to be incomplete, are merely check moisture contents for a few of the moisture cells. CBR and density values were not obtained near the crack during the initial testing at any of the fields. The artificial crack at Goodfellow Air Force Base was sealed in early 1949 and has not been reopened. The crack at Berg-strom Air Force Base was sealed in 1948 and reopened in April 1949. No testing was done at either of the fields while the cracks were closed.
The sampling is performed in holes in a pattern of concentric circles around the point at which the moisture content is desired. Four holes (one in each quadrant) are tested at each sampling. Density determinations are made on the base course by the water-balloon method, and on the top of the subgrade by a drive-cylinder method. In-place CBR determinations are made on the base course and top of the subgrade following usual procedures, except that the determinations are made in 4-in, diameter holes and no surcharge weights are used. Moisture samples are obtained from the base course, top of the subgrade, and at a depth of about 18 in. from the surface of the subgrade. Atterberg limits and classification tests are performed in the laboratory on selected samples from each field.
A description of the pavement at each field and a brief rsume' of the behavior and maintenance at each field are given in the following paragraphs. The location numbers referred to throughout the discussions are the standard locations shown on Figure 1. Location 1 is the center line of the pavement, location 2 near the quarter-point, location 3 near the pavement edge, location 4 in the unpaved shoulder, and locations 5 through 13 near the artificial crack.
At Kirtland Ai r Force Base (Table 1) the pavement consists of 2 in. of asphalt wearing course, 8. 5-in, of sand-caliche base course which classifies as GM, and a sand subgrade which classifies as SM. This pavement has received considerable inter-mittent traffic from heavy planes and has remained in good condition since its con-struction.
The pavement at the Santa Fe Airport (Table 2) is composed of 2. 5-in, of asphalt wearing course, 8. 5-in, of caliche-gravel base course which classifies as GC, and a clay subgrade which classifies as CL. The pavement has been sealed but cracks have continued to appear. This field has received very little traffic since 1945.

128
The pavement at Clovis Air Force Base (Table 3) is composed of 1. 5-in, of asphalt wearing course, 12 in. of caliche base course which classifies as GC, and a lean clay subgrade which classifies as CL. The wearing course was in good condition until late 1948 or early 1949 when cracks began to appear. No patching or sealing has been done since the cracking began, so the study of this field covers a series of conditions rang-ing from satisfactory to complete failure. The wearing course was cracked, apparently from the almost total lack of traffic since its construction, and this allowed sufficient moisture to enter the base course and subgrade to produce a failing condition in each.
The pavement at the Lubbock Municipal Airport (Table 4) consists of 1. 5 in. of asphalt wearing course, and the base course consists of 7 in. of caliche which classifies as GC. The subgrade is a sand which classifies as SC. The pavement has been in fair condition during the entire period of study. This pavement has received considerable traffic from medium to heavy planes.
At Goodfellow Air Force Base (Table 5) the pavement is composed of 2 in. of asphalt wearing course, 14 in. of caliche base course which classifies as GC, and a fat clay subgrade which classifies as CH. Some cracking had occurred on the field prior to the initiation of the study but this had been sealed adequately. The entire area was sealed early in 1949, and the artificial crack was covered after only two samplings had been performed. It has not been reopened to date. This pavement has received considerable traffic from light-weight planes.
The pavement at Bergstrom Air Force Base (Table 6) is composed of 2 in. of asphalt wearing course, 9 in. of crushed stone base course which classifies as GW, 6 in. of sand subbase which classifies as SC, and a fat clay subgrade which classifies as CH. Traffic on the pavement has consisted of a few cycles of medium-weight planes and the pavement has been maintained in good condition.
The pavement at Keesler Field (Table 7) is composed of 2 in. of asphalt wearing course, 9 in. of shell base course material which classifies as GW, and a sand sub-grade which classifies as SW. The pavement has been in good condition during the study. Traffic has consisted of a relatively large number of medium- to heavy-weight planes.
The municipal airport at Memphis (Table 8) is paved with 3 in. of asphalt wearing course on a clay-gravel base course 9 in. thick which classifies as GC, and a lean clay subgrade which classifies as CL. The pavement has been in fair condition during the study with some cracking occurring from time to time. Traffic has been composed of a moderate number of medium-weight planes.
While it is recognized that the observations recorded in Tables 1 through 8 have not extended as long as desired, it is believed that the following trends are indicated
Edge versus center. Gravel base courses with plastic fines, GC, and clay sub-grades, CL and CH, generally showed higher values of moisture content and percent saturation at the edge than at the center. The base course at Santa Fe (Table 2) is an example. Exceptions occurred, for example the subgrade at Clovis (Table 3), but the exceptions were cases where no trend was exhibited rather than the reverse of the trend described above. The other base courses and subgrades generally do not show con-sistent trends, although in a number of instances, e. g. , the subgrade at Kirtland (Table 1), the moisture content at the edge is lower than in the center.
Pavement versus shoulder. A comparison of conditions in the shoulder (location 4) with those under the pavement shows that, regardless of rainfall or type of material, the maximum moisture content and percent saturation were generally higher under the pavement than in the shoulder. Exceptions occurred, as for example at Memphis (Table 8).
Crack. It was found that the CBR in the base course and subgrade generally in-creasedwith distance from the crack, while the moisture content generally decreased, although exceptions did occur.
Time effects. A study of the changes in condition with time reveals that there was a seasonal variation in moisture content in both the base and subgrade at most of the fields, except in the sand subgrade at Keesler Field (Table 7) where no appreciable changes have occurred.

129
Figures 2 and 3 show frequency distribution curves (in percent of total observations) of the moisture contents and degrees of saturation for the base courses and subgrades at each of the fields. The plots are grouped according to type of material and arranged in order of increasing rainfall from left to right. It will be noted that a number of the plots are bimodal (having two peaks); the base material at Kirtland, Figure 2, is an example. The occurrence of two peaks in a frequency distribution curve usually means that the data represent two separate sets of influencing conditions. In the case of Clovis, it was determined that the two peaks represented conditions 'before failure" and "after failure;" therefore, separate plots have been made for this field. It is believed that bimodal curves in the other cases are related to the seasonal variations as a trend in this direction occurred, but the sampling has not been sufficiently frequent to establish this definitely.
Table 9 is a summary of the moisture content and percent saturation plotted in Figures 2 and 3. The moisture contents and percent saturation were read from the plots at the point where the curve crosses the 20 -percent frequency line on the high side of the peak. As an example, the value for the percent saturation of the Santa Fe base course mate-rial at the 20-percent frequency line is 78. Where the curve crosses the 20-percent frequency line more than once on the high side of the peak, the highest moisture content or percent saturation value was used. Moisture content and percent saturation values of 80 percent of the total number of observations are less than those given by the 20-percent frequency line. The 20-percent value is considered more satisfactory than a numerical average which would be unconservative. In the subsequent discussion of the data contained in Table 9, references to moisture content and percent saturation are to the 20-percent values.
It has been found from laboratory studies that the degree of saturation obtained in the 4-day soaking period ranges from about 75 to 95 percent, depending on soil type, molding moisture content, and other variables.
It is seen from Table 9 that there is little or no direct correlation between moisture content and rainfall for any of the materials. An attempt was made to determine a correlation based on the moisture as a percentage of the plastic limit, but it was not satisfactory.
There is a general trend for the degree of saturation to vary according to rainfall. In the GC base course materials, the percentage is lowest in the low rainfall zone and highest in the high rainfall zone. The degree of saturation was within the range of the values predicted by the laboratory -soaked procedures in the medium and high rainfall zones but was near the lower limit or slightly below the laboratory range in the low rainfall zone, if the failure condition at Clovis is excepted. The GM base course mate-rial was tested only in the low rainfall zone; the degree of saturation was about the same as for the GC base course material in the low rainfall zone. The degree of saturation in the GW base material was below the laboratory range in both the medium and high rainfall zones which were the only two zones tested.
The CH subgrade was tested only in the medium rainfall zone and the degree of satu-ration was at the upper limit of the range of values indicated by the 4-day laboratory soaking procedure. The CL subgrade materials were tested in the low and high rain-fall zones and if the failure condition at Clovis is excepted, a fair correlation with rainfall exists. The degree of saturation in the low rainfall zone was at the lower limit of or below the laboratory range, whereas in the high rainfall zone it was near the upper limit of this range. The SC, SM, and SW subgrade materials were tested in only one rainfall zone each and no correlation with rainfall could be made. It is noted that the degree of saturation varied with plasticity index since the SW material was nonplastic, the SM mathrial had a plasticity index of 5 percent, the SC subgrade had a plasticity index of 14 percent. The degree of saturation in the SC subgrade was well within the range of the laboratory -soaked values. In the SM material which was tested in the low rainfall zone, the degree of saturation was below the laboratory range, and in the SW subgrade it was far below the range of the laboratory -soaked values even though it occurred in the high rainfall zone.
In the course of several years of study, the Waterways Experiment Station has

130
collected a large amount of information about the soil native to the station grounds when used as a subgrade. Most of the information was collected in connection with an asphalt stability test section. This test section is described in detail in Waterways Experiment Station Technical Memorandum No. 3-254, "Investigation of the Design and Control of Asphalt Paving Mixtures," May 1948. The subgrade is a lean clay (formerly designated silty clay before the adoption of the Corps of Engineers' classification system) classi-fied as ML to CL by the Corps of Engineers' classification. Figure 4 shows the results of the laboratory design CBR tests conducted during the design of the test section. Ac-cording to the Corps of Engineers' criteria, an airfield pavement on this subgrade would be designed on the basis of samples compacted to 95 percent of modified AASHO den-sity at optimum moisture content. These values are 108 lb. per cu. ft. and 15 percent, respectively. Samples prepared to conform to these conditions absorbed, during the 4-day soaking procedure, additional water until a moisture content of about 19. 7 per-cent was reached. This represented a saturation of about 97 percent. The CBR of samples prepared at 108 lb. per Cu. ft. and 15 percent moisture and subjected to the 4-day soaking test was about 18 percent, as indicated by either the center or right plot on Figure 4. In actual construction, however, a range of moisture and density values would occur. In the particular case of the subgrade in question, tests made in the fall of 1944 immediately after construction at 15 locations (three or more tests were made at each location) showed an average moisture content of 16. 1 percent, a density of 106 lb. per cu. ft. and a percent saturation of 75. A range of about 3 percent in moisture content and about 5 lb. per cu. ft. in density occurred. The laboratory-soaked CBR value for all the combinations of moisture and density conditions at the 15 locations ranged between 10 and 20 percent, and the laboratory-soaked CBR values for the average (16. 1 percent moisture and 106 lb. per cu. ft. density) was 15 percent. The value to use in design would be a matter of judgment. If the designer was familiar with the soil and sure that construction would be adequate, the average probably would be the best design value. Under less favorable circumstances, the designer might lean toward a lower figure such as the 20-percent value. The actual design of the asphalt stability test section was based on a subgrade CBR of 20 percent, because it was considered that traffic testing would be completed before the subgrade accumulated any appreciable amount of moisture and, if anything, the subgrade would tend to in-crease in strength as a result of the consolidating effects of traffic.
To continue with the history of the subgrade conditions, the in-place CBR of the subgrade at the 15 locations tested in the fall of 1944 was 28 percent, well above the range for the laboratory-soaked values. In the summers of 1945 and 1946, three test tracks of the test section were subjected, respectively, to 1500 coverages with a 37,000-lb. single-wheel load with a 110-psi, airplane tire, to 1500 coverages of a 60,000 -lb. dual-wheel load also equipped with airplane tires inflated to 110 psi. and 3500 coverages with a 15,000-lb. wheel load equipped with earth-mover tires inflated to 50 psi. The blocky treads on the earth-mover tires resulted in a net contact pres-sure of 106 psi. After this traffic moisture contents averaged 16. 6 percent, the av-erage density showed an increase of 1 lb. per cu. ft. , and the CBR averaged 32 percent. The average percent saturation was 80. Between 1946 and 1949 the test section was subjected to incidental traffic of cars, trucks, and rubber-tired construction equipment. Maintenance of drainage has been questionable as the prefabricated bituminous surfac-ing (PBS) over the earth island between the two tracks of the test section deteriorated and it is probable that water entered the test section from the island as well as at several locations where patches around test pits failed. Also, drainage along one side of the test strip was blocked during one winter by soil piled along the shoulder. This undoubtedly resulted in ponding of water at certain locations on the subgrade. Main-tenance at an airfield normally would be better; therefore, the conditions that existed in this test section are considered to represent an extreme case. In the summer of 1949 in-place CBR tests were made in connection with additional traffic which is de-scribed later. Tests were made inside the traffic lane (1949) prior to the application of traffic. Tests also were made in some locations adjacent to the traffic lane during and after the completion of traffic to obtain the "before-traffic" condition. These latter

131
values are noted in the following table, since they might have been influenced slightly by the 12,000-lb. load on the outrigger wheels of the test cart.
Before Traffic - 1949 Tests
In-place Percent Section Item No. CBR Moisture Density Saturation
2A-1-2 53* 8 17. 1 - - 1C-3-3 27* . 10 17.3 - - 1A-1-2 2 15 18.2 - - 1A-3-1 7* .16 17.5 - - 2C-1-2 35 19 18.4 105. 8 85 ic-i-i 19 19 17.2 - -
Average 14 T7 1B-2-1 13* 23 16. 8 - - 4C-1-1 100 24 16.2 - - 1A-3-3 9* 24 16.4 - - 2A-2-2 50 26 16.5 - - iA-i-i 1* 32 16.4 - - 4A-1-3 84 32 16.0 107.4 77
Average
*Adjacent to traffic lane
It can be seen that in the first six cases listed in the preceding table the moisture content has shown a definite increase, averaging 1. 0 percent above the value at. the end of traffic in 1946, and the CBR values are within the range of those predicted by the laboratory tests on soaked specimens. The average moisture content in the other six cases showed a slight decrease between 1946 and 1949, and the CBR values remain-ed above the range of the laboratory tests. Density values are limited, but they are in general agreement with the values determined at the end of traffic in 1946.
The conditions cited above reflect the conditions that occur through absorption of moisture even though quantitatively the amounts were comparatively small. Even more serious conditions can develop when the absorption of moisture is accompanied by densification, as illustrated in the following paragraphs.
The additional traffic mentioned in an earlier paragraph was made with a twin-tan-dem whee assembly loaded to 120, 000lb. and with a single wheel loaded to 30, 000 lb. In both cases the tires were inflated to 200 psi. These loads were more severe than any of the previous loads applied to the test section, as evidenced by rapid failures which developed in from 30 to 300 coverages. In addition to the CBR tests made to determine the before-traffic conditions as described above, tests also were made to determine the after-traffic conditions. The results are tabulated on the following page.
The moisture contents of the after-traffic data fall into two groups similar to the before-traffic data, with the first group showing an average of 17. 5 percent, and the second group showing an average of 15. 8 percent. These percentages are close to the average of the before-traffic data. The CBR values in the first group averaged 10 per-cent and in the second group 26 percent.
A study of the density values in the table shown indicates that a material increase in density occurred in the subgrade. At the lower moisture contents, an increase in CBR also occurred, but at the higher moisture contents, a severe reduction occurred and CBR values as low as 5 and 6 percent were measured. This behavior is illustrated in Figure 5 which is a plot of CBR versus moisture content for the tests on the sub-grade. Tests made prior tothe application of any traffic are shown as open circles, and tests made in the traffic path after traffic had been applied are shown as solid circles. The before-traffic conditions obtained outside the traffic path are shown as

132
circles with X's.I All.points are plotted at the average moisture content for all tests at the same location. Points for, tests with the 30,000-lb;, single-wheel are identified by an S preceding the item number; all other points are for tests with the 120, 000-lb. twin-tandem load. . ..
'Item'No
After Traffic - 1949 Tests
CBR Moisture Percent
Density 'saturation
4 53* 49* 50.* 27 26
7 47*
13 Average
9*
9 1
204 Average
5 18.2 - - 6 17.6 109.3 90 7 17.9 110.6 94, 1 17.1. ' 109.6 88
10. 17.8 - - 12 -' 17.4. 111.5 .94 12 17.4 - - 14 • . 17.0 111.8 93 19,1 17.0 . - -
19 .. 16.3 113..0 92 20. . 16.0 ' - . - 30. 15.8 - - 35 14.7 26 ,,. 15.8
1-2-1 2A -1-2 2A-2-1 2A-2-2 1C-3-3 1C-3-2 1-3-1 2A-3-2 1B-2-1
1A-3-3 1A-3-3 1-1-1 21A-3-1
* Single wheel .
Fairly good correlation of, CBR and'.moisture occurs for both the before- and after-traffic data. A dashed curve is shown representing the. best average curve for the before-traffic data, and a solid curve is shown for .the after-traffic data. In drawing the curve for the befor-1traffic data, the tests, made .outsidethe traffic lane have been used to some extent, even though the data were influenced slightly by the outrigger wheels. Also shown on the plate are two curves, representing laboratory test data which were taken from Figure 4. The portions of the curves beyond a moisture content of about 17. 2 percent are extrapolated. . .
The table below summarizes the history of the subgrade conditions in the asphalt-stability-test section. The values for percent saturation in the, 1949. measurements are based on the over-all average density and the indicated moisture content. ,
Conditions . . Mois- , Den- Percent CBR ,ture sity . Sat.
Laboratory design, as-molded condition " 40 15.0 108 74 Laboratory design, after soaking 18 19. 7 108 97 After construction, 1944 . . . 28 16.1 106, , 75 After traffic, 1946 " . 32 .16..6 107 80 Before traffic, 1949, where moisture increased .14 17.. 6 107 84 Before traffic, 1949, where no moisture increase 27 . 16.4 107 79
occurred . After traffic, 1949, where moisture increased '. 10 . 17. 5 111 93 After traffic, 1949, where no moisture increase 26 15. 8 111 84
occurred
It is believed' that the CBR-moisture relationships exhibited in this test section are entirely valid, and the following postulation is' offered as explanation. The traffic with the 110-psi, tires in 1945 and 1946 caused an increase in CBR values from the as-con-structed value of 28 percent to 32 percent. As previously described, the PBS blanket

133
on the center island had deteriorated, the patches around old test pits and failed areas had opened up, and subgrade drainage had been restricted one winter thus allowing access and retention of water. This resulted in an average increase of about 1. 0 per-cent in moisture content, which in turn resulted in a decrease of the CBR to 14 percent, which was about the design value based on laboratory -soaked specimens During ap-plication of traffic with the high-pressure tires, the subgrade consolidated, and stresses were set up in the pore spaces in those areas with the higher moisture contents thus producing a lowering of the CBR value to an average of 10 percent (percent saturation of 93). Where the moisture contents were lower no stresses were setup in the pore spaces and the CBR remained about the same, averaging 26 percent (percent saturation of 84).
Conclusions
The data obtained to date from the locations included in the field.moisture studies indicate the following trends in the relationship of the prototype to the soaked laboratory specimen:
The percent saturation of plastic subgrades and base courses with plastic fines tends to vary with rainfall, the lowest values occurring in the low rainfall zone. Non-plastic materials or materials with low plasticity were not tested in enough zones to establish a trend.
The degree of saturation of GC, GM, CH, CL, SC, and SM materials was within the range of values obtained by the 4-day laboratory soaking procedure in the high and medium rainfall zones but tended to be below the laboratory range in the low rainfall zone.
The GW and SW materials showed degrees of saturation which were well below the laboratory -soaked range in both the medium and high rainfall zones (only zones tested).
The degree of saturation and the CBR values that develbped in the asphalt-stability-test section, in those sections which absorbed additional moisture, approxi-mated those predicted by the 4-day soaking procedures.
Where absorption of moisture is accompanied by densification from traffic producing high degrees of saturation, CBR values can occur which are well below those predicted by tests on samples subjected to the 4-day soaking test.
From the results of the observations of moisture conditions at locations included in the field moisture studies and from the study of the test section at the Waterways Experiment Station, it is concluded that the moisture conditions and the resulting CBR values obtained to date generally have been slightly to moderately more favorable than those based on samples subjected to the 4-day soaking procedures. This does not take into consideration possible detrimental effects due tp consolidation by traffic.
Additional study is needed to predict with complete reliability where the con-ditions will be more favorable or less favorable than indicated by the laboratory -soaked value. -

TABLE1
KIRTLAND AIR R)RCE BASE SUMMARY OF TEST DATA .
Mntrri.1 Cln.slflontioo U. IL 11
B... 00 18 114 4 2.61 Subgrnle 014 22 17 5 2.65
Gotober 19145 15 Jur. 46 23 Sept 46 31 Dec 146 28 1.5 47 27 880 47 20 Be. 148 2 Jo.oeb.r 19149 16 IprIl 1950 Sept14 trot Or; Density Moisture Per Cent Moisture Moisture Moisture Moisture Moisture koistutr Del 000.tty Moisture Per Cent 017 O*o.lty Moistnhr. Per 1nt
Loostion Course Durfno. - In. R Lb/Cu It Content Sntorntteo Content COnt,nt Content Content Content Content R Lb/Cu Pt Content Snturotion CO G Lb/Cu It Cooteot Snturntlon
1 14... 3 53 130.9 8.7 72 b.2 5.2 . 6.2 8.14 3.2 2.8 115 158.1 3.1 79 152 138.9 3.1 47 SubgroMe 11 28 116.6 11.0 68 9.6 105 10.6 11.1 9.6 8.6 448 - 8.8 - 53 122.6 9.3 b8 Subrthe 29 5 101.1 9.1 46 8.7 9.1 914 10.1 9.5 7.5 - - 8.7 - - - . 0.1 -
2 14... 3 3.1 3.2 2.7 108 11414.3 3.9 80 155 143. 1 2.2 414 Subgre.de 11 8.9 8.0 7.1 66 - b.1 52 . - 8.1 - Cub0r.4. 29 6.9 8.5 7.14 - - 8.1 - - - 7.6 -
3 Bose 3 109 138.7 3.6 514 . 2.9 2.5 63 - 139.0 3.2 49 77 138.14 2.7 40 Sub8rthe 11 11 113.6 7.2 142 9.2 6.8 61 - 6.2 50 - 7.5 - Iubgr.d. 29 3 105.3 6.5 30 8.14 8.6 - - 8.3 - - . 8.3 -
4 Subgrnoe 3 32 1014.8 3.9 18 5.6 5.2 5.0 3.2 3.2 - - 3.1 - 4.1 Subgr. th 13 18 99.8 4.8 20 4.8 7.8 14.2 5.8 3.3 43 101.3 5.0 21 3.1 Subgr.4e 29 114 97.2 5.1 20 4.8 6.9 5.2 5.4 14.14 - - 3.7 - 4.3
5 Bose 3 3.9 4.3 4.7 .146 14.5 140 139.3 4.7 72 36 1142.3 14)4 80 Subgrnde 13 7.0 8.8 9.7 9.8 9.0 30 . 108.7 9.14 59 33 - 10.8 - 3ub6rndo . 29 7.3 6.1 . 7.5 10.8 7.1 - - 5.5 - - - b.7 -
Be.. 3 3.14 9.5 3.7 3.8 14.14 28 126.6 3.9 35 41 .137.7 . 5.14 77 lubVnd. 13 7.9 10.0 10.5 8.0 7.3 63 120.6 8.14 b3 39 118.3 10.7 714 Subgrnde 29 6.9 9.8 10.1 9.6 7.5 - - 6.8 - - - 9.2 -
7 Bose 3 3.0 3.44 14.1 80 135.6 3.1 3b 38 1314.9 .0 bil. Suigrods 13 6.2 . 8.8 7.9 u3 115.14 8.3 53 27 120.8 11.3 814 Cebgr.de 29 6.9 .b 14.8 - - 7.8 - - - .6 -
8 Boue 3 3.0 . 14.3 - 14.7 - 14.7 5.0 443 1141.5 5.1 89 26 - 1147.5 6.1 - SubOrede 13 8.1 8.8 9.7 10.6 10.2 26 - 11.6 - 314 119.3 11.3 80 Sub0r.do 29 6.2 6.1 7.5 11.8 15.14 - - 9.7 - - - 73 -
9 Be.. 3 3.0 9.5 3.7 4.5 4.8 56 152.0 4.14 - 43 138.2 4.3 63 3u.u6rnd. 13 8.1 50.74 10.5 . 10.2 9.0 36 120.5 9.9 60 314 119.0 9.8 09 Bubgrnde 09 6.2 44.8 10.1 9.8 9.7 - 10.0 - - - 10.8 -
10 Be. 3 3.0 14.6 4.5 io6 153.6 4.5 - 744 137.8 5.44 77 Subgrnd. 13 8.1 . 10.14 8.7 51 118.5 . 8.2 57 30 121.1 . 11.6 87 Bubjrnde 29 6.2 6.7 8.0 - - 8.9 - - - 8.44

TABLE 2
SANTA FE MUNICIPAL AIRPORT
SUMMARY OF TEST DATA
Materiel C1...lfll.110, !! Sp. G. - 8... IC 29 17 12 2.63 SnI1480M. m 43 214 19 2.67
20 Ortob.. 1945 24 10 '46 26 Sept 414b joh, 47 5 80.-1h 47 114 May 47 214 May 47 19 Nov 148 30 Octob.r 19149 12 40r11 1950 ,... D.pt14 from 287 D.o.itp IIot.tur. P., coot 6.1.tu,e Mol.tur. 6,1.10,. M.i.t... 8,1.10,. I4,t.tur. 601.10,. 20y 2.8.117 M.I.t.,. P., Cut 287 Do.1l7 Ml1tUo• PP Cont
£08.11., Co.... Soot... - I.,. 008 Lb/Co 74 C.ot..,t S.t,1,,tI,, Oont.,t Co,t.ut Coot.ut Co,t.nt Cont.ot 000t..,t C..,t.,t 000 Lb/Co it Cont.,t S.tu,8tiOo COO Lb/Co it COttOot S.tllr.tiOo
1 Be.. . 5.0 42 4.1 60 115.14 4.0 25 158 138.1 3.14 18 lubgrM. 13 10.3 . 13.1 11.14 20 102.9 15.7 87 29 108.7 13.1 85 8ob4..d. 29 143.0 . 12.6 13.9 - - 11.3 - - - 15.8
2 8... 4 91 133.2 3.5 40 4,4 - 314 4.6 68 125.2 5.14 1414 49 133.3 4.6 53 500gr68. 13 28 86.9 114.5 42 11.0 10.8 13.5 19 96.8 16.5 59 26 9b. 4 15.8 39 Sobgr.4. 29 7 93.3 10.1 34 12.1 . 16.2 11414 - - 21.11 - - - 20.2 -
3 Be.. 11 38 128.6 3.9 37 4.2 4.6 5.1 77 137.5 8.9 92 24 13b.0 5.8 73 S41b61M. 13 5 86.6 ib.4 47 15.8 114.14 17.5 21 91.1 19.2 bO 13 90.9 20.b 65 SobVth. 29 4 814.8 114.2 39 15.1. 13.6 13.2 - - . 20.8 - - - 20.7 -
4 lobg..4. 4 5 87.8 15.4 414 18.2 21.8 12.4 15.8 17.3 17.'l - - - 12.8 _ - 11.2 Sr1bgr.d 13 12 77.0 11.8 27 17.3 18.7 9.2 18.3 15.2 18.0 11.9 9 12.8 b 90.5 . 16.5 53 1ob6..d. 29 29 91.5 7.6 26 16.3 110.0 10.7 13.4 1.2.1 17.2 13.3 - . 16.8 - - 16.3 -
5 Be" 10 5.5 7.3 6.6 13 131.3 7.6 79 7. 138.5 9.0 125 IobU.4. 13 14.0 20.5 16.8 2 109.6 16.0 83 5 109.5 17.2 85 Subgraut 29 111.0 . . . 18.4 18.0 - - 20.3 - - - 18.5 -
14 8... 44 3.8 5.8 b.5 1.0 7.1 6.8 8.7 9 127.3 7.6 68 9 128.5 8.1 15 1.bgM. 13 14.8 - 15.0 13.3 i14.9 15.4 18.7 19.1 9 111.2 16.9 400 7 103.5 22.2 98 bob6,... 29 14.14 15.8 114.7 114.9 16.0 18.3 18.8 - . - 214.9 - - - 23.1 -
7 all 4 b.14 . 6.7 75 14 135.3 7.2 88 9 132.0 1.7 64
S41b61.4. 13 14.1 13.9 114.8 8 119.9 14.7 100 0 113.2 17.1 98 Sob6,.4. 29 - 15.6 - 16.4 9.2 - - 26.8 - - - 18.3 -
8 2... 44 5.5 7.44 8.3 11 130.6 8.2 83 3 136.1 8.2 100 Sub6..g. 13 14.0 - 16.3 17.0 6 116.4 16.6 100 8 107.14 19.0 94 Subg.68. 29 14.0 - 18.2 15.6 - - 17.9 - - - 18.2
9 B.. 4 .8 5.8 6.5 7.0 - 7.1 6.6 9.2 6 120.3 7.3 52 10 136.2 6.6 85 011bjr68. 13 114.6 15.0 - 15.3 114.9 15.4 15.14 16.4 7 116.5 16.2 100 8 - 21.2 - S14b6r.d. 29 114.14 15.8 14.7 - 14.9 16.0 17.5 15.2 - - 19.2 - - - 16.7 -
- 10 2... 4 64 7.5 7.1 8 1430.2 7)4 714 7 127.4 7.8 40
70 Sobg2. 13 14.1 . 15.0 15.9 13 117.0 17.4 100 11 109.0 16.3 63 (71 Sob6,68. 29 - 1.6 16.4 20.3 - - 19.0 - - - 19.9 -

TABLE 3
CLOVIS AIR Ft)RCE BASE
SUMMARY OF TEST DATA
N.t.rt1 Cl...tft..tI,u LI. PL Pt P'. II. Be.. BC 214 17 7 2.63 2044g..d. CI. 29 13 16 2.65
25 01tobr 19145 25 2.. 446 23 Wy 446 jjenj 4 Npb 47 13 N.j 447 1 2... 147 26 Nov 48 8 I,v..b.r 19'49 8 Apr11 19 D.pth f,. Dry Dr,.tty M.i.t... For C.t M.i.t.,. 6,1.81.. MoltuI 6,1.80,. Moi.tur. 8.1.8,4,. 6,1.81.. Dry Dr,.Ity w,i.iur. P.. C.,t Dry D.,.tty 6,1.tur. P.. C.,t
L.,.tl,, C..,.. Suri.. - 1.. CR0 Lb/C. Pt Cor.t.,t S.tllr.ti,, Co,t.,t C.nt.,t C.,t.,t Cont.pt Co.t.rlt 000t..t Co.t..t 000 Lb/C. it Ct..t S.tu,.ti,, 000 Lb/Cu it Co.t.,t St0,ti0
1 B... 3 42 117.5 10.44 69 9.8 10.5 11.9 15.2 8.6 10.8 214 120.0 12.1 86 32 123.9 10.6 87 S,4b.d. 15 2'4 '125.6 9.0 75 12.1 9.1 10.1 9.14, 11.0 10.5 13 122.1 13.6 100 11 116.2 13.2 82 Cubgr.d. 32 6 99.5 9.6 38 20.5 11.9 10.2 11.2 12.2 11.3 - - 12.8 - - - 12.7 -
2 Be.. 3 9.3 8)4 8.14 12.2 10 111.44 15.2 85 27 1214.2 12)4 100 Subgr.4. 15 12.2 12.0 . 12.7 11.14 9 118.7 13.0 88 j14 117.2 13.5 87 Cub0,M. 32 9.7 9.44 . 8.9 9.9 - - 11.5 - - - 10.b -
3 B... 3 96 120.5 8.5 68 12.3 10.9 114.2 15.6 11.2 12.0 8 117.5 15.5 100 18 110.3 13.14 72 Subgr.4. 15 10 119.8 10.5 744 11.14 11.7 11.14 12.6 12.l4 12.3 27 118.2 12.6 8'l 17 117.6 12.9 85 Subg.4. 32 2 101.7 7.9 33 8.5 10.2 8.8 11.9 9.6 9.8 - - 12.0 - - - 11.7 -
44 S.bg,.d. 3 114 13.44 12.1 7.9 - 12.2 - -. - 6.8 - Bub.4. 15 13.8 12.3 111 .3 11.7 9 1014.5 13.7 63 7 101.0 11.0 446 B0b42.d. 32 10.9 11.7 144.5 10.1 - - 13.1 - - - 11.1 -
5 B... lê 7.9 13.6 16.9 5 87.7 14.9 445 114 108.4 15.8 81 Sllbg..d. 16 11.7 . 114.6 13.3 13 121.2 14.5 100 13 118.6 13.5 . 93 SubgrM. 314 10.5 10.6 12.14 - - 10.7 - - - 11.3 -
6 o... 14 9.5 12.6 15.0 4 117.6 16.9 100 7 119.9 16.1 - s,lbgr.4. 16 12.8 119• 7 13.1 7 11t4.2 144.l4 87 11 117.44 13.1 87 BubgrM. 344 10.0 10.2 11.9 - 11.0 - - 11.2 -
7 Be.. 4 7.5 . 12.5 14.9 6 109.b 18.6 99 9 117.2 15.l4 100 BAIQA. 16 11.0 . 13.3 13.9 8 117.14 13.4 89 16 119.5 13.14 96 S..b9.4. 544 9.0 10.3 11.0 - - 11.3 - - - 11.3 -
8 B... 4 7.9 . 13.5 13.9 14 t06.7 16.3 79 12 115.2 15.2 944 BuB.d. 16 11.7 . 114.7 13.9 j14 - 119.7 144.2 100 10 - 13.6 -
10.5 10.7 10.8 - 12.14 - -
9 Be. 14 ' 9.5 12.4 16.5 3 113.5 15.5 92 8 112)4 114.8 84 B.b8rM. 16 I 12.8 . 14.1 13.7 16 - 144.0 12 121.0 13.9 100 8ub6r.d. 344 10.0 ' 10.6 11.1 - - 12.7. - - ' 12.5 -
10 B... 44 7.5 13.6 16.6 2 1214)4 15.6 6 115.14 16.6 100 Bubg.d. 16 11.0 13.8 13.8 18 123.6 144.0 10 119.1 114.2 100' 24b.A. 344 9.0 10.0 10.7 - - 12.1 - - 11.6 -
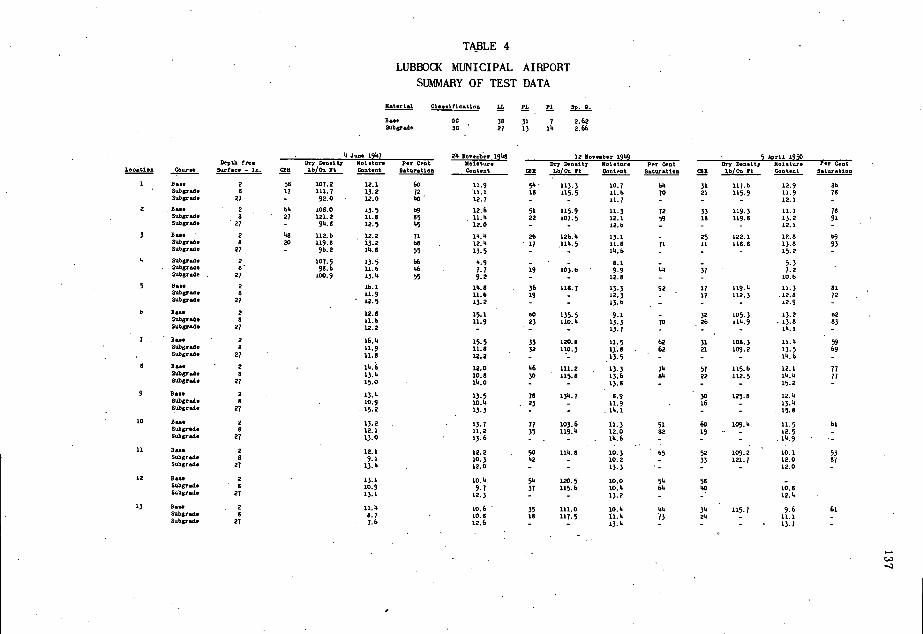
TABLE 4
LUBBOCK MUNICIPAL AIRPORT SUMII4ARY OF TEST DATA
Nut., jul C1.,.tfieuttou LI P1. Pt
Bu.. .00 36 317 2.62 SC 27 13 114 2.614
- 4 Jue. 191.7 214 Wovueb.r 1918 12 8.v..b.r 19149 5 2ri1 1950 Depth free Dry Dretty N,1.tur. Per Crut Not.tur. Dry D.u.ity Ne1.tue. P.0 Ceut Dry D.u.ltl Noittur. P.r C.ut
Loc.ttou 004.... 82,0cc. - to. COB lb/Cu Pt content Botur.tton Couteut IR Lb/Cu Pt Control i.tueuttoe COB Lb/Cult Coutect lutoocticu
1 B.. 2 58 107.2 12.1 60 11.9 514- 113.3 10.7 1414 31 117.6 12.9 86 Sub6eo4. 8 17 111.7 13.2 72 11.1 18 115.5 11.b 70 21 115.9 11.9 78 Subg,.d. 27 - 92.0 12.0 140 12.7 - - 11.7 - - - 12.1 -
2 Boo. 2 1414 108.0 13.5 b9 12.6 51 115.9 11.3 72 33 119.3 11.1 78 Subge.4. 8 27 121.2 11.8 85 - 11.1 22 107.5 12.1 59 18 119.8 13.2 91 Sobgrud. 27 - 96.8 12.5 65 12.0 - - 12.6 - - - 12.1 -
3 Boo. - 2 148 112.b 12.2 71 14.'4 26 126.6 13.1 - 25 122.1 10.8 69 S006e..i. 8 20 119.6 13.2 b8 - 12.6 - 17 1114.5 11.8 71 11 118.8 13.8 93 lubgr.4. 27 - - 9b.2 114.8 55 13.5 - - lb.b - - - 15.2 -
4 Subgeoo. 2 107.5 13.5 66 4.9 - - - 8.1 - - 5.3 - SubgroO. 8 98.6 11.6 46 - 7.7 19 103.6 - 9.9 414 37 - 7.2 Subgoud. - 27 100.9 13.14 55 9.2 - - 12.8 - - 10.b
5 Bc.. 2 16.1 114.8 - 36 118.7 13.3 92 17 119.14 11.3 81 1Ubch. 8 11.9 11.6 19 - 12.3 - 17 112.3 .12.6 72 SubM. 27 - 12.5 13.2 - - 13.6 - - - 12.9 - 8 3... 2 12.6 15.1 60 135.5 9.1 - 32 105.3 13.2 82
Subgr.4. 8 11.6 11.9 23 110.14 13.3 70 26 114.9 .13.8 83 1ubu. 27 1.2.2 - - 13.7 - - 16.1 -
7 Boo. - 2 16.14 - 15.5 33 120.8 11.5 62 31 108.3 11.1. 59 S46ge.4. 6 11.9 11.8 32 110.3 11.8 - 62 21 109.2 13.5 69 lubgrM. 27 - 11.8 12.2 - - 13.5 - - 114.6 -
6 Boo. 2 . 114.6 12.0 46 111.2 13.3 714 57 115.6 12.1 77 Sub.4. 8 13.14 10.8 30 - 115.8 13.6 814 22 112.5 114.14 77 10146CM. 27 15.0 114.0 - - 13.6 - - 15.2 - 9 Boo. 2 - 13.4 13.9 78 1314.7 6.9 - 30 125.8 12.6
BuIgrul. 8 - 10.9 10.14 . 23 - 11.9 . 16 - 13.6 S14148fl4. 27 15.2 13.3 - - - 114.1 - - - 15.6
10 3oo. 2 13.2 13.7 77 103.6 61.3 51 60 109.14 11.5 61 S4bgoM. 8 12.1 11.2 35 119.14 12.0 82 19 -. - 12.5 - 1ub40.4. 27 13.0 13.6 - - - . 114.6 - - - 114.9
11 Boo. 2 12.1 12.2 50 116.8 10.3 - 65 52 1092 10.1 53 lubgr.d. 8 9.1 10.3 142 - 10.2 - 33 121.7 12.0 67 Bubgru4. 27 13.4 - 12.0 - - 13.3 - - 12.0 -
12 B... - 2 - 13.1 - 10.14 51. 120.5 10.0 514 58 - 50146CM. 8 10.9 9.7 37 115.6 10.14 64 60 10.8 51b6C.4. 27 13.1 12.3 - - 13.2 - -. 12.14 -
13 Be- - 2 11.14 10.6 - 35 111.0 10.14 414 314 115.7 9.6 61 S.bgrth. 8 8.7 10.8 16 117.5 11.74 73 214 - 11.1 - SuIgrul. 27 - 76 12.6 - - 13.14 - - - . 13.7 -

TABLE5 co
GOODFELLOW AIR FORCE BASE
SUMMARY OF TEST DATA
- Kstrri.1 C1.ssifieotlos LI. P1. P1
- B... CC 20 18 10 2.67 Sub8r.40 04 51 21 30 2.69
12- J00. 1917 26 loee.ber 19148 16 loe..ber 19119 1' April 1950 - Depth Ire. Dry D.o.ity Moisture Per Crot Metnur. Dry usd07 601.001. Per Cent Dry Density- Moisture Per Coot
Loc.tio, Course Surf.c. - In. 048 Lb/Co It Contest, Sitnr.t105 00,00,0 086 Lb/Cu Pt Content 9.001.110, 089 Lb/Cu ft Content 1.101,1100
1 Dose 3 48 122.6 10.6 179 9.6 39 117.0 11.3 72 18 117.0 10.7 68
Subgrnde 17 21 100.3 22.9 81 - 20.6 19 1014.3 22.6 99 . 114 - 22.8 - Subr.d. 33 - 83.0 21.2 56 19.0 - . - 20.6 - - - 20.3 -
2 Bone 3 514 122.6 11.9 09 10.9 142 125.7 12.1 100 25 116.6 11.7 69 Snb6r.30 17 22 101.0 23.3 100 21.2 17 106.2 22.5 99 12 . - 23.6 - Subgr.de 33 - 88.7 20.7 62 20.2 - - , 20.7 - - - 21.7
3 Dote 3 36 118.0 13.9 90 11.7 311 123.0 13.2 100 25 111.0 12.9 69 Subge.D. 17 25 100.6 22.6 90 21.6 . 17 102.2 26.1 100 15 - 26.3 - Su'ogrode 33 - 89.6 21.8 67 21.1 , - - 21.8 - - - 21.3
Ii Subgro4e 3 87.b 11.9 53 - . 22.' - . 12.1 - Sub8r,de 17 95.0 20.6 72 15.0 5 25. 10 114.9 Subgrode 33 86.8 19.1 52 15.44 17.5 - 17.2
5 Bose 3 - 10.5 11.9 Cubge.D. 17 20.0 18.5 - Subgr.ie 33 16.o 15.1
b Bone - 3 10.2 11.1 Subgr.de 17 18.0 - Subgee4. 33 16.0 15.9 -
7 Bone 3 10.3 - 11.3 sub8roA. 17 21.6 17.6 - Subgr62o - 33 15.5 18.1
8 Bone 3 10.7 10.7 Sub8r.4. 17 ' 21.0 18.8 Sub8r.d. '39 18.6 - - -
9 . B... 3 11.7 ' 11.3 Dubdro.d. 17 - .19.2- 12.5 . lubgre4e 33 16.6 11.1
10 B.,. 3 12.9 ' 11.1 - SubMr.4. 17 19.8 17.9 -
SubMoud. 33 18.1 15.0
11 Don. 3 9.8 10.8 Subpr.de 17 19.6 -. 17.5 Sub€r.4. 33 16.7 17.0
12 Do.. - 3 9.3 10.1 Subgr.de 17 17.9 17.9
- $ubgr.d. 33 15.0 15.2 - 13 Bone 3 - . 10.1 - 9.9
Subre.de 17 , 18.5 1716
.2 - Subgrede 33' 114.8 ' - .6
MDCCI Crook ...1..i I. cony 19149 and fleece reopened.

lAtiLt b
BERGSThOM AIRFORCE BASE
SUMMARY OF TEST DATA
9!3.E.1 ..lfiutl.0 LL FL Pt 244.. 26 16 15 1 2.67 SubS... SC 21 114 7 2.70 Subgr.4. (34 50 23 27 2.73
16 2... 19147 28 Jo...b.r 19146 19 Avr1l 19149 19 Ior..b.r 1959 29 April 1950 D.pth Pro. (07 Dro.ity )IO1.tu1. P.r C44t MO1.tur. NO1t44o Dr7 D.o.tty Mo1.t. Pro C.ut Dry D.u.147 44,1.4... P.r C..t Lo44otiou C,.. Sun,.. - to. fl Lb/Cu Pt Coot.ot 3.tu,.tto, Oo,t.ot Ooui.,t MR Lb/Cu Ft Cout.ot 2utu.tioo 260 Lb/Cu Pt Cout.ot S.tu.,tIou 2... 3 100 134 14.2 47 3.9 5.0 126 1140.0 5.2 73 83 13b.3 4.9 60 Subbo.. 12 26 111 9.1 48 8.2 9.7 46 - 8.6 - - - Subg.4. 18 10 . 100 22.8 88 19.2 19.9 - -. - - 22 - 20.7 - 544543.4. 314 - 125 15.7 - 14.3 15.4 - - 16.8 - - - 42.5 -
2 5..• 3 100 133 3.0 32 2.9 5.2 1141, 135.7 4.2 50 1014 131.8 4.1 42 54454... 12 29 116 8.6 53 8.6 13.7 42 - 94 - - - - OubjrM. . 18 19 109 19.5 96. 23.6 25.7 - - - 26 - 32.0 - 541b.4. 314 - 101 26.3 - 25,2 26.14 - - 25.5 - - . - 27.8 -
3 2..o 3 100 1142 5.8 91 5.1 6.5 . 92 126.1 6.3 57 56 127.0 5.5 47 Oubbu.. 12 20 113 . 12.5 89 10.0 12.9 30 . 109.3 11.1 55 - - - - Sub.4. 18 12 103 22.6 9(4 20.0 22.2 - - - - 20 - 25.7 -. Subgr.40 (b - 1. 22.9 99 17.6 23.4 - - 21.9 - - - 22.6 - 44 2°b.d.. 3 . 16.9 25.3 214.2 - 19.9 - - 114.2 -
Sb6r.4o 12 10.1 25.0 23.1 - - - - 1ub.4. 18 14.7 14.1 21.7 5 21.3 5 98.5 20.7 17 Oub8r.d. 34 16.2 11.2 17.8 - 17.2
. - - 18.4 - 5 8... 3 5.4 130 12941 6.0 56 100 136.6 5.6 69 3.bb... 12 9.0 . 27 117.0 9.6 56 - - - - 8ub43th. 16 22.3 . - - - 26 - 21.b - Dubgr.4. 314 18.6 - - 18.5 - - . 18.9 -
8,.. 3 . 5.7 . . 105 1140.1 5.7 82 100 13(4.1 5.6 65 CubS,.. 12 8.9 20 - 9.3 - 27 1114.2 10.6 60 308r'd' 15
23.4 - -, - - - - Subg.4. 3(4 15.9 . . - - 15.7 - - . - 17.6 -
7 B• 3 . 5)4 93 . 1(45.9 5.6 130 . 51 129.0 5.14 50 344bbu 12 9.7 26 116.9 9.6 58 28 115.5 11.1 414 CubV.t 20b43.d.
16 34 -
25.1 17.2
. - 16.3
- - 19.1 -
8 3..44 3 5.6 - 105 129.6 7.0 6 614 130.1 5.14 52. 0(4145... 12 9.0 28 121.5 10.1 69 - - - - 1ub.4. 16 21.3 - - - - 27 - 21.3 - 144543.4. 344 20.2 - - 12.1 - - - 16.9 - 9 0,.. 3 5)4 135 131.1 6.3 63 95 135.5 5.8 68 001468.. 12 9.2 30 112.6 . 8.9 48 - - - . - 2ubM. 18 22.l4 - - - 33 - 20.14. 044bMe 314 16.0 - - 19.3 18.1 -
10 2... 3 . 5.1 122 137.5 5.9 76 53 127.5 5.4 . 46 CubS... 12 50.3 39 - 9.6 31 1114.2 10.0 56 044b43.4. 16 21.14 - - - - - - - - Du68r.4. 34 16.3 . - - 19.0 - . - 15.0 -
11 3... 3 . 5.2 65 1314.9 6.14 714 Oubb... 344bg.4o
12 18
. . 10.0 22.6 . 12 - 116.9 - 12.2 . 77
644543.4. 3(4 18.7 - -
. - - 16.6 - 12 0... 3 5.2 . . 71 136.6 5.6 70 SubS... 12 10.5 . 20 1114.14 12.0 68 SubpM.
Oubgr.4. 18 314
22.3 16.9
. . - - - -
13 3... 3 5.9 . 149 140.0 5.6 60 CD
Oubbo.. 12 10.0 16 115.6 10.2 65 6ubM. 18 214.6 - - - - 34414(3.4. 34 19.7 - - 18.2

TABLE 7
KEESLER AIR FORCE BASE
SUMMARY OF TEST DATA
)4atertsi Classification LL FL PS .a.2..
Base OW Nonplastic 2.73 Subgrade SW Nonplostir 2.445 -
23 June 19447 8 November 19148 12 Decenber 19149 44 Marco 1950
Sept44 from Dry Density Moisture Per Cent Moisture Dry Density Moisture Per Cent liry Density Moisture Per Cent
.ocation Course Surface - In. 42R Lb/Cu It Content Saturation Contest CNN Lb/Cu It Content Saturation CNN Lb/Cu Pt Content Saturation
1. Base 3 53 136 5.7 63 5.44 25 120.8 5.7 38 141 - 5.14 - Sub6rade 12 36 109 44.2 22 44.1 ts5 - 4444 - 50 107.44 4.2 21
Subgrade 30 - 97 3.44 . 13 3.2 - - 3.44 - - - 4.8
2 Base 3 38 127 5.5 445 14.9 . 19 1144.8 5.44 31 35 - 5.3 - - Subgrade 142 4444 107 3.8 19 3.6 443 - 3.5 - 50 1044.0 3.3
3.14 15
Subgrade . 30 - 98 14.3 17 4.5 - - 3.6 - - -
3 Base 3 b7 13" 5.5 57 44.9 40 129.2 5.3 446 05 - 5.1 - Subgrade 12 26 105 44.5 21 3.2 32 - 44.0 - 22 1014.2 3.2 144
Subgrade 30 - 98 3.5 13 2.9 - - 3.3 - - _ 3.2 -
44 Subgrade 3 106 44.9 23 5.9 - 5.0 . - 5.2
Subgrade 12 1014 3.9 18 5.0 33 2)4 14
Subgrade 30 100 5.1 21 3.3 - 3.2 - 44.7
5 Base 3 . 5.5 6.1 42 127.3 14.1- 50 3b - . 5.0 - Sub6rsBs 12 44• 4 0.0 28 - 5.5 - 414 105.8 b.3 30
Subgrade 30 5.7 5.5 - - 5.2 . - - - 14.9 -
0 Base 3 5.8 5.1 53 1314.6 6.3 77 441 - 5.9 - 36
Subgrade 12 5.1 44.8 50 - 5.1 - 50 102.0 -
8.5 5.14 -
Subgrade 30 5.b 5.3 - - 5.2 - -
7 Base 3 6.2 4.9 140 1314.14 5.6 59 30 5.1
Subgrade 12 5.6 0.0 39 -. 44.8 - 60 0.7
Subgrade 30 5.5. 5.3 - - 0.3 - - 5.3
8 Base 3 5.2 5.8 447 131.8 0.3 sO 449 5.1
Subgrsde 12 7.1 5.3 53 - 0.8 - 25 12.3
Subgrade 30 5)4 8.6 - - 5)4 - - 5.0
9 Base . 3 5.3 5.6 76 129.6 14.5 58 30 - 44.7
Subgrade 12 0.8 0.2 .35 - 14.3 - 38 101.2 1) 31
Subgrade 30 . . 5.5 5.2 - - 6.3 - - - 5.2 -
10 Base 3 14.9 44.9 146 138.0 .b.5 77 38 . 5.7
Subgrade 12 4444 5.1 . 443 - . 6.0 - 4' . . 6.5
Subgrade 30 5.3 5)4 - - 5.0 - - . 4.9
11 Base 3 5.2 5)4 03 1314.14 1444 68 30 - 5.9 - Subgrade 12 . - 8.1 51 - 9.0 - 31 97.3 11.3 44 - Subgrade 30 5.3 44.7 - - - 5.5 - - - 0.3 -
12 Base 3 b.2 5.9 145 122.5 144 445 26 - 5.3 - Subgrade 12 44.5 7.5 445 - 9)4 - 6 106.3 8.1 39
Subgrad. 30 5.3 44.3 - - 7.0 - .. - 8.6 -
13 Base 3 5.1 5.14 38 123.8 b.0 444 39 - 5.1 - Subgrade 12 5.3 b.6 07 - 7.9 - 143 109.2 5)4 28
Subgrade 30 . 5.6 44.44 - - 4.9 . - - - 4.5 -
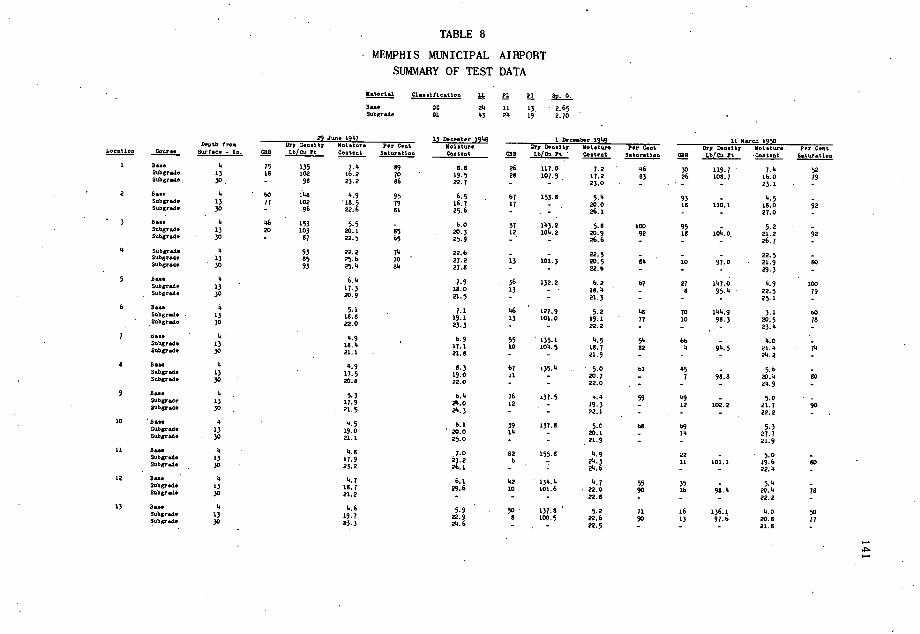
TABLE 8
MEMPHIS MUNICIPAL AIRPORT
SUMMARY OF TEST DATA
8..ter160 C1...Iflc.tjo, LL FL F! B... IC 214 1 1 13 2.65 Bubgr.e OL 33 214 19 2.90
29 3..., 19147 Ipth .o. Pr 0.3.187 81.tn4. For C.ut Lo...tto, Co..... 1300.0. - 1.. 026 Lb/Cu It Cout.ot B.tm.tbo,
1 20.. 44 75 135 7.44 69 Subg...4. 13 18 102 16.2 70 Subo.4. 30 - 98 23.2 86 2 B,.. l 60 1148 14.9 95 S.4bg..4. 13 77 102 16.5 79 Sub.r60. 30 - 96 22.6 61 3 B... 4 46 153 5.5 - Subg..B. 13 20 103 20.1 85 Iu69r.4. 30 - 87 22.5 65
4 S,b.d. l 93 22.2 71e Subg..4. 13 85 25. b 70 Subg..60. - 30 93 25.14 914
5 B... I. 6.4 SubgoM. 13 - 17.3 S3b8..4. 30 20.9 6 3... 14 5.1 Sub€..4. - 13 18.8 Subo.4. 30 22.0 7 a... - 4- 4.9
Subg..4. 13 18.'4 Sub.60. 30
8 0... 4 4.9 lubgr60. 13 - 1.7.5 1u69.th. 30 20.8
9 3... 4 5.3 Subgr,d. 13 17.9 Bubg.M. 30 21.5 10 'B... 14 - 4.5 Cubg..4. 13 19.0 1,418.60. 30 21.1 11 B... l - 13.8 Sub.d, 13 17.9 .4. Sub8. - 30 - 23.2 12 B... - 14 14.7 0ub,.4. 13 18.1 1.090.4. 30 21.2 13
B". 4 14.6 Bubgt.4. 13 19.7 0.490.4. 30 63.3
13 D ...60.. 19148 1 0.1.60.. 19149 11 .oB 1950 P. C.ot DF7 0.3010, 3301.1,40. P.r C30t C000.,.t COO Lb/Cu Pt C.0t..t S.t,r.ti,u 028 Lb/Cu it -C.0t.,t B.t,u.tl,,
8.8 26 117.0 7.2 - 46 30 119.7 - 7.14 52 19.5 28 107.9 17.2 63 26 108.7 16.0 79 22.7 - - 23.0 - - - - - 23.1 - - 6. - 67 153.8 5.44 93 - 14.5 - 16. 17 - 20.0 18 110.1 16.0 92 25.6 - - - 26.1 - - 27.0 - 6.0 57 1l43.2 5.33 100 95 - 5.2 20.3 12 1014.2 00.9 92 18 1014.0 21.2 92 25.9 - - 26.6 - - - 26.7 -
22.6 - - 22.5 - - - 22.5 -S 27.2 13 101.3 20.5 - 814 10 97.0 - 21.9 80 27.6 - - 22.6 - - - 29.3 - 7.9 36 132.2 6.2 67 27 147.0 14.9 100 16.0 13 - S 18.13 - - 8 95.14 - 22.5 79 21.5 - - 21.3 - - - 25.1 - 7.1 46 127.9 5.2 148 70 144.9 3.1 00
19.1 13 101.0 19.1 77 10 96.3 20.5 78 23.3 - - 22.2 - - - 23.4 - 6.9 55 - 135.1 4.5 544 614
- 4 - 17.1 10 1044.5 16.7 82 44 94.5 214 - 74
21.6 - - 21.9 - - - 24.0 - 8.3 147 135.4 - - 5.0 61 445 - 5.6 - 19.0 11 - 20.7 - 7 98.8 20.4 80 22.0 - - 22.0 - - - 214.9 - 6.l. 76 .37.5 .4. - 59 49 - 5.0 - - 213.0 12 - 19.3 - - 12 102.2 21.7 90 26.3 - - 22.1 - - - 22.2 - - 6.1 39 137.8 5.0 66 69 5.3 20.0 14 - 20.1 - 14 27.7 25.0 - - 21.9 - - 21.9 7.0 82 155.8 14.9 22 - - 5.0 - 23.2 6 - 24.3 11 101.1 19.6 80 26.1 - - - 214.6 - - 22.44 - 6.1 42 - 134.4 47 55 35 - 5.44 -
29.6 10 101.6 - 20.0 90 lb 96.13 20.14 78 - - - 22.8 - - - 22.2 - 5.9 - 50 - 137.8 5.2 71 16 136.1 14.0 50 22.9 8 100.5 22.6 90 13 97.6 20.6 77 24.6 - - - 22.5 - - - 21.8

TABLE 9
SUMMARY OF MOI SlimE CONTENTS AND
DEGREES OF SATURATION
Material Name of Field Rainfall Moisture Percent
Zone Content Saturation
Bose Course
Clay gravel, GC Santa Fe Lob 4.8 78
Clovis (before failure) Low 9.8 68
Clovis (after failure) Los, 15.1 98
Lubbock Medium 13.2 71
Goodfellow Medium 12.5 . 98
Memphis High 8.1 98
Silty gravel, GM Kirtland Low 3.8 79
Sand gravel, GW Bergstrom Medium 5.3 65
Keesler High 5.7 61
Subgrade
Fat clay, CH Bergstrom Medium 25.0 97
- Goodfellow Medium 24.1 99
Lean clay, CL Santa Fe Low 16.8 65
Clovis (before failure) Low 12.5 75
Clovis (after failure) Low 13.5 91
Memphis High 20.8 91
Clayey sand, SC Lubbock Medium 13.5 92
Silty sand. SM Kirtland Low 10.8 67
Sand, SW Keesler High 4.5 22
NOTE: Eighty percent of the observations of moisture content and percent
Saturation were less than the values shown in these columns.
OF PAVEMENT -_
LOCATION
L .4 PPROX 1/4 PVA4T WIDTH
4L0C IiLOC.,
L0C 8 4LOC 5
EI4LOC.I2
LOC.6 LOC. 6 LOCATION 2
LOC.13 O LOC. 1
APPROX8FT—.J LOCATION 3
EDGE OF PAVEMENT
VARIABLE
UNPAVED SIOULDER _Lc?_
LOCATION 4
142
Figure la Key to Testing Locations. Not to Scale.

100 100 100 - ___________________ - 100 00 °-T1 100
60 60 80 - _____ - eol 80 80 NO O8SERVATIONS/7 NO. OBSERVATIONS 8 NO. OBSER VAT/ONS 17 I O8SERVATIONS 6 NO. OBSER VAT,ONS 2 NO. O8SERN4TIONS=5 260 60 z6C--- aO 60 60 40 40
B40-- 401 40 40
____ 2: : RR ____ 2 3 4 5 6 7 0 20 40 60 60 100 8 9 0 II 2 IS 14 IS lb 10 II 12 13 14 IS lB 0 20 40 60 60 100 0 20 40 60 80 100 MOISTURE CONTENT PERCENT SATURATION MOISTURE CONTENT MOISTURE CONTENT PERCENT SATURATION PERCENT SATURATION (BEFORE FAILURE) (AFTER FAILURE) (BEFORE FAILURE) (AFTER FAILURE) SANTA FE MUNICIPAL AIRPORT—LOW RAINFALL ZONE CLOVIS AIR FORCE BASE — LOW RAINFALL ZONE
100 100
80 80 NO. OB5ERVAT/ONS=/5 NO. OBSERVATIOA,s=a
Z60 60 D
40 40
20 20
0 0 11
10 II 12 13 14 15 0 20 40 60 80 100 MOISTURE CONTENT PERCENT SATURATION
LUBBOCK MUNICIPAL AIRPORT — MEDIUM RAINFALL ZONE
I:_____ :
20
_i
811 r0jc12 :J 40 60 awo
MOISTURE CONTENT PERCENT SATURATION
G000FtLLOW AIR FORCE BASE— MEDIUM RAINFALL ZONE
100 100
60 80
NO. O8SERVAT/ONSI2 NO.OBSERV4TIONS5
200 60
40 40
20
4
5 6 7 89
2:
20. 4060 60 100
MOISTURE CONTENT PERCENT SATURATION
MEMPHIS MUNICIPAL AIRPORT— HIGH RAINFALL ZONE
lOG— - 100
BC— - 80 NO. OBSERVAr,ONS=l9 NO. OB5ERV4r/ONS
4
8 2 60 -
scf- - - - - -- 40
2C_ 1
6769 00 20 40 60 80 100 MOISTURE CONTENT .PERCENT SATURATION
KIRTLAND AIR FORCE BASE—LOW RAINFALL ZONE
GC BASE COURSE MATERIALS
100 100
60 60
NO. OBSERVA TIOAIS =15 NOOBSERVATION5=9 60 Z 60
40
20
2 3 4 S 8 7 0 20 40 60 80 100
MOISTURE CONTENT PERCENT SATURATION
BERGSTROM AIR FORCE BASE— MEDIUM RAINFALL ZONE
00 I
00
BC I 601 I NO. O85(R VAT/ON5/2 I NO.O8SERVATION$6
2 60 J 60 1
40
20
1
20__________________
03 4 5 6 00 20 40 60 80 100 MOISTURE CONTENT PERCENT SATURATION
KEESLER AIR FORCE BASE— HIGH RAINFALL ZONE
GM BASE COURSE MATERIALS
GW BASE COURSE MATERIALS.
Figure 2. Frequency Distribution. Moisture Contents and Percents Saturation Base Course Materials. CO

bc I I I NO O8SERVATIONSII - NO. 08S(RVATIONSS
207 J~:~ : 11__
9 20 21 22 23 24 25 26 0 20 40 80 80 100 MOISTURE CONTENT PERCENT SATURATION
BERGSTROM AIR FORCE BASE -MEDIUM RAINFALL ZONE
100 00 110. OBSER VA TION5IJ NO.OBSERVATIONS -6
80 60
40 so-
20 21 22 23 24 25 28 0 2F 40 6r 80 100 MOISTURE CONTENT PERCENT SATURATION
G000FELLOW AIR FORCE BASE-MEDIUM RAINFALL ZONE
100 100
NO. OBSERVATIONS - /7 NO. OBSERVATIONS 8
CF
_________
1012 1418 182022 020406080100
MOISTURE CONTENT PERCENT SATURATION
SANTA FE MUNICIPAL AIRPORT-LOW RAINFALL ZONE
CH SUBGRADE MATERIALS CL SUBGRADE MATERIALS
0) I I I ••1•••••••• 100 I I I 00 I I 61 100 I I I I 00 I I I I I 100 I I
NO O8SERVATIONS 18 NO. OBSERVATIONS6 NO. OBSERVATIONSS NO OBSERVATIONS • 6 NO OBSERVATIONS - /2 NO. OBSERVATIONS 6
_ ____________ 20 20--
j. A -
9 10 II 12 13 14 15 12 13 14 15 18 Il 18 0 20 40 80 80 00 0 20 40 60 80 100 16 I? 16 9 20 21 22 0 20 40 60 80 100
MOISTURE CONTENT MOISTURE CONTENT PERCENT SATURATION PERCENT SATURATION MOISTURE CONTENT PERCENT SATURATION
IBEFORE FAILURE) (AFTER FAILURE) (REPORt FAILURE) IAFTER FAILURE)
CLOVIS AIR FORCE BASE - LOW RAINFALL ZONE MEMPHIS MUNICIPAL AIRPORT - HIGH -RAINFALL ZONE
CL SUBGRADE MATERIALS
100 to0 NO OBSERVATIONS'S
40 40
20
9LH _________
I 12 3 14 15 16 Ii 0 20 40 60 80 100 MOISTURE CONTENT PERCENT SATURATION
LUBBOCK MUNICIPAL AIRPORT- MEDIUM RAINFALL ZONE
100 00 NO. OBS(RVATIO¼S16
fl
OBS(RVATIONS
J
J
so
;RI1' 9 7 9 9 10 II 12 0 20 40 80 80 100
MOISTURE CONTENT PERCENT SATURATION
KIRTLAND AIR FORCE BASE - LOW RAINFALL ZONE
bC 100 NO OBSERVATIONS -IS Na OBSERVATIONS 6
80 80
0 8I 60
40
40
3 4 S 6 0 20 40 60 80 100 MOISTURE CONTENT PERCENT SATURATION
KEESLER AIR FORCE BASE - HIGH RAINFALL ZONE
SC SUBGRADE MATERIALS . . SM SUBGRADE MATERIALS . - :SW SUBGRADE MATERIALS
Figure 3. Frequency Distribution. Moisture Contents and Percents Saturation Subgrade Materials.

".1
I- 2 Li 25 60 0
Li ° 20 55 z Ir IS 50 0
10 I— 45 0 2
Li Li 0
cK 5
40 0 a.
0 2
- 35 Ix
0 -- 30 I— U- Li
p. D
U ui 25 0
ac Li a- 20
-J 15
Li 10 U) z Li 0
5 >- cr
U) 10 20 25 100 lOS 110 115 WATER CONTENT IN PERCENT DRY WEIGHT MOLDED DRY DENSITY IN LBS PER CU FT
MOLDING WATER CONTENT VS DENSITY VS CBR DENSITY AND CBR
NOTE: SPECIMENS SOAKED FROM TOP AND LEGEND BOTTOM. SURCHARGE 30 LBS SOAKING AND PENETRATION. 0 55 BLOWS PER LAYER SPECIMENS SHOWED NO SWELL DURING 0 26 BLOWS PER LAYER SOAKING. . . 2 BLOWS PER LAYER ALL SPECIMENS COMPACTED WITH 10 LB HAMMER, 5 LAYERS, 18 INCH DROP.
-------------
.. iiiiiiiiiiii.
a•uuuuu•u•ui ••uuuuuu•u•i •••u••iu•u•• ••U•U••U•U•UU• MMEMMEMMEMENEM .. ..u.m•u•u .............. ............. mommommmmammom
EMEMEMEMIMEMEM IS 16 17
MOLDING WATER CONTENT IN PERCENT DRY WEIGHT
WATER CONTENT VS COR
Figure i. Design CBR Tests Subgrade. . Cli

No
MENEM, 0 MEN m M
M MMM"Emm ME
32
36
8
4
21
2
8
12
-- MOISTURE CONTENT
LEGEND
O BEFORE TRAFFIC
0 DURING TRAFFIC-OUTSIDE OF TRAFFIC PATH
DURING TRAFFIC WITH TIRES INFLATED TO 200 PSI-WITHIN TRAFFIC PATH
NOTE FIELD TESTS WERE IN-PLACE TESTS Figure 5. Effect of Traffic on Subgrade CBR-Moisture Relationships.

147
BASIC DATA PERTAINING TO FROST ACTION
HEAT TRANSFER AND TEMPERATURE DISTRIBUTION IN SOILS FOR TRANSIENT HEAT FLOW DUE TO CYLINDRICAL SOURCES AND SINKS
Y. S. Touloukian, Assistant Professor of Mechanical Engineering; J. D. Bottorf, Graduate Westinghouse Fellow, School of Mechanical Engineering; and Thor Harsen,
Graduate XR Fellow, School of Mechanical Engineering; Purdue University.
Synopsis
Several methods of solving problems of transient temperature distribu-tion and heat flow in the earth surrounding embedded heat sources and sinks in which the temperature is suddenly changed from that of the surrounding medium to a new value and maintained at this new level are presented.
Solutions of the differential equations for the temperature distribution and heat flow for the idealized case are evaluated in terms of dimensionless para-meters. A numerical method is used in the study of the problem with real boundary conditions obtained from experimental observations. The method of electrical analogy is also presented as a rapid and accurate means of solv•-ing this problem. The thermal recovery (recuperation time) of the thermally disturbed soil is also studied and results shown.
The freezing or thawing rates of soils are a problem which can be studied by some of the methods used in the study of complex heat-transfer problems. The sudden change of thermophysical properties and the latent heat of transformation which results from the thawing and freezing of soils are not encountered, however, in the majority of heat-transfer problems, and therefore, appropriate modifications must be made in existing solutions to account for such phenomena. The electrical analogy method and the numer-ical methods are more readily adapted to include such phenomena than any other methods presently known.
It is not the purpose of. this paper to solve any specific problem involving the freezing of soil but rather to discuss three basic methods of calculation which have been used in the study of transient temperature distribution in soils. In the examples used in this dis-cussion the change of thermophysical properties of the soil which occur at the freezing temperature is not considered, since the work upon which this paper is based was of a preliminary nature and was concerned only with methods which would yield general so-lutions regarding temperature distribution in soils.
The exchange of heat between cylindrical heat sources or sinks and soil has attracted increasing interest lately by the recent attempts at a more rational solution of the prob-lems involving the cooling of underground pipe lines and electrical tables and the use of the reverse-cycle refrigeration system for residence heating. Kafadar et. al. (1) presented a method for investigating the effects of freezing upon the temperature dis-tribution in the soil around a cylindrical heat sink withdrawing heat from the soil at a constant rate. From the mathematical solution of the differential equation for this case they found a temperature gradient due to sensible heat withdrawal alone. Successive corrections of this gradient, which account for the latent heat withdrawal from the freez-ing zone and a final adjustment for the thermal conductivity of the frozen soil, lead to a temperature gradient compatible with the physical phenomenon.
Although the temperature gradients and the heat flow at any one point in the soil surrounding constant temperature heat sources or sinks are never invarient with re-spect to time; they will approach in time a near steady-state condition where their rates of change are very small. The time rates of change of the temperature distribution and heat flow, both of which may be extremely large during the initial part of the transient flow period, are of the utmost importance in many fields of engineering applications.

NOMENCLATURE
Symbol Quantity Units
A Area Ft2
a Tube radius Ft
C Heat capacity B F 1
CE Electrical capacitance Farads
Ce Electrical capacitivity Sec Ohm' Ft 3
C.1. Heat capacity B F 1
C Volumetric heat capacity 13 Ft-3 F 1
c Specific heat B 1b 1 F'
e Napierian Logarithm base Dimensionless
J0 Bessel Function of the first kind
and the zero order Dimensionless
K Thermal conductance B Hr' F 1
k Thermal conductivity B Hr- Ft- 'F'
m Scale factor (in analogy) Ohm B Sec 1 F'
No Bessel Function of the second kind
and the zero order Dimensionless
n Time factor (in analogy) Hr Sec'
q Rate of heat flow B
RE Electrical resistance Ohms
H Electrical resistivity Ohms Ft
Thermal resistance Hr F B 1
Rt Thermal resistivity Hr Ft F B'
r Radial distance Ft
t Temperature F
u Variable of integration Ft'
V Electrical potential Volts
v Variable of integration (au) Dimensionless
x Distance . Ft
X Radius parameter, (!) Dimensionless
Greek
a. Thermal diffusivity, 5'"" Ft2 Hr-1
aT Time parameter, Dimensionless
Temperature difference parameter, q Dimensionless
60 Difference between initial uniform
temperature and tube temperature F
8 Difference between initial uniform
temperature and temperature at a
given time and position F
T Time flours
p Density lb F 3
subscripts
1,2, -n refer to a particular region
21, etc. effect of region 2 on region 1, etc
148

149
This paper deals with the transient temperature gradients in soil surrounding long, cy-lindrical heat sources or sinks, the temperature of which is suddenly changedfrom thatof the soil and maintained constant at the newvalue. Thepaper also considersthe changes in temperature gradients in the soil alter the removal of the heat source or sink, that 'is, when the source or sink is no longer maintained at the constant temperature but is allowed to follow the soil temperature as the soil recovers towards its undisturbed thermal state.
Three different methods of approach to the problem are used.' First, the exact mathematical solution of the differential equation of heat flow is evaluated. Unfortunately, this differential equation has been solved for only an idealized set of boundary conditions, but the complexity of this solution and its evaluation indicate that the solution for more practical boundary conditions would be too tedious to be practicable. Secondly, a nu-merical method of solution is used in which small finite time and' space increments replace the corresponding quantities of differential magnitude. By means of this meth-od practical boundary conditions can be embodied in the solution and the thermal re-covery time of the soil can be investigated. The, numerical method should be the most easily adapted to the study of frost penetration and thawing in soils. Thirdly, the meth-od of the electrical analogy to the flow of heat is applied to the study of the problem. Again by this method real boundary conditions can be treated and the time for thermal recovery of the soil can be investigated.
Methods of Solution
In the application of each of the methods used in this paper certain general simplify-ing assumptions have been made. The soil surrounding the heat source or sink has been assumed to be homogeneous and isotropic. Although in only very few cases are soils reasonably homogeneous, the nature of the unhomogeneity is so unpredictible that such an assumption is advisable to enable the formulation of a manageable solution. The assumption of isotropicity seems to be generally sound. Heat flow in the soil is assumed to take place by conduction only, since in most dense, finely gramed soils the effects of convection and radiation are negligible. Further, the effects of the change of thermophysical properties of the soil due to freezing or thawing and of migration of soil moisture due to the thermal gradients have been ignored. Although the change of the thermophysical properties would be exceedingly difficult to incorporate into the mathematical and electrical analogue methods, it could be done quite easily in the nu-merical method. The available data concerning moisture migration are inadequate, at present, to support an accounting for this effect; however, when such data become more plentiful the influence of moisture migration can be readily incorporated into the numerical method.
Mathematical Solution of Differential Equation
The differential equation describing the radial temperature history of the region surrounding a long cylindrical heat source is given by.
80 fa'o 1 ao\ (1)
Carsiaw and Jaeger (2) have solved this equation for the following' boundary conditions: (1) The heat source consists of an infinitely long cylinder of radius a; (2) the surround-ing medium is homogenous, of infinite extent in all directions, and at a uniform initial temperature of zero; and (3) at time equals zero the cylinder is suddenly raised to the temperature o,, , after which it is maintained at this temperature. For these bound-ary conditions the solution of the differential equation was found to be
0 = , + 20 Jo (vr)No (ua) - I'To(ur)Jo (oa) dv (2)
,r Jo J (ua) + Nl (ua) u

150
Using this equation for the temperature distribution in the general equation for radial heat flow,
q= _k2rr() (3)
Carslaw and Jaeger found the heat flow across the' surface of the cylinder to be
48,k r e du q=—t 2 a,r' jo u[Jl(ua) + N0 (ua)I
In rearranging Equations 2 and 4 for evaluation Gemant (3) introduced the following dimensionless parameters:
X ='
a a2 = , v = au,
Substituting these parameters into Equations 2 and 4 the equation for the temperature distribution becomes
o = i + ie' Jo(xv)No(v) — Jo(v)No(xv) dv (5) irJo J(v)+N(v) v
and the equation for heat flow becomes
8 r- dv Oo/c or Jo °
v[J(v) + N(v)I (6)
For numerical evaluation the integrals of Equations 5 and 6 are broken down into three parts:
= ++
(7)
It has been shown by Gemant that if a value of v1 be chosen such that << i and xv0 <<1 then the first integral of Quation 5, when reduced to the form of Equation 7, becomes
..., Jo(xv)No(v) — Jo(v)No(xv) dv = In. x e
Jl(v) +Nl(v) v In. v1 — 0.116 (8)
It was also shown that by choosing v2 such that
3
the third integral of Equation 5, when reduced to .the form of Equation 7, can be neglected. Equation 5' therefore has been reduced to
mx 2 (". _,, Jo(xv)No(v) — Jo(v)ATo(xv) dv
0 = 1 + Inu + 0.116 + - J Jl(v) + Nl(v) 'T (9)
The integral of Equation 9 can be evaluated numerically between the finite limits v, and Vg

151
In a similar manner it has been shown that by choosing
vi <<l, and
Equation 6 can be reduced to the form
= —2ir + r' - dv
Ok mv, - 0.116 ,, e v[J(v) + N(v)] (10)
which also can be evaluated numerically. The transient temperature distribution in the medium surrounding a line source or
sink can be deteriñined from Equation 9 and the heat flow at the surface of the source or sink from Equation 10.
Numerical Method of Solution
Numerical methods have been used in the solution of engineering problems for many years. Much has been written on the subject of these methods applied to special fields of interest (4), (5). The method applied to heat conduction as presented by G. M. Dusinberre (6) consists of dividing the thermal system into a number of reference regions and establishing simultaneous and independent heat balances between each re-gion and its adjoining regions. This application of the method is based upon the follow-
ing three assumptions: (1) Negligible error is introduced by using the tempera-ture change of a central point many region in computing the change of heat stored in the region due to this temperature change, (2) a time interval can be chosen sufficient-
T ly small that there is negligible error in t 2 t6 using the initial temperature gradient be-
tween central points of adjoining regions in computing the heat flow between these regions during this time interval, and (3) during this time interval any region is affected only by those regions adjoining it.
The rate of heat flow between any two
Figure lÀ. Thermal System for One Dimen- adjoining regions is dependent upon the
sional Heat Flow Through a Slab, overall transmittance, K, and the temper- I 2 3 4 5 6 ature difference between the two regions.
The rate of heat flow from a region 2 into a region 1 may be expressed as
1 21 :1. T. qu = - t,) (11) Figure lB. Electrical Circuit Analogous
to Thermal System. Similar equations may be written for the flow into region 1 from all other adjoining
regions, so that the total rate of heat flow into region 1 becomes
= K,,t, + K,,t, + + K,.,t, -E K,,t, (12)
According to assumption 2 above, Equation 12 gives the rate of heat flow into region 1 during the time intervalr. Duringthis time interval the temperature of the midpoint of region 1 changes from ti to ti' , hence, according to assumption 1, the rate of heat storage in region 1 during this time interval can be given as
- t,)
q, - -. (13)

152
Since heat is stored in a region as a consequence of the net heat flow into the region, Equations 12 and 13 can be equated to give:
, K21 A7t2 K,, 13 K,, art. r K, r1
+[1—_—JtI (14) C.
as an expression for the temperature, t1', of the midpoint of region 1 after the time interval 6T. In equation 14 it is apparant that the coefficients of the temperatures of various regions are constants depending upon the physical constants of the particular problem. These coefficients are known as weighting factors and Equation 14 can be rewritten as:
ti = F 2,t2 + F,,t, + - + + F,,t, (15)
If F11 were chosen to be negative, an erroneous oscillation or divergence in the calculated temperature would occur, since the new temperature of point 1 would depend upon its old temperature in a negative sense. The criterion for convergence must therefore be . .
(16)
or. . .: . (17)
The maximum value of & permissible must therefore be
. Cl (18)
If the temperature distribution in a medium in which heat conduction is taking place is known at any time, i- , the temperature distribution at a time + i- can be found by subdividing the medium into appropriate regions and solving Equation 15 for each region. If any region undergoes a process involving latent heat it may be taken into accouflt by adding a latent heat term, q. , to Equation 12 which appears as the added term, in Equations 14 and:15. If a region. undergoes a change of thermophysical properties the weighting factors involving this region must of course be changed for subsequent steps of the calculation.
Method of Electrical Analogy .
The mathematical laws expressing the conduction of heat in solids and the flow of current in certain noninductive circuits are identical, therefore, it is possible to con-struct an electrical circuit in which the flow of current is analogous to the flow of heat in a solid and the potential distribution is analogous to the temperature distribution in the solid. The time factors In such an analogous electrical circuit can be so adjusted at will that a thermal process can be reproduced electrically in much greater or less time than would be required for the actual thermal. process to take place. For this reason the electrical -analogy method is to be preferred for the study of many heat-transfer problems which involve long time periods.
For a slab of infinite length such as is shown in Figure 1A, the temperature history can be described by the differential equation
at 8't (19)
In Equation 19 - . . .. . ... k pc !

\IIIIT 0
153
If we let T = R, (thermal resistivity) and pc. = c (volumetric heat capacity) then
a I and Equation 19 becomes RCg
at_ '1 a2t 20 .-r, R4 C,az
For an electrical circuit with uniformly distributed resistance and capacitance such as is shown in Figure lB the voltage hitory can be described by the differential equation
ov ia'v är _. R.C. Oz
The similarity of the flow of electricity and heat can be seen by comparison of Equations 20 and 21. The heat capacities of the four
- -elements 2, 3, 4, and 5 of Figure 1A are - represented electrically by the condensers
Fiure 2. Temperature Gradients 'in Ground. - C2, C3, C4, and C5 in Figure lB. Similar- ly, the thermal resistivity between any two
points of Figure 1A is represented by the corresponding section in Figure lB. A circuit can be constructed in which the values of the resistance and capacitance are
numerically equal to those of the corresponding thermal quantities. In such a circuit the transient voltage changes occur in the same time in seconds as the analogous tem-perature changes occur in hours.- Paschkis (7), has suggested that the electrical analogy can be made more -versatile in the following manner. 1f it is desired for the transient time factors in the electrical circuit to be different from those in the thermal circuit the ., appearing in Equation' 20 may, be reduced- by a factor, n, such that,, hr.. The denom-inator of the right side of Equation 20 must also be reduced by the same factor, n. Equation 20 therefore becomes:
- • aV 1 81v
a c - ' .'. , - (22)
It is possible that the resistance and capacitance units which correspond in: magnitude to the desired thermal properties may not be obtainable. The constant- m -may be introduced into the right side of Equation 22 in such a manner that the equation is not changed.----
'OV 1 81V . • - - - -. • - 97. (( 8x'. - , -. -,- • -. (23)
- - - - • It is evident that Equations 23 and 21 are identical if-the two conditions
R,m - • - - -- - ' -- - (24)
-' .- - •'•
'(25)
are fulfilled. By proper' selectiän of the:-magnitude of n and m to satisfy the condition Tj = ni-. as well as Equations 24 and 25 a convenient time increment and feasible sizes of,resistors and condensers may be obtained. The voltage Vcan be any convenient value. It must only be remembered that the total applied voltage V represents the over-all tem-perature differenceand that' the voltage -at any pointinthe circuit represents 'the temper-ature excess at the corresponding point in the thermal system
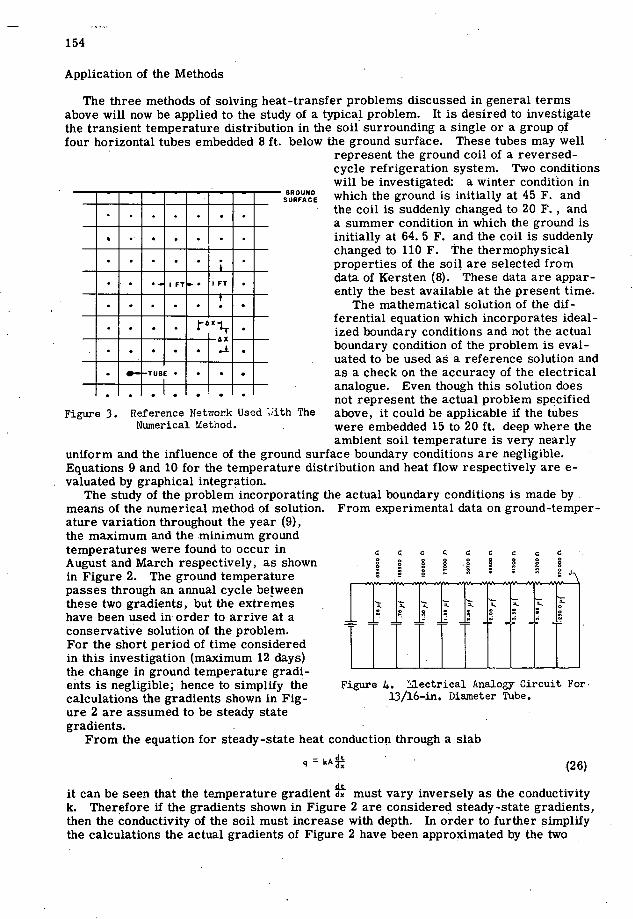
154
Application of the Methods
The three methods of solving heat-transfer problems discussed in general terms above will now be applied to the study of a typical problem. It is desired to investigate the transient temperature distribution in the soil surrounding a single or a group of four horizontal tubes embedded 8 ft. below the ground surface. These tubes may well
represent the ground coil of a reversed- cycle refrigeration system. Two conditions will be investigated: a winter condition in
GROUND which the ground is initially at 45 F. and SURFACE
the coil is suddenly changed to 20 F., and a summer condition in which the ground is initially at 64. 5 F. and the coil is suddenly changed to 110 F. The thermophysical properties of the soil are selected from data of Kersten (8). These data are appar-ently the best available at the present time.
The mathematical solution of the dif-ferential equation which incorporates ideal-ized boundary conditions and not the actual boundary condition of the problem is eval-uated to be used as a reference solution and as a check on the accuracy of the electrical analogue. Even though this solution does not represent the actual problem specified
Figure 3. Reference Network Used with The above, it could be applicable if the tubes Numerical Method. . were embedded 15 to 20 ft. deep where the
ambient soil temperature is very nearly uniform and the influence of the ground surface boundary conditions are negligible. Equations 9 and 10 for the temperature distribution and heat flow respectively are e-valuated by graphical integration.
The study of the problem incorporating the actual boundary conditions is made by means of the numerical method of solution. From experimental data on ground-temper-ature variation throughout the year (9), the maximum and the minimum ground temperatures were found to occur in August and March respectively, as shown 8§ § § § § in Figure 2. The ground temperature -. passes through an annual cycle between these two gradients, but the extremes have been used in order to arrive at a conservative solution of the problem. - For the short period of time considered in this investigation (maximum 12 days) the change in ground temperature gradi- ents is negligible; hence to simplify the Figure 4. 3.ectrical Analogy Circuit For. calculations the gradients shown in Fig- 13/16-in. Diameter Tube. ure 2 are assumed to be steady state gradients.
From the equation for steady-state heat conduction through a slab dt qkA . (26)
it can be seen that the temperature gradientAL d. must vary inversely as the conductivity
k. Therefore if the gradients shown in Figure 2 are considered steady-state gradients, then the conductivity of the soil must increase with depth. In order to further simplify the calculations the actual gradients of Figure 2 have been approximated by the two
Monsoon Noncoms BEENEEN IEamon N101010010 B
INUMmomm 3 Wa
LJJJJ_T_T_J_J_T_
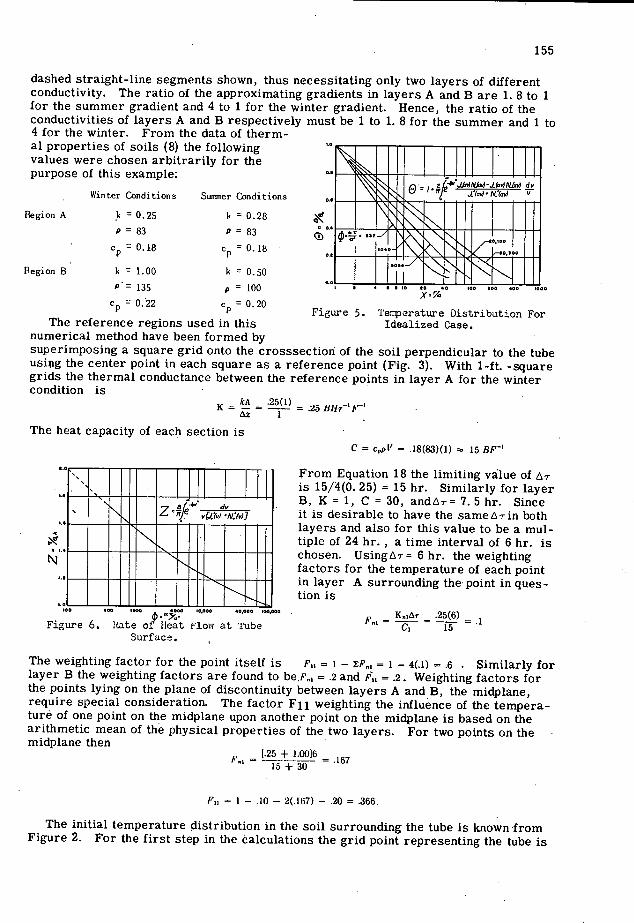
155
dashed straight-line segments shown, thus necessitating only two layers of different conductivity. The ratio of the approximating gradients in layers A and B are 1. 8 to 1 for the summer gradient and 4 to 1 for the winter gradient. Hence, the ratio of the conductivities of layers A and B respectively must be 1 to 1. 8 for the summer and 1 to 4 for the winter. From the data of therm- al properties of soils (8) the following values were chosen arbitrarily for the ON purpose of this example: MEMO! i1IlUU
Winter Conditions Sununer Conditions
Region A Ic = 0.25 Ic = 0.28
P=83 P83
c = 0.18 c = 0.18
iUIII Region B k = 1.00 Ic = 0.50
P•= 135 p = 100 UUIE
c =0.22 c =0.20 P p Figure 5. Tenerature Distribution For The reference regions used in this Idealized Case.
numerical method have been formed by superimposing a square grid onto the crosssection of the soil perpendicular to the tube using the center point in each square as a reference point (Fig. 3). With 1-ft. -square grids the thermal conductance between the reference points in layer A for the winter condition is
kA = = 5(i) = 25 BHr'Y
The heat capacity of each section is C = c9pV = .18(83)(I) nu 15 BF'
ilIlIllUllIllIfi NEI!IIM-Mr UIIflhii!IUIII
iI.IuI.IuII,iii Figure 6. 1ate Jlleat Flow at Tube
Surface.
From Equation 18 the limiting value of i.-r is 15/4(0. 25) = 15 hr. Similarly for layer B, K = 1, C = 30, andir= 7.5 hr. Since it is desirable to have the same&rin both layers and also for this value to be a mul-tiple of 24 hr. , a time interval of 6 hr. is chosen. Usingr= 6 hr. the weighting factors for the temperature of each point in layer A surrounding the point in ques-tion is
- K,1i- - .25(6)
The weighting factor for the point itself is P = I - = I - 4(1) = .6 . Similarly for layer B the weighting factors are found to be./',.1 .2 .2 and F = .2. Weighting factors for the points lying on the plane of discontinuity between layers A and B, the midplane, require special consideration. The factor Fil weighting the influence of the tempera-ture of one point on the midplane upon another point on the midplane is based on the arithmetic mean of the physical properties of the two layers. For two points on the midplane then
L.25 + 1.0016 - =
15+30 - .167
Fu = I - .10 - 2(167) - .20 = .366.
MOMMIS 4MILM
UI uIIuhIi
II
The initial temperature distribution in the soil surrounding the tube is known from Figure 2. For the first step in the êalculations the grid point representing the tube is

156
2 I- IL
4
0
I'
ti6
a z 0
0 1 UI0 CD
.0 z d 12 I-
0
MEN NONE rdEE roF-APEN FAME
990 Old
DISTANCE FROM CENTER OF SOURCE - FT
(0) SINGLE TUBE (b) FOUR TUBES
Figure 7. Temperature Distribution After Three Jays Operation of 110 F Source.
assigned the temperature 20 F. which is held constant throughout the remaining steps. The ground-surface temperature is fixed at a constant value of 29 F. although it could be varied at will. Equation 15 is now calculated for each grid intersection to find the new temperature distribution after the time incrementAT = 6 hr. This process is con-tinued for 12 steps to find the temperature distribution after three days. To study the thermal recovery of the ground after the heat sink is removed, calculations are con-tinued as above using as a starting distribution the calculated distribution existing at the time the heat sink is removed. The grid intersection representing the tube is now no longer maintained at 20 F. but is allowed to change as any other point and its tem-perature calculated at each step.
The method of the electrical analogy as used here serves two purposes. The data obtained can be compared directly with the results of the mathematical solution as a check on the electrical analogue results. Also, the data can be interpreted in such a manner as to afford a check between it and the numerical method of solution.
The electrical analogue circuit itself is representative of the idealized boundary conditions which were assumed in the mathematical solution. The primary interest is the zone within 2 ft. of the heat source and from the results of the mathematical solution it is found that there is no disturbance of the temperature beyond 8 ft. from the source in the 12 days considered here. Consequently, the zone from the source to a radius of 2 ft. from the source is divided into eight concentric sections each 0. 25 ft. wide. The zone from 2 ft. to 8 ft. radius from the source is lumped into one section. Normally one second in the electrical analogue represents one hr. 'in the thermal' system, however, itisdesirable to let one second in the analogue represent 24 hr. in the thermal system, hence, -
rnr.
241-Irs. = ,&X lSec.
n = 24
It is known that the amount of heat conduction through a hollow cylinder is given by
,rkL q= - 2— (12—ti)
-(27)

157
This equation may be written as
q=—-(t,—tj) : (28)
Comparing Equations 27 and 28 it is seen that the thermal resistance, R1 ,is.given by
Rr Ti
The thermal resistance for the first section in the A regián for the winter condition is found to be 25
ifl68 liT = ______ = 1.14 HrPB
2irC28)(1)
Based on Equation 24,
m 1.14m or =11,
n 24
Choosingm = 11.3 X iO°gives R. = 534000 which is a reasonably sized maximum resistance unit. Checking this value of m to find what maximum size condenser is required we find that
CT = c2pV = cp7r(r - r) L = .18(83) ir(.252 - .033682) = 2.88 BP'
and on the basis of Equation 25
C2 = = 2.88
106 = .26 X 1O faradá = .26 f
This results in condensers of reasonable size. Continuing in this manner using m = 11. 3 x 10⁶ and n = 24, the sizes required.for the remaining resistors and condensers
2 I-
0
I-
08 Cc ID
0 -j
Ui 0
ID n
0 2 4 6 0 2 • 4 6 8 DISTANCE FROM CENTER OF SIN% FT
(a) SINGLE TUBE (b) FOUR TUBES -. .
Figure 8 leriperature Distributori After Th'ee Days Operation of 20 F Sink
là.
0
-
-"'fl'- 4
-.I-_ z W10 'i-0 I--
12 ____ _____ SEEN I- ___________________
__

158
,Il _-_
—uJ1flW]II11;V1.IlB w4 W 12
I 4 I- 0
IENT
514 55 65 75 85 95 lOS 55 65 75 85 95 05
TEMPERATURE - F
(0) SINGLE TUBE (b) FOUR TUBES
Figure 9. Thermal Recovery of Soil After Three Days Operation of 110 F Source.
I, 4
0
0
0
IC
PIk1fl _
are determined. The electrical analogue circuit is shown in Figure 4. In order to use the same electrical circuit for the layers A and B, which have dif-
ferent thermophysical properties, the time factor must be different for the two regions. Since the electrical units are the same, the time constant must be changed by the same ratio as the thermal units.
H.. C,. n8 H,B C, R.4 C.a ha H.4 C,4
or =
[k A
[ ]18 R,4 C.4
= 24 (100 X .20)
28 Hence, from Equation 24
c.4 ) (83 X .18)
r, 24H = - = fl8 18 HrSec' = 1 Sec.
The same circuit thus represents the layer B if the data are interpreted such that 1-1/3 seconds in the electrical circuit are equivalent to 24 hr. in the thermal system.
The thermal recovery of the soil after removal of the heat source is investigated by removing the applied voltage and allowing the condensers to discharge to ground poten-tial at point J in Figure 4.
To compare the results of the electrical analogue with those of the numerical method, the data obtained for layers A and B must be combined graphically. The data correspond-ing to region B is combined by. smooth curves with the data of region A and the result-ing distribution is then superimposed graphically upon the assumed steady-state gradient which existed in the undisturbed soil.
Discussion
The results obtained by using the methods previously outlined are presented in Figures 5 to 11. Figure 5 shows the evaluation of Equation 9 for the temperature dis-tribution around a cylindrical heat source embedded in a homogeneous medium initially at uniform temperature. These results are presented in terms of the dimensionless parameters and are applicable over a wide range of the variables involved. Similarly Figure 6 presents the data obtained by the evaluation of Equation 10. This curve rep-resents the heat-transfer rate across the surface of a single tube. The rate of heat flow is theoretically infinite at the initial moment, but as seen, it decreases rapidly to

159
- I1:J.1IaI1l11.I;yi.JFcI1
12 z 4 I-
65 75 85 95 TEMPERATURE — F
(0) SINGLE TUBE (b) Figure 10. Thermal Recovery of Soil After Three Days
lOS 55 65
NERM oRNAMEMMI Er _
4I i 11- 1 ffla, u r u -
'HEEE1 MEMO. FOUR TUBES
0pertion of 20 F Sink.
15 85 95 05
a finite value. The results obtained by using the numerical method for finding the tem-perature distribution around a single tube placed 8 ft. under the ground surface and operated as a heat source at 110 F. for three days are presented in Figure 7. The fig-ure also shows the temperature distribution around a group of four tubes when operated in the same manner. The extreme right portion of each part of the figure shows the horizontal extent of the distance of influence, and the temperature distribution here is that of the original undisturbed soil. Similarly Figure 8 shows the results corresponding to conditions of Figure 7 for the case of a heat sink operated at 20 F. for three days. Figures 9 and 10 present the results of the numerical calculations of the thermal re-covery of soil after removing the sources and sinks respectively. Part (A) of each figure shows the temperature distribution along the vertical center line of the single tube during thermal recovery and
X. Sr
(B) the corresponding distribution for the group of four tubes. The initial gradient in each case is that which was found to exist after operating the sources and sinks for three days. It is seen that after operating the sources and sinks for three days, nine days are required for the soil at the depth of the tubes to return to with- in about 3 F. of the original undisturbed temperature, It was also found that after one and two days of operation of the heat sources and sinks a recovery time three times as long as the operation time was required.
Figure 11 shows a comparison between E the results obtained from the electrical-. To
analogy circuit and the mathematical solution for a 13/16-in, diameter tube. As can be seen from the figure the re-sults of the two methods are in good lcrppnsssnt
—b 0.20 0.50 0.0 .00 .05 .00 ITS 5.00
A comparison of the results obtained 0050500 0005 055555 OF souse! -
from the numerical method and the Figure 11. Temperature Gradient in Soil electrical-analogy method for the region Around 13/16-in. Source Maintained at close to the tube showed that for corre- 110 F. For One Day and For Three Days.
Dots - - -
- - - ON! 0AY
NAtU!SST10AL SOLJJYIOS 55, - --ILSOTmOAI. ASOLOSY SOLUTION

160
sponding points in the system the electrical method gave a slower response to a change of tube temperature than did the numerical method. The more rapid response observed in the results of the numerical method is actually an error due to a violation of the first assumption upon which the method is based. The first assumption as given previously implies that the temperature of the central point in any region is the average tempera-ture of the entire region. In the region that includes the tube this is not true, especially during the time immediately after the tube temperature is changed if the volume of the region is large compared to that of the tube. Since this assumption implies that the tube completely fills its own region the accuracy may be increased by choosing space increments near the tube much smaller than the 1 ft. used in this example. A check made using space and time increments much smaller showed that the temperature at a point 1 ft. away from the source approached more closely the temperature obtained by the electrical analogue.
In this respect the advantages of the use of cylindrical coordinates for this particular problem are worth mention. By using cylindrical coordinates the space increments near the source or sink can be made small and increasingly larger further away from the source. This will improve the accuracy to a great extent but at the expense of more computational labor.
The methods discussed in this paper should prove to be valuable tools in the study of the rates of frost penetration and thawing in soils. The application of all of the methods is considerably simplified when large, plane heat sources and sinks are concerned. Mathematical solutions are advantageous in only those cases in which the boundary con-ditions are simply defined. The electrical -analogy method should prove very useful when one geometrical system is to be studied under several different sets of boundary conditions and thermophysical properties. If a single study incorporating complex boundary conditions is to be made, then in general, the numerical method should prove to be the most useful.
References
Kafadar, A. D., Budenholzer, R. A., Fieldhouse, I. B., "Temperature Dis-tribution and Effect of Ice Formation Around the Ground Coil of a Heat Pump," flhinois Institute of Technology, 1947, (to be published)
Carslaw, H. S. and Jaeger, J. C., Conduction of Heat in Solids, London, The Oxford University Press, p. 280,. 1947.
Gemant, A., "Transient Temperatures Around Pipes Maintained at Constant Temperature,?? rournal of Applied Physics, Vol. 17, p. 1076-1081, Dec., 1946.
Grinter, L. E., Numerical Methods of Analysis in Engineering, New York, Macmillan Co., 1949.
Dusinberre, G. M., Numerical Analysis of Heat Flow, New York, McGraw-Hill Book Co. , 1949.
Dusinberre, G. M., "Numerical Methods for Transient Heat Flow," ransactions, American Society of Mechanical Engineers, Vol. 67, p. 701-712, November, 1945.
Paschkis, V. and Baker, H. D., "A Method for Determining Unsteady State Heat Transfer by Means of an Electrical Analogy," Transactions, American Society of Me- chanical Engineers, Vol. 64, p. 105-112, February, 1942.
Kersten, M. S. , "Thermal Properties of Soils,?! University of Minnesota Insti-
tuteof Technology, Bulletin No. 28. Bottorf, J. D., "Ground Temperature Measurements,?? An unpublished report
on the results of an investigation conducted by the Engineering Experiment Station, Purdue University, 1948.

161
THERMAL PROPERTIES OF SOILS
Miles S. Kersten, Associate Professor, Civil Engineering, University of Minnesota
Calculation of depth and rate of frost penetration or depth and rate of thaw of frozen soils requires a knowledge of the thermal properties of soils. These properties include thermal conductivity; specific heat and volumetric heat capacity, and thermal diffusivity. Definitions of these terms, together with the units used in this paper follow:
The coefficient of thermal conductivity, k, is ameasure of the quantity of heat that will pass through a unit area of unit thickness in unit time under a unit temperature gradient. It is common in this country to express k in British thermal units trans-mitted per hour through a body 1 sq. ft. in area and 1 in. thick with a temperature dif-ferential of 1 deg. F.
Specific heat, 5, is the ratio of the quantity of heat required to raise a unit mass of a substance 1 deg. to the quantity required to raise a unit mass of water 1 deg. Numerical-ly, S may be considered as calories per gram per deg. C. or Btu's per lb. per deg. F.
Volumetric heat capacity, C, is the amount o heat required to raise a unit volume of material 1 deg. With soils, a unit of Btu's per cu. ft. per deg. F. is commonly used. Volumetric heat capacity of a soil is dependent principally upon its density, moisture content, and temperature (frozen or unfrozen).
Thermal diffusivity, h2 , is an index of the facility with which a material will undergo temperature change. It may be calculated by the basic equation
- C
With units of k and C as previously noted, the equation becomes
2 - 0. 08333k h C
with h2 in ft. 2 per hr.
Specific Heat and Volumetric Heat Capacity
The specific heat of the various rocks and minerals present in soils can be found in various handbooks (see Bibi. 2, for ex-ample.) On the basis of such tabulations many investigators have selected a value of about 0. 19 or 0. 20 as being character-istic for the general run of soils. Shannon and Wells used such values in their de-termination of thermal conductivity values (12). A series of specific heat tests made at the University of Minnesota (5, 7) in-dicates that such values are entirely reasonable at a temperature of 140 F. plus or minus, but are too high for tem-peratures close to the freezing point. Figure 1 shows a plot of the results of four tests made on a single soil at four dif-ferent temperatures. Figure 2 gives such curves for six soils with the individual test points omitted. These figures clearly indicate the decrease in specific heat for a decrease in temperature and that 0. 16 or 0. 17 is probably a reasonable value to assume for soils when temperatures close
111171 oiiizii
- 6(
40
20
/0
SPECIFIC jEST
Figure 1. Variation of Specific Heat With Mean Tenerature. (Soil P4701 Graded
Ottawa Sand).

162
to the freezing point are being considered. The Handbook of Physical Constants of the Geological Society of America (2) indicates a similar change of specific heat with change in temperature for various rocks. Many of the rocks listed have a specific heat of about 0. 17 at 32 F.
The soils shown in Figure 2 represent a variety of mineral compositions and textures. Tests were also made on six other soils but at only one temperature; these gave values similar to those shown. On the basis of these tests it would seem reasonable to assume a specific heat of about 0. 17 at 32 F. for most soils.
The volumetric heat capacity of a dry soil may be computed, if its specific heat and density are known, by the formula
C=S&
P4701 GRADED OTTAWA SAND
DO
P4604 LOWELL SAND—.
S FA1BASLI LOAN
P4706 CRUSHED GRANITE
so- P4505 NORThWAY
A/1—
SLT LOAM
40
~—,P4503 NORTHWAY 545 20L
// '. ., J7 J J9
SPECIFIC HEA1
Figure 2. Variation of Specific Heat With Mean Temperature. (Curves for Six Soils).
wherein C is the volumetric heat capacity in Btu' s' per cu. ft. per deg. F., S is the specific heat, and 8 the density in lb. per cu. ft.
It has been shown (5, 7) that the specific heat of a soil-water mixture may be com-puted by proportion according to the per-centages by weight of the soil and water and the specific heats of the components. Thus one may write
Sm - 100.5
l00 ++ ww
1.0
wherein Sm is the specific heat of the mix-ture (wet soil), S the specific heat of the dry soil and w the moisture content of the soil expressed as a percentage of the dry weight.
The 1. 0 in the above equation represents the specific heat of the water. If the soil is frozen, the specific heat of ice should be substituted. This is about 0. 5. Thus, for frozen soils:
Sm - 100. 10S 0+w + w• 0. 5
If S is assumed to be 0. 17 for soils close to the freezing point these equations become
For unfrozen soils, Sm =
17 + w 100 + w
For frozen soils, 5m 17 + 0.5 w
100 + w
The volumetric heat capacities would be
For unfrozen soils, Cm 17 + w
100 + w Im 8 (1 +
For frozen soils, Cm =
(17+0.5w + w 100 + w
C m is in Btu's per cu. ft. per deg. F., 8 is the dry density in lb. per cu. ft., and w is the moisture content as a percentage of the dry weight.

163
Thermal Conductivity
There have been numerous investigations to determine the coefficient of thermal conductivity of soils. The earliest extensive results were reported by H. E. Patten (9). Comprehensive reports have been made by W. 0. Smith (13, 14, 15), W. L. Shannon and W. A. Wells (12), and M. S. Kersten (6, 7). Gunnar Beskow has given a rather complete discussion of the important factors to be considered in soil conductivity (2). Recently studies of thermal properties of soil, including conductivity, have been undertaken in coimection with work on heat pumps. Such investigations are now being made, for example, at the University of Kentucky (10) and Texas A. and M. College (17).
As would be expected, the thermal conductivity of a soil is dependent upon many factors, including density, moisture content, temperature, (above or below freezing point), texture, structure, and mineral composition. The influence of each of these factors will be briefly discussed and the general range of soil conductivities noted in the following paragraphs. This discussion is based largely on the investigation con-ducted at the University of Minnesota which was sponsored and financed by the Corps of Engineers (6, 7). The general results are in agreement with the studies of the New England Office of the Corps of Engineers (12). In some of the other investigations the soils information reported is not sufficiently complete or does not cover a sufficient range to yield exact relationships.
Temperature
The important aspect of temperature on the thermal conductivity of soil is whether the soil is frozen or not. The difference in conductivity of frozen and unfrozen soils is chiefly dependent on moisture content. On relatively dry soils no change in the coef-ficient k occurs in passing through 32 F. At low moisture contents, i. e. , up to about 6 percent in sandy soils or 12 percent in fine textured soils, the conductivity is lower below freezing than above. With further increases in moisture, however, the k of frozen soil is greater than that for unfrozen. Tests indicate that at the so-called modified optimum moisture content, the k below freezing averages about 17 percent greater than that above freezing; at 5 percent of moisture above this point, the frozen k is 35 percent greater. Shannon and Wells (12) state that "for highwater contents the thermal c.onductivity of the frozen material is (with the exception of one material tested) approximately 50 percent greater than the corresponding value for the material unfrozen. Beskow is also in general agreement with these results if the soils are sandy, but not for clays. For sandy soils he concludes that the increase in k when a soil freezes "is about 10-15 and at the most 20-30 percent. " (2). Data cited by Muller (8) show an in-crease of about 50 percent for clays and an even greater increase for extremely wet sands. -
Density -
Tests have shown that an increase in the dry density of a soil, the percentage of moisture remaining the same, results in an increase in thermal conductivity. The rate of increase is about the same at all moisture contents and is not particularly different for frozen and unfrozen soils. As a general rule, it may be assumed for a given soil that a change in dry density of 1 lb. per cu. ft. will result in a change of 3 percent in its thermal conductivity.
Moisture Content
The moisture content of a soil has a very important effect on its thermal conductivity. At a constant dry density, any increase in moisture results in an increase in conductivity. This result has been obtained by all investigators. (6, 9, 11, 12, 15) A characteristic sandy soil, for example, might have a k of 6 at 3 percent moisture and 12 at 15 per-

I.-U-
20
0 Cr 110 a.
l00
I- 90
z w 0 80
70
..i 120
I- Ito U) z
100
0 go
164
cent. The increase continues up to the point of saturation. The moisture content has a like effect in the frozen state.
Texture
If soils of different texture are tested at equal moisture contents and densities it will be found in general that the coarse-grained materials, such as gravels and sands, will have high conductivities; fine-grained soils such as silt barns and clays, low con-ductivities; and intermediate-textured soils values between these two. Bayer (1) cites several investigations which show this variation. Smith (15) states that soils with high organic contents have the lowest conductivity, those high in clay an intermediate ability to transmit heat, and those of sandy texture the greatest ability. It should be noted, however, that in the field sandy soils ordinarily exist at higher densities and lower
130
UNFROZEN
0 ~1' OVER 0
MOISTURE CONTENT - PER CENT
UNFROZEN
tO 20 30 MOISTURE CONTENT - PER CENT
0
Figure 3.
80
7r
FROZEN ELI E
R!• 110
Cn
100
9O tO 20 30 - 40 0 10 20 30 MOISTURE CONTENT - PER CENT MOISTURE CONTENT - PER CENT
Chart for Estimating Thermal Conductivity of Soil. (k in Btu's per sq. ft. per inch per hour per deg. F.)
130
120
SANDY
FR , OZEN 0 WHO
PLINN No
0 a' I A
50 hh~
am
E E 4 W 10 h N III OR
moisture contents than-silt-or clay soils.. -Hence the differences noted in laboratory -
testing may not occur in soils in their natural position. It has been found expedient at the University of Minnesota to divide soils into two general classes for construction of thermal conductivity charts, i. e. , sandy soils, and silt and clay soils.
Mineral Composition
Consideration of mineral composition has shown that this factor does have some effect on the thermal conductivity of a soil. It is a factor, however, which is difficult

165
to evaluate, since mineral composition is not commonly determined in soil testing. Compiled tables (for example, Table 174, Bibl. 2) indicate that the conductivity of the various rocks of which soils are composed vary over a wide range. Quartz, for ex-ample, is reported as having thermal conductivity values from 50 to 85 Btu's per sq. ft. per in. per hr; per deg. F. whereas basalts, trap rock, and gabbro vary from 11 to 17. In general, tests indicate that sands with a high quartz content have greater conductivities than sands with high contents of such minerals as plagioclase feldspar and pyroxene, which are constituents of basic rocks. Soils with high contents of kaolinite and other clay minerals have relatively low conductivities. It appears rather difficult on the basis of available information, however, to take mineral composition into account when estimating thermal conductivity . Smith has suggested an equation for k in which the conductivity of the rock constituents is taken into account. (13)
Structure
Most thermal conductivity studies on soil have been on so-called "disturbed" sam-ples. Soils in the field may have distinctive structure or laminations which may have a large effect on their conductivity. Smith has considered this factor in his studies (13). He found that for granular structured soils, there was Jittle, if any, differences in test results on undisturbed soils and materials which had been broken down and re-compacted. However, for most other structure patterns, k values for the undisturbed materials are greater than those on the same soil after a breaking down of the struc-ture.
truc-ture. In some cases it may be twice as great as that observed for the reduced state. These results are for dry soils. Smith has suggested a structure factor to take this soil condition into account.
In frozen soils, particularly those with ice lenses, the effect of stratification may be very important. This factor requires additional study.
Prediction of Thermal Conductivity
For most field calculations it will not be feasible to make thermal conductivity tests of the soil under consideration. For this reason it is highly desirable to make use of present knowledge to estimate a k value for the soil. Four charts for this purpose were published in the 1948 Proceedings of the Highway Research Board (6). It is hoped to modify and correct these charts as additional information is obtained. In fact, changes have already been incorporated in two of them The four charts are shown in Figure 3. Two are for sandy soils and two for silt and clay soils; for both classes of soil, one chart is for frozen soil, and the other for unfrozen. The division point in texture may be based on silt and clay contents (particles smaller than 0. 05 mm.). Soils with more than 50 percent silt and clay are in the fine textured group, those with less than 50 percent in the sandy group.
Diffusivity
Diffusivity values are of interest in frost calculations since they indicale the rate at which a soil will change temperature when the temperature of the surrounding medium changes. Since this constant can be determined if its volumetric heat capacity and thermal conductivity are known, no specific values need be given herein. However, it should be noted that for soils with high moisture contents, the diffusivity of a frozen soil is appreciably higher than for the unfrozen condition. At 15 percent moisture con-tent, for example, the diffusivity of a frozen soil may be 50 percent greater than that of the unfrozen soil. Thus the average temperature of a frozen body of wet soil will change more rapidly than a similar body of unfrozen soil at a given temperature dif-ferential between the soil and the surrounding medium.
In calculations involving the freezing or thawing of a soil it is necessary to take into account the latent heat of fusion of the ice. This amounts to about 144 Btu's per lb. If a soil is thawing, the temperature change is delayed because of the latent heat of fusion.

166
Conclusion
Our knowledge of the thermal properties has increased considerably during the last few years. Numerical values of the various constants permit mathematical checks of various heat-transfer problems in connection with frost action in soils. The numerical values of specific heat and thermal conductivity given in this paper, with which diff u-sivities may also be calculated, are offered for use in such calculations. It is hoped that use of these values and additional research may lead to corrections and improve-ments in the stated values.
It should be noted that most of the thermal property information available is from laboratory tests. The need for field checks is apparent.
Bibliography
Bayer, L. D., "Soil Physics," New York, John Wiley and Sons, 370 pp., pp. 153-155 and 275-289, 1940.
Beskow, G., "Soil Freezing and Frost Heaving with Special Application to Roads and Railroads," Swedish Geological Society, Ser. C. , No. 375, 26th Yearbook, No. 3, 1935. With a special supplement for the English translation of progress from 1935 to 1946. Evanston, Illinois: Northwestern University, Technological Institute, Nov., 1947. (Translated by J. 0. Osterberg).
Ingersoll, L. R. and Koepp, E., "Thermal Diffusivity and Conductivity of Soils and Materials," Physical Review, July, 1924.
Kennelly, A. E. and Shepard, E. R., "The Heating of Copper Wires by Electric Currents," Transactions American Institute of Electrical Engineers, Vol. 26, p. 969, 1907.
Kersten, M. S. , "Specific Heat Tests on Soils," Proceedings Second Inter-national Conference on Soil Mechanics and Foundation Engineering, Vol. 3, 1948.
Kersten, M. S., "The Thermal Conductivity of Soils," Proceedings, Highway Research Board, Vol. 28, 1948.
Kersten, M. S., "Thermal Properties of Soils," Bulletin 28, Engineering Ex-periment Station, University of Minnesota, June, 1949.
Muller, S. W., "Permafrost or Permanently Frozen Ground and Related Engi-neering Problems," U. S. Geological Survey, Special Report, Strategic Engineering Study No. 62, Prepared for Military Intelligence Division, Office., Chief of Engineers, U. S. Army, 1945. 2nd Printing. Ann Arbor, Michigan. J. W. Edwards, Inc., 1947. Reprint. 231 pp.
Patten, H. E. "Heat Transference in Soils," United States Department of Agriculture, Bureau of Soils, Bulletin No. 59, September, 1909.
Penrod, E. B. and others, "Earth Heat Pump Research," Bulletin No. 14, Engineering Experiment Station, University of Kentucky, December, 1949.
Shanklin, G. B., "Effects of Moisture on Thermal Conductivity of Soils," Journal of A. I. E. E., February, 1922.
Shannon, W. L. and Wells, W. A., "Tests for Thermal Diffusivity of Granular Materials," Proceedings American Society for Testing Materials, Vol. 47, 1947.
Smith, W. 0., "Thermal Conductivity of Dry Soils," Soil Science, Vol. 53, June, 1942.
Smith, W. 0., "The Thermal Conductivity of Dry Soils of Certain of the Great Soil Groups," Proceedings Soil Science Society of American, Vol. 3, 1938.
Smith, W. 0., "Thermal Conductivity of Moist Soils," Proceedings Soil Science of America, Vol. 4, 1939.
U. S. Department of the Interior, Bureau of Reclamation, "Thermal Properties of Concrete," Part VII, Bulletin I, Boulder Canyon Project, Final Reports.
Vestal, D. M., Jr., "Heat Pump Buried Coil Design - The Soil Problem", Refrigerating Engineering, Vol. 47, p. 573, 1949.

167
RELATION OF FROST ACTION TO THE CLAY-MINERAL COMPOSITION OF SOIL MATERIALS
Ralph E. Grim, Geologist and Head, Division of Clay Resources and Clay Mineral Technology, University of Illinois
Within the last 25 years the occurrences and properties of the clay-mineral com-ponents of soil materials and the characteristics of clay -mineral -water systems have been the subject of many researches. It is the, object of the present paper to analyze the data and concepts that have come out of recent clay-mineral researches that are pertinent to the matter of frost action and frost heaving.
Factors Involved in Frost Action
There are two factors regarding frost action in clay materials particularly perti-nent to a consideration of the influence of the clay minerals:
Taber (1) has shown that frost heaving is due to the growth of ice crystals rather than to a volume change accompanying a change in state. An increase in the size of ice crystals requires that the growing crystal be fed by a supply of water, i. e. there must be movement of water through the soil material. On freezing, soil material frequently shows segregation of ice masses into layers which require move-ment of water to the' point of segregation.
Very fine colloid-sized clay materials show very little or no segregation of ice on freezing (1). Further it is well known'that certain clays, e.g., some of the bent-onites from Wyoming, are substantially impervious to water movement. Students of agricultural soils have shown that a certain percentage of water held by soils does not freeze at moderately low temperatures (2). Those and other considerations suggest that water held in soil, pores of all sizes and in soils of all kinds may not all have the same characteristics. Water directly adjacent to an adsorption surface, e. g. , a clay-mineral surface, in a soil is likely to be in a different physical state than the water in the center of a fairly large pore.
Winterkorn (3) has attempted to summarize ideas on the character of a pore water in soil material:
"Directly adjacent to the adsorbing soil solidly adsorbed water is to be found, the center of a pore space is occupied by ordinary water, freezingat about 0 C., and between the ordinary water and the solidly adsorbed water there is a zone of liquid water possessing a melting point down to -22 C. which serves as a passageway for the conduction of water to freezing centers.
Composition of Soil Materials
It is generally agreed by almost all students of soils that most soil materials are composed essentially of extremely small, usually colloid-sized, crystalline particles of one or more minerals that have been called "clay minerals" (4). Some clay minerals are equidimensional and flake-shaped, others are elongate and lath- or needle-shaped, and some seem to be tubular. The clay mineral composition is the major factor controlling the properties of most soils. The surface of the clay min-erals provides the major adsorption surface in soil materials, and the adsorption characteristics towards water and various ions and organic molecules vary for the different clay minerals.
Montmorillonite Soils
It is preferable to beginan analysis of the relation of clay-mineral composition to frost action by. considering a soil composed solely of montmorillonite. In montmor-illonite, adsorption water penetrates between the individual molecular layers, and as a consequence such material has tremendous adsoption surface and enormous water-

168
TABLE 1
CLAY MINERALS
Kaolinite (OH)8Si4A14O10
Halloysite - high hydrate form (OH)8Si4A140102H20
low hydrate form (OH)8Si4A14010
Montmorillonite (OH)4Si8Al4020xH20 *
flUte - muscovite type (OH)4K(Si8_'Al1)(M94 Al4 Fe4)0
biotite type (OH)4Ky(Si8_y.Aly)(Mg•Fe)6020
Vermiculite (OH)4(SiAl)(MgFe) 60af4R20
Chlorite
Attapulgite-.Palygorskite **
* In montmorillonite some magnesium always replaces aluminum, and the replacement may be substantially complete. Iron in varying amounts may also re-place the aluminum.
The attapulgite-palygorskite clay minerals are not well known and no general formula can yet be written for the group. The minerals are hydrous magnesium silicates, with some replacement of magnesium by aluminum and with a hornblende-type crystal structure.
adsorption capacity. The theoretical total adsorption surface of montmorillonite is computed as 800 sq. m. per gram.
Hendricks and Jefferson (5) have presented structural evidence that the water molecules adsorbed on montmorillonite surfaces show a crystalline configuration and have suggested a concept of the actual configuration, which is reproduced in Figure 1. MacKenzie (6), and Barshad (7), while agreeing that the initially adsorbed water shows a definite configuration, have presented alternative concepts of the actual structure to the one suggested by Hendricks and Jefferson. In montmorillonite, all the basal plane surfaces, which provide almost all the surface area, possess structural character-istics which seem to favor particularly the development of a crystalline configuration in the water molecules immediately adjacent to it.
There seems to be little doubt that the water adsorbed on the surface of mont-morillonite particles would consist of water molecules in a definite pattern and, there-fore, the water would not be fluid or mobile. Grim (8) has presented an analysis of certain properties of clay-water mixtures which provided convincing evidence that the water initially adsorbed is rigid rather than mobile or fluid and that at varying distances from the adsorbed surface the rigid water changes to liquid water. Figure 2 presents a diagrammatic sketch of the condition of the water in the plastic and non-plastic states.
Montmorillonite has high adsorption capacity for certain cations, anions, and or-ganic molecules. In ordinary soils the usual adsorbed cations (exchangeable bases) are alkaline earths, alkalies, and/or hydrogen, and it can be computed on the basis of cation-exchange capacity that an adsorbed cation is present for about every 140 sq. Angstrom units of total surface. The adsorbed ions areheld on the adsorbing water surfaces. The tremendously significant fact is that the character of the adsorbed ion to a very considerable extent controls the perfection of orientation of the water mole-

169
culés and the thickness of the water layers, showing a definite configuration, and as a consequence exerts an enormous influence on the properties of clay-water systems (8).
In montmorillonite carrying sodium as the adsorbed ion, water can enter easily between all the unit layers, and in the presence of an abundance of water, adsorbed water layers with a definite configuration of water molecules can build up to great thicknesses (probably with thicknesses of the order of at least 100 Angstrom units). Thus even in the presence of large amounts of water in-which the water content would be in excess of the clay-mineral content, there would be no fluid water. Such clays are, therefore, substantially impervious, and on freezing there is little or no con- centration of ice in layers. -
In montmorillonite carrying calcium, magnesium, or hydrogen as the exchangeable ion, the situation would be quite different than for a sodium montmorillonite. When the alkaline earths or hydrogen are present as adsorbed-ions, water enters between the unit layers with some difficulty, and forms relatively thin layers of rigid adsorbed water. In such clays, water present beyond a certain relatively small amount (about 40 percent of the dry clay); in comparison with Na+ montmorillonite clay, is fluid. In such clays, therefore, concentration of ice in layers may develop on freezing only if the moisture content is fairly high.
In montmorillonite clays containing potassium, there is very little adsorption of water with a definite configuration. Therefore, in the presence of even small amounts of water, some fluid water would be present.
It should be emphasized that the adsorbed ions are exchangeable, and therefore a
- :h1ca :;0:raI - -
-
---- --------
- Oriented water . - - .. - -
- molecules - - - - - -
%Ô % '
Figure 1. configuration Proposed by Hendricks and Jefferson of the Water Adsorbed - Directly Adjacent to Basal Plane Surfaces of W.ontmoriflonite. - -
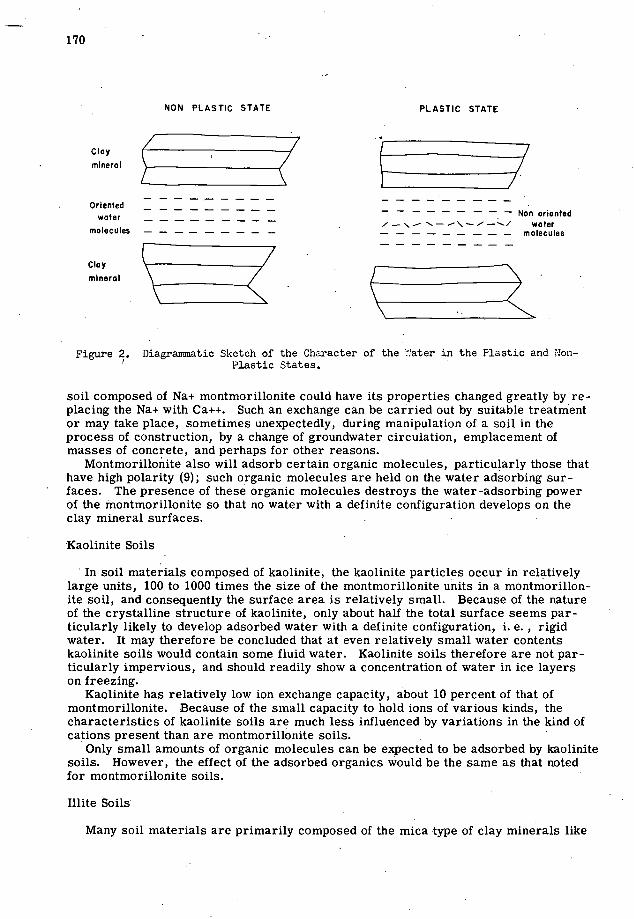
170
NON PLASTIC STATE
Cloy
mineral
Oriented water
molecules
Clay
mineral
PLASTIC STATE
- Non oriented / - \ — —\ - - --/ water
molecules
Figure 2. Diagrammatic Sketch of the Character of the water in the Plastic and Non— I Plastic States.
soil composed of Na+ montmorillonite could have its properties changed greatly by re-placing the Na+ with Ca++. Such an exchange can be carried out by suitable treatment or may take place, sometimes unexpectedly, during manipulation of a soil in the process of construction, by a change of groundwater circulation, emplacement of masses of concrete, and perhaps for other reasons.
Montmorillonite also will adsorb certain organic molecules, particularly those that have high polarity (9); such organic molecules are held on the water adsorbing sur-faces. The presence of these organic molecules destroys the water-adsorbing power of the montmorillonite so that no water with a definite configuration develops on the clay mineral surfaces.
Kaolinite Soils
In soil materials composed of kaolinite, the kaolinite particles occur in relatively large units, 100 to 1000 times the size of the montmorillonite units in a montmorillon-ite soil, and consequently the surface area is relatively small. Because of the nature of the crystalline structure of kaolinite, only about half the total surface seems par-ticularly likely to develop adsorbed water with a definite configuration, i. e. , rigid water. It may therefore be concluded that at even relatively small water contents kaolinite soils would contain some fluid water. Kaolinite soils therefore are not par-ticularly impervious, and should readily show a concentration of water in ice layers on freezing.
Kaolinite has relatively low ion exchange capacity, about 10 percent of that of montmorillonite. Because of the small capacity to hold ions of various kinds, the characteristics of kaolinite soils are much less influenced by variations in the kind of cations present than are montmorillonite soils.
Only small amounts of organic molecules can be expected to be adsorbed by kaolinite soils. However, the effect of the adsorbed organics would be the same as that noted for montmorillonite soils.
Illite Soils
Many soil materials are primarily composed of the mica -type of clay minerals like
171
illite and chlorite. The characteristics of such soils range between those of kaolinite soils and montmorillonite soils but usually are closer to the former than the latter. Illite soils contain adsorption surfaces of the same order of magnitude as kaolinite soils; however, in illite all the adsorption surface (rather than half as in kaolinite) has a structure configuration likely to foster the development of orientation in adjacent water molecules. Somewhat more adsorbed water would be immobilized in illite clays than in kaolinite clays, but the total quantity would still be relatively small, and at rel-atively low water content illite clays would be expected to contain fluid water. Ulite clays are not impervious and should show readily the concentration of water in ice layers on freezing.
Soil materials composed of illite and chlorite clay-minerals have an ion exchange capacity about 2 to 5 times that of kaolinite soils but still only about 1/4 to 1/2 that of montmorillonite soils. The influence of various cations would be expected to be less than that for montmorillonite but considerably more than that for kaolinite. The in-fluence of the particular cations would be the same as that stated for the previous soils.
Many illite soils contain small amounts of montmorillonite interlaminated with the illite layers. It has been pointed out previously (8) that small amounts of such mont-morillonite can have an effect on physical properties out of all proportion to the amount actually present. This conclusion should also apply to frost action. A small amount of montmorillonite would greatly increase the amount of water immobilized, particularly if adsorbed sodium ions were present and as a consequence increase the. imperviousness and decrease the tendency for water to concentrate in ice layers on freezing.
Halloysite Soils
Recent investigations by the author (10) have shown that halloysite soils are likely to have unusual and troublesome properties for the engineer. However, because of structural similarities to kaoliriite so far as frost action is concerned, halloysite soils should act similarly to kaolinite soils.
Vermiculite Soils
Soils containing vermiculite are not yet known to be very common. Vermiculite appears to have somewhat similar water adsorbing properties to those of calcium montmorillonite. It has about the same ion-exchange capacity as montmorillonite, and therefore, vermiculite soils would be expected to react to freezing similarly to calcium montmorillonite soils.
A ttapulgite -palygorskite Soils
Soils composed of these clay minerals appear to be relatively rare. It is noteworthy that the present known occurrences seem to be limited to dry areas of high tempera-ture where frost action would not be encountered. The scant data regarding the struc-ture and properties of these minerals permit only the tentative suggestion that soils containing them would act like montmorillonite soils except insofar as the influence of adsorbed cations is concerned. Clay water systems of these clay minerals show con-siderably less variation because of cation variation than do montmorillonite soils.
Influence of Salts added to Soils
Salts added to soils may produce cations which will be adsorbed by the clay minerals or cause base-exchange reactions with resulting effects, such as previously described. Salts added in large quantities than required for adsorption, or of a kind or under con-ditions where there is no ion exchange reaction, may act otherwise on frost properties. It is not the purpose of the present paper to analyze the effect of such added salts, but

172
it is obvious that one of the effects of some such salts -may be to hydrate. On hydra-tibn the salt would develop a hydration structure, which in effect would immobilize the water involved in the hydration. An effect of the addition of the salt is, therefore, to tie up some water in an immobile form.
Bibliography
Taber, S., The Mechanics of Frost Heaving, ]our. Geol. 38, pp. 303-317, 1930. Bouyoucos, G. J., The Dilatometer Method as an Indirect Means of Determin-
ing the Permanent Wilting Point of Soils, Soil Sci. 42, pp. 217-223, 1936. Winterkorn, H., The Condition of Water in Porous Systems, Soil Science,
Vol. 56, 1943.. - - -
Grim, R. E., Modern Concepts of Clay Materials, Jour. Geol. 50, pp. 225- - 275, 1942. Rept. mv. 80, Illinois Geol. Survey, 1942. -
Hendricks, S. B. and Jefferson, M. E., Structure of Kaolin and Talopyro-phyllite Hydrates and Their Bearing on Water Sorption of the Clays, Am. Mm. 23, pp. 863-875, 1938. - - -
MacKenzie, R. C., Some Notes on the Hydration of Montmorillonite, Bulletin of the Clay Mineral Group of Great Britain, 1949.
Barshad, I., The Nature of Lattice Expansion and its Relation to Hydration in
m Montorillonite and Vermiculite, Am. Mm. 34, pp. 675-684, 1949. - Grim, R. E., Some Fundamental Factors Influencing the Properties of Soil
Materials, Second International Conf. Soil Mechanics Proc. Vol. III, pp. 8-12, 1948. MacEwan, D. M. C., Complexes of Clays with Organic Compounds, Trans.
Feraday Soc. 44, pp. 349-367, 1948. Grim, R. E., The Composition in Relation to the Properties of Certain Soils,
Geotechnique, Vol. 1, pp. 139-147, 1949.
ICE-BLOCKED DRAINAGE AS A PRINCIPAL FACTOR IN FROST HEAVE,- SLUMP,
AND SOLIFLUCTION
Paul A. Siple, Chief of Environmental Research Section, Department of the Army
Synopsis
Frost heave is caused by the freezing expansion of excess water accu- mulation either in the active zone above permafrost, or in the "vernal active zone" above the horizon of winter frozen ground. Normal gravita- tional drainage is blocked by an impervious ice horizon below the active zone. Water from melted snow cover, rain, and low evaporative rate in cool weather causes the soil of the active zone to become saturated; and as the excess accumulates, it increases the hydrostatic head. Ex- pansive action of diurnal freezing in the active zone deforms the soils and permits formation of pockets-, lenses, and layers which refill with free water or ice. The thicker these free-water layers become the greater becomes the expansive or frost heave force, disrupting the active soils above them. Frost heave under highways is intensified because winter freezing is abnormally deep due both to high conduc- tivity of -pavement and diurnal ("vernal active zone") activity. - It is also more violent because of deep thawing due to solar heating of the pavement in daytime and unrestricted radiant cooling at night which results in rap- id and deep freezing. Ice horizons may also block drainage and create water accumulation troughs. Control measures must either insulate pavement areas to neutralize these anomalies, or must provide positive drainage. - -
In sloping land, water accumulates at the base of the active zone, lying on the impermeable frozen layers which, of course, may also slope. Gray-

173
itational forces increase the hydrostatic head, and water instead of accumu-lating in layers and lenses tends to move laterally down the slope through the soils. The most plastic portion of the soil tends to be where the hydrostatic force is greatest just above the impermeable ice layer. Soil slump or move-ment of the active layer down-grade will occur when the critical moment is reached, i. e., when the force of soil weight at the gravity slope angle exceeds the soil plasticity constant, the inertia, the deformation resistance of thawed soil zone, and the surface vegetation binder resistance. Effective control measures would include positive prevention of excess water accumulation from above, which might be achieved by means of an impervious ground sur-face cover that would cause water from melting snow and rains to drain off the surface directly without downward penetration; by positive drainage at the critical depth to prevent complete saturation of the active zone;, and pos-sibly by vertical sumps draining downward through the frozen soil zone to an absorptive layer beneath. (Vertical perforated drain pipes, however, may be impractical in deep permafrost areas.)
This paper deals with conclusions and theories derived from personal observations in the field. In general, they are based on several assumptions:
That frost heave, slump, and solifluction do not generally occur or may be elim-inated by corrective action whenever good subsoil drainage extends below the frost line, e. g. typical coarse' gravels.
That frost heave, slump and solifluction do occur under the conditions represented by water-saturated soil at or above the frost line.
That with the exception of obvious cases of continually high water table resulting from purely topographic features or from the presence of impermeable sub-surface layers, freezing ground deformation must be attributed to a winter seasonal accumula-tion of water within the freezing zone especially where the drainage and run-off appears otherwise adequate during the "warm-wet" season.
That when gravitational force exceeds molecular attractive forces (capillarity, cohesion, and adhesion) free water will tend to migrate downward to a base level and accumulate there.
That soils which normally drain well become relatively impervious when frozen, and the soil interstices are also ice-filled.
That saturated soils are generally more plastic than dry or partially moist soils, and will tend to migrate (solifluction, etc.) under pressure or gravitational forces of sufficient magnitude, and in some areas, as is well known, such solifluction may take place due to vibrations.
That freeze-thaw action of free water accumulated in soil has a "jacking" or ratchet action which deforms the soil about it, and leaves voids during the thaw cycle which are replaced by free water.
That water accumulation can come from vertically downward gravitational action from surface moisture; horizontal migration from accumulation elsewhere, or vertically upward migration by either capillary action or by vapor deposition process.
That frost deformation phenomena occur most typically during the early vernal season in soils of fair drainage characteristics, but may occur at anytime during the freezing season in poorly drained soils or where a high water table exists.
From the foregoing, and based on climatic considerations discussed in a companion paper of this conference, it is visualized that frost deformation phenomena in the ground which give rise to frost heave, slump, solifluction, etc. can be explained by a simple process of ice blocked drainage.
Thermal lag, from seasonal accumulation or loss of surface heat, creates ground-temperature anomalies in a theoretical curve representing the thermal gradient between the surface temperature and the deep iso-thermal or mean annual temperature zone.
As winter sets in there is a strong positive heat anomaly representing stored summer heat a short distance beneath the surface, whereas both at the surface and at deeper levels the temperature is lower. As winter progresses this stored heat anomaly grad-

174
ually dissipates itself and gives way to a descending cold condition, which in turn be-comes a strong "temperature-deficit" anomaly in late spring and early summer. When frost penetrates into the ground it produces the additional characteristics of frozen ground which, until thawed, forms a part of the temperature-anomaly regime, espe-cially after mid-winter. In areas of permafrost, of course, the summer and winter thermal anomalies are within the frozen soil zone.
As winter sets in frost penetration is inhibited by the stored-heat anomaly and a quick freeze at the surface may be melted subsequently from below even though the surface remains slightly below freezing. Also, if the soil in the anomaly zone is damp there will be a strong tendency, because of higher vapor pressure, for moisture mi-gration upward with condensation in the cold surface ground where the vapor pressure is low. This tends to saturate the surface and give rise to muddy conditions even though precipitation may be light. Moisture may further accumulate by dew, frost, and direct absorption from the atmosphere during periods of the day when the surface temperature is below air temperature. Thus independent of precipitated moisture an accumulation of water begins to form at the surface, preparing the soil for solid freezing, and also in itself supplying a source of moisture sufficient in many types of fine-grained soils to fill voids with free water which later becomes ice.
As winter progresses and the temperature -deficit zone reaches its maximum in-tensity, and the frozen zone reaches it maximum depth, the warming cycle begins to create an active freeze-thaw layer which we may call the vernal active zone. Beneath the vernal active zone is a frozen zone which, after mid-winter, is colder than the surface. The returning sun daily becomes more intense in its heating ability, and on clear days or during warm spells thawing may be deep; but at night refreezing is equally intense, for the water layer is not only chilled by atmospheric causes but it is also dissipating its heat into the cold and frozen soil immediately beneath it.
It is reasonable to assume that freeze-thaw action tends to keep soil particles suf-ficiently disturbed so that free water accumulated at the surface is able to migrate downward.
Initially, during the heat of the day, any downward migrating water aids in deeper thawing of the frozen soil, but as freezing conditions set in again at the surface the melt water zone may be arrested and freeze in position and become an accretion of the frozen layer. Many variations can be expected depending upon depth of the thaw and the duration and intensity of atmospheric freezing conditions. In some cases the whole vernal active layer may freeze while in others the melt water remians liquid and ready to continue its thawing journey downward. It has been observed that water on top of lake ice but protected by snow insulation can remain unfrozen for days at a time even when the air temperature was recorded as low as -50 F.
Thus we are picturing a migrating layer of water in saturated soil with free-water accumulation gradually working downward on the upper surface of a frozen zone of soil. The frozen layer remains impervious, for even if it were fissured, water seep-ing in under hydrolitic pressure would soon freeze and cement the leak. However, there appears to be little reason to suspect that the downward migration of the thaw layer is uniformly level, even if the upper surface of the ground is essentially flat. Pockets will form of varying size and shape prrducing 'inter-soil puddles" at various levels. Some soil horizons undoubtedly thaw more readily than others, and isolated blocks of sections of layers of frozen ground become isolated as enclaves or occlusions. Lateral progress may be faster in one zone than another, so in advanced stages we may picture a somewhat chaotic melting pattern. Such a pattern, or lack of pattern, would be expected on level land, whereas on slopes the migration of water is more likely to concentrate and flow down through the soil on the surface of an especially thaw resistant layer. This surmise is based upon the fact that gravity will continue to pull the water down this hypothetical inter-soil slope formed by frozen and im-pervious soil, somewhat parallel to the surface, rather than form inter-soil puddles as postulated for flat-land cases.
If we now postulate a period of deep freezing while the thawing action is well ad-vanced, we recognize that the zones of water accumulation will constitute potential
175
areas of abnormal expansion and the source of frost heave deformation upon freezing. Although other factors which produce impermeability can likewise contribute to
water accumulation and consequent frost heave, it appears most likely that ice forma-tions blocking spring drainage are the most wide-spread cause of frost heave phenom-ena. It is further postulated that the foregoing conception explains the formation of ice lenses of certain types described in permafrost investigations. Frost heave develop-ment is probably self aggravating. That is, heave action is strongest over inter-soil-puddle-type water accumulations. Deformation tends to make more area for water accumulation and in turn bigger and better heaves. When ice lenses thaw out from time to time the weight of material above undoubtedly creates sufficient hydrostatic pres-sure to force the water upward to the surface. This, in turn, suggests the origin of ice dykes, sills, polygon patterns, slumps, etc.
On sloping land of the southfacing type, so typical of solifluction action in the north country, we find again by the above reasoning a fairly simple explanation of solifluction and downhill slump. Permafrost investigations have shown that the permanently frozen ground is deepest beneath hills and shallowest in valleys. Thus if we picture a vernal thaw zone percolating its waters downward to the upper frozen horizon, we can see that the ice-blocked impermeable layer may be steeper than the surface configuration of the hill would indicate. This should hold true whether the frozen ground below is only a winter feature or not. The melt water layer should further gain in magnitude by migratory accumulation as the water moves downhill, thus creating in turn greater melting potential and further tendipg to steepen the sloped surface of the upper ice horizon. If we can agree that gravitational accumulation of water increases at the impermeable, ice-blocked sub-surface, it is but one step more to recognize that sat-uration will weaken the strength of the soil as well as lubricate the surface of the im-permeable layer. When the weight of the mass above overcomes inertia and plastic resistance of the soil, the whole surface of the hill side may slump downward.
Two common evidences are offered in support of this concept of solifluction. First, slump more often than not begins part-way down from the hill crest. This is believed to be due to the better drainage higher up on the hill. That is, there is less available surface moisture and vector drainage, or water migration is not supported from further up slope as is the case farther down hill. The second evidence is the frequent occurence of spring-like out-flows of water from beneath solifluction slumps after movement has taken place not only immediately afterwards but on subsequent years.
If the theory of ice-blocked drainage here discussed can be substantiated by further field study, the control can be improved. For example, a highway over flat country affected by frost heave may prove to be creating a subsurface trough in spring which is accumulating migratory water down ice-blocked, inter-soil slopes created by the presence of the highway. That is, the road surface is such that in most cases it favors intensive freeze-thaw beneath it. The surface is exposed to the sky and open sweep of the wind and generally consists of higher thermal conductive materials than the surround-ing surface. The surface heats fast in daytime and cools fast at night. Although it is fair to assume without supporting evidence that winter freezing beneath roads is deeper than on the shoulders, especially where snow is cleared for traffic, it can also be assumed that melting under the highway will progress more rapidly in spring. We may assume that thawing will let drainage accumulate in the thawed zone beneath the road where capacity for receiving it is increased over that of the vertical ice-blocked drain-age beneath the shoulders. The presence of the migrating water further activates melting and deepening of the trough" and presents a sizable quantity of water to support frost heaving. Thus it is suggested that restudy of the problem is required to determine methods of lessening the tendency of trough formation.
In respect to solifluction and slumping, it appears that surface moisture accumula-tion is an important point to be controlled, for it feeds the water drainage accumula-tion above the ice-blocked, inter-soil surface. In certain critical areas slumping tendency may be minimized by producing an impervious run-off surface.

176
SOIL INSTABILITY ON SLOPES IN REGIONS OF PERENNIALLY-FROZEN GROUND
H. S. Sigafoos and D. M. Hopkins, U. S. Geological Survey
Synopsis
Road construction in many parts of Alaska north of the Alaska Range and elsewhere in northern latitudes must contend with problems resulting from intensive frost action and the presence of perennially-frozen ground. Be-cause of poor drainage, wet soils, disturbances caused by repeated cycles of freezing and thawing, and the presence of a glide plane at the surface of • the perennially-frozen ground, slopes subject to rapid creep are much more common than in more temperate regions. In tundra areas the soil is cover-ed by a mat of shallow-rooted vegetation which modifies but does not prevent the characteristic soil movements on slopes. Special precautions must be taken to cope with these conditions during highway construction and mainte-nance.
Soil movements on slopes produce a set of characteristic micro-relief features including soil terraces (solifluction terraces, altiplanation ter-races), soil lobes (solifluction lobes, zunge), peat-mound stripes, peat rings, tussock-birch-heath stripes, rock stripes, and swales. Many con-struction problems on Seward Peninsula can be anticipated by identification of these features along proposed routes. Recognition of their significance permits the field worker to estimate the character and degree of instability of the soil, the drainage conditions, and the danger of subsidence upon thaw in areas in which these features are found. In many localities, study of the microrelief features would assist in selecting the best of several routes.
Frost action in soil of arctic regions creates unusual problems in the construction and maintenance of roads. Roads built on perennially-frozen silt or peat are subject to considerable subsidence if the silt or peat is allowed to thaw. Flood plains and perennial springs are sites of winter "icings" (Muller, 1945, p. 76) that cover roads and make them impassable. Movement of soil on gentle slopes causes difficulty in maintaining road cuts and grades onhillsides. Despite such movement, in the tundra regions 1/ of Alaska the slopes afford the best location for road construction.
Instability of soil on slopes in arctic regions manifests itself in such microrelief features as soil terraces, lobate terraces, soil lobes, tundra mudflows, and stone stripes. Most of the field studies on which this report is based were confined to the Seward Peninsula within the coastal tundra zone. The principles presented here, how-ever, are believed to apply to tundra regions elsewhere.
Seward Peninsula, which is between the Arctic Ocean and the Bering Sea in west-central Alaska, has a rigorous continental climate, with wet cool summers and cold winters. Frequent periods of alternating freeze and thaw occur in early summer and fall. Peaty soils from 1 to 30 ft. thick cover the floors of most valleys, lower slopes, and summits of low hills. Sandy soils mantle lower slopes of hills composed of schist, marble, and slate and cover the surface of older lava flows present at several local-ities. Large areas underlain with peaty silt or muck are present in the valley bottoms, on lower slopes of dissected uplands, and on coastal plains. Nearly all soils, except pure sand, are wet as compared with soils of temperate regions. Even on hill summits silty soils are wet, plastic, and difficult, if not impossible, to drain.
Most of Seward Peninsula is beyond the Arctic timber line; the vegetation consists of mosses, sedges, dwarf willows, and small birch and heath shrubs. Spruce grows in the southeastern part, where small amounts of it are cut for rough timber.
\mdra is defined here as those areas in high latitudes in which timber is lacking and the ground bears a partial or complete cover of sedges, iliows, dwarf birches, mosses, and lichens.

177
During the summers of 1947-1950, the writers studied processes of intensive frost action and related phenomena on Seward Peninsula. This project was part of the perma-frost program of the U. S. Geological Survey financed in part by the Corps of Engineers, United States Army. The present report is a by-product of that study.
Sincere appreciation is expressed to L. L. Ray and F. C. Whitmore, Jr. , for their helpful criticism during the preparation of this report.
Highway Construction Methods
In 1949 Seward Peninsula had 350 miles of road and tramway (Mr. J. D. Hudert,
- • •• •.
.. ............. •..''-•..-
'). ••)
-
Fiu.re 1. oad Conrnction in rea of Perennially 'rozn Peat ariL. .i1t Near Council, Alaska. Grwel is Lai. on Tundra without Disturbn )urface Ve."ctatjon.
District Engineer, Alaska Road Commission, personal communication). The road net consists of a group of connected roads serving mining areas near Nome and several short, isolated roads extending inland from other coastal towns. Traffic is light, and consequently roads are constructed as cheaply as possible; none are paved. No attempt is made to keep the roads cleared of snow during winter except in the city of Nome.
Areas mantled with muck and silt are avoided in highway construction, because the surfaces are poorly drained and subject to subsidence if the perennially frozen peat and silt are allowed to thaw. A 4-ft. layer of gravel was put on a road north of Nome in 1941, according to Mr. Hudert; by 1950, because of subsidence, the surface was level with the surrounding terrain. Where these areas must be crossed, roads are construct-ed by placing gravel upon the undisturbed vegetation in order to minimize subsidence from deep thawing (Fig. 1). Part of a road across deep, frozen silt was constructed by removing 1 to 3 ft. of the surface soil along the right-of-way and using it for a subgrade. The remainder of the road had no subgrade preparation prior to spreading gravel on the surface. The part that had subgrade preparation has required the more maintenance, as severe subsidence and erosion have formed ditches as much as 20 ft. deep along the sides of the road.

178
Most valley bottoms and lowland areas are underlain by perennially frozen silt and peat from 6 to 50 ft. thick. Bare gravel is exposed adjacent to the channels of many streams, however, and is one of the best sources of road material. On slopes bedrock is commonly near the surface, mantled by only a few feet of soil and weathered rock.
Roads have been constructed on gravel bars along some small, swift streams. The bars are cleared and graded with bulldozers. Fords are required at close intervals in order to take advantage of bars on alternate sides of the stream. Such roads are not satisfactory in areas of heavy traffic, however, because they are impassable during high-water stages in summer. Flood-plain icings along most streams render parts of the roads impassable during winter. According to Mr. Hudert, an icing more than 8 ft. thick formed across a road in the winter of 1949-50. Because of threats from these sources, it is commonly desirable to avoid the valley bottoms and lowlands, and to build roads on the valley slopes. Construction on slopes, however, present problems unique to the Arctic.
Instability on Slopes
Creep resulting from frost action is a primary factor in moving masses of surficial material downslope in tundra regions. Soils also are transported by slow and rapid viscous flow. Running water, one of the most important agents of erosion in temperate regions, is of minor importance. The relative intensity of creep and viscous flow de- termines the form of the resulting microrelief features.
Differential movement of rock fragments in fine -grained soil forms garlands and stripes of stones. These features have been described by Sharp (1942). They commonly occur in the higher and steeper parts of the slopes, upslope from the terrace forms and mudflows. Fragments are broken from bedrock by congelifraction or frost riving (Bryan, 1946, p. 627) and moved individually downslope by creep. Continued congelifraction reduces them until the deposit is predominantly silt. The deposits of silt, then, are moved farther downslope by creep and viscous flow and eventually form soil terraces, lobate terraces, soil lobes, and mudflows. Ideally rubble, stone stripes, and garlands extend downslope to soil lobes, soil lobes down to lobate terraces, and lobate terraces down to soil terraces. Tundra mudflows occur in areas of soil lobes and lobate terraces but are more common on steeper slopes. The zone between the terrace forms and the rubble forms is marked by a conspicuous break in slope. Terrace forms develop on slopes locally as teep as 25 deg., usually less than 20 deg.
Creep
"Creep" is defined by Sharpe (1938, p. 21) as "the slow downslope movement of superficial soil or rock debris, usually imperceptible except to observations of long duration." It results chiefly from expansion of the soil normal to the slope during heat-ing or freezing followed by vertical subsidence upon cooling or thawing. Downslope movements that result from wedging of the soil by plant roots and from burrowing by animals contribute to creep. Sharpe regards viscous flow as a component of creep; we regard creep and viscous flow as two distinct processes between which, however, there is a complete gradation.
Soil involved in creep moves primarily during the autumn freezing cycle. Wet soils are distended upon freezing, owing to the segregation of lenses of clear ice. Individual crystals of ice within the lenses grow by elongation of their axes, which are oriented normal to the cooling surface. (Taber, 1943, p. 1456)
No part of the substratum can be termed a "glide plane" during the progress of creep. Soil movement downslope is greater in the surface layer than at the base of the season-ally thawed layer because the surface, on freezing, is distended more, and thus moves farther horizontally from its original position. Vertical subsidence upon thawing con-sequently moves the surface material farther downslope than the underlying layers. This horizontal-vertical step process is illustrated in Figure 2A.
The rate of downslope creep is not constant over the entire slope. When the rate of

179
A
0 0.5 Feet
A Flowing water Clean gravel
Turf mat Yellow- brown silt
Peat Reddish-brown silt
SIlty gravel ElIJiHIHJl!I Froz en
Figure 2. Diagrammatic Illustration of Creep Mechanism and Terrace Formation. A) The-oretical mechanism of creep. ;iide black bars represent theoretical columas of soil whose distension upon freezing is shown by thin lines parallel to slope. Upon thawing, coluisis 'send donslope, owing to vertical su:si.dence of soil. (B) Illustration of terrace forma-tion by creep, horizontal thrusting, and viscous flow. Soil moves downslope farther than vertical subsidence would carry it, as it is pushed by frost thrusting, and it flows.

180
freezing varies widely within a radius of a few feet, ice lenses are formed most abun-dantly in the material that freezes first. Growing ice lenses in the freezing soil draw water from adjoining unfrozen areas. Areas with only a thin cover of peat or areas of abundant "frost scars" (Hopkins and Sigafoos, 1951, p. 66) are subject to more intense heaving than areas with a thick mantle of peat. Several factors are involved in this relationship: (1) Ice lenses form more abundantly in silty soil than in turf or peat. (2) Peat and turf form an insulating blanket that retards the freezing and thawing of the underlying soil. (3) Thick mats of roots, stems, and peat resist disruption by heaving because of their greater strength over thinner mats of turf.
Expansion of the soil below breaks the thin turf cover and permits bare frost scars to develop. Continued expansion enlarges the frost scars and the soil involved moves downslope. Heaving normal to the slope, vertical subsidence upon thawing, and lateral movement by thrusting move the soil over the turf on the downslope side of the frost scar or force the turf into a small ridge. Simultaneously, soil moves out from under the turf on the upslope side of the bare soil area. This type of downslope soil move-ment, which is illustrated in Figure 1B, constitutes creep. The intensity of frost heaving depends also upon the amount of water available during autumn freezing. Late summer rains, persistent snowbanks, ground-water seeps, and swampy areas furnish abundant water for the formation of ice lenses in late autumn.
Viscous Flow
Two rates of viscous flow - slow and rapid - are effective in forming microrelief features on slopes. Slow viscous flow is a component of soil movement in all terrace forms; rapid viscous flow forms mudflows.
slow viscous flow is mass movement of fluid soil, most conspicuous during spring and early summer, when meltwater from snow and ground ice wets the soil until it becomes a suspension. The cohesive forces between mineral grains fail, and the weight of the soil falls on outside restraining turf. The wet soil mass slowly moves downslope in the direction of least resistance until the soil is no longer fluid or until it is stopped by the restraining turf. Conditions are most favorable for viscous flow in areas where frost heaving was most intense during the previous autumn. Here, turf cover is thin or lacking and a 2- to 6-inch layer of soil has thawed and is fluid whereas thicker turf in adjoining areas is still frozen firmly to the underlying frozen soil.
Rapid viscous flow, which forms mudflows, consists of sudden fluid movement of fine-grained soils saturated with water. Exceptionally favorable conditions for mud-flows exist in areas with a perennially frozen substratum on steep slopes mantled with soil. Mudflows originating under these cdnditions are described and illustrated by Eakin (1918, p. 50 and p1. 8), Capps (1940, pp. 167-168), and Taber (1943 and p1. 13).
Typical mudflows of tundra regions represent a type not included in Sharpe's classification (1938, pp. 58-61). Mudflows occur on sloping surfaces mantled with silt-rich soil covered with a turf mat that is locally underlain by fibrous peat. During spring, surface layers of soil are saturated with water set free by seasonal thawing. Perennially frozen soil or bedrock at shallow depth prevents downward percolation of the excess water, and surface drainage is impeded by the dense plant cover. "The interstitial water adds to the weight of the soil mass and acts as a lubricant, thus de-creasing stability and facilitating both slow and rapid downhill movement. . . . Mud with a high water content occasionally bursts through the turf and spews down steep slopes" (Taber, 1943, p. 1458). Excessive water also may accumulate in the annually thawed zone during the later summer rainy season; some mudflows probably occur during that season.
Mudflows in areas of shallow annual thaw are limited to that zone; thus they com-monly involve only a thin layer of soil. Commonly the slopes are indented 3 to 6 ft. at the heads of flows; one flow illustrated by Taber (1943, p1. 13B), however, left a scarp 10 ft. high at its head. Eakin (1918, p. 50) described a mudflow that started on a 10 deg. slope and stopped on an 8 deg. slope.

181
Slope Movements as Seen in the Field
Creep and viscous flow rarely occur separately, but one process or the other generally predominates in the movement of given bodies of soil. A complete grad-ation exists between the two processes Soil heaved by freezing flows slightly dur-
. • ing subsidence. Soil moved predominantly -. .'-, by viscous flow is heaved normal to the
slope when it freezes During autumn, when the soil is relatively dry, creep may
- - -. predominate because freezing is progress-
4 ing and little water is available for vis- cous flow. In the spring, when the soil is
Figure 3. .o: of •3e:ard Prir...uia wet and plastic, it moves predominantly Traim-:ay D1cp2 ci b overnent of Active by viscous flow because excess water is
Lobate Terrace. present. Part of a microrelief feature may be formed by viscous flow, another
part by creep, the processes responding to varying drainage conditions or varying in-sulating properties of the plant cover, respectively.
These processes combine to produce net downslope movements perceptible to obser-vations continued over periods as short as one year. Roadside and placer ditches on Seward Peninsula are being filled slowly by sod-covered soil encroaching from upslope. T. L. Pew (personal communication) reports similar phenomena along ditches wherd spruce-birch forest was removed at altitudes of approximately 1,200 feet near Fair-banks, Alaska. A ditch 15 feet wide, cut through unconsolidated material on Seward Peninsula, has been completely obliterated in places in the 40 years since the ditch was abandoned. The Seward Peninsula tramway has been displaced as much as a foot with-in the last decade where the tracks cross active lobate terraces (Fig. 3).
Climate ultimately determines the areal distribution of conditions favorable for creep and viscous flow. Local microclimatic variations in the number and intensity of annual freeze-thaw cycles are reflected by variations in the relative intensity of the two proc-esses. Shallow movements, involving less than 6 inches of the surface soil, result from short-period cycles of freezing and thawing due to diurnal and air-mass tempera-ture fluctuations. Frequent, intense, short-period cycles promote severe movements in the upper 3 to 6 inches of the soil but have little effect on the deeper layers, which are affected only by long-period, seasonal temperature fluctuations. The optimum climatic conditions for soil creep and flow are found in climates with large fluctuations between winter and summer temperatures and in climates with fre- quent summer frosts and winter thaws.
The intensity of movement varies with the character of the soil, if the angle of . slope and moisture conditions remain , constant 1ubbly soils lacking a silt or fine sand matrix undergo little percep- ... tible movement. Grain size and shape • . .-. . '. - ,•'., .•. -!. are more important than the chemical composition of the soil The grain size
of arctic soils, however, is largely a . function 01 the type of parent rock ...-. -.
(Hopkins and Sigafoos). Soils with a -ure ,. Front of Active Soil Terrace, high proportion of silt are most unstable North Central Se:ard Peninsula. Note and are subject to detectable movement Concent.r.tion of i3oulders in Re—itrant on the gentlest slopes, in Scarp at Center.

182
Slope movements due to creep and viscous flow are modified by the plant cover. A tight mat of roots, stems, and peat at the surface forms an insulating blanket that tends to maintain a high frost table. By retarding runoff, vegetation tends to promote mois-ture conditions favorable for slope movements. This effect is counterbalanced, in part, by the stabilizing effect of an elastic turf mat, which inhibits free movement of underlying soil. Creep and viscous flow proceeding beneath layers of turf produce a set of characteristic microrelief features that are discussed below. These features are best developed in areas of tundra vegetation, but they have been observed also at, altitudinal timber line in Alaska. Activity of soil at timber line is indicated by bent tree trunks, split trunk bases, and irregular sequences of suppression rings within individual trees growing on the unstable ground.
Microrelief Features
Soil terraces, lobate terraces, soil lobes, and mudflows are members of a contin-uous, gradational series of convex slope features that play an important part in the building and maintenance of roads on slopes. Soil terraces are formed chiefly by creep. Creep is the chief process involved in the formation of lobate terraces, but viscous flow plays a minor role. Soil lobes, on the other hand, are formed chiefly by slow viscous flow, aided by creep. Mudflows are formed by rapid, viscous flow of saturated soils. Soil terraces are found on relatively well drained slopes, lobate ter-races on wetter 'slopes, and soil lobes and mudflows on slopes that are extremely wet during at least part of the year. All are confined to slopes ranging generally from 5 deg. to 30 deg.
Soil Terraces
Soil terraces ("solifluction terraces") are described by Obruchev (1937) and many others. They are regular steplike or benchlike physiograph.ic features formed by soil creep on slopes ranging from 5 deg. to 15 deg. (Fig. 4). They consist of abrupt escarpments 3 to 20 feet high extending 300 to 4, 000 feet along the slope nearly parallel to the contour, capped by broad, gently inclined surfaces 100 to 600 feet wide.
The escarpments slope from 30 deg. to vertical, and locally they overhang. The terrace surfaces are inclined at angles of 3 deg. to 10 deg. in the direction of major slope; the slope is gentlest near the rear edge and steepest just upslope from the escarpment.
Turf and peat 0. 5 to 1. 5 feet thick, supporting a sedge sod, cover most of the ter-race surface, including the frontal scarp, but may be lacking near the upslope edge. In the upper part of the scarp, the surface peat is folded and involuted into the under-lying soil. At the base of the scarp, a long stringer of peat, representing overridden turf, extends several feet upslope beneath a layer of mineral soil (Fig. 5). The ter-race soil generally consists of coarse, unsorted sandy silt containing abundant angular rock fragments ranging from a few inches to several feet in longest dimension. The soil ranges in thickness from 1. 5 to 20 feet or more. It is thinnest beneath the upper part of the terrace surface and thickest at the downslope edge. Rocks are especially abundant just beneath the turf for a distance of a few feet above and below the scarp. The frontal scarp of some terraces consists entirely of boulders contain-ing little or no fine material in the interstices. The bedrock surface, which underlies the terraces, generally is smoothly inclined and does not reflect the relief of the terrace surface. In some older terraces, however, a low escarpment is present in the bedrock surface beneath the terrace front.
The substratum of most soil terraces is perennially frozen at depths ranging from 3 feet beneath swampy areas at the rear of the terrace to 6 feet beneath the drier frontal portions. Relief of the frost table is a subdued expression of the surface relief. The soil thaws downward as a hummocky surface; each point is more or less equidistant from the surface directly above except as it is modified by insulating peat and vegeta-tion of various thicknesses. The substratum of some terraces near Nome is unfrozen.

183
A B
TP
A B C DE
THAWED
r - 2
AB F
B C 0 B FROZEN
A B C D E F
THAWED
Peat & turf Mineral soil
IIllii1tllhIII ______________ Feet 2 Frozen __
Figure 5. Cross Section Through Terrace Scarps. (A) Section Through Small Scarp. Note that scale is t;ice that of B. (B) Section Through Larger Scarp.

184
Seeps and small springs emerge at the base of frontal scarps and water runs in small rills to swampy areas at the rear of the terrace surface below. Water percolates into the soil near the middle of the terrace surface to re-emerge in seeps at the base of the next terrace scarp.
The spacing and height of the terrace fronts vary according to degree of slope and character of the soil. Terrace fronts become higher and more closely spaced with in-crease in slope. Terrace fronts containing abundant boulders generally are much high-er than those in which rocks are scarce or lacking.
Rate of Movement - Soil in soil terraces moves at a relatively slow rate. The fronts appear to advance only a fraction of an inch each year, and under specialized cOnditions may retreat slowly upsiope. Large soil terraces are rather permanent features and can be expected to persist in recognizable form long alter the processes of creep that fo'rme4 them have ceased to be active.
Origin and Development - Soil terraces originate as small ridges in the turf and soil on initially smooth slopes. The ridges form when moving soil overrides more slowly moving soil lower on the slope. These differential downslope movements result from differences in the intensity of frost-heaving on various parts of the slope. Creep due to repeated cycles of heaving and subsidence is the dominant component in the soil movements which ultimately result in the formation of soil terraces, but localized vis-cous flow is a contributing factor. A perennially frozen substratum is not essential for the initiation of soil terraces, but it does accelerate their development.
The development of turf ridges heightens the contrast in rates of creep on various parts of the slope. The thickened peat in, the ridges stands slightly above the water table and becomes slightly drier than peat and soil elsewhere on the slope. Dry peat is an even better insulator than wet peat; moreover, a smaller quantity of water is available for the formation of ice lenses in the ridges. ', Consequently, frost heaving is at a minimum at these sites and the ridges act as flexible barriers to moving soil immediately upsiope. Soil moving downslope by small annual increments in separated areas accumulates behind the ridge and a soil terrace is formed. Continued pressure from the moving soil pushes the front of the terrace forward so that it overrides the rear portion of the next terrace downslope, forming an involution of turf in the base of the terrace escarpment.
After a distinct terrace front is developed, ground-water seeps or springs appear at the base of the escarpment. Silt and sand are sluiced from the escarpment of some, terraces and washed out in miniature alluvial fans across the surface of the next lover terrace. Loss of fines further reduces the intensity of frost-heaving and the rate of advance of the terrace front. In terraces composed of rocky soil, removal of the fines may result in the formation of an open rubble covered with a layer of turf at the terrace front. When this stage is reached, the terrace front probably becomes stationary or may even begin to retreat upsiope owing to spring sapping at the base of the escarpment.
Downslope migration gradually reduces the thickness of the soil in the rear parts of terraces. The soil mantle becomes so thin that the soil and upper layers of bedrock thaw during the summer; blocks are split from bedrock by frost riving, adding to the concentrations of rubble on the rear parts of the terraces.
Soil terraces reflect relatively slow downslope movements caused by creep. The terrace scarp represents the most slowly moving part of the mass, and in many cases may be stationary or even retreating.
Lobate Terraces
Lobate terraces ("lobate benches," "turf-banked detritus benches") are described and illustrated by Taber (1943, pp. 1460-1463, p1. 4) and many other previous authors. They are characterized by festooned escarpments,' 1 to 5 feet high, on slopes ranging from 7 to 20 deg. '(Fig. 6). The terrace scarps are vertical or overhanging and sep-arate the more gently sloping terraces, which are inclined at 5 to 10 deg.' Individual

185
- - - r -
-- -
--- S.-
- I * _
z - -, _.i; • - I ,- ,t4._' ". -
Figure h. LoaLe jerraces Along Road r3etween Solomon and Council, Alaska.
lobes are 20 to 100 feet wide; the frontal scarps are spaced at intervals of 10 to 100 feet on the slope. Hummocks, cracks, folds in the turf, miniature lobate terraces, and lobate frost scars with fronts 0. 2 to 1 feet high mark the surfaces and indicate move-ment of soil by frost heaving and downslope adjustment to gravity. The vegetation cover consists of grasses and low, matted woody plants.
Lobate terraces are found on slopes throughout the tundra region, and at and just above altitudinal timber line on slopes within the forested country (Sigafoos, in press). Open stands of spruce trees and alder shrubs characterize the forest margin. The trees grow on the terrace scarps and surfaces. Trees growing on lobate terraces at alti-tudinal timber line on Seward Peninsula are commonly bent and some have split trunk bases. Studies of annual tree rings show periods of suppressed growth that are due to disturbance of the roots by moving soil.
Most of the terrace surfaces are covered with turf and peat, 3 to 6 inches thick, but many areas of bare soil break the cover. Stringers of peat extend several feet upslope in the soil beneath the scarp. Buried layers and infolded masses of living Sphagnum moss and peat, as in soil terraces (Fig. 2B), indicate recent movement.
Lobate soil terraces are composed of unsorted, sandy silt with many angular rock fragments a few inches to 2 feet in longest dimension. The soil ranges in thickness from 1. 5 to 6 feet; it is shallow at the rear of the terraces and deepest under the scarp. Rock fragments are most abundant in the frontal scarp beneath the turf. Slabby or platy fragments generally rest on edge. Lundqvist (1949) believes that their orientation in-dicates their direction of movement. As the terrace front advances, the stones are forced out of the soil by frost action and are rolled farther downslope. Loose soil or voids occur within the scarp on the upslope side of the boulders, offering further evidence of downslope movement.
The bedrock forms a smooth, inclined surface at depths of 3 to 6 feet below the turf. Soil beneath many active lobate terraces is not perennially frozen; frost table may lie below the bedrock, or perennially frozen ground may be lacking. Perennially frozen soil is not essential for the formation of the terraces.
Surfaces of lobate terraces are generally better drained than well-developed soil terraces during most of the summer. The driest soil in lobate terraces is immediately above the scarp; the wettest areas are at the back, for ground water emerges from the base of the next higher scarp and flows a short distance across the surface. Lobate
186
terraces commonly are limited to the wetter parts of slopes; they are found below ground-water seeps, and below persistent snowbanks and in wide re-entrants where surface drainage is concentrated.
Lobate terraces are only temporary features of hill slopes. Once they become stabilized by changing climate, by angle of slope, or possibly by deeply rooted trees, they are soon destroyed by small-scale frost action and gullying. Most recognizable lobate terraces, therefore, are active.
Rate of Movement - The soil of lobate terraces moves downslope more rapidly than that in soil terraces. The rate may vary, however, from year to year. Tree-ring studies of spruce near Council indicate periods of stability as long as 30 years; these long periods are separated by 1- to 5-year periods during which the soil moved several inches to 1 foot. Injury of roots by moving soil retards growth and is recorded in the cross section of the trunk as annual layers of wood that are much thinner than those grown during years of soil stability. Series of eccentric rings are evidence that the tree has been tilted (Pillow and Luxford, 1937, pp. 11-13), for tilted coniferous trees grow more rapidly on the lower side of the stem.
The rate of terrace movement depends upon the frequency and areal extent of soil movement. Movement of soil probably occurs annually on the wettest slopes and may be as much as 1 to 6 inches. Washburn (1947, p. 92) reported that the center of a small terrace on Victoria Island in Arctic Canada moved 1. 75 inches in 7 months, June to January. The track of the small railroad north of Nome, Alaska, constantly moves out of alignment where it crosses lobate soil terraces. The track was laid without grading and requires frequent realigning.
Origin and Development - Lobate terraces, like the larger soil terraces, originate as turf ridges. Creep is the chief mechanism of movement but viscous flow also plays a prominent role in the development of the lobate forms. Late-lasting seasonal frozen ground impedes drainage and contributes moisture to the upper layers of soil during the critical spring thaw season. Moisture from external sources such as snowbanks and ground-water seeps appears to be essential to the formation of lobate terraces.
The relative importance of the roles of viscous flow and creep in the development of lobate terraces varies widely. In some terraces movement by creep predominates; in others, movement is mostly by viscous flow. In general, lobate terraces resulting from creep are larger, more widely spaced, and more regular in outline than those formed by viscous flow; the larger ones approach the form of soil terraces. Lobate terraces formed mostly by viscous flow are smaller, lower, more closely spaced, and approach the garland form of soil lobes. Nearly 50 percent of the surfaces of lobate terraces that move chiefly by creep are barren of vegetation and are covered with frost scars, ridges, splits in the turf, and low hummocks. Surfaces of lobate terraces that move chiefly by viscous flow are covered with an unbroken turf and are relatively smooth. Lobate terraces that move chiefly by viscous flow are found in re-entrants of slopes around drainage lines, or on broad, wet slopes where well-defined drainage lines are lacking. Lobate terraces that move chiefly by creep occur on the lower slopes of the better drained spurs.
Soil Lobes
Soil lobes are probably equivalent to the "Zunge" of various German ,authors. They are tonguelike microrelief features 1 to 5 feet high, 10 to 30 feet wide, and 20 to 150 feet long; they are formed chiefly by viscous flow and are found on slopes ranging from 20 to at least 25 deg. Their surfaces slopes at angles of 10 to 15 deg., or less steeply than the general slopes of the hillside. At the upslope end of the lobes, a small, steep-walled, cirquelike indentation in the hillside is generally present. The volume of the depression is approximately equal to the volume of the lobe. Most of the central part of the soil lobe is barren of vegetation or supports only a few scattered plants. Matted woody plants and grasses form a complete cover on the outer edge and scarp of the lobes.

187
Soil lobes are found downslope from persistent snowbanks and ground-water seeps. Bedrock forms an inclined plane at depths of 1 to 5 feet beneath the surface. The bedrock may be perennially frozen at depth.
Drainage of the lobes is poor, and during spring thaw the soil is extremely wet and nearly fluid until it has thawed to a depth of a foot or more. Soil is thawed to these depths 20 to 30 feet downslope from snowbanks. Only the well-drained soil at the upper edge of the scarp is firm; that upslope is nearly fluid. In summer the soil be-comes drier, but by comparison with soils in temperate regions, it is wet.
Rate of Movement - Measurements of the rate of soil movement in soil lobes are being made by the writers near Nome. It is believed that soil lobes move faster than lobate terraces and soil terraces because movement is more frequent. Soil in the lobes moves short distances, but it moves a few inches each spring. During extremely wet years movement is greater. Because of the small size of the soil lobes, even rapid rates of movement do not result in the transport of much material downslope.
Origin and Development - Soil lobes originate in scattered areas of thin soil on steep slopes downslope from persistent snowbanks and ground-water seeps. Soil ac-cumulates on the slope by increased frost riving and by deposition from rills of running water. Where soil accumulates to depths of 1 to 3 feet and meltwater wets the soil until it is nearly fluid, slow viscous flow occurs. Movement continues until the mois-ture content in the soil drops or the degree of slope lessens. Creep then becomes more effective in moving the soil. Water draining from the soil is filtered through the turf and little soil is removed from the lobes by running water; alter spring snows have melted, the soil in the lobes becomes dry enough to retard viscous flow.
Soil moves downslope under the turf cover, pushing the frontal scarp forward, breaking and stretching the turf on the upslope surface of the lobe. Increased frost heaving on this surface effectively prevents the growth of plants.
Tundra Mudflows
Tundra mudflows are characteristic features of certain undisturbed tundra areas
9.
r:T .......•r • ,.- . .-- - . -
J .-
J._i• - - - -. ...-. - -- 4.
- Figure 7. Mudflow Scar 15 Mi. North of Norne, Alaska. Note niche at 1ft of nan,
huimnocky topography in right roreground.
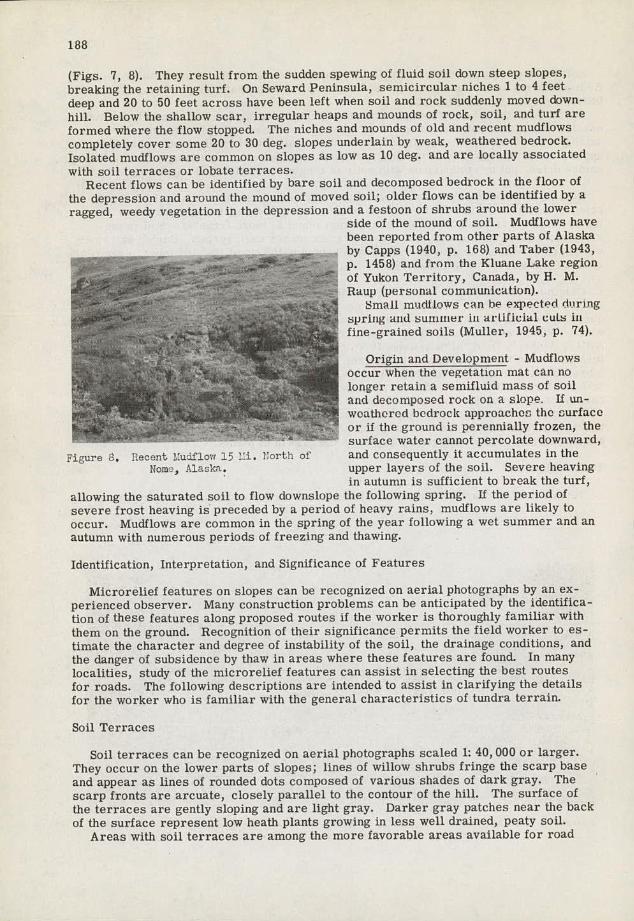
188
(Figs. 7, 8). They result from the sudden spewing of fluid soil down steep slopes, breaking the retaining turf. On Seward Peninsula, semicircular niches 1 to 4 feet deep and 20 to 50 feet across have been left when soil and rock suddenly moved down-hill. Below the shallow scar, irregular heaps and mounds of rock, soil, and turf are formed where the flow stopped. The niches and mounds of old and recent mudflows completely cover some 20 to 30 deg. slopes underlain by weak, weathered bedrock. Isolated mudflows are common on slopes as low as 10 deg. and are locally associated with soil terraces or lobate terraces.
Recent flows can be identified by bare soil and decomposed bedrock in the floor of the depression and around the mound of moved soil; older flows can be identified by a ragged, weedy vegetation in the depression and a festoon of shrubs around the lower
side of the mound of soil. Mudflows have been reported from other parts of Alaska
-- .. by Capps (1940, P. 168) and Taber (1943, - p. 1458) and from the Kluarie Lake region
of Yukon Territory, Canada, by H. M.
.-. -. Raup (personal communication). Small mudilows can be expected dorirtg
- : - spring and sunilner in artificial cuts in fine -grained soils (Muller, 1945, p 74)
Origin and De\ elopment - Mudflows occur when the vegetation mat can no
:- .- longer retain a semifluid mass of soil - ... and decomposed rock on a slope. If un-
yr.. • . weathered bedrock approaches the surface -. •. - -- - -. . or if the ground is perennially frozen, the - - surface water cannot percolate downward,
Figure d. ilecent. Mud.flo;; 15 i. UorLi of and consequently it accumulates in the
Nom-, Alaska. upper layers of the soil. Severe heaving in autumn is sufficient to break the turf,
allowing the saturated soil to flow downslope the following spring. If the period of severe frost heaving is preceded by a period of heavy rains, mudflows are likely to occur. Mudflows are common in the spring of the year following a wet summer and an autumn with numerous periods of freezing and thawing.
Identification, Interpretation, and Significance of Features
Microrelief features on slopes can be recognized on aerial photographs by an ex-perienced observer. Many construction problems can be anticipated by the identifica-tion of these features along proposed routes if the worker is thoroughly familiar with them on the ground. Recognition of their significance permits the field worker to es-timate the character and degree of instability of the soil, the drainage conditions, and the danger of subsidence by thaw in areas where these features are found. In many localities, study of the microrelief features can assist in selecting the best routes for roads. The following descriptions are intended to assist in clarifying the details for the worker who is familiar with the general characteristics of tundra terrain.
Soil Terraces
Soil terraces can be recognized on aerial photographs scaled 1: 40, 000 or larger. They occur on the lower parts of slopes; lines of willow shrubs fringe the scarp base and appear as lines of rounded dots composed of various shades of dark gray. The scarp fronts are arcuate, closely parallel to the contour of the hill. The surface of the terraces are gently sloping and are light gray. Darker gray patches near the back of the surface represent low heath plants growing in less well drained, peaty soil.
Areas with soil terraces are among the more favorable areas available for road

189
construction because the slopes are gentle and these areas lie near valley bottoms. Roads can and should be built with a minimum of artificial cuts at the roadside. It is impractical to lay subgrade on bedrock in most soil-terrace areas because of the great thickness of overburden and because much of the overburden is frozen. Surface heav-ing and downslope creep are less intense, however, than in areas with lobate terraces, soil lobes, or mudflows. Removal of the surface mat of peat and vegetation will cause surface subsidence in some soil-terrace areas and will result in severe gullying in many areas. Drainage is difficult, especially within 100 feet downslope from terrace scarps. Small mudflows will form on faces of cuts and excavations and will clog drain-age ditches.
Lobate Terraces
Lobate terraces can be recognized on aerial photographs scaled 1: 40, 000 or larger. A lobate terrace appears as a scalloped line trending parallel to the contour of slopes of 7 to 20 deg. , steeper than those on which soil terraces occur. The dimension of the lobate terraces parallel to the direction of slope is greater than the width àf an indi-vidual lobe. The upper edge of the scarp is lighter gray than the scarp face and the surface of the terrace. Willow shrubs grow below the scarp, forming a line of rounded dots parallel to the scarp. The surface below the scarp is light gray, contrasting with the darker willow shrubs. Lobate terraces are best developed below persistent snow-banks.
Areas with lobate terraces are considerably less favorable for road construction than areas with soil terraces because of steeper slopes, poorer drainage, and greater soil instability. Artificial faces will be necessary along much of the roadside and-these will be subject to slumps and small mudflows throughout most of the thawing season. Surface heaving and downslope creep are intense, but deformation of the roadbed can be reduced by excavating overburden to - bedrock and replacing with suitable fill. Sub-sidence due to abnormal thawing will be negligible. Wet conditions prevail throughout lobate-terrace areas, especially during spring and early summer, and.good drainage will be difficult to maintain.
Soil Lobes
Soil lobes appear as tongues extending parallel to the direction of maximum slope. They can be identified on aerialphotographs scaled larger than 1: 40, 000. The dimen-sion parallel to the slope is two to four times the width of the lobes. The slope of the surface is less than the overall slope of the hillside. Isolated patches of willows grow around the margin of the lobes. Soil lobes are associated with lobate terraces on slopes; the forms are gradational from one to the other.
Areas with soil lobes ares somewhat less favorable for road construction than areas with soil terraces because of steeper slopes and because of greater soil instability in local areas. They are more favorable than areas of lobate terraces because drainage is better and overburden is thinner. Artificial cuts will be necessary along most of the roadside but these will be composed largely of fractured bedrock, rather than overburden. The wetter areas will be subject to slumps and small mudflows, but these can be reduced by stripping overburden for several tens of feet upslope from the top of the cut. Surface heaving and downslope creep are locally intense, but deformation of the roadbed can be reduced by excavating overburden to bedrock in these areas and replacing with artificial fill. Subsidence due to abnormal thawing will be negligible. Extremely wet conditions prevail locally, and in these areas good drainage will be difficult to maintain.
Tundra Mudflows
Tundra mudflows consist of semicircular depressions merging downslope into fan-like convexities. They extend several hundreds of feet parallel to the direction of slope.

• TABLE 1. QIABACTEBISTICS OF. WITAIN MI000BELIEF. FEATURES POSiNG W SI.OPES
Feature Topographic 'vepreasion Development Soil and Sabutratom Vegetation Water, table and perennially Character doring periods
and posatton process froaen ground of thaw
Terrote aequenceaapaced Drainootly br0 and pest 0.5 to Sedgee, catted Perennially franca ground en thin
Eacsrparnt cell druoned; atanding enter or high
at intervals of 100 to creep. 1.5 feet thick ower- and Ion ohrubhy hentha, sod one-
generally prnoent to 6 feet of sorfane; notOr table clone to
600 feet on lower hill lying sandy silt 1.5 awa on terrace lly absent. Water onnoaioca aurfece at esnarpaeat
Sail slopea of 5 to 15 . to 20 feet thick; Willows, aurface. table controlled by per- cod on buck of terrane.
Terrace Abrnpt terrace cacorp- abnndent angulor hentho, nod other connally froaen ground, Seepage. anne at bane
sent. ateeper than 350, bouldera, enpeci ally fringe baae shrubs lost cloae to surface, of eanarpment.
henght 3 to 20 feet, eatnnd in encorpeent. at base of energies 300 to 4,000 feet parullel
to slope contoura.
of escarpment. escarpment.
Scalloped escarpoonta Creep and Turf and peat 0.25 to Matted ecody pinote Generally perecoaally fros- . Soil wet and aesifloid doriegapriag tkoeiag
bnrderang to rranea opined eincooa 0.5 foot thick neer- on our face. Low en below the bedrock our- fine. Water table move eaaoc. Dy, ce
i ic0
real f 10 to llOft. flow, orted soody l 6.0 feet s
yn1
nto
hrabhynilIna fring ae of dawn with thawing of
r
ll dr a
r dter
tect
up o
d oor
g ly 7 t 20 idaloen o
S on o f hil Is. Eunarpnento 1 to i thck;okondiut an- eecsrpeent. fences ground. d ry L
teoh
rarat ce bouldero. golar
dro mind during rainy feet high eotend 100 to Sf0 feet parellel to sIn e
. eeather.
contours. ledieidua1 lobea 20 to 100 feet wide.
Tonguelike lobe. on upper Desisantly Turf 0.25 to 0.5 foot 'Weedy" vegetation Perennially fraaen belon Soil set, sesifluid during thnw.
hill elopes of 20° to 25° dennis flew; tbicb acer candy ailt 0.5 to 5 feet deep.
of acstternd plsots the hedruok surface. Water table sones down with
spring Dry, well drained,
Height 1 to 5 feet; eidth sane creep. at hook of lobe, Matted willows, thosiog of froasn ground, sod fire durangre-
Soil 10 to 30 feet; daen.lnpe Sore soil enpcaed at lobe. bath of onil cad aedgeo griwsea,
nainder of stoner.
lobe leagtk 20 to 150 feet. 00 ncsrp. Isolated
Lobe sorfoor slopes 10° to . pitches of enllon
Deunli ateep-sulled fringe base of indeotstion at upolope and acarp. equal in eolun,e to thatof lobe. .
Sosicirculor sichen epslnpe Sodden Turf 0.25 to 0.5 font Matted ahalloe- Perenoially froaen below 1 to
Soil vwt,nesiflund daring C ring thaw,
from far of hoonoch soil eiacaos thick ueern ilty noil rooted plsats in bedrocb norfece or 4 feet kelon torf. Water Dry, wel'l drniaed,
turf, and r k logroopa floe. 1 to 5 feet deep; area prnur to flow. 'Wendy" table meets down with sad farm duruag re-
Tundra on 300 to 3 alopes or abasdost engelar bauldero. plants and freg- thawing of frozen ground. naisder of aur.
a dfl w an inulot d featores no 000 to 20 slopes. Niche
. senta of eriginnl
1 to 5 feet dccc. 20 to SO eegetatnon otter flee.
feet across, cod 50 to 100 feet long. Dehriv pile proportional nnauie to
Appearance osnortsl Conatructaus phntogrwpha (iioratteeiatina
Identifiable no photographs One of the more faenrable on s scale of 1:40,000 or siteo for rondo hecsowe of larger na nearly continuous,
r
wide diatribatios on ba sa l arcste nena l
l.
spope npes Surface heaving,
Rauallel to 000teur. donvaope creep lens in-
gr nded dots o nsrioun ahndea tense . Drai
c
cage lean ay
rrepreoent vegetation t difftcult. Sown terrace
escamnt barder; vegetation renoubbdeent to enneso-' p e of te ce,
neeere
lighter gray. gullyisg opon dustarhaocn of surface vegetation.
Identifiableon photographs Loan fnvorahle for roado 00 acslea of 1:40,000 or bensone of isatabality of larger as ann Ilupanonves coil, poor drainage. deenslope but rooghly por- Nuallon anile peraut olin1 toaloenco tours. foundations on hedrnnb Length parolinl to contour but aurface hesenog, greater than eidth of mdi- donnnlopr creepintense. eidusl lobee. Sarfsno of Desionge very 3iffacolt ncerp dark gray, 000rp edge doe aug npr ing. Fanen of lighter cuts subject to amall
eudflunn.
Identifiable on photographs Somewhat lee. faeoraklo at annIe larger than 5:46,000. for rooda becsose of Length parollel to slope 2 .teep alopen. Shellac to 4 tioee width. Isolsted noilo permit. fouodatians patches of will os appear cc
on bedrock. Serfice
roonded duta of earioua heaving. dnnnwlope creep ahadee of grey srouod lover locslly tateose. Drainage
morgin of lube.
Faces of cuts bodily sub-ject to ainor l and slides and sodfloea.
Identifiable on photographs Very uofnnurable for roads
sculod 1:40.000 or larger. because of eatreon nssta- Semicircular niches opalope hility af soil. Surface
from huaa,ocky fao of debrin. beaconS sad doonslope
Wper end of frenh fan a very creep aoteoae. Drninnge laeht grey; loner and darker generally difficnit. Band
on3 irrogelarly sattled. wny be imundoted orre- Older flees knee darker tones coved by new flees. thruogbaut.

191
On the downslope edge of the depressions are deposits of soil and rubble, forming low mounds. Mudflows on Seward Peninsula can be identified on aerial photographs scaled 1: 40, 000 or larger.
Areas with mudflows are very unfavorable for construction of roads and should be avoided because of the extreme instability of the soil. Artificial faces will be nec-essary along much of the roadside and these will be subject to large mudflows, which can obstruct or destroy sections of road. Surface heaving and downslope creep are intense. In many areas it is impracticable to lay subgrade on bedrock, because of thick overburden. In other areas bedrock is deeply weathered and does not constitute a stable foundation. Subsidence due to abnormal thawing will occur in many mudf low areas. Drainage is difficult.
Summary and Conclusion
Roads are preferably built on hill slopes in regions of perennially frozen ground be-cause the hill slopes are subject to less heaving and less severe subsidence than the marshy lowlands and some hill summits, and because the roads are out of reach of the winter icings that occur along stream channels.
In regions of cold climate, weathered materials are transported downslope mostly by mass movement of soil and rock through processes of frost action, viscous flow, and gravity. The rates of movement - rapid or slow - depend upon the material, slope, amount of water available, and the type and density of plant cover. Slow mass move-ment of silty soil mantled with shallow-rooted, dwarf vegetation forms characteristic microrelief features on gentle slopes. Perennially frozen ground, seasonally frozen ground, or bedrock at shallow depths prevents downward percolation. Tight, silty soil inhibits lateral drainage, and a dense plant cover inhibits surface runoff and erosion. Under these conditions, the surface layers of soil become nearly fluid, es-pecially during spring thaw, and the unstable soil forms soil terraces, lobate terraces, and soil lobes. If movement is sudden and extensive, mudflows develop.
All four features described are gradational in form, in areal distribution, and in origin. Soil terraces, the largest of these features, occur on gentler slopes, and are formed mostly by frost heaving and subsidence. Lobate terraces form on steeper slopes than soil terraces, are smaller, and result from frost heaving, subsidence, and viscous flow. A perennially frozen substratum is not necessary for their formation; persistent seasonally frozen ground or sloping bedrock close to the surface, which aids in maintaining a high moisture content in the soil, is sufficient for their initiation and development. Soil in lobate terraces moves in numerous isolated areas over the surface, resulting in net downslope movement of the scarp. Soil lobes are individual tongues of soil occurring downslope from persistent snowbanks or ground-water seeps on steeper slopes - 20 to 25 deg. Movement of the soil is by viscous flow and is most rapid in the spring, when meitwater is abundant and seasonally frozen ground is close to the sur-face. Perennially frozen ground is not necessary for the initiation or development of lobes, but their formation requies impervious bedrock close to the surface, or wet, fluid soils when seasonally frozen ground is near the surface. Mudflows result from the sudden flow of semifluid soil and rock downslope when the turf has been broken either by frost heaving or by the weight of the saturated soil. Mudflows are most common after a wet summer and an autumn with numerous cycles of freezing and thaw-ing.
An understanding of the significance of these slope features on the ground would aid in determining the best location of roads and other installations in tundra regions. Rec-ognition of the features on aerial photographs would aid in mapping of hill-slope conditions.
References
1. Bryan, Kirk, Cryopedology - The Study of Frozen Ground and Intensive Frost-Action, With Suggestions on Nomenclature, Am. Jour. Sc., Vol. 244, pp. 622-642, 1946.

192
Capps, S. R., Geology of the Alaska Railroad Region, U.S. Geol. Survey Bull. 907, pp. 1-201, 1940.
Eakin, H. M., The Cosna-Nowitna Region, Alaska, U. S. Geol. Survey Bull. 667, pp. 1-54, 1918.
Frost Action and Vegetation Patterns on Hopkins, D. M. and Sigafoos, R. s., Seward Peninsula, Alaska, U. S. Geol. Survey Bull. 974, pp. 51-100, 1951.
Lundqvist, C., The Orientation of the Block Material in Certain Species of Flow Earth: Geografiska Annaler (Stockholm), Hafte 1-2, pp. 336-347, 1949.
Muller, S. W., Permafrost or Permanently Frozen Ground and Related Engi-neering Problems: Strategic Engineering Study 62, MID, OCE, U. S. Army, pp. 1-231, 1945.
Obruchev, S. N., Solifluctional Terraces and Their Origin, Based on Studies in the Chukotsk Region: Problemy Arktiky No. 3, pp. 27-48; No. 4, pp. 57-83, 1937, English Abstract by Dr. E. Golomshtok at Engineer Library, Ft. Belvoir, Va., 1937.
Pillow, M. V. and Luxford, R. F., Structure, Occurrence, and Properties of Compression Wood: U. S. Dept. Agr. Tech.- Bull. 546, pp. 1-32, 1937.
Sharp, R. P., Soil Structures in the Saint Elias Range, Yukon Territory: Jour. Geomorphology, Vol. 5, pp. 274-301, 1942.
Sharpe, C. F. S., Landslides and Related Phenomena: A Study of Mass Move-ments of Soil and Rocic Columbia Univ. Press, New York, pp. 1-137, 1938.
Sigafoos, R. S., Some Effects of Congeliturbation Upon the Development of Veg-etation, Seward Peninsula, Alaska: Ecological Mon., (in press).
Taber, Stephen, Perennially Frozen Ground in Alaska, Its Origin and History, Geol.' Soc. Am. Bull., Vol. 54, pp. 1433-1548, 1943.
Washburn, A. L., Reconnaissance Geology of Portions of Victoria Islands and Adjacent Regions, Arctic Canada: Geol. Soc. Am. Mem. 22, pp. 1-142, 1947.
CALCULATION OF DEPTH OF THAW IN FROZEN GROUND
Harry Carlson, Chief, Permafrost Division, St. Paul District, Corps of Engineers
Synopsis
An investigation was started in 1945 under the general direction of the chief of engineers, Department of the Army, on the design and construction of airfields in arctic and subarctic regions.. This investigation, which is still in progress, is being conducted by the St. Paul District, Corps of Engineers
Observations of existing structures have been made at various airfields in Alaska since 1945. Additional test structures were constructed near Fairbanks in 1946 and 1947. Laboratory research has been carried on at the University of Minnesota to determine the thermal properties of soils and certain insulation materials. Library research has also been conduct-ed to locate information pertaining to calculation of depth of thaw in frozen ground.
Equations for depth of freezing located in the library research were checked and modified to permit their use in calculating depth of thaw. A correction factor was developed for the relation between air temperatures and the temperature of various surfaces, such as concrete, asphalt, gravel, and vegetation. This correction factor is used in the equation for depth of thaw and in effect converts the basis of calculation from normal air tern-peratures to surface temperatures. Calculations of depth of thaw are made for different soil conditions and under various surfaces and structures. The data used in these calculations include those obtained in the field tests of soil density and moisture content, field observations of air temperatures, and laboratory tests of thermal conductivity of soils. The calculations can be

193
made for conditions where several soil strata exist in which the moisture, density, and thermal properties are different. In most cases, the calculat-ed depths of thaw check the observed depths of thaw very closely.
The procedures used in the calculation of depth of thaw in frozen ground can also be used in computing the depth of frost penetration in thawed ground, if the factors applicable to winter conditions are included in the equation.
Observations of ground temperatures, soil conditions, and settlement of runways and structures have been made at various airfields and weather stations in Alaska since 1945. Model test structures were constructed near Fairbanks in 1946 and 1947 on which observations are being made. Laboratory research has been done at the Engi-neering Experiment Station at the University of Minnesota to determine the thermal properties of soils and certain insulation materials. Library searches have been made to locate information pertaining to heat transfer in ground. Equations for depth of freezing were found in articles by Berggren, Beskow, and Sumgin. The Frost Effects Laboratory, New England Division, Corps of Engineers has also developed equations for depth of freezing which are shown in "Addendum No. 1, 1945-1947" to "Report on Frost Investigation 1944-1945, ' published October 1949. The equations for depth of thaw described in this paper were developed and modified from the various equations for depth of freezing.
Acknowledgement is made of the assistance and valuable suggestions provided by Mr. 0. M. Bjeldanes, physicist, in making theoretical studies and reviewing this paper. At the present time the Permafrost Division of the St. Paul District is under the Arctic and Subarctic Investigations Staff of which Lt. Colonel Arthur H. Lahlum, C. E. , is head. Colonel L. G. Yoder, C. E. , is district engineer.
The purpose of this paper is to present the development of a method of computation based on theory, laboratory experiments, and field observations which will enable the engineer to determine with reasonable accuracy the depth of thaw in frozen ground under natural or artificial surfaces or structures in areas where permafrost is encountered.
Permafrost, or permanently frozen ground, is a condition encountered in major por-tions of the arctic and subarctic regions. Permafrost has an important influence on the behavior of structures placed on it, especially where the soil contains clear ice or has frost heaving characteristics. Heat from a building may flow into the ground under the floor and cause settlement of the foundations if proper design precautions are not taken. Disturbance of natural surface vegetation, which normally acts as an insulator, or con-struction of an earth fill for a road or runway will produce a change in the thermal equilibrium of the ground. Such changes in thermal equilibrium may also cause settle-ments of the natural ground and superimposed fills. In order to cope with these prob-lems, it is necessary to know how the thermal conditions in the ground change under various climatic and soil conditions.
In order to illustrate the method of computation developed, data from several run-way test sections and from one large building in Alaska are discussed. Effects of moisture, density, thermal conductivity and other physical properties of the ground on heat transfer are illustrated. Ground temperatures are associated with their causes, such as solar radiation and other climatic conditions. Calculations are made for sit-uations where the mean annual temperature of the surface is close to 32 F. For sit-uations where the mean annual temperatures are quite removed from 32 F. , several equations are suggested.
A study of available published literature revealed very few references which might be used to calculate the depth of thaw of the ground. A bibliography of literature per-tinent to analysis of heat transfer in the ground is included at the end of this paper. Equations exist for the temperature within a thick body having a plane surface and having a sinusoidal temperature variation on the surface (1, 2). Generally, these e-quations are of small value, if any, when applied to soil which freezes and thaws since the effect of latent heat of fusion of water is not considered. Standard physics books may be used for the commonly known equations of heat flow (3).
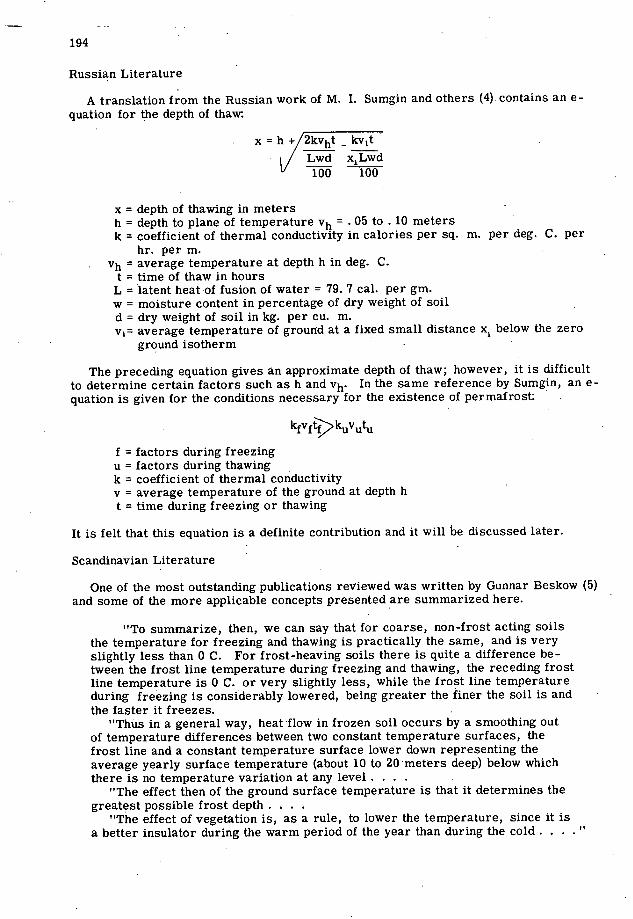
194
Russian Literature
A translation from the Russian work of M. I. Sumgin and others (4) contains an e-quation for the depth of thaw.
x = h -l-/2kvht - kV1t
Lwd x1Lwd 100 100
x = depth of thawing in meters h = depth to plane of temperature vh = . 05 to . 10 meters k = coefficient of thermal conductivity in calories per sq. m. per deg. C. per
hr. per m. vh = average temperature at depth h in deg. C.
t = time of thaw in hours L = latent heat of fusion of water = 79. 7 cal. per gm. w = moisture content in percentage of dry weight of soil d = dry weight of soil in kg. per cu. m. v1= average temperature of ground at a fixed small distance x1 below the zero
ground isotherm
The preceding equation gives an approximate depth of thaw; however, it is difficult to determine certain factors such as h and vh. In the same reference by Sumgin, an e-quation is given for the conditions necessary for the existence of permafrost:
kfVf kvt5
f = factors during freezing u = factors during thawing k = coefficient of thermal conductivity v = average temperature of the ground at depth h t = time during freezing or thawing
It is felt that this equation is a definite contribution and it will be discussed later.
Scandinavian Literature
One of the most outstanding publications reviewed was written by Gunnar Beskow (5) and some of the more applicable concepts presented are summarized here.
"To summarize, then, we can say that for coarse, non-frost acting soils the temperature for freezing and thawing is practically the same, and is very slightly less than 0 C. For frost-heaving soils there is quite a difference be-tween the frost line temperature during freezing and thawing, the receding frost line temperature is 0 C. or very slightly less, while the frost line temperature during freezing is considerably lowered, being greater the finer the soil is and the faster it freezes.
"ThUs in a general way, heat -flow in frozen soil occurs by a smoothing out of temperature differences between two constant temperature surfaces, the frost line and a constant temperature surface lowerdown representing the average yearly surface temperature (about 10 to 20 meters deep) below which there is no temperature variation at any level. . .
"The effect then of the ground surface temperature is that it determines the greatest possible frost depth . . .
"The effect of vegetation is, as a rule, to lower the temperature, since it is a better insulator during the warm period of the year than during the cold. . .

195
___
Ililluwi I__Ill-- ul•
1J;{II1uI__u.__uI
IoirIwJuhhu"uhmn1.1c:I
An equation for the depth of frost is as fol-lows:
X \/
o ':::::rfiT::.::1::...... x = depth of freeze in cm. ------
t = time that surface temperature is be- 1::: low 0 C. in hours
i kf = heat conductivity of frozen soil in cal -20
:::.;:::: :X:::::: ::t:::1T per cm. per sec. per deg. C. v0 = average of surface temperature during
/ . freezing season in deg C 1.10
P = frost storing capacity P = 79. 7 w d + y (0. 45wd+0. 55 d) cal.
100 2 100
1.00 __ per cu. cm.
:ZT:- '.:::::::: wd = weight of water per unit volume of soil 79.7= latent heat of fusion of ice in cal. per
m..: gm. 20 213 0. 45 = approximate specific heat of ice in
MOISTURE CONTENT, PER CENT cal. per gm. Figure 1. atio of Conductivity of Silt d = dry density of the soil in glIls. per Loam oi1s Deloa to Conductivity Above CU. cm.
Freezing point. w = water content of the soil in percent of dry weight
0. 55 = specific heat of the soil The product v0t is called the "freezing resistance" and is determined by measuring the area under a time -temperature curve for the air by means of a planimeter. Complicat- ing factors in determining the depth of frost are snow cover, heat radiation, heat con- duction from below, freezing point of the soil, etc. Each layer of soil parallel to a plane surface requires a defininte number of degree hours to freeze as given by the fol- lowing equation:
F = v0t = P1 b 1 2
deg. C. -hrs. kf2
P = "freezing resistance" of layer 1 b1 = thickness of layer in cm. P1 = frost storing capacity in cal.per cu. cm.
In the article "Scandinavian Soil Frost Research of the Past Decade," Proceedings of the twenty-seventh Annual Meeting of the Highway Research Board (6), Beskow again described methods of computing frost depth from temperature conditions and material properties.
American Literature
For the case discussed in his article "Prediction of Temperature Distribution in Frozen Soils," Part III, Transactions of 1943, American Geophysical Union (7), W. P. Berggren develops the theory in a remarkable manner, but he points out that the Stefan equation
x = /2kf (32 - v0) t \/ L

196
is "almost an exact solution" when the latent heat of material is large compared to its heat capacityand when the temperature of the soil is equal to the freezing point.
x = depth of freeze kf = thermal conductivity of frozen soil L = latent heat per cu. ft.
32 = freezing point of the material in deg. F. v0 = fixed subfreezing surface temperature in deg. F.
t = time in hours
Berggren also points out that (32 - vo)t may be the integral of the temperature difference and time or the area swept by the curve. These statements parallel those of Beskow and support the theory as developed in this paper. The Corps of Engineers, Frost Effects Laboratory, has developed a graphical solution for W. P. Berggren's theory. This graphical solution is included in "Report on Frost Investigations, 1944-1945," published April 1947, New England Division, Corps of Engineers, Boston, Massachusetts, Figure 22. In "Addendum No. 1, 1945-1947" to "Report on Frost Investigation 1944-1945" pub-lished by the Frost Effects Laboratory, New England Division, October 1949, a com-parison between predicted depths of frost penetration as determined from four equations, a design curve (Fig. 2, Engineering Manual, Part XII, Chapter 4, March 1946), and ob-served depths of freezing at several airfields in the United States is presented. The e-quations used in this comparison to predict depth of frost are the following:
83 .x=/48kF VL
93 x =/48kF '\ VL+Cçvo-32+F
1
154 x= / 24kF V L + C fv0-32+F
2t
24 k F
158 x = - V+ ( _d) L + C(vo-32+F '
2t J
x = depth of frost penetration in feet k = thermal conductivity in Btu per sq. ft. per deg. F. per hr. per ft. F = freezing index in deg. -days L = average latent heat in Btu per cu. ft. C = average volumetric heat in Btu. per cu. ft. per deg. F.
v0 = mean annual air temperature in deg. F. t = duration of freezing period in days d = thickness of insulation layer in ft.
"An average for thermal conductivity "k" = 1. 3 Btu. per ft. 2 per deg. F. per hr. per
ft. is used throughout these equations." "Value for "d" used in equation 158 is thickness of topsoil in feet." Equation 83 is basically the same as the equation described in this paper to compute
the depth of thaw except that a correction factor has been added in the latter to provide for the variation between air and surface temperatures. Equation 93 includes the amount of heat lost when each square foot of soil from the surface to maximum depth of frost is cooled from the mean annual temperature down to 1/2 the average number of degrees below 32 F. which the air temperature reaches during the freezing season. It is set up for heat conduction through the average depth of frost. Equation 154 is differentfrom

Equation 93 in that it is set up for heat conduction during the freezing season through the maximum depth of frost rather than through the average depth. Equation 158 allows for the thermal resistance of the top soil layer assuming the top soil has no latent heat and the average thermal con-ductivity is the same as in the rest of the soil. It may be derived from the following equation used in a similar form in each of the depth of thaw calculations in this paper:
F=L2x2 (R1 +R2)
24 2
except that the full resistance of layer 2 is used in Equation 158 rather than the average.
F L2x2 (R1 1 112) L2 X2 (d+ X2) 24 24 k
197
- 0 4 I It UI 0
0I$TURt CONTENT. PER CENT
F L2 x2d I L2 (x2)2 igure 2. Hatio of UonUuctivit of Sana 247 24k So1s eiow to Condctivity Above freez-
ing Point.
24 k F = L2 x2d + L2(x2)2
(x2 )2 + x2d -24 k F - 0 L2
x -d/d2
-4(-24kF) L2
2
x - -dV(2) d + 24 k F 2 L2
When the volumetric heat capacity times average temperature change is added to the latent heat, the above equation becomes:
V(2)' + L24
4
k
CF
(v0 -32+)
Conditions Necessary for the Existence of Permafrost
For permafrost to exist without change from year to year , the average annual tem-perature gradient in the ground in a homogeneous soil layer below the maximum seasonal thaw must remain the same. Since heat flows from the depths of the earth to the surface, the temperature gradient must be negative toward the surface as heat always flows from warmer toward colder regions. The depth of the bottom of permafrost is a function of the natural temperature gradient in the ground and of the mean annual surface temperature.

198
Figure 3. Decree Days Above and Below 32 F., Fairbanks, Alaska.
When the mean annual surface temperature and the temperature gradient in the soil are known, a projection of the gradient to the freezing point gives the approximate depth of permafrost, provided that the soil characteristics in the projected depth are the same as in the known depth.
If the mean annual temperature of the surface or any soil layer below the surface is raised, the heat balance is destroyed and the natural temperature gradient is changed. The new temperature gradient from the bottom to the top of permafrost decreases the heat flow from the bottom and, since the heat flow from the depths of the earth does not change, less heat flows to the ground surface from the bottom of permafrost than is received there, resulting in thaw at the latter plane. In other words, raising the mean annual temperature of the earth's surface results in decreasing the thickness of perma-frost. This thawing at the bottom of permafrost is very slow, but it continues until the heat flowing to and from the bottom of permafrost is in equilibrium.
During the annual cycle of temperature change in the top layers of the earth, heat flows into the earth as long as the surface temperature is higher than that of the layer adjacent to the surface and heat flows out when the reverse is true. This means that heat flows into the ground from shortly after the time of coldest surface temperature to shortly after the time of warmest temperature. To maintain the same mean annual temperature, the surface possesses the same amount of heat energy on the average from year to year. Expressed another way, the heat lost by the surface by any method whatsoever must equal the heat gained.
Heat is lost by the surface to the atmosphere and outer space by surface conductance and radiation during all of the year. An increase in wind velocity produces an increase in surface conductance. When a cold wind blows, the so-called "chill effect" is notice-able; objects and people are cooled rapidly. When air is moist, its specific heat is greater, which means that a cool, moist wind can lower the temperature of a ground surface more than a cool, dry wind because the heat that passes from the surface to

199
the air does not raise the temperature of the moist air as much as it would the dry air. Since the energy radiated from a body is a function of the' fourth power of its. absolute temperature, the radiation from the ground surface is higher in the summer than in the winter. Surface conductance and radiation tend to equalize surface temperature and air temperature. However, other factors such as moving air masses, evaporation, tran-spiration, daily radiation cycles, snow cover, latent heat, type of surface, localized shading, reflected radiation, cycles of low and high atmospheric pressure, and so forth, will make surface temperatures somewhat different from the air temperatures as observ-ed by the Weather Bureau..
As long as there is a surface temperature higher than 32 F. , it is possible that frozen soil is melting below the surface. Even though the surface temperature is below 32 F. at the end of the thawing season, there may be heat stored in the ground between the surface and the thawing layer which causes thawing to continue for some time. As long as the surface temperature is below 32 F. , it is possible that soil is freezing.
Near the end of the freezing season, in regions of permafrost, the seasonally thawed layer generally has been completely frozen, and the ground is being cooled below the freezing point. To maintain the level of the permafrost table, it is only necessary to freeze back in winter that which has thawed during the previous summer. However, if the mean annual temperature of the surface is raised, permafrost will melt upward from the bottom because of the decreased gradient in the permafrost. Assuming that the tem-perature of the soil below the level of seasonal freeze is 32 F. , that the temperature gradients in homogeneous ground in the active layer during the thawing season and the freezing season are approximately straight lines (an assumption which ground tempera-ture readings show to be reasonable), and that the depth of the frozen ground at the end of the freezing season is equal to the depth of the ground thawed during the thawing sea-son, then the approximate amount of heat which flows into the ground during the thawing season per square foot of level ground is:
Qu = 24 kuGutu = 48 kul x/2 x (1)
Qu = total amount of heat in Btu's which enters the ground during the period the ground thaws
ku = thermal conductivity of the thawed soil Gu = average surface temperature in deg. F. during the thawing season minus 32. tu= number of days the surface temperature is above 32 deg. F. x = maximum depth of thaw in feet
x/2 = average depth of thaw during season 24 = number of hours in a day
I = Gutu = thawing index or number of deg. -days of thaw
Similarly, the equation for the heat flow during the freezing season may be written:
Qf = 24 kfGftf = 48 kf F
x/2 x (2)
Qf = total amount of heat which flows out of the ground during the freezing season kf = thermal conductivity of the frozen soil Gf = 32 minus the average surface temperature during the freezing season tf = number of days the surface temperature is below 32 deg. F. F = Gftf = freezing index or number of degree days of freeze
Since the heat necessary to thaw layer x is equal to the heat given up in-freezing it, and any other heat involved is neglected as an approximation, the preceding equations may be combined .

200
ki = kf F
(3)
This means that, under the conditions given by the equation, no permfrost exists and seasonal thaw is equal to the seasonal freeze.
When seasonal thaw does not melt all of the frozen ground, permafrost does exist, and,
kf F------ku I
kf
For Fairbanks Silt Loam, conductivity values determined by experiment are: Moisture
Dry Density Content Mean Temp. Thermal Conductivity lb. per cu. ft. Percent Deg. F. Btu per sq. ft. per hr. per deg. F. per in.
93.3 24.4 40.0
9. 55
93.3 24.2 24.9
13. '23
Then = = 1. 39, andv must be less than 1. 39 for permafrost to. exist. It should
be noted that the ratio can be greater than 1. 00. In other words, permafrost can exist even though the thawing index is greater than the freezing index.
The thermal conductivity of ice is approximately 16 Btu per sq. ft. per hr. per deg. F. per in. and of water .4 Btu per sq. ft. per hr. per deg. F. per in. which makes the ratio of the two 4 to 1. The conductivity of frozen soil is a function of the moisture con-tent. Under most conditions, the greater the moisture content, the greater is the ratio of the thermal conductivity of the soil frozen to that of the soil thawed. The preceding statements being true, the ratio of thawing index to freezing index may be larger for higher moisture contents than in the above example and not violate the conditions nec-essary for the existence of permafrost. Figures 1 and ,2 show how the ratio of the thermal conductivity at 25 F. to the thermal conductivity at 40 F. varies with moisture content in silt loam and sandy soils, respectively. It may be seen that moisture content is definitely a factor in causing permafrost.
It has been found by study of the Weather Bureau records at Fairbanks, Alaska that the ratio of 4. based on air temperatures was 3055 or 0. 61 for the summer of 1947
and the winter of 1947-1948. See Figure 3. For bituminous surfaces, the corrected thawing index is 2. 19 x 3055 = 6690, and from available information, it is known that the corrected freezing index is 0. 72 x 5042 = 3630. The ratio I = 6690 = 1. 84. To
F 3630 maintain permafrost in silt loam soils under these conditions, very high moisture contents are required.
Assuming the thickness of thaw in the saturated gravel to be layer x and the, heat lost during the freezing season to be just sufficient to freeze back layer x, the approximate amount of heat conducted per square foot of plane surface may be written
Qf = Gftf(24) = 24 F = 24 F (4)
Rf , lT2+f Yr +
T 2kf
Qu = Gutu(24). = 241 '= 24 I
- r1 + r2 + Fu Jr + X , (5) 2ku
Qf=Qu (6)

201
24F 241 r + x =r+x
x
1= ____ (7) r+ X
Tkj
= thermal resistance down to the thawing layer x = thickness of the thawing layer (or freezing layer)
ku = thermal conductivity of layer x unfrozen kf = thermal conductivity of layer x frozen
For permafrost conditions: Q)Q andr + x should be greater than I ____ V
tr +X 2kf
In general, the natural temperature gradient in the ground is the best means of es-timating the thickness of permafrost. Permafrost melts upward from the bottom when the gradient in the ground is decreased. Any change in materialsat the surface affects the ratio of thermal conductivities and indexes and changes the temperature gradient. (Depth of thaw is a function of the amplitude of surface temperature oscillation). An estimate of the maximum rate of thaw of permafrost upward from the bottom may be made. Under natural conditions, it may be assumed that the temperature gradient in the permafrost from about 30 ft. down is stable and that the heat flow to the surface of the earth is the same as the heat flow from lower depths to the bottom of permafrost. It is recognized that this assumption is not strictly true because of the changes being made in the earth's climate and in geologic changes in the surface. When the thermal gradient in permafrost is diminished to zero by causing thaw to exceed freeze at the surface, a condition for maximum rate of thaw at the bottom has been brought about. All the heat which flows to the bottom of permafrost from below thaws the frozen ground, and this heat is equal to:
dQ1 = dQ2 =_: kAdt = Ldx1 = 1. 434 wddx1 (8)
dQ1 = heat flow to the bottom plane surface of permafrost from below dQ2 = heat flow to the surface of the earth from the bottom, plane surface of
permafrost when gradients are stable dT = thermal gradient in permafrost dx
k = thermal conductivity of permafrost at point where thermal gradient is determined
A = area = 1 sq. ft. generally dt = time in hours
143. 4 = latent heat of fusion of 1 lb. of ice in Btu's w = moisture content of soil in percent at the bottom, plane surface of perma-
frost d = dry density of soil at the bottom, plane surface of permafrost
The rate of thaw may be Written
dx1 = k dTx1= k dT t 43 dr 1.4wd dx 1.434wd (9)


203
At Umiat, these approximate data were estimated:
dT = 1 deg. (from temperature observations) dx 58'
w = 30 percent (by estimation) d = 85 lb. per cu. ft. (by estimation) k = 1. 08 Btu. per sq. ft. per hr. per deg. F. per ft. (from chart -Fig. 9)
Approximately
x1 = 1.08 1 (365) (24) = 0.044 ft. 1. 434 (30) (85)
which means that the approximate maximum rate of thaw is 0. 044 ft. per yr. or that it would take at least 22. 7 yr. to thaw one foot of permafrost upward from the bottom by means of heat from the earth. This value is meant only to give the order of magnitude because of the nature of the data.
Depth of Thaw in Frozen Ground
The depth of thaw in frozen ground is dependent upon such location factors as latitude, altitude, direction of exposure to the sun, shading or decrease in radiation, refleètion or intensification of radiation, proximity to large bodies of water, and proximity to local sources of heat. The surface of the earth receives heat energy from the sun and from the center of the earth. During the years 1936 to 1947 inclusive, the solar radiation re-ceived annually at Fairbanks, Alaska averaged 303, 000 Btu's per sq. ft. However, not all of the radiation received is absorbed since the earth's surface radiates heat into outer space. During periods when the radiation received is greater than the radiation given off an increase in ground temperature results. The amount of heat transmitted from the center of the earth is very small compared to that received from the sun.
Surface temperature is one of the factors in the equation for depth of thaw. It is de-pendent upon the solar radiation received and emitted, heat lost to the air by conduction and convection, heat lost or gained due to evaporation or condensation of surface moisture, thermal diffusivity of the soil below the surface, and heat transferred from the interior of the earth. Surface temperature data are not commonly available for most areas. How-ever, air temperatures which are observed at all weather stations are related to surface temperatures. Normally, the surface of the earth heats the air so the surface is warmer than the air. Vegetation affects air and surface temperature because of shading and transpiration. The effect of vegetation is to lower the mean annual temperature of the surface and to preserve permafrost. Vegetation may be a very important factor when it is the purpose of the engineer to maintain permafrost. Since many factors affect sur-face temperature, it is necessary to measure the temperature or to estimate it from air temperatures for, use in the succeeding equations.
The following equation is a standard heat equation for parallel plane surfaces:
Q = k(v-v)At = (v1-v2)At = T At
x x/k R (10)
Q = total amount of heat transferred in Btu's T = temperature difference between surfaces in deg. F. A = rea in sq. ft. R = = thermal resistance in deg. F. per Btu per sq. ft. per hr.
= temperature of one face of conducting layer V2 = temperature of other face of conducting layer I = time in hours

Figure 5. Air and Bituminous Surface Temperatures, Fairbanks, Alaska, Summer-197.

205
x = thickness of layer in ft. k = thermal conductivity in Btu per hr. per deg. F. per sq. ft. per ft. of thickness
WhenA=l and t=1, Q= R
A large plane surface is assumed and edge effects are ignored. When time is measured in days and a one sq. ft. area is considered, Equation (10) may be written:
24 Tt 241 H
Q = total number of Btu's per thawing season I = T t = maximum number of deg. -days of thaw based on surface temperature
"1" is the thawing index and is determined by a summation of the deg. -days of thaw based on the average daily temperatures of the surface during the thawing season.
It is recognized that Equation (10) is true only when the thickness of the layer and the temperature difference between surfaces are constants. However, a study of the tem-perature gradients in the ground during the thawing season (or freezing season) reveals the close approximation of the gradient to a linear condition during most of the thawing season and especially so during the height of the season which makes it possible to adapt the equation to estimating heat flow in the ground. See Figure 4. This drawing also shows that a concave gradient at the beginning of the season at Fairbanks, Alaska is balanced, more or less, by a convex gradient at the end of the season, that the perma-frost is very close to 0 C. -, that during most of the time that the ground is thawing heat is flowing directly from the surface to the thawing layer, and that during most of the time that the ground is freezing heat is flowing directly from the freezing layer to the surface. Figure 4 may be used to determine what heat in addition to latent heat is ab-sorbed on the average by each cubic foot of soil in changing temperature during the thawing season.
Since air temperatures are generally available and surface temperatures are not, a study has been mace of data from Fairbanks, Alaska to determine the relation between a thawing or freezing index calculated from air temperature and indexes calculated from the temperatures of different types of surfaces. This study has resulted in correction factors for various types of surfaces. Data available at present indicate values for the correction factor as shown in Table 1 for the horizontal surfaces investigated. The correction factors for the various surfaces investigated are determined from data such as that shown in Figures 5 and 6. Air temperatures are based on data collected by the U. S. Weather Bureau at Weeks Field in 1947 and early 1948. Surface temperatures are those obtained at test sections in the Permafrost Research Area during the same period. The correction factor is merely the ratio of the deg. -days above or below 0 C. for the surface temperature to the . deg. -days of the air temperature during the same period. The deg. -days are most simply obtained by-planimetering the area between the 0 C. line and the air or surface temperature curve. These data indicate that, on the average, the ground surface temperature under a cover of trees, brush and moss is only one third as high above freezing as the air temperature during the thawing season. Bitumi-nous surface temperatures average twice as high above freezing as the air temperatures during the same period. Snow was removed from the bituminous concrete and gravel surfaces and left in place on the other surfaces.
The heat which flows into the ground melts ice and raises the temperature of both thawed and frozen ground. In subarctic regions where the mean annual temperature is close to the freezing point, the heat which raises the soil temperature can be ignored. This procedure introduces a small error which is one of safety as far as design is con-cerned since it results in a calculated depth of thaw greater than the actual thaw. Con-sidering only the latent heat of fusion, the number of Btu's per sq. ft. of area required to thaw the soil to depth "x" is:

206
TABLE 1
COMPUTATION OF CORRECTION FACTORS FOR VARIOUS SURFACES IN Fl ELI) RESEARQI AREA
SUMMER 1947 & WINTER 1947-48
Summer 1947 Winter 1947-48 Area Degree-Days Above 32° F. Correc- Degree-Days Below 320 F. Correc-
Type of and Air Period Surface Period tion Air Period Surface Period tion
Surface Section Temp. Covered Temp. Covered Factor Temp. Covered Temp. Covered Factor
Used
1. Spruce trees, brush Area 1- 3055 4-13-47 1130 5-12-47 .37 5042 9-30-47 1430 10-6-47 .29
A moss over peat Sect. A to to to to
soil 9-30-47 10-6-47 5-3-48 5-10-48
2. Cleared of trees & Area 1- " 2220 4-28-47 .73 " 1245 10-6-47 .25
brush but with moss Sect. B to to
in place over peat 10-6-47 4-22-48
soil.
3. Silt loam cleared & Area 1-. " 3720 4-21-47 1.22 " " 1660 10-6-47 .33
stripped of trees & Sect. C to to
vegetation. 10-6-47 5-3-48
4. Gravel Area 2- 6080 4-11-47 " " 3840 10-14-47
Sect. BN-3 to to
10- 14-47 5-3-48
Sect. RN-26 6140 4-6-47 3160 10-10-47
to to
10-10-47 4-28-48
Av. 6110 Av. 3500 .70
5. Concrete Area 2-" " 6320 4-6-47 " " 3730 10-11-47
Sect. RN-16 to to
10-11-47 4-27-48
Sect. RN-17 5650 4-4-47 3800 10-11-47
to to
• 10-11-47 4-29-48
Area 2-
Sect. RN-18 6160 4347 4090 10-11-47
to to
10-11-47 4-13-48
Sect. RN-23 6520 4-5-47 • 4280 10-11-47
to to
10-11-47 4-13-48
Sect. RN-24 6360 4-3-47 3500 10-11-47
to to
10-11-47 4-25-48
a Av. = 6202 2.03 Av. = 3880 .77
6. Bituminous Area 2- " 6560 4-8-47 " " 3650 10-13-47
Sect. RN-2 to to
10-13-47 4-29-48
Sect. RN-15 6450 4-10-47 3950 10-10-47
to to
10-10-47 4-29-48
- Sict. RN-25 -------- 6980 3-2947 ------ - -- 3290 --10-12-47-
to to
• . 10- 12-47 4-4-48
Av. = 6663 2.19 Av. = 3630 .72
Note: Snow was not removed from Surfaces 1, 2, and 3.
Snow was removed from Surfaces 4, 5, and 6.

Figure 6. Air and Bituminous Surface Temperatures, Fairbanks, Alaska, winter - 1947-198.
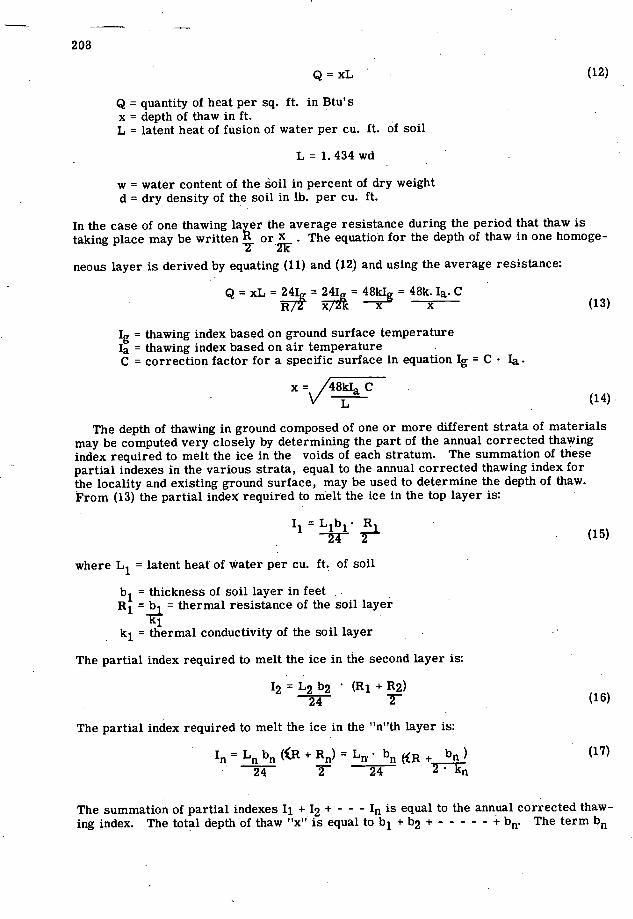
208
Q=xL (12)
Q = quantity of heat per sq. ft. in Btu' S
x = depth of thaw in ft. L = latent heat of fusion of water per cu. ft. of soil
L = 1. 434 wd
w = water content of the soil in percent of dry weight d = dry density of the soil in lb. per cu. ft.
In the case of one thawing layer the average resistance during the period that thaw is taking place may be written R or. The equation for the depth of thaw in one homoge-
neous layer is derived by equating (11) and (12) and using the average resistance:
Q=xL=241 =241 =40
5 7Fk = 48k. Ia. C
7
(13)
19 = thawing index based on ground surface temperature 'a = thawing index based on air temperature C = correction factor for a specific surface in equation 1g = C
x= /
[WI
The depth of thawing in ground composed of one or more different strata of materials may be computed very closely by determining the part of the annual corrected thawing index required to melt the ice in the voids of each stratum. The summation of these partial indexes in the various strata, equal to the annual corrected thawing index for the locality and existing ground surface, may be used to determine the depth of thaw. From (13) the partial index required to melt the ice in the top layer is:
R r (15)
where L1 = latent heat of water per cu. ft. of soil
b1 = thiákness of soil layer in feet R1 = b = thermal resistance of the soil layer
= thermal conductivity of the soil layer
The partial index required to melt the ice in the second layer is:
12=L2b2 (Rl+R2) 24 (16)
The partial index required to melt the ice in the n"th layer is:
in = Ln b ((R + Rn) = Ln. b ((R + bn) (17)
24 24 2kn
The summation of partial indexes Ii + 12 + - - - In is equal to the annual corrected thaw-ing index. The total depth of thaw 'Tx" is equal to b1 + b2 + -- - - - + b. The term bn

TABLE 2
COMPUTED DEPTh OF ThAW
RUNWAY TEST SECTION RN-4 - FAIRBANKS RESEARCH AREA
• a" L" • " b d" - Water 1.434 ad
Thich- Dry Content Volu- °k" H = b I = Thawing Indexa
ness Density of Soil metric Thermal k of of Soil in Latent Conductivity Thermal YJR
Layer lb. per Percent of 1-leat of Btu/sq. ft./ Resist- Il 2 Increment Summation Layer Material in ft. cu. ft. Dry Wt. Fusion hr/°F/ft. ánce
Thawing Index for 1947 based on air temperature = 3055. Corrected = 3055 2.19 = 6690.
1 Asphalt 0.4 150 0 0 10.3 = 0.86 0.47 0 0.24 0 0 12
2 Gravel (GW) 3.8 143 3.7 759 22.0 = 1.83 2.08 0.47 1.51 759 3.8 :1.51=181 181 12 24
3 Silt (MH) 2.5 99 27.7 3932 10.0 = 0.83 3.02 2.55 4.06 3932 2.5 4.06=1665 1846 U 24
4 Peat 1.5 25 81.9 2936 2.0 = 0.17 8.80 5.57 9.97 2936 1.5 '9.971824 3670 12 24
5 Silt and Peat 1.0 62 50.0 • 4445 6.0 = 0.50 2.00 14.37 15.37 4445 1.0 '15.37=2840 510 U 24
6 Silt and Peat x = 0.05 78.2 39.5 4429 7.5 = 0.63 x 16.37 16. 37 x
4429 'x ' (16. 37+iT)180 6690 9.25 12 0.63 + 24 1.26
= L1b1 . H1 1 2 = L2b2 (H1 + 112) 13 = Lb3 (11
+ 2 + 113) In -
= L0b ( R + H) - 24 2 24 2 - 24 2 24 2
Solving for x in Layer 6 I, = Lb (ä + b)
24 ( 2k)
.
180 = 4429x(16.37 + x
24 (
x 0.05 Computed Depth = 9.25. Actual Depth = 10.2

1000
DENSITY- POUNDS PER CUBIC FOOT
Figure 7. i,verage Therm1 Conductivity for Silt, Clay, and Peat - Unfrozen, Mean Teaprature 40 F.

211
may be equal to or less than the thickness of the final layer, since all of the final layer may or may not be thawed.
A sample computation of depth of thaw in groundS composed of several different soil layers is given in Table 2. The thawing index based on air temperatures at Fairbanks during 1947 was 3055. The correction factor for a bituminous surface is 2. 19. Thus, the thawing index based on surface temperatures was (3055) (2. 19) = 6690. Values for thickness, density, and moisture content of the various soils are based on field tests. Values of thermal conductivity were obtained from Figures 7 and 8 which were derived from tests of thermal properties made at the University of Minnesota under a contract with the St. Paul District, Corps of Engineers. The computed and actual field test data are plotted in Figure 11.
The above analysis does not take into account the heatnecessary to raise the ground temperature above the freezing point. In most cases, this additional•heat is of relatively small importance as compared with the heat required to melt the ice in the soil. How-ever, under those conditions where the soil contains little moisture for a considerable depth, the available heat energy is used principally in raising the soil temperature. Such a condition can occur where a porous gravel fill is placed above the natural ground-water table. Ordinarily a relatively small amount of heat is expanded in heating the dry gravel while a large amount of heat is expended in melting ice below the ground-water table. The amount of heat used in raising the temperature of unfrozen soil with a surface area of one sq. ft. , one deg. F. is:
= 1. 0) (d)(x) + (c)(d)(x) (18) 100
x = thickness of the soil layer in ft. w = moisture content of the soil in percent of dry weight d = dry density of the soil in lb. per cu. ft. c = specific heat of the soil (approx. 0. 19 Btu. per lb.)
1. 0 = specific heat of the water
The amount of heat required during the thawing season to raise the temperature of the thawed soil to the mean temperature during the period is equal to:
= (I)(d)(x) (w + c) 2t (100 ) (19)
I = thawing index in degree days t = number of days that the surface temperature is above 32 F.
The amount of heat required to raise the temperature of frozen soil from the mean annual temperature of the soil up to 32 F. is:
= (32 - M)(0. 5 wdx + cdx) (20) .100
32 F = freezing point of water M = mean annual temperature of soil surface
0. 5 = specific heat of ice
A more exact calculation of depth of thaw would include the above factors in Equation (13).
Heat absorbed = heat conducted (per sq. ft.)

212
xL + Id (w + c) + x(32 - M)(0. 5 wd + cd) UT)
= 48kIaC x
and x/ 48kJaC
\,/ L+Id (w +c)+(32 -M)(0.5wd +cd) (21) 2t 100 100
Computed depths of thaw for uniform layers of peat, silt loam, sand, and gravel from Northway and the Permafrost Research Area near Fairbanks, Alaska, are shown on Figure 12. It may be noted that for a given density condition, large variations in moisture content have very little effect on the depth of thaw in peat and silt loam and that the variation in depth between the high and low density conditions is only a few feet. From the knowledge of the fact that thermal conductivity increases gen- erally as the moisture content increases, it may appear strange that the depth of thaw does not also increase as the moisture con lo - tent is increased. However, the latent heat capacity of the soil varies in propor-tion to the moisture content and, in the case of the peat and silt loam studied, acts to very nearly compensate for the increase in thermal conductivity. In the cases of MOSUfl EN.PECET
sand or gravel, the latent heat capacity increases faster than the effect of thermal conductivity and, as a result, the depth of Figure 8. Average Thermal Conductivity for thaw is less in wet than in dry sand or dry Sandy Soils Unfrozen,ean Tenperature 40 F. gravel. The effect of density on depth of thaw is very pronounced in sand or gravel with a range of about 15 ft. from maximum to minimum. High density in either the silt loam or gravel causes thawing to greater depths than does low density. It is evident that greater depths of thaw are likely to occur in corase-grained material such as gravel than in fine-grained material such as silt loam.
In normal construction operations, it is usual practice to place fills at the highest practicable density to support structural loads. Such fills, which are generally coarse-grained, will produce conditions most suitable for deep thawing. The tests and studies reported on herein indicate that it is impracticable to construct fills under runways or highways to sufficient depth to entirely prevent thawing below the fills. Frost heaving in itself is not generally thmaging to a runway or highway if it is uniform. However, where the subgrade is not uniform in soil characteristics, differential heaving can be expected. Although it may be somewhat difficult to operate traffic over pavements where differential heaving has taken place, the most serious effect of the frost action is due to the loss in bearing capacity of the subgrade during the period that the ice lenses are melting. Since frost action in soils depends, among other things, on the grain size, available water supply, and capillarity of the soil, it is possible, according to Beskow (1), to reduce frost action by constructing in the fill a well-drained layer of corase-grained soil having low capillarity. The effect of this layer is to break the capillary flow of water to any fine-grained soil placed above it. In general, the fine-grained material is a better thermal insulator than the coarse-grained. Thus, a


214
--'---r.1--r. -----.. combination of layers of fine and coarse
'
materials may, under certain circumstances and with proper drainage techniques, prove
T::ffiTE to be the most satisfactory solution. Medium sand has a capillarity of only a few inches,
L_L _ therefore, a one foot layer of this material,
I if well drained, would normally be ample to in sure that the fine-grained material placed above did not receive sufficient water to form ice lenses and cause heav-
V. - - ing Frost heaving is not caused in any
~~F. Nil , soil by the water normally contained in the
voids but only by the water drawn from I iA 5 e,,o groundwater reservoirs by capil]rity. It
MOIS1uE C-TENT. PER CERT is known that water exists in soil in the form of vapor and moves by diffusion from
Figure 10. Average Thermal Conductivity points of high to low vapor pressure. Such
for Sandy Soils Frozen, Mean Temperature pressure differences occur as the result of 25 F. temperature differences or differences in
capillary tension between surfaces. Tem- perature differences during the fall, when freezing proceeds downward from the ground surfaces, tend to cause vapor travel in the soil to the cold upper surface. In the spring with the warming of the ground, surface vapor travel is downward to the colder interior. According to Beskow (1), "the diffusion due to temperature difference is so small, that for water flow in frost-heaving soils (being only a few millimeters per day), it is of no importance."
Thawing under a building depends to a large extent on the size of the building. A long, narrow building will have a smaller depth of thaw than a square building with the same ground area because of the differences in heat flow laterally. In general, the depth of thaw in permafrost under a building subject to a uniform heat condition is proportional to the square root of the time during which the heat condition is maintained. If allowance is made for the heat absorbed by the thawing ground under the floor but not for the heat absorbed by the permafrost below the thawing layer, an equation similar to the others in this article may be derived:
Heat absorbed = heat conducted
Lx + ( w )(d)(I)(x) + (d)(c)(I)(x) = (k)(T)(24t) (2 x/2
x= L + (w )(d)(T) + (d)(c)(T)
V ti)tY (_)
x=/ 48kTt -
/L+Td(w +c) (22) V
T = temperature difference between the building floor and the perma-frost surface
t = total number of days
A sample calculation using this formula and available data from observations of the hangar at Northway Airfield, Alaska,
IHASING INDEX. DEGRIE r DXfl
Figure U. Runway Test Section, Depth of Thaw, Fairbanks, Alaska.

w w U- z
3
I- U- 0 I I- Ui 0
MOISTURE CONTENT IN PERCENT OF DRY WEIGHT
00
NOTE: FORMULA FOR DEPTH OF THAW IN
SINGLE LAYER OF UNIFORM SOIL IS
h/24C2k WHERE
h DEPTH OF THAW IN FEET. I THAWING INDEX IN DEGREE DAYS. C CONSTANT TO CORRECT THAWING INDEX
FOR SURFACE CONDITIONS. It • COEFFICIENT OF THERMAL CONDUCTIVITY. L .434 x OENSITY x MOISTURE CONTENT.
FOR THIS GRAPH, THAWING INDEX TAKEN EQUAL TO 3000 AND FACTOR CAS FOLLOWS.
C SOIL
0.37 PEAT 1.22 FAIRBANKS SILT LOAM 2.00 FAIRBANKS GRAVEL 2.00 NORTHWAY SAND
Figure L.. Computed Depth of Thaw in Peat, Silt Loam, Sand, and 6ravei, Fairbanks, Alaska.

216
is as follows, based on uniform soil conditions:
Sandy soil w= 25 percent d= 93 lb. per cu. ft. k= 19.5 = 1.62 c = 0.17
T = 60 deg. (at floor surface) - 32 deg. = 28 deg.
L = 143. 4 (w)(d) = 143. 4 (25) (93) = 3334 Btu per cu. ft. 100
The hangar was constructed in 1943 and heating started on November 1, 1943. Computed depth of thaw to 1 November 1945 = 730 days after construction.
x,/48 (1. 62)(28)(730) = 3334 + 28 (93)(. 25 + .17)
2 ___
v11'5_________
90'000 /= 20.2 ft. 3334 + 560 = Observed depth was 20 ft.
b. Computed depth of thaw to November 1, 1946 = 1, 095 days after Construction.
x = 20. 2 /T = 20. 2 (1. 225) = 24. 8 ft. 30
Observed depth was 22. 5 ft.
C. Computed depth of thaw in 10 years t = 3,650 days
x = 20. 2 /T3O = 20. 2 (2. 24) = 45. 2 V7O
d. Computed depth of thaw in 30 years t = 10, 950 days
x = 20.2 IT5 = 20. 2 (3. 88) = 78. 4 \J 730
A graph of these computations is shown in Figure 13. The size of this building is 162 ft. by 208 ft. and the concrete floor is in direct contact with the ground.
Depth of Frost Penetration
The depth of frost penetration can be calculated by the same principles used to cal-culate the depth of thaw. Correction factors applied to the freezing index based on air temperatures are generally much smaller than the correction factors applied to the thawing index and generally smaller than unity. When the mean annual temperature of a surface is higher than the mean annual temperature of the air, the annual temperature amplitude would have to be increased more than the difference between the mean annual temperatures just to make the freezing indexes equal. However, on the average, sur-face temperatures are higher than air temperatures during both winter and summer. In calculating depth of frost penetration, values of thermal conductivity for the soil in a frozen condition are used. The example shown in Table 3 illustrates the application of the method described above for calculating depth of thaw to the calculation of depth of frost penetration for the same soil conditions used in Table 2. The calculated depth of frost is 8. 4 ft. , while the depth of frost from temperature gradients was approxi-mately 8. 5 ft. See Figure 14. It may be noted on comparison of the results obtained in Tables 2 and 3 that the calculated depth of thaw was 9. 25 ft. and the calculated depth of frost was 8. 4 ft. These results shOw that the depth of thaw is greater than the depth of frost which indicates that thaw is probably progressing from year to year and that perma-
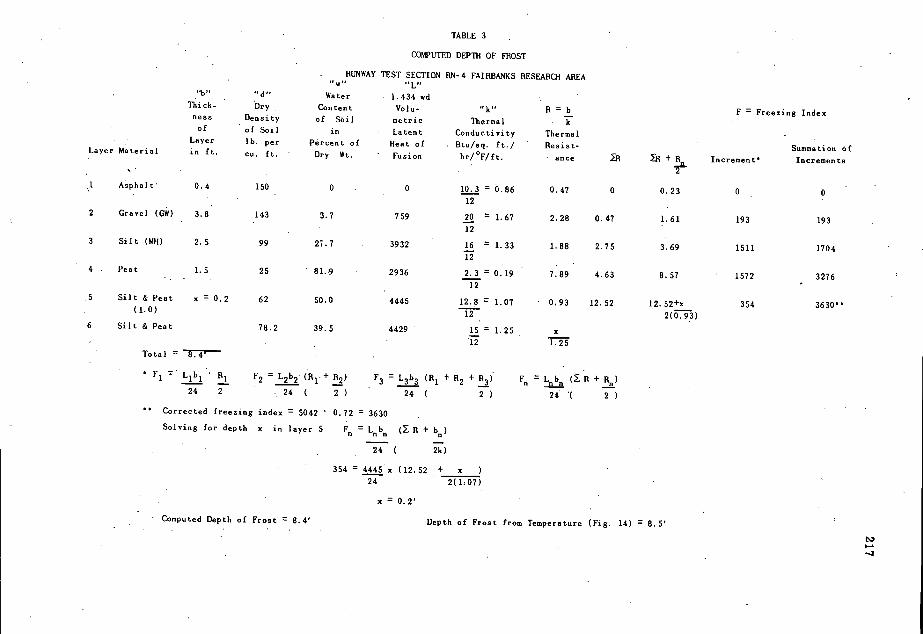
TABLE 3
COMPUTED DEPTh OF FROST
RUNWAY TEST SECTION RN- 4 FAIRBANKS RESEARCH AREA
"cl" Water 1.434 wd Thick- Dry Content Volu- "k B ness Density of Soil metric Thermal k of of Soil in Latent Conductivity Thermal
Layer lb. per Percent of Heat of Btu/sq. ft./ Resist- Layer Material in ft. cu. ft. Dry Wt. Fusion hr/°F/ft. ance
1 Asphalt 0.4 150 0 0 10.3 = 6.86 0.47 0
12
2 Gravel (GW) 3.8 143 3.7 759 20 = 1.67 2.28 0.47 12
3 Silt (MH) 2.5 99 27.7 3932 1.6 = 1.33 1.88 2.75
12
4 Peat 1.5 25 81.9 2936 2.3 = 0.19 7.89 4.63
12
5 Silt & Peat x = 0.2 62 50.0 4445 12.8 = 1.07 0.93 12.52 (1.0) U
6 Silt & Peat 78.2 39.5 4429 15 = 1.25 x
12 1.25
Total = 8.4'
F1 Lb B F2 = L2b2 (R1.+R2) F3 =L3b3 (B1 +B2 f-B3) Fn = 1 n bn ( +R)
24 2 24 ( 2 ) 24 ( 2 ) 24 ( 2 ) Corrected freezing index = 5042 0.72 = 3630
Solving for depth x in layer 5 F0 = Lnbn B + b)
24 ( 2k)
354 = 4445 x (12.52 + x
24 2(1.07)
x0.2'
F = Freezing Index
+ R Increment
0.23 0
1.61 193
3.69 1511
8.57 1572
12. 52+x 354
2(0. 93)
Summation of
Incremen ta
0
193
1704
- 3276
3630"
Computed Depth of Frost = 8.4'
Depth of Frost from Temperature (Fig, 14) = 8.5'

218
PRORAILI RUTH OF T0 ORDIR WARREn (ROSTER FLOOR TIIR*TUTL RR.T
Figure 13. Probable Depth of Tha':: Under Hangar Estimated Floor Temperature 60 F.,
Northway Airfield, Alaska.
(.P(RATUR P Ct GOES CttT,LtADt
0 _
iIIiil 1S'1
OhIIIIIH1Iimufflm it.iflhiiiIuui;;iuiuuiIWWIH
NONEII1 MENP MENiiE
MEN Figure 14. Temperature Gradients Under Bituminous Surface, Fairbanks, Alaska.
frost is degrading. It accounts theoretically for the discrepancy between the computed depth of thaw, 9. 25 ft. , and the observed depth, 10. 2 ft. See Table 2. The rate of degradation of permafrost might be calculated in this case by subtracting the number of degree days necessary to thaw 8. 4 ft. of seasonal frost from the corrected thawing index, 6, 690 deg. -days, and using the difference in the equation for depth of thaw to conWute the increments of thaw gained below 8. 4 ft. each year. Figure 15 illustrates the com-puted relative depths of frost penetration for typical soil types in the vicinity of Fair-banks, Alaska, where the average freezing index is 5,220 deg. -days based on a 45-year record of air temperatures through 1948.
Suggested Research
Thawing and freezing indexes for use in the equations described in this paper have been determined by measuring the area between the time temperature curve and the freezing temperature line for the thawing and freezing seasons. Air and surface tem-peratures have been obtained periodically by observations of potentiometer or wheat-stone bridge type temperature indicators. The ratio of the surface index to the air index is the correction factor used in Equation 14. Studies are now being made of temperatures of the air and various surfaces which are measured many times each day by automatic temperature recorders.
Data concerning air temperatures are available for weather stations all over the world. From these data the mean annual temperature and annual temperature amplitude of the air at any locality can be determined. It appears that relations may exist between the mean annual temperatures of the air and ground surface and the annual temperature amplitudes of the air and ground surface. Additional research will be required to validate this assumption.
For locations where the mean annual temperature and annual temperature amplitude of the air are known it is possible to compute the thawing index or freezing index from the sine law. The annual temperature amplitude may be determined from a graph of monthly mean temperatures or by calculation using the following Equation 23:

0
5
_ I Ui w
-.----i-1- FAIRBANKS GRAVEL
NKS PEAT -DENSITY-10/CU FTl—', :
S SILT L0AM-DENSIT 704/CU FTI- .
............... .j....j_FAIRBANKS STLOAM'DENSITYII0/C id1THWAY SA .ND-DEN Y-0/CUT
INORTHWAYSAND -DENSITYU
—H.................................H: .......
-DENSI" -5"'CU FT
NOTE FORMULA FOR DEPTH OF FROST IN
SINGLE LAYER OF UNIFORM SOIL IS
24cF(2k) WHERE
X DEPTH OF FROST IN FEET. F FREEZING INDEX IN DEGREE DAYS. C CONSTANT TO CORRECT FREEZING INDEX.
COEFFICIENT OF THERMAL CONDUCTIVITIY OF FROZEN SOIL.
L 1.434 X DENSITY X MOISTURE CONTENT.
FOR THIS GRAPH, THE FREEZING INDEX IS TAKEN EQUAL TO 5220 DEGREE DAYS AND FACTOR "C' AS FOLLOWS.
C SOIL .25 PEAT* .33 FAIRBANKS SILT LOAM* .70 FAIRBANKS GRAVEL .70 NDRTHWAY SAND (ESTIMATED)
* SNOW COVER NOT REMOVED
U, 0 15 U, U. 0
a-U,
20
25
Figure 15. Computed Lepth of Frst in Feat, Silt Lom, Sano, and Gravel, Fairbanks, Alaska. Co

220
A=i.41 ,/iiiT32 (23)
A = amplitude in degrees 1. 414 = factor to change the. root mean square value to amplitude
= summational symbol M = mean annual temperature m = mean monthly temperature
The equation for a sine curve may be integrated to obtain equations for the thawing index as follows:
y=Asinx A = amplitude x = angle in radians ydxAsinxdx X2 X2
f ydx=At sinxdx Xi 1
X2 = A cos XD
xi
= A [_ cos x2 -(- cos xifl =A Fosx1 -cosx
and since x2 is an angle in the second quadrant equal to (ii - xj radians), cos x2 is the same as cos xi with a negative sign; therefore;
X2
Jr y dx = A (2 cos xi) degree radii xl
To convert the angle xi into degrees xi may be written xi = 360 t1 365
and the whole equation must be multiplied by 365 to convert to deg. -days. 2ir
y dx = 365 (A)(2 cos 360 t1) deg. -days tj 2ir 365
For Figure 16 this integration gives area EOQHI, from which area EOHI must be sub-tracted to get the area above 32.deg. F.
I = 365 (A)(2 cos 360 t1) - (32 - M)(t2 - t1) EF 365
(24),
t1 = number of days required for the temperature to change from the mean annual temperature to 32 .F; --
t2 = number of days required for the temperature to rise from the mean annual temperature to maximum displacement and to fall back to 32 F.
(360/365)ti = angle in degrees, not radians
The factor t1 may be obtained from the following reiationship:
sin (360 ti) = 32 - M : (25) To A

221
and t2 from the following:
t2 = 182. 5 - tl (26)
By a similar integration, the equation for the freezing index may be obtained.
= 2 f32 - M)t1- 365 (A)(1 - cos 360 ti31 + 365(32 - M)+365 A (27) J T2
The preceding equations hold for I and F when the mean annual temperature is below 32 F., but the following equations are true when the mean annual temperature is above 32 F.
I = 2 [(M -32) t1 - 365(A)(1 - cos 360 t)j (28) 2ir 365 J
+ 365 (M - 32) + 365 (A) 2 IT
sin(360t1)=M-32 365 A (29)
F = 365 (A) (2 cos 360 t1) - (M - 32)(t2 - t1) (30) 365
Data from Fairbanks, Alaska and Minneapolis, Minnesota for air temperatures have been applied to these equations and the resulting indexes have been very close to those determined by other methods.
The advantage of the equations above is that only two factors, namely, mean annual temperature and annual temperature amplitude are required for calculation of indexes at a given loca.lity.
It appears possible to determine the mean annual temperature and the annual temper-ature amplitude of a given surface from similar properties of the air by adding or sub-tracting a temperature difference. The indexes for the surface may then be approxi-mated by means of the equations above.
Further research is necessary and appears desirable to validate these assumptions and to determine the temperature difference between air and surface mean annual tem-perature and annual temperature amplitude for various localities.
Conclusions
The results indicate a practical method of calculating the depth of thaw and the depth of frost below plane surfaces. The procedures outlined herein can be applied to con-ditions in the temperate zone providing information is available concerning the relation between air temperatures and the temperature of the particular surface being investigat-ed. Information must also be available concerning soil density, moisture, and thermal conductivity. It is believed that information obtained from such' studies will be of con-siderable value in indicating therelative merits of various types of materials in pre-venting frost penetration and associated problems.
Bibliography
Jakob, Max, and Hawkins, George A., "Elements of Heat Transfer and Insula-tion," John Wiley and Sons, Inc., New York, 169 pp.,' 1942.
Carslaw, H. S., "Introduction to the Mathematical Theory of the Conduction of Heat in Solids," Dover Publications, New York, 268 pp. , 1945.
Cork, James M., "Heat," John Wiley and Sons, Inc., New York, 294 pp., 1942.

METHOD I
EMPIRICAL DATA FOR INDEXES
MEAN DEGREE DAYS DEGREE DAYS MONTH MONTHLY T OF FREEZE OF THAW
-167 15097 F -169 13692 N -14.8 145O.8 A - 0.2 966.0 N 19.5 3875 J 34.7 A08r16.0 OCD 97.0
J 40.0 248.0 A 385 2015
S 31.0 HLM 46.5 FHGrI6.5
0 16.6 4774 N 0.0 960.0 D -11.7 13547
TOTAL Fr8537.8° DAYS I°563.0° DAYS
METHOD II
THEORETICAL CALCULATN OF INDEXES
01 306 F° AMPLITUDE (A) 1.414 12
sin (360ti)° - 32-N
46.6 DAYS
It, 365 -46.6° 135.9 DAYS
AREA EOQHI-AREA EON) FrAREA NOPs-AREA HJK+ AREA KJNP+ AREA KRP
AREA EOOHI° -(A)(2Cos360 365 - ti) AREA NOP+AREA HJK 2[tu(32-M)- -- (A)
AREA EOH)° (32-M)(ta-ti) (1-Cos - 360 ti)] 966.2° DAYS 365
506,9° DAYS AREA KJNP z --(32-M)° 4015° DAYS
AREA KRPr --A°3555.7°DAYS V
Fr 8536.9° DAYS
JAN - FEB MAR APN MAY JUNt -- -, 50,
I TI1AWING INDEX
401 - i - - FREEZING INDEX:
_______ ____ N
30
- HIL
V, _7B AMPLITUDE (A)
20
I ) MEAN ANNUA1MPEPATURE 10 F. 10.
I I --- -- -
t•'.' . . . : .
20
FFR MAR APR MAY JUNE JULY AUG SEPT OCT NOV DEC
A =TIME FOR AIR TEMPERATURE TO RISE Mr MEAN ANNUAL TEMPERATURE Fz FREEZING INDEX.
FROM MEAN ANNUAL TO 32° p. A' AMPLITUDE OF AIR TEMPERATURE THAWING INDEX.
TIME FOR AIR TEMPERATURE TO CHANGE VARIATION VE4AXIkIUM TEMPERATURE
FROM MEAN ANNUAL THROUGH THE m MEAN MONTHLY TEMPERATURE. VARIATION.
MAXIMUM AND 8ACX TO 32F t 'MEAN MONTHLY TEMPERATURE.
TWO METHOOS OF DETERMINING THE THAWING
AND FREEZING INDEXES FROM MEAN MONTHLY AIR TEMPERATURES AT
BARROW, ALASKA
Figure 16. Two Methods of Letermtning the Thawing and Freezing Indexes from Mean Monthly Air Temperatures at Barrow, Alaska.
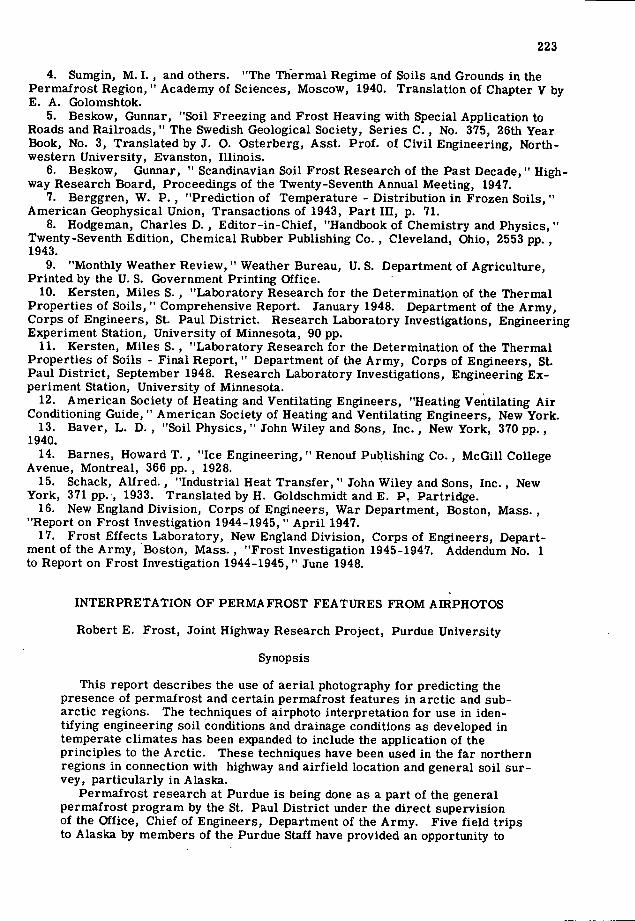
223
Sumgin, M. I., and others. "The Thermal Regime of Soils and Grounds in the Permafrost Region," Academy of Sciences, Moscow, 1940. Translation of Chapter V by E. A. Golomshtok.
Beskow, Gunnar, "Soil Freezing and Frost Heaving with Special Application to Roads and Railroads," The Swedish Geological Society, Series C., No. 375, 26th Year Book, No. 3, Translated by J. 0. Osterberg, Asst. Prof. of Civil Engineering, North-western University, Evanston, Illinois.
Beskow, Gunnar, "Scandinavian Soil Frost Research of the Past Decade," High-way Research Board, Proceedings of the Twenty-Seventh Annual Meeting, 1947.
Berggren, W. P., 'Prediction of Temperature - Distribution in Frozen Soils," American Geophysical Union, Transactions of 1943, Part Ill, p. 71.
Hodgeman, Charles D., Editor-in-Chief, "Handbook of Chemistry and Physics," Twenty-Seventh Edition, Chemical Rubber Publishing Co., Cleveland, Ohio, 2553 pp., 1943.
"Monthly Weather Review," Weather Bureau, U. S. Department of Agriculture, Printed by the U. S. Government Printing Office.
Kersten, Miles S., "Laboratory Research for the Determination of the Thermal Properties of Soils," Comprehensive Report. January 1948. Department of the Army, Corps of Engineers, St. Paul District. Research Laboratory Investigations, Engineering Experiment Station, University of Minnesota, 90 pp.
Kersten, Miles S., "Laboratory Research for the Determination of the Thermal Properties of Soils - Final Report," Department of the Army, Corps of Engineers, St. Paul District, September 1948. Research Laboratory Investigations, Engineering Ex-periment Station, University of Minnesota.
American Society of Heating and Ventilating Engineers, "Heating Ventilating Air Conditioning Guide," American Society of Heating and Ventilating Engineers, New York.
Bayer, L. D., "Soil Physics," John Wiley and Sons, Inc., New York, 370 pp., 1940.
Barnes, Howard T., "Ice Engineering," Renouf Publishing Co., McGill College Avenue, Montreal, 366 pp., 1928.
Schack, ALfred., "Industrial Heat Transfer," John Wiley and Sons, Inc., New York, 371 pp.., 1933. Translated by H. Goldschmidt and E. P. Partridge.
New England Division, Corps of Engineers, War Department, Boston, Mass., "Report on Frost Investigation 1944-1945," April 1947.
Frost Effects Laboratory, New England Division, Corps of Engineers, Depart-ment of the Army, Boston, Mass. , "Frost Investigation 1945-1947. Addendum No. 1 to Report on Frost Investigation 1944-1945," June 1948.
INTERPRETATION OF PERMAFROST FEATURES FROM AIRPHOTOS
Robert E. Frost, Joint Highway Research Project, Purdue University
Synopsis
This report describes the use of aerial photography for predicting the presence of permafrost and certain permafrost features in arctic and sub-arctic regions. The techniques of airphoto interpretation for use in iden-tifying engineering soil conditions and drainage conditions as developed in temperate climates has been expanded to include the application of the principles to the Arctic. These techniques have been used in the far northern regions in connection with highway and airfield location and general soil sur-vey, particularly in Alaska.
Permafrost research at Purdue is being done as a part of the general permafrost program by the St. Paul District under the direct supervision of the Office, Chief of Engineers, Department of the Army. Five field trips to Alaska by members of the Purdue Staff have provided an opportunity to

224
study frost phenomenon of many types under a wide range of arctic and sub-arctic conditions.
In permafrost regions engineering problems associated directly with permafrost result from an upset in the thermal balance in those situations where fine-textured soils exist. Influencing factors are topographic position, surface insulation, soil temperature, soil texture, exposure to heat, and moisture. Problems associated with the permafrost can be predicted from airphotos if such items as topographic position, soil texture, cover, and drainage condition can be determined and evaluated in light of the climate, type of permafrost, and exposure to heat.
Many surface features directly associated with natural permafrost phe-nomena can be seen on airphotos of suitable scale. These are related to such processes as freezing or thawing and are exhibited in a variety of forms. Many of the surface features indicate to a large extent the type of action tak-ing place.
Prediction of engineering difficulties in the "active zone," or the "frost zone" in permafrost regions is done by determination and evaluation of topo-graphic position, soil texture, and drainage in light of climate and depth of seasonal thaw. Because of the usually small areal extent of such features they often can not be seen on small-scale airphotos and they are not predict-ed directly. It is necessary to determine many of the influencing factors from airphotos by detailed study of soil-permafrost patterns before such features can be predicted and evaluated.
In no,npermafrost areas of the Arctic and Sub-Arctic, frost susceptible soils can be identified from airphoto study by applying certain of the air-photo interpretation principles. Since silty soils are the most susceptible to frost difficulties it often becomes a matter of identifying and separating silt soils from those in other textural classes. One of the most important influencing factors, ground water, must be inferred from an evaluation of such items as topographic differences, parent material structure and texture,. and vegetation, since little research has been done in photo identification of ground-water conditions in the Arctic.
Interpretation in temperate regions for predicting frost action is somewhat difficult, particularly in areas having a highly cyclic climate throughout a year, Soil textures can be identified in nearly all climatic belts, and the frost susceptible soils determined, but evidences of frost action are not pronounc-ed, particularly from the standpoint of photo interpretation, due to the min-ute photo scale of the frost phenomenon in an area.
From the standpoint of airphoto interpretation and frost susceptibility of soils it is believed that predictions in the Arctic and Sub-Arctic can be done with a high degree of accuracy. Airphotos can be used to locate and identify adverse permafrost conditions where difficulties of construction and subse-quent failure will result. Likewise, the photo method can be used to locate and identify the sites containing the better engineering soils.
This paper is directed toward the identification and interpretation of permafrost and permafrost features using aerial photographs. The purpose of the paper is to present the more general aspects of interpretation of soils and permafrost from airphotos and to present airphotos of some of the peculiar surface configurations of permafrost patterns.
The data were obtained in connection with a study covering the airphoto interpreta-tion of permafrost (1) being prepared by the University for the Office, Chief of Engi-neers, Corps of Engineers, through a contract between the University and the St. Paul District. Three papers (2, 3, 4) and one progress report (5) have been published cov-ering various aspects of photo interpretation of permafrost regions. The permafrost study is designed to determined procedures for identifying and interpreting engineering soils and permafrost conditions, from aerial photographs of arctic and subarctic regions. The project has been confined to the Territory of Alaska and five summers have been

225
spent in the field gathering data. This paper does not contain a review of
the airphoto interpretation techniques since they are discussed elsewhere (6 to 28 mci.) The paper reports on field observations by the Purdue parties and on observations made by others who have studied the permafrost phenomenon. The more important obser-vations and opinions of others have been referenced in the bibliography.
Permafrost
Definition - Several definitions of perma- frost appear in the literature. Perma- .; 't ;. / frost may be defined as permanently fro- t zen earth materials which include bed- / rocks having a temperature below freez- ing and other materials which have become solidtike by low temperatures and have remained in such a state continuously for a long period of time (29, p 3) (30, p 1,436) Permafrost may be defined on the fti' basis of temperature exclusively irrespec- -, - tive of degree of induration, water content, Figure 1. Dry—Frozen Sand. or lithologic character (29, p. 3). Perma- frost may be defined as permanently frozen subsurface material not subject to seasonal freezing or thawing.
Setting - Permafrost exists in areas where winter freezing exceeds summer thawing as stated by Taber (30, p. 1, 505). It occurs where the mean annual temperature is below freezing. Some believe that permafrost areas correspond closely with the unglaciated
Figure 2. Ice V.'edge in Detrimental Perma— Figure 3. leo Lenses in Detrimental frost. Permafrost.

Figure 6. Massive Ground Ice.
226
Figure 4. Lajudnated Ice-Soil Structure. Figure 5. Ice Crystals.
areas in arctic and subarctic regions. Muller points out that it occurs in almost one-half of the USSR and in most of Alaska and northern Canada (29, P. 1). The depth of the permanently frozen materials varies considerably from just a few feet near the southern limits to nearly a thousand feet in the northern coastal plain of the American Continent.
Mode of Occurrence - Permafrost exists in the following forms: dry frozen or detri-mentally frozen.
Active Zone - This is the entire layer of ground above the upper surface of the permafrost layer, most of which freezes and thaws every year. In the Arctic and the SubArctic the thickness of the active zone depends on such factors as soil texture, top-ographic position, vegetative cover (insulation), and exposure to heat or summer's warmth, as stated by Leffingwell (31, p. 181). In the Arctic Coastal Plain well-drained gravels situated high topographically have an active layer thickness of several feet, often six or more. The finely textured soils which are situated in low topographic positions in the Arctic have an active layer varying in thickness from 12 to perhaps 20 inches. In areas where a thick moss carpet exists the active layer is very shallow - ice can be found beneath the moss in many instances even as late in the season as September. In southern parts of permafrost regions the active zone is much thicker since soil temperatures in the permafrost are warmer and the duration of summer heat is longer than in the Arctic. In well-drained granular soils which are situated high topographically the active zone is much deeper than in the areas of fine-textured soils. Finely textured soils which are relatively unprotected from a thick moss cover or a forest growth may thaw 12 or more feet. However, where protection is afforded seasonal thaw is considerably less.
Frost Zone - This is the top layer of ground subject to seasonal freezing and thaw-ing. Where seasonal freezing penetrates to or below the upper surface of the perma-frost layer the frost zone and active zone are identical.
Dry-Frozen Materials - Dry frozen refers to a condition in elastic materials in which the mass is rendered solid by the freezing of interstitial water. In the nor- mal and unfrozen state such soils would be well-drained internally. Ice lenses, ice wedges, or ground-ice areas usually are lacking and such soils can experience thaw without severe settlement. They do not contain free ice as a cementing substance (29, p. 3) (32, p. 1). Such soils are usually confined to granular areas situated high topographically and having what would normally be a low ground-water table.

227
Typical soil types are those associated with sand dunes or high sand terraces.
Detrimentally Frozen Materials - This type of permafrost includes: fine-textured soils which contain a large percentage of ice in their mass in the form of crystals, small lenses, or small wedges; soil masses which have been so arranged by segrega-tion of ice and soil particles that they form polygonal blocks of varying size and types; materials situated low topographically and having large masses of ground ice as an integral part of their mass; and large masses of ground ice. In general, the most detrimental permafrost situations may occur on nearly all common landform types provided that soil textures are fine and that the topographic situation is somewhat de-pressed, very slightly sloping, or exceedingly flat. Thus, such land forms as broad flat plains (level or slightly sloping); valley fill; transition zones; low colluvial slopes; lake beds; backwater flood plains; and others of a similar nature which contain finely-textured soils can be expected to contain detrimental permafrost.
Engineering Significance
With regard to the effect of permafrost on engineering construction, it has been found that both good and bad soils occur in permafrost regions. For the most part the good construction areas contain well-drained granular materials which occur in elevat-ed positions in comparison to the surrounding terrain. The poor areas are those gen-erally low areas which consist of the fine -grained soils having subsurface ice layers and ice wedges.
The engineering problems are contingent on which type of permafrost exists or which type exerts the greatest influence on a structure. Structures confined to the active zone are subjected to seasonal freezing and thawing which will be accompanied by considerable movement if the soils are finely-textured. This is particularly ob-jectionable for such structures as highways, railroads, power lines, buildings, pipe lines, and utilidors. The period of most severe damage is during and shortly follow-ing the spring breakup. It is during this period that paved surfaces suffer the greatest distress. Unpaved areas or areas of natural cover in which the soils are silty are rendered non-trafficable for vehicular traffic during and immediately following such a period. Such areas recover rapidly once the frost leaves and the water drains away.
Structures placed on permafrost of the dry-frozen type usually do not experience serious damage from the resulting thaw. Airfields, runways, roads, and buildings have been placed on frozen sands and gravels and have performed satisfactorily not only following construction but throughout the critical breakup seasons as well. There are, however, often local areas containing detrimental permafrost which lie within the bounds of dry frost which should be avoided in engineering construction. Such areas are common in landforms associated with water deposition.
Those structures placed on detrimentally frozen materials experience severe distress almost immediately following construction. Thaw is usually continuous under heated structures which have not been insulated properly from the ground surface. The destruction, or merely disturbance, of the protective natural insulation renders detrimentally frozen areas non-usable for structures and non-trafficable for most vehicles. Recovery of permafrost of the-detrimental type in disturbed areas is ex-tremely slow, even after completely abandoning a disturbed site.
Permafrost Pattern Features
On the basis of the field and laboratory work performed to date in connection with the research program designed to develop means of locating various degrees of perma-frost in arctic and subarctic regions, it has been found that aerial photographs can be used to distinguish good materials and good site areas from detrimentally frozen mate-rials and unsatisfactory site areas (1). Aerial photographs can be used to identify soil textures and permafrost conditions associated with various arctic and subarctic land forms. By utilizing airphoto interpretation procedures in arctic and subarctic regions,
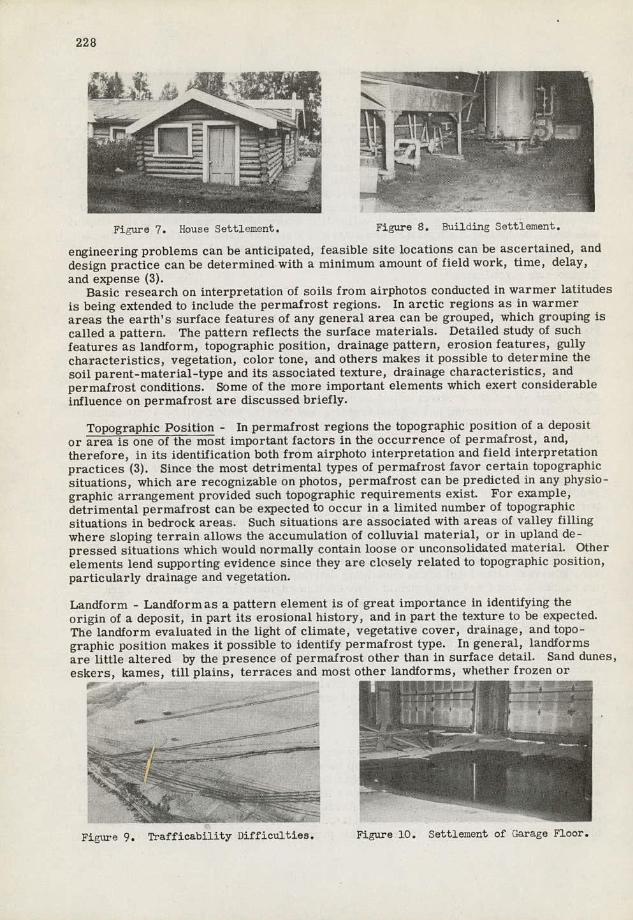
228
r__---- —.-- fr
Fi.u.re 7. House Settlement.
Figure 8. Building Settlement.
engineering problems can be anticipated, feasible site locations can be ascertained, and design practice can be determined with a minimum amount of field work, time, delay, and expense (3).
Basic research on interpretation of soils from airphotos conducted in warmer latitudes is being extended to include the permafrost regions. In arctic regions as in warmer areas the earth's surface features of any general area can be grouped, which grouping is called a pattern. The pattern reflects the surface materials. Detailed study of such features as landform, topographic position, drainage pattern, erosion features, gully characteristics, vegetation, color tone, and others makes it possible to determine the soil parent-material-type and its associated texture, drainage characteristics, and permafrost conditions. Some of the more important elements which exert considerable influence on permafrost are discussed briefly.
Topographic Position - In permafrost regions the topographic position of a deposit or area is one of the most important factors in the occurrence of permafrost, and, therefore, in its identification both from airphoto interpretation and field interpretation practices (3). Since the most detrimental types of permafrost favor certain topographic situations, which are recognizable on photos, permafrost can be predicted in any physio-graphic arrangement provided such topographic requirements exist. For example, detrimental permafrost can be expected to occur in a limited number of topographic situations in bedrock areas. Such situations are associated with areas of valley filling where sloping terrain allows the accumulation of colluvial material, or in upland de-pressed situations which would normally contain loose or unconsolidated material. Other elements lend supporting evidence since they are closely related to topographic position, particularly drainage and vegetation.
Landform - Landformas a pattern element is of great importance in identifying the origin of a deposit, in part its erosional history, and in part the texture to be expected. The landform evaluated in the light of climate, vegetative cover, drainage, and topo-graphic position makes it possible to identify permafrost type. In general, landforms are little altered by the presence of permafrost other than in surface detail. Sand dunes, eskers, kames, till plains, terraces and most other landforms, whether frozen or
•••;
?
-/ -
Figure 9. Trafficabiity Difficulties. Figure 10. Settlement of Garage Floor.

Figure 11.
229
Airpnoto Pattern of VIell-L)rained, Unfrozen Gravel Terrace,
S S_ S ;S \
•SS 3' A.
S S
Si
t
rt
Figure 12. Airphoto Pattern of Detrimentally-Frozen Silt-Covered Terrace. (NOTE: Bar scale on all photos, where shown, represents 1000 feet.)

230
unfrozen, have the same respective landform characteristics in any climate. Varia-tions attributed to permafrost are reflected in the macrodetail on the surface such as changes in vegetation, erosional characteristics, color or other features, most of which can be seen on airphotos. Chief among the surface features are soil polygons.
Drainage Pattern - In general, the areal-drainage pattern is little altered by the pres-ence of permafrost. The physiographic arrangement is by far the greatest factor in controlling the major pattern of a watershed. At best, the areal-drainage pattern assists in identifying the major parent-material-type and its structural arrangement (24). Lo-cally, permafrost may exert considerable influence, particularly on the gully character-istics.
.•s
....-.'. .'
.. MCI' I- . ....
..
,•. - •.•4
.;_.
- :••- •c-:;. -
44 :-,.
-
Figure 13. Airphoto Pattern of a Detrimentally-Frozen Terrace-Flood Plain Area.
Erosion Features - Frozen soils erode chiefly by thaw, either by running water or by a sudden upset in the thermal balance existing between air-soil temperature as controlled by vegetative cover and exposure to heat.
Erosion by running water is common in upland areas where a gully system will be forced to carry a sudden increase of flow. In such instances if polygons are present the polygon channels become gullies and destruction of the polygon net is rapid. The ice in the channel portion thaws first causing a general subsidence in and adjacent to

231
the polygon channel. This is indicated by overhanging vegetation mats along channels. If thawing is particularly active due to the addition of excess surface water or a partic-ularly warm summer, complete polygons will be destroyed, leaving only isolated mounds of soils as remnants.
When polygonal ground is cleared prior to cultivation, the thermal balance is upset and the ice in the soil melts. If surface gullying does not start or is not allowed to progress, the subsoils will thaw slowly and the water will flow away as ground water. This will result in considerable settlement in areas underlain by ice wedges or other ice masses and will create a topography consisting of a series of domes or mounds of considerable regularity in size and spacing. These features also can be seen on air-photos.
One of the most common types of gully systems in permafrost regions is that asso-ciated with button drainage. Inland, and some distance away from the immediate effects of a coast line, or some other erosional base level, thaw in polygon areas usually starts at the intersections of the polygon channels by the formation of small circular pools of water. If any surface flow is established an irregular and angular arrangement to the
4 ! 4
I
I' - ,
1 -
-
Figure ]h.
-'t.& '•1 - •'-k'-
., '•t 4 --•.- c
Airphoto Pattern of a Dry—Frozen Sand Terrace.
-
Figure 16. Polygon iernnants. Figure 15. Airphoto of Polygon rosion,

232
gully plan is obtained in which a series of connected pools exists. This type of drain-age is commonly called button drainage and occurs widespread in the Arctic, partic- ularly in somg~n; e of the broad gently sloping upland valley -fill situations. Such features are easily discernible on airphotos.
Another of the more common erosional features found in pPvTThfrOst regions is the wrtirreaee of 'caving of frozen banks'
along the banks of streams and the shores iigure 17. Sat :innacle of Center of
Po1yion ernnart. of large bodies of water. In such instances the under-cutting action produced either by
waves or by moving water causes considerable thaw and undermining at the water line which results in caving banks. In areas where timber occurs "leaning trees" accompany the action. Where polygons intersect a waterline or a shore line under-cutting is severe and great blocks of frozen soil break off, usually along the ice-soil contact of the first polygon channel inland. Erosional features of this type are easily discernible on good quality photos.
There are other features which are often exhibited on airphotos in permafrost areas which in one sense may be thought of as part of the erosional pattern. Some of these, such as thermokarst, solifluction, and altiplanation terraces, are discussed under "Special Permafrost Features."
Gully Characteristics - In southern latitudes, or more generally speaking in unfrozen soil areas, gully characteristics such as slope and cross-section, are reliable indicators of soil texture and soil-profile development. This is not true of permanently frozen soils. The full significance of permafrost on gully characteristics has not been complete-ly worked out; however, a few general observations are worthy of mention. Granular soils, both during and after a thaw, exhibit the customary V-shaped cross-section accompanied by a short steep gradient, and textural determinations based on these features are reliable. In finely textured frozen soils, textural predictions based on gully characteristics are unreliable. Melting of the ice in the soil is rapid when in direct contact with running water. This usually allows the "waterfall-type" of gully to occur in which the waterfall rapidly works upstream leaving a vertical U-shaped trench. Where quantities of water are great the trenches are broad, thus allowing the action of the sun's heat to accelerate sidewall thaw. When quantities of water are small the channels are narrow and usually the overhanging mat of moss and vegetation acts as a protector from the sun's heat and may hold a gully in check until the following winter freeze. Such features are of such small magnitude that they are extremely difficult to see on air-photos, even in tundra regions. In timbered areas the screening blanket of vegetation usually obliterates all but the extremely large gullies.
Vegetation - As pointed out by Spurr (13,p194)in his book on photo interpretation of tree species, identification is an ecological problem and the interpreter must have an under-standing of the distribution of the species, particularly as correlated with topography and site. The interpreter should have cognizance of complex factors of plant succession, since the vegetation is con- stantly changing and the factors governing
/
changes are local in effect (33, p. 27). This is particularly true in the Arctic and .
Sub-Arctic where exposure to light and heat and the location of the timber line with respect to latitude as well as logging operations, fire, and permafrost are Figure 13. Airphoto of Button Drainage.

233
important factors governing growth and changes in species. For example, in some situations the north-facing slopes will be mantled with spruce whereas the south-facing slopes will be mantled with aspen and near the limits of timber cover, the east-and-south facing slopes may be timbered while the north-facing slopes are barren.
According to Jenness (34, p. 23), permafrost affects vegetation in two ways. In areas where the active layer is shallow the frozen ground represses all deep-rooted species and limits the growth to those varieties that have shallow roots. In low-lying areas the upper layer is usually waterlogged and all but the most water-loving species are eliminated.
As an example of the per mafro st -vegetation relationship in one of the major river valleys of the Sub-Arctic, Stoeckeler says (33, p. 5): "White spruce-paper birch forests occur on both frozen and unfrozen soils, black spruce-tamarack stands grow on frozen muskegs; aspen occurs on dry, unfrozen, south-facing slopes; balsam poplar stands are confined to sites adjacent to active streams having moist, sandy soils, unfrozen to a depth of at least ten feet; pure dense willow stands grow on bare river bars which are unfrozen to ten feet or more; and pure alder brush occurs on wet peaty soils frozen at a depth of 30 inches."
Vegetation should not be used alone as a permafrost indicator. Permafrost con-ditions can be inferred, in many instances, by correlating cover types with soil texture, drainage, and topographic position.
Color Tones - The element color tone has little significance as a direct indicator of soil texture in regions of permafrost. The permafrost is a natural barrier to downward movement of water, hence, surface soils are usually of a high moisture content, often saturated. This condition, of course, renders depressed areas or other waterlogged soils dark in tone regardless of texture. Only on high, unfrozen, well-drained areas, such as terraces or sand dunes, are color tones light. Therefore, for color tones to have any significance it is necessary that they be evaluated in the light of topographic position, landform, and drainage.
Special Permafrost Features
Permafrost patterns range from some of the easiest to some of the most difficult to interpret using aerial photographs. Fortunately the majority of the detrimental types are easily identified on fair-quality photos and engineering evaluation is. farily straight-forward. The majority of the detrimental patterns contain a variety of configurations or surface features which may be associated with areas of ground ice, unstable thawed zones, severe frost susceptibility, or various types of associated earth movement. Those features creating recognizable patterns include polygons, pingos, altiplanation terraces, thermokarst, certain types of soil flows, mud boils, humpies, and button-type drainage. Some of the features only occur in association with permafrost, others may occur in any region where the requirements of soil texture, moisture, tempera-ture variation, topographic position, and slope exert the correct influence.
Soil Polygons - Soil polygons are one' of the chief identifying surface features of perma-nently frozen ground. In arctic and subarctic regions polygons indicate detrimentally frozen ground, with the one exception being a particular type fou'nd in a gravel-soil outwash area. Polygons are geometric configurations which are presumably formed by an adjustment of the frozen earth mass, just beneath the surface, to stresses from seasonal expansion and contraction which are brought about by temperature variations. Leffingwell (31, pp. 205-212), in his discussion on polygons, states that the process of polygon formation is a continuously growingthing, since the summer melt water flows into new cracks and freezes upon contact with the permafrost. Since the ice-soil con-tact is a plane of weakness the addition of seasonal melt water from the surface snows causes continued ice-wedge growth in the cracks. Leffingwell continues by stating that the wedge ice grows from year to year and that ice may increase until approximately one-fifth a polygon block area will be underlain by ice and that such action could proceed

234
-.
.T .5.
--
I/ 5. -
'-
•' .,- - S S - - - 5-
- ..
- *- !!!4
Figure 19. Airphoto of taised—Center Polygons.
Figure 20. Airphoto of Depressed—Center Polygons.
to such a stage that instead of having ice intruding into the mass of surface earth that ice would be the major material, and it would appear that the earth materials would be intruding into the mass of ice.
There are a variety of sizes, shapes, and types of polygons and descriptions contained in the literature (30, 31, 35, 36). The two most important types associated with perma-frost are: (1) those with depressed centers or pans which are inclosed by raised dykes or perimeters and (2) those with raised centers and depressed perimeters as outlining channels. Polygons of both types vary in size from 15 or 20 ft. to perhaps 200 ft. across the polygon. The number of sides varies from four to six with five-sided figures being the most common.

235
Soil polygons in permafrost areas are confined to unconsolidated materials which have been rendered solid by freezing, and they commonly occur throughout most of the perma-frost regions. They do not occur as an integral part of bedrock areas. The only place polygons occur in bedrock areas is in the colluvial materials on the side slopes of hills or in places where the bedrock is overlain by a relatively deep unrelated soil mantle. In the Arctic, polygons abound, being particularly abundant in the Arctic Coastal Plain, where they are easily seen because of the absence of timber cover. In the Arctic, poly-gons are found on silt and sand and one variation is found on gravel soils. To the south, polygons are more closely associated with silt soils, a low topographic position, and a source of water than are those in the Arctic. This limits their occurrence to those alluvial and colluvial silts which satisfy the requirements of topography and moisture in southern regions.
Raised-Center Polygons - Polygons of the raised type consist, for the most part, of a soil mass in block form which is outlined or surrounded by a perimeter consisting of a series of channels underlain by ice in wedge form. The largest are often over 200 ft. across with the surrounding channels 10 to 15 ft. in width and 4 to 6 ft. in depth. In arctic regions, quite frequently a secondary system of smaller polygons will have formed within the larger polygon outlines. Well-developed polygons of this type are associated with frozen-silt soils, and they usually occur on the level topography associated with high terraces and on the higher areas of the flood plains. Frequently, well-formed polygons occur in bedrock areas, but they are confined either to an unrelated surface mantle or to broad valley-fill situations and to lower and mid-colluvial slopes of hills. Polygons also occur widespread throughout the timbered areas, but they are more closely related to topography, slope, moisture, soils, and vegetative cover than in the arctic regions to the north.
In general, polygons in the southern areas of the Arctic and Sub-Arctic are confined to water deposited materials, to low colluvial slopes in bedrock areas, and in generally depressed situations in glacial drift areas. The polygons are somewhat smaller than those which occur in the north. Shapes and designs vary considerably, but five-and six-sided figures seem to predominate. In water-deposited materials, particularly stream valleys, polygons are confined to low intermediate situations in which the major soil type is silt. They occur both in areas covered with timber and in areas covered with tundra-type vegetation. The depth to permafrost varies considerably; howe'er, in gen-eral, the depth of maximum thaw is approximately 24 in. in polygon areas where moss is relatively thick and somewhat less under timber cover and a thick moss.
The depressed-center polygons are most commonly found in the Arctic regions, chiefly tundra. They are associated with a depressed topographic position and occur in such situations as a depression in an old flood plain, a depression of a stream terrace, the bed of an old lake, or in broad and generally depressed areas of coastal plains. Depressed-center polygons are found in association with silt, sandy silt, and fine sands of coastal plain soils. They also occur in back-water or ponded areas of broad flood plains.
This polygon consists of a "pan" or "paddle" surrounded by a raised rim or series of dykes. The centers usually consist of a thick mat of floating grass and roots; often the water is as much as two ft. in depth. A layer of ice, often several feet thick forms the bottom of the pan. The dykes, which completely inclose the polygon, are often 2 ft. above the water level (or the level of the inclosed pan surface) and are covered with grass, moss, lichens and occasionally niggerheads. The dykes, or mounds, have longitudinal cracks or depressions in their centers. The dykes often attain a width at the base of 8 to 10 ft. and at the top 4 to 5 ft. The small channel in the center of the dykes are often as much as a foot below the top surface of the dykes. These channels frequently contain water above the ice and beneath a thick mat of moss.
In general the depressed-center polygons are not as large as the raised-center type. When the two types are found in close association the depressed-center type occupies the lowest topographic position. In transition zones, such as the change between the beach of a lakebed and the adjacent upland, the two types of polygons often merge into one another with geometric regularity.

236
Figure 21. Airphoto of a True Pingo.
Polygons of a different type occur on some of the gravel bars and gravel spits or other low depressed areas adjacent to the coast. For the most part the polygons are rectangular in shape; channels do not always intersect at common corners. Sizes vary considerably as do the depths of the channels. At one location studied channels were as much as 5 ft. in depth and about 8 ft. across; surface water was present in the channels. Some squares were nearly 200 ft. across. In most of these situations the surface of the beach deposit was a matter of a few feet above the water level and soils were gravel or sand. Whether or not ice existed at any depth beneath the polygon markings could not be determined, since sampling was done with a shovel and with a soil auger (dangers encountered with using dynamite in loose gravel precluded its use); however, the patterns, their shapes and arrangements, are believed to be significant even though the full significance is not clearly understood. The only vegetation consisted of lichens and grass, the grass occurring in the channels.
Pingos and Other Mounds - Frost mounds of many types occur at scattered locations throughout the Arctic and Sub-Arctic. In the Arctic the most outstanding mounds are those called "pingos" which occur in the Arctic Coastal Plain. In Alaska they occur in an area extending from the Canadian border generally westward to Wainwright; in the narrow coastal plain region between Pt. Hope and the Seward Peninsula; the coastal plain which forms a fringe around the major part of the Seward Peninsula; to a limited extent in the delta region of the lower Kuskokwim-Yukon valleys; and in the interior of the Seward Peninsula which is in the Kuzitrin-Noxapaga Basin. A few scattered mounds believed to be associated with other frost phenomenon occur in isolated areas in the interior, principally in some of the major stream valleys.
The pingos seem to be of three general types, as far as the writer is able to deter-mine from field observation and literature survey. These are: (1) the true pingos, or frost mounds, which are believed to be the result of upheaval of the earth's crust from pressure of ice from beneath the surface; (2) the isolated dome-shaped terrace remnants, which are the result of peculiarities of arctic erosion and dissection which rendered the mounds conical in shape; and (3) those mounds formed by upward flow of water and/or soils to the surface through an orifice of some type.
Mounds of the dissected-terrace-remnant type occur in stream valley situations and occur topographically on the next highest elevation above the flood plain. Many have steep side slopes and all are usually dome-shaped. When viewed from a distance all

: -. ....' .._Q ,..-,.- - --
237
appear to have the same general surface elevation. Those studied by the Purdue group showed no signs of having been cracked open or distorted in any way due to pressure from beneath. The soils were sand and gravel. Collier (37, p. 26) and Brooks (38, p. 310) both describe and discuss mounds of this type in the interior of the Seward Penin-sula. They say that they are hillocks of stratified gravels, are about 50 ft. high, and are remnants of a former plain left by erosion. They suggest that they resemble hay-stacks.
Mounds of the type built up from upward flow of water and/or soil occur at many scattered locations in Alaska. One large mud cone occurs in the Cooper Valley near, Gulkana and the local people refer to it as the mud volcano. It appears to be rather young, as it is in the process of burying the surrounding trees with soil flowing down the slopes of the cone. Vegetation is not yet established on the side slopes. Mertie and Harrington (39, p. 8) describe a large mound in the Ruby District which they said was 25 ft. high and 75 to 100 yards long and was formed by a spring bringing up from below the material that had formed the mound.
The mounds in the Arctic Plain are distinctively different from those which occur in other parts of the territory. Many writers mention seeing them and have given short descriptions; some have suggested theories of their origin. Porsild (40, p. 46-58) says that the most outstanding types are those which show signs of having been forced up-ward by pressure from below. Great cracks or fissures occur in the crest of these mounds and radiate downward. He mentions some mounds having hollow craters nestled in the cavity in the top. Some of the largest ones he describes as being 160 ft. high and in one instance he tells of one having a circumference of 2, 700 ft. Of particular interest are his remarks about finding stratified soils in the inside of a particular pingo which consisted of interstratified lacustrine soils-clay and peat.
Leffingwell, in his report on the Canning River region (31 , p. 150 to 155) presents a discussion of what he calls pleistocene and recent gravel mounds. In one instance he cites having seen about 30 mounds from a single point. He has measured mounds which were 230 ft. above the plain. Leffingwell, too, ventures a theory as to the origin of these mounds. He discusses several hypotheses but he believes that the result of hy-draulic pressure offers the best explanation. He believes that at the beginning of the arctic climate the ground became frozen progressively downward and formed am imper-vious layer over a tilted water-bearing stratum, giving rise to conditions favorable to artesian wells. Hydraulic pressure may have acted so slowly as to bulge up and fracture the frozen crust locally without any great outflow of water, or it may have occurred suddenly with a great outflow of water which carried up material from the underlying beds. The coarse material may have been depositied at the outsetof the spring, thus building up a mound (31, p. 153).
Smith (41, p. 28), in his report of the Noatak-Kobuk Region, mentions seeing mounds in the Mission Lowland of the Noatak Basin, and he says, ". . . here and there rounded hills one-hall mile in diameter at the base rise 100 to 300 ft. above the general surface of this plain. They are symmetrical in shape, and although irregularly distributed over the plain, suggest, when viewed from a distance, giant haystacks.
It is believed that pingo, or frost mounds, are associated with the elongated lakes of the Arctic Coastal Plain, since many of the mounds occur in the geometric center of
Figure 22. oblique Photo of a Pingo. Figure 23. Mud Volcano.

238
elongated lakes which are either in the
-• * process of drying up or which recently
/r
have been dried up. Several of these were visited by the Purdue party, and one in particular was studied in detail. The mound
.. in question was situated in the center of an elliptical lake, the longest dimension of which was approximately three-fourths of
N a mile. The surrounding rim of the lake-
____ bed was situated about JO ft above the bottom and was somewhat serrated. The
Figure 24. Mud Volcano, mound was oblong and was estimated to be 85 or 90 ft. in height. At this particular location there appeared to be a series of low benches or shelves between the mound and the highest rim, which formed con-centric patterns about the mound. The a . ' mound, together with the surrounding lake
- basin, had the appearance of having been - - formed recently, since the normal process
V. V of erosion had not commenced to destroy or alter the surface features of the mound - or the cleft in the mound. The side slopes
Figure 25. Ground View of a 1-ingo. of the mound were quite steep and were covered with a dense mat of willow. The
trees on the mound were much larger than the miniature willow in the surrounding area. Those on the outside of the mound were about 4 or 5 ft. in height and were densely tan-gled. Situated in the mound was a great V-shaped cleft which extended more than hail way down the mound. In the cleft the willows were 6 to 8 ft. in height. The bottom of the cleft contained about 3 ft. of water; ice occurred beneath the water. The soils, as exposed on the sides of the cleft, were horizontally stratified and appeared to be tilted parallel to the outside slope of the mound. In this one instance the surface -- : material consisted of brown peat under- lain with 3 or 4 in. of what appear to be volcanic ash, which in turn was underlain by stratified sands of various colors.
From studies made on the ground, V - studies of airphotos, and studies of a re- connaissance nature from the air of many .
of these arctic mounds, the following gen- . VV
eral statements can be made: (1) the
mounds are situated in depressions which resemble old lakebeds; (2) the lakebeds Figure 2". ongated Lakes, are either dried up or contain very little water; (3) the lakebed soils generally con- tain a peat surface cover on top of strat- ified
V
tern within the confines of the lakebed, - - which is arranged such that concentric groupings of polygons occur; (5) mounds do not occur in the high coastal plain areas where surface drainage is partic-
ularly well developed; (6) some mounds,
which appeared to be young in their stage Figure 27. Therrsokarst Lakes.

239
of development, were merely "bulged-up" areas, and the polygon nets appeared to cross the bulge portion without any apparent relationship to the axis of the bulge; (7) mounds vary in shape from nearly conical and somewhat symmetrical domes to irregularly-shaped dome-like expressions; (8) for the most part, the mounds in the areas east of the Colville appear to be older, larger, and more irregularly shaped than the mounds west of the Colville, which appear to be young, newly formed, regular in shape, associated with recently drained lakes, and are little altered by erosion. If previous observers are correct in their statements of origin, the significance of such features lies in their indicating sources of ground water.
Elongated Lakes - One of the outstanding . •--•-._ - features of the almost featureless Arctic ..• Coastal Plain is the presence of a myriad - - of elongated lakes. Most of the lakes are --- -- elliptical in shape, and nearly all have a . directional trend a few degrees west of true north Striking similarity exists be- '.. -. . tween these lakes and the famous and some- - - what controversial Carolina Bays of the '- Atlantic Coastal Plain (42). There is con- '- siderable discussion as to the Origin of -• these lakes (43, 44, 45); sonic of the the- ones include meteors, solution, segment- Figure 28. Thermokarst Lakes. ed lagoons, and thawing permafrost. It is the theory concerning thaw sinks in permafrost which makes the lakes of significance as far as this paper is concerned.
From the standpoint of photo interpretation, the lakes are one of the features of lower coastal plain patterns, since lakes of this type have not been noted associated with other physiographic arrangements. They occur in sand and silt soils and many are intercon-nected and form part of the exceedingly sluggish coastal-plain drainage. Those which have been dried up or drained are often marked with concentric rings of polygon nets. Of considerable interest particularly from an engineering standpoint are the elongated sand dunes which occur at right angles to the major axes of the lakes.
Thermokarst - Another condition found in the Arctic and Sub-Arctic associated with permafrost and which creates a definite photo pattern is commonly called "thermokarst." Thermokarst generally refers to lakes or basins in permafrost areas believed to have been formed largely by thawing of large ice masses. The resulting depressions are ir-regular in shape and contain a volume of water much less than that occupied by ice (32, 46). The lakes appear to be sunken in the land surface and are often easy to differentiate from lakes formed by other means because they are below the general topographic sur-roundings; they are fringed with leaning trees (46). Such lakes do not have an outlet and are not a part of a water-network in an area. Similar features are described by Hopkins in his discussion of the Seward Peninsula (47) and by Moffit (48, p. 121) in his discussion of the Mentasta Valley. As far as the writer is able to determine, the only significance lies in the belief that a delicate thermal balance exists in permafrost areas where thermokarst occurs. The lakes of this type are usually found in low-lying flat areas in which the soils are predominantly silt.
From the standpoint of airphoto interpretation such features are easily interpreted. For example, thermokarst sinks are irregular in shape, are not connected, appear sunken, and are fringed with leaning trees - all of which can be seen clearly on good quality airphotos. Thermokarst lakes are common in the southern or warmer, perma-frost areas. They are also found in the northern regions but not commonly.
Solifluction - One of the characteristic features of hillsides, particularly noticeable in treeless areas, is the lobate surface-flow markings or "earth runs" which occur on the sides of hills. Most of the flow markins seen on airphotos are associated with the processes

240
f!
, )r
Figure 29. Airphoto of Soil Flows.
of solifluction. In the Arctic and Sub-Arctic the processes of solifluction are active agents of erosion or land destruction. Lobeck (49, p. 83) defines solifluction as " a term applied to the slow imperceptible flowing from higher to lower ground masses of rock and soil saturated with water."
The earth runs or flows consist of nonsorted waste material believed associated with freezing and thawing, slope, gravity, moisture, and vegetative cover (50, P. 97) (51, pp. 66-68). Capps, in discussing soil flow in the Alaska Railroad Region, states that soil flow on the south side of the Alaska Range is not conspicuous, while on the north slopes, where permafrost is present, soil flow is active (52, p. 167-170). It is believed that the process is limited to sloping areas having a shallow surface mantle (52, pp. 76-82).
Figure 30. Oblique Photo of Soil Flows.

241
The action is slow, often requiring years to make a noticeable advance, as stated by
:cn:w of Troll's mono- graph on solifluction appears in the March -. 1949 Journal of Geology (55). According . to the review, Troll presents a genetic -.
-
classification of frost-caused earthforms. Solifluction and related phenomena are discussed by many in connection with dis- '_- ______ V cussions of various types of earth move- ---- - - - 'j'i.' -•-". ... ment (56, 572 58). Figure 31. Ground Photo of Soil Flows.
Solifluction processes create striking airphoto patterns, particularly in tundra regions. Contrasts in vegetation type on parts of a flow area, as well as changes in relief of a hillside which accompany directional features, create this unusual pattern. The features produced by this phenomenon are often on a large scale and in areas of hilly or rolling terrain will be found on nearly all hillsides. Surface markings vary from long "streamers" of rubble which extend parallel down a slope to a series of broken, irregularly shaped flows, which give a scalloped appearance. Entire hillsides appear to be sliding down the slopes.
From the standpoint of the purpose of this paper, such areas indicate unstable soils which should be considered in connection with structures to be placed on hillsides. These unstable soil areas can be identified by photo interpretation procedures.
Altiplanation Terraces - Throughout the Arctic and the Sub-Arctic are many "sloping terraces, sloping benches, or altiplanation terraces." They vary in size from narrow, dissected bench-remnants situated high on the side slopes of a valley to vast tilted sur-faces of several square miles in area in large valleys. Because of their unusual surface features and peculiar shape, that of a tilted plain appearing as transition between high and low areas, they create a distinct airphoto pattern. The landform is that of a sloping bench or shelf having a relatively flat to slightly concave surface which ends rather ab-ruptly at the outward and lower face. The areal drainage pattern of such features is parallel, and small streams and gullies seldom deviate from their straight course.
The processes creating such features are believed to be a peculiar type of solifluction, since they contain accumulations of loose rock materials which appear to have been moved by some type of flow (59, p. 78). Harrington believes they are associated with certain types of vegetal growth and confined to areas above the timber line (60, p. 55). Such features occur in areas rather mature in the erosional cycle where topography is well-rounded, smooth, and does not have great differences in elevation.
From an engineering standpoint, areas of detrimental permafrost may be found most anywhere on the surface of these sloping benches. Polygons often exist. Since such areas slope, erosion and thaw are apt to be severe if permitted to develop. Many of the terraces are dotted with minute mounds (53, p. 80) indicating frost activity.
Mud Boils, Hummocks, and Humpies - In some areas south of the permafrost re-gions, the action of freezing and thawing produces a series of minute mounds or hummocks, some of which can be seen on airphotos, particularly in tundra regions or areas above the timber line. One very curious area of mounds (called humpiesby local residents) occurs in the Willow Pass area between Palmer and Willow Creek. Capps (61, 52) and Sharp (62), describe these mounds as appearing to have been furrowed with a plow, because of their
-10
V 'V
- -
Figure 32. Oblique Photo of Altiplanation Terraces.

Figure 34. Ground Photo of Mud Boils.
V.
.. - -
- -;
•_
242
Figure 33. Cblique Photo of Mud Boils.
.-;-w f 44
Figure 35. Ground Photo of Hunpies.
regularity of size and spacing. These small mounds occur on the upper portion of colluvial slopes, just below the in-place materials of the rocky slopes. Evidence of soil flow, sudden or slow, was not present in the mound areas studied in the Willow Creek Pass. Several were dug into and were found to be composed of silt'with a heavy moss and heather cover. There was no evidence of upward or lateral soil flow either within or around the mounds. However, they are believed related to soil texture, moisture, vegetation, frozen ground and/or frost action, and slope.
Mounds of another type were studied on colluvial slopes in the Colville Valley of the Arctic Plateau. There are many areas on the side slopes of hills containing minute circular areas of bare soil which appear to have been formed by frost action processes. On the upper portions of hillsides the mounds examined were circular; down the slope the mounds were elongated, giving the appearance of flow. Samples taken in the centers revealed silt and silty clay and clay shale fragments for considerable depth. The mounds were 30 to 48 in. in diameter and spaced fairly regularly about 5 or 6 ft. aparL Tundra type vegetation separated the mounds. Soils beneath the tundra vegetation were frozen below 12 to 14 in.
Often minute frost boils were studied at many locations in the Arctic Coastal Plain. In each instance silty soils had been forced upward through cracks or holes in the sur-face and had spread out over the tundra vegetation. Some appeared to have been newly

243
formed, since a wet silty soil was found on the surface in areas where the active layer had not thawed completely. Others were much older, perhaps several seasons, since they were covered with tundra vegetatIon and were 2 or 3 ft. high.
The significance of such surface features is that they are associated with frost action in surface soils, which suggests unstable conditions as far as engineering use is con-cerned. Many of the mounds occur in sufficient numbers in an area to create a definite and recognizable pattern on airphotos of fair quality.
Earthen mounds of the frost type and of other types have intrigued researchers in many fields and many have presented theories of origin (63 to 69).
Summary
The following statements summarize the present thinking on airphoto interpretation of permafrost and related phenomena in the Arctic and Sub-Arctic:
Aerial photographs can be used to predict soil textures and permafrost conditions with a high degree of reliability.
In permafrost areas where the frost zone or the active zone is thick, airphotos can be used to differentiate between severe frost -susceptible soils and nonfrost-sus-ceptible soils.
Many surface configurations associated with the existance of permafrost and re-lated phenomena can be seen on aerial photos and indicate instability of soils for potential engineering use.
in nonpermafrost areas, interpretation and evaluation of frost-susceptibility of soils is based on indirect methods, including analysis of soil textures in the light of drainage, climate, exposure, and vegetative cover.
Bibliography
Frost, Robert E., "Evaluation of Soils and Permafrost Conditions in the Territory of Alaska by Means of Aerial Photographs," Engineering Experiment Station, Purdue University for the Corps of Engineers, Department of the Army, St. Paul District, June 1950.
Frost, Robert E., Hittle, J. E., and Woods, K. B., "Correlation Between Perma-frost and Soils as Indicated by Aerial Photographs," Proceedings of the 2nd International Conference on Soil Mechanics and Foundation Engineering, V. 1, Rotterdam, June 1948.
Frost, Robert E., and Mintzer, Olin W., "Influence of Topographic Position in Airphoto Identification of Permafrost," a paper presented at the 29th Annual Meeting, Highway Research Board, December 1949.
Frost, Robert E. and Cummins, Tom, "Permafrost," Purdue Engineer, Vol. 45, No. 2, p. 10, November, 1949.
Frost, Robert E., Hittle, Jean E., and Woods, K. B., "Summary and Statement of Technique Aerial Photographic Reconnaissance Investigation Frozen Soils in Territory of Alaska," Engineering Experiment Station, Purdue University, Appendix No. 3, of "Comprehensive Report Investigation of Airfield Construction in Arctic and Subarctic Regions," Corps of Engineers, St. Paul District, 2nd Revision, May, 1948.
Frost, Robert E., Hittle, Jean E., and Woods, K. B., "Photo Interpretation of Vegetation in the Tropical Pacific Area and its Use as an Indicator of Kind of Ground," by U. S. Geological Survey under direction of Office, Chief of Engineers, Military Intelligence Division, Engineering Notes No. 20, August, 1944.
Frost, Robert E., Hittle, Jean E., and Woods, K. B., "Pacific Land Forms and Vegetation," Air Intelligence Group, Division of Naval Intelligence, Office of the Chief of Naval Operations, Photo Intelligence Center, Report No. 7, OPNAV-16 VP10I, May, 1945.
Eardley, A. J., "Aerial Photographs and the Distribution of Constructional Mate-rials," Proceedings, Highway Research Board, 23rd Annual Meeting, November, 1943.
Sarason, S. D., "Application of Aerial Mapping to Highway Construction," Pro-ceedings, Highway Research Board, 9th Annual Meeting, December, 1929.

244
Kingery, Robert, "Aerial Mapping Used in Regional Highway Planning," Pro-ceedings, Highway Research Board, 23rd Annual Meeting, November, 1943.
Smith, H. T. U., "Aerial Photographs and Their Applications," Appleton Century, 1943.
Eardiley, A. J., "Aerial Photographs: Their Use and Interpretation," Harper, 1942.
Spuir, Stephen, H., "Aerial Photographs in Forestry," Ronald Press Co., 1948. Belcher, P. J., "The Engineering Significance of Soil Patterns, " Proceedings,
Highway Research Board, Vol. 23, 1943. Hittle, rean E., "The Application of Aerial Strip Photography to Highway and
Airport Engineering, " Proceedings, 26th Annual Meeting, Highway Research Board, December, 1946.
Frost, Robert E., "The Use of Aerial Maps in Soil Studies and Location of Borrow Pits," Proceedings, Kansas Highway Engineering Conference, July 1, 1946.
Frost, Robert E., "Identification of Granular Deposits by Aerial Photography, ' Proceedings, Highway Research Board, Vol. 25, January, 1945.
Frost, Robert E., "How Can a Highway Department Use Aerial Photographs, Proceedings, Mississippi Valley Highway Conference, March, 1949.
Frost, R. E., and Woods, K. B., "Aerial Photographs Used as an Engineering Evaluation of Soil Materials, " Proceedings of the 2nd International Conference on Soil Mechanics and Foundation Engineering, Vol. 1, Rotterdam, June, 1948.
Hittle, Jean E., "The Use of Aerial Photographs in Identifying Granular Deposits and Other Soils," Proceedings, 29th Annual Purdue Road School, March, 1943.
Belcher, D. J., "The Development of Engineering Soil Maps," Proceedings, 29th Annual Purdue Road School, March, 1943.
Belcher, D. J., "Identifying Land Forms and Soils by Aerial Photographs, Proceedings, 30th Annual Purdue Road School, March, 1944.
McCullough, Charles R., "An Engineering Soil Map of Indiana Prepared from Airphotos," Proceedings, 35th Annual Purdue Road School, April, 1949.
Parvis, Merle, "Development of Drainage Maps from Aerial Photographs," Proceedings 26th Annual Meeting, Highway Research Board, December, 1946.
Mollard, L D., "Airphoto Mapping of Montgomery County Soils for Engineering Purposes," Proceedings, 33rd Annual Purdue Road School, Purdue University, July, 1947.
Frost, Robert E., "Prospecting for Engineering Materials Using Aerial Photo-graphs," a paper prepared for the Pan American Engineering Conference, June, 1949.
Jenkins, D. S., C. A. A.; Belcher, D. J., Gregg, L. E. and Woods, K. B., Purdue University, "The Origin, Distribution, and Airphoto Identification of United States Soils," Technical Development Report No. 52, C..A. A., Washington, D. C., May, 1946.
Frost, Robert E., and Woods, K. B., "The Airphoto Patterns of Soils of the Northwestern United States," Supplement to Technical Development Report No. 52, Civil Aeronautics Administration, Washington, D. C., August, 1948.
Muller, S. W., "Permafrost or Permanently Frozen Ground and Related Engi-neering Problems," Edwards Bros., Ann Arbor, Michigan, 1947.
Taber, Stephen, "Perennially Frozen Ground in Alaska Its Origin and History," Bulletin of the Geological Society of America, Vol. 54, 1943.
Leffingwell, Ernest deK, "The Canning River Region, Northern Alaska," U. S. Geological Survey, Professional Paper 109, 1919.
Wa1lacèRobert E., "Cave-in or Thermokarst Lakes in the Nebesna, Chisana, and Tanana River Valleys, Eastern Alaska," U. S. Geological Survey, Progress Report No. 4, Permafrost Program, 1946.
Stoeckeler, E. G., "Identification and Evaluation of Alaskan Vegetation from Airphotos with Reference to Soil, Moisture, and Permafrost Conditions," a preliminary paper, Corps of Engineers, St. Paul District, June 1948.
Jenness, John L., "Permafrost in Canada," Arctic, Vol. 2, No. 1. 1949.

245
Rozanski, G., "Stone-centered Polygons on the Rock Ledge Bordering the Genessee River at Letchworth Park, N. Y. ," Journal of Geology, Vol. 51, 1943.
Conrad, V., 'Polygon Nets and Their Physical Development," American Journal of Science, Vol. 244, No. 4, April 1946.
Collier, Arthur J., "A Reconnaissance of the Northwestern Portion of Seward Peninsula, Alaska," U. S. Geological Survey, Professional Paper, No. 2, 1902.
Collier, Arthur, J., Hess, Frank L., Smith, Phillip S., and Brooks, Alfred H., "The Gold Placers of Parts of Seward Peninsula, Alaska, including the Nome, Council, Kougarok, Port Clarence, and Goodhope Precincts," U. S. Geological Survey, Bulletin 328, 1907.
Mertie, J. B. Jr., and Harrington, G. L., "The Ruby-Kuskokwim Region Alaska," U. S. Geological Survey, Bulletin 754, 1924.
Porsild, A. E., "Earth Mounds in Unglaciated Arctic Northwestern America," Geographical Review, Vol. 24, No. 4, 1934.
Smith, Phillip S., "The Noatak-Kobuk Region Alaska," U. S. Geological Survey, Bulletin 536, 1913.
Johnson, Douglas, "Mysterious Craters of the Carolina Coast," American Sci-entist, Vol. 32, No. 1, January, 1944.
Cabot, Edward C., "The Northern Alaskan Coastal Plain Interpreted from Aerial Photographs," Geographical Review, Vol. 37, 1947.
Black, Robert F., and Barksdale, Wm. L., "Oriented Lakes of Northern Alaska." Journal of Geology, Vol. 57, No. 2, March, 1949.
Cooke, C. Wythe, "Elliptical Bays," Journal of Geology, Vol. 51, No. 6, August-September 1943, PP. 419-427.
Wallace, R. E., "Cave-in Lakes in the Nabesna, Chisana, and Tanana River Valleys, Eastern Alaska," Journal of Geology, Vol. 56, No. 3, 1948.
Hopkins, David M., "Thaw Lakes and Thaw Sinks in the Imuruk Lake Aera, Seward Peninsula," Journal of Geology, Vol. 57, No. 2, March, 1949.
Moffit, Fred H., "The Slana District, Upper Copper River Region, Alaska," U. S. Geological Survey, Bulletin 824-B, 1931.
Lobeck, A. K., "Geomorphology," McGraw-Hill Book Co., 1939. 50 Smith, Phillip S., "Geology and Mineral Resources of the Solomon and Casa-
depaga Precincts Seward Peninsula Alaska," U. S. Geological Survey, Bulletin 433, 1910.
Capps, Stephen R., "The Kantishna Region Alaska," U. S. Geological Survey, Bulletin 687, 1919.
Capps, Stephen R., "Geology of Alaska Railroad Region," U. S. Geological Survey, Bulletin 907, 1940.
Eakin, Henry M., "The Yukon-Koyukuk Region Alaska," U. S. Geological Sur-vey, Bulletin 631, 1916.
Moffit, Fred H., "Headwater Regions of Gulkana and Susitna Rivers Alaska," U. S. Geological Survey, Bulletin 498, 1912.
'Troll, Carl, "Strukturboden, Solifluktion, und Frostklimate der Erde," a re-view of a paper, Journal of Geology, Vol. 57, No. 2, March, 1949.
Wahrhaftig, Clyde, "The Frost-Moved Rubbles of Jumbo Dome and Their Sig-nificance in the Pliestocene Chronology of Alaska," Journal of Geology, Vol. 57, No. 2, March 1949.
Judson, Sheldon, "Rock-Fragment Slopes Caused by Past Frost Action in the Jura Mountains (AIN) France," Journal of Geology, Vol. 57, No. 2, March 1949.
Sharpe, C. F., "Landslides and Related Phenomena," Columbia University Press, 1938.
Smith, Phillip S., "Areal Geology of Alaska," U. S. Geological Survey, Pro-fessional Paper No. 192, 1939.
Harrington, George L., "The Anvik-Andreafski Region Alaska," U. S. Geo-logical Survey, Bulletin 683, 1918.
Capps, S. R., "The Willow Creek District," U. S. Geological Survey, Bulletin 607, 1915.
246
Sharp, R. P., "Soil Structure in the St. Elias Range, Yukon Territory," Journal of Geomorphology, Vol. 5, No. 4, 1942.
Hobbs, W. H., "Soil Flow," Bulletin, American' Geographical Society, Vol. 45, No. 4, 1913.
Daiquest, Walter W. and Scheffer, Victor B., "The Origin of the Mima Mounds of Western Washington," Journal of Geology, Vol. 50, No. 1, January-February, 1942, p. 68-84.
Krinitzsky, E. L., "Origin of Pimple Mounds," American Journal of Science, Oct. 1947. Vol. 247, p. 706-714.
Campbell, M. R., "Natural Mounds," Journal of Geology, Vol.14, November, December, 1906, pp. 708-717.
Koons, Frederick C., "The Sand Mounds of Louisiana and Texas," Scientific Monthly, Vol. 66, April 1948, pp. 297-300.
Price, W. A., "Pocket Gophers as Architects of Mima Mounds of the Western United States," Texas Journal of Science, Vol. 1, 1949, pp. 1-17.
Scheffer, V. B., "The Mystery of the Mima Mounds," Scientific Monthly, Vol. 65, 1947, pp. 283-294.
Pewe, Troy L., "Origin of the Mima Mounds," Scientific Monthly, Vol. 66, April 1948, p. 293.
COLD-ROOM STUDIES OF FROST ACTION IN SOILS
James F. Haley, Assistant Chief, and Chester W. Kaplar, Engineer Frost Effects Laboratory, New England Division, Corps of Engineers, U. S. Army
Synopsis
Cold-room studies of frost action in soils are being performed by the Frost Effects Laboratory, New England Division, Corps of Engineers, for the Airfields Branch, Office, Chief of Engineers, Department of the Army, as part of a continuing program of frost investigations aimed toward estab-lishing and improving design and evaluation criteria for roads, highways and airfield runways constructed on soils subject to seasonal"freezing and thawing. The present laboratory studies are being made chiefly to deter-mine the quantitative effects of individual factors which influence ice seg-regation in soils, such as gradation, percent finer than 0. 02 mm., percent stone, permeability, capillarity, proximity of water supply, cOmpaction, and the initial degree of saturation in a closed system.
The chief purpose of this paper is to present the testing program and methods and equipment used. The cold-room studies were begun in Feb-ruary 1950 and are currently in progress. The data presented herein are incomplete, and final conclusions must await the completion of the various phases of the investigation.
The data available indicate that percentage finer than 0. 02 mm. size is not, by itself, an adequate indicator and that other factors must be con-sidered in recognizing with accuracy a frost -susceptible soil or in predict-ing the intensity of ice segregation possible in a given soil. Tests have shown the character and distribution of the fines have an important bearing on frost susceptibility.
In some soils the degree of compaction at the start of freezing has a marked effect on the amount of heave which occurs. In other soils the effect may be small. In some a critical degree of compaction, may occur at which ice segregation is most intense, with less heaving occurring at densities higher or lower than the critical density. '
Closed-system tests on a saturated lean clay indicate considerable ice segregation can occur without water being availablefrom an outside source.

247
The increase in the weights of military and commercial aircraft and increased use of highways by heavily loaded trucks during the last decade has intensified problems en-countered in the design of airfield and highway pavements, particularly in the northern latitudes, where seasonal freezing and thawing of the ground takes place. The occurrence of ice segregation in frost susceptible soils may result in nonuniform heaving of the pave-ments or loss of supporting capacity during the frost-melting period, and costly mainte-nance or repair measures may be required. Loss of pavement strength results when rapid thawing occurs from the surface down and the excess water released from ice lenses is prevented from draining downward by the still-frozen underlying soil and ice layers. Frost boils, pumping, and subsequent pavement breakup may occur under traffic as a result of the nearly liquid condition of the subgrade during this period. Interruption of traffic and damage to aircraft as a result of frost action must be avoided.
To develop pavement design and evaluation criteria for such frost conditions the Frost Effects Laboratory was established in the New England Division in 1944 by authority of the Chief of Engineers, Department of the Army. The Laboratory has since conducted field investigations, including traffic tests, at various airfields in the northern part of the United States to observe and study the effects of frost action. As a result of these studies, extensive field data have been compiled from a number of sites, covering many naturally varying conditions of soil, temperature, and moisture. These data have been assembled by the Frost Effects Laboratory in two published reports entitled "Report on Frost Investigation, 1944-1945," dated April 1947, and "Addendum No. 1, 1945-1947, to Report on Frost Investigation, 1944-1945," dated October 1949. A third major report, entitled " Summary Report of Frost Investigations, 1944-1947," has been prepared and will be published in the near future. It unifies and summarizes the principal results of observations and tests made and presents design and evaluation criteria for both airfield and highway pavements.
The field studies have shown a need for comprehensive laboratory investigations, under controlled conditions, to study the effect of each of the several variables on ice segrega-tion in soils. To meet this need, the Chief of Engineers in June 1949 authorized the con-struction of a cold room at the Frost Effects Laboratory. The room was completed and placed in operation in January 1950. 1/ Studies conducted with its specially -designed facilities give a clearer understanding of frost action in soils, resulting in the develop-ment of improved criteria for the design and evaluation of pavements. These criteria are useful in construction not only of airfield runways, taxiways, and aprons but also of roads and highways.
With the available facilities, base-course and subgrade soils whose frost suscepti-bility is in question may be tested in the cold room prior to construction to determine behavior under freezing conditions. This more precise determination of degree of frost susceptibility permits closer and more economical design. Borderline soils available in the subgrades or in the proximity of construction sites which under present criteria would be rejected or would require expensive treatment may, in many cases, be proven non-frost susceptible and satisfactory for use after being subjected to the laboratory tests.
Overall Program of Tests
The cold room and its equipment have been designed to enable studies to be made under controlled conditions of all frost phenomena occurring in soils which are reason-ably adaptable to investigation by laboratory methods. The presently planned program includes tests to determine the followingS. (1) Effect of particle size distribution on ice segregation in soils; (2) Effect of degree of compaction on ice segregation in frost sus-ceptible soils; (3) Effect of initial degree of saturation on ice segregation in a frost-susceptible soil in a closed system (in which no water is made available to the bottom of the sample);(4) Effect of surcharge or overburden pressure on ice segregation in frost-
/ A supplementary cold room designed for tests on ice, snow, and frozen soil speciniens at temperatures down to —40 F., constructed during 1950, is not covered in the pres—ent paper.

248
susceptible soils; (5) Effect of alternate freezing and thawing on permanence of initial compacted density and strength of soils; (6) Effect of soil properties such as void ratio, permeability, and capillarity on ice segregation; (7) Effect of proximity of water table on ice segregation in frost-susceptible soils; (8) Effect of frost melting on strength characteristics of soils, including time required for weakened soils to return to normal strength after thawing; (9) Effect of admixtures in preventing or retarding the formation of ice lenses in frost-susceptible soils; (10) Effect of the chemical nature of the soil minerals and of the dissolved salts in the pore water on ice segregation; (11) Frost-susceptibility or non-frost-susceptibility of base and subgrade soils from various air-fields in northern United States; (12) The nature of physical laws governing ice seg-gregation in soils, an understanding of which is needed to aid the development of design criteria.
Laboratory studies in the cold room were begun in February 1950. This report presents only the data and results available up to mid-1950, covering partially com-pleted phases of the first four items of the above-listed general program, on which tests are still in progress.
Definitions
Description of the tests and analysis of results involve specialized use of certain terms and words. Definitions of these words and terms as used in this paper are as follows:
Frost Heave - is the raising of the surface of the test specimen due to the accumulation of ice lenses in the underlying soil. The amount of heave in most soils is approximately equal to the cumulative thickness of ice lenses.
Frost-Susceptible Soils - are those in which significant ice segregation will occur when moisture is available and the requisite freezing conditions are present. (Previous in-formation has indicated that most soils containing 3 percent or more of grains finer by weight than 0. 02 mm. are susceptible to ice segregation, and this limit has been widely applied to both uniformly and variably graded soils. Although it has been found that some uniform sandy soils may have as high as 10 percent of grains finer than 0. 02 mm. by weight without being considered frost susceptible, there is some question as to the practical value of attempting to consider such soils separately, because of their rarity and tendency to occur intermixed with other soils. Cold-room tests now in progress in the Frost Effects Laboratory are expected to result in improved knowledge concerning limits between frost-susceptible and non-frost-susceptible soils.)
Frost Action - is a general term used in referring to freezing of moisture in materials and the resultant effects of these materials and on structures of which they are a part.
Ice Segregation - in soils is the growth of bodies of ice during the freezing process, most commonly as ice lenses or layers oriented normal to the direction of heat loss, but also as veins and masses having other patterns.
Percent Heave - is the ratio, expressed as a percentage, of the amount of heave to the depth of the frozen soil before freezing.
Degree of Saturation - is the ratio, expressed as a percentage; of the volume of water in a given soil mass to the total volume of intergranular space. Percent saturation is synonymous with degree of saturation in this report.
Ground-Water Table - is the free-water surface nearest to the ground surface.
Dry Density - is defined as the dry unit weight in pounds per cubic foot.

249
Capillarity - is that property which enables a soil to draw and hold water above the elevation at which atmospheric pressure exists in the water.
Overburden Pressure - is the force exerted at any given point in a soil by the weight of the overlying material.
Closed System - is a test condition where no free water is made available from outside the specimen during the freezing process.
Open System - is a test condition where free water is made available from outside the specimen during the freezing process.
This investigation is being conducted by the Frost Effects Labàratory for the Air-fields Branch, Engineering Division, Military Construction,, Office of the Chief of Engineers, Department of the Army, of which Gayle MacFadden is chief and Thomas B. Pringle is head of the Runways Section. Colonel H. J. Woodbury is the division engineer, New England Division, Corps of Engineers. Iohn E. Allen is chief of the Engineering Division, to which the Frost Effects Laboratory is attached. The testing program was initiated under the direct supervision of the late Ralph Hansen, former chief of the Frost Effects Laboratory, who was succeeded by Kenneth A. Linell.
Arthur Casagrande of Harvard University, Philip C. Rutledge of Northwestern University and Kenneth B. Woods of Purdue University are consultants on the Frost Investigation program.
The cold-room studies have as their basis the fundamental relationships and tests developed and presented by previous investigators, particularly S. Taber (1 to 8), A. Casagrande (9), G. Beskow (10), H. F. Winn and P. C. Rutledge (11), and A. Ducker (12, 13).
Description of Room and Equipment
The cold room is a walk-in refrigerator, approximately 9 ft. wide, 20 ft. long, and 6. 5 ft. high (in inside dimensions). It is insulated on all sides with 6 in. of mineral wool. It is constructed of 22 separate panels bolted together, enabling reasonably easy dismantling and providing flexibility for enlargement when and if necessary. The panels are faced on both sides with 20-gauge galvanized sheet metal.
A 1-1/2-H. P. water-cooled compressor located outside the cold room wall furnishes the Freon gas refrigerant to two unit coolers mounted at the rear of the cold room. Room temperature is controlled with a Minneapolis-Honeywell bimetallic mercury-bulb thermostat, within limits of plus or minus 2 F. The cold room has been designed to operate between plus 10 and plus 40 Fahrenheit.
Test Cabinets - Nine individual test cabinets insulated on the top and sides with 6 in. of sheet cork are located in the cold room. Refrigerant is provided separately to each by 1/4-H. P. aircooled units. Cooling inside the test cabinets at temperatures ranging from cold-room temperatures to -20 F. is accomplished by passing the refrigerant through single embossed coils inside a 14-in, wide, zinc-coated, copper refrigerating plate fitted to three sides of the cabinet, beginning 13 in. from the bottom and con-tinning to the top. Temperature in each cabinet is controlled by a De Khotinsky bi-metallic helical thermoregulator with an accuracy of plus or minus 1/2-deg. Exterior views of the test cabinets are shown in Figures 1 and 2. A section through the cabinets is shown in Figure 3.
The bottoms of the test cabinets consist of open grill work to allow the cold room temperature to be applied to the bottoms of the soil specimens being tested, while the tops of the samples are being subjected to the cabinet temperatures. During freezing tests, cabinet temperatures are gradually lowered in small daily decrements to pro-duce a rate of frost penetration into the samples simulating natural field conditiOns. Samples are placed over porous discs in individual receptacles to which water can be

250
vi1
Figure 1. Inside of Cold Room as Seen Through Themmopane iindow. work bench and Saturating Equipment at Lower Right.
j
tt 1II•H1 4 Ii 1lI
t
A
'1 1'
J1 Figure 2. View of Left Side of Cold Room Showing Six Test Cabinets.
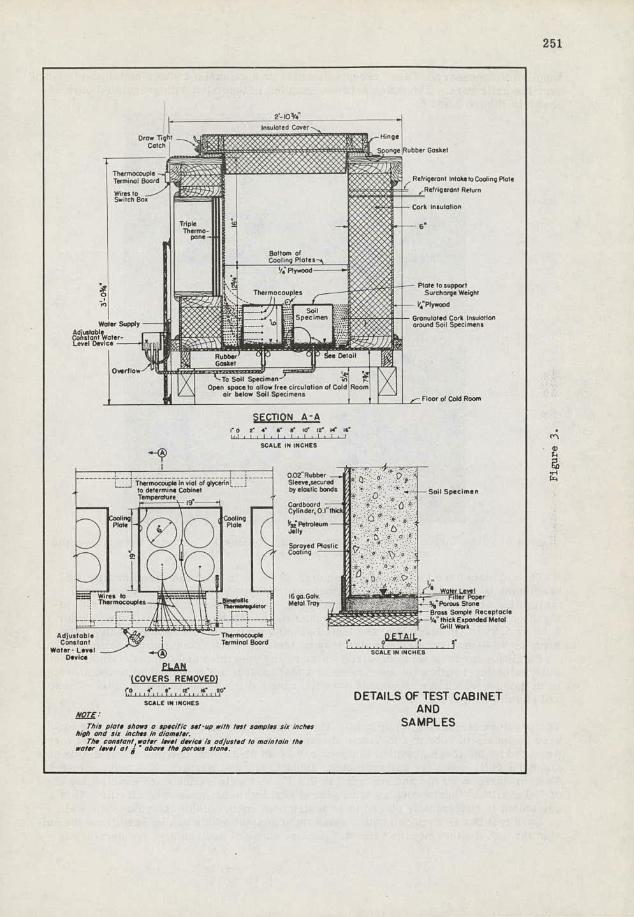
251
- 2-lOW -
lololed Cover
Draw Tight - HInge Catch
Thermocouple Plate
Switch Poe -- -
Cork lr$oIoti0n
Triple Thermo-
III Bottom of
-
Cooling Ploles-.%
0 - III
—. -
— Plate ton ppoet
The oco pies —5I/ \ SatthvrgeWeeght
s —PIywood
Specimen
QnIolod Cok l0Ot 00
Level
IXI Overflow
T~T~=' to 0110* -sifree CirClot,on of Cold Room ale below Soil Specimens
-fio0rolCoWRo0snn
SECTION A -A
10 F 4 4 0 0 2 0 IC WALflJ. I
SCA(.( IN INCHES
0 0 2Rubber_, Tha moc Dupia in vial of glycer It Sleeve,secured 9
-- -
to 6010,10100 Colonel by elallic bonds - - -.-- - Soil Speciesae
Temperature rl I9•- Cordboord -
0 Ô
Cylinde,,O.lrhic
D O0II18k = w lo pnsHl IS QO Gab
Wot L0 pe
The 'nOCOSCteI Metal Tray S Poroos Stone -Brass SoenpleReceptacle / lb a E ponded Metal
-
- - - 1 Work Adjustable Theomocosple Constant Tenninal Booed I o 1
W0Tor- -L::.t ___- -(k) SCALE IN INCHES Device
PLAN (COVERS REMOVED)
It'I 20
l DETAILS OF TEST CABINET
SCALE IN INCHES AND NO
Ti,,, pia, shows a sp.cific os/-up with lost sompiss s/s inch.s SAMPLES h/pit and six mci,., In dbms/is-.
Tie. Cons/ant otsI- iris/ dS,ics is od/uslsd to main/a/n the
waist Isy./ at oboe. /60 peons Stans.
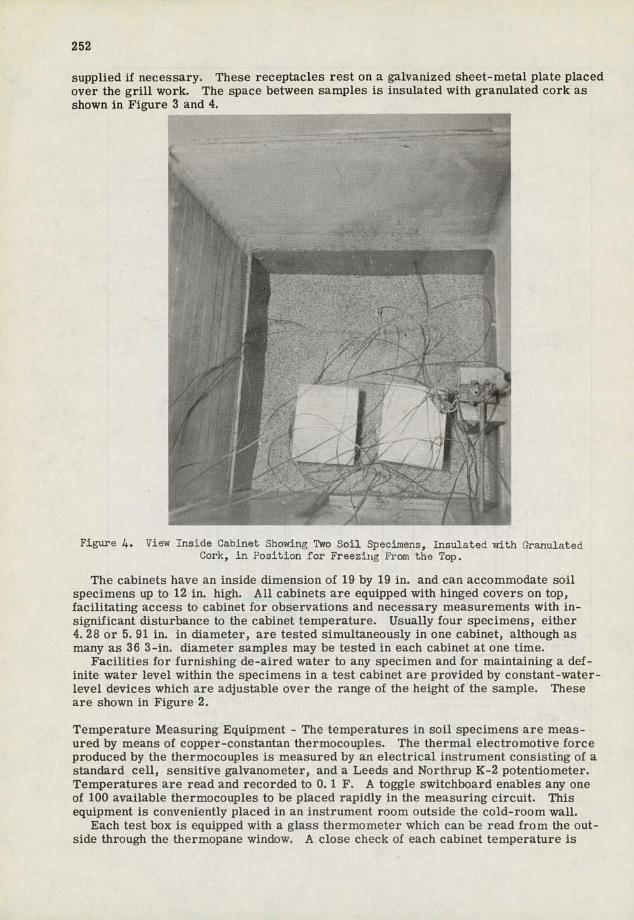
252
supplied if necessary. These receptacles rest on a galvanized sheet-metal plate placed over the grill work. The space between samples is insulated with granulated cork as shown in Figure 3 and 4.
Figure 4. View Inside Cabinet Showing Two Soil Specinens, Insulated with Granulated Cork, in Position for Freezing From the Top.
The cabinets have an inside dimension of 19 by 19 in. and can accommodate soil specimens up to 12 in. high. All cabinets are equipped with hinged covers on top, facilitating access to cabinet for observations and necessary measurements with in-significant disturbance to the cabinet temperature. Usually four specimens, either 4. 28 or 5. 91 in. in diameter, are tested simultaneously in one cabinet, although as many as 36 3-in, diameter samples may be tested in each cabinet at one time.
Facilities for furnishing de-aired water to any specimen and for maintaining a def-inite water level within the specimens in a test cabinet are provided by constant -water-level devices which are adjustable over the range of the height of the sample. These are shown in Figure 2.
Temperature Measuring Equipment - The temperatures in soil specimens are meas-ured by means of copper-constantan thermocouples. The thermal electromotive force produced by the thermocouples is measured by an electrical instrument consisting of a standard cell, sensitive galvanometer, and a Leeds and Northrup K-2 potentiometer. Temperatures are read and recorded to 0. 1 F. A toggle switchboard enables any one of 100 available thermocouples to be placed rapidly in the measuring circuit. This equipment is conveniently placed in an instrument room outside the cold-room wall.
Each test box is equipped with a glass thermometer which can be read from the out-side through the thermopane window. A close check of each cabinet temperature is

253
maintained, however, by means of a thermocouple inserted in a glycerin-filled, rubber-stoppered glass vial, 1 in. in diameter and 3 in. long, suspended near the top of the specimens. The glycerin damps out the temperature fluctuations occurring in the test cabinet during a normal operating cycle of the compressor, thus permitting an average temperature to be read and recorded. The value of the average daily cabinet tempera-ture is determined from the average of several readings with the thermocouple in the vial.
Figure 5. Split Steel Molding Cylinders, 4.28 Inches and 5.91 Inches in ujsjneter, .espectively. Note Movable Pistons in Cylinder on Right.
Molding of Specimens
The specimens being tested in the cold room for this investigation are prepared in steel cylindrical molds to a 6-in, height. Generally, the fine-grained soils, or those containing grains smaller than 1/4-in. , are prepared in a 4. 28-in, diameter mold, and soils with stones up to 2 in. in diameter are prepared in a 5. 91-in, steel mold.
Two methods are used in compacting these specimens to the desired density. Coarse-grained or gravelly soils, such as the sands and gravelly sands, are generally pre-pared by an adaptation of the Providence Vibrated Density Test method. In the method used, a predetermined dry weight of soil is placed in the steel cylinder and a load of approximately 1,000 lb. applied by a piston at each end and a heavy spring at the top. The soil within the cylinder is compacted by vibrating the cylinder with hammer blows on the sides. Finely grained soils, such as the uniform fine sands, silts, and glacial tills, are prepared in an open-ended steel cylinder by applying pressure to movable pistons at both ends with a Southwark-Emery compression machine, using an average pressure of 1, 500 lb. per sq. in. and a maximum 4,000 lb. per sq. in. Some speci-mens have been prepared by a combination of the two methods described.
Split-molding cylinders were used during the early stages of the testing program but were later replaced by solid-steel cylinders because of the distortion of the cyl-inder caused by hammer blows. Samples are removed from the latter cylinders by piston pressure at the bottom of the sample; the inside walls of the cylinder are lub-
254
ricated with a thin coating of petrolatum, followed by paraffin, before molding. The split-molding cylinders, of bofh diameters, are shown in Figure 5.
Specimens are compacted when moist to densities approximately 95 percent of Modified AASHO density or of Providence Vibrated density, whichever is applicable for the type of soil being tested. Base and subgrade soils obtained from beneath air-field pavements are compacted to approximately natural field densities as shown in Airfield Pavement Evaluation Reports.
After removal from the molding cylinders, the sides of the cylindrical specimen, excluding top and bottom faces, are sprayed with a light coating of a plastic material to hold the sample together during handling and to prevent water evaporation. Over the. plastic coating a heavy layer of petrolatum is applied and the specimens are fitted snugly into 6-in. -high cardboard cyliners, open on both ends.
Saturation of Specimens
All specimens thus far tested in the open system have been saturated prior to freez-ing. Saturation is carried out in the cold room. Filter papers, porous discs 3/8-in. thick, and brass caps (which also serve as sample receptacles in the freezing cabinets) are fitted to both ends of the soil specimen in its cardboard container, using rubber sleeves and bands to seal against air leakage. Specimens are then evacuated and sat-urated with de-aired water. The degree of saturation for each specimen is computed from weights of sample and container before and after saturating.
Placing Specimens in Test Cabinet
After Laturation, the specimens are placed in the test cabinet, the upper cap or receptacle removed and the bottom receptacle kept in place. The de-aired water supply is connected to the bottom of each receptacle, the constant -water -level device having been previously adjusted to a height such that the water in the receptacle will rise to approximately 1/8 in. above the porous stone and be in contact with the soil.. The specimens are insulated from each other with granulated cork, as shown in Figures 3 and 4.
Surcharge
Most specimens are tested under a surcharge load of 0. 5 lb. per sq. in. to simulate field conditions consisting of a 6-in, thickness of pavement and base. A thin layer of bentonite is spread over the top of the sample before the base-plate is set to provide a uniform contact between the steel surcharge-weight baseplate and the soil particles. Four tugs are attached to the base plate to raise the lead weights 1-1/2-in. , so as to permit air circulation over the top of the sample.
Thermocouples in Samples
Thermocouples are placed at 1-in, intervals along the longitudinal axis, including top and bottom, in one of the four specimens in a test cabinet, providing a means of checking the temperatures within the specimen and observing the progress of freezing temperature into the specimen. Two thermocouples are also placed, at the top and bottom, in one additional specimen in each cabinet. The thermocouples are inserted through the side of the specimen in holes punched with a slender pointed instrument. Entrance points are sealed with heavy grease.
Specimen Freezing Procedure
Tests are begun when the specimens in the cabinet have cooled uniformly to cold room temperature of approximately 38 F., which usually is attained after the speci-mens have been in place overnight with the cabinet lid open. The freezing test is

0 38 36 34 32 3fl 2R 9 A 94 99
Pe
JI
of the thermocouples rather Than at their positions after heaving This type of - plot is used in preparing curves of doily penetration of the 32F temperature
I into the sample as shown on Figure 7
Numbers in circles represent i --- J number of days after start of test ... ......
: of. SórnpI.
34 32 30
28
22 H
16 DEGREES FAHRENHEIT
PLOTS OF TEMPERATURES IN SAMPLE NH-13 (NEW HAMPSHIRE SILT)
5
6
Figure 6. C;' C;'

5
200 SURCNAR3E LE
E 50...NH-13
f E NH-44 I
LAJ ioo NH '5 2
4 4 3
50
5 6 7 8
6.5 U)
-T...t ht H/3\:Lv_rH/5 Ht1: iIJL ::T i;
DAYS IN TEST I 0. _ II 42 43 44 IS 6 47 .. ,?.,.,..?_ 5_4232
28
U) 2 Ui I 0 z
C-0. LU 0
48 72 96 20 44 65 92 2:6 240 268 288 342 336 360 384 6°5 888 :: 65 47' ,,... HOURS IN TEST
25 48 7296:20 :54 68 :92 446 250264288 312 336 36o 384 408 531.- .596 483 964 528 552 576 600 624 648 7000
7000 ' ° ______,—+ _. _F _ 1 1 I 1J°
6000 ACCUMULATIVE DEGREE HOURS BELOW32_F VS TIME - L ° 1
-T., _:
j 44) 04
. +i-'•: -4-- I '?ArE OP 4. P1° 4 4 -- I
it 5 Ø0 it I
I IL 1
DA OR N? RE
2 3 5 6 7 8
it
PENETRATION OF 32 F. ,-rrrr-4-.---'-'
I '4 oli
TEMPERATURE VS TIME
4.
ftrr: 1 :3 : ' 4 4 f-:::: : : : -
4
t; N L .L I
Figure 7.

257
, - I
I
0 r11
Figure 8. Photograph of 3oil Specimen Being Split on the Compression Machine. Note Thermocouple 'ires in -'lace.
started by closing the lid and lowering the temperature in the cabinet to approximately 30 F. for a period of two days and then dropping it to 29 F. for two more days and to 28 F. for two days. After that period, the temperatures within the cabinet are changed only by an amount necessary to maintain the rate of penetration of the 32 F. tempera-ture in the samples at approximately 1/4 in. per thy. Temperatures within the soil specimens are read daily and temperatures in the cabinets are adjusted accordingly, depending upon the progress of the 32-F. temperature within the sample. Readings of vial temperatures to determine the average daily cabinet temperature are obtained at intervals of 10 to 15 minutes for a continuous period of 1 to 2 hr. each day. A typical plot showing the daily temperatures in a sample of New Hampshire Silt is shown in Figure 6. The position of the 32-F. temperature in the sample is indicated by the intersection of the apparent temperature gradient and the vertical 32-F. line.
Heave readings are made daily and are read to the nearest half-millimeter. Meas-urements are obtained with a meter stick placed on a designated point on the surcharge weights over the sample; the reading is taken at the intersection of the stick and a steel bar across the top of the cabinet opening.
A typical plot showing the heave, degree-hours and the penetration of the 32-F. temperature versus time for two New Hampshire Silt specimens is shown in Figure 7.
At completion of test, usually after 24 days, the samples are removed from their containers, weighed to determine the change in water content, and then split longi-tudinally in a compression machine with the aid of a steel wedge. A photograph of a sample being split is shown in Figure 8. Measurements for amount of heave and ob-servations for the location, distribution, and magnitude of ice-lens formation are made on one-half of the specimen. The remaining half of the sample is photographed and retained for supplemental laboratory tests. A photograph of a typical specimen alter splitting is shown in Figure 9. Water contents are obtained for every inch of the depth of the split specimen.

OMENS
-I r i. _____
_______ 1i V.
0 100 200 300 400 500 600 700
WATER CONTENT-PER CENT DRY WEIGHT
Figure 9. Vter Content Versus Lepth of Frozen Sarnle of New Hampshire Silt.
bI2
-
-----.
"-- ••-••---
cTTI E:
LLJ
800


260
Supplementary Tests
The following laboratory tests are performed on all specimens tested, using stand-ard procedures, for correlation, if possible, with heave or rate of ice segregation:
gradation, (2) permeability, (3) specific gravity, (4) atterberg limits (if applicable), (5) compaction characteristics (if necessary).
Soils Selected for Tests
The soils selected for testing in this investigation are summarized in Table 1. They consist of two groups: (1) nine basic soils ranging from a well-graded sandy gravel (GW) to a medium plastic clay (CL), chosen for testing both in their natural gradations and in various blends with one another in order to vary the physical char-acteristics which influence ice segregation, and (2) base and subgrade soils obtained from 11 airfields in the northern United States, to be tested for degree of frost sus-ceptibility for correlation with field data available in the Corps of Engineers Frost In-vestigation Reports or Pavement Failure Reports. Results of tests on soils in group
are not presented in this paper. The gradations of the nine basic soils in group (1) are given in Figure 10.
Status of Investigations
The studies initiated upto July 1950 are summarized in Table 2, which lists the invèstigationil categories, materials used, and results of basic measurements and tests.
Only elementary analysis of results is attempted at this time. Because of the inter-relationships between the numerous factors to be examined, detailed analysis must await completion of the program, so that effects of all factors may be considered together.
It should be noted that the percent heave values obtained in these laboratory tests and reported herein are not necessarily quantitatively the same as would be obtained under natural field conditions. This laboratory-field relationship is presently in pro-cess of determination. However, this does not affect the value of the data in showing the relative influence of the variables involved.
Tests on Soil Finer than 0. 02 mm.
These tests are being made to check the validity of the present criteria for frost susceptible soils and to determine, for soils of various gradations, ranging from well-graded gravelly sand to uniform fine sand, the minimum percentages of grains finer than 0. 02 mm. at which ice segregation will occur.
The initial results, summarizedatthe top of Table 2, are shown in Figure 11 in a plot of percent heave versus percent finer than 0. 02 mm. The data presented indicate considerable variation in heave may result among soils having a given percent finer than 0. 02 mm. Figure 11 shows, for example, that specimens of Peabody, Mass. sandy gravel blended with East Boston Till (sample AGI-5 in Table 2), heaved 10. 9 percent with 3 percent, by weight, finer than 0. 02 mm., whereas some other soils having about the same percent finer than 0. 02 mm. heaved only one or two percent. Even greater differences occur if degrees of compaction are varied.
The effect of the character of the portion of material finer than 0. 02 mm. is clearly brough out in Figure 11, which shows that much greater heave resulted in a specimen of uniform fine sand (Manchester, N. H.) blended with a glacial till (East Boston, Mass.), samples MFS-1 through MFS-4 in Table 2, than in the same sand blended with a silt soil from New Hampshire, samples MFS-5 through MFS-8 in Table 2. Only that portion of the glacial till passing the No. 40 U. S. Standard sieve was used for blending. The great difference in heave, at approximately equal percentages by weight of soil grains finer than 0. 02 mm. , is undoubtedly due to the greater

261 TABLE I
8011.3 SMLECTED FOB COLD ROOM TEST PROORAM
TEST CORPS OF FINER THAN MAXIMU
j2OO IDENTIFICATION SOURCE DESCRIPTION ENGINEERS DRY
SYMBOL UNIFORM SOIL MESH DENSITY CLASSIFICATION
(a) BASIC 5051.3
LEG Linestone AFB Sandy gravel base OW 7 5 139 (2) Liow,tone, Maine
- AG Pasbody, Clean sandy gravel OW < 1 130 (3) Massachusetts (Used to ,sake artificial
gradations for blending with other soils. Denoted by symbol. AG1 and 1.02)
IS Lowe 11, Massachuaett. Bell-graded sand (1) 8W 3 110 (3)
MFS Manchester, Uniform fine sand (1) 1W 8 1 109 (3) New Hampshire
NH 00ff'. Falls, New Silt ML - 97 58 107 (Ii) Hampshire (Referred to as New Hampshire Silt)
EBT GOvernor's Island, Gravelly, sandy, clsyey ailt MG-CL 57 1414 131 (14)' East Boston (Glacial Till) (Referred to as East Boston Till) .
SC Horth Cambridge. Clay CL 99 814 )Aa,eachuaetta (Referred to as Boston Blue Clay)
ID rraax AFB, Madison, Drwslin Soil. Silty gravelly SM . 28-30 16-18 139 (14) Wisconsin sand Base and Subbase (Tested
in natural and artificial gradations)
LF Ladd Field, Silt Subsoil ML 91 37 Fairbanks, Alaska
(b) TYPICAL BASES AND SUBGRADES FROM VARIOJS AIRFIELDS
LA Lowry AFB, Denver, ' Clayey silty aand Subgrade SM-SC 36-142 214-31 Colorado
'PA Pierre Airfield, Silty gravelly sand Base GM-SM 17 9 Pierre, South Dakota
CA Casr AFB, Casper. Silty gravelly sand Base and SM 23 15 Wyoming Silty sand Subgrade SM 21-39 16-18
FA Fargo lunicipal Clayey gravelly sand, Base SC 16 9 Airfield, Fargo, N.D.
RN Wendover AFB, . Silty sandy gravel Base ' GM iL 9 Wendover,, Utah
SF Sioux Falls Airfield ' Silty sandy gravel Base GM ' 15 9 Sioux Falls, S.C.
RC Rapid City AFB Silty sandy gravel Base GM 12 ' B (V.eaver Base) Rapid City, S.D.
HF ' Hill AFB, Ogden, Utah . Silty sand Subgrade SM 27 , 13
PT Patterson Field, Clayey, silty, sandy gravel GM-GO 22 15 Fairfield, Ohio Base
CL, Clinton County AFB, Clayey, silty, sandy gravel GM-aC 20 ' lJ.& Wilmington, Ohio Base
SPK ' Spokane AS'S, Gravelly sand Base Sp-Op ' 6 Is Spokane, Washington,
NOTES. (1) Blended with New Hampshire Silt and also with East Boston'Till to vary the fins.. -(2) Providence Vibrated Density on' minus, 3/Ia-inoh material. (3) Prov1.denoe Vibrated Density on ninu. l-i.noh material. (14) Modified 1.38)10 Method. ' ,

262.
7821211 50.1102! OP T00T iATL•
P 0018 .1St 14 1.100- 285... of
0r
4810,8011
Tp,0tT01t.. 868016,1 16.woob. 3,
° t r 1108 08 U 7. 3 6.6 136.1. i 801-1181610
220008 of P.r 0011 11001 Th
LOG-i 1,15-2
1.10.0180. 00147 (001601 (3/1. o• 01o•) 31 13 7 5.5 6.2 136.1. 0.21.0 - 100
00 8 0.00 20-3 29 11. 9 6.5 183 136.1. 0.8.0 - 96
26 . (Op.. 87.8.1) 120-1. 27 17 11.5 9 11..? 336.6 0.8.0 - 10, 7
49 20 5 2 0.2 123.0 0.770 7.9.0 100 6.10-P1..tlo 001.1 001-2
P..000p o.00y 0r.v.i 01.10.04.1 7.7 27 9 5 1.3 123.0 0.370
0.371 75.0 36.0
93 07 581-3 00. o.pohfr, Gilt (1/2" ..o. .1..) 7.5 2. 12 7 2.3 127.0
0.371 350.0 91 o1.1. 7.!. 27 17 9 . 2.1 123.0
502-5 P.1668y S. 810,01 ll..6,S with 06 31 7 3 2.1 125.0 0.366 7.0 10, 91
601..P101ti0
£01.4 0.w 0.op10,1r. lilt (1j1. ..o. .1..) 69 32 11 6 7.5 5.8
127.0 127.0
0.325 0.325
2.55 2.05 97
0(2.7 72 35 13 10
7 10 7.9 127.0 P. 1.06 86 500 70 3!.
001-5 P..b.47 S.,dy 071,01 00..4,0 wIth 51 23 6 3 10.9 133.0 0.206 0.85 0.60
112 36
l01..P101180
A. 0000 0o.00w 7111 (1/31.... .1.,) 7.7 23 8 10
5 7
10.5 12.0
133.0 136.2
0.270 0.259 0.215 91
001-7 7.9 25 13 9 11.0 136.2 0.260 0.150 09 16 3
081.0 50 27
Li-i 1..011 S4 01wi wIth 100 72 6 3 0.9 136.0 0.611 - 96 87
8.,.P122810
1.5.2 00.8 08,00 7111 108 69 60
8 10
I. 6
0.5 0.0
106.0 136.0
0.612 0.615
- - 18
1.5-3 Li-I.
100 10, 78 U. 11 1.9 136.0 0.610 90
15-5 Lo.1ll 5.00 00.10.0 with 99 69 13 9.5 3.5 100.6 0.9.8 61.0 10.8
99 108
Oo,-P101000
1.1-6 00.1 00000. Till 99 70 19 16.5 10
6.9 21.1
109.5 109.5
0.559 0.51.3 6.9 100
02-7 97 75 2. 26 25.3 106.5 0.561 2.8 108
12-6 97 77 31
0,0-1 (800S0t00 Fl,. 1.08 21.0810 with 108 09. U 3.5 6
8.8 107.0 107.0
0.501. 0.509
7.2 3.05
108 108
100.151.810 -
'05.2 00.1 01080. Till 10, 100
99. 99.
17 17 9.5
11.9 10.1 107.0 0.568 6.1 100
7254 615.1. 108 59. 08.5 U 16.9 107.0 0.770 2.5 108
121-5 00.0500t01 11,1. 1l6 268 .081 100 99. 16 7 1.0 127.0 0.560 0.568
6.1 5.7
99 99
-P101080
0,5.6 0 O0.p.hfre liii 188 100
99. 99.
18 00
9 11
2.1 0.7
107.0 107.0 0.562 6.25 99
175-7 99. 27 14 2,5 107.0 0,307. 3.08 95 011-8 100
121-9 6.sdl..t.1 91w, 5.00 01410 with 108 99. 29 16 18
6.6 9.6
111..0 116.0
0.7.65 0.605
1.1.7 0.72.
100 96 .
0.1-11.0816
615-10 00. 0.op01i7. 1119 108 108
99. 99.
31. 39 21 5.0 116.0 0.1.70 0.00 108
171-11 090-12 105 99. 75 26 16.0 114.0 0.670 0.36 97
81 68 7 2 3.7 0 0.9.8 - 96 TI-i 70-2
Truwo API SIlty, 01'0,.l19 5.00 (.001,4.6 80 03 72 11 6 8.3 5 0.321 - 100
98 70-3 'p 000 01... 7/2." .... .1..) 65 76 22 13 10.2 0 0.295
0.270 - 100 - 90 02 36 20 17.1
08 79 20 16 23.2 5 0.308 92 lIo.o-PlOOtiO 71-5 0000 SF0
Silty 0.070117 5.08 (70.5 i. 88 78 35 21 28.2 5 0.315 . 97. 11 2
oiuiur. Or 801 000010.1. •.opl. 71.6 i. ty7600.1 0000.01 .0061.4O)
OttOOi .7 0,0100 01-1 5 0019.8170 Silt 108 99 96 96
58 58
(.0.1. 68.8
0 0
t83-81
0.872 0.773
0.78 0.745
100 100
27
ofC0op.081125 07-2 10, 108
99 99 96 98 72.7 .6 0.712 0.285 100
(Op.. Sy.t) 00-3 55.!. 100 99 96 98 126.2 .0 0.559 0.131 100
117-1 7,01 000007111 (5/3.' .. .1.,) 80 72 56 U. 109.1 .0 0.565 0.13 00066
100 100
23
107-2 60 80
72 72
56 56
U. 74
115.0 95.3
.0
.6 0.155 0.371 0.00093 108
80 72 56 U. 7.7.7 .0 0.321. 0. 100
LI-i 1084 11626, 21.000, SilO 0,6.111 100 100 90 37 7.8 .8 1.360 21
1.2
98
96
32
1.1.2 108 100 100
90 90
37 37
11.9 25.5
.0 97..!.
0.899 0,811 0.86 108 -
7.2.3 118 100 - 100 90 37 76.5 90.1. 0.737 0.10. 108
1.08-5 L1...0000 821 body Gr..01 28 9 3 2 13.1 123.0 0.372. - 91 96
Ioo.?lw.0i0
1.00.6 (3/.? 00. .10.. 0,68,4 00 05,006, 30 10 U
7. 7. 3
3 8.3
18.3 130.0 136.7
0.300 0.257
- - - 100
1.01-7 p90.wi01t.iY 3% fSool 00w 0.02 wo.) 32 12 5 I. 16.6 136.7 0.237 - 97
128-8 . 33
TI-? T.uuw SIB 11187 0,u..117 8.54 08 78 39 21 21
7.6 13,0
119.3 125.6
0.623 0.350 -
91 90
us 2
70-8 (3/2? ..w. .1..) Be 09
78 78
35 55 21 22.2 130.0 0.303 - 100
70-9 78-10 88 70 35 21 14.7 136.0 0.269 - 98
010-13 ld,,,tO7 £6,. S 0101468 with 108 99. 7 7. 3.8 106.1. 0.573 0.59.
7.1 9.0
108 100
001.1100810
121-27. 001 00,80. Till 100 99. 17 11.
6 6
3J 5.7
105.0 110.0 0.900 2,08 108 -
010-15 100 99 11. 7 6,5 110.6 0,513 2.30 160
521.16 108 9
021008 07 Si.. 1.50-9 1.101.000, 8.wdp 000.l (1,1268 to 31 27 9 1. 3 10.7 14.0
177.3 1353.
0.230 8.2.0
- -
100 93
0.u-PL.OtiO
.08 P.r 0.18 120-10 .501.12 .p09'S., 3% 0.02 . with 1 27 9 12
7. 5
3 7. 11.5 135.2 0.250 - 188
58010 1.51-11 010. 01600 - 10,000) °
32 7.0 15 7 Is 02.3 173.7 0.26!. - 95
(Op.. 0216.1) 120-12
LSG 1.100.000. 50.82 0ro..l (00.21.. 2' l 31
"i 12
'T 7
T 6
33.1 32.
136.5 137.9
0.056 0.269
- -
108 96
2.. 6 121-11. ..1lp68" to 01. •io .0.1,01)
37 17. 9 7 17.1. 135,0 0.25!. - 92 1.58-15 L.S-16 ' 55 23 15 13 56.7 133.9 0.265 - 99 -
TO-li 77000 875 Silty Gr.v.11y 10.0 2' 7.0 7.2 18 8. 10 11. 3.11 9.11
1555.0 130.5
0.310 0.302
- -
91 188
14 2
T2-12 (coo... ..0.oIot. .68 to 1' 4'
65 60
56 69 30 17 10.8 129.2 0.315 - 85
70-19 71-14
,0 010. .1600 01 .1001) - 96 85 36 20 16.6 128.2 0.319 - 86
20 S.gr.ti00 01-1 0088.0.sIbwi 05.8.0 Ii... Cloy 108 100 106
108 100
01. 07.
9.5 11.6
83.6 83.3
1.030 1.037
- -
100 108
7.7 00 -
1w 1580.0568 00-2 188 100 100 100 07. 6.1 79.7. 1.132 - 100
0199 Sw . 010.68 00-5 100 100 100 8!. 14.3 '79.1 1.11.6 - 180 871100 01.6
0 100 99 96 58 195.1 136.7 0.609 0.11.7 100 27 0 021.08 of 00-13
SO-I!. 001 S.op01i,'. Silt 2
(1'.'sMr' .0.1.01, 18./to 5 1 100 99 .96 50 190.1. 105.0 0.605 0.115 106 106 S"o00r.
(Op.0 Sy01..) 071.15 2 3
100 100
99 99
96 96
98 58
76.7 90.0
185.6 105.6
0.995 1 0.559
0.135 0.135 108
- .701.. 6,81, prO001t. data 0,011.510 (1) 0.5. 18.10014 0100. So1 (3)00.5 015 0,'05.00l 001558 00 0-0._ p018100 up 00 1 .So 950ly 1. 8401810001 00.8. (2) U.S. 08.08.001100.00. 208 . (7.) 0.010 07 ,51 of1.140 to v.1,...
Si Sw 0100100, o..t. .1.d• 00 .16sl 9000105th. U. S. 05.68014 10. .0

30
2
263
-x--- Lowel ,Moss. Sand Blende I with East I oston iII-
(L -1 thro LS78
imesti ine,Me Sandy - Grovel LSG-I hruLS \ X i rManchest ine $ 8 and -
\wit i E. Bo ton Till (MFS I thru MFS-1 ),
- Grove A Li WIYI -
A BI nded with G ovelly ond C \ / E Bo ton Ti I th uTD-
-t ~1 XG I - 5) 1 nr 4 A I -8y --~—---- — i'---
I I.
I A/v V
—L — — — — — —
we 2 -
onches er Fin
77 e Silt
— — — 4 2- -
U -
mni /
P '
odyl q$ ndyG aJ _ — :
X Blrnd d wit New ompsl ire Sil •
---- -
(A 1-i th u AGI-4)&( G2-5 hru A( 2-8)
L!A 5 10 15 20 25 30
PER CENT FINER BY WEIGHT THAN 0.02mm.
Figure 11. Effect of Percent Finer Than 0.02 mm. Size on Percent Heave
percentage of colloclial-clay sizes present in the glacial till. It is also recognized that the chemical composition of these sizes exerts a great influence on ice segregation (13). Tests are being continued with other, soils blended with fines of varied character and composition to provide sufficient data for comprehensive analysis. A micropetrographic and chemical analysis will be made of all soils tested.
In general, the test results available in this phase of the investigation indicate that the presently used criterion, which states that well-graded soils with less than 3 per-cent, by weight, finer than 0. 02 mm. are not frost susceptible, has proven to be a useful rule but that other factors, such as the character of the fines, must be consider-ed in recognizing frost susceptible soilswlth accuracy or in predicting the intensity of ice segregation which may be expected.
Effect of Compaction
In a given soil, dry density (dry unit weight) is a soil property which may be used to study the combined effects of such physical soil characteristics as permeability, void size, and internal structure on ice segregation. Increasing the dry unit weight of a soil by compaction decreases the void size but also decreases the permeability, thereby controlling the rate of growth of ice lenses. Tests for frost action conducted

264
on sandy clay mixtures by Winn and Rutledge (11) indicate "there is one density at which frost action occurs most readily, while at higher or lower densities the action is not so pronounced.•. . . . Apparently there is one arrangement of the soil parti-cles, which might be called the critical density, that results in the most favorable combination of capillarity and permeability."
The data thus far available from tests at the Frost Effects Laboratory on the effect of degree of compaction on ice segregation are presented as the second main grouping in Table 2 and are plotted in Figure 12. The data in this figure indicate that heaving increases with increase in original dry density in silt soils such as New Hampshire Silt and Ladd Field, Alaska, subsoil. The tests on East Boston Till show increased heaving with increase in density up to 120 lb. per cu. ft., followed by a rapid decrease in heaving with further increase in density. A similar result is also shown for Truax Drumlin material. However, in each of the latter two cases the indicated trend is de-pendent upon the position of a single point and additional test results are needed. The tests on the sandy gravel from Limestone show an apparent reverse trend, but the results for this material have thus far proved erratic due to large variations in per-cent heave with small changes in percent of 0. 02 mm. material. It is expected that the reverse trend will be disproved by obtaining additional test points.
It is apparent that many additional tests are needed before final conclusions can be drawn concerning the effect of degree of compaction on percent heave. However, Figure 12 shows that percent heave may either increase or decrease with increase in original density and the effect of density change may be large or small, depending on the density range investigated and the characteristics of the particular soil.
Effect of Size and Percent Stone
In applying the present criteria for frost susceptible soils, questions have frequent-ly arisen concerning the effect of large stones in soil gradations on ice segregation. The inclusion or exclusion of even a small number of stones (say 2 to 4 in. in diameter) in a 25-lb. sample can affect considerably the indicated overall percent, by weight, of sizes finer than 0. 02 mm. It may appear that ice segregation should not be affected, since the matrix of the soil (minus 1/4-in, material) has not been altered. However, the presence of stones in a soil gradation may reduce frost heave because of the in-creased rate of frost penetration due to the higher thermal conductivity of rock, the smaller amount of volumetric and latent heat in the soil mass, the reduced volume of frost susceptible material, and the reduced overall permeability.
Data from tests on four specimens of sandy gravel from Limestone, Maine, (sam-ples LSG-9 to LSG-12, inclusive, in Table 2) show decrease in heave with increase in the maximum-sized stone from 1/4-in, to 2 in. in diameter, the percentages finer than 2. 0 mm. ranging from 27 to 40, and the percentages finer than 0. 02 mm. equal to 3 and 4. The data obtained from tests of four specimens of pit-run sandy gravel from Lime-stone, Maine, (samples LSG-13 through LSG-16) wherein the maximum stone sizes were decreased (scalped)- each time, allowing the percentage of fines to increase, were inconsistent. However, tests results on four 'specimens of Truax Drumlin material (samples TD-ll through TD-14) show progressive increase in percent heave with de-crease in maximum size and percentage of stone.
Additional tests are being conducted to determine the effect of adding various sizes and percentages of stone to silt and clay subgrade soils.
Saturated Clay in Closed System
Ice segregation can occur only if water can be made available to the growing ice lens. It is possible for such segregation to occur in very fine-grained soils which are very remote from a water table by the withdrawal of pore water from below the zone of freezing, the resulting reduced soil moisture content not going below the shrinkage limit. Sufficient tensile force is developed in the pore water in the process of ice segregation to consolidate the soil, the reduction in volume being equal to the volume

265
of water removed. In such cases heaving may be negligible, although sizeable ice lenses may be formed. The release of water from such lenses in the frost melting period may thus cause subgrade weakening even though there is relatively small pave-ment heave during the preceding freezing period.
Results of tests on four cylindrical samples, 6 in. high, of undisturbed Boston Blue Clay, 100-percent saturated and tested in a closed system, are given near the bottom of Table 2. All specimens showed considerable ice segregation. The measured amount
MMM ES, pMlAllI.rT1L.i.Tr.rTrrT.JiT1rTn1iu__
MEMEMEM M41 MEN MOMMEMEMMEME MENMEMEMOMME MEMEMEMEMEME MEMMOMMEMEME MEMEMEMMOMME MEMEMEMOMMEM MMMM
_ MI
MOMMOMMEMME MEMEMEMOMEME MOMMEMMEMEME EMM MMIMMM EMEMEMOMMEMS
rii MEMMEMMEMOMMi7il
90 100 110 120 130 140 DRY UNIT WEIGHT (Ibs./cu.ft.)
Figure 12. Effect of Degree of Compaction on Percent Heave.
(60
14C
12C
100 w
uJ
I- 2 Sc w 0
Ui 0
6C
4C
2C
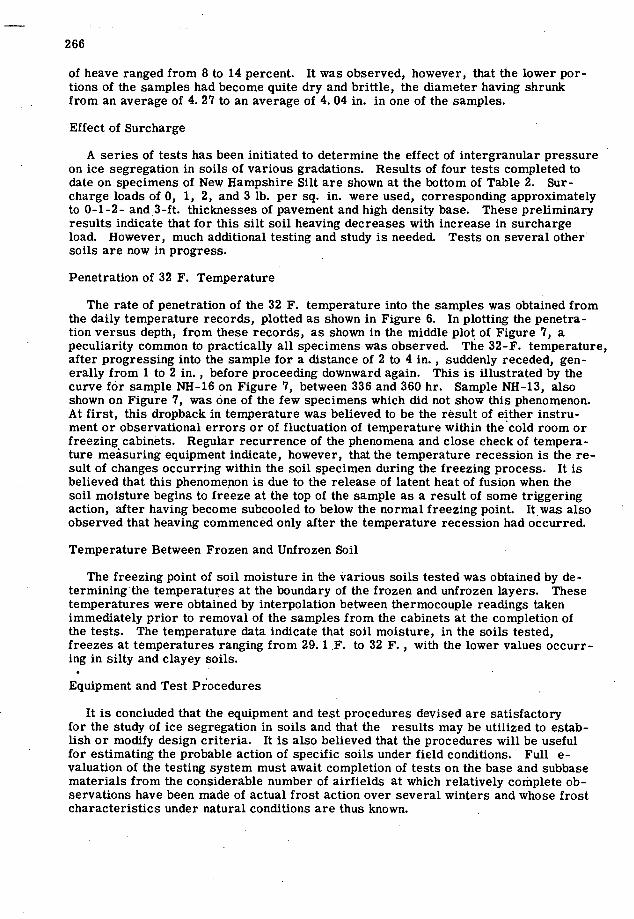
266
of heave ranged from 8 to 14 percent. It was observed, however, that the lower por-tions of the samples had become quite dry and brittle, the diameter having shrunk from an average of 4. 27 to an average of 4. 04 in. in one of the samples.
Effect of Surcharge
A series of tests has been initiated to determine the effect of intergranular pressure on ice segregation in soils of various gradations. Results of four tests completed to date on specimens of New Hampshire Silt are shown at the bottom of Table 2. Sur-charge loads of 0, 1, 2, and 3 lb. per sq. in. were used, corresponding approximately to 0-1-2- and 3-ft. thicknesses of pavement and high density base. These preliminary results indicate that for this silt soil heaving decreases with increase in surcharge load. However, much additional testing and study is needed. Tests on several other soils are now in progress.
Penetration of 32 F. Temperature
The rate of penetration of the 32 F. temperature into the samples was obtained from the daily temperature records, plotted as shown in Figure 6. In plotting the penetra-tion versus depth, from these records, as shown in the middle plot of Figure 7, a peculiarity common to practically all specimens was observed. The 32-F. temperature, after progressing into the sample for a distance of 2 to 4 in. , suddenly receded, gen-erally from 1 to 2 in., before proceeding downward again. This is illustrated by the curve for sample NH-16 on Figure 7, between 336 and 360 hr. Sample NH-13, also shown on Figure 7, was one of the few specimens which did not show this phenomenon. At first, this dropback in temperature was believed to be the result of either instru-ment or observational errors or of fluctuation of temperature within the cold room or freezing cabinets. Regular recurrence of the phenomena and close check of tempera-ture measuring equipment indicate, however, that the temperature recession is the re-sult of changes occurring within the soil specimen during the freezing process. It is believed that this phenomenon is due to the release of latent heat of fusion when the soil moisture begins to freeze at the top of the sample as a result of some triggering action, after having become subcooled to below the normal freezing point. It was also observed that heaving commenced only after the temperature recession had occurred.
Temperature Between Frozen and Unfrozen Soil
The freezing point of soil moisture in the various soils tested was obtained by de-terminingthe temperatures at the boundary of the frozen and unfrozen layers. These temperatures were obtained by interpolation between thermocouple readings taken immediately prior to removal of the samples from the cabinets at the completion of the tests. The temperature data indicate that soil moisture, in the soils tested, freezes at temperatures ranging from 29. 1 .F. to 32 F. , with the lower values occurr-ing in silty and clayey soils.
Equipment and Test Procedures
It is concluded that the equipment and test procedures devised are satisfactory for the study of ice segregation in soils and that the results may be utilized to estab-lish or modify design criteria. It is also believed that the procedures will be useful for estimating the probable action of specific soils under field conditions. Full e-valuation of the testing system must await completion of tests on the base and subbase materials from the considerable number of airfields at which relatively complete ob-servations have been made of actual frost action over several winters and whose frost characteristics under natural conditions are thus known.

267
Bibliography
Taber, S. ," The Growth of Crystals Under External Pressure," American Journal of Science, Vol. 16, pp. 532-556, 1916.
Taber, S., "Pressure Phenomena Accompanying the Growth of Crystals," Na-tional Academy of Sciences, Vol. 3, pp. 297-302, April 1917.
Taber, S., "Ice Forming in Clay Soils Will Lift Surface Weights," Engineering News-Record, Vol. 80, No. 6, pp. 262-263, Feb. 7, 1918.
Taber, S., "Surface Heaving Caused by Segregation of Water Forming Ice Crystals," Engineering News-Record, Vol. 81, pp. 683-684, 1918.
Taber, S., "Frost Heaving," Journal of Geology, Vol. 37, No. 5, pp.. 428-461, July-August, 1929.
Taber, S., "Freezing and Thawing of Soils as Factors in the Destruction of Road Pavements," Public Roads, Vol. 11, No. 6, pp. 113-132, August 1930.
Taber, S., "The Mechanics of Frost Heaving," Journal of Geology, Vol. 38, pp. 303-317, 1930.
Taber, S., "Discussion on Frost Heaving, "(Abstracted), Proceedings, Highway Research Board, Vol. 11, Part I, pp. 173-1.77, 1932.
Casagrande, A., "Discussion of Frost Heaving," Proceedings, Highway Re-search Board, Vol. 11, pp. 168-172, 1932.
Beskow, G., "Soil Freezing and Frost Heaving; with Special Reference to High-ways and Railroads," Statents Vaginstitut, Meddelande 48, Swedish Geological Society, Series C., No. 375, Stockholm, 1935. 242 pp. (Translated by J. 0. Osterberg and published by Northwestern University, Evanston, 111., November 1947.)
Winn, H. F. and Rutledge, P. C., "Frost Action in Highway Bases and Subgrade," Purdue University, Engineering Bulletin Vol. XXIV, No. 2 (Research Series No. 73) Highway Research Bulletin No. 4.
Ducker, A., "Experimental Study of Effect of Texture on Freezing of Non-co-hesive Soils; Freezing of Texture Fractions of Soils and Their Mixtures," Forschung-sarbeiten aus dem Strassenwessen, Bulletin 17, 1939. (In German).
Ducker, A., "Soil Colloids and Their Behavior when Subjected to Frost Action" (Uber "Bodenkolloide" und ihr Verhalten bei Frost),, Der Bauingenieur, pp. 235-237, August 1942. (Translated by Engineer Department, Research Center, U. S. Water-ways Experiment Station, Vicksburg, Mississippi. TR. 141. 44-40).
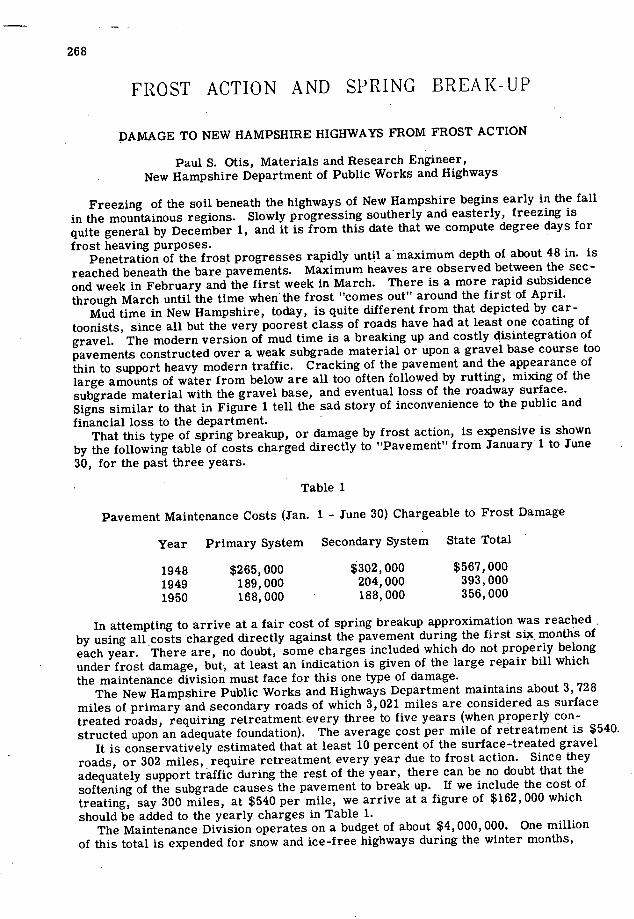
268
FROST ACTION AND SPRING BREAK-UP
DAMAGE TO NEW HAMPSHIRE HIGHWAYS FROM FROST ACTION
Paul S. Otis, Materials and Research Engineer, New Hampshire Department of Public Works and Highways
Freezing of the soil beneath the highways of New Hampshire begins early in the fall in the mountainous regions. Slowly progressing southerly and easterly, freezing is quite general by December 1, and it is from this date that we compute degree days for frost heaving purposes.
Penetration of the frost progresses rapidly until a maximum depth of about 48 in. is reached beneath the bare pavements. Maximum heaves are observed between the sec-ond week in February and the first week in March. There is a more rapid subsidence through March until the time when' the frost "comes out" around the first of April.
Mud time in New Hampshire, today, is quite different from that depicted by car-toonists, since all but the very poorest class of roads have had at least one coating of gravel. The modern version of mud time is a breaking up and costly disintegration of pavements constructed over a weak subgrade material or upon a gravel base course too thin to support heavy modern traffic. Cracking of the pavement and the appearance of 'large amounts of water from below are all too often followed by rutting, mixing of the subgrade material with the gravel base, and eventual loss of the roadway surface. Signs similar to that in Figure 1 tell the sad story of inconvenience to the public and financial loss to the department.
That this type of spring breakup, or damage by frost action, is expensive is shown by the following table of costs charged directly to "Pavement" from January 1 to June 30, for the past three years.
Table 1
Pavement Maintenance Costs (Jan. 1 - June 30) Chargeable to Frost Damage
Year Primary System Secondary System State Total
1948 $265,000 $302,000 $567,000
1949 189,000 204,000 393,000
1950 168,000 ' 188,000 356,000
In attempting to arrive at a fair cost of spring breakup approximation was reached, by using all costs charged directly against the pavement during the first six, months of each year. There are, no doubt, some charges included which do not properly belong under frost damage, but, at least an indication is given of the large repair bill which the maintenance division must face for this one type of damage.
The New Hampshire Public Works and Highways Department maintains about 3, 728 miles of primary and secondary roads of which 3,021 miles are considered as surface treated roads, requiring retreatment every three to five years (when properly con-structed upon an adequate foundation). The average cost per mile of retreatment is $540.
It is conservatively estimated that at least 10 percent of the surface-treated gravel roads, or 302 miles,, require retreatment every year due to frost action. Since they adequately support traffic during the rest of the year, there can be no doubt that the softening of the subgrade causes the pavement to break up. If we include the cost of treating, say 300 miles, at $540 per mile, we arrive at a figure of $162,000 which should be added to the yearly charges in Table 1.
The Maintenance Division operates on a budget of about $4, 000, 000. One million of this total is expended for snow and ice-free highways during the winter months,
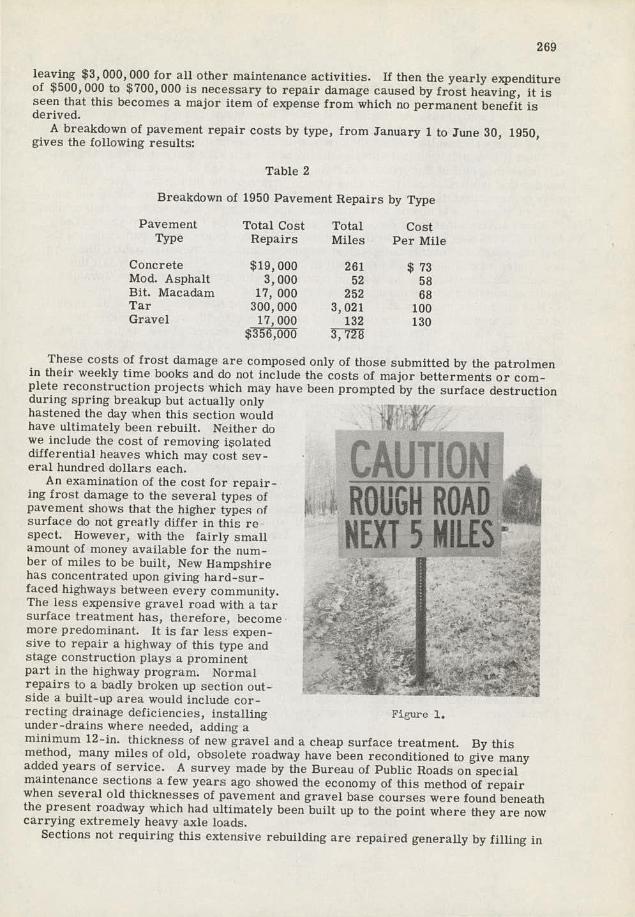
269
leaving $3, 000, 000 for all other maintenance activities. If then the yearly expenditure of $500, 000 to $700, 000 is necessary to repair damage caused by frost heaving, it is seen that this becomes a major item of expense from which no permanent benefit is derived.
A breakdown of pavement repair costs by type, from January 1 to June 30, 1950, gives the following results:
Table 2
Breakdown of 1950 Pavement Repairs by Type
Pavement Total Cost Total Cost Type Repairs Miles Per Mile
Concrete $19,000 261 $ 73 Mod. Asphalt 3,000 52 58 Bit. Macadam 17, 000 252 68 Tar 300,000 3,021 100 Gravel 17,000 132 130
$356,000 3,72k
These costs of frost damage are composed only of those submitted by the patrolmen in their weekly time books and do not include the costs of major betterments or com- plete reconstruction projects which may have been prompted by the surface destruction during spring breakup but actually only hastened the day when this section would have ultimately been rebuilt. Neither do we include the cost of removing isolated differential heaves which may cost sev- eral hundred dollars each. (C" A U T 10 N'
An examination of the cost for repair- ing frost damage to the several types of
ROUGH ROAD pavement shows that the higher types of , Ami surface do not greatly differ in this re spect. However, with the fairly small NEXT 5 MILES amount of money available for the num- ber of miles to be built, New Hampshire
: has concentrated upon giving hard-sur- -- - . - faced highways between every community. The less expensive gravel road with a tar surface treatment has, therefore, become .' more predominant It is far less expen- sive to repair a highway of this type and stage construction plays a prominent .f pait in the highway program Normal repairs to a badly bioken up section out-side a built-up area would include cor- recting drainage deficiencies, installing Figure 1. under-drains where needed, adding a minimum 12-in, thickness of new gravel and a cheap surface treatment. By this method, many miles of old, obsolete roadway have been reconditioned to give many added years of service. A survey made by the Bureau of Public Roads on special maintenance sections a few years ago showed the economy of this method of repair when several old thicknesses of pavement and gravel base courses were found beneath the present roadway which had ultimately been built up to the point where they are now carrying extremely heavy axle loads.
Sections not requiring this extensive rebuilding are repaired generally by filling in
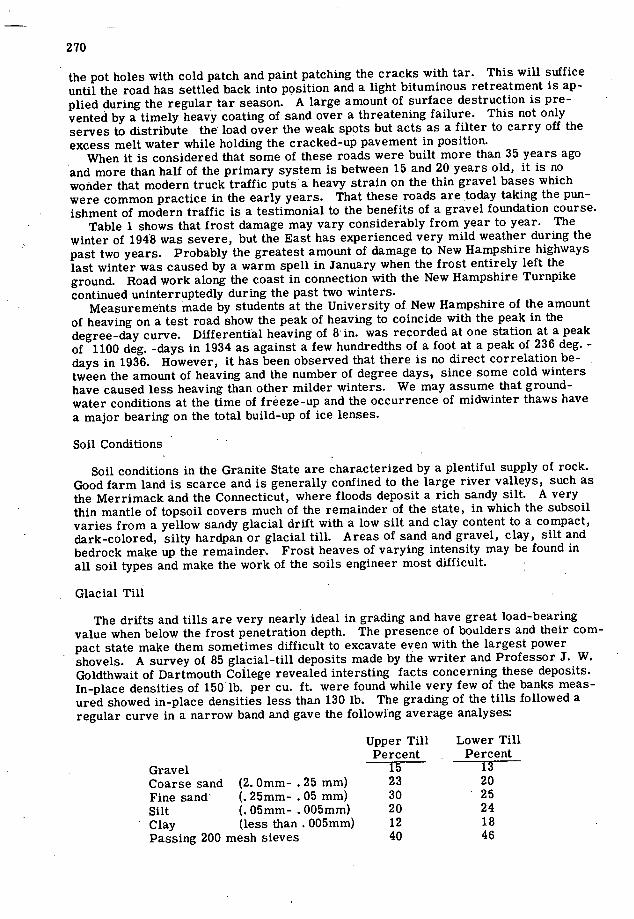
270
the pot holes with cold patch and paint patching the cracks with tar. This will suffice until the road has settled back into position and a light bituminous retreatment is ap-plied during the regular tar season. A large amount of surface destruction is pre-vented by a timely heavy coating of sand over a threatening failure. This not only serves to distribute the load over the weak spots but acts as a filter to carry off the excess melt water while holding the cracked-up pavement in position.
When it is considered that some of these roads were built more than 35 years ago and more than half of the primary system is between 15 and 20 years old, it is no wonder that modern truck traffic putsa heavy strain on the thin gravel bases which were common practice in the early years. That these roads are today taking the pun-ishment of modern traffic is a testimonial to the benefits of a gravel foundation course.
Table 1 shows that frost damage may vary considerably from year to year. The winter of 1948 was severe, but the East has experienced very mild weather during the past two years. Probably the greatest amount of damage to New Hampshire highways last winter was caused by a warm spell in January when the frost entirely left the ground. Road work along the coast in connection with the New Hampshire Turnpike continued uninterruptedly during the past two winters.
Measurements made by students at the University of New Hampshire of the amount of heaving on a test road show the peak of heaving to coincide with the peak in the degree-day curve. Differential heaving of 8' in. was recorded at one station at a peak of 1100 deg. -days in 1934 as against a few hundredths of a foot at a peak of 236 deg. - days in 1936. However, it has been observed that there is no direct correlation be-tween the amount of heaving and the number of degree days, since some cold winters have caused less heaving than other milder winters. We may assume that ground-water conditions at the time of freeze-up and the occurrence of midwinter thaws have a major bearing on the total build-up of ice lenses.
Soil Conditions
Soil conditions in the Granite State are characterized by a plentiful supply of rock. Good farm land is scarce and is generally confined to the large river valleys, such as the Merrimack and the Connecticut, where floods deposit a rich sandy silt. A very thin mantle of topsoil covers much of the remainder of the state, in which the subsoil varies from a yellow sandy glacial drift with a low silt and clay content to a compact, dark-colored, silty hardpan or glacial till. Areas of sand and gravel, clay, silt and bedrock make up the remainder. Frost heaves of varying intensity may be found in all soil types and make the work of the soils engineer most difficult.
Glacial Till
The drifts and tills are very nearly ideal in grading and have great load-bearing value when below the frost penetration depth. The presence of boulders and their com-pact state make them sometimes difficult to excavate even with the largest power shovels. A survey of 85 glacial-till deposits made by the writer and Professor J. W. Goldthwait of Dartmouth College revealed intersting facts concerning these deposits. In-place densities of 150' lb. per Cu. ft. were found while very few of the banks meas-ured showed in-place densities less than 130 lb. The grading of the tills followed a regular curve in a narrow band and gave the following average analyses:
Upper Till Lower Till Percent , Percent
Gravel 15 13
Coarse sand (2. 0mm- . 25 mm) 23 20 Fine sand' (.25mm- . 05 mm) 30 ' 25
Silt (.05mm- . 005mm) 20 24
Clay (less than . 005mm) 12 18 Passing 200 mesh sieves 40 46

271
Freshly exposed cuts up to 100 feet - deep were studied. The so-called upper till, or brownish layei, was found to ex- tend down as far as 20 ft from the sur- face Comparisons of this soil and its included stone content revealed very little difference from the lower blue till and indicate that both were formed at one time, The difference in coloring can be . I
explained by weathering Densities in the upper till are generally less than that . of the lower and appreciable thicknesses - . • of iron rust have been noted at the con- tact line of the two tills Figure 2.
The drifts and tills are frost suscep- tible, but differential heaving is not a major problem, except at the contact point with other soil types and when the silt content is very high. They generally fall in the B. P. R. A2 classification while some are referred to as A2-4. The looser upper tills and drift quite often require underdrains to cut off the side-hill movement of water, while free water is rare in the more compact lower tills. An 18-in, gravel base course has proved adequate to support present-day axle loads and serious infiltration of the subgrade into the gravel has not been noted using the. 18-in, depth. Thinner layers of gravel over the more silty tills have failed by rutting and shoving during the frost melting period. It is impractical to attempt to compact the lower tills to their original density; allowance is made for swelling instead of shrinkage, in computing earth quantities.
In rare instances glacial tills in New Hampshire are capable of producing up to 8 in. of differential heaving and may double their thickness due to an accumulation of ice lenses. An exploration pit dug in the shoulder to ascertain the cause of a 5-in, frost heave in a newly constructed road revealed the reason why the total elimination of frost heaves may be very expensive. It was realized from the soil profile that frost-heaving silty till was present in this road cut, so 30 in. of gravel base was constructed beneath a 3-in, road mix pavement. In addition, a 6 in. perforated underdrain was constructed along both edges of the roadway to a depth of 5 ft. beneath the pavement. The test pit revealed that frost had penetrated to a depth of 48 in. , that there was no infiltration of the subgrade into the gravel, and that numerous thick ice lenses were present beneath the gravel. The effected area was only about 20 ft. long.
Sand and Gravel
Large deposits of glacial sand and gravel are found generally throughout the state and are of excellent quality. Both the sand and gravel make excellent concrete aggre-gates with a minimum of washing to remove the infiltrated loam. The stone has a Los Angeles wear varying between 25 and 40 percent with a few deposits showing slightly more wear. Except for a narrow band along the ocean, the aggregates are considered sound and durable under frost action. Intrusions of silt layers or streaks are the only
bad feature and must be avoided during construction.
4 / The features which make them ideal for road construction purposes is their free draining qualities and the ability of the :... - . road builder to obtain good compaction
- . through the use of smooth rollers and
-. . sprinkling. Even the loose sands when once 'compacted through watering retain their stability under a thin bituminous mat, - - in spite of the lack of binder.
Figure J1 . In order to insure that melt water in

272
the gravel base course will be promptly
JII drained from beneath the road, a maximum
I of 5 percent passing the 200-mesh sieve is
lL a1.M f - allowed in the specifications. A recent survey of the cause of certain frost heaves
-- - - disclosed the fact that sufficient water is --------------- present in clean gravel bases to freeze
solidly during the winter, a phenomenon not observed in the gravel bank. This ex-
- . -- - plains to some degree the large amounts of -. - Ai water which appear on a cracked pavement - during a warm day in the spring. One 6-in.
Figure 4. frost heave was excavated and found to have 12 in. of frozen gravel directly beneath the
pavement. Below the frozen gravel, there was a 12 in. layer of dry loose uniform size coarse sand which could be poured from the hand. Below this layer a sandy till was found to be frozen an additional 18 in. with numerous contained ice lenses which caused the heaving. It is evident that capillary water could not have furnished the moisture necessary to freeze the gravel base but that the moisture must have been derived from temperature changes occurring beneath the pavement which brought up moist air from the earth below.
Figure 2 shows water emerging from a transverse crack caused by a frost heave. This was taken on a warm spring day. A 3 to 4 percent grade is downhill to the left and there is 18 in. of good gravel under the bituminous road mix pavement.
Clay
True clays, as found in other parts of the country, are rare in New Hampshire and occur mostly near the ocean as dried-out blue marine clay. Brickyards have flourished for many years in this area. Due partly to the more temperate climate near the ocean and the fact that the glaciers have covered much of this area with a stony drift, road building is not too difficult. Ledge outcrops are very common and extremely erratic, appearing and disapperaing in a very short space. Vertical faces are very common and most of the state's deposit of trap rock is found here. Frost heaving and breakup is not severe if a 12 in. blanket of clean gravel is used for a base course.
Silt
Silt, or a mixture of fine sand and silt, is responsible for the majority of the dif-ferential frost heaves so prevalent in the spring. While not nearly so costly as the spring breakup caused by frost action, these abrupt heaves are probably more wearing on the motorists' nerves than a longer broken up section of road. No sooner does one pick up speed after slowing down than another heave is found, and then again one may go for miles without any visibile evidence of heaving. A concerted effort has been made for years to rid our highways of these menaces, and each serious bump is now marked each winter by a large "BUMP"
The cost of sign, shown in Figure 3. - removing individual frost heaves will vary from a few hundred to several thou- - sand dollars, and extreme caution is ob- served during the progress of any con- V . -- struction project to eliminate as far as -_-
possible all differential heaving. - _.,__ AM
Silt generally occurs as layers in a - V T.• -
sand or gravel deposit, as shallow pockets -- - -
or as dikes. One dike was found in a Fiure 5.

Figure 6.
273
I:
.-,'-. \ jL
Figure 7.
coarse sand plain to extend across the highway for a width of 10 ft. A grain-size anal-ysis showed 24 percent fine sand, 65 percent silt and 11 percent clay. A concrete pavement constructed over the old road on a 4-ft. fill cracked in this location during the first winter. A pocket of silt encountered in the bottom of a 20-ft. deep gravel cut consisted of 50 percent fine sand and 50 percent silt ajid extended for 50 feet along the full width of the excavation. It is general practice in New Hampshire to remove silt to a depth of 4 ft. below the pavement and to backfill with gravel or selected excavation. Care is also taken to drain the resulting low point and to make long tapering cuts.
Silt layers occur so frequently in fine sand deposits that it is rather common practice to make a series of auger borings into the subsoil after excavation is completed to de-tect their presence. It is sometimes very difficult to distinguish between the fine sands and silts by inspection, so a laboratory analysis is required. Cut banks containing a high percentage of silt are difficult to maintain at ordinary slopes. Upon thawing in the spring, the liquid silt flows down the banks and into the roadway and sometimes requires sandbag barricades to keep the pavement clear. The expense of cleaning the ditches and removing the sloughed material is an added expense to the maintenance division. Good success has been obtained with the use of flat slopes and a hay mulch spread over the raw banks to encourage vegetation.
Underdrain
The presence of copious amounts of water in shallow underground streams tremen-dously complicates the soil engineer's prediction of future frost heaves. It is normal practice to make very complete records of the existing frost heaves during survey work for new construction. If time is available, the old road is studied the winter and spring before construction starts. If not, the old pavement is studied for cracks and failures and the section patrolman is consulted. When the soil profile is made during a dry season it is extremely difficult to determine the necessity for side drains. However, unless it is extremely dry, underground springs and water channels can usually be lo-
cated by the resident engineer during the construction period and the side drains in-
- stalled. It is not unusual to construct under- drains through every cut on a project through sheer necessity. The most difficult drainage problem is that encountered when the road-
IL way runs perpendicular to the Contours and side drains are not effective in cutting off the flow of water in a longitudinal direction. -- ..- Since the gravel base courses in New Hamp-
I - shire are constructed from slope-to-slope and ditch-to-ditch, water has an opportunity to follow the crown of the subgrade and es-
Figure 5. cape from beneath the pavement.

274
Ledge
Frost heaves are common in ledge excavation and a 2-ft. gravel base course is.al-ways constructed through the ledge sections. Many small veins of water and large springs flow from cracks in the ledges. Underdrains are installed if there is any sign of water entering the roadway. This is not generally the case in good sound rock.
Most of the heaving in ledge is caused by the undulating surface of the rock cut by the grade line in such a manner as to leave alternate short stretches of ledge and soil. Moisture trapped in the soil pockets causes unequal heaving.
Boulders
Boulders beheath the surface have been the cause of much rough-riding pavement and are not always suspected of being responsible since the strength of the pavement has a tendency to flatten out the heaves. The writer has seen several long sections of high-way excavated to remove a frost heave only to find one boulder 2 to 3 ft. in diameter the only apparent reason for the heaving. An example of this condition is shown in Figure 5.
Illustrations
Figures 4, 5, 6 and 7 illustrating typical highway destruction through frost damage, are included to show the effects of traffic upon a bituminous surface inadequately sup-ported by a thin, gravel base course constructed over a frost susceptible soil. In each case heavily loaded trucks can probably be blamed for the damage. While no rigd load ban is placed upon New Hampshire highways in the spring, a cooperative agreement has been worked out between the Division Engineers and the heavy truckers whereby the truckers are notified when the roads are in a weakened condition and they voluntarily reduce their load weights to the desired limits. If a freeze occurs, they are permitted to increase the weight of the loads until another thaw weakens the subgrade support.
The damage shown in the illustrations is confined mostly to highways which have not been constructed in recent years. It is generally true throughout the state that modern highways designed and built with proper attention to soil and drainage problems have not suffered excessive frost damage. A few projects where it was necessary to use a poor grade of gravel or where the grade line was set too low in wet areas are now showing signs of distress. Figure 8 shows a modern bituminous road mix pavement containing a considerable amount of longitudinal cracking caused by a deeper penetration of frost in the center of the road than under the snow banks on the shoulders. The unequal heaving inthe cross section has exceeded the tensile strength of the bituminous binder and the cracking has required sealing.
275
FROST ACTION AND SPRING BREAK-UP IN COLORADO
R. E. Livingston, Planning and Research Engineer, Colorado State Highway Department
San Luis Valley
The San Luis Valley in Colorado is a high mountain valley with an average elevation of approximately 7, 500 ft. It is confined between the Sangre de Christo Range on the east and the San Juan Mountains on the wet in the south-central part of Colorado and is part of the Rio Grande Drainage Basin. The valley is one of the most productive ag-ricultural areas in the state, producing some of the finest vegetables to be found in the Rocky Mountain West. The entire area is subirrigated by water trapped in a major geologic fault, giving the effect of an underground lake. The entire valley is dotted with artesian wells which have constant flow when drilled to depths between 100 and 300 ft. The size of the valley is roughly 50 by 70 miles.
Yampa Valley
The Yampa Valley is situated in northwestern Colorado and is part of the Colorado River Drainage Basin. It has an approximate elevation of 7, 500 ft. and is also sub-irrigated. It produces large quantities of mountain-valley hay and small grains, which thrive due to the constant source of water. The water table generally is not more than 2 ft. below the natural ground elevation.
Typical of the high mountain passes, which suffer°frost damage, is Wolf Creek Pass located in southwestern Colorado. The pass is located on the Continental Divide, the eastern slope of which drains into the Rio Grande Drainage Basin; the western slope of which feeds the San Miguel River, which ultimately finds its way into the Colorado River Drainage. The elevation of the mountain pass at the point where the highway crosses the divide is approximately 11,000 ft. Snow falls, which aggregate from 300 to 600 in. annually, are normal in this area, the amount of waterin the snow ranging from 7 in. of snow to 1 in. of moisture to as high as 15 in. of snow to 1 in. of moisture.
The affected areas described above are not the only ones of their type in the state, but are typical of a number of similar situations and probably have more pronounced characteristics than others that might have been selected.
Soil Types
In the San Luis Valley, a recent project awarded to contract lies between the Towns of Moffat and Mineral Hot Springs. It is 12. 1 mi. long and has a maximum elevation of 7, 745 ft. and a minimum elevation of 7, 560 ft. From this it can be de-duced that the total fall in the 12. 1 mi. is 185 ft. , an average of 15 ft. per mi. , re-suiting in an average roadway grade of approximately 0. 3 percent. This is typical of the type of grade that exists in the area. Such grades do not provide sufficient lateral difference in elevation to furnish the characteristics of good drainage. Recapped be-low are three of the typical soils that are to be found generally along the project, the range being from the best to the poorest. All sOil classifications given are those es-tablished by the use of the Highway Research Board classification.
Soils
Type A 2-4(0) A 4(0) A 7-5(20) P. I. N. P. to 5. 4 7.7 32 L. L. 20.2 to 25 26.7 65 Percent -No. 200 30 to 35 36 90 C. B. R. 28. 5 to. 30 28.5 2

276
It will be noted that the soils range from a granular soil, the fines of which are non-plastic to highly plastic and having a high percentage of -No. 200, to silts and fairly heavy clays. The predominance of silt is to be noted in all of the soil samples. In order to diminish the amount of difficulty that has been experienced in the past, present design practice places finish grade lines 4 to 5 ft. above the side drainage ditches or the natural ground line. All fill sections are built of a selected soil obtained from side borrow pits. The best of the nonpiastic soils are, of course, used for this purpose.
In the Yampa Valley, a project recently awarded to contract was 9. 9 mi. long, lo-cated between Haybro and Phippsburg. The maximum elevation found on this project was 7, 900 ft. and a minimum of 7, 400 ft. This results in a total difference in eleva-tion of 500 ft. or a fall of approximately 50 ft. to the mi. with a resultant average grade of 1 percent. As opposed to the areas of the San Luis Valley, the lateral grade is suf-ficient to provide good lateral drainage. Tabulated below is the range of soil types typical to the area.
Soils
Type A 2-4(0) A 6(12) A 7-6(15) P.!. N.P. 20 20 L.L. 35 38 45 Percent -No. 200 24 85 98 C.B.R. 42 2 2
The design grade lines in this area are held between 4 and 5 ft. above the side ditches. or the natural ground line. Embankments are constructed of the best available soils of the granular free-draining type. It has been found of particular necessity to superim-pose a blanket of sand over the natural soils to prevent intrusion of the organic silt and clays. Where this practice has not been used, the intrusion of the inferior grade mate-rials into the free-draining soils has taken place to such an extent that the ever-present moisture has been provided capillary columns through the free-draining material.
In Wolf Creek Pass, as in all mountain pass areas, lateral drainage is not a matter of consideration. Roads constructed to the mountain passes, in practically all cases, have a controlling 6 percent grade, and sufficient distance is introduced to keep the grade in this control limit. Practically all of the work is side-hill construction with numerous through-cuts always being present. Short sections of through-fill occur where the location crosses drainage courses. Soils normally encountered in the area are tabulated below.
Soils
Type A 2-5(0) A 2-7(2) A 7-5(15) P.!. 8 29 25 L.L. 45 55 68 Percent -No. 200 16 30 63 C.B.R. 36 10 2
The high liquid limits for the area are produced regardless of the soil type. This is most logically explained by the fact that the parent rock in the area includes consider-able micaceous material. This is also an area where heavy annual snow loads are to be found.
Temperature Range
In the San Luis Valley area, temperatures of as low as -50 F. are experienced, and during normal years, temperatures in the range of -40 F. are common. Summer temperatures of ground surface may go as high as +110 F. The freezing cycle normal-ly begins around the first of November with the extremes of low temperature usually

277
taking place in ranuary or early February. Frost penetration depths of as much as 5 ft. are common. Through areas of fairly uniform soil, the frost heave does not cause any particular difficulty because of its uniformity. Where mixed soils are encounter-ed, or where the soil types change at frequent intervals and the amounts of consolida-tion of the embankments are distinctly different, there is sufficient differential frost heave to cause disruption of pavement surfaces. No record of the difference of eleva-tion occasioned by frost heaving has been kept.
In the spring breakup period, which usually starts at the end of April, there is a boiling action which is quite severe. Areas of frost boils with breakup approximately 18 in. to 2 ft. in depth are common on those sections which do not have a blanket of approximately 30 in. of granular soil immediately underlying the paved surface. Boils occur on sections with an ordinary gravel surface as well as those covered by bitumi-nous mat. The more recent construction projects in the area all carry the 30-in. granular blanket, and on these projects there is practically no frost damage.
In the Yampa Valley, the freezing cycle starts in early November and the minimum temperatures are generally present during January with temperatures of -30 F. being common. The maximum ground surface temperature during the summer is in the range of +90 F. Similar to the San Luis Valley area, where areas of uniform soil are involved, there is practically no damage due to frost heave. In the non-uniform soil sections, or where soil types change rapidly, there is differential heaving which disrupts pavement surfaces. The frost penetration in this area ranges from 36 to 48 in. During the thaw-ing period, which starts in April and May, frost boils are common and extend as much as 18 in. .below the pavement surface. The newer construction projects, similar to the San Luis Valley, have heavy courses of granular material, and in such cases there is practically no frost damage.
Wolf Creek Pass
In this area the snow falls start at the higher elevations in October. The snow load builds up to its maximum in early March. The temperature ranges as low as -30 F. to -40 F., with maximum temperature in the summer months being in the neighborhood of +60 F. Possibly because of the extreme snow load carried in areas of this type, there is very little differential frost heave. During the thawing periods, starting in April, frost boils are noted at any point where there is not a granular blanket of ap-proximately 24 in. made up of either normal excavation or imported material. Frost penetrations of 24 in. to 36 in. are common.
Soaking Characteristics
In the San Luis Valley the normal water table lies practically at the grass roots. The high subsurface water table is a constant feeder source for the capillary soils which predominate. For this reason, there is never a period of the year when water is not available to feed the areas of frost action. Ice lenses start building the minute the temperature range drops to where freezing takes place. The buildup of the ice lenses continues during the period of freezing temperatures.
The Yampa Valley, being similar to the San Luis Valley, has no distinct differences in the manner or extent of frost heave and ice formation.
In the Wolf Creek Pass area, as in all other mountain pass areas, the predominant source of water contributing to frost damage comes from snow. During the early fall snows, when the temperature moves back and forth between freezing and nonfreezing temperatures, water is fed into the subgrade and side ditches, and the entire area surrounding a road structure becomes completely saturated. Ice lenses are built up until such time as the snow load is sufficiently heavy to act as a thermal insulating blanket. The reverse condition occurs in the spring thawing period, and for this reason, the amount of loil experienced is not as severe as experienced in the valley areas where the snow load never is sufficiently heavy to act as an insulating medium.

278
General
A review of the temperature ranges, soil types, and the water sources indicates that frost heave in itself is rearely a problem of great magnitude in Colorado. It does have significance in the fact that those soils having a high percentage of fines and which lie in close proximity to a water source take on sufficient moisture in the form of ice during the freezing periods to become a matter of major concern during the thawing cycle. From the previous discussions, it is noted that in the mountain valley areas, frost penetrations of 4 to 5 ft. are common. This entire frozen area immedi-ately becomes a matter of concern when the thawing cycle starts.
In the fine-grained soils, the amount of moisture present has been found to be in excess of the plastic limit and often approaches the liquid limit during the thawing cycle. Under such conditions, it is obvious that the amount of support provided to any pave-ment structure could never be adequate to prevent complete disruption. The obvious answer, as we have found it, is to provide sufficient thickness of non-frost-reactive material together with grade lines which provide complete drainage of the roadway prism to a depth equal to the frost penetration. In high mountain areas, where the frost penetration is of a lesser depth, the granular blankets over soils similar to those in the high mountain valleys can be reduced only to the extent that the frost penetration is reduced.
FROST ACTION IN MICHIGAN
0. L. Stokstad, Engineer of Soils, Michigan State Highway Department
Michigans cool and moist climate is typical of the Great Lakes Region. The annual percipitation of 35 in. is well distributed throughout the year. The freezing index ranges from about 600 in the southern limits of the State to about 1800 in the Upper Peninsula. The Great Lakes have a moderating influence on temperatures thus pre-venting extremes of both heat and cold. Under this climatic environment the soils of the state have developed profiles belonging to the Podzol and Gray-Brown Podzolic soil groups. The northern Podzol group grades into the Gray-Brown Podzolic on a line ex-tending across the central portion of the Lower Peninsula of Michigan.
The problem of frost action in Michigan is usually discussed under the headings of frost heaves and spring breakups. Common usage defines a frost heave as a bump or series of bumps high enough to be damaging to pavement and often dangerous to traffic. The term spring breakup is used in referring to the detrimental softening of the sub-grade and associated surface failures which occur during spring thawing periods. Such softening is often most destructive when it occurs during a sudden January or February thaw.
Frost Heaves
Differential frost heaving is a spectacular expression of frost action now seldom seen on the main roads because of corrective measures consistantly applied. It occurs when certain soil textures, certain drainage conditions or a combination are found within the subgrade frost zone. Silts and very fine sand are soil textures commonly referred to as frost-heave materials. It would be more correct to say that a frost-heave material is a soil texture in which silt and fine sand are the dominating constit-uents or soil fractions. These materials are easily identified in the field visually and by feel. They have the capacity for moving large quantities of capillary water rapidly through the soil to points where such water is being removed, as, for instance, by evaporation or by the formation of ice crystals in the soil. Silt pockets do not nec-essarily depend on some water table as a reservoir for capillary water. Water stored in the body of the deposit as capillary water is normally sufficient in quantity to form ice layers and detrimental heaving.

-
-, -
1
2
US -1
7a•
Figure 5. Granular Lift Necessary Before a Bituminous Surface Can Survive a Spring
Breakup.
279
Figure 1. Pavement Droken as a Result of Differential Heaving.
.: - 4_J
-'
I
- •--.• -
Figure 4. Frost Boil - Mud Breaking Through the Surface at the Shoulder.
Figure 2 • Different jul Heaving Diagonal Cracking Parallel to Old Road Fill Cross-
ed at Grade.
Figure 3. Cracked Ifeadwall Caused by Figure 6. Spring Breakup on Heavy Soils- Frost Heaving of Shaflow Culvert Pipe. l3ituniinous Surface Treatment on Gravel.

280
Minor heaves may also be caused by sudden and wide changes in the texture of the subgrade soil. Clay pockets in an otherwise sandy subgrade, the weathered horizons of certain soils and marl layers within the frost range illustrate textural variations which will cause heaving.
There are certain drainage situations which also cause heaving. Ground water seep-ing into the zone of freezing, for instance, will cause layers of ice to build up in any soil texture through which gravitational moisture can move. On the other hand, a stag-nant water table in a clean and unfirmly granular soil will not cause serious heaving even when occurring within a few inches of the pavement.
There are a number of specia situa- tions which can result in winter heaves. Sewer and tile trenches in heavy soils backfilled with sand and gravel will result in bumps at each side of the trench. ..• Crossing old road fills at grade in finely 'c --- grained soils will often result in a heave - at point of transition from old fill to new - - fill Rock knobs within the range of frost penetration can cause extremely irreg- -. ular heaves as the soil between the rock - - and pavement varies in depth. Small - -' culvert pipe placed within 2 ft of the sur- face have a tendency to heave out of the rO e- - ground in certain soils and thus cause summer heaves in highway surfaces. Such heaves become more serious with Fjr'ljre 7. Suhrade Softenin; - Rutting - each succeeding season until rebuilding First Stop in Bitundnous Mat Failure. the culvert becomes necessary.
Spring Breakup
The spring breakup is a maintenance problem on older highways which have not been built to modern standards of design. Construction previous to 1935 did not provide for subgrade strengthening over soils which become soft during thawing periods. In areas of cohesive soils, therefore, most of the land access roads and a large proportion of the state trunkline mileage suffers considerable breakup damage each spring. Gravel, bituminous seals, and other flexible surfaces are most sensitive to the loss of subgrade support. Portland cement concrete pavements may reach middle age before serious failures begin to appear, provided the volume of truck traffic is not so great as to in-duce pavement pumping. For gravel surface the spring breakup is not too serious a problem since the road's original usefulness can be quickly restored by simple mainte-nance operations. The surface can be reshaped and otherwise repaired with little hand labor as soon as the frost is out and good drying weather removes the excess water. It is the bituminous surfaces which suffer most from lack of subgrade support during a winter or spring thaw. When these surfaces punch through to the extent of about 10 percent of the surface area the entire road begins to take on an appearance of general failure.
Michigan has extensive areas of sandy soils not susceptible to spring breakup. Areas where road construction is relatively simple and cheap. Unfortunately from a road foundation point of view, most of the people do not live on these sands. They live in regions of good farm land, areas of finely grained soils, good for farming but poor for building roads. It is a rare neighborhood, on the other hand, which will not yield some good construction materials if, in addition to upland sources, underwater deposits are also considered. To locate such suitable materials is one of the functions of the detailed soil surveys carried out for all projects on a state wide basis. Present design standards have been developed to satisfy requirements necessary to build a highway system capable of uniform service throughout the year: A system which will carry normal traffic of legal loads without pavement destruction.

281
FROST DAMAGE TO ROADS IN GREAT BRITAIN*
D. Croney, Road Research Laboratory, Harmondsworth, Middlesex, England
In Great Britain low temperature conditions sufficiently prolonged to cause serious damage to roads rarely occur. Potential damage by frost is not therefore a factor which is always taken into account in the design of highways. Nevertheless during occasional very severe winters widespread damage does occur, often attended by a temporary dislocation of traffic.
The mean sea level temperature of the British Isles in January, approximately 40 F., is higher than that of all the central and northern United States. Periodically, however, winters occur during which one or more months have an average temperature of the or-der of 30 F., and it is during these winters that serious damage to roads may occur.
It is found in Great Britain, in common with other countries, that the severity of a frost period (as indicated by the mean air temperature) is broadly related to its dura-tion, i. e., the longer the cold period the lower the mean air temperature. In view of this, and the fact that most forms of frost damage to roads entail some penetration of freezing into the surface, the severity of the damage depends more on the duration of the cold period than on the actual air temperatures.
Experience in the last 20 years indicates that in Great Britain the air temperature must remain at or about the freezing point for some 40 consecutive days before roads suffer serious damage. Temperature records taken over the last 100 years show that on this basis serious damage to roads (as at present constructed) would have occurred during 9 winters, of which 5 occurred in the 22 years 1874-1895 and three in the period 1929- 1947.
At several stations in the British Isles soil temperatures are recorded at depths down to 4 ft. below grass cover. The records indicate that during prolonged frost, freezing occurs down to depths of approximately 18 in. , although there is evidence that this figure is exceeded in the case of roads on high exposed ground.
Damage to roads caused by frost may occur in the surfacing only, in the surfacing and the base, or in the surfacing, base and subgrade.
Damage to Surfacings
The most common form of frost damage to concrete when used as a road surfacing, is spalling arising from the expansion on freezing of the water contained in the upper voids of the concrete. An example of this type of damage is shown in Figure 1. Spall-ing is most likely to occur in concrete made with a high water to cement ratio (above 0. 7 by weight), which favors the formation of a surface laitance.
Damage to bituminous surfacings may arise due to stripping of the aggregate with the result that local areas of the surfacing disintegrate under traffic. This is particu-larly liable to occur when ha)1-melted snow is allowed to lie on the road surface for long
__________
4
- .-. .:.4.
Figure 1. Surfo.ce .3p:LLng )ue to'rot (Concrete Construction).
* Crovn copyright reserved.
Figure 2.Thparion of j'ao Oouzes of 2—Coat ..spha1t Due to Frost Action.

282
--
L?&
L '-' 1 —• .e..d
- ZE-
• _•_)•
Figure 3. reakup of urface Lue to the try of •.ater into a Low unlity Base.
periods. Frost can also cause the separa-tion of the upper layers of compound bitu-minous surfacings. This also leads to failure of local areas under traffic (Fig. 2). Freezing of water at the interfaces between the layers is probably the original cause of separation.
Damage by the Entry of Water Through Porous Surface
When the rainfall on a pervious surfac-
ing is not large, and adequate surface I II IIII I I drains are provided, only a small pro- 2
II I Ii
un; ilfi I 111111111
portion of the water percolates through ° jIIi I
_ the surface, and any damage which results I II I II11. to the road structure usually occurs only 2 •0
Q I II ii I itutuI
after a fairly prolonged period. However, ti _ III
_ _
I
__ '
in the early stages of a thaw, the surface 20 III
1
11 1 11111
drains are often blocked by ice, and in I_ _
_
I
_
_ 1111111 these circumstances large quantities of 0 to to
water from melting snow may enter the QARTICLE SIZE - base or subgrade causing the immediate I_I_Gr..I I failure of the road. This form of damage Figure 4. Particle-Size Limits Vlithin frequently occurs where a base material /hich Soils are Likely to be Frost Sue- containing an appreciable quantity of ceptible (Based on Investigations in So. particles passing the No. 7 B. S. sieve England.) has been put down and rolled dry during the construction of the road. The sudden in-
gress of water during the thaw encourages additional compaction of the base under traffic. Figure 3 shows damage of this type which arose from the entry of water
JP into a brick rubble base after a sudden thaw P iw in 1947
Damage from Frost Heave in Subgrade
Heave in the sthgride gives rise to the mosi serious form of frost damage to roads. The extent to which a road is liable to heave depends both on the nature of the subgrade and on the thickness of non-frost susceptible material in the road structure. In Great Britain, if the thickness of construction is greater than about 18 in. ,the possibility of damage from frost heave is almost negli-ble. This means that highways falling with-in the Ministry of Transport classifications of Trunk, Class 1, and Class 2 roads, which together form about one quarter of the total length of roads in Great Britain, are largely exempt from the possibility of frost heave, due to their thickness. There is, however, one important exception to this - roads built
Figure 5. Frost heave on Country Road in Southern ngland.

I M- 0- ~~' "17 W
283
Figure 6. Jen'a:e Caused b- Froct Heavc in Chalk Fill.
on chalk subgrades; these are discussed Slabs.
later. Frost heave is largely confined to Class 3 roads (One quarter of the total mile-age), and unclassified roads (One half of the total mileage).
Figure 4 shows the approximate limits of particle-size distribution for soils which are frost susceptible under British climatic conditions. These curves are based on a number of subgrade investigations carried out during the very cold winters of 1940 and 1947. It will be seen that the upper curve indicates a total clay and silt content much greater than is usually associated with frost susceptible soils. In fact, the particle-size distribution of most of the soils tested were close to the lower limiting curve. In a few cases, however, where the free-water table was close to the surface of the sub-grade, soils having a clay content approaching 30 percent were found to exhibit appre-ciable heave. In such soils it is probable that lowering the water table would have entirely prevented heave. In the case of many of the coarser subgrades investigated, the water table was at a considerable depth and it was clear that the water required to promote ice segregation was being drawn from the soil immediately beneath the frozen zone rather than directly from the water table. Figure 5 shows typical damage to an unclassified road in southern England. For generations prior to the advent of the tar surfacing, such roads were kept open in winter by the tipping of any available granular material into the deep ruts caused by iron-tired vehicles. There tends therefore to be a considerable thickness of frost-resistant material near the edges and only a compar-atively thin layer at the center of the road. This accounts for the heave and subsequent breakup being confined largely to the crown of the road.
Chalk, which occurs near the ground surface over considerable areas of S. E. and E. England, is a particularly troublesome subgrade material from the Point of view of frost heave. The upper few feet of the chalk are generally intersected by weathering and temperature cracks between which ice lenses form when freezing occurs, the nec-essary water being drawn from the chalk beneath. When the subgrade of a road consists of compacted chalk fill the heave is likely to be much greater than in the case of natural (undisturbed) chalk subgrades. Figure 6 shows the breakup subsequent to thawing to a suburban road where a compacted chalk subbase about 8 in. in thickness was used on a heavy clay (non-frost susceptible) soil. The road structure in this case consisted of a tar-macadam surfacing on a base of compacted brick rubble 8 in. thick.
Except under freezing conditions, chalk, being in effect a soft rock, provides a par-ticularly stable subgrade material on which only a few inches of surface construction are required to carry even the heaviest traffic loads. In the past, therefore, it has been usual to make roads on chalk with a much thinner structure than is Possible for highways of the same class on other subgrade materials. The result is that in very severe winters even trunk roads on chalk may be affected by frost heave. Figure 7 shows a modern concrete road consisting of an 8-in, slab placed directly on compacted chalk, photographed during the severe frost of 1947. The central construction strip which was laid on a narrow concrete raft and had a total thickness of 18 in. did not move, whilst the slabs on either side heaved almost uniformly by about 1 to 2 in.

284
After the thaw the surface of this road returned to normal level with very little perma-nent damage. Traffic was not restricted during the thaw.
Measures Taken to Minimize Frost Damage
The type of frost damage which affects the surfacing only can largely be avoided by cooperation between the research worker and the engineer responsible for the road construction. Research in progress at the Road Research Laboratory into the laying and compaction of dry concrete mixes and into the stripping of the aggregates used in bituminous carpets should go a long way towards the prevention of purely surfacing damage. Research is also being undertaken into the stability of base materials, par-ticularly low cost materials such as brick rubble and colliery shale.
The problem of frost heave, is however, a more difficult matter. In the case of new roads constructed on chalk subgrades, attention is now generally being paid to the frost question, and the depth of possible frost penetration is accepted as the design criterion rather than the normal high strength of the subgrade. The comparatively rare occurrence of serious frost in Great Britain precludes on economic grounds either the wholesale reconstruction of existing roads known to be affected by frost heave, or the construction of new roads, other than those falling in the Trunk and Class 1 categories, to completely non-frost susceptible standards. During the last few years, however, the counties and other authorities responsible for road construc-tion and maintenance have b'come increasingly conscious of the frost problem. As soon as the thaw sets in after a bad frost, affected roads are, as far as possible, closed to traffic until subgrade moisture conditions have returned more nearly to normal. This frequently prevents any extensive breakup of the surface. It is usual too for authorities to keep plans of their areas on which stretches of road susceptible to frost heave are marked. In this way the lengths most liable to give trouble are located and the economies of remedial measures can be considered in relation to these sections only.
Acknowledgement
The work described in this paper was carried out at the Road Research Laboratory of the Department of Scientific and Industrial Research. The paper is submitted by permission of the Director of Road Research.
LOAD CARRYING CAPACITY OF ROADS AS AFFECTED BY FROST ACTION
T. B. Lawrence, Soils Research Engineer, Minnesota Highway Department
For a number of years, highway engineers have known that a general weakening of the road structure occurs during and after the spring thaw. This loss in supporting value manifests itself in two forms the most obvious of which is the notorious "frost boil" where complete breakdown of the pavement structure results in sections of the road becoming impassible or practically so. The soil conditions causing this type of failure are readily identifiable as to soil types and proper corrective treatments made during grading operations will eliminate their occurrence.
The correction of these localized failures, however, has not eliminated the less spectacular, but still serious progressive failure which accumulates over a period of years. This is the reduction in load-carrying ability of the road structure resulting from the detrimental effect of frost action. Field observations have consistently shown that the weakening occurs during and two or three months following the spring thaws. Recognition of this phenomenon has led to the practice in Minnesota of re-stricting axle loads to values below the legal 9-ton axle load limit on all types of pave-ment structure, excepting concrete pavements. In Minnesota the degree of restric-tion has, in the past, been based on the considered opinion of the District Maintenance

285
Engineer arrived at by observations of performance of each road in question. This program has proven quite effective in the reduction of road damage which would other-wise result during and following the spring thaw. Maintenance repair costs have been reduced proportionately.
However1 it was recognized that the load restrictions adopted in this practice were not always consistent with the actual load-carrying capacity of the road. The amount of loss in load-carrying ability was not known, nor was it known whether such losses occurred in all soil types and all classes of pavement structure design. In 1946 a field-testing program was initiated in Minnesota in an attempt to evaluate the losses using "full-scale" plate field bearing tests employing loads and bearing contact areas
FIgure 1.
approximating those of actual traffic. Figure 1 illustrates the present equipment. The first cycle of tests consisted of a series of tests in the fall of 1946 and during
the spring of 1947. These were exploratory in nature and covered a number of pro-jects. The results indicated that a measurable loss in load-carrying capacity of roads did occur during and after the spring thaw. This loss was very nearly fifty percent of the fall bearing values, the latter being the optimum condition for load-carrying capacity.
As a result of these preliminary tests, a Committee on Load Carrying Capacity of Roads as Affected by Frost Action, Project Committee No. 7 of the Department of Maintenance, was established by the Highway Research Board. The assigned objective of the committee was the determination of the loss in carrying capacity of completed roads, road bases, subbases and subgrades during the spring of the year because of frost action and the determination of subsequent recovery. It is the aim to determine, as well as possible, the percentage loss in road strength and not to determine proper design values, although such may to some extent be a by-product of the study. A num-ber of states are actively participating in the study and interesting information is being obtained. The reader is referred to the reports of the committee, of which two have already been published, for the more detailed data being obtained. The following des-cribes briefly some of the results obtained in the Minnesota tests.
The program of investigation in Minnesota has followed the plan to accomplish the committee's objective while at the same time attempting to obtain information bearing on the cause or causes of the weakening action.

RIWA . -a---.--
286
The test cycles from 1947 through the summer of 1949 were limited to a relatively small areas of the state to provide the de-
NOTE: Each plotted point tail necessary for mapping the complete
20 IS
o
O Ofl overage of cycle of loss and recovery of load-carrying
60 ft
8 test points. capacity.A graph illustrating this cycle ° is shown in Figure 2. The bearing tests
have been made for the most part with a -- fl - ___ _L__ .. 1..4.. 41, ,%n,.nc.nnf OflIflfl fJ lh-lfl. uiameiei LLC, ui
ment permitting a total reaction load on the plate of 28,000 lb. Data has also been obtained concerning temperature and mois-ture changes in the flexible -pavement structure and in the subgrade soil. Analysis of this information may contribute to a bet-ter understanding of the causes of the loss in bearing value and the changes in design required to compensate for or overcome
Figure 2. Minnesota Bearing Tests 1949 such loss.
Loading Cycle,12-in. Bearing Plate Loss Following the completion of the 1948-
of Road Strength and Recovery. 1949 cycle, which as stated above was confined to a limited area of the state, a
series was started to cover the full length of the state to establish as a fact that the loss in carrying capacity occurred on all soil types and flexible -pavement structures all over the state. Because of the serious flood conditions this spring in thenorthern part of the state, it was not possible to obtain bearing tests in that area. Data was accumu-lated for 126 test points and the results have substantiated the previous observations.
The test points have included granular and cohesive soils and all types of surface and base design with the exception of concrete pavement. The tests were made on the sur-face of the road structure. The average loss in bearing value for the 126 test points was 42 percent of the fall bearing value. As is apparent from the tabulation below the• percentage loss, within experimental error, was substantially the same for all soil types and flexible pavement design. The average bearing value in psi is also shown.
B. P. R. Number of Average Spring Average Loss
Classification Test Points Bearing Value in Percent
- (P. S. I. at 0. 2-in. Dell.)
A-2 16 205 - 40
A-4 9. 222 - - 46- -
A-4-7 14 - 145 - - • 45
A-7 71 96 - 42
A-6 13 85 - - 40
A-5-7 - 3 62 41
The details of test procedure and data will be found in a -future report of the Corn- mittee on Load Carrying Capacity of Roads as Affected by Frost -Action. -
Bibliography
Subcommittee Report on Project No. 7, Load Carrying Capacity of Roads as Affected by Frost Action, C. L. Motl, Highway Research Board Department of Main- tenance, December, 1948.
Subcommittee Report on Project No. 7, Highway Research Board, Research - Report No. 10-D, December, '1949. -
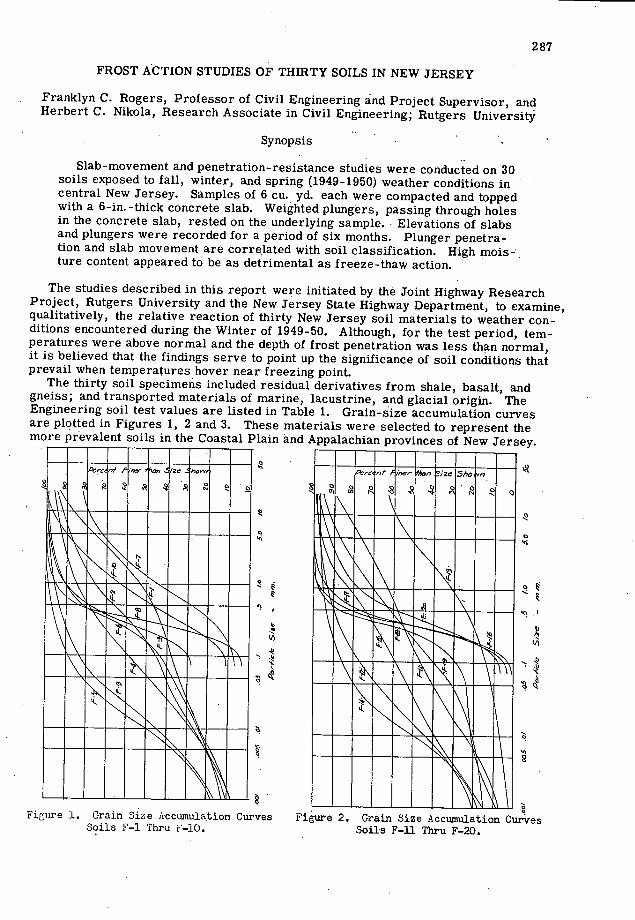
iiiMINE !III
I1iI' "uIIII'i'
Figure 2. Grain Size Accumulation Cui4es Soils F—li Thru F-20.
287
FROST ACTION STUDIES OF THIRTY SOILS IN NEW JERSEY
Franklyn C. Rogers, Professor of Civil Engineering and Project Supervisor, and Herbert C. Nikola, Research Associate in Civil Engineering; Rutgers Universit
Synopsis
Slab-movement and penetration-resistance studies were conducted on 30 soils exposed to fall, winter, and spring (1949-1950) weather conditions in central New Jersey. Samples of 6 cu. yd. each were compacted and topped with a 6-in. -thick concrete slab. Weighted plungers, passing through holes in the concrete slab, rested on the underlying sample. Elevations of slabs and plungers were recorded for a period of six months. Plunger penetra-tion and slab movement are correlated with soil classification. High mois-ture content appeared to be as detrimental as freeze-thaw action.
The studies described in this report were initiated by the Joint Highway Research Project, Rutgers University and the New Jersey State Highway Department, to examine, qualitatively, the relative reaction of thirty New Jersey soil materials to weather con-ditions encountered during the Winter of 1949-50. Although, for the test period, tem-peratures were above normal and the depth of frost penetration was less than normal, it is believed that the findings serve to point up the significance of soil conditions that prevail when temperatures hover near, freezing point.
The thirty soil specimens included residual derivatives from shale, basalt, and gneiss; and transported materials of marine, lacustrine, and glacial origin. The Engineering soil test values are listed in Table 1. Grain-size accumulation curves are plotted in Figures 1, 2 and 3. These materials were selected to represent the more prevalent soils in the Coastal Plain and Appalachian provinces of New Jersey.
iuuui hl'
irniiiii IiiIJII Wflum
Figure 1. Grain Size kccuinulation Curves Soils F—i Thru 1-10.

roncre/e ,c'oh --'-v--'- -,
Figure 4, Frost Study Installation.
It is estimated that the twenty soil series listed in Table 1, cover 70 to 80 percent of the state's area. Group classification 1/ ranges from A-i-a to A-7-6, with group indices from 0 to 15.
Samples of the thirty soils (approxi-mately 6 cu. yd. each) were compacted in a 24 to 30-in, deep trench, in 6-in, layers, using a pneumatic tamping device. The final dimensions of the soil specimen were 9 ft. sq. The to!) surface was leveled at approximately the natural ground surface and finished by rolling with a 400-lb. lawn roller.
288
C
Figure 3. Grain Size Accumulation Curves Soils F-il Thru F-30.
A concrete slab, 4-ft. sq. by 6-in, thick, was cast on the center of each 9-ft. sq. soil specimen. The slabs were provided with four brass plugs located near the cor-ners, and four one-and-one-hall-in, diameter, brass -tube-lined, vertical holes at the quarter points of each diagonal. Monel-clad-steel plungers 1. 3 in. in diameter, were placed through the holes so as to bear on the prepared soil surface. The upper hail of the clearance space between plung- - er and brass liner was packed with water- repellant grease, which was also plast- ered generously around the plunger above •.- -
the slab to exclude water from rain and melting snow. The four plungers on each soil specimen were loaded with concrete weights to develop contact pressures on the soil of 25, 50, 75 and 100 psi. respect- ively. Additional sample material, placed .. around the slab, simulated the shoulder .;.-..__ material along the edge of pavement slabs. .
Dimensions and arrangements of each installation are shown in Figure 4. A Figure 5. Concrete Slab and eihted photo of a single installation appears in Plungers.
j Harold Allen et al., 'eport of Committee on Classifica;ion of trirl for tub-grades and dranui:r Irpe oads, Froceeclinie, Tv:enty-?ifbh Annual eetthi, way Research Board, Jarniary, 1946.
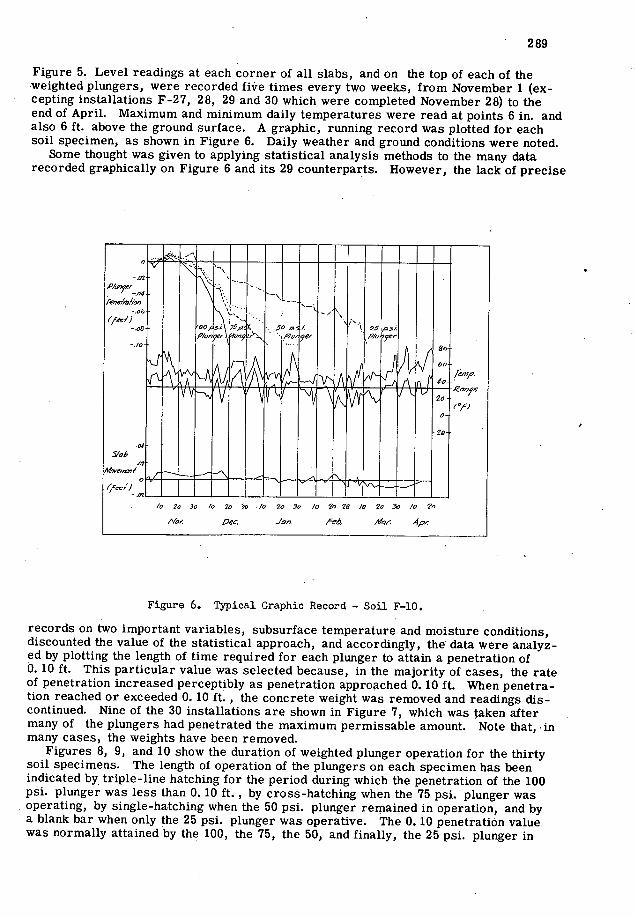
289
Figure 5. Level readings at each corner of all slabs, and on the top of each of the weighted plungers, were recorded five times every two weeks, from November 1 (ex-cepting installations F-27, 28, 29 and 30 which were completed November 28) to the end of April. Maximum and minimum daily temperatures were read at points 6 in. and also 6 ft. above the ground surface. A graphic, running record was plotted for each soil specimen, as shown in Figure 6. Daily weather and ground conditions were noted.
Some thought was given to applying statistical analysis methods to the many data recorded graphically on Figure 6 and its 29 counterparts. However, the lack of precise
0 \ ZRI'051"
go 0
(F)
20
.04
.02
(f0S)
/0 2o 3o I, 2o 90 /o 20 3e, /0 20 28 /0 2o 90 Ic, 26
Dec.Joln fo6. ft/oi 4p
Figure 6. Typical Graphic Record — Soil F-b.
records on two important variables, subsurface temperature and moisture conditions, discounted the value of the statistical approach, and accordingly, the data were analyz-ed by plotting the length of time required for each plunger to attain a penetration of 0. 10 ft. This particular value was selected because, in the majority of cases, the rate of penetration increased perceptibly as penetration approached 0. 10 ft. When penetra-tion reached or exceeded 0. 10 ft., the concrete weight was removed and readings dis-continued. Nine of the 30 installations are shown in Figure 7, which was taken after many of the plungers had penetrated the maximum permissable amount. Note that, in many cases, the weights have been removed.
Figures 8, 9, and 10 show the duration of weighted plunger operation for the thirty soil specimens. The length of operation of the plungers on each specimen has been indicated by triple-line hatching for the period during which the penetration of the 100 psi. plunger was less than 0. 10 ft., by cross-hatching when the 75 psi. plunger was operating, by single-hatching when the 50 psi. plunger remained in operation, and by a blank bar when only the 25 psi. plunger was operative. The 0. 10 penetratiOn value was normally attained by the 100, the 75, the 50, and finally, the 25 psi. plunger in
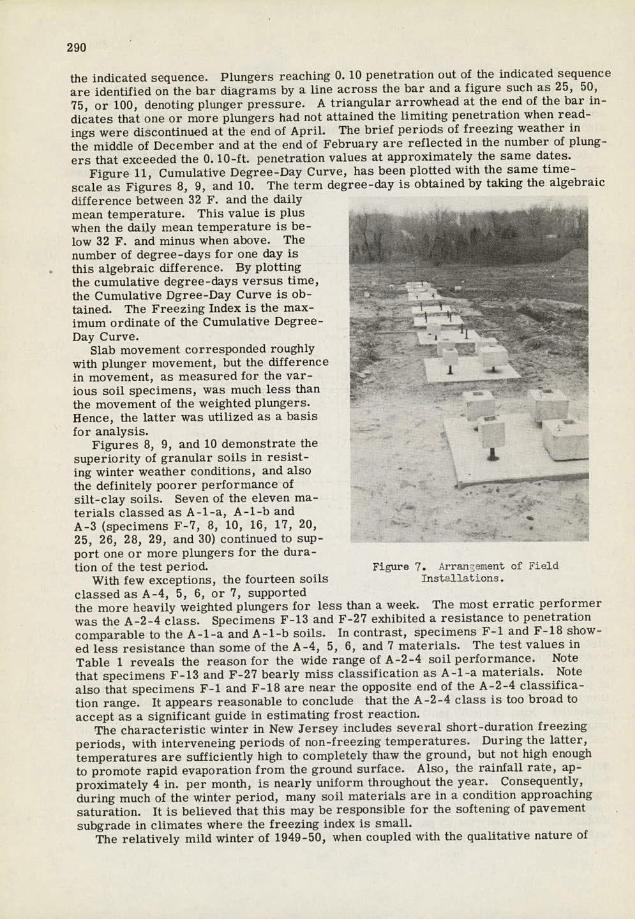
290
the indicated sequence. Plungers reaching 0. 10 penetration out of the indicated sequence are identified on the bar diagrams by a line across the bar and a figure such as 25, 50, 75, or 100, denoting plunger pressure. A triangular arrowhead at the end of the bar in-dicates that one or more plungers had not attained the limiting penetration when read-ings were discontinued at the end of April. The brief periods of freezing weather in the middle of December and at the end of February are reflected in the number of plung-ers that exceeded the 0. 10-ft. penetration values at approximately the same dates.
Figure 11, Cumulative Degree-Day Curve, has been plotted with the same time-scale as Figures 8, 9, and 10. The term degree-thy is obtained by taking the algebraic difference between 32 F. and the daily mean temperature. This value is plus when the daily mean temperature is be- low 32 F. and minus when above The number of degree-days for one day is RE V log ' this algebraic difference By plotting - the cumulative degree-days versus time, ..-... the Cumulative Dgree-Day Curve is ob- tamed The Freezing Index is the max- imum ordinate of the Cumulative Degree- Day Curve.
Slab movement corresponded roughly L .. with plunger movement, but the difference . . in movement, as measured for the var- I
ious soil specimens, was much less than the movement of the weighted plungers. V Hence, the latter was utilized as a basis for analysis. 4 '
Figures 8, 9, and 10 demonstrate the superiority of granular soils in resist- ing winter weather conditions, and also . S the definitely poorer performance of
silt-c lay soils. Seven of the eleven ma- terials classed as A-i-a, A-i-b and - - -. A-3 (specimens F-7, 8, 10, 16, 17, 20, - 25, 26, 28, 29, and 30) continued to sup- - port one or more plungers for the dura- tion of the test period. Figure 7. Arran:ement of Field
With few exceptions, the fourteen soils Installations. classed as A-4, 5, 6, or 7, supported the more heavily weighted plungers for less than a week. The most erratic performer was the A-2-4 class. Specimens F-13 and F-27 exhibited a resistance to penetration comparable to the A-i-a and A-i-b soils. In contrast, specimens F-i and F-18 show-ed less resistance than some of the A-4, 5, 6, and 7 materials. The test values in Table 1 reveals the reason for the wide range of A-2-4 soil performance. Note that specimens F-13 and F-27 bearly miss classification as A-i-a materials. Note also that specimens F-i and F-18 are near the opposite end of the A-2-4 classifica-tion range. It appears reasonable to conclude that the A-2-4 class is too broad to accept as a significant guide in estimating frost reaction.
The characteristic winter in New Jersey includes several short-duration freezing periods, with interveneing periods of non-freezing temperatures. During the latter, temperatures are sufficiently high to completely thaw the ground, but not high enough to promote rapid evaporation from the ground surface. Also, the rainfall rate, ap-proximately 4 in. per month, is nearly uniform throughout the year. Consequently, during much of the winter period, many soil materials are in a condition approaching saturation. It is believed that this may be responsible for the softening of pavement subgrade in climates where the freezing index is small.
The relatively mild winter of 1949-50, when coupled with the qualitative nature of

291
/4 -2-4(0)
A- (3) XXXxXx
/4-2-4 (0)
/4-4 (4)
A-B (8)
A- ()
A-I-b (o)
A-3 (0)
A- 7-C ('3)
A-I- h (0)
- Pe'2e7fr-o7'Io,, of eff/eff /o'fec,'
LX2-Pe"c/,-a/,on o( 76,fc' c( l5A2P2"79e'f less #7Q/7 ./'o feeA Pene/,-cn',o,,o/5oF
I. ,149'J /ess /hn .lo ,c'e,
of ,p/Ifr?9er /Cfj )?r .lo fee
Pe,,e,'rthon idicafq' 9/f9e eicceea'd .10 fe
a Jo /0 20 Jo /0 20 28 Ia 7o Jo /o 20 No Oec Jo' feb. iiloi
Figure 8. Duration of Weighted Plunger Operation - Soils F-i Thru F-lO.
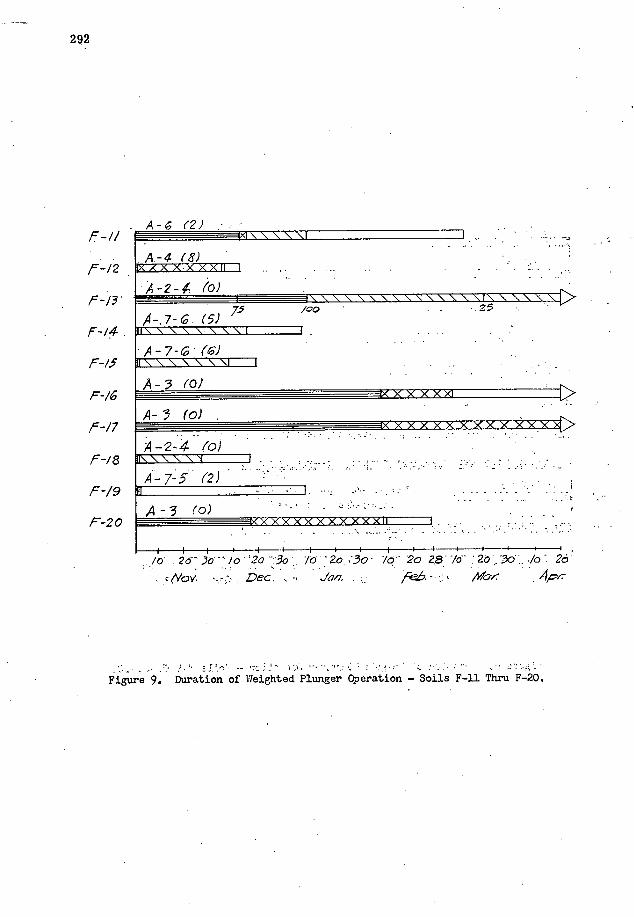
292
A-. (2) . f _/I ____________________________________I.
A.-4(8) KAXXXXXII I .... ... ... .
A-2-
A-7-6 (5) 75 /00
I\\\\\\\\I i. ..
A-7-G(6) . .. \
F-16
\\\\\ I
b(XXXX)I
A-3 (0) . .. P(XXXXXXXXXXXX)>
A-2-4 (0) F-/8 •1 ...................... .
,4-7-5 (2) f" I ...........--
A - 3(°) --.
vxxxxxxxXXXXu .., .•
/0 2636Jo 20 3o /d26..30 - / 2o 287o :2..3o:./oT 26
Vov. -.. Dec.
_ --.- ..-.-...•- - Figure 9. Duration of Weighted Plunger Operation - Soils F-U Thru F-20.

F -2/
f-22
f-23
F-24
F-25
f-26
F-27
F-28
f-29
f -30
293
A - G (6)
A - 4- ()
A•-4 (3)
A-I- (a)
A .3 •(a)
/0 2o 3° /o,. 20 3o Ia 26 Jo Ia 20 28 /0 2o 3o /0 2o NOY rn6. . Abc
Figu'e 10. Duration of Weighted Plunger Operation - Soils F-21 Thru F-30.

294
77
Is 2s 3o /0 is ,2o /0 20 50 /0 20 2X /0 20 '30 /0' 10
4'ou £n. ..i. Po.b Mxiji Ap.
Figure U. Cumulative Degree-Day Curve.
TABLE 1.'
SUMMARY OF SOIL TEST DATA
Sample Agronomic Test Results HRB Remarks
Sieve Analysis Hyd. Axial. Physical Proctor No. Name Designation
(as mapped :mulative Percent Silt 'Clay Minus No. 40 Max.. Opt. Sub- Group
1917-27 ). Passing izes Sizes Dens. m.c. grade Index Ti "PTT % 4 10 1 40 200 % , % % % p.c.f. % Group
F-1 Penn 94 76 63 46 35 16 19 31 7 106 17 A-2-4 0
F-2 Wethersfield 94 86 82 64 43 19 23 32 16 119 13 A-6 3
F-3 Dunellen 00 '98 95 76 27 -- -- 16 '0 120 12 A24 0
F-4 Gloucester 96 90 86 79 56 31 21 25 6 109 16 A-4 , 4
F-S Whippany 00 100 100 98 83 43 37 41 7 100 22 A-S 8
F-6 Sassafras 99 95 93 79 42 20 21 28 12 117 14 A-6 2
F-? . Sassafras 88 67 61 28 . 7 -- - - N.L. N. P.' 120 .12, , A- 1-b 0
F-8 Sassafras 00 100 98 78 '4 ' -- - N.L. N.P. 106 15 A-3 0
F-9 Hagerstown 00 99 98 92 83 42 34 43 20 101 20 A-7-6 13
F-10 Merrimac L00 90 77' 41' 11 --' -- N.L. NP,., 125 9 A-i-b 0
F-il Chester 89 74 70 55 46 26 16 ' 33 ii 109 18 A-6 2
F-12 Elkton 99 97 95 89, 79 45 31 28 10 108 -16 A-4 8 Gradin
F-13
,
Montalto 63 49 .36 23 12 6 S 32 9 114 17 A-2-4 0 neets A- x
F-14 Croton 97 80 73 68 64 23 27 41 21 100 21 A-7-6 15 group req.
F-iS Lansdale 99 87 85 69 55 21 32 41 15 ,95 26 A-.7-6 6
F-16 Lakewood 00 100 100 73 1 -- -- N.L. N.P. 102 115 A-3 0
F-i? Lakewood 00 99 98 64 3 -- -- N.L. N.P. 106 14 A-3 0
F-18 Collington 00 100 100 80 26 10 is 32 8 105 23 A-2-4 0
F-19 Collington 96 91 87 69 39 12 18 48 14 97 27 A-75 2
F-20 Portsmouth ' 99 87 84 56 7 -- -- N.L. N.P. 118 10 A-3 0
F-21 Holyoke 99 98 96 89 60 32 20 27 12 116 14 A-6 6
F-22 Washington 93 88 85 76 64 25 36 31 10 104 18 A-4 6
F-23 Dutchess 93 84 72 61 52 26 18 31 9 110 15 A-4 3
F-24 Dover - " 82' 72 '66 '54 37 ' 20 14 ' 31 9 112 ' 16 'A-4 0
F-25 Subbase 97 96 93 54 6 -- -- N.L. N.P. 106 15, A-3 0
Sand Hills
F-26 Subbase 93 86 78 36 10 -- -- N.L. N.P. 120 12 A-i-h 0
Farrington ' Close to
F-27 Subbase 85 48 40 24 10 3 6 25 7 122 12 A-2-4 0 A-i-a
Nixon
F-28 Subbase 94 78 71 41 2 - -- N.L. N.P. 108 16 A-i-b 0
Perrinevill
F-29 Subbase Top 87 35 26 12 3 -- -- N.L. N.P. 123 10 A-i-a 0
Jamesburg
F-30 Subbase Sot. 89 66 48 17 4 -- -- N.L. N.P. 119 13 A-i-a 0
Jamesburg

295
this study, presupposes the generalities of any statements. With this in mind, the fol-lowing conclusions have been drawn:
Soils and soil material in the A-3 class, consisting essentially of fine sands, when confined, show little loss of bearing power in the lower range of the contact pres-sures when subjected to freeze-thaw conditions. Little heaving occurs in these soils when subjected to freezing weather.
Silty materials, designated as A-4, appear to be the worst reactors; both in heaving characteristics and loss of bearing power.
Granular material, classified as A-i-a and A-i-b, show good support, especially for the lower contact pressures under conditions of freezing and thawing. Little heaving was measured'when these soils were subjected to freezing weather.
Clayey soils and soil material exhibit varied reactions as to loss of bearing power under freeze-thaw conditions. In consideration of the relatively mild winter, these soils showed considerable heaving under freezing conditions.
Attention is called to the fact that this study is being continued through the coming winter (1950-51), when subsurface temperatures will be obtained and movements of plungers and slabs will be recorded.
The authors wish to express their appreciation to the New Jersey State Highway De-partment for encouraging and sponsoring this work, and to Rutgers University for use of the facilities in the College of Engineering.
INVESTIGATION OF THE EFFECT OF FROST ACTION ON PAVEMENT-SUPPORTING CAPACITY
Kenneth A. Linell, Chief, and James F. Haley, Assistant Chief; Frost Effects Laboratory, New England Division, Corps of Engineers, U. S. Army
Synopsis
This paper presents studies made of the effect of frost action on pavement-supporting capacities as part of a comprehensive frost-investigation program initiated by the Corps of Engineers in 1944 to develop design and evaluation criteria for pavements constructed on subgrade soils subject to frost action. The studies described herein represent the first large-scale investigation directed toward the development of pavement design and evaluation criteria based on the weakened condition of thawed subgrade soils.
Investigations have been conducted at several airfield sites in the north-ern United States. Plate-bearing testa and in-place California-Bearing-Ratio tests have been performed during the normal and frost melting periods to determine the duration and magnitude of weakening due to melting of ice lenses. Accelerated traffic tests have been performed on both rigid and flexible pavements at four of the airfield sites during the frost-melting pe-riod, using wheel loads ranging from 7, 000 to 60, 000 lb.
Based on the results of these investigations, design curves and criteria have been established for the design and evaluation of flexible and rigid pave-ments on subgrades susceptible to frost action. Methods for recognizing conditions of soil, water, and temperature which are conducive to frost ac-tion and recommended design procedures, when frost conditions are encount-ered, are presented in Chapter 4, Part XII of the Engineering Manual en-titled "Frost Conditions, Airfield Pavement Design" currently in use by the Corps of Engineers, U. S. Army.
The results of the traffic tests indicate that the design curves which have been developed by the Corps of Engineers for frost conditions, for both flexible and rigid pavements, provide adequate pavement design thicknesses to withstand the anticipated traffic with a margin of safety consistent with economical design.

296
During the extensive airfield-pavement evaluation program undertaken by the Corps of Engineers in 1943, the need for special pavement design and evaluation criteria which would take into account the loss in strength of subgrade soils in northern airfields during the frost-melting period became increasingly apparent. The Chief of Engineers therefore initiated a comprehensive program of frost investigations in the Spring of 1944, and the Frost Effects Laboratory of the New England Division was established and was assigned the responsibility of organizing and carrying out the investigations, under supervision of the Airfields Branch, Engineering Division, Military Construction, Office of the Chief of Engineers.
The purpose of the frost investigation program has been to provide test data and analyses to establish criteria and methods for the design and evaluation of airfield pave-ments where conditions are conducive to frost action, both in theaters of operation and in the United States.
Figure 1. Ice Lens Formttion in Cl Subgrade at Turfed area - Dow Field, Bangor, Maine.
The results of the frost investigations have been published in detail in two previous reports: "Report on Frost Investigation 1944-1945," dated April 1947, and 'Addendum No. 1, 1945-1947 to Report on Frost Investigation 1944-1945," dated October 1949. They contain results of investigations conducted during the fiscal years 1944 through 1947. A third major report has been prepared and will be published in the near future; it unifies and summarizes the principal results of observations and tests made and presents design and evaluation criteria for both airfield and highway pavements result-ing from a study of the accumulated data.
Field investigations have been conducted at a total of 35 test areas at 17 airfields in the northern United States. The investigational sites were selected so as to en-compass a wide range of the variables which influence frost action. At each test area explorations were made to determine classification of base and subgrade soils and surface and subsurface temperatures; ground-water elevations were measuredthrough-out a number of freezing and thawing cycles. The soils were classified in accordance with the Airfield Soil Classification System shown on Table 1. The effects of frost action were observed by measuring pavement heave, determining changes in density and water content of the soils throughout the year, and observing the frost penetration and intensity of ice segregation in the subgrade soils by means of test pits (see Fig. 1). The data obtained in this manner were utilized to assist in establishment of criteria for recognizing soil types and ground-water conditions conducive to frost action and to correlate magnitude and duration of freezing temperatures with frost penetration. At several of the test areas, investigations were made of the reduction in strength of soils
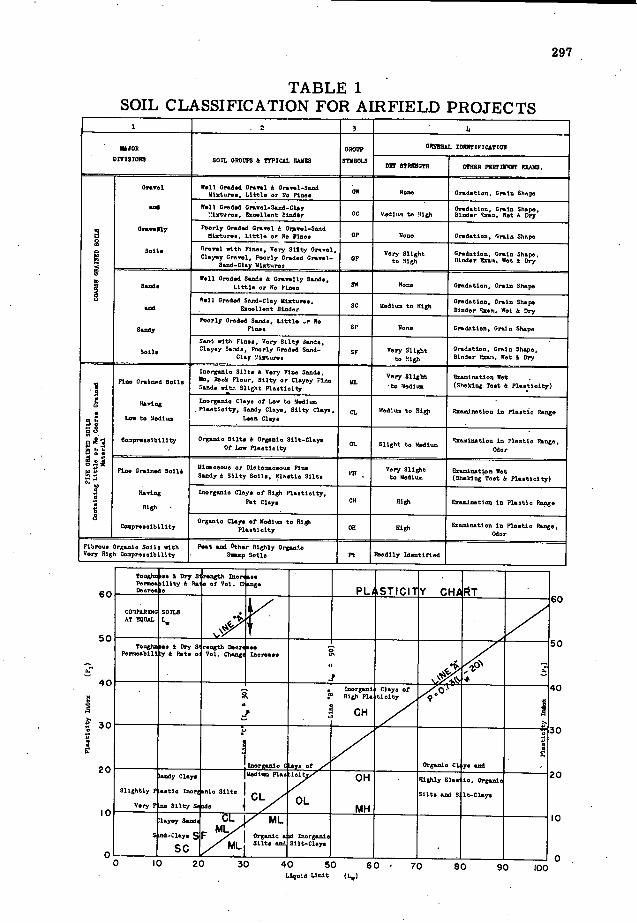
297
TABLE 1 SOIL CLASSIFICATION FOR AIRFIELD PROJECTS
1 .2 3 Ii
MuON GROUP ONNUAL IDWTIFIC&TIOJ
DIVISIONS 8011, GROUPS & TYPICAL DAMNS SYMBOLS DRT 8T0TN GROSS PWST INNS? RIAJIS.
Grovel 5.11 Gr4.d Grovel &Gro.el-Somd NO.. Gradation. Groin Shop.
5.11 Grod.d Gee.vel-S.nd-Clpy Grodotlon, G.eln Shop., irtoro,, DAoell.et DindAr CC ilediuo to High Binder to,.o. Wet & Dry
Poorly Oend.d Grovel & Gebvel-Snod Orov.Yly flioture., Little or N. Dth.. OP Some Uredotiom, Groin Shop.
Soil. Grovel with Fine,, V..7 Silty Grovel, Cloyey Grovel, Very Slight Orodotien, Groin Shop.. Poorly Uroded G,rel to Hl,h Died.,' S_o. Wet & Dry
Send_Cloy U1.toreo
5.11 Seeded S.W. & Orevelly Good. Good. Little or No P, SW Roe. Geodotion, Groin Shop.
Nell Grodod SnOd_Cloy ML.tur.. Orodotien, Groin Shope end tooelleot Biodor c
-
' °
Medi t Hi B, Binder S_u. W.t & Dry Poorly Orndod Good., Littl. .r No
Snndy Fine. SF No" Grodotion, Groin Shop.
Send vith Fine., Very Silts Jeude, Cloyey Snv,I,, Poorly tended Snud- SF Very Slight Srodotion, Groin Shop.,
Cloy Ii.tu,.e to High Bimder toe.. Net & Dry
Pin. Ur.Bnrd 8011. Pio.tioity)
Inorgoelo Cloy, of 1.0. to Bi.diueo Ple.tioity, Nndy Cloy,, Silty Clay,, CL Hedtu, to High tonuiootien in Pln.tlo R.W.
ion to Sedium Loon Cloy.
Conpr..eihillty Orgoolo Silt. OL Slight to M.diu,n tooninotieninpinetio Rouge,
Odor
Pin. Sined 80111 Ul000eeuo or Dint0000.ou. Fin. Very Slight tonoinntioe Not Gondy & Silty Soil., Hln.tio Silt. to Medium (Sh.klng?o.t & Plo.tiolty)
Snorgnnio Cloy, of High Plo.tioity, P.1mg 9 High' Pot Cloy. CO High tooniention in Pl.otio Rong.
Conpre.eibility Orgonlo to High
High toe.ientioojnple.tio Nnmg., Od
Fihrou. Orgenie Soil. .tth POOt end Other Highly Orgonte Very High Compre.elhility S_np SoIl. Pt Fmodily Identified
Tough. ne & Dry S reugtt Inn,' .. PM tlity& No of Vol. C ng.
PL STICI' V CII !T COILRING 1011.8 AT FinAL I,
Tough .. & Dry N r.ogth Deor .. permeability A Rote o Vol. Chog boron.. 0'
Z~ "0a
- . Ioorgooi Clnyo of High Plo tiolty
GH
'Imorg-tho CLy. of _ Orgoolo Cl Y. .ed endy Cloy. IiLedien P1.4isi OH . Nighiy Elm. 10, Orgoni.
SlIghtly o.tio Soor ci. Silt. Silts and B It_Cloy. OL Very ne Silty S de / , MH
ly.y Send, CL ML M,-'
S nd-Cloy. S F Orgonlo i ruorgoni
sc ,.,/ ML1 Silt, end Silt-ClOy.
"J ev 30 'PU U 60 ' 70 80 90 Liquid Limit (I.,)
6C
5C
4C
3C 4
20
I0
—0 :oo

298
TABLE 1 (Cont'd) SOIL CLASSIFICATION FOR AIRFIELD PROJECTS
1 5 6 7 8 9
PVINCIPA1. 0*1.0! *9 V*LGS AS 5*55 POTOUTIAL 8*501 053500001003 *95 T53?0 CL*330010*T109 TOUTS P5055ATION DIR8CVLT 09000 P000?
010198000 AT083 08 880005*L CS 51.11CR (ON 118000000 .8891.00) 00*3100 800011C3 uc,000
No to 0.00.1 Dry 0._it 0eiht or Void 0.tio. ieoh00104l £ooly.i. Not.Ii.ot 0004 to 5301000 Very Sligi.
8104.. No.11.ot Pci, to Ruoalloot 8.4100 Degreo of COOpe.OtiOO.
0.ch.010I Lady.!. Good to boelloot Poor to 0004 No- to Onnfly Cc.ett.tioo. Donbllitp of GnGoo.
a..h.oio.l LoGly.i.. Slight t 0
Otretifiootioo a Oniosgo Cbsr,et.ri.tio.. Liquid & flotio 14._Ito 0o Binder if uppliosbie
000 to bo.li.ot Poor to Good Sdi Oe
IS.haolal LnIy.i. Good to TOoolI.ot Poor to Good No- to
lr000d S.t.r 000dItioo..
T. to T••t• LiquIdePls.tle Lloit.:u 010d.r Good to Ruo.ileot Poor to 000d *04100 tad
100h..olo.l Loaly.l. P.lr to Good Not Sultoblo VeNo to ry Slight Lsr. .00.1. 1.0.4 Test. or
0.01._dual Loolp.is 01 9
ht Soil. 085 T. Liquid 8 fls.tGo Lisit. 00 Siodsr Fsir to Good Not 30110110 8 - if Applioablo
8.00400001 £sly.l.. Nadi- to Fin. Orelord Soil. Volt
Ltquld&Ptt.tioi.t.Gis Fair to p._y Not luituble 007. 1.igi.t, Na-000teot & VoId Patio.
Iiedi 1 .2 ..._ Cot.i.t.Goy - Vodl.turbod & R.eOlded. LIquid 11 Pls.tlo LIalte Psir to Poor Not Suitable gh
1.00 to 004100 Stntifioetio, Root Bob., Pi.sore.. no.,
Liquid & Pla.tio Li.lt. Frog Natural C008itioo Poor Not Suitable 11.41 to
High £1 000preeeibillt7 .
Dnio.ge 11 Ground Nstor Cooditbog.. 8 Lft.r Oreo Drylo,
Floe Ortin.d Soil. 8eol.ogio.i £aly.i.
Liquid S fls.tlo Ll.lt. If *ppiiotblo
poor Not Sul*bl. 4.41 t Vny RigS o Trsffio To.te,
Rsoieg I.M. Soole Load To.te,
Llqoid & fl..tio LimIt. Poor to Very Poor Not 1015.51. 8.4100 nig, COO y..t. or
Liquid 8 Fl.stio Limits .2 Cocprn.eibiliiy Coopns.boo Test. Proc Netur.l Citioo Very Poor Sot Suitoblo 11.4100
fibrous Vrg.nio Soil. otto 100.1.10007. TextUre end Sotuont Water Coot.tt Votnooly Poor Sot Suitablo Slight Very High Coupre.sibility -
50950, 1. Col T. 0010., som for salVed. sod Go.l no..... 000.pl f.r I.ea 000.r..e d1r005ly .r aaa,kog st1p.0..
value. I. Col.. 7 &04 8 are for goid.00e 0017. Design ehoold I. booed oo t..t re.uit. I. .000rdaooe mitt t.ot.
Dali night. I. Colic 13 ore for toll. lith .psoifto 5r000tiel r.ogi.g be.o 2.85 sad 2.75.
d.tttOs 04th 5 ..00gble I., Ta Co1 1.2, oha eqolneot listed .tli usually produe. th. reqoired re rn outher o f p5.50. to. ogmotur, 000lltioo. sod thioSue.. of lift are properly 000troll.d. 10 lostocoe.. 5.00mm types of eqoiot are bietod, b0040ee rerisbie soil oh.rsotert.titeWtthlo . floe, soil group 007 1.53000 100 GROUP 0130014 requiro differeot equlpoeot. 10 p000 1o.t4000e. a 000510.0100 of tOO 1)70. al, be 0000.54,7.
P0000.554 be.. eaton.1. sad Other togulsr ..t.Ti.i.. 3-1ette.led roller, en reeodod for S 0404 tord eagol.r torbsls .5th ii.slt.d floes or eor.soltg.. Rubber tired .qui1aeot I. reoonnded for .00Nor u- 0. 007 Floe 0404. SIlt. Nook now
C - Cloy adtnrialssubjeoi to de5rsd.tioO. p. - poet I. f)j)3j. Rubber tired equlp.eo.....0000500.4 for rolilog duritg P1005 sOaping operstin. fir P - floe.. Sail CO.l oa
cost soils sad pr005.sed iori.i.. . 0 S- Sell Greded
S5olsot .is.. Tb. following sis.. of .qoieot are o.nes.sry to a..ure thl bitt. deesiti.. P - Poorly Graded 1. Lo, to Nd. Co.pre.eibility requind for eirfield oos.tr.otioo, O - Nigh Cooprooelbility
Creoler type traotor - totol eeight I. noes. of 30,000 y000ds.
Rubber tired equipe.ot - oh.el 10.4 10.00... of 15.000 po.od.. 04es1 1050, a. hIgh 50 40.000 p00.4. al, be .eoe.e.ry to obt.in tOo required de..ities for so.. tertale.
Sh.epefoot roller. - uolt pres.ur. (oo6 to 9 10. is. foot) to be I. s000.s of 390 pound. per square loot. Pall proe.ur.. a. hSØn so 700 pOund. per .quare bob -y to noeseaty to obtain the required de001tiee for eon. .storisls.
Note:
The soil classification system shown on this table was used in classifying all
soils during the frost investigations.
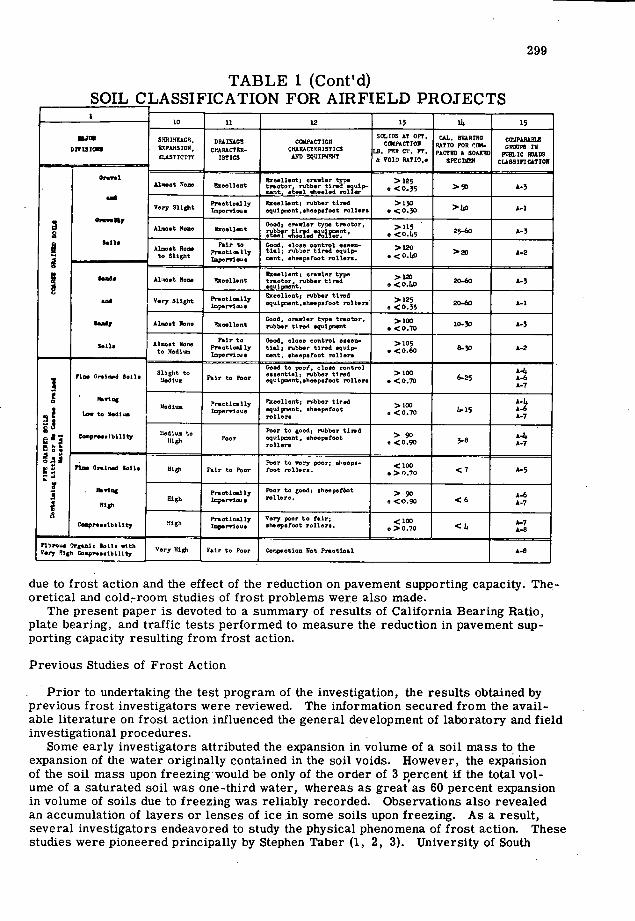
299
TABLE 1 (Cont'd) SOIL CLASSIFICATION FOR AIRFIELD PROJECTS
10 11 12 13 14 15
SHRIDSAO. DRLXSAOS CIPACTI0O SOLIDS AT OPT.
CiPACTTOW CAL. SoARrRo cOIZPAFABLS WON
Division HIPA23100, CHARACTRO- CR&RP.CTRRISTIIN LB. PRR CD. PT. GoTSO FOR r20 PACTRI) & SOAKGI)
SHIRTS IN RUSTICITY ISYICS AR!) 00UITS'iI & VoID So?I0e SPECOIRN
pum.c IADS cusoinc.?IoJ
Soo.11.ot. or*nler typ. >125 Ajoot Gone S000ll.nt trnotorrobb..ttredeip- t. .<0.35 >30
Very Slight Pre.otto.11y SooeSl.nti robb.r tired >130 — inpereioo. eqoipn.nt,.heop.toot roller. . <0.30
Atoo.t None SooeLlnet Good; orenier typ. trnotor. >115 23-60 A-S 1llltldeorflt. e <0.1.5
AtoOOt 800. r 14_ >120 to Slight 0<
>20 6-2 Inpereloos 000t. .heeperoot roller..
selod. Sooelloot; orneler type
Aloo.t Ron. Plooll.nt treotor. robber tired .4olot. , <o.i.o
Very Slight Pr.otie.11y oqui 50.60 6-1 nod e
Alno.t Son, Ro od7 RAll.nt oe Good, o,neler type trootor, robber tired .qutpeent
>100 <0.70
10-30 6-3
A1.oet Ron. Feir to Good. oloee oontrOl o..en- >105 to Medbne Prootionily ttol, robber tired .qoip- <o.60 Inper.loe neot. .h.op.foot roller.
Good to p00', 010.0 control Ft.. Groteed Roll. Slight to
Foir to Rhor 6-25 equ oot ller. •
e o 1.-15
Poor Conpr.e.ibillty Idton to
Poor to good; robber tired
equipoet. •heop. foot > 90 0<0.90 3-8 8-7
31 FIn. Grelned Soil. High F.ir to Poor Poor to .ery poor; heep.- root roller..
<n_ <7 5 > 0.70
Pr.otlo.ily Poor to good; eheepethot 6-6 .5 High Inpervin.. rollere. e <&90 <6
High
High Prnotio.ily Very poor to feir; <100 6-7 Cre..ibi1ity S.r,ioo. heop.root roller.. 0>0.70 <1. 6-8
Flbro.e Orgnelo Roll. .0th Very High Ce.pro..ibiilty very High FoIr to Poor Conpootion Rot Prootlool A-H
due to frost action and the effect of the reduction on pavement supporting capacity. The-oretical and cold-room studies of frost problems were also made.
The present paper is devoted to a summary of results of California Bearing Ratio, plate bearing, and traffic tests performed to measure the reduction in pavement sup-porting capacity resulting from frost action.
Previous Studies of Frost Action
Prior to undertaking the test program of the investigation, the results obtained by previous frost investigators were reviewed. The information secured from the avail-able literature on frost action influenced the general development of laboratory and field investigational procedures.
Some early investigators attributed the expansion in volume of a soil mass to the expansion of the water originally contained in the soil voids. However, the expansion of the soil mass upon freezingwould be only of the order of 3 percent if the total vol-ume of a saturated soil was one-third water, whereas as great as 60 percent expansion in volume of soils due to freezing was reliably recorded. Observations also revealed an accumulation of layers or lenses of ice in some soils upon freezing. As a result, several investigators endeavored to study the physical phenomena of frost action. These studies were pioneered principally by Stephen Taber (1, 2, 3). University of South

300
Carolina, starting 1914, when his experiments in the field under natural freezing con-ditions showed that frost heaving was due to the growth of segregated ice in the soil, and that freezing soils draw water to the zone of ice-lense formation from outside sources.
From the results of extensive laboratory investigations commenced in 1927. Taber (4 to 7 inclusive) developed a hypothesis which he summarized on p. 173 in reference (7) as follows:
"Frost heaving is due to the growth of ice crystals and not to change in volume of water on freezing. Pressure is developed in the direction of crystal growth, which is usually determined chiefly by the direction of cooling. Excessive heaving results when water is pulled up through the soil to build up layers of lenticular masses of segregated ice, which grow in thickness because water molecules are pulled into the thin film that separates the growing columnar ice crystals from the underlying soil particles."
Field and laboratory investigations by Casagrande (8), Beskow (9), Winn and Rutledge (10), and others have essentially confirmed Taber's explanation of the physical phe-nomena of frost action in soils.
A considerable amount of literature exists concerning the effect of frost action on highway pavements, reported principally by state highway departments. Numerous instances are recorded of extensive highway damage caused by frost heaving, frost boils, and highway breakup. The frost boils, as referred to by highway engineers, are caused by a rapid thawing of an area of severe frost action beneath a flexible pavement. Such thawing occurs largely from the surface down and the excess water liberated from the thawed area is prevented from draining downward by the still-frozen underlying soil and ice layers. The excess water causes the thawed soil to become exceedingly soft. Likewise the pumping of water from joints in concrete slabs during the spring may be the result of excess water in the subgrade liberated from thawed ice layers.
Definitions
Description of the tests and analysis of results involve specialized use of certain terms and words. Definitions of these words and terms as used in this paper are:
Frost action is a general term used in reference to freezing of moisture in mate- rials and the resultant effects on these materials and structures of which they are a part.
Ice segregation in soils is the growth of bodies of ice during the freezing process, most commonly as ice lenses or layers oriented normal to the direction of heat loss, but also as veins and masses having other patterns.
Frost penetration is the maximum depth from the surface to the bottom of the frozen zone.
Frost heave is the raising of the pavement surface due to the accumulation of ice lenses. The amountof heave in most soils is approximately equal to the cumulative thickness of ice lenses.
Frost susceptible soils are those in which significant ice segregation will occur when moisture is available and the requisite freezing conditions are present. (Pre- vious information has indicated that most soils containing 3 percent or more of grains finer by weight than 0. 02 mm. are susceptible to ice segregation, and this limit has been widely applied to both uniformly andvariably graded soils. Although ithas been found that some uniform sandy soils may have as high as 10 percent of grains finer than 0. 02 mm, by weight without being considered frost susceptible, there is some question as to the practical value of attempting to consider such soils separately, because of their rar- ity and tendency to occur'intermixed with other soils. Cold room tests now in progress in the Frost Effects Laboratory are expected to result in improved knowledge concern- ing limits between frost susceptible and non-frost susceptible soils.)
Normal period is the time of the year, summer and fall, when there is no reduction in strength of foundation materials due to frost action.
Traffic lane is the area of the pavement subjected to controlled test traffic, usually that portion of the test section over which one set of traffic equipment wheels pass.
301
Coverage is one application of the wheel load over each point in a traffic lane. Equipment pass is one movement of the traffic equipment along the traffic lane;
synonymous with "trip."
Acknowledgements
This investigation was conducted for the Airfields Branch, Engineering Division, Military Construction, Office Chief of Engineers, of which Gayle MacFadden is chief. Thomas B. Pringle, head, Runways Section of the Airfields Branch administered the program for that office.
Colonel H. J. Woodbury is the division engineer, New England Division, Corps of Engineers, U. S. Army. John E. Allen is Chief of the Engineering Division, to which the Frost Effects Laboratory is attached. The work was initiated and carried out dur-ing the period 1944-1946 under the direct supervision of William L. Shannon, then chief of the Frost Effects Laboratory. In 1946 Shannonwas succeeded by the late Ralph Hansen. Acknowledgement is made of the contributions of numerous other personnel of the Frost Effects Laboratory during the period since 1944 in supervising field in-vestigations and in preparing data and analyzing results.
The program was alsp assisted by personnel of the Great Lakes and Missouri River Divisions of the Corps of Engineers.
Dr. Arthur Casagrande of Harvard University and Dr. Philip C. Rutledge of North-western University were consultants on the investigation.
Weather data used were provided by the U. S. Weather Bureau, Department of Com-merce. Assistance in performance of tests was received from U. S. Air Force and installations officers at the various test locations.
Effect of Frost Action on Supporting Capacity of Flexible Pavements
The supporting capacity of flexible pavements was investigated by means of in-place California Bearing-Ratio and plate-bearing tests conducted during the normal period and the frost-melting period and by traffic tests conducted during and after the frost melting period.
California Bearing-Ratio Tests
The field-test procedures for the CBR tests were as outlined in Chapter XX, Para-graph 20-18d, "CBR Tests on Soils in Place," U. S. Army, Corps of Engineers, Engi-neering Manual (March 1943).
In-place CBR tests were conducted on top of the base materials and the subgrade at a total of nine flexible-paved test areas. The tests were performed during the normal period in the fall of 1944 and repeated in the frost-melting period in the spring of 1945. The average CBR values for the normal period, in the summer and fall of 1944, and for the frost-melting period in the spring of 1945, generally showed a reduction in strength in both the frost susceptible base materials and frost susceptible subgrades. The results at these test areas are compared in the tabulation in the following page.
At the majority of the test areas the reductions in CBR values during frost melting are consistent with the intensity of ice segregation experienced in the materials tested. At Pierre the CBR tests were conducted in a portion of the test area which showed slight subsidence and no ice segregation. No ice lenses were observed at Casper while at Bismarck a few scattered lenses of hairline thickness were observed.
Plate Bearing Tests
The plate-bearing tests were of two types: static and repeating-load tests. The static plate-bearing tests were conducted in the manner outlined in Chapter XX,
Paragraph 20-41, Engineering Manual (March 1943) except that the 30-in. -diameter plate was placed directly on top of the bituminous concrete pavement. Loads were

302 Average CBR
Test Normal Frost Melting Site Area Material Period Period
Otis Field, A ML Subgrade 44 18 Camp Edwards, (GP and SP) Massachusetts
Truax Field, A GF Subbase 64 33 Madison, CL Subgrade 4 2 Wisconsin
Truax Field, B GF Subbase 41 31 Madison, CL Subgrade 5 3 Wisconsin
Watertown A GF-SF Base 37 27 Airfield, OL-CL Subgrade 12 8 Watertown, South Dakota
Pierre Airfield, B GF Base 30 30 Pierre, S. Dakota CL Subgrade 12 16
Sioux Falls, Airfield A GC Base 37 14 Sioux Falls, CL Subbase 16 6 South Dakota CL-CH Subgrade 10 5
Fargo Municipal A CL-SF Subbase 15 8 Airfield, OH-CH Subgrade 7 5 North Dakota
Casper Air B GW Base 58 28 Base, SF-CL Subgrade 27 21 Casper, Wyoming
Bismarck A GF Base 24 21 Airfield, SF-ML Subgrade 24 18 Bismarck, North Dakota
applied to the plate in approximately five or six equal increments to a load in excess of the proportional limit or to the maximum permitted by the test equipment. Each increment was held constant until the rate of plate deflection was negligible.
The repeating-load tests used the same type and arrangement of testing apparatus as employed for the static-load tests, except that a 24-in, diameter plate was used on top of the bituminous pavement. A seating load of 3, 500 lb. was applied for 5 mm. and release3. A load of 20, 000 lb. was then rapidly applied in one increment. The load was maintained for 10 mm. during which the deformation was measured at the end of 1/4, 12 2-1/4, 6-1/4, and 10 mm. The load was rapidly released, and defor-mation readings were taken at the end of a 5-mm. period. The loading procedure was then repeated until ten load repetitions had been made. A 19-in. -diameter plate was used instead of a 24-in. -diameter plate during the normal period in the 1943-1944 in-vestigations at Dow Field.
Static and repeating-load tests were performed at Dow, Presque Isle, Traux, Pierre, and Sioux Falls airfields during the fall and during and after the frost-melting period, in various years in the period from 1943 through 1947.
The results of the static-load tests performed on top of flexible pavements with the 30-in. -diameter plate, at areas where tests were carried out during both normal and

303
frost melting periods, and covering all investigational years, are summarized on Table 2. The normal-period loads for 0. 1-in, deflection tabulated in column 11 of the table are the averages of all tests performed between September 1 and the start of the freez-ing period. The frost melting period loads shown in column 12 are the average loads at 0. 1-in, deflection of all tests performed during the two-week period in which the pave-ment showed minimum strength. Since the load-test data did not revealany significant yearly variations in normal period results or frost-melting period results, the data were grouped to give more representative values. Column 13 shows the ratios between the frost melting period and normal period static load test values.
STATIC PLATE GEARING TEST LOAD ON PAVEMENT SURFUCE RUPTURE TESTS AT SLAG CORNERS-AVERAGE RATIO
AVERAGE RATIO OF FROST MELTING TO NORMAL PERIOD OF FROST MELTING TO NORMAL PERIOD LOAD AT 0.1
LOAD AT 0.1 INCH OEFLECTION. -------- 1 . INCH DEFLECTION - - - - -
—r o I
.03
0.90.C— - --- -- - - 0 z
0.8 0.1 -
0.7 0.— - - - -
0.6 0.b ZAVERAGE RATIO OF FROST MELTING TO - - NORMAL PERIOD WHEEL LOAD EVALUA ION FOR TAXIWAT PAVEMENTS. uuuuluu..,cr 0.5o0. —
U-
0.4u0.- 0
0.320. - I—
IOGT.INOV.IDEC.IJAN.IFEBJMAR.IAPR.IMAYIJUNEIJULYI°2 ° 'i OCT INOV.IOEG.IJAN.IFEB.IMAR.IAPR.IMAY IJUNEIJULYI
FLEXIBLE PAVEMENT (A) RIGID PAVEMENT (B)
REDUCTION IN PAVEMENT SUPPORTING CAPACITY NOTES-
Curves based on static load tests from nine flexible paved test areas and from rupture tests on six rigid paved, test areas at six airfields (Reference Tables 2 and 3 ).
Single wheel load evaluations (100 psi tire pressure) for normal period based on airfield pavement design curves dated 13 June 950 and evaluations for frost melting period using frost design curves doted IS August 950.
..pj.tuuIIuI uuuuiiuiii• uu.uI.IuII uulullu" .. uuiuiiuriuiu IUUUI IPJ!III
uuIulilili
Figure 2.
Wheel-load evaluations for both normal' and frost-melting periods and their ratios were determined for each test area included on Table 2, as shown in the last three columns. The normal period evaluations were based on in-place CBR test results in the flexible-pavement design curves for single-wheel loads with 100-psi. tire pressure and frost-melting period evaluations on frost-condition design curves currently in use.
The average of the ratios of frost-melting to normal-period statié test loads for 0. 1- in. plate deflections for the nine test areas shown on Table 2 is 0. 50. The ratios of the frost condition to the normal -period evaluations for these same pave- ments are consistently lower than the static-load ratios and average 0.29. These ratios are also shown on Figure 2(A), which presents a plot of the duration and magnitude of pavement weakening as determined by averaging the static-load test results from all the test areas. These results indicate that the reduction in pavement -supporting capac-ity due to frost melting as determined from static-load tests is considerably less than the reduction that is allowed for by the frost-condition design criteria for wheel-load traffic.
Since the normal-period design criteria are based on a large number of traffic tests and CBR tests and have been proven by satisfactory pavement performance after sev-eral years' of traffic usage:, the normal-period 'wheel-load evaluations shown in Table 2 are not considered to be excessive. Further, the results of traffic tests, presented

C., 0 41
TABLE 2
SUMMARY OF STATIC LOAD TESTS ON SURFACE OF FLEXIBLE PAVEMENTS
Pavement Base &ibgrade Frost Static Load Tests 'Design Wheel Load
Site Test Thickness _-•.._._-._...- ... Penetration Load at 0.1 in. Deflection
Area (inches) Clasai- Thickness Percent Finer Classi- Percent Finer Normal (feet) Normal Frost Ratio
fication (inches) than fication than CER Period Melting Loads Normal Frost Ratio
0.02 ann. 0.02 eel. Period FM/N Period Melting Design
(1) (2) (3) (4) (5) (6) (7) (8) (9) (10) (11) (12) (13) (14) Period FM/N
(15) (16)
Dow B 4.0 GW 27 3-6 U.. 40-97 8 4.3 34,000 (4) 17,000 (3) .50 80,000 27,000 .34
3.5 " 40 " " " " 4.3 41,500 (2) 26,000 (1) .62. 150,000 48,000 .32
I & III 4.0 " 16 " " 4.0 34,000 (3) 15,500 (2) .42 33,000 .11,000 .33
C 4.0 ' 43 " " " 4.7 44,000 (4) 26,000 (3) .59 150,000 57,000 .38
3.5 " 32 " " " 4.7 34,000 (1) 17,000 (1) . 50 106,000 33,000 .31
Presque C 4.5 Cr. Rock 3 - GC 10-40 10 6.2 60,000 (1) 32,000 (4) .53. 108,000 27,000 .25
Isle 11W 24 0-6 - O 4.0 Cr. Rock 3 - GC " ' 5.8 49,000 (3). 24.000 (9) .49 108,000 28,000 .26
11W 24 0-6
Truax A 2.5 Cr. Rock 8 - CL 60-80 5 3.9 36,000 (2) 14,000 (2) .39 32,060 . 7,000 .22
GF 16 10-20 SF . 7
B 2.5 Cr. Rock 19 • CL . 60-80 4 4.9 51,500 (5) 24,000 (7) .47 73,000 26,000 .36
GF 23 10-20 SF 7 .
Pierre B 1.5 GF 12 6-14 CL 30-58 13 3.7 42,000 (1) 17,500 (7) .37 27,000 5,500 .20
6.0 GF 9 " " 3.7 69,500 (1) 38,000 (8) .55 ' 35,000' 6,500 .19
Sioux A 2.0 GC . 10 6-12 CL 35-48 10 3.7 23,500 (1) 12,500 (3) .53 14,000 4,000 " .29
Falls (Subbase) ' Avg=.50 , ' Avg .29
NOTE: Design wheel loads for normal period were determined from the Flexible Pavement Design Curves (single wheel load, 100 psi, tire pressure) dated 13 June, 1950.
Design wheel loads for frost conditions were determined from the Frost Design Curves dated 15 August 1950. The GF subbase material at Truax was 'frost
susceptible and was considered to control frost condition design.
Figures in parentheses indicate number of tests used in computing the average loads at 0. 10 inch deflection.
LEGEND: N - Normal Peripd
FM - Frost Melting Period

305
later in this paper, and service behavior studies of existing pavements demonstrate that the frost condition design criteria are not excessively conservative and have a mar-gin of safety consistent with the duration of weakening. It is therefore believed that the degree of reduction in wheel-load supporting capacity of flexible pavements due to frost action as indicated by the design criteria for the normal and frost melting periods is essentially correct.
On the other hand, the static-load tests do not give a correct measure of the relative traffic -supporting capacity during the frost-melting period. The loss of pavement strength as measured by these static-load tests is not analogous to traffic loading for two reasons: (1) the gradually applied load used in the tests allows escape of water, consolidation, and build up of resistance in the subgrade soils, which influences to a great extent the frost-melting-period test results; and (2) the static-load tests do not reflect the weakening due to. subgrade remolding under repetitive loading such as the pavement is subjected to under traffic usage. This remolding is particularly critical during the frost-melting period when excess or segregated water is available in the sub-grade.
A measure of the duration of subgrade weakening is provided by the results of the plate-bearing tests, as is shown in Figures 3 through 12. Figures 3 through 9 present plots of repeating-load test results at Presque Isle, Truax, Dow, and Sioux Falls air-fields. Figures 10 through 12 present results of static-load tests for Presque Isle, Truax, and Dow airfields for all investigational years, showing the ratio of frost-melt-ing period load to normal-period load to produce 0. 1-in, deflection. The'average pen-etrations of frost into the subgrade soils at the three sites covered in the latter three figures were: 3. 1 ft. at Presque Isle; 1. 5 ft. at Truax; and 1. 8 ft. at Dow. Based on the trend of static -plate -bearing -test data presented in Figures 10 through 12, the period required for the pavement to return from approximately 50 percent to 80 percent of normal strength was three months at Presque Isle, one and one-half months at Truax, and two months at Dow Field. Thus, the duration was approximately proportional to the depth of frozen subgrade at the three sites. The short time required'to regain strength at Truax is also probably influenced by a fine-sand stratum underlying the silty clay, CL, subgrade.
A study of the plate-bearing-test data for all investigational years was made to de-termine the relationship between loads at deflections of 0. 05, 0. 1 and 0. 2-in. Plots showing the relationships between loads at 0. 1-in, deflection and 0. 2-in, deflection and between loads at 0. 05-in. deflection and 0. 2-in, deflection for the individual plate bear-ing tests are shown on Figure 13. These plots indicate that within the ranges of de-flections analyzed the same relationship exists between loads for any two specific de-flections during the normal as during the frost melting period.
Traffic Tests
Traffic tests were conducted on five flexible paved test areas at Dow, Truax, and Pierre airfields using wheel loads selected to bracket or approximate the evaluation of the specific pavements for frost-melting conditions. The equipment to;obtain the var-ious loads ranged from trucks to large, rubber-tired construction equipment. The ap-plication of traffic was made on the basis of a specified number of dailycoverages dur-ing and after the frost-melting period to simulate continuous use of a pavement by air-craft. Based upon the best available information it was assumed that 15 coverages per day was equivalent to maximum runway use and 45 .coverages per day was equivalent to maximum taxiway use. In all cases it was not possible with the available equipment to apply exactly 15 and 45 coverages; therefore, individual tests varied in the number of daily coverages. Traffic was started at the beginning of the frost-melting period and continued through the frost-melting period or until imminent failure had occurred. Measurements of the vertical deformation in the traffic test areas and observations of the behavior of the pavement were made daily. At the end of the traffic tests detailed measurements were made of the pavement surface and trenches were excavated in traf-fic test areas to observe and measure the relative positions and condition of the pave-

C
TABLE 3
SS1ARY OF RUPTIM TESTS ON RIGID PAMENT SLAB COERS
- Static Load Tests
Pavement Base Subgrade Load at 0.1 in. Deflection Design Wheel Load
Site Test Thickneis ..-.--___--..__---- Frost . Flex. Frost
Area (inches) Clasal- Thickness Percent Finer Classi- Percent Finer Pen. Normal Frost Ratio •Strength Normal Period Melting Period Ratio
fication (inches) than fication than (ft.) Period Melting Loads of Cone. Sub. Load Sub. Load Design
0.02 mn. 0.02 mix. Period FM/N (psi.) Mod. lb. Mod. lb. RuIN
(1) (2) (3) (4) (5) (6) (7) (8) (9) (10) (11) (12) (13) (14) (15) (16) (17) (18)
1944- 1945
Dow A 7.0 . 04 13 3-6 Ii 40-97 4.1 50,000 (2) 28.000 (2) 0.56 600 .. 315 16,000 75 .11.000 -
Truax C 6:0 GF 40 10-20 Ii 60-80 4.6 86,000 (1) 55,000 (5) 0.65 750 250 14,000 60 11,000 .79
1945 - 1946
Dow F 7.0 GW 22.5 3-6 C.. 40-97 4.5 40,000 (1) 27,000 (1) 0.67 600 315 16,000 120 12,000 .75
8.0 GW 32 0-6 GC 10-40 5.8 60,000 (1) 47,000 (3) 0.78 690 340 27,000 170 21,000 .78 Presque A
Isle
Truax C 70 GF 39 10-20 C.. 60-80 4.0 84.000 (1) 48,000 (1) 0.57 750 250 20.000 60 14,000 .70
C 6.0 GF 53 10-20 C.. 60-80 4.0 71,000 (1) 43,000 (2) 0.61 750 250 14.000 60 11,000 .79
Selfridge A 11.0 GF 8 3 ML 34 2.9 85,000 (1) 61,500 (3) 0.72 735 . 165 50,000 55 39,000 .78 SF 20 . .
Pierre A 7.0 GF 7 6-14 C.. 30-58 4.0 44,000 (2) 37,000 (2) 0.84 700 120 15,000 55 13,000 .87
Sioux Falls A 6.0 - - - th 55-83 3.5 35,000 (2) 28,000 (2) 0.80 675 48 9,000 30 8,000 .89
1946 - 1947 - 136w F . 8.0 GW 19 3-6 0.. 40-97 3.7 42,000 (3) 28,500 (2) 0.68 600 315 22,000 110 16,000 -
- Avg. .69 Avg. .79
NOTE: Design wheel loads for normal period were determined from the Rigid Pavement Design Curves (single wheel load, 100 psi. tire pressure) dated 13 June 1950.
Design wheel loads for frost conditions were determined from the Rigid Pavement Design Curves (single wheel loads, 100 psi. tire pressure) dated 13 June 1950,
using subgrade moduli obtuimed from Frost Design Curves dated 15 August 1950. The GF base material at Truax was frost susceptible and was considered to.
control the design.
Figures in parentheses indicate number of tests used in computing the average loads at 0.10 inch deflection.
LEGEND: N - Normal Period
Rut - Frost Melting Period -
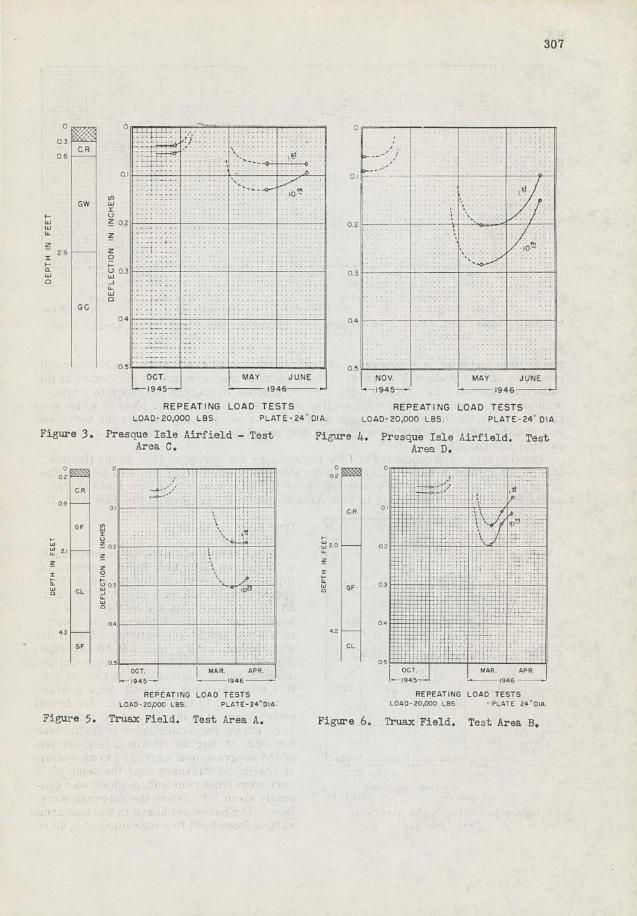
307
03
061-- - .
0_- _-_
2.6
02
0 03 03
U- Ui . - 0 -
GO
051 :
_ _ :
__
I1 MAY JUNE NOV 1 MAY JLJNE
I945j 946- 1945--- -. --
REPEATING LOAD TESTS REPEATING LOAD TESTS LOAD-20,000 LBS PLATE-24 DIA L00020,000 LBS. PLATE-24 DIA
Figure 3. Presaue Isle Airfield - Test Figure 4. Presque Isle Airfield. Test Area C. Area D.
C ...
. . CR
09 - - GF ..
_ I
2
z z - . . - . ... .. -
A.
a
CL
04
.....
. - 42 - SF
0.5
_I 1946
REPEATING LOAD TESTS L060-20p00 LBS PLA1E24016-
Figure 5. Truax Field. Test Area A.
02
3
GF
CL
,945 946 -
REPEATING LOAD TESTS LOAD 20000 L8S PLSTE 2401A.
Figure 6. Trua7c Field. Test Area B.

308
ui-I Ina • _
NOV. MAR. APR, MAY L.1945... 946
REPEATING LOAD TESTS LOAD-20000 LBS. PLATE 24" OIA.
Figure 8. Dow Field. Test Area B (;est Portion).
03
35j
CL
Figure 7
ment, base material, and subgrade. A test lane was considered to be in a condition of imminent failure if about 20 percent of the area was map-cracked or the flexing of the pavement reached 1 in. Efforts were made to hold the damage of pavement to a mini-mum consistent with positive test results. Imminent failure or the point at which pro-gressive failure commenced was used as a basis for determining whether the pavement was satisfactory or unsatisfactory rather than complete failure which would leave the pavement impassable.
Traffic tests were conducted at Dow Field during the spring of 1944 on the flexible pavements at Test Area I-HI located on the E-W Runway. During the 1945 frost-melt-ing period, traffic tests were conducted on the flexible pavement at Dow Field in Test Areas B and C, at Truax Field in Test Area B, and at Pierre Airfield in Test Area B.
02
SC
- CL
S
CL OR Q
5 CR
AC -
SP-CL
a.
06
NOV MAR APR MAY CAR --
REPEATING LOAD TESTS L0A025,000 LBS PLATE 24' 55
Figure 9. Sioux Falls Airfield. Test Area A.
Dow Field (1943-1944)
In the series of traffic tests performed at Test Area I-Ill, Dow Field, immediately following the frost-melting period in the spring of 1944, wheel loads of 10, 000 and 20, 000 lb. were obtained by the use of a 5-yd. truck and Gar Wood scraper towed by a 5-yd. truck, respectively. The traffic was applied at the rate of 4 to 50 coverages per day, to several test lanes over two large areas at which a bituminous pavement 3. 5 to 4. 0 in. thick overlay a GW base course ranging from 15 to 37 in. thick. Ice lenses were observed in the CL and GC subgrade soils during the winter prior to traffic test and were of hairline thickness near the top of the subgrade and increased to an average of 1/4-in, in thickness near the depth of maximum frost penetration which was gen-erally about 2 ft. below the subgrade sur-face. The pavement heave in the test areas ranged from 0. 00 to a maximum of 0. 40 ft.
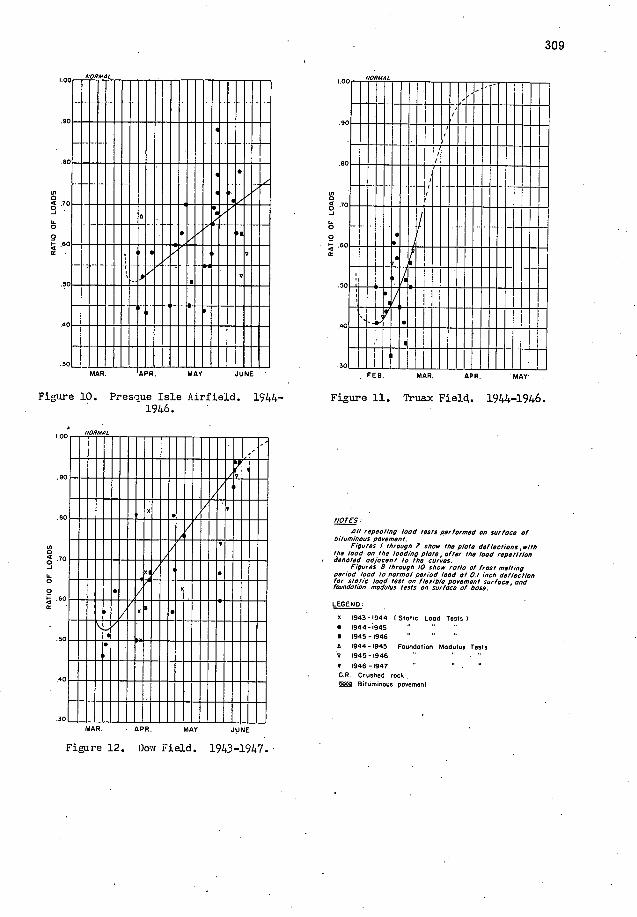
309
Co 0 4 0 -J
0 0
.6
.5
4
.3
HIIHIIHIIIIIIIIIIIIIII iIIHIIIIIIIIIIOhiIIIIii IIOIIIIIIIIIIIIIIOPI!!I IIIIuuuuI!IIuuIIup1iIuI iIIIIuII1'iiuuIIIIIII iiiuiuuiiIiuiiiii.rnuui
lIHIuuuuIIuIuuuIIIIIflhI uIIIIIIIIIIIIIIIIIIIIuuII IIIIIIIIIIIIIIIIIIIHIIII !flhiiIiiIIIIIIIIIIIHhIU
MAR. APR. MAY JUNE -
Figure 10. Presque Isle Airfield. 1944- 1946.
• flhIiiouiiiuiiuiuii IIIIIlHuIUhIIIIIIIIIi IIHIIIIIHIIIIIIIIIIIII IIllhIIIIIuIIIuIIIIuhI IHHhIIIIiIIllhIIIIIIII uIllhInhIIIIHhIIIIlIH
011hiIIIINIIIllIO IIHKIIIIIIIIIIIIIII IIIIlI!411111H111111H11 IIH!dIIIIIIllhIIIHhII Ill!4I!IIlluIIIIllIH IIIIIIPIHIIIIIIIIIIIIII IIIIIIIIllhIIIIIIIIllIH
FEO. MAR. APR. MAY
Figure 11. Truax Field. 1944-1946.
100
.90
.80
Sn 0
.70
0
0 .60
50
40
.30
NOTES.
All repeating load tests performed on surface of bituminous pavement.
Figures / through 7 s/too the plate deflections, o/tlt the load 0 the lOading plate, of/er the load repetItion denoted adjacent to the curves.
Figures 8 through /0 s/too ratio of frost melting period load to normal period toad at 0./inch deflection for static load test on flenible pavement surface, and foundation modulus tests on surface of base.
LEGEN0
o 1943-1944 ( Stot,c Lood Tests 1944-1945 1945-1946
O 1944-1945 Foondtion Modulus Tests 9 1945-1946
1946-1947 ' CR. Crushed rock EM Bituminous pavement
MAR. - APR. MAY JUNE
Figure 12. Dow Field. 1943-1947.

TABLE 4. FROST INVESTIGATION 1944-1947 SUMMARY OF TRAFFIC TESTS PAVEMENT BASE
CLASS. AND %FINER K OR C0BR( IN PLACE) TYPE AND NORMAL FROST MELT
L E IRFIE D THICKNESS THICKNESS THAN ICE SEGREGATION (INCHES) (INCHES) 0.02mm. PERIOD P08100
50 . 0015 No.. Ob.,r,.d - 2 (19143.-Il) B.C. 14.0 00 15 • . - 3 1.0. 14•3 ,4 15 - I. -LC.b.O 0815
5.2 08 15 6 B.C. 14.0 00 18 * - 7 D.C. 1.0 58 18 8 3.0. 5.0 08 23 9 LC.3.5 0835
10 B.C. 3.5 00 30 11 S.C. 3.5 0036 12 S.C. 3.5 08 37 - 13 LI. : 08 19 -
S.C. 3.5 08 19
15 (191.t..-J.5) S.C. 4.0 00 25..38 Coy.t.1. Th.ohm*t 16 S.C. 3.5 - 08 314 • 17 S.C. 5.3 IV 21 - is B.c. li 0825 - 19 0.1. 3.5 08 29.1.0 - 20 S.C. 3.5 08 20-51 - 20 B.C. 3.5 00 52-1.2 22W .0 08 20 No Dcl. 23 0tt.7.1.0 08 lb-214 . . -
St%.2,.1.0 08 20
89 B.C. 3.5 08 21-30 Cry.tol. 1oct - 96 B.C. 3.5 08 43-1.8
B.C. 3.5 081414 B.C. 3.5 08 145-50
'9 lIlt.1o.1.0 08 23 . 8, Dcl.
30 T,u.0 LCr. Rock 19 - L.Cry.001. IV Co. Sock 51 (01) 31 31 (19145-1.9) B.C. 2.5 fl 01214 I. P7., 20.L000*. I. G 1.1 31
32 S.C. 2.0 LC5. Sock 214 - LCri.tcic 10 Cr,Sock 41 (01) 31 33 B.C. 2.0 I 01 214 10-20 P1., 81.1.0*... II 07 141 31
314 71.77, S.C. 7.0 07 6 1 T I icc C77.tol. I. Be.. 30 30 35 (191.5-1.5) B.C. 3.5 07 8 I r ocO 210-b... 30 30 36 S.C. 2.0 07 12), I 30 30
B.C. 6.o OF I Soc C.7.tol. in So., 30 50 30 B.C. 7.0 01 7 . L ood Sub.b..o - 50 30 39 0.1. 2.5 07 12 ..A9 30 30 1.0 S.C. 2.5 0711 . 30 30
41 S.C. 1.0 07 8 . I 7.. C7.t.1. to B*o• 30 30 42 B.C. 6.o 07 8 I I cod 100-bc.. 30 30
1.3 B.C. 2.5 07 13 • I I- 30 30 tO. S.C. 2.5 07 12 - 30 30
15 B.C. 2.5 07 5.5j _j_ . 30 30
l. Do. F.C.C. 7.0 G C icc. 05.0o8d 315 - 1.7 (19143-l) F.C.C. 7.0 OW 15 • 515 - Iii. F.C.C. 7.0 08 17 . 315 - 49 F.C.0 70 . 08 17 • 31* - 50 F.C.C.7..0 SW 15 • _3lc - 51 F.C.C. 1.0 08 15.5 So... Cb,.,,.0 315 - 52 F.C.C. 7.0 08 114.5 'Y • 315 - 53 F.C.C. 1.0 08 III • 315 - 51. F.C.C. 1.0 08 12 I No.. 0b..'od 315 55 F.C.C. 7.0 08 p • 315 -
1'.C.C. 1.0 00 13_- • 31 - 51 S.c., F.C:C. 6.0 07 36 T 70101. cOd 10.0700. 25°
.58 (ig511.5) I.C.C. 6.0 01 36 LOu... 81.-if 16 250 - 59 F.C.C. 6.0 57 36 01. cod 00.070,4.
I
230 Go F.C.C. 6.0 If 36 I.,... 01.-1/16 250 61 F.C.C. 6.o 07 t. - 250 - 62 F.C.C. 6.0 57 1.8 .1 250 - 63 Ft.,,. F.C.C. 7.0 ziT 81. 1..,... Ic 8.b-bu.* 1.20 -
(191.5-1.5) F.C.C. 7.0 OF 0C ., 120
65 F.C.C. 7.0 .0 L ci. i.e... 1* 210-bc 120- - 66 F.C.C. 7.0 01_1Cc1
17 18 OF 11 120 -
67 8.11,1080 P.V.C. 10.0 3 3
C77.to]. Thr.ckout . . .
165 165 - 66 (191.5-1.6) F.C.C. ICC
71.c..c1 11707.4511 of Cocc7.t*
Do, 600 p.l ?r.o.. 750 p.I 71,778 700 p.O 1,1071030 735 p.1
01. - 8.1.11eV C. - C.u.h.d
310

TABLE 4. FROST INVESTIGATION 1944-47 (Cont'd) 'SUMMARY OF TRAFFIC TESTS - SUBGRADE FROST AVERAGE %FIN KORGaR.(INPtACE) LINE PENE- PAVEMENT
NORMAL FROST MELT CLASS. THAN ICE SEGREGATION TRATION HEAVE
a02mnt PERIOD PERIOD (FEET) (FEET)
ci c'_ . . . .'
4.1 I4• -
O 6
CL CL 1 1 1 11.0 -
7 SC 13-35 . . 16 - 4.0 14.0
0.25 0.10 • CL . - I4 0:20
9 Cl. • 1.2 0.20 10 CL • 11.2 0.15 11 CL . 1.2 0.10 12 CL . 11.2 0.05
13 Cl. leo Th10 L.,,.. ' 14.c 0.20 11. CL C C 11.0 0.20
15 CL Ce7nt.l,,La..., O0.-3/O 4.0 0.05 16 CL ' C 4.2 0.25 17 CL • 14.2 0.25 10 CL • 11.2 0.25 19 CL -' Cey.tol.,Lce.... 01.-i/Il ' 5.2 0.15 00 CI. • 5.2 0.15 01
(.) CL CL
' I
C 5.2 0.15
2) CL 00 cj
19 CL 81.-3/0 11.2 0.25 Ci. Cry.t,1,L,,... K1.-1/14 5.2 0.10
00 CL CL
C 5.2 0.10 C C
C 5.2 0.10 CL • No Out.
30 31
CL 6o-ooi CC.El.1/A? "Cu"- - 5 3 14.7 0.20 CL 6o-€oJ tog t .11 plo,,. 5 3 l.7 0.20
32 CL H1.-1/20 o,cur- 5 3 4.7 0.20 33 CL 6o-6o,..J tog 1, .11 pta. 5 3 IIJ 0.20 34 35
CL tort Pie. 1.,... 13 16 - 0.00
36 CL • 13 i6 - - CL C 13 16 - -
37 CL Sheet Pt,. 1..,... 13 16 - 0.00
' CL 13 16
41 1.5
CL I Sho#t 11,. a.... 13 16 - 0.00
'3 I . 13 16 , - 0.00
CL I • 13 16 - - 1.5
CL I C e 13 16 - -
CL - j. . ' 13 16 - -
46 117 OC T L.,l...N5.-I./IIC - 90 4.1 0.55 69
00 - 05 11.1 0.55 49
SC C C C - 95 4.1 0.55 SC C C • 95 14.1 0.55 SC . C - 00 14.1 0.55
CL SC '9' L.a... O1...1/14. - os 11.1 - 52 95 OC •CL .. C - 05 14.1 0.145 SC C - 100 14.1 0.145 511 CL I La..e. Ni...ifl4C 70 14.1 0.10 51. ' 75 11.1 0.'0 - CLOC J_ C C - 75 14.1 0.lO 17 CLT T 0a..rou. Pt,, La.... - Go 14.6 0.10 '4 CL- J * .. Go 14.6 0.10 9 CL W..,r.u. Pt,• a.... - Go 14.6 0.10 1.0 CL 6 • - Go 11.6 0.10 bi 6
CL ' ,et ire... - 60 4.6 0.10 -_L CL
ci. Cu -r • -t - Go 14.6 0.10
63 ni. 3..,. ' - Go - 0.01 66 CL,CR e - 65 - 0.01 605 CLCR Go - 0.C1 66 ' CL.CR
EL 311_
C • - 65 - 0.01 67 MLJI bal *a Len... •1.-l/O• 100 2.5 0.03 66 6 8720 C • - 70 2.9
1.___ 0.08
Sot.. Ile.o.1 ported thick,.,.o. were deterei,.d fr lla.tbl. ..d Rigid Poa...ct D..igo Cu,.,. OOt.d 13 Jo0.
1950. P.v.ct de.tgo thick,...., for Pro.t C008ttto,s or. ba.ed an Pro.t Design Cure,.. dutod 15 5440u.t 1950.
The P.. Ca.t of Design Thick,... ..lu.s d.cot. the perCectogc colt, of the .*tul cc.bi,.d thick,,.s of fl,*ibl. pa....cl and 11..e a.ur.e to the d.sig, thIck,.., or the perc.ctuge rollo of the .,tu.i rigid p.vo0oct .1.11 thick,.., to the 0.eigo thick,... of .1.14.. I, c..os oh..e thor. were ,.,i,ttc,. An the thick,,,s of fl... 1111, povoea.t .od 11.., 1og . tr.ffic te.t 1..o the 1...t thtc... a.. ,,M when the pavo,ect did not fail and the greotc.t ihick,o.. used .11cc f.ti,.e er.urr.d to co,puit.g a.b.c .f Per C.ct of De.igc Thtckco...
311
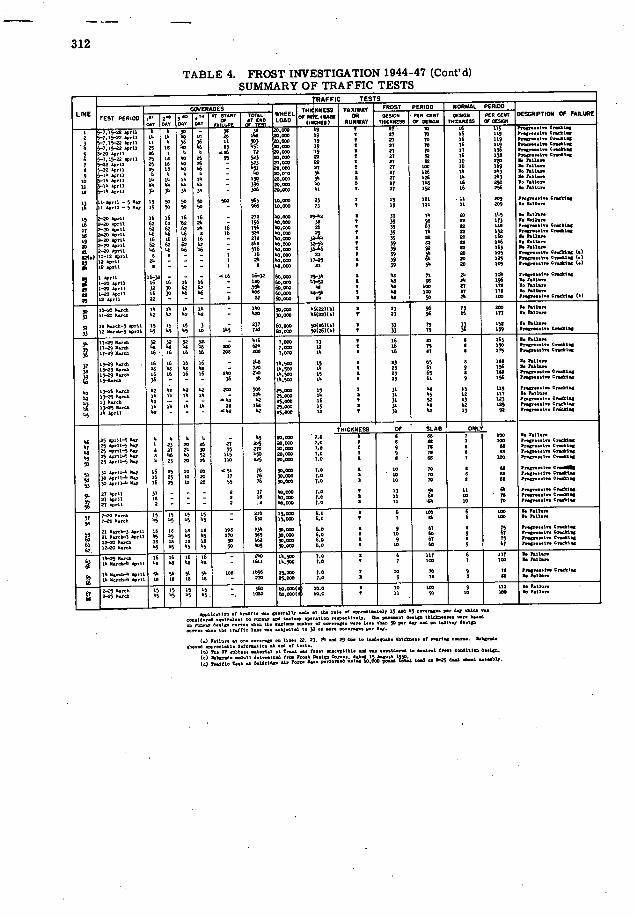
312
TABLE 4. FROST INVESTIGATION 1944-47 (Cont'd) TTMMARY OF TRAFFIC TESTS
- IRAPPIC - TESTS
CG6ERAOES THI4RNCSS TAXIWAY ...ff9IL.. P30(90 NOR28AL PERIOD LINE
TEST PERIOD - ' -
0o
- ,o oa.. .U4EEL
LOAD OR 001*6. P10 34*5, 7051054 PER cool OESERIPTI001 OF FAILIRIE
030 00.0 .LL. Lio°ot RUNWAY 7*034*0000 70013*60 T*1C110301 70
'7.15-20 25,10 3 T W 32 s 23.5
, 39 a,
- 6 ,
SF a,
is 70
ir 06
-iir *19
-......o,. .,..... .Ocfl..*1. O'. 1..
2 3
'7.37-22 As,Il '1.15-22321*0
*6 11
III ¼
So 36
4*1 36
a 00 303
, . 19 27 70
78 16 *6
119 119
?nSO...122 01.11193 55.0222.1.. *o*.2
6 .7. 35-22 32130 25 00 *10 S
56 ¼
03 51 , II '09 B
51 57 70 07 036 Pngn..lfl C,.001.2
6 .20 22o11
20131 7.15-22 26 25
I 15 50 36 95 523 , 224 81 28 36 135 P1o**80 *0005
7 42 10,20 as II *10 26 - 733 .010 22 a, 1. 10 220 I. *010.00
£ 5-20 24*111 25 1
18 *1
50 *1
56 *1
- - 32 *0
.000
.700 27 36
7 2
27 27
000 306
IS 14 2*13
*69 5. 7.11...
9 30
II' 23011 'l'. 50,22 II. 15 lb (I. - 030 ,703 55
50 I ,.
27 026 64
1¼ 16
2*13 250
5. 1.61.., 0, 1.1*0*0
13 18
lb 19130 15 £p,Il
*1*1 3*1
66 30 30 3*
396 0.
27 27 152 II 256 2070313..
11-$11 - 5 ,n 15 50 50 50 500 965 ,fl 23 1 19 *21 . Il 109 11.70*080,0 31.20101 03 I II 29111 - 5 0.3 05 50 50 56 - 965 ,OD 23 0 *9 121 II 209 5, *010.22
30 25111 16 16 16 16 - 212 , 29.02 I 39 78 22 11*5 I. 7.00170 0 3 50 5011* 62 62 '62 24 - 796 , 35 S 39 95 22
22 173 I.
2. 5011.00 222c.Is. 31.81305
17 20 291*2 62 62 62 23 16 796 , 26 5 *
39 39
67 72* 22 152 1.oIl02 11.80152
02 30 24*710 *16 06 16
*16 16
0 16
16 52 273
. 29 32.6* * 39 RI 70 160
19 20 20013 2-25 Apfll
16 62 62 62 62
- - I'S
, ¼0, 32_55 39 *0 22 316 5. *001*1.
22 2-22 20,10 56 *6 06 36 - 576 36316 5 39 32 10 069 8. 7013350 507
1062) 022 21*120 5 2¼
0 - - -
0 0
16 2¼
h0, 50,093
7,1 17-25
2 5
39 39
36 91
70 70 125
105 CaflI.. 1fl522,002 011.1112 (.7
53 •
2 £2711 2 31,1* I
- -
- - - I I 4..m 39 5¼ 20 009 1nn.st0. 3..*I.a (.1
70 39111 16-32 - - - *0 16 1*132 106
60. 25-35 2 2
60 50
73 20 24
105 196
700522.0*.. 1,.20l. •• 70115,.
-20 32110 16 16 93
16 62
16 62
- -
6o,0 10,
57-52 52 S 52 185 II 170 82*001.,.
a -20 221*2 -20 30011
.82 *6 30 56 06 - 60,000 004* 5 02 100 27 III No 7.11*00
7.) 2 09121 22 - - - I 22 (0,012 2$1 a Ii 50 2¼ 11. 1I*. ..... 11.20185
p 10-200*225 II 16 15 16 - Iko 30,OD 606227(0) I 23
31 *1.223.9*6 62 12 *12 62 - ,ox 06(227(0) 9 29 96 56 017 .. Ia....
33 320.3.6.322111 05 25 15 3 - 237 60,000 556267(0) 2 33 79 33 153 0.1.10*,.
33 120.9063 29920 35 53 55 10 165 722 60,000 50(067(61 5 33 79 36 139 l.12221.01.l5*.I0ll
36 0129 3,720 32 32 32 32. - 700
6,6 62*1
3 5 5
.6 16
22 75
s 5
163 055
I 1311.22 I3n..t0. C,..01.a
35 36
029 0*720 07-2900700 16 . 16 16
0 16 205 225 7,
7, 22 05 I 16 21 0 119 1.nT...000 1r1..
13.4900720 . 16 16 16 06 - 1*12 720
16.500 15 16
0 5
23 23
65 6*
8 9
*52 I. 10*033*00 I. 2.02*,.
32 67-39 00750 13-29 0.700
55 16
55 16
50 16
55 16
- 2*10 2*10
31,500 05.500 15 I 83 65 5 028 1505n..2.. 111.00.4
50 13-0.100 36 - - - 36 36 15.500 1 0 23 61 9 356 lnç..o.1fl 0n11005
0326 0.010 58 *2 62 53 - 505 89, 15 5 31 65 *3 115 11.0.0200 Cr.fl0*g
03-29 0.,0 15 15 16 16 - .002
225 *12
23,093 1 16
2 5
31 65 52
12 15
017 123
0.1.11.22
13 0.90* 0.100
68 16
- l's
- 16
- 06 22 164
55, 5,, 15 I
31 31 hO 12 129 I5.5n..lo. 11.10*20
13.35 1 35110 33 - - - 462 52 25. 32 5 31 02 13 98 Pngn..I.. 1,2,0*20
4
'3OIC6NESS OF SLAB ONL
25 4.'I15 0., 6 ¼ h 6 - 65 . 7.0 - 193 110
I. *011.22 nc...... C,.clI..
I 2
I 5
85 00
7 7
17 25 32110 0*7 I 23 20 26 21 325 270
22,030 22,
1.0 7.0 0 9 70 5 II lnro.1n 12203005
2520111 11.7 0 0
27 66
36 00
30 53
39 115 SO 10.OD 7.0 5 9 15 5 IS lngy...1.. 01.11205
3.7 25 ApollS 25 2,l1*5 0.35 5 23 20 at 110 225 22. 7,0 0 0 ' 58 7 010 55o5,.*Ilfl C,1.I
ID
51 3- 041116 0.7 36 23 10 20 '*052 76 76
93, 7.0 I 2
10 II
70 10
I 5
58 00
1,n,...l0. *?0 ins,...1,. 01.80028
30 ooll-0 I 16 II
25 29
10 10
20 22
17 55 16
93. 93.OD
7.0 7,0 10 10 5 25 inc......11.11105
3O237l1fl
27 *51*1 31 - - - 2 37 00,880 7.0 5 03 35 *1 91 iflflflOIO. 31.20001, inc...t.. 0.00I
27 32,31 27 27,12
IS 2
- -
- -
- -
2 2
15 .2
l0, 50,070
7,5 1.0
2 I
11 11
70 10
30 00
75 75 112510031. 01.11028
- 7-201.,26 *5 15 05 15 - 230 *% 6.3 2 6 608 06
6 6
020 110
1074*1*00 00 1.11.1.
7-20 0.103 65 65 05 5 - 630 I9. 6.0 0 7
210.006-332.11 15 II 12 IS 105 73) 98, 6.0 6,5
I 5
9 *5
67 So
I 9
75 67
inc...t.. 0,.a1.g P'01*040I'• 0,0.91.0 a s.00a.s *soto ss s ss
15 05 II
270 II
505 062
30, 98, 5,0 I 9 67 I 75 1s,••j0 3,020805
6 62
124000700 12.20 0.006
10 4
12 4 4 65 90 *05 93,OD 6,0 5 10 60 9 57 1.8522.031. 01.10305
06 16 16 16 - ISO 1*1,500 7.0 0 6 oo 6 III 1.1*111.1. 193
160.3ot-h29111 60 62 65 62 - 1611 10,500 7,0 5 1 110 7
15 3,0014 81811 511 56 51 5*1 lOS 0690 35,0.6 LO 5 10 70 9 78 U
11.50.001. *0000152 1.1.1021.
Ill 027,64* SpIll IS 10 II 15 - 270 35,OD 7.0 I 9 75 5
- 3635 l 15 15 15 - 100 60,OD( 10.0 I 5
10 01
100 91
9 1*
111 300
Is 1.00*22 I. 1.60.00 67
6. .na 55 65 3*5 55, -. 1000 l0,I 10.0
1100t13* of 01.2700 12. o.1152 .00. .006. 00*• 57 N070fl1.**7 10 .12 .7 *n0000 27' o,*.10.o.0 .9111.1.11 IS 10*227 .00 1.01.07 70.1.111* o..p.oII,.lJ. t p500* 01.100 *60101.....022 bn.0 00 0.0107 20l70 SO10ON *t•* *0* .301.1* .1.1.8.8 000•1.O• **1. ....... 93 4*01 5.3 .72 0* 11200$ O..1 0*fl•• *0.0 06. (22100, 008. 220 .413.0*00 *0 30 01 1.22 0*1*220*0 001 257.
1.) 7.1141. 1*530*00.2220 *0 11*30 22 23. 06 .00 29 0*. 0* 1*00.70000 161101... 2110*1152 01210.. 10*155.2. .605.2 .22,5,1201. 5.f.s..lI0* 20 072 0......
(II 56.01 .010*.. .33.10.1 0 5.0.0120 1,5.3 .0.0.0II*1. •th 512 02.200.1.0 1.0,10001 110.0 .a.00100 0.1100. (*1 San2. *00*11 4.1.1.10.8 III. 722.0 10•Io, (0) 5n271* S....0*2210420 331 Ton. *52. p.fl*n.0 0.1.2 60,010 po. (.0.3 1 0 0-89 5*00 ..1 2271.017.

313
Results of the traffic tests using the 20, 000-lb. wheel load are shown in Lines 1 to 12 inclusive in Table 4. At five test lanes in which the combined thickness of pave-ment and base was 19 in. , progressive cracking started after between 11 and 83 cov-erages. Progressive cracking commenced after 95 coverages along one lane with a pavement and base thickness of 22 in. These failures were all in areas with CL sub-grade material. One lane with a combined pavement and base thickness of 22 in. was in satisfactory condition after 523 total coverages in an area with GC subgrade material (see Line 7, Table 4), although the wearing course stripped to some extent in one area and shifted laterally, which was attributed to the circular traffic pattern used at this test lane. The 20, 000-lb. wheel did not cause failure at the five remaining lanes in which the combined thickness of pavement and base ranged from 27 to 41 in. and over-lay a CL subgrade. It is indicated by this test series that a combined thickness of pavement and base between 22 and 27 in. in thickness is required over the CL subgrade material in Test Area I-Ill to satisfactorily support traffic of a 20, 000-lb. wheel load in the frost-melting period. From the Engineering Manual, the frost condition design thickness at this test area for a 20, 000-lb. wheel load is 27 in. Assuming a 24-in. thickness of pavement and base is at the boundary between safety and failure the sub-grade CBR value during the test period was of the order of 5 percent, according to the flexible pavement design curves dated June 13, 1950. A 24-in, pavement and base thickness is 89 percent of the 27-in, frost-condition design thickness. The results of the traffic tests using the 10, 000-lb. wheel load are shown on lines 13 and 14 on Table 4. The 10, 000-lb. wheel load equipment was routed around a 90-ft. diameter circular tract with combined pavement and base thickness of 23 in. Minor flexing and cracking occurred at three locations representing 25 percent of the total test track. Failure principally consisted of ravelling at longitudinal construction joints and sliding and minor deformation of wearing course. The failures are attributed principally to the short-radius circular traffic pattern and local weaknesses in pavement and base course, although visible flexing in the three distressed areas of 0. 3 in. and maximum permanent deformation of 0. 7 in. possibly were due to excessive subgrade deformation since the combined thickness of pavement and base was 23 in. or only 4 in. more than the frost condition design thickness for a 10, 000-lb. wheel load.
Dow Field (1944-1945)
Traffic tests were conducted with 40, 000 and 60, 000-lb. wheel loads on the flexible pavements at Test Areas B and C respectively which were located along the E-W Run-way. The equipment used to obtain the traffic wheel loads consisted of the rubber-tired scraper shown on Figure 14. The tests were started on April 1, 1945, near the end of the frost-melting period and continued to April 20, 1945. Tests were conducted both on the runway, where the pavement was 3. 5 in. in thickness on base ranging in thickness from 21 to 51 in., and on the runway shoulder area which had 1-in, bitumi-nous-treated wearing course on a base 16 to 24 in. in thickness. During the winter of 1944-1945 frost penetrated into the CL subgrade to a depth of approximately 4. 5 ft. be-low the pavement surface. Numerous ice lenses from hairline to 3/8-in, in thickness were observed in the subgrade and resulted in fairly uniform pavement heave averag-ing 0. 20 ft.
Results of the series of tests with the 40,000- and 60, 000-lb. wheel loads are pre-sented in lines 15 to 29 inclusive on Table 4. Where the pavement and base thickness was relatively uniform along a test lane only one figure is shown, and when a variation in thickness occurred along a test lane, two figures are shown to denote the range.
The frost condition design thickness for a 40, 000-lb. wheel load with the subgrade condition at these two test areas is 39 in. The traffic tests results show progressive cracking occurred in all six lanes under the 40, 000-lb. wheel load where the pavement and base thickness was less than 29 in. Three of these, lanes had a bituminous-treated wearing course which did not withstand one coverage; however, the tests were continued and excessive subgrade deformation indicated the base thickness was also inadequate for the wheel load. The 3. 5-in. thick pavement remained in satisfactory condition under

314
LOAD AT OOD INCH DEFLECTION
NOTE - D' DU,4 STATIC LOAD TESTS - FLEXIBLE PAVEMENTS
30 INCH DAM€TEPLA1E_0ZA EMENT SURFACE 20 0 60
Figure 13.
as high as 62 coverages per day of the 40, 000-lb. wheel load traffic at the four lanes where the pavement and base thickness was in excess of 32 in. Assuming 32 in. is the boundary between a satisfactory and unsatisfactory thickness, the subgrade CBR was of the order of 4. 5 according to the flexible pavement design curves. A 32-in, pavement and base thickness is 82 percent of the 39-in, frost condition design thickness. Figure 15 shows a failed portion of a test lane after being subjected to 40, 000-lb. wheel-load traffic.
The traffic tests using a 60, 000-lb. wheel load showed that a pavement and base thickness of 34 in. , which is 71 percent of the 48-in, design thickness, was not adequate, while three lanes which had pavement and bases 98 percent and greater of the design thickness gave satisfactory performance. The thickness of pavement and base that is just adequate to support traffic of the 60, 000-lb. wheel load is thus bracketed between 71 percent and 98 percent of the design thickness of 48 in. Using these two limiting per-centages, the CBR value of the subgrade as computed from the design curve was between 3 and 5 percent.
In the bituminous surface treatment area tested under the 60, 000-lb. wheel load, failure of the wearing course occurred after one coverage, and after 22 coverages there was ample evidence of failure due to subgrade deformation, which is consistent with the other test results since the base was only 50 percent of that required by frost condition design.
Truax Field (1944-1945)
Traffic tests using 30, 000- and 60, 000-lb. single-wheel loads provided by large, rubber-tired construction equipment were conducted at Test Area B, Truax Field, dur-ing the frost-melting period in March 1945. At the area tested with the 30, 000-lb. load, the total pavement and base thickness was 46 in. , consisting of 2-1/2 in. of bituminous pavement, 20 in. of crushed rock base and 24 in. of sand-clay-gravel subbase. The test lane where the 60, 000-lb. wheel load was applied had 2 in. of pavement, 24 in. of crush-ed rock base and 24 in. of sand-clay-gravel subbase. Frost penetrated to a depth of 52
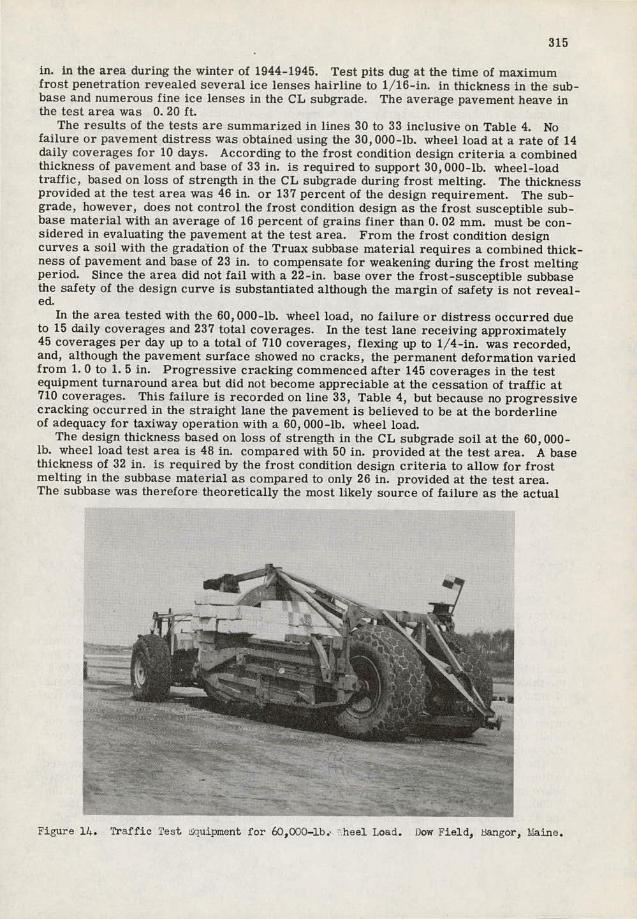
-
- --,---- _: -
315
in. in the area during the winter of 1944-1945. Test pits dug at the time of maximum frost penetration revealed several ice lenses hairline to 1/16-in, in thickness in the sub-base and numerous fine ice lenses in the CL subgrade. The average pavement heave in the test area was 0. 20 ft.
The results of the tests are summarized in lines 30 to 33 inclusive on Table 4. No failure or pavement distress was obtained using the 30, 000-lb. wheel load at a rate of 14 daily coverages for 10 days. According to the frost condition design criteria a combined thickness of pavement and base of 33 in. is required to support 30, 000-lb. wheel-load traffic, based on loss of strength in the CL subgrade during frost melting. The thickness provided at the test area was 46 in. or 137 percent of the design requirement. The sub-grade, however, does not control the frost condition design as the frost susceptible sub-base material with an average of 16 percent of grains finer than 0. 02 mm. must be con-sidered in evaluating the pavement at the test area. From the frost condition design curves a soil with the gradation of the Truax subbase material requires a combined thick-ness of pavement and base of 23 in. to compensate for weakening during the frost melting period. Since the area did not fail with a 22-in, base over the frost -susceptible subbase the safety of the design curve is substantiated although the margin of safety is not reveal-ed.
In the area tested with the 60, 000-lb. wheel load, no failure or distress occurred due to 15 thily coverages and 237 total coverages. In the test lane receiving approximately 45 coverages per day up to a total of 710 coverages, flexing up to 1/4-in, was recorded, and, although the pavement surface showed no cracks, the permanent deformation varied from 1. 0 to 1. 5 in. Progressive cracking commenced after 145 coverages in the test equipment turnaround area but did not become appreciable at the cessation of traffic at 710 coverages. This failure is recorded on line 33, Table 4, but because no progressive cracking occurred in the straight lane the pavement is believed to be at the borderline of adequacy for taxiway operation with a 60, 000-lb. wheel load.
The design thickness based on loss of strength in the CL subgrade soil at the 60, 000-lb. wheel load test area is 48 in. compared with 50 in. provided at the test area. A base thickness of 32 in. is required by the frost condition design criteria to allow for frost melting in the subbase material as compared to only 26 in. provided at the test area. The subbase was therefore theoretically the most likely source of failure as the actual
Figure 114. Traffic Test uipment for 60,000-lb.- heel Load. Dow Field, tangor, Maine.

316
pavement was 79 percent of design based on subbase and 104 percent based on subgrade. In either case the design curves are verified within reasonably close limits. Since crack-ing and deformation were minor the measurements and explorations after the traffic test did not conclusively ascertain the source of these failure symptoms. If the observ-ed defects were due to excessive subgrade deformation the CBR during period of test was slightly less than 3, while in the event the cracking was due to the subbase the CBR was about 5. 5, based on the CBR design curves.
Pierre Airfield (1944-1945)
Traffic tests using 7, 000, 14, 500, and 25, 000-lb. wheel loads were conducted at Test Area B, Pierre Airfield immediately following the frost melting period in the spring
-
Figure 15. Condition of 4 in. Bituminous Concrete Pavement After 524 Coverages of 40,000 -lb. Wheel Load in 17 Days (see line 18, Table 4). Dow Field, bangor, Maine.
of 1945. The equipment used to obtain the various wheel loads consisted of large, rubber-tired construction equipment and trucks. Traffic test lanes were located both on a taxiway pavement where slight pavement subsidence occurred during the freezing period and on adjacent shoulder areas where the pavement heave averaged approximately 1/4-in. The combined thickness of pavement and base in the test area averaged 15 in., consisting of a bituminous concrete pavement 6 to 7 in. thick on the taxiway and 2 to 3 in. thick on the shoulder area, on a sandy gravel GF base course. An 8-in, thickness of sandy clay CL overlay a silty clay CL subgrade. Explorations made during the freez-ing period revealed that the frost penetrated the silty clay subgrade for an average depth of 1 ft. Ice lens formations were not discernible in the sandy gravel base or the sandy clay subbase materials but a few short fine ice lenses were present in the silty clay subgrade.
The results of the traffic tests at both the taxiway and shoulder areas are presented in lines 34 to 45 inclusive on Table 4. On the shoulder areas, where minor pavement heave had been recorded, progressive cracking followed by rutting occurred under the 7,000, 14, 500, and 25, 000-lb. wheel loads applied at approximate rates of both 15 and 45 coverages per day. The taxiway pavement which had subsided and which had no discernible ice lenses in the subgrade soil withstood traffic of all three wheel loads

160
0
4 Z 2100
Za LU 20 LU
'41
>1-
Q0 cr 80
Z u-
Cl)
60 0 I- z LU 0
6 40 0
20
___U11flh11 _ _ Riliflhl _ _ .1111111 _ iuinii ___•uuuiiii uiiui ••iuini _ uiinn ____•UIihii _ uuuuuii _ 11111111 -.1111111 ___Ruullhhl _ uuuiuii _ UuiIIIIIUuI!IIhI ____•uuuIhhI _ uIuIhhl _ .uIflhI _ uuuuuui ___•uuunu___ uuuui _ .uuuinl !!IIfl ___•uuuIhuI _ uiiiuui _ UIfliii•ULil ___•uiuuuui uiiiuii___ ___•uuuuiui _ P!!!hHflhIIiILIIIHhI ___UUIIIIHrIIIIIIIIIIhI _ IIII9I ___•UuIIIIk_UuIIIIII iuiiui uuuiiui ___.uIIIIH uuuIhhI .IIflI uuIuhI ____•IIflhhI uIuiuhl uiuuii .1111111 uuinu uuuun muuuuun u.Inn
100 200 300 400 500 1000
14
NOTES:— NUMBER OF COVERAGES
Data obtained from accelerated traffic tests performed during the frost melting period on flexible pavements at Dow, Truax,and Pierre Airfields.
Numbers adjacent to plotted points refer to line numbers on Table 4.
LEGEND:
X Povemenl Foiled or at Imminent Failure.
Pavement Sotisfactory.
4( Pavement Foiled at less than Indicated Number nf Coverages. C.,
FIgure 16.

318
vopoo
/7-
-
- H -
LOAD Al 000 INCH 000LCCTION 1000 AT 010 INCH 000LEOIION
100000 RUPTURE TESTS— RIGID PAVEMENTS NO TE-r: : ,.1.
I::9 !..; . . 00011,1 P11104 TISIt 1*00,....... £1111 0 I00• IA 00 1M$ 0l4 P.0.1 OilIng 0,1100 TU?I 0001000 lROAMfl$ 100 00 1*M• IA 110 •1CIAS
Figure 17.
except one lane where progressive cracking occurred after 200 coverages of the 25, 000-lb. wheel load at the rate of 42 coverages per day.
The frost condition design thicknesses shown on Table 4 were based on weakening of the sandy clay subbase material and in all cases the actual combined pavement and base thickness in the test areas was less than was required by the frost condition design cri-teria. Pavement failures in the areas of pavement heave are therefore consistent with the design although thin wearing surface thicknesses at these areas may have been a contributing cause. The one failure in the area of pavement subsidence was at the max-imum coverages of the heaviest wheel load. Test trenches dug at completion of the tests revealed that the surface of the subbase material had deformed to a profile similar to the pavement deformation profile. This failure of the subbase material is not necessar-ily attributed to frost melting, since the failure indicated the actual CBR of the subbase during the test period was about 12 percent which corresponds closely with the labora-tory CBR value of this material at actual field density.
Summary of Traffic Tests on Flexible Pavements
Traffic test data from all flexible paved test areas are summarized in Figure 16, which shows the relationship between the percentage ratio of the actual pavement and base thickness to the Corps of Engineers frost condition design thickness for the specific traffic test wheel load, the number of traffic coverages and the pavement behavior. The plotted points are numbered to correspond with line numbers on Table 4 where the de-tails of the traffic tests are presented. Figure 16 demonstrates that unless the pavement and base thickness was at least 75 percent of the frost condition design thickness progres-sive cracking commenced within 240 and, in most cases, within 100 coverages of the traffic test wheel. The only exceptions to this are Points 37, 38, and 42 at Pierre which were in areas of pavement subsidence and for which the applicability of the frost condition design criteria is therefore in doubt. No pavement failures occurred where the actual pavement was greater than 90 percent of the design requirement. The frost condition design criteria are very conclusively substantiated by the traffic test results, and pave-

319
ment and base thicknesses that are barely safe are generally indicated to be between 80 and 90 percent of the thicknesses required by the present frost condition design cri-teria. The margin of safety that is indicated as being present in the existing criteria is believed justified to allow for heavy traffic usage in emergencies, and as a preventative against excessive maintenance expenditures.
Effect of Frost Action on Supporting Capacity of Rigid Pavements
The supporting capacity of rigid pavements was investigated by means of pavement rupture tests conducted during the normal period and the frost-melting period and by traffic tests conducted during and after the frost-melting period.
The pavement rupture tests were made by loading a 24-in, diameter plate !/ placed on the surface of the pavement at a corner of a slab made by the intersection of a longi-tudinal construction joint and a transverse expansion joint. The edge of the plate was about three inches inside the slab edges. The test procedure was as follows: the plate was seated on a thin layer of sand, two extensometers were placed in a line bisecting the right angle formed by the pavement joints, and the load was applied in increments to give successive loads of 20, 30, 35, 40, 45, 50, 55, and 60 thousand pounds. If the available load was not sufficient to cause failure, the load was released and re-applied by increments. The procedure was repeated until rupture occurred or for a total of five repetitions.
Pavement rupture tests were conducted during the normal and frost melting periods for at least one investigational year at Dow, Truax, Presque Isle, Seifridge, Pierre, and Siowc Falls airfields. In addition pavement rupture tests were performed during the frost-melting period in 1945 at Watertown Airfield.
Results of the tests conducted during both the frost melting and normal periods are summarized on Table 3. A comparison of the loads causing 0. 1-in, deflection during the normal and frost melting periods, tabulated in columns 10 and 11 of Table 3, respec-tively, shows, a consistent reduction in pavement strength during the frost-melting per-iod, the average ratio of frost-melting to normal-period load at 0. 1-in, deflection for all test areas being 0. 69. Approximately the same ratio between frost-melting and normal-period loads was found to exist at . 05-in, and 0. 2-in. plate deflections. This may be understood from examination of Figure 17, which shows that consistent rela-tionships hold between test loads at . 05 and 0. 1 in. and between 0. 1 and 0. 2 in., which are about the same for the frost-melting period as for the normal period.
For purposes of analysis, wheel-load evaluations of the pavements at the locations of the rupture tests were made for both normal and frost-melting periods using the latest Corps of Engineers design curves for single-wheel loads with 100-psi. tire pressure. The wheel load evaluations for each test area are shown in columns 15 and 17 of Table 3. The average ratio of the frost melting to normal-period wheel-load evaluations is 0. 79 as shown on Table 3 as compared with the average ratio of weaken-ing of 0. 69 indicated by the pavement rupture tests. A comparison of the ratios of frost-melting period to normal-period rupture test loads and design wheel loads is presented in Figure 2B. Although the ratios of weakening by both methods of approach are of the same order, the load at 0. 1-in, deflection on the bearing plate was on the average four times greater than the design wheel load for the same period. Since the rupture tests were carried either to the maximum loading capacity of the equipment or to slab failure which was in all cases at deflection in excess of 0. 1 in. , the rupture loads in all instances were many times greater than the design wheel loads.
Consideration of the factors involved indicates that in these static loading tests on rigid pavements, as in the comparable tests on flexible pavements, many influences exist which tend toward rendering an incorrect ratio for the reduction in pavement supporting capacity, in relation to that determined by actual traffic testing. Neverthe-less the agreement between the values 0. 79 and 0. 69 here obtained for rigid pavements
A 19-in. diameter plate was used instead of a 24-in, diameter plate for the rupture tests at vow rield during the normal period in the fall of 1944.

320
is clearly better than for the comparable situation for flexible pavements. As shown on Figure 2, the pavement- rupture tests do demonstrate well the pavement weakening that results from frost melting and indicate the duration of the weakening period.
Traffic Tests
Traffic tests were conducted on portland cement concrete pavements at Dow, Truax, Pierre, and SeLfridge airfields using wheel loads consistent with the evaluations of the specific test area. The wheel loads were provided by loaded trucks, Tournapulls, and scrapers. The equipment was the same as that used for the traffic tests conducted concurrently on bituminous concrete pavements. The assumptions as to traffic fre-quency were also the same as for flexible pavements; that is 15 coverages per day was considered equivalent to the maximum operation for runways, and 45 coverages per day was considered equivalent to the maximum operation for taxiways. The nearest practical figures to these were used. The test lane was located with its center line over a construction joint and the traffic pattern was so designed as to gradually attain by steps the maximum coverages in the test lane. Traffic tests were generally started just before the beginning of the frost-melting period and continued through the frost-melting period or until imminent failure occurred. A test lane was considered to be in-adequate to support the traffic-test wheel load if pavement cracking became progressive with additional application of traffic.
Traffic tests were conducted at Dow Field on the rigid pavement at Test Area A im-mediately following the frost-melting period during the spring of 1944. During the frost-melting period in the spring of 1945 traffic tests were conducted at Test Area C, Truax Field and Test Area A, Pierre Airfield. Traffic tests were also conducted on rigid pavement at Test Area A, Seifridge Field, during the frost-melting period in the spring of 1946.
The results of the traffic tests on portland-cement concrete pavements at Dow, Truax, Pierre, and Seifridge Airfields are discussed and correlated with design criteria in the following paragraphs:
___ arl -
•
Figure ia. Condition of 7 in. Concrete Slab After 54 Coverages per Day for 15 Days and 178 Coverages per Day for 5 Days of 25,000-lb. wheel Load (see line 65, Ta5le 4).
Pierre Airfield, Pierre, South Dakota.
321
Dow Field (1943-1944)
In the series of traffic tests conducted at Test Area A, Dow Field during and im-mediately following the frost-melting period in the spring of 1944, wheel loads of 20,000 30,000 and 40,000 lb. were applied at between 4 and 52 coverages per day along several lanes on the 7-in, thick concrete slab. The equipment used to obtain the wheel loads consisted of a Gar Wood scraper towed by a 5-ton truck, which was the same equipment used for the 60, 000-lb. wheel-load traffic tests on flexible pavements. This equipment is shown in the photograph on Figure 14. The wheel loads were varied as required by the removal or addition of ballast on the scraper. The GW base course, which varied between 12 and 17 in. in thickness within the area, had no ice formations during the winter of 1943-1944. Ice lenses in the CL and GC subgrade soils were of hairline thick-ness near the top of the subgrade and increased to an average of 1/4-in, in thickness near the depth of maximum frost penetration, which was approximately 2 ft. below the subgrade surface. The maximum pavement heave within the test area ranged from 0. 40 to 0. 55 ft.
Progressive cracking of the slabs occurred, as shown in lines 46 to 56 inclusive on Table 4, in all test lanes except one, which withstood four daily coverages of the 20, 000 -lb. wheel load for 9 days. When traffic of the 20, 000-lb. wheel load was applied in excess of 25 coverages per day, a few transverse cracks and cracks at slab corners appeared after a few days of traffic. Cracking became progressive and it was consid-ered that the pavement had failed although the pavement withstood as many as 450 cover-ages and was not badly damaged. The cracking of the pavement under the 30, 000-lb. wheel-load traffic was more severe, and widespread pavement break-up resulted after few coverages of the 40, 000-lb. wheel load. Pumping of water at joints occurred in all test lanes after a few coverages of traffic.
The frost-condition design thicknesses for rigid pavements at the traffic-test area for runway traffic of 20, 00.0, 30, 000, and 40, 000-lb. wheel loads are 8 in., 10 in. and 11 in. respectively, and for taxiway traffic of 20, 000, and 40, 000-lb. wheel loads are 9 and 13 in. Since the pavement was 7 in. thick and failure occurred at all test wheel loads except at the lane subjected to four coverages per day of the 20, 000-lb. wheel load, the results were consistent with the design criteria. Except for the 20, 000-lb. wheel load, however, the loads were excessively heavy to provide a close check of the criteria. Although failure was considered to have occurred under traffic of the 20, 000-lb. wheel load the cracking was relatively minor and it is believed the pavement would have been adequate for wheel loads slightly less than 20,000 lb.
Truax Field (1944-1945)
The 6-in, rigid pavement at Test Area A, Truax Field, was subjected to approxi-mately 15 and 45 coverages per day of both 15, 000- and 30, 000-lb. wheel loads during the frost-melting period in the spring of 1945. The wheel loads were obtained by load-ed trucks and Tournapulls and loaded scrapers, the same as used for the traffic tests conducted concurrently on the bituminous concrete paved areas. During the winter prior to the traffic tests, ice lenses from hairline to 1/16-in, in thickness were present in the sand -clay -gravel, GF, base course material, particularly in the upper portion of the base. Since the base course ranged from 36 to 48 in. thick and frost penetrated approximately 55 in. below the surface of the pavement, the depth of silty clay, CL, subgrade frozen varied from 0 to approximately 1 ft. Numerous fine ice lenses were present in the portion of the subgrade frozen. The pavement heave was relatively uni-form and averaged 0. 10 ft.
The traffic test results are summarized in lines 57 to 62 inclusive, Table 4, which show that the pavement satisfactorily withstood 15, 000-lb. wheel-load traffic applied at both 15 and 45 coverages per day. Progressive failure commenced after a total of 90 coverages of 30, 000-lb. wheel-load traffic applied at 18 and 45 coverages per day although the subgrade had not been frozen under the test lanes (see lines 61 and 62, Table 4). It is indicated, therefore, that failure was the result of frost melting

120
Bel
- 00 (J)V U, w z C.)
90
-j- - ("a 80
w o
0 I— 70 z Ui 0Cr Ui 0.-
6C
.5c
DO
IIIII•uuinn
IIIflfl 11110IM"'Iiflill auuulni suunnI
MONSOONflhll RUllilil 11111111 ____U1111hh1 Ulilihil !IIflhi 11111h1
No 11111i uuuIflfl IIIIhIi uuuuuhll ____•Iflfln RIIflIfl RUllifli Uuhuuhll ___Ullilhil EUEIflhIUUIIH aUhilin
UhIIhII MENlill muiinii Rihiflhl ___•uuiniu uuunuuuiuin uuinii ___•uuiflUUEiIhIIR1hIIIfl-__auuiuin ___uuuiunauuifl—UUhuiifl uuuuin
uuunhi auhuul! ruuunii uuunn 01M 1111ii on 111111 MNS 111111110110111111111111
Will ME 11111 mmmliiiiimmmloiii ___•uuiiui uuuiun auuuuiii uuunui
11111111. auuuuiu 1.1. t.i.t.i.i.- :
uuuiiuu•uu II1•V•T•I•.!•DI•4II
I.'.
N0TES— NUMBER OF COVE9AGES
Data obtained from accelerated traffic tests performed during the frost melting period on rigid pavements at Dow, Truax, Pierre and Seifridge Airfields.
Numbers adjacent to plotted points refer to line numbers on Table 4.
V V 'Figure 19.
40 1.0
- LEGEND: X Pavement Foiled or at
V Imminent Failure. Pavement Satisfactory.
Pavement Foiled at less than Indicated Number
- Of Coveroges.
C.)

323
in the base course. Pumping of water through the joints and cracks occurred during the application of both the 15, 000- and 30, 000-lb. wheel loads up to March 17 and then pumping ceased. Fines were carried up through the joints and cracks by this pumping action and undoubtedly, resulted in loss of subgrade support. It isbelieved that loss of fines would have been prevented by the use of a free-draining base-course material.
A test series using a 30, 000-lb. wheel load at a rate of 18 and 45 coverages per day was started on March 21, 1945 (see lines 59 and 60, Table 4). Progressive cracking commenced after 108 total coverages applied at the rate of 18 per day and 270 total coverages applied at the rate of 45 per day. Pumping at joints and cracks did not occur and the cracking was much less severe and took place more gradually than the similar test series, lines 61 and 62, Table 4, which had been started on March 12. Therefore, it is indicated that some of the excess water drained from the base and that the pavement rapidly regained strength. The short period of time required for the pavement to regain strength at Truax Field is also demonstrated by plate bearing test results plotted on Figure 11.
The traffic test results indicate that the pavement thickness required by frost con-dition design is adequate. The existing 6-in, slab was satisfactory to support a 15, 000-lb. wheel load, while the frost condition design thickness for taxiway traffic is 7 in., and for runway traffic is 6 in. , for, the conditions at the test area. Failure under the 30, 000-lb. wheel load was to be expected as the slab thickness was only 60 to 67 per-cent of the 10-in, and 9-in, frost-condition design thicknesses for taxiway and runway traffic respectively.
Pierre Airfield (1944-1945)
The 7-in, portland-cement concrete pavement at Test Area A, Pierre Airfield, was subjected to heavy construction equipment traffic of 14, 500-and 25, 000-lb. wheel loads applied at the rates of approximately 15 and 45 coverages per day starting on March 14, 1945, which was at the end of the frost-melting period. During the winter of 1944-1945 a few very fine ice lenses were present in the sandy clay subbase and silty clay subgrade materials which resulted in a fairly uniform pavement heave of 0. 01 ft.
The summary of traffic test data presented in lines 63 to 66 inclusive, Table 4, shows that the pavement satisfactorily withstood traffic of the 14, 500-lb. wheel load applied at both 16 and 48 daily coverages. The pavement also proved adequate to sup-port traffic of the 25, 000-lb. wheel load applied at 18 coverages per day, but failure did occur after two days of traffic by the 25, 000-lb. wheel load applied at 54 coverages per day.
Pumping of water occurred at the joints during traffic tests and it was noted that pumping and pavement cracking increased following a rainfall, indicating that infiltra-tion of water through the pavement might also have weakened the supporting capacity of the pavement. Since frost action was minor at this test site, the failure under the 25, 000-lb. wheel load is not necessarily attributed to frost melting.
Selfridge Field (1945-1946)
In the series of traffic tests conducted on the 10-in, slab at Test Area A, Seifridge Field, during the frost melting period in the spring of 1946, a 60,000-lb. load on a B-29 dual-wheel assembly was applied at the rates of 15 and 45 coverages per day. The center lines of the wheels were spaced at 3. 08 ft. apart. During the winter of 1945-1946, ice lenses from hairline to 1/8-in, in thickness were present in the sandy silt , ML subgrade. The average pavement heave in the test lane subjected to 15 coverages per day was 0. 03 ft., while in the lane subjected to 45 coverages per day the average heave was 0. 08 ft.
The traffic test results summarized in lines 67 and 68, Table 4, show that the pavement was satisfactory for the traffic applied. Pavement cracking did not occur in either test lane with exception of slight spalling along the longitudinal and transverse dummy joints.
324
The existing 10-in, pavement at the test area was equal to the pavement thickness required by frost condition design criteria for runway traffic, while the design curves for taxiway traffic required an 11-in, slab thickness. The satisfactory performance of the pavement under traffic up to 45 coverages per day indicates the criteria require adequate slab thicknesses for the conditions tested.
Summary of Traffic Tests on Rigid Pavements
The traffic test data from all rigid-pavement test areas are plotted on Figure 19, which shows the relationship between the percentage ratio of the actual slab thickness to the frost condition design thickness for the traffic-test wheel load, the number of traffic coverages and pavement behavior. The design thicknesses were determined using values of subgrade moduli from Corps of Engineers frost-condition design curves dated August 15, 1950 and rigid pavement design curves dated June 13, 1950. The plotted points are numbered to correspond with line numbers on Table 4 where the de-tails of the traffic tests are presented.
The data from rigid pavement tests is much more limited than that obtained from flexible pavement tests as presented in Figure 16. From the available data, however, it may be seen that failure occurred in all test lanes except one when the existing pave-ment was less than 85 percent of that required by frost-condition design criteria for the traffic-test wheel loads. The exception was at Pierre where limited frost action occurred; the pavement withstood 18 coverages per day of a 25,000-lb. load (point 66), but failed under 54 coverages per day of the same wheel load (point 65).
There were two instances of failure where the slab thickness was 88 percent of that required by the frost condition design criteria. These failures occurred under the 20, 000-lb. wheel-load traffic at Dow Field (points 47 and 50). The failed test lanes were subjected to approximately 26 coverages per day and slab design thickness of 8 in. was based on runway design curves. Based on taxiway design curves, these two lanes had slab thicknesses 78 percent of that required by design. Although the intensity of frost action at Dow Field was more severe than at the other traffic test sites the failure at 88 percent of runway design thickness is partially attributed to application of traffic at a rate greater than is anticipated by runway design criteria. At adjacent test lanes slabs of the same thickness with similar base and subgrade conditions withstood 20, OOO-lb wheel-load traffic applied at a rate of 4 coverages per day (point 46) and failed when traffic was applied at more than 30 coverages per day (points 48 and 49).
Based on the available traffic test data on rigid pavements, satisfactory pavement performance resulted when the slab thickness along the test lane was in excess of 90 percent of that required by Corps of Engineers frost condition design criteria, while failures generally occurred when the slab thickness was less than 80 percent of frost condition design requirement.
Conclusions
Based on the results of CBR tests, plate-bearing tests, and traffic tests, to determine the effect of frost action on pavement supporting capacity, it is concluded that:
Marked reduction in pavement supporting capacity occurs during the frost-melt-ing period, after which the pavement gradually returns to normal strength as excess water escapes from the zone of frost melting, or as melt water from segregated ice is redistributed through the subgrade soil.
The plate-bearing test is not a reliable measure of the percent reduction of traffic-wheel-load supporting capacity of flexible pavements in the frost-melting period.
The ratio of the safe wheel load during the period of maximum weakening due to frost action, to the safe wheel load during the normal period, is approximately 0. 3 for flexible pavements and approximately 0. 8 for rigid pavements.
Where frost-susceptible subgrades exist, combined thicknesses of flexible pave-ment and base course and rigid-pavement slab thicknesses that are at the boundary be-tween satisfactory and unsatisfactory are indicated to be of the order of 80 to 90 percent
325
of the thicknesses required by the frost condition design criteria which are'presented in Chapter 4, Part XII of the Engineering Manual.
(5). The Engineering Manual frost-condition design criteria are reasonable, the small indicated factor of safety being considered justified to allow for heavy-traffic usage in emergencies and for other variations from assumed conditions, and as a pre-ventative against excessive maintenance expenditures.
Bibliography
Taber, S., "The Growth of Crystals UnderExternal Pressure," American Journal of Science, Vol. 16, pp. 532-556, 1916.
Taber, S., "Pressure Phenomena Accompanying the Growth of Crystals," National Academy of Sciences, Vol. 3, pp.. 297-302, April 1917.
Taber, S., "Surface Heaving Caused by Segregation of Water Forming Ice Crystals," Engineering News-Record, Vol. 81, pp. 683-684, 1918.
Taber, S., "Frost Heaving," Iournal of Geology, Vol. 37, pp. 428-461, 1929. Taber, S., "The Mechanics of Frost Heaving," Iournal of Geology, Vol. 38,
pp. 303, 317,1930. Taber, S., "Freezing and Thawing of Soils as Factors in the Destruction of
Road Pavements," Public Roads, Vol. 11, No. 6, pp.. 113-132, August 1930. Taber, S., "DiscUssion of Frost Heaving," Proceedings, Highway Research
Board, Vol. 11, pp. 173-177, 1932. Casagrande, A., "Discussion of Frost Heaving," Proceedings, Highway Research
Board, Vol. 11, Part 1, pp. 168-172, 1932. . . Beskow, G.., "Soil Freezing and Frost Heaving,." Sveriges Geologiska Undersokn-
ing, Stockholm, 1935 Series CV, No. 375, 242 pp. (Translated into English by J. 0. Osterberg and published by Northwestern University, Evanston, Ill., November 1947)..
10; Winn, H. F., and Rutledge, P. C., "Frost Action in Highway Bases and Sub-grades," Purdue University. Engineering Experiment Station, Ser. 73, 100 pp., 1940.
326
REMEDIES AND TREATMENTS
CALCIUM CHLORIDE TREATMENT OF FROST ACTION
H. R. Smith, Engineering Service, Solvay Division, Allied Chemical and Dye Corporation, New York, New York
Chemical treatment of soils to correct damaging effects from frost action has been used for several years. An early report of this type treatment described a method of incorporating calcium chloride into the subgrade soil through holes drilled in the road which were back-filled with two parts pea gravel and one part chloride (1). During the past several years, much additional data have been accumulated, both on the effects of chemical treatment on frost action and on theories of frost action itself. This paper, however, describes methods of controlling the detrimental damage from frost action through various types of treatments from experience gained from field projects and laboratory research.
Chemical treatment of soils or soil aggregate for frost control has been accomplished by various types of applications, depending upon the particular problem encountered. These can be grouped in three classifications: (1) treatment to prevent freezing of subgrade soil or foundations during cold weather construction; (2) treatment to permit the drainage of melt water trapped above frozen ground; and (3) treatment to minimize frost action and controlling' the loss of subgrade support during the spring melting period.
The low freezing property of a calcium chloride solution is no doubt the major factor in its successful application for the above uses. F. 0. Slate described the antifreeze property in relation to frost control (2). The presence of calcium chloride in the soil lowers the freezing point so that a lower temperature is required to produce the ice lenses that cause frost heave. The freezing point of pure water is lowered from 32 F. to 23 F. by the addition of 10 percent of chloride. Any fraction or multiple of this per-centage will lower the freezing point a corresponding amount, that is, the freezing point lowering is directly proportional to the amount of chemical present. However, a soil containing 10 percent solution will have a freezing point well below 23 F. because soil itself begins to freeze at lower temperatures than pure water (3).
It should be noted that just below its freezing point, water freezes solid. For ex-ample, if pure water is held at 3.0 F. for some time, it will become completely solid. However, a solution of calcium chloride does not freeze solid at, or just below, its freezing point, only a few crystals of ice are formed. This ice is composed of nearly pure water, which upon being frozen, releases its calcium chloride. The extra chloride is added to the remaining solution making it more concentrated and thus lowering its freezing point. (Because of this mechanism, a 10 percent solution does not freeze solid until a temperature of -1. 5 F. is reached.)
This low solid-freezing point permits the use of relative small percentages to be effective in minimizing frost damage. When calcium chloride is used as an admixture for moisture control and compaction aid in densely graded aggregate bases and sub-bases, it serves a double purpose, in minimizing voids through increased density and by giving antifreeze properties to the soil moisture. Even a very small increase in density represents a substantial reduction in the total voids or moisture absorbing capacity of soil (4).
Prevention of Freezing of Subgrade During Cold-Weather Construction
Most construction is planned for completion during favorable weather conditions.. This is not always possible, however, and in the northern climates, contractors are often forced to continue construction during below-freezing temperatures. Calcium

327
Fiu! e 1. 'i['ure 2.
chloride has proven effective for treating newly prepared foundations and subgrades to prevent freezing during the period of grading and placing of the construction material. This was especially true for airport construction during World War II. Specifications covering this use are of a general nature permitting the contractor to use judgement as to method and quantity of material, depending upon the weather and construction con-ditions. An example is a paragraph taken from the United States Army Engineers' Specification on the Lockbourne Air Base, Columbus, Ohio.
"The contractor is cautioned that frozen material is not permitted for use in subbase, nor is it permitted that concrete be placed upon frozen subbase. When freezing weather threatens, the contractor shall take measures to pre-vent freezing of the subbase by covering it with straw or other acceptable methods. The use of calcium chloride mixed with the subbase for the purpose of preventing freezing is permitted providing the quantity does not exceed one (1) pound per square yard per inch of depth and that it is bladed and mixed uniformly throughout the portion of the subbase so treated.
The method now recommended to permit uninterrupted paving is to apply 1-1/2 to 2 lb. calcium chloride per sq. yd. bladed or mixed into the top 2 to 3 in. of subgrade material. This provides protection for the normal period between grading and paving at minimum temperatures of 10 to 15 F. For periods of longer duration (48 hr.)or lower temperatures and added protection of straw or marsh grass hay is recommended.
Treatment of Frost Heave Areas
Maximum frost penetration is the depth to which the frost has penetrated during the winter season and the range is 3 to 6 ft. in the northern half of the United States. At this depth, and with gradually rising temperatures, the frost ceases to penetrate and starts to recede. At this same time, the frost at the surface also starts to melt, this melting action gradually penetrating down into the soil. This period of change is a critical one since the load-carrying capacity of the road is greatly reduced.
During the surface-melting action, there is an intermediate layer of frozen soil through which the free moisture above cannot drain. Thus, this moisture along with other surface moisture from melting snow, etc. is trapped above the still frozen soil
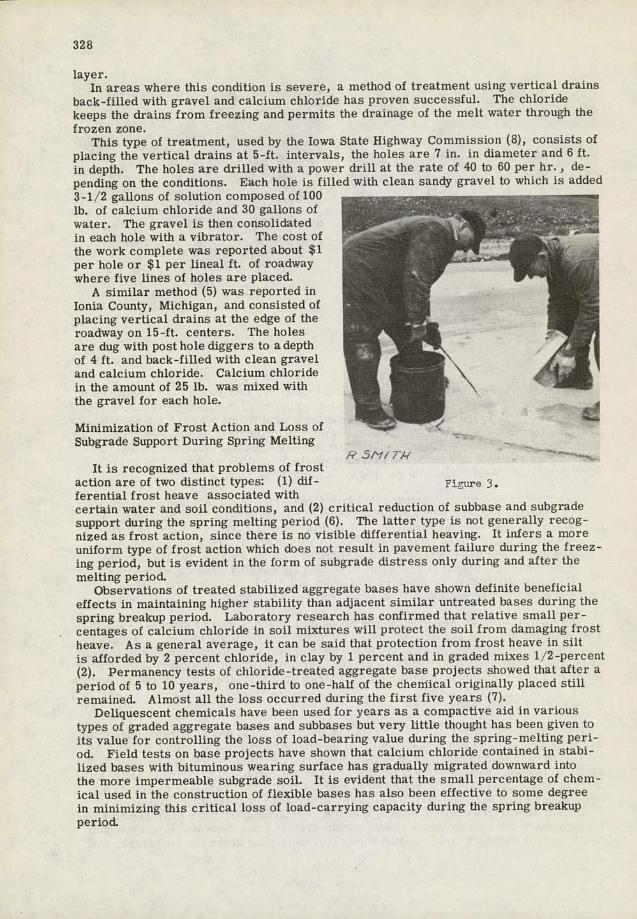
328
layer. In areas where this condition is severe, a method of treatment using vertical drains
back-filled with gravel and calcium chloride has proven successful. The chloride keeps the drains from freezing and permits the drainage of the melt water through the frozen zone.
This type of treatment, used by the Iowa State Highway Commission (8), consists of placing the vertical drains at 5-ft. intervals, the holes are 7 in. in diameter and 6 ft. in depth. The holes are drilled with a power drill at the rate of 40 to 60 per hr. , de-pending on the conditions. Each hole is filled with clean sandy gravel to which is added 3-1/2 gallons of solution composed of 100 lb. of calcium chloride and 30 gallons of * •- water. The gravel is then consolidated -. in each hole with a vibrator. The cost of •. •. -
the work complete was reported about $1 per hole or $1 per lineal ft. of roadway where five lines of holes are placed.
A similar method (5) was reported in lonia County, Michigan, and consisted of placing vertical drains at the edge of the roadway on 15-ft. centers. The holes are dug with post hole diggers to a depth of 4 ft. and back-filled with clean gravel and calcium chloride. Calcium chloride in the amount of 25 lb. was mixed with the gravel for each hole. -
Minimization of Frost Action and Loss of Subgrade Support During Spring Melting
k 5/1/l Tk ' It is recognized that problems of frost
action are of two disUnct types: (1) dii- F1UrO 3. ferential frost heave associated with certain water and soil conditions, and (2) critical reduction of subbase and subgrade support during the spring melting period (6). The latter type is not generally recog-nized as frost action, since there is no visible differential heaving. It infers a more uniform type of frost action which does not result in pavement failure during the freez-ing period, but is evident in the form of subgrade distress only during and after the melting period.
Observations of treated stabilized aggregate bases have shown definite beneficial effects in maintaining higher stability than adjacent similar untreated bases during the spring breakup period. Laboratory research has confirmed that relative small per-centages of calcium chloride in soil mixtures will protect the soil from damaging frost heave. As a general average, it can be said that protection from frost heave in silt is afforded by 2 percent chloride, in clay by 1 percent and in graded mixes 1/2-percent (2). Permanency tests of chloride -treated aggregate base projects showed that after a period of 5 to 10 years, one-third to one-half of the chemical originally placed still remained. Almost all the loss occurred during the first five years (7).
Deliquescent chemicals have been used for years as a compactive aid in various types of graded aggregate bases and subbases but very little thought has been given to its value for controlling the loss of load-bearing value during the spring-melting peri-od. Field tests on base projects have shown that calcium chloride contained in stabi-lized bases with bituminous wearing surface has gradually migrated downward into the more impermeable subgrade soil. It is evident that the small percentage of chem-ical used in the construction of flexible bases has also been effective to some degree in minimizing this critical loss of load-carrying capacity during the spring breakup period.
329
Application of Chemical
The procedure for treatment of the subbase or subgrade is relatively simple. The basic idea is incorporating the chemical into the top portion of material immediately below the base course, consisting of densely graded aggregate (subbase) or finely grained soil (subgrade). Since calcium chloride will gradually migrate downward in soil covered with an impervious wearing surface, it need only be incorporated into the upper portion of the section to be treated. When the, subbase or subgrade has been prepared, it is recommended that the required amount of chloride be spread over the surface and bladed or scarified into the material to a depth of 3 or 4 in. and compacted as required.
Recommended range of depth for estimated treatement is 6 to 12 in. Observations have shown the area near the surface of the subgrade is the critical zone during the spring-melting period.
Quantity of Chemical
Recommended quantity is one percent by weight of the soil for minimum temperatures of zero or below and 1/2-percent for minimum temperature of zero or above. Assum-ing compacted soil to have a density of 100 lb. per Cu. ft., these quantities represent the following amount on a square-yard basis:
Depth of Calcium Chloride Treatment Treatment per sq. yd. Percent in. lb.
1/2 6 2.25 1/2 12 4.5 1 6 4.5 1 ' 12 9.0
This treatment is considered as an added factor of safety in the design of flexible bases: bases designed for sufficient load-carrying capacity may fail entirely or be damaged severely due to critical loss of bearing value during the short period of the melting action. The value of the chemical in the subbase has a dual purpose as a corn-pactive aid and a frost-action control.
Field projects and laboratory research, sponsored by the Calcium Chloride Asso-ciation, is now under investigation in measuring the loss of load-bearing capacity due to frost action and the effective control of calcium -chloride treatments, which should be of value for consideration in the design of flexible bases in frost-affected areas.
Bibliography
Miller, H. H., and Smith, D. N. "Methods for Prevention of Road Failures Due to Frost," Roads and Streets, June, 1934.
Slate, F. 0., "Use of Calcium Chloride in Subgrade Soils for Frost Prevention," Highway Research Board Proceedings, pp. 422-440, 1942.
Bouyoucos, G. J., "Further Studies on the Freezing Point Lowering of Soils," Michigan Agricultural College Experimental Station, Technical Bulletin No. 31, 1916.
Gregg, L. E., and Woods, K. B., "The Effect of Calcium Chloride on Soil Compaction," Report to the Highway Research Board Committee on Soil Calcium Chloride Roads, 1945.
Williams, Allan M., "Frost Partition and Leaky Roof Blamed for Spring Break-up," Calcium Chloride Association News, February, 1946.
Motl, C. L., "Load Carrying Capacity of Roads as Affected by Frost Action," Report of Highway Research Board Committee, Research Report No. 10-D. , pp. 1-10, May, 1950.
330
Slate, F. 0., "Permanence of Calcium Chloride in Subgrade and Stabilized Bases and Its Effectiveness on Base Course Densities," Report to Highway Research Board Committee on Frost Heave and Frost Action in Soil, Purdue University Bulletin No. 14, pp. 6-8, 1948.
Perry, T. R., Assistant Maintenance Engineer, Iowa State Highway Commission, Personal Correspondence, 1950.
CONTROLLING THE EFFECTS OF FROST ACTION IN MICHIGAN
0. L. Stokstad, Engineer of Soils, Michigan State Highway Department
The development of frost-action control in Michigan is the result of an evolutionary process. The problem became serious at about the same time that snow removal was adapted as standard practice on the trunkline system. Excavation into heaves while frost was still in the ground indicated the heaves were caused by layers of clear ice in the soil. Further study showed this condition to be limited to silt deposits. Early efforts at control, therefore, consisted of excavating silt where it occurred in the sub-grade within frost range.
Frost-Action Control in the Surface
The effect of frost action on highway pavements is first controlled by selecting con-struction materials least effected by freezing and thawing. Further control is gained by the use of a highway cross section crowned to drain freely and maintained in such manner that this built-in characteristic is retained. Gravel maintenance avoids the development of secondary ditches along the edge of the metal. Snow banks are not permitted on the shoulder because of the drainage problem. Figures 1 and 2 show winter and spring scenes in the North country which illustrate the difficulties of follow-ing good maintenance practice. Note especially the pitting damage to the gravel sur-face where traffic has had to travel through water ponded by hard snow banks left on the shoulders.
Freezing-and-thawing is one of the strong environmental factors considered when specifying materials to be used in building, a highway wearing course. The amount and quality of clay binder to use in stabilized gravel and the character of aggregates to be used in bituminous and portland-cement concretes are studied carefully in an attempt to keep the destructive effect of frost action to a niinimum.
Frost-Heave Control
Soil materials capable of causing frost heaving of sufficient magnitude to be de-structive of pavements.and dangerous to traffic is removed from the highway subgrade. The bottom width of the excavation is 4 ft. wider than the width of the overlying highway surface. The depth of excavation varies from 2-1/2 to 3 ft. in the gray-brown Podzolic soils and from 3 to 4 ft. in the Podzol soils. These depths are measured from the bot-tom of the proposed surfacing structure. They do not indicate maximum frost penetra-tion but approximate average penetration. Damage resulting from frost penetration beyond the depth of frost heave excavation has been found to be negligible. Figure 3 is the standard section for frost-heave excavation.
Frost-heave excavations are backfilled with soil materials similar to the material surrounding the frost heave pocket. If the normal soil texture is sand and gravel the excavation is backfilled with sand and gravel. If the normal texture is clay the ex-cavation is backfilled with clay up to the bottom of the granular subbase. The reason for this procedure is to avoid creating a "bath tub" in the grade which if present would require tile edge drain to drain excavation.
When frost-heaving textures occur in thin seams or small pockets their detrimental

331
I-
I oil . Ft
Figure 1. Snow Banks on the Highway Shoulder Indicating Drainage Problems
to Come.
Figure 2. Snow Banks Preventing Proper Surface Drainage of,Cross Section.
Figure 3. Section of Frost Heave Excavation.
Figure 4. Drainage of .'et Sand Over Clay, Berrien Soils.

332
influence may be destroyed by a mixing operation. This work is usually done with a carry-all scraper in a manner which requires double handling for only half the quan-tities involved. Overhaul of material from some selected borrow is thus eliminated. The mixing technique is also used to eliminate sudden changes in subgrade soil tex-tures which so often characterize morainic deposits, Crossing old embankments at grade or cutting through the weathered portion of soil profiles are examples of other causes of foundation inequalities eliminated in the same manner.
Studies and recommendations for frost-heave treatment are made sufficiently early during construction operations so that any necessary excavation can be done while ex-cavating equipment is working in the immediate area. Frost-heaving textures may then be used for filling in the lower portions of embankments under construction. Such materials should not be used within the frost -penetration range. Depths and widths for mixing are the same as for excavating frost-heaving materials.
Bad drainage may also be the cause of frost heaving. Free water flowing through the subgrade within the range of frost penetration can be quite destructive of road surfaces. Wherever possible the elevation of watertables and springy areas are made available to the design engineer so that an adequate grade height above water can be provided for whenever other factors permit. Drainage pipe is a poor substitute for an adequate grade height, largely because of the difficulty experienced in maintaining a free outlet. On the other hand, there are times when the engineer has no choice in the matter. Springy areas encountered in cut sections for instance usually require edge drains. When underground drainage structures are necessary they should be placed 5 ft. below the roadway grade and carried far enough to outlet into a drainage-way sufficiently deep to provide a foot outfall at the outlet. Detailed specifications cover the installation of edge drains. Figure 4 is a sketch showing a typical drainage problem presented by a sand-over-clay type of soil. Figure 5 illustrates outlet block-ing resulting from inadequate maintenance and poor outlet design.
Small cross culverts improperly installed can be the cause of serious "summer heaves." In the region of podzol soils these structures require a minimum of 2 ft. of cover between the top of the pipe and the bottom of the pavement. Otherwise frost will gradually lift the pipe out of the ground, causing a bad bump in the roadway sur-face
Rock cuts present another special drainage problem. These are undercut one foot from ditch bottom to ditch bottom, crowned so as to drain to the sides and then back-filled with granular material. Sand and gravel subbases wherever used likewise are built through the shoulder from ditch to ditch so as to provide subgrade drainage by what has been called a continuous bleeder. To obtain this effect it is important that the subbase material have free-draining characteristics.
Spring Breakup Control
Spring breakup is most commonly experienced on flexible land-access roads. Good farm land involves soils especially susceptible to spring breakup. Unfortunately, therefore, the need for land-access roads is the greatest in areas where the soils are the poorest for road construction. Here again an adequate grade height is the best solution wherever other factors permit. Two feet of fill over level clay farm lands is preferable to tile or ditches.
The most effective means for controlling spring breakup is an adequate granular subbase. Most subbases are built from 12 to 18 in. thick except that an 8-in, depth is sometimes used where advantage can be taken of an existing gravel road. The material used for this purpose is the best sand or gravel most readily available. Pit-run material is used, and if this cannot be made available through selective grading, the state buys granular borrow, which is placed by the contractor at his regular con-tract price for earth excavation. Figure 6 illustrates the subbase section most com-monly used.

333
Condition Survey
Obviously all the land-access roads of a state cannot be rebuilt to modern stand-ards at once. A long range program is necessary which to be practical must take advantage of every local resource. The ultimate objective is to bring these roads all to a level of excellence necessary to carry their normal traffic load without failure throughout the entire year. As a first step in this program, a speedometer survey of the main secondary road system is made showing soils, road conditions dur-ing the spring breakup, and such landmarks as may be necessary for location in later use of the map in the field. An attempt is made to bring this map up-to-date each
Fiure 5. Tile Outlet Without Proper Outfall.
- - 1 cb,/,z'Ec1'hihOu/thiiJ
Gr-ad. r I 4
ôolfom ..kbbiz 6rcd 10 lhj
ftho., co/f.c' for or' p/on.'
Figure 6. Section of Granular Subbase.
Figure 7. Soil Survey, Project 34-41, lonia County, 1-1-166 from Portland to lyons, April 1948. Remarks. Height 01 Grade, Good, Average Ditch, 1-ft. Valley. Recoimaendations: Ditch Imp ovement. at 4.00 to 4.35 P. and L, Ditch improvement at 4.55 to 4.85 F; ftaise
Grade 15 in. at 4.55 to 4.85.
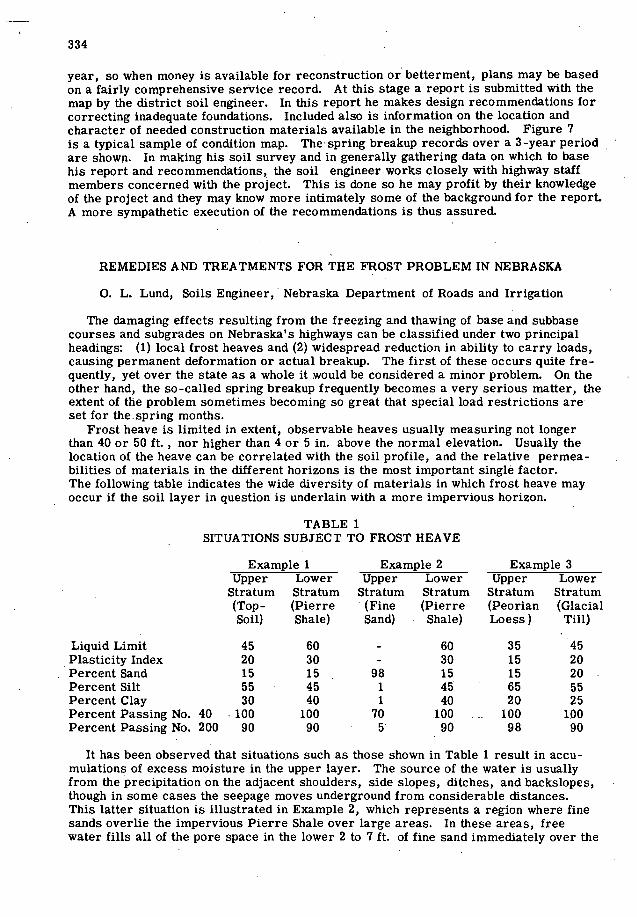
334
year, so when money is available for reconstruction or betterment, plans may be based on a fairly comprehensive service record. At this stage a report is submitted with the map by the district soil engineer. In this report he makes design recommendations for correcting inadequate foundations. Included also is information on the location and character of needed construction materials available in the neighborhood. Figure 7 is a typical sample of condition map. The spring breakup records over a 3-year period are shown. In making his soil survey and in generally gathering data on which to base his report and recommendations, the soil engineerworks closely with highway staff members concerned with the project. This is done so he may profit by their knowledge of the project and they may know more intimately some of the background for the report. A more sympathetic execution of the recommendations is thus assured.
REMEDIES AND TREATMENTS FOR THE FROST PROBLEM IN NEBRASKA
0. L. Lund, Soils Engineer, Nebraska Department of Roads and Irrigation
The damaging effects resulting from the freezing and thawing of base and subbase courses and subgrades on Nebraska's highways can be classified under two principal headings: (1) local frost heaves and (2) widespread reduction in ability to carry loads, causing permanent deformation or actual breakup. The first of these occurs quite fre-quently, yet over the state as a whole it would be considered a minor problem. On the other hand, the so-called spring breakup frequently becomes a very serious matter, the extent of the problem sometimes becoming so great that special load restrictions are set for the.spring months.
Frost heave is limited in extent, observable heaves usually measuring not longer than 40 or 50 ft., nor higher than 4 or 5 in. above the normal elevation. Usually the location of the heave can be correlated with the soil profile, and the relative permea-bilities of materials in the different horizons is the most important single factor. The following table indicates the wide diversity of materials in which frost heave may occur if the soil layer in question is underlain with a more impervious horizon.
TABLE 1 SITUATIONS SUBFECT TO FROST HEAVE
Example 1 Example 2 Example 3 Upper Lower Upper Lower Upper Lower
Stratum Stratum Stratum Stratum Stratum Stratum (Top- (Pierre (Fine (Pierre (Peorian (Glacial Soil) Shale) Sand) Shale) Loess) Till)
Liquid Limit 45 60 - 60 35 45 Plasticity Index 20 30 - 30 15 20 Percent Sand 15 15 98 15 15 20 Percent Silt 55 45 1 45 65 55 Percent Clay 30 40 1 40 20 25 Percent Passing No. 40 - 100 100 70 100 100 100 Percent Passing No. 200 90 90 5 90 98 90
It has been observed that situations such as those shown in Table 1 result in accu-mulations of excess moisture in the upper layer. The source of the water is usually from the precipitation on the adjacent shoulders, side slopes, ditches, and backslopes, though in some cases the seepage moves underground from considerable distances. This latter situation is illustrated in Example 2, which represents a region where fine sands overlie the impervious Pierre Shale over large areas. In these areas, free water fills all of the pore space in the lower 2 to 7 ft. of fine sand immediately over the

335
shale and if the subgrade of a highway is constructed at an elevation within about 3 ft. of this water table, frost - heave is the inevitable result.
In other cases, such as in Example 3, the rate of downward percolation of surface moisture thro.igh the Peorian Loess is greater than that through the more clayey till, and under these circumstances frost heaves often occur even though free water is not found at the bess-till contact. In most cases, however, an excess of moisture -is found in the lower foot of the bess and these moisture contents are often greater than the liquid limit.
The frost heaves discussed above present dangers to the traveling public in the form of rough riding surfaces during the frozen period, but probably the most detrimental result arising from these circumstances is the extreme softening of the more silty or clayey subgrades during and for an extended time alter the thawing period. The de-crease in ability of the subgrade to adequately support base courses results in bitumi-nous pavement breakup and severe cracking and settlements in concrete pavements.
The other problem, the general softening of subgrades and base courses during and after the spring thaw, not, however, accompanied by differential heave during the frozen period, is of vastly greater consequence in Nebraska when measured in terms of dollars required to prevent- failure or to make repairs subsequent to failure. It has been ob-served that generalized excessive softening may sometimes be due to circumstances of the soil profile as indicated above to be related to frost heave but that more often the soil profile is not the significant factor. This line of thinking is supported by the obser-vation that general softening occurs probably as frequently on fills as in cut sections.
Though the mechanics of softening of subgrades and base courses by frost action is still a subject of much discussion and divergence of opinion, it would appear that in-creases in the moisture content of the subgrade soil is one important factor. The data of Table 2 support this statement.
Table 2 AVERAGE MOISTURE CONTENTS
Project A* Project B**
Depth Condition Condition Sampled Failure Good Failure Good
Percent Percent
Base Course 4.6 3.8 5.1 4.3 1 in. below 18.5 17.2 19.0 17.0 6 in. below 18.8 15.9 19.8 18.0 36 in. below 19.7 17.3 20.4 17. 5,
* 10 borings in failed areas, 7 borings in good sections ** 27 borings in failed areas,17 borings in good sections
The tests represented in the table above were made during the spring breakup and the term failure includes a range of conditions from slight cracking to badly deformed and cracked pavement.
While the differences between average moisture contents in failing and good sections are not great, it is possible that those of the failed sections are slightly above, and those of the good sections are slightly below some critical moisture content beyond which increasingly greater deformations occur for any given load.
The data collected in the field for Project B included rather detailed descriptions of the various failures and a further breakdown ofthese data is shown in Table 3 on the following page. The grouping in this table representing two very distinctly different conditions, was made to determine if the higher moisture contents in the failed sections of Project B actually existed before the failures occurred or if they resulted from the

336
TABLE 3 AVERAGE MOISTURE CONTENTS
Project B. Condition
Slight Surface Cracking* Badly Cracked and Deformed** Depth Sampled Incipient Failure Plastic Flow in Subgrade
Percent Percent
Base Course 4.9
5.5 1 in. below 19.5
17.6
6 in. below 19.4
19.7 36 in. below 18.7
22.7
*Averages of 11 of the 27 borings in failures of Project B.. **Averages of 7 of the 27 borings in failures of Project B.
percolation of surface water through the failing surface. It is believed that practically no surface water had penetrated the surface course in the cases of incipient failure but that ample opportunity had existed for such entry in the cases represented by the right-hand column. It will be noted that the moisture contents in the cases of the incipient failures were already higher than those of the unfailed sections of Table 2, and that in general the moisture contents continued to increase alter failure had pro-gressed to an extent which permitted the entry of surface water. In this connection, it should be pointed out that the project was used as a gravelled road for a time previous to the construction of the pavement, and that considerable sand gravel had been in-corporated into the first 1 in. of soil below the base course. This sand-gravel con-tent was quite variable and therefore the moisture contents shown for this depth are not the true moisture contents of the soil mortar. This is believed to account for the apparently low (17. 6 percent) moisture content at a depth of 1 in. below the base course in the right-hand column of Table 3.
As the samples of subgrade soil were taken during the investigation of Project B, they were tested to determine if their respective moisture contents were above or be-low a plastic limit defined as the minimum moisture content at which a 1/2-in, cube can be molded without cracking. In other words, an attempt was made in each case to mold such a cube and the degree of success was reported for each specimen. Table 4 reports the results of these tests.
TABLE 4 PERCENTAGE OF SOIL SAMPLES SUFFICIENTLY WET TO PERMIT
THE MOLDING OF A 1/2-IN. CUBE WITHOUT CRACKING
Project B.
Depth Below Condition Base Course Failures Good Sections
in. Percent . Percent
1 96 41
6 56 35.
36 41 18
It is apparent that the actual moisture content of the soil mortar in the first inch below the base course was higher thai would be indicated by the data of Tables 2 and 3.
Figure 1 shows data collected during the investigation of spring failures On Project C. The grading work on this project was completed in early fall of 1939, temporary gravel surfacing was placed and the roaa was used during the winter of 1939-40. During
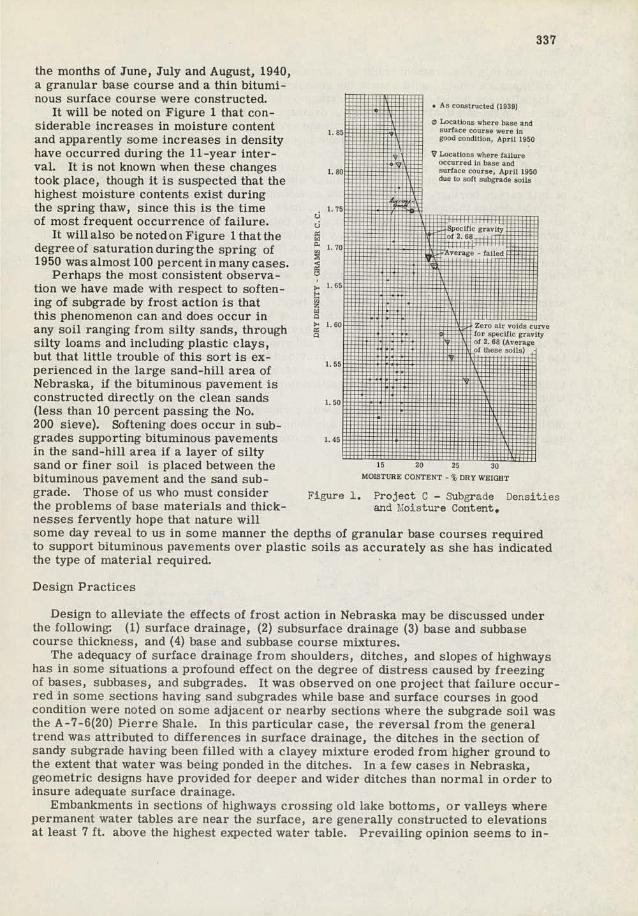
337
the months of June, July and August, 1940, a granular base course and a thin bitumi- nous surface course were constructed. TH
It will be noted on Figure 1 that con- I: . A. constructed (1939)
siderable increases in moisture content -- .. 0 L eatlons where base and surface
............................. .
and apparently some increases in density I course were ls
T" g od Co d tion April 1950
have occurred during the 11-year inter- :1 ?Locatlons where faiture
val. It is not known when these changes occurred in base and surface .'?.\i - course, April 1950
took place, though it is suspected that the 1.80
due to soft subgrade soils
highest moisture contents exist during H the spring thaw, since this is the time 1.75
of most frequent occurrence of failure I It willalso benotedon Figure l that the \, .
c12 68
degree of saturation during the spring of e a failed4
1950 wasalrnost 100 percent in many cases I Perhaps the most consistent observa- I
tion we have made with lespect to soften- 1.65
- ing of subgrade by frost action is that this phenomenon can and does occur in any soil ranging from silty sands, through 9' 1.60 ---- ......-................ -..,,.,.. Z,'ro iii voids rune
for
silty barns and including plastic clays, - .. . •... specificg i Ity . 1 2.68 (Average
but that little trouble of this sort is ex- in the large sand-hill perienced area of 55
'1 \ r Nebraska, if the bituminous pavement is I
- \ constructed directly on the clean sands 1.50
::t: i:::::=::::: (less than 10 percent passing the No. 200 sieve). Softening does occur in sub- grades supporting bituminous pavements 145
in the sand-hill area if a layer of silty _f(j1
sand or finer soil is placed between the 15 20 25 30
bituminous pavement and the sand sub- MOISTURE CONTENT - % DRY WEIGHT
grade. Those of us who must consider Figure 1. Project C — Subgi'ade Desitie the problems of base materials and thick- and oisture Content. nesses fervently hope that nature will some day reveal to us in some manlier the depths of granular base courses required to support bituminous pavements over plastic soils as accurately as she has indicated the type of material required.
Design Practices
Design to alleviate the effects of frost action in Nebraska may be discussed under the following: (1) surface drainage, (2) subsurface drainage (3) base and subbase course thickness, and (4) base and subbase course mixtures.
The adequacy of surface drainage from shoulders, ditches, and slopes of highways has in some situations a profound effect on the degree of distress caused by freezing of bases, subbases, and subgrades. It was observed on one project that failure occur-red in some sections having sand subgrades while base and surface courses in good condition were noted on some adjacent or nearby sections where the subgrade soil was the A-7-6(20) Pierre Shale. In this particular case, the reversal from the general trend was attributed to differences in surface drainage, the ditches in the section of sandy subgrade having been filled with a clayey mixture eroded from higher ground to the extent that water was being ponded in the ditches. In a few cases in Nebraska, geometric designs have provided for deeper and wider ditches than normal in order to insure adequate surface drainage.
Embankments in sections of highways crossing old lake bottoms, or valleys where permanent water tables are near the surface, are generally constructed to elevations at least 7 ft. above the highest expected water table. Prevailing opinion seems to in-
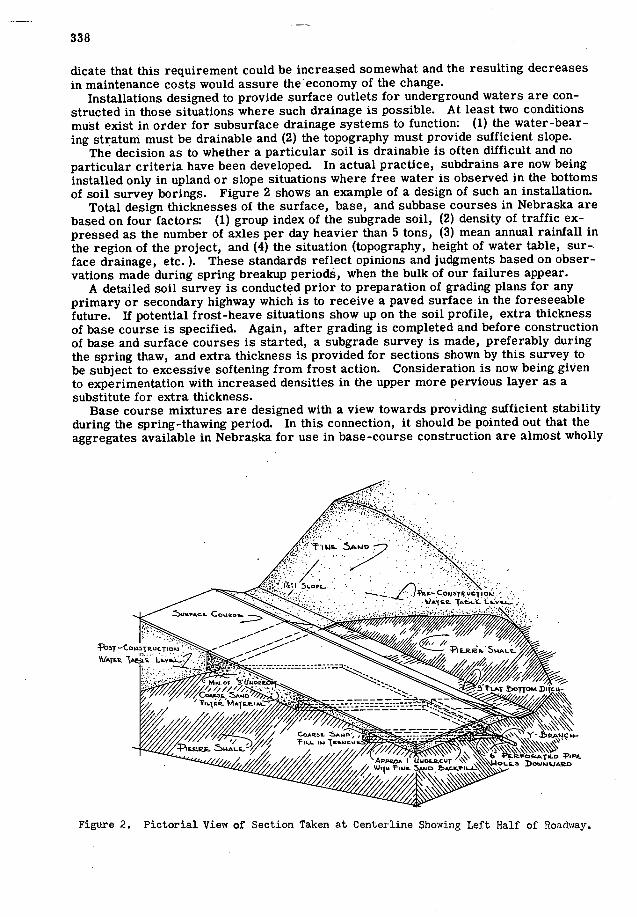
338
dicate that this requirement could be increased somewhat and the resulting decreases in maintenance costs would assure the economy of the change.
Installations designed to provide surface outlets for underground waters are con-structed in those situations where such drainage is possible. At least two conditions must exist in order for subsurface drainage systems to function: (1) the water-bear-ing stratum must be drainable and (2) the topography must provide sufficient slope.
The decision as to whether a particular soil is drainable is often difficult and no particular criteria have been developed. In actual practice, subdrains are now being installed only in upland or slope situations where free water is observed in the bottoms of soil survey borings. Figure 2 shows an example of a design of such an installation.
Total design thicknesses of the surface, base, and subbase courses in Nebraska are based on four factors: (1) group index of the subgrade soil, (2) density of traffic ex-pressed as the number of axles per day heavier than 5 tons, (3) mean annual rainfall in the region of the project, and (4) the situation (topography, height of water table, sur-face drainage, etc.). These standards reflect opinions and judgments based on obser-vations made during spring breakup periods, when the bulk of our failures appear.
A detailed soil survey is conducted prior to preparation of grading plans for any primary or secondary highway which is to receive a paved surface in the foreseeable future. If potential frost-heave situations show up on the soil profile, extra thickness of base course is specified. Again, after grading is completed and before construction of base and surface courses is started, a subgrade survey is made, preferably during the spring thaw, and extra thickness is provided for sections shown by this survey to be subject to excessive softening from frost action. Consideration is now being given to experimentation with increased densities in the upper more pervious layer as a substitute for extra thickness.
Base course mixtures are designed with a view towards providing sufficient stability during the spring-thawing period. In this connection, it should be pointed out that the aggregates available in Nebraska for use in base-course construction are almost wholly
OUCTIO - - -
fr%L bOUOM D11c14-
- -- ---- -- - '( R.AI4C*-
r\_ Mo DoJuJAao
MAL T r
pmzr' 9ALL
Figure 2. Pictorial View of Section Taken at Centerline Showing Left Half of Roadway.

339
the rounded waterworn sands and gravels which were rolled from the Rocky Mountains at the bottoms of Tertiary and Pleistocene channels. Some coarse sands found in the Nebraskan and Kansan Till sheets are slightly more angular in shape. All of these materials are relatively fine in texture, having maximum fineness moduli of about 5. With such aggregates, particular attention must be given to gradation. The trend through the years in design has been towards less binder, until the concensus now is that these base courses should be laid with the minimum clay content necessary for stability during construction. The following table indicates the typical test character-istics of granular mixtures now considered to be stable during and after the thawing period, and at the same time having sufficient cohesion that surface course mixing and laydown operations can proceed on the compacted base course.
TABLE 5 TYPICAL BASE MIXTURES
Percent Passing Sieve Number
P1 Sand Silt Clay 4 10 20 40 100 200 P ercent Percent Percent
2 94 4 2 75 50 35 25 12 9
Three different admixtures have been used in granular base courses in Nebraska in attempting to provide sufficient load-carrying capacity through the thawing period. These are asphaltic oils, portland cement, and calcium chloride. Sufficient success has been had with the first of these that its use has become commonplace. It should be pointed out that more minus-200 material (15-20 percent) is added to these base-course mixtures.
Granular base courses for concrete pavements are constructed in Nebraska in all cases where the percentage of minus-200 material in the subgrade soil is greater than 35 or the plasticity index is higher than 6.
The following principal reasons for constructing base courses for concrete pave-ments have been advanced (1) to prevent pumping, (2) to prevent cracking of the pavement, and (3) to prevent heave or settlement at the joints.
Pumping at the joints probably is prevented to some degree by the base courses constructed in Nebraska, since they generally are of freely draining materials such as fine or coarse sands and the base courses are either constructed to extend from shoulder slope to shoulder slope or are provided with French drains.
It is believed that the 'greatest benefit derived from providing base courses for con-crete pavements in this state is in the prevention of heave or settlement at the joints. Some of the loessial soils have the property of absorbing water quite readily and yet contain enough clay to result in considerable swell upon wetting. As a result, joint heave sometimes occurs during extended rainy seasons and, less often, during the period of below-freezing temperature. The sandy base courses, by providing a mote uniform distribution of leakage water to the subgrade soil, tend to prevent the differ-ential swelling in the summertime and jOint heave when the'ground is frozen.
Remedial Measures
Returns from a recent questionnaire directed to supervisors of maintenance crews reflect a line of thinking very similar to that' of the Design Division with respect to the requirements of a highway subgrade and pavement structure if it is to be free of the damaging effects of frost action. It is almost universally agreed that a freCly draining granular base course of sufficient thickness will eliminate troubles due to frost action, provided, of course, the surface course is adequate to perform its functions.
Two principal methods of repair of failures in' bituminous pavements due to frost action are employed by the' maintenance forces. The'method used hingeson the
circumstances surrounding. the failure. ' ' '
340
One method consists of the removal of a depth of the offending subgrade material and the replacement of this material with soil of better quality, base course mixture (granular), or bitumenized patching material. This method is used in those cases where it is determined that a relatively thin stratum of unsatisfactory soil occurs im-mediately below the base course and that its removal would solve the problem. The most frequently encountered situations of this type are found on the older roads in the sand-hill area, in cases where the upper 6 in. or so of the original subgrade had been constructed of clay or binder soil for the purpose of providing temporary wearing sur-faces. To repair such failures, the clay layer is removed and wasted, fine sand is backfilled in this space, and the bituminous pavement is replaced.
The method of undercutting and wasting poor subgrade material is also employed in certain instances where deep strata of poor subgrade material cause failures for short distances. Cretaceous shales of the Pierre, Niobrara, Carlyle, Granerous, and Dakota formations are sometimes encountered in excavations of the eastern hail of the state. Usually Pleistocene deposits overlie those of Cretaçeous age. If these projects were graded today, the shales would be undercut and replaced with granular materials of the younger formations. But this was not done on the older projects, and as a result the maintenance forces sometimes find it necessary to perform this op-eration to avoid being confronted with repeated failures in the same locations after each spring thaw.
The other principal method of repair of bituminous pavements after failure due to frost action is to increase the total thickness of base and surface courses. In many cases, where slight cracking and deformation have occurred during and after the spring thaw, the failures have tendencies to heal themselves during the following summer. Some have found that such sections needonly small increases in thickness and reseal-ing to be permanently repaired. In many cases additional bituminous mix material laid only 1 or 2 in. thick resulted in a satisfactory surface for several additional years.
In those cases of serious and more complete failure of bituminous pavements, suf-ficient additional thickness of surface course sometimes cannot be applied over the old pavements without narrowing the riding surface more than is desirable, since a shoul-der slope of about 3: 1 has to be maintained. The only satisfactory method of adding thickness in such situations is to remove the surface and base courses and a thickness of subgrade soil equal to the increase required. Old base material, new base mate-rial, and surface course are then placed. This of course then becomes the same as the first method above.
Materials used by maintenance forces in replacing subgrade soil found to be sus-ceptible to effects of frost action vary from crushed rock through coarse sand to fine sand. Since crushed rock must, for the most part, be imported from the neighboring states, and since the cost of shipment becomes prohibitive for most of Nebraska, the bulk of materials used for such purposes are the corase sands and fine sands of Pleistocene age. These have been discussed previouslyin this report.
Little has been done by the maintenance forces to remedy frost heaves, since these constitute a minor problem. Intercepting drains have been tried in some cases, but these have not always proved to be effective, possibly in some cases due to improper installation. Crushed concrete and crushed rock have been used as filter materials in some of the drains and these probably have become plugged. Cases are noted where the flow immediately after installation was considerable, but discontinued after a year or two. Some of the drains probably are of insufficient depth, usually not over 3or 4 ft. below the surface.
If the frost heave of the frozen period becomes a frost boil during and after the thawing period, then of course, repairs are made as outlined above. Some experi-mentation with calcium chloride as a preventative of failure due to frost action has been attempted by the maintenance forces, but reported results are inconclusive.
Two investigations are now under way at the testing laboratory of the Department of Roads and Irrigation in connection with the effects of frost action. The first is an attempt to adopt the triaxial test method to the design of base-course mixtures which will be free from the damaging effect of frost. The second concerns the effects of

341
density and moisture content at the time of compaction, on the ability of our loessial materials to maintain their load-supporting characteristics through the freezing-and-thawing period.
REMEDIES AND TREATMENTS BY CONNECTICUT HIGHWAY DEPARTMENT
Philip Keene, Engineer of Soils and Foundations, Connecticut Highway Department
Synopsis
Frost action is a major problem in Connecticut highway work due to the climate, widespread existence of silty or clayey glacial till, and frequent small areas of silt and clay glacial lake deposits.
The remedies and treatments used are adequate subbase and underdrains. The subbase is invariably clean bank-run gravel, found abundantly through-out the state. On new construction of primary roads, the combined thickness of pavement (surface and base) plus subbase in earth cuts is from 20 to 32 in., which is 2/3 or 3/4 of frost penetration; the combined thickness is 32 in. in rock cuts and about 14 in. in earth fills. The last may be reduced to 8 in. if cuts exceed fills. On secondary roads these thicknesses are reduced slightly. On tertiary roads (town aid), these thicknesses of pavement plus subbase total 8 to 20 in., depending on conditions. These thicknesses are influenced by soil types, the greater amounts being used in silts and clays and the lesser in tills. In clean sands and gravels, subbase is greatly re-duced or eliminated.
On new construction an underdrain is placed in wet cuts to drain the sub-base, intercept sidehill seepage, lower the water table, or do all three. The underdrain is located under the middle of the shoulder or under the gut-ter. Depth of underdrain depends on frost penetration, type of soil and thickness of pavement and subbase; usually it is 5 ft. below top of shoulder in earth cuts. In rock cuts, the underdrain is 4 ft. below top of shoulder, serving only to drain the subbase.
On existing roads, the usual practice is to install an underdrain where frost action has occurred. The underdrain is usually cheaper than re-moving the pavement and poor soil and then installing subbase and new pavement. Also the underdrain often is needed to drain the subbase and pavement and sometimes to carry surface water as well. The same design for the underdrain is used on an existing road as for a new road, except that where the existing road is deficient in subbase, the underdrain may be deeper. Subbase deficiency in old roads is a frequent condition, particularly under the shoulders. However, when the soil is practically pure silt or clay, pavement and shoulders are removed and subgrade excavated to almost full depth of frost and replaced with good gravel subbase and new pavement and shoulders.
The climate in Connecticut is fairly cold, producing depths of frost of about 24 in. in the southern half of the state and increasing to 36 in. at the northern border; in the western part of the state, frost is 6 to 12 in, deeper than the above figures because of the higher altitude. These figures are under surfaces kept free of a snow cover, such as ploughed highways. Precipitation is rather high, averaging about 45 in. per year, and is quite evenly distributed over the months. About 80 percent of the state's area (1) is covered with glacial till, composed of approximately 30 percent boulders, cobbles and gravel, 40 percent sand and 30 percent silt, with or without clay. These percent-ages may vary plus or minus 15 or 20 percent. These tills are very dense in the natural state, weighing from 125 to 145 lb. per Cu. ft., dry density. They are rather imper-vious. They heave appreciably but usually uniformly and hence their chief trouble is

342
from frost boils (spring breakup) in flexible pavements and some pumping action at joints and cracks of rigid pavements. Most of the remaining 20 percent of the state is covered with glacial lake deposits which occur in every valley in the state. As the highways often follow the valleys, their importance is greater in highway work than their comparatively small area would indicate. These glacial lake deposits produce excellent bank-run gravels and coarse sands which are excellent for highway work and also fine sands, silts and clays. The last two are bad in heaving and in breakup or pumping; frequently they occur as a small arm of a temporary glacial lake and hence the highway has an abrupt heave when it crosses such spots. The latter are sometimes known as silt or clay pockets. These short differential heaves are sometimes from 4
-: • 91••U.
EMMMIN •• ••u••miu•u .. . ••_____________ ___________ ......•••.•._______________
• •
. ..
mom
u•x:u .••..••.••••
MMEEMMM
••••• u••uu..
U..... . .. ••.••uuu••.u•u••uu..••.•••u..•u•... .UU.••UUUU••UUU•••U• ...... .........•.... .............
amwm
.:h... ............. .•...•.......
._. S._.
... rn. __ - duu...u.... l.
.Mono .......U..•. --------- .........•• .......I MEMMENEEM .........•u.uuu.............U...
U•••••••••••••••••••S•U•••••U••U•
35 30 25 20 15 /0 5 0 5 II) IS eu 01$/once in Feet from (ost (dge of Pavement
Figure 1. These cross-sections indicate host shoulder heaving was practically eliminated by excavating to a 30 -in. depth and filling with clean bank-run gravel in the preceding
Call.
to 7 in. high and usually are a hazard to traffic. The silts heave 20 or 25 percent (i. e., when the silt develops ice lenses, its thickness increases 20 or 25 percent). Clays heave slightly less, and tills heave about 10 percent.
An example of heaving in silt is shown in Figure 1. The highway, built in 1941 in a northern Connecticut town, passed over the west edge of an old glacial lake-bed on soil that for at least a depth of 12 ft. is a light-brown silt having a small amount of fine sand. The pavement was an 8-in, concrete slab on a 10-in, gravel base, but the shoulders consisted simply of 6 in. of gravel, surfaced with oil.
When the road was built, a 6-in, perforated-metal underdrain was laid under the west gutter near the foot of a hillside; the invert was placed 50 in. below the pavement. In prolonged wet weather there is a good discharge from the underdrain, since it in-tercepts seepage off the hillside; but in dry weather it is dry. Under the opposite or east shoulder, the ground-water table in summer was 9 ft. below the pavement; but early in the spring it was 6-1/2-ft. below the pavement. Frost penetrates to about 3 ft. below the pavement. In spite of the underdrain, heaving of both shoulders was severe. The rise of the shoulders prevented lateral runoff of surface water in the winter, resulting in an icy pavement. Figure 1 gives cross-sections at the worst heave area. Heaving averaged about 5 in. at the east shoulder, 4 in. at the west shoulder and 2 in. at the pavement.
Later the east shoulder was excavated to a 30-in, depth for one-hall its length and
j.090
708.5
7080
izl
709.5
7090
708.5

343
clean bank-run gravel placed, resulting in only about 1 in. of heaving where thus treat-ed. Samples of frozen silt taken where the shoulders had not been excavated showed a water content about one-half more than the normal. This excess water was sucked up from below during the heaving process to form ice layers; its volume, plus the ex-pansion of all the water when changing to ice, checked very well with the actual ob-served heaves where these samples were taken.
The object of the design and treatments is not to eliminate frost action, but to reduce it to a low amount so that damage and maintenance will be very small and load restric-tions during the spring are not necessary.
The remedies and treatments used are adequate subbase and underdrains. On new construction the primary requirement is adequate subbase, as an additional amount cannot well be added after the pavement is placed. The subbase is invariably clean bank-run gravel; crushed stone with a sand filler is also included in the specifications but is never used because the gravel is abundant and probably will continue to be for a considerable time. The gravel specification is as follows:
Sieve Size 5 in. 1/4 in. No. 40 No. 100 Percent Passing 100 30 to 65 5 to 30 0 to 10
The portion passing the No. 100 sieve shall not have sufficient plasticity to permit performing the plastic limit test, AASHO, Number T-90.
Frost action in such gravels appears to be negligible. Little difficulty has been ex-perienced in obtaining gravel to meet this severe specification, except in a narrow area of about 200 sq. mi. around Hartford where the red gravels (of Triassic origin) have considerable clay. Specifications for subbase in use before 1942 were identical with AASHO, Specification No. M-147-49 for base course; some of the red gravels passed that specification and were used at that time and subsequently have given some trouble in slight heaving, breakup, pumping at joints, etc. but probably the chief reason for changing to the more severe specification is that the better gravels are abundant.
Gravel base course and gravel surface (wearing) course, each 4 in. thick and to-gether constituting the pavement, have the same specification as for gravel subbase, except that 100 percent shall pass the 3-1/2-in. sieve.
The lack of silt or clay binder in these pavement courses may be questioned by highway engineers. Such binder appears unnecessary in Connecticut highways as the gravel has excellent gradation andthus can be densely compacted, to about 130 or 135 lb. per cu. ft. and also the surface is bound by oil, tar or asphalt. On the minor town roads which are engineered, built and maintained by the towns, some are dirt roads and their surfaces probably include a silt or clay binder.
On new construction of primary roads such as parkway, federal aid, and trunk line, the combined thickness of pavement (surface and base) plus subbase in earth cuts is from 20 to 32 in. , which is 2/3 or 3/4 of frost penetration; the combined thickness is 32 in. in rock cuts and about 14 in. in earth fills. The last may be reduced to 8 in. if cuts exceed fills. On secondary roads these thicknesses are reduced slightly. On tertiary roads (town aid), these thicknesses of pavement plus subbase total 8 in. to 20 in., depending on conditions. In low fills over wet ground, subbase requirements are the same as for earth cuts. The reason for the latter is that the water table is as close to the roadway surface (say 5 ft.) at the low wet fill as it is in a wet cut with under-drainage. Therefore unless such a fill is composed of clean material throughout its height, conditions for frost action are about the same in both cases and subbase re-quirements are the same.
Depth of subbase also is influenced by soil types, the greater depths given above being used in silts and often in clays and the lesser depths in tills. In clean sands and gravels, subbase is reduced to 6 in. or zero.
Subbase is carried out to the gutter on each side in cuts and to full width of shoulders in fills. Also the thickness in cuts is carried without diminution into fills for a mini-mum distance of 50 ft. before tapering down to the normal thickness in the fills. In the past this was not done, which resulted in bad heaves in the topsoil at the grade points.

344
The underdrain is located under the
PAVOUOUT-7 SUB-BASB---) middle of the shoulder or under the gutter. Depth of underdrain depends on frost pen-etration, type of soil and thickness of pave-
NON- POST NG/' '" ment and subbase; usually it is 5 ft. below
CULVHRT top of shoulder in earth cuts. If the sub- (NOTE; FOUNDATION COUDITIONS UNDPM PIPE MD AEJACOUT IF PIPE SHOULD 4
BE UNIFORM TO MAKE SUTTLaUNTS UNIFORM (IF ANn) ase e en e o u ep 0 frost, e
underdrain could be shallower, serving Figvre 2. Method of Iniminating Serious Differential Frost Heavino Due toChiinney
only to drain the subbase, but this would
Action in Culvert, increase the cost of construction material- ly. In rock cuts, the underdrain is 4 ft.
below top of shoulder,, serving only to drain the subbase. Six-in, pipe is used, usually perforated, asphalt-coated metal pipe, except that larger pipe is used if it is to carry surface water also. Perforations are usually on the top side of pipe, but if the water table is about level, they are on the bottom side; the recently-approved design with perforations below middle of pipe is now being used. Backfill is 1/2-in, stone, except that where the soil is fine -grained with no coarse fraction, washed concrete sand is used. The choice is usually determined by the piping ratio of backfill to soil (3).
On existing roads, the usual practice is to install an underdrain where frost action has occurred. The underdrain is usually cheaper than removing the pavement and poor soil and then instaUing subbase and new pavement. Also the underdrain often is needed to drain the subbase and pavement and sometimes to carry surface water as well. Another benefit is to lower the water table at the adjacent slope and thereby stop seepage onto the gutter and shoulder which is an ice hazard in winter. The same de-sign for the underdrain is used on an existing road as for a new road, except that where the existing road is deficient in subbase, the underdrain may be deeper. Subbase de-ficiency in old roads is a frequent condition, particularly under the shoulders. However, when the soil is practically pure silt or clay, the pavement and shoulders are removed and subgrade excavated to almost full depth of frost, and replaced with good gravel subbase and a new pavement and shoulders.
A special case of frost action under pavements is due to chimney action in culverts, especially in cross culverts of large-diameter pipe. Cold air circulates through cul-verts, unless blocked with snow or water, and causes frost penetration into the earth outside the pipe. This frost penetration will result in vertical and horizontal heaving if the earth is a frost-heaving type and sufficient moisture is available.
An example of harmful chimney action is in a central Connecticut city where a dual-lane expressway crosses a wet area for about one mile. The 9 in. concrete pavement and 12 in. gravel subbase are on a low fill of alluvial silt; top of pavement is 4 to 7 ft. above ground. The ground is swampy, with water table at or near the ground sur-face. Elevations taken on 100 points on the pavement revealed that the ordinary heave here was 1/2-in, to 1-1/2-in., but at the four 36 and 48 in. cross culverts, heaves were 1 or 1-1/2-in, greater. The pavement was not reinforced, because of the steel shortage, and large transverse cracks developed at and near these culverts because of the nonuniform heaving. At the numerous 12 in. cross culverts, extending only one-hall the width of the expressway, heaves were about 1/2-in, greater than normal and cracks developed over and near them also.
A good remedy for chimney action is the placing of non -frost -heaving fill around the pipe for a thickness equal to the frost penetratibn around the pipe. Above this fill would be the normal embankment material. If this amount is diffièult to determine, an easier method is to fill with the good material up to subgrade and for some distance each side of the culvert, as in Figure 2.. If the culvert is far below the pavement, this method would be expensive. In such cases, no remedy would be necessary, except in unusual cases, as the heaving around the pipe would be diffused over a wide area by upward arching in the embankment and largely absorbed by compressive strains in the embankment.
A working rule in Connecticut is to use one of the above treatments if the embankment will be a bad frost-heaving soil and if top of pipe will be less than 4 or 5 ft. below top of

345
pavement and flow line is less than 4 ft. above ground water table. Chimney action at box culverts is not a problem as the roof is usually 12 in. or
more in thickness and more than 5 ft. above water table. Pervious material placed for several feet beyond the walls serves to prevent capillary rise from below.
Bibliography
Flint, R. F., "Glacial Geology of Connecticut," Bulletin 47, Connecticut State Geological and Natural History Survey, 1930.
Keene, P., "Modern Underdrain Practice in Connecticut," Better Roads, July 1945.
Keene, P., "Underdrain Practice of the Connecticut Highway Department," Proceedings, Highway Research Board Vol. 24, 1944.
THE INFLUENCE OF FROST ON HIGHWAY FOUNDATIONS
Earl I. Fuller, Senior Soils Engineer, Bureau of Soil Mechanics New York State Department of Public Works
It is the purpose of thispaper to point out a few of the most frequently encountered types of conditions along some of the highways in the State of New York where damage has been unquestionably caused by frost action, to explain as simply as possible just what seems to have taken place, and to recommend some practical measures which should correct these conditions.
Highways can go bad and wear out from the bottom up, just as well as from the top down. We all know that when only the top wears out there are several accepted and widely used methods of replacement, none of which is excessively costly. But when portions of the foundation bulge under a pavement or bulge and later contract into weak, saturated. pockets offering zero support, they usually require extensive repairs which can run into heavy costs.
This problem of highways wearing out from the bottom up is one with which mainte-nance engineers have long been familiar, and one which both design engineers and con-struction engineers are coming to recognize. It bears out, more and more, the reason for that most basic of all rules for successful road building and road maintenance - drainage. Stripped of all technicalities, we could almost boil this entire frost problem down to a few simple statements, statements which will hold true regardless of out-door temperatures, i. e., adequate drainage, no wet subgrade, dry subgrade, no frost heave.
Some heaving will occur whenever there is a concentration of water in the subgrade near enough to the surface to be subject to frost, and it will be observed that the most frequent and most violent frost heaves are generally encountered in pavement built through cut sections. The causes are almost invariably the same - too much water and not enough drainage. A little study of such areas usually uncovers the underlying causes of this condition. Perhaps the ditches are too shallow, or too narrow or both. An honest appraisal, after driving over a few miles of average highways during winter or spring thaws, should be enough to convince any highway designer that most of our road ditches could safely be made deeper and wider. Sometimes' the grade of the ditchline could be improved to effect better run-off. Snow banks, pushed back by winter plowing, are very apt to pile up over the ditches. When the atmospheric tem-perature rises sufficiently, the upper parts of this snow begin to thaw. Meltwater seeps downward to the colder portions along the bottom, freezes again and eventually, as solid ice, fills the ditch. This blocks any possible drainage and the roadway be-comes, in effect, a sluice for all run-off not otherwise carried away from farther up the grade. A part of this blocked water, however, has time to seep into the subgrade under the pavement just at the upper transition from fill to cut, and frost heaving is

346
bound to result. Broken and cracked pavements totaling countless miles in extent will attest the frost damage which has resulted from this one condition alone. Or, if sur-face drainage appears to be adequate, an investigation with augers or probing rods may disclose the presence of unexposed rock ledges just under the bottom of the ditch. These barriers, blocking or misdirecting the flow of groundwater, cause the foundation to become saturated, and frost heaves result. The remedy then calls for cutting through this rock and providing proper drainage, either by a deeper open ditch or by tile under-drain. Such treatment should go far towards removing the cause of heaves. It has also been found that an excessive growth of underbrush along the backslopes of narrow cuts sometimes connotes a subsoil so full of roots that it acts like a sponge and defies all drainage attempts. Once this brush is killed and cleared away, these places have been known to dry up and give no further trouble.
Then, there are the problems which arise during the design of proposed new high-way construction. When a cut is to be made through an impervious, moisture-retain-ing soil undercutting to a depth of at least 40 to 60 percent of the normal depth of frost penetration and replacing with a layer of properly drained medium sand has been rec-ommended. If economically feasible, this is the most satisfactory method of dealing with cuts in nondrainable soils. The dry sand layer also serves as good insulation.
Boulders, where embedded in the foundation soil at depths within the range of frost penetration, have a way of working to the subsurface where they eventually cause bumps in the pavement. They may vary in size from a foot or so in diameter to many times larger. Their damaging action is usually first noted in flexible pavements but is evident, sooner or later, in rigid types when the boulders are very large. As far as maintenance is concerned, once a pavement has been built over large boulders, the only remedy lies in their removal. This is a costly operation when the offending boulder is located under a concrete slab. But it can be done. In one New York high-way district, this troublesome boulder problem has been met in design by undercutting the proposed pavement area 4 ft. below the finished centerline grade and then back-filling and recompacting. This design method is now their standard practice through known boulder areas. The initial construction cost is raised, of course, but the chances of certain damage to come later from frost-heaved boulders have been largely removed. It would seem as if practices such as these might well come under the head-ing of "Built-in Foundation Maintenance," and it is the writer's opinion that if the battle against frost damage to our highway pavements is ever to be successfully won, it must be started in the design.
In the northern and eastern sections of New York State, considerable portions of our highways are laid through rock cuts. The foundations under the pavements placed upon such excavations, especially at transitions from cut to fill, may be considered among the most likely points where frost can be expected. Where rock is excavated, it is practically impossible to leave smooth surfaces. The cuts invariably consist of rough, jagged areas full of potential nondraining water pockets. It would seem that much of the future trouble from frost heaves in these spots could be avoided if more attention were paid to such rough surfaces before permitting backfilling. In no case should spalls or other rock excavation litter be used for leveling, and care should be taken to make the blasted areas as free-draining as is economically possible. One of our highway districts in New York is planning to meet this problem in design by esti-mating, for these undrainable pockets, a backfill consisting of a fine-grained bitumi-nous mix. Such backfill is to be built up sufficiently with well-tamped layers to form a smooth top-surface gradient which will drain any water seepage from under the pavement. This same district has also had some success in using a low-grade con-crete, in lieu of the bituminous mix. It is also recommended that a cushion of run-of-bank gravel, having a minimum thickness of 12 in. be placed between the pavement and this backfilled area. It is believed that if this method of treating rock excavation is followed, there will be a noticeable decrease in the number of frost heaves. It might also be mentioned that wherever transitions are made from rock cuts to fils,in fact, where transitions are made from cuts to fills in any type of material, New York State specifications call for benching to a depth of 4 ft. below finished center-line

347
grade and backfilling with suitable material, properly compacted. Such design would seem to be a factor in lowering the costs which future maintenance would inevitably be compelled to charge against almost certain damage from frost.
The installation of properly placed tile underdrain can be effectively done only alter a comprehensive study of the subsoils and ground-water conditions. This applies to the design for proposed construction, as well as to the completed highways where the causes of frost damage to the foundation soil have been recognized as a drainage prob-lem. A study of flow lines under highway sections would seem to indicate that in many instances, tile placed along pavements within 2 ft. of the outer edge, and at a minimum depth of 4 ft. below the center-line grade elevation, should give better protection against moist subgrade and damage from frost than similar tile located under the ditch. This rule is contingent, of course, upon the nature and structure of the underlying subsoils. Any such installations, however, will keep the areas well drained only so long as the system is maintained and continues to function as planned. Because they are seldom properly marked, outlets of subsurface drains often become obstructed due to lack of maintenance. It has been found a good practice to lay a small base under the outlet end of such tiles and to otherwise protect this opening with a little laid-up stone. Some states have small white wooden posts erected to mark these outlets.
A further suggestion for a measure to aid in subsurface drainage for side-hill cuts is to remove the small, excess berm of material which would otherwise remain back of the ditch on the low side of the cut. This extra excavation could be made as a contin-uation of the shoulder slope down to a point where it intersects the existing surface. In this way, ground-water flow, under a head from the higher side of the cut, is provided a freer access to the surface and subsequent evaporation, leaving just that much less moisture in the subsoil under the pavement. The removal of this berm is recommended only where the sidehill is fairly steep, and where the otherwise remaining backslope would not be more than 4 ft. high.
A high water table, or even one just high enough to be within the capillary range of the foundation soil, is not the only way in which moisture can get under a pavement. Water seeps down through leaky joints in concrete or through cracks of porous macadam pavement. Good maintenance requires that such openings be kept well sealed. Should-ers have a habit of building up near the outer edge and leaving a trough next to the pave-ment. This depression, actually it may be just a rut or a series of ruts, collects the water from the pavement run-off and lets it seep into the subgrade rather than to follow out and drain into the ditch. Such troughs should be filled whenever possible and the high outer ridge should be scraped down before winter sets in. This problem also brings up a question regarding the advisability of designing, into the shoulders, some thickness of impervious material or waterproof cover to serve as a shelf wide enough to deflect the surface water on out to the ditch. A mixture of fine gravel and bitumi-nous material (about 15 gal. per cu. yd.) spread and rolled into a trench 4 to 6 in. deep and 1 to 3 ft. wide, as a part of the shoulder next to the pavement, has met with suc-cess when installed as a maintenance operation.
Still another condition found along our highways each spring, exacting its toil in frost-heaved pavements, is the saturated subsoil caused by blocked side-road and farm-driveway ditches. In the case of the driveways, the existing pipe is often too small, or is plugged, or no pipe was installed in the first place. These spots are usually further aggravated by banks of snow and ice left around the corners by plows. Frost heaves in-variably result where the road is located on the low side of such areas, particularly if the foundation material is comprised of finely-grained soil. Culverts, especially the smaller-sized structures, are prone to obstructions, whether of debris, silt and sand accumulations, or ice layers. Once plugged, they become a hazard, causing satura-tion of the highway foundation. Constant vigilance on the part of maintenance patrol crews is probably the only answer to troubles of this nature.
Field observations provide countless examples of frost damage following the use of silty soils in embankments. This is especially true where such fills have been made over, or near, a convenient source of moisture. It has been a well -established fact that anything which causes a discontinuity of the capillary height will choke off the flow

348
of water and stop the formulation of additional ice lenses in the frost zone. So by placing a layer of gravel between the highest water table and the frost line, the capil-lary flow is cut off, and aside from the moisture contained in the body of the soil sub-ject to freezing, frost heave can usually be held within reasonable limits. Nor is frost damage resulting from the use of bad soils confined solely to the action of heaving and breaking pavement surfaces. We have recorded instances where silty sand embank-ments, built around and over concrete structures, such as cattle-passes, have so ex-panded from frost as to crush the walls inwardly from both sides. Auger borings made at these structures showed the soil in the embankments to be saturated by capillarity to a height of 5 ft. or so above floor slabs which looked perfectly dry at the time of the investigations. The only remedy in these cases called for entirely new structures, and it was obvious that the embankment material at hand was not fit for use as backfill. Present day New York State specifications call for a well-compacted gravel to be plac-ed under and around all such structures, drainage or otherwise, a precaution which should greatly decrease the chances for a recurrence of the damage just described.
It is noticeable that wherever road sections have been built up, that is, where the pavement has been carried along at an elevation of 3 ft. or more above the surrounding terrain, there are few indications of frost damage. This holds true almost invariably, regardless of whether the pavement is of a rigid or a flexible type. It would, therefore, seem that the ideal road section should have its pavement held at just such a minimum raised elevation, be carried above wide, curved ditches through cuts, have wide shoul-ders, and have ample clearance excavated back of the ditches to provide room for push-ing snow. Road sections of this type would naturally have a higher first cost, which could be considered as insurance against future damage from frost.
THE NORWEGIAN STATE RAILWAYS' MEASURES AGAINST FROST HEAVING
Sv. Skaven-Haug, Civil Engineer, Norwegian State Railways, Oslo
Frost heaving is a serious economic and technical problem for Norwegian roads and railways, due to severe winter cold and the extensive occurrence of fine-grained sedi-ments and moraine deposits.
A section through frozen and strongly frost-heaving soil reveals a series of isolated and nearly horizontal ice layers that can vary in thickness from 1 to 100 mm. These ice layers are often limited in horizontal extent and are thickest through the middle section. A local accumulation of a number of such lens-shaped layers often manifests itself at the surface by marked and sharply defined "frost h.imps."
The formation of the ice layers is due to special physical conditions during the proc-ess of freezing, which only in recent years have been made clear. The water is furnish-ed by capillary action in the underlying unfrozen soil, and this movement is initiated by forces of diffusion through films of water at the lower limit of the frost zone. If this limit remains unchanged for a period of time and the temperature is sufficiently low, the thickness of the ice will increase. It is the resultant surplus of water that gives the ground a nearly fluid consistency after the spring thaw.
The Norwegian State Railways was forced at an early stage to take up the battle a-gainst the evils of frost, and the following account will set forth the methods chosen to combat them..
One measure that to a certain extent reduces the harmful action of frost is the laying of an 0. 5 m. thick ballast (gravel or broken stone) on a well-drained roadbed. And where the roadbed is of such a consistency that it becomes saturated in the spring thaws and thus loses its carrying capacity, reinforcements have usually been effected by the laying of stone or gravel foundations. On the most difficult stretches, especially deep ditches or covered drains have been used. Even though the ballast under the ties still gets pressed down into the roadbed in spring on a few old sections, so that the soil works its way up 'between the ties (Fig. 1), such occurrences are rare enough to be

349
-r .. ;)
considered a thing of the past. But the main difficulty for the railways
today is the uneven swelling of the ground Figure 2. Isolated frost humps introduce due to frost, as any relative vertical dis- a menace to the safety of trains. The placement of one or both rails from ap- height and number of humps increase dur- proximately 10 mm. and up constitutes in7 the winter. Terrorary surfacing is
a menace to traffic and a hindrance to attained by shimming. On older lines where the disturbances from frost heav- the development of speed. Frost humps ing are severe, one may find shims 6 in.
grow both vertically and horizontally in thick, as shown in the fi-iire. the course of the winter; some develop early in the season, others late. In the December-March period an ever-watchful serv-icing of the line is required, and shimming in winter embraces about 7 percent (about 300 km.) of the total length of the railway network, mostly older lines.
While a frost hump still is low, the base plates over the middle of it are knocked away, and the parts of the track over the periphery are levelled out by insertion of thin wedge-shaped wooden plates under the base of the rail. As the frost humps grow in number and size through the winter, more and more shims are inserted and on stretches with especially great frost heaving are cases where up to 6-in, thick shims are used (Fig. 2). The labor involved and the considerable wear on ties caused by constant re-spiking are such an expense that even extensive improvements and work on foundations pay dividends in eliminating shimming.
Measures that have been taken against destructive frost heaving are drainage, lifting of rails, and soil replacement.
Attempts to drain the ground under the subgrade by means of longitudinal covered drains on one or both sides of the line have sometimes yielded good results. But very often the soils involved are so fine-grained that even 3-m. -deep drains will not suffice to adequately lower the level of ground water drawn up by capillary action. This is true of clay and clayoy soils as well as silt. Experience has shown that such drainage re-duces frost heaving, particularly in cracked ground and in silt, but only rarely can it eliminate shimming altogether. Drainage intended to prevent frost heaving should not be undertaken unless examination of the ground has indicated the possibility of an ade-quate lowering of the ground-water level.
Lifting of the line by increase of the ballast depth from 0. 5 m. to, say, 1. 0 m. can make possible the elimination of shims in cases where the ground conditions are favor-
Figure 1. Fine-grained sand slirhtly mix-ed with clay has worked its way up etv:cen the ties. This happens when the ground thaws out in spring and the soil in the roadbed still contains a surplus of pore- water.
A charactei'i tic frost-phenomenon where the depth of the ballast-section is
too small (gravel ballast).

350
able, especially, perhaps, in that the frost heaving becomes evenly distributed and therefore harmless. But on stretches with difficult conditions of ground frost this measure does not by any means suffice. The most effective but also the most expen - sive method is soil replacement. Soils susceptible to frost heaving are removed and replaced by materials that do not expand much upon freezing. The excavation must be so deep that the frost, even in the most unfavorable winters, cannot penetrate to the roadbed. The width is equal to the length of the ties plus 1. 50 m. - that is, 4. 0 or 4. 2 M.
Soil replacement has been carried out on our lines more or less systematically since the beginning of this century. Gravel, broken stone or peat has been used as the re-placement material in new lines, and on roads already in operation, cinders from the locomotive furnaces have been used with good results.
The proportions of the soil-replacement section before World War II were somewhat too rigidly fixed. Particularly in new constructions a so-called normal section had e-volved, in which the depth of the excavation was 1. 0 m. below ground level and the fill-ing material stone. The bottom and sides of the trough were lined with peat (Fig. 3). This lining of peat, which, originally was 0. 2-0. 3 m. thick and which was intended to prevent the surrounding fine -grained I materials from penetrating into the layer -- _ of stones, is of special interest. It was discovered that such a replacement sec- tion eliminated the need for shimming on . certain stretches, while it failed to pre
''" vent destructive frost heaving on other stretches which were not particularly Figure 3. cold. Investigations showed that the lay- er of peat at the bottom sometimes was displaced and in patches entirely lacking, prob-ably because of careless dumping of stone, and at such places troublesome frost humps occurred even where the stones were not mixed with soil. On the other hand, there was direct evidence that any layer of peat at the bottom of the trough, even as thin as 0. 05 m., effects some insulation against frost.
The frost problem is a many-sided and difficult one, which can be solved only by systematic studies of soils, ground water, and temperature conditions, to mention only a few of the factors involved. Even though a better understanding of the nature of frost in the ground had been achieved before the last war, a method of handling the problem on a large scale was still lacking. Recent studies of the freezing and expansion of soil have, however, yielded a rich and comprehensive literature, and Scandinavia is far ahead in this field (1).
About 1940 the Norwegian Institute of Technology published pioneering investigations, and for the first time methods were indicated for computing the penetration of frost into various soils (2). These investigations and computations explain, according to the laws of physics, a number of phenomena which have long been known in practice. It has com-monly been observed, for example, that frost penetrates but little into a marsh, but probably few people realize that this is due primarily to the great water content of the peat, and not so much to its poor conductivity of heat. As a matter of fact, it has been specifically demonstrated that frost penetrates deeper into dry peat than into wet (3), and the explanation of this according to physics is that the larger the quantity. of water to be frozen, the larger the quantity of heat tobe reduced. The depth of the frost de-pends on two dominant factors, namely the amount of local frost and the thermostatic constants in the ground. The amount of frost F is defined as the product of time and degrees temperature, from the time in the autumn when the accumulation of cold be-gins, to a point of time in late winter, when the accumulation ceases. Subtractions are made for mild periods, and the amount of frost F then becomes a collective figure for that part of the winter cold which increases the depth of frost in the ground. In practice, the amount of frost is computed on the basis of average temperatures for given periods of time (f. ex. pentads or months) within the period of accumulation of

I4•PAVOM ..MWAVAPM
••• ...... to
48
4'
44
42
351
and cold, ana tne lormula we use is Hours x Degrees Centigrade. Practical charts have been worked out for all of Norway (5), with curves showing normal as well as maximum amounts of frost.
Another important set of factors in de-termining the depth of frost is the ability of the soil to conduct heat and to accumulate cold. Since both of these factors are strong-iy dependent on the water content, much work has been put into determining the a-mount of water the different soils or re-placement. materials
e- placement.materials have in their, proper
' 4 W -MW SSV#(IW locations along the line. A great quantity Figm'e 4 of water stores up a great quantity of cold
when transformed into ice and thus impedes further penetration of frost. On the other hand, the conductivity of heat increases in direct proportion to the' amount of water, and this tends to aid the penetration of frost. The problem therefore is to select replacement materials or combinations of these de-posited in a succession adapted to the needs of each particular situation.
The resistance to frost fl in a layer deposited at a given depth under other materials is determined by the following equation:
d2 rl 2 = q
+ ( + 4o )j Denomination h deg. c
The total resistance to frost to of the combined layers that lie upon each other and freeze completely through in the course of the winter is equal to the amount of frost F. The symbols of the equations have the following meanings:
d thickness of layer in meters q cold-storing capacity of material in Cal. per cu. m. x heat conductivity of material in Cal. per m. h °C a heat transmission constant between surface and air in Cal per sq. m hC
resistance to penetration of heat in top layer in sq. m h °C per Cal. Xe (The term Cal. refers to large or kilogram-calories.)
In the following computations a number of approximations have been reached by ig-noring the resistance to transmission of heat between surface and air; 0. 06 m. of hard-packed snow has been assumed to cover the ballast after the latter has been fro-zen through.
In Table 1 below, heat constants for the most commonly used materials are given, based on measured water content along the line in the course of the winter.
TABLE 1
V
Substance
Hard-packed snow Ballast stone Ballast gravel Cinders (mci. ash) Peat
Percent water by volume
50 8
13 20 85
Calq per Cu. m.
7800 12300 17400 70700
Cal per m hC
0.5 0.57 0.80 0.40 1.05
Figure 4 shows the necessary depth of replacement d for different materials, de-pending on the amount of frost F. This presupposes an 0. 5-rn. -deep ballast section

352
of stone which, after freezing through, is assumed to be covered by a layer of hard snow averaging 0. 06 m. in thick- ness. While stone and gravel alone are inferior replacement materials, cinders and above all peat are excellent. Those replacement materials which have the greatest water content on the line are the best, as their ability to store up cold is of the greatest significance. For the 42 ballast materials on top, on the other hand, the ability to conduct heat is more
MEN MMEMMEP FA
No
OWN,!% 01 -1 W, _M, WE important and it is desirable to have the ballast material as dry as possible.
2...400 J88'8 ANXhCJI8'I
Figure 5 shows the necessary depth of Figure 5. replacement d when there are 0. 20 m. of pressed peat at the bottom of the trough and gravel, stone, or cinders above. The
0 C combination gravel or stone on peat is Ct7/70'C//9 33888 /Y' economical in new constructions. If the peat is unpressed, it should be deposited to a depth of at least 0.40 m., and care 58 Bro*eflS/s7t/e 5a'//a's/ should be taken that it is not displaced. 4
To achieve the greatest possible corn- 887 bined resistance to frost in soil layers placed upon each other, the rule is top layer (ballast) as dry as possible and bottom layer as wet as possible. The Figure 6. idea that the bottom layer should have the greatest possible water content may disturb many who will feel that it conflicts with the common experience that drying of the foundation reduces frost heaving. Attention is called, however, to the fact that the drainage ditches usually have been dug in foundations where in influx of water from below or from the side has caused formation of ice layers and consequently great frost heaving, while it is a requirement of any replacement mate-rial that it should not form ice layers and should not expand considerably even if its pores are saturated with water. It is a further requirement that the replacement layer should be so thick that the frost, even in the severest winters, cannot penetrate farther than to the bottom of it.
Let us examine the standard section for new constructions before the war (Fig. 3) and evaluate it critically. The layer of peat at the bottom of the stone-filled, 1. 0-rn. - deep trough is usually after a short time pressed down to 0. 10 m. According to the formula, then, this section has a resistance to frost of 33, 000 h deg. C., adequate for a moderately cold district in Norway, but inadequate for the cold inland and mountain regions. If the peat layer is reduced to 24, 500 h deg. C., and if it is entirely removed, the resistance in the stone -filled trough is only 16,000 h deg. C. The peat layer, which has been deposited to insulate against infiltration of soil into the layer of stones, conse-quently has great significance in combatting frost, and it can be assumed that the varying effectivity of the normal section is due to varying thicknesses of the peat layer. In the future, a thicker peat lining will be used in the stone-peat combination, and.care will be taken to prevent the peat from getting displaced when the stone is dumped. It should be expected that loosely placed peat will be compressed to half the original thickness.
On lines already in operation, which so far have had a good supply of waste materials from the locomotive furnaces (cinders, unburnt coal, and ashes), this mixture, here-after referred to simply as cinders, has been used with good results as replacement material. For a moderately cold district, take for the sake of comparison the same amount of frost (33, 000 h deg. C) as eariler, the computed thickness of the layer of cinders is 0. 87 m. as shown in Figure 6, that is, a slightly shallower excavation than

353
in Figure 3. Loosely deposited cinders lose about 20-percent depth when packed down and are therefore given a corresponding surplus depth. A considerable part of this com-pression is effected already with the passing of the first train. As all grades of the cinders are evenly distributed through the mixture, it does not become adulterated by the surrounding soil.
As early as the beginning of the century, peat was laid down as a replacement mate-rial on a couple of sections, one of which was 600 m. long. This peat (sphagnum) was placed in the trough in the form of half-dry clumps. Examination of the almost 50-year old experimental stretches, where the line still is shim-free, has shown that the origi-nally loose peat has been pressed down to half thickness and is now covered by a corre-spondingly thicker layer of ballast gravel. In spite of drainage from the trough, the peat is saturated with water, and since the peat has retained its fibrous nautre, it ap-parently has not undergone any decay in the line. It is still sharply defined in relation to the adjacent soil.
Figure 7 shows the necessary depth of the peat layer for the same moderately cold district (33, 000 h deg. C). Of all known replacement materials, peat that is compress-ed and soaked through requires the smallest depth of excavation.
Since 1930, pressed peat blocks have been used as replacement materials on operat-ing lines. The blocks contain dried and torn peat (sphagnum) and are baled with two wooden frames and steel wire. They are of standard length (1. 00 m.) and breadth (0. 50 m.), while their thickness may be 0. 30, 0. 40 or 0. 50 m., depending on the local amount of frost; 50 to 90 kg. in weight, they are easily-handled units, and their form allows for temporary stacking along the line - an important consideration for example in nar-row cuts. As shown in Figures 8 and 9, eight blocks are laid per meter of line (8000 per km.). The blocks are laid from they sides and in towards the center line, and the trough is dug so narrow (4. 15 to 4. 20 in.) that the two middle blocks have to be forced down. The peat fill formerly was tapered towards the ends of the trough, but now it is ended abruptly, and no practical difficulties have resulted.
On the first rainy autumn, the peat layer becomes entirely saturated with water. A large number of measurements has shown that whether the peat has lain in the line one year or fifty, the volume is very nearly the same for fibrous peat. Summer and winter alike, the peat contains in round numbers, by volume, 10 percent peat, 85 percent
water and 5 percent air. The density of ,9ir/Resis/o'nce the layer, which can be expressed in terms CI7flCC/7f JJ999 of volume percent peat, appears to differ
but little from the original form before it was laid into the line. Light, undecayed
S8. Briifreti S/one peat has a compactness or density of about 8, and somewhat decayed, moderately dark
S8 Con .pr_fleo'/ peat about 10. It has been. established that the first blocks, which were supplied to the ordinary market as standard agricul-tural equipment, were too loosely pressed,
Fcure . as they were quickly reduced by 20 percent in the line. Even though this settling is no greater than that encountered with cm-
Suruae . ders, it is more troublesome because it - makes itself felt materially and necessi-
tates more frequent adjustments of the rails through the year. Attempts are now made to eliminate this evil by the use of more firmly pressed peat blocks, which are required to have the same compact-ness, 8 to 10, as a peat-layer that has beenpeveral years in the line (6).
Figure 8.

354
Recent Developments
During the winter of 1945-46, observations were made of frost penetration into the gravel ballast and the underlying peat layer on five different sections of the railway network, and the results for one of these sections are shown in Figure 10 along with the frost limits. At the top, the local amount of frost is shown for all seasons, based on the mean air temperature for every 5th day. This figure represents a moderately cold winter. The frost limit that has been given has been determined on the basis of the water (ice) content of the ballast at all times, and it will be seen that this water content W increases steadily from 10. 5 to 18. 9 percent by volume through the winter. In the peat lining, the water con- tent remains constant at about 86 percent by volume, summer and winter alike. - The correspondence between observed
\ . and computed frost limit is very good, in fact the difference is no greater than 0.05m.
It can be seen that the frost has slight- ly penetrated the roadbed, despite the fact that the winter represented is only moderately cold, and it seems strange that this same peat lining succeeded in \ preventing harmful frost swelling and the need for shimming in the severe winters 1940-41, 1941-42 and 1942-43. But it is now clear that the ballast layer Figure 9. The peatbiocks are laid in a in really cold winters, with few mild narrow trench as closely as possible and
periods, is substantially drier than in without removing the wrapping. The length
moderately cold winters; and the drier of the trench that can be excavated in one
ballast gravel considerably increases the operation may vary between 4 and 12 me- ters, depending upon the intervals between
frost resistance of the underlying peat the trains. layer. The bottom of the figure shows that the frost heaving in this ballast layer of gravel has been about 2 mm. and in the completely frozen through peat, 15 mm. With 86 percent by volume water in an 0. 40 m. peat layer, the expansion in freezing should theoretically cause a 30 mm. upward swelling, and the somewhat smaller amount measured in actual practice is probably due to compression of the unfrozen peat by the frozen layer above. An even swelling of say, 30 mm. is completely harmless on an open line.
Of all the five sections under observation, there was close correspondence between computed and actual movement of frost down through the layers. The greatest differ-ence between computed and observed frost limit in the peat lining was 0. 07 m. , in most cases less (7).
The Norwegian State Railways has not laid down 0. 3 to 0. 5-rn. -thick pressed peat mats on scattered stretches totalling 19 km. Objections have been made to such a thick layer of peat under the ordinary 0. 5 mile thick ballast layer, on the grounds that the resiliency of the peat would result in a low ballast coefficient. 1/ The answer to this is that upwards of 18-years' experience has failed to reveal any tendency toward an increase in breakage or displacement of rails or in wear of the superstructure. An undeniable drawback is the increased labor of surfacing in the first years, but this drawback should be eliminated by the use of firmer peat blocks and by avoidance of short replacement stretches.
There have been divided opinions on the justification of necessity for draining the bottom of the trough. Cross-drains were formerly used, leading from the bottom of
/ The ballast coefficient is the pressure per unit of area in kg. per sq. cm. requir-ed to depress a tie 1 cm.

Figure 10.
355
28888—. /8888 - /1888—
i?ingL R8U/1//Ofl7UP8/t
Krn/644-4F.
2/488 , OC
/Va1fl7C//f 171404
2881 Mal
+ _____ I
AIN, Bec ,tfarc/'. '15 Igis.
\' \
—H- _ ___ ___ __
9iio/egrc/ed C/cfeg de aver Rack W28Z
at.4mlyeal Prast Weaving
f'bi Ifarc,' Apr,/
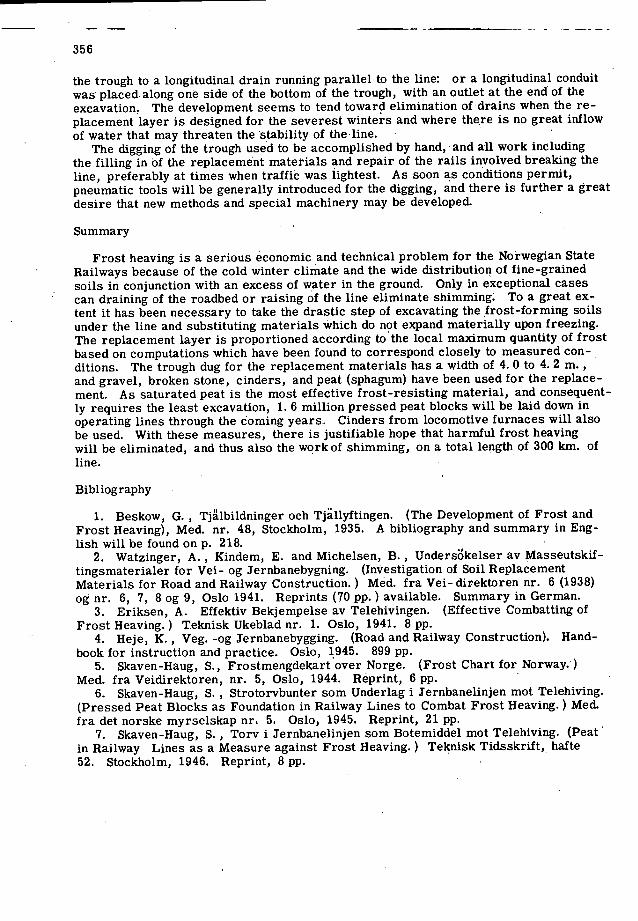
356
the trough to a longitudinal drain running parallel to the line: or a longitudinal conduit was placed. along one side of the bottom of the trough, with an outlet at the end of the excavation, The development seems to tend toward elimination of'drains when the re-placement layer is designed for the severest winters and where there is no great inflow of water that may threaten the stability of the-line.
The digging of the trough used to be accomplished by hand, and all work including the filling in of the replacement materials and repair of the rails involved breaking the line, preferably at times when traffic was lightest. As soon as conditions permit, pneumatic tools will be generally introduced for the digging, and there is further a great desire that new methods and special machinery may be developed.
Summary
Frost heaving is a serious economic and technical problem for the Norwegian State Railways because of the cold winter climate and the wide distribution of fine-grained soils in conjunction with an excess of water in the ground. Only in exceptional cases can draining of the roadbed or raising of the line eliminate shimming. To a great ex-tent it has been necessary to take the drastic step of excavating the frost-forming soils under the line and substituting materials which do not expand materially upon freezing. The replacement layer is proportioned according to the local maximum quantity of frost based on computations which have been found to correspond closely to measured con-ditions. The trough dug for the replacement materials has a width of 4. 0 to 4. 2 m., and gravel, broken stone, cinders, and peat (sphagum) have been used for the replace-ment. As saturated peat is the most effective frost-resisting material, and consequent-ly requires the least excavation, 1. 6 million pressed peat blocks will be laid down in operating lines through the coming years. Cinders from locomotive furnaces will also be used. With these measures, there is justifiable hope that harmful frost heaving will be eliminated, and thus also the work of shimming, on a total length of 300 km. of line.
Bibliography
Beskow, G., Tjâlbildninger och Tjàllyftingen. (The Development of Frost and Frost Heaving), Med. nr. 48, Stockholm, 1935. A bibliography and summary in Eng-lish will be found on p. 218.
Watzinger, A., Kindem, E. and Michelsen, B., Underskelser av Masseutskif-tingsmaterialer for Vei- og Jernbanebygning. (Investigation of Soil Replacement Materials for Road and Railway Construction.) Med. fra Vei- direktoren nr. 6 (1938) og nr. 6, 7, 8 og 9, Oslo 1941. Reprints (70 pp.) available. Summary in German.
Eriksen, A. Effektiv Bekjempelse av Telehivingen. (Effective Combatting of Frost Heaving.) T.eknisk Ukeblad nr. 1. Oslo, 1941. 8 pp.
Heje, K., Veg. -og rernbanebygging. (Road and Railway Construction). Hand-book for instruction and practice. Oslo, 1945. 899 pp.
Skaven-Haug, S., Frostmengdekart over Norge. (Frost Chart for Norway.) Med. fra Veidirektoren, nr. 5, Oslo, 1944. Reprint, 6 pp.
Skaven-Haug, S., Strotorvbunter som Underlag i Jernbanelinjen mot Telehiving. (Pressed Peat Blocks as Foundation in Railway Lines to Combat Frost Heaving.) Med. fra det norske myrsclskap nr. 5. Oslo, 1945. Reprint, 21 pp.
Skaven-Haug, S., Tory i rernbanelinjen som Botemiddel mot Telehiving. (Peat' in Railway Lines as a Measure against Frost Heaving.) Teknisk Tidsskrift, ha.fte 52. Stockholm, 1946. Reprint, 8 pp.
357
RESULTS OF A QUESTIONNAIRE ON REMEDIES AND TREATMENTS
Tilton E. Shelburne, Director of Research, Virginia Department of Highways, University of Virginia
To secure pertinent information concerning the frost action problem throughout the country a questionnaire was prepared and circulated to all 48 state highway departments. The questionnaire was designed to secure information not only on the extent and serious-ness-of- the problem but also to determine current practices employed in minimizing or eliminating this problem. A brief summary of the information received from the survey is shown in Table 1.
Extent of Problem
The question was asked, "Is damage caused by freezing of road bases, subbases, and/or subgrade soils a problem in your state?" The majority (40) answered in the affirmative. Only five southern states (Louisiana, Mississippi, New Mexico, North Carolina, and Oklahoma) indicated that it was not a problem. Twenty-two replied that the problem was a major one in their state. Some stated that the seriousness varied from year to year depending upon climatic conditions. Others indicated that the prob-lem was more pronounced in certain areas, particularly those of high elevation.
Base and Subbase Types
The next question was, "What type(s) of base or subbase materials seems most sus-ceptible to damage by freezing?" As might be expected, a variety of answers were received to this question. Some stated that they used base materials not susceptible to freezing and that the trouble was usually in the subgrade (or basement) soils. Two southern states mentioned limerock bases as being susceptible to freeze damage. Others reported that any permeable bases were troublesome. The majority indicated that soil bases containing predomiriatingly fine sands and silts were the worst offenders.
Subgrade Soils
A further question asked for information on the geological (or soil) formations or major soil types most. susceptible to damage by freezing. Since a wide variety of soils exist it was anticipated that the information obtained in this respect would vary. Some gave pedological names of the soils, others gave physical test constants, and some H. R. B. soil classification. Still others gave general geological parent rock formations, or soil areas. For a complete tabulation of the replies to this question, the reader is referred to Table 1. In general, it appears that those soils most susceptible to frost heaving are those containing high silt contents. In one state they may be in the Coastal Plain, in another they are found as glacial lake deposits and in still a third as wind- blown or loessial materials. I .
Another question, "In soil areas susceptible to frost action, is the damage related to profile development?", was asked. It was intended to read soil profile development; however, the word "soil" was inadvertently omitted and some of those replying referred to the profile of the road. The majority of those replying were of the opinion that dam-age. is related to soil profile development. Some observed that damage was mostly in cut sections.- The experience of at least one state indicated that any soil except corase sands and gravels are susceptible to frost heaving when underlain by a more impervi-ous formation within a depth of about six feet of grade elevation.
Current Design and Construction Practices
In those states where road damage by freezing prevails the replies indicated con-siderable thought has been given to remedies and treatments in current design and

TABLE 1. DATA FROM STATE HIGHWAY
Base Ssbgrade
State Reported by Is dsaage caused by What type or types of B of State Give geslogical(or scsi) % of State In soil areos susceptible
freezing orroad hose or subboses mate- area affect- formations, or nojor area affect- to frost actaoo, is the
- bases, oubbaseo, and/or nob are coat sos-ed. (Eat.) soil types most sus- ed (Est. ( daosge misted to anti
sobgrode soils o prob-neptible to domoge ceptable to dosmge by profile devebopsont?
lee in your state? by freezing? freezing.
Yes No Major Minor - Yea No Remorbs
Al.. J.L. Lund a Very Those booing high silt 25% slightly Those derived from Prsotaoally o For the oust manor non te, A-i Friable or a tintrrvsls disintegrated stone none-such part sos is that
plastic-L.L. P.!. or P. of enemy 4 nod those oner hard cress are could be affected L.sntnncessori ly re- years. pose or impervious corrected by frost are loted to frost sotino. & isclincd stratnu by base or treated uncover- Cont'd.los tenp.plao of hard pun. subbase. ed sufficient to good uapply of fringe . - peevest their snsstnre octel Crates machang be tceps.
Aria. H.l1.Brnno a Inhigh- Those honing a h4h per- 5-10% of Frost dsosge is con- 5 Nose
en clv- ovotoge of vs ten) State faced principally to - notions passing No. 200 aievc. ho9bsmy the bass.
savage
Amh. L. Wiles a a - - A-4 Type Soils 50 B
Calif. N. Ilveec o Very Trouble is asnally in bose- - Sandy clay less than 5% a Damage occurs minor nent sal ls . oostl yin o,,ta.
Cole. BE. Liningstnc Thnae in high per- 40 B All of the A-2 graup 40 B n in moe cress. restage of Na. 200 and the A-4 nod S fall necta005 are
• (15% or greater) gnonps. such I essaus-ceptsble to dos-
• a age thnn arc out areas ohich silos isfiltratius of
Coon. Philip 0 0 Nanv.Bsses and sub- - Sil tatrats (gbonsol 95 B Some- Is the older
Scene . basesamecless hanb lobe deposita)sre tioesroodo,eueessi cv oftne - mao gravel nr 01cm. '
honk ran sand. carat fnroatioos. Clay strata (glacisi
heaving uccursco the "A"
lobe deposits) are hnrssons t the nest.Glucial tills rade points. (ground mnraine de- ¶bsa has bvnv pnoito(are saderately largel ynlananated
so the neser roeda bid - the ountsis 20 50% to silt and clay. by Lhl
nbb:s:50ft. in. to the fills and tohing care to re-
• mnvv the "A" hnri-
Del. Fruek Basemy n In severe Nave. Be ins and sub- 30 % Strsti find nil to 00 10 B Some- Topography is ninters. buoys are dense frnot
prnuf Atlantic Coastal Pbom. tseee generolly flat.
Onsasage dif- . aes le d y & isc tlay
F
g1r
i5nesand t
h
aion of ca-
25% silt, tvl; ter -25% coy, L.L. 25-
35% P.I. 0
or less. toble are prim cnnsidvrstions.
358

DEPARTMENTS ON THE FROST ACTION PROBLEM
State Give current design and Does thickness of subbase Is there correlation between Is research underway or nostenplotod
construction pructi ceo and base construction vary degree of distress sttri hot- in neor futore coocerning frees-
esplsyed in rnininieing with depth of frost peno- able to front notion and jog of bones, subbase5, eodJor
or eliminating damage. trntion? chaotic cosditiono? subgrade soils?
359
Boson & Ssbgrnde Yes No Give design think- Yen No
&bhsoeo Soils neon for ear, frost
peoetratioo depths
Al.. 1. A nininon Caners Frost isnninnr thickness of B is. with problem ordinnrily, for base and nor-non- frost our base 005roes fsnio the ordi- action are thinber thon nary depth of frost noterislo frost peoetrntrs. nct0000e this to n depth state. grenter 2. Bnsen nod sub- than front beses of non-frost will affected soils for penetrate. lood support, free dnnissge and frost
Aria. Use 4-6in. thich- No opeciol nesn of base treotoent course sell grodcd nonpinotic nstericl nithnssinonof 8%
g:ssing No.200 sieve.. bbose esteriol hue-
iogP.l.nogreater than 5 and no more than 12% passing No. 200 nieve.Sobbnne esrieo fron 6. to 15 is.
Ark. - -
Calif.Nospeci al effort is Frost bails n - mode to elieinste are removed. frost action becoose Affected neidesnea of such areas bock trouble nrc conpars- filled with tied yrenes t. gravell
coterie 1.
CaIn. Utilieation of No attempt o One third of the parr enteriuls ni th other thon eeighted colne •ninl o nooplantic denoifics- which de tereinen . ly feller kinder, tine of totsl thieboesr No. 200 notariol snbgrnde is cnntrol led soils at
depends on the depth of frost
.sthin narrow proper penetruti en in limita;i.e. .5- noisture highly reactive 00% where peosible. content, frost areso. rscge
is fran ISin. to 27 is.
Gino. These are elves - a 20 in. psoesen t, base boebran grovel & ssbbsse nhere 24 100% pose S in. frant 28 in. sieeA,30 to 65% who36 in. frost; pass (un.. 1-30% 32 60. where 48 in. passes Na.40,0-10% frost as prinary posses No. 100, por- tins passing No.100
randa. Thenbneso is shoot 75% of
has on ploaticity Underdrain at 5 ft.
shove is oecsndery rnnds. Use 6 in.
hal sense face in in. subbase is fills stalled where needed to drain sabbose or
on "barrow" jobs.
Inner enter toble or intercept wide- bill seepnge.
Del. Cnnstrscting nan- Laeering a Design thickness of heaving bsses end outer table psoenenc + hose nsbkaoes of suf- by drain- + nsbknoe ° 20 ficient thickness n . em- io. tonnnsnsse playing free danugo by fr
ost. drnuoiog note-
illary est off. Uniog nao-susceptible nsterinls where prncticoble.
Hoeever, most of our damage coams
pLiad folleed nedintely by o flesh freeze.
Macorbs Yes Na List reaearah projects and
stote if is progress or
contesploted
None
Mast dnmngn by frost action a coors insarth-cr0 psrtion of stete.
The snootninoss regians in the oorthesstern psrt of the a tatesro the soly pisces shere scat. tered nieor dozooge doe to frost action has
If the soil cssditisns orefa vorable, there doe s oat sees to be W. ozuch demo re- gordless of the cli-
Bavesodermey a directly related resesrcb jab coo-nerning seasonal ooistsra uhvegre and effect oc
Nane
Dis tress is spproni-n setely propurtional to clenatic conditions mr any psrticnlsr
Soil type is the most impnrtsnt fnctur. Ground ester ccnditioso and frost penetrate' on depth or.
l.Vnrintion of fruot heseing with depth of saver tsble. SAid gsven by sashed ssnd ucderdrnin backfill to cap-ill ory nec in silty sail. 3.Dopthn of feast penetru-tin0 belun pseenents in vsninnn parts of the stone. 4,Observstions of hcnvns and bails in rnsdsbuilt eith less than stoodard sub-base. Iteno 1 & 2 are can-teeplutod. Itens 3 & 4 are an prcgrnns.
Best troonsinsion of soils (in prsgrons(.
Thickness of base s Little or no distress 0 Recent survey of hones and subbose do- from frost in altitudes tubea from oltitudes helen pends princepolly helon upprocanstely 5000 ft. shooed that some no character of 3500 ft. uhace sea cern prrforminp notiofoctory subgrnde soil, level. Progressicely and sone snoatssfactorily.
worse shone 5000 ft. The condition of the pro'ects Approninately little . hss been coordinated sit defferenco between test forfrost ounceptibility. 5000-8000 It.Prenipits- Additional work still probably tioniecreaseoei th in- cresow of altitude.
he done this year.
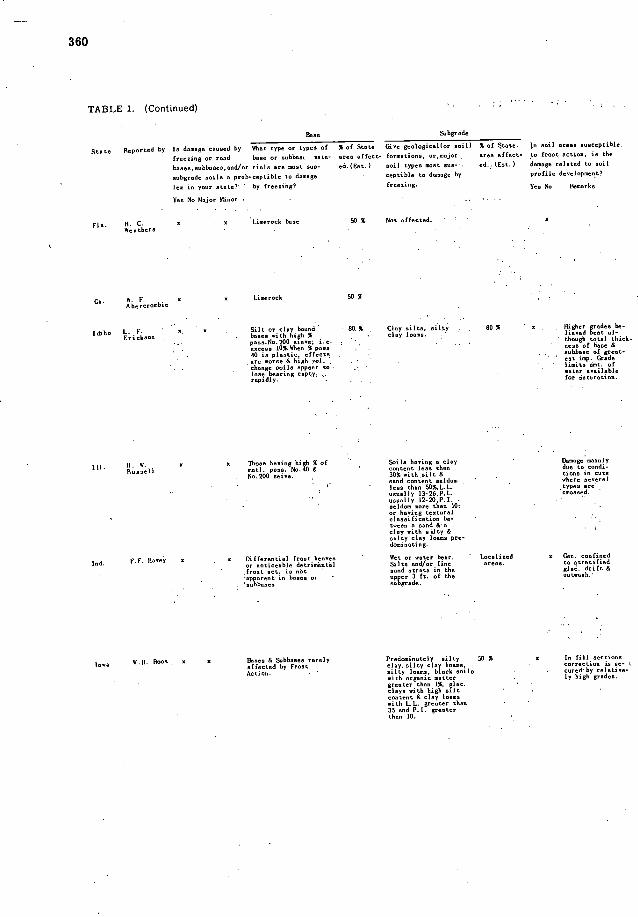
TABLE 1. (Continued)
Boae Sabgrade
state Reported by is damage caused by What type or types of % of State Give geological(or soil) % of State.
In soil area! susceptible.-
freezing or rood hose or nobhnni sate- area affect- formations. or,ssjor . area affect- to frost octane, is the
haaes.oubhaaeo,dnd/ar riala are mci taos-ed. (Eat.) soil types sos tass--. ed.. (Eat.) dsmage related to soil
aubgrode sails a prah-ceptible to damage - ceptible to damage by profile developsent?
lea in year otote? by freezing? freesieg. Yes No Remarks
Yea No Mujor Minor . . . ... -
FIs. H. C. o a Lieeroch base 50 % Not affented. . a
Weathers 0
Ga. W. F. h a a Lineracb 50 %
ldcha L. F. 5 a Silt or clay booed - HO S Clay auto, silty . . 80% a -. Higher gradea be-
Erichaee . baaea with high 5- . . clay loans. - lseeed beat ml-
psss.No.200 aaeee; i.e. . . thoagh total think-
cacaos lO%.Wl,en S pass . . . ceas of bssc &
40 is plaxtit. effecta. . . . . subbase of great-
ore eurae & high. vol. - - . . eat iyp. Geade
change soil a appear to .. limits set. of
- - Inac bearing nipty... . eater nenilable
rapidly. . for coLoration.
360
Ill. Ruaaell
a
led. F. F. Hovey a Differectial frost hesees cr noticeshle de trieeeta 1 frost set, is net
in beava or
Inca W.H. Root . u a Beaea & Sabbaaea rarely
affected by Frost Action.
Sails having a clay Damage mainly
content leaa than 4ue to onodi- 30% with silt & Lions in auto sand content seldom ehereaeceri
less this 50%,L.L. types are usuallyl3-26,P.L. craaawd.
usually l2-20.P.I. seldne more than 18; or having textural elasni ficatiun be- - tseen a sued & 0 clay with silty & - silty clay lasso pre- dasicating.
Wet as enter hear. l.ocalizmd o Gee, confined
Silts and/ar fine sreaa. to stratified
sand atrato in the glsd. drift & outmsoh. upper 3 ft. of the
subgrsde.
Predominately silty 50 5 a In fill sections
clay. silty clay lcaoia, - correntaca is an- I silty loos, black sails . m . cured'hy relntiee- with organic mstter - . ly high grades.
greater thio 1%, glic. clays with high out content & clay looms with L. L. grester than
35 lI0 grenter
a o
Thone having high S of matl. paso. No.40 & No. 200 seine.

State Give current design nnd' Dais thickness of aibbuse - Is there correlation between is- research underway or contemplated
tonotructianproctices and base construction vary degree of distress sttrilosi- in near future'concerning -freen-
eplyd g h~ dep th of frost p bi ft iion and i,gfb bband/or
1 gd g lima tic cond itions? bgrd
B,sTs& Ssbgrd V N 0 d gnthbY N lie b Y N La hpj d
Subbaneo Soils neon for var. frost state if in progress or
penetration depths contemplated -:
FIn. Made nearing None a a If excessive roan- nsrfs. thich- fall precedes a er & more freeze the dosage deose. Double to lineroch bsaea unurse surf, - is onnsidersbly in, ...
treot.& rn- creased. trend ci th -
heve repl ac ed pIa-
Cm. 2. . , e
- The greater the -- a • , .v ' - -, - .' - sointore in the - . .
. : .............. .
lienroch, the gient- -
or the diotreso
Idaho One cnn-plan- Use sand a Design total a Varies xi th net. of tic bases & blanket or .thicbnenore- coin ture available subbase with 3/4io. to - :' loted .to'.!teir-' . and cycles of freen- opendioinoge dust or. 'ing.cap,ty. s's ..... ing & thawing. fo- chorocter in- tics. Unit
gravel or or. roch
indiodtbd. by perforeance'
ceed. ne loll or apriog gives trooble
Nc. 200 to
blsnbet Records over for hreshup. lisa to- nsa. 12% pro- over fine ainilar nails tsl thkcbneoo of 8- fer ann.
of 6 groinod noile in ores 15 in, Frost peset. or 8% & son- shads8 P.1 range to depths of plastic over S and/ar 4 ft. in anna areas.
linear mhrinb- ageocer50%. Smoke tcourse . ' ...
considered - -.
port of base or subbase thichneon & is genera lip non- plastsa.
Ill., Use aof '
Rplbc
ques-'
' ' ' ' - n Doasge sttribnted dnne tn-fost
action
ed rsculor sitls. with confined to northern cotUb. iii more stable - onethird of state. bones & sub- soils or goon-
Use drainage to loner -
nater table.
md. None Depend on a Moat frost deicage o Mesber of Pm3. Cam- cocdidnsa treatment nay
. confined to north holf of atote.
nittee No. 7, HR. B.. Laud Carrying C.npnnity
of Reads an Affeoted eithnr or by Frost Actiss." beth: esco- nsticc and repl ocesec t
abl soils sathgrcnu-,
- - ' ceg. depths. - nf 3ft. & nab-
ourf. drainage
boA Bues & ' iMmoral ogg. s Doly with respect to Subhaaen ss)nngod fron neasasal ore mm ly old roadbed, an- sffoctcd by lnct. gravel bach- frost - fill & gloc.cluy sotioc. - bsckfilled in
- depth. 12-24 in. 2. Frnut lleave on surfaced highways nacacote suhgrsde to de th. 2.0-3 ft. & hsckfilled aith -
nell coap. deane graded or. atoCe.
361

362
TABLE 1. (Continued)
Base Saabgrode
Stote Reported by is damage coused by What type or types of 5 of State Give geologioul(or soil) S of Stete In soil aroaosonceptible
freezing of rood base or subbase mote- area affect- foraatiooa, or major area affect- to frost 000150, cv the
bases, sobbames. ond/or nab ore most son- . ed. (Eat.) soil types so, taos-cd. (Eat.) damage related to sail
subgende soils a prnb_ oepcihln to damage oeptible to damage by . profile development?
leo in your atste? by freezing? freeaang. . Yea No Remarks
Yea NoMajor Mioor
(sn. Noinfaeao- .
Ky. W.R.Drake a a Bases not ouaoeptible Alloniulsvltn,Eden 15 5 shale origin, Canenaugh
Lo. HI. a Lehmsnn .
Me L. D. a s ('icc. iii anita with more 100 5Silty glan. soils & 75 % Rare- All harsoons
Borross than 10% psaa.Na. 200 . anyatlanial or marine ly act sinalsrly -
sie.n & where draioage deposits nhich are fine is general
is inadequate. . textured orhave poor
gd. J.E.Wond a a Fine sands 20 5 A-A-silt caaatnl plain 50 5 a In areas of pravinoeA-7-aluys'thru high miter of out state A-5-Micncesus and oasis of
- silt-Piedmont pinteao . high napillurcty
grade of oats
Mann .1. K. x Snbhasea containing more 65 + Gtaniaflaviil S Glucia- oo + n Die to insdeqonte
Lacreace Bacon- Ca prim. thus 10% (by at.) of - lmcsstrine. illness1 - drasonge oupillury
dory roada silty mataraa 1PM class & fill deposits attraction in
Reads A-A subgrade in saamp areas.
Mich. A. E. a n Silt and nary fine aaad Thraugh- Morainen sad till plosna Through- Usua- Heavy "B" hors-
Mathems nut state out state Ily an of gravelly not narains & Out-
nash plains
troublv
Mon. S.S. a a Not particolarly damug' Glacial drift silts; 90 % Sr a Duffereatia
Wuthies ing to bases and nub- clays & their vneioua mare (mat beaning as
bases canbiontiaas; ssnd quate defiv italy bloom ailts; loo- relited to pro- ontniiesii tu & slays file development
Miss. H. 0. Tbampnan
Ma. W.C. Davis 5minyr
Loessial (Murahill, 50 5 lions) Glacial IGroedy) Residual (Lebanon), all silt bonn
lebanon, an aid, atognoat, thoman h-ghl leached soil
hixh ice ° ruabe it tinen.Harhsoll, Eons & Grundy give troubleuaoulby only ahere silty top sai boo benvvavcentroted in snags by colbuciol
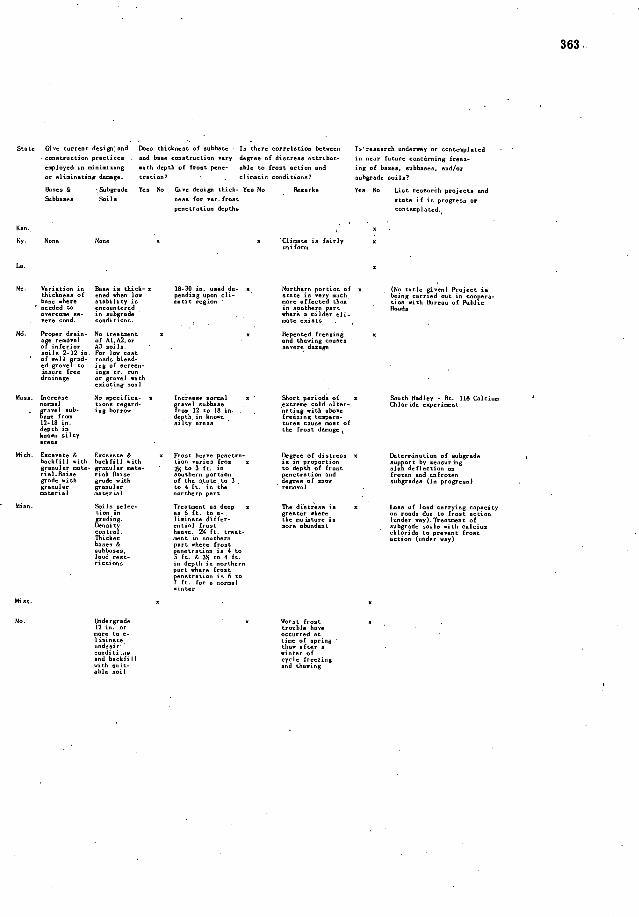
State Give current design: and Deco thickness of subbase Is there correlation between Is research underway or contemplated
constraction practices , and base constructs' on nary degree of din tress nttribat- in near fotore000cdrning frees.
employed in sinimising with depth of frost Penn- able to frost acts' so and isg of bases. oabbasea, and/or
cv eliminating damage. trstiss? - clisatic esoditioss? sabgeode soils? --
Bases & 'Subgrsde Yea No Gave design thonh- Yea No Ressrho Yen No Us tresearih projects and Ssbbases Saila ness for ear, frost state if in prngreas or
pevetrati on depths nonteeploted,
Ky. None None a a Clirasto is fairly
Lu. o
Me. Vsriatjoo in Bese is think- n 18-30 in. used de- a Northern portion of a (No titlo given) Project is thickness of need when lan pending ages cli. ' stoteisnery each being carried ma a in csopers bnse where needed to
stability is encountered
ma tan region ' acre offected than in soathere port
tine with Rireau of Pabltn Roads
overcome se- insub0rade , ehere a ailder cli- vere cond. conditsons. . - ma teenists
Md. Proper dross- No treatment a a Repeated frewaing renivsl of Al,A2, or and thawing onuses
of inferior soils 2-12 in.
43 on) In, ' For Inc cost
. severe damage
of' cell rod- rosdo blend- ed grovel to ing of screen-
cc
or gr eaistangnoo I
Maso. crease No epecifios- s Increase vernal a ' Sbort period of a Sooth Hsdley - Nt. 116 Calciaw nsrssl tions regard- easel sabbaxe estrese cold alter- Oil orideeoperie.enc grand nab- ing bcrrne boo. 12 to 18 in. . . 'natisf eith above base Iran . depth, in bnosv , freisan g tempera- 12.18 in. depth in
silty areas tores noose most of the frost dslsafe
booms ailty
Mach. Esoavate & Excavate & o Frost heave penetro. Degree of distreosv Ge tereination of aabgrade bonhfil) with backfill with tioonariea from a is in prnpsrtiov sup net by aeaoar ing granular sate- granular sate- ' to 3 ft.
in to depth of frost slob deflection on
vial Rn sac ro al Rssse osathera portion pesetrstson and frosen and unfrosen grade with grode nith of the otote to 3 , degree of snoc , subgrwdna (in progeewe) graou br granular to 4 ft. in the removal ma terso I sotersal narthern part
Minn. Son In arlen- Treatioesc as deep a The die tr'essian Lass of load carrying capani ty taso in as 6 ft. to e- greater where cv roads due to frost satios gradang. I amsoate d'sffer- the so iatureia (under nay). Treatment of Oenaaty entanl frost more abundant aubgrade nnilx with calnius , cnntrol. he000. 2% ft. treat- chlanide to prevent frost Thinker vent in soathern action (aider nay) bases & part where frost
o subhaes. lundrest-
enetrativa is 4 to Ifa. &3(lto4ft.
notions in depth in nvrthern port where frost
in 6 to rnetration for a nones1
winter
Mias. s .
Mo. Iindergrade - s Warot frost 12 in. or trouble have
1 ia.anste tiseof spring - undesar' nonditi.,.o
than after a winter of
sod bsnhfill cycle freeaing
withsu at- and thawing
able vail
363

TABLE 1. (Continued)
Hose Sobgsnde
Reportdd lIi donis'ge csuod by I Whattype or typea of % of State Give geologicsl(or soil) S of State: In.,eosl ar000. susceptible State
- freehingof road " hsse or subbase mate- area affect- formations, or major - area affect- to frost action, an the
'basns,sobhaseo,aod/or s4ala ore mont sun-ed. (Eat.) soil types most sun- ed (Eat.) damage related to soil
aubgrnde soil' o ptoh-cepiible to domoge ceptuble to dosoge by profile. development?
lea in yauc.utoto? by freesiog? frensiog. -Yes No Remarba
ot'yes 0oMoj6rMinor
H ot. g.fl.Gogle o Vorien All typee from A2 to nWhen the ester
table height is from yr.to
A?. WA and AS are t. narO , . involved.
yr.
0. L. Land . Silty nndsohd nta- 'oo 5 ' Lalomd 50 Front heave mby Nab.
biliaed soil base, -, : Lneoa.GlocislTs11 0005ran any
nonroessi th mori Pierre Whole, Pin- iubgrnde eocept & coarse sand than 10% panning , .
No.200 sieve eo- ., - brarn O,slb, top ooils & nahnoils de- gravels ehmn
ecially thone aith veloped in lake hot- underlain by
high plasticity indices tons of the sand hallo more impervious formation aithan higher than about 4. -
. a distance of shout 6 ft. of grade elevation
F. 6. s m Goonulor hoses Silts & aslty loans 2 S Nov.
Harms50
N.H. P.S. Otis n o Baneo non taming more Qoite gnu- All 0000pt Al sod the 90 5 than S Spanning Na erolly an better A3 nosln. Great-
200 the older . nonntrac-ond
eat damage in A4 oilta A-2-4 glociol tills
- -
tiom having high percentage
- - passing No. 200 Steve
y.j. JR. Snha?1 e r n - - en crashed ntone bose 40 5 Whal comtssni og mere 60 5 - ' placod is a boo oCction surrounded by on so-
than 10% finer than .05 am. disc. Eooiroo-
pervious soil & grsnulsr went & number of hey. . - -
- ' hanh ran mntl. contain- load repetitions have ing more than' 12% passing a considerable an-
- . Na. 200 oie(e . El aenne no nnuanpts- - . ' bility to damagn
364
F.B. Bnil a •, -

365
- .... State 'Give currezt 'deiii sndu,' Duesthifbness of subbase 'Is there correlation between I a researchsundernay or contemplated
cnstrueaioa practici's' and bose construction vary .5 degree'of distress attribtt- in near future concerning freer-
nploedin dikioiaivg' 'lith'drpth of frost penm- i mble to frost action and . jog of bases, osbbsaeo. and/or
or li,instiog dosage. trstion' chaotic conditions? ouhgrsde.voils?
8ea & ' SIsbgrode Yes No Give dcssgo thick- Yes No Remarks Yes 'No List es'evrch yrkjats and
Sobbnses Snilo ness for car, frost state if in progress or
peontrntion depths contespinted
Mont. In niens If sobgrsde . ..............n A dry season before n Will make so inveotigotion when condi
me tions currant it.. having high soils are A4
mster teblea to Al these '' - winter freeze minI.
sizes frost netion. profiles are osterisla are - .......... Slow and istermsttent sept high. blonheted
Carcfsl ot- with a sand . .s :' freeaiog and thoniog increusmu trust
ten tionischshwrcoursw . .. . dasosge. govem to am- ooreprnper . drninnge.
- -------. . -
Neb. Limit No. 200 Install sub s ' . a Greatest distress in s Reductinn of strength of material to surface droim- . areas where Ice tom- I oeooi sI mi In and grams Icr 8 to 10% nge.Use of rel- ......... pers torem cnincidw base onuroen due to frnst P.
equsl sticely geevter ... a oath high roinfoll. octimm.A lsbnrntnryeeri- 3 ar 4 subbase & gron- - - ". . oemt,00ing the tris0is
slur hose . " eqoopsent an determine thickness. - ..- . .e strecgths. -
Nev. Additimcal m More base is used hoses added in adder cliasotes
N.H. Use cleno Vory depth v Geoeel depths nun s A dry seecce before a Reduction of Inod bearin5 gravel hocimg with type be reduced shoot
iic. in a nhollaa
winter freesewi ci- - capacity durang the thawang mum.of 5% of subgeode wires frost avtinn. period. pnooing No. noil. Use hand ulmog the Midsinter thoos opt 200-mieve. 12 in. veer coost nhich hos s to increase frost Gravel best A2 I esmer pemetroainm actiam. Aspid spr ing shoulders to moteri vI 30 offrost and higher thms'imgimereanes the full in. over poor overoge winter tee- sprimg breohup. width of the A-2-4 sail. peretore
use of svdcr droinoga high profile mhere- ever possible.
N.J. Umnerslly Reenvul of m broken
o Degree of silo tresns Comteo late obtainin field
stunt, ar vvia
vlag. bonhrvn si Its & is natributable to the cu of hey. 1usd
1X1 values on nnbgro0e and sobbsses durimg aioo. Ge-
& comeerseal nucbs.Fie- repetitions. Cii- termivotiov of resiatnnee of rand acm- placed oi th ostic conditiaco von ous soil types, ausered biced.in thick- coal, hue, have not been stud- nith sodel enmerete slobs, mess of from seg leso . . md very thoroughly am the pevea. of pl oogers with 8 ic.tm 12 an. thsv 10% p005 These coals No.200 uieoe.
var. unit loads_Can prn8nesn). . host o high % Cover sd Ii - - of mcd & having high grace I testurol cloy content sines & u very aith u sc- Ion % of five leeted . osnd & silt, borrow, or Entro depth of eovavotiom mobbuse is moth. hsvn spec Iliad in 10% or less ormas where paoc.No. 200 ground mater nieve. - tuble is in . close prOaimity to the subbone & where the v. - bearing of the . . . .
. '.5 .
N.M. S
/

a High oil tnsvte Gbscsal draft port-
mornnsc ucsbnrl Ohio C.W.Allee
o noiba assally with areas.6 so anne 50% ormore pr- a
OS allsoiol silt.
ticlea bw tseen & .00S css.P.l.)eao than 10,106B Clans. A_4.0tcnaisoa lly hod & frost hean sog on very fine lake sonda in northern
Ohio.
OhIo. G.E.McCsny a 200-220 frost
free dayn per yr.Ang. frost
pen- el 5-10 is.
60 5 Salty & vlsyevtype
One. JR. a a
Soil a containing 3-10% by eght.sI
l soils generslY of on alluvial thsroc-
Sthoob nsnl.less than tee. .02 ma. dims,
60% n
75 S No t notave-nbly.
TABLE 1 (Continued)
Bsee Babgrsdc
State Reported by Is damage caused by What type or types of S of State Give geolsgscol(or soil) S of Stats In soil areas susceptible
Erecting of rood base or subbase ma te- ares affect- formations, or nsjor arroaffec t- to frost action, as the
bosen, oubbaoes, oedlsr ri,ls are most ass- ed (Eat.)... .asi I typea most ass- nd. (Eat.) damage related, to soil
aubgrade soils a prob_ ceptible to damage ceptible to damage by profile, development?
lee in your otote? by frenal'ng? freeanng. , Yes No Remarks
Yea No Major Minor
N.Y. George W. a s ''Dirty" Run of Bash Tills aith"Hardpan" or Ne or I
Mcklpia' ' Gesvrl; that is, nhvre "cIa? pod' layer, no- - slasys a
the persen tmge hoer roinac nails, thin tills, heave where "B"
than Ns.200 mesh is Heave on I acastnise soils horiaon is
greater than about in minor and tends to be '. crossed to
10 in. sei form cauning co,opsra- tonal soils tinely alight dosage, eovept as fine osody de- posits. Heaves are trouble- some an half bs , bog, hydromsphic and plan e oanla if grade in not kept high .
nn ostsanh if the ground esters's high and drain-
aith boulders hesving beneath the paeeeent.
p.c. L.D.Hicks °
N.D. W.A.Wsne ' e a Stukilised guasabor
100 5 A6_7,hvy.cboye &
base csotsining high 6-4,6.6 7 - silty
p.!. of 6-9 nhere boina.
70% .5 fleaning& see11 18
cold & set eeather reap lnstobi!ity
thaning,& serious shrinkage doria8 dry periods.
366
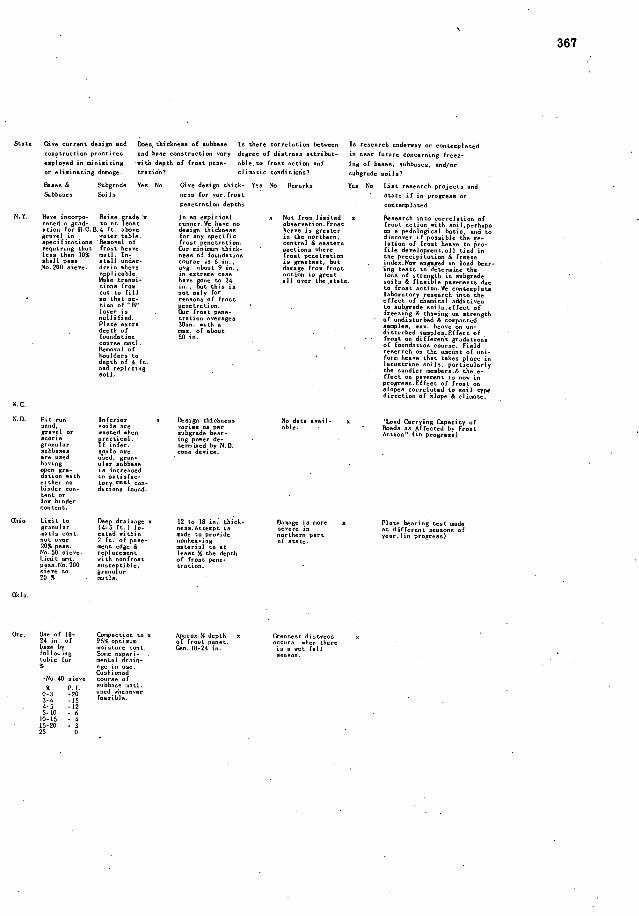
367 11
State Ga we current design and Ones, thickness of subbase Is therm correlation between Is research underway or nontenpioted
constructs on practices and be on construction vary degree of distress attribnt- innenr fs Lure concerns'eg frees-
employed in nininiaing with depth of frost penn- able to frost action and ing of bases, subbaseu, and/or or elioinoting doesge. tration? climatic nonditiuno' eubgrsda soila'
Bases & Ssbgrsde Yen No Cbs design think- Yes No Remarks Yes No Lis t research projects and
Saibbanes Soils ness for nar.frost state if is prngresa or
pecntrotioo depthn contenpboted
N.Y. Have incorpo- B5555 grade x In sneaipsrsool a Not from lioited a Research into cnrrelotion of rated a grad- to ot least esneer We have no sbseroation. Frsst frost action with soil,perhaps Oct00 for ROB. 4 ft. above deesgn thickness hence is greater so a pedological basis, and to grovel ce mater tsble. for any speci fic in the northern, dsaooeeri I possible the Fe- apecafacotsona Renonol of frost penetrutsen. central & esstero lataon of frost heave to pro- reqairang that frost heave Qir msnanun thick- sections nhere file developnent,nll Lied in less than 10% maLl. Is- ness of Inundation frost penetratinn the precipitotion & freene skull psas eta11 under- course is 6 in., is greatest, but indea.Nsn engaged in load benr- No. 200 sieve. drosonhere ocg. ohout 9 in.. dosage from frost ing tests to determine the
op licohle. Make tranas-
aneetrese case hone 24 gone to
action ss great all over the state.
loss of acres th in subgrsde
tssvs free an., lost this ss seile & flesible poeeaeotn due
vat to fall not only for to frost octiss. We 000template
so chat so- reasens of frost laboratory research into the effect of chemical additives
cane of "B" penetrstaon. - to sabgrade soila, effect of layer so . Our frost pens- freeaing & thesing on strangth nollifsed. trotion coeroges - of sndiotarbed & compacted Plane entra depth ef
30ie. with a man, of shout
samples, man, heave on an- diotorbed samplea.fffeot of
foundation course eatl.
50 an. . frast so difforent gssdscions
Removal of boulders to .
. of foundation course. Field reoeorch on the awehet of sni-
ale th of 4 ft. - fern heave that takes place in
and replocang Icons trite aoi Is. particularly
soal.. . the sandier aembera,& the ,e-
flect onpaveown tim now inprogresa.Effent of frost on slopes correlated to soil type direction of slope & climate.
N. C.
N.D. Pit ron Inferior s Design thickness Na data ceoil- a '1_cad Carrying Capacity af send, gravy1 or
soils are mast_cd nheo
verses as per able. Reads as Affected by Freot
scoras subgrode hose- Actioo" (in progress)
gronalar prectscnl. If infer,
tog poser de-term bend by ND.
snbbuses are ased
soils are cone device.
hoving a'aed, fran- slav subbase
opon gre- is increased dation nith cn sutisfac- either on torynest con- bivdcroon- ditaoss found.
lam binder 000 ten t.
Ohio Lsnat to Deep droaosge m 12 to 18 in. thiok- Damage is more a Plate bearing test made granular (4-5 ft.)
J. oves.Atteapt is smcerviv at different seasons of
sods cost, outed si thin made topranide northern part year. )io progress) not 00cr 20% pass.
2 ft. ofpane-
went edge & nonheacang caterial to at
of state.
No.50 scece. replacement cost 14 the depth Linac ant. oi th nonfrost of frost penn- psso.No. 200 susceptible, i_cation. sieve to granular 20 % cuLls.
OhI a.
Ore. Oue of 18- action to Ap2
oo.9 depth s Greatest diureoa f %ptun froat peoet. occurs when therm
busc by vu sscnre cant. Gee. 18-24 in. is a enc fall foll000sg So cv caper i - season. cable for mcnlol drain- S
-No.40 siene Goshiovvd course of
P 1 uubhaae not1. .
0-3 -20 noed whenever
3-4 -1 5 con i c, - 4-5-12 5-10 - 6 10-15 - 4 15-20 - 3 25 0
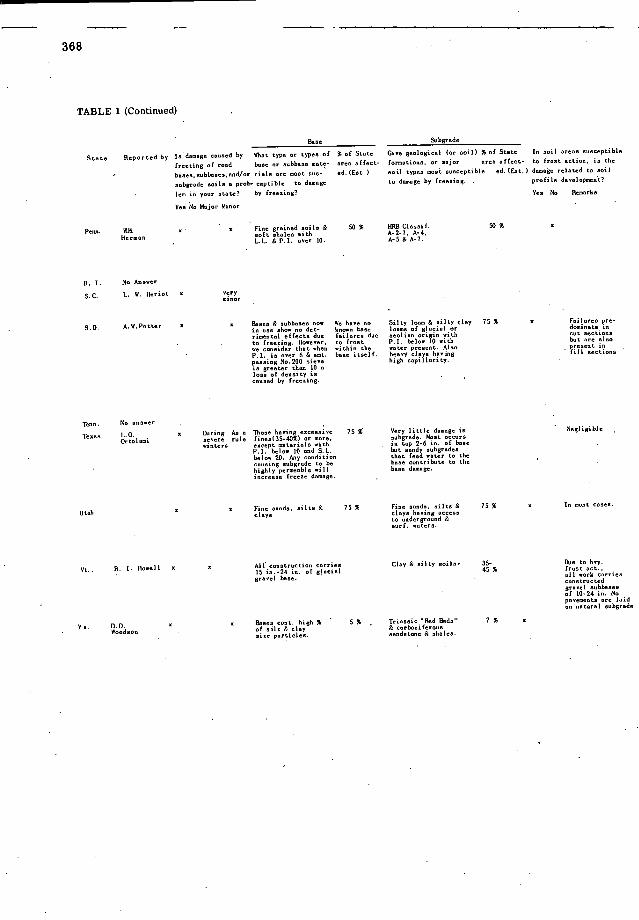
368
TABLE 1 (Continued)
Raze Snbgride
State Reported by Is damoge caused by IThot type or types of % of State Give geologicol (or soil) S of Stoic In soil oreoaaosceptible
freezing of rood base or subbase mote- area otfect- formations, or major area effect- to frost action, is the
bases, sobboses, sod/or risln are moat nun- ed. (Ent.) so il types most susceptible ed. (Eat.) dainagc related to sosl
aubgrode sails a prob_ ceptible to dosnoge to dsnnsge by freezing. . profile development?
lea in your state? by freezing? Yea No Remarks
Yes No Major Msenr
a a Fine grsioed soils & 50 5 MOB Claaasf. 50 5 a Pece, lilt soft nholes with A-S-i, A-A,
Hnrmac L.L. & P.I. over 10. A-S & A-i.
B. I. Na Aaaeer
S.C. L. W. Ilerint a minor
s a Osoem & aabbaaeannm Wv bane an Silty loon & silty clay 15 5 a Failarea pro. S.D. A.W.Pntter
in use show no det- boone hasm looms of glacial or dominate in
rasental effects due failares due aeslisa art amos• th 10 P.O. below aith
cot acctaona but arealso to freezing. banner,
we consider that shea to front ni thie the mater preneo t. Alan prenentin
P.O. is ovvi' 6 & set, base itself. hencA cloym haviog fill
panaiog No.200 nieve high copallarity. isgreater than 10 loss of deosity is esosed by freezing.
Teen. No answer . -
L.O. a Earing As a Those honing oanemsiwe 75 5 Very lsttle dosage in Negligible Team
Ortolaoi secerera It fieea(35-40%) or 'or. subgrsde. Rent nccira in. base winters eocept sateriala with
P.O. helne 10 and S.L. in tap 2-6 of but siedy oubgradea
below 20. Any condition that feed water to the vsasiog suhgrade to be base contribute to the highly perneobla ;ll base damage.
a a Fine asodo, silts & 75 5 Fine sands, salts & 75 5 a In sue icases.
utah clnya clips having occena to nnodcrgroind &
1 Rose!l R. a a All 000straction carries Cloy & silty mousy 35- Doe to hwy. frost nut. Vi.. 15 in. -24 in. of glacial 45 5 all cork Carriea
grace! base. connirnuted grace! nabbasca of 10-24 No pacementa are laid on natural aakgrsde
D.D. 5 a Bumea coot, high S ' S S , Tranaaic "Red Reds" 7 5 a Vc.
Woodaon of silt & cl5 & corhonsferosa sine portinlea. sandstone & aholea. -

State - Give current design and Ones thickness of subbase Is there correlation be- Is construction practices and bose construe tine wary
research underway or contemplated tween degree of die tress in fleer future concerns• s frees.
employed in esniniosng with depth of frost pete. ottrihotable to frost ing bones, or eliminating dosage. tration?
of subbasen, and/or action & climatic conditions? sobgrade anUs'
bIases & Sabgrsde Yea No Give design thick- Yes No Remarks Yea No Lb treneorch Subbonen Soils ness for cur, frost
projects and
state if in in progress or penetretina deptkn
contemplated Peon. Useof 6 in. None o 0
ein.dpth. of
so ti over cot. gradung
8.1.
S.C. No Fl,ng.cin de
to a.
affected.
S.D. Bane & nub- Reploced by a Give denign thick- a Degree of damage bane are placed 24 so, grao- neos for csr. frost due to frost nation full asdth. ular nubksae penctration dwptha: dependwnt largely on B. thack- incritaca I NOTE:Thickwr banns the unt, of noistsrn nesses nary cot snatu. are used ahera hvy. present in the soil
from6 an, to Joe 12 in. cloy soils predcna- - at the tine of frees.
12 ic. Subbooc gr000lor nub. thickceineo boon for
vote & ehereoilty ing. A wet full, fol-
using pat run crstscel fill noils(50% ailt or greater) keying P.1.
need b a severe ' winter 5 u qoich spring revel nary
fran 6 an. to aectu. Under- under 10 oppear. the n coasen wont damage. -
24 in. cut subgrade Thickceusen are not A great nunbnr of freene soil in placed dewp in falls,
directly wotobliohed by depth frost uf
thoc cycles also ploy an
pecccrotsoc. inportant pert in taos. iog frost dosage.
Inca.
Teosa Soul leaky n Nat definite in the surfacing, strengthen. freenc donage ama.
in. of the
: keep P.I. helom 12, the % - 40 below 25 after rolling.
Utah KIev. rofile 4 ft. + cater
Usuoll yse-o lect
o ha treon in moot a Cocatraction of 2 projects tables & pm.
fran- ular noUn,
senernin oh. carnally to
aver urean of bad frost ciding dncae weather.
heociog & breaking soils. grude baie , In progress. have matahnd
for tao years. provide uoder.
Vt. 15.24 in. Heoviwr rae. o Frost penet. grace I sib- bunco laid
aobboae Toid chereal Icy
in earn or lens cacs tunt
on old cork 'seA/or clny throaghnut
a th, depends subsoils are the atote, nail char-
& enceunterad -
road doom,
Vs. Not token o o Nigh prncipi tutionoConductvd Stotwaide Rood in to acat, plus lan temp. . Condi tin0 Survey ut time in prea. design
cauacoeacnnaioe of 1948 npring breakup. methods,
. danagn. (Ocnuro about every 10
369
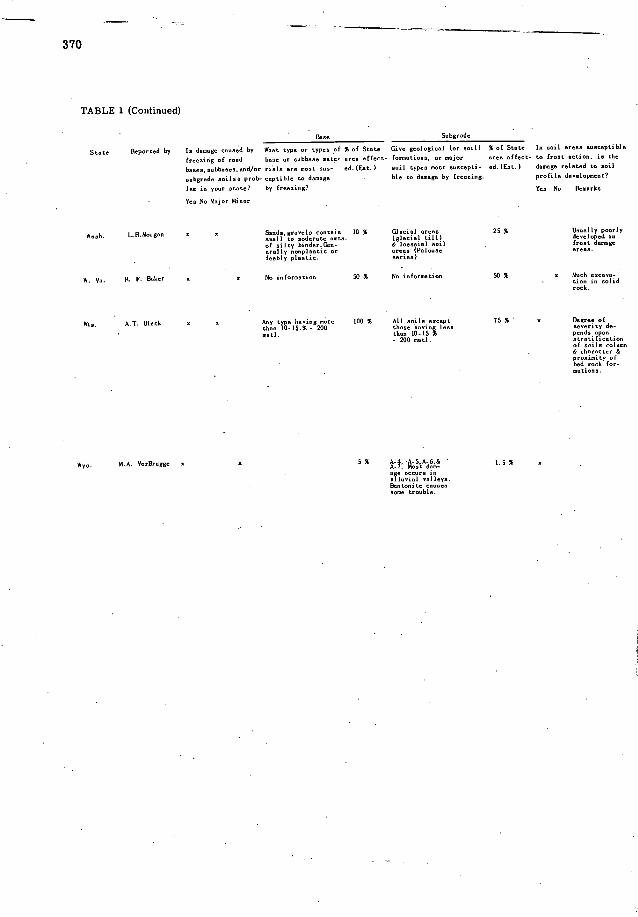
370
TABLE 1 (Continued)
Bios Sobgrade
State Reported by Is damage cauaed by Riot type or types of % of State Give geological (or ecu) % of State In soil areas ausoeptable
freeaing of road base or subbase mate-area affect- formation a, or major area affeo t- to fraatsotion, as the
bases, subbaaea,and/or riala are most sum -ed. (Eat.) mail types most suocmpti- ed (Eat.) damage related to oath
aubgrade aailaa prab- veptible to damage ble to damage by frenaang. prafale development'
Ins in yauratate? by freeain g? Yea Na Bnmarha
Yea No Majar Minor
Wash. L.Il.Margao a n Saodn,gravsIaoaotoo 10 5 GlntaaIarea) 25 5 Ueaelly poorly
of ailty binder.Eao- & lanaaial mail frast damage
erally macplastic ar areas (Palaaae areas.
feebly pleouio. aeriea)
W. Ma. B. F. Baker a a No in(arentioo SO S No infnraatass 50 5 a Moch encasa- sian is solid
Wi5. A.T. RIcoh 5 5 Any type having more 100 5 All soil a noon Pt 75 5 a Degeem of
than 10-IS.% - 200 those haviog leas soneroty de-
eatl. than 10-15 5 penda upas - 200 matl. atrotification
of scum valuso
Wyo. M.A. VerBruggn
:: tkA 5 1. 5 5
occaia?eya.
Bnotuoite causes some trauble.

372
construction practices. Many of them indicated that where soil susceptible to frost action are encountered that they are excavated and a backfill is made with granular materials. The replies emphasized the importance of an elevated or raised profile, particularly in areas having a high-water table. The survey revealed a wide variety of specification employed by the individual states in minimizing or eliminating frost action damages.
Only ten states replied that design thickness of subbase and base was varied depend-ing upon depth of frost penetration. In some cases the states indicated that the charac-acter of the subgrade soil was the governing factor rather than the depth of, frost penetration.
The majority (31) noted a correlation between pavement distress attributable to frost action and climatic conditions.
Research
Fourteen states have research projects underway or contemplated in the near future concerning freezing of bases, subbase, and/or subgrade soil. Others replied that such studies have been made in the past. -
Acknowledgements
Thewriter wishes to acknowledge the assistance and to express his sincere appre-ciation for the cooperation given by a large number of individuals in supplying the data for this summary. It is understood that in some instances the field .forces supplied data which in turn were summarized by the state contact man supplying the information.

StoLe Ga Ce current design and Doeu thickness of subbsoe Is there correlation keteeen I sreuearch underway or con- c505tructaon pructaceu and bose construction vary degree of distress nttribut- teeploted in near future coo- employed in naniosaceg with depth of frost pene- able to frost notion & nerning freezing of bases, or eliminating damoge. tretaco? climatic conditions? . subbuiesend/or oobgrsde soils'
Bases & Subgrnde Yes No Gave deaign thick- Yes No Resarks Yes No Liat research pro- Subboses Soils • owns for vor. fruit .
iecta & state if in pcontrataofl depths • progeein or 000ten-
plated
Pooh. Soil aortae Addutasosl Sonetiees Uaefrom 1/3 to a Sisne sreos are an a Inceotigatino of shall have ourfccaeg 1/2 of macfrost dry that frnst frost penetration L.L. not used over peeet. depth Ia does no damage in progress. 00cr 25: frost sos- P.1. not ceptible ..
frost damsge aresu only.
e000sn oil ty soila.
W. Vs.
over
S passing No ports- o . . No iofursiutine o One of fly-ash as No. 200 color de- - . on sdmistore for sieve 55 aign prsc- soil otskiliautino
greater he en uied. rarely Lace (Plonned).
thou 10.
Wns. Utiluse o n lctisstely full nidth . sooscisted with prvioua
nund gravel of the partivolar
to 151,. thick. Baoe
of cruahed & graded gravel or since, hav- ing less than 10 5 pnssieg No. 20! sieve. Base course thick ness varies from 6 to 12 in. dependivg on troffuc. -
Wyn. r :sin rnlof P.I. v both nontaic i
nvthod of paveeert
boom & sub- i 19
trncss design.
ice& back - fill with sot iafsc tory notl. Ssse increase in
fcing Mesa.
371
3,73
NEEDED RESEARCH PERTAINING TO FROST ACTION
REPORT OF QUESTIONNAIRE ON RESEARCH NEEDS
Frank R. Olmstead, Chairman, Subcommittee on Research Needs, Highway Research Board
Few engineers are aware of the vast amount of information developed in the study of frost action in subgrades and base courses during the past 20 years. Much of this information is widely scattered in the engineering literature, and it is only recently that a sincere effort has been made to assemble significant information on frost and its related highway problems. There is an urgent need for making a systematic ap-praisal of this knowledge so that remedies and treatments can be made available to the practicing engineer for design and maintenance purposes.
The Highway Research Board, through its Correlation Service and committee ac-tivities, has made considerable progress during the past several years by assembling and reporting significant research on the highway frost problem. Periodic visits to state and university laboratories, questionnaires, solicitation of technical papers for the annual meeting of. the Highway Research Board, compilation of bibliographies, ab-stracts of technical articles, and the committee discussions of significant phases of frost research are some of the devices which have been used to collect, assemble, and organize this frost information on a nation-wide basis.
It is recognized that even with the research work that has been completed there will be certain aspects of the frost problem that need additional study. For this reason a nation-wide survey was made to obtain the opinions of a selected group of engineers and scientists to ascertain which phases of the frost problem should be considered in future research which will be of interest to a majority of engineers working with this problem.
A questionnaire was sent to 238 engineers and scientists located in state highway departments, government organizations and engineering schools to obtain as complete a cross-section of opinion as possible by this method of survey. More than 68 percent of these questionnaires were returned with complete answers. About 10 percent re-turned the questionnaires stating that they were not in a position to answer the ques-tionnaire or they failed to rate the six categories of research. Only questionnaires with complete answers were considered in summarizing the results of this study. In most instances the opinion of at least one state or government engineer and one pro-fessor of civil engineering was obtained from each state. In some of the frost states more than one opinion was obtained from each of the three groups previously mentioned.
Questionnaire
We have directed this questionnaire to you because the Committee on Frost Action wishes to obtain your opinion. Your name will not be used in the tabulation of these data.
We want you to rate the following six categories A through F by assigning numbers, one through six, in the order of importance to the frost problem in your area. In case you have additional frost problems in your area which are not included in the categories listed, add them to the questionnaire and give them a numberical rating so that we can obtain your relative rating of all the categories:
(A) Soil Temperature Research work within this category includes the tabulation of actual temperature
measurements over a long period of time which will be correlated with local climatic conditions, local soil conditions, surface cover conditions, and the effect of the soil moisture on the movement of temperature within the subgrade of pavements. Included

374
will be the studies of the effect of various thicknesses of insulation courses to reduce frost penetration.
Soil Moisture and Moisture Movement Research work within this category includes the collection of factual information on
subgrade moisture content data together with information on soils, pavement structure, and climate; the development and improvement of moisture -measuring devices for sub-grade soils; and the study of theories of moisture movement in soils.
Climate and Distribution of Soils Research work within this category includes the development of a generalized soil
map and the development of a climatic map for the United States with special reference to the damage of highways due to freezing.
Frost Heave, Basic Data, and Definitions Research work within this category includes the fundamental study of the phenomena
of frost action, the collection of basic data on the effects of frost action in various types of soils and the definition of terms associated with the problem of frost action.
Frost Action and Spring Breakup Research work within this category includes the collection of field data on loss of
stability of subgrade soils during the spiing breakup together with data on soils, mois-ture changes, climate and pavement structure; and laboratory investigation of the acifon of freezing upon moisture in soils as related to stability.
Remedies and Treatments Research work in this category includes the collection of information on the design
and construction practices that are followed to remedy or minimize the frost problem in various parts of the United States, such as, drainage, use of base course, making the soil more uniform, etc.
Other Fields of Research Research work in this category includes research studies on problems not included
in the six categories, or additional comments on the frost problem, if necessary.
Results of Questionnaire
The data obtained from the questionnaires were tabulated by states and the ratings for each of the six categories of research were summarized under three subheadings so that comparisons could be made among the ratings assigned to those six categories by professors of engineering schools and government and state highway engineers located, in various parts of the country. The results of this' study are summarized in Table 1 on a percentage basis so that direct comparisons can be made between the various opinions. In this table the data have been summarized :0 a nationwide basis to show the consensus of opinion expressed by the three different groups answering the questionnaire. These data have been subdivided into two areas, non-frost and frost, to indicate the influence of climatic conditions on the opinions of these three groups.
The percentage distribution based on the number of papers presented in this sym-posium is shown to indicate the relation of this symposium to the consensus of opinion found by the questionnaire.
A study of the data in Table 1 warrants the following general conclusions: (1) It appears to be the concensus of opinion on a nationwide basis, that the most im-
portant categories for research studies are (F), (E), and (B). These three are about of equal importance. There is a slight trend toward placing more emphasis on (F) - "Remedies and Treatments." The next category of importance is (D) which is about 70 percent as important as (F), (E), and (B). The least important are (A) and (C) which are about 40 percent as important as the highest rated categories of frost research.
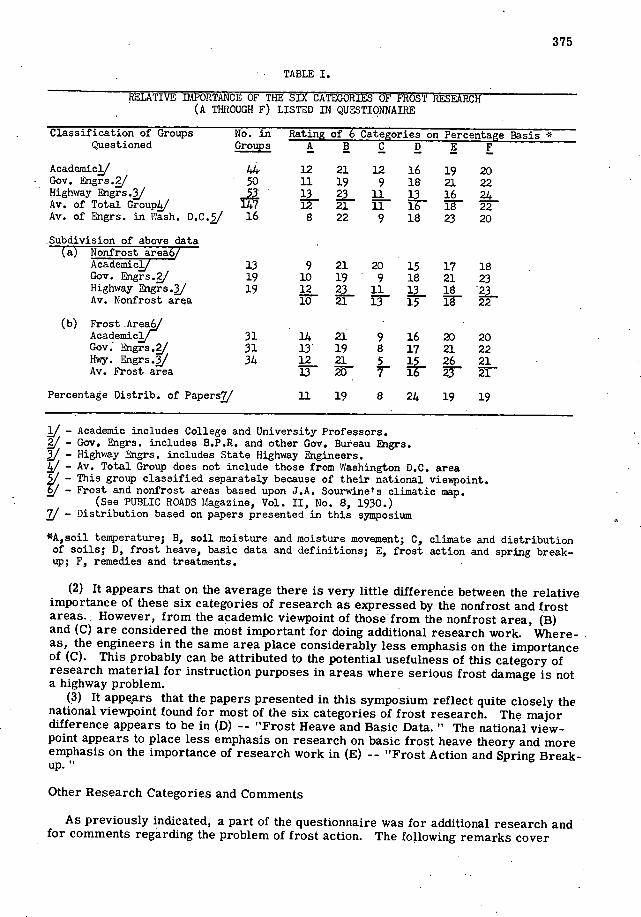
375
TABLE I.
RELATIVE ThIPOFtTANCE OF THE SIX CATEGORIES OF FROST RESEARCH (A THROUGH F) LISTED IN QUESTIONNAIRE
Classification of Groups No. in Rating of 6 Categories on Percentage Basis * Questioned Groups A B C D B F
Academic/ 44 12 21 12 16 19 20 Gov. Engrs.2/ 50 II 19 9 18 21 22 Highway Engrs./ 13 11 13 16 24 Av. of Total Group 147 12 21 II Ir M 22 1w. of Engrs. in Wash. D.C./ 16 8 22 9 18 23 20
Subdivision of above data (a) Nonfrost area6/
Academic/ 13 9 21 20 15 17 18 Gov. Engrs.2/ 19 10 19 9 18 21 23 Highway Engrs./ 19 12 23 11 13 18 Av. Nonfrost area 10 21 13 15 1W 22
(b) Frost .Area/ Academic/ 31 14 21 9 16 20 20 Gov. Engrs./ 31 13 19 8 17 21 22 Hwy. Engrs.J 34 12 21 5 1 26 21 Av. Frost area 13 20 7 16 21
Percentage Distrib. of Papers7/ U 19 8 24 19 19
- Academic includes College and University Professors. - Gov. Engrs. includes B.P.R. and other Gov. Bureau Engrs. - Highway Engrs. includes State Highway Engineers. - Av. Total Group does not include those from Washington D.C. area - This group classified separately because of their national viewpoint. - Frost and nonfrost areas based upon J.A. Sourwine's climatic map.
(See PUBLIC ROADS Nagazine, Vol. II, No. 8, 1930.) Distribution based on papers presented in this symposium
A,soil temperature; B, soil moisture and moisture movement; C, climate and distribution of soils; D, frost heave, basic data and definitions; E, frost action and spring break-. up; F. remedies and treatments.
It appears that on the average there is very little differenée between the relative importance of these six categories of research as expressed by the nonfrost and frost areas. However, from the academic viewpoint of those from the nonfrost area, (B) and (C) are considered the most important for doing additional research work. Where-as, the engineers in the same area place considerably less emphasis on the importance of (C). This probably can be attributed to the potential usefulness of this category of research material for instruction purposes in areas where serious frost damage is not a highway problem.
It appears that the papers presented in this symposium reflect quite closely the national viewpoint found for most of the six categories of frost research. The major difference appears to be in (D) - - "Frost Heave and Basic Data." The national view-point appears to place less emphasis on research on basic frost heave theory and more emphasis on the importance of research work in (E) -- "Frost Action and Spring Break-up."
Other Research Categories and Comments
As previously indicated, a part of the questionnaire was for additional research and for comments regarding the problem of frost action. The following remarks cover

376
some of the comments obtained by this nationwide questionnaire on frost research. These comments and other phases of research are tabulated by states. In most cases they are excerpts of statements made by one or more of the groups in the state and they are presented in random order to conceal the source of information. These opinions and suggestions were treated in this manner since it was stated in the questionnaire that personal names would not be used in this report. Consequently they may or may not reflect design practices in the states.
Arizona - Research studies should be made to determine (1) which component of the pavement structure is primarily responsible for most frost damage (applicable only, of course, in pavement structure that is otherwise completely adequate); (2) which factors are causing the damage in the distressed pavement components; and (3) a practical test method which can be used in the field to detect the factors responsible for frost damage. These field and laboratory studies should be confined to roads built in accordance with modern design practice with respect to thickness and quality of the materials used for each structural component of the pavement.
California - Frost heave is a minor problem confined to the northeasterly mountain-.ous regions. We are, howeyer, interested in the factors affecting the development and movement of soil moisture.
Georgia - Frost damage is a very minor problem. Some damage is experienced with base courses of roads built in the northern part of the state. during extremely cold winters.
Idaho - There is a need for the development of a control test that can be used to pre-dict the susceptibility of base course materials to frost damage. It also is desirable to study the form taken by frost in penetrating and heaving base and subgrade. Additional information is needed on the accumulation of moisture beneath bituminous surfaces with untreated shoulders and some study should be made of snow removal methods in relation to the penetration of frost.
Illinois - The effect of soil moisture on the movement of temperature has been stud-ied and can be computed. Research is needed to determine the thickness of pavement and base necessary to carry highway loads over a frost melting subgrade.
Iowa - Research work is needed in the study of vapor movement of soil moisture through the subgrade and base course.
Kentucky - It is desirable to obtain additional data on the minimum thickness of pave-ments with bituminous surfaces for use on lightly traveled roads.
Louisiana - The temperature rarely falls below 25 F. and stays too short a period to make frost action a serious factor in the life of pavements. Our problem is high water table and saturated subgrades. A study of pavement pumping in connection with movement of moisture in soils and their corrective treatments is needed.
Maine - Additional information is needed concerning the effect of frost action on culverts and minor structures. Studies should be made on the relative displacement of structures and adjacent soils due to the freezing of soil moisture and.on the effect of thawing on the stability of culverts and minor structures displaced by frost action.
Research work is needed in "Frost Action and Spring Breap," in "Remedies and Treatments," and in "Soil Moisture and Moisture Movement" as it ultimately will show the relative efficiency of various construction types in resisting frost action. The im-provement in pavement design to resist frost action is one of the paramount needs in this area. Experience has indicated that highway damage is not necessarily dependent upon the overall severity of a given winter, but rather upon the details of temperature fluctuations and moisture conditions and traffic characteristics. It is the accumulation

377
of excess moisture that causes trouble regardless of what the climatic conditions may be, even though subfreezing temperatures produce the most accumulation of moisture. The past winter has demonstrated that extremely severe damage may occur during the course of a winter of moderate severity.
Maryland - Additional studies should be made in the use of chemical admixtures to provide for protection of pavements against frost heave. Information is needed on what percent of chemical would be required, to what depth the treatment should be and how long it will be effective after placement.
Massachusetts - There are too many independent investigations made by various organizations. It is highly desirable in the interest of progress to coordinate these efforts and to make a better dissemination of the results of these studies.
A study should be made of the colloid chemistry of soil constituents, their inter-action, and how they can best be stabilized to offer a basis for highway construction unaffected by moisture frost, etc.
Michigan - Climate and the distribution of soils are very important to the highway industry as a whole. There are some conflicting ideas on basic frost heave thta that need clarification. Field practices are well established and the pressure for research is, therefore, not too great. There is a need for economic studies in connection with the design of highways to prevent frost damage. How much money can be spent to pro-tect highways against frost damage considering construction and maintenance costs and traffic loads?
Missouri - Research studies are needed in soil moisture and the movement of mois-ture-as this information is needed for other purposes. Remedies and treatments be-come important after the others have been determined.
Montana - Studies should be made in soil moisture movement and frost action to de-termine the effect of lowering the free water table in frost conductive soils by means of drainage facilities, such as, open ditches, underdrains, etc.
New rersey - A critical analysis from a fundamentally scientific viewpoint of avail-able information.jn these six categories of research and coordination into theoretical structure is needed to show the futility of much of the presently planned work, and it would render more valuable the really more important investigations.
There is a need for studying the intermediate frost action zone where the freezing index ranges from 0. to possibly 300. Studies recently made indicate that pavement subgrades are weakened considerably by the presence of excess moisture throughout the winter period. Such conditions appear to exist even when the subgrade soil is frozen relatively few days during the critical period.
New Hampshire - There is need for field studies on the destructive effects of frost heave with respect to cracking and joint failures and their relation to pumping under the action of traffic. Also, studies should be made to determine the relation of ground water level to frost action in various types of soils.
North Dakota - A study of frost action in soils at culverts in northern climates is needed to determine corrective measures in bedding, backfill, etc. to prevent grade subsidence that occurs frequently from 2 to 5 years after construction in fills less than 5 ft. in height. No trouble is found in deep fills where the cover over culverts is great-er than 5 ft. A study is needed in local load restrictions applied during spring breakup. This should include the determination of the best method of restricting local limits to prevent damage to various types of pavement surfaces because of loss in stability or load-carrying capacities in subgrades and bases during the spring breakup period. Should such restrictions be based on maximum allowable loads per inch of tire width,
378
per wheel load, per axle load, or by gross weight of vehicle or combination thereof? The collection of information on such practices throughout those states confronted with the spring breakup problem would assist in the solution of this highway problem.
Ohio - "Frost Action and Spring Breakup," and "Remedies and Treatments," should be expanded to include base courses, such as, soil-aggregate, macadam or soil-cement.
Pennsylvania - There is a need for the collection of basic data on the effect of frost action in various types of soils; and for the study of the effects of various thicknesses of insulation courses to reduce frost penetration. It is desirable to acquire as quickly as possible any information which would qualify or disqualify remedial measures now generally in use. This would make available useful information for immediate applia-tion while the long term research studies are underway.
Virginia - There is a need for relating spring breakup to soils and climatic factors and for accumulating information on remedies and treatments which can be correlated with data on frost action such as, temperature and soil moisture movements. Studies should be made to determine the effect of freezing in well-graded granular soils which have high percentages passing the No. 200 mesh sieve and high liquid limits and plasticity indexes. More emphasis should be placed upon the evaluation of information collected and tabulated. This is the link for bridging the gap between scientific re-search and engineering practice. For example, the collection of information on rem-edies and treatments should be relatively simple, but, the evaluation of the effective-ness of various remedies will be difficult and probably controversial. Yet it is eval-uation that the practicing engineer wants.
Washington - It is believed by some engineers that in most cases, if sufficient granular base is constructed to meet strength requirements, it will also take care of the local frost problem. Some local research may be in order to determine the accu-racy of this belief. Studies are needed to correlate the frost hazard with ground water table and soil properties as a means of determining the frost susceptibility of soils used for highway construction purposes.
Wisconsin - Research is needed to establish the potential of water tables in the soil column below the pavement structure, the potential manners in which moisture can accumulate or have access to soil column and geological influence contributing to such potential.
Wyoming - It is suggested that studies be made of the profile shape taken by the top of the frost layer, under various types of pavements andhoulders, as the frost leaves the rold, to provide data on why some roads give satisfactory performance during some winters and go to pieces in others. This information would be useful for determining corrective measures for design purposes.
Washington, D. C. Area - If remedies are to be applied, and if designs are to be improved, fundamental understanding of the laws of physics involved must first be ob-tained. Research is needed to determine the effect of freezing and thawing on the sta-bility of base courses and subgrades in border line areas where prolonged freezing is not considered a factor in design. Studies should be made to determine the soil char-acteristics which make a soil susceptible and to determine the effect of gradation (silt and clay content) on frost action. Suggest a follow-up questionnaire to state and fed-eral organizations concerning their research in the categories listed in the questionnaire to obtain brief statements of results obtained to date from work now in progress. Re-search is needed to study in particular the phenomenon of thermo-osmosis in connec-tion with temperature studies, soil moisture movements, and the distribution of cli-mate and soils.

379
mate and soils. The following fields of research are suggested: (a) Effect of grain size, rock con-
tent, density, and gradation on frost action; (b) Effect of alternating freezing and thaw-ing, water table, and degree of saturation on frost action; (c) Effect of permeability, rate of frost penetration, and thermal properties of soil on frost action; (d) Study the length of thaw period or time the bearing capacity is reduced and determine methods to remedy conditions; (e) Development of freezing index data for areas studied; and (f) Prepare soil and climatic map showing areas of different types of frost damage or spring breakup.
It would be desirable to assemble all information as to areas where frost damage is a problem on a map or maps and then select the problems which are of most importance for an accurate and intense study of all conditions related to the frost damage. "Soil Moisture and Moisture Movement (Category B)" and "Frost Heave and Basic Data (D)" can be studied simultaneously and "Frost Action and Spring Breakup (E)" could be studied in conjunction with "Temperature (A)". After all these conditions have been tabulated and studied, conclusions may be reached and remedies and treatments pre-scribed.
Attention is directed to the fact that the mileage of highways reached for construction or reconstruction each year is insignificant when compared with the total mileage in our highway transportation system. It will, therefore, be many years before these improv-ed practices, developed as a result of research and correlation studies of factors re-lated to frost damage, will result in any relief to the maintenance forces and funds from the costly annual problem of repairing damage from frost action on many miles of roads.
Summary
There is an urgent need for the correlation of frost research now in progress in this country and means must be developed to obtain and disseminate more freely the results of investigation so that future research can be directed into the phases that need additional development.
It appears that considerable research has been reported without an organized attempt to evaluate this information so that it can readily be applied to the improvement of high-way design and maintenance practices. The bibliography on frost prepared by the High-way Research Board is an excellent initial step as it organizes the available informa-tion, but, considerable more work must be done in the appraisal of this information so that recommendations can be made to minimize frost heave and frost damage in our existing highways.
Not all the future frost research should be directed to laboratory studies. There appears to be a real need for field research in connection with soil moisture and mois-ture movement and freeze damage in border line areas where frost action has not been considered a major problem.
The practicing engineer needs a field control test which can be used to predict the susceptibility of base course and subbase materials to frost damage.
The accumulation of excessive moisture in the subgrades due to temperatures at or near the freezing point and the subsequent loss of subgrade support appears to be an important field of research for both frost and nonfrost areas. Research reported by some states indicates that a moderately severe winter may cause considerably more road damage than a severe winter. It suggests that more attention must be given to influence of variations in climate on frost damage. A study of freezing indexes over a long period of years should assist in the solution of this frost problem.
Attention is directed to the need for studying frost heave of culverts and minor sturcutres especially with reference to the type of material used for bedding and back-fill as well as the minimum cover needed to protect these minor drainage structures against frost damage.

380
NEEDED RESEARCH PERTAINING TO FROST ACTION AND RELATED PHENOMENA
A. W. Johnson, Engineer of Soils and Foundations, Highway Research Board
The Committee on Frost Heave and Frost Action in Soil is operating under a long-range plan consisting of three main steps. The first is to summarize the available knowledge on the subject. That consists in reviewing and summarizing the published literature on frost action and related phenomena, and in keeping abreast with current developments. The review of published literature has been completed, and is ready for publication this year. This symposium is the result of the committee's efforts to learn of current developments which result from investigations and experience. The second step is to analyze the available knowledge in the light of recurring damage which may be attributed to frost action and state the phases on which information is lacking or on which available information may not be reliable. This will then be followed by the third step which will consist in planning, in some detail, the investigations which can be ex-pected to help fill in present gaps in knowledge or verify that which is believed to be un-reliable. The three steps are believed to constitute a sound and orderly approach toward increasing the knowledge of the effects of frost action so that knowledge can be put to the best use.
The highway problems associated with frost action, like the phenomenon itself are not simple ones. The elements of climate, soil, soil water, pavement, and traffic in-dividually and collectively, are factors which determine just how detrimental frost action can be. The overall problem involves proper road maintenance; regulation of loads on existing roads during and following the frost-melting period; and design to prevent detrimental action in new roads. Any action resulting from freezing or thaw-ing of the base or subgrade which stresses the road surface, base or subgrade, changes the water content, porosity or structure of the base or subgrade, or changes their ca-pacity to support loads is within the scope of the problem. Thus it includes both the primary effects of freezing as well as the secondary effects of thawing road foundations.
The complexity of the problem and the probable involvements of investigations need-ed make it impossible to state all the details in need of study. Some of the more im-portant gaps in present knowledge are listed here.
A statement of needed research can be divided into four parts. First, there is need for a better understanding of the extent and nature of damage caused by frost action. Second, there is need for more precise information on the technological aspects of the process of freezing and thawing and of the influence of the elements which are in-volved in the process. Third, in order here but of prime importance, is the develop-ment of means for predicting the load-carrying capacity of existing pavements and their foundations and protecting them from load damage during the frost-melting period. Fourth, and this is the ultimate goal of frost studies is the inclusion in designs for new roads, means for minimizing the detrimental effect of freezing and thawing of road foundations.
Extent and Nature of Damage Due to Frost Action
The reports of damage to pavements and small structures due to frost action in-dicate that only a few of those reports are based on a comprehensive appraisal of the extent of the damage. There is need for more specific information on the following items: (1) The extent of damage geographically so that the damage can be related to traffic, pavement designs or soils or geologic parent materials on an area basis; (2) The nature of the damage, its severity and whether the damage can be attributed justly to frost action; and (3) The frequency at which the different degrees of damage reoccur.
Freeze damage has a habit of differing from year to year, little or no damage oc-curring some years while severe damage occurs at other times. That habit tends to over emphasize frost effects at one time and underemphasize it at other times. A persistent annual appraisal of road conditions should indicate not only the extent and degree of damage but should show those areas which are most susceptible to damage.

381
The records could then make possible a better correlation with climatic conditions which set the stage for the damage. When correlated among the states they could help define the limits of soil or geologic regions most susceptible to detrimental frost action.
Data on freeze damage can be obtained by means of extensive condition surveys by trained crews. A good appraisal of frost damage can also be made by maintenance supervisory personnel as a regular and routine duty if each is trained to detect the tell-tale evidence of frost effects, and, if a systematic effort is made to obtain the desired information.
Observations on the Fundamentals of Frost Action
Without doubt some progress could be made in designing for protection against frost action by cut and try methods. However, an understanding of the basic processes of soil freezing and thawing, how they affect load-carrying capacity, and an understanding of the factors which influence frost action should speed the progress.
Perhaps there are more unanswered questions concerning the role of soil moisture in frost action than for other factors which influence it. There is a need for an explan-ation of the accumulation of moisture directly under the pavement or in the upper part of subgrades. Is it the result of movements due to temperature differences? Or is it solely to the "suction" from below as water is being drawn into growing ice crystals? How much is attributed to surface infiltration at pavement edges? Are surfaces sUffi-ciently permeable to permit entrance by that means?
There is no doubt that water accumulates when the soil freezes and causes a reduc-tion in bearing capacity when the water is released suddenly on thawing. However, there is some lack of agreement on whether or not the small increases in soil moisture sometimes observed can account for the large reductions in bearing capacity. Is the reduction in bearing capacity caused substantially by increase in porosity or is it caused largely by the released water being in a "more free state" than it was prior to freezing? What is the nature of the distribution of the melt water which accompanies a regain in bearing capacity? What is the real effect of the water table on the move-ment of water? Is it necessary to have ice lens formation to segregate enough water to cause critical reduction in bearing capacity or can that result from development of ice crystals not segregated into lenses?
Those questions may appear academic, yet if answered adequately they could point the way to betterment of designs. They do point to one practical question which is not yet satisfactorily answered. That is, what minimum moisture contents cause detri-mental reduction in bearing capacity on freezing and thawing of various soils?
A large proportion of past studies of frost effects has attempted to relate the nature of the soil, that is, the grain size and grading, to the effect of freezing. It is now gen-erally accepted that free draining soils do not permit the occurrence of detrimental differential frost heave. However, granular soils do suffer a reduction in load carrying capacity following thawing. Much work has been done to relate the fraction finer than the No. 200 sieve and the fraction finer than 0. 02 mm. diameter to susceptibility of soils to damage by frost. The results obtained to date are useful but are not yet ade-quate. The proportion of fines does not alone govern the stability of granular base materials. More needs to be known concerning the nature of the fines as well as the amount. Also, more needs to be known concerning the effects of grading in the sand fraction and the coarse aggregate fraction for it affects not only the heave but also the bearing capacity.
The influence of climate in bringing about detrimental frost action has long been recognized It has been accepted generally that wet fall seasons followed by severe winters cause serious heaving and spring breakup. More recently it has been brought out that spring breakup has occurred in areas where cold winters do not occur and that damage does not necessarily depend on the severity of the winter cold but rather on the nature of the temperature fluctuations and moisture conditions as they are related to traffic.
There is need for knowledge of the effect of cycles of freezing and thawing, rate of

382
frost penetration, and rate of thawing, particularly for areas where light freezing is followed by a reduction in bearing capacity on thawing. A study of climatic conditions with respect to reduction in bearing capacity could well be extended over a period which would include spring seasons showing a wide range of frost damage. Data on maximum and average depths of frost penetration are not yet completely reliable. Also, the ther-mal properties of soils need to be studied in connection with climate to determine whether or not those thermal properties will markedly affect designs.
Protection from Damage Following Frost-Melting Period
Investigations have been made by several state highway departments and one federal agency to measure the reduction in load carrying capacity of pavements from the so-called normal period in summer and early fall to the frost-melting period. That has been done by plate bearing tests, penetration tests, and accelerated traffic tests. Those efforts have been directed towards determining the traffic which different types and thicknesses of pavement will carry during the critical period. There is lack of agreement as to the adequacy of a plate bearing test as now used in measuring the re-duction in bearing capacity of flexible pavements. That is believed to be due to the slow loading of the plates, allowing some buildup of strength in the pavement foundation, and its inability to evaluate the effect of repeated loadings in disturbing the soil. Meth-ods of measuring the load-carrying capacity of pavements needs further study.
Efforts should be made to use data on traffic and relate them with pavement perform-ance during the critical period. That is true also in determining interrelationships be-tween traffic and climate.
Many existing roads will deteriorate rapidly if maximum legal loadings are permitted to operate during the critical period. The problem of determining the most satisfactory basis for setting up adequate local load restrictions is in need of study. How should those restrictions be specified to be most effective in preventing damage to existing roads? The measurement of load-bearing capacity of pavements is being carried on by the Committee on Load Carrying Capacity of Roads as Affected by Frost Action. The work and its need are mentioned here to bring out the interrelationships of parts of the frost problem.
Designs to Prevent Damage to New Roads
Development of information on the items suggested will make possible a better understanding of the basic laws which govern frost action and of the various elements which influence the magnitude, severity or rate at which the different phases of frost action take place. That is essential if designs are to be improved.
Engineers are now well acquainted with severe differential frost heave and can pre-dict with reasonable accuracy where such heaves will occur. Also they can set up designs including drainage, excavation and replacement or other means to prevent det-rimentaiheaving. The problem then is, in the main, one of designing to prevent det-rimental reduction in load-carrying capacity of roads.
The quality of base and subgrade materials as determined by its composition, grain size and grading characteristics, and its susceptibility to breaking down (degradation) during construction or weathering in service and its relation to frost action have been mentioned. There remains the problem of determining the appropriate cross section design for the road. Here is need for methods of design for determining the thickness and width of base for specific soil and traffic conditions. Many organizations how have design methods which take into account frost conditions. However, there are few, if any, who feel their methods cannot be improved.
Difference in the degree of spring breakup damage brings out the question of econom-ics of pavement design. Should designs be made with sufficient factors of safety that they are adequate to prevent spring season damage under the severe conditions which might happen at intervals of from 3 or 4 to 10 or 15 years or should they be designed on the premise that load restrictions will be imposed to prevent damage at those times?

383
What should be the relative difference in the factors of safety for a lightly traveled secondary highway compared to that of a trunk highway?
There continues to be a difference in opinion as to the efficiency of full width bases compared to bases, slightly wider than pavement surfaces. The types of materials best suited for each and the conditions where each is most effective deserve study. There have been too few field investigations to determine the shape of the frost layer as affect-ed by pavement type, snow removal and storage practices, and climatic conditions. The practicability of drainage of bases with relation to their permeability and cross section designs is questioned by some engineers. This is in need of clarification.
Summary
Advances and improvements beyond the present state may be slow but they will be brought about most quickly by an orderly program of study. As soon as the review of literature and this symposium are available to all, there should follow a critical anal-ysis of available information. There can then follow the preparation of a set of rec-ommended practices adaptable to local conditions. Concurrently there can be prepared outlines of investigations pointedtoward filling gaps in present.knowledge. These can be done best by coordinated efforts of all who wish to participate in the studies. The staff of the Highway Research Board will continue to work with the committee in these activities.

384
DISCUSSION ON THE FROST SYMPOSIUM
Miles S. Kersten, Associate Professor, University of Minnesota, Minneapolis
The various papers of this symposium have been chiefly concerned with frost prob-lems on highways. Frost is also an important item which must be considered in build-ing construction. The matter is most commonly handled by placing footings beneath the depth of frost penetration. In structures such as cold-storage warehouses, how-ever, the problem is not so simply handled, since the maintenance of below-freezing temperatures in these buildings presents a continuous condition of possible freezing of the soil on which the structure is founded. Thus the designers of such structures have an interest in such subjects as frost penetration, frost heaving, and measures for treat-ment or prevention of frost heaving.
Where the floor of a freezing room is placed directly on the soil without any inter-vening warm rooms or dead air space below it, the freezing of the soil may occur to relatively great depths with the possibility of accompanying damaging frost heave. This is due to the large number of degree-days of freezing which occur. If such a room operates at a temperature of 0 F., for example, it represents 32 x 365 = 11,680 deg. - days of freezing per year. This may be compared with the 5,000 to 6,000 deg. -days which occur in a winter season at Fairbanks, Alaska, as reported in the paper by Carlson. Some stores may be run with temperatures even less than 0 F. One should also note that the accumulated deg. -days of freeze continues to increase, since there is no intervening period of thaw normally characteristic of the summer season.
One can find numerous accounts in technical literature of heaving and resultant structural damage of refrigerated warehouses (1,2,3). In most such accounts where information is, given on the soils underlying the structures it is found that the soils are fine grained, with clays or silty soils being predominent. Various means of combatt-ing this damaging frost action have been suggested and are in use. These include constructing the main floor above ground at platform level with an air space of 2 ft. or more between the floor and the ground surface. Proper insulation then prevents loss of heat from the ground through the supporting columns to the cold store. If the building is constructed with the floor at or below the ground level, substantial thick-nesses of insulation are necessary to prevent the ground from freezing. The principles of heat-flow calculations in Carison's paper are valuable in determining the penetration of frost which may result from a given set of conditions. Various schemes of intro-ducing a source of heat between the floor of the cold rooms and the soil in the form of a ventilated air cavity, pipes through which hot water is circulated, or an electrical heating system. have been suggested.
Designers of such structures would be aided considerably by a knowledge of the frost susceptibility of the underlying soil. The experience of highway engineers in recogniz-ing those soils and moisture conditions which will result in heaving when freezing occurs and likewise in recognizing those soils and conditions under which no heave will occur should be of value in design of refrigerated buildings. Soil surveys for such structures should be more extensive than those made for the sole purpose of selection of a bearing value for footings. In cases where non-frost-susceptible soils, such as clean sands and gravels, are encountered, it may be possible to simplify the design of the floor system. .
Bibliography
Stevermann, M., "Warmegange der Kuhlhausgrundungen," Bautechnik, 1936, 14 (38) 547-8. .
Cooling, L. F. and Ward, W. H., "Some Examples of Foundation Movements Due to Causes Other than Structural Loads," Proceedings,. Second International

385
Conference on Soil Mechanics and Foundation Engineering, Vol. 2, pp. 162-7, 1948. 3. Dockstader, E. A., "Effect of Freezing and Thawing of Soil Under Foundations
of Cold Storage Warehouse," Proceedings, International Conference on Soil Mechanics and Foundation Engineering, Harvard University, Vol. 3, pp. 171-3, 1936.

The Highway Research Board is
organized under the auspices of
the Division of Engineering and
Industrial Research of the Na-
tional Research Council to pro-
vide a clearinghouse for highway
research activities and informa-
tion. The National Research
Council is the operating agency
of the National Academy of
Sciences, a private organization
of eminent American scientists
chartered in 1863 (under a spe-
cial act of Congress) to "investi-
gate, examine, experiment, and
report on any subject of science
or art."
U
I