TRB Webinar - Transportation Research Board
62
TRB WEBINAR: HIGHWAY PERFORMANCE MONITORING SYSTEM TRAVEL TIME DATA PROCESSING Maaza Christos Mekuria, PhD, PE, PTOE Moderated by Dan Seedah, PhD, PE 1
-
Upload
khangminh22 -
Category
Documents
-
view
1 -
download
0
Transcript of TRB Webinar - Transportation Research Board

TRB WEBINAR:HIGHWAY PERFORMANCE MONITORING SYSTEM TRAVEL TIME DATA PROCESSING
Maaza Christos Mekuria, PhD, PE, PTOEModerated by Dan Seedah, PhD, PE
1

WEBINAR OUTLINE
Describe NPMRDS
Getting NPMRDS travel time data
Quality of Travel Time Data : Local comparison
NPMRDS TMC’s & LRS
NPMRDS Local Repository
HPMS Export Data Items Generation
Travel Time Visualizations
2

TRAFFIC MESSAGE CHANNEL (TMC)
3
NPMRDS - NATIONAL PERFORMANCE MANAGEMENT RESEARCH DATASET
Archived travel time and speed 5 Minute Interval
Covers the NHS
Two Vehicle Types : Truck and Passenger
4

NPMRDS - NATIONAL PERFORMANCE MANAGEMENT RESEARCH DATASET
TMC Shapefile available at https://npmrds.ritis.org
TMC Identification table (.csv)
Speed/travel time data table (.csv)
5

GETTING NPMRDS DATA
6
Sign up for an account at npmrds.ritis.org
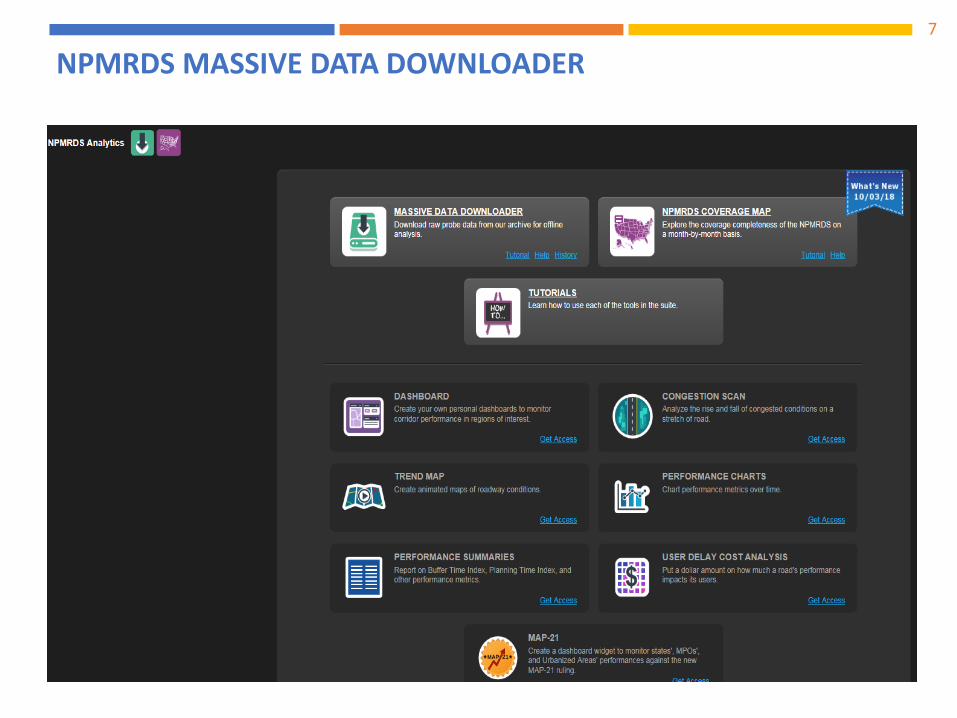
NPMRDS MASSIVE DATA DOWNLOADER7

HAWAII NPMRDS COVERAGE MAP8

HAWAIIAN ISLANDS NPMRDS COVERAGE MAP TMC COUNTS9
Island TMCs2018 TMCs2017
Hawaii 128 94
Kauai 63 68
Maui 122 134
Oahu 817 815

HIGHWAY PERFORMANCE MONITORING SYSTEM (HPMS) AND TRAFFIC MESSAGE CHANNEL (TMC) LINK FILE
[Ref. FHWA]
10
No. TMC Fields No. HPMS Fields1 tmc 20 f_system2 road 21 urban_code3 direction 22 faciltype4 intersection 23 structype5 state 24 thrulanes6 county 25 route_numb7 zip 26 route_sign8 start_latitude 27 route_qual9 start_longitude 28 altrtename
10 end_latitude 29 aadt11 end_longitude 30 aadt_singl12 miles 31 aadt_combi13 road_order 32 nhs14 timezone_name 33 nhs_pct1
15 type 34 strhnt_typ16 country 35 strhnt_pct1
17 tmclinear 36 truck18 frc 37 isprimary1
19 border_set1 38 active_start_date1
39 active_end_date1

SPEED/TRAVEL TIME DATA FILE
[Ref. FHWA]
11
Field Name Description datasource Indicates all vehicles, passenger vehicles, or trucks.tmc_code The unique 9-digit value identifying the TMC segment.
measurement_tstamp Date and time of data recorded
speed Observed average speed in mph for a time interval
average_speed The historical average speed for the roadway segment for that hour of the day and day of the week in miles per hour.
reference_speed
The calculated "free flow" mean speed for the roadway segment in miles per hour. This attribute is calculated based upon the 85th-percentile point of the observed speeds on that segment for all time periods.
travel_time Corresponds to the “speed” field; in minutes (or seconds)
data_density
Data density indicator, where: A = 1 to 4 reporting vehicles , B = 5 to 9 reporting vehicles, C = 10 or more reporting vehicles

TRAFFIC MESSAGE CHANNEL (TMC)
12

TRAFFIC MESSAGE CHANNEL (TMC) & LINEAR REFERENCING
13

TRAFFIC MESSAGE CHANNEL (TMC) & LINEAR REFERENCING
14

TRAFFIC MESSAGE CHANNEL (TMC) & LINEAR REFERENCING
15

R - PROCESSING
16

CONNECT TO DATABASE
# R Helper functions ========================================================
# Install and load all packages provided from a character vector load_pkgs = function(pkgs) { new_pkgs = pkgs[!(pkgs %in% installed.packages()[ , 'Package'])] if (length(new_pkgs) > 0) install.packages(new_pkgs) invisible(lapply(pkgs, function(x) suppressMessages(library(x, character.only = TRUE))) ) }
[Adapted from FHWA - CPI Manual 2001]
17

CONNECT TO DATABASE
# list of helpful packages to load
libs <-c("rgdal","spatial","MASS","dplyr","tidyr","cluster","ggmap","tmap","shiny","data.table","lubridate","RSQLite","maptools","sp","spatial","DBI","RODBC")
[Adapted from FHWA - CPI Manual 2001]
18

CONNECT TO DATABASE AND READ NPMRDS DATA
dbCon <- dbConnect(SQLite(), dbname = "HPMS/Traffic/NPMRDS/rnpmrds.sqlite", loadable.extensions = TRUE, cache_size = NULL, synchronous = "off",flags = SQLITE_RW, vfs = NULL)
paliebwdpre2pospm <-as.data.table(dbReadTable(dbCon, "paliebwdpre2pospm", row.names=NULL, check.names = TRUE))
[Adapted from FHWA - CPI Manual 2001]
19

PERIOD LEVEL TRAVEL TIME DATA
# Generate the period level travel time data
Select the HPMS distinct period data using the time stamp (TStamp Field) for trucks and all vehicles.
# Weekday AM
ttam17 <- NPMRDSTT[(wday(TStamp)>1 & wday(TStamp)<7) & (hour(TStamp) >= 6 & hour(TStamp) <10)]
ttrkam17 <- NPMRDSTTRK[(wday(TStamp)>1 & wday(TStamp)<7) & (hour(TStamp) >= 6 & hour(TStamp) <10)]
# Weekday Midday
ttmid17 <- NPMRDSTT[(wday(TStamp)>1 & wday(TStamp)<7) & (hour(TStamp) >= 10 & hour(TStamp) <16)]
trkmid17 <- NPMRDSTTRK[(wday(TStamp)>1 & wday(TStamp)<7) & (hour(TStamp) >= 10 & hour(TStamp) <16)]
[Adapted from FHWA - CPI Manual 2001]
20
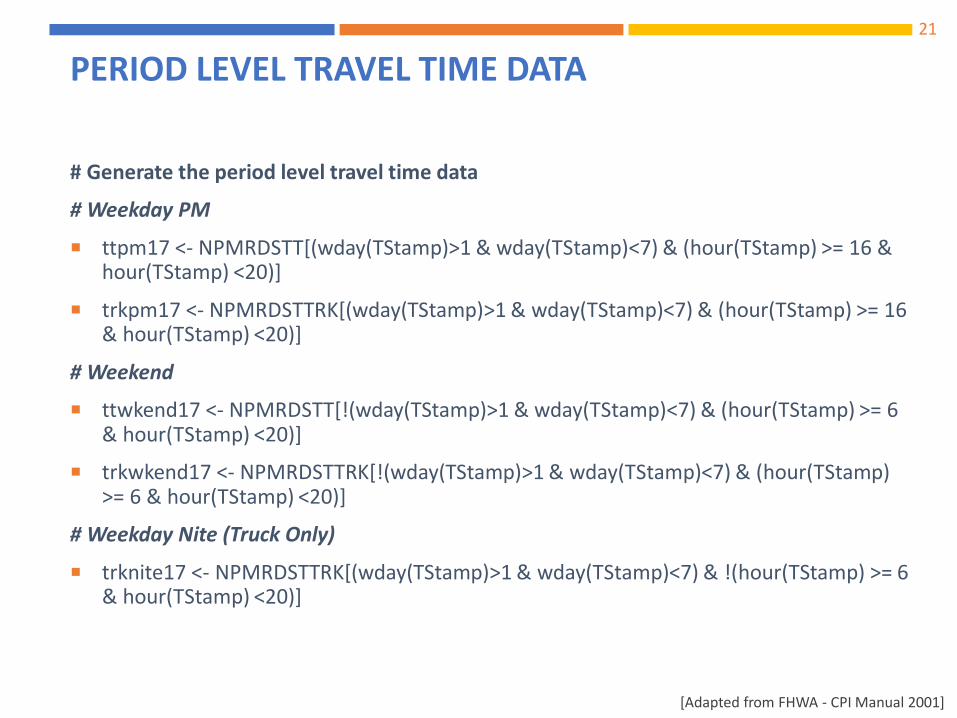
PERIOD LEVEL TRAVEL TIME DATA
# Generate the period level travel time data
# Weekday PM
ttpm17 <- NPMRDSTT[(wday(TStamp)>1 & wday(TStamp)<7) & (hour(TStamp) >= 16 & hour(TStamp) <20)]
trkpm17 <- NPMRDSTTRK[(wday(TStamp)>1 & wday(TStamp)<7) & (hour(TStamp) >= 16 & hour(TStamp) <20)]
# Weekend
ttwkend17 <- NPMRDSTT[!(wday(TStamp)>1 & wday(TStamp)<7) & (hour(TStamp) >= 6 & hour(TStamp) <20)]
trkwkend17 <- NPMRDSTTRK[!(wday(TStamp)>1 & wday(TStamp)<7) & (hour(TStamp) >= 6 & hour(TStamp) <20)]
# Weekday Nite (Truck Only)
trknite17 <- NPMRDSTTRK[(wday(TStamp)>1 & wday(TStamp)<7) & !(hour(TStamp) >= 6 & hour(TStamp) <20)]
[Adapted from FHWA - CPI Manual 2001]
21

GENERATE PERCENTILE VALUES IN R
# Generate the 50th, 80th , 95th percentile speed and travel time summary data for each period by TMC
# Weekday AM
ttamq17 <- ttam17[,.(ttq50=quantile(TTSecs,probs=0.5), ttq80=quantile(TTSecs,probs=0.8), spq50=quantile(speed,probs=0.5), spq80=quantile(speed,probs=0.8), rspq50=quantile(RefSpd,probs=0.5,na.rm=TRUE)), by=tmc_code]
trkamq17 <- trkam17[,.(ttq50=quantile(TTSecs,probs=0.5), ttq95=quantile(TTSecs,probs=0.95), spq50=quantile(speed,probs=0.5), spq95=quantile(speed,probs=0.95), rspq50=quantile(RefSpd,probs=0.5,na.rm=TRUE)), by=tmc_code]
[Adapted from FHWA - CPI Manual 2001]
22

CONNECT TO DATABASE IN R
# Generate the 50th, 80th, 95th percentile speed and travel time summary data for each period by TMC
# Weekday Midday
ttmidq17 <- ttmid17[, .(ttq50=quantile(TTSecs,probs=0.5), ttq80=quantile(TTSecs,probs=0.8), spq50=quantile(speed,probs=0.5), spq80=quantile(speed,probs=0.8), rspq50=quantile(RefSpd,probs=0.5,na.rm=TRUE)), by=tmc_code]
trkmidq17 <- trkmid17[, .(ttq50=quantile(TTSecs,probs=0.5), ttq95=quantile(TTSecs,probs=0.95), spq50=quantile(speed,probs=0.5), spq95=quantile(speed,probs=0.95), rspq50=quantile(RefSpd,probs=0.5,na.rm=TRUE)), by=tmc_code]
[Adapted from FHWA - CPI Manual 2001]
23

TRAVEL TIME PROCESSING IN R24
# Weekday PM ttpmq17 <- ttpm17[, .(ttq50=quantile(TTSecs,probs=0.5),
ttq80=quantile(TTSecs,probs=0.8),spq50=quantile(speed,probs=0.5), spq80=quantile(speed,probs=0.8), rspq50=quantile(RefSpd,probs=0.5,na.rm=TRUE)), by=tmc_code]
trkpmq17 <- ttpm17[, .(ttq50=quantile(TTSecs,probs=0.5), ttq95=quantile(TTSecs,probs=0.95),spq50=quantile(speed,probs=0.5), spq95=quantile(speed,probs=0.95), rspq50=quantile(RefSpd,probs=0.5,na.rm=TRUE)), by=tmc_code]
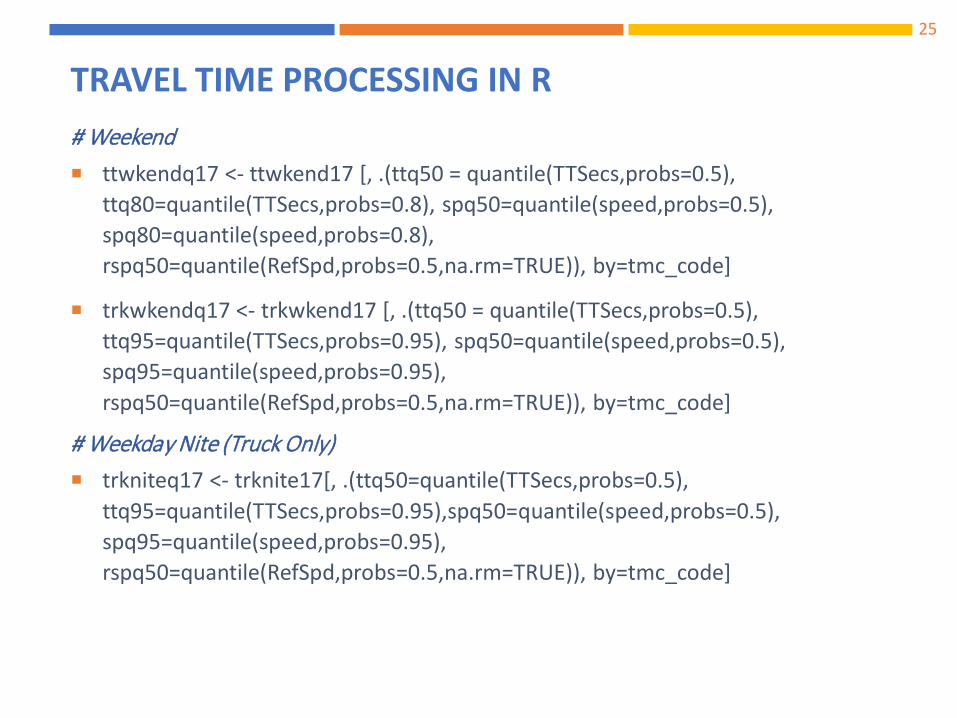
TRAVEL TIME PROCESSING IN R25
# Weekend ttwkendq17 <- ttwkend17 [, .(ttq50 = quantile(TTSecs,probs=0.5),
ttq80=quantile(TTSecs,probs=0.8), spq50=quantile(speed,probs=0.5), spq80=quantile(speed,probs=0.8), rspq50=quantile(RefSpd,probs=0.5,na.rm=TRUE)), by=tmc_code]
trkwkendq17 <- trkwkend17 [, .(ttq50 = quantile(TTSecs,probs=0.5), ttq95=quantile(TTSecs,probs=0.95), spq50=quantile(speed,probs=0.5), spq95=quantile(speed,probs=0.95), rspq50=quantile(RefSpd,probs=0.5,na.rm=TRUE)), by=tmc_code]
# Weekday Nite (Truck Only) trkniteq17 <- trknite17[, .(ttq50=quantile(TTSecs,probs=0.5),
ttq95=quantile(TTSecs,probs=0.95),spq50=quantile(speed,probs=0.5), spq95=quantile(speed,probs=0.95), rspq50=quantile(RefSpd,probs=0.5,na.rm=TRUE)), by=tmc_code]

WRITE TO SQLITE DATABASE FROM R26
# Write result tables into database
dbWriteTable(dbCon,"HINPMRDSTTAMQ17", ttamq17)
dbWriteTable(dbCon,"HINPMRDSTTMIDQ17", ttmidq17)
dbWriteTable(dbCon,"HINPMRDSTTPMQ17", ttpmq17)
dbWriteTable(dbCon,"HINPMRDSTRKAMQ17", trkamq17)
dbWriteTable(dbCon,"HINPMRDSTRKMIDQ17", trkmidq17)
dbWriteTable(dbCon,"HINPMRDSTRKPMIDQ17", trkpmq17)

DATABASE PM3 MEASURE GENERATION
27

NPMRDS’ FOUR PM3 MEASURES
Reliability Percent of person-miles traveled on the
Interstate that are reliable Percent of person-miles traveled on the non-
Interstate NHS that are reliable Freight Truck Travel Time Reliability (TTTR) IndexCMAQ Peak Hour Excessive Delay (PHED) Annual Hours of PHED Per Capita
28

SUMMARY OF PM3 TRAVEL TIME BASED MEASURES29

NPMRDS LINK TABLE AND PM3 RESULT TABLES
Create table HINPMRDS2017AMPK as
SELECT t1.tmc_code, t1.ttq50 TT_AMP50PCT , t1.ttq80 TT_AMP80PCT , round(t1.ttq80/(t1.ttq50),2) LOTTR_AMP , t2.Tmc, t2.TmcType, t2.RoadNumber, t2.RoadName, t2.IsPrimary, t2.FirstName, t2.TmcLinear, t2.Country, t2.State, t2.County, t2.Zip, t2.Direction, t2.StartLat, t2.StartLong, t2.EndLat, t2.EndLong, t2.Miles, t2.FRC, t2.Border_Set, t2.Funsystem, t2.Urban_Code, t2.FacilType, t2.StrucType, t2.ThruLanes, t2.Route_Numb, t2.Route_Sign, t2.Route_Qual, t2.AltRteName, t2.AADT, t2.AADTSing, t2.AADTComb, t2.NHS, t2.NHS_Pct, t2.STRHNETYPE, t2.STRHNETPCT, t2.Truck, t2.Shape
FROM HINPMRDSTTAMQ17 t1 , HINPMRDS2017 t2
where t1.TMC_Code = t2.TMC
ORDER BY t2.AltRteName , t1.tmc_Code;
30
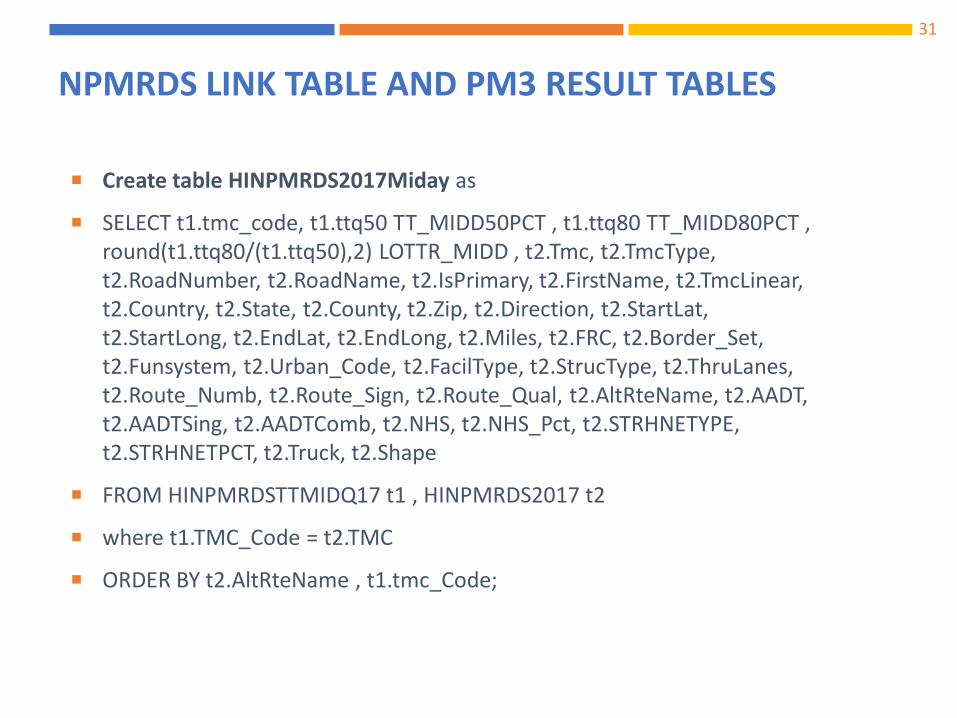
NPMRDS LINK TABLE AND PM3 RESULT TABLES
Create table HINPMRDS2017Miday as
SELECT t1.tmc_code, t1.ttq50 TT_MIDD50PCT , t1.ttq80 TT_MIDD80PCT , round(t1.ttq80/(t1.ttq50),2) LOTTR_MIDD , t2.Tmc, t2.TmcType, t2.RoadNumber, t2.RoadName, t2.IsPrimary, t2.FirstName, t2.TmcLinear, t2.Country, t2.State, t2.County, t2.Zip, t2.Direction, t2.StartLat, t2.StartLong, t2.EndLat, t2.EndLong, t2.Miles, t2.FRC, t2.Border_Set, t2.Funsystem, t2.Urban_Code, t2.FacilType, t2.StrucType, t2.ThruLanes, t2.Route_Numb, t2.Route_Sign, t2.Route_Qual, t2.AltRteName, t2.AADT, t2.AADTSing, t2.AADTComb, t2.NHS, t2.NHS_Pct, t2.STRHNETYPE, t2.STRHNETPCT, t2.Truck, t2.Shape
FROM HINPMRDSTTMIDQ17 t1 , HINPMRDS2017 t2
where t1.TMC_Code = t2.TMC
ORDER BY t2.AltRteName , t1.tmc_Code;
31

NPMRDS LINK TABLE AND PM3 RESULT TABLES
Create table HINPMRDS2017PMPK as
SELECT t1.tmc_code, t1.ttq50 TT_PMP50PCT , t1.ttq80 TT_PMP80PCT , round(t1.ttq80/(t1.ttq50),2) LOTTR_PMP , t2.Tmc, t2.TmcType, t2.RoadNumber, t2.RoadName, t2.IsPrimary, t2.FirstName, t2.TmcLinear, t2.Country, t2.State, t2.County, t2.Zip, t2.Direction, t2.StartLat, t2.StartLong, t2.EndLat, t2.EndLong, t2.Miles, t2.FRC, t2.Border_Set, t2.Funsystem, t2.Urban_Code, t2.FacilType, t2.StrucType, t2.ThruLanes, t2.Route_Numb, t2.Route_Sign, t2.Route_Qual, t2.AltRteName, t2.AADT, t2.AADTSing, t2.AADTComb, t2.NHS, t2.NHS_Pct, t2.STRHNETYPE, t2.STRHNETPCT, t2.Truck, t2.Shape
FROM HINPMRDSTTPMQ17 t1 , HINPMRDS2017 t2
where t1.TMC_Code = t2.TMC
ORDER BY t2.AltRteName , t1.tmc_Code;
32

NPMRDS LINK TABLE AND PM3 RESULT TABLES
Create table HINPMRDS2017WKEND as
SELECT t1.tmc_code, t1.ttq50 TT_WE50PCT , t1.ttq80 TT_WE80PCT , round(t1.ttq80/(t1.ttq50),2) LOTTR_WE , t2.Tmc, t2.TmcType, t2.RoadNumber, t2.RoadName, t2.IsPrimary, t2.FirstName, t2.TmcLinear, t2.Country, t2.State, t2.County, t2.Zip, t2.Direction, t2.StartLat, t2.StartLong, t2.EndLat, t2.EndLong, t2.Miles, t2.FRC, t2.Border_Set, t2.Funsystem, t2.Urban_Code, t2.FacilType, t2.StrucType, t2.ThruLanes, t2.Route_Numb, t2.Route_Sign, t2.Route_Qual, t2.AltRteName, t2.AADT, t2.AADTSing, t2.AADTComb, t2.NHS, t2.NHS_Pct, t2.STRHNETYPE, t2.STRHNETPCT, t2.Truck, t2.Shape
FROM HINPMRDSTTWKENDQ17 t1 , HINPMRDS2017 t2 where t1.TMC_Code = t2.TMC
ORDER BY t2.AltRteName , t1.tmc_Code;
33

NPMRDS LINK ALLDAY PM3 RESULT TABLES
34
create View VWHINPMRDS2017TTPM3 as
SELECT 2017 yr, t0.Tmc, t0.TmcType, t0.RoadNumber, t0.RoadName, t0.IsPrimary, t0.FirstName, t0.TmcLinear, t0.Country, t0.State, t0.County, t0.Zip, t0.Direction, t0.StartLat, t0.StartLong, t0.EndLat, t0.EndLong, t0.Miles, t0.FRC, t0.Border_Set, t0.Funsystem, t0.Urban_Code, t0.FacilType, t0.StrucType, t0.ThruLanes, t0.Route_Numb, t0.Route_Sign, t0.Route_Qual, t0.AltRteName, t0.AADT, t0.AADTSing, t0.AADTComb, t0.NHS, t0.NHS_Pct, t0.STRHNETYPE, t0.STRHNETPCT, t0.Truck, (t0.MILES*t0.AADT *365) VMT, t0.Shape, round(t1.ttq50) TT_AMP50PCT , round(t1.ttq80) TT_AMP80PCT , round(t1.ttq80/(nullif(t1.ttq50,0)),2) LOTTR_AMP , round(t1.spq50) TTAMSP50 , round(t1.spq80) TTAMSP80 , round(t1.rspq50) TTAMRSP50, round(t2.ttq50) TT_MIDD50PCT , round(t2.ttq80) TT_MIDD80PCT , round(t2.ttq80/(nullif(t2.ttq50,0)),2) LOTTR_MIDD , round(t2.spq50) TTMISPD50 , round(t2.spq80) TTMISPD80 , round(t2.rspq50) TTMIRSPD50, round(t3.ttq50) TT_PMP50PCT , round(t3.ttq80) TT_PMP80PCT , round(t3.ttq80/(nullif(t3.ttq50,0)),2) LOTTR_PMP, round(t3.spq50) TTPMSPD50 , round(t3.spq80) TTPMPSPD80 , round(t3.rspq50) TTPMRSPD50, round(t5.ttq50) TT_WE50PCT , round(t5.ttq80) TT_WE80PCT , round(t5.ttq80/(nullif(t5.ttq50,0)),2) LOTTR_WE, round(t5.spq50) TTWESPD50 , round(t5.spq80) TTWESPD80 , round(t5.rspq50) TTWERSPD50
FROM HINPMRDS2017 t0, HINPMRDSTTAMQ17 t1, HINPMRDSTTMIDQ17 t2, HINPMRDSTTPMQ17 t3, HINPMRDSTTWKENDQ17 t5
where t0.tmc = t1.tmc_code(+) and t1.tmc_code = t2.tmc_code(+) and t2.tmc_code = t3.tmc_code(+) and t3.tmc_code = t5.tmc_code(+)
ORDER BY t0.AltRteName , t0.tmc;

FINAL HPMS EXPORT NPMRDS PM3 RESULT TABLE
35
Create Table HINPMRDS2017TTPM3 as SELECT 2017 yr, t0.Tmc, t0.TmcType, t0.RoadNumber, t0.RoadName,
t0.IsPrimary, t0.FirstName, t0.TmcLinear, t0.Country, t0.State, t0.County, t0.Zip, t0.Direction, t0.StartLat, t0.StartLong, t0.EndLat, t0.EndLong, t0.Miles, t0.FRC, t0.Border_Set, t0.Funsystem, t0.Urban_Code, t0.FacilType, t0.StrucType, t0.ThruLanes, t0.Route_Numb, t0.Route_Sign, t0.Route_Qual, t0.AltRteName, t0.AADT, t0.AADTSing, t0.AADTComb, t0.NHS, t0.NHS_Pct, t0.STRHNETYPE, t0.STRHNETPCT, t0.Truck, t0.Shape, t0.TT_AMP50PCT , t0.TT_AMP80PCT , t0.LOTTR_AMP , t0.TTAMSP50 , t0.TTAMSP80 , t0.TTAMRSP50, t0.TT_MIDD50PCT , t0.TT_MIDD80PCT , t0.LOTTR_MIDD , t0.TTMISPD50 , t0.TTMISPD80 , t0.TTMIRSPD50, t0.TT_PMP50PCT , t0.TT_PMP80PCT , t0.LOTTR_PMP, t0.TTPMSPD50 , t0.TTPMPSPD80 , t0.TTPMRSPD50, t0.TT_WE50PCT , t0.TT_WE80PCT , t0.LOTTR_WE, t0.TTWESPD50 , t0.TTWESPD80 , t0.TTWERSPD50
FROM VWHINPMRDS2017TTPM3 t0 ORDER BY t0.AltRteName , t0.tmc;

NPMRDS SPEED DATA COMPARISON
36

HAWAII DOT COUNT STATIONS37

PERMANENT STATIONS SPEED COMPARISON38
Station H13P – on Interstate H-2 at mile point 4.02
Station C7L – on Interstate H-1 at mile point 11.74
Station SL71 – on Interstate H-1 at Ward Avenue exit at mile point 22.1
Station C6U – on Interstate H-201 at mile point 0.21

PERMANENT STATIONS SPEED COMPARISON39

NPMRDS AND COUNT STATION SPEED PROFILES40
0
10
20
30
40
50
60
70
0 6 12 18 24
Spee
d M
PH
HiDOT Stn C6-U WB at NPMRDS TMC 126P04150Speed Comparison for March 31, 2015
HI Stn-C6-U WB
NPMRDS_0331WB
3 per. Mov. Avg. (NPMRDS_0331WB)
Time of Day

41
0
10
20
30
40
50
60
70
0 6 12 18 24
Spee
d M
PHHiDOT Stn C6-U EB at NPMRDS TMC 126N04150
Speed Comparison for March 31, 2015
HI Stn-C6-U EB
NPMRDS_0331EB
3 per. Mov. Avg. (NPMRDS_0331EB)
Time of Day
NPMRDS AND COUNT STATION SPEED PROFILES

NPMRDS AND COUNT STATION SPEED PROFILES42
0
10
20
30
40
50
60
0 6 12 18 24
Spee
d M
PHHiDOT Stn C6-U EB at NPMRDS TMC 126N04150
Speed Comparison for April 1, 2015
HI Stn-C6-U EB
NPMRDS_0401EB
2 per. Mov. Avg. (NPMRDS_0401EB)
Time of Day

NPMRDS AND COUNT STATION SPEED PROFILES43
0
10
20
30
40
50
60
70
80
0 6 12 18 24
Spee
d M
PHHiDOT Stn H-13 WB at NPMRDS TMC 126P04120
Speed Comparison for March 31, 2015
HI Stn-H-13 WB
NPMRDS_0331WB
3 per. Mov. Avg. (NPMRDS_0331WB)
Time of Day

NPMRDS AND COUNT STATION SPEED PROFILES44
0
10
20
30
40
50
60
70
0 6 12 18 24
Spee
d M
PHHiDOT H-1 Stn H-13 WB at NPMRDS TMC 126P04120
Speed Comparison for April 1, 2015
HI Stn-H-13 WB
NPMRDS_0401WB
3 per. Mov. Avg. (NPMRDS_0401WB)
Time of Day

NPMRDS AND COUNT STATION SPEED PROFILES45
0
10
20
30
40
50
60
0 6 12 18 24
Spee
d M
PH
HI DOT H-1 Stn SL71 WB at NPMRDS TMC 126P04109Speed Comparison for March 31, 2015
HI Stn-SL71 WB
NPMRDS_0331WB
4 per. Mov. Avg. (NPMRDS_0331WB)
Time of Day

NPMRDS AND COUNT STATION SPEED PROFILES46
0
10
20
30
40
50
60
0 6 12 18 24
Spee
d M
PH
HI DOT H-1 Stn SL71 WB at NPMRDS TMC 126P04109Speed Comparison for April 1, 2015
HI Stn-SL71 WB
NPMRDS_0401WB
2 per. Mov. Avg. (NPMRDS_0401WB)
Time of Day

BEFORE AND AFTER STUDEIS
47
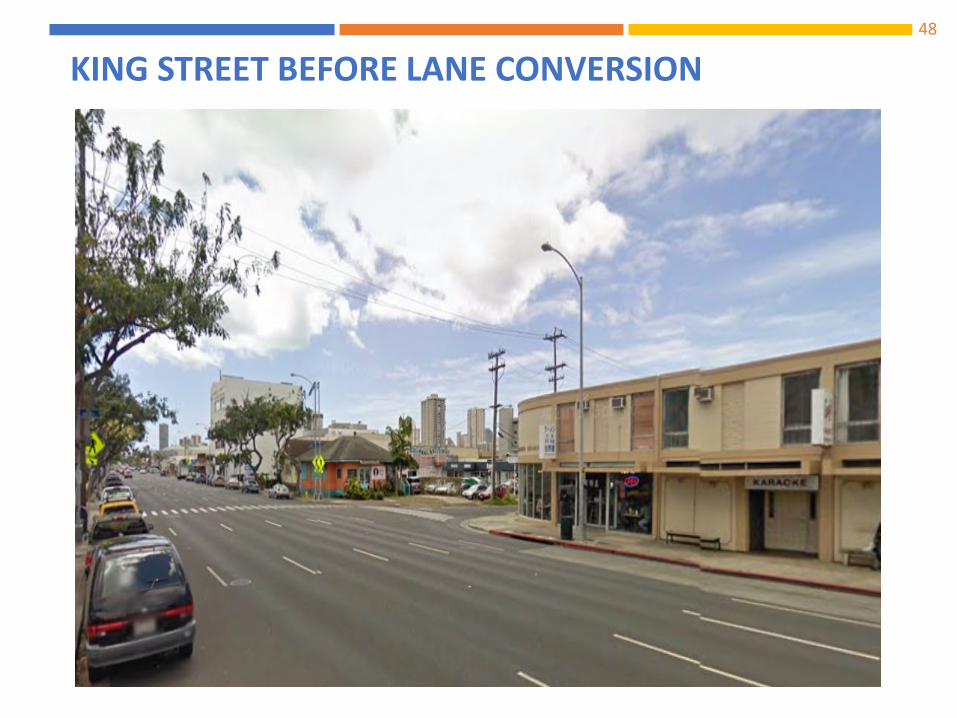
KING STREET BEFORE LANE CONVERSION48

KING STREET AFTER LANE CONVERSION49
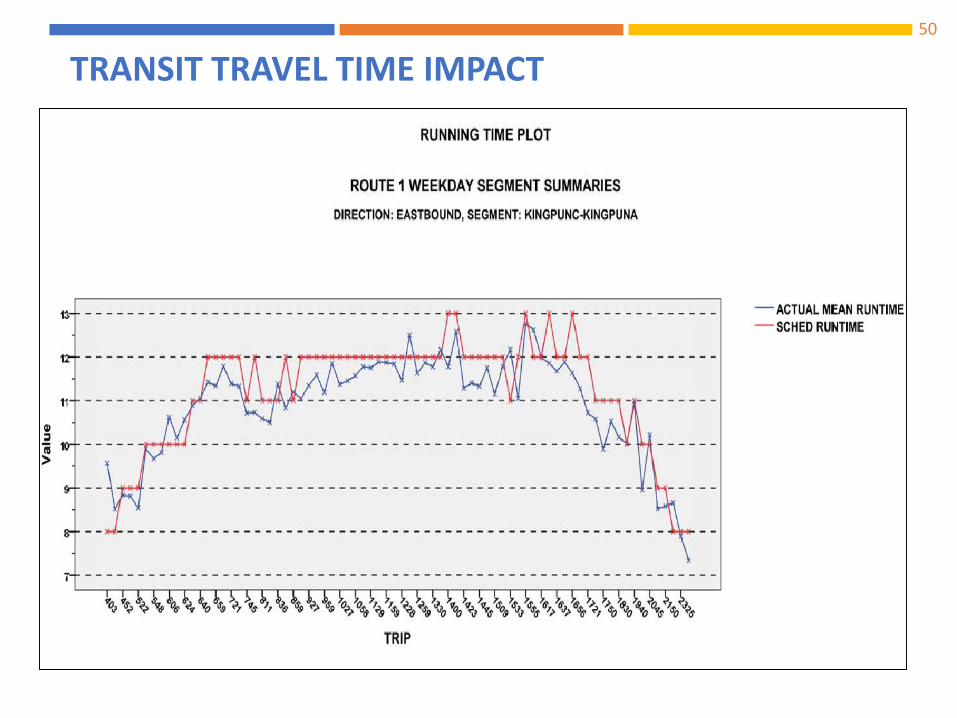
TRANSIT TRAVEL TIME IMPACT50

TRANSIT TRAVEL TIME IMPACT51
-400
-300
-200
-100
0
100
200
300
400
0 6 12 18 24
Chan
ge o
f tra
vel T
ime
in S
econ
ds
Time of Day
Sunday
Monday
Tuesday
Wednesday
Thursday
Friday
Saturday

TRANSIT TRAVEL TIME IMPACT52
-700
-500
-300
-100
100
300
500
0 6 12 18 24
Tuesday
Thursday
Friday
Aver
age
Trav
el ti
me
chan
ge in
Sec
onds
(+ve
Incr
ease
in T
rave
l Tim
e-De
lay)

PALI HIGHWAY SPEED CHANGE BEFORE AND AFTER IMPROVEMENTS
53

PALI HIGHWAY TRAVEL TIME CHANGE BEFORE AND AFTER IMPROVEMENTS
54

TRAVEL TIME BETWEEN TMC’S
55

PALI HIGHWAY TRAVEL TIME (SECS) BETWEEN TMC’S BEFORE AND AFTER IMPROVEMENTS
56

SPEED PROFILE 57

EXPLORATORY ANALYSIS58
rpivotTable(vwpaliebwdpre2posamdf,rows=c("road_order","intersection"),cols="hrsmins")

TRAVEL TIME DIFFERENCE AM PEAK PERIOD59

SPEED STANDARD DEVIATION AM PEAK60

REFERENCES
HPMS 2016 Field Manual and supplemental travel time manual
Understanding NPMRDS Usage for Certain Performance Data Needs, Wenjing Pu, HIS, Nov. 15, 2017, Washington, DC
61