Webinar - Non-performing loans_23-out_Deck.pdf - Deloitte
85
Non-Performing Loans? Respond to thrive post-moratorium October 23 rd 2020
-
Upload
khangminh22 -
Category
Documents
-
view
4 -
download
0
Transcript of Webinar - Non-performing loans_23-out_Deck.pdf - Deloitte

Non-Performing Loans? Respond to thrive post-moratorium
October 23rd 2020

Non-Performing Loans? Respond to thrive post-moratoriumChallenges for the real economy or challenges for the banking sector?
© 2020 For more information, contact Deloitte Corporate Finance, S.A. 2
Agenda
Challenges for the real economy or challenges for the banking sector? 9AM - 10:15 AM
Q&A and closing
Webinar foundations - the prospects of NPL ecosystem• Joaquim Paulo, Deloitte• Nuno Martins, Caixa Geral de Depósitos
Challenges for the real economy – the “Day after”• Tom Simmons, Deloitte UK
The Portuguese case – script for the banking sector• Álvaro Nascimento, Católica Porto Business School

Challenges for the real economy – the “Day after”
Tom Simmons, Economist | 23rd October 2020

4Non-Performing Loans? Respond to thrive post-moratoriumChallenges for the real economy or challenges for the banking sector?
© 2020 For more information, contact Deloitte Corporate Finance, S.A.
Lockdowns drive huge contraction in second quarter GDP
Real GDP
Source: Refinitiv Datastream
H1 overall mobility vs GDP

5Non-Performing Loans? Respond to thrive post-moratoriumChallenges for the real economy or challenges for the banking sector?
© 2020 For more information, contact Deloitte Corporate Finance, S.A.
Monetary and fiscal stimulus have supported activity and financial markets
Source: Refinitiv Datastream
Source: OECD
Substantial fiscal support has been announced since the pandemic began: Official estimates of fiscal support
USD, trillionsCentral bank balance sheet, total assets
Lending to non-financial corporates
Central bank policy rates
Source: Refinitiv Datastream
Source: Refinitiv Datastream
% of 2019 GDP

6Non-Performing Loans? Respond to thrive post-moratoriumChallenges for the real economy or challenges for the banking sector?
© 2020 For more information, contact Deloitte Corporate Finance, S.A.
Strong initial recovery
Third quarter bounce:
• Fiscal stimulus
• Monetary stimulus
• Low infection rates – lagged impact of lockdowns
• Pent up demand
Composite Markit / NBS PMIs
Source: Refinitiv Datastream

7Non-Performing Loans? Respond to thrive post-moratoriumChallenges for the real economy or challenges for the banking sector?
© 2020 For more information, contact Deloitte Corporate Finance, S.A.
But the recovery is slowing and faces significant headwinds - COVID-19 infections are rising
New daily COVID-19 cases
Source: Refinitiv Datastream
COVID-19 new daily deaths
Source: Refinitiv Datastream
Per million of the population, 7 - day averagePer million of the population, 7 - day average

8Non-Performing Loans? Respond to thrive post-moratoriumChallenges for the real economy or challenges for the banking sector?
© 2020 For more information, contact Deloitte Corporate Finance, S.A.
Unemployment set to rise
Euro area unemployment rate and hours worked
Source: Refinitiv Datastream Source: Refinitiv Datastream
% of workforce
US unemployment rate

9Non-Performing Loans? Respond to thrive post-moratoriumChallenges for the real economy or challenges for the banking sector?
© 2020 For more information, contact Deloitte Corporate Finance, S.A.
Consumer confidence has fallen sharply
Euro area consumer confidence
Source: Refinitiv Datastream Source: Refinitiv Datastream
UK & US % of disposable income, euro area gross savings rate
Household savings rates

10Non-Performing Loans? Respond to thrive post-moratoriumChallenges for the real economy or challenges for the banking sector?
© 2020 For more information, contact Deloitte Corporate Finance, S.A.
Significant headwinds for corporates
• Lower demand
• Higher levels of debt
• Operating below capacity due to restrictions
• Uncertainty
A relative majority of companies expect to get back to pre-crisis levels in one-year’s time at the earliest.Based on the information you have so far, when do you expect your company to return to a pre-crisis level of revenue generation?*
Source: Deloitte European CFO Survey

11Non-Performing Loans? Respond to thrive post-moratoriumChallenges for the real economy or challenges for the banking sector?
© 2020 For more information, contact Deloitte Corporate Finance, S.A.
Prospects vary significantly by industry
Some sectors are coming back to pre-crisis levels at a more rapid pace.Based on the information you have so far, when do you expect your company to return to a pre-crisis level of revenue generation?
Source: Deloitte European CFO Survey

12Non-Performing Loans? Respond to thrive post-moratoriumChallenges for the real economy or challenges for the banking sector?
© 2020 For more information, contact Deloitte Corporate Finance, S.A.
Corporates are prioritising defensive balance sheet strategies
Corporate priorities in the next 12 months% of CFOs who rate each of the following as a strong priority for their business in the next 12 months
Source: Deloitte CFO Survey

13Non-Performing Loans? Respond to thrive post-moratoriumChallenges for the real economy or challenges for the banking sector?
© 2020 For more information, contact Deloitte Corporate Finance, S.A.
When are regions expected to return to pre-crisis levels?
Source: Consensus Forecasts
When Are Regions Expected to Regain Lost Output?Asia Pacific Already on the Way;Western Europe to Return to Pre-Crisis Levels in 2023

14Non-Performing Loans? Respond to thrive post-moratoriumChallenges for the real economy or challenges for the banking sector?
© 2020 For more information, contact Deloitte Corporate Finance, S.A.
Interest rates lower for longer
Expect 3m interest rates by December 2021
Source: Refinitiv Datastream

15Non-Performing Loans? Respond to thrive post-moratoriumChallenges for the real economy or challenges for the banking sector?
© 2020 For more information, contact Deloitte Corporate Finance, S.A.
Euro area banks expect credit standards to tighten in Q3
Banks expect credit standards for enterprises to tighten considerably in the third quarter, which is reported to be related to the expected end of state guarantee schemes for loans in some large euro area countries. – ECB euro area bank lending survey
ECB bank lending survey: tightening/easing lending standards to corporates
Source: Refinitiv Datastream

16Non-Performing Loans? Respond to thrive post-moratoriumChallenges for the real economy or challenges for the banking sector?
© 2020 For more information, contact Deloitte Corporate Finance, S.A.
Corporate bond spreads have recovered, despite ongoing downgrades
Spread of BBB corporate bonds yields over government bonds
Source: Refinitiv Datastream Source: Refinitiv Datastream
Equity indices

17Non-Performing Loans? Respond to thrive post-moratoriumChallenges for the real economy or challenges for the banking sector?
© 2020 For more information, contact Deloitte Corporate Finance, S.A.
Government debt has risen sharply, bond yields remain low
Euro area government debt
Source: IMF
10 year bond yields in the euro area
Source: Refinitiv Datastream

18Non-Performing Loans? Respond to thrive post-moratoriumChallenges for the real economy or challenges for the banking sector?
© 2020 For more information, contact Deloitte Corporate Finance, S.A.
1. 2020 likely to see biggest downturn in centuries
2. Easing of lockdown, pent up demand, stimulus = bounce back
3. Momentum has slowed over recent weeks with rising infections, restrictions
4. Corporates and households face lower income and rising debt burdens
5. Headwinds from scarring, debt, caution, social distancing
6. 2 years before economy returns to pre-crisis GDP
7. Central banks countered initial financial stress and supported asset prices, but credit conditions may tighten
Summary

19Non-Performing Loans? Respond to thrive post-moratoriumChallenges for the real economy or challenges for the banking sector?
© 2020 For more information, contact Deloitte Corporate Finance, S.A.
For a fresh view on economics subscribe to our weekly email…just Google:
Deloitte Monday Briefing
To follow the latest health and economic data Google & bookmark:
Deloitte Covid Monitor
Follow economics with Deloitte

NPL ecosystem in Portugalwebinar, Deloitte23 de Outubro de 2020Porto, CPBS, Álvaro Nascimento ⓒ
FactoryofNPLsRisk&Return in the Portuguese Corporation

21
purposeis there hidden value to unlock in Portuguese corporations?
Where: St. Barbara’s Church in Kutna Hora. Czech RepublicAbout: Fibonacci spiral, Golden Ratio

22
viewpointFinancial Intermediaries are
enablers, weaving threads that link investors and
corporations.Where: Farolim de Felgueiras, Porto. Portugal

Working Capital
Cash Conversion
TechCapital
Production Technology
23
From a financial (not
managerial) perspective, we can
represent the corporation as a
portfolio of assets (i.e.,
microeconomics capital)
essential for production, which
needs to be funded.
The CorporationToolkit
About: Operations behind blind walls (opaque transactions), Coase (1937)

24
Financial Markets and
Institutions exist to perform
two basic functions: [1] serve
the payments system; and [2]
intermediate savings and
investments.
The Financial SystemToolkit
Where: Chicago Mercantile Exchange floor, 1997Author: Andreas Gursky | https://www.andreasgursky.com/en/works/1997/chicago-mercantile-exchange
Householdssavings
CorporationsInvestment
RiskManagement

25
brokers
RiskManagement
✕
investment trusts
investment banks
Rating agencies
Financial Systempoolingandscreening
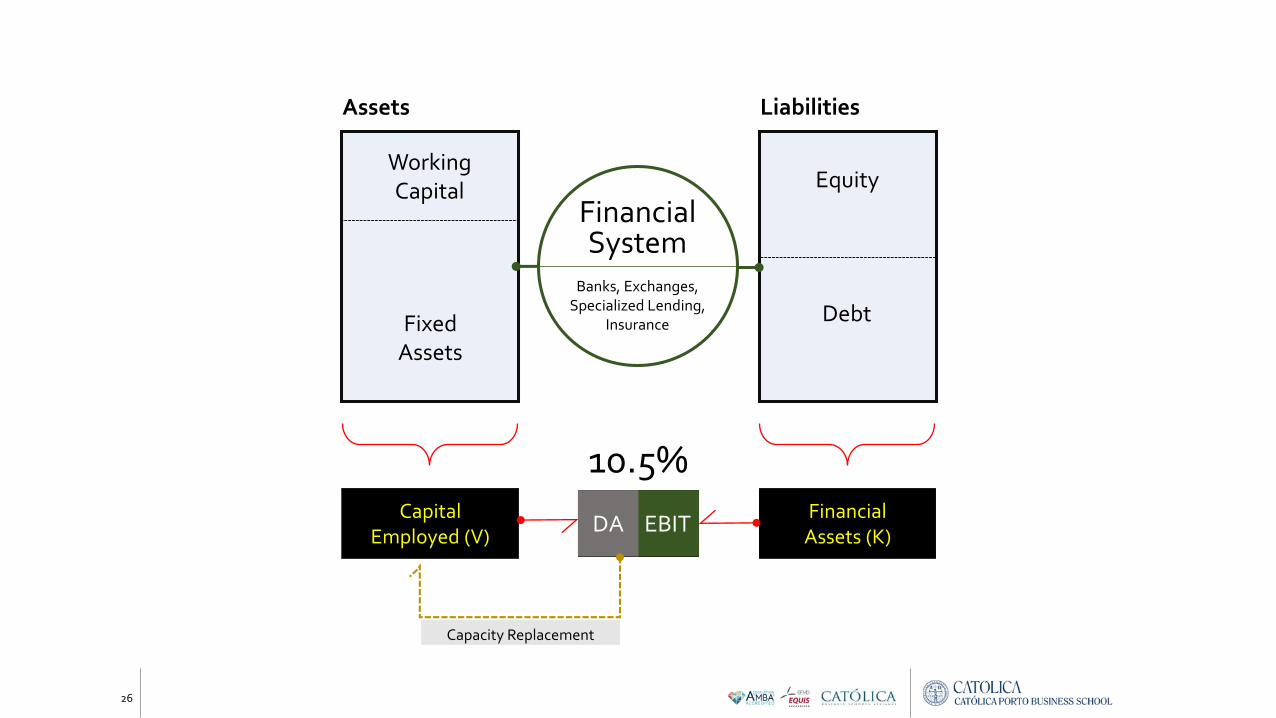
26
Equity
Debt
Liabilities
Working Capital
Fixed Assets
Assets
Capital Employed (V)
Financial Assets (K)
Financial System
Banks, Exchanges, Specialized Lending,
Insurance
EBITDAEBITDA
Capacity Replacement
10.5%

27
insightCorporations offer
returns far lower than required, given business
risk exposures.
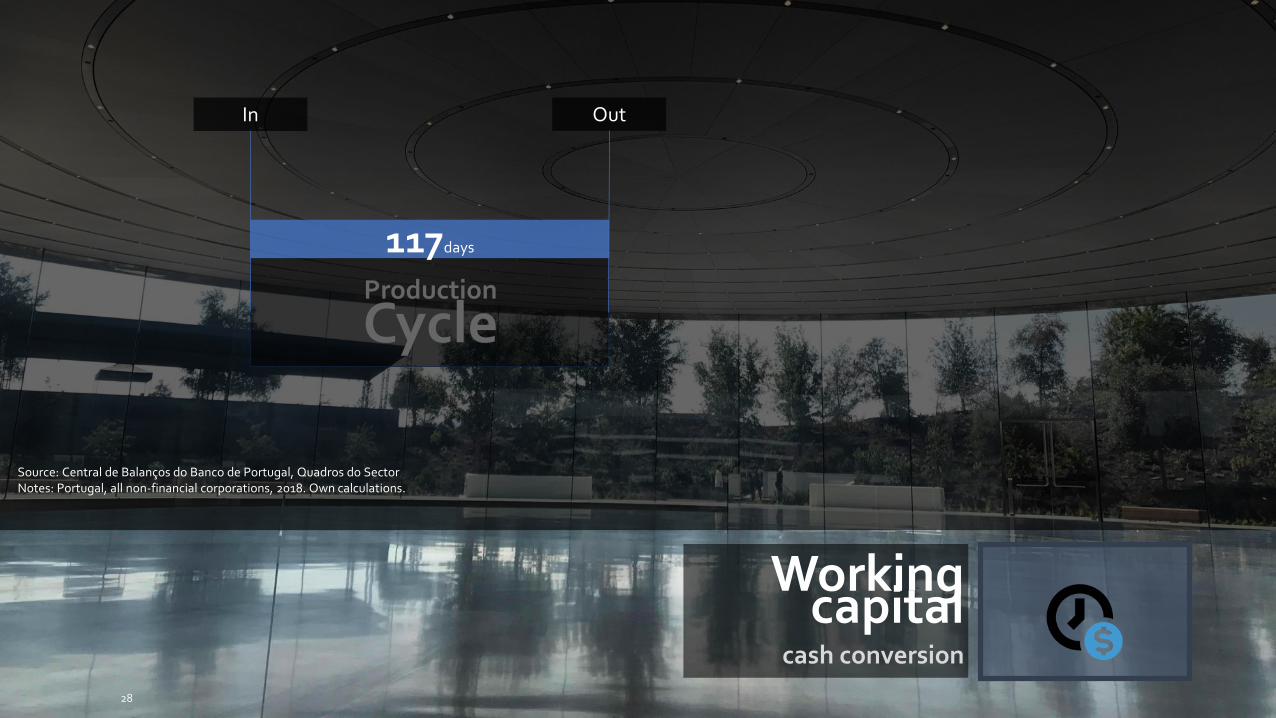
Production
Cycle
28
117days
In Out
Source: Central de Balanços do Banco de Portugal, Quadros do SectorNotes: Portugal, all non-financial corporations, 2018. Own calculations.
Workingcapital
cash conversion

Workingcapital
cash conversion
117days
In Out
Collection(receivables)
63days
Payment(supplyers)
72days
109days
29
Source: Central de Balanços do Banco de Portugal, Quadros do SectorNotes: Portugal, all non-financial corporations, 2018. Own calculations.

Tech Capital
production & technology
Productivity |Innovation | Balance
socialcontracting
Final Goods and Services
Production Parts and Services
Labour
Workerslabour markets
Supplyersmarkets for inputs
Customersmarkets for goods
Machinery and Equipment
Capital markets
Funding
30

valuesharing
Capital Employed
Production & Technology
Labour
Workerslabour markets
Production Parts and Services
Supplyersmarkets for inputs
Machinery and Equipment
Fundingcapital markets
Final Goodsand Services
31Productivity |Innovation | Balance
socialcontracting

Equity (4.2%)
Loans (1.6%)
Taxes (1.3%)
Supplyersmarkets for inputs
Final Goodsand Services
Workerslabour market
Fundingcapital markets
52,5% 22,3%
14,2%
Customersmarkets for goods
11,0%
32
Capital Employed
Production & Technology
Productivity |Innovation | Balance
Source: Central de Balanços do Banco de Portugal, Quadros do SectorNotes: Portugal, all non-financial corporations, 2018. Own calculations.
Society
Lenders
Owners
valuesharing

33
Capital Employed
Production & Technology
Productivity |Innovation | Balance
Source: Central de Balanços do Banco de Portugal, Quadros do SectorNotes: Portugal, all non-financial corporations, 2018. Own calculations.
Equity (4.2%)
Loans (1.6%)
Taxes (1.3%)Society
Lenders
Owners
onReturnCapitalEmployed
6.7%

34
Capital Employed
Production & Technology
Productivity |Innovation | Balance
Source: Central de Balanços do Banco de Portugal, Quadros do SectorNotes: Portugal, all non-financial corporations, 2018. Own calculations.
Equity (4.2%)
Loans (1.6%)
Taxes (1.3%)Society
Lenders
Owners
onReturnCapitalEmployed
4.3%
2014

balance sheets
35
Investing

36
Return on CapitalEmployed2018Too small returns for too many small corporations: micro firms account for 16% of revenue and 26% of capital employed; small and medium perform alike.
Source: Central de Balanços do Banco de Portugal, Quadros do SectorNotes: Portugal, all non-financial corporations, 2018. Own calculations.

37
410bi,€
Capital Employed
449kAll Corporations
Too Many… Too Small
Micro corporations account for almost 30% of overall capital
employed: similar to large corporations, yet only (less
than) half profitable!
Source: Central de Balanços do Banco de Portugal, Quadros do SectorNotes: Portugal, all non-financial corporations, 2018. Own calculations.
&NOTProfitable!

38
Return on CapitalEmployed2014+2.4pp
change ’10-14
+2.6% +1.3% +2.3% +3.3%
Strong improvement for largeand small corporations.
Source: Central de Balanços do Banco de Portugal, Quadros do SectorNotes: Portugal, all non-financial corporations, 2014. Own calculations.
Return on Capital Employed(percentage points, chg. ‘10-14)
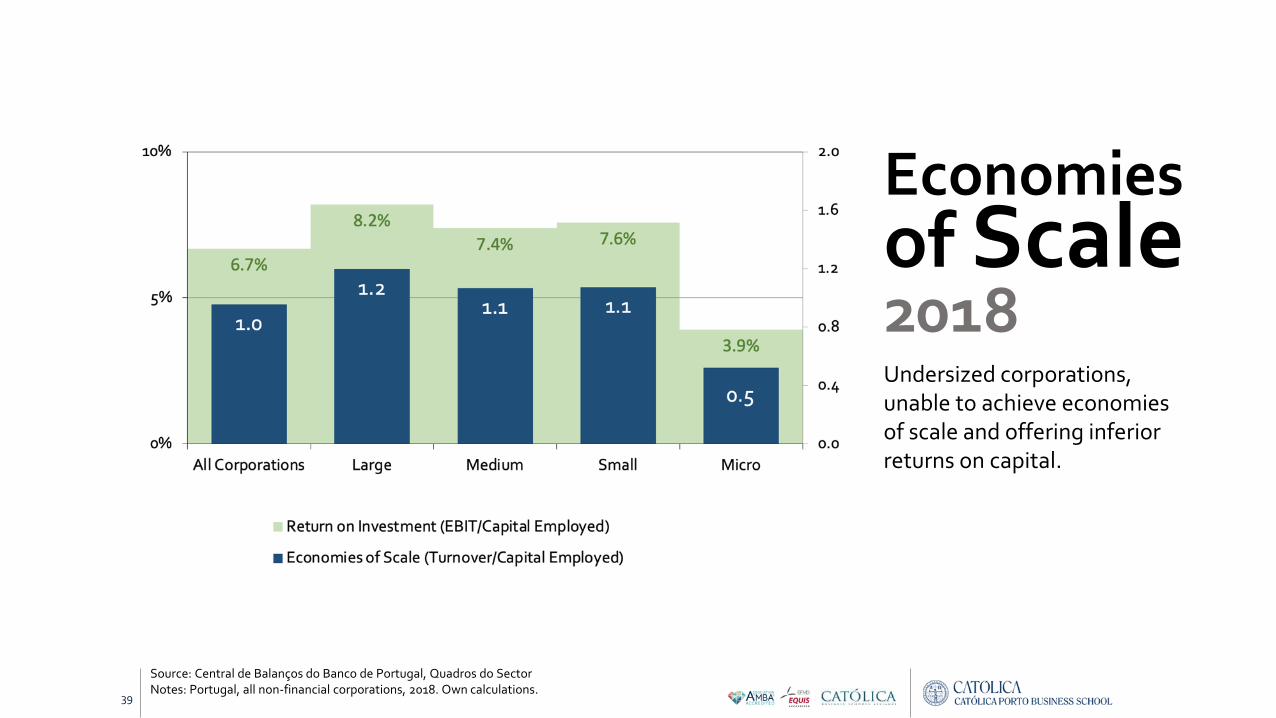
39
Economies of Scale2018Undersized corporations, unable to achieve economies of scale and offering inferior returns on capital.
Source: Central de Balanços do Banco de Portugal, Quadros do SectorNotes: Portugal, all non-financial corporations, 2018. Own calculations.

40
Economies of Scale2014Excessive capital employed, high fixed costs, and suboptimal operational leverage shown in low levels of profitability.
Source: Central de Balanços do Banco de Portugal, Quadros do SectorNotes: Portugal, all non-financial corporations, 2014. Own calculations.

32.2
41.8
36.4
28.0
22.0
134.2
152.5
134.2
94.6
151.7
0
50
100
150
200
250
0
10
20
30
40
50
All Corporations Large Medium Small Micro
GVA per worker (left scale)
Turnover per worker (right scale)
Capital Employed per worker (right scale)
41
ProductivityPuzzles[labour]2018Large corporations make better use of labour resources than any other. Yet, Large and Medium sized firms are equally productive (when normalized by capital).
Source: Central de Balanços do Banco de Portugal, Quadros do SectorNotes: Portugal, all non-financial corporations, 2018. Own calculations. Values as thousand of euros.
+14%
0.274 0.271 0.296Productivity of Capital(GVA/Capital Employed)
+14%

28.3
40.9
34.2
24.9
15.2
142.1
189.5
140.5
95.8
139.6
0
50
100
150
200
250
0
10
20
30
40
50
All Corporations Large Medium Small Micro
GVA per worker (left scale)
Turnover per worker (right scale)
Capital Employed per worker (right scale)
42
ProductivityPuzzles2014Overall, firms optimized usage of capital and labour: small and medium sized posted labour productivity gains; while the larger decreased capital employed without loss in GVA.
Source: Central de Balanços do Banco de Portugal, Quadros do SectorNotes: Portugal, all non-financial corporations, 2014. Own calculations. Values as per thousand of euros.
+2% +6% +12%Labour Productivity Gain(GVA per worker, chg. ‘10-14)
Capital Productivity Gain(GVA/Capital, chg. ‘10-14) +27% +11% +13%

43
Valuesharing[wages]
2014-18Similar employee remuneration in large and medium sized firms, despite higher labour average productivity in the former.
Source: Central de Balanços do Banco de Portugal, Quadros do SectorNotes: Portugal, all non-financial corporations. Own calculations. Values as thousand of euros.
18.2
21.4 21.1
17.4
12.917.1
21.2 20.2
16.4
11.5
0.0
5.0
10.0
15.0
20.0
25.0
All Corporations Large Medium Small Micro
Compensation per Employee,2018
Compensation per Employee,2014

44
sharing Gains[capital]2014-18Productivity gains use to increase remuneration of capital, while labour was kept approximately constant, except micro and small firms: is labour a fixed cost?
Source: Central de Balanços do Banco de Portugal, Quadros do SectorNotes: Portugal, all non-financial corporations. Own calculations. Values as thousand of euros.

45
usage of Capital2018All corporations decreased capital employed between 2014 and 2018, on average. Exception to micro firms. Yet, overall capital employed in the Portuguese corporate world increased.
Source: Central de Balanços do Banco de Portugal, Quadros do SectorNotes: Portugal, all non-financial corporations, 2014. Own calculations. Values as thousand of euros.
1.131.06
1.15 1.16 1.19
1.02
0.860.95 0.99
1.08
0.0
0.5
1.0
1.5
0.0
0.5
1.0
1.5
All Corporations Large Medium Small Micro
Capital Employed (all corporations) | Base 100: 2014
Capital Employed (average corporation) | Base 100: 2014
114.4 11.9 1.7Corporation Size(avg., mi. €, 2018) 0.9 0.3

28.6%
17.6%
31.9%36.1% 34.6%
0%
25%
50%
75%
100%
All Corporations Large Medium Small Micro
Working Capital Technological Capital
46
CapitalEfficiency[cash cycle&capacity]
2018Capital Employed structure kept stable during ‘14-18, signalling better resource allocation: [1] improved cash conversion cycle; [2] higher technological productivity.
Source: Central de Balanços do Banco de Portugal, Quadros do SectorNotes: Portugal, all non-financial corporations, 2018. Own calculations. Values as thousand of euros.

47
after-taxReturn2018The after-tax return on Capital Employed increased as compared to 2014, not only because of productivity gains, but also because the tax wedge decreased.
Source: Central de Balanços do Banco de Portugal, Quadros do SectorNotes: Portugal, all non-financial corporations, 2018. Own calculations. Values as thousand of euros.
6.7%
8.2%
7.4% 7.6%
3.9%5.1%
6.5%5.7% 5.7%
2.7%
0%
5%
10%
0%
5%
10%
All Corporations Large Medium Small Micro
Return on Investment (EBIT/Capital Employed)
After-Tax Return on Investment (EBIT–Taxes/Capital Employed)
20.7% 23.0% 25.0%Tax Burden(avg. corporate rate) 23.8% 30.7%

48
Too Many… Too Small& Profitable!Too Much
Capitaldespite adjustment during ‘14-18!

49
6.7% -40% -30% -20% -10% 0% 10% 20% 30% 40%
20% 16.9% 15.6% 14.2% 12.8% 11.5% 10.1% 8.8% 7.4% 6.1% 20%
15% 15.7% 14.4% 13.0% 11.6% 10.3% 8.9% 7.6% 6.2% 4.9% 15%
10% 14.5% 13.2% 11.8% 10.4% 9.1% 7.7% 6.4% 5.0% 3.7% 10%
5% 13.3% 12.0% 10.6% 9.2% 7.9% 6.5% 5.2% 3.8% 2.5% 5%
0% 12.1% 10.8% 9.4% 8.0% 6.7% 5.3% 4.0% 2.6% 1.3% 0%
-5% 10.9% 9.6% 8.2% 6.8% 5.5% 4.1% 2.8% 1.4% 0.1% -5%
-10% 9.7% 8.4% 7.0% 5.6% 4.3% 2.9% 1.6% 0.2% -1.1% -10%
-15% 8.5% 7.2% 5.8% 4.4% 3.1% 1.7% 0.4% -1.0% -2.3% -15%
-20% 7.3% 6.0% 4.6% 3.2% 1.9% 0.5% -0.8% -2.2% -3.5% -20%
-40% -30% -20% -10% 0% 10% 20% 30% 40%
VA
B s
ho
ck
Employee Compensation Adjustment
after-COVID resilience
Returns on Investment (EBIT/Capital Employed) after a shock in production (VAB), considering mitigating circumstances (layoff and furlough schemes).
Easily return to 2014!
Source: Central de Balanços do Banco de Portugal, Quadros do SectorNotes: Portugal, all non-financial corporations, 2018. Own calculations.
4.3%
gross return on capital employed ´14

balance sheets
50
Funding

51
Source: Central de Balanços do Banco de Portugal, Quadros do SectorNotes: Portugal, all non-financial corporations, 2018. Own calculations. % of total assets.
71%Technological
Capital53%Debt
29%Working
Capital47%Equity
0%
25%
50%
75%
100%
Capital Employed
FinancialAssets
5.1%
after corporate tax
enoughReturn?

52
Capitalfinancing2018On average there is not big difference between large and small corporations regarding the structure of financing (i.e., capital structure).
Source: Central de Balanços do Banco de Portugal, Quadros do SectorNotes: Portugal, all non-financial corporations, 2018. Own calculations. % of total assets.

53
Capitalfinancing2014-18All corporations are financially more robust in 2018, as compared to 2014 (asset sales used to pay back loans and decrease financial leverage).
Source: Central de Balanços do Banco de Portugal, Quadros do SectorNotes: Portugal, all non-financial corporations, 2018. Own calculations. % of total assets.
52.9% 53.7% 52.2%48.4%
55.2%
0%
25%
50%
75%
100%
0%
25%
50%
75%
100%
All Corporations Large Medium Small Micro
Debt ('14) Equity (´14)
Debt ('18) Equity ('18)

54
Debt’financing2018Currently banks are responsible for financing less than 20% of total corporate assets (i.e., capital employed). Overall, debt contracts have an average interest rate of 3.3% (quite likely, the cost of bank loans is higher).
Source: Central de Balanços do Banco de Portugal, Quadros do SectorNotes: Portugal, all non-financial corporations, 2018. Own calculations. % of total assets.
18.0%10.8%
26.1% 24.6%16.7%
0%
25%
50%
75%
100%
All Corporations Large Medium Small Micro
Debt (banks & credit institutions) Debt (bonds) Debt (owners & others) Equity

55
cost ofDebt2018Implicit interest rates paid on debt reflect financing options available and managers’ choices: small and micro corporations resort to highly collateralized debt contracts (i.e. leasing) and borrowing from shareholders.
Source: Central de Balanços do Banco de Portugal, Quadros do SectorNotes: Portugal, all non-financial corporations, 2018. Own calculations.
2.8%
3.2%3.4%
3.1%
1.8%2.1%
2.5% 2.6%2.3%
1.3%
0%
1%
2%
3%
4%
0%
1%
2%
3%
4%
All Corporations Large Medium Small Micro
gross cost of debt after-tax cost of Debt

56
cost ofEquity2018Available return left for equity holders is, on average 8.4%. Large corporations offer a 200bp excess return over small and medium sized corporations.
Source: Central de Balanços do Banco de Portugal, Quadros do SectorNotes: Portugal, all non-financial corporations, 2018. Own calculations.
2.8%
3.2%3.4%
3.1%
1.8%8.4%
11.1%
9.1% 8.9%
4.4%
0%
4%
8%
12%
16%
0%
1%
2%
3%
4%
All Corporations Large Medium Small Micro
gross cost of debt, left-hand scale
Return on Equity (Earnings/Equity), right-hand scale

57
cost ofEquity2014Available return left for equity holders in 2014 was just 1.9%. High financial leverage then, not enough to offset high interest rates and low (labour and capital) productivity effects.
Source: Central de Balanços do Banco de Portugal, Quadros do SectorNotes: Portugal, all non-financial corporations, 2018. Own calculations.
4.1%
4.9%4.6%
4.3%
2.7%
1.9%
3.9%
5.7%
3.8%
-2.5%
-4%
0%
4%
8%
12%
-2%
0%
2%
4%
6%
All Corporations Large Medium Small Micro
gross cost of debt, left-hand scale
Return on Equity (Earnings/Equity), right-hand scale

58
requiredwacc2018Equity Risk Premium (ERP) for Portugal estimated to be 10% (Damodaran, 2020). Assume the average corporation beta to be 1.0 (well diversified portfolio). Difficult for PE to invest in medium and small Portuguese corporations.
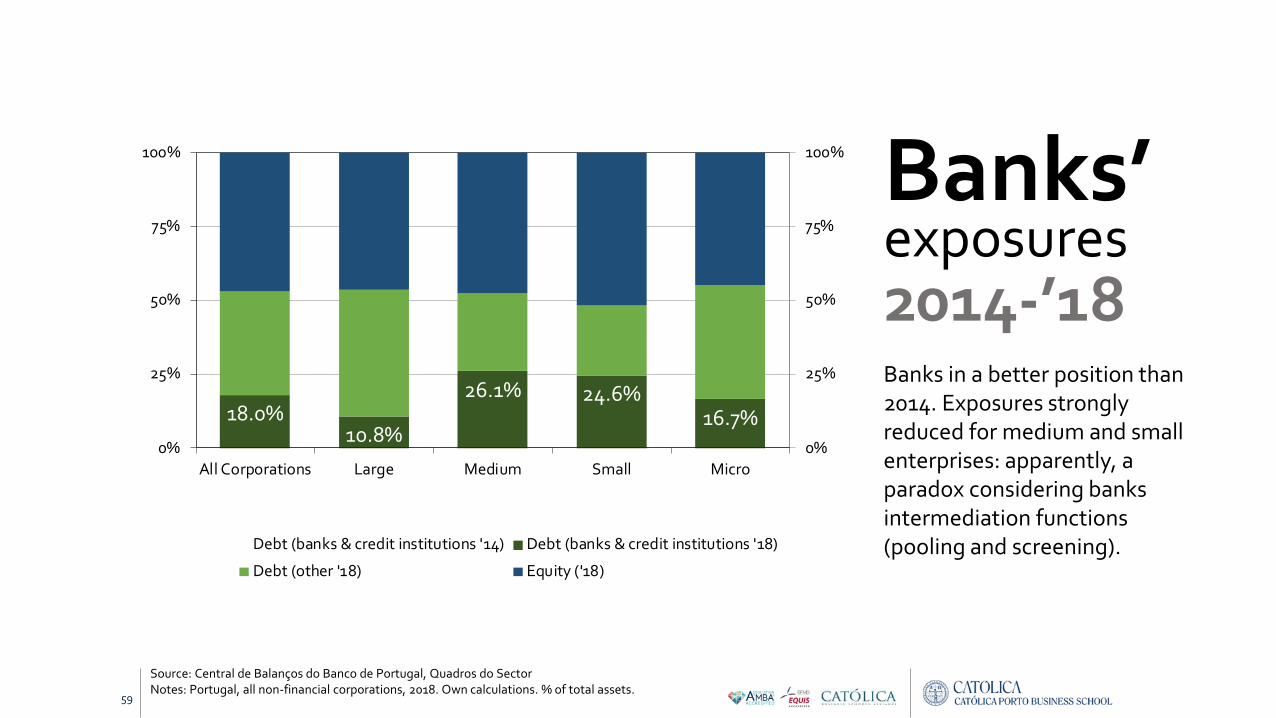
59
Banks’exposures2014-’18Banks in a better position than 2014. Exposures strongly reduced for medium and small enterprises: apparently, a paradox considering banks intermediation functions (pooling and screening).
Source: Central de Balanços do Banco de Portugal, Quadros do SectorNotes: Portugal, all non-financial corporations, 2018. Own calculations. % of total assets.
18.0%10.8%
26.1% 24.6%16.7%
0%
25%
50%
75%
100%
0%
25%
50%
75%
100%
All Corporations Large Medium Small Micro
Debt (banks & credit institutions '14) Debt (banks & credit institutions '18)
Debt (other '18) Equity ('18)

loans to corporations, 2018Financing Assets and Banks’ Exposures, Portugal
Equity
Debt
Liabilities
Reserves
Loans
Deposits
Equity
Investments Funding
Banking Book
Loans and Deposits
216.8bi,€
All-corporations (loans: 185.5bi; and others: 31.3bi).
73.7bi,€
Gross Lending to non-financial corporations (18.0% of firms’ total assets).
60
Source: Central de Balanços do Banco de Portugal, Quadros do SectorNotes: 1bi=1ooo million euros
34%
52.9%
Working Capital
Capital Employed
Assets
28.6%

loans to corporations, 2014Financing Assets and Banks’ Exposures, Portugal
Equity
Debt
LiabilitiesAssets
61
Source: Central de Balanços do Banco de Portugal, Quadros do SectorNotes: 1bi=1ooo million euros
220.2bi,€
All-corporations (loans: 191.8bi; and others: 28.4bi).
87.8bi,€
Gross Lending to non-financial corporations (24.2% of firms’ total assets).
40%
Banking Book
Loans and Deposits
60.6%
–16%
cumulative growth ’10-14
–6.2pp
debt share chg. ’10-14
Reserves
Loans
Deposits
Investments Funding
Equity
+0.5pp
working capital chg. ’10-14
Capital Employed
Working Capital
28.1%

capital structure and debt holders, 2018Financing Assets and Banks’ Exposures, Portugal: large corporations
Fonte: Central de Balanços do Banco de Portugal, Quadros do SectorNotas: utiliza-se como convenção 1bi=1ooo milhões de euros
62
Equity
Debt
Liabilities
Working Capital
Capital Employed
Assets
Banking Book
Loans and Deposits
53.7%
17.6%
Reserves
Loans
Deposits
Investments Funding
Equity73.9bi,€ 14.9bi,€
10.8%
45.7bi,€
Other (Parent Co. & Owners)
13.3bi,€
Bonds
9.7% 33.2%
59.8%
78.0bi,€11.8% 16.0bi,€
9.5% 36.2%
17.4%
x.x%
x.xbi,€
x.x%
x.xbi,€
2014 figures
2018 figures

capital structure and debt holders, 2018Financing Assets and Banks’ Exposures, Portugal: medium-sized corporations
Fonte: Central de Balanços do Banco de Portugal, Quadros do SectorNotas: utiliza-se como convenção 1bi=1ooo milhões de euros
63
Equity
Debt
Liabilities
Working Capital
Capital Employed
Assets
Banking Book
Loans and Deposits
52.2%
31.9%
Reserves
Loans
Deposits
Investments Funding
Equity42.5bi,€ 21.3bi,€
26.1%
18.1bi,€
Other (Parent Co. & Owners)
3.1bi,€
Bonds
3.8% 22.3%
59.7%
42.2bi,€31.3% 24.3bi,€
2.6% 20.6%
37.8%
x.x%
x.xbi,€
x.x%
x.xbi,€
2014 figures
2018 figures

capital structure and debt holders, 2018Financing Assets and Banks’ Exposures, Portugal: small-sized corporations
Fonte: Central de Balanços do Banco de Portugal, Quadros do SectorNotas: utiliza-se como convenção 1bi=1ooo milhões de euros
64
Equity
Debt
Liabilities
Working Capital
Capital Employed
Assets
Banking Book
Loans and Deposits
48.4%
36.1%
Reserves
Loans
Deposits
Investments Funding
Equity34.9bi,€ 17.8bi,€
24.6%
15.3bi,€
Other (Parent Co. & Owners)
1.9bi,€
Bonds
3.8% 22.3%
56.2%
34.9bi,€32.6% 21.6bi,€
2.6% 20.6%
38.7%
x.x%
x.xbi,€
x.x%
x.xbi,€
2014 figures
2018 figures

capital structure and debt holders, 2018Financing Assets and Banks’ Exposures, Portugal: micro corporations
Fonte: Central de Balanços do Banco de Portugal, Quadros do SectorNotas: utiliza-se como convenção 1bi=1ooo milhões de euros
65
Equity
Debt
Liabilities
Working Capital
Capital Employed
Assets
Banking Book
Loans and Deposits
55.2%
34.6%
Reserves
Loans
Deposits
Investments Funding
Equity65.5bi,€ 19.8bi,€
16.7%
44.8bi,€
Other (Parent Co. & Owners)
0.9bi,€
Bonds
0.7% 37.7%
65.0%
65.1bi,€25.1% 25.9bi,€
0.1% 37.8%
32.9%
x.x%
x.xbi,€
x.x%
x.xbi,€
2014 figures
2018 figures

66
Banks’exposures2018Overall banks decreased lending to corporations in Portugal, therefore still shielded from economic downturn, except if compelled to build up their exposures (moratorium period)…
Source: Central de Balanços do Banco de Portugal, Quadros do SectorNotes: Portugal, all non-financial corporations, 2018. Own calculations. Values as of million euros.
16 022
24 279
21 575
25 941
14 897
21 232
17 78019 788
0
10 000
20 000
30 000
0
10 000
20 000
30 000
Large Medium Small Micro
Bebt (banks & credit institutions '14)
Debt (banks & credit institutions)
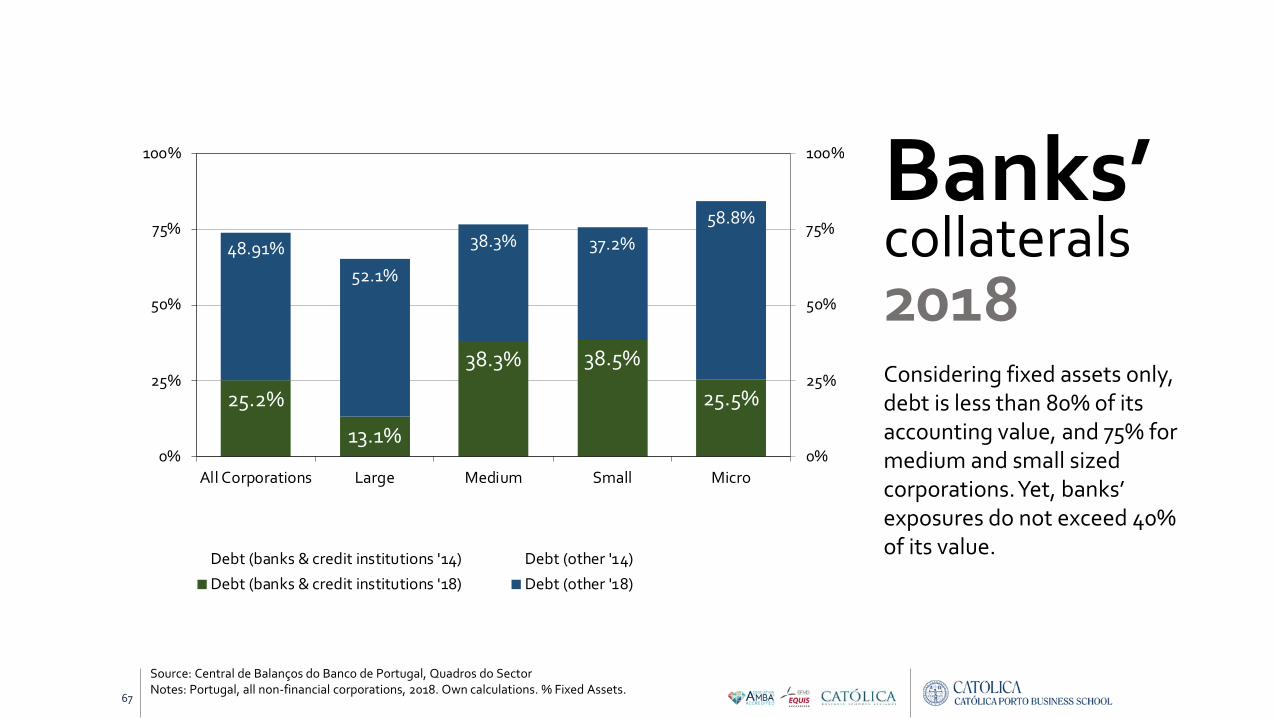
67
Banks’collaterals2018Considering fixed assets only, debt is less than 80% of its accounting value, and 75% for medium and small sized corporations. Yet, banks’ exposures do not exceed 40% of its value.
Source: Central de Balanços do Banco de Portugal, Quadros do SectorNotes: Portugal, all non-financial corporations, 2018. Own calculations. % Fixed Assets.
25.2%
13.1%
38.3% 38.5%
25.5%
48.91%
52.1%
38.3% 37.2%
58.8%
0%
25%
50%
75%
100%
0%
25%
50%
75%
100%
All Corporations Large Medium Small Micro
Debt (banks & credit institutions '14) Debt (other '14)
Debt (banks & credit institutions '18) Debt (other '18)

68
Banks’potential risks
2018What if we restore the 2014 level of bank loans per firm, assuming 2018 fixed assets? From a “real estate value” perspective, things do not look much different now…
Source: Central de Balanços do Banco de Portugal, Quadros do SectorNotes: Portugal, all non-financial corporations, 2018. Own calculations. % Fixed Assets.
33.2%
17.3%
52.9% 54.9%
36.7%
48.91%
52.1%
38.3% 37.2%58.8%
0%
25%
50%
75%
100%
0%
25%
50%
75%
100%
All Corporations Large Medium Small Micro
Debt (other '14)
Debt (banks & credit institutions '14)
Debt (other '18)
Simulated Debt (banks & credit institutions '18)

69
after-COVID resilience
Returns on Equity (Earnings/Equity) after a shock in production (VAB), considering mitigating circumstances (layoff and furlough schemes) and debt contractual obligations.
Source: Central de Balanços do Banco de Portugal, Quadros do SectorNotes: Portugal, all non-financial corporations, 2018. Own calculations.
8.4% -40% -30% -20% -10% 0% 10% 20% 30% 40%
20% 24.9% 22.8% 20.6% 18.4% 16.2% 14.0% 11.8% 9.6% 7.4% 20%
15% 23.0% 20.8% 18.6% 16.4% 14.2% 12.1% 9.9% 7.7% 5.5% 15%
10% 21.1% 18.9% 16.7% 14.5% 12.3% 10.1% 7.9% 5.7% 3.5% 10%
5% 19.1% 16.9% 14.7% 12.6% 10.4% 8.2% 6.0% 3.8% 1.6% 5%
0% 17.2% 15.0% 12.8% 10.6% 8.4% 6.2% 4.0% 1.9% -0.3% 0%
-5% 15.2% 13.1% 10.9% 8.7% 6.5% 4.3% 2.1% -0.1% -2.3% -5%
-10% 13.3% 11.1% 8.9% 6.7% 4.5% 2.4% 0.2% -2.0% -4.2% -10%
-15% 11.4% 9.2% 7.0% 4.8% 2.6% 0.4% -1.8% -4.0% -6.2% -15%
-20% 9.4% 7.2% 5.0% 2.8% 0.7% -1.5% -3.7% -5.9% -8.1% -20%
-40% -30% -20% -10% 0% 10% 20% 30% 40%
VA
B s
ho
ck
Employee Compensation Adjustment
1.9%
average return on equity ‘14

70
Bottompotential risks
2018There are more than 220 thousand corporations – half of the Portuguese corporate world – with a return (EBIT as % revenues) to financing less than 3.3%, just enough to pay debt holders!
Source: Central de Balanços do Banco de Portugal, Quadros do SectorNotes: Portugal, all non-financial corporations, 2018. Own calculations. % Fixed Assets.
506.8% 6.7% 6.8% 6.9% 7.2%
3.3%
4.2% 3.9% 3.7%3.1%
0%
5%
10%
0%
5%
10%
All Corporations Large Medium Small Micro
Return on Revenue (mean) Return on Revenue (median)

71
after-COVID resilience
Returns on Equity (Earnings/Equity) after a shock in production (VAB), considering mitigating circumstances (layoff and furlough schemes) and debt contractual obligations.
Source: Central de Balanços do Banco de Portugal, Quadros do SectorNotes: Portugal, all non-financial corporations, 2018. Own calculations.
2.0% -40% -30% -20% -10% 0% 10% 20% 30% 40%
20% 21.8% 18.9% 16.1% 13.2% 10.3% 7.4% 4.6% 1.7% -1.2% 20%
15% 19.7% 16.9% 14.0% 11.1% 8.2% 5.4% 2.5% -0.4% -3.3% 15%
10% 17.6% 14.8% 11.9% 9.0% 6.1% 3.3% 0.4% -2.5% -5.4% 10%
5% 15.5% 12.7% 9.8% 6.9% 4.0% 1.2% -1.7% -4.6% -7.5% 5%
0% 13.4% 10.6% 7.7% 4.8% 2.0% -0.9% -3.8% -6.7% -9.5% 0%
-5% 11.4% 8.5% 5.6% 2.7% -0.1% -3.0% -5.9% -8.8% -11.6% -5%
-10% 9.3% 6.4% 3.5% 0.6% -2.2% -5.1% -8.0% -10.9% -13.7% -10%
-15% 7.2% 4.3% 1.4% -1.4% -4.3% -7.2% -10.1% -12.9% -15.8% -15%
-20% 5.1% 2.2% -0.7% -3.5% -6.4% -9.3% -12.2% -15.0% -17.9% -20%
-40% -30% -20% -10% 0% 10% 20% 30% 40%
VA
B s
hock
Bottompotential risks 50220k
firms

72
Bottompotential risks
2018There are more than 110 thousand corporations with a negative return (EBIT as % revenues) to financing!
Source: Central de Balanços do Banco de Portugal, Quadros do SectorNotes: Portugal, all non-financial corporations, 2018. Own calculations. % Fixed Assets.
25

73
after-COVID resilience
Returns on Equity (Earnings/Equity) after a shock in production (VAB), considering mitigating circumstances (layoff and furlough schemes) and debt contractual obligations.
Source: Central de Balanços do Banco de Portugal, Quadros do SectorNotes: Portugal, all non-financial corporations, 2018. Own calculations.
-15.0% -40% -30% -20% -10% 0% 10% 20% 30% 40%
20% 1.4% -1.5% -4.3% -7.2% -10.1% -12.9% -15.8% -18.7% -21.6% 20%
15% 0.2% -2.7% -5.6% -8.4% -11.3% -14.2% -17.1% -19.9% -22.8% 15%
10% -1.1% -3.9% -6.8% -9.7% -12.6% -15.4% -18.3% -21.2% -24.1% 10%
5% -2.3% -5.2% -8.1% -10.9% -13.8% -16.7% -19.6% -22.4% -25.3% 5%
0% -3.5% -6.4% -9.3% -12.2% -15.0% -17.9% -20.8% -23.7% -26.5% 0%
-5% -4.8% -7.7% -10.5% -13.4% -16.3% -19.2% -22.0% -24.9% -27.8% -5%
-10% -6.0% -8.9% -11.8% -14.7% -17.5% -20.4% -23.3% -26.2% -29.0% -10%
-15% -7.3% -10.1% -13.0% -15.9% -18.8% -21.6% -24.5% -27.4% -30.3% -15%
-20% -8.5% -11.4% -14.3% -17.1% -20.0% -22.9% -25.8% -28.6% -31.5% -20%
-40% -30% -20% -10% 0% 10% 20% 30% 40%
VA
B s
hock
Bottompotential risks 25110k
firms

74
after-COVID resilience
Returns on Equity (Earnings/Equity) after a shock in production (VAB), considering mitigating circumstances (layoff and furlough schemes) and debt contractual obligations.
Source: Central de Balanços do Banco de Portugal, Quadros do SectorNotes: Portugal, large non-financial corporations, 2018. Own calculations.
Bottompotential risks 25
300largecorporations!
-6.9% -40% -30% -20% -10% 0% 10% 20% 30% 40%
20% 12.8% 9.8% 6.8% 3.7% 0.7% -2.3% -5.3% -8.4% -11.4% 20%
15% 10.9% 7.9% 4.8% 1.8% -1.2% -4.2% -7.3% -10.3% -13.3% 15%
10% 9.0% 6.0% 2.9% -0.1% -3.1% -6.1% -9.2% -12.2% -15.2% 10%
5% 7.1% 4.0% 1.0% -2.0% -5.0% -8.1% -11.1% -14.1% -17.1% 5%
0% 5.2% 2.1% -0.9% -3.9% -6.9% -10.0% -13.0% -16.0% -19.0% 0%
-5% 3.2% 0.2% -2.8% -5.8% -8.9% -11.9% -14.9% -17.9% -21.0% -5%
-10% 1.3% -1.7% -4.7% -7.7% -10.8% -13.8% -16.8% -19.8% -22.9% -10%
-15% -0.6% -3.6% -6.6% -9.7% -12.7% -15.7% -18.7% -21.7% -24.8% -15%
-20% -2.5% -5.5% -8.5% -11.6% -14.6% -17.6% -20.6% -23.7% -26.7% -20%
-40% -30% -20% -10% 0% 10% 20% 30% 40%
VA
B s
ho
ck
Employee Compensation Adjustment

75
after-COVID resilience
Returns on Equity (Earnings/Equity) after a shock in production (VAB), considering mitigating circumstances (layoff and furlough schemes) and debt contractual obligations.
Source: Central de Balanços do Banco de Portugal, Quadros do SectorNotes: Portugal, large non-financial corporations, 2018. Own calculations.
Bottompotential risks 25
100kmicrocorporations!
-13.3% -40% -30% -20% -10% 0% 10% 20% 30% 40%
20% -3.2% -5.1% -7.0% -8.9% -10.8% -12.7% -14.6% -16.5% -18.4% 20%
15% -3.9% -5.8% -7.7% -9.6% -11.5% -13.4% -15.3% -17.2% -19.1% 15%
10% -4.5% -6.4% -8.3% -10.2% -12.1% -14.0% -15.9% -17.8% -19.7% 10%
5% -5.1% -7.0% -8.9% -10.8% -12.7% -14.6% -16.5% -18.4% -20.3% 5%
0% -5.7% -7.6% -9.5% -11.4% -13.3% -15.2% -17.1% -19.0% -20.9% 0%
-5% -6.4% -8.3% -10.2% -12.1% -14.0% -15.9% -17.8% -19.7% -21.6% -5%
-10% -7.0% -8.9% -10.8% -12.7% -14.6% -16.5% -18.4% -20.3% -22.2% -10%
-15% -7.6% -9.5% -11.4% -13.3% -15.2% -17.1% -19.0% -20.9% -22.8% -15%
-20% -8.2% -10.1% -12.0% -13.9% -15.8% -17.7% -19.6% -21.5% -23.4% -20%
-40% -30% -20% -10% 0% 10% 20% 30% 40%
VA
B s
hock

76
enterprise classification
Source: Central de Balanços do Banco de Portugal, Quadros do SectorNotes: Portugal, all non-financial corporations, 2018.values as million of euros.
2018 2014 2018 2014 2018 2014
All Corporations 6.8 6.3 0.871 0.777 0.913 0.895
Large 750.2 701.5 137.056 136.841 114.423 132.938
Medium 88.9 89.0 12.701 12.009 11.923 12.506
Small 18.4 18.3 1.871 1.817 1.744 1.757
Micro 2.0 2.0 0.155 0.134 0.297 0.275
Number of employees Annual Turnover Employed Capital

77
practices
Managing

Productivity and profitability depend on management practices“Management Practice” scores
78
Source: Bloom, Genakos, Sadun & Reenen, 2012Notes: international study on management practices in 20 countries around the world, comprising companies ranging between 100 e 5000 employees. Portugal is represented with 247 firms | management scores on a scale from 1 (min) to 5 (max).
2,67
2,71
2,71
2,73
2,87
2,90
3,02
3,02
3,02
3,23
3,35
Índia
Brasil
China
Grécia
Portugal
Polónia
França
Itália
Reino Unido
Alemanha
Estados Unidos
20
1918
1714
128
76
31 “In the United States, a plant at the 90th percentile has
labor productivity 4x a plant at the 10th percentile
(Syverson, 2004), total factor productivity is 2x.”
Portugal & Greece…recall:
United States Brazil

79
Source: Van Reenen, John (2017). “Management and the Wealth of Nations”. World Bank Empirical Management Conference, Washington.
management istechnology
A positive relationship between management practices (scores), productivity, and economic development and growth.

Corporate performance…depends on management practices
In the United States, a plant at the 90th percentile has labor productivity 4x a plant at the 10th percentile (Syverson, 2004), total factor productivity is 2x
Fonte: Bloom, Genakos, Sadun & Reenen, 2012Source: international study on management practices in 20 countries around the world, comprising companies ranging between 100
e 5000 employees. Portugal is represented with 247 firms | management scores on a scale from 1 (min) to 5 (max).
Brasil
0.2
.4.6
.8
De
nsi
ty
1 2 3 4 5management
Total Factor Productivity: 2x
Labour Factor Productivity: 4x
80

81
0 1 2 3 4 5
Vestuário
Metalomecânica
Couro e Calçado
Edição e Impressão
Máquinas industriais
Carvão e Petróleo
Texteis
Instrumentos de Precisão
Papel
Borracha e Plásticos
Produtos Químicos
Electrónica
Alimentação e Bebidas
Mobiliário
Transportes
Metalúrgicas
Cerâmicas
Madeira
23
3431
27
352
92
238
26
302
836
20
25
3733
322
4
Source: Bloom, Genakos, Sadun & Reenen, 2012Notes: international study on management practices in 20 countries around the world, comprising companies ranging between 100 e 5000 employees. Portugal is represented with 247 firms | management scores on a scale from 1 (min) to 5 (max).

82
• prevalência por modelos de propriedade e de governo
• “Management Practice” scores
2,53
2,70
2,93
2,97
2,97
3,01
3,13
3,30
Founder
Family owned, family CEO
Managers
Family owned, external CEO
Private Individuals
Government
Private Equity
Dispersed Shareholders
Portugal
2,64
2,77
2,94
3,14
2,95
2,74
3,21
3,24
Founder
Family owned, family…
Managers
Family owned, external…
Private Individuals
Government
Private Equity
Dispersed Shareholders
Total 20 países
Source: Bloom, Genakos, Sadun & Reenen, 2012Notes: international study on management practices in 20 countries around the world, comprising companies ranging between 100 e 5000 employees. Portugal is represented with 247 firms | management scores on a scale from 1 (min) to 5 (max).
corporations
investors
83

Non-Performing Loans? Respond to thrive post-moratoriumChallenges for the real economy or challenges for the banking sector?
© 2020 For more information, contact Deloitte Corporate Finance, S.A. 84
Next session: Recovery instruments and the Investors’ narrative
October 30th – from 9AM to 10:15AM
Q&A and closing
Webinar reloaded - NPL ecosystem at a glance• Joaquim Paulo, Deloitte Portugal• Susana Bento, Deloitte Portugal
The outbreak of recovery instruments• Andrew Grimstone, Deloitte UK• Ricardo Reis, Deloitte Portugal• Jorge Marrão, Deloitte Portugal
Voice to investors: a new narrative?• Benjamin Collet, Deloitte UK• André Nunes, Whitestar• Martim Avillez Figueiredo, Core Capital

© 2020 For more information, contact Deloitte Corporate Finance, S.A.
Deloitte refers to one or more of Deloitte Touche Tohmatsu Limited (“DTTL”), its global network of member firms, and their related entities. DTTL (also referred to as “Deloitte Global”) and each of its member firms are legally separate and independent entities. DTTL does not provide services to clients. Please see www.deloitte.com/about to learn more.
Deloitte is a leading global provider of audit and assurance, consulting, financial advisory, risk advisory, tax and related services. Our network of member firms in more than 150 countries and territories serves four out of five Fortune Global 500® companies. Learn how Deloitte’s approximately 312,000 people make an impact that matters at www.deloitte.com.
This communication contains general information only, and none of Deloitte Touche Tohmatsu Limited, its member firms or their related entities (collectively, the “Deloitte network”) is, by means of this communication, rendering professional advice or services. Before making any decision or taking any action that may affect your finances or your business, you should consult a qualified professional adviser. No entity in the Deloitte network shall be responsible for any loss whatsoever sustained by any person who relies on this communication.