Annual Report 2013 - TRB Traffic Simulation Committee ACP80
54
SimSub Annual Report: December 2013 _____________________________________________________ Page 1 Chairman’s Message SimSub Chair Dr. George List NC State University It is always a pleasure to introduce you to the SimSub newsletter. This issue is reaching you contemporous with the 2014 Annual TRB Meeting. Many thanks to all the SimSub supporters who attended the Traffic Simulation Workshop and the SimSub meeting. SimSub continues to be very active. More than 150 people attended the Traffic Simulation Workshop. There was evidence of excitement about the future of simulation and further ad- vances. Modeling safety was a high- light. Another was the use of models in combination to balance expeditious re- sults with detailed analysis. We are pre- paring a TRB Circular that will contain the papers prepared for the workshop. A new development is a webinar series. Working in conjunction with the ITE SimCap group, we are lining up speak- ers for this year and next. We are very pleased that this activity is flourishing. It will likely raise the visibility of both SimSub and SimCap and further en- courage the use of simulation models for traffic analyses. Our thanks to Mi- randa Wells for spearheading this ef- fort. As with prior years, we will be holding midyear meetings in conjunction with our sponsoring committees. One will be held in conjunction with the midyear meeting of the Traffic Flow Theory Committee on August 11-13, 2014 in Portland, Oregon. Another will be in conjunction with the midyear meeting of the Highway Capacity Meeting on June 11-14, 2014 in Lexington, Ken- tucky. As always, we need to thank David Hale for his efforts as the new newslet- ter editor. He works diligently and tire- lessly to assemble this document for our benefit. In closing, we look forward to your continuing involvement and support; and to seeing you at the midyear meet- ing or at the next annual meeting in January 2015. Sponsor Committees AHB45: TRAFFIC FLOW THEORY AHB40: HIGHWAY CAPACITY AND QUALITY OF SERVICE AHB20: FREEWAY OPERATIONS AHB25: TRAFFIC SIGNAL SYSTEMS ADB30: TRANSPORTATION NETWORK MODELING AHB55: WORK ZONE TRAFFIC CONTROL ADC20: TRANSPORTATION AND AIR QUALITY TRANSPORTATION RESEARCH BOARD JOINT TRAFFIC SIMULATION SUBCOMMITTEE Annual Report 2013 AHB45 (1) SimSub Web Site Alex Stevanovic, Webmaster http://sites.google.com/site/trbcommitteeahb45 Contents Upcoming 2014 Events Recent 2013 Events Recent 2013 Research SimSub 2013 Activities 2013 Product Updates
-
Upload
khangminh22 -
Category
Documents
-
view
0 -
download
0
Transcript of Annual Report 2013 - TRB Traffic Simulation Committee ACP80
SimSub Annual Report: December 2013 _____________________________________________________ Page 1
Chairman’s Message
SimSub Chair
Dr. George List
NC State University
It is always a pleasure to introduce you
to the SimSub newsletter. This issue is
reaching you contemporous with the
2014 Annual TRB Meeting. Many
thanks to all the SimSub supporters
who attended the Traffic Simulation
Workshop and the SimSub meeting.
SimSub continues to be very active.
More than 150 people attended the
Traffic Simulation Workshop. There
was evidence of excitement about the
future of simulation and further ad-
vances. Modeling safety was a high-
light. Another was the use of models in
combination to balance expeditious re-
sults with detailed analysis. We are pre-
paring a TRB Circular that will contain
the papers prepared for the workshop.
A new development is a webinar series.
Working in conjunction with the ITE
SimCap group, we are lining up speak-
ers for this year and next. We are very
pleased that this activity is flourishing.
It will likely raise the visibility of both
SimSub and SimCap and further en-
courage the use of simulation models
for traffic analyses. Our thanks to Mi-
randa Wells for spearheading this ef-
fort.
As with prior years, we will be holding
midyear meetings in conjunction with
our sponsoring committees. One will be
held in conjunction with the midyear
meeting of the Traffic Flow Theory
Committee on August 11-13, 2014 in
Portland, Oregon. Another will be in
conjunction with the midyear meeting
of the Highway Capacity Meeting on
June 11-14, 2014 in Lexington, Ken-
tucky.
As always, we need to thank David
Hale for his efforts as the new newslet-
ter editor. He works diligently and tire-
lessly to assemble this document for
our benefit.
In closing, we look forward to your
continuing involvement and support;
and to seeing you at the midyear meet-
ing or at the next annual meeting in
January 2015.
Sponsor Committees AHB45: TRAFFIC FLOW THEORY
AHB40: HIGHWAY CAPACITY
AND QUALITY OF SERVICE
AHB20: FREEWAY OPERATIONS
AHB25: TRAFFIC SIGNAL SYSTEMS
ADB30: TRANSPORTATION
NETWORK MODELING
AHB55: WORK ZONE TRAFFIC
CONTROL
ADC20: TRANSPORTATION AND AIR
QUALITY
T R A N S P O R T A T I O N R E S E A R C H B O A R D J O I N T T R A F F I C S I M U L A T I O N S U B C O M M I T T E E
Annual Report 2013 AHB45 (1)
SimSub Web Site Alex Stevanovic, Webmaster http://sites.google.com/site/trbcommitteeahb45
Contents
Upcoming 2014 Events
Recent 2013 Events
Recent 2013 Research
SimSub 2013 Activities
2013 Product Updates
SimSub Annual Report: December 2013 _____________________________________________________ Page 2
T R A N S P O R T A T I O N R E S E A R C H B O A R D J O I N T T R A F F I C S I M U L A T I O N S U B C O M M I T T E E
AHB45 (1)
Joint Traffic Simulation Subcommittee Draft Meeting Agenda
Transportation Research Board Annual Meeting
Monday, January 13, 2014, 7:30-9:30PM Marriott, Washington B1
A. Introductions - George List
B. Sponsoring Committee Chair Remarks - attending chairs or liaisons
C. Task Group Reports
a. Annual Workshop Report (brief synopsis) – Rob Bertini
b. Research Needs and Resources Task Group - Mohammad Hadi
c. Calibration, Verification and Validation Task Group - Ray Benekohal
d. Awards – Ed Lieberman
e. Liaison and Outreach Task Group – David Hale
f. Mesoscopic Task Group – Yi-Chang Chiu
g. Safety Simulation Task Group – Bill Young
h. Agent-Based Simulation Task Group – Monty Abbas
D. FHWA Update – James Colyar
E. New Business
a. TRB Circular based on 2014 Workshop – Rob Bertini
b. Joint ITE Webinars – Miranda Wells
c. 2014 Midyear activities – George List
d. 2015 Annual Workshop Planning – George List
F. Multitude Project Report - Vincenzo Punzo
G. Other Items (including new task groups and upcoming conferences)
H. Closing
Sponsoring Committees
AHB45: Traffic Flow Theory & Characteristics*
ADB30: Transportation Network Modeling
AHB20: Freeway Operations
AHB25: Traffic Signal Systems
AHB40: Highway Capacity and Quality of Service
AHB55: Work Zone Traffic Control
ADC20: Transportation and Air Quality
SimSub Annual Report: December 2013 _____________________________________________________ Page 3
T R A N S P O R T A T I O N R E S E A R C H B O A R D J O I N T T R A F F I C S I M U L A T I O N S U B C O M M I T T E E
AHB45 (1)
2014 TRB Sunday Workshop on Simulation (SimSub):
Looking Back and Looking Ahead
Program
Welcome from George List SimSub Chair 1:30
Moderator: Constantinos Antoniou
1) Femke van Wageningen‐Kessels, Traffic Flow Modeling: A Genealogy 1:30‐1:45
2) Ed Lieberman,History of the Use of Simulation in Traffic Analysis 1:45‐2:00
3) Tom Rioux, Evolution of the TEXAS Model and Traffic Simulation 2:00‐2:15
4) Peter Vortisch, History of VISSIM Development 2:15‐2:30
5) Peter Wagner, Evolution of SUMO Simulation Model 2:30‐2:45
Break 2:45‐3:00
Moderator: Robert Bertini
6) Alex Skabardonis, Thoughts on Traffic Simulation Models 3:00‐3:15
7) Vincenzo Punzo, Future Directions for Managing Uncertainty in Stochastic Traffic Models 3:15‐3:30
8) Kaan Ozbay, Big Data and the Calibration and Validation of Traffic Simulation Models 3:30‐3:45
9) William Young, Looking Back and Forward at Modeling the Safety System 3:45‐4:00
10) Audience Input Panel: Nate Gartner, Hani Mahmassani, George List, Jeff Lindley 4:00‐4:30
SimSub Annual Report: December 2013 _____________________________________________________ Page 4
2014 Upcoming Events
2014 FSITE Winter Workshop Traffic Analysis Tools and Specialized Applications
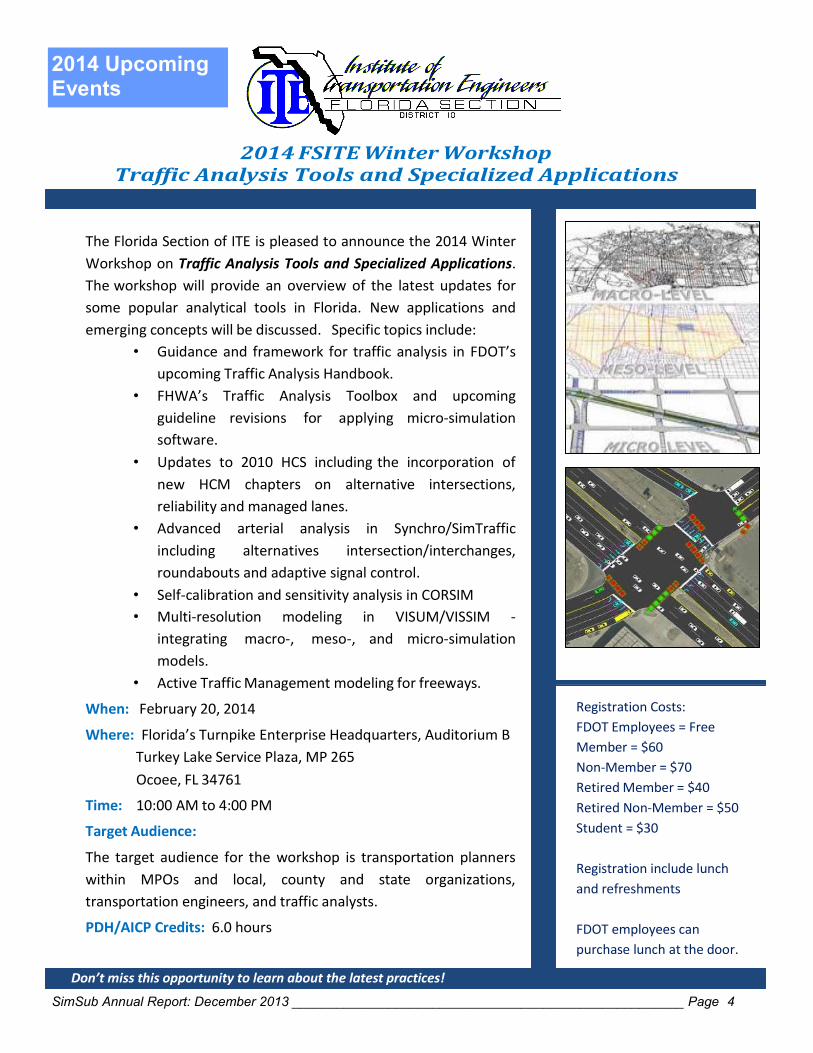
The Florida Section of ITE is pleased to announce the 2014 Winter
Workshop on Traffic Analysis Tools and Specialized Applications.
The workshop will provide an overview of the latest updates for
some popular analytical tools in Florida. New applications and
emerging concepts will be discussed. Specific topics include:
• Guidance and framework for traffic analysis in FDOT’s
upcoming Traffic Analysis Handbook.
• FHWA’s Traffic Analysis Toolbox and upcoming
guideline revisions for applying micro-simulation
software.
• Updates to 2010 HCS including the incorporation of
new HCM chapters on alternative intersections,
reliability and managed lanes.
• Advanced arterial analysis in Synchro/SimTraffic
including alternatives intersection/interchanges,
roundabouts and adaptive signal control.
• Self-calibration and sensitivity analysis in CORSIM
• Multi-resolution modeling in VISUM/VISSIM -
integrating macro-, meso-, and micro-simulation
models.
• Active Traffic Management modeling for freeways.
When: February 20, 2014
Where: Florida’s Turnpike Enterprise Headquarters, Auditorium B
Turkey Lake Service Plaza, MP 265
Ocoee, FL 34761
Time: 10:00 AM to 4:00 PM
Target Audience:
The target audience for the workshop is transportation planners
within MPOs and local, county and state organizations,
transportation engineers, and traffic analysts.
PDH/AICP Credits: 6.0 hours Don’t miss this opportunity to learn about the latest practices!
Registration Costs:
FDOT Employees = Free
Member = $60
Non-Member = $70
Retired Member = $40
Retired Non-Member = $50
Student = $30
Registration include lunch
and refreshments
FDOT employees can
purchase lunch at the door.
SimSub Annual Report: December 2013 _____________________________________________________ Page 5
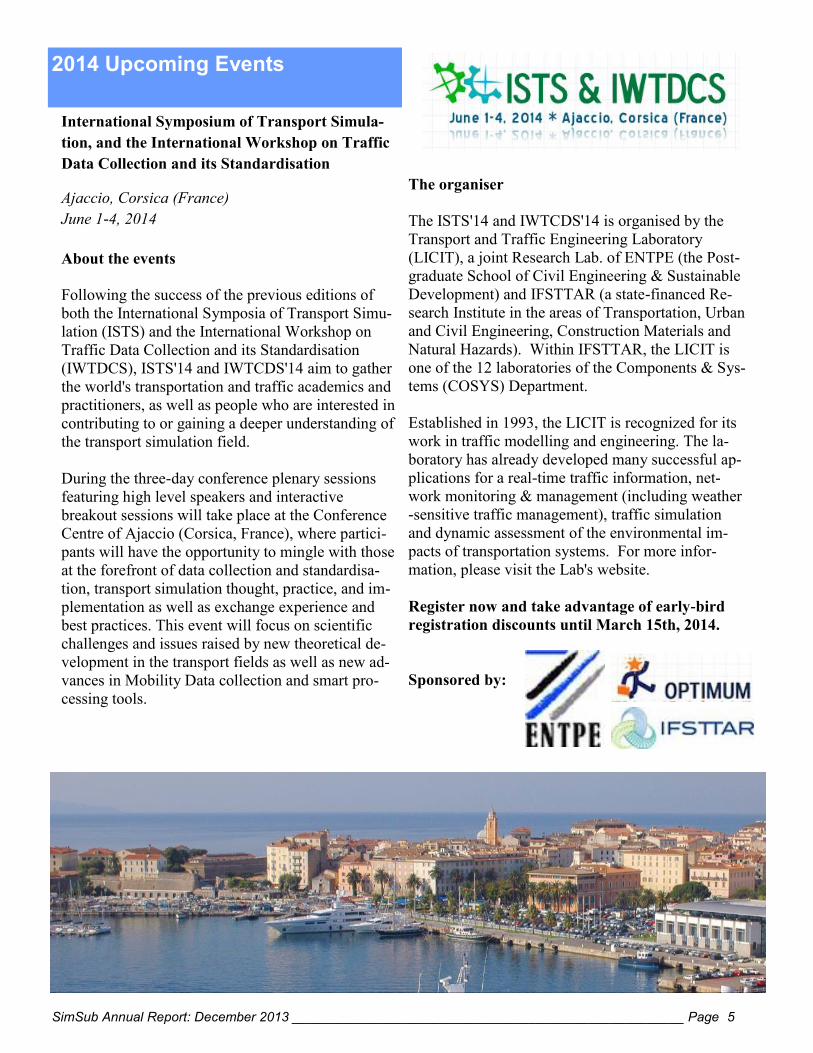
International Symposium of Transport Simula-
tion, and the International Workshop on Traffic
Data Collection and its Standardisation
Ajaccio, Corsica (France)
June 1-4, 2014
About the events
Following the success of the previous editions of
both the International Symposia of Transport Simu-
lation (ISTS) and the International Workshop on
Traffic Data Collection and its Standardisation
(IWTDCS), ISTS'14 and IWTCDS'14 aim to gather
the world's transportation and traffic academics and
practitioners, as well as people who are interested in
contributing to or gaining a deeper understanding of
the transport simulation field.
During the three-day conference plenary sessions
featuring high level speakers and interactive
breakout sessions will take place at the Conference
Centre of Ajaccio (Corsica, France), where partici-
pants will have the opportunity to mingle with those
at the forefront of data collection and standardisa-
tion, transport simulation thought, practice, and im-
plementation as well as exchange experience and
best practices. This event will focus on scientific
challenges and issues raised by new theoretical de-
velopment in the transport fields as well as new ad-
vances in Mobility Data collection and smart pro-
cessing tools.
The organiser
The ISTS'14 and IWTCDS'14 is organised by the
Transport and Traffic Engineering Laboratory
(LICIT), a joint Research Lab. of ENTPE (the Post-
graduate School of Civil Engineering & Sustainable
Development) and IFSTTAR (a state-financed Re-
search Institute in the areas of Transportation, Urban
and Civil Engineering, Construction Materials and
Natural Hazards). Within IFSTTAR, the LICIT is
one of the 12 laboratories of the Components & Sys-
tems (COSYS) Department.
Established in 1993, the LICIT is recognized for its
work in traffic modelling and engineering. The la-
boratory has already developed many successful ap-
plications for a real-time traffic information, net-
work monitoring & management (including weather
-sensitive traffic management), traffic simulation
and dynamic assessment of the environmental im-
pacts of transportation systems. For more infor-
mation, please visit the Lab's website.
Register now and take advantage of early-bird
registration discounts until March 15th, 2014.
Sponsored by:
2014 Upcoming Events
SimSub Annual Report: December 2013 _____________________________________________________ Page 6
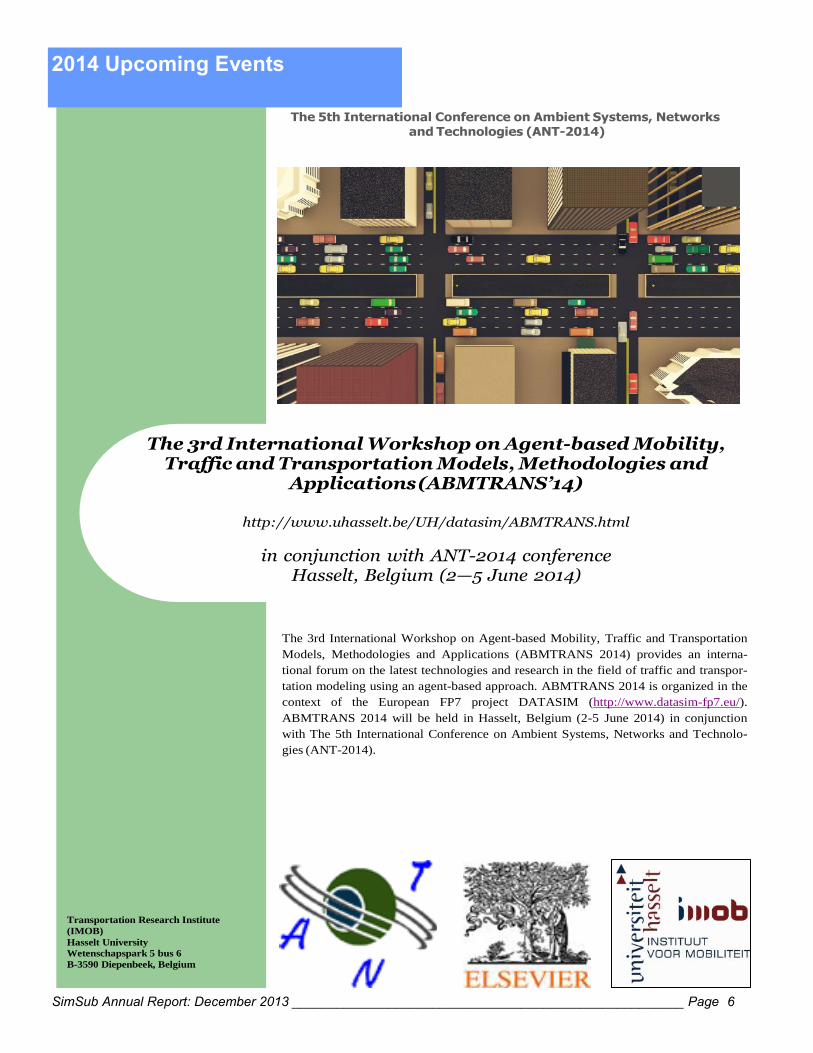
The 5th International Conference on Ambient Systems, Networks
and Technologies (ANT-2014)
The 3rd International Workshop on Agent-based Mobility, Traffic and Transportation Models, Methodologies and
Applications (ABMTRANS’14)
http://www.uhasselt.be/UH/datasim/ABMTRANS.html
in conjunction with ANT-2014 conference
Hasselt, Belgium (2—5 June 2014)
The 3rd International Workshop on Agent-based Mobility, Traffic and Transportation
Models, Methodologies and Applications (ABMTRANS 2014) provides an interna-
tional forum on the latest technologies and research in the field of traffic and transpor-
tation modeling using an agent-based approach. ABMTRANS 2014 is organized in the
context of the European FP7 project DATASIM (http://www.datasim-fp7.eu/).
ABMTRANS 2014 will be held in Hasselt, Belgium (2-5 June 2014) in conjunction
with The 5th International Conference on Ambient Systems, Networks and Technolo-
gies (ANT-2014).
Transportation Research Institute
(IMOB)
Hasselt University
Wetenschapspark 5 bus 6
B-3590 Diepenbeek, Belgium
2014 Upcoming Events

SimSub Annual Report: December 2013 _____________________________________________________ Page 7
2014 Upcoming Events SCOPE
This workshop provides a multidisciplinary collaborative forum for researchers and practitioners to submit papers presenting new research results and novel ideas related to the theory or the practice of agent-based traffic and trans- portation modeling. This workshop also invites researchers to submit their work focusing on the data mining, man- agement and configuration for agent-based traffic and transportation modeling.
Topics of interest include (but are not limited to):
Agent-based modeling and simulation
Agent-human interactions
Environment modeling and interaction protocols
Data mining, learning and adaptation
Marketing decision support
Collaboration, cooperation, competition, coalitions in traffic and transportation models
Agent-based negotiation of QoS and SLAs in traffic and transportation models
Social and emergent behavior in MAS-T (multi-agent systems applied to traffic and transport)
Large scale simulation of agent-based microscopic traffic models
Calibration and validation of agent-based models for traffic and transportation
Role of multi-agent methodologies for complex systems
Conceptual modeling of agent-based approach
Agent-based freight transportation modeling
Multi-modal routing of agents in a dynamic traffic environment Agent-based scheduling to establish synthetic agenda for day-to-day activities
SUBMISSION AND PROCEEDINGS
All papers accepted for workshops will be included in the ANT-2014 proceedings, which will be published by Elsevier. The
authors must follow Elsevier guidelines as given in ANT-2014 website (http://cs-conferences.acadiau.ca/ant-14/). The number of
pages for workshop papers is limited to 6 pages. Authors should submit their contributions electronically in PDF format at:
https://www.easychair.org/conferences/?conf=abmtrans2014.
The submission processes will be managed by easychair.org. If you have used this system before, you can use the same user-
name and password. If this is your first time using EasyChair, you will need to register for an account by clicking "I have no
EasyChair account" button. Upon completion of registration, you will get a notification email from the system and you are ready
for submitting your paper. You can upload and re-upload the paper to the system by the submission due date.
The selective outstanding papers presented at the workshops, after further revision, will be considered for publication in journals
special issues. In case of any problem with submission, please contact the workshop chair for assistance.
All workshops accepted papers will be printed in the conference proceedings published by Elsevier Science in the open-access
Procedia Computer Science series (on-line). Procedia Computer Sciences is hosted on www.Elsevier.com and on Elsevier con-
tent platform ScienceDirect (http://www.sciencedirect.com), and will be freely available worldwide. All papers in Procedia will
also be indexed by Scopus (http://www.scopus.com) and Engineering Village (Ei) (http://www.engineeringvillage.com). This
includes EI Compendex (http://www.ei.org/compendex). All accepted papers will also be indexed in DBLP (http://dblp.uni-
trier.de/).
The selective outstanding papers presented at the workshops, after further revision, will be considered for publication in journals
special issues at ANT'14.
IMPORTANT DATES
Submission due: 28 January, 2014.
Notification of acceptance: 1 March, 2014.
Camera-ready due: 1 April, 2014.
Workshop: 2– 5 June, 2014.
SimSub Annual Report: December 2013 _____________________________________________________ Page 8
2014 Upcoming Events
PROGRAM COMMITTEE
Tom Bellemans, IMOB - Hasselt University (Belgium)
Davy Janssens, IMOB - Hasselt University (Belgium)
Bruno Kochan, IMOB - Hasselt University (Belgium)
Reinhilde D'Hulst, VITO (Belgium)
Fjo Deridder, VITO (Belgium)
Tom Holvoet, Katholieke Universiteit Leuven (Belgium)
Rutger Claes, Katholieke Universiteit Leuven (Belgium)
Davy Preuveneers, Katholieke Universiteit Leuven (Belgium)
Ghasan Bhatti, OKTAL - University of Toulouse (France)
Stephane Galland, UTBM (France) Nicolas Gaud, UTBM (France)
Fabrice Marchal, CNRS (France)
Theo Arentze, Eindhoven University of Technology (the Netherlands)
Harry Timmermans, Eindhoven University of Technology (the Netherlands)
Marco Luetzenberger, DAI-Labor (Germany)
Anders Peterson, Linkoping University (Sweden)
Paul Davidsson, Malmo University (Sweden)
Rashid A. Waraich, ETH Zurich (Switzerland)
Phuc V. Nguyen, Arkansas State University (USA)
Daniel Keren, University of Haifa (Israel)
Irith Ben-Arroyo Hartman, University of Haifa (Israel)
David Yang, Federal Highway Administration, U.S. Department of Transportation (USA)
Matthew Roorda, University of Toronto (Canada)
Kai Nagel, TU Berlin (Germany)
Oded Cats, KTH Stockholm (Sweden)
Johan Holmgren, Blekinge Institute of Technology (Sweden)
Michal Jakob, Czech Technical University (Czech Republic)
REGISTRATION
Please visit: http://cs-conferences.acadiau.ca/ant-14/#registration for more information.
VENUE, ACCOMMODATION & VISA REQUIREMENTS
Please visit: http://cs-conferences.acadiau.ca/ant-14/#conferenceVenue for more information.
WORKSHOP ORGANIZERS
Dr. Ansar-Ul-Haque Yasar Transportation Research Institute Hasselt University, Belgium [email protected]
ir. Luk Knapen Transportation Research Institute Hasselt University, Belgium [email protected]
If you have any further questions please contact one of the workshop organizers.
SimSub Annual Report: December 2013 _____________________________________________________ Page 9
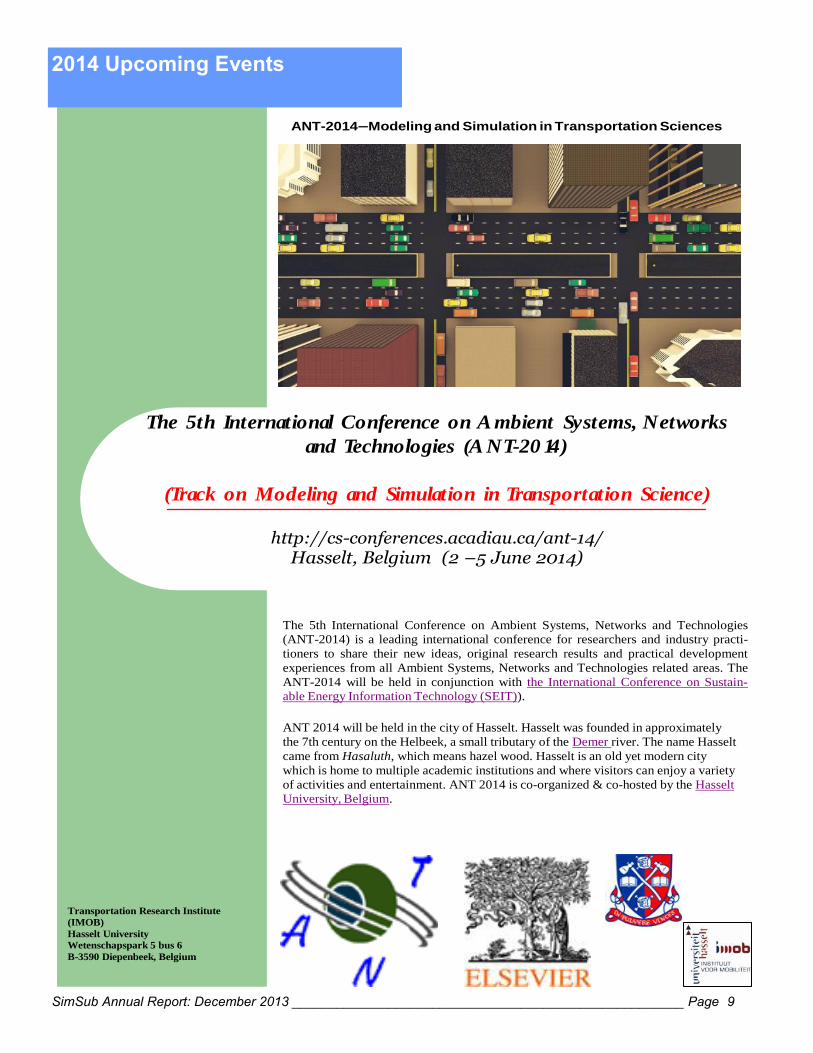
ANT-2014—Modeling and Simulation in Transportation Sciences
The 5th International Conference on A mbient Systems, Networks
and Technologies (A NT-20 14)
(Track on Modeling and Simulation in Transportation Science)
http://cs-conferences.acadiau.ca/ant-14/
Hasselt, Belgium (2 –5 June 2014)
The 5th International Conference on Ambient Systems, Networks and Technologies
(ANT-2014) is a leading international conference for researchers and industry practi-
tioners to share their new ideas, original research results and practical development
experiences from all Ambient Systems, Networks and Technologies related areas. The
ANT-2014 will be held in conjunction with the International Conference on Sustain-
able Energy Information Technology (SEIT)).
ANT 2014 will be held in the city of Hasselt. Hasselt was founded in approximately
the 7th century on the Helbeek, a small tributary of the Demer river. The name Hasselt
came from Hasaluth, which means hazel wood. Hasselt is an old yet modern city
which is home to multiple academic institutions and where visitors can enjoy a variety
of activities and entertainment. ANT 2014 is co-organized & co-hosted by the Hasselt
University, Belgium.
Transportation Research Institute
(IMOB)
Hasselt University
Wetenschapspark 5 bus 6
B-3590 Diepenbeek, Belgium
2014 Upcoming Events
SimSub Annual Report: December 2013 _____________________________________________________ Page 10
2014 Upcoming Events SCOPE
The goal of the ANT-2014 conference is to provide an international forum for scientists, engineers, and managers in academia,
industry, and government to address recent research results and to present and discuss their ideas, theories, technologies, sys-
tems, tools, applications, work in progress and experiences on all theoretical and practical issues arising in the ambient systems
paradigm, infrastructures, models, and technologies that have significant contributions to the advancement of ambient systems
theory, practices and their applications.
At ANT-2014, there is a dedicated track on Modeling and Simulation in Transportation Sciences (MSTS) organized by the
Transportation Research Institute (IMOB), Hasselt University, Belgium. This aim of this track is to bring together communities
interested in the computation, knowledge discovery and technology policy aspects of transportation systems. The organizers of
ANT-2014 (MSTS track) welcomes papers from researchers in the domains of transportation sciences and engineering, com-
puter science, urban and regional planning, civil engineering, geography, geo-informatics and related disciplines to submit pa-
pers for consideration for presentation and for publication in the conference proceedings.
Topics of interest in the MSTS track include (but are not limited to):
Collaborative transport, including collaborative multi-modal transport
Data mining and statistical learning for travel information
Human factors including adaptive driving, travel behavior, persuasive technology
Human-computer interfaces in intelligent transportation applications
Logistics and transportation management
Mathematical optimization in traffic engineering
Novel applications targeted to health, mobility, liveability and sustainability
Renewable energy sources in transportation
Simulation of traffic, passenger flows, assisted driving or collaborative transport
Social and institutional information related to travel
Traffic flow and transportation model
Travel information, including recommender systems and user feedback systems
Uncertain information in collaborative transport and assisted traveling
SUBMISSION AND PROCEEDINGS
All ANT-2014 accepted papers will be printed in the conference proceedings published by Elsevier Science in the open-access
Procedia Computer Science series (on-line). Procedia Computer Sciences is hosted on www.Elsevier.com and on Elsevier con-
tent platform ScienceDirect (www.sciencedirect.com), and will be freely available worldwide. All papers in Procedia will also
be indexed by Scopus (www.scopus.com) and Engineering Village (Ei) (www.engineeringvillage.com). This includes EI Com-
pendex (www.ei.org/compendex). The papers will contain linked references, XML versions and citable DOI numbers. You will
be able to provide a hyperlink to all delegates and direct your conference website visitors to your proceedings. All accepted pa-
pers will also be indexed in DBLP (http://dblp.uni-trier.de/).
Submitted technical papers must be no longer than 8 pages for full papers and 5 pages for short papers including all figures, ta-
bles and references.
Authors are requested to submit their papers electronically using the online conference management system in PDF format be-
fore the deadline (see Important Dates).
The submission processes will be managed by easychair.org. If you have used this system before, you can use the same user-
name and password. If this is your first time using EasyChair, you will need to register for an account by clicking "I have no
EasyChair account" button. Upon completion of registration, you will get a notification email from the system and you are ready
for submitting your paper. You can upload and re-upload the paper to the system by the submission due date.
IMPORTANT DATES
Submission due: 4 January, 2014.
Notification of acceptance: 1 March, 2014.
Camera-ready due: 4 April, 2014.
Conference: 2—5 June, 2014.
SimSub Annual Report: December 2013 _____________________________________________________ Page 11
2014 Upcoming Events
PROGRAM COMMITTEE (MSTS Track)
Tom Bellemans, IMOB - Hasselt University (Belgium)
Davy Janssens, IMOB - Hasselt University (Belgium)
Bruno Kochan, IMOB - Hasselt University (Belgium)
Reinhilde D'Hulst, VITO (Belgium)
Fjo Deridder, VITO (Belgium)
Tom Holvoet, Katholieke Universiteit Leuven (Belgium)
Rutger Claes, Katholieke Universiteit Leuven (Belgium)
Davy Preuveneers, Katholieke Universiteit Leuven (Belgium)
Ghasan Bhatti, OKTAL - University of Toulouse (France)
Stephane Galland, UTBM (France) Nicolas Gaud, UTBM (France)
Fabrice Marchal, CNRS (France)
Theo Arentze, Eindhoven University of Technology (the Netherlands)
Harry Timmermans, Eindhoven University of Technology (the Netherlands)
Marco Luetzenberger, DAI-Labor (Germany)
Anders Peterson, Linkoping University (Sweden)
Paul Davidsson, Malmo University (Sweden)
Rashid A. Waraich, ETH Zurich (Switzerland)
Phuc V. Nguyen, Arkansas State University (USA)
Daniel Keren, University of Haifa (Israel)
Irith Ben-Arroyo Hartman, University of Haifa (Israel)
David Yang, Federal Highway Administration, U.S. Department of Transportation (USA)
Matthew Roorda, University of Toronto (Canada)
Kai Nagel, TU Berlin (Germany)
Oded Cats, KTH Stockholm (Sweden)
Johan Holmgren, Blekinge Institute of Technology (Sweden)
Michal Jakob, Czech Technical University (Czech Republic)
REGISTRATION
Please visit: http://cs-conferences.acadiau.ca/ant-14/#registration for more information.
VENUE, ACCOMMODATION & VISA REQUIREMENTS
Please visit: http://cs-conferences.acadiau.ca/ant-14/#conferenceVenue for more information.
PROGRAM VICE-CHAIRS
Prof. dr. Davy Janssens Transportation Research Institute Hasselt University, Belgium [email protected]
Prof. dr. Tom Bellemans Transportation Research Institute Hasselt University, Belgium [email protected]
Prof. dr. Harry Timmermans Technical University Eindhoven The Netherlands [email protected]
If you have any further questions please contact one of the program vice-chairs.
You may also visit our website (http://cs-conferences.acadiau.ca/ant-14/) for more details.
SimSub Annual Report: December 2013 _____________________________________________________ Page 12
2014 Upcoming Events
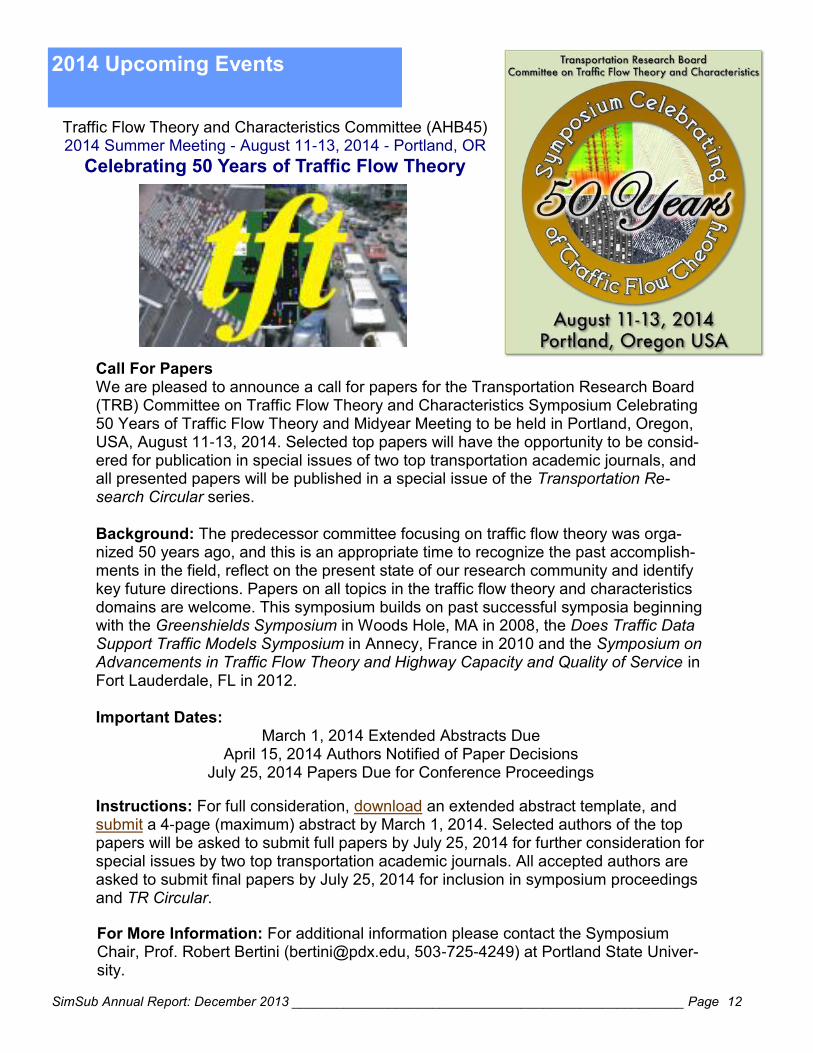
Traffic Flow Theory and Characteristics Committee (AHB45) 2014 Summer Meeting - August 11-13, 2014 - Portland, OR
Celebrating 50 Years of Traffic Flow Theory
Call For Papers
We are pleased to announce a call for papers for the Transportation Research Board (TRB) Committee on Traffic Flow Theory and Characteristics Symposium Celebrating 50 Years of Traffic Flow Theory and Midyear Meeting to be held in Portland, Oregon, USA, August 11-13, 2014. Selected top papers will have the opportunity to be consid-ered for publication in special issues of two top transportation academic journals, and all presented papers will be published in a special issue of the Transportation Re-search Circular series.
Background: The predecessor committee focusing on traffic flow theory was orga-nized 50 years ago, and this is an appropriate time to recognize the past accomplish-ments in the field, reflect on the present state of our research community and identify key future directions. Papers on all topics in the traffic flow theory and characteristics domains are welcome. This symposium builds on past successful symposia beginning with the Greenshields Symposium in Woods Hole, MA in 2008, the Does Traffic Data Support Traffic Models Symposium in Annecy, France in 2010 and the Symposium on Advancements in Traffic Flow Theory and Highway Capacity and Quality of Service in Fort Lauderdale, FL in 2012.
Important Dates: March 1, 2014 Extended Abstracts Due
April 15, 2014 Authors Notified of Paper Decisions
July 25, 2014 Papers Due for Conference Proceedings
Instructions: For full consideration, download an extended abstract template, and submit a 4-page (maximum) abstract by March 1, 2014. Selected authors of the top papers will be asked to submit full papers by July 25, 2014 for further consideration for special issues by two top transportation academic journals. All accepted authors are asked to submit final papers by July 25, 2014 for inclusion in symposium proceedings and TR Circular.
For More Information: For additional information please contact the Symposium Chair, Prof. Robert Bertini ([email protected], 503-725-4249) at Portland State Univer-sity.

SimSub Annual Report: December 2013 _____________________________________________________ Page 13
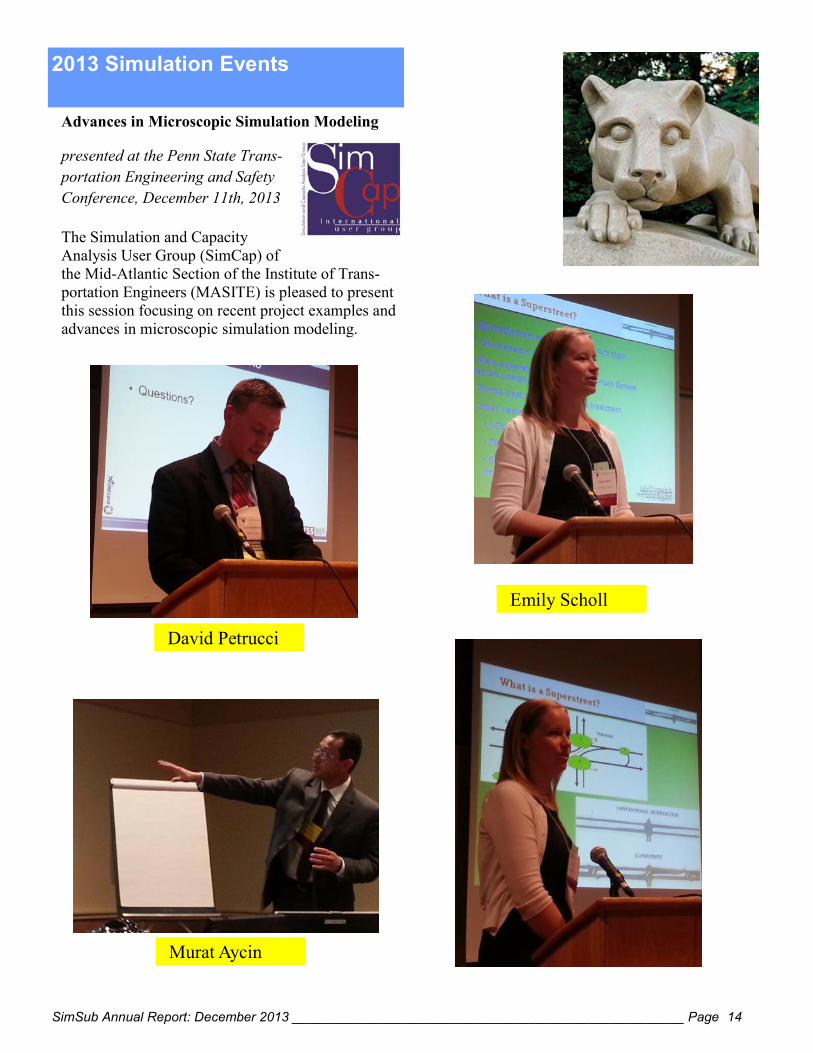
2013 Simulation Events
Advances in Microscopic Simulation Modeling
presented at the Penn State Trans-
portation Engineering and Safety
Conference, December 11th, 2013
The Simulation and Capacity
Analysis User Group (SimCap) of
the Mid-Atlantic Section of the Institute of Trans-
portation Engineers (MASITE) is pleased to present
this session focusing on recent project examples and
advances in microscopic simulation modeling.
Moderator: David A. Petrucci, Jr., P.E., PTOE,
Traffic Discipline Leader, Borton-Lawson
Self-Calibration and Sensitivity Analysis in
TSIS / CORSIM – David Hale, Ph.D., Assistant
in Engineering, University of Florida
Advanced Aimsun Applications: Online Sys-
tem and Evacuation – Murat Aycin, Ph.D.,
Senior Traffic Engineer, Transportation Simula-
tion Systems, Inc.
VISSIM Modeling of the Route 10 Super-
street Project, ChesterField County, VA –
Emily Scholl, E.I., Traffic Engineer, McCormick
Taylor, Inc.
Speaker Biographies:
Murat Ayçin was born in Ankara Turkey in 1969.
After graduating from Middle East Technical Uni-
versity with a degree in Civil Engineering, he came
to Urbana-Champaign to continue his studies in
Transportation. He received Ms. And PhD from the
University of Illinois in 2000. In the small town
called Chicago, he realized that the transportation
jobs didn't require a PhD so he came to New York
city where the traffic congestion never sleeps. He
has been tackling with the traffic problems in NY
since 2001. Murat's focus areas are traffic simula-
tion, toll plaza operations, project management and
the maintenance and protection of traffic (MPT) pro-
jects. He has twelve years’ experience modeling and
analyzing traffic operations of complex facilities
such as the streets of Midtown Manhattan, tunnels
(Holland and Midtown) and bridges (Throgs Neck
and Henry Hudson).
His notable projects
include Broadway
Model which was uti-
lized in analyzing the
impacts of closing
Broadway Avenue to
vehicular traffic in
Times Square and
Lower Manhattan
Model which was utilized in World Trade Center
Campus Security Plan. He dreams in Aimsun 3D.
Ms. Emily Scholl, E.I. joined the Traffic Department
of McCormick Taylor in August 2007 with a Bache-
lor’s Degree in Civil Engineering from the Universi-
ty of Delaware. As a member of the Traffic Group,
Emily has been involved in a number of projects
which have gained her experience ranging from traf-
fic studies and traffic operations to the preparation
of design plans. Her design experience includes the
development of temporary and permanent signal
plans, signing and pavement marking plans and traf-
fic control plans. She has also worked on traffic
studies which have involved Traffic Impact Study
review, crash data analysis, data collection pro-
grams, pedestrian studies, trip distribution, traffic
control warrant analysis, and detailed capacity anal-
ysis. She has extensive microsimulation experience
using Vissim including a variety of different traffic
networks such as freeways, roundabouts, toll plazas
and signals on projects in New Jersey, Pennsylvania
and Virginia. Emily is an active volunteer in the pro-
fession. She is member of the DVRPC VISSIM
Study Advisory Committee; participates annually in
the Futures Cities Competition and led the Engineers
Club of Philadelphia Science Day activities and
serves as the Outreach Chair for MASITE.
Call for Presentations:
The Thomas D. Larson Pennsylvania Transportation
Institute announces the 20th annual TESC confer-
ence on December 10-12, 2014. Abstracts should be
submitted by March 31st to [email protected].
Selected presenters will be notified by May 30th.
SimSub Annual Report: December 2013 _____________________________________________________ Page 14
2013 Simulation Events
Advances in Microscopic Simulation Modeling
presented at the Penn State Trans-
portation Engineering and Safety
Conference, December 11th, 2013
The Simulation and Capacity
Analysis User Group (SimCap) of
the Mid-Atlantic Section of the Institute of Trans-
portation Engineers (MASITE) is pleased to present
this session focusing on recent project examples and
advances in microscopic simulation modeling.
David Petrucci
Murat Aycin
Emily Scholl
SimSub Annual Report: December 2013 _____________________________________________________ Page 15
2013 Simulation Events
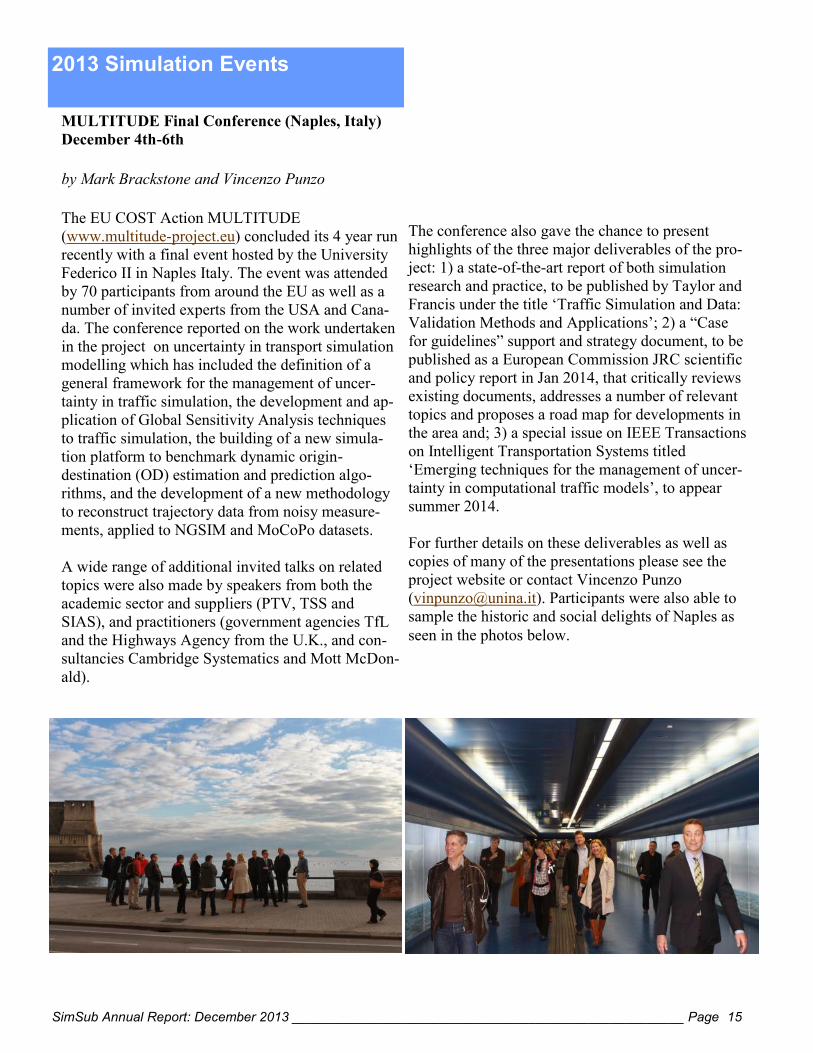
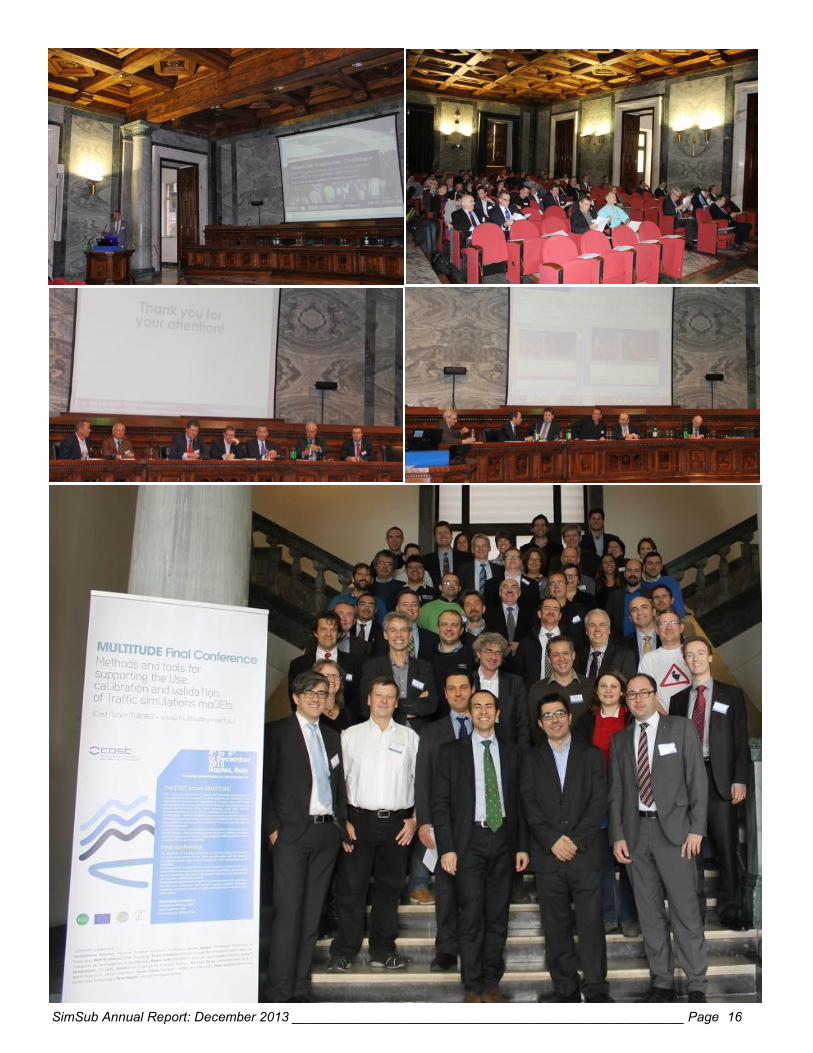
MULTITUDE Final Conference (Naples, Italy)
December 4th-6th
by Mark Brackstone and Vincenzo Punzo
The EU COST Action MULTITUDE
(www.multitude-project.eu) concluded its 4 year run
recently with a final event hosted by the University
Federico II in Naples Italy. The event was attended
by 70 participants from around the EU as well as a
number of invited experts from the USA and Cana-
da. The conference reported on the work undertaken
in the project on uncertainty in transport simulation
modelling which has included the definition of a
general framework for the management of uncer-
tainty in traffic simulation, the development and ap-
plication of Global Sensitivity Analysis techniques
to traffic simulation, the building of a new simula-
tion platform to benchmark dynamic origin-
destination (OD) estimation and prediction algo-
rithms, and the development of a new methodology
to reconstruct trajectory data from noisy measure-
ments, applied to NGSIM and MoCoPo datasets.
A wide range of additional invited talks on related
topics were also made by speakers from both the
academic sector and suppliers (PTV, TSS and
SIAS), and practitioners (government agencies TfL
and the Highways Agency from the U.K., and con-
sultancies Cambridge Systematics and Mott McDon-
ald).
The conference also gave the chance to present
highlights of the three major deliverables of the pro-
ject: 1) a state-of-the-art report of both simulation
research and practice, to be published by Taylor and
Francis under the title ‘Traffic Simulation and Data:
Validation Methods and Applications’; 2) a “Case
for guidelines” support and strategy document, to be
published as a European Commission JRC scientific
and policy report in Jan 2014, that critically reviews
existing documents, addresses a number of relevant
topics and proposes a road map for developments in
the area and; 3) a special issue on IEEE Transactions
on Intelligent Transportation Systems titled
‘Emerging techniques for the management of uncer-
tainty in computational traffic models’, to appear
summer 2014.
For further details on these deliverables as well as
copies of many of the presentations please see the
project website or contact Vincenzo Punzo
([email protected]). Participants were also able to
sample the historic and social delights of Naples as
seen in the photos below.
SimSub Annual Report: December 2013 _____________________________________________________ Page 16
SimSub Annual Report: December 2013 _____________________________________________________ Page 17
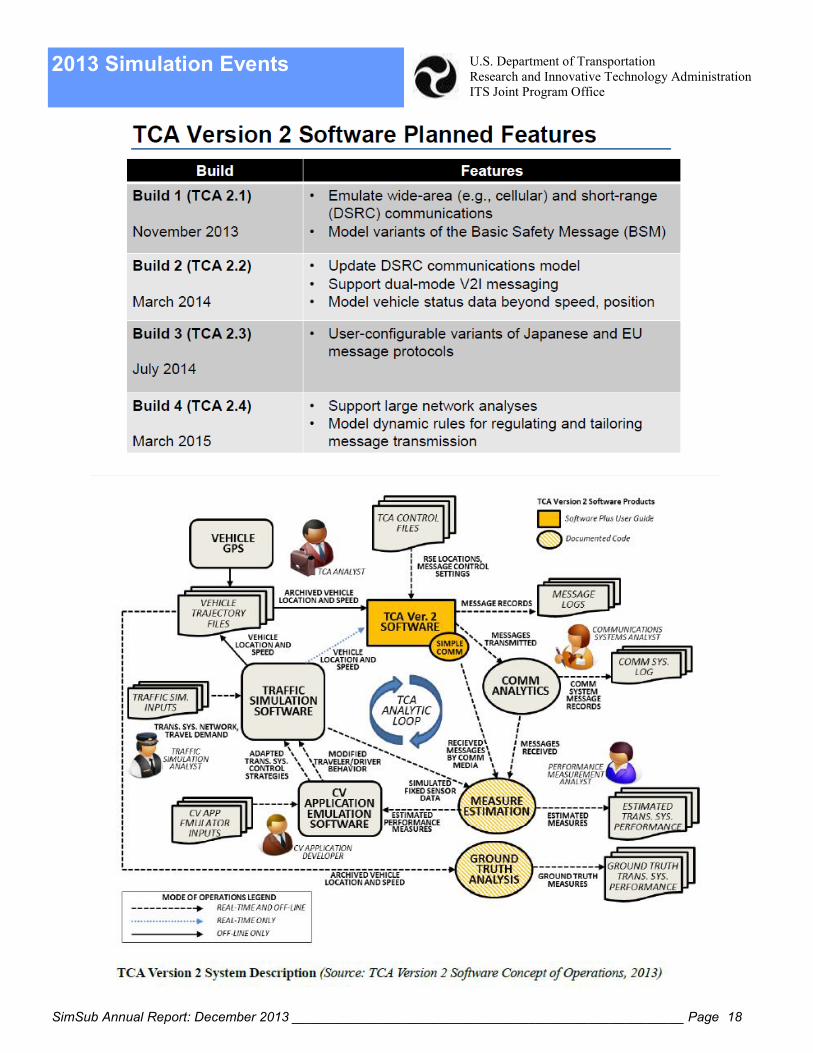
2013 Simulation Events
Analyzing Alternative Vehicle-to-Infrastructure
Messaging Variants: Trajectory Conversion Al-
gorithm Version 2 Software
Date: 7 November 2013
Time: 11:30-Noon Eastern
Cost: Free
Overview Connected vehicle research includes the assessment
of alternative vehicle-to-infrastructure messaging
mechanisms to support new mobility, safety and en-
vironmental applications. This webinar provides an
overview of the Trajectory Conversion Algorithm
(TCA) Version 2 software, recently released cost-
free and under open source license. The objective of
the TCA Version 2 software is to simulate the gener-
ation, capture and transmission of vehicle-based data
under a range of configurable messaging strategies,
including the SAE J2735 Basic Safety Message
(BSM). TCA Version 2 software is now available to
the connected vehicle research/development com-
munity as an offline tool or in real-time with either
the VISSIM or PARAMICS traffic simulation mod-
els.
The TCA software development project is one of
several related research and development activities
within of the Data Capture and Management (DCM)
Program, which is in turn a part of the USDOT con-
nected vehicle research effort considering mobile
data communications in surface transportation to
improve safety, mobility, and the environment. This
webinar is sponsored by the Intelligent Transporta-
tion Systems Joint Program Office of the USDOT.
To register for this webinar please visit
www.itsa.org/bsmwebinar
Target Audience
Researchers and evaluators interested in con-
nected vehicle technology, and connected vehi-
cle information providers and application devel-
opers
Learning Objectives
Describe how the TCA Version 2 software can
be incorporated into related research and evalua-
tion efforts
Acquire TCA Version 2 software and supporting
documentation under open source license
Outline key features in upcoming TCA Version
2 builds
Host: Jim McCarthy, PE PTOE, FHWA-Minnesota Division
Jim McCarthy is a traffic operations engineer with the Federal Highway Administra-
tion (FHWA) in St. Paul, Minnesota. His work includes traffic analysis, traffic opera-
tions and ITS deployment. Jim is a member of FHWA’s Traffic Analysis Team, and
TRB Highway Capacity and Quality of Service Committee. He holds a MS in Traffic
Engineering from the University of Minnesota.
Presenter: Karl Wunderlich, Principal Investigator, Noblis
Karl Wunderlich is a Fellow for Transportation Analysis in Washington, DC. He is an
expert in the use of simulation and modeling techniques to evaluate emerging technol-
ogies intended to improve traveler mobility or system productivity. He is also a
thought leader in the facilitation of collaborative transportation research through open
source and open data communities. Karl holds a Ph.D. in Industrial and Operations En-
gineering from the University of Michigan.
U.S. Department of Transportation
Research and Innovative Technology Administration
ITS Joint Program Office
SimSub Annual Report: December 2013 _____________________________________________________ Page 18
2013 Simulation Events
U.S. Department of Transportation
Research and Innovative Technology Administration
ITS Joint Program Office
SimSub Annual Report: December 2013 _____________________________________________________ Page 19
2013 Simulation Events
TRAMAN21 Workshop 2013
1st November 2013
08:15
Registration
Chairman: Dr. Claudio
Roncoli, Technical
University of Crete,
Greece
08:45
Introduction
* Welcome to TRAMAN21 Workshop 2013
Prof. Markos Papageorgiou, Technical University of
Crete, Greece
* Vehicle Automation and Control Systems: Past,
Present and Future Perspectives
Dr. Christina Diakaki, Technical University of
Crete, Greece
09:45
1st Session
* Macroscopic Traffic Flow Modeling and Numeri-
cal Simulation: Recent Advances
Assist. Prof. Ioannis Nikolos, Technical University
of Crete, Greece
10:45
Coffee and Refreshments (including poster session)
11:15
2nd Session
* Traffic Flow Simulation of Vehicle Automation
and Communication Systems
Prof. Bart van Arem, Delft University of Technolo-
gy, The Netherlands
13:15
Lunch
Chairman: Assist. Prof. Argiris Delis, Technical
University of Crete, Greece
14:30
3rd Session
* Traffic Flow Modeling and Control: Closing the
Loop
* Intelligent Vehicles: Adaptive Cruise Control and
beyond
Prof. Petros Ioannou, University of Southern Cali-
fornia, USA
16:30
Coffee and Refreshments (including poster session)
17:00
4th Session
* Motorway Traffic Control in Presence of VACS
(Vehicle Automation and Communication Systems)
Prof. Markos Papageorgiou, Technical University of
Crete, Greece
18:00
Round Table Discussion
19:00
End of the Workshop
20:30
Dinner
SimSub Annual Report: December 2013 _____________________________________________________ Page 20
2013 Simulation Events
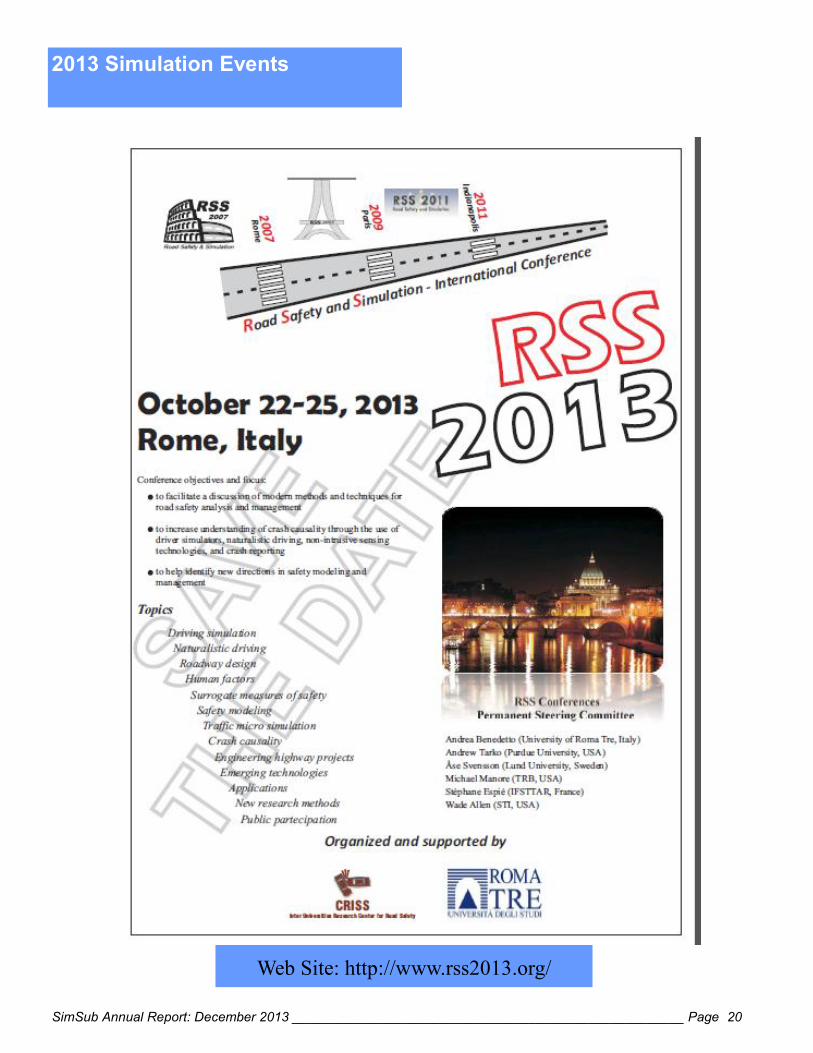
Web Site: http://www.rss2013.org/
SimSub Annual Report: December 2013 _____________________________________________________ Page 21
2013 Simulation Events
SimSub Annual Report: December 2013 _____________________________________________________ Page 22
2013 Simulation Events
SimSub Annual Report: December 2013 _____________________________________________________ Page 23
2013 Simulation Events
INSTITUTE OF TRANSPORTATION ENGINEERS
TRAFFIC ENGINEERING COUNCIL NATIONAL SIMULATION AND CAPACITY ANALYSIS USER GROUP (SIMCAP) MEETING
MEETING AGENDA – ITE 2013 ANNUAL MEETING AND EXHIBIT (BOSTON, MA)
WEDNESDAY, AUGUST 7, 2013 (10:00 PM – 11:30 PM EDT)
SHERATON BOSTON & HYNES CONVENTION CENTER (MEETING ROOM: HYNES 108)
1. Welcome and SimCap Mission Statement (Dave Petrucci)
2. Section and Chapter Updates
a. Virginia (Sanhita Lahiri)
b. MET (Luigi Casinelli)
c. Mid-Atlantic (Dave Petrucci)
d. Washington DC (Alek Pochowski)
e. LOCATE (John Albeck)
f. North Central (Pat Otto)
g. Wisconsin (Jess Billmeyer)
h. North Carolina (Bastian Schroeder)
i. Colorado Wyoming (Freddy He)
j. Oregon (Miranda Wells)
k. San Diego (Erik Ruehr)
l. Washington (Matt Beaulieu)
m. Toronto (Matt Davis)
n. Dallas (Josh Smith)
o. Houston (Raj Basavaraju)
p. Florida (David Hale)
3. European Commission MULTITUDE Project Update (Mark Brackstone)
4. Automated Self-Calibration and HCM-Based Genetic Algorithm Optimization (David Hale)
5. Integration of Analysis, Modeling, and Simulation Tools (Ram Jagannathan and Brandon Nevers)
6. ITE E-Community Site (Dave Petrucci)
7. SimCap Activities & Projects, Settings the Agenda for 2014 (Everyone)
8. Next Meeting / Conference Call (Hyatt Regency, Miami, FL, March 9-12, 2014)
SimSub Annual Report: December 2013 _____________________________________________________ Page 24
2013 Simulation Events
SimSub Annual Report: December 2013 _____________________________________________________ Page 25
SimSub Annual Report: December 2013 _____________________________________________________ Page 26
2013 Simulation Events
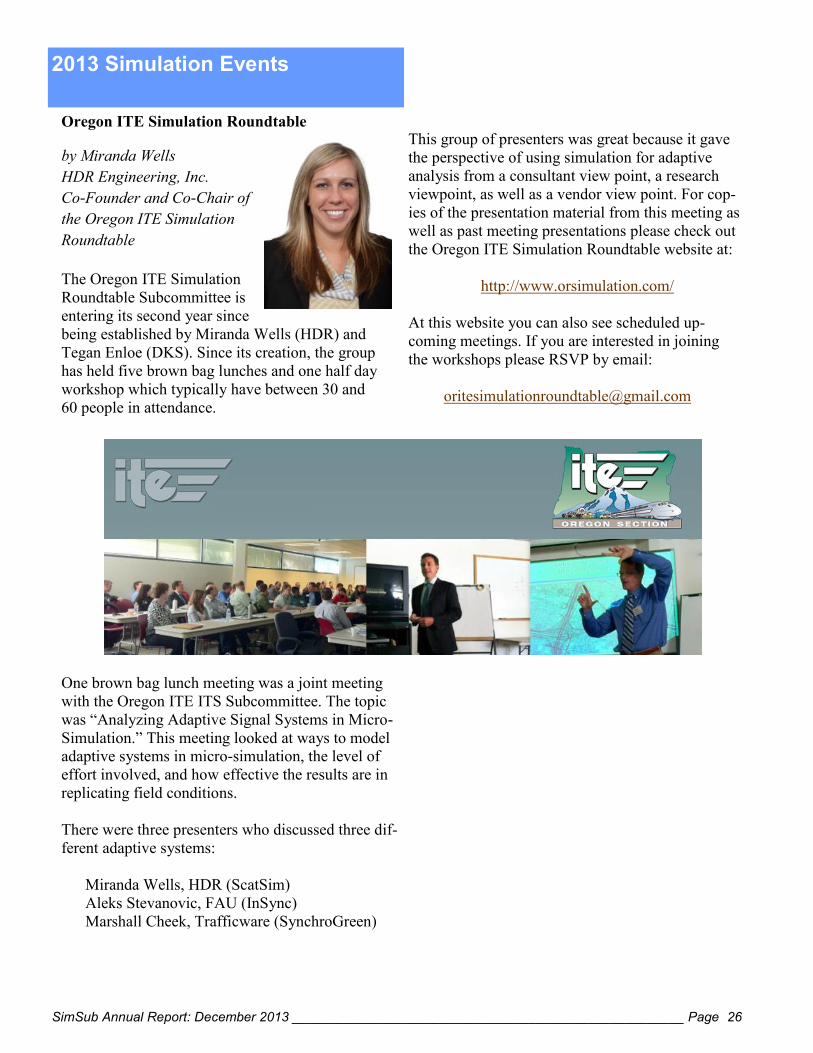
Oregon ITE Simulation Roundtable
by Miranda Wells
HDR Engineering, Inc.
Co-Founder and Co-Chair of
the Oregon ITE Simulation
Roundtable
The Oregon ITE Simulation
Roundtable Subcommittee is
entering its second year since
being established by Miranda Wells (HDR) and
Tegan Enloe (DKS). Since its creation, the group
has held five brown bag lunches and one half day
workshop which typically have between 30 and
60 people in attendance.
One brown bag lunch meeting was a joint meeting
with the Oregon ITE ITS Subcommittee. The topic
was “Analyzing Adaptive Signal Systems in Micro-
Simulation.” This meeting looked at ways to model
adaptive systems in micro-simulation, the level of
effort involved, and how effective the results are in
replicating field conditions.
There were three presenters who discussed three dif-
ferent adaptive systems:
Miranda Wells, HDR (ScatSim)
Aleks Stevanovic, FAU (InSync)
Marshall Cheek, Trafficware (SynchroGreen)
This group of presenters was great because it gave
the perspective of using simulation for adaptive
analysis from a consultant view point, a research
viewpoint, as well as a vendor view point. For cop-
ies of the presentation material from this meeting as
well as past meeting presentations please check out
the Oregon ITE Simulation Roundtable website at:
http://www.orsimulation.com/
At this website you can also see scheduled up-
coming meetings. If you are interested in joining
the workshops please RSVP by email:
SimSub Annual Report: December 2013 _____________________________________________________ Page 27
2013 Simulation Events
Benchmarking of OD Estimation Algorithms
by Dr. Constantinos Antoniou
The EU COST Action
TU0903 - MULTITUDE
(Methods and tools for sup-
porting the Use, caLibration
and validaTIon of Traffic sim-
Ulations moDEls,
www.multitude-project.eu),
has now entered its last year and is set to culminate with
a range of outreach activities and documents, in addition
to finalising technical work on a number of issues.
One of these activities is performing a bench-
marking exercise of origin-destination (OD) estimation
and prediction algorithms, in a way that is fair to the vari-
ous approaches and provides a level playing field for un-
biased evaluation. The objective is not to conclude that
one approach is better than another, but instead to illus-
trate the advantages and disadvantages of the various
approaches, highlighting the conditions under which each
might become more relevant. Several experienced OD
estimation researchers are involved in this task, including
several TFT and SimSub members, bringing expertise
from diverse fields of OD estimation. The list of partici-
pants includes (in alphabetical order): Costas Antoniou
(NTUA), Jaume Barcelo (UPC), Jordi Casas (TSS), Ern-
esto Cipriani (UniRoma3), Biagio Ciuffo (EU JRC),
Tamara Djukic (TU Delft), Gunnar Flötteröd (KTH), Vitto-
rio Marzano (UniNa), and Tomer Toledo (Technion).
A common evaluation and benchmarking frame-
work has been developed, so that a number of algo-
rithms can be implemented and tested under the same
conditions. The framework is implemented in Matlab and
python and uses the AIMSUN traffic simulator for the
function evaluation/assignment. The mesoscopic simula-
tor level of AIMSUN has been considered suitable for this
task (considering computational requirements) and there-
fore this is the one that is being used in this task. Howev-
er, the framework is flexible. Besides providing a com-
mon platform, the developed framework requires each
participant to simply implement their algorithm (in
Matlab), while taking advantage of the remaining infra-
structure for the tedious tasks of interfacing with the sim-
ulator, performing (and averaging the output of) the repli-
cations and computing the goodness-of-fit statistics.
An experimental design has been performed
along multiple dimensions, including:
OD estimation and prediction algorithms;
Networks;
Data sources;
Demand levels; and
Levels of sensor coverage, depending on location of sensors, type of surveillance information, as well as quality of surveillance information.
The considered algorithms include (i) Kalman
filter variants (in which case the problem is formulated as
a state-space model), such as the Extended Kalman Fil-
ter (EKF), the Limiting EKF and quasi-dynamic Kalman
Filter and (ii) direct optimization algorithms (in which case
the problem is formulated as a standard optimization
problem), such as SPSA, GLS, and LSQR.
Three networks are being used in this effort: (i) a
test network, used primarily for debugging and verifica-
tion purposes, (ii) a network from Vittoria, Basque coun-
try, Spain (57 centroids, 600km road network, 2800 inter-
sections, 389 detectors) and (iii) a network from Barcelo-
na, Catalonia, Spain (130 centroids, 1570 nodes, 2800
links).
Different types of data are considered by differ-
ent groups. Besides the conventional loop detectors,
counts from Bluetooth detectors and travel time infor-
mation between detectors (e.g. Bluetooth sensors) are
also considered.
Preliminary results of this task have been pre-
sented in a hands-on workshop in a recent MULTITUDE
meeting in Delft, The Netherlands, on February 2013.
Based on the results of this workshop, further refine-
ments to the common platform and individual codes have
been made and revised results will be presented at the
MULTITUDE Management Committee meeting in Cha-
nia, Greece, in the end of May 2013. We expect that the
results will be able to be published soon, hopefully in
TRB2014!
SimSub Annual Report: December 2013 _____________________________________________________ Page 28
2013 Simulation Events
Managed Lanes Webinar and Computer Lab
Workshop
Presented by
Dr. Dimitra Michalaka
Course Content:
Pricing Strategies
Lane Choice Models
Toll Structures
Simulation of Managed Lanes using COR-
SIM
The Managed Lane Operations and Simulation using
CORSIM Webinar and Computer Lab Workshop
was held on April 29 & 30, 2013 at the University of
Florida, Gainesville, and was presented by Dr. Di-
mitra Michalaka.
This two-part event consisted of a 1.5 hour webinar
on April 29th; followed by 4-hour, hands-on com-
puter lab workshops on April 30th.
In a typical setting, lanes on a given freeway are
designated either as regular or managed toll lanes.
The former has no toll while the latter can only be
accessed by paying a toll. If high-occupancy vehi-
cles (HOVs) do not need to pay, the facility is wide-
ly known as a high-occupancy/toll (HOT) facility.
Some of the HOT lane facilities currently imple-
mented in the U.S. are single-segment (e.g., SR-91
in California and 95 Express in Florida), while oth-
ers are multi-segment (e.g., I-15 in Utah, I-10 in
Texas, and I-394 in Minnesota). A single-segment
HOT facility has essentially one entrance, one exit,
and one tolling point. In contrast, a multi-segment
HOT facility has multiple ingress and egress points
that are located distantly from each other, and multi-
ple tolling points. This webinar focuses on the oper-
ations of single and multi-segment managed lanes. It
covers several components of managed lane opera-
tions such as pricing strategies, lane choice models,
and toll structures. It also demonstrates how to use
CORSIM to simulate managed lanes with one or
multiple segments.
SimSub Annual Report: December 2013 _____________________________________________________ Page 29
2013 Simulation Events
SimSub Annual Report: December 2013 _____________________________________________________ Page 30
2013 Simulation Events
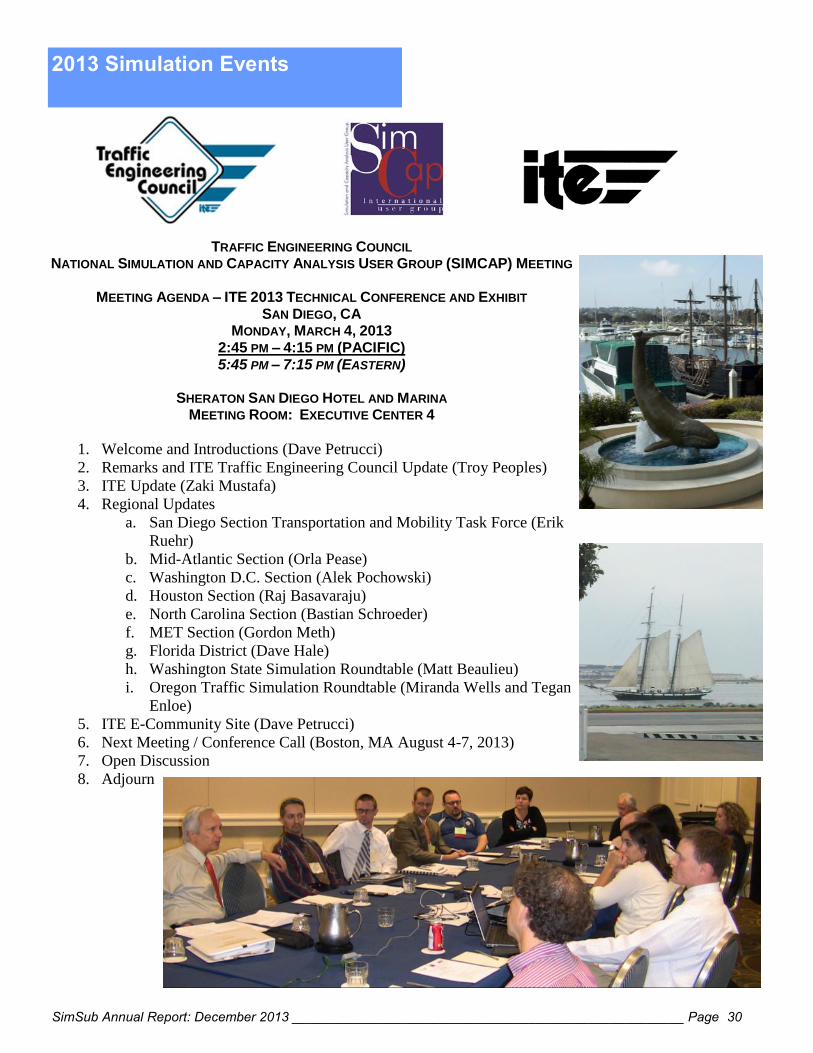
INSTITUTE OF TRANSPORTATION ENGINEERS
TRAFFIC ENGINEERING COUNCIL NATIONAL SIMULATION AND CAPACITY ANALYSIS USER GROUP (SIMCAP) MEETING
MEETING AGENDA – ITE 2013 TECHNICAL CONFERENCE AND EXHIBIT
SAN DIEGO, CA MONDAY, MARCH 4, 2013
2:45 PM – 4:15 PM (PACIFIC) 5:45 PM – 7:15 PM (EASTERN)
SHERATON SAN DIEGO HOTEL AND MARINA
MEETING ROOM: EXECUTIVE CENTER 4
1. Welcome and Introductions (Dave Petrucci)
2. Remarks and ITE Traffic Engineering Council Update (Troy Peoples)
3. ITE Update (Zaki Mustafa)
4. Regional Updates
a. San Diego Section Transportation and Mobility Task Force (Erik
Ruehr)
b. Mid-Atlantic Section (Orla Pease)
c. Washington D.C. Section (Alek Pochowski)
d. Houston Section (Raj Basavaraju)
e. North Carolina Section (Bastian Schroeder)
f. MET Section (Gordon Meth)
g. Florida District (Dave Hale)
h. Washington State Simulation Roundtable (Matt Beaulieu)
i. Oregon Traffic Simulation Roundtable (Miranda Wells and Tegan
Enloe)
5. ITE E-Community Site (Dave Petrucci)
6. Next Meeting / Conference Call (Boston, MA August 4-7, 2013)
7. Open Discussion
8. Adjourn
SimSub Annual Report: December 2013 _____________________________________________________ Page 31
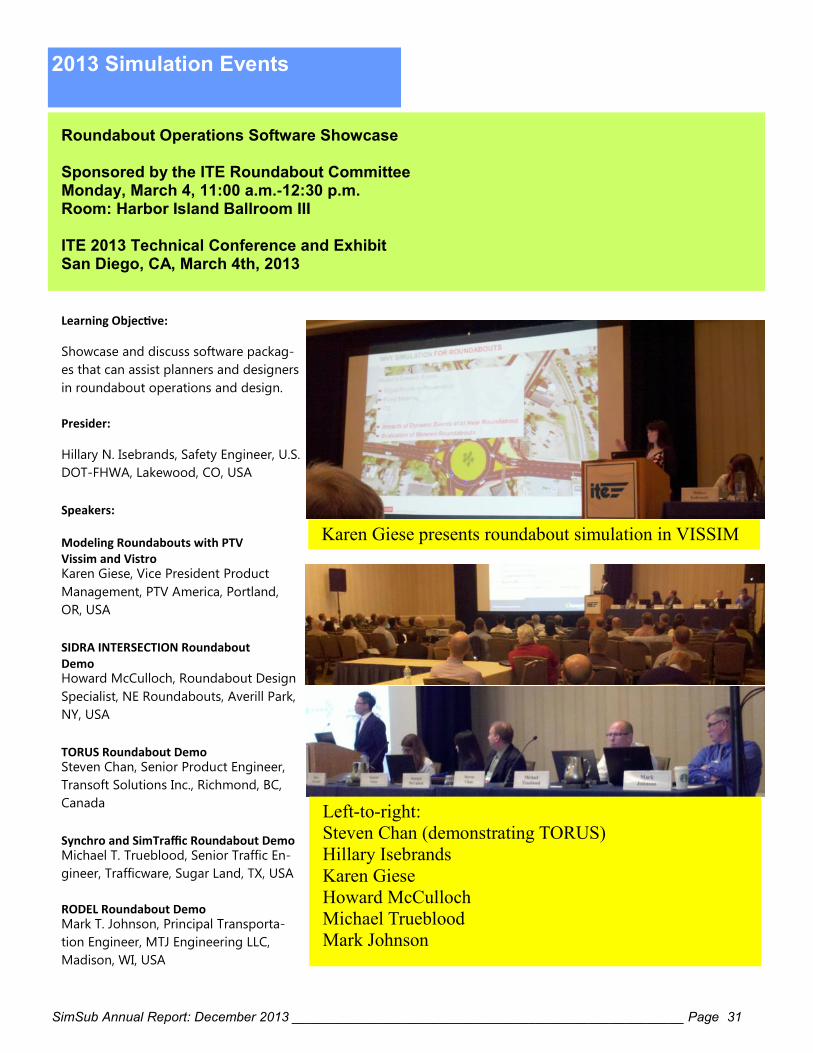
2013 Simulation Events
Learning Objective: Showcase and discuss software packag-
es that can assist planners and designers
in roundabout operations and design.
Presider: Hillary N. Isebrands, Safety Engineer, U.S.
DOT-FHWA, Lakewood, CO, USA
Speakers: Modeling Roundabouts with PTV Vissim and Vistro Karen Giese, Vice President Product
Management, PTV America, Portland,
OR, USA
SIDRA INTERSECTION Roundabout Demo Howard McCulloch, Roundabout Design
Specialist, NE Roundabouts, Averill Park,
NY, USA
TORUS Roundabout Demo Steven Chan, Senior Product Engineer,
Transoft Solutions Inc., Richmond, BC,
Canada
Synchro and SimTraffic Roundabout Demo Michael T. Trueblood, Senior Traffic En-
gineer, Trafficware, Sugar Land, TX, USA
RODEL Roundabout Demo Mark T. Johnson, Principal Transporta-
tion Engineer, MTJ Engineering LLC,
Madison, WI, USA
Roundabout Operations Software Showcase Sponsored by the ITE Roundabout Committee Monday, March 4, 11:00 a.m.-12:30 p.m. Room: Harbor Island Ballroom III ITE 2013 Technical Conference and Exhibit San Diego, CA, March 4th, 2013
Karen Giese presents roundabout simulation in VISSIM
Left-to-right:
Steven Chan (demonstrating TORUS)
Hillary Isebrands
Karen Giese
Howard McCulloch
Michael Trueblood
Mark Johnson
SimSub Annual Report: December 2013 _____________________________________________________ Page 32
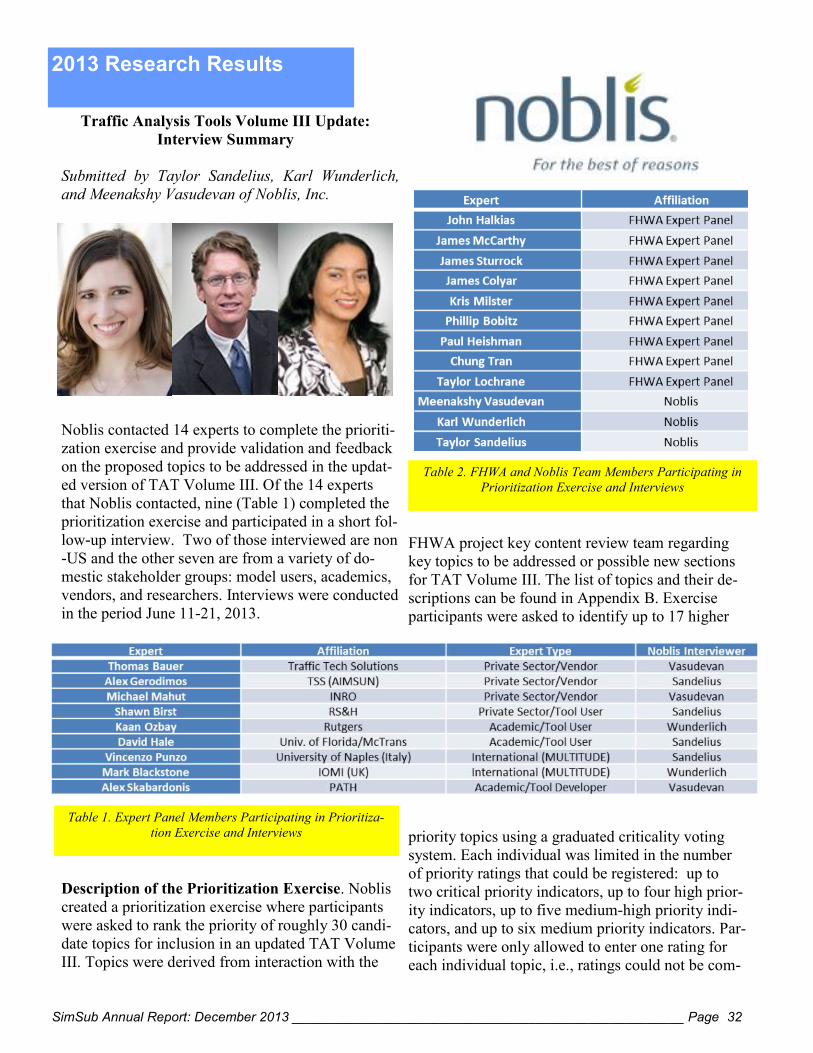
Traffic Analysis Tools Volume III Update:
Interview Summary
Submitted by Taylor Sandelius, Karl Wunderlich,
and Meenakshy Vasudevan of Noblis, Inc.
Noblis contacted 14 experts to complete the prioriti-
zation exercise and provide validation and feedback
on the proposed topics to be addressed in the updat-
ed version of TAT Volume III. Of the 14 experts
that Noblis contacted, nine (Table 1) completed the
prioritization exercise and participated in a short fol-
low-up interview. Two of those interviewed are non
-US and the other seven are from a variety of do-
mestic stakeholder groups: model users, academics,
vendors, and researchers. Interviews were conducted
in the period June 11-21, 2013.
Description of the Prioritization Exercise. Noblis
created a prioritization exercise where participants
were asked to rank the priority of roughly 30 candi-
date topics for inclusion in an updated TAT Volume
III. Topics were derived from interaction with the
FHWA project key content review team regarding
key topics to be addressed or possible new sections
for TAT Volume III. The list of topics and their de-
scriptions can be found in Appendix B. Exercise
participants were asked to identify up to 17 higher
priority topics using a graduated criticality voting
system. Each individual was limited in the number
of priority ratings that could be registered: up to
two critical priority indicators, up to four high prior-
ity indicators, up to five medium-high priority indi-
cators, and up to six medium priority indicators. Par-
ticipants were only allowed to enter one rating for
each individual topic, i.e., ratings could not be com-
2013 Research Results
Table 1. Expert Panel Members Participating in Prioritiza-
tion Exercise and Interviews
Table 2. FHWA and Noblis Team Members Participating in
Prioritization Exercise and Interviews
SimSub Annual Report: December 2013 _____________________________________________________ Page 33
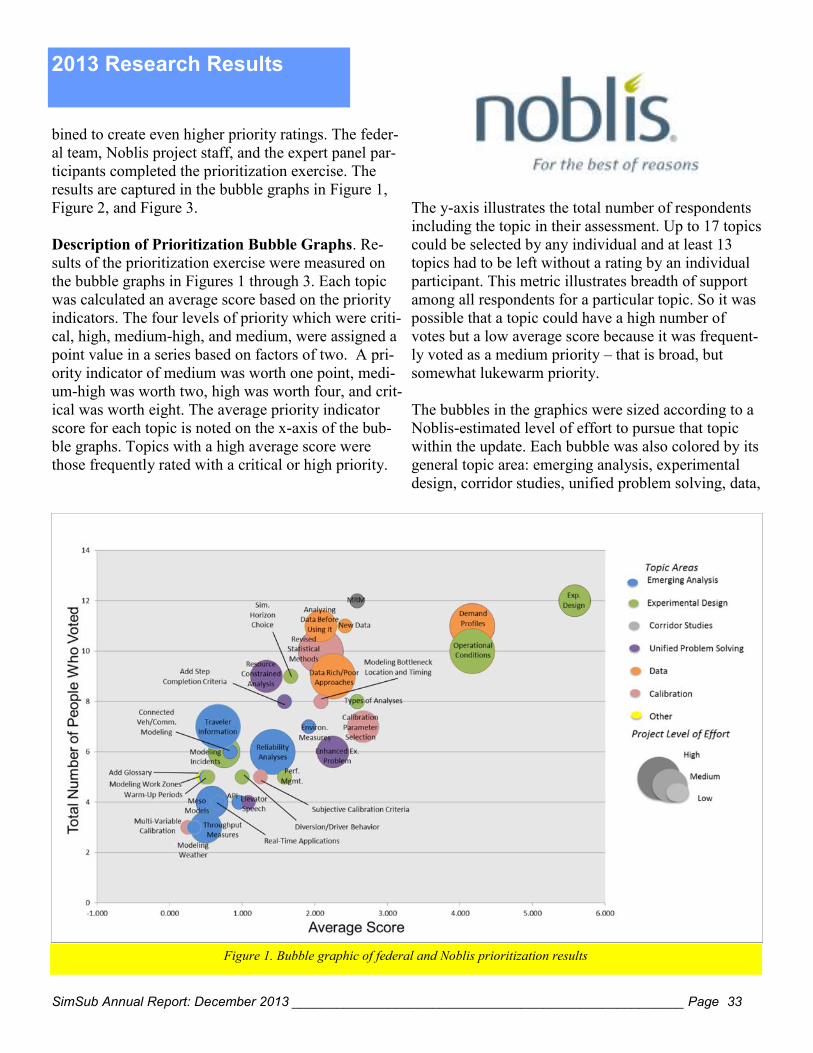
bined to create even higher priority ratings. The feder-
al team, Noblis project staff, and the expert panel par-
ticipants completed the prioritization exercise. The
results are captured in the bubble graphs in Figure 1,
Figure 2, and Figure 3.
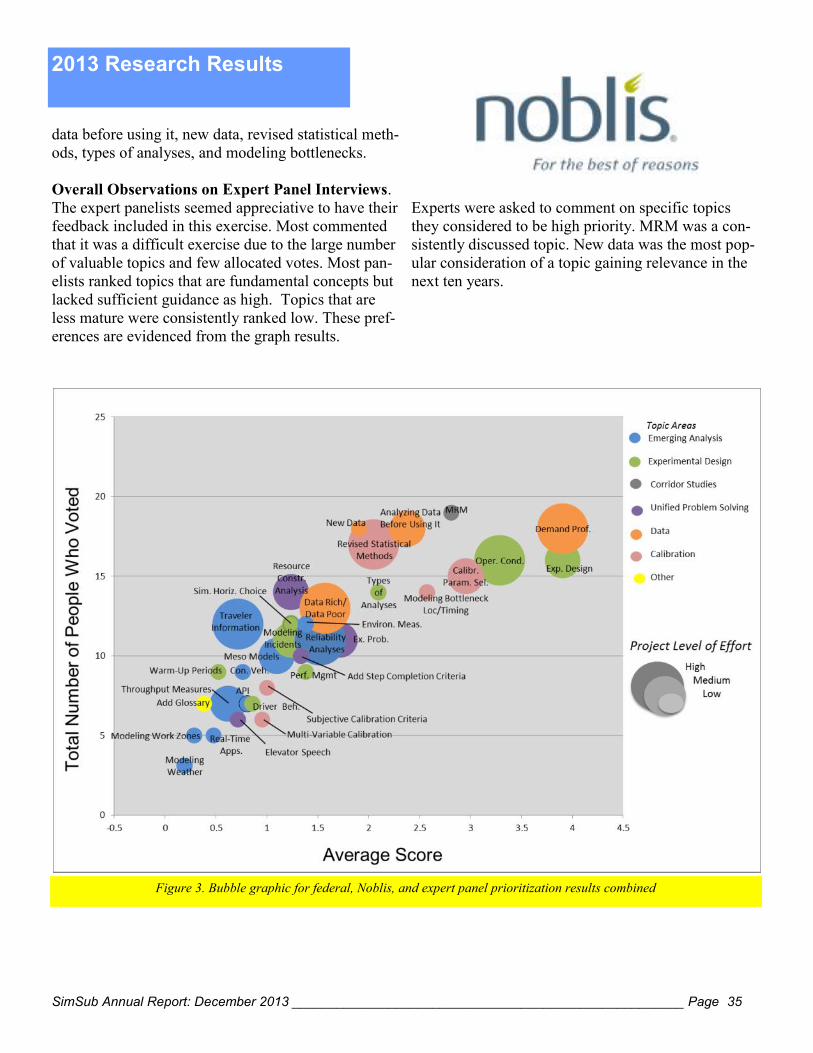
Description of Prioritization Bubble Graphs. Re-
sults of the prioritization exercise were measured on
the bubble graphs in Figures 1 through 3. Each topic
was calculated an average score based on the priority
indicators. The four levels of priority which were criti-
cal, high, medium-high, and medium, were assigned a
point value in a series based on factors of two. A pri-
ority indicator of medium was worth one point, medi-
um-high was worth two, high was worth four, and crit-
ical was worth eight. The average priority indicator
score for each topic is noted on the x-axis of the bub-
ble graphs. Topics with a high average score were
those frequently rated with a critical or high priority.
The y-axis illustrates the total number of respondents
including the topic in their assessment. Up to 17 topics
could be selected by any individual and at least 13
topics had to be left without a rating by an individual
participant. This metric illustrates breadth of support
among all respondents for a particular topic. So it was
possible that a topic could have a high number of
votes but a low average score because it was frequent-
ly voted as a medium priority – that is broad, but
somewhat lukewarm priority.
The bubbles in the graphics were sized according to a
Noblis-estimated level of effort to pursue that topic
within the update. Each bubble was also colored by its
general topic area: emerging analysis, experimental
design, corridor studies, unified problem solving, data,
2013 Research Results
Figure 1. Bubble graphic of federal and Noblis prioritization results
SimSub Annual Report: December 2013 _____________________________________________________ Page 34
calibration, or other. Each individual was permitted to
give only up to two topics a critical rating.
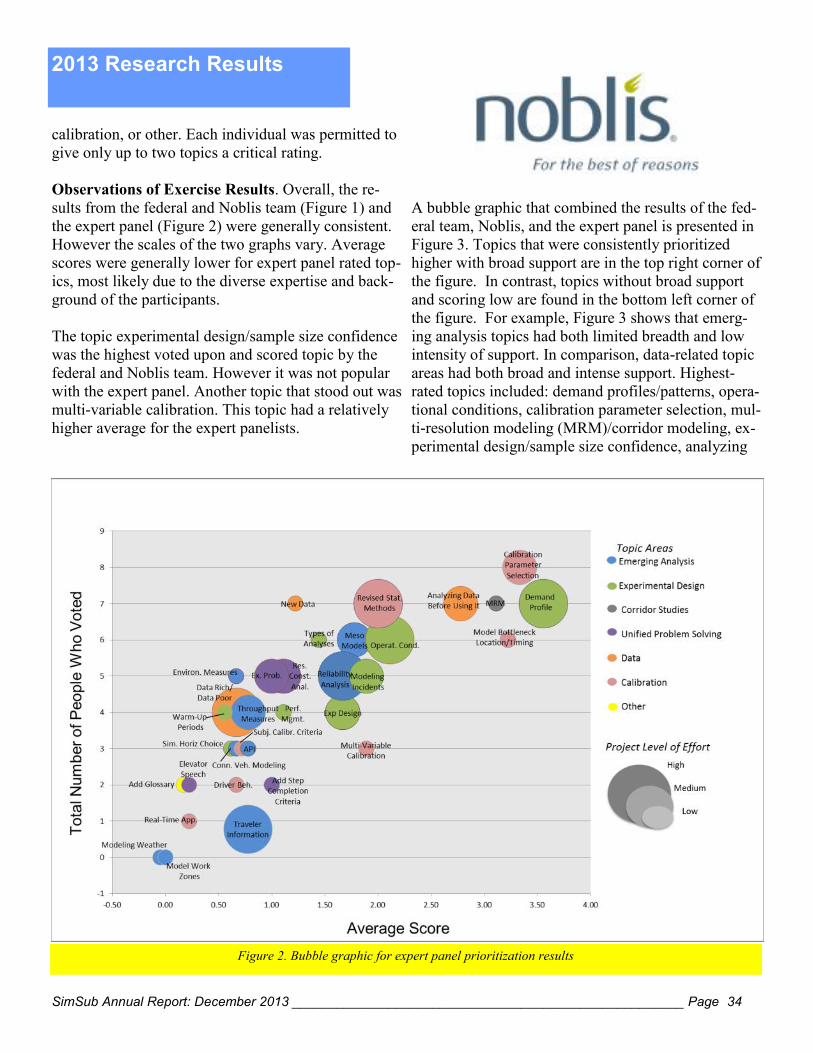
Observations of Exercise Results. Overall, the re-
sults from the federal and Noblis team (Figure 1) and
the expert panel (Figure 2) were generally consistent.
However the scales of the two graphs vary. Average
scores were generally lower for expert panel rated top-
ics, most likely due to the diverse expertise and back-
ground of the participants.
The topic experimental design/sample size confidence
was the highest voted upon and scored topic by the
federal and Noblis team. However it was not popular
with the expert panel. Another topic that stood out was
multi-variable calibration. This topic had a relatively
higher average for the expert panelists.
A bubble graphic that combined the results of the fed-
eral team, Noblis, and the expert panel is presented in
Figure 3. Topics that were consistently prioritized
higher with broad support are in the top right corner of
the figure. In contrast, topics without broad support
and scoring low are found in the bottom left corner of
the figure. For example, Figure 3 shows that emerg-
ing analysis topics had both limited breadth and low
intensity of support. In comparison, data-related topic
areas had both broad and intense support. Highest-
rated topics included: demand profiles/patterns, opera-
tional conditions, calibration parameter selection, mul-
ti-resolution modeling (MRM)/corridor modeling, ex-
perimental design/sample size confidence, analyzing
2013 Research Results
Figure 2. Bubble graphic for expert panel prioritization results
SimSub Annual Report: December 2013 _____________________________________________________ Page 35
data before using it, new data, revised statistical meth-
ods, types of analyses, and modeling bottlenecks.
Overall Observations on Expert Panel Interviews.
The expert panelists seemed appreciative to have their
feedback included in this exercise. Most commented
that it was a difficult exercise due to the large number
of valuable topics and few allocated votes. Most pan-
elists ranked topics that are fundamental concepts but
lacked sufficient guidance as high. Topics that are
less mature were consistently ranked low. These pref-
erences are evidenced from the graph results.
Experts were asked to comment on specific topics
they considered to be high priority. MRM was a con-
sistently discussed topic. New data was the most pop-
ular consideration of a topic gaining relevance in the
next ten years.
2013 Research Results
Figure 3. Bubble graphic for federal, Noblis, and expert panel prioritization results combined
SimSub Annual Report: December 2013 _____________________________________________________ Page 36
Simulation-Based Tools for Perfor-
mance Measures of Signalized Arterials
by Aleksandar Stevanovic, PhD, PE
Florida Atlantic University
Since MAP 21 was enacted
in mid-2012, performance
measures and performance-
measures-based decision mak-
ing have been emphasized in
the US transportation industry
like never before (1). To ac-
commodate new MAP 21 re-
quirements (e.g. performance targets and plans) our
consulting and academic industries should contin-
ue to seek better ways to process, visualize, and
deliver abundant data from the field and/or applica-
ble simulation tools. This article presents a small
contribution from FAU’s Center for Adaptive
Traffic Operations and Management (CATOM) on
the development of new performance measure
tools based on well-known traffic engineering con-
cepts and data/outputs from simulation models. The
tools discussed here are based on PTV software VIS-
SIM but similar concepts can be developed with data
from other simulation platforms.
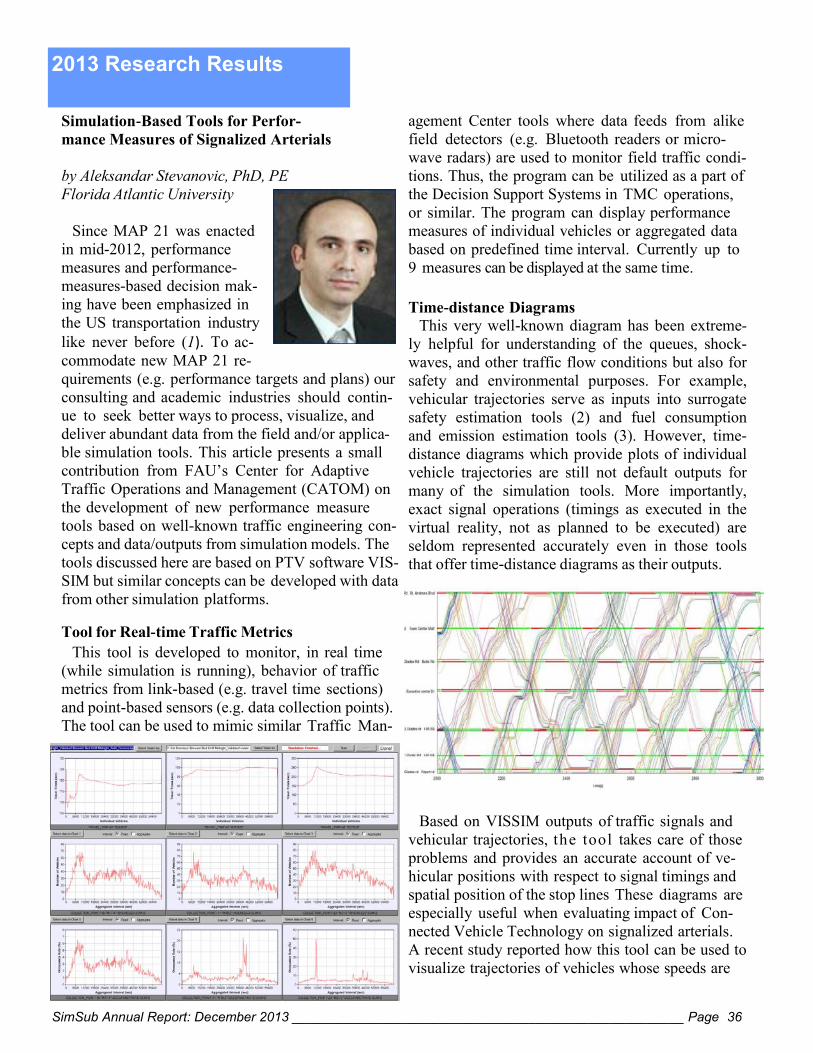
Tool for Real-time Traffic Metrics
This tool is developed to monitor, in real time
(while simulation is running), behavior of traffic
metrics from link-based (e.g. travel time sections)
and point-based sensors (e.g. data collection points).
The tool can be used to mimic similar Traffic Man-
agement Center tools where data feeds from alike
field detectors (e.g. Bluetooth readers or micro-
wave radars) are used to monitor field traffic condi-
tions. Thus, the program can be utilized as a part of
the Decision Support Systems in TMC operations,
or similar. The program can display performance
measures of individual vehicles or aggregated data
based on predefined time interval. Currently up to
9 measures can be displayed at the same time.
Time-distance Diagrams This very well-known diagram has been extreme-
ly helpful for understanding of the queues, shock-
waves, and other traffic flow conditions but also for
safety and environmental purposes. For example,
vehicular trajectories serve as inputs into surrogate
safety estimation tools (2) and fuel consumption
and emission estimation tools (3). However, time-
distance diagrams which provide plots of individual
vehicle trajectories are still not default outputs for
many of the simulation tools. More importantly,
exact signal operations (timings as executed in the
virtual reality, not as planned to be executed) are
seldom represented accurately even in those tools
that offer time-distance diagrams as their outputs.
Based on VISSIM outputs of traffic signals and
vehicular trajectories, the tool takes care of those
problems and provides an accurate account of ve-
hicular positions with respect to signal timings and
spatial position of the stop lines These diagrams are
especially useful when evaluating impact of Con-
nected Vehicle Technology on signalized arterials.
A recent study reported how this tool can be used to
visualize trajectories of vehicles whose speeds are
2013 Research Results
SimSub Annual Report: December 2013 _____________________________________________________ Page 37
adjusted to enable stopples passing through signal-
ized intersections (concept known as GLOSA—
Green Light Optimized Speed Advisory) (4).
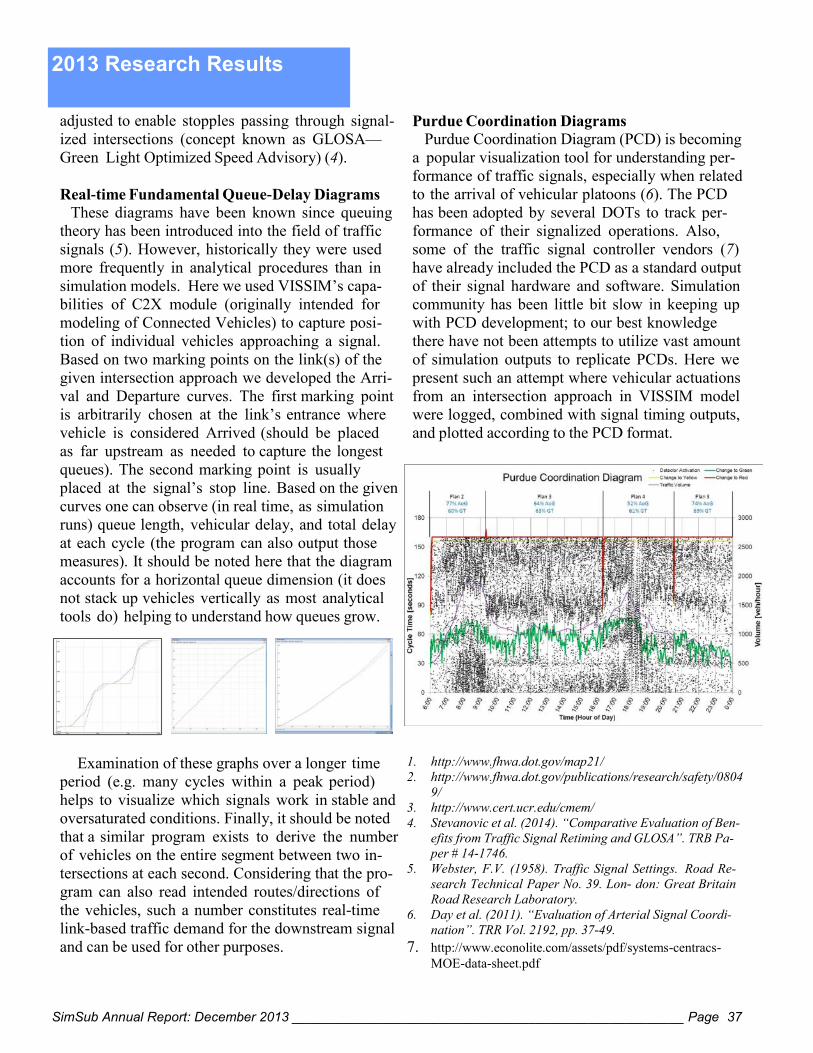
Real-time Fundamental Queue-Delay Diagrams These diagrams have been known since queuing
theory has been introduced into the field of traffic
signals (5). However, historically they were used
more frequently in analytical procedures than in
simulation models. Here we used VISSIM’s capa-
bilities of C2X module (originally intended for
modeling of Connected Vehicles) to capture posi-
tion of individual vehicles approaching a signal.
Based on two marking points on the link(s) of the
given intersection approach we developed the Arri-
val and Departure curves. The first marking point
is arbitrarily chosen at the link’s entrance where
vehicle is considered Arrived (should be placed
as far upstream as needed to capture the longest
queues). The second marking point is usually
placed at the signal’s stop line. Based on the given
curves one can observe (in real time, as simulation
runs) queue length, vehicular delay, and total delay
at each cycle (the program can also output those
measures). It should be noted here that the diagram
accounts for a horizontal queue dimension (it does
not stack up vehicles vertically as most analytical
tools do) helping to understand how queues grow.
Examination of these graphs over a longer time
period (e.g. many cycles within a peak period)
helps to visualize which signals work in stable and
oversaturated conditions. Finally, it should be noted
that a similar program exists to derive the number
of vehicles on the entire segment between two in-
tersections at each second. Considering that the pro-
gram can also read intended routes/directions of
the vehicles, such a number constitutes real-time
link-based traffic demand for the downstream signal
and can be used for other purposes.
Purdue Coordination Diagrams Purdue Coordination Diagram (PCD) is becoming
a popular visualization tool for understanding per-
formance of traffic signals, especially when related
to the arrival of vehicular platoons (6). The PCD
has been adopted by several DOTs to track per-
formance of their signalized operations. Also,
some of the traffic signal controller vendors (7)
have already included the PCD as a standard output
of their signal hardware and software. Simulation
community has been little bit slow in keeping up
with PCD development; to our best knowledge
there have not been attempts to utilize vast amount
of simulation outputs to replicate PCDs. Here we
present such an attempt where vehicular actuations
from an intersection approach in VISSIM model
were logged, combined with signal timing outputs,
and plotted according to the PCD format.
1. http://www.fhwa.dot.gov/map21/
2. http://www.fhwa.dot.gov/publications/research/safety/0804
9/
3. http://www.cert.ucr.edu/cmem/
4. Stevanovic et al. (2014). “Comparative Evaluation of Ben-
efits from Traffic Signal Retiming and GLOSA”. TRB Pa-
per # 14-1746.
5. Webster, F.V. (1958). Traffic Signal Settings. Road Re-
search Technical Paper No. 39. Lon- don: Great Britain
Road Research Laboratory.
6. Day et al. (2011). “Evaluation of Arterial Signal Coordi-
nation”. TRR Vol. 2192, pp. 37-49.
7. http://www.econolite.com/assets/pdf/systems-centracs-
MOE-data-sheet.pdf
2013 Research Results
SimSub Annual Report: December 2013 _____________________________________________________ Page 38
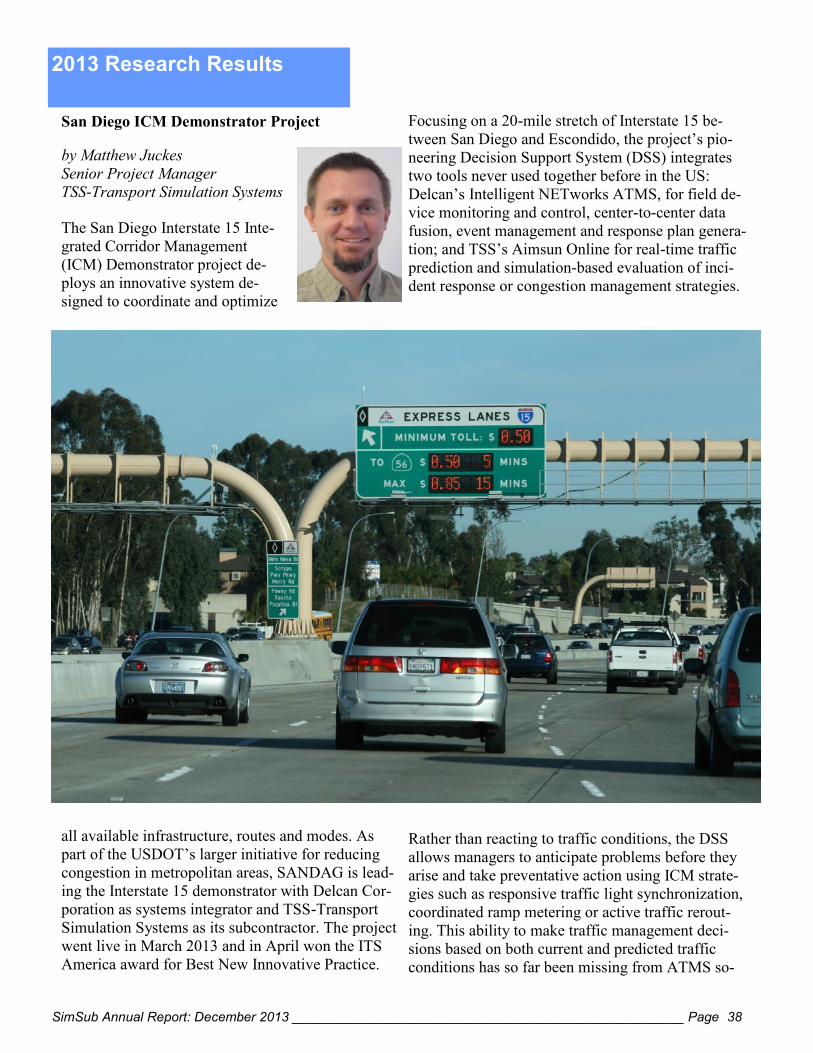
San Diego ICM Demonstrator Project
by Matthew Juckes
Senior Project Manager
TSS-Transport Simulation Systems
The San Diego Interstate 15 Inte-
grated Corridor Management
(ICM) Demonstrator project de-
ploys an innovative system de-
signed to coordinate and optimize
all available infrastructure, routes and modes. As
part of the USDOT’s larger initiative for reducing
congestion in metropolitan areas, SANDAG is lead-
ing the Interstate 15 demonstrator with Delcan Cor-
poration as systems integrator and TSS-Transport
Simulation Systems as its subcontractor. The project
went live in March 2013 and in April won the ITS
America award for Best New Innovative Practice.
Focusing on a 20-mile stretch of Interstate 15 be-
tween San Diego and Escondido, the project’s pio-
neering Decision Support System (DSS) integrates
two tools never used together before in the US:
Delcan’s Intelligent NETworks ATMS, for field de-
vice monitoring and control, center-to-center data
fusion, event management and response plan genera-
tion; and TSS’s Aimsun Online for real-time traffic
prediction and simulation-based evaluation of inci-
dent response or congestion management strategies.
Rather than reacting to traffic conditions, the DSS
allows managers to anticipate problems before they
arise and take preventative action using ICM strate-
gies such as responsive traffic light synchronization,
coordinated ramp metering or active traffic rerout-
ing. This ability to make traffic management deci-
sions based on both current and predicted traffic
conditions has so far been missing from ATMS so-
2013 Research Results
SimSub Annual Report: December 2013 _____________________________________________________ Page 39
lutions.
Aimsun Online takes an accurate reproduction of the
current traffic status as the starting point for the
forecasting process. By comparing the records from
the previous 30 minutes with the historical patterns
in the database, Aimsun Online allows system man-
agers to load the appropriate trip tables (Origin-
Destination matrices) and simulate the network un-
der its current capacity status. This sophisticated,
simulation-based monitoring procedure is supported
by time-series analysis and not only produces accu-
rate travel time forecasts but also offers advanced
incident detection capabilities.
Simulation has the potential to significantly improve
the accuracy and relevance of travel-time forecasts.
Because it takes capacity changes and network ef-
fects into account, it is the only technique that can
allow operators to compare the effectiveness of
complex alternative traffic management strategies
quickly and objectively, leading to: more effective
and efficient incident management; reduced incident
impact and quicker recovery period; earlier dissemi-
nation of incident information to the public; reduced
manpower resources; shorter journey times and, as a
corollary, increased economic savings.
2013 Research Results
SimSub Annual Report: December 2013 _____________________________________________________ Page 40
Micro-Simulation Software
Characteristics Survey
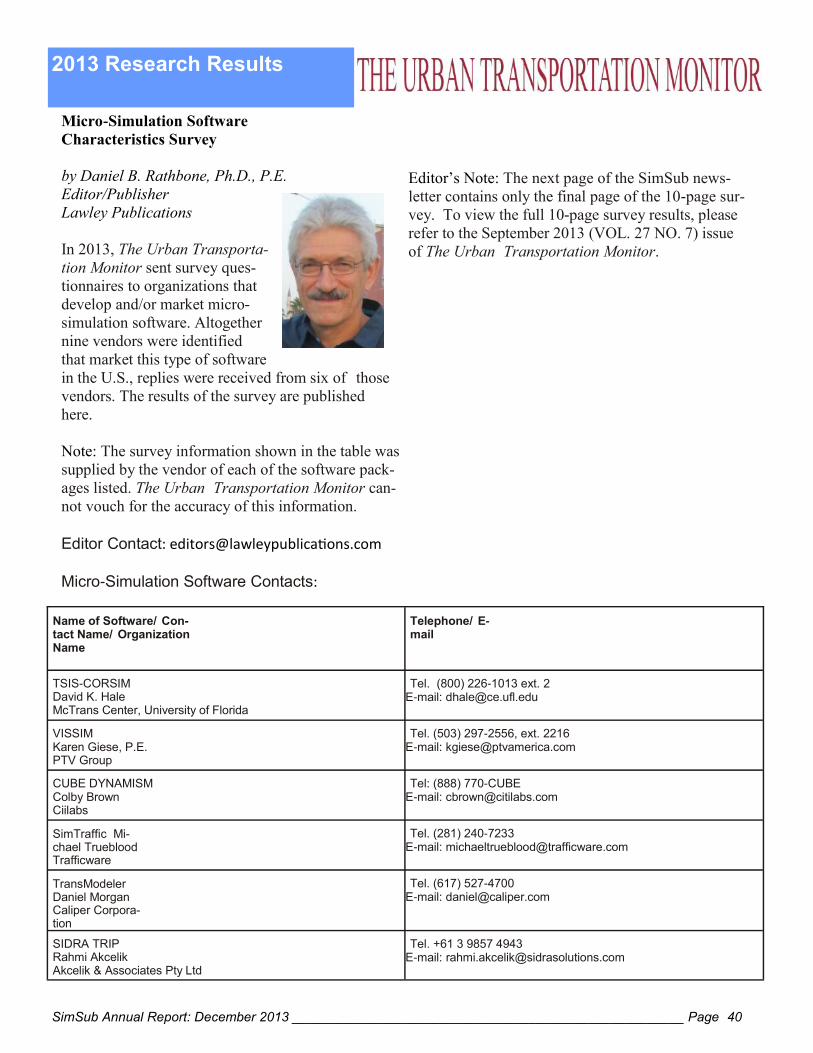
by Daniel B. Rathbone, Ph.D., P.E.
Editor/Publisher
Lawley Publications
In 2013, The Urban Transporta-
tion Monitor sent survey ques-
tionnaires to organizations that
develop and/or market micro-
simulation software. Altogether
nine vendors were identified
that market this type of software
in the U.S., replies were received from six of those
vendors. The results of the survey are published
here.
Note: The survey information shown in the table was
supplied by the vendor of each of the software pack-
ages listed. The Urban Transportation Monitor can-
not vouch for the accuracy of this information.
Editor Contact: [email protected]
Micro-Simulation Software Contacts:
Editor’s Note: The next page of the SimSub news-
letter contains only the final page of the 10-page sur-
vey. To view the full 10-page survey results, please
refer to the September 2013 (VOL. 27 NO. 7) issue
of The Urban Transportation Monitor.
2013 Research Results
Name of Software/ Con-tact Name/ Organization Name
Telephone/ E-mail
TSIS-CORSIM David K. Hale McTrans Center, University of Florida
Tel. (800) 226-1013 ext. 2 E-mail: [email protected]
VISSIM Karen Giese, P.E. PTV Group
Tel. (503) 297-2556, ext. 2216 E-mail: [email protected]
CUBE DYNAMISM Colby Brown Ciilabs
Tel: (888) 770-CUBE E-mail: [email protected]
SimTraffic Mi-chael Trueblood Trafficware
Tel. (281) 240-7233 E-mail: [email protected]
TransModeler Daniel Morgan Caliper Corpora-tion
Tel. (617) 527-4700 E-mail: [email protected]
SIDRA TRIP Rahmi Akcelik Akcelik & Associates Pty Ltd
Tel. +61 3 9857 4943 E-mail: [email protected]
SimSub Annual Report: December 2013 _____________________________________________________ Page 41
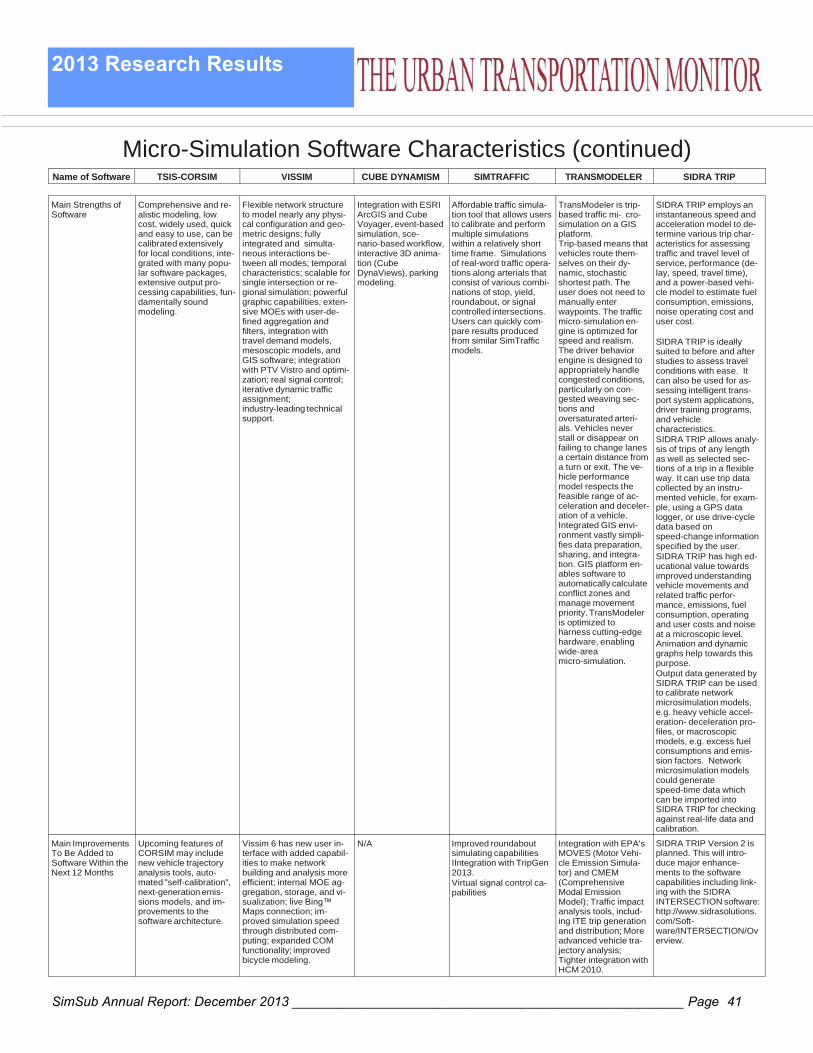
Micro-Simulation Software Characteristics (continued)
Name of Software TSIS-CORSIM VISSIM CUBE DYNAMISM SIMTRAFFIC TRANSMODELER SIDRA TRIP
Main Strengths of Software
Comprehensive and re- alistic modeling, low cost, widely used, quick and easy to use, can be calibrated extensively for local conditions, inte- grated with many popu- lar software packages, extensive output pro- cessing capabilities, fun- damentally sound modeling.
Flexible network structure to model nearly any physi- cal configuration and geo- metric designs; fully integrated and simulta- neous interactions be- tween all modes; temporal characteristics; scalable for single intersection or re- gional simulation; powerful graphic capabilities, exten- sive MOEs with user-de- fined aggregation and filters, integration with travel demand models, mesoscopic models, and GIS software; integration with PTV Vistro and optimi- zation; real signal control; iterative dynamic traffic assignment; industry-leading technical support.
Integration with ESRI ArcGIS and Cube Voyager, event-based simulation, sce- nario-based workflow, interactive 3D anima- tion (Cube DynaViews), parking modeling.
Affordable traffic simula- tion tool that allows users to calibrate and perform multiple simulations within a relatively short time frame. Simulations of real-word traffic opera- tions along arterials that consist of various combi- nations of stop, yield, roundabout, or signal controlled intersections. Users can quickly com- pare results produced from similar SimTraffic models.
TransModeler is trip-based traffic mi- cro-simulation on a GIS platform. Trip-based means that vehicles route them- selves on their dy- namic, stochastic shortest path. The user does not need to manually enter waypoints. The traffic micro-simulation en- gine is optimized for speed and realism. The driver behavior engine is designed to appropriately handle congested conditions, particularly on con- gested weaving sec- tions and oversaturated arteri- als. Vehicles never stall or disappear on failing to change lanes a certain distance from a turn or exit. The ve- hicle performance model respects the feasible range of ac- celeration and deceler- ation of a vehicle. Integrated GIS envi- ronment vastly simpli- fies data preparation, sharing, and integra- tion. GIS platform en- ables software to automatically calculate conflict zones and manage movement priority. TransModeler is optimized to harness cutting-edge hardware, enabling wide-area micro-simulation.
SIDRA TRIP employs an instantaneous speed and acceleration model to de- termine various trip char- acteristics for assessing traffic and travel level of service, performance (de- lay, speed, travel time), and a power-based vehi- cle model to estimate fuel consumption, emissions, noise operating cost and user cost.
SIDRA TRIP is ideally suited to before and after studies to assess travel conditions with ease. It can also be used for as- sessing intelligent trans- port system applications, driver training programs, and vehicle characteristics.
SIDRA TRIP allows analy- sis of trips of any length as well as selected sec- tions of a trip in a flexible way. It can use trip data collected by an instru- mented vehicle, for exam- ple, using a GPS data logger, or use drive-cycle data based on speed-change information specified by the user.
SIDRA TRIP has high ed- ucational value towards improved understanding vehicle movements and related traffic perfor- mance, emissions, fuel consumption, operating and user costs and noise at a microscopic level. Animation and dynamic graphs help towards this purpose.
Output data generated by SIDRA TRIP can be used to calibrate network microsimulation models, e.g. heavy vehicle accel- eration- deceleration pro- files, or macroscopic models, e.g. excess fuel consumptions and emis- sion factors. Network microsimulation models could generate speed-time data which can be imported into SIDRA TRIP for checking against real-life data and calibration.
Main Improvements To Be Added to Software Within the Next 12 Months
Upcoming features of CORSIM may include new vehicle trajectory analysis tools, auto- mated "self-calibration", next-generation emis- sions models, and im- provements to the software architecture.
Vissim 6 has new user in- terface with added capabil- ities to make network building and analysis more efficient; internal MOE ag- gregation, storage, and vi- sualization; live Bing™ Maps connection; im- proved simulation speed through distributed com- puting; expanded COM functionality; improved bicycle modeling.
N/A Improved roundabout simulating capabilities IIntegration with TripGen 2013.
Virtual signal control ca- pabilities
Integration with EPA's MOVES (Motor Vehi- cle Emission Simula- tor) and CMEM (Comprehensive Modal Emission Model); Traffic impact analysis tools, includ- ing ITE trip generation and distribution; More advanced vehicle tra- jectory analysis; Tighter integration with HCM 2010.
SIDRA TRIP Version 2 is planned. This will intro- duce major enhance- ments to the software capabilities including link- ing with the SIDRA INTERSECTION software: http://www.sidrasolutions. com/Soft- ware/INTERSECTION/Ov erview.
2013 Research Results
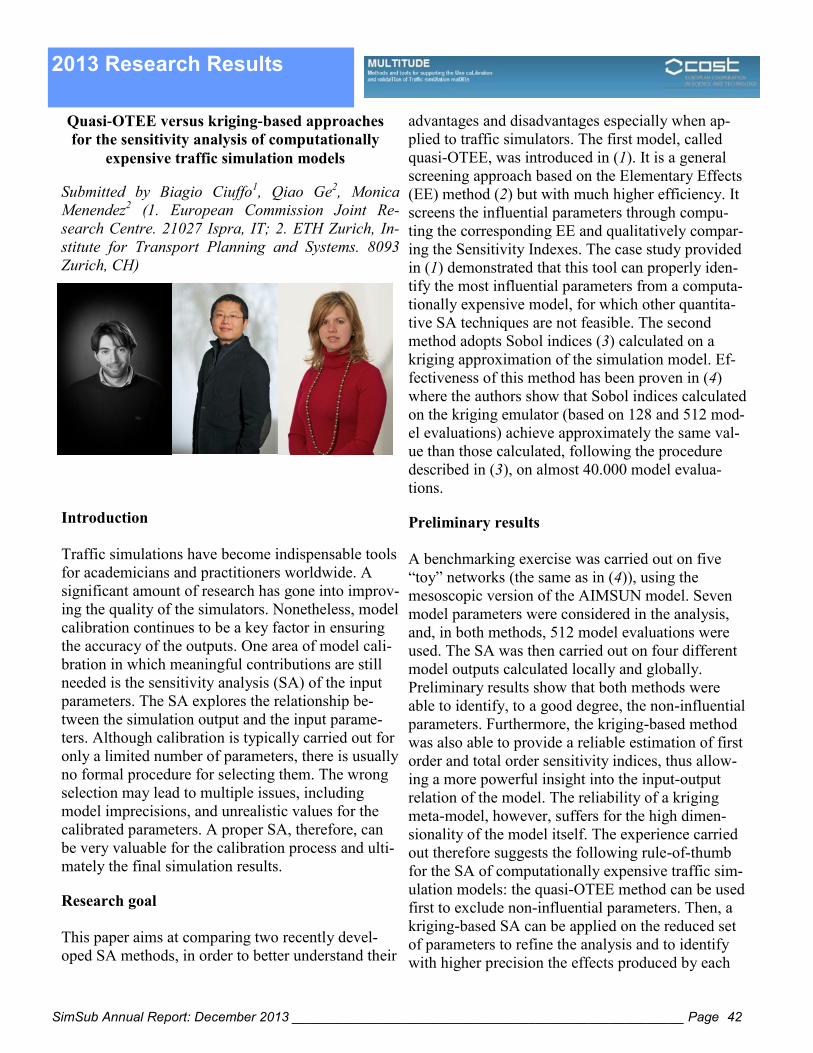
SimSub Annual Report: December 2013 _____________________________________________________ Page 42
Quasi-OTEE versus kriging-based approaches
for the sensitivity analysis of computationally
expensive traffic simulation models
Submitted by Biagio Ciuffo1, Qiao Ge2, Monica
Menendez2 (1. European Commission Joint Re-
search Centre. 21027 Ispra, IT; 2. ETH Zurich, In-
stitute for Transport Planning and Systems. 8093
Zurich, CH)
Introduction
Traffic simulations have become indispensable tools
for academicians and practitioners worldwide. A
significant amount of research has gone into improv-
ing the quality of the simulators. Nonetheless, model
calibration continues to be a key factor in ensuring
the accuracy of the outputs. One area of model cali-
bration in which meaningful contributions are still
needed is the sensitivity analysis (SA) of the input
parameters. The SA explores the relationship be-
tween the simulation output and the input parame-
ters. Although calibration is typically carried out for
only a limited number of parameters, there is usually
no formal procedure for selecting them. The wrong
selection may lead to multiple issues, including
model imprecisions, and unrealistic values for the
calibrated parameters. A proper SA, therefore, can
be very valuable for the calibration process and ulti-
mately the final simulation results.
Research goal
This paper aims at comparing two recently devel-
oped SA methods, in order to better understand their
advantages and disadvantages especially when ap-
plied to traffic simulators. The first model, called
quasi-OTEE, was introduced in (1). It is a general
screening approach based on the Elementary Effects
(EE) method (2) but with much higher efficiency. It
screens the influential parameters through compu-
ting the corresponding EE and qualitatively compar-
ing the Sensitivity Indexes. The case study provided
in (1) demonstrated that this tool can properly iden-
tify the most influential parameters from a computa-
tionally expensive model, for which other quantita-
tive SA techniques are not feasible. The second
method adopts Sobol indices (3) calculated on a
kriging approximation of the simulation model. Ef-
fectiveness of this method has been proven in (4)
where the authors show that Sobol indices calculated
on the kriging emulator (based on 128 and 512 mod-
el evaluations) achieve approximately the same val-
ue than those calculated, following the procedure
described in (3), on almost 40.000 model evalua-
tions.
Preliminary results
A benchmarking exercise was carried out on five
“toy” networks (the same as in (4)), using the
mesoscopic version of the AIMSUN model. Seven
model parameters were considered in the analysis,
and, in both methods, 512 model evaluations were
used. The SA was then carried out on four different
model outputs calculated locally and globally.
Preliminary results show that both methods were
able to identify, to a good degree, the non-influential
parameters. Furthermore, the kriging-based method
was also able to provide a reliable estimation of first
order and total order sensitivity indices, thus allow-
ing a more powerful insight into the input-output
relation of the model. The reliability of a kriging
meta-model, however, suffers for the high dimen-
sionality of the model itself. The experience carried
out therefore suggests the following rule-of-thumb
for the SA of computationally expensive traffic sim-
ulation models: the quasi-OTEE method can be used
first to exclude non-influential parameters. Then, a
kriging-based SA can be applied on the reduced set
of parameters to refine the analysis and to identify
with higher precision the effects produced by each
2013 Research Results
SimSub Annual Report: December 2013 _____________________________________________________ Page 43
input on the outputs. In this way, just a few hun-
dreds simulations can produce results as accurate
and reliable as any other more computationally ex-
pensive sensitivity analysis tool.
Acknowledgements
Research contained within this paper benefited from
participation in EU COST Action TU0903 – Meth-
ods and tools for supporting the Use caLibration and
validaTIon of Traffic simUlation moDEls.
References
1. Ge, Q., and M. Menendez. An improved approach
for the sensitivity analysis of computationally
expensive microscopic traffic models: a case
study of the Zurich network in VISSIM. Pro-
ceedings of the 92th TRB Annual Meeting,
Washington DC, 2013.
2. Morris, M. D. Factorial sampling plans for pre-
liminary computational experiments. Techno-
metrics, Vol. 33, No. 2, 1991, pp. 161 - 174.
3. Saltelli, A.; Ratto, M.; Anres, T.; Campolongo, F.;
Cariboni, J.; Gatelli, D.; Saisana, M.; Tarantola.
S.; Global Sensitivity Analysis – The Primer;
John Wiley and Sons Ltd: Cheichester, England,
2008.
4. Ciuffo, B., Casas, J., Montanino, M., Perarnau, J.,
Punzo, V. From Theory to Practice: Gaussian
Process Meta-Models for Sensitivity Analysis
of Traffic Simulation Models: Case Study of
Aimsun Mesoscopic Model. Proceedings of the
92th TRB Annual Meeting, Washington DC,
2013.
2013 Research Results
SimSub Annual Report: December 2013 _____________________________________________________ Page 44
Traffic Simulation in Research Projects
by Dr. Li Zhang, Zhitong Huang, and Yi Wen
Mississippi State University
Traffic simulation has been extensively used for
simulating traffic systems in transportation research
projects at the Department of Civil and Environmen-
tal Engineering, Mississippi State University. In the
project “Coordination of Connected Vehicle and
Transit Signal Priority on Transit Evacuations”, we
developed the complete Gulf Coast traffic network
in TSIS-CORSIM. Traffic signals, freeways, high-
ways, traffic signs, and traffic flow were simulated.
The simulation was implemented in an emergency
evacuation scenario to help us evaluate the proposed
Transit Signal Priority (TSP) system. In addition, a
Run Time Extension (RTE) was developed for the
simulation to help us on the evaluation. For exam-
ple, RTE enabled us to implement Transit Signal
Priority (TSP) operations at specific signalized inter-
sections. Moreover, Connected Vehicle, which is a
technology under development for wireless commu-
nication among vehicles and infrastructures, was
simulated and integrated with TSP to improve transit
evacuation efficiency. We could also simulate dif-
ferent scenarios for different levels of evacuations.
The proposed TSP strategies were demonstrated ef-
fective by the simulation.
In the project “I-55 Integrated Diversion Traffic
Management Benefit Study”, simulation was used to
create a scenario in which the freeway was very con-
gested and freeway traffic was diverted to arterials
to bypass the congested segment. RTE was also de-
veloped for the simulation. We implemented our
models and algorithms in the simulation to optimize
the diverted traffic volume and traffic signals on the
arterials. We performed before/after simulations to
evaluate the diversion system performance. It pro-
vided us valuable results which were helpful on the
analysis of diversion traffic pattern, diversion route
selection, DMS implementation, and traffic signals
on the arterial roads when there is serious conges-
tion on the freeway.
2013 Research Results
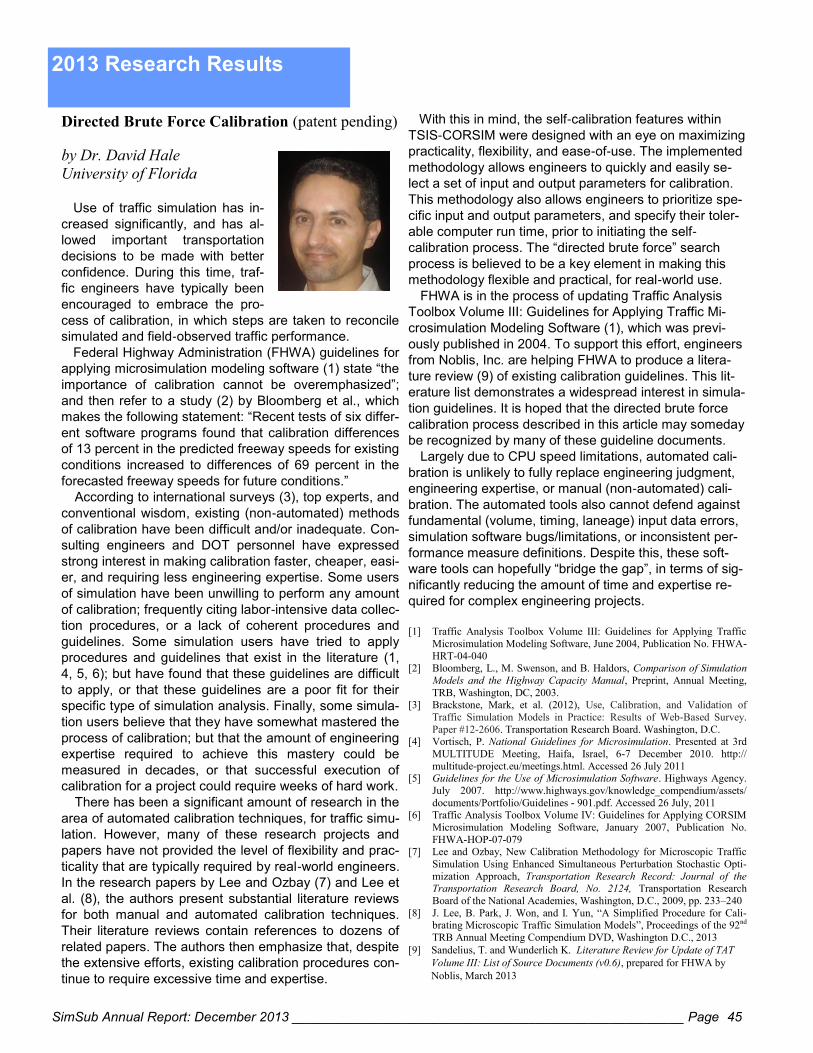
SimSub Annual Report: December 2013 _____________________________________________________ Page 45
Directed Brute Force Calibration (patent pending)
by Dr. David Hale
University of Florida
Use of traffic simulation has in-
creased significantly, and has al-
lowed important transportation
decisions to be made with better
confidence. During this time, traf-
fic engineers have typically been
encouraged to embrace the pro-
cess of calibration, in which steps are taken to reconcile
simulated and field-observed traffic performance.
Federal Highway Administration (FHWA) guidelines for
applying microsimulation modeling software (1) state “the
importance of calibration cannot be overemphasized”;
and then refer to a study (2) by Bloomberg et al., which
makes the following statement: “Recent tests of six differ-
ent software programs found that calibration differences
of 13 percent in the predicted freeway speeds for existing
conditions increased to differences of 69 percent in the
forecasted freeway speeds for future conditions.”
According to international surveys (3), top experts, and
conventional wisdom, existing (non-automated) methods
of calibration have been difficult and/or inadequate. Con-
sulting engineers and DOT personnel have expressed
strong interest in making calibration faster, cheaper, easi-
er, and requiring less engineering expertise. Some users
of simulation have been unwilling to perform any amount
of calibration; frequently citing labor-intensive data collec-
tion procedures, or a lack of coherent procedures and
guidelines. Some simulation users have tried to apply
procedures and guidelines that exist in the literature (1,
4, 5, 6); but have found that these guidelines are difficult
to apply, or that these guidelines are a poor fit for their
specific type of simulation analysis. Finally, some simula-
tion users believe that they have somewhat mastered the
process of calibration; but that the amount of engineering
expertise required to achieve this mastery could be
measured in decades, or that successful execution of
calibration for a project could require weeks of hard work.
There has been a significant amount of research in the
area of automated calibration techniques, for traffic simu-
lation. However, many of these research projects and
papers have not provided the level of flexibility and prac-
ticality that are typically required by real-world engineers.
In the research papers by Lee and Ozbay (7) and Lee et
al. (8), the authors present substantial literature reviews
for both manual and automated calibration techniques.
Their literature reviews contain references to dozens of
related papers. The authors then emphasize that, despite
the extensive efforts, existing calibration procedures con-
tinue to require excessive time and expertise.
With this in mind, the self-calibration features within
TSIS-CORSIM were designed with an eye on maximizing
practicality, flexibility, and ease-of-use. The implemented
methodology allows engineers to quickly and easily se-
lect a set of input and output parameters for calibration.
This methodology also allows engineers to prioritize spe-
cific input and output parameters, and specify their toler-
able computer run time, prior to initiating the self-
calibration process. The “directed brute force” search
process is believed to be a key element in making this
methodology flexible and practical, for real-world use.
FHWA is in the process of updating Traffic Analysis
Toolbox Volume III: Guidelines for Applying Traffic Mi-
crosimulation Modeling Software (1), which was previ-
ously published in 2004. To support this effort, engineers
from Noblis, Inc. are helping FHWA to produce a litera-
ture review (9) of existing calibration guidelines. This lit-
erature list demonstrates a widespread interest in simula-
tion guidelines. It is hoped that the directed brute force
calibration process described in this article may someday
be recognized by many of these guideline documents.
Largely due to CPU speed limitations, automated cali-
bration is unlikely to fully replace engineering judgment,
engineering expertise, or manual (non-automated) cali-
bration. The automated tools also cannot defend against
fundamental (volume, timing, laneage) input data errors,
simulation software bugs/limitations, or inconsistent per-
formance measure definitions. Despite this, these soft-
ware tools can hopefully “bridge the gap”, in terms of sig-
nificantly reducing the amount of time and expertise re-
quired for complex engineering projects.
[1] Traffic Analysis Toolbox Volume III: Guidelines for Applying Traffic
Microsimulation Modeling Software, June 2004, Publication No. FHWA-
HRT-04-040 [2] Bloomberg, L., M. Swenson, and B. Haldors, Comparison of Simulation
Models and the Highway Capacity Manual, Preprint, Annual Meeting,
TRB, Washington, DC, 2003. [3] Brackstone, Mark, et al. (2012), Use, Calibration, and Validation of
Traffic Simulation Models in Practice: Results of Web-Based Survey.
Paper #12-2606. Transportation Research Board. Washington, D.C. [4] Vortisch, P. National Guidelines for Microsimulation. Presented at 3rd
MULTITUDE Meeting, Haifa, Israel, 6-7 December 2010. http://
multitude-project.eu/meetings.html. Accessed 26 July 2011 [5] Guidelines for the Use of Microsimulation Software. Highways Agency.
July 2007. http://www.highways.gov/knowledge_compendium/assets/
documents/Portfolio/Guidelines - 901.pdf. Accessed 26 July, 2011
[6] Traffic Analysis Toolbox Volume IV: Guidelines for Applying CORSIM
Microsimulation Modeling Software, January 2007, Publication No.
FHWA-HOP-07-079 [7] Lee and Ozbay, New Calibration Methodology for Microscopic Traffic
Simulation Using Enhanced Simultaneous Perturbation Stochastic Opti-
mization Approach, Transportation Research Record: Journal of the Transportation Research Board, No. 2124, Transportation Research
Board of the National Academies, Washington, D.C., 2009, pp. 233–240
[8] J. Lee, B. Park, J. Won, and I. Yun, “A Simplified Procedure for Cali-brating Microscopic Traffic Simulation Models”, Proceedings of the 92nd
TRB Annual Meeting Compendium DVD, Washington D.C., 2013
[9] Sandelius, T. and Wunderlich K. Literature Review for Update of TAT
Volume III: List of Source Documents (v0.6), prepared for FHWA by
Noblis, March 2013
2013 Research Results
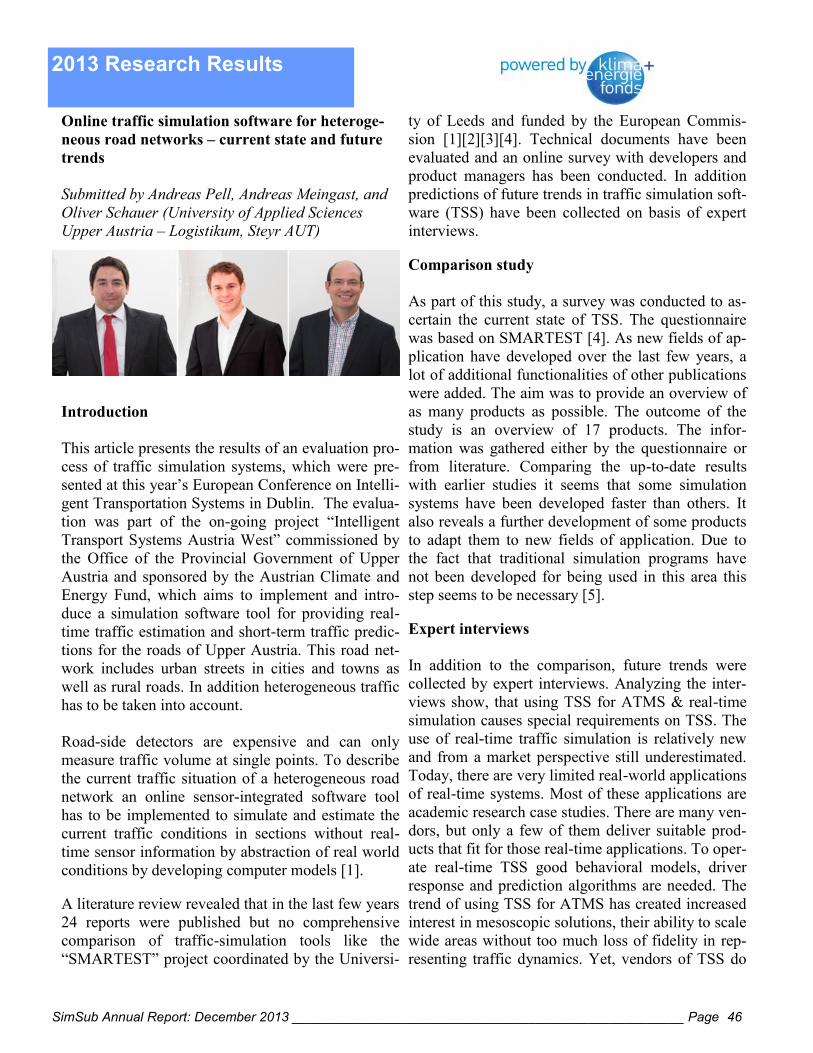
SimSub Annual Report: December 2013 _____________________________________________________ Page 46
Online traffic simulation software for heteroge-
neous road networks – current state and future
trends
Submitted by Andreas Pell, Andreas Meingast, and
Oliver Schauer (University of Applied Sciences
Upper Austria – Logistikum, Steyr AUT)
Introduction
This article presents the results of an evaluation pro-
cess of traffic simulation systems, which were pre-
sented at this year’s European Conference on Intelli-
gent Transportation Systems in Dublin. The evalua-
tion was part of the on-going project “Intelligent
Transport Systems Austria West” commissioned by
the Office of the Provincial Government of Upper
Austria and sponsored by the Austrian Climate and
Energy Fund, which aims to implement and intro-
duce a simulation software tool for providing real-
time traffic estimation and short-term traffic predic-
tions for the roads of Upper Austria. This road net-
work includes urban streets in cities and towns as
well as rural roads. In addition heterogeneous traffic
has to be taken into account.
Road-side detectors are expensive and can only
measure traffic volume at single points. To describe
the current traffic situation of a heterogeneous road
network an online sensor-integrated software tool
has to be implemented to simulate and estimate the
current traffic conditions in sections without real-
time sensor information by abstraction of real world
conditions by developing computer models [1].
A literature review revealed that in the last few years
24 reports were published but no comprehensive
comparison of traffic-simulation tools like the
“SMARTEST” project coordinated by the Universi-
ty of Leeds and funded by the European Commis-
sion [1][2][3][4]. Technical documents have been
evaluated and an online survey with developers and
product managers has been conducted. In addition
predictions of future trends in traffic simulation soft-
ware (TSS) have been collected on basis of expert
interviews.
Comparison study
As part of this study, a survey was conducted to as-
certain the current state of TSS. The questionnaire
was based on SMARTEST [4]. As new fields of ap-
plication have developed over the last few years, a
lot of additional functionalities of other publications
were added. The aim was to provide an overview of
as many products as possible. The outcome of the
study is an overview of 17 products. The infor-
mation was gathered either by the questionnaire or
from literature. Comparing the up-to-date results
with earlier studies it seems that some simulation
systems have been developed faster than others. It
also reveals a further development of some products
to adapt them to new fields of application. Due to
the fact that traditional simulation programs have
not been developed for being used in this area this
step seems to be necessary [5].
Expert interviews
In addition to the comparison, future trends were
collected by expert interviews. Analyzing the inter-
views show, that using TSS for ATMS & real-time
simulation causes special requirements on TSS. The
use of real-time traffic simulation is relatively new
and from a market perspective still underestimated.
Today, there are very limited real-world applications
of real-time systems. Most of these applications are
academic research case studies. There are many ven-
dors, but only a few of them deliver suitable prod-
ucts that fit for those real-time applications. To oper-
ate real-time TSS good behavioral models, driver
response and prediction algorithms are needed. The
trend of using TSS for ATMS has created increased
interest in mesoscopic solutions, their ability to scale
wide areas without too much loss of fidelity in rep-
resenting traffic dynamics. Yet, vendors of TSS do
2013 Research Results
SimSub Annual Report: December 2013 _____________________________________________________ Page 47
not offer all of these functionalities in one single
product. By providing interfaces in TSS vendors en-
sure, that missing functionalities can be implement-
ed. However, for customizing TSS, a lot of research,
coding and calibration must be done. Therefore, it
needs more than a tool from a user’s perspective.
Real-time traffic simulation needs a bundle of soft-
ware tools, knowledge and sometimes know-how.
Another challenge will be to process great volumes
of data provided by vehicles, mobile phones or road
side sensors. They all have to be integrated in TSS
to provide real-time traffic estimation, prediction
and predictive route guidance. Predictions are re-
quired in order to anticipate congestion and drivers‘
response to any guidance that is disseminated to
them. Some real-time systems without sophisticated
prediction models exist in practice. Real-time pre-
dictive methodologies are still in the research/
academic domain.
TSS in rural areas have to deal with different chal-
lenges. Comparing rural areas with urban and inter-
urban areas it arises, that rural areas have to deal
with motorized and non-motorized traffic. Due to
the fact that pedestrians, bicycles, cars, trucks, bus-
ses, etc. interact on these roads, parameters require a
calibration. Freight traffic also needs to be properly
calibrated to be able to take into account the effects
of trucks on traffic congestion. To model heteroge-
neous traffic it is possible to change parameters in
microscopic simulation systems and develop
mesoscopic models. TSS need to adapt their meth-
ods of assignment on the different road categories
rural, interurban and urban. In some cases legacy
asset management and network information systems
have to be replaced with more comprehensive data-
base solutions. Additionally, poor data quality, a
small amount of real-time data and communication
costs in remote rural areas are common challenges –
not only for operators, but also for vendors.
Conclusions
A state-of-the art review report has been drawn up.
The results of the evaluation show, those existing
simulation systems can estimate current traffic situa-
tion and predict traffic conditions.
Most of the simulation tools are designed for
“urban”, “interurban” or “combined” road networks
and can deal with real-time data. No system delivers
all functionalities; no system seems to have a focus
on a single field of application. Some of these sys-
tems use hybrid models (micro+meso, mi-
cro+macro, micro+meso+macro); some of them
have limitations in links, etc. A detailed network
model is necessary. A GIS data based network mod-
el would improve data consistency and efficiency,
which is often not recognized by software vendors.
There is a lack of online traffic simulation software
applications specially designed for heterogeneous
road transportation networks in peripheral regions.
Regarding the rising performance of traffic simula-
tion systems, future research could be done to fur-
ther develop this functionality in simulation systems
to can use them better for providing real-time traffic
information and short-term traffic predictions in
mixed wide areas (rural, urban, inter-urban) by the
use of vehicle probe data without focusing only on
highways, highly-ranked arterial roads and conurba-
tions. Customization provides more room to develop
future applications but also overstrains some users.
1. Ratrout, N. T., S. M. Rahman (2009). A Comparative Analy-
sis of Currently Used Microscopic and Macroscopic Traffic
Simulation Software, The Arabian Journal for Science and En-
gineering, vol.34, Number 1B, April 2009, pp. 121-133.
2. Kotushevski, G., K. A. Hawick (2009). A Review of Traffic
Simulation Software, Computational Science Technical Note
CSTN-095, Massey University, Albany, North Shore 102-904,
Auckland, New Zealand.
3. Jones, S. L. et al (2004). Traffic Simulation Software Com-
parison Study, University Transportation Center for Alabama
Report. 4. Barceló, J., et al (1999). SMARTEST - Simulation Modelling
Applied to Road Transport European Scheme Tests – Simula-
tion Report, University of Leeds, Faculty of Environment.
5. Boxill, S., L. Yu (2000). An Evaluation of Traffic Simula-
tion Models for Supporting ITS Development, Cleburne: Texas
Southern University.
2013 Research Results
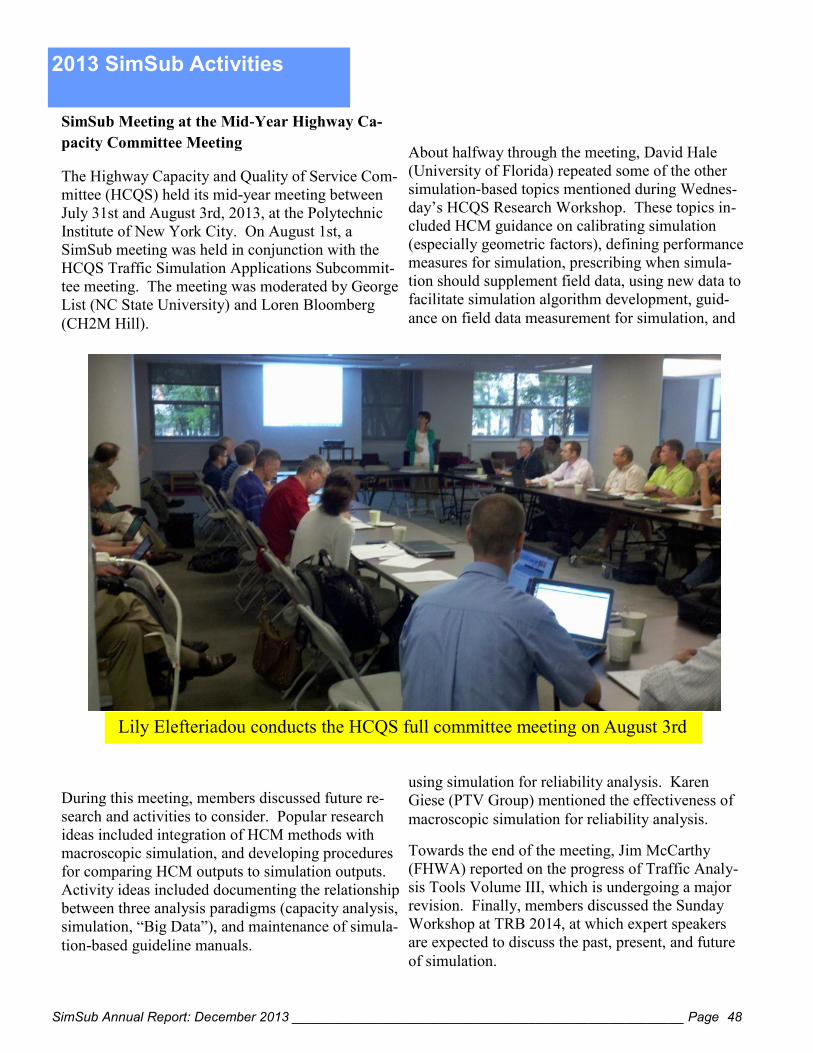
SimSub Annual Report: December 2013 _____________________________________________________ Page 48
SimSub Meeting at the Mid-Year Highway Ca-
pacity Committee Meeting
The Highway Capacity and Quality of Service Com-
mittee (HCQS) held its mid-year meeting between
July 31st and August 3rd, 2013, at the Polytechnic
Institute of New York City. On August 1st, a
SimSub meeting was held in conjunction with the
HCQS Traffic Simulation Applications Subcommit-
tee meeting. The meeting was moderated by George
List (NC State University) and Loren Bloomberg
(CH2M Hill).
During this meeting, members discussed future re-
search and activities to consider. Popular research
ideas included integration of HCM methods with
macroscopic simulation, and developing procedures
for comparing HCM outputs to simulation outputs.
Activity ideas included documenting the relationship
between three analysis paradigms (capacity analysis,
simulation, “Big Data”), and maintenance of simula-
tion-based guideline manuals.
About halfway through the meeting, David Hale
(University of Florida) repeated some of the other
simulation-based topics mentioned during Wednes-
day’s HCQS Research Workshop. These topics in-
cluded HCM guidance on calibrating simulation
(especially geometric factors), defining performance
measures for simulation, prescribing when simula-
tion should supplement field data, using new data to
facilitate simulation algorithm development, guid-
ance on field data measurement for simulation, and
using simulation for reliability analysis. Karen
Giese (PTV Group) mentioned the effectiveness of
macroscopic simulation for reliability analysis.
Towards the end of the meeting, Jim McCarthy
(FHWA) reported on the progress of Traffic Analy-
sis Tools Volume III, which is undergoing a major
revision. Finally, members discussed the Sunday
Workshop at TRB 2014, at which expert speakers
are expected to discuss the past, present, and future
of simulation.
2013 SimSub Activities
Lily Elefteriadou conducts the HCQS full committee meeting on August 3rd
SimSub Annual Report: December 2013 _____________________________________________________ Page 49
Animations of Traffic Flow Phenomena
by Dr. Aleks Stevanovic
I’ve created a page on our website
that lists some of the websites that
contain simulations/animations of
traffic flow phenomena. The list is
not inclusive and it contains links
which were either given to us or
were known from personal experi-
ences. If you know any other sim-
ilar links which you think deserve to
be included please let us know
([email protected]). Animations of traffic
conditions (e.g. shock waves, ramp metering, signalized
operations) are great visual tools to popularize the traffic
engineering discipline and great resources for our stu-
dents in traffic engineering/ traffic flow theory courses. If
you have any ideas how to improve this page please send
your comments to the email address given above.
Carlos Daganzo's Animations of Traffic Phenomena
http://www.ce.berkeley.edu/~daganzo/index.htm
Ben Coifman's (OSU) Shock Wave Animations
http://www2.ece.ohio-state.edu/~coifman/shock/
This page illustrates wave propagation on freeways. In
the extreme, such waves take on the form of stop and go
traffic. All of the data shown here come from real traffic,
having been reduced by hand from video.
Jorge Laval's (GA Tech) Online Simulations
http://trafficlab.ce.gatech.edu/ Here you will find information and resources on vehicu-
lar traffic simulation models. Most of the models includ-
ed in this website are based on the kinematic wave model
(also known as the LWR model), which is the simplest
model able to capture basic traffic dynamics features
such as the propagation of congestion in the form of
"waves".
Martin Treiber's Traffic Animations
1. MovSim
Homepage of the Multi-model open-source vehicular
traffic simulator (MovSim): www.movsim.org Besides working with/contributing to the open-source
simulator, you can play two online games:
*Ramp-Metering Game*: Control interactively a signal-
ized freeway access and try to beat the high-score, i.e.,
the minimum simulation time to manage all the pre-
scribed traffic demand. If your control abilities are low,
you will create massive jams, or even a gridlock, on the
secondary road.
*Routing Game*: Reroute interactively some of the pre-
scribed freeway traffic demand over a deviation to avoid/
delay traffic breakdown. However, you can do too much
of a good thing and create massive jams on the deviation.
Again, the goal is to beat the high-score, i.e., the mini-
mum time to manage all the traffic demand. The routing
game will be available as an Android App, soon.
By the nature of the traffic management simulated in the
games, action and effect are significantly delayed. This
makes it tricky (and interesting) to obtain good scores.
Both games have been tested on our annual science fair
for pupils and the general public ("Lange Nacht der Wis-
senschaften") and can be made available for similar
events.
2. Traffic-Simulation (DE)
www.traffic-simulation.de In this interactive Java applet, you can create your own
traffic jam in different situations, provoked by bottle-
necks, traffic demand peaks, external perturbations, or by
changing the driver's behavior. All the above elements
can be controlled interactively.
3. Traffic-States
www.traffic-states.com This is a searchable graphical data base for spatial-
temporal traffic jam patterns.
SimSub Web Site Alex Stevanovic, Webmaster http://sites.google.com/site/trbcommitteeahb45
2013 SimSub Activities
SimSub Annual Report: December 2013 _____________________________________________________ Page 50
TransModeler is Caliper’s trip-based traffic mi-
crosimulation on a GIS platform. During July of
2013, Caliper started shipping TransModeler 3.0 Re-
lease 2, or R2.
R2 has a variety of improvements. Of particular note
is the addition of a disaggregate emissions model in
the Comprehensive Modal Emissions Model
(CMEM). This post-processor enables the calcula-
tion of emissions and fuel consumption. CMEM ena-
bles users to calculate these various sustainability,
environmental and public safety metrics.
TransModeler 3.0r2 further leverages the product’s
GIS platform. One such new feature is the ability to
add dynamic Web Map Layers from services like
Google and OpenStreetMap. This feature pulls the
relevant map tile from the Internet as the user moves
through the map.
Other highlights include:
Expanded API functionality, including an exam-
ple that enables simulating scenarios in batch
Ability to launch and run two sessions of the
software simultaneously
Expanded support for intersections with more
unusual geometries (e.g., greater than six inter-
secting links)
Driver behavior improvements for roundabouts
A new toolbox for connecting simulation data-
bases to centroids in a planning line layer
Improved toll revenue reporting for HOT lanes
and toll plazas
New features for creating copies of projects for
build scenarios
Improvements in AVL-based transit signal prior-
ity
Improved support of reversible lanes
2013 Product Updates
SimSub Annual Report: December 2013 _____________________________________________________ Page 51
TSIS-CORSIM version 6.3 was released in August
2012, and has been mailed to all registered offices
with a current support subscription. TSIS 6.3 con-
tains several improvements including the Streets Edi-
tor, Freeways Editor, HOT lanes, advanced toll pla-
zas, interactive lane alignment in TSIS Next, adap-
tive cruise control, and bug fixes.
Streets Editor and Freeways Editor. Based on the
Urban Streets and Freeway Facilities modules from
HCS, these new editors use basic volume and timing
data from the user to automatically construct com-
plex simulation networks within seconds.
High Occupancy Toll (HOT) Lanes. The new ver-
sion of CORSIM supports different HOT lane pric-
ing algorithms, monetary value of time for each ve-
hicle type, HOT pricing output data, and specifica-
tion of vehicle types permitted to use HOT lanes in
each time period. In addition, the user can specify a
percentage of transponders for each vehicle type, and
numerous calibration parameters to customize vehi-
cle behaviors near HOT lanes.
Advanced Toll Plazas. CORSIM now supports dif-
ferent types of toll payment in each lane, vehicle
type restrictions in each lane, and the percentage of
vehicles using each payment type. In addition, the
toll plazas now allow all settings to vary between
time periods, and numerous calibration parameters to
customize vehicle behaviors near toll plazas.
TRAFVU 6.3 has been modified to indicate ad-
vanced toll plazas, and provides color coding to indi-
cate payment types for each vehicle.
Interactive Lane Alignment in TSIS Next. TSIS
Next users can now drag-and-drop entire roadway
sections to achieve better upstream/downstream lane
alignment. Endpoints are used to control intersection
and node alignments, and the midpoints are still
available to affect curvature. Alternatively, a pop-up
dialog is available to manually enter the X/Y feature
point values.
Adaptive Cruise Control (ACC). CORSIM now
allows the user to specify the percentage of advanced
technology vehicles in the traffic stream, plus car-
following time headways for each ACC driver type.
New Input Screens in TSIS Next. TSIS Next has
been updated for version 6.3; with added support for
ACC, HOT lanes, and advanced toll plazas.
Minor Improvements and Bug Fixes. Increased the
number of lanes allowed at interface nodes; fixed the
control delay calculation on NETSIM entry links;
fixed a problem with freeways that split into two
branches and then rejoin downstream; improved
some of the input error checking logic; updated the
CSV output format to handle 9-lane approaches; cor-
rected a bug in spillback checking that occurred
when the right receiving link and the right-diagonal
receiving link were the same link; fixed the calcula-
tion of travel times and average speeds on interface
links.
Upcoming Developments. Upcoming features of
CORSIM may include new vehicle trajectory analy-
sis tools, automated “self-calibration”, next-
generation emissions models, and improvements to
the software architecture.
2013 Product Updates
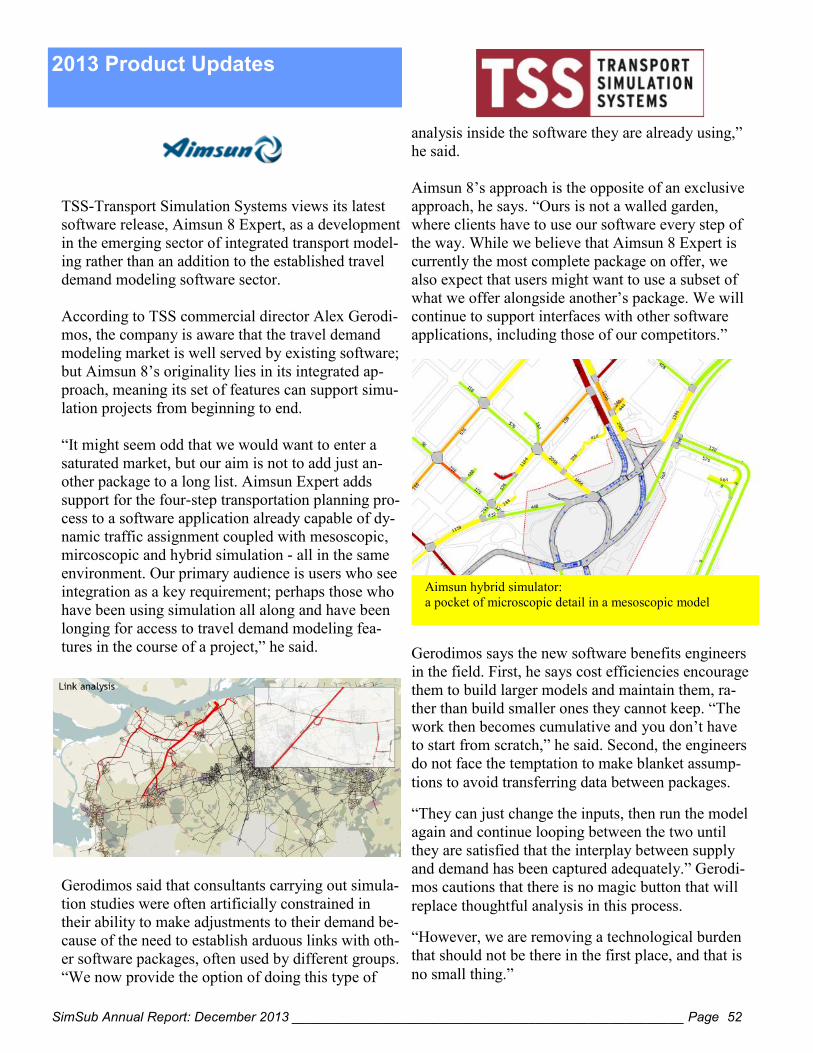
SimSub Annual Report: December 2013 _____________________________________________________ Page 52
TSS-Transport Simulation Systems views its latest
software release, Aimsun 8 Expert, as a development
in the emerging sector of integrated transport model-
ing rather than an addition to the established travel
demand modeling software sector.
According to TSS commercial director Alex Gerodi-
mos, the company is aware that the travel demand
modeling market is well served by existing software;
but Aimsun 8’s originality lies in its integrated ap-
proach, meaning its set of features can support simu-
lation projects from beginning to end.
“It might seem odd that we would want to enter a
saturated market, but our aim is not to add just an-
other package to a long list. Aimsun Expert adds
support for the four-step transportation planning pro-
cess to a software application already capable of dy-
namic traffic assignment coupled with mesoscopic,
mircoscopic and hybrid simulation - all in the same
environment. Our primary audience is users who see
integration as a key requirement; perhaps those who
have been using simulation all along and have been
longing for access to travel demand modeling fea-
tures in the course of a project,” he said.
Gerodimos said that consultants carrying out simula-
tion studies were often artificially constrained in
their ability to make adjustments to their demand be-
cause of the need to establish arduous links with oth-
er software packages, often used by different groups.
“We now provide the option of doing this type of
analysis inside the software they are already using,”
he said.
Aimsun 8’s approach is the opposite of an exclusive
approach, he says. “Ours is not a walled garden,
where clients have to use our software every step of
the way. While we believe that Aimsun 8 Expert is
currently the most complete package on offer, we
also expect that users might want to use a subset of
what we offer alongside another’s package. We will
continue to support interfaces with other software
applications, including those of our competitors.”
Gerodimos says the new software benefits engineers
in the field. First, he says cost efficiencies encourage
them to build larger models and maintain them, ra-
ther than build smaller ones they cannot keep. “The
work then becomes cumulative and you don’t have
to start from scratch,” he said. Second, the engineers
do not face the temptation to make blanket assump-
tions to avoid transferring data between packages.
“They can just change the inputs, then run the model
again and continue looping between the two until
they are satisfied that the interplay between supply
and demand has been captured adequately.” Gerodi-
mos cautions that there is no magic button that will
replace thoughtful analysis in this process.
“However, we are removing a technological burden
that should not be there in the first place, and that is
no small thing.”
2013 Product Updates
Aimsun hybrid simulator:
a pocket of microscopic detail in a mesoscopic model
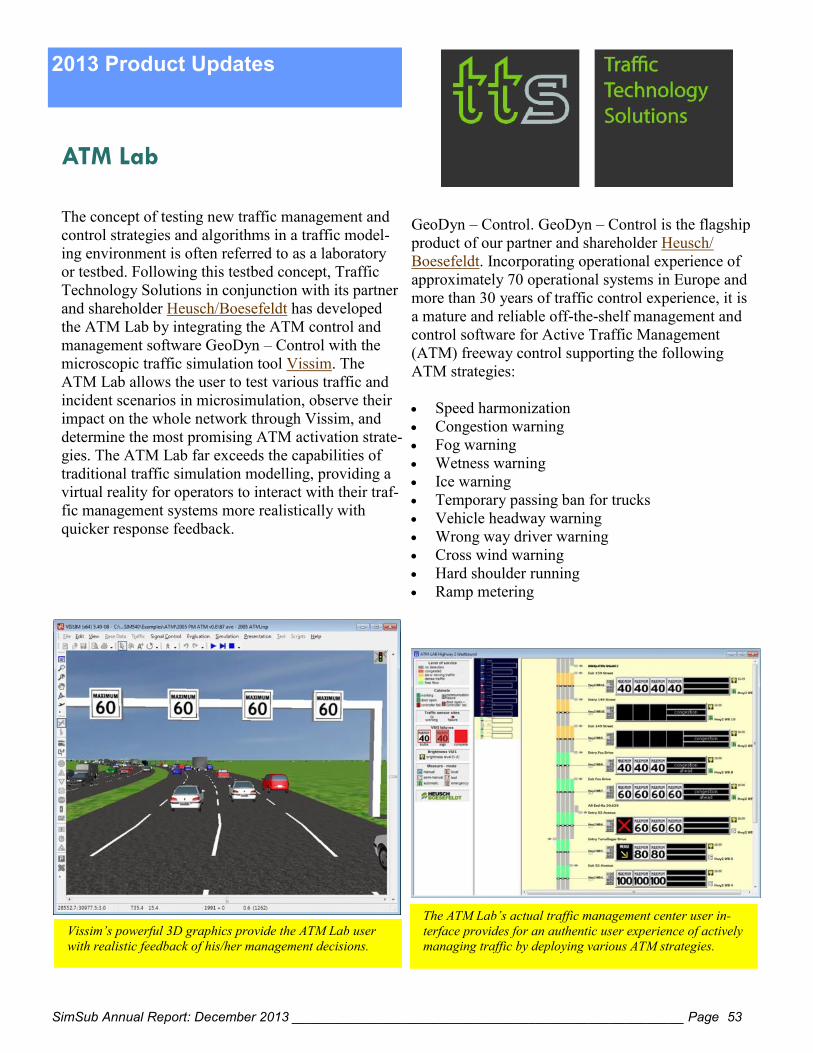
SimSub Annual Report: December 2013 _____________________________________________________ Page 53
ATM Lab
The concept of testing new traffic management and
control strategies and algorithms in a traffic model-
ing environment is often referred to as a laboratory
or testbed. Following this testbed concept, Traffic
Technology Solutions in conjunction with its partner
and shareholder Heusch/Boesefeldt has developed
the ATM Lab by integrating the ATM control and
management software GeoDyn – Control with the
microscopic traffic simulation tool Vissim. The
ATM Lab allows the user to test various traffic and
incident scenarios in microsimulation, observe their
impact on the whole network through Vissim, and
determine the most promising ATM activation strate-
gies. The ATM Lab far exceeds the capabilities of
traditional traffic simulation modelling, providing a
virtual reality for operators to interact with their traf-
fic management systems more realistically with
quicker response feedback.
GeoDyn – Control. GeoDyn – Control is the flagship
product of our partner and shareholder Heusch/
Boesefeldt. Incorporating operational experience of
approximately 70 operational systems in Europe and
more than 30 years of traffic control experience, it is
a mature and reliable off-the-shelf management and
control software for Active Traffic Management
(ATM) freeway control supporting the following
ATM strategies:
Speed harmonization
Congestion warning
Fog warning
Wetness warning
Ice warning
Temporary passing ban for trucks
Vehicle headway warning
Wrong way driver warning
Cross wind warning
Hard shoulder running
Ramp metering
2013 Product Updates
Vissim’s powerful 3D graphics provide the ATM Lab user
with realistic feedback of his/her management decisions.
The ATM Lab’s actual traffic management center user in-
terface provides for an authentic user experience of actively
managing traffic by deploying various ATM strategies.
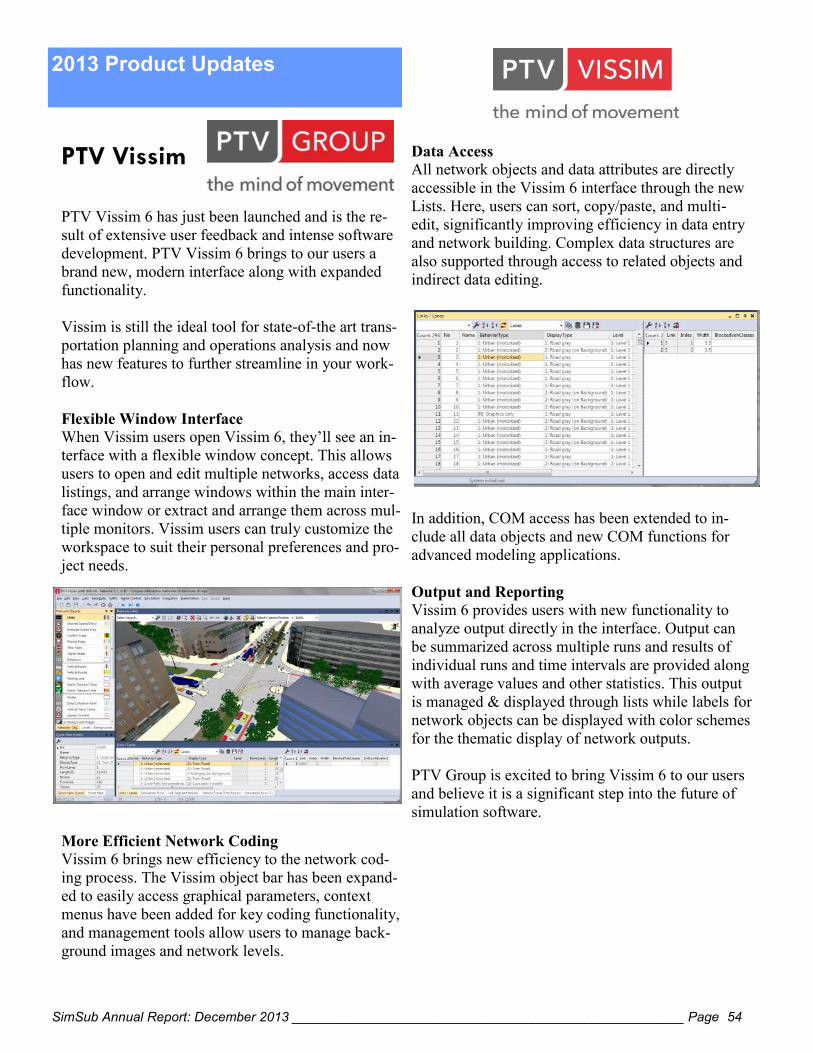
SimSub Annual Report: December 2013 _____________________________________________________ Page 54
PTV Vissim
PTV Vissim 6 has just been launched and is the re-
sult of extensive user feedback and intense software
development. PTV Vissim 6 brings to our users a
brand new, modern interface along with expanded
functionality.
Vissim is still the ideal tool for state-of-the art trans-
portation planning and operations analysis and now
has new features to further streamline in your work-
flow.
Flexible Window Interface
When Vissim users open Vissim 6, they’ll see an in-
terface with a flexible window concept. This allows
users to open and edit multiple networks, access data
listings, and arrange windows within the main inter-
face window or extract and arrange them across mul-
tiple monitors. Vissim users can truly customize the
workspace to suit their personal preferences and pro-
ject needs.
More Efficient Network Coding
Vissim 6 brings new efficiency to the network cod-
ing process. The Vissim object bar has been expand-
ed to easily access graphical parameters, context
menus have been added for key coding functionality,
and management tools allow users to manage back-
ground images and network levels.
Data Access
All network objects and data attributes are directly
accessible in the Vissim 6 interface through the new
Lists. Here, users can sort, copy/paste, and multi-
edit, significantly improving efficiency in data entry
and network building. Complex data structures are
also supported through access to related objects and
indirect data editing.
In addition, COM access has been extended to in-
clude all data objects and new COM functions for
advanced modeling applications.
Output and Reporting
Vissim 6 provides users with new functionality to
analyze output directly in the interface. Output can
be summarized across multiple runs and results of
individual runs and time intervals are provided along
with average values and other statistics. This output
is managed & displayed through lists while labels for
network objects can be displayed with color schemes
for the thematic display of network outputs.
PTV Group is excited to bring Vissim 6 to our users
and believe it is a significant step into the future of
simulation software.
2013 Product Updates