Ribosome association primes the stringent factor Rel for tRNA ...
Upload
independentCategory
view
3download
0
High-Resolution View of the Yeast Meiotic Program Revealed byRibosome Profiling
Gloria A. Brar1, Moran Yassour2,3,4, Nir Friedman4,5, Aviv Regev2,3, Nicholas T. Ingolia1,†,*,and Jonathan S. Weissman1,†
1Howard Hughes Medical Institute, Department of Cellular and Molecular Pharmacology,University of California, San Francisco, and California Institute for Quantitative Biosciences, SanFrancisco, CA 94158, USA2Broad Institute of Massachusetts Institute of Technology and Harvard, Cambridge, MA 02142,USA3Howard Hughes Medical Institute, Department of Biology, Massachusetts Institute ofTechnology, Cambridge, MA 02139, USA4School of Engineering and Computer Science, Hebrew University, Jerusalem, 91904, Israel5Alexander Silberman Institute of Life Sciences, Hebrew University, Jerusalem, 91904, Israel
AbstractMeiosis is a complex developmental process that generates haploid cells from diploid progenitors.We measured messenger RNA (mRNA) abundance and protein production through the yeastmeiotic sporulation program and found strong, stage-specific expression for most genes, achievedthrough control of both mRNA levels and translational efficiency. Monitoring of proteinproduction timing revealed uncharacterized recombination factors and extensive organellarremodeling. Meiotic translation is also shifted toward noncanonical sites, including short openreading frames (ORFs) on unannnotated transcripts and upstream regions of known transcripts(uORFs). Ribosome occupancy at near-cognate uORFs was associated with more efficient ORFtranslation; in contrast, some AUG uORFs, often exposed by regulated 5′ leader extensions, actedcompetitively. This work reveals pervasive translational control in meiosis and helps to illuminatethe molecular basis of the broad restructuring of meiotic cells.
Sexual reproduction is enabled by meiosis, a strongly conserved cell division that generateshaploid progeny from a diploid precursor. Meiosis has been studied for over a centuryincluding extensive analyses in the budding yeast Saccharomyces cerevisiae [reviewed in (1,2)], where it is linked to spore formation. These efforts have provided a wealth ofknowledge about the movement and changes in organization of meiotic chromosomes. Farless is known about the molecular basis of the remodeling events that impact other aspectsof meiotic cellular physiology. Pioneering microarray studies (3) provided a basic
†To whom correspondence should be addressed. [email protected] (N.T.I.); [email protected] (J.S.W.).*Present address: Department of Embryology, Carnegie Institution for Science, Baltimore, MD 21218, USA.
Note added in proof: YDR506C and YLR445W are now named GMC1 and GMC2, respectively.
Supporting Online Materialwww.sciencemag.org/cgi/content/full/science.1215110/DC1Materials and MethodsFigs. S1 to S22Tables S1 to S7References (41–57)Files S1 and S2
NIH Public AccessAuthor ManuscriptScience. Author manuscript; available in PMC 2012 August 08.
Published in final edited form as:Science. 2012 February 3; 335(6068): 552–557. doi:10.1126/science.1215110.
NIH
-PA Author Manuscript
NIH
-PA Author Manuscript
NIH
-PA Author Manuscript
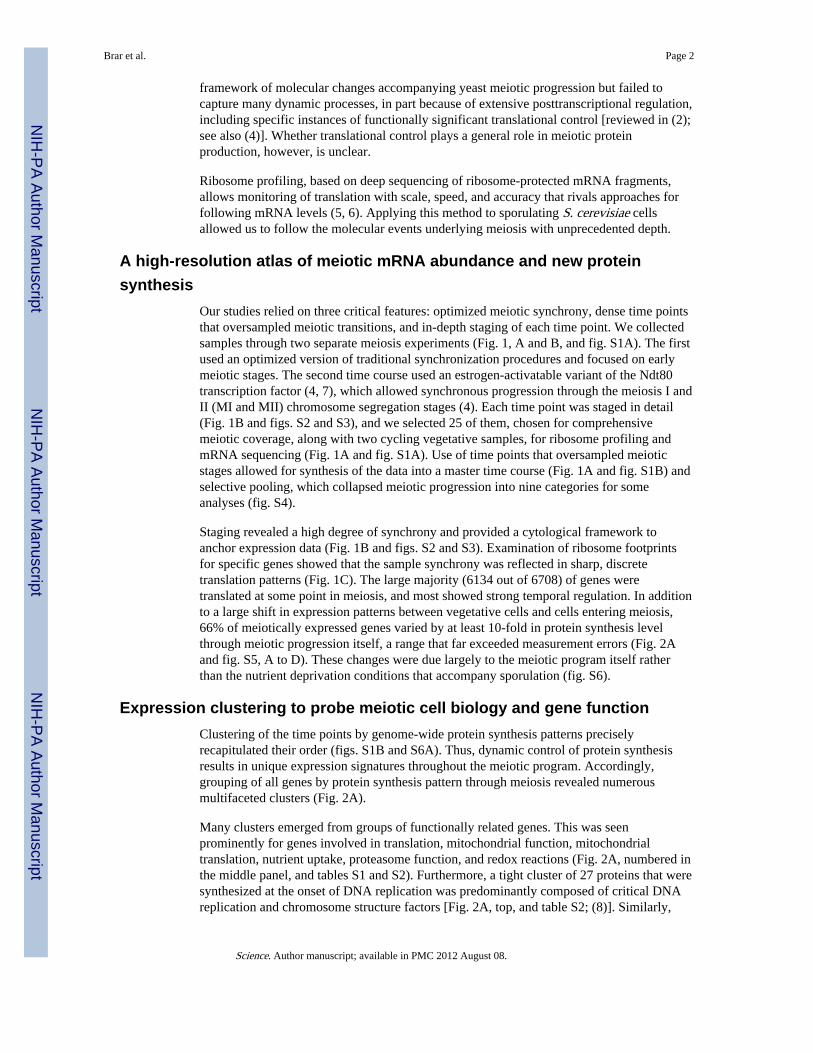
framework of molecular changes accompanying yeast meiotic progression but failed tocapture many dynamic processes, in part because of extensive posttranscriptional regulation,including specific instances of functionally significant translational control [reviewed in (2);see also (4)]. Whether translational control plays a general role in meiotic proteinproduction, however, is unclear.
Ribosome profiling, based on deep sequencing of ribosome-protected mRNA fragments,allows monitoring of translation with scale, speed, and accuracy that rivals approaches forfollowing mRNA levels (5, 6). Applying this method to sporulating S. cerevisiae cellsallowed us to follow the molecular events underlying meiosis with unprecedented depth.
A high-resolution atlas of meiotic mRNA abundance and new proteinsynthesis
Our studies relied on three critical features: optimized meiotic synchrony, dense time pointsthat oversampled meiotic transitions, and in-depth staging of each time point. We collectedsamples through two separate meiosis experiments (Fig. 1, A and B, and fig. S1A). The firstused an optimized version of traditional synchronization procedures and focused on earlymeiotic stages. The second time course used an estrogen-activatable variant of the Ndt80transcription factor (4, 7), which allowed synchronous progression through the meiosis I andII (MI and MII) chromosome segregation stages (4). Each time point was staged in detail(Fig. 1B and figs. S2 and S3), and we selected 25 of them, chosen for comprehensivemeiotic coverage, along with two cycling vegetative samples, for ribosome profiling andmRNA sequencing (Fig. 1A and fig. S1A). Use of time points that oversampled meioticstages allowed for synthesis of the data into a master time course (Fig. 1A and fig. S1B) andselective pooling, which collapsed meiotic progression into nine categories for someanalyses (fig. S4).
Staging revealed a high degree of synchrony and provided a cytological framework toanchor expression data (Fig. 1B and figs. S2 and S3). Examination of ribosome footprintsfor specific genes showed that the sample synchrony was reflected in sharp, discretetranslation patterns (Fig. 1C). The large majority (6134 out of 6708) of genes weretranslated at some point in meiosis, and most showed strong temporal regulation. In additionto a large shift in expression patterns between vegetative cells and cells entering meiosis,66% of meiotically expressed genes varied by at least 10-fold in protein synthesis levelthrough meiotic progression itself, a range that far exceeded measurement errors (Fig. 2Aand fig. S5, A to D). These changes were due largely to the meiotic program itself ratherthan the nutrient deprivation conditions that accompany sporulation (fig. S6).
Expression clustering to probe meiotic cell biology and gene functionClustering of the time points by genome-wide protein synthesis patterns preciselyrecapitulated their order (figs. S1B and S6A). Thus, dynamic control of protein synthesisresults in unique expression signatures throughout the meiotic program. Accordingly,grouping of all genes by protein synthesis pattern through meiosis revealed numerousmultifaceted clusters (Fig. 2A).
Many clusters emerged from groups of functionally related genes. This was seenprominently for genes involved in translation, mitochondrial function, mitochondrialtranslation, nutrient uptake, proteasome function, and redox reactions (Fig. 2A, numbered inthe middle panel, and tables S1 and S2). Furthermore, a tight cluster of 27 proteins that weresynthesized at the onset of DNA replication was predominantly composed of critical DNAreplication and chromosome structure factors [Fig. 2A, top, and table S2; (8)]. Similarly,
Brar et al. Page 2
Science. Author manuscript; available in PMC 2012 August 08.
NIH
-PA Author Manuscript
NIH
-PA Author Manuscript
NIH
-PA Author Manuscript

genes involved in recombination and synaptonemal complex (SC) formation were expressedprecisely when these processes occurred, and they emerged as a discrete group containing46 genes from unbiased clustering of the full data set (Fig. 2A, bottom, and table S2).Notably, this cluster included the large majority of meiotic genes with characterized roles indouble-strand–break formation, crossover-noncrossover choice, and SC structure [reviewedin (9–11)].
Several uncharacterized genes were found in the recombination/SC cluster, which suggestedthat they are involved in these intensely studied processes (1). Indeed, loss of eitherYDR506C or YLR445W delayed nuclear division, consistent with a role for these factors inprophase, when recombination and SC formation occur (Fig. 2, B and C, and fig. S7A).ydr506cΔ and ylr445wΔ cells showed distinct, specific defects in SC morphogenesis (fig.S7, B and C), and in both cases, the meiotic progression delay was largely alleviated whenthe recombination checkpoint was bypassed by deletion of SPO11 (Fig. 2, B and C, and fig.S7A). The strong delay in ylr445wΔ cells, however, was not fully dependent on Spo11 (Fig.2C and fig. S7A), which implied that this gene has additional functions.
Evidence for cellular remodelingWhereas our ability to observe precise temporal regulation allowed specific coclustering ofsome genes, there were prominent cases in which genes with a common function orlocalization showed highly disparate expression patterns. For example, we found tightlycontrolled but distinct patterns of expression among endoplasmic reticulum (ER) proteins,which suggested major ER remodeling events (fig. S8 and table S3). A strong down-regulation (relative to vegetative cells) of a set of ER genes, including ergosterolbiosynthesis components, occurred before meiotic induction. After meiotic entry, a broadgroup of ER genes was induced, including glycosylation factors (table S3). Finally, after MI,a subset of folding factors, sphingolipid biosynthetic genes, and trafficking componentswere up-regulated. This last remodeling phase is accompanied by induction of the unfoldedprotein response (UPR) (12, 13) [Fig. 1C, see also Fig. 3F below].
Autophagy components also showed discrete patterns of expression, which suggesteddynamic control of distinct autophagic processes during sporulation [fig. S9A and table S4;(14)]. ATG8, a gene central to many branches of autophagy (15), was highly expressed fromearly in the meiotic program, and its deletion caused an early and profound meiotic defect(fig. S9, B and C). By contrast, ATG32, a mitophagy-specific factor (16, 17), showed lowexpression until the meiotic divisions (fig. S9B). Delayed onset of mitophagy may ensurefull mitochondrial function, which is needed to power early meiotic stages (18).Consistently, atg32Δ cells progressed normally past prophase, but showed delayed meioticcompletion (fig. S9D).
Translational control in meiosisControl of protein production reflects both regulation of mRNA levels and the efficiencywith which these messages are translated into proteins. Measuring translation rates andmRNA levels allowed us to evaluate their relative contributions. Much transcriptionalregulation was observed, but translational control also regulated the magnitude and timing ofprotein production in meiotic cells. An example of this interplay is provided by the adjacentSPS1 and SPS2 genes (Fig. 3A). mRNA for both genes accumulated late in prophase andpersisted through the meiotic divisions, consistent with their transcriptional control byNDT80 (19). By contrast, SPS1, but not SPS2, was strongly translationally regulated,delaying Sps1 protein synthesis until MII (Fig. 3, A and B).
Brar et al. Page 3
Science. Author manuscript; available in PMC 2012 August 08.
NIH
-PA Author Manuscript
NIH
-PA Author Manuscript
NIH
-PA Author Manuscript

To quantitatively evaluate the role of translational control, we calculated relative translationefficiencies [TEs; ribosome footprint RPKM/mRNA RPKM; where RPKM is reads perkilobase of coding sequence per million mapped reads, as in (6)] for messages across ourtime course. Replicates indicated high TE reproducibility (error <20%), which allowedsensitive measurement of dynamic translational control [fig. S5, E and F; (6)]. Thisapproach confirmed, both in timing and degree, the strong MI-specific translationalrepression that regulates the B-type cyclin, CLB3 [(4), Fig. 3C]. At least 10 genes showed apattern of translational regulation highly similar to that of CLB3—including SPS1 (Fig. 3A),GIP1, and SPO20—which, like CLB3, have known roles only late in meiosis (20–22).
Genome-wide analysis revealed that meiotic translational regulation is both pervasive andnuanced (Fig. 3D). As seen for vegetative cells (6), meiotic cells showed strong basaldifferences in translation rates among genes (Fig. 3D). Globally, we observed a net decreasein translation, relative to vegetative cells in their exponential growth phase, that was mostpronounced at the very earliest and latest time points (fig. S10). Further, gene-specificregulation was widely used to dynamically tune gene expression. For example, 24% ofgenes during the “core meiotic” period showed greater than threefold TE changes, a periodduring which net translation capacity appears stable (fig. S10). More than 200 genes in thefull time course and 66 in the core meiotic period exhibited a dynamic range in TE that wascomparable to the ~10-fold changes seen for GCN4, an archetype of strong translationalregulation (23).
Changes in TE frequently correlated with timing of gene function (Fig. 3E). The DNAreplication factor ORC1 (24), for example, showed strong translational repression at latermeiotic stages when cells do not replicate DNA. Zip1, an SC component (25), specificallyshowed poor translation in vegetative cells and spores, consistent with the lack of SC ineither state. Chitin deposition factor Rcr1 (26) is translated efficiently only at late timepoints, concomitant with new cell wall generation. Finally, HAC1, the central UPR mediator(12, 13), showed transient translational activation shortly upon transfer of cells to nutrient-limited conditions, followed by a later, stronger translational activation during the meioticdivisions, as cells are synthesizing new membrane and spore walls (Fig. 3F). HAC1 isregulated translationally through cytoplasmic splicing of its message (27). Consistently,HAC1 mRNA splicing mirrored TE measurements, both in timing and degree (Fig. 3F). TheUPR has been heavily studied in yeast using harsh inhibitors of ER folding (e.g.,dithiothreitol). This study reveals a novel physiological setting to follow UPR induction.
Noncanonical translationBeyond translational control of canonical open reading frames (ORFs), we also observed ashift toward noncanonical translation during the meiotic program. Whereas vegetative cellsexhibited ~5% of ribosome footprints mapping outside annotated ORFs, in meiotic cells, upto ~30% of footprints mapped outside of these regions (Fig. 4A). These footprints largelymapped to discrete novel translation sites with well-defined AUG starts and stop codonstops. We systematically annotated translation units by exploiting the strong peak inribosome density seen at translation initiation sites to identify utilized start codons [fig. S11;(6)]. This strategy was sensitive and allowed de novo identification of start codons for mostknown ORFs (fig. S12A) and specific, strongly enriching for ORFs initiating at AUG (fig.S13).
Novel ORFs were found on noncanonical mRNAs, including transcripts antisense to knownORFs, alternate transcripts at canonical loci, and transcripts in regions thought to beintergenic (Fig. 4, B and C, and figs. S12A, S14, and S15A). We also identified instances ofgenome misannotation (e.g., fig. S15B). Many newly annotated ORFs were on stable
Brar et al. Page 4
Science. Author manuscript; available in PMC 2012 August 08.
NIH
-PA Author Manuscript
NIH
-PA Author Manuscript
NIH
-PA Author Manuscript

transcripts, similar to those predicted as noncoding in a meiotic tiling array study [(28), fig.S14]. Our empirical strategy found translation of short ORFs (sORFs) (fig. S12A) that werewell-expressed (fig. S12, B and C) and highly regulated (fig. S16) but below the cutoff of 80to 100 amino acids used historically to computationally identify yeast ORFs.
Recent studies have identified cellular functions for short peptides (29, 30), although thefunction of these meiotic sORFs remains an open question. Minimally, our data suggest theexport of many novel transcripts into the cytoplasm, allowing translation by ribosomes.Conversely, this data set facilitates identification of transcripts that act at the RNA level. Forexample, most antisense transcripts are poorly translated, including RME2 and RME3(antisense to IME4 and ZIP2, respectively), which are known to act through direct cis-transcriptional interference of their sense counterpart [figs. S12C and S17, A, B, and D; (31,32)]. By contrast, a transcript antisense to YFL012W that shows no transcriptionalinterference activity contained prominent regions of translation [(31), fig. S17, C and D].
uORFs in meiosisThe second major source of novel meiotic ribosome density was leader sequences[commonly called 5′ untranslated regions (5′UTRs)], situated upstream of the canonicalORFs (Fig. 4D and fig. S18A). We saw no general meiotic increase in footprints in 3′UTRs,which argues against a nonspecific increase in translational background noise. Examinationof individual gene leaders revealed short footprint spans that started at either AUGs or near-cognate codons and generally spanned the region until the next stop codon (Fig. 4D and fig.S18A). Nearly 300 of such upstream ORFs (uORFs) have been identified in yeast understarvation conditions [(6), reviewed in (33)], but we found them to be far more common inmeiosis.
We annotated 10,226 meiotic uORFs, present in the leaders of 3026 genes (fig. S11). TheseuORFs contained a density of ribosome footprints far greater than the ribosome footprintdensity in non-uORF leader regions, which suggested that our annotation approach wasthorough and specific (fig. S19, A and B). Ribosome occupancy at uORFs was higher inmeiotic than vegetative cells (Fig. 4D and figs. S18A and S19, B and C), and most of thiseffect derives from the meiotic program itself rather than the starvation conditions thataccompany sporulation (fig. S19D). As expected, AUG, when present, was efficiently usedfor uORF translation initiation. The near-cognate codons that showed most efficientinitiation, UUG and CUG (fig. S18, B and C), have also been shown to be most efficient inmammalian cells and in vitro (5, 34).
uORFs have been implicated in translational regulation, although no universal functionalrole has emerged. uORFs that have been well-characterized through reporter studies showdiverse effects: enhancing, decreasing, or having little impact on downstream ORFtranslation [reviewed in (33)]. Three features of our study ideally positioned us to evaluatethe role of uORFs in translation. First, we annotated many uORFs, which allowed us todistill general principles. Second, we collected data for each time point on mRNAabundance and rates of translation, which provided instantaneous quantification of TE foreach downstream ORF, whereas traditional approaches require TE inference by steady-stateprotein abundance. Finally, our analysis of numerous sequential points through a dynamicprocess permitted us to detect temporal trends. Comparison of ribosome occupancy ofleaders and TE of their corresponding downstream ORFs over 10 time points (see fig. S4)typically revealed a strong positive correlation (Fig. 4, E and F). However, a subset ofleaders containing at least one AUG uORF showed a negative correlation, which suggesteda competitive relation between uORF and ORF translation in these cases (Fig. 4F and fig.S20; see Fig. 5E below).
Brar et al. Page 5
Science. Author manuscript; available in PMC 2012 August 08.
NIH
-PA Author Manuscript
NIH
-PA Author Manuscript
NIH
-PA Author Manuscript
Leader extensions and competitive uORFsFor some messages, we found that enriched footprint occupancy of leaders was caused by aprogrammed change in the transcript length during meiosis. Systematic analysis identified192 genes with regulated leader length (Fig. 5, A to C; fig. S21; and table S5). For example,ORC1 showed an extended leader after prophase. This extension revealed a number of well-translated uORFs (Fig. 5B) and was accompanied by a concurrent decrease in translation ofthe ORC1 coding region (Figs. 3E and 5, B and D). Of genes with regulated leaders, aprominent subset showed a similar inverse relation, often corresponding well with knowngene function. Orc1 and Ndj1, for example, have no characterized function late in meiosis(24, 35), and RED1, a key meiotic prophase factor (36), is translationally repressedexclusively in vegetative cells (Fig. 5D).
For genes with leader extensions containing one or more AUG uORF, at least half showed astrong negative correlation between the ribosome occupancy of the leader and TE of theORF (Fig. 5E). By contrast, for leaders containing uORFs starting only with near-cognate,non-AUG codons, this correlation was strongly positive (Fig. 5E). Regulated leaders havebeen observed in budding yeast and mammalian cells, with longer forms often associatedwith poor ORF translation (37, 38). Here we have observed a far broader and more nuancedrole for leader extensions in providing temporal translational control to many meiotic genes.
More generally, our analyses point to disparate roles for AUG and near-cognate uORFs(Figs. 4F and 5E). A fraction of AUG uORFs appear to competitively down-modulate ORFexpression. By contrast, near-cognate uORFs are more common and show a generally strongpositive correlation with expression of their downstream ORF, which may allow cells todivert limited resources to an important subset of messages. Whether uORFs directly primetranslation of their downstream ORF is unclear. Nonetheless, genes with the strongestpositive correlation between leader ribosome occupancy and ORF TE are highly enrichedfor known function in sporulation (table S6), which suggests physiological relevance of thisregulation. The broad monitoring of gene expression by genomics has underscored theimportance of quantitative modulation, beyond a model of binary on-off control.MicroRNAs provide a prominent example of developmental control through subtleregulation of broad sets of genes. uORFs may similarly allow condition-specific tuning ofprotein synthesis for a large portion of the genome.
The preponderance of uORFs suggests a shift of the translation initiation mechanism inmeiotic cells from the predominant mechanism in which the initiation factors recognize themRNA cap and the initiation complex scans the message for the first AUG to commencetranslation [reviewed in (23)]. A link between alternative translation initiation mechanismsand the use of uORFs is suggested by analysis of messages that were shown to support cap-independent translation in nitrogen-starved yeast cells (YMR181C, GPR1, BOI1, FLO8,NCE102, MSN1, and GIC1) (39). We found that all had leaders with well-translated near-cognate uORFs and a strong positive correlation between leader ribosome occupancy andORF translation (Fig. 4F; fig. S22, excluding BOI1 as it has a complicating leader extension;table S5).
PerspectiveWe find that even in the extensively studied yeast, S. cerevisiae, genome coding has acomplexity not captured by existing annotations. Ribosome profiling also captured a layer ofregulation that is invisible to mRNA measurements and which revealed extensive anddynamic translational regulation of canonical ORFs. Transcription studies have enabled theidentification of cis- and trans- transcriptional elements that control diverse cellularprocesses, whereas a similarly broad understanding of the importance and mechanisms of
Brar et al. Page 6
Science. Author manuscript; available in PMC 2012 August 08.
NIH
-PA Author Manuscript
NIH
-PA Author Manuscript
NIH
-PA Author Manuscript

translational control remains elusive. This data set provides a valuable foundation foridentifying such cis- and trans-translational regulators.
This study also gives a holistic view of the metabolic and cellular reorganization, seenthrough the yeast meiotic program that extends beyond a traditional chromosome-centricpicture. Previous studies suggested that meiotic transcriptional control was limited to a fewdiscrete waves (3, 40). Our data reveal multifaceted control of protein production, enabledby the tightly timed induction of many translational and transcriptional programs, includingthose driving translation factors, the proteasome, and the UPR. Indeed, the view of suchresponses as environmentally controlled stress pathways may reflect the historical context oftheir discovery rather than their sole physiological role.
Supplementary MaterialRefer to Web version on PubMed Central for supplementary material.
AcknowledgmentsWe thank E. Ünal, A. Amon, and members of the Weissman laboratory for critical reading of this manuscript; C.Chu for sequencing assistance; J. Dunn for protocol development assistance; F. Van Werven for the MATa/a strain;and F. Klein for the the Zip1 antibody. G.A.B. is supported by American Cancer Society Postdoctoral Fellowship117945-PF-09-136-01-RMC. M.Y. is supported by a Clore Fellowship. This work was supported by a grant fromthe U.S.-Israel Bi-national Science Foundation (N.F. and A.R.), an NIH P01 award (AG10770; N.T.I.), a Ruth L.Kirschstein National Research Service Award (GM080853; N.T.I.), and Howard Hughes Medical Institute funding(J.S.W. and A.R.). A patent on the ribosome profiling approach has been assigned to the University of California.Supporting files are in the SOM and at www.ncbi.nlm.nih.gov/geo/ with series accession number GSE34082.
References and Notes1. Zickler D, Kleckner N. Meiotic chromosomes: Integrating structure and function. Annu Rev Genet.
1999; 33:603.10.1146/annurev.genet.33.1.603 [PubMed: 10690419]
2. Marston AL, Amon A. Meiosis: Cell-cycle controls shuffle and deal. Nat Rev Mol Cell Biol. 2004;5:983.10.1038/nrm1526 [PubMed: 15573136]
3. Chu S, et al. The transcriptional program of sporulation in budding yeast. Science. 1998;282:699.10.1126/science.282.5389.699 [PubMed: 9784122]
4. Carlile TM, Amon A. Meiosis I is established through division-specific translational control of acyclin. Cell. 2008; 133:280.10.1016/j.cell.2008.02.032 [PubMed: 18423199]
5. Ingolia NT, Lareau LF, Weissman JS. Ribosome profiling of mouse embryonic stem cells revealsthe complexity and dynamics of mammalian proteomes. Cell. 2011; 147:789.10.1016/j.cell.2011.10.002 [PubMed: 22056041]
6. Ingolia NT, Ghaemmaghami S, Newman JR, Weissman JS. Genome-wide analysis in vivo oftranslation with nucleotide resolution using ribosome profiling. Science. 2009; 324:218.10.1126/science.1168978 [PubMed: 19213877]
7. Benjamin KR, Zhang C, Shokat KM, Herskowitz I. Control of landmark events in meiosis by theCDK Cdc28 and the meiosis-specific kinase Ime2. Genes Dev. 2003; 17:1524.10.1101/gad.1101503[PubMed: 12783856]
8. Spellman PT, et al. Comprehensive identification of cell cycle-regulated genes of the yeastSaccharomyces cerevisiae by microarray hybridization. Mol Biol Cell. 1998; 9:3273. [PubMed:9843569]
9. Lynn A, Soucek R, Börner GV. ZMM proteins during meiosis: Crossover artists at work.Chromosome Res. 2007; 15:591.10.1007/s10577-007-1150-1 [PubMed: 17674148]
10. Keeney S, Neale MJ. Initiation of meiotic recombination by formation of DNA double-strandbreaks: Mechanism and regulation. Biochem Soc Trans. 2006; 34:523.10.1042/BST0340523[PubMed: 16856850]
Brar et al. Page 7
Science. Author manuscript; available in PMC 2012 August 08.
NIH
-PA Author Manuscript
NIH
-PA Author Manuscript
NIH
-PA Author Manuscript

11. Page SL, Hawley RS. The genetics and molecular biology of the synaptonemal complex. AnnuRev Cell Dev Biol. 2004; 20:525.10.1146/annurev.cellbio.19.111301.155141 [PubMed:15473851]
12. Cox JS, Walter P. A novel mechanism for regulating activity of a transcription factor that controlsthe unfolded protein response. Cell. 1996; 87:391.10.1016/S0092-8674(00)81360-4 [PubMed:8898193]
13. Mori K, Kawahara T, Yoshida H, Yanagi H, Yura T. Signalling from endoplasmic reticulum tonucleus: Transcription factor with a basic-leucine zipper motif is required for the unfolded protein-response pathway. Genes Cells. 1996; 1:803.10.1046/j.1365-2443.1996.d01-274.x [PubMed:9077435]
14. Piekarska I, Kucharczyk R, Mickowska B, Rytka J, Rempola B. Mutants of the Saccharomycescerevisiae VPS genes CCZ1 and YPT7 are blocked in different stages of sporulation. Eur J CellBiol. 2010; 89:780.10.1016/j.ejcb.2010.06.009 [PubMed: 20709422]
15. Xie Z, Klionsky DJ. Autophagosome formation: Core machinery and adaptations. Nat Cell Biol.2007; 9:1102.10.1038/ncb1007-1102 [PubMed: 17909521]
16. Kanki T, Wang K, Cao Y, Baba M, Klionsky DJ. Atg32 is a mitochondrial protein that confersselectivity during mitophagy. Dev Cell. 2009; 17:98.10.1016/j.devcel.2009.06.014 [PubMed:19619495]
17. Okamoto K, Kondo-Okamoto N, Ohsumi Y. Mitochondria-anchored receptor Atg32 mediatesdegradation of mitochondria via selective autophagy. Dev Cell. 2009; 17:87.10.1016/j.devcel.2009.06.013 [PubMed: 19619494]
18. Jambhekar A, Amon A. Control of meiosis by respiration. Curr Biol. 2008; 18:969.10.1016/j.cub.2008.05.047 [PubMed: 18595705]
19. Chu S, Herskowitz I. Gametogenesis in yeast is regulated by a transcriptional cascade dependenton Ndt80. Mol Cell. 1998; 1:685.10.1016/S1097-2765(00)80068-4 [PubMed: 9660952]
20. Neiman AM. Prospore membrane formation defines a developmentally regulated branch of thesecretory pathway in yeast. J Cell Biol. 1998; 140:29.10.1083/jcb.140.1.29 [PubMed: 9425151]
21. Tachikawa H, Bloecher A, Tatchell K, Neiman AM. A Gip1p-Glc7p phosphatase complexregulates septin organization and spore wall formation. J Cell Biol. 2001; 155:797.10.1083/jcb.200107008 [PubMed: 11724821]
22. Friesen H, Lunz R, Doyle S, Segall J. Mutation of the SPS1-encoded protein kinase ofSaccharomyces cerevisiae leads to defects in transcription and morphology during sporeformation. Genes Dev. 1994; 8:2162.10.1101/gad.8.18.2162 [PubMed: 7958886]
23. Sonenberg N, Hinnebusch AG. Regulation of translation initiation in eukaryotes: Mechanisms andbiological targets. Cell. 2009; 136:731.10.1016/j.cell.2009.01.042 [PubMed: 19239892]
24. Bell SP, Kobayashi R, Stillman B. Yeast origin recognition complex functions in transcriptionsilencing and DNA replication. Science. 1993; 262:1844.10.1126/science.8266072 [PubMed:8266072]
25. Sym M, Engebrecht JA, Roeder GS. ZIP1 is a synaptonemal complex protein required for meioticchromosome synapsis. Cell. 1993; 72:365.10.1016/0092-8674(93)90114-6 [PubMed: 7916652]
26. Imai K, Noda Y, Adachi H, Yoda K. A novel endoplasmic reticulum membrane protein Rcr1regulates chitin deposition in the cell wall of Saccharomyces cerevisiae. J Biol Chem. 2005;280:8275.10.1074/jbc.M409428200 [PubMed: 15590673]
27. Sidrauski C, Cox JS, Walter P. tRNA ligase is required for regulated mRNA splicing in theunfolded protein response. Cell. 1996; 87:405.10.1016/S0092-8674(00)81361-6 [PubMed:8898194]
28. Lardenois A, et al. Execution of the meiotic noncoding RNA expression program and the onset ofgametogenesis in yeast require the conserved exosome subunit Rrp6. Proc Natl Acad Sci U S A.2011; 108:1058.10.1073/pnas.1016459108 [PubMed: 21149693]
29. Kondo T, et al. Small peptides switch the transcriptional activity of Shavenbaby during Drosophilaembryogenesis. Science. 2010; 329:336.10.1126/science.1188158 [PubMed: 20647469]
30. Xu Y, Ganem D. Making sense of antisense: Seemingly noncoding RNAs antisense to the masterregulator of Kaposi’s sarcoma-associated herpesvirus lytic replication do not regulate that
Brar et al. Page 8
Science. Author manuscript; available in PMC 2012 August 08.
NIH
-PA Author Manuscript
NIH
-PA Author Manuscript
NIH
-PA Author Manuscript

transcript but serve as mRNAs encoding small peptides. J Virol. 2010; 84:5465.10.1128/JVI.02705-09 [PubMed: 20357088]
31. Gelfand B, et al. Regulated antisense transcription controls expression of cell-type-specific genesin yeast. Mol Cell Biol. 2011; 31:1701.10.1128/MCB.01071-10 [PubMed: 21300780]
32. Hongay CF, Grisafi PL, Galitski T, Fink GR. Antisense transcription controls cell fate inSaccharomyces cerevisiae. Cell. 2006; 127:735.10.1016/j.cell.2006.09.038 [PubMed: 17110333]
33. Hood HM, Neafsey DE, Galagan J, Sachs MS. Evolutionary roles of upstream open reading framesin mediating gene regulation in fungi. Annu Rev Microbiol. 2009; 63:385.10.1146/annurev.micro.62.081307.162835 [PubMed: 19514854]
34. Kolitz SE, Takacs JE, Lorsch JR. Kinetic and thermodynamic analysis of the role of start codon/anticodon base pairing during eukaryotic translation initiation. RNA. 2009; 15:138.10.1261/rna.1318509 [PubMed: 19029312]
35. Wu HY, Burgess SM. Two distinct surveillance mechanisms monitor meiotic chromosomemetabolism in budding yeast. Curr Biol. 2006; 16:2473.10.1016/j.cub.2006.10.069 [PubMed:17174924]
36. Rockmill B, Roeder GS. RED1: A yeast gene required for the segregation of chromosomes duringthe reductional division of meiosis. Proc Natl Acad Sci U S A. 1988; 85:6057.10.1073/pnas.85.16.6057 [PubMed: 3413075]
37. Badhai J, Schuster J, Gidlöf O, Dahl N. 5′UTR variants of ribosomal protein S19 transcriptdetermine translational efficiency: Implications for Diamond-Blackfan anemia and tissuevariability. PLoS ONE. 2011; 6:e17672.10.1371/journal.pone.0017672 [PubMed: 21412415]
38. Law GL, Bickel KS, MacKay VL, Morris DR. The undertranslated transcriptome revealswidespread translational silencing by alternative 5′ transcript leaders. Genome Biol. 2005;6:R111.10.1186/gb-2005-6-13-r111 [PubMed: 16420678]
39. Gilbert WV, Zhou K, Butler TK, Doudna JA. Cap-independent translation is required forstarvation-induced differentiation in yeast. Science. 2007; 317:1224.10.1126/science.1144467[PubMed: 17761883]
40. Mitchell AP. Control of meiotic gene expression in Saccharomyces cerevisiae. Microbiol Rev.1994; 58:56. [PubMed: 8177171]
41. Longtine MS, et al. Additional modules for versatile and economical PCR-based gene deletion andmodification in Saccharomyces cerevisiae. Yeast. 1998; 14:953.10.1002/(SICI)1097-0061(199807)14:10<953::AID-YEA293>3.0.CO;2-U [PubMed: 9717241]
42. Brar GA, Hochwagen A, Ee LS, Amon A. The multiple roles of cohesin in meiotic chromosomemorphogenesis and pairing. Mol Biol Cell. 2009; 20:1030.10.1091/mbc.E08-06-0637 [PubMed:19073884]
43. Visintin R, et al. The phosphatase Cdc14 triggers mitotic exit by reversal of Cdk-dependentphosphorylation. Mol Cell. 1998; 2:709.10.1016/S1097-2765(00)80286-5 [PubMed: 9885559]
44. Loidl J, Klein F, Engebrecht J. Genetic and morphological approaches for the analysis of meioticchromosomes in yeast. Methods Cell Biol. 1998; 53:257.10.1016/S0091-679X(08)60882-1[PubMed: 9348512]
45. Nairz K, Klein F. mre11S—a yeast mutation that blocks double-strand-break processing andpermits nonhomologous synapsis in meiosis. Genes Dev. 1997; 11:2272.10.1101/gad.11.17.2272[PubMed: 9303542]
46. Yassour M, et al. Strand-specific RNA sequencing reveals extensive regulated long antisensetranscripts that are conserved across yeast species. Genome Biol. 2010; 11:R87.10.1186/gb-2010-11-8-r87 [PubMed: 20796282]
47. de Hoon MJ, Imoto S, Nolan J, Miyano S. Open source clustering software. Bioinformatics. 2004;20:1453.10.1093/bioinformatics/bth078 [PubMed: 14871861]
48. Eisen MB, Spellman PT, Brown PO, Botstein D. Cluster analysis and display of genome-wideexpression patterns. Proc Natl Acad Sci U S A. 1998; 95:14863.10.1073/pnas.95.25.14863[PubMed: 9843981]
49. Saldanha AJ. Java Treeview—extensible visualization of microarray data. Bioinformatics. 2004;20:3246.10.1093/bioinformatics/bth349 [PubMed: 15180930]
Brar et al. Page 9
Science. Author manuscript; available in PMC 2012 August 08.
NIH
-PA Author Manuscript
NIH
-PA Author Manuscript
NIH
-PA Author Manuscript
50. Homann OR, Johnson AD. MochiView: Versatile software for genome browsing and DNA motifanalysis. BMC Biol. 2010; 8:49.10.1186/1741-7007-8-49 [PubMed: 20409324]
51. Yassour M, et al. Ab initio construction of a eukaryotic transcriptome by massively parallel mRNAsequencing. Proc Natl Acad Sci U S A. 2009; 106:3264.10.1073/pnas.0812841106 [PubMed:19208812]
52. Moll T, Tebb G, Surana U, Robitsch H, Nasmyth K. The role of phosphorylation and the CDC28protein kinase in cell cycle-regulated nuclear import of the S. cerevisiae transcription factor SWI5.Cell. 1991; 66:743.10.1016/0092-8674(91)90118-I [PubMed: 1652372]
53. Cohen-Fix O, Peters JM, Kirschner MW, Koshland D. Anaphase initiation in Saccharomycescerevisiae is controlled by the APC-dependent degradation of the anaphase inhibitor Pds1p. GenesDev. 1996; 10:3081.10.1101/gad.10.24.3081 [PubMed: 8985178]
54. Hochwagen A, Amon A. Checking your breaks: Surveillance mechanisms of meioticrecombination. Curr Biol. 2006; 16:R217.10.1016/j.cub.2006.03.009 [PubMed: 16546077]
55. Keeney S, Giroux CN, Kleckner N. Meiosis-specific DNA double-strand breaks are catalyzed bySpo11, a member of a widely conserved protein family. Cell. 1997; 88:375.10.1016/S0092-8674(00)81876-0 [PubMed: 9039264]
56. Bergerat A, et al. An atypical topoisomerase II from Archaea with implications for meioticrecombination. Nature. 1997; 386:414.10.1038/386414a0 [PubMed: 9121560]
57. He F, et al. Genome-wide analysis of mRNAs regulated by the nonsense-mediated and 5′ to 3′mRNA decay pathways in yeast. Mol Cell. 2003; 12:1439.10.1016/S1097-2765(03)00446-5[PubMed: 14690598]
Brar et al. Page 10
Science. Author manuscript; available in PMC 2012 August 08.
NIH
-PA Author Manuscript
NIH
-PA Author Manuscript
NIH
-PA Author Manuscript

Fig. 1.Ribosome profiling through meiosis. (A) Time points (white lines) were taken through twooverlapping time courses. Cartoon representations of meiotic stages are below. (B) A subsetof staging controls. Positions of staging plots correspond to time points in (A). (C)Ribosome footprints across specific genes are shown for categories in fig. S4. Scales on they axis are independent by gene.
Brar et al. Page 11
Science. Author manuscript; available in PMC 2012 August 08.
NIH
-PA Author Manuscript
NIH
-PA Author Manuscript
NIH
-PA Author Manuscript

Fig. 2.A global view of protein synthesis through sporulation. (A) Ribosome footprints (RPKMs)were summed over each yeast gene (columns) for all samples except steady-state spores(rows). The summed expression of each gene over time points was normalized for the timecourse, and genes were subjected to clustering. Several clusters are noted by lines below thechart: 1, Mitochondrial ribosome; 2, nutrient uptake and/or amino acid biosynthesis; 3,mitochondrial function; 4, proteasome; 5, redox and energy generation; and 6, ribosome andtranslation machinery. Meiotic progression is indicated pictorially to the right. (Top) Acluster containing genes responsible for DNA replication, with the gene identities to theright. To the left is the average footprint density across the cluster, with time pointscorresponding to bulk DNA replication represented by arrows. (Bottom) A cluster of genesassociated with recombination and SC formation. The bar to the left shows the timing ofthese events as determined by staging controls. Single asterisks identify genes analyzed in(B) and (C) and fig. S7. Double asterisks indicate that both MND1 and the overlappingORF, YGL182C, were identified in this cluster. (B) Wild-type, ydr506cΔ, and ydr506cspo11Δ cells were induced to sporulate. At indicated times, samples were scored for nucleardivision. (C) Wild-type, ylr445wΔ, and ylr445wΔ spo11Δ cells were induced to sporulateand were treated as in (B).
Brar et al. Page 12
Science. Author manuscript; available in PMC 2012 August 08.
NIH
-PA Author Manuscript
NIH
-PA Author Manuscript
NIH
-PA Author Manuscript

Fig. 3.Widespread dynamic translational control in meiosis. (A) Log2 mRNA and footprints(RPKM) for a region containing SPS1 and SPS2 over pooled time points (fig. S4). (B)SPS1-3HA and SPS2-FLAG cells carrying an estrogen-inducible NDT80 allele wereinduced to sporulate. At 6 hours, β-estradiol was added. Samples from indicated times weresubjected to Western blotting (WB) and Northern blotting (NB). (C) Log2 TE values forCLB3 and YPT1 for pooled time points (fig. S4). MI and MII are indicated by coloredshading as boxes. (D) Cluster analysis of log2 TE through meiosis for pooled categories (fig.S4) for all genes. (E) Log2 TEs are plotted as in (C) for AMA1, RCR1, ORC1, and ZIP1.(F) Log2 TEs are plotted as in (C) for HAC1. Below, total RNA from the original timecourse (see fig. S1) was subjected to Northern blotting for HAC1.
Brar et al. Page 13
Science. Author manuscript; available in PMC 2012 August 08.
NIH
-PA Author Manuscript
NIH
-PA Author Manuscript
NIH
-PA Author Manuscript

Fig. 4.Noncanonical translation is pervasive in meiotic cells. (A) Footprints from pooled timepoints (see fig. S4) were mapped. The percentage of these footprints outside of known ORFannotations is plotted. (B) mRNA and ribosome occupancy profiles around YOL092W, withsense above the line for each time point and antisense below. Single asterisk denotes thesORF start site. The “AUG unit” (sORF) was annotated by the strategy shown in fig. S11.(C) The region around SAS4 is displayed as in (B), with truncated ORF start denoted by asingle asterisk. (D) Ribosome occupancy profile for vegetative cells in exponential growthphase and meiotic cells over the leader of ACB1. (E) For pooled time points (see fig. S4),TEs are plotted for ORFs and for leaders (see SOM for a discussion of leader TEdetermination) for IME1, CDC28, and PDS1. Values are normalized to the same range forboth plots. (F) Correlation coefficients [determined from plots as in (E)] were determinedfor each gene with uORFs for leaders with only near-cognate uORFs and at least one AUGuORF. The positions of six genes that support cap-independent translation (39) are noted.
Brar et al. Page 14
Science. Author manuscript; available in PMC 2012 August 08.
NIH
-PA Author Manuscript
NIH
-PA Author Manuscript
NIH
-PA Author Manuscript
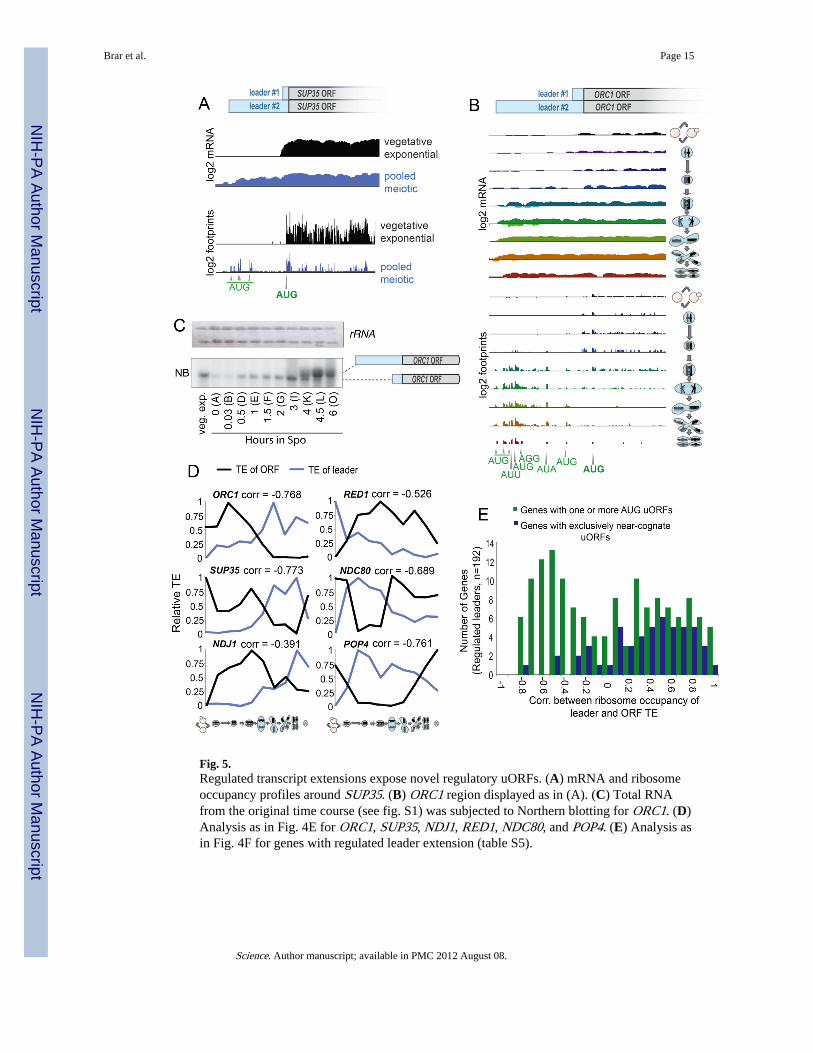
Fig. 5.Regulated transcript extensions expose novel regulatory uORFs. (A) mRNA and ribosomeoccupancy profiles around SUP35. (B) ORC1 region displayed as in (A). (C) Total RNAfrom the original time course (see fig. S1) was subjected to Northern blotting for ORC1. (D)Analysis as in Fig. 4E for ORC1, SUP35, NDJ1, RED1, NDC80, and POP4. (E) Analysis asin Fig. 4F for genes with regulated leader extension (table S5).
Brar et al. Page 15
Science. Author manuscript; available in PMC 2012 August 08.
NIH
-PA Author Manuscript
NIH
-PA Author Manuscript
NIH
-PA Author Manuscript
Copyright © 2022 FDOKUMEN