High-resolution computed tomography of single breast cancer microcalcifications in vivo
16
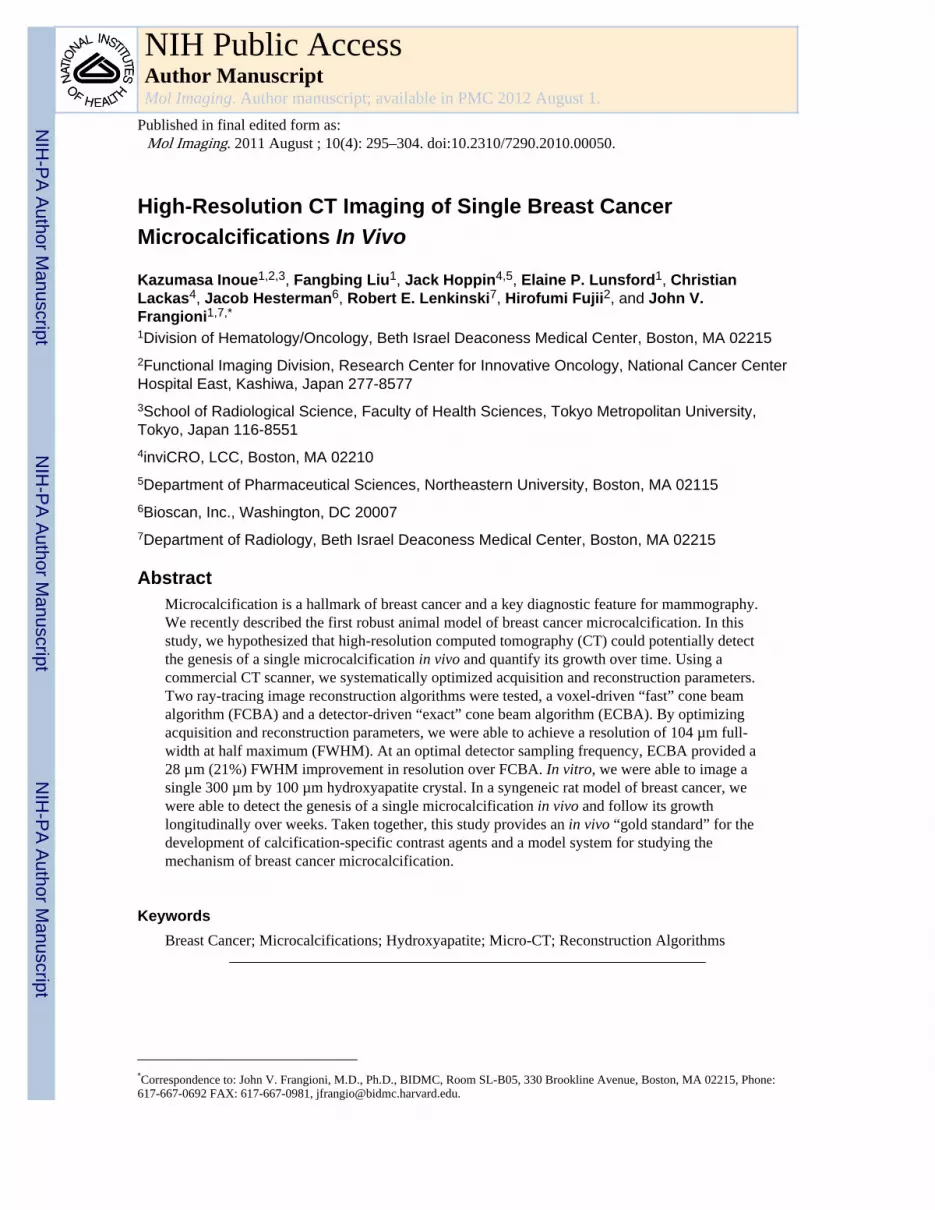
High-Resolution CT Imaging of Single Breast Cancer Microcalcifications In Vivo Kazumasa Inoue 1,2,3 , Fangbing Liu 1 , Jack Hoppin 4,5 , Elaine P. Lunsford 1 , Christian Lackas 4 , Jacob Hesterman 6 , Robert E. Lenkinski 7 , Hirofumi Fujii 2 , and John V. Frangioni 1,7,* 1 Division of Hematology/Oncology, Beth Israel Deaconess Medical Center, Boston, MA 02215 2 Functional Imaging Division, Research Center for Innovative Oncology, National Cancer Center Hospital East, Kashiwa, Japan 277-8577 3 School of Radiological Science, Faculty of Health Sciences, Tokyo Metropolitan University, Tokyo, Japan 116-8551 4 inviCRO, LCC, Boston, MA 02210 5 Department of Pharmaceutical Sciences, Northeastern University, Boston, MA 02115 6 Bioscan, Inc., Washington, DC 20007 7 Department of Radiology, Beth Israel Deaconess Medical Center, Boston, MA 02215 Abstract Microcalcification is a hallmark of breast cancer and a key diagnostic feature for mammography. We recently described the first robust animal model of breast cancer microcalcification. In this study, we hypothesized that high-resolution computed tomography (CT) could potentially detect the genesis of a single microcalcification in vivo and quantify its growth over time. Using a commercial CT scanner, we systematically optimized acquisition and reconstruction parameters. Two ray-tracing image reconstruction algorithms were tested, a voxel-driven “fast” cone beam algorithm (FCBA) and a detector-driven “exact” cone beam algorithm (ECBA). By optimizing acquisition and reconstruction parameters, we were able to achieve a resolution of 104 μm full- width at half maximum (FWHM). At an optimal detector sampling frequency, ECBA provided a 28 μm (21%) FWHM improvement in resolution over FCBA. In vitro, we were able to image a single 300 μm by 100 μm hydroxyapatite crystal. In a syngeneic rat model of breast cancer, we were able to detect the genesis of a single microcalcification in vivo and follow its growth longitudinally over weeks. Taken together, this study provides an in vivo “gold standard” for the development of calcification-specific contrast agents and a model system for studying the mechanism of breast cancer microcalcification. Keywords Breast Cancer; Microcalcifications; Hydroxyapatite; Micro-CT; Reconstruction Algorithms * Correspondence to: John V. Frangioni, M.D., Ph.D., BIDMC, Room SL-B05, 330 Brookline Avenue, Boston, MA 02215, Phone: 617-667-0692 FAX: 617-667-0981, [email protected]. NIH Public Access Author Manuscript Mol Imaging. Author manuscript; available in PMC 2012 August 1. Published in final edited form as: Mol Imaging. 2011 August ; 10(4): 295–304. doi:10.2310/7290.2010.00050. NIH-PA Author Manuscript NIH-PA Author Manuscript NIH-PA Author Manuscript
-
Upload
independent -
Category
Documents
-
view
3 -
download
0
Transcript of High-resolution computed tomography of single breast cancer microcalcifications in vivo
High-Resolution CT Imaging of Single Breast CancerMicrocalcifications In Vivo
Kazumasa Inoue1,2,3, Fangbing Liu1, Jack Hoppin4,5, Elaine P. Lunsford1, ChristianLackas4, Jacob Hesterman6, Robert E. Lenkinski7, Hirofumi Fujii2, and John V.Frangioni1,7,*
1Division of Hematology/Oncology, Beth Israel Deaconess Medical Center, Boston, MA 022152Functional Imaging Division, Research Center for Innovative Oncology, National Cancer CenterHospital East, Kashiwa, Japan 277-85773School of Radiological Science, Faculty of Health Sciences, Tokyo Metropolitan University,Tokyo, Japan 116-85514inviCRO, LCC, Boston, MA 022105Department of Pharmaceutical Sciences, Northeastern University, Boston, MA 021156Bioscan, Inc., Washington, DC 200077Department of Radiology, Beth Israel Deaconess Medical Center, Boston, MA 02215
AbstractMicrocalcification is a hallmark of breast cancer and a key diagnostic feature for mammography.We recently described the first robust animal model of breast cancer microcalcification. In thisstudy, we hypothesized that high-resolution computed tomography (CT) could potentially detectthe genesis of a single microcalcification in vivo and quantify its growth over time. Using acommercial CT scanner, we systematically optimized acquisition and reconstruction parameters.Two ray-tracing image reconstruction algorithms were tested, a voxel-driven “fast” cone beamalgorithm (FCBA) and a detector-driven “exact” cone beam algorithm (ECBA). By optimizingacquisition and reconstruction parameters, we were able to achieve a resolution of 104 µm full-width at half maximum (FWHM). At an optimal detector sampling frequency, ECBA provided a28 µm (21%) FWHM improvement in resolution over FCBA. In vitro, we were able to image asingle 300 µm by 100 µm hydroxyapatite crystal. In a syngeneic rat model of breast cancer, wewere able to detect the genesis of a single microcalcification in vivo and follow its growthlongitudinally over weeks. Taken together, this study provides an in vivo “gold standard” for thedevelopment of calcification-specific contrast agents and a model system for studying themechanism of breast cancer microcalcification.
KeywordsBreast Cancer; Microcalcifications; Hydroxyapatite; Micro-CT; Reconstruction Algorithms
*Correspondence to: John V. Frangioni, M.D., Ph.D., BIDMC, Room SL-B05, 330 Brookline Avenue, Boston, MA 02215, Phone:617-667-0692 FAX: 617-667-0981, [email protected].
NIH Public AccessAuthor ManuscriptMol Imaging. Author manuscript; available in PMC 2012 August 1.
Published in final edited form as:Mol Imaging. 2011 August ; 10(4): 295–304. doi:10.2310/7290.2010.00050.
NIH
-PA Author Manuscript
NIH
-PA Author Manuscript
NIH
-PA Author Manuscript

INTRODUCTIONBreast cancer is a common malignancy, accounting for 26% of all new cancer cases inwomen.1 The 192,370 new cases of breast cancer diagnosed in the US in 2009 willultimately result in an estimated 40,170 deaths.1 Since survival is a strong function ofdisease stage at diagnosis, early detection is of paramount importance.
Despite multiple technical limitations, x-ray mammography presently remains the screeningapproach of choice. A key diagnostic feature for mammography, seen in 30% to 50% ofwomen with biopsy-confirmed breast cancer, is microcalcification.2 Whereas benigncalcifications are typically composed of calcium oxalate, malignant calcifications aretypically composed of hydroxyapatite (HA) deposited in specific patterns.3 HAmicrocalcifications range in size from 100 µm single crystals to clusters up to centimeters indiameter.4
To overcome the limitations of mammography, our group is developing calcification-specific diagnostic agents that have high sensitivity and high specificity for the HA calciumsalt over all other calcium salts present in the human body.5–7 Since this approach requiresa robust and reproducible animal model, we have created three different models of HAbreast cancer microcalficiation.6,8,9 The newest model requires only a single intraperitoneal(IP) injection of recombinant bone morphogenetic protein-2 (rBMP-2) at four days aftertumor cell implantation, and produces microcalcifications in 100% of animals in a dose- andtime-controllable fashion.9
Armed with this animal model, the missing technology for diagnostic agent development isan in vivo “gold standard” to which newer HA-specific diagnostic agents can be compared.High-resolution computed tomography (CT) has the potential to provide such an internalgold standard, especially if it can be optimized to detect the genesis of a single breast cancermicrocalcification and quantify its growth over time. Moreover, high-resolution CT imagingwould permit tumor biologists to study the mechanism of breast cancer microcalcificationby separating the processes of calcium salt nucleation from crystal growth.
High-resolution CT scanners for small animal imaging have been studied since the 1990sand have played a major role in molecular imaging.10–18 We hypothesized thatoptimization of a commercially available CT scanner might permit imaging and quantitationof single breast cancer microcalcifications in an animal model.
MATERIALS AND METHODSHigh-Resolution CT Scanner
CT images were acquired on a NanoSPECT/CT™ imaging system (Bioscan, Washington,DC) equipped with an 8 W micro-focus x-ray source (Thermo, Scotts Valley, CA). It has atungsten target at 40° with a cone beam x-ray and a 130 µm thick beryllium window toreduce the fluence of the low-energy window. The x-ray flux at 90 kVp is 27 Rem/min. Thesize of the focal spot is less than 9 µm at 8 W and less than 7 µm at 4 W. The system iscapable of a range of tube voltages from 20 to 90 kVp, with a maximum tube current of 200µA. The CT detection system consists of four complementary metal-oxide semiconductor(CMOS) sensors (Rad-icon, Sunnyvale, CA), each with a pixel array of 256 × 512 pixels(1024 × 2048 total), and a 48-µm pixel pitch, creating a total active area of 49.9 cm × 98.3cm. The signal from each sensor is digitized to 12 bits. The acquisition software used wasNucline (Mediso, Budapest, Hungary).
Inoue et al. Page 2
Mol Imaging. Author manuscript; available in PMC 2012 August 1.
NIH
-PA Author Manuscript
NIH
-PA Author Manuscript
NIH
-PA Author Manuscript

Reconstruction AlgorithmsAll scanned data were reconstructed using a modified Feldkamp ray-tracing thatappropriately models the cone beam geometry19: the “fast” cone beam algorithm (FCBA)and the “exact” cone beam algorithm (ECBA). FCBA defines a ray from the source througheach voxel in the reconstructed field of view (FOV). The value of the projection data to beback-projected is determined via interpolation of data on the x-ray detector. The number ofvoxels set in the image reconstruction volume determines the number of rays. ECBA definesrays from the pixels on the detector to the focal spot of the x-ray source. The value along theray deposited in the voxel during back-projection is determined by the intersection of the rayand the voxel. The number of rays (sampling number) in ECBA depends on the number ofpixels x (sampling number)2. Schematics for each algorithm are shown in Figure 1.Reconstruction was performed using these algorithms as implemented in InVivoScope post-processing software (Bioscan).
Measurement of Maximum Resolution of Projected and Reconstructed ImagesTo measure the line spread function (LSF), a 12.7 µm diameter tungsten wire, orientedaxially, was placed 10 mm transaxially from the center of the FOV in order to minimize anyinfluence of potential center of rotation artifacts. A CT scan was performed at 45 kVp, 177µA current, 3000 ms/projection, 360 projections/rotation, and a detector pixel size of 48 µm.The total acquisition time was 18 min/scan. The modulation transfer function (MTF) of theprojected image was calculated by performing a Fourier transform of the LSF. The MTFwas calculated by using the method developed by Melnyk et al.20 Spatial frequency wasmeasured at 10% of the MTF. Resolution was calculated using the full-width at halfmaximum (FWHM) of the projected image. Projection data were reconstructed using theaforementioned FCBA and ECBA algorithms. The sampling number (i.e., samplingfrequency, binning) of the ECBA was set to 1, 2, 4, 6, and 8 (i.e., ECBA-1, -2, -4, -6, and-8), corresponding to 1, 4, 16, 36, and 64 x-rays per detector pixel, respectively. A Sheppand Logan filter21 was used during the reconstruction process for both the FCBA andECBA algorithms, and voxel size was set to 10 µm. The MTF and FWHM were obtained byusing a method similar to the one used for the projection image.
To evaluate the dependence of CT detector size on the resolution of the reconstructed image,the tungsten wire was scanned using detector pixel sizes of 48, 96, 192, and 384 µm.Additionally, to evaluate the dependence on voxel size, projection data obtained with a pixelsize of 48 µm were reconstructed by using either FCBA or ECBA with sampling numbers of1, 2, 4, 6, and 8, with voxel size set to 10, 50, 100, 200, and 400 µm, respectively. TheFWHM was measured on each projected and reconstructed image.
Measurement of Image NoiseA 21 mm diameter syringe phantom was filled with water and scanned to evaluate imagenoise. The phantom was placed in the center of the FOV. Image noise was evaluated bymeasuring the standard deviation (SD) of the averaged signal. A region of interest (ROI)with a diameter of 15 mm was set at the center of reconstructed image to measure SD. Thereconstruction was performed by using either the FCBA or ECBA algorithm, again withsampling numbers of 1, 2, 4, 6, and 8 and a Shepp and Logan filter. The following tests wereperformed:
Effect of CT detector pixel size: CT scans were performed at 45 kVp, 177 µA current,3000 ms/projection, and 360 projections/rotation. The pixel size of the detector was setto either 48, 96, 192, or 384 µm. Projection data were reconstructed with a voxel size of100 µm. The SD as a function of the pixel size of the detector was measured.
Inoue et al. Page 3
Mol Imaging. Author manuscript; available in PMC 2012 August 1.
NIH
-PA Author Manuscript
NIH
-PA Author Manuscript
NIH
-PA Author Manuscript

Effect of exposure time: CT scans were performed at 45 kVp, 177 µA, 360 projections/rotation, and a 48 µm pixel size. Exposure time was set to 400, 1000, 1500, or 3000 ms/projection. Projection data were reconstructed by setting the voxel size to 100 µm. TheSD as a function of the exposure time was measured.
Effect of voxel size on the reconstructed image: Projection data were scanned with thefollowing parameters: 45 kVp, 177 µA current, 3000 ms/projection, 360 projections/rotation, and a detector pixel size of 48 µm. Projection data were reconstructed bysetting the voxel size to 10, 50, 100, 200, or 400 µm. The SD as a function of exposuretime was measured and the images were evaluated visually.
Imaging of a Single HA CrystalA single HA crystal (catalog #391947, Calbiochem, La Jolla, CA) was scanned with thefollowing parameters: 45 kVp, 177 µA current, 3000 ms/projection, 360 projections/rotation, and a detector pixel size of 48 µm. The crystal was placed on an acrylic sheet witha thickness of 0.762 mm and immobilized with a drop of Fluoromount-G (Southern Biotech,Birmingham, AL). Spots of iodine-containing contrast (Renografin-60, Bracco DiagnosticsInc., Princeton, NJ) were used on the slide as fiducial markers. CT reconstruction wasperformed using the optimal parameters determined in preliminary studies (describedbelow). Immediately after CT acquisition, a brightfield microscopy image was obtained andmerged with the maximal intensity project (MIP) of the reconstructed CT image.
Syngeneic Rodent Model of Breast Cancer MicrocalcificationsAnimal experiments were conducted under the supervision of a protocol approved by theInstitutional Animal Care and Use Committee. Female Fischer 344 rats were obtained fromTaconic Farms (Germantown, NY). At the time of tumor cell inoculation, rats averaged 7 to9 weeks of age and weighed 130 ± 20 g. R3230 syngeneic breast cancer cells were grown inDMEM (Mediatech, Inc., Manassas, VA) supplemented with 10% fetal bovine serum, 100U/ml penicillin, and 100 mg/ml streptomycin, harvested, and suspended in DMEM fortumor cell implantation. Rats were anesthetized with isoflurane (2% in oxygen) andapproximately 2 × 10⁷ cells in 0.3 mL DMEM were injected subcutaneously into themammary fat pad. rBMP-2 was prepared as described in detail previously.3 One hundred µgof rBMP-2 was administered as a single IP injection to four rats bearing R3230 breasttumors 4 days following tumor cell implantation.3
In Vivo and Ex Vivo Imaging of Rat Breast Cancer MicrocalcificationsAnimals were anesthetized with isoflurane (2% in oxygen) for imaging. Breast cancer-bearing rats were scanned daily by high-resolution CT beginning 12 d after rBMP-2injection using a reconstruction voxel size of 50 µm. For both in vivo and ex vivomeasurements, scan parameters were 45 kVp, 177 µA current, 3000 ms/projection, 360projections/rotation, and a detector pixel size of 48 µm, and reconstruction was performedusing the optimal parameters determined in preliminary studies (described below). Ratswere sacrificed 33 d post-administration of rBMP-2, and the tumor was excised and scannedex vivo using varying reconstruction voxel sizes of 50, 100, 200, and 400 µm.
RESULTSMaximum Obtainable Resolution of Projected and Reconstructed Images
As shown in Figure 2 (top), the MTF curve of the projected image obtained using a 12.7 µmdiameter tungsten wire exhibited a spatial frequency of 7.20 lp/mm at 10% of peak MTF.The FWHM of the projected image was 126 µm.
Inoue et al. Page 4
Mol Imaging. Author manuscript; available in PMC 2012 August 1.
NIH
-PA Author Manuscript
NIH
-PA Author Manuscript
NIH
-PA Author Manuscript

The MTF and LSF curves of reconstructed images with a reconstruction voxel size of 10µm, obtained using different reconstruction algorithms and sampling (i.e., detector binning)numbers, are shown in Figure 2 (bottom). The resolution of FCBA showed significantdegradation compared to ECBA. The spatial frequencies of FCBA and ECBA with samplingnumbers of 1, 2, 4, 6, and 8 were 5.90, 8.60, 8.41, 8.38, 8.33, and 8.17 lp/mm, respectively.FWHMs of reconstructed images obtained using FCBA and ECBA with sampling numbersof 1, 2, 4, 6, and 8 were 132, 95, 96, 98, 99, and 99 µm, respectively.
FWHM of projected and reconstructed images as a function of detector pixel size andreconstruction voxel size are shown in Figure 3. When the pixel size of the detector becomessmall, FWHM is dramatically improved. The resolution with a pixel size of 48 µm wasimproved by 568 µm over that with a pixel size of 400 µm (Figure 3, left). FWHMs ofreconstructed images as a function of reconstruction voxel size are shown in Figure 3 (right).FWHMs of ECBA-based reconstructions suggest higher resolution compared to FCBA. Thisobservation also occurs when the voxel size is smaller than 100 µm, albeit with a lowerslope. FWHMs of reconstructed images at a reconstruction voxel size of 50 µm obtainedusing FCBA and ECBA with sampling numbers of 1, 2, 4, 6 and 8 were 132, 103, 98, 104,104 and 105 µm, respectively. Using ECBA-6, the FWHM were improved by 28 µm (21%)compared to FCBA.
Measurement of Image NoiseThe correlation between the SD of image noise and the detector pixel size is shown inFigure 4A. With both reconstruction algorithms, there is an inverse relationship betweendetector pixel size and SD. Specifically, SD of FCBA at a detector pixel size of 48 µm wassignificantly higher than SD of ECBA. SD decreased by 52.7% when using ECBA-6 orECBA-8. Figure 4B shows SD as a function of exposure time. As expected, when exposuretime increases, SD decreases. SD was lowest at 3000 ms/projection. Figure 4C shows SD asa function of the reconstructed voxel size. SD was independent of voxel size for FCBA butdependent on voxel size for ECBA. When voxel size was greater than 50 µm, SD for ECBA(with the exception of ECBA-1) was smaller than SD for FCBA. SDs of ECBA-6 and -8decreased by 20% and 85% at voxel sizes of 50 µm and 400 µm, respectively, compared toFCBA. Conversely, when voxel size was smaller than 50 µm, FCBA showed the smallestSD. Reconstructed phantom images using reconstruction voxel sizes of 10 and 50 µm areshown in Figure 4D. The results of visual evaluation of the phantom images are inagreement with the results shown in Figure 4C.
Based on this study, we selected a detector pixel size of 48 µm, an exposure time of 3000ms/projection, the ECBA-6 reconstruction algorithm, and a reconstruction voxel size of 50µm in order to achieve the highest possible resolution and image quality for in vivoexperiments.
In Vitro Imaging of Single HA CrystalsSingle HA crystals were imaged sequentially by high-resolution CT and brightfieldmicroscopy. A single crystal with a diameter of approximately 300 µm by 100 µm is seenclearly in the reconstructed CT image, which co-registered perfectly with the opticalmicroscopy image (Figure 5 and Supplementary Video).
In Vivo and Ex Vivo Imaging of Breast Cancer MicrocalcificationsLongitudinal monitoring of syngeneic breast cancer in rat revealed the first evidence oftumor microcalcification 14 d post-injection with rBMP-2. As shown in a representativeanimal (Figure 6), the first two detectable calcifications, presumably single crystals orextremely small clusters, had dimensions of 300 µm and 100 µm in diameter. After initial
Inoue et al. Page 5
Mol Imaging. Author manuscript; available in PMC 2012 August 1.
NIH
-PA Author Manuscript
NIH
-PA Author Manuscript
NIH
-PA Author Manuscript

nucleation, sites of microcalcification expanded rapidly over the next 19 d, with high-resolution CT being capable of following individual clusters and quantifying tumor volumeand calcification volume over time.9 The effect of reconstructed voxel size on image quality(see also Figures 3 right and 4C) is shown in Figure 7 for an excised tumor. Asreconstructed voxel size was reduced from 400 µm to 50 µm, image quality improvedsteadily, albeit at the expense of reconstruction time, which increased from 30 min for 400µm voxels to 180 min for 50 µm voxels.
DISCUSSIONTo the best of our knowledge, this is the first report of imaging single breast cancermicrocalcifications in vivo using high-resolution CT. We purposely utilized a commerciallyavailable scanner for the study to demonstrate that systematic optimization of acquisitionand reconstruction parameters can result in satisfactory imaging without specializedhardware or software. Nor did the in vivo results we presented employ correction forrespiratory motion of the rib cage to which the breast tumor was adhered. Addition of suchcorrection would be expected to improve image quality even further, towards that seenduring ex vivo scanning (compare Figure 6 to Figure 7).
The detection of single breast cancer microcalcifications by high-resolution CT, and theability to quantify calcification volume over time,9 have several implications. First, groupslike ours who are interested in developing HA-specific contrast agents5–7 now have an invivo gold-standard to which to compare sensitivity of various imaging modalities. Forexample, when developing a HA-specific radiotracer for positron emission tomography(PET), it is now possible to know the precise location of single HA crystals in a tumor,which in turn will permit measurement of the limit of detection of PET radiotracers as afunction of PET voxel size and scanner sensitivity. This is particular important in PET,where voxel resolution will typically be ≈ 10-fold lower than CT. Second, the technologywe describe (i.e., combination of animal model and high-resolution CT scanning) willpermit biologists interested in the mechanism of breast cancer microcalcification to quantifycalcification burden after modulation of gene expression. In a prior study, for example, wedemonstrated that the effect of rBMP-2 was humoral, rather than local, in inducingmicrocalficiations.8 Finally, our technology provides a convenient method to test possiblepharmacologic modulators of breast cancer microcalcification. For example, rBMP-2-likeagents could be developed that increase the sensitivity of screening mammography byinducing microcalcification (i.e., increasing detectability) of otherwise occult malignancies.
Our study is complementary to ongoing clinical studies using dedicated clinical breast CTscanners pioneered by the Boone group at the University of California, Davis.22 In a studyby Gong et al., breast calcifications on the order of 175 µm in diameter could be detectedusing their system.4 In our study, we evaluated the use of FCBA vs. ECBA reconstructionalgorithms and found that the best tradeoff between resolution and image noise was foundwith ECBA and an optimal sampling frequency (i.e., detector binning). Resolution of ECBAimproved by 28 µM (21%) of FWHM compared to FCBA. We believe this is due to the factthat projection data are interpolated using adjacent pixels using FCBA, which degradesresolution. In contrast, ECBA is reconstructed by binning each pixel on the detector intosquares according to the sampling number. We suggest that ECBA is superior for high-resolution imaging of in vivo microcalcifications. Other parameters that appear to optimizehigh-resolution imaging include a detector pixel size of 48 µm and a reconstructed voxelsize of less than 100 µm. Of note, the default reconstructed voxel size for rat imaging on theNanoSPECT/CT is 400 µm, which is far from optimal.
Inoue et al. Page 6
Mol Imaging. Author manuscript; available in PMC 2012 August 1.
NIH
-PA Author Manuscript
NIH
-PA Author Manuscript
NIH
-PA Author Manuscript

Since small pixel and voxel sizes are required to obtain high-resolution images, there is therisk that image noise might be increased in the process. We evaluated noise as a function ofpixel size, exposure time, and reconstructed voxel size. Image noise of FCBA issignificantly increased compared to ECBA, when detector pixel size is held constant at 48µm. SD increases as pixels are interpolated to a larger size, therefore image noise was higherwith FCBA compared to ECBA. We also evaluated the correlation between image noise andreconstructed voxel size. Since projected data is interpolated based on voxel size prior toback-projection, image noise of the FCBA was relatively independent of voxel size. Incontrast, since projection data are not interpolated with ECBA, image noise depends on thevoxel size. The image noise of the ECBA also depends on the relationship between detectorpixel size and reconstructed voxel size. Specifically, when the reconstructed voxel size issmaller than the detector pixel size, image noise is increased dramatically. The number ofrays used to reconstruct each voxel decreases when the pixel size of the detector is muchgreater than the reconstructed voxel size. Our data suggest that if the pixel size of thedetector is larger than the voxel size, ECBA may help reduce image noise.
Acquisition and reconstruction times are important parameters. Marxen et al. reported ahigh-resolution CT scanner that had a 38 lp/mm improvement in resolution over our data.17However, the acquisition of CT data took ≈ 2 h to image mice. Since small animals arestressed by anesthesia, minimization of scan time is important. In the optimized protocol wedescribe, the total scan time for visualizing single microcalcifications is only 18 min, thusproviding both high-resolution and practicality.
Supplementary MaterialRefer to Web version on PubMed Central for supplementary material.
AcknowledgmentsWe thank Eugenia Trabucchi for administrative assistance and Lorissa Moffitt and Mary McCarthy for editing. Wegratefully acknowledge funding from the following sources: National Institutes of Health High-End InstrumentationGrant (S10-RR-023010) to J.V.F.; Lewis Family Foundation to J.V.F.; Foundation for Promotion of CancerResearch to K. I.; Tokyo Metropolitan University to K. I.; BIRD of Japan Science and Technology Agency to K. I.and H. F.
REFERENCES1. American Cancer Society: Cancer facts and figures. 2010.
www.cancer.org/downloads/STT/500809web.pdf.2. Morgan MP, Cooke MM, McCarthy GM. Microcalcifications associated with breast cancer: an
epiphenomenon or biologically significant feature of selected tumors? J Mammary Gland BiolNeoplasia. 2005; 10:181–187. [PubMed: 16025224]
3. Haka AS, Shafer-Peltier KE, Fitzmaurice M, et al. Identifying microcalcifications in benign andmalignant breast lesions by probing differences in their chemical composition using Ramanspectroscopy. Cancer Res. 2002; 62:5375–5380. [PubMed: 12235010]
4. Gong X, Vedula AA, Glick SJ. Microcalcification detection using cone-beam CT mammographywith a flat-panel imager. Phys Med Biol. 2004; 49:2183–2195. [PubMed: 15248571]
5. Bhushan KR, Misra P, Liu F, et al. Detection of breast cancer microcalcifications using a dual-modality SPECT/NIR fluorescent probe. J Am Chem Soc. 2008; 130:17648–17649. [PubMed:19055348]
6. Lenkinski RE, Ahmed M, Zaheer A, et al. Near-infrared fluorescence imaging of microcalcificationin an animal model of breast cancer. Acad Radiol. 2003; 10:1159–1164. [PubMed: 14587634]
7. Zaheer A, Lenkinski RE, Mahmood A, et al. In vivo near-infrared fluorescence imaging ofosteoblastic activity. Nat Biotechnol. 2001; 19:1148–1154. [PubMed: 11731784]
Inoue et al. Page 7
Mol Imaging. Author manuscript; available in PMC 2012 August 1.
NIH
-PA Author Manuscript
NIH
-PA Author Manuscript
NIH
-PA Author Manuscript

8. Liu F, Bloch N, Bhushan KR, et al. Humoral bone morphogenetic protein 2 is sufficient for inducingbreast cancer microcalcification. Mol Imaging. 2008; 7:175–186. [PubMed: 19123988]
9. Liu F, Misra P, Lunsford EP, et al. A dose- and time-controllable syngeneic animal model of breastcancer microcalcification. Breast Cancer Res Treat. 2009
10. Paulus MJ, Sari-Sarraf H, Gleason SS, et al. A new X-ray computed tomography system forlaboratory mouse imaging. IEEE Trans Nucl Sci. 1999; 46:558–564.
11. Guldberg RE, Lin AS, Coleman R, et al. Microcomputed tomography imaging of skeletaldevelopment and growth. Birth Defects Res C Embryo Today. 2004; 72:250–259. [PubMed:15495187]
12. Ritman EL. Molecular imaging in small animals--roles for micro-CT. J Cell Biochem Suppl. 2002;39:116–124. [PubMed: 12552611]
13. Wyss C, Schaefer SC, Juillerat-Jeanneret L, et al. Molecular imaging by micro-CT: specific E-selectin imaging. Eur Radiol. 2009; 19:2487–2494. [PubMed: 19440717]
14. Zhu S, Tian J, Yan G, et al. Cone Beam Micro-CT System for Small Animal Imaging andPerformance Evaluation. Int J Biomed Imaging. 2009:960573. 2009. [PubMed: 19794829]
15. Burghardt AJ, Kazakia GJ, Laib A, Majumdar S. Quantitative assessment of bone tissuemineralization with polychromatic micro-computed tomography. Calcif Tissue Int. 2008; 83:129–138. [PubMed: 18685797]
16. Du LY, Umoh J, Nikolov HN, et al. A quality assurance phantom for the performance evaluationof volumetric micro-CT systems. Phys Med Biol. 2007; 52:7087–7108. [PubMed: 18029995]
17. Marxen M, Thornton MM, Chiarot CB, et al. MicroCT scanner performance and considerations forvascular specimen imaging. Med Phys. 2004; 31:305–313. [PubMed: 15000616]
18. Seo Y, Hashimoto T, Nuki Y, Hasegawa BH. In vivo microCT imaging of rodent cerebralvasculature. Phys Med Biol. 2008; 53:N99–N107. [PubMed: 18364539]
19. Feldkamp LA, Davis LC, Kress JW. Practical cone-beam algorithm. J. Opt. Soc. Am. A. 1984;1:612–619.
20. Melnyk R, DiBianca FA. Modeling and measurement of the detector presampling MTF of avariable resolution x-ray CT scanner. Med Phys. 2007; 34:1062–1075. [PubMed: 17369872]
21. Shepp LA, Logan BF. The Fourier reconstruction of a head section. IEEE Trans Nucl Sci. 1974;21:21–43.
22. Lindfors KK, Boone JM, Nelson TR, et al. Dedicated breast CT: initial clinical experience.Radiology. 2008; 246:725–733. [PubMed: 18195383]
Inoue et al. Page 8
Mol Imaging. Author manuscript; available in PMC 2012 August 1.
NIH
-PA Author Manuscript
NIH
-PA Author Manuscript
NIH
-PA Author Manuscript

Figure 1. CT Reconstruction AlgorithmsSchematic of the fast cone beam algorithm (FCBA; top) and the exact cone beam algorithm(ECBA; bottom), as detailed in Materials and Methods. Shown are the ray tracings from X-ray source to detector, along with their relationship to reconstructed voxels. Also shown arethe CT detector binnings (for ECBA) used to create various detector sampling frequencies.
Inoue et al. Page 9
Mol Imaging. Author manuscript; available in PMC 2012 August 1.
NIH
-PA Author Manuscript
NIH
-PA Author Manuscript
NIH
-PA Author Manuscript

Figure 2. Maximum Resolution of CT Detector and Reconstructed ImagesThe modulation-transfer functions (MTF; left) and line-spread functions (LSF; right) asmeasured during acquisition (top) and reconstruction (bottom) using a 12.7 µm diametertungsten wire. CT acquisition parameters were: 45 kVp, 3000 ms/projection, and 360projections/rotation. ECBA reconstruction sampling number is defined in Figure 1.
Inoue et al. Page 10
Mol Imaging. Author manuscript; available in PMC 2012 August 1.
NIH
-PA Author Manuscript
NIH
-PA Author Manuscript
NIH
-PA Author Manuscript

Figure 3. Full-Width Half-Maxima (FWHM) of Projected and Reconstructed Images
A. FWHM of projected image as a function of detector pixel size.
B. FWHM of reconstructed image as a function of voxel size. ECBA reconstructionsampling number is defined in Figure 1.
Inoue et al. Page 11
Mol Imaging. Author manuscript; available in PMC 2012 August 1.
NIH
-PA Author Manuscript
NIH
-PA Author Manuscript
NIH
-PA Author Manuscript

Figure 4. Analysis of Image NoiseImage noise was measured using a 21 mm diameter syringe phantom as detailed in Materialsand Methods.
A. The relationship between standard deviation of image noise and detector pixel sizeas a function of reconstruction algorithm.
B. The relationship between standard deviation of image noise and exposure time as afunction of reconstruction algorithm.
C. The relationship between standard deviation of image noise and reconstructedvoxel size as a function of reconstruction algorithm.
D. Reconstructed phantom images obtained using 10 µm (top) or 50 µm (bottom)reconstruction voxels, as a function of reconstruction algorithm.
Inoue et al. Page 12
Mol Imaging. Author manuscript; available in PMC 2012 August 1.
NIH
-PA Author Manuscript
NIH
-PA Author Manuscript
NIH
-PA Author Manuscript

Figure 5. CT Imaging of a Single Hydroxyapatite CrystalBrightfield microscopy image (left), CT image (middle), and a merge of the two (right).Arrows indicate single HA crystal measuring 300 µm × 100 µm. CT parameters included:45 kVp, 177 µA current, 3000 ms/projection, 360 projections/rotation, and a detector pixelsize of 48 µm. FM = Iodine-containing fiducial markers. See also Supplementary Video.
Inoue et al. Page 13
Mol Imaging. Author manuscript; available in PMC 2012 August 1.
NIH
-PA Author Manuscript
NIH
-PA Author Manuscript
NIH
-PA Author Manuscript

Figure 6. In Vivo Imaging of the Genesis and Growth of Breast Cancer Microcalcifications overTimeHigh-resolution CT scanning of a syngeneic rat breast cancer at days 14, 16, 19, and 33 dayspost-injection with rBMP-2. Shown are the maximal intensity projection (MIP; left) and twotransaxial (TA) slices (middle and right) whose positions are indicated with dotted anddashed lines on the MIP. Arrows indicate 300 µm (TA #1) and 100 µm (TA #2)microcalcifications first seen at day 14, which grew over time. CT acquisition parametersincluded: 45 kVp, 177 µA current, 3000 ms/projection, 360 projections/rotation, and adetector pixel size of 48 µm. Reconstruction parameters included the ECBA algorithm with
Inoue et al. Page 14
Mol Imaging. Author manuscript; available in PMC 2012 August 1.
NIH
-PA Author Manuscript
NIH
-PA Author Manuscript
NIH
-PA Author Manuscript

a sampling number of 6 (ECBA-6) and a voxel size of 50 µm. Data are representative of n =3 independent experiments.
Inoue et al. Page 15
Mol Imaging. Author manuscript; available in PMC 2012 August 1.
NIH
-PA Author Manuscript
NIH
-PA Author Manuscript
NIH
-PA Author Manuscript

Figure 7. Ex vivo Imaging of Breast Cancer MicrocalcificationsHigh-resolution, ex vivo CT scanning of a syngeneic rat breast tumor 33 d post-injectionwith rBMP-2. Shown are MIPs (left), and transaxial (TA) and sagittal (Sag) slices asindicated with dotted and dashed lines, respectively. CT acquisition parameters included: 45kVp, 177 µA current, 3000 ms/projection, 360 projections/rotation, and a detector pixel sizeof 48 µm. Reconstruction parameters included the ECBA algorithm with a sampling numberof 6 (ECBA-6). Reconstructed voxel size was varied from 400 µm (top row; instrumentdefault) to 50 µm (bottom row). Data are representative of n = 3 independent experiments.
Inoue et al. Page 16
Mol Imaging. Author manuscript; available in PMC 2012 August 1.
NIH
-PA Author Manuscript
NIH
-PA Author Manuscript
NIH
-PA Author Manuscript