In vivo fluorescence lifetime detection of an activatable probe in infarcted myocardium
Upload
independentCategory
view
1download
0
O
AeBSSH
Dd
PP
m
1d
Journal of Cardiovascular Computed Tomography (2008) 2, 26–32
riginal Research Article
utomated multidetector computed tomographyvaluation of subacutely infarcted myocardiumalázs Ruzsics, MDb, Pál Surányi, MDb, Pál Kiss, MDb, Brigitta C. Brott, MDa,atinder S. Singh, MDd, Silvio Litovsky, MDc, Inmaculada Aban, PhDe,teven G. Lloyd, MD, PhDa, Tamas Simor, MD, PhDb, Gabriel A. Elgavish, PhDa,b,imanshu Gupta, MDa*
epartments of aMedicine (Cardiovascular Disease), bBiochemistry and Molecular Genetics, cAnatomic Pathology,
Radiology, and eBiostatistics, University of Alabama at Birmingham, Birmingham, AL 35294, USABACKGROUND: Delayed enhanced (DE) multidetector computed tomography (MDCT) can identifyacute and chronic myocardial infarct. To our knowledge, automated techniques for infarct quantifica-tion on DE-MDCT have not been used.
OBJECTIVE: We evaluated an automated signal intensity (SI) threshold method for quantification ofsubacute myocardial infarct and identified and quantified microvascular obstruction (MO) in subacuteinfarct.
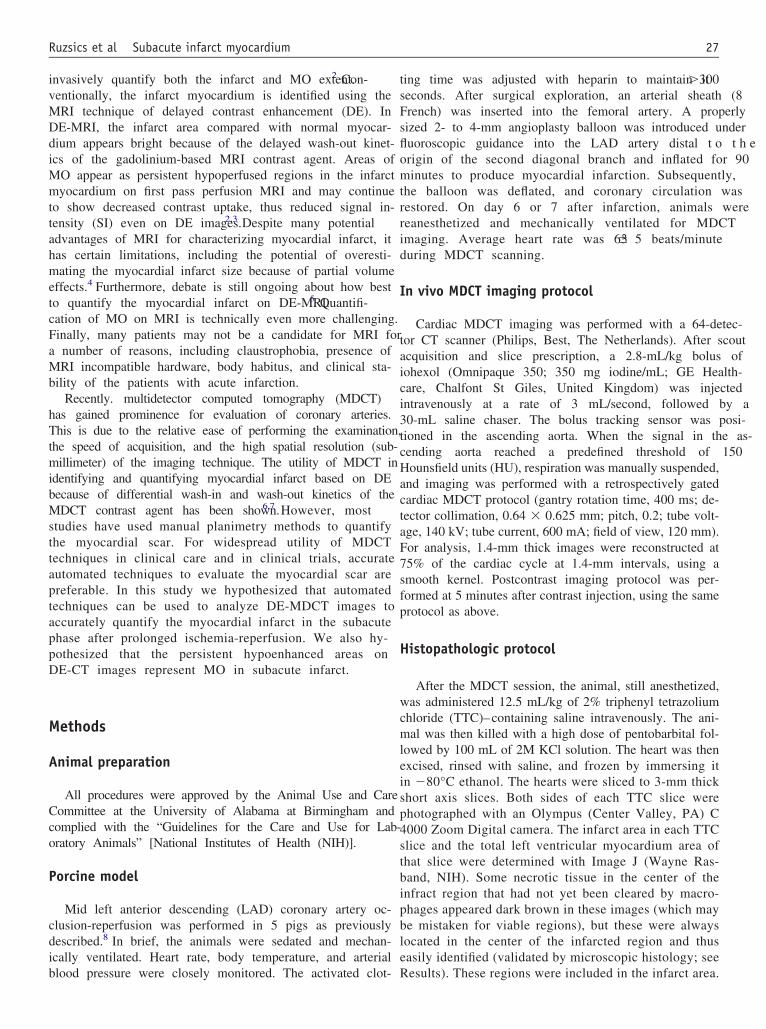
METHODS: DE-MDCT imaging was performed on 5 pigs 6 –7 days after mid left anterior descend-ing artery occlusion-reperfusion. DE-MDCT images were compared with triphenyl tetrazolium chloride(TTC) staining for infarct quantification and with hematoxylin and eosin (H&E) staining for MOquantification. Pixels with SI more than the mean SI of a remote normal myocardial region (SIremote)plus 2 times the standard deviation (SIremote � 2 SD) value were considered infarct pixels. The ratioof infarct to total area of a given slice, the percentage of infarct area per slice (PIS), was calculated. MOas a percentage of total infarct area was also calculated.
RESULTS: The average density values on DE-MDCT (5 minutes after contrast injection) wereremote normal myocardium of 93 � 19 Hounsfield units (HU), infarct myocardium of 159 � 40 HU,blood of 140 � 26 HU, and MO of 85 � 30 HU. PISMDCT showed substantial agreement with PISTTC
(y � 1.003x � 4.12; R � 0.90, P � 0.05). A relation was also shown between MO determined byMDCT compared with H&E staining (y � 0.74x � 3.4).
CONCLUSIONS: We show the feasibility of using a semiautomated SI threshold technique forquantification of subacute myocardial infarct. We also show the persistent MO in subacute myocardialinfarct on DE-MDCT images.© 2008 Society of Cardiovascular Computed Tomography. All rights reserved.
KEYWORDS:Delayed enhancement;Magnetic resonanceimaging;Microvascularobstruction;Multidetector CT;Myocardial infarct;No-reflow zone
I
porf
Conflict of interest: Dr. Surányi and Dr. Kiss were employees of Elgavisharamagnetics Inc., Birmingham, AL. Dr. Elgavish is the president of Elgavisharamagnetics Inc. The other authors report no conflicts of interest.
Mailing address: BDB 101, CVMRI, University of Alabama at Bir-ingham, 1808 7th Ave. South, Birmingham, AL 35294.
* Corresponding author.E-mail address: [email protected]
iSubmitted May 30, 2007. Accepted for publication November 7, 2007.
934-5925/$ -see front matter © 2008 Society of Cardiovascular Computed Tomoi:10.1016/j.jcct.2007.11.003
ntroduction
Coronary artery occlusion results in well-characterizedathologic changes in the affected myocardium. The extentsf infarct size and microvascular obstruction (MO) as aesult of coronary artery occlusion are important indicatorsor predicting poor clinical outcomes.1 Magnetic resonance
maging (MRI) has gained a widespread acceptance to non-ography. All rights reserved.
ivMDdiMmttahmetcFaMb
hTtmibMsttaptappD
M
A
Cco
P
cdib
tsFsflomtrrid
I
taici3tcHactaF7sfp
H
wcmleisp4stbipble
27Ruzsics et al Subacute infarct myocardium
nvasively quantify both the infarct and MO extent.2 Con-entionally, the infarct myocardium is identified using theRI technique of delayed contrast enhancement (DE). InE-MRI, the infarct area compared with normal myocar-ium appears bright because of the delayed wash-out kinet-cs of the gadolinium-based MRI contrast agent. Areas of
O appear as persistent hypoperfused regions in the infarctyocardium on first pass perfusion MRI and may continue
o show decreased contrast uptake, thus reduced signal in-ensity (SI) even on DE images.2,3 Despite many potentialdvantages of MRI for characterizing myocardial infarct, itas certain limitations, including the potential of overesti-ating the myocardial infarct size because of partial volume
ffects.4 Furthermore, debate is still ongoing about how besto quantify the myocardial infarct on DE-MRI.5 Quantifi-ation of MO on MRI is technically even more challenging.inally, many patients may not be a candidate for MRI for number of reasons, including claustrophobia, presence ofRI incompatible hardware, body habitus, and clinical sta-
ility of the patients with acute infarction.Recently. multidetector computed tomography (MDCT)
as gained prominence for evaluation of coronary arteries.his is due to the relative ease of performing the examination,
he speed of acquisition, and the high spatial resolution (sub-illimeter) of the imaging technique. The utility of MDCT in
dentifying and quantifying myocardial infarct based on DEecause of differential wash-in and wash-out kinetics of theDCT contrast agent has been shown.6,7 However, most
tudies have used manual planimetry methods to quantifyhe myocardial scar. For widespread utility of MDCTechniques in clinical care and in clinical trials, accurateutomated techniques to evaluate the myocardial scar arereferable. In this study we hypothesized that automatedechniques can be used to analyze DE-MDCT images toccurately quantify the myocardial infarct in the subacutehase after prolonged ischemia-reperfusion. We also hy-othesized that the persistent hypoenhanced areas onE-CT images represent MO in subacute infarct.
ethods
nimal preparation
All procedures were approved by the Animal Use and Careommittee at the University of Alabama at Birmingham andomplied with the “Guidelines for the Care and Use for Lab-ratory Animals” [National Institutes of Health (NIH)].
orcine model
Mid left anterior descending (LAD) coronary artery oc-lusion-reperfusion was performed in 5 pigs as previouslyescribed.8 In brief, the animals were sedated and mechan-cally ventilated. Heart rate, body temperature, and arterial
lood pressure were closely monitored. The activated clot- Ring time was adjusted with heparin to maintain it �300econds. After surgical exploration, an arterial sheath (8rench) was inserted into the femoral artery. A properlyized 2- to 4-mm angioplasty balloon was introduced underuoroscopic guidance into the LAD artery distal t o t h erigin of the second diagonal branch and inflated for 90inutes to produce myocardial infarction. Subsequently,
he balloon was deflated, and coronary circulation wasestored. On day 6 or 7 after infarction, animals wereeanesthetized and mechanically ventilated for MDCTmaging. Average heart rate was 63 � 5 beats/minuteuring MDCT scanning.
n vivo MDCT imaging protocol
Cardiac MDCT imaging was performed with a 64-detec-or CT scanner (Philips, Best, The Netherlands). After scoutcquisition and slice prescription, a 2.8-mL/kg bolus ofohexol (Omnipaque 350; 350 mg iodine/mL; GE Health-are, Chalfont St Giles, United Kingdom) was injectedntravenously at a rate of 3 mL/second, followed by a0-mL saline chaser. The bolus tracking sensor was posi-ioned in the ascending aorta. When the signal in the as-ending aorta reached a predefined threshold of 150ounsfield units (HU), respiration was manually suspended,
nd imaging was performed with a retrospectively gatedardiac MDCT protocol (gantry rotation time, 400 ms; de-ector collimation, 0.64 � 0.625 mm; pitch, 0.2; tube volt-ge, 140 kV; tube current, 600 mA; field of view, 120 mm).or analysis, 1.4-mm thick images were reconstructed at5% of the cardiac cycle at 1.4-mm intervals, using amooth kernel. Postcontrast imaging protocol was per-ormed at 5 minutes after contrast injection, using the samerotocol as above.
istopathologic protocol
After the MDCT session, the animal, still anesthetized,as administered 12.5 mL/kg of 2% triphenyl tetrazolium
hloride (TTC)–containing saline intravenously. The ani-al was then killed with a high dose of pentobarbital fol-
owed by 100 mL of 2M KCl solution. The heart was thenxcised, rinsed with saline, and frozen by immersing itn �80°C ethanol. The hearts were sliced to 3-mm thickhort axis slices. Both sides of each TTC slice werehotographed with an Olympus (Center Valley, PA) C000 Zoom Digital camera. The infarct area in each TTClice and the total left ventricular myocardium area ofhat slice were determined with Image J (Wayne Ras-and, NIH). Some necrotic tissue in the center of thenfract region that had not yet been cleared by macro-hages appeared dark brown in these images (which maye mistaken for viable regions), but these were alwaysocated in the center of the infarcted region and thusasily identified (validated by microscopic histology; see
esults). These regions were included in the infarct area.
Pletwww
M
tsri
ding co
Fc3
28 Journal of Cardiovascular Computed Tomography, Vol 2, No 1, January/February 2008
ercentage of infarct area per slice (PISTTC) was calcu-ated for comparison with CT data. From each pig, anntire transverse cross-section of TTC-stained left ven-ricle was submitted for histologic examination. Samplesere divided into sections that fit a histology cassette,ere paraffin-embedded, sectioned at 5 �m, and stainedith hematoxylin and eosin (H&E).
Figure 1 Reconstructed left anterior descen
igure 2 Cardiac MDCT images for the purpose of myocardiontiguous MDCT images is shown. Every seventh image corresp
-mm thick slabs.) (B) Selected raw CT image set for viability evaluatioO analysis
After microscopic photography, from the individual sec-ions, a composite microscopic photograph was recon-tructed that encompassed the entire infarct and the sur-ounding 5- to 10-mm peri-infarct region. The myocardialnfarct was quantified by drawing the infarcted territory on
ronary artery from one experimental animal.
ility assessment are shown. (A) An entire set of 1.4-mm thicko the localization of a 10-mm thick slice. (TTC was evaluated in
al viabonds t
n. (C) Threshold CT images delineating myocardial infarct.

e(dla
C
cDaacwrndawSwifia
ihbbnMaipa
S
t
lfl
FC MDCT
i
F(uC
29Ruzsics et al Subacute infarct myocardium
ach composite. At the center of the infarct the MO regionie, no-reflow zone) was defined as distinctive undigested,ead myocardium with focal hemorrhages. MO was calcu-ated as a percentage of the myocardial infarction, percent-ge area of MO per infarct per slice (PAMOMICRO).
T image analysis
True short-axis cardiac slices 1.4-mm thick at the 75%ardiac phase were reconstructed on a Philips workstation.irect slice-by-slice comparisons of MDCT and TTC im-
ges were accomplished with multiplanar reconstructions ofxial slices that matched the short-axis postmortem myo-ardial slices. A 49-slice image stack was acquired, fromhich every seventh image was used for further analysis,
epresenting the same image locations at 10-mm slice thick-ess. Images were analyzed automatically after manual en-ocardial and epicardial contour tracing. For DE imagenalysis, the mean SI of a remote, normal myocardial regionas measured (SIremote, approximately 100 pixels). MeanIremote plus 2 times the standard deviation (SIremote� 2 SD)as used to define the threshold limit. Pixels with signal
ntensities above this threshold value were considered in-arct pixels. Infarct pixels were counted, and the ratio ofnfarct to total area of a given slice, the percentage of infarctrea per slice (PISDE) was calculated.
In the thresholded MDCT images the center of thenfarct represented similar SI values as did remote,ealthy myocardium. Such areas completely surroundedy infract represented the MO zone. This MO zone coulde obtained directly from the pixel values without theeed for any additional processing. Percentage area ofO per infarct in MDCT (PAMOMDCT) was calculated
s the number of MO pixels divided by the number ofnfarcted pixels multiplied by 100. Slice-by-slice com-arison was performed between MO measured in MDCTnd in microscopy.
tatistical analysis
To investigate the agreement between MDCT and his-
igure 3 Data for individual slice per animal are shown. Raw CT image panel, followed by corresponding TTC panel. The PIS
ndividual swine.
ology, we first obtained the estimate of the Pearson corre- l
ation and found the best-fit linear model. Next, we per-ormed a statistical test to evaluate how different the fittedine is from the identity line by simultaneously testing the
ge for each swine are on the extreme left, followed by thresholdand PISTTC values are depicted in the 2 panels on the right for
igure 4 (A) Relationship between PISMDCT and PISTTC
y � 1.003x � 4.12%; R � 0.90; P � 0.05). The slope is nearnity, and the minimal offset indicates good agreement betweenT and TTC staining. Line of identity is shown as a gray dashed
T ima
ine. (B) Bland-Altman plot of PISMDCT and PISTTC.

hatoePmwmd
auw
R
o
FIscn(
30 Journal of Cardiovascular Computed Tomography, Vol 2, No 1, January/February 2008
ypotheses of zero intercept and unit slope. We also lookedt the residual plots resulting from these fitted linear modelso check whether any systematic patterns would indicatether sources of measurement error bias. We used the gen-ralized linear model for repeated measures using SASROC MIXED (SAS Institute, Cary, NC) to obtain esti-ates and P values. All readings from the same swineere used as individual observations, and the repeatedeasures feature of the generalized linear model proce-
ure was used to accommodate possible correlation
igure 5 Identification of microvascular obstruction (MO) and mn vivo raw (A) and thresholded CT images (B). Postmortem grosslice shown in panels A and B. Arrowheads show no-reflow zoonfirmed with larger magnitude (F). A sample of border (H) witho-reflow zone (I). MO contains dead, not yet digested myoc
magnification �100).mong the readings taken from the same swine. All testssed a 5% level of significance. Bland-Altman analysisas also performed.9
esults
Coronary artery reconstruction showed patent LAD cor-nary artery in all the animals (Fig. 1). A representative set
ial infarction by MDCT, postmortem TTC and H&E microscopy.ogy (TTC) (C) and microscopic histology (H&E) (D) of the samee sharp demarcation between infarcted and viable tissue (E) isubacute myocardial infarction between granulation tissue (G) and
with loss of nuclei (I) and focal hemorrhages at the center
yocardpatholne. Thin the sardium

omatH2uwwP(Bg
suhasaSasrHTobiriua(
ia
rH
D
atsqdwirvalTumr
ateqirtdi(ctlsacmttm5bo
L
ammac
Fw3
31Ruzsics et al Subacute infarct myocardium
f cardiac MDCT images and the result of the semiauto-ated thresholds are shown in Figure 2 and Figure 3. The
verage density values on DE-MDCT (5 minutes after con-rast injection) were remote normal myocardium of 93 � 19U, infarct myocardium of 159 � 40 HU, blood of 140 �6 HU, and MO of 85 � 30 HU. Two SD thresholds weresed to evaluate nonviable infarct myocardium comparedith the remote normal myocardium. A significant relationas found between PISMDCT and the reference standardISTTC for viability assessment with slope parallel to unityR � 0.9; P � 0.05; y � 1.003x � 4.12) (Fig. 4A).land-Altman analysis of PISMDCT and PISTTC showedood agreement between the 2 methods (Fig. 4B).
MO was noted as persistent low attenuation, hypoperfu-ion on DE-MDCT images. We analyzed images at 5 min-tes after contrast injection, because previous investigatorsave shown that DE images best represent MO 5 minutesfter contrast injection.6 Representative MDCT images arehown in Figure 5. Raw and thresholded images (Fig. 5And 5B) delineate myocardial infarction (bright region).ubendocardially at the center of the infarct no contrastgent could accumulate. In the thresholded image it showsimilar SI values as remote myocardium. This region rep-esents the MO or no-reflow zone. In Figure 5C and 5D an&E-stained composite can be seen from the correspondingTC-stained infarcted slice. Two demarcated borders can bebserved within the slice. A sharp border was observedetween the healthy, remote myocardium (Fig. 5F) and thenfarction. Another border was detected between the no-eflow zone and the granulation tissue (Fig. 5H). Within thenfarct the sharply demarcated no-reflow region containsndigested myocardium with focal hemorrhages (Fig. 5I)nd necrotic tissue mass with early scar formationFig. 5G).
The MO was expressed as a percentage of the entirenfarcted area in a given slice, and microscopic slices serveds the reference standard for MDCT measurements. The
igure 6 Quantification of microvascular obstruction (MO). MOas expressed as a percentage of total infarct area (y � 0.73x �
h.4%).
elation between MO per infarct in MDCT and that from&E microscopy is shown in Figure 6.
iscussion
The main findings of our study are that automated SInalysis of DE-MDCT can be used for accurate quantifica-ion of subacute infarct myocardium. Baks et al10 havehown an excellent correlation of MRI and MDCT foruantification of subacute infarct. However, they used user-efined contour delineation, in contrast to our study inhich we used automated algorithms with minimal user
nterface to quantify the infarct. With MDCT submillimeteresolution can be obtained that markedly reduces the partialolume effects that are seen in MRI. However, this relativedvantage of MDCT is to be taken in the context of certainimitations of MDCT techniques when compared with MRI.hese include relatively restricted dynamic range of atten-ation (ie, SI values between the normal and the nonviableyocardium) on MDCT. Therefore, the contrast-to-noise
atio is lower on MDCT compared with MRI.Previous investigators have accurately quantified MO in
cute as well as chronic infarct on DE-MDCT images ob-ained 5 minutes after the contrast injection.6 We havextended the observations made by these investigators anduantified MO regions in the subacute phase of myocardialnfarction. We noted on light microscopy that the infarctegion has complex histologic features. The borders be-ween the infarct and the noninfarct myocardium were wellefined. The nonresorbed necrotic tissue in the center of thenfarct corresponded to regions of enhancement defectslow CT absorption) within the enhanced region on delayedontrast MDCT images. Previously, these regions were at-ributed to a combination of factors, including microvascu-ar obstruction, hemorrhage, and tissue edema. Wu et al11
howed in humans that MO as defined by hypointense areasfter contrast injection on MRI was associated with in-reased cardiovascular events and is a strong prognosticarker even after normalization for total myocardial scar. In
he present study MO was quantified with MDCT images inhe subacute phase of myocardial infarct. The 1.4-mm thickyocardium slab acquired by MDCT was compared with
-�m thick microscopic sections. Although the agreementetween these techniques is not perfect, a relation wasbserved (Fig. 6), even with this limited number of animals.
imitations
We acquired submillimeter resolution DE-MDCT im-ges. For clinical purposes such a high spatial resolutionay not be needed. Acquisition of thicker slices results inuch lower radiation dose because the time needed for
cquisition of the images covering the whole heart is de-reased. Acquisition of thicker slices probably results in a
igher signal-to-noise ratio, although at the expense of
lqm
C
tfaM
R
1
1
32 Journal of Cardiovascular Computed Tomography, Vol 2, No 1, January/February 2008
ower contrast-to-noise ratio. Thicker slices may also re-uire optimization of the automated SI thresholds to mini-ize the effects of partial volume effects.
onclusions
We show the feasibility of using automated SI thresholdechnique for quantification of subacute myocardial infarctrom DE-MDCT. We also show the persistent MO in sub-cute myocardial infarct that can be identified on DE-DCT images.
eferences
1. Choi CJ, Haji-Momenian S, Dimaria JM, Epstein FH, Bove CM,Rogers WJ, Kramer CM: Infarct involution and improved functionduring healing of acute myocardial infarction: the role of microvas-cular obstruction. J Cardiovasc Magn Reson. 2004;6(4):917–25.
2. Gerber BL, Rochitte CE, Melin JA, McVeigh ER, Blueme DA, WuKC, Becker LC, Lima JA: Microvascular obstruction and left ventric-ular remodeling early after acute myocardial infarction. Circulation.2000;101:2734–41.
3. Judd RM, Lugo-Olivieri CH, Arai M, Kondo T, Croisille P, Lima JA,Mohan V, Becker LC, Zerhounia EA: Physiological basis of myocar-dial contrast enhancement in fast magnetic resonance images of 2-day-old reperfused canine infarcts. Circulation. 1995;92:1902–10.
4. Fieno DS, Kim RJ, Chen EL, Lomasney JW, Klocke FJ, Judd RM:Contrast-enhanced magnetic resonance imaging of myocardium atrisk: distinction between reversible and irreversible injury throughout
infarct healing. J Am Coll Cardiol. 2000;36:1985–91.5. Lund GK, Stork A, Saeed M, Bansmann MP, Gerken JH, Muller V,Mester J, Higgins CB, Adam G, Meinertz T: Acute myocardial infarc-tion: evaluation with first-pass enhancement and delayed enhancementMR imaging compared with 201Tl SPECT imaging. Radiology. 2004;232:49–57.
6. Lardo AC, Cordeiro MA, Silva C, Amado LC, George RT, SaliarisAP, Schuleri KH, Fernández VR, Zviman M, Nazarian S, HalperinHR, Wu KC, Hare JM, Lima JA: Contrast-enhanced multidetectorcomputed tomography viability imaging after myocardial infarction:characterization of myocyte death, microvascular obstruction, andchronic scar. Circulation. 2006;113:394–404.
7. Gerber BL, Belge B, Legros GJ, Lim P, Poncelet A, Pasquet A GiselluG, Coche E, Vanoverscelde JL: Characterization of acute and chronicmyocardial infarcts by multidetector computed tomography: compar-ison with contrast-enhanced magnetic resonance. Circulation. 2006;113(6):823–33.
8. Turschner O, D’hooge J, Dommke C, Claus P, Verbeken E, DeScheerder I, Bijnens B, Sutherland GR: The sequential changes inmyocardial thickness and thickening which occur during acute trans-mural infarction, infarct reperfusion and the resultant expression ofreperfusion injury. Eur Heart J. 2004;25:794–803.
9. Bland JM, Altman DG. Statistical methods for assessing agreementbetween two methods of clinical measurement. Lancet. 1986;1(8476):307–10.
0. Baks T, Cademartiri F, Moelker AD, Weustink AC, van Geuns RJ,Mollet NR, Krestin GP, Duncker DJ, de Feyter PJ: Multislice com-puted tomography and magnetic resonance imaging for the assessmentof reperfused acute myocardial infarction. J Am Coll Cardiol. 2006;48:144–52.
1. Wu KC, Kim RJ, Bluemke DA, Rochitte CE, Zerhouni EA, BeckerLC, Lima JC: Quantification and time course of microvascular ob-struction by contrast-enhanced echocardiography and magnetic reso-nance imaging following acute myocardial infarction and reperfusion.
J Am Coll Cardiol. 1998;32:1756–64.Copyright © 2022 FDOKUMEN