HIF-1 mediates adaptation to hypoxia by actively downregulating mitochondrial oxygen consumption
11
HIF-1 mediates adaptation to hypoxia by actively downregulating mitochondrial oxygen consumption Ioanna Papandreou, 1,2 Rob A. Cairns, 1,2 Lucrezia Fontana, 1 Ai Lin Lim, 1 and Nicholas C. Denko 1, * 1 Division of Radiation and Cancer Biology, Department of Radiation Oncology, Stanford University School of Medicine, Stanford, California 94305 2 These authors contributed equally to this work. *Correspondence: [email protected] Summary The HIF-1 transcription factor drives hypoxic gene expression changes that are thought to be adaptive for cells exposed to a reduced-oxygen environment. For example, HIF-1 induces the expression of glycolytic genes. It is presumed that increased glycolysis is necessary to produce energy when low oxygen will not support oxidative phosphorylation at the mitochondria. However, we find that while HIF-1 stimulates glycolysis, it also actively represses mitochondrial function and oxygen con- sumption by inducing pyruvate dehydrogenase kinase 1 (PDK1). PDK1 phosphorylates and inhibits pyruvate dehydrogenase from using pyruvate to fuel the mitochondrial TCA cycle. This causes a drop in mitochondrial oxygen consumption and re- sults in a relative increase in intracellular oxygen tension. We show by genetic means that HIF-1-dependent block to oxygen utilization results in increased oxygen availability, decreased cell death when total oxygen is limiting, and reduced cell death in response to the hypoxic cytotoxin tirapazamine. Introduction Tissue hypoxia results when supply of oxygen from the blood- stream does not meet demand from the cells in the tissue. Such a supply-demand mismatch can occur in physiologic con- ditions such as the exercising muscle, in the pathologic condi- tion such as the ischemic heart, or in the tumor microenviron- ment (Hockel and Vaupel, 2001; Semenza, 2004). In either the physiologic circumstance or pathologic conditions, there is a molecular response from the cell in which a program of gene ex- pression changes is initiated by the hypoxia-inducible factor-1 (HIF-1) transcription factor. This program of gene expression changes is thought to help the cells adapt to the stressful envi- ronment. For example, HIF-1-dependent expression of erythro- poietin and angiogenic compounds results in increased blood vessel formation for delivery of a richer supply of oxygenated blood to the hypoxic tissue. Additionally, HIF-1 induction of gly- colytic enzymes allows for production of energy when the mito- chondria are starved of oxygen as a substrate for oxidative phosphorylation. We now find that this metabolic adaptation is more complex, with HIF-1 not only regulating the supply of ox- ygen from the bloodstream, but also actively regulating the ox- ygen demand of the tissue by reducing the activity of the major cellular consumer of oxygen, the mitochondria. Perhaps the best-studied example of chronic hypoxia is the hypoxia associated with the tumor microenvironment (Brown and Giaccia, 1998). The tumor suffers from poor oxygen supply through a chaotic jumble of blood vessels that are unable to ad- equately perfuse the tumor cells. The oxygen tension within the tumor is also a function of the demand within the tissue, with ox- ygen consumption influencing the extent of tumor hypoxia (Gul- ledge and Dewhirst, 1996; Papandreou et al., 2005b). The net re- sult is that a large fraction of the tumor cells are hypoxic. Oxygen tensions within the tumor range from near normal at the capillary wall, to near zero in the perinecrotic regions. This perfusion-lim- ited hypoxia is a potent microenvironmental stress during tumor evolution (Graeber et al., 1996; Hockel and Vaupel, 2001) and an important variable capable of predicting for poor patient out- come. (Brizel et al., 1996; Cairns and Hill, 2004; Hockel et al., 1996; Nordsmark and Overgaard, 2004). The HIF-1 transcription factor was first identified based on its ability to activate the erythropoetin gene in response to hypoxia (Wang and Semenza, 1993). Since then, it is has been shown to be activated by hypoxia in many cells and tissues, where it can induce hypoxia-responsive target genes such as VEGF and Glut1 (Airley et al., 2001; Kimura et al., 2004). The connection be- tween HIF-regulation and human cancer was directly linked when it was discovered that the VHL tumor suppressor gene was part of the molecular complex responsible for the oxic deg- radation of HIF-1a (Maxwell et al., 1999). In normoxia, a family of prolyl hydroxylase enzymes uses molecular oxygen as a sub- strate and modifies HIF-1a and HIF2a by hydroxylation of pro- lines 564 and 402 (Bruick and McKnight, 2001; Epstein et al., 2001). VHL then recognizes the modified HIF-a proteins, acts as an E3-type of ubiquitin ligase, and along with elongins B and C is responsible for the polyubiquitination of HIF-as and their proteosomal degradation (Bruick and McKnight, 2001; Chan et al., 2002; Ivan et al., 2001; Jaakkola et al., 2001). Muta- tions in VHL lead to constitutive HIF-1 gene expression, and pre- dispose humans to cancer. The ability to recognize modified HIF-as is at least partly responsible for VHL activity as a tumor suppressor, as introduction of nondegradable HIF-2a is capable of overcoming the growth–inhibitory activity of wild-type (wt) VHL in renal cancer cells (Kondo et al., 2003). Mitochondrial function can be regulated by PDK1 expression. Mitochondrial oxidative phosphorylation (OXPHOS) is regulated by several mechanisms, including substrate availability (Brown, 1992). The major substrates for OXPHOS are oxygen, which is the terminal electron acceptor, and pyruvate, which is the pri- mary carbon source. Pyruvate is the end product of glycolysis CELL METABOLISM 3, 187–197, MARCH 2006 ª2006 ELSEVIER INC. DOI 10.1016/j.cmet.2006.01.012 187 ARTICLE
-
Upload
theprincessmargaret -
Category
Documents
-
view
0 -
download
0
Transcript of HIF-1 mediates adaptation to hypoxia by actively downregulating mitochondrial oxygen consumption
A R T I C L E
HIF-1 mediates adaptation to hypoxia by actively downregulatingmitochondrial oxygen consumption
Ioanna Papandreou,1,2 Rob A. Cairns,1,2 Lucrezia Fontana,1 Ai Lin Lim,1 and Nicholas C. Denko1,*
1 Division of Radiation and Cancer Biology, Department of Radiation Oncology, Stanford University School of Medicine, Stanford, California 943052 These authors contributed equally to this work.
*Correspondence: [email protected]
Summary
The HIF-1 transcription factor drives hypoxic gene expression changes that are thought to be adaptive for cells exposed toa reduced-oxygen environment. For example, HIF-1 induces the expression of glycolytic genes. It is presumed that increasedglycolysis is necessary to produce energy when low oxygen will not support oxidative phosphorylation at the mitochondria.However, we find that while HIF-1 stimulates glycolysis, it also actively represses mitochondrial function and oxygen con-sumption by inducing pyruvate dehydrogenase kinase 1 (PDK1). PDK1 phosphorylates and inhibits pyruvate dehydrogenasefrom using pyruvate to fuel the mitochondrial TCA cycle. This causes a drop in mitochondrial oxygen consumption and re-sults in a relative increase in intracellular oxygen tension. We show by genetic means that HIF-1-dependent block to oxygenutilization results in increased oxygen availability, decreased cell death when total oxygen is limiting, and reduced cell deathin response to the hypoxic cytotoxin tirapazamine.
Introduction
Tissue hypoxia results when supply of oxygen from the blood-stream does not meet demand from the cells in the tissue.Such a supply-demand mismatch can occur in physiologic con-ditions such as the exercising muscle, in the pathologic condi-tion such as the ischemic heart, or in the tumor microenviron-ment (Hockel and Vaupel, 2001; Semenza, 2004). In either thephysiologic circumstance or pathologic conditions, there is amolecular response from the cell in which a program of gene ex-pression changes is initiated by the hypoxia-inducible factor-1(HIF-1) transcription factor. This program of gene expressionchanges is thought to help the cells adapt to the stressful envi-ronment. For example, HIF-1-dependent expression of erythro-poietin and angiogenic compounds results in increased bloodvessel formation for delivery of a richer supply of oxygenatedblood to the hypoxic tissue. Additionally, HIF-1 induction of gly-colytic enzymes allows for production of energy when the mito-chondria are starved of oxygen as a substrate for oxidativephosphorylation. We now find that this metabolic adaptation ismore complex, with HIF-1 not only regulating the supply of ox-ygen from the bloodstream, but also actively regulating the ox-ygen demand of the tissue by reducing the activity of the majorcellular consumer of oxygen, the mitochondria.
Perhaps the best-studied example of chronic hypoxia is thehypoxia associated with the tumor microenvironment (Brownand Giaccia, 1998). The tumor suffers from poor oxygen supplythrough a chaotic jumble of blood vessels that are unable to ad-equately perfuse the tumor cells. The oxygen tension within thetumor is also a function of the demand within the tissue, with ox-ygen consumption influencing the extent of tumor hypoxia (Gul-ledge and Dewhirst, 1996; Papandreou et al., 2005b). The net re-sult is that a large fraction of the tumor cells are hypoxic. Oxygentensions within the tumor range from near normal at the capillarywall, to near zero in the perinecrotic regions. This perfusion-lim-
CELL METABOLISM 3, 187–197, MARCH 2006 ª2006 ELSEVIER INC.
ited hypoxia is a potent microenvironmental stress during tumorevolution (Graeber et al., 1996; Hockel and Vaupel, 2001) and animportant variable capable of predicting for poor patient out-come. (Brizel et al., 1996; Cairns and Hill, 2004; Hockel et al.,1996; Nordsmark and Overgaard, 2004).
The HIF-1 transcription factor was first identified based on itsability to activate the erythropoetin gene in response to hypoxia(Wang and Semenza, 1993). Since then, it is has been shown tobe activated by hypoxia in many cells and tissues, where it caninduce hypoxia-responsive target genes such as VEGF andGlut1 (Airley et al., 2001; Kimura et al., 2004). The connection be-tween HIF-regulation and human cancer was directly linkedwhen it was discovered that the VHL tumor suppressor genewas part of the molecular complex responsible for the oxic deg-radation of HIF-1a (Maxwell et al., 1999). In normoxia, a family ofprolyl hydroxylase enzymes uses molecular oxygen as a sub-strate and modifies HIF-1a and HIF2a by hydroxylation of pro-lines 564 and 402 (Bruick and McKnight, 2001; Epstein et al.,2001). VHL then recognizes the modified HIF-a proteins, actsas an E3-type of ubiquitin ligase, and along with elongins Band C is responsible for the polyubiquitination of HIF-as andtheir proteosomal degradation (Bruick and McKnight, 2001;Chan et al., 2002; Ivan et al., 2001; Jaakkola et al., 2001). Muta-tions in VHL lead to constitutive HIF-1 gene expression, and pre-dispose humans to cancer. The ability to recognize modifiedHIF-as is at least partly responsible for VHL activity as a tumorsuppressor, as introduction of nondegradable HIF-2a is capableof overcoming the growth–inhibitory activity of wild-type (wt)VHL in renal cancer cells (Kondo et al., 2003).
Mitochondrial function can be regulated by PDK1 expression.Mitochondrial oxidative phosphorylation (OXPHOS) is regulatedby several mechanisms, including substrate availability (Brown,1992). The major substrates for OXPHOS are oxygen, which isthe terminal electron acceptor, and pyruvate, which is the pri-mary carbon source. Pyruvate is the end product of glycolysis
DOI 10.1016/j.cmet.2006.01.012 187
A R T I C L E
and is converted to acetyl-CoA through the activity of the pyru-vate dehydrogenase complex of enzymes. The acetyl-CoA thendirectly enters the TCA cycle at citrate synthase where it is com-bined with oxaloacetate to generate citrate. In metazoans, theconversion of pyruvate to acetyl-CoA is irreversible and there-fore represents a critical regulatory point in cellular energy me-tabolism. Pyruvate dehydrogenase is regulated by three knownmechanisms: it is inhibited by acetyl-CoA and NADH, it is stim-ulated by reduced energy in the cell, and it is inhibited by regu-latory phosphorylation of its E1 subunit by pyruvate dehydroge-nase kinase (PDK) (Holness and Sugden, 2003; Sugden andHolness, 2003). There are four members of the PDK family in ver-tebrates, each with specific tissue distributions (Roche et al.,2001). PDK expression has been observed in human tumor bi-opsies (Koukourakis et al., 2005), and we have reported thatPDK3 is hypoxia-inducible in some cell types (Denko et al.,2003). In this manuscript, we find that PDK1 is also a hypoxia-responsive protein that actively regulates the function of the mi-tochondria under hypoxic conditions by reducing pyruvate entryinto the TCA cycle. By excluding pyruvate from mitochondrialconsumption, PDK1 induction may increase the conversion ofpyruvate to lactate, which is in turn shunted to the extracellularspace, regenerating NAD for continued glycolysis.
Results
Identification of HIF-dependent mitochondrial proteinsthrough genomic and bioinformatics approachesIn order to help elucidate the role of HIF-1a in regulating metab-olism, we undertook a genomic search for genes that were reg-ulated by HIF-1 in tumor cells exposed to hypoxia in vitro. Weused genetically matched human RCC4 cells that had lostVHL during tumorigenesis and displayed constitutive HIF-1 ac-tivity, and a cell line engineered to re-express VHL to establishhypoxia-dependent HIF activation. These cells were treatedwith 18 hr of stringent hypoxia (<0.01% oxygen), and microarrayanalysis performed. Using a strict 2.5-fold elevation as our cut-off, we identified 173 genes that were regulated by hypoxia and/or VHL status (Table S1 in the Supplemental Data available withthis article online). We used the pattern of expression in theseexperiments to identify putative HIF-regulated genes—onesthat were constitutively elevated in the parent RCC4s indepen-dent of hypoxia, downregulated in the RCC4VHL cells undernormoxia, and elevated in response to hypoxia. Of the 173 hyp-oxia and VHL-regulated genes, 74 fit the putative HIF-1 targetpattern. The open reading frames of these genes were runthrough a pair of bioinformatics engines in order to predict sub-cellular localization, and 10 proteins scored as mitochondrial onat least one engine. The genes, fold induction, and mitochon-drial scores are listed in Table 1.
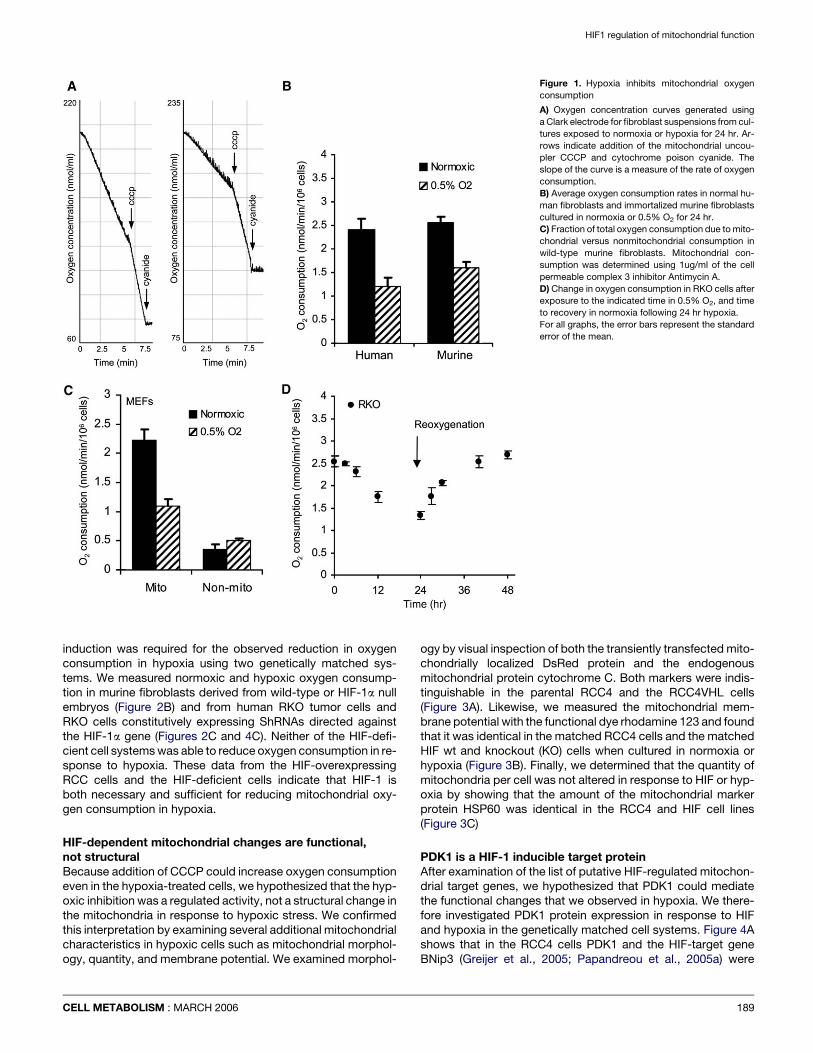
HIF-1 downregulates mitochondrialoxygen consumptionHaving identified several putative HIF-1 responsive gene prod-ucts that had the potential to regulate mitochondrial function,we then directly measured mitochondrial oxygen consumptionin cells exposed to long-term hypoxia. While other groupshave studied mitochondrial function under acute hypoxia (Chan-del et al., 1997), this is one of the first descriptions of mitochon-drial function after long-term hypoxia where there have been ex-tensive hypoxia-induced gene expression changes. Figure 1A is
188
an example of the primary oxygen trace from a Clark electrodeshowing a drop in oxygen concentration in cell suspensions ofprimary fibroblasts taken from normoxic and hypoxic cultures.The slope of the curve is a direct measure of the total cellular ox-ygen consumption rate. Exposure of either primary human orimmortalized mouse fibroblasts to 24 hr of hypoxia resulted ina reduction of this rate by approximately 50% (Figures 1A and1B). In these experiments, the oxygen consumption can be stim-ulated with the mitochondrial uncoupling agent CCCP (carbonylcyanide 3-chloro phenylhydrazone) and was completely in-hibited by 2 mM potassium cyanide. We determined that thechange in total cellular oxygen consumption was due tochanges in mitochondrial activity by the use of the cell-perme-able poison of mitochondrial complex 3, Antimycin A. Figure 1Cshows that the difference in the normoxic and hypoxic oxygenconsumption in murine fibroblasts is entirely due to the Antimy-cin-sensitive mitochondrial consumption. The kinetics withwhich mitochondrial function slows in hypoxic tumor cells alsosuggests that it is due to gene expression changes because ittakes over 6 hr to achieve maximal reduction, and the reversalof this repression requires at least another 6 hr of reoxygenation(Figure 1D). These effects are not likely due to proliferation ortoxicity of the treatments as these conditions are not growth in-hibitory or toxic to the cells (Papandreou et al., 2005a).
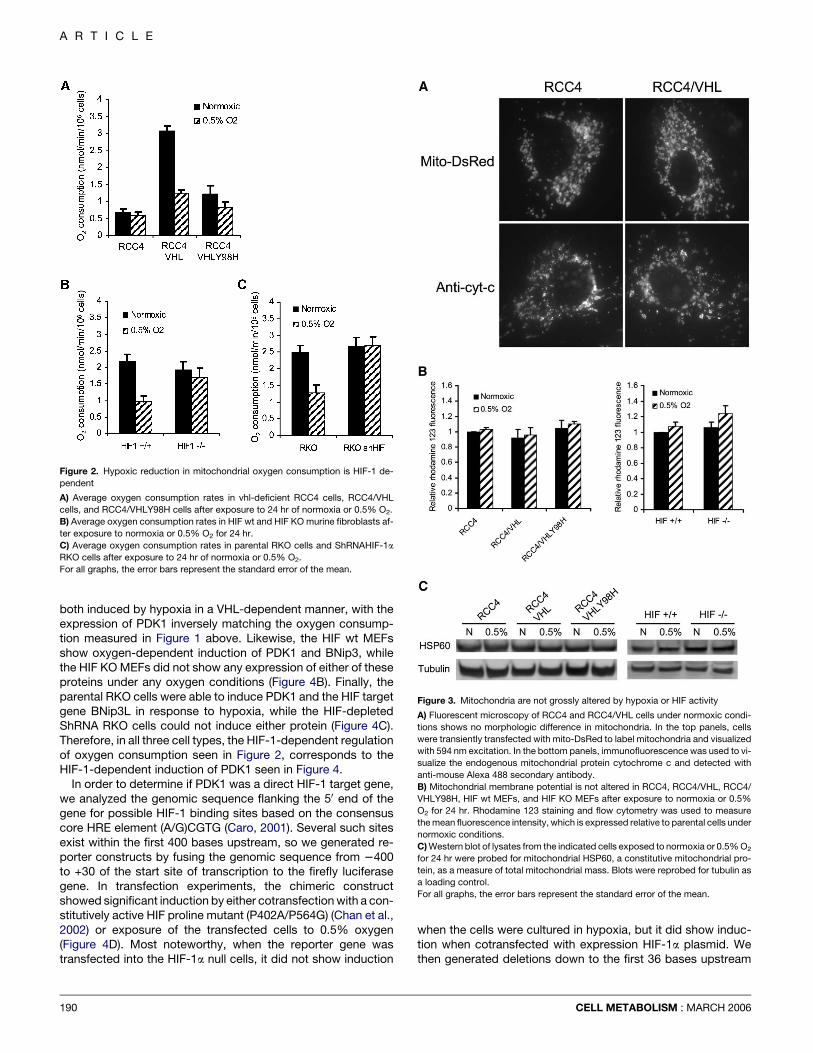
Since we had predicted from the gene expression data thatthe mitochondrial oxygen consumption changes were due toHIF-1-mediated expression changes, we tested several geneti-cally matched systems to determine what role HIF-1 played inthe process (Figure 2). We first tested the cell lines that hadbeen used for microarray analysis and found that the parentalRCC4 cells had reduced mitochondrial oxygen consumptionwhen compared to the VHL-reintroduced cells. Oxygen con-sumption in the parental cells was insensitive to hypoxia, whileit was reduced by hypoxia in the wild-type VHL-transfectedcell lines. Interestingly, stable introduction of a tumor-derivedmutant VHL (Y98H) that cannot degrade HIF was also unableto restore oxygen consumption. These results indicate thatincreased expression of HIF-1 is sufficient to reduce oxygenconsumption (Figure 2A). We also investigated whether HIF-1
Table 1. Identification of putative HIF-1a-regulated mitochondrial proteins
through microarray, bioinformatics, and data-mining approaches
Gene Identifier Ind 1 Ind 2 Loc 1 Loc 2
SLC9A6 Na/H exchanger 6 AF030409 13.0 19.0 M Mit
GPT2 Glut/pyr transaminase AY029173 10.0 10.0 M C/Mit
MCG45806 (Rab 39-like) Hs.55272 13.0 19.0 2 Mit
BNIP3 E1B 19 kD-interacting
protein 3
AF002697 9.1 4.3 2 Mem Mit
PPP1R3C protein
phosphatase 1 3C
BC012625 7.3 6.9 M C
AP1G1 Adaptor-related
complex 1 1
Y12226 3.5 3.2 M C
PDK1 Pyruvate
dehydrogenase kin 1
L42450 3.1 5.9 M Mit
Hypothetical protein FLJ36666 AK093985 2.9 9.0 2 Mit
PFKFB4 phosphofructo-2
kinase 4
BC010269 2.6 2.6 2 Mit
PTPN14 Protein tyr
phosphotase
BC017300 2.5 3.0 M Mem Mit
Ind 1 and 2 represent the fold induction for the indicated gene based on the two
microarray experiments, Loc1 is the predicted subcellular location based on Tar-
getP V1.0 (www.cbs.dtu.dk), and Loc2 is the predicted subcellular localization
based on ProtComp V6.0 (www.softberry.com).
CELL METABOLISM : MARCH 2006
HIF1 regulation of mitochondrial function
Figure 1. Hypoxia inhibits mitochondrial oxygen
consumption
A) Oxygen concentration curves generated using
a Clark electrode for fibroblast suspensions from cul-
tures exposed to normoxia or hypoxia for 24 hr. Ar-
rows indicate addition of the mitochondrial uncou-
pler CCCP and cytochrome poison cyanide. The
slope of the curve is a measure of the rate of oxygen
consumption.
B) Average oxygen consumption rates in normal hu-
man fibroblasts and immortalized murine fibroblasts
cultured in normoxia or 0.5% O2 for 24 hr.
C) Fraction of total oxygen consumption due to mito-
chondrial versus nonmitochondrial consumption in
wild-type murine fibroblasts. Mitochondrial con-
sumption was determined using 1ug/ml of the cell
permeable complex 3 inhibitor Antimycin A.
D) Change in oxygen consumption in RKO cells after
exposure to the indicated time in 0.5% O2, and time
to recovery in normoxia following 24 hr hypoxia.
For all graphs, the error bars represent the standard
error of the mean.
induction was required for the observed reduction in oxygenconsumption in hypoxia using two genetically matched sys-tems. We measured normoxic and hypoxic oxygen consump-tion in murine fibroblasts derived from wild-type or HIF-1a nullembryos (Figure 2B) and from human RKO tumor cells andRKO cells constitutively expressing ShRNAs directed againstthe HIF-1a gene (Figures 2C and 4C). Neither of the HIF-defi-cient cell systems was able to reduce oxygen consumption in re-sponse to hypoxia. These data from the HIF-overexpressingRCC cells and the HIF-deficient cells indicate that HIF-1 isboth necessary and sufficient for reducing mitochondrial oxy-gen consumption in hypoxia.
HIF-dependent mitochondrial changes are functional,not structuralBecause addition of CCCP could increase oxygen consumptioneven in the hypoxia-treated cells, we hypothesized that the hyp-oxic inhibition was a regulated activity, not a structural change inthe mitochondria in response to hypoxic stress. We confirmedthis interpretation by examining several additional mitochondrialcharacteristics in hypoxic cells such as mitochondrial morphol-ogy, quantity, and membrane potential. We examined morphol-
CELL METABOLISM : MARCH 2006
ogy by visual inspection of both the transiently transfected mito-chondrially localized DsRed protein and the endogenousmitochondrial protein cytochrome C. Both markers were indis-tinguishable in the parental RCC4 and the RCC4VHL cells(Figure 3A). Likewise, we measured the mitochondrial mem-brane potential with the functional dye rhodamine 123 and foundthat it was identical in the matched RCC4 cells and the matchedHIF wt and knockout (KO) cells when cultured in normoxia orhypoxia (Figure 3B). Finally, we determined that the quantity ofmitochondria per cell was not altered in response to HIF or hyp-oxia by showing that the amount of the mitochondrial markerprotein HSP60 was identical in the RCC4 and HIF cell lines(Figure 3C)
PDK1 is a HIF-1 inducible target proteinAfter examination of the list of putative HIF-regulated mitochon-drial target genes, we hypothesized that PDK1 could mediatethe functional changes that we observed in hypoxia. We there-fore investigated PDK1 protein expression in response to HIFand hypoxia in the genetically matched cell systems. Figure 4Ashows that in the RCC4 cells PDK1 and the HIF-target geneBNip3 (Greijer et al., 2005; Papandreou et al., 2005a) were
189
A R T I C L E
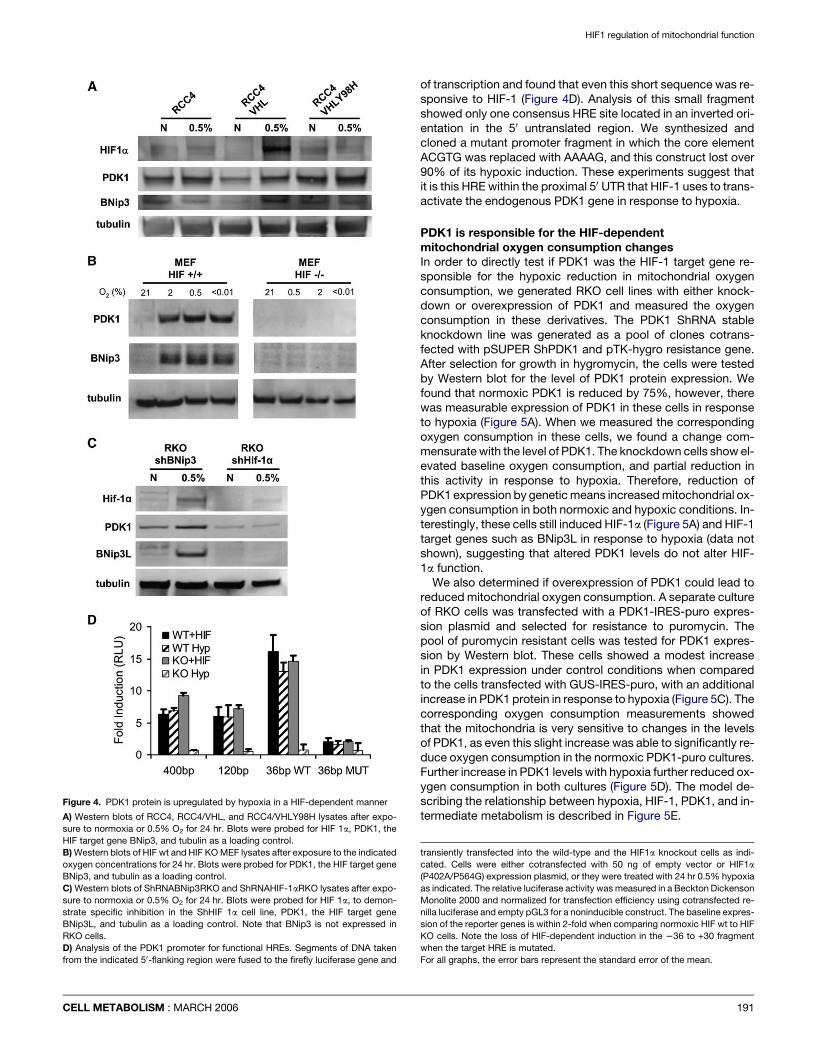
both induced by hypoxia in a VHL-dependent manner, with theexpression of PDK1 inversely matching the oxygen consump-tion measured in Figure 1 above. Likewise, the HIF wt MEFsshow oxygen-dependent induction of PDK1 and BNip3, whilethe HIF KO MEFs did not show any expression of either of theseproteins under any oxygen conditions (Figure 4B). Finally, theparental RKO cells were able to induce PDK1 and the HIF targetgene BNip3L in response to hypoxia, while the HIF-depletedShRNA RKO cells could not induce either protein (Figure 4C).Therefore, in all three cell types, the HIF-1-dependent regulationof oxygen consumption seen in Figure 2, corresponds to theHIF-1-dependent induction of PDK1 seen in Figure 4.
In order to determine if PDK1 was a direct HIF-1 target gene,we analyzed the genomic sequence flanking the 50 end of thegene for possible HIF-1 binding sites based on the consensuscore HRE element (A/G)CGTG (Caro, 2001). Several such sitesexist within the first 400 bases upstream, so we generated re-porter constructs by fusing the genomic sequence from 2400to +30 of the start site of transcription to the firefly luciferasegene. In transfection experiments, the chimeric constructshowed significant induction by either cotransfection with a con-stitutively active HIF proline mutant (P402A/P564G) (Chan et al.,2002) or exposure of the transfected cells to 0.5% oxygen(Figure 4D). Most noteworthy, when the reporter gene wastransfected into the HIF-1a null cells, it did not show induction
Figure 2. Hypoxic reduction in mitochondrial oxygen consumption is HIF-1 de-
pendent
A) Average oxygen consumption rates in vhl-deficient RCC4 cells, RCC4/VHL
cells, and RCC4/VHLY98H cells after exposure to 24 hr of normoxia or 0.5% O2.
B) Average oxygen consumption rates in HIF wt and HIF KO murine fibroblasts af-
ter exposure to normoxia or 0.5% O2 for 24 hr.
C) Average oxygen consumption rates in parental RKO cells and ShRNAHIF-1a
RKO cells after exposure to 24 hr of normoxia or 0.5% O2.
For all graphs, the error bars represent the standard error of the mean.
190
when the cells were cultured in hypoxia, but it did show induc-tion when cotransfected with expression HIF-1a plasmid. Wethen generated deletions down to the first 36 bases upstream
Figure 3. Mitochondria are not grossly altered by hypoxia or HIF activity
A) Fluorescent microscopy of RCC4 and RCC4/VHL cells under normoxic condi-
tions shows no morphologic difference in mitochondria. In the top panels, cells
were transiently transfected with mito-DsRed to label mitochondria and visualized
with 594 nm excitation. In the bottom panels, immunofluorescence was used to vi-
sualize the endogenous mitochondrial protein cytochrome c and detected with
anti-mouse Alexa 488 secondary antibody.
B) Mitochondrial membrane potential is not altered in RCC4, RCC4/VHL, RCC4/
VHLY98H, HIF wt MEFs, and HIF KO MEFs after exposure to normoxia or 0.5%
O2 for 24 hr. Rhodamine 123 staining and flow cytometry was used to measure
the mean fluorescence intensity, which is expressed relative to parental cells under
normoxic conditions.
C) Western blot of lysates from the indicated cells exposed to normoxia or 0.5% O2
for 24 hr were probed for mitochondrial HSP60, a constitutive mitochondrial pro-
tein, as a measure of total mitochondrial mass. Blots were reprobed for tubulin as
a loading control.
For all graphs, the error bars represent the standard error of the mean.
CELL METABOLISM : MARCH 2006
HIF1 regulation of mitochondrial function
Figure 4. PDK1 protein is upregulated by hypoxia in a HIF-dependent manner
A) Western blots of RCC4, RCC4/VHL, and RCC4/VHLY98H lysates after expo-
sure to normoxia or 0.5% O2 for 24 hr. Blots were probed for HIF 1a, PDK1, the
HIF target gene BNip3, and tubulin as a loading control.
B) Western blots of HIF wt and HIF KO MEF lysates after exposure to the indicated
oxygen concentrations for 24 hr. Blots were probed for PDK1, the HIF target gene
BNip3, and tubulin as a loading control.
C) Western blots of ShRNABNip3RKO and ShRNAHIF-1aRKO lysates after expo-
sure to normoxia or 0.5% O2 for 24 hr. Blots were probed for HIF 1a, to demon-
strate specific inhibition in the ShHIF 1a cell line, PDK1, the HIF target gene
BNip3L, and tubulin as a loading control. Note that BNip3 is not expressed in
RKO cells.
D) Analysis of the PDK1 promoter for functional HREs. Segments of DNA taken
from the indicated 50-flanking region were fused to the firefly luciferase gene and
CELL METABOLISM : MARCH 2006
of transcription and found that even this short sequence was re-sponsive to HIF-1 (Figure 4D). Analysis of this small fragmentshowed only one consensus HRE site located in an inverted ori-entation in the 50 untranslated region. We synthesized andcloned a mutant promoter fragment in which the core elementACGTG was replaced with AAAAG, and this construct lost over90% of its hypoxic induction. These experiments suggest thatit is this HRE within the proximal 50 UTR that HIF-1 uses to trans-activate the endogenous PDK1 gene in response to hypoxia.
PDK1 is responsible for the HIF-dependentmitochondrial oxygen consumption changesIn order to directly test if PDK1 was the HIF-1 target gene re-sponsible for the hypoxic reduction in mitochondrial oxygenconsumption, we generated RKO cell lines with either knock-down or overexpression of PDK1 and measured the oxygenconsumption in these derivatives. The PDK1 ShRNA stableknockdown line was generated as a pool of clones cotrans-fected with pSUPER ShPDK1 and pTK-hygro resistance gene.After selection for growth in hygromycin, the cells were testedby Western blot for the level of PDK1 protein expression. Wefound that normoxic PDK1 is reduced by 75%, however, therewas measurable expression of PDK1 in these cells in responseto hypoxia (Figure 5A). When we measured the correspondingoxygen consumption in these cells, we found a change com-mensurate with the level of PDK1. The knockdown cells show el-evated baseline oxygen consumption, and partial reduction inthis activity in response to hypoxia. Therefore, reduction ofPDK1 expression by genetic means increased mitochondrial ox-ygen consumption in both normoxic and hypoxic conditions. In-terestingly, these cells still induced HIF-1a (Figure 5A) and HIF-1target genes such as BNip3L in response to hypoxia (data notshown), suggesting that altered PDK1 levels do not alter HIF-1a function.
We also determined if overexpression of PDK1 could lead toreduced mitochondrial oxygen consumption. A separate cultureof RKO cells was transfected with a PDK1-IRES-puro expres-sion plasmid and selected for resistance to puromycin. Thepool of puromycin resistant cells was tested for PDK1 expres-sion by Western blot. These cells showed a modest increasein PDK1 expression under control conditions when comparedto the cells transfected with GUS-IRES-puro, with an additionalincrease in PDK1 protein in response to hypoxia (Figure 5C). Thecorresponding oxygen consumption measurements showedthat the mitochondria is very sensitive to changes in the levelsof PDK1, as even this slight increase was able to significantly re-duce oxygen consumption in the normoxic PDK1-puro cultures.Further increase in PDK1 levels with hypoxia further reduced ox-ygen consumption in both cultures (Figure 5D). The model de-scribing the relationship between hypoxia, HIF-1, PDK1, and in-termediate metabolism is described in Figure 5E.
transiently transfected into the wild-type and the HIF1a knockout cells as indi-
cated. Cells were either cotransfected with 50 ng of empty vector or HIF1a
(P402A/P564G) expression plasmid, or they were treated with 24 hr 0.5% hypoxia
as indicated. The relative luciferase activity was measured in a Beckton Dickenson
Monolite 2000 and normalized for transfection efficiency using cotransfected re-
nilla luciferase and empty pGL3 for a noninducible construct. The baseline expres-
sion of the reporter genes is within 2-fold when comparing normoxic HIF wt to HIF
KO cells. Note the loss of HIF-dependent induction in the 236 to +30 fragment
when the target HRE is mutated.
For all graphs, the error bars represent the standard error of the mean.
191

A R T I C L E
Figure 5. PDK1 expression directly regulates cellu-
lar oxygen consumption rate
A) Western blot of RKO cell and ShRNAPDK1RKO
cell lysates after exposure to 24 hr of normoxia or
0.5% O2. Blots were probed for HIF 1a, PDK1, and
tubulin as a loading control.
B) Oxygen consumption rate in RKO and
ShRNAPDK1RKO cells after exposure to 24 hr of
normoxia or 0.5% O2.
C) Western blot of RKOiresGUS cell and RKOir-
esPDK1 cell lysates after exposure to 24 hr of nor-
moxia or 0.5% O2. Blots were probed for HIF 1a,
PDK1, and tubulin as a loading control.
D) Oxygen consumption rate in RKOiresGUS and
RKOiresPDK1 cells after exposure to 24 hr of nor-
moxia or 0.5% O2.
E) Model describing the interconnected effects of
HIF-1 target gene activation on hypoxic cell metabo-
lism. Reduced oxygen conditions causes HIF-1 to
coordinately induce the enzymes shown in boxes.
HIF-1 activation results in increased glucose trans-
porter expression to increase intracellular glucose
flux, induction of glycolytic enzymes increases the
conversion of glucose to pyruvate generating energy
and NADH, induction of PDK1 decreases mitochon-
drial utilization of pyruvate and oxygen, and induc-
tion of LDH increases the removal of excess pyruvate
as lactate and also regenerates NAD+ for increased
glycolysis.
For all graphs, the error bars represent the standard
error of the mean.
Altering oxygen consumption alters intracellular oxygentension and sensitivity to hypoxia-dependent cell killingThe intracellular concentration of oxygen is a net result of therate at which oxygen diffuses into the cell and the rate at whichit is consumed. We hypothesized that the rate at which oxygenwas consumed within the cell would significantly affect itssteady-state intracellular concentrations. We tested this hy-pothesis in vitro using the hypoxic marker drug pimonidazole(Bennewith and Durand, 2004). We plated high density culturesof HIF wild-type and HIF knockout cells and placed these cul-tures in normoxic, 2% oxygen, and anoxic incubators for over-night treatment. The overnight treatment gives the cells timeto adapt to the hypoxic conditions and establish altered oxygenconsumption profiles. Pimonidozole was then added for the last4 hr of the growth of the culture. Pimonidazole binding was de-
192
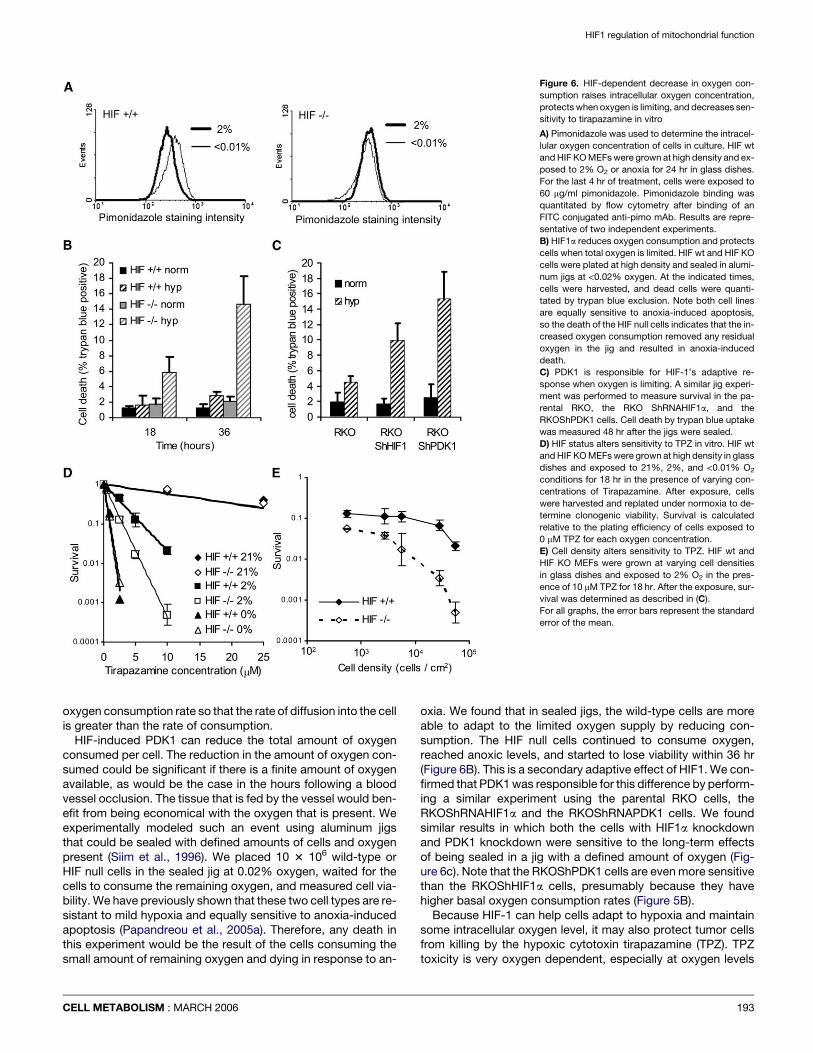
tected after fixation of the cells using an FITC labeled anti-pimo-nidazole antibody and it was quantitated by flow cytometry. Thequantity of the bound drug is a direct indication of the oxygenconcentration within the cell (Bennewith and Durand, 2004).The histograms in Figure 6A show that the HIF-1 knockoutand wild-type cells show similar staining in the cells grown in0% oxygen. However, the cells treated with 2% oxygen showthe consequence of the genetic removal of HIF-1. The HIF-pro-ficient cells showed relatively less pimonidazole binding at 2%when compared to the 0% culture, while the HIF-deficient cellsshowed identical binding between the cells at 2% and those at0%. We interpret these results to mean that the HIF-deficientcells have greater oxygen consumption, and this has loweredthe intracellular oxygenation from the ambient 2% to closeto zero intracellularly. The HIF-proficient cells reduced their
CELL METABOLISM : MARCH 2006
HIF1 regulation of mitochondrial function
Figure 6. HIF-dependent decrease in oxygen con-
sumption raises intracellular oxygen concentration,
protects when oxygen is limiting, and decreases sen-
sitivity to tirapazamine in vitro
A) Pimonidazole was used to determine the intracel-
lular oxygen concentration of cells in culture. HIF wt
and HIF KO MEFs were grown at high density and ex-
posed to 2% O2 or anoxia for 24 hr in glass dishes.
For the last 4 hr of treatment, cells were exposed to
60 mg/ml pimonidazole. Pimonidazole binding was
quantitated by flow cytometry after binding of an
FITC conjugated anti-pimo mAb. Results are repre-
sentative of two independent experiments.
B) HIF1a reduces oxygen consumption and protects
cells when total oxygen is limited. HIF wt and HIF KO
cells were plated at high density and sealed in alumi-
num jigs at <0.02% oxygen. At the indicated times,
cells were harvested, and dead cells were quanti-
tated by trypan blue exclusion. Note both cell lines
are equally sensitive to anoxia-induced apoptosis,
so the death of the HIF null cells indicates that the in-
creased oxygen consumption removed any residual
oxygen in the jig and resulted in anoxia-induced
death.
C) PDK1 is responsible for HIF-1’s adaptive re-
sponse when oxygen is limiting. A similar jig experi-
ment was performed to measure survival in the pa-
rental RKO, the RKO ShRNAHIF1a, and the
RKOShPDK1 cells. Cell death by trypan blue uptake
was measured 48 hr after the jigs were sealed.
D) HIF status alters sensitivity to TPZ in vitro. HIF wt
and HIF KO MEFs were grown at high density in glass
dishes and exposed to 21%, 2%, and <0.01% O2
conditions for 18 hr in the presence of varying con-
centrations of Tirapazamine. After exposure, cells
were harvested and replated under normoxia to de-
termine clonogenic viability. Survival is calculated
relative to the plating efficiency of cells exposed to
0 mM TPZ for each oxygen concentration.
E) Cell density alters sensitivity to TPZ. HIF wt and
HIF KO MEFs were grown at varying cell densities
in glass dishes and exposed to 2% O2 in the pres-
ence of 10 mM TPZ for 18 hr. After the exposure, sur-
vival was determined as described in (C).
For all graphs, the error bars represent the standard
error of the mean.
oxygen consumption rate so that the rate of diffusion into the cellis greater than the rate of consumption.
HIF-induced PDK1 can reduce the total amount of oxygenconsumed per cell. The reduction in the amount of oxygen con-sumed could be significant if there is a finite amount of oxygenavailable, as would be the case in the hours following a bloodvessel occlusion. The tissue that is fed by the vessel would ben-efit from being economical with the oxygen that is present. Weexperimentally modeled such an event using aluminum jigsthat could be sealed with defined amounts of cells and oxygenpresent (Siim et al., 1996). We placed 10 3 106 wild-type orHIF null cells in the sealed jig at 0.02% oxygen, waited for thecells to consume the remaining oxygen, and measured cell via-bility. We have previously shown that these two cell types are re-sistant to mild hypoxia and equally sensitive to anoxia-inducedapoptosis (Papandreou et al., 2005a). Therefore, any death inthis experiment would be the result of the cells consuming thesmall amount of remaining oxygen and dying in response to an-
CELL METABOLISM : MARCH 2006
oxia. We found that in sealed jigs, the wild-type cells are moreable to adapt to the limited oxygen supply by reducing con-sumption. The HIF null cells continued to consume oxygen,reached anoxic levels, and started to lose viability within 36 hr(Figure 6B). This is a secondary adaptive effect of HIF1. We con-firmed that PDK1 was responsible for this difference by perform-ing a similar experiment using the parental RKO cells, theRKOShRNAHIF1a and the RKOShRNAPDK1 cells. We foundsimilar results in which both the cells with HIF1a knockdownand PDK1 knockdown were sensitive to the long-term effectsof being sealed in a jig with a defined amount of oxygen (Fig-ure 6c). Note that the RKOShPDK1 cells are even more sensitivethan the RKOShHIF1a cells, presumably because they havehigher basal oxygen consumption rates (Figure 5B).
Because HIF-1 can help cells adapt to hypoxia and maintainsome intracellular oxygen level, it may also protect tumor cellsfrom killing by the hypoxic cytotoxin tirapazamine (TPZ). TPZtoxicity is very oxygen dependent, especially at oxygen levels
193

A R T I C L E
between 1%–4% (Koch, 1993). We therefore tested the relativesensitivity of the HIF wt and HIF KO cells to TPZ killing in highdensity cultures (Figure 6D). We exposed the cells to the indi-cated concentrations of drug and oxygen concentrations over-night. The cells were then harvested and replated to determinereproductive viability by colony formation. Both cell typeswere equally resistant to TPZ at 21% oxygen, while both celltypes are equally sensitive to TPZ in anoxic conditions where in-tracellular oxygen levels are equivalent (Figure 6A). The identicalsensitivity of both cell types in anoxia indicates that both celltypes are equally competent in repairing the TPZ-inducedDNA damage that is presumed to be responsible for its toxicity.However, in 2% oxygen cultures, the HIF null cells displayeda significantly greater sensitivity to the drug than the wild-typecells. This suggests that the increased oxygen consumptionrate in the HIF-deficient cells is sufficient to lower the intracellu-lar oxygen concentration relative to that in the HIF-proficientcells. The lower oxygen level is significant enough to dramati-cally sensitize these cells to killing by TPZ.
If the increased sensitivity to TPZ in the HIF ko cells is deter-mined by intracellular oxygen consumption differences, thenthis effect should also be cell-density dependent. We showedthat this is indeed the case in Figure 6E where oxygen andTPZ concentrations were held constant, and increased cell den-sity lead to increased TPZ toxicity. The effect was much morepronounced in the HIF KO cells, although the HIF wt cellsshowed some increased toxicity in the highest density cultures,consistent with the fact they were still consuming some oxygen,even with HIF present (Figure 1). The in vitro TPZ survival data istherefore consistent with our hypothesis that control of oxygenconsumption can regulate intracellular oxygen concentration,and suggests that increased oxygen consumption could sensi-tize cells to hypoxia-dependent therapy.
Discussion
The findings presented here show that HIF-1 is actively respon-sible for regulating energy production in hypoxic cells by an ad-ditional, previously unrecognized mechanism. It has beenshown that HIF-1 induces the enzymes responsible for glycoly-sis when it was presumed that low oxygen did not support effi-cient oxidative phosphorylation (Iyer et al., 1998; Seagroveset al., 2001). The use of glucose to generate ATP is capable ofsatisfying the energy requirements of a cell if glucose is in ex-cess (Papandreou et al., 2005a). We now find that at the sametime that glycolysis is increasing, mitochondrial respiration isdecreasing. However, the decreased respiration is not becausethere is not enough oxygen present to act as a substrate for ox-idative phosphorylation, but because the flow of pyruvate intothe TCA cycle has been reduced by the activity of pyruvate de-hydrogenase kinase. Other reports have suggested that oxygenutilization is shifted in cells exposed to hypoxia, but these re-ports have focused on other regulators such as nitric oxide syn-thase (Hagen et al., 2003). NO can reduce oxygen consumptionthrough direct inhibition of cytochrome oxidase, but this effectseems to be more significant at physiologic oxygen concentra-tions, not at severe levels seen in the tumor (Palacios-Callenderet al., 2004).
Several reports have also suggested a link between alteredmitochondrial function in hypoxia and HIF activation (Brunelleet al., 2005; Guzy et al., 2005; Mansfield et al., 2005). While
194
the models are not mutually exclusive, our results indicate thatHIF target gene activation is upstream of mitochondrial function,and responsible for altering mitochondrial activity. The questionbecomes more complicated with the acute (biochemical) andchronic (epigenetic) changes that occur with different kinetics.In fact, there may be several levels of adaptive response andfeedback-feedforward cycles such as the recently reporteddownregulation of succinate dehydrogenase by hypoxia (Dahiaet al., 2005).
This hypoxic shift in intermediate metabolism away from oxi-dative phosphorylation provides an elegant means for the cell tomaintain both energy and redox states (diagrammed in Figure 5)(Semenza et al., 2001). ATP is produced through the breakdownof glucose to pyruvate but requires NAD as a cofactor for glyc-eraldehyde phosphate dehydrogenase (GAPDH), where it is re-duced into NADH. NADH is routinely oxidized by the mitochon-dria to produce high energy electrons for electron chain transferand is regenerated to NAD for glycolysis. Under anoxic condi-tions, NADH is not recycled by the mitochondria, and so itmust be regenerated by another means. The alternative nonoxy-gen requiring pathway is through the conversion of pyruvate tolactate by lactate dehydrogenase (LDH). Lactate is secretedinto the extracellular space, and NAD is regenerated. The NADcycle and redox state of the cell is therefore maintained throughthe activity of several interrelated systems, all of which are coor-dinately regulated by HIF-1 (glycolytic enzymes, pyruvate dehy-drogenase kinase, and lactate dehydrogenase) (Leong et al.,2003).
Inhibiting HIF-1 activity in the hypoxic tumor cells is predictedto have several therapeutic effects. One primary rationale for tar-geting HIF-1 is that it should only be activated within the hypoxictumor, so that therapy directed against HIF should not have sys-temic side effects. Current tumor models suggest that inhibitingHIF target genes such as VEGF will reduce tumor angiogenesis(Moeller et al., 2004). However, the data supporting HIF inhibi-tion as a means for direct tumor toxicity are mixed, and it ap-pears that a HIF inhibitor will probably not be curative on itsown. It is therefore imperative to determine what would be themost effective combination of drugs to use with a HIF inhibitor.We propose that one result of HIF inhibition would be to increaseoxygen consumption and make tumors more hypoxic. HIF inhib-itors might therefore be best used in clinical practice in conjunc-tion with hypoxic cytotoxins such as Tirapazamine.
Experimental procedures
Cell lines and cell culture
Primary human fibroblasts have been described (Denko et al., 2003) and
RKO human colon carcinoma cells were obtained from the American Type
Culture Collection (ATCC, Manassas, VA). RCC4, RCC4/VHL, and RCC4/
Y98H human renal cell carcinoma cell lines have also been described previ-
ously (Chan et al., 2005). Wild-type and HIF-1a knockout mouse embryo fi-
broblasts (MEFs) were a gift from Dr. R Johnson (University of California,
San Diego). All cells were grown in Dulbecco’s Modified Eagle’s Media
(DMEM) supplemented with 10% fetal bovine serum (FBS). For moderate
hypoxia, cell culture dishes were placed into an Invivo2 humidified hypoxia
workstation (Ruskinn Technologies, Bridgend, UK) at the indicated oxygen
concentrations. Severe hypoxia was generated in an anaerobic workstation
with a palladium catalyst (Sheldon Co., Cornelius, OR). Tirapazamine (a gift of
M. Brown, Stanford University) toxicity was measured in cells after overnight
growth at the indicated density in glass dishes. The next day, fresh media
was added containing the indicated concentration of TPZ, and the cells
CELL METABOLISM : MARCH 2006
HIF1 regulation of mitochondrial function
placed in the indicated oxygen environment. Eighteen hours later, the cells
were trypsinized, counted, and plated for colony formation in normoxia.
Plasmids and siRNAs
Full-length human PDK1 cDNA was obtained from the mammalian gene col-
lection (MGC), through the ATCC, and was cloned into pEF2aIRESpuro cre-
ating pPDK1IRESpuro. pDsRed2-mito was constructed by cloning a 28
amino acid mitochondrial targeting sequence from human cytochrome c ox-
idase subunit VIII into the pDsRed2-N1 vector (Clontech, Mountain View,
CA). For knockdown experiments, the target sequences used were: HIF-
1a, UGAGGAAGUACCAUUAUAU and PDK1, CGACACAAUGAUGUCAU
UCCCACAA. For construction of stable knockdown cell lines, the sequences
listed above were cloned into pSUPER using synthetic 64-mer oligonucleo-
tides (Brummelkamp et al., 2002). RKO/shPDK1 and RKO/shHIF-1a stable
knockdown cells were created by cotransfecting RKO cells with pTKhygro,
and either empty pSuper, pSuper-shPDK1 or pSuper-shHIF-1a (1:20 ratio)
using Lipofectamine (Invitrogen, Carlsbad, CA), followed by selection in
500 ug/ml hygromycin. The RKOPDK1IRESpuro stable overexpressing cell
lines were established by transfecting RKO cells with pPDK1IRESpuro using
Lipofectamine followed by culture in 2 mg/ml puromycin.
Microarray analysis
Total RNA was extracted using TriZol reagent (Invitrogen). Preparation of
cDNA and cRNA was conducted following instructions in the Affymetrix Gen-
eChip Expression Analysis Manual (Affymetrix, Santa Clara, CA). cRNA was
hybridized to an oligo-based array, washed and scanned according to stan-
dard Affymetrix protocols. Data from the scanning of the Affymetrix Gene-
Chips was gathered using the Affymetrix Microarray Suite v4.0 and exported
to Microsoft Excel.
Oxygen consumption measurements
Cells were trypsinized and suspended at 3 3 106 to 6 3 106 cells per ml in
normoxic DMEM + 10% FBS. Oxygen consumption was measured in a 0.5
ml volume using an Oxytherm electrode unit (Hansatech, Norfolk, UK). This
system employs a Clark-type oxygen electrode to monitor the dissolved ox-
ygen concentration in a sealed measurement chamber over time. The data
are exported to a computerized chart recorder (Oxygraph 1.01, Hansatech,
Norfolk, UK), which calculates the rate of oxygen consumption. A small stir
bar maintains the cells in suspension, and a peltier heating block maintains
the temperature at 37ºC. Since the electrode consumes oxygen during mea-
surement, the rate of oxygen drop in 0.5 ml of DMEM media without cells was
established and subtracted from the total oxygen consumption rates for the
cell suspensions.
Western blotting
In brief, treated cells were harvested directly in RIPA buffer containing prote-
ase inhibitors, protein concentrations were quantitated, 25–50 mg were elec-
trophoresed on a reducing Tris-Tricine gel, and electroblotted to PVDF mem-
brane. Antibodies used were murine a-HIF-1 Transduction Labs (1:1000),
rabbit a-PDK1 Stressgen (1:2000), murine a-a tubulin Research Diagnostics
(1:2000) goat a-HSP60 Santa Cruz (1:2000), and rabbit a-Bnip3 and a Bnip3L
were described previously (1:500) (Papandreou et al., 2005a). Primary anti-
bodies were detected with species-specific secondary antibodies labeled
with Alkaline Phosphatase (Vector labs 1:3000) and visualized with ECF
(Amersham) on a Storm 860 phosphoimager (Molecular Devices).
Mitochondrial membrane potential staining and flow cytometry
Rhodamine 123 (R123) (Molecular Probes, Eugene, OR) uptake was used to
measure mitochondrial membrane potential. Cells were trypsinized,
counted, and suspended at 5 3 105 cells per ml in DMEM + 10% FBS with
10 mg/ml R123, at 37ºC for 10 min. The cells were pelleted by centrifugation
and resuspended in cold DMEM + 10% FBS. Fluorescence was measured in
a FACSCalibur flow cytometer (Becton Dickinson, San Jose, CA). Forward
scatter and side scatter values were used to gate on whole cells, and R123
fluorescence was measured for 10,000 cells per sample using the FL2 chan-
nel. All gain and amplifier settings were held constant for the duration of the
experiment. Since the R123 fluorescence values for all samples displayed
a log normal distribution, the geometric mean was used as a quantitative
measure of the cell population’s membrane potential.
CELL METABOLISM : MARCH 2006
Immunocytochemistry and fluorescence microscopy
Cells were plated on glass multiwell chamber slides (Nalge Nunc, Naperville,
IL) in DMEM + 10% FBS. For examination of mitochondrial DsRed2, cells
were transfected using Lipofectamine, 48 hr later they were fixed in 4% para-
formaldehyde, and mounted in Vectashield (Vector Laboratories, Burlin-
game, CA). For cytochrome c immunocytochemistry, chamber slides were
fixed in 4% paraformaldehyde, blocked in PBS Tween milk (0.2% Tween
20, 5% nonfat dry milk, in PBS) overnight at 4 C. Cytochrome c was visual-
ized using a mouse monoclonal antibody 1:250 (BD Pharmingen, San Diego,
CA) and an anti-mouse Alexa 488 secondary antibody 1:500 (Molecular
Probes). Cells were visualized on a Nikon Eclipse E800 microscope, with
a Spot RT Slider CCD digital camera using standard FITC and Texas Red fil-
ter blocks (Diagnostic Instruments, Sterling Heights, MI).
Pimonidazole staining
Hypoxyprobe 1 (pimonidazole hydrochloride) was purchased from Chem-
icon (Temecula, CA). Cells were treated at 60 mg/liter in the culture medium
during the final 4 hr of the hypoxic exposure, harvested, fixed in 4% parafor-
maldehyde, blocked in PBS containing 5% nonfat dry milk and 0.1%Triton
and 4% FBS (PBS-T-milk-FBS). After 2 hr blocking, cells were treated with
FITC-labeled anti-pimonidozole mAb at 1:25 dilution for 2 hr in PBS-T-
milk-FBS. The cells were then washed in PBS-T-milk-FBS and relative
FITC was measured on FL1 in a Beckton-Dickenson FacScanner.
Data analysis
Oxygen consumption experiments were repeated three times in duplicate,
survival was measured three times in triplicate, reporter assays were re-
peated two times in quadruplicate. Error bars represent the standard error
of the mean.
Supplemental data
Supplemental data include one table and can be found with this article online
at http://www.cellmetabolism.org/cgi/content/full/3/3/187/DC1/.
Acknowledgments
This work was supported by grant CA67166 from the National Cancer Insti-
tute (NCI). These findings were first presented at the NCI Workshop ‘‘Mito-
chondrial Function and Cancer’’ in May 2004 (Perry et al., 2004).
Received: November 3, 2005Revised: December 19, 2005
Accepted: January 31, 2006
Published: March 7, 2006
References
Airley, R., Loncaster, J., Davidson, S., Bromley, M., Roberts, S., Patterson,A., Hunter, R., Stratford, I., and West, C. (2001). Glucose transporter glut-1expression correlates with tumor hypoxia and predicts metastasis-free sur-vival in advanced carcinoma of the cervix. Clin. Cancer Res. 7, 928–934.
Bennewith, K.L., and Durand, R.E. (2004). Quantifying transient hypoxia inhuman tumor xenografts by flow cytometry. Cancer Res. 64, 6183–6189.
Brizel, D.M., Scully, S.P., Harrelson, J.M., Layfield, L.J., Bean, J.M., Prosnitz,L.R., and Dewhirst, M.W. (1996). Tumor oxygenation predicts for the likeli-hood of distant metastases in human soft tissue sarcoma. Cancer Res. 56,941–943.
Brown, G.C. (1992). Control of respiration and ATP synthesis in mammalianmitochondria and cells. Biochem. J. 284, 1–13.
Brown, J.M., and Giaccia, A.J. (1998). The unique physiology of solid tumors:opportunities (and problems) for cancer therapy. Cancer Res. 58, 1408–1416.
Bruick, R.K., and McKnight, S.L. (2001). A conserved family of prolyl-4-hy-droxylases that modify HIF. Science 294, 1337–1340.
195
A R T I C L E
Brummelkamp, T.R., Bernards, R., and Agami, R. (2002). A system for stableexpression of short interfering RNAs in mammalian cells. Science 296, 550–553.
Brunelle, J.K., Bell, E.L., Quesada, N.M., Vercauteren, K., Tiranti, V.,Zeviani, M., Scarpulla, R.C., and Chandel, N.S. (2005). Oxygen sensingrequires mitochondrial ROS but not oxidative phosphorylation. Cell Metab1, 409–414.
Cairns, R.A., and Hill, R.P. (2004). Acute hypoxia enhances spontaneouslymph node metastasis in an orthotopic murine model of human cervical car-cinoma. Cancer Res. 64, 2054–2061.
Caro, J. (2001). Hypoxia regulation of gene transcription. High Alt. Med. Biol.2, 145–154.
Chan, D.A., Sutphin, P.D., Denko, N.C., and Giaccia, A.J. (2002). Role ofprolyl hydroxylation in oncogenically stabilized hypoxia-inducible factor-1al-pha. J. Biol. Chem. 277, 40112–40117.
Chan, D.A., Sutphin, P.D., Yen, S.E., and Giaccia, A.J. (2005). Coordinateregulation of the oxygen-dependent degradation domains of hypoxia-induc-ible factor 1(alpha). Mol. Cell. Biol. 25, 6415–6426.
Chandel, N.S., Budinger, G.R., Choe, S.H., and Schumacker, P.T. (1997).Cellular respiration during hypoxia. Role of cytochrome oxidase as the oxy-gen sensor in hepatocytes. J. Biol. Chem. 272, 18808–18816.
Dahia, P.L., Ross, K.N., Wright, M.E., Hayashida, C.Y., Santagata, S., Baron-tini, M., Kung, A.L., Sanso, G., Powers, J.F., Tischler, A.S., et al. (2005). AHIF1alpha regulatory loop links hypoxia and mitochondrial signals in pheo-chromocytomas. PLoS Genet 1, 72–80.
Denko, N.C., Fontana, L.A., Hudson, K.M., Sutphin, P.D., Raychaudhuri, S.,Altman, R., and Giaccia, A.J. (2003). Investigating hypoxic tumor physiologythrough gene expression patterns. Oncogene 22, 5907–5914.
Epstein, A.C., Gleadle, J.M., McNeill, L.A., Hewitson, K.S., O’Rourke, J.,Mole, D.R., Mukherji, M., Metzen, E., Wilson, M.I., Dhanda, A., et al. (2001).C. elegans EGL-9 and mammalian homologs define a family of dioxygenasesthat regulate HIF by prolyl hydroxylation. Cell 107, 43–54.
Graeber, T.G., Osmanian, C., Jacks, T., Housman, D.E., Koch, C.J., Lowe,S.W., and Giaccia, A.J. (1996). Hypoxia-mediated selection of cells with di-minished apoptotic potential in solid tumours. Nature 379, 88–91.
Greijer, A.E., van der Groep, P., Kemming, D., Shvarts, A., Semenza, G.L.,Meijer, G.A., van de Wiel, M.A., Belien, J.A., van Diest, P.J., and van derWall, E. (2005). Up-regulation of gene expression by hypoxia is mediated pre-dominantly by hypoxia-inducible factor 1 (HIF-1). J. Pathol. 206, 291–304.
Gulledge, C.J., and Dewhirst, M.W. (1996). Tumor oxygenation: a matter ofsupply and demand. Anticancer Res. 16, 741–749.
Guzy, R.D., Hoyos, B., Robin, E., Chen, H., Liu, L., Mansfield, K.D., Simon,M.C., Hammerling, U., and Schumacker, P.T. (2005). Mitochondrial complexIII is required for hypoxia-induced ROS production and cellular oxygen sens-ing. Cell Metab 1, 401–408.
Hagen, T., Taylor, C.T., Lam, F., and Moncada, S. (2003). Redistribution ofintracellular oxygen in hypoxia by nitric oxide: effect on HIF1alpha. Science302, 1975–1978.
Hockel, M., Schlenger, K., Aral, B., Mitze, M., Schaffer, U., and Vaupel, P.(1996). Association between tumor hypoxia and malignant progression in ad-vanced cancer of the uterine cervix. Cancer Res. 56, 4509–4515.
Hockel, M., and Vaupel, P. (2001). Tumor hypoxia: definitions and currentclinical, biologic, and molecular aspects. J. Natl. Cancer Inst. 93, 266–276.
Holness, M.J., and Sugden, M.C. (2003). Regulation of pyruvate dehydroge-nase complex activity by reversible phosphorylation. Biochem. Soc. Trans.31, 1143–1151.
Ivan, M., Kondo, K., Yang, H., Kim, W., Valiando, J., Ohh, M., Salic, A., Asara,J.M., Lane, W.S., and Kaelin, W.G., Jr. (2001). HIFalpha targeted for VHL-mediated destruction by proline hydroxylation: implications for O2 sensing.Science 292, 464–468.
196
Iyer, N.V., Kotch, L.E., Agani, F., Leung, S.W., Laughner, E., Wenger, R.H.,Gassmann, M., Gearhart, J.D., Lawler, A.M., Yu, A.Y., and Semenza, G.L.(1998). Cellular and developmental control of O2 homeostasis by hypoxia-inducible factor 1 alpha. Genes Dev. 12, 149–162.
Jaakkola, P., Mole, D.R., Tian, Y.M., Wilson, M.I., Gielbert, J., Gaskell, S.J.,Kriegsheim, A., Hebestreit, H.F., Mukherji, M., Schofield, C.J., et al. (2001).Targeting of HIF-alpha to the von Hippel-Lindau ubiquitylation complex byO2-regulated prolyl hydroxylation. Science 292, 468–472.
Kimura, S., Kitadai, Y., Tanaka, S., Kuwai, T., Hihara, J., Yoshida, K., Toge,T., and Chayama, K. (2004). Expression of hypoxia-inducible factor (HIF)-1alpha is associated with vascular endothelial growth factor expressionand tumour angiogenesis in human oesophageal squamous cell carcinoma.Eur. J. Cancer 40, 1904–1912.
Koch, C.J. (1993). Unusual oxygen concentration dependence of toxicity ofSR-4233, a hypoxic cell toxin. Cancer Res. 53, 3992–3997.
Kondo, K., Kim, W.Y., Lechpammer, M., and Kaelin, W.G., Jr. (2003). Inhibi-tion of HIF2alpha is sufficient to suppress pVHL-defective tumor growth.PLoS Biol. 1, e83. 10.1371/journal.pbio.0000083.
Koukourakis, M.I., Giatromanolaki, A., Sivridis, E., Gatter, K.C., and Harris,A.L. (2005). Pyruvate dehydrogenase and pyruvate dehydrogenase kinaseexpression in non small cell lung cancer and tumor-associated stroma. Neo-plasia 7, 1–6.
Leong, H.S., Brownsey, R.W., Kulpa, J.E., and Allard, M.F. (2003). Glycolysisand pyruvate oxidation in cardiac hypertrophy–why so unbalanced? Comp.Biochem. Physiol. A Mol. Integr. Physiol. 135, 499–513.
Mansfield, K.D., Guzy, R.D., Pan, Y., Young, R.M., Cash, T.P., Schumacker,P.T., and Simon, M.C. (2005). Mitochondrial dysfunction resulting from lossof cytochrome c impairs cellular oxygen sensing and hypoxic HIF-alpha ac-tivation. Cell Metab 1, 393–399.
Maxwell, P.H., Wiesener, M.S., Chang, G.W., Clifford, S.C., Vaux, E.C.,Cockman, M.E., Wykoff, C.C., Pugh, C.W., Maher, E.R., and Ratcliffe, P.J.(1999). The tumour suppressor protein VHL targets hypoxia-inducible factorsfor oxygen-dependent proteolysis. Nature 399, 271–275.
Moeller, B.J., Cao, Y., Li, C.Y., and Dewhirst, M.W. (2004). Radiation acti-vates HIF-1 to regulate vascular radiosensitivity in tumors: role of reoxygena-tion, free radicals, and stress granules. Cancer Cell 5, 429–441.
Nordsmark, M., and Overgaard, J. (2004). Tumor hypoxia is independent ofhemoglobin and prognostic for loco-regional tumor control after primary ra-diotherapy in advanced head and neck cancer. Acta Oncol. 43, 396–403.
Palacios-Callender, M., Quintero, M., Hollis, V.S., Springett, R.J., and Mon-cada, S. (2004). Endogenous NO regulates superoxide production at low ox-ygen concentrations by modifying the redox state of cytochrome c oxidase.Proc. Natl. Acad. Sci. USA 101, 7630–7635.
Papandreou, I., Krishna, C., Kaper, F., Cai, D., Giaccia, A.J., and Denko, N.C.(2005a). Anoxia is necessary for tumor cell toxicity caused by a low-oxygenenvironment. Cancer Res. 65, 3171–3178.
Papandreou, I., Powell, A., Lim, A.L., and Denko, N. (2005b). Cellular reactionto hypoxia: sensing and responding to an adverse environment. Mutat. Res.569, 87–100.
Perry, M.E., Dang, C.V., Hockenbery, D., and Moll, U. (2004). Highlights of theNational Cancer Institute Workshop on mitochondrial function and cancer.Cancer Res. 64, 7640–7644.
Roche, T.E., Baker, J.C., Yan, X., Hiromasa, Y., Gong, X., Peng, T., Dong, J.,Turkan, A., and Kasten, S.A. (2001). Distinct regulatory properties of pyruvatedehydrogenase kinase and phosphatase isoforms. Prog. Nucleic Acid Res.Mol. Biol. 70, 33–75.
Seagroves, T.N., Ryan, H.E., Lu, H., Wouters, B.G., Knapp, M., Thibault, P.,Laderoute, K., and Johnson, R.S. (2001). Transcription factor HIF-1 is a nec-essary mediator of the pasteur effect in mammalian cells. Mol. Cell. Biol. 21,3436–3444.
Semenza, G.L. (2004). O2-regulated gene expression: transcriptional controlof cardiorespiratory physiology by HIF-1. J. Appl. Physiol. 96, 1173–1177.
CELL METABOLISM : MARCH 2006

HIF1 regulation of mitochondrial function
Semenza, G.L., Artemov, D., Bedi, A., Bhujwalla, Z., Chiles, K., Feldser, D.,Laughner, E., Ravi, R., Simons, J., Taghavi, P., and Zhong, H. (2001). ‘Themetabolism of tumours’: 70 years later. Novartis Found. Symp. 240, 251–260.
Siim, B.G., van Zijl, P.L., and Brown, J.M. (1996). Tirapazamine-induced DNAdamage measured using the comet assay correlates with cytotoxicity to-wards hypoxic tumour cells in vitro. Br. J. Cancer 73, 952–960.
Sugden, M.C., and Holness, M.J. (2003). Recent advances in mechanismsregulating glucose oxidation at the level of the pyruvate dehydrogenasecomplex by PDKs. Am. J. Physiol. Endocrinol. Metab. 284, E855–E862.
CELL METABOLISM : MARCH 2006
Wang, G.L., and Semenza, G.L. (1993). General involvement of hypoxia-inducible factor 1 in transcriptional response to hypoxia. Proc. Natl. Acad.Sci. USA 90, 4304–4308.
Accession numbers
Microarray raw data has been uploaded to National Center for Biotechnology
Information (NCBI) Gene Expression Omnibus (GEO) database for public ac-
cess with the accession number GSE4186.
197