Extending Students' Practice of Metacognitive Regulation ...

Elsevier Editorial System(tm) for Earth and Planetary Science Letters Manuscript Draft Manuscript Number: EPSL-D-11-00160R2 Title: Relationship between topography, rates of extension and mantle dynamics in the actively-extending Italian Apennines. Article Type: Regular Article Keywords: Active normal faults; Italy; strain-rates; topography Corresponding Author: Dr Gerald Roberts, Corresponding Author's Institution: First Author: Joanna Faure Walker, PhD Order of Authors: Joanna Faure Walker, PhD; Gerald Roberts; Patience A Cowie; Ioannis Papanikolaou; Alessandro Michetti; Peter Sammonds; Maxwell Wilkinson; Kenneth McCaffrey; Richard Phillips Abstract: To investigate the mechanism driving active extension in the central and southern Italian Apennines and the geography of seismic hazard, we compare spatial variations in upper crustal strain-rate measured across exposed fault scarps since 15 ±3 ka with data on cumulative upper-crustal strain and topographic elevation, and free-air gravity, P-wave tomography and SKS splitting delay times that are a proxy for strain in the mantle. High extensional strain-rates across the Apennines since 15 ±3 ka (0.4-3.1 mm/yr along 90 km transects) occur in two areas (Lazio-Abruzzo; SE Campania and Basilicata) where values for finite extensional strains that have developed since 2-3 Ma are highest (2-7 km cumulative throw), and where mean elevation in 5 x 90 km NE-SW boxes is > 600 m; the intervening area (NW Campania and Molise) with < 600 m mean elevation in 5 x 90 km boxes has extension-rates < 0.4 mm/yr and lower values for finite extensional strains (< 2 km cumulative throw). These two areas with high upper-crustal strain-rates overlie mantle that has relatively-long spatially-interpolated SKS delay times (1.2-1.8 seconds) indicating relatively-high mantle strains and free-air gravity values (140-160 mGals); the intervening area of lower extension-rate has shorter spatially-interpolated SKS delay times (0.8-1.2 seconds) and lower free-air gravity values (120 mGals). The two areas with high upper crustal strain-rates and strain, mean elevation, and mantle strain, coincide with the northern and southern edges of a slab window in the Tyrrhenian-Apennines subducting plate that has been inferred from published P-wave tomography. Together these correlations suggest that dynamic support of the topography by mantle flow through the slab window may control the present day upper crustal strain-rate field in the Apennines and the geography of seismic hazard in the region.

Relationship between topography, rates of extension and
mantle dynamics in the actively-extending Italian
Apennines.
Faure Walker, J. P.1, Roberts, G. P.1, Cowie, P. A.2, Papanikolaou, I.1,Michetti, A. M.3, Sammonds, P.1,Wilkinson, M.4, McCaffrey, K. J. W.4,
Phillips, R.2
1Research School of Earth Sciences, UCL/Birkbeck, Gower Street, London, WC1E 6BT, UK
2Institute of Geography School of GeoSciences, University of Edinburgh, Drummond Street,Edinburgh, EH8 9XP, UK
3Universita dell’Insubria, Dipartimento di Scienze, CC.FF.MM., Via Lucini, 3, 22100,Como, Italy
4Department of Earth Sciences, University of Durham, Durham DH1 3LE, UK
Abstract
To investigate the mechanism driving active extension in the central and south-ern Italian Apennines and the geography of seismic hazard, we compare spatialvariations in upper crustal strain-rate measured across exposed fault scarps since15±3 ka with data on cumulative upper-crustal strain and topographic eleva-tion, and free-air gravity, P-wave tomography and SKS splitting delay timesthat are a proxy for strain in the mantle. High extensional strain-rates acrossthe Apennines since 15±3 ka (0.4-3.1 mm/yr along 90 km transects) occur intwo areas (Lazio-Abruzzo; SE Campania and Basilicata) where values for fi-nite extensional strains that have developed since 2-3 Ma are highest (2-7 kmcumulative throw), and where mean elevation in 5 x 90 km NE-SW boxes is> 600 m; the intervening area (NW Campania and Molise) with < 600 mmean elevation in 5 x 90 km boxes has extension-rates < 0.4 mm/yr and lowervalues for finite extensional strains (< 2 km cumulative throw). These two ar-eas with high upper-crustal strain-rates overlie mantle that has relatively-longspatially-interpolated SKS delay times (1.2-1.8 seconds) indicating relatively-high mantle strains and free-air gravity values (140-160 mGals); the interveningarea of lower extension-rate has shorter spatially-interpolated SKS delay times(0.8-1.2 seconds) and lower free-air gravity values (120 mGals). The two ar-eas with high upper crustal strain-rates and strain, mean elevation, and mantlestrain, coincide with the northern and southern edges of a slab window in theTyrrhenian-Apennines subducting plate that has been inferred from publishedP-wave tomography. Together these correlations suggest that dynamic supportof the topography by mantle flow through the slab window may control thepresent day upper crustal strain-rate field in the Apennines and the geographyof seismic hazard in the region.
Keywords: Active Normal Fault, Strain, Italy, Late Pleistocene-Holocene,Topography, Extension
Preprint submitted to Elsevier January 19, 2012
*ManuscriptClick here to view linked References

1. Introduction
Northeast-southwest active extension accommodated by normal faults in theApennines, localised on the crest of ~ 700 km long, < 90 km wide, NW-SEtrending topographic bulge of the Apennine mountains, occurs in previouslyshortened continental crust positioned within the zone of convergence betweenthe Eurasian and African Plates [2, 14, 31, 38] (Figure 1). Debate continuesconcerning the mechanism driving this extension. One view is that the exten-sion is driven by edge effects, that is, the forces resulting from motions thatoccur along the neighbouring plate boundaries; these forces are a product of therelative motions of rigid plates rotating about Euler poles [10]. Another viewis that extension is influenced by uplift within the Apennines, where “mantleupwelling beneath the central Apennines has been the dominant geodynamicalprocess during the Quaternary, controlling both the geomorphological evolu-tion and the distribution of active deformation” [11]. This second viewpoint hasemerged because admittance analysis of gravity data shows that the topographicrelief at wavelengths longer than 150 km is supported dynamically by mantleconvection, suggesting that the topographic bulge, and the active normal faults,have formed due to upwelling mantle beneath the Apennines [11]. Although aqualitative link between mantle upwelling and the location of extension has beendescribed [11], this study did not quantify the relationship between strain-ratesand finite strains in the upper crust, topography and geophysical evidence forflow/strain in the mantle.
We investigate the proposed relationship between uplift, topography, man-tle upwelling, and strain and strain-rates in the upper crust. If topography isa proxy for uplift produced by mantle upwelling (whilst taking lithology anderosion properly into account), and the upwelling influences the extension (assuggested by [11]), we would expect spatial variation in upper-crustal strain-rates to correlate with spatial variation in topography. We have measured thespatial variation in upper-crustal strain-rates produced by long-term (since 15±3ka) slip-rates on active normal faults in the central and southern Apennines andcompared these with spatial variations in mean elevation (Figures 1 and 2). Thestrain-rates have been calculated by combining (1) slip-rate data derived fromfaulted offsets of land surfaces and deposits formed during the last glacial max-imum, and (2) slip-directions measured from outcropping striated faults. Thesecombined data allow determination of strain-rate tensors for the time periodsince 15±3 ka. We also examine the total offsets that have accumulated acrossthe faults during the Quaternary and perhaps since 2-3 Ma. The mean elevationshave been sampled from SRTM data. We show that upper-crustal strain-ratesand finite strain vary along the length of the central and southern Apennines,showing a positive correlation with mean elevation. We review published mea-surements influenced by the mantle such as free-air gravity, SKS splitting delaytimes and P-wave tomography and compare them with our measurements of theupper crust (Fig. 3). We find spatial correlations between independent datasets(Fig. 4), implying that uplift related to mantle flow influences extension in theupper crust. We use this to discuss continental extension in the Apennines andthe geography of seismic hazard in the region.
2
2. Extension, uplift and seismicity of the Apennines
Extension in the central and southern Apennines, associated with moder-ate/large magnitude earthquakes such as the 6th April 2009 M 6.3 L’Aquilaearthquake (307 deaths, 80,000 homeless [3, 4, 59]), commenced after thrustingin this region ceased during the Pliocene [8] (Fig. 1). Importantly for this paper,extension has been accompanied by uplift relative to sea-level, which increasesin magnitude away from the Adriatic and Tyrrhenian coasts inwards towardsthe Apennine Mountains [11].
The present-day/recent uplift-rates in the Apennines have been measuredthrough repeated geodetic levelling of road networks during the periods 1870-1905, 1943-1959 and 1980-2003 [12]. This re-levelling reveals uplift rates in therange of 0-0.5 mm/yr close to the coasts increasing to 1.0-1.5 mm/yr in thecentre of the topographic bulge of the Apennines. This bulging mimics thetopographic variations in the Italian peninsula with low elevation coastal plainsseparated by the high elevations (up to 2900 m) of the Apennines.
Regional bulging has been active during the Quaternary and perhaps ear-lier, based on the elevations of marine terraces and Holocene coastal notches [6].For example, near the Tyrrhenian coast, remnant Neogene-Pleistocene marinedeposits increase in elevation inland towards the northeast [36]. Early Pleis-tocene shorelines inland of Rome, exposed for almost 100 km along NW-SEstrike, have been uplifted by 200-400m by a large-wavelength regional uplift [1];strontium isotope analyses of palaeoshoreline deposits constrains the age of theyoungest at 1.65-1.5 Ma, giving estimated uplift rates of 0.17-0.34±0.03 mm/yr[35]. Further inland in the Apennine mountains, remnants of a flat palaeoland-scape formed by erosional processes close to sea-level during the Pliocene havebeen identified at high elevations (1350-1500m), indicating uplift of over 1000msince the Pliocene [24]. An uplift rate of 2.5 mm/yr over the last 1.6 Ma hasbeen estimated using geological units and sedimentation rates for this portionof the central Apennines [25]. Quaternary uplift rates decrease NE towardsthe Adriatic coast evidenced by the northeast trending parallel drainage net-work [13, 15, 16, 37], and northeast dipping Pleistocene marine-deltaic deposits[7, 44]. Uplift of the Apennines has produced high erosion rates recorded bythe high volume of Quaternary sediments in the northern Tyrrhenian Sea [61].This regional uplift occurs at rates that are high enough to uplift both the foot-walls and the hangingwalls of the active normal faults relative to sea-level. Forexample, the occurrence of a marine ostracod assemblage in the Upper Plioceneto Lower Pleistocene deposits in the hangingwall of the Rieti fault (R on Figure3) indicate that brackish/marine marshes deposited close to sea-level have beenuplifted by c. 400 metres after the Early Pleistocene [26]. A similar patternof uplift exists in the Southern Apennines, evidenced by marine terraces andcoastal notches, basal unconformities, shallow-marine regression surfaces, andcontinental erosional surfaces [22].
It has been suggested that the timing of the uplift of the Apennines coincideswith or post-dates the change from shortening to extension ruling out crustalthickening as the dominant cause [11], although [41], who identify P-to-S phasesconverted at the Moho, show that the crustal thickness may peak at 39-47 kmunder the high topography of the Apennines, and suggest that topography couldbe supported, at least in part, by a crustal root. However, values for free-air gravity, together with study of the admittance associated with these data,
3
suggests that the topography is dynamically supported by mantle convection,specifically mantle rising beneath the main topographic bulge of the Apennines[11]. These authors point out that other independent lines of evidence supportthe contention that mantle processes contribute to the regional uplift in theApennines, such as (i) attenuated upper mantle seismic velocities beneath theApennines [39, 40], (ii) Quaternary mantle-derived magmatism [5, 56], and (iii)mantle-derived helium in ground waters and natural gases Hooker et al. [27],Italiano et al. [30]. The area is underlain by a window through a subducted slabimaged by P-Wave tomography [51, Fig. 3i]. SKS splitting delay times varyalong the strike of the Apennines and have been discussed in terms of mantlestrain associated with flow through the slab window [33, 34, Fig. 3h].
Extension in the upper crust in the central and southern Apennines is ac-commodated by active normal faults (Fig. 1). These major faults have lengthsof 20-30 km, throws that have accumulated in the Quaternary and perhaps since2-3 Ma of 0.75-2.0 km (see 50 for discussion of this timing), and throw-rates av-eraged since 15±3 ka of 0.3-2.0 mm/yr measured from offsets of sediments andlandforms that were produced during the last glacial maximum [19, 21, 20, 23?, 46, 47? , 50]. Some of these authors also measured the kinematics of the faults,recorded by striated and corrugated fault planes exposed along the post 15±3 kascarps (Figs. 3e and f). These combined data for the active normal faults allowstrain-rate tensors to be calculated [19, 21, see below]. Geological cross-sectionsconstrain faulted offsets of Mesozoic strata in the upper crust across the activenormal faults [19, 46, 50]. These cross-sections demonstrate offsets of up to 2 kmon individual faults that have accumulated during the Quaternary and perhapssince 2-3 Ma. When summed across strike, these throw measurements recordthe spatial variation in finite strain produced during the extension (Figure 3cand d).
It has long been known that destructive earthquakes in central and southernItaly occur along active normal faults located on the crest of the Apennines.It has been noted that (1) the active extension is concentrated along the maintopographic ridge of the Apennines and (2) an increase in width of the zonecontaining active normal faults (between northings 4800000 and 4600000) cor-relates with the higher elevation and increased width of the topographic belt[11]. However, although it is known that extension is concentrated on the crestof the Apennines, and it is thought that the high topography appears to resultfrom mantle upwelling suggesting a causal link between mantle processes andthe extension [11], to date we are unaware of any study that demonstrates acorrelation between the mean elevations and strain-rates in the upper crust.By searching for a correlation between mean elevation and strain-rates, we pro-vide a test of the hypothesis that uplift driven by mantle upwelling causes theextension.
3. Method
In order to calculate strain-rates we modify equations presented by Kostrov[32] that allow us to convert field measurements of the directions and amounts ofslip on active normal faults since 15±3 ka into strain-rates within boxes whosemap dimensions we can define. In this case we define 5 x 5 km boxes [see 19, 21],that we combine into 5 x 90 km boxes that traverse the Apennines in a NE-SWdirection, parallel to the extension direction and minimum stress orientation
4

[50]. A full derivation of the equations involved are available [19, 21], but wesummarise the main relationships below.
Kostrov [32] demonstrated that, if all the strain in a volume is seismic andthe dimensions of the faults are small relative to the region, the average straintensor, εij , within the volume can be obtained by summing the moment tensorsof all the earthquakes occurring along faults within it:
εij =1
2µV
K∑
k=1
Mkij (1)
where εij represents the ith component of strain acting on the plane normalto the jth axis, Mk
ij is the ijth component of the moment tensor of the kthearthquake occurring within a volume V , and µ is the shear modulus. K isthe total number of earthquakes in the volume V . However, following Molnar,and England and Molnar [17, 43], here we modify this relationship to considerkinematic and deformation rate data for active faults since 15±3 ka instead ofindividual earthquakes. We make use of the following field measurements: faultstrike (Φ), dip (ϑ), slip direction (φ), plunge (p), throw (T ) and length of thefault (L).
Expressing Equation (1) in terms of independent components that can bemeasured in the field and including terms that define a time period over whichwe measure deformation rates gives the following equations for the horizontalprincipal strain-rate axis angle (θ) and the strain rate in this direction ( ˙ε
′
1′1′)and perpendicular to it ( ˙ε
′
2′2′) :
θ =1
2arctan
(
∑K
k=1LkT k cot pk cos
(
φk +Φk)
∑K
k=1LkT k cot pk sin (φk +Φk)
)
(2)
˙ε′
1′1′ =1
2at
K∑
k=1
LkT k cot pk
[
sin(
φk − Φk)
+ sin
(
φk +Φk + arctan
(
∑K
k=1LkT k cot pk cos
(
φk +Φk)
∑K
k=1LkT k cot pk sin (φk +Φk)
))]
(3)
˙ε′
2′2′ =1
2at
K∑
k=1
LkT k cot pk
[
sin(
φk − Φk)
− sin
(
φk +Φk + arctan
(
∑K
k=1LkT k cot pk cos
(
φk +Φk)
∑K
k=1LkT k cot pk sin (φk +Φk)
))]
(4)We use these equations to calculate the components of the average strain-ratetensor in the horizontal principal directions within 5 x 90 km boxes on a Univer-sal Transverse Mercator (UTM) map projection within the Italian Apennines(Figure 1). The data defining the amounts and directions of slip across activefaults used in this study come from new fieldwork (Supplementary Table 1)that augments data presented in the literature [? ? ? 19, 21, 20? , 46, 47?, 49, 50? ] (Supplementary Table 2) (e.g. See Figure 3a, b and e). The datadocument spatial variation in throws across active normal faults that have ac-cumulated since 15±3 ka recorded at 123 sites along the major normal faultsusing chain surveying techniques, hand-held laser range finders, total stationsand LiDAR laser scans, and 13,280 measurements of the slip-direction that in-clude the strike, dip, slip-direction, and plunge of the slip-direction at 222 sitesmade using compass and clinometer measurements of striated and corrugated
5
fault planes. Comparison of our fault map with active fault maps from otherresearch groups [23, 29, 45, 53] is favourable, suggesting that there is broadagreement on the locations of active faults, and that we have not omitted majorfaults mentioned elsewhere in the literature.
Topographic profiles located along the centre of the 5 x 90 km boxes wereconstructed from SRTM 90 metre DEM data using GeoMapApp. Each of thetopographic data sets are orientated southwest-northeast and separated along-strike by 5 km intervals. Spot heights along the topographic profiles were sam-pled approximately every 850 m and used to sample the mean elevation for eachprofile and study the long wavelength topography. The 5 km width transectswere also combined to calculate the mean elevation within 20 x 90 km tran-sects (Fig. 3g and Supplementary Figure A1). The 95% confidence intervalsof the mean elevation were calculated for each topographic profile using theassumption of a normal distribution in the topograpic spot heights:
Given a sample size n from a normal population with variance σ2, a 95%confidence interval for the population mean is given by:
[
x− 1.96σ√n, x+ 1.96
σ√n
]
(5)
where x is the sample mean.The mean elevations for each profile were then plotted to show how the
topography changes along the length of the Apennines (Fig. 2).In order to produce cross-plots that investigate the relationships between
strain-rate and topography presented herein, and cumulative throw and SKSdelay times from the literature (Fig. 4), values were projected across strikeonto a transect running through the centres of the strain-rate bars in Figure 1b.SKS delay times from Lucente and Margheriti [33] were sampled along the sametransect. Errors in strain-rate incorporate both the uncertainty in the age ofthe offset landforms (15±3 ka), and variability in measured offset (±1 m), anderrors were summed where values for individual faults were summed across strike(Figs 1, 2, 3a and 4). Variability of ± 1 m in vertical offset across an individualscarp over distances of a few tens of metres is typical, quantified by variabilitymeasured with millimetre precision from thousands of scarp profiles measuredwith ground-based LiDAR. Errors in cumulative throw are set by the thicknessesof Mesozoic and Cenozoic formations offset across the active faults recordedon published geological maps, because the formation thicknesses control theresolution of throw measurements. Throw errors for individual locations onfaults are on the order of ±100 m [46, 50], and errors have been summed wherevalues from individual faults were summed across strike.
4. Results: relationships between faulting and topography
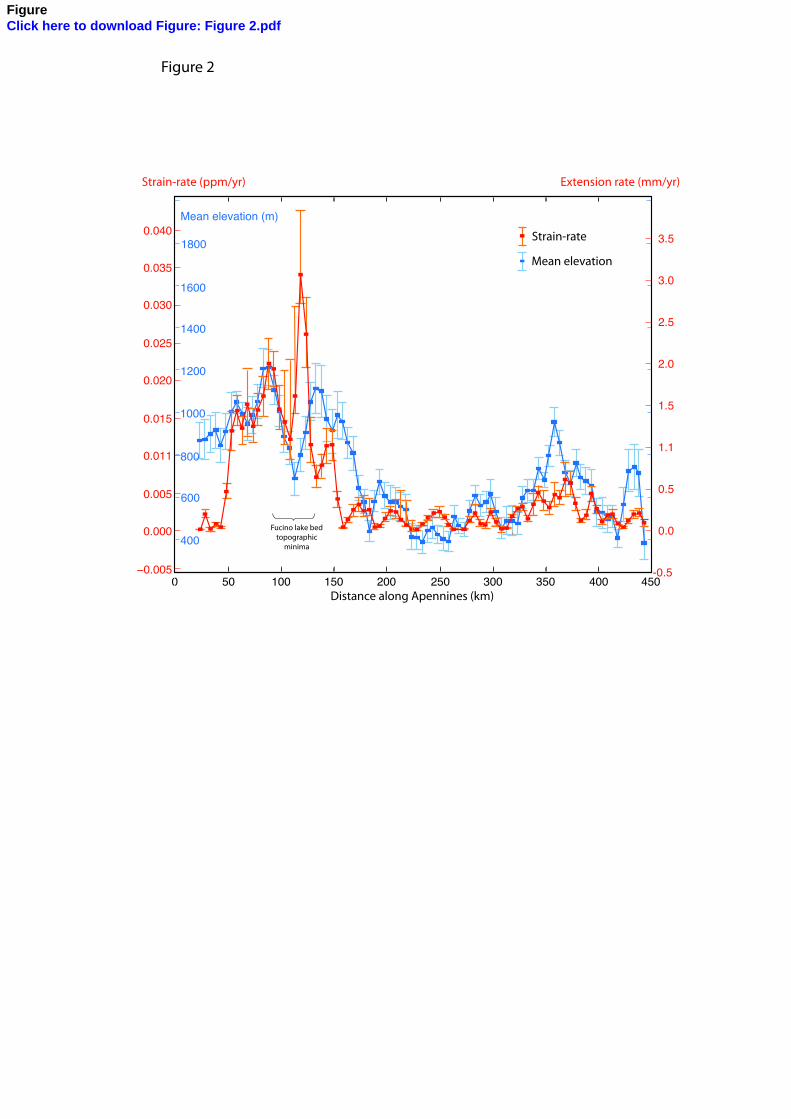
The principal horizontal strain-rates averaged since 15±3 ka in 90km ×5km transects across the Apennines are shown in Figures 1 and 2 (strain-ratesperpendicular to these values are stated in Supplementary Table 3). The ex-tensional strain-rates are greatest in the northwest of the study area (Abruzzo-Lazio), they are low in the central section (Molise and NW Campania) and thenappear to increase slightly in the southeast of the study area (SE Campania andBasilicata). The greatest strain-rate associated with a 5 x 90km transect is found
6

crossing the Fucino basin, Abruzzo, (3.41+0.83−0.40
×10−8/yr) corresponding to an
extension-rate of 3.1+0.7−0.4
mm/yr (Figure 2). Within the southern Apennines,
the greatest strain-rate associated with a 90 km transect is 6.71±2.26×10⁻⁹/yr,corresponding to an extension-rate of 0.6±0.2 mm/yr. Extension does continueNW and S of our study area into Umbria and Calabria respectively, but we areunaware of published 15±3 ka throw-rate and 2-3 Ma throw data summed acrossstrike so it is not yet possible to compare our data with these regions. How-ever, for the area we study, in order to investigate whether the aforementionedgeographic pattern of strain-rates only applies since 15±3 ka, or conversely, isconsistent with strain accumulation over a longer period of the history of fault-ing, we have plotted values of throw-rate summed across strike against valuesof cumulative throw summed in the same way (Fig. 3a-d and Fig. 4a). Asmentioned above the cumulative throws have developed during the Quaternaryand perhaps since 2-3 Ma [50]. We find a strong relationship between throwmeasured over 2-3 Myrs along each transect and throw-rate measured in thesame way (R2 = 0.828; Fig. 4a). We interpret this to mean that the post 15±3ka strain-rate field is a long-lived feature of the deformation of the Apennines asit has dominated the throw accumulation on faults that have been active duringthe Quaternary and perhaps since 2-3 Ma [50].
Figure 2 shows the relationships between strain-rates averaged since 15±3ka and the mean elevation within 5 x 90 km box transects. High extensionalstrain rates across the central and southern Apennines (0.4-3.0 mm/yr) arefound in 5 x 90 km boxes with mean elevation of > 600 m; boxes with < 600m mean elevation have extension rates < 0.4 mm/yr. Strain-rates and themean elevations calculated in 20 x 90 km transects show the same shape andtrends, but with a smoothed signal (Fig. 3g, Supplementary Figure A1 andSupplementary Table 4). Note that values of topographic gradient averagedalong NE-SW transects across the width of the Italian peninsula would showa similar spatial pattern. This is because the Apennines are sub-parallel to 2coastlines at sea-level, and both coastal plains are approximately equidistantfrom the transect line we have chosen running through the strain-rate bars inFigure 1b (see 18 for the significance of topographic gradients in continentaldeformation). The areas of high post 15±3 ka strain-rate and relatively-highelevation/gradient coincide with areas with high values for throw summed acrossstrike (Fig. 3a-d). We interpret this to mean that the relationship betweenstrain-rate and elevation/slope is long-lived, as a strain-rate field similar to thatmeasured post 15±3 ka has dominated throw accumulation in the Quaternaryand perhaps since 2-3 Ma (Fig. 4a). This also suggests that fault lengths wereestablished early in the deformation.
To investigate the strength of the relationship between 15±3 ka strain-rateand mean elevation, we have plotted values of mean elevation in each 90km× 5km box, averaged over 50 km along strike, against strain-rate averaged inthe same way; we find a strong correlation (R2 = 0.924; Fig. 4b). We choosethe 50 km length scale as it is longer than the length of individual faults (20-30 km), thus averaging out short length scale variations due to displacementgradients on faults and pre-faulting topography due to local erosion. Note thatthe relationship appears to be non-linear, and we discuss this below.
Overall, for the central and southern Apennines, there are clear correlationsbetween the spatial variation in upper crustal strain-rates, finite strain in the
7

upper crust, and mean elevation.
5. Discussion
We have demonstrated for the first time quantitative correlations betweenelevation, upper-crustal strain-rate and upper-crustal finite strain within thecentral and southern Apennines. If the topography is controlled by active upliftthat has been in operation during the Quaternary, and uplift results from themantle upwelling envisaged by D’Agostino et al. [11], the correlation betweenelevation/slope, upper crustal strain-rate and finite strain is consistent with thehypothesis that “mantle upwelling beneath the central Apennines has been thedominant geodynamical process during the Quaternary, controlling both thegeomorphological evolution and the distribution of active deformation” [11].
Furthermore we point out that strain-rates, finite strains and elevation mea-sured in the upper crust correlate with measurements that include the influenceof the mantle (Fig. 3h-i and Fig. 4c-e). Firstly, free air gravity values arehigh (140-160 mGals; Fig. 3h) in the along strike position where upper crustalextension rate and finite throw values are high (0.4-3.1 mm/yr; 2-7 km cumu-lative throw summed across strike; Figure 3a-d), and low (120 mGals) whereupper crustal extension rate and finite throw values are low (< 0.4 mm/yr; <2 km cumulative throw). Secondly, SKS splitting delay times vary along thestrike of the Apennines (Figure 3h). Lucente and Margheriti [33] interpolatedindividual splitting time delays over a 10o latitude and 10o longitude grid. Twomaxima in these interpolated delay times in the Apennines (c. 1.3-1.7 seconds)coincide spatially with the two areas that exhibit peaks in post 15±3 ka strain-rate, finite strain, mean elevation and free air gravity; the area between thesepeaks is characterised by a shorter SKS delay time of 0.8-1.3 seconds (see 33,their Fig. 1, and our Fig. 3h). In order to quantify these correlations, Figure4 shows that (1) SKS delay times in the mantle correlate with mean elevationin 90km × 5km transects (Fig. 4c; R2 = 0.910 and 0.686), (2) SKS delay timesin the mantle correlate with upper crustal post 15±3 ka strain-rates (Fig. 4d;R2 = 0.771 and 0.677), and (3) SKS delay times in the mantle correlate withthrows across faults in the upper crust that have developed during the Quater-nary and perhaps since 2-3 Ma (Fig. 4e; R2 = 0.899 and 0.876). We discuss thedifferences in these correlations for Abruzzo and the S. Apennines below. How-ever, before this, we note that SKS anisotropy is thought to record alignment ofolivine crystals in the mantle and hence cumulative strain in the mantle; longerSKS delay times indicate stronger anisotropy and hence higher strains in themantle. Thus, we suggest that two peaks in upper crustal strain-rate, finitestrain and mean elevation overlie two peaks in strain in the mantle evidencedby SKS delay times. These correlations (Fig. 4), together with evidence ofdynamic support of the topography in the Apennines [11], suggests mantle flowinfluences rates and amounts of extension in the upper crust. We suggest thatthis coupling between mantle flow and upper-crustal extension is long-lived, ev-idenced by the fact that cumulative throws across faults that have developedover the Quaternary and perhaps since 2-3 Ma, when summed across strike,correlate with summed offsets that have accumulated since 15±3 ka, and so inturn correlate with mean elevation, Free Air Gravity data and SKS delay times(Figure 3c and d). These correlations are consistent with the hypothesis thatmantle flow influences rates of extension in the upper-crust, and also suggests
8

that such coupling has influenced the throws and hence long-term growth ratesof the faults during the Quaternary and perhaps since 2-3 Ma.
The different correlations that exist between SKS delay time and elevation,strain-rate and finite strain for the southern Apennines and Abruzzo in thecentral Apennines (Figs. 4c-e) suggest that coupling between mantle strainaccumulation and upper crustal strain accumulation differs between these tworegions. We note the difference in upper crustal strain-rate over 15± 3 ka forthese two regions. It may be that there is a non-linear rheological relationshipbetween the driving force and strain-rate, explaining the non-linear relationshipbetween mean elevation and strain-rate shown in Figure 4b; however, it is clearthat this needs to be studied further, with rheological modelling, before firmconclusions can be drawn.
We speculate that the reason why mantle flow influences upper-crustal ex-tension may be that the north and south edges of the Central Apennines SlabWindow imaged using P-wave tomography ([51, 60], Fig. 3i), coincide geo-graphically, when projected onto our transect line, with the two peaks in uppercrustal strain-rate and strain overlying two peaks in strain in the mantle (Figs.3, 4 and 5). Asthenospheric mantle may be being forced through the window inthe sinking slab, as suggested by Lucente et al. [34] (see their Fig. 5d), produc-ing higher strain-rates in the mantle close to the edges of the slab window dueto bunching of the stream lines. Slab pull forces may also be concentrated atthe edges of the torn slab [60]. Moreover, experimental studies of mantle flowassociated with broken subducting slabs predict a component of upward forceassociated with toroidal flow around slab edges from the high-pressure bottomside of the slab to the low-pressure top side [48, 52, 57, 61]. This upward forcemay provide a plausible mechanism to explain the uplift and high topography,although the magnitude of the uplift that could be produced in this way is un-constrained by our study. This physical mechanism for uplift is consistent withthe ideas of D’Agostino et al. [11] in that topography is supported dynamicallyby motion of the mantle. However, in the scenario suggested herein, the mo-tions and strain-rates would be controlled predominantly by pressure gradientsproduced by mantle flow and constriction to this flow represented by the slabwindow, rather than solely by temperature gradients. This hypothesis impliesthat the age of the slab window is Quaternary and perhaps as old as 2-3 Ma(see 50 for a summary of the debate concerning the age of the initiation of ex-tension). We note that Rosenbaum et al. [51], using magmatic evidence, havesuggested that tears in the slab were developing as far back as at least 4-6 Ma,with slab break and slab window formation at ~2 Ma.
If we are correct that mantle flow controls strain-rates in the upper crustin the Apennines, it follows that mantle flow will control the geography ofseismic hazard in the region, as seismic hazard is controlled by rates of slipacross active normal faults. As fault specific earthquake recurrence intervalsfor a given magnitude are inversely proportional to the slip-rates on faults,one would expect more earthquakes of the given magnitude per unit time inregions with higher upper crustal strain rates. Thus, one would expect thenumber of earthquakes per unit time of a given magnitude to vary along thestrike of the Apennines. However, we are left with a problem because it iswell-known that horizontal principal strain-rates derived from summation ofmoment tensors for large (> Mw 6) historical earthquakes since 1349 A.D. [54],and shear strain rates from GPS re-occupation of a 1875 A.D. triangulation
9

network [28] show little if any significant difference in strain-rate along thestrike of the Apennines (although, GPS rates from reference [55] are higher inthe central Apennines, by a factor of about 2, than in Molise-north Campaniaand the southern Apennines). The problem is how to reconcile the strain-ratefield since 15±3 ka, that correlates with mantle strains and finite upper crustalstrains, perhaps over 2-3 Myrs, with the differing strain-rate fields implied by< c. 100 year-averaged geodetic and moment summation data. We suggestthe following way to reconcile strain-rate fields over different timescales: (1)spatial strain-rate variations measured over numerous seismic cycles (15±3 kys)and longer (2-3 Myrs) that correlate with mean elevation, free-air gravity andSKS splitting delay times should be considered to be the 1st order measureof the geography of seismic hazard; (2) deviations from the 1st order measure,derived over timescales that are short (< c. 100 yrs) relative to the seismic cycle(hundreds to thousands of years) (e.g. historical seismicity and geodesy) provideimportant data on the natural temporal variability in the strain-rate field; (3)study of deviations from the 1st order measure could be inverted to derive theefficacy of second order controls on earthquake recurrence such as triggering viaCoulomb stress transfer [9] or fluid effects Miller et al. [42], Terakawa et al. [58]that may operate on shorter timescales and lengthscales.
6. Conclusions
Active normal faults in Italy are localised on the crest of a ~ 200 km topo-graphic bulge elongated along the strike of the Apennines. Spatial variationsin upper crustal strain-rate and finite strain across these faults correlate withspatial variations in mean elevation, free-air gravity and SKS splitting delaytimes for the Italian Apennines. High extension rates across these faults (0.4-3.1 mm/yr in 5 x 90 km boxes traversing the Apennines) are associated withfinite cumulative throws of 2-7 km, mean elevation of > 600 m, free-air gravityvalues of 140-160 mGals, and SKS delay times of 1.2-1.8 seconds; boxes with< 600 m mean elevation have extension rates < 0.4 mm/yr, cumulative finitethrows of < 2 km, free-air gravity values of 120 mGals, and SKS delay times of0.8-1.2 seconds. The strong relationships between these variables (R2 = 0.92-0.67; see Fig. 4) suggests that flow in the mantle, perhaps controlled by flowthrough the slab window, produces uplift that drives active extension in theupper crust and thus controls seismic hazard in the region.
7. Acknowledgements
This study was funded by a studentship to J.P. Faure Walker (NER/S/A/2006/14042)and NERC Grants NE/H003266/1, NE/E01545X/1, NE/B504165/1, GR9/02995and NE/I024127/1.
References
[1] Ambrosetti, P., Carraro, F., Deiana, G., Dramis, F., 1982. Il sollevamentodell’Italia Centrale tra il Pleistocene inferiore e il Pleistocene medio. C.N.R.P.F.G. 513, 219–223.
10
[2] Anderson, H., Jackson, J., 1987. Active tectonics of the Adriatic region.Geophysical Journal International 91 (3), 937–983.
[3] Anzidei, M., Boschi, E., Cannelli, V., Devoti, R., Esposito, A., Galvani,A., Melini, D., Pietrantonio, G., Riguzzi, F., Sepe, V., Serpelloni, E., 2009.Coseismic deformation of the destructive April 6, 2009 L’Aquila earth-quake (central Italy) from GPS data. Geophysical Research Letters 36,doi:10.1029/2009GL039145.
[4] Atzori, S., Hunstad, I., Chini, M., Salvi, S., Tolomei, C., Bartolini, C.,Caputo, R., Pieri, M., 1996. Pliocene-Quaternary sedimentation in thenorthern Apennine foredeep and related denudation. Geological Magazine133 (3), 255–273.
[5] Beccaluva, L., Brotzu, P., Macciotta, G., Morbidelli, L., Serri, G.,Traversa, G., 1989. Cainozoic tectono-magmatic evolution and inferredmantle sources in the Sardo-Tyrrhenian area. In: Boriani, A., Bonafede,M., G.B., G. P., Vai (Eds.), The Lithosphere in Italy. Accademia dei Lincei,Rome, pp. 229–248.
[6] Bordoni, P., Valensise, G., 1998. Deforemation of the 125ka marine ter-race in Italy: Tectonic implications. In: Stewart, I., Vita-Finzi, C. (Eds.),Coastal Tectonics. Vol. 146. pp. 71–110.
[7] Cantalamessa, G., Centamore, E., Chiocchini, U., Colalongo, M. L., Mi-carelli, A., Nanni, T., Pasini, G., Potetti, M., Lucchi, F. R., 1986. Il Plio-Pleistocene delle Marche.
[8] Cavinato, G. P., Celles, P. G. D., 1999. Extensional basins in the tectoni-cally bimodal central Apennines fold-thrust belt, Italy: response to cornerflow above a subducting slab in retrograde motion. Geology 27 (10), 955–958.
[9] Cowie, P. A., Roberts, G. P., 2001. Constraining slip rates and spacings foractive normal faults. Journal of Structural Geology 23, 1901–1915.
[10] D’Agostino, N., Avallone, A., Cheloni, D., D’Anastasio, E., Mantenuto, S.,Selvaggi, G., 2008. Active tectonics of the Adriatic region from GPS andearthquake slip vectors. Journal of Geophysical Research 113, B12413.
[11] D’Agostino, N., Jackson, J., Dramis, F., Funiciello, R., 2001. Interactionsbetween mantle upwelling, drainage evolution and active normal faulting:an example from the central Apennines (Italy). Geophysical Journal Inter-national 147, 475–497.
[12] D’Anastasio, E., De Martini, P. M., Selvaggi, G., Pantosti, D., Marchioni,A., Maseroli, R., 2006. Short-term vertical velocity field in the Apennines(Italy) revealed by geodetic levelling data. Tectonophysics 418, 219–234.
[13] Demangeot, J., 1965. Geomorphologie des Abruzzes Adriatiques. No. 403.Mem. Documents, Centre Rech. Docum. Cartogr., num. H.s., CNRS Paris,403.
11
[14] Doglioni, C., 1995. Geological remarks on the relationship between exten-sion and convergent geodynamic settings. Tectonophysics 252, 253–267.
[15] Dramis, F., 1992. Il ruolo dei sollevamenti tettonici a largo raggio nellagenesi del rilievo appenninico. Studi Geologici Camerti, Vol. Spec. 1992/1,9–15.
[16] Dufaure, J. J., Bossuyt, D., Rasse, M., 1989. Deformations quaternaires etmorphogenese de l’Apennin Central adriatique. Physio-Geo. 18, 9–46.
[17] England, P., Molnar, P., 1997. Active deformation of Asia: from kinematicsto dynamics. Science 278, 647–650.
[18] England, P., Molnar, P., 2005. Late Quaternary to decadal veloc-ity fields in Asia. Journal of Geophysical Research 110 (B12401),doi:10.1029/2004JB003541.
[19] Faure Walker, J. P., 2010. Mechanics of continental extension from Quater-nary strain field in the Italian Apennines. Ph.D. thesis, University CollegeLondon.
[20] Faure Walker, J. P., Roberts, G. P., Cowie, P. A., Papanikolaou, I.,Michetti, A. M., Sammonds, P., Phillips, R., 2009. Horizontal strain-ratesand throw-rates across breached relay-zones, central Italy: implications forthe preservation of throw deficits at points of normal fault linkage. Journalof Structural Geology 31 (doi:10.1016/j.jsg.2009.06.01), 1145–1160.
[21] Faure Walker, J. P., Roberts, G. P., Sammonds, P., Cowie, P. A. C., 2010.Comparison of earthquake strains over 100 and 10,000 year timescales:insights into variability in the seismic cycle in the central Apennines, Italy.Journal of Geophysical Research 115 (B10418), doi:10.1029/2009JB006462.
[22] Ferranti, L., Oldow, J. S., 2005. Latest Miocene to Quaternary horizontaland vertical displacement rates during simultaneous contraction and exten-sion in the Southern Apennines orogen, Italy. Terra Nova 17, 209–214.
[23] Galadini, F., Galli, P., 2000. Active tectonics in the Central Apennines(Italy) - input data for seismic hazard assessment. Natural Hazards 22,225–270.
[24] Galadini, F., Messina, P., Giaccio, B., Sposato, A., 2003. Early uplift his-tory of the Abruzzi Apennines (central Italy): available geomorphologicalconstraints. Quaternary International 101-102, 125–135.
[25] Ghisetti, F., Vezzani, L., 1999. Depth and modes of Pliocene-Pleistocenecrustal extension of the Apennines (Italy). Terra Nova 11, 67–72.
[26] Gliozzi, E., Mazzini, I., 1998. Paleoenvironmental analysis of Early Pleis-tocene brackish marshes in the Rieti and Tiberino intraappenninic basins(Latium and Umbria, Italy) using ostracods (Crustacea). PalaeogeographyPalaeoclimatology Palaeoecology 140, 325–333.
[27] Hooker, P. J., Bertrami, R., Lombardi, S., O’Nions, R. K., Oxburgh, E. R.,1985. Helium-3 anomalies and crust-mantle interactions in Italy. Geochim-ica et Cosmochimica Acta 49, 2505–2513.
12

[28] Hunstad, I., Selvaggi, G., D’Agostino, N., England, P., Calrke, P., Pierozzi,M., 2003. Geodetic strain in peninsular Italy between 1875 and 2001. Geo-physical Research Letters 30 (4), 1181–1184.
[29] ISPRA, 2007. Ithaca project.URL http://www.apat.gov.it/site/en-GB/Projects
[30] Italiano, F., Martelli, M., Martinelli, G., Nuccio, P. M., 2000. Geochem-ical evidence of melt intrusions along lithospheric faults of the SouthernApennines, Italy: Geodynamic and seismogenic implications. Journal ofGeophysical Research 105, 13569–13578.
[31] Jolivet, L., Facenna, C., Goffe, B., Mattei, M., Rosseti, F., Brunet, C.,Storti, F., Funiciello, R., Cadet, J. P., D’Agostino, N., Parra, T., 1998. Mid-crustal shear zones in postorogenic extension: Example from the northernTyrrhenian Sea. Journal of Geophysical Research 103 (B6), 12123–12160.
[32] Kostrov, V. V., 1974. Seismic moment and energy of earthquakes, andseismic flow of rock. Izv., Earth Physics 1, 23–40 (translation UDC 550.341,pp13–21).
[33] Lucente, F. P., Margheriti, L., 2008. Subduction rollback, slab breakoff,and induced strain in the uppermost mantle beneath Italy. Geology 36 (5),375–378.
[34] Lucente, F. P., Margheriti, L., Piromallo, C., Barruol, G., 2006. Seismicanisotropy reveals the long route of the slab through the western-centralMediterranean mantle. Earth and Planetary Science Letters 241, 517–529.
[35] Mancini, M., D’Anastasio, E., Barbieri, M., Martini, P. M. D., 2007. Geom-prphological, paleontological and 87sr/86sr isotope analyses of early Pleis-tocene paleoshorelines to define the uplift of Central Apennines (Italy).Quaternary Research 67, 487–501.
[36] Marinelli, G., Barberi, F., Cioni, R., 1993. Sollevamenti neogenici e intru-sioni acide della Toscana e del Lazio settentrionale. Memorie della SocietàGeologica d’ Italia 49, 279–288.
[37] Mazzanti, R., Trevisan, L., 1978. Evoluzione della rete idrograficanell’Appennino centro-settentrionale. Geogr. Fis. Din. Quat. 1, 55–62.
[38] Mazzoli, S., Helman, M., 1994. Neogene patterns of relative plate motionsfor Africa-Europe: Some implications for recent central Mediterranean tec-tonics. Geol. Rundsch. 83, 464–468.
[39] Mele, G., Rovelli, A., Seber, D., Barazangi, M., 1996. Lateral variations ofPn propagation in Italy: Evidence for a high-attenuation zone beneath theApennines. Geophysical Research Letters 23, 709–712.
[40] Mele, G., Rovelli, A., Seber, D., Barazangi, M., 1997. Shear wave atten-uation in the lithosphere beneath Italy and surrounding regions; tectonicimplications. Journal of Geophysical Research 102, 11863–11875.
13

[41] Mele, G., Sandvol, E., Cavinato, G. P., 2006. Evidence of crustal thickeningbeneath the central Apennines (Italy) from teleseismic receiver functions.Earth and Planetary Science Letters 249, 41510.1016/j.epsl.2006.05.024.
[42] Miller, S. A., Colletini, C., Chiaraluce, L., Cocco, M., Varchiand, M., Kaus,B. J. P., 2004. Aftershocks driven by a high-pressure CO2 source at depth.Nature 427, 724–727.
[43] Molnar, P., 1983. Average regional strain due to slip on numerous faults ofdifferent orientations. Journal of Geophysical Research 88, 6430–6432.
[44] Ori, G. C., Serafini, G., Visentini, G., Lucchi, F. R., Casnedi, R., Co-lalongo, M. L., Mosna, S., 1993. Depositional history of the Pliocene-Pleistocene Adriatic foredeep (Central Italy) from surface and subsurfacedata. In: Specer, A. (Ed.), Generation, accumulation and production of Eu-rope’s hydrocarbon III. Vol. 3. Special Publication, European Associationof Petroleum Geoscientists, pp. 233–258.
[45] Pace, B., Peruzza, L., Lavecchia, G., Boncio, P., 2006. Global seismogenicsource modelling and probabilistic seismic hazard analysis in Central Italy.Bulletin of the Seismological Society of America 96 (1), 107–132.
[46] Papanikolaou, I. D., Roberts, G. P., 2007. Geometry, kinematics and defor-mation rates along the active normal fault system in the southern Apen-nines : Implications for fault growth. Journal of Structural Geology 29,166–188.
[47] Papanikolaou, I. D., Roberts, G. P., Michetti, A. M., 2005. Fault scarps anddeformation rates in Lazio-Abruzzo, Central Italy: Comparison betweengeological fault slip-rate and GPS data. Tectonophysics 408, 147–176.
[48] Piramallo, C., Becker, T. W., Funiciello, F., Facenna, C., 2006. Three-dimensional instantaneous mantle flow induced by subduction. GeophysicalResearch Letters 33 (L08304), doi:10.1029/2005GL025390.
[49] Roberts, G. P., 2008. Visualisation of active normal fault scarps in theApennines, Italy: a key to assessment of tectonic strain release and earth-quake rupture.
[50] Roberts, G. P., Michetti, A. M., 2004. Spatial and temporal variationsin growth rates along active normal fault systems: an example from theLazio-Abruzzo Apennines, central Italy. Journal of Structural Geology 26,339–376.
[51] Rosenbaum, G., Gasparon, M., Lucente, F. P., Peccerillo, A.,Miller, M., 2008. Kinematics of slab tear faults during subductionsegmentation and implications for Italian magmatism. Tectonics 27,doi:10.1029/2007TC002143.
[52] Schellart, W. P., 2004. Kinematics of subduction and subduction-inducedflow in the upper mantle. Journal of Geophysical Research 109 (B07401),doi: 10.1029/2004JB002970.
14
[53] Schlagenhauf, A., 2009. Identification des forts seismes passes sur les faillesnormales actives de la region Lazio-Abruzzo (Italie centrale) par "data-tions cosmogeniques” (36Cl) de leurs escarpments. Ph.D. thesis, l’UniversiteJoseph Fourier„ Grenoble, France.
[54] Selvaggi, G., 1998. Spatial distribution of horizontal seismic strain in theApennines from historical earthquakes. Annali di Geofisica 41 (2).
[55] Serpelloni, E., Anzidei, M., Baldi, P., Casula, G., Galvani, A., 2005. Crustalvelocity and strain-rate fields in Italy and surrounding regions: new resultsfrom the analysis of permanent and non-permanent GPS networks. Geo-physical Journal International 161, 861–880.
[56] Serri, G., Innocenti, F., Manetti, P., 1993. Geochemical and petrologi-cal evidence of the subduction of delaminated Adriatic continental litho-sphere in the genesis of the Neogene-Quaternary magmatism of centralItaly. Tectonophysics 223, 117–147.
[57] Stegman, D. R., Freeman, J., Schellart, W. P., Moresi, L., May, D., 2006.Influence of trench width on subduction hinge retreat rates in 3-D mod-els of slab rollback. Geochemistry, Geophysics, Geosystems 7 (Q03012),doi:10.1029/2005GC001056.
[58] Terakawa, T., Zoporowski, A., Galvan, B., Miller, S. A., 2010. High-pressure fluid at hypocentral depths in the L’Aquila region inferred fromearthquake focl mechanisms. Geology 38 (doi:10.1130/G32457.1), 995–998.
[59] Walters, R. J., Elliott, J. R., D’Agostino, N., England, P. C., Hunstad,I., Jackson, J. A., Parsons, B., Phillips, R. J., Roberts, G. P., 2009. The2009 L’Aquila earthquake (central Italy): A source mechanism and im-plications for seismic hazard. Geophysical Research Letters 36 (L17312),doi:10.1029/2009GL039337.
[60] Wortel, M. J. R., Spakman, W., 2000. Subduction and slab detachment inthe Mediterranean-Carpathian Region. Science 290, 1910–1917.
[61] Zattin, M., Landuzzi, A., Picotti, V., Zuffa, G. C., 2000. Discriminat-ing between tectonic and sedimentary burial foredeep succession, NorthernApennines. Journal of the Geological Society of London 157, 629–633.
8. Figure Captions
Figure 1. Map showing the spatial variation in principal horizontal straincalculated in 5 x 90 km boxes (dashed lines) traversing the Italian Apennines,derived from the directions and magnitudes of faulted-offsets since 15±3 kaof landforms dating from the last glacial maximum. (a) Location of study areaindicated in the inset box. (b) SRTM DEM with strain-rate bars overlain with aUTM grid. U = Umbria, L = Lazio, A = Abruzzo, M = Molise, C = Campania,B = Basilicata, Ca = Calabria.
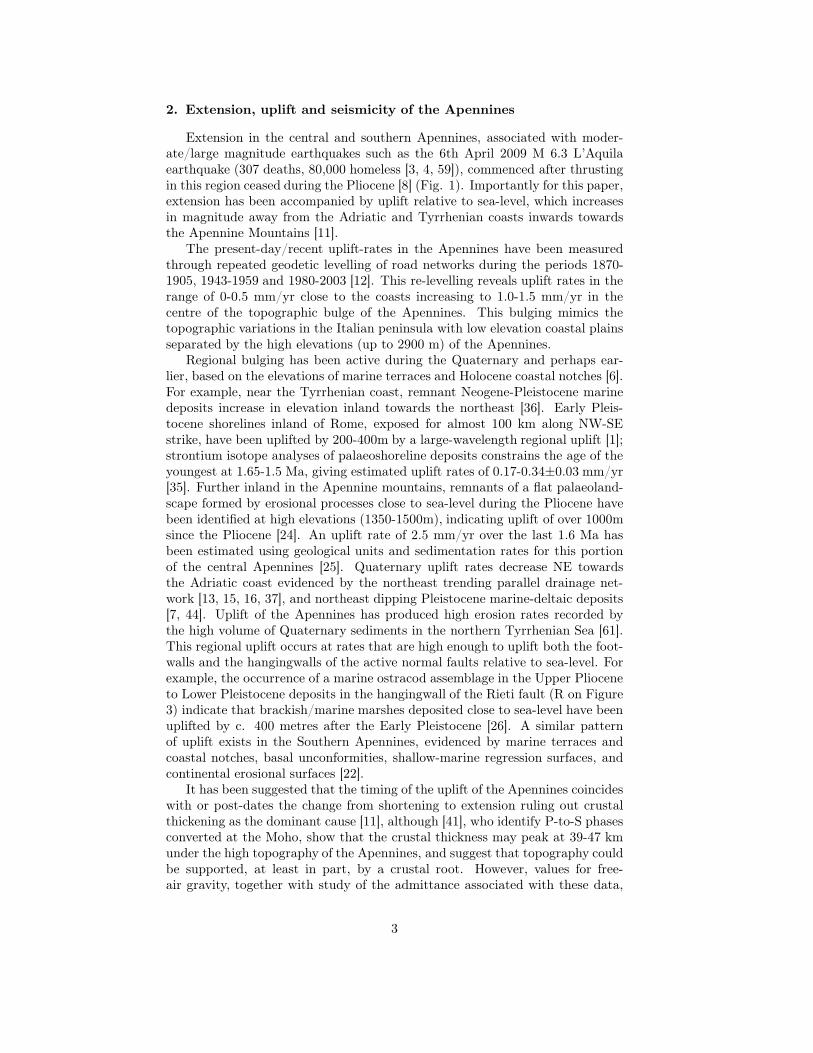
Figure 2. Graph showing spatial variation in strain-rate, extension rate andmean elevation along the strike of the Apennines. Extension rates are calculated
15

from strains within the 5 x 90 km boxes shown in Figure 1. Topography hasbeen sampled from the SRTM 90 m DEM. Transect is through the strain-ratebars in Figure 1.
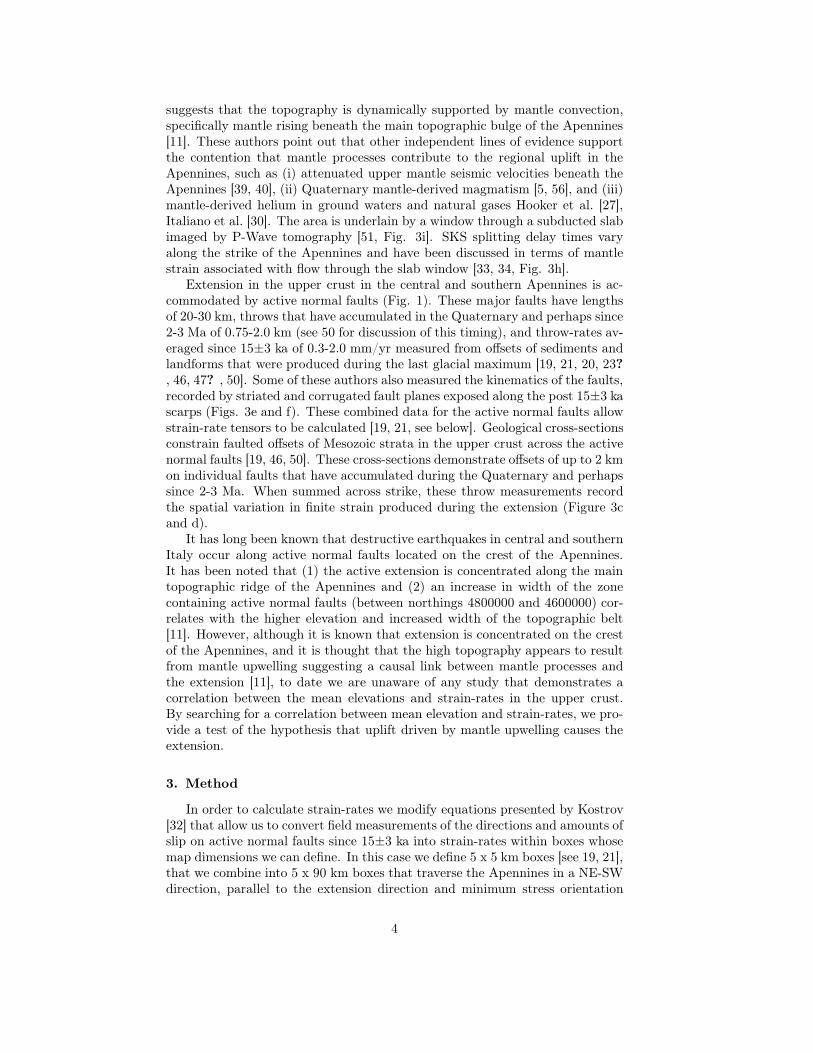
Figure 3. Spatial relationships between throw-rates since 15±3 ka summedacross strike (a, b), throws in the Quaternary and perhaps since 2-3 Ma summedacross strike (c, d; from [50] and [46]), SRTM topography and a fault map(e), post 15±3 ka strain-rates calculated in 20 x 90 km boxes and topography(g), free-air gravity and SKS splitting delay times (h), and P-wave tomography(i). (e) and (f) summarise kinematic data for the active faults derived fromstriated and corrugated fault planes [from 19, 21, 46, 47, 50]. All panels areat the same scale and are aligned with respect to distance along the strikeof the Apennines and data have been projected onto a transect through thestrain-rate bars in Figure 1. Free-air gravity values are from a profile fromLongitude 42.3505o, Latitude 12.5943o to Longitude 39.6680o, Latitude 16.3674o
across Fig. 4b of D’Agostino et al. [11]. SKS splitting delay times in (h)were sampled along a traverse from Longitude 42.5588o, Latitude 12.8093o toLongitude 40.08342o, Latitude 16.5267o across Fig. 1 of Lucente and Margheriti[33]. The tomographic profile in (j) is re-drawn from Fig. 4 of Rosenbaum etal. [51], sampled from Longitude 42.6171o, Latitude 12.7399o to Longitude39.5674o, Latitude 16.2729o, but has been projected onto a line from Longitude42.6653o, Latitude 12.8093o to Longitude 40.0834o, Latitude 16.5267o to showhow the slab window relates to the other datasets. R in (e) locates the RietiBasin.
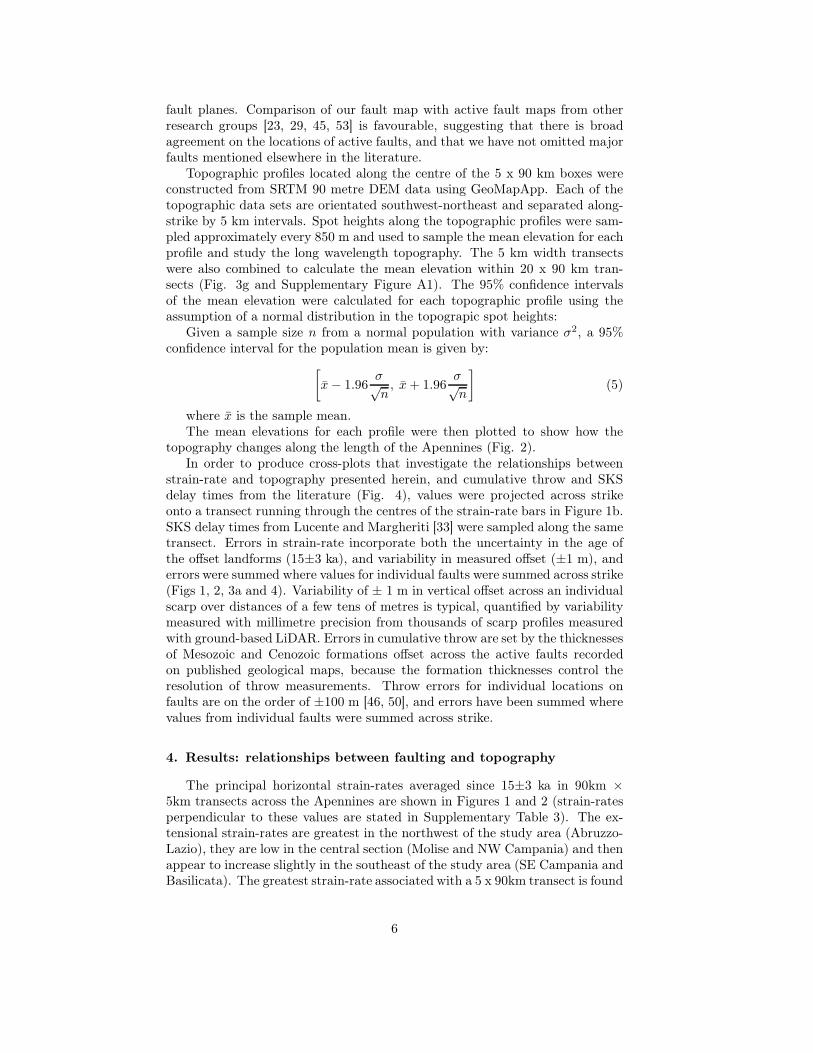
Figure 4. Correlations between strain-rate, mean elevation, cumulative strainin the upper crust, and SKS delay times in the mantle. Data from the area of theFucino Lake Bed have been excluded because very high values for slip-rate onlocal faults are defeating the regional uplift and incision to produce an interiordrainage basin. This anthropogenically-drained lake is found within the largestexample of a hydrologically closed basin in the Apennines, that has formed dueto relatively-high values for local normal fault throw rates (1-2 mm/yr; 37; thesevalues approach or exceed uplift rates measured geodetically - see [12]; 1.0-1.5mm/yr). Thus, although this local patch of high fault slip-rates has producedsome of the highest values for relief across active normal faults in the central andsouthern Apennines (1729 m relief across the Velino fault between Magliano at716 m [hangingwall] and Monte Velino at 2445 m [footwall]), and deeply-incisedfootwall drainage (Gole di Celano with c. 1000 m of incision), this obscures theregional strain-rate/elevation signal, hence why we have excluded the data. Er-rors in (a) and (e) from Roberts and Michetti [50] and Papanikolaou and Roberts[46]. Errors in (b), (c) and (d) from Supplementary Table 3 (see Method sectionfor more detail on errors).
Figure 5. 3D cartoon of the geometry of extension and uplift in the Apen-nines relative to the geometry of the central Apennines Slab Window (modifiedfrom [51]), and asthenospheric flow through the slab window (modified from[34]).
16

Research Highlights 1) A strain-rate field for the central and southern Apennines is calculated from amounts and directions of offset across surface fault scarps averaged since 15 ka. 2) Strain-rates in 5 x 90 km boxes crossing the Apennines correlate with cumulative throws across the faults, topographic data, SKS splitting delays times, free-air gravity and location relative to a slab window. 3) We suggest strain rates in the upper crust are controlled by mantle strain-rates, instead of solely by plate motions.
*Research Highlights

0.005 ppm/yr (offset since 15ka)maximum valueminimum value
350000 400000 450000 500000 550000 600000
4450000
4500000
4550000
4600000
4650000
4700000
(b)
Active normal fault
Figure 1
Tyrrhenian Sea
AdriaticSea
NeogeneOcean Crust
TethyanOcean Crust
L AM
CB
Ca
U
(a)
UTM coordinates
F
F Fucino lake bed
38o
42o
16o12o
FigureClick here to download Figure: Figure 1.pdf
0 50 100 150 200 250 300−0.005
0.000
0.005
0.011
0.015
0.020
0.025
0.030
0.035
0.040
350 400Distance along Apennines (km)
Strain-rate (ppm/yr)
Strain-rate
Mean elevation
450
Extension rate (mm/yr)
1200
1000
800
600
400
1400
1600
1800
-0.5
0.0
0.5
1.1
1.5
2.0
2.5
3.0
3.5
Figure 2
Fucino lake bed topographic
minima
Mean elevation (m)
FigureClick here to download Figure: Figure 2.pdf

Active normal faults with post 12-18 ka offsets
1400
1200
1000
800
600
2.5
2.0
1.5
1.0
0.5
160
140
120
0
4000
8000
0
3
6
Thro
w R
ate
(mm
/yr)
Thro
w(m
etre
s)
160140120100806040200Distance (km)
16014012010080604020Distance (km)
140120100806040200Distance (km)
14012010080604020Distance (km)
From offset 12-18 ka landforms From offset 12-18 ka landforms
From offset Mesozoic
Fault slip-directions. Each arrow is a mean of ~ 40 measurements.
0
4000
8000
0
3
6
Thro
w R
ate
(mm
/yr)
Thro
w(m
etre
s)
NaplesN=84N=78 N=88
Typical kinematic data on lower hemisphere stereoplots constraining slip directions
Elev
atio
n(m
etre
s)
Exte
nsio
n (m
m/y
r)
Free
Air
Gra
vity
(mG
als)
Elevations are means in 20 x 90 km boxes traversing the ApenninesExtension rates are calculated from strain-rates in 20 x 90 km boxes
ExtensionElevation
Fucino Lake Bed
Free Air Gravity(D’Agostino et al. 2001)
From geological cross-sections showing summed offsets of Mesozoic limestones
(e)
(f )
(g)
(h)1.8
1.6
1.4
1.2
1.0
SKS
δt (s
ec)
NNN
Figure 3
(a) (b)
(c) (d)
R
SKS splitting delay time(Lucente and Margheriti 2008)
Latitude
100
200
300
Central ApenninesSlab Window
Dep
th (k
m)
P-Wave tomography from Rosenbaum et al. (2008)
42o 41o
(i)
FigureClick here to download Figure: Figure 3.pdf

y = 0.006xR2 = 0.82798
0
1
2
3
4
5
6
0 2000 4000 6000 8000
Thro
w-ra
te (m
m/y
r)
Throw (m)
Throw versus throw-rate for combinedAbruzzo, Molise and S.Apennines data
0.00E+00
5.00E-09
1.00E-08
1.50E-08
2.00E-08
2.50E-08
0 200 400 600 800 1000 1200
Stra
in-ra
te
Mean Elevation (m)
Topography (averaged 50 km along strike) versus strain-rate (averaged 50 km along strike)
Molise
S. Apennines
Abruzzo
y = 1E-10e0.0048xR2 = 0.92379
0
200
400
600
800
1000
1200
1400
1 1.2 1.4 1.6 1.8
Mea
n El
evat
ion
(m)
SKS delay time (sec)
SKS delay time versus topography (averaged over 50 km along strike)
Abruzzo
S. Apennines
y = 615.71x - 305.17R² = 0.6859
y = 1205.1x - 821.35R2 = 0.91022
0.00E+00
5.00E-09
1.00E-08
1.50E-08
2.00E-08
2.50E-08
1.2 1.4 1.6 1.8
Stra
in-ra
te
SKS delay time versus strain-rate (averaged over 50 km along strike)
Abruzzo
S. Apennines
y = 4E-08x - 5E-08R2 = 0.77113
y = 9E-09x - 1E-08R² = 0.67703
SKS delay time (sec)
0
1000
2000
3000
4000
5000
6000
Thro
w (m
)
SKS delay time versus throw (averaged over 50 km along strike)
S.Apennines
Abruzzo
1.2 1.4 1.6 1.8SKS delay time (sec)
y = 10760x - 13116R2 = 0.89976
y = 4331.5x - 5304.2R² = 0.87613
(a) (b)
(c) (d)
(e)
Figure 4
FigureClick here to download Figure: Figure 4.pdf

Figure 5
Slabwindow
Area of high extensional strain-rate and
uplift/topography
Asthenosphere from lower plate owing through the slab
window with a component of upward force
Surface expression of subduction/thrust zone
FigureClick here to download Figure: Figure 5.pdf

0.005 ppm/yr (offset since 15ka)maximum valueminimum value
350000 400000 450000 500000 550000 600000
4450000
4500000
4550000
4600000
4650000
4700000
Supplementary Figure A1
UTM coordinates
FigureClick here to download Figure: Figure A1.pdf

Supplementary material for on-line publication onlyClick here to download Supplementary material for on-line publication only: Faure Walker et al EPSL supplement.tex

Electronic Supplement1
New throw-rate and slip direction data2
Table 1: New data sites. Note only throws shown calculated from a scarp profile (column 6) or3
in square brackets (column 7) are used in calculation of strain-rates4
fault x utm y utm slipdirection
slipplunge
15±3kyrthrow
measuredfrom scarpprofile (m)
notes on offsets of geomorphologicalfeatures
Pozzilli 0421357 4597134 132 45 -
Smooth fault plane exposed by road withmm and 10cm scale oblique striations,exposed for approx. 20m along strike,cannot determine offset due to road -
expect most of fault plane is exposed byexcavation for road, could not see offset
to SE away from road
Pozzilli 0421407 4597084 130 33 -Limestone fault plane exposed by road,fault plane has very oblique striations,
estimate approx 1m throw.
Pozzilli 0422255 4596601 225 71 -
Very degraded fault plane, somefracturing parallel to strike of fault,
contact between scarp and lower slope isat a gradient, throw estimated between
0-5m, strike 190o
Pozzilli 0427760 4592447 213 61 3.3Scarp profile constructed using metre
ruler [3.3m], poorly preserved fault planenear base of triangular facets.
Pozzilli 0430588 4590797 218 77 -
Limestone exposed almost continuouslyalong strike (by road) for approx. 50m,clear mm scale striations on two approx
1sq.m planes, maximum height ofexposure about 10m - throw difficult to
determine due to road
Pozzilli 0432189 4589723 281 60 -
Fault plane exposed by road, cannotdetermine throw, unsure whether it is
main fault plane or hangingwall fault, itis most likely within a few metres of the
main fault planeBoiano 0441865 4600008 101 41 - -
1

Boiano 0442836 4599327 353 62 2.6
Scarp profile constructed using a metreruler shows a [2.6m] offset (profile
constructed across path), plane exposedby path and for approx. 8m along strike,
steep upper and lower slope.Boiano 0446590 4595063 029 82 - -Boiano 0456475 4592076 046 58 - -
Boiano 0450693 4590651 019 70 -
Approx. NW striking planar limestonesurface exposed by road, quite fracturedbehind, exposed semi-continuously alongstrike for approx. 8m and approx. 4mdown dip, road next to plane prevents
estimation of throw, no preferredorientation to fracturing on the plane,
possibly some approx 8mm scalecorrugations.
Boiano 0461244 4587763 352 68 - -
Boiano 0461163 4587626 329 64 -Fault plane exposed behind chicken wire
next to road.
Boiano 0458615 4587389 012 46 6.6
Fault plane exposed in outside church,scarp profile constructed with metre rulerin woods, note this was done away from
large fan surfaces, calculated throw[6.6m], but lower and upper slope are not
parallel.
Irpinia 0516377 4519069 58 73 -
Very degraded semi-planar limestonesurface which undulates with average
strike approx. 330o exposed by track forapprox. 20m along strike and up to 6mdown-dip. Slope appears to over-steepen,
but track and shallower lower slopeprevent estimations of offset. No free face.
AntitheticIrpinia
0543268 4514411 187 71 -
Limestone degraded scarp almostcontinuous along strike, estimate throwapprox. 5m, small patches (<20cm) of
smooth free face with striations.
AntitheticIrpinia
0543393 4514310 5.0
Profile constructed with metre ruler[5.0m] very degraded plane almost
continuous along strike (120o). No freeface. Planar lower slope.
2

SanGregorioMagno
0533128 4502318 3.0
Degraded plane semi-continuous alongstrike for 10-20m at a time. Continuousgrassy/prickly upper and lower slope,
NB/ lower slope looks continuous all waydown to valley but cannot continue profiledue to impenetrable vegetation. Scarpprofile constructed with a metre ruler
[3.0m].
Alburni 0534691 4485310 329 28 -
Large planar limestone surface exposedfor >20m along strike (approx. 320o) andapprox. 25m down-dip (not 15kyr offset),cut clasts present on planes, undefinedHolocene/Pleistocene sediments seenoutcropping on top of fault plane.
Val diDiano
0538184 4492468 8.4Continuous scarp with planar limestonesurface. Scarp profile constructed with
metre ruler [8.4m].
Val diDiano
0538400 4492298 205 59 -Continuous fault plane with large upperdegraded slope, lower slope has many
gullies.
Val diDiano
0538715 4491952 206 62 -
Plane within footwall of degraded scarp,polished in places, estimate throw
between 7-9m (appears same as (fA1),crumbled limestone behind plane.
Val diDiano
0538756 4491945 10.1
Continuous scarp with planar limestonesurface with fractured limestone behind,no free face, exposed for approx. 4m
down-dip. Scarp profile constructed withmetre ruler [10.1m].
Val diDiano
0545913 4479765 8.5
Very degraded scarp at top of cultivatedslope, bottom of bedrock scarp possibly
has free face exposed, strike approx. 140o,along strike offset continues but limestone
scarp does not, NB/ there are a fewmetres of bracken etc. between the scarp
and the cultivated land, upper slopeappears slightly steeper than lower slope,
fractured limestone behind free face.Scarp profile constructed using metre rule
[8.5m].
Val d’Agri 0575943 4465991 262 46 -Limestone exposed by road, a few planes
with striations
3

Maratea 0555869 4443186 226 52 -
Limestone fault plane exposedsemi-continuously down-dip and alongstrike for 10s metres. Appears to havebeen excavated by abandoned quarry.
Planar surface extends to underbreccia/gravel. Some very smooth shinysurfaces. Planar surfaces preserved acrossundulations, axis of undulation has a
trend 222o.
Maratea 0562756 4428445 255 49 -
Very planar continuous limestone scarpundulating on a 2m scale with striationsand cut clasts. Double line of cosmogenicsampling. Contact with lower slope is atan approx. 30o angle as it is at the edgeof a cone coming down from a gully from
NE of site. Do not see any brecciacemented to fault plane.
Maratea 0562940 4428053 261 54 -
Continuous limestone scarp for hundredsof metres, degraded plane exposed forapprox 14m down dip. Planes with
striations on are 1.5-2m up from groundand have dimensions of order 1 sq.m.
Mercure 0582178 4429633 -
Scarp profile constructed using a metreruler [6.6m], very degraded scarp with nofree face, NB/ short lower slope as beyondprofile the slope steepens into the path,then after the path there are a series ofsteps likely associated with tree roots.
Pollino 0590990 4416166 188 62 -
Fault plane preserved within scree/brokenlimestone by road, semi-continuous forapprox 15m along strike, striations andcut clasts. Where fault plane is missing,the broken limestone behind is furthereroded (i.e. fault plane acting as an
erosion barrier). Broken segments of theplane (20-50cm diameter) are seen, which
have fallen off. Strike/dip of outcropapprox. 120/60. NB/ Plane undulates onan approx 1.5-2m scale, note preserved
planes are on one side of theseundulations.
4

PiedmonteMatese
0446175 4578916 173 55 -
Triangular facets seen at top of fan, whichpre-dates the Holocene (assumption fromits great size), no offsets seen in fan fromdistance - max throw of 5m could bemissed through trees, therefore assume
throw is less than 5m
Letino 0436874 4588979 189 60 -
Fault plane exposed at side of road withmatrix supported fault breccias on top ofthe plane and metre scale corrugations,
striations seen in vadose calcite flow-stonesuggesting it was sub aerial when grooveswere formed, the road and cultivation ofland prevents accurate estimation ofthrow, looking into distance estimatethrow could be up to approx. 3m.
Miranda-Pesche
0438258 4609791 202 301 -
Limestone planes exposed for approx. 5malong strike and approx. 5m down dip byroad, grooves on 0.5cm-10cm scale notpitted like water erosion, planes haveapprox. same dip as slope, 0.7-1.5m ofsoil on top of plane, note grooves are
present under soil, large eroded bouldersby road, in situ limestone breccia (on top)of where expect planes to meet in middle
Previously published throw-rate and slip direction data5
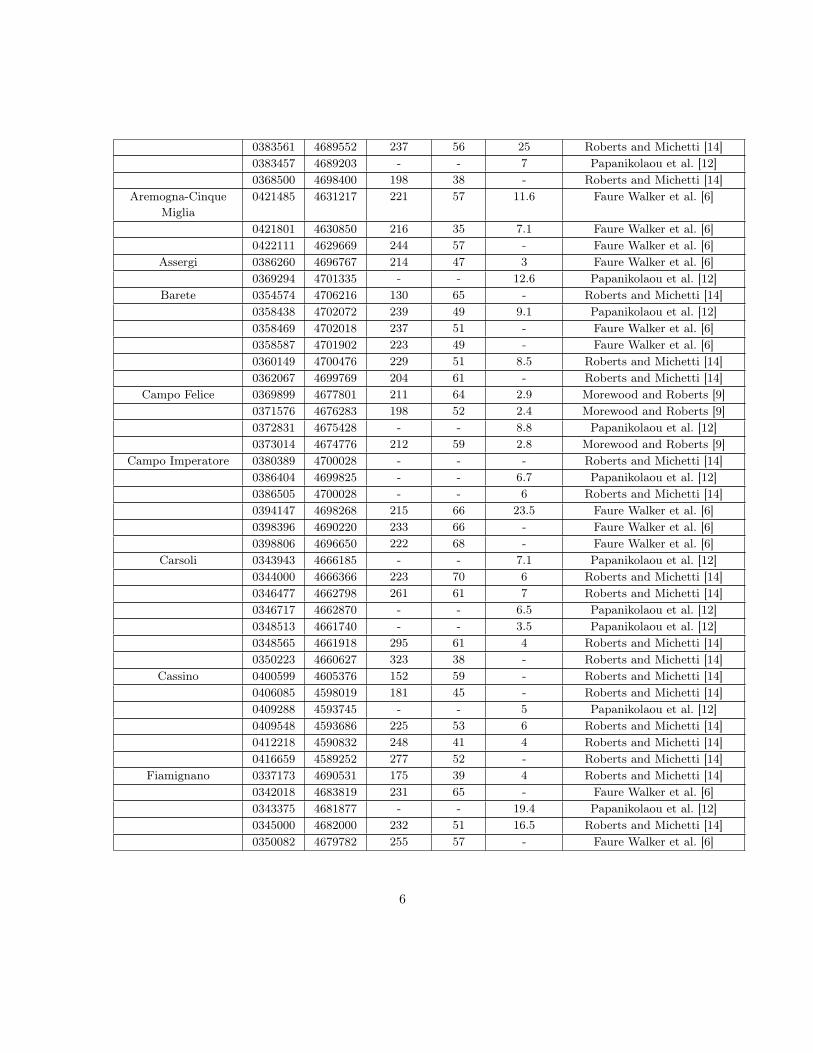
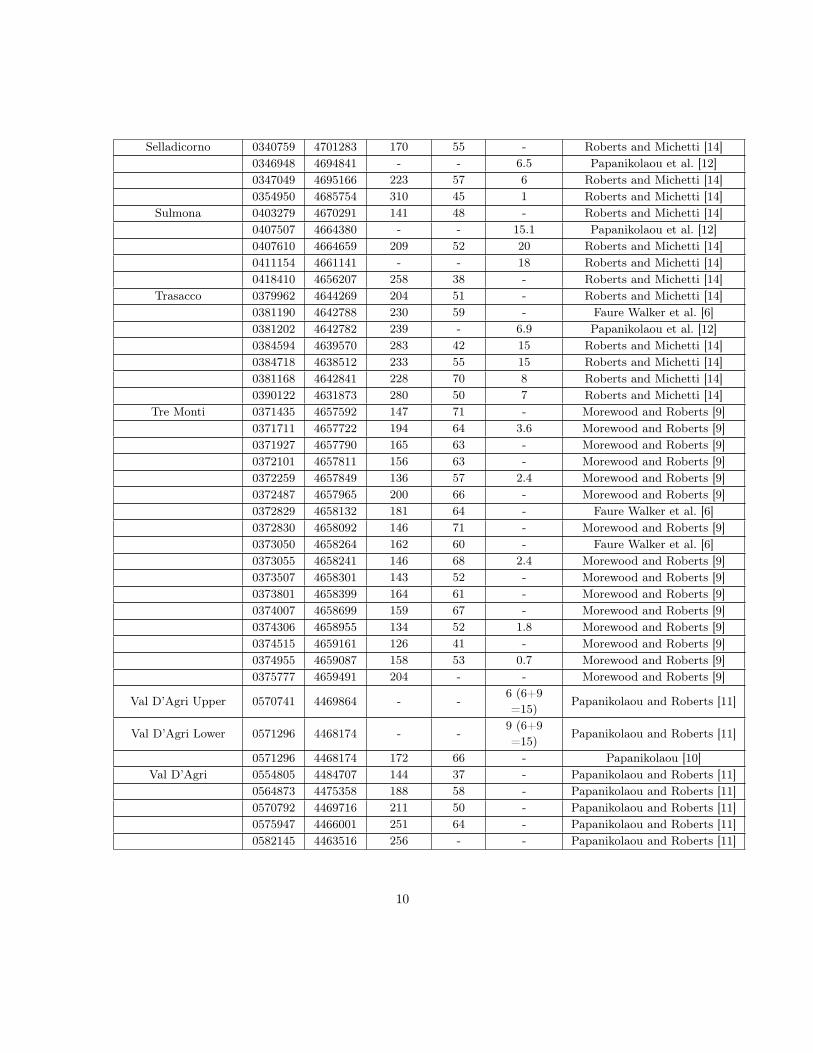
Table 2: Previously published data collected using same method as this paper, note that locations6
from Morewood and Roberts [9] were assigned UTM coordinates in Faure Walker et al. [6]. For details7
of individual sites see relevent paper.8
fault x utm y utmslip
directionslip
plunge15± 3kyrthrow (m)
source
Alburni 0521078 4490920 059 80 - Papanikolaou and Roberts [11]0529594 4486994 034 48 - Papanikolaou and Roberts [11]0535093 4484835 348 61 - Papanikolaou and Roberts [11]0535103 4485272 358 44 - Papanikolaou and Roberts [11]0536228 4484680 008 42 - Papanikolaou and Roberts [11]0540187 4484648 342 46 - Papanikolaou and Roberts [11]
Aquila 0391951 4679798 256 42 5 Roberts and Michetti [14]0391907 4679658 - - 5.7 Papanikolaou et al. [12]0386594 4688439 - - 3.5 Papanikolaou et al. [12]0385225 4687517 - - 6.6 Papanikolaou et al. [12]0384225 4687552 - - 3.5 Papanikolaou et al. [12]
5
0383561 4689552 237 56 25 Roberts and Michetti [14]0383457 4689203 - - 7 Papanikolaou et al. [12]0368500 4698400 198 38 - Roberts and Michetti [14]
Aremogna-CinqueMiglia
0421485 4631217 221 57 11.6 Faure Walker et al. [6]
0421801 4630850 216 35 7.1 Faure Walker et al. [6]0422111 4629669 244 57 - Faure Walker et al. [6]
Assergi 0386260 4696767 214 47 3 Faure Walker et al. [6]0369294 4701335 - - 12.6 Papanikolaou et al. [12]
Barete 0354574 4706216 130 65 - Roberts and Michetti [14]0358438 4702072 239 49 9.1 Papanikolaou et al. [12]0358469 4702018 237 51 - Faure Walker et al. [6]0358587 4701902 223 49 - Faure Walker et al. [6]0360149 4700476 229 51 8.5 Roberts and Michetti [14]0362067 4699769 204 61 - Roberts and Michetti [14]
Campo Felice 0369899 4677801 211 64 2.9 Morewood and Roberts [9]0371576 4676283 198 52 2.4 Morewood and Roberts [9]0372831 4675428 - - 8.8 Papanikolaou et al. [12]0373014 4674776 212 59 2.8 Morewood and Roberts [9]
Campo Imperatore 0380389 4700028 - - - Roberts and Michetti [14]0386404 4699825 - - 6.7 Papanikolaou et al. [12]0386505 4700028 - - 6 Roberts and Michetti [14]0394147 4698268 215 66 23.5 Faure Walker et al. [6]0398396 4690220 233 66 - Faure Walker et al. [6]0398806 4696650 222 68 - Faure Walker et al. [6]
Carsoli 0343943 4666185 - - 7.1 Papanikolaou et al. [12]0344000 4666366 223 70 6 Roberts and Michetti [14]0346477 4662798 261 61 7 Roberts and Michetti [14]0346717 4662870 - - 6.5 Papanikolaou et al. [12]0348513 4661740 - - 3.5 Papanikolaou et al. [12]0348565 4661918 295 61 4 Roberts and Michetti [14]0350223 4660627 323 38 - Roberts and Michetti [14]
Cassino 0400599 4605376 152 59 - Roberts and Michetti [14]0406085 4598019 181 45 - Roberts and Michetti [14]0409288 4593745 - - 5 Papanikolaou et al. [12]0409548 4593686 225 53 6 Roberts and Michetti [14]0412218 4590832 248 41 4 Roberts and Michetti [14]0416659 4589252 277 52 - Roberts and Michetti [14]
Fiamignano 0337173 4690531 175 39 4 Roberts and Michetti [14]0342018 4683819 231 65 - Faure Walker et al. [6]0343375 4681877 - - 19.4 Papanikolaou et al. [12]0345000 4682000 232 51 16.5 Roberts and Michetti [14]0350082 4679782 255 57 - Faure Walker et al. [6]
6

0352528 4676458 237 54 - Faure Walker et al. [6]0353069 4675846 254 54 - Faure Walker et al. [6]0355500 4674500 262 67 - Roberts and Michetti [14]
Fucino 0372948 4671938 198 72 0.4 Morewood and Roberts [9]0372984 4671918 176 74 - Morewood and Roberts [9]0373053 4671901 175 66 - Morewood and Roberts [9]0373103 4671881 130 40 - Morewood and Roberts [9]0373204 4671850 151 59 11.0 Morewood and Roberts [9]0373304 4671818 171 58 - Morewood and Roberts [9]0373504 4673145 167 52 - Roberts and Michetti [14]0373539 4671738 165 64 1.5+3.6=5.1 Morewood and Roberts [9]0373633 4671704 146 63 - Morewood and Roberts [9]0375178 4670658 166 63 - Morewood and Roberts [9]0375523 4670449 236 58 - Morewood and Roberts [9]0375636 4670399 182 44 11.0 Morewood and Roberts [9]0376188 4667985 230 48 - Morewood and Roberts [9]0376292 4667537 204 50 14.5 Morewood and Roberts [9]0376469 4667058 204 42 20.0 Morewood and Roberts [9]0376591 4666522 197 65 - Morewood and Roberts [9]0377014 4665929 204 46 - Roberts and Michetti [14]0377082 4665632 176 53 23.5 Morewood and Roberts [9]0377290 4664336 229 - - Morewood and Roberts [9]0377290 4664336 229 - - Morewood and Roberts [9]0377544 4664498 197 65 - Roberts and Michetti [14]0389372 4647259 229 59 - Morewood and Roberts [9]0389418 4647451 229 59 - Roberts and Michetti [14]0393128 4644651 248 71 - Morewood and Roberts [9]0393500 4645000 248 71 9 Roberts and Michetti [14]0394044 4644126 261 72 - Morewood and Roberts [9]0394670 4643792 283 38 5.0 Morewood and Roberts [9]0395000 4643700 261 72 9 Roberts and Michetti [14]
Gioia Vecchio 0394595 4640092 - - 9.9 Papanikolaou et al. [12]0394927 4640055 289 43 6 Roberts and Michetti [14]
Irpinia 0512000 4523200 109 60 - Papanikolaou and Roberts [11]0515000 4521000 078 65 - Papanikolaou and Roberts [11]0515232 4520580 - - 9.8 Papanikolaou and Roberts [11]0517500 4518500 062 65 - Papanikolaou and Roberts [11]0525300 4511000 336 56 - Papanikolaou and Roberts [11]0527000 4509500 358 49 - Papanikolaou and Roberts [11]
Irpinia Antithetic 0542557 4514780 - - 4 Papanikolaou and Roberts [11]Leonessa 0332371 4714421 053 58 6.5 Roberts and Michetti [14]
0332381 4714191 - - 5.7 Papanikolaou et al. [12]Liri 0356964 4654004 150 53 6 Roberts and Michetti [14]
7

0357047 4653842 - - 7.7 Papanikolaou et al. [12]0361395 4651777 155 50 10 Roberts and Michetti [14]0364129 4648781 - - 12 Papanikolaou et al. [12]0365852 4647538 212 71 20 Roberts and Michetti [14]0373946 4638900 - - 14.7 Papanikolaou et al. [12]0374387 4638749 215 74 18 Roberts and Michetti [14]0376509 4634762 221 38 - Roberts and Michetti [14]0379508 4633299 226 58 20 Roberts and Michetti [14]0385349 4626065 296 74 6 Roberts and Michetti [14]0393000 4620000 - 70 - Roberts and Michetti [14]
Maiella 0422270 4660086 - - 12.5 Roberts and Michetti [14]0425392 4642381 227 50 - Faure Walker et al. [6]
Maratea 0558920 4443809 167 56 - Papanikolaou and Roberts [11]0566197 4435333 233 55 - Papanikolaou and Roberts [11]0562618 4429845 251 63 - Papanikolaou and Roberts [11]0562700 4429519 - - 7.8 Papanikolaou and Roberts [11]0562700 4429519 247 70 - Papanikolaou [10]0564076 4425853 270 60 - Papanikolaou and Roberts [11]
Mercure 0577628 4431226 164 61 - Papanikolaou and Roberts [11]0581379 4430162 - - 3 Papanikolaou and Roberts [11]0582833 4429747 192 60 - Papanikolaou and Roberts [11]0582178 4429629 - - 6.7 Papanikolaou and Roberts [11]0590742 4423481 252 64 - Papanikolaou and Roberts [11]
Monte Alpi 0582282 4441140 261 75 - Papanikolaou and Roberts [11]0583142 4438100 274 59 - Papanikolaou and Roberts [11]
Montechristo 0381519 4697280 - - 3.8 Papanikolaou et al. [12]0383799 4695998 240 52 4.7 Faure Walker et al. [6]
Parasano 0391986 4650700 224 56 - Faure Walker et al. [5]0392144 4650643 237 57 8 Roberts and Michetti [14]0392776 4649992 - - 5.2 Papanikolaou et al. [12]
Parasano PescinaBreach
0391544 4650707 224 60 9.7 Faure Walker et al. [5]
Pescina 0389531 4652123 - - 5.5 Papanikolaou et al. [12]0390541 4651399 235 - 3.0 Faure Walker et al. [5]
Pescasseroli 0397490 4635700 158 68 - Roberts and Michetti [14]0399361 4634061 206 - 4.9 Papanikolaou et al. [12]0399424 4633872 205 75 - Faure Walker et al. [6]0401500 4631200 188 51 10 Roberts and Michetti [14]0403875 4627983 226 64 10 Roberts and Michetti [14]0403907 4627565 - - 9.1 Papanikolaou et al. [12]0407351 4626281 241 9 10 Roberts and Michetti [14]0408903 4626329 249 27 5 Roberts and Michetti [14]0411513 4624397 262 32 3 Roberts and Michetti [14]
8

Pescocostanzo 0422364 4641081 216 50 - Faure Walker et al. [6]0422905 4640424 - - 3.0 Faure Walker et al. [6]0423282 4640149 222 42 - Faure Walker et al. [6]0424055 4639203 238 52 2.4 Faure Walker et al. [6]0424380 4638982 256 51 - Faure Walker et al. [6]
Pollino 0588419 4416598 175 60 - Papanikolaou [10]0591153 4416303 176 60 - Papanikolaou and Roberts [11]0604376 4413447 214 60 - Papanikolaou and Roberts [11]0605223 4412845 - - 5.4 Papanikolaou and Roberts [11]0605483 4412366 - - 6 Papanikolaou and Roberts [11]0611287 4409150 - - 3.5 Papanikolaou and Roberts [11]
Rieti segment 0323500 4711000 205 46 5 Roberts and Michetti [14]Rieti 0328705 4701991 266 82 - Roberts and Michetti [14]
0332000 4695000 310 59 - Roberts and Michetti [14]Rocca Preturo 0389808 4673299 - - - Faure Walker et al. [6]
0392116 4672919 202 61 - Faure Walker et al. [6]0392297 4672778 191 59 - Faure Walker et al. [6]0392799 4672407 236 57 7 Faure Walker et al. [6]0393685 4671822 235 57 - Faure Walker et al. [6]0394322 4671027 259 48 7 Faure Walker et al. [6]
San Gregorio 0528458 4502743 115 - - Papanikolaou and Roberts [11]0531997 4502634 187 - - Papanikolaou and Roberts [11]0532772 4502364 - - 5.3 Papanikolaou and Roberts [11]0532772 4502364 193 50 - Papanikolaou [10]0541359 4499943 232 - - Papanikolaou and Roberts [11]
San Gregorio (NNWdipping)
0535297 4499874 093 - - Papanikolaou and Roberts [11]
0537554 4499123 015 - - Papanikolaou and Roberts [11]San Sebastiano 0395300 4652521 226 65 - Faure Walker et al. [6]
0395728 4651053 254 63 - Faure Walker et al. [6]0395887 4650748 238 62 - Faure Walker et al. [6]0397378 4644678 - - 5 Papanikolaou et al. [12]0397461 4644793 264 64 5 Roberts and Michetti [14]
Scurcola 0346556 4672543 150 49 - Faure Walker et al. [6]0346579 4672869 176 52 5.5 Roberts and Michetti [14]0352977 4665855 - - 7.4 Papanikolaou et al. [12]0353281 4665769 251 49 15 Roberts and Michetti [14]0357118 4661864 195 70 - Faure Walker et al. [6]0360200 4660135 215 70 - Faure Walker et al. [6]0360679 4660054 235 57 - Faure Walker et al. [6]0362173 4658970 232 68 - Roberts and Michetti [14]0365000 4656530 261 42 - Roberts and Michetti [14]0368480 4650441 270 53 - Roberts and Michetti [14]
9
Selladicorno 0340759 4701283 170 55 - Roberts and Michetti [14]0346948 4694841 - - 6.5 Papanikolaou et al. [12]0347049 4695166 223 57 6 Roberts and Michetti [14]0354950 4685754 310 45 1 Roberts and Michetti [14]
Sulmona 0403279 4670291 141 48 - Roberts and Michetti [14]0407507 4664380 - - 15.1 Papanikolaou et al. [12]0407610 4664659 209 52 20 Roberts and Michetti [14]0411154 4661141 - - 18 Roberts and Michetti [14]0418410 4656207 258 38 - Roberts and Michetti [14]
Trasacco 0379962 4644269 204 51 - Roberts and Michetti [14]0381190 4642788 230 59 - Faure Walker et al. [6]0381202 4642782 239 - 6.9 Papanikolaou et al. [12]0384594 4639570 283 42 15 Roberts and Michetti [14]0384718 4638512 233 55 15 Roberts and Michetti [14]0381168 4642841 228 70 8 Roberts and Michetti [14]0390122 4631873 280 50 7 Roberts and Michetti [14]
Tre Monti 0371435 4657592 147 71 - Morewood and Roberts [9]0371711 4657722 194 64 3.6 Morewood and Roberts [9]0371927 4657790 165 63 - Morewood and Roberts [9]0372101 4657811 156 63 - Morewood and Roberts [9]0372259 4657849 136 57 2.4 Morewood and Roberts [9]0372487 4657965 200 66 - Morewood and Roberts [9]0372829 4658132 181 64 - Faure Walker et al. [6]0372830 4658092 146 71 - Morewood and Roberts [9]0373050 4658264 162 60 - Faure Walker et al. [6]0373055 4658241 146 68 2.4 Morewood and Roberts [9]0373507 4658301 143 52 - Morewood and Roberts [9]0373801 4658399 164 61 - Morewood and Roberts [9]0374007 4658699 159 67 - Morewood and Roberts [9]0374306 4658955 134 52 1.8 Morewood and Roberts [9]0374515 4659161 126 41 - Morewood and Roberts [9]0374955 4659087 158 53 0.7 Morewood and Roberts [9]0375777 4659491 204 - - Morewood and Roberts [9]
Val D’Agri Upper 0570741 4469864 - -6 (6+9=15)
Papanikolaou and Roberts [11]
Val D’Agri Lower 0571296 4468174 - -9 (6+9=15)
Papanikolaou and Roberts [11]
0571296 4468174 172 66 - Papanikolaou [10]Val D’Agri 0554805 4484707 144 37 - Papanikolaou and Roberts [11]
0564873 4475358 188 58 - Papanikolaou and Roberts [11]0570792 4469716 211 50 - Papanikolaou and Roberts [11]0575947 4466001 251 64 - Papanikolaou and Roberts [11]0582145 4463516 256 - - Papanikolaou and Roberts [11]
10

Vallo di Diano 0537182 4492810 - - 3.3 Papanikolaou and Roberts [11]0538539 4492238 - - 7.3 Papanikolaou and Roberts [11]0538539 4492238 190 57 - Papanikolaou [10]0538722 4492225 188 55 - Papanikolaou and Roberts [11]0538726 4491971 - - 8 Papanikolaou and Roberts [11]0541066 4491239 209 62 - Papanikolaou and Roberts [11]0545958 4479775 - - 9.8 Papanikolaou and Roberts [11]0546264 4479056 240 55 - Papanikolaou and Roberts [11]0552369 4471395 255 56 - Papanikolaou and Roberts [11]0559487 4454453 293 45 - Papanikolaou and Roberts [11]
Velino-Magnola 0356017 4680128 167 71 Morewood and Roberts [9]0362971 4668034 170 58 1.4 Morewood and Roberts [9]0364000 4667000 193 44 - Roberts and Michetti [14]0364655 4666220 - - 8.4 Faure Walker et al. [6]0368944 4665314 193 52 3.4 Morewood and Roberts [9]0371346 4664348 194 56 3.4 Morewood and Roberts [9]0371954 4664067 185 46 3.5 Morewood and Roberts [9]0374140 4664191 194 41 - Roberts and Michetti [14]0375742 4663069 159 62 - Morewood and Roberts [9]
Ventrino 0391544 4658336 215 49 - Roberts and Michetti [14]0391986 4657816 245 58 2.7 Faure Walker et al. [6]0393070 4657467 255 56 - Faure Walker et al. [6]
This data set does not include a few of the faults so in these cases throw-rates and slip vectors9
derived from other authors are used.10
The displacement of a stratigraphic boundary, radiocarbon dated at 2020±80 BC, along the11
Carpino-Le Piano Fault suggests a throw-rate of 0.75 to 1.00mmyr−1 near the centre of the fault12
that tends to zero towards the tips [3].13
Topographic profiles across a displaced terrace show that the vertical slip rate (throw-rate) of the14
Laga Fault is 0.7-0.9mm/yr [7]. The average slip vector at the centre of the fault is 225o ± 5o [1] and15
the plunge is estimated to be 65± 5o (strike 140o − 150o and dip 60o − 70o [1]).16
Observations on the Ocre Fault reveal a 3m high scarp [15].17
For the Pettino Fault, a throw-rate of 0.47-0.86mm/yr was obtained from a 15-20m vertical offset18
of an alluvial terrace dated using stratigraphic correlation with the slope deposits in the area [7].19
Based on the offset of a 36 ka unit, Cinque et al. [2] report throw-rates of 0.2-0.5mmyr−1 on the20
Piana Volturno Fault [2].21
The South Ufita Valley Fault has an estimated throw-rate of 0.2mmyr−1 since the last glacial22
maximum [2] based on the offset of dated successions.23
The centre of the Fucino basin fault is unexposed as it has been covered by lake beds. Here, we24
assign a throw of 8-18m, calculated using InSAR [13]. There is an additional error in the maximum25
throw for the InSAR measurements so as to allow for sedimentation on the lake beds. This error was26
estimated by extrapolating the sedimentation rate over 2000yrs in a near trench site [8].27
We are not aware of any throw-rate measurements for the Apice, Avella, Benevento and Capitig-28
nano faults hence an estimate of 0.2mm/yr was derived by comparing them with faults within the area29
which have a similar length and known seismic activity. Whether there is a Late Pleistocene-Holocene30
11
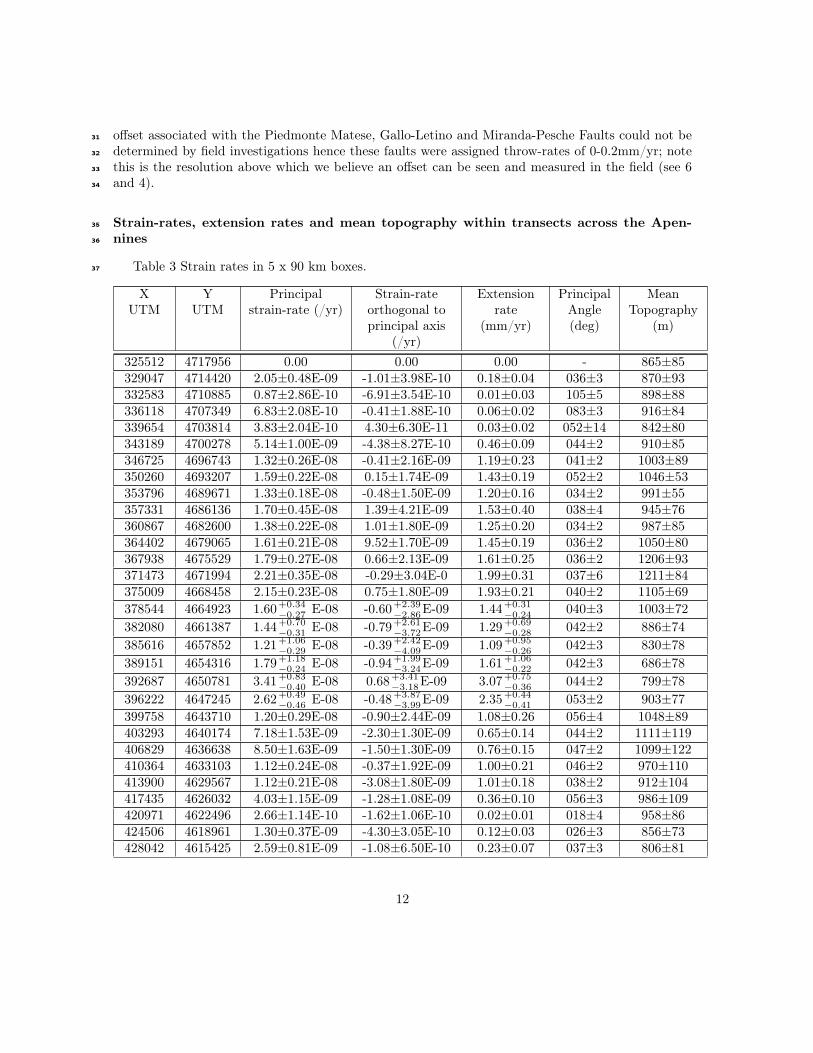
offset associated with the Piedmonte Matese, Gallo-Letino and Miranda-Pesche Faults could not be31
determined by field investigations hence these faults were assigned throw-rates of 0-0.2mm/yr; note32
this is the resolution above which we believe an offset can be seen and measured in the field (see 633
and 4).34
Strain-rates, extension rates and mean topography within transects across the Apen-35
nines36
Table 3 Strain rates in 5 x 90 km boxes.37
XUTM
YUTM
Principalstrain-rate (/yr)
Strain-rateorthogonal toprincipal axis
(/yr)
Extensionrate
(mm/yr)
PrincipalAngle(deg)
MeanTopography
(m)
325512 4717956 0.00 0.00 0.00 - 865±85329047 4714420 2.05±0.48E-09 -1.01±3.98E-10 0.18±0.04 036±3 870±93332583 4710885 0.87±2.86E-10 -6.91±3.54E-10 0.01±0.03 105±5 898±88336118 4707349 6.83±2.08E-10 -0.41±1.88E-10 0.06±0.02 083±3 916±84339654 4703814 3.83±2.04E-10 4.30±6.30E-11 0.03±0.02 052±14 842±80343189 4700278 5.14±1.00E-09 -4.38±8.27E-10 0.46±0.09 044±2 910±85346725 4696743 1.32±0.26E-08 -0.41±2.16E-09 1.19±0.23 041±2 1003±89350260 4693207 1.59±0.22E-08 0.15±1.74E-09 1.43±0.19 052±2 1046±53353796 4689671 1.33±0.18E-08 -0.48±1.50E-09 1.20±0.16 034±2 991±55357331 4686136 1.70±0.45E-08 1.39±4.21E-09 1.53±0.40 038±4 945±76360867 4682600 1.38±0.22E-08 1.01±1.80E-09 1.25±0.20 034±2 987±85364402 4679065 1.61±0.21E-08 9.52±1.70E-09 1.45±0.19 036±2 1050±80367938 4675529 1.79±0.27E-08 0.66±2.13E-09 1.61±0.25 036±2 1206±93371473 4671994 2.21±0.35E-08 -0.29±3.04E-0 1.99±0.31 037±6 1211±84375009 4668458 2.15±0.23E-08 0.75±1.80E-09 1.93±0.21 040±2 1105±69378544 4664923 1.60+0.34
−0.27 E-08 -0.60+2.39−2.86E-09 1.44+0.31
−0.24 040±3 1003±72382080 4661387 1.44+0.70
−0.31 E-08 -0.79+2.61−3.72E-09 1.29+0.69
−0.28 042±2 886±74385616 4657852 1.21+1.06
−0.29 E-08 -0.39+2.42−4.09E-09 1.09+0.95
−0.26 042±3 830±78389151 4654316 1.79+1.18
−0.24 E-08 -0.94+1.99−3.24E-09 1.61+1.06
−0.22 042±3 686±78392687 4650781 3.41+0.83
−0.40 E-08 0.68+3.41−3.18E-09 3.07+0.75
−0.36 044±2 799±78396222 4647245 2.62+0.49
−0.46 E-08 -0.48+3.87−3.99E-09 2.35+0.44
−0.41 053±2 903±77399758 4643710 1.20±0.29E-08 -0.90±2.44E-09 1.08±0.26 056±4 1048±89403293 4640174 7.18±1.53E-09 -2.30±1.30E-09 0.65±0.14 044±2 1111±119406829 4636638 8.50±1.63E-09 -1.50±1.30E-09 0.76±0.15 047±2 1099±122410364 4633103 1.12±0.24E-08 -0.37±1.92E-09 1.00±0.21 046±2 970±110413900 4629567 1.12±0.21E-08 -3.08±1.80E-09 1.01±0.18 038±2 912±104417435 4626032 4.03±1.15E-09 -1.28±1.08E-09 0.36±0.10 056±3 986±109420971 4622496 2.66±1.14E-10 -1.62±1.06E-10 0.02±0.01 018±4 958±86424506 4618961 1.30±0.37E-09 -4.30±3.05E-10 0.12±0.03 026±3 856±73428042 4615425 2.59±0.81E-09 -1.08±6.50E-10 0.23±0.07 037±3 806±81
12
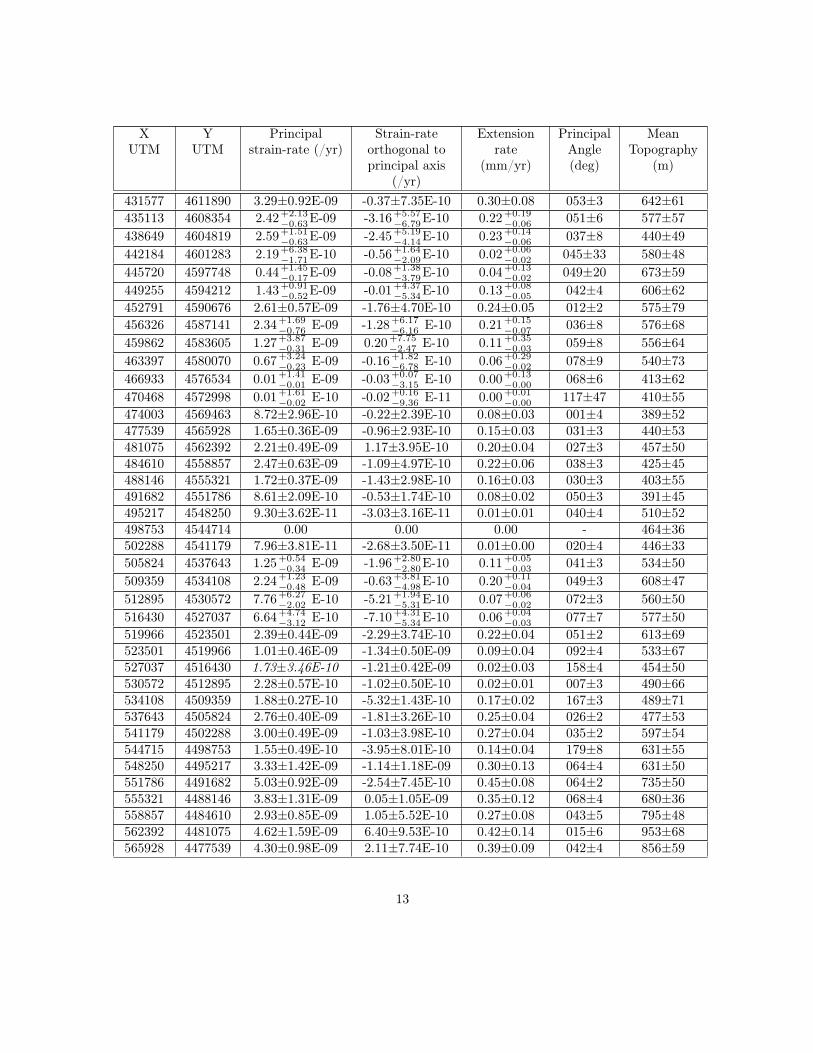
XUTM
YUTM
Principalstrain-rate (/yr)
Strain-rateorthogonal toprincipal axis
(/yr)
Extensionrate
(mm/yr)
PrincipalAngle(deg)
MeanTopography
(m)
431577 4611890 3.29±0.92E-09 -0.37±7.35E-10 0.30±0.08 053±3 642±61435113 4608354 2.42+2.13
−0.63E-09 -3.16+5.57−6.79E-10 0.22+0.19
−0.06 051±6 577±57438649 4604819 2.59+1.51
−0.63E-09 -2.45+5.19−4.14E-10 0.23+0.14
−0.06 037±8 440±49442184 4601283 2.19+6.38
−1.71E-10 -0.56+1.64−2.09E-10 0.02+0.06
−0.02 045±33 580±48445720 4597748 0.44+1.45
−0.17E-09 -0.08+1.38−3.79E-10 0.04+0.13
−0.02 049±20 673±59449255 4594212 1.43+0.91
−0.52E-09 -0.01+4.37−5.34E-10 0.13+0.08
−0.05 042±4 606±62452791 4590676 2.61±0.57E-09 -1.76±4.70E-10 0.24±0.05 012±2 575±79456326 4587141 2.34+1.69
−0.76 E-09 -1.28+6.17−6.16 E-10 0.21+0.15
−0.07 036±8 576±68459862 4583605 1.27+3.87
−0.31 E-09 0.20+7.75−2.47 E-10 0.11+0.35
−0.03 059±8 556±64463397 4580070 0.67+3.24
−0.23 E-09 -0.16+1.82−6.78 E-10 0.06+0.29
−0.02 078±9 540±73466933 4576534 0.01+1.41
−0.01 E-09 -0.03+0.07−3.15 E-10 0.00+0.13
−0.00 068±6 413±62470468 4572998 0.01+1.61
−0.02 E-10 -0.02+0.16−9.36 E-11 0.00+0.01
−0.00 117±47 410±55474003 4569463 8.72±2.96E-10 -0.22±2.39E-10 0.08±0.03 001±4 389±52477539 4565928 1.65±0.36E-09 -0.96±2.93E-10 0.15±0.03 031±3 440±53481075 4562392 2.21±0.49E-09 1.17±3.95E-10 0.20±0.04 027±3 457±50484610 4558857 2.47±0.63E-09 -1.09±4.97E-10 0.22±0.06 038±3 425±45488146 4555321 1.72±0.37E-09 -1.43±2.98E-10 0.16±0.03 030±3 403±55491682 4551786 8.61±2.09E-10 -0.53±1.74E-10 0.08±0.02 050±3 391±45495217 4548250 9.30±3.62E-11 -3.03±3.16E-11 0.01±0.01 040±4 510±52498753 4544714 0.00 0.00 0.00 - 464±36502288 4541179 7.96±3.81E-11 -2.68±3.50E-11 0.01±0.00 020±4 446±33505824 4537643 1.25+0.54
−0.34 E-09 -1.96+2.80−2.80E-10 0.11+0.05
−0.03 041±3 534±50509359 4534108 2.24+1.23
−0.48 E-09 -0.63+3.81−4.98E-10 0.20+0.11
−0.04 049±3 608±47512895 4530572 7.76+6.27
−2.02 E-10 -5.21+1.94−5.31E-10 0.07+0.06
−0.02 072±3 560±50516430 4527037 6.64+4.74
−3.12 E-10 -7.10+4.31−5.34E-10 0.06+0.04
−0.03 077±7 577±50519966 4523501 2.39±0.44E-09 -2.29±3.74E-10 0.22±0.04 051±2 613±69523501 4519966 1.01±0.46E-09 -1.34±0.50E-09 0.09±0.04 092±4 533±67527037 4516430 1.73±3.46E-10 -1.21±0.42E-09 0.02±0.03 158±4 454±50530572 4512895 2.28±0.57E-10 -1.02±0.50E-10 0.02±0.01 007±3 490±66534108 4509359 1.88±0.27E-10 -5.32±1.43E-10 0.17±0.02 167±3 489±71537643 4505824 2.76±0.40E-09 -1.81±3.26E-10 0.25±0.04 026±2 477±53541179 4502288 3.00±0.49E-09 -1.03±3.98E-10 0.27±0.04 035±2 597±54544715 4498753 1.55±0.49E-10 -3.95±8.01E-10 0.14±0.04 179±8 631±55548250 4495217 3.33±1.42E-09 -1.14±1.18E-09 0.30±0.13 064±4 631±50551786 4491682 5.03±0.92E-09 -2.54±7.45E-10 0.45±0.08 064±2 735±50555321 4488146 3.83±1.31E-09 0.05±1.05E-09 0.35±0.12 068±4 680±36558857 4484610 2.93±0.85E-09 1.05±5.52E-10 0.27±0.08 043±5 795±48562392 4481075 4.62±1.59E-09 6.40±9.53E-10 0.42±0.14 015±6 953±68565928 4477539 4.30±0.98E-09 2.11±7.74E-10 0.39±0.09 042±4 856±59
13
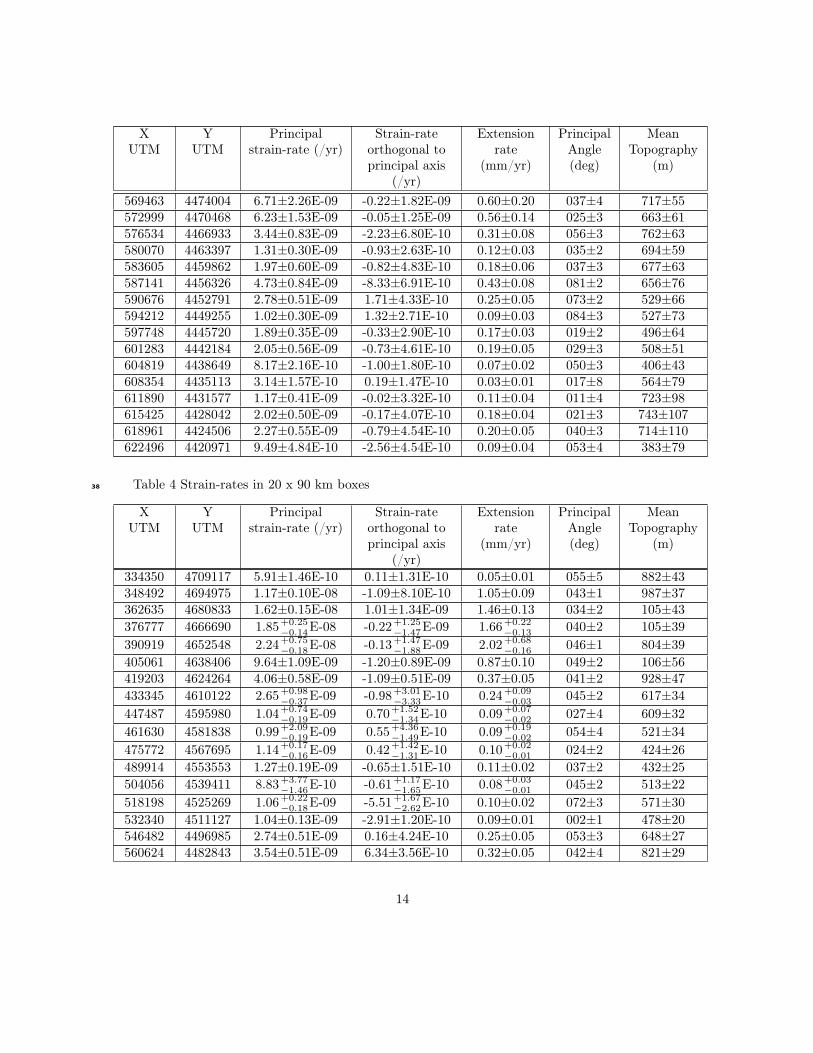
XUTM
YUTM
Principalstrain-rate (/yr)
Strain-rateorthogonal toprincipal axis
(/yr)
Extensionrate
(mm/yr)
PrincipalAngle(deg)
MeanTopography
(m)
569463 4474004 6.71±2.26E-09 -0.22±1.82E-09 0.60±0.20 037±4 717±55572999 4470468 6.23±1.53E-09 -0.05±1.25E-09 0.56±0.14 025±3 663±61576534 4466933 3.44±0.83E-09 -2.23±6.80E-10 0.31±0.08 056±3 762±63580070 4463397 1.31±0.30E-09 -0.93±2.63E-10 0.12±0.03 035±2 694±59583605 4459862 1.97±0.60E-09 -0.82±4.83E-10 0.18±0.06 037±3 677±63587141 4456326 4.73±0.84E-09 -8.33±6.91E-10 0.43±0.08 081±2 656±76590676 4452791 2.78±0.51E-09 1.71±4.33E-10 0.25±0.05 073±2 529±66594212 4449255 1.02±0.30E-09 1.32±2.71E-10 0.09±0.03 084±3 527±73597748 4445720 1.89±0.35E-09 -0.33±2.90E-10 0.17±0.03 019±2 496±64601283 4442184 2.05±0.56E-09 -0.73±4.61E-10 0.19±0.05 029±3 508±51604819 4438649 8.17±2.16E-10 -1.00±1.80E-10 0.07±0.02 050±3 406±43608354 4435113 3.14±1.57E-10 0.19±1.47E-10 0.03±0.01 017±8 564±79611890 4431577 1.17±0.41E-09 -0.02±3.32E-10 0.11±0.04 011±4 723±98615425 4428042 2.02±0.50E-09 -0.17±4.07E-10 0.18±0.04 021±3 743±107618961 4424506 2.27±0.55E-09 -0.79±4.54E-10 0.20±0.05 040±3 714±110622496 4420971 9.49±4.84E-10 -2.56±4.54E-10 0.09±0.04 053±4 383±79
Table 4 Strain-rates in 20 x 90 km boxes38
XUTM
YUTM
Principalstrain-rate (/yr)
Strain-rateorthogonal toprincipal axis
(/yr)
Extensionrate
(mm/yr)
PrincipalAngle(deg)
MeanTopography
(m)
334350 4709117 5.91±1.46E-10 0.11±1.31E-10 0.05±0.01 055±5 882±43348492 4694975 1.17±0.10E-08 -1.09±8.10E-10 1.05±0.09 043±1 987±37362635 4680833 1.62±0.15E-08 1.01±1.34E-09 1.46±0.13 034±2 105±43376777 4666690 1.85+0.25
−0.14E-08 -0.22+1.25−1.47E-09 1.66+0.22
−0.13 040±2 105±39390919 4652548 2.24+0.75
−0.18E-08 -0.13+1.47−1.88E-09 2.02+0.68
−0.16 046±1 804±39405061 4638406 9.64±1.09E-09 -1.20±0.89E-09 0.87±0.10 049±2 106±56419203 4624264 4.06±0.58E-09 -1.09±0.51E-09 0.37±0.05 041±2 928±47433345 4610122 2.65+0.98
−0.37E-09 -0.98+3.01−3.33E-10 0.24+0.09
−0.03 045±2 617±34447487 4595980 1.04+0.74
−0.19E-09 0.70+1.52−1.34E-10 0.09+0.07
−0.02 027±4 609±32461630 4581838 0.99+2.09
−0.19E-09 0.55+4.36−1.49E-10 0.09+0.19
−0.02 054±4 521±34475772 4567695 1.14+0.17
−0.16E-09 0.42+1.42−1.31E-10 0.10+0.02
−0.01 024±2 424±26489914 4553553 1.27±0.19E-09 -0.65±1.51E-10 0.11±0.02 037±2 432±25504056 4539411 8.83+3.77
−1.46E-10 -0.61+1.17−1.65E-10 0.08+0.03
−0.01 045±2 513±22518198 4525269 1.06+0.22
−0.18E-09 -5.51+1.67−2.62E-10 0.10±0.02 072±3 571±30
532340 4511127 1.04±0.13E-09 -2.91±1.20E-10 0.09±0.01 002±1 478±20546482 4496985 2.74±0.51E-09 0.16±4.24E-10 0.25±0.05 053±3 648±27560624 4482843 3.54±0.51E-09 6.34±3.56E-10 0.32±0.05 042±4 821±29
14

XUTM
YUTM
Principalstrain-rate (/yr)
Strain-rateorthogonal toprincipal axis
(/yr)
Extensionrate
(mm/yr)
PrincipalAngle(deg)
MeanTopography
(m)
574767 4468701 4.26±0.71E-09 0.14±5.66E-10 0.38±0.06 036±2 709±30588909 4454558 2.41±0.27E-09 0.60±2.24E-10 0.22±0.02 073±2 597±35603051 4440416 1.23±0.18E-09 -0.03±1.45E-10 0.11±0.02 028±2 494±31617193 4426274 1.49±0.23E-09 0.18±1.87E-10 0.13±0.02 037±2 640±51
[1] Boncio, P., Lavecchia, G., Milana, G., Rozzi, B., 2004. Seismogenesis in central Apennines,39
Italy: an integrated analysis of minor earthquake sequences and structural data in the Amatrice-40
Campotosto area. Annals of Geophysics 47 (6), 1723–1740.41
[2] Cinque, A., Ascione, A., Caiazzo, 2000. Distribuzione spazio-temporale e caratterizzazione della42
fagliazione quaternaria in Appennino meridionaleDistribuzione spazio-temporale e caratteriz-43
zazione della fagliazione quaternaria in Appennino meridionale. CNR-Gruppo Nazionale per la44
Difesa dai Terremoti - Roma, pp. 203–218.45
[3] Di Bucci, D., Corrado, S., Naso, G., 2002. Active faults at the boundary between central and46
southern Apennines (Isernia, Italy). Tectonophysics 359 (47-63).47
[4] Faure Walker, J. P., 2010. Mechanics of continental extension from Quaternary strain field in48
the Italian Apennines. Ph.D. thesis, University College London.49
[5] Faure Walker, J. P., Roberts, G. P., Cowie, P. A., Papanikolaou, I., Michetti, A. M., Sammonds,50
P., Phillips, R., 2009. Horizontal strain-rates and throw-rates across breached relay-zones, central51
Italy: implications for the preservation of throw deficits at points of normal fault linkage. Journal52
of Structural Geology 31 (doi:10.1016/j.jsg.2009.06.01), 1145–1160.53
[6] Faure Walker, J. P., Roberts, G. P., Sammonds, P., Cowie, P. A. C., 2010. Comparison of54
earthquake strains over 100 and 10,000 year timescales: insights into variability in the seis-55
mic cycle in the central Apennines, Italy. Journal of Geophysical Research 115 (B10418),56
doi:10.1029/2009JB006462.57
[7] Galadini, F., Galli, P., 2000. Active tectonics in the Central Apennines (Italy) - input data for58
seismic hazard assessment. Natural Hazards 22, 225–270.59
[8] Michetti, A. M., Brunamonte, F., Serva, L., Vittori, E., 1996. Trench investigations of the 191560
Fucino earthquake fault scarps (Abruzzo, Central Italy): geological evidence of large historical61
events. Journal of Geophysical Research 101 (B3), 5921–5936.62
[9] Morewood, N., Roberts, G. P., 2000. The geometry, kinematics and rates of deformation within63
an en echelon normal fault boundary, central Italy. Journal of Structural Geology 22, 1027–1047.64
[10] Papanikolaou, I., 2005. Ph.D. thesis, University College London.65
[11] Papanikolaou, I. D., Roberts, G. P., 2007. Geometry, kinematics and deformation rates along the66
active normal fault system in the southern Apennines : Implications for fault growth. Journal67
of Structural Geology 29, 166–188.68
15

[12] Papanikolaou, I. D., Roberts, G. P., Michetti, A. M., 2005. Fault scarps and deformation rates69
in Lazio-Abruzzo, Central Italy: Comparison between geological fault slip-rate and GPS data.70
Tectonophysics 408, 147–176.71
[13] Pizzi, A., Pugliese, G., 2004. InSAR-DEM analyses integrated with geologic field methods for72
the study of long-term seismogenic fault behavior: Applications in the axial zone of the central73
Apennines (Italy). Journal of Seismology 8, 313–329.74
[14] Roberts, G. P., Michetti, A. M., 2004. Spatial and temporal variations in growth rates along ac-75
tive normal fault systems: an example from the Lazio-Abruzzo Apennines, central Italy. Journal76
of Structural Geology 26, 339–376.77
[15] Salvi, S., Cinti, F. R., Collini, L., D’Addezio, G., Doumaz, F., Pettinelli, E., 2003. Investigation78
of the active Celano-L’Aquila Fault System, Abruzzi (central Apennines, Italy) with combined79
ground penetrating radar and palaeoseismic trenching. Geophysical Journal International 155,80
805–818.81
16
Copyright © 2022 FDOKUMEN