Extending value stream mapping through waste definition ...
32
Extending value stream mapping through waste definition beyond customer perspective Mahvish Khurum, Kai Petersen* ,† and Tony Gorschek School of Computing, Blekinge Institute of Technology, Box 520, SE-372 25, Karlskrona, Sweden ABSTRACT Value stream mapping (VSM) is one of the several Lean practices, which has recently attracted interest in the software engineering community. In other contexts (such as military, health and production), VSM has achieved considerable improvements in processes and products. The goal is to capitalize on these benefits in the software intensive product development context. The primary contribution is that we are extending the definition of waste to fit in the software intensive product development context. As tradition- ally in VSM everything that is not considered valuable is waste, we do this practically by looking at value beyond the customer perspective and using the software value map. An evaluation has been conducted through an industrial case study. First, the instantiation and motivations for selecting certain strategies have been provided. Second, the outcome of the VSM is described in detail. The instantiation of VSM via workshops was considered good as workshops allowed active interaction and discussion stakeholders’ groups that are distant from each other in the regular work. With respect to waste and improvement identification, the participants were able to identify similar improvement suggestions. In a retrospective, the value stream approach was perceived positively by the practitioners with respect to process and outcome. Copyright © 2014 John Wiley & Sons, Ltd. Received 13 September 2012; Revised 29 October 2013; Accepted 4 February 2014 KEY WORDS: lean software development; software process improvement; value stream mapping; software product management; software project management 1. INTRODUCTION Software development industry is faced with the challenges such as global competitiveness and shorter time-to-market. In order to address these challenges, there is a need for better processes/tools/methods/ models/techniques to create quality software quickly, repeatedly, and reliably. Lean initiatives in manufacturing, logistics, services, and product development have led to radical improvements in quality, cost and delivery time [1–5]; however, the question in hand is whether lean principles can possibly be as effective for software development? According to the authors in [5–7], the answer seems to be of course. Lean is emerging as a popular way to make processes better [5]. Lean is a way of thinking that supports organizations to ‘specify value, line up value-creating actions in the best sequence, conduct these activities without interruption whenever someone requests them, and perform them more and more effectively’ [8]. According to Wang et al. [9], the current understanding of lean software development is largely shaped by practitioners’ writings [5, 10, 11]. The main focus of lean is the identification and elimination of waste from the process with respect to customer value [9]. Value stream mapping *Correspondence to: Kai Petersen, School of Computing, Blekinge Institute of Technology, Box 520, SE-372 25, Karlskrona, Sweden. † E-mail: [email protected] Copyright © 2014 John Wiley & Sons, Ltd. JOURNAL OF SOFTWARE: EVOLUTION AND PROCESS J. Softw. Evol. and Proc. (2014) Published online in Wiley Online Library (wileyonlinelibrary.com). DOI: 10.1002/smr.1647
-
Upload
khangminh22 -
Category
Documents
-
view
0 -
download
0
Transcript of Extending value stream mapping through waste definition ...
Extending value stream mapping through waste definition beyondcustomer perspective
Mahvish Khurum, Kai Petersen*,† and Tony Gorschek
School of Computing, Blekinge Institute of Technology, Box 520, SE-372 25, Karlskrona, Sweden
ABSTRACT
Value stream mapping (VSM) is one of the several Lean practices, which has recently attracted interest inthe software engineering community. In other contexts (such as military, health and production), VSMhas achieved considerable improvements in processes and products. The goal is to capitalize on thesebenefits in the software intensive product development context. The primary contribution is that we areextending the definition of waste to fit in the software intensive product development context. As tradition-ally in VSM everything that is not considered valuable is waste, we do this practically by looking at valuebeyond the customer perspective and using the software value map. An evaluation has been conductedthrough an industrial case study. First, the instantiation and motivations for selecting certain strategies havebeen provided. Second, the outcome of the VSM is described in detail. The instantiation of VSM viaworkshops was considered good as workshops allowed active interaction and discussion stakeholders’groups that are distant from each other in the regular work. With respect to waste and improvementidentification, the participants were able to identify similar improvement suggestions. In a retrospective,the value stream approach was perceived positively by the practitioners with respect to process and outcome.Copyright © 2014 John Wiley & Sons, Ltd.
Received 13 September 2012; Revised 29 October 2013; Accepted 4 February 2014
KEYWORDS: lean software development; software process improvement; value stream mapping; softwareproduct management; software project management
1. INTRODUCTION
Software development industry is faced with the challenges such as global competitiveness and shortertime-to-market. In order to address these challenges, there is a need for better processes/tools/methods/models/techniques to create quality software quickly, repeatedly, and reliably. Lean initiatives inmanufacturing, logistics, services, and product development have led to radical improvements inquality, cost and delivery time [1–5]; however, the question in hand is whether lean principles canpossibly be as effective for software development? According to the authors in [5–7], the answerseems to be of course. Lean is emerging as a popular way to make processes better [5]. Lean is away of thinking that supports organizations to ‘specify value, line up value-creating actions in thebest sequence, conduct these activities without interruption whenever someone requests them, andperform them more and more effectively’ [8].
According to Wang et al. [9], the current understanding of lean software development is largelyshaped by practitioners’ writings [5, 10, 11]. The main focus of lean is the identification andelimination of waste from the process with respect to customer value [9]. Value stream mapping
*Correspondence to: Kai Petersen, School of Computing, Blekinge Institute of Technology, Box 520, SE-372 25,Karlskrona, Sweden.†E-mail: [email protected]
Copyright © 2014 John Wiley & Sons, Ltd.
JOURNAL OF SOFTWARE: EVOLUTION AND PROCESSJ. Softw. Evol. and Proc. (2014)Published online in Wiley Online Library (wileyonlinelibrary.com). DOI: 10.1002/smr.1647
(VSM) is a one of the several lean practices that can be employed to eliminate waste and optimize thewhole [5]. VSM assists to identify bottlenecks in a process that impedes it from flowing at its optimum[5, 12]. It enables organization to understand any workflow with an end-to-end perspective [12–14].VSM has been applied at a relatively smaller scale with success in the context of manufacturing,where it enabled substantial reduction in lead time, setup time, cycle time and inventory levels [15].Another example is the application of VSM to supplier networks, which enabled efficiency gains incollaborating with suppliers, and provided valuable input for benchmarking [16]. Besides the benefitsrelated to concrete outcomes, the use of VSM helps to visualize the process seeing the end-to-end flow,guides to focus on not only waste, but also value, facilitates the use of a common language, guidesscheduling and forecasting activities, and forms the basis for lean production (cf. [17]). Overall, theoutcomes for value stream studies are positive, and hence, software engineers should capitalize on thebenefits. However, VSM is mainly focused on time, whereas value and waste in software engineeringare more complex. VSM is not well investigated within software engineering ([18] claimed being thefirst empirical study); however, this study was performed using a simplified view.
The Massachusetts Institute of Technology (MIT) Product Development VSM (PDVSM) manualprovides guidelines as how to do VSM in product development based on the authors’ experiences in leanengineering within the aerospace industry [12]. The main focus of PDVSM manual is cost reductionwith focus on value adding activities. Traditionally, waste is defined as any activity that consumesresources, time or space but does not add value to the product as perceived by the customer. All leanapproaches focus on identifying and eliminating waste (see [19] for further details on the measurementand visualization of the flow of lean software development). However, most of the literature reportinguse of VSM talks about the seven wastes purely in manufacturing context. Whereas, in the context ofsoftware development, there can be activities and steps that do not add value directly and thus may betermed as waste. For example, in manufacturing or engineering, performing detailed analysis to ensurearchitectural flexibility and maintainability for future sustainability might be termed as a waste. Whereasin the software development context, it could be highly value-adding for future additions andmodifications consequently reducing lead-time for future releases. Moreover, it is fundamental to realizethat a reduction in lead time might be negatively impacting other value considerations, such as quality ofthe product and architecture, human capital value, innovation capability and so on. Thus, in an effort toeliminate waste, extreme caution has to be taken. Value is the end (i.e., what we should deliver), andremoving waste is the means to maximize value. To the best of our knowledge, this has not beendiscussed explicitly in existing literature related to VSM. Our primary contribution is that we areextending the definition of waste. As everything that is not considered valuable for customer is waste, wedo this practically by looking at value beyond the customer perspective, and using the software valuemap [20] to drive waste identification. Detailed evaluation of VSM in an industrial case at Ericsson is acontribution within software product development context as such an extensive evaluation has not beenreported in Software Engineering literature so far. A detailed illustration, via VSM application atEricsson, demonstrates usability and usefulness of the proposed extension.
Given that there are too few applications in the software engineering context, the goal of thisresearch is to evaluate the ability of VSM to identify waste and value in the software engineeringcontext, which has been very valuable in other domains. By design, the practitioners will evaluatetheir processes from the additional value and waste perspectives. This study (a) illustrates theinstantiation of the value stream framework in an explanatory way, allowing others to learn from theexperience of executing the process; and (b) evaluates whether VSM supports the practitioners inidentifying waste in the current situation and supports them to identify improvements consistently.These two contributions relate to the two separate sections in the results, namely instantiation of theframework (Section 7.1 relating to (a), and outcome of the framework application (Section 7.2relating to (b)). Detailed experiences of (a) have not been reported yet, and for (b), no results existso far, given that modifications have been made to the value stream process.
The remainder of the paper is structured as follows: Section 2 presents background on lean andVSM. Section 3 contains related work focusing on lean in general and VSM application in particular.Section 4 presents the software value map used to evaluate the impact of improvements on differentvalue considerations. Section 5 presents the VSM framework for software development. Section 6contains the case study design used to evaluate the VSM frame work. Section 7 illustrates the
M. KHURUM, K. PETERSEN AND T. GORSCHEK
Copyright © 2014 John Wiley & Sons, Ltd. J. Softw. Evol. and Proc. (2014)DOI: 10.1002/smr
instantiation of the framework in the case company, as well as the documented outcome of applying theframework. The implications and lessons learned are discussed in Section 8. Section 9 concludes the paper.
2. BACKGROUND
The concept of lean is not a concept unique to software development. Its origin can be traced back to theToyota Production System in the 1950s [21]. However, Toyota revolutionized the automobile industrywith their approach of ‘lean manufacturing’ in the 1980s. The core five inherently interlinked guidinglean concepts taken in [9] are the following:
value: It is defined by the customer, and it is extremely important to have a clear understanding of what that is.value stream: A map that identifies every step in the process and classifies each step with respect to the
value it adds.flow: It is important that the production process flows continuously.pull: Customer orders pull product, guaranteeing that nothing is built before it is actually needed.perfection: Striving toward perfection in the process by continuously identifying and eliminating waste.
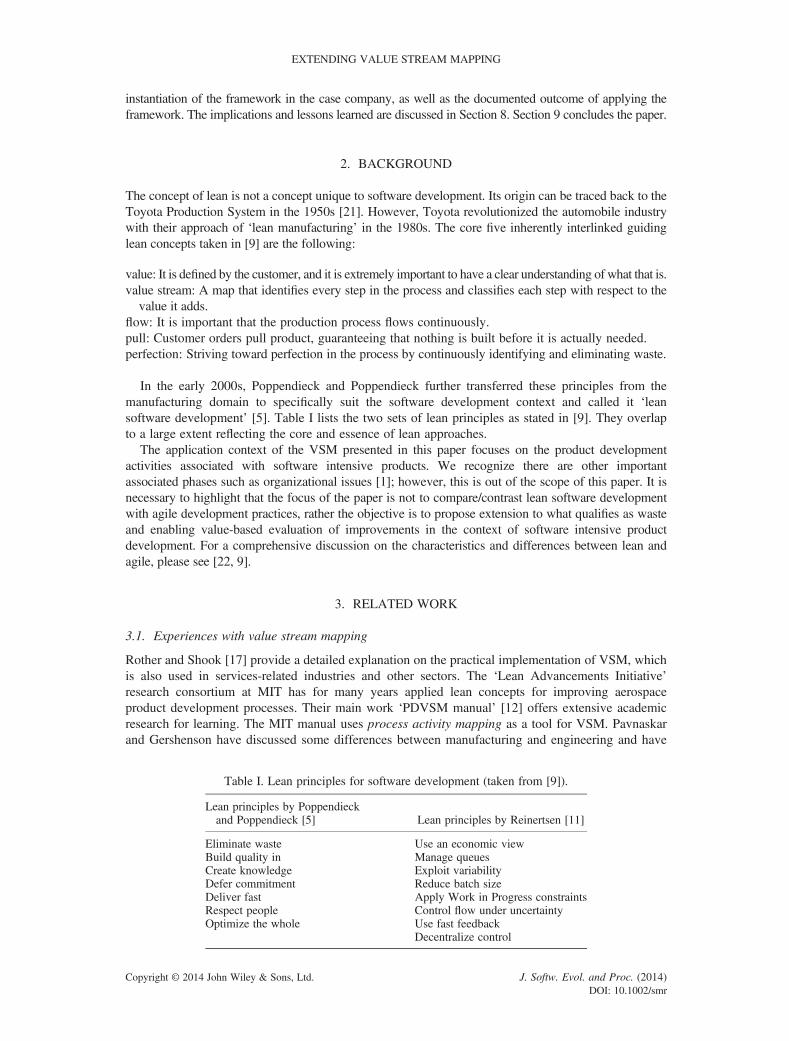
In the early 2000s, Poppendieck and Poppendieck further transferred these principles from themanufacturing domain to specifically suit the software development context and called it ‘leansoftware development’ [5]. Table I lists the two sets of lean principles as stated in [9]. They overlapto a large extent reflecting the core and essence of lean approaches.
The application context of the VSM presented in this paper focuses on the product developmentactivities associated with software intensive products. We recognize there are other importantassociated phases such as organizational issues [1]; however, this is out of the scope of this paper. It isnecessary to highlight that the focus of the paper is not to compare/contrast lean software developmentwith agile development practices, rather the objective is to propose extension to what qualifies as wasteand enabling value-based evaluation of improvements in the context of software intensive productdevelopment. For a comprehensive discussion on the characteristics and differences between lean andagile, please see [22, 9].
3. RELATED WORK
3.1. Experiences with value stream mapping
Rother and Shook [17] provide a detailed explanation on the practical implementation of VSM, whichis also used in services-related industries and other sectors. The ‘Lean Advancements Initiative’research consortium at MIT has for many years applied lean concepts for improving aerospaceproduct development processes. Their main work ‘PDVSM manual’ [12] offers extensive academicresearch for learning. The MIT manual uses process activity mapping as a tool for VSM. Pavnaskarand Gershenson have discussed some differences between manufacturing and engineering and have
Table I. Lean principles for software development (taken from [9]).
Lean principles by Poppendieckand Poppendieck [5] Lean principles by Reinertsen [11]
Eliminate waste Use an economic viewBuild quality in Manage queuesCreate knowledge Exploit variabilityDefer commitment Reduce batch sizeDeliver fast Apply Work in Progress constraintsRespect people Control flow under uncertaintyOptimize the whole Use fast feedback
Decentralize control
EXTENDING VALUE STREAM MAPPING
Copyright © 2014 John Wiley & Sons, Ltd. J. Softw. Evol. and Proc. (2014)DOI: 10.1002/smr
proposed a set of icons, definition of process data, and added representation of parallel and sequencingprocessing [23]. There are six other tools for VSM, namely production variety funnel, supply chainresponse matrix, demand amplification mapping, quality filter mapping, decision point analysis andphysical structure mapping [24]. However, they are more suitable for production and manufacturingindustries given the type of waste to be identified and reduced/eliminated (for details refer to [13, 25, 26]).
Mujtaba et al. applied VSM to reduce lead time in software product customizations and provided somehints and tips as how different steps in ‘VSM’ (drawing current state map, identifying waste, etc.) can beperformed [18]. However, this study only focused on reducing lead time and did not consider valueconsiderations beyond customers’ perspective.
3.2. Seven wastes in lean
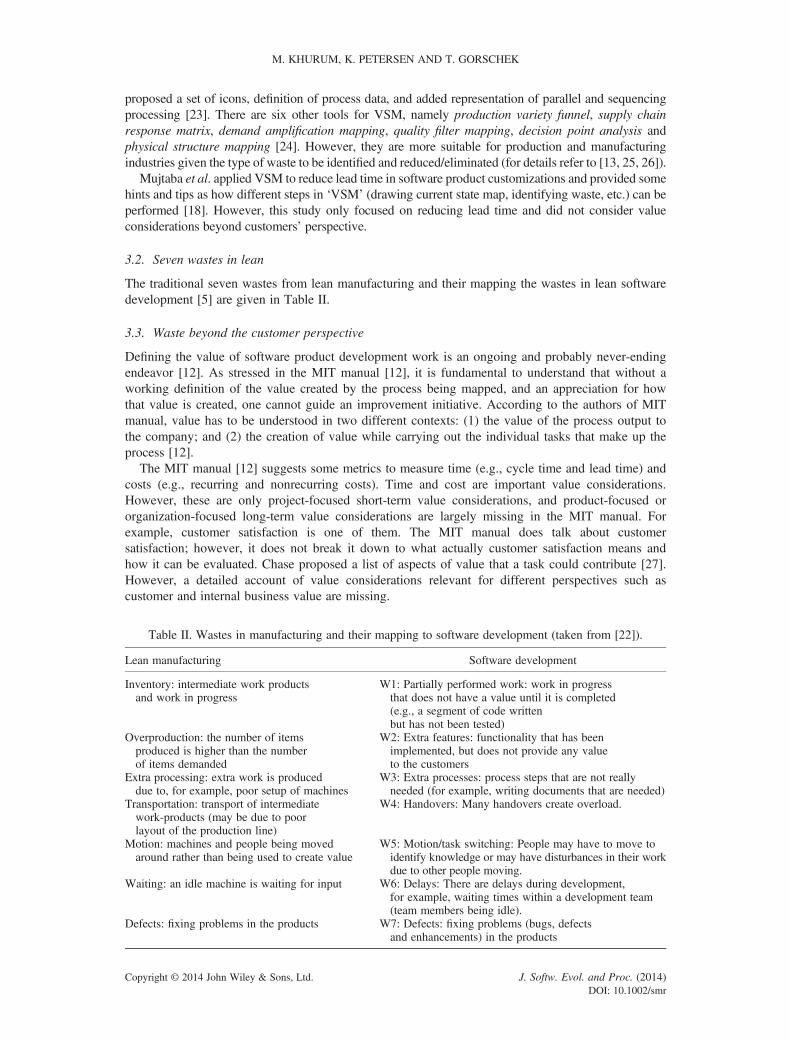
The traditional seven wastes from lean manufacturing and their mapping the wastes in lean softwaredevelopment [5] are given in Table II.
3.3. Waste beyond the customer perspective
Defining the value of software product development work is an ongoing and probably never-endingendeavor [12]. As stressed in the MIT manual [12], it is fundamental to understand that without aworking definition of the value created by the process being mapped, and an appreciation for howthat value is created, one cannot guide an improvement initiative. According to the authors of MITmanual, value has to be understood in two different contexts: (1) the value of the process output tothe company; and (2) the creation of value while carrying out the individual tasks that make up theprocess [12].
The MIT manual [12] suggests some metrics to measure time (e.g., cycle time and lead time) andcosts (e.g., recurring and nonrecurring costs). Time and cost are important value considerations.However, these are only project-focused short-term value considerations, and product-focused ororganization-focused long-term value considerations are largely missing in the MIT manual. Forexample, customer satisfaction is one of them. The MIT manual does talk about customersatisfaction; however, it does not break it down to what actually customer satisfaction means andhow it can be evaluated. Chase proposed a list of aspects of value that a task could contribute [27].However, a detailed account of value considerations relevant for different perspectives such ascustomer and internal business value are missing.
Table II. Wastes in manufacturing and their mapping to software development (taken from [22]).
Lean manufacturing Software development
Inventory: intermediate work productsand work in progress
W1: Partially performed work: work in progressthat does not have a value until it is completed(e.g., a segment of code writtenbut has not been tested)
Overproduction: the number of itemsproduced is higher than the numberof items demanded
W2: Extra features: functionality that has beenimplemented, but does not provide any valueto the customers
Extra processing: extra work is produceddue to, for example, poor setup of machines
W3: Extra processes: process steps that are not reallyneeded (for example, writing documents that are needed)
Transportation: transport of intermediatework-products (may be due to poorlayout of the production line)
W4: Handovers: Many handovers create overload.
Motion: machines and people being movedaround rather than being used to create value
W5: Motion/task switching: People may have to move toidentify knowledge or may have disturbances in their workdue to other people moving.
Waiting: an idle machine is waiting for input W6: Delays: There are delays during development,for example, waiting times within a development team(team members being idle).
Defects: fixing problems in the products W7: Defects: fixing problems (bugs, defectsand enhancements) in the products
M. KHURUM, K. PETERSEN AND T. GORSCHEK
Copyright © 2014 John Wiley & Sons, Ltd. J. Softw. Evol. and Proc. (2014)DOI: 10.1002/smr
Moreover, the authors argue that MIT recommendations to classify tasks as value adding andnon-value-adding are inadequate; due to the fact that different perspectives for value evaluations areignored. For example, a certain task can be adding pure business value (e.g., improving productarchitecture maintainability), which externally does not have visible value from the customerperspective. According to the MIT recommendations, it should be regarded as non-value-adding as itdoes not add to a product or process definition or reduce uncertainty in any apparent way. Whereasfrom the business sustainability perspective, it improves product architecture sustainability by making itmaintainable. Therefore, this task should not be regarded as non-value-adding or pure waste. Intraditional manufacturing, a task adds value directly to a process or product, whereas in a softwaredevelopment context, there can be several tasks that do not add direct the product or process value (asexemplified earlier); however, they do add value to the business by making the product more sustainable.
Section 4 gives a brief account of the software value map, which is proposed to be used forextending waste definition by incorporating value considerations beyond customer during VSM.
4. SOFTWARE VALUE MAP
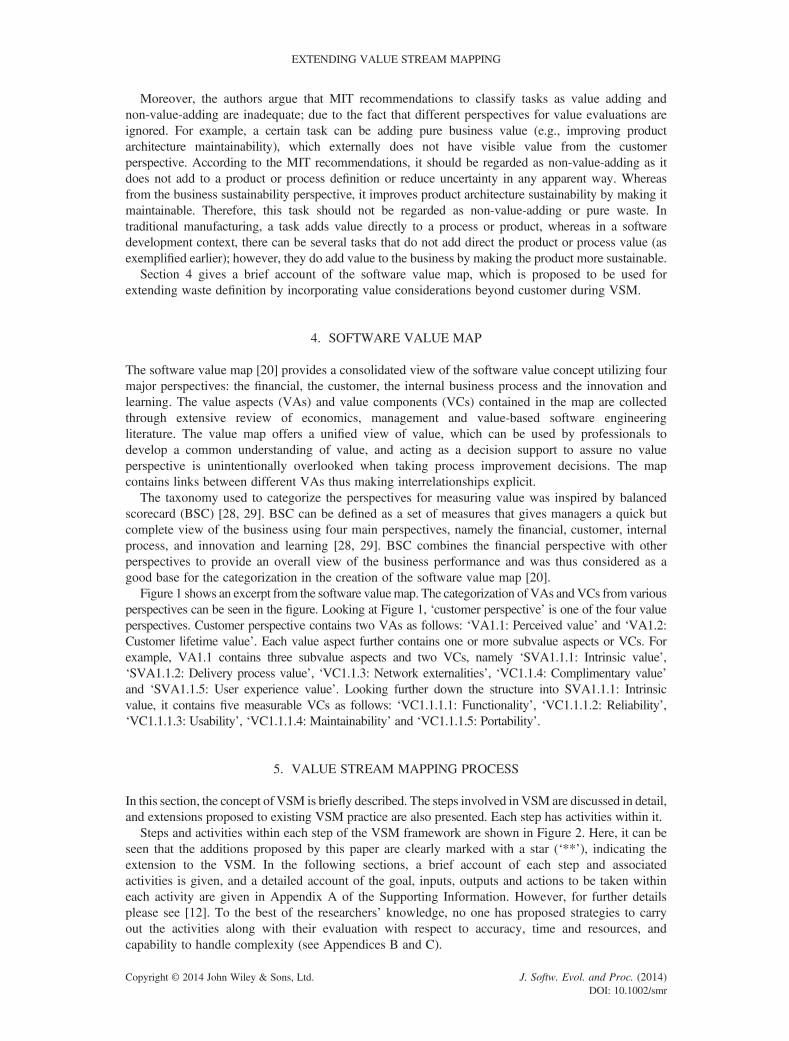
The software value map [20] provides a consolidated view of the software value concept utilizing fourmajor perspectives: the financial, the customer, the internal business process and the innovation andlearning. The value aspects (VAs) and value components (VCs) contained in the map are collectedthrough extensive review of economics, management and value-based software engineeringliterature. The value map offers a unified view of value, which can be used by professionals todevelop a common understanding of value, and acting as a decision support to assure no valueperspective is unintentionally overlooked when taking process improvement decisions. The mapcontains links between different VAs thus making interrelationships explicit.
The taxonomy used to categorize the perspectives for measuring value was inspired by balancedscorecard (BSC) [28, 29]. BSC can be defined as a set of measures that gives managers a quick butcomplete view of the business using four main perspectives, namely the financial, customer, internalprocess, and innovation and learning [28, 29]. BSC combines the financial perspective with otherperspectives to provide an overall view of the business performance and was thus considered as agood base for the categorization in the creation of the software value map [20].
Figure 1 shows an excerpt from the software valuemap. The categorization of VAs andVCs from variousperspectives can be seen in the figure. Looking at Figure 1, ‘customer perspective’ is one of the four valueperspectives. Customer perspective contains two VAs as follows: ‘VA1.1: Perceived value’ and ‘VA1.2:Customer lifetime value’. Each value aspect further contains one or more subvalue aspects or VCs. Forexample, VA1.1 contains three subvalue aspects and two VCs, namely ‘SVA1.1.1: Intrinsic value’,‘SVA1.1.2: Delivery process value’, ‘VC1.1.3: Network externalities’, ‘VC1.1.4: Complimentary value’and ‘SVA1.1.5: User experience value’. Looking further down the structure into SVA1.1.1: Intrinsicvalue, it contains five measurable VCs as follows: ‘VC1.1.1.1: Functionality’, ‘VC1.1.1.2: Reliability’,‘VC1.1.1.3: Usability’, ‘VC1.1.1.4: Maintainability’ and ‘VC1.1.1.5: Portability’.
5. VALUE STREAM MAPPING PROCESS
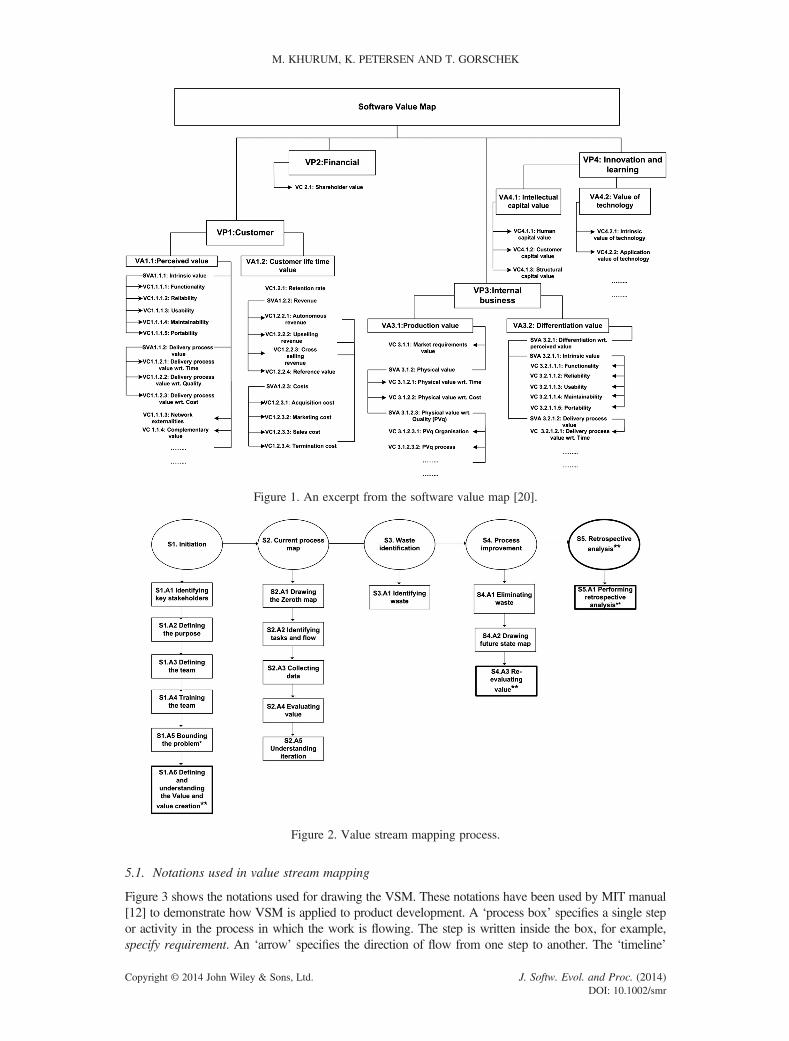
In this section, the concept of VSM is briefly described. The steps involved in VSM are discussed in detail,and extensions proposed to existing VSM practice are also presented. Each step has activities within it.
Steps and activities within each step of the VSM framework are shown in Figure 2. Here, it can beseen that the additions proposed by this paper are clearly marked with a star (‘**’), indicating theextension to the VSM. In the following sections, a brief account of each step and associatedactivities is given, and a detailed account of the goal, inputs, outputs and actions to be taken withineach activity are given in Appendix A of the Supporting Information. However, for further detailsplease see [12]. To the best of the researchers’ knowledge, no one has proposed strategies to carryout the activities along with their evaluation with respect to accuracy, time and resources, andcapability to handle complexity (see Appendices B and C).
EXTENDING VALUE STREAM MAPPING
Copyright © 2014 John Wiley & Sons, Ltd. J. Softw. Evol. and Proc. (2014)DOI: 10.1002/smr
5.1. Notations used in value stream mapping
Figure 3 shows the notations used for drawing the VSM. These notations have been used by MIT manual[12] to demonstrate how VSM is applied to product development. A ‘process box’ specifies a single stepor activity in the process in which the work is flowing. The step is written inside the box, for example,specify requirement. An ‘arrow’ specifies the direction of flow from one step to another. The ‘timeline’
Figure 2. Value stream mapping process.
Figure 1. An excerpt from the software value map [20].
M. KHURUM, K. PETERSEN AND T. GORSCHEK
Copyright © 2014 John Wiley & Sons, Ltd. J. Softw. Evol. and Proc. (2014)DOI: 10.1002/smr
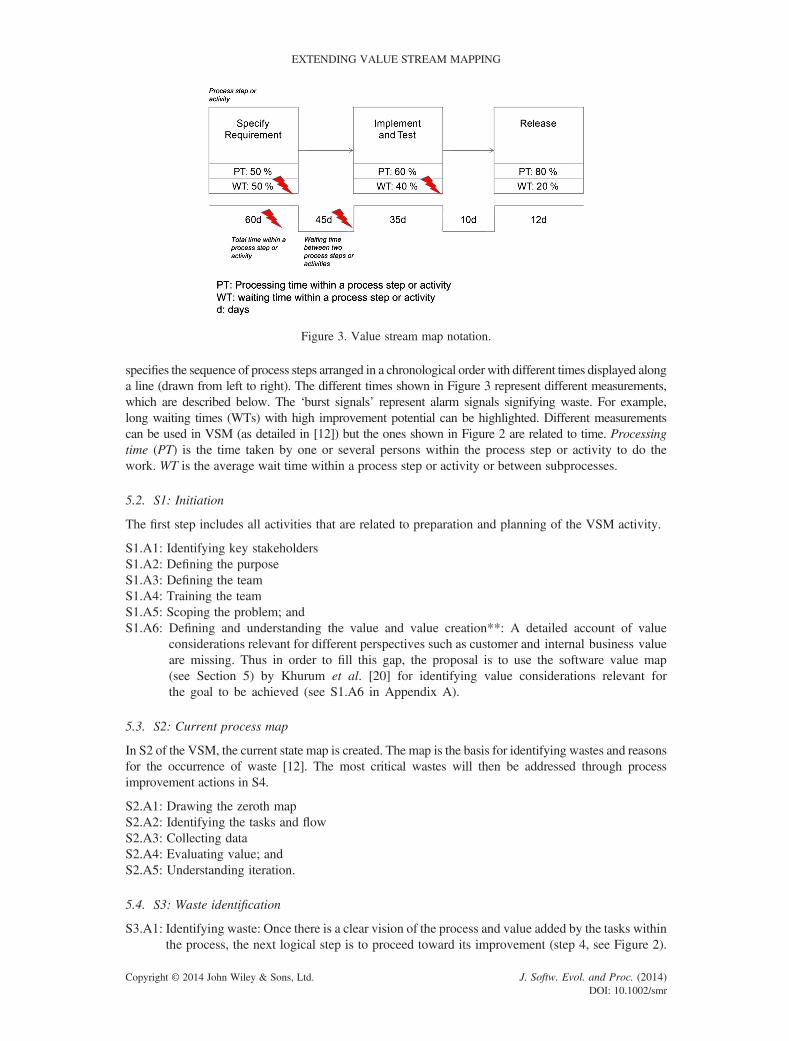
specifies the sequence of process steps arranged in a chronological order with different times displayed alonga line (drawn from left to right). The different times shown in Figure 3 represent different measurements,which are described below. The ‘burst signals’ represent alarm signals signifying waste. For example,long waiting times (WTs) with high improvement potential can be highlighted. Different measurementscan be used in VSM (as detailed in [12]) but the ones shown in Figure 2 are related to time. Processingtime (PT) is the time taken by one or several persons within the process step or activity to do thework. WT is the average wait time within a process step or activity or between subprocesses.
5.2. S1: Initiation
The first step includes all activities that are related to preparation and planning of the VSM activity.
S1.A1: Identifying key stakeholdersS1.A2: Defining the purposeS1.A3: Defining the teamS1.A4: Training the teamS1.A5: Scoping the problem; andS1.A6: Defining and understanding the value and value creation**: A detailed account of value
considerations relevant for different perspectives such as customer and internal business valueare missing. Thus in order to fill this gap, the proposal is to use the software value map(see Section 5) by Khurum et al. [20] for identifying value considerations relevant forthe goal to be achieved (see S1.A6 in Appendix A).
5.3. S2: Current process map
In S2 of the VSM, the current state map is created. The map is the basis for identifying wastes and reasonsfor the occurrence of waste [12]. The most critical wastes will then be addressed through processimprovement actions in S4.
S2.A1: Drawing the zeroth mapS2.A2: Identifying the tasks and flowS2.A3: Collecting dataS2.A4: Evaluating value; andS2.A5: Understanding iteration.
5.4. S3: Waste identification
S3.A1: Identifying waste: Once there is a clear vision of the process and value added by the tasks withinthe process, the next logical step is to proceed toward its improvement (step 4, see Figure 2).
Figure 3. Value stream map notation.
EXTENDING VALUE STREAM MAPPING
Copyright © 2014 John Wiley & Sons, Ltd. J. Softw. Evol. and Proc. (2014)DOI: 10.1002/smr
Prior to that, a rudimentary step is identification of waste from the process in all of its forms. Thesources of waste in product development processes are many and can be different, thus it is notpossible to prescribe a recipe for its identification and elimination (for some recommendations,see S3.A1 in Appendix A).
5.5. S4: Process improvement
In this step, improvement alternatives are suggested, and the effect of the improvement alternatives aredocumented in the future state map.
S4.A1: Eliminating wasteS4.A2: Drawing future state mapS4.A3: Reevaluating value**: The MIT manual does not discuss reevaluation of value after drawing the
future map, which the researchers believe is an essential step during VSM. The agreed strategiesfor waste reduction/elimination might be reducing/eliminating one type of waste, for example,WT; however, theymight be compromising an important value consideration, for example, quality.Thus, it is important to evaluate the impact of the agreed strategies on the derived value consider-ations (derived from the goal, see S1.A3 in Appendix A). The impacts could be positive and/ornegative on one or several VCs, and these need to be evaluated because cutting costs or reducingwait times are not the only important value considerations during software development.
5.6. S5: Retrospective analysis**
S5.A1: Performing retrospective analysis: After drawing current state map, identifying waste, drawing afuture state map and reevaluation of value, it is deemed necessary to walk-through the futurestate maps and results of evaluation with the team members in a workshop. This has not beenprescribed in the MIT manual, but the researchers emphasize it as a fundamental activitybecause it allows rectifying misunderstandings during the workshop and is similar to memberchecking in empirical studies (e.g., [30]). Furthermore, the retrospective should include areflection on the value stream process to identify improvement opportunities. The next timethe value stream is conducted, it can be performed in a more efficient way based on the feedback.
6. RESEARCH DESIGN
The research method used in this paper is a case study. Case studies are particularly well-suited to studyphenomena in a real-world environment with the researcher making observations and consulting multiplesources of evidence (e.g., documentation, interviews and observations) [30, 31]. Given that the approachis new, we need qualitative insights (i.e., rationales) and gain a deep understanding of how to approachVSM in an industrial context. Therefore, a case study has been chosen. Experiments would not havebeen suitable as they would not scale, and population-based studies would not provide qualitativeinsights and rationales for instantiation that we wanted to achieve. The case being studied is EricssonAB, a leading telecommunication company. The company is ISO 9001:2000 certified.
6.1. Case description
The case and context are described, as this allows for generalizing the results to a specific context.Other companies in a similar context are likely to find the results transferable to their context [32].The process used at the company follows a system of systems (SoS) approach.
Multiple definitions of SoS exist (cf. [33, 34]). All agree on that a system in a SoS shall be possible to bedistributed alone. However, a set of systems also shall have the capability to operate together in a SoS.Different strategies of how to develop the SoS are characterized in [33], namely virtual, collaborative,acknowledged and directed. The SoS investigated in this study is directed. According to the definitionin [33], a directed SoS is characterized by a well-specified purpose, the development is centrallymanaged, and that ‘component systems maintain an ability to operate independently, but their normaloperational mode is subordinated to the central managed purpose’ [33]. Recently, the term has been
M. KHURUM, K. PETERSEN AND T. GORSCHEK
Copyright © 2014 John Wiley & Sons, Ltd. J. Softw. Evol. and Proc. (2014)DOI: 10.1002/smr
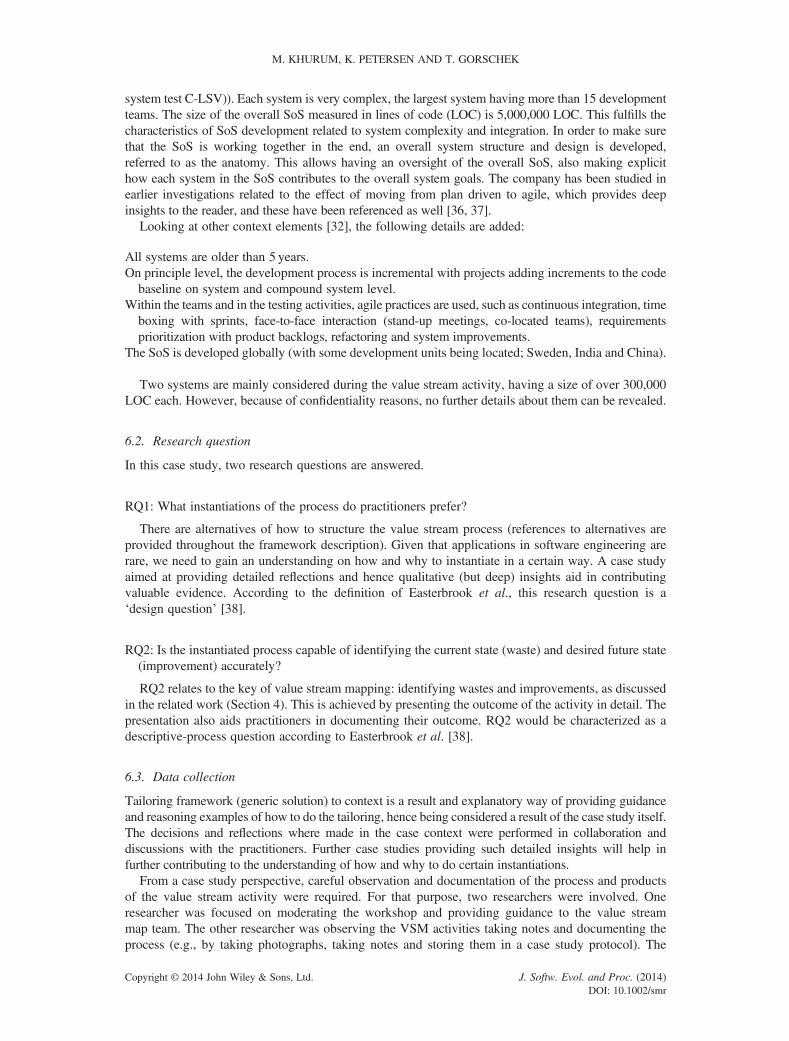
recognized within the field of software engineering, requiring that an SoS should have a number of thecharacteristics shown in Table III. The overall architecture of the SoS studied at Ericsson consists of 12 systems.
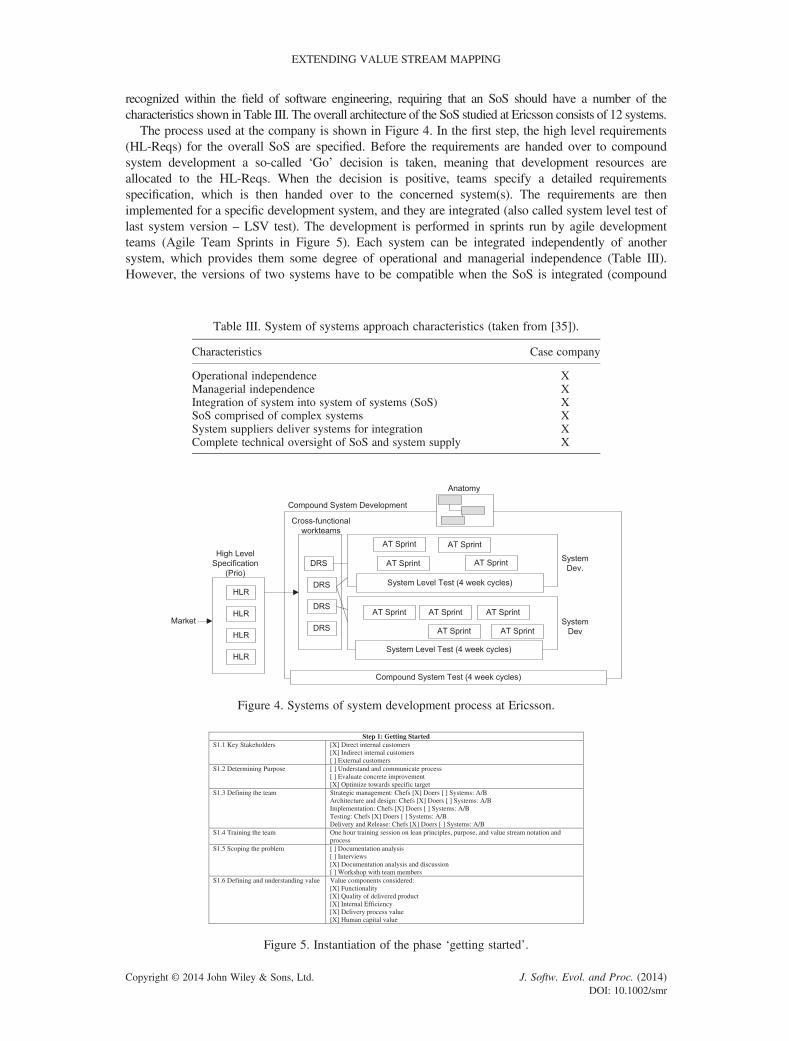
The process used at the company is shown in Figure 4. In the first step, the high level requirements(HL-Reqs) for the overall SoS are specified. Before the requirements are handed over to compoundsystem development a so-called ‘Go’ decision is taken, meaning that development resources areallocated to the HL-Reqs. When the decision is positive, teams specify a detailed requirementsspecification, which is then handed over to the concerned system(s). The requirements are thenimplemented for a specific development system, and they are integrated (also called system level test oflast system version – LSV test). The development is performed in sprints run by agile developmentteams (Agile Team Sprints in Figure 5). Each system can be integrated independently of anothersystem, which provides them some degree of operational and managerial independence (Table III).However, the versions of two systems have to be compatible when the SoS is integrated (compound
Figure 4. Systems of system development process at Ericsson.
Table III. System of systems approach characteristics (taken from [35]).
Characteristics Case company
Operational independence XManagerial independence XIntegration of system into system of systems (SoS) XSoS comprised of complex systems XSystem suppliers deliver systems for integration XComplete technical oversight of SoS and system supply X
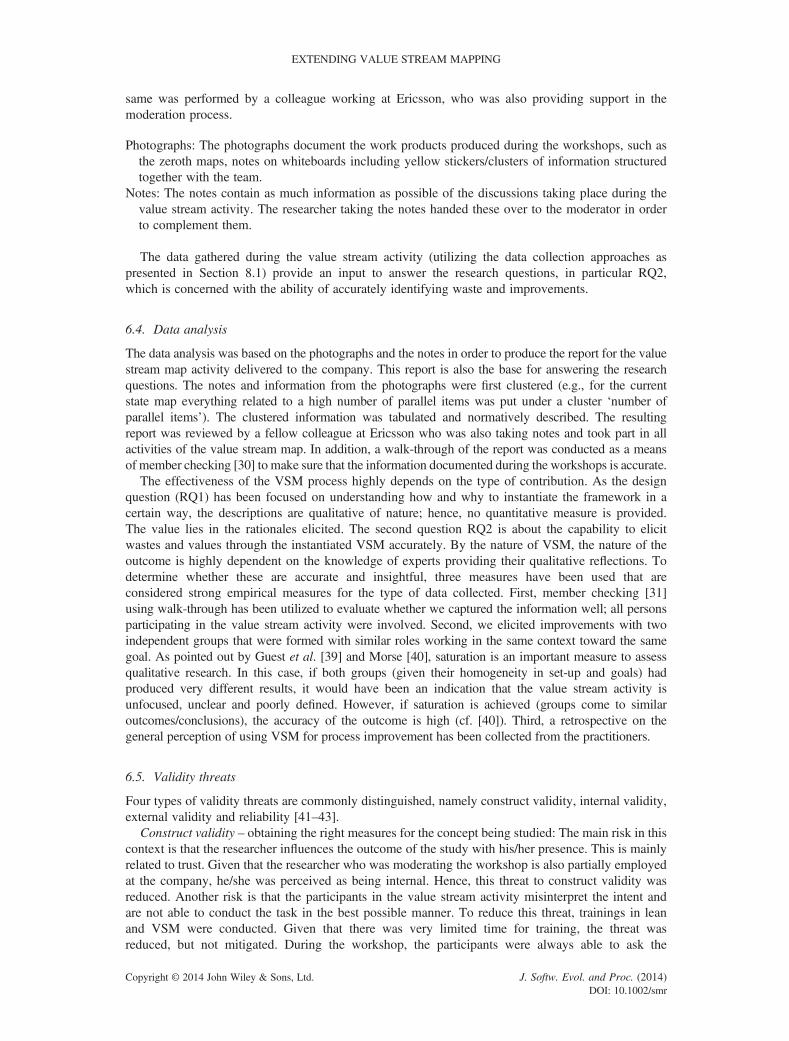
Step 1: Getting Started S1.1 Key Stakeholders [X] Direct internal customers
[X] Indirect internal customers [ ] External customers
S1.2 Determining Purpose [ ] Understand and communicate process [ ] Evaluate concrete improvement [X] Optimize towards specific target
S1.3 Defining the team Strategic management: Chefs [X] Doers [ ] Systems: A/B Architecture and design: Chefs [X] Doers [ ] Systems: A/B Implementation: Chefs [X] Doers [ ] Systems: A/B Testing: Chefs [X] Doers [ ] Systems: A/B Delivery and Release: Chefs [X] Doers [ ] Systems: A/B
S1.4 Training the team One hour training session on lean principles, purpose, and value stream notation and process
S1.5 Scoping the problem [ ] Documentation analysis [ ] Interviews [X] Documentation analysis and discussion [ ] Workshop with team members
S1.6 Defining and understanding value Value components considered: [X] Functionality [X] Quality of delivered product [X] Internal Efficiency [X] Delivery process value [X] Human capital value
Figure 5. Instantiation of the phase ‘getting started’.
EXTENDING VALUE STREAM MAPPING
Copyright © 2014 John Wiley & Sons, Ltd. J. Softw. Evol. and Proc. (2014)DOI: 10.1002/smr
system test C-LSV)). Each system is very complex, the largest system having more than 15 developmentteams. The size of the overall SoS measured in lines of code (LOC) is 5,000,000 LOC. This fulfills thecharacteristics of SoS development related to system complexity and integration. In order to make surethat the SoS is working together in the end, an overall system structure and design is developed,referred to as the anatomy. This allows having an oversight of the overall SoS, also making explicithow each system in the SoS contributes to the overall system goals. The company has been studied inearlier investigations related to the effect of moving from plan driven to agile, which provides deepinsights to the reader, and these have been referenced as well [36, 37].
Looking at other context elements [32], the following details are added:
All systems are older than 5 years.On principle level, the development process is incremental with projects adding increments to the codebaseline on system and compound system level.
Within the teams and in the testing activities, agile practices are used, such as continuous integration, timeboxing with sprints, face-to-face interaction (stand-up meetings, co-located teams), requirementsprioritization with product backlogs, refactoring and system improvements.
The SoS is developed globally (with some development units being located; Sweden, India and China).
Two systems are mainly considered during the value stream activity, having a size of over 300,000LOC each. However, because of confidentiality reasons, no further details about them can be revealed.
6.2. Research question
In this case study, two research questions are answered.
RQ1: What instantiations of the process do practitioners prefer?
There are alternatives of how to structure the value stream process (references to alternatives areprovided throughout the framework description). Given that applications in software engineering arerare, we need to gain an understanding on how and why to instantiate in a certain way. A case studyaimed at providing detailed reflections and hence qualitative (but deep) insights aid in contributingvaluable evidence. According to the definition of Easterbrook et al., this research question is a‘design question’ [38].
RQ2: Is the instantiated process capable of identifying the current state (waste) and desired future state(improvement) accurately?
RQ2 relates to the key of value stream mapping: identifying wastes and improvements, as discussedin the related work (Section 4). This is achieved by presenting the outcome of the activity in detail. Thepresentation also aids practitioners in documenting their outcome. RQ2 would be characterized as adescriptive-process question according to Easterbrook et al. [38].
6.3. Data collection
Tailoring framework (generic solution) to context is a result and explanatory way of providing guidanceand reasoning examples of how to do the tailoring, hence being considered a result of the case study itself.The decisions and reflections where made in the case context were performed in collaboration anddiscussions with the practitioners. Further case studies providing such detailed insights will help infurther contributing to the understanding of how and why to do certain instantiations.
From a case study perspective, careful observation and documentation of the process and productsof the value stream activity were required. For that purpose, two researchers were involved. Oneresearcher was focused on moderating the workshop and providing guidance to the value streammap team. The other researcher was observing the VSM activities taking notes and documenting theprocess (e.g., by taking photographs, taking notes and storing them in a case study protocol). The
M. KHURUM, K. PETERSEN AND T. GORSCHEK
Copyright © 2014 John Wiley & Sons, Ltd. J. Softw. Evol. and Proc. (2014)DOI: 10.1002/smr
same was performed by a colleague working at Ericsson, who was also providing support in themoderation process.
Photographs: The photographs document the work products produced during the workshops, such asthe zeroth maps, notes on whiteboards including yellow stickers/clusters of information structuredtogether with the team.
Notes: The notes contain as much information as possible of the discussions taking place during thevalue stream activity. The researcher taking the notes handed these over to the moderator in orderto complement them.
The data gathered during the value stream activity (utilizing the data collection approaches aspresented in Section 8.1) provide an input to answer the research questions, in particular RQ2,which is concerned with the ability of accurately identifying waste and improvements.
6.4. Data analysis
The data analysis was based on the photographs and the notes in order to produce the report for the valuestream map activity delivered to the company. This report is also the base for answering the researchquestions. The notes and information from the photographs were first clustered (e.g., for the currentstate map everything related to a high number of parallel items was put under a cluster ‘number ofparallel items’). The clustered information was tabulated and normatively described. The resultingreport was reviewed by a fellow colleague at Ericsson who was also taking notes and took part in allactivities of the value stream map. In addition, a walk-through of the report was conducted as a meansof member checking [30] to make sure that the information documented during the workshops is accurate.
The effectiveness of the VSM process highly depends on the type of contribution. As the designquestion (RQ1) has been focused on understanding how and why to instantiate the framework in acertain way, the descriptions are qualitative of nature; hence, no quantitative measure is provided.The value lies in the rationales elicited. The second question RQ2 is about the capability to elicitwastes and values through the instantiated VSM accurately. By the nature of VSM, the nature of theoutcome is highly dependent on the knowledge of experts providing their qualitative reflections. Todetermine whether these are accurate and insightful, three measures have been used that areconsidered strong empirical measures for the type of data collected. First, member checking [31]using walk-through has been utilized to evaluate whether we captured the information well; all personsparticipating in the value stream activity were involved. Second, we elicited improvements with twoindependent groups that were formed with similar roles working in the same context toward the samegoal. As pointed out by Guest et al. [39] and Morse [40], saturation is an important measure to assessqualitative research. In this case, if both groups (given their homogeneity in set-up and goals) hadproduced very different results, it would have been an indication that the value stream activity isunfocused, unclear and poorly defined. However, if saturation is achieved (groups come to similaroutcomes/conclusions), the accuracy of the outcome is high (cf. [40]). Third, a retrospective on thegeneral perception of using VSM for process improvement has been collected from the practitioners.
6.5. Validity threats
Four types of validity threats are commonly distinguished, namely construct validity, internal validity,external validity and reliability [41–43].
Construct validity – obtaining the right measures for the concept being studied: The main risk in thiscontext is that the researcher influences the outcome of the study with his/her presence. This is mainlyrelated to trust. Given that the researcher who was moderating the workshop is also partially employedat the company, he/she was perceived as being internal. Hence, this threat to construct validity wasreduced. Another risk is that the participants in the value stream activity misinterpret the intent andare not able to conduct the task in the best possible manner. To reduce this threat, trainings in leanand VSM were conducted. Given that there was very limited time for training, the threat wasreduced, but not mitigated. During the workshop, the participants were always able to ask the
EXTENDING VALUE STREAM MAPPING
Copyright © 2014 John Wiley & Sons, Ltd. J. Softw. Evol. and Proc. (2014)DOI: 10.1002/smr
moderators for clarifications with respect to the task at hand, which also contributes positively toreducing the threat of misinterpretation.
External validity/generalizability – ability to generalize the usability and usefulness of the proposedframework: External validity/generalizability is a common threat in single case studies, as this is onlyable to focus on single cases, but at the same time allow gaining an in-depth understanding of the caseand provide detailed insights of a real-world application. The results obtained in this case study are truein the context of the case. As argued by Wieringa in his recent keynote titled ‘Case study research ininformation systems engineering: How to generalize, how not to generalize, and how not to generalizetoo much’ at CAISE 2013, he argued that generalizing between cases should be performed by analogyand from one case to another [44]. Given that the research is qualitative in nature aiming at providingdeep and detailed insights, as argued by Wieringa, random sampling-based approaches are not suitablefor case study research. He rather argues that cases need to be compared by architectural analogy(referring to similar contexts), what he calls generalizing through analogy. This applies to externalgeneralizability to other groups and companies (cf. [45]). Internal generalizability (generalizable withina group, see [45]) has been supported by the use of source triangulation and using two similar teamsidentifying improvements independently.
In order to allow others to judge the degree of usability and usefulness, researchers have taken carein describing as many contextual elements as possible using the checklist provided in [32] as a guide.In addition, the VSM framework is designed providing alternatives of how to implement differentactivities. This makes the value stream map flexible.
Reliability – interpretation of the data is influenced by the background of the researcher/repetition of thestudy: Whenever conducting studies with a vast amount of qualitative information, there is a risk that theinterpretation of the data is influenced by the background of the researcher. The risk cannot be mitigated,but only reduced. In order to reduce this threat, the following actions have been taken: (1) Tworesearchers were involved in the interpretation of the notes and documentation; (2) the documented resultwas reviewed by a colleague at the company; and (3) the colleague at the company was also taking notesduring the workshop allowing for a comparison of notes. In addition, member checking with the wholeVSM team has been conducted during the retrospective activity in the value stream process.
Internal validity was not considered a threat in this study as the researchers do not aim at forming astatistical causal relationship between variables (this threat is mainly considered in experimental/sampling studies [46]).
7. CASE STUDY RESULTS
The case study results are split into two main parts. The first part illustrates how the value streamframework is instantiated in the specific case and provides arguments of why in the given contextcertain decisions for instantiations were made. In the second part, the actual outcome in the form ofcurrent state map, future state map and retrospective are presented.
7.1. Instantiation of the framework
The management of the case study company agreed to commit 12 persons to the value stream mapactivity for approximately 10 h (including the steps mapping the current value stream map,identifying waste, improving the process and performing retrospective analysis), which adds up to120 person hours. The selection of strategies and the distribution of time between steps wereperformed under these constraints.
7.1.1. S1: Initiation. As outlined in the framework, the steps for getting started are the selection ofkey stakeholders, determining the purpose, defining the team, training the team, scoping theproblem, defining the value and understanding value creation.
S1.A1 Identifying key stakeholders: Three alternative options are suggested, namely direct internalcustomers, indirect internal customers and external customers (see S1.A1 in Appendix A). As thecompany is operating in a market-driven context where a product is developed for a mass market
M. KHURUM, K. PETERSEN AND T. GORSCHEK
Copyright © 2014 John Wiley & Sons, Ltd. J. Softw. Evol. and Proc. (2014)DOI: 10.1002/smr
with many potential customers, no external customer was invited to participate. If the companywould have been in a bespoke and contract-based situation, the external customer would be moreeasily accessible. Hence, only direct internal customers and indirect internal customers are included.In the case company, direct internal customers are people working with the release and packaging ofthe software product. Indirect internal customers are participants of the process, such as peopleresponsible for design and testing.
S1.A2 Determining the purpose: During the planning phase, the purpose was to evaluate a concreteimprovement. The reason for evaluating a concrete improvement and not focusing on theoverall process was to not flood the organization with too many new improvement initiatives,which would be a risk for the ongoing improvements. The concrete improvement to beevaluated was focused on restructuring the communication between product managers, require-ments engineers and development teams in order to facilitate frequent exchange of informationand feedback. This was changed after activity S2.A4 as the analysis showed that the improve-ment evaluated did not target the wastes that received the highest priorities by the team. Inconsequence, it was decided to change the purpose to optimize end-to-end process toward aspecific target with respect to lead time. It was made explicit that the ongoing improvementscould be incorporated when improving the current state process, but at the same time newimprovements can be proposed.
The workshop participants received the following instructions for the VSM activity:
Your task is to redraw a map that cuts the lead-time down to X days. Here you should implementimprovements (e.g. the suggestions related to improved communication between productmanagers, requirements engineers, and development teams) and determine what changes shouldbe done in order to achieve a shorter lead-time. Keep in mind, however, that later you will evaluatethe process based on other attributes (e.g. perceived quality by the customer, cost, etc.), which mightbe negatively affected. Also keep in mind whether the root-causes for waste are addressed. If youcannot achieve the X days without compromising other important value considerations (see valuecomponents), determine what would be a realistic improvement.
In short, this translates into the following goal that should be achieved: ‘Reduce the lead-time by X%while developing usable and useful features for the customers, without defects, as efficiently aspossible, and at the right time.’
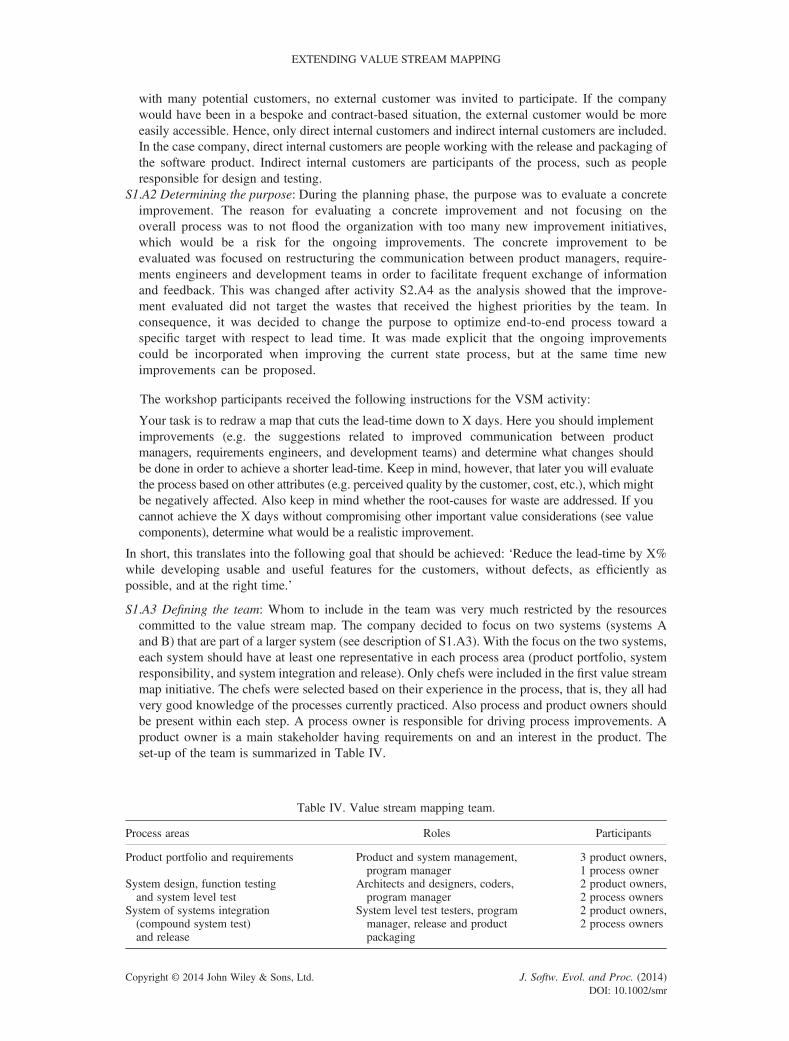
S1.A3 Defining the team: Whom to include in the team was very much restricted by the resourcescommitted to the value stream map. The company decided to focus on two systems (systems Aand B) that are part of a larger system (see description of S1.A3). With the focus on the two systems,each system should have at least one representative in each process area (product portfolio, systemresponsibility, and system integration and release). Only chefs were included in the first value streammap initiative. The chefs were selected based on their experience in the process, that is, they all hadvery good knowledge of the processes currently practiced. Also process and product owners shouldbe present within each step. A process owner is responsible for driving process improvements. Aproduct owner is a main stakeholder having requirements on and an interest in the product. Theset-up of the team is summarized in Table IV.
Table IV. Value stream mapping team.
Process areas Roles Participants
Product portfolio and requirements Product and system management,program manager
3 product owners,1 process owner
System design, function testingand system level test
Architects and designers, coders,program manager
2 product owners,2 process owners
System of systems integration(compound system test)and release
System level test testers, programmanager, release and productpackaging
2 product owners,2 process owners
EXTENDING VALUE STREAM MAPPING
Copyright © 2014 John Wiley & Sons, Ltd. J. Softw. Evol. and Proc. (2014)DOI: 10.1002/smr
S1.A4 Training the team: The teams were trained through a Powerpoint presentation containing thefollowing information: (1) The goals of VSM and the potential benefits illustrated through the casestudy presented in the MIT VSMmanual; (2) an overview of the VSM process; (3) To-Dos related tothe current state map; (4) notations of VSM; (5) To-Dos related to the future state map; and (6)presentation of the VCs with examples. After the presentation, there was a question and answersession where the content of the presentation was clarified.
S1.A5 Scoping the problem: Solely focusing on documentation analysis was not considered as opinions(through discussions) are needed to understand why specific problem bounds should be defined.Moreover, it is very important to involve key persons in the discussion who can champion theVSM in order to gather the required competence needed for the initiative. Collecting as muchinformation about the existing process before going into an interview is recommended, becausethe discussion can be focused on scoping the problem.
Workshops were not chosen as they require toomuch effort early on in the mapping process. Therefore,documentation analysis and discussion was used as a trade-offs between documentation analyses andinterviews. From the documentation analysis, the researchers identified the main process steps. Thefollowing decisions were made regarding the problem bounds with respect to the critical elementsdefined in the framework (see description of S1.5):
End-to-end process: The process starts with the requirements gathering and definition activity, andends with the system verification activity. The reason for choosing the end-to-end process is theobservation that different parts of the process influence each other and hence considering onlyone activity might lead to suboptimization. For example, a change in the requirements activity couldhave a significant impact on testing and product packaging activities.
Products: The product that was chosen is an SoS. As described in the research method (Section 7.1), thecompany is employing an SoS development approach. In total, nine systems are parts of the overallsystem. The most critical systems were selected for the mapping activity, that is, a delay in thedevelopment of systems A and B has the most significant effect on the development of the overallsystem. This is due to the size of the systems and the number of dependencies to the other systems.
Product owner: For each of the process areas, a process and product owner have been identified(Table IV).
Customer of output: The internal customer is release and product packaging responsible for deliveringthe verified system and making sure it is installed and configured according to the customers’ needs.The external customers are telecommunication operators on the market.
Delivery of input: The high level needs are identified bymarket units (e.g., throughmarket surveys and cus-tomer visits). The market units then communicate with the development units regarding the requirements.
S1.6 Defining the value and understanding value creation: The selection of VCs is driven by the goalquestion value approach. The goal can be subdivided into several subgoals:
develop useful and usable features;without defects;as efficient as possible; andat the right time.
From these corresponding questions and related VCs were derived using the software value map, shownin Table V. The impact of proposed improvements will be evaluated with respect to the identified VCs.
An overview of the instantiation of the phase ‘getting started’ can be found in Figure 5.
7.1.2. S 2: Mapping the current value stream. As outlined in the framework, the steps for creating thecurrent state value stream map are the zeroth map, identification of tasks and flows, data collection,evaluation of value and understanding of iteration.
S2.A1: Drawing the zeroth map: The principle tasks were retrieved from documentation andmeasurements and were already well-known to the researchers and the organization. Hence, this steprequired little investigative effort. The main steps of the zeroth map were defined on the basis of the
M. KHURUM, K. PETERSEN AND T. GORSCHEK
Copyright © 2014 John Wiley & Sons, Ltd. J. Softw. Evol. and Proc. (2014)DOI: 10.1002/smr
states that requirements can enter (e.g., being in specification, being in design and being in test) andso forth. An overview of the states can be found in [47].
S2.A2: Identifying tasks and flow: The high level activities of the zeroth map were not further refinedfor the VSM activity. The motivation was that (1) objective measurements were available for thesteps; and (2) in discussion with the practitioners, the researchers came to the agreement that theanalysis of the high level steps will reveal the wastes and improvement potentials with respect tovalue. Furthermore, the map could be further refined when needed (e.g., if the researchers feel thatimportant wastes could not be discovered because of a too high abstraction level). Given the goodunderstanding that the researchers already had of the main flows and tasks, documentation analysisand discussion was sufficient. In other cases where the processes are not documented and measured,more time intensive methods might be required to obtain a more complete picture (such asworkshops and/or in-depth interviews, see Appendix B).
S2.A3: Collecting data: Often data in software engineering show a high degree of variance, be it withregard to productivity [48, 49] or with regard to lead times [50]. Hence, few critical requirementshave to be chosen that would lead to general improvements in the development process and thatcan be used to retrieve measurements and set a baseline for the VSM activity. In this case, therequirements chosen should (1) affect multiple systems in the SoS structure as single systemrequirements are less problematic to develop; (2) the requirements should be of medium sizeaccording to the interval set by the company. Three requirements fulfilling these criteria wereselected and based on these requirements an initial draft of the value streammapwas prepared includingactual measurements. The requirements were selected based on documentation/measurements anddiscussion with the practitioners at the company. After having an initial map with tasks, flow andmeasurement data, a workshop was conducted to finalize the current value stream map.
S2.A4 is described in S3 as these activities were combined.
S2.A5: Understanding iteration: An approach for understanding iteration was not implemented in thisvalue streammap because the zerothmap was used as an input for the activity, given that measurementswere available on that abstraction level. However, this does not mean that challenges related to iterationwill not be discovered. In fact, several root causes related to iterative behavior in the current valuestream map were identified (see Section 8.2 – loopbacks, test cycles and rework iterations/steps).
An overview of the instantiation of the phase ‘mapping the current value stream’ can be found in Figure 6.
7.1.3. S3: Waste identification. This step was combined with S2.A4 (evaluation of value). The reasonbeing that all activities contribute some value (either external or internal). For example, everyonewould argue that testing is valuable. Hence, in this case, the researchers found it is more suitable tostart focusing on improvement potential based on long waiting/lead times. The workshop as anapproach was selected as people in different roles should interact with each other and provideimmediate feedback. This could not be achieved with any other alternative provided (e.g. individualinterviews and study of documentation). Furthermore, agreements and disagreements are revealedimmediately and can be resolved. In the end of the current value stream map activity, it is importantthat everyone in the team has the same understanding of the current state map and agrees on the
Table V. Goals, questions and values.
Subgoals Questions Value components
Useful and usablefeatures
Which functions are really needed,and how easy are they to use?
Functionality, quality of delivered product
Without defects What is the level of quality with respectto reliability, portability and maintainability?
Quality of delivered product
As efficient aspossible
Are we developing the product efficiently,and do we have the knowledgeand motivation needed to do so?
Internal efficiency, human capital value(please note that these value componentsare beyond customer perspective)
At the right time Are we able to deliver and install thesystem efficiently?
Delivery process value
EXTENDING VALUE STREAM MAPPING
Copyright © 2014 John Wiley & Sons, Ltd. J. Softw. Evol. and Proc. (2014)DOI: 10.1002/smr
outcome. This is important as the current state map serves as the reference for creating the future statemap. In the workshop, the team was asked to perform the following activities:
Review data collection: Review the prepared times (lead times, WTs and PTs) and change themaccording to their experience. (30min)
Identify wastes: Identify parts in the process with the highest improvement potential; For example, inwhich phase do we see the majority of waiting, where are the activities that take very long time? Thiswas performed by putting burst signals within the value stream map containing the updated and agreedupon lead and WTs. The burst signals were then prioritized by the team. For prioritization, cumulativevoting was used as this is known to be a fast and accurate method to prioritize items [51]. (30min)
Identify reasons for wastes: Identify the reasons/root causes for long WTs/PTs and prioritize the rootcauses. This was achieved by having each participant write the main root cause for each of the burstsignals on a yellow sticker. The moderator (second author of the paper) collected the yellow stickersand clustered them with the help of the workshop participants. (45min)
Information about the next steps. (5min)
The practitioners received a presentation of the value dimensions tomake sure that when they decide onwhat is waste, they have a clear picture of the dimensions. What might be waste from one dimension(example: ‘waiting to allow for a second thought as desired outcome’ in Table VII might be wastefulfrom the internal efficiency – time perspective in Appendix D B.3) may not be from another (e.g., theexternal customer perspective in the example as practitioners need time to think, reflect and clarify toreally deliver the functions the customer needs). Later, the dimensions were used for a rating of theeffect of the improvement implementation on the values, combined with the practitioners providingrationales. This also relates strongly to defining waste beyond the customer perspective, reflected in thetitle of this paper, as waste as well as improvements are looked at from different perspectives, henceextending the view of what is used in previous value stream analyses (based on the well-known sevenwastes presented in, for example, [5]).
7.1.4. S4: Process improvement. This step contains of three activities: (S4.A1) identify strategies toeliminate the waste, (S4.A2) draw the future state map, and (S4.A3) to reevaluate value. S4.A1 andS4.A2 were combined in a single workshop. Other alternatives would have been to conductdocument analysis, interviews, or a combination of document analysis and discussions. However,for the same reason presented in S3 (Section 8.1.3), workshops were conducted, that is, to allow forinteraction and immediate feedback between team members. The workshop was structured as follows:
Introduction: Presentation of the results from the first workshop (i.e., current state map and root causes)was given to the participants to refresh their memory of the results. Furthermore, the VCs werepresented again, as this need to be considered when proposing the improvements. (30min)
Identify improvements and redraw map: The participants were to identify improvements that can tacklethe root causes and to redraw the process based on the improvements identified. Ongoing
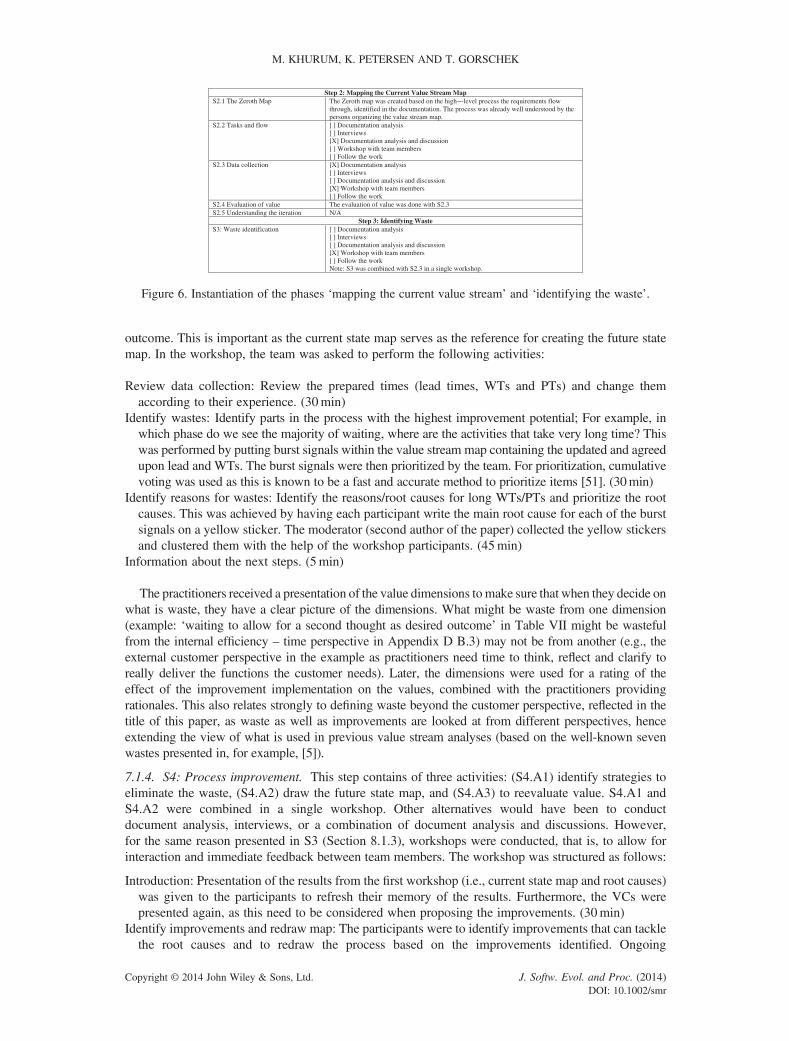
Step 2: Mapping the Current Value Stream Map S2.1 The Zeroth Map The Zeroth map was created based on the high---level process the requirements flow
through, identified in the documentation. The process was already well understood by the persons organizing the value stream map.
S2.2 Tasks and flow [ ] Documentation analysis [ ] Interviews [X] Documentation analysis and discussion [ ] Workshop with team members [ ] Follow the work
S2.3 Data collection [X] Documentation analysis [ ] Interviews [ ] Documentation analysis and discussion [X] Workshop with team members [ ] Follow the work
S2.4 Evaluation of value The evaluation of value was done with S2.3 S2.5 Understanding the iteration N/A
Step 3: Identifying Waste S3: Waste identification [ ] Documentation analysis
[ ] Interviews [ ] Documentation analysis and discussion [X] Workshop with team members [ ] Follow the work Note: S3 was combined with S2.3 in a single workshop.
Figure 6. Instantiation of the phases ‘mapping the current value stream’ and ‘identifying the waste’.
M. KHURUM, K. PETERSEN AND T. GORSCHEK
Copyright © 2014 John Wiley & Sons, Ltd. J. Softw. Evol. and Proc. (2014)DOI: 10.1002/smr
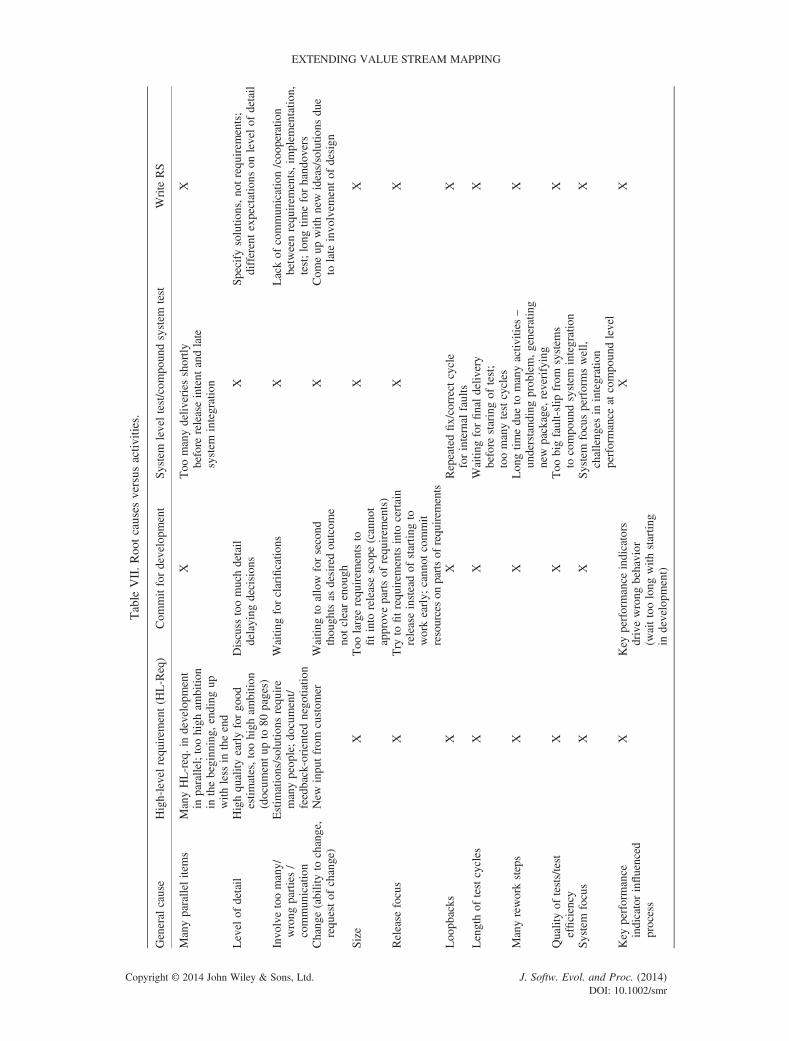
Table
VII.Rootcauses
versus
activ
ities.
General
cause
High-levelrequirem
ent(H
L-Req)
Com
mitfordevelopm
ent
System
leveltest/com
poundsystem
test
Write
RS
Manyparallelitems
ManyHL-req.indevelopm
ent
inparallel;toohigh
ambitio
nin
thebeginning,
ending
upwith
less
intheend
XToo
manydeliv
eriesshortly
before
releaseintent
andlate
system
integration
X
Level
ofdetail
Highquality
earlyforgo
odestim
ates,toohigh
ambitio
n(docum
entup
to80
pages)
Discuss
toomuchdetail
delaying
decisions
XSpecify
solutio
ns,notrequirem
ents;
differentexpectations
onlevelof
detail
Involvetoomany/
wrong
parties/
communication
Estim
ations/solutions
requ
ire
manypeople;document/
feedback-orientednegotiatio
n
Waitin
gforclarificatio
nsX
Lackof
communication/cooperatio
nbetweenrequirem
ents,im
plem
entatio
n,test;long
timeforhandovers
Change(abilityto
change,
requestof
change)
New
inputfrom
custom
erWaitin
gto
allow
forsecond
thoughtsas
desiredoutcom
enotclearenough
XCom
eup
with
new
ideas/solutio
nsdue
tolate
involvem
entof
design
Size
XToo
largerequirem
entsto
fitinto
releasescope(cannot
approvepartsof
requirem
ents)
XX
Release
focus
XTry
tofitrequirem
entsinto
certain
releaseinsteadof
startin
gto
workearly;
cannot
commit
resourceson
partsof
requirem
ents
XX
Loopbacks
XX
Repeatedfix/correctcycle
forinternal
faults
X
Lengthof
testcycles
XX
Waitin
gforfinaldeliv
ery
before
staringof
test;
toomanytestcycles
X
Manyreworksteps
XX
Longtim
edueto
manyactiv
ities
–understandingproblem,g
enerating
new
package,reverifying
X
Qualityof
tests/test
efficiency
XX
Too
bigfault-slip
from
system
sto
compoundsystem
integration
X
System
focus
XX
System
focusperformswell,
challenges
inintegration
performance
atcompoundlevel
X
Key
performance
indicatorinfluenced
process
XKey
performance
indicators
drivewrong
behavior
(waittoolong
with
startin
gin
developm
ent)
XX
EXTENDING VALUE STREAM MAPPING
Copyright © 2014 John Wiley & Sons, Ltd. J. Softw. Evol. and Proc. (2014)DOI: 10.1002/smr
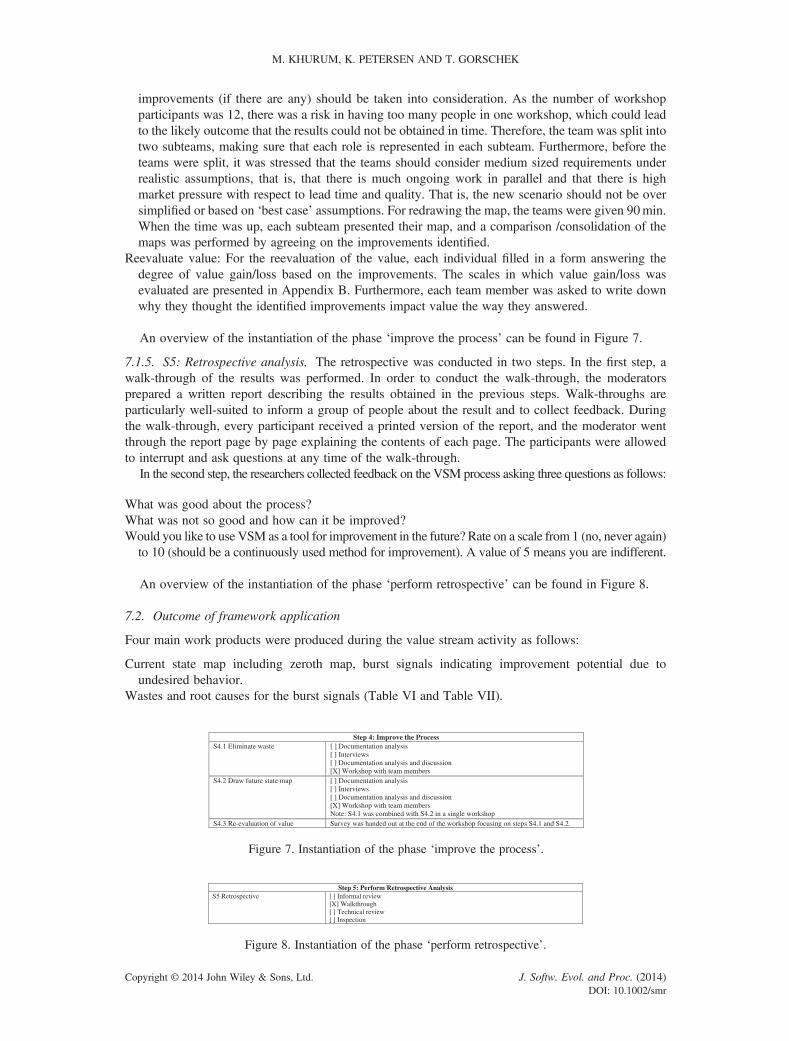
improvements (if there are any) should be taken into consideration. As the number of workshopparticipants was 12, there was a risk in having too many people in one workshop, which could leadto the likely outcome that the results could not be obtained in time. Therefore, the team was split intotwo subteams, making sure that each role is represented in each subteam. Furthermore, before theteams were split, it was stressed that the teams should consider medium sized requirements underrealistic assumptions, that is, that there is much ongoing work in parallel and that there is highmarket pressure with respect to lead time and quality. That is, the new scenario should not be oversimplified or based on ‘best case’ assumptions. For redrawing the map, the teams were given 90min.When the time was up, each subteam presented their map, and a comparison /consolidation of themaps was performed by agreeing on the improvements identified.
Reevaluate value: For the reevaluation of the value, each individual filled in a form answering thedegree of value gain/loss based on the improvements. The scales in which value gain/loss wasevaluated are presented in Appendix B. Furthermore, each team member was asked to write downwhy they thought the identified improvements impact value the way they answered.
An overview of the instantiation of the phase ‘improve the process’ can be found in Figure 7.
7.1.5. S5: Retrospective analysis. The retrospective was conducted in two steps. In the first step, awalk-through of the results was performed. In order to conduct the walk-through, the moderatorsprepared a written report describing the results obtained in the previous steps. Walk-throughs areparticularly well-suited to inform a group of people about the result and to collect feedback. Duringthe walk-through, every participant received a printed version of the report, and the moderator wentthrough the report page by page explaining the contents of each page. The participants were allowedto interrupt and ask questions at any time of the walk-through.
In the second step, the researchers collected feedback on the VSM process asking three questions as follows:
What was good about the process?What was not so good and how can it be improved?Would you like to use VSM as a tool for improvement in the future? Rate on a scale from 1 (no, never again)to 10 (should be a continuously used method for improvement). A value of 5 means you are indifferent.
An overview of the instantiation of the phase ‘perform retrospective’ can be found in Figure 8.
7.2. Outcome of framework application
Four main work products were produced during the value stream activity as follows:
Current state map including zeroth map, burst signals indicating improvement potential due toundesired behavior.
Wastes and root causes for the burst signals (Table VI and Table VII).
Step 5: Perform Retrospective Analysis ][
[X] Walkthrough [ ] Technical review [ ] Inspection
Informal reviewS5 Retrospective
Figure 8. Instantiation of the phase ‘perform retrospective’.
Step 4: Improve the Process S4.1 Eliminate waste [ ] Documentation analysis
[ ] Interviews [ ] Documentation analysis and discussion [X] Workshop with team members
S4.2 Draw future state map [ ] Documentation analysis [ ] Interviews [ ] Documentation analysis and discussion [X] Workshop with team members Note: S4.1 was combined with S4.2 in a single workshop
S4.3 Re-evaluation of value Survey was handed out at the end of the workshop focusing on steps S4.1 and S4.2.
Figure 7. Instantiation of the phase ‘improve the process’.
M. KHURUM, K. PETERSEN AND T. GORSCHEK
Copyright © 2014 John Wiley & Sons, Ltd. J. Softw. Evol. and Proc. (2014)DOI: 10.1002/smr
Future state map including improvement proposals, a future state map indicating changes based onimprovement proposals, and estimates for new lead and WTs. Furthermore, the reevaluation of valuewas conducted.
Retrospective containing reflections on the value stream process and the delivered result. In the following,a narrative of the work products and the reflections provided by the workshop participants are given.
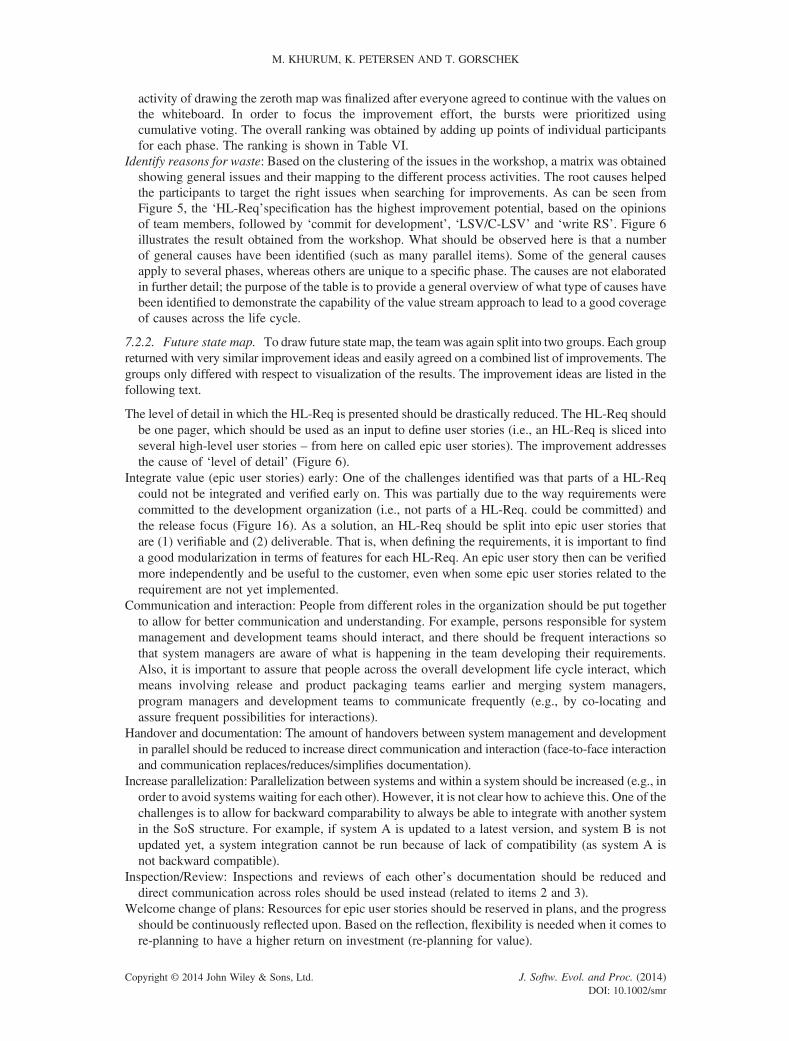
7.2.1. Current state map.Review data collection/zeroth map: The workshop started with a presentation of the zeroth map thatwas drafted by the researchers prior to the workshop. The map is shown in Figure 9. It contains thefollowing activities:
HL-Req: The requirement is specified such that the development organization has an idea of thecustomer’s needs, and estimations for time can be made. This activity maps to high level specification(prio) in Figure 4.
Commit for dev: At this point, a decision is made whether the development organization shouldcommit development resources in order to implement the requirement. The answer has to be ‘yes’in order for the requirement to enter the ‘compound system development’ box (in Figure 4).
Write requirements specification (RS): The detailed requirement is specified, so that it is precise enough tobe developed in system development, this activity maps to the detailed requirements specification(DRS) activity in Figure 4.
Design and function testing (FT): The requirement is implemented in system development and testedwithin the teams (Agile Team Sprint in Figure 4).
LSV/C-LSV: The integrated result of the system development is tested at the LSV. The compoundsystem is tested in the C-LSV.
During the workshop, the team filled in the lead times and WTs within the activity in percentages, asthese were not available as data prior to the workshop. Furthermore, some of the WTs in-betweenactivities were moved into the activities, as the participants argued that there is some overlap betweenthe phases, and that items generally do not get stuck in between the activities. Given the description ofthe activities after 37% of the lead time, development resources are committed to development. After82% of the lead time, the first verifiable version of the requirement is completed, and after 100% of thelead time, a verified and usable feature is ready to be made available to the customer.
Identify wastes: Based on the lead time/WT distribution, the burst signals were placed, indicatingimprovement potential/need for improvement in terms of overall process lead time or WT. The
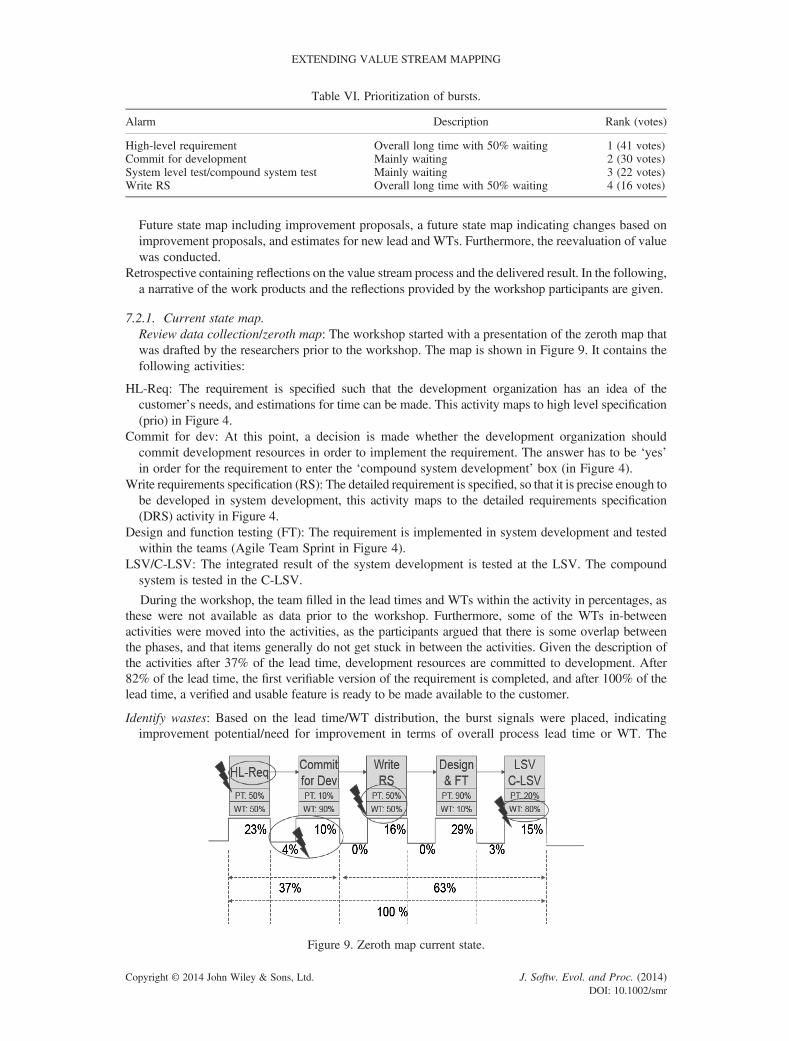
Table VI. Prioritization of bursts.
Alarm Description Rank (votes)
High-level requirement Overall long time with 50% waiting 1 (41 votes)Commit for development Mainly waiting 2 (30 votes)System level test/compound system test Mainly waiting 3 (22 votes)Write RS Overall long time with 50% waiting 4 (16 votes)
Figure 9. Zeroth map current state.
EXTENDING VALUE STREAM MAPPING
Copyright © 2014 John Wiley & Sons, Ltd. J. Softw. Evol. and Proc. (2014)DOI: 10.1002/smr
activity of drawing the zeroth map was finalized after everyone agreed to continue with the values onthe whiteboard. In order to focus the improvement effort, the bursts were prioritized usingcumulative voting. The overall ranking was obtained by adding up points of individual participantsfor each phase. The ranking is shown in Table VI.
Identify reasons for waste: Based on the clustering of the issues in the workshop, a matrix was obtainedshowing general issues and their mapping to the different process activities. The root causes helpedthe participants to target the right issues when searching for improvements. As can be seen fromFigure 5, the ‘HL-Req’specification has the highest improvement potential, based on the opinionsof team members, followed by ‘commit for development’, ‘LSV/C-LSV’ and ‘write RS’. Figure 6illustrates the result obtained from the workshop. What should be observed here is that a numberof general causes have been identified (such as many parallel items). Some of the general causesapply to several phases, whereas others are unique to a specific phase. The causes are not elaboratedin further detail; the purpose of the table is to provide a general overview of what type of causes havebeen identified to demonstrate the capability of the value stream approach to lead to a good coverageof causes across the life cycle.
7.2.2. Future state map. To draw future state map, the teamwas again split into two groups. Each groupreturned with very similar improvement ideas and easily agreed on a combined list of improvements. Thegroups only differed with respect to visualization of the results. The improvement ideas are listed in thefollowing text.
The level of detail in which the HL-Req is presented should be drastically reduced. The HL-Req shouldbe one pager, which should be used as an input to define user stories (i.e., an HL-Req is sliced intoseveral high-level user stories – from here on called epic user stories). The improvement addressesthe cause of ‘level of detail’ (Figure 6).
Integrate value (epic user stories) early: One of the challenges identified was that parts of a HL-Reqcould not be integrated and verified early on. This was partially due to the way requirements werecommitted to the development organization (i.e., not parts of a HL-Req. could be committed) andthe release focus (Figure 16). As a solution, an HL-Req should be split into epic user stories thatare (1) verifiable and (2) deliverable. That is, when defining the requirements, it is important to finda good modularization in terms of features for each HL-Req. An epic user story then can be verifiedmore independently and be useful to the customer, even when some epic user stories related to therequirement are not yet implemented.
Communication and interaction: People from different roles in the organization should be put togetherto allow for better communication and understanding. For example, persons responsible for systemmanagement and development teams should interact, and there should be frequent interactions sothat system managers are aware of what is happening in the team developing their requirements.Also, it is important to assure that people across the overall development life cycle interact, whichmeans involving release and product packaging teams earlier and merging system managers,program managers and development teams to communicate frequently (e.g., by co-locating andassure frequent possibilities for interactions).
Handover and documentation: The amount of handovers between system management and developmentin parallel should be reduced to increase direct communication and interaction (face-to-face interactionand communication replaces/reduces/simplifies documentation).
Increase parallelization: Parallelization between systems and within a system should be increased (e.g., inorder to avoid systems waiting for each other). However, it is not clear how to achieve this. One of thechallenges is to allow for backward comparability to always be able to integrate with another systemin the SoS structure. For example, if system A is updated to a latest version, and system B is notupdated yet, a system integration cannot be run because of lack of compatibility (as system A isnot backward compatible).
Inspection/Review: Inspections and reviews of each other’s documentation should be reduced anddirect communication across roles should be used instead (related to items 2 and 3).
Welcome change of plans: Resources for epic user stories should be reserved in plans, and the progressshould be continuously reflected upon. Based on the reflection, flexibility is needed when it comes tore-planning to have a higher return on investment (re-planning for value).
M. KHURUM, K. PETERSEN AND T. GORSCHEK
Copyright © 2014 John Wiley & Sons, Ltd. J. Softw. Evol. and Proc. (2014)DOI: 10.1002/smr
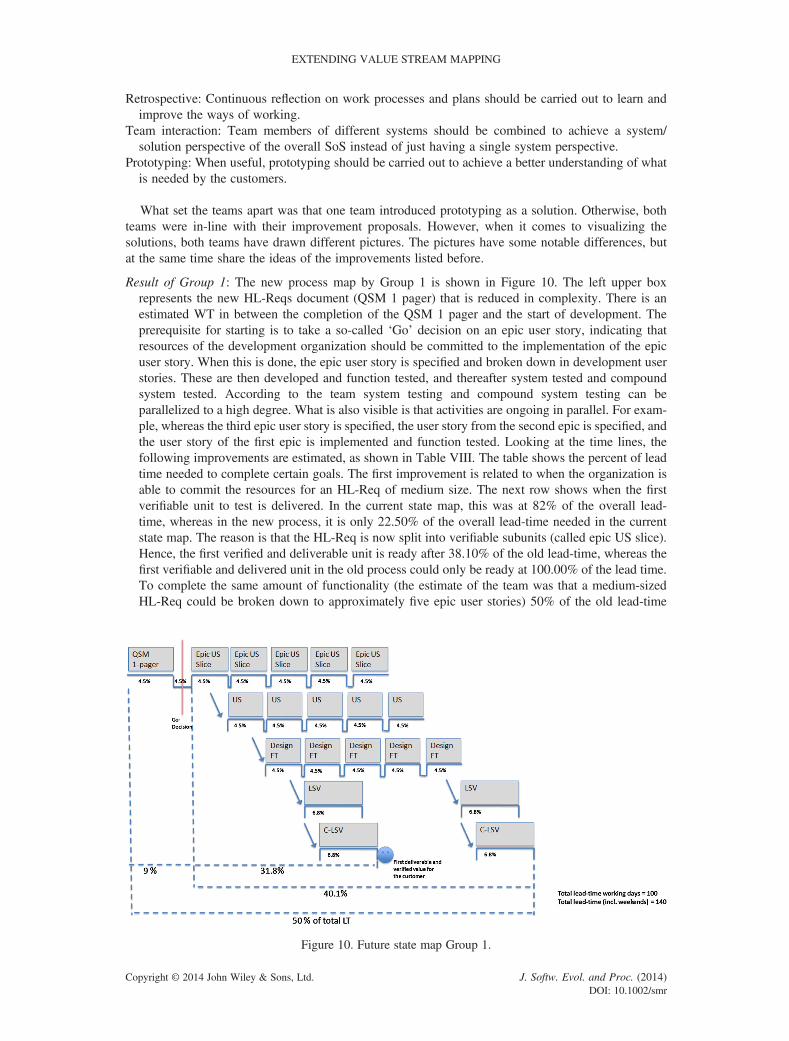
Retrospective: Continuous reflection on work processes and plans should be carried out to learn andimprove the ways of working.
Team interaction: Team members of different systems should be combined to achieve a system/solution perspective of the overall SoS instead of just having a single system perspective.
Prototyping: When useful, prototyping should be carried out to achieve a better understanding of whatis needed by the customers.
What set the teams apart was that one team introduced prototyping as a solution. Otherwise, bothteams were in-line with their improvement proposals. However, when it comes to visualizing thesolutions, both teams have drawn different pictures. The pictures have some notable differences, butat the same time share the ideas of the improvements listed before.
Result of Group 1: The new process map by Group 1 is shown in Figure 10. The left upper boxrepresents the new HL-Reqs document (QSM 1 pager) that is reduced in complexity. There is anestimated WT in between the completion of the QSM 1 pager and the start of development. Theprerequisite for starting is to take a so-called ‘Go’ decision on an epic user story, indicating thatresources of the development organization should be committed to the implementation of the epicuser story. When this is done, the epic user story is specified and broken down in development userstories. These are then developed and function tested, and thereafter system tested and compoundsystem tested. According to the team system testing and compound system testing can beparallelized to a high degree. What is also visible is that activities are ongoing in parallel. For exam-ple, whereas the third epic user story is specified, the user story from the second epic is specified, andthe user story of the first epic is implemented and function tested. Looking at the time lines, thefollowing improvements are estimated, as shown in Table VIII. The table shows the percent of leadtime needed to complete certain goals. The first improvement is related to when the organization isable to commit the resources for an HL-Req of medium size. The next row shows when the firstverifiable unit to test is delivered. In the current state map, this was at 82% of the overall lead-time, whereas in the new process, it is only 22.50% of the overall lead-time needed in the currentstate map. The reason is that the HL-Req is now split into verifiable subunits (called epic US slice).Hence, the first verified and deliverable unit is ready after 38.10% of the old lead-time, whereas thefirst verifiable and delivered unit in the old process could only be ready at 100.00% of the lead time.To complete the same amount of functionality (the estimate of the team was that a medium-sizedHL-Req could be broken down to approximately five epic user stories) 50% of the old lead-time
Figure 10. Future state map Group 1.
EXTENDING VALUE STREAM MAPPING
Copyright © 2014 John Wiley & Sons, Ltd. J. Softw. Evol. and Proc. (2014)DOI: 10.1002/smr
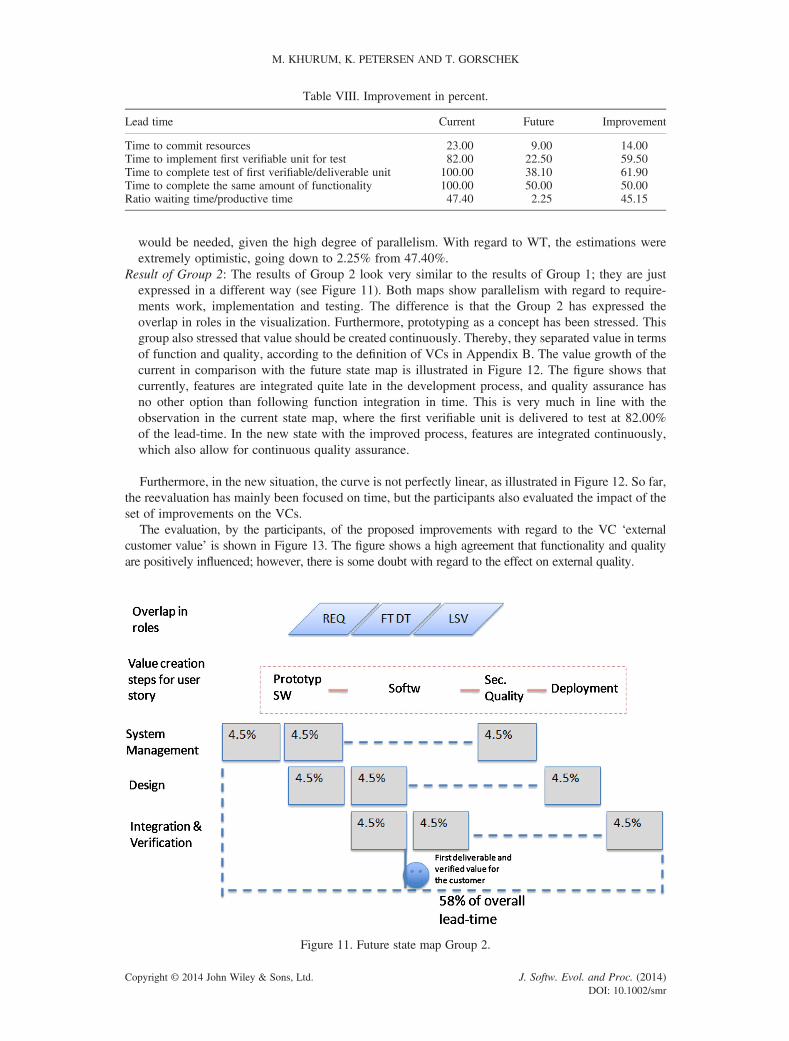
would be needed, given the high degree of parallelism. With regard to WT, the estimations wereextremely optimistic, going down to 2.25% from 47.40%.
Result of Group 2: The results of Group 2 look very similar to the results of Group 1; they are justexpressed in a different way (see Figure 11). Both maps show parallelism with regard to require-ments work, implementation and testing. The difference is that the Group 2 has expressed theoverlap in roles in the visualization. Furthermore, prototyping as a concept has been stressed. Thisgroup also stressed that value should be created continuously. Thereby, they separated value in termsof function and quality, according to the definition of VCs in Appendix B. The value growth of thecurrent in comparison with the future state map is illustrated in Figure 12. The figure shows thatcurrently, features are integrated quite late in the development process, and quality assurance hasno other option than following function integration in time. This is very much in line with theobservation in the current state map, where the first verifiable unit is delivered to test at 82.00%of the lead-time. In the new state with the improved process, features are integrated continuously,which also allow for continuous quality assurance.
Furthermore, in the new situation, the curve is not perfectly linear, as illustrated in Figure 12. So far,the reevaluation has mainly been focused on time, but the participants also evaluated the impact of theset of improvements on the VCs.
The evaluation, by the participants, of the proposed improvements with regard to the VC ‘externalcustomer value’ is shown in Figure 13. The figure shows a high agreement that functionality and qualityare positively influenced; however, there is some doubt with regard to the effect on external quality.
Table VIII. Improvement in percent.
Lead time Current Future Improvement
Time to commit resources 23.00 9.00 14.00Time to implement first verifiable unit for test 82.00 22.50 59.50Time to complete test of first verifiable/deliverable unit 100.00 38.10 61.90Time to complete the same amount of functionality 100.00 50.00 50.00Ratio waiting time/productive time 47.40 2.25 45.15
Figure 11. Future state map Group 2.
M. KHURUM, K. PETERSEN AND T. GORSCHEK
Copyright © 2014 John Wiley & Sons, Ltd. J. Softw. Evol. and Proc. (2014)DOI: 10.1002/smr
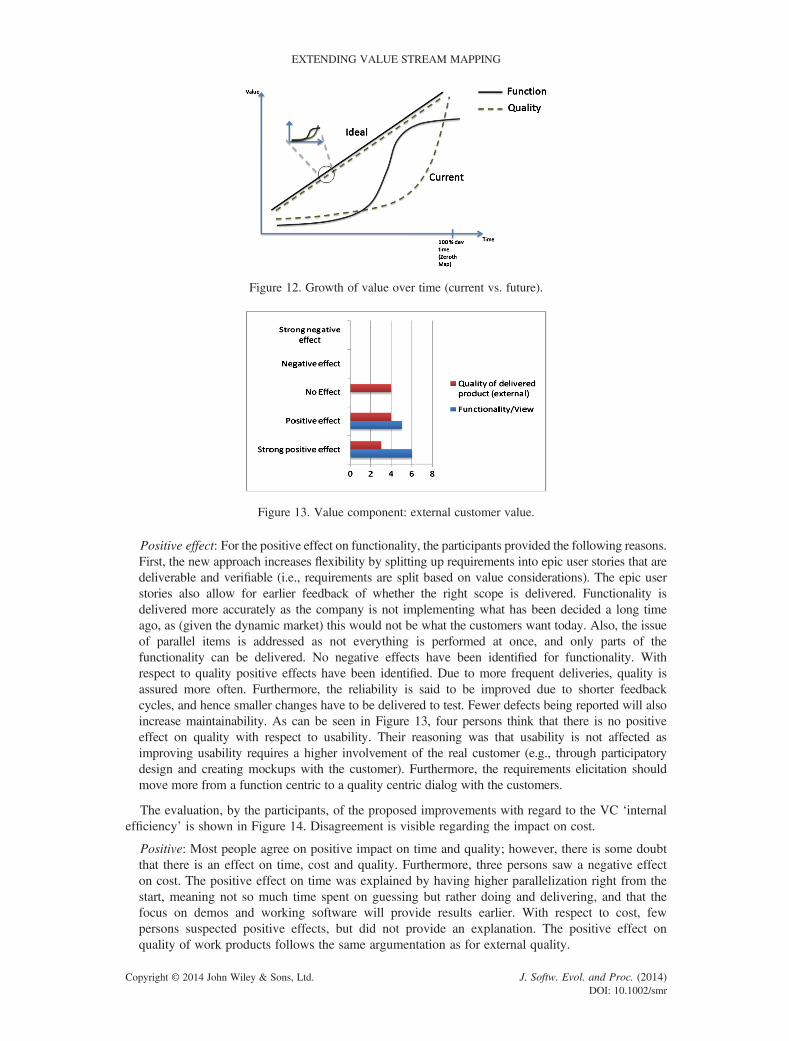
Positive effect: For the positive effect on functionality, the participants provided the following reasons.First, the new approach increases flexibility by splitting up requirements into epic user stories that aredeliverable and verifiable (i.e., requirements are split based on value considerations). The epic userstories also allow for earlier feedback of whether the right scope is delivered. Functionality isdelivered more accurately as the company is not implementing what has been decided a long timeago, as (given the dynamic market) this would not be what the customers want today. Also, the issueof parallel items is addressed as not everything is performed at once, and only parts of thefunctionality can be delivered. No negative effects have been identified for functionality. Withrespect to quality positive effects have been identified. Due to more frequent deliveries, quality isassured more often. Furthermore, the reliability is said to be improved due to shorter feedbackcycles, and hence smaller changes have to be delivered to test. Fewer defects being reported will alsoincrease maintainability. As can be seen in Figure 13, four persons think that there is no positiveeffect on quality with respect to usability. Their reasoning was that usability is not affected asimproving usability requires a higher involvement of the real customer (e.g., through participatorydesign and creating mockups with the customer). Furthermore, the requirements elicitation shouldmove more from a function centric to a quality centric dialog with the customers.
The evaluation, by the participants, of the proposed improvements with regard to the VC ‘internalefficiency’ is shown in Figure 14. Disagreement is visible regarding the impact on cost.
Positive: Most people agree on positive impact on time and quality; however, there is some doubtthat there is an effect on time, cost and quality. Furthermore, three persons saw a negative effecton cost. The positive effect on time was explained by having higher parallelization right from thestart, meaning not so much time spent on guessing but rather doing and delivering, and that thefocus on demos and working software will provide results earlier. With respect to cost, fewpersons suspected positive effects, but did not provide an explanation. The positive effect onquality of work products follows the same argumentation as for external quality.
Figure 12. Growth of value over time (current vs. future).
Figure 13. Value component: external customer value.
EXTENDING VALUE STREAM MAPPING
Copyright © 2014 John Wiley & Sons, Ltd. J. Softw. Evol. and Proc. (2014)DOI: 10.1002/smr
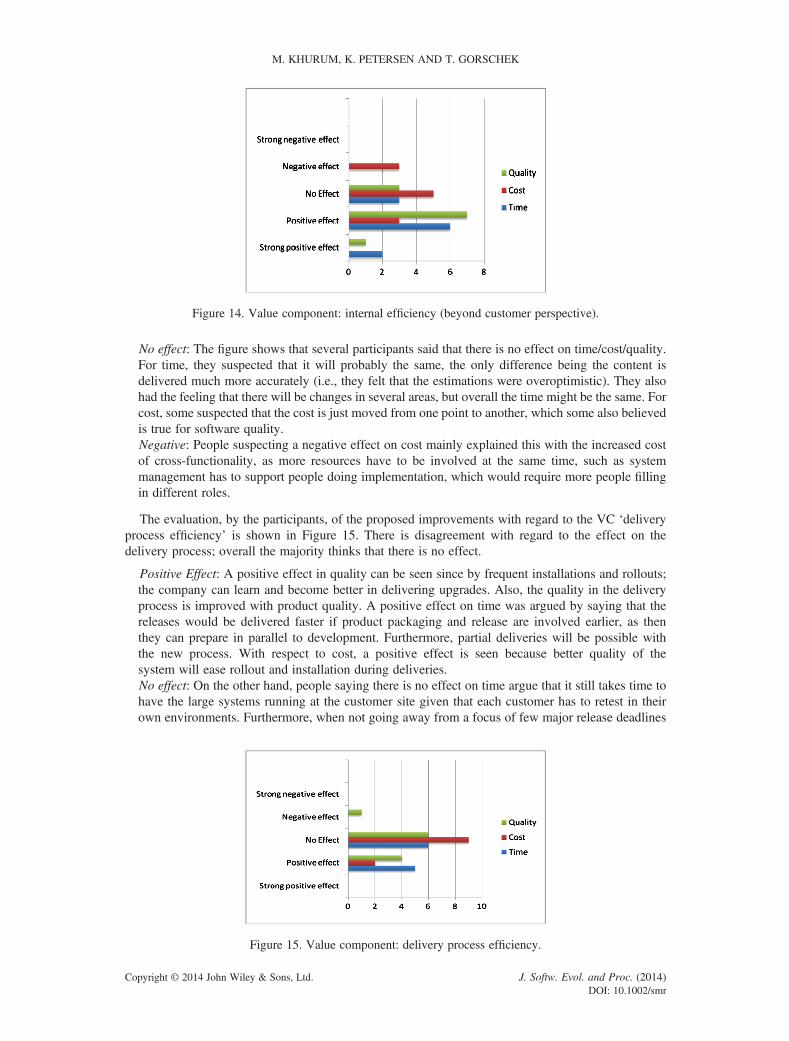
No effect: The figure shows that several participants said that there is no effect on time/cost/quality.For time, they suspected that it will probably the same, the only difference being the content isdelivered much more accurately (i.e., they felt that the estimations were overoptimistic). They alsohad the feeling that there will be changes in several areas, but overall the time might be the same. Forcost, some suspected that the cost is just moved from one point to another, which some also believedis true for software quality.Negative: People suspecting a negative effect on cost mainly explained this with the increased costof cross-functionality, as more resources have to be involved at the same time, such as systemmanagement has to support people doing implementation, which would require more people fillingin different roles.
The evaluation, by the participants, of the proposed improvements with regard to the VC ‘deliveryprocess efficiency’ is shown in Figure 15. There is disagreement with regard to the effect on thedelivery process; overall the majority thinks that there is no effect.
Positive Effect: A positive effect in quality can be seen since by frequent installations and rollouts;the company can learn and become better in delivering upgrades. Also, the quality in the deliveryprocess is improved with product quality. A positive effect on time was argued by saying that thereleases would be delivered faster if product packaging and release are involved earlier, as thenthey can prepare in parallel to development. Furthermore, partial deliveries will be possible withthe new process. With respect to cost, a positive effect is seen because better quality of thesystem will ease rollout and installation during deliveries.No effect: On the other hand, people saying there is no effect on time argue that it still takes time tohave the large systems running at the customer site given that each customer has to retest in theirown environments. Furthermore, when not going away from a focus of few major release deadlines
Figure 14. Value component: internal efficiency (beyond customer perspective).
Figure 15. Value component: delivery process efficiency.
M. KHURUM, K. PETERSEN AND T. GORSCHEK
Copyright © 2014 John Wiley & Sons, Ltd. J. Softw. Evol. and Proc. (2014)DOI: 10.1002/smr
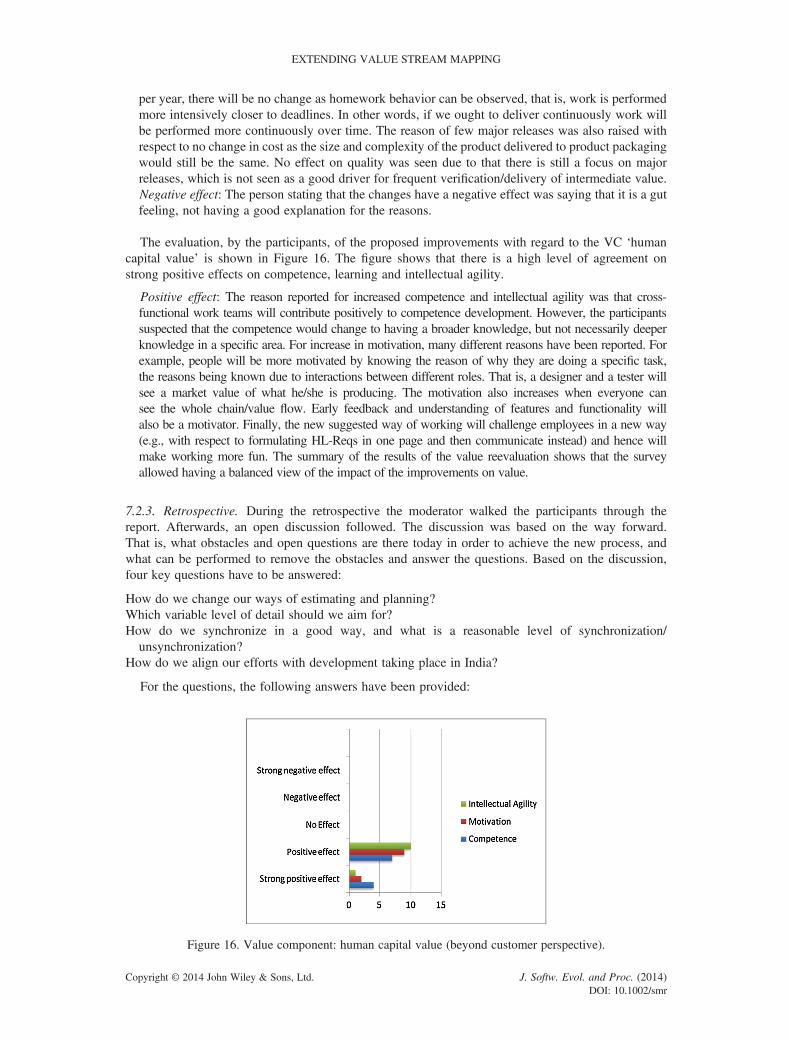
per year, there will be no change as homework behavior can be observed, that is, work is performedmore intensively closer to deadlines. In other words, if we ought to deliver continuously work willbe performed more continuously over time. The reason of few major releases was also raised withrespect to no change in cost as the size and complexity of the product delivered to product packagingwould still be the same. No effect on quality was seen due to that there is still a focus on majorreleases, which is not seen as a good driver for frequent verification/delivery of intermediate value.Negative effect: The person stating that the changes have a negative effect was saying that it is a gutfeeling, not having a good explanation for the reasons.
The evaluation, by the participants, of the proposed improvements with regard to the VC ‘humancapital value’ is shown in Figure 16. The figure shows that there is a high level of agreement onstrong positive effects on competence, learning and intellectual agility.
Positive effect: The reason reported for increased competence and intellectual agility was that cross-functional work teams will contribute positively to competence development. However, the participantssuspected that the competence would change to having a broader knowledge, but not necessarily deeperknowledge in a specific area. For increase in motivation, many different reasons have been reported. Forexample, people will be more motivated by knowing the reason of why they are doing a specific task,the reasons being known due to interactions between different roles. That is, a designer and a tester willsee a market value of what he/she is producing. The motivation also increases when everyone cansee the whole chain/value flow. Early feedback and understanding of features and functionality willalso be a motivator. Finally, the new suggested way of working will challenge employees in a new way(e.g., with respect to formulating HL-Reqs in one page and then communicate instead) and hence willmake working more fun. The summary of the results of the value reevaluation shows that the surveyallowed having a balanced view of the impact of the improvements on value.
7.2.3. Retrospective. During the retrospective the moderator walked the participants through thereport. Afterwards, an open discussion followed. The discussion was based on the way forward.That is, what obstacles and open questions are there today in order to achieve the new process, andwhat can be performed to remove the obstacles and answer the questions. Based on the discussion,four key questions have to be answered:
How do we change our ways of estimating and planning?Which variable level of detail should we aim for?How do we synchronize in a good way, and what is a reasonable level of synchronization/
unsynchronization?How do we align our efforts with development taking place in India?
For the questions, the following answers have been provided:
Figure 16. Value component: human capital value (beyond customer perspective).
EXTENDING VALUE STREAM MAPPING
Copyright © 2014 John Wiley & Sons, Ltd. J. Softw. Evol. and Proc. (2014)DOI: 10.1002/smr
Planning was performed on the basis of major release intent. However, in the new situation where moreflexibility is possible and not so much details are available, planning has to change as well (e.g., howto handle estimations). This also raises the question as how to handle release planning and roadmapping of features. A solution for this question has not been provided at this stage.
This question is related on how to obtain development started within 9% of the lead time being spenton HL-Reqs. There might be different needs with respect to detail (some might need more detail,whereas others need less). One possible solution was provided by looking at company internalsuccess stories. Experiences from one product showed good results with prototyping, which meansthat full picture is not needed before starting. Moreover, requirements stated by product managers inan understandable and precise manner also help to start working. Currently, requirements are oftenone liners, but there are good examples from other systems recently as how to write HL-Reqs in anunderstandable way. A way forward might be to find these ‘model’ requirements as a guide forimprovements (e.g., good use cases). Complementary, workshops with software product managersand developers early on can also be useful.
In order to achieve shorter lead times in the early phase (before the decision of committing develop-ment resources), systems need to be able to work more out of sync. However, too much out of synccauses a risk when requirements change, and the systems do not work as a whole after integration. Apossible solution is that one system takes lead in developing the core, and other systems catch upbuilding on the core. Furthermore, the degree of dependencies between nodes highly depends onthe handling of interfaces and network protocols in order to allow for backward compatibility.
Improvement efforts should be aligned with improvement efforts carried out in India. A possible solutionproposed was to conduct a similar value stream activity with development sites in India to identify theiridea of process improvements focusing on value and waste. The proposition/gut feeling is that whendrawing the future state map India would like to have the technical details in place before starting.
After having discussed the way forward, the participants assessed the overall value stream activitysaying what went well, what can be improved, and whether they would like to have VSM implementedas a process improvement method. The following points have been raised as being positive throughoutthe value stream activity:
Very good discussions in the workshop.Every part of the organization was involved to exchange views and learned from each other.Good reporting/documentation of the value stream activity.The activity helped everyone to understand the way of working/processes end-to-end.Pre-meetings and trainings were good to mitigate the risk of not discussing the issues at hand in theworkshops.
Everyone participated in the workshops after being invited.The view and consideration of different values.The end-to-end focus.
The following points have been raised as being not so good throughout the value stream activity:
Only chefs, not doers in the workshop.The VSM used in the start was not a good representation (did not show overlaps between activities),the requirements were not a common case, and the most complicated case was selected, but theseshortcomings were overcome in the workshops.
The process is perceived as being too academic.Time intensive to conduct (but, as commented: if actions follow, very much worth it).The solutions were quite black and white and oversimplified.
Three improvement proposals have been provided:
Shorter time and fewer people versus involve India and also include technical people.Clearer expectations on the outcome.Present goals of the workshops more clearly to everyone.
M. KHURUM, K. PETERSEN AND T. GORSCHEK
Copyright © 2014 John Wiley & Sons, Ltd. J. Softw. Evol. and Proc. (2014)DOI: 10.1002/smr
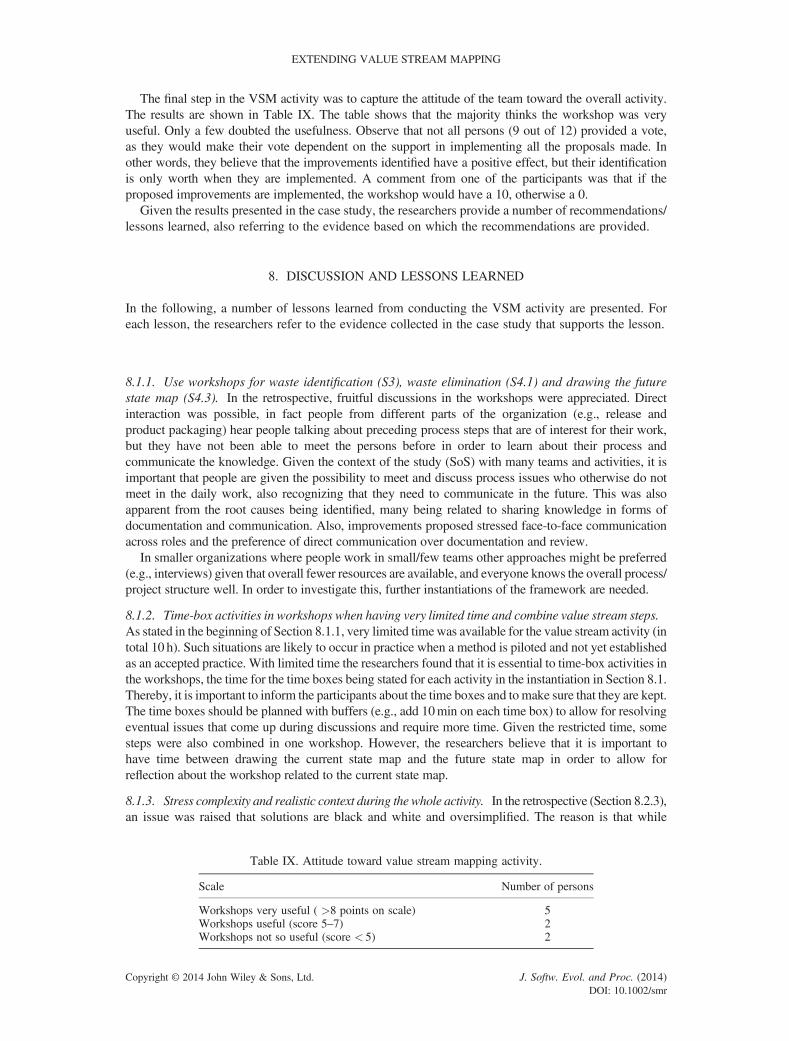
The final step in the VSM activity was to capture the attitude of the team toward the overall activity.The results are shown in Table IX. The table shows that the majority thinks the workshop was veryuseful. Only a few doubted the usefulness. Observe that not all persons (9 out of 12) provided a vote,as they would make their vote dependent on the support in implementing all the proposals made. Inother words, they believe that the improvements identified have a positive effect, but their identificationis only worth when they are implemented. A comment from one of the participants was that if theproposed improvements are implemented, the workshop would have a 10, otherwise a 0.
Given the results presented in the case study, the researchers provide a number of recommendations/lessons learned, also referring to the evidence based on which the recommendations are provided.
8. DISCUSSION AND LESSONS LEARNED
In the following, a number of lessons learned from conducting the VSM activity are presented. Foreach lesson, the researchers refer to the evidence collected in the case study that supports the lesson.
8.1.1. Use workshops for waste identification (S3), waste elimination (S4.1) and drawing the futurestate map (S4.3). In the retrospective, fruitful discussions in the workshops were appreciated. Directinteraction was possible, in fact people from different parts of the organization (e.g., release andproduct packaging) hear people talking about preceding process steps that are of interest for their work,but they have not been able to meet the persons before in order to learn about their process andcommunicate the knowledge. Given the context of the study (SoS) with many teams and activities, it isimportant that people are given the possibility to meet and discuss process issues who otherwise do notmeet in the daily work, also recognizing that they need to communicate in the future. This was alsoapparent from the root causes being identified, many being related to sharing knowledge in forms ofdocumentation and communication. Also, improvements proposed stressed face-to-face communicationacross roles and the preference of direct communication over documentation and review.
In smaller organizations where people work in small/few teams other approaches might be preferred(e.g., interviews) given that overall fewer resources are available, and everyone knows the overall process/project structure well. In order to investigate this, further instantiations of the framework are needed.
8.1.2. Time-box activities in workshops when having very limited time and combine value stream steps.As stated in the beginning of Section 8.1.1, very limited timewas available for the value stream activity (intotal 10 h). Such situations are likely to occur in practice when a method is piloted and not yet establishedas an accepted practice. With limited time the researchers found that it is essential to time-box activities inthe workshops, the time for the time boxes being stated for each activity in the instantiation in Section 8.1.Thereby, it is important to inform the participants about the time boxes and to make sure that they are kept.The time boxes should be planned with buffers (e.g., add 10min on each time box) to allow for resolvingeventual issues that come up during discussions and require more time. Given the restricted time, somesteps were also combined in one workshop. However, the researchers believe that it is important tohave time between drawing the current state map and the future state map in order to allow forreflection about the workshop related to the current state map.
8.1.3. Stress complexity and realistic context during the whole activity. In the retrospective (Section 8.2.3),an issue was raised that solutions are black and white and oversimplified. The reason is that while
Table IX. Attitude toward value stream mapping activity.
Scale Number of persons
Workshops very useful ( >8 points on scale) 5Workshops useful (score 5–7) 2Workshops not so useful (score < 5) 2
EXTENDING VALUE STREAM MAPPING
Copyright © 2014 John Wiley & Sons, Ltd. J. Softw. Evol. and Proc. (2014)DOI: 10.1002/smr
creating the new map, an optimal context seemed to be assumed by the participants (i.e., fewdependencies to other systems and ability to plan). Hence, it is always important to stress a realisticcontext. Therefore, the researchers propose to prepare scenarios for the participants that should beevaluated against the new future state map (e.g., what if a project is not completed in a sprint, what ifthere are many dependencies to another system and that system is delayed, and so forth).These scenarios could be used to update estimation values. The oversimplification issue has beenpartially addressed in this value stream activity already in the reassessment of value and theretrospective (Section 8.2.3). In the reevaluation of value, the participants provided possible riskswhy the improvements might not have an effect, and in the retrospective, they discussed the mainobstacles/issues that have to be resolved in order to make the improved process work. Theresearchers believe this provides important insights in order to succeed in implementing a version ofthe future process that is close to the one proposed in the future state map.
8.1.4. Allow teams to express processes in their own words. During the initiation, there was aquestion whether to require a specific notation for the new process or to let people express theprocess in their own words. The researchers decided for the latter alternative as participantsindicated it would easier to express the ideas and improvements in their own ways. However, theonly requirement posed was the times (waiting as well as PTs) could be derived from the newprocess map, allowing for comparability to the current state map. As is indicated in the two mapsproduced by the groups, a comparison could be made for a HL-Req of similar size and systemimpact. Hence, there is no foreseeable reason to prescribe a specific notation. In short, it is importantwhat information is captured and not how. In addition, the maps should be complemented byinformation regarding discussions that the scribe should document (see previous lesson).
8.1.5. Introduce different value components to avoid suboptimization. In lean development ‘seeingthe whole’ is an important principle to avoid suboptimization of specific aspects of the softwareprocess [5, 6]. In the case study reported, suboptimization was avoided in two different ways asfollows: (1) the goal of the VSM activity was focused on reducing lead time, but it was given as arestriction that other values (derived from the goals) should not be compromised. In case there is aneed for compromise, a realistic new goal for lead-time reduction should be set. (2) At the end ofthe value stream activity the improvements were evaluated with respect to multiple VCs. As hasbeen revealed in the data, not only the positive aspects were discovered. At the same time risksassociated to the improvements were identified, such as an increase in cost (see ‘Value revaluation’ inSection 8.2.3). Hence, multiple value considerations should always be considered when conductingVSM to make sure that no important value is compromised through improvements. In addition, theresearchers recommend capturing the rationales for value revaluation.
8.2. Further observations
8.2.1. Assure cross-functionality and end-to-end focus. The end-to-end focus is generally stressed inthe lean methodology (cf. [5, 6, 19]). As can be seen in the results, root causes have been identified forevery stage of the process, which is often not possible when only looking at one activity. For example,an undesired behavior such as long waiting in a specific phase does not necessarily have the root causein the same phase. With respect to improvement proposals, the process was redrawn end to end, whichalso required the input from all parties during the discussion.
8.2.2. Document the process and products produced during the ‘value stream mapping’ activitycarefully. In the retrospective, the participants appreciated the quality of the reporting (Section 8.2.3).It is central to capture and document the activities carefully as a vast amount of information isproduced with respect to root causes, improvements, process charts, reflections and so forth. To be ableto later on take actions and spread the knowledge of the results in a very large organization, carefuldocumentation and analysis is the key.
8.2.3. Assure handshaking of goals and expected outcomes as early as possible. From experiencewith previously held workshops in industry, the researchers know when the goals of an activity arenot clear, they are discussed during the workshop; consequently, the actual task is not completed. In
M. KHURUM, K. PETERSEN AND T. GORSCHEK
Copyright © 2014 John Wiley & Sons, Ltd. J. Softw. Evol. and Proc. (2014)DOI: 10.1002/smr
order to focus the effort on the actual value stream activity, the goal of the VSM activity washandshaked with the management, and each participant received written documentation of the goals.Given that the activity was successfully completed within the time boxes, there is a strong indicationthat the initial effort in defining and agreeing on the goals and expected outcomes of the activitycontributed to a complete result from the VSM activity.
8.2.4. Involve chefs and doers. As discussed earlier, the number of participants in the workshopneeds to be limited in order to be able to finish discussions in a reasonable time frame. In the idealsituation, everyone should be involved. The researchers completely agree with the observations ofthe participants that it is important to involve the doers as well. However, in this case this was notpossible, since time the effort spent on the activity was already perceived as high (see‘Retrospective’ in Section 8.2.3). Hence, in the future it is important to conduct subsequent VSMactivities with doers, as well as with stakeholders in India.
8.3. Research agenda
Although we have detailed the lessons learned from the case study, further case studies are needed to testthe approach in different contexts (e.g., smaller companies), different domains (e.g., safety critical/embedded systems) or different development methodologies (e.g., purely plan-driven). Furthermore,longitudinal studies are needed that report on using VSM and seeing the effects after years of usage,looking at suggested and implemented improvements and their effects. In order to have a good startingpoint, this study lays the foundation.
9. CONCLUSION
This paper presents a framework for conducting VSM in software engineering. The framework outlinesthe process of the VSM activity and provides alternative strategies of how to conduct each step. A casestudy has been conducted showing an instantiation of the framework. Based on the application,answers to the research questions are posed as follows:
RQ1: What instantiations of the process do practitioners prefer?
The instantiation of the value stream process was performed for each of the steps (S1: instantiation,S2: current state map, S3: waste identification, S4: process improvement and S5: retrospective). Thecontext of the company influenced the choices of instantiation.
The size of the company developing multiple interaction systems required the use of workshops toallow discussion and interaction between groups of stakeholders that are distant from each other in theregular work activities, but are highly dependent on each other’s input (e.g., requirements and support);this was particularly essential during S2 to S4. During S3, an interesting finding was that thepractitioners perceived the current state map as a too simple representation of the reality, which wasfound during the retrospective. The notation does not allow illustrating iterations and overlappingactivities in a good way. Hence, a possible solution or improvement in future work could be torepresent the map in the form of a dynamic model (e.g., using process simulation). During S4, welearned that practitioners could express themselves more freely when exploring improvement ideaswhen they could use their own notation to describe the processes.
Furthermore, the type of interaction with the market influenced how the map is instantiated. In thevalue stream activity it was found challenging to involve customers, given that the company works in amarket-driven context. That is, a high number of potential customers play a role, which are notaccessible yet. In this situation, people representing the product portfolio and requirementsperspective were involved. The limited time available also only allowed involving chefs, and notdoers. Thus in future activities, it was considered to also involve the doers who conduct the testingand write the code for the product more.
EXTENDING VALUE STREAM MAPPING
Copyright © 2014 John Wiley & Sons, Ltd. J. Softw. Evol. and Proc. (2014)DOI: 10.1002/smr
The value dimensions being considered might change. Companies in a different context (e.g., bespokedevelopment or a different domain such as safety critical software systems) might select and emphasizedifferent VCs when compared with this case. In the instantiation emphasis was given on consideringfive VCs derived on the basis of the goals of the VSM activity. Choosing multiple VCs was motivatedby the intention to not suboptimize.
RQ2: Is the initiated process capable of identifying the current state (waste) and desired future state(improvement) accurately?
The outcome of this question highly relies on the expertise of the practitioners participating in the valuestream activity. Two measures suggested in literature are member checking and saturation to assess theelicitation of qualitative information. In the case of value stream mapping, the qualitative informationconstitutes current state map, waste and future state map incorporating improvements. During memberchecking, the practitioners committed and agreed to the outcome. Very similar improvements andfuture state maps were identified by two separate groups of practitioners having similar roles in eachgroup, which indicates that the value stream activity is capable of accurately identifying waste anddesired state. Furthermore, the practitioners evaluated the improvement actions positively againstexternal customer value, internal efficiency (quality and time) and human capital value (intellectualagility, motivation, and competence). However, some limitations have been mentioned. In particular,one concern was that the improvements and their effect were perceived as a black and whiterepresentation that is oversimplified. One potential solution to address this concern is to evaluatealternatives through demonstrating the behavior of the process in a simulation.
In future work, further evaluations and instantiations of the VSM solution presented in this paper shouldbe conducted. An interesting direction for research is to represent the current and future state mapdynamically so that practitioners can play through alternative scenarios using simulation, which couldpotentially address the issue of the perception of having oversimplified solutions and views on the process.
REFERENCES
1. Morgan JM, Liker JK. The Toyota Product Development System: Integrating People, Process and Technology.New York: Productivity Press, 2006.
2. Dalgobind M, Anjani K. The effect of lean manufacturing on product quality and industrial productivity: an empiricalsurvey. Advances in Production Engineering & Management 2009; 4:221–32.
3. Tong A, Li YH. Achieving productivity gain through lean manufacturing. Hong Kong Engineer 2007; 35:25–6.4. Waters M, Bevan J. Journey to lean [lean practices in aerospace product development]. Engineering Management
2005; 15:10–13.5. Poppendieck M, Poppendieck T. Implementing Lean Software Development: From Concept to Cash. Upper Saddle
River, N.J.: Addison-Wesley, 2008.6. Petersen K, Wohlin C. Software process improvement through the lean measurement. Journal of Systems and
Software 2010; 83:1275–1287.7. Mehta M, Anderson D, Raffo D. Providing value to customers in software development through lean principles.
Software Process: Improvement and Practice 2008; 13:101–9.8. Womack JP, Jones DT. Lean thinking: banish waste and create wealth in your corporation. Revised And Updated
Author: James P. Womack, Daniel T, 2003.9. Wang X, Conboy K, Cawley O. “Leagile” software development: an experience report analysis of the application of
lean approaches in agile software development. Journal of Systems and Software 2012; 85:1287–1299.10. Hibbs C, Jewett S, Sullivan M. The art of lean software development. A Practical and Incremental Approach.
Sebastopol, CA: O’Reilly Media, Inc., 2009.11. Reinertsen DG. The Principles of Product Development Flow: Second Generation Lean Product Development.
Celeritas: Redondo Beach, Canada, 2009.12. McManus HL. Product Development Value Stream Mapping (PDVSM) manual. ed, 2005.13. Vujica Herzog N, Polajnar A, Kostanjevec T. Value Stream Mapping for Effective Lean Manufacturing. Vienna,
Austria: Wiley InterScience, 2008; 1515–16.14. Srambikal V. Implementation of cellular manufacturing in a foundry setting: a lean six sigma case study. One SME
Drive - P.O. Box 930, Dearborn, 48121–0930, United States, 2008; 1–12.15. Grewal C. An initiative to implement lean manufacturing using value stream mapping in a small company.
International Journal of Manufacturing Technology and Management 2008; 15:404–417.16. Hines P, Rich N, Esain A. Value stream mapping: a distribution industry application. Benchmarking: An
International Journal 1999; 6:60–77.
M. KHURUM, K. PETERSEN AND T. GORSCHEK
Copyright © 2014 John Wiley & Sons, Ltd. J. Softw. Evol. and Proc. (2014)DOI: 10.1002/smr
17. Rother M, Shook J. Learning to see: Value Stream Mapping to Create Value and Eliminate Muda. Lean EnterpriseInstitute: USA, 2003.
18. Mujtaba S, Feldt R, Petersen K. Waste and lead time reduction in a software product customization process with valuestream maps. in Proceedings of the 21st Australian Software Engineering Conference (ASWEC 2010), Auckland,New Zealand, 2010; 139–148.
19. Petersen K, Wohlin C. Measuring the flow in lean software development. Software: Practice and Experience 2011;41:975–996.
20. Khurum M, Gorschek T, Wilson M. Software value map – an exhaustive collection of value aspects for thedevelopment of software intensive products. Journal of Software: Evolutaion and Process 2012; Published onlinein Wiley Online Library (wileyonlinelibrary.com). DOI: 10.1002/smr.1560
21. Ōno T. Toyota Production System: Beyond Large-Scale Production. Cambridge, Mass.: Productivity Press, 1988.22. Petersen K. Is lean agile and agile lean?: a comparison between two software development paradigms. in Modern
Software Engineering Concepts and Practices: Advanced Approaches, A. H. Dogru and V. Bicar, Eds., ed, 2010.23. Pavnaskar SJ, Gershenson JK. The Application of Value Stream Mapping to Lean Engineering. Salt Lake City, UT,
United states, 2004; 833–842.24. Hines P, Rich N. The seven value stream mapping tools. International Journal of Operations and Production
Management 1997; 17:46–64.25. Singh P, Singh H. Application of lean tool (value stream mapping) in minimisation of the non-value added waste:
(a case study of tractor industry). in Applied Mechanics and Materials vol. 110–116, ed, 2062–2066.26. Mohanraj R, Sakthivel M, Vinodh S. QFD integrated value stream mapping: an enabler of lean manufacturing.
International Journal of Productivity and Quality Management 2011; 7(4):501–522.27. Chase JP. Value creation in the product development process. PhD, Massachusetts Institute of Technology,
Massachusetts 2001.28. Kaplan RS, Norton DP. The balanced scorecard: measures that drive performance. Harvard Business Review 2005;
83:172–80.29. Kaplan R. S, Norton DP. The Balanced Scorecard: Translating Strategy into Action. Harvard Business School Press:
Boston, USA, 2003.30. Robson C. Real World Research: A Resource for Social Scientists and Practitioner-Researchers (2nd edn).
Blackwell: Oxford, 2002.31. Yin RK. Case study research: design and methods (3rd edn). Sage Publications: Thousand Oaks, 2003.32. Petersen K, Wohlin C. Context in industrial software engineering research. Proceedings of the 2009 3rd
International Symposium on Empirical Software Engineering and Measurement, Piscataway, NJ, USA: IEEEComputer Society, 2009; 401–404.
33. S. a. s. e. DoD. Systems engineering guide for systems of systems, version 1.0., Tech. Rep. ODUSD(A&T)SSE.Office of the Deputy Under Secretary of Defense for Acquisition and Technology,Washington, DC, USA 2008.
34. Lane JA. Synthesizing SoS concepts for use in cost modeling. Systems Engineering 2007; 10:297–308.35. Lane JA, Valerdi R. Synthesizing SoS concepts for use in cost modeling. Systems Engineering 2007; 10:297–308.36. Petersen K, Wohlin C. The effect of moving from a plan-driven to an incremental software development approach
with agile practices. Empirical Software Engineering 2010; 15:654–693.37. Petersen K, Wohlin C. A comparison of issues and advantages in agile and incremental development between state of
the art and an industrial case. Journal of Systems and Software 2009; 82:1479–1490.38. Easterbrook S, Singer J, Storey M-A, Damian D. Selecting empirical methods for software engineering research.
Guide to Advanced Empirical Software Engineering, Shull F, Singer J, Sjøberg DIK (eds.). Springer, 2008; 285–311.39. Guest G, Bunce A, Johnson L. How many interviews are enough? An experiment with data saturation and variability.
Field methods 2006; 18:59–82.40. Morse JM. Designing funded qualitative research. 1994.41. Wohlin C, Runeson P, Host M, Ohlsson C, Regnell B, Wesslén A. Experimentation in software engineering: an
introduction. 2000.42. Yin RK. Case Study Research: Design and Methods vol. 5. London: Sage Publications, Incorporated, 2008.43. Runeson P, Höst M. Guidelines for conducting and reporting case study research in software engineering. Empirical
Software Engineering 2009; 14:131–164.44. Cruzes DS, Dyba T, Runeson P, Host M. Case studies synthesis: brief experience and challenges for the future. in
Empirical Software Engineering and Measurement (ESEM), 2011 International Symposium on, 2011; 343–346.45. Petersen K, Gencel C. Worldviews, research methods, and their relationship to validity in empirical software
engineering research. presented at the Proceedings of the Joint Conference of the 23rd International Workshop onSoftware Measurement and the 8th International Conference on Software Process and Product Measurement(IWSM-Mensura 2013), Istanbul, Turkey, 2013.
46. Wohlin C. Experimentation in Software Engineering: An Introduction. Kluwer: Boston, 2000.47. Petersen K, Wohlin C, Baca D. The waterfall model in large-scale development. Product-Focused Software Process
Improvement, Oulu, Finland: Springer, 2009; 386–400.48. Petersen K. Measuring and predicting software productivity: a systematic map and review. Information and Software
Technology 2011; 53:317–343.49. Kitchenham B, Jeffery DR, Connaughton C. Misleading metrics and unsound analyses. IEEE Software 2007; 24:73–78.
EXTENDING VALUE STREAM MAPPING
Copyright © 2014 John Wiley & Sons, Ltd. J. Softw. Evol. and Proc. (2014)DOI: 10.1002/smr
50. Petersen K. An empirical study of lead-times in incremental and agile software development. in ProceedingsInternational Conference on Software Process, Berlin, Germany, 2010; 345–56.
51. Leffingwell D, Widrig D. Managing Software Requirements: A Unified Approach. Addison-Wesley: Reading, 1999.
AUTHORS’ BIOGRAPHIES
Dr Mahvish Khurum is the Managing Director at KMH Solution in England. Shereceived her PhD degree in Strategic Software Engineering in 2011 from Blekinge Instituteof Technology, Sweden. Dr. Khurum’s research area is Strategic Software Engineering,which touches both software engineering and industrial technology and management.She is also working with practical innovation. Dr Khurum bases her research on chal-lenges identified in industry, then develops solutions in collaboration with industrypractitioners, and ultimately validates and tests the solutions in a real industrial setting.She has researched in collaboration with IBM, Qtema, and Ericsson. She is also a memberof Software Product Management Organization. (http://ispma.org/personalmembers/mahvish-khurum/)
Dr Kai Petersen is a senior researcher at Blekinge Institute of Technology (BTH), Sweden.He received his PhD fromBTH in 2010. His research focuses on software processes, softwaremetrics, lean and agile software development, quality assurance, and software security inclose collaboration with industry partners. Kai has authored over 40 articles in internationaljournals and conferences, and has been the industry chair of REFSQ 2013.
Dr Tony Gorschek is a Professor of Software Engineering at Blekinge Institute ofTechnology. He has over 10 years industrial experience not only as a Senior executiveconsultant and engineer but also as chief architect and product manager. Currently, hemanages his own consultancy company, works as a Chief Technology Officer, and serveson several boards in companies developing cutting edge technology and products. Hisresearch interests include requirements engineering, technology and productmanagement, process assessment and improvement, quality assurance, and practical inno-vation. Dr Gorschek bases his research on challenges identified in industry, then developssolutions in collaboration with industry practitioners, and ultimately validates and teststhe solutions in a real industrial setting. Industrial partners include, but not limited toIBM, Qtema, Ericsson, Daimler AG, and Volvo Cars. For more information/ publications,contact http://www.gorschek.com.
SUPPORTING INFORMATION
Additional supporting information may be found in the online version of this article at the publisher’sweb-site.
M. KHURUM, K. PETERSEN AND T. GORSCHEK
Copyright © 2014 John Wiley & Sons, Ltd. J. Softw. Evol. and Proc. (2014)DOI: 10.1002/smr