Extending Students' Practice of Metacognitive Regulation ...
205
Loyola University Chicago Loyola University Chicago Loyola eCommons Loyola eCommons Dissertations Theses and Dissertations 2014 Extending Students' Practice of Metacognitive Regulation Extending Students' Practice of Metacognitive Regulation Strategies in the Undergraduate Chemistry Laboratory and Strategies in the Undergraduate Chemistry Laboratory and Investigation of Pb2+ Binding to Calmodulin with Circular Investigation of Pb2+ Binding to Calmodulin with Circular Dichroism and Molecular Dynamics Modeling Dichroism and Molecular Dynamics Modeling Mary Twist Van Opstal Loyola University Chicago Follow this and additional works at: https://ecommons.luc.edu/luc_diss Part of the Science and Mathematics Education Commons Recommended Citation Recommended Citation Van Opstal, Mary Twist, "Extending Students' Practice of Metacognitive Regulation Strategies in the Undergraduate Chemistry Laboratory and Investigation of Pb2+ Binding to Calmodulin with Circular Dichroism and Molecular Dynamics Modeling" (2014). Dissertations. 1309. https://ecommons.luc.edu/luc_diss/1309 This Dissertation is brought to you for free and open access by the Theses and Dissertations at Loyola eCommons. It has been accepted for inclusion in Dissertations by an authorized administrator of Loyola eCommons. For more information, please contact [email protected]. This work is licensed under a Creative Commons Attribution-Noncommercial-No Derivative Works 3.0 License. Copyright © 2014 Mary Twist Van Opstal
-
Upload
khangminh22 -
Category
Documents
-
view
3 -
download
0
Transcript of Extending Students' Practice of Metacognitive Regulation ...
Loyola University Chicago Loyola University Chicago
Loyola eCommons Loyola eCommons
Dissertations Theses and Dissertations
2014
Extending Students' Practice of Metacognitive Regulation Extending Students' Practice of Metacognitive Regulation
Strategies in the Undergraduate Chemistry Laboratory and Strategies in the Undergraduate Chemistry Laboratory and
Investigation of Pb2+ Binding to Calmodulin with Circular Investigation of Pb2+ Binding to Calmodulin with Circular
Dichroism and Molecular Dynamics Modeling Dichroism and Molecular Dynamics Modeling
Mary Twist Van Opstal Loyola University Chicago
Follow this and additional works at: https://ecommons.luc.edu/luc_diss
Part of the Science and Mathematics Education Commons
Recommended Citation Recommended Citation Van Opstal, Mary Twist, "Extending Students' Practice of Metacognitive Regulation Strategies in the Undergraduate Chemistry Laboratory and Investigation of Pb2+ Binding to Calmodulin with Circular Dichroism and Molecular Dynamics Modeling" (2014). Dissertations. 1309. https://ecommons.luc.edu/luc_diss/1309
This Dissertation is brought to you for free and open access by the Theses and Dissertations at Loyola eCommons. It has been accepted for inclusion in Dissertations by an authorized administrator of Loyola eCommons. For more information, please contact [email protected].
This work is licensed under a Creative Commons Attribution-Noncommercial-No Derivative Works 3.0 License. Copyright © 2014 Mary Twist Van Opstal
LOYOLA UNIVERSITY CHICAGO
EXTENDING STUDENTS’ PRACTICE OF METACOGNITIVE REGULATION
STRATEGIES IN THE UNDERGRADUATE CHEMISTRY LABORATORY
AND
INVESTIGATION OF Pb2+ BINDING TO CALMODULIN WITH CIRCULAR
DICHROISM AND MOLECULAR DYNAMICS MODELING
A DISSERTATION SUBMITTED TO
THE FACULTY OF THE GRADUATE SCHOOL
IN CANDIDACY FOR THE DEGREE OF
DOCTOR OF PHILOSOPHY
PROGRAM IN CHEMISTRY
BY
MARY TWIST VAN OPSTAL
CHICAGO, IL
DECEMBER 2014

Copyright by Mary Twist van Opstal, 2014
All rights reserved
iii
ACKNOWLEDGMENTS
I would like to thank all of the people who made my research experience possible.
My advisors Patrick Daubenmire and Alanah Fitch, they not only supported me in my
research at all times, but also gave me the reins to manage my research and implement
new instructional strategies into the learning laboratory. They allowed me to have
experience as a teacher in both the classroom and lab when I guest taught lecture and ran
the laboratory as the head TA. Patrick and Alanah guided me in my ideas and helped to
balance my two projects in education and bench work chemistry. Patrick introduced me
to many chemistry education colleagues, and he encouraged me to attend conferences to
present my research and run workshops. I know I have a great network of colleagues that
I can use after graduation and in my career. Both advisors supported me in my work life
balance and through the birth of both my children while researching. Additionally, I
would like to thank my committee member, Duarte Mota de Freitas for the guidance in
my biochemical research study. When I decided to become involved in an additional
research project on lead binding to calmodulin through molecular dynamics, Ken Olsen
provided support and ideas in the completion of that project. I had several undergraduates
assist me in my research. I thank them for the time spent running experiments and coding
interviews. I could not have done the research without my research participants! I thank
them for their wonderful words and insights during interviews.
iv
I would also like to thank the Loyola University Chicago Chemistry Department
and the Graduate School for the teaching fellowships and tuition scholarships that
allowed me to attend Loyola and complete my research.
Finally, I would like to thank my family who have supported me through the long
hours, stressful times and the exciting results and projects I’ve completed. I thank my
parents for supporting me from the very first time I became interested in chemistry,
making science projects at home a part of my life, and instilling hard work in me. Thank
you to Tami van Opstal and Barbara Twist for editing. Thank you to my husband, Chris,
who has always been interested in my research and supported me every step of the way,
and to my children, Marius and Kai for their smiling faces and laughter when I needed it.

To my mother
vi
TABLE OF CONTENTS
ACKNOWLEDGMENTS iii
LIST OF TABLES ix
LIST OF FIGURES xi
LIST OF ABBREVIATIONS xii
CHAPTER ONE: INTRODUCTION 1
Structure of Dissertation 1
Chemistry Education Study 1
Reasons for Research 1
Research Goals 3
Research Questions 3
CHAPTER TWO: LITERATURE REVIEW 4
Constructing Learning Opportunities 4
Metacognition 6
Supporting Metacognitive Strategy Use in the General Chemistry Laboratory 10
Reflective Prompting 10
Collaborative Learning 12
Inquiry-Based Pedagogy 13
Instructional Strategies for Metacognitive Strategy Practice 16
The Science Writing Heuristic 17
A Need for Metacognitive Strategy Practice to Solve Open-Ended Problems 20
Writing and Metacognitive Strategy Use 21
Summary 23
CHAPTER THREE: EXPERIMENTAL DESIGN 25
Methods 25
Participants 26
Instructional Environment 27
Open-Ended Laboratory Problems 29
Data Collection 30
Assessments 30
Interviews 31
Lab Reports 33
Qualitative Data Analysis 34
Coding 34
Validity and Reliability 37
Quantitative Data Analysis 37
Power Analysis 38
Equivalency Test 39
Summary 41
vii
CHAPTER FOUR: RESULTS 43
Assessment Results 44
Baseline Results 44
Post-Assessment Results 45
Correlations 48
Interview Results 49
The Coding Framework 50
Students’ Strategy Use Revealed Through Process of Solving
Open-Ended Problems 53
Students Experience Differential Support from Peers 62
Comparison of Individual and Peer Use of Metacognitive Strategies 70
Students Experience Differential Support from Structure of Weekly
Instructional Labs 72
Summary 77
CHAPTER FIVE: DISCUSSION 79
Similarities between SWH and Non-SWH Students 80
MCAI Results 80
Writing and Metacognitive Strategy Use 83
Differences between SWH and Non-SWH Students 84
Peers Support Practice of Metacognitive Strategies 85
SWH Supports Practice of Metacognitive Strategies 87
Conclusion 89
Limitations 91
Reflexivity as a Qualitative Researcher 91
Experimental Design 92
Data Analysis 93
Future Research 94
CHAPTER SIX: INTRODUCTION FOR STUDIES ON THE Pb-CAM BINDING
INTERACTION 97
Calmodulin 97
Lead Toxicity 99
Pb-CaM Interaction 100
Binding Characteristics of Pb2+ 102
CHAPTER SEVEN: STUDY 1: EFFECT OF Pb2+ BINDING ON CAM SECONDARY
STRUCTURE THROUGH CIRCULAR DICHROISM 104
Introduction 104
Research Goals 106
Method 106
Materials 106
Circular Dichroism Instrument Parameters 107
Titration Experiments 108
Denaturation Experiments 108
Data Analysis 109
viii
Results 112
Conformation Stability of CaM 112
Pb-CaM vs. Ca-CaM 116
Analysis of Secondary Structure 117
Discussion 119
Conclusion 122
CHAPTER EIGHT: STUDY 2: MOLECULAR DYNAMICS MODELING
OF Pb2+ BINDING TO CAM 123
Introduction 123
Research Goals 124
Methods 124
Results 127
Permanent Binding vs. Transient Binding 127
Peptide Residues Binding Pb2+ on CaM 129
Prediction of Pb2+ Binding Sites with Simulation 131
Order, Binding, and Conformational Change 132
Discussion 136
Conclusion 140
Future Research 141
APPENDIX A: CONSENT FORM 142
APPENDIX B: SAMPLE SWH LAB EXPERIMENT 146
APPENDIX C: METACOGNITIVE STRATEGIES PAGE IN LAB MANUAL 151
APPENDIX D: SAMPLE OPEN-ENDED LAB PROBLEM 154
APPENDIX E: MCAI AND CIC SURVEYS 156
APPENDIX F: INTERVIEW PROTOCOLS 160
APPENDIX G: LAB REPORT SCORING RUBRIC 163
APPENDIX H: GPOWER3.1 ANALYSIS 170
APPENDIX I: ELECTROSTATIC AND VAN DER WAALS INTERACTION
ENERGY GRAPH 173
REFERENCE LIST 175
VITA 191
ix
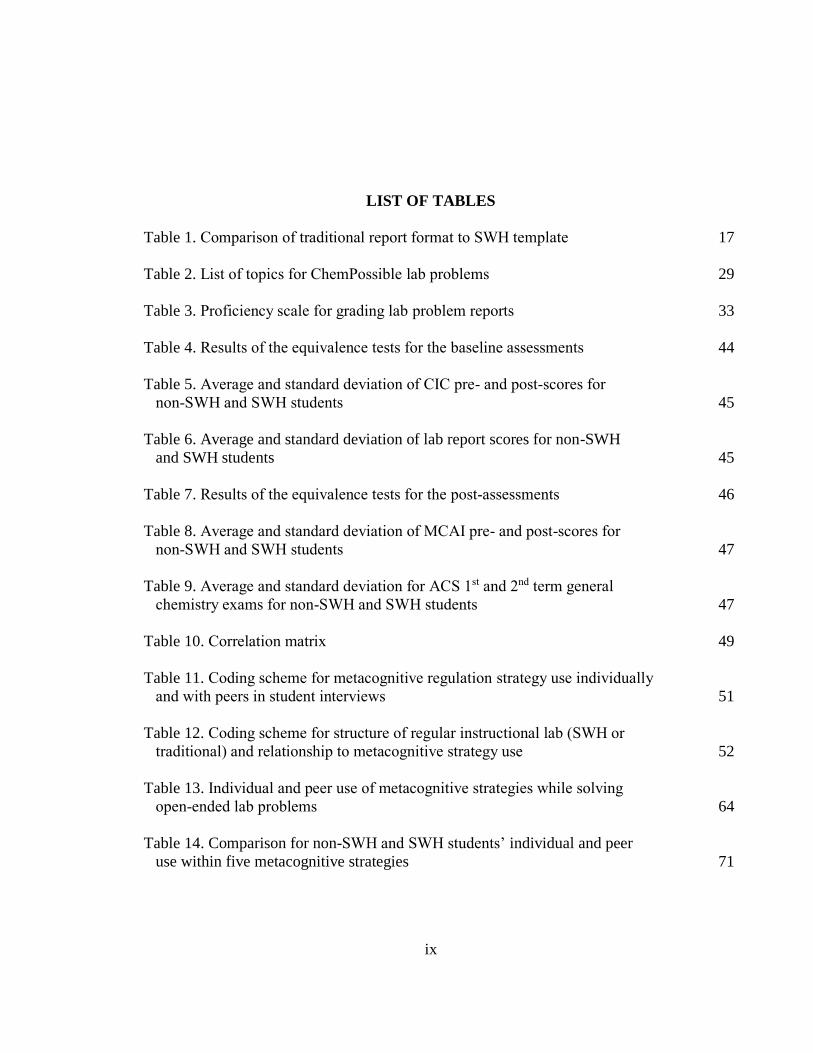
LIST OF TABLES
Table 1. Comparison of traditional report format to SWH template 17
Table 2. List of topics for ChemPossible lab problems 29
Table 3. Proficiency scale for grading lab problem reports 33
Table 4. Results of the equivalence tests for the baseline assessments 44
Table 5. Average and standard deviation of CIC pre- and post-scores for
non-SWH and SWH students 45
Table 6. Average and standard deviation of lab report scores for non-SWH
and SWH students 45
Table 7. Results of the equivalence tests for the post-assessments 46
Table 8. Average and standard deviation of MCAI pre- and post-scores for
non-SWH and SWH students 47
Table 9. Average and standard deviation for ACS 1st and 2nd term general
chemistry exams for non-SWH and SWH students 47
Table 10. Correlation matrix 49
Table 11. Coding scheme for metacognitive regulation strategy use individually
and with peers in student interviews 51
Table 12. Coding scheme for structure of regular instructional lab (SWH or
traditional) and relationship to metacognitive strategy use 52
Table 13. Individual and peer use of metacognitive strategies while solving
open-ended lab problems 64
Table 14. Comparison for non-SWH and SWH students’ individual and peer
use within five metacognitive strategies 71
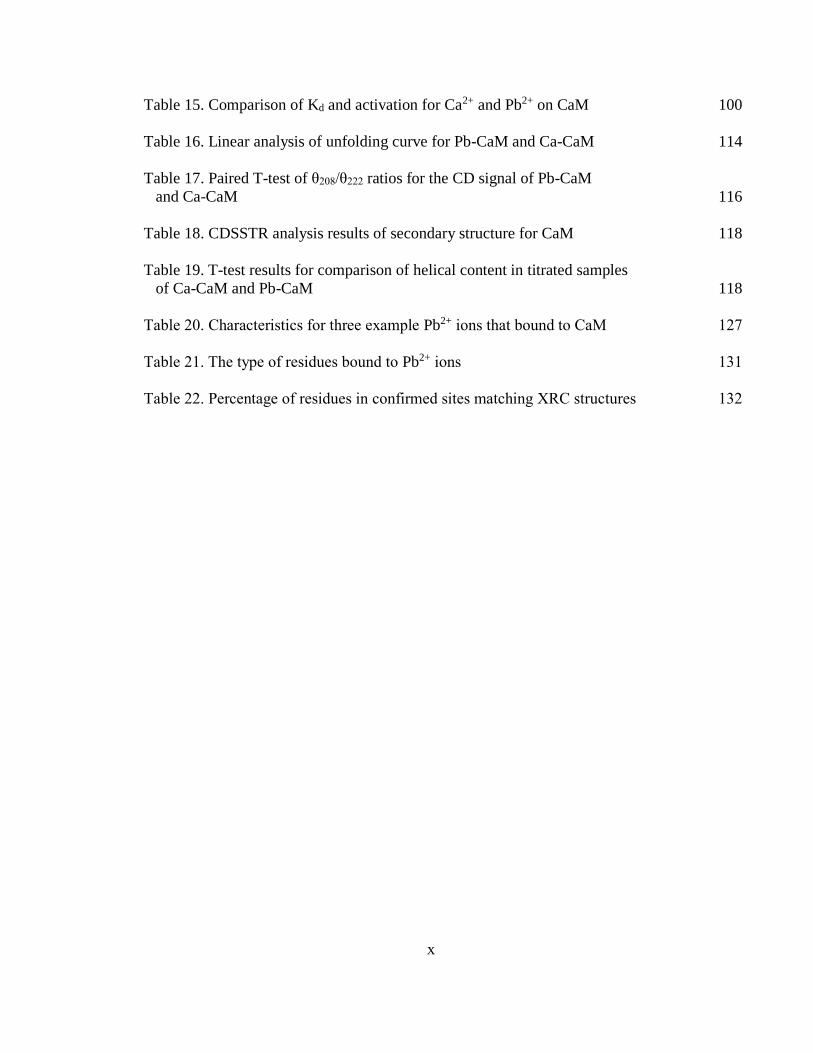
x
Table 15. Comparison of Kd and activation for Ca2+ and Pb2+ on CaM 100
Table 16. Linear analysis of unfolding curve for Pb-CaM and Ca-CaM 114
Table 17. Paired T-test of θ208/θ222 ratios for the CD signal of Pb-CaM
and Ca-CaM 116
Table 18. CDSSTR analysis results of secondary structure for CaM 118
Table 19. T-test results for comparison of helical content in titrated samples
of Ca-CaM and Pb-CaM 118
Table 20. Characteristics for three example Pb2+ ions that bound to CaM 127
Table 21. The type of residues bound to Pb2+ ions 131
Table 22. Percentage of residues in confirmed sites matching XRC structures 132
xi
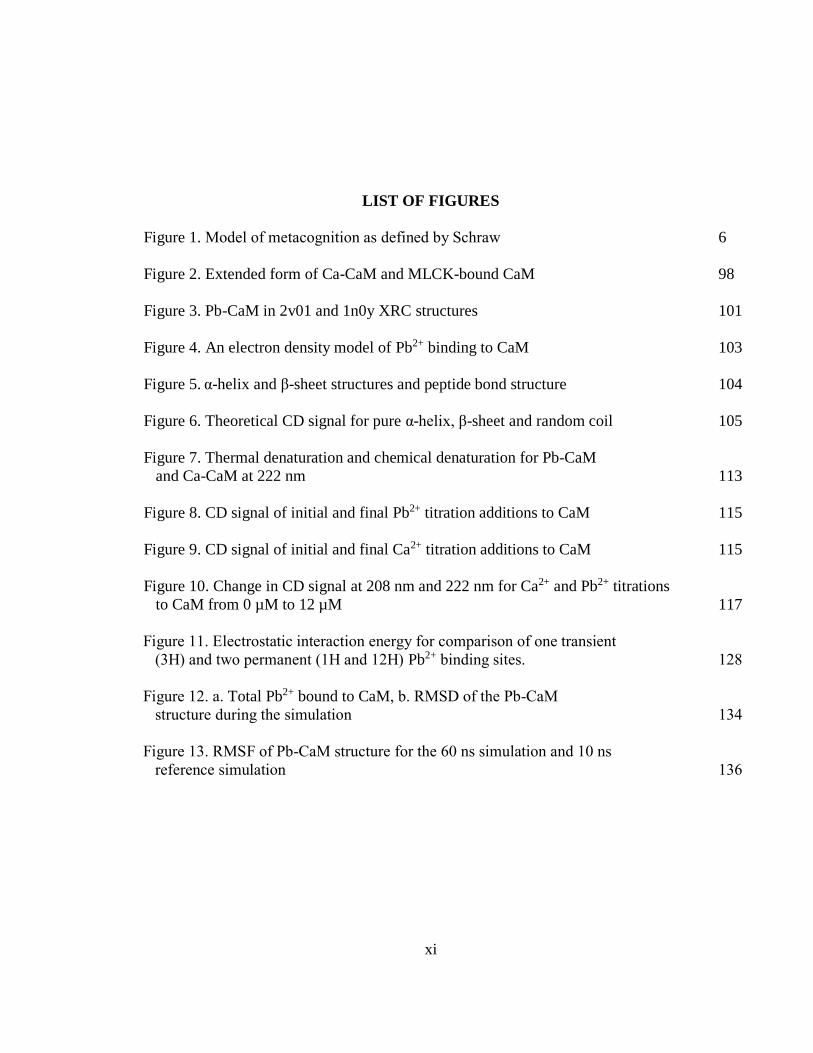
LIST OF FIGURES
Figure 1. Model of metacognition as defined by Schraw 6
Figure 2. Extended form of Ca-CaM and MLCK-bound CaM 98
Figure 3. Pb-CaM in 2v01 and 1n0y XRC structures 101
Figure 4. An electron density model of Pb2+ binding to CaM 103
Figure 5. α-helix and β-sheet structures and peptide bond structure 104
Figure 6. Theoretical CD signal for pure α-helix, β-sheet and random coil 105
Figure 7. Thermal denaturation and chemical denaturation for Pb-CaM
and Ca-CaM at 222 nm 113
Figure 8. CD signal of initial and final Pb2+ titration additions to CaM 115
Figure 9. CD signal of initial and final Ca2+ titration additions to CaM 115
Figure 10. Change in CD signal at 208 nm and 222 nm for Ca2+ and Pb2+ titrations
to CaM from 0 µM to 12 µM 117
Figure 11. Electrostatic interaction energy for comparison of one transient
(3H) and two permanent (1H and 12H) Pb2+ binding sites. 128
Figure 12. a. Total Pb2+ bound to CaM, b. RMSD of the Pb-CaM
structure during the simulation 134
Figure 13. RMSF of Pb-CaM structure for the 60 ns simulation and 10 ns
reference simulation 136
xii
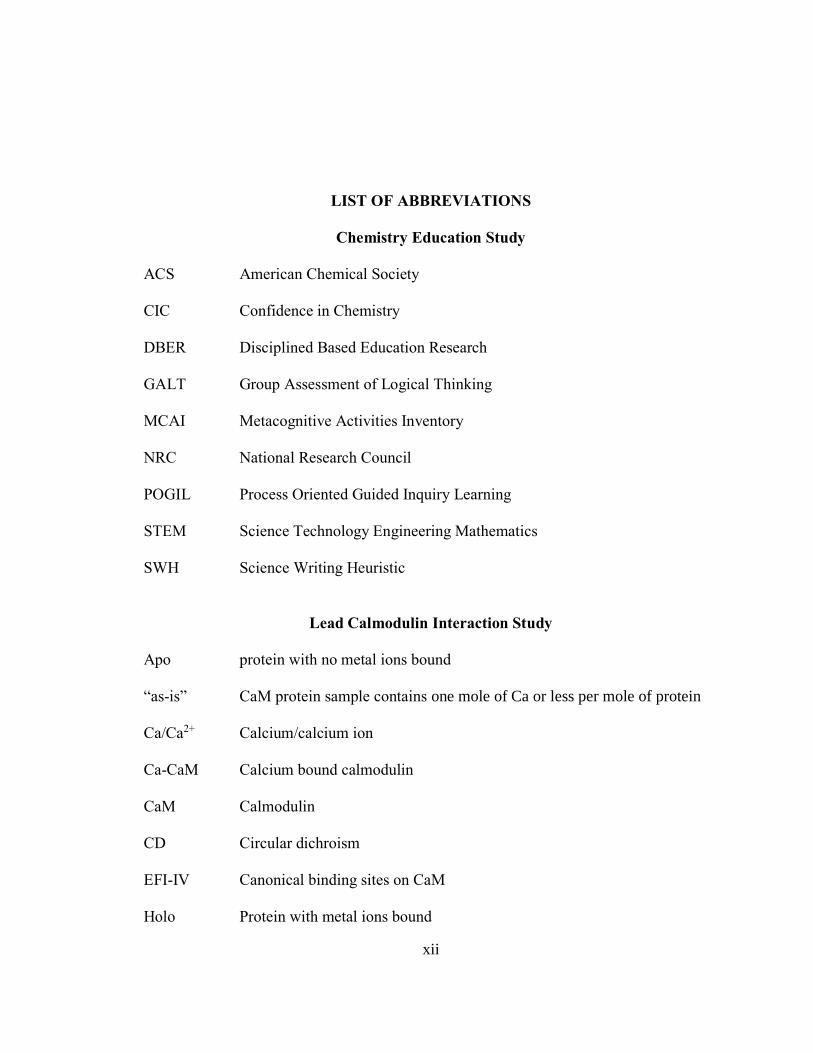
LIST OF ABBREVIATIONS
Chemistry Education Study
ACS American Chemical Society
CIC Confidence in Chemistry
DBER Disciplined Based Education Research
GALT Group Assessment of Logical Thinking
MCAI Metacognitive Activities Inventory
NRC National Research Council
POGIL Process Oriented Guided Inquiry Learning
STEM Science Technology Engineering Mathematics
SWH Science Writing Heuristic
Lead Calmodulin Interaction Study
Apo protein with no metal ions bound
“as-is” CaM protein sample contains one mole of Ca or less per mole of protein
Ca/Ca2+ Calcium/calcium ion
Ca-CaM Calcium bound calmodulin
CaM Calmodulin
CD Circular dichroism
EFI-IV Canonical binding sites on CaM
Holo Protein with metal ions bound
xiii
Kd Dissociation constant
MD Molecular Dynamics
ME Molar Ellipticity (unit of CD signal)
MLCK Myosin Light Chain Kinase
NMR Nuclear Magnetic Resonance
Pb/Pb2+ Lead/lead ion
Pb-CaM Lead bound calmodulin
PDB Protein Data Bank
RMSD Root mean square deviation
RMSF Root mean square fluctuation
VMD Visual Molecular Dynamics
XRC X-Ray Crystallography
1
CHAPTER ONE
INTRODUCTION
Structure of Dissertation
With the recent addition of chemistry education to the graduate program in
chemistry at Loyola, I had the opportunity to explore both chemistry education and bench
work chemistry in my doctoral research. The resulting dissertation is composed of two
studies, the main study in chemistry education and the second study in bench and
computational biochemistry. The chemistry education study is presented first. Following
this section in chapter one, the introduction, research goals and research questions are
described. Chapters two through five fully describe the research on students’
metacognitive strategy use in the general chemistry laboratory. Three chapters follow this
study that describe the interaction of the toxic metal lead, Pb2+, with calmodulin (CaM), a
calcium binding protein. Chapter six provides an introduction to the area of research.
Chapter seven describes the Pb-CaM interaction through the circular dichroism
technique. Chapter eight describes a molecular dynamics modeling study to predict the
binding sites of Pb on CaM as well as its effects on the structure of CaM.
Chemistry Education Study
Reasons for Research
Recently, the Discipline Based Education Research (DBER) Report from the
National Research Council (2012) emphasized that metacognitive strategies be
2
incorporated into the teaching of STEM disciplines including the chemistry laboratory
because these strategies are essential for greater learning of science concepts and skills.
In addition, a few studies suggest that undergraduate students use few metacognitive
strategies when learning (Karpicke, Butler, & Roediger III, 2009; McCrindle &
Christensen, 1995) or are not aware of their strategy use. It is beneficial for students to
use and be aware of their regulation strategies because people with greater use of
metacognition have significantly improved learning and understanding of content
because they are more able to recognize gaps in their knowledge and can better plan and
monitor skill development during the learning process (Garner & Alexander, 1989; Kuhn,
1989; Schraw & Dennison, 1994). Recent research showed that students have improved
regulation strategies when metacognitive strategies were integrated into the curriculum
(Kuhn, 2000; Mathabathe & Potgieter, 2014; Rickey & Stacy, 2000; Schraw, Crippen, &
Hartley, 2006).
The chemistry learning laboratory is one environment that we hope students are
learning science concepts and skills. Yet there is little research to date that suggests that
students are actually learning chemistry concepts in lab especially in the common
traditional “cookbook” labs that most students experience at the undergraduate level
(Hofstein & Lunetta, 2004). To date there has been significant research to improve the
state of laboratory curriculums by using different instructional strategies that promote
conceptual learning and science skills. Recently developed instructional strategies include
guided-inquiry labs (Science Writing Heuristic) (Greenbowe & Hand, 2005), problem-
based laboratories (Argument-Driven Inquiry) (Walker, Sampson, & Zimmerman, 2011),
3
research-based labs (Kelly & Finlayson, 2007), and cooperative learning environments
(Cooper & Kerns, 2006). These are all methods that have been shown to improve
students’ chemistry knowledge and skills more than traditional labs (Russell & Weaver,
2011).
Research Goals
Further research may elucidate whether these methods of instruction in the lab
provide environments for students to practice metacognitive regulation strategies. There
is research to support that students use metacognitive strategies in cooperative and
inquiry labs (Kipnis & Hofstein, 2008; Sandi-Urena, Cooper, & Stevens, 2012). Our
research sought to first understand how students naturally used metacognitive regulation
strategies while performing experiments in one of the recently developed instructional
environments described above, the Science Writing Heuristic. We explored the types of
regulation strategies that students used to solve open-ended problems and how they
described their strategy use when engaged in a collaborative inquiry environment
(Science Writing Heuristic) in the undergraduate chemistry laboratory.
Qualitative Research Questions
How does the process by which students solve and report on open-ended
laboratory problems reveal use of metacognitive regulation strategies?
Does the type of laboratory instructional environment (SWH vs. Traditional)
that students regularly experience elicit any differences in students’ use of
metacognitive regulation strategies while solving open-ended laboratory
problems?
4
CHAPTER TWO
LITERATURE REVIEW
Constructing Learning Opportunities
The chemistry laboratory in educational settings has long been considered to be
essential for conceptual learning (Berry, Mulhall, Gunstone, & Loughran, 1999; Cooper
& Kerns, 2006; Lloyd, 1992; Poock, Burke, Greenbowe, & Hand, 2007). However, in a
review of the instructional practices, goals and learning outcomes in the chemistry
laboratory over two decades, little evidence was found that the laboratory impacts
students’ learning of chemistry (Hofstein & Lunetta, 2004). Students may learn technical
skills through the rote verification labs, but little to no learning of chemistry concepts
occurs. There is no doubt that technical skills are an essential component of the hands-on
lab experience, but they are not the only goal of laboratory learning. Students in most
traditional verification laboratory classrooms are not provided with an environment in
which problem-solving or critical thinking skills are required, thus, they display a lack of
conceptual learning. If we are to take advantage of the chemistry laboratory as an
essential part of students’ learning of chemistry concepts, then it is important to
understand how people learn. This understanding may help us shape laboratory
instruction that is aligned to the key principles of how people learn(National Research
Council (U.S.), 2000).
5
Students bring preconceptions (prior knowledge) whether right or wrong to any
class. Research supports that when teachers engage the students to discover their current
ideas, students’ misconceptions can be revealed, and instruction can be shaped to address
those misconceptions (Teichert & Stacy, 2002). Therefore, frequent assessment is
essential to ensure that students are resolving their misconceptions and retaining the new
subject matter. Secondly, students learn by seeing patterns of meaningful information and
by chunking information in relationship with big ideas. Using these patterns and chunks,
students build and integrate new information into an organized conceptual framework
that promotes long-term learning and conceptual understanding (Perkins & Salomon,
1989). Subject matter that is taught within a context promotes transfer of knowledge to
new situations and quick retrieval of the information. Teachers must be very
knowledgeable of their subject matter so they can both teach students the material and
help students to successfully integrate this new information into their conceptual
framework. Teachers also can assist students by providing an environment where
learning for understanding, as opposed to mere memorization of facts and or skills, is
promoted. Teacher-centered learning situations such as a lecture where students have no
opportunities for active engagement, may be established with the intention of promoting
learning for understanding, yet students in these learning settings only achieve
memorization of facts provided by the instructor. This misalignment in student learning
and teaching goals may be remedied by incorporating opportunities for student-centered
learning in which students are actively engaged with concepts and can integrate these
concepts into their mental frameworks (Bunce, 2009). Finally, students who have
6
metacognitive strategies can take control of their learning and improve their academic
performance. Within a knowledge-centered and students-centered environment, teachers
can support students’ practice of metacognitive strategies by modeling and integrating
metacognitive strategies into the curriculum(National Research Council (U.S.), 2000;
Schraw, 1998).
Metacognition
Several studies in the STEM disciplines have shown that people with greater use
of metacognition have significantly improved learning and understanding of content
because they are more able to recognize gaps in their knowledge and can better plan and
monitor skill development during the learning and problem-solving process (Kuhn, 2000;
Mathabathe & Potgieter, 2014; Schraw, Crippen, & Hartley, 2006; Veenman, Kok, &
Blöte, 2005). Flavell (1979) was the first to use the term “metacognition” which he
described as cognitive monitoring. Metacognition is the knowledge of and ability to
understand and to self-monitor the cognitive strategies used while learning (Flavell, 1979;
Schraw & Dennison, 1994).
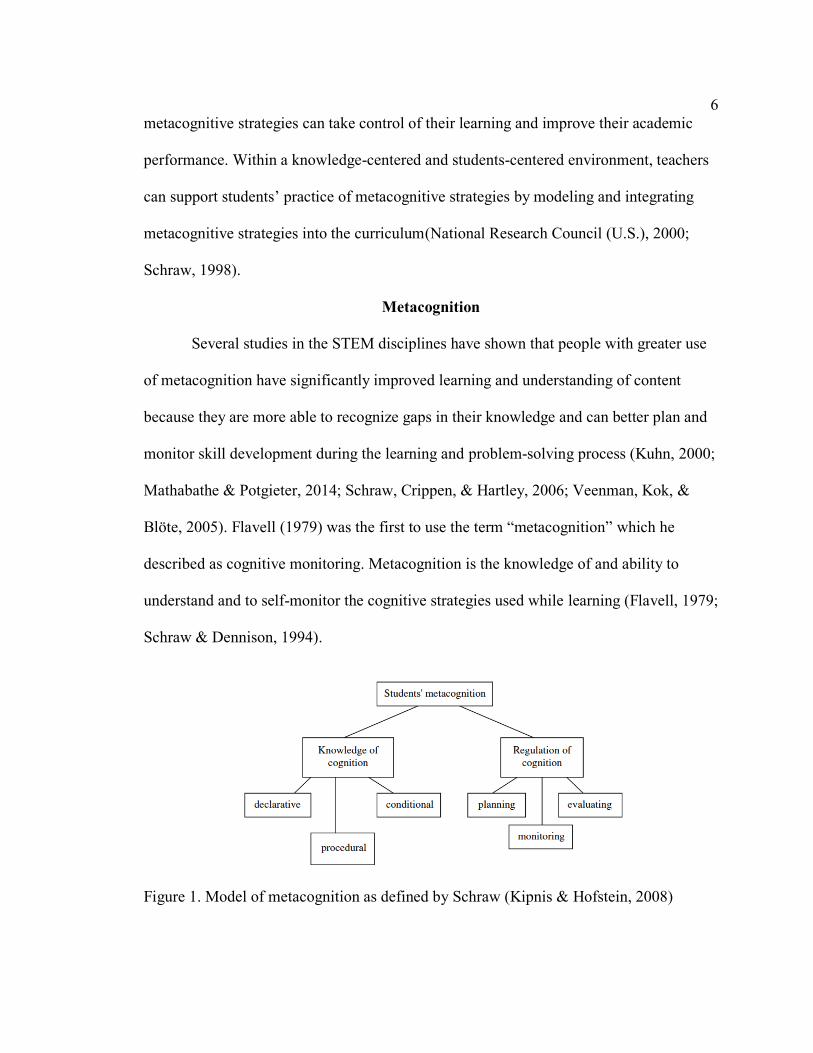
Figure 1. Model of metacognition as defined by Schraw (Kipnis & Hofstein, 2008)
7
It is described as an internal conversation with one’s self about how one is learning. In
general, metacognition consists of two components: knowledge of cognition and
regulation of cognition (Brown, 1987; Georghiades, 2004).
Knowledge of cognition (metacognitive knowledge) has three components: (1)
declarative, which is knowledge about one’s personal learning characteristics; (2)
procedural, which is knowledge about how to perform a task; and (3) conditional
knowledge, which is knowledge about when and why to select strategies to perform a
task (Schraw & Moshman, 1995). An example of a task that requires metacognitive
knowledge is students working to solve an open-ended lab problem. In a laboratory
course, students are provided with a scenario in which they are asked to determine the
concentration of a metal ion in rainwater. First, they might recognize what knowledge
they have or lack to solve the problem. The students may have had previous experience
or knowledge in metal ion analysis and know to use a calibration curve of known
concentrations of the metal ion with spectrophotometry to plan their procedure. During
the data analysis, they might recognize that in order to properly analyze data, they should
graph the relationship between the absorbance and concentration of the metal ion to
determine a linear equation to calculate the unknown ion concentration.
The second branch of metacognitive thought and the focus of this research is
regulation of cognition (metacognitive skillfulness). It is a skill set including the
planning, monitoring and evaluating of cognitive strategies that allows students to control
and monitor their learning to complete a task. Planning is the step in which students think
about how they will accomplish a task, what relevant previous knowledge they may have,
8
and what gaps in their knowledge may exist (Brown, 1987). Students’ abilities to plan
may affect their performance on a task (Pintrich & De Groot, 1990). For example, when
preparing to run an experiment to determine the freezing point depression of a solution, a
student who does not consider the goals of the experiment and techniques used in lab
may not acquire enough temperature data to adequately calculate the freezing point
depression. When monitoring, students self-assess their knowledge about the task as well
as the strategies they use to perform the task. In running a lab, for example, students may
ask themselves questions and compare results with a partner to ensure that their data
make sense. Finally, evaluating is the step in which students reflect on the strategies and
goals they used to complete the task and whether they could have used different strategies
to better complete the task. During this step, for example, students may reflect on their
procedure for completing an experiment. They might think about what they learned and
how they could improve their procedure to take more accurate and precise data if they
performed the lab again.
Metacognitive knowledge and regulation strategies are innate in humans and
essentially intertwined. Metacognitive knowledge is late developing in humans, but once
it is developed, it is stable and people are able to reflect on and discuss this knowledge
(Brown, 1987). Regulation strategies, unlike metacognitive knowledge, develop earlier,
but may not be stable nor may not be recognized by the people using the strategies
(Brown, 1987). As children, metacognitive processes increase naturally to a degree, such
as knowledge about one’s memory abilities (Garner & Alexander, 1989). However, when
moving into adolescence, people will develop further metacognition only if it becomes
9
necessary to do so. For example, adolescent students may be able use certain cognitive
strategies such as asking questions about a problem in order to learn more information
while still lacking the ability to monitor that they are actually learning the new
information unless the learning environment requires in some way that they do so.
Research supports that as students enter adolescence they need to be taught how to
recognize their memory capabilities and how to monitor their learning to become better
problem solvers (Veenman, Elshout, & Meijer, 1997). Often students are not explicitly
taught these strategies, which means that they may not recognize these processes even
exist. Teaching students that they can know about and regulate their learning by
providing an environment that encourages them to do so can be helpful in moving
students from thinking like novices to thinking more like experts (Sternberg, 1998).
Experts exhibit high levels of metacognitive knowledge and skill use when
compared to novices because they have well-organized mental frameworks that recognize
when their current level of understanding is insufficient and what they need to do to close
that gap in understanding (Chi, Feltovich, & Glaser, 1981; Sternberg, 1998). Through
metacognition, experts are also better able to transfer strategies and knowledge to new
learning situations (Palinscar & Brown, 1984; Scardamalia & Bereiter, 1994). The
development of metacognitive strategies by learners is essential to their learning because
it leads to greater independence and self-regulation of learning, which in turn builds a
foundation for efficient and lifelong learning (Veenman et al., 2005). Metacognitive
strategies are considered by some to be mostly domain (topic) specific (White &
Frederiksen, 1998) although others contend that they are general strategies that can be
10
used across many domains (Schraw, 1998). Although one may be knowledgeable of
one’s metacognitive knowledge and skillfulness and can apply these skills in various
domains, it is likely that different forms of metacognitive strategies are necessary when
solving a chemistry problem or reviewing a book for a literature class. The type of
context or environment, such as learning in an online environment, a lecture or a
research-based lab may also affect the types of metacognitive strategies students use.
Continued research on how metacognitive strategies are learned and used in specific
learning environments is necessary.
Supporting Metacognitive Strategy Use in the General Chemistry Laboratory
Several studies have identified that chemistry students lack metacognitive use and
awareness in laboratory classrooms (Georghiades, 2004; Haidar & Al Naqabi, 2008;
Rickey & Stacy, 2000). However, other studies show that providing an environment in
which metacognitive strategy use is supported improves metacognitive strategy use and
awareness in chemistry students (Case, Gunstone, & Lewis, 2001; Kipnis & Hofstein,
2008; Sandi-Urena S., Cooper M.M., & Stevens R.H., 2011; Sandi-Urena, Cooper, &
Stevens, 2012; White & Frederiksen, 1998). These studies have identified characteristics
of instruction that support metacognitive strategy use. They include: (1) reflective
prompting, (2) a supportive social environment and (3) inquiry-based approaches to
instruction.
Reflective Prompting
Lin (2001) provides two frameworks for promoting metacognitive strategy use in
students: strategy training and social environment. Reflective prompting, a type of
11
strategy training, by the teacher or the structuring of lab activity is a common way to
encourage students to self-assess their knowledge and learning. One research study
assessed students’ learning through activity and self-monitoring prompts. Secondary
school students performed week-long science projects where they collected data from the
internet in an online environment called the Knowledge Integration Environment. The
environment was designed to encourage deep understanding of concepts as opposed to
compiling scientific facts. The study found that using self-monitoring reflective prompts
(“To do a good job critiquing, we need to…?”) promoted students’ integration of
knowledge into science projects more than activity prompts (“Claim 1 should say…”).
When explaining a concept, the students who received reflective prompts compared to
activity prompts made more connections to outside knowledge in addition to general
science principles learned in class (Davis & Linn, 2000). Davis (2003) also found that
students understood such concepts as thermal equilibrium significantly more if they were
provided with generic reflective prompts (“What are you thinking right now?”) compared
to specific reflective prompts (“ To do a good job critiquing, we need to…?”) before and
after the activity they performed. Students can monitor and integrate knowledge more
effectively with properly timed and directed reflective prompts (Bielaczyc, Pirolli, &
Brown, 1995; Davis, 2003; Ge & Land, 2003; Lin & Lehman, 1999).
Another form of strategy training is informed training where students learn to use
metacognitive strategies. Students are not only provided with strategies, but they also
learn how these strategies might be useful to their learning. When students were provided
with metacognitive prompts and discussed the relationship between the metacognitive
12
prompts and their learning, it helped them better understand why they were using the
strategies (Bielaczyc et al., 1995). One study in math instruction found that students who
were provided explicit self-addressed prompts in all problem-solving activities in an a
program called IMPROVE not only outperformed their fellow students who did not
receive these self-addressed prompts, but also reported using more metacognitive
regulation strategies (Mevarech 2008). Providing students with instances to reflect and
understand the benefits of metacognitive strategies may assist them in learning to ask
themselves questions to monitor and evaluate their learning.
Collaborative Learning
In the second framework, a social environment where students feel that they can
acknowledge what they don’t know, play a useful role for their peers, and personally
reflect on their work supports metacognitive strategy use (Lin, 2001). In a learning
environment, this can be described as cooperative learning in which students actively
participate in the learning process through peer interactions. There are five essential
characteristics of cooperative learning that promote learning: (1) common goal among
students within the group, (2) accountability of each individual to the group, (3) support
system to build social skills, (4) communication-skill learning for all group members, and
(5) evaluation of the group’s learning and processes (Johnson & Johnson, 1999).
Research supports that students in these types of environments demonstrate stronger
content knowledge (Hein, 2012) and better problem-solving skills (Ge & Land, 2003;
Sandi-Urena et al., 2012) than students in passive learning environments. Sandi-Urena et
al., (2011) found that the instructional interventions that included peer interactions and
13
reflective prompting improved metacognitive awareness and, in turn, improved problem-
solving ability and conceptual understanding. In labs that were instructed using the
Science Writing Heuristic (SWH) (Rudd, Greenbowe, Hand, & Legg, 2001), an inquiry-
based instructional approach, students had the opportunity to collaborate to share
knowledge and to use skills to better understand the content. Proper implementation of
SWH labs has shown significant improvement in students’ chemical knowledge
understanding (Akkus, Gunel, & Hand, 2007; Greenbowe, Rudd, & Hand, 2007; Kingir,
Geban, & Gunel, 2012) and critical thinking skills (Gupta, Burke, Mehta, & Greenbowe,
2014).
In collaborative learning situations, students use their peers to regulate learning
processes and construct knowledge. Collaborative learning is a valuable learning process;
however, it is essential that students take an individual active part in their learning
(Hodson & Hodson, 1998). Regulation strategies may be part of the social learning
processes that students experience while collaborating. While developing individually as
chemistry learners, students may internalize these strategies they used with their peers to
strengthen their own learning processes (Kuhn, 2000).
Inquiry-Based Pedagogy
Inquiry labs engage students more than “verification” style labs, and students
demonstrate greater conceptual understanding of subject matter and improved scientific
reasoning abilities in inquiry-based learning environments (Cacciatore & Sevian, 2006;
Hofstein & Lunetta, 2004; Rudd et al., 2001; Russell & Weaver, 2011; Sampson,
Grooms, & Walker, 2011). Inquiry is an effective approach to learning because it is a
14
process where active learning by the students is emphasized to achieve content
understanding through scientific skills and critical thinking (National Research Council
(U.S.), 2000). An inquiry environment is student-centered, which means that a classroom
or laboratory is more discussion or activity-oriented rather than centered upon lecture or
the sort of laboratory class where students follow predetermined, step-by-step
instructions to verify concepts presented in lecture. Knowledge creation and concept
learning is not likely to occur in these passive learning settings because students are not
actively engaged in learning (Hofstein & Lunetta, 2004; Rickey & Stacy, 2000).
An approach called the learning cycle demonstrates the active learning process
where students construct new knowledge based on previous knowledge and experience
(Lawson & National Association for Research in Science Teaching., 1989). First,
students explore a concept by assimilating the information from the environment around
them. This is followed by concept invention where students make sense of the concept
based on what they already know. Finally in concept application, students integrate and
organize the new concept into their pre-existing knowledge and mental structure
(Abraham, 2011). Iterations of this learning cycle provide students with multiple
opportunities to deepen their understanding.
An example of the learning cycle in the laboratory might be when students are
asked to confirm that identify of their product as carbon dioxide from the reaction of
calcium hydroxide and hydrochloric acid. Students may use the information from the
prompt as well as equipment in the lab and information they find in their textbook,
internet resources and their peers to explore the concept. Then students may move onto
15
making sense of the concept of confirming a product through previous knowledge about
the properties of carbon dioxide or experience with similar experiments to come up with
confirmation tests. Once students have acquired results that confirm or disconfirm their
product of carbon dioxide, they will likely integrate the knowledge they gained from
experiment into their mental framework. The new information gained might be organized
into different parts of their frameworks about identifying gases, or confirmation testing.
Through more trials of the experiment, peer discussion, or writing a report, students have
the opportunity to go through more iterations of the learning cycle to integrate the
information about confirming the identity of a reaction product.
Inquiry-based practices provide opportunities for students to build knowledge by
asking questions and determining what data needs to be collected as well as by learning
how it is collected rather than being told the information and confirming a stated idea.
Students might use skills such as observing, predicting, collecting and analyzing data,
and formulating conclusions to learn a new concept (Leonard & Penick, 2009). By
practicing such skills, students are likely to use metacognitive processes because they
have to plan, monitor, and evaluate their skills to make sure that they draw sound
conclusions from the data.
Several chemistry education studies support the idea that inquiry-based
instruction improves students’ use of metacognitive strategies (Haidar & Al Naqabi,
2008; Kipnis & Hofstein, 2008; Rickey & Stacy, 2000; Sandi-Urena S. et al., 2011;
Sandi-Urena et al., 2012). Kipnis and Hofstein (2008) investigated metacognitive use and
awareness in the laboratory while conducting open inquiry-based experiments. Their
16
results supported that inquiry experiments provided opportunities for students to use their
metacognitive strategies and knowledge. Inquiry labs provide a strong base for
supporting metacognitive strategies because of their structure and the guidance by the
instructor, who assists students in using metacognitive strategies by asking questions as
well as by guiding and promoting peer interactions.
Instructional Strategies for Metacognitive Strategy Practice
These results emphasize the importance not only of metacognition for learning
chemistry concepts but also of providing an environment in which students can practice
metacognitive regulation strategies. It is proposed that if teachers want their students to
better understand chemistry, it is necessary to teach them metacognitive strategies
(Rickey & Stacy, 2000). In recent years, research has provided several instructional
strategies for laboratory environments that are inquiry-based, collaborative and reflective
experiences for students. Several of these instructional strategies --, the MORE Thinking
Frame, Argument Driven Inquiry (ADI), and Science Writing Heuristic (SWH) -- claim
to promote metacognitive strategy use (Hand, Hohenshell, & Prain, 2004; Tien, Teichert,
& Rickey, 2007; Walker, Sampson, & Zimmerman, 2011). The MORE Thinking Frame
prompts students to think more like scientists in the laboratory through a process of
reflection on their own ideas in order to understand experimental evidence. Students in
this environment (1) Model (2) Observe (3) Reflect and (4) Explain during their
laboratory experiments. This framework likely affords them opportunities to practice
some metacognitive strategies. Argument Driven Inquiry sets up students to determine
their own procedure, gather their own data and form an argument. The essential pieces to
17
ADI are the stage in which students establish an argument to support their claim with
their experimental evidence and the stage in which they have the chance to peer review
one another’s work. Therefore, ADI also affords students opportunities to practice
metacognitive strategies. The SWH is described in detail below because it was the
instructional strategy examined in this study with respect to students’ use of
metacognitive strategies during their laboratory experience.
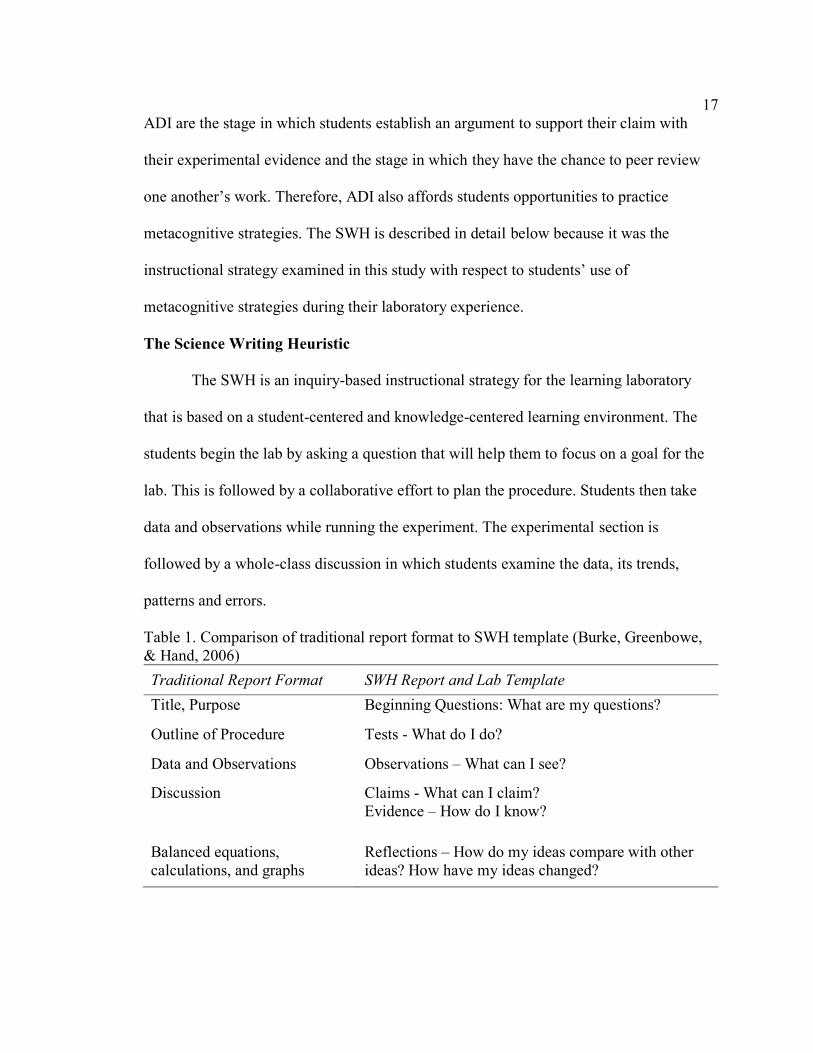
The Science Writing Heuristic
The SWH is an inquiry-based instructional strategy for the learning laboratory
that is based on a student-centered and knowledge-centered learning environment. The
students begin the lab by asking a question that will help them to focus on a goal for the
lab. This is followed by a collaborative effort to plan the procedure. Students then take
data and observations while running the experiment. The experimental section is
followed by a whole-class discussion in which students examine the data, its trends,
patterns and errors.
Table 1. Comparison of traditional report format to SWH template (Burke, Greenbowe,
& Hand, 2006)
Traditional Report Format SWH Report and Lab Template
Title, Purpose Beginning Questions: What are my questions?
Outline of Procedure Tests - What do I do?
Data and Observations Observations – What can I see?
Discussion Claims - What can I claim?
Evidence – How do I know?
Balanced equations,
calculations, and graphs
Reflections – How do my ideas compare with other
ideas? How have my ideas changed?
18
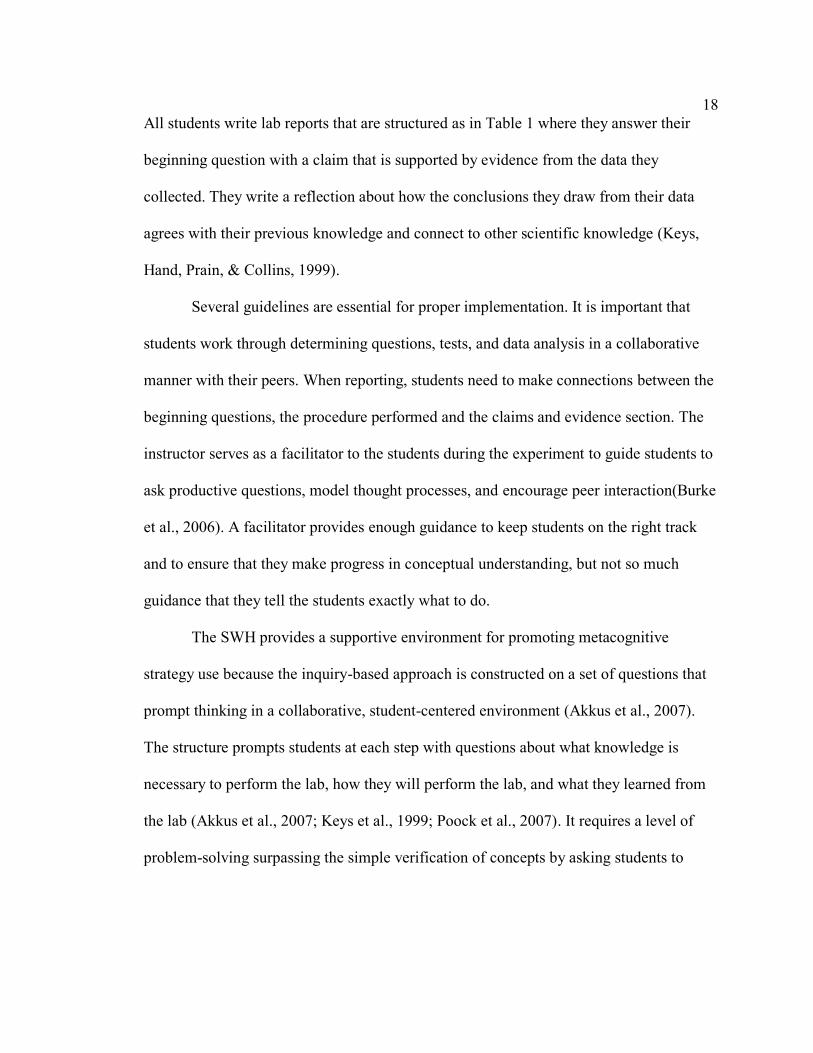
All students write lab reports that are structured as in Table 1 where they answer their
beginning question with a claim that is supported by evidence from the data they
collected. They write a reflection about how the conclusions they draw from their data
agrees with their previous knowledge and connect to other scientific knowledge (Keys,
Hand, Prain, & Collins, 1999).
Several guidelines are essential for proper implementation. It is important that
students work through determining questions, tests, and data analysis in a collaborative
manner with their peers. When reporting, students need to make connections between the
beginning questions, the procedure performed and the claims and evidence section. The
instructor serves as a facilitator to the students during the experiment to guide students to
ask productive questions, model thought processes, and encourage peer interaction(Burke
et al., 2006). A facilitator provides enough guidance to keep students on the right track
and to ensure that they make progress in conceptual understanding, but not so much
guidance that they tell the students exactly what to do.
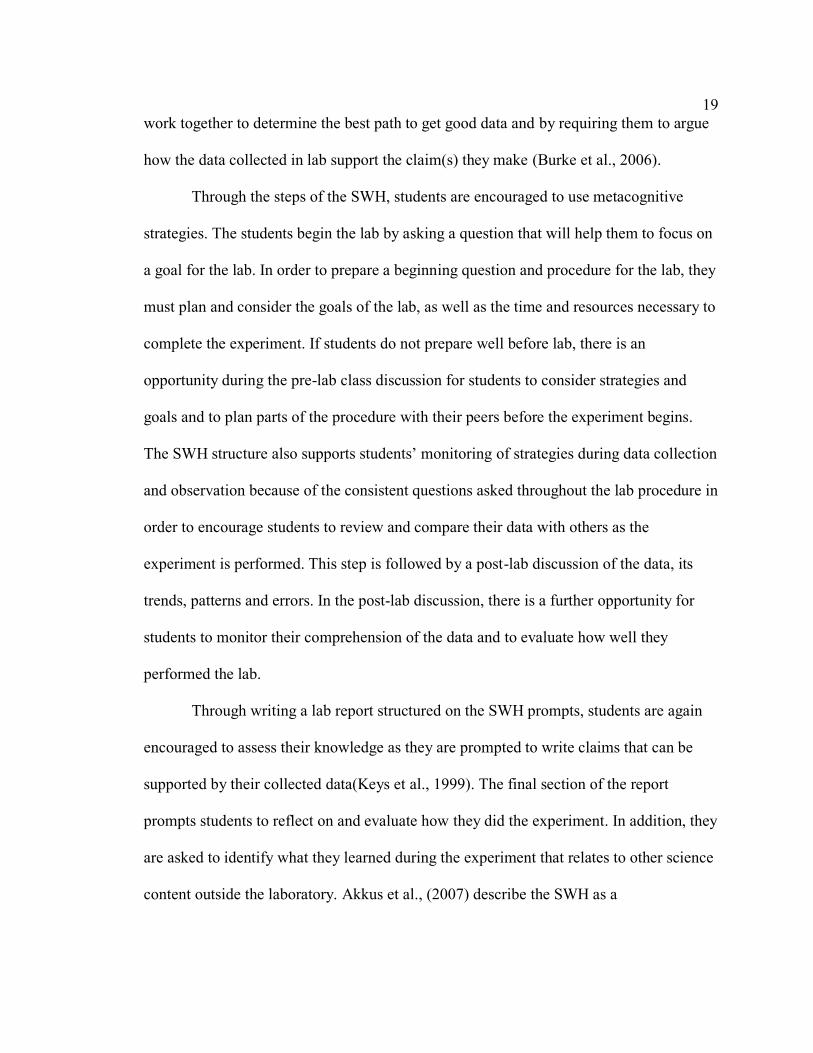
The SWH provides a supportive environment for promoting metacognitive
strategy use because the inquiry-based approach is constructed on a set of questions that
prompt thinking in a collaborative, student-centered environment (Akkus et al., 2007).
The structure prompts students at each step with questions about what knowledge is
necessary to perform the lab, how they will perform the lab, and what they learned from
the lab (Akkus et al., 2007; Keys et al., 1999; Poock et al., 2007). It requires a level of
problem-solving surpassing the simple verification of concepts by asking students to
19
work together to determine the best path to get good data and by requiring them to argue
how the data collected in lab support the claim(s) they make (Burke et al., 2006).
Through the steps of the SWH, students are encouraged to use metacognitive
strategies. The students begin the lab by asking a question that will help them to focus on
a goal for the lab. In order to prepare a beginning question and procedure for the lab, they
must plan and consider the goals of the lab, as well as the time and resources necessary to
complete the experiment. If students do not prepare well before lab, there is an
opportunity during the pre-lab class discussion for students to consider strategies and
goals and to plan parts of the procedure with their peers before the experiment begins.
The SWH structure also supports students’ monitoring of strategies during data collection
and observation because of the consistent questions asked throughout the lab procedure in
order to encourage students to review and compare their data with others as the
experiment is performed. This step is followed by a post-lab discussion of the data, its
trends, patterns and errors. In the post-lab discussion, there is a further opportunity for
students to monitor their comprehension of the data and to evaluate how well they
performed the lab.
Through writing a lab report structured on the SWH prompts, students are again
encouraged to assess their knowledge as they are prompted to write claims that can be
supported by their collected data(Keys et al., 1999). The final section of the report
prompts students to reflect on and evaluate how they did the experiment. In addition, they
are asked to identify what they learned during the experiment that relates to other science
content outside the laboratory. Akkus et al., (2007) describe the SWH as a
20
“metacognitive support” that “prompts student reasoning about data.” The SWH affords
students opportunities to use metacognitive strategies through the inquiry nature of lab,
the supportive social environment and consistent reflective prompts during lab and report
writing. The SWH provides metacognitive strategy practice for students in each
experiment which supports the repetition necessary for students to build heuristics into
their learning processes as experts do (National Research Council (U.S.), 2000).
A Need for Metacognitive Strategy Practice to Solve Open-Ended Problems
Guided instructional labs may allow transfer of skills to more unstructured
situations. Kapa (2007) found that students who were provided metacognitive support
mechanisms (MSM) were better able to transfer ability from structured problems to open-
ended problems in a computerized math environment. Open-ended problems are ill-
structured problems in that they may have a vague goal and multiple solutions or paths to
a solution (Jonassen, 1997). In comparison to traditional lab procedures and guided-
inquiry labs, open-ended problems are almost completely student-centered. Open-ended
problems provide an initial prompt, but students are not only required to come up with
their own procedure, but they must also form their own argument from their data and use
outside resources to support their argument. The results are left open to the students but
are known to the instructor (Domin, 1999). A guided-inquiry lab such as the SWH
provides some or all of the procedure, and students are guided how to formulate claims
and evidence in order to set up an arguments. Open-ended problems can provide students
with opportunities not often found in traditional lab instruction for creativity, data
ownership, and problem-solving (Domin, 1999).
21
Metacognitive regulation strategies help a student to solve open-ended problems,
and research shows that one’s ability to solve this type of ill-structured problem is
affected by one’s metacognitive processes (Ge & Land, 2003). Students require greater
use of metacognitive strategies to solve open-ended problems as compared to completion
of a structured problem (or traditional experiment) (Jonassen, 1997; Shin, Jonassen, &
McGee, 2003). In astronomy, Shin et al., (2003) found that students’ ill-structured
problem-solving skills could be predicted by domain knowledge, justification skills,
science attitudes and planning and monitoring metacognitive regulation strategies.
Students who were provided with reflective prompts to justify their reasoning were better
able to solve ill-structured problems in computer simulated biology experiments than
students who received prompts to justify based on rules, emotions or no prompt (Lin &
Lehman, 1999). Because many students lack sufficient metacognitive regulation
strategies to solve these types of problems, integrating practice of metacognitive
strategies into the laboratory environment may be beneficial to students when solving
unstructured problems.
Writing and Metacognitive Strategy Use
A critical component to most instructional environments that is likely to support
metacognitive strategy practice is writing. In the SWH, it is not only the laboratory
experience that provides students a learning experience, but also the time they spend
writing the report in which they form an argument that supports their experimental data.
The SWH is founded on the theory of writing-to-learn where students learn through the
discussion with peers about the scientific language they will use to write (Hohenshell &
22
Hand, 2006). Writing affords students opportunities for deeper thinking, making
connections between their previous knowledge and the new knowledge they are learning,
and seeing the possible gaps in their current knowledge (Emig, 1977; Wallace, Hand, &
Prain, 2004). The SWH report was built on the model of writing called the knowledge-
transforming framework. This model views writing as problem solving. Students learn to
connect the data from the experiment as evidence to the claims they make through
writing. By writing, students reflect on the meaning of the data and they communicate
that meaning to an audience through rhetoric (Bereiter & Scardamalia, 1987). In this way,
writing can promote conceptual understanding (Wallace et al., 2004). A meta-analysis of
six studies that each looked at the relationship of the use of SWH as a learning tool to
gains in conceptual understanding showed significant gains in conceptual understanding
for students who wrote reports using the SWH as compared to students who used
traditional writing strategies including writing chapter summaries or traditional lab
reports (table 1) or answering post-lab questions (Gunel, Hand, & Prain, 2007).
Writing can also promote metacognitive thought. Metacognitive thought is not
only an end goal, but it is also part of the writing process. For example, setting goals
before and during writing assisted students’ construction of scientific explanations(Klein,
2004). Wallace, Hand and Prain (2004) suggest that students must learn metacognitive
strategies to get the most out of writing. Although, writing can initiate metacognitive
thought, it does not always do so. One research study found that students who were asked
to describe their process of writing short essays in a biology class used very few
metacognitive strategies while writing. It was clear that just writing does not mean
23
students use metacognitive strategies or have awareness. This suggests that we may need
to be explicit in teaching students about their metacognitive capabilities (Armstrong,
Wallace, & Chang, 2008). McCrindle and Christensen (1995) asked some students to
write journal entries to reflect on their process of writing and what they learned. They
found that students who reflected using the journals while writing scientific reports used
more metacognitive strategies than students who wrote a traditional report, even though
both groups, when asked, believed that metacognitive strategies were important to use
while writing. Writing as a learning process is linked to metacognitive thought. This
relationship can shape students’ laboratory experience and affect what they do because of
that experience.
Summary
To provide students with an environment that supports their conceptual learning,
an understanding of how people best learn must be gained. People who have greater
metacognitive skill are better able to know what they don’t know, and manage their
learning. Recent guidelines from the Disciplined Based Education Research community
describe the importance of metacognitive strategies in science learning and recommend
that metacognitive strategies be integrated into the learning laboratory(National Research
Council (U.S.), 2012). Research supports that a laboratory environment with properly
timed and directed reflective prompts, collaborative learning, and inquiry-based
pedagogy is likely to support the practice of metacognitive regulation strategies. The
SWH as an instructional strategy and report-writing template is framed by these three

24
essential components and may afford students the opportunity to practice metacognitive
regulation strategies during weekly laboratory instruction.
25
CHAPTER THREE
EXPERIMENTAL DESIGN
Methods
This research study used a mixed methods experimental design to answer the
following research questions:
How does the process by which students solve and report on open-ended
laboratory problems reveal use of metacognitive regulation strategies?
Does the type of laboratory instructional environment (SWH vs. Traditional) that
students regularly experience elicit any differences in students’ use of
metacognitive regulation strategies while solving open-ended laboratory
problems?
The primary method of data collection was qualitative while quantitative data were
collected to triangulate results obtained in the study (Creswell, 2009). Qualitative
methods were chosen because the research goals were to understand how and when
students used metacognitive strategies in the chemistry laboratory as well to explore any
differences between students in a collaborative, reflective and inquiry-based instructional
environment (SWH) and a traditional “cookbook” lab environment. To gain insight into
this phenomenon, quantitative surveys or exams would not adequately provide students’
descriptions and perceptions of this experience in the lab. The methods are supported by
basic qualitative research protocols. Merriam (2009) describes this type of research as
26
focusing on the meaning, understanding, or process of the studied phenomenon, and how
the participants might perceive it.
The following chapter describes the methods for obtaining participants, and the
instructional environments. These descriptions are followed by the data collected:
surveys, exams, and students’ words and thoughts through interviews. Finally, the data
analysis process for the assessments and interview data are fully described.
Participants
Students from a declared chemistry majors course at a private, research university
were asked to participate in the semester long study (The Carnegie Foundation for the
Advancement of Teaching, 2010). The chemistry majors course was chosen as the site of
the study because it limited the type of students to all chemistry and biochemistry majors.
The students all took the same lecture course that was aligned with the lab content. Most
students also took the same general chemistry course in the previous semester. These
boundaries helped to reduce variability in the participant population. It was necessary to
reduce variability so that that the results on metacognitive strategies could be compared
between students. Following IRB protocol, all students who volunteered to participate in
the study signed a consent form (see Appendix A). To protect students’ identities, all
students’ names were converted to codes and pseudonyms by which they were identified
in data results. The population in the course in spring 2012 and 2013 was 114 students.
Of the 114 students, a total of 62 students consented to participate. Thirty-five students in
the non-SWH group received a traditional laboratory instruction (Spring 2012) and 27
students received laboratory instruction with the SWH (Spring 2013). The majority of the
27
students (86% of non-SWH group and 92% of SWH group) were first year undergraduate
students at the university. In the non-SWH group, 49% of the students were female, and
in the SWH group, 48% were female. Participants from both non-SWH and SWH groups
took each exam and survey.
Instructional Environment
In the spring of 2012, students in the non-SWH group experienced a traditional
instructional strategy in their weekly laboratory meetings. Students were provided with a
published laboratory manual of experiments (Nelson, Kemp, & Stoltzfus, 2011) that
contained step-by-step procedures. They performed experiments with a lab partner.
Students individually filled out report sheets in their lab manuals with the data obtained
from lab and answered pre- and post-laboratory questions. In this laboratory format,
students followed a preset procedure to verify a concept or outcome that they learned in
lecture.
In the spring of 2013, students were instructed using the SWH (Burke &
Greenbowe, 2012). Each weekly lab session began with a student discussion about
testable questions to be investigated during the experiment. The teaching assistants (TAs)
guided the discussion with prompts when students were not sure how to proceed with
beginning questions or procedures. After reviewing necessary protocols, students worked
in groups of three or four and as a whole class to determine how the data would be
collected. They ran their experiments while TAs monitored student progress by asking
guiding questions when needed and encouraging peer discussion about the data being
collected. The lab ended with a student-led discussion to compare data results and discuss
28
trends or patterns evident in the data. The TAs guided the discussion when it was not
productive. Each student wrote a lab report using the SWH format (Chapter 2, Table 1).
The SWH as the instructional environment was used instead of ADI or the MORE
thinking framework for several reasons. The SWH is a well-established instructional
strategy that has been used for over a decade not only at the undergraduate level, but also
in secondary level schools. There is a large volume of literature available that describes
effects of the instruction on student’s learning, conceptual understanding and writing
abilities. In addition to the research literature available, there are several articles and
handouts that explain how to properly implement the instructional strategy. Lab manuals
with SWH experiments are also available for use.
The topics for the experiments covered qualitative analysis, acid base reactions,
kinetics, solubility, and equilibrium. The experimental procedures were similar and
sometimes identical for both groups. Several of the verification lab procedures were re-
written by the researcher as SWH experimental procedures. An example of an SWH lab
procedure is found in appendix B. Other SWH experiments obtained through Burke and
Greenbowe (2012) were matched to topics of the verification lab procedures.
Inclusion of metacognitive strategies in the SWH environment. In the SWH
students’ lab manual, a two-page explanation of metacognitive strategies (see appendix
C), their relationship to the SWH, and how they might be useful while the student was in
lab was included. The SWH students received a short presentation at the beginning of the
semester on metacognitive strategies and the relationship to the SWH and were reminded
half way through the semester about metacognitive strategies. These presentations
showed students how metacognitive strategies might be supported by their lab
29
experience. The sessions were not explicit that students were required to use these
strategies, but rather provide students with information about the strategies. Identification
and discussion of metacognitive strategies with students might help them better
understand why they are using the strategies and how these strategies may benefit their
learning (Bielaczyc, Pirolli, & Brown, 1995).
Open-Ended Laboratory Problems
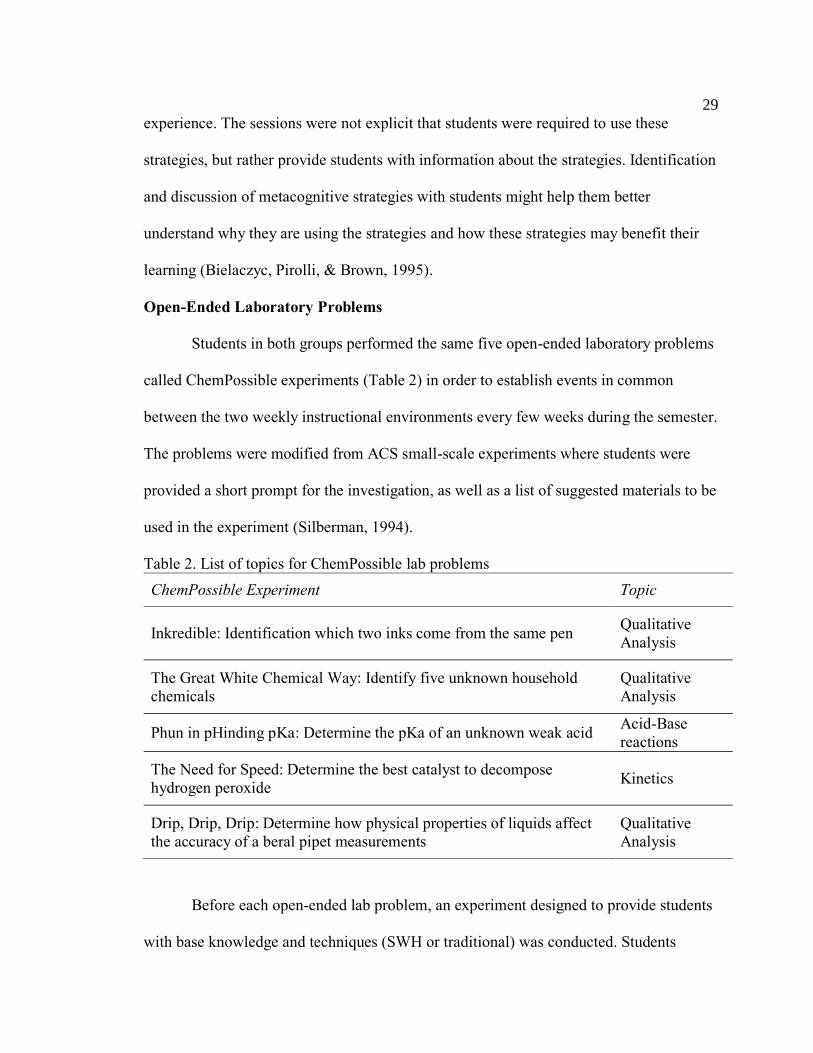
Students in both groups performed the same five open-ended laboratory problems
called ChemPossible experiments (Table 2) in order to establish events in common
between the two weekly instructional environments every few weeks during the semester.
The problems were modified from ACS small-scale experiments where students were
provided a short prompt for the investigation, as well as a list of suggested materials to be
used in the experiment (Silberman, 1994).
Table 2. List of topics for ChemPossible lab problems
ChemPossible Experiment Topic
Inkredible: Identification which two inks come from the same pen Qualitative
Analysis
The Great White Chemical Way: Identify five unknown household
chemicals
Qualitative
Analysis
Phun in pHinding pKa: Determine the pKa of an unknown weak acid Acid-Base
reactions
The Need for Speed: Determine the best catalyst to decompose
hydrogen peroxide Kinetics
Drip, Drip, Drip: Determine how physical properties of liquids affect
the accuracy of a beral pipet measurements
Qualitative
Analysis
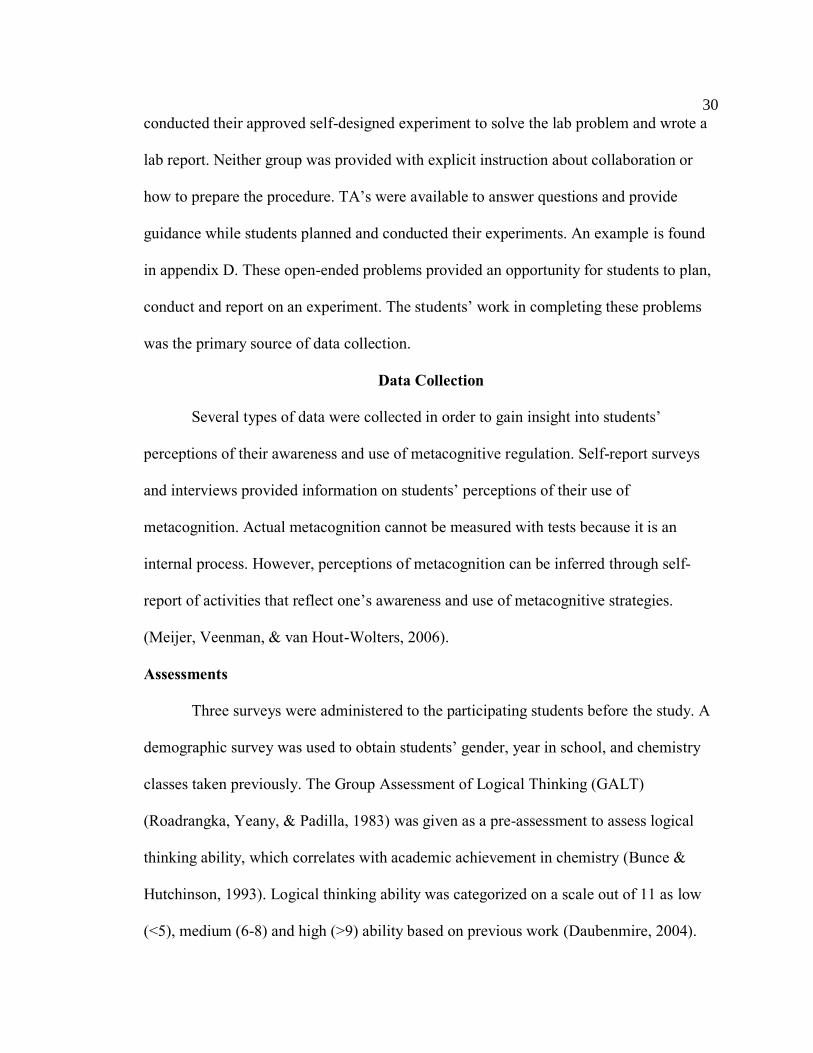
Before each open-ended lab problem, an experiment designed to provide students
with base knowledge and techniques (SWH or traditional) was conducted. Students
30
conducted their approved self-designed experiment to solve the lab problem and wrote a
lab report. Neither group was provided with explicit instruction about collaboration or
how to prepare the procedure. TA’s were available to answer questions and provide
guidance while students planned and conducted their experiments. An example is found
in appendix D. These open-ended problems provided an opportunity for students to plan,
conduct and report on an experiment. The students’ work in completing these problems
was the primary source of data collection.
Data Collection
Several types of data were collected in order to gain insight into students’
perceptions of their awareness and use of metacognitive regulation. Self-report surveys
and interviews provided information on students’ perceptions of their use of
metacognition. Actual metacognition cannot be measured with tests because it is an
internal process. However, perceptions of metacognition can be inferred through self-
report of activities that reflect one’s awareness and use of metacognitive strategies.
(Meijer, Veenman, & van Hout-Wolters, 2006).
Assessments
Three surveys were administered to the participating students before the study. A
demographic survey was used to obtain students’ gender, year in school, and chemistry
classes taken previously. The Group Assessment of Logical Thinking (GALT)
(Roadrangka, Yeany, & Padilla, 1983) was given as a pre-assessment to assess logical
thinking ability, which correlates with academic achievement in chemistry (Bunce &
Hutchinson, 1993). Logical thinking ability was categorized on a scale out of 11 as low
(<5), medium (6-8) and high (>9) ability based on previous work (Daubenmire, 2004).
31
The Metacognitive Activities Inventory (MCAI) was administered as a baseline for self-
report of habitual metacognitive strategy use during problem-solving (Cooper & Sandi-
Urena, 2009). It was also given as a post-survey at the end of the semester to measure any
changes over the semester. The MCAI was designed specifically for use in the chemistry
classroom or laboratory for problem-solving. The Confidence in Chemistry (CIC) was
given as a pre- and post-survey to measure a student’s confidence in completing the
chemistry course (The LEAD Center, 1996). See appendix E for MCAI and CIC. In order
to assess students’ content knowledge in general chemistry, standardized exams were
given. The ACS First and Second Term General Chemistry Paired Questions exams were
chosen based their use in a previous study on the implementation of SWH. ACS content
exams were used to determine if SWH had an effect on conceptual understanding in
lecture (Greenbowe & Hand, 2005). The first term ACS exam was given at the beginning
of the course as a baseline measure to assess students’ first semester chemistry content
knowledge (ACS Exams Institute, 2005). This type of exam pairs algorithmic and
conceptual questions for each of the topics on the exam (ACS Exams Institute, 2005). To
measure content knowledge at the end of the second semester, the similarly structured
ACS Second Term General Chemistry Paired Questions Exam was administered (ACS
Exams Institute, 2007). The ACS exam scores were converted to normed percentiles
(ACS Examinations Institute, 2013) for comparison between the two exams.
Interviews
Interviews were chosen as the main source of data because it afforded access to
students’ perceptions and descriptions of their metacognitive strategy use. Interviews
have been used in previous research to study students’ description of their metacognitive
32
strategies (McCrindle & Christensen, 1995). Nine students from the non-SWH group and
ten students from the SWH group were interviewed twice during each 15-week spring
semester by the primary researcher. The students were chosen using a stratified, random
sampling based on the GALT scores. At least three students were randomly chosen from
each GALT category. Because the GALT generally correlates with academic
achievement, this sampling would provide perspectives of participants at all levels of
academic achievement. The interview protocol was semi-structured, which provided a
pre-determined set of structured and open-ended questions but allowed for opportunities
for the interviewer to ask for clarification or further information in follow-up questions
(Herrington & Daubenmire, in press). An open-ended question such as “How do you
think you are learning in lab?” provided an opportunity for the student to talk about any
number of factors that they used to learn in the lab. A structured question such as “How
much time do you set aside to prepare for lab?” provided a direct response about the
amount of time students spent planning for the lab, but it still allowed students to answer
in greater depth about lab preparation if they wanted to.
Interview questions were built around the constructs of metacognitive regulation
strategies and learning perceptions. The main goal of the interviews was to have students
explain the steps and strategies they used to plan, conduct, and report on their open-ended
lab problem. In addition to students’ descriptions of how they solved open-ended lab
problems, the protocols allowed students to describe their experience in lab, their
perceptions of their learning, and their reflections about their strategies for problem-
solving changed throughout the semester. The first interview was four weeks into the
semester, after students had performed two weekly labs and two open-ended lab
33
problems. Students were asked about how they learned in lab as well as the steps and
strategies they used to perform the lab problems and write the lab reports. The second
interview occurred one to two weeks before the end of the semester. These interviews
focused on how students perceived their progress over the semester as well as how
conducting the open-ended experiments and their weekly lab experiments helped them
learn. Students in both groups were asked the same interview questions, although SWH
students were also asked directly about their metacognitive strategies practice at the end
of each interview. Interviews ranged from fifteen minutes to one hour and averaged about
30-35 minutes. The interview protocol is found in appendix F.
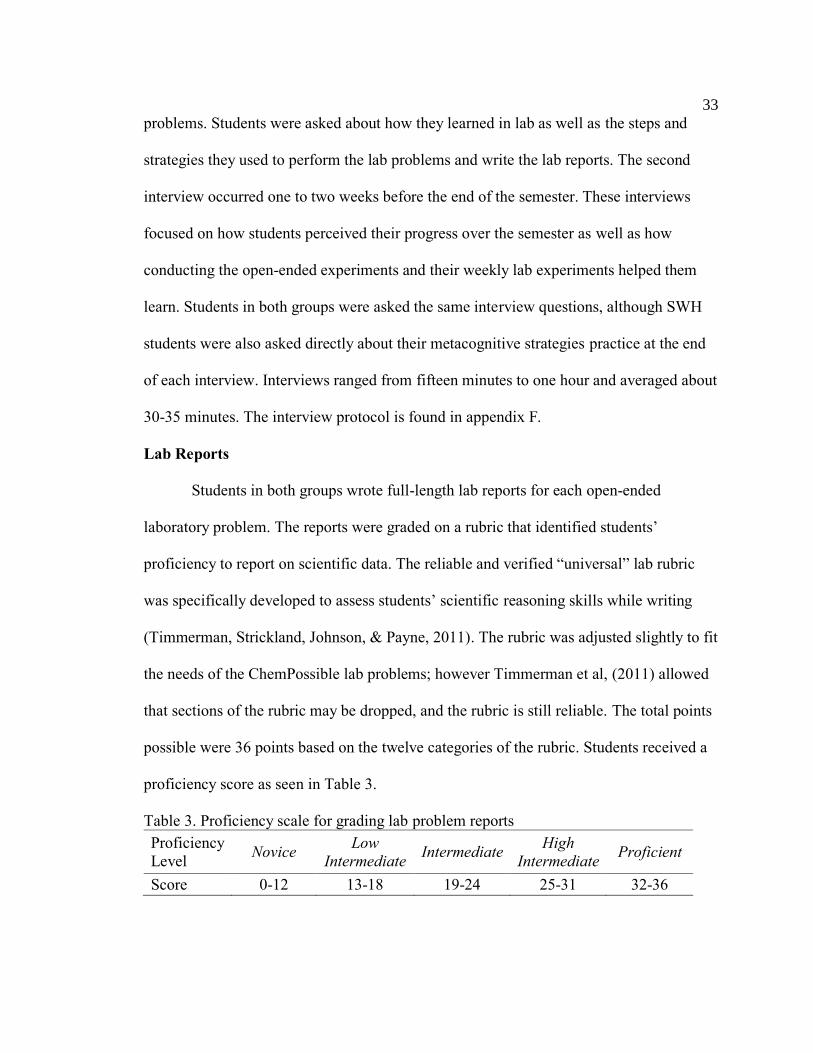
Lab Reports
Students in both groups wrote full-length lab reports for each open-ended
laboratory problem. The reports were graded on a rubric that identified students’
proficiency to report on scientific data. The reliable and verified “universal” lab rubric
was specifically developed to assess students’ scientific reasoning skills while writing
(Timmerman, Strickland, Johnson, & Payne, 2011). The rubric was adjusted slightly to fit
the needs of the ChemPossible lab problems; however Timmerman et al, (2011) allowed
that sections of the rubric may be dropped, and the rubric is still reliable. The total points
possible were 36 points based on the twelve categories of the rubric. Students received a
proficiency score as seen in Table 3.
Table 3. Proficiency scale for grading lab problem reports
Proficiency
Level Novice
Low
Intermediate Intermediate
High
Intermediate Proficient
Score 0-12 13-18 19-24 25-31 32-36
34
TAs were trained on the rubric to grade all reports. If there was a discrepancy in the
grade, the TAs and professor worked to resolve the discrepancy and reach consensus
about the grade. The rubric is found in appendix G. The average of all completed lab
reports was used for analysis.
Qualitative Data Analysis
Coding
The qualitative data was collected and analyzed based on basic qualitative
research protocols. Merriam (2009) describes basic qualitative research as a way to
examine the meaning, understanding or process of a phenomenon, and how participants
perceive that phenomenon. Interviews were used to gain access to students’ perceptions
and descriptions of their metacognitive strategy use. The process by which the interviews
transcripts were analyzed was systematic, iterative, and, initially inductive (Merriam,
2009). The qualitative analysis program NVivo 9.2 (QSR International Pty Ltd., 2013)
was used in all analyses. First, a researcher transcribed all interview audio. Important
phrases, themes, and patterns were initially parsed from one or two transcripts and
identified as categories through open coding. Categories were determined by the data and
the theory that supported the study. The number of categories in the first round of coding
was large, about thirty. The constant comparison method was used to ensure that the
categories matched the data in all transcripts. As more documents were analyzed,
categories were grouped together conceptually. The process of data analysis became
deductive as more transcripts were parsed for the already defined categories. If codes did
not match data in all documents, then re-coding of previous data occurred. The categories
can be named according to participants’ words, the researchers’ thoughts or theory.
35
Categories in this research were named according to theory and the participants’ words.
The coding process was iterative and it required revision and many rounds of coding to
ensure that the categories were saturated with all the essential data fitting into a category.
At the conclusion of data analysis, there were between four to seven large categories. It
was important that these categories were mutually exclusive and no coded phrases fit into
more than one category. The categories were also specific to the data coded and were at
the same level of abstraction (Merriam, 2009). In this research, codes were initially based
on the instances where metacognitive regulation occurred. In a sense, these codes were
predetermined and allowed for a more systematic analysis of the data; however it was
essential that data were not forced into these codes. If the data did not fit into the
predetermined codes, then new codes were formed.
Each transcript went through an iterative consensus coding process and was coded
by at least two coders. On the first few transcripts, the researchers coded together to
understand the characteristics of the code and agreed on the how to label the data
(Creswell, 2009). The two coders coded all data. The agreement between the coders was
measured using the Kappa coefficient. Cohen’s Kappa accounts for not only the
agreement between the coders, but also the likelihood of agreement occurring by chance
between the coders. NVivo suggests that above 0.75 is excellent agreement between
coders (Landis & Koch, 1977). The Kappa coefficient calculated by NVivo for coder
agreement of all codes in the study was 0.80. In the thirty-eight interviews, coding was
performed until no more instances of metacognitive strategies and themes were found in
the data. Theses iterations of coding led to saturation of the codes (Creswell, 2009). The
constant comparison method was used to ensure that the categories matched the data in
36
all documents. If codes did not match data in all documents, then re-coding of previous
data occurred (Merriam, 2009). For example, if a category was found to contain several
types of monitoring, then the codes in that category in all transcripts were re-coded to fit
into more specific categories. This ensured not only that the phrases coded in each
category were specific, but also that they also helped to answer the research questions.
Sometimes, codes were eliminated because they became redundant or did not add new
information to answer the research questions.
In order to communicate findings; the data was represented in a way that
appropriately answered the research questions. To compare categories of strategy use
between groups, the number of students who described using a specific strategy was
counted (Miles & Huberman, 1994). For example, under “draws on previous knowledge
and experience”, all nine non-SWH students and all ten SWH students described this
metacognitive strategy. These values were converted to percentages to compare between
the groups because the sample sizes were not equal. Therefore, 100% of the non-SWH
and 100% of the SWH students described using this strategy. Individual students may
have described this strategy more than once in their interview; however, each student was
counted as either using the strategy or not using the strategy. These frequencies allowed
for comparison of individual and peer use between the groups. In this way, the interview
data was represented through actual quotes from individual students as well as a more
general view of the overall frequency of strategy use for all students who were
interviewed. This provided a way to compare metacognitive strategy use in the two
instructional environments.
37
Validity and Reliability
To ensure validity and reliability of the data and the analysis, several types of data
were measured to show different perspectives about the same phenomenon. It was
essential to include as much information from a variety of sources to describe the
phenomenon (Creswell, 2009). The data collected, the theory to support the research, and
the methods to analyze the data were triangulated in order to ensure internal validity and
reliability of the results (Maxwell, 2005). Validity of the data was also accounted through
a rich and thick description of the themes and patterns represented in the codes. Actual
student quotes in the results section provided this rich description of the phenomenon.
Negative cases were noted to ensure results represented the themes appropriately and
were not overstated.
Quantitative Data Analysis
Quantitative data were analyzed using SPSS 21.0 (IBM corporation, 2012) and
Microsoft Excel. The threshold value for significance was set at 0.05 for all analyses
(Howell, 2010). Each survey was tested for reliability for each group (alpha >0.7)
(Cronbach, 1951). Effect sizes used in this study were based on Cohen’s definition of
effect size (1992) for small (0.1), medium (0.25), large (0.4) (1992) for ANOVA tests,
and small (0.2), medium (0.5), large (0.8) for t-tests. Data that were analyzed included:
the GALT, CIC, MCAI surveys, ACS exams, and the lab report scores. Scores were
converted to percentages for all analyses. Bivariate Pearson correlations were also
performed on MCAI, ACS scores and course grades for both groups. Guidelines suggest
any correlation between 0 and 0.3 is weak to non-existent in social science. Only
38
correlations above 0.3 (moderate) were considered for analysis. This provided
information about the how the variables were related to each other.
Power Analysis
A mixed model repeated measures ANOVA design was to be used to determine if
there were statistically significant differences between non-SWH and SWH groups as
well as within the groups themselves for MCAI survey and the ACS exams. The
assumptions for repeated measures ANOVA of independence, normality, homogeneity of
variance, and homogeneity of intercorrelations (sphericity) were met. However, a power
analysis using GPower3.1 suggested that the power of the study was too low (< .80)
using the mixed model ANOVA test because of the small sample size and effect size
(Faul, Erdfelder, Lang, & Buchner, 2007). Power in the statistical sense, predicts the
probability that a test will correctly reject the null hypothesis. A lower power value,
between 1 and 0, increases the likelihood that a type II error may occur and that the null
hypothesis was accepted when it should have been rejected (Cohen, 1992). For example,
a test found that the difference between two groups’ exam scores was significant (p is
less than 0.05), and the power was 0.4. A power value of 0.4 indicated there was a 40%
probability of correctly rejecting the null hypothesis that the two groups’ scores were
equal. The probability of a type II error was 60%. If low power is calculated from a
statistical test, caution should be taken when interpreting the statistical results.
Independent T-tests and non-parametric tests on assessment data were also eliminated
because of small sample size and low power.
In GPower 3.1, an apriori power analysis was run to estimate the sample sizes
required for both a repeated measures ANOVA between factors and within factors (see
39
Appendix H). These are tests for differences between the two groups (between factors)
and differences within an individual in a group (within factors) over time, respectively.
To estimate sample size for two effect sizes, 0.25 and 0.4 (medium and large), the
following parameters were used: power = 0.8, alpha = 0.1, correlation between measures
= 0.5, and sphericity = 1. For between factors (between two groups) in repeated measures
ANOVA, GPower3.1 calculated the sample sizes for a medium and a large effect size as
76 and 32, respectively. For within factors, the sample sizes were 28 and 12 for medium
and large effect sizes, respectively. The study sample size was 62, if the effect sizes were
larger than 0.4 (large effect size), then effectively there was enough power to adequately
draw statistical conclusions.
For the MCAI scores, neither effect size (within: 0.17 and between: 0.13) was
larger than 0.25, thus resulting in a power value below 0.8. For the ACS scores, the
between factor (group) effect size of 0.12 was less than 0.25 as well. If any differences
were anticipated, the statistical results should be interpreted with caution because of the
increased likelihood that the null hypothesis was incorrectly rejected when it should have
been accepted. The within factor for the ACS exam scores could be interpreted because
the effect size of 0.6 for both groups was greater than 0.4 (large effect size) thus a power
value of larger than 0.8. The results of this test could be interpreted with some safety that
the likelihood of having a Type II error was less than 20%.
Equivalency Test
Information from the power analysis suggested that a different method other than
ANOVA or t-tests should be used to compare the SWH and non-SWH groups at the
beginning and end of the study. For both ACS and MCAI scores, the null hypotheses
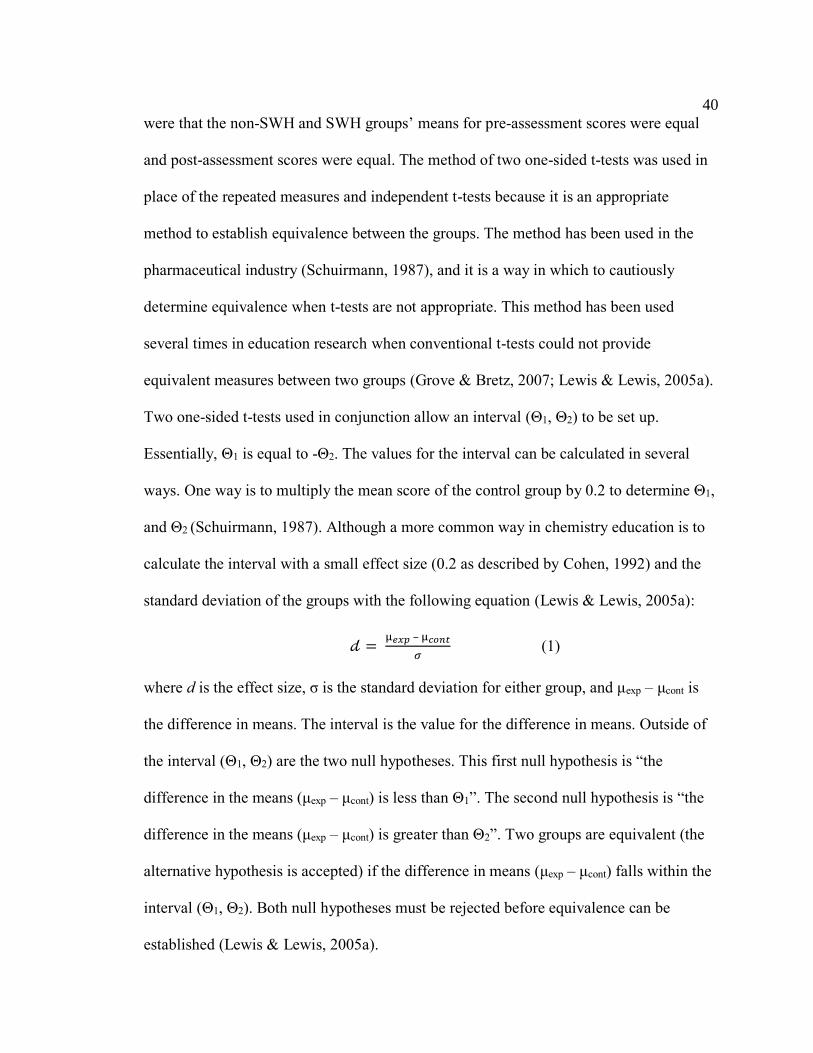
40
were that the non-SWH and SWH groups’ means for pre-assessment scores were equal
and post-assessment scores were equal. The method of two one-sided t-tests was used in
place of the repeated measures and independent t-tests because it is an appropriate
method to establish equivalence between the groups. The method has been used in the
pharmaceutical industry (Schuirmann, 1987), and it is a way in which to cautiously
determine equivalence when t-tests are not appropriate. This method has been used
several times in education research when conventional t-tests could not provide
equivalent measures between two groups (Grove & Bretz, 2007; Lewis & Lewis, 2005a).
Two one-sided t-tests used in conjunction allow an interval (Θ1, Θ2) to be set up.
Essentially, Θ1 is equal to -Θ2. The values for the interval can be calculated in several
ways. One way is to multiply the mean score of the control group by 0.2 to determine Θ1,
and Θ2 (Schuirmann, 1987). Although a more common way in chemistry education is to
calculate the interval with a small effect size (0.2 as described by Cohen, 1992) and the
standard deviation of the groups with the following equation (Lewis & Lewis, 2005a):
𝒹 = μ𝑒𝑥𝑝 – μ𝑐𝑜𝑛𝑡
𝜎 (1)
where d is the effect size, σ is the standard deviation for either group, and μexp – μcont is
the difference in means. The interval is the value for the difference in means. Outside of
the interval (Θ1, Θ2) are the two null hypotheses. This first null hypothesis is “the
difference in the means (μexp – μcont) is less than Θ1”. The second null hypothesis is “the
difference in the means (μexp – μcont) is greater than Θ2”. Two groups are equivalent (the
alternative hypothesis is accepted) if the difference in means (μexp – μcont) falls within the
interval (Θ1, Θ2). Both null hypotheses must be rejected before equivalence can be
established (Lewis & Lewis, 2005a).

41
𝑡1 =((𝑋𝑒𝑥𝑝−𝑋𝑐𝑜𝑛𝑡𝑟𝑜𝑙)−𝛩1)
𝑠𝑝√(1
𝑁𝑒𝑥𝑝+
1
𝑁𝑐𝑜𝑛𝑡𝑟𝑜𝑙)
≥ 𝑡1−𝑎(𝑣) (2)
𝑡2 =(𝛩2−(𝑋𝑒𝑥𝑝−𝑋𝑐𝑜𝑛𝑡𝑟𝑜𝑙))
𝑠𝑝√(1
𝑁𝑒𝑥𝑝+
1
𝑁𝑐𝑜𝑛𝑡𝑟𝑜𝑙)
≥ 𝑡1−𝑎(𝑣) (3)
In equations 2 and 3, x is the group mean, N is the sample size, and sp is the
pooled standard deviation of the means.
The interval was determined in this study by the method of multiplying the mean
by 0.2 (Schuirmann, 1987). An effect size of 0.2 similar to the Lewis and Lewis study
(2005a) was too conservative to calculate the interval because there was a large standard
deviation for each of the surveys and exams, and a small sample size. The α-level used
for the analysis was 0.10, which gave a t-value of 1.29 (Howell, 2010). If the calculated t-
values for both tests are greater than the t-value for α (1.29) than the two groups scores
are equivalent. Microsoft Excel was used to perform all equivalency tests for GALT,
MCAI, and 1st and 2nd term ACS exams.
Summary
This chapter described the experimental design that was used to investigate
students’ practice of metacognitive regulation strategies through surveys, exams and
interviews. Chemistry majors who participated in the study experienced either an SWH
or traditional instructional environment. Students took a metacognitive assessment as
well as a chemistry content exam to determine their strategy use and content knowledge.
The assessments were analyzed for any differences between groups and over the course
of the study. These results were built-in to triangulate results from the analysis of in-
depth interviews. The interview data was analyzed using a coding scheme that first

42
identified when students used metacognitive regulation strategies during open-ended
problems. Second, the coding scheme identified and helped to describe how students used
the strategies and what supported their use of the strategies when solving their open-
ended problems. The analysis with the coding scheme also delineated between
metacognitive strategy use in the two instructional environments. The experimental
design allowed for in-depth qualitative data and quantitative assessment scores to be
combined in order to answer the research questions.
43
CHAPTER FOUR
RESULTS
The following chapter presents and describes the assessment and interview data that was
collected and analyzed to answer the two research questions:
How does the process by which students solve and report on open-ended
laboratory problems reveal use of metacognitive regulation strategies?
Does the type of laboratory instructional environment (SWH vs. Traditional)
that students regularly experience elicit any differences in students’ use of
metacognitive regulation strategies while solving open-ended laboratory
problems?
The assessment data is presented first to provide information about all students who
participated in the study. The survey and exam results provide not only a look at their
regulation strategy use, but also their content knowledge from ACS exams and their
confidence in passing the course. This provides context for the students who were
interviewed and whose words richly describe their metacognitive experience in lab. The
process by which coding framework was formed is explained. This is followed by the
results of students’ interviews and the themes that emerged from the coding.
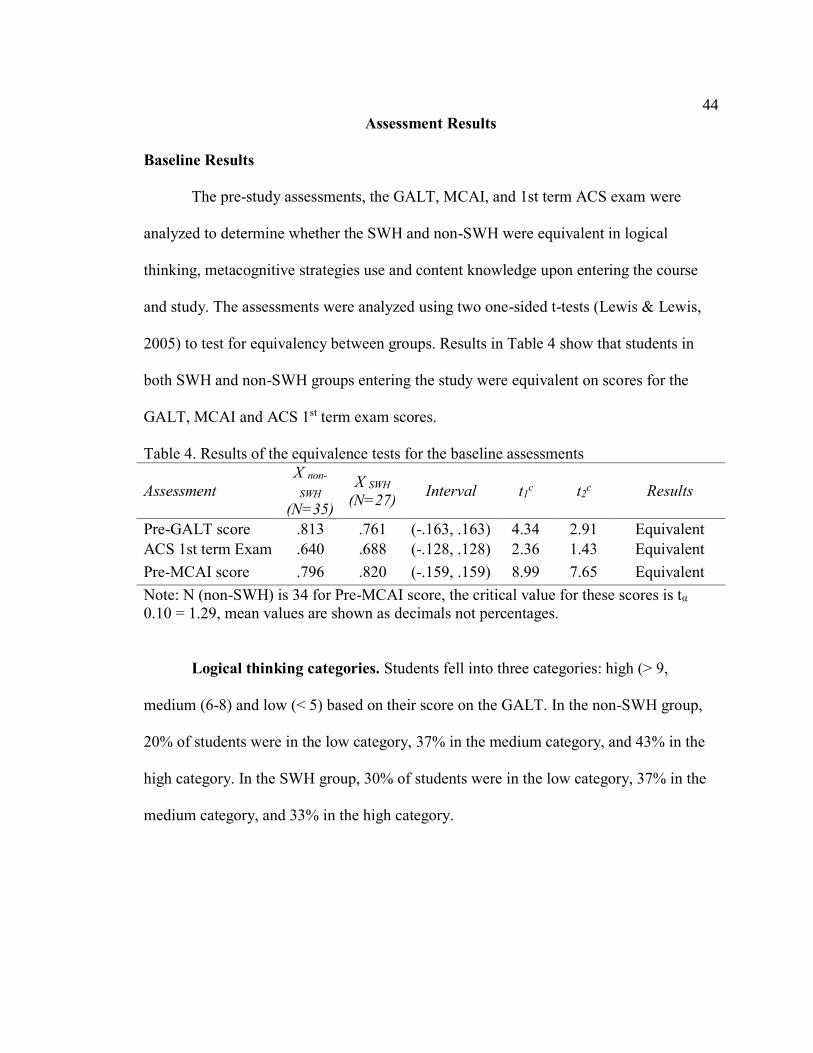
44
Assessment Results
Baseline Results
The pre-study assessments, the GALT, MCAI, and 1st term ACS exam were
analyzed to determine whether the SWH and non-SWH were equivalent in logical
thinking, metacognitive strategies use and content knowledge upon entering the course
and study. The assessments were analyzed using two one-sided t-tests (Lewis & Lewis,
2005) to test for equivalency between groups. Results in Table 4 show that students in
both SWH and non-SWH groups entering the study were equivalent on scores for the
GALT, MCAI and ACS 1st term exam scores.
Table 4. Results of the equivalence tests for the baseline assessments
Assessment
X non-
SWH
(N=35)
X SWH
(N=27) Interval t1
c t2c Results
Pre-GALT score .813 .761 (-.163, .163) 4.34 2.91 Equivalent
ACS 1st term Exam .640 .688 (-.128, .128) 2.36 1.43 Equivalent
Pre-MCAI score .796 .820 (-.159, .159) 8.99 7.65 Equivalent
Note: N (non-SWH) is 34 for Pre-MCAI score, the critical value for these scores is tα
0.10 = 1.29, mean values are shown as decimals not percentages.
Logical thinking categories. Students fell into three categories: high (> 9,
medium (6-8) and low (< 5) based on their score on the GALT. In the non-SWH group,
20% of students were in the low category, 37% in the medium category, and 43% in the
high category. In the SWH group, 30% of students were in the low category, 37% in the
medium category, and 33% in the high category.
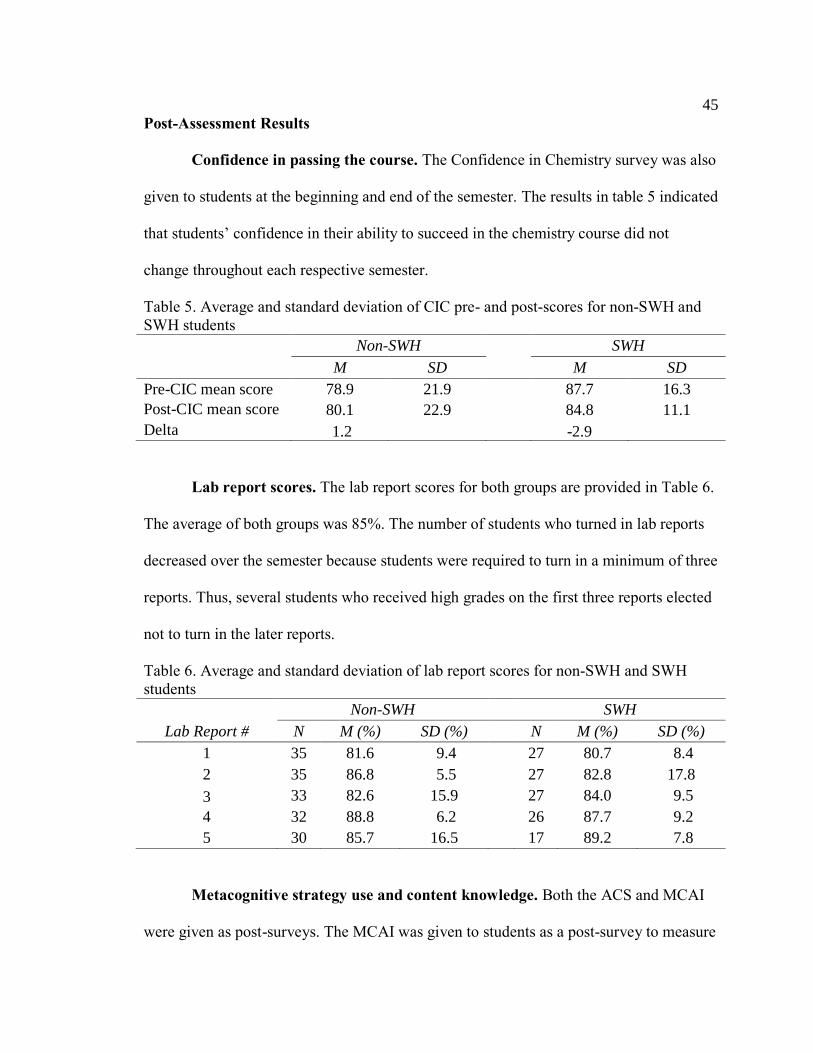
45
Post-Assessment Results
Confidence in passing the course. The Confidence in Chemistry survey was also
given to students at the beginning and end of the semester. The results in table 5 indicated
that students’ confidence in their ability to succeed in the chemistry course did not
change throughout each respective semester.
Table 5. Average and standard deviation of CIC pre- and post-scores for non-SWH and
SWH students
Non-SWH SWH
M SD M SD
Pre-CIC mean score 78.9 21.9
87.7 16.3
Post-CIC mean score 80.1 22.9
84.8 11.1
Delta 1.2 -2.9
Lab report scores. The lab report scores for both groups are provided in Table 6.
The average of both groups was 85%. The number of students who turned in lab reports
decreased over the semester because students were required to turn in a minimum of three
reports. Thus, several students who received high grades on the first three reports elected
not to turn in the later reports.
Table 6. Average and standard deviation of lab report scores for non-SWH and SWH
students
Non-SWH
SWH
Lab Report # N M (%) SD (%) N M (%) SD (%)
1 35 81.6 9.4
27 80.7 8.4
2 35 86.8 5.5
27 82.8 17.8
3 33 82.6 15.9
27 84.0 9.5
4 32 88.8 6.2
26 87.7 9.2
5 30 85.7 16.5 17 89.2 7.8
Metacognitive strategy use and content knowledge. Both the ACS and MCAI
were given as post-surveys. The MCAI was given to students as a post-survey to measure
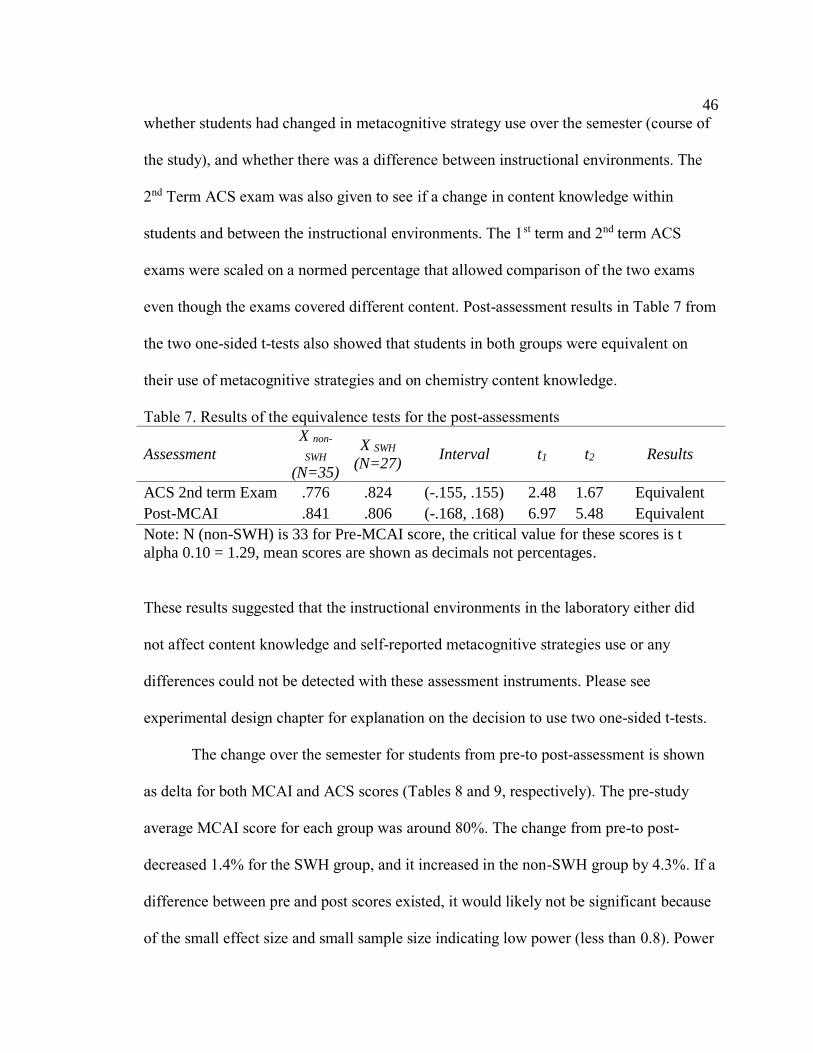
46
whether students had changed in metacognitive strategy use over the semester (course of
the study), and whether there was a difference between instructional environments. The
2nd Term ACS exam was also given to see if a change in content knowledge within
students and between the instructional environments. The 1st term and 2nd term ACS
exams were scaled on a normed percentage that allowed comparison of the two exams
even though the exams covered different content. Post-assessment results in Table 7 from
the two one-sided t-tests also showed that students in both groups were equivalent on
their use of metacognitive strategies and on chemistry content knowledge.
Table 7. Results of the equivalence tests for the post-assessments
Assessment
X non-
SWH
(N=35)
X SWH
(N=27) Interval t1 t2 Results
ACS 2nd term Exam .776 .824 (-.155, .155) 2.48 1.67 Equivalent
Post-MCAI .841 .806 (-.168, .168) 6.97 5.48 Equivalent
Note: N (non-SWH) is 33 for Pre-MCAI score, the critical value for these scores is t
alpha 0.10 = 1.29, mean scores are shown as decimals not percentages.
These results suggested that the instructional environments in the laboratory either did
not affect content knowledge and self-reported metacognitive strategies use or any
differences could not be detected with these assessment instruments. Please see
experimental design chapter for explanation on the decision to use two one-sided t-tests.
The change over the semester for students from pre-to post-assessment is shown
as delta for both MCAI and ACS scores (Tables 8 and 9, respectively). The pre-study
average MCAI score for each group was around 80%. The change from pre-to post-
decreased 1.4% for the SWH group, and it increased in the non-SWH group by 4.3%. If a
difference between pre and post scores existed, it would likely not be significant because
of the small effect size and small sample size indicating low power (less than 0.8). Power
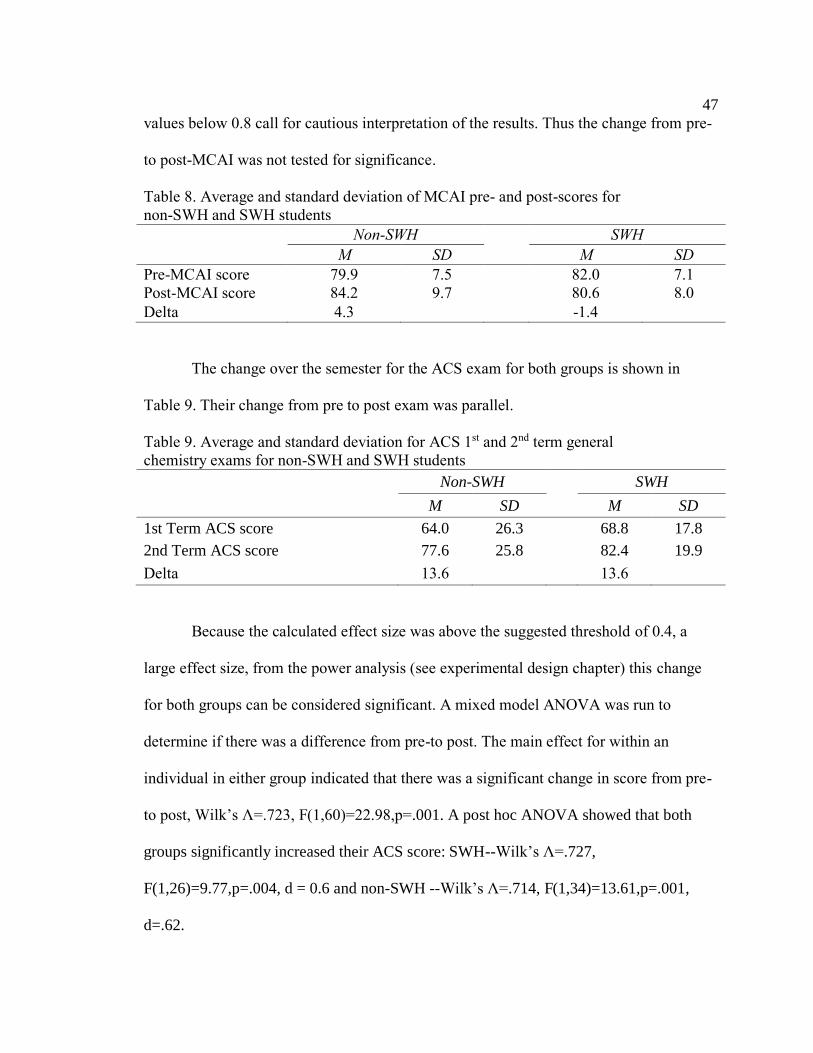
47
values below 0.8 call for cautious interpretation of the results. Thus the change from pre-
to post-MCAI was not tested for significance.
Table 8. Average and standard deviation of MCAI pre- and post-scores for
non-SWH and SWH students
Non-SWH SWH
M SD M SD
Pre-MCAI score 79.9 7.5 82.0 7.1
Post-MCAI score 84.2 9.7
80.6 8.0
Delta 4.3 -1.4
The change over the semester for the ACS exam for both groups is shown in
Table 9. Their change from pre to post exam was parallel.
Table 9. Average and standard deviation for ACS 1st and 2nd term general
chemistry exams for non-SWH and SWH students
Non-SWH SWH
M SD M SD
1st Term ACS score 64.0 26.3
68.8 17.8
2nd Term ACS score 77.6 25.8
82.4 19.9
Delta 13.6 13.6
Because the calculated effect size was above the suggested threshold of 0.4, a
large effect size, from the power analysis (see experimental design chapter) this change
for both groups can be considered significant. A mixed model ANOVA was run to
determine if there was a difference from pre-to post. The main effect for within an
individual in either group indicated that there was a significant change in score from pre-
to post, Wilk’s Λ=.723, F(1,60)=22.98,p=.001. A post hoc ANOVA showed that both
groups significantly increased their ACS score: SWH--Wilk’s Λ=.727,
F(1,26)=9.77,p=.004, d = 0.6 and non-SWH --Wilk’s Λ=.714, F(1,34)=13.61,p=.001,
d=.62.
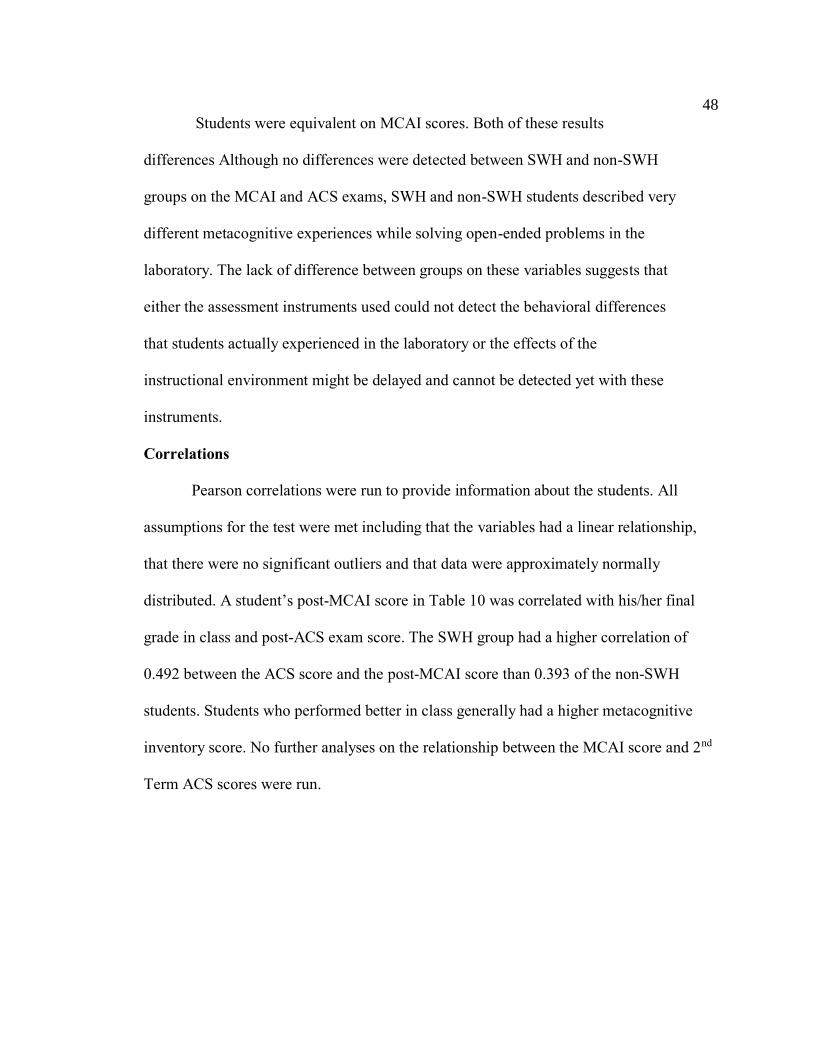
48
Students were equivalent on MCAI scores. Both of these results
differences Although no differences were detected between SWH and non-SWH
groups on the MCAI and ACS exams, SWH and non-SWH students described very
different metacognitive experiences while solving open-ended problems in the
laboratory. The lack of difference between groups on these variables suggests that
either the assessment instruments used could not detect the behavioral differences
that students actually experienced in the laboratory or the effects of the
instructional environment might be delayed and cannot be detected yet with these
instruments.
Correlations
Pearson correlations were run to provide information about the students. All
assumptions for the test were met including that the variables had a linear relationship,
that there were no significant outliers and that data were approximately normally
distributed. A student’s post-MCAI score in Table 10 was correlated with his/her final
grade in class and post-ACS exam score. The SWH group had a higher correlation of
0.492 between the ACS score and the post-MCAI score than 0.393 of the non-SWH
students. Students who performed better in class generally had a higher metacognitive
inventory score. No further analyses on the relationship between the MCAI score and 2nd
Term ACS scores were run.
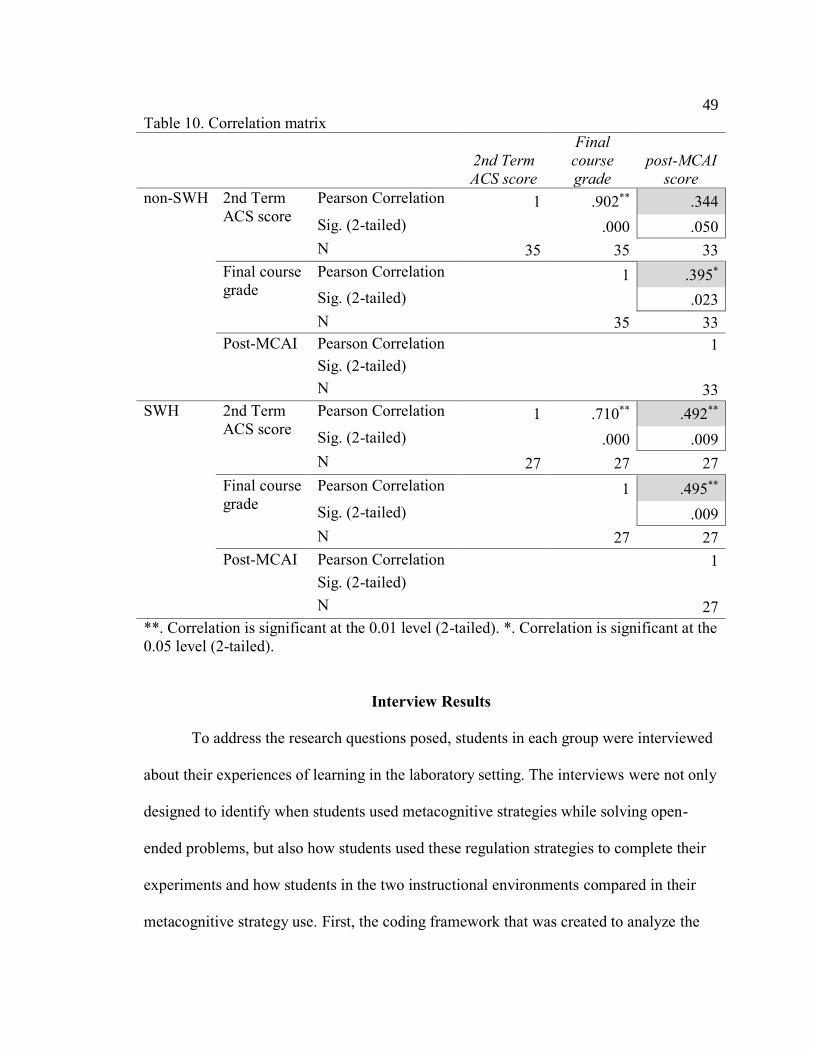
49
Table 10. Correlation matrix
2nd Term
ACS score
Final
course
grade
post-MCAI
score
non-SWH 2nd Term
ACS score
Pearson Correlation 1 .902** .344
Sig. (2-tailed)
.000 .050
N 35 35 33
Final course
grade
Pearson Correlation
1 .395*
Sig. (2-tailed)
.023
N 35 33
Post-MCAI Pearson Correlation
1
Sig. (2-tailed)
N 33
SWH 2nd Term
ACS score
Pearson Correlation 1 .710** .492**
Sig. (2-tailed)
.000 .009
N 27 27 27
Final course
grade
Pearson Correlation
1 .495**
Sig. (2-tailed)
.009
N 27 27
Post-MCAI Pearson Correlation
1
Sig. (2-tailed)
N 27
**. Correlation is significant at the 0.01 level (2-tailed). *. Correlation is significant at the
0.05 level (2-tailed).
Interview Results
To address the research questions posed, students in each group were interviewed
about their experiences of learning in the laboratory setting. The interviews were not only
designed to identify when students used metacognitive strategies while solving open-
ended problems, but also how students used these regulation strategies to complete their
experiments and how students in the two instructional environments compared in their
metacognitive strategy use. First, the coding framework that was created to analyze the
50
interviews is explained. The coding framework is followed by students’ descriptions of
their strategy use and the overarching themes that were identified during coding.
The Coding Framework
All interview transcripts were coded using this coding framework. The initial
categories were coded as instances in which students described using strategies (Table
11) that were consistent with planning, monitoring and evaluating (Schraw & Moshman,
1995). Previous research used a similar coding process to analyzing children’s
metacognitive strategy use while writing in collaborative groups (Larkin, 2009). First a
metacognitive phrase was identified:
And then I had my research I did at home, I told you that I looked up stuff
of how does this react with that, and why does it happen, and everything.
So I kind of had an idea [about how to run the experiment].
In the first round of coding, this statement was coded as planning. As more transcripts
were coded, it became apparent that students described actions consistent with several
types of metacognitive strategies in each category of planning, monitoring and
evaluation. The phrase was later recoded as “researches information while planning
experiment” as a more defined code within planning. Because of these data and following
prior studies in this area (Brown, 1987; Meijer, Veenman, & van Hout-Wolters, 2006;
Schraw & Dennison, 1994), further codes within each regulation category were
identified. Additional examples include “monitors for knowledge to check
understanding” and “monitors for execution of procedure” under the general category of
monitoring (Table 11). All transcripts including initial transcripts were coded with the
detailed categories.
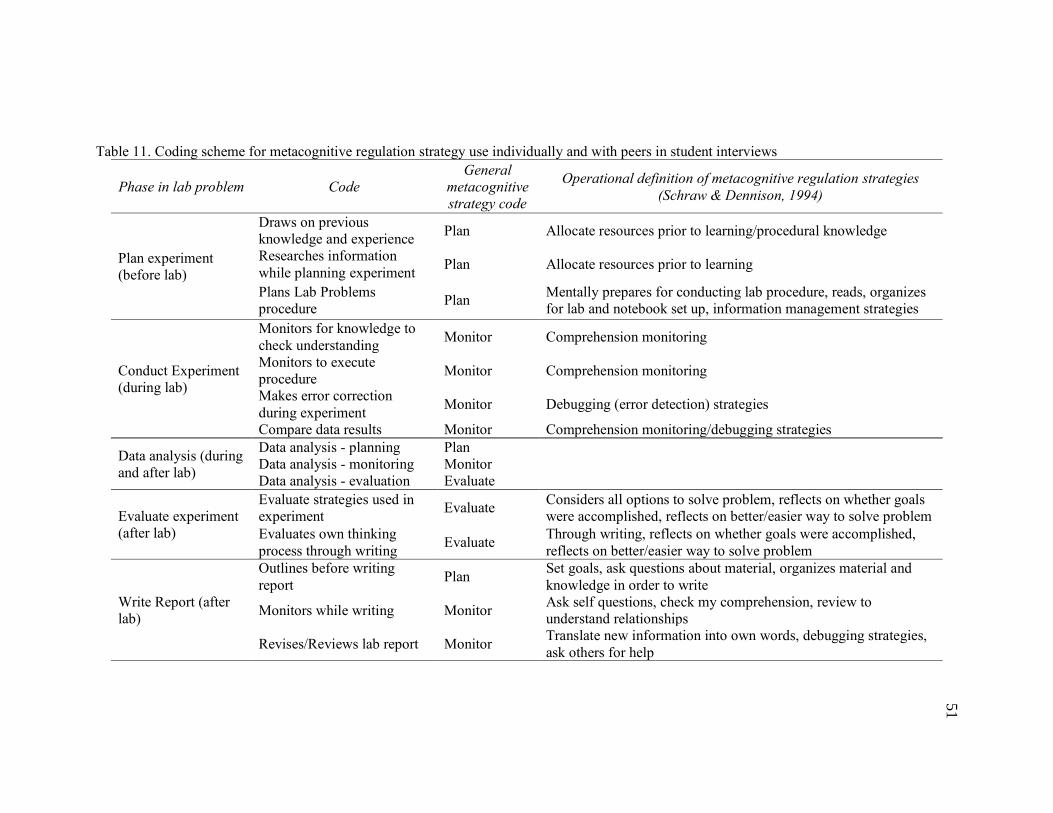
Table 11. Coding scheme for metacognitive regulation strategy use individually and with peers in student interviews
Phase in lab problem Code
General
metacognitive
strategy code
Operational definition of metacognitive regulation strategies
(Schraw & Dennison, 1994)
Plan experiment
(before lab)
Draws on previous
knowledge and experience Plan Allocate resources prior to learning/procedural knowledge
Researches information
while planning experiment Plan Allocate resources prior to learning
Plans Lab Problems
procedure Plan
Mentally prepares for conducting lab procedure, reads, organizes
for lab and notebook set up, information management strategies
Conduct Experiment
(during lab)
Monitors for knowledge to
check understanding Monitor Comprehension monitoring
Monitors to execute
procedure Monitor Comprehension monitoring
Makes error correction
during experiment Monitor Debugging (error detection) strategies
Compare data results Monitor Comprehension monitoring/debugging strategies
Data analysis (during
and after lab)
Data analysis - planning Plan
Data analysis - monitoring Monitor
Data analysis - evaluation Evaluate
Evaluate experiment
(after lab)
Evaluate strategies used in
experiment Evaluate
Considers all options to solve problem, reflects on whether goals
were accomplished, reflects on better/easier way to solve problem
Evaluates own thinking
process through writing Evaluate
Through writing, reflects on whether goals were accomplished,
reflects on better/easier way to solve problem
Write Report (after
lab)
Outlines before writing
report Plan
Set goals, ask questions about material, organizes material and
knowledge in order to write
Monitors while writing Monitor Ask self questions, check my comprehension, review to
understand relationships
Revises/Reviews lab report Monitor Translate new information into own words, debugging strategies,
ask others for help
51
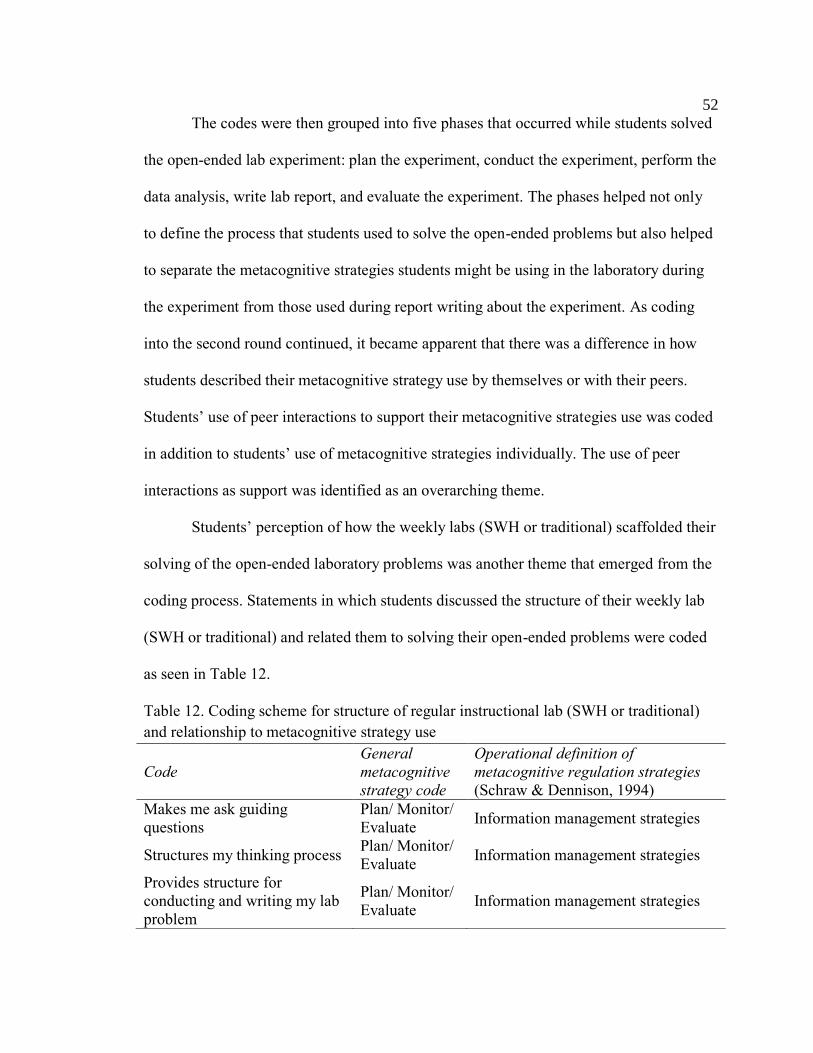
52
The codes were then grouped into five phases that occurred while students solved
the open-ended lab experiment: plan the experiment, conduct the experiment, perform the
data analysis, write lab report, and evaluate the experiment. The phases helped not only
to define the process that students used to solve the open-ended problems but also helped
to separate the metacognitive strategies students might be using in the laboratory during
the experiment from those used during report writing about the experiment. As coding
into the second round continued, it became apparent that there was a difference in how
students described their metacognitive strategy use by themselves or with their peers.
Students’ use of peer interactions to support their metacognitive strategies use was coded
in addition to students’ use of metacognitive strategies individually. The use of peer
interactions as support was identified as an overarching theme.
Students’ perception of how the weekly labs (SWH or traditional) scaffolded their
solving of the open-ended laboratory problems was another theme that emerged from the
coding process. Statements in which students discussed the structure of their weekly lab
(SWH or traditional) and related them to solving their open-ended problems were coded
as seen in Table 12.
Table 12. Coding scheme for structure of regular instructional lab (SWH or traditional)
and relationship to metacognitive strategy use
Code
General
metacognitive
strategy code
Operational definition of
metacognitive regulation strategies
(Schraw & Dennison, 1994)
Makes me ask guiding
questions
Plan/ Monitor/
Evaluate Information management strategies
Structures my thinking process Plan/ Monitor/
Evaluate Information management strategies
Provides structure for
conducting and writing my lab
problem
Plan/ Monitor/
Evaluate Information management strategies
53
Many of the statements made related to how their metacognitive regulation
strategies were supported. For example, SWH students often stated that the SWH labs
helped them to ask questions while they performed the open-ended problems. An
example statement is: “SWH gets you thinking more about the actual lab, of what
happened, so it asks you more engaging questions in the rubric.” These instances were
coded as “makes me ask guiding questions.” In order to describe students’ experience in
the lab, phrases that compared their current lab experience to previous lab experiences as
well as how weekly labs compared to solving open-ended problems were coded. These
codes provided a richer description of metacognitive use in the instructional setting.
Students’ Strategy Use Revealed Through Process of Solving Open-Ended Problems
Planning the experiment. When asked what steps and strategies they used to
conduct the experiments, students in both groups consistently began that they always did
some planning before they performed their lab problem experiment. This planning phase
occurred prior to or during the first half hour of the lab period. The amount of time for
planning generally depended on whether students felt they had a procedure prepared that
would accomplish their goal. When students in both groups were asked, “How much time
do you set aside to prepare for lab?” they responded in several ways. The first way was a
general way to plan. This was coded as “planning lab problem”.
Josie (non-SWH):
I'll definitely sit down and spend at least fifteen minutes on, okay, what's
this lab asking me, like what other additional materials do I think I need,
what information do I need, like maybe for my introduction or something
like that, and that will help me do the lab.
54
Thomas (SWH)
For a lab report [compared to an SWH report], it’s a little bit shorter
because there is usually a lot less variables, but you have to design the
whole experiment yourself. And as long as I have a basic idea of what’s
the properties I need to apply in this lab, how they work, then I’m, I try to
put something together, but I always leave room open for another step I
could have forgotten, or a better method.
A second way in which students planned was through looking up information about how
to run the experiment, different ways to complete the procedure, and concepts they might
use in the experiment.
Olivia (non-SWH):
If we get a lab problem, I'll sit there, and I'll do research for an hour or
two. I'll just go on the internet and see what I can find, like, flip through
my book, read those sections, so I have a really thorough understanding
of what is even going on. Like, what I'm even looking for before I can
even set up an experiment.
Abby (SWH):
And then I had my research I did at home, I told you that I looked up stuff
of how does this react with that, and why does it happen, and everything.
So I kind of had an idea.
The third mode of planning was to draw on previous knowledge and experience from
high school, chemistry knowledge or other outside knowledge.
Charles (non-SWH)
*laugh* Like this sounds really hard, I don't know. How am I gonna know
what these things are, but when I think about it I've done similar things in
lab before that helped me.
Sophie (SWH)
I knew baking soda and vinegar. They are just like volcanoes and just like
when you were little and stuff you react that and you know your teachers
would show you that.
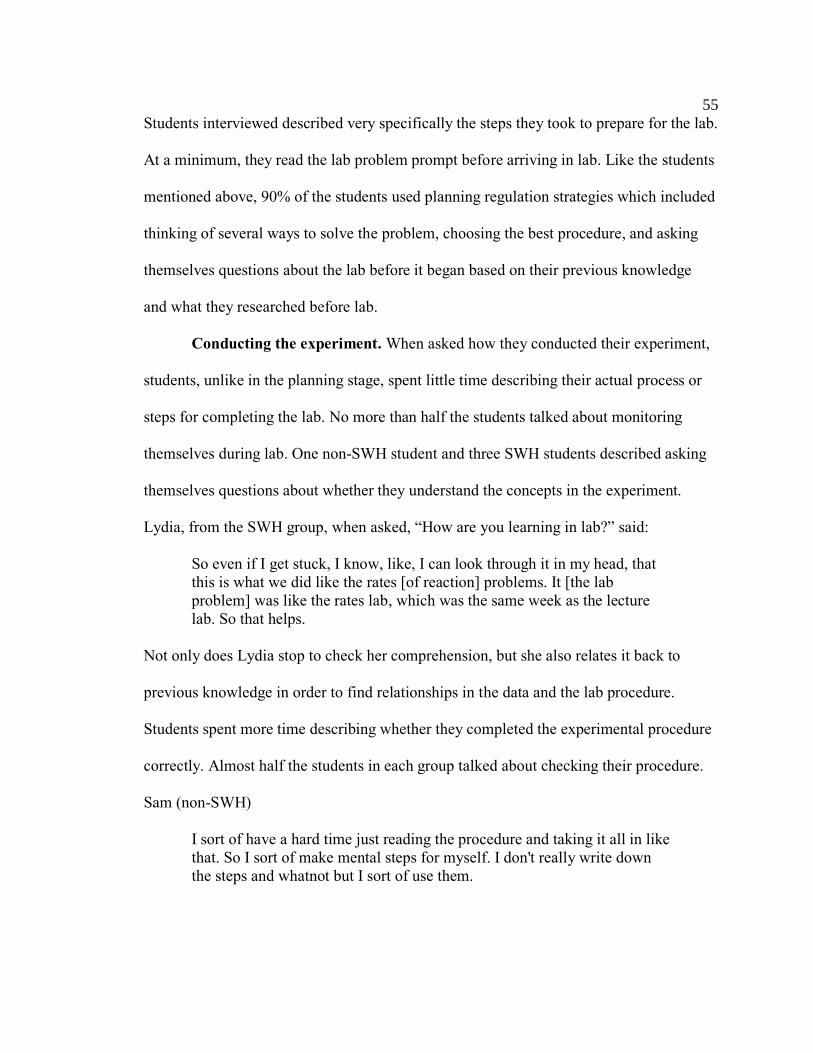
55
Students interviewed described very specifically the steps they took to prepare for the lab.
At a minimum, they read the lab problem prompt before arriving in lab. Like the students
mentioned above, 90% of the students used planning regulation strategies which included
thinking of several ways to solve the problem, choosing the best procedure, and asking
themselves questions about the lab before it began based on their previous knowledge
and what they researched before lab.
Conducting the experiment. When asked how they conducted their experiment,
students, unlike in the planning stage, spent little time describing their actual process or
steps for completing the lab. No more than half the students talked about monitoring
themselves during lab. One non-SWH student and three SWH students described asking
themselves questions about whether they understand the concepts in the experiment.
Lydia, from the SWH group, when asked, “How are you learning in lab?” said:
So even if I get stuck, I know, like, I can look through it in my head, that
this is what we did like the rates [of reaction] problems. It [the lab
problem] was like the rates lab, which was the same week as the lecture
lab. So that helps.
Not only does Lydia stop to check her comprehension, but she also relates it back to
previous knowledge in order to find relationships in the data and the lab procedure.
Students spent more time describing whether they completed the experimental procedure
correctly. Almost half the students in each group talked about checking their procedure.
Sam (non-SWH)
I sort of have a hard time just reading the procedure and taking it all in like
that. So I sort of make mental steps for myself. I don't really write down
the steps and whatnot but I sort of use them.
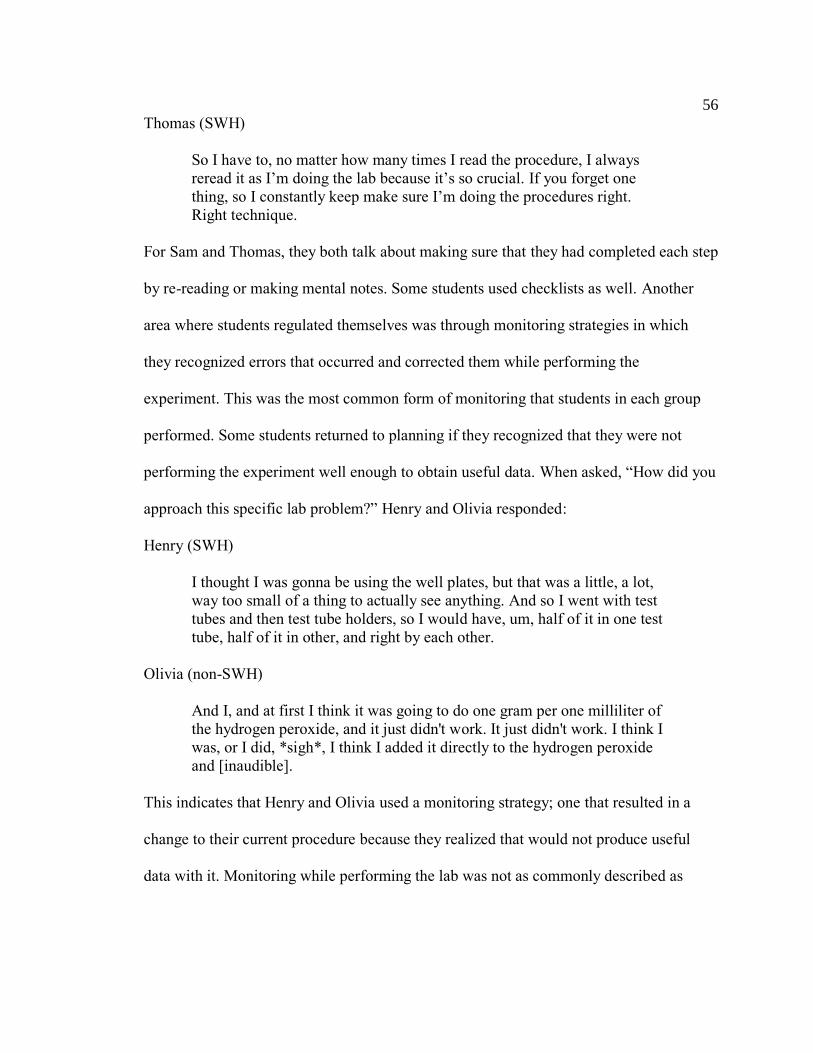
56
Thomas (SWH)
So I have to, no matter how many times I read the procedure, I always
reread it as I’m doing the lab because it’s so crucial. If you forget one
thing, so I constantly keep make sure I’m doing the procedures right.
Right technique.
For Sam and Thomas, they both talk about making sure that they had completed each step
by re-reading or making mental notes. Some students used checklists as well. Another
area where students regulated themselves was through monitoring strategies in which
they recognized errors that occurred and corrected them while performing the
experiment. This was the most common form of monitoring that students in each group
performed. Some students returned to planning if they recognized that they were not
performing the experiment well enough to obtain useful data. When asked, “How did you
approach this specific lab problem?” Henry and Olivia responded:
Henry (SWH)
I thought I was gonna be using the well plates, but that was a little, a lot,
way too small of a thing to actually see anything. And so I went with test
tubes and then test tube holders, so I would have, um, half of it in one test
tube, half of it in other, and right by each other.
Olivia (non-SWH)
And I, and at first I think it was going to do one gram per one milliliter of
the hydrogen peroxide, and it just didn't work. It just didn't work. I think I
was, or I did, *sigh*, I think I added it directly to the hydrogen peroxide
and [inaudible].
This indicates that Henry and Olivia used a monitoring strategy; one that resulted in a
change to their current procedure because they realized that would not produce useful
data with it. Monitoring while performing the lab was not as commonly described as
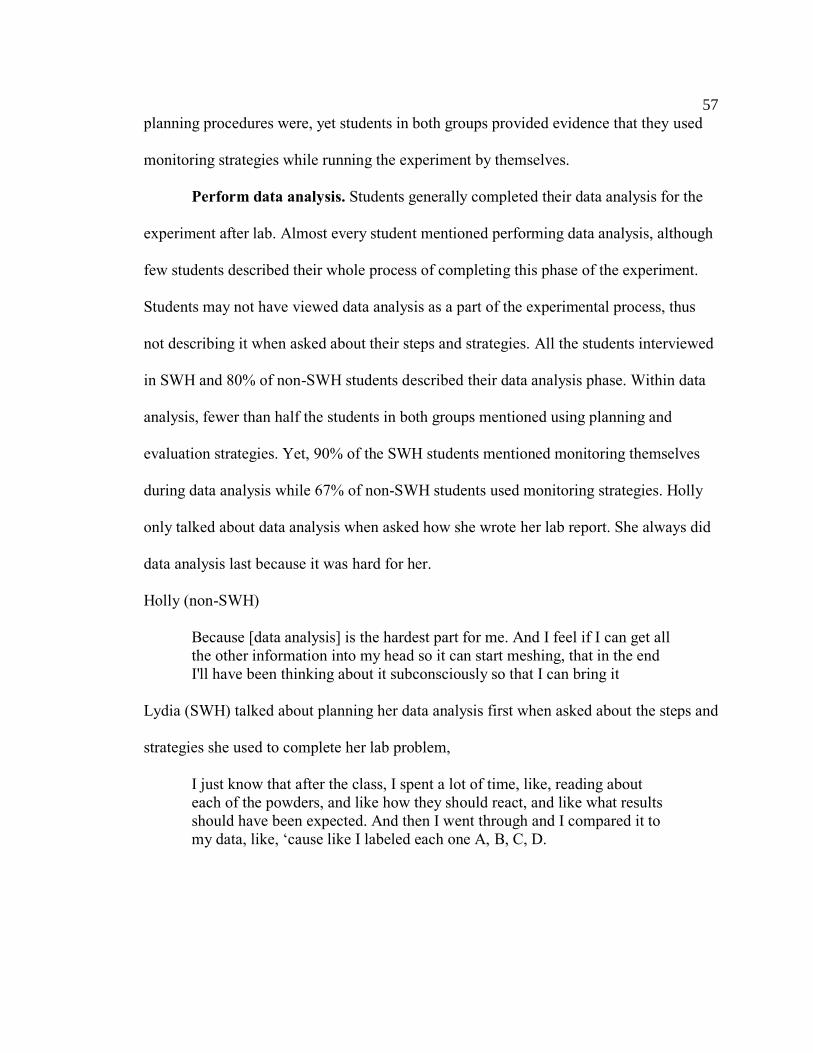
57
planning procedures were, yet students in both groups provided evidence that they used
monitoring strategies while running the experiment by themselves.
Perform data analysis. Students generally completed their data analysis for the
experiment after lab. Almost every student mentioned performing data analysis, although
few students described their whole process of completing this phase of the experiment.
Students may not have viewed data analysis as a part of the experimental process, thus
not describing it when asked about their steps and strategies. All the students interviewed
in SWH and 80% of non-SWH students described their data analysis phase. Within data
analysis, fewer than half the students in both groups mentioned using planning and
evaluation strategies. Yet, 90% of the SWH students mentioned monitoring themselves
during data analysis while 67% of non-SWH students used monitoring strategies. Holly
only talked about data analysis when asked how she wrote her lab report. She always did
data analysis last because it was hard for her.
Holly (non-SWH)
Because [data analysis] is the hardest part for me. And I feel if I can get all
the other information into my head so it can start meshing, that in the end
I'll have been thinking about it subconsciously so that I can bring it
Lydia (SWH) talked about planning her data analysis first when asked about the steps and
strategies she used to complete her lab problem,
I just know that after the class, I spent a lot of time, like, reading about
each of the powders, and like how they should react, and like what results
should have been expected. And then I went through and I compared it to
my data, like, ‘cause like I labeled each one A, B, C, D.
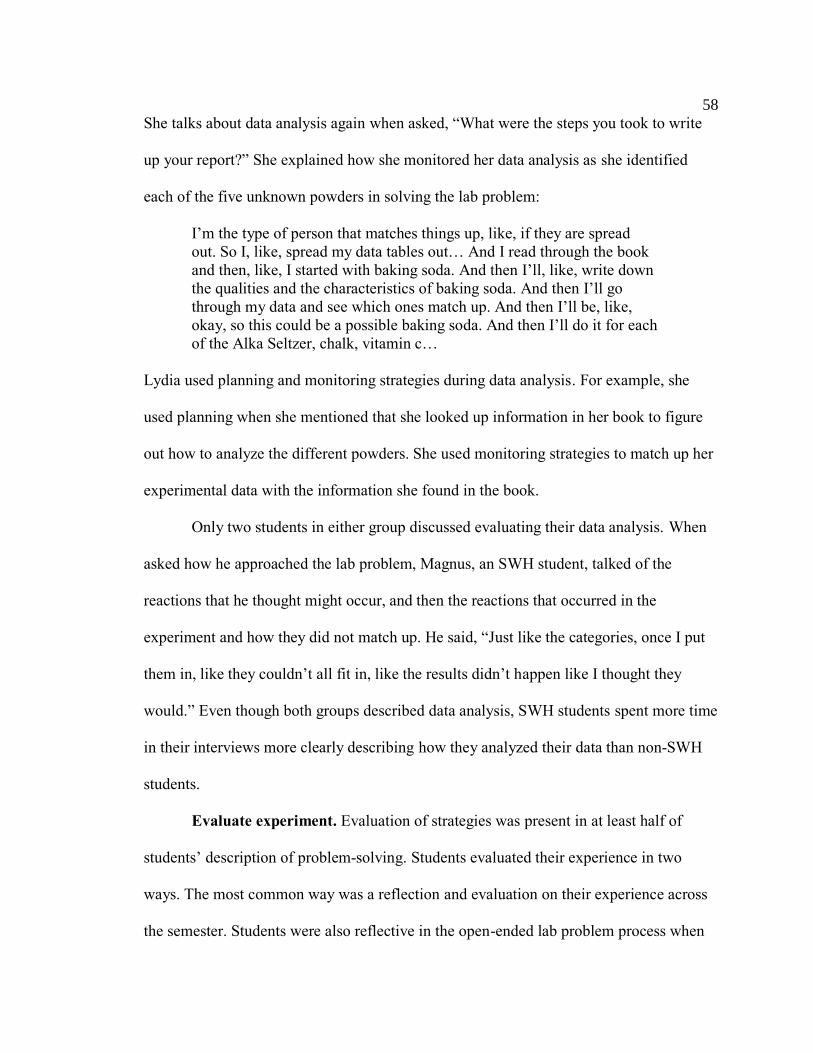
58
She talks about data analysis again when asked, “What were the steps you took to write
up your report?” She explained how she monitored her data analysis as she identified
each of the five unknown powders in solving the lab problem:
I’m the type of person that matches things up, like, if they are spread
out. So I, like, spread my data tables out… And I read through the book
and then, like, I started with baking soda. And then I’ll, like, write down
the qualities and the characteristics of baking soda. And then I’ll go
through my data and see which ones match up. And then I’ll be, like,
okay, so this could be a possible baking soda. And then I’ll do it for each
of the Alka Seltzer, chalk, vitamin c…
Lydia used planning and monitoring strategies during data analysis. For example, she
used planning when she mentioned that she looked up information in her book to figure
out how to analyze the different powders. She used monitoring strategies to match up her
experimental data with the information she found in the book.
Only two students in either group discussed evaluating their data analysis. When
asked how he approached the lab problem, Magnus, an SWH student, talked of the
reactions that he thought might occur, and then the reactions that occurred in the
experiment and how they did not match up. He said, “Just like the categories, once I put
them in, like they couldn’t all fit in, like the results didn’t happen like I thought they
would.” Even though both groups described data analysis, SWH students spent more time
in their interviews more clearly describing how they analyzed their data than non-SWH
students.
Evaluate experiment. Evaluation of strategies was present in at least half of
students’ description of problem-solving. Students evaluated their experience in two
ways. The most common way was a reflection and evaluation on their experience across
the semester. Students were also reflective in the open-ended lab problem process when
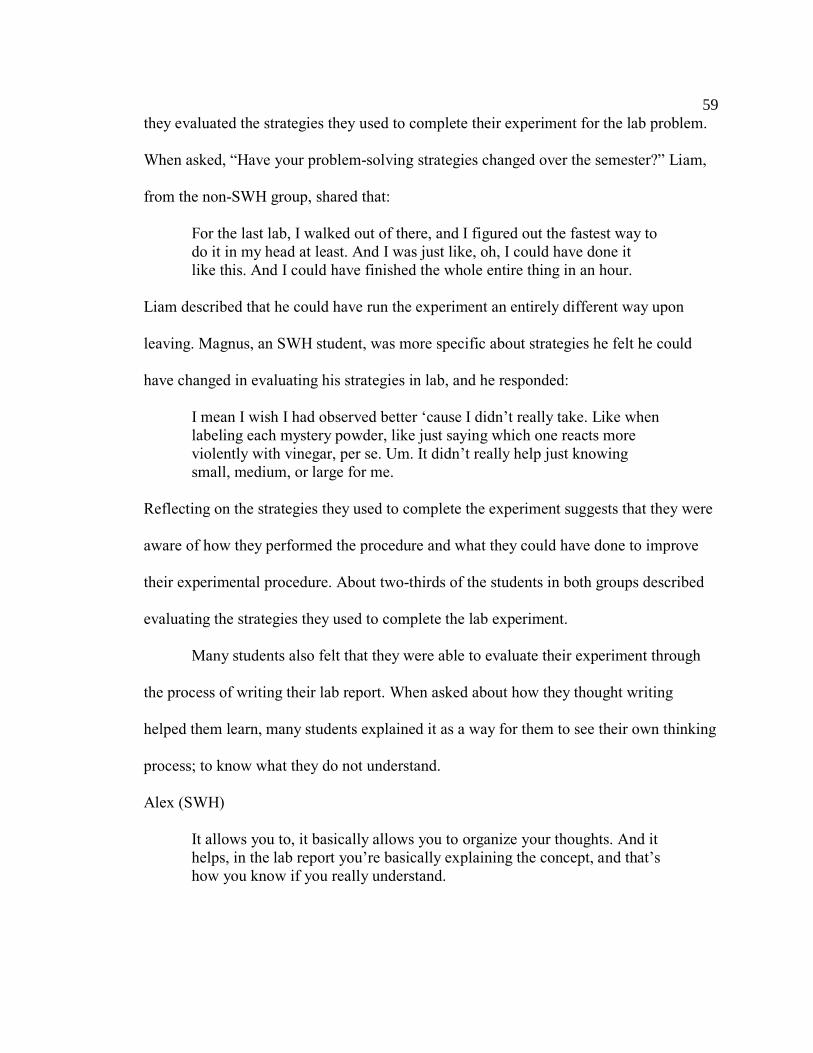
59
they evaluated the strategies they used to complete their experiment for the lab problem.
When asked, “Have your problem-solving strategies changed over the semester?” Liam,
from the non-SWH group, shared that:
For the last lab, I walked out of there, and I figured out the fastest way to
do it in my head at least. And I was just like, oh, I could have done it
like this. And I could have finished the whole entire thing in an hour.
Liam described that he could have run the experiment an entirely different way upon
leaving. Magnus, an SWH student, was more specific about strategies he felt he could
have changed in evaluating his strategies in lab, and he responded:
I mean I wish I had observed better ‘cause I didn’t really take. Like when
labeling each mystery powder, like just saying which one reacts more
violently with vinegar, per se. Um. It didn’t really help just knowing
small, medium, or large for me.
Reflecting on the strategies they used to complete the experiment suggests that they were
aware of how they performed the procedure and what they could have done to improve
their experimental procedure. About two-thirds of the students in both groups described
evaluating the strategies they used to complete the lab experiment.
Many students also felt that they were able to evaluate their experiment through
the process of writing their lab report. When asked about how they thought writing
helped them learn, many students explained it as a way for them to see their own thinking
process; to know what they do not understand.
Alex (SWH)
It allows you to, it basically allows you to organize your thoughts. And it
helps, in the lab report you’re basically explaining the concept, and that’s
how you know if you really understand.
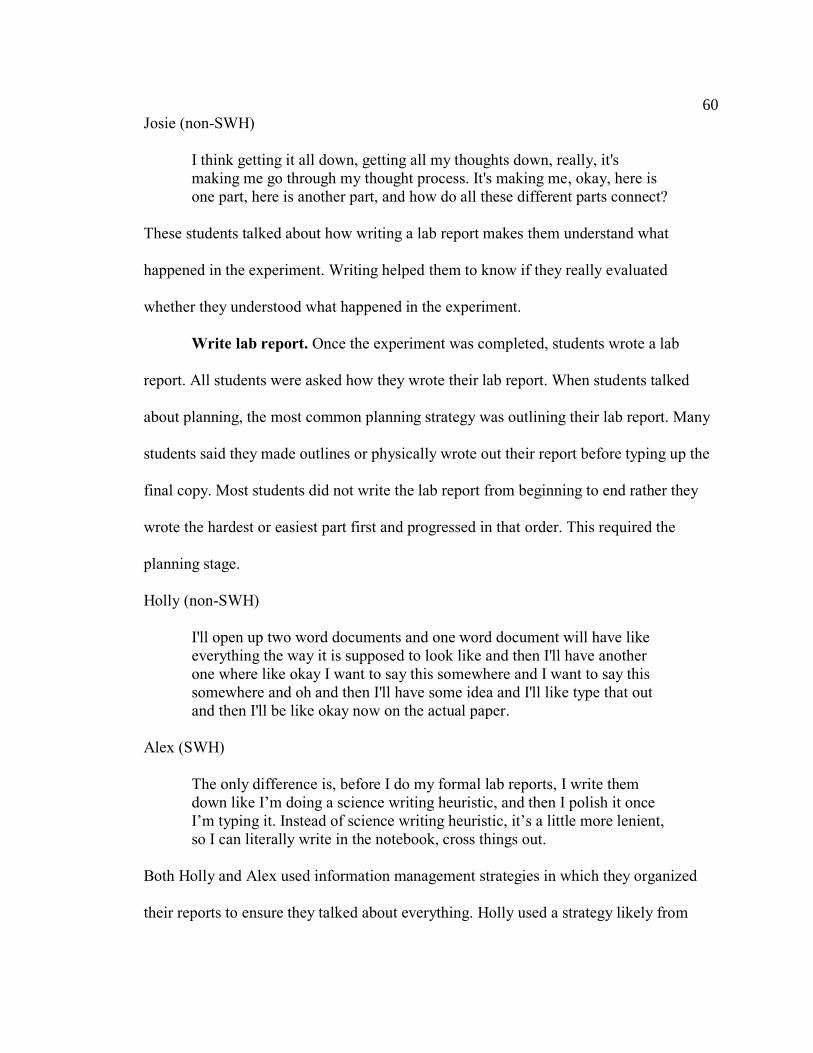
60
Josie (non-SWH)
I think getting it all down, getting all my thoughts down, really, it's
making me go through my thought process. It's making me, okay, here is
one part, here is another part, and how do all these different parts connect?
These students talked about how writing a lab report makes them understand what
happened in the experiment. Writing helped them to know if they really evaluated
whether they understood what happened in the experiment.
Write lab report. Once the experiment was completed, students wrote a lab
report. All students were asked how they wrote their lab report. When students talked
about planning, the most common planning strategy was outlining their lab report. Many
students said they made outlines or physically wrote out their report before typing up the
final copy. Most students did not write the lab report from beginning to end rather they
wrote the hardest or easiest part first and progressed in that order. This required the
planning stage.
Holly (non-SWH)
I'll open up two word documents and one word document will have like
everything the way it is supposed to look like and then I'll have another
one where like okay I want to say this somewhere and I want to say this
somewhere and oh and then I'll have some idea and I'll like type that out
and then I'll be like okay now on the actual paper.
Alex (SWH)
The only difference is, before I do my formal lab reports, I write them
down like I’m doing a science writing heuristic, and then I polish it once
I’m typing it. Instead of science writing heuristic, it’s a little more lenient,
so I can literally write in the notebook, cross things out.
Both Holly and Alex used information management strategies in which they organized
their reports to ensure they talked about everything. Holly used a strategy likely from
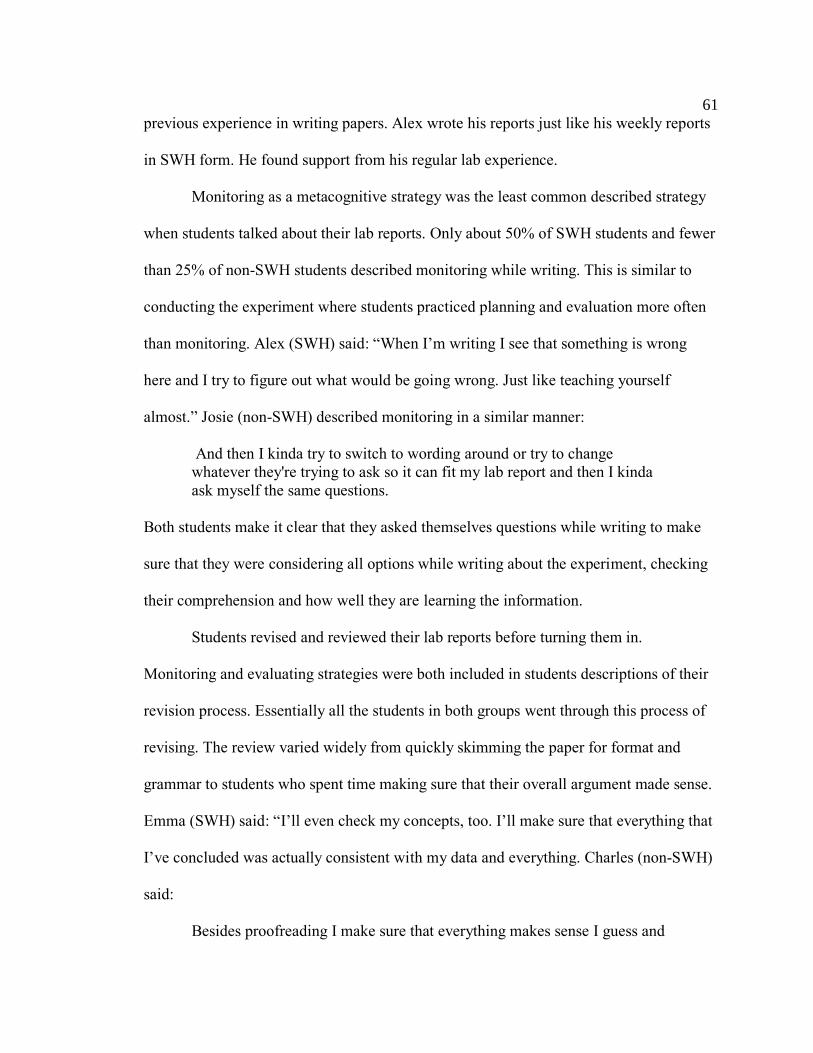
61
previous experience in writing papers. Alex wrote his reports just like his weekly reports
in SWH form. He found support from his regular lab experience.
Monitoring as a metacognitive strategy was the least common described strategy
when students talked about their lab reports. Only about 50% of SWH students and fewer
than 25% of non-SWH students described monitoring while writing. This is similar to
conducting the experiment where students practiced planning and evaluation more often
than monitoring. Alex (SWH) said: “When I’m writing I see that something is wrong
here and I try to figure out what would be going wrong. Just like teaching yourself
almost.” Josie (non-SWH) described monitoring in a similar manner:
And then I kinda try to switch to wording around or try to change
whatever they're trying to ask so it can fit my lab report and then I kinda
ask myself the same questions.
Both students make it clear that they asked themselves questions while writing to make
sure that they were considering all options while writing about the experiment, checking
their comprehension and how well they are learning the information.
Students revised and reviewed their lab reports before turning them in.
Monitoring and evaluating strategies were both included in students descriptions of their
revision process. Essentially all the students in both groups went through this process of
revising. The review varied widely from quickly skimming the paper for format and
grammar to students who spent time making sure that their overall argument made sense.
Emma (SWH) said: “I’ll even check my concepts, too. I’ll make sure that everything that
I’ve concluded was actually consistent with my data and everything. Charles (non-SWH)
said:
Besides proofreading I make sure that everything makes sense I guess and
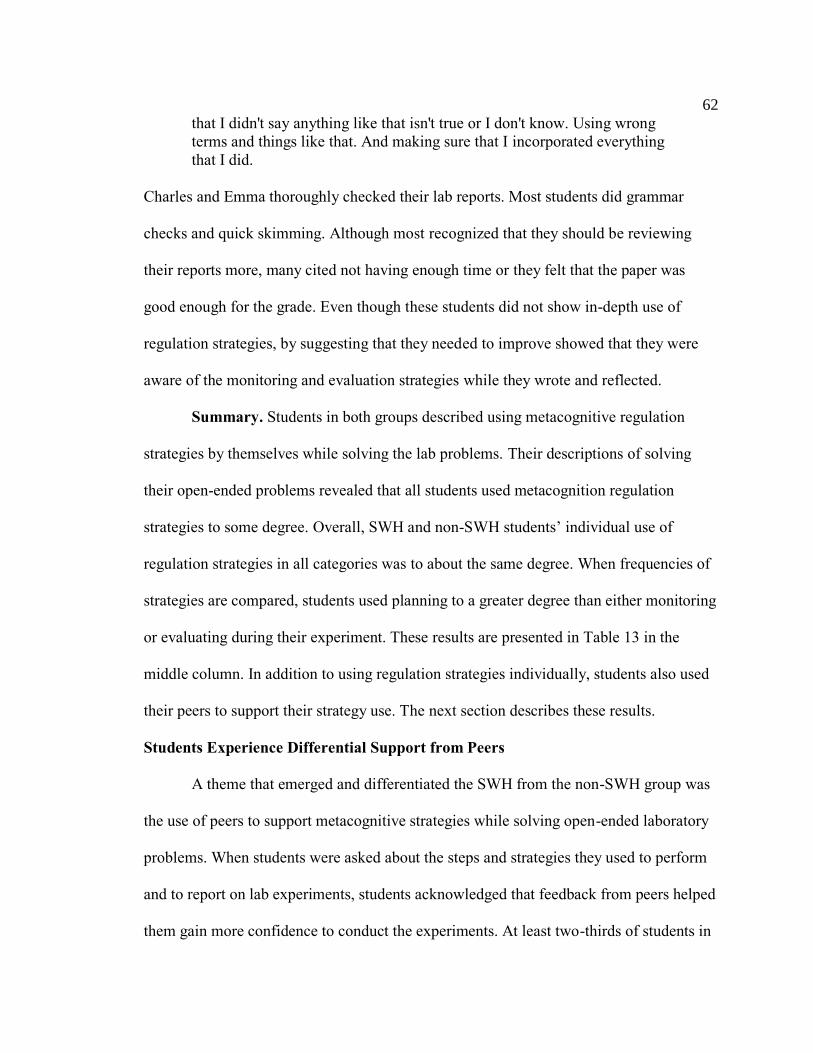
62
that I didn't say anything like that isn't true or I don't know. Using wrong
terms and things like that. And making sure that I incorporated everything
that I did.
Charles and Emma thoroughly checked their lab reports. Most students did grammar
checks and quick skimming. Although most recognized that they should be reviewing
their reports more, many cited not having enough time or they felt that the paper was
good enough for the grade. Even though these students did not show in-depth use of
regulation strategies, by suggesting that they needed to improve showed that they were
aware of the monitoring and evaluation strategies while they wrote and reflected.
Summary. Students in both groups described using metacognitive regulation
strategies by themselves while solving the lab problems. Their descriptions of solving
their open-ended problems revealed that all students used metacognition regulation
strategies to some degree. Overall, SWH and non-SWH students’ individual use of
regulation strategies in all categories was to about the same degree. When frequencies of
strategies are compared, students used planning to a greater degree than either monitoring
or evaluating during their experiment. These results are presented in Table 13 in the
middle column. In addition to using regulation strategies individually, students also used
their peers to support their strategy use. The next section describes these results.
Students Experience Differential Support from Peers
A theme that emerged and differentiated the SWH from the non-SWH group was
the use of peers to support metacognitive strategies while solving open-ended laboratory
problems. When students were asked about the steps and strategies they used to perform
and to report on lab experiments, students acknowledged that feedback from peers helped
them gain more confidence to conduct the experiments. At least two-thirds of students in
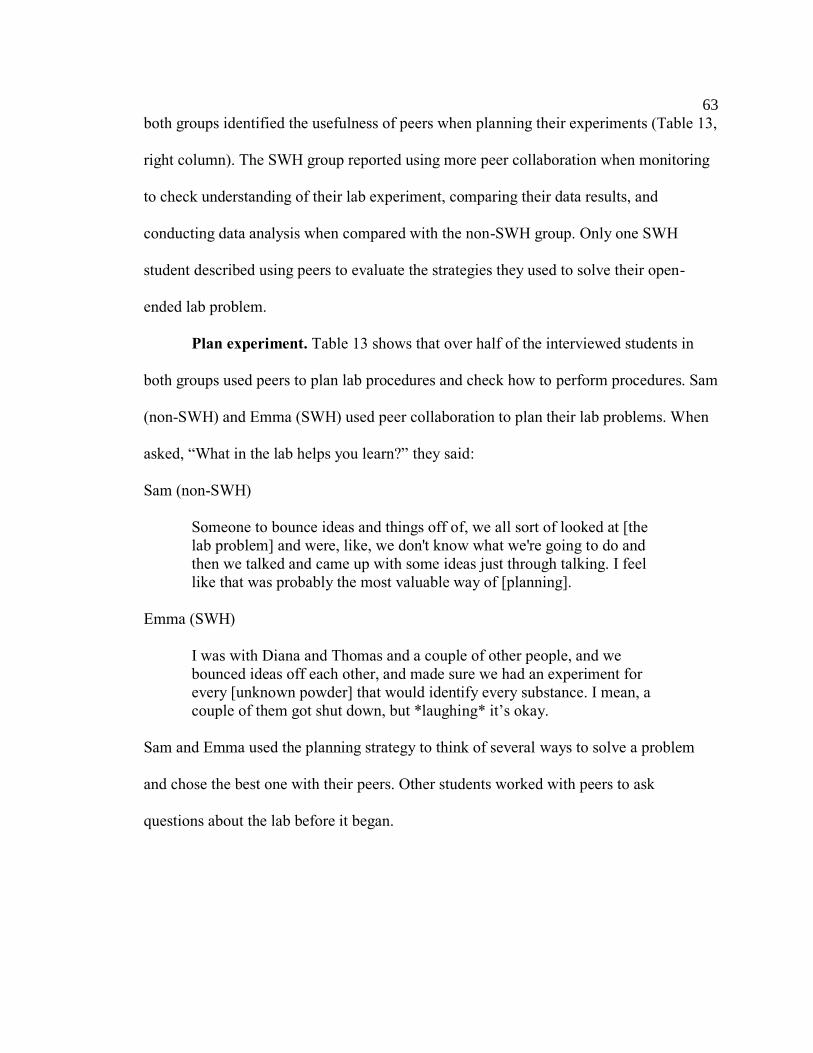
63
both groups identified the usefulness of peers when planning their experiments (Table 13,
right column). The SWH group reported using more peer collaboration when monitoring
to check understanding of their lab experiment, comparing their data results, and
conducting data analysis when compared with the non-SWH group. Only one SWH
student described using peers to evaluate the strategies they used to solve their open-
ended lab problem.
Plan experiment. Table 13 shows that over half of the interviewed students in
both groups used peers to plan lab procedures and check how to perform procedures. Sam
(non-SWH) and Emma (SWH) used peer collaboration to plan their lab problems. When
asked, “What in the lab helps you learn?” they said:
Sam (non-SWH)
Someone to bounce ideas and things off of, we all sort of looked at [the
lab problem] and were, like, we don't know what we're going to do and
then we talked and came up with some ideas just through talking. I feel
like that was probably the most valuable way of [planning].
Emma (SWH)
I was with Diana and Thomas and a couple of other people, and we
bounced ideas off each other, and made sure we had an experiment for
every [unknown powder] that would identify every substance. I mean, a
couple of them got shut down, but *laughing* it’s okay.
Sam and Emma used the planning strategy to think of several ways to solve a problem
and chose the best one with their peers. Other students worked with peers to ask
questions about the lab before it began.
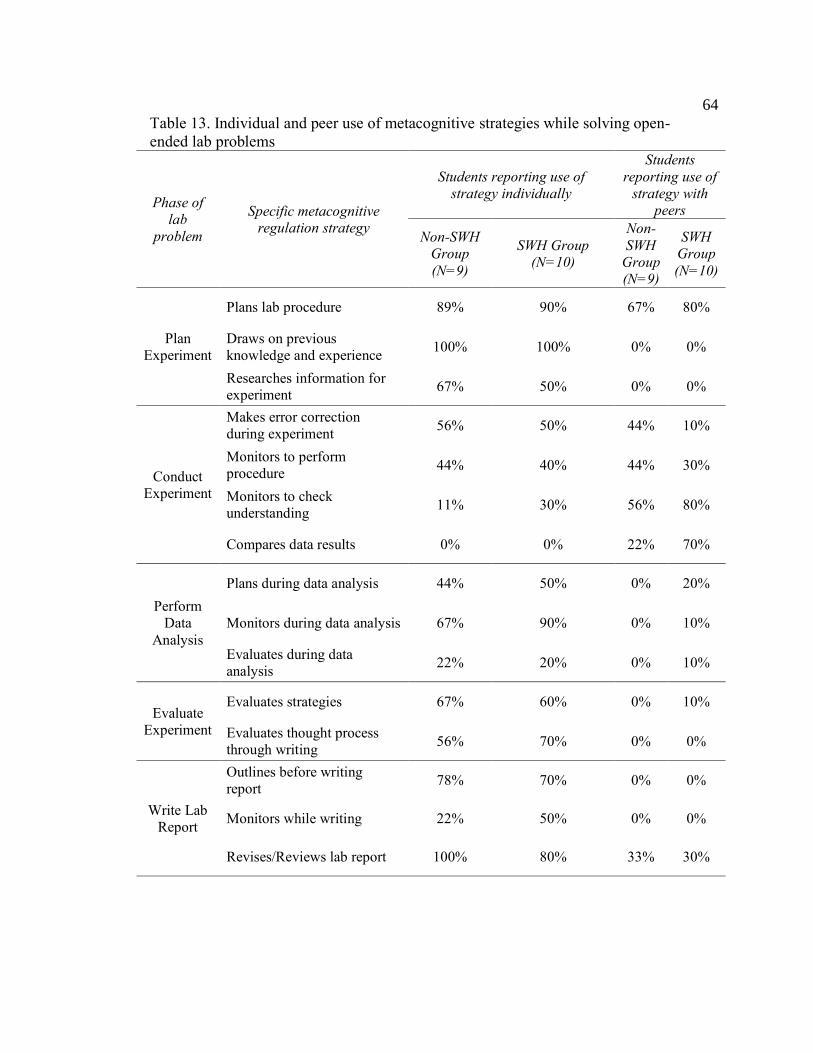
64
Table 13. Individual and peer use of metacognitive strategies while solving open-
ended lab problems
Phase of
lab
problem
Specific metacognitive
regulation strategy
Students reporting use of
strategy individually
Students
reporting use of
strategy with
peers
Non-SWH
Group
(N=9)
SWH Group
(N=10)
Non-
SWH
Group
(N=9)
SWH
Group
(N=10)
Plan
Experiment
Plans lab procedure 89% 90% 67% 80%
Draws on previous
knowledge and experience 100% 100% 0% 0%
Researches information for
experiment 67% 50% 0% 0%
Conduct
Experiment
Makes error correction
during experiment 56% 50% 44% 10%
Monitors to perform
procedure 44% 40% 44% 30%
Monitors to check
understanding 11% 30% 56% 80%
Compares data results 0% 0% 22% 70%
Perform
Data
Analysis
Plans during data analysis 44% 50% 0% 20%
Monitors during data analysis 67% 90% 0% 10%
Evaluates during data
analysis 22% 20% 0% 10%
Evaluate
Experiment
Evaluates strategies 67% 60% 0% 10%
Evaluates thought process
through writing 56% 70% 0% 0%
Write Lab
Report
Outlines before writing
report 78% 70% 0% 0%
Monitors while writing 22% 50% 0% 0%
Revises/Reviews lab report 100% 80% 33% 30%
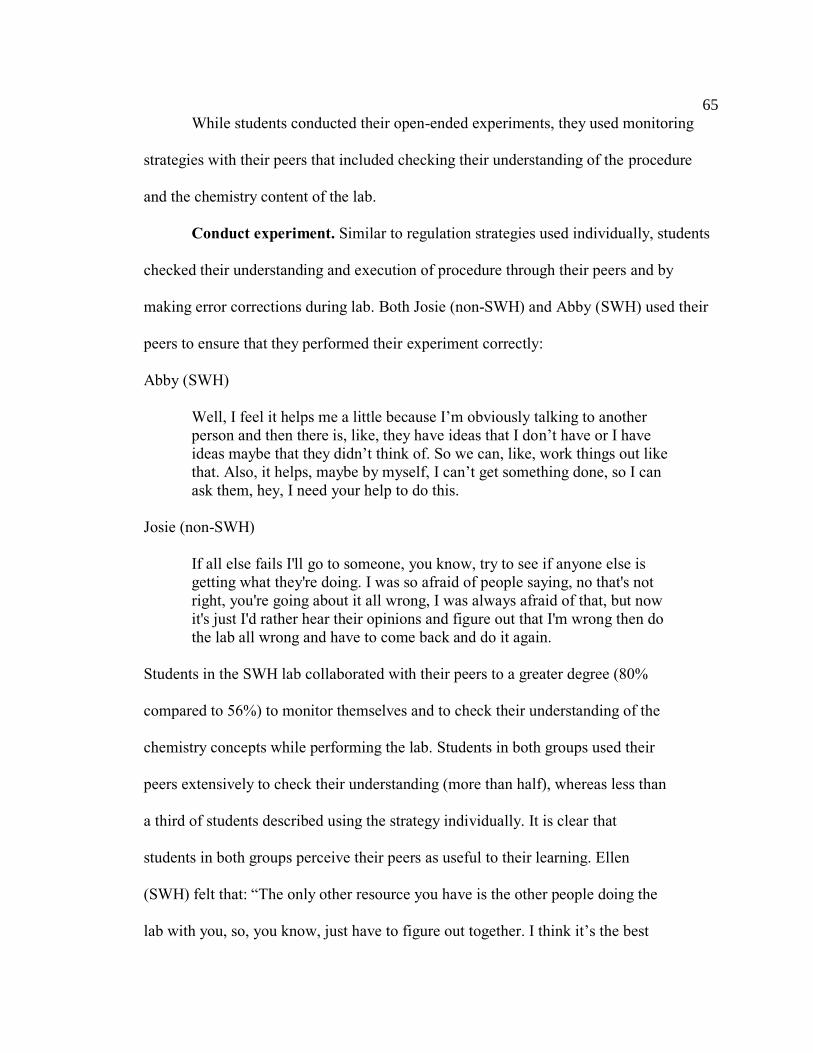
65
While students conducted their open-ended experiments, they used monitoring
strategies with their peers that included checking their understanding of the procedure
and the chemistry content of the lab.
Conduct experiment. Similar to regulation strategies used individually, students
checked their understanding and execution of procedure through their peers and by
making error corrections during lab. Both Josie (non-SWH) and Abby (SWH) used their
peers to ensure that they performed their experiment correctly:
Abby (SWH)
Well, I feel it helps me a little because I’m obviously talking to another
person and then there is, like, they have ideas that I don’t have or I have
ideas maybe that they didn’t think of. So we can, like, work things out like
that. Also, it helps, maybe by myself, I can’t get something done, so I can
ask them, hey, I need your help to do this.
Josie (non-SWH)
If all else fails I'll go to someone, you know, try to see if anyone else is
getting what they're doing. I was so afraid of people saying, no that's not
right, you're going about it all wrong, I was always afraid of that, but now
it's just I'd rather hear their opinions and figure out that I'm wrong then do
the lab all wrong and have to come back and do it again.
Students in the SWH lab collaborated with their peers to a greater degree (80%
compared to 56%) to monitor themselves and to check their understanding of the
chemistry concepts while performing the lab. Students in both groups used their
peers extensively to check their understanding (more than half), whereas less than
a third of students described using the strategy individually. It is clear that
students in both groups perceive their peers as useful to their learning. Ellen
(SWH) felt that: “The only other resource you have is the other people doing the
lab with you, so, you know, just have to figure out together. I think it’s the best
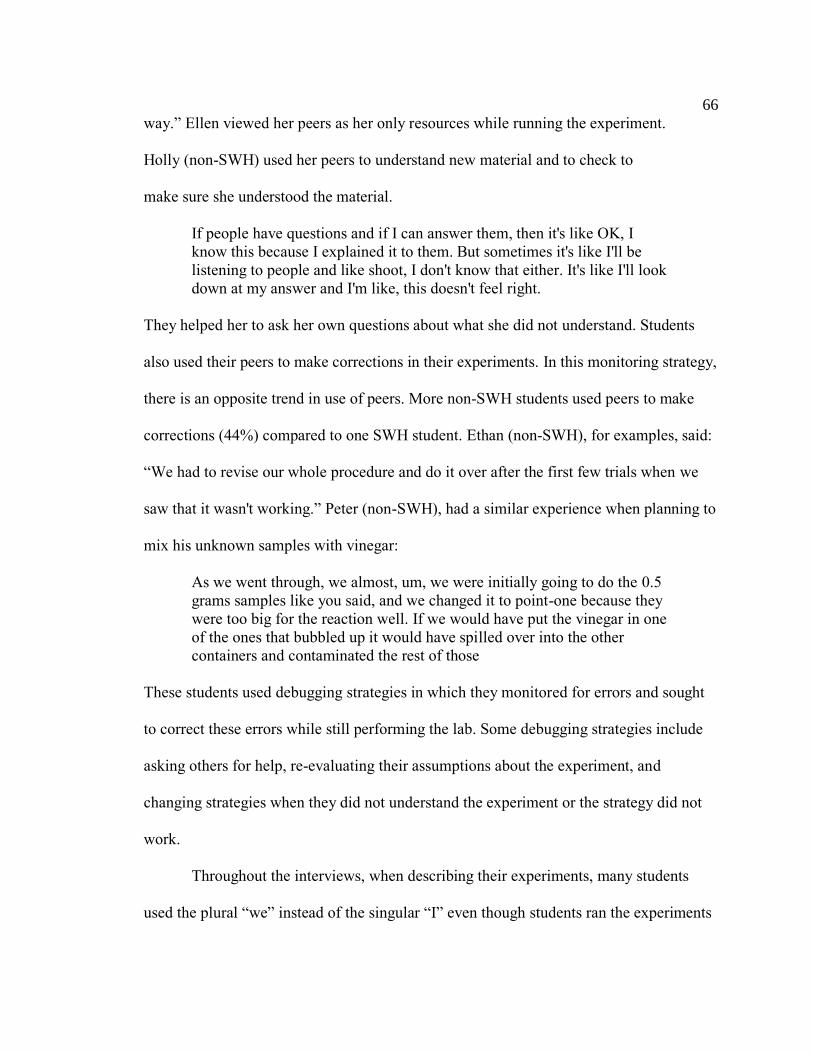
66
way.” Ellen viewed her peers as her only resources while running the experiment.
Holly (non-SWH) used her peers to understand new material and to check to
make sure she understood the material.
If people have questions and if I can answer them, then it's like OK, I
know this because I explained it to them. But sometimes it's like I'll be
listening to people and like shoot, I don't know that either. It's like I'll look
down at my answer and I'm like, this doesn't feel right.
They helped her to ask her own questions about what she did not understand. Students
also used their peers to make corrections in their experiments. In this monitoring strategy,
there is an opposite trend in use of peers. More non-SWH students used peers to make
corrections (44%) compared to one SWH student. Ethan (non-SWH), for examples, said:
“We had to revise our whole procedure and do it over after the first few trials when we
saw that it wasn't working.” Peter (non-SWH), had a similar experience when planning to
mix his unknown samples with vinegar:
As we went through, we almost, um, we were initially going to do the 0.5
grams samples like you said, and we changed it to point-one because they
were too big for the reaction well. If we would have put the vinegar in one
of the ones that bubbled up it would have spilled over into the other
containers and contaminated the rest of those
These students used debugging strategies in which they monitored for errors and sought
to correct these errors while still performing the lab. Some debugging strategies include
asking others for help, re-evaluating their assumptions about the experiment, and
changing strategies when they did not understand the experiment or the strategy did not
work.
Throughout the interviews, when describing their experiments, many students
used the plural “we” instead of the singular “I” even though students ran the experiments
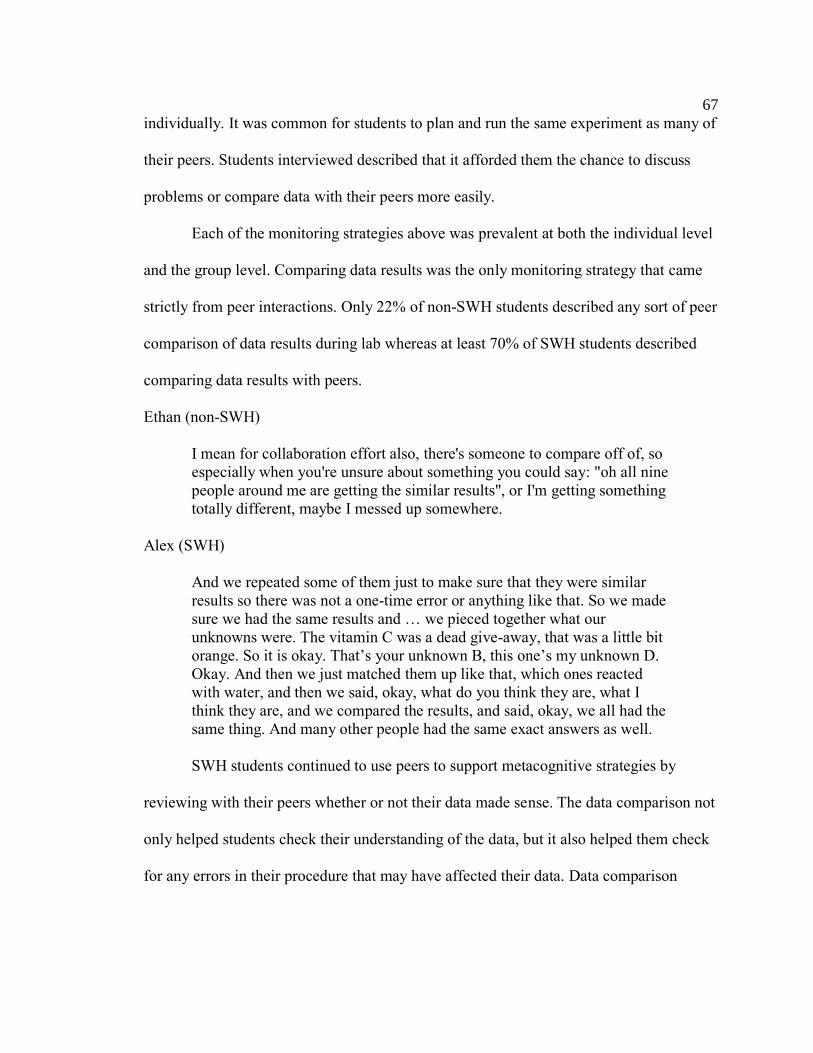
67
individually. It was common for students to plan and run the same experiment as many of
their peers. Students interviewed described that it afforded them the chance to discuss
problems or compare data with their peers more easily.
Each of the monitoring strategies above was prevalent at both the individual level
and the group level. Comparing data results was the only monitoring strategy that came
strictly from peer interactions. Only 22% of non-SWH students described any sort of peer
comparison of data results during lab whereas at least 70% of SWH students described
comparing data results with peers.
Ethan (non-SWH)
I mean for collaboration effort also, there's someone to compare off of, so
especially when you're unsure about something you could say: "oh all nine
people around me are getting the similar results", or I'm getting something
totally different, maybe I messed up somewhere.
Alex (SWH)
And we repeated some of them just to make sure that they were similar
results so there was not a one-time error or anything like that. So we made
sure we had the same results and … we pieced together what our
unknowns were. The vitamin C was a dead give-away, that was a little bit
orange. So it is okay. That’s your unknown B, this one’s my unknown D.
Okay. And then we just matched them up like that, which ones reacted
with water, and then we said, okay, what do you think they are, what I
think they are, and we compared the results, and said, okay, we all had the
same thing. And many other people had the same exact answers as well.
SWH students continued to use peers to support metacognitive strategies by
reviewing with their peers whether or not their data made sense. The data comparison not
only helped students check their understanding of the data, but it also helped them check
for any errors in their procedure that may have affected their data. Data comparison
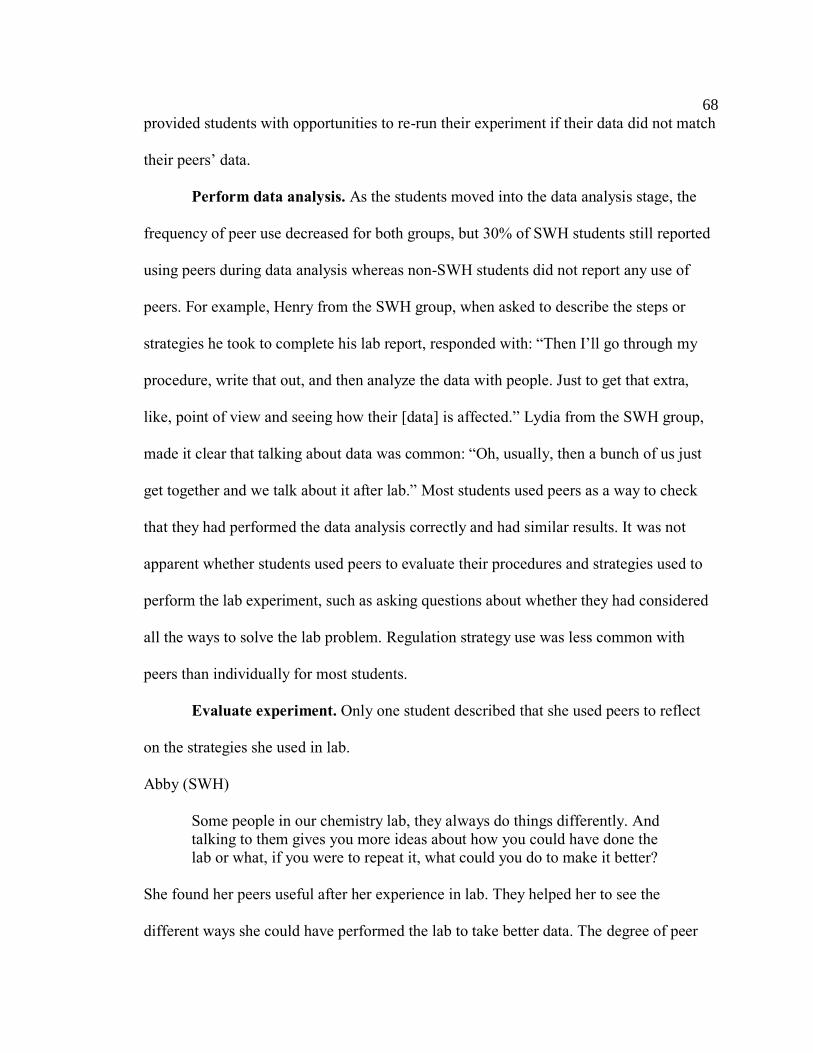
68
provided students with opportunities to re-run their experiment if their data did not match
their peers’ data.
Perform data analysis. As the students moved into the data analysis stage, the
frequency of peer use decreased for both groups, but 30% of SWH students still reported
using peers during data analysis whereas non-SWH students did not report any use of
peers. For example, Henry from the SWH group, when asked to describe the steps or
strategies he took to complete his lab report, responded with: “Then I’ll go through my
procedure, write that out, and then analyze the data with people. Just to get that extra,
like, point of view and seeing how their [data] is affected.” Lydia from the SWH group,
made it clear that talking about data was common: “Oh, usually, then a bunch of us just
get together and we talk about it after lab.” Most students used peers as a way to check
that they had performed the data analysis correctly and had similar results. It was not
apparent whether students used peers to evaluate their procedures and strategies used to
perform the lab experiment, such as asking questions about whether they had considered
all the ways to solve the lab problem. Regulation strategy use was less common with
peers than individually for most students.
Evaluate experiment. Only one student described that she used peers to reflect
on the strategies she used in lab.
Abby (SWH)
Some people in our chemistry lab, they always do things differently. And
talking to them gives you more ideas about how you could have done the
lab or what, if you were to repeat it, what could you do to make it better?
She found her peers useful after her experience in lab. They helped her to see the
different ways she could have performed the lab to take better data. The degree of peer
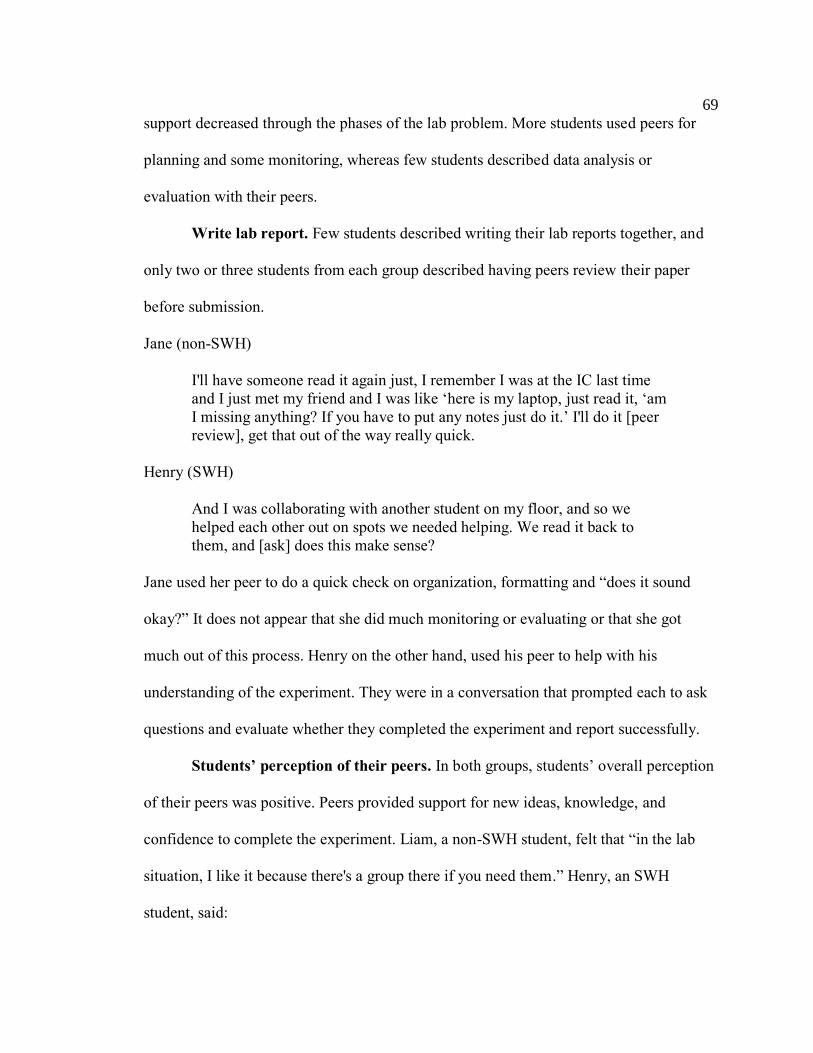
69
support decreased through the phases of the lab problem. More students used peers for
planning and some monitoring, whereas few students described data analysis or
evaluation with their peers.
Write lab report. Few students described writing their lab reports together, and
only two or three students from each group described having peers review their paper
before submission.
Jane (non-SWH)
I'll have someone read it again just, I remember I was at the IC last time
and I just met my friend and I was like ‘here is my laptop, just read it, ‘am
I missing anything? If you have to put any notes just do it.’ I'll do it [peer
review], get that out of the way really quick.
Henry (SWH)
And I was collaborating with another student on my floor, and so we
helped each other out on spots we needed helping. We read it back to
them, and [ask] does this make sense?
Jane used her peer to do a quick check on organization, formatting and “does it sound
okay?” It does not appear that she did much monitoring or evaluating or that she got
much out of this process. Henry on the other hand, used his peer to help with his
understanding of the experiment. They were in a conversation that prompted each to ask
questions and evaluate whether they completed the experiment and report successfully.
Students’ perception of their peers. In both groups, students’ overall perception
of their peers was positive. Peers provided support for new ideas, knowledge, and
confidence to complete the experiment. Liam, a non-SWH student, felt that “in the lab
situation, I like it because there's a group there if you need them.” Henry, an SWH
student, said:
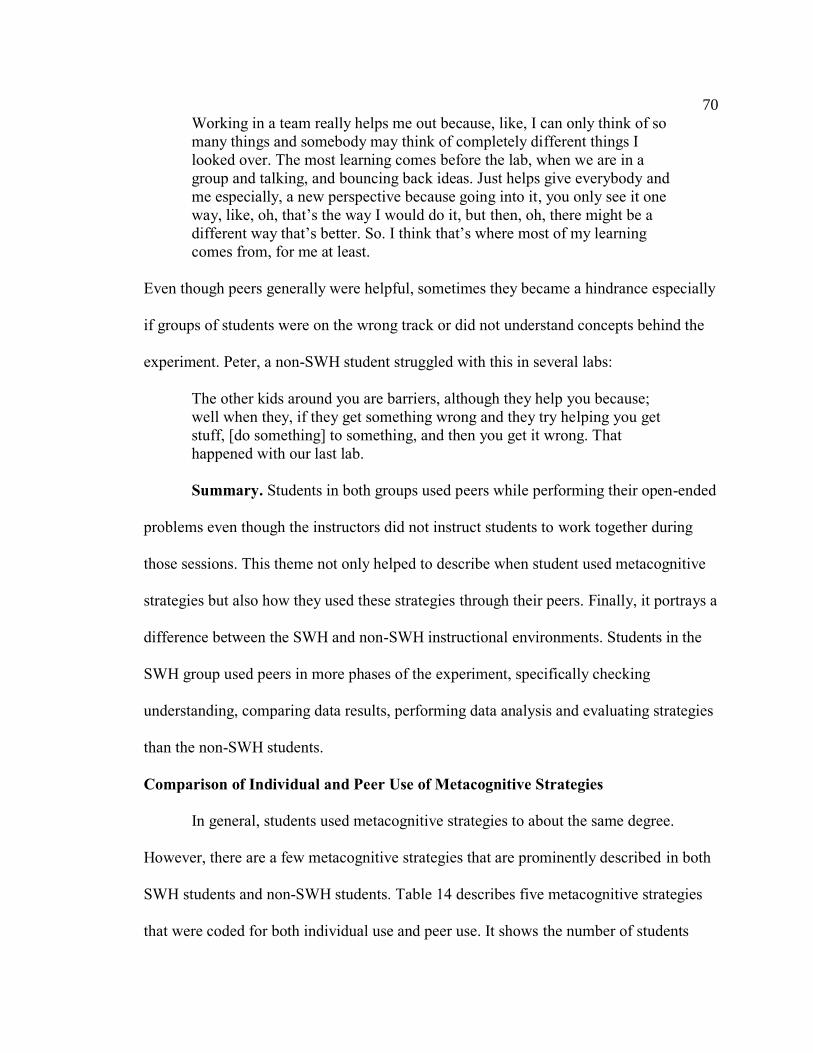
70
Working in a team really helps me out because, like, I can only think of so
many things and somebody may think of completely different things I
looked over. The most learning comes before the lab, when we are in a
group and talking, and bouncing back ideas. Just helps give everybody and
me especially, a new perspective because going into it, you only see it one
way, like, oh, that’s the way I would do it, but then, oh, there might be a
different way that’s better. So. I think that’s where most of my learning
comes from, for me at least.
Even though peers generally were helpful, sometimes they became a hindrance especially
if groups of students were on the wrong track or did not understand concepts behind the
experiment. Peter, a non-SWH student struggled with this in several labs:
The other kids around you are barriers, although they help you because;
well when they, if they get something wrong and they try helping you get
stuff, [do something] to something, and then you get it wrong. That
happened with our last lab.
Summary. Students in both groups used peers while performing their open-ended
problems even though the instructors did not instruct students to work together during
those sessions. This theme not only helped to describe when student used metacognitive
strategies but also how they used these strategies through their peers. Finally, it portrays a
difference between the SWH and non-SWH instructional environments. Students in the
SWH group used peers in more phases of the experiment, specifically checking
understanding, comparing data results, performing data analysis and evaluating strategies
than the non-SWH students.
Comparison of Individual and Peer Use of Metacognitive Strategies
In general, students used metacognitive strategies to about the same degree.
However, there are a few metacognitive strategies that are prominently described in both
SWH students and non-SWH students. Table 14 describes five metacognitive strategies
that were coded for both individual use and peer use. It shows the number of students
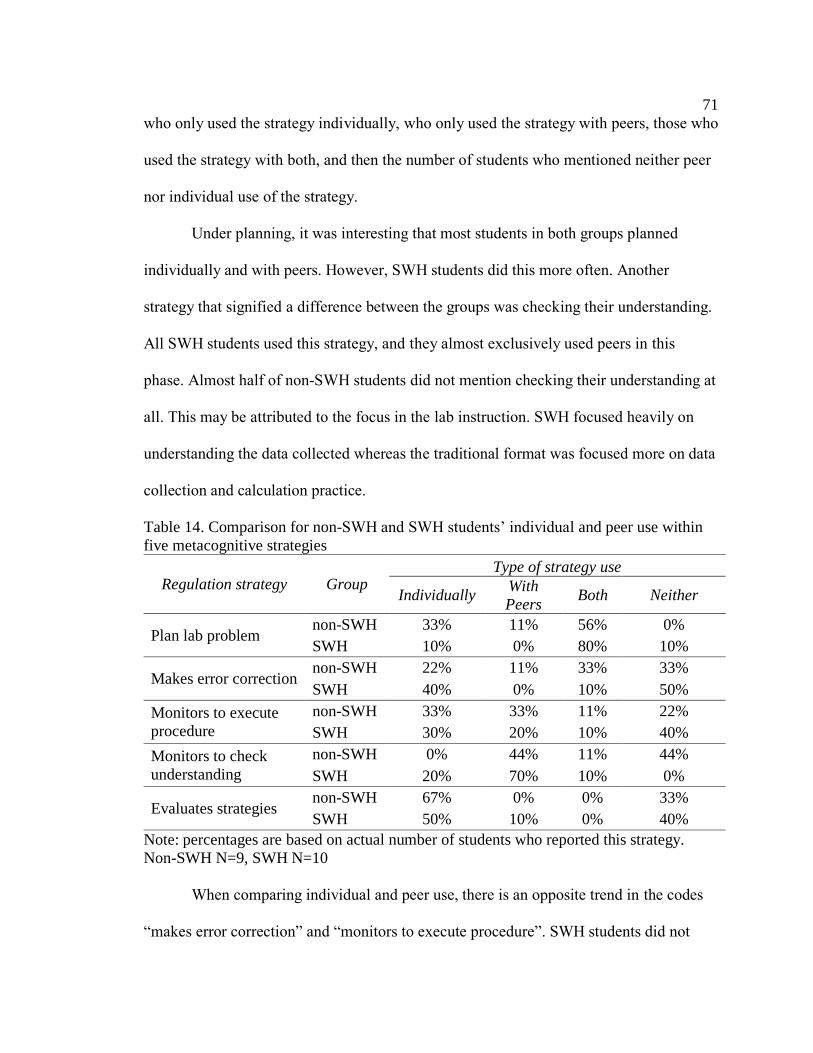
71
who only used the strategy individually, who only used the strategy with peers, those who
used the strategy with both, and then the number of students who mentioned neither peer
nor individual use of the strategy.
Under planning, it was interesting that most students in both groups planned
individually and with peers. However, SWH students did this more often. Another
strategy that signified a difference between the groups was checking their understanding.
All SWH students used this strategy, and they almost exclusively used peers in this
phase. Almost half of non-SWH students did not mention checking their understanding at
all. This may be attributed to the focus in the lab instruction. SWH focused heavily on
understanding the data collected whereas the traditional format was focused more on data
collection and calculation practice.
Table 14. Comparison for non-SWH and SWH students’ individual and peer use within
five metacognitive strategies
Regulation strategy Group Type of strategy use
Individually With
Peers Both Neither
Plan lab problem non-SWH 33% 11% 56% 0%
SWH 10% 0% 80% 10%
Makes error correction non-SWH 22% 11% 33% 33%
SWH 40% 0% 10% 50%
Monitors to execute
procedure
non-SWH 33% 33% 11% 22%
SWH 30% 20% 10% 40%
Monitors to check
understanding
non-SWH 0% 44% 11% 44%
SWH 20% 70% 10% 0%
Evaluates strategies non-SWH 67% 0% 0% 33%
SWH 50% 10% 0% 40%
Note: percentages are based on actual number of students who reported this strategy.
Non-SWH N=9, SWH N=10
When comparing individual and peer use, there is an opposite trend in the codes
“makes error correction” and “monitors to execute procedure”. SWH students did not
72
describe error correction or monitoring to check they are performing the experiment
correctly as much as non-SWH students. It is possible that SWH students did not use
these strategies because they felt it was unnecessary. As SWH students planned
individually and together, it is possible that since they had a better prepared procedure,
they did not need to check on their execution of the experiment nor did they run into as
many errors during the experiment. Perhaps in this way, they had more time to focus on
understanding the data. Evaluation was the only strategy in which both groups
exclusively practiced this individually or not at all. It is clear that both groups used
strategies to various degrees, with and without peers.
Students Experience Differential Support from Structure of Weekly Instructional
Labs
Students’ responses about metacognitive strategy use during open-ended lab
problems were affected by their weekly experiences with the instructional format (SWH
or non-SWH). This theme reveals a difference between SWH and non-SWH instructional
environments and students’ experience of metacognitive strategy use. Students were
asked in the interview “How do you think the weekly [SWH or regular] lab experiments
prepare you to solve and report on the open-ended lab problems?” The non-SWH and
SWH groups did not describe similar experiences when asked whether their weekly
instructional labs (non-SWH or SWH) supported them solving the open-ended problems.
It became clear from the interviews that the weekly SWH lab experiments provided
students with more effective opportunities to transfer metacognitive regulation strategies
from the weekly labs to the open-ended lab problems than the non-SWH weekly
experiments. SWH students described that the lab problems were comparable to their
SWH experiments, whereas the non-SWH group found little to no connection between
73
their weekly traditional labs and the open-ended problems. Charles (non-SWH) replied to
the above question with:
I would say it [the weekly experiment] gives me, like, a general direction
of where to go with the lab problems. How to start, I guess, and how to
approach coming up with a procedure. But other than that I think they're
kind of different, so I don't know. I kind of have trouble seeing any direct
correlation between them.
Charles found that his weekly lab experience did not support or prompt him to think
about how to solve the open-ended problems. Sam, a non-SWH student who had
performed open-ended lab problems in high school, found the lab problems easy and
thought that the scientific method in general provided structure. He responded to the
same interview question with:
I guess just through all of my, like, chemistry experiences, even high
school, there is a set structure that everything is supposed to [go through],
you make the procedure and then you make a hypothesis, then you make a
procedure, and then you perform it. So, like, that structure is still the
expectation in the lab problems. And I mean that's the proven scientific
method.
Students in the non-SWH group who may have not had as much experience with lab
problems from prior courses as Sam felt lost while performing the open-ended lab
problems. Some cited that they always needed examples to start something. With respect
to the open-ended problems compared to the traditional weekly labs, Holly said, “Yeah,
my senses are overloaded, and I don't know where to begin.” She struggled to find
support for the open-ended problems from her weekly labs,
I think they show good examples of how the lab, the write-up should be
setup. So, I try to draw from that. And it gives you more experience for
when you have like to setup a problem or know like when the um, like
whether to use like the reaction plates or like the test tubes, and that’s
about it.
74
Like many other non-SWH students and as Holly and Charles mentioned, the
traditional instructional environment did not provide support for how to think about
solving the problem. Contrarily, SWH students felt that the weekly SWH labs provided
support to solve their open-ended lab problems. Often they cited that SWH labs and lab
problems were about the same difficulty, and sometimes lab problems were easier than
the SWH labs.
SWH provides structure for thinking process. SWH students thought SWH
labs provided both writing and thinking frameworks for solving the open-ended lab
problems. Answering the question, “How do the SWH labs help you to prepare for the
lab problems?” Sophie, an SWH student, shared that:
[An SWH lab experiment] helps me to process things and think through
things. Like, if I can’t deal with certain things. Like, with the
phenolphthalein, I just couldn’t just put it with the solids. You have to
dissolve it with water. It helps me think more, if we do the group
discussions or just thinking.
The SWH instructional format provided Sophie with instances in which she described
using metacognitive strategies, including monitoring her knowledge and correcting for
errors that occurred in lab. Thomas explained that the repetition of the SWH labs helped
him to know what to think about when performing and reporting on the lab problems.
“You just, you know what things to think about, or what things to write about from doing
so many SWHs.” Each step of the SWH was repeated each week in lab. Students were
reminded in lab how to set up an experiment, and the report template prompted students
while planning and writing. This consistency is a crucial component of the SWH that
helped students to see this instructional framework as the natural way to think in lab.
SWH encourages self-questioning. Forty percent of the SWH students found
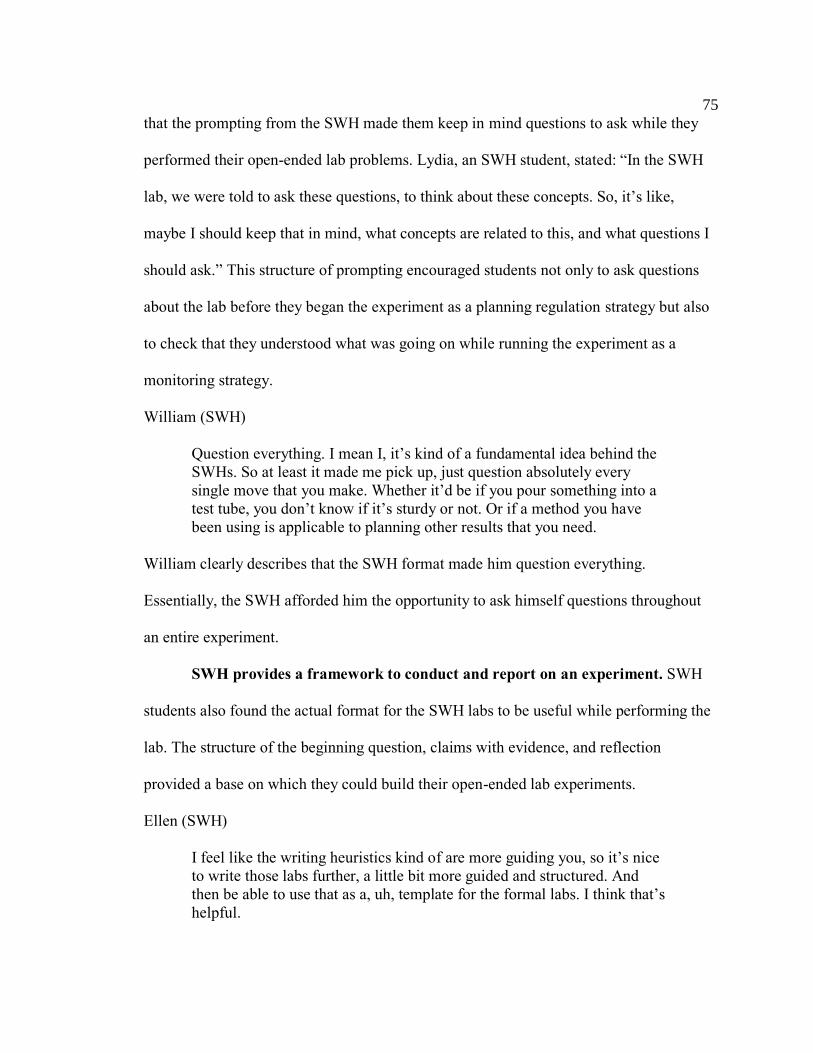
75
that the prompting from the SWH made them keep in mind questions to ask while they
performed their open-ended lab problems. Lydia, an SWH student, stated: “In the SWH
lab, we were told to ask these questions, to think about these concepts. So, it’s like,
maybe I should keep that in mind, what concepts are related to this, and what questions I
should ask.” This structure of prompting encouraged students not only to ask questions
about the lab before they began the experiment as a planning regulation strategy but also
to check that they understood what was going on while running the experiment as a
monitoring strategy.
William (SWH)
Question everything. I mean I, it’s kind of a fundamental idea behind the
SWHs. So at least it made me pick up, just question absolutely every
single move that you make. Whether it’d be if you pour something into a
test tube, you don’t know if it’s sturdy or not. Or if a method you have
been using is applicable to planning other results that you need.
William clearly describes that the SWH format made him question everything.
Essentially, the SWH afforded him the opportunity to ask himself questions throughout
an entire experiment.
SWH provides a framework to conduct and report on an experiment. SWH
students also found the actual format for the SWH labs to be useful while performing the
lab. The structure of the beginning question, claims with evidence, and reflection
provided a base on which they could build their open-ended lab experiments.
Ellen (SWH)
I feel like the writing heuristics kind of are more guiding you, so it’s nice
to write those labs further, a little bit more guided and structured. And
then be able to use that as a, uh, template for the formal labs. I think that’s
helpful.
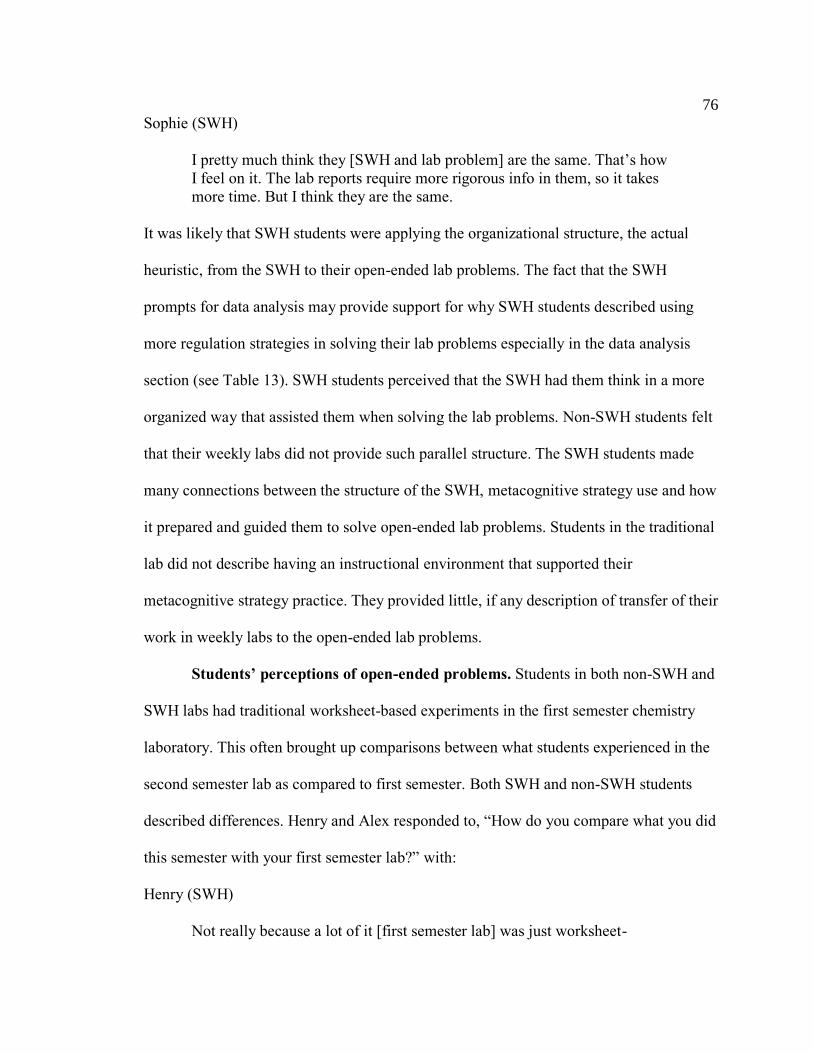
76
Sophie (SWH)
I pretty much think they [SWH and lab problem] are the same. That’s how
I feel on it. The lab reports require more rigorous info in them, so it takes
more time. But I think they are the same.
It was likely that SWH students were applying the organizational structure, the actual
heuristic, from the SWH to their open-ended lab problems. The fact that the SWH
prompts for data analysis may provide support for why SWH students described using
more regulation strategies in solving their lab problems especially in the data analysis
section (see Table 13). SWH students perceived that the SWH had them think in a more
organized way that assisted them when solving the lab problems. Non-SWH students felt
that their weekly labs did not provide such parallel structure. The SWH students made
many connections between the structure of the SWH, metacognitive strategy use and how
it prepared and guided them to solve open-ended lab problems. Students in the traditional
lab did not describe having an instructional environment that supported their
metacognitive strategy practice. They provided little, if any description of transfer of their
work in weekly labs to the open-ended lab problems.
Students’ perceptions of open-ended problems. Students in both non-SWH and
SWH labs had traditional worksheet-based experiments in the first semester chemistry
laboratory. This often brought up comparisons between what students experienced in the
second semester lab as compared to first semester. Both SWH and non-SWH students
described differences. Henry and Alex responded to, “How do you compare what you did
this semester with your first semester lab?” with:
Henry (SWH)
Not really because a lot of it [first semester lab] was just worksheet-
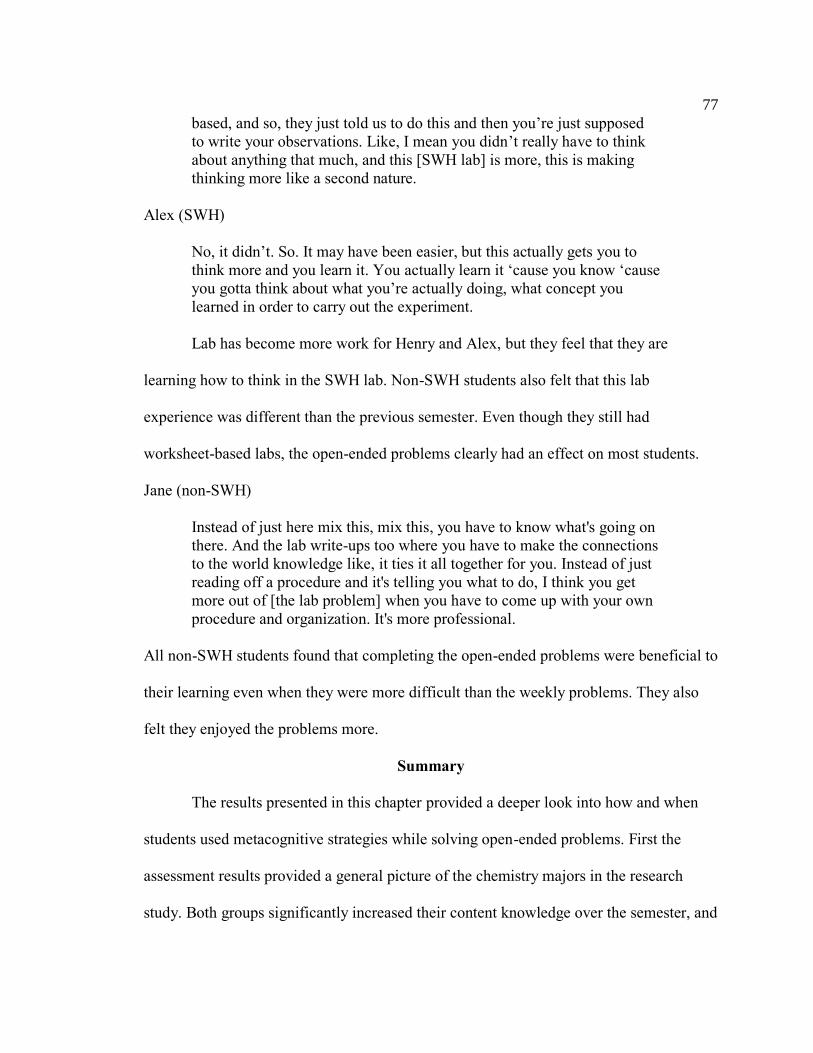
77
based, and so, they just told us to do this and then you’re just supposed
to write your observations. Like, I mean you didn’t really have to think
about anything that much, and this [SWH lab] is more, this is making
thinking more like a second nature.
Alex (SWH)
No, it didn’t. So. It may have been easier, but this actually gets you to
think more and you learn it. You actually learn it ‘cause you know ‘cause
you gotta think about what you’re actually doing, what concept you
learned in order to carry out the experiment.
Lab has become more work for Henry and Alex, but they feel that they are
learning how to think in the SWH lab. Non-SWH students also felt that this lab
experience was different than the previous semester. Even though they still had
worksheet-based labs, the open-ended problems clearly had an effect on most students.
Jane (non-SWH)
Instead of just here mix this, mix this, you have to know what's going on
there. And the lab write-ups too where you have to make the connections
to the world knowledge like, it ties it all together for you. Instead of just
reading off a procedure and it's telling you what to do, I think you get
more out of [the lab problem] when you have to come up with your own
procedure and organization. It's more professional.
All non-SWH students found that completing the open-ended problems were beneficial to
their learning even when they were more difficult than the weekly problems. They also
felt they enjoyed the problems more.
Summary
The results presented in this chapter provided a deeper look into how and when
students used metacognitive strategies while solving open-ended problems. First the
assessment results provided a general picture of the chemistry majors in the research
study. Both groups significantly increased their content knowledge over the semester, and
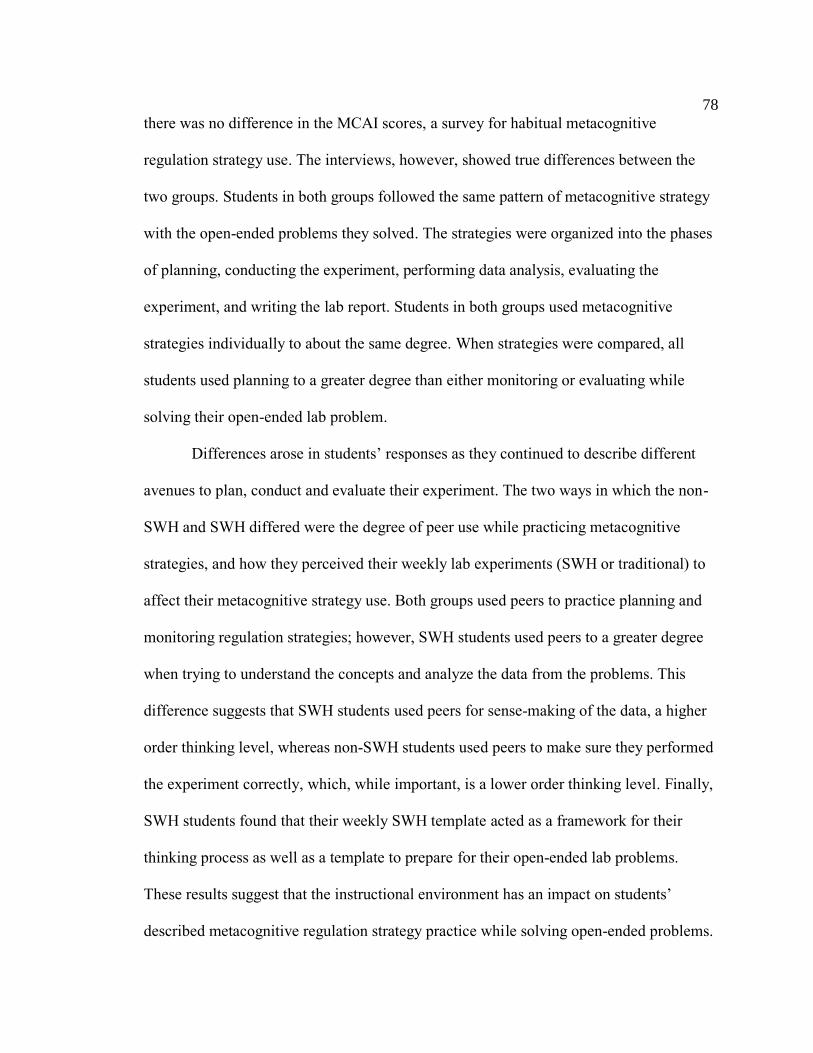
78
there was no difference in the MCAI scores, a survey for habitual metacognitive
regulation strategy use. The interviews, however, showed true differences between the
two groups. Students in both groups followed the same pattern of metacognitive strategy
with the open-ended problems they solved. The strategies were organized into the phases
of planning, conducting the experiment, performing data analysis, evaluating the
experiment, and writing the lab report. Students in both groups used metacognitive
strategies individually to about the same degree. When strategies were compared, all
students used planning to a greater degree than either monitoring or evaluating while
solving their open-ended lab problem.
Differences arose in students’ responses as they continued to describe different
avenues to plan, conduct and evaluate their experiment. The two ways in which the non-
SWH and SWH differed were the degree of peer use while practicing metacognitive
strategies, and how they perceived their weekly lab experiments (SWH or traditional) to
affect their metacognitive strategy use. Both groups used peers to practice planning and
monitoring regulation strategies; however, SWH students used peers to a greater degree
when trying to understand the concepts and analyze the data from the problems. This
difference suggests that SWH students used peers for sense-making of the data, a higher
order thinking level, whereas non-SWH students used peers to make sure they performed
the experiment correctly, which, while important, is a lower order thinking level. Finally,
SWH students found that their weekly SWH template acted as a framework for their
thinking process as well as a template to prepare for their open-ended lab problems.
These results suggest that the instructional environment has an impact on students’
described metacognitive regulation strategy practice while solving open-ended problems.
79
CHAPTER FIVE
DISCUSSION
The following chapter discusses how the interview and survey data results that
were obtained and interpreted answer the two research questions:
How does the process by which students solve and report on open-ended
laboratory problems reveal use of metacognitive regulation strategies?
Does the type of laboratory instructional environment (SWH vs.
Traditional) that students regularly experience elicit any differences in
students’ use of metacognitive regulation strategies while solving open-
ended laboratory problems?
The discussion addresses the findings for both questions. First, the process by which the
students solved the open-ended problems is discussed. This is followed by an exploration
of similarities found between the two groups descriptions of strategy use and lab
experience. The assessment results are discussed to describe why the two groups may be
similar. Finally, the key differences in the two groups’ strategy use and support of their
strategy use is discussed through interviews. The type of weekly instructional
environment (SWH and non-SWH) elicits qualitative differences in the types and degrees
of use of these regulation strategies.
80
Similarities between SWH and Non-SWH Students
Research shows that while undergraduate students have some natural
metacognitive ability (Garner & Alexander, 1989) and also demonstrate some
metacognitive strategy use, it is less than they could be using. In two studies, students
often had opportunities to employ metacognitive strategies to a greater degree but did not
act on the opportunities (Armstrong, Wallace, & Chang, 2008; Kung & Linder, 2007).
Clearly, students use metacognitive strategies although they may or may not be aware of
these strategies. The interviews revealed that most SWH and non-SWH students
practiced metacognitive strategies including planning, monitoring and evaluating by
themselves. These strategies were described in five phases: (1) plan experiment, (2)
conduct experiment, (3) analyze data, (4) evaluate experiment, and (5) write report.
Generally, students practiced planning strategies more than monitoring or evaluating in
conducting and reporting on their experiment.
MCAI Results
It was hypothesized that students in the SWH group might have higher MCAI
scores after completion of the semester. It was reasoned that students would be implicitly
experiencing metacognitive regulation practice during SWH labs because the
instructional environment was inquiry-based, collaborative with reflective prompting.
These three characteristics have been shown to support metacognitive strategy practice.
SWH students were also provided with two opportunities to learn about how
metacognitive strategies were related to the SWH and how these strategies might be
useful to them. Such identification and discussion of metacognitive strategies with
81
students might help them better understand why they are using the strategies (Bielaczyc,
Pirolli, & Brown, 1995).
Yet, based on the MCAI results, students in the SWH were equivalent to non-
SWH students on self-reported strategy use at the end of the course. There are several
factors that might explain the lack of difference between groups. The MCAI asks students
only about their individual use of strategies (Cooper & Sandi-Urena, 2009) which align
with the interview results where students in both groups described using the same pattern
of strategies and approximately the same number of strategies individually. Students in
both groups started with high pre-study scores around 80%. In two previous research
studies, the MCAI scores of first semester general chemistry students were around 75%
(Cooper & Sandi-Urena, 2009; Sandi-Urena S., Cooper M.M., & Stevens R.H., 2011).
The average of MCAI scores for first-year graduate students was about 80% (Cooper &
Sandi-Urena, 2009). The students in this study had scores similar to first-year graduate
students rather than general chemistry students. As a higher inventory score indicates
greater metacognitive strategy use, it is likely that the chemistry majors in this study were
already highly metacognitive as defined by the inventory. The high pre-score may cause a
potential ceiling effect where students are not likely to report a much higher inventory
score. Thus the change from pre- to post- may be too small.
It is also possible that the MCAI could not detect the differences in behaviors that
the students described in the interviews because the effect of the instructional
environment may be delayed or students needed to experience the environment longer to
report any difference in their strategy use. Finally, students may not report a difference in
82
metacognitive behavior on this survey because of their lack of awareness of the
strategies. Piaget’s theory of regulation suggests that using regulation strategies may not
be always be a conscious experience. Therefore, it is also possible that students use
strategies but they are not aware of the strategies enough to recognize their use of them
(Brown, 1987) or rate them on a survey.
Correlation between ACS scores and MCAI scores. The results showed that
students’ self-reported regulation strategy use, the MCAI results, was moderately
correlated with their final ACS exam score and with final course grade. A higher post-
ACS exam score generally indicated a higher post-MCAI score. Previous research has
shown that metacognitive abilities are moderately correlated with learning performance
and a student’s grade in the course (Cooper & Sandi-Urena, 2009; Veenman, Kok, &
Blöte, 2005). The SWH group had a higher correlation value between both the MCAI and
ACS scores and MCAI and final course grade than the non-SWH group.
Metacognitive strategy use and content knowledge. The results showed that
groups were equivalent on the pre-and post-ACS exam scores. Students in both groups
also increased equally from pre- to post-score. It was reasoned that students in the SWH
group might have higher scores based on previous research from Greenbowe and Hand
(2005). They found that students who participated in an SWH lab and a lecture course
had significantly higher scores on the 1st term ACS exam than non-SWH students in the
lecture course. This research approach varied from the Greenbowe and Hand (2005)
study in two ways. SWH was only taught second semester and the second semester
lecture course for each group was taught using the POGIL method by the same professor,
83
not through traditional lecture as in the SWH comparison study. Although SWH had an
effect on content knowledge in the comparison study, the POGIL method in the lecture
course may have overshadowed any differences in the study. When compared with
lecture, research supports that POGIL significantly increases content knowledge scores
on algorithmic and conceptual exam questions (Daubenmire & Bunce, 2008; Lewis &
Lewis, 2005b; Straumanis & Simons, 2008). Both groups exhibited the same pattern of
statistically significant growth in scores from the 1st term ACS exam to the 2nd term ACS
exam (Table 9). These results suggest that the difference in laboratory environment did
not affect students’ content knowledge as measured by the ACS exams while in the
study.
Writing and Metacognitive Strategy Use
During the writing phase, students in both groups used metacognitive strategies to
about the same degree. When asked how writing helped them learn, most students felt
that writing was useful particularly in a reflective manner such that they could see what
they knew and did not know. Writing helped them see the gaps in their knowledge, after
which they could take steps to close those gaps (Emig, 1977; Klein, 1999). Students in
the SWH group described more often that they monitored themselves while writing. This
may be attributed to the focus in the SWH template on checking that one’s argument
makes sense. The interview results have some agreement with previous research that
showed that students who were provided with instances to practice metacognitive
strategy use while writing used more metacognitive strategies (McCrindle & Christensen,
1995). Students in this study wrote the lab report in the same style based on the same
84
rubric. During instruction, the TAs did not show students how writing their weekly lab
reports might support them to write their open-ended lab reports. Both groups scored an
average of 85% on their five lab reports. A recent pilot research study found that students
who experienced an SWH style lab compared to a traditional lab scored no differently
when asked to write a formal summary lab report in which they had to support an
argument with their data. However, SWH students were significantly more likely to
receive a higher score on the argument in the report (Cronje, Murray, Rohlinger, &
Wellnitz, 2013). Although, the arguments in the lab reports were not scored separately in
this study, SWH students may be able to better formulate their data and support their
argument properly with the evidence. The ability to support an argument correlates with
metacognitive strategies use (Klein, 2004).
Differences between SWH and Non-SWH Students
Although the assessments and report writing did not indicate differences between
the SWH and non-SWH groups, the interview results provided two substantial
differences in the students’ choice to use metacognitive regulation strategies. The
differences that arose between the instructional environments involved peer support and
support from the structure of weekly laboratory experiences for metacognitive strategy
use. These differences indicated behaviors that SWH students tended to practice more
metacognitive strategies while conducting and reporting on their open-ended problems
than non-SWH students. The type of instructional environment that students experience
can shape students’ behavior and practice of metacognitive regulation strategies.
85
Peers Support Practice of Metacognitive Strategies
The first distinguishing feature between the two instructional environments is that
students in the SWH group described using their peers for regulation activities to a
greater degree than the non-SWH group. The finding that students employ peers for
metacognitive strategy use is supported in other research as well (Sandi-Urena S. et al.,
2011; Sandi-Urena, Cooper, & Stevens, 2012). Their research found that when students
worked in groups to solve ill-structured problems, students not only used metacognitive
regulation strategies, but also reported more strategy use over the intervention period.
This research expands on these results to describe how students used their peers
during the phases of solving the open-ended lab problems (Table 12) to support their
strategy use. Even though both groups used peers to about the same degree in planning
and checking that they were performing the procedure correctly, SWH students used
peers to support metacognitive regulation to a greater degree to check their understanding
of the experiment, to compare data and to perform data analysis. Students sought out
different points of view from peers to support their strategy use while conducting the
experiment. These results are supported by Grimberg (2007) in her analysis of students’
reflective actions in an SWH environment.
By checking with their peers about procedural steps, both non-SWH and SWH
students monitored their procedures in order to get reliable data for analysis. For the non-
SWH students, the use of peer support seemed to stop there. They did not use their peers
much to foster understanding for why they were doing the experiment. SWH students, on
the other hand, used their peers to monitor and to help them understand what was
86
happening in the experiment and how this knowledge might be used for data analysis.
Kung and Linder (2007) observed students’ metacognitive behavior in a physics lab.
They found that students made metacognitive statements, but students did not always act
on those statements. Students who did act on their statements appeared to participate in
more sense-making by discussing the concepts and data from the experiment. SWH
students may be experiencing more of this sense-making while conducting the
experiment and performing data analysis. They spent more time on higher order thinking.
The instances in which students compared data with peers while conducting the
experiment informed decisions about running more trials and helped them check whether
they had consistent results.
Only SWH students reported using their peers outside instructional time in order
to gather another viewpoint on their data as a way to support their data evaluation. Again,
the instructional setting may have influenced this decision. SWH students worked
together to form beginning questions, decide on procedures, and compare data results
during weekly lab instruction. In addition to using their peers to perform data analysis,
students elected to use their peers while they planned for the experiment and wrote lab
reports. Each of these instances was an unstructured situation outside of the laboratory
time. Students who use peers to practice regulation strategies may be able to more easily
integrate these strategies into their own learning framework and use them effectively
(Hodson & Hodson, 1998). Working with peers also provided students instances where
they used metacognitive strategies socially which may allow for eventual internal use of
87
these strategies by the individual students (Kuhn, 2000). The elective use of peers likely
pushed students to gain more expert-like skills while solving the open-ended problems.
Non-SWH students did not describe any use of peers when performing data
analysis or evaluation although some described use of peers while report writing. The
non-SWH “traditional” labs in this study did not explicitly prompt students to work
together to plan, monitor, or evaluate their experiments. This may explain why students
in non-SWH, traditional lab courses used peers less during metacognitive regulation. It is
not part of their regular practice to use peers. Even though non-SWH students did not
describe collaborating with peers much during laboratory time and very little outside of
the laboratory time, their overall perception of using their peers was positive which is
shown in other studies (Cooper & Kerns, 2006).
SWH Supports Practice of Metacognitive Strategies
The second distinguishing feature between instructional settings was students’
descriptions of how their weekly (SWH or traditional) labs helped them to structure their
open-ended lab problems. Overall, SWH students indicated that their regulation strategy
use was impacted by the structure of the SWH when solving open-ended lab problems.
The SWH supported them through the prompting from the SWH template as well as the
inquiry-based pedagogy. They felt that the SWH provided them a template to prepare
open-ended problems as well as a scaffold for how to think and process knowledge.
These results are in agreement with two other studies on SWH instruction in secondary
school age students (Grimberg, 2007; Hohenshell & Hand, 2006). Both studies
maintained that students demonstrated behaviors consistent with metacognitive
88
awareness and strategy use when prompted by the reflective statements in their SWH
labs. When students were asked in the interview about how their weekly lab supported
their open-ended problem-solving, only SWH students responded that the prompting
from their weekly labs helped them solve their open-ended problems. A recent study
found that when students used the SWH template for report writing, their use of reflective
statements was greater in guided inquiry labs compared to verification style labs (Xu &
Talanquer, 2013).
These findings confirm and expand earlier research that shows inquiry-based labs
provide opportunities for students to use metacognitive strategies during laboratory
(Kipnis & Hofstein, 2008). Through interviews and observations, they found that students
elicited metacognitive knowledge awareness and general regulation strategies while
performing inquiry-based labs. SWH students tended to describe that their weekly lab
instruction was teaching them ways to think: teaching them how to ask themselves
questions, how to plan an experiment and how to frame their thinking, which are all
metacognitive processes. Non-SWH student identified few and in some cases, none of
these types of relationships between their weekly instruction and open-ended problems.
The SWH students’ use of metacognitive regulation strategies during lab time and outside
of lab may suggest that they are learning how to better integrate and organize knowledge
into their long-term learning structures.
SWH students’ greater use of metacognitive regulation strategies allowed them to
feel more prepared to solve their open-ended lab problems. Non-SWH students identified
that they enjoyed solving the problems but did not always feel prepared or that they “felt
89
more lost.” These results agree with research that students in inquiry-based labs perceive
that they learn more and enjoy the open-ended problems more than traditional forms of
instructional labs (Berg, Bergendahl, Lundberg, & Tibell, 2003). By providing an
environment with inquiry strategies, effective prompting, and productive peer
interactions, instruction can strengthen and deepen students’ use of metacognitive
regulation strategies.
Conclusion
There have been several research studies on metacognition in the lab setting.
Some have focused on whether students are using general metacognitive strategies.
Others have identified whether an intervention might impact a student’s practice (Case,
Gunstone, & Lewis, 2001; Kipnis & Hofstein, 2008; Sandi-Urena et al., 2012). This
study moves this area of research forward by going beyond simply identifying that
students are using planning, monitoring and evaluating strategies in the lab environment.
It first examined when and how students used specific metacognitive regulation strategies
as identified by Schraw and Dennsion (1994) under the general strategies of planning,
monitoring and evaluation. The research then explored how an environment that supports
metacognitive strategy practice through inquiry-based pedagogy, reflective prompting
and peer collaboration affected students’ practice of these strategies while solving open-
ended problems.
Overall, both groups described practicing regulation strategies individually. They
described using planning more than monitoring or evaluation strategies when conducting
and reporting on their open-ended lab problems. This was supported by survey and
90
interview evidence. The differences in the two environments supported by student
interviews suggest that the SWH environment allowed students greater practice of
metacognitive strategies. Through the support of their peers and the structure of their
weekly lab instruction, SWH students described more metacognitive regulation
strategies. Strategies that were predominately used by SWH students included checking
understanding of concepts and data comparison during the experiment. This indicated
that they likely spent more time making sense of their data. SWH group also performed
data analysis with their peers. On the other hand, non-SWH students used many
metacognitive strategies individually; however they found less support through their
peers and almost no support for their practice through weekly lab instruction. This
research not only provided a lens into students’ descriptions of their regulation strategy
practices in the laboratory, but it also supported that the way that a laboratory
environment is arranged can affect these regulation strategy practices and their transfer to
new situations.
These results may be useful for instructional purposes to those instructors who are
interested in adding a focus on metacognitive strategies to their instruction. The SWH is a
well-established instructional strategy and can be implemented as is or provide a template
for an instructor to build an instructional environment that is collaborative, inquiry-based
with reflective prompting where metacognitive strategy use is encouraged.
91
Limitations
Reflexivity as a Qualitative Researcher
The importance of understanding the limitations of one’s research is necessary in
qualitative research. I as the researcher was the main instrument for data collection. Not
only did I collect the data, but I was also part of the data in the interview process and
through my presence as the teaching assistant in the laboratory. I interacted with the
students outside of the research study on a weekly basis during the period of the study.
As a TA, I did not grade any student’s assignments that participated in the study. As a
researcher, I consistently reflected how my bias and experiences might affect the data and
analysis.
In the study, I built in components that would strengthen the validity. As a
researcher I was a part of all the laboratory sessions. In this way, I was able to understand
the context in which students described their strategy use. I also kept notes after each
session for me to record what I saw happen during lab and think about how it might
affect the research. When planning the study, I included several types of data collection,
including interviews and surveys. For the interview process, students were randomly
chosen.
As a TA, I had a desire for the students to succeed in both traditional and SWH
lab formats. I had to actively monitor that I was teaching according to each style. To
ensure that I did not cross-teach these methods, the traditional format section was taught
the spring before the SWH section. I also worked with a TA who not only taught both
92
sections to reduce instructor variability, but also was aware of the research but not aware
of the research questions.
My perspective as a qualitative researcher is not to remove my bias and
assumptions from my research but allow readers to interpret my research with an
understanding of these biases and perspectives. Maxwell’s quote more eloquently
describes my perspective as a qualitative researcher:
The reason for making your perspective, biases, assumptions clear to the
reader is not to eliminate “variance between researchers in values and
expectations they bring to the study, but with the understanding how a
particular researcher’s values and expectations influence the conduct and
conclusions of the study” (Maxwell, 2005, pg. 108).
Unlike a single data point in quantitative research, qualitative research with human
participants is “holistic, multidimensional, and ever-changing” (Merriam, 2009). A
researcher who is involved and close to the data and participants can describe a more
realistic picture of the phenomenon studied.
Experimental Design
SWH was implemented for one semester, and research supports that one semester
of a new environment may not provide lasting support for students in changing their
learning or skill use in subsequent learning situations (Engelbrecht, Harding, & Du Preez,
2007). Even though change in students’ conceptual understanding and learning
performance has been detected in previous studies, little change in metacognitive strategy
use was reported by students in the MCAI in this study. Perhaps one semester of the
instructional environment was not enough for change to be evident through these self-
report surveys. It is also possible that the types of differences seen in the students’
93
metacognitive behavior could not be detected with this instrument. A survey in which
students are asked about how their metacognitive strategies are supported may provide a
better measure for these regulation behaviors that students described during lab time.
Students pre-scores were high on the MCAI which suggests that change might not be
detected because of a ceiling effect. The data provided a lens into students’ use of
metacognitive strategies during this specific laboratory experience. It did not provide a
latitudinal or longitudinal view on whether students might continue to use these strategies
in other chemistry laboratory courses.
The students selected for the study were declared chemistry majors who generally
came into the university courses with a considerable high school background in
chemistry, i.e. Advanced Placement or honors high school chemistry. Most participants,
though, had no experience in solving open-ended problems, and many had little high
school laboratory experience. The type of students chosen reduces the ability to
generalize to other types of students taking chemistry such as non-majors, yet this study
suggests that students of all levels of academic achievement use some degree of
metacognitive strategies, and students in the SWH environment generally used more of
those strategies.
Data Analysis
As data analysis occurred, it became clear that the interviews would provide the
bulk of the data. Survey and assessment data were more difficult to interpret because of
small sample sizes. The anticipated size of the study was about twice as many students
than the number who actually participated in the study. The small sample size made it
94
difficult to perform statistical tests on the data for generalization beyond the chemistry
majors course. Even though the MCAI surveys were given in the laboratory setting, the
lab and lecture class were considered one course. When answering the survey, students
may have thought of the strategies they used to answer chemistry problems in class
instead of or in addition to the problems in lab. This study was specifically interested in
the strategies students used while in the lab and performing the open-ended problems. In
future work, it may be beneficial to give the students surveys immediately before and
after the open-ended lab problems. The ACS exams selected also targeted content that is
more aligned with lecture sections than with laboratory courses. The ACS exam was also
a section of the final exam in the course and was heavily weighted. Final exam stress may
have been a variable that was not accounted for in the study.
Future Research
This research study was completed during the second semester of a chemistry
course. To date, data has been collected in a secondary study for a full year of general
chemistry lab. This will provide a longitudinal picture of students’ metacognitive strategy
use in their general chemistry laboratory experience. It will also provide opportunities to
investigate further students’ strategy use during report writing. The sample size provided
excellent qualitative data for support; however, if generalization to other chemistry
students is desirable, a larger sample size is necessary for statistical analysis of the MCAI
and ACS exams. Since the population only consisted of chemistry majors, there is an
interest in how different types of students, for example non-majors or students who took
95
less chemistry in high school, and their strategy use are affected by an SWH
environment.
This study found that the qualitative differences of students’ behaviors to use
peers and their weekly laboratory labs to support their metacognitive strategy practice
were not detected in the quantitative assessments. These results indicate that further
research on instruments that might characterize students’ differences in regulation
behavior is necessary. An instrument may need to be developed that can characterize
students’ strategy use through the supports (peers, lab structure) in the laboratory. In
addition, the MCAI provides information about the level of students’ regulation strategy
use. It may be useful to test the instrument in a variety of laboratory environments and
with a variety of students to determine a normed standard to which instructors could
compare their students. The students’ scores in this study were found to be about 5%
higher than those reported in earlier research.
It is desirable for students to not only learn and use metacognitive strategies in
their learning, but also continue to use those strategies in subsequent learning situations.
If the SWH supports practice of metacognitive strategies, further research on students’
use of metacognitive strategies in subsequent laboratory classes, regardless or even in
spite of instructional approaches would be useful. Other instructional strategies such as
ADI and the MORE thinking frame are likely to support transfer of metacognitive
strategy use like the SWH. A comparison of the impact of these instructional strategies
on strategy use may provide further understanding of the characteristics that support
strategy use. This research only looked at students regulation strategy use. Because

96
metacognitive knowledge is often intertwined with metacognitive strategy use
(skillfulness), there is a need to understand how students are aware of their knowledge of
their metacognitive processes during a lab situation.
97
CHAPTER SIX
INTRODUCTION FOR STUDIES ON THE Pb-CAM BINDING INTERACTION
Calmodulin
Research to investigate binding, structure, and function of calmodulin (CaM), a
common calcium binding protein, with metal ions is extensive. The binding of calcium,
physiological ions like magnesium, and toxic metals to CaM has been investigated
through several techniques including circular dichroism (CD), fluorescence spectroscopy,
Nuclear Magnetic Resonance (NMR), and binding assays (Kirberger, Wong, Jiang, &
Yang, 2013; Martin & Bayley, 1986; Ouyang & Vogel, 1998; Shirran & Barran, 2009).
CaM is not only heat and pH resilient (Blumenthal & Stull, 1982; Brzeska, Venyaminov,
Grabarek, & Drabikowski, 1983), but it is also relatively inexpensive and commercially
available. It is commonly used as a model for calcium binding proteins. Calmodulin is
part of the calcium binding protein (CaBP) superfamily. As an essential calcium binding
protein, CaM assists other proteins that lack the ability to bind calcium. It regulates
calcium for muscle contraction, memory, nerve growth, immune response and signal
transducing. It is one of the most highly conserved eukaryotic proteins with 90%
sequence similarity between multicellular eukaryotes (Celio, Pauls, & Schwaller, 1996).
CaM is a small 17 kD dumbbell shaped protein with a 148 residue sequence. It contains
two domains connected by a flexible central linker.
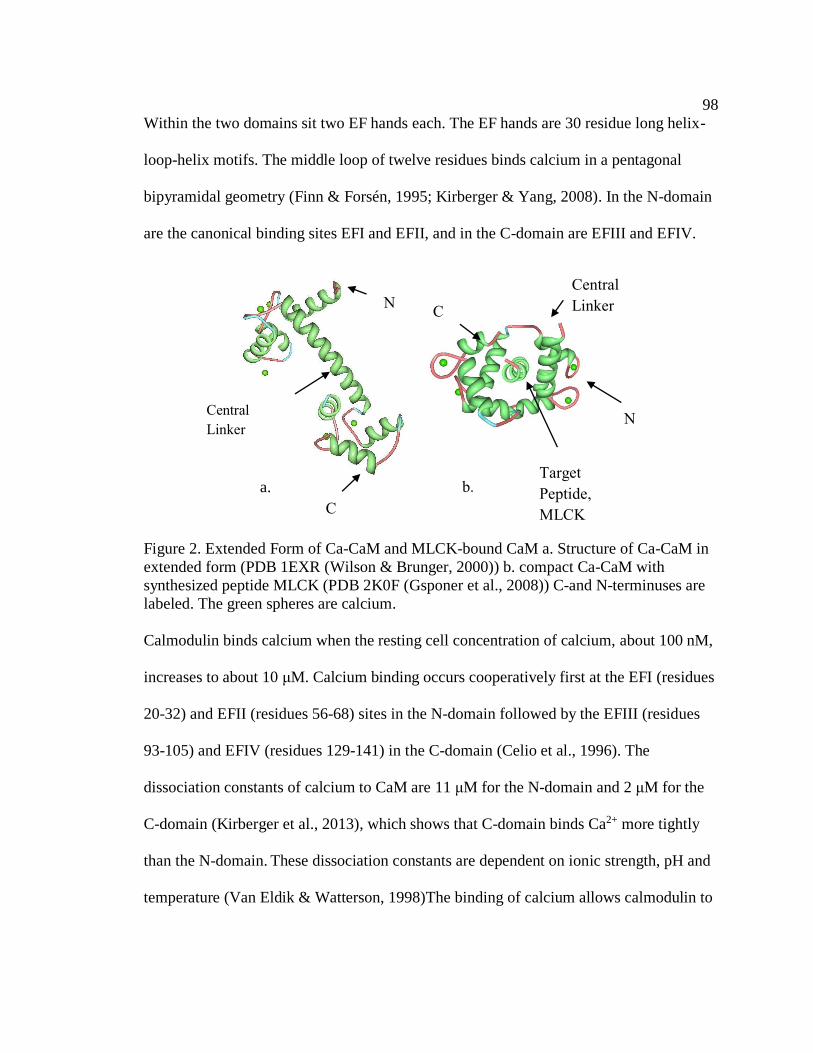
98
Within the two domains sit two EF hands each. The EF hands are 30 residue long helix-
loop-helix motifs. The middle loop of twelve residues binds calcium in a pentagonal
bipyramidal geometry (Finn & Forsén, 1995; Kirberger & Yang, 2008). In the N-domain
are the canonical binding sites EFI and EFII, and in the C-domain are EFIII and EFIV.
Figure 2. Extended Form of Ca-CaM and MLCK-bound CaM a. Structure of Ca-CaM in
extended form (PDB 1EXR (Wilson & Brunger, 2000)) b. compact Ca-CaM with
synthesized peptide MLCK (PDB 2K0F (Gsponer et al., 2008)) C-and N-terminuses are
labeled. The green spheres are calcium.
Calmodulin binds calcium when the resting cell concentration of calcium, about 100 nM,
increases to about 10 μM. Calcium binding occurs cooperatively first at the EFI (residues
20-32) and EFII (residues 56-68) sites in the N-domain followed by the EFIII (residues
93-105) and EFIV (residues 129-141) in the C-domain (Celio et al., 1996). The
dissociation constants of calcium to CaM are 11 μM for the N-domain and 2 μM for the
C-domain (Kirberger et al., 2013), which shows that C-domain binds Ca2+ more tightly
than the N-domain. These dissociation constants are dependent on ionic strength, pH and
temperature (Van Eldik & Watterson, 1998)The binding of calcium allows calmodulin to
Central
Linker
Central
Linker N
C
N
C
Target
Peptide,
MLCK
a. a. b.
99
bind target proteins such as myosin light chain kinase (MLCK) in the central pocket.
Figure 2 shows the transition from a saturated calcium structure to the globular structure
bound to a target peptide of MLCK. The central linker bends for target protein activation
(Figure 2b) (Finn et al., 1995)CaM activates about 100 target proteins and enzymes.
Several common calmodulin binding proteins include the aforementioned smooth muscle
MLCK used for calcium signaling in muscle tissue, phosphorylase kinase used in
glycogen metabolism, nitric oxide synthase for signaling in the synthesis of nitric oxide
(Celio et al., 1996).
Lead Toxicity
The importance of understanding the effect of lead on a biological system is
essential. Lead targets the central nervous system and soft tissues, and it is stored in the
bones. It commonly displaces many essential metals in the body including calcium, zinc,
and magnesium. Lead (Pb2+) is similar in ionic radius and charge to Ca2+, 1.20 Å vs. 0.99
Å, respectively (Lide, 2004). Not only can Pb2+ gain entrance to the cell via Ca2+ voltage
channels, but it can also improperly activate or deactivate calcium binding proteins
(Chao, Bu, & Cheung, 1995; Kern, Wisniewski, Cabell, & Audesirk, 2000; Ouyang &
Vogel, 1998). Symptoms of lead poisoning include memory loss, anemia, bone loss,
elevated blood pressure, and neurobehavioral and learning problems (Bridges & Zalups,
2005). There are several ways in which lead enters the body, most readily through
inhalation and ingestion. Some Pb2+ is excreted; however, much of it is stored in the bone
where it easily displaces calcium in osteocalcin (Dowd, Rosen, Mints, & Gundberg,
2001). The most vulnerable populations of lead poisoning are children, pregnant women
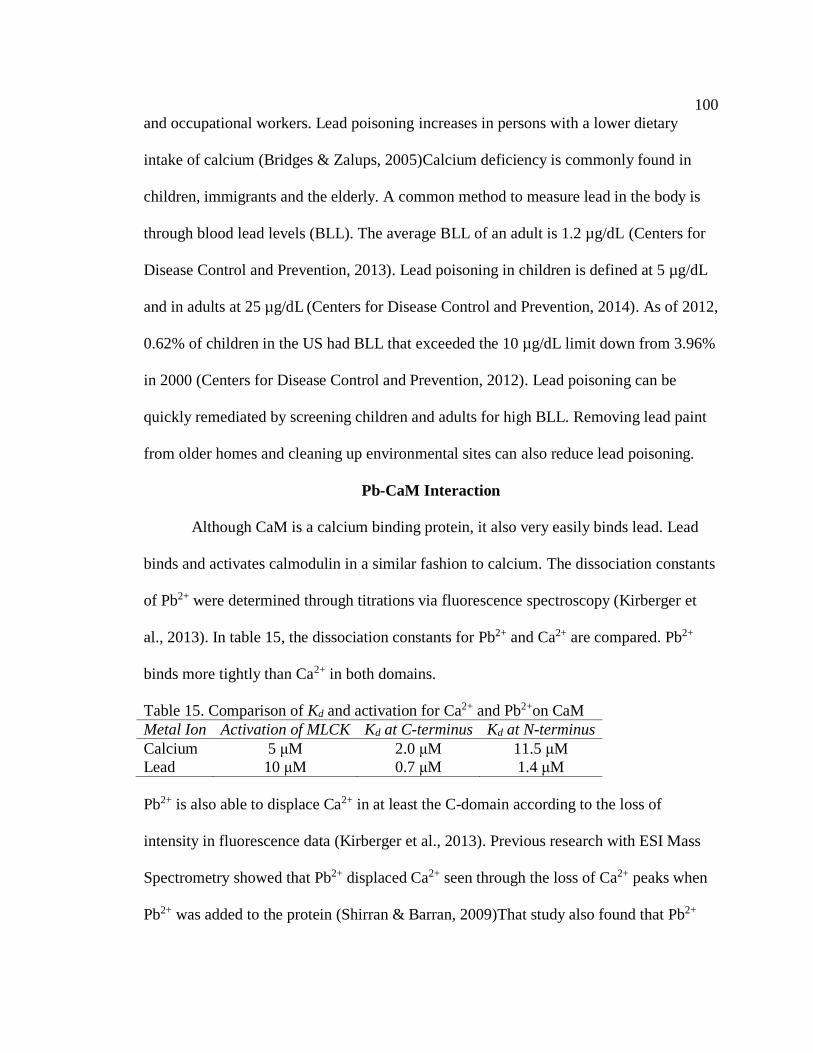
100
and occupational workers. Lead poisoning increases in persons with a lower dietary
intake of calcium (Bridges & Zalups, 2005)Calcium deficiency is commonly found in
children, immigrants and the elderly. A common method to measure lead in the body is
through blood lead levels (BLL). The average BLL of an adult is 1.2 µg/dL (Centers for
Disease Control and Prevention, 2013). Lead poisoning in children is defined at 5 µg/dL
and in adults at 25 µg/dL (Centers for Disease Control and Prevention, 2014). As of 2012,
0.62% of children in the US had BLL that exceeded the 10 µg/dL limit down from 3.96%
in 2000 (Centers for Disease Control and Prevention, 2012). Lead poisoning can be
quickly remediated by screening children and adults for high BLL. Removing lead paint
from older homes and cleaning up environmental sites can also reduce lead poisoning.
Pb-CaM Interaction
Although CaM is a calcium binding protein, it also very easily binds lead. Lead
binds and activates calmodulin in a similar fashion to calcium. The dissociation constants
of Pb2+ were determined through titrations via fluorescence spectroscopy (Kirberger et
al., 2013). In table 15, the dissociation constants for Pb2+ and Ca2+ are compared. Pb2+
binds more tightly than Ca2+ in both domains.
Table 15. Comparison of Kd and activation for Ca2+ and Pb2+on CaM
Metal Ion Activation of MLCK Kd at C-terminus Kd at N-terminus
Calcium 5 μM 2.0 μM 11.5 μM
Lead 10 μM 0.7 μM 1.4 μM
Pb2+ is also able to displace Ca2+ in at least the C-domain according to the loss of
intensity in fluorescence data (Kirberger et al., 2013). Previous research with ESI Mass
Spectrometry showed that Pb2+ displaced Ca2+ seen through the loss of Ca2+ peaks when
Pb2+ was added to the protein (Shirran & Barran, 2009)That study also found that Pb2+
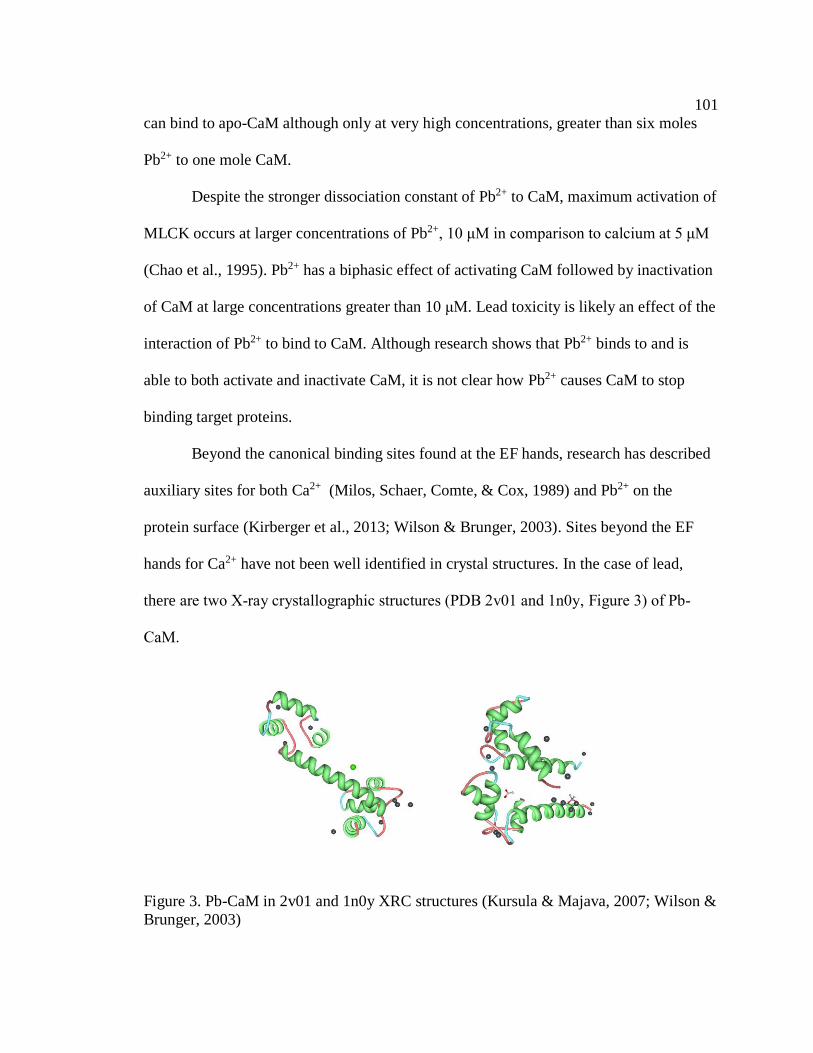
101
can bind to apo-CaM although only at very high concentrations, greater than six moles
Pb2+ to one mole CaM.
Despite the stronger dissociation constant of Pb2+ to CaM, maximum activation of
MLCK occurs at larger concentrations of Pb2+, 10 μM in comparison to calcium at 5 μM
(Chao et al., 1995). Pb2+ has a biphasic effect of activating CaM followed by inactivation
of CaM at large concentrations greater than 10 μM. Lead toxicity is likely an effect of the
interaction of Pb2+ to bind to CaM. Although research shows that Pb2+ binds to and is
able to both activate and inactivate CaM, it is not clear how Pb2+ causes CaM to stop
binding target proteins.
Beyond the canonical binding sites found at the EF hands, research has described
auxiliary sites for both Ca2+ (Milos, Schaer, Comte, & Cox, 1989) and Pb2+ on the
protein surface (Kirberger et al., 2013; Wilson & Brunger, 2003). Sites beyond the EF
hands for Ca2+ have not been well identified in crystal structures. In the case of lead,
there are two X-ray crystallographic structures (PDB 2v01 and 1n0y, Figure 3) of Pb-
CaM.
Figure 3. Pb-CaM in 2v01 and 1n0y XRC structures (Kursula & Majava, 2007; Wilson &
Brunger, 2003)
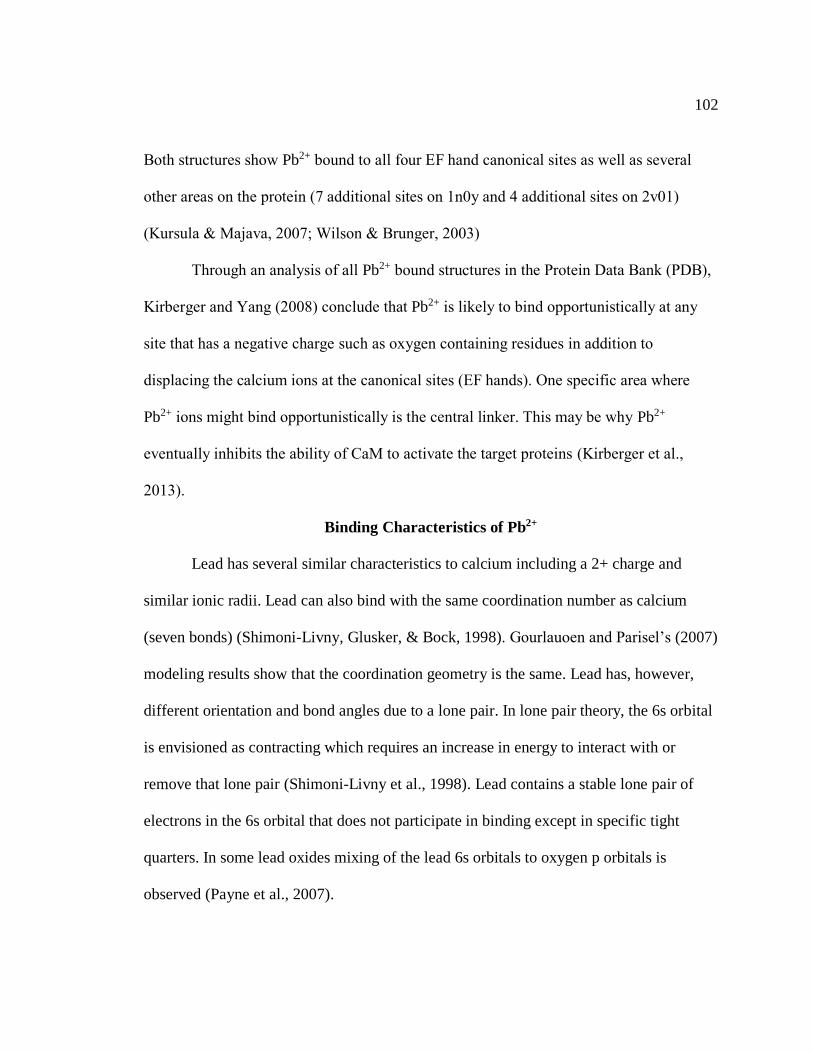
102
Both structures show Pb2+ bound to all four EF hand canonical sites as well as several
other areas on the protein (7 additional sites on 1n0y and 4 additional sites on 2v01)
(Kursula & Majava, 2007; Wilson & Brunger, 2003)
Through an analysis of all Pb2+ bound structures in the Protein Data Bank (PDB),
Kirberger and Yang (2008) conclude that Pb2+ is likely to bind opportunistically at any
site that has a negative charge such as oxygen containing residues in addition to
displacing the calcium ions at the canonical sites (EF hands). One specific area where
Pb2+ ions might bind opportunistically is the central linker. This may be why Pb2+
eventually inhibits the ability of CaM to activate the target proteins (Kirberger et al.,
2013).
Binding Characteristics of Pb2+
Lead has several similar characteristics to calcium including a 2+ charge and
similar ionic radii. Lead can also bind with the same coordination number as calcium
(seven bonds) (Shimoni-Livny, Glusker, & Bock, 1998). Gourlauoen and Parisel’s (2007)
modeling results show that the coordination geometry is the same. Lead has, however,
different orientation and bond angles due to a lone pair. In lone pair theory, the 6s orbital
is envisioned as contracting which requires an increase in energy to interact with or
remove that lone pair (Shimoni-Livny et al., 1998). Lead contains a stable lone pair of
electrons in the 6s orbital that does not participate in binding except in specific tight
quarters. In some lead oxides mixing of the lead 6s orbitals to oxygen p orbitals is
observed (Payne et al., 2007).
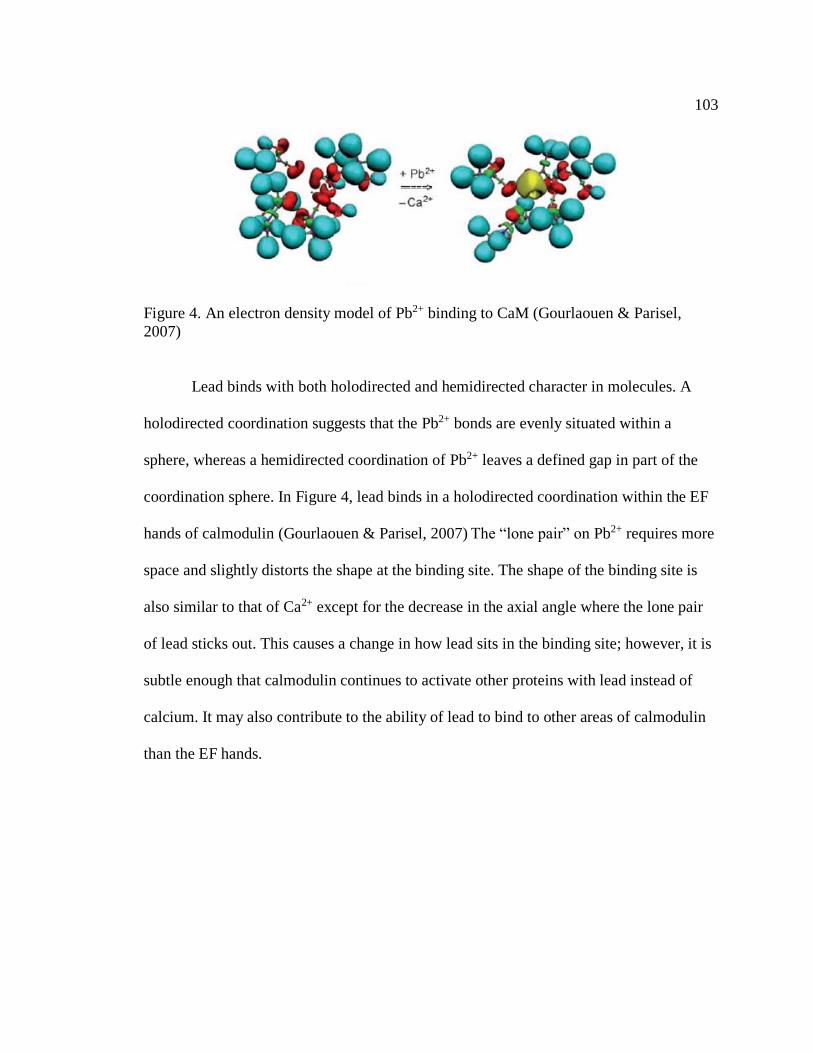
103
Figure 4. An electron density model of Pb2+ binding to CaM (Gourlaouen & Parisel,
2007)
Lead binds with both holodirected and hemidirected character in molecules. A
holodirected coordination suggests that the Pb2+ bonds are evenly situated within a
sphere, whereas a hemidirected coordination of Pb2+ leaves a defined gap in part of the
coordination sphere. In Figure 4, lead binds in a holodirected coordination within the EF
hands of calmodulin (Gourlaouen & Parisel, 2007) The “lone pair” on Pb2+ requires more
space and slightly distorts the shape at the binding site. The shape of the binding site is
also similar to that of Ca2+ except for the decrease in the axial angle where the lone pair
of lead sticks out. This causes a change in how lead sits in the binding site; however, it is
subtle enough that calmodulin continues to activate other proteins with lead instead of
calcium. It may also contribute to the ability of lead to bind to other areas of calmodulin
than the EF hands.
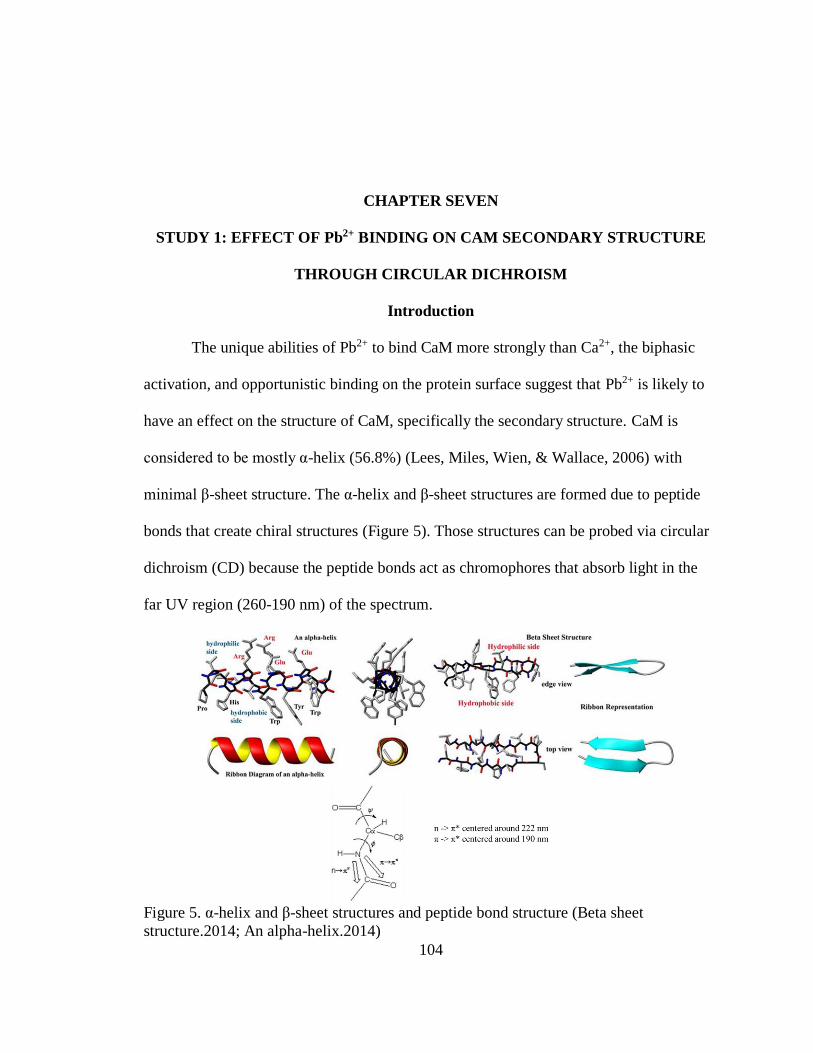
104
CHAPTER SEVEN
STUDY 1: EFFECT OF Pb2+ BINDING ON CAM SECONDARY STRUCTURE
THROUGH CIRCULAR DICHROISM
Introduction
The unique abilities of Pb2+ to bind CaM more strongly than Ca2+, the biphasic
activation, and opportunistic binding on the protein surface suggest that Pb2+ is likely to
have an effect on the structure of CaM, specifically the secondary structure. CaM is
considered to be mostly α-helix (56.8%) (Lees, Miles, Wien, & Wallace, 2006) with
minimal β-sheet structure. The α-helix and β-sheet structures are formed due to peptide
bonds that create chiral structures (Figure 5). Those structures can be probed via circular
dichroism (CD) because the peptide bonds act as chromophores that absorb light in the
far UV region (260-190 nm) of the spectrum.
Figure 5. α-helix and β-sheet structures and peptide bond structure (Beta sheet
structure.2014; An alpha-helix.2014)
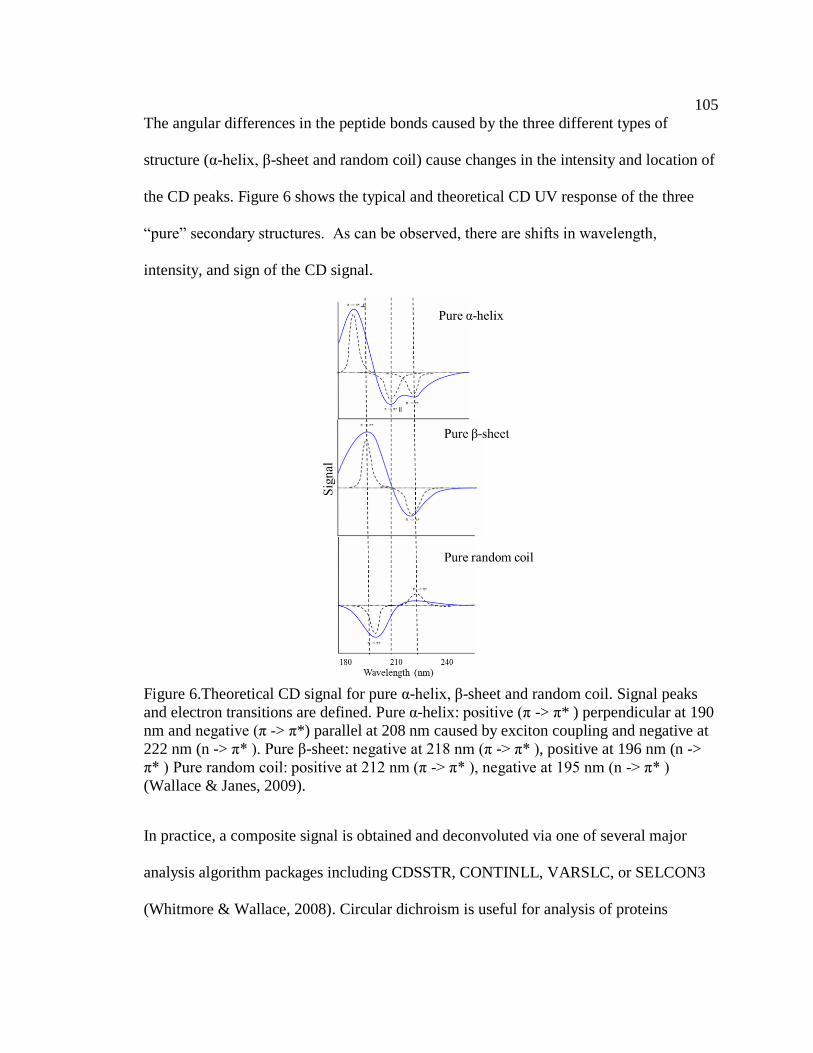
105
The angular differences in the peptide bonds caused by the three different types of
structure (α-helix, β-sheet and random coil) cause changes in the intensity and location of
the CD peaks. Figure 6 shows the typical and theoretical CD UV response of the three
“pure” secondary structures. As can be observed, there are shifts in wavelength,
intensity, and sign of the CD signal.
Figure 6.Theoretical CD signal for pure α-helix, β-sheet and random coil. Signal peaks
and electron transitions are defined. Pure α-helix: positive (π -> π* ) perpendicular at 190
nm and negative (π -> π*) parallel at 208 nm caused by exciton coupling and negative at
222 nm (n -> π* ). Pure β-sheet: negative at 218 nm (π -> π* ), positive at 196 nm (n ->
π* ) Pure random coil: positive at 212 nm (π -> π* ), negative at 195 nm (n -> π* )
(Wallace & Janes, 2009).
In practice, a composite signal is obtained and deconvoluted via one of several major
analysis algorithm packages including CDSSTR, CONTINLL, VARSLC, or SELCON3
(Whitmore & Wallace, 2008). Circular dichroism is useful for analysis of proteins
106
because the technique is very sensitive to protein structure and dynamics. Because CaM
is mostly α-helix, the changes in signal at the two peaks (208 nm and 222 nm) are of
interest. Changes in negative peaks at 208 nm and 222 nm are indicators for secondary
structure change, generally, a loss or gain in α-helical content.
Research Goals
Circular dichroism has been used to identify secondary structure changes within
CaM when bound with Ca2+, toxic metals or target peptides (Martin & Bayley, 1986;
Maune, Beckingham, Martin, & Bayley, 1992). Cadmium, a toxic metal, bound to CaM
showed no secondary structure change in CD spectra when compared to calcium (Martin
& Bayley, 1986). Pb2+ is also a very toxic metal, and has not been described using CD.
The primary goals of the study were to determine: (1) whether the addition of Pb2+ to
CaM caused a change in secondary structure that could be detected using CD, and (2) if a
change occurred, the minimum amount of Pb2+ that was needed for the change to occur.
Method
Materials
Lyophilized CaM (from bovine brain) was purchased from Ocean Biologics
(Seattle, WA). All CaM samples contained about one mole of Ca2+ per mole of protein
unless dialyzed to the apo-form (no metal bound) (Bauman, 2012). These samples are
referred to as the “as-is” form. The following chemicals were used: Lead nitrate
(Pb(NO3)2), Calcium nitrate (Ca(NO3)2), Tris-hydrochloride buffer (Tris-HCl), sodium
ethylenediaminetetraacetic acid (EDTA), Guanidinium chloride (GuHCl) and Chelex
(BioRad). Nanopure water was used for all solutions. The buffer was 20 mM Tris-HCl
with pH 7.6. At this pH, CaM activates its target proteins(Blumenthal & Stull, 1982).

107
Trace metal ions were removed from the buffer solutions and water with Chelex beads in
a column or batch method (Bio-rad Technologies). The CaM was stored at -20°C in
filtered nanopure water and dialyzed into 20 mM Tris-HCl before use. Glassware and
plasticware were rinsed in 1 M hydrochloric acid and 1 M EDTA to remove trace metals.
Protein concentration. Protein concentration was measured using a
spectrophotometer with a quartz cuvette (Hellma Optics, Plainview, NY) of 1 cm
pathlength and 20 mM Tris-HCl buffer as the baseline. The measurement was made at
280 nm where CaM has an optical density of 0.2 cm-1 for 1 mg/ml concentration
(Bauman, 2012). For concentration calculations, this value was converted to the molar
extinction coefficient of 3338 M-1 cm-1.
Circular Dichroism Instrument Parameters
Spectra were taken with an Olis DSM CD spectrophotometer (Olis, Inc., Bogart,
CA). The method for calculating the CD spectra is known as digital subtraction (DSM)
where the raw data for the difference in absorbance (Aleft and Aright) is measured directly.
The quartz cylindrical cell (Hellma Optics, Plainview, NY) had a pathlength of 10 mm
and a volume of 2500 uL. CD spectra were recorded from 260-190 nm in the far UV in 5
mM Tris-HCl buffer. A low concentration of buffer was used to reduce interfering
absorbance of the buffer below 210 nm. The number of scans ranged from one to three.
The bandwidth was 0.5 nm. Protein concentrations between 0.015 and 0.04 mg/ml were
used for all analyses. Even though data was taken between 200 nm and 190 nm, it was
not often used because of the signal interference from the buffer absorbance.
108
Titration Experiments
Titrations with Ca(NO3)2 and Pb(NO3)2, separately, were performed to determine
effects on CD signal. The lowest concentration used was 100 pM, which is lower than the
cellular level concentrations of Ca2+ and Pb2+ concentrations, 10 µM and 100 nM
respectively (Godwin, 2001). The highest concentration used was 40 µM for
approximately a 0.02 mg/ml CaM sample. Titrations were performed by adding 5 mM
Pb2+ or Ca2+ solution in increments of 1 µM to 10 µM to the CaM sample. The titrations
were added directly to the CaM sample in the cuvette. The cuvette was only removed to
mix the solution, and then placed back in the sample compartment for measurement.
Denaturation Experiments
Chemical denaturation. Pb2+ and Ca2+ saturated samples of CaM were denatured
on the OLIS instrument at 222 nm at 25 °C. Guanidinium chloride (GuHCl) was used as
the denaturant. The molarity of the denaturant was determined using both refractive index
and by weight (Shirley, 1995). It is suggested that urea is a more appropriate denaturant
to use because it has fewer complex interactions with calmodulin. However, these
interactions are minimized when calmodulin is saturated with ions such as calcium
(Masino, Martin, & Bayley, 2000). GuHCl was used because it does not absorb at the
wavelength 222 nm where the data points were taken (Shirley, 1995). Signal at 208 nm
was not taken because GuHCl absorbs significantly at this wavelength. Two stock
solutions were prepared: (1) 5 mM Tris-HCl buffer, pH 7.6 with Pb-CaM or Ca-CaM,
and (2) 6 M GuHCl denaturant with Pb-CaM or Ca-CaM. Protein concentrations ranged
from 0.02 mg/ml to 0.03 mg/ml for all samples. About 2 mM of Ca2+ or Pb2+ was added
to each sample to saturate it. This value was calculated from the results of the titration
109
experiments when the change in spectra stopped for Pb-CaM. Stock solutions 1 and 2
were combined to prepare samples that contained no denaturant to 6 M denaturant in
increments of 0.20 M and 0.50 M. Samples sat for at least 15 minutes at room
temperature before analysis to allow for denaturation to occur. Each sample was analyzed
in triplicate via CD. Each sample was added and removed from the cuvette using a
pipette. The cuvette was not removed from the sample chamber in order to decrease
fluctuation in baseline.
Thermal Denaturation. Calmodulin was studied with far-UV CD at 208 nm and
222 nm in 5 mM Tris-HCl, pH 7.6. CaM samples were prepared in 5 mM Tris-HCl, and
were saturated with 2mM Ca2+ or Pb2+ each similar to chemical denaturation. The
samples were heated from 20○ to 90 °C at an interval of 5 °C /min. The sample
temperature was measured with the sample holder jacket. For reversibility, the samples
were cooled to the initial temperature of 25 °C. Each sample obtained its initial signal.
Data Analysis
The acquired CD data was automatically subtracted from the baseline and
digitally filtered using a seven data point smoothing process using the Savitsky-Golay
algorithm in the OLIS software. All spectra were exported as ASCII files and imported
into Microsoft EXCEL. The signal in millidegrees (𝜃) was converted to molar ellipticity
[𝜃]𝑚𝑟𝑤 in order to account for the concentration of each sample:
[𝜃]𝑚𝑟𝑤 =(𝑠𝑖𝑔𝑛𝑎𝑙(𝜃) ∗ 𝑀𝑊𝑚𝑟𝑤)
(10∗𝑐𝑜𝑛𝑐𝑛∗𝑝𝑎𝑡ℎ𝑙𝑒𝑛𝑔𝑡ℎ) (4)
In equation 4, the signal units are millidegrees and the mean residue weight (MWmrw) is
112.7 kDa per residue. This was calculated from protein weight and the number of amino
110
acid residues (16686 kDa/148 residues) (UniProt Consortium, 2014). The units for the
concentration of the sample are mg/ml, and the pathlength units are cm. The units for the
signal are molar ellipticity, degrees*cm2/dmol. All comparisons of CD signal data were
in units of molar ellipticity (ME).
Secondary structure fractions were determined through the CDSSTR program
(Sreerama & Woody, 2000) available on the Dichroweb website (Whitmore & Wallace,
2008). The CDSSTR program analyzes CD spectra through the singular value
decomposition algorithm. It provides six types of structure. α-helix and β-sheets fall into
two types of categories, regular and distorted followed by categories for turns and
unordered structure (commonly referred to as random coil). The reference data set SP175
that was used for the CDSSTR analysis contains a CaM structure (Lees et al., 2006).
According to the protein circular dichroism databank (PCDDB), CaM contains 56.8% α-
helix. This percentage was determined using DSSP, an algorithm that calculates the most
likely secondary structure based on the 3D structure of the protein (the crystal structure)
(Joosten et al., 2011). The 3D structure (PDB 1LIN) was fitted to the CD spectrum of
CaM (Whitmore L et al., 2011).
T-tests (two-tailed) were used to test the significance of the signal change at 208
and 222 nm and the ratio θ208/θ222 for Ca2+ and Pb2+ titrations to CaM. The Microsoft
Excel Data Analysis package was used for all calculations. If the significance value (p)
was less than 0.05, then the change in signal was statistically significant.
Chemical Denaturation. The overall stability of a protein was determined by the
difference in free energy between the folded and unfolded state. A two-state folding
mechanism was used to calculate the free energy (Shirley, 1995):
111
𝐹 ⇌ 𝑈
In order to calculate the free energy of the protein, the following equations were used:
𝑓𝑈 = (𝑦𝐹 − 𝑦) (𝑦𝐹 − 𝑦𝑈)⁄ (5)
𝐾 = 𝑓𝑈
𝑓𝐹= 𝑓𝑈 (1 − 𝑓𝑈)⁄ = (𝑦𝐹 − 𝑦) (𝑦 − 𝑦𝑈)⁄ (6)
∆𝐺 = −𝑅𝑇𝑙𝑛(𝐾) = −𝑅𝑇𝑙𝑛[(𝑦𝐹 − 𝑦) (𝑦 − 𝑦𝑈)⁄ ] (7)
First the amount of protein unfolded in the presence of denaturant is calculated using
equation 5. The amount of protein unfolded is represented by 𝑓𝑈, and y represents the
observed CD signal at 222 nm for the protein fully folded (yF) and unfolded (yU) and for
each concentration of guanidine hydrochloride. In equation 6, 𝑓𝐹 represents the amount of
protein folded. The equilibrium constant K can be calculated by equation 6. Finally ΔG is
calculated with equation 7. The temperature used was 298 K and the R value was 1.987
cal/mol*K. To determine the stability of each sample, the data points from the transition
area on the curve are graphed, and a line of best fit is calculated. The line of best fit is
represented by equation 8:
∆𝐺 = ∆𝐺𝐻2𝑂 − 𝑚[𝐷] (8)
[𝐷]12⁄ =
∆𝐺𝐻2𝑂
𝑚 (9)
The denaturant concentration is [𝐷], and m is slope. By extrapolation back to the y-axis,
the equation provides the free energy with no denaturant (∆𝐺𝐻2𝑂). A larger free energy
suggests a more stable protein. The point at which half the protein is unfolded with
denaturant [D]1/2 is calculated using equation 9.
Previous research indicates that the unfolding of calmodulin follows a two-state
mechanism (Moosavi-Movahedi, Naderi, & Farzami, 1994). However, more recently, it
112
is suggested to be three-state where the intermediate is the C-terminus unfolding followed
by the N-terminus (Masino et al., 2000; Protasevich et al., 1997).. Other research suggests
that calmodulin follows a two-state folding in its holo form and a three-state folding in its
apo form (Wang, Liang, Czader, Waxham, & Cheung, 2011). Data was only analyzed
using a two-state mechanism based on the suggestion of Wang et al., (2011).
Results
Conformational Stability of CaM
Thermal denaturation was performed to compare Pb-saturated CaM and Ca-
saturated CaM. Data were taken at 208 nm and 222 nm in the far-UV CD spectrum.
Figure 7 indicates that a loss in signal occurred at 222 nm in both samples. A loss of
signal was also seen at 208 nm for both samples (data not shown). The change in signal at
222 nm was greater than 208 nm. The relative signal change between 222 and 208 nm
might be explained with reference to Figure 7. The change in the signal at 208 is
primarily due to loss of the n →π* negative peak with no anticipated corresponding
increase from the random coil signal. The signal change at 222 nm arises due to both loss
in negative going signal from the n →π*associated with the α-helix and an increase in the
positive n →π*signal associated with the random coil. In practice, however, the relative
magnitude of the 208 and 222 peaks is frequently observed to remain constant, as will be
discussed below.
Neither sample unfolded completely. The change in signal was less than 7500
molar ellipticity (ME) units when heated to 90 °C. This signal is just more than half of
the signal loss (12000 ME) for complete denaturation as seen in the chemical
denaturation in Figure 7. Melting temperatures (tm) for the thermal denatured samples
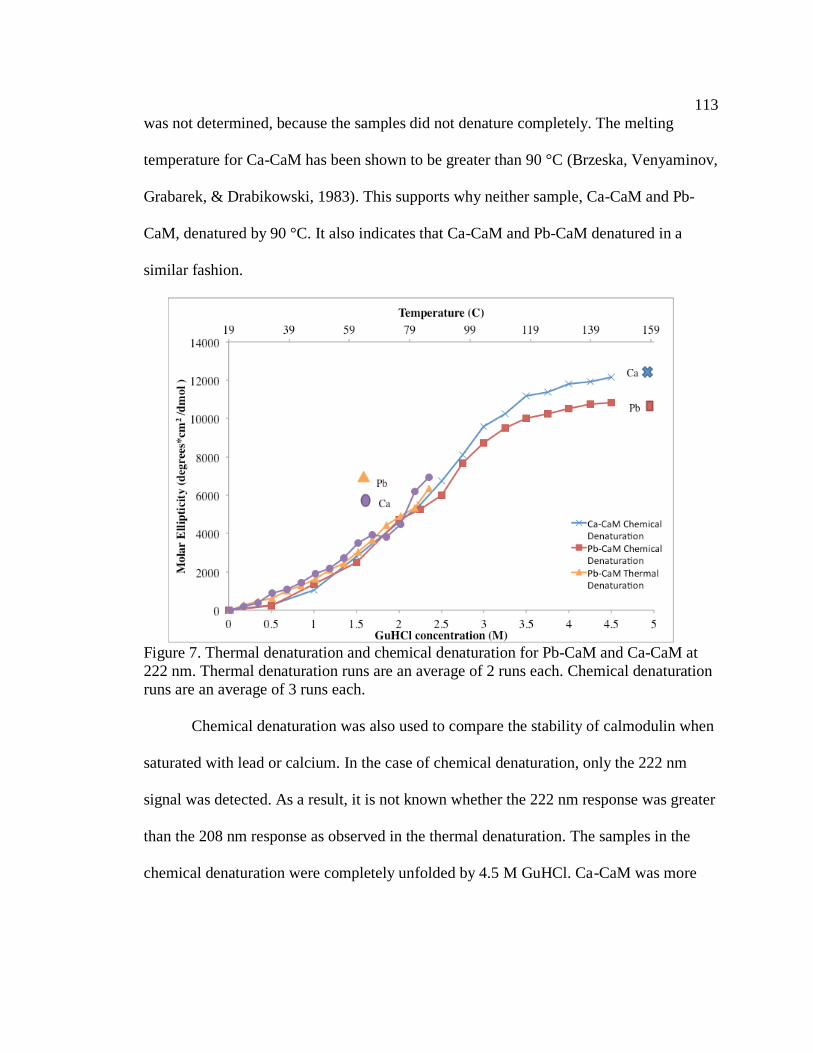
113
was not determined, because the samples did not denature completely. The melting
temperature for Ca-CaM has been shown to be greater than 90 °C (Brzeska, Venyaminov,
Grabarek, & Drabikowski, 1983). This supports why neither sample, Ca-CaM and Pb-
CaM, denatured by 90 °C. It also indicates that Ca-CaM and Pb-CaM denatured in a
similar fashion.
Figure 7. Thermal denaturation and chemical denaturation for Pb-CaM and Ca-CaM at
222 nm. Thermal denaturation runs are an average of 2 runs each. Chemical denaturation
runs are an average of 3 runs each.
Chemical denaturation was also used to compare the stability of calmodulin when
saturated with lead or calcium. In the case of chemical denaturation, only the 222 nm
signal was detected. As a result, it is not known whether the 222 nm response was greater
than the 208 nm response as observed in the thermal denaturation. The samples in the
chemical denaturation were completely unfolded by 4.5 M GuHCl. Ca-CaM was more
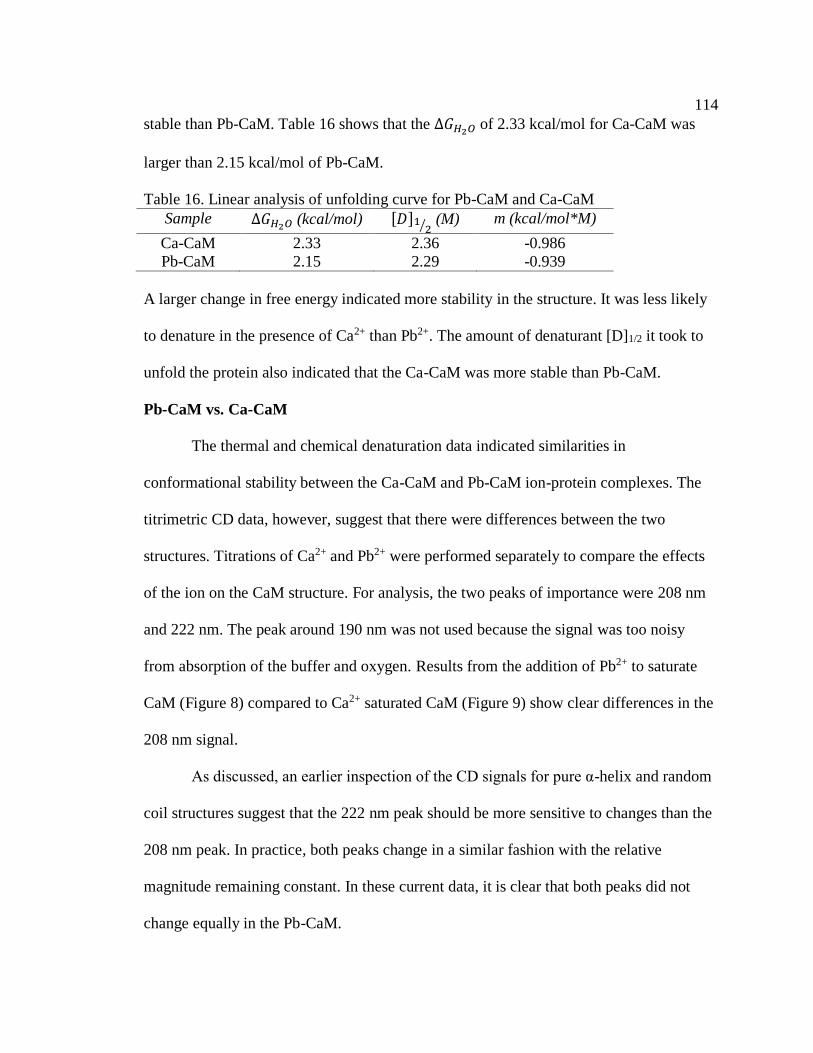
114
stable than Pb-CaM. Table 16 shows that the ∆𝐺𝐻2𝑂 of 2.33 kcal/mol for Ca-CaM was
larger than 2.15 kcal/mol of Pb-CaM.
Table 16. Linear analysis of unfolding curve for Pb-CaM and Ca-CaM
Sample ∆𝐺𝐻2𝑂 (kcal/mol) [𝐷]12⁄ (M) m (kcal/mol*M)
Ca-CaM 2.33 2.36 -0.986
Pb-CaM 2.15 2.29 -0.939
A larger change in free energy indicated more stability in the structure. It was less likely
to denature in the presence of Ca2+ than Pb2+. The amount of denaturant [D]1/2 it took to
unfold the protein also indicated that the Ca-CaM was more stable than Pb-CaM.
Pb-CaM vs. Ca-CaM
The thermal and chemical denaturation data indicated similarities in
conformational stability between the Ca-CaM and Pb-CaM ion-protein complexes. The
titrimetric CD data, however, suggest that there were differences between the two
structures. Titrations of Ca2+ and Pb2+ were performed separately to compare the effects
of the ion on the CaM structure. For analysis, the two peaks of importance were 208 nm
and 222 nm. The peak around 190 nm was not used because the signal was too noisy
from absorption of the buffer and oxygen. Results from the addition of Pb2+ to saturate
CaM (Figure 8) compared to Ca2+ saturated CaM (Figure 9) show clear differences in the
208 nm signal.
As discussed, an earlier inspection of the CD signals for pure α-helix and random
coil structures suggest that the 222 nm peak should be more sensitive to changes than the
208 nm peak. In practice, both peaks change in a similar fashion with the relative
magnitude remaining constant. In these current data, it is clear that both peaks did not
change equally in the Pb-CaM.
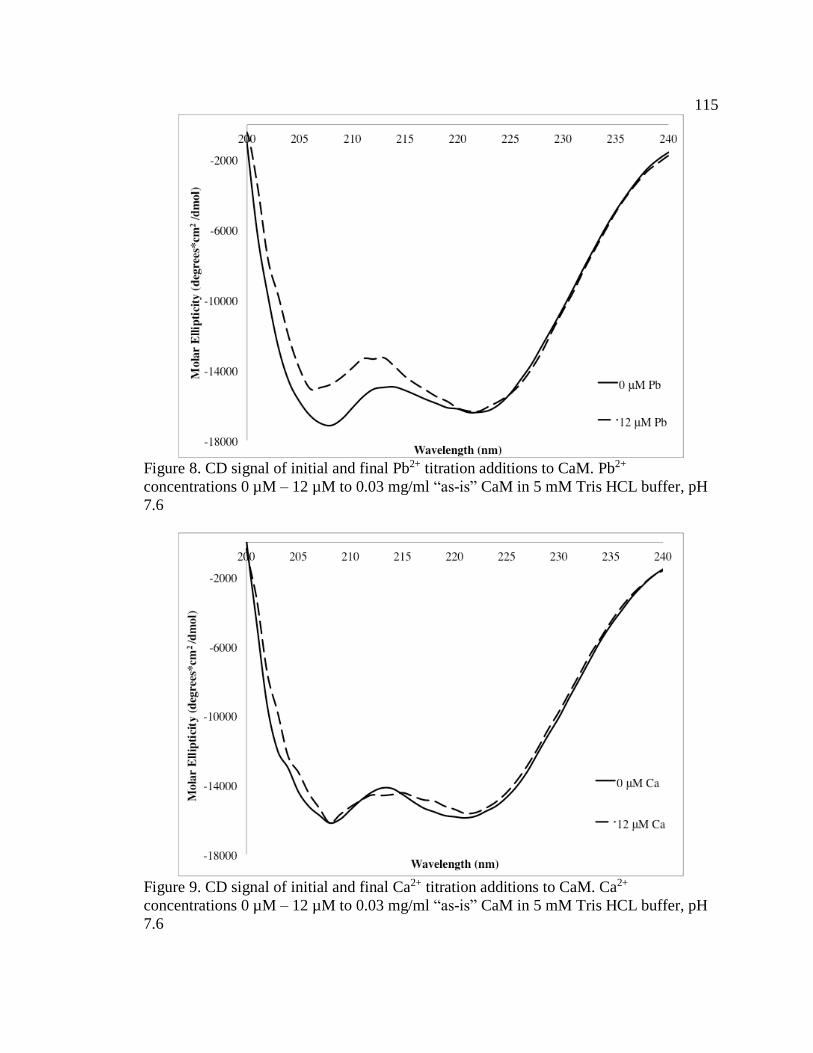
115
Figure 8. CD signal of initial and final Pb2+ titration additions to CaM. Pb2+
concentrations 0 µM – 12 µM to 0.03 mg/ml “as-is” CaM in 5 mM Tris HCL buffer, pH
7.6
Figure 9. CD signal of initial and final Ca2+ titration additions to CaM. Ca2+
concentrations 0 µM – 12 µM to 0.03 mg/ml “as-is” CaM in 5 mM Tris HCL buffer, pH
7.6
116
A ratio of the signal peaks (θ208/θ222) in molar ellipticity for each CD spectrum
produced was calculated for three samples: “as-is” CaM, Pb-CaM and Ca-CaM. The ratio
of signals at 208 nm and 222 nm provided information about how the two peaks change
in relationship to each other. Ca-CaM and Pb-CaM were saturated with 12 µM Ca2+ or
Pb2+. This concentration was chosen for saturation because it is proposed that ions may
bind to CaM at other auxiliary sites than the four EF hand canonical sites (Milos, Schaer,
Comte, & Cox, 1989). Thus more than four moles of Pb2+ or Ca2+ to one mole of protein
were required to saturate the canonical sites and any other possible sites on the protein.
The signal at 208 nm was divided by the signal at 222 nm (Figures 8 and 9). In previous
research, Sun, Yin, Coffeen, Shea, & Squier, (2001) determined a ratio of 1.03 for CaM
saturated with Ca2+. In Table 17, the ratio for Pb-CaM (0.88) was much smaller than Ca-
CaM (1.01) and the “as-is” CaM sample (1.02). The difference was statistically
significant indicated by a t-test. These results indicated that the CD signal of CaM
significantly changed when Pb2+ was titrated into “as-is” CaM. However, the signal did
not change when Ca2+ was titrated into to “as-is” CaM.
Table 17. Paired T-test of θ208/θ222 ratios for the CD signal of Pb-CaM and Ca-CaM
Sample Mean of θ208/θ222 ratioa df t-value p-value
“as-is” CaM 1.02 (.02)b
Ca-CaMc 1.01 (.02) 3 1.28 .289
Pb-CaMc .88 (.02) 6 18.03 <.001* aEach sample was compared against CD spectra with no additions of Ca2+ or Pb2+, “as-is”
CaM. The variation in the “as-is” sample values is caused by the slight variation in the
CD signals. bThe ratio for CaM is an average of all samples before Ca2+ or Pb2+ was
added to saturate the sample. csamples were saturated with 12 µM Pb2+ or Ca2+.
*statistically significant at p<0.05 standard deviations are in parentheses
The difference in signal from Figures 8 and 9 are compared in Figure 10. The
signal change was calculated by subtracting the titrated signal for the titration of Ca2+ and
Pb2+ to “as-is” CaM from the sample signal before any titration was made. It is evident
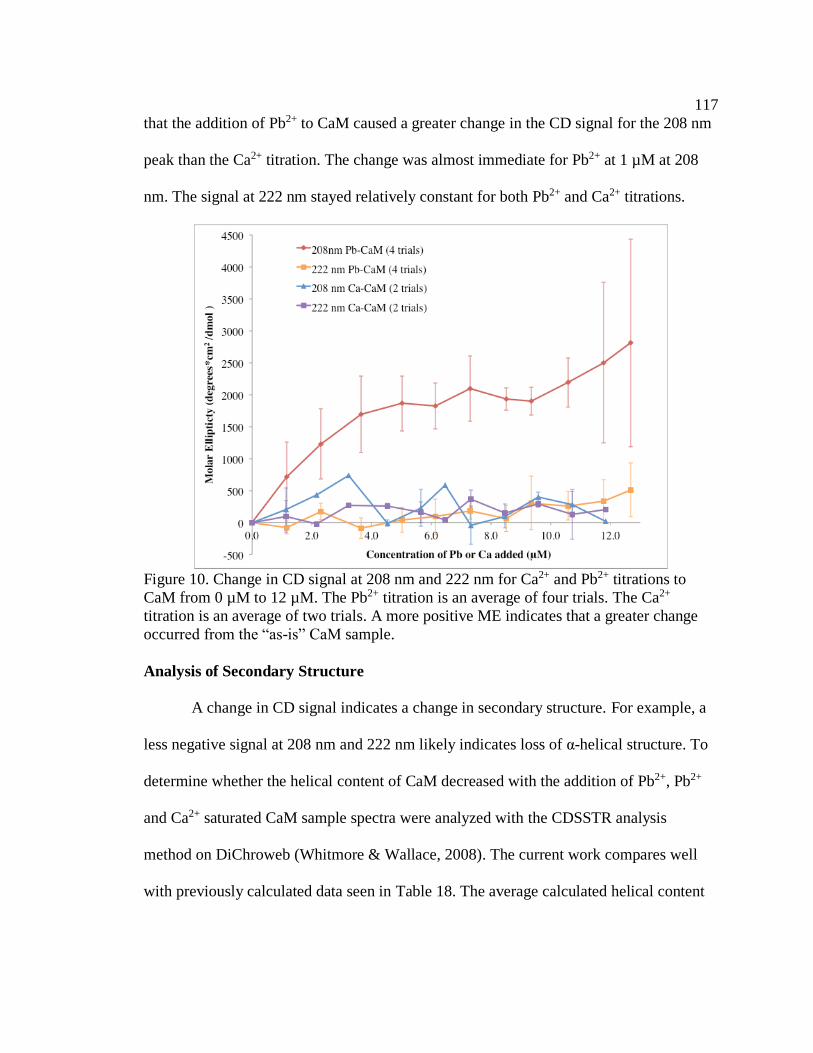
117
that the addition of Pb2+ to CaM caused a greater change in the CD signal for the 208 nm
peak than the Ca2+ titration. The change was almost immediate for Pb2+ at 1 µM at 208
nm. The signal at 222 nm stayed relatively constant for both Pb2+ and Ca2+ titrations.
Figure 10. Change in CD signal at 208 nm and 222 nm for Ca2+ and Pb2+ titrations to
CaM from 0 µM to 12 µM. The Pb2+ titration is an average of four trials. The Ca2+
titration is an average of two trials. A more positive ME indicates that a greater change
occurred from the “as-is” CaM sample.
Analysis of Secondary Structure
A change in CD signal indicates a change in secondary structure. For example, a
less negative signal at 208 nm and 222 nm likely indicates loss of α-helical structure. To
determine whether the helical content of CaM decreased with the addition of Pb2+, Pb2+
and Ca2+ saturated CaM sample spectra were analyzed with the CDSSTR analysis
method on DiChroweb (Whitmore & Wallace, 2008). The current work compares well
with previously calculated data seen in Table 18. The average calculated helical content
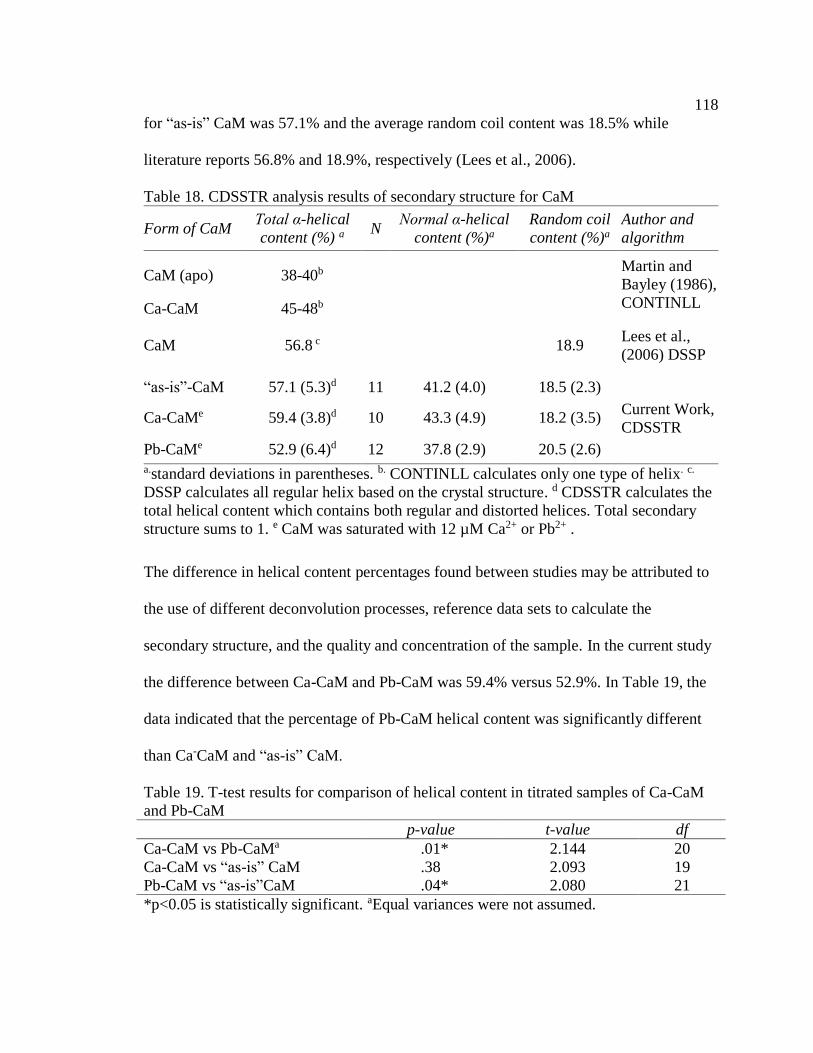
118
for “as-is” CaM was 57.1% and the average random coil content was 18.5% while
literature reports 56.8% and 18.9%, respectively (Lees et al., 2006).
Table 18. CDSSTR analysis results of secondary structure for CaM
Form of CaM Total α-helical
content (%) a N Normal α-helical
content (%)a
Random coil
content (%)a
Author and
algorithm
CaM (apo) 38-40b Martin and
Bayley (1986),
CONTINLL Ca-CaM 45-48b
CaM 56.8 c 18.9 Lees et al.,
(2006) DSSP
“as-is”-CaM 57.1 (5.3)d 11 41.2 (4.0) 18.5 (2.3)
Current Work,
CDSSTR Ca-CaMe 59.4 (3.8)d 10 43.3 (4.9) 18.2 (3.5)
Pb-CaMe 52.9 (6.4)d 12 37.8 (2.9) 20.5 (2.6)
a.standard deviations in parentheses. b. CONTINLL calculates only one type of helix. c.
DSSP calculates all regular helix based on the crystal structure. d CDSSTR calculates the
total helical content which contains both regular and distorted helices. Total secondary
structure sums to 1. e CaM was saturated with 12 µM Ca2+ or Pb2+ .
The difference in helical content percentages found between studies may be attributed to
the use of different deconvolution processes, reference data sets to calculate the
secondary structure, and the quality and concentration of the sample. In the current study
the difference between Ca-CaM and Pb-CaM was 59.4% versus 52.9%. In Table 19, the
data indicated that the percentage of Pb-CaM helical content was significantly different
than Ca-CaM and “as-is” CaM.
Table 19. T-test results for comparison of helical content in titrated samples of Ca-CaM
and Pb-CaM
p-value t-value df
Ca-CaM vs Pb-CaMa .01* 2.144 20
Ca-CaM vs “as-is” CaM .38 2.093 19
Pb-CaM vs “as-is”CaM .04* 2.080 21
*p<0.05 is statistically significant. aEqual variances were not assumed.
119
This data supported the decrease in signal at the 208 nm peak, and the statistically
significant difference in the θ208/θ222 ratio for Pb-CaM when compared to Ca-CaM.
Overall, the CD spectral data suggested that there may be a structural change or a
rearrangement occurring in Pb-CaM that was not present in Ca-CaM.
Discussion
There is considerable research on the biphasic effects of Pb2+ on the activation of
CaM (Chao, Bu, & Cheung, 1995; Kern, Wisniewski, Cabell, & Audesirk, 2000). Yet it
is still not understood how Pb2+ might cause these effects on CaM. One hypothesis is that
Pb2+ binds opportunistically to the areas of the protein other than the canonical EF
binding sites based on negative charge density (Kirberger, Wong, Jiang, & Yang, 2013).
Although CD spectral data did not provide binding sites for the Pb2+ ions, changes
present in the CD spectral data suggest that the secondary structure of CaM was affected
differently by the binding of Pb2+ ions to the protein than the binding of Ca2+ ions.
The thermal denaturation data of Pb-CaM compared to Ca-CaM (Figure 7)
indicated that there was little difference in the unfolding of the protein. When saturated
with either metal, the melting temperature was above 80 ○C, which has been presented
previously in research (Browne, Strom, Martin, & Bayley, 1997; Brzeska et al., 1983).
This indicated little change occurred in the protein. The chemical denaturation data
provided additional support that the change is not dramatic, yet that the Ca-CaM has a
slightly more stable conformation than Pb-CaM.
Titrimetric CD data showed the greatest difference between Ca-CaM and Pb-
CaM. CD spectral data depicted a greater change in signal at the 208 nm negative peak
with no change in the 222 nm negative peak (Figure 8). This change occurred only when

120
“as-is” CaM was titrated with Pb2+ as compared to Ca2+. Titrimetric CD data with
cadmium, zinc and tin were completed as well (data not shown), and no change in CD
spectra was evident when compared with Ca-CaM. The θ208/θ222 ratio of peaks for Pb-
CaM (0.88) was determined to be significantly different than either Ca-CaM (1.01) or
“as-is” CaM (1.02). A ratio value of one indicates that the peak at 208 nm has the same
signal as the peak at 222 nm and the protein contains mostly helical content. For ratios
that are significantly less than one as seen in the Pb-CaM samples, causes are less
understood (Paulucci et al., 2002). Libante, Thion and Lane (2001), in a study of the
binding of ATP to SopA proposed that a loss of signal at 208 nm indicated a decrease in
the proportion of α-helical structure to β-sheet structure. The smaller ratio has been
attributed to more random coil, interaction of helices, and rearrangement of helices
(Lawton et al., 2002; Woolley & Wallace, 1993)
The present data exhibited an increase (less negative ME) in the CD spectrum
(Figure 7) at 208 nm when Pb2+ was bound to CaM, and this may indicate more random
coil structure, which has a negative CD signal at 195 nm. This is supported by the
analysis from the CDSSTR deconvolution program in Table 18. The results showed that
as α-helical structure decreased in Pb-CaM by 4.2%, there was a 2% increase in random
coil structure when compared to “as-is” CaM. Ca-CaM showed an increase of 2.3% in α-
helical structure. The data in Table 19 indicated that α-helical structure was significantly
less in Pb-CaM than in Ca-CaM. NMR and crystal structure data support an increase in
random coil structure (Kirberger et al., 2013; Wilson & Brunger, 2003). The change in
random coil structure may occur outside of the EF hands in areas closer to the linker
(residues 76-84). The crystal structure 1n0y in Figure 3 (Chapter 6) shows seven
121
additional Pb2+ ions bound to sites outside of the EF hands closer to the linker region
(Wilson & Brunger, 2003). The theory of opportunistic binding proposes that Pb2+ ions
bound in areas of negative charge on CaM. The linker region contains several glutamic
acid and aspartic acid residues that commonly bind Pb2+ ions. The linker region may have
more random coil if Pb2+ ions are bound in that region similar to the binding of target
proteins (Kirberger et al., 2013).
Recently with the use of NMR data, research showed that Pb2+ binding to CaM
may cause a conformational change that is similar to a target protein binding to
calmodulin (Kirberger et al., 2013). When binding a target protein, the conformation of
CaM becomes closed and the domains are closer together with a bend in the linker. Areas
of the protein become hydrophobic. The hydrophobicity of the environment around the
protein can affect the ratio of θ208/θ222 (Rodger & Norden, 1997). Paulucci et al., (2002),
proposed that solvent effects or conformational changes in helices would affect the ratio.
Several studies note that the addition of an organic solvent trifluoroethanol (TFE)
increased helical content (Bayley, Martin, & Jones, 1988; Dunlap, Kirk, Pena, Yoder, &
Creamer, 2013) and the ratio of θ208/θ222 (Paulucci et al., 2002). Theoretical modeling of
the 208 nm transition suggested that interaction of helices contributed to the
conformational change (Bode & Applequist, 1997). These previous results taken together
with the current results indicate that there was a loss of helical structure in Pb-CaM
corresponding with an increase in a more hydrophobic environment around the remaining
helices.
122
Conclusion
Changes in CD signal were observed when less than 1 µM Pb2+ bound with CaM
to saturated concentrations of Pb2+. The CD signal and deconvolution data supported that
α-helical content decreased as random coil content increased when Pb2+ bound to CaM.
These results provided further support that Pb2+ has unique characteristics when
interacting with CaM when compared with other metals including Ca2+, Cd2+, or Mg2+.
Although, CD is an excellent technique to probe the secondary structure, further research
is necessary to understand why the signal change occurred. Experiments to show why the
Pb-CaM gave a small ratio of θ208/θ222 when compared to Ca-CaM are needed. Further
data to support the small ratio may come from studies on the hydrophobic areas of the
protein, how the helices on the protein change in relationship to each other, and
examination of the tertiary structure of CaM. Molecular dynamics studies may provide
more information on the increase in random coil, where it occurs on the protein, and if it
is associated with an increase in the hydrophobic domains.
123
CHAPTER EIGHT
STUDY 2: MOLECULAR DYNAMICS MODELING OF Pb2+ BINDING TO CAM
Introduction
There has been considerable research to understand what happens when lead
binds to calmodulin (CaM) as well as research to understand where Pb2+ binds on CaM.
To date, the interaction of Pb2+ and CaM has not been explored through molecular
dynamics simulations. Most simulations have been used to determine how Ca2+ and other
ions including magnesium, strontium and lanthanum bind to CaM (Lepšík & Field, 2007)
as well as the effects of binding on the conformation of the CaM structure (Fiorin,
Biekofsky, Pastore, & Carloni, 2005; Komeiji, Ueno, & Uebayasi, 2002; van der Spoel,
de Groot, Hayward, Berendsen, & Vogel, 1996). Generally the interest has been in the
conformation of calmodulin in solution (Shepherd & Vogel, 2004; Wriggers, Mehler,
Pitici, Weinstein, & Schulten, 1998) because the crystal structures do not accurately
depict the flexible nature of the central linker (Kuboniwa et al., 1995). Molecular
dynamics modeling was used to predict the location of Pb2+ binding sites on CaM and to
investigate how Pb2+ binds to CaM.
The technique that was used in this study allowed for the CaM protein structure to
interact with randomly placed Pb2+ ions in the simulation water box.
124
Pang et al., (2013) used fragment homology modeling and molecular dynamics to predict
Ca2+ binding sites on CaM. That study randomly placed about ten Ca2+ ions around
individual binding site from calcium binding proteins in the simulation. They were able
to correctly predict Ca2+ binding sites about 87.7% of the time, although they found that
it was essential to place the Ca2+ ions in energy minimized areas around the binding sites
to accurately predict the sites. Another study predicted the Ca2+ binding sites on calcium
binding protein including CaM by using the MUGSR algorithm with side chain torsional
rotation (Wang et al., 2010). The MUGSR algorithm finds oxygen clusters and then
calculates a calcium center near those groups based on certain filters. If sites are
eliminated the side chains are rotated to determine if they might fit a calcium center. This
method had 78% accuracy with three correct residue hits within a site. Another study has
predicted Ca2+ binding sites on calcium binding proteins by using the carbon atoms near
the oxygen atoms that bind Ca2+ with high accuracy (Zhao et al., 2012). These
simulations and algorithms have successfully predicted binding sites for calcium on
calcium binding proteins.
Research Goals
The goals in the molecular dynamics study were: (1) to predict Pb2+ binding sites
on CaM and the degree of accuracy in binding, (2) to gain insight into how Pb2+ binds to
CaM, and (3) to investigate how Pb2+ binding affects the flexibility and structure of CaM.
Methods
The protein structure for holo Pb-CaM (PDB: 2v01; Kursula & Majava, 2007)
was acquired from the Protein Data Bank (Berman et al., 2000). A charge was added to
125
His residue 107 HSE visually after assessing its interactions with surrounding
carboxylates. The molecule was prepared for the simulation using the molecular graphics
program, VMD 1.9.1 (Humphrey, Dalke, & Schulten, 1996). The 2v01 protein structure
and 100 randomly added Pb2+ ions were placed in a TIP3+ water box that extended 20 Å
past the protein. The total number of atoms in the box was about 370,000. The charge in
the simulation was neutralized with 172 sodium ions and 348 chloride ions. In the protein
structure (2v01), the eight Pb2+ ions in the original structure were removed.
The equilibration procedure involved energy minimization with and without
restraints on the protein coordinates (3000 steps each) with a conjugated gradient
algorithm using the CHARMM27 force field (MacKerell et al., 1998) and the NAMD
molecular dynamics (MD) program (Phillips et al., 2005). This was followed by slow
heating from 10 to 310 K (30,000 steps), and then pressure and temperature equilibration
using a Langevin piston (10,000 steps). Finally, unrestrained dynamics for 30,000 steps
were done before data acquisition. The time step was 2 fs. Every 150th step was saved in
the trajectory for analysis. Periodic boundary conditions were used. For long-range
electrostatic potential, the Particle Mesh Ewald technique was applied. The cutoffs for
nonbonding (van der Waals and electrostatic) interactions were 12 Å. The switch distance
was 10 Å, and 1.0 1–4 scaling factor was used. This process constitutes equilibration of
the structure. A production MD simulation was then run for 60 ns using the same
parameters. Due to the size of the box, it took about 2 days per nanosecond.
A reference simulation was run for 10 ns using the same procedure with the structure of
2v01 with the eight Pb2+ and one Ca2+ ions retained.
126
All diagrams were generated using VMD 1.9.1. Visual analysis of results was
performed using VMD. Each interaction between a Pb2+ ion and residue was recorded. A
bonding interaction was considered to occur at distances less than three angstroms
between the Pb2+ ion and an atom of the protein. Data included the residue, the type of
atom on the residue with which Pb2+ interacted, and the time that interaction lasted. An
interaction longer than 5 ns was considered to be permanent in the simulation.
Interactions between 1 ns and 5 ns were considered transient binding sites. All
interactions less than 1 ns were not considered for analysis for two reasons. Some Pb2+
ions were expected to be near the protein yet the electrostatic interaction for these Pb2+
ions with residues would be too small for the binding to be permanent. A second reason
was some of these sites were not oxygen atoms, but hydrogen or carbon atoms that were
unlikely to permanently bind a Pb2+ ion. Non-bonding electrostatic and van der Waals
interaction energies were calculated for each Pb2+ that bound to the protein using NAMD.
Root Mean Standard Deviation (RMSD) of the protein and Root Mean Square
Fluctuation (RMSF) per residue of the alpha carbons on the main chain were calculated
for the protein. RMSD is the standard deviation of the protein conformation from a
reference conformation for each time step in the simulation. In this simulation, the
reference simulation is the protein in the first time step of the simulation. RMSF values
are the standard deviations of the RMSD values over the time of the simulation. RMSF
accounts for the magnitude of change (fluctuation) in each residue when compared to the
average change of that residue.
The resulting Pb-CaM structure (based on 2v01) from the simulation was
compared to the two X-ray crystallography (XRC) structures of Pb-CaM (2v01 and 1n0y)
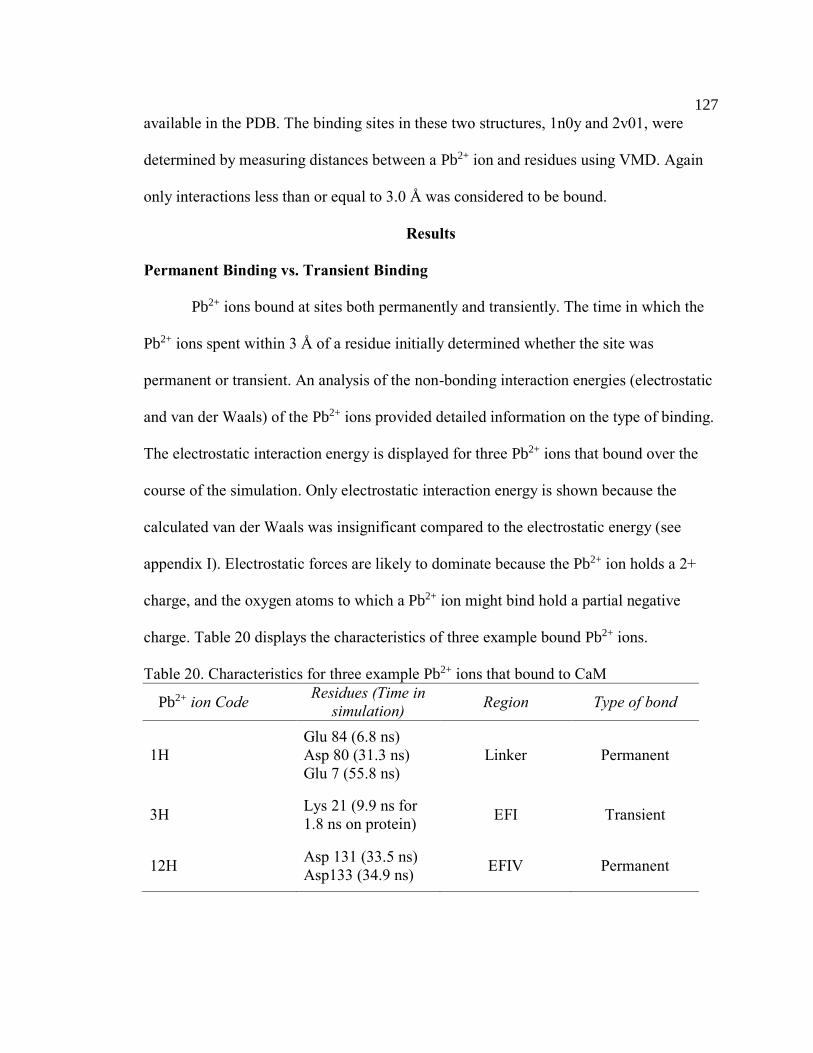
127
available in the PDB. The binding sites in these two structures, 1n0y and 2v01, were
determined by measuring distances between a Pb2+ ion and residues using VMD. Again
only interactions less than or equal to 3.0 Å was considered to be bound.
Results
Permanent Binding vs. Transient Binding
Pb2+ ions bound at sites both permanently and transiently. The time in which the
Pb2+ ions spent within 3 Å of a residue initially determined whether the site was
permanent or transient. An analysis of the non-bonding interaction energies (electrostatic
and van der Waals) of the Pb2+ ions provided detailed information on the type of binding.
The electrostatic interaction energy is displayed for three Pb2+ ions that bound over the
course of the simulation. Only electrostatic interaction energy is shown because the
calculated van der Waals was insignificant compared to the electrostatic energy (see
appendix I). Electrostatic forces are likely to dominate because the Pb2+ ion holds a 2+
charge, and the oxygen atoms to which a Pb2+ ion might bind hold a partial negative
charge. Table 20 displays the characteristics of three example bound Pb2+ ions.
Table 20. Characteristics for three example Pb2+ ions that bound to CaM
Pb2+ ion Code Residues (Time in
simulation) Region Type of bond
1H
Glu 84 (6.8 ns)
Asp 80 (31.3 ns)
Glu 7 (55.8 ns)
Linker Permanent
3H Lys 21 (9.9 ns for
1.8 ns on protein) EFI Transient
12H Asp 131 (33.5 ns)
Asp133 (34.9 ns) EFIV Permanent
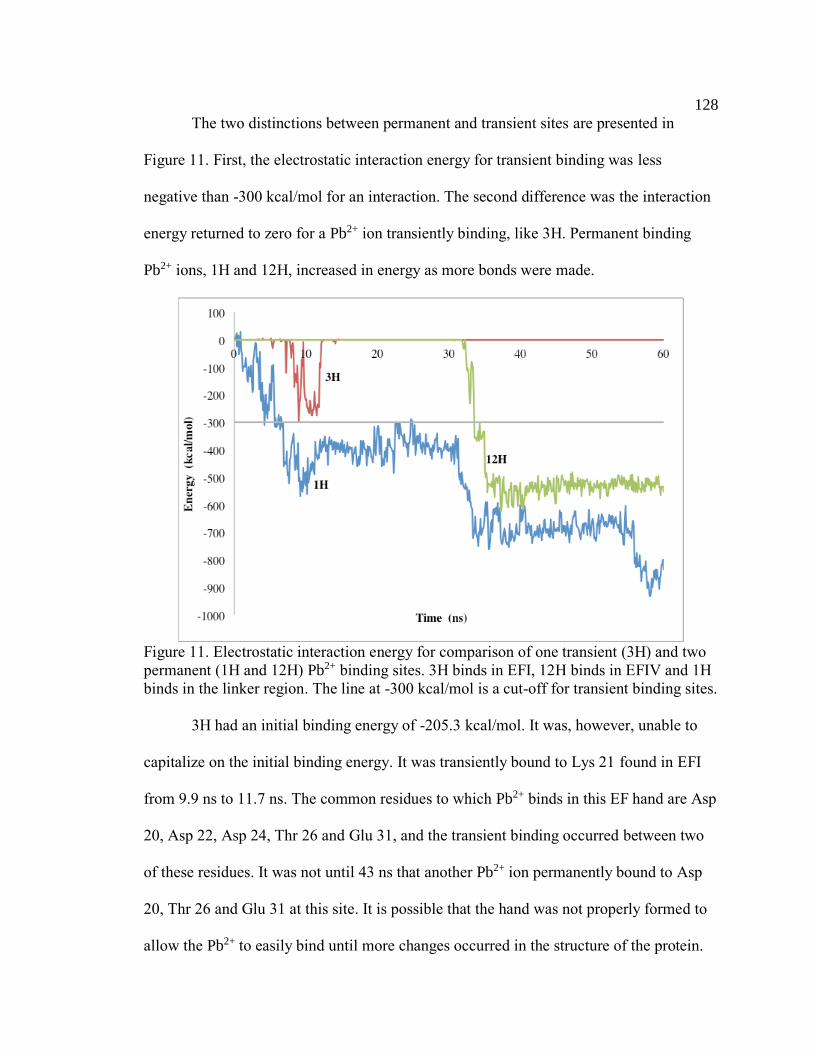
128
The two distinctions between permanent and transient sites are presented in
Figure 11. First, the electrostatic interaction energy for transient binding was less
negative than -300 kcal/mol for an interaction. The second difference was the interaction
energy returned to zero for a Pb2+ ion transiently binding, like 3H. Permanent binding
Pb2+ ions, 1H and 12H, increased in energy as more bonds were made.
Figure 11. Electrostatic interaction energy for comparison of one transient (3H) and two
permanent (1H and 12H) Pb2+ binding sites. 3H binds in EFI, 12H binds in EFIV and 1H
binds in the linker region. The line at -300 kcal/mol is a cut-off for transient binding sites.
3H had an initial binding energy of -205.3 kcal/mol. It was, however, unable to
capitalize on the initial binding energy. It was transiently bound to Lys 21 found in EFI
from 9.9 ns to 11.7 ns. The common residues to which Pb2+ binds in this EF hand are Asp
20, Asp 22, Asp 24, Thr 26 and Glu 31, and the transient binding occurred between two
of these residues. It was not until 43 ns that another Pb2+ ion permanently bound to Asp
20, Thr 26 and Glu 31 at this site. It is possible that the hand was not properly formed to
allow the Pb2+ to easily bind until more changes occurred in the structure of the protein.

129
A permanent site tended to have a more negative initial interaction energy.
Consider, the Pb2+ ion, 1H. This was the third Pb2+ ion in the simulation to bind after one
each in EFI and EFIV. 1H bound Glu 84 in a bidentate fashion quickly at -303 kcal/mol
and -429 kcal/mol. The interaction energy decreased to -680 kcal/mol when Asp 80
bound. These first two events occurred in the linker region (Met 76 to Glu 84). In the
simulation, the binding occurred very quickly starting at 6.8 ns with Glu 84. The Pb2+ ion
later bound Asp 80 at 31.3 ns. It is likely that the large time difference between these two
residues is due to conformation. The Pb2+ ion may not have been close enough to any
other residue until the linker was bent more (see next section). Finally, it bound Glu 7
close to the end of the simulation at 55.8 ns dropping the interaction energy to -824
kcal/mol. The residue Glu 7 is not in the linker region. It is outside of EFI near the C-
terminus. This bond could only have occurred because of a conformational change in the
protein. The C-terminus was close enough to the linker to have bound the Pb2+ ion, 1H.
Although permanent sites generally had larger negative energy values, this was
not always the case. Consider the case of Pb2+ ion, 12H. 12H bound Asp 131 at 33.5 ns
with a much lower initial energy of -203 kcal/mol, yet within 1 ns, Asp 133 bound with -
334 kcal/mol and finished binding the other oxygen on Asp 131 with -506 kcal/mol at
37.1 ns. These residues bound in quick succession for a dramatic decrease in electrostatic
interaction energy. It appears that some Pb2+ ions such as 12H wait until a suitable
binding spot opens up before permanent binding occurs.
Peptide Residues Binding Pb2+ on CaM
Each of the canonical [EF hands] sites contains a number of residues that
contribute to binding. Consequently, both sites and residues within those sites
130
characterized binding. The results showed that Pb2+ ions bound in several sites in addition
to the canonical sites. Over the course of 60 ns simulation, 16 Pb2+ ions of the 100 Pb2+
ions in the water box interacted with 26 residues on the protein. Many of the Pb2+ ions
bound to more than one residue on the protein. A total of 12 Pb2+ ions were permanently
bound to 12 sites. Within those sites, a total of 21 residues were bound. It was found that
14 residues (58%) bound to seven Pb2+ ions matched with the XRC structures, 1n0y and
2v01. Seven residues sites permanently bound with five Pb2+ ions (27%) not found in the
XRC structures. There were four transient sites each with one Pb2+ bound (15%) each not
confirmed with XRC structure data.
The residues that do not match XRC structural data were not unusual. Most
unconfirmed residues were either Glu or Asp on the protein generally just outside of a
canonical EF binding site. The area that had the largest concentration of unconfirmed
residues binding was in EFIV from Asp 118 to Ala 128 where one Pb2+ ion bound at Glu
119, and one at Glu 123 and Glu 127. A Pb2+ ion also bound outside of EFII at Asp 50
and Glu 54.
The most common residues bound to Pb2+ ions were Glu and Asp followed by
Asn and Gln, Thr, Met, Lys and Ser indicated in Table 21. The order represented is
supported by a previous PDB analysis of the most common Pb2+ binding sites to side
chain residues with available oxygen atoms (see last column in Table 21) (Kirberger &
Yang, 2008). The confirmed sites had a larger number of Asp residues bound than Glu
residues. In the unconfirmed binding sites, there was a greater number of Glu residues
over Asp residues. The transient sites consisted of residues that do not commonly bind
with Pb2+ (Gln 143, Asn 42, Ser 17, and Lys 21). These residues were either just outside
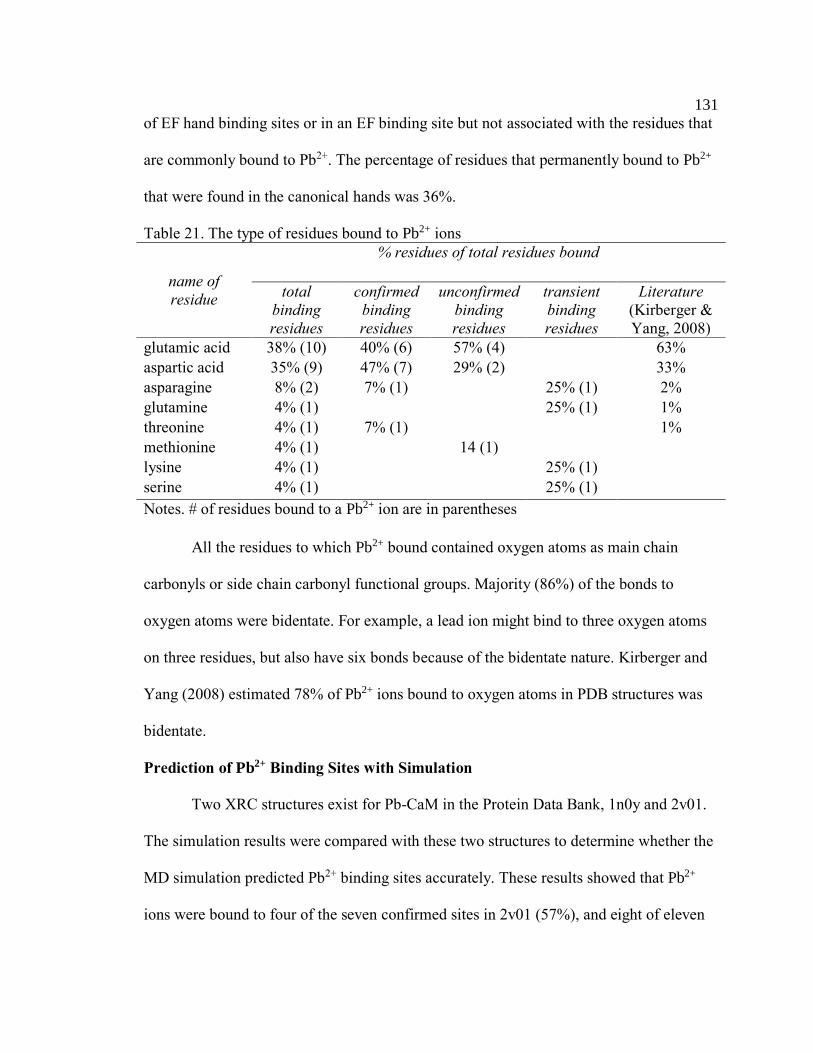
131
of EF hand binding sites or in an EF binding site but not associated with the residues that
are commonly bound to Pb2+. The percentage of residues that permanently bound to Pb2+
that were found in the canonical hands was 36%.
Table 21. The type of residues bound to Pb2+ ions
name of
residue
% residues of total residues bound
total
binding
residues
confirmed
binding
residues
unconfirmed
binding
residues
transient
binding
residues
Literature
(Kirberger &
Yang, 2008)
glutamic acid 38% (10) 40% (6) 57% (4) 63%
aspartic acid 35% (9) 47% (7) 29% (2) 33%
asparagine 8% (2) 7% (1) 25% (1) 2%
glutamine 4% (1) 25% (1) 1%
threonine 4% (1) 7% (1) 1%
methionine 4% (1) 14 (1)
lysine 4% (1) 25% (1)
serine 4% (1) 25% (1)
Notes. # of residues bound to a Pb2+ ion are in parentheses
All the residues to which Pb2+ bound contained oxygen atoms as main chain
carbonyls or side chain carbonyl functional groups. Majority (86%) of the bonds to
oxygen atoms were bidentate. For example, a lead ion might bind to three oxygen atoms
on three residues, but also have six bonds because of the bidentate nature. Kirberger and
Yang (2008) estimated 78% of Pb2+ ions bound to oxygen atoms in PDB structures was
bidentate.
Prediction of Pb2+ Binding Sites with Simulation
Two XRC structures exist for Pb-CaM in the Protein Data Bank, 1n0y and 2v01.
The simulation results were compared with these two structures to determine whether the
MD simulation predicted Pb2+ binding sites accurately. These results showed that Pb2+
ions were bound to four of the seven confirmed sites in 2v01 (57%), and eight of eleven
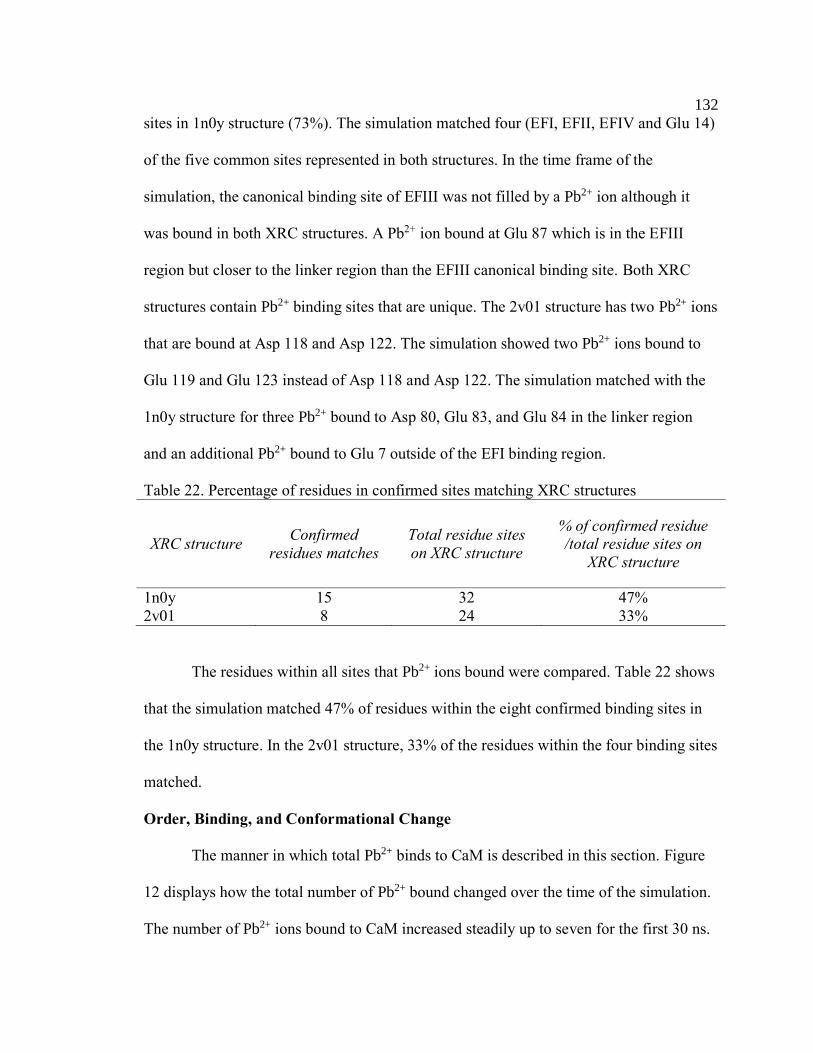
132
sites in 1n0y structure (73%). The simulation matched four (EFI, EFII, EFIV and Glu 14)
of the five common sites represented in both structures. In the time frame of the
simulation, the canonical binding site of EFIII was not filled by a Pb2+ ion although it
was bound in both XRC structures. A Pb2+ ion bound at Glu 87 which is in the EFIII
region but closer to the linker region than the EFIII canonical binding site. Both XRC
structures contain Pb2+ binding sites that are unique. The 2v01 structure has two Pb2+ ions
that are bound at Asp 118 and Asp 122. The simulation showed two Pb2+ ions bound to
Glu 119 and Glu 123 instead of Asp 118 and Asp 122. The simulation matched with the
1n0y structure for three Pb2+ bound to Asp 80, Glu 83, and Glu 84 in the linker region
and an additional Pb2+ bound to Glu 7 outside of the EFI binding region.
Table 22. Percentage of residues in confirmed sites matching XRC structures
XRC structure Confirmed
residues matches
Total residue sites
on XRC structure
% of confirmed residue /total residue sites on
XRC structure
1n0y 15 32 47%
2v01 8 24 33%
The residues within all sites that Pb2+ ions bound were compared. Table 22 shows
that the simulation matched 47% of residues within the eight confirmed binding sites in
the 1n0y structure. In the 2v01 structure, 33% of the residues within the four binding sites
matched.
Order, Binding, and Conformational Change
The manner in which total Pb2+ binds to CaM is described in this section. Figure
12 displays how the total number of Pb2+ bound changed over the time of the simulation.
The number of Pb2+ ions bound to CaM increased steadily up to seven for the first 30 ns.
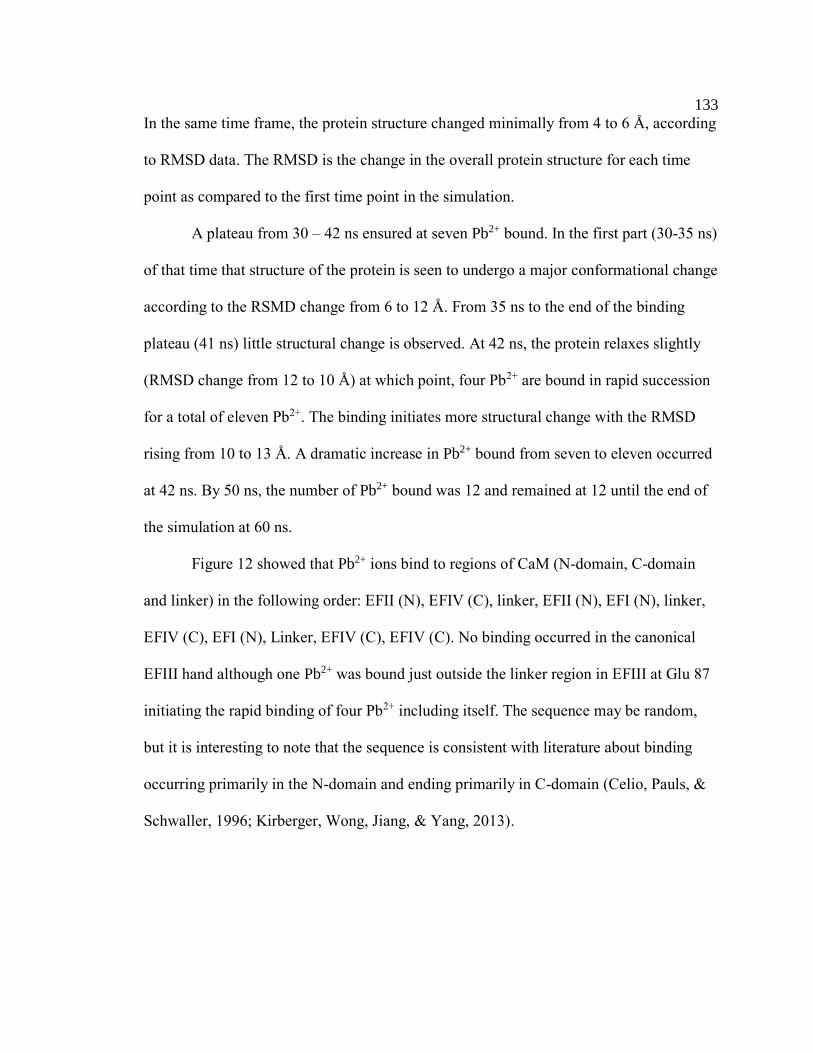
133
In the same time frame, the protein structure changed minimally from 4 to 6 Å, according
to RMSD data. The RMSD is the change in the overall protein structure for each time
point as compared to the first time point in the simulation.
A plateau from 30 – 42 ns ensured at seven Pb2+ bound. In the first part (30-35 ns)
of that time that structure of the protein is seen to undergo a major conformational change
according to the RSMD change from 6 to 12 Å. From 35 ns to the end of the binding
plateau (41 ns) little structural change is observed. At 42 ns, the protein relaxes slightly
(RMSD change from 12 to 10 Å) at which point, four Pb2+ are bound in rapid succession
for a total of eleven Pb2+. The binding initiates more structural change with the RMSD
rising from 10 to 13 Å. A dramatic increase in Pb2+ bound from seven to eleven occurred
at 42 ns. By 50 ns, the number of Pb2+ bound was 12 and remained at 12 until the end of
the simulation at 60 ns.
Figure 12 showed that Pb2+ ions bind to regions of CaM (N-domain, C-domain
and linker) in the following order: EFII (N), EFIV (C), linker, EFII (N), EFI (N), linker,
EFIV (C), EFI (N), Linker, EFIV (C), EFIV (C). No binding occurred in the canonical
EFIII hand although one Pb2+ was bound just outside the linker region in EFIII at Glu 87
initiating the rapid binding of four Pb2+ including itself. The sequence may be random,
but it is interesting to note that the sequence is consistent with literature about binding
occurring primarily in the N-domain and ending primarily in C-domain (Celio, Pauls, &
Schwaller, 1996; Kirberger, Wong, Jiang, & Yang, 2013).
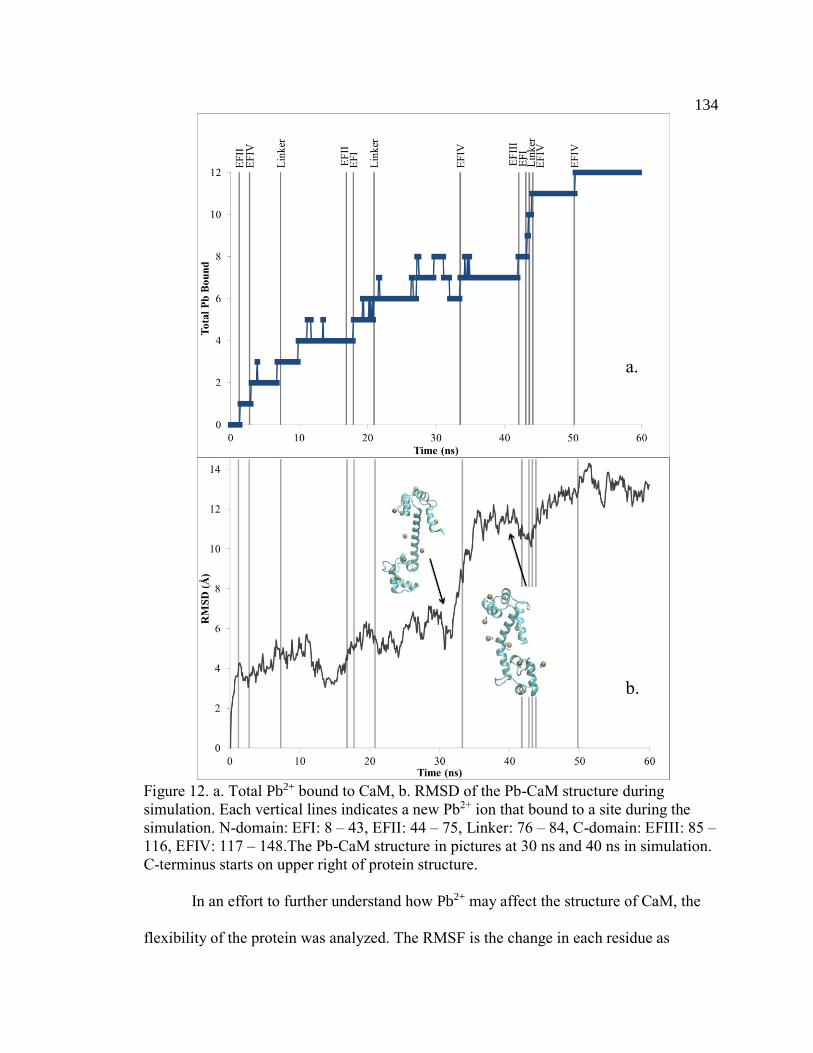
134
Figure 12. a. Total Pb2+ bound to CaM, b. RMSD of the Pb-CaM structure during
simulation. Each vertical lines indicates a new Pb2+ ion that bound to a site during the
simulation. N-domain: EFI: 8 – 43, EFII: 44 – 75, Linker: 76 – 84, C-domain: EFIII: 85 –
116, EFIV: 117 – 148.The Pb-CaM structure in pictures at 30 ns and 40 ns in simulation.
C-terminus starts on upper right of protein structure.
In an effort to further understand how Pb2+ may affect the structure of CaM, the
flexibility of the protein was analyzed. The RMSF is the change in each residue as
a.
b.
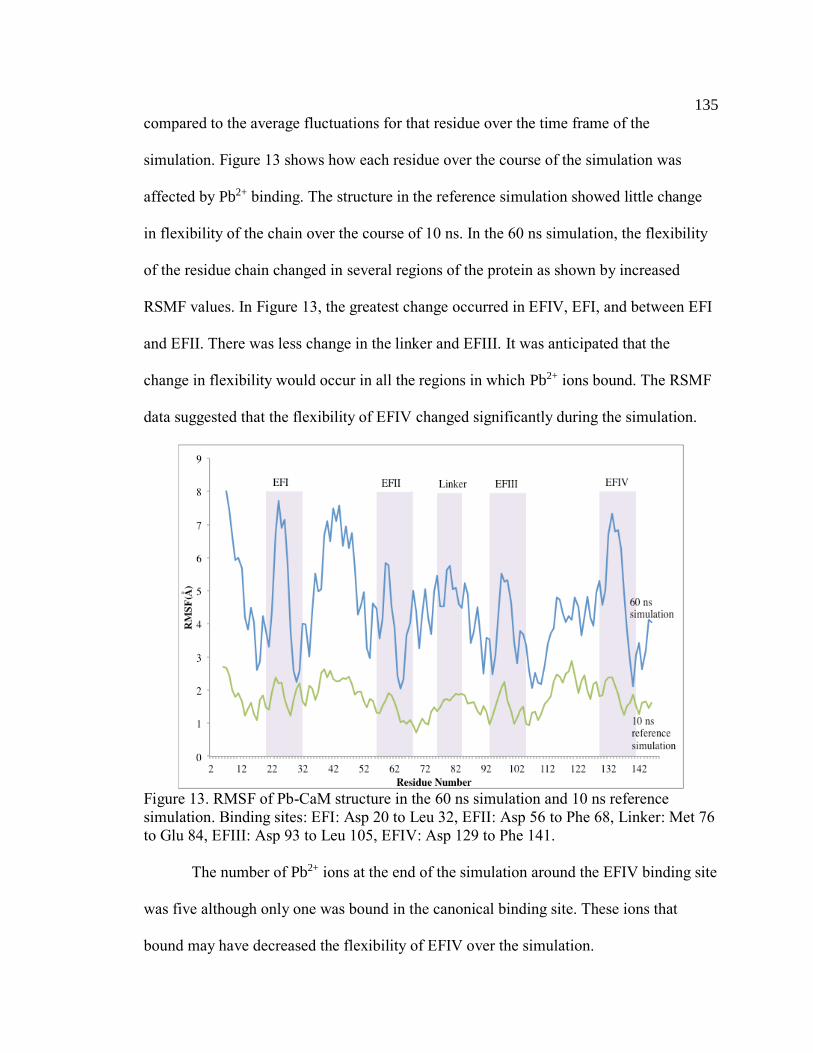
135
compared to the average fluctuations for that residue over the time frame of the
simulation. Figure 13 shows how each residue over the course of the simulation was
affected by Pb2+ binding. The structure in the reference simulation showed little change
in flexibility of the chain over the course of 10 ns. In the 60 ns simulation, the flexibility
of the residue chain changed in several regions of the protein as shown by increased
RSMF values. In Figure 13, the greatest change occurred in EFIV, EFI, and between EFI
and EFII. There was less change in the linker and EFIII. It was anticipated that the
change in flexibility would occur in all the regions in which Pb2+ ions bound. The RSMF
data suggested that the flexibility of EFIV changed significantly during the simulation.
Figure 13. RMSF of Pb-CaM structure in the 60 ns simulation and 10 ns reference
simulation. Binding sites: EFI: Asp 20 to Leu 32, EFII: Asp 56 to Phe 68, Linker: Met 76
to Glu 84, EFIII: Asp 93 to Leu 105, EFIV: Asp 129 to Phe 141.
The number of Pb2+ ions at the end of the simulation around the EFIV binding site
was five although only one was bound in the canonical binding site. These ions that
bound may have decreased the flexibility of EFIV over the simulation.

136
The region between EFI and EFII had one Pb2+ ion bound. The change in flexibility in
this region may be attributed to the Pb2+ ion bound that bound residue Asp 50 at 1.4 ns, or
it may be caused by a Pb2+ ion that first bound Asp 58 in EFII at 11.1 ns followed by a
Pb2+ ion that first bound Asp 20 at 43.3 ns. According to Figure 13, there is greater
change in the RSMF of residues in the N-domain (EFI and EFII) than the C-domain
(EFIII and EFIV). This indicated that the N-domain had more flexibility than the C-
domain over the course of the simulation.
Discussion
This research with the Pb-CaM complex through molecular simulations provided
the very first simulation of the Pb-CaM interaction and described where and how Pb2+
bound to CaM and how it affected the flexibility of the protein structure. In addition, the
simulation provided a new method in which binding sites may be predicted using
molecular dynamics.
The simulation was able to predict known binding sites of Pb2+ ions to CaM in
both XRC structures. It extends research in the area of prediction modeling of binding
sites in calcium binding proteins. To date most of prediction modeling has revolved
around calcium binding in calcium binding proteins (Pang et al., 2013; Wang et al., 2010;
Zhao et al., 2012). There is some previous research that predicted Pb2+ binding to
osteocalcin with genetic algorithm molecular dynamics. That study predicted that Pb2+
ions bound to oxygen atoms on Gla residues, which was supported by NMR and CD data
(Dowd, Li, & Gundberg, 2008). This method in this study was similar to Pang et al.,
(2013) in which they randomly placed Ca2+ ions around binding sites in eighteen crystal
structures to predict the binding sites and residues within those sites. They found 87.8%
137
accuracy with the binding sites and 71.1% with residues within those sites when
compared to the crystal structures. The method in this study was 57% accurate with the
2v01 XRC structure and 73% accurate with the 1n0y structure for binding sites and 47%
and 33%, respectively for residues within those binding sites. Although, the accuracy is
lower, this is likely because Pb2+ ions were placed randomly in the water box with the
entire protein rather than near specific binding sites like in the work of Pang et al. This
method shows promise as a simple method to predict binding sites with ligands on a
protein.
The binding sites and the specific residues to which Pb2+ ions bound matched
XRC structural data. The simulation matched three of the four canonical hand sites to
which Pb2+ ions are known to bind (Kirberger et al., 2013). The EFIII canonical binding
site never bound a Pb2+ ion in contrast to XRC structural data. However, a deeper
analysis of the occupancy in the crystal structure sites for 1n0y shows a much lower
occupancy of 0.3 than the unity occupancy of the remaining EF hands (Wilson &
Brunger, 2003). Other previous research indicated issues with metal binding in EFIII. In
the analysis of the solution structure of 1cfd, apo-CaM, the averaging process for the C-
domain and specifically EFIII provided poor and hard to interpret NMR NOE data
(Kuboniwa et al., 1995).
There were sites found in the simulation that were unique to either 2v01 or 1n0y
XRC structure. When compared to the 2v01 structure, there were two residues in the
simulation bound to Glu 119 and Glu 123 instead of Asp 118 and Asp 122 in the 2v01
XRC structure. There are several reasons why the bound residues in the simulation do not
exactly match those in the 2v01 structure. First, Pb2+ is more attracted to Glu (40%) over

138
Asp (20%) as indicated in the Protein Data Bank analysis of atoms that most commonly
bind to Pb2+ (Kirberger & Yang, 2008). Secondly, Glu is longer than Asp and may
contribute to Pb2+ interacting with Glu first if the conformation of the protein is more
closed in this region of the protein. Finally, the simulation allows for a moving protein
whereas a crystal structure may have packing forces that drive the Pb2+ ions to interact
differently than they might in solution. Other simulations of Ca-CaM have suggested that
crystal packing forces contributed to the differences between modeling and crystal
structures (Fiorin et al., 2005; Wriggers et al., 1998).
Another area where the simulation showed unique binding sites to one of the
XRC structures was the linker region found in the 1n0y structure. It is proposed that Pb2+
ions bind in the linker region (Met 76 to Glu 84). The linker region contains three Glu
and two Asp residues within the nine residues. The data not only support a binding site in
the linker, but also suggest that there may be at least two Pb2+ binding sites. Previous
NMR research indicated dramatic changes in the linker region when Pb2+ was added to
Ca-CaM. That study attributed the dramatic changes at Asp 78, Asp 80, Ser 81, Glu 82,
Glu 83 and Glu 84 as an addition of a binding site in the linker region (Kirberger et al.,
2013). In addition, previous research suggested a metal binding site in the linker region
based on the disappearance of NMR signals (Bertini, Gelis, Katsaros, Luchinat, &
Provenzani, 2003). This is strengthened by data from the XRC structure of 1n0y in which
three Pb2+ ions were bound at 76, 80, and 82 and 83, 87 (Wilson & Brunger, 2003). The
three Pb2+ binding sites in the simulation were at residues 78, 80, 83, and 84. In the 2v01
structure, although a Pb2+ was not bound in the linker, there was a Ca2+ ion bound at
residues 74 and 78 (Kursula & Majava, 2007). These data not only confirmed earlier
139
work that metal ions can bind to auxiliary sites on CaM outside the canonical EF hands
(Milos, Schaer, Comte, & Cox, 1989), but they also supported the theory of opportunistic
binding of Pb2+ to CaM. Opportunistic binding does not displace an ion, but binds
through electrostatic interactions with residues with oxygen atoms like Glu and Asp
(Kirberger et al., 2013).
Other previous data show that there are significant changes between residues Thr
117 and Arg 126 (Kirberger et al., 2013; Kursula & Majava, 2007). The RMSF data in
Figure 13 indicated that there is greater flexibility in this area for Pb-CaM. RSMF data
also suggested that the linker region (Met 76 to Glu 84) was flexible. Kuboniowa et al.,
(1995) proposed that the linker was highly flexible in solution in the analysis of the apo-
CaM. In the analysis of the crystal structure of 1n0y, the electron density of the linker
could not be determined, which suggested that it is flexible (Wilson & Brunger, 2003).
Other research using simulations of Ca-CaM found that the linker bent and became less
α-helical (Wriggers et al., 1998; Yang, Jas, & Kuczera, 2004). The simulation data as
seen in Figure 12 showed that the linker changed and bent bringing the two domains
closer together. This again supports the theory of opportunistic binding where Pb2+ ions
bind to close off the linker region where target proteins should bind.
Pb2+ ion binding to CaM affected the structure and stability. The RMSF data in
Figure 13 showed that the C-domain was more stable than the N-domain. A more stable
protein is indicated by less change in the fluctuations for residues. Computational
modeling with Ca-CaM presented that the N-domain was less stable than the C-domain
(Shepherd & Vogel, 2004). Chemical and thermal denaturation of the Ca2+ bound
140
domains with fluorescence and CD also provided evidence that the C-domain was more
stable (Masino, Martin, & Bayley, 2000).
Tyrosine fluorescence and NMR chemical shifts from previous research provided
evidence that Pb2+ displaces Ca2+ in EFI and EFII; however Pb2+ does not displace Ca2+
in EFIII or EFIV (Kirberger et al., 2013). The simulation data support the binding in EFI
and EFII, however, Pb2+ bound in EFIV as well. The simulation involved a holo protein
(Pb-CaM) that had original Pb2+ ions removed before the addition of free Pb2+ ions to the
water box. The removal of the original Pb2+ ions allowed the protein structure more
flexibility as seen in Figure 13 perhaps making the structure more similar to the apo-
CaM. NMR data support that in apo-CaM, a Pb2+ ion binds to EFIV first, followed by
binding at EFI, EFII and EFIII (Kirberger et al., 2013).
Conclusion
Often experimental studies have had problems with Pb2+ precipitating at larger
concentrations (Kirberger et al., 2013; Ouyang & Vogel, 1998; Shirran & Barran, 2009),
this research provided a new way to look at the Pb-CaM interaction without those
experimental issues in molecular dynamics modeling. The results not only support
previous research that proposed that Pb2+ ions bound outside of the canonical hands, but
it also described how Pb2+ bound to CaM and how it affected the flexibility of the protein
structure. The research supported the theory of opportunistic binding in which Pb2+ ions
bound to the linker and auxiliary sites and may inhibit CaM from binding with target
proteins and contributing to Pb2+ toxicity.
Limitations to the research include the comparison of simulation data with that of
experimental Pb2+ ion displacement data. Although the simulation did not show
141
displacement of an ion by Pb, the results of binding sites and order of binding are
relatively consistent. The time scale of the simulation was 60 ns. This is a long
simulation, but many of the sites with Pb2+ bound only had one or two residues bound to
the Pb2+ atom. Analysis of the XRC structures suggests that four to six bonds are
available. A longer simulation would likely increase the accuracy of the prediction
results.
Future Research
With the current simulation data, code will be written to monitor the
hydrophobicity changes near the linker and in the EF hands with time, similar to the data
obtained for the RSMD. Further more the amount of the α-helix present will be obtained
by running the structural (PDB) coordinates from the simulation through secondary
structure analysis data packages like DSSP in a manner similar to that used in analyzing
the CD data. This will help to validate and confirm the changes in α-helix content
observed in CD. To date, a second study simulating Pb2+ binding to apo-CaM has been
performed. Although most CaM in the cell has some amount of calcium in it, how Pb2+
ions bind to the apo form may suggest why Pb2+ binds to certain auxiliary sites. Future
research would seek to answer whether the major conformation change around 31 ns
occurs in Ca-CaM compared to Pb-CaM, and whether the same type of binding triggers
the change in conformation. This could be achieved by running a simulation with Ca2+
similar to that of Pb2+. Additional simulations of thermal denaturation of Ca-CaM and
Pb-CaM may be performed to compare with experimental data from thermal denaturation
using circular dichroism. These data would provide the stability and conformational
changes that occur with Pb-CaM.

142
APPENDIX A
CONSENT FORM
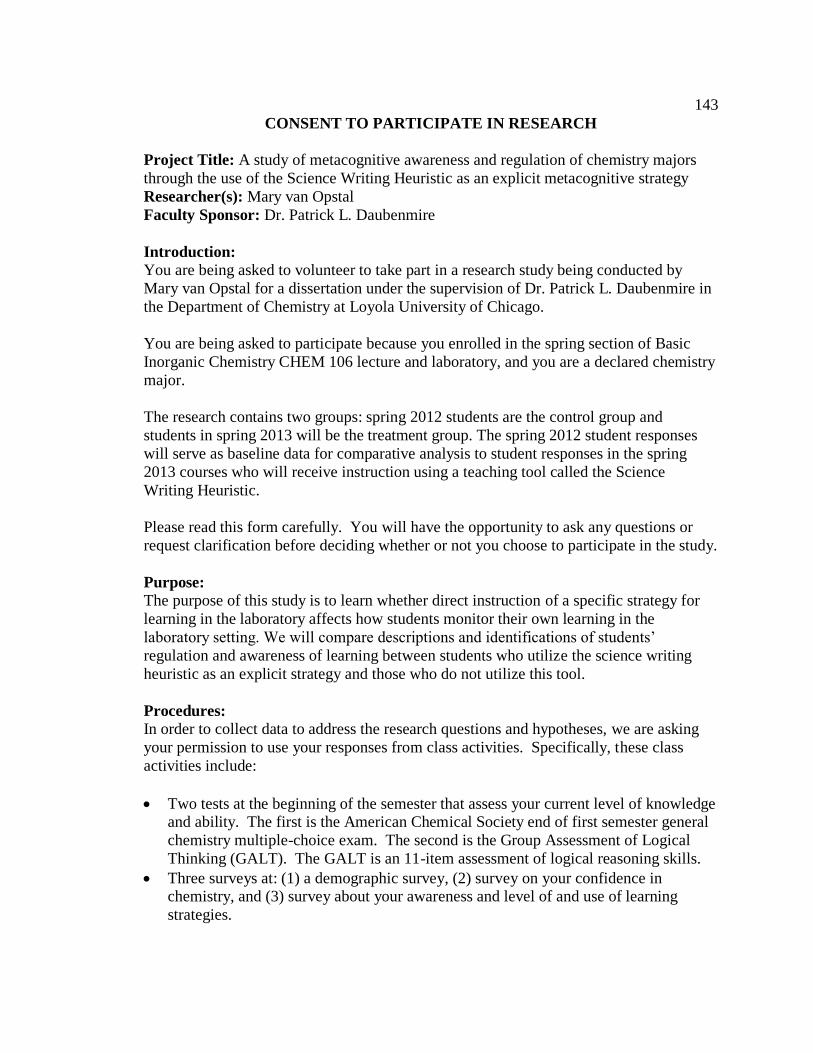
143
CONSENT TO PARTICIPATE IN RESEARCH
Project Title: A study of metacognitive awareness and regulation of chemistry majors
through the use of the Science Writing Heuristic as an explicit metacognitive strategy
Researcher(s): Mary van Opstal
Faculty Sponsor: Dr. Patrick L. Daubenmire
Introduction:
You are being asked to volunteer to take part in a research study being conducted by
Mary van Opstal for a dissertation under the supervision of Dr. Patrick L. Daubenmire in
the Department of Chemistry at Loyola University of Chicago.
You are being asked to participate because you enrolled in the spring section of Basic
Inorganic Chemistry CHEM 106 lecture and laboratory, and you are a declared chemistry
major.
The research contains two groups: spring 2012 students are the control group and
students in spring 2013 will be the treatment group. The spring 2012 student responses
will serve as baseline data for comparative analysis to student responses in the spring
2013 courses who will receive instruction using a teaching tool called the Science
Writing Heuristic.
Please read this form carefully. You will have the opportunity to ask any questions or
request clarification before deciding whether or not you choose to participate in the study.
Purpose:
The purpose of this study is to learn whether direct instruction of a specific strategy for
learning in the laboratory affects how students monitor their own learning in the
laboratory setting. We will compare descriptions and identifications of students’
regulation and awareness of learning between students who utilize the science writing
heuristic as an explicit strategy and those who do not utilize this tool.
Procedures:
In order to collect data to address the research questions and hypotheses, we are asking
your permission to use your responses from class activities. Specifically, these class
activities include:
Two tests at the beginning of the semester that assess your current level of knowledge and ability. The first is the American Chemical Society end of first semester general
chemistry multiple-choice exam. The second is the Group Assessment of Logical
Thinking (GALT). The GALT is an 11-item assessment of logical reasoning skills.
Three surveys at: (1) a demographic survey, (2) survey on your confidence in chemistry, and (3) survey about your awareness and level of and use of learning
strategies.
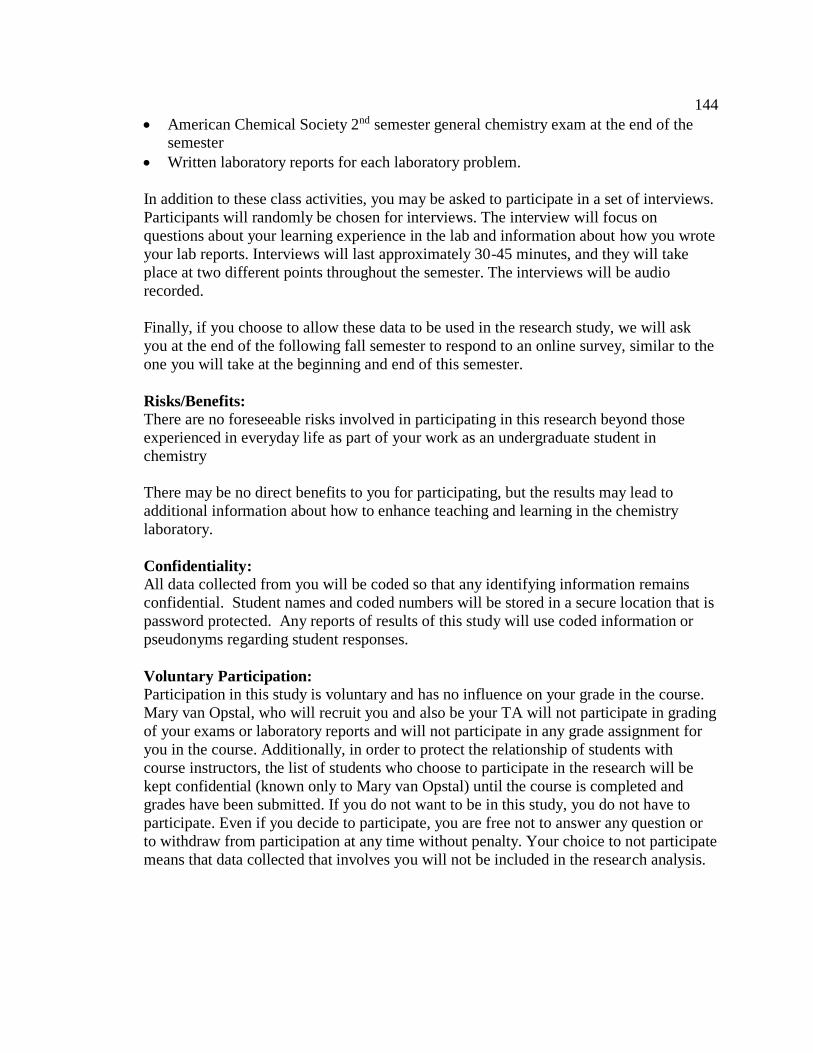
144
American Chemical Society 2nd semester general chemistry exam at the end of the semester
Written laboratory reports for each laboratory problem.
In addition to these class activities, you may be asked to participate in a set of interviews.
Participants will randomly be chosen for interviews. The interview will focus on
questions about your learning experience in the lab and information about how you wrote
your lab reports. Interviews will last approximately 30-45 minutes, and they will take
place at two different points throughout the semester. The interviews will be audio
recorded.
Finally, if you choose to allow these data to be used in the research study, we will ask
you at the end of the following fall semester to respond to an online survey, similar to the
one you will take at the beginning and end of this semester.
Risks/Benefits:
There are no foreseeable risks involved in participating in this research beyond those
experienced in everyday life as part of your work as an undergraduate student in
chemistry
There may be no direct benefits to you for participating, but the results may lead to
additional information about how to enhance teaching and learning in the chemistry
laboratory.
Confidentiality:
All data collected from you will be coded so that any identifying information remains
confidential. Student names and coded numbers will be stored in a secure location that is
password protected. Any reports of results of this study will use coded information or
pseudonyms regarding student responses.
Voluntary Participation:
Participation in this study is voluntary and has no influence on your grade in the course.
Mary van Opstal, who will recruit you and also be your TA will not participate in grading
of your exams or laboratory reports and will not participate in any grade assignment for
you in the course. Additionally, in order to protect the relationship of students with
course instructors, the list of students who choose to participate in the research will be
kept confidential (known only to Mary van Opstal) until the course is completed and
grades have been submitted. If you do not want to be in this study, you do not have to
participate. Even if you decide to participate, you are free not to answer any question or
to withdraw from participation at any time without penalty. Your choice to not participate
means that data collected that involves you will not be included in the research analysis.
145
Compensation:
If you are asked to participate in an interview and complete the set of interviews, you will
be entered into a drawing to receive a $50 iTunes gift card.
Contacts and Questions:
If you have questions about this research study, please feel free to contact:
Mary van Opstal at [email protected] or 616.706.7713 or
Patrick Daubenmire at [email protected] or 773.508.8248
If you have questions about your rights as a research participant, you may contact the
Loyola University Office of Research Services at (773) 508-2689.
Statement of Consent:
Your signature below indicates that you have read the information provided above, have
had an opportunity to ask questions, and agree to participate in this research study. You
will be given a copy of this form to keep for your records.
_________________________ ___________________ __________________
Participant’s Signature Printed name Date
____________________________________________ ___________________
Researcher’s Signature Date

146
APPENDIX B
SAMPLE SWH LAB EXPERIMENT
147
SWH Lab: Spectrophotometry and Equilibrium
Prepared by: Mary van Opstal
Reference: Experiment 22 of Laboratory
Experiments to Accompany Chemistry:
The Central Science, 12th edition.
Theodore E. Brown, John H. Nelson,
Kenneth C. Kemp, Matthew Stoltzfus.
2012, Pearson Prentice Hall.
Introduction: Similar to the cobalt
equilibrium lab last week, we can see the
reaction between iron nitrate and sodium
thiocyanate as the color of the solution
changes. With the use of
spectrophotometry and the knowledge of
the proportional relationship between
absorbance and concentration (Beer’s
Law A=Elc), you will calculate the
equilibrium constant of for this chemical
reaction.
Safety:
Please wear your goggles at all times
and gloves while working directly with
reagents. Be careful when working with
any chemical: acid, base, solid or liquid.
None of these should make contact with
your skin or eyes.
Chemicals
2.00*10-1M Iron nitrate, Fe(NO3)3
2.00*10-3M Sodium thiocyanate NaSCN
0.1M Nitric acid HNO3
Equipment
50.00mL volumetric flasks
Thermometer
10.00mL graduated pipet
5.00mL serological pipet
small beakers
test tubes (medium-large)
Spectrovis unit (with directions)
Cuvette
Fe(NO3)3 + NaSCN <-> NaNO3 +
FeNCS2+
You will first generate a calibration
curve of standard solutions of FeNCS2+
within known concentrations. From this
data, you will be able to determine the
concentrations of FeNCS2+ solutions you
make in Part B. Finally you will
calculate the equilibrium constant (Keq)
for the reaction above.
Techniques:
Volumetric and serological pipet with
bulbs
Volumetric flasks
Procedure:
Work Strategies: You and your group (of
4) will prepare six known concentrations
of FeNCS2+. These are known as
standard solutions. How will you ensure
replication of each concentration? How
will you determine concentrations? Each
pair (within a group) will run standard
solution on their own spectrophotometer.
For Part B, you and your group (of 4)
will prepare six additional solutions of
FeSCN2+ in Part B to determine the
equilibrium constant of the above
reaction. Each pair will then run each
solution on their own spectrophotometer.
How will you ensure replication?
Part A. Preparation of a calibration
curve You will need to prepare 0M and
2.00*10-4M FeNCS2+, as well as four
concentrations of FeNCS2+, between 0M
and 2.00*10-4M FeNCS2+
concentrations. What concentrations will
you make up?
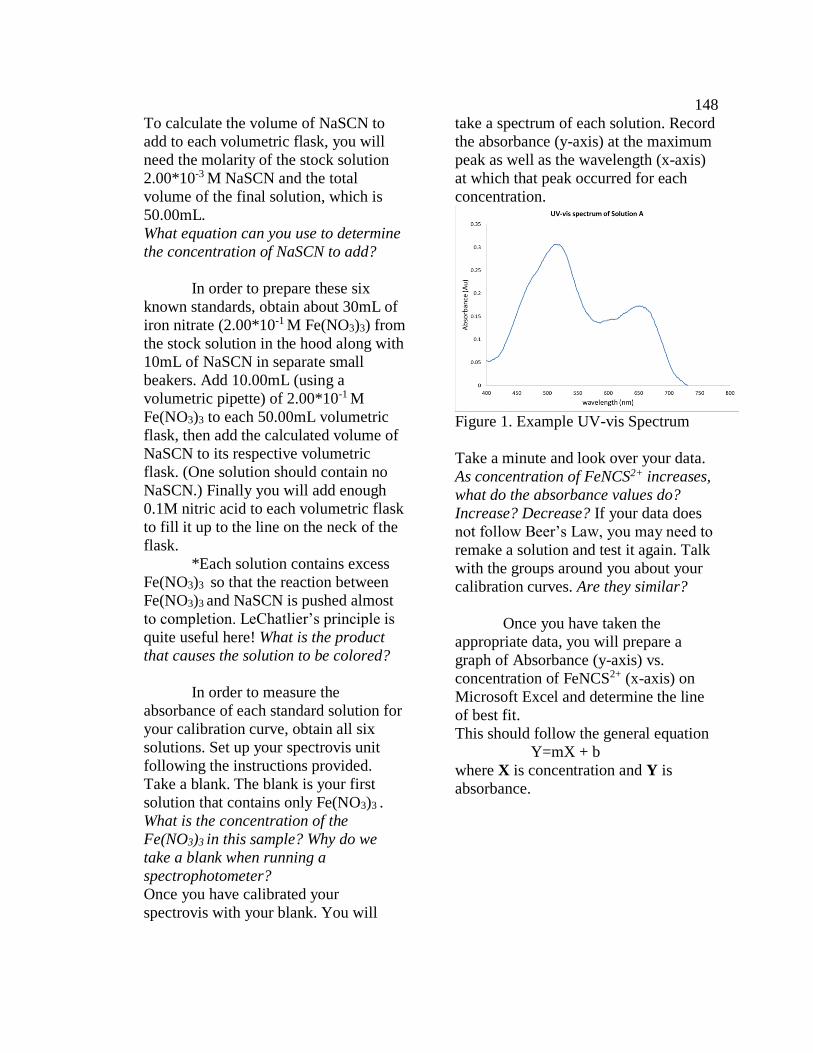
148
To calculate the volume of NaSCN to
add to each volumetric flask, you will
need the molarity of the stock solution
2.00*10-3 M NaSCN and the total
volume of the final solution, which is
50.00mL.
What equation can you use to determine
the concentration of NaSCN to add?
In order to prepare these six
known standards, obtain about 30mL of
iron nitrate (2.00*10-1 M Fe(NO3)3) from
the stock solution in the hood along with
10mL of NaSCN in separate small
beakers. Add 10.00mL (using a
volumetric pipette) of 2.00*10-1 M
Fe(NO3)3 to each 50.00mL volumetric
flask, then add the calculated volume of
NaSCN to its respective volumetric
flask. (One solution should contain no
NaSCN.) Finally you will add enough
0.1M nitric acid to each volumetric flask
to fill it up to the line on the neck of the
flask.
*Each solution contains excess
Fe(NO3)3 so that the reaction between
Fe(NO3)3 and NaSCN is pushed almost
to completion. LeChatlier’s principle is
quite useful here! What is the product
that causes the solution to be colored?
In order to measure the
absorbance of each standard solution for
your calibration curve, obtain all six
solutions. Set up your spectrovis unit
following the instructions provided.
Take a blank. The blank is your first
solution that contains only Fe(NO3)3 .
What is the concentration of the
Fe(NO3)3 in this sample? Why do we
take a blank when running a
spectrophotometer?
Once you have calibrated your
spectrovis with your blank. You will
take a spectrum of each solution. Record
the absorbance (y-axis) at the maximum
peak as well as the wavelength (x-axis)
at which that peak occurred for each
concentration.
Figure 1. Example UV-vis Spectrum
Take a minute and look over your data.
As concentration of FeNCS2+ increases,
what do the absorbance values do?
Increase? Decrease? If your data does
not follow Beer’s Law, you may need to
remake a solution and test it again. Talk
with the groups around you about your
calibration curves. Are they similar?
Once you have taken the
appropriate data, you will prepare a
graph of Absorbance (y-axis) vs.
concentration of FeNCS2+ (x-axis) on
Microsoft Excel and determine the line
of best fit.
This should follow the general equation
Y=mX + b
where X is concentration and Y is
absorbance.
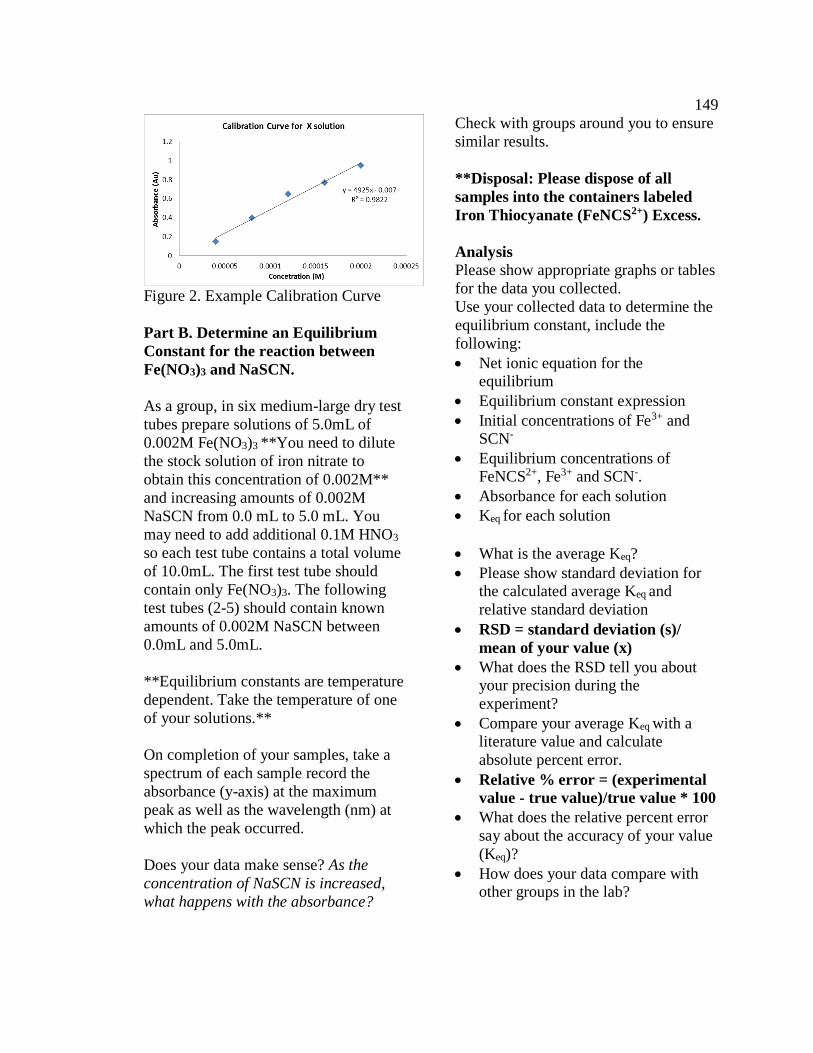
149
Figure 2. Example Calibration Curve
Part B. Determine an Equilibrium
Constant for the reaction between
Fe(NO3)3 and NaSCN.
As a group, in six medium-large dry test
tubes prepare solutions of 5.0mL of
0.002M Fe(NO3)3 **You need to dilute
the stock solution of iron nitrate to
obtain this concentration of 0.002M**
and increasing amounts of 0.002M
NaSCN from 0.0 mL to 5.0 mL. You
may need to add additional 0.1M HNO3
so each test tube contains a total volume
of 10.0mL. The first test tube should
contain only Fe(NO3)3. The following
test tubes (2-5) should contain known
amounts of 0.002M NaSCN between
0.0mL and 5.0mL.
**Equilibrium constants are temperature
dependent. Take the temperature of one
of your solutions.**
On completion of your samples, take a
spectrum of each sample record the
absorbance (y-axis) at the maximum
peak as well as the wavelength (nm) at
which the peak occurred.
Does your data make sense? As the
concentration of NaSCN is increased,
what happens with the absorbance?
Check with groups around you to ensure
similar results.
**Disposal: Please dispose of all
samples into the containers labeled
Iron Thiocyanate (FeNCS2+) Excess.
Analysis
Please show appropriate graphs or tables
for the data you collected.
Use your collected data to determine the
equilibrium constant, include the
following:
Net ionic equation for the equilibrium
Equilibrium constant expression
Initial concentrations of Fe3+ and SCN-
Equilibrium concentrations of FeNCS2+, Fe3+ and SCN-.
Absorbance for each solution
Keq for each solution
What is the average Keq?
Please show standard deviation for the calculated average Keq and
relative standard deviation
RSD = standard deviation (s)/
mean of your value (x)
What does the RSD tell you about your precision during the
experiment?
Compare your average Keq with a literature value and calculate
absolute percent error.
Relative % error = (experimental
value - true value)/true value * 100
What does the relative percent error
say about the accuracy of your value
(Keq)?
How does your data compare with other groups in the lab?
150
Postlab questions
1. How would the accuracy of your
determined Keq change if all your
volume measurements were made
with graduated cylinders rather than
volumetric (or serological) pipets?
2. If all the SCN- was not converted
completely to FeNCS2+ when the
calibration curve was prepared,
would this raise or lower the value of
Keq? Explain.
3. Use the mean value you determined
for Keq to calculate the SCN=
concentration in a solution where the
initial Fe concentration is 4.00x10⁻²
and the initial SCN= concentration is
1.00x10⁻³M. Is all of the SCN= in
the form of FeNCS2+?
4. Does the resolute of calculation in
question 3 justify your original
assumption that all of the SCN= is in
the form of FeNCS2+?
5. Based upon your answer to question
4, is your measured value of Keq too
high or too low?
151
APPENDIX C
METACOGNITIVE STRATEGIES PAGE IN LAB MANUAL
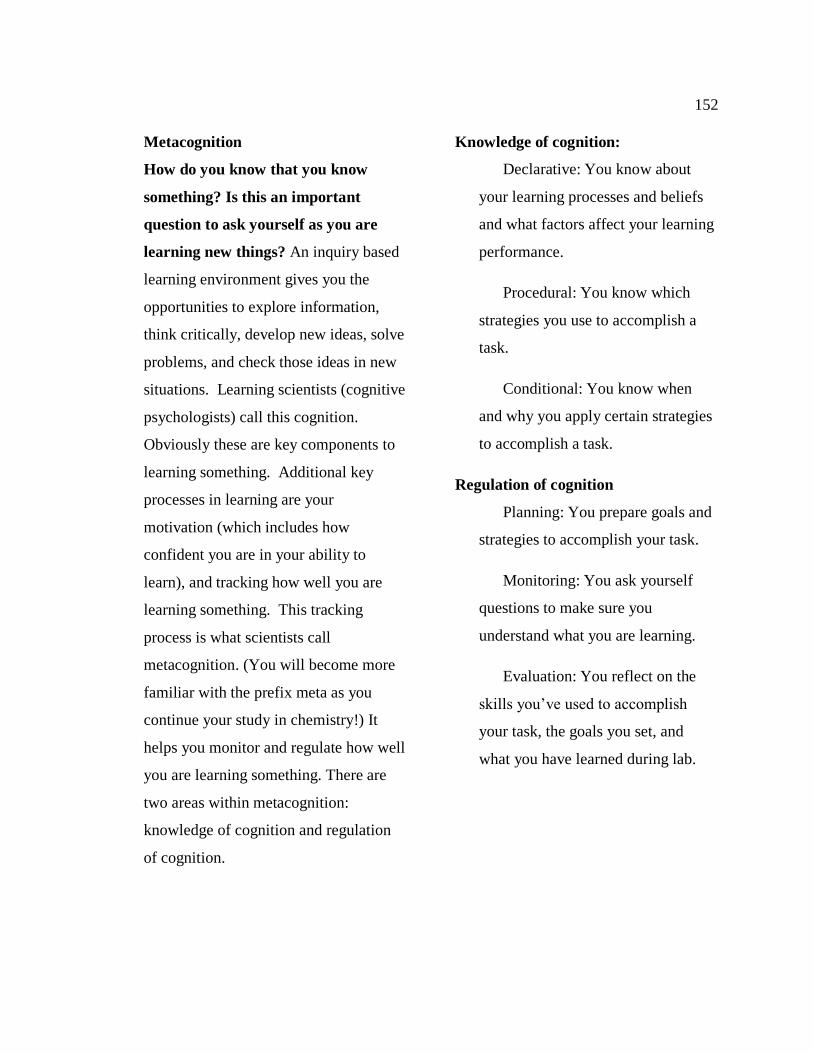
152
Metacognition
How do you know that you know
something? Is this an important
question to ask yourself as you are
learning new things? An inquiry based
learning environment gives you the
opportunities to explore information,
think critically, develop new ideas, solve
problems, and check those ideas in new
situations. Learning scientists (cognitive
psychologists) call this cognition.
Obviously these are key components to
learning something. Additional key
processes in learning are your
motivation (which includes how
confident you are in your ability to
learn), and tracking how well you are
learning something. This tracking
process is what scientists call
metacognition. (You will become more
familiar with the prefix meta as you
continue your study in chemistry!) It
helps you monitor and regulate how well
you are learning something. There are
two areas within metacognition:
knowledge of cognition and regulation
of cognition.
Knowledge of cognition:
Declarative: You know about
your learning processes and beliefs
and what factors affect your learning
performance.
Procedural: You know which
strategies you use to accomplish a
task.
Conditional: You know when
and why you apply certain strategies
to accomplish a task.
Regulation of cognition
Planning: You prepare goals and
strategies to accomplish your task.
Monitoring: You ask yourself
questions to make sure you
understand what you are learning.
Evaluation: You reflect on the
skills you’ve used to accomplish
your task, the goals you set, and
what you have learned during lab.
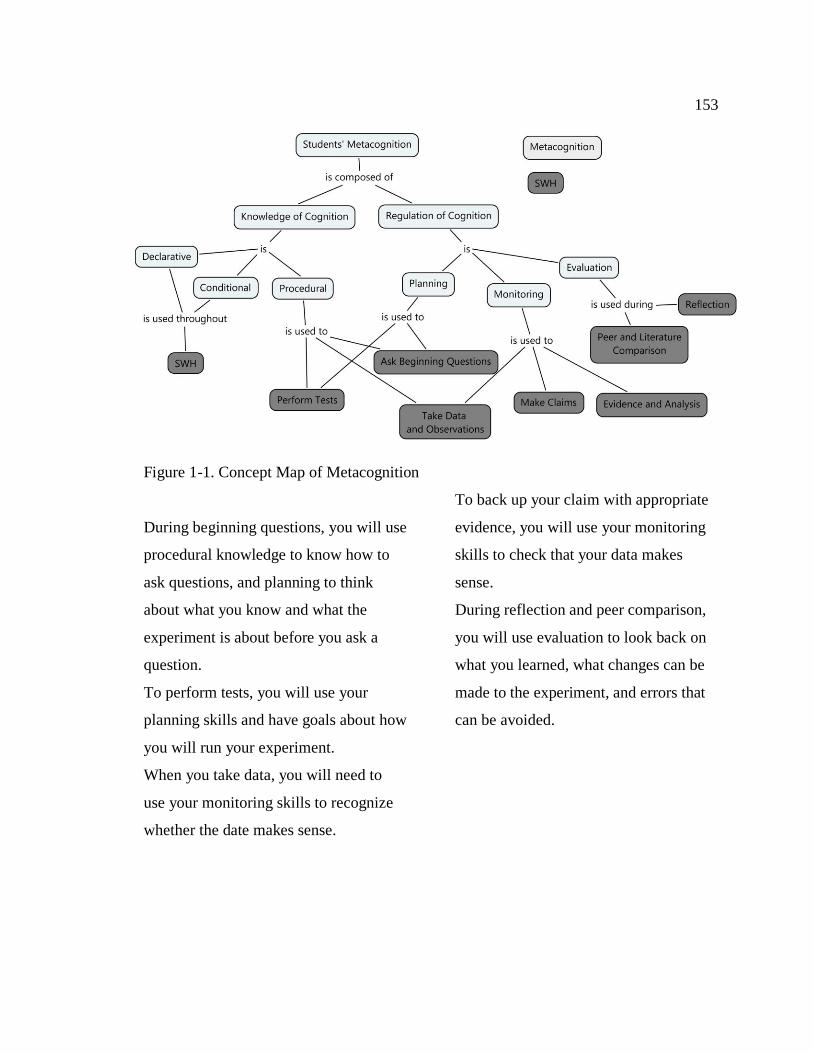
153
Figure 1-1. Concept Map of Metacognition
During beginning questions, you will use
procedural knowledge to know how to
ask questions, and planning to think
about what you know and what the
experiment is about before you ask a
question.
To perform tests, you will use your
planning skills and have goals about how
you will run your experiment.
When you take data, you will need to
use your monitoring skills to recognize
whether the date makes sense.
To back up your claim with appropriate
evidence, you will use your monitoring
skills to check that your data makes
sense.
During reflection and peer comparison,
you will use evaluation to look back on
what you learned, what changes can be
made to the experiment, and errors that
can be avoided.

154
APPENDIX D
SAMPLE OPEN-ENDED LAB PROBLEM
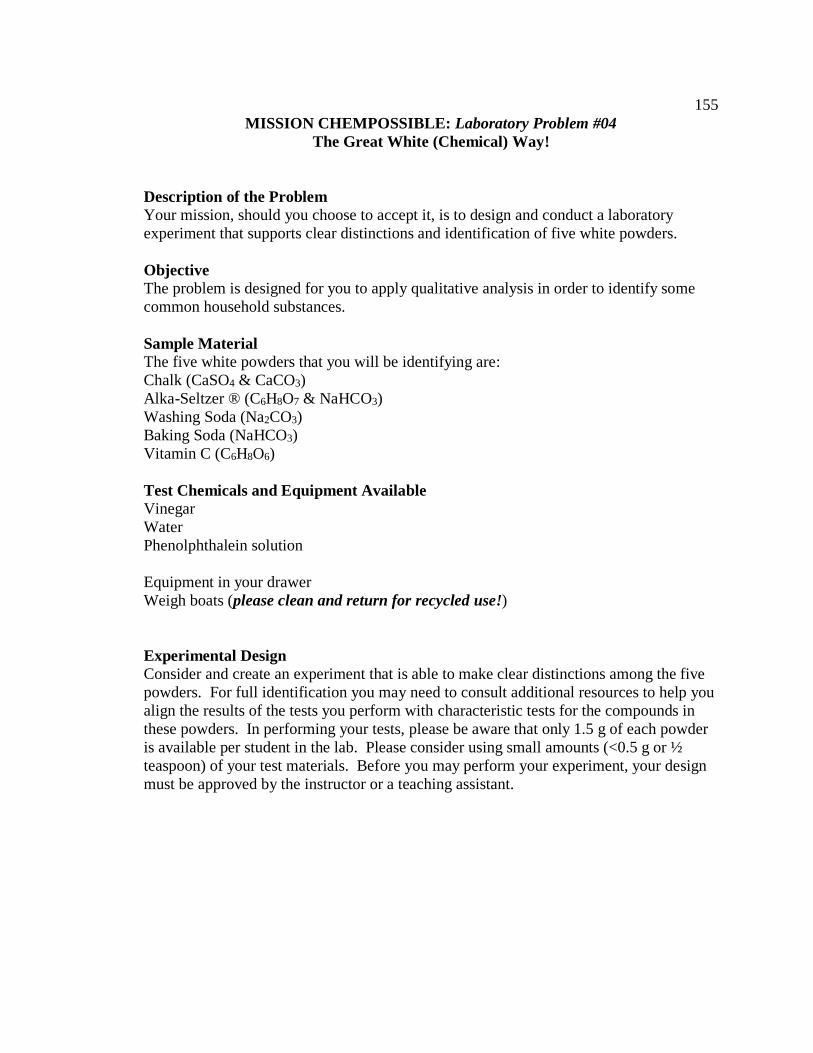
155
MISSION CHEMPOSSIBLE: Laboratory Problem #04
The Great White (Chemical) Way!
Description of the Problem
Your mission, should you choose to accept it, is to design and conduct a laboratory
experiment that supports clear distinctions and identification of five white powders.
Objective
The problem is designed for you to apply qualitative analysis in order to identify some
common household substances.
Sample Material
The five white powders that you will be identifying are:
Chalk (CaSO4 & CaCO3)
Alka-Seltzer ® (C6H8O7 & NaHCO3)
Washing Soda (Na2CO3)
Baking Soda (NaHCO3)
Vitamin C (C6H8O6)
Test Chemicals and Equipment Available
Vinegar
Water
Phenolphthalein solution
Equipment in your drawer
Weigh boats (please clean and return for recycled use!)
Experimental Design
Consider and create an experiment that is able to make clear distinctions among the five
powders. For full identification you may need to consult additional resources to help you
align the results of the tests you perform with characteristic tests for the compounds in
these powders. In performing your tests, please be aware that only 1.5 g of each powder
is available per student in the lab. Please consider using small amounts (<0.5 g or ½
teaspoon) of your test materials. Before you may perform your experiment, your design
must be approved by the instructor or a teaching assistant.
156
APPENDIX E
MCAI AND CIC SURVEYS
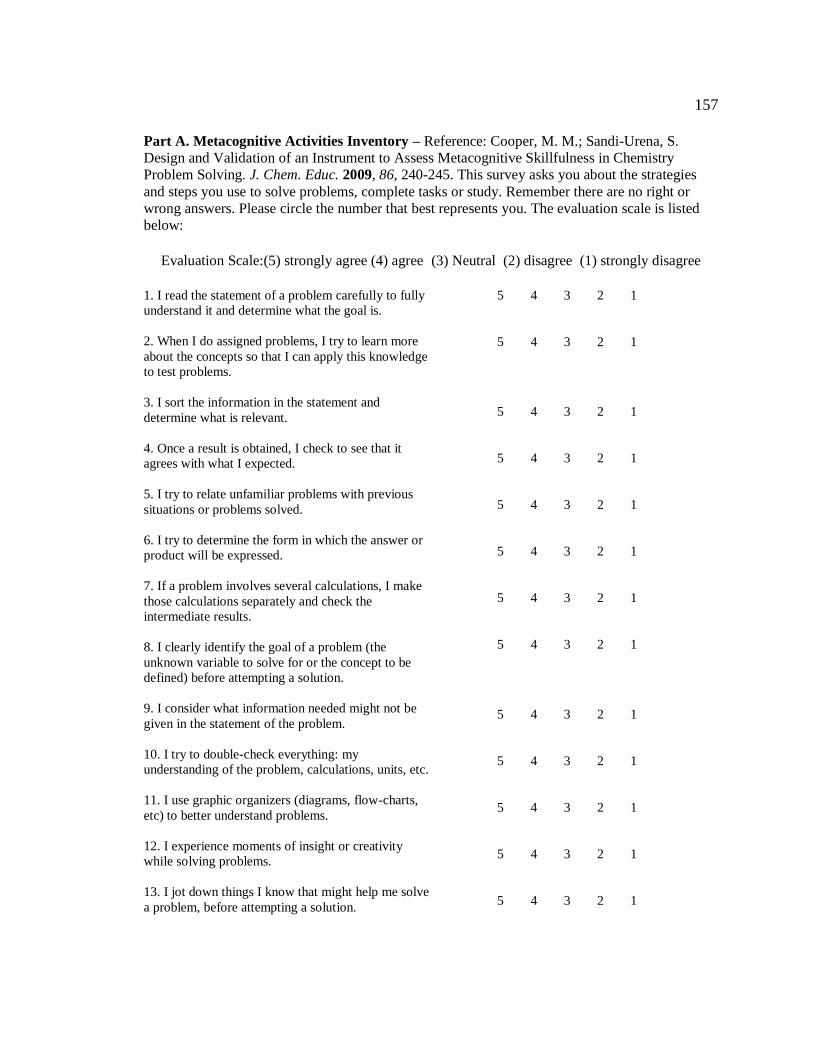
157
Part A. Metacognitive Activities Inventory – Reference: Cooper, M. M.; Sandi-Urena, S.
Design and Validation of an Instrument to Assess Metacognitive Skillfulness in Chemistry
Problem Solving. J. Chem. Educ. 2009, 86, 240-245. This survey asks you about the strategies
and steps you use to solve problems, complete tasks or study. Remember there are no right or
wrong answers. Please circle the number that best represents you. The evaluation scale is listed
below:
Evaluation Scale:(5) strongly agree (4) agree (3) Neutral (2) disagree (1) strongly disagree
1. I read the statement of a problem carefully to fully
understand it and determine what the goal is.
2. When I do assigned problems, I try to learn more
about the concepts so that I can apply this knowledge
to test problems.
3. I sort the information in the statement and
determine what is relevant.
4. Once a result is obtained, I check to see that it
agrees with what I expected.
5. I try to relate unfamiliar problems with previous
situations or problems solved.
6. I try to determine the form in which the answer or
product will be expressed.
7. If a problem involves several calculations, I make
those calculations separately and check the
intermediate results.
8. I clearly identify the goal of a problem (the
unknown variable to solve for or the concept to be
defined) before attempting a solution.
9. I consider what information needed might not be
given in the statement of the problem.
10. I try to double-check everything: my
understanding of the problem, calculations, units, etc.
11. I use graphic organizers (diagrams, flow-charts,
etc) to better understand problems.
12. I experience moments of insight or creativity
while solving problems.
13. I jot down things I know that might help me solve
a problem, before attempting a solution.
5 4 3 2 1
5 4 3 2 1
5 4 3 2 1
5 4 3 2 1
5 4 3 2 1
5 4 3 2 1
5 4 3 2 1
5 4 3 2 1
5 4 3 2 1
5 4 3 2 1
5 4 3 2 1
5 4 3 2 1
5 4 3 2 1
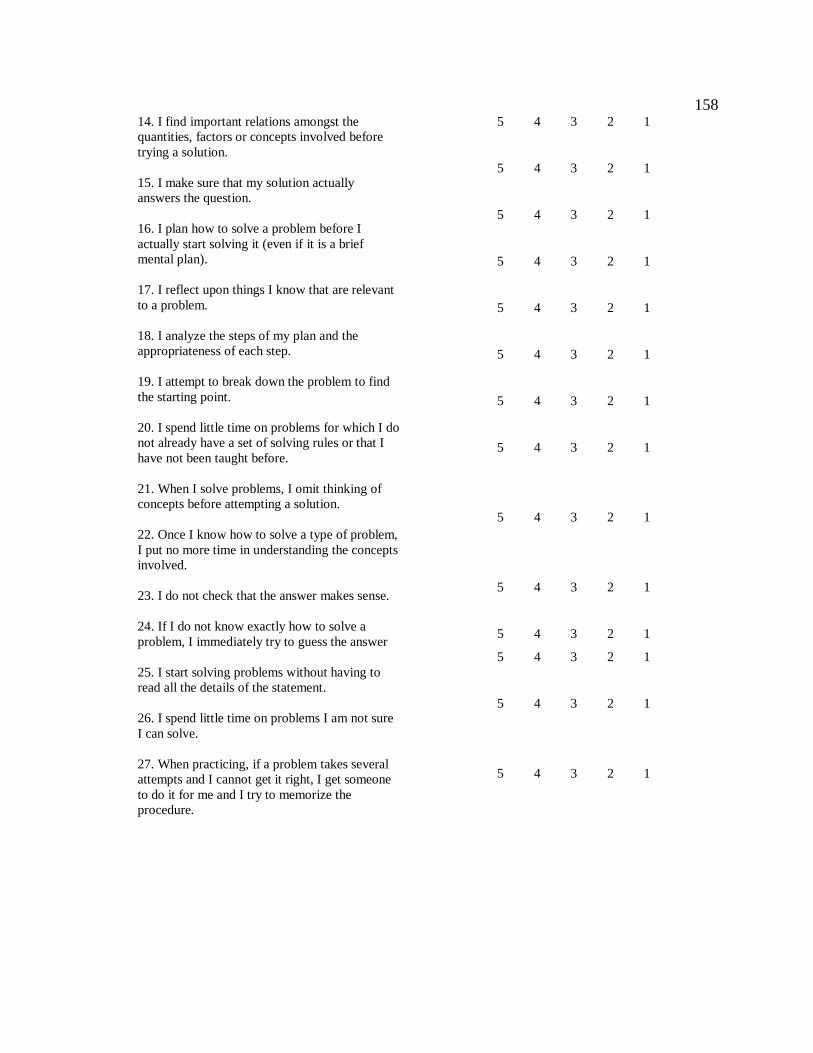
158
14. I find important relations amongst the
quantities, factors or concepts involved before
trying a solution.
15. I make sure that my solution actually
answers the question.
16. I plan how to solve a problem before I
actually start solving it (even if it is a brief
mental plan).
17. I reflect upon things I know that are relevant
to a problem.
18. I analyze the steps of my plan and the
appropriateness of each step.
19. I attempt to break down the problem to find
the starting point.
20. I spend little time on problems for which I do
not already have a set of solving rules or that I
have not been taught before.
21. When I solve problems, I omit thinking of
concepts before attempting a solution.
22. Once I know how to solve a type of problem,
I put no more time in understanding the concepts
involved.
23. I do not check that the answer makes sense.
24. If I do not know exactly how to solve a
problem, I immediately try to guess the answer
25. I start solving problems without having to
read all the details of the statement.
26. I spend little time on problems I am not sure
I can solve.
27. When practicing, if a problem takes several
attempts and I cannot get it right, I get someone
to do it for me and I try to memorize the
procedure.
5 4 3 2 1
5 4 3 2 1
5 4 3 2 1
5 4 3 2 1
5 4 3 2 1
5 4 3 2 1
5 4 3 2 1
5 4 3 2 1
5 4 3 2 1
5 4 3 2 1
5 4 3 2 1
5 4 3 2 1
5 4 3 2 1
5 4 3 2 1
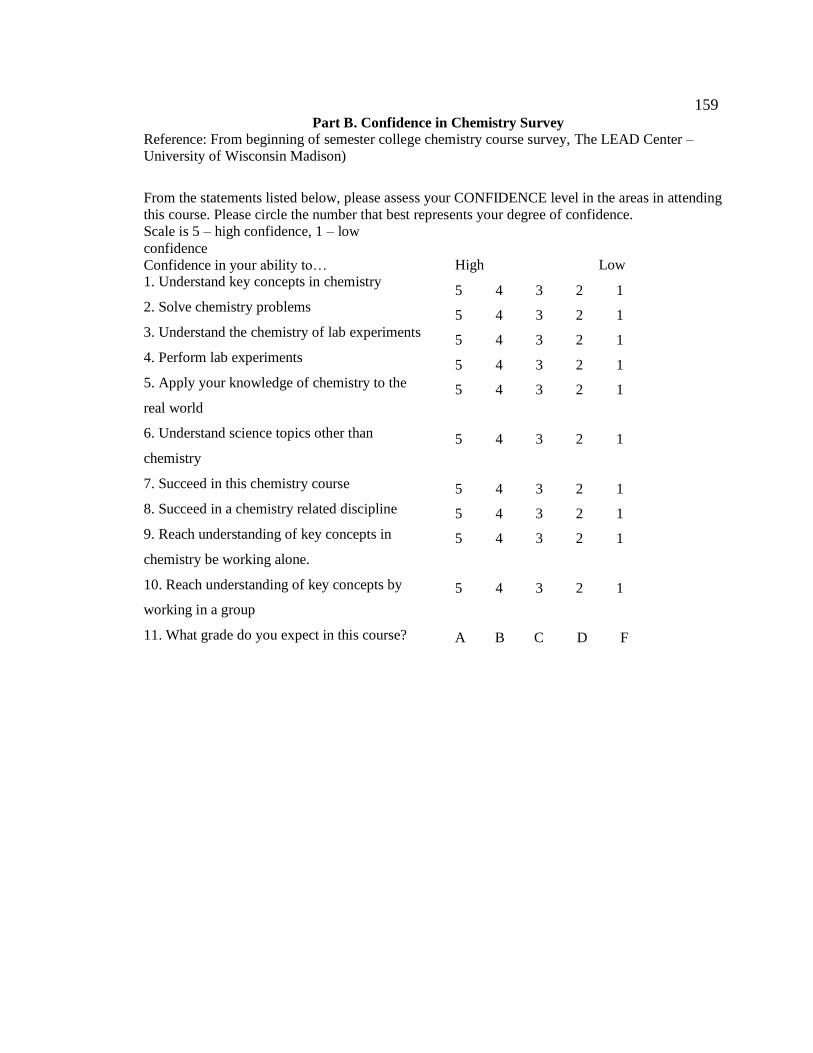
159
Part B. Confidence in Chemistry Survey
Reference: From beginning of semester college chemistry course survey, The LEAD Center –
University of Wisconsin Madison)
From the statements listed below, please assess your CONFIDENCE level in the areas in attending
this course. Please circle the number that best represents your degree of confidence.
Scale is 5 – high confidence, 1 – low
confidence
Confidence in your ability to… 1. Understand key concepts in chemistry
2. Solve chemistry problems
3. Understand the chemistry of lab experiments
4. Perform lab experiments
5. Apply your knowledge of chemistry to the
real world
6. Understand science topics other than
chemistry
7. Succeed in this chemistry course
8. Succeed in a chemistry related discipline
9. Reach understanding of key concepts in
chemistry be working alone.
10. Reach understanding of key concepts by
working in a group
11. What grade do you expect in this course?
High Low
5 4 3 2 1
5 4 3 2 1
5 4 3 2 1
5 4 3 2 1
5 4 3 2 1
5 4 3 2 1
5 4 3 2 1
5 4 3 2 1
5 4 3 2 1
5 4 3 2 1
A B C D F

160
APPENDIX F
INTERVIEW PROTOCOLS
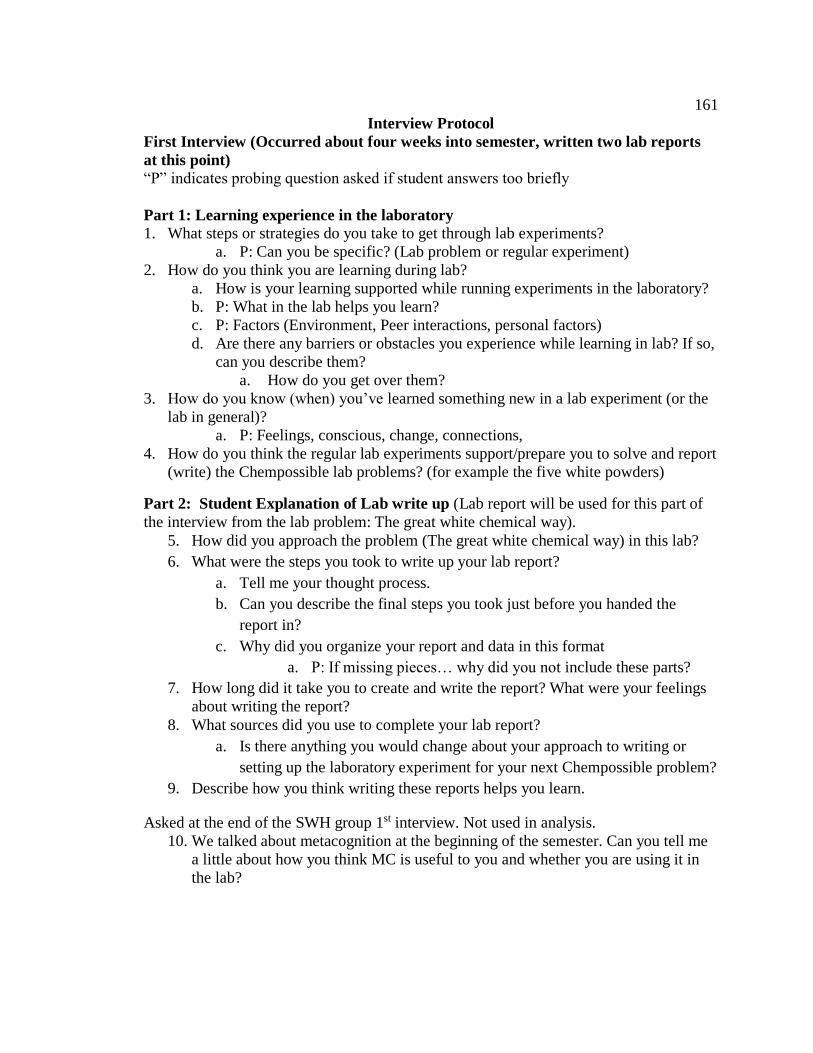
161
Interview Protocol
First Interview (Occurred about four weeks into semester, written two lab reports
at this point)
“P” indicates probing question asked if student answers too briefly
Part 1: Learning experience in the laboratory
1. What steps or strategies do you take to get through lab experiments?
a. P: Can you be specific? (Lab problem or regular experiment)
2. How do you think you are learning during lab?
a. How is your learning supported while running experiments in the laboratory?
b. P: What in the lab helps you learn?
c. P: Factors (Environment, Peer interactions, personal factors)
d. Are there any barriers or obstacles you experience while learning in lab? If so,
can you describe them?
a. How do you get over them?
3. How do you know (when) you’ve learned something new in a lab experiment (or the
lab in general)?
a. P: Feelings, conscious, change, connections,
4. How do you think the regular lab experiments support/prepare you to solve and report
(write) the Chempossible lab problems? (for example the five white powders)
Part 2: Student Explanation of Lab write up (Lab report will be used for this part of
the interview from the lab problem: The great white chemical way).
5. How did you approach the problem (The great white chemical way) in this lab?
6. What were the steps you took to write up your lab report?
a. Tell me your thought process.
b. Can you describe the final steps you took just before you handed the
report in?
c. Why did you organize your report and data in this format
a. P: If missing pieces… why did you not include these parts?
7. How long did it take you to create and write the report? What were your feelings
about writing the report?
8. What sources did you use to complete your lab report?
a. Is there anything you would change about your approach to writing or
setting up the laboratory experiment for your next Chempossible problem?
9. Describe how you think writing these reports helps you learn.
Asked at the end of the SWH group 1st interview. Not used in analysis.
10. We talked about metacognition at the beginning of the semester. Can you tell me
a little about how you think MC is useful to you and whether you are using it in
the lab?
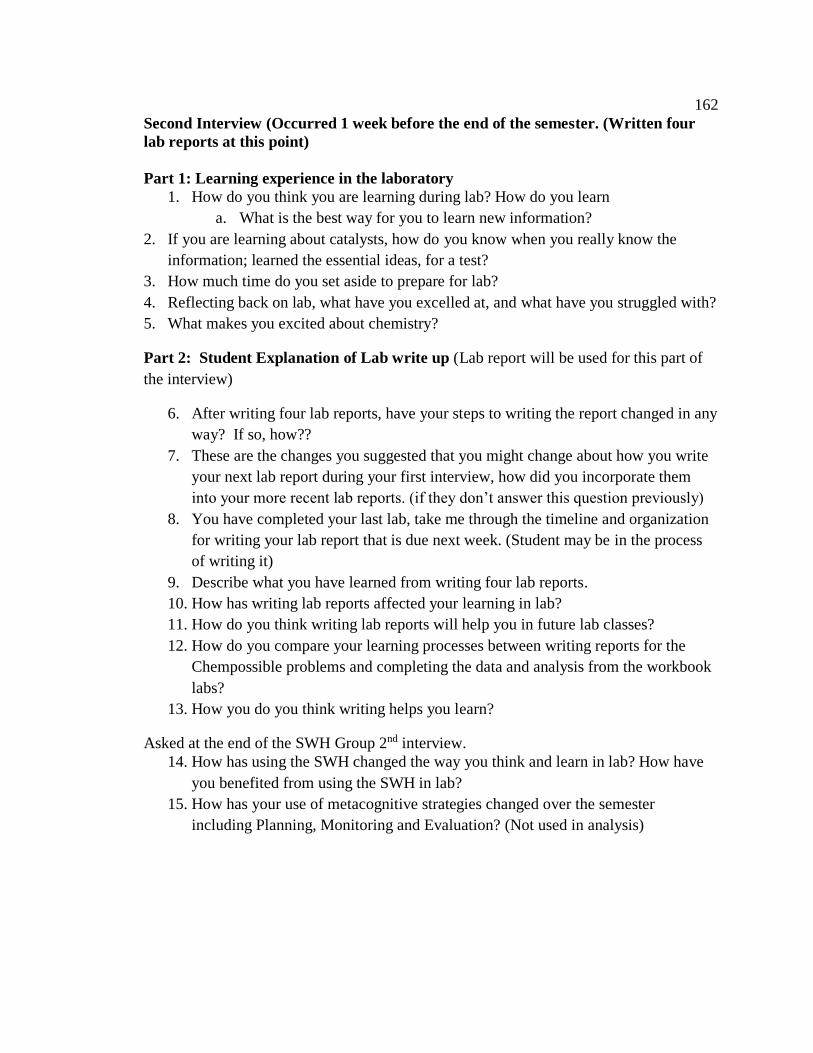
162
Second Interview (Occurred 1 week before the end of the semester. (Written four
lab reports at this point)
Part 1: Learning experience in the laboratory
1. How do you think you are learning during lab? How do you learn
a. What is the best way for you to learn new information?
2. If you are learning about catalysts, how do you know when you really know the
information; learned the essential ideas, for a test?
3. How much time do you set aside to prepare for lab?
4. Reflecting back on lab, what have you excelled at, and what have you struggled with?
5. What makes you excited about chemistry?
Part 2: Student Explanation of Lab write up (Lab report will be used for this part of
the interview)
6. After writing four lab reports, have your steps to writing the report changed in any
way? If so, how??
7. These are the changes you suggested that you might change about how you write
your next lab report during your first interview, how did you incorporate them
into your more recent lab reports. (if they don’t answer this question previously)
8. You have completed your last lab, take me through the timeline and organization
for writing your lab report that is due next week. (Student may be in the process
of writing it)
9. Describe what you have learned from writing four lab reports.
10. How has writing lab reports affected your learning in lab?
11. How do you think writing lab reports will help you in future lab classes?
12. How do you compare your learning processes between writing reports for the
Chempossible problems and completing the data and analysis from the workbook
labs?
13. How you do you think writing helps you learn?
Asked at the end of the SWH Group 2nd interview.
14. How has using the SWH changed the way you think and learn in lab? How have
you benefited from using the SWH in lab?
15. How has your use of metacognitive strategies changed over the semester
including Planning, Monitoring and Evaluation? (Not used in analysis)
163
APPENDIX G
LAB REPORT SCORING RUBRIC
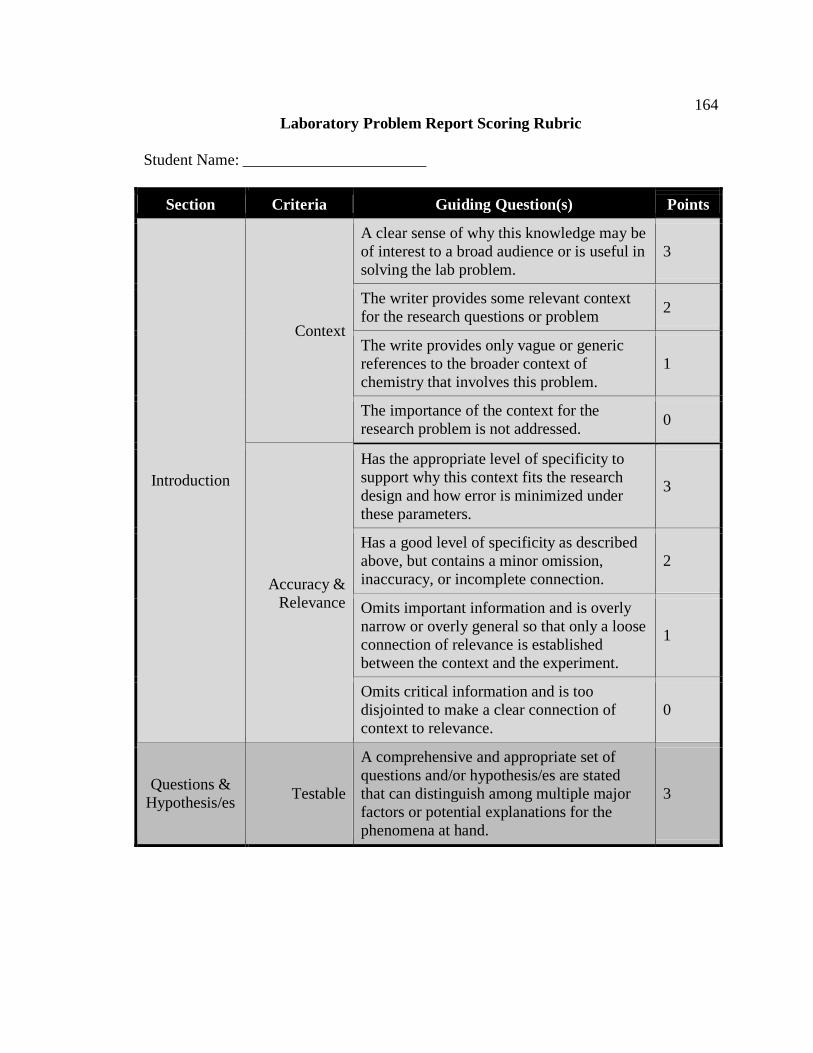
164
Laboratory Problem Report Scoring Rubric
Student Name: _______________________
Section Criteria Guiding Question(s) Points
Introduction
Context
A clear sense of why this knowledge may be
of interest to a broad audience or is useful in
solving the lab problem.
3
The writer provides some relevant context
for the research questions or problem 2
The write provides only vague or generic
references to the broader context of
chemistry that involves this problem.
1
The importance of the context for the
research problem is not addressed. 0
Accuracy &
Relevance
Has the appropriate level of specificity to
support why this context fits the research
design and how error is minimized under
these parameters.
3
Has a good level of specificity as described
above, but contains a minor omission,
inaccuracy, or incomplete connection.
2
Omits important information and is overly
narrow or overly general so that only a loose
connection of relevance is established
between the context and the experiment.
1
Omits critical information and is too
disjointed to make a clear connection of
context to relevance.
0
Questions &
Hypothesis/es Testable
A comprehensive and appropriate set of
questions and/or hypothesis/es are stated
that can distinguish among multiple major
factors or potential explanations for the
phenomena at hand.
3
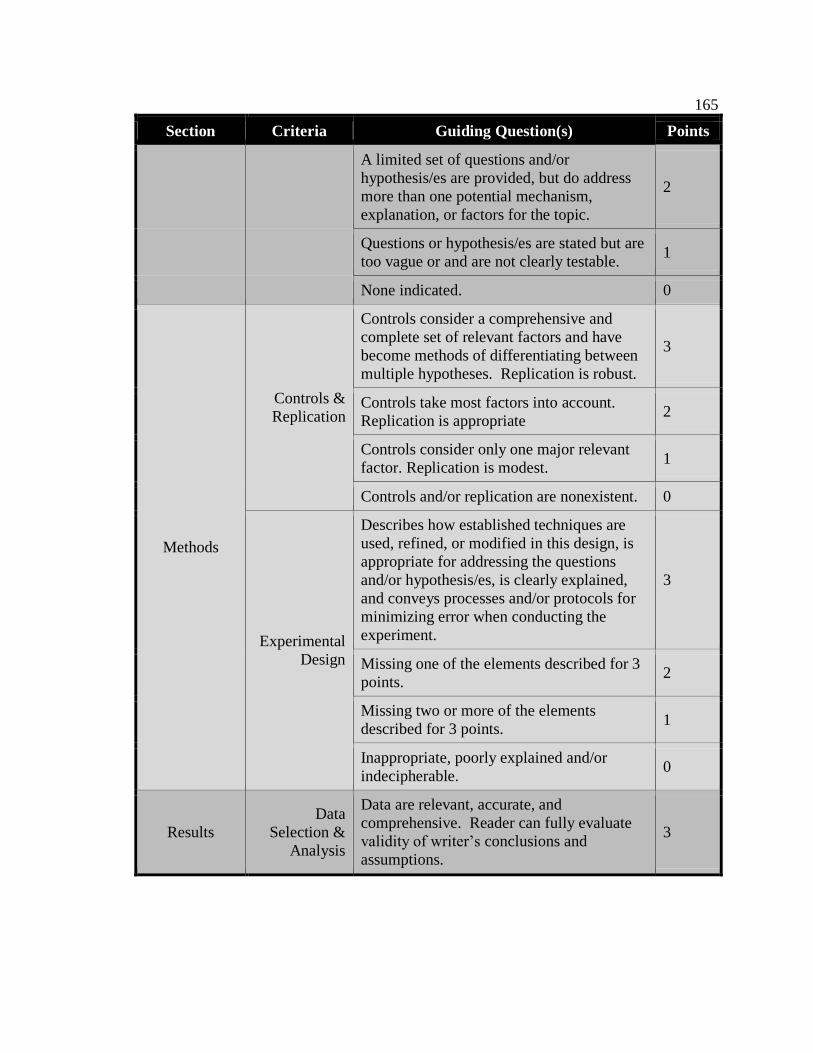
165
Section Criteria Guiding Question(s) Points
A limited set of questions and/or
hypothesis/es are provided, but do address
more than one potential mechanism,
explanation, or factors for the topic.
2
Questions or hypothesis/es are stated but are
too vague or and are not clearly testable. 1
None indicated. 0
Methods
Controls &
Replication
Controls consider a comprehensive and
complete set of relevant factors and have
become methods of differentiating between
multiple hypotheses. Replication is robust.
3
Controls take most factors into account.
Replication is appropriate 2
Controls consider only one major relevant
factor. Replication is modest. 1
Controls and/or replication are nonexistent. 0
Experimental
Design
Describes how established techniques are
used, refined, or modified in this design, is
appropriate for addressing the questions
and/or hypothesis/es, is clearly explained,
and conveys processes and/or protocols for
minimizing error when conducting the
experiment.
3
Missing one of the elements described for 3
points. 2
Missing two or more of the elements
described for 3 points. 1
Inappropriate, poorly explained and/or
indecipherable. 0
Results
Data
Selection &
Analysis
Data are relevant, accurate, and
comprehensive. Reader can fully evaluate
validity of writer’s conclusions and
assumptions.
3
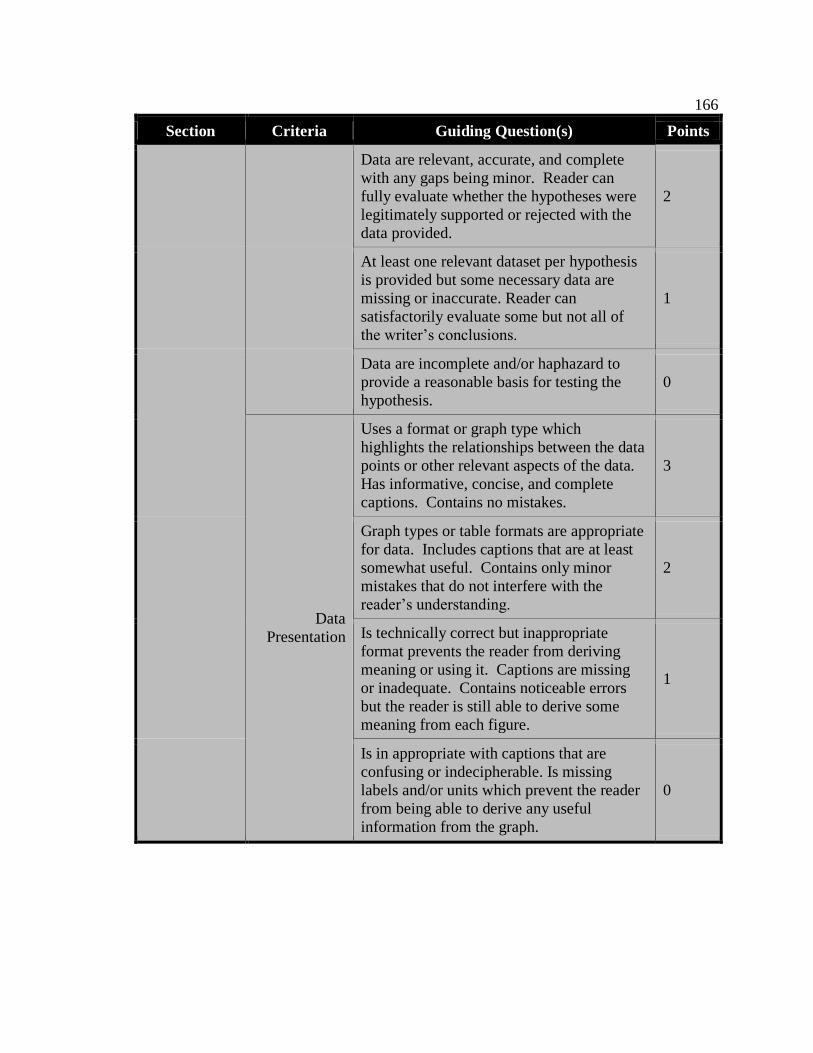
166
Section Criteria Guiding Question(s) Points
Data are relevant, accurate, and complete
with any gaps being minor. Reader can
fully evaluate whether the hypotheses were
legitimately supported or rejected with the
data provided.
2
At least one relevant dataset per hypothesis
is provided but some necessary data are
missing or inaccurate. Reader can
satisfactorily evaluate some but not all of
the writer’s conclusions.
1
Data are incomplete and/or haphazard to
provide a reasonable basis for testing the
hypothesis.
0
Data
Presentation
Uses a format or graph type which
highlights the relationships between the data
points or other relevant aspects of the data.
Has informative, concise, and complete
captions. Contains no mistakes.
3
Graph types or table formats are appropriate
for data. Includes captions that are at least
somewhat useful. Contains only minor
mistakes that do not interfere with the
reader’s understanding.
2
Is technically correct but inappropriate
format prevents the reader from deriving
meaning or using it. Captions are missing
or inadequate. Contains noticeable errors
but the reader is still able to derive some
meaning from each figure.
1
Is in appropriate with captions that are
confusing or indecipherable. Is missing
labels and/or units which prevent the reader
from being able to derive any useful
information from the graph.
0
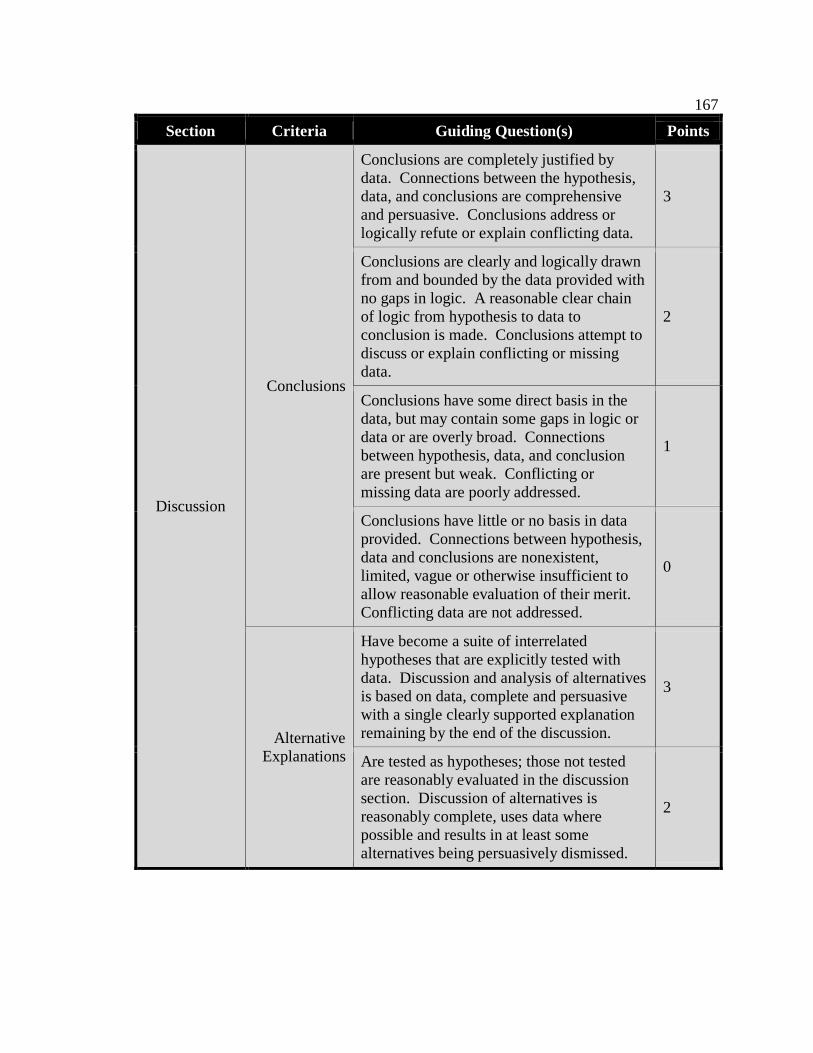
167
Section Criteria Guiding Question(s) Points
Discussion
Conclusions
Conclusions are completely justified by
data. Connections between the hypothesis,
data, and conclusions are comprehensive
and persuasive. Conclusions address or
logically refute or explain conflicting data.
3
Conclusions are clearly and logically drawn
from and bounded by the data provided with
no gaps in logic. A reasonable clear chain
of logic from hypothesis to data to
conclusion is made. Conclusions attempt to
discuss or explain conflicting or missing
data.
2
Conclusions have some direct basis in the
data, but may contain some gaps in logic or
data or are overly broad. Connections
between hypothesis, data, and conclusion
are present but weak. Conflicting or
missing data are poorly addressed.
1
Conclusions have little or no basis in data
provided. Connections between hypothesis,
data and conclusions are nonexistent,
limited, vague or otherwise insufficient to
allow reasonable evaluation of their merit.
Conflicting data are not addressed.
0
Alternative
Explanations
Have become a suite of interrelated
hypotheses that are explicitly tested with
data. Discussion and analysis of alternatives
is based on data, complete and persuasive
with a single clearly supported explanation
remaining by the end of the discussion.
3
Are tested as hypotheses; those not tested
are reasonably evaluated in the discussion
section. Discussion of alternatives is
reasonably complete, uses data where
possible and results in at least some
alternatives being persuasively dismissed.
2
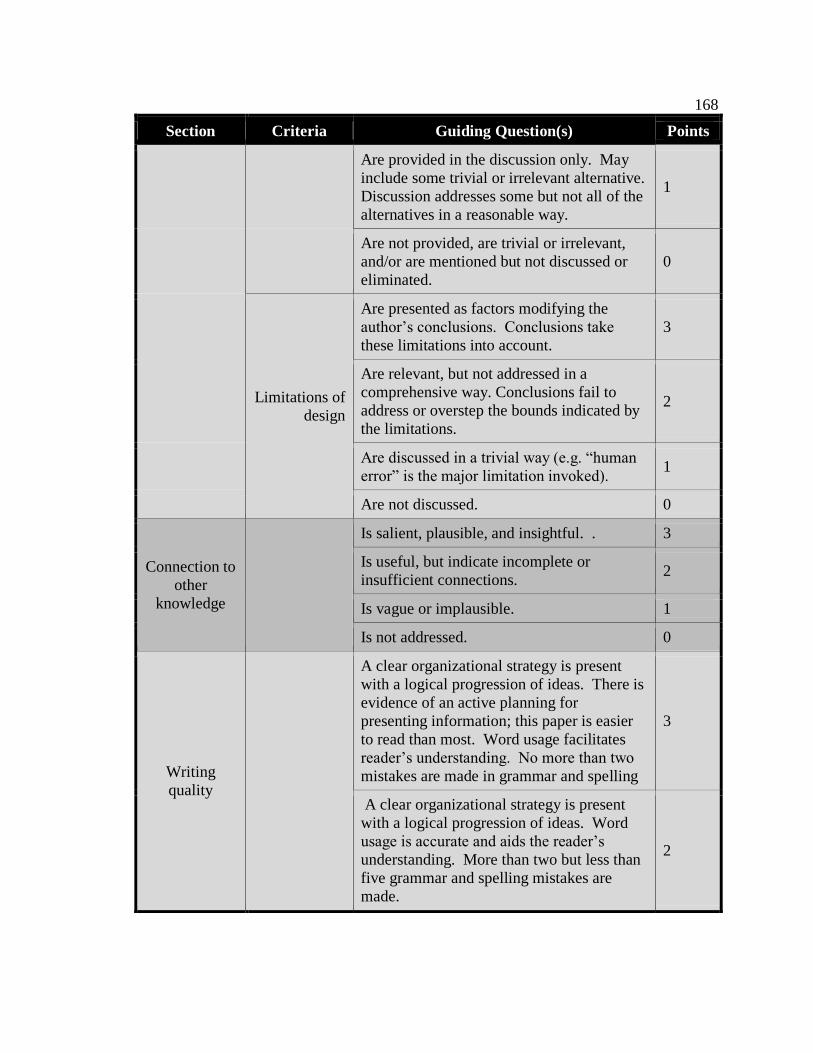
168
Section Criteria Guiding Question(s) Points
Are provided in the discussion only. May
include some trivial or irrelevant alternative.
Discussion addresses some but not all of the
alternatives in a reasonable way.
1
Are not provided, are trivial or irrelevant,
and/or are mentioned but not discussed or
eliminated.
0
Limitations of
design
Are presented as factors modifying the
author’s conclusions. Conclusions take
these limitations into account.
3
Are relevant, but not addressed in a
comprehensive way. Conclusions fail to
address or overstep the bounds indicated by
the limitations.
2
Are discussed in a trivial way (e.g. “human
error” is the major limitation invoked). 1
Are not discussed. 0
Connection to
other
knowledge
Is salient, plausible, and insightful. . 3
Is useful, but indicate incomplete or
insufficient connections. 2
Is vague or implausible. 1
Is not addressed. 0
Writing
quality
A clear organizational strategy is present
with a logical progression of ideas. There is
evidence of an active planning for
presenting information; this paper is easier
to read than most. Word usage facilitates
reader’s understanding. No more than two
mistakes are made in grammar and spelling
3
A clear organizational strategy is present
with a logical progression of ideas. Word
usage is accurate and aids the reader’s
understanding. More than two but less than
five grammar and spelling mistakes are
made.
2
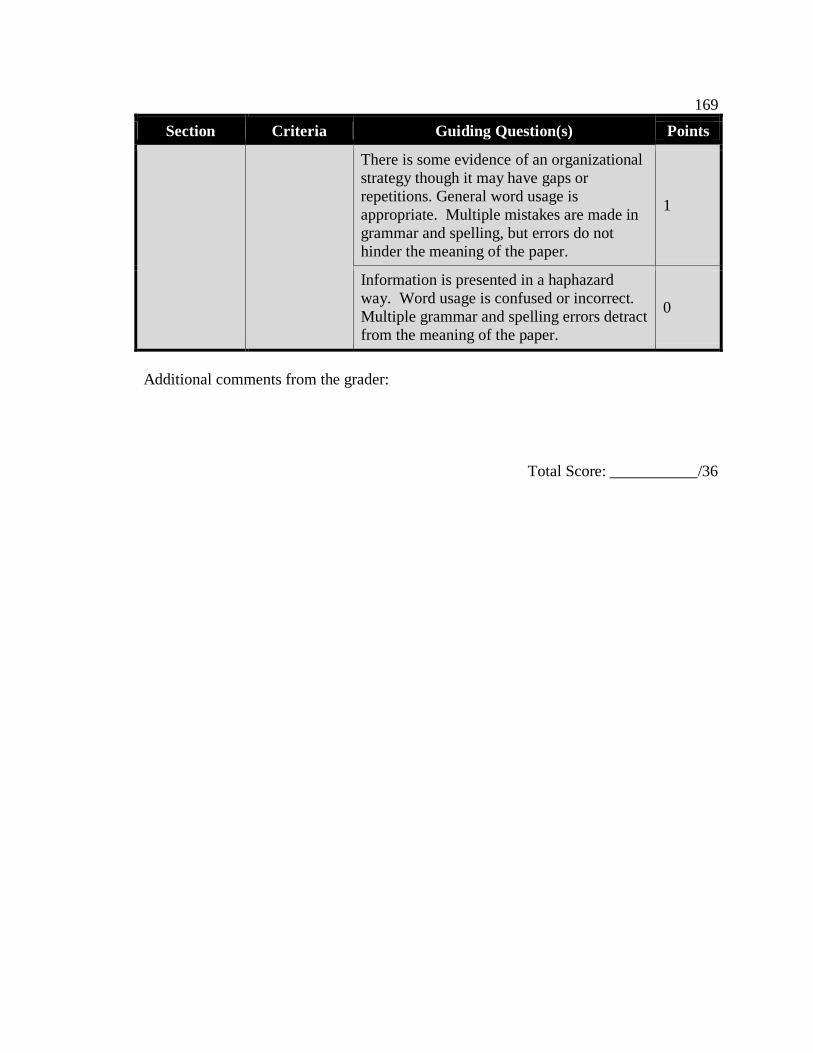
169
Section Criteria Guiding Question(s) Points
There is some evidence of an organizational
strategy though it may have gaps or
repetitions. General word usage is
appropriate. Multiple mistakes are made in
grammar and spelling, but errors do not
hinder the meaning of the paper.
1
Information is presented in a haphazard
way. Word usage is confused or incorrect.
Multiple grammar and spelling errors detract
from the meaning of the paper.
0
Additional comments from the grader:
Total Score: ___________/36

170
APPENDIX H
GPOWER3.1 ANALYSIS
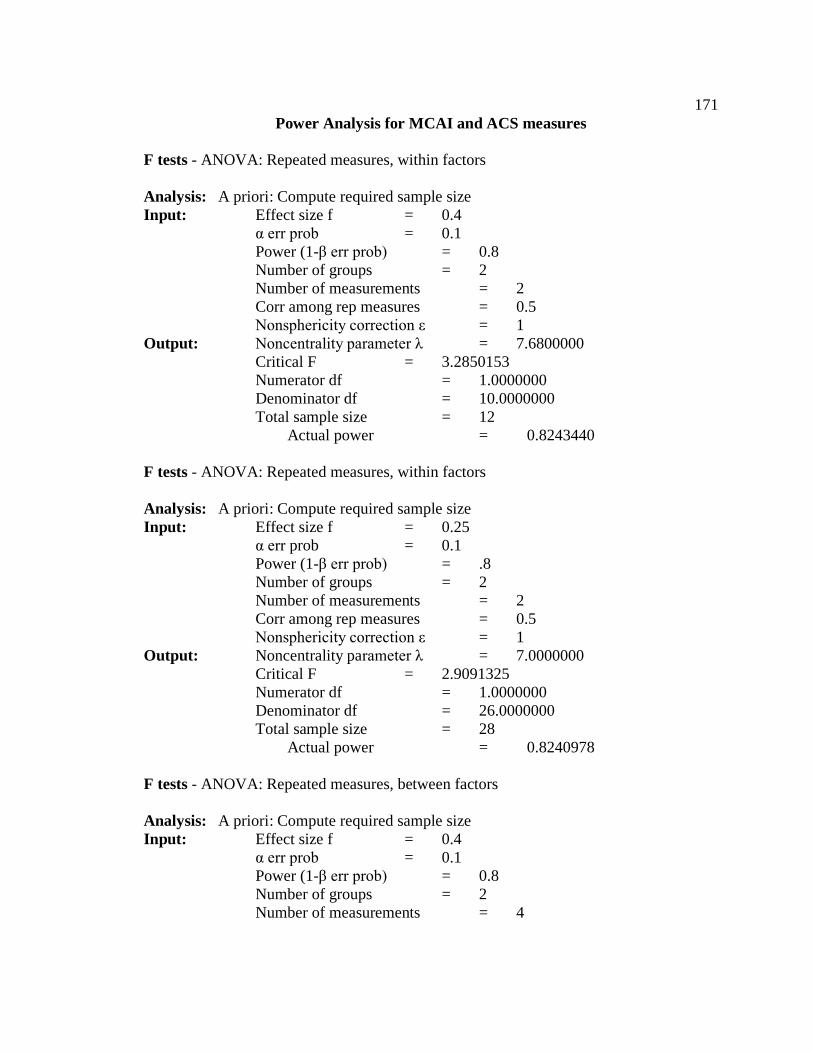
171
Power Analysis for MCAI and ACS measures
F tests - ANOVA: Repeated measures, within factors
Analysis: A priori: Compute required sample size
Input: Effect size f = 0.4
α err prob = 0.1
Power (1-β err prob) = 0.8
Number of groups = 2
Number of measurements = 2
Corr among rep measures = 0.5
Nonsphericity correction ε = 1
Output: Noncentrality parameter λ = 7.6800000
Critical F = 3.2850153
Numerator df = 1.0000000
Denominator df = 10.0000000
Total sample size = 12
Actual power = 0.8243440
F tests - ANOVA: Repeated measures, within factors
Analysis: A priori: Compute required sample size
Input: Effect size f = 0.25
α err prob = 0.1
Power (1-β err prob) = .8
Number of groups = 2
Number of measurements = 2
Corr among rep measures = 0.5
Nonsphericity correction ε = 1
Output: Noncentrality parameter λ = 7.0000000
Critical F = 2.9091325
Numerator df = 1.0000000
Denominator df = 26.0000000
Total sample size = 28
Actual power = 0.8240978
F tests - ANOVA: Repeated measures, between factors
Analysis: A priori: Compute required sample size
Input: Effect size f = 0.4
α err prob = 0.1
Power (1-β err prob) = 0.8
Number of groups = 2
Number of measurements = 4
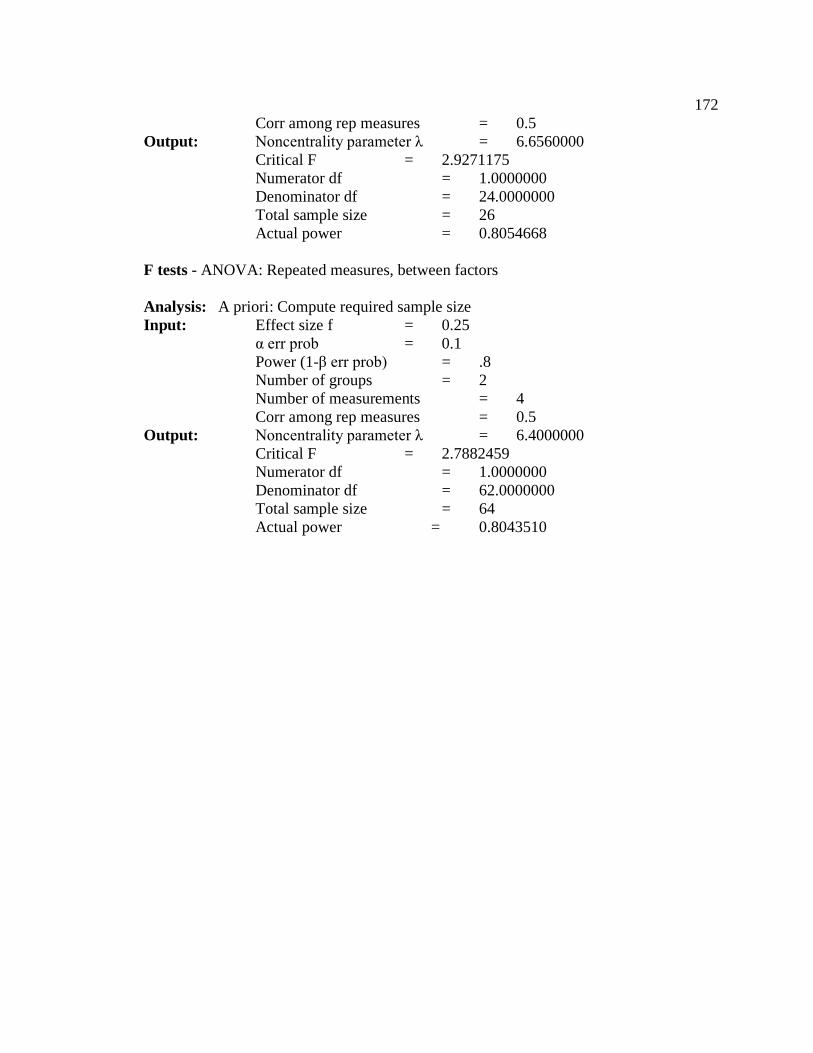
172
Corr among rep measures = 0.5
Output: Noncentrality parameter λ = 6.6560000
Critical F = 2.9271175
Numerator df = 1.0000000
Denominator df = 24.0000000
Total sample size = 26
Actual power = 0.8054668
F tests - ANOVA: Repeated measures, between factors
Analysis: A priori: Compute required sample size
Input: Effect size f = 0.25
α err prob = 0.1
Power (1-β err prob) = .8
Number of groups = 2
Number of measurements = 4
Corr among rep measures = 0.5
Output: Noncentrality parameter λ = 6.4000000
Critical F = 2.7882459
Numerator df = 1.0000000
Denominator df = 62.0000000
Total sample size = 64
Actual power = 0.8043510

173
APPENDIX I
ELECTROSTATIC AND VAN DER WAALS INTERACTION ENERGY GRAPH
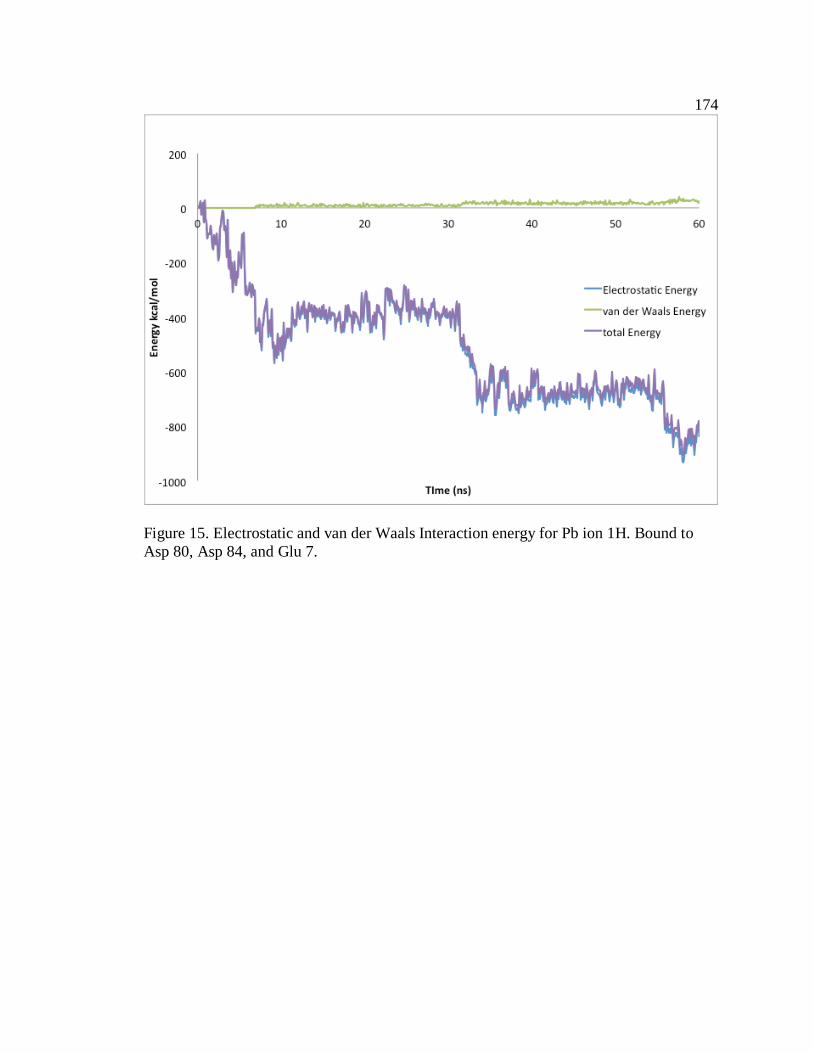
174
Figure 15. Electrostatic and van der Waals Interaction energy for Pb ion 1H. Bound to
Asp 80, Asp 84, and Glu 7.

175
REFERENCE LIST
Abraham, M. R. (2011). What can be learned from laboratory activities? Revisiting 32
years of research. Journal of Chemical Education, doi:10.1021/ed100774d
ACS Examinations Institute. (2013). National norms. Retrieved from
http://chemexams.chem.iastate.edu/national-norms/
ACS Exams Institute. (2005). 2005 general chemistry 1st Term paired questions exam.
American Chemical Society Division of Chemical Education Examination Institute;.
ACS Exams Institute. (2007). 2007 general chemistry 2nd Term paired questions exam
American Chemical Society Division of Chemical Education Examinations Institute.
Akkus, R., Gunel, M., & Hand, B. (2007). Comparing an inquiry-based approach known
as the science writing heuristic to traditional science teaching practices: Are there
differences? International Journal of Science Education, 29(14), 1745-1765.
An alpha-helix. (2014). Retrieved from
http://en.citizendium.org/images/thumb/2/26/AlphaHelixByDEVolk.jpg/500px-
AlphaHelixByDEVolk.jpg
Armstrong, N., Wallace, C., & Chang, S. (2008). Learning from writing in college
biology. Research in Science Education, 38(4), 483-499.
Bauman, A. (2012). Ocean biologics
Bayley, P., Martin, S., & Jones, G. (1988). The conformation of calmodulin: A
substantial environmentally sensitive helical transition in Ca4-calmodulin with
potential mechanistic function. FEBS Letters, 238(1), 61-66.
Bereiter, C., & Scardamalia, M. (1987). The psychology of written composition.
Hillsdale, N.J.: L. Erlbaum Associates.
Berg, C. A. R., Bergendahl, V. C. B., Lundberg, B. K. S., & Tibell, L. A. E. (2003).
Benefiting from an open-ended experiment? A comparison of attitudes to, and
outcomes of, an expository versus an open-inquiry version of the same experiment.
International Journal of Science Education, 25(3), 351-72.
176
Berman, H. M., Westbrook, J., Feng, Z., Gilliland, G., Bhat, T. N., Weissig, H., . . .
Bourne, P. E. (2000). The protein data bank. Nucleic Acids Research, 28(1), 235-
242. doi:gkd090
Berry, A., Mulhall, P., Gunstone, R., & Loughran, J. (1999). Helping students learn from
laboratory work. Australian Science Teachers Journal, 45(1), 27-31.
Bertini, I., Gelis, I., Katsaros, N., Luchinat, C., & Provenzani, A. (2003). Tuning the
affinity for lanthanides of calcium binding proteins. Biochemistry, 42(26), 8011-
8021.
Beta sheet structure. (2014). Retrieved from
http://en.citizendium.org/images/thumb/2/29/BetaSheetByDEVolk.jpg/500px-
BetaSheetByDEVolk.jpg
Bielaczyc, K., Pirolli, P. L., & Brown, A. L. (1995). Training in self-explanation and self-
regulation strategies: Investigating the effects of knowledge acquisition activities on
problem solving. Cognition and Instruction, 13(2), 221-252.
Blumenthal, D. K., & Stull, J. T. (1982). Effects of pH, ionic strength, and temperature
on activation by calmodulin and catalytic activity of myosin light chain kinase.
Biochemistry, 21(10), 2386-2391.
Bode, K. A., & Applequist, J. (1997). Helix bundles and coiled coils in α‐spectrin and
tropomyosin: A theoretical CD study. Biopolymers, 42(7), 855-860.
Bridges, C. C., & Zalups, R. K. (2005). Molecular and ionic mimicry and the transport of
toxic metals. Toxicology and Applied Pharmacology, 204(3), 274-308.
doi:10.1016/j.taap.2004.09.007
Brown, A. L. (1987). Metacognition, executive control, self-regulation, and other more
mysterious mechanisms. In F. E. Weinert, & R. Kluwe (Eds.), Metacognition,
motivation, and understanding (pp. 65-116). Hillsdale, N.J.: L. Erlbaum Associates.
Browne, J. P., Strom, M., Martin, S. R., & Bayley, P. M. (1997). The role of β-sheet
interactions in domain stability, folding, and target recognition reactions of
calmodulin. Biochemistry, 36(31), 9550-9561.
Brzeska, H., Venyaminov, S. V., Grabarek, Z., & Drabikowski, W. (1983). Comparative
studies on thermostability of calmodulin, skeletal muscle troponin C and their tryptic
fragments. FEBS Letters, 153(1), 169-173. doi: 10.1016/0014-5793(83)80141-0
177
Bunce, D. M. (2009). Teaching is more than lecturing and learning is more than
memorizing. 2007 James Flack Norris award. Journal of Chemical Education, 86(6),
674.
Bunce, D. M., & Hutchinson, K. D. (1993). The use of GALT (group assessment of
logical thinking) as a predictor of academic success in college chemistry. Journal of
Chemical Education, 70(3), 183.
Burke, K. A., & Greenbowe, T. J. (2012). Chem 178L laboratory experiments. Plymouth,
MI: Hayden-McNeil.
Burke, K. A., Greenbowe, T. J., & Hand, B. M. (2006). Implementing the science writing
heuristic in the chemistry laboratory. Journal of Chemical Education, 83(7), 1032-
1038.
Cacciatore, K. L., & Sevian, H. (2006). Teaching lab report writing through inquiry: A
green chemistry stoichiometry experiment for general chemistry. Journal of
Chemical Education, 83(7), 1039-1041.
Case, J., Gunstone, R., & Lewis, A. (2001). Students' metacognitive development in an
innovative second year chemical engineering course. Research in Science Education,
31(3), 313-335.
Celio, M. R., Pauls, T. L., & Schwaller, B. (1996). Guidebook to the calcium-binding
proteins. Oxford; New York: Sambrook & Tooze Publication at Oxford University
Press.
Centers for Disease Control and Prevention. (2012). Number of children tested and
confirmed EBLLs by state, year, and BLL group, children < 72 months old.
Retrieved from http://www.cdc.gov/nceh/lead/data/StateConfirmedByYear1997-
2012.htm
Centers for Disease Control and Prevention. (2013). Reference blood lead levels for
adults in the United States. Retrieved from
http://www.cdc.gov/niosh/topics/ables/pdfs/ReferenceBloodLevelsforAdults_2013-
10-22.pdf
Centers for Disease Control and Prevention. (2014). Blood lead levels in children.
Retrieved from
http://www.cdc.gov/nceh/lead/ACCLPP/Lead_Levels_in_Children_Fact_Sheet.pdf
Chao, S., Bu, C., & Cheung, W. (1995). Stimulation of myosin light-chain kinase by
Cd2+ and Pb2+. Archives of Toxicology, 69(3), 197-203.
doi:10.1007/s002040050158
178
Chi, M. T., Feltovich, P. J., & Glaser, R. (1981). Categorization and representation of
physics problems by experts and novices*. Cognitive Science, 5(2), 121-152.
Cohen, J. (1992). A power primer. Psychological Bulletin, 112(1), 155-159.
Cooper, M. M., & Kerns, T. S. (2006). Changing the laboratory: Effects of a laboratory
course on students' attitudes and perceptions. Journal of Chemical Education, 83(9),
1356. doi:10.1021/ed083p1356
Cooper, M. M., & Sandi-Urena, S. (2009). Design and validation of an instrument to
assess metacognitive skillfulness in chemistry problem solving. Journal of Chemical
Education, 86(2), 240-245.
Creswell, J. W. (2009). Research design: Qualitative, quantitative, and mixed methods
approaches (3rd ed.). Los Angeles: Sage.
Cronbach, L. J. (1951). Coefficient alpha and the internal structure of tests.
Psychometrika 16(3), 297-334.
Cronje, R., Murray, K., Rohlinger, S., & Wellnitz, T. (2013). Using the science writing
heuristic to improve undergraduate writing in biology. International Journal of
Science Education, 35(16), 2718-2731.
Daubenmire, P. L., & Bunce, D. M. (2008). What do students experience during POGIL
instruction? In R. S. Moog, & J. N. Spencer (Eds.), Process-oriented guided inquiry
learning (POGIL) (pp. 85-97). Washington DC: American Chemical Society.
Daubenmire, P. L. (2004). A longitudinal investigation of student learning in general
chemistry with the guided inquiry approach. The Catholic University of America.
Davis, E. (2003). Prompting middle school science students for productive reflection:
Generic and directed prompts. Journal of the Learning Sciences, 12(1), 91-142.
Davis, E. A., & Linn, M. C. (2000). Scaffolding students' knowledge integration:
Prompts for reflection in KIE. International Journal of Science Education, 22(8),
819-837.
Domin, D. S. (1999). A review of laboratory instruction styles. Journal of Chemical
Education, 76(4), 543. doi:10.1021/ed076p543
Dowd, T. L., Li, L., & Gundberg, C. M. (2008). The 1H NMR structure of bovine Pb2+-
osteocalcin and implications for lead toxicity. Biochimica Et Biophysica Acta
(BBA) - Proteins & Proteomics, 1784(11), 1534-1545.
doi:10.1016/j.bbapap.2008.08.010
179
Dowd, T. L., Rosen, J. F., Mints, L., & Gundberg, C. M. (2001). The effect of Pb2+ on
the structure and hydroxyapatite binding properties of osteocalcin. Biochimica Et
Biophysica Acta (BBA) - Molecular Basis of Disease, 1535(2), 153-163.
doi:10.1016/S0925-4439(00)00094-6
Dunlap, T. B., Kirk, J. M., Pena, E. A., Yoder, M. S., & Creamer, T. P. (2013).
Thermodynamics of binding by calmodulin correlates with target peptide -helical
propensity. Proteins: Structure, Function, and Bioinformatics, 81(4), 607-612.
Emig, J. (1977). Writing as a mode of learning. College Composition and
Communication, 28(2), 122-128.
Engelbrecht, J., Harding, A., & Du Preez, J. (2007). Long-term retention of basic
mathematical knowledge and skills with engineering students. European Journal of
Engineering Education, 32(6), 735-744.
Faul, F., Erdfelder, E., Lang, A., & Buchner, A. (2007). G* power 3: A flexible statistical
power analysis program for the social, behavioral, and biomedical sciences.
Behavior Research Methods, 39(2), 175-191.
Finn, B. E., Evenas, J., Drakenberg, T., Waltho, J. P., Thulin, E., & Forsen, S. (1995).
Calcium-induced structural changes and domain autonomy in calmodulin. Nature
Structural and Molecular Biology, 2(9), 777-783. Retrieved from
http://dx.doi.org/10.1038/nsb0995-777
Finn, B. E., & Forsén, S. (1995). The evolving model of calmodulin structure, function
and activation. Structure, 3(1), 7-11. doi:10.1016/S0969-2126(01)00130-7
Fiorin, G., Biekofsky, R. R., Pastore, A., & Carloni, P. (2005). Unwinding the helical
linker of calcium-loaded calmodulin: A molecular dynamics study. Proteins, 61(4),
829-39.
Flavell, J. H. (1979). Metacognition and cognitive monitoring: A new area of cognitive-
developmental inquiry. American Psychologist, 34(10), 906-11.
Garner, R., & Alexander, P. A. (1989). Metacognition: Answered and unanswered
questions. Educational Psychologist, 24(2), 143-158.
Ge, X., & Land, S. M. (2003). Scaffolding students’ problem-solving processes in an ill-
structured task using question prompts and peer interactions. Educational
Technology Research and Development, 51(1), 21-38.
180
Georghiades, P. (2004). From the general to the situated: Three decades of
metacognition. research report. International Journal of Science Education, 26(3),
365-383.
Godwin, H. A. (2001). The biological chemistry of lead. Current Opinion in Chemical
Biology, 5(2), 223-227. doi:10.1016/S1367-5931(00)00194-0
Gourlaouen, C., & Parisel, O. (2007). Is an electronic shield at the molecular origin of
lead poisoning? A computational modeling experiment. Angewandte Chemie
(International Ed.in English), 46(4), 553-6.
Greenbowe, T. J., & Hand, B. M. (2005). Introduction to the science writing heuristic. In
N. J. Pienta, M. M. Cooper & T. J. Greenbowe (Eds.), Chemists' guide to effective
teaching (pp. 140). Upper Saddle River, NJ: Pearson Prentice Hall.
Greenbowe, T. J., Rudd, J. A., & Hand, B. M. (2007). Using the science writing heuristic
to improve students' understanding of general equilibrium. Journal of Chemical
Education, 84(12), 2007. doi:10.1021/ed084p2007
Grimberg, B. I. (2007). Promoting higher order thinking skills through the use of the
science writing heuristic. In B. M. Hand (Ed.), Science inquiry, argument and
language: A case for the Science Writing Heuristic (pp. 87-97) Sense Publishers.
Grove, N., & Bretz, S. L. (2007). CHEMX: An instrument to assess students' cognitive
expectations for learning chemistry. Journal of Chemical Education, 84(9), 1524.
Gsponer, J., Christodoulou, J., Cavalli, A., Bui, J. M., Richter, B., Dobson, C. M., &
Vendruscolo, M. (2008). A coupled equilibrium shift mechanism in calmodulin-
mediated signal transduction. Structure, 16(5), 736-746.
Gunel, M., Hand, B., & Prain, V. (2007). Writing for learning in science: A secondary
analysis of six studies. International Journal of Science and Mathematics Education,
5(4), 615-637.
Gupta, T., Burke, K., Mehta, A., & Greenbowe, T. J. (2014). Impact of guided-inquiry-
based instruction with a writing and reflection emphasis on chemistry students’
critical thinking abilities. Journal of Chemical Education,
Haidar, A. H., & Al Naqabi, A. K. (2008). Emiratii high school students' understandings
of stoichiometry and the influence of metacognition on their understanding.
Research in Science & Technological Education, 26(2), 215-237.
181
Hand, B., Hohenshell, L., & Prain, V. (2004). Exploring students' responses to conceptual
questions when engaged with planned writing experiences: A study with year 10
science students. Journal of Research in Science Teaching, 41(2), 186-210.
Hein, S. M. (2012). Positive impacts using POGIL in organic chemistry. Journal of
Chemical Education, 89(7), 860-864.
Herrington, D. G., & Daubenmire, P. L. (in press). Using interviews in CER projects:
Options, considerations, and limitations. Tools of chemistry education research
American Chemical Society.
Hodson, D., & Hodson, J. (1998). From constructivism to social constructivism: A
Vygotskian perspective on teaching and learning science. School Science Review,
79(289), 33-41.
Hofstein, A., & Lunetta, V. N. (2004). The laboratory in science education: Foundations
for the twenty-first century. Science Education, 88(1), 28-54.
Hohenshell, L., & Hand, B. (2006). Writing-to-learn strategies in secondary school cell
biology: A mixed method study. International Journal of Science Education, 28(2-3),
261-289.
Howell, D. C. (2010). Statistical methods for psychology. Belmont, Calif.: Wadsworth.
Humphrey, W., Dalke, A., & Schulten, K. (1996). VMD: Visual molecular dynamics.
Journal of Molecular Graphics, 14(1), 33-38.
IBM Corporation. (2012). IBM SPSS statistics for windows
Johnson, D. W., & Johnson, R. T. (1999). Making cooperative learning work. Theory into
Practice, 38(2), 67-73.
Jonassen, D. H. (1997). Instructional design models for well-structured and III-structured
problem-solving learning outcomes. Educational Technology Research and
Development, 45(1), 65-94.
Joosten, R. P., te Beek, T. A., Krieger, E., Hekkelman, M. L., Hooft, R. W., Schneider,
R., Vriend, G. (2011). A series of PDB related databases for everyday needs.
Nucleic Acids Research, 39(Database issue), D411-9. doi:10.1093/nar/gkq1105
Kapa, E. (2007). Transfer from structured to open-ended problem solving in a
computerized metacognitive environment. Learning and Instruction, 17(6), 688-707.
182
Karpicke, J. D., Butler, A. C., & Roediger III, H. L. (2009). Metacognitive strategies in
student learning: Do students practise retrieval when they study on their own?
Memory, 17(4), 471-479. doi:10.1080/09658210802647009
Kelly, O. C., & Finlayson, O. E. (2007). Providing solutions through problem-based
learning for the undergraduate 1st year chemistry laboratory. Chemical Education
Research and Practice, 8(3), 347-361.
Kern, M., Wisniewski, M., Cabell, L., & Audesirk, G. (2000). Inorganic lead and calcium
interact positively in activation of calmodulin. Neurotoxicology, 21(3), 353-63.
Keys, C. W., Hand, B., Prain, V., & Collins, S. (1999). Using the science writing
heuristic as a tool for learning from laboratory investigations in secondary science.
Journal of Research in Science Teaching, 36(10), 1065-84.
Kingir, S., Geban, O., & Gunel, M. (2012). How does the science writing heuristic
approach affect students' performances of different academic achievement levels? A
case for high school chemistry. Chemistry Education Research and Practice, 13(4),
428-436.
Kipnis, M., & Hofstein, A. (2008). The inquiry laboratory as a source for development of
metacognitive skills. International Journal of Science and Mathematics Education,
6(3), 601-627.
Kirberger, M., Wong, H. C., Jiang, J., & Yang, J. J. (2013). Metal toxicity and
opportunistic binding of Pb2 + in proteins. Journal of Inorganic Biochemistry,
125(0), 40-49. doi:10.1016/j.jinorgbio.2013.04.002
Kirberger, M., & Yang, J. J. (2008). Structural differences between Pb2+ and Ca2+
binding sites in proteins: Implications with respect to toxicity. Journal of Inorganic
Biochemistry, 102(10), 1901-1909. doi:10.1016/j.jinorgbio.2008.06.014
Klein, P. D. (1999). Reopening inquiry into cognitive processes in writing-to-learn.
Educational Psychology Review, 11(3), 203-270.
Klein, P. D. (2004). Constructing scientific explanations through writing. Instructional
Science, 32(3), 191-231.
Komeiji, Y., Ueno, Y., & Uebayasi, M. (2002). Molecular dynamics simulations revealed
Ca2+-dependent conformational change of calmodulin. FEBS Letters. 521(1), 133.
Kuboniwa, H., Tjandra, N., Grzesiek, S., Ren, H., Klee, C. B., & Bax, A. (1995).
Solution structure of calcium-free calmodulin. Nature Structural Biology, 2(9), 768-
776.
183
Kuhn D. (1989). Children and adults as intuitive scientists. Psychological Review, 96(4),
674-89.
Kuhn, D. (2000). Metacognitive development. Current Directions in Psychological
Science, 9(5), 178-181.
Kung, R. L., & Linder, C. (2007). Metacognitive activity in the physics student
laboratory: Is increased metacognition necessarily better? Metacognition and
Learning, 2(1), 41-56.
Kursula, P., & Majava, V. (2007). A structural insight into lead neurotoxicity and
calmodulin activation by heavy metals. Acta Crystallographica Section F: Structural
Biology and Crystallization Communications, 63(8), 653-656.
Landis, J. R., & Koch, G. G. (1977). A one-way components of variance model for
categorical data. Biometrics, 671-679.
Larkin, S. (2009). Socially mediated metacognition and learning to write. Thinking Skills
and Creativity, 4(3), 149-159.
Lawson, A. E., & National Association for Research in Science Teaching. (1989). A
theory of instruction: Using the learning cycle to teach science concepts and thinking
skills. [s.l.]: The National Association for Research in Science Teaching.
Lawton, D. G., Longstaff, C., Wallace, B. A., Hill, J., Leary, S. E., Titball, R. W., &
Brown, K. A. (2002). Interactions of the type III secretion pathway proteins LcrV
and LcrG from yersinia pestis are mediated by coiled-coil domains. The Journal of
Biological Chemistry, 277(41), 38714-38722. doi:10.1074/jbc.M203632200
Lees, J. G., Miles, A. J., Wien, F., & Wallace, B. A. (2006). A reference database for
circular dichroism spectroscopy covering fold and secondary structure space.
Bioinformatics, 22(16), 1955-1962.
Leonard, W. H., & Penick, J. E. (2009). Is the inquiry real? Working definitions of
inquiry in the science classroom. Science Teacher, 76(5), 40-43.
Lepšík, M., & Field, M. J. (2007). Binding of calcium and other metal ions to the EF-
hand loops of calmodulin studied by quantum chemical calculations and molecular
dynamics simulations. The Journal of Physical Chemistry B, 111(33), 10012-10022.
Lewis, S. E., & Lewis, J. E. (2005a). The same or not the same: Equivalence as an issue
in educational research. Journal of Chemical Education, 82(9), 1408.
184
Lewis, S. E., & Lewis, J. E. (2005b). Departing from lectures: An evaluation of a peer-
led guided inquiry alternative. Journal of Chemical Education, 82(1), 135.
doi:10.1021/ed082p135
Libante, V., Thion, L., & Lane, D. (2001). Role of the ATP-binding site of SopA protein
in partition of the F plasmid. Journal of Molecular Biology, 314(3), 387-399.
Lide, D. R. (2004). CRC handbook of chemistry and physics CRC press.
Lin, X., & Lehman, J. D. (1999). Supporting learning of variable control in a computer-
based biology environment: Effects of prompting college students to reflect on their
own thinking. Journal of Research in Science Teaching, 36(7), 837-858.
Lin, X. (2001). Designing metacognitive activities. Educational Technology Research
and Development, 49, 23-40.
Lloyd, B. W. (1992). The 20th century general chemistry laboratory: Its various faces.
Journal of Chemical Education, 69(11), 866. doi:10.1021/ed069p866
MacKerell, A. D., Bashford, D., Bellott, M., Dunbrack, R., Evanseck, J., Field, M. J., Ha,
S. (1998). All-atom empirical potential for molecular modeling and dynamics studies
of proteins. The Journal of Physical Chemistry B, 102(18), 3586-3616.
Martin, S. R., & Bayley, P. M. (1986). The effects of Ca2+ and Cd2+ on the secondary
and tertiary structure of bovine testis calmodulin. A circular-dichroism study.
Biochemical Journal, 238(2), 485-490.
Masino, L., Martin, S. R., & Bayley, P. M. (2000). Ligand binding and thermodynamic
stability of a multidomain protein, calmodulin. Protein Science, 9(8), 1519-1529.
Mathabathe, K. C., & Potgieter, M. (2014). Metacognitive monitoring and learning gain
in foundation chemistry. Chemistry Education Research and Practice, 15(1), 94-104.
Maune, J. F., Beckingham, K., Martin, S. R., & Bayley, P. M. (1992). Circular dichroism
studies on calcium binding to two series of calcium binding site mutants of
drosophila melanogaster calmodulin. Biochemistry, 31(34), 7779-7786.
Maxwell, J. A. (2005). Qualitative research design: An interactive approach (2nd ed.).
Thousand Oaks, Calif.: Sage Publications.
McCrindle, A. R., & Christensen, C. A. (1995). The impact of learning journals on
metacognitive and cognitive processes and learning performance. Learning and
Instruction, 5(2), 167-185.
185
Meijer, J., Veenman, M. V. J., & van Hout-Wolters, B. H. A. M. (2006). Metacognitive
activities in text-studying and problem-solving: Development of a taxonomy.
Educational Research and Evaluation, 12(3), 209-237.
Merriam, S. B. (2009). Qualitative research: A guide to design and implementation (2nd
ed.). San Francisco: Jossey-Bass.
Miles, M. B., & Huberman, A. M. (1994). Qualitative data analysis: An expanded
sourcebook (2nd ed.). Thousand Oaks: Sage Publications.
Milos, M., Schaer, J., Comte, M., & Cox, J. A. (1989). Evidence for four capital and six
auxiliary cation-binding sites on calmodulin: Divalent cation interactions monitored
by direct binding and microcalorimetry. Journal of Inorganic Biochemistry, 36(1),
11-25.
Moosavi-Movahedi, A. A., Naderi, G. A., & Farzami, B. (1994). The denaturation
behaviour of calmodulin in sodium n-dodecyl sulphate, dodecyl trimethyl
ammonium bromide, guanidine hydrochloride and urea. Thermochimica Acta.,
239(COM), 61.
National Research Council (U.S.). (2000). How people learn: Brain, mind, experience,
and school. Washington, D.C.: National Academy Press.
National Research Council (U.S.). (2012). Discipline-based education research:
Understanding and improving learning in undergraduate science and engineering.
Washington DC: National Academies Press.
Nelson, J. H., Kemp, K. C., & Stoltzfus, M. (2011). Laboratory experiments for
chemistry: The central science (12th ed.). Upper Saddler River, NJ: Prentice Hall.
Ouyang, H., & Vogel, H. J. (1998). Metal ion binding to calmodulin: NMR and
fluorescence studies. BioMetals, 11(3), 213-222. doi:10.1023/A:1009226215543
Palinscar, A. S., & Brown, A. L. (1984). Reciprocal teaching of comprehension-fostering
and comprehension-monitoring activities. Cognition and Instruction, 1(2), 117-175.
Pang, C., Cao, T., Li, J., Jia, M., Zhang, S., Ren, S., . . . Zhan, Y. (2013). Combining
fragment homology modeling with molecular dynamics aims at prediction of Ca2
binding sites in CaBPs. Journal of Computer-Aided Molecular Design, 27(8), 697-
705.
Paulucci, A. A., Hicks, L., Machado, A., Miranda, M. T., Kay, C. M., & Farah, C. S.
(2002). Specific sequences determine the stability and cooperativity of folding of the
186
C-terminal half of tropomyosin. The Journal of Biological Chemistry, 277(42),
39574-84.
Payne, D. J., Egdell, R. G., Law, D. S., Glans, P., Learmonth, T., Smith, K. E., . . .
Watson, G. W. (2007). Experimental and theoretical study of the electronic
structures of α-PbO and β-PbO 2. Journal of Materials Chemistry, 17(3), 267-277.
Perkins, D. N., & Salomon, G. (1989). Are cognitive skills context-bound? Educational
Researcher, 18(1), 16-25.
Phillips, J. C., Braun, R., Wang, W., Gumbart, J., Tajkhorshid, E., Villa, E.,Schulten, K.
(2005). Scalable molecular dynamics with NAMD. Journal of Computational
Chemistry, 26(16), 1781-1802.
Pintrich, P. R., & De Groot, E. V. (1990). Motivational and self-regulated learning
components of classroom academic performance. Journal of Educational
Psychology, 82(1), 33-40.
Poock, J. R., Burke, K. A., Greenbowe, T. J., & Hand, B. M. (2007). Using the science
writing heuristic in the general chemistry laboratory to improve students' academic
performance. Journal of Chemical Education, 84(8), 1371.
Protasevich, I., Ranjbar, B., Lobachov, V., Makarou, A., Gilli, R., Briand, C., Haiech, J.
(1997). Conformation and thermal denaturation of apocalmodulin: Role of
electrostatic mutations. Biochemistry. 36(8), 2017.
QSR International Pty Ltd. (2013). NVivo qualitative data analysis software (10th ed.)
Rickey, D., & Stacy, A. M. (2000). The role of metacognition in learning chemistry.
Journal of Chemical Education, 77(7), 915-20.
Roadrangka, V., Yeany, R., & Padilla, M. (1983). The construction of a group assessment
of logical thinking (GALT). 58th Annual Meeting of the National Association for
Research in Science Teaching, Dallas, Texas.
Rodger, A., & Norden, B. (1997). Circular dichroism and linear dichroism. Oxford; New
York: Oxford University Press.
Rudd, J. A., Greenbowe, T. J., Hand, B. M., & Legg, M. J. (2001). Using the science
writing heuristic to move toward an inquiry-based laboratory curriculum: An
example from physical equilibrium. Journal of Chemical Education, 78(12), 1680.
doi:10.1021/ed078p1680
187
Russell, C. B., & Weaver, G. C. (2011). A comparative study of traditional, inquiry-
based, and research-based laboratory curricula: Impacts on understanding of the
nature of science. Chemistry Education Research and Practice, 12(1), 57-67.
Sampson, V., Grooms, J., & Walker, J. P. (2011). Argument‐Driven inquiry as a way to
help students learn how to participate in scientific argumentation and craft written
arguments: An exploratory study. Science Education, 95(2), 217-257.
Sandi-Urena S., Cooper M.M., & Stevens R.H. (2011). Enhancement of metacognition
use and awareness by means of a collaborative intervention. International Journal of
Science Education, 33(3), 323-340.
Sandi-Urena, S., Cooper, M., & Stevens, R. (2012). Effect of cooperative problem-based
lab instruction on metacognition and problem-solving skills. Journal of Chemical
Education, 89(6), 700-706.
Scardamalia, M., & Bereiter, C. (1994). Computer support for knowledge-building
communities. The Journal of the Learning Sciences, 3(3), 265-283.
Schraw, G. (1998). Promoting general metacognitive awareness. Instructional Science,
26(1), 113.
Schraw, G., Crippen, K. J., & Hartley, K. (2006). Promoting self-regulation in science
education: Metacognition as part of a broader perspective on learning. Research in
Science Education, 36(1), 111-139. doi:10.1007/s11165-005-3917-8
Schraw, G., & Dennison, R. S. (1994). Assessing metacognitive awareness.
Contemporary Educational Psychology, 19(4), 460.
Schraw, G., & Moshman, D. (1995). Metacognitive theories. Educational Psychology
Review, 7(4), 351.
Schuirmann, D. J. (1987). A comparison of the two one-sided tests procedure and the
power approach for assessing the equivalence of average bioavailability. Journal of
Pharmacokinetics and Biopharmaceutics, 15(6), 657-680.
Shepherd, C. M., & Vogel, H. J. (2004). A molecular dynamics study of ca 2+ -
calmodulin: Evidence of interdomain coupling and structural collapse on the
nanosecond timescale. Biophysical Journal, 87(2), 780-791.
Shimoni-Livny, L., Glusker, J. P., & Bock, C. W. (1998). Lone pair functionality in
divalent lead compounds. Inorganic Chemistry. 37(8), 1853.
188
Shin, N., Jonassen, D. H., & McGee, S. (2003). Predictors of well-structured and ill-
structured problem solving in an astronomy simulation. Journal of Research in
Science Teaching, 40(1), 6-33. doi:10.1002/tea.10058
Shirley, B. A. (1995). Protein stability and folding: Theory and practice. Totowa, N.J.:
Humana Press.
Shirran, S. L., & Barran, P. E. (2009). The use of ESI-MS to probe the binding of
divalent cations to calmodulin. Journal of the American Society for Mass
Spectrometry, 20(6), 1159-1171. doi:10.1016/j.jasms.2009.02.008
Silberman, R. G. (1994). ACS small scale laboratory assessment activities. American
Chemical Society Division of Chemical Education Examinations Institute.
Sreerama, N., & Woody, R. (2000). Estimation of protein secondary structure from
circular dichroism spectra: Comparison of CONTIN, SELCON, and CDSSTR
methods with an expanded reference set. Analytical Biochemistry, 287(2), 252-260.
Sternberg, R. J. (1998). Metacognition, abilities, and developing expertise: What makes
an expert student? Instructional Science, 26(1-2), 127-140.
Straumanis, A., & Simons, E. A. (2008). A multi-institutional assessment of the use of
POGIL in organic chemistry. In R. S. Moog, & J. N. Spencer (Eds.), Process-
oriented guided inquiry learning (pp. 226-239). Washington DC: American
Chemical Society. doi:10.1021/bk-2008-0994.ch019
Sun, H., Yin, D., Coffeen, L. A., Shea, M. A., & Squier, T. C. (2001). Mutation of
Tyr138 disrupts the structural coupling between the opposing domains in vertebrate
calmodulin. Biochemistry, 40(32), 9605-17.
Teichert, M. A., & Stacy, A. M. (2002). Promoting understanding of chemical bonding
and spontaneity through student explanation and integration of ideas. Journal of
Research in Science Teaching, 39(6), 464-496.
The Carnegie Foundation for the Advancement of Teaching. (2010). The Carnegie
classification of institutions of higher education. Retrieved from
http://classifications.carnegiefoundation.org/
The LEAD Center. (1996). New traditions: Introductory chemistry beginning of semester
survey. Madison: University of Wisconsin.
Tien, L. T., Teichert, M. A., & Rickey, D. (2007). Effectiveness of a MORE laboratory
module in prompting students to revise their molecular-level ideas about solutions.
Journal of Chemical Education, 84(1), 175-181.
189
Timmerman, B. E. C., Strickland, D. C., Johnson, R. L., & Payne, J. R. (2011).
Development of a "universal" rubric for assessing undergraduates' scientific
reasoning skills using scientific writing. Assessment & Evaluation in Higher
Education, 36(5), 509-547.
UniProt Consortium. (2014). Activities at the universal protein resource (UniProt).
Nucleic Acids Research, 42(Database issue), D191-8. doi:10.1093/nar/gkt1140
van der Spoel, D., de Groot, B. L., Hayward, S., Berendsen, H. J., & Vogel, H. J. (1996).
Bending of the calmodulin central helix: A theoretical study. Protein Science: A
Publication of the Protein Society, 5(10), 2044-53.
Van Eldik, L. J., & Watterson, D. M. (1998). Calmodulin and signal transduction. San
Diego: Academic Press.
Veenman, M., Elshout, J., & Meijer, J. (1997). The generality vs domain-specificity of
metacognitive skills in novice learning across domains. Learning and Instruction,
7(2), 187-209.
Veenman, M., Kok, R., & Blöte, A. (2005). The relation between intellectual and
metacognitive skills in early adolescence. Instructional Science, 33(3), 193-211.
Walker, J. P., Sampson, V., & Zimmerman, C. O. (2011). Argument-driven inquiry: An
introduction to a new instructional model for use in undergraduate chemistry labs.
Journal of Chemical Education, 88(8), 1048-1056.
Wallace, C. S., Hand, B., & Prain, V. (2004). Writing and learning in the science
classroom. Dordrecht; Boston: Kluwer Academic Publishers.
Wallace, B. A., & Janes, R. W. (2009). Modern techniques for circular dichroism and
synchrotron radiation circular dichroism spectroscopy. Amsterdam; Washington,
DC: IOS Press.
Wang, Q., Liang, K. C., Czader, A., Waxham, M. N., & Cheung, M. S. (2011). The effect
of macromolecular crowding, ionic strength and calcium binding on calmodulin
dynamics. PLoS Computational Biology, 7(7)
Wang, X., Zhao, K., Kirberger, M., Wong, H., Chen, G., & Yang, J. J. (2010). Analysis
and prediction of calcium‐binding pockets from apo‐protein structures exhibiting
calcium‐induced localized conformational changes. Protein Science, 19(6), 1180-
1190.
190
White, B. Y., & Frederiksen, J. R. (1998). Inquiry, modeling, and metacognition: Making
science accessible to all students. Cognition and Instruction, 16(1), 3-118.
Whitmore L, Woollett B, Miles A.J., Klose D.P., Janes R.W., & Wallace B.A. (2011).
PCDDB: The protein circular dichroism data bank, a repository for circular
dichroism spectral and metadata. Nucleic Acids Research, 39(Database issue), 480-
6.
Whitmore, L., & Wallace, B. A. (2008). Protein secondary structure analyses from
circular dichroism spectroscopy: Methods and reference databases. Biopolymers -
New York-, 89(5), 392-400.
Wilson, M. A., & Brunger, A. T. (2003). Domain flexibility in the 1.75 A resolution
structure of Pb2+-calmodulin. Acta Crystallographica. Section D, Biological
Crystallography, 59(Pt), 1782-92.
Wilson, M. A., & Brunger, A. T. (2000). The 1.0 Å crystal structure of Ca2+-bound
calmodulin: An analysis of disorder and implications for functionally relevant
plasticity. Journal of Molecular Biology, 301(5), 1237-1256.
Woolley, G. A., & Wallace, B. A. (1993). Temperature dependence of the interaction of
alamethicin helices in membranes. Biochemistry, 32(37), 9819-25.
Wriggers, W., Mehler, E., Pitici, F., Weinstein, H., & Schulten, K. (1998). Structure and
dynamics of calmodulin in solution. Biophysical Journal, 74(4), 1622-39.
Xu, H., & Talanquer, V. (2013). Effect of the level of inquiry of lab experiments on
general chemistry students' written reflections. Journal of Chemical Education,
90(1), 21-28.
Yang, C., Jas, G. S., & Kuczera, K. (2004). Structure, dynamics and interaction with
kinase targets: Computer simulations of calmodulin. Biochimica Et Biophysica Acta
(BBA) - Proteins & Proteomics, 1697(1-2), 289-300.
doi:10.1016/j.bbapap.2003.11.032
Zhao, K., Wang, X., Wong, H. C., Wohlhueter, R., Kirberger, M. P., Chen, G., & Yang,
J. J. (2012). Predicting Ca2 ‐binding sites using refined carbon clusters. Proteins:
Structure, Function, and Bioinformatics, 80(12), 2666-2679.
191
VITA
Mary Twist van Opstal was born in Ada, Michigan. Before attending Loyola
University Chicago, she attended Hillsdale College and completed a Bachelor of Science
degree in Chemistry, with Highest Distinction, in 2008.
While at Loyola, Dr. van Opstal received a teaching fellowship from 2009 to
2013. She was a research assistant on a NSF grant-funded project from 2013-2014 that
introduced and encouraged high school students to use environment friendly behaviors
and learn about sustainability of the environment. In addition to teaching general
chemistry and instrumental analysis laboratories, Mary implemented a well-established
inquiry and collaborative method of instruction, the Science Writing Heuristic, in the
chemistry majors two-semester general chemistry course. Dr. van Opstal was also a
representative from the chemistry department to the Graduate Student Organization from
2010-2012.