Gloaguen, Yoann (2017) Supporting analysis, visualisation ...
Upload
khangminh22Category
view
0download
0
Visualisation of active normal fault scarps in the Apennines, Italy: a keyto assessment of tectonic strain release and earthquake rupture.
Gerald P. Roberts
Journal of the Virtual Explorer, Electronic Edition, ISSN 1441-8142, volume 29, paper 4In: (Ed.) Declan De Paor, Google Earth Science, 2008.
Download from: http://virtualexplorer.com.au/article/2008/197/active-normal-fault-scarps-in-the-apennines
Click http://virtualexplorer.com.au/subscribe/ to subscribe to the Journal of the Virtual Explorer.Email [email protected] to contact a member of the Virtual Explorer team.
Copyright is shared by The Virtual Explorer Pty Ltd with authors of individual contributions. Individual authors mayuse a single figure and/or a table and/or a brief paragraph or two of text in a subsequent work, provided this work is ofa scientific nature, and intended for use in a learned journal, book or other peer reviewed publication. Copies of thisarticle may be made in unlimited numbers for use in a classroom, to further education and science. The VirtualExplorer Pty Ltd is a scientific publisher and intends that appropriate professional standards be met in any of itspublications.
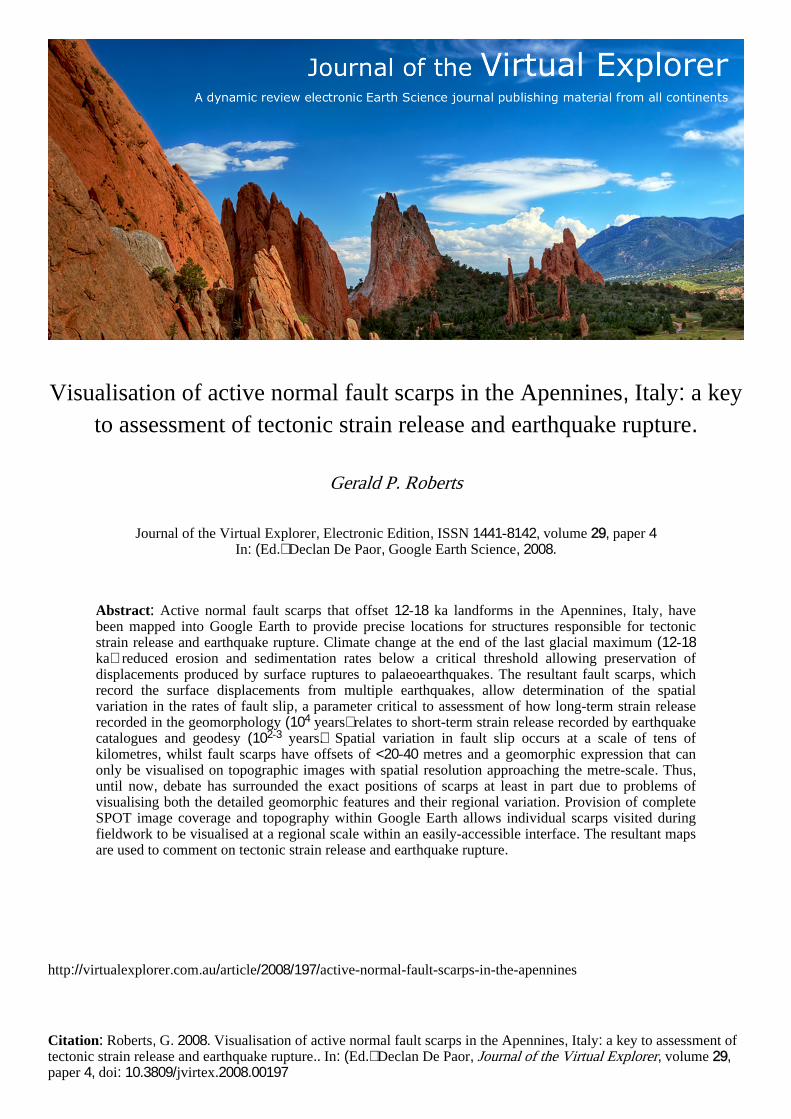
Visualisation of active normal fault scarps in the Apennines, Italy: a keyto assessment of tectonic strain release and earthquake rupture.
Gerald P. Roberts
Journal of the Virtual Explorer, Electronic Edition, ISSN 1441-8142, volume 29, paper 4In: (Ed.) Declan De Paor, Google Earth Science, 2008.
Abstract: Active normal fault scarps that offset 12-18 ka landforms in the Apennines, Italy, havebeen mapped into Google Earth to provide precise locations for structures responsible for tectonicstrain release and earthquake rupture. Climate change at the end of the last glacial maximum (12-18ka) reduced erosion and sedimentation rates below a critical threshold allowing preservation ofdisplacements produced by surface ruptures to palaeoearthquakes. The resultant fault scarps, whichrecord the surface displacements from multiple earthquakes, allow determination of the spatialvariation in the rates of fault slip, a parameter critical to assessment of how long-term strain releaserecorded in the geomorphology (104 years) relates to short-term strain release recorded by earthquakecatalogues and geodesy (102-3 years). Spatial variation in fault slip occurs at a scale of tens ofkilometres, whilst fault scarps have offsets of <20-40 metres and a geomorphic expression that canonly be visualised on topographic images with spatial resolution approaching the metre-scale. Thus,until now, debate has surrounded the exact positions of scarps at least in part due to problems ofvisualising both the detailed geomorphic features and their regional variation. Provision of completeSPOT image coverage and topography within Google Earth allows individual scarps visited duringfieldwork to be visualised at a regional scale within an easily-accessible interface. The resultant mapsare used to comment on tectonic strain release and earthquake rupture.
http://virtualexplorer.com.au/article/2008/197/active-normal-fault-scarps-in-the-apennines
Citation: Roberts, G. 2008. Visualisation of active normal fault scarps in the Apennines, Italy: a key to assessment oftectonic strain release and earthquake rupture.. In: (Ed.) Declan De Paor, Journal of the Virtual Explorer, volume 29,paper 4, doi: 10.3809/jvirtex.2008.00197

IntroductionThe Italian Apennines suffers devastating earthquakes
related to the ongoing crustal extension in this part of theconvergent boundary between the African and Europeantectonic plates (e.g. 1915 Fucino Earthquake Ms 6.9,33,000 deaths; Margottini and Screpanti 1988, Andersonand Jackson 1987) (Figure 1a).
Figure 1. Active faults of the Italian Apennines
Map of active faults for the Italian Apennines. Active faultsare defined by clear structural offsets that have formed since12-18 ka. These offsets are evidenced by limestone bedrockfault scarps offsetting landforms from 12-18 ka that can beseen clearly on Google Earth. Such offsets are accompaniedby landforms that can be seen on Google Earth such as in-cised of footwall drainage, triangular facets, and oversteep-ened bases to footwall fault escarpments. See the accompa-nying “kmz” file to zoom into this view and visualise thelandforms. Red lines show faults visited in the field. Whitelines show faults not visited in the field but with relativelyclear geomorphic expression as seen on Google Earth. Fig-ure 6 shows an interpretation of the lateral continuity of ac-tive faults, where the view in this figure has been combinedwith structural measurements such as total throw, throwsince 12-18 ka, and kinematic data revealing the slip-direc-tions associated with the extensional tectonics. More activefaults exist to tthe northwest and southeast of the area con-sidered in this paper. Boxes locate Figures 2, 3 and 4. Pre-cise geographic coordinates for the fault scarps can extrac-ted from the “paths” in the “kmz” file (e.g. Fig. 5).
Such earthquakes produce surface ruptures that are15-20 km in length and have surface offsets of about 1metre along pre-existing faults (Serva et al. 1986, Wellsand Coppersmith 1994). The historical earthquake cata-logue for the Apennines records events that have dam-aged Rome back to Roman times, and the catalogue isthought to be complete for large magnitude events (>Ms6.0) since 1349 A.D.. However, the recurrence times forsuch large earthquake are 500-3000 years, recordedthrough palaeoseismological trench investigations (e.g.Michetti et al. 1996, Pantosti et al. 1996), so a longer re-cord of fault slip is needed to assess the relationship be-tween long-term strain release recorded in the geomor-phology (104 years) and short-term strain release recor-ded by earthquake catalogues and geodesy (102-3 years).A key observation is that the cumulative effect of suchearthquakes over 104 year timescale has been preserveddue to the fact that the rate of vertical offset of theground surface across faults (0.2-2.0 mm/yr; Roberts andMichetti 2004, Papanikoloau and Roberts 2007) is higherthan erosion and sedimentation rates since the last glacialmaximum (12-18 ka) (Figure 1b). The timing of surfaceoffsets for this 12-18 ka timescale have been constrainedby palaeoseismological trench investigations (Michetti etal. 1996, Pantosti et al. 1996), tephrachronology (e.g.Giraudi 1995), and 36Cl cosmogenic surface exposuredating of fault planes that emerge out of the ground alongthe scarps during earthquakes (Palumbo et al. 2006) (Fig-ure 2a) and (Figure 2b).
Journal of the Virtual Explorer, 2008Volume 29
Paper 4http://virtualexplorer.com.au/
Visualisation of active normal fault scarps in the Apennines, Italy: a key to assessment of tectonic strain release and earthquake rupture. Page 3
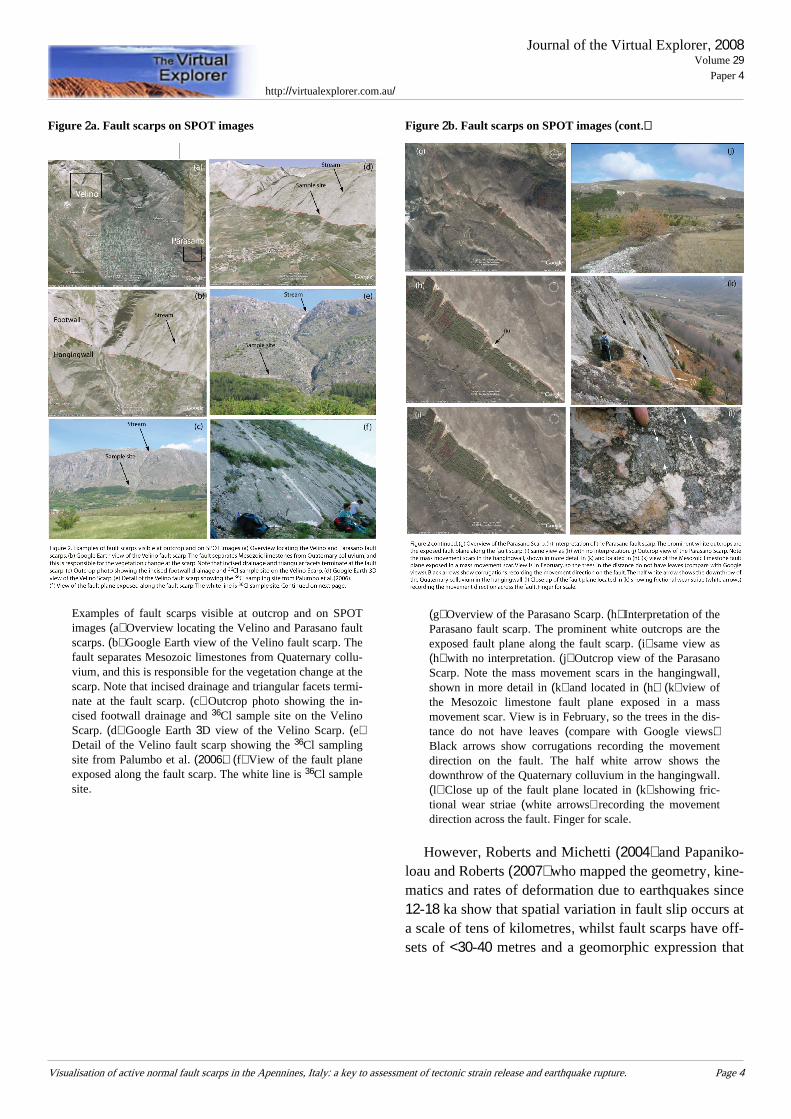
Figure 2a. Fault scarps on SPOT images
Examples of fault scarps visible at outcrop and on SPOTimages (a) Overview locating the Velino and Parasano faultscarps. (b) Google Earth view of the Velino fault scarp. Thefault separates Mesozoic limestones from Quaternary collu-vium, and this is responsible for the vegetation change at thescarp. Note that incised drainage and triangular facets termi-nate at the fault scarp. (c) Outcrop photo showing the in-cised footwall drainage and 36Cl sample site on the VelinoScarp. (d) Google Earth 3D view of the Velino Scarp. (e)Detail of the Velino fault scarp showing the 36Cl samplingsite from Palumbo et al. (2006). (f) View of the fault planeexposed along the fault scarp. The white line is 36Cl samplesite.
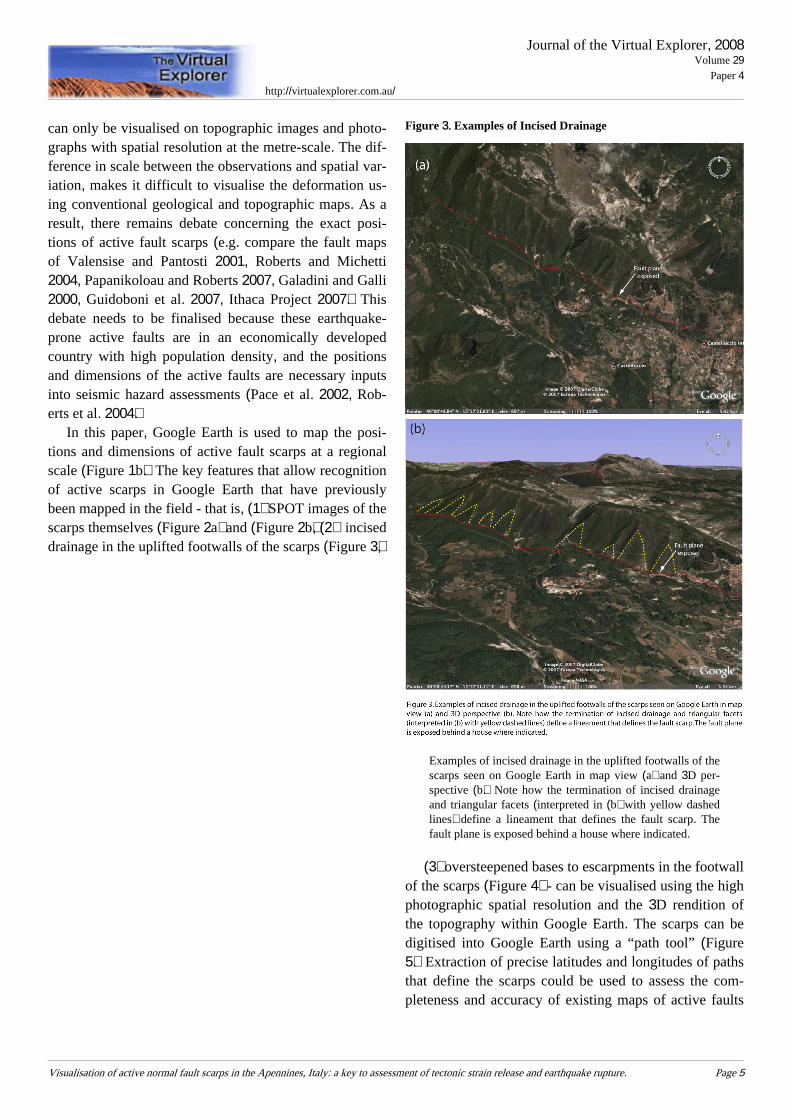
Figure 2b. Fault scarps on SPOT images (cont.)
(g) Overview of the Parasano Scarp. (h) Interpretation of theParasano fault scarp. The prominent white outcrops are theexposed fault plane along the fault scarp. (i) same view as(h) with no interpretation. (j) Outcrop view of the ParasanoScarp. Note the mass movement scars in the hangingwall,shown in more detail in (k) and located in (h). (k) view ofthe Mesozoic limestone fault plane exposed in a massmovement scar. View is in February, so the trees in the dis-tance do not have leaves (compare with Google views).Black arrows show corrugations recording the movementdirection on the fault. The half white arrow shows thedownthrow of the Quaternary colluvium in the hangingwall.(l) Close up of the fault plane located in (k) showing fric-tional wear striae (white arrows) recording the movementdirection across the fault. Finger for scale.
However, Roberts and Michetti (2004) and Papaniko-loau and Roberts (2007) who mapped the geometry, kine-matics and rates of deformation due to earthquakes since12-18 ka show that spatial variation in fault slip occurs ata scale of tens of kilometres, whilst fault scarps have off-sets of <30-40 metres and a geomorphic expression that
Journal of the Virtual Explorer, 2008Volume 29
Paper 4http://virtualexplorer.com.au/
Visualisation of active normal fault scarps in the Apennines, Italy: a key to assessment of tectonic strain release and earthquake rupture. Page 4
can only be visualised on topographic images and photo-graphs with spatial resolution at the metre-scale. The dif-ference in scale between the observations and spatial var-iation, makes it difficult to visualise the deformation us-ing conventional geological and topographic maps. As aresult, there remains debate concerning the exact posi-tions of active fault scarps (e.g. compare the fault mapsof Valensise and Pantosti 2001, Roberts and Michetti2004, Papanikoloau and Roberts 2007, Galadini and Galli2000, Guidoboni et al. 2007, Ithaca Project 2007). Thisdebate needs to be finalised because these earthquake-prone active faults are in an economically developedcountry with high population density, and the positionsand dimensions of the active faults are necessary inputsinto seismic hazard assessments (Pace et al. 2002, Rob-erts et al. 2004).
In this paper, Google Earth is used to map the posi-tions and dimensions of active fault scarps at a regionalscale (Figure 1b). The key features that allow recognitionof active scarps in Google Earth that have previouslybeen mapped in the field - that is, (1) SPOT images of thescarps themselves (Figure 2a) and (Figure 2b), (2) inciseddrainage in the uplifted footwalls of the scarps (Figure 3),
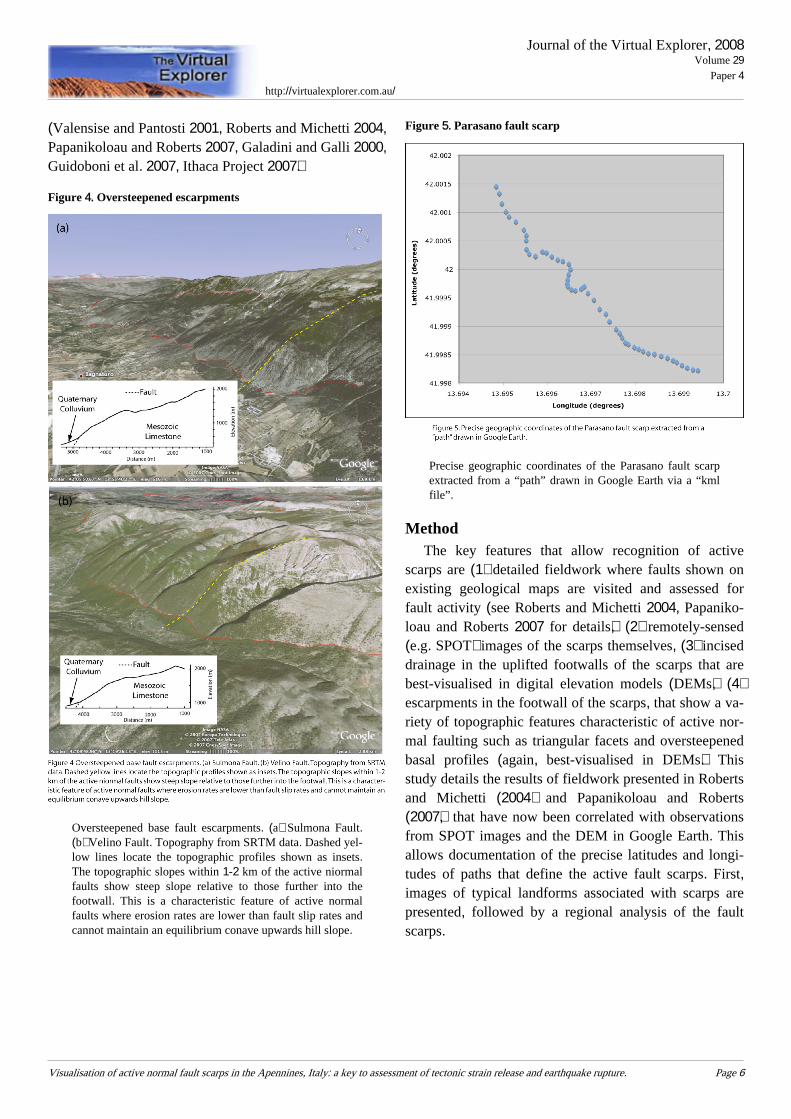
Figure 3. Examples of Incised Drainage
Examples of incised drainage in the uplifted footwalls of thescarps seen on Google Earth in map view (a) and 3D per-spective (b). Note how the termination of incised drainageand triangular facets (interpreted in (b) with yellow dashedlines) define a lineament that defines the fault scarp. Thefault plane is exposed behind a house where indicated.
(3) oversteepened bases to escarpments in the footwallof the scarps (Figure 4) - can be visualised using the highphotographic spatial resolution and the 3D rendition ofthe topography within Google Earth. The scarps can bedigitised into Google Earth using a “path tool” (Figure5). Extraction of precise latitudes and longitudes of pathsthat define the scarps could be used to assess the com-pleteness and accuracy of existing maps of active faults
Journal of the Virtual Explorer, 2008Volume 29
Paper 4http://virtualexplorer.com.au/
Visualisation of active normal fault scarps in the Apennines, Italy: a key to assessment of tectonic strain release and earthquake rupture. Page 5
(Valensise and Pantosti 2001, Roberts and Michetti 2004,Papanikoloau and Roberts 2007, Galadini and Galli 2000,Guidoboni et al. 2007, Ithaca Project 2007).
Figure 4. Oversteepened escarpments
Oversteepened base fault escarpments. (a) Sulmona Fault.(b) Velino Fault. Topography from SRTM data. Dashed yel-low lines locate the topographic profiles shown as insets.The topographic slopes within 1-2 km of the active niormalfaults show steep slope relative to those further into thefootwall. This is a characteristic feature of active normalfaults where erosion rates are lower than fault slip rates andcannot maintain an equilibrium conave upwards hill slope.
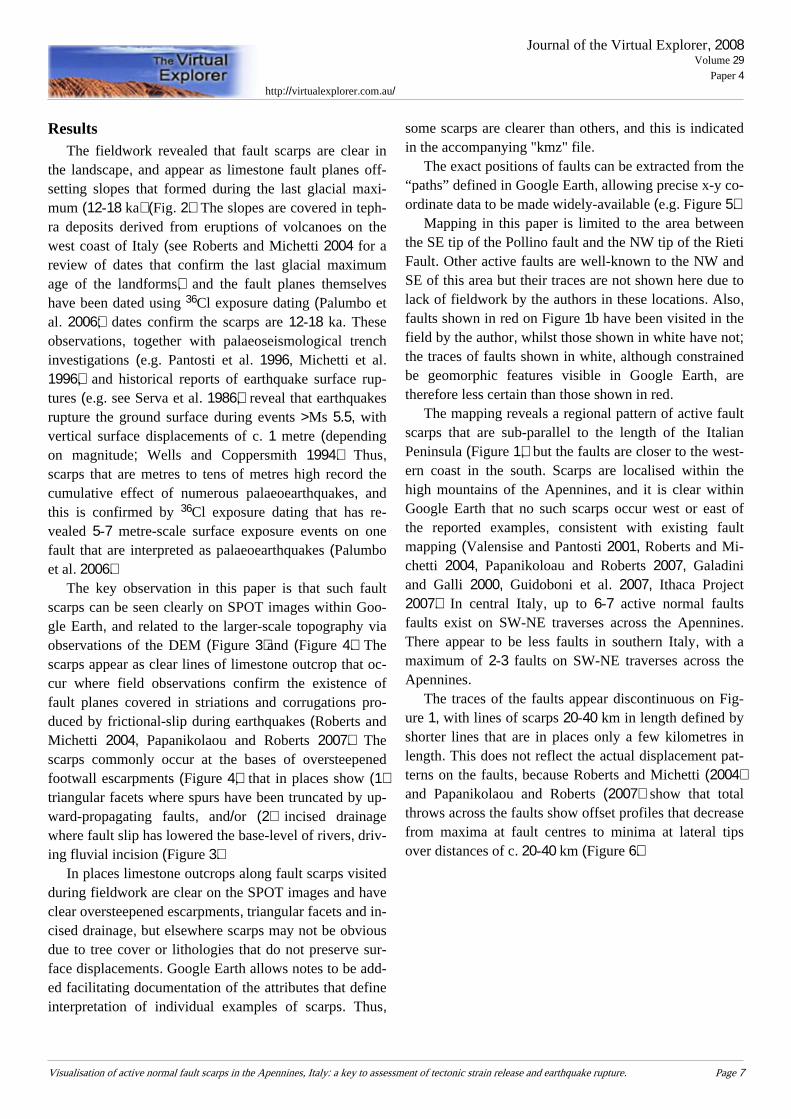
Figure 5. Parasano fault scarp
Precise geographic coordinates of the Parasano fault scarpextracted from a “path” drawn in Google Earth via a “kmlfile”.
MethodThe key features that allow recognition of active
scarps are (1) detailed fieldwork where faults shown onexisting geological maps are visited and assessed forfault activity (see Roberts and Michetti 2004, Papaniko-loau and Roberts 2007 for details), (2) remotely-sensed(e.g. SPOT) images of the scarps themselves, (3) inciseddrainage in the uplifted footwalls of the scarps that arebest-visualised in digital elevation models (DEMs), (4)escarpments in the footwall of the scarps, that show a va-riety of topographic features characteristic of active nor-mal faulting such as triangular facets and oversteepenedbasal profiles (again, best-visualised in DEMs). Thisstudy details the results of fieldwork presented in Robertsand Michetti (2004) and Papanikoloau and Roberts(2007), that have now been correlated with observationsfrom SPOT images and the DEM in Google Earth. Thisallows documentation of the precise latitudes and longi-tudes of paths that define the active fault scarps. First,images of typical landforms associated with scarps arepresented, followed by a regional analysis of the faultscarps.
Journal of the Virtual Explorer, 2008Volume 29
Paper 4http://virtualexplorer.com.au/
Visualisation of active normal fault scarps in the Apennines, Italy: a key to assessment of tectonic strain release and earthquake rupture. Page 6
ResultsThe fieldwork revealed that fault scarps are clear in
the landscape, and appear as limestone fault planes off-setting slopes that formed during the last glacial maxi-mum (12-18 ka) (Fig. 2). The slopes are covered in teph-ra deposits derived from eruptions of volcanoes on thewest coast of Italy (see Roberts and Michetti 2004 for areview of dates that confirm the last glacial maximumage of the landforms), and the fault planes themselveshave been dated using 36Cl exposure dating (Palumbo etal. 2006); dates confirm the scarps are 12-18 ka. Theseobservations, together with palaeoseismological trenchinvestigations (e.g. Pantosti et al. 1996, Michetti et al.1996), and historical reports of earthquake surface rup-tures (e.g. see Serva et al. 1986), reveal that earthquakesrupture the ground surface during events >Ms 5.5, withvertical surface displacements of c. 1 metre (dependingon magnitude; Wells and Coppersmith 1994). Thus,scarps that are metres to tens of metres high record thecumulative effect of numerous palaeoearthquakes, andthis is confirmed by 36Cl exposure dating that has re-vealed 5-7 metre-scale surface exposure events on onefault that are interpreted as palaeoearthquakes (Palumboet al. 2006).
The key observation in this paper is that such faultscarps can be seen clearly on SPOT images within Goo-gle Earth, and related to the larger-scale topography viaobservations of the DEM (Figure 3)and (Figure 4). Thescarps appear as clear lines of limestone outcrop that oc-cur where field observations confirm the existence offault planes covered in striations and corrugations pro-duced by frictional-slip during earthquakes (Roberts andMichetti 2004, Papanikolaou and Roberts 2007). Thescarps commonly occur at the bases of oversteepenedfootwall escarpments (Figure 4), that in places show (1)triangular facets where spurs have been truncated by up-ward-propagating faults, and/or (2) incised drainagewhere fault slip has lowered the base-level of rivers, driv-ing fluvial incision (Figure 3).
In places limestone outcrops along fault scarps visitedduring fieldwork are clear on the SPOT images and haveclear oversteepened escarpments, triangular facets and in-cised drainage, but elsewhere scarps may not be obviousdue to tree cover or lithologies that do not preserve sur-face displacements. Google Earth allows notes to be add-ed facilitating documentation of the attributes that defineinterpretation of individual examples of scarps. Thus,
some scarps are clearer than others, and this is indicatedin the accompanying "kmz" file.
The exact positions of faults can be extracted from the“paths” defined in Google Earth, allowing precise x-y co-ordinate data to be made widely-available (e.g. Figure 5).
Mapping in this paper is limited to the area betweenthe SE tip of the Pollino fault and the NW tip of the RietiFault. Other active faults are well-known to the NW andSE of this area but their traces are not shown here due tolack of fieldwork by the authors in these locations. Also,faults shown in red on Figure 1b have been visited in thefield by the author, whilst those shown in white have not;the traces of faults shown in white, although constrainedbe geomorphic features visible in Google Earth, aretherefore less certain than those shown in red.
The mapping reveals a regional pattern of active faultscarps that are sub-parallel to the length of the ItalianPeninsula (Figure 1), but the faults are closer to the west-ern coast in the south. Scarps are localised within thehigh mountains of the Apennines, and it is clear withinGoogle Earth that no such scarps occur west or east ofthe reported examples, consistent with existing faultmapping (Valensise and Pantosti 2001, Roberts and Mi-chetti 2004, Papanikoloau and Roberts 2007, Galadiniand Galli 2000, Guidoboni et al. 2007, Ithaca Project2007). In central Italy, up to 6-7 active normal faultsfaults exist on SW-NE traverses across the Apennines.There appear to be less faults in southern Italy, with amaximum of 2-3 faults on SW-NE traverses across theApennines.
The traces of the faults appear discontinuous on Fig-ure 1, with lines of scarps 20-40 km in length defined byshorter lines that are in places only a few kilometres inlength. This does not reflect the actual displacement pat-terns on the faults, because Roberts and Michetti (2004)and Papanikolaou and Roberts (2007) show that totalthrows across the faults show offset profiles that decreasefrom maxima at fault centres to minima at lateral tipsover distances of c. 20-40 km (Figure 6).
Journal of the Virtual Explorer, 2008Volume 29
Paper 4http://virtualexplorer.com.au/
Visualisation of active normal fault scarps in the Apennines, Italy: a key to assessment of tectonic strain release and earthquake rupture. Page 7
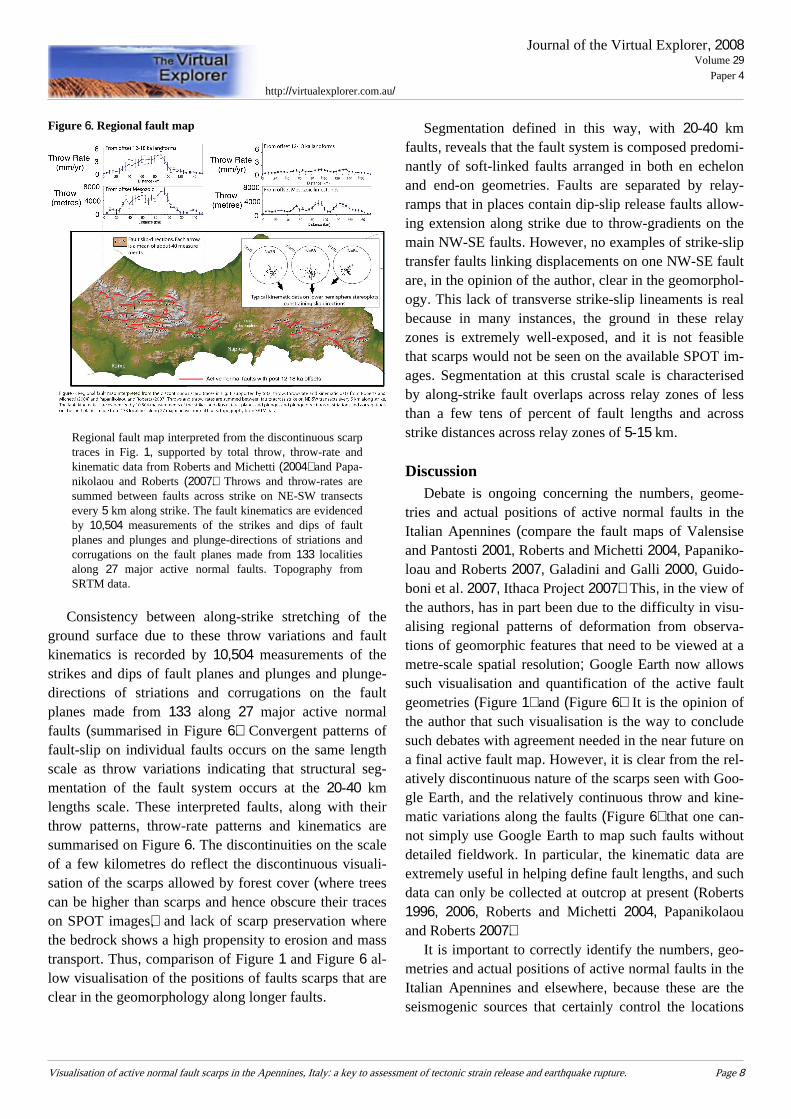
Figure 6. Regional fault map
Regional fault map interpreted from the discontinuous scarptraces in Fig. 1, supported by total throw, throw-rate andkinematic data from Roberts and Michetti (2004) and Papa-nikolaou and Roberts (2007). Throws and throw-rates aresummed between faults across strike on NE-SW transectsevery 5 km along strike. The fault kinematics are evidencedby 10,504 measurements of the strikes and dips of faultplanes and plunges and plunge-directions of striations andcorrugations on the fault planes made from 133 localitiesalong 27 major active normal faults. Topography fromSRTM data.
Consistency between along-strike stretching of theground surface due to these throw variations and faultkinematics is recorded by 10,504 measurements of thestrikes and dips of fault planes and plunges and plunge-directions of striations and corrugations on the faultplanes made from 133 along 27 major active normalfaults (summarised in Figure 6). Convergent patterns offault-slip on individual faults occurs on the same lengthscale as throw variations indicating that structural seg-mentation of the fault system occurs at the 20-40 kmlengths scale. These interpreted faults, along with theirthrow patterns, throw-rate patterns and kinematics aresummarised on Figure 6. The discontinuities on the scaleof a few kilometres do reflect the discontinuous visuali-sation of the scarps allowed by forest cover (where treescan be higher than scarps and hence obscure their traceson SPOT images), and lack of scarp preservation wherethe bedrock shows a high propensity to erosion and masstransport. Thus, comparison of Figure 1 and Figure 6 al-low visualisation of the positions of faults scarps that areclear in the geomorphology along longer faults.
Segmentation defined in this way, with 20-40 kmfaults, reveals that the fault system is composed predomi-nantly of soft-linked faults arranged in both en echelonand end-on geometries. Faults are separated by relay-ramps that in places contain dip-slip release faults allow-ing extension along strike due to throw-gradients on themain NW-SE faults. However, no examples of strike-sliptransfer faults linking displacements on one NW-SE faultare, in the opinion of the author, clear in the geomorphol-ogy. This lack of transverse strike-slip lineaments is realbecause in many instances, the ground in these relayzones is extremely well-exposed, and it is not feasiblethat scarps would not be seen on the available SPOT im-ages. Segmentation at this crustal scale is characterisedby along-strike fault overlaps across relay zones of lessthan a few tens of percent of fault lengths and acrossstrike distances across relay zones of 5-15 km.
DiscussionDebate is ongoing concerning the numbers, geome-
tries and actual positions of active normal faults in theItalian Apennines (compare the fault maps of Valensiseand Pantosti 2001, Roberts and Michetti 2004, Papaniko-loau and Roberts 2007, Galadini and Galli 2000, Guido-boni et al. 2007, Ithaca Project 2007). This, in the view ofthe authors, has in part been due to the difficulty in visu-alising regional patterns of deformation from observa-tions of geomorphic features that need to be viewed at ametre-scale spatial resolution; Google Earth now allowssuch visualisation and quantification of the active faultgeometries (Figure 1) and (Figure 6). It is the opinion ofthe author that such visualisation is the way to concludesuch debates with agreement needed in the near future ona final active fault map. However, it is clear from the rel-atively discontinuous nature of the scarps seen with Goo-gle Earth, and the relatively continuous throw and kine-matic variations along the faults (Figure 6) that one can-not simply use Google Earth to map such faults withoutdetailed fieldwork. In particular, the kinematic data areextremely useful in helping define fault lengths, and suchdata can only be collected at outcrop at present (Roberts1996, 2006, Roberts and Michetti 2004, Papanikolaouand Roberts 2007).
It is important to correctly identify the numbers, geo-metries and actual positions of active normal faults in theItalian Apennines and elsewhere, because these are theseismogenic sources that certainly control the locations
Journal of the Virtual Explorer, 2008Volume 29
Paper 4http://virtualexplorer.com.au/
Visualisation of active normal fault scarps in the Apennines, Italy: a key to assessment of tectonic strain release and earthquake rupture. Page 8
of future devastating earthquakes, and possibly the maxi-mum magnitudes of expected earthquakes (Wells andCoppersmith 1994, Pace et al. 2002). Through compari-son of multi-seismic-cycle strain-rates defined by slipacross fault scarps and single-seismic-cycle strain ratesfrom instrumental seismicity and geodesy (e.g. Roberts2006), one may be able to constrain the stress-loadingand strain-release patterns that govern earthquake recur-rence, through improved understanding of the mechanicsof the seismic cycle; visualisation of active fault geome-tries is a key waypoint on the journey to this goal.
ConclusionsGoogle Earth has been used to map active normal
fault scarps that offset 12-18 ka landforms in the Apen-nines, Italy. This map provides precise locations forstructures responsible for tectonic strain release andearthquake rupture. Spatial variation in fault slip occursat a scale of tens of kilometres, whilst fault scarps haveoffsets of <30-40 metres and a geomorphic expressionthat can only be visualised on topographic images withspatial resolution at the metre-scale. Thus, until now, de-bate has surrounded the exact positions of scarps due, in
part, to problems of visualising both the detailed geomor-phic features and their regional variation. Provision ofcomplete SPOT image coverage and topography withinGoogle Earth allows individual scarps visited duringfieldwork to be visualised at a regional scale within aneasily-accessible interface. The resultant fault map is animportant step towards agreement on a final fault map,which is needed to facilitate comparison of multi-seis-mic-cycle strain-rates defined by slip across fault scarpsand single-seismic-cycle strain rates from instrumentalseismicity and geodesy. Such a comparison is needed toconstrain the stress-loading and strain-release patternsthat govern earthquake recurrence, through improved un-derstanding of the mechanics of the seismic cycle.
AcknowledgementsThe work was funded by NERC Grants NE/E01545X/
1, NE/B504165/1, and GR9/02995, and Birkbeck, Uni-versity of London. Discussions with Alessandro Michetti,Patience Cowie, Ioannis Papanikolaou, Nigel Morewood,Joanna Faure Walker, Eutizio Vittori, Alex Whittaker,Mikael Attal and Greg Tucker are gratefully acknowl-edged.
Journal of the Virtual Explorer, 2008Volume 29
Paper 4http://virtualexplorer.com.au/
Visualisation of active normal fault scarps in the Apennines, Italy: a key to assessment of tectonic strain release and earthquake rupture. Page 9
References
Anderson, H., Jackson, J.,1987. Active tectonics of the Adriaticregion. Geophysical Journal of the Royal Astronomical Society,91, 937-983.
Galadini, F., Galli, P., 2000. Active tectonics in the central Apennines(Italy) – Input data for seismic hazard assessment. NaturalHazards, 22, 225-270. 10.1023/A:1008149531980
Giraudi, C., 1995. I detriti di versante al margin della piana del Fucino(Italia centrale): significato palaeoclimatico ed impatto antropico.Il Quaternario, 8, 203-210.
Guidoboni E., G. Ferrari, D.Mariotti, A.Comastri, G.Tarabusi andG.Valensise 2007 - CFTI4Med, Catalogue of Strong Earthquakesin Italy (461 B.C.-1997) and Mediterranean Area (760B.C.-1500). INGV-SGA. Available from http://storing.ingv.it/cfti4med/.
Ithaca Project 2007. http://www.apat.gov.it/site/en-GB/Projects/ITHACA_-_ITaly_HAzards_from_CApable_faults/
Margottini, C., Screpanti, A., 1988. Temporal evolution of the seismiccrisis related to the 13th January 1915, Avezzano earthquake, in"Historical seismicity of central-eastern mediterranean region",Proceedings of the 1987 ENEA-IAEA International Workshop,edited by Margottini C. and L. Serva, 185-193, ENEA, Roma.
Michetti, A. M., Brunamonte, F., Serva, L., Vittori, E., 1996. Trenchinvestigations of the 1915 Fucino earthquake fault scarps(Abruzzo, Central Italy): geological evidence of large historicalevents. Journal of Geophysical Research, 101, 5921-5936.10.1029/95JB02852
Pace, B., Peruzza, L., Lavecchia, G., Boncio, P., 2002. Seismogenicsources in central Italy: from causes to effects. Mem. Soc. Geol.It., 57, 419-429.
Palumbo, L., L. Benedetti, D. Bourles, A. Cinque, R. Finkel, 2004.Slip history of the Magnola fault (Apennines, Central Italy) from36Cl surface exposure dating: evidence for strong earthquakesover the Holocene, Earth Planet. Sci. Lett. 225, 163-176. 10.1016/j.epsl.2004.06.012
Pantosti, D., D'Addezio, G., Cinti, F., 1996. Paleoseismicity of theOvindoli-Pezza fault, central Apennines, Italy: a history includinga large, previously unrecorded earthquake in the Middle Ages(860-1300 A.D.). Journal of Geophysical Research. 101,5937-5960. 10.1029/95JB03213
Papanikoloau, I., Roberts, G. P., 2007. Geometry, kinematics anddeformation rates along the active normal fault system in thesouthern Apennines: implications for fault growth. Journal ofStructural Geology, 29, 166-188. 10.1016/j.jsg.2006.07.009
Roberts, G. P., 1996. Variation in fault-slip directions along activeand segmented normal fault systems, Journal of StructuralGeology, 18, 835-845. 10.1016/S0191-8141(96)80016-2
Roberts, G. P., 2006. Multi-seismic cycle velocity and strain fields foran active normal fault system, central Italy. Earth and PlanetaryScience Letters, 252, 44-51. 10.1016/j.epsl.2005.11.066
Roberts, G. P., Michetti, A. M., 2004. Spatial and temporal variationsin growth rates along active normal fault Systems: an examplefrom Lazio-Abruzzo, central Italy. Journal of Structural Geology,26, 339-376. 10.1016/S0191-8141(03)00103-2
Roberts, G. P., P. Cowie, I. Papanikoloau, Michetti. A. M., 2004.Fault scaling relationships, deformation rates and seismic hazards:an example from Lazio-Abruzzo region, central Italy. Journal ofStructural Geology, 26, 377-398. 10.1016/S0191-8141(03)00104-4
Serva, L., Blumetti, A. M., Michetti, A. M. 1986. Gli effetti sulterreno del terremoto del Fucino (13 Gennaio 1915); tentative diinterpretazione della evoluzione tettonica recente di alcunestrutture. Mem. Soc. Geol. It., 35, 893-907.
Valensise, G., Pantosti, D., 2001. The investigation of potentialearthquake sources in peninsular Italy: A review. Journal ofSeismology, 5, 287-306. 10.1023/A:1011463223440
Wells, D. I., Coppersmith, K. J., 1994. New empirical relationshipsamong magnitude, rupture length, rupture width, rupture area, andsurface displacement. Bulletin of the Seismological Society ofAmerica, 84, 974-1002.
Journal of the Virtual Explorer, 2008Volume 29
Paper 4http://virtualexplorer.com.au/
Visualisation of active normal fault scarps in the Apennines, Italy: a key to assessment of tectonic strain release and earthquake rupture. Page 10
Copyright © 2022 FDOKUMEN