![Crítica à Execução Penal [2a edição]](https://static.fdokumen.com/doc/165x107/631ae641d43f4e176304a750/critica-a-execucao-penal-2a-edicao.jpg)
HIF-2a is essential for carotid body development and function
26
*For correspondence: [email protected] (DM); [email protected] (RSJ) Competing interests: The authors declare that no competing interests exist. Funding: See page 23 Received: 27 December 2017 Accepted: 18 April 2018 Published: 19 April 2018 Reviewing editor: Kari Alitalo, University of Helsinki, Finland Copyright Macias et al. This article is distributed under the terms of the Creative Commons Attribution License, which permits unrestricted use and redistribution provided that the original author and source are credited. HIF-2a is essential for carotid body development and function David Macias 1 *, Andrew S Cowburn 1,2 , Hortensia Torres-Torrelo 3 , Patricia Ortega-Sa ´ enz 3 , Jose ´ Lo ´ pez-Barneo 3 , Randall S Johnson 1,4 * 1 Department of Physiology, Development and Neuroscience, University of Cambridge, Cambridge, United Kingdom; 2 Department of Medicine, University of Cambridge, Cambridge, United Kingdom; 3 Instituto de Biomedicina de Sevilla, Seville, Spain; 4 Department of Cell and Molecular Biology, Karolinska Institute, Stockholm, Sweden Abstract Mammalian adaptation to oxygen flux occurs at many levels, from shifts in cellular metabolism to physiological adaptations facilitated by the sympathetic nervous system and carotid body (CB). Interactions between differing forms of adaptive response to hypoxia, including transcriptional responses orchestrated by the Hypoxia Inducible transcription Factors (HIFs), are complex and clearly synergistic. We show here that there is an absolute developmental requirement for HIF-2a, one of the HIF isoforms, for growth and survival of oxygen sensitive glomus cells of the carotid body. The loss of these cells renders mice incapable of ventilatory responses to hypoxia, and this has striking effects on processes as diverse as arterial pressure regulation, exercise performance, and glucose homeostasis. We show that the expansion of the glomus cells is correlated with mTORC1 activation, and is functionally inhibited by rapamycin treatment. These findings demonstrate the central role played by HIF-2a in carotid body development, growth and function. DOI: https://doi.org/10.7554/eLife.34681.001 Introduction Detecting and responding to shifts in oxygen availability is essential for animal survival. Responding to changes in oxygenation occurs in cells, tissues, and at the level of the whole organism. Although many of responses to oxygen flux are regulated at the transcriptional level by the hypoxia inducible transcription factor (HIF), at tissue and organismal levels there are even more dimensions to the adaptive process. In vertebrates, the actors in adaptation are found in different peripheral chemore- ceptors, including the neuroepithelial cells of the gills in teleosts, and in the carotid body (CB) of mammals. The CB regulates many responses to changes in oxygenation, including alterations in ven- tilation and heart rates. The carotid body is located at the carotid artery bifurcation, and contains glomeruli that contain O 2 -sensitive, neuron-like tyrosine hydroxylase (TH)-positive glomus cells (type I cells). These glomus cells are responsible for a rapid compensatory hypoxic ventilatory response (HVR) when a drop in arterial O 2 tension (PO 2 ) occurs (Lo ´ pez-Barneo et al., 2016b; Teppema and Dahan, 2010). In addi- tion to this acute reflex, the CB plays an important role in acclimatization to sustained hypoxia, and is commonly enlarged in people living at high altitude (Arias-Stella and Valcarcel, 1976; Wang and Bisgard, 2002) and in patients with chronic respiratory diseases (Heath and Edwards, 1971; Heath et al., 1982). This enlargement is induced through a proliferative response of CB stem cells (type II cells)(Pardal et al., 2007; Platero-Luengo et al., 2014). During embryogenesis, the initiating event in CB organogenesis occurs when multipotent neural crest cells migrate toward the dorsal aorta, to give rise to the sympathoadrenal system (Le Douarin, Macias et al. eLife 2018;7:e34681. DOI: https://doi.org/10.7554/eLife.34681 1 of 26 RESEARCH ARTICLE
-
Upload
khangminh22 -
Category
Documents
-
view
1 -
download
0
Transcript of HIF-2a is essential for carotid body development and function

*For correspondence:
[email protected] (DM);
[email protected] (RSJ)
Competing interests: The
authors declare that no
competing interests exist.
Funding: See page 23
Received: 27 December 2017
Accepted: 18 April 2018
Published: 19 April 2018
Reviewing editor: Kari Alitalo,
University of Helsinki, Finland
Copyright Macias et al. This
article is distributed under the
terms of the Creative Commons
Attribution License, which
permits unrestricted use and
redistribution provided that the
original author and source are
credited.
HIF-2a is essential for carotid bodydevelopment and functionDavid Macias1*, Andrew S Cowburn1,2, Hortensia Torres-Torrelo3,Patricia Ortega-Saenz3, Jose Lopez-Barneo3, Randall S Johnson1,4*
1Department of Physiology, Development and Neuroscience, University ofCambridge, Cambridge, United Kingdom; 2Department of Medicine, University ofCambridge, Cambridge, United Kingdom; 3Instituto de Biomedicina de Sevilla,Seville, Spain; 4Department of Cell and Molecular Biology, Karolinska Institute,Stockholm, Sweden
Abstract Mammalian adaptation to oxygen flux occurs at many levels, from shifts in cellular
metabolism to physiological adaptations facilitated by the sympathetic nervous system and carotid
body (CB). Interactions between differing forms of adaptive response to hypoxia, including
transcriptional responses orchestrated by the Hypoxia Inducible transcription Factors (HIFs), are
complex and clearly synergistic. We show here that there is an absolute developmental
requirement for HIF-2a, one of the HIF isoforms, for growth and survival of oxygen sensitive
glomus cells of the carotid body. The loss of these cells renders mice incapable of ventilatory
responses to hypoxia, and this has striking effects on processes as diverse as arterial pressure
regulation, exercise performance, and glucose homeostasis. We show that the expansion of the
glomus cells is correlated with mTORC1 activation, and is functionally inhibited by rapamycin
treatment. These findings demonstrate the central role played by HIF-2a in carotid body
development, growth and function.
DOI: https://doi.org/10.7554/eLife.34681.001
IntroductionDetecting and responding to shifts in oxygen availability is essential for animal survival. Responding
to changes in oxygenation occurs in cells, tissues, and at the level of the whole organism. Although
many of responses to oxygen flux are regulated at the transcriptional level by the hypoxia inducible
transcription factor (HIF), at tissue and organismal levels there are even more dimensions to the
adaptive process. In vertebrates, the actors in adaptation are found in different peripheral chemore-
ceptors, including the neuroepithelial cells of the gills in teleosts, and in the carotid body (CB) of
mammals. The CB regulates many responses to changes in oxygenation, including alterations in ven-
tilation and heart rates.
The carotid body is located at the carotid artery bifurcation, and contains glomeruli that contain
O2-sensitive, neuron-like tyrosine hydroxylase (TH)-positive glomus cells (type I cells). These glomus
cells are responsible for a rapid compensatory hypoxic ventilatory response (HVR) when a drop in
arterial O2 tension (PO2) occurs (Lopez-Barneo et al., 2016b; Teppema and Dahan, 2010). In addi-
tion to this acute reflex, the CB plays an important role in acclimatization to sustained hypoxia, and
is commonly enlarged in people living at high altitude (Arias-Stella and Valcarcel, 1976; Wang and
Bisgard, 2002) and in patients with chronic respiratory diseases (Heath and Edwards, 1971;
Heath et al., 1982). This enlargement is induced through a proliferative response of CB stem cells
(type II cells)(Pardal et al., 2007; Platero-Luengo et al., 2014).
During embryogenesis, the initiating event in CB organogenesis occurs when multipotent neural
crest cells migrate toward the dorsal aorta, to give rise to the sympathoadrenal system (Le Douarin,
Macias et al. eLife 2018;7:e34681. DOI: https://doi.org/10.7554/eLife.34681 1 of 26
RESEARCH ARTICLE
1986). Segregation of sympathetic progenitors from the superior cervical ganglion (SCG) then cre-
ates the CB parenchyma (Kameda, 2005; Kameda et al., 2008). This structure is comprised of O2-
sensitive glomus cells (type-I cells) (Pearse et al., 1973), glia-like sustentacular cells (type-II cells)
(Pardal et al., 2007) and endothelial cells (Annese et al., 2017).
The cellular response to low oxygen is in part modulated by two isoforms of the HIF-a transcrip-
tion factor, each with differing roles in cellular and organismal response to oxygen flux: HIF-1a and
HIF-2a. At the organismal level, mouse models hemizygous for HIFs-a (Hif1a+/- and Epas1+/-) or
where HIF inactivation was induced in adults showed contrasting effects on CB function, without in
either case affecting CB development (Hodson et al., 2016; Kline et al., 2002; Peng et al., 2011).
Nevertheless, in both settings Epas1 (not Hif1a) inactivation, had major effects on the proliferative
response of the CBs to protracted hypoxia (Hodson et al., 2016).
Transcriptome analysis has confirmed that Epas1 is the second most abundant transcript in neo-
natal CB glomus cells (Tian et al., 1998; Zhou et al., 2016), and that it is expressed at far higher lev-
els than are found in cells of similar developmental origins, including superior cervical ganglion
(SCG) sympathetic neurons (Gao et al., 2017). It has also been recently shown that Epas1 but not
Hif1a, overexpression in sympathoadrenal cells leads to enlargement of the CB (Macıas et al.,
2014). Here, we report that Epas1 is required for the development of CB O2-sensitive glomus cells,
and that mutant animals lacking CB function have impaired adaptive physiological responses.
Results
Sympathoadrenal Epas1 loss blocks carotid body glomus celldevelopmentTo elucidate the role of HIFa isoforms in CB development and function, we generated mouse strains
carrying Hif1a or Epas1 embryonic deletions (TH-HIF-1aKO and TH-HIF-2aKO) restricted to catechol-
aminergic tissues by crossing them with a mouse strain expressing cre recombinase under the con-
trol of the endogenous tyrosine hydroxylase (Th) promoter (Macıas et al., 2014).
Histological analysis of the carotid artery bifurcation dissected from adult (8–12 weeks old) TH-
HIF-2aKO mice revealed virtually no CB TH+ glomus cells (Figure 1A, bottom panels) compared to
HIF-2aWT littermate controls (Figure 1A, top panels). Conversely, TH-HIF-1aKO mice showed a typi-
cal glomus cell organization, characterized by scattered clusters of TH+ cells throughout the CB
parenchyma (Figure 1B, bottom panels) similar to those found in HIF-1aWT littermate controls
(Figure 1B, top panels). These observations were further corroborated by quantification of the total
CB parenchyma volume (Figure 1D–1F).
Other catecholaminergic organs whose embryological origins are similar to those of the CB,
for example, the superior cervical ganglion (SCG), do not show significant differences in structure or
volume between TH-HIF-2aKO mutants and control mice (Figure 1A–C). This suggests a specific role
of HIF-2a in the development of the CB glomus cells, and argues against a global role for the gene
in late development of catecholaminergic tissues. Further evidence for this comes from phenotypic
characterization of adrenal medulla (AM) TH+ chromaffin cells. No major histological alterations were
observed in adrenal glands removed from TH-HIF-2aKO and TH-HIF-1aKO mutant mice compared to
HIF-2aWT and HIF-1aWT littermate controls (Figure 1G and H). Consistent with this, the amount of
catecholamine (adrenaline and noradrenaline) present in the urine of TH-HIF-2aKO and TH-HIF-1aKO
deficient mice was similar to that found in their respective littermate controls (Figure 1I).
To determine deletion frequencies in these tissues, we crossed a loxP-flanked Td-Tomato
reporter strain (Madisen et al., 2010) with Th-IRES-Cre mice. Td-Tomato+ signal was only detected
within the CB, SCG and AM of mice expressing cre recombinase under the control of the Th pro-
moter (Figure 1—figure supplement 1A). Additionally, SCG and AM from HIF-2aWT, HIF-1aWT, TH-
HIF-2aKO and TH-HIF-1aKO were quantified for Epas1 and Hif1a deletion efficiency using genomic
DNA. As expected, there is a significant level of deletion of Epas1 and Hif1a genes detected in TH-
HIF-2aKO and TH-HIF-1aKO mutant mice compared to HIF-2aWTand HIF-1aWT littermate controls
(Figure 1—figure supplement 1B and C).
To determine whether absence of CB glomus cells in adult TH-HIF-2aKO mice is a result of
impaired glomus cell differentiation or cell survival, we examined carotid artery bifurcations dis-
sected from TH-HIF-2aKO mice at embryonic stage E18.5 (i.e., 1–2 days before birth), and postnatally
Macias et al. eLife 2018;7:e34681. DOI: https://doi.org/10.7554/eLife.34681 2 of 26
Research article Human Biology and Medicine Developmental Biology and Stem Cells

TH/DAPI
TH/DAPI
SCG
CB
SCG
HIF
-2α
WT
TH
-HIF
-2α
KO
0
1 x10⁸
2 x10⁸
3 x 10⁸
SC
G v
olu
me (μ
m3)
ns ns
HIF
-2αW
T
TH-H
IF-2αKO
HIF
-1αW
T
TH-H
IF-1αKO
HIF
-1α
WT
TH
-HIF
-1α
KO
SCG
SCG
CB
CB
TH/DAPI
TH/DAPI
0
2 x10⁶
4 x10⁶
6 x10⁶
8 x10⁶
CB
pa
ren
ch
ym
a (μ
m3)
HIF
-2αW
T
TH-H
IF-2αKO
HIF
-1αW
T
TH-H
IF-1αKO
ns
A
B
C
D
TH
+ c
ells
/CB
ns
HIF
-2αW
T
TH-H
IF-2αKO
HIF
-1αW
T
TH-H
IF-1αKO
E
TH
+ c
ells d
en
sit
y
(cells/1
00μ
m2)
ns
HIF
-2αW
T
TH-H
IF-2αKO
HIF
-1αW
T
TH-H
IF-1αKO
F
HIF
-2α
WT
TH
-HIF
-2α
KO
AM
AM
TH/DAPI
TH/DAPI
G H
HIF
-1α
WT
TH
-HIF
-1α
KO
HIF
-2αW
T
TH-H
IF-2αKO
HIF
-1αW
T
TH-H
IF-1αKO
HIF
-2αW
T
TH-H
IF-2αKO
HIF
-1αW
T
TH-H
IF-1αKO
ns
ns
ns
ns
0
50
100
150
200
250
Ad
ren
alin
e/C
rea
tin
ine
(n
M/m
M)
0
500
1000
1500
No
r ad
ren
alin
e/C
rea
tin
ine
(n
M/m
M)
**
**
**
AM
TH/DAPI
TH/DAPI
AM
0
500
1000
1500
2000
0
0.1
0.2
0.3
0.4
0.5
I
ICAECA
ICAECA
ICA
ICA
ECA
Figure 1. Selective loss of carotid body glomus cells in sympathoadrenal-specific Epas1, but not Hif1a, deficient mice. (A and B) Tyrosine hydroxylase
(TH) immunostaining on carotid bifurcation sections from HIF-2aWT (A, top panels), TH-HIF-2aKO (A, bottom panels), HIF-1aWT (B, top panels) and TH-
HIF-1aKO (B, bottom panels) mice (8–12 weeks old). Micrographs showed in A (bottom) were selected to illustrate the rare presence of TH+ glomus cells
in TH-HIF-2aKO mice (white arrowheads). Dashed rectangles (left panels) are shown at higher magnification on the right panels. SCG, superior cervical
Figure 1 continued on next page
Macias et al. eLife 2018;7:e34681. DOI: https://doi.org/10.7554/eLife.34681 3 of 26
Research article Human Biology and Medicine Developmental Biology and Stem Cells

(P0) (Figure 2A). Differentiated TH+ glomus cells were found in the carotid bifurcation of TH-HIF-
2aKO mutant mice at both stages (Figure 2A). However, there is a significant reduction in the total
CB parenchyma volume and in the number of differentiated TH+ glomus cells in TH-HIF-2aKO mice
at E18.5, and this reduction is even more evident in newborn mice (Figure 2B and C). Since CB vol-
ume and cells number of mutant mice decreased in parallel, no significant changes were seen in TH+
cell density at these two time points, however (Figure 2D).
Consistent with the results described above (Figure 1C), the SCG volume was not different in
mutant newborns relative to wild type controls (Figure 2E). We next assessed cell death in the
developing CB, and found a progressive increase in the number of TUNEL+ cells within the CB
parenchyma of TH-HIF-2aKO mice compared to HIF-2aWT littermates (Figure 2F and G). These data
demonstrate that HIF-2a, but not HIF-1a, is essential for the survival of CB glomus cells.
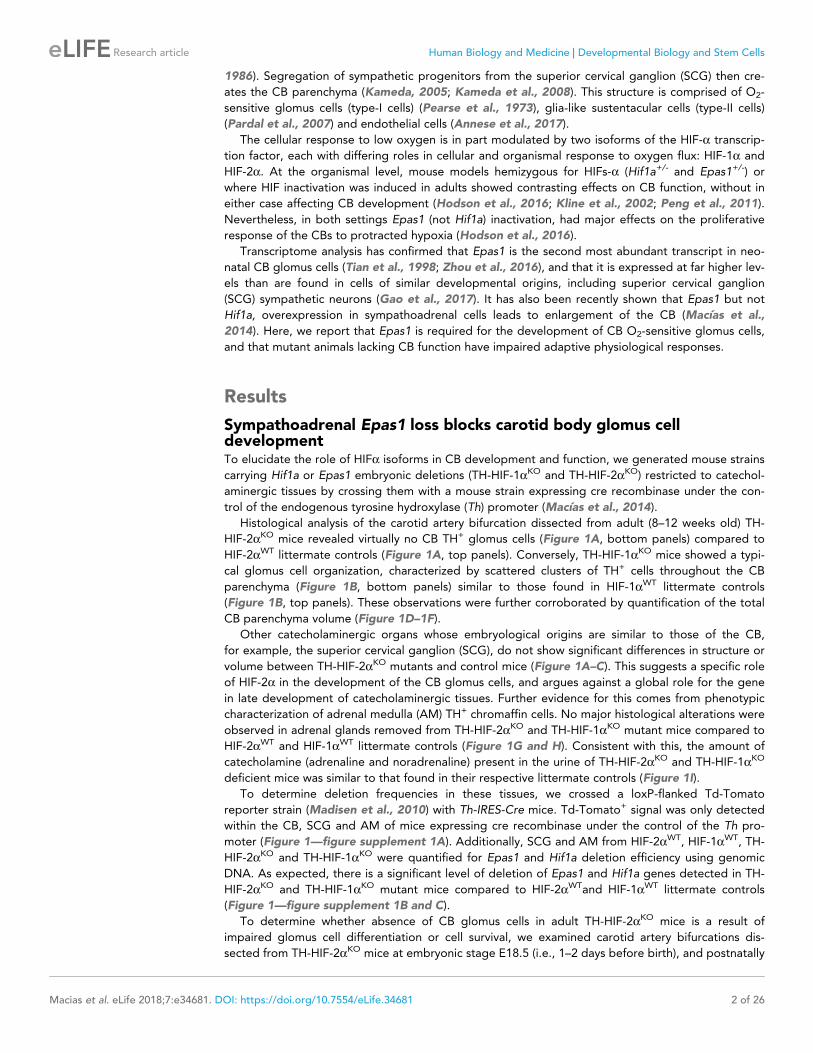
Impaired ventilatory response and whole-body metabolic activity in TH-HIF-2aKO mice exposed to hypoxiaTo study the impact of the TH-HIF-2aKO mutation on respiratory function, we examined ventilation
in normoxia (21% O2) and in response to environmental normobaric hypoxia (10% O2) via whole-
body plethysmography. Figure 3A illustrates the changes of respiratory rate during a prolonged
hypoxic time-course in HIF-2aWT and TH-HIF-2aKO littermates. HIF-2aWT mice breathing 10% O2
had a biphasic response, characterized by an initial rapid increase in respiratory rate followed by a
slow decline. In contrast, TH-HIF-2aKO mice, which have normal ventilation rates in normoxia
(Figure 3A–C), respond abnormally throughout the hypoxic period. Averaged respiratory rate and
minute volume during the initial 5 min of hypoxia show a substantial reduction in ventilation rate in
TH-HIF-2aKO mutant mice relative to HIF-2aWT controls (Figure 3B and C). However, the respiratory
response to hypercapnia (5% CO2) was preserved in TH-HIF-2aKO mice, indicating normal function
of the respiratory center (Figure 3B and C).
Additional respiratory parameters altered by the lack of CB in response to hypoxia are shown in
Figure 3—figure supplement 1. Consistent with a failed HVR, hemoglobin saturation levels
dropped to 50–55% in TH-HIF-2aKO mice, as compared to 73% saturation in control animals after
exposure to 10% O2 for 5 min (Figure 3D). However, HIF-2aWT and TH-HIF-2aKO mice showed fully
saturated hemoglobin levels while breathing 21% O2 (Figure 3H). HIF-1aWT and TH-HIF-1aKO mice
have similar respiratory responses to 21% O2 and 10% O2, which indicates that HIF-1a is not
required for the CB-mediated ventilatory response to hypoxia (Figure 3E–G; Figure 3—figure sup-
plement 1F–J).
We next determined metabolic activity in HIF-2aWTand TH-HIF-2aKO littermates in a 21% O2 or
10% O2 environment. Circadian metabolic profiles (VO2, VCO2 and RER) were similar in WT and TH-
HIF-2aKO mutant mice (Figure 3I–K). After exposure to hypoxia, however, TH-HIF-2aKO mice
showed lower VO2 and VCO2 peaks and had a significantly hampered metabolic adaptation to low
oxygen (Figure 3L and M). There is no shift in substrate usage, as the respiratory exchange ratio
(RER) was similar in HIF-2aWTand TH-HIF-2aKO littermates exposed to 10% O2 (Figure 3N).
Although TH-HIF-2aKO deficient mice did not show an apparent phenotype in the AM or SCG, it
was important to determine whether their secretory or electrical properties were altered (Figure 3—
figure supplement 2). The secretory activity of chromaffin cells under basal conditions and in
Figure 1 continued
ganglion; CB, carotid body; ICA, internal carotid artery; ECA, external carotid artery. Scale bars: 200 mm (left panels), 50 mm (right panels). (C–F)
Quantification of total SCG volume (C), total CB volume (D), TH+ cell number (E) and TH+ cell density (F) on micrograph from HIF-2aWT(black dots,
n = 4 for SCG and n = 6 for CB), TH-HIF-2aKO (red squares, n = 4), HIF-1aWT (black triangles, n = 4) and TH-HIF-1aKO (blue triangles, n = 3) mice. Data
are expressed as mean ± SEM. Mann-Whitney test, **p<0.001; ns, non-significant. (G and H) TH-immunostained adrenal gland sections from HIF-
2aWT(G, top panel), TH-HIF-2aKO (G, bottom panel), HIF-1aWT (H, top panel) and TH-HIF-1aKO (H, bottom panel) littermates. AM, adrenal medulla.
Scale bars: 200 mm. (I) Normalized adrenaline (left) and noradrenaline (right) urine content measured by ELISA. HIF-2aWT(black dots, n = 8), TH-HIF-
2aKO (red squares, n = 7), HIF-1aWT (black triangles, n = 7) and TH-HIF-1aKO (blue triangles, n = 4). Mann-Whitney test, ns, non-significant.
DOI: https://doi.org/10.7554/eLife.34681.002
The following figure supplement is available for figure 1:
Figure supplement 1. Sympathoadrenal gene deletion by Th-IRES-Cre mouse strain.
DOI: https://doi.org/10.7554/eLife.34681.003
Macias et al. eLife 2018;7:e34681. DOI: https://doi.org/10.7554/eLife.34681 4 of 26
Research article Human Biology and Medicine Developmental Biology and Stem Cells

HIF
-2α
WT
TH
-HIF
-2α
KO
Embryo stage E18.5 Postnatal stage P0
TH/DAPI
TH/DAPI
TH/DAPI
TH/DAPI
A
E18.5 P00
1 x10⁶
2 x10⁶
3 x10⁶
4 x10⁶
CB
pa
ren
ch
ym
a (μ
m3)
E18.5 P00
500
1000
1500
TH
+ c
ells
/CB
E18.5 P00
0.5
1.0
1.5
TH
+ c
ells d
en
sity
(cells/1
00μ
m2)
HIF-2αWT
TH-HIF-2αKO
HIF-2αWT
TH-HIF-2αKO
**
****HIF-2αWT
TH-HIF-2αKO
*
***
****
ns
ns
B C D
Embryo stage E18.5 Postnatal P0
HIF
-2α
WT
TH
-HIF
-2α
KO
TH/TUNEL/DAPI
TH/TUNEL/DAPI
F
E18.5 P00
0.2
0.4
0.6
0.8
TU
NE
L+ c
ells/1
00
0μ
m2
G
HIF-2αWT
TH-HIF-2αKO
**
****
*
0
2 x10⁷
4 x10⁷
6 x10⁷
8 x10⁷
SC
G v
olu
me (μ
m3)
HIF-2αWT
TH-HIF-2αKO
P0
E
ns
SCG
CBICA
ECA
SCG
ECA
ICA
CB
SCG
CB
ICA
ECA
SCG
CB
ICA
Figure 2. Progressive CB glomus cells death during development of TH-HIF-2aKO mouse. (A) Representative micrographs illustrating CB TH+ glomus
cells appearance at embryo stage E18.5 (left) and postnatal stage P0 (right) in HIF-2aWT(top panels) and TH-HIF-2aKO (bottom panels) mice. Dashed
rectangles (left panels) are shown at higher magnification on the right panels. SCG, superior cervical ganglion; CB, carotid body; ICA, internal carotid
artery; ECA, external carotid artery. Scale bars: 100 mm. (B–E) Quantitative histological analysis of CB volume (B), TH+ cells number (C), TH+ cell density
(D) and SCG volume (E) from TH-HIF-2aKO compared to HIF-2aWTmice. HIF-2aWT(E18.5, n = 8; P0, n = 4; SCG, n = 5), TH-HIF-2aKO (E18.5, n = 7; P0,
n = 5; SCG, n = 5). SCG, superior cervical ganglion. Data are expressed as mean ±SEM. Two-way ANOVA, *p<0.05, **p<0.01, ***p<0.001,
****p<0.0001, ns, non significant. (F) Representative pictures of double TH+ and TUNEL+ (white arrows) stained carotid bifurcation sections from HIF-
2aWT(top panels) and TH-HIF-2aKO (bottom panels) mice at E18.5 (left) and P0 (right) stages. (G) Number of TUNEL+ cells within the CB (TH+ area) of
HIF-2aWT(E18.5, n = 9; P0, n = 5) and TH-HIF-2aKO (E18.5, n = 5; P0, n = 4) mice at E18.5 and P0 stages. Data are expressed as mean ±SEM. Two-way
ANOVA, *p<0.05, **p<0.01, ****p<0.0001. Scale bars: 50 mm.
Figure 2 continued on next page
Macias et al. eLife 2018;7:e34681. DOI: https://doi.org/10.7554/eLife.34681 5 of 26
Research article Human Biology and Medicine Developmental Biology and Stem Cells

response to hypoxia, hypercapnia and high (20 mM) extracellular K+ was not changed in TH-HIF-
2aKO mice (8–12 weeks old) relative to control littermates (Figure 3—figure supplement 2A–D).
Current-voltage (I-V) relationships for Ca2+ and K+ currents of dispersed chromaffin cells (Figure 3—
figure supplement 2E) and SCG neurons (Figure 3—figure supplement 2F) were also similar in
HIF-2aWT and TH-HIF-2aKO animals. These data further support the notion that HIF-2a loss in the
sympathoadrenal lineages predominantly affects CB glomus cells.
Deficient acclimatization to chronic hypoxia in mice with CBs lossThe CB grows and expands during sustained hypoxia, due to the proliferative response of glia-like
(GFAP+) neural crest-derived stem cells within the CB parenchyma (Arias-Stella and Valcarcel,
1976; Pardal et al., 2007). Despite the absence of adult TH+ oxygen sensing cells in TH-HIF-2aKO
mice, we identified a normal number of CB GFAP+ stem cells in the carotid artery bifurcation of
these animals (Figure 4—figure supplement 1A). We then determined the rate at which CB progen-
itors from TH-HIF-2aKO mice were able to give rise to newly formed CB TH+ glomus induced by
chronic hypoxia in vivo. Typical CB enlargement and emergence of double BrdU+ TH+ glomus cells
was seen in HIF-2aWT mice after 14 days breathing 10% O2 (Figure 4—figure supplement 1B–D), as
previously described (Pardal et al., 2007). However, no newly formed double BrdU+ TH+ glomus
cells were observed in TH-HIF-2aKO mice after 14 days in hypoxia (Figure 4—figure supplement
1B–D). These observations are consistent with the documented role of CB glomus cells as activators
of the CB progenitors proliferation in response to hypoxia (Platero-Luengo et al., 2014).
HIF-2aWT, HIF-1aWT and TH-HIF-1aKO mice adapted well and survived up to 21 days in a 10% O2
atmosphere normally. However, long-term survival of the TH-HIF-2aKO deficient mice kept in a 10%
O2 environment was severely compromised, and only 40% reached the experimental endpoint
(Figure 4A). Mouse necropsies revealed ascites, congestive hepatomegaly and internal haemor-
rhages in the gut, which are most likely due to right ventricular failure. TH-HIF-2aKO mice also
showed increased haematocrit and haemoglobin levels relative to HIF-2aWTlittermates when main-
tained for 21 days in a 10% O2 atmosphere (Figure 4B and C). Additionally, platelet counts were sig-
nificantly reduced, whereas lymphocytes, granulocytes and monocytes were unchanged in TH-HIF-
2aKO mice compared to HIF-2aWTlittermates (Figure 4—figure supplement 1E–H). Consistent with
this, after 21 days in hypoxia, heart and spleen removed from TH-HIF-2aKO mice were enlarged rela-
tive to HIF-2aWTlittermates, likely due to increased blood viscosity and extramedullary hematopoie-
sis, respectively (Figure 4D–G). TH-HIF-1aKO mice did not show significant differences compared to
HIF-1aWT littermates maintained either in a 21% O2 or 10% O2 environment (Figure 4—figure sup-
plement 2A–D).
Chronic exposure to hypoxia induces pulmonary arterial hypertension (PAH) in mice
(Cowburn et al., 2016; Stenmark et al., 2009). The right ventricle was found to be significantly
enlarged in TH-HIF-2aKO mice relative to control mice after 21 days of 10% O2 exposure, indicating
an aggravation of pulmonary hypertension (Figure 4H). This result was further confirmed by direct
measurement of right ventricular systolic pressure (RVSP) on anaesthetised mice (Figure 4I). Lung
histology of mice chronically exposed to 10% O2 (Figure 4J) shows that the percentage of fully mus-
cularized lung peripheral vessels is significantly increased in TH-HIF-2aKO mice relative to controls.
The tunica media of lung peripheral vessels was also significantly thicker in TH-HIF-2aKO mice com-
pared to HIF-2aWT littermates after 21 days of hypoxic exposure (Figure 4K). Taken together, these
data demonstrate that adaptation to chronic hypoxia is highly reliant on a normally functioning CB.
Cardiovascular homeostasis is altered in mice lacking CBsAn important element of the CB chemoreflex is an increase in sympathetic outflow (Lopez-
Barneo et al., 2016b). To determine whether this had been affected in TH-HIF-2aKO mutants, car-
diovascular parameters were recorded on unrestrained mice by radiotelemetry. Circadian blood
pressure monitoring showed a significantly hypotensive condition that was more pronounced during
the diurnal period (Figure 5A and B) and did not correlate with changes in heart rate, subcutaneous
Figure 2 continued
DOI: https://doi.org/10.7554/eLife.34681.004
Macias et al. eLife 2018;7:e34681. DOI: https://doi.org/10.7554/eLife.34681 6 of 26
Research article Human Biology and Medicine Developmental Biology and Stem Cells
0
10
20
30
40
50
MV
(m
l/m
in)
HIF-2αWT TH-HIF-2αKO
HIF-1αWT TH-HIF-1αKO
21%
O2
10%
O2
21%
O2
10%
O2
A
E F G
0 5 10 15 20 25 30 3550
100
150
200
250
300
Time (minutes)
10% O2
HIF-1αWT
TH-HIF-1αKO
Bre
ath
s/m
in
Bre
ath
s/m
in
20
40
60
80
100
120
0 100 200 300 400
Pe
rip
he
ral O
2 s
atu
rati
on
(%
)
Time (sec)
10% O2
DHIF-2αWT
TH-HIF-2αKO
****
0 5 10 15 20 25 30 3550
100
150
200
250
300
Time (minutes)
10% O2
Bre
ath
s/m
in
HIF-2αWT
TH-HIF-2αKO **
0
50
100
150
200
250
300
21%
O2
10%
O2
21%
O2
10%
O2
** ** ** *
0 6 12 18 24 30 36 42 48 54 600
2000
4000
6000
8000
Time (h)
VO
2 (
ml/k
g/h
r)
HIF-2αWT
TH-HIF-2αKO
ns
ns
0 6 12 18 24 30 36 42 48 54 600
2000
4000
6000
8000
Time (h)
VC
O2 (
ml/k
g/h
r)
HIF-2αWT
TH-HIF-2αKOns
0 12 24 36 48 60 72 84 96 1080
2000
4000
6000
Time (h)
VO
2 (m
l/kg
/hr)
10% O2
HIF-2αWT
TH-HIF-2αKO****
0 12 24 36 48 60 72 84 96 1080
2000
4000
6000
Time (h)
VC
O2 (m
l/kg
/hr)
10% O2
HIF-2αWT
TH-HIF-2αKO ****
I
L
J
M
0
100
200
300
400
0
20
40
60
80
MV
(m
l/m
in)
Bre
ath
s/m
in
21%
O2
10%
O2
21%
O2
10%
O2
5% C
O 2
5% C
O 2
****
ns
**** ****
21%
O2
10%
O2
21%
O2
10%
O2
5% C
O 2
5% C
O 2
****
*
**** ****
B C
50
60
70
80
90
100
110
0 200 400 600 800 1000 1200
Time (sec)
Pe
rip
he
ral O
2 s
atu
rati
on
(%
)
HIF-2αWT
TH-HIF-2αKO
21% O2
H
0 6 12 18 24 30 36 42 48 54 600.7
0.8
0.9
1.0
1.1
Time (h)
RE
R
HIF-2αWT
TH-HIF-2αKOns
K
0 12 24 36 48 60 72 84 96 1080.0
0.5
1.0
1.5
Time (h)
RE
R
10% O2
HIF-2αWT
TH-HIF-2αKO ****
N
Figure 3. Effects of HIF-2a and HIF-1a sympathoadrenal loss on the HVR and whole-body metabolic activity in response to hypoxia. (A and E) HVR in
TH-HIF-2aKO (A, red line, n = 4) and TH-HIF-1aKO (E, blue line, n = 3) deficient mice compared to control HIF-2aWT(A, black line, n = 4) and HIF-1aWT
(E, black line, n = 3) mice. Shift and duration of 10% O2 stimulus (30 min) are indicated. Shaded areas represent the period of time analysed in B and C
or F and G, respectively. Data are presented as mean breaths/min every minute ±SEM. Two-way ANOVA, **p<0.01, ns, non-significant. (B and C)
Averaged respiratory rate (B) and minute volume (C) of HIF-2aWT(black, n = 4) and TH-HIF-2aKO (red, n = 4) mice before and during the first 5 min of
10% O2 (shaded rectangle in A) or 5% CO2 exposure. Data are expressed as mean ±SEM. Two-way ANOVA, *p<0.05, ***p<0.001, ****p<0.0001, ns,
non-significant. (D and H) Peripheral O2 saturation before, during and after 10% O2 (D) and 21% O2 (H) in HIF-2aWT(black, n = 8 in D, n = 4 in H) and
TH-HIF-2aKO (red, n = 9 in D, n = 4 in H) mice. Data are expressed as mean percentage every 10 s ± SEM. Two-way ANOVA, ****p<0.0001. (F and G)
Averaged respiratory rate (F) and minute volume (F) of HIF-1aWT (black, n = 3) and TH-HIF-1aKO (blue, n = 3) mice before and during the first 5 min of
10% O2 exposure (shaded rectangle in E). Data are expressed as mean ±SEM. Two-way ANOVA, *p<0.05, **p<0.01. (I–K) Baseline metabolic activity of
HIF-2aWT(black, n = 3) and TH-HIF-2aKO (red, n = 3) mice. Data are presented as mean oxygen consumption (VO2, (I), carbon dioxide generation
(VCO2, (J) and respiratory exchange ratio (RER, (K) every hour ±SEM. White and black boxes depict diurnal and nocturnal periods, respectively. Area
under the curve followed by Mann-Whitney test, ns, non-significant. (L–N) Whole-body metabolic analysis of HIF-2aWT(black, n = 4) and TH-HIF-2aKO
(red, n = 6) mice in response to 10% O2. Shift and duration of 10% O2 stimulus are indicated. Data are presented as mean oxygen consumption (VO2,
Figure 3 continued on next page
Macias et al. eLife 2018;7:e34681. DOI: https://doi.org/10.7554/eLife.34681 7 of 26
Research article Human Biology and Medicine Developmental Biology and Stem Cells

temperature or activity (Figure 5C; Figure 5—figure supplement 1A and B). We next subjected
radiotelemetry-implanted HIF-2aWTand TH-HIF-2aKO littermates to a 10% O2 environment preceded
and followed by a 24 hr period of normoxia (Figure 5D–F; Figure 5—figure supplement 1C–E).
Normal control HIF-2aWTmice have a triphasic response to this level of hypoxia, characterised by a
short (10 min) initial tachycardia and hypertension, followed by a marked drop both in heart rate and
blood pressure; a partial to complete recovery is then seen after 24–36 hr (Figure 5D and E; Fig-
ure 5—figure supplement 1C and D)(Cowburn et al., 2017). However, while TH-HIF-2aKO mice
experienced similar, but less deep, hypotension 3 hr post hypoxic challenge, they failed to recover,
and showed a persistent hypotensive state throughout the hypoxic period (Figure 5D; Figure 5—
figure supplement 1C and D). Interestingly, the bradycardic effect of hypoxia on heart rate was
abolished in TH-HIF-2aKO animals (Figure 5E). Subcutaneous temperature, an indirect indicator of
vascular resistance in the skin, showed an analogous trend to that seen in the blood pressure of TH-
HIF-2aKO mutants (Figure 5F). Activity of TH-HIF-2aKO mice during hypoxia was slightly reduced rel-
ative to littermate controls (Figure 5—figure supplement 1E).
The carotid body has been proposed as a therapeutic target for neurogenic hypertension
(McBryde et al., 2013; Pijacka et al., 2016). To determine the relationship between CB and hyper-
tension in these mutants, we performed blood pressure recordings in an angiotensin II (Ang II)-
induced experimental hypertension model (Figure 5G). As shown, TH-HIF-2aKO animals showed
lower blood pressure relative to HIF-2aWTlittermate controls after 7 days of Ang II infusion
(Figure 5H; Figure 5—figure supplement 1F and G). Heart rate, subcutaneous temperature and
physical activity were unchanged throughout the experiment (Figure 5K–M; Figure 5—figure sup-
plement 1). Collectively, these data highlight the CB as a systemic cardiovascular regulator which,
contributes to baseline blood pressure modulation, is critical for cardiovascular adaptations to hyp-
oxia and delays the development of Ang II-induced experimental hypertension.
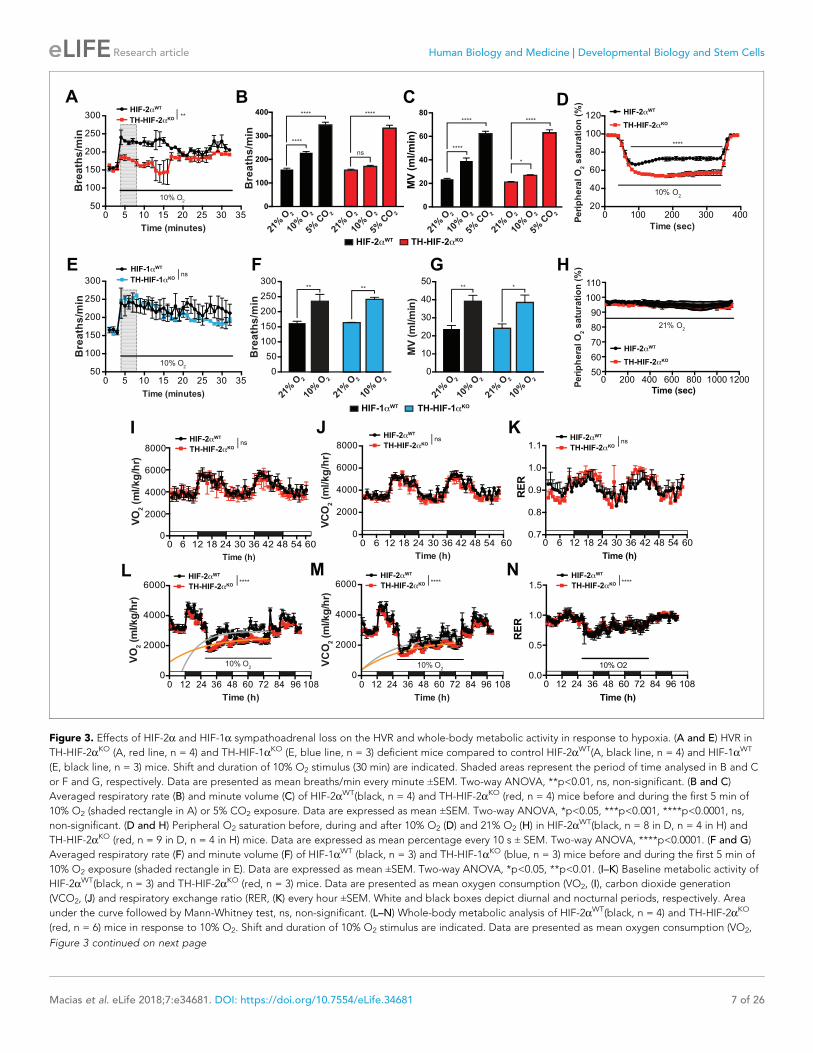
Adaptive responses to exercise and high glucose are affected in micewith CB dysfunctionWe next questioned whether this mutant, which lacks virtually all CB function, can inform questions
about adaptation to other physiological stressors. In the first instance, we assessed metabolic activity
during a maximal exertion exercise test. Oxygen consumption and carbon dioxide production (VO2
and VCO2, respectively) were comparable in HIF-2aWTand TH-HIF-2aKO mice at the beginning of the
test. However, TH-HIF-2aKO mutants reached VO2max much earlier than wild type controls, with sig-
nificantly decreased heat generation (Figure 6A,B and D). There was no shift in energetic substrate
usage, as evidenced by the lack of difference in respiratory exchange ratio (RER) (Figure 6C). There
was a significant reduction in both aerobic capacity and power output relative to littermate controls
(Figure 6E–G). Interestingly, although no significant changes were found in glucose blood content
across the experimental groups and conditions (Figure 6H), lactate levels in TH-HIF-2aKO mice were
significantly lower than those observed in HIF-2aWTmice after running (Figure 6I).
Carotid body function has been associated with glucose sensing (Gao et al., 2014; Pardal and
Lopez-Barneo, 2002). To determine whether this model was suitable for studying this phenomenon,
we next examined the response of TH-HIF-2aKO mice to hyperglycemic and hypoglycemic challenge.
Baseline glucose levels of HIF-2aWTand TH-HIF-2aKO animals were not statistically different under
fed and fasting conditions (Figure 6J and K), and metabolic activity during fasting was unaffected
(Figure 6—figure supplement 1A–D). However, TH-HIF-2aKO mutant mice showed significant
Figure 3 continued
(L), carbon dioxide generation (VCO2, (M) and respiratory exchange ratio (RER, (N) every hour ±SEM. White and black boxes depict diurnal and
nocturnal periods, respectively. Recovery across the hypoxia period was analysed by one-phase association curve fitting. ****p<0.0001.
DOI: https://doi.org/10.7554/eLife.34681.005
The following figure supplements are available for figure 3:
Figure supplement 1. Respiratory parameters of TH-HIF-2aKO and TH-HIF-1aKO mice exposed to acute hypoxia.
DOI: https://doi.org/10.7554/eLife.34681.006
Figure supplement 2. Secretory and electrophysiological properties in AM and SCG from TH-HIF-2aKO mice.
DOI: https://doi.org/10.7554/eLife.34681.007
Macias et al. eLife 2018;7:e34681. DOI: https://doi.org/10.7554/eLife.34681 8 of 26
Research article Human Biology and Medicine Developmental Biology and Stem Cells

0
5
10
15
20
25
Tu
nic
a m
ed
ia th
ick
ne
ss
(%
ve
ss
el)
0 5 10 15 20 250
25
50
75
100
Days in 10% O2
Pe
rce
nt
su
rviv
al
HIF-1αWT
TH-HIF-1αKO
HIF-2αWT
TH-HIF-2αKO
***
HIF-2αWT TH-HIF-2αKO
HG
B (g
/dl )
5
10
15
20
25
21% O2
10% O2 (21d)
ns
***
*
****
Haem
ato
cr i
t (%
)
21% O2
10% O2 (21d)
30
40
50
60
70
80
90
100
ns
****
****
****
A B C
HIF-2αWT TH-HIF-2αKO
D F
H
Heart
/bo
dy
weig
ht (m
g/g
)
0
5
10
15
21% O2
ns
****
ns
****
10% O2 (21d) S
ple
en
/bo
dy
we
igh
t (m
g/g
)
0
10
20
30
21% O2
ns
****
ns
****
10% O2 (21d)
RV
/(L
V+sep
tum
)
0.0
0.2
0.4
0.6
0.8
21% O2
ns
****
****
****
10% O2 (21d)
RV
SP
(m
mH
g)
0
10
20
30
40
50
21% O2
ns
****
***
**
10% O2 (21d)
I
0
20
40
60
80
100
Pe
r ip
he
ral v
es
se
ls
mu
sc
ula
riza
tio
n (%
)none partial full
HIF
-2αW
T
TH-H
IF-2αKO
HIF
-2αW
T
TH-H
IF-2αKO
10% O2 (21d)10% O
2 (14d)
HIF-2αWT TH-HIF-2αKO
21% O2
10% O2 (21d)
J K
HIF-2αWT TH-HIF-2αKO
* *
ns
****
**
*
HIF-2αWT TH-HIF-2αKO
HIF
-2α
WT
TH
-HIF
-2α
KO
10% O2 (21d)
HIF
-2α
WT
TH
-HIF
-2α
KO
10% O2 (21d)E G
Figure 4. Impaired acclimatisation to chronic hypoxia and severe pulmonary hypertension in mice lacking CBs. (A) Kaplan-Meier survival curve of the
indicated mice housed at 10% O2 up to 21 days. HIF-2aWT(n = 12), TH-HIF-2aKO (n = 11), HIF-1aWT (n = 8) and TH-HIF-1aKO (n = 8). ***p<0.001. (B and
C) Haematocrit (B) and haemoglobin (C) levels of HIF-2aWT(black) and TH-HIF-2aKO (red) littermates kept in normoxia (21% O2) and after 21 days at
10% O2. In B, HIF-2aWT(21% O2, n = 6; 10% O2, n = 18), TH-HIF-2aKO (21% O2, n = 7; 10% O2, n = 8). In C, HIF-2aWT(21% O2, n = 5; 10% O2, n = 8), TH-
HIF-2aKO (21% O2, n = 5; 10% O2, n = 7). Data are expressed as mean ± SEM. Two-way ANOVA, *p<0.05, ***p<0.001, ****p<0.0001, ns, non-significant.
(D and F) Normalized heart (D) and spleen (F) weight of HIF-2aWT(black) and TH-HIF-2aKO (red) before and after 21 days in hypoxia (10% O2). In D, HIF-
2aWT(21% O2, n = 16; 10% O2, n = 23), TH-HIF-2aKO (21% O2, n = 15; 10% O2, n = 13). In F, HIF-2aWT(21% O2, n = 5; 10% O2, n = 23), TH-HIF-2aKO
(21% O2, n = 5; 10% O2, n = 13). Data are expressed as mean ± SEM. Two-way ANOVA, ****p<0.0001, ns, non-significant. (E and G) Hematoxylin and
eosin staining of heart (E) and spleen (G) of HIF-2aWT(top panel) and TH-HIF-2aKO (bottom panel) after 21 days in hypoxia (10% O2). Scale bars: 500 mm
in E and 100 mm in G. (H) Fulton index on hearts dissected from HIF-2aWT(black, 21% O2, n = 17; 10% O2, n = 23) and TH-HIF-2aKO (red, 21% O2,
n = 15; 10% O2, n = 17) mice before and after 21 days in hypoxia (10% O2). Data are expressed as mean ± SEM. Two-way ANOVA, ****p<0.0001, ns,
non-significant. RV, right ventricle. LV, left ventricle. (I) Right ventricular systolic pressure (RVSP) recorded on HIF-2aWT(black, 21% O2, n = 6; 10% O2,
n = 7) and TH-HIF-2aKO (red, 21% O2, n = 5; 10% O2, n = 5) mice maintained in normoxia (21% O2) or hypoxia (10% O2) for 21 days. Data are expressed
as mean ± SEM. Two-way ANOVA, **p<0.01, ***p<0.001, ****p<0.0001, ns, non-significant. (J and K) Lung peripheral vessels muscularization (J) and
arterial medial thickness (K) in HIF-2aWTand TH-HIF-2aKO mice exposed to 10% O2 for 14 and/or 21 days. In H, HIF-2aWT(10% O2 14d, n = 4; 10% O2
21d, n = 3), TH-HIF-2aKO (10% O2 14d, n = 6; 10% O2 21d, n = 3). In I, HIF-2aWT(21% O2, n = 5; 10% O2 21d, n = 8), TH-HIF-2aKO (21% O2, n = 5; 10%
O2 21d, n = 8). Data are expressed as mean ± SEM. Two-way ANOVA, *p<0.05, **p<0.01, ****p<0.0001, ns, non-significant.
DOI: https://doi.org/10.7554/eLife.34681.008
The following figure supplements are available for figure 4:
Figure supplement 1. Impaired hypoxia-induced CB proliferation in TH-HIF-2aKO mice.
DOI: https://doi.org/10.7554/eLife.34681.009
Figure supplement 2. Adaptation to hypoxia in TH-HIF-1aKO animals.
Figure 4 continued on next page
Macias et al. eLife 2018;7:e34681. DOI: https://doi.org/10.7554/eLife.34681 9 of 26
Research article Human Biology and Medicine Developmental Biology and Stem Cells

changes in glucose tolerance, with no change in insulin tolerance when compared to HIF-
2aWTlittermates (Figure 6L and M). TH-HIF-2aKO mice also showed an initially hampered lactate
clearance relative to control mice (Figure 6N). Together, these data demonstrate that the mutants
demonstrate intriguing roles for the CB in metabolic adaptations triggered by both exercise and
hyperglycemia.
CB development and proliferation in response to hypoxia requiremTORC1 activationHypoxia has differential effects on cell proliferation. While HIF-1a is known to promote cell arrest via
mTORC1 repression and other mechanisms (Brugarolas et al., 2004; Cam et al., 2010;
Carmeliet et al., 1998; Goda et al., 2003; Koshiji et al., 2004), HIF-2a can activate mTORC1 to
induce cell proliferation and growth in a number of cell types and organs, for example, tumour cells
or the lung epithelium (Brusselmans et al., 2003; Cowburn et al., 2016; Elorza et al., 2012;
Gordan et al., 2007; Hubbi and Semenza, 2015; Kondo et al., 2003; Raval et al., 2005; Torres-
Capelli et al., 2016). Physiological proliferation and differentiation of the CB induced by hypoxia
closely resembles CB developmental expansion (Annese et al., 2017; Pardal et al., 2007; Platero-
Luengo et al., 2014); therefore a potential explanation for the developmental defects in CB expan-
sion observed in above could be defects in mTORC1 activation.
To test this hypothesis, we first determined mTORC1 activation levels in the CB of mice main-
tained at 21% O2 or 10% O2 for 14 days. This was done via immunofluorescent detection of the
phosphorylated form of the ribosomal protein S6 (p-S6) (Elorza et al., 2012; Ma and Blenis, 2009).
In normoxia, there was a faint p-S6 expression within the TH+ glomus cells of the CB in wild type
mice; this contrasts with the strong signal detected in SCG sympathetic neurons (Figure 7A, left
panels; Figure 7—figure supplement 1A, left panel). However, after 14 days in a 10% O2 environ-
ment, we saw a significantly increased p-S6 signal within the CB TH+ cells while the SCG sympathetic
neurons remained at levels similar to those seen in normoxia (Figure 7A and B; Figure 7—figure
supplement 1A and B). TH expression, which is induced by hypoxia (Schnell et al., 2003), was also
significantly elevated in CB TH+ cells, and trended higher in SCG sympathetic neurons (Figure 7B;
Figure 7—figure supplement 1B).
We next assessed the role of HIF-2a in this hypoxia-induced mTORC1 activation. We began with
evaluating expression of p-S6 in late stage embryos. In E18.5 embryos there was a striking accumula-
tion of p-S6; this is significantly reduced in HIF-2a deficient CB TH+ cells in embryos from this stage
of development (Figure 7C and D). p-S6 levels in SCG TH+ sympathetic neurons of HIF-2aWTand
TH-HIF-2aKO E18.5 embryos were unaffected, however (Figure 7—figure supplement 1C and D).
These data indicate that HIF-2a regulates mTORC1 activity in the CB glomus cells during
development.
To determine whether this pathway could be pharmacologically manipulated, we then studied
the effect of mTORC1 inhibition by rapamycin on CB proliferation and growth following exposure to
environmental hypoxia. mTORC1 activity, as determined by p-S6 staining on SCG and CB TH+ cells
after 14 days of hypoxic treatment, was inhibited after in vivo rapamycin administration (Figure 7—
figure supplement 1E). Interestingly, histological analysis of rapamycin injected wild type mice
maintained for 14 days at 10% O2 showed decreased CB parenchyma volume, TH+ cells number,
and showed a dramatic reduction in the number of proliferating double BrdU+ TH+ cells when com-
pared to vehicle-injected mice (Figure 7E–H). Rapamycin treatment did not alter the phenotype pre-
viously observed in TH-HIF-2aKO mice (Figure 7E–H; Figure 4—figure supplement 1). Additionally,
rapamycin administration had no effect on CB parenchyma volume or TH+ cell numbers of wild type
mice breathing environmental oxygen (Figure 7—figure supplement 1).
In addition, we assessed the ventilatory acclimatization to hypoxia (VAH), as a progressive
increase in ventilation rates is associated with CB growth during sustained exposure to hypoxia
(Hodson et al., 2016). Consistent with the histological analysis above, rapamycin treated mice had a
decreased VAH compared to vehicle-injected control mice following 7 days at 10% O2 (Figure 7I).
Figure 4 continued
DOI: https://doi.org/10.7554/eLife.34681.010
Macias et al. eLife 2018;7:e34681. DOI: https://doi.org/10.7554/eLife.34681 10 of 26
Research article Human Biology and Medicine Developmental Biology and Stem Cells

HIF-2αWT TH-HIF-2αKO
Mean
BP
(m
mH
g)
0 12 24 36 48 60 72 84 9640
60
80
100
120
140
160
Time (h)
10% O2
Su
bc
uta
ne
ou
s t
em
p (
ºC)
0 12 24 36 48 60 72 84 9628
30
32
34
36
Time (h)
10% O2
HIF-2αWT TH-HIF-2αKO
Mean
BP
(m
mH
g)
0 6 12 18 24 30 36 42 48100
120
140
160
180
Time (h)
7 days after Ang II infusion
HR
(b
pm
)
0 6 12 18 24 30 36 42 48400
500
600
700
800
Time (h)
7 days after Ang II infusion
Mean
BP
(m
mH
g)
0 6 12 18 24 30 36 42 48100
120
140
160
180
Time (h)
14 days after Ang II infusion
HR
(b
pm
)
0 6 12 18 24 30 36 42 48400
500
600
700
800
Time (h)
14 days after Ang II infusion
Mean
BP
(m
mH
g)
0 6 12 18 24 30 36 42 4880
100
120
140
160
180
Time (h)
21 days after Ang II infusion
HR
(b
pm
)
0 6 12 18 24 30 36 42 48400
500
600
700
800
Time (h)
21 days after Ang II infusion
HIF-2αWT TH-HIF-2αKO
CB
FED
JIH
MLK
Baseline blood pressure
Blood pressure in response to hypoxia
Angiotensin II-induced hypertension model
A
Sy
sto
lic
BP
(m
mH
g)
0 6 12 18 24 30 36 42 48 5460
80
100
120
140
160
Time (h)
0 6 12 18 24 30 36 42 48 5460
80
100
120
140
160
Time (h)M
ean
BP
(m
mH
g)
0 6 12 18 24 30 36 42 48 54400
500
600
700
800
Time (h)
HR
(b
pm
)
HR
(b
pm
)
0 12 24 36 48 60 72 84 96200
300
400
500
600
700
800
Time (h)
10% O2
Dia
sto
lic
BP
(m
mH
g) AUC; p = 0.06
AUC; p = 0.02 AUC; p = 0.02 AUC; p = 0.26
AUC; p = 0.04
AUC; p = 0.76
AUC; p = 0.25
AUC; p = 0.75
AUC; p = 0.95
AUC; p = 0.86
p < 0.0001 p < 0.0001 p < 0.0001
-3
pump
implatation
Ang II infusion
0 7 14 21
G
Figure 5. Effects of CB dysfunction on blood pressure regulation. (A–C) Circadian variations in baseline systolic blood pressure (A, continued line),
diastolic blood pressure (A, broken line), mean blood pressure (B) and heart rate (C) of HIF-2aWT(black, n = 10) and TH-HIF-2aKO (red, n = 8) littermates
recorded by radiotelemetry. White and black boxes depict diurnal and nocturnal periods, respectively. Data are presented as averaged values every
hour ±SEM. Area under the curve followed by unpaired t-test are shown. BP, blood pressure. HR, heart rate in beats per minute. (D–F) Mean blood
Figure 5 continued on next page
Macias et al. eLife 2018;7:e34681. DOI: https://doi.org/10.7554/eLife.34681 11 of 26
Research article Human Biology and Medicine Developmental Biology and Stem Cells

Failed ventilatory response to hypoxia was still observed in TH-HIF-2aKO mice after rapamycin treat-
ment (Figure 7I). Haematocrit levels were comparable between vehicle control and rapamycing
treated wild type mice after 7 days in hypoxia (Figure 7—figure supplement 1F).
Collectively, these data suggest that mTORC1 activation is required for CB glomus cell develop-
ment, in a HIF-2a-dependent manner, and that this activation regulates CB growth as well as VAH
during prolonged hypoxia.
DiscussionMetabolic homeostasis depends on a complex system of O2-sensing cells and organs. The carotid
body is central to this, via its regulation of metabolic and ventilatory responses to oxygen (Lopez-
Barneo et al., 2016a). At the cellular level, the HIF transcription factor is equally central for
responses to oxygen flux. However, how HIF contributes to the development and function of CB O2-
sensitivity is still not completely understood. Initial studies performed on global Hif1a-/- or Epas1-/-
mutant mice revealed that HIFs are critical for development (Compernolle et al., 2002; Iyer et al.,
1998; Peng et al., 2000; Ryan et al., 1998; Scortegagna et al., 2003; Tian et al., 1998), but
only Epas1-/- embryos showed defects in catecholamine homeostasis, which indicated a potential
role in sympathoadrenal development (Tian et al., 1998).
Investigations using hemizygous Hif1a+/- and Epas1+/- showed no changes in the CB histology or
overall morphology (Kline et al., 2002; Peng et al., 2011). However, our findings demonstrate that
embryological deletion of Epas1, but not Hif1a, specifically in sympathoadrenal tissues (TH+) pre-
vents O2-sensitive glomus cell development, without affecting SCG sympathetic neurons or AM
chromaffin cells of the same embryological origin. A potential explanation for this restricted effect of
HIF-2a ablation in CB glomus cells development, as opposed to a more global effect on sympathoa-
drenal development (Tian et al., 1998) could be due to the developmental timing of Cre recombi-
nase expression. However, at embryonic stage E13, when the CB is yet not developed, there are
abundant numbers of TH-expressing cells both in the superior cervical ganglion (SCG) and the adre-
nal medulla (Huber et al., 2002; Kameda, 2005). Therefore, these results highlight the specific role
of HIF-2a in CB glomus cell development, rather than a generalized effect on late development of
the sympathoadrenal system.
It was previously reported that HIF-2a, but not HIF-1a overactivation in catecholaminergic tissues
led to marked enlargement of the CB (Macıas et al., 2014). Mouse models of Chuvash polycythe-
mia, which have a global increase in HIF-2a levels, also show CB hypertrophy and enhanced acute
hypoxic ventilatory response (Slingo et al., 2014). Thus either over-expression or deficiency of HIF-
2a clearly perturbs CB development and, by extension, function.
Sustained hypoxia is generally thought to attenuate cell proliferation in a HIF-1a-dependent fash-
ion (Carmeliet et al., 1998; Goda et al., 2003; Koshiji et al., 2004). However, environmental hyp-
oxia can also trigger growth of a number of specialized tissues, including the CB (Arias-Stella and
Valcarcel, 1976; Pardal et al., 2007) and the pulmonary arteries (Madden et al., 1992). In this con-
text, the HIF-2a isoform seems to play the more prominent role, and has been associated with pul-
monary vascular remodeling as well as with bronchial epithelial proliferation (Brusselmans et al.,
Figure 5 continued
pressure (D), heart rate (E) and subcutaneous temperature (F) alteration in response to hypoxia in radiotelemetry-implanted TH-HIF-2aKO (red, n = 5)
compared to HIF-2aWT(black, n = 5). Shift and duration of 10% O2 are indicated in the graph. White and black boxes represent diurnal and nocturnal
periods, respectively. Data are presented as averaged values every hour ±SEM. Recovery across the hypoxia period was analysed by one-phase
association curve fitting. BP, blood pressure. HR, heart rate in beats per minute. (G) Schematic representation of the protocol followed in the Ang II-
induced experimental hypertension model. (H–M) Mean blood pressure and heart rate recorded from HIF-2aWT(black, n = 8) and TH-HIF-2aKO (red,
n = 8) mice after 7 days (H and K), 14 days (I and L) and 21 days (J and M) of Ang II infusion. White and black boxes depict diurnal and nocturnal
periods, respectively. Data are presented as averaged values every hour ±SEM. Area under the curve followed by unpaired t-test are shown. BP, blood
pressure. HR, heart rate in beats per minute.
DOI: https://doi.org/10.7554/eLife.34681.011
The following figure supplement is available for figure 5:
Figure supplement 1. Cardiovascular homeostasis in response to hypoxia and Ang II-induced experimental hypertension.
DOI: https://doi.org/10.7554/eLife.34681.012
Macias et al. eLife 2018;7:e34681. DOI: https://doi.org/10.7554/eLife.34681 12 of 26
Research article Human Biology and Medicine Developmental Biology and Stem Cells
2003; Bryant et al., 2016; Cowburn et al., 2016; Kapitsinou et al., 2016; Tan et al., 2013; Torres-
Capelli et al., 2016).
CB enlargement induced by hypoxia to a large extent recapitulates the cellular events that give
rise to mature O2-sensitive glomus cells in development. In a recent study, global HIF-2a, but not
HIF-1a, inactivation in adult mice was shown to impair CB growth and associated VAH caused by
exposure to chronic hypoxia (Hodson et al., 2016). Therefore, we used this physiological prolifer-
ative response as a model to understand the developmental mechanisms underpinning of HIF-2a
deletion in O2-sensitive glomus cells.
-500
0
500
1000
1500
0 5 5 7 9 11 13 15 17 19 21 23 25 27
meter/min
∆ V
O2 (m
l/kg
/hr)
0 5 5 7 9 11 1315 1719 21 2325 270
500
1000
1500
meter/min
∆ V
CO
2 (m
l/kg
/hr)
0 5 5 7 9 1113151719212325270.7
0.75
0.8
0.85
0.9
0.95
meter/min
RE
R
0 5 5 7 9 11 13 1517 19 2123 25 27-0.05
0.00
0.05
0.10
0.15
0.20
meter/min
∆ h
eat
(kcal/h
r)
25
30
35
40
45
Tim
e t
o e
xh
au
sti
on
(m
in)
Before running After running
Glu
co
se
(m
mo
l/L
)
Before running After running
La
cta
te (
mm
ol/L
)
0.9
1.0
1.1
1.2
1.3
1.4
1.5
VO
2m
ax
/Ba
sa
l V
O2
0.0
0.5
1.0
1.5
2.0
2.5
Po
we
r o
utp
ut
at
VO
2m
ax
(W
)
HIF-2αWT
TH-HIF-2αKO
0
5
10
15
HIF-2αWT TH-HIF-2αKO
0
2
4
6
8
10
HIF-2αWT TH-HIF-2αKO HIF-2αWT TH-HIF-2αKO HIF-2αWT TH-HIF-2αKO
p = 0.06
*
*ns
ns
ns
ns
ns
****
ns
HIF-2αWT
TH-HIF-2αKO
HIF-2αWT
TH-HIF-2αKO
HIF-2αWT
TH-HIF-2αKO
150
Insulin tolerance test
0
50
100
150
200
250
Time (min)
Glu
co
se
mg
/dL
A B DC
HGFE
HIF-2αWT TH-HIF-2αKO
L MJ
0 15 30 60 90 1200
5
10
15
Time (min)
La
cta
te (m
mo
l/L)
Lactate tolerance testN
Time (min)0 15 30 60 90 120
0
100
200
300
400
500
Glu
co
se
mg
/dL
Glucose tolerance test
***
*ns
**
0
5
10
15
Glu
co
se
(m
mo
l/L
)
HIF-2αWT TH-HIF-2αKO
Fed
Glu
co
se
(m
mo
l/L
)
HIF-2αWT TH-HIF-2αKO
FastingK
I
* ****
*
******
***
***
*
0 15 30 60 90 120
*
0
2
4
6nsns
Figure 6. Exercise performance and glucose management in mice lacking CBs. (A–D). Time course showing the increment in O2 consumption (A),
increment in CO2 generation (B), respiratory exchange ratio (C) and increment in heat production (D) from HIF-2aWT(black, n = 8) and TH-HIF-2aKO
(red, n = 10) mice during exertion on a treadmill. Mice were warmed up for 5 min (5 m/min) and then the speed was accelerated 2 m/min at 2.5 min
intervals until exhaustion. Averaged measurements every 2.5 min intervals ± SEM are charted. Two-way ANOVA, *p<0.05, **p<0.01, ***p<0.001,
****p<0.0001. RER, respiratory exchange ratio. (E) Running total time spent by HIF-2aWT(black, n = 8) and TH-HIF-2aKO (red, n = 10) mice to become
exhausted. Data are expressed as mean ± SEM. Unpaired t-test. (F and G) Aerobic capacity (F) and power output (G) measured in HIF-2aWT(black,
n = 8) mice compared to TH-HIF-2aKO (red, n = 10) mice when performing at VO2max. Data are expressed as mean ± SEM. Unpaired t-test. *p<0.05. (H
and I) Plasma glucose (H) and lactate (I) levels of HIF-2aWT(black, before, n = 7; after, n = 12) and TH-HIF-2aKO (black, before, n = 6; after, n = 12)
littermates before and after running to exhaustion. Data are expressed as mean ± SEM. Two-way ANOVA, *p<0.05. ***p<0.001. ns, non-significant. (J
and K) Plasma glucose levels of HIF-2aWT(black, n = 6) and TH-HIF-2aKO (red, n = 6) mice fed (J, n = 6 per genotype) or fasted over night (K, HIF-
2aWT(n = 8) and TH-HIF-2aKO (n = 10). Data are expressed as mean ± SEM. Unpaired t-test. (L–M) Time courses showing the tolerance of HIF-2aWTand
TH-HIF-2aKO mice to glucose (L, n = 7 per genotype) insulin (M, n = 11 per genotype) and lactate (N, n = 7 per genotype) injected bolus. Data are
presented as mean ± SEM. Two-way ANOVA, *p<0.05, **p<0.01, ns, non-significant.
DOI: https://doi.org/10.7554/eLife.34681.013
The following figure supplement is available for figure 6:
Figure supplement 1. Related to Figure 6.
DOI: https://doi.org/10.7554/eLife.34681.014
Macias et al. eLife 2018;7:e34681. DOI: https://doi.org/10.7554/eLife.34681 13 of 26
Research article Human Biology and Medicine Developmental Biology and Stem Cells

21% O2
10% O2
(14d)
0
20
40
60
Mea
n p
ixels
in
ten
sit
y (
a.u
.) p-S6
21% O2
10% O214 days
TH/p-S6/DAPI TH/p-S6/DAPI
p-S6/DAPI p-S6/DAPI
TH/p-S6/DAPI
HIF-2αWT
TH/p-S6/DAPI
TH-HIF-2αKO
21% O2
10% O2
(14d)
0
20
40
60
Me
an
pix
els
in
ten
sit
y (
a.u
.) TH
*
*
8 w
ee
ks-o
ld C
57
BL
/6J m
ice
Em
bry
o s
tag
e E
18
.5
0
10
20
30
40
Me
an
pix
els
in
ten
sit
y (
a.u
.)
p-S6 TH
**
p = 0.07
HIF-2αWT
TH-HIF-2αKO
BrdU/TH/DAPI BrdU/TH/DAPI
WT vehicle WT rapamycin
10% O2for 14 days
AB
C D
E
H
Bre
ath
s p
er
min
Vehicle
Rapamycin
21% O2
10% O2
21% O2
10% O2
Normoxia After 7 days
at 10% O2
****
I
ns
nsns
0
100
200
300
400
Veh
icle
Rap
amyc
in0
2 x10⁶
4 x10⁶
6 x10⁶
8 x10⁶
CB
pa
ren
ch
ym
a (μ
m3)
After 14 days at 10% O2
*
F
TH-H
IF-2αKO
Rap
amyc
in
BrdU/TH/DAPI
TH-HIF-2αKO rapamycin
0
1000
2000
3000
TH
+ c
ells
pe
r C
B
After 14 days at 10% O2
p = 0.06
G
Veh
icle
Rap
amyc
in
TH-H
IF-2αKO
Rap
amyc
in
0
20
40
60
TH
+ B
rdU
+/t
ota
l T
H+ c
ells
(%
)
After 14 days at 10% O2
****
Veh
icle
Rap
amyc
in
TH-H
IF-2αKO
Rap
amyc
in
TH-HIF2αKO Rapamycin
ns
****
ns
****
Figure 7. mTORC1 activation in CB development and hypoxia-induced CB neurogenesis. (A) Double TH and p-S6 (mTORC1 activation marker)
immunofluorescence on adult wild type CB slices to illustrate the increased p-S6 expression after 14 days in hypoxia (10% O2). For clarity, bottom
panels only show p-S6 staining. TH+ outlined area (top panels) indicates the region used for pixels quantification. Scale bars: 50 mm. (B) Quantification
of p-S6 (top) and TH (bottom) mean pixels intensity within the CB TH+ cells of wild type mice breathing 21% O2 or 10% O2 for 14 days. Each data point
Figure 7 continued on next page
Macias et al. eLife 2018;7:e34681. DOI: https://doi.org/10.7554/eLife.34681 14 of 26
Research article Human Biology and Medicine Developmental Biology and Stem Cells

Our findings reveal that mTORC1, a central regulator of cellular metabolism, proliferation and
survival (Laplante and Sabatini, 2012), is necessary for CB O2-sensitive glomus cell proliferation;
and further, that impact in the subsequent enhancement of the hypoxic ventilatory response induced
by chronic hypoxia. Importantly, we found that mTORC1 activity is reduced in HIF-2a-deficient
embryonic glomus cells, but not in SCG sympathetic neurons, which likely explains the absence of a
functional adult CB in these mutants.
Contrasting effects of HIF-a isoforms on the mammalian target of rapamycin complex 1
(mTORC1) activity can be found in the literature that mirror the differential regulation of cellular pro-
liferation induced by hypoxia in different tissues (see above) (Brugarolas et al., 2004;
Brusselmans et al., 2003; Cam et al., 2010; Elorza et al., 2012; Liu et al., 2006; Torres-
Capelli et al., 2016). For instance, the activity of mTORC1 may be repressed via HIF-1a-induced
gene expression of Ddit4 or Bnip3 (Brugarolas et al., 2004; Li et al., 2007). On the other hand, it
has been shown that HIF-2a regulates mTORC1 activity in VHL-deficient tumour cells through the
transcriptional control of the amino acid transporter Slc7a5 (Elorza et al., 2012).
As HIF-2a regulates mTORC1 activity to promote proliferation, this connection could prove rele-
vant in pathological situations; for example, both somatic and germline EPAS1 gain-of-function
mutations have been found in patients with paraganglioma, a catecholamine-secreting tumor of neu-
ral crest origin (Lorenzo et al., 2013; Zhuang et al., 2012). Indeed, CB tumors are 10 times more
frequent in people living at high altitude (Saldana et al., 1973). As further evidence of this link, it
has been shown that the mTOR pathway is commonly activated in both paraganglioma and pheo-
chromocytoma tumors (Du et al., 2016; Favier et al., 2015).
CB chemoreception plays a crucial role in homeostasis, particularly in regulating cardiovascular
and respiratory responses to hypoxia. Our data show that mice lacking CB O2-sensitive cells (TH-
HIF-2aKO mice) have impaired respiratory, cardiovascular and metabolic adaptive responses.
Although previous studies have linked HIF-2a and CB function (Hodson et al., 2016; Peng et al.,
2011), none of them exhibited a complete CB loss of function. This might explain the differing
effects observed in hemizygous Epas1+/- mice (Hodson et al., 2016; Peng et al., 2011) compared
to our TH-HIF-2aKO mice.
Mice with a specific Hif1a ablation in CB O2-sensitive glomus cells (TH-HIF-1aKO mice) did not
show altered hypoxic responses in our experimental conditions. Consistent with this, hemizygous
Hif1a+/- mice exhibited a normal acute HVR (Hodson et al., 2016; Kline et al., 2002) albeit some
otherwise aberrant CB activities in response to hypoxia (Kline et al., 2002; Ortega-Saenz et al.,
2007).
Alterations in CB development and/or function have recently acquired increasing potential clinical
significance and have been associated with diseases such as heart failure, obstructive sleep apnea,
Figure 7 continued
depicts the average of 3–4 pictures. 21% O2, n = 5; 10% O2 14d, n = 9 per genotype. Data are presented as mean ± SEM. Unpaired t-test, *p<0.05. (C)
Representative micrographs of TH and p-S6 double immunostaining of HIF-2aWTand TH-HIF-2aKO embryonic (E18.5) carotid bifurcations. TH+ outlined
area indicates the region used for pixels quantification. Scale bars: 50 mm. (D) Quantitative analysis performed on HIF-2aWT(black, n = 12) and TH-HIF-
2aKO (red, n = 10) micrographs previously immuno-stained for p-S6 and TH. Each data point depicts the average of 3–4 pictures. Data are presented as
mean ± SEM. Unpaired t-test, **p<0.01. (E) Double BrdU and TH immunofluorescence on carotid bifurcation sections from wild type mice (left and
central panels) or TH-HIF-2aKO mice (right panel) exposed to 10% O2 and injected with rapamycin or vehicle control for 14 days. Notice the striking
decrease in double BrdU+ TH+ cells (white arrowheads) in the rapamycin treated wild type mice compared to vehicle control animals. Scale bars: 100
mm. (F–H) Quantification of total CB volume (F), TH+ cells number (G) and percentage of double BrdU+ TH+ over the total TH+ cells (H) in wild type
mice (black) or TH-HIF-2aKO mice (red) breathing 10% O2 and injected with rapamycin or vehicle control for 14 days. Wild type, n = 5 mice per
treatment. TH-HIF-2aKO, n = 3. (I) Averaged breaths per minute during the first 2 min of acute hypoxia (10% O2) exposure from vehicle or rapamycin
injected wild type mice (black) or TH-HIF-2aKO (red) mice before and after 7 days of chronic hypoxia (10% O2) treatment. Wild type, n = 14 mice per
condition and treatment. TH-HIF-2aKO, n = 3. Data are presented as mean ± SEM. B, D, F, G and H, unpaired t-test, *p<0.05, ****p<0.0001. I, two-way
ANOVA followed by Tukey’s multiple comparison test. ****p<0.0001, ns, non-significant.
DOI: https://doi.org/10.7554/eLife.34681.015
The following figure supplement is available for figure 7:
Figure supplement 1. mTORC1 activity in SCG TH+ sympathetic neurons and effect of rapamycin treatment.
DOI: https://doi.org/10.7554/eLife.34681.016
Macias et al. eLife 2018;7:e34681. DOI: https://doi.org/10.7554/eLife.34681 15 of 26
Research article Human Biology and Medicine Developmental Biology and Stem Cells

chronic obstructive pulmonary disease, sudden death infant syndrome and hypertension
(Iturriaga et al., 2016; Lopez-Barneo et al., 2016b).
We describe here the first mouse model with specific loss of carotid body O2-sensitive cells: a
model that is viable in normoxia but shows impaired physiological adaptations to both acute and
chronic hypoxia. In addition, we describe new and likely important roles for the CB in systemic blood
pressure regulation, exercise performance and glucose management (Figure 8). Further investiga-
tion of this mouse model could aid in revealing roles of the carotid body in both physiology and
disease.
Type I
(TH+)
Type II
Afferent
nerve fibre
Blood vessle
Acute
HVR
Hypoxia-induced
neurogenesis
Respiratory and
cardiovascular
adaptive responses
Acclimatization
Rapamycin
HIF-2α mTORC1?
HIF-2α
Type I (TH+)mTORC1
Type II
Afferent
nerve fibre
Blood vessle
Embryo development
pO2
pO2
Maladaptation
More severe
hypoxaemia
Polycythaemia
Pulmonary hypertension
Right heart hypertrophy
Dead
O2 independent
effects
Homeostatic adaptive responses
Hypotension
Poorer exercise performance
Glucose intolerance
A C
B D
HIF-2α
(Hodson et al., 2015)
Efferent
nerve fibre
Efferent
nerve fibre
Figure 8. Graphic abstract of the role of HIF-2a in CB development and function. (A) Schematic representation of a CB glomerulus. In CB development
mTORC1 activity is high, which likely contributes to normal CB proliferation and growth. (B) Embryonic Epas1 (Hif-2a) ablation in TH+ cells (type I cells)
leads to repressed mTORC1 activity and progressive O2-sensitive cell loss via a direct or indirect mechanism. (C) Upon low arterial pO2, CB O2-sensitive
glomus cells trigger an acute hypoxic ventilatory response (HVR) increasing O2 uptake by the lungs. Sustained hypoxia induces CB growth, a process
that is HIF-2a-dependent (Hodson et al., 2016) and blocked by rapamycin (mTORC1 inhibitor). Hypoxia-induced CB neurogenesis further increases
ventilation and regulates cardiovascular function allowing adaptation. (D) The absence of CB responses to low pO2 leads to a more severe hypoxaemia,
resulting in pathological polycythaemia, pulmonary hypertension, and right ventricular failure. Other adaptive responses, such as arterial pressure,
exercise performance and glucose homeostasis, are also impaired by CB loss. Taken together, we show that HIF-2a is essential for CB development
and that its absence results in the disruption of key homeostatic adaptive responses.
DOI: https://doi.org/10.7554/eLife.34681.017
Macias et al. eLife 2018;7:e34681. DOI: https://doi.org/10.7554/eLife.34681 16 of 26
Research article Human Biology and Medicine Developmental Biology and Stem Cells

Materials and methods
Key resources table
Reagent type (species)or resource Designation Source or reference Identifiers Additional information
Gene (Mus musculus) Hif1a NA MGI:106918
Gene (M. musculus) Epas1 NA MGI:109169
Gene (M. musculus) Th NA MGI:98735
Strain, strainbackground(M. musculus)
C57BL/6J The Jacksonlaboratory
Jax:000664
Geneticreagent (M. musculus)
HIF-1aWT PMID:10945599 Jax: 007561
Geneticreagent (M. musculus)
HIF-2aWT PMID:17284606 Jax:008407
Geneticreagent (M. musculus)
TH-Cre PMID:15452869 MGI:3056580
Geneticreagent (M. musculus)
Td-Tomato PMID:20023653 Jax:007909
Antibody anti-TH(rabbit polyclonal)
Novus Biologicals Novus Biologicals:NB300-109
(1:1000)
Antibody anti-TH(chicken polyclonal)
abcam abcam:ab76442 (1:1000)
Antibody anti-GFAP(rabbit polyclonal)
Dako Dako:Z0334 (1:500)
Antibody anti-BrdU(rat polyclonal)
abcam abcam:ab6326 (1:100)
Antibody anti-phospho S6(rabbit polyclonal)
Cell SignalingTechnology
Cell signaling:2211 (1:200)
Antibody anti-SMAa(mouse monoclonal) Sigma-Aldrich Sigma-Aldrich:A-2547 (1:200)
Antibody Alexa 488- or568- secondaries
ThermoFisher (1:500)
Sequence-basedreagent
Hif1a_probe IDT 5’-/56-FAM/CCTGTTGGTTGCGCAGCAAGCATT/3BHQ_1/–3’
Sequence-basedreagent
Hif1a_F IDT 5’-GGTGCTGGTGTCCAAAATGTAG-3’
Sequence-basedreagent
Hif1a_R IDT 5’-ATGGGTCTAGAGAGATAGCTCCACA-3’
Sequence-basedreagent
Epas1_probe IDT 5’-/56-FAM/CCACCTGGA/ZEN/CAAAGCCTCCATCAT/3IABkFQ/�3’
Sequence-basedreagent
Epas1_F IDT 5’-TCTATGAGTTGGCTCATGAGTTG-3’
Sequence-basedreagent
Epas1_R IDT 5’-GTCCGAAGGAAGCTGATGG-3’
Peptide,recombinant protein
AngII Sigma-Aldrich Sigma-Aldrich:A2900
Peptide,recombinant protein
Insulin (human) Sigma-Aldrich Sigma-Aldrich:11 376497 001
Peptide,recombinant protein
Collagenase type IA Sigma-Aldrich Sigma-Aldrich:C9891
Peptide,recombinant protein
Trypsin Sigma-Aldrich Sigma-Aldrich:93610
Commercialassay or kit
LSAB+, Dako REALDetection Systems
Dako Dako:K5001
Continued on next page
Macias et al. eLife 2018;7:e34681. DOI: https://doi.org/10.7554/eLife.34681 17 of 26
Research article Human Biology and Medicine Developmental Biology and Stem Cells

Continued
Reagent type (species)or resource Designation Source or reference Identifiers Additional information
Commercialassay or kit
Epinephrine/NorepinephrineELISA Kit
Abnova Abnova:KA1877
Commercialassay or kit
DNeasy Blood and Tissue Kit Qiagen Qiagen:69506
Commercialassay or kit
TaqMan Universal PCRMaster Mix
Applied Biosystems Applied biosystems:4304437
Commercialassay or kit
Click-iT TUNEL AlexaFluor 488 Imaging Assay
ThermoFisher ThermoFisher:C10245
Chemicalcompound, drug
BrdU Sigma-Aldrich Sigma-Aldrich:B5002
Chemicalcompound, drug
Rapamycin LC Laboratories LC Laboratories:R-5000
Chemicalcompound, drug
D-Glucose Sigma-Aldrich Sigma-Aldrich:G8270
Chemicalcompound, drug
Sodium L-Lactate Sigma-Aldrich Sigma-Aldrich:71718
Software,algorithm
Fiji http://imagej.net/Fiji
Other EVG stain Merck Merck:115974
Other Hematoxylin Solution,Mayer’s
Sigma-Aldrich Sigma-Aldrich:MHS16
Other Eosin Y solution, aqueous Sigma-Aldrich Sigma-Aldrich:HT110216
Other DAPI stain Molecular probes Molecular probes:D1306 (1:5000)
Mouse husbandryThis research has been regulated under the Animals (Scientific Procedures) Act 1986 Amendment
Regulations 2012 following ethical review by the University of Cambridge Animal Welfare and Ethical
Review Body (AWERB) Home Office Licenses 80/2618 and PC64B8953. Targeted deletion of Hif1a,
Epas1 and Td-Tomato in sympathoadrenal tissues was achieved by crossing homozygous mice carry-
ing loxP-flanked alleles Hif1atm3Rsjo (Ryan et al., 1998), Epas1tm1Mcs (Gruber et al., 2007) or Gt
(ROSA)26Sortm9(CAG-tdTomato)Hze (Madisen et al., 2010) into a mouse strain of cre recombinase
expression driven by the endogenous tyrosine hydroxylase promoter (Thtm1(cre)Te)(Lindeberg et al.,
2004), which is specific of catecholaminergic cells. LoxP-flanked littermate mice without cre recombi-
nase (Hif1aflox/flox, Epas1flox/flox or Td-Tomatoflox/flox) were used as control group (HIF-1aWT, HIF-
2aWTand Td-Tomato, respectively) for all the experiments. C57BL/6J wild type mice were purchased
from The Jackson laboratory (Bar Harbor, Maine, US). All the experiments were performed with age
and sex matched control and experimental mice.
Tissue preparation, immunohistochemistry and morphometryNewborn (P0) and adult mice (8–12 weeks old) were killed by an overdose of sodium pentobarbital
injected intraperitoneally. E18.5 embryos were collected and submerged into a cold formalin solu-
tion (Sigma-Aldrich, Dorset, UK). The carotid bifurcation and adrenal gland, were dissected, fixed for
2 hr with 4% paraformaldehyde (Santa Cruz Biotechnology) and cryopreserved (30% sucrose in PBS)
for cryosectioning (10 mm thick, Bright Instruments, Luton, UK). Tyrosine hydroxylase (TH), glial fibril-
lary acidic protein (GFAP), bromodeoxyuridine (BrdU) and phospho-S6 ribosomal protein (p-S6)
were detected using the following polyclonal antibodies: rabbit anti-TH (1:5000, Novus Biologicals,
Abindong, UK; NB300-109) for single immunofluorescence or chicken anti-TH (1:1000, abcam, Cam-
bridge, UK; ab76442) for double immunofluorescence, rabbit anti-GFAP (1:500, Dako, Cambridge,
UK; Z0334), rat anti-BrdU (1:100, abcam, ab6326), and rabbit anti-phospho-S6 ribosomal protein
(1:200, Cell Signaling, 2211), respectively. Fluorescence-based detection was visualized using, Alexa-
Fluor 488- and 568-conjugated anti-rabbit IgG (1:500, ThermoFisher, Waltham, MA US), Alexa-Fluor
488-conjugated anti-chicken IgG (1:500, ThermoFisher) and Alexa-Fluor 488-conjudaged anti-rat IgG
Macias et al. eLife 2018;7:e34681. DOI: https://doi.org/10.7554/eLife.34681 18 of 26
Research article Human Biology and Medicine Developmental Biology and Stem Cells

(1:500, ThermoFisher) secondary antibodies. Chromogen-based detection was performed with Dako
REAL Detection Systems, Peroxidase/DAB+, Rabbit/Mouse (Dako, K5001) and counterstained with
Carrazzi hematoxylin. For the Td-Tomato detection, carotid bifurcation and adrenal gland were dis-
sected, embedded with OCT, flash-frozen into liquid N2 and sectioned (10 mm thick, Bright Instru-
ments). Direct Td-Tomato fluorescence was imaged after nuclear counterstain with 4’,6-diamidino-2-
phenylindole (DAPI).
CB glomus cell counting, area measurements and pixel mean intensity were calculated on micro-
graphs (Leica DM-RB, Wetzlar, Gernany) taken from sections spaced 40 mm apart across the entire
CB using Fiji software (Schindelin et al., 2012) as previously reported (Macıas et al., 2014). CB and
SCG volume was estimated on the same micrographs according to Cavalieri’s principle. Lung tissue
was removed in the distended state by infusion into the trachea of 0.8% agarose and then fixed in
4% paraformaldehyde for paraffin embedding. Lung sections (6 mm thick) were stained with H and E
and EVG stain to assess morphology (Merck, Darmstadt, Germany). Vessel medial thickness was
measured on micrographs using Fiji software. To determine the degree of muscularization of small
pulmonary arteries, serial lung tissue sections were stained with anti-a smooth muscle actin (1:200,
Sigma-Aldrich, A2547). Heart and spleen sections (6 mm thick) were stained with H and E to assess
morphology. Tissue sections were independently coded and quantified by a blinded investigator.
Gene deletionGenomic DNA was isolated from dissected SCG and AM using DNeasy Blood and Tissue Kit (Qia-
gen, Hilden, Germany). Relative gene deletion was assayed by qPCR (One-Step Plus Real-Time PCR
System; ThermoFisher Scientific) using TaqMan Universal PCR Master Mix (ThermoFisher Scientific)
and PrimeTime Std qPCR Assay (IDT, Coralville, IA US).
For Hif1a,
Hif1a_probe: 5’-/56-FAM/CCTGTTGGTTGCGCAGCAAGCATT/3BHQ_1/–3’
Hif1a_F: 5’-GGTGCTGGTGTCCAAAATGTAG-3’
Hif1a_R: 5’-ATGGGTCTAGAGAGATAGCTCCACA-3’
For Epas1,
Epas1_probe: 5’-/56-FAM/CCACCTGGACAAAGCCTCCATCAT/3IABkFQ/�3’
Epas1_F: 5’-TCTATGAGTTGGCTCATGAGTTG-3’
Epas1_R: 5’-GTCCGAAGGAAGCTGATGG-3’
Relative gene deletion levels were calculated using the 2DDCT method.
Tissue preparation for amperometry and patch clamp experimentsAdrenal glands and SCG were quickly removed and transferred to ice-cooled PBS. Dissected AM
was enzymatically dispersed in two steps. First, tissue was placed in 3 ml of extraction solution (in
mM: 154 NaCl, 5.6 KCl, 10 Hepes, 11 glucose; pH 7.4) containing 425 U/ml collagenase type IA and
4–5 mg of bovine serum albumin (all from Sigma-Aldrich), and incubated for 30 min at 37˚C. Tissuewas mechanically dissociated every 10 min by pipetting. Then, cell suspension was centrifuged (165
g and 15–20˚C for 4 min), and the pellet suspended in 3 ml of PBS containing 9550 U/ml of trypsin
and 425 U/ml of collagenase type IA (all from Sigma-Aldrich). Cell suspension was further incubated
at 37˚C for 5 min and mechanically dissociated by pipetting. Enzymatic reaction was stopped by
adding » 10 ml of cold complete culture medium (DMEM/F-12 (21331–020 GIBCO, ThermoFisher
Scientific) supplemented with penicillin (100 U/ml)/streptomycin (10 mg/ml), 2 mM L-glutamine and
10% fetal bovine serum. The suspension was centrifuged (165 g and 15–20˚C for 4 min), the pellet
gently suspended in 200 ml of complete culture medium. Next, cells were plated on small coverslips
coated with 1 mg/ml poly-L-lysine and kept at 37˚C in a 5% CO2 incubator for settlement. After-
wards, the petri dish was carefully filled with 2 ml of culture medium and returned to the incubator
for 2 hr. Under these conditions, cells could be maintained up to 12–14 hr to perform experiments.
To obtain SCG dispersed cells, the tissue was placed in a 1.5 ml tube containing enzymatic solu-
tion (2.5 mg/ml collagenase type IA in PBS) and incubated for 15 min in a thermoblock at 37˚C and
300 rpm. The suspension was mechanically dissociated by pipetting and centrifuged for 3 min at 200
g. The pellet was suspended in the second enzymatic dispersion (1 mg/ml of trypsin in PBS), incu-
bated at 37˚C, 300 rpm for 25 min and dissociated again with a pipette. Enzymatic reaction was
stopped adding a similar solution than used for chromaffin cells (changing fetal bovine serum for
Macias et al. eLife 2018;7:e34681. DOI: https://doi.org/10.7554/eLife.34681 19 of 26
Research article Human Biology and Medicine Developmental Biology and Stem Cells

newborn calf serum). Finally, dispersed SCG cells were plated onto poly-L-lysine coated coverslips
and kept at the 37˚C incubator. Experiments with SCG cells were done between 24–48 hr after fin-
ishing the culture.
To prepare AM slices, the capsule and adrenal gland cortex was removed and the AM was
embedded into low melting point agarose at when reached 47˚C. The agarose block is sectioned
(200 mm thick) in an O2-saturated Tyrode’s solution using a vibratome (VT1000S, Leica). AM slices
were washed twice with the recording solution (in mM: 117 NaCl, 4.5 KCl, 23 NaHCO3, 1 MgCl2, 1
CaCl2, 5 glucose and five sucrose) and bubbled with carbogen (5% CO2 and 95% O2) at 37˚C for 30
min in a water bath. Fresh slices are used for the experiments during 4–5 hr after preparation.
Patch-clamp recordingsThe macroscopic currents were recorded from dispersed mouse AM and SCG cells using the whole
cell configurations of the patch clamp technique. Micropipettes ( » 3 MW) were pulled from capillary
glass tubes (Kimax, Kimble Products, Rockwood, TN US) with a horizontal pipette puller (Sutter
instruments model P-1000, Novato, CA US) and fire polished with a microforge MF-830 (Narishige,
Amityville, NY US). Voltage-clamp recordings were obtained with an EPC-7 amplifier (HEKA Electro-
nik, Lambrecht/Pfalz, Germany). The signal was filtered (3 kHz), subsequently digitized with an ana-
log/digital converter (ITC-16 Instrutech Corporation, HEKA Electronik) and finally sent to the
computer. Data acquisition and storage was done using the Pulse/pulsefit software (Heka Electronik)
at a sampling interval of 10 msec. Data analysis is performed with the Igor Pro Carbon (Wavemetrics,
Portland, OR US) and Pulse/pulsefit (HEKA Electronik) programs. All experiments were conducted at
30–33˚C. Macroscopic Ca2+, Na+, and K+ currents were recorded in dialyzed cells. The solutions
used for the recording of Na+ and Ca2+ currents contained (in mM): external: 140 NaCl, 10 BaCl2,
2.5 KCl, 10 HEPES, and 10 glucose; pH 7.4 and osmolality 300 mOsm/kg; and internal: 110 CsCl, 30
CsF, 10 EGTA, 10 HEPES, and 4 ATP-Mg; pH 7.2 and osmolality 285 mOsm/kg. The external solu-
tion used for the recording of whole cell K+ currents was (in mM): 117 NaCl, 4.5 KCl, 23 NaHCO3, 1
MgCl2, 2.5 CaCl2, 5 glucose and five sucrose. The internal solution to record K+ currents was (in
mM): 80 potassium glutamate, 50 KCl, 1 MgCl2, 10 HEPES, 4 MgATP, and 5 EGTA, pH 7.2. Depola-
rizing steps of variable duration (normally 10 or 50 msec) from a holding potential of �70 mV to dif-
ferent voltages ranging from �60 up to +50 mV (with voltage increments of 10 mV) were used to
record macroscopic ionic currents in AM and SCG cells.
Amperometric recordingTo perform the experiments, single slices were transferred to the chamber placed on the stage of an
upright microscope (Axioscope, Zeiss, Oberkochen, Germany) and continuously perfused by gravity
(flow 1–2 ml min-1) with a solution containing (in mM): 117 NaCl, 4.5 KCl, 23 NaHCO3, 1 MgCl2, 2.5
CaCl2, 5 glucose and five sucrose. The ‘normoxic’ solution was bubbled with 5% CO2, 20% O2 and
75 % N2 (PO2 » 150 mmHg). The ‘hypoxic’ solution was bubbled with 5% CO2 and 95% N2 (PO2 »
10–20 mmHg). The ‘hypercapnic’ solution was bubbled with 20% CO2, 20% O2 and 60 % N2 (PO2 »
150 mmHg). The osmolality of solutions was » 300 mosmol kg�1 and pH = 7.4. In the 20 mM K+
solution, NaCl was replaced by KCl equimolarly (20 mM). All experiments were carried out at a
chamber temperature of 36˚C. Amperometric currents were recorded with an EPC-8 patch-clamp
amplifier (HEKA Electronics), filtered at 100 Hz and digitized at 250 Hz for storage in a computer.
Data acquisition and analysis were carried out with an ITC-16 interface and PULSE/PULSEFIT soft-
ware (HEKA Electronics). The secretion rate (fC min�1) was calculated as the amount of charge trans-
ferred to the recording electrode during a given period of time.
Catecholamine measurementsCatecholamine levels were determined by ELISA (Abnova, Taipei, Taiwan) following manufacture’s
instructions. Spontaneous urination was collected from control and experimental mice (8–12 weeks
old) at similar daytime (9:00am). HIF-2aWTand TH-HIF-2aKO or HIF-1aWT, TH-HIF-1aKO samples were
collected and assayed in different days.
Macias et al. eLife 2018;7:e34681. DOI: https://doi.org/10.7554/eLife.34681 20 of 26
Research article Human Biology and Medicine Developmental Biology and Stem Cells

Tunel assayCell death was determined on CB sections using Click-iT TUNEL Alexa Fluor 488 Imaging Assay
(ThermoFisher Scientific), following manufacture’s indications. TUNEL+ cells across the whole CB
parenchyma were counted and normalized by area.
PlethysmographyRespiratory parameters were measured by unrestrained whole-body plethysmography (Data Scien-
ces International, St. Paul, MN US). Mice were maintained in a hermetic chamber with controlled nor-
moxic airflow (1.1 l/min) of 21% O2 (N2 balanced, 5000ppm CO2, BOC Healthcare, Manchester, UK)
until they were calm (30–40 min). Mice were then exposed to pre-mixed hypoxic air (1.1 l/min) of
10% O2 (N2 balanced, 5000ppm CO2, BOC Healthcare) or 5% CO2 (21% O2, N2 balanced, BOC,
Healthcare) for 30 min (time-course experiments) or 10 min (VAH and hypercapnia experiments).
Real-time data were recorded and analyzed using Ponemah software (Data Sciences International).
Each mouse was monitored throughout the experiment and periods of movements and/or grooming
were noted and subsequently removed from the analysis. The transition periods between normoxia
and hypoxia (2–3 min) were also removed from the analysis.
Oxygen saturationOxygen saturation was measured using MouseOx Pulse Oximeter (Starr Life Sciences Corp, Oak-
mont, PA US) on anaesthetised (isofluorane) mice. Anaesthetic was vaporized with 2 l/min of 100%
O2 gas flow (BOC Healthcare) and then shift to 2 l/min of pre-mixed 10% O2 flow (N2 balanced,
5000ppm CO2, BOC Healthcare) for 5 min. Subsequently, gas flow was switched back to 100% O2.
For oxygen saturation in normoxia anaesthetic was vaporized with 2 l/min of 21% O2 gas flow.
Whole-body metabolic assessmentsEnergy expenditure was measured and recorded using the Columbus Instruments Oxymax system
(Columbus, OH US) according to the manufacturer’s instructions. Mice were randomly allocated to
the chambers and they had free access to food and water throughout the experiment with the
exception of fasting experiments. An initial 18–24 hr acclimation period was disregarded for all the
experiments. Once mice were acclimated to the chamber, the composition of the influx gas was
switched from 21% O2 to 10% O2 using a PEGAS mixer (Columbus Instruments). For maximum exer-
tion testing, mice were allowed to acclimatize to the enclosed treadmill environment for 15 min
before running. The treadmill was initiated at five meters/min and the mice warmed up for 5 min.
The speed was increased up to 27 meters/min or exhaustion at 2.5 min intervals on a 15˚ incline.Exhaustion was defined as the third time the mouse refused to run for more than 3–5 s or when was
unable to stay on the treadmill. Blood glucose and lactate levels were measured before and after
exertion using a StatStrip Xpress (nova biomedical, Street-Waltham, MA US) glucose and lactate
meters.
Chronic hypoxia exposure and in vivo CB proliferationMice were exposed to a normobaric 10% O2 atmosphere in an enclosed chamber with controlled O2
and CO2 levels for up to 21 days. Humidity and CO2 levels were quenched throughout the experi-
ments by using silica gel (Sigma-Aldrich) and spherasorb soda lime (Intersurgical, Wokingham, UK),
respectively. Haematocrit was measured in a bench-top haematocrit centrifuge. Haemoglobin levels
and blood cell counts were analyzed with a Vet abc analyzer (Horiba, Kyoto, Japan) according to the
manufacture’s instructions. Heart, spleen tissues were removed and their wet weights measured.
Right ventricular systolic pressures were assessed using a pressure-volume loop system (Millar, Hous-
ton, TX US) as reported before (Cowburn et al., 2016). Mice were anaesthetized (isoflurane) and
right-sided heart catheterization was performed through the right jugular vein. Lungs were proc-
essed for histology as describe above. Analogous procedures were followed for mice maintained in
normoxia.
For hypoxia-induced in vivo CB proliferation studies, mice were injected intraperitoneally once a
week with 50 mg/kg of BrdU (Sigma-Aldrich) and constantly supplied in their drinking water (1 mg/
ml) as previously shown (Pardal et al., 2007). In vivo mTORC inhibition was achieved by intraperito-
neal injection of rapamycin (6 mg kg�1 day�1). Tissues were collected for histology after 14 days at
Macias et al. eLife 2018;7:e34681. DOI: https://doi.org/10.7554/eLife.34681 21 of 26
Research article Human Biology and Medicine Developmental Biology and Stem Cells
10% O2 as described above. VAH was recorded in vehicle control and rapamycin-injected C57BL/6J
mice after 7 days in chronic hypoxia by plethysmography as explained above.
Blood pressure measurement by radio-telemetryAll radio-telemetry hardware and software was purchased from Data Science
International. Surgical implantation of radio-telemetry device was performed following University
of Cambridge Animal Welfare and Ethical Review Body’s (AWERB) recommendations and according
to manufacturer’s instructions. After surgery, mice were allowed to recover for at least 10 days. All
baseline telemetry data were collected over a 72 hr period in a designated quiet room to ensure
accurate and repeatable results. Blood pressure monitoring during hypoxia challenge was conducted
in combination with Columbus Instruments Oxymax system and PEGAS mixer. Mice were placed in
metabolic chambers and allowed to acclimate for 24 hr before the oxygen content of the flow gas
was reduced to 10%. Mice were kept for 48 hr at 10% O2 before being returned to normal atmo-
spheric oxygen for a further 24 hr. For hypertension studies, mice were subsequently implanted with
a micro osmotic pump (Alzet, Cupertino, CA; 1002 model) for Ang II (Sigma-Aldrich) infusion (490
ng min�1 kg�1) for 2 weeks. Blood pressure, heart rate, temperature and activity were monitored for
a 48 hr period after 7, 14 and 21 days after osmotic pump implantation.
Glucose, insulin and lactate tolerant testsAll the blood glucose and lactate measurements were carried out with a StatStrip Xpress (nova bio-
medical) glucose and lactate meters. Blood was sampled from the tail vein. For glucose tolerance
test (GTT), mice were placed in clean cages and fasted for 14–15 hr (overnight) with free access to
water. Baseline glucose level (0 time point) was measured and then a glucose bolus (Sigma-Aldrich)
of 2 g/kg in PBS was intraperitoneally injected. Glucose was monitored after 15, 30, 60, 90, 120 and
150 min. For insulin tolerance test, mice were fasted for 4 hr and baseline glucose was measured (0
time point). Next, insulin (Roche, Penzberg, Germany) was intraperitoneally injected (0.75 U/kg) and
blood glucose content recorded after 15, 30, 60, 90 and 120 min. For lactate tolerance test, mice
were injected with a bolus of 2 g/kg of sodium lactate (Sigma-Aldrich) in PBS and blood lactate mea-
sured after 15, 30, 60, 90 and 120 min.
Statistical analysisParticular statistic tests and sample size can be found in the figures and figure legends. Data are pre-
sented as the mean ± standard error of the mean (SEM). Shapiro-Wilk normality test was used to
determine Gaussian data distribution. Statistical significance between two groups was assessed by
un-paired t-test in cases of normal distribution with a Welch’s correction if standard deviations were
different. In cases of non-normal distribution (or low sample size for normality test) the non-paramet-
ric Mann-Whitney U test was used. For multiple comparisons we used two-way ANOVA followed by
Fisher’s LSD test. Non-linear regression (one-phase association) curve fitting, using a least squares
method, was used to model the time course data in Figures 3 and 5 and Figure 6—figure supple-
ment 1. Extra sum-of-squares F test was used to compare fittings, and determine whether the data
were best represented by a single curve, or by separate ones. Individual area under the curve (AUC)
was calculated for the circadian time-courses in Figures 3 and 5; and Figure 6—figure supplement
1 and Figure 7—figure supplement 1, followed by un-paired t-test or non-parametric Mann-Whit-
ney U test as explained above. Statistical significance was considered if p�0.05. Analysis was carried
out using Prism6.0f (GraphPad software, La Jolla, CA US) for Mac OS X.
AcknowledgementsThis work is funded by the Wellcome Trust (grant WT092738MA).
Macias et al. eLife 2018;7:e34681. DOI: https://doi.org/10.7554/eLife.34681 22 of 26
Research article Human Biology and Medicine Developmental Biology and Stem Cells

Additional information
Funding
Funder Grant reference number Author
Wellcome WT092738 Randall Johnson
The funders had no role in study design, data collection and interpretation, or the
decision to submit the work for publication.
Author contributions
David Macias, Conceptualization, Data curation, Formal analysis, Validation, Investigation, Methodol-
ogy, Writing—original draft, Writing—review and editing; Andrew S Cowburn, Formal analysis,
Investigation, Methodology, Writing—review and editing; Hortensia Torres-Torrelo, Data curation,
Investigation; Patricia Ortega-Saenz, Investigation, Methodology; Jose Lopez-Barneo, Data curation,
Formal analysis, Supervision, Methodology, Writing—review and editing; Randall S Johnson, Con-
ceptualization, Formal analysis, Supervision, Funding acquisition, Writing—original draft, Project
administration, Writing—review and editing
Author ORCIDs
David Macias http://orcid.org/0000-0002-8676-1964
Randall S Johnson http://orcid.org/0000-0002-4084-6639
Ethics
Animal experimentation: This work was carried out with approval and following review of the Univer-
sity of Cambridge AWERB (Animal Welfare Ethical Review Board) and under license of the UK Home
Office (Home Office License numbers 80/2618 and PC64B8953).
Decision letter and Author response
Decision letter https://doi.org/10.7554/eLife.34681.022
Author response https://doi.org/10.7554/eLife.34681.023
Additional filesSupplementary files. Transparent reporting form
DOI: https://doi.org/10.7554/eLife.34681.018
Data availability
All data generated or analysed during this study are included in the manuscript and supporting files.
ReferencesAnnese V, Navarro-Guerrero E, Rodrıguez-Prieto I, Pardal R. 2017. Physiological plasticity of neural-crest-derivedstem cells in the adult mammalian carotid body. Cell Reports 19:471–478. DOI: https://doi.org/10.1016/j.celrep.2017.03.065, PMID: 28423311
Arias-Stella J, Valcarcel J. 1976. Chief cell hyperplasia in the human carotid body at high altitudes; physiologicand pathologic significance. Human Pathology 7:361–373. DOI: https://doi.org/10.1016/S0046-8177(76)80052-4, PMID: 939535
Brugarolas J, Lei K, Hurley RL, Manning BD, Reiling JH, Hafen E, Witters LA, Ellisen LW, Kaelin WG. 2004.Regulation of mTOR function in response to hypoxia by REDD1 and the TSC1/TSC2 tumor suppressorcomplex. Genes & Development 18:2893–2904. DOI: https://doi.org/10.1101/gad.1256804, PMID: 15545625
Brusselmans K, Compernolle V, Tjwa M, Wiesener MS, Maxwell PH, Collen D, Carmeliet P. 2003. Heterozygousdeficiency of hypoxia-inducible factor-2alpha protects mice against pulmonary hypertension and rightventricular dysfunction during prolonged hypoxia. Journal of Clinical Investigation 111:1519–1527.DOI: https://doi.org/10.1172/JCI15496, PMID: 12750401
Macias et al. eLife 2018;7:e34681. DOI: https://doi.org/10.7554/eLife.34681 23 of 26
Research article Human Biology and Medicine Developmental Biology and Stem Cells

Bryant AJ, Carrick RP, McConaha ME, Jones BR, Shay SD, Moore CS, Blackwell TR, Gladson S, Penner NL,Burman A, Tanjore H, Hemnes AR, Karwandyar AK, Polosukhin VV, Talati MA, Dong HJ, Gleaves LA, Carrier EJ,Gaskill C, Scott EW, et al. 2016. Endothelial HIF signaling regulates pulmonary fibrosis-associated pulmonaryhypertension. American Journal of Physiology-Lung Cellular and Molecular Physiology 310:L249–L262.DOI: https://doi.org/10.1152/ajplung.00258.2015, PMID: 26637636
Cam H, Easton JB, High A, Houghton PJ. 2010. mTORC1 signaling under hypoxic conditions is controlled byATM-dependent phosphorylation of HIF-1a. Molecular Cell 40:509–520. DOI: https://doi.org/10.1016/j.molcel.2010.10.030, PMID: 21095582
Carmeliet P, Dor Y, Herbert JM, Fukumura D, Brusselmans K, Dewerchin M, Neeman M, Bono F, Abramovitch R,Maxwell P, Koch CJ, Ratcliffe P, Moons L, Jain RK, Collen D, Keshert E, Keshet E. 1998. Role of HIF-1alpha inhypoxia-mediated apoptosis, cell proliferation and tumour angiogenesis. Nature 394:485–490. DOI: https://doi.org/10.1038/28867, PMID: 9697772
Compernolle V, Brusselmans K, Acker T, Hoet P, Tjwa M, Beck H, Plaisance S, Dor Y, Keshet E, Lupu F, NemeryB, Dewerchin M, Van Veldhoven P, Plate K, Moons L, Collen D, Carmeliet P. 2002. Loss of HIF-2alpha andinhibition of VEGF impair fetal lung maturation, whereas treatment with VEGF prevents fatal respiratorydistress in premature mice. Nature Medicine 8:702–710. DOI: https://doi.org/10.1038/nm721, PMID: 12053176
Cowburn AS, Crosby A, Macias D, Branco C, Colaco RD, Southwood M, Toshner M, Crotty Alexander LE,Morrell NW, Chilvers ER, Johnson RS. 2016. HIF2a-arginase axis is essential for the development of pulmonaryhypertension. PNAS 113:8801–8806. DOI: https://doi.org/10.1073/pnas.1602978113, PMID: 27432976
Cowburn AS, Macias D, Summers C, Chilvers ER, Johnson RS. 2017. Cardiovascular adaptation to hypoxia andthe role of peripheral resistance. eLife 6:e28755. DOI: https://doi.org/10.7554/eLife.28755, PMID: 29049022
Du J, Tong A, Wang F, Cui Y, Li C, Zhang Y, Yan Z. 2016. The Roles of PI3K/AKT/mTOR and MAPK/ERKSignaling Pathways in Human Pheochromocytomas. International Journal of Endocrinology 2016:5286972.DOI: https://doi.org/10.1155/2016/5286972, PMID: 27990160
Elorza A, Soro-Arnaiz I, Melendez-Rodrıguez F, Rodrıguez-Vaello V, Marsboom G, de Carcer G, Acosta-Iborra B,Albacete-Albacete L, Ordonez A, Serrano-Oviedo L, Gimenez-Bachs JM, Vara-Vega A, Salinas A, Sanchez-Prieto R, Martın del Rıo R, Sanchez-Madrid F, Malumbres M, Landazuri MO, Aragones J. 2012. HIF2a acts as anmTORC1 activator through the amino acid carrier SLC7A5. Molecular Cell 48:681–691. DOI: https://doi.org/10.1016/j.molcel.2012.09.017, PMID: 23103253
Favier J, Amar L, Gimenez-Roqueplo AP. 2015. Paraganglioma and phaeochromocytoma: from genetics topersonalized medicine. Nature Reviews Endocrinology 11:101–111. DOI: https://doi.org/10.1038/nrendo.2014.188, PMID: 25385035
Gao L, Bonilla-Henao V, Garcıa-Flores P, Arias-Mayenco I, Ortega-Saenz P, Lopez-Barneo J. 2017. Geneexpression analyses reveal metabolic specifications in acute O2 -sensing chemoreceptor cells. The Journal ofPhysiology 595:6091–6120. DOI: https://doi.org/10.1113/JP274684, PMID: 28718507
Gao L, Ortega-Saenz P, Garcıa-Fernandez M, Gonzalez-Rodrıguez P, Caballero-Eraso C, Lopez-Barneo J. 2014.Glucose sensing by carotid body glomus cells: potential implications in disease. Frontiers in Physiology 5:398.DOI: https://doi.org/10.3389/fphys.2014.00398, PMID: 25360117
Goda N, Ryan HE, Khadivi B, McNulty W, Rickert RC, Johnson RS. 2003. Hypoxia-inducible factor 1alpha isessential for cell cycle arrest during hypoxia. Molecular and Cellular Biology 23:359–369. DOI: https://doi.org/10.1128/MCB.23.1.359-369.2003, PMID: 12482987
Gordan JD, Bertout JA, Hu CJ, Diehl JA, Simon MC. 2007. HIF-2alpha promotes hypoxic cell proliferation byenhancing c-myc transcriptional activity. Cancer Cell 11:335–347. DOI: https://doi.org/10.1016/j.ccr.2007.02.006, PMID: 17418410
Gruber M, Hu CJ, Johnson RS, Brown EJ, Keith B, Simon MC. 2007. Acute postnatal ablation of Hif-2alpharesults in anemia. PNAS 104:2301–2306. DOI: https://doi.org/10.1073/pnas.0608382104, PMID: 17284606
Heath D, Edwards C. 1971. The carotid body in cardiopulmonary disease. Geriatrics 26:110–111. PMID: 5123966Heath D, Smith P, Jago R. 1982. Hyperplasia of the carotid body. The Journal of Pathology 138:115–127.DOI: https://doi.org/10.1002/path.1711380203, PMID: 6215475
Hodson EJ, Nicholls LG, Turner PJ, Llyr R, Fielding JW, Douglas G, Ratnayaka I, Robbins PA, Pugh CW, BucklerKJ, Ratcliffe PJ, Bishop T. 2016. Regulation of ventilatory sensitivity and carotid body proliferation in hypoxia bythe PHD2/HIF-2 pathway. The Journal of Physiology 594:1179–1195. DOI: https://doi.org/10.1113/JP271050,PMID: 26337139
Hubbi ME, Semenza GL. 2015. Regulation of cell proliferation by hypoxia-inducible factors. American Journal ofPhysiology-Cell Physiology 309:C775–C782. DOI: https://doi.org/10.1152/ajpcell.00279.2015, PMID: 26491052
Huber K, Bruhl B, Guillemot F, Olson EN, Ernsberger U, Unsicker K. 2002. Development of chromaffin cellsdepends on MASH1 function. Development 129:4729–4738. PMID: 12361965
Iturriaga R, Del Rio R, Idiaquez J, Somers VK. 2016. Carotid body chemoreceptors, sympathetic neuralactivation, and cardiometabolic disease. Biological Research 49:13. DOI: https://doi.org/10.1186/s40659-016-0073-8, PMID: 26920146
Iyer NV, Kotch LE, Agani F, Leung SW, Laughner E, Wenger RH, Gassmann M, Gearhart JD, Lawler AM, Yu AY,Semenza GL. 1998. Cellular and developmental control of O2 homeostasis by hypoxia-inducible factor 1 alpha.Genes & Development 12:149–162. DOI: https://doi.org/10.1101/gad.12.2.149, PMID: 9436976
Kameda Y, Ito M, Nishimaki T, Gotoh N. 2008. FRS2 alpha 2F/2F mice lack carotid body and exhibitabnormalities of the superior cervical sympathetic ganglion and carotid sinus nerve. Developmental Biology314:236–247. DOI: https://doi.org/10.1016/j.ydbio.2007.12.002, PMID: 18177855
Macias et al. eLife 2018;7:e34681. DOI: https://doi.org/10.7554/eLife.34681 24 of 26
Research article Human Biology and Medicine Developmental Biology and Stem Cells
Kameda Y. 2005. Mash1 is required for glomus cell formation in the mouse carotid body. Developmental Biology283:128–139. DOI: https://doi.org/10.1016/j.ydbio.2005.04.004, PMID: 15878769
Kapitsinou PP, Rajendran G, Astleford L, Michael M, Schonfeld MP, Fields T, Shay S, French JL, West J, HaaseVH. 2016. The endothelial Prolyl-4-hydroxylase domain 2/Hypoxia-inducible factor 2 axis regulates pulmonaryartery pressure in mice. Molecular and Cellular Biology 36:1584–1594. DOI: https://doi.org/10.1128/MCB.01055-15, PMID: 26976644
Kline DD, Peng YJ, Manalo DJ, Semenza GL, Prabhakar NR. 2002. Defective carotid body function and impairedventilatory responses to chronic hypoxia in mice partially deficient for hypoxia-inducible factor 1 alpha. PNAS99:821–826. DOI: https://doi.org/10.1073/pnas.022634199, PMID: 11792862
Kondo K, Kim WY, Lechpammer M, Kaelin WG. 2003. Inhibition of HIF2alpha is sufficient to suppress pVHL-defective tumor growth. PLoS Biology 1:E83. DOI: https://doi.org/10.1371/journal.pbio.0000083, PMID: 14691554
Koshiji M, Kageyama Y, Pete EA, Horikawa I, Barrett JC, Huang LE. 2004. HIF-1alpha induces cell cycle arrest byfunctionally counteracting Myc. The EMBO Journal 23:1949–1956. DOI: https://doi.org/10.1038/sj.emboj.7600196, PMID: 15071503
Laplante M, Sabatini DM. 2012. mTOR signaling in growth control and disease. Cell 149:274–293. DOI: https://doi.org/10.1016/j.cell.2012.03.017, PMID: 22500797
Le Douarin NM. 1986. Cell line segregation during peripheral nervous system ontogeny. Science 231:1515–1522. DOI: https://doi.org/10.1126/science.3952494, PMID: 3952494
Li Y, Wang Y, Kim E, Beemiller P, Wang CY, Swanson J, You M, Guan KL. 2007. Bnip3 mediates the hypoxia-induced inhibition on mammalian target of rapamycin by interacting with Rheb. Journal of Biological Chemistry282:35803–35813. DOI: https://doi.org/10.1074/jbc.M705231200, PMID: 17928295
Lindeberg J, Usoskin D, Bengtsson H, Gustafsson A, Kylberg A, Soderstrom S, Ebendal T. 2004. Transgenicexpression of Cre recombinase from the tyrosine hydroxylase locus. Genesis 40:67–73. DOI: https://doi.org/10.1002/gene.20065, PMID: 15452869
Liu L, Cash TP, Jones RG, Keith B, Thompson CB, Simon MC. 2006. Hypoxia-induced energy stress regulatesmRNA translation and cell growth. Molecular Cell 21:521–531. DOI: https://doi.org/10.1016/j.molcel.2006.01.010, PMID: 16483933
Lorenzo FR, Yang C, Ng Tang Fui M, Vankayalapati H, Zhuang Z, Huynh T, Grossmann M, Pacak K, Prchal JT.2013. A novel EPAS1/HIF2A germline mutation in a congenital polycythemia with paraganglioma. Journal ofMolecular Medicine 91:507–512. DOI: https://doi.org/10.1007/s00109-012-0967-z, PMID: 23090011
Lopez-Barneo J, Macıas D, Platero-Luengo A, Ortega-Saenz P, Pardal R. 2016a. Carotid body oxygen sensingand adaptation to hypoxia. Pflugers Archiv - European Journal of Physiology 468:59–70. DOI: https://doi.org/10.1007/s00424-015-1734-0, PMID: 26373853
Lopez-Barneo J, Ortega-Saenz P, Gonzalez-Rodrıguez P, Fernandez-Aguera MC, Macıas D, Pardal R, Gao L.2016b. Oxygen-sensing by arterial chemoreceptors: Mechanisms and medical translation. Molecular Aspects ofMedicine 47-48:90–108. DOI: https://doi.org/10.1016/j.mam.2015.12.002, PMID: 26709054
Ma XM, Blenis J. 2009. Molecular mechanisms of mTOR-mediated translational control. Nature ReviewsMolecular Cell Biology 10:307–318. DOI: https://doi.org/10.1038/nrm2672, PMID: 19339977
Macıas D, Fernandez-Aguera MC, Bonilla-Henao V, Lopez-Barneo J. 2014. Deletion of the von Hippel-Lindaugene causes sympathoadrenal cell death and impairs chemoreceptor-mediated adaptation to hypoxia. EMBOMolecular Medicine 6:1577–1592. DOI: https://doi.org/10.15252/emmm.201404153, PMID: 25385837
Madden JA, Vadula MS, Kurup VP. 1992. Effects of hypoxia and other vasoactive agents on pulmonary andcerebral artery smooth muscle cells. American Journal of Physiology-Lung Cellular and Molecular Physiology263:L384–L393. DOI: https://doi.org/10.1152/ajplung.1992.263.3.L384, PMID: 1415563
Madisen L, Zwingman TA, Sunkin SM, Oh SW, Zariwala HA, Gu H, Ng LL, Palmiter RD, Hawrylycz MJ, Jones AR,Lein ES, Zeng H. 2010. A robust and high-throughput Cre reporting and characterization system for the wholemouse brain. Nature Neuroscience 13:133–140. DOI: https://doi.org/10.1038/nn.2467, PMID: 20023653
McBryde FD, Abdala AP, Hendy EB, Pijacka W, Marvar P, Moraes DJ, Sobotka PA, Paton JF. 2013. The carotidbody as a putative therapeutic target for the treatment of neurogenic hypertension. Nature Communications 4:2395. DOI: https://doi.org/10.1038/ncomms3395, PMID: 24002774
Ortega-Saenz P, Pascual A, Piruat JI, Lopez-Barneo J. 2007. Mechanisms of acute oxygen sensing by the carotidbody: lessons from genetically modified animals. Respiratory Physiology & Neurobiology 157:140–147.DOI: https://doi.org/10.1016/j.resp.2007.02.009, PMID: 17360248
Pardal R, Lopez-Barneo J. 2002. Low glucose-sensing cells in the carotid body. Nature Neuroscience 5:197–198.DOI: https://doi.org/10.1038/nn812, PMID: 11850631
Pardal R, Ortega-Saenz P, Duran R, Lopez-Barneo J. 2007. Glia-like stem cells sustain physiologic neurogenesis inthe adult mammalian carotid body. Cell 131:364–377. DOI: https://doi.org/10.1016/j.cell.2007.07.043,PMID: 17956736
Pearse AG, Polak JM, Rost FW, Fontaine J, Le Lievre C, Le Douarin N. 1973. Demonstration of the neural crestorigin of type I (APUD) cells in the avian carotid body, using a cytochemical marker system. Histochemie 34:191–203. DOI: https://doi.org/10.1007/BF00303435, PMID: 4693636
Peng J, Zhang L, Drysdale L, Fong GH. 2000. The transcription factor EPAS-1/hypoxia-inducible factor 2alphaplays an important role in vascular remodeling. PNAS 97:8386–8391. DOI: https://doi.org/10.1073/pnas.140087397, PMID: 10880563
Peng YJ, Nanduri J, Khan SA, Yuan G, Wang N, Kinsman B, Vaddi DR, Kumar GK, Garcia JA, Semenza GL,Prabhakar NR. 2011. Hypoxia-inducible factor 2a (HIF-2a) heterozygous-null mice exhibit exaggerated carotid
Macias et al. eLife 2018;7:e34681. DOI: https://doi.org/10.7554/eLife.34681 25 of 26
Research article Human Biology and Medicine Developmental Biology and Stem Cells
body sensitivity to hypoxia, breathing instability, and hypertension. PNAS 108:3065–3070. DOI: https://doi.org/10.1073/pnas.1100064108, PMID: 21288809
Pijacka W, Moraes DJ, Ratcliffe LE, Nightingale AK, Hart EC, da Silva MP, Machado BH, McBryde FD, AbdalaAP, Ford AP, Paton JF. 2016. Purinergic receptors in the carotid body as a new drug target for controllinghypertension. Nature Medicine 22:1151–1159. DOI: https://doi.org/10.1038/nm.4173, PMID: 27595323
Platero-Luengo A, Gonzalez-Granero S, Duran R, Dıaz-Castro B, Piruat JI, Garcıa-Verdugo JM, Pardal R, Lopez-Barneo J. 2014. An O2-sensitive glomus cell-stem cell synapse induces carotid body growth in chronic hypoxia.Cell 156:291–303. DOI: https://doi.org/10.1016/j.cell.2013.12.013, PMID: 24439383
Raval RR, Lau KW, Tran MG, Sowter HM, Mandriota SJ, Li JL, Pugh CW, Maxwell PH, Harris AL, Ratcliffe PJ.2005. Contrasting properties of hypoxia-inducible factor 1 (HIF-1) and HIF-2 in von Hippel-Lindau-associatedrenal cell carcinoma. Molecular and Cellular Biology 25:5675–5686. DOI: https://doi.org/10.1128/MCB.25.13.5675-5686.2005, PMID: 15964822
Ryan HE, Lo J, Johnson RS. 1998. HIF-1 alpha is required for solid tumor formation and embryonicvascularization. The EMBO Journal 17:3005–3015. DOI: https://doi.org/10.1093/emboj/17.11.3005, PMID:9606183
Saldana MJ, Salem LE, Travezan R. 1973. High altitude hypoxia and chemodectomas. Human Pathology 4:251–263. DOI: https://doi.org/10.1016/S0046-8177(73)80012-7, PMID: 4706179
Schindelin J, Arganda-Carreras I, Frise E, Kaynig V, Longair M, Pietzsch T, Preibisch S, Rueden C, Saalfeld S,Schmid B, Tinevez JY, White DJ, Hartenstein V, Eliceiri K, Tomancak P, Cardona A. 2012. Fiji: an open-sourceplatform for biological-image analysis. Nature Methods 9:676–682. DOI: https://doi.org/10.1038/nmeth.2019,PMID: 22743772
Schnell PO, Ignacak ML, Bauer AL, Striet JB, Paulding WR, Czyzyk-Krzeska MF. 2003. Regulation of tyrosinehydroxylase promoter activity by the von Hippel-Lindau tumor suppressor protein and hypoxia-inducibletranscription factors. Journal of Neurochemistry 85:483–491. DOI: https://doi.org/10.1046/j.1471-4159.2003.01696.x, PMID: 12675925
Scortegagna M, Ding K, Oktay Y, Gaur A, Thurmond F, Yan LJ, Marck BT, Matsumoto AM, Shelton JM,Richardson JA, Bennett MJ, Garcia JA. 2003. Multiple organ pathology, metabolic abnormalities and impairedhomeostasis of reactive oxygen species in Epas1-/- mice. Nature Genetics 35:331–340. DOI: https://doi.org/10.1038/ng1266, PMID: 14608355
Slingo ME, Turner PJ, Christian HC, Buckler KJ, Robbins PA. 2014. The von hippel-lindau chuvash mutation inmice causes carotid-body hyperplasia and enhanced ventilatory sensitivity to hypoxia. Journal of AppliedPhysiology 116:885–892. DOI: https://doi.org/10.1152/japplphysiol.00530.2013, PMID: 24030664
Stenmark KR, Meyrick B, Galie N, Mooi WJ, McMurtry IF. 2009. Animal models of pulmonary arterialhypertension: the hope for etiological discovery and pharmacological cure. American Journal of Physiology-Lung Cellular and Molecular Physiology 297:L1013–L1032. DOI: https://doi.org/10.1152/ajplung.00217.2009,PMID: 19748998
Tan Q, Kerestes H, Percy MJ, Pietrofesa R, Chen L, Khurana TS, Christofidou-Solomidou M, Lappin TR, Lee FS.2013. Erythrocytosis and pulmonary hypertension in a mouse model of human HIF2A gain of function mutation.Journal of Biological Chemistry 288:17134–17144. DOI: https://doi.org/10.1074/jbc.M112.444059,PMID: 23640890
Teppema LJ, Dahan A. 2010. The ventilatory response to hypoxia in mammals: mechanisms, measurement, andanalysis. Physiological Reviews 90:675–754. DOI: https://doi.org/10.1152/physrev.00012.2009, PMID: 20393196
Tian H, Hammer RE, Matsumoto AM, Russell DW, McKnight SL. 1998. The hypoxia-responsive transcriptionfactor EPAS1 is essential for catecholamine homeostasis and protection against heart failure during embryonicdevelopment. Genes & Development 12:3320–3324. DOI: https://doi.org/10.1101/gad.12.21.3320, PMID: 9808618
Torres-Capelli M, Marsboom G, Li QO, Tello D, Rodriguez FM, Alonso T, Sanchez-Madrid F, Garcıa-Rio F,Ancochea J, Aragones J. 2016. Role of Hif2a oxygen sensing pathway in bronchial epithelial club cellproliferation. Scientific Reports 6:25357. DOI: https://doi.org/10.1038/srep25357, PMID: 27150457
Wang ZY, Bisgard GE. 2002. Chronic hypoxia-induced morphological and neurochemical changes in the carotidbody. Microscopy Research and Technique 59:168–177. DOI: https://doi.org/10.1002/jemt.10191, PMID: 12384961
Zhou T, Chien MS, Kaleem S, Matsunami H. 2016. Single cell transcriptome analysis of mouse carotid bodyglomus cells. The Journal of Physiology 594:4225–4251. DOI: https://doi.org/10.1113/JP271936, PMID: 26940531
Zhuang Z, Yang C, Lorenzo F, Merino M, Fojo T, Kebebew E, Popovic V, Stratakis CA, Prchal JT, Pacak K. 2012.Somatic HIF2A gain-of-function mutations in paraganglioma with polycythemia. New England Journal ofMedicine 367:922–930. DOI: https://doi.org/10.1056/NEJMoa1205119, PMID: 22931260
Macias et al. eLife 2018;7:e34681. DOI: https://doi.org/10.7554/eLife.34681 26 of 26
Research article Human Biology and Medicine Developmental Biology and Stem Cells