Growth and Innovation Strategies In Global Competition
27
Tjalling C. Koopmans Research Institute
-
Upload
khangminh22 -
Category
Documents
-
view
1 -
download
0
Transcript of Growth and Innovation Strategies In Global Competition

Tjalling C. Koopmans Research Institute
Tjalling C. Koopmans Research Institute Utrecht School of Economics Utrecht University Vredenburg 138 3511 BG Utrecht The Netherlands telephone +31 30 253 9800 fax +31 30 253 7373 website www.koopmansinstitute.uu.nl The Tjalling C. Koopmans Institute is the research institute and research school of Utrecht School of Economics. It was founded in 2003, and named after Professor Tjalling C. Koopmans, Dutch-born Nobel Prize laureate in economics of 1975. In the discussion papers series the Koopmans Institute publishes results of ongoing research for early dissemination of research results, and to enhance discussion with colleagues. Please send any comments and suggestions on the Koopmans institute, or this series to [email protected] ontwerp voorblad: WRIK Utrecht
How to reach the authors Please direct all correspondence to the first author. Utz Weitzel Utrecht University Utrecht School of Economics Vredenburg 138 3511 BG Utrecht The Netherlands. E-mail: [email protected]
This paper can be downloaded at: http://www.koopmansinstitute.uu.nl

Utrecht School of Economics Tjalling C. Koopmans Research Institute Discussion Paper Series 05-29
Growth and innovation Strategies In Global Competition*
Utz Weitzel
Utrecht School of Economics Utrecht University
September 2005
Abstract This paper develops a model of firm dynamics in global competition and experimentally analyzes multinational growth strategies and optimal coordination of innovative activities. It shows that growth and innovation strategies of operatively engaged headquarters (business or corporate) with a geocentric focus dominate alternative concepts, like ethnocentric, financial or flexible headquarters. The analysis identifies two crucial strategic advantages for successful multinational companies: economies of stability and global learning.
Keywords: Multinational Enterprise (MNE), Research and Development (R&D) Multinational Organization, Firm Dynamics, Innovation JEL classification: F2, L2, M1, M2
* An earlier version of this paper was discussed at the J.L. Kellogg Graduate School of Management and the Humboldt Universität Berlin. I thank the participants for their helpful comments and suggestions. All remaining errors should, of course, be attributed to me.

INTRODUCTION Intensive competition forces multinational enterprises (MNE) to constantly scrutinize every subsidiary's performance. However, for the creation of truly global competitive advantages, MNEs need a growth and innovation strategy that effectively utilizes and channels the interplay between subsidiaries, divisions, corporate headquarters, and holdings. Such a strategy must be flexible and open enough for local excellence without loosing too much of its global reach and sustainability. While previous approaches, such as the core competence framework, emphasize commonalities between business units, contemporary concepts in strategic management explicitly focus on an MNE’s center of global coordination and analyze how well its strategies and skills fit the needs and opportunities of various subsidiaries and divisions. Successful headquarters (HQ), irrespective of whether they coordinate a specific division or the whole corporation, do not only create more value than they cost, they also create a competitive advantage and more stakeholder value than any of their rivals. To accomplish this, four ways are identified: direct influence on each subsidiary as an entity; promotion of lateral linkages within the MNE; provision of functional leadership; and corporate (portfolio) development. The more productivity pressures force MNEs to disperse their activities throughout the world and the more competitive pressures impel close coordination of these operations, the more global growth strategies play a pivotal role in the success of the whole company. Empirical studies found that the coordination of research and development (R&D) portfolios and projects is not only highly complex and demanding, but also offers high potential returns to well defined global growth and innovation strategies (Campbell et al., 1995a; Buchanan & Sands, 1994). Since the objective of this paper is to analyze the impact of such strategies it is useful to focus on the various mechanisms of global R&D coordination and their impact on MNE growth and performance in international competition. To achieve this objective a number of obstacles must be overcome: First, there is the need to survey the international management literature and develop a robust framework for the analysis of different growth strategies. Second, a theoretical base encompassing organizational and managerial aspects of multinational R&D has to be developed. Here, a behavioral innovation model is suggested as conceptual foundation for the analysis of MNE’s coordination of R&D. Since the complexity of the research problem makes it virtually impossible to obtain analytical solutions, a simulation model is used. Third, the dynamic dimensions of both the HQs’ growth strategy and corporate R&D, and their combined influence on the innovation-led growth of MNEs, must be considered. Although the ‘process school’ of international management emphasizes some of these aspects (Doz & Prahalad, 1981, 1984; Bartlett & Goshal, 1987, 1989; Hedlund, 1986), "despite the label of the school, the process orientation in the theoretical body of the school is undeveloped" (Melin, 1992, p.111). However, in a purely national setting, there do exist some process oriented simulation models of innovation-led firm growth (Nelson &
2

Winter 1977a/b). Therefore, in analyzing the dynamic advantages of MNEs, this paper merges two disparate strands of research: a solid theoretical base explaining national firm growth and the primarily static analysis of MNEs in global competition. The paper is structured as follows. In the first section two elementary dimensions of multinational coordination are derived from the literature, which are then employed to advance six coordination types for further analysis. In the second section a simulation model of MNE growth and R&D coordination is developed. The third section presents the simulation results and a discussion of their strategic significance for HQ-subsidiary interactions and multinational R&D coordination. The paper concludes with a short summary and some implications for theory and management.
3
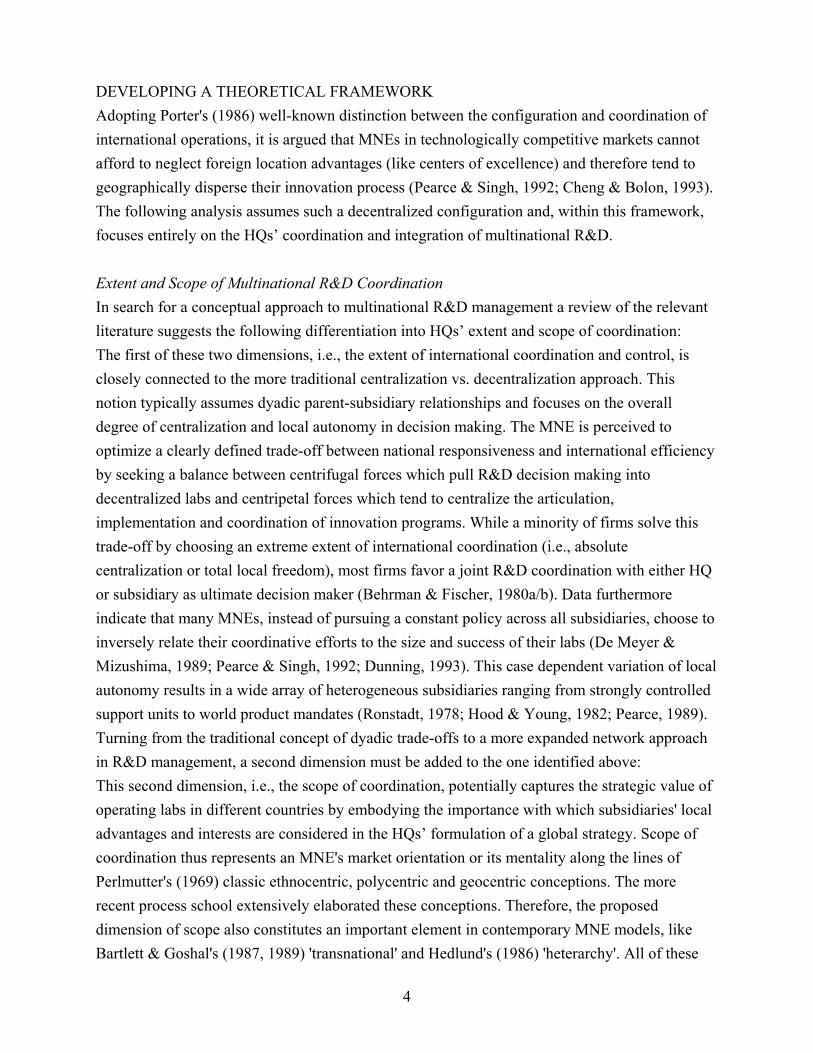
DEVELOPING A THEORETICAL FRAMEWORK Adopting Porter's (1986) well-known distinction between the configuration and coordination of international operations, it is argued that MNEs in technologically competitive markets cannot afford to neglect foreign location advantages (like centers of excellence) and therefore tend to geographically disperse their innovation process (Pearce & Singh, 1992; Cheng & Bolon, 1993). The following analysis assumes such a decentralized configuration and, within this framework, focuses entirely on the HQs’ coordination and integration of multinational R&D. Extent and Scope of Multinational R&D Coordination In search for a conceptual approach to multinational R&D management a review of the relevant literature suggests the following differentiation into HQs’ extent and scope of coordination: The first of these two dimensions, i.e., the extent of international coordination and control, is closely connected to the more traditional centralization vs. decentralization approach. This notion typically assumes dyadic parent-subsidiary relationships and focuses on the overall degree of centralization and local autonomy in decision making. The MNE is perceived to optimize a clearly defined trade-off between national responsiveness and international efficiency by seeking a balance between centrifugal forces which pull R&D decision making into decentralized labs and centripetal forces which tend to centralize the articulation, implementation and coordination of innovation programs. While a minority of firms solve this trade-off by choosing an extreme extent of international coordination (i.e., absolute centralization or total local freedom), most firms favor a joint R&D coordination with either HQ or subsidiary as ultimate decision maker (Behrman & Fischer, 1980a/b). Data furthermore indicate that many MNEs, instead of pursuing a constant policy across all subsidiaries, choose to inversely relate their coordinative efforts to the size and success of their labs (De Meyer & Mizushima, 1989; Pearce & Singh, 1992; Dunning, 1993). This case dependent variation of local autonomy results in a wide array of heterogeneous subsidiaries ranging from strongly controlled support units to world product mandates (Ronstadt, 1978; Hood & Young, 1982; Pearce, 1989). Turning from the traditional concept of dyadic trade-offs to a more expanded network approach in R&D management, a second dimension must be added to the one identified above: This second dimension, i.e., the scope of coordination, potentially captures the strategic value of operating labs in different countries by embodying the importance with which subsidiaries' local advantages and interests are considered in the HQs’ formulation of a global strategy. Scope of coordination thus represents an MNE's market orientation or its mentality along the lines of Perlmutter's (1969) classic ethnocentric, polycentric and geocentric conceptions. The more recent process school extensively elaborated these conceptions. Therefore, the proposed dimension of scope also constitutes an important element in contemporary MNE models, like Bartlett & Goshal's (1987, 1989) 'transnational' and Hedlund's (1986) 'heterarchy'. All of these
4
concepts go beyond the traditional parent-subsidiary dichotomy by emphasizing lateral information flows and technology transfers between interdependent subsidiaries as idiosyncratic characteristics of integrated networks - an aspect which many empirical studies confirm to be crucial for a globally effective innovation process (Pearce & Papanastassiou, 1996; Pearce & Singh, 1992; De Meyer & Mizushima, 1989; Goshal & Bartlett, 1988). Typology of MNE’s central coordination Table 1 shows six different HQ types that can be derived from respective combinations of the two dimensions, extent and scope of international coordination.
5
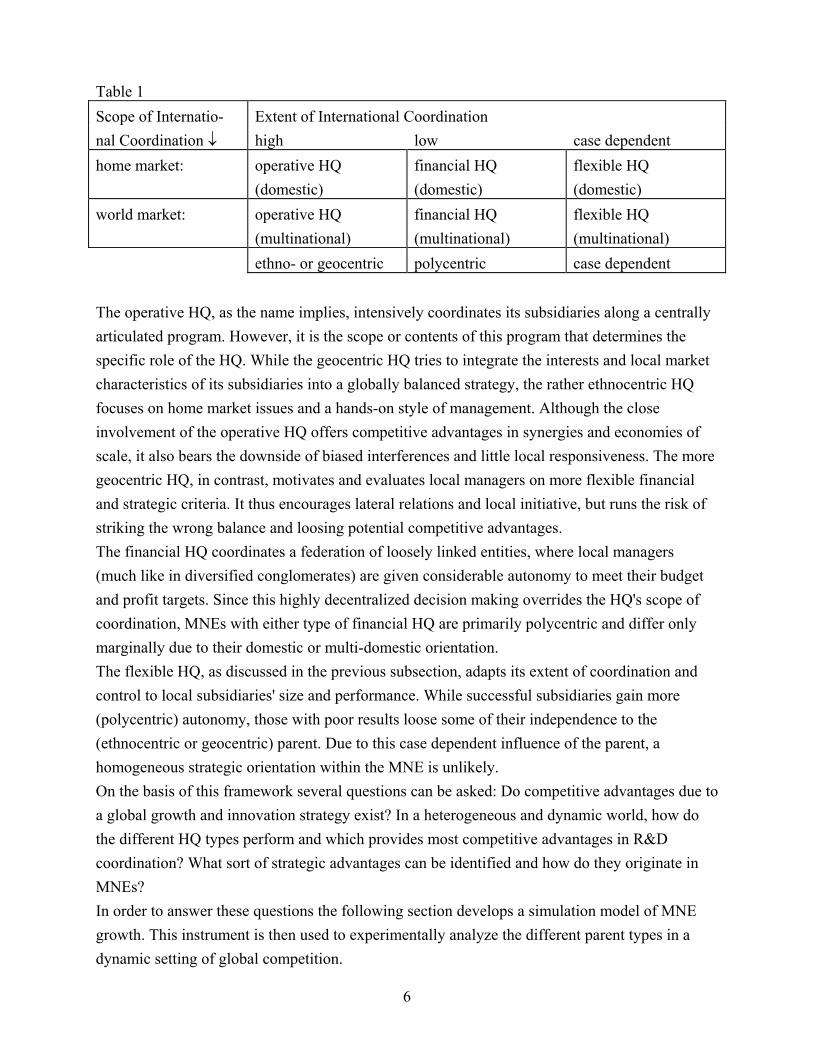
Table 1 Scope of Internatio- Extent of International Coordination nal Coordination ↓ high low case dependent home market: operative HQ
(domestic) financial HQ (domestic)
flexible HQ (domestic)
world market: operative HQ (multinational)
financial HQ (multinational)
flexible HQ (multinational)
ethno- or geocentric polycentric case dependent The operative HQ, as the name implies, intensively coordinates its subsidiaries along a centrally articulated program. However, it is the scope or contents of this program that determines the specific role of the HQ. While the geocentric HQ tries to integrate the interests and local market characteristics of its subsidiaries into a globally balanced strategy, the rather ethnocentric HQ focuses on home market issues and a hands-on style of management. Although the close involvement of the operative HQ offers competitive advantages in synergies and economies of scale, it also bears the downside of biased interferences and little local responsiveness. The more geocentric HQ, in contrast, motivates and evaluates local managers on more flexible financial and strategic criteria. It thus encourages lateral relations and local initiative, but runs the risk of striking the wrong balance and loosing potential competitive advantages. The financial HQ coordinates a federation of loosely linked entities, where local managers (much like in diversified conglomerates) are given considerable autonomy to meet their budget and profit targets. Since this highly decentralized decision making overrides the HQ's scope of coordination, MNEs with either type of financial HQ are primarily polycentric and differ only marginally due to their domestic or multi-domestic orientation. The flexible HQ, as discussed in the previous subsection, adapts its extent of coordination and control to local subsidiaries' size and performance. While successful subsidiaries gain more (polycentric) autonomy, those with poor results loose some of their independence to the (ethnocentric or geocentric) parent. Due to this case dependent influence of the parent, a homogeneous strategic orientation within the MNE is unlikely. On the basis of this framework several questions can be asked: Do competitive advantages due to a global growth and innovation strategy exist? In a heterogeneous and dynamic world, how do the different HQ types perform and which provides most competitive advantages in R&D coordination? What sort of strategic advantages can be identified and how do they originate in MNEs? In order to answer these questions the following section develops a simulation model of MNE growth. This instrument is then used to experimentally analyze the different parent types in a dynamic setting of global competition.
6
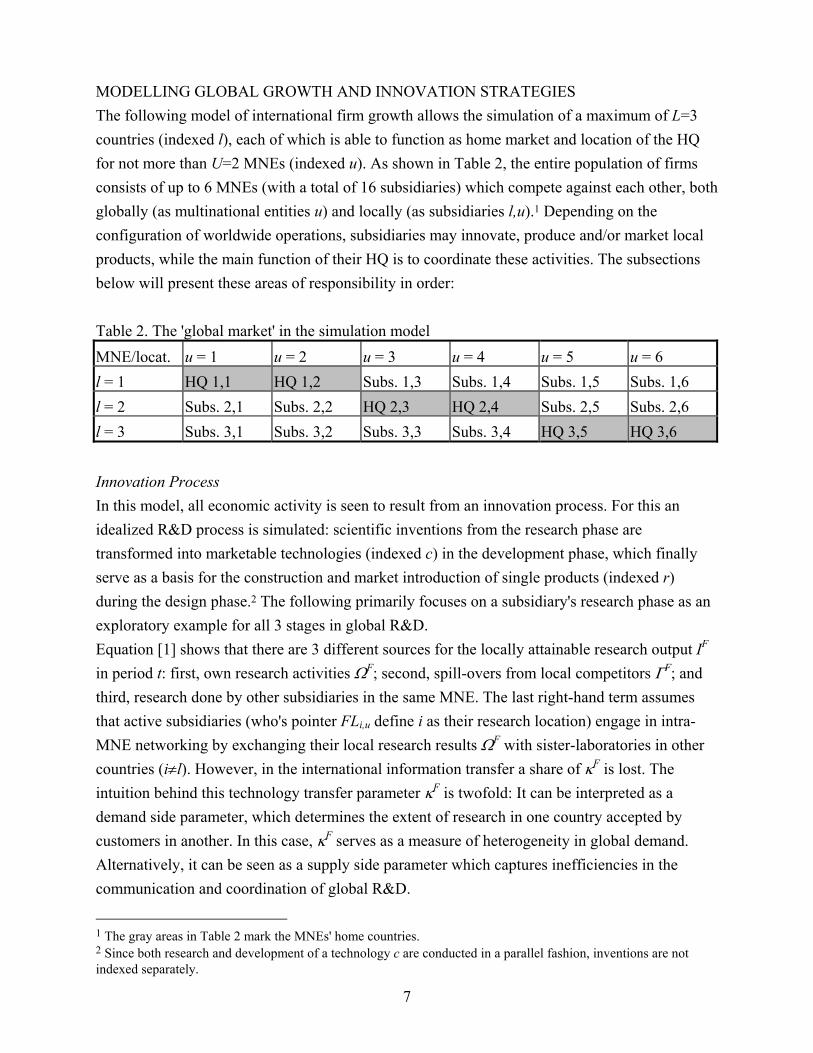
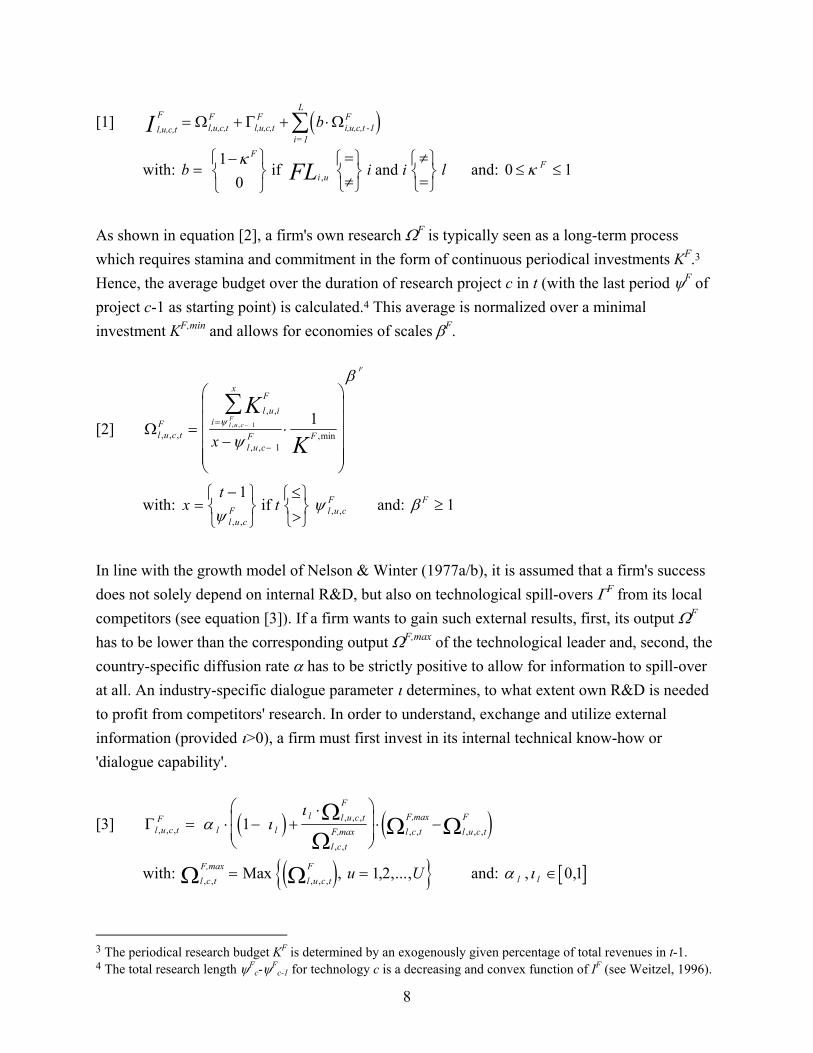
MODELLING GLOBAL GROWTH AND INNOVATION STRATEGIES The following model of international firm growth allows the simulation of a maximum of L=3 countries (indexed l), each of which is able to function as home market and location of the HQ for not more than U=2 MNEs (indexed u). As shown in Table 2, the entire population of firms consists of up to 6 MNEs (with a total of 16 subsidiaries) which compete against each other, both globally (as multinational entities u) and locally (as subsidiaries l,u).1 Depending on the configuration of worldwide operations, subsidiaries may innovate, produce and/or market local products, while the main function of their HQ is to coordinate these activities. The subsections below will present these areas of responsibility in order: Table 2. The 'global market' in the simulation model MNE/locat. u = 1 u = 2 u = 3 u = 4 u = 5 u = 6 l = 1 HQ 1,1 HQ 1,2 Subs. 1,3 Subs. 1,4 Subs. 1,5 Subs. 1,6 l = 2 Subs. 2,1 Subs. 2,2 HQ 2,3 HQ 2,4 Subs. 2,5 Subs. 2,6 l = 3 Subs. 3,1 Subs. 3,2 Subs. 3,3 Subs. 3,4 HQ 3,5 HQ 3,6 Innovation Process In this model, all economic activity is seen to result from an innovation process. For this an idealized R&D process is simulated: scientific inventions from the research phase are transformed into marketable technologies (indexed c) in the development phase, which finally serve as a basis for the construction and market introduction of single products (indexed r) during the design phase.2 The following primarily focuses on a subsidiary's research phase as an exploratory example for all 3 stages in global R&D. Equation [1] shows that there are 3 different sources for the locally attainable research output IF in period t: first, own research activities ΩF; second, spill-overs from local competitors ΓF; and third, research done by other subsidiaries in the same MNE. The last right-hand term assumes that active subsidiaries (who's pointer FLi,u define i as their research location) engage in intra-MNE networking by exchanging their local research results ΩF with sister-laboratories in other countries (i≠l). However, in the international information transfer a share of κF is lost. The intuition behind this technology transfer parameter κF is twofold: It can be interpreted as a demand side parameter, which determines the extent of research in one country accepted by customers in another. In this case, κF serves as a measure of heterogeneity in global demand. Alternatively, it can be seen as a supply side parameter which captures inefficiencies in the communication and coordination of global R&D.
1 The gray areas in Table 2 mark the MNEs' home countries. 2 Since both research and development of a technology c are conducted in a parallel fashion, inventions are not indexed separately.
7
[1] ( )l,u,c,tF
l,u,c,tF
l,u,c,tF
i,u,c,t -1F
i=1
L
I b= + + ⋅∑Ω Γ Ω
with: b i and: 0i l 1F
i uFL=−
=≠
≠=
if and 1
0κ
, ≤ ≤κ F
As shown in equation [2], a firm's own research ΩF is typically seen as a long-term process which requires stamina and commitment in the form of continuous periodical investments KF.3 Hence, the average budget over the duration of research project c in t (with the last period ψF of project c-1 as starting point) is calculated.4 This average is normalized over a minimal investment KF,min and allows for economies of scales βF.
[2] Ωl u c tF
l u iF
i
x
l u cF F
K
Kl u cF
F
x, , ,
, ,
, ,,min
, ,=−
⋅
=
−
−
∑ψ
ψ
β
1
1
1
with: x = ψ and: β F ≥
tt
l u cF
F−
≤>
1ψ
, ,, , if l u c 1
In line with the growth model of Nelson & Winter (1977a/b), it is assumed that a firm's success does not solely depend on internal R&D, but also on technological spill-overs ΓF from its local competitors (see equation [3]). If a firm wants to gain such external results, first, its output ΩF has to be lower than the corresponding output ΩF,max of the technological leader and, second, the country-specific diffusion rate α has to be strictly positive to allow for information to spill-over at all. An industry-specific dialogue parameter ι determines, to what extent own R&D is needed to profit from competitors' research. In order to understand, exchange and utilize external information (provided ι>0), a firm must first invest in its internal technical know-how or 'dialogue capability'.
[3] ( ) ( )Γ ΩΩ
Ω Ωl u c tF
l ll l u c t
F
l c tF,max l c t
F,maxl u c tF
, , ,, , ,
, ,, , , , ,= ⋅ − +
⋅
⋅ − α ι
ι1
with: Ω Ω and: ( ) l c tF,max
l u c tF u, , , , , , ,= =Max , ...,1 2 U [ ]l l, ,∈ 0 1α ι
3 The periodical research budget KF is determined by an exogenously given percentage of total revenues in t-1. 4 The total research length ψF
c-ψFc-1 for technology c is a decreasing and convex function of IF (see Weitzel, 1996).
8

At this point the research phase of the simulated innovation process is fully defined. With the exception of the following differences, equations [1]-[3] analogously apply to the development and design stage: For the determination of firm's output in the development phase, equation [2] does not look at an average, but an accumulation of periodical investments. Thus, in contrast to research, the development output increases with each period, reflecting the notion that the distinct nature of this stage is one of learning by trial-and-error.5 The main difference between (technological) research and (product) design is the relatively short and manageable time horizon of the latter. Here, equation [2] considers a simple time-cost trade-off, which a firm chooses for each new design project (see Weitzel, 1996). Production Process Total production costs are split into a variable part KP,var and a fixed part KP,fix. In equation [4], the latter is primarily a function of fixed unit costs kP,fix and local production volume V in t-1.6 Fixed costs are investment decisions made in the past. So, for simplicity, the production volume V in t-1 is used to calculate the fixed costs in t. The final right-hand term in [4] represents experience effects which are positively influenced by the cumulative amount of produced goods and a learning rate λ. (The total variable costs KP,var are determined analogously to [4] with the distinction that they are linked to the current volume V in t.)
[4] l u c r tP fix
lP fix
l u c r t l u c r ii
t
K k V V, , , ,, ,
, , , , , , , ,= ⋅ ⋅
−
=
− −
∑11
1 λ
Diffusion Process A firm's total sales are calculated on the basis of the Bass diffusion model (1969). Due to its widespread recognition, the following only briefly discusses how the concept is utilized in this paper, i.e., how a selection of firm-specific parameters labeled 'marketing package' influences the purchase behavior of consumers. Since potential demand M is divided into φM venturesome 'innovators' and (1-φ)M risk averse 'imitators', each product of each firm has 2 corresponding marketing packages.7 For innovators, who are disposed to trying a new product (mainly because of its novelty), the most important influence to buy is the extent of R&D incorporated in the innovation.8 Low prices certainly have a positive effect, but their weight in the marketing
5 In other words: The longer and the more intensively a development team tests and improves a new technology the safer, easier to handle and more comfortable it eventually is for the customer. 6 Note that the production volume V is not restricted to local sales only. Depending on the global configuration of production capacity, it can also be the volume of a world scale plant. 7 To avoid the so-called 'Bass trap' the market is split a priori (see Weitzel, 1996). 8 In the marketing package the extent of R&D is represented by output I (see equation [1]).
9
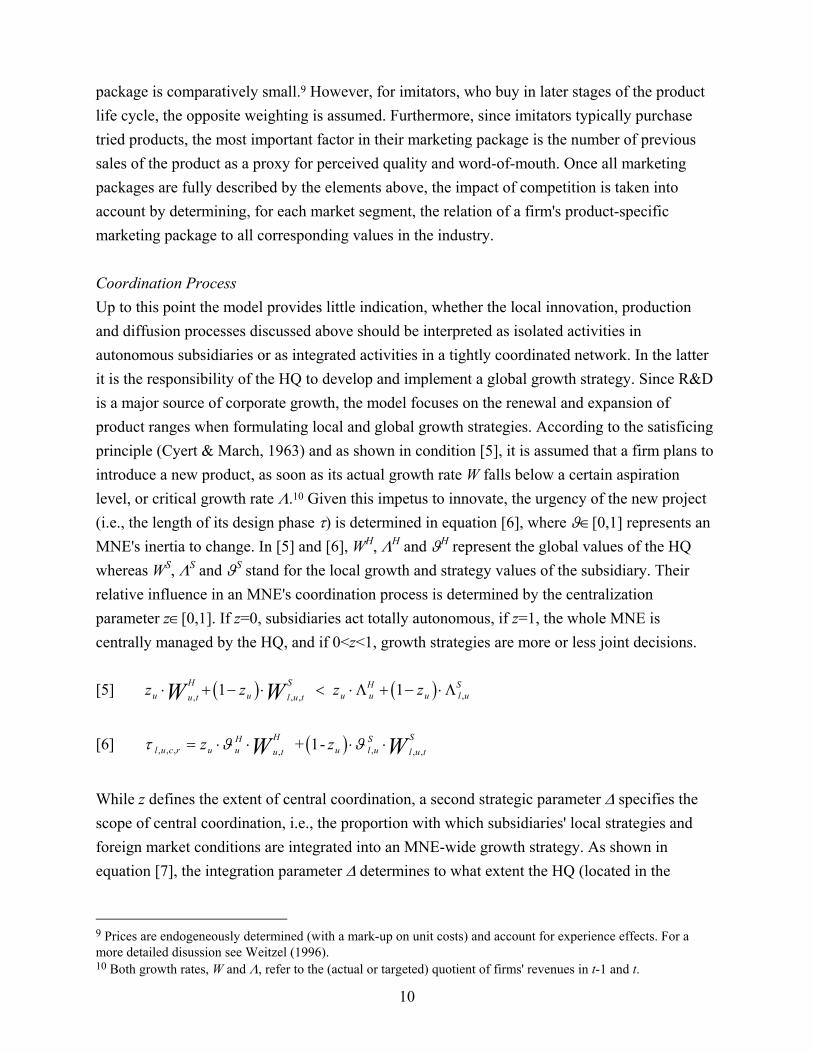
package is comparatively small.9 However, for imitators, who buy in later stages of the product life cycle, the opposite weighting is assumed. Furthermore, since imitators typically purchase tried products, the most important factor in their marketing package is the number of previous sales of the product as a proxy for perceived quality and word-of-mouth. Once all marketing packages are fully described by the elements above, the impact of competition is taken into account by determining, for each market segment, the relation of a firm's product-specific marketing package to all corresponding values in the industry. Coordination Process Up to this point the model provides little indication, whether the local innovation, production and diffusion processes discussed above should be interpreted as isolated activities in autonomous subsidiaries or as integrated activities in a tightly coordinated network. In the latter it is the responsibility of the HQ to develop and implement a global growth strategy. Since R&D is a major source of corporate growth, the model focuses on the renewal and expansion of product ranges when formulating local and global growth strategies. According to the satisficing principle (Cyert & March, 1963) and as shown in condition [5], it is assumed that a firm plans to introduce a new product, as soon as its actual growth rate W falls below a certain aspiration level, or critical growth rate Λ.10 Given this impetus to innovate, the urgency of the new project (i.e., the length of its design phase τ) is determined in equation [6], where ϑ∈[0,1] represents an MNE's inertia to change. In [5] and [6], WH, ΛH and ϑH represent the global values of the HQ whereas WS, ΛS and ϑS stand for the local growth and strategy values of the subsidiary. Their relative influence in an MNE's coordination process is determined by the centralization parameter z∈[0,1]. If z=0, subsidiaries act totally autonomous, if z=1, the whole MNE is centrally managed by the HQ, and if 0<z<1, growth strategies are more or less joint decisions. [5] ( ) ( )z z z zu u t
Hu l u t
Su u
Hu l
SW W⋅ + − ⋅ < ⋅ + − ⋅, , , ,1 1 Λ Λ u
[6] ( )τ ϑ ϑl u c r u u
Hu tH
u l uS
l u tSz zW W, , , , , , ,= ⋅ ⋅ ⋅ ⋅ + 1-
While z defines the extent of central coordination, a second strategic parameter ∆ specifies the scope of central coordination, i.e., the proportion with which subsidiaries' local strategies and foreign market conditions are integrated into an MNE-wide growth strategy. As shown in equation [7], the integration parameter ∆ determines to what extent the HQ (located in the
9 Prices are endogeneously determined (with a mark-up on unit costs) and account for experience effects. For a more detailed disussion see Weitzel (1996). 10 Both growth rates, W and Λ, refer to the (actual or targeted) quotient of firms' revenues in t-1 and t.
10
MNE's home country, where pointer HQl,u equals l) considers the local growth WS of its subsidiaries abroad (HQl,u≠l) when calculating WH for its global strategy. For simplicity, it is
assumed that the critical growth rate ΛH and degree of inertia ϑH are calculated analogously.
[7] ( )u t
H
ul u tS
l
L
W WLb, ,=
+ ⋅ −⋅ ⋅
=∑ 1
1 1 1∆ ,
with: b l and: 0 1u
l uHQ=
≠=
if ∆1 ,
≤ ≤∆u
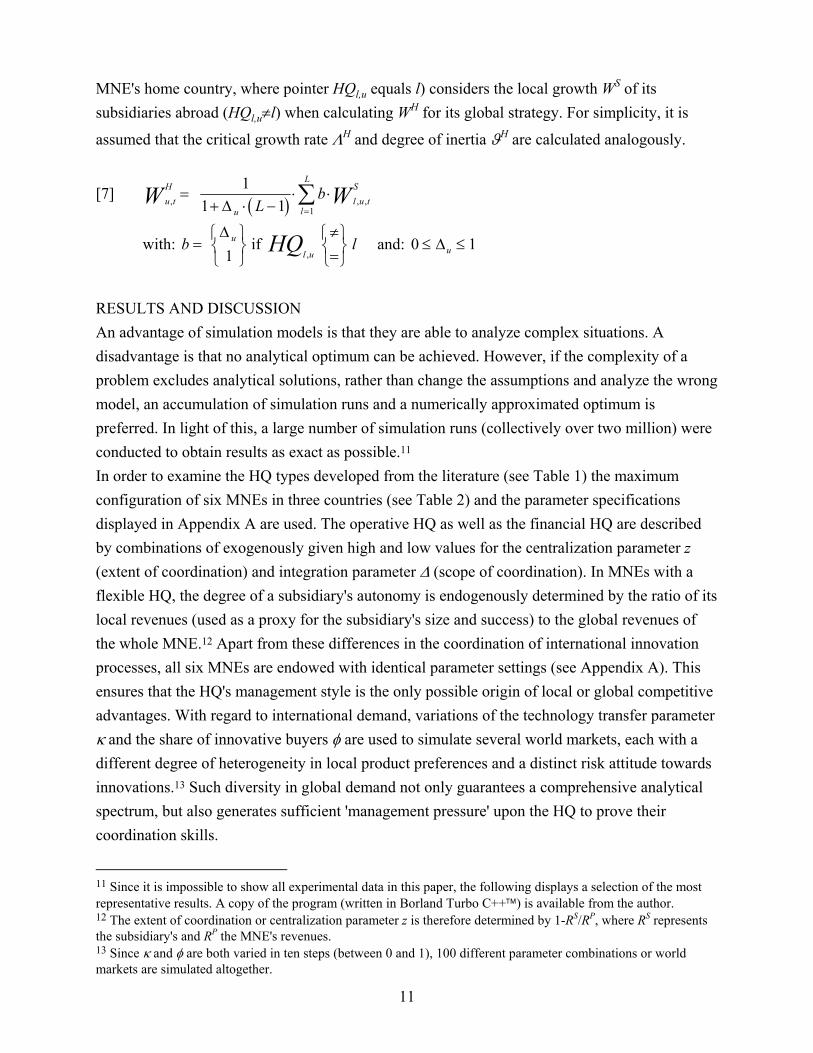
RESULTS AND DISCUSSION An advantage of simulation models is that they are able to analyze complex situations. A disadvantage is that no analytical optimum can be achieved. However, if the complexity of a problem excludes analytical solutions, rather than change the assumptions and analyze the wrong model, an accumulation of simulation runs and a numerically approximated optimum is preferred. In light of this, a large number of simulation runs (collectively over two million) were conducted to obtain results as exact as possible.11 In order to examine the HQ types developed from the literature (see Table 1) the maximum configuration of six MNEs in three countries (see Table 2) and the parameter specifications displayed in Appendix A are used. The operative HQ as well as the financial HQ are described by combinations of exogenously given high and low values for the centralization parameter z (extent of coordination) and integration parameter ∆ (scope of coordination). In MNEs with a flexible HQ, the degree of a subsidiary's autonomy is endogenously determined by the ratio of its local revenues (used as a proxy for the subsidiary's size and success) to the global revenues of the whole MNE.12 Apart from these differences in the coordination of international innovation processes, all six MNEs are endowed with identical parameter settings (see Appendix A). This ensures that the HQ's management style is the only possible origin of local or global competitive advantages. With regard to international demand, variations of the technology transfer parameter κ and the share of innovative buyers φ are used to simulate several world markets, each with a different degree of heterogeneity in local product preferences and a distinct risk attitude towards innovations.13 Such diversity in global demand not only guarantees a comprehensive analytical spectrum, but also generates sufficient 'management pressure' upon the HQ to prove their coordination skills.
11 Since it is impossible to show all experimental data in this paper, the following displays a selection of the most representative results. A copy of the program (written in Borland Turbo C++) is available from the author. 12 The extent of coordination or centralization parameter z is therefore determined by 1-RS/RP, where RS represents the subsidiary's and RP the MNE's revenues. 13 Since κ and φ are both varied in ten steps (between 0 and 1), 100 different parameter combinations or world markets are simulated altogether.
11
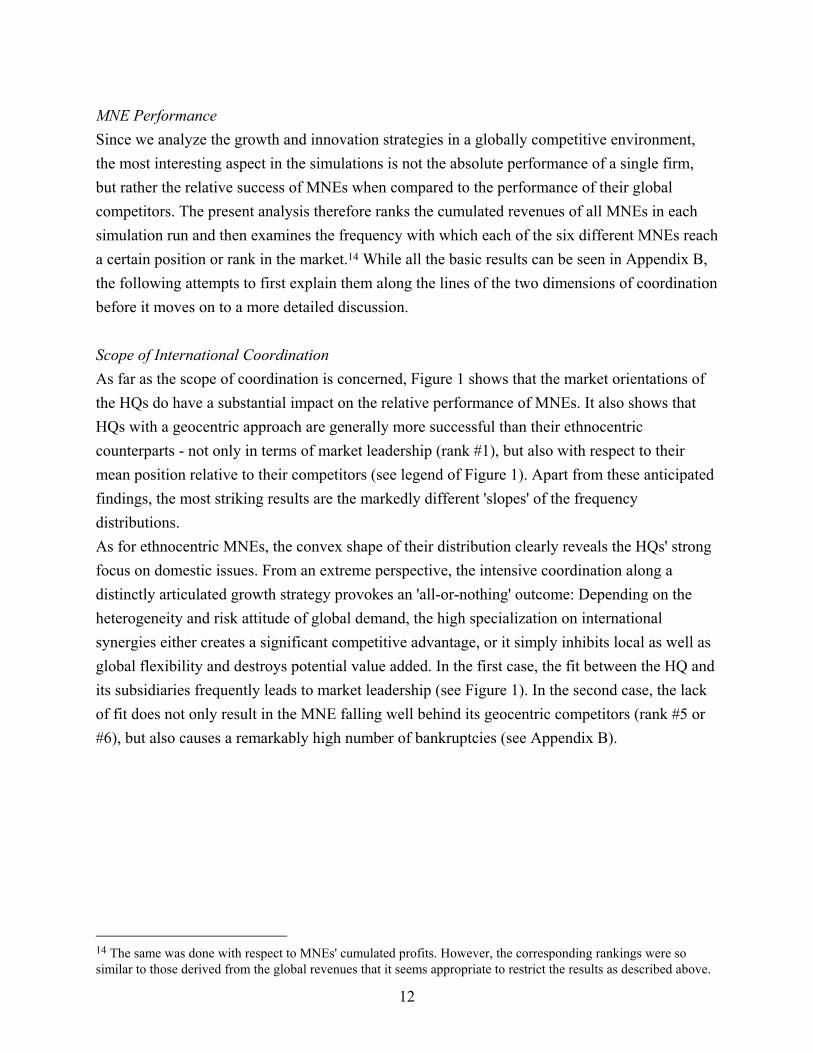
MNE Performance Since we analyze the growth and innovation strategies in a globally competitive environment, the most interesting aspect in the simulations is not the absolute performance of a single firm, but rather the relative success of MNEs when compared to the performance of their global competitors. The present analysis therefore ranks the cumulated revenues of all MNEs in each simulation run and then examines the frequency with which each of the six different MNEs reach a certain position or rank in the market.14 While all the basic results can be seen in Appendix B, the following attempts to first explain them along the lines of the two dimensions of coordination before it moves on to a more detailed discussion. Scope of International Coordination As far as the scope of coordination is concerned, Figure 1 shows that the market orientations of the HQs do have a substantial impact on the relative performance of MNEs. It also shows that HQs with a geocentric approach are generally more successful than their ethnocentric counterparts - not only in terms of market leadership (rank #1), but also with respect to their mean position relative to their competitors (see legend of Figure 1). Apart from these anticipated findings, the most striking results are the markedly different 'slopes' of the frequency distributions. As for ethnocentric MNEs, the convex shape of their distribution clearly reveals the HQs' strong focus on domestic issues. From an extreme perspective, the intensive coordination along a distinctly articulated growth strategy provokes an 'all-or-nothing' outcome: Depending on the heterogeneity and risk attitude of global demand, the high specialization on international synergies either creates a significant competitive advantage, or it simply inhibits local as well as global flexibility and destroys potential value added. In the first case, the fit between the HQ and its subsidiaries frequently leads to market leadership (see Figure 1). In the second case, the lack of fit does not only result in the MNE falling well behind its geocentric competitors (rank #5 or #6), but also causes a remarkably high number of bankruptcies (see Appendix B).
14 The same was done with respect to MNEs' cumulated profits. However, the corresponding rankings were so similar to those derived from the global revenues that it seems appropriate to restrict the results as described above.
12
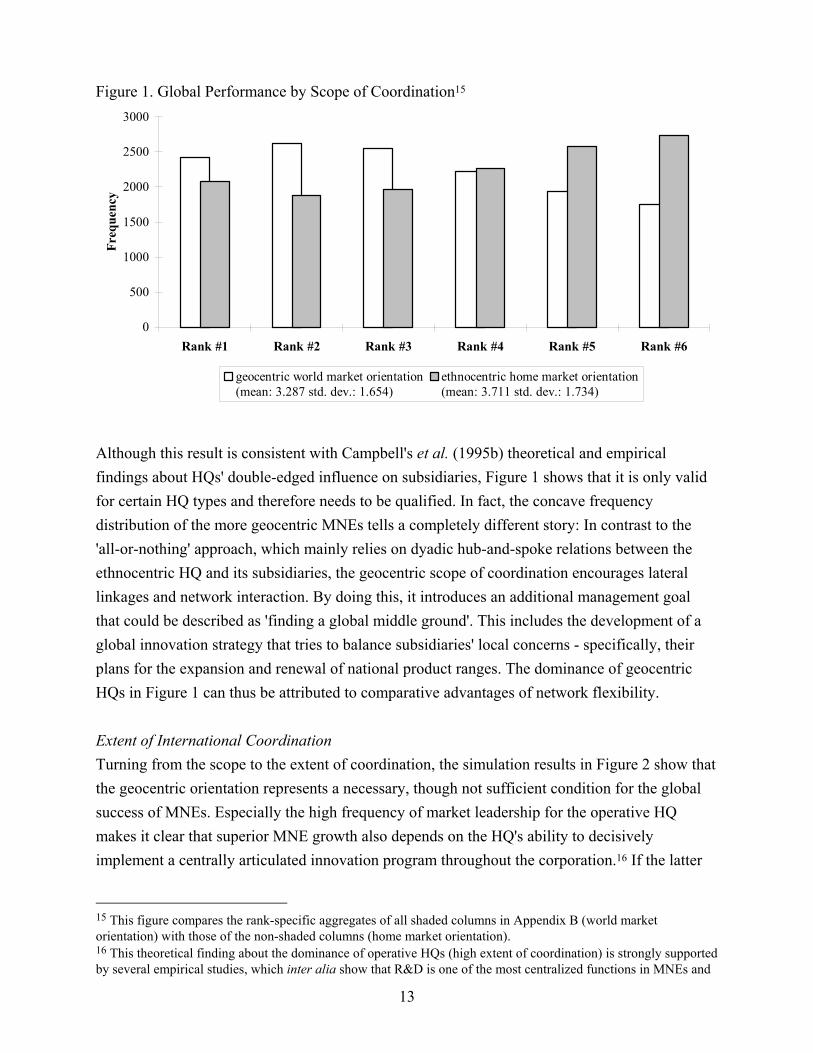
Figure 1. Global Performance by Scope of Coordination15
0
500
1000
1500
2000
2500
3000
Rank #1 Rank #2 Rank #3 Rank #4 Rank #5 Rank #6
Freq
uenc
y
geocentric world market orientation(mean: 3.287 std. dev.: 1.654)
ethnocentric home market orientation(mean: 3.711 std. dev.: 1.734)
Although this result is consistent with Campbell's et al. (1995b) theoretical and empirical findings about HQs' double-edged influence on subsidiaries, Figure 1 shows that it is only valid for certain HQ types and therefore needs to be qualified. In fact, the concave frequency distribution of the more geocentric MNEs tells a completely different story: In contrast to the 'all-or-nothing' approach, which mainly relies on dyadic hub-and-spoke relations between the ethnocentric HQ and its subsidiaries, the geocentric scope of coordination encourages lateral linkages and network interaction. By doing this, it introduces an additional management goal that could be described as 'finding a global middle ground'. This includes the development of a global innovation strategy that tries to balance subsidiaries' local concerns - specifically, their plans for the expansion and renewal of national product ranges. The dominance of geocentric HQs in Figure 1 can thus be attributed to comparative advantages of network flexibility. Extent of International Coordination Turning from the scope to the extent of coordination, the simulation results in Figure 2 show that the geocentric orientation represents a necessary, though not sufficient condition for the global success of MNEs. Especially the high frequency of market leadership for the operative HQ makes it clear that superior MNE growth also depends on the HQ's ability to decisively implement a centrally articulated innovation program throughout the corporation.16 If the latter
15 This figure compares the rank-specific aggregates of all shaded columns in Appendix B (world market orientation) with those of the non-shaded columns (home market orientation). 16 This theoretical finding about the dominance of operative HQs (high extent of coordination) is strongly supported by several empirical studies, which inter alia show that R&D is one of the most centralized functions in MNEs and
13
dimension of coordination is of little concern to the HQ, as in the case of the financial HQ, the chances of reaching the top rank in the competitive field are more than halved (see Figure 2). This is mainly due to the insufficient team-work by the subsidiaries and a subsequent lack of synergies in the international innovation process. However, in exchange, the high local responsiveness of the decentralized units prevents a greater number of bankruptcies (see Appendix B). While flexibility alone is not sufficient for strong market leadership, it does contain enough growth potential for second and third best positions.
that there is a general tendency in MNEs towards more centralized decision making (for an overview see Martinez & Jarillo (1989) and Dunning (1993)).
14
Figure 2. Global Performance by Extent of Coordination17
0
250
500
750
1000
1250
1500
1750
2000
2250
2500
2750
Rank #1 Rank #2 Rank #3 Rank #4 Rank #5 Rank #6
Freq
uenc
y
operative HQ(mean: 3.23 std. dev.: 1.804)
financial HQ(mean: 3.239 std. dev.: 1.426)
flexible HQ(mean: 4.027 std. dev.: 1.744)
The most interesting result in Figure 2 is the remarkably poor performance of MNEs with a flexible HQ. It is highly counter-intuitive, as this type of HQ explicitly rewards successful subsidiaries by granting them more autonomy, and, because it pushes less successful subsidiaries by intensifying the pressure from central management. Nevertheless, the drawback of this 'carrot and stick' approach lies in the unstable and myopic coordination of local product ranges: While successful subsidiaries are increasingly allowed to focus on their own R&D and thereby detach themselves from international innovation projects, the less successful, centrally coordinated rest of the MNE is left behind with little mutual support. Further, the worse the collective performance of this group, the less potential synergy effects there are in international R&D, and the less local flexibility is left for the subsidiaries to at least partially offset their low product quality. Once such a polarity between successful and unsuccessful subsidiaries has developed within the MNE, even the more autonomous subsidiaries experience difficulties in global competition, given that they basically operate as locally isolated firms. Hence, they often end up in the same vicious cycle of centrally reinforced decline. This long-term argument specifically explains why the flexible HQ has the highest bankruptcy rate of all HQ types (see Appendix B). Concluding this subsection, a combined analysis of the figures above and the results in Appendix B show that, in a heterogeneous and dynamic world, the geocentric operative HQ dominates all other HQ types - not only along the two dimensions of coordination but also in terms of its individual market leadership. Furthermore, both the ethnocentric operative HQ and the
17 This figure compares the rank-specific aggregates of the first pair of columns in Appendix B (operative HQ) with those of the second (financial HQ) and third pair (flexible HQ).
15
multinational financial HQ are found to be considerably stronger and more competitive than either of the flexible HQs (see Appendix B). As all simulated MNEs differ only in their type of HQ, the diversity in their growth patterns provides evidence of the existence and importance of strategic advantages. However, despite this finding, it remains unclear which specific aspects of the model lead to superior performance. The following subsection examines this issue. Identification and Characterization of Strategic Advantages A closer look at the reasons for the dominance of the geocentric operative HQ reveals two central advantages. Both of them are based on dynamic arguments: Strategic Advantage #1: Economies of Stability The first strategic advantage hinges on the existence of economies of stability in MNE growth. In order to gain these economies, two conditions must be met: MNE growth has to be stable not only over time but also across geographical markets. While stability over time focuses on the smooth local growth of individual subsidiaries, geographical stability emphasizes a globally balanced growth path for the entire MNE. One advantage of stability over time is that subsidiaries with few fluctuations in local growth build up higher financial reserves and thus face a lower risk of bankruptcy. Conversely, as equation [4] shows, unstable growth results in frequent production overheads. Another even more important advantage of stability over time lies in avoiding a disproportional investment in new technologies and products. As discussed in connection with equation [2], one of the most discriminatory features of the innovation process is the time horizon of individual R&D stages. Since unstable growth and local crises induce subsidiaries to specialize on short-term instruments of success, like the design and introduction of incremental innovations, they tend to neglect long-term commitment in research. Thus, persistent growth fluctuations are found to lead to an investment gap that causes significant disadvantages with respect to future core competencies. As for the flexible HQ, a globally unbalanced growth strategy may cause a polarization between subsidiaries and thereby impair corporate competitiveness and performance. However, diminishing synergies within the MNE are not the only reason for the importance of geographical stability. Next to this internal motive there is also a strong external argument for an internationally stable growth path. According to equation [3], subsidiaries with limited or irregular R&D are less able to receive or utilize local technological spillovers, because they have a poor capacity to understand external information or, in case of joint ventures, little of their own information to return. It does not help to establish only sporadically active windows or observation posts in other countries. In order to ensure a continuous dialogue capability and to
16
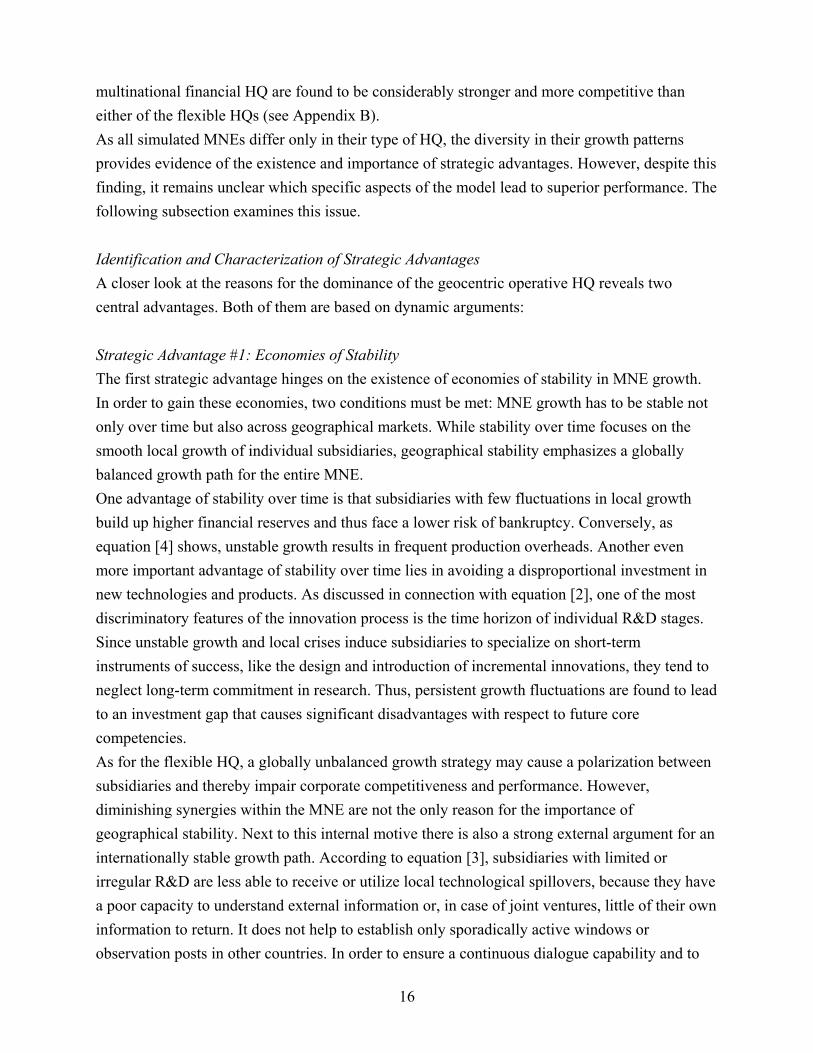
obtain external R&D results, "one must be a player, not a spectator" (Bartlett & Goshal, 1986, p.91). To be part of technological developments around the world, MNEs must commit to continually invest into a network of foreign R&D labs. The more geographical stability in terms of internationally balanced growth, the more such a global innovation strategy is supported. Figure 3 illustrates the general importance of an effective R&D network by simulating the extreme case of a two-country / two-firm setting, where one MNE centralizes its R&D in the home market while the other invests into a decentralized configuration.18 With the variation of economies of scale in R&D (represented by β) and market heterogeneity (technology transfer parameter κ), two classic factors of configuration are used to establish a framework for the following analysis.19 As the base case on the left of Figure 3 shows, cumulated revenues of the decentralized MNE are higher than those of its centralized competitor whenever market heterogeneity is high and economies of scale are low.20 In a second simulation run, the global diffusion rate α is increased from 5% in the base case to 10%. As the enlarged white area on the right of Figure 3 shows, a higher degree of technological spill-overs forms a strong incentive for more decentralized R&D. In an additional simulation, the introduction of a third country with a local center of excellence curtails the central MNE's range of superior performance by the light gray area.21 This significant reduction of the dark gray area (over all simulations) supports the above argument for the construction and maintenance of an international R&D network. As well as providing support for economies of scale and market heterogeneity, the results reveal the importance of other exogenous factors, like technological spill-overs and foreign know-how agglomerations.
18 Apart from these changes to the previous simulation, all parameter values remain the same (see Appendix A). 19 See equations [2] and [1], respectively. For empirical evidence on the importance of these two determinants in R&D configuration see Pearce & Singh (1992). 20 White areas in Figure 3 represent a ratio of centralized to decentralized cumulated revenues smaller than 1. Gray areas represent a ratio greater than 1. 21 For the simulation of a foreign center of excellence a purely national firm with a ceteris paribus doubled R&D intensity was specified.
17
0% 10%
20%
30%
40%
50%
60%
70%
80%
90%
100%
1
1.05
1.1
1.15
1.2
1.25
1.3
1.35
1.4
1.45
1.5
Market Heterogeneity
Econom
ies of Scale
DECENTRALCONFIGURATION
CENTRALCONFIGURATION
0% 10%
20%
30%
40%
50%
60%
70%
80%
90%
100%
1
1.05
1.1
1.15
1.2
1.25
1.3
1.35
1.4
1.45
1.5
Market Heterogeneity
Econom
ies of Scale
CENTRALCONFIGURATION
DECENTRALCONFIGURATION
Figure 3. Optimal Multinational Configuration of R&D After the analysis of the advantages of local stability over time and global stability across geographical markets, these two positive effects can be used to explain the different performances of MNEs growth and innovation strategies. As for the financial HQ, the high autonomy of its subsidiaries ensures a stable local growth, but at the same time impedes the coordination of a globally balanced development. Conversely, the ethnocentric HQ emphasizes a centrally stabilized MNE growth, but tends to neglect its subsidiaries' concerns and thus causes local crises and fluctuations. Only the global growth policy of the geocentric operative HQ combines both components into economies of stability. It thereby successfully creates a strong strategic advantage over all other coordination types. Strategic Advantage #2: Global Learning The second strategic advantage is based on the ability of the whole MNE to learn from the local successes of individual subsidiaries. To accomplish this, an HQ must ensure that national
18

advantages are perceived, communicated and appropriated throughout the corporation. Learning is therefore understood as geographical learning, where local success factors of demand and supply are integrated into a global growth strategy, which then is implemented in all subsidiaries.22 For demand side factors, such as consumers' attitude towards risk, the argument runs as follows: Subsidiaries react to high risk levels in local markets (increased share of innovative buyers φ) by accelerating their R&D and expanding their product range. As Figure 4 illustrates, this has a positive effect on their innovation rate and growth. If the HQ's coordinative efforts support a global learning process, the increased innovation rate is transferred to subsidiaries in less challenging markets. Figure 4. Local Growth by Share of Innovators
0
1
2
3
4
5
6
7
8
0 2 4 6 8 10 12 14 16 18 20 22 24 26 28 30 32 34 36 38 40 42 44 46 48 50 52 54 56 58 60
Simulation Periods
Peri
odic
al R
even
ues
Share of Innovators = 1% Share of Innovators = 45% Share of Innovators = 90%
Share of Innovators:∅ Research Length:∅ Design Length:No. of Products:
1%17 Per.2.89 Per.19
45%16.3 Per.2.64 Per.23
90%15.3 Per.2.0 Per.30
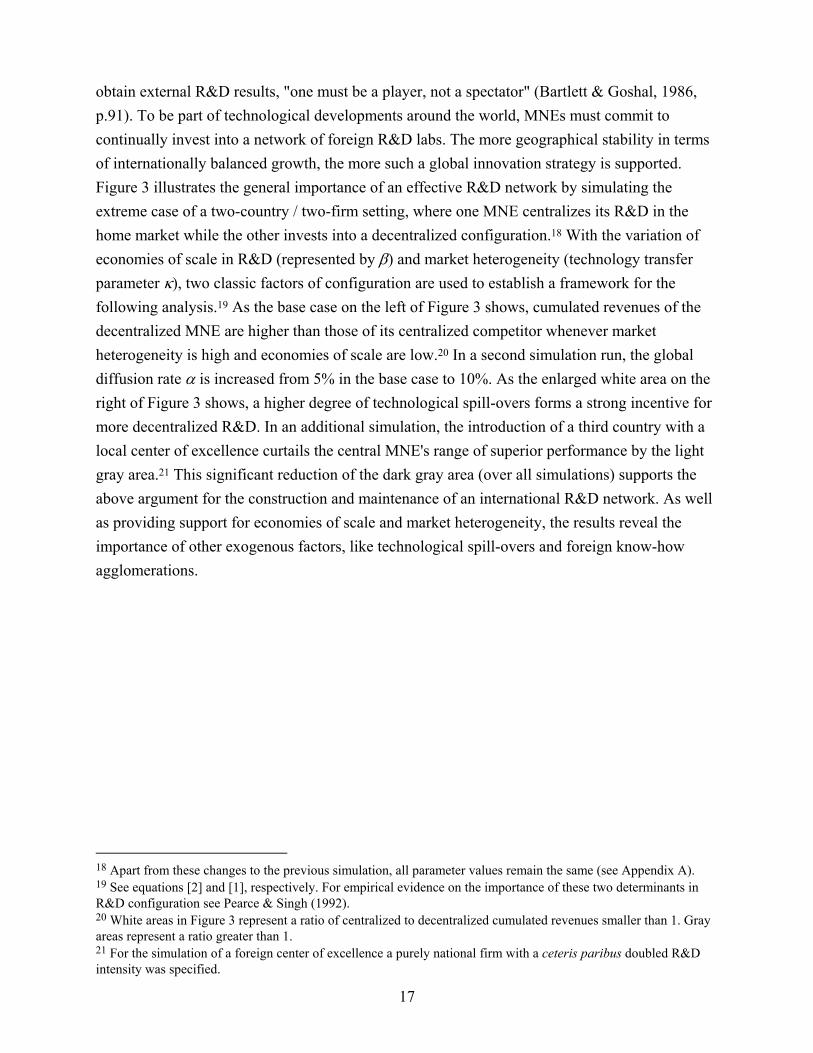
For supply side factors, such as firms' aspiration levels, a similar argument can be made: Subsidiaries often try to compensate for disadvantages in foreign countries by pursuing a more aggressive innovation strategy (higher critical growth rate Λ) than their local competitors. As depicted in Figure 5, such focus on the frequent introduction of new products generally results in stronger growth. Additionally, the continuity of innovations tends to stabilize the subsidiary's development, as demonstrated by a comparison with the highly fluctuating and crises induced growth path of the lowest aspiration level (Λ=0.8). Again, with global learning, it is generally
22 For the first aspect of integration see equation [7], for the second aspect of implementation see [5] and [6].
19
possible to transfer these innovation incentives to less sensitive subsidiaries and thereby enhance MNE performance. Figure 5. Local Growth by Aspiration Levels / Ciritical Growth Rates
0
1
2
3
4
5
6
7
0 2 4 6 8 10 12 14 16 18 20 22 24 26 28 30 32 34 36 38 40 42 44 46 48 50 52 54 56 58 60
Simulation Periods / Period of Product Introduction
Peri
odic
al R
even
ues
Critical Growth Rate = 0.8 Critical Growth Rate = 1.0 Critical Growth Rate = 1.2Product Launch (CGR 0.8) Product Launch (CGR 1.0) Product Launch (CGR 1.2)
Altogether, the general predominance of the geocentric operative HQ hinges on the fact that it simultaneously satisfies both conditions for global learning: the integration and implementation of local advantages. While the financial HQ fails to properly enact its central strategy and therefore violates the second condition, the ethnocentric operative HQ does not meet the first condition, because it is too involved with domestic issues. CONCLUSION The study of a HQs’ growth and innovation strategy and its role in global R&D is crucial to international management, for it is literally at the center of an MNE’s competitive advantages. Unfortunately, previous international business research provides little insight into the impact of dynamic and organizational factors on such strategic advantages in global innovation. This paper has developed a dynamic model that can assist MNE top managers in evaluating and reconsidering the growth strategies, coordination mechanisms, and parent-subsidiary relationships in their firms. Specifically, it has proposed a robust typology of HQs' approaches to innovation strategy and multinational R&D management. A numerical analysis of this typology leads to four major results: First, in constantly changing global markets, geocentric operative HQs have the most strategic advantages and dominate
20

alternative concepts like ethnocentric HQs and financial HQs. Second, HQs that grant successful subsidiaries a higher local autonomy run the risk of destroying potential strategic advantages, because of polarized MNE structures. Third, economies of stability in MNE growth represent a crucial strategic advantage, as they support the construction and maintenance of global innovation networks. Fourth, global learning, another strategic advantage in the coordination of international innovation processes and MNE growth, ensures that local advantages are perceived, communicated and appropriated throughout the whole company. With respect to the development of a potential all embracing theory of the MNE, this paper qualifies the dominating explanation of foreign investments, the 'eclectic paradigm' (Dunning, 1980, 1988). The eclectic paradigm argues that three distinct sets of advantages explain internationalization: ownership-specific advantages, internalization advantages, and localization advantages. The elements of strategic coordination developed in this paper are easily linked to these sets of advantages. While HQs' central coordination and integration of subsidiaries can be interpreted as internalization advantages, subsidiaries' innovation incentives (arising from local demand factors) can be related to localization advantages. Furthermore, subsidiaries' innovation strategies may represent local ownership-specific advantages.23 Provided these three sets of advantages constitute an international configuration of R&D, the experimental results of this analysis show that only an optimal relation between localization, internalization and ownership-specific factors ensures competitive advantages in an MNE’s global growth and innovation strategy. Specifically, global learning and economies of stability are identified as important strategic advantages. A second, more general implication of this analysis is that inter-firm transactions and growing interdependencies in global competition highlight the increasing importance of fine-tuned growth and innovation strategies for MNEs. This finding strongly supports the above approach and implications to global strategic management which also is in line with a recent reappraisal of the eclectic paradigm by Dunning (1995).
23 Critics of the eclectic paradigm claim that ownership-specific advantages should not be considered separately, for they stem from either localization or internalization advantages (Itaki, 1991). Of course, it is also possible to adapt the elements of the model to this line of argument.
21
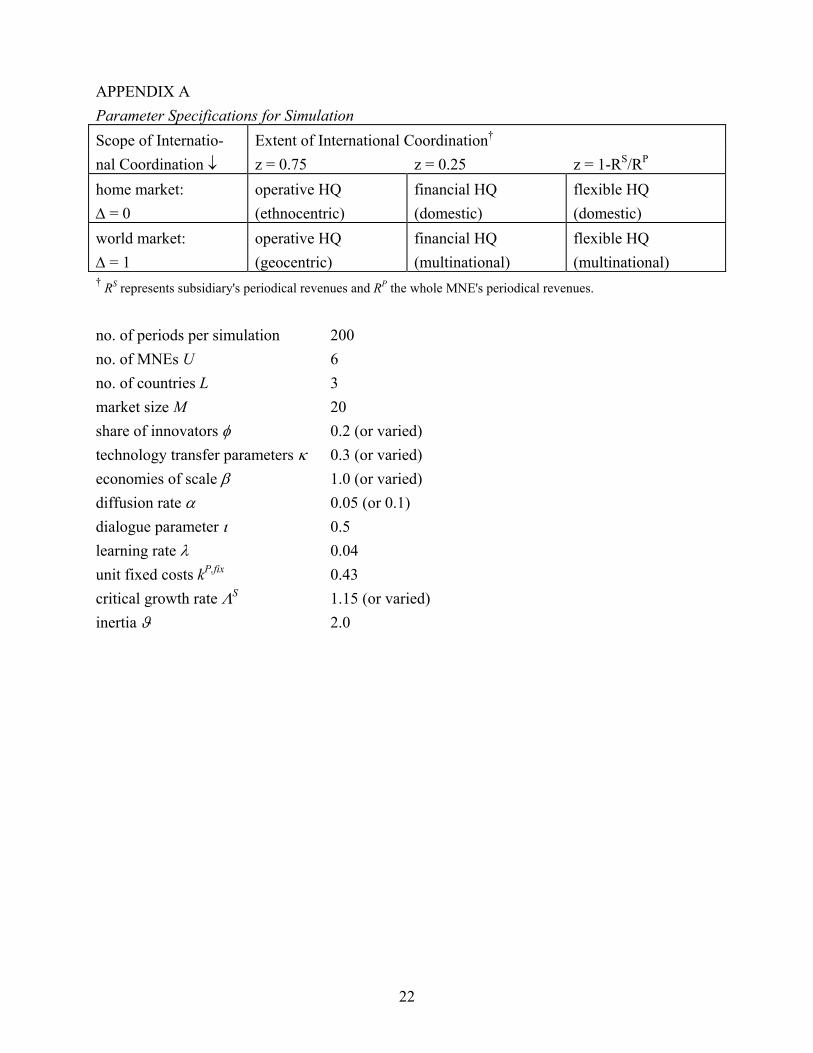
APPENDIX A Parameter Specifications for Simulation Scope of Internatio- Extent of International Coordination† nal Coordination ↓ z = 0.75 z = 0.25 z = 1-RS/RP home market: ∆ = 0
operative HQ (ethnocentric)
financial HQ (domestic)
flexible HQ (domestic)
world market: ∆ = 1
operative HQ (geocentric)
financial HQ (multinational)
flexible HQ (multinational)
† RS represents subsidiary's periodical revenues and RP the whole MNE's periodical revenues.
no. of periods per simulation 200 no. of MNEs U 6 no. of countries L 3 market size M 20 share of innovators φ 0.2 (or varied) technology transfer parameters κ 0.3 (or varied) economies of scale β 1.0 (or varied) diffusion rate α 0.05 (or 0.1) dialogue parameter ι 0.5 learning rate λ 0.04 unit fixed costs kP,fix 0.43 critical growth rate ΛS 1.15 (or varied) inertia ϑ 2.0
22

APPENDIX B Basic Simulation Results Type → operative HQ financial HQ flexible HQ Total† Rank ↓ geocentr. ethnocentr multinat. domestic multinat. domestic
# 1 1207 1170 673 342 547 570 4509 # 2 727 590 1321 770 571 512 4491 # 3 745 508 1185 967 616 488 4509 # 4 737 538 712 1166 775 563 4491 # 5 611 857 400 795 919 928 4510 # 6 473 837 209 460 1072 1439 4490 Bankrupt 904 1276 608 892 1182 1526 6388 Total‡ 4500 4500 4500 4500 4500 4500 † If two MNEs reach the same amount of cumulated revenues they both are denoted the same rank (e.g. #4) while
the following rank (#5) is omitted. However, the MNE with the lowest cumulated revenues is still ranked last (#6).
As the results show, this system can lead to slight differences in the total number of ranks denoted to all MNEs.
‡ The total number of 4500 simulation runs is put together as follows: 100 combinations of two demand parameters
(with a 10 step variation each) multiplied by 45 'world market combinations' of MNE home countries and possible
configurations of local competitors.
Proof for the existence of 45 world market combinations: For homogeneous world market combinations (all
countries are identical ) it can be shown that there exist A3hom=15 different configurations for 6 MNEs (with 2 HQs
in each of the L=3 countries), because of:
( )A 2 jhomN
j 1
N= −
=∏ 1
.
[proof by complete induction.]
Heterogeneous world market combinations can be described by 2N-k, k=1,...,2N-1 homogeneous combinations of
the order N-1:
( ) ( )A k A N 2 N 1 2 j 1 N AhetN
k 1
2 N 1
homN 1
j 1
N 1
homN= ⋅ = ⋅ − ⋅ − = ⋅
=
−−
=
−
∑ ∏
Hence, with 3 different national markets, which all represent home countries for exactly 2 MNEs, altogether 45
world market combinations have to be considered (A3het=45).
23

REFERENCES Bartlett, C.A., & Goshal, S. 1986. Tap your subsidiaries for global reach. Harvard Business Review, 64(6): 87-94. Bartlett, C.A., & Goshal, S. 1987. Managing across borders: New organizational responses. Sloan Management Review, 28(1): 43-53. Bartlett, C.A., & Goshal, S. 1989. Managing across borders: The transnational solution. Boston, MA: Harvard Business School Press. Bass, F.M. 1969. A new product growth model for consumer durables. Management Science, 15(5): 215-227. Behrman, J.N., & Fischer, W.A. 1980a. Overseas R&D activities of transnational companies. Cambridge MA: Oelgeschlager, Gunn & Hain. Behrman, J.N., & Fischer, W.A. 1980b. Transnational corporations: Market orientations and R&D abroad. Columbia Journal of World Business, XV(3): 55-60. Buchanan, R., & Sands, R. 1994. Creating an effective corporate centre: The influence of strategy on head office role. European Business Journal, 6(4): 17-27. Campbell, A., Goold, M., & Alexander, M. 1995a. The value of the parent company. California Management Review, 38(1): 79-97. Campbell, A., Goold, M., & Alexander, M. 1995b. Corporate strategy: The quest for parenting advantage. Harvard Business Review, 73(2): 120-132. Cheng, J.L.C., & Bolon, D.S. 1993. The management of multinational R&D: A neglected topic in international business research. Journal of International Business Studies, 24(1): 1-18. Cyert, R.M., & March, J.G. 1963. A behavioral theory of the firm. Englewood Cliffs, NJ: Prentice-Hall. De Meyer, A., & Mizushima, A. 1989. Global R&D management. R&D Management, 19(2): 135-146. Doz, Y., & Prahalad, C.K. 1981. Headquarters influence and strategic control in MNCs. Sloan Management Review, 23(1): 15-29. Doz, Y., & Prahalad, C.K. 1984. Patterns of strategic control in multinational corporations. Journal of International Business Studies, 15(2): 55-72. Dunning, J.H. 1980. Toward an eclectic theory of international production: some empirical tests. Journal of International Business Studies, 11(1): 9-30. Dunning, J.H. 1988. The eclectic paradigm of international production: A restatement and some possible extensions. Journal of International Business Studies, 19(1): 1-31. Dunning, J.H. 1993. Multinational enterprises and the global economy. Wokingham, England: Addison-Wesley.
24
25
Dunning, J.H. 1995. Reappraising the eclectic paradigm in an age of alliance capitalism. Journal of International Business Studies, 26(3): 461-491. Goshal, S., & Bartlett, C.A. 1988. Creation, adoption, and diffusion of innovations by subsidiaries of multinational corporations. Journal of International Business Studies, 19(3): 365-388. Hedlund, G. 1986. The hypermodern MNC - a heterarchy?. Human Resource Management, 25(1): 9-35. Hood, N., & Young, S. 1982. US multinational R&D: Corporate strategies and policy implications for the UK. Multinational Business, 2(1): 10-23. Itaki, M. 1991. A critical assessment of the eclectic theory of the multinational enterprise. Journal of International Business Studies, 22(3): 445-460. Martinez, J.I., & Jarillo, J.C. 1989. The evolution of research on coordination mechanism in multinational corporations. Journal of International Business Studies, 20(3): 489-514. Melin, L. 1992. Internationalization as a strategy process. Strategic Management Journal, [Special issue]. Winter 13: 99-118. Nelson, R.R., & Winter, S.G. 1977a. Simulation of Schumpeterian competition. American Economic Review, 67(1): 271-276. Nelson, R.R., & Winter, S.G. 1977b. Dynamic competition and technical progress. In B. Balassa & R.R. Nelson (Eds.), Economic progress: Private values and public policy: 57-101. New York, NY: North-Holland. Pearce, R.D. 1989. The internationalization of research and development by multinational enterprises. London, England: Macmillan. Pearce, R.D., & Papanastassiou, M. 1996. R&D networks and innovation: Decentralised product development in multinational enterprises. R&D Management, 26(4): 315-333. Pearce, R.D., & Singh, S. 1992. Globalizing research and development. London, England: Macmillan. Perlmutter, H.V. 1969. The tortuous evolution of the multinational corporation. Columbia Journal of World Business, 4(1): 9-18. Porter, M.E. (Ed.). 1986. Competition in global industries. Boston, MA: Harvard Business School Press. Ronstadt, R.C. 1978. International R&D: The establishment and evolution of research and development abroad by seven U.S. multinationals. Journal of International Business Studies, 9(1): 7-23. Weitzel, U. 1996. Dynamics of innovative firms in global competition: A simulation model. Discussion paper No. 96-87, J.L. Kellogg Graduate School of Management, Northwestern University, Department of Management and Strategy, Evanston, IL.