
Entrepreneurship and Innovation Strategies in ICT SMEs in Enlarged Europe (EU25
40
#2008-016 Entrepreneurship and Innovation Strategies in ICT SMEs in Enlarged Europe (EU25) Kaushalesh Lal and Theo Dunnewijk Working Paper Series United Nations University - Maastricht Economic and social Research and training centre on Innovation and Technology Keizer Karelplein 19, 6211 TC Maastricht, The Netherlands Tel: (31) (43) 388 4400, Fax: (31) (43) 388 4499, e-mail: [email protected], URL: http://www.merit.unu.edu
Transcript of Entrepreneurship and Innovation Strategies in ICT SMEs in Enlarged Europe (EU25

#2008-016
Entrepreneurship and Innovation Strategies in ICT SMEs in
Enlarged Europe (EU25)
Kaushalesh Lal and Theo Dunnewijk
Working Paper Series
United Nations University - Maastricht Economic and social Research and training centre on Innovation and Technology
Keizer Karelplein 19, 6211 TC Maastricht, The Netherlands Tel: (31) (43) 388 4400, Fax: (31) (43) 388 4499, e-mail: [email protected], URL: http://www.merit.unu.edu

2

3
Entrepreneurship and Innovation Strategies in ICT SMEs in Enlarged Europe (EU25)
Kaushalesh Lal1 and Theo Dunnewijk2
Senior Researchers UNU-MERIT
Keizer Karelplein 19 6211 TC Maastricht, The Netherlands
Abstract Innovation strategies of entrepreneurs are mapped with growth and performance of their firms in this study. Findings of the study are based on the data collected from 1238 small ICT firms located in 25 member states of European Union. The survey was conducted during October 2006 and March 2007. Results of Logit analysis suggest that firms that pursued continuous innovation strategies experienced more employment growth, higher profitability, and better sales dynamics than those that adopted occasional innovation approach. Market growth of continuous innovating firms realized faster pace than other type of firms. Another distinguishing characteristic of two types of firms emerged is market preference. Target market of continuous innovating firms has been European or global markets while innovative activities of other firms targeted domestic market. The study concludes that European innovation policies should be focused towards continuous innovation activities with due attention at human resource development policies. Keywords: dynamic capabilities, continuous innovation, occasional innovation, competitiveness, human resources, internationalization
UNU-MERIT Working Papers ISSN 1871-9872
Maastricht Economic and social Research and training centre on Innovation and
Technology, UNU-MERIT
UNU-MERIT Working Papers intend to disseminate preliminary results of research
carried out at the Centre to stimulate discussion on the issues raised.
1 Corresponding Author, Email: [email protected] 2 Email: [email protected]

4

5
INTRODUCTION
Continuous innovation is a central theme in the literature of strategic knowledge
management and in the literature of organizational learning. Continuous innovation
can be understood as continuous improvement or as a proactive attitude towards the
external world.
Based on the distinction between continuous and occasional innovation, rich
typologies of entrepreneurs and organizational learning systems can be found in the
literature. In this paper we investigate empirically the innovation behavior of
entrepreneurs in small and medium sized enterprises in the ICT sector of the European
Union. The attitude of entrepreneurs towards innovation and learning is very
significant for the performance of the whole enterprise. A well known distinction in
innovation behavior is given by Porter (1979), it ranges from the innovating
entrepreneurs via the imitating ones to the followers. Other authors make the
distinction between prospectors and defenders entrepreneurs. The crucial difference
between these two types is contained in their attitude and in their management
qualities. (O’Regan and Ghobadian, 2004).
Earlier survey studies came up with ‘silver spoons’ these entrepreneurs have
been at the firms for substantially longer than average, worked fewer hours than their
innovative counterparts (called ‘young Turks’ and ‘blue chips) and exhibited further
low management qualities while their product- and marketing strategies were
engineered long ago and continued to serve them well. The environment had no
significant impact on the ‘silver spoons’ type of entrepreneurs, while especially the
innovative entrepreneurs as the ‘blue chips’ perceived the environment as of great
importance for their innovations. The innovative small and medium sized enterprises
(SMEs) were either characterized as led by ‘young Turks’ or ‘blue chips’ and these

6
firms were younger, more proactive, more prone to risk taking and also exhibiting
more product differentiation and higher R&D spending. (Kahn and
Manopichetwattana, 1989).
The attitude towards innovation is also seen as a part the entrepreneurs’
strategic orientation and perception of the environment (O’Regan and Ghobadian,
2004). Especially knowledge intensive firms exhibit an international growth
orientation which is neglected in the literature (Nummela, Puumlainen and
Saarenketo, 2005).
Continuous improvement is very much related to continuous innovation and
the former goes back to managerial decision making in the Japanese scale-intensive
industries. ‘Kaizen’ or continuous improvement is rooted in the design of socio-
technical systems, human relations and the discussion surrounding lean and mean
manufacturing (Imai, 1986; Baba, 1989). Once the capability to improve continuously
is established, it can easily contribute to continuous innovation. (Bessant, et al. 2001)
Innovation is not done in isolation, relationships also matter and a high level of
strategic interdependence grew among groups of firms, hardware and ICT service
providers alike. This is especially true for ICT production due to the modular and
complementary character of the interoperating ICT components. Therefore inter-
company collaboration and company networks in many industries are essential for
surviving harsh competition (Chapman and Corso, 2005). This fuels continuous
innovation which is firmly based on dynamic capabilities of firms (Teece et al., 1997);
knowledge creation and absorption, knowledge integration and knowledge
reconfiguration (Verona and Ravasi, 2003). Continuous innovation is also connected
to the firms’ knowledge management systems and processes (Chapman and Hyland,
2004). Extra alertness due to Original Equipment Manufacture (OEM) relationships
and pressure from internationalization causes long term investment in sustainable
competitive advantage mainly in R&D and innovation (Knight, 2001).

7
International business for a long time was the territory of multinational
enterprises, but recently evidence shows that SMEs are internationally active.
Spontaneous decisions by managers reacting to business opportunities often play a big
role, and management decisions are always heterogeneous and this might be
particularly true for the ICT sector (Lacity and Willcocks, 2000).
Perceptions of the environment impact the innovation strategy of SMEs.
SMEs that feels pressurized to innovate by the environment react by modifying
existing products rather than introducing new ones. SMEs that have a strong external
orientation and continuously look for opportunities are much more likely to be
engaged in new product development or management practices (O’Regan and
Ghobedian, 2004).
High entry barriers and highly concentrated industries are thought to be
engaged in creative accumulation while easier to enter markets populated by many
small enterprises are characterized by Schumpeterian creative destruction. In the
market of ICT SMEs the entry barriers are low and as a consequence the market is
populated by many small enterprises. Hence creative destruction might be a good
description of technological development in this sector.
Goal of this paper
In this paper we address the innovation strategies of SMEs engaged in the production
of ICT products and services. We base our conclusions on an analysis of primary data
collected in a survey of 1238 ICT small and medium sized firms in all EU25 Member
States, held between October 2006 and March 2007.
This paper is organized as follows. In the first section we present and discuss
the characteristics and profile of ICT SMEs in Europe. In the second section
characteristics of sample firms are presented. Hypotheses are formulated in Section
three. Statistical results are presented and discussed in Section four. In Section five

8
the complicated structure of EU policies aimed at ICT SMEs is discussed and we end
with some recommendations to enhance the impact of these policies on innovation
behavior of ICT SMEs in the last section.
ICT SMEs IN EU25 AND THE SURVEY
ICT SMEs make up a considerable part of the total population ICT enterprises in
Europe. The share of ICT SMEs in total ICT employment in EU25 is 44% for ICT
manufacturing and 52% for ICT services (see Table 1) In terms of value added these
shares are 35% and 33% respectively. Hence ICT services SMEs exhibit a
productivity level that equals 63% of the average for total ICT service sector while
ICT manufacturing SMEs reach the 80% mark. Therefore scale economies might be
present in ICT services but are likely to be absent in ICT manufacturing.
Insert Table 1
Due to the relatively low level of labor productivity in ICT services the smaller SMEs
we might a-priori expect to encounter less innovative ICT service SMEs in the smaller
size classes than ICT manufacturing SMEs because the level of productivity depends
on past (process) innovations.(Parisi et al., 2006). The relatively low level of labor
productivity in ICT services SMEs is mainly the consequence of the extraordinary
high level of labor productivity of the largest firms coinciding with a relatively high
share of micro firms (firms with between 1 and 9 employees) in ICT services in
Europe (see Table 1 A).
Insert Table 1A

9
Large enterprises in ICT services are 1000 times as large as the smallest ICT service
enterprises, measured in terms of value added per enterprise, in ICT manufacturing
this ratio is only 66.
The data used in this paper is obtained from the population of small and
medium sized enterprises (SMEs) that are active in the ICT sectors in EU25 by means
of an interview by telephone. The firms in the sample are all ICT SMEs, i.e. employ
more than one and less than 250 employees and produce ICT hard- and/or software
and services. All firms included in the sample also have invested (internally or
externally) in R&D, and the majority (84%) of these firms introduced a least one
product or service innovation new for the firm not necessarily for the market in the
year 2005 preceding the year the interview was held. As a consequence of the
screening on R&D expenditure and or innovations, all firms in the survey can be
regarded as innovative. However conceptually a definition of innovative firm is
problematic because what should be measured is something that is either ‘new’ or an
improvement of an existing product or service. Measuring innovation thus implies
commensurability and novelty and these are basic problems for innovation indicators
in general (Smith, 2005). The (European) Community Innovation Survey (CIS3)3
indicators are problematic because they are designed to measure innovation in
manufacturing inspired by the OSLO manual and not innovative services (OECD,
1992). These indicators measure not only the input of R&D but also the existence of
‘new’ activities and products as the result of a firm’s investment in tangible as well as
intangible assets. Especially measuring innovation in the more heterogeneous service
sector is a Herculean task of measuring the immeasurable i.e. the intangibles.
3 The Community Innovation Survey (CIS) is the main statistical instrument of the European Union that allows the monitoring of innovation in Europe. The CIS creates a better understanding of the innovation process and facilitates the analysis of the effects of innovation on the economy. The CIS has been carried out for the first time in 1992. CIS2 took place in 1996 and CIS3 in 2001. Since 2000, the CIS has become a major data source of the “European Innovation Scoreboard”, which basically is a measurement and coordination tool and stimulates typically European open coordination of innovation among the Member States.

10
Therefore we define “innovative ICT SMEs” in this study in terms of input
(performing R&D) as well as output indicators (having produced an innovation).
Firms included in the sample are firms that belong to the ICT sector and exhibit -at
the time of the interview- an engagement in innovative activities or having the
capacity to perform research and technology development (RTD) activities and
supplying innovative ICT products and services as a main element of their business
offerings. Furthermore our approach to innovative SMEs is firmly based on financial
and economic performance of ICT manufacturing and services firms rather than on
innovation inputs or outputs. We therefore define the successful innovative ICT SME
as a firm that shows excellent financial and economic performance in the first place.
Other relevant characteristics are the ones used in the CIS3 for manufacturing firms
that are more adaptive to the service firm, like productivity levels, supplier, customer
or network oriented production and the mode of innovation being continuous or
occasional.
HYPOTHESES AND THEORETICAL FRAMEWORK
Innovativeness has always been in the centre of the economic development and the
adoption of new technologies. During 1980s and early 1990s innovation was the key
driving force for large enterprises and Multinational Corporations. With the advent of
more affordable and reliable communication and information networks in the late
1990s the effect of innovations can be easily seen on small firms. Although
governments in developing and developed countries have been engaged in providing
support to small enterprises so that they can survive onslaught posed by globalization,
the death rate of SMEs has been significant particularly in developing countries
(Oyelaran-Oyeyinka and Lal, 2007).

11
One of the main reasons cited for exit of firms is the inability of firms to
innovate (Cefis and Marsali, 2006). However factors of lack of innovation in large
and small firms are very different. In large firms innovation activities are constrained
by lack of vision, management structure, growth strategies, and monopoly power of
firms whereas small firms could not engage in innovation activities due to resource
crunch and protection of their market. In the era of the globalized information society
the factors impacting innovations became more similar in large firms as well as small.
Large firms do not enjoy monopoly any more and small firms became more exposed
to external factors. However, availability of financial and human resources are several
such factors that still affect large and firms differently.
An essential difference between large and small firms is that large firms have
material advantages, while small firms’ advantages are behavioral: the motivation of
the owner and the flexibility of the firms (Nooteboom, 1993). In small firms the
decisions are usually taken by a single individual who owns the firms whereas in large
firms decisions are taken by a group of people. Risk absorbing capacity of firms also
influences the decision making process. Since the objective of the paper is to identify
the factors that influence the innovation strategies in small firms, hypotheses and
theoretical framework are aimed in that direction.
Hypothesis I: innovation strategies are influenced by entrepreneurship
The role of the entrepreneur in a firm is described in the literature as the ’leader’, the
manager and coordinator and the one who carries out new combinations and is
responsible for the direction the firms goes. This traditional Marshallian-
Schumpeterian-Knightian description is mainly tagged with small businesses. For
instance the entrepreneur is often defined as one who starts his own, new and small
business for his own risk. Entrepreneurship has been a driving force in the growth of
firms even during the era of protectionism (Drucker, 1993). Intense competition and

12
globalization have put innovation in the forefront of industrial development. However
lack of risk absorbing capacity and uncertainty involved in successful innovation
many times inhibit small firms to be innovative. Governments in Europe support
actively the formation and growth of entrepreneurship with industrial (enterprise)
policies and cohesion policies (De Propris, 2007). By definition the entrepreneur has
to take risks in carrying out new combinations while success is measured in terms of
profitability (Schumpeter, 1943).
Irrespective of the type of innovation, i.e. process or product, risk taking
ability and leadership of the entrepreneur determines success. Choice of innovation is
often determined by the market in which the firm operates. For less cost sensitive
markets product innovation may be preferred while process innovations are aimed at
flexibility in production processes, improvement in quality and reliability, and for
productivity gains in quality seeking markets. Whatever be the case an entrepreneur
has to have innovation strategies for growth and survival of firms in the era of
globalization. Hence we hypothesize that innovation strategies are influenced by
entrepreneurship.
Hypothesis II: management structure might influence innovation strategies
We intend to identify the relationship between management structure and innovation
strategies. Small firms are usually individually owned firms. They are less likely to be
public limited firms. Hence the decision to be more innovative or less innovative lies
with the single individual. However, in case of firms that are private limited liability4
corporations, decision about innovation strategies is very likely not taken by a single
individual but collectively in a committee of executives. Outcome of both the decision
making processes has advantages as well as disadvantages. Individually owned firms
4 A private limited liability company comes in three types: private limited liability company by shares or Pty. Ltd, by guarantee (not in shares but with members liable to a fixed amount) and by publicly traded shares or PLC.

13
can take quick decision, employ motivated people, and have unique or scarce
competencies (Nooteboom, 1993). But the decision taken by small firms is not
debated so misapprehensions may go unopposed. On the other hand decisions taken
by a committee are thoroughly debated and are based on inputs of several persons.
The possibility of unopposed misapprehension in lager firms is less likely. Hence it is
hypothesized that management structure might influence innovation strategies.
Hypothesis III: market preferences and actual network relations influence choice of
innovations
Geographical market preference is also expected to have impact on innovation
strategies. If a firm steps into the international markets, it must meet requirements of
those markets such as international quality of products, modular products,
international network of economic agents etc. whereas in local markets, firms need to
concentrate on local requirement (e.g. customized products/services) in terms of
product characteristics, quality and local standards. One of the main reasons for firms
going global is the higher profit margins and outsourcing of inefficient production
processes. For firms operating in local markets the pressure for innovations may not
be intense. On the other hand firms dealing in international markets are subjected to
intense competition from international firms and hence they need to have regular
innovation strategies. Based on these arguments we hypothesize that market
preferences and actual network relations influence choice of innovations.
Hypothesis IV: performance of firms and innovation strategies mutually reinforce
each other.
Firms need to carry out innovations because of several reasons such as
competitiveness, reduction in input factor prices, miniaturization of products, search
for new products and markets, productivity gains, growth of firm, and better

14
performance etc. We will prefer to limit our discussion to the factors related to ‘better
performance’. Performance of firms can be measured by several variables such as
growth of employment, higher sales turnover, higher profit margins, increase in
market share, creation of new markets etc. The relationship between innovations
strategies and performance is not straight forward. Usually innovative firms perform
better than others but in the process they acquire more resources to be more
innovative. If things go well they are in a virtuous circle, on the other hand less
innovative firms remain caught in a vicious circle.
Several studies have investigated the relationship between innovativeness and
profitability (Lööf, et al., 2001; Gellatley and Baldwin, 2003, and others). Lööf et al.
(2001) use CIS data for Finland Norway and Sweden and conclude that there is strong
positive relationship between innovation and labor productivity. Innovativeness was
measured with the number of patents applications as a proxy for the degree of
innovativeness. Gellatley and Baldwin (2003) argued that innovation is the lifeblood
of a market economy. They illustrate that being innovative is the only way for small
firms to survive in globalized economy. Based on the empirical literature on
innovativeness and performance and theoretical arguments, we hypothesize that
performance of firms and innovation strategies mutually reinforce each other.
These five hypotheses together make up a theoretical framework used in the
study and is depicted in Figure 1.
Insert Figure 1.
As shown in Figure 1, the causal relationship between innovation strategies
and factors affecting it is not always unidirectional. For instance innovation strategies
are influenced by entrepreneurship and management structure of firms whereas choice
of market influences as well as influenced by innovation activities. Choice of markets

15
and the preference to network are also interrelated and jointly or apart these forces
impact the firm’s innovation strategy. Similarly the causal relationship between
performance indicators and innovation strategies is bidirectional as a consequence of
the feedback of performance variables on the future innovation strategies.
DATA AND SAMPLE FIRMS’ CHARACTERISTICS
Computer Assisted Telephonic Interview (CATI) technique was used to collect data
from sample firms located in 25 member states5. The details of sample size in each
member state are presented in Appendix II. The survey was conducted during October
2006 and March 2007. The sample consists of firms belonging to both ICT
manufacturing as well as ICT service sectors. Distribution of sample firms by
technological area and NACE classification, a Classification of Economic Activities
in the European Community, is presented in Appendix I. Purposive sampling
technique was applied to identify sample firms. All sample firms fall in the category
of SMEs, i.e. firms employing less than 250 persons. Although definition of SMEs is
not uniform across all member states, we followed the definition of the Commission6
for sampling.
Sample firms were grouped in two categories, namely; (1) firms that were only
occasionally engaged in innovative activities and (2) firms that pursued continuous
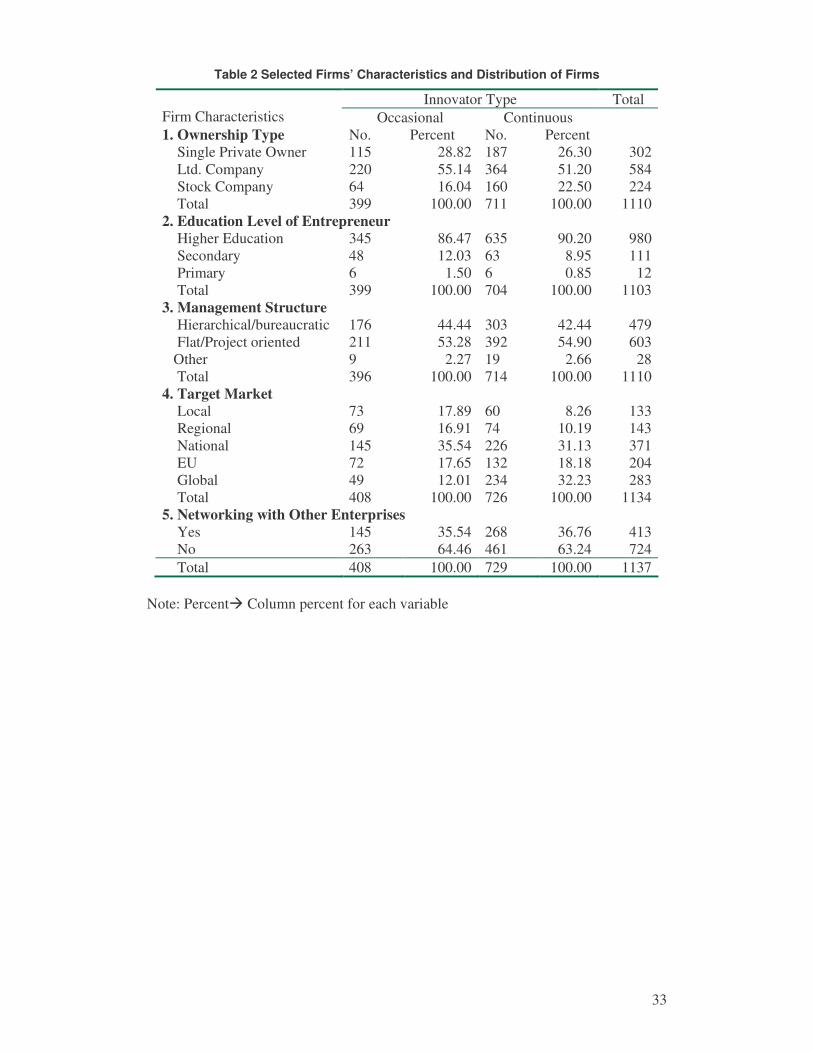
innovation strategies. Selected characteristics of sample firms classified by innovation
strategies are presented in Table 2. It can be seen from the table that type of
ownership does not differ much between two types of firms though fairly large
percent of firms were either Ltd. Companies or stock companies irrespective of the
innovation strategies adopted by the firms.
5 In 17 member states CATI was applied, while in Cyprus, Malta, Baltic Republics, Slovenia and Slovakia local IDC representatives conducted the interviews. 6 Although the European Commission’s definition also includes criteria for balance sheets and annual sales these criteria were not included in the interviews for reasons of efficiency.

16
Insert Table 2
Table 2 shows that the level of educational attainment of the managing
directors (MDs) of two types of firms differs considerably. Roughly 87 per cent of
firms that adopted occasion innovation approach were being managed by the person
with higher education whereas the percentage of such managers was more than 90 per
cent in firms that followed continuous innovation strategies. There was no noticeable
difference in two types of firms related to management structure.
Innovation strategies are significantly influenced by the market preference of
firms. This is captured by the data presented in Table 2 were it can be seen that firms
that preferred local markets adopted ad hoc innovation approach. Only 8.26 per cent
of continuous innovation strategy firms preferred local market whereas the percentage
of other type of firms was more than double that had similar market preference. On
the other hand the market preference of 32.23 per cent of continuous innovating firms
was global while merely 12.01 per cent of occasional innovating firms targeted global
markets. Networking with other enterprises is not very different for continuous or
occasional innovators.
Performance of firms classified by their innovation strategies is presented in
Table 3. As indicators of performance sales dynamics, employment dynamics,
profitability dynamics, and market growth have been used. It can be seen from Table
3 that there is a noticeable difference in sales dynamics of two types of firms.
Roughly 15 per cent of O7 firms experienced more than 10 per cent of growth in sales
turnover in the last three years whereas more than double of this (31.84 per cent) of C8
firms realized the growth of this magnitude.
7 Firms that adopted occasional innovation approach. 8 Firms that followed continuous innovation strategy.

17
Insert Table 3
Table 3 also shows that employment dynamics followed the similar pattern as
sales dynamics. C type of firms created more jobs than others. Profitability dynamics
followed more or less the similar trend to that of sales and employment dynamics
except that “up to 5%” category of profitability dynamics. Percentage of C firms is
less than O type of firms in this category though difference is marginal. Scenario for
market growth is by and large is similar to that of other performance indicators except
that both type of firms experienced decline in market growth. Surprisingly both type
of firms experienced similar market decline rate (more than 5 per cent). One firm
which is categorized as C type experienced fast market decline. The firm might have
lost market because of other factors rather than economic.
STATISTICAL ANALYSIS
Subsequently statistical analysis of data was carried out. Data were analyzed using
univariate and multivariate methods. Univariate analysis (T-tests) results are
presented in Table 4. Before interpreting the results, it is important to discuss
measurement of variables used in the analysis.
Innovation type variable was measured on a binary scale, i.e. value 0 was
assigned for O and 1 for C type of firms. Ownership was measured on a three point
Lickert scale, quantified as 1 for Single Private Owner, 2 for Ltd. Company, and 3 for
Stock Company. Education of the entrepreneur was also measured on a three point
Lickert scale, quantified as 1 for Higher Education, 2 for Secondary, and 3 for
Primary Education. Management structure variable has been quantified as 1 for
Hierarchical/bureaucratic, 2 for Flat/Project oriented, and 3 for other. Annual RTD
budget and RTD employees are measured in Euros and numbers. Five types of target
markets were considered and values assigned to them are: 1 for Local, 2 for Regional,

18
3 for National, 4 for EU, and 5 for Global. Employment, Sales, and Profitability
dynamics variables were quantified as 1 for 10+ % growth, 2 for 5-10% growth, 3 for
up to 5% growth, 4 for No Change, 5 for Decline up to 5%, 6 for Decline 5 – 10%, 7
for Decline 10+%. Market growth was measured on a five point Lickert scale namely;
1 for Fast Growth, 2 for Growth, 3 for No Change, 4 for Decline, and 5 for Fast
Decline, without specifying these categories cardinally.
Insert Table 4
It can be seen from Table 4 that management structure, the annual
RTD budget and the scale of operation measured by the sales turnover did not differ
significantly in two types of firms. Results presented in Table 4 Table 4 suggest that
the educational attainment of managing directors of C type of firms is higher than in
O type of firms, though the level of significance was 10%. O types of firms were
dominated by single private ownership while the majority of C types of firms were
either Ltd. or stock company, though the difference was significant at 5 %. Rest of the
variables were significantly (1 % level) different between two type of firms. However
the results do not capture the relative importance of variables in differentiating O and
C types of firms. In order to show the relative impact of a variable we analyzed the
data in a multivariate framework.
The binary logistics function provides estimates that must lie in the range
between 0 and 1 and the accompanying cumulative density function in explicit form
would be:
1)( )1()( −−−= XfeXP ,

19
with X the set of variables: {OWNER, MEDU, MAN_STRU, RTD_EMP, TAR_MAR,
SAL_DYN, EMP_DYN, PRF_DYN, MAR_GR, STO_EUR, NET_ENT}9
The odds ratio is a log linear function and is given by its Logit transformation:
ln[p/(1-p)]
ENTNETEURSTOGRMARDYNPRFDYNEMP
DYNSALMARTAREMPRTDSTRUMANMDEDUOWNER
_____
____
1110987
6543210
ββββββββββββ
+++++++++++=
We choose to apply maximum likelihood estimation for estimating the
parameters in the model since it requires no restriction on the characteristics of the
independent variables. Hypotheses are:
0:0 =iH β
0:1 ≠iH β
Logit analysis results are presented in Table 5. As can be seen from the table
that four different models have been tried. This was necessary to control for
multicollinearity caused by EMP_DYN, SAL_DYN and PRF_DYN. In Model I all
the variables except those that were insignificant in univariate analysis were specified
while in other models different combinations of explanatory variables have been
specified. In Logit analysis sales turnover (STO_EUR) was converted into EUR
million.
Insert Table 5
Results of the first Logit model suggest that only three variables, namely;
target market (TAR_MAR) employees in RTD departments (RTD_EMP) and
networking with other enterprises (NET_ENTR) were significantly different in the
9 The variables appear in the order of table 4. OWNER is the first variable in table 4 indicating ownership, while NET_ENT is the last variable in table 4.

20
two types of firms. Results are by and large according to our expectation. Emergence
of TAR_MAR as significant (1% level) determinant suggest that firms that target EU
or global market preferred continuous innovation strategies whereas firms whose
orientation was local or regional markets preferred need based innovation strategies.
Networking is not preferred by C type of firms. On the other hand O type of firm is
more inclined to network with others firms. It was further found during analysis that
employment; sales, and profitability dynamics, target market variables were highly
correlated with each other. Hence to identify the parameters better, profitability
dynamic and target market variables were dropped in the second specification.
Management structure which was insignificant in univariate test was also dropped. In
addition ownership variable was also removed in the Model II.
Parameter estimates of Model II suggest that educational attainment of the
managing directors (MD_EDU ) and sales dynamics variables (SAL_DYN) were
added in the list of significant determinants of type of innovation strategies followed
by sample firms. Literature on growth of firms suggests that it is the academic
background and qualification of managing directors that helps them understand the
benefits of continuous innovation and globalization. Several earlier studies (Lal, 2002;
Cohen, 1995) have also found the critical role being played by the knowledge base of
entrepreneur in the performance of firms. Hence emergence of MD_EDU as a key
determinant of innovation strategies is in line with the existing literature and is
according to our expectation. Findings of the study that continuous innovating firms
experienced better sales dynamics is as hypothesized. It seems that continuous
innovating firms have been able to increase their sales turnover by targeting global
markets. This might have been possible by manufacturing market-specific products.
This could have been achieved by continuous innovations.
In Model III we retained only market growth (TAR_GR) and profitability
dynamics (PRF_DYN) variables. We had to treat employment dynamics

21
(EMP_DYN) variable separately because of its high correlation with sales dynamics
(SAL_DYN) as can be concluded from Appendix III. This was done in specification
of Model IV. The results of Model III and IV suggest that all the three variables
emerged significant determinant of innovation strategies. Although MAR_GR
emerged significant, the level of significance is 10%. As the correlation analysis
suggests, all performance indicators are related to each other. And the same
explanation can be used to justify the better performance of continuous innovating
firms. The results suggest that continuous innovating firms experienced higher market
growth than the rest. This could be partly because of market preference. Market
preference of C type of firms has been EU or global. Major growth in market share
might have come from demand in East European markets or developing countries’
markets.
EU INNOVATION POLICIES AIMED AT ICT SMEs
The unifying principle of the single market of the European Union is the free
movement of labor, capital, goods and services, delivering the free circulation of
knowledge in the EU. Important players on the large single European market are the
SMEs, and they are considered by the European Commission (EC) as important
drivers of innovation, employment as well as social and local integration in Europe.
Therefore SMEs need the best possible environment, a goal set by the EC and
explained in the “European Charter for Small Enterprises”10 and in the
Communication “A Modern SME Policy for Growth”11 as well.
Because ICT has been broadly embraced as a key element in the so-called
renewed Lisbon strategy, which essentially is a growth and competitiveness strategy
aiming at job creation and boosting productivity, eventually determining EU’s
10 This Charter was adopted at the Feira Economic Council, 19-20 June 2000, http://ec.europa.eu/enterprise/enterprise_policy/charter/docs/charter_en.pdf 11 Modern SME policy for growth and employment, COM (2005) 551 final

22
capacity to innovate12 and compete. This has led to the promotion of the development,
production and use of ICT which became a policy line of its own. This policy line is
broadly accepted by the Member States and implemented in National Information
Society and Innovation policies. Furthermore the ICT Policy Support Programme
(ICT PSP) is one of the means to support the renewed Lisbon agenda stressing the
ICT dimension explicitly. It builds on the lessons learned from previous programmes
like eTen13, eContent14 and MODINIS15, whilst improving synergies between them
and improving their impact.
Despite the awareness of the importance of innovation, knowledge and ICT
for productivity and competitiveness, investment in R&D and ICT in Europe is
persistently lower than in the US. The reason for this lagging behind in ICT is
burdensome market regulation in the EU. Labor market rigidities and the highly
regulated services sector prevent a larger contribution of ICT to GDP in Europe
(Barrios and Burgelman, 2007).
To stimulate innovation in SMEs in general and lower the hurdles that SMEs
face with regard to access to capital and finance the EC developed specific policies
aimed at ICT SMEs along three lines; namely: Policies aimed at improving access to
markets and finance: cheaper and faster start-ups, better access to loans, more
efficient taxation and less burdensome regulation16. Secondly policies aimed at
12i2010: A European Information Society for Growth and Employment, COM (2005) 229 final for a theoretical underpinning of the impact of ICT on growth and jobs: Dunnewijk, Meijers and van Zon, 2006 and for the policy implications Barrios and Burgelman, 2007. 13 eTEN (formerly TEN-Telecom) was supporting the deployment of trans-European e-services in the public interest. The programme aimed to accelerate the take-up of services to sustain the European social model of an inclusive, cohesive society. eTEN’s six themes included eGovernment, eHealth, eInclusion, eLearning, Services for SMEs and Trust & Security. Admitted projects can have up to 50% of the costs or 30% of initial deployment costs eligible for refunding. 14 The eContentplus Programme, (2005-2008) aims to support the development of multi-lingual content for innovative, on-line services across the EU; part of the eContentplus programme is the Digital Libraries Initiative. 15 A multi annual programme (2003-2005) for the monitoring of eEurope 2005 action plan, dissemination of good practices and the improvement of network and information security (MODINIS), see Official Journal of the European Union 23.12.2003, L 336/1-5 16 The European Council (Spring 2006) agreed to take the following priority actions to unlock unleashed potentials of SMEs in the Union by lowering administrative hurdles: one stop shopping for setting up a company, encourage entrepreneurship, recruitment of a first employee should not involve

23
boosting public and private R&D, technology development, and innovation including
absorption capacity of SMEs and top class SME support for these matters, hence and
thirdly policies aimed at human capital: entrepreneurship17, skills and training18.
These three policy lines are supported in several Community spending programmes.
In the near future more emphasize will be given to SMEs in these programmes (for
the period 2007-2013) and more funds will be channeled towards SMEs. The most
important programmes/policies are: Cohesion (Regional) policies, the largest funding
instruments for SMEs in general: € 59 billion. The 7-th Framework (Research)
Programme (FP7: € 9 billion for 2007-2013) as well the Competitiveness and
Innovation Framework Programme (CIP: € 0.7 billion) while SAFER Internet Plus
and MEDIA (€ 0.7 billion for 2007-2013), are also important. In these programmes
access to finance and the conditions to support SMEs are much better than before.
More than €2 billion is available for ICT R&D from FP7 (for the period 2007-2008)
and more than €1 billion has been earmarked for financial instruments within the CIP
framework programme (from the total of €3.6 billion for the period 2007-2013). This
amount will enable financial institutions to provide about €30 billion of new finance
to SMEs. Furthermore the so-called JEREMIE initiative, jointly launched by EC, the
European Investment Bank (EIB) and the European Investment fund (EIF), in October
2005, improve the availability of sustainable finance for SMEs considerably. In
addition to FP7 and CIP there is the PRO INNO Europe initiative19 which is a focal
point for innovation policy analysis, learning and development in Europe. One of the
more than one public administration point, think small as a guiding principle and facilitate SMEs to access to public procurement. 17 In the Community Integrated Guidelines for Growth and Jobs especially guideline 10 calls for a more entrepreneurial culture and create a supportive environment for SMEs. The SME dimension in EU’s innovation policy is especially present in the Entrepreneurship and Innovation Programme (EIP) 18 For an overview of these SMEs policy projects see: http://ec.europa.eu/enterprise/entrepreneurship/support_measures/index.htm 19 http://www.proinno-europe.eu/

24
dedicated themes is gazelles, i.e fast growing SMEs and several actions are focusing
on networking and design in SMEs.
The main research and innovation policies in the EU are embedded in FP7
and CIP. SMEs are increasingly encouraged to participate in research actions, also by
means of innovation vouchers20. The proposed rules for participation in FP7 specify a
funding rate of 75% for research and development activities of SMEs, rather than the
50% currently applicable in FP6 (the previous framework programme). This should
make it more attractive for SMEs to participate in the FP7 by lowering their financial
burden. The FP7 programme builds on the aims of the previous programmes and will
support the aims of the new integrated strategy i2010 - European Information Society
2010.
In order to help innovation communities in Europe to coordinate their efforts
and align it with the common strategic research agendas European Technology
Platforms (ETP) have been established by the EC. Each ETP represents all major
stakeholders including SMEs and the knowledge of each stakeholder is brought into
the platform. In the sample four most relevant platforms cover 87.6% of the activities
ICT SMEs in Europe (see Figure 2): software, grids and dependability (35.2% of the
firms in the sample), the communication networks (19.8%) and nanotechnology,
electronics, components, the and micro systems (15.3%) and the embedded systems,
computing and controlling (7.3%).
It might be clear that EU’s policies aimed at innovative ICT SME’s are rather
complicated and very versatile, these policies and initiatives are recently introduced
and are implemented now or in the near future. Therefore we cannot expect them to
have much impact right now. Most important is that Member States align their
20 See: SME TechWeb at http://ec.europa.eu/research/sme-techweb/index_en.cfm

25
innovation and information society policies with those of the EC. At the moment the
differences between the National and Regional policies are large and we cannot speak
of a level playing field in EU-25 as far as these policies are concerned. This is an
important source of differences in participation of SMEs in the above mentioned
programmes.
Insert Figure 2
According to national policy makers and representatives of SMEs, national
innovation policies aimed at ICT SMEs have a very high relevance in Sweden, and
are highly relevant in Denmark, Finland, France, Germany, Luxembourg, Spain and
the UK, while these policies are absent (or in a nascent stage) in the New Member
States like Cyprus, Czech Republic, Estonia, Lithuania, Malta, Poland and Slovakia.
This can be taken as an indication that sophisticated policies grow with technological
progress, thus we can expect these polices to become more sophisticated and aligned
in the course of time due to the catching up and convergence in New Member States.
In this respect the EU can gain substantially if the new Members States develop more
sophisticated policies that enhance innovation in ICT SMEs.
This short overview of EC initiated policies to stimulate innovation in SMEs shows
clearly the complicated and intertwined structure of these policy measures21. Several
web portals exist to provide information for (financial) assistance suitable for ICT
SMEs in EU22.
From all ICT SMEs in the sample only 22.2% received funding from an EU
sponsored programme (see Table 6). Thus getting funded is a real problem especially
21 It is beyond the scope of this paper to elucidate the inns and outs of EU policies aimed at innovative ICT SMEs, more information is contained in the full study. 22 See e.g. www.eib.org and www.eurograntsadvisor.ie

26
for the smaller SMEs, while protection of their property rights is insufficient
guaranteed if an SME takes part in a research programme carried out by a consortium.
As an intermediate conclusion we can say that participation of SMEs in EU
sponsored programmes is rather low and there are serious hurdles for SMEs to take
part in EU sponsored RTD projects.
Insert Table 6
From Table 6 we can conclude that funded enterprises exhibit higher growth
rates and are the ones that bring the Lisbon agenda closer to reality, not because they
spend so much on R&D but because they grow faster and create more jobs.
SUMMARY AND CONCLUSIONS
The study aims at identifying and analyzing firm specific characteristics that
influenced the decision of entrepreneurs to pursue different innovation strategies. The
study is based on the data collected from 1238 small firms located in 25 Member
States of the European Union. The survey was conducted during October 2006 and
March 2007. Computer Assisted Telephonic Interview (CATI) method was used to
survey sample firms. Sample consists of innovative small and medium-sized firms
engaged in manufacturing and services in the field on ICTs. Firm specific data on
various aspects such as background of firm, product profile, innovation strategies,
performance, and market preferences were collected through a semi-structured
questionnaire.
Sample firms were grouped in two categories based on their innovation
strategies. First category of firms is those that adopted occasional innovation
approach. Innovation activities of such firms were ad hoc in nature. They were
engaged in innovation activities as and when there were external pressures to do so.

27
Effectively their innovation strategy was focused on need-based. They tend to follow
market trends. On the other hand there were firms that had continuous innovation
programs classified in the second category. In addition to follow market trends their
innovation activities aimed at new, differentiated, and modular products. It was found
during the survey that second category of firms paid attention to developing market-
specific products.
Logit analysis was used to identify factors that affected firms to follow
different innovation strategies. Results suggest that firms that adopted continuous
innovation strategy were being managed by higher educated and better informed
managers than the rest. Academic background of managers has been used as a proxy
of entrepreneurship. The study substantiates the findings of earlier studies that
reported entrepreneurial characteristics of managers influenced the strategies of firms
(Lal, 2002; Cohen 1995).
It was also found that market preference coincides with a specific kind of
innovation strategy of firms. Firms that targeted markets at arms length such as local
or regional markets adopted occasional innovation policies. It seems such firms
carried out innovations as and when there was threat to their existence. Moreover the
markets for such firms seem to be in some extent protected and they followed an
occasional innovation strategy. On the other hand firms that targeted European or
global markets followed continuous innovation approach; they are more able to
absorb the relevant knowledge. This kind of innovation strategy is inevitable for firms
that have global orientation. This is because firms operating in global markets face
more stiff competition than those doing business in domestic market. They face more
severe price as well as non-price competitions. In addition to competitive pressures,
globally oriented firms need to develop market-specific products to serve a particular
market. That can only be done through continuous innovation.

28
Several performance indicators such as sales, employment, and profitability
dynamics, market growth were included in the analysis. The findings of the study
suggest that performance of continuous innovative firms was better than others.
Performance variables were measured on a qualitative scale and converted to
quantitative scale for the analysis. But we had one quantitative variable, i.e., sales
turnover of firm in 2005. Surprisingly this variable was not significantly different in
the two types of firms. One of the possible explanations could be the presence of
outliers. There were few occasionally innovating firms whose sales turnover was very
high. This was captured by the large variance of sales turnover of these firms. These
outliers had a kind of monopoly power in domestic market and hence performing well
without regular innovation activities.
One of the major policy implications of the study is the pursuance of different
kinds of innovation programs by the European Commission. There have been several
incentives and initiatives by the Commission to encourage innovation in small firms
as explained in the previous section. Most of the programs have been very successful.
But they may no longer be enough as the globalization is the landscape of markets.
Firms can no longer enjoy market protection. One of the possible ways to face the
onslaught of globalization is target international markets. This can only be achieved
by encouraging small firms not just to be innovative but the continuity in innovation
activities. Without institutional support small firms may not be able to become
globally competitive as their risk absorbing capacity is low.
Therefore we conclude that policy makers need to focus on policies towards
small firms that ensure the continuity of innovation activities in EU industrial policies.
ICT SMEs cannot afford any more to focus on local markets only, globalization
demands exposure to international trade leading to ever increasing specialization.
Policy makers should take into account that combining cluster polices aimed at the
technological areas (see Figure 2) together with innovation policies that discriminate

29
against occasionally innovating ICT SMEs will bring the Lisbon agenda a bit closer to
reality.
Acknowledgement
This paper originates from our contributions to the EC funded project “Study on
Innovative ICT SMEs in Europe (EU 25)” funded by the European Commission
Directorate – General Information Society and Media, Contract Nr 30-CE-
0067591/00-41. This project was led by IDC Italy with participation of ISTAT
(Statistics Italy) and the authors at UNU-MERIT. We are grateful to the EC for
financial support and our partners the latter who provided us with the database as well
as with suggestions and comments. The results presented in this paper remain the sole
responsibility of the authors.

30
References
Baba Y. 1989. The Dynamics of Continuous Innovation in Scale-Intensive Industries, Strategic Management Journal, 10 (1): 89-100.
Barrios S. and Burgelman J-C. 2007, Information and Communication Technologies, Market Rigidities and Growth: Implications for EU Policies, IPTS technical Reports 23027: 1-58.
Bessant J. Caffyn S. and Gallagher M. 2001, An evolutionary model of continuous improvement behaviour, Technovation, 21: 67-77.
Cefis E. and Marsali O., 2006, Survivor: The role of innovation in firms’ survival, Research Policy, 2006, 35: 626-641. Chapman R. and Corso, 2005, M, From continuous improvement to collaborative innovation: the next challenge in supply chain management, Production Planning & Control, 16 (4): 435-458. Chapman R., and Hyland P., 2004. Complexity and learning behaviors in product innovation, Technovation, 24 (7): 553-61. Cohen W., 1995, Empirical Studies of Innovative Activity, in: Paul Stoneman (ed.), Handbook of the Economics of Innovation and Technological Change, Blackwell, Oxford: 182-264. De Propris L., 2007, Reconciling Cohesion and Competitiveness through EU cluster policies, Policy Studies, 28 (4): 327-345 Drucker P., 1993, Innovation and Entrepreneurship, Collins: London Dunnewijk, T., Meijers H. and Van Zon A., 2007, Accounting for the Impact of Information and Communication Technologies on Total Factor Productivity: Towards and Endogenous Growth Approach (editor S. Barrios). Seville: European Commission, Joint Research Centre, IPTS. . Gellatley G. and Baldwin, J., 2003, Innovation Strategies and Performance in Small Firms, Edward Elgar: Cheltenham, UK Imai M., 1986, Kaisen: The Key to Japan’s Competitive Success, McGraw-Hill Publishing Company: New York, NY.
Inventory of Innovative ICT SMEs in Europe, IDC, Milan, 2007, a study commissioned by the EC Contract Nr 30-CE-0067591/00-41.
Kahn A. and Manopichetwattana V., 1989, Innovative and Noninnovative Small Firms: Types and Characteristics, Management Science, 35 (5): 597-606 Knight, G., 2001, Entrepreneurship and strategy in the International SME, Journal of Management, 7: 155-171

31
Lacity, M. and Willcocks, 2000, L., Inside IT Outsourcing: A State-Of-Art Report. Templeton College, Oxford. Lal, K. 2002, E-business and Manufacturing Sector: A Study of Small and Medium-sized Enterprises in India”, Research Policy, 31 (7): 1199-1211. Lööf, H., Heshmati A., Asplund, R., and Nåås, S-O., 2001, Innovation and performance in manufacturing industries: A Comparison of the Nordic Countries, Stockholm School of Economics, (SSE/EFI) Working Paper Series in Economics and Finance, No. 457. http://swopec.hhs.se/hastef/papers/hastef0457.pdf Nooteboom, B., 1994, Innovation and Diffusion in Small Firms: Theory and Evidence, Small Business Economics, 6: 327-347 Nummela, N., Puumlainen K. and Saarenketo S., 2005, International Growth Orientation of Knowledge Intensive SMEs, Journal of International Entrepreneurship, 3: 5-18. O’Regan N.and Ghobadian A., 2005, Innovation in SMEs: the impact of strategic orientation and environmental perceptions, International Journal of Productivity and Performance Management, 54 (2): 81-97.
OSLO Manual, 1992, The Measurement of scientific and Technological Activities, Proposed Guidelines for Collecting and Interpreting Technological Innovation Data, OECD, European Commission, Eurostat. http://www.oecd.org/dataoecd/35/61/2367580.pdf
Oyelaran-Oyeyinka B. and Lal K. 2006, SMEs and New Technologies; Learning E-Business and Development. Palgrave MacMillan: Hampshire and New York Parisi M., Schiantarelli F. and Sembenelli A., 2006, Productivity, innovation and R&D: Micro evidence for Italy, European Economic Review, 50: 2037-2061. Porter, M., 1979, How competitive forces shape strategy, Harvard Business review, 57(2): 137-145. Schumpeter, J., 1943, Capitalism, Socialism and Democracy, London: George Allen & Unwin Ltd. Smith, K, 2005, Measuring Innovation. In J. Fagerberg et al. The Oxford Handbook of Innovation, Oxford University Press, Oxford, 2005
Teece, D., Pisano G. and Shuen A., Dynamic capabilities and strategic management, Strategic Management Journal, 18: 509-533.
Verona G. and Ravasi D., 2003, Unbundling dynamic capabilities: an exploratory study of continuous product innovation, Industrial and Corporate Change, 12 (3): 577-606.

32
Table 1 Share in Employment and Value Added of ICT SMEs in ICT manufacturing and services in EU25 (2002/3)
ICT manufacturing ICT services employment 44% 52% value added 35% 33% labour productivity (av=100) 80% 63% source: UNU-MERIT
Table 1A. Value added per employee and per enterprise in ICT manufacturing and ICT
service in EU25 (2005) size classes 1_9 10_49 50_250 >250 ICT manufacturing value added per employee € 29,911 € 39,282 € 46,208 € 57,023 value added per enterprise € 71,950 € 750,588 € 4,724,541 € 4,776,737 share in value added 6.52% 10.64% 18.15% 64.69% ICT services value added per employee € 47,044 € 55,131 € 63,905 € 120,449 value added per enterprise € 135,795 € 1,102,358 € 6,294,017 € 137,228,779 share in value added 8.38% 11.58% 13.25% 66.79%
Source: UNU-MERIT
Figure 1 Theoretical Framework
33
Table 2 Selected Firms’ Characteristics and Distribution of Firms
Innovator Type Total Firm Characteristics Occasional Continuous 1. Ownership Type No. Percent No. Percent Single Private Owner 115 28.82 187 26.30 302 Ltd. Company 220 55.14 364 51.20 584 Stock Company 64 16.04 160 22.50 224 Total 399 100.00 711 100.00 1110 2. Education Level of Entrepreneur Higher Education 345 86.47 635 90.20 980 Secondary 48 12.03 63 8.95 111 Primary 6 1.50 6 0.85 12 Total 399 100.00 704 100.00 1103 3. Management Structure Hierarchical/bureaucratic 176 44.44 303 42.44 479 Flat/Project oriented 211 53.28 392 54.90 603 Other 9 2.27 19 2.66 28 Total 396 100.00 714 100.00 1110 4. Target Market Local 73 17.89 60 8.26 133 Regional 69 16.91 74 10.19 143 National 145 35.54 226 31.13 371 EU 72 17.65 132 18.18 204 Global 49 12.01 234 32.23 283 Total 408 100.00 726 100.00 1134 5. Networking with Other Enterprises Yes 145 35.54 268 36.76 413 No 263 64.46 461 63.24 724 Total 408 100.00 729 100.00 1137
Note: Percent� Column percent for each variable

34
Table 3 Performance of Firms and Choice of Innovation
Innovator Type Variables Occasional Continuous Sales Dynamics for the last 3 Years
No. Percent No. Percent Total
10 + % 60 15.11 227 31.84 287 5 - 10 % 176 44.33 295 41.37 471 up to 5 % 72 18.14 92 12.90 164 No change 69 17.38 86 12.06 155 Decline up to 5% 11 2.77 7 0.98 18 Decline 5 - 10 % 4 1.01 3 0.42 7 Decline 10 + % 5 1.26 3 0.42 8 Total 397 100.00 713 100.00 1110 Employment Dynamics for the last 3 Years 10 + % 54 13.43 146 20.53 200 5 - 10 % 120 29.85 202 28.41 322 up to 5 % 57 14.18 118 16.60 175 No change 146 36.32 216 30.38 362 Decline up to 5% 15 3.73 20 2.81 35 Decline 5 - 10 % 8 1.99 4 0.56 12 Decline 10 + % 2 0.50 5 0.70 7 Total 402 100.00 711 100.00 1113 Profitability Dynamics for the last 3 Years 10 + % 43 11.00 132 19.02 175 5 - 10 % 148 37.85 286 41.21 434 up to 5 % 78 19.95 122 17.58 200 No change 104 26.60 131 18.88 235 Decline up to 5% 12 3.07 13 1.87 25 Decline 5 - 10 % 5 1.28 6 0.86 11 Decline 10 + % 1 0.26 4 0.58 5 Total 391 100.00 694 100.00 1085 Market Growth Fast Growth 52 12.81 134 18.69 186 Growth 181 44.58 339 47.28 520 Stability 148 36.45 207 28.87 355 Decline 25 6.16 36 5.02 61 Fast Decline 1 0.14 1 Total 406 100.00 717 100.00 1123 Note: Percent� Column percent for each variable

35
Table 4 Univariate Analysis (T-test)
Innovator Type Variables Occasional Continuous Mean Mean
T-value
Sig. Ownership 1.87 1.96 2.135 0.033 Education level of entrepreneur 1.15 1.11 -1.859 0.063 Management Structure 1.58 1.61 0.901 0.368 Annual RTD budget in EUR 597,635.33 633,233.96 0.105 .916 RTD employees in 2005 3.59 8.51 5.242 0.000 Target market 2.89 3.56 8.678 0.000 Sales dynamics for the last 3 Years 2.56 2.12 -6.127 0.000 Employment dynamics for the last 3 Years
2.95 2.71 -3.034 0.002
Profitability dynamics for the last 3 Years
2.78 2.48 -4.049 0.000
Market growth 2.36 2.21 -3.122 0.002 Sales turnover in 2005 in EUR 3,113,358 3,871,854 -1.040 0.299 Networking with other Enterprises 1.42 1.47 -0.412 0.681
Note: Numbers are mean values of the variables
Table 5 Logit Analysis
Dependent variable: Innovation choice Independent Variables Model I Model II Coeff. Z Coeff. Z Intercept 0.3124 0.5386 OWNER -0.0190 -1.517 MD_EDU -0.1406 -0.399 -0.4529 -1.758* MAN_STRU 0.3053 1.249 RTD_EMP 0.0349 2.088** 0.0269 2.367** TAR_MAR 0.3087 2.951*** 0.3161 4.237*** SAL_DYN -0.0299 -0.196 -0.2880 -3.092*** EMP_DYN -0.0799 -0.656 0.0709 .801 PRF_DYN -0.1060 -0.747 MAR_GR -0.1592 -0.941 STO_EUR -0.0135 -1.080 NET_ENT -0.4889 -1.886* Observations 308 606 Log Likelihood -180.0214 [0.00005] -351.0783 [0.0000] Classification power of the model
69.48 70.63
Note: Figures in square brackets are level of significance of the function; *� 10%, **� 5 %, ***� 1% level of significance

36
Table 5: Logit analysis (Contd.) Dependent variable: Innovation choice Independent
Variables Model III Model IV Coeff. Z Coeff. Z Intercept 1.3587 0.9907 OWNER MD_EDU MAN_STRU RTD_EUR TAR_MAR SAL_DYN EMP_DYN -0.1486 -3.014*** PRF_DYN -0.1791 -3.075*** MAR_GR -0.1408 -1.656* Observations 1077 1113 Log Likelihood -696.0054 [0.0001] -723.4375 [0.0025] Classification power of the model
63.69 63.61
Note: Figures in square brackets are level of significance of the function; *� 10%,
**� 5 %, ***� 1% level of significance
C o m m u n ic a tio n n e tw o rk s
1 9 ,8 %
O th e r1 0 ,3 %
N a n o te c h n o lo g y e le c tro n ic s ,
C o m p o n e n ts a n d M ic ro s y s te m s
1 5 ,3 %
E m b e d d e d s y s te m s ,
c o m p u tin g a n d c o n tro l
7 ,3 %
K n o w le d g e , c o g n itiv e a n d
le a rn in g s y s te m s3 ,5 %
S im u la tio n , v is u a liz a tio n ,
in te ra c tio n a n d v ir tu a l re a lit ie s
2 ,2 %
S o ftw a re , g r id s , s e c u r ity a n d
d e p e n d a b ility3 5 ,2 %
D K / N A6 ,5 %
(% o f to ta l re s p o n d e n ts )
Figure 2 Distribution of ICT SMEs by Technology Area
Base=1,238, Source: Inventory of Innovative ICT SMEs in Europe

37
Table 6 Funding of ICT SMEs in relation to source of funding and destination of high, medium and low growth firms
Totala High growth (>10%)
Medium growth (5-10%)
Low growth (>0-5%)
No growth (<=0%)
No Answer
Did not received Funding
77.8% 24 40 14 17 5
Received Funding
22.2% 28 44 12 8 8
EC 8.9% National 10.4% Regional 5.7% Local 3.6%
Appendix I: Distribution of Firms by NACE Classification
Innovator Type Technological Area
Occasional Continuous Total
NACE Classification
No. Percent
No. Percent
Manufacturing 300 25 36.23 44 63.77 69 Office, accounting and computing
machinery 313 4 33.33 8 66.67 12 Insulated wire and cable 321 28 45.16 34 54.84 62 Electronic valves and tubes and other
electronic components 322 3 18.75 13 81.25 16 Television and radio transmitters and
apparatus for line telephony and line telegraphy
323 7 43.75 9 56.25 16 Television and radio receivers, sound or video recording or reproducing apparatus and associated goods
332 11 24.44 34 75.56 45 Instruments and appliances for measuring, checking, testing, navigating, and other purposes, except industrial process equipment
333 20 35.71 36 64.29 56 Industrial process equipment Total Manufacturing 276 Services
642 44 36.36 77 63.64 121 Telecommunications 720 4 30.77 9 69.23 13 Computer and related activities 721 26 46.43 30 53.57 56 Hardware consultancy 722 115 35.11 261 69.41 376 Software consultancy and supply 723 17 32.08 36 67.92 53 Data Processing 724 7 33.33 14 66.67 21 Database activities 725 13 48.15 14 51.85 27 Maintenance and repair of office,
accounting and computing machinery 726 84 43.30 110 56.70 194 Other computer related activities
Total Services 861 Total 408 37.38 729 64.12 1137

38
Appendix II: Member State Distribution of Firms
Member State Firms No. Percent
Austria 51 4.12 Belgium 50 4.04 Cyprus 30 2.42 Czech 30 2.42 Denmark 50 4.04 Estonia 30 2.42 Finland 50 4.04 France 100 8.08 Germany 100 8.08 Greece 30 2.42 Hungary 30 2.42 Ireland 50 4.04 Italy 99 8.00 Latvia 30 2.42 Lithuania 30 2.42 Luxemburg 30 2.42 Malta 30 2.42 Netherlands 48 3.88 Poland 30 2.42 Portugal 30 2.42 Slovakia 30 2.42 Slovenia 30 2.42 Spain 100 8.08 Sweden 50 4.04 UK 100 8.08 Total 1238 100.00
Appendix III: Correlation Matrix
OWNER MD_EDU MAN_STRU RTD_EMP TAR_MAR SAL_DYN EMP_DYN PRF_DYN MAR_GR STO NET_ENT OWNER 1.000 MD_EDU 0.041 MAN_STRU 0.013 0.064 RTD_EMP -0.026 -0.094 -0.053 TAR_MAR 0.018 -0.152 0.062 0.265 SAL_DYN 0.004 -0.080 0.004 -0.010 -0.109 EMP_DYN -0.004 0.015 0.026 -0.075 -0.170 0.597 PRF_DYN 0.022 -0.060 0.069 -0.016 -0.062 0.658 0.518 MAR_GR 0.030 0.108 -0.007 -0.010 -0.164 0.340 0.360 0.299 STO -0.025 -0.078 -0.002 0.335 0.208 0.0008 -0.032 0.035 0.0004 NET_ENT -0.042 -0.0007 -0.063 -0.026 -0.045 -0.070 -0.032 -0.105 0.015 -0.103 1.000

39
40
The UNU-MERIT WORKING Paper Series
2008-01 Title to be announced by Luc Soete 2008-02 Reframing technical change: Livestock Fodder Scarcity Revisited as Innovation
Capacity Scarcity. Part 1. A Review of Historical and Recent Experiences by Andy Hall, Rasheed Sulaiman V., Mona Dhamankar, Peter Bezkorowajnyj & Leela Prasad
2008-03 Reframing technical change: Livestock Fodder Scarcity Revisited as Innovation
Capacity Scarcity. Part 2. A Framework for Analysis by Andy Hall, Rasheed Sulaiman, V. and Peter Bezkorowajnyj
2008-04 Reframing technical change: Livestock Fodder Scarcity Revisited as Innovation
Capacity Scarcity.Part 3. Tools for Diagnosis and Institutional Change in Innovation Systems by Andy Hall, Rasheed Sulaiman and Peter Bezkorowajnyj
2008-05 Is Inter-Firm Labor Mobility a Channel of Knowledge Spillovers? Evidence from a
Linked Employer-Employee Panel by Mika Maliranta, Pierre Mohnen & Petri Rouvinen
2008-06 Financial Constraints and Other Obstacles:Are they a Threat to Innovation
Activity? By P. Mohnen, F.C. Palm, S. Schim van der Loeff and A. Tiwari 2008-07 Knowledge-based productivity in ‘low-tech’ industries: evidence from firms in
developing countries by Micheline Goedhuys, Norbert Janz and Pierre Mohnen 2008-08 The Voyage of the Beagle in Innovation Systems Land.Explorations on Sectors,
Innovation, Heterogeneity and Selection by Martin Srholec & Bart Verspagen 2008-09 Crafting Firm Competencies to Improve Innovative Performance by Boris Lokshin,
Anita van Gils & Eva Bauer 2008-10 The Economics and Psychology of Personality Traits by Lex Borghans, Angela Lee
Duckworth, James J. Heckman & Bas ter Weel 2008-11 Embedding Research in Society: Development Assistance Options for Supporting
Agricultural Innovation in a Global Knowledge Economy by Andy Hall 2008-12 Playing in Invisible Markets: Innovations in the Market for Toilets to Harness the
Economic Power of the Poor by Shyama V. Ramani 2008-13 Explaining Success and Failure in Development by Adam Szirmai 2008-14 Running The Marathon by William Cowan, Robin Cowan and Patrick Llerena 2008-15 Productivity effects of innovation, stress and social relations by Rifka Weehuizen,
Bulat Sanditov and Robin Cowan 2008-16 Human Capital Intensity in R&D performing firms Located in Portugal: Do Foreign
Multinationals Matter? By Ana Teresa Tavares 2008-17 Entrepreneurship and Innovation Strategies in ICT SMEs in Enlarged Europe
(EU25) by Kaushalesh Lal and Theo Dunnewijk