ACADEMY OF ENTREPRENEURSHIP JOURNAL
196
Volume 20, Number 2 Print ISSN: 1087-9595 Online ISSN: 1528-2686 ACADEMY OF ENTREPRENEURSHIP JOURNAL Martin Bressler, Editor Southeastern Oklahoma State University The Academy of Entrepreneurship Journal is owned and published by Jordan Whitney Enterprises, Inc. Editorial content is under the control of the Academy of Entrepreneurship, Inc., an affiliate of the Allied Academies, Inc. Both are non-profit associations of scholars, whose purpose is to support and encourage research and the sharing and exchange of ideas and insights throughout the world.
-
Upload
khangminh22 -
Category
Documents
-
view
0 -
download
0
Transcript of ACADEMY OF ENTREPRENEURSHIP JOURNAL
Volume 20, Number 2 Print ISSN: 1087-9595 Online ISSN: 1528-2686
ACADEMY OF ENTREPRENEURSHIP JOURNAL
Martin Bressler, Editor Southeastern Oklahoma State University
The Academy of Entrepreneurship Journal is owned and published by Jordan Whitney Enterprises, Inc. Editorial content is under the control of the Academy of Entrepreneurship, Inc., an affiliate of the Allied Academies, Inc. Both are non-profit associations of scholars, whose purpose is to support and encourage research and the sharing and exchange of ideas and insights throughout the world.

Page ii
Academy of Entrepreneurship Journal, Volume 20, Number 2, 2014
Authors execute a publication permission agreement and assume all liabilities. Neither Jordan Whitney Enterprises, Academy of Entrepreneurship, nor Allied Academies is responsible for the content of the individual manuscripts. Any omissions or errors are the sole responsibility of the authors. The Editorial Board is responsible for the selection of manuscripts for publication from among those submitted for consideration. The Publishers accept final manuscripts in digital form and make adjustments solely for the purposes of pagination and organization. The Academy of Entrepreneurship Journal is owned and published by Jordan Whitney Enterprises, Inc., PO Box 1032, Weaverville, NC 28787, USA. Those interested in communicating with the Journal, should contact the Executive Director of the Allied Academies at [email protected].
Copyright 2014 by Jordan Whitney Enterprises, Inc., Weaverville, NC, USA

Page iii
Academy of Entrepreneurship Journal, Volume 20, Number 2, 2014
EDITORIAL BOARD MEMBERS
Ismet Anitsal Tennessee Tech University Cookeville, Tennessee
Stephanie Bardwell Christopher Newport University Newport News, Virginia
Thomas M. Box Pittsburg State University Pittsburg, Kansas
Martin Bressler Houston Baptist University Houston, Texas
Kent Byus Texas A&M University, Corpus Christi Corpus Christi, Texas
Shawn M. Carraher Indiana Wesleyan University Marion, Indiana
Sanjib Chowdhury Eastern Michigan University Ypsilanti, Michigan
Jo Ann M. Duffy Sam Houston State University Huntsville, Texas
Ramaswamy Ganesan BITS-Pilani Goa Campus Goa, India
Robert D. Gulbro Athens State University Athens, Alabama
Abdalla Hagen Grambling State University Grambling, Louisiana
Michael Harris Eastern Michigan University Ypsilanti, Michigan
Kirk Heriot Columbus State University Columbus, Georgia
Robert J. Hockin TechArch, Inc
Mark Hoelscher Illinois State University Normal, Illinois
William T. Jackson University of South Florida, St. Petersburg St. Petersburg, Florida
Desti Kannaiah Middlesex University London, Dubai Campus Dubai, United Arab Emirates
Kenneth J. Lacho University of New Orleans New Orleans, Louisiana
Bill Laing Anderson University Anderson, Indiana
Jonathan Lee University of Windsor Ontario, Canada
Donatus Okhomina Alabama State University Montgomery, Alabama
Terry Pearson West Texas A&M University Canyon, Texas
Keramat Poorsoltan Frostburg State University Frostburg, Maryland
Felipa Lopes dos Reis Open University and Universidade Lusíada de Lisboa Portugal
Sherry Kay Robinson Penn State University New Albany, Pennsylvania
Sujata Satapathy Indian Institute of Technology New Delhi, India

Page iv
Academy of Entrepreneurship Journal, Volume 20, Number 2, 2014
EDITORIAL BOARD MEMBERS
Susan E. Saxton Capella University Minneapolis, Minnesota
Linda Shonesy Athens State University Athens, Alabama
Charles R. B. Stowe Lander University Lander, South Carolina
Rodney C. Vandeveer Purdue University West Lafayette, Indiana
Paul G. Wilhelm Kentucky State University Frankfort, Kentucky
Thomas Wright University of Nevada - Reno Reno, Nevada
Page v
Academy of Entrepreneurship Journal, Volume 20, Number 2, 2014
TABLE OF CONTENTS EDITORIAL BOARD MEMBERS ...............................................................................................III LETTER FROM THE EDITOR .................................................................................................. VII A QUANTITATIVE STUDY OF BUSINESS OWNERS AND PERCEIVED NETWORK BENEFITS: COLLECTIVIST VS. INDIVIDUALIST BASED CULTURES ...............................1
Cheryl Luczak, Saint Xavier University Sumaria Mohan-Neill, Roosevelt University Gerald Hills, University of Illinois at Chicago
DISCOVERING HETEROGENEITY OF ENTREPRENEURS: A COMPARISON OF FOOD AND NON-FOOD ENTREPRENEURS......................................19
Chyi-lyi (Kathleen) Liang, University of Vermont Paul Dunn, University of Louisiana at Monroe
A FRAMEWORK FOR INFORMAL ECONOMY ENTRY: SOCIO-SPATIAL, NECESSITY-OPPORTUNITY, AND STRUCTURAL-BASED FACTORS..............................33
SherRhonda R. Gibbs, The University of Southern Mississippi Charlie E. Mahone, Jr., University of the District of Columbia Micah E. S. Crump, Howard University
OLDER AND WISER? AN ANALYSIS OF ADVICE NETWORKS BY AGE .........................59
Sherry Robinson, Penn State University/Buskerud University College Hans Anton Stubberud, Buskerud University College
THE RELATIONSHIP BETWEEN METACOGNITION, ENTREPRENEURIAL ORIENTATION, AND FIRM PERFORMANCE: AN EMPIRICAL INVESTIGATION ..........71
Young Sik Cho, The University of Texas-Pan American Joo Y. Jung, The University of Texas-Pan American
DISAGGREGATING JAMAICA’S MICRO, SMALL AND MEDIUM FIRMS ON CHALLENGES FACED FOR BETTER POLICY DEVELOPMENT AND PLANNING .........87
Trevor A. Smith, University of the West Indies Derrick D. Deslandes, University of the West Indies
Page vi
Academy of Entrepreneurship Journal, Volume 20, Number 2, 2014
WHAT MATTERS, AND HOW: DOES PROCEDURAL UTILITY EXPLAIN SELF-EMPLOYMENT? ...................................103
David McClough, Ohio Northern University John Hoag, Bowling Green State University Mary Ellen Benedict, Bowling Green State University
SMALL BUSINESSES USE OF AN IPO...................................................................................121
Don B. Bradley III, University of Central Arkansas Kalyn Camp, University of Central Arkansas
THE REVERSE FAMILY BUSINESS: AN EMERGING TREND IN ENTREPRENEURSHIP? ............................................................................................................137
Martin S. Bressler, Southeastern Oklahoma State University Kitty Campbell, Southeastern Oklahoma State University Brett Elliott, Southeastern Oklahoma State University
SOCIAL ENTERPRISES AND SOCIAL ENTREPRENEURS: ONE SIZE DOES NOT FIT ALL ...............................................................................................152
William T. Jackson, University of South Florida St. Petersburg Mary Jo Jackson, University of Tampa
ABDUCTION, DEDUCTION AND INDUCTION AS CONCEPTS FOR UNDERSTANDING ENTREPRENEURIAL OPPORTUNITIES A META-PERSPECTIVE BASED ON THREE VIEWS OF THE MARKET PROCESS .......164
Øystein Rennemo, Nord-Trøndelag University Håvard Åsvoll, Nord-Trøndelag University

Page vii
Academy of Entrepreneurship Journal, Volume 20, Number 2, 2014
LETTER FROM THE EDITOR We are extremely pleased to present the Academy of Entrepreneurship Journal, an official journal of the Academy of Entrepreneurship, Inc. The AOE is an affiliate of the Allied Academies, Inc., a non profit association of scholars whose purpose is to encourage and support the advancement and exchange of knowledge, understanding and teaching throughout the world. The AEJ is a principal vehicle for achieving the objectives of both organizations. The editorial mission of this journal is to advance the knowledge and understanding of entrepreneurship throughout the world. To that end, the journal publishes high quality, theoretical and empirical manuscripts, which advance the entrepreneurship discipline. The manuscripts contained in this volume have been double blind refereed. The acceptance rate for manuscripts in this issue, 25%, conforms to our editorial policies. The Editorial Policy, background and history of the organization, and calls for conferences are published on the Allied Academies’ web site. In addition, we keep the web site updated with the latest activities of the Academy and its affiliated organizations. Please visit our site and know that we welcome hearing from you at any time.
Martin Bressler, Editor Southeastern Oklahoma State University

Page viii
Academy of Entrepreneurship Journal, Volume 20, Number 2, 2014

Page 1
Academy of Entrepreneurship Journal, Volume 20, Number 2, 2014
A QUANTITATIVE STUDY OF BUSINESS OWNERS AND PERCEIVED NETWORK BENEFITS: COLLECTIVIST
VS. INDIVIDUALIST BASED CULTURES
Cheryl Luczak, Saint Xavier University Sumaria Mohan-Neill, Roosevelt University
Gerald Hills, University of Illinois at Chicago
ABSTRACT Do the cultural roots of business owners influence their market orientation, social
networks, and ultimately affect the benefits derived from these networks? This study focuses on the relationship between culture and network benefits and further explores a conceptual model related to cultural aspects of network benefits for small business owners proposed in an earlier qualitative study by Luczak, Mohan and Hills (2010) This study provides an empirical exploration of how business owners’ culture moderate and influence their marketing orientation and networking processes.
Based on Hofstede’s cultural dimensions, it is suggested that business owners from a collectivist culture exhibit a relational market orientation (1991). Business owners exhibiting relational market orientations also exhibit stronger social ties than owners with transactional orientations, allowing business owners’ greater access to economic, relational and intellectual capital. Data for this study was collected from a sample of American and Indian small business owners. Building on Hofstede’s model and the proposed theoretical framework, this research explores the differences between Indian and Western culture, shared values, trust and commitment in the context of small business owners. Fundamental differences that distinguish between collectivist and individualistic cultures are used as a basis to identify differences in networking practices between the two cultures. This analysis contributes to the scholarly understanding of networking theory through the exploration of the relationship between culture, market orientation and network benefits to small business owners. This research addresses an existing gap in the marketing literature by exploring the moderating effect of culture on business owners’ networking activities and determining if this effect represents a competitive advantage
PURPOSE OF STUDY
This study considers the cultural roots of business owners and possible moderating
effects of the owners’ market orientation on the strength of their social ties and perceived benefits derived from the owners’ networks. Hofstede’s model of national culture, networking
Page 2
Academy of Entrepreneurship Journal, Volume 20, Number 2, 2014
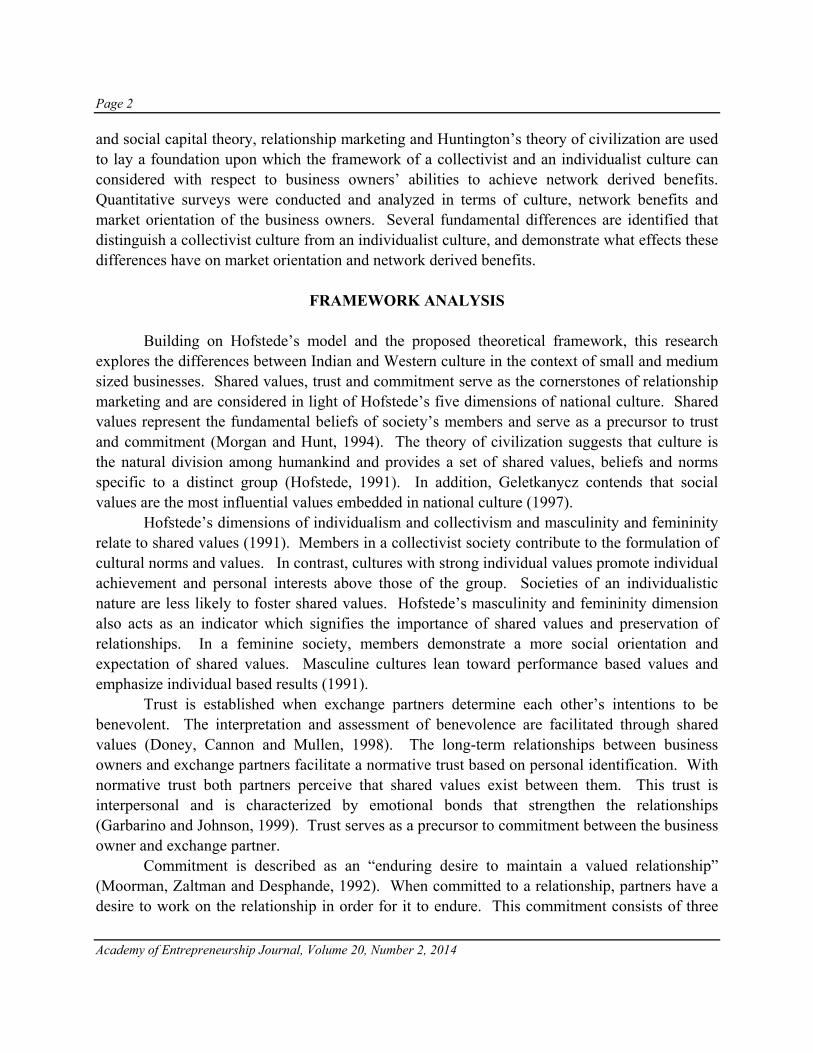
and social capital theory, relationship marketing and Huntington’s theory of civilization are used to lay a foundation upon which the framework of a collectivist and an individualist culture can considered with respect to business owners’ abilities to achieve network derived benefits. Quantitative surveys were conducted and analyzed in terms of culture, network benefits and market orientation of the business owners. Several fundamental differences are identified that distinguish a collectivist culture from an individualist culture, and demonstrate what effects these differences have on market orientation and network derived benefits.
FRAMEWORK ANALYSIS Building on Hofstede’s model and the proposed theoretical framework, this research
explores the differences between Indian and Western culture in the context of small and medium sized businesses. Shared values, trust and commitment serve as the cornerstones of relationship marketing and are considered in light of Hofstede’s five dimensions of national culture. Shared values represent the fundamental beliefs of society’s members and serve as a precursor to trust and commitment (Morgan and Hunt, 1994). The theory of civilization suggests that culture is the natural division among humankind and provides a set of shared values, beliefs and norms specific to a distinct group (Hofstede, 1991). In addition, Geletkanycz contends that social values are the most influential values embedded in national culture (1997).
Hofstede’s dimensions of individualism and collectivism and masculinity and femininity relate to shared values (1991). Members in a collectivist society contribute to the formulation of cultural norms and values. In contrast, cultures with strong individual values promote individual achievement and personal interests above those of the group. Societies of an individualistic nature are less likely to foster shared values. Hofstede’s masculinity and femininity dimension also acts as an indicator which signifies the importance of shared values and preservation of relationships. In a feminine society, members demonstrate a more social orientation and expectation of shared values. Masculine cultures lean toward performance based values and emphasize individual based results (1991).
Trust is established when exchange partners determine each other’s intentions to be benevolent. The interpretation and assessment of benevolence are facilitated through shared values (Doney, Cannon and Mullen, 1998). The long-term relationships between business owners and exchange partners facilitate a normative trust based on personal identification. With normative trust both partners perceive that shared values exist between them. This trust is interpersonal and is characterized by emotional bonds that strengthen the relationships (Garbarino and Johnson, 1999). Trust serves as a precursor to commitment between the business owner and exchange partner.
Commitment is described as an “enduring desire to maintain a valued relationship” (Moorman, Zaltman and Desphande, 1992). When committed to a relationship, partners have a desire to work on the relationship in order for it to endure. This commitment consists of three
Page 3
Academy of Entrepreneurship Journal, Volume 20, Number 2, 2014
components: attitudinal, temporal, and instrumental. The attitudinal component primarily involves a personal attachment or identification between the exchange partners. The temporal commitment implies intent to remain in the relationship with a partner. The instrumental component involves an investment on behalf of the partners (Gundlock, Archrol and Mentzer, 1995). These components help form the exchange partners’ attitudes.
HYPOTHESIS DEVELOPMENT
Hofstede’s dimensions of national culture are used to differentiate a collectivist culture
from individualist culture. According to Hofstede, these dimensions “allow us to make predictions on the way that society operates” based on cultural considerations (1993). This study is built on Hofstede’s cultural differences highlighted in the framework analysis, which supports the notion that culture can affect business owners’ market orientations and network derived benefits. This study builds on the idea that market orientation can affect the strength of social ties and focuses attention on the relationship between an owner and their exchange partners. These relationships that exist between a business owner and his exchange partners range from relational to transactional (Dwyer, Schurr and Oh, 1987). The owner with a relational market orientation focuses on enhancing and building long-term relationships, as opposed to a transactionally oriented owner who is not interested in the social context of the relationship (Woodside, Wilson and Milner, 1990).
National culture also influences the development of trust through the processes of predictability and intentionality. The dimension of individualism and collectivism influences trust by establishing the value that society places on conformity and using that value to predict behavior within a society. Long-term orientation has a positive influence on trust; relationships, once formed, are expected to last forever. Trust is fostered by a long-term orientation through emphasis on social sanctions (Chung, Sternquist and Chen, 2006). Additionally, power distance provides a basis upon which to form trust. Societies with higher power distance trust within their social network, however they have a lower propensity to trust between different social networks. This breakdown in trust reduces the access to resources that can be provided by “weak” ties. Business owners utilize their week ties to increase their exposure to different circles in an effort to identify more opportunities (Davidson and Honig, 2003). Low power distance societies believe that superiors are accessible and similar to the other members of society. Cultures with low power distance promote equality within societies and suggest that superiors are accessible and similar to the other members of society (Hofstede, 1980; Robert, Probst, Martocchio, Drasgow and Lawler, 2002). In addition, societies marked by low power distance emphasize mutual dependence resulting in an increased propensity to access “weak” ties (Doney, Canon and Mullen, 1998). Based on the presumption that cultures can be classified within the framework of the Hofstede power distance dimensions as either collectivist or individualist and that the culture
Page 4
Academy of Entrepreneurship Journal, Volume 20, Number 2, 2014
is a predictor of market orientation as being either relational or transactional , the following hypotheses are offered: Hypothesis 1: Owners from a collectivist culture will exhibit a higher level of trust with their exchange
partners. Hypothesis 2: Owners from an individualist culture will exhibit a lower level of trust with their exchange
partners. Hofstede’s dimensions of individualism and collectivism and masculinity and femininity
relate to shared values. Members in a collectivist society contribute to the formulation of cultural norms and values. In contrast, cultures with strong individual values promote individual achievement and personal interests above those of the group. Societies of an individualistic nature are less likely to foster shared values. Hofstede’s masculinity/femininity dimension also acts as an indicator which signifies the importance of shared values and preservation of relationships. In a feminine society, members demonstrate a more social orientation and expectation of shared values. Masculine cultures lean toward performance based values and emphasize individual based results.
Hypothesis 3: Owners from a collectivist culture will exhibit a higher level of shared values with their
exchange partners. Hypothesis 4: Owners from an individualist culture will exhibit a lower level of shared values with their
exchange partners. Hofstede’s dimensions of individualism and collectivism, uncertainty avoidance and log-
term orientation influence the development of commitment between business owners and their exchange partners. When committed to a relationship, partners have a desire to work on the relationship in order for it to endure. In a collectivist culture a person learns to respect the group to which they belong, they remain loyal, thus promoting commitment to the group and putting the groups’ interests above their own individual interests (Hofstede, 1980). The degree of uncertainty avoidance also influences commitment. Societies with high uncertainty avoidance try to reduce uncertainty through the enforcement of strict laws and or formal rules. Low uncertainty avoidance societies reduce risk by engaging in long-term relationships, as opposed to enforcing strict laws and formal rules (Doney, Canon, and Mullen, 1998). Long-term orientation fosters commitment through emphasis on social sanctions (Chung, Sternquist and Chen, 2006). Relationships between business owners and exchange partners are grounded in cultural heritage that emphasizes long-term perspectives in its members, which to commitment when exchange partners develop a close and enduring relationship (Kim and Oh, 2002). Hypothesis 5: Owners from a collectivist culture will exhibit a higher level of commitment to their

Page 5
Academy of Entrepreneurship Journal, Volume 20, Number 2, 2014
exchange partners. Hypothesis 6: Owners from an individualist culture will exhibit a lower level of commitment to exchange
partners.
It is also hypothesized that exchange partners attitudes exhibiting a relational market orientation will have a positive effect on network benefits received by business owners. The potential networking benefits explored in this study include relational, financial and intellectual capital. Relational capital includes referrals, and increased access to distributors and suppliers. Financial capital includes start-up capital, low or no interest loans, as well as reduced or free labor. Intellectual capital includes idea generation, innovation, and improved business strategies. A business owner’s country of origin can predict the owner’s market orientation, which affects the strength of his social ties and ultimately affects the benefits that an owner derives from his network. The relationship between market orientation and network benefits forms the basis of the conceptual model proposed in Fig.1. A business owner from a collectivist culture is expected to possess a relational market orientation that exhibits a pattern of positive social networking behavior. A shared value system is one of the effects of a collectivist society. Relational and group affiliations within a collectivist society foster shared values and promote relational orientations amongst it’s’ members. In addition to the shared values, the long-term relationships between business owners and exchange partners also facilitate normative trust based on personal identification. Trust serves as a precursor to commitment between the business owner and exchange partner in which commitment is solidified by desire to maintain a valued relationship.
Effective networking helps business owners accelerate the rate of growth and creation of wealth through additional connections with distributors and suppliers, increased innovation in terms of products, methods of production and markets, synthesizing of ideas and suggestions, and increased learning regarding product and process (Ramachandran and Ramnarayan, 1993). Social networks serve to expand business owners’ boundaries in terms of knowledge and information (Waldinger, Aldrich and Ward, 1990). The constructs of shared values, trust and commitment affect an owner’s market orientation and ultimately affects social networks. Based on the proposed relationship between market orientation and social networks the following hypotheses are offered:
Hypothesis 7a:Business owners with higher levels of shared values will have stronger social network ties,
than owners exhibiting lower levels of shared values. Hypothesis 7b: Business owners with higher levels of trust will have stronger social network ties, than
owners exhibiting lower levels of trust. Hypothesis 7c:Business owners with higher levels of commitment will have stronger social network ties,
than owners exhibiting lower levels of commitment.

Page 6
Academy of Entrepreneurship Journal, Volume 20, Number 2, 2014
It is the premise of this study that the differences in Hofstede’s cultural dimensions differentiate countries of origin which predict business owners market orientations, as relational or transactional, and ultimately affect network benefits. The network benefits consist of social capital including relational capital, economic capital and intellectual capital. Economic capital may include start-up capital, low or no interest loans, as well as free or reduced labor (Diomande, 1990). Relational capital rests on close interpersonal ties at a dyadic level and includes connections, alliances, business advice and referrals (Kale, Singh and Perlmutter, 2000). Intellectual capital revolves around accessing and acquiring critical information, and includes learning new capabilities, new business ideas, and product or service improvement ideas.
Business owners utilize their social ties to increase their exposure to different people and situations, in an effort to identify more opportunities for themselves and obtain access to additional resources (Alvarez and Busenitz, 2001). Based on the proposed relationship between a business owners’ relational orientations, social networks and perceived network benefits the following hypotheses are offered:
Hypothesis 8: Business owners that exhibit strong social ties will receive more economic capital than
owners exhibiting weak social ties. Hypothesis 9: Business owners that exhibit strong social ties will receive more relational capital than
owners exhibiting a weak social
Strength of Social Ties
Country of Origin
Relation/ Transactional Orientation
Economic Capital
Relational Capital
Intellectual Capital
Fig. 1 Conceptual Model of Network Derived Benefits
Page 7
Academy of Entrepreneurship Journal, Volume 20, Number 2, 2014
Hypothesis 10: Business owners that exhibit strong social ties will receive more intellectual capital than owners exhibiting weak social ties.
RESEARCH METHODOLOGY
Quantitative surveys were used to test the hypotheses proposed in this study. The Indian
culture was selected to represent a collective society and the U.S. was selected to represent an individualist society. The sample population consisted of 251 Indian and American motel owners. Designation as Indian or American was determined by the owner’s country of birth. Single industry studies are often preferable in the study of business owners. The survey included 228 motel owners: 114 Indian owned and 114 American owned, located in Illinois, Indiana, Wisconsin and Ohio. The sample population was limited to small motel owners to eliminate noise that may otherwise be present, due to the variances across different types of service firms. In an effort to minimize any noise that may be created by sampling a combination of different sized companies, the study’s focus was also on small motels of less than 50 employees and no more than 200 rooms.
Data Collection
A three-part survey was administered to the business owners. The first part of the survey included items from Hofstede’s Value Survey Module to determine the differences between the comparison cultures in power distance, individualism and collectivism, masculinity and femininity, uncertainty avoidance and long-term and short-term orientation (Hofstede, 1994). The second part of the survey contains items borrowed from several relevant marketing studies to determine the relational or transactional orientation of the respondents and the strength of their social ties (Sin, Tse, Yau, Chow, Lee and Lau 2005; Monroy and Alzoa, 2005). The third part of the survey consists of demographic questions. The Hofstede items were scored using a weighted formula set forth in the Value Survey Module. The questions in the second part of the survey have been scored using a five-point Likert scale.
The instrument was pre-tested using four motel owners, two Indian owners and two American owners. Any ambiguities were resolved prior to administering the final survey. A total of 350 surveys were administered through US postal mail, e-mail and in person. 251 surveys were completed and returned, yielding a response rate of 71 percent. According to Hofstede the samples of respondents for comparative national studies need not be representative but need only be functionally matched. In order to match the sample sizes, 228 data files were randomly chosen using an SPSS function to provide equal groups in terms of country and gender. The 228 surveys that were randomly selected consisted of 114 Indian respondents (33 female respondents and 81 male) and 114 American respondents (33 female and 81 male).

Page 8
Academy of Entrepreneurship Journal, Volume 20, Number 2, 2014
Reliability
The data from the surveys was analyzed in terms of the five Hofstede dimension to see if these dimensions could identify a business owners culture based on the country of origin and if the business owners’ market orientations could be predicted based on constructs of shared values, trust and commitment. In addition, items from the survey were analyzed to determine the strength of the owners’ social ties. The strength of business owners’ social ties were the analyzed to predict the benefits derived from the business owners’ social networks.
A reliability test was run on the Hofstede items. The five dimensions of the Hofstede Values Survey Module resulted in the following Cronbach’s Alpha’s: Power Distance Index .289, .119 Individuality Index, .049 Masculinity, .101 Uncertainty Avoidance Index and .462 Long Term Orientation. The low Cronbach Alphas may be explained by Hofstede’s suggestion that the measure of his items should be considered on a national or regional level as opposed to an individual level of comparison (Hofstede, 1994). However, given the Hofstede condition that between culture variances must exist, hypotheses one through ten suggest that individuals who are from countries that differ on cultural dimensions need only show a systematic variance. In Hofstede’s analysis of variance of his Value Survey Module he did show significant country effect. On average “a sample of respondents from nationality A will (nearly) always score higher, or always score lower than a comparable sample of people of nationality B” (Hofstede, 1994). The means of the data collected for each of Hofstede’s five dimensions were assigned a value according to the formula given in Hofstede’s Value Survey Module (Fig. 2). An example of Hofstede’s formula for power distance would be PDI= -35m(03)+35m(06) +25m(14)-20m(17)-20, in which m(03) is the mean score for question 03, etc. To establish group membership as a proxy for the Power Distance Index (PDI), Individualism Index (IDV), Masculinity Index (MAS), Uncertainty Avoidance Index (UAI), and Long-term Orientation (LTO) the groups’ means were compared on each of the five constructs separately.
Fig. 2 Hofstede’s Value Survey Module PDI= -35m(03)+35m(06)+25m(14)-20m(17)-20 IDV= -50m(01)+30m(02)+20m(04)-25m(08)+130 MAS= 60m(05)-20m(07)+20m(15)-70m(20)+100 UAI= 25m(130+20m(16)-50m(18)-15m(19)+120
LTO= -20m(10)+20m(12)+40
In addition, independent sample t-tests were used to examine mean differences between
groups because of their robustness to violations of the homogeneity assumption. In an effort to

Page 9
Academy of Entrepreneurship Journal, Volume 20, Number 2, 2014
detect violations of normality assumption, the skewness and kurtosis were calculated using SPSS.
Table 1: Hofstede Dimensions Mean Comparison and Reliability
Indian American Difference P-value
Cronbach Alpha
t
PDI 28.07 31.54 -3.465 0.613 0.289 .507 IDV 58.6 63.38 -4.781 0.434 0.119 .784 UAI 48.55 66.58 -18.026 0.001 0.049 3.378 MAS 8.16 98.68 -90.526 0.000 0.101 10.271 LTO 49.82 30.18 19.649 .0000 0.462 -7.124 N = 114 each group; Sig: P< .05 (2-tailed)
In the current sample, univariate normality was established on all five dimensions of the
Hofstede Index with the absolute skewness values ranging from .265 to .004, suggesting that distribution approaches normality. Values of skewness that are less than 2.00 are generally accepted as adequately normally distributed (Lomax, 2001). The kurtosis statistics were also generated through SPSS and analyzed to determine if any extreme values (on their side of the mean) existed that could bias the estimation of the mean and the regression analysis. All five dimensions demonstrated acceptable absolute kurtosis scores ranging from .024 to .528. These kurtosis scores are less than 2.00 and therefore are accepted as being normally distributed (Lomax, 2001).
ANALYSIS
The Hofstede dimensions were tested using items taken directly from Hofstede’s Value
Survey Module. The items used to test the five dimensions of power distance, individualism, masculinity, uncertainty avoidance and long-term orientations are identified in Table 1. The overall differences on Masculinity, Uncertainty Avoidance, and Long-term Orientation were statistically significant (p >.001). Specifically, American born respondents scored significantly higher for Masculinity with a mean score of 98.68 as compared to Indian born respondents scoring a mean of 8.16. These research results are consistent with the literature on Hofstede’s gender dimension which explores the dominant values associated with masculinity and femininity. The U.S. culture emphasizes masculinity a value associated with performance, competition and success, while Indian culture exhibits femininity and emphasizes creating and nurturing relationships as well as ensuring solidarity within the group (Hofstede, 1983).
American born respondents demonstrated significantly higher scores for uncertainty avoidance with a mean score of 66.58, as compared to Indian born respondents with a mean score of 48.55. These results mirror the findings in Hofstede’s multi-cultural analysis that the

Page 10
Academy of Entrepreneurship Journal, Volume 20, Number 2, 2014
Indian culture measures lower in uncertainty avoidance than that of the United States. This suggests that Indian culture exhibits a greater tolerance for uncertainty and tends to be less formal and more flexible. The U.S. culture exhibits a low tolerance for uncertainty, a preference for more structure and those in the culture may feel threatened by ambiguity and uncertainty (Hofstede, 1980; Doney, Canon and Mullen, 1998).
Long-term orientation in Indian born respondents demonstrated significantly higher scores than those of American respondents, with a mean score of 49.82 as compared to a score of 30.18. Long-term perspectives tend to concentrate on the future and focus on long-term relationships, as compared to short-term perspectives concentrating on the past and the present and involve values congruent with transactional based relationships. These transactional based relationships are more specific and short term (Grimmer and Oddy, 2007; Hofstede, 1993).
Additionally, American born respondents scored higher for individualism than Indian born respondents, although this difference was not statistically significant. The literature characterizes Indian culture as having a more collective dimension; as compared to the individualistic nature of Western culture (Mines, 1992; Triandis, 1995; Chhokar, 1999; Robert, Probst, Martocchio, Drasgow, and Lawler, 2002).
All mean differences were in the expected direction, except for the dimension of power distance. Power distance describes the amount of inequality between people within a society that is deemed as appropriate or acceptable. Power distance was slightly higher, though not statistically significantly, for American born respondents, at a mean of 31.54 as compared to a mean of 28.07 for Indian born respondents (Table1).
These comparisons indicate that Masculinity, Uncertainty Avoidance, and Long-term Orientation may be the strongest proxies of cultural differences based on group membership, compared to Power Distance and Individualism. Overall, predominantly expected differences between countries of origin groups, Indian vs. American, in combination with existing research establishing the validity of the Hofstede Index for similar samples, suggest that the five dimensions of the Hofstede Index may be used as a proxy for cultural differences, identifying Indian culture as a collectivist culture and the U.S. as an individualist culture.
The second part of the questionnaire contained items borrowed from previous studies to determine the relational or transactional orientation of the respondents and the perceived importance of social ties (Sin, Tse, Yau, Chow, Lee and Lau 2005; Monroy and Alzoa, 2005). Items from the second part of the study’s survey instrument have been tested for reliability using Cronbach’s Alpha. The study’s sample demonstrated strong reliability for measures of Social Ties (α=.865), Shared Values (α=.917), Trust (α=.873), Commitment (α=.901), Economic Capital (α=.942), Relational Capital (α=.887) and Intellectual Capital (α=.917). To further evaluate the assumptions inherent to the proposed regression analysis, univariate normality was assessed by examining the skewness and kurtosis statistics generated through SPSS and no violations were confirmed.

Page 11
Academy of Entrepreneurship Journal, Volume 20, Number 2, 2014
Analysis of the hypotheses were conducted using hierarchical multiple regression. Regressions were conducted hierarchically to control for all relevant covariates while evaluating only the unique variance of the variable of interest. Hierarchical regression was used to split the analysis into blocks, to effectively control for variables. Variables within each block were then introduced simultaneously. In addition to the assumptions already considered, regression analysis assumes that predictors in any given model are linearly related to the outcome in the model. Prior to regression analysis, t-tests and correlation analysis were conducted to establish that group membership is linearly related to a respondent’s score on the outcome (dependent) variables. Additionally, correlation analyses were also used to determine which covariates were to be included in the regression model in order to minimize bias in the estimation of our predictor variable’s relationship to the dependent variable. Covariates were included and entered prior to the target predictor, so that their influence could be partialled out of the estimation of association between the predictor and the dependent variable. The covariates were controlled in an effort to determine if significant effects exist independently of the influence that any covariate may have. Any covariate that demonstrated linearity to any hypothesized outcome was included in all regression models to establish a standard for comparison. Exceptions were made in cases where inclusion of a covariate may violate a statistical or theoretical assumption.
Results indicate that respondent’s country of birth was significantly related to all outcomes including: Shared Values, Trust, Commitment, Social Ties, Economic Capital, Relational Capital, and Intellectual Capital. Additionally, the following covariates were included in all regression models for control, based on their significant association to at least one outcome: age, education, type of job, number of business owned (or if first), and gender). The variables satisfied univariate regression assumptions, demonstrating skewness and kurtosis statistics near or less than 2.0. To identify potential outliers that may unduly influence regression estimate, variables were also examined using a box plot. In the current sample, no cases were identified as outliers, thus no cases were deleted.
Hypotheses one through six consider the influence of national culture on the constructs of trust, shared values and commitment. Business owners from collectivist culture should be predicted as having a relational market orientation and owners from an individualist culture a transactional market orientation based on their demonstration of trust, shared values and commitment. The dimensions of individualism/collectivism influence trust by establishing the value that society places on conformity and using that value to predict behavior within a society. Trust also serves as a precursor to commitment between the business owner and exchange partner. Commitment is described as an “enduring desire to maintain a valued relationship” (Moorman, Zaltman and Desphande, 1992). In a collectivist society there is significant emphasis placed on conformity, shared values and collective interest. A person is able to predict that their exchange partner will act as to benefit the collective, as opposed to the individual.
Hypothesis 1: Owners from a collectivist culture will exhibit a higher level of trust with their exchange
Page 12
Academy of Entrepreneurship Journal, Volume 20, Number 2, 2014
partners Hypothesis 2: Owners from an individualist culture will exhibit a lower level of trust with their exchange
partners.
Hypotheses one and two predicted that respondents from a collectivist culture would exhibit a higher level of trust with their exchange partners as compared with respondents from an individualist culture. Hypotheses one and two are supported as being born in America predicted a lower level of trust with exchange partners than respondents born in India. Being born in India significantly predicted a higher level of trust t= -19.397, β= -.820, p<.05, R2 =.728
Hypothesis 3: Owners from a collective culture will exhibit a higher level of shared values toward their
exchange partners. Hypothesis 4: Owners from an individualistic culture will exhibit a lower level of shared values toward
their exchange partners
Hypotheses three and four predicted that respondents from a collectivist culture would exhibit a higher level of shared values with their exchange partners as compared with respondents from an individualist culture. Hypotheses three and four are supported as being born in America predicted a lower level of shared values with exchange partners than respondents born in India. Being born in India significantly predicted a higher level of shared values t= -20.094, β= -.824, p<.05, R2 =.744.
Hypothesis 5: Owners from a collectivist culture will exhibit a higher level of commitment to their
exchange partners. Hypothesis 6: Owners from an individualist culture will exhibit a lower level of commitment to exchange
partners.
Hypotheses five and six predicted that respondents from a collectivist culture would exhibit a higher level of commitment to their exchange partners as compared with respondents from an individualist culture. Hypotheses five and six are supported as being born in America predicted a lower level of shared values with exchange partners than respondents born in India. Being born in India significantly predicted a higher level of shared values t= -26.367, β= -.880, p<.05, R2 =.831.
Hypothesis 7a: Business owners with higher levels of shared values will have stronger social network
ties, than owners exhibiting lower levels of shared values. Hypothesis 7b: Business owners with higher levels of trust will have stronger social network ties, than
owners exhibiting lower levels of trust. Hypothesis 7c: Business owners with higher levels of commitment will have stronger social network ties,

Page 13
Academy of Entrepreneurship Journal, Volume 20, Number 2, 2014
than owners exhibiting lower levels of commitment. Ethnic networks supply economic, intellectual and relational capital to businesses based on
social ties and relationships that are built on shared values, trust and commitment. These ties and relationships depend on exchange partners within that cultural enclave (Waldinger, Aldrich and Ward, 1990). It is expected that business owners from a collectivist culture will have more social ties, based on the cultural emphasis on relationships and extended family. Hypothesis 7a predicts that respondents with higher levels of shared values will have stronger social ties than owners exhibiting lower levels of shared values. Hypothesis 7a is supported as having higher shared values predicts stronger social ties t=9.930, β=.567, p<.05, R2 =.480. Hypothesis 7b predicts that respondents with higher levels of trust will have stronger social ties than owners exhibiting lower levels of trust. Hypothesis 7b is supported as having higher trust predicts stronger social ties t=7.543, β=.458, p<.05, R2 =.402. Hypothesis 7c predicts that respondents with higher levels of commitment will have stronger social ties than owners exhibiting lower levels of commitment. Hypothesis 7c is supported as having higher commitment predicts stronger social ties t=9.191, β=.544, p<.05, R2 =.456.
The final three hypotheses examine the effects between the strength of social ties and economic, relational, and intellectual capital. Analysis of the hypotheses were conducted using hierarchical multiple regression. Regressions were conducted hierarchically to control for all relevant covariates while evaluating only the unique variance of the variable of interest. Hierarchical regression was used to split the analysis into blocks, to effectively control for variables. Variables within each block were then introduced simultaneously. Covariates were included and entered prior to the target predictor, so that their influence could be partialled out of the estimation of association between the predictor and the dependent variable. The covariates were controlled in an effort to determine if significant effects exist independently of the influence that any covariate may have. Using multiple regression, first, covariates are entered into the first block of the hierarchical regression, controlling for extraneous influences on the outcome. Next, the predictor was entered simultaneously in block two, estimating their partial effects on the outcome.
Hypothesis 12: Business owners that have strong social ties will generate more conomic capital
than owners with weaker social ties Business owners utilize their strong social ties in an effort to provide consistent access to
economic capital, including start-up capital, low or no interest loans and free or reduced labor. Hypothesis twelve predicts that business owners with stronger social ties will generate more economic capital than owners with weaker social ties. Multiple regression analysis indicates that strong social ties are significant in generating economic capital t. t= 6.034, β= .321, p<.05, R2
=.677.

Page 14
Academy of Entrepreneurship Journal, Volume 20, Number 2, 2014
Hypothesis 13: Business owners that have strong social will generate more relational capital than owners
with weaker social ties Through the use of social networks business owners can develop social capital in the
form of relational capital which is built on trust, commitment and shared values. This relational capital may consist of business connections, business advice and referrals (Kale, Singh and Perlmutter, 2000; Granovetter, 1985). Hypothesis thirteen predicts that business owners with stronger social ties will generate more relational capital than owners with weaker social ties. Multiple regression analysis indicates that strong social ties are significant in generating relational capital t=3.969, β= .246, p<.05, R2 =.561.
Hypothesis 14: Business owners that have strong social will generate more intellectual capital than
owners with weaker social ties Networking theory suggests that successful business owners’ possess positive patterns of
social networking. These networking practices lead to the acquisition of scarce resources such as intellectual capital, gained by leveraging social relations. Intellectual capital revolves around accessing and acquiring critical information, new business ideas and service improvement ideas (Kale, Singh and Perlmutter, 2000). Hypothesis fourteen predicts that business owners with stronger social ties will generate more intellectual capital than owners with weaker social ties. Multiple regression analysis indicates that strong social ties are significant in generating intellectual capital t=4.206, β= .224, p<.05, R2 =.675.
LIMITATIONS AND CONCLUSION The limitations of the study include a sample population consisting of only American and
Indian born respondents from a single industry made up of motel owners. Given these limitations, the findings in this study may not be generalizable to other cultures and other service industries.
Additionally, the population was restricted to American born and Indian born respondents which may not be generalizable across different cultures. A comparison of American and Indian culture represents a comparison of a high wealth nation with that of a low wealth nation. According to Hofstede, third world countries tend to be separated from wealthy nations in terms of power distance and collectivism, where as masculinity and uncertainty avoidance are both unrelated to national wealth. The findings in this study may not be extended to the comparison of two third world countries or two wealthy nations. Comparison of national cultures is also dependent on the homogeneity of culture within each nation. American and Indian nations have been identified as reasonably homogeneous in terms of culture. However, the finding in this study may not generalize across culturally heterogeneous nations (Hofstede, 1994).

Page 15
Academy of Entrepreneurship Journal, Volume 20, Number 2, 2014
This study provides insight into the culture and its influence on business owners’ market orientation and the effects on their networking activities. Business owners’ market orientations have been shown to affect the strength of the owners’ social ties. The strength of owners’ social ties was related to the generation of economic, relational and intellectual capital.
Business owners exhibiting relational market orientations based on higher levels of shared values, trust and commitment, exhibited stronger social ties than owners exhibiting transactional orientations. Also greater access to economic and intellectual capital was reported by business owners, exhibiting strong social ties. This study support the idea that business owners from a collective culture are more likely to exhibited a relational market orientation and engaged in network practices that lead to strong ties in order to provide access to economic, relational and intellectual capital.
REFERENCES
Aldrich, H., Reese, P.R., Dubini, P., Rosen, B., and Woodward, B. (1989), “Women on the verge of breakthrough:
Networking between entrepreneurs in the United States and Italy,” Babson Entrepreneurial Conference, St. Louis, USA.
Aiyar, S., (1999), “India’s Economic Prospects: The Promise of Services,” CASI Occasional Paper, Center for Advanced Study of India; University of Pennsylvania, n. 9.
Aldrich, H., Renzulli, L. and Langton, N., (1998), “Passing on privilege: Resources provided by self-employed parents to their self-employed children,” Research in Social Stratification and Mobility: A Research Annual, v. 16, pp: 291-317.
Aldrich, H., and Zimmer, C., (1986), “Entrepreneurship through social networks,” Population Perspectives on Organizations, Acta Universitatis Upsaliensis, Uppsala, pp: 13-28.
Alvarez, S. and Busenitz, L. (2001), “The entrepreneurship of resource-based theory,” Journal of Management, v. 27, pp: 755-775.
Astone, N., Nathanson, C., Shoen, R. and Kim, Y., (1999), “Family Demography, Social Theory, and Investment in Social Capital,” Population and Development Review, v. 25, n. 1, pp: 1-31.
Athanassopoulou and Johnes (2002), “Effective communication with lead customers in developing new banking products,” International Journal of Bank Marketing, v. 22, n.2, pp: 100-125
Bachmann, R. and Lane, C. (1998), Trust within and between Organizations. New York: Oxford University Press, 3. Bain, Y., (1997), “Brining Strong Ties Back in: Indirect Ties, Network Bridges and Job Searches in China,”
American Sociological Review, v. 62, pp: 366-385. Baldwin, J. and Peter, A., (2001) Innovation and Connectivity: The Nature of Market Linkages and Innovation
Networks in Canadian Manufacturing Industries, Micro-Economic Analysis Division: Canada. Barney, J. B., (1995), “Looking inside for competitive advantage,” Academy of Management Executive, v. 9, pp: 49-
61. Basu, A., and Altinay, E., (2002), “The Interaction between Culture and Entrepreneurship in London’s Immigrant
Business,” International Small Business Journal, v. 20, n. 4, pp: 371-393. Benton Jr., Raymond, (1985), “Alternate Approaches to Consumer Behavior,” Research in Marketing, V. 2, n.2, pp:
197-219. Berry, L. (1995), “Relationship Marketing Services – Growing Interest, Emerging Perspectives,” Journal of the
Academy of Marketing Science, v. 23, pp: 23-24.

Page 16
Academy of Entrepreneurship Journal, Volume 20, Number 2, 2014
Birley, S., Cromie, S., and Myers, A., (1991), “Entrepreneurial networks: Their emergence in Ireland and overseas,” International Small Business Journal, v. 9 n. 4, pp: 56-74.
Chhokar, J.S., (1999), “Leadership and culture in India: The Globe Research Project. In R.J. House and J.S. Chhokar (Eds), Studies of Managerial Cultures in 12 Countries. www.bsos.umd.edu/psyc/hanges/globepag.htm.
Chung, J., Sternquist, B. and Chen, Z, (2006), “Retailer-buyer supplier relationships: the Japanese differences,” Journal of Retailing, v. 82, n. 4, pp: 349-355.
Crosby, L., Evans, K. and Crowels, D. (1990), “Relationship Quality in Service Selling: An Interpersonal Influence Perspective,” Journal of Marketing, v.54, n. 3, pp: 68-82.
Davidson, P., and Honig, B., (2003), “The role of social and human capital among nascent entrepreneurs,” Journal of Business Venturing, v. 18, pp: 301-331.
Diomande, M., (1990), “Business creation with minimal resources some lessons from the African experience,” Journal of Business Venturing, v. 5, pp: 191-200.
Doney, P., Cannon, J. and Mullen, M. (1998), “Understanding the Influence of National Culture on the Development of Trust,” Academy of Management Review, v. 23, n. 3, pp: 601-620.
Dwyer, F. R., Schurr, P.H. and Oh, S. (1987), “Developing Buyer-Seller Relationships,” Journal of Marketing, v. 51, pp: 11-27.
Garbarino, E. and Johnson, M. (1999), “The Different Roles of Satisfaction, Trust and Commitment in Customer Relationships,” Journal of Marketing, v.63, pp: 70-87.
Granovetter, M. (1985), “Economic action and social structure: The problem of embeddedness,” American Journal of Sociology, v. 91, n. 3, pp: 481-510.
Geletkanycz, M. (1997), “The Salience of Culture’s Consequences: The Effects of Cultural Values on Top Executive Commitment to the Status Quo,” Strategic Management Journal, v. 18, n. 8, pp: 615-634.
Grimmer, M. and Oddy, M. (2007), “Violation of the Psychological Contract: The Mediation Effect of Relational Versus Transactional Beliefs,” Australian Journal of Management, v. 32, n. 1, pp: 153-174.
Gundlock, t., Archol, R. and Mentzer, J. (1995), “The Structure of Commitment in Exchange,” Journal of Marketing, v. 59, pp: 78-92.
Herbig, P. (2002), “Hofstede and Negotiations,” Working Paper, San Antonio Texas http://www.geocities.com/Athens/Delphi/9158/paper19.html
Hofstede, G., (1980), “Motivation, leadership, and organizations: Do American theories apply abroad?,” Organizational Dynamics, v. 9, pp: 42-63
Hofstede, G. (1983), “The Cultural Relativity of Organizational Practices and Theories, “Journal of International Business Studies, Vol. 14, No. 2, Special Issue on Cross-Cultural Management (Autumn, 1983), pp. 75-89
Hofstede, G. (1991), “Cultures and Organizations: Software of the Mind – Intercultural Cooperation and its importance for Survival,” Maidenhead: McGraw-Hill.
Hofstede, G., (1993), “Cultural constraints in management theories,” Academy of Management Executive, v. 7, n. 1, pp: 81-93.
Homans, G. (1950), “The Human Group,” New York: Harcourt, Brace and World. Hultman, C. and Shaw, E. (2003), “The Interface between Transactional and Relational Orientation in Small Service
Firm’s Marketing Behavior: A Study of Scottish and Swedish Small Firms in the Service Sector,” Journal of Marketing Theory and Practice, v. 11, n. 1, pp: 36-51.
Huntington, S., (1993), “The Clash of Civilizations,” Foreign Affairs, v. 72, n. 3, pp: 22-49. Javillonar, G. and Peters, G. (1973), “Sociological and Social Psychological Aspects of Indian Entrepreneurship,”
The British Journal of Sociology, v. 24, n. 3, pp: 314-328. Kale, P., Singh, H. and Perlmutter, H. (2000), “Learning and Protection of Proprietary Assets in Strategic Alliances:
Building Relational Capital,” Strategic Management Journal, v.21, pp: 217-237.

Page 17
Academy of Entrepreneurship Journal, Volume 20, Number 2, 2014
Kim, K. and Oh, C. (2002), “On Distributor Commitment in Marketing Channels for Industrial Products: Contrast Between the United States and Japan,” Journal of International Marketing, v. 10, n. 1, pp: 72-97.
Lomax, R.G. ((2001), Statistical Concepts A Second Course for Education and the Behavioral Sciences, New Jersey: Lawrence Erlbaum Associates Publishers.
Lovelock, C., Gummesson, E., (2004), “Whither Services Marketing,” Journal of Service Research, v.7, n.1, pp: 20-41.
Luczak, C., Mohan-Neill, S. and Hills, G., (2010), “National Culture, Market Orientation and Network Derived Benefits: Conceptual Model for Service SME’s,” Academy of Entrepreneurship Journal, v. 16, n. 2, pp: 1-20.
Macneil, I.R. (1980), “Power, Contract, and the Economic Model,” Journal of Economic Issues, v. 14, n. 4, pp: 909-134.
Mitchell, B. (2003), “The Role of Networks among Entrepreneurs from Different Ethnic Groups,” The Small Business Monitor, v. 1, n. 1, pp: 77-86.
Mines, M., (1992), “Individuality and Achievement in South Indian Social History,” Modern Asian Studies, v. 26, n. 1, pp: 129-156.
Moller, K. and Halinen (1999), “Business Relationships and Networks: Managerial Challenge of Network Era,” Industrial Marketing Management, v. 28, n. 5, pp: 413-427.
Morgan, R. and Hunt, S., (1994), “The Commitment-Trust Theory of Relationship Marketing,” Journal of Marketing, v. 58, n. 3, pp: 20-38.
Mormon, Deshpande and Zaltman (1992) Murray, K. and Schlacter, J., (1990), “The Impact of Services versus Goods on Consumers’ Assessment of
Perceived Risk and Variability,” Journal of the Academy of Marketing Science, v. 18, n. 1, pp: 51-65. Nafziger, E. W. (1977), “Entrepreneurship, Social Mobility, and Income Redistribution in South India,” The
American Economic Review, v. 67, n. 1, pp: 76-80. Nicholson, C., Compeau, L. and Sethi, A. (2001), “The Role of Interpersonal Liking in Building Trust in Long-term
Channel Relationships,” Journal of the Academy of Marketing Sciences, v. 29, n. 1, pp: 3-15. Pandya, A. and Dholakia, N. (1992), “An Institutional Theory of Exchange in Marketing,” European Journal of
Marketing, v. 26, n. 12, pp: 19-42. Perry, C. (1998), “Process of a Case Study for Post-graduate Research in Marketing,” European Journal of
Marketing, v. 32, n. 9/10, pp:785-802. Ramachandran, K. and Ramnarayan, S.(1993), “Entrepreneurial Orientation and Networking: Some Indian
Evidence,” Journal of Business Venturing, V. 8, pp: 513-524 Robben, A., (1984) “Entrepreneurs and Scale: Interactional and Institutional Constraints on the Growth of Small
Scale Enterprises in Brazil,” Anthropological Quarterly, v. 57, n. 3, pp: 125-138. Robert, C., Probst, T., Martocchio, J., Drasgow, F. and Lawler, J., (2000), “Empowerment and Continuous
Improvement in the United States, Mexico, Poland, and India: Predicting Fit on the Basis of the Dimensions of Power Distance and Individualism,” Journal of Applied Psychology, v. 85, n. 5, pp: 643-658.
Robinson, P. and Sexton, E., (1994), “The effect of education and experience on self-employment success,” Journal of Business Venturing, V. 9, pp: 141-156.
Pillai, K. G. and Sharma, A. (2003), “The Impact of Transactional and Relational Strategies in Business Markets: An Agenda for Inquiry,” Industrial Marketing Management, v. 32, pp: 623-626.
Sheth, J.N. and Parvatiyar, A. (1995), Relationship Marketing in Consumer Markets: Antecedents and Consequences,” Journal of the Academy of Marketing Science, v. 23, 255-271.
Shivani, S., Mukherjee, S.K. and Sharan, R. (2006), “Socio-cultural influences on Indian entrepreneurs: The need for appropriate structural interventions,” Journal of Asian Economics, v. 17, pp: 5-13.

Page 18
Academy of Entrepreneurship Journal, Volume 20, Number 2, 2014
Sin, L., Tse, A., Yau, O., Chow, R., Lee, J. and Lau, L. (2005), “Relationship Marketing Orientation: Scale Development and Cross-cultural Validation,” Journal of Business Research, v. 58, pp: 185-194.
Subrahmanya, M. H. Bala, (2003), “Pattern of technological innovations in small enterprises: a comparative perspective of Bangalore (India) and Northeast England (UK),” Technovation, v. 25, pp: 269-280.
Triandis, H., (1995), Individualism and Collectivism, Boulder, Co: Westview Press. Waldinger, R, Aldrich, h. and Ward, R., (1990), “Opportunities, group characteristics and strategies in Waldinger,
R, Aldrich, h. and Ward, R., (ED) Entrepreneurs, Immigrants and Ethnic Business in Western Industrial Societies, Newbury Park: Sage.
Wilson, Michelle (2002), “Establishing Credibility in the Absence of Reputation,” in Research at the Marketing/Entrepreneurship Interface, Gerry E. Hills and David J. Hansen and Bill Merrilees (Eds) Institute for Entrepreneurial Studies.
Woodside, A.G., Wilson, J. and Milner, P (1990), Relationship Marketing of Business Services: Auditing Customers’ Perceptions, Attitudes and Behaviors, Louisiana: Freeman School of Business Tulane University.

Page 19
Academy of Entrepreneurship Journal, Volume 20, Number 2, 2014
DISCOVERING HETEROGENEITY OF ENTREPRENEURS: A COMPARISON OF FOOD AND
NON-FOOD ENTREPRENEURS
Chyi-lyi (Kathleen) Liang, University of Vermont Paul Dunn, University of Louisiana at Monroe
ABSTRACT
This study, as a preliminary study to a larger study about food systems, was undertaken
to determine if and to what extent food entrepreneurs were different from non food entrepreneurs. Food entrepreneurs (farmers, food processors, food distributors, wholesale, retail, and eating and drinking business owners) face some risks that non food entrepreneurs do not. This study shows that food entrepreneurs may be a little different, but are, by and large, very similar to their non food counterparts.
BACKGROUND OF FOOD ENTREPRENEURS VERSUS NON-FOOD ENTREPRENEURS
This research was conducted to complement additional research being done in agriculture
economics related to food systems. Understanding our food systems has become an important topic, but little attention has been given to the area of food entrepreneurs who often lead the revolution of how food interacts with our lives. In general, entrepreneurship studies focus on how individuals transform in the process of renovation, new venture creation, and learning. Existing literature has provided an extensive discussion regarding entrepreneurial individuals (traits, characteristics, decision making), entrepreneurial families (family dynamics, family conflicts or collaborations, joint decisions), environmental and circumstantial factors (triggers of entrepreneurial decisions, economic factors), and entrepreneurial learning (failure, challenges, rewards). Most of the literature reports on the general behavior of entrepreneurs, not on particular types of entrepreneurs with respect to different industries. This paper provides a closer look at the differences between food entrepreneurs and non-food entrepreneurs. We define food entrepreneurs are those involve in “food system” including farmers, food processors, food distributors, wholesale, retail, and eating and drinking business owners.
Why is it important for us to examine the differences between food entrepreneurs and non-food entrepreneurs? First of all, the interactions between upstream enterprises and downstream enterprises are much closer yet unpredictable in the food industry. Farmers rely on

Page 20
Academy of Entrepreneurship Journal, Volume 20, Number 2, 2014
a good set of conditions offered by nature to create desirable quality and quantity of the outputs. Although farmers might be able to manage and control some of the climate variations using technology, climate change still influence farming operations significantly. Secondly, food entrepreneurs face different levels and types of risks compared with non-food entrepreneurs. This is particularly true based on the relationship between the downstream enterprises and upstream enterprises in the food system. When there is a natural disaster or a pandemic outbreak, food entrepreneurs are totally vulnerable and are exposed to a chain-link reaction which could destroy the operations of numerous farms and their related partners. Thirdly, it is very challenging and difficult to identify and pinpoint the origin of the problems if there is a dysfunctional breakdown in food system. Therefore even if we know the problems and issues within the food system, it takes a long time to cease the operations and to isolate the problems before we figure out how to fix these problems.
This paper contributes to existing discussions and studies in entrepreneurship and food system in many ways: (1) we provide a comparison between food entrepreneurs and non-food entrepreneurs with respect to their characteristics, demographics, expectations, optimism, pessimism, realism, and learning experiences; (2) we attempt to reveal the myths existing in the literature regarding “all entrepreneurs are similar.”
LITERATURE REVIEW
Many unique characteristics of entrepreneurs – confidence, independence, being in
control, risk taking, creativity, to name a few, have been studied. There has been a great deal of work on entrepreneurial characteristics such as high achievement driven, action oriented, internal locus of control, tolerance for ambiguity, moderate risk taking, commitment, opportunistic, initiative, independence, commitment/tenacity, creativity, and optimism (Liang & Dunn, 2003; Malach-Pines, Sadeh, Dvir, & Yafe-Yanai, 2002; Crane & Sohl, 2004; Liang & Dunn, 2008(1)). These researchers seem to agree that optimism links to other entrepreneurial characteristics when we identify who entrepreneurs are.
Small business and entrepreneurship literature has also considered optimism and its relationship to other entrepreneurial characteristics and how optimism impacts on decision making and firm performance. Researchers discussed the levels of unrealistic optimism leading to various consequences in venture development such as financial problems and dissatisfied personal and family life (Schneider, 2005; Liang & Dunn, 2008(1); Liang & Dunn, 2008(2); Kuratko & Hodgetts, 2004; Litt, Tennen, Affleck & Klock, 1992; Seligman & Schulman, 1986; McColl-Kennedy & Anderson, 2005; Baron & Shane, 2005; Hey, 1984; Petrakis, 2005; De Meza & Southey, 1996; Coelho & De Meza, 2006; Brocas & Carrillo, 2004; Puri and Robinson, 2004). Many of these researchers had also argued about certain entrepreneurial characteristics led to biased business decision, business failure, family disputes, and other types of risks. The economy in 2012 is improving and individual decision in creating a new venture is seen as a

Page 21
Academy of Entrepreneurship Journal, Volume 20, Number 2, 2014
force that stimulates our economy. Some research has shown that optimistic entrepreneurs appear to perform better and more competitive in select environments and organizations (Manove, 2000). Researchers have assumed that entrepreneurs in general follow similar paths in new venture creation – entrepreneurs seem to have the same traits and characteristics, and they seem to believe in owning their businesses as a solution to financial improvement and satisfaction from both their personal and family perspectives. However, there has been limited information or no information to verify the heterogeneity in entrepreneurial characteristics, demographics, decision making, expectations, and outcome assessments for entrepreneurs in different types of industries.
Psychologists’ discussions of optimism and other personal characteristics have often been gathered anecdotally in case specific situations (Weinstein, 1980 & 1982; Taylor, 1989). The discussions in entrepreneurship and economics are typically in the conceptual state (Aidis, Mickiewica & Sauka, 2008). Evidence shows an increasing trend in new venture formation during the economic recession according to the reports of U.S. Department of Commerce, Small Business Administration, and other census information. The development of new ventures seems to have a positive relationship with the economic activities, and entrepreneurs respond to economic recessions with an optimistic manner (Barbera, 2004; Carver, 2008; Fraser & Greene, 2006; Simon & Houghton, 2002). A few questions have never been answered are: do entrepreneurs see economic recession as an opportunity? Do entrepreneurs follow similar paths of making decision to create their own businesses no matter what industries they are in? Do entrepreneurs assess their expectations and business outcomes the same way even if they are in different industries?
Food industry entrepreneurs clearly face different challenges compared with non-food industry. There is a significant difference in establishing a successful business model for food versus non-food businesses. Economic variables such as taxes, employment, and sales create significantly different ripple effects from downstream enterprises to upstream enterprises for food industry compared with non-food industry. In recent years, the U.S. Department of Agriculture has invested tremendous amount of grants to support research, education, and extension programs related to local and regional food systems. Many of these programs provide technical support and training curricula for food entrepreneurs to establish new businesses, new farms, or new food distribution venues. Much the information applied and shared with food entrepreneurs are similar to those applied and shared with non-food entrepreneurs. The argument is simple: business is business. The real problem is: do we even know if food entrepreneurs behave the same way as non-food entrepreneurs when it comes to new venture creation?
There have been no studies to verify if there exist any discrepancies between food entrepreneurs and non-food entrepreneurs with respect to their characteristics, demographics, experiences, needs, challenges, barriers, and new venture formation process. We may accept the general argument about traits among entrepreneurs, their decision making process, reasons to

Page 22
Academy of Entrepreneurship Journal, Volume 20, Number 2, 2014
start their own businesses, and they all learn from failure. It does not imply all entrepreneurs are the same, and the relationship between entrepreneurial individuals and their characteristics, demographics, decision making, expectations, and learning experiences must be studied across different industries (Liang & Dunn, 2008(1); Liang & Dunn, 2008(2)).
METHODOLOGY
Survey design
A survey instrument was designed and pre-tested among entrepreneurs to assess entrepreneurial characteristics, business profile, entrepreneurial optimism/pessimism/realism, expectations, new venture creation outcomes, and learning experiences. This instrument has been applied in a series of entrepreneurship studies since 2005. Questions about entrepreneurs’ demographics included: gender, age, race, and education level. Entrepreneurial characteristics were gathered from existing literature which included: being independent, being creative, wanting to take control, and willingness to accept risks (in Likert Scale from 1 being strongly agree to 5 being strongly disagree). Business profile questions included: when the business was started, previous operation/management/start up experiences, business location, and numbers of full time and part time employees. Optimism and pessimism questions were chosen from the Life Oriented Test Revised survey (Creed, Patton, & Bartrum, 2002) which included: I always expect the best, I am always optimistic, I always expect more good than bad, I don’t expect things to go my way, I rarely count on good things, and whatever can go wrong will go wrong. Answers to these questions were recorded by Likert Scale with 1 being “agree a lot” and 5 being “disagree a lot”.
The statements to assess realism were created by authors and had been tested for reliability and in the field for over 3 years. These statements include: I set achievable goals, I am realistic about the future, I always look before I leap, I weigh the risks and the rewards before making decisions, I weigh negative and positive outcomes before making decisions, I am always certain about the situation, and I always find information before making decisions. Answers to these questions were also recorded by Likert Scale with 1 being “agree a lot” and 5 being “disagree a lot”. Finally a set of questions were used to evaluate business outcomes related to sales, profits, business process, personal and family happiness and financial situations, and outlook for the future based on entrepreneurs’ satisfaction levels.
Sampling method
This survey was conducted between 2009 and 2011 with the assistance of students enrolled in the Introduction to Community Entrepreneurship course at the University of Vermont. Totally over 500 undergraduate students conducted the surveys during the Thanksgiving breaks in November 2009 and November 2010, and in the Spring break in March

Page 23
Academy of Entrepreneurship Journal, Volume 20, Number 2, 2014
2010 and in March 2011. Each student was given 2 copies of the surveys – one for food entrepreneur and the other for non-food entrepreneur. Each student received training prior to conducting the survey. Each student chose entrepreneurs to survey wherever he or she travelled to during the breaks. They collected and completed had usable surveys from 417 food entrepreneurs and 485 non-food entrepreneurs in 2 years. All businesses were checked to prevent duplications and inconsistent answers.
Statistical Analysis
Data of all surveys were entered into SPSS for statistical analysis. Descriptive statistics were calculated to summarize responses. Chi Square and Gamma tests were calculated to test for statistical significance while comparing responses between food entrepreneurs and non-food entrepreneurs. P-values for Chi Square and Gamma tests were also provided.
FINDINGS OF THE STUDY
A majority of the respondents in both food and non food were from New England and the
northeast U.S. as would be expected. The remainder was from throughout the nation and several were international including Canada, Mexico, Ireland and Nepal.
Table 1. Respondent Location
State/Other Food Nonfood CA .01 .01 CO .01 .01 CT .05 .06 FL .03 .03 IL .01 .01 MA .17 .18 MD .01 .01 ME .03 .03 NH .04 .03 NJ .05 .06 NY .17 .15 OH .01 .02 PA .04 .03 RI .01 .01 VA .01 .01 VT .31 .30 OTHER .02 .03 INTERNATIONAL .02 .01 Total 1.00 1.00 n 433 518
A majority of the food entrepreneurs and non-food entrepreneurs surveyed shared similar
demographics (Table 2). Most of the respondents in food and non-food businesses are male, less than 50 years old, white, and with at least some college education. More non-food respondents

Page 24
Academy of Entrepreneurship Journal, Volume 20, Number 2, 2014
were over 50 years old. A slightly higher percentage of the non-food respondents were white. There were some statistical significant differences in the distributions of age, race, and education between food and non-food entrepreneurs in our sample.
There were some statistical significance differences between food entrepreneurs and non-food entrepreneurs with respect to their business profile and work experiences (Table 3). Many food entrepreneurs started their businesses less than 5 years, while 31 percent of the non-food entrepreneurs started their businesses over 15 years ago. Fifty-one percent of the non-food businesses were located in rural areas, compared with 44 percent of the food businesses. Over 50 percent of the non-food businesses hire 1-5 full time employees, and 1-5 part time employees. More food businesses relied on part time employees, compared with non-food businesses. In terms of previous experiences prior to start up, over 2/3 of the respondents in both food and non-food businesses had line experiences. Only few entrepreneurs did not have any experiences prior to start up. More food entrepreneurs (54%) versus non-food entrepreneurs (45%) had 1-5 years in management positions.
All of our respondents revealed similar entrepreneurial characteristics of being independent, being in control, and being creative (Table 4). A slightly higher percentage of the food entrepreneurs (93%) agreed or strongly agreed that they were willing to accept risks compared with non-food entrepreneurs (92%).
Table 2. Entrepreneurs' Demographics
Food Nonfood Food Nonfood Sex Age
Female 0.36 0.39 <30 0.10 0.12 Male 0.64 0.61 30-50 0.60 0.46 Total 1.00 1.00 >50 0.30 0.42
n 412 485 Total 1.00 1.00 Chi Square .0.179 n 405 474
Gamma 0.321 Chi Square 0.00*** Race Gamma 0.017**
White 0.79 0.86 Education African Ame 0.06 0.06 < High School 0.02 0.01
Asian 0.06 0.04 High School 0.16 0.14 Hispanic 0.08 0.03 Some College 0.23 0.18
Ame Indian 0.02 0.01 College Degree 0.50 0.50 Other 0.00 0.00 Graduate Degree 0.08 0.16 Total 1.00 1.00 Total 1.00 1.00
n 410 481 n 412 482 Chi Square 0.018* Chi Square 0.005**
Gamma 0.005** Gamma 0.001*** Note: ‘*’ indicates significant at 0.1 level, ‘**’ indicates significant at 0.01 level, and ‘***’ indicates significance at 0.001 level. The
same rules apply to all the tests listed in all tables in this paper.
Realism has not been investigated thoroughly in entrepreneurship theories. Our survey results show that a majority of the respondents, in both food and non-food businesses, believed they were realistic in the new venture creation process. Over 70% of the total respondents agreed or strongly agreed that they set achievable goals, they were realistic about the future, they looked before they leaped, they weigh the risks and rewards carefully, they weigh negative and

Page 25
Academy of Entrepreneurship Journal, Volume 20, Number 2, 2014
positive outcomes before making decisions, they were certain about the situation, and they always found information to assist in decision making (Table 5).
Table 3. Business Demographics Food Non Food Food Non Food
When Started Mgt Exp Before Last 5 0.34 0.26 1 - 5 years 0.36 0.34
6-10 years 0.25 0.22 6 -10 years 0.19 0.13 11-15 years 0.15 0.21 11+ years 0.11 0.15
Over 15 years 0.27 0.31 None 0.34 0.38 Total 1.00 1.00 Total 1.00 1.00
n 316 386 n 321 378 Chi Square 0.018* Chi Square 0.083*
Gamma 0.008** Gamma 0.148 Line Experience Location
Yes 0.69 0.67 Rural 0.44 0.51 No 0.31 0.33 Urban 0.56 0.49
Total 1.00 1.00 Total 1.00 1.00 n 399 476 n 414 484
Chi Square 0.304 Chi Square 0.028* Gamma 0.556 Gamma 0.047*
Operations Experience Full Time 1 - 5 years 0.41 0.44 1 - 5 emp 0.49 0.58 6 - 10 years 0.29 0.29 6 - 10 emp 0.28 0.16 11+ Years 0.27 0.22 11+ emp 0.20 0.20
None 0.04 0.05 None 0.03 0.06 Total 1.00 1.00 Total 1.00 1.00
n 245 286 n 399 443 Chi Square 0.697 Chi Square 0.000***
Gamma 0.456 Gamma 0.020* Managerial Experience Part Time
1 - 5 years 0.54 0.45 1 - 5 emp 0.45 0.53 6 -10 years 0.25 0.23 6 - 10 emp 0.25 0.16 11+ years 0.13 0.19 11+ emp 0.24 0.16
None 0.08 0.12 None 0.06 0.14 n 1.00 1.00 Total 1.00 1.00
Total 226 245 n 372 387 Chi Square 0.089* Chi Square 0.000***
Gamma 0.017* Gamma 0.483
Table 4. Entrepreneurial Characteristics
Food Non Food Food Non Food Independence CreativeStrongly Agree 0.59 0.60 Strongly Agree 0.46 0.46 Agree 0.35 0.32 Agree 0.43 0.41 Disagree 0.05 0.06 Disagree 0.10 0.11 Strongly Disagree 0.01 0.01 Strongly Disagree 0.01 0.01 Total 1.00 1.00 Total 1.00 1.00 n 410 477 n 412 482 Chi Square 0.589 Chi Square 0.974 Gamma 0.804 Gamma 0.978 Control Risk AcceptanceStrongly Agree 0.58 0.60 Strongly Agree 0.51 0.58 Agree 0.36 0.33 Agree 0.42 0.34 Disagree 0.05 0.05 Disagree 0.05 0.06 Strongly Disagree 0.01 0.01 Strongly Disagree 0.02 0.01 Total 1.00 1.00 Total 1.00 1.00 n 411 480 n 412 479 Chi Square 0.801 Chi Square 0.093* Gamma 0.713 Gamma 0.064*

Page 26
Academy of Entrepreneurship Journal, Volume 20, Number 2, 2014
Table 5. Realism among Entrepreneurs Food Non Food Food Non Food
Set Achievable Goals Realistic About the Future Agree .47 .48 Agree a Lot .30 .31 Neither .39 .36 Agree .44 .43 Disagree .06 .08 Neither .14 .15 Disagree a Lot .05 .06 Disagree .09 .08 Total 1.00 1.00 Disagree a Lot .02 .02 n 416 485 Total 1.00 1.00 Chi Square .812 n 414 481 Gamma .905 Chi Square .968 Look Before I Leap Gamma .716 Agree .36 .38 Weigh the risks and rewards Neither .37 .36 Agree a Lot .37 .45 Disagree .15 .16 Agree .45 .39 Disagree a Lot .09 .07 Neither .11 .08 Total 1.00 1.00 Disagree .05 .04 N 414 479 Disagree a Lot .02 .02 Chi Square 0.740 Total 1.00 1.00 Gamma 0.675 n 406 476 Weigh Negative and Positive Outcomes Chi Square .156 Agree a Lot .47 .50 Gamma .024 Agree .34 .34 Certain About the Situation Neither .11 .10 Agree a Lot .41 .41 Disagree .06 .03 Agree .45 .44 Disagree a Lot .02 .03 Neither .07 .10 Total 1.00 1.00 Disagree .05 .04 n 414 483 Disagree a Lot .02 .02 Chi Square .281 Total 1.00 1.00 Gamma .282 n 410 485 Find Information Chi Square 0.622 Agree a Lot .43 .44 Gamma 0.770 Agree .39 .34 Neither .10 .14 Disagree .06 .05 Disagree a Lot .02 .03 Total 1.00 1.00 n 414 478 Chi Square .456 Gamma .792
Table 6, however, tells a very consistent story regarding how entrepreneurs assess their own optimism and pessimism with respect to new venture creation. It is very obvious that over 60% of the respondents in both food and non-food businesses were very optimistic about their business decisions. Does the optimistic attitude relate to their assessment on satisfaction with the new venture creation? Not necessarily. Between 50% and 60% of the respondents in both food and non-food businesses believed their sales were about the same as they had expected, and the profits were about the same as they expected (Table 7). Over 80% of the total respondents believed their businesses were up and running well, despite the sales and profits were not as high as they might have expected.
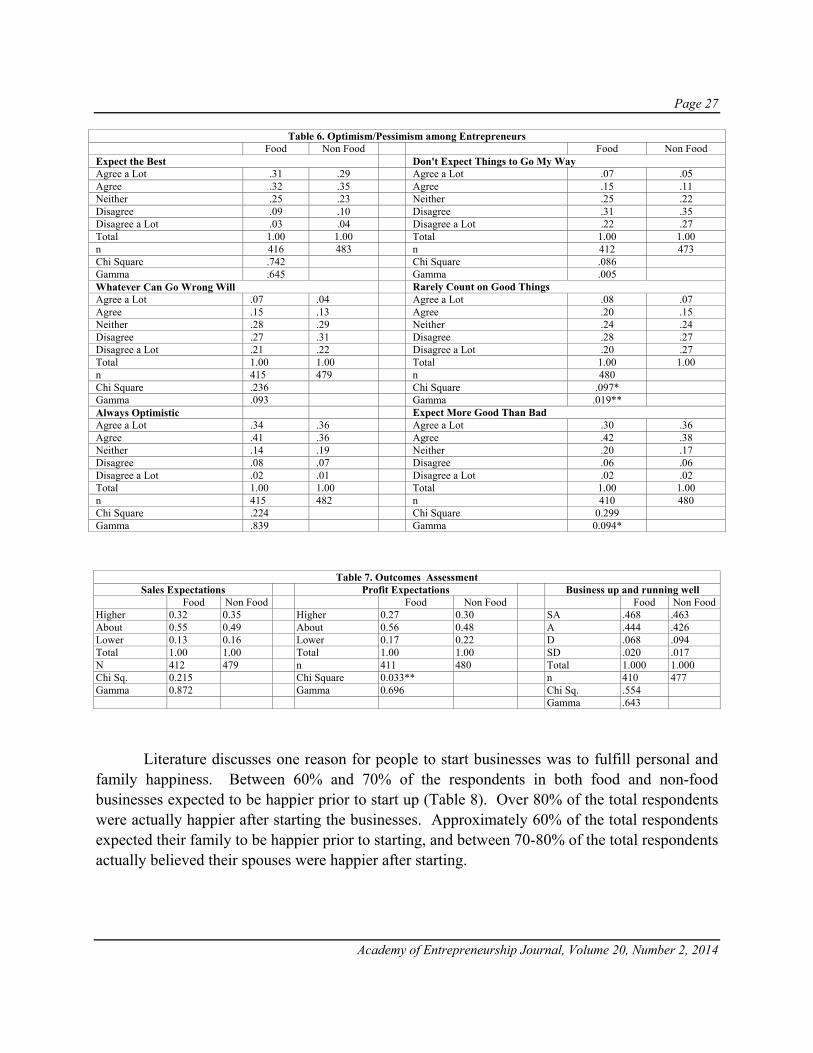
Page 27
Academy of Entrepreneurship Journal, Volume 20, Number 2, 2014
Table 6. Optimism/Pessimism among Entrepreneurs Food Non Food Food Non Food Expect the Best Don't Expect Things to Go My Way Agree a Lot .31 .29 Agree a Lot .07 .05 Agree .32 .35 Agree .15 .11 Neither .25 .23 Neither .25 .22 Disagree .09 .10 Disagree .31 .35 Disagree a Lot .03 .04 Disagree a Lot .22 .27 Total 1.00 1.00 Total 1.00 1.00 n 416 483 n 412 473 Chi Square .742 Chi Square .086 Gamma .645 Gamma .005 Whatever Can Go Wrong Will Rarely Count on Good Things Agree a Lot .07 .04 Agree a Lot .08 .07 Agree .15 .13 Agree .20 .15 Neither .28 .29 Neither .24 .24 Disagree .27 .31 Disagree .28 .27 Disagree a Lot .21 .22 Disagree a Lot .20 .27 Total 1.00 1.00 Total 1.00 1.00 n 415 479 n 480 Chi Square .236 Chi Square .097* Gamma .093 Gamma .019** Always Optimistic Expect More Good Than Bad Agree a Lot .34 .36 Agree a Lot .30 .36 Agree .41 .36 Agree .42 .38 Neither .14 .19 Neither .20 .17 Disagree .08 .07 Disagree .06 .06 Disagree a Lot .02 .01 Disagree a Lot .02 .02 Total 1.00 1.00 Total 1.00 1.00 n 415 482 n 410 480 Chi Square .224 Chi Square 0.299 Gamma .839 Gamma 0.094*
Table 7. Outcomes Assessment Sales Expectations Profit Expectations Business up and running well
Food Non Food Food Non Food Food Non FoodHigher 0.32 0.35 Higher 0.27 0.30 SA .468 .463 About 0.55 0.49 About 0.56 0.48 A .444 .426 Lower 0.13 0.16 Lower 0.17 0.22 D .068 .094 Total 1.00 1.00 Total 1.00 1.00 SD .020 .017 N 412 479 n 411 480 Total 1.000 1.000 Chi Sq. 0.215 Chi Square 0.033** n 410 477 Gamma 0.872 Gamma 0.696 Chi Sq. .554
Gamma .643
Literature discusses one reason for people to start businesses was to fulfill personal and
family happiness. Between 60% and 70% of the respondents in both food and non-food businesses expected to be happier prior to start up (Table 8). Over 80% of the total respondents were actually happier after starting the businesses. Approximately 60% of the total respondents expected their family to be happier prior to starting, and between 70-80% of the total respondents actually believed their spouses were happier after starting.
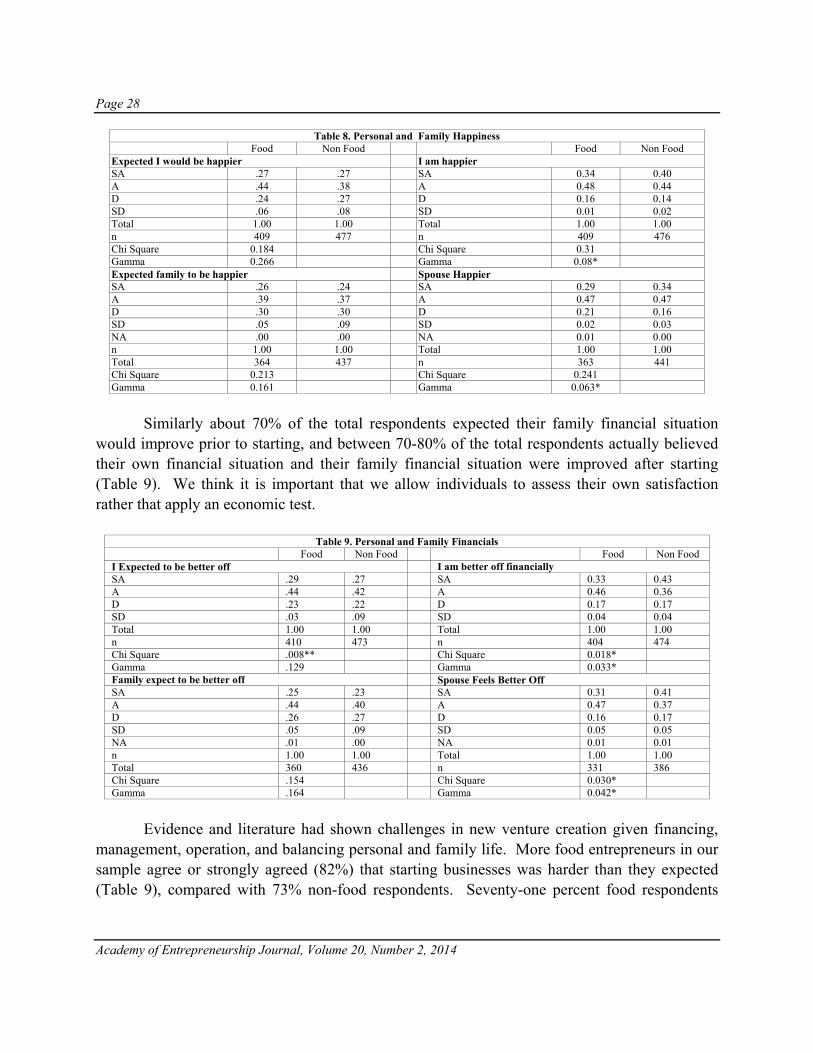
Page 28
Academy of Entrepreneurship Journal, Volume 20, Number 2, 2014
Table 8. Personal and Family Happiness Food Non Food Food Non Food Expected I would be happier I am happier SA .27 .27 SA 0.34 0.40 A .44 .38 A 0.48 0.44 D .24 .27 D 0.16 0.14 SD .06 .08 SD 0.01 0.02 Total 1.00 1.00 Total 1.00 1.00 n 409 477 n 409 476 Chi Square 0.184 Chi Square 0.31 Gamma 0.266 Gamma 0.08* Expected family to be happier Spouse HappierSA .26 .24 SA 0.29 0.34 A .39 .37 A 0.47 0.47 D .30 .30 D 0.21 0.16 SD .05 .09 SD 0.02 0.03 NA .00 .00 NA 0.01 0.00 n 1.00 1.00 Total 1.00 1.00 Total 364 437 n 363 441 Chi Square 0.213 Chi Square 0.241 Gamma 0.161 Gamma 0.063*
Similarly about 70% of the total respondents expected their family financial situation
would improve prior to starting, and between 70-80% of the total respondents actually believed their own financial situation and their family financial situation were improved after starting (Table 9). We think it is important that we allow individuals to assess their own satisfaction rather that apply an economic test.
Table 9. Personal and Family Financials
Food Non Food Food Non Food I Expected to be better off I am better off financially SA .29 .27 SA 0.33 0.43 A .44 .42 A 0.46 0.36 D .23 .22 D 0.17 0.17 SD .03 .09 SD 0.04 0.04 Total 1.00 1.00 Total 1.00 1.00 n 410 473 n 404 474 Chi Square .008** Chi Square 0.018* Gamma .129 Gamma 0.033* Family expect to be better off Spouse Feels Better OffSA .25 .23 SA 0.31 0.41 A .44 .40 A 0.47 0.37 D .26 .27 D 0.16 0.17 SD .05 .09 SD 0.05 0.05 NA .01 .00 NA 0.01 0.01 n 1.00 1.00 Total 1.00 1.00 Total 360 436 n 331 386 Chi Square .154 Chi Square 0.030* Gamma .164 Gamma 0.042*
Evidence and literature had shown challenges in new venture creation given financing,
management, operation, and balancing personal and family life. More food entrepreneurs in our sample agree or strongly agreed (82%) that starting businesses was harder than they expected (Table 9), compared with 73% non-food respondents. Seventy-one percent food respondents

Page 29
Academy of Entrepreneurship Journal, Volume 20, Number 2, 2014
also believed that it took them longer than expected to start their businesses, compared with 64% non-food respondents.
Table 10. Assessment of Difficulty
Food Non Food Food Non Food Harder Than Expected Longer Than Expected SA .37 .31 SA .29 .25 A .45 .42 A .42 .39 D .16 .20 D .25 .29 SD .02 .07 SD .04 .07 Total 1.00 1.00 Total 408 479 n 408 478 n 1.00 1.00 Chi Square .001*** Chi Square 0.084* Gamma 0.002** Gamma 0.015*
Evidence and literature had shown challenges in new venture creation given financing,
management, operation, and balancing personal and family life. More food entrepreneurs in our sample agree or strongly agreed (82%) that starting businesses was harder than they expected (Table 9), compared with 73% non-food respondents. Seventy-one percent food respondents also believed that it took them longer than expected to start their businesses, compared with 64% non-food respondents.
Table 11. Personal and Family Future
Would Start Again Family would support me again Food Non Food Food Non Food SA 0.40 0.52 SA 0.37 0.45 A 0.43 0.32 A 0.44 0.39 D 0.14 0.13 D 0.14 0.13 SD 0.03 0.03 SD 0.04 0.03 NS 0.00 0.00 NS 0.01 0.01 Total 1.00 1.00 NA 0.00 0.00 n 406 472 Total 1.00 1.00 Chi Square 0.004** n 357 435 Gamma 0.002** Chi Square 0.355
Gamma 0.031*
Interestingly fewer food entrepreneurs in our sample would start another business again
(83%) versus non-food entrepreneurs (84%) (Table 11). Over 80% of the total respondents, however, still believed their family would support them in another new venture creation process.
CONCLUSIONS AND IMPLICATIONS
Food entrepreneurs deal with different levels of risks and challenges compared to non-
food entrepreneurs. Based on our survey results, all entrepreneurs had similar characteristics and demographics. Our respondents were dominated by male, younger than 50 years of age, white, and with at least some college education. Food entrepreneurs established their businesses in more recent years, located more in urban areas, hired fewer full time employees, and relied on more part time employees. Most of the respondents in both food and non-food businesses had

Page 30
Academy of Entrepreneurship Journal, Volume 20, Number 2, 2014
some experiences in operation and management prior to starting their own business. They all agreed to be realistic and optimistic about their business development. They all believed the sales and profits were about the same as they had expected prior to starting the business. A slightly higher percentage of the food entrepreneurs seemed to agree their businesses were up and running well compared to non-food entrepreneurs. All entrepreneurs expected to be happier and financially better off, and the outcomes of the new venture formation seemed to satisfy their situations. More food entrepreneurs thought starting the business was harder and it took longer than they had expected compared to non-food entrepreneurs. And finally, a significant higher percentage of non-food entrepreneurs would start another venture again compare to food entrepreneurs. Fewer food entrepreneurs believed their family members might support them in starting another venture compared to non-food entrepreneurs.
It is reasonable to conclude that food entrepreneurs in our sample seem to have slightly different experiences than non-food entrepreneurs, even though they all had similar entrepreneurial characteristics. Creating a food related venture definitely involves different types of risks in terms climate risks, quality control, business management, distribution channel, seasonality in operation, and financial barriers. The follow up research based on our results will be to understand types of challenges, concerns, and barriers for food entrepreneurs versus non-food entrepreneurs. It will also be important to examine how food entrepreneurs respond to disasters and risky events compared to non-food entrepreneurs. These future studies will improve our understanding of the heterogeneity of food and non-food entrepreneurs, and will also provide more information to design programs for technical assistance and family support.
REFERENCES Aidis, R., Mickiewicz, T. & Sauka, A. (2008). Why Are Optimistic Entrepreneurs Successful? William Davidson
Institute Working Paper, No. 914, available at http://ssrn.com/abstract=1147771 Barbera, R. (2004). Boom, Gloom, and Excess, The International Economy, Winter, p. 22. Baron, R. & Shane. S (2005). Entrepreneurship: A Process Perspective, 1st Edition, Mason, Ohio, South-Western
Publishing, p. 60. Brocas, I., & Carrillo, J. (2004). Entrepreneurial Boldness and Excessive Investment, Journal of Economics &
Management Strategy, Vol. 13, Number 2, Summer, Malden, MA, p. 322. Carver, Charles, Optimism Definition and History, http://dccps.cancer.gov/brp/constructs/dispositional_optimism/
dispositional_optimism.pdf. Accessed February, 2008. Coelho, M. & De Meza, D. (2006). Self Deception, Self Selection, Self Destruction: An Experimental Investigation
of Adverse Selection, London School of Economics, http://cebr.dk/upload/demeza-001.pdf Crane, F. & Sohl, J. (2004), Imperatives to Venture Success, International Journal of Entrepreneurship and
Innovation, Vol. 5, No. 2, p. 99. Creed, P., Patton, W. & Bartrum, D. (2002). Multidimensional Properties of the LOT-R: Effects of Optimism and
Pessimism on Career and Well-being Related Variables in Adolescents, Journal of Career Assessment, Vol. 10, No. 1, pp. 42-61.
De Meza, D. & Southey, C. (1996). The Borrower’s Curse: Optimism, Finance and Entrepreneurship, The Economic Journal, 106, March, Cambridge, MA, p. 385.
Page 31
Academy of Entrepreneurship Journal, Volume 20, Number 2, 2014
Fraser, S. & Greene, F. J. (2006). The Effects of Experience on Entrepreneurial Optimism and Uncertainty, Economica, Vol. 73, pp. 169-192.
Hey, J. (1984). The Economics of Optimism and Pessimism, KTKLOS, Vol. 37, Fasc. 2. University of York, England, p. 204.
Kuratko, D. & Hodgetts, R. (2004). Entrepreneurship, 5th Edition, Mason Ohio, South-Western, p. 111. Liang, K. & Dunn, P. (2003). Love, Life, and Family Ties: Couples’ Assessment of New Venture Creation and
Business Development and Family Relationships, Proceedings of the Association for Small Business and Entrepreneurship. http://www.sbaer.uca.edu/research/asbe/2003/pdfs/hub/24Liang&.pdf
Liang, K. & Dunn, J. (2008) (1). Are Entrepreneurs Optimistic, Realistic, Both or Fuzzy?. Academy of Entrepreneurship, 14(1 & 2), 51-76.
Liang, K. & Dunn, P. (2008) (2). Exploring the Myths of Optimism and Realism in Entrepreneurship Related to Expectations and Outcomes. Journal of Business and Entrepreneurship, Vol. 20, No. 1, March, Pages 1-17.
Litt, M. D., Tennen, H., Affleck, G. & Klock, S. (1992). Coping and Cognitive Factors in Adaptation to in Vitro Fertilization Failure, Journal of Behavioral Medicine, Vol. 15, pp. 171-187.
Malach-Pines, A., Sadeh, A., Dvir, D., & Yafe-Yanai, O. (2002) Entrepreneurs and Managers: Similar Yet Different, The International Journal of Organizational Analysis, Vol. 10, No. 2, p. 174.
Manove, M. (2000). Entrepreneurs, Optimism and The Competitive Edge, Boston University and CEMFI, http://www.bu.edu/econ/faculty/manove/Opt.pdf
McColl-Kennedy, J. R. & Anderson, R. D. (2005). Subordinate-Manager Gender Combination and Perceived Leadership Style Influence on Emotions, Self-Esteem and Organizational Commitment, Journal of Business Research, Vol. 58, No. 2, pp. 115.
Petrakis, P.E. (2005). Risk Perception, Risk Propensity and Entrepreneurial Behavior: The Greek Case, The Journal of American Academy of Business, Vol. 7, Num. 1, September, Cambridge, p. 237.
Puri, M. & Robinson, D. T. (2004). Optimism, Work/Life Choices, and Entrepreneurship, http://www.worldbank.org/finance/assets/images/manju_puri_entrepreneurship_dr_3.pdf
Schneider, M. (2005). A Measure of Entrepreneurial Risk Preference and Optimism Using Field Experiments, Master Thesis, Department of Economics, University of Central Florida, Orlando, Florida.
Seligman, M. E. P. & Schulman, P. (1986). Explanatory Style as a Predictor of Productivity and Quitting Amongst Life Insurance Sales Agents, Journal of Personality and Social Psychology, Vol. 50, pp. 832-838.
Simon, M. & Houghton, S. (2002). The Relationship Among Biases, Misperceptions, and the Introduction of Pioneering Products: Examining Differences in Venture Decision Contexts, Entrepreneurship Theory and Practice, Winter, Baylor University, p. 118.
Taylor, S. E. (1989). Positive Illusions: Creative Self-Deception and the Healthy Mind, Basic Books. Weinstein, N. D. (1980). Unrealistic Optimism about Future Life Events, Journal of Personality and Social
Psychology, pp. 806-820. Weinstein, N. D. (1982). Unrealistic Optimism about Susceptibility to Health Problems, Journal of Behavioral
Medicine, Vol. 4 (December), pp. 441-460.

Page 32
Academy of Entrepreneurship Journal, Volume 20, Number 2, 2014
Page 33
Academy of Entrepreneurship Journal, Volume 20, Number 2, 2014
A FRAMEWORK FOR INFORMAL ECONOMY ENTRY: SOCIO-SPATIAL, NECESSITY-OPPORTUNITY, AND
STRUCTURAL-BASED FACTORS
SherRhonda R. Gibbs, The University of Southern Mississippi Charlie E. Mahone, Jr., University of the District of Columbia
Micah E. S. Crump, Howard University
ABSTRACT
The informal economy plays a critical role in the economies of most countries and its role has increased recently due to economic conditions. Consequently, there is rising interest in informal economy, the differential motivations for participation, and entry modes. Scholars have considered various contextual and situational explanatory factors, but usually in isolation. To address this gap, three interrelated informal economy theories are examined culminating in the development of a contextual framework that suggests appropriate theory selection for informal economy entry decisions. This framework assists policymakers in developing appropriate economic and regulatory policies by ascertaining factors that motivate informal economy entry. Keywords: Informal Economy, Informal Economy Theories, Socio-Spatial Variations, Informal Entrepreneurs, Externally-Stimulated Opportunities, Internally-Stimulated Opportunities, Necessity Entrepreneurship
INTRODUCTION
The informal economy, commonly referred to as “undeclared,” “unregistered” or “shadow” economy, is a prevalent feature of developed and developing economies (Portes, Castells, & Benton, 1989; Williams & Nadin, 2010b). Due to sustained high unemployment levels and the prolonged global economic recovery, individuals from diverse socioeconomic backgrounds are entering the informal economy. Economists state that informal economy activities are nearly nine percent of U.S. GNP, and more than 50 percent of GNP in many developing countries (Schneider, 2002; Weiler, Silverstein, Chalmers, & Lacey, 2003). Drawing from economics, sociology, and management disciplines the informal economy is defined as unregulated legitimate income generating activities through which actors recognize and exploit opportunities (Castell & Portes, 1989; Webb, Tihanyi, Ireland, & Sirmon, 2009). The informal economy includes individuals from all socioeconomic strata. Some groups participate out of

Page 34
Academy of Entrepreneurship Journal, Volume 20, Number 2, 2014
necessity, while others exploit opportunity gaps emerging from formal and informal institutional incongruences (Slack, 2006; Webb et al., 2009; Williams, 2007a). An expanding informal economy adversely impacts the formal economy through decreased tax collections, understated income, ineffective monetary policies, overstated unemployment rates, and unexplained currency growth (Williams & Nadin, 2010b). A concerted effort is required from policymakers to minimize the impact on the macro-economy but public policymakers need clarity on the motives and contextual factors prompting informal economy entry modes.
To facilitate the improvement of public policy and to contribute to theory, a Multi-theoretical Informal Economy Entry Selection framework (MTIEES) is developed which integrates: (1) contextual factors - socio-spatial variations; (2) entry typologies - necessity-based versus opportunity-driven; and (3) external structural factors - structuralist, neo-liberal, and post-structuralist. The MTIEES framework is created through the integration of literature on each of these three dimensions thereby attempts to close a gap in the literature. To accomplish our objective, the MTIEES framework addresses the following interrelated research questions:
1. Given socio-spatial variations, why do some individuals (e.g. Affluent, Middle-
income, Poverty-stricken) in disparate geographic locations (e.g. Urban, Suburban, and Rural) choose to enter the informal economy?
2. What are differentiating characteristics of necessity-based versus opportunity driven informal entrepreneurs?
3. Which external structural factors (Structuralism, neo-liberalism, and Post-
Structuralism) best explain the informal economy entry of various individuals?
To proceed, background and current literature on the informal economy and entry motives is provided. We offer definitions for socio-spatial variations and examine the role socio and spatial variations play in the informal economy. Entry typologies and external structural factors are discussed to establish foundation for the MTIEES framework. Our framework is then created through the integration of literature on socio-spatial variations (e.g. socioeconomic status, locale) and entry typologies (necessity-based versus opportunity-driven). Propositions are offered and personal vignettes provided that demonstrate the effectiveness and limitations of the framework.
Page 35
Academy of Entrepreneurship Journal, Volume 20, Number 2, 2014
LITERATURE REVIEW
Background and recent contributions on the Informal Economy
Some studies have found that the majority of informal economy participants are employees working for others, in sweatshops or out of their homes in contract relationships to producers (Edgcombe & Thetford, 2004). But, many are also self-employed. The very nature of being a micro (or very small) enterprise lends itself to operating in the informal economy. These enterprises are largely invisible or, at best, operate at low levels of visibility. Many operate without licenses, and are often engaged in casual hiring, non-reporting of income, and other informal labor practices. They can be easily relocated, open or closed at will, and thus, can simply hide from regulation. In many environments (affluent, suburban, and rural), observers fault excessive bureaucracy and regulation, formal market incapacity to satisfy the needs of impoverished masses (De Soto, 1989), lack of requisite capital, discriminatory practices, and growing one’s wealth as motives for entry in the informal economy (Webb et al., 2009). Notable contributions on informal economy entry include macro-level frameworks apprising licit/illicit exchanges and internal governance, institutional incongruence between formal and informal institutions as impetus for informal economy entry, and tri-theoretic factors (e.g. institutional polycentrism, resource-allocation, and deviance) influencing opportunity recognition and exploitation in the informal economy (e.g. see Godfrey, 2011; Webb et al., 2009; and Webb, Bruton, Tihanyi, & Ireland, 2012 for detailed discussion). To facilitate development of an integrative framework (e.g. macro- and micro-level) of informal economy entry, definitional context of socio-spatial variations and the informal economy must first be provided. Socio and Spatial variations
Socio-spatial variation is a general concept rooted in sociology but applicable to a wide range of fields, including science, public policy, economics, and others. For the purposes of this study, we define the concept at its root from two perspectives: (1) socio-variation focuses on socioeconomic status, i.e., differences in income levels; and (2) Spatial variations are characterized by nonproximal heterogeneous geographic environments. This definition embraces conjecture by scholars that socioeconomic status (Reynolds, 1991), regional contexts and spatial distribution might explain firm founding and evolution (Drakopoulou Dodd & Hynes, 2012). Socioeconomic Status and the Informal Economy
Prior research suggests that socioeconomic status is an important contextual factor to consider when studying the informal economy (e.g. Edgcomb & Thetford, 2004; Chen, 2006;

Page 36
Academy of Entrepreneurship Journal, Volume 20, Number 2, 2014
Williams & Round, 2007). A study commissioned by ACCION (1999) concluded that of the 13.1 million microentrepreneurs in the U.S., 10.8 million never received a bank loan and 2.3 million are considered low income. However, informal entrepreneurs are often polarized at two ends of the income spectrum, concentrated in both the poorest and most affluent households in terms of gross household income (Williams & Nadin, 2010b; Galemba, 2008; Zuin, 2004).
Williams and Round’s (2010a) study of informal entrepreneurs in Moscow found that the nature of informal activities differ across socioeconomic status. For instance, in affluent communities, registered businesses often participate in partially off-the-books transactions, whereas in deprived areas, unregistered businesses operate almost entirely off the books as a survival tactic.
Informal entrepreneurs living in affluent communities are employed, but in the lower income brackets of that community (e.g. Middle-Income). In contrast, in deprived communities, informal entrepreneurs are usually unemployed, and represented in both low and high income brackets. Having established clear evidence of socioeconomic groups’ variations and unique approaches towards informal economy activities, Williams and Nadin (2010b) found that 80 percent of informal entrepreneurs operate off-the-books in deprived areas, compared with only 55 percent of self-employed in affluent areas.
According to Reynolds (1991, p. 55), the “socioeconomic system provides the context in which entrepreneurs will found new firms” and differences in the economic well-being of groups is associated with entrepreneurship. Reynolds (1991) work substantiates socioeconomic status as an important situational factor prompting entry into the informal economy. Its choice as a factor is based on the widely accepted relationship between income level, access to capital, and entrepreneurial activity success in economics and entrepreneurship literatures. Spatial Variations and the Informal Economy
Economic geography and entrepreneurial environment are well-established determinants of new firm formation and characteristics (Armington & Acs, 2002). Williams (2007b) suggests that entrepreneurship and enterprising culture are inextricably intertwined and finds differences in enterprising culture between individuals living in rural areas as compared to those living in urban areas. These led to him concluding that spatial variations (due to shared experiences by individuals living in certain areas and regions) are notable factors to consider with regards to entrepreneurship and enterprising cultures. Lee, Florida and Acs (2004) similarly argue the importance of regionality and social diversity in new firm formation. Drakopoulou Dodd and Hynes (2012) concur and concluded that regionality plays a specific role in shaping, stimulating, and facilitating entrepreneurial activity as a knowledge context.
Local business contacts and knowledge flows may be necessary preconditions for informal entrepreneurship as high concentrations of knowledge sources may constitute a seedbed for regional clusters of informal entrepreneurship (Trettin & Welter, 2011). Murphy and

Page 37
Academy of Entrepreneurship Journal, Volume 20, Number 2, 2014
Wallace (2010) further illustrate the importance of regionality and community resources. They found that as poverty levels rise in the suburbs, these locales become more organizationally deprived. Due to this deprivation, social mobility is stifled such that suburban poor neighborhoods have fewer resources when compared to urban poor neighborhoods. These spatial factors may lead to increasing levels of informal or necessity-based entrepreneurship. Williams (2010) concluded that informal entrepreneurs in deprived, rural localities demonstrate a greater preponderance for trading off-the-books than their urban counterparts, and hypothesized that rural informal entrepreneurs may be more enterprising than urban informal entrepreneurs. Scholars also note that there are marked differences in entrepreneurial activity and quality based on regional and entrepreneurial support mechanisms (Barkham, 1992; Hosier, 1987).
Collectively, these findings supports Lewis’ (1954/1958) notion of dualism, which argued that rural areas are home to a thriving informal sector. Hidden or legitimate enterprise cultures vary spatially when considering the nature and preponderance of informal entrepreneurship (Williams & Nadin 2010b). Taken together, socio and spatial variations appear to be important. As such, we incorporate socioeconomic status (e.g. affluent, middle income, and poverty stricken) and locales (e.g. urban, suburban, and rural) as important contextual factors to consider when examining informal economy entry. Table 1 summarizes general findings from the literature, particularly those using socio-spatial variations.
Table 1: Informal Economy Summary of Literature Author(s) Summary of Findings
Cross (1997) Urban informal entrepreneurs who operate independent of customers and suppliers are candidates for transitioning into the formal economy.
Cross (2000) Street vendors in Latin America did so out of choice to transform work identity.
DeCastro, Balkin and Shepherd (2008)
Product piracy (informality) can increase the value of and demand for legitimate products of entrepreneurial firms.
Edgcomb and Thetford (2004) Low income individuals enter the informal economy for both survivalist and because of personal fulfillment (choice).
Godfrey (2011) Developed a 2x2 matrix of the informal economy focusing on the dimensions of external compliance, engagement in illicit or licit practices and internal governance (separated into bureaucratic versus nonbureaucratic.
Guillermo, Maloney et al (2007)
1) Economic agents choose informality as an exit mechanism, rather than due to exclusion, after considering the cost/benefit of doing so. 2) Informality has resulted in social equilibrium in Latin American and Caribbean countries.
Jones, Ram and Edwards (2006) Ethnic minority informal entrepreneurs employment of illegal migrants in UK employ use neo-liberal approaches to the informal economy and marginalization.

Page 38
Academy of Entrepreneurship Journal, Volume 20, Number 2, 2014
Table 1: Informal Economy Summary of Literature Author(s) Summary of Findings
Khavul, Bruton, and Wood (2009)
1) In Africa, individuals enter informality due to the administrative hurdles in place which make it difficult to register and license a business and lack of resources. 2) Informality presented opportunities to some entrepreneurs to rapidly cycle to higher value creating ventures due to low entry barriers. Men experiment more with different ideas while women sought to improve their initial idea. 3) Family ties tend to constrain female entrepreneurs.
Lozano (1989) Showed ratio of necessity-based to opportunity-driven Informal entrepreneurs in Northern California flea market. 80% involuntary and 20% voluntary.
Maloney (2004)
1) Those who entered informal self-employment voluntarily from formal work earned more than those who transitioned involuntarily. Women disproportionately represented in informal sector due to work-life balance. Low-skilled workers drawn to informality for dignity and autonomy. 2) Informal entrepreneurs skeptical of institutions and uncertain benefits provided in formal sector.
Siqueira and Bruton (2010)
Found a positive relationship between technology investment and firm performance in high technology firms in emerging economies. Informality positively moderated the relationship between technology investment and firm performance for firms with greater resource constraints and higher levels of informality.
Snyder (2004) Study of NYC urban informal entrepreneurs did so out of choice, to reveal their true selves.
Slack (2006) Informal participation rates similar among Low-income, Middle income and High income earners.
Webb et al. (2009) Lack of capital, discriminatory practices reason for low income informal activities; Growing wealth, Business acumen and access to resources reasons for affluent entry.
Webb, Bruton, Tihanyi, and Ireland (2013)
1) Examined institutional incongruence and weak enforcement (institutional polycentricity) which facilitates opportunity recognition and exploitation in informal economy. 2) Reviewed motivational theories on deviance to explain how and why individuals deviate from societal rules and use resource allocation theory to explain how informal entrepreneurs manage tangible resources, risks and different domains (e.g. business versus family). 3) Informal entrepreneurs use resource allocation strategies such as carrying smaller inventories, agglomeration, informal loans and using free raw materials to subsist in the economy.
Williams (2006) In rural areas informal work done for social/distributive reasons.
Williams (2008)
1) Informal work is the main source of income for the poor for reasons of necessity. Affluent become informal for social reasons; secondary source of income. They exploit opportunities from pre-existing formal employment. 2) Informal entrepreneurs proceed through a temporal shift from necessity to opportunity, becoming more opportunity-driven over time.

Page 39
Academy of Entrepreneurship Journal, Volume 20, Number 2, 2014
Table 1: Informal Economy Summary of Literature Author(s) Summary of Findings
Williams (2010)
1) Poor, rural entrepreneurs participated in more informal work than poor urbans. 2) In English locales, greater numbers of opportunity-driven than necessity-based informal entrepreneurs. 3) Higher levels of necessity entrepreneurship in poverty-stricken areas, and opportunity-driven entrepreneurship in Affluent areas.
Williams and Nadin (2010b)
1) In urban areas, larger numbers of poverty-stricken individuals participate in informal transactions than affluents. 2) Affluent communities have more informal enterprises emerging out of formal work; Deprived communities informal work emerge out of hobbies, or personal interest. 3) In affluent communities, informal entrepreneurs are clustered in lowest income level of that community; In deprived areas, informal entrepreneurs less likely to be employed - clustered at lowest (e.g. house cleaning) and highest income levels (e.g. plumbers, builders) of deprived communities.
Williams and Round (2007)
1) Individuals in low to middle income seeking to reduce risk with formal employment participate in informal work. 2) Described middle-income entrepreneurs (e.g. carpenters) as participating in informal work for hobby/personal interest by choice.
Williams and Round (2008)
1) Urban affluent informal entrepreneurs give and receive paid favors (post-structuralist) more than any other group. 2) In Ukraine, Affluent started their business to both escape corruption and bribes. Informality was opportunity-driven (neoliberal).
Williams and Round (2010a) In affluent communities informal activities done by choice or opportunity; In deprived areas informal activities used for survival.
Williams and Windebank (1994) 1) Low income in affluent areas will participate in informal work more often - due to the little free time of the affluent. 2) More informal work takes place in rural areas than urban areas.
Note. Studies having multiple findings are indicated by numbered lists (e.g. 1, 2, etc.).
Entrepreneurial Entry Typology: Necessity-based or Opportunity-Driven
Along with socio-spatial contextual factors, entrepreneurship scholars cite two additional reasons entrepreneurs pursue new ventures: necessity-based, and opportunity-driven. Williams (2011) contends that necessity-based entrepreneurs are “pushed” into informal entrepreneurship because other options for work are absent and unsatisfactory, and opportunity-driven entrepreneurs are “pulled” into informal entrepreneurship out of choice to exploit some business opportunity, or due to their desire for independence or to own a business.
This entrepreneurial entry typology is derived from Bhave (1994) whose model of opportunity recognition explored the implications of choosing internally- versus externally-

Page 40
Academy of Entrepreneurship Journal, Volume 20, Number 2, 2014
stimulated opportunity recognition. An externally-stimulated opportunity occurs when the decision to start a venture precedes opportunity recognition (Bhave, 1994). Here, an individual decides to become an (informal) entrepreneur and then seeks out opportunities that can lead to a business venture (or firm). Informal entrepreneurs who recognize the opportunities for their businesses through this process engage in an ongoing search for opportunities which they filter, massage, and elaborate on before selecting one and founding their firms. Externally-stimulated opportunity recognition, in the present study, is considered equivalent to necessity-based (informal) entrepreneurship. An alternative venture creation path results from internally-stimulated opportunity recognition. At this juncture, informal entrepreneurs discover a problem to solve, or an unmet market need, and decide to create a venture to address the problem or need (Bhave, 1994). The entrepreneur may not have been actively attempting to create a new venture, but the opportunity presented itself and led to a new entrepreneurial firm. Internally-stimulated opportunity recognition is comparable to opportunity-driven (informal) entrepreneurship. Some authors explore entry typologies in research on the informal economy. Thus far, the majority of findings indicate that opportunity-driven entrepreneurship occurs across all socio-spatial contexts (Snyder, 2004; Edgcomb & Thetford, 2004; Williams, 2011). While some studies in the U.S. on ethnic and immigrant informal entrepreneurs found that engagement in informal work was necessity-based (Raijman, 2001; Sassen, 1997); others on urban street vendors concluded that informal work emerged out of choice, and could be characterized as both necessity-based and opportunity-driven (Cross, 2000; Lozano, 1989; Snyder, 2004). More recently, scholarly debate has focused on the ratio of necessity-based to opportunity-driven entrepreneurs (see Harding, Brooksbank, Hart, Jones-Evans, Levie, & Walker, 2006). Brunjes and Diez (2012) for example, found that for rural settings in Vietnam, better access to non-farm employment increased the number of opportunity entrepreneurs, but had no effect on necessity entrepreneurs. In certain instances, they purported that informal businesses may be driven by both necessity and opportunity.
A major theme underlying these investigations is whether informal entrepreneurs operate along a continuum of necessity-based and opportunity-driven work (Minniti, Bygrave, & Autio, 2006). Williams’ (2010) findings show that opportunity-driven informal entrepreneurship seems to dominate most spatial contexts and socioeconomic classes. However, the ratio of opportunity-driven to necessity-based informal entrepreneurship among poverty-stricken individuals is roughly one to one. In keeping with our objectives, we now turn discussion towards external structural factors that motivate informal economy entry. These factors are best described by three theoretical perspectives: structuralist, neo-liberal, and post-structuralist.

Page 41
Academy of Entrepreneurship Journal, Volume 20, Number 2, 2014
External Structural Factors
Structuralist Perspective
Lewis (1954/1958) and Polanyi (1957) offer a dualistic view of the economy from which the structuralist perspective of the informal economy originates. Lewis argues that excessive investments in some parts of the economy and underinvestment in others creates two sectors, formal and informal. The formal sector consists of activity primarily in urban areas with waged labor, capital-intensive firms and high productivity of labor that encourages capitalist investment. The informal sector exists primarily in rural areas with low wages, low productivity, less capital intensive firms, where the marginal productivity of labor is negligible and characterized by labor surpluses and low investment. Polanyi’s (1957) work introduced the commonly accepted concept of formalism and differentiated this concept from substantivism. Formalism suggests that individuals pursue utility maximization while the substantive motivation presupposes that humans establish their livelihoods from social and natural environments, and is based on cultural values, morals, personal relationships, and religion. The human economy, consequently, is embedded in both economic and noneconomic institutions (Polanyi, 1957). The structuralist perspective was the first to characterize informal entrepreneurship as extensive and expanding, and an emergent mode of production (Williams & Nadin, 2010a). Wallerstein (1974/2007) develops a world systems framework describing an informal periphery of low wages and minimal economic activity. Fortuna and Prates (1989) describe informality as a feature of labor-capital relations distinguished by deinstitutionalization of productive activities and movement away from regulations issued by the state. The “rich formal sector extracts value from the poor informal sector” to lock in a persistent inequitable world system (Godfrey, 2011, p. 246). Widespread poverty and unemployment cause structurally isolated communities to seek informal economic arrangements for “survival” as means to escape abject poverty and misery (Castells & Portes, 1989; Godfrey, 2011). Venkatesh (2006, p. 385) also purported that the “underground economy enables poor communities to survive but can lead to alienation from the wider world.” It has been suggested that due to exploitative practices of globalization and lack of regulations, informal entrepreneurs are forced to work in the underground economy because they are unable to compete with low wage workers in foreign countries or find work given their limited education levels (Castells & Portes, 1989; Valenzuela, 2001). The structuralist perspective considers informal entrepreneurs as “survivalists” pursuing informal economic activities out of necessity.
Neo-Liberal Perspective
Neoliberal scholars theorize that entry into the informal economy is a direct result of state and federal overregulation of the economy, increased taxation, and social legislation (Castells &

Page 42
Academy of Entrepreneurship Journal, Volume 20, Number 2, 2014
Portes, 1989; De Soto, 1989). The results of these overregulation policies facilitated the rise of the welfare state which in turn prompts companies to escape its reach. Consequently, neoliberalism focuses on the institutional causes of informality. The theme of neoliberalism is one of limited government, and political and social freedoms. Friedman’s response during a 1979 interview where he was questioned about the virtues of capitalism, highlights this school of thought: “…the world runs on individuals pursuing their own separate interests… there is no alternative way, so far discovered, of improving the lot of the ordinary people, that can hold a candle to the productive activities that are unleashed by the free enterprise system (Donahue, 1979).” Becker (2004) asserts that neoliberal theorists view informal work arrangements as microentrepreneurs’ response to overregulation. Ultimately, a rise in informal entrepreneurship is triggered by workers trying to avoid costs and efforts associated with formal registration, and feeling stifled by state-imposed constraints (Perry & Maloney, 2007; Packard, 2007). In this perspective, entrepreneurs are viewed as heroes “bucking” the repressive rules and regulations of the state (De Soto, 1989). Neoliberals see informality as free choice, which contrasts with structuralists who view informality as imposed constraint deeply rooted in economic structures (Godfrey, 2011).
Post-Structuralist Perspective
Post-structuralism (also referred to as post-capitalism), has its roots in international relations which characterize informal entrepreneurs as social and not economic actors (Williams & Nadin, 2010a). This perspective is primarily concerned with power and agency, purporting that informal entrepreneurship is a choice for social, redistributive, and identity reasons, and not purely financial (Persson & Malmer, 2006; Round & Williams, 2008). In the post-structuralist view, informal entrepreneurs make a purposeful “exit” from the formal economy. Williams, Round and Rodgers (2011) state that this exit does not occur for market-like profit motivated work, but rather, these informal entrepreneurs are social actors who resist the perceived exploitation of workers and corruption under the neo-liberal global system of corruption (Biles, 2009; Whitson, 2007). Alternatively, entry into the informal economy might be the result of a desire to transform work identities into informal businesses that represents their true nature (Snyder, 2004). Post-structuralists impute agency to informal entrepreneurs as a livelihood method pursued for resistance reasons (Biles, 2009; Whitson, 2007).
In the past, scholars portrayed these three perspectives as mutually exclusive (Amin, Cameron, & Hudson, 2002). However, a simple dichotomous classification of informal entrepreneurs does not sufficiently explain the nature and extent of informal economy entry. In fact Williams et al. (2011, p. 749) argued that “no one theory accurately displays the rationale for participation in all types of informal employment and motives of all population groups…” and only by applying an integrative approach incorporating all theories, can a comprehensive,
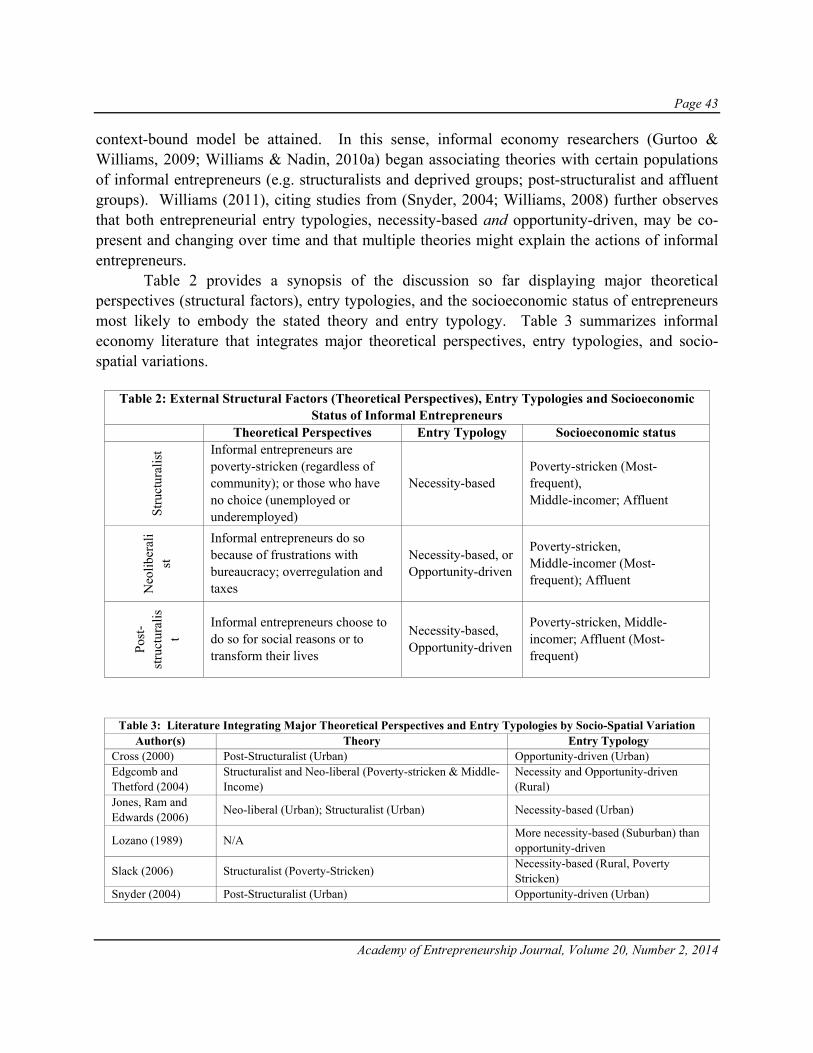
Page 43
Academy of Entrepreneurship Journal, Volume 20, Number 2, 2014
context-bound model be attained. In this sense, informal economy researchers (Gurtoo & Williams, 2009; Williams & Nadin, 2010a) began associating theories with certain populations of informal entrepreneurs (e.g. structuralists and deprived groups; post-structuralist and affluent groups). Williams (2011), citing studies from (Snyder, 2004; Williams, 2008) further observes that both entrepreneurial entry typologies, necessity-based and opportunity-driven, may be co-present and changing over time and that multiple theories might explain the actions of informal entrepreneurs.
Table 2 provides a synopsis of the discussion so far displaying major theoretical perspectives (structural factors), entry typologies, and the socioeconomic status of entrepreneurs most likely to embody the stated theory and entry typology. Table 3 summarizes informal economy literature that integrates major theoretical perspectives, entry typologies, and socio-spatial variations.
Table 2: External Structural Factors (Theoretical Perspectives), Entry Typologies and Socioeconomic Status of Informal Entrepreneurs
Theoretical Perspectives Entry Typology Socioeconomic status
Str
uctu
rali
st Informal entrepreneurs are
poverty-stricken (regardless of community); or those who have no choice (unemployed or underemployed)
Necessity-based Poverty-stricken (Most-frequent), Middle-incomer; Affluent
Neo
liber
ali
st
Informal entrepreneurs do so because of frustrations with bureaucracy; overregulation and taxes
Necessity-based, or Opportunity-driven
Poverty-stricken, Middle-incomer (Most-frequent); Affluent
Pos
t-st
ruct
ural
ist
Informal entrepreneurs choose to do so for social reasons or to transform their lives
Necessity-based, Opportunity-driven
Poverty-stricken, Middle-incomer; Affluent (Most-frequent)
Table 3: Literature Integrating Major Theoretical Perspectives and Entry Typologies by Socio-Spatial Variation Author(s) Theory Entry Typology
Cross (2000) Post-Structuralist (Urban) Opportunity-driven (Urban) Edgcomb and Thetford (2004)
Structuralist and Neo-liberal (Poverty-stricken & Middle-Income)
Necessity and Opportunity-driven (Rural)
Jones, Ram and Edwards (2006)
Neo-liberal (Urban); Structuralist (Urban) Necessity-based (Urban)
Lozano (1989) N/A More necessity-based (Suburban) than opportunity-driven
Slack (2006) Structuralist (Poverty-Stricken) Necessity-based (Rural, Poverty Stricken)
Snyder (2004) Post-Structuralist (Urban) Opportunity-driven (Urban)

Page 44
Academy of Entrepreneurship Journal, Volume 20, Number 2, 2014
Table 3: Literature Integrating Major Theoretical Perspectives and Entry Typologies by Socio-Spatial Variation Author(s) Theory Entry Typology
Webb et al. (2009) Structuralist (Poverty-stricken) versus Post-structural (Affluent); Necessity-based (Poverty stricken) versus Post-structuralism (Affluent)
Opportunity-driven
Williams (2006) Post-structuralist (Rural) Opportunity-driven (Rural)
Williams (2010) Neo-liberal and Post-Structuralist (Affluent); Necessity-based (Poverty-stricken)
Opportunity-driven (Affluent); Necessity-based (Poverty-stricken)
Williams (2011) Neo-liberal (Rural Affluent); Structuralist (Poverty-stricken)
Opportunity-driven (Affluent); Necessity-based (Poverty-stricken)
Williams and Nadin (2010b)
Neo-liberal (Affluent) versus Post-Structuralist (Poverty-stricken)
Opportunity-driven (Affluent & Poverty-stricken)
Williams and Round (2007)
Neo-liberal (Poverty-stricken, Middle Income, & Affluent)
Opportunity-driven (Urban, Suburban, Rural)
Williams and Round (2008)
Neo-liberal and Post-structuralist (Urban Affluents); Structuralist (Urban and Rural Poverty-stricken); Neo-liberal (Middle-Income)
Opportunity-driven (Urban affluent, Suburban Affluent); Necessity-based (Urban and Rural Poverty-stricken)
Williams and Round (2010a)
Neo-liberal and Post-structuralist (Urban Affluents) and Structuralist (Poverty-stricken)
N/A
Williams and Round (2010b)
Structuralist (Urban Poverty-Stricken); Neoliberal and Post-structuralist (Urban Affluents); Neo-liberal (Middle-income)
Necessity-based (Urban Poverty-stricken)
Williams, Round and Rodgers (2011)
Structuralist (Poverty-stricken); Neoliberal(Middle-Income and Affluent); Post-structuralist (Middle Income; Affluent)
N/A
Note. In the table, the column labeled Theory shows which theories best explain informal economy entry, relevant spatial setting, and socioeconomic status (if reported by authors). The column labeled Entry Typology describes which entry motivations/typology (e.g. necessity-based or opportunity-driven) was used by informal entrepreneurs, along with spatial setting and socioeconomic status (if reported). Some studies did not report entry typologies, socioeconomic status, or spatial variation, for these cases, we have marked an N/A.
We attempt to fill the gap in the literature by developing a multi-theoretic selection
framework of informal economy entry that combines socio-spatial factors, theoretical perspectives using typologies of necessity-based and opportunity-driven entrepreneurship, and external structural factors. What follows is development of the integrative framework that fulfills the key objectives of the research.
THE MULTI-THEORETIC INFORMAL ECONOMY ENTRY SELECTION
FRAMEWORK (MTIEES) Framework: Theory Selection and Contextual Application for Informal Economy Entry
To develop the basic MTIEES theoretic framework and corresponding propositions, we examine environmental conditions faced by informal entrepreneurs in urban, rural and suburban settings for all socioeconomic strata. Consequential differences in informal entrepreneurs’ behavior are so noted when relevant to framework development.
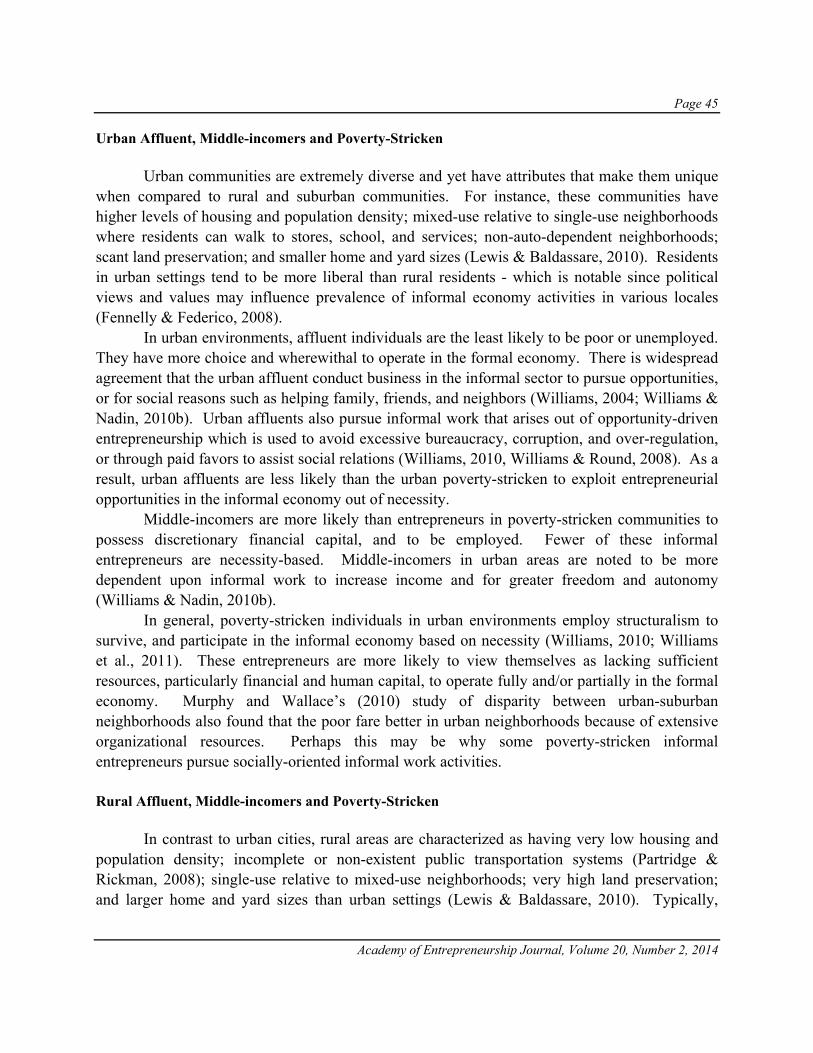
Page 45
Academy of Entrepreneurship Journal, Volume 20, Number 2, 2014
Urban Affluent, Middle-incomers and Poverty-Stricken Urban communities are extremely diverse and yet have attributes that make them unique
when compared to rural and suburban communities. For instance, these communities have higher levels of housing and population density; mixed-use relative to single-use neighborhoods where residents can walk to stores, school, and services; non-auto-dependent neighborhoods; scant land preservation; and smaller home and yard sizes (Lewis & Baldassare, 2010). Residents in urban settings tend to be more liberal than rural residents - which is notable since political views and values may influence prevalence of informal economy activities in various locales (Fennelly & Federico, 2008).
In urban environments, affluent individuals are the least likely to be poor or unemployed. They have more choice and wherewithal to operate in the formal economy. There is widespread agreement that the urban affluent conduct business in the informal sector to pursue opportunities, or for social reasons such as helping family, friends, and neighbors (Williams, 2004; Williams & Nadin, 2010b). Urban affluents also pursue informal work that arises out of opportunity-driven entrepreneurship which is used to avoid excessive bureaucracy, corruption, and over-regulation, or through paid favors to assist social relations (Williams, 2010, Williams & Round, 2008). As a result, urban affluents are less likely than the urban poverty-stricken to exploit entrepreneurial opportunities in the informal economy out of necessity. Middle-incomers are more likely than entrepreneurs in poverty-stricken communities to possess discretionary financial capital, and to be employed. Fewer of these informal entrepreneurs are necessity-based. Middle-incomers in urban areas are noted to be more dependent upon informal work to increase income and for greater freedom and autonomy (Williams & Nadin, 2010b). In general, poverty-stricken individuals in urban environments employ structuralism to survive, and participate in the informal economy based on necessity (Williams, 2010; Williams et al., 2011). These entrepreneurs are more likely to view themselves as lacking sufficient resources, particularly financial and human capital, to operate fully and/or partially in the formal economy. Murphy and Wallace’s (2010) study of disparity between urban-suburban neighborhoods also found that the poor fare better in urban neighborhoods because of extensive organizational resources. Perhaps this may be why some poverty-stricken informal entrepreneurs pursue socially-oriented informal work activities. Rural Affluent, Middle-incomers and Poverty-Stricken
In contrast to urban cities, rural areas are characterized as having very low housing and population density; incomplete or non-existent public transportation systems (Partridge & Rickman, 2008); single-use relative to mixed-use neighborhoods; very high land preservation; and larger home and yard sizes than urban settings (Lewis & Baldassare, 2010). Typically,

Page 46
Academy of Entrepreneurship Journal, Volume 20, Number 2, 2014
individuals living in rural areas earn lower wages and endure higher rates of poverty and underemployment than do their urban and suburban counterparts (Edgcomb & Thetford, 2004; Slack, 2006). Here, there seems to be an overrepresentation of totally informal business. Given the remoteness of location, individuals residing in rural areas quite often experience periods of protracted unemployment or underemployment, and therefore feel compelled to enter into the informal economy in order to patch income levels until gainful employment is attained (De Soto, 1989; Slack, 2006). Affluent residents who reside in rural neighborhoods are less likely than those in poverty-stricken rural neighborhoods to exploit entrepreneurial opportunities in the informal economy out of necessity. Similar to entrepreneurs in urban and affluent neighborhoods, these entrepreneurs have more choice and wherewithal to operate in the formal economy (Slack, 2006). They operate in the informal economy more likely for social reasons such as helping family, friends, and neighbors (Williams, 2004), or to pursue a peripheral career based on their lifestyle (Snyder, 2004), indicating higher levels of opportunity-driven, neoliberal motivations among rural affluent informal entrepreneurs. Middle-income individuals living in rural areas possess attributes that differ from their urban counterparts. Having greater education levels than others in their communities, they are more likely to possess discretionary financial capital, and to be employed in the formal sector. Slack (2006) suggests that even with some discretionary income, middle-incomers in rural areas lack access to essential services, which necessitates reliance on informal institutions. He further suggests that middle-incomers participate in the informal economy by choice, after having weighed their perceived short-term cost advantages in operating in the informal economy against the more regulated alternative. Rural poverty-stricken individuals view themselves as lacking sufficient resources, particularly financial and human capital, to operate at all in the formal economy. Williams’ (2010) purported there were greater levels of informality in “deprived” rural areas. While scholars agree that the rural poverty-stricken pursue informal work out of necessity (Slack, 2006; Williams & Nadin, 2010b), some studies indicate that informal work arrangements may also be a strategy imposed from the outside as big firms restructure and outsource functions to subcontractors both to minimize costs and maximize flexibility. Under these arrangements, workers are pushed out of the formal economy into the informal economy where they suffer without protections of the legal system. This suggests some level of necessity-based structuralist motivations. Informal workers move fluidly back and forth between the two worlds, some by necessity, and others by choice (Edgcomb & Thetford, 2004). Suburban Affluent, Middle-incomers, and Poverty-Stricken
Suburban communities are characterized as having: less housing and population density than urban environments, but greater density than in rural areas; incomplete public transportation
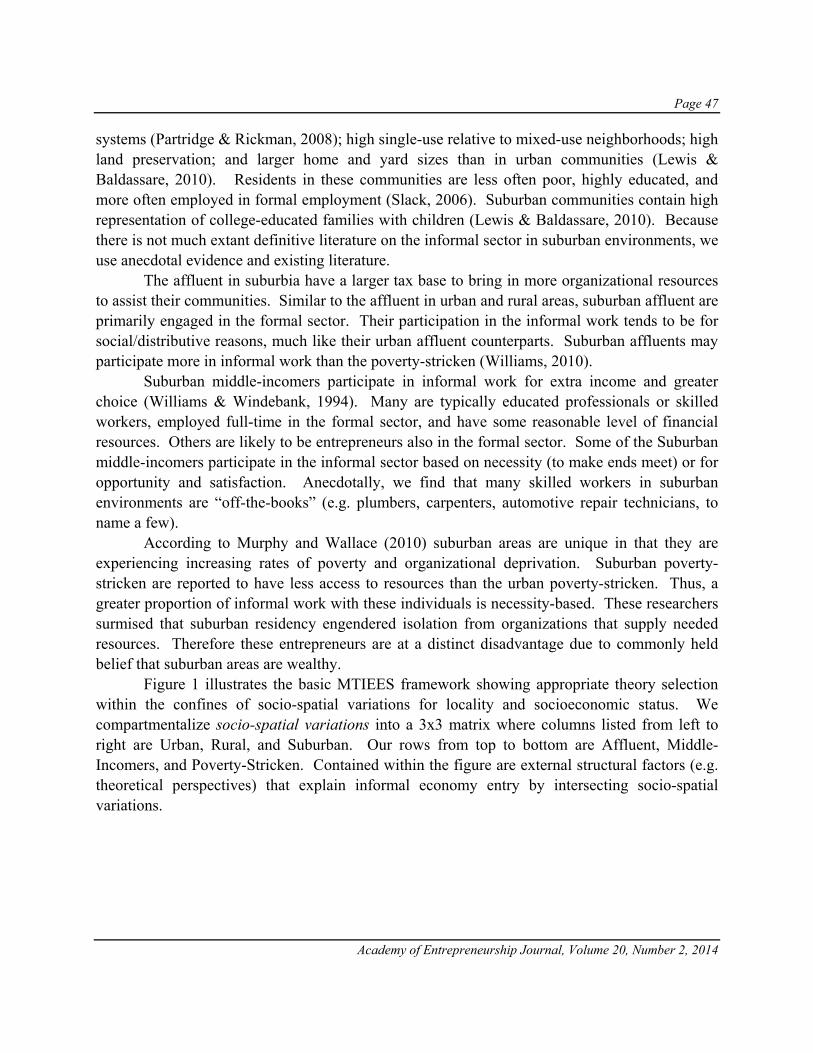
Page 47
Academy of Entrepreneurship Journal, Volume 20, Number 2, 2014
systems (Partridge & Rickman, 2008); high single-use relative to mixed-use neighborhoods; high land preservation; and larger home and yard sizes than in urban communities (Lewis & Baldassare, 2010). Residents in these communities are less often poor, highly educated, and more often employed in formal employment (Slack, 2006). Suburban communities contain high representation of college-educated families with children (Lewis & Baldassare, 2010). Because there is not much extant definitive literature on the informal sector in suburban environments, we use anecdotal evidence and existing literature. The affluent in suburbia have a larger tax base to bring in more organizational resources to assist their communities. Similar to the affluent in urban and rural areas, suburban affluent are primarily engaged in the formal sector. Their participation in the informal work tends to be for social/distributive reasons, much like their urban affluent counterparts. Suburban affluents may participate more in informal work than the poverty-stricken (Williams, 2010). Suburban middle-incomers participate in informal work for extra income and greater choice (Williams & Windebank, 1994). Many are typically educated professionals or skilled workers, employed full-time in the formal sector, and have some reasonable level of financial resources. Others are likely to be entrepreneurs also in the formal sector. Some of the Suburban middle-incomers participate in the informal sector based on necessity (to make ends meet) or for opportunity and satisfaction. Anecdotally, we find that many skilled workers in suburban environments are “off-the-books” (e.g. plumbers, carpenters, automotive repair technicians, to name a few). According to Murphy and Wallace (2010) suburban areas are unique in that they are experiencing increasing rates of poverty and organizational deprivation. Suburban poverty-stricken are reported to have less access to resources than the urban poverty-stricken. Thus, a greater proportion of informal work with these individuals is necessity-based. These researchers surmised that suburban residency engendered isolation from organizations that supply needed resources. Therefore these entrepreneurs are at a distinct disadvantage due to commonly held belief that suburban areas are wealthy. Figure 1 illustrates the basic MTIEES framework showing appropriate theory selection within the confines of socio-spatial variations for locality and socioeconomic status. We compartmentalize socio-spatial variations into a 3x3 matrix where columns listed from left to right are Urban, Rural, and Suburban. Our rows from top to bottom are Affluent, Middle-Incomers, and Poverty-Stricken. Contained within the figure are external structural factors (e.g. theoretical perspectives) that explain informal economy entry by intersecting socio-spatial variations.

Page 48
Academy of Entrepreneurship Journal, Volume 20, Number 2, 2014
Figure 2 shows what happens to our model when necessity-based (labeled “necessity”) and opportunity-driven (labeled “opportunity”) entry typologies are factored into the MTIEES framework. As shown in Figure 2, once the motivation for trading in the informal economy is recognized as necessity-based by an entrepreneur, the structuralist perspective becomes the best external structural factor to explain the behavior. This reflects a change for the affluent and middle-incomers (see Figure 1 for prior classification). When opportunity-driven is factored in as the motivation for trading in the informal economy, we find that the external structural factors which may best explain the informal economy entry of entrepreneurs (in all socio-spatial settings) changes to the neo-liberal and post-structuralist perspectives.
URBAN RURAL SUBURBAN
Figure 1
Multitheoretic Informal Economy Entry Selection (MTIES) Framework : Basic
Notes. The diagonal line indicates that either theory may explain informal economy entry.
SOCIOECONOMIC STATUS
SPATIAL VARIATION
Structuralist Structuralist Structuralist
Neo-liberal Neo-liberal Neo-liberal
Figure 1. Multitheoretic Informal Economy Entry Selection (MTIES) Framework : Basic
AFFLUENT
MIDDLE-INCOMER
POVERTY-STRICKEN
Neo-liberal
Post-structuralist
Neo-liberal
Post-structuralist
Neo-liberal
Post-structuralist
Necessity Opportunity Necessity Opportunity Necessity Opportunity
Notes: Denotes the co-presence of necessity-based and opportunity-driven informal work and the multiple theories that may explain informal entry activities.
SPATIAL VARIATION
SOCIOECONOMIC STATUS
URBAN RURAL SUBURBAN
AFFLUENT Structuralist Structuralist Structuralist
MIDDLE-INCOMER Structuralist Structuralist
Bolded theories show which theory (along with structuralist and socio-spatial variation) most often describes informal economy entry when necessity and opportunity are co-present. For the poverty-stricken, when necessity and opportunity are co-present, neo-liberal or post-structuralist perspectives may describe (at equal rates of utility) informal economy entry (in tandem with the structuralist perspective and appropriate spatial variation).
Structuralist
Figure 2
POVERTY-STRICKEN Structuralist Structuralist Structuralist
Multitheoretic Informal Economy Entry Selection (MTIES) Framework: Necessity-based and Opportunity-driven
N & O
Neo-liberal
Post-structuralist
Neo-liberal
Post-structuralist
Neo-liberal
Post-structuralist
Neo-liberal
Post-structuralist
Neo-liberal
Post-structuralist
Neo-liberal
Post-structuralist
Neo-liberal
Post-structuralist
Neo-liberal
Post-structuralist
Neo-liberal
Post-structuralist
N & O
N & O
N & O
N & O
N & O N & O
N & O
N & O
N & O
Page 49
Academy of Entrepreneurship Journal, Volume 20, Number 2, 2014
PROPOSITIONS The following propositions define our model:
P1 The reasons why Affluent, regardless of spatial variation (urban, rural, and suburban), enter the
informal economy is best explained by the neo-liberal (e.g. freedom and control, avoid excessive taxes and bureaucracy), or post-structuralist perspectives (e.g. informal entrepreneurs start ventures for social/distributive reasons and not necessarily for economic gain).
P2 The reasons why Middle-incomers, regardless of spatial variation (urban, rural, and suburban),
enter the informal economy are best explained by the neo-liberal perspective (e.g. freedom and control, avoid excessive taxes and bureaucracy).
P3 The reasons why Poverty-Stricken, regardless of spatial variation (urban, rural, and suburban),
enter the informal economy is best explained by the structuralist perspective (e.g. for survival and out of necessity).
P4 The structuralist perspective best explains the informal economy entry of necessity-based
entrepreneurs in all socio-spatial settings while the neo-liberal, or post-structuralist perspectives best explain the informal economy entry of opportunity-driven entrepreneurs in all socio-spatial settings.
P5 When necessity-based and opportunity-driven typologies are co-present, the structuralist and
neoliberal, or, the structuralist and post-structuralist perspectives may best explain the informal economy entry of each of the socio-variations in all spatial settings. The affluent and middle income, more often than not, pursue opportunity-driven informal work while the poverty-stricken, more often than not, pursue necessity-based informal work.
Propositions 1, 2 and 3 apply to Figure 1, while propositions 4 and 5 can be applied to
Figure 2. Now that the models and propositions are presented, we test the face validity of the models using personal vignettes of entrepreneurs in the informal economy. MTIEES framework placement: Profiles of real informal entrepreneurs
To facilitate clarity, we present scenarios demonstrating the single- or co-presence of necessity-based and opportunity-driven informal entrepreneurship. Here, multiple theoretical perspectives (external structural factors) and typologies might explain informal work.
Scenario 1.
Sally is a 45 year old low income homemaker living in rural, central Louisiana. She’s been in the informal economy for 25 years, selling food out of her home since the age of 15. During this period, her product lines expanded to selling DVDs (pirated), clothing

Page 50
Academy of Entrepreneurship Journal, Volume 20, Number 2, 2014
and shoes. Sally’s quick wit and humorous personality facilitated development of longstanding relationships with suppliers and business contacts. Sally entered informal work due to sustained unemployment and perceived discriminatory hiring practices. Throughout the years, she acquired some low wage jobs, but none that paid the bills. Since entering the informal economy, Sally’s business and product lines have grown considerably. Recently, she pondered starting a formal business selling consumer products, but lacked the technical assistance and knowledge to do so. One day, Sally wants to open a game room or a flea market. Because she has been in the informal economy for so long, Sally receives no benefits from the state and has never filed a tax return for business earnings. She is quite content with her life, and business which generates enough income to live comfortably in a rural housing project.
Sally’s Informal entry mode: MTIEES Figure 1 – Socio-Spatial Variation: Rural, Poverty-Stricken, External Structural Factor: Structuralist Scenario 2.
Tom, a 55 year old middle class truck driver, enjoys repairing cars in his spare time. He lives in a rural town in northern Louisiana. A self-taught mechanic, repairing vehicles has been his hobby for three decades. As a young man, he repaired cars for friends and family to earn extra money on the weekends. Soon, friends and family begin requesting that he provide services consistently. For the past 30 years, he happily pursued this informal side business, never officially registering it with state or Federal agencies. At one point, business was so good that he rented a garage to keep up with demand. Tom has contemplated “officially” opening a shop for years, but has yet to do so. Although he enjoys the work and extra income, he has no plans of opening a formal garage.
Tom’s Informal entry mode: MTIEES Figure 2 – Socio-Spatial Variation: Rural, Middle-Income; Entry Typology: Opportunity-Driven, External Structural Factor: Post-Structuralist
Scenario 3. Nick is a 24 year old recent college graduate with a degree in Business. He is from a middle-class family in suburban Mississippi. Given the tepid job market, Nick has been unable to find gainful employment. He believes that part of his difficulty in finding employment stems from wearing hair locks, a hairstyle that is often frowned upon in corporate environments. Prior to graduating from college, Nick witnessed a narcotic-addicted man perform yard work for a friend for an obscenely low price. Seeing this as
Page 51
Academy of Entrepreneurship Journal, Volume 20, Number 2, 2014
an opportunity for himself, Nick thought “I could do that and charge the correct price.” Consequently, he started a lawn service business in lieu of finding suitable employment. When asked why he has not registered the business, given his educational background, Nick stated that business revenues were not sufficient to pursue cumbersome registration requirements.
Nick’s Informal entry mode: MTIEES Figure 2 – Socio-Spatial Variation: Suburban, Poverty-stricken; Entry Typology: Necessity and Opportunity-driven, External Structural Factors: Structuralist and Neo-liberal
DISCUSSION
The MTIEES framework makes it evident that theory selection is extremely
circumstantial, particularly as it relates to locality and socioeconomic status. These findings demonstrate that the basic MTIEES framework (see Figure 1), while useful in some settings, does not fully substantiate influential factors for theory selection. We find more plausible contextual application with the advanced MTIEES framework (see Figure 2) that includes entrepreneurial entry typologies, necessity-based and opportunity-driven informal entrepreneurship. The basic MTIEES framework illustrates that more often than not, the informal activities of middle-incomers can be best explained using a neo-liberal perspective, and irrespective to spatial variation, informal activities of the affluent might be best explained using the neo-liberal or post-structural perspective. Consequently, in answering our first research question, the basic MTIEES framework demonstrates why some individuals from diverse socioeconomic backgrounds in heterogeneous geographic settings may enter the informal economy. Our second question asked whether the MTIEES framework could sufficiently characterize and capture necessity-based and opportunity-driven entrepreneurship. We established through literature review the impetus for necessity-based versus opportunity-driven informal economy entry, the possibility of co-present motivations (both necessity and opportunity), and the ability of the advanced MTIEES framework to effectively classify the informal economy activities of both necessity-based and opportunity-driven informal entrepreneurs. Finally, we endeavored to discover which external structural factors might best explain the informal economy entry of individuals. As a case in point, the advanced framework shows that informal work among poverty-stricken entrepreneurs may be best explained by the structuralist perspective. But at times, when necessity and opportunity are co-present, both the structuralist and neo-liberal, or the structuralist and post-structuralist perspectives may apply. Personal vignettes offer preliminary support for the MTIEES framework with real-world profiles of informal entrepreneurs and their entry motivations. Establishing a multi-theoretic selection

Page 52
Academy of Entrepreneurship Journal, Volume 20, Number 2, 2014
framework which encapsulates socio-spatial variations and entrepreneurs’ motives for entering the informal economy provides much needed direction for scholarly activity in the field.
THEORETICAL AND PRACTICAL IMPLICATIONS
Our findings contribute to entrepreneurship literature in several ways. First, the MTIEES framework advances the conversation on entrepreneurial activities and localities integrating concepts from multiple disciplines (e.g. sociology, economics, management) to present a multifaceted model of informal economy entry modes within the confines of socio-spatial variations. Second, Williams and Nadin (2011) purported that no one theorization of informal economy activity is universally applicable, and argued that all theories may be valid for the various forms of informal entrepreneurship. They emphasized the need for a combined, comprehensive model to explain the complex phenomenon. We believe the MTIEES framework presents such a model. Third, given the scant literature, the framework may be the first to explore suburban informal economy entry modes with the integration of entrepreneurial entry typologies. Finally, the MTIEES model develops propositions that can be converted to testable hypotheses which provide yet another contribution to the literature. Policy Implications
Public policy makers wishing to increase the numbers of entrepreneurs transitioning from the informal economy to the formal economy can enact economic and regulatory policies that benefit entrepreneurs with stronger proclivities towards formality. The present study describes how and why socio and spatial variations are important for understanding the proclivity of certain groups to engage in informal economic activity. The MTIEES framework stresses the importance of flexibility for policymakers contemplating the multifarious dynamics that define informal economy entry.
To curtail informal economy entry, policy-makers must tailor-fit policies to incentivize entrepreneurs to transition fully into the formal economy. Any eradication strategies must account for the reality that entrepreneurs may remain in the informal economy if unable to find suitable wage work or if formal business environments are plagued by excessive taxation and regulations. Perhaps, grassroots, community-based nonprofit organizations might be useful mechanisms from which to transition informal businesses to the formal sector, particularly for the poverty-stricken who operate informal businesses beyond the reach of traditional economic policies.

Page 53
Academy of Entrepreneurship Journal, Volume 20, Number 2, 2014
Limitations and Future Research
Entering the informal economy is a highly subjective endeavor, impacted not only by contextual factors, but values, customs and social norms. In its current form, the MTIEES framework cannot capture conscious values-driven criteria and cultural factors that drive informal economy entry decision (see Godfrey, 2011). Some population groups have an inherent distrust of formal institutions, preferring social and economic interactions with family, and members of their own ethnic group. To fully capture informal economy entry among these populations, the nature and extent of this distrust must be characterized using applicable management theories. Such an endeavor would certainly contribute to the literature. To advance the MTIEES framework, future researchers might consider inclusion of factors that impact human thought, action and motivation (e.g. self-efficacy, affect). Cognitive variables measure important aspects of entrepreneurial action that should be accounted for in future studies.
There is a paucity of research on the informal economy in suburban settings. Within suburban areas, future researchers should investigate when, where, and how changes occur in entrepreneurs’ transitioning between the informal and formal sectors, along with motivational shifts from necessity-based to opportunity-driven. Assessing the extent to which informal entrepreneurs effectuated their ventures would make a significant contribution to the literature (see Sarasvathy, 2001). Without a doubt, informal entrepreneurs are all too familiar with uncertainty. Although our framework stops at the decision to enter, effectuation may explain how individuals with limited means leverage their resources to create informal ventures.
CONCLUSION
The MTIEES framework represents the first step in the development of a multi-theoretical selection model of informal economy entry modes activities. Not only can the exploratory framework guide researchers’ selection of theory, but its predictive ability of pre- and post-entry activities may also guide policymakers’ decision processes. Instead of creating broad-based policies, the MTIEES framework has the potential to provide direction for more nuanced public policies. As informal economy entry levels rise, the motivations and factors driving these activities are of increasing importance to policy makers. Extensions to the framework may provide the foundations from which researchers can begin to conduct population-specific research on informal entrepreneurs.
What can be surmised from the current endeavor is that the nature of informal entrepreneurship is extremely complex. Informal entrepreneurs operate along a continuum of necessity-based and opportunity-driven entrepreneurship, whereas necessity-based or opportunity-driven may be singly dominant, or both may be equally co-present. In either case, the advanced MTIEES framework captures informal economy entry along this continuum. We

Page 54
Academy of Entrepreneurship Journal, Volume 20, Number 2, 2014
hope that our study initiates lively debate and strongly encourage scholars to suggest framework improvements with the ultimate goal of finding methods and processes for transitioning informal entrepreneurs successfully into the formal economy.
REFERENCES
ACCION USA, (1999). Executive summary: the microlending market in the U.S., October. Amin, A., A. Cameron, & R. Hudson (2002). Placing the social economy. London: Routledge Publishing. Armington, C., & Z.J. Acs (2002). The determinants of regional variation in new firm formation. Regional Studies,
36, 33-45. Becker, K.F. (2004). The informal economy. Swedish International Development Agency: Stockholm. Bhave, M.P. (1994). A process model of entrepreneurial venture creation. Journal of Business Venturing, 9, 223-
242. Biles, J. (2009). Informal work in Latin America: Competing perspectives and recent debates. Geography Compass,
3, 214-236. Brunjes, J., & J.R. Diez (2013). ‘Recession push’ and ‘prosperity pull’ entrepreneurship in a rural developing
context. Entrepreneurship and Regional Development, 25(3-4) 251-271. Castells, M, & A. Portes (1989). World underneath: The origins, dynamics, and effects of the informal economy.
The informal economy: studies in advanced and less developed countries, A. Portes, M. Castells, & L.A. Benton, (Eds.). Johns Hopkins University Press: Baltimore; 11-37.
Chen, M.A. (2006). Rethinking the informal economy: Linkages with the formal economy and the formal regulatory environment. Linking the formal and informal economy, B. Guha-Khansnobis, R. Kanbur, & E. Ostrom, (Eds.). Oxford University Press: Oxford, England; 93-120.
Cross, J.C. (2000). Street vendors, modernity and postmodernity: Conflict and compromise in the global economy. International Journal of Sociology and Social Policy, 20, 29-51.
De Soto, H. (1989). The other path: the economic answer to terrorism. Harper and Row: London. Donahue, P. (1979). November 7, Host/Executive Producer. The Phil Donahue Show. [Television broadcast].
Chicago, IL: Multimedia, Inc. Retrieved June 15, 2012 from http://www.youtube.com/watch?v=RWsx1X8PV_A.
Drakopoulou Dodd, S.D., & B.C. Hynes (2012). The impact of regional entrepreneurial context upon enterprise education. Entrepreneurship and Regional Development, 24, 741-766.
Edgcomb, E.L., & T. Thetford (2004). The Informal Economy: Making it in Rural America. Aspen Institute: Washington, DC.
Fennelly, K., & C. Federico (2008). Rural residence as a determinant of attitudes toward US immigration policy. International Migration, 46, 151-189.
Fortuna, J.C., & S. Prates (1989). Informal sector versus informalized labor relations in Uruguay. The informal economy: studies in advanced and less developed countries. A. Portes, M. Castells, & L.A. Benton, (Eds.). John Hopkins University Press; 78-94.
Galemba, R.B. (2008). Informal and illicit entrepreneurs: fighting for a place in the neo-liberal economic order. Anthropology of Work Review, 29, 19-25.
Godfrey, P.C. (2011). Toward a theory of the informal economy. Academy of Management Annals, 5, 231-277. Gurtoo, A., & C.C. Williams (2009). Entrepreneurship and the informal sector: some lessons from India.
International Journal of Entrepreneurship and Innovation, 10, 55-62.
Page 55
Academy of Entrepreneurship Journal, Volume 20, Number 2, 2014
Harding, R.D., D. Brooksbank, M. Hart, D. Jones-Evans, J. Levie, & J. Walker (2006). Global Entrepreneurship Monitor United Kingdom 2005. London Business School: London.
Hosier, R.H. (1987). The informal sector in Kenya: spatial variation and development alternatives. The Journal of Developing Areas, 21, 383-402.
Lee S. Y., R. Florida, & Z.J. Acs (2004). Creativity and entrepreneurship: a regional analysis of new firm formation, Regional Studies, 38, 879-891.
Lewis, W. A. (1954/1958). Economic development with unlimited supplies of labor. The economics of underdevelopment. A.N. Agarwala, & S.P. Singh, (Eds.). Oxford University Press: London.
Lewis, P.G., & M. Baldassare (2010). The complexity of public attitudes toward compact development. Journal of the American Planning Association, 76, 219-237.
Lozano, B. (1989). The Invisible Workforce: Transforming American Business with Outside and Home-Based Workers. The Free Press: New York.
Minniti, M., W. Bygrave, & E. Autio (2006). Global Entrepreneurship Monitor: 2005 Executive Report. London Business School: London.
Murphy, A.K., & D. Wallace (2010). Opportunity for making ends meet and upward mobility: differences in organizational deprivation across urban and suburban poor neighborhoods. Social Science Quarterly, 91, 1165-1186.
Packard, T. (2007). Do workers in Chile choose informal employment? A dynamic analysis of sector choice. World Bank Latin American and the Caribbean Region Social Projection Unit: Washington DC.
Partridge, M.D., & D.S. Rickman (2008). Distance from urban agglomeration economics and rural poverty. Journal of Regional Science, 48, 285-310.
Perry, G.E., & W.F. Maloney (2007). Overview: Informality – exit and exclusion. In Informality, exit and exclusion. G.E. Perry, W.F. Maloney, O.S. Arias, P. Fajnzylber, A.D. Mason, & J. Saavedra-Chanduvi, (Eds.). World Bank: Washington DC.
Persson, A., & H. Malmer (2006). Purchasaing and performing informal employment in Sweden: part 1: results from various studies. Skatteverket: Malmo.
Polanyi, K. (1957). The economy as instituted process. Trade and market in the early empires. K. Polanyi, C.M. Arensberg, & H.W. Pearson, (Eds.). Henry Regnery Company: Chicago. 243-270.
Portes, A., M. Castells, & L.A. Benton (1989). Introduction. The informal economy: studies in advanced and less developed countries. A. Portes, M. Castells, & L.A. Benton, (Eds.). Johns Hopkins University Press: Baltimore.
Raijman, R. (2001). Mexican immigrants and informal self-employment in Chicago, Human Organization, 60(1), 47-55.
Reynolds, P. (1991) Sociology and entrepreneurship: concepts and contribution. Entrepreneurship Theory and Practice, Winter: 47-70.
Round, J., & C.C. Williams (2008). Everyday tactics and spaces of power: the role of informal economies in post-Soviet Ukraine. Social and cultural geography, 9, 171-185.
Sarasvathy, S. D. (2001). Causation and effectuation: toward a theoretical shift from economic inevitability to entrepreneurial contingency. Academy of Management Review, 26, 243-263.
Sassen, S. (1997). Informalisation in Advanced Market Economies. Issues in Development Discussion Paper 20. International Labor Office: Geneva.
Slack, T. (2006). Work, welfare and the informal economy: an examination of family livelihood strategies in rural Pennsylvania. Working paper No. 06-06. Rural Poverty Research Center: Columbia, MO.
Schneider, F. (2002). Size and measurement of the informal economy in 110 countries around the world. Paper presented at Workshop of Australian National Tax Centre, Canberra, Australia.
Snyder, K.A. (2004). Routes to the informal economy in New York’s East village: crises, economics and identity. Sociological Perspectives, 47, 215-240.

Page 56
Academy of Entrepreneurship Journal, Volume 20, Number 2, 2014
Trettin, L, and Welter, F. (2011). Challenges for spatially oriented entrepreneurship research. Entrepreneurship and Regional Development, 23, 575-602.
Valenzuela, A. (2001). Day labourers as entrepreneurs. Journal of Ethnic and Migration Studies, 27, 335-352. Venkatesh, S.A. (2006). Off the books: the underground economy of the urban poor. Harvard University Press:
Cambridge, MA. Wallerstein, I. (1974/2007). World-systems analysis (5th ed). Durham, NC: Duke University Press. Webb, J.W., L. Tihanyi, R.D. Ireland, & D.G. Sirmon (2009). You say illegal, I say legitimate: entrepreneurship in
the informal economy. Academy of Management Review, 34, 492 – 510. Webb, J.W., G.D. Bruton, L. Tihanyi, & R.D. Ireland (2012). Research on entrepreneurship in the informal
economy: framing a research agenda. Journal of Business Venturing, 17 pages, doi: 10.10161j.jbusvent.2012.05.003.
Weiler, S., J. Silverstein, K. Chalmers, & E. Lacey (2003). Understanding the retail business potential of inner cities. Journal of Economic Issues, 37, 1075-1105.
Whitson, R. (2007). Hidden struggles: spaces of power and resistance in informal work in urban Argentina. Environment and Planning A, 39, 2916-2934.
Williams, C.C. (2004). Cash-in-hand work: The underground sector and the hidden economy of favours. Palgrave Macmillan: Basingstoke.
Williams, C.C.(2006). Beyond market oriented readings of paid informal work: some lessons from rural England. American Journal of Economics and Sociology, 65, 383-406.
Williams, C.C.(2007a). Entrepreneurs operating in the informal economy: necessity or opportunity driven? Journal of Small Business and Entrepreneurship, 20, 309-320.
Williams, C.C.(2007b). Socio-spatial variations in the nature of entrepreneurship. Journal of Enterprising Communities: People and Places in the Global Economy, 1, 27-37.
Williams, C.C.(2008). Beyond necessity-driven versus opportunity-driven entrepreneurship: a study of informal entrepreneurs in England, Russia and Ukraine. International Journal of Entrepreneurship and Innovation, 9, 157-166.
Williams, C.C.(2010). Spatial variations in the hidden enterprise culture. Entrepreneurship and Regional Development, 22, 403-423.
Williams, C.C.(2011). Entrepreneurship, the informal economy and rural communities. Journal of Enterprising Communities: People and Places in the Global Economy, 5, 145-157.
Williams, C.C, & S. Nadin (2010a). Entrepreneurship and the informal economy: an overview. Journal of Developmental Entrepreneurship, 15, 361-378.
Williams, C.C, & S. Nadin (2010b). The commonality and character of off-the-books entrepreneurship: a comparison of deprived and affluent urban neighbourhoods. Journal of Developmental Entrepreneurship, 15, 1-14.
Williams, C.C, & S. Nadin (2011). Evaluating entrepreneurs in the shadow economy: economic or social entrepreneurship? International Journal of Management and Enterprise Development, 11, 20-33.
Williams, C.C., & J. Round (2007). Entrepreneurship and the informal economy: a study of Ukraine’s hidden enterprise culture. Journal of Developmental Entrepreneurship, 12, 119-136.
Williams, C.C., & J. Round (2008). Retheorizing the nature of informal employment: some lessons from Ukraine. International Sociology, 23, 367 – 388.
Williams, C.C., & J. Round (2010a). Spatial variations in the character of off-the-books entrepreneurship: lessons from a study of contrasting districts in Moscow. International Journal of Entrepreneurship and Small Business, 10, 287-301.
Williams, C.C., & J. Round (2010b). Explaining participation in undeclared work. European Societies, iFirst (04 May 2010), 1 – 28.

Page 57
Academy of Entrepreneurship Journal, Volume 20, Number 2, 2014
Williams, C.C., J. Round, & P. Rodgers (2011). Explaining the normality of informal employment in Ukraine: a product of exit or exclusion? The American Journal of Economics and Sociology, 70, 729-755.
Williams, C.C., & J. Windebank (1994). Spatial variations in the informal sector: a review of evidence from the European Union. Regional Studies, 28, 819 – 825.
Zuin, V. (2004). Business Strategies of Informal Micro-Entrepreneurs in Lima, Peru. International Institute for Labour Studies: Geneva.

Page 58
Academy of Entrepreneurship Journal, Volume 20, Number 2, 2014
Page 59
Academy of Entrepreneurship Journal, Volume 20, Number 2, 2014
OLDER AND WISER? AN ANALYSIS OF ADVICE NETWORKS BY AGE
Sherry Robinson, Penn State University/Buskerud University College Hans Anton Stubberud, Buskerud University College
ABSTRACT
Information and knowledge are intangible resources vital to business success. Networks can help provide these resources to entrepreneurs starting and growing their ventures. As people grow older and gain more experience, they may develop more contacts from whom they can obtain advice and other resources. This study uses Eurostat data to determine if business owners in different age groups use the same advice networks. The results show that family/friends and professional acquaintances were the top two sources for all age groups, but there were significant differences in the proportion of each age group that named a given source. Those under 30 were the most likely to name their friends/family as a source of advice. Business owners between 30 and 39 years of age were more likely to list professional acquaintances as a source of advice. Those 40 and over were the most likely to say they needed no advice. These findings should be helpful to organizations that wish to assist entrepreneurs, especially younger people who have less developed networks.
INTRODUCTION Networks can provide new business owners valuable information and knowledge that are essential for establishing and growing new firms. Research has shown that personal relationships are vital in providing knowledge and advice for decision-making and problem-solving, as well as more tangible resources such as financing and materials (Anderson, Drakopoulou-Dodd & Jack, 2010; Birley, 1985; Farr-Wharton & Brunetto, 2007; Gulati, Nohria & Zaheer, 2000; Hoang & Antoncic, 2003; Ireland, Hitt, Camp & Sexton, 2001; Kregar, DeNoble & Antoncic, 2012; Loscocco, Monnat, M Hampton, Cooper & McGowan, 2009; Moore & Lauber, 2009; Robinson & Stubberud, 2009, 2010, 2011a, 2011b; Shaw, 2006; Taylor & Thorpe, 2004). Social networks are likely to change over time. As the business grows through different stages, business owners are likely to network with different groups of people (Anderson et al., 2010; Drakopoulou-Dodd, Jack, & Anderson, 2006). On a personal level, business owners enter into new and expanded networks as they work with new colleagues, join industry and social associations, etc. Thus, people can change the sources of advice they use as they go through life. This study seeks to determine whether new business owners in different age groups use similar advice networks. The following section provides a brief overview of networks in business. The method, data and results of this study are then presented.

Page 60
Academy of Entrepreneurship Journal, Volume 20, Number 2, 2014
NETWORKS AND KNOWLEDGE
Granovetter’s (1973) classic work on networks classified ties as either weak or strong
depending on the frequency of contact and reciprocity within the relationship. Strong ties with frequent contact and high levels of reciprocity were most often found among family and friends, whereas weak ties characterized the connections between people with less frequent and intense contact, such as professional acquaintances. Granovetter saw value in weak ties that provided diverse knowledge, even though they involved less contact and reciprocity. Contacts with relevant knowledge provide a better network in terms of the importance of the information they can provide (Bruderl & Preisendorfer, 1998; Frenzen & Nakamoto, 1993; March, 1991; Nebus, 2006; Zhao & Aram, 1995). Despite the quality of information that weak ties can provide, the time and effort required to access them can limit the net value. Diminishing returns are reaped from repeated contact with the same source as valuable time could be spent on other activities (Gonum, Verreynne & Kastelle, 2012; Haas & Hansen, 2005; Hansen & Haas, 2002; Watson, 2007).
Several studies (e.g. Anderson et al., 2010; Bruderl & Preisendorfer, 1998; Cooper, Woo, Dunkelberg & William, 1989; Kregar et al., 2012; Loscocco et al., 2009; Robinson, & Stubberud, 2011a, 2011b, 2010, 2009; Shaw, 2006; Smeltzer, Fann & Nikolesean, 1988; Watson, 2007) have examined the different sources of advice used by small business owners. Watson (2007) determined that accountants were the most important source of advice for success. Robson and Bennett (2000) also found accountants to be named most frequently, but they were not associated with firm performance. Robinson and Stubberud (2009) found that family/friends and professional acquaintances were the most commonly named sources. These informal sources were also popular in the study by Smeltzer and associates (1988).
The business owner’s gender, age and the stage of business establishment have also been related to the source of advice used, with women and small companies using more friends/family (Anderson et al., 2010; Cooper et al., 1989; Hisrich & Brusch, 1986; Klyver & Terjesen, 2007; Renzulli, Aldrich & Moody, 2000; Robinson & Stubberud, 2009; Sandberg, 2003: Smeltzer & Fann, 1989). Women tend to have more females in their networks and rely more on family and friends for advice, while men receive more advice from professional acquaintances (Robinson & Stubberud, 2009). Older entrepreneurs tend to have more experience and stronger social networks (Arkebauer, 1995; Barclays Economic Reports, 2001; Birley, 1985; Gray, 1998; Hindle & Rushworth, 2002; Weber & Schaper, 2004). The age of the business can also influence advice sources. Entrepreneurs just starting their companies and thus attempting to locate employees, buildings, equipment and supplies used business contacts, but then later on used banks (Birley, 1985).
Information is a valuable intangible resource for entrepreneurs. While no individual can possess all knowledge, new business owners can obtain information through others in their networks. As people age and gain experience, their knowledge bases as well as their networks are likely to increase (Rae, 2005). The following section provides the results of this study, which examined the sources of advice named by business owners in different age groups.

Page 61
Academy of Entrepreneurship Journal, Volume 20, Number 2, 2014
METHODOLOGY AND RESULTS
This study used data from Eurostat’s metadata database (Eurostat, 2013). The participants in this 2005-2006 survey were business owners who had started firms in 2002 and were still personally managing them in 2005. Therefore, the respondents were all relatively new business owners with businesses of approximately the same age. The countries included in the “European aggregate based on available data,” were Austria, Bulgaria, the Czech Republic, Denmark, Estonia, France, Italy, Latvia, Lithuania, Luxembourg, Portugal, Slovakia, Slovenia and Sweden. For this study, Denmark, France, Luxembourg and Romania were excluded due to incomplete data. This left a total of 296,727 participants, 80,594 (27.2%) of whom were under 30, 107,893 (36.4%) of whom were between 30 and 39, and 108,240 (36.5%) of whom were 40 or over.
Table 1 shows the percentages of people in each age category who said they had received advice from a given source. Family and friends were clearly the most popular source, ranking first with all age groups. There was, however, a statistically significant association between age group and obtaining advice from this source. The youngest business owners were usually far more likely than their older counterparts to use this informal source of advice (56.5%4 compared to 45.2% and 40.0%).
Table 1 USE OF VARIOUS SOURCES OF ADVICE BY AGE GROUP
Source Under 30 30-39 years old
40 and over
Chi-sq P<
Friends and family 56.5% (1) 45.2% (1) 40.0% (1) 5950 .001 Professional acquaintances 35.0 (2) 39.5 (2) 34.2 (2) 831 .001 Professional consultants 18.5 (3) 19.3 (3) 17.0 (4) 221 .001 No advice needed 12.9 (4) 15.2 (4) 21.2 (3) 2934 .001 No access to any relevant advice 11.5 (5) 13.3 (5) 10.9 (5) 353 .001 Organizations specializing in business start-up
6.4 (6) 8.1 (6) 6.0 (6) 491 .001
Training course for entrepreneurs 4.8 (7) 4.6 (7) 4.2 (7) 43 .001 Unemployment administration 2.7 (8) 3.2 (8) 2.6 (8) 90 .001 Financial institution 0.8 (9) 1.3 (9) 1.9 (9) 463 .001
Professional acquaintances were the next most popular source, especially among those in
the 30-39 year old group (39.5%), with approximately the same proportion of 30-39 year olds using professional acquaintances as the proportion of the 40+ group accessing friends and family. Surprisingly, the percentage of those under 30 and over 40 were very similar (35.0% and 34.2%) for this source. It was expected that younger people would ask family and friends for advice because they have had less time to develop relationships with a variety of professional acquaintances, while those 40 and over would be the most likely to consult professional acquaintances. A similar pattern was found for professional consultants, with those 30-39 being the most likely to name this source, but by a much smaller margin. Those 40 and over were least likely to use consultants and this was their fourth, rather than third, ranked source.

Page 62
Academy of Entrepreneurship Journal, Volume 20, Number 2, 2014
A clue to understanding this pattern comes in the “source” ranked third among those 40 and over: no advice needed. Over 20% of those in this age category felt they did not need advice from external sources, perhaps due to their own industrial or business experience and/or education. Only 13% - 15% of the younger business owners stated they needed no advice. The third ranked source for both of the younger groups was professional consultants. It should be noted that of the sources included in this study, professional consultants are the most likely to require payment in return for advice.
Over 10% of participants in each age group said they had no access to any relevant advice, with those 30-39 being the most likely to say this. These people may have felt that their friends and family were supportive but could not provide relevant advice. They apparently did not know about or could not access the organizations specializing in business start-ups or training courses for entrepreneurs given that these sources were used by relatively few of the participants.
The data were further analyzed by country and source to determine if the overall pattern found in the European aggregate was consistent across nations. Rankings are included in parentheses as they were in Table 1 because the tendency to obtain advice from any source appears to vary by country. For example, in Bulgaria, friends and family were the top ranked source, with percentages ranging from 64% to 73% (see Table 2). In Slovenia, family and friends were also the most commonly used source, but the percentages ranged from 33.1% to 45.5%.
Table 2 USE OF FAMILY AND FRIENDS BY AGE GROUP
Country Under 30 30-39 years old
40 and over
Chi-sq P<
Austria 43.6% (1) 39.4% (2) 30.5% (3) 151 .001 Bulgaria 73.2 (1) 66.5 (1) 64.0 (1) 85 .001 Czech Republic 56.4 (1) 44.8 (1) 30.9 (3) 2777 .001 Estonia 56.8 (2) 57.4 (2) 56.0 (1) 0.3 .852 Italy 52.2 (1) 37.8 (2) 30.5 (3) 4479 .001 Latvia 64.9 (1) 57.8 (2) 53.1 (2) 15 .001 Lithuania 60.9 (1) 60.0 (1) 58.8 (1) 0.5 .763 Portugal 62.1 (1) 52.4 (1) 40.0 (1) 312 .001 Slovakia 51.6 (1) 40.3 (2) 33.8 (2) 489 .001 Slovenia 45.5 (1) 41.9 (1) 33.1 (1) 43 .001 Sweden 61.2 (1) 53.3 (1) 33.5 (2) 653 .001 Bulgaria was clearly the country where the highest proportions of business owners in all
three age groups obtain advice from their family and friends (see Table 2). There was a statistically significant association between age group and use of this source in every country except Estonia and Lithuania. In the other countries, participants under 30 reported receiving advice from family and friends significantly more often than did older respondents. In fact, among those under 30, there were only two countries in which less than half named family and friends as a source of advice. There were five countries in the 30-39 age group and seven countries in the 40 and over age group in which under 50% name this source. The Czech

Page 63
Academy of Entrepreneurship Journal, Volume 20, Number 2, 2014
Republic showed the biggest gap with a 25% difference between those under 30 (56.4%) and those 40 and over (30.9%). Italy, Portugal, Slovakia and Sweden all showed 18-22% difference between these age groups, while Austria, Bulgaria, Latvia and Slovenia showed 11-13% difference. In Austria, Italy and the Czech Republic, friends and family was the only the third-ranked source among those 40 and over. Therefore, the overall pattern found for the European aggregate held true in most countries: the youngest business owners were the most likely and the oldest were the least likely to report receiving advice from family and friends.
There was a sizable drop in the overall percentages of people naming professional acquaintances as a source of advice compared to family and friends (see Table 3). Slightly fewer differences are evident, with no statistically significant association between age and use in three countries. One of these countries, Latvia, was over 50% in all three age groups, and the older groups gave this source the top rank. Latvia and Estonia were the only countries in which more than half of participants in each age group named this source.
Table 3
USE OF PROFESSIONAL ACQUAINTANCES BY AGE GROUP Country Under 30 30-39
years old 40 and over
Chi-sq P<
Austria 38.1% (2) 40.0% (1) 33.0% (2) 68 .001 Bulgaria 31.3 (2) 34.4 (2) 33.0 (2) 8.5 .014 Czech Republic 28.2 (2) 31.4 (2) 33.0 (2) 118 .001 Estonia 70.1 (1) 58.8 (1) 55.2 (2) 28 .001 Italy 45.6 (2) 54.5 (1) 53.1 (1) 862 .001 Latvia 58.1 (2) 58.4 (1) 56.6 (1) 0.6 .733 Lithuania 40.8 (2) 43.2 (2) 38.8 (2) 4.8 .092 Portugal 42.2 (2) 49.8 (2) 39.5 (2) 104 .001 Slovakia 50.6 (2) 42.7 (1) 40.7 (1) 163 .001 Slovenia 33.4 (2) 35.4 (2) 31.6 (2) 4.4 .109 Sweden 43.5 (2) 43.1 (2) 38.1 (1) 35 .001 Professional consultants, who are likely to be paid, formal sources of advice, were used
most in Italy, Latvia and Lithuania (see Table 4). In fact, this source was ranked second by Italians 40 and over with 38.5% saying they used it. In other countries, consultants were less popular and the differences between age groups were small even when there was a statistically significant association. For example, in the Czech Republic, where professional consultants ranked only 6th among those under 30, 8th among those 30-39 and 7th among those 40 and over, there was a statistically significant association between age group and use of consultants. These differences were, however, quite small in terms of percentage points (2.7% for those under 30, 1.1% for those 30-39, 2.0% for those 40 and over).

Page 64
Academy of Entrepreneurship Journal, Volume 20, Number 2, 2014
Table 4
USE OF PROFESSIONAL CONSULTANTS BY AGE GROUP Country Under 30 30-39
years old 40 and over
Chi-sq P<
Austria 18.1% (5) 18.3% (5) 16.5% (5) 7.5 .024 Bulgaria 8.2 (4) 6.9 (5) 7.2 (4) 5 .080 Czech Republic 2.7 (6) 1.1 (8) 2.0 (7) 128 .001 Estonia 13.3 (6) 11.8 (6) 11.8 (6) 0.9 .644 Italy 34.7 (3) 35.3 (3) 38.5 (2) 156 .001 Latvia 29.5 (3) 31.4 (3) 30.2 (3) 0.5 .787 Lithuania 28.9 (3) 23.5 (3) 22.3 (4) 3.5 .171 Portugal 11.1 (6) 13.5 (5) 15.6 (5) 23 .001 Slovakia 3.6 (6) 5.4 (6) 6.6 (6) 72 .001 Slovenia 17.6 (3) 15.6 (3) 17.2 (4) 1.8 .403 Sweden 8.7 (6) 5.1 (7) 9.4 (6) 69 .001
Table 5 shows that many business owners felt they did not need any advice. This “source” was the top ranked source among Czech participants 40 and over, making it more popular than professional acquaintances (2) and family and friends (3). There were statistically significant associations between the age groups in all but two of the countries included in this study. In every case, participants 40 and over were the most likely to say they needed no advice. Austria, Italy and Latvia were the only countries in which this source ranked lower than third among those 40 and over. Portuguese business owners in all age groups were the least likely to say they needed no advice. As shown in Tables 2 and 3, high percentages of Portuguese business owners reported that they obtained advice from friends and family and from professional acquaintances. If entrepreneurs starting new businesses feel they need help from others, they probably use the networks they have, starting with these two informal sources that are probably easy to access. If they have strong social networks, they are likely to have more people from whom they can obtain advice.
Table 5
NO ADVICE NEEDED BY AGE GROUP Country Under 30 30-39
years old 40 and over
Chi-sq P<
Austria 18.3% (4) 20.3% (4) 28.7% (4) 147 .001 Bulgaria 12.9 (3) 14.4 (3) 21.2 (3) 170 .001 Czech Republic 24.1 (3) 27.1 (3) 40.7 (1) 1550 .001 Estonia 29.3(3) 32.5 (3) 37.4 (3) 9 .010 Italy 10.1 (6) 13.6 (5) 18.5 (4) 1309 .001 Latvia 14.7 (5) 16.0 (5) 17.7 (5) 1.8 .401 Lithuania 10.6 (5) 18.3 (4) 25.3 (3) 31 .001 Portugal 6.3 (6) 8.5 (5) 15.4 (5) 164 .001 Slovakia 17.8 (3) 22.6 (3) 27.3 (3) 192 .001 Slovenia 12.2 (5) 14.8 (4) 21.0 (3) 36 .109 Sweden 10.8 (5) 12.2 (5) 23.7 (3) 307 .001

Page 65
Academy of Entrepreneurship Journal, Volume 20, Number 2, 2014
On the other hand, business owners in Portugal were the least likely to say they had no need of advice. As shown in Table 6, a sizable group said they had “no access to any relevant advice,” making this the third ranked “source” in all age groups. Over 20% of Portuguese entrepreneurs 40 and over stated they had no access to any relevant advice. The percentages were similar in Estonia, which ranked this source fourth. Business owners in the Czech Republic and Italy also ranked this source fourth, with percentages ranging from 16.5-18.5% in the former and 14.0-18.5% in the latter. There was a statistically significant association between age and stating “no access” in seven of the countries, but no clear pattern was evident and the differences in proportions in each age group were relatively small.
Table 6
NO ACCESS TO ANY RELEVANT ADVICE BY AGE GROUP Country Under 30 30-39
years old 40 and over
Chi-sq P<
Austria 6.5% (7) 4.7% (9) 5.0% ( 9) 7.3 .026 Bulgaria 8.1 (5) 7.8 (4) 6.0 (5) 27 .001 Czech Republic 16.5 (4) 17.2 (4) 18.5 (4) 31 .001 Estonia 19.1 (4) 20.8 (4) 20.8 (4) 0.7 .715 Italy 14.0 (4) 18.5 (4) 16.3 (5) 373 .001 Latvia 6.8 (8) 5.9 (7) 6.4 (8) 0.3 .848 Lithuania 7.8 (7) 14.4 (5) 13.9 (5) 5.7 .059 Portugal 14.9 (3) 16.4 (3) 21.6 (3) 62 .001 Slovakia 6.5 (5) 7.7 (5) 9.7 (5) 54 .001 Slovenia 10.1 (6) 12.5 (5) 13.0 (5) 5 .083 Sweden 4.0 (8) 7.3 (6) 5.6 (7) 28 .001 Austrians were generally the least likely to say they had no access to advice, perhaps
because they were the most likely to obtain advice from organizations specializing in business start-ups (see Table 7). In fact, this was the top ranked source among those 40 and over. Austrians in each age group were 3-4 times more likely than those in other countries to use this source. Those under 30 were the most likely to obtain advice from these organizations (40.8%), followed by Austrians 30-39 years old (35.7%) and those 40 and over (35.4%). Although Lithuania, Slovenia and Sweden had much lower percentages, the pattern was similar, with those under 30 being the most likely to access this source. In Sweden, approximately 15% of those aged 30-39 and under 30 named this source, making it their third ranked source of advice. The differences between proportions were not particularly large, but there were nonetheless statistically significant associations. In these countries, as well as in Italy, those 40 and over were the least likely to name these organizations as a source of advice.

Page 66
Academy of Entrepreneurship Journal, Volume 20, Number 2, 2014
Table 7 USE OF ORGANIZATIONS SPECIALIZING IN BUSINESS START-UPS BY AGE GROUP
Country Under 30 30-39 years old
40 and over
Chi-sq P<
Austria 40.8% (3) 35.7% (3) 35.4% (1) 16 .001 Bulgaria 0.3 (8-9) 1.2 (8-9) 0.8 (8-9) 19 .001 Czech Republic 1.0 (8) 0.2 (9) 1.4 (9) 156 .001 Estonia 4.4 (8) 5.9 (8) 7.6 (8) 5 .085 Italy 10.8 (5) 12.0 (6) 8.7 (6) 295 .001 Latvia 8.5 (7) 4.9 (8) 8.2 (7) 8 .020 Lithuania 10.1 (6) 6.6 (8) 4.2 (8) 15 .001 Portugal 4.0 (8) 5.1 (7) 5.2 (6) 3.7 .157 Slovakia 0.5 (8) 1.4 (9) 1.7 (9) 48 .001 Slovenia 12.5 (4) 10.3 (6) 9.3 (6) 6 .048 Sweden 14.7 (3) 14.5 (3) 10.8 (5) 40 .001
Training courses were relatively popular in Estonia, Sweden and Slovakia, ranking fourth among all three age groups in Sweden and Slovakia and fifth in Estonia (see Table 8). Estonians were actually the most likely to use this source, with 14.3% of those under 30, 13.4% of the 30-39 year old group, and 13.6% of those 40 and over taking the courses. Approximately 10-12% of Latvians and Austrians also used this source.
Table 8 USE OF TRAINING COURSE FOR ENTREPRENEURS BY AGE GROUP
Country Under 30 30-39 years old
40 and over
Chi-sq P<
Austria 9.9% (6) 10.3% (6) 11.8% (6) 9 .011 Bulgaria 1.4 (7) 1.8 (7) 1.6 (6) 1.6 .442 Czech Republic 4.7 (5) 4.1 (5) 4.1 (5) 12 .003 Estonia 14.3 (5) 13.4 (5) 13.6 (5) 0.2 .891 Italy 5.5 (7) 4.3 (7) 2.8 (8) 394 .001 Latvia 10.2 (6) 11.4 (6) 10.2 (6) 0.7 .715 Lithuania 5.6 (8) 6.5 (8) 6.2 (7) 0.2 .900 Portugal 2.5 (9) 6.5 (6) 5.0 (7) 37 .001 Slovakia 7.3 (4) 10.4 (4) 12.7 (4) 121 .001 Slovenia 4.7 (7-8) 6.9 (8) 5.5 (8) 5 .074 Sweden 11.9 (4) 12.4 (4) 12.4 (4) 0.4 .807
Unemployment administrations were not used by many of the participants (see Table 9).
Slovenia, Austria and Italy showed the highest percentages, with Slovenians 40 and over being the mostly like (6.9%) to use an unemployment administration for advice. Statistically significant associations were found between the age groups in six countries, but the percentage differences were not great. The highest was in Austria, where 3.1% of those under 30, 5.0% of those 30-39 and 5.9% of those 40 and over used their unemployment administration. It is possible that new business owners do not generally perceive these organizations as useful for giving advice in

Page 67
Academy of Entrepreneurship Journal, Volume 20, Number 2, 2014
starting new firms, or that these organizations do not, in general, give advice about entrepreneurship.
Table 9
USE OF UNEMPLOYMENT ADMINISTRATION BY AGE GROUP Country Under 30 30-39
years old 40 and over
Chi-sq P<
Austria 3.1% (9) 5.0% (8) 5.9% (7) 20 .001 Bulgaria 0.3 (8-9) 1.2 (8-9) 0.8 (8-9) 18 .001 Czech Republic 1.7 (7) 3.3 (6) 1.6 (8) 174 .001 Estonia 0.8 (9) 0.9 (9) 1.9 (9) 3.9 .145 Italy 4.3 (8) 4.2 (8) 4.1 (7) 3.9 .140 Latvia 2.0 (9) 2.4 (9) 3.1 (9) 1.7 .434 Lithuania 2.8 (9) 2.1 (9) 1.2 (9) 4.1 .126 Portugal 5.0 (7) 2.1 (9) 1.6 (9) 70 .001 Slovakia 1.8 (7) 3.4 (7) 3.2 (9) 38 .001 Slovenia 4.7 (7-8) 5.9 (8) 6.9 (7) 5 .085 Sweden 1.6 (9) 3.2 (9) 4.8 (8-9) 45 .001
Although financial institutions ranked last in the European aggregate, they ranked fourth
in all age groups of Latvia (16.1-18.5%) and in the youngest group from Lithuania (11.7%). Estonian percentages were higher (12.9%, 10.6% and 10.3%) but only ranked seventh. The only statistically significant associations between age group and use of this source were very small and showed no consistent pattern.
Table 10 USE OF FINANCIAL INSTITUTIONS BY AGE GROUP
Country Under 30 30-39 years old
40 and over
Chi-sq P<
Austria 4.2% (8) 5.1% 7) 5.3% (8) 3.0 .225 Bulgaria 1.8 (6) 2.6 (6) 1.3 (7) 31 .001 Czech Republic 0.8 (9) 1.4 (7) 3.2 (6) 363 .001 Estonia 12.9 (7) 10.6 (7) 10.3 (7) 2.3 .310 Italy 0.6 (9) 0.7 (9) 0.8 (9) 18 .001 Latvia 16.1 (4) 18.5 (4) 18.1 (4) 0.9 .631 Lithuania 11.7 (4) 12.0 (6) 10.4 (6) 1.5 .470 Portugal 7.7 (5) 4.9 (8) 3.8 (8) 42 .001 Slovakia 0.2 (9) 1.7 (8) 2.9 (8) 163 .001 Slovenia 4.0 (9) 1.6 (9) 2.0 (9) 15 .001 Sweden 4.5 (7) 4.9 (8) 4.8 (8-9) 0.6 .745
Taken together, these results indicate that information sources such as family/friends,
professional acquaintances and one’s self (no advice needed) were the most popular sources of advice. The proportions of people naming organizations specializing in business start-up and training courses for entrepreneurs were relatively small, except in Austria, where a large proportion obtained advice from organizations specializing in business start-ups. Only
Page 68
Academy of Entrepreneurship Journal, Volume 20, Number 2, 2014
unemployment administrations and financial institutions were named less frequently. This is rather surprising since these groups specialize in giving advice to new business owners. There also seems to be a lack of information or coordination in that the percentage of people who stated they had no access to any relevant advice was higher than the percentage that used these four formal sources.
CONCLUSIONS This study sought to examine the sources of advice used most often by business owners
in three age groups. One advantage of this study was that all participants had been in business for roughly the same amount of time, so the age of the business was similar across the sample. A significant limitation of this study is that data included only age, and not other demographic information such as sex, education, prior experience, etc. All of these variables could help further explain the choice of advice sources used by entrepreneurs.
The top two sources in most countries were family and friends and professional acquaintances, both information sources based on personal social networks. Family and friends were the most common source for those under 30, and those in that age group tended to be the most likely to say they had used that source of advice. In contrast, professional acquaintances were less popular among those under 30, but more popular with older participants. It would seem reasonable that those who have more experience in life and work have developed larger and stronger networks of professional acquaintances who can give advice. Younger entrepreneurs who have not developed these networks use the sources most easily accessible to them—family and friends.
Those over 40 were most likely to say they needed no advice, and in most countries, this was the third most popular “source.” One the one hand, it may be that they truly know what they need to do and need no advice. On the other hand, older business owners may need advice, but do not recognize that fact. Rae (2005) suggests that mid-career entrepreneurs may have more knowledge and expertise, which itself can “restrict their entrepreneurial outlook” (p. 570). They may need to “reframe or ‘unlearn’ less useful aspects of their prior learning” (p. 570). Skills that are valuable in other contexts might not be as useful in starting a new firm. Cull (2006, p. 10) states that some entrepreneurs rely too much on their own personal experience. Networks can help them give more consideration to their options and actions.
For those who seek to help new business owners, those in the 30-39 age range seem to be the most likely to accept assistance. They were the most likely to take advice from professional consultants and organizational specializing in business start-up. They were also the most likely to state that they had no access to relevant advice. These results indicate that new business owners in this age group could be a prime “target market” for entrepreneurial advice. Future research should examine this issue by determining if new business owners in each age group have access to (and are willing to accept) advice needed at each stage of business.

Page 69
Academy of Entrepreneurship Journal, Volume 20, Number 2, 2014
REFERENCES Anderson, A. R., S. D. Dodd & S. Jack. (2010). Network practices and entrepreneurial growth. Scandinavian
Journal of Management. 26, 121-133. Arkebauer, J.B. (1995). Golden entrepreneuring: The mature person’s guide to a successful business. New York:
McGraw-Hill, Inc. Barclays Economic Reports. (2001). Third age entrepreneurs: Profiting from experience. London: Barclays PLC. Birley, S. (1985). The role of networks in the entrepreneurial process. Journal of Business Venturing, 3(1), 107-117. Bruderl, J. & P. Preisendorfer. (1998). Network support and the success of newly founded businesses. Small
Business Economics, 19, 213-225. Cooper, A. C., C. Woo, C., Y. Dunkelberg, & C. William. (1989). Entrepreneurship and the initial size of firms. Journal of Business Venturing, 4(5), 317-334. Cull, J. (2006). Mentoring young entrepreneurs: What leads to success? International Journal of Evidence Based Coaching and Mentoring, 4(2), 8-18. Drakopoulou-Dodd, S., S. Jack & A.R. Anderson. (2006). Entrepreneurial networks: Structure, process, and change. In D. Shepherd, J. A. Katz, J. Wiklund & D. Dimov (Eds.), Advances in entrepreneurship, firm emergence and growth, 9, 107-145. Elesevier. Eurostat. (2013). Epp.eurostat.ec.europa.eu. retrieved 4.August 2013. Farr-Wharton, R. & Y. Brunetto. (2007). Women entrepreneurs, opportunity recognition and government-sponsored
business networks: A social capital perspective. Women in Management Review, 22(3), 187-207. Frenzen, J. & K. Nakamoto. (1993). Structure, cooperation, and the flow of market information. Journal of
Consumer Research, 20 (December), 360-75. Granovetter, M. 1973. The strength of weak ties. American Journal of Sociology, 78:1360-1380 Gray, J.H. (1998). Self-employment as a career option for redundant workers. Working paper 51/98. Monash
University. Gronum, S., M.-L. Verreynne & T. Kastelle. (2012). The role of networks in small and medium-sized enterprise
innovation and firm performance. Journal of Small Business Management, 50(2), 257-282. Gulati R., N. Nohria, & A. Zaheer. (2000). Strategic networks. Strategic Management Journal, 21(3), 203–215. Haas, M. R. & Hansen, M. T. (2005). When using knowledge can hurt performance: The value of organizational
capabilities in a management consulting company. Strategic Management Journal, 26, 1-24. Hamton, A., S. Cooper & P. McGowan. (2009). Female entrepreneurial networks and networking activity in
technology-based ventures. International Small business Journal, 27(2), 193-214. Hanson, M. T. & Haas, M. (2002). Are organizational capabilities valuable? An empirical test of the pitfalls of
leveraging knowledge. Paper presented at the annual meeting of the Academy of Management, Denver. Hindle, K. & S. Rushworth. (2002). Global entrepreneurship monitor: Australia 2002. Hawthorn: Swinburne
University of Technology. Hisrich, R. & Brush, C. (1986). The woman entrepreneur. Lexington, MA: Lexington Books. Hoang, H., & B. Antoncic. (2003). Network-based research in entrepreneurship: A critical review. Journal of
Business Venturing, 18, 165-187. Ireland, R. D., Hitt, M.A., Camp, S. M. & Sexton, D. L. (2001). Integrating entrepreneurship and strategic
management actions to create firm wealth. Academy of Management Executive, 15(1), 49-63. Klyver, K. & Terjesen, S. (2007). Entrepreneurial network composition: An analysis across venture development
stage and gender. Women in Management Review, 22(8), 682-688. Kregar, T. B., A. F. DeNoble & B. Antoncic. (2012). The entrepreneur’s personal network structure and firm
growth. International Journal of Innovation and Regional Development, 4(3/4), 232-249. Loscocco, K., S. Monnat, G. Moore & K. B. Lauber. (2009). A comparison of women’s and men’s small business
networks. Gender & Society, 23(3), 388-411.
Page 70
Academy of Entrepreneurship Journal, Volume 20, Number 2, 2014
March, J. G. (1991). Exploration and exploitation in organizational learning. Organization Science, 2(1), 71-87. Nebus, J. (2006). Building collegial information networks: A theory of advice network generation. Academy of
Management Review, 31(3), 615-637. Renzulli, L., Aldrich, H. & Moody, J. (2000). Family matters: Gender, networks and entrepreneurial outcomes.
Social Forces, 79(2), 523-546. Robinson, S. & Stubberud, H.A. (2011a). Social Networks and Entrepreneurial Growth. International Journal of
Management & Information Systems, 15(4), 65-70. Robinson, S. & Stubberud, H.A. (2011b). Sources of Information and Cooperation for Innovation in Norway.
Journal of International Business Research, 10(2), 79-90. Robinson, S. & Stubberud, H.A. (2010). An Analysis of Social Networks by Industry. International Journal of
Entrepreneurship, 14, 1-12. Robinson, S. & Stubberud, H.A. (2009). Sources of advice in entrepreneurship: Gender differences in business owners’ social networks. International Journal of Entrepreneurship, 13, 83-101. Robson, P. J. A. & R. J. Bennett. (2000). SME growth: The relationship with business advice and external collaboration. Small Business Economics, 15(3), 193-208. Sandberg, K. W. (2003). An exploratory study of women in micro enterprises: Gender-related differences. Journal of Small Business and Enterprise Development, 10(4), 408-417. Shaw, E. (2006). Small firm networking. International Small Business Journal, 24(1), 5-29. Smeltzer, L. R., & Fann, G. L. (1989). Gender differences in external networks of small business owner/managers. Journal of Small Business Management, 27 (2), 25-32. Smeltzer, L. R., G. L. Fann, & V. N. Nikolaisen. (1988). Environmental scanning practices in small business.
Journal of Small Business Management, July, 55-62. Taylor, D.W. & Thorpe, R. (2004). Entrepreneurial learning: A process of co-participation. Journal of Small Business and Enterprise Development,11(2), 203-211. Watson, J. (2007). Modeling the relationship between networking and firm performance. Journal of Business
Venturing, 22, 852-874. Weber, P. & M. Schaper. (2004). Understanding the grey entrepreneur. Journal of Enterprising Culture,12(2), 147-
164. Zhao, L. & J.D. Aram. (1995). Networking and growth of young technology-intensive ventures in China. Journal of
Business Venturing, 10, 349-370.

Page 71
Academy of Entrepreneurship Journal, Volume 20, Number 2, 2014
THE RELATIONSHIP BETWEEN METACOGNITION, ENTREPRENEURIAL ORIENTATION, AND FIRM
PERFORMANCE: AN EMPIRICAL INVESTIGATION
Young Sik Cho, The University of Texas-Pan American Joo Y. Jung, The University of Texas-Pan American
ABSTRACT
This study aims to examine the relationship between an entrepreneur’s metacognition, entrepreneurial orientation (EO), and firm performance. We collected primary data from 190 entrepreneurs (business owners or founders) working in the U.S. through a survey. By performing both the confirmatory factor analysis (CFA) and the structural equation modeling (SEM), we tested our hypothesized research model that represented the metacognition-EO-firm performance relationship. The results from the statistical analysis demonstrate that an entrepreneur's metacognition has a significant positive impact on EO. Furthermore, the study result shows that EO has a full mediating effect on the relationship between entrepreneurial metacognition and firm performance. We, thus, anticipate that the findings of this study will help entrepreneurs to understand the mechanism on how their metacognitions impact their business outcomes as well as to recognize why they should consider their metacognitive abilities while executing entrepreneurial tasks.
Keywords: Entrepreneurial metacognition, metacognitive knowledge, metacognitive strategy, entrepreneurial orientation (EO), confirmatory factor analysis (CFA), and structural equation modeling (SEM)
INTRODUCTION In the context of entrepreneurial research, "cognition is defined as the knowledge structure that people use to make assessments and decisions involving opportunity evaluation, venture creation, or growth (Mitchell et al., 2002a, b)" (Haynie, Shepherd, Mosakowski, & Earley, 2010: 220). On the other hand, "metacognition" can be defined as the awareness and understanding of one's own cognitive processes; in other words, it can be shown as a higher-order process that reflects one's awareness and control over the knowledge structure people use in making an assessment or a decision (Haynie, 2005; Haynie & Shepherd, 2009). In particular, within the context of entrepreneurship, Haynie et al. (2010) argued that "metacognitive knowledge" can be considered as “a resource that is informed based on what the entrepreneur understands to be true about people, tasks, and strategy, and can be brought to bear upon the task of formulating a metacognitive strategy to realize a desired outcome from the entrepreneurial

Page 72
Academy of Entrepreneurship Journal, Volume 20, Number 2, 2014
task at hand” (Haynie et al.: 222). Furthermore, through their conceptual study, Haynie et al. (2010) demonstrated that “foundations of an entrepreneurial mindset are metacognitive in nature" (Haynie et al.: 217). Based on these arguments, it is, thus, rationally assumed that entrepreneurs having a strong metacognitive ability might be better positioned to successfully carry out their entrepreneurial tasks. However, the existing literature does not suggest enough guidance to understand how entrepreneurial metacognition affects entrepreneurial tasks, in particular, entrepreneurial orientation (EO) and their business performance. These relationships have not been yet examined empirically and statistically. Therefore, the purpose of this study is to verify the conceptually developed relationship between metacognitive ability of entrepreneurs and their task performance through empirical test methods such as confirmatory factor analysis (CFA) and structural equation modeling (SEM). Specifically, this study intends to evaluate the following research questions:
(1) How does an entrepreneur’s metacognition influence entrepreneurial orientation (EO)? (2) How does an entrepreneur’s metacognition influence firm performance? (3) How does EO influence the relationship between metacognition and firm performance?
THEORETICAL BACKGROUND AND HYPOTHESIS DEVELOPMENT
Entrepreneurial Orientation Entrepreneurial orientation (EO) can be defined as the practices, processes, and decision-making activities that lead to new entry (Lumpkin & Dess, 1996). EO differs from entrepreneurship in that it is essentially the entrepreneurial process, that is, how entrepreneurship is undertaken—the methods, practices, and decision-making styles used to act entrepreneurially (Sang & Suzanne, 2000). In terms of EO dimensions, Miller (1983) suggested three dimensions—risk-taking, proactiveness, and innovativeness—in order to characterize entrepreneurship. Later, Lumpkin & Dess (1996) identified two more dimensions of EO—competitive aggressiveness and autonomy. Among the dimensions of EO, autonomy refers to the independent action of an individual or a team in bringing forth an idea or a vision and carrying it through to completion (Lumpkin & Dess, 1996). It means the ability and will to be self-directed in the pursuit of opportunities (Lumpkin & Dess, 1996: 140). Competitive aggressiveness represents the intensity of a firm’s efforts to outperform industry competitors and is characterized by a strong offensive posture directed at overcoming rivals (Lumpkin & Dess, 2001). This is an important element of EO since new ventures are much more likely to fail than established businesses and an aggressive stance is critical to the success and survival of a new start-up (Lee & Peterson, 2000). Proactiveness is defined as “seeking new opportunities which may or may not be related to the present line of operations, introduction of new products and brands ahead of competition, strategically eliminating operations which are in the mature or

Page 73
Academy of Entrepreneurship Journal, Volume 20, Number 2, 2014
declining stages of life cycle” (Venkatraman, 1989a: 949). According to Lumpkin & Dess (1996), innovativeness is regarded as a critical factor to identify the characteristics of an entrepreneur. They delineate the innovativeness as "a firm's tendency to engage in and support new ideas, novelty, experimentation, and creative processes that may result in new products, service, or technological processes" (Lumpkin & Dess, 1996:142). In addition, risk-taking is also one of the most widely recognized characteristics of an entrepreneur, because an individual who is willing to accept the uncertainty and riskiness associated with being self-employed is typically considered an entrepreneur (Lee & Peterson, 2000). EO and Firm Performance
Concerning the relationship between EO and a firm's performance, Wiklund & Shepherd (2003) found that EO, universally, has a positive influence on a firm’s performance. Other empirical studies also support EO's positive effect on a firm's performance (Zahra, 1991; Wiklund, 1999). However, the study of Lumpkin & Dess (1996) indicated that the features of a firm's external environment and internal organizational characteristics would have a significant impact on the relationship between EO and firm performance. Furthermore, in later studies, Lumpkin & Dess (2001) found that the EO dimensions varied independently rather than covary; in fact, their initial test demonstrated that proactiveness was positively associated with performance but competitive aggressiveness was not strongly related to firm performance. The longitudinal study of Zahra & Covin (1995) also argued that EO was associated with the firm's performance to some degree but, there were some mixed research findings regarding the relationship. Nevertheless, Morris (1998) illustrated that EO was significantly important not only for the survival and growth of firms but also for the economic prosperity of nations. Entrepreneurial Metacognition Metacognition. Flavell (1987) described metacognition as the process of formulating strategies in order to select from a set of possible cognitive mechanisms, based on the individual’s understanding of his or her own strengths, weaknesses, assumptions, and motivations. For instance, activities such as “to be self-aware, to think aloud, to reflect, to be strategic, to plan, to have a plan in mind, to know what to know, and to self-monitor” (Guterman, 2002: 285) can be considered examples of metacognitive thinking. Moreover, metacognition can be described as “the control that the individual has over their own cognitions as a function of a differing ability to consider alternative cognitive strategies in light of a changing environment; it follows that control over one's cognitions that results in an ability to consider alternative cognitive strategies makes for more dynamic information processing” (Haynie et al., 2010: 219). Specifically, metacognition can be classified into the following categories: goal orientation, metacognitive knowledge, metacognitive experience, metacognitive strategy (or metacognitive choice), and monitoring (Flavell, 1979, 1987; Griffin & Ross, 1991; Nelson, 1996; Hayine & Shepherd, 2009).

Page 74
Academy of Entrepreneurship Journal, Volume 20, Number 2, 2014
Metacognitive Knowledge and Strategy In particular, "metacognitive knowledge" refers to one’s conscious and cognitive
understanding of people, tasks, and strategy (Flavell, 1987). According to the definitions of Haynie et al. (2010: 222), metacognitive knowledge consists of the following three specific aspects; (i) "metacognitive knowledge of people," referring to “perceptions about oneself, and about others, in terms of competencies,” (ii) "metacognitive knowledge of tasks," reflecting “the nature of information acquired by an individual concerning a specific activity (i.e., writing a business plan, or calculating cash flows),” and (iii) "metacognitive knowledge of strategy," referring to “procedures for ensuring that a cognitive strategy is appropriate for achieving some desired goal” (Haynie et al. 2010: 222). Hence, within the context of entrepreneurship, metacognitive knowledge can be delineated as “a resource that is informed based on what the entrepreneur understands to be true about people, tasks, and strategy, and can be brought to bear upon the task of formulating a metacognitive strategy to realize a desired outcome from the entrepreneurial task at hand” (Haynie et al.: 2010, 222). In addition, "metacognitive strategy" can be defined as the selection of the most suitable cognitive response from a set of available cognitive responses (Fiske & Taylor, 1991). Within the context of entrepreneurship, metacognitive strategy can be described as the framework formulated by an entrepreneur through evaluating alternative responses to the entrepreneurial task process (Haynie et al., 2010). Research Model The following Figure 1 demonstrates the hypothesized research model of this study. The model is composed of entrepreneurial metacognition, EO, and firm performance. Each path in Figure 1 is labeled with the related hypothesis, and every relation is argued in the following sections.
Figure 1: Hypothesized Research Model: the Relations among Metacognition, EO, and Firm Performance
The Relations among Entrepreneurial Metacognition, EO, and Firm Performance Shane & Venkataraman (2000) defined entrepreneurship as the discovery, evaluation, and exploitation of opportunities to bring into existence a service and product. In general, a primary aspect of entrepreneurship is a high level of dynamism and uncertainty in the entrepreneurial circumstance. Therefore, the intrinsic uncertainty and dynamism in an entrepreneurial environment require entrepreneurs “to rethink current strategic actions, organization structure,

Page 75
Academy of Entrepreneurship Journal, Volume 20, Number 2, 2014
communications systems, corporate culture, asset deployment, investment strategies, in short every aspect of a firm's operation and long-term health” (Hitt et al., 1998). In the context of entrepreneurship, a metacognition can be described as “the dynamic consideration of cognitive functioning focused on how decision heuristics and strategies develop, adapt, and are employed over the duration of the entrepreneurial process” (Haynie et al., 2010: 218). Furthermore, Haynie et al. (2010: 217) argue that “foundations of an entrepreneurial mindset are metacognitive in nature, and subsequently detail how, and with what consequence, entrepreneurs formulate and inform higher-order cognitive strategies in the pursuit of entrepreneurial ends.” Thus, considering the relationship between the metacognitive process and the intrinsic characteristics of entrepreneurship such as uncertainty and dynamism, it is rationally assumed that metacognitive knowledge is a basis for an entrepreneur to establish an effective strategic framework for his or her entrepreneurial task. In turn, such a well-developed metacognitive knowledge and strategy of entrepreneurs might affect their entrepreneurial orientation positively. In order to examine the relationship between entrepreneurial orientation and metacognitive abilities of entrepreneur, the following hypothesis is, thus, proposed:
H1 Entrepreneurial metacognition has a positive impact on entrepreneurial orientation.
Additionally, grounded on the logic above, it is also anticipated that such an EO based on a strong metacognitive ability of entrepreneur could be eventually committed to realizing their desired business performance because numerous studies supported EO's positive effect on a firm's performance (Zahra, 1991; Lumpkin & Dess, 1996; Wiklund, 1999; Lee & Peterson, 2000; Wiklund & Shepherd, 2003). In other words, it is sensibly assumed that a strong metacognitive ability of entrepreneur positively influences entrepreneurial task performance through their enhanced EO. Therefore, the following hypothesis is posited to scrutinize the mediating effect of EO between entrepreneurial metacognition and firm performance:
H2 Entrepreneurial orientation positively mediates the relationship between entrepreneurial metacognition and firm performance.
METHODOLOGY Target Sample I collected the primary data through a survey research. The target respondents of this study were actual entrepreneurs such as business owners or founders. However, in some cases, actual entrepreneurs were not available to respond. Hence, some criteria in choosing target respondents were created. My first criterion was the choice of a single respondent from a company. My second criterion was the position of the target respondent in the organization, preferably an actual entrepreneur of a firm. My third criterion was that the target respondent was likely to have not only the knowledge of the firm's EO but also knowledge of the firm's
Page 76
Academy of Entrepreneurship Journal, Volume 20, Number 2, 2014
entrepreneurial firm performance. If there was more than one subject from the same organization, I chose the target respondent based on his or her position in the organization (the highest rank among the target respondents) and the likelihood of his or her access to the information requested in the questionnaire. Measurement For this study, I used a questionnaire that consisted of items related to metacognition, EO, and entrepreneurial firm performance. Based on the prior EO studies, I employed the five EO dimensions such as proactiveness, risk-taking, autonomy, innovation, and competitive aggressiveness (Miller, 1983; Lumpkin & Dess, 1996, 2001) to test the developed hypotheses in this study. Most of the EO items were adopted directly from the empirical study of Lumpkin & Dess (2001); however, I created one competitive aggressiveness item (EC3) and all autonomy items (EA1, EA2, and EA3), by referring to the conceptual study of Lumpkin & Dess (1996). In addition, all items related to metacognition were adopted from the empirical study of Haynie & Shepherd (2009) but, some items were slightly revised to reflect the purpose of this study. For measuring the performance of entrepreneurial firm, I added the following items: sales growth, net profit margin, and market share growth. Moreover, for each item, the respondents indicated the extent to which they disagree or agree with the statement on a seven-point Likert type scale anchored by strongly disagree (1) and strongly agree (7). Appendix 1 lists the final selected measurement items after CFA test. Pilot Testing Initially, I conducted a pilot study (n = 57) with MBA students. However, I used the pilot test only to identify any problematic items and questions, to measure the length of time to complete the survey, and to pre-examine whether the hypothesized model fits this study. Data Collection Procedure I collected data via an online survey agency for the following reasons. First, sources for collecting the entrepreneurs' information were very limited. Second, typical entrepreneurs’ information was only available through small regional-level authorities. Generalizing the findings based on such regional data would have limited the scope and impact of this study. Thus, email survey questionnaires were sent through the online survey agency to target respondents all over the U.S. I received a total of 190 usable responses for a response rate of 18 percent within two-wave surveys. The majority of respondents were small to medium size business owners or senior managers who were over 35 years of age. Of the respondents, 59.3% were male, and 40.7%, female; 55.9% were aged 45~60, 23.7% were 30~44, and 20.3% were over 60; 38.4% had a bachelor’s degree, 32.2% had a graduate degree, 20.9% had a college degree, and 8.5% had a high school degree. In addition, among the respondents, 39.0% of firms

Page 77
Academy of Entrepreneurship Journal, Volume 20, Number 2, 2014
had less than 100 employees, 19.2% had 100~500 employees, and 41.8% had more than 500 employees; 90.4% of firms were in the service industry, and 9.6% in manufacturing.
RESULTS Confirmatory Factor Analysis (CFA) I used IBM SPSS and AMOS to process the data. Structural equation modeling (SEM) was adopted as the primary analytical method to test the hypotheses of this study. However, an SEM analysis can be conducted only after acceptable reliability and validity of the measures has been established (Hair, Black, Babin, & Anderson, 2010). Thus, I first conducted a confirmatory factor analysis (CFA) to assess the reliability of scales for each construct and the validity for each construct, and then assessed the hypothesized SEM of this study. Goodness-of-fit of the Model.
The key goodness-of-fit (GOF) indices of this study contained the chi-square (X2) statistic, normed chi-square (X2/df), comparative fit index (CFI), Tucker-Lewis coefficient (TLI), Parsimony normed fit index (PNFI), and root mean square error of approximation (RMSEA). The Chi-square value (X2) was 341.812 (N =190, degree of freedom = 168, p-value < .001) and the normed Chi-square (X2/df) was 2.035 in the CFA model. The normed Chi-square value below 2.0 is the great acceptable fit and the value between 2.0 and 5.0 is regarded as the moderately acceptable fit level (Hair et al., 2010). Hence, the normed Chi-square 2.035 suggests an acceptable fit for the CFA model. In addition, Hu and Bentler (1999) suggest that a comparative fit index (CFI) value higher than .90 represents a good model fit, and Rigdon (1996) indicates that a RMSEA value less than .08 represents a reasonable fit. In this CFA model, I obtained an RMSEA value of .074 and a CFI value of .937, suggesting a good model fit. Moreover, TLI value (.914) and PNFI value (.644) also meet the desirable thresholds for each fit index (TLI is close to 1.00; PNFI > 0.50), showing a fully acceptable fit (Bentler & Bonett, 1980; Mulaik, James, Van Altine, Bennett, Lind, & Stilwell, 1989).
Test for Reliability and Validity
By calculating Cronbach's alpha coefficient for each construct, the reliability of scales for each construct can be evaluated (Cronbach, 1951; Nunnally, 1967). As represented in Table 1, the values of Cronbach's alpha for all constructs went over the limit of the acceptable level point of 0.70 (Hair et al., 2010). In addition, I conducted the validity analysis of constructs by calculating factor loading estimates. Construct validity can be defined as the extent to which a set of measured items actually reflects the theoretical latent construct those items are designed to measure, so it deals with the accuracy of measurement (Hair et al., 2010). A factor loading represents the correlation between an original variable and its factor; at a minimum, all factor

Page 78
Academy of Entrepreneurship Journal, Volume 20, Number 2, 2014
loadings should be statistically significant (Anderson & Gerbing, 1988). In a sample of 150 respondents, factor loadings of .45 and above could be considered as having practical significance (Hair et al. 2010). Since the sample size of this study was 190, I set the minimum threshold of factor loading at 0.45 or above. Unfortunately, the innovativeness construct of this study had only one item that the standardized factor loading estimate was above the threshold of 0.45, so I could not include the construct in this research model. Table 1 represents the final results of CFA after I removed the all items that could not satisfy the suggested threshold of 0.45. After this process, all standardized factor loading estimates in the seven constructs were eventually above the threshold of 0.45, indicating the acceptable validity of the constructs. Furthermore, I evaluated convergent validity by average variance extracted (AVE). Convergent validity is an estimate of how well the individual items, which indicate a specific construct, converge or share a high proportion of variance. With CFA, the AVE is calculated as the mean variance extracted for the item loadings on a construct and is a summary indicator of convergence (Fornell & Larcker, 1981). This value can be calculated using standardized loadings of CFA. An AVE of .5 or higher is a good rule of thumb suggesting adequate convergence (Hair et al., 2010). Table 1 also demonstrates AVE estimates that were computed for each construct. AVE estimates of each construct ranged from 50% (.497) for the proactiveness construct to 81% (.805) for the metacognitive strategy construct. Thus, the convergent validity of this model was reasonably acceptable.
Table 1: Test Results of Confirmatory Factor Analysis (CFA)
Construct Factor Item Standardized
Factor Loading
S.E. C.R.
(t-value) P AVEa Cronbach's
alpha
Proactiveness
EP3 .782
.497 .710 EP2 .816 .093 10.965 ***
EP1 .461 .097 6.034 ***
Risk-taking
ER3 .845
.692 .870 ER2 .852 .075 13.933 ***
ER1 .798 .078 12.725 ***
Autonomy
EA3 .816
.671 .854 EA2 .899 .074 14.339 ***
EA1 .735 .079 11.074 ***
Competitive Aggressiveness
EC3 .877
.711 .876 EC2 .855 .066 14.427 ***
EC1 .796 .071 13.079 ***
Metacognitive Knowledge
MK3 .803
.628 .839 MK2 .680 .083 9.988 ***
MK1 .882 .089 14.048 ***
Metacognitive MS3 .881 .805 .927

Page 79
Academy of Entrepreneurship Journal, Volume 20, Number 2, 2014
Table 1: Test Results of Confirmatory Factor Analysis (CFA)
Construct Factor Item Standardized
Factor Loading
S.E. C.R.
(t-value) P AVEa Cronbach's
alpha
Strategy MS2 .912 .073 18.193 ***
MS1 .898 .072 17.692 ***
Firm Performance
Market Share Growth
.777
.733 .888 Net Profit
Margin .929 .102 12.912 ***
Sales Growth
.856 .103 12.332 ***
Note: Not estimated when loading set to fixed value (i.e., 1.000); N = 190; X2/df = 2.035; CFI = 0.937; TLI = 0.914; RMSEA = 0.074; PNFI = 0.644; ***Significant at p < 0.001 level; aAverage Variance Extracted.
Structural Equation Modeling (SEM) Analysis Test Results of the Hypothesized SEM. The hypothesized model in this study was tested by SEM analysis using AMOS; the analysis results are shown in Figure 2. In terms of the fit indices, the normed Chi-square (X2/df) was 2.868, suggesting a moderately acceptable fit (Hair et al. 2010). Also, the CFI value (.902) was higher than the suggested threshold of 0.90 (Hu & Bentler, 1999) and PNFI value (.718) was higher than the threshold of 0.50 (Mulaik et al., 1989), demonstrating that the hypothesized SEM in this study has a fully acceptable model fit.
Figure 2: Test Results of the Hypothesized Structural Equation Modeling (SEM)
Note: Standardized estimates; ***Significant at p < 0.001 level; N = 190; X2/df = 2.868; CFI = 0.902; PNFI = 0.718

Page 80
Academy of Entrepreneurship Journal, Volume 20, Number 2, 2014
As shown in Figure 2, the SEM result indicates that entrepreneurial metacognition has a not only positive but also strongly significant impact on entrepreneurial orientation (ß = .707, t = 7.249, p < 0.001). Thus, hypothesis 1 is strongly supported. Test Results of the Mediating Effect of EO. In order to examine the mediating effect of entrepreneurial orientation (EO) between entrepreneurial metacognition and entrepreneurial firm performance, I adopted the Baron & Kenny’s (1986) steps. First, to investigate whether entrepreneurial metacognition has a direct effect on entrepreneurial firm performance, I developed a simple model (N = 190, X2/df = 2.713, CFI = 0.996, TLI = 0.935). The test results show that entrepreneurial metacognition has a significant positive direct effect on entrepreneurial firm performance (ß = .212, t = 2.529, p = .011), as represented in Figure 3.
Figure 3: Direct Effect of Metacognition on Entrepreneurial Firm Performance
Note: Standardized estimates; *Significant at p < 0.05 level; N = 190; X2/df = 2.713; CFI = 0.996; TLI = 0.935
In addition, I constructed a competing model (N = 190, X2/df = 2.388; CFI = 0.910; TLI =
0.884), shown in Figure 4, to examine whether EO play mediating roles between entrepreneurial metacognition and entrepreneurial firm performance. Figure 4 indicates that the effect of entrepreneurial metacognition on entrepreneurial firm performance becomes significantly negative (ß = -.228, t = -1.983, p = .047) when inserting the EO factor between metacognition and firm performance. On the other hand, the results shows that EO has a not only positive but also strongly significant impact on entrepreneurial firm performance (ß = .625, t = 4.739, p < 0.001), as demonstrated in Figure 4. Consequently, the results confirm that the EO has a complete mediating effect on the relationship between entrepreneurial metacognition and firm performance. Therefore, hypothesis 2 is fully supported as well.
Figure 4: Mediating Effect of EO between Metacognition and Entrepreneurial Firm Performance
Note: Standardized estimates; ***Significant at p < 0.001 level; **Significant at p < 0.01 level; *Significant at p < 0.05 level; N = 190, X2/df = 2.388; CFI = 0.910; TLI = 0.884

Page 81
Academy of Entrepreneurship Journal, Volume 20, Number 2, 2014
The Impact of Firm Size. The target sample of this study was actual entrepreneurs such as founders or owners. However, in some cases, actual entrepreneurs were not available; therefore, I contacted senior managers who were knowledgeable about their firm-level EO and business performance. In particular, such cases were prevalent in large-sized firms consisting of more than 500 employees. As reviewed in the methodology section, among our sample data, 41.8% of firms had more than 500 employees.
Table 2: Test Results: Impact of Firm Size
Small to Medium Firms Large Firms
Number of Employees < 500 ≥ 500 Sample Size N = 118 N = 72
Direct Effect of EMa on EOb and FPc
EMEO ß = .632*** (t = 4.913) ß = .724*** (t = 5.110) EMFP ß = .921** (t = 2.307) ß = .946** (t = 2.104)
Mediating Effect of EO between EM and FP
EMEO ß = .621*** (t = 4.853) ß = .720*** (t = 5.100) EOFP ß = .510*** (t = 3.433) ß = .757*** (t = 3.553) EMFP ß = -.067 (t = -.531, p = .595 ) ß = -.368 (t = -1.905, p = .057)
Note: Standardized estimates; ***Significant at p < 0.001 level; **Significant at p < 0.01 level; aEntrepreneurial Metacognition; bEntrepreneurial Orientation; cFirm Performance.
Thus, in order to investigate any impact of firm size on our study results, I divided the
sample into two groups by firm size. Firms that had less than 500 employees were classified under the ‘small to medium firms’ sample group (N = 118), and firms that had more than 500 employees were classified under the ‘large firms’ sample group (N = 72). Subsequently, I re-conducted the SEM analysis for each group individually. However, contrary to our concerns about firm size, the test results represented that there was no statistical difference between the two sample groups, as illustrated in Table 2. Furthermore, these two test results also showed a high statistical similarity with the initial test result obtained by a full of sample data (N = 190). Thus, it is obvious that firm size does not have any influence on the findings of this study.
DISCUSSION
The results of this study provide explicit answers to my initial research questions. With regard to my first research question, "How does entrepreneurial metacognition influence entrepreneurial orientation?", the study results show that entrepreneurial metacognition has a strong positive influence on EO. As to my second research question, " How does entrepreneurial metacognition influence firm performance?”, the results also clearly demonstrate that the metacognitive abilities of entrepreneurs have a not only positive but also significant effect on their firm performance.

Page 82
Academy of Entrepreneurship Journal, Volume 20, Number 2, 2014
Table 3: Summary of Test Results and Implications
Hypothesis Test Result Implication
H1 Supported
Entrepreneurial metacognition has a strongly positive impact on EO (H1).
EO fully mediates the relationship between entrepreneurial metacognition and firm performance (H2).
A well-developed metacognitive ability leads entrepreneurs to establish a strong EO; subsequently, the enhanced EO positively contributes to producing better desirable outcomes from their entrepreneurial tasks (H1 & H2).
H2 Supported
Regarding my last research question, "How does entrepreneurial orientation influence
the relationship between entrepreneurial metacognition and their firm performance?", the study results show that EO play a strong mediating role between entrepreneurs' metacognition and their firm performances.
Considering these findings, it is anticipated that a well-developed entrepreneur's metacognition could have a kind of leverage effect on the process of EO-business performance. In other words, the study findings imply that entrepreneurs' metacognitive abilities such as metacognitive knowledge and strategy could have a strong positive impact on the enhancement of their EO and could subsequently contribute toward producing better desirable outcomes from their entrepreneurial tasks. Table 3 summarizes this study results and the implications in brief.This study has some limitations. First, we could not include the "innovativeness" factor in the SEM model of this study because the AVE estimates of the factor did not satisfy the threshold of this study. Second, metacognition can be classified into five dimensions in general: goal orientation, metacognitive knowledge, metacognitive experience, metacognitive strategy, and monitoring (Flavell, 1979, 1987; Griffin & Ross, 1991; Nelson, 1996; Michael & Dean, 2009). However, this study simplified the metacognitive process and considered only two dimensions of metacognition—metacognitive knowledge and metacognitive strategy. Thus, we are unable to generalize the relationship between metacognition, EO, and entrepreneurial firm performance until all relationships with other metacognitive dimensions are completely examined. Hence, for future research, we suggest investigating how other dimensions of metacognition influence EO and entrepreneurial task performance.
Page 83
Academy of Entrepreneurship Journal, Volume 20, Number 2, 2014
CONCLUSION
We believe that the findings of this study contribute to extending the field of entrepreneurial cognition research. First, most of existent research were conducted at the cognitive level of analysis but, this study was examined at the metacognitive level of analysis within the context of entrepreneurship. Furthermore, although some conceptual studies regarding the relationship between an entrepreneur's metacognition and entrepreneurial task performance exist, the relationship has not been evaluated empirically and statistically yet. Therefore, it is anticipated that the findings of this study will help entrepreneurs to understand how their metacognitions impact EO and their business outcomes as well as recognize why they should consider metacognition while executing their entrepreneurial tasks.
REFERENCES \ Baron, R. M., & Kenny, D. A. (1986). The moderator-mediator variable distinction in social psychological research:
Conceptual, strategic and statistical considerations. Journal of Personality and Social Psychology, 51, 1173-1182.
Bentler, P. M., & Bonett, D. G. (1980). Significance tests and goodness of fit in the analysis of covariance structures. Psychological Bulletin, 88, 588-606.
Bobko, P. (1991). Multivariate correlational analysis. In M. Dunnette & L. Hough (Eds.), Handbook of industrial and organizational psychology (2nd ed.). Palo Alto, CA: Consulting Psychologist Press.
Cronbach, L. J. (1951). Coefficient alpha and the internal structure of tests. Psychometrika, 16, 297-334. Fiske, S., & Taylor, S. (1991). Social cognition (2nd ed.). New York, NY: Mcgraw-Hill Book Company. Flavell, J. (1979). Metacognition and cognitive monitoring: A new area of cognitive-developmental inquiry.
American Psychologist, 34, 906–911. Flavell, J. (1987). Speculations about the nature and development of metacognition. In F.E. Weinert & R.H. Kluwe
(Eds.), Metacognition, motivation, and understanding. Hillside, NJ: Erlbaum. Fornell, C., & Larcker, D. F. (1981). Evaluating Structural Equations Models with Unobservable Variables and
Measurement Error. Journal of Marketing Research 18, 39– 50. Gerbing, D. W., & Anderson, J. C. (1988). An updated paradigm for scale development incorporating
unidimensionality and its assessment. Journal of Marketing Research, 25, 186-92. Griffin, D., & Ross, L. (1991). Subjective construal, social inference, and human misunderstanding. In M. Zanna
(Eds.), Advances in experimental social psychology, 24, 319–356. NY: Academic Press. Guterman, E. (2002). Toward a dynamic assessment of reading: applying metacognitive awareness guiding to
reading assessment tasks. Journal of Research in Reading. 25(3), 283–298. Hair, J. F., Black, W. C., Babin, B. J., & Anderson, R. E. (2010). Multivariate Data Analysis (7th ed.). Pearson. Haynie, J. M. (2005). Cognitive adaptability: the role of metacognition and feedback in entrepreneurial decision
polices, Doctoral dissertation, University of Colorado at Boulder. Haynie, J. M., & Shepherd, D. A. (2009). A measure of adaptive cognition for entrepreneurship research.
Entrepreneurship Theory and Practice, 33, 695-714.

Page 84
Academy of Entrepreneurship Journal, Volume 20, Number 2, 2014
Haynie, J. M., Shepherd, D. A., Mosakowski, E., & Earley, P. C. (2010). A situated metacognitive model of the entrepreneurial mindset. Journal of Business Venturing, 25, 217-229.
Hitt, M., Keats, B., & DeMarie, S. (1998). Navigating in the new competitive landscape: building strategic flexibility and competitive advantage in the 21st century. Academy of Management Executive. 12(4), 22–42.
Hu, L. & Bentler, P. M. (1999). Cutoff criteria for fit indices in covariance structure analysis: conventional criteria versus new alternatives. Structural Equation Modeling, 6(1), 1-55.
Rigdon, E. E. (1996). CFI versus RMSEA: a comparison of two fit indices for structural equation modeling. Structural Equation Modeling, 3(1), 369-79.
Joreskog, K. G., & Sorbom, D. (1993). LISREL 8: Structural Equation Modeling with the SIMPLIS Command Language. Hillsdale NJ: Lawrence Erlbaum Associates Publishers.
Kerlinger, F. N. (1986). Foundations of behavioral research (3rd ed.). Ft Worth, TX: Holt, Rinehart and Winston, Inc.
Lee, S. M., & Peterson, S. J. (2000). Culture, entrepreneurial orientation, and global competitiveness. Journal of World Business, 35(4), 401-416.
Lumpkin, G. T., & Dess, G. G. (1996). Clarifying the entrepreneurial orientation construct and linking it to performance. Academy of Management Review, 21(2), 135–172.
Lumpkin, G. T., & Dess, G. G. (2001). Linking two dimensions of entrepreneurial orientation to firm performance: the moderating role of environment and industry life cycle. Journal of Business Venturing, 16, 429-451.
Mitchell, R., Busenitz, L., Lant, T., McDougall, P., Morse, E., & Smith, B. (2002a). Toward a theory of entrepreneurial cognition: rethinking the people side of entrepreneurship research. Entrepreneurship Theory & Practice, 27(2), 93–105.
Mitchell, R.K., Smith, J.B., Morse, E.A., Seawright, K.W., Peredo, A.M., & McKenzie, B. (2002b). Are entrepreneurial cognitions universal? Assessing entrepreneurial cognitions across cultures. Entrepreneurship Theory & Practice, 26(4), 9–33.
Morris, M. H. (1998). Entrepreneurial intensity: Sustainable advantages for individuals, organizations, and societies. Westport, CT: Quorum Books.
Mulaik, S. A., James, L. R., Van Altine, J., Bennett, N., Lind, S., & Stilwell, C. D. (1989). Evaluation of goodness-of-fitness indices for structural equation models. Psychological Bulletin, 105, 430–445.
Nelson, T. (1996). Consciousness and metacognition. American Psychologist, 51, 102–129. Nunnally, J. C. (1967). Psychometric theory (1st ed.). New York, NY: McGraw Hill Book Company. Nunnally, J. C. (1978). Psychometric theory (2nd ed.). New York, NY: McGraw-Hill Book Company. Shane, S., Venkataraman, S., (2000). The promise of entrepreneurship as a field of research. Academy of
Management Review, 25(1), 217–227. Venkatraman, N. (1989a). Strategic orientation of business enterprises: The construct, dimensionality, and
measurement. Management Science, 35(8), 942–962. Wiklund, J. (1999). The sustainability of the entrepreneurial orientation–performance relationship, Entrepreneurship
Theory and Practice, 24, 37-48. Wiklund, J., & Shepherd, D. (2003). Knowledge-based resources, entrepreneurial orientation, and the performance
of small and medium-sized businesses. Strategic Management Journal, 24(13), 1307-1314. Zahra, S. (1991). Predictors and financial outcomes of corporate entrepreneurship: An explorative study. Journal of
Business Venturing, 6, 259-285. Zahra, S., & Covin, J. (1995). Contextual influence on the corporate entrepreneurship-performance relationship: a
longitudinal analysis. Journal of Business Venturing, 10, 43-58.

Page 85
Academy of Entrepreneurship Journal, Volume 20, Number 2, 2014
APPENDIX A: SURVEY MEASUREMENT ITEMS These items are the final items used in this study, according to the results of the CFA test. Most of the EO items were employed from the study of Lumpkin & Dess (2001); however, all autonomy items (EA1, EA2, and EA3) and one competitive aggressiveness item (EC3) were fully created by referring to the study of Lumpkin & Dess (1996). All metacognition related items were employed from the study of Haynie & Shepherd (2009) but, some items were slightly revised to reflect the purpose of this study. Proactiveness EP1. In dealing with competitors, we typically initiate actions which competitors then respond to. EP2. In general, the top managers of my firm have a strong tendency to be ahead of others in introducing novel ideas or products. EP3. In dealing with competitors, we are very often the first business to introduce new products/services, administrative techniques, operating technologies, etc. Risk-taking ER1. We tend to choose and do high risk projects with chances of very high returns. ER2. When confronted with decisions involving uncertainty, my firm typically adopts a bold posture in order to maximize the probability of exploiting opportunities. ER3. Owing to the nature of the environment, my firm usually considers that bold, wide-ranging acts are necessary to achieve the firm’s objectives. Autonomy (fully created) EA1. In general, the top managers of my firm place a strong emphasis on self-direction in the pursuit of opportunities. EA2. The independent action of an individual or a team in bringing forth a novel idea and carrying it through to completion is usually held in high regard. EA3. In dealing with novel ideas, we remain free to act independently, to make key decisions, and to proceed in order to promote the ideas into a new market. Competitive Aggressiveness EC1. My firm is very aggressive and intensely competitive. EC2. My firm typically adopts a very competitive "undo-the-competitors" posture. EC3. My firm pursues various activities aimed at overcoming rivals so that we achieve a competitive advantage in the marketplace.
Page 86
Academy of Entrepreneurship Journal, Volume 20, Number 2, 2014
Metacognitive Knowledge MK1. We think of several ways to solve a problem and choose the best one. MK2. We try to use strategies that have worked in the past. MK3. We focus on the meaning and significance of new information. Metacognitive Strategy MS1. We ask ourselves if we have learned as much as we could have when we finished the task. MS2. We ask ourselves if we have considered all the options when solving a problem. MS3. We ask ourselves if there was an easier way to do things after we finish a task. Entrepreneurial Firm Performance 1. Market Share Growth 2. Net Profit Margin 3. Sales Growth

Page 87
Academy of Entrepreneurship Journal, Volume 20, Number 2, 2014
DISAGGREGATING JAMAICA’S MICRO, SMALL AND MEDIUM FIRMS ON CHALLENGES FACED FOR
BETTER POLICY DEVELOPMENT AND PLANNING
Trevor A. Smith, University of the West Indies Derrick D. Deslandes, University of the West Indies
ABSTRACT
This study is motivated by the overabundance of literature in the field of entrepreneurship that has inappropriately treated micro, small and medium entities (MSMEs) as a collective even after acknowledging vast differences among entity types in scope, definition and challenges. Moreover, MSMEs are known to perform such significant roles in employment generation, poverty alleviation and economic growth thus requiring a disaggregation of the troika for more targeted approach to policy and planning. This study has addressed this gap; and utilized both focus groups and survey for collecting data on challenges faced by the entities. On analysis of survey data through One –Way ANOVA and Scheffe Post Hoc test, the results showed that energy and security costs are the only two variables that micro firms are less challenged than small and medium; while on all other indicators (such as ability to prepare tax returns, technological capabilities, marketing and ability to access credit) micro firms were much more challenged than their MSME counterparts. Notably, no significant differences were found between small and medium firms on challenges faced. Recommendations for policy, limitations and opportunities for further research are also discussed.
INTRODUCTION
Jamaica has long recognized the need to support and stimulate business activity with the aim of developing the local economy as well as to provide a mechanism through which the unemployed can find gainful, profitable engagement to sustain their livelihoods. From as early as the 1950’s (Jamaica gained its independence from the British in 1962), the country established the Industrial Development Corporation to provide technical and financial support to new industries; those that would reduce imports and stimulate exports; and those that are labour intensive. Since then, several policy positions have been put forward in response to the needs of the MSME sector. This policy intervention has recently culminated with the 13th draft of the MSME and Entrepreneurship Policy of 2012. Notably, MSMEs, both in the developed and developing economies, have contributed significantly to economic growth, employment generation, innovation and poverty alleviation (Beck, et al., 2005; Gruzina & Zvirbule-Berzina,

Page 88
Academy of Entrepreneurship Journal, Volume 20, Number 2, 2014
2012; Vega & Rojas, 2011;Venkateswarlu & Ravindra, 2012; ); thus signalling the importance of this sector to modern economies. Despite Jamaica’s early thrust to promote entrepreneurship, its economy has under-performed with cumulative growth since independence of approximately zero percent; and unemployment now standing at 20 percent.
One of the unsettling issues on MSMEs that was addressed by the 13th draft of the Policy is the definition of ‘MSME’. Previously, several definitions co-existed in Jamaica, with different criteria used for measuring micro, small and medium entities. The Private Sector Organization of Jamaica used total sales as the criterion for delineating entity types within MSMEs; the Small Business Association of Jamaica used total sales and the number of employees, the Planning Institute of Jamaica used total sales and total assets, and the Ministry of Industry, Investment and Commerce (MIIC) used the number of employees and total sales. However, in order to craft a singular national definition, MIIC partnered with the Mona School of Business (University of the West Indies) to hold a one day workshop in July 2011. This workshop involved participants from the public and private sectors, including the respective associations representing MSMEs. At the end of the exercise, it was agreed that the MSME should be defined as contained in Table 1.
Table1: Jamaica’s MSME Definition
Jamaica’s MSME Definition Firm Size No. of Employees Total Annual Sales/Turnover
Micro ≤ 5 ≤J$10 million Small 6 – 20 >J$10 million ≤ J$50 million Medium 21 – 50 >J$50 million ≤J$150 million Source: MSME and Entrepreneurship Policy (13th Draft) 2012; US$1 = J$100
This definitional concern is no less a problem across international boundaries with
classifications of micro, small and medium varying markedly among agencies, both within and across countries. For example, the Commonwealth Secretariat’s classification for small states is much different from the European Commission; and classifications across multilateral institutions, in general, bear no relation either in subcategory definition [of micro, small and medium] or in aggregation.
Table 2: SME Definitions (in aggregate) Used by Multilateral Institutions
Institution Max. # of Employees Max. Revenues or Turnover (US$) Max. Assets (US$) World Bank 300 15,000,000 15,000,000
MIF-Inter American Development Bank
100 3,000,000 None
African Development Bank 50 None None
Asian Development Bank No official definition. Use definition of individual national governments UNDP 200 None None
Source: Gibson and van der Vaart (2008)

Page 89
Academy of Entrepreneurship Journal, Volume 20, Number 2, 2014
See Table 2 for definition of SMEs across multilateral institutions in aggregate terms. The acronym MSME came about as a means of updating the SME classification to include micro enterprises (Gibson & van der Vaart, 2008). Based on these aggregations of small and medium enterprises (SMEs), there are vast disparities in definition and scope among multilateral institutions; and even with the World Bank and the Multilateral Investment Fund (MIF) of the Inter-American Development Bank, which expectedly would have some level of consistency, these disparities are not the slightest bit reconcilable; thus questioning the rigour and scientific basis on which definitions on MSMEs/SMEs are developed (Gibson & van der Vaart, 2008). Hence, the definitional conundrum coupled with aggregation of unrelated classifications of each of the three subcategories has exacerbated this problem; leaving policymakers across nations to plan with MSME data that are spurious and irreconcilable.
Further, the contemporary literature has not reconciled these problems; and even with the overabundance of literature in the field of entrepreneurship, we are no closer to an universal definition on MSME nor are we treated with the necessary literature that adequately explicate the challenges faced within each subcategory. In addition, policies written on the sector are focused on the collective, certainly in the case of Jamaica, and scarcely, if at all, address differences between subsectors.
This study has therefore addressed this gap and calls for a country-wise solution (where each country having its own definition where conformance to existing definitions are impractical) to an universal problem; and argues that better policy planning and development can be attained by first cauterising the problem through a functional definition on micro, small and medium by country; and then disaggregating challenges faced by entity type in an attempt to better understand and address the nuances of the subcategories within the MSME sector. The study is by no means purporting that aggregate data (grouping all three subcategories) on MSMEs is not important as obviously the macro picture on the sector depends on this aggregation. However, the study argues that with the multiplicity of challenges faced by MSMEs, seemingly to varying degrees across subcategories, a disaggregation of the troika for advancing policy planning and development is perhaps the best way for addressing these challenges. This study, we believe, is especially needed, at this time, in light of the challenges that MSMEs are facing in Jamaica which are reported to include (MSME & Entrepreneurship Draft Policy 2012):
Un-competitiveness Lack of access to credit High unit costs of production Poor quality products Inconsistency in the supply of products Low levels of technology and technical skills Weak business and management skills

Page 90
Academy of Entrepreneurship Journal, Volume 20, Number 2, 2014
Financial market perceived risk of MSMEs and lack of appropriate collateral. These challenges identified by the Policy were used to inform a focus group guide; and a
focus group session conducted [in the first phase of this study] on challenges faced uncovered the following convergent themes (Table 3). (See section on Methodology for details on focus group.)
Table 3: Themes on Challenges faced by the MSME Sector
Energy cost Differentiation of products/services Interest rates on loans in market Utilization of technological skills among workers Level of bureaucracy encountered when doing business with government agencies
Firm's ability to market products and services
Security cost Firm's ability to access credit Access to relevant industry information through government/non-government
Firm's dependency on foreign currency
Firm's ability to prepare tax returns Collateral for accessing loans Firm's capacity for innovation Firm's ability to trade across boundaries Firm technological capabilities
This paper will utilize Jamaica’s MSME definition promulgated in the draft MSME and Entrepreneurship Policy of 2012; and has so far outlined the rationale for this study and the problem presented though disparate definition of micro, small and medium enterprises. The issue of disaggregating MSME data for better policy planning and development was also highlighted; with the section ending with a list of challenges faced by the sector that were uncovered by focus group. The next section will present the review of literature on challenges faced by MSMEs; and will be followed by a discussion on the methodology for carrying out the study. Next, the results will be presented, first by describing the survey sample, and followed by the inferential findings. The section on discussion of the study finding will follow; and the paper will culminate with concluding remarks along with recommendations for policy, limitations and opportunities for further research.
LITERATURE REVIEW High energy cost, high cost of security along with a devaluating currency are three of the most significant challenges that MSMEs are facing (at least in the case of Jamaica); and have led to business closure, retarded business growth and reduced competitiveness within the sector ( Draft MSME & Entrepreneurship Policy/ Jamaica, 2012). In addition, marketing is perhaps one of the weakest areas of operations among these entities (Tambunan, 2011). This is due mainly to a tentative attitude of managers and owners within MSMEs towards marketing and the lack of resources necessary for executing effective marketing programs (Vega & Rojas, 2011).

Page 91
Academy of Entrepreneurship Journal, Volume 20, Number 2, 2014
Attracting more customers and product development along with innovation were found to be integral to the challenges in marketing within small and medium firms (Evans & Sawyer, 2009). Further, Meredith (1994) opined that marketing orientation is equally necessary with smaller type entities as with larger firms, particularly in the retail business; and found that location, ability to attract customers, attitude of staff and quality products and services were key antecedents to small business success. Globalization has also led to a fundamental shift in world economy and has resulted in markets in which individual nations have become a part of one global marketplace with reduction in trade barriers; thus paving the way for smaller type entities to participate in international trade (Ekeledo & Bewayo, 2009). However, trading across borders (e.g. through import and export) continues to be a major challenge for MSMEs, particularly micro and small firms of developing economies (Lahiri, 2012), who struggle to compete and consequently are not able to capitalize on the merits of globalization. Given the export potential of small and medium sized firms though, Government policymakers should expend its limited resources on programs that are focused on these entities rather than spreading resources thin across large and micro firms that may not provide the required levels of export-led growth that are promised by small and medium firms (International Trade Forum, 1999). Access to credit or access to financing is perhaps the most reported challenge experienced by MSMEs across national borders (Evans & Sawyers, 2009; Gruzina & Zvirbule-Berzina, 2012; Lahiri, 2012 ;). In most instances, the formal banking procedures on lending are not suited to meet the needs of the sector and so MSMEs, particularly micro and small firms, will often finance their operations informally through personal savings and loans from friends and family. Moreover, banks consider this sector to be risky due to factors such as low growth rate, informal business practices, inability to maintain collateral security and lack of creditworthiness (Lahiri, 2012). Notably, collateral requirements of banks were found to be key drivers of access to debt financing with results showing that “larger firms have higher access to debt financing than smaller and medium sized firms” (Kira & He, 2012, p.115). In turn, MSMEs consider the banks’ loan procedures to be cumbersome and collateral demands for such loans excessive (Ekeledo & Bewayo, 2009). Also, high interest rate on loans was identified among the top three challenges experienced my MSMEs owner/ managers with this problem rating significantly high among all three subcategories (Venkateswarlu & Ravindra, 2012). Doing business with Government agencies can also be a very daunting experience for entrepreneurs as many areas of Government policy such as regulatory policy, trade policy, labour market policy, regional development policy, social policy and gender policy are often complex and messy (Asghar, et al., 2011). Problems caused by cumbersome and costly bureaucratic procedures through Government agencies have been identified as a dominant bugbear of the MSME (Tambunan, 2011). Further, inconsistencies between central Government policies and policies carried out by Government agencies are also seen as a major challenge within the sector (Onu & Ekine, 2009).

Page 92
Academy of Entrepreneurship Journal, Volume 20, Number 2, 2014
With much fewer resources than large firms, MSMEs are reluctant to invest in technology; thus resulting in entities that are lacking in technical knowledge and technical skills among workers (Evans & Sawyer, 2009). In addition, small businesses often find it difficult to access reliable sources of industry information for supporting their businesses and often do not seek advice from consultants and Government agencies for improving their operations (Macgregor, 2003). MSMEs could also find themselves excluded from markets due to out-dated technologies which invariably will lower quality and raise cost, making products undifferentiated and uncompetitive (International Trade forum, 1999). In the area of innovation, the importance of SMEs was addressed in the works of Schumpeter who argued that despite difficulties, these entities could play a significant role in this area (Hagedoorn, 1996). On comparison across entity types, micro enterprises are characteristically more challenged than their MSME counterparts on taxation issues; and many of them, particularly those operating informally and not registered, simply do not pay taxes. Some of the suggestions offered for improving this subsector include: decreasing establishment cost, simplifying bookkeeping system, creating friendly taxation policy and simplify access to finance (Microenterprise Support Concept, 2009). One of the characteristic features of the micro enterprise is that it typically has much lower levels of productivity and wages than small and medium. Along the same vein, small firms are reported to have lower levels of productivity than their medium counterpart (Tambunan, 2011). In addition, large losses due to scrap rate, breakage, sabotage and crime were identified among the top economic problems faced by owners/ managers of MSMEs with micro firms being less affected than small and medium (Venkateswarlu & Ravindra, 2012).
METHODOLOGY The study utilized a combination of focus group and telephone survey for uncovering challenges faced by the MSME sector in Jamaica. These methods were employed as it was felt that the focus group would unearth the difficult realities facing the businesses; and the survey, particularly the island wide survey done, would seek to attain representativeness and generalization on these challenges. Focus Group
A sample for conducting the focus group session was selected from the Jamaica Red
Book telephone directory for 2013. The version of Red Book utilized consists of businesses that are located in three parishes in Jamaica - Kingston, St. Andrew and St. Catherine. It is felt that selecting participants from these three parishes would provide a good representation of the wider Jamaica as St. Catherine, in particular, is often described as a microcosm of Jamaica. Moreover, focus groups utilized in studies in Jamaica, do not usually employ large and comprehensive

Page 93
Academy of Entrepreneurship Journal, Volume 20, Number 2, 2014
samples of all parishes; and so it was felt that the Red Book directory would provide a more than adequate frame for this undertaking. This activity involved the hosting of the session with selected business owners or managers representing each of the business type – micro, small and medium. The focus group discussions afforded participants the opportunity to freely express their opinions on the challenges faced by each of the three sub-sectors. There were 12 participants in total with the medium sized entity comprised of four participants from the following industry types: retail trade (photo studio and water cooler services), manufacturing (woodwork) and transportation. The small entity group was represented by four informants from the following industry types: retail trade (information technology products and hair care services), manufacturing (plastics) and tourism; while the micro group comprised the other four individuals: retail trade (computer cartridges and health products), manufacturing (clothing), and financial services. The main themes emerged from the focus group were analysed for convergence in views among the three entity types and the combined list of challenges across all three sub-sectors was compiled.
Telephone Survey
A survey instrument was developed based on challenges identified from the focus group. The instrument also included types of entity, industry type along with demographic and other general information pertaining to respondents. The Jamaica Online Yellow Pages 2013 was used as the sample frame for conducting the telephone survey. This we believe to be an ideal frame as it constitutes the large majority of active businesses operating in Jamaica. A representative sample of over 600 firms was pulled from the frame and was stratified by industry-type and parish; and the entity type designated as micro, small and medium was determined through a survey question on ‘number of employees in the firm’. The MIIC/ Mona School of Business (UWI) agreed upon definition for entity type was used for carrying out the study. However, it is to be noted that the revenues associated with the entity type from the definition was not used as this information could not be ascertained from the firms. It was also determined (at the onset) that a much larger sample than required for analysis was needed for this survey (and so a sample of over 600 was selected) as experience has shown that telephone surveys in Jamaica are associated with very low response rates. A final sample of 200 was used for study. Notwithstanding the constraints in sampling, every effort was made to ensure representativeness and that the population characteristics were reflected in the sample.
Data Analysis
In the quantitative analysis (second phase of the study), SPSS version 16 was the
software utilized. Summary statistics were generated for describing the sample. For the continuous variables on challenges faced by the MSME Sector, captured by 5-point Likert

Page 94
Academy of Entrepreneurship Journal, Volume 20, Number 2, 2014
scales, parametric testing via One-Way Anova was used to determine significant difference between means in relation to the three categories of business types. This was followed up with the Post Hoc test using Scheffe for determining the magnitude of the differences through multi-comparison of means.
RESULTS Description of Survey Sample
The final sample consisted of 200 firms that were distributed as follows: Micro (39%),
Small (44%) and Medium (18%). This distribution (spreading across the 14 parishes of Jamaica) provided a fairly good representation of the island as estimates indicate that over 80% of Jamaican firms are either micro or small. These firms were also distributed across industry types with Real Estate & Professional Services (25%), Wholesale & Retail Trade (16%), Transportation & Communication (16%) and Manufacturing (15%). Seventy eight percent of respondents surveyed were either owners or managers, with the remaining (22%) being supervisors or individuals who were in senior positions with the company and were therefore deemed suitable to participate in the study, based on knowledge and experience with the firm. These respondents were evenly split across gender: Male (50%) and Female (50%). Almost 80% of individuals surveyed reported tertiary education as the last level of attainment; 17% with secondary/high school education; and less than 4% with primary education as the final level; thus indicating that the large majority of owner/ managers in these MSMEs are qualified to carry out the job; having tertiary level training (Table 4).
INFERENTIAL FINDINGS ON CHALLENGES FACED BY MSMES ACROSS ENTITY TYPE
The results of the survey indicated that the most significant challenges faced by the sector
are high impact of energy costs, lack of ability to deal with tax returns, high interest rates on loans and lack of capacity for innovation. Micro enterprises were less affected by the cost of energy and cost of security than both medium and small entities. However, on most of the other challenges, such as ability to prepare tax returns, technological capabilities, utilization of technological skills among workers, marketing and access to credit, micro firms were more challenged (rated less) than their MSME counterparts. The results further showed that there were no significant differences between the entities on many of the challenges such as interest rates on loans, bureaucracy across Government agencies, access to industry information, capacity for innovation, differentiation of products/services, dependency on foreign exchange, collateral requirements for accessing loans and firm’s ability to trade across borders (Table 5).

Page 95
Academy of Entrepreneurship Journal, Volume 20, Number 2, 2014
Table 4: Descriptive Statistics on Survey Sample
Variables Frequency Percent Firm Type Micro 77 38.5 Small 87 43.5 Medium 36 18.0 Total 200 100.0 Industry Type Agriculture 10 5.0 Manufacture 30 15.1 Energy & Water 29 14.6 Construction 6 3.0 Wholesale & Retail Trade
31 15.6
Transportation & Communication
32 16.1
Financial Services 12 6.0 Real Estate & Professional Services
49 24.6
Total 199 100.0 Position of Respondent Owner 63 32.8 Manager 87 45.3 Other 42 21.9 Total 192 100.0 Gender of Respondent Male 97 50.5 Female 95 49.5 Total 192 100.0 Last Level of Educational Attainment Primary School 7 3.6 Secondary/High School 33 17.1 Tertiary 153 79.3 Total 193 100.0

Page 96
Academy of Entrepreneurship Journal, Volume 20, Number 2, 2014
Table 5: Challenges Faced By MSMEs Across Entity Type
Challenges N Min Max Mean ANOVA Results
Micro (MI), Small (SM), Medium (MI)
Energy cost 194 1 5 4.12
F (2,191) =8.876; p =. 000; eta squared=09; MI:[M=3.75, SD=1.21];
SM:[M=4.28, SD=.934]; ME:[M=4.53, SD=.706]
MI < SM* & MI < ME*; (*p<.05) Interest rates on loans in market 180 1 5 3.87 n/s
Level of bureaucracy encountered when doing business with government agencies
195 1 5 3.59 n/s
Security cost 195 1 5 3.26
F (2,192) =13.218; p =. 000; eta squared= .12; MI:[M=2.78,
SD=1.219]; SM:[M=3.44, SD=1.001]; ME:[M=3.83, SD=.954]
MI < SM* & MI < ME*; (*p<.05) Access to relevant industry information through government/non-government
186 1 5 2.91 n/s
Firm's ability to prepare tax returns 184 1 5 3.99
F (2,181) =7.967; p =. 000; eta squared= .08; MI:[M=3.62,
SD=1.246]; SM:[M=4.22, SD=.806]; ME:[M=4.25, SD=.880]
MI < SM* & MI < ME*; (*p<.05) Firm's capacity for innovation 198 1 5 3.83 n/s
Firm technological capabilities 197 1 5 3.76
F (2,194) =8.056; p =. 000; eta squared= .08; MI:[M=3.41,
SD=1.260]; SM:[M=4.02, SD=.698]; ME:[M=3.83, SD=.910]
MI < SM* (*p<.05) Differentiation of products/services 197 1 5 3.66 n/s
Utilization of technological skills among workers
198 1 5 3.66
F (2,195) =9.418; p =. 000; eta squared= .09; MI:[M=3.29,
SD=1.228]; SM:[M=3.97, SD=..813]; ME:[M=3.67, SD=.756]
MI < SM* (*p<.05)
Firm's ability to market products and services
191 1 5 3.60
F(2,188)=6.680; p =. 002; eta squared= .07; MI:[M=3.29,
SD=1.075]; SM:[M=3.78, SD=..822]; ME:[M=3.86, SD=.912]
MI < SM* & MI < ME*; (*p<.05)
Firm's ability to access credit 179 1 5 3.35
F(2,176)=6.668; p =. 002; eta squared= .07; MI:[M=3.00,
SD=1.167]; SM:[M=3.58, SD=..886]; ME:[M=3.53, SD=.973]
MI < SM* (*p<.05) Firm's dependency on foreign currency 192 1 5 3.29 n/s
Collateral for accessing loans 183 1 5 2.96 n/s Firm's ability to trade across boundaries 174 1 5 2.65 n/s
n/s indicates that there were no significant differences between entity types.
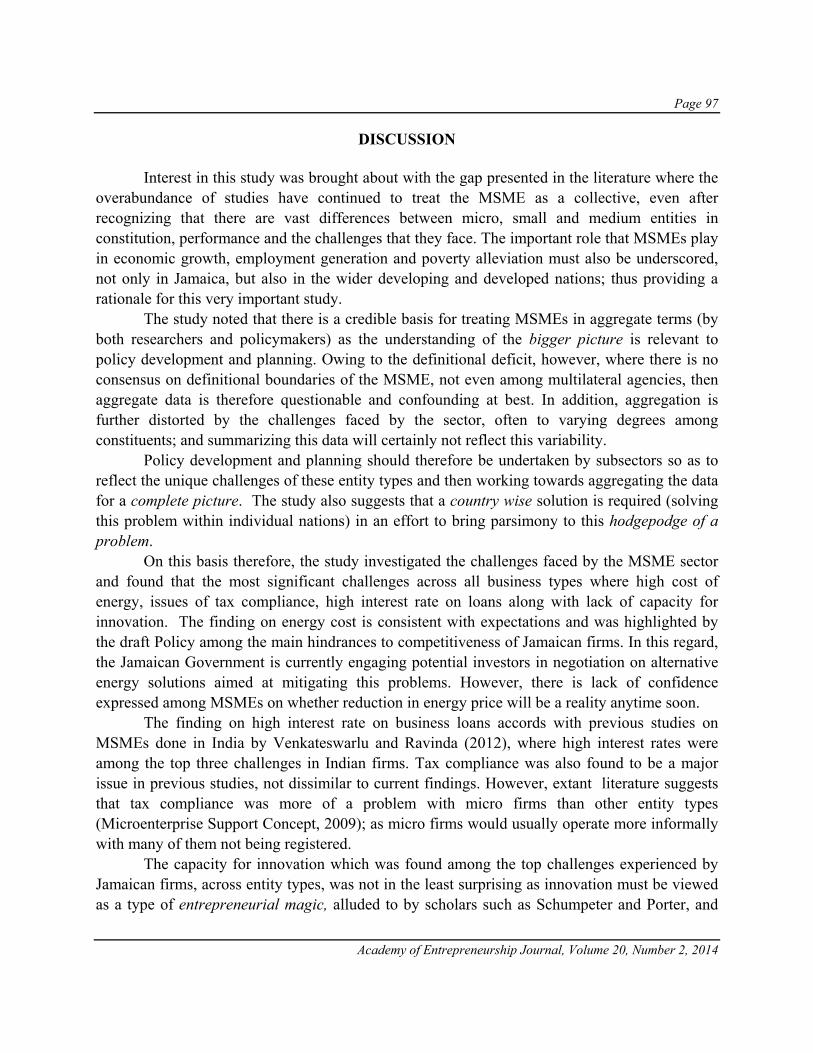
Page 97
Academy of Entrepreneurship Journal, Volume 20, Number 2, 2014
DISCUSSION
Interest in this study was brought about with the gap presented in the literature where the overabundance of studies have continued to treat the MSME as a collective, even after recognizing that there are vast differences between micro, small and medium entities in constitution, performance and the challenges that they face. The important role that MSMEs play in economic growth, employment generation and poverty alleviation must also be underscored, not only in Jamaica, but also in the wider developing and developed nations; thus providing a rationale for this very important study.
The study noted that there is a credible basis for treating MSMEs in aggregate terms (by both researchers and policymakers) as the understanding of the bigger picture is relevant to policy development and planning. Owing to the definitional deficit, however, where there is no consensus on definitional boundaries of the MSME, not even among multilateral agencies, then aggregate data is therefore questionable and confounding at best. In addition, aggregation is further distorted by the challenges faced by the sector, often to varying degrees among constituents; and summarizing this data will certainly not reflect this variability.
Policy development and planning should therefore be undertaken by subsectors so as to reflect the unique challenges of these entity types and then working towards aggregating the data for a complete picture. The study also suggests that a country wise solution is required (solving this problem within individual nations) in an effort to bring parsimony to this hodgepodge of a problem.
On this basis therefore, the study investigated the challenges faced by the MSME sector and found that the most significant challenges across all business types where high cost of energy, issues of tax compliance, high interest rate on loans along with lack of capacity for innovation. The finding on energy cost is consistent with expectations and was highlighted by the draft Policy among the main hindrances to competitiveness of Jamaican firms. In this regard, the Jamaican Government is currently engaging potential investors in negotiation on alternative energy solutions aimed at mitigating this problems. However, there is lack of confidence expressed among MSMEs on whether reduction in energy price will be a reality anytime soon.
The finding on high interest rate on business loans accords with previous studies on MSMEs done in India by Venkateswarlu and Ravinda (2012), where high interest rates were among the top three challenges in Indian firms. Tax compliance was also found to be a major issue in previous studies, not dissimilar to current findings. However, extant literature suggests that tax compliance was more of a problem with micro firms than other entity types (Microenterprise Support Concept, 2009); as micro firms would usually operate more informally with many of them not being registered.
The capacity for innovation which was found among the top challenges experienced by Jamaican firms, across entity types, was not in the least surprising as innovation must be viewed as a type of entrepreneurial magic, alluded to by scholars such as Schumpeter and Porter, and

Page 98
Academy of Entrepreneurship Journal, Volume 20, Number 2, 2014
Jamaican firms that are so challenged to survive could find it difficult to actualize or to engender the knowledge and technological capabilities for such innovation.
On support for disaggregating the troika for more in-depth understanding of the constituents, the study showed that micro firms were less challenged than the other two business forms on energy and security costs. Intuitively, this could be explained by the experience on the ground where many micro firms operating in Jamaica, while considering energy cost to be fairly high (as evidenced by a rating of 3.75 on a 5-point scale) seemingly subsume this cost in personal expenses (as many operate from homes or rented cover-charge offices) and therefore have difficulties in treating this cost as a line item and so may not be sure of its true magnitude on their businesses. Again, the other two business types, usually being armed with more machinery and equipment, would naturally be more susceptible to higher energy costs than micro firms. Similarly, security cost, which is considered a troubling problem for Jamaican firms (with the high level of crimes in the country) is not usually factored in as a line item among micro firms as reflected by the low rating of 2.78 on cost of security on the 5-point scale. However, experience has shown that small and medium size firms operating in Jamaica often employ security guards and watch-men to protect their properties which invariably will affect their bottom-line, more than that of the micro firms.
Support for disaggregating data was also found among other challenges such as technological capabilities, utilization of technological skills among workers, marketing and access to credit. On all these attributes, micro firms were found to be more challenged than other firm types. The problem of technological handicap experienced by micro firms could be explained by the findings of Evans and Sawyer (2009) who found that with much fewer resources, smaller type firms are more reluctant to invest in technology than larger firms; thus resulting in technological hindrances within these firms. On the ability to market goods and services, MSMEs on the whole, were found to be wanting among each component of its triad (Tambunan, 2011). This could be due to scarcity of resources and tentative attitude to marketing (Vega & Rojas, 2011), particularly among the micro business form. In addition, micro firms were more challenged than other business types on ability to access credit. This could be explained by Kira and He (2012) who found a positive relationship between firm size and access to debt financing. The findings of this study have not delineated challenges by firm type on some factors such as interest rate on loans, government bureaucracy and dependency on foreign exchange. All entity types, it would seem, are equally challenged on these macroeconomic imperatives. However, the call for disaggregation of data for a more accurate assessment of the situation and more targeted policy development and planning should not be ignored (on these attributes) as the one policy fitting all cannot be the way forward; with evidence suggesting that there are many difference among the troika on challenges faced within Jamaican MSMEs. Although the study attempted to explicate the challenges faced by MSMEs and provided the necessary arguments for disaggregating data for more targeted development and planning,
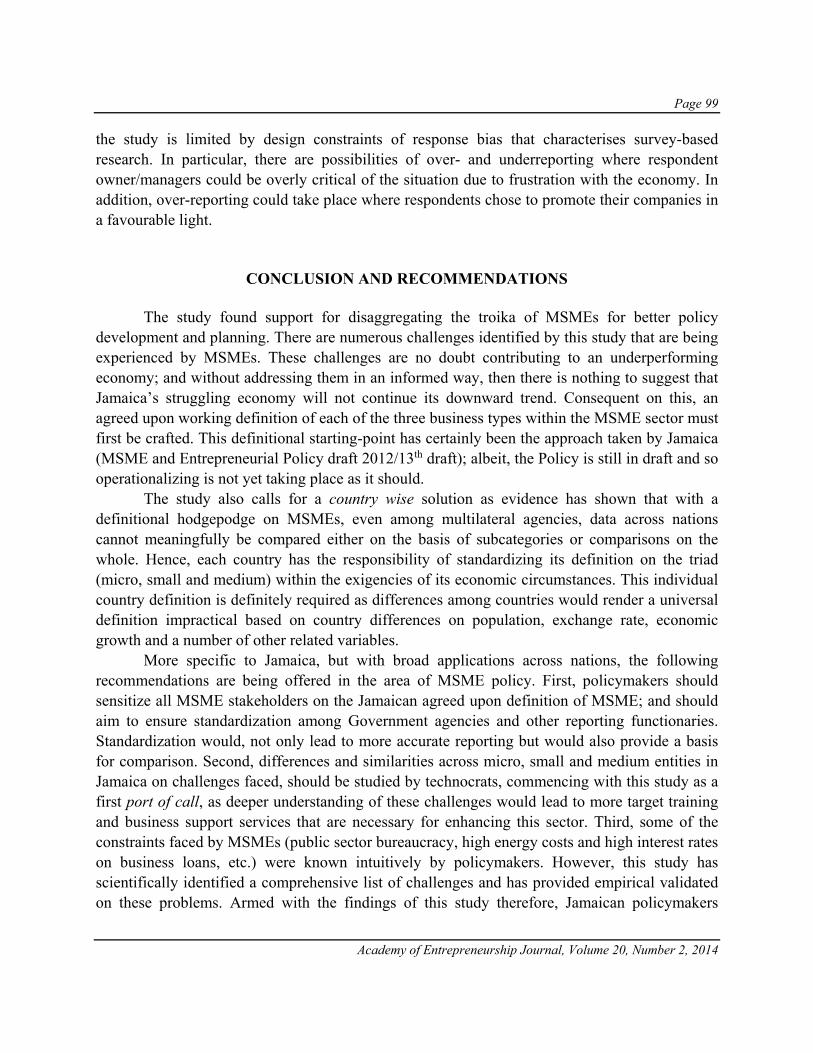
Page 99
Academy of Entrepreneurship Journal, Volume 20, Number 2, 2014
the study is limited by design constraints of response bias that characterises survey-based research. In particular, there are possibilities of over- and underreporting where respondent owner/managers could be overly critical of the situation due to frustration with the economy. In addition, over-reporting could take place where respondents chose to promote their companies in a favourable light.
CONCLUSION AND RECOMMENDATIONS The study found support for disaggregating the troika of MSMEs for better policy development and planning. There are numerous challenges identified by this study that are being experienced by MSMEs. These challenges are no doubt contributing to an underperforming economy; and without addressing them in an informed way, then there is nothing to suggest that Jamaica’s struggling economy will not continue its downward trend. Consequent on this, an agreed upon working definition of each of the three business types within the MSME sector must first be crafted. This definitional starting-point has certainly been the approach taken by Jamaica (MSME and Entrepreneurial Policy draft 2012/13th draft); albeit, the Policy is still in draft and so operationalizing is not yet taking place as it should. The study also calls for a country wise solution as evidence has shown that with a definitional hodgepodge on MSMEs, even among multilateral agencies, data across nations cannot meaningfully be compared either on the basis of subcategories or comparisons on the whole. Hence, each country has the responsibility of standardizing its definition on the triad (micro, small and medium) within the exigencies of its economic circumstances. This individual country definition is definitely required as differences among countries would render a universal definition impractical based on country differences on population, exchange rate, economic growth and a number of other related variables.
More specific to Jamaica, but with broad applications across nations, the following recommendations are being offered in the area of MSME policy. First, policymakers should sensitize all MSME stakeholders on the Jamaican agreed upon definition of MSME; and should aim to ensure standardization among Government agencies and other reporting functionaries. Standardization would, not only lead to more accurate reporting but would also provide a basis for comparison. Second, differences and similarities across micro, small and medium entities in Jamaica on challenges faced, should be studied by technocrats, commencing with this study as a first port of call, as deeper understanding of these challenges would lead to more target training and business support services that are necessary for enhancing this sector. Third, some of the constraints faced by MSMEs (public sector bureaucracy, high energy costs and high interest rates on business loans, etc.) were known intuitively by policymakers. However, this study has scientifically identified a comprehensive list of challenges and has provided empirical validated on these problems. Armed with the findings of this study therefore, Jamaican policymakers

Page 100
Academy of Entrepreneurship Journal, Volume 20, Number 2, 2014
should be more surefooted in approaching the problems and be more decisive in implementing solutions. Fourth, while we must mitigate these challenges in moving forward, every effort must be expended, at this time, to ensure that the MSME sector delivers on the promise on economic growth amidst the heightened austerity measures that have arisen through the recent IMF deal of 2012. And so, while the Government of Jamaica must meet the targets set out in the IMF arrangements; balance has to be foremost (austerity and growth); thus ensuring that the MSME provides the catalyst for growth by fixing both demand and supply sides of the sector. Fifth, it was also found that constraints affecting the sector were more impactful on the micro firms that on their counterparts. With the micro firm being endangered therefore, policy provision must be put in place to address this subsector, and, it is being recommended that immediate action be taken to turn around the fortunes of the micro firm (helping them with financing and marketing, in particular) as they constitute a sizable proportion of the MSME market; and being micro they could prove to be more agile than other firms, thereby engendering capacity for innovation and growth. It is therefore imperative that an initiative for improving the micro firms be led by Government, so as to transition them from limited means to economic sustainability. Sixth, in the final analysis, policymaker should aim to engender a culture of entrepreneurship and innovation across the triad of entities and create an enabling environment for business to flourish.
After all, the literature is replete with reference to the MSMEs’ contribution to economic growth, employment generation, innovation and poverty alleviation (Beck, et al., 2005; Gruzina & Zvirbule-Berzina, 2012; Vega & Rojas, 2011;Venkateswarlu & Ravindra, 2012; ); thus signalling the seriousness in attention that should be given at the level of policy. It is certainly felt that the successful implementation of the study’s recommendations (though discussed here in broad terms, and would certainly need to be detailed in an operational plan) is absolutely necessary for further development and sustainability of the MSME sector in Jamaica. The findings also suggest a number of avenues for further research. First, three focus group, one for each component of the triad, instead of only one used in this study, could be conducted. This would result in more homogenous groupings and could therefore lead to different sets of challenges faced by each group in the qualitative phase of the analysis. Second, a replication of this study could be done in other developing country, with similarities and differences to Jamaica as more work needs to be done in disaggregating MSME data towards more generalised findings. Finally, in disaggregating the troika, further studies should seek to explicate differences between challenges of small and medium firms; as in the current study, these differences were not evident.

Page 101
Academy of Entrepreneurship Journal, Volume 20, Number 2, 2014
REFERENCES Asghar, A. J., K. Nawaser, M. J. Paghaleh, S. Mohammad & S. Khaksar (2011). The role of government policy and
the growth of entrepreneurship in the micro, small (&) medium-sized enterprises in India: An overview. Australian Journal of Basic and Applied Science, 5(6), 1563-1571.
Beck, T., A. Demirguc-Kunt & R. Levine (2005). SMEs, growth, and poverty: Cross-Country evidence. Journal of Economic Growth, 10(3), 199-229.
Berger, A. N. & G. F. Udell (1998). The economics of small business finance: The roles of private equity and debt markets in the financial growth cycle. Journal of Banking & Finance, 22(6-8), 613-673.
Ekeledo, I. & E.D. Bewayo (2009). Challenges and opportunities facing African entrepreneurs and their small firms. International Journal of Business Research, 9 (3), 52-59.
Evans, N. & J. Sawyer (2009). The mining boom: Challenges and opportunities for small businesses in regional South Australia. Australian Journal of Regional Studies, 15(3), 355-372.
European Commission, MSME Definition (2003). Retrieved September 9, 2013 from: http://ec.europa.eu/ enterprise/policies/sme/facts-figures-analysis/sme-definition/
T. Gibson & H. J. van der Vaart (2008, September). Defining SMEs: A less imperfect way of defining small and medium enterprises in developing Countries. Brookings Global Economy and Development.
Gruzina, Z. & A. Zvirbule-Berzina (2012). Support diversification for micro, small and medium size enterprises in Zemgale region. Economic Science for Rural Development, 28, 49-55.
Hagedoorn, J. (1996). Innovation and entrepreneurship: Schumpeter revisited. Oxford University Press. Kira, A. R. & Z. He (2012). The impact of firm characteristics in access of financing by small and medium-sized
enterprises in Tanzania. International Journal of Business and Management, 7(24), 108-119. Lahiri, R. (2012). Financing micro, small and medium enterprises (MSMES) in India during post liberalization
period: A study on traditional and unconventional approaches of financing. Indian Streams Research Journal, 2(8), 1-8.
MacGregor, R. C. (2003). Strategic alliances and perceived barriers to electronic commerce adoption in SMEs. Journal of Systems and Information Technology, 7(1), 27-28 Meredith, G. G. (1994). Small Business Management in Australia (Fourth Edition). Australia, McGraw Hill
Professional. Microenterprise Support Concept 2009. (2012). Retrieved on September 14, 2013 from http://llufb.llu.lv/conference/economic_science_rural/2012/ESRD_2012_28.pdf MSME & Entrepreneurship Policy 2012 (13th Draft), Ministry of Industry, Investment and Commerce. New challenges for trade promotion: Export strategies for small firms. (1999). International trade Forum, 1.
Retrieved September 14 from http://www.tradeforum.org/Export-Strategies-for-Small-Firms/ Onu, M.E & D.I. Ekine (2009). Critical challenges to small-scale rural business firms: A case study of poultry farm
enterprise in Ido LGA, Oyo State. Asia-Pacific Journal of Rural Development, 19 (2), 143-166. Tambunan, T.T.H. (2011). Development of micro, small and medium enterprises and their constraints: A story from
Indonesia. Gadjah Mada International Journal of Business, 13(1), 21-43 Vega, R. & S. Rojas (2011). Knowledge, perception, and application of strategic marketing in MSMEs (micro, small
and medium enterprises) in Bogota. Journal of Marketing Development and Competitiveness, 5(4), 119-130.
Venkateswarlu, P. & P.S. Ravindra (2012). Economic problems in micro, small and medium enterprises (MSMEs) in India. Advances in Management, 5(9), 36-40.
Zvirbule-Berzina, A. & Z. Gruzina (2011). Development of MSMEs in the regions of Latvia. Economic Science for Rural Development, (26), 246-251.

Page 102
Academy of Entrepreneurship Journal, Volume 20, Number 2, 2014

Page 103
Academy of Entrepreneurship Journal, Volume 20, Number 2, 2014
WHAT MATTERS, AND HOW: DOES PROCEDURAL UTILITY EXPLAIN SELF-
EMPLOYMENT?
David McClough, Ohio Northern University John Hoag, Bowling Green State University
Mary Ellen Benedict, Bowling Green State University
ABSTRACT
We find evidence that procedural utility is a useful explanatory variable of self-employment status among a sample of highly educated workers. We find no evidence indicating that procedural utility is useful in explaining the transition to self-employment. However, we do find that traditional employment attributes associated with outcome utility motivate the decision to move into paid-employment and are related to being in paid work generally. Our findings add to the literature examining the usefulness of procedural utility as an explanatory variable and motivate further examination of the relationship between procedural and outcome utility. Keywords: occupational choice, job satisfaction JEL Classifications: J24, J28
INTRODUCTION
Self-employed workers consistently report higher job satisfaction than paid workers despite evidence that self-employment requires more hours and pays less, on average. Previous research reveals that autonomy, the work itself, and opportunity for creativity drive the higher job satisfaction scores for the self-employed, and apparently compensate for lower pay and increased hours. Highly satisfied paid employees identify salary, benefits, opportunity for advancement, and responsibility as key factors. These distinct findings reveal that workers are not homogeneous. It reasons therefore that self-employed and paid workers likely specify utility functions with similar yet distinctly weighted arguments. Psychologists refer to procedural utility to distinguish benefits associated with the process of achieving utility linked to a particular outcome. Some economists have recently embraced the concept of procedural utility and have begun to evaluate the explanatory power of the concept.
This paper departs from the more common compensating wage approach. Rather than using employment status to explain job satisfaction, we model the effect of procedural and outcome utility on employment status. Empirically, our paper groups the attributes of job

Page 104
Academy of Entrepreneurship Journal, Volume 20, Number 2, 2014
satisfaction using factor analysis to create explanatory variables conforming to procedural and outcome utility. We then use employment status as our dependent variable to assess the explanatory power of outcome and procedural utility. We do not, in this model, include the impacts of income on the individual’s choice. In part, because individuals in our sample choose either paid or self-employment, we do not know the income foregone by that choice. Our analysis also includes measures of both procedural and outcome utility which are missing from most other papers.
Using the National Survey of College Graduates (NSCG) of 2003, we investigate the relationship between familiar job attributes and employment status. The NSCG provides demographic information, employment status, and data regarding the importance of key job attributes. The NSCG also indicates whether a respondent changed jobs in the past two years. With this data we are able to construct variables comprised of key job attributes that are inputs to procedural utility and the more traditional outcome-based utility. We include the constructed variables in a probit regression model for the full sample and for a subsample comprised of respondents who changed jobs in the past two years. The organization of this paper proceeds as follows: section II briefly summarizes the existing literature, section III presents the economic and econometric models, section IV states the research question and presents hypotheses for testing, section V describes the data and analysis, and presents the results, and conclusions are presented in section VI.
LITERATURE REVIEW
Studies grounded in microeconomics employ a utility maximization framework emphasizing the earnings differential between paid- and self-employment (Rees and Shah 1986, Evans and Leighton 1989, Dolton and Makepeace 1990). An established literature suggests that self-employment is more satisfying than paid employment (Blanchflower and Oswald 1998, Taylor 2004, Kawaguchi 2008, Benz and Frey 2008a). To explore why self-employment is more satisfying, research has focused on attributes beyond income.
Taylor (1996) suggests that the decision to pursue and sustain self-employment rather than paid employment implies greater utility associated with self-employment. Using UK panel data, Taylor finds that expected higher earnings and autonomy contribute to greater utility. Blanchflower and Oswald (1998) use longitudinal data from Great Britain to find that self-employed workers report greater job and life satisfaction than paid employees. Job satisfaction numbers are higher for the self-employed despite evidence of lower average income (Hamilton 2000, Andersson 2008). Greater job satisfaction is somewhat surprising given disadvantages associated with self-employment, including: more hours, greater responsibility, less job security, and increased incidence of mental health problems (Blanchflower 2004, Taylor 2004, Andersson 2008, Georgellis et al. 2007, Turan and Kara 2007). Gavin Cassar (2007) examines the motivation of nascent entrepreneurs and finds that financial motives are important considerations

Page 105
Academy of Entrepreneurship Journal, Volume 20, Number 2, 2014
of aspiring entrepreneurs, despite empirical evidence that the financial rewards, on average, fail to surpass those of paid employment. Given the lower pay and abundance of undesirable attributes, what makes self-employment so satisfying compared to paid employment?
Empirical studies consistently identify autonomy and independence as important factors in higher job satisfaction among the self-employed (Blanchflower and Oswald 1991; Taylor 1996; Turan and Kara 2007; Andersson 2008). Attributes closely related to autonomy have also been identified as important factors. Mark Taylor (2004) finds that self-employed workers are generally more satisfied with the work itself. Georgellis et al. (2007) examine self-employment survival and exit and find that opportunity to use initiative contributed to job satisfaction. Scase and Goffee (1982) conclude that ideology contributes to a preference for autonomy and freedom, and the ideology finds expression through concepts like the American Dream that emphasize the potential for upward social mobility through self-employment as well as paid employment. It may also be useful to recall that Ely Chinoy (1955) reported in his classic ethnography that US auto workers viewed self-employment as an alternative to the alienation associated with the assembly line and as an opportunity to determine their work. Makenzie (1973) offers supporting evidence of the importance of self-determination in his study of craftsmen who sought self-employment to control the quality of their work.
Two recent threads have emerged in the literature. The first examines the influence of culture in the decision to pursue self-employment. Uhlaner et al. (2002) examine the relationship between self-employment and post-materialism. Post-materialism is a term coined by Inglehart (1977) describing the dominance of non-material goals over material goals in society. Inglehart (1996) observes diminishing returns to well-being and survival associated with income gains. He concludes that economic necessity dominates life style preferences at lower incomes but eventually yields to life style preferences once an income threshold is achieved. The transition to post-materialist values associated with lifestyle is observed across developed countries and is inversely correlated with age as older members of society retain materialist values and younger members of society increasingly report post-materialistic values.
The second new thread in the literature challenges the conception of utility as traditionally applied in microeconomics. Procedural utility refers to benefits generated in the process of attaining outcome utility. Utility is derived not only from outcomes but utility is derived independently from the process leading to the outcomes (Fry et al. 2003, Fuchs-Schundeln 2009). Frey, Benz and Stutzer (2003) suggest that procedural utility deviates from traditional outcome utility due to an emphasis on non-instrumental determinants of utility, well-being, and acknowledgement of a sense of self. Benz and Frey (2008a) find that self-employment produces procedural utility through a higher measure of self-determination and freedom. Using household level panel data from Germany, the UK, and Switzerland, Benz and Frey find that the independence associated with self-employment explains the variance in job satisfaction, which is used as a proxy for utility. Using a sample of 23 countries, Benz and Frey (2008b) find that higher job satisfaction is associated with more interesting jobs and autonomy,

Page 106
Academy of Entrepreneurship Journal, Volume 20, Number 2, 2014
two attributes of self-employment that contribute to procedural utility. Block and Koellinger (2009) find that nascent entrepreneurs are more satisfied with their start-up than necessity entrepreneurs. They emphasize the importance of procedural utility in their conclusion that greater satisfaction of nascent entrepreneurs is associated with the free will to pursue a start-up in contrast to the lower satisfaction of nascent entrepreneurs for whom a lack of labor market opportunities dictated the necessity of a start-up
RESEARCH QUESTION AND HYPOTHESES On average, highly educated individuals possess greater marginal productivity and,
therefore, can be expected to confront a larger opportunity set of paid employment options featuring attributes consistent with higher job satisfaction. What motivates highly educated individuals to forego paid employment opportunities in favor of self-employment opportunities characterized by more working hours, greater stress, documented adverse health effects, and low monetary compensation? This paper will examine this research question by testing the following hypotheses: H1: Highly educated workers assigning greater importance to attributes consistent with the concept of procedural utility are more likely to be self-employed. H2: Highly educated workers assigning greater importance to attributes consistent with the concept of outcome utility are more likely to be paid workers.
The hypotheses emphasize the type of employment as an outcome (self- or paid employment) and not the transition from one to the other however, it seems reasonable to consider how procedural and objective utility inform the decision to switch from one type of employment to the other. Studies reveal a link between procedural utility and the movement into self-employment. Blanchflower and Oswald (1998) present international survey data revealing a preference for self-employment regardless of the respondents’ current employment status. Expectations of autonomy and greater flexibility make self-employment desirable. Moreover, expectation of large financial returns informs preferences for self-employment. However, studies reveal that, on average, financial rewards are less than paid employment. Accordingly, it seems reasonable to anticipate that individuals transitioning into self-employment from paid employment will possess a different mix of procedural and objective utility compared to self-employed individuals who continue with self-employment based on actual experience in contrast to expectations. We might, therefore, expect individuals transitioning from one self-employment situation to another self-employment to weight attributes consistent with the idea of procedural utility relatively highly compared to individuals transitioning from self-employment to paid employment. It is more difficult to anticipate the motivation to transition from paid employment to self-employment. It is not clear whether attributes associated with procedural utility will dominate attributes associated with objective utility or vice versa.
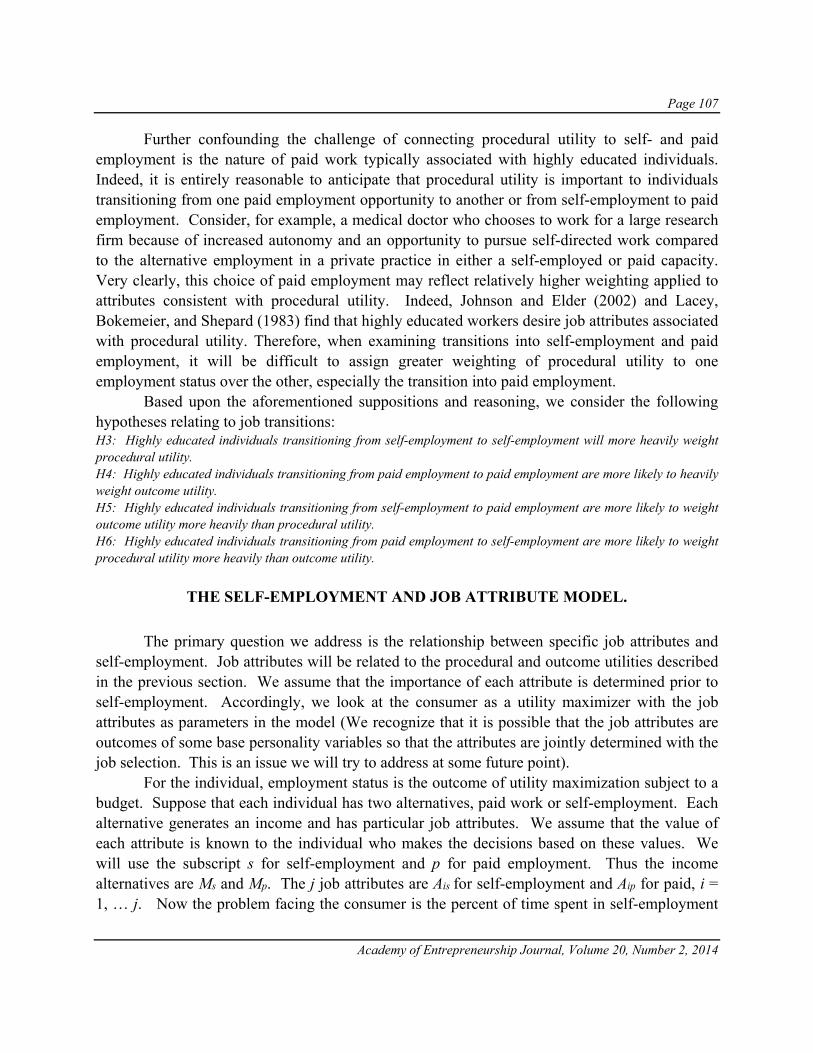
Page 107
Academy of Entrepreneurship Journal, Volume 20, Number 2, 2014
Further confounding the challenge of connecting procedural utility to self- and paid employment is the nature of paid work typically associated with highly educated individuals. Indeed, it is entirely reasonable to anticipate that procedural utility is important to individuals transitioning from one paid employment opportunity to another or from self-employment to paid employment. Consider, for example, a medical doctor who chooses to work for a large research firm because of increased autonomy and an opportunity to pursue self-directed work compared to the alternative employment in a private practice in either a self-employed or paid capacity. Very clearly, this choice of paid employment may reflect relatively higher weighting applied to attributes consistent with procedural utility. Indeed, Johnson and Elder (2002) and Lacey, Bokemeier, and Shepard (1983) find that highly educated workers desire job attributes associated with procedural utility. Therefore, when examining transitions into self-employment and paid employment, it will be difficult to assign greater weighting of procedural utility to one employment status over the other, especially the transition into paid employment. Based upon the aforementioned suppositions and reasoning, we consider the following hypotheses relating to job transitions: H3: Highly educated individuals transitioning from self-employment to self-employment will more heavily weight procedural utility. H4: Highly educated individuals transitioning from paid employment to paid employment are more likely to heavily weight outcome utility. H5: Highly educated individuals transitioning from self-employment to paid employment are more likely to weight outcome utility more heavily than procedural utility. H6: Highly educated individuals transitioning from paid employment to self-employment are more likely to weight procedural utility more heavily than outcome utility.
THE SELF-EMPLOYMENT AND JOB ATTRIBUTE MODEL.
The primary question we address is the relationship between specific job attributes and self-employment. Job attributes will be related to the procedural and outcome utilities described in the previous section. We assume that the importance of each attribute is determined prior to self-employment. Accordingly, we look at the consumer as a utility maximizer with the job attributes as parameters in the model (We recognize that it is possible that the job attributes are outcomes of some base personality variables so that the attributes are jointly determined with the job selection. This is an issue we will try to address at some future point). For the individual, employment status is the outcome of utility maximization subject to a budget. Suppose that each individual has two alternatives, paid work or self-employment. Each alternative generates an income and has particular job attributes. We assume that the value of each attribute is known to the individual who makes the decisions based on these values. We will use the subscript s for self-employment and p for paid employment. Thus the income alternatives are Ms and Mp. The j job attributes are Ais for self-employment and Aip for paid, i = 1, … j. Now the problem facing the consumer is the percent of time spent in self-employment

Page 108
Academy of Entrepreneurship Journal, Volume 20, Number 2, 2014
and then the remainder of time spent in paid employment. We will use the letter s for the percent of time in self-employment. The problem can then be stated as follows. The consumer purchases a good X at price P from the income generated by employment. Thus the budget constraint will be PX = sMs + (1-s)Mp. Utility depends on the consumption of X and the attributes of the employment choice. Thus we have the consumer choosing the value of s to maximize U(X, sA1s + (1-s)A1p, sA2s + (1-s)A2p, … , sAjs + (1-s)Ajp) subject to sMs + (1-s)Mp – PX = 0. We will solve the constraint for X and use this value of X in the utility function before carrying out the maximization. There is one first order condition, and we solve for the value of s. In this case, we will have an equation
s = f(P, Ms, Mp, A1s, A1p, A2s, A2p, … , Ajs,, Ajp) (1)
Because our data are collected after employment status is determined and the value of s will be zero or one, the equation we estimate will be a bit simpler. Here only the attributes of the alternative choice will enter the equation where i = s or p depending on the choice we observe.
s = f(P, Mi, A1i, A2i, … , Aji) (2)
To include the job attribute variables in our utility maximization problem means that we would have a significant number of variables, some of which may be strongly related to others, or may be measuring nearly similar attributes. One way to sort out how the variables interact is to use factor analysis. Once we have the relevant factors determined, we can use these factors as the Ai variables in the estimation of the equation above. Additionally, because the variables in our analysis are really attitudes about the importance of certain attributes and not measures of the attribute itself and because the actual attributes may be unmeasured, latent variables, it makes sense for us to control for these unmeasured or latent variables using factor analysis. This empirical problem is found in the psychology and sociology literature, where attitudinal surveys are common (Factor analysis is also used by economists. For example, see Train et al. (1987) where factor analysis helps to determine consumer preferences in a demand model for electricity and Lankford and Wyckoff (2000) for a study on parental attitudes toward public and private schooling). Factor analysis estimates relationships among observed or “manifest” variables, which are used to determine a small set of factors. Although some subjective interpretation is involved, the factor analysis is useful when the unobserved factors are undetectable otherwise. As noted above, individuals face a binary choice of either becoming self-employed or working for someone else.1

Page 109
Academy of Entrepreneurship Journal, Volume 20, Number 2, 2014
s= αx + βy + ε (3)
Let be the latent variable model reflecting the value of self-employment, and the choice is
made only if s > 0. If the individual is self-employed, let s = 1 or, s = 0 if the individual chooses paid work; x is a vector of observable variables that affect the self-employment choice such as demographic variables, number of small children, and educational attainment; y is a vector of unobserved job attribute variables. The α and β are vectors of parameters to be estimated and ε is the error term assumed to be N(0, σ2). Even though the y are not observed, we do observe manifest variables z that are presumed to be indicators of the latent explanatory variables y. In our case, the z are the variables representing the importance of certain job attributes, for which we have data. In other words,
z= Γy + u (4) where Γ is a set of M x K parameters and u is the error term, also normally distributed with mean 0 and a covariance matrix equal to Σ. We also assume that z and y are normally distributed with mean 0 and covariance matrices Ω and Ψ, respectively. Because factor analysis uses the covariance matrices to determine common factors, we must consider the relationships between Σ , Ω and Ψ. The model includes the assumption that the off-diagonal elements of Ψ are zero and the diagonal elements of Ω are 1. Under the assumption that βy and u are independent, the relationship of the covariance matrices is Σ = ΓΩΓ’ + Ψ. Factor analysis uses this relationship to estimate the elements of Γ, Ω, and Ψ. These estimates are then used to develop the underlying factors:
y | z ~ N(Λ z, Ω - Λ ΓΩ) (5) where Λ is the K x M matrix of factor score coefficients (Λ =Ω Γ’(ΓΩΓ’ + Ψ)-1). As Train et al. (1987) note, except under special circumstances, the factor score is not the true value of y for a particular observation. Rather, the score represents a consistent estimate of the conditional mean of the distribution of y, given the values of z. Without exact values for y, the conditional means of y are used to estimate the probability in equation (3). We use a probit model to estimate the probability that an individual is self-employed: P(s=1)= P( αx + β( Λ z) + ε > 0) = 1-Φ [(αx + β( Λ z) /σn](6) where, as with convention using probit models, σn = 1 to make estimate of the parameters α and β feasible (See Lankford and Wyckoff (2000) for a full explanation of how the current model yields consistent parameter estimates).

Page 110
Academy of Entrepreneurship Journal, Volume 20, Number 2, 2014
DATA DESCRIPTION AND ANALYSIS.
The National Survey of College Graduates (NSCG) is a “once in a decade opportunity” to examine the educational and career characteristics of the United States college-level individuals (sestat.nsf.gov/sestat/sestat.html). The National Science Foundation conducts this and other surveys to form the SESTAT system (Scientists and Engineers Statistical Data System). The NSCG was given in October 2003, to a random sample of individuals living in the United States, under the age of 76, who had received a bachelor’s degree or higher prior to the new millennium. The public-use sample includes data on 100,042 individuals. When we include only the observations of individuals currently working with all the information on the variables used in the analysis, we are left with 83,024 individuals, of which 16.5% (n=13,740) are self-employed. It is important to note that the NSCG employs a sampling method that controls for stratification by groups and nonresponse bias. Thus, SESTAT includes a weighting factor that we use in this analysis. The weighting factor slightly changes the statistical results of the subsequent analysis, but by very little (For example, the unweighted percentage of self-employed is 16.5 percent; the weighted percentage is 17.5 percent. Results without the weighting factor are available from the authors). We use the weights provided by SESTAT for all statistical analyses. Based on the literature regarding the factors that influence one’s decision to be self-employed, the control variables include: information on individual characteristics (age, gender, race, foreign or domestic-born status, retirement status) and family characteristics (marital status, number of small children, and whether the spouse works). To capture the human capital, we include Years Since Highest Degree as a proxy for overall work experience. In addition, three binary variables capture the level of educational attainment: whether one has completed a Masters level degree, a doctoral degree, or a professional degree (e.g. MD, JD, DDS).2
Table 1 presents the descriptive statistics of the variables used in the analysis for the full sample, paid, and self-employed workers. Means tests between the paid and self-employed workers reveal that self-employed workers tend to be white, male, married, and more than two years older than paid workers. As noted above, we employ a factor analysis to summarize individual opinions about job attributes. Respondents were asked, “When thinking about a job, how important is each of the following factors to you?” Individuals rated the various attributes on a four-point scale, from very important to not important at all. Table 2 presents the variables we selected for the factor analysis. These variables represent the z in the model and include: benefits, challenge, independence, responsibility, salary, job security, and social responsibility.3 Using a principal factor analysis, we tested several factor loadings, and the results always indicated two common factors among the variables.4 The rotated factor patterns are then used to interpret the common factors, while the standardized coefficients (the Λ in Equation (6)) are used to create weighted individual factor scores. These results are also presented in Table 2.

Page 111
Academy of Entrepreneurship Journal, Volume 20, Number 2, 2014
Although interpretation of factor analysis is subjective, it does appear that two distinct common factors arise from the analysis and these factors appear to be tied to the literature descriptions related to job satisfaction and self-employment. We employ a common heuristic in factor analysis and assume that any individual attribute score from the rotated factors that is at least 0.3 indicates that the variable is important to the common factor. Thus, we find that challenge, independence, responsibility, and social responsibility are statistically important to the first common factor, with scores for these variables ranging from 0.518 to 0.651. This common factor appears to be comprised of attributes consistent with procedural utility. In contrast, job benefits, importance of salary, and job security with scores ranging from 0.572 to 0.0.675 load on the second common factor. The attributes loading on the second common factor are consistent with traditional outcome-based utility. Given the rather clear demarcation associated with the factor analysis, we are inclined to refer to the first common factor as procedural utility and the second common factor as outcome utility. The next step in the analysis is to examine how the common factors procedural utility and outcome utility are related to self-employment. We define the dependent variable, Self-Employment, equal to 1 if the individual is currently self-employed and 0 if in paid work. As typical of qualitative dependent variable analysis, we use a reduced form probit regression estimation method (A reduced form model implies that income is not included in the analysis in order to avoid simultaneity bias). The probit results are presented in Table 3. A likelihood-ratio test indicates an overall good fit to the model (The Chi-square value tests whether the variables in the model jointly contribute to the explanation of the variance in the probability of self-employment). Due to the nature of probability models, the coefficients in Column (1) of Table 2 do not represent the marginal effects of individual variables on the dependent variable; Column (2) presents these effects. The average probability for our base case was calculated at the means of all continuous variables and at zero for all binary variables and was estimated at 17.1 percent (Estimated results are available from the authors). As expected, the family and demographic characteristics are in the direction expected. Females have an average probability of being self-employed that is 3.9 percentage points lower than males. Likewise, except for those of Asian descent, African-Americans and other races (this grouping includes all other races not captured by the two race variables) are less likely to be self-employed than their white counterparts (average probabilities are 8.2 and 1.9 percentage points lower, respectively, for African-Americans and the Other Race category). On the other hand, foreign-born individuals have a 2.2 percentage point higher average probability of being self-employed compared to native-born individuals. The presence of small children also increases the probability of being self-employed, and an additional child increases the average probability by 1.2 percentage points. Being married is not statistically important to this model, perhaps because we have included whether the spouse works, which does increase the average probability of self-employment, although the effect is very small (0.5 percentage point increase).

Page 112
Academy of Entrepreneurship Journal, Volume 20, Number 2, 2014
Finally, individuals who were previously retired have an increased average probability of self-employment of 0.8 percentage points compared to those workers who never retired. When we turn to the human capital-related variables, we find that age increases the probability of being self-employed. A one-year increase in age increases the probability of self-employment by 0.1 percentage points. Thus, ceteris paribus, one would need to age about ten years in order to increase the probability of being self-employed by 1 percentage point. The variable “years since attaining one’s highest degree” has a similar level of effect on being self-employed (.3 percentage point change). Finally, the binary variables that control for educational attainment indicate that only a professional degree increases the likelihood of self-employment. Individuals with a professional degree have a 22 percentage point higher average probability of being self-employed than those with a bachelor’s degree. Receipt of a Masters or doctoral degree reduce the average probability of self-employment compared to completion of a bachelor’s degree. The human capital results are very similar to what has been found in previous research (Aaronson 1999, Benedict et al. 2010). The variables of particular interest to this paper are those related to the two common factors. As hypothesized, the procedural utility factor is positively associated with being self-employed. A tenth of a point increase in the factor’s index increases the probability of being self-employed by 1.9 percentage points (Because these factors are normalized to a mean of 0 and variance of 1, we decided to make the marginal change be 0.10). Similarly, as hypothesized, the outcome utility factor has the opposite effect and a tenth of a point increase in outcome utility lowers the probability of being self-employed by 4.9 percentage points. These results are consistent with the findings summarized in the literature review. The probability of self-employment is positively associated with attributes contributing to procedural utility and negatively associated with attributes contributing to outcome utility. Thus, in our model, the probability of paid employment is negatively associated with procedural utility and positively associated with outcome utility.
The last part of the analysis examines a subset of the workers. Recent work on self-employment has focused on transitioning to paid or self-employed work rather than the current work status of the individual. Some researchers contend that the movement to self-employment is more interesting because the transition reveals a preference for self-employment. We cannot track job changes using the NSCG.5 However, we can identify workers who changed jobs between the 2001 and 2003. Only those who were working during the survey weeks for both years and changed jobs are included in the modified dataset. These conditions result in a sample of 13,979 observations; 2,387 report being self-employed and 11,592 report being in paid work on the 2003 survey. This sample comprised entirely of respondents reporting changing jobs, switchers, is very similar to the full sample, although the average age and years of experience is approximately two years less (Results available from authors upon request). We do not know the employment status of workers in 2001. We know only that they were working in 2001 and their

Page 113
Academy of Entrepreneurship Journal, Volume 20, Number 2, 2014
current job status in 2003. Given this shortcoming of the data, we cannot empirically test hypotheses 3-6.
The factor analysis using the subsample of job switchers yields the identical common factors as with the full sample. The probit results are very similar; however, the procedural utility factor is no longer statistically significant and the marginal effect, although still positive, is not statistically different from zero. Given our earlier discussion, it may be that procedural utility is an important factor for moving from one job to another, regardless of whether the switch is into paid or self-employment. Thus, because movement into paid work is motivated by procedural utility as is movement into self-employment, the statistical and economic significance of the variable is a wash.
For the switchers, the coefficient estimate for the outcome utility factor remains negative, indicating a decrease in the probability of transitioning into self-employment (3.6 percentage points) and similar to the effect for the full sample. Thus, we find that greater importance assigned to pecuniary job attributes comprising the outcome utility factor decreases the probability of moving into self-employment and increases the probability of moving into paid employment.
CONCLUSION Departing from the compensating wage approach, we test the extent to which procedural utility explains variation in employment status among paid and self-employed workers. This paper contributes to the existing literature by employing factor analysis to identify variables representing procedural and outcome utility. We contend that using factor analysis to group job attributes is a compelling alternative to using reports job satisfaction as a proxy for utility. We include the grouped attribute factors as independent variables in a probit regression model with employment status as the dependent variable. Our results indicate that more importance placed on the attributes comprising the procedural utility factor increases the probability of being situated in self-employment whereas more importance placed on the attributes comprising the outcome utility factor reduces the probability of being situated in self-employment.
Examination of a subsample of switchers, who changed jobs in the two-year period prior to the 2003 survey, reveals the importance of attributes comprising the outcome utility factor among respondents. Our results do not reveal a similar importance of the attributes comprising procedural utility. Given that the sample includes only highly educated workers, this result is no surprise. Highly educated workers likely derive procedural utility from attractive paid employment opportunities that require at least a baccalaureate degree. Thus, the draw of procedural utility-related job attributes that move an individual from one job to another appear to have similar effects for transitioning into paid work as they do for self-employment.
In conclusion, we find evidence that procedural utility is a useful explanatory variable of self-employment status among a sample of highly educated workers. We find no evidence indicating that procedural utility is useful in explaining the transition to self-employment.

Page 114
Academy of Entrepreneurship Journal, Volume 20, Number 2, 2014
However, we do find that traditional employment attributes associated with outcome utility motivate the decision to move into paid-employment and are related to being in paid work generally. Our findings add to the literature examining the usefulness of procedural utility as an explanatory variable and motivate further examination of the relationship between procedural and outcome utility. Given the body of evidence suggesting the usefulness of procedural utility as explanatory variable of the self-employment decision, future research would contribute further understanding by exploring the transition to self-employment and paid employment. We have provided discussion and four hypotheses that we assert guides future research in this context.
Table 1: Means and Standard Deviations The Self-Employed and Paid Work College Graduates
Variable name
Variable description Full
Sample n = 83,024
Self-Employed n=13,740
Paid Workers n=69,284
T-test on Means
Married Marital status 0.770
(0.421) 0.802
(0.398) 0.764
(0.425)
-8.96***
Small kids Number of children
under age 6 0.277
(0.624) .252
(0.610) 0.282
(0.626) 4.90***
Age Age at time of survey 44.982 (10.622
47.770 (11.162)
44.389 (10.407)
-34.21***
Female Gender, 1 if Female 0.441
(0.496) 0.365
(0.481) 0.457
(0.498) 20.79***
African-American Race 1, if Black 0.068
(0.251) 0.032
(0.176) 0.075
(0.264) 19.18***
Asian Race 1, if Asian 0.094
(0.292) 0.095
(0.293) 0.094
(0.292) -0.70
Otherrace Race 1, if other race 0.025
(0.155) 0.022
(0.145) 0.025
(0.157) 2.47**
Foreignborn 1 if born outside the
US 0.175
(0.380) 0.179
(0.383) 0.174
(0.379) -1.86*
Yrs Since Highest
Deg Years since highest
degree 18.015
(10.695) 21.649
(11.328) 17.243
(10.393)
-45.15***
Spousework 1 if spouse working 0.582
(0.493) 0.585
(0.493) 0.581
(0.493)
-0.51
Prev Retiree 1 if previously retired 0.035
(0.184) 0.048
(0.214) 0.032
(0.177)
-8.96***
Hi MA 1 if Highest degree is
a Masters 0.285
(0.451) 0.208
(0.406) 0.301
(0.459) 24.36***
Hi PhD 1 if Highest degree is
Ph.D. 0.065
(0.246) 0.041
(0.198) 0.070
(0.255) 13.12***
Hi Prof 1 if Highest degree is
professional 0.067
(0.250) 0.155
(0.362) 0.048
(0.215) -51.62***
Data Source: National Science Foundation, The 2003 National Survey of College Graduates, weighted for stratification and nonresponse bias. Standard deviations are in parentheses. T-statistics test the difference between the means of paid and self-
employed workers. A negative sign on the t-test indicates that the average is larger for the self-employed. ***=statistical significance at the 1 percent level, **=statistical significance at the 5 percent level, and *=statistical significance at the 10 percent
level of significance.
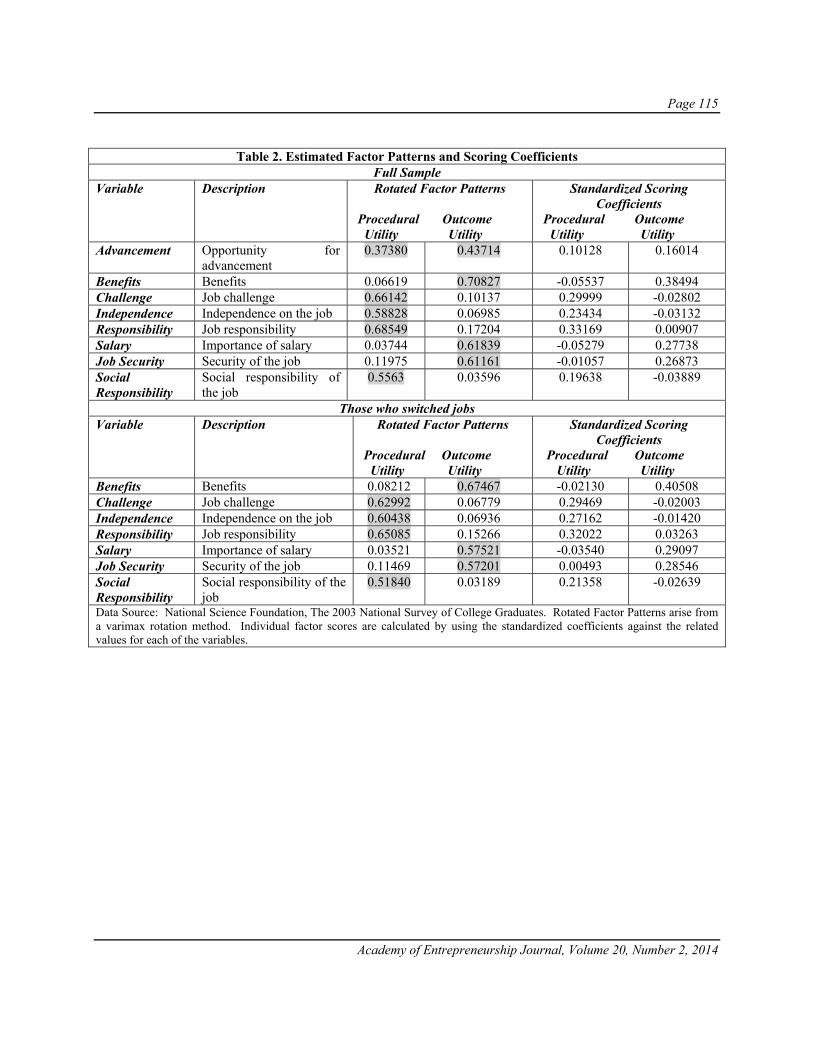
Page 115
Academy of Entrepreneurship Journal, Volume 20, Number 2, 2014
Table 2. Estimated Factor Patterns and Scoring Coefficients
Full Sample Variable Description Rotated Factor Patterns
Procedural Outcome Utility Utility
Standardized Scoring Coefficients
Procedural Outcome Utility Utility
Advancement Opportunity for advancement
0.37380 0.43714 0.10128 0.16014
Benefits Benefits 0.06619 0.70827 -0.05537 0.38494 Challenge Job challenge 0.66142 0.10137 0.29999 -0.02802 Independence Independence on the job 0.58828 0.06985 0.23434 -0.03132 Responsibility Job responsibility 0.68549 0.17204 0.33169 0.00907 Salary Importance of salary 0.03744 0.61839 -0.05279 0.27738 Job Security Security of the job 0.11975 0.61161 -0.01057 0.26873 Social Responsibility
Social responsibility of the job
0.5563 0.03596 0.19638 -0.03889
Those who switched jobs Variable Description Rotated Factor Patterns
Procedural Outcome Utility Utility
Standardized Scoring Coefficients
Procedural Outcome Utility Utility
Benefits Benefits 0.08212 0.67467 -0.02130 0.40508 Challenge Job challenge 0.62992 0.06779 0.29469 -0.02003 Independence Independence on the job 0.60438 0.06936 0.27162 -0.01420 Responsibility Job responsibility 0.65085 0.15266 0.32022 0.03263 Salary Importance of salary 0.03521 0.57521 -0.03540 0.29097 Job Security Security of the job 0.11469 0.57201 0.00493 0.28546 Social Responsibility
Social responsibility of the job
0.51840 0.03189 0.21358 -0.02639
Data Source: National Science Foundation, The 2003 National Survey of College Graduates. Rotated Factor Patterns arise from a varimax rotation method. Individual factor scores are calculated by using the standardized coefficients against the related values for each of the variables.

Page 116
Academy of Entrepreneurship Journal, Volume 20, Number 2, 2014
Table 3: Probit Results Full Sample
(N=83,024) (1)
Marginal Effect
(2)
Switchers (N= 13,979)
(3)
Marginal Effect
(4) Intercept -0.667***
(0.075) -0.971***
(.175)
Married 0.006 (0.013)
0.001 -0.010 (0.030)
-0.003
Children <5 yrs. old 0.047*** (0.007)
0.012 0.0468*** (0.015)
0.019
Age -0.030*** (0.004)
0.001 -0.015* (0.009)
0.006
Age-squared 0.0004*** (.00004)
NA 0.0002** (0.0001)
NA
Female -0.153*** (0.008)
-0.039 -0.060*** (0.019)
-0.010
African-American -0.371*** (0.018)
-0.082 -0.216*** (0.039)
-0.050
Asian 0.00001 (0.016)
-0.0001 0.060* (0.036)
0.022
Other Race -0.069** (0.025)
-0.019 0.059 (0.054)
0.022
Foreign Born 0.087*** (0.012)
0.022 0.053* (0.029)
0.021
Yrs. Since Highest Degree
0.025*** (0.002)
0.003 0.028*** (0.004)
0.010
Yrs. Since Highest Degree –squared
-0.0002*** (.00004)
NA -0.0004*** (0.0001)
NA
Working Spouse 0.024** (0.010)
0.005 0.040 (0.025)
0.017
Previous Retiree 0.036* (0.020)
0.008 0.033 (0.043)
0.015
Highest Degree – MA
-0.216*** (0.010)
-0.052 -0.163*** (0.024)
-0.034
Highest Degree – PhD
-0.406*** (0.018)
-0.088 -0.296*** (0.044)
-0.062
Highest Degree—Professional
0.667*** (0.013)
0.220 0.428*** (0.033)
0.139
Procedural Utility 0.076*** (0.005)
0.019 0.004 (0.0109)
0.007
Outcome Utility -0.203*** (0.004)
-0.049 -0.170*** (0.011)
-0.036
Log Likelihood -70977 -12477 Log Likelihood Ratio
11842*** 937.3***
Data source: National Survey of College Graduates 2003 weighted for stratified and nonresponse bias. *** statistically significant at p<.001 level; ** statistically significant at p<.05 level; * statistically significant at p<.10 level. Marginal effects for Age and Yrs Since Highest Degree include the nonlinear component.

Page 117
Academy of Entrepreneurship Journal, Volume 20, Number 2, 2014
End Notes 1. We use the notation in the Train et al. (1987) and Lankford and Wyckoff (2000) to create the latent
variable model. In regard to the job choice, there are obviously other choices, such as unemployment or moving out of the labor force. However, other studies have used the binary decision between self and paid-work (Blanchflower and Oswald, 1998; Taniguichi, 2002). The notion is that the choice is particularly relevant between the two and less so between working and nonworking status. The model could be extended to include nonwork status with a multinomial probit, but this extension is left for future research.
2. See Parker (2004) for a review of the literature that finds associations between self-employment and individual, family, and human capital characteristics. We also recognize that there has been some work on financial capital constraints and self-employment (Evans and Jovanovic 1989), but the NSCG does not provide information that would capture this relationship. To the degree that this relationship exists, we would expect that some bias would exist on the coefficients of the included variables. For example, if older individuals have a better credit rating, they may have access to debt financing. However, we also know that the estimated impact of financial variables on self-employment has not been large, so the resulting bias is likely to be small.
3. Note that NSCG also included opportunity for advancement and location as two additional job attributes. However, the advancement factor cross-loads on both factors and was removed as is the norm for this type of analysis. Further, factor analysis uses correlations to create the factors and location does not have any theoretical connection to the included variables. It could be that location is important to the self-employment choice, as some individuals may be limited in paid work choices in certain areas of the country, but one’s attitude about location is not relevant to this analysis.
4. Typical eigenvalue and scree tests were employed. The eigenvalue test requires that the number of factors with an eigenvalue score greater than 1indicates the number of factors. The scree tests present the eigenvector scores against the number of variables, and one examines the resulting graph for “elbows” in the plot, where the scores level off. We also examined a three-factor load, but it was excluded by these tests and the fact that it produced a “singlet” factor, meaning only one variable was important to that common factor. Two factors were present as a result of these tests.
5. A few national surveys, such as the Panel Study of Income Dynamics (PSID), present monthly job information over more than one year for respondents. However, the PSID does not provide the level of detail we desire on attitudes regarding job attributes; thus, we opted for the NSCG for the present study.

Page 118
Academy of Entrepreneurship Journal, Volume 20, Number 2, 2014
REFERENCES Aronson, Robert L., Self-Employment: A Labor Market Perspective, ILR Press, Ithaca, New York, 1991. Acs, Z. J., D. B. Audretsch, and D. S. Evans (1994) “Why does the self-employment rate vary across countries and
over time?”, Centre for Economic Policy Research, Discussion Paper No. 871. Amit, Raphael, Kenneth R. MacCrimmon, Charlene Zietsma, and John M. Oesch (2000), “Does money matter?:
wealth attainment as the motive for initiating growth-oriented technology ventures”, Journal of Business Venturing, 16, 119-143.
Andersson, Pernilla (2008), “Happiness and health: well-being among the self-employed”, Journal of Socio-
Economics, 37, 213-236. Benedict, Mary Ellen, John Hoag, David McClough (2010), “STEM: A Path to Self-Employment?”, Working
Paper, 2010. Benz, Matthias, and Bruno S. Frey (2008a), “Being independent is a great thing: subjective evaluations of self-
employment and hierarchy”, Economica, 75, 362-383. Benz, Matthias, and Bruno S. Frey (2008b), “the value of doing what you like: evidence from the self-employed in
23 countries”, Journal of Economic Behavior and Organization, 68, 445-455. Blanchflower, David G. and Andrew J. Oswald (1991), “Self-employment and Mrs. Thatcher’s enterprise culture”,
Center for Economic Performance, Discussion Paper no. 125. Blanchflower, David G. and Andrew J. Oswald (1998), “What makes and entrepreneur?” Journal of Labor
Economics, 16, 1, 26-60. Blanchfower, David G., Oswald, Andrew, and Alois Stutzer (2001), “Latent entrepreneurship across nations”,
European Economic Review, 45, 4-6, 680-691. Blanchflower, D. (2004), Self-employment: more may not be better, Manuscript, Dartmouth College. Block, Joern and Philipp Koellinger (2009), “I can’t get no satisfaction—necessity entrepreneurship and procedural
utility”, Kyklos, 62, 2, 191-209. Bogenhold, D. and U. Staber (1991), “The decline and rise of self-employment”, Work, Employment, and Society,
5,223-239. Burke, Andrew E., Felix R. FitzRoy, and Michael A. Nolan (2008), “What makes a die-hard entrepreneur? Beyond
the employee or entrepreneur dichotomy”, Small Business Economics, 31, 93-115. Cassar, Gavin (2007), “Money, money, money? A longitudinal invetigation of entrepreneur career reasons, growth
preferences and achieved growth”, Entrepreneurship and Regional Development, 19, 89-107. Chinoy, Ely (1955). Automobile Workers and the American Dream. Garden City New York: Doubleday. Dolton, P. J. and G. H. Makepeace (1990), “Self-employment among graduates”, Bulletin of Economic Research,
42, 35-53.

Page 119
Academy of Entrepreneurship Journal, Volume 20, Number 2, 2014
Evans, David S. and Boyan Jovanovic (1989), “An estimated model of entrepreneurial choice under liquidity constraints”, Journal of Political Economy, 97, 4, 808-827.
Evans, David S. and Linda S. Leighton (1989), “Some empirical aspects of entrepreneurship”, American Economic
Review, 79, 519, 519-535. Frey, Bruno S., Matthias Benz, and Alois Stutzer (2003), “Introducing procedural utility: Not only what, but also
how matters”, Zurich IEER Working Paper No. 129. Fuchs-Schundeln, Nicola (2009), “On preferences for being self-employed”, Journal of Economic Behavior and
Organization, 71, 162-171. Georgellis, Yannis, John Sessions, and Nikolaos Tsitsianis ( 2007), “Pecuniary and non-pecuniary aspects of self-
employment survival”, Quarterly Journal of Economics and Finance, 47, 94-112. Hamilton, B. H. (2000), “Does entrepreneurship pay? An empirical analysis of the returns to self-employment”,
Journal of Political Economy, 108, 604-631. Hipple, Steve (2004). Self-employment in the United States: an update, Monthly Labor Review, July: 13-23. Hostede, G. (2001). Cutlture’s Consequences, 2nd ed. Thousand Oaks, CA: Sage. Inglehart, Ronald (1996), “The diminishing utility of economic growth: from maximizing security toward
maximizing subjective well-being”, Critical Review, 10, 4, 509-531. Johnson, Monica K. & Elder, Glenn H. (2002), “Educational pathways and work value trajectories”, Sociological
Perspectives, 45, 113–138. Kavilanz, Parija B. (2009), “Rx for money woes: Doctors quit medicine,” Accessed March 9, 2010:
http://money.cnn.com/2009/09/14/news/economy/health_care_doctors_quitting/index.htm?postversion=2009093015.
Kavilanz, Parija B. (2010), “Jailhouse docs choose inmates over insurance”, Accessed March 9, 2010:
http://money.cnn.com/2009/12/23/news/economy/healthcare_doctors_in_prison/index.htm. Kawaguchi, Daiji (2008), “Self-employment rents: evidence from job satisfaction scores”, Hitotsubashi Journal of
Economics, 49, 1, 35-45. Lacy, William B., Janet L. Bokemeier, Jon. M. Shepard (1983), “Job attribute preferences and work Commitment of men and women in the United States”, Personnel Psychology, 36. 315-329. Lankford, Hamilton and James Wychoff (2000), “Who would be left behind by enhanced private school choice”,
working paper. Lowes, Robert, “Hopitals are hiring again”, Medical Economics, April 7, 2006. Mackenzie, Gavin (1973). The Aristocracy of Labour. Cambridge, UK: Cambridge University Press. McClelland, D. C. (1961), The Achieving Society, New York: von Nostrand

Page 120
Academy of Entrepreneurship Journal, Volume 20, Number 2, 2014
Noorderhaven, Niels, Roy Thurik, Sander Wenneders, and Andre van Stel (2004), “The role of dissatsifaction and per capita income in explaining self-employment across15 European countries”, Entrepreneurship Theory and Practice, Fall 2004, 447-466.
Parker, Simon, The Economics of Self-Employment and Entrepreneurship, Cambridge University Press, 2004. Rees and Shah (1986), “An empirical analysis of self-employment in the U.K.”, Journal of Applied Econometrics,
1, 95-108. Scase R. and R. Goffee (1982). The entrepreneurial middle class. London: Croom Helm. Taylor, Mark (2004), “Self-employment in Britain: when, who, and why?”, Swedish Economic Policy Review, 11,
139-173. Taylor, Mark P. (1996), “Earnings, independence, or unemployment: why become self-employed?” Oxford Bulletin
of Economics and Statistics, 58, 2, 253-266. Train, Kenneth E., Daniel L. McFadden, and Andrew A. Goett (1987), “Consumer attitudes and voluntary rate
schedules for public utilities”, The Review of Economics and Statistics, 69, 3, 383-391. Turan, Mehmet and Ali Kara (2007), “An exploratory study of characteristics and attributes of Turkish
entrepreneurs: a cross-country comparison to Irish entrepreneurs”, Journal of International Entrepreneurship, 5, 25-46.
Page 121
Academy of Entrepreneurship Journal, Volume 20, Number 2, 2014
SMALL BUSINESSES USE OF AN IPO
Don B. Bradley III, University of Central Arkansas Kalyn Camp, University of Central Arkansas
ABSTRACT
The IPO is a lucrative tool that a small business owner looking to generate a large, non-
interest bearing sum of capital can use in order to grow or expand his or her business. The process involves various stakeholders, such as the small business owner, the underwriting investment bank, and the investors buying into the new shares of the small business. Once the process has been completed, the small business will be a new publically traded entity. Liability will be shifted from the founders to the new stakeholders in the business, and the managers of the business will be free to use to new capital gained from the IPO to expand or pay off debts and other obligations. The underwriting bank and the investors will all play a part in successfully bringing the business out into the public market and each will have benefits that they will reap as well.
INTRODUCTION In a country where over 97% of the economy is driven by what is considered in the
business world as "small business," these small, privately owned firms are an increasingly valuable and necessary part of our lives. When we think of business, we will likely find that the first thing that comes to mind is that of the large, Fortune 500 companies such as Wal-Mart, Hewlett-Packard, Microsoft, and the like. We often fail to realize that while these large firms have an unmistakable and inescapable presence in the business world, without the small firm, our lives would be vastly different. For example, the smartphone is a growing product in the cellular phone industry, with each brand of phone making use of a large market of applications tailored for that phone, such as Apple's App Store if its iPhone line of phones, or the Android Market for its various Android OS phones. However, it is not the large companies like Apple and AT&T making the majority of the thousands of applications on these markets. Most of the applications that we use on our smartphones everyday are created by independent programmers and small development groups. If you were to remove all the applications from these application markets that were created by "small developers," and only left the applications developed by large firms, the number of applications available for our use would be drastically cut. In this example, we can see how small businesses help to lead the way in innovation and directly impact our lives, whether we realize it or not.

Page 122
Academy of Entrepreneurship Journal, Volume 20, Number 2, 2014
This paper will look at the IPO process through the eyes of both stakeholders in the IPO process: the business putting out its initial public offering, and the public investors who will potentially be buying into the firm. With the firm, the details on how a small business goes through the process of becoming a publicly shared company, when it is recommended that the firm should start considering going public and the options available to the prospective firm will be addressed. Then, the IPO process will be analyzed through the eyes of the investing public, focusing on how an investor or investing group can take part in, and capitalize on, an IPO.
Why an IPO?
In trying economic times, such as the great recession that began in 2008, it can often be
difficult for small businesses to stay afloat, or to remain competitive. It is becoming increasingly difficult for small firms to obtain loans from banks in order to start up, continue operations, or expand. Aside from revenue generated through operations and loans from the bank, there are other, less considered options available to small businesses that can help them raise capital. One such option, which will be the focus of this paper, is on the issuance of an initial public offering, or an IPO.
An IPO, as defined by the Securities and Exchange Commission (SEC), is the event in which "a company first sells its shares to the public." An IPO is a firm's transition from a privately owned business into a publically owned and traded business. The capital gained from the sale of shares directly from the company to investors can then be used by the company to grow and expand, or to help cover costs and debts. The capital earned through the selling of initial stock is interest free for the company and does not have to be paid back to another entity in the future, which gives it an advantage over high interest bearing loans that must be eventually repaid to a bank or other debtor. The investor that buys stock in the company will benefit by purchasing partial ownership into the company, thereby giving the investor rights to a share of the company's future profits.
IPOs are becoming a much more lucrative option for small business owners seeking growth a return (refer to Table 1). In the past decade, from 2000 through 2010, IPOs have received an average first day return on offering of 23.4%, significantly above the overall average of 16.8%, which has aggregated the yearly average first day returns since 1960. Despite troubling economic times from the later part of the 2000-2010 decade, average returns are still on an upward trend from previous years. The 23.4% decade average is up from the 1990-1999 average of 21.0%, which is itself up from the 1980-1989 average of only 6.8%. In fact, the average first day returns for 2000-2010 are the highest returns of any decade from 1960 until present day. Note that first day returns are computed as the percentage return from the offering price to the first closing market price. Gross proceeds from IPOs are also on the rise, with total gross proceeds reaching $326,165 million in 2000-2010, which makes up almost half of the $700,560 million total gross proceeds ever collect. Interestingly, while more gross proceeds were made in 2000-2010 ($326,165 million) compared to 1990-1999 ($297,441), there were actually fewer IPOs from 2000-2010 compared to 1990-1999, at 1,438 and 4,205 respectively. With
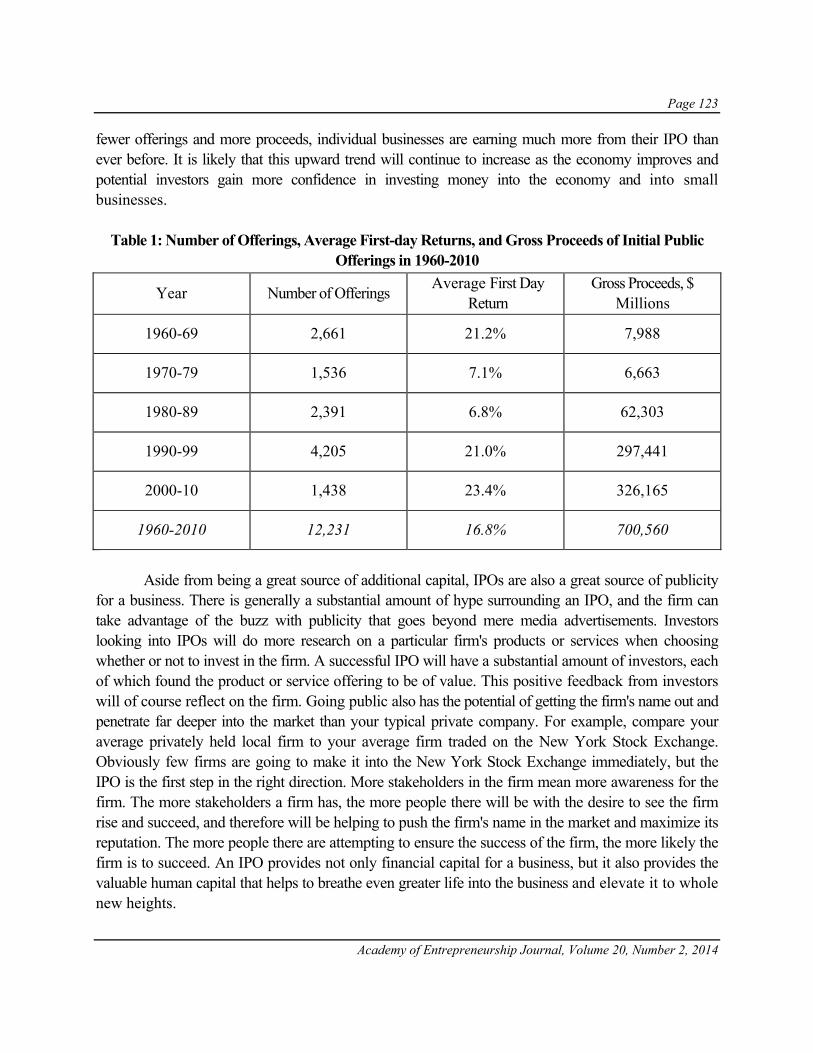
Page 123
Academy of Entrepreneurship Journal, Volume 20, Number 2, 2014
fewer offerings and more proceeds, individual businesses are earning much more from their IPO than ever before. It is likely that this upward trend will continue to increase as the economy improves and potential investors gain more confidence in investing money into the economy and into small businesses.
Table 1: Number of Offerings, Average First-day Returns, and Gross Proceeds of Initial Public
Offerings in 1960-2010
Year Number of Offerings Average First Day
Return Gross Proceeds, $
Millions
1960-69 2,661 21.2% 7,988
1970-79 1,536 7.1% 6,663
1980-89 2,391 6.8% 62,303
1990-99 4,205 21.0% 297,441
2000-10 1,438 23.4% 326,165
1960-2010 12,231 16.8% 700,560
Aside from being a great source of additional capital, IPOs are also a great source of publicity
for a business. There is generally a substantial amount of hype surrounding an IPO, and the firm can take advantage of the buzz with publicity that goes beyond mere media advertisements. Investors looking into IPOs will do more research on a particular firm's products or services when choosing whether or not to invest in the firm. A successful IPO will have a substantial amount of investors, each of which found the product or service offering to be of value. This positive feedback from investors will of course reflect on the firm. Going public also has the potential of getting the firm's name out and penetrate far deeper into the market than your typical private company. For example, compare your average privately held local firm to your average firm traded on the New York Stock Exchange. Obviously few firms are going to make it into the New York Stock Exchange immediately, but the IPO is the first step in the right direction. More stakeholders in the firm mean more awareness for the firm. The more stakeholders a firm has, the more people there will be with the desire to see the firm rise and succeed, and therefore will be helping to push the firm's name in the market and maximize its reputation. The more people there are attempting to ensure the success of the firm, the more likely the firm is to succeed. An IPO provides not only financial capital for a business, but it also provides the valuable human capital that helps to breathe even greater life into the business and elevate it to whole new heights.
Page 124
Academy of Entrepreneurship Journal, Volume 20, Number 2, 2014
Key Players in the IPO Process
As a firm, before understanding how you can begin the IPO process, it is first necessary to
understand the key players in the IPO process. The largest and most important player for the firm in the IPO process is the investment bank. The firm should interview several investment banking groups, before choosing one to work with in bringing forth its IPO. Sometimes a firm can elect to hire more than one investment firm, in which case one investment firm is chosen to be the lead underwriter, while the other hired firms will act as co-managers in the process.
Both the underwriters and the company will each be represented by legal counsel. The company's legal counsel will review the company's documents, records, and business to identify potential legal problems and make required disclosures on the prospectus. A prospectus is a document detailing the securities that are to be offered by the company to potential investors, as well as information such as a description of the company, biographies of company executives, any legal litigation the company is involved with, and financial statements. The prospectus is eventually distributed by the underwriter to potential investors. The company legal counsel also coordinates the drafting of the company's registration statement and guides it through the SEC review process, as well as helps in negotiating the underwriter's agreement. The underwriters' legal counsel represents the underwriters in the drafting of the registration statement, in the underwriters' due diligence process, and in the presentation of the underwriter's agreement.
Auditors will assist the company by reviewing financial documents and identifying any financial discrepancies that may arise in the preparation of the financial documents for the prospectus. They also intermediate between the company and the SEC as well as handle any accounting issues. Typically, the company's legal counsel, the underwriters' legal counsel, the underwriters themselves, and the auditors will meet and delegate duties, as well as coordinate time tables and deadline goals that would like to be reached. Once the players have all done their part in preparing the legal and financial documents, financial printers will print the prospectus, which will then be distributed by the underwriters, transfer agents will issue and transfer the company's shares and coordinate shareholder mailings once the offering has been made, and a bank note company will design and print the new stock certificates that will be issued to all investors partaking in the IPO of the company. All of these players work together as a large and cohesive team in the interest of the company to ensure that its IPO is issued in a timely and effective manner.
Should an IPO be Considered?
While there are many advantages to bringing out an IPO for a company, there are issues that
must be considered by the company before it decides to make the leap into the public market. The first consideration a company should take is whether or not it has the ability to afford the expenses of the IPO process. It falls on the company to finance all of the players and their operations in carrying out
Page 125
Academy of Entrepreneurship Journal, Volume 20, Number 2, 2014
the IPO process. While there is great potential for the company to earn a substantial amount of capital from the IPO, it must be weighed against the expenses that must be incurred in order to issue the IPO. The entire process can easily cost the company $250,000 or more, which will eat into the potential profits gained through the IPO. With that in mind, it may be more advantageous for the company to wait on issuing its IPO until a time in which it can guarantee that its valuation will be higher, as thus earn more from the offering, which will work to offset the large, expense.
If the company feels that it can adequately foot the bill, then the hired underwriters will evaluate the company and determine whether an IPO would be an appropriate use of the company's time and resources. The overall attractiveness of the company is measured using various financial ratios, such as the debt-to-equity, liquidity, and debt coverage ratios. The underwriters evaluate the company's financial ratios and compare them to industry averages. Ideally, the company should at least meet if not exceed industry averages with its various financial ratios. If the company's ratios are below industry averages, it is unlikely that they will be adequately competitive in the industry, making the company less attractive to investors who would invest in the IPO.
Stability is another key factor in determining the viability of an IPO. Underwriters encourage firms to start considering an IPO when they have had three to five years of significant growth in revenue and net income to ensure investors that the firm has a firm and stable foothold in the industry. Also, investors tend to look more favorably on firms looking to release their IPO in order to expand, as opposed to firms looking to cover their debts. If a firm is solely trying to cover its debts with its IPO, investors will likely view the firm as a very risky investment, causing the value of the IPO to decrease significantly for the company. Growth tells investors that the firm is growing in size and their investment would be more likely to be profitable. This would increase demand for the IPO, which would in turn raise the value for the company.
While a company can use a portion of the raised capital from an IPO to pay off debts, it is advantageous for the company to put a positive spin on its reasons for wanting to put out an IPO, to communicate assurance and success to the investors. Essentially, the effectiveness of an IPO is determined by how well a firm can sell itself to investors as a good investment capable of producing attractive returns. The better a company is positioned in its industry, in its market, and in its own financial situation, the more attractive the firm will look to investors. A firm must not only be in a good present position, but it must also show potential to remain profitable in the future. Investors will gauge a firm's future potential and profitability based on their past performance. In order to maximize the value of an IPO, it may be best for a firm to wait until it has stable growth and profitability, or a highly positive public image, in order to attract the largest number of investors and increase demand in its offering.
Another challenge to going public that a firm should consider is the fact that the firm will be subjected to a great many more rules, regulations and obligations that it must abide by. Once a firm because a public company, it must focus on transparency, and the leaders within the business must realize that as a public entity, the business will be monitored and subject to the rules and regulations of the Securities and Exchange Commission (SEC). As a privately held firm, many business owners

Page 126
Academy of Entrepreneurship Journal, Volume 20, Number 2, 2014
probably focus on running and managing their business as they desire, answering only to themselves. Once the business goes public, however, it will have to disclose its internal information, once privy only to the owners of the business, to the new investors in the business, as well as all other stakeholders who share in partial ownership of the business. While the process of putting out an IPO is costly in itself, these newly public companies will also have to bear the added expenses that accompany these new regulations and procedures. Some of the added costs include generation of financial reports at specified times in the year, audit fees, investor relation departments, and accounting oversight committees. Expenses like these can be especially difficult for a newly public company to bear, since many fledgling public companies tend to be smaller, they do not immediately generate enough revenue to cover these expenses, or they simply are not prepared to face the extra costs associated with being a public company immediately after their transition from the private sector. Choosing the Right Investment Banker
As a small business owner, once you have evaluated the advantages and disadvantages of the
IPO process and decided that you wish to put out a public offering for your business, the first (and probably most important) step in the IPO process is selecting and hiring an investment banker to underwrite on behalf of your business. Essentially, a business owner will scout out several investment bankers which could be potential hires. The investment bankers will then perform an initial evaluation of the business, appraising the potential benefits and risks of issuing an IPO specific to the company. The investment bankers will determine if they feel that an IPO would be a profitable endeavor for the small business and give a presentation of their research. Included in their presentation is a valuation of the IPO, or amount of capital that the bank guarantees it will raise through the IPO for the business minus the bank's fees. After each investment banker has presented his or her research, the business owner will choose which to actually hire as the official underwriter for the business during the IPO. Typically, the business owners will hire the bank that gives the highest IPO valuation. However, this should not be the only factor in choosing a banker to hire. The promise of more money can be very tempting, but at the same time very misleading. It is possible for a bank to exaggerate the preliminary IPO valuation in order to gain the business of the firm owner. The business owner should focus on hiring the most qualified banker relative to the business in order to ensure that the entire IPO process goes smoothly, and enables an IPO to reach its maximum potential. There are three key factors to consider when choosing an investment banker to hire as your business's underwriter: personality, expertise, and experience.
Personality
This factor is probably the most subjective of the three factors discussed here, but it is extremely important nonetheless. The investment banker that the business owner chooses will be working with him or her throughout the entire IPO process. Therefore, it makes the process easier for both parties if their personalities mesh well. The underwriter will also be working with legal officials,

Page 127
Academy of Entrepreneurship Journal, Volume 20, Number 2, 2014
potential investors, and all other stakeholders in the IPO process, which makes it even more important for the business owner to hire a friendly and personable underwriter who will represent the IPO well. An unsociable underwriter can easily scare away potential investors, while a likable underwriter is more likely to have greater connections and a larger pool of potential investors to draw from.
Expertise
Investment bankers typically specialize in specific markets or industries. It is important for the business owner to select a banker who specializes in the industry and market in which the business is located. The investment banker should know the ins and outs of the business environment. This will allow the underwriter to take the most effective and efficient actions in favor of the business. Also, since the underwriter will be highly knowledgeable about the business, the environment, and other businesses within the environment, the underwriter will be able to produce a more accurate valuation of the IPO. One of the jobs of the underwriter is to sell your business to potential investors. In being familiar with the environment, the underwriter will be better able to attract investors to the IPO, which will result in higher capital earned for the business owner.
Experience
Experience plays a huge role in investor confidence in investment banking. A highly experience investment banker will not only likely have a greater network of investors to draw from, but will also be much more likely to win the confidence of new potential investors for the IPO. With experience comes confidence. The more confident the investment banker is raising a high amount of capital for the business, the more likely that investment banker is to achieve those goals for the business.
All three of these factors are interrelated in a sense. An investment banker with a great deal of experience is likely to have a large network of investors, as is the specialized banker and the friendly banker. If a banker has a great deal of experience, it is likely that they have been successful because they also had the personality and expertise to back them up. However, these factors must be balanced in order to produce the greatest yield for the business. A banker can be extremely friendly and personable and even produce an attractive valuation of the firm for the owner, but the same banker could lack the knowledge of the business environment that other bankers possess, or the banker could be relatively new to underwriting for IPOs, making it risky to put that banker in charge of the entire underwriting process for your business. In a case such as this, a banker who may be slightly less personable but more experienced or familiar with the field could be more beneficial to the business. Truly, choosing the right banker is highly circumstantial, and the business owner needs to get a feel for several in order to find the right fit. An owner should give a great deal of thought to this decision, because the outcome of the IPO will ride on which investment banker is chosen and how that investment banker performs in his or her underwriting job for the business. The key is to consider these factors along with the bottom line, rather than considering the bottom line exclusively.
Page 128
Academy of Entrepreneurship Journal, Volume 20, Number 2, 2014
Steps Involved in the IPO Process After a suitable investment banker has been chosen, it is finally time to initiate the IPO
process. To begin the IPO process, the underwriting investment bank will audit the financials of the business. This will be an in depth analysis of the financial health of the business, that will usually go deeper into depth than the initial company valuation that the bank performed earlier when it was competing with the other banks during the bank hiring process. It is to be noted that the underwriters must meet minimum SEC listing requirements, and therefore there will be a full disclosure of all company financial information. If the underwriters were to withhold any financial information from the SEC concerning the business, it could potentially be considered securities fraud, which would result in fines, possible imprisonment, and a delay or indefinite termination of the IPO process.
There is a certain degree of relativity when it comes to valuing a private business. The underwriting bank will evaluate an approximate value for the business based on the financial information that is provided by the business. Because of the degree of relativity in the valuation of a private business, once the underwriter arrives at an estimated value, the business can negotiate an official value for itself. This negotiable wiggle room provides additional opportunity for either the underwriting bank or the business going public. The underwriting bank will try to negotiate a lower value for the business. A lower initial stock price allows for greater growth and returns in the secondary stock market. Since the investment bank is buying the initial stock from the business in order to sell it to investors in the secondary market, the investment back would benefit most from buying the stock at a lower price, so that it can then sell that stock to investors in the secondary market at a higher price, earning the bank a higher return. It follows the old investment mentality of "buy low, sell high." It is similar to a store buying its inventory from its supplier at the lowest cost possible, so that it can gain a higher contribution margin on the product that it sells to its customers. However, the business putting out its IPO does not benefit from capital gains in the secondary stock market. The capital it raises is solely from the initial issuance of stock from the IPO, thus the business will want to try to negotiate a higher company value for the IPO. Each side can gain from the altering negotiations between the company's total valuations, unfortunately to some degree at the expense of the other party. This is why the decision of which underwriting bank to hire for the IPO process is extremely important. The business must find an underwriting investment bank that has the company's best interests in mind. Hiring a bank that is primarily interested in future gains from aftermarket stock growth will likely drive the value of the company down in both their valuation and in negotiations. This steals large amounts of potential revenue away from the company going public. On the other hand, a company should be wary of the investment bank that values the company unusually high compared to the competing banks. While a high valuation will look attractive to the business owner looking to gain from the IPO, numbers that are too high could raise a red flag with entities such as the SEC, which might feel it necessary to audit the financials of the business. This could not only drive down the value of the company, but it could also damage the reputation and public image of the company, making it harder to actually sell its shares to the public. Also, valuing the initial stock of

Page 129
Academy of Entrepreneurship Journal, Volume 20, Number 2, 2014
the business too high can make it too expensive or unattractive to most investors, making it difficult for the business to actually sell all shares of its IPO. Careful consideration should go into not only the specific investment bank to underwrite and valuate the company, but also into exactly how high or low that initial company value should be.
Once the value of the firm has been agreed upon and set, a prospectus is written up detailing everything about the company, from the strengths and weaknesses of the company, to the potential risks of investing in the company. Full disclosure is to be given in the prospectus. The company's first prospectus has a legal disclaimer stamped on the cover in red, earning the initial prospectus the nickname "red herring." Once the "red herring" has been finalized and printed, the officers of the company are expected to travel to each of the underwriting investment bank's main locations and give a presentation to the bank's employees, informing them of the company and why it is profitable to invest in the company. This traveling around to the different bank locations is known as the "road show" and typically takes place about 48 hours prior to the issuance of the IPO.
Once the company receives permission from the SEC to release its IPO, the bank will set a specified date and time in which the company's stock will begin trading on the market. At the specified time, the stock is released to the public, and investors free to buy up the company's stock. Typically, the underwriter will have already lined up a full array of buyers for the IPO ahead of the official issuance, and it is simply a matter of formally exchanging stock titles and money will predetermined buyers. However, occasionally outside investors who find the offering and react quickly enough can buy into the IPO as well. Once all of the stock offered by the company has been sold and is in the hands of various investors, the once private company is officially a publically traded company.
Analysis and Recommendations
In the interest of the small business owner, it is imperative to understand the workings of the
IPO process. Small business owners have many benefits that can be reaped from going public. For example, the liability of the business will be shifted from the owners themselves onto the new stakeholders of the business, such as the stockholders and the directors. As a private business, if the business failed, the responsibility of the debts fell upon the private owners of the business. This could work to damage the financial health and wellbeing of the individual owners. When a public business fails, responsibility of the debt falls upon the business itself, since there are no longer any private individuals who officially own the business.
Also, there is a huge amount of capital that can be gained from the initial sale of public stock. That capital can be used to grow and expand the business, increasing the depth and scope of its operations within the market. The capital can also be used to update the equipment and infrastructure of the business. Up-to-date and better equipment will allow the business to run more efficiently and to better compete with other firms in its market and industry. The business can also use the capital to pay off its debts. It is not recommended that the business put out an IPO solely to pay off debts, but it is

Page 130
Academy of Entrepreneurship Journal, Volume 20, Number 2, 2014
not unheard of for a business to use some of its generated capital to pay off portions of its outstanding debts.
There is no definitive yes-or-no answer as to whether a small private business should go public, since each business situation is different and falls under completely different circumstances. However, there are universal tips and guidelines that a small business owner can follow when deciding if an IPO is the correct path to take. A SWOT analysis should be taken to evaluate the strengths and weaknesses of the business as well as the external opportunities and threats that the business faces. First and foremost, a business must look internally and ensure that it is capable of competing in the public market. The financial statements should be strong and healthy. The culture of the business must also be considered. Operational changes will have to be made to accommodate for the public changes, such as the new instatement of the board of directors, and the shift in focus from simply generating revenue to appeasing the stockholders. With the internal factors considered, if the company has strong financial and a culture that will support the new public operations, then going public could be a viable option. If the business is weak in either of these areas, then it should spend some time strengthening itself internally and reconsider going through the IPO process at a later time.
The business should also consider its external environment. As a publically traded entity, the business will have stronger competition. It must compete not only on a local or confined level, as it did as a private small business, but it must also compete nationally, benchmarking itself with national firms. The business will be competing for national, and even global, market share. The business will likely have stockholders from all over the nation that it must appease.
These far reaching and far ranging externalities may prove to be too much for the small business. As mentioned before, operations will have to be reorganized to a degree in order to allow the business to be competitive on a necessary greater scale. If the owners and managers of the business feel that the business is up for the challenge, then the IPO process should be considered.
There are internal strengths and external opportunities that can be gained from the IPO process that should be considered as well. From an internal standpoint, the business will be strengthened as it prepares itself to compete on a larger scale. This will make the business more competitive and better able to meet challenges. The inflow of capital from the IPO can also be used to strengthen the business. From an external standpoint, while the business will be facing greater competition, it will also have an opportunity to reach a wider market. It will be able to grow and penetrate markets that it previously left untouched. The reach of the business will grow, and with that, the revenue and profit potential of the business will also grow. The business will have greater access to resources that will help it to overcome challenges and succeed on a larger and more adverse playing field. Truly, there are many benefits that a business can attain from shifting from a private to a public business. Upon reviewing its own individual SWOT analysis of the IPO process, if the potential strengths and opportunities outweigh the potential weaknesses and threats, then the business owners would be recommended to begin serious consideration on undertaking the IPO process.

Page 131
Academy of Entrepreneurship Journal, Volume 20, Number 2, 2014
The IPO Through the Eyes of the Investor
Up to this point, the primary focus of discussion has been on the IPO process through the eyes
of the business. After all, the business that is undergoing the IPO process is the primary stakeholder, and the entity that will be forever changed from the IPO process. However, the business is not the only stakeholder in the process. Another very important stakeholder to consider is the individual investor. These investors are the ones who will be buying the initial shares of stock in the business, providing the necessary capital to the business going public. Without the investors, there would be no capital and no need for an IPO in the first place.
Difficulty for the Individual Investor
Individual investors will likely find it difficult to partake in buying shares in an IPO. This is
best understood when considering how the distribution of IPO shares is normally set up. The SEC does not regulate the means in which an IPO is allocated, and instead gives that control to the business and the investment bank handling the IPO. Typically, the IPO shares are issued to investors on the public market through an "underwriting syndicate," which is a group of underwriters who agree to purchase the IPO shares from the business with the intent of selling the shares to the public investors. These underwriters are the ones hired by the company to carry out the IPO process. Because the members of the underwriting syndicate are privy to the IPO shares before they actually hit the public market, the underwriters are truly the ones with the most control over who gets to buy into the initial stock of a new IPO. These underwriters and investment banks typically have personal clients with which they share new IPOs and investment opportunities with, meaning that only those clients with intimate connects with the underwriting bank will likely have an opportunity to invest in the IPO. The underwriters set what percentage of their IPO shares will be sold to institutions and to individual investors. Thus, underwriters tend to mostly target institutions and wealthy individual investors more so than the average individual public investor, with the rationale that institutions and wealthy investors will not only be able to buy larger blocks of the IPO, but they will also be able to better assume the financial risks of the new and still unproven investment, and they will be able to hold the investment for a longer period. The brokers who sell the shares of the IPO to the various investors frown upon the investors flipping the stock, or buying the stock then selling it a short time (as in a few days) later to earn a quick profit. They prefer that the investors hold onto the stocks for a longer period to enable to stock to stabilize on the market faster. However, there are no laws against flipping the stock, and it can usually be quite profitable for the investor. There is a chance that the investment bank who sold the piece of the IPO could blacklist the investor from future opportunities if the investor ends up flipping the newly bought IPO stock. The risks should be weighed and the relationship between the investor and the investment bank should be considered by the investor before deciding if flipping the stock is the course of action that the investor wishes to take.

Page 132
Academy of Entrepreneurship Journal, Volume 20, Number 2, 2014
IPOs that are considered "hot" are those that are considered valuable and in high demand. But as the laws of supply and demand dictate when the demand is high and the supply is limited, such as the number of shares available for purchase in an IPO, the price and value of the product increases. Because of this, most underwriters will offer hot IPOs to their most valued or wealthiest clients, leaving little, if anything, for the average individual consumer. Smaller IPOs from smaller companies, while they will tend to be less valuable, provide an easier option for the individual investor. Another avenue for the individual investor is the online broker. It is easier for the average investor to access opportunities that are normally more exclusive in a brick-and-mortar investment bank. However, a downside to the online broker option is the fact that the online brokers generally get a smaller proportion of the IPO's shares to distribute, so even if the investor did have an opportunity to invest in an attractive IPO, the breadth of shares available for investing from the online investment bank will likely be short. Also, smaller IPOs tend to do more distributing to online banks, so there is a greater chance that the IPO purchased online will be of lesser quality or potentially greater risk.
It should also be noted that there are various risks involved with buying into an IPO that the investors should consider. The investment bank will consider many factors before selling a portion of an IPO to an individual investor, and it is possible that the investment bank will refuse to sell to an individual investor due to not meeting certain requirements set by the bank selling the IPO. These factors include evaluating elements of the individual investor such as income and net worth, other investment holdings by the investor, risk tolerance, and investment objectives of the investor. Because of the risky nature of the IPO, the investment bank must deem the investor able to bear the burden of risk of the IPO. If an investor wishes to begin investing in IPOs, it would be wise for the individual investor to consider his or her finances and improve on any weak areas in order to make him or herself more attractive to the investment banks looking for potential investors to sell IPO shares to.
What an Investor Should Look for in an IPO
As mentioned before, investing in an IPO is truly a risky investment. The investor is
essentially investing in a company that has no real public history. A small private business and a larger public business are on two different playing fields. The public business has new regulations and business operations that it must adhere to, such as dealing with stockholder wealth and a board of directors, that it did not have to deal with as a private company, and there is no guarantee that the newly public business will be able to cope in its new public environment. The investor must consider and be cautious of the IPO investment in question.
The primary source of information that an investor will have concerning the potential IPO investment is the red herring, or the initial prospectus issued by the company putting out its IPO. The investor should carefully study the prospectus of the company and search for any abnormalities or irregularities in the prospectus that could raise a red flag. For example, downward trends in cash flows or other financials continued drawing on lines of credit without significant increases in assets, high interest expenses, inventories or accounts receivable rising
Page 133
Academy of Entrepreneurship Journal, Volume 20, Number 2, 2014
more rapidly than revenue, or an unusually high liabilities account could all be negative signs for the investment. If the prospectus does not already contain them, a financial ratio analysis should be done to measure the financial health of the company. Also, consider the long term goals of the company and how it plans to use the capital gained from the IPO. It would also be wise to consider the managers of the company, who backgrounds should be in the prospectus. A good investor will be able to get a feel for the managers and determine if they are likely capable of leading the company in a positive direction.
The business's projected ability to continue operations into the future should be evaluated. It is probably not a good investment if the investment in question has no long term sustainability. In the "Report of Independent Auditors" section of the prospectus, the accountants give their opinion as to the sustainability of the company. If the accountant feels that the business's practices raise "substantial doubt about the firm's ability to continue as a going concern," then a red flag should be raised for the investor. It is likely that the business is relying heavily on the capital raised from the IPO to pay its debts in order to continue its operations. A company that is so highly in debt that its ability to continue as a going concern is called into question, then the quality of the business is likely unfavorable, and the risk of the investment will be immense. Consideration should be given to the manager of the business, and their ability to manage the business responsibly, keeping its debt at a reasonable level.
Another source of consideration is the investment bank that is underwriting for the business and bringing out its IPO. Larger investment banks are more likely to underwrite for quality IPOs, since they will have a greater pool of potential clients and businesses to do business with. Smaller investment banks tend to be more lenient in who or what they will underwrite. Since smaller banks may not have the same reputation has the larger banks, the quality of the businesses going to them for underwriting may not be as high. The quality of IPOs coming from large versus small banks is not a rule, however. Quality IPOs can come from small investment banks and poor IPOs can be underwritten by large banks. Simply put, more caution should be given to IPOs coming from smaller investment banks. That's not to say that IPOs coming from larger investment banks should be taken at complete face value either. Due diligence on the part of the investor must be observed regardless.
The underwriters for the business are essentially salespeople trying to sell their product to the customer. Therefore, the underwriters will attempt to generate hype for the IPO in order to bolster interest and sales in the weeks leading up to the sale of the IPO. It is important for investors to keep a level head and not give in to the hype. Since a business only puts out an IPO once, the underwriters will likely sell the IPO as a "once in a lifetime opportunity," however, there is no guarantee that the IPO will be successful and profitable. Some IPOs truly do skyrocket in value and earn significant profit for its investors, but there are also IPOs that sell below value and end up fizzling out.

Page 134
Academy of Entrepreneurship Journal, Volume 20, Number 2, 2014
The IPO Through the Eyes of the Investment Bank Just like the individual investor, the investment bank must carefully examine the business
and determine if it would be a quality investment for the investment bank and its clients. If an investment bank is approached by an unattractive business, it could, and in many cases should, turn down bringing out the business's IPO, or at least offer the business counsel in improving itself in order to maximize the potential for profit and success from the IPO. Many of the factors previously discussed that the individual investor should consider in deciding whether to invest in an IPO holds true for the investment ban
Factors the Investment Bank Should Consider
As mentioned before with the individual investors, the investment bank should take
careful consideration of the business's financial health. It will not be as clearly spelled out for the investment bank since the prospectus will not have been drawn up at this point. However, it is likely that the business will have drawn up some form of a business plan to offer to the investment bank in order to try and convince the bank to underwrite the IPO during the investment bank hiring process for the business. The investment bank will also do an extensive financial ratio analysis as it tries to evaluate the company during the same initial bank selection process. During this process, the investment bank will be able to become fully acquainted with the business and its financials, which should give it a clear future outlook for the business.
Other than the quantitative analysis found in the financial ratios and financial statements, the investment bank should consider various qualitative factors as well. Competition is a major harm or destroy the company if the customer were to take its business elsewhere. Reliance on a small number of customers or suppliers is not always bad business and it should not always be viewed in a negative light by the investment bank, but it should raise a red flag with the bank and warrant closer investigation as to the operating environment of the business and its sustainability.
A company must have the necessary "fit" in going public. As discussed before, when a company transitions from being private to public, several changes must occur in operations. A company must elect a board of directors to steer the business and the focus on the company shifts from making a profit for the owners and employees to making a profit for the shareholders and improving the stock price. A company could be performing well in its market with solid financials but still be deemed by the investment bank as an unfit candidate for an IPO simply because the company's culture would not fit the necessary changes that going public would require.
How it All Fits Together
In the whole IPO process there are three key players: the business, the investment bank, and the
investors. Each of these entities play an integral role in the IPO process, and without all three of them,

Page 135
Academy of Entrepreneurship Journal, Volume 20, Number 2, 2014
there would be no IPO process. This paper discussed the role of each entity and the challenges that each must overcome in order to maximize the success of the IPO. Each member of this trifecta should fully understand the role that each member plays in the process. A greater understanding of the process will bring about mutual cooperation and a greater return for all stakeholders involved. For example, if the business owner recognizes the role and importance of having solid financial statements, then the business owner will work to have his or her financial statements cleaned up and improved, which will cause the business to look more attractive to investors, earning more capital for the business owner because of the increased value of the business, and also earning more for the investment bank, as an attractive business is an easier sell to investors, and of course having solid financial health decreases the investment's risk and increases the potential return to investors. Every positive action taken by each player can potentially improve the gains and outcomes for the other players as well. Recognizing that in the IPO process the three stakeholders should cooperate and help one another will bring about a greater chance of success for the IPO, higher gains for all stakeholders, and a much smoother ride along the way.
ENDNOTES
http://www.ehow.com/how-does_4587097_an-ipo-work.html http://www.sec.gov/answers/ipo.html http://www.sos.mo.gov/securities/pubs/How%20to%20Read%20A%20Prospectus_01.2005.pdf http://www.ehow.com/how_4674287_apply-ipo.html http://www.ehow.<x)m/how_5932791_company-public-penny-stocks.html http://www.inc.com/articles/1999/ll/15746.html http://www.ehow.com/how_l6552_manage-ipo.html http://www.ehow.com/info_7915110_would-choosing-investment-banker-ipo.html http://www.gaebler.com/Choosing-an-Investment-Banker.htm http://www.sec.gov/answers/ipodiff.htm http://www.sec.gov/answers/ipoelig.htm http://www.sec.gov/answers/ipopricing.htm http://www.sec.gov/info/smallbus/qasbsec.htm http://www.poynerspruill.com/publications/Pages/IPOIsitAppropriate.aspx http://www.investopedia.com/ask/answers/06/ipoadvantagedisadvantage.asp http://bear. warrington.ufl.edu/ritter/IPOs2010underpricing.pdf http://www.investopedia.com/university/ipo/ipo2.asp

Page 136
Academy of Entrepreneurship Journal, Volume 20, Number 2, 2014

Page 137
Academy of Entrepreneurship Journal, Volume 20, Number 2, 2014
THE REVERSE FAMILY BUSINESS: AN EMERGING TREND IN ENTREPRENEURSHIP?
Martin S. Bressler, Southeastern Oklahoma State University Kitty Campbell, Southeastern Oklahoma State University
Brett Elliott, Southeastern Oklahoma State University
ABSTRACT You may recall the movie some years ago in which Jamie Lee Curtis and Lindsay Lohan co-starred in a movie titled Freaky Friday. Jamie Lee Curtis played the part of a mom about to remarry, while Lindsay Lohan played her teenage daughter. In the movie they appear to be having some common mother-daughter types of disagreements. In an unusual magical moment they switch bodies and roles. Jamie Lee Curtis now has to go to high school and act like a teenager, while Lindsay Lohan assumes the role of Mom and working professional. Both of them must now adjust to the others’ life for one “Freaky Friday”. In some cases, entrepreneurs go through a role reversal when their parents work for them, rather than they working for their parents. In this paper, the authors examine the issues and day-to-day problems when “Freaky Friday” strikes the entrepreneur family.
INTRODUCTION
O’Hara (2012) reports the Hoshi Hotel in Japan to be the oldest family business in the world. The Hoshi hotel reportedly began operations in 718 A.D., and to this day continues to operate under the 49th generation of Hoshi family management. O’Hara (2012) also reports some other long-term family businesses such as Venetian glassmakers Barovier & Toso. Their family-operated glassmaking business dates back to 1295. Up until 2010, experts considered the Tuttle Market Farms to be the oldest continuously operating family business in the United States (O’Hara, 2012). Located in Dover, New Hampshire, the Tuttle family farm dates back to 1632. Up until recently, the 11th generation of the Tuttle family managed the day-to-day operation of the farm. According to the 2007 Survey of Business Owners (SBO), 52 percent of the 27.9 million small businesses reportedly operate as home-based businesses. The Institute for Entrepreneurial Excellence (Pitz, 2007) reports a somewhat higher 60 percent of employment in the United States that can be attributed to family-owned businesses. Further, the Institute (Pitz, 2007) also finds that family-owned businesses provide for 78 percent of all new jobs and approximately half

Page 138
Academy of Entrepreneurship Journal, Volume 20, Number 2, 2014
of the nation’s gross domestic product. This data indicates that although the usual “Mom and Pop” business might not be exciting, the small family-owned business serves as the foundation to our economy. Usually in a family business children go to work for their parents. Today however, that might not be the case. The new family business might be a reverse family business, where the parent or parents go to work for one of their children. Think about it. Would you want to hire your Mom or Dad, or both parents to work for you? You might be surprised to find that some entrepreneurs in fact, do hire one or both parents to work for them in their business. There are several examples of well-known persons who recruited their parents to fill important positions in their businesses. As one example, Microsoft founder and CEO Bill Gates hired his father to choose an attorney to defend Microsoft in a lawsuit by the government (Fisher, 2007). In addition, Gates later hired his father to serve as the Gates Foundation Chairman. Another example Fisher (2007) reports on is Francis Ford Coppola. Coppola recruited his father to write the music used in his films. The films Godfather II and Apocalypse Now helped him win the Oscar and Golden Globe awards due to their success. The greatest challenge for some small business owners could be the psychological shift from CEO or some other responsible position in industry to working for one or more of your children. In the reverse family business, the children you raised become the boss and now tell you what to do. Ganus (2007) suggests this reverse family business (or what we call “Freaky-Friday” entrepreneurship) trend could be the result of baby-boomers living longer and possibly becoming bored with retirement. Leland (2004) supports this idea and refers to an American Association of Retired Persons (AARP) study which found 68 percent of workers 50-70 years old reported their intention to continue working. Additionally, an AARP study by Brown (2012), reports that 78 percent of workers age 50 or over are either currently working or seeking employment. Of those, 19 percent indicated seeking employment for non-financial reasons. Brown (2012) further states that this number increases with age, with 41percent of workers aged 70 and above seeking employment for non-financial reasons. Family drama Working with your family members could present a challenge, regardless which relatives you work with. Siblings, parents, and other relatives often prove to be better relatives than employees. In most instances, children go to work in their parents’ business and remain working there until the parents decide to retire. However, when you work with your parents with you as their boss you could face the biggest challenge of all. Sometimes the parent will be called back to help with the business as a result of industry contacts or special industry knowledge. In other instances, parent employees function as low-cost help or even free labor to a new small business that might be struggling. Fisher (2007) provides Robert Shipman, the retired CEO of a manufacturing company, as an example. Shipman went to work for his daughter Marissa, who
Page 139
Academy of Entrepreneurship Journal, Volume 20, Number 2, 2014
started and operates her own cosmetics company. Her cosmetics firm, Balm, markets a complete line of products to a nationwide market. The research does not clearly identify a consistent model of “Freaky-Friday” entrepreneur businesses because in some cases, Mom or Dad becomes a member of the business to provide some financial assistance and become a partner in that business. In other cases, parents join the company as regular employees, in many cases on a part-time basis in order to supplement retirement income. Certainly, having highly-experienced employees you know you can trust can be a major asset for the small business owner. History and Background One of the most significant differences observed with parents who work for their children can be found with their employment history. Parents of entrepreneurs occasionally will hand down a business to one or more of their children but choose to stay with the business to help ensure an easier transition. In other cases, parents might join the family businesses to offer expertise in certain aspects of the business where the son or daughter might be lacking key skills. The areas of expertise might be specific to the particular industry or working with suppliers and/or having established key customer connections. The literature also cites other examples where the parents join the business because they want to help out their children or because the children might be helping the parent(s) by providing them with part-time employment and additional retirement income. Could there be any other reason that would explain why a lot of baby boomers started working in their kids’ business? According to Miller (2007), members of Generation Y (Gen Y) adhere more strongly to work-life balance than previous generations. In addition, Miller (2007) refers to a BusinessWeek article that reports of a survey by Universum, that found 59 percent of college graduates indicated their number one career goal as attaining a balance between personal and professional life. As children, members of Generation Y often observed their parents appearing to be working all the time. Although Gen Y members do not object to long hours and hard work, they want to be able to dictate how they work. Gen Y employees want a comfortable and informal work environment, and also expect to be able to use their cell phone for personal phone calls, listen to their iPod, or search the internet, as long as they get their work done. Miller (2007) found that differences in generational values notwithstanding, Generation Y children appear more likely to maintain better relationships with their parents. In addition, Miller (2007) refers to a Gallup poll in which 90 percent of Gen Y children consider themselves having a very close relationship with their parents. This contrasts with findings from back in 1974, when 40 percent of Baby-Boomers reported they would be better off without their parents. This emerging trend of parents going to work for their children seems to be initiated by a number of lifestyle and social changes. The National Federation for Independent Business (NFIB) points to other factors in addition to the closer relationships between Baby-Boomer

Page 140
Academy of Entrepreneurship Journal, Volume 20, Number 2, 2014
parents and their Generation Y children. The NFIB cites a study by Zipkin (2000) that found persons under 35 years of age represent 42 percent of all new business ventures. This data contrasts twenty years ago when the average age for an entrepreneur would be in their forties. Jackson (2010) calls this new business paradigm as the “reverse family business”. Rationale Usually in a family business, one or more children choose to work in the business venture that one parent or both parents founded. In many instances, one or more of the children state a desire to take over the family business when the parents decide to leave the business to retire. Although there could be certain advantages to owning a family business, not all family businesses survive the same test of time as the Tuttle Market Farms in New Hampshire. Gary (2008) refers to a study conducted by the Family Business Institute that found only 30 percent of family businesses continue to the second generation, only 12 percent survive to the third generation, and only three percent survive to the fourth generation and beyond. Small business owners report several important benefits when hiring their parents to work in the business venture. Hiring parents can be particularly beneficial when taking over control of a business that the parents formed and managed for many years. Established customer relationships, important business contacts, and expert knowledge can prove very useful to the new business owner. Parents sometimes also serve as a source of start-up capital or for funding business expansion. This more often occurs when a parent chooses to retire and looks for another means of investing retirement funds other than traditional annuities or Certificates of Deposit that generally generate a smaller return. When Robert Shipman (Fisher, 2007) went to work for his daughter’s cosmetics firm, he also purchased 25 percent ownership in her company, thereby providing a much needed infusion of capital to the new business venture. Challenges and opportunities In small businesses where parents work for their children, both parents and children can benefit from several things. Parents can find working for their children helps them transition from the corporate world to retirement life. Even though the corporate world might not appreciate and recognize skills of older workers, their entrepreneur children will likely value and welcome the expertise parents can bring to the business. Retired parents also find working in the family business provides additional income and benefits to those parents who need it. This could be especially important if their savings or retirement plan benefits do not meet their retirement living needs. Perhaps one of the most important benefits to children entrepreneurs could be the opportunity to recruit employees with a high level of expertise, often for a lower salary than they otherwise would be able to do. Entrepreneurs often report hiring their parents to be an important

Page 141
Academy of Entrepreneurship Journal, Volume 20, Number 2, 2014
business advantage as they feel confident that they are hiring trustworthy and dependable employees. Davidson (2001) argues that business owners can ask their parent/employee to do tasks at work that they might otherwise be reluctant to require of a regular employee. An example might be when children entrepreneurs ask their parents to remain late at work or to work on weekends or holidays. The degree of commitment to the family business and to their children can be much greater than from an employee outside the family. Parents can also be frank with their children in instances in which a non-family member could be afraid of losing their job for speaking out in opposition to a policy or an idea of the small business owner. Tozzi (2008) cites Bryan Sims of Brass Media as an example of an entrepreneur who found that having his father serve on the Board of Directors of his company added both credibility and integrity to him and his company when working with both existing and potential clients. An additional benefit to both parents and children entrepreneurs could be the prospect of having daily interaction with family members, something that seems to be missing in today’s corporate world. This could even become more likely with millennial family business owners, as parent-child relationships seem to work better than that of the relationships Baby-Boomers experienced with their own parents. Although recruiting your parents for your business might not work for every small business owner, Stanleigh (2012) argues that perhaps the best rationale for hiring your parents could be the increased level of trust with your parents that you might not expect from someone outside the family. Whether it be confidential information, computer passwords, or company secrets, who else would you feel as comfortable with? Small business, big impact Many consider small businesses the engine that powers the nation’s economy. According to the U.S. Small Business Administration (SBA), small businesses comprise 99.7% of all U.S. businesses and employ 49.2 percent of all American workers. Small businesses also dominate the U.S. economy with regard to adding new jobs. The SBA also indicates that companies with 500 or fewer employees accounted for 67 percent of net new job growth since the beginning of the latest recession from mid-2009 to 2011. These small businesses not only supply employment for nearly half of all U.S. workers but also provide for more than half of gross domestic product (U.S. Census Bureau, 2007). The data confirms that when small businesses succeed the national economy also tends to do well. According to data compiled by the U.S. Small Business Administration (SBA), U.S. small businesses employ 59.7 million workers, approximately half of the U.S. workforce. Small businesses with fewer than 500 employees also account for 99.9 percent of the estimated 27.1 million businesses in 2010 (SBA, Office of Advocacy). Among those small businesses, 52 percent represent home-based businesses and 2 percent franchises. In addition, small businesses account for 98 percent of exporting companies and 31 percent of total export value (SBA, Office
Page 142
Academy of Entrepreneurship Journal, Volume 20, Number 2, 2014
of Advocacy). Finally, small businesses produce 16.5 times more patents per employee than larger companies (SBA, Office of Advocacy, 2012).
DEFINITION OF TERMS Baby-Boomer- The 76 million people born in the United States between 1946 and 1964. The wants and needs of baby boomers have been endlessly studied by companies that want to market goods and services to this generally well-heeled generation (The American Heritage Dictionary of Business Terms cited at http://www.yourdictionary.com/baby-boomer-generation). Employer businesses-Firms with paid employees, including workers on the payroll and excluding sole proprietors and partners (http://www.census.gov/econ/sbo). Generation Y- refers to the generation that follows Generation X and also referred to as the Millennials, Generation We, the Global generation, the Net Generation, and the Echo Boomers. Although there are not exact dates assigned to the definition, Generation Y usually refers to those born between 1980 and 2000. (http://en.wikipedia.org/wiki/Generation_y)
Multi-generation business ownership-businesses that transfer ownership from one generation to the next. Nonemployer businesses-firms without paid employees, including sole proprietors and partners of unincorporated businesses that do not have any other employees on the payroll (http://www.census.gov/econ/sbo). Reverse family business-opposite of the typical family business where the kids work for their parents, in the reverse family business, the parents work for their kids (http://www.secondact.com/2010/10/joining-the-reverse-family-business) Short-skilled workers-workers lacking the specific skills necessary for available jobs in the local labor market (http://sbaer.uca.edu/research/asbe/2003/pdfs/hub/23Bressler&.pdf)
RESEARCH METHODOLOGY
In this study, the researchers searched for answers to several important questions. First, the researchers wanted to find out how typical it would be to find the owners’ parents working in small businesses. Second, the researchers wanted to identify which parent (or both parents) would more commonly be employed in the small business. In addition, the researchers sought to collect general business demographic data to compare with existing data which could include industry classification, owner demographics, and size of business. Using a compiled database of small business owners, the researchers queried the database to select small businesses with less than 500 employees from across the country. The researchers then selected ten thousand small business owners to email the survey questionnaire. Many of those ten thousand email addresses proved invalid, possibly due to a change in the email address or perhaps due to the small business no longer being in operation. The remaining 8,112 small

Page 143
Academy of Entrepreneurship Journal, Volume 20, Number 2, 2014
businesses received the emailed survey and after an additional follow-up reminder 828 small business owners responded with usable survey data, resulting in an effective 10.2 percent response rate. Of those small businesses responding to the survey questionnaire, 113 (13.7 percent) responded that one or both parents worked in their business. Measures In the first section of the survey questionnaire the researchers questioned owners with regard to their experiences working with their parents. Of the 828 small business owners responding to the survey questionnaire, 113 reported one or both parents working in their business. The researchers wanted to find the reason(s) their parents work in their small business. Would it be for their business expertise or in order to provide financial assistance, or for some other reason? In the next section of the survey questionnaire the researchers included questions with regard to the impact of their work and family relationship. The researchers asked small business owners whether or not they believed their parent working in the business resulted in a closer relationship. In the last section of the survey questionnaire, the researchers asked about business ownership. This section included questions regarding what industry the business operates in and the number of employees in the business. This section also included questions on owner demographics such as race and gender. Limitations of the study An important limitation of the study resulted from Hurricane Sandy, the powerful storm that ravaged the east coast of the United States in fall, 2012. Because many small businesses could possibly be destroyed and closed business while others could be unable to respond to the survey questionnaire, the researchers chose not to select small businesses from those states along the eastern seaboard. This resulted in responses from 24 states, primarily from the southern and western regions of the country. Another limitation of the study would be that only those small businesses with a computer and business listed email address would be included in the small business database. In addition, only those small businesses listed in the researchers’ database received survey questionnaires and finally, only those small business owners who chose to respond represent survey results.
FINDINGS The researchers sought answers to several important questions. First and foremost, the researchers sought to determine whether parents working for their children could be considered
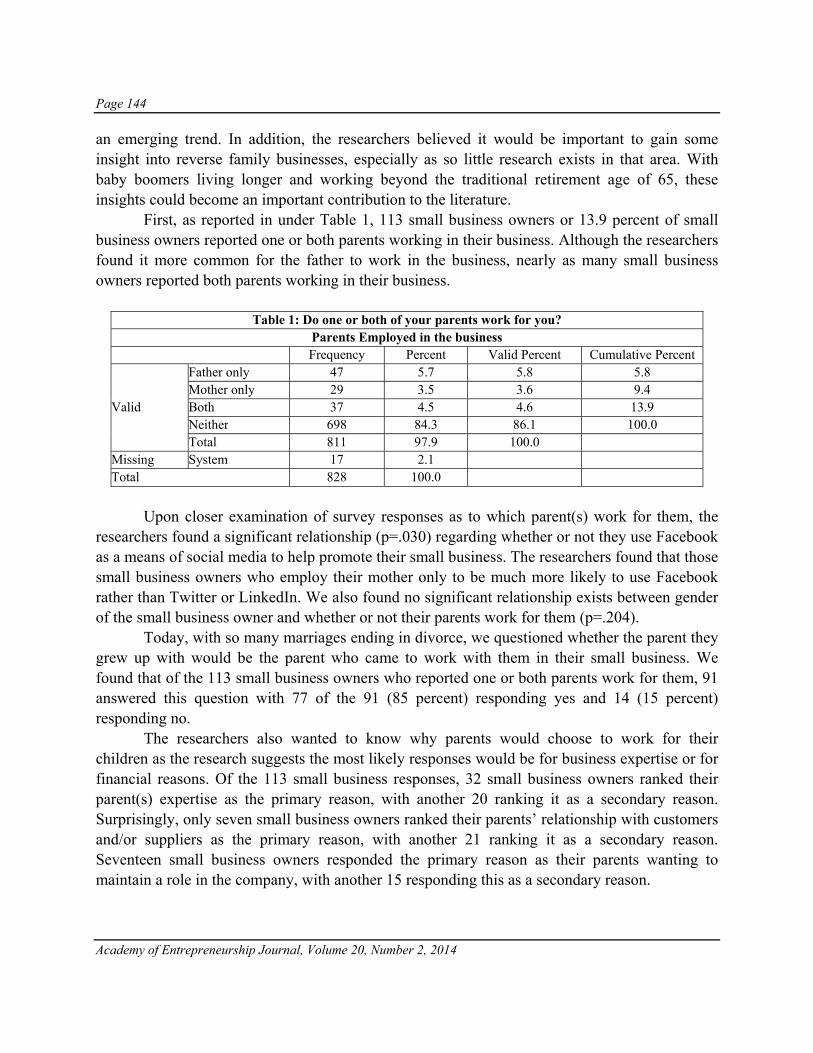
Page 144
Academy of Entrepreneurship Journal, Volume 20, Number 2, 2014
an emerging trend. In addition, the researchers believed it would be important to gain some insight into reverse family businesses, especially as so little research exists in that area. With baby boomers living longer and working beyond the traditional retirement age of 65, these insights could become an important contribution to the literature. First, as reported in under Table 1, 113 small business owners or 13.9 percent of small business owners reported one or both parents working in their business. Although the researchers found it more common for the father to work in the business, nearly as many small business owners reported both parents working in their business.
Table 1: Do one or both of your parents work for you? Parents Employed in the business
Frequency Percent Valid Percent Cumulative Percent
Valid
Father only 47 5.7 5.8 5.8 Mother only 29 3.5 3.6 9.4 Both 37 4.5 4.6 13.9 Neither 698 84.3 86.1 100.0 Total 811 97.9 100.0
Missing System 17 2.1 Total 828 100.0
Upon closer examination of survey responses as to which parent(s) work for them, the researchers found a significant relationship (p=.030) regarding whether or not they use Facebook as a means of social media to help promote their small business. The researchers found that those small business owners who employ their mother only to be much more likely to use Facebook rather than Twitter or LinkedIn. We also found no significant relationship exists between gender of the small business owner and whether or not their parents work for them (p=.204). Today, with so many marriages ending in divorce, we questioned whether the parent they grew up with would be the parent who came to work with them in their small business. We found that of the 113 small business owners who reported one or both parents work for them, 91 answered this question with 77 of the 91 (85 percent) responding yes and 14 (15 percent) responding no. The researchers also wanted to know why parents would choose to work for their children as the research suggests the most likely responses would be for business expertise or for financial reasons. Of the 113 small business responses, 32 small business owners ranked their parent(s) expertise as the primary reason, with another 20 ranking it as a secondary reason. Surprisingly, only seven small business owners ranked their parents’ relationship with customers and/or suppliers as the primary reason, with another 21 ranking it as a secondary reason. Seventeen small business owners responded the primary reason as their parents wanting to maintain a role in the company, with another 15 responding this as a secondary reason.

Page 145
Academy of Entrepreneurship Journal, Volume 20, Number 2, 2014
With so many baby boomers living longer and working longer, the researchers wanted to determine whether a financial reason might account for so many parents working for their children. Of the 113 small business owners who responded to the survey questionnaire, 21 listed helping their parents financially as the primary reason, with another 14 listing this as a secondary reason. This number could continue to increase as Social Security and limited personal savings could cause financial pressures on retirees. The popular press reports of some small business owners receiving financial assistance from one or both parents and points to Robert Shipman as an example (cited in Fisher, 2007). Shipman, a retired manufacturing company CEO, began working for his daughter Marissa but also assisted with financing his daughter’s start-up business. Of those small business owners responding to our survey, only six small business owners indicated the primary reason to be that their parents invested money in the business venture, with another 18 respondents citing this as a secondary reason. As some family businesses tend to be passed down from one generation to the next, the researchers wanted to determine whether this would be the case among these “reverse family businesses.” The researchers asked whether the business previously had been owned by one or both of your parents. Responses to that question as reported in Table 2 indicated that forty-eight respondents (42.4%) answered “Yes” to this question. The researchers also inquired whether the small business owner previously worked for their parents. Fifty-four survey respondents (47.7 percent) answered “Yes” to this question. Finally, we asked whether the small business owner planned to take over their parents’ business. Thirty-two respondents (28.3 percent) answered “Yes” to this question (see Table 4). The researchers found very similar results (p=.000) regarding the relationship between whether their parents work for them and whether or not they had planned to take over the business. If both of their parents work for them, then they were more likely to have planned to take over the business.

Page 146
Academy of Entrepreneurship Journal, Volume 20, Number 2, 2014
Table 2: Parent previous ownership of the business
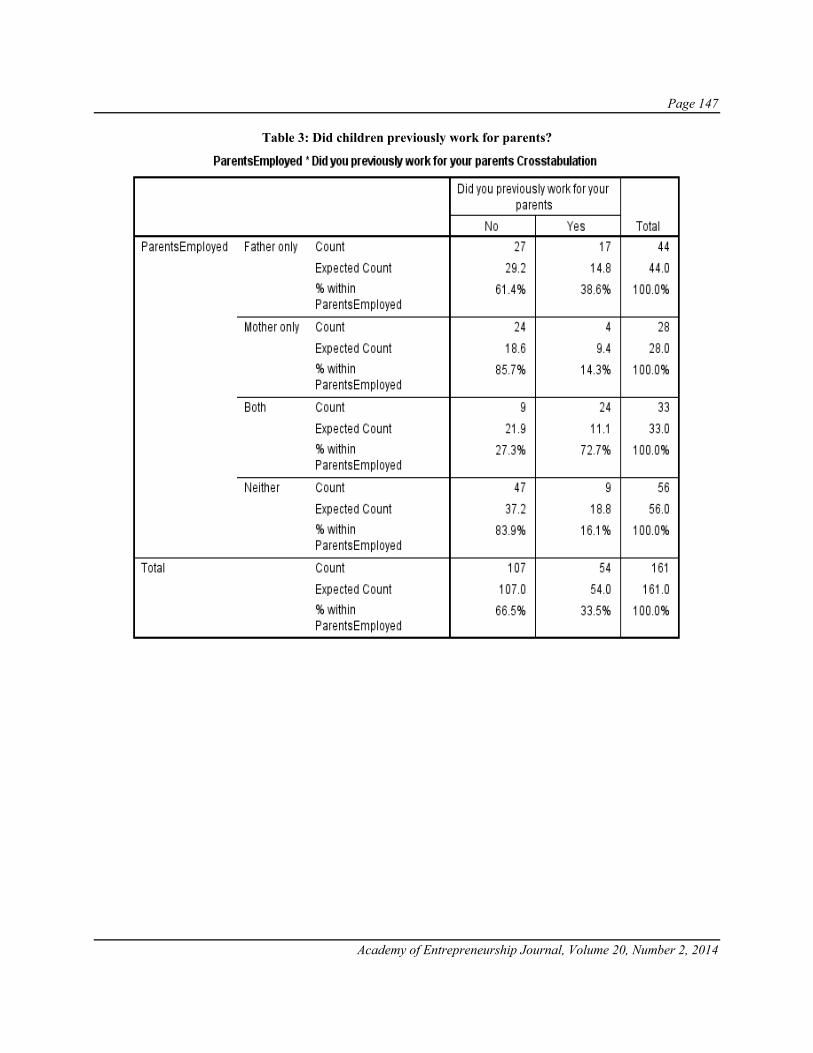
Page 147
Academy of Entrepreneurship Journal, Volume 20, Number 2, 2014
Table 3: Did children previously work for parents?

Page 148
Academy of Entrepreneurship Journal, Volume 20, Number 2, 2014
Table 4: Plans to take over the business
The literature also suggested there could be a negative impact with the relationship between parents and children business owners. Responses from our study found 77 of respondents (50.3 percent) indicated no impact on their relationship, 49 (32 percent) indicated that their relationship with their parents became closer, 27 (17.6 percent) indicated their relationship became more difficult. The researchers found a significant relationship (p=.000) with regard to the relationship between parents and entrepreneur children and which parent(s) work for them. The researchers found relationships more likely to be unaffected (either direction) when the mother rather than the father works in the business.
Table 5: Did your parents working for you affect your relationship?
Frequency Percent Valid Percent Cumulative Percent
Valid
No 77 9.3 50.3 50.3 Yes, grown closer 49 5.9 32.0 82.4 Yes, more difficult 27 3.3 17.6 100.0 Total 153 18.5 100.0
Missing System 675 81.5 Total 828 100.0

Page 149
Academy of Entrepreneurship Journal, Volume 20, Number 2, 2014
Survey responses yielded some additional interesting information. For example, responses indicate a significant relationship (p=.027) exists between industry type and whether or not their parents work for them. Small business owners operating in manufacturing or construction reported were found to be and more likely to have their parents working for them.
Table 6: Parent working for you and industry
The researchers also found there to be a significant relationship (p=.000) between the size of the small business and whether or not their parents work for them. Responses indicate that businesses with 1-9 employees significantly less likely to have a parent working for them. The researchers also found a significant relationship (p=.001) between age and whether or not their parents work for them. Findings support that the younger the business owner, the more likely their parents work for them. Somewhat related to age, we found no significant relationship exists between whether the small business owner would be a veteran and whether or

Page 150
Academy of Entrepreneurship Journal, Volume 20, Number 2, 2014
not their parents work for them. However, the statistical result proved close (p=.089). It was close because veterans responded their parents as less likely working for them, (10.7 percent vs. 15.2 percent for non-veterans). This could be due to veterans typically being older meaning that their parents may not still be living.
DISCUSSION Despite limited survey response, the data does provide some insight into small business ownership. Not only do we find parents working in a small business owned by one of their children, we also understand more of the challenges and problems faced by typical small business owners. If additional research supports Zipkin’s (2000) study findings, we could see significant increases in the number of parents working for their entrepreneur children. Early research suggests that there could be a growing and significant trend toward parents working for their kids. Perhaps with maturing millennials reaching the typical age of business ownership along with more senior parents needing additional income, we could see significantly increasing numbers of parents working for their kids. Researchers should also continue to monitor lifestyle changes and attitude shifts, such as those changes reported by Miller (2007) which could continue to fuel this emerging trend.
CONCLUSION
Implications for future research More research in this area could uncover some additional important information. For example, could we determine with greater certainty to what extent parents work for their children? Will we continue to find the father parent involved in the small business and will the level of father parent involvement change over time? Second, it would be interesting to determine the impact on family relationships resulting from the close interaction of the work environment with reversed roles. Relationship differences could be studied further in instances where only the father works in the business, only the mother works in the business, or when both parents work in the business. The researchers suspect that very different interactions would be found in small businesses where both parents work for the adult children.
Summary Although we cannot state for certain whether working for your children will become a significant trend, conditions necessary to propel such a trend appear to be in place. For example, we know that people are living longer and could become bored with retirement or possibly

Page 151
Academy of Entrepreneurship Journal, Volume 20, Number 2, 2014
require additional income to supplement Social Security or other retirement income. In addition, some baby-boomers might be able to provide financing for their children’s businesses using their 401k or other retirement accounts. Finally, more and more examples of business fraud, embezzlement, and other crimes against business seem to be occurring, whom can you trust more than your parents?
REFERENCES
Baby boomer generation. (n.d.). Retrieved October 25th, 2013, from http://www.yourdictionary.com/baby-boomer-
generation Brown, S.K. (2012, June). What Are Older Workers Seeking? An AARP/SHRM Survey of 50+ Workers. AARP
Research & Strategic Analysis. (http://www.aarp.org/work/on-the-job/info-06-2012/older-workers-employment-benefits.html).
Davidson, H. (2001). Parents on the payroll: the new economy is creating a new kind of family business. Profit, 20(2). April 01, 32-36.
Fisher, A. (2007). Working for your kids. Fortune, 155(12), 130-138. Ganus, S. (2007, October 14). I work for my kid: parents, children strike a balance in working relationships. The
Oklahoman. (http://redding.com/news/2007/oct/14/1-work-for-my-kid). Gary, A. (2008). Getting pulled back into the family business. Rockford Register Star. March 8.
(http://www.rrstar.com/news/yourtown/x39085063). Jackson, N. (2010). Joining the (Reverse) Family Business. October 18.
(http://www.secondact.com/2010/10/joining-the-reverse-family-business). Miller, K. (2007). Gen Y Rewrites the rules for Family Biz.
(http://www.businessweek.com/print/smallbiz/content/mar2007/sb20070319_730816htm. O’Hara, W.T. (2012). The oldest Family Businesses in America. Bryant College Institute for Family Enterprise.
(http://web.bryant.edu/business/family_business.html). Pitz, M. (2007). Parents working for their kids can strengthen family ties. Tribune Business News, Washington
March 20, 2007. Stanleigh, S. (2012, August 20). These businesses hired their mothers. The Globe and Mail.
(http://license.icopyright.net.user/viewFreeUse.act). Tozzi, J. (2008). Should you hire your parents? BusinessWeek.com retrieved from
(http://brassmedia.com/press/should-you-hire-your-patrents). Zipkin, A. (2000). Start-Up Need Help? Hire Dad or Mom. The New York Times, April 1.
(http://nytimes.com/2000/04/05/jobs/start-up-need-help-hire-dad-or-mom.html?).
Page 152
Academy of Entrepreneurship Journal, Volume 20, Number 2, 2014
SOCIAL ENTERPRISES AND SOCIAL ENTREPRENEURS: ONE SIZE DOES NOT FIT ALL
William T. Jackson, University of South Florida St. Petersburg
Mary Jo Jackson, University of Tampa
ABSTRACT
As with evaluating the potential of a new entrepreneurial firm, criteria should be in place to gauge the potential for success for Social Enterprises (SE). Unfortunately, most of the decisions to start (and support) a SE have been impacted significantly by an emotional attachment of the “job to be done” (in these cases, fixing a social problem). It is argued that a better approach to success would be to base these startup decisions on the “Solution” and the nature of the “Who” is impacted by the problem rather than the gravity of the JTBD. Thus, a preliminary inquiry into creating a model of evaluating SE startups is proposed with a goal of focusing on those enterprises that have the highest potential for success in creating the greatest good for society is proposed.
INTRODUCTION
A clear understanding of Social Enterprises (SE) and Social Entrepreneurs has been allusive. This lack of clarity is impacted first by the definition itself and then further exasperated by the universal application of the term “entrepreneur” as the agent of change within those organizations. It almost seems that the SE is falling into the same trap that the overall field of entrepreneurship found (and maybe even to this day finds) itself in at the last two decades of the twentieth century. Not recognizing a standard unit of observation, many researchers have taken the shotgun approach in defining and supporting many just causes. This paper is an attempt to provide an exploratory study in clarifying the definition and offering a platform of future inquiry into organization entities associated with Social Enterprises. In the remainder of this manuscript, a clearer framework of how to define SEs will be provided along with potential areas of future research. Social missions are extremely valuable for our society and those individuals that are negatively impacted by various environmental maladies. If, however, we do not understand the makeup of these organizations we can neither create as great an impact on solving these social ills nor sustain support in doing so.
Page 153
Academy of Entrepreneurship Journal, Volume 20, Number 2, 2014
In order to accomplish the goals outlined above, it is necessary to first revisit the definition of SEs to determine if there exists a more directed and understandable definition. In addition, a typology for exploring entrepreneurial firms in general will be discussed and offered as a means of clearly identifying the types of firms engaged in social enterprises as well as how to best focus our attention on those that have the potential for the greatest impact on society.
SOCIAL ENTERPRISES (SEs)
In offering the most accepted to date definition of “social entrepreneurship”, Dess (2001) clearly admitted that a problem still existed in defining the phenomenon. According to Dess, the concept still means many different things to different audiences. This is not surprising in that the SE is seen as not-for-profits, social purpose ventures, for profit development banks, hybrid organizations mixing for and not-for-profit organizations.
Dess choose to apply several principles associated with giants (namely Schumpeter and Drucker) in the field of entrepreneurship to better understand the concept. Using previously established premises, Dess held that the social entrepreneurship created value, were change agents, looked for opportunities, and shifted economic resources. And, that starting a social enterprise in itself was not necessarily entrepreneurial. Based upon these concepts his “idealized definition” was: Social entrepreneurs play the role of change agents in the social sector by:
1. Adopting a mission to create and sustain social value (not just private value), 2. Recognizing and relentlessly pursuing new opportunities to serve that mission, 3. Engaging in a process of continuous innovation, adaptation, and learning, 4. Acting boldly without being limited by resources currently in hand, and 5. Exhibiting heightened accountability to the constituencies served and for the
outcomes created. (p. 4) As should be obvious if this (again the most popular definition for SE) is applied to most
not-for-profit or most SEs in general, few meet these requirements. Most have difficulty in sustaining value over time, are generally singularly focused, generate little discontinuous change for society, are severely constrained by resources, and often lack accountability to both investors and stakeholders.
Over the years many tangent explanations of SEs have emerged. Many have tied the concepts of for-profit with that of not-for-profit or at least indicating a need to remain sustainable (Domenico & Haugh, 2009; Haugh, 2007; LeRoux, 2005). Still others have applied a broader brush in suggesting these firms engage in “a process involving the innovative use and combination of resources to pursue opportunities to catalyze social change and/or address social needs” (Mair and Marti, 2006, p. 37).

Page 154
Academy of Entrepreneurship Journal, Volume 20, Number 2, 2014
Many investigations into the impact of SEs have come to the unfortunate conclusion that, while good intentioned not many SEs reach their intended impact goals especially in terms of economic growth ( Sharir & Lerner, 2006; McMullen, 2011). McMullen argues that a greater emphasis in merging business and true entrepreneurial market applications with social consciousness is necessary. Sharir and Lerner agree that characteristics of successful entrepreneurial firms are essential for SEs to be successful. As a part of entrepreneurial success, access to resources is paramount. A few other conditions necessary included:
1. Previous experience 2. Positive external environment 3. Access to capital 4. Strong social network 5. Dedication to the ideal (passion) 6. Strong team
All of these run parallel to conditions necessary for success in any entrepreneurial firm. A recent argument (and one worthy of further consideration) is that social enterprises can be defined best by tying the concept to one of corporate social responsibility (CSR) (McWilliams and Shrader, 2011). The premise behind this assumption is that SEs main focus (as is the case with CSR) is addressing social problems through action. While at the same time, this approach avoids the problematic issue that many individuals that start a SE are not, in fact, true entrepreneurs especially if applied to the definition made popular by Dess (2001). There are many others that see the application of CSR to entrepreneurial firms as a logical extension of the concept of SE (Burton and Goldsby, 2010; Acar, Aupperle, & Lowy, 2001). Using one of the most popular frameworks of CSR (Wood, 1991; Carroll, 1979) suggest that being socially responsibility requires attention and action at four primary levels—economic, legal, ethical, and discretionary (philanthropic). The distribution of these efforts impacts the same stakeholders that are impacted by those of a purely social entity. Because of that relationship, it is suggested that it be used as the social side of the proposed framework in this study. Using Carroll’s domains (1979), an organization has social responsibilities in varying levels within this framework. The highest level of obligation is that the organization must be economically sustainable. This is followed by the organization obeying all laws and covenants related to their business. The third level of responsibility is to operate ethically—while this is not mandatory, it is expected. Finally, the organization should directly contribute to elements of society from its rents earned—again this is not required but is expected and desired. These relationships can be seen in the table below.

Page 155
Academy of Entrepreneurship Journal, Volume 20, Number 2, 2014
Table 1: Carroll’s CSR Model Area of Responsibility Obligation Level of Commitment Economic A firm owes it to its
stakeholders to remain sustainable economically. This is true in regard to its employees, suppliers, the community in which it exists, etc.
Required
Legal A firm has an obligation to society to obey all laws in relationship to its operations
Required
Ethical A firm should behave in an ethical manner in all organizational dealings
Expected/Desired
Philanthropic A firm should give back some of its rents to the communities in which it exists
Expected/Desired
ENTREPRENEURIAL TYPES
In spite of the effort of numerous researchers in the field of entrepreneurship, there remains an absence of a consensus of what the term means. No theoretical consensus of how to study the full spectrum of entrepreneurial types has been accepted into the folds of the academic community that allows consistent examination of the principles and theories that make this illusive group such a significant part of the economic engine that drives our economies. There has been no diminishing attention to the phenomenon yet over the past forty years, still no answer. Some researchers have made strides on identifying entrepreneurial characteristics (Carland et al, 1995; Stewart et al, 1998 & 2003). Others have focused on the strategic relationships (Naffziger, Hornsby, and Kuratko, 1994; Carland et al., 1984; Jackson & Jackson 2007, 2005). However, a review of the literature suggests no integration of the two has moved forward with any success toward creating this consensus. While it is not within the scope of this article to rehash the debate of defining the entrepreneur, most will agree that a legitimate framework is necessary for future exploration (Runyan, Droge, & Swinney, 2008).

Page 156
Academy of Entrepreneurship Journal, Volume 20, Number 2, 2014
The initial criteria for establishing a framework for analysis is to identify the strategic groups that would be competing using a focus strategy. There have been numerous studies that have attempted to specify these groups based upon categories of operations (see Hornaday, 1990 or Carland, Hoy, Boulton & Carland, 1984 for a thorough listing). Most of these categorizing attempts have used either only two groups or have attempted to utilize traits (Hornaday, 1990). In this study, the extremely popular and widely accepted framework of Michael Porter (1980) will be used. Porter posited generic strategies that would be available for firms pursuing strategies in fragmented industries available to entrepreneurial firms. According to Porter, fragmented industries were those industries not dominated by a small set of firms, but rather industries “in which no firm has a significant market share and can strongly influence the industry outcome” (p. 191) and where “the competitive structure requires focus or specialization” (p. 211). If the field of Social Entrepreneurship is to avoid the same problems that Entrepreneurship in general has faced over the past thirty years, careful articulation of a model of study is warranted. A review of the general literature indicates that no theoretical consensus exists and that a significant problem has emerged due to the problem of operationalizing the term “Entrepreneurship”. While there has been a new resurgence in the literature with empirical investigations from such leading journals as Journal of Management, Entrepreneurship, Theory and Practice, and Strategic Management Journal, little has been resolved. In fact, the extant literature lacks specifications of the spectrum of entrepreneurial types or motivation of the activity involved in these ventures.
The current framework is an application of the entrepreneurial types identified in Jackson & Jackson (2007). While others have attempted to apply a framework of entrepreneurial characteristics to social responsibility (McMullen, 2011), the approach offered in this paper advocates for combining both characteristics as well as strategic orientation.
A brief summary of the concepts of strategic orientation (SO) and personal characteristics found in the Jackson and Jackson (2007) framework is as follows. Each of the SO choices is based upon the concept of industry lifecycle. Differentiation, Entrepreneurial Focus: These entrepreneurial firms are the creators, innovators, introducers of unique and novel ideas into the market. In bringing this new idea to market,

Page 157
Academy of Entrepreneurship Journal, Volume 20, Number 2, 2014
Figure 1: Entrepreneurial Continuum
The concepts previously discussed provide the foundation for the primary focus of this
paper—how do we determine which SE to foster and support? As is the case with advancing economic development from a commercial perspective, the same concept is recommended for the socially driven organization. As described in the Kauffmann Foundation Research Series: Firm Formation and Economic Growth, Stangler (2010) asserts:
While previous research has emphasized the importance of new and young companies to
job creation overall, this paper focuses on high-growth firms—the so-called “gazelles” that, despite their relatively small numbers, nonetheless account for a disproportionate share of job creation. (p2).
Stangler goes on to indicate that the top-performing 1 percent of firms generate roughly 40 percent of new job creation and generate 10 percent of all new jobs in any given year. It is suggested here that the same approach needs to be applied to firms supported in the social enterprise arena as well. Using the framework provided on entrepreneurial types and the various areas of CSR it is obvious where our attentions should be focused. If, in fact, creating the greatest good for the greatest number of social needs is the goal of SE, then selecting those firms carefully that can accomplish this is imperative given limited resources. So, if these goals translate into staying sustainable, avoiding legal mine fields, accomplishing the directives of the firm ethically, and with the hope of significant contributions to our “social” communities, then firms that are motivated to accomplish this should be our focus. The table below indicates, based upon the frameworks provided within this paper, the operations that should be invested in to create this greater good.

Page 158
Academy of Entrepreneurship Journal, Volume 20, Number 2, 2014
Table 2: Likelihood of Meeting CSR Criteria by Entrepreneurial Type
CSR Criteria Subsistence Firms
Non-Serial SSB Serial SSB Entrepreneur
Economic No Yes Yes No Legal No Yes Yes Yes Ethical No Yes Yes Yes Philanthropic No No/Yes No/Yes No/Yes Low-Cost Entrepreneurial Focus Based upon their position of under-capitalization and the compelling requirement of maintaining the lowest possible operating costs, the low-cost entrepreneurial social enterprise represents limited potential for meeting its social mission of CSR. This type of firm must continuously rely on capital infusion to stay marginally operational.
Proposition 1a: Subsistence entrepreneurial firms (those pursuing a low-cost focus strategy) are less likely to be successful SEs due to the inability to maintain sustainable economic performance. Proposition 1b: Subsistence entrepreneurial firms (those pursuing a low-cost focus strategy) are less likely to be successful SEs due to their likelihood of not meeting all legal requirements for operations. Proposition 1c: Subsistence entrepreneurial firms (those pursuing a low-cost focus strategy) are less likely to be successful SEs due to their likelihood to trade off ethical considerations when faced with choices between ethical dilemmas and survival. Proposition 1d: Subsistence entrepreneurial firms (those pursuing a low-cost strategy are less likely to be successful SEs due to their likelihood to be unable to engage in philanthropic endeavors due to the
marginal profitability of their firms.
Mixed Non-Serial Entrepreneurial Focus As discussed above, this group of entrepreneurs is focused heavily in ensuring continuous
and consistent returns on investments. Where the level of ROI is possibly restricted by focusing on one venture, the longevity of the firms clearly offers a unique perspective in regards to social responsibility. Much of the success of these firms is contingent upon long-standing relationships with multiple internal and external stakeholders. This fact, in and of itself, would suggest these firms would be successful as a SE in most aspects.
Proposition 2a: Mixed Non-Serial Entrepreneurial Focus firms are very likely to meet the CSR requirement of sustainable economic performance necessary for being successful SEs.
Proposition 2b: Mixed Non-Serial Entrepreneurial Focus firms are very likely to meet the CSR requirement of legal compliance performance necessary for being successful SEs.
Proposition 2c: Mixed Non-Serial Entrepreneurial Focus firms are very likely to demonstrate the CSR element of ethical behavior expected for being successful SEs.
Proposition 2d: Mixed Non-Serial Entrepreneurial Focus firms are unlikely to engage in significant philanthropic activity desired/expected for being successful SEs.

Page 159
Academy of Entrepreneurship Journal, Volume 20, Number 2, 2014
Mixed Serial Entrepreneurial Focus Characteristics of this group are very similar to the Mixed Non-Serial Entrepreneurial Focus with a few exceptions that would impact SEs. First, as serial entrepreneurs this group would suggest greater capacity in terms of generating a consistent and continuous returns. This success should work in the favor of preforming in a socially responsive way. In addition, in even a more robust manner, these firms rely on the relationships developed for internal and external stakeholders. This group may also have generated longer term equity positions in their business portfolios.
Proposition 3a: Mixed Serial Entrepreneurial Focus firms will be the most likely group to meet the CSR requirement of sustainable economic performance on a continuous basis of all types for being successful SEs.
Proposition 3b: Mixed Serial Entrepreneurial Focus firms will be high in meeting the CSR requirement of legal compliance necessary for being successful SEs.
Proposition 3c: Mixed Serial Entrepreneurial Focus firms will be high in meeting the CSR expected performance of ethical behavior to be successful SEs.
Proposition 3d: Mixed Serial Entrepreneurial Focus firms will be actively involved in Philanthropic activity even though at a modest level locally making them successful SEs.
Differentiated Entrepreneurial Focus Firms Being the group most associated with dynamically successful entrepreneurial firms along with multiple failures along the way to success, results of social responsibility in probably a mixed bag. For the first time founder the focus of these firms is generally geared toward getting an idea off the ground and positioning it for significant growth. If successful, the predominant trend is capitalizing on another opportunity. In these situations where success is achieved all areas of social responsibility can then be a focus. Until that time, philanthropic endeavors are usually avoided.
Proposition 4a: Differentiated Entrepreneurial Focus Firms (true entrepreneurs) are less likely to be successful SEs from an economic sustainability perspective due to the high number of failures in starting up a new venture in a dynamic industry. Successful firms in this category, however, are likely to be extremely profitable creating a significant impact on numerous stakeholders.
Proposition 4b: Differentiated Entrepreneurial Focus Firms are likely to be the most compliant in regard to meeting legal obligations due to the scrutiny involved for due diligence being accomplished for their firms and therefore successful as SEs.
Proposition 4c: Differentiated Entrepreneurial Focus Firms, again for the same reason of due diligence being accomplished on their firms and founders individually, are most likely to meet ethical compliance and thus being successful SEs.
Proposition 4d: Differentiated Entrepreneurial Focus Firms, in general, will not likely engage in philanthropic activity as a whole. However, most of the major philanthropic activity will be found by serial entrepreneurs in this group after a firm successful launch. In other words, Differentiated Entrepreneurial Focus Firms that are on their second or later venture will be the most likely group to engage in philanthropy at a major
level and thus be successful SEs.

Page 160
Academy of Entrepreneurship Journal, Volume 20, Number 2, 2014
IMPLICATIONS LIMITATIONS AND CONCLUSIONS
In an attempt to explore the possibility of multiple types of entrepreneurs, Carland, Carland & Ensley (2001) suggested that: Attempts to differentiate entrepreneurs from small business owners or to categorize
business owners in any fashion present an incomplete picture of the entrepreneur. A full portrait must recognize that entrepreneurship is a continuum and new words may be required to help researchers differentiate individuals under study along that continuum (p. 52). The same concept should be applied to the field of social entrepreneurship. In addition, as
previously discussed, this continuum must also be tempered by a clearer understanding of the end results associated with the social activity—an overall positive impact of society in general. Or, as previously recommended to align this activity with a previously established framework that is indicative with these results—social responsibility.
The term social entrepreneur has mirrored the term entrepreneur causing significant confusion in relation to how we study, teach, approach, and avail those firms in advancing social issues. This preliminary inquiry into the subject attempts to provide a better understanding of SE by supporting the idea that these firms should be addressed in terms of social responsibility rather than applying the broad concept of “entrepreneur” In addition it attempts to suggest that a better platform for studying, teaching and approaching these firms can be achieved by adopting a continuum of entrepreneurial activities. In that this was a preliminary inquiry, propositions for testing were provided for each type of entrepreneurial firm using a continuum of types. Until studies attempt to address entrepreneurial concepts based upon tested typologies little will be gained from studying either the entrepreneur or the social entrepreneur.
REFERENCES
Acar, W., K. E. Aupperle, & R. M. Lowy (2001). An empirical exploration of measures of social responsibility across the spectrum of organizational types. International Journal of Organizational Analysis, 9, 26-57.
Auerswald, P. (2009). Creating social value. Stanford Social Innovation Review, Spring 7 (2), 51-55. Austin, J. H. Stevenson, & J. Wei-Skillern (2006). Social and commercial entrepreneurship: Same, different, or
both?. Entrepreneurship Theory and Practice, 30 (1), 1-22. Beer, H., E. Gamble, & P. Moroz (2012). Increasing the impact of social enterprise: The search for a performance
measurement regime. USASE Proceedings, 1265. Burton, B. K., Goldsby, M. (2009). Corporate social responsibility orientation, goals, and behavior: A study of small
business owners. Business & Society, 48, 88-104.
Page 161
Academy of Entrepreneurship Journal, Volume 20, Number 2, 2014
Bygrave, D. W., D. D’Heilly, M. McMullen & N. Taylor (1996). Not-for-profit entrepreneurship: Towards an analytical framework. Paper presented at the Babson College Entrepreneurship Research Conference, Seattle.
Carroll, A. B. (1979). A three-dimensional conceptual model of corporate social performance. Academy of Management Review, 4, 497-506.
Crossan, D., P. Ibbotson, & J. Bell (2011). The hologram effect in entrepreneurial “social commericial” enterprises: Triggers and tipping points. Journal of Small Business and Enterprise Development, 18 (4), 655-672.
Dess, J. G. (2001). The meaning of “social entrepreneurship”. Working paper. Stanford University, Stanford, California.
Dess, J. G. (2007). Taking social entrepreneurship seriously. Society, 44 (3), 24-31. Domenico, M. D., P. Tracey, & H. Haugh (2009). The dialectic of social exchange: Theorizing corportate-social
enterprise collaboration. Organizational Studies, 30 (8), 887-907. Dyer, W. G., Jr. & D. A. Whetten (2006). Family firms and social responsibility: Preliminary evidence from the
S&P 500. E T & P, November, 785-802. Girling, R. (2010). Global innovators: How some companies are working to improve social conditions around the
world. Journal of Applied Business and Economics. Granados, M. L., V. Hlupic, E. Coakes & S. Mohamed (2011). Social enterprise and social entrepreneurship Journal,
7 (3), 198. Haugh, H. (2007). Nonprofit social entrepreneurship. In Parker, S.C. (ed.) International Handbook Series on
Entrepreneurship: The Life Cycle of Entrepreneurial Ventures, 3, 401-436. Jackson, W. & Jackson, M. (2007). Application of the small business typology of strategic intent to small family
business ventures. Journal of Business & Entrepreneurship, 19 (1), 40-50. Jackson, W. T., Jackson, M. J. & Gaulden, C. (2006). Curricula Assessment Using the Course Diagnostic Survey: A
Proposal. Academy of Educational Leadership Journal, 10 (3), 37-48. Jackson, W.T. & Vaughan, M.J. (2005). The entrepreneurial continuum: A new prescription for future studies.
Academy of Entrepreneurship Journal, 11 (1), 9- 25. Kuratko, D. F., J. S. Horsby, & J. S. McMullen (2012). Conceptualizaing the developmet of a social corporate
entrepreneurship scale. USAS Proceedings, 163. Lane, M. D. & M. Casile (2011). Angels on the head of a pin. Social Enterprise Journal, 7 (3), 238. LeRoux, K. M. (2005). What drives nonprofit entrepreneurship?: A look at budge trends of metro Detroit social
service agencies. American Review of Public Administration, 35 (4), 350-362. Mair, J. & I. Martí (2006). Social entrepreneurship research: A source of explanation, prediction, and delight.
Journal of World Business, 41, 36-44. Martin, R. L., S. Osberg (2007). Social entrepreneurship: The case for definition. Stanford Social Innovation
Review, (Spring), 28-39. McMullen, J. S. (2011). Delineating the domain of development entrepreneurship: A market-based approach to
facilitation inclusive economic growth. E T & P, Jan., 185-215. McWilliams, A., & R. C. Shrader (2012). Toward measuring the social impact of entrepreneurial firms. USAS
Proceedings, 837. Mendoza-Abarea, K. & S. Anokhim (2012). The influence of environmental factors o social-venture creation.
USASBE Proceedings, 883. Murphy, P. J. & S. M. Coombes (2008). A model of social entrepreneurial discovery. Journal of Business Ethics, 87,
325-336. Peterson, R. T. & M. Jun (2009). Perceptions of social responsibility: The entrepreneurial vision. Business &
Society, 48, 385-405.
Page 162
Academy of Entrepreneurship Journal, Volume 20, Number 2, 2014
Robinson, D. F., A. L. Sherwood, & C. A. DePaolo (2010). Service-Learning by doing: How a student-run consulting company finds relevance and purpose in a business strategy capstone course. Journal of Management Education, July 6, 88-112.
Runyan, R., C. Droge, & J. Swinney (2008). Entrepreneurial orientation versus small business orientation: What are their relationships to firm performance?. Journal of Small Business Management, 46 (4), 567-588.
Sharir, M. & M. Lerner (2005). Gauging the success of social ventures initiated by individual social entrepreneurs. Journal of World Business, 9, 6-20.
Schumpeter, J. (1934). The theory of economic development. Public Opinion Quarterly, 20, 358-480. Stangler, D. (2010). High-growth firms and the future of the American economy. Kaufman Foundation Research
Series: Firm Formation and Economic Growth. Kaufman, the Foundation of Entrepreneurship: Kansas City, MO.
Stewart, W. H., W. E. Watson, J. C. Carland, & J. W. Carland (1998). A proclivity for entrepreneurship: A comparison of entrepreneurs, small business owners, and corporate managers. Journal of Business Venturing, 14, 189-214.
Stewart, W. H., J. C. Carland, & J. W. Carland, W. E. Watson, & R. Sweo (2003). Entrepreneurial dispositions and goal orientations: A comparative exploration of United States and Russian Entrepreneurs. Journal of Small Business Management, 41 (1), 27-46.
Trexler, J. (2008). Social entrepreneurship as an algorithm: Is social enterprise sustainable? E-CO, 10 (3), 65-85. Young, D. R. (2001). Social enterprise in the United States: Alternate identities and forms. The Social Enterprise: A
Comparative Perspective,the EMES Conference Proceedings. Trento, Italy.

Page 163
Academy of Entrepreneurship Journal, Volume 20, Number 2, 2014

Page 164
Academy of Entrepreneurship Journal, Volume 20, Number 2, 2014
ABDUCTION, DEDUCTION AND INDUCTION AS CONCEPTS FOR UNDERSTANDING
ENTREPRENEURIAL OPPORTUNITIES. A META-PERSPECTIVE BASED ON THREE VIEWS OF THE
MARKET PROCESS
Øystein Rennemo, Nord-Trøndelag University Håvard Åsvoll, Nord-Trøndelag University
ABSTRACT
There is a considerable amount of literature about entrepreneurial opportunities
containing different views and strategies. Three such views focus on entrepreneurial opportunity as a market process: the allocative, discovery and the creative process. Thus it is possible to understand the entrepreneur in different contexts of opportunities. Using these three views of entrepreneurial oriented research, this article presents an extended and complementary meta-perspective in terms of C. S. Peirce`s concepts of abduction, deduction and induction. By means of an instrumental case study of the entrepreneurial firm Bread and Circus, we describe the non-linear, recursive and multiple dependent processes of opportunity practice.
INTRODUCTION AND PROBLEM
Developments in the field of entrepreneurial research have become more pressing since
there is a need to understand how the entrepreneur manages and relates to opportunities. “Opportunity” is today regarded as a key term to understanding entrepreneurship and economic change (Fiet, 1996; Gartner, 2001; Shane & Venkataram, 2000; Sarasvathy et al., 2003; Eckhardt & Shane, 2003; Short, Ketchen, Shook & Ireland, 2010). For example, Venkataraman (1997) and Shane & Venkataraman (2000) argue that the relation between the entrepreneur and opportunity should be the distinctive domain of entrepreneurship research. There are several approaches to research in ‘entrepreneurial opportunity’ (Shepherd, 2011); here we draw upon three major streams in economic literature that are pertinent. Among the key authors who have identified three different and contrasting views or processes are Littlechild (1986) (neo-classical, Austrian and radical subjectivism); Buchanan and Vanberg (1991) (allocative-, discovery- and creative processes; and Sarasvathy et al. (2003) (opportunity recognition, opportunity discovery and opportunity creation). In the following we combine the common features of these typologies, which we describe as:
1) The allocative view and the neo-classical entrepreneurial ‘recognizer’ 2) The discovery view and the Kirznerian alert entrepreneur

Page 165
Academy of Entrepreneurship Journal, Volume 20, Number 2, 2014
3) The creative view and Sarasvathy’s concept of effectuation The purpose is to illuminate three important views on opportunity and then examine four central assumptions within each view (as shown in Table 1 which illustrates the assumptions concerning ontology, strategy/risk and logic). Our argument is that these views and processes should be studied as interconnected and mutually dependent aspects of the entrepreneurship phenomena of opportunity, instead of being considered as the most relevant and primary dimension of opportunity. Here, researchers’ normative preferences are prevalent regarding the neo-classical ‘recognizer’, the Kirznerian ‘discoverer’ and Sarasvathy’s claims about creative effectuation. Consequently, we wish to raise awareness about the interconnected, recursive and non-sequential nature regarding how the different approaches to opportunities can be understood. We propose the following objectives for this paper:
1) To reconceptualize and develop a (meta)framework in order to understand how an entrepreneurial project can accomplish matters involving all three processes and logics of opportunity practice over a period of time.
We believe that such a framework will contribute to a better theoretical understanding of opportunity practice. Greater understanding of the interwoven and multifaceted opportunities will lead to improved research on the use of opportunities in entrepreneurial practice. Seeing opportunities as an interwoven and complex phenomenon can potentially reveal their manageability. It can also be helpful to entrepreneurs to have a tool to understand and run their projects more efficiently.
This paper has the following structure. First we describe the pragmatic perspective of C. S. Peirce and the interconnected concepts of abduction, deduction and induction Then we describe the three views on opportunity and some of their central assumptions. After introducing the instrumental case study in the empirical section, we explicate interconnected opportunities based on the entrepreneurial firm Bread and Circus. This leads to tentative remarks and discussions about some major theoretical and practical implications. Finally, we comment on the limitations and the direction of future research.
THE PERSPECTIVE OF PRAGMATISM AND PEIRCE
The American philosopher and pragmatist C. S. Peirce (1839 – 1914) explored the practical or pragmatic consequences of life and inquiries. Peirce (1960) is best known for his philosophical system, referred to as pragmatism. In pragmatism, all human inquiry is tied to experience, and experience is active and is a mode for opening up new areas of experience for exploration. What then is pragmatism? Peirce (1960) considers it to be ‘a theory of inquiry’ embedded in a methodology. This theory and methodology entail the scientific succession of abduction, deduction and induction. In addition, it describes the modes of reality in terms of firstness (indeterminacy, originality), secondness (compulsion, effect, negation) and thirdness (continuity, relatedness, and generality) respectively. The relations asserted between abduction (firstness), deduction (secondness) and induction (thirdness) are one (melting) version among many which represent simplifications. Although Peirce was not an entrepreneurially oriented

Page 166
Academy of Entrepreneurship Journal, Volume 20, Number 2, 2014
researcher, it is not irrelevant to recognize some of the connections between his abductive, deductive and inductive cycles and entrepreneurial research. It can be argued that any presentation of abduction, deduction and induction that dismisses the entire variations and complexities of these concepts is impractical. However, it is important to note that any (empirical) application of his complex philosophy and methodology may require some extrapolation. Although there are more detailed means of describing Peirce’s work (Sheriff, 1989; Short, 1996; Sorrell, 2004), the main purpose in this paper is to describe some of its practical value and logic for entrepreneurial researchers.
Peirce (1960) defined logic as the theory of correct inquiry, of what inquiry ought to be. This is analogous to entrepreneurial opportunity research, which is concerned with what we ought to do in different research perspectives. Peirce (1960) wished to demonstrate how it is possible to make new discoveries in a methodological and logical manner. Translated into opportunity research abduction (firstness) plays the role of generating new ideas or hypotheses; deduction (secondness) functions as evaluating the hypotheses; and induction (thirdness) is justifying the hypotheses with empirical data. For Peirce (1960), abduction, deduction and induction do not constitute a static order, but follow in a transformative and often unpredictable order. This is the unalterable logic in pragmatic methodology and we now describe each of its pivotal terms. Abduction Abduction, as the first core concept, constitutes the first stage of any scientific investigation, and of all interpretative processes (Peirce, 1960, paragraph 6. 469). The basis for abduction is our examination of a certain number of facts. We attempt to sort out the facts in order to attain an idea of what we find before us, but we fail to immediately achieve a satisfactory understanding and explanation of the phenomenon. When something new is required, it can be a relevant strategy to start from surprising facts or from minor details, and try with them to find a tentative hypothesis. As noted, for Peirce (1960) abduction represents the first interpretative operation in any (scientific) inquiry. For an entrepreneur located in a specific context, abduction is a question of a (preliminary) settlement of (presumed) relevant empirical data in order to create an opportunity. The phase of abduction consists of unexplained or surprising phenomena. The process involves actively working with alternative explanations and constructions (Alvesson & Kärreman, 2007). According to Peirce (1960, p. 315), the person at stake or the entrepreneur can reach this abductive hypothesis in two creative ways or modes, either by the presence of genuine doubt or by musement. For Peirce (1960), doubt arises from surprise or as he says:
Genuine doubt always has an external origin, usually from surprise; and that it is as impossible for a man to create in himself a genuine doubt by such an act of the will as would suffice to imagine the condition of a mathematical theorem, as it would be for him to give himself a genuine surprise by a simple act of the will. (Paragraph 5. 443)

Page 167
Academy of Entrepreneurship Journal, Volume 20, Number 2, 2014
Peirce (1960) also recommends that the mind can wander with no specific purpose. He calls this mental play without rules musement, a game of meditation or daydreaming. How one achieves the condition of daydreaming may be seen in the following formulation by Peirce (1960):
Enter your skiff of musement, push off into the lake of thought, and leave the breath of heaven to swell your sail. With your eyes open, awake to what is about or within you, and open conversation with yourself: for such is all meditation! [...] It is, however, not a conversation in words alone, but is illustrated, like a lecture, with diagrams and with experiments. (Paragraphs 6. 460–461)
We may say that abduction implies looking for and exploring potential explanatory patterns in a phenomenon. Even though this can be done in different ways, the patterns act as a cognitive means towards possible hypotheses. In other words, finding an answer to entrepreneurial problems requires a certain amount of creativity: “it is the idea of putting together what we had never before dreamed of putting together which flashes the new suggestion before our contemplation” (Peirce, 1960, paragraph 5. 181). The possible abductive explanatory hypotheses reveal a path from facts to ideas and theory, or expressed differently: the abductive hypotheses seek theory and deduction. Deduction After the abductive steps have brought us to selected theories that may be fitted to explain the facts, according to Peirce (1960) we find ourselves on the deductive level. The second core concept, deduction or the deductive mode, is based on theory and the theory’s hypotheses. Deduction involves drawing logical consequences from premises. An inference is endorsed as deductively valid when the truth of all premises guarantees the truth of conclusion. This can be illustrated by a syllogism (Peirce, 1986): First premise: All the beans from the bag are white (True). Second premise: These beans are from this bag (True). Conclusion: Therefore, these beans are white (True).
Evidently, deduction is possible because even without relating to reality, propositions can be judged as true or false within a logical and conceptual system. Deduction involves this kind of analytical inference. This may correspond to when the entrepreneur is introduced to a rule or a theory which is aimed at understanding an opportunity. In this mode, the opportunity is ‘recognized’ when both supply and demand are known. A deductive process can in other words mean obtaining probable, applicable and recognizable experiential consequences (hypotheses), based on theorizing or theory. In this way, deduction, like abduction, contributes a conceptual understanding of the phenomenon of empirical facts.
Deduction cannot produce new hypotheses or assumptions, because it is fundamentally self-referring. It is important to bear in mind that this kind of reasoning cannot lead to the discovery of knowledge that is not already embedded in the premise (Peirce, 1960). Brown (1963) illustrated this weakness by using an example in entrepreneurship: An entrepreneur seeks maximization of profits. The maximum profits will be gained when marginal revenue equals
Page 168
Academy of Entrepreneurship Journal, Volume 20, Number 2, 2014
marginal cost. An entrepreneur will operate his or her business at the equilibrium between marginal cost and marginal revenue.
However, Peirce (1960) in line with the inventor of deductive syllogisms, Aristotle, did not isolate formal logic from external reality and repeatedly admitted the importance of induction. This ‘only exclusive deduction’ thinking is not endorsed by the Peircean philosophical system, which emphasizes the search for a deeper insight of a surprising fact by the help of the interconnected terms of abduction, deduction and induction. Induction Inductive logic is often based upon the notion that probability is the relative frequency in the long run and a general law can be concluded based on numerous cases. For examples, A1, A2, A3 ... A100 are B. A1, A2, A3 ... A100 are C. Therefore, B is C. Or A1, A2, A3, … A100 are B. Hence, all A are B.
Peirce (1960) also uses the example of an investigator who starts from a hypothesis and tries to test it, elaborating some conditional predictions out of it. In order to assess the hypothesis, the investigator must judge and estimate the combined value of the evidence. Accordingly, the entrepreneur must judge the value of the demand/market (A) and if they are reasonable compared to his or her facts - supply/product (B). Then prediction takes the form: A1,A2,A3…A100 are B. Thus, A101 will be B.
Induction may shed light on important interpretations that in some way reflect what is actually going on in entrepreneurial practice. Clearly, a strategy that is faithful to everyday realities, where opportunities are carefully induced from empirical facts, can ensure that theory (deduction) is closely related to the daily significant opportunities which may be discovered. Induction can be justified if instances of which we have no experience resemble those of which we have experience. Thus, the problem of induction is also known as “the skeptical problem about the future” (Hacking, 1975). Take the previous argument as an example. If A101 is not B, the statement "B is C" will be refuted. As indicated in the title of this paper, abduction, deduction and induction signify the main features of three different theoretical views of opportunity. Within entrepreneurial oriented research there has been little discussion related to addressing questions with regard to the ‘confoundedness’ among theoretical views of opportunity. It is precisely in this reflexive research perspective that Peirce’s concepts may serve to raise awareness of how different but interdependent opportunity views can act in the entrepreneurial context. Therefore it is important to bear in mind a description and exemplification of Peirce`s (1960) concepts. Their relevance in the instrumental case study will be demonstrated. First there is a description of the three views of opportunity.

Page 169
Academy of Entrepreneurship Journal, Volume 20, Number 2, 2014
THE ALLOCATIVE OPPORTUNITY VIEW
The allocative view asserts that opportunities arise from inefficient allocations in the market which can be exploited. Several authors state that the theoretical foundation for those advocating that opportunity is best recognized through active search is consistent with the neo-classical/allocative view of economics (Detienne and Chandler, 2004).). Representatives of the neo-classical view consider the markets operate in equilibrium. The equilibrium framework assumes that everyone can recognize entrepreneurial opportunities. Economic agents are equally likely to detect a given opportunity and the markets are assumed to be in competitive equilibrium. Neo-classical economic theory discusses allocative efficiency properties of markets and its implications for opportunity recognition. The assumptions are that prices of homogeneous goods and factors are uniform throughout the economy. That is to say that all factors are perfectly mobile; returns to scales are constant; and economic agents have perfect knowledge about available alternatives. An opportunity is any possibility of putting resources to better use. In a state of equilibrium there are no opportunities because resources have been optimally allocated and they are already recognized.
According to Sarasvathy et al. (2003) if both sources of supply and demand exist, the opportunity for bringing them together has to be "recognized" and then the match-up between supply and demand has to be implemented either through an existing firm or a new firm. Examples include arbitrage and franchises. It is assumed that entrepreneurs know a priori where the innovation is to be made. Therefore it is important that the entrepreneur can accurately weight the cost and benefits of acquiring new information relevant to the invention.
Opportunity is then defined as any possibility of putting resources to better use. The opportunity is ‘recognized’ through deductive processes and occurs when both supply and demand are known. The deductive logic in entrepreneurial practice is based upon the principle that the entrepreneur is introduced to a rule, a principle or a theory which attempts to increase his or her understanding of an opportunity. The specific knowledge is drawn from the general rules or principles. In the general sense any process of reasoning by means of which one draws conclusions from principles or information already known. An example of allocative-based opportunity exploitation is arbitrage. In principle an arbitrage is risk-free and may refer to expected profit. So, by deduction one moves from the general to the particular, descending the theoretical ladder which terminates in facts about particular profitable products, individuals or events. The entrepreneurial recognizer can discern new opportunities that are not yet seen or considered by other individuals, this involves assimilating, organizing, categorizing and prioritizing information that enable them to make decisions about emerging opportunities. The uneven exploitation of opportunities is due to differences among those who recognize the opportunities. Given the external nature of structure and opportunity, opportunity recognition concentrates on connecting the dots with and minimizing risk. As Miller (2007) states; “Consistent with this conception of risk is a notion of rationality as maximizing the subjective probability-weighted utilities of possible outcomes. Opportunity recognition requires foresightful attention to alternative states and their performance implications” (p.61). Risk arises from the entrepreneur’s inability to predict future environmental states. The risk is considered unpredictable when maximizing expected utility is the purpose.

Page 170
Academy of Entrepreneurship Journal, Volume 20, Number 2, 2014
Opportunity recognition can be considered a highly relevant skill in the field of technology, where some significant product innovations have largely involved the transfer of a ‘low-value’ technology from one business sector to another where it becomes ‘high-value’ (Christensen, 1997). Opportunity recognition can be viewed as a first key step in the entrepreneurial process (e.g. Venkatraman, 1997). This is only an initial step in a continuing process, and can be combined with detailed feasibility evaluations of opportunities and from active steps to actually exploiting them. Opportunity exploitation includes activities associated with the evaluation and development of an opportunity including the investments resources to move from a prototype to full-scale operations to take advantage of an opportunity to gain returns (Choi and Shepherd, 2004).
THE DISCOVERY OPPORTUNITY VIEW
The discovery view can be traced back to the Austrian economic tradition. There are numerous scholars in this tradition and some of the most influential works on economic theory are von Mises (1996), F. Hayek (1945) and Knight (1921). These works have been developed further by I. Kirzner (1973) who introduced an alternative view of entrepreneurship in order to understand the nature of the market process and the dynamic character of market competition. Kirzner’s framework is among other things based on a combination of Hayek’s and Mises’ ideas about the entrepreneur as the driving force of the economy and spontaneous coordination. Kirzner (1992) cast light on the alert entrepreneur or the entrepreneur’s alertness and how he or she is systematically "attracted to notice suboptimalities because they respond to the scent of pure profit which accompanies such suboptimalities" (p.174). Kirzner, (1973) states that all the entrepreneur “needs is to discover where buyers have been paying too much and where sellers have been receiving too little” (p. 41). Hence, opportunities are regarded to be due to the imperfect knowledge of market participants, and they can be seized by anyone discovering their existence before others have done so. For example Hayek (1945) shows how the production plans and use of tin from other producers was updated by the novel use of tin by one individual. The distinctive features are the entrepreneur with an ‘‘alertness’’ to ‘‘discover’’ ‘‘opportunities’’. This may imply that an opportunity can be found ‘out there’, i.e. the opportunity can be depicted as a pre-existing entity waiting to be discovered by the proficient perception of the entrepreneur. In other words, opportunities are not created by the entrepreneur, but presupposed to already exist and be discovered (Shane, 2003).
Kirzner (1973) argues that entrepreneurship is not only the alertness to new opportunities, but also the actions following the discovery of an opportunity. Opportunity discovery can be described as a creative path between supply and demand. If only one of these exists, i.e. supply but not demand and vice versa, then the non-existent side has to be "discovered" before the match-up can be implemented. Examples include: Cures for diseases (demand exists; supply has to be discovered); and applications for new technologies such as the PC (supply exists, demand has to be discovered). It could be argued that the discovery view is inductive in the sense that consequences have to be experienced and explored in the absence of knowledge and information. Here, entrepreneurial practice is based upon the principle that the entrepreneur draws knowledge and recognition from his or her own experience. This can happen

Page 171
Academy of Entrepreneurship Journal, Volume 20, Number 2, 2014
through past experiences or through experiences and experiments made in a certain environment. Conclusions or generalizations are made from the specific experiences to generate knowledge. This means searching or systematically scanning the environment to discover opportunities to produce new products or services. Kirzner (1973, 1985, 1997) holds that opportunities exist even in the absence of new information. For example in the absence of prices people form beliefs in response to information they possess. Because these beliefs are influenced by a wide variety of changing factors, they are never 100% accurate. Here, the risk in unknowable. In this respect Miller (2007) argues that; “Knowledge of how to search is much more fundamental than knowledge of probabilities, because the chosen search procedure affects the set of possible outcomes and their probabilities of being discovered” (p. 64).
THE CREATION OPPORTUNITY VIEW
According to Miller (2007, p. 64) there are two schools of thought regarding creativity in opportunity creation. We will concentrate on Sarasvathy’s development of the effectuation creation view inspired by the school of Herbert Simon’s (1981) research on the ‘science of design’. Some scholars have started to question the validity of the discovery/recognition view. They suggest that the effectual logic is a pragmatist view that stands in sharp contrast to the discovery and causation model. As an alternative, these scholars have developed a model of entrepreneurship as a means-driven, risk-aversive, and circular process involving ‘effectuation’ (Sarasvathy, 2001; Sarasvathy & Dew, 2005). This alternative view could be described as the pragmatist view of entrepreneurship. Sarasvathy mentions the classical works and philosophers from American pragmatism such as James (1907), Peirce (1958), Dewey (1934), and Joas (1997) as interesting developments in the broader social sciences (Dew & Sarasvathy, 2002: 12; , 2003: 25; Sarasvathy & Dew, 2005: 553-554; Venkataraman & Sarasvathy, 2001: 11-13). These scholars consider that pragmatist entrepreneurship is radically different from teleological entrepreneurship (i.e. recognition/discovery view) and that these are alternative modes applicable in different situations.
In entrepreneurial literature, effectuation is seen as a useful logic for entrepreneurs with limited resources (Sarasvathy, 2001). The benefits from utilizing this is the processes this logic implies, henceforth termed as effectuation processes. By definition “Effectuation processes take a set of means as given and focus on selecting between possible effects that can be created with that set of means” (Sarasvathy, 2001, p. 245). Effectuation is necessary to undertake decisions and action (Dew & Sarasvathy, 2002). Sarasvathy (1998) found that the entrepreneurs not only did not assume the existence of the market, but also expressed their belief that the existence of the market cannot be known in advance. Rather than using the causation-based logic 'To the extent you can predict the future, you can control it', the subjects in the study (74% of the subjects over 63% of the time) followed the logic of effectuation that 'To the extent that you can control the future, you do not need to predict it.' (Sarasvathy, 2001, p. ?? )
By using the “logic of control”, entrepreneurs manage the utilization of available resources rather than satisfying planned goals. Unlike the logic of prediction, the logic of control does not assume pre-existing goals. Decisions made using the logic of control start with a very vague notion of goals, allowing entrepreneurs to use an incremental development in which

Page 172
Academy of Entrepreneurship Journal, Volume 20, Number 2, 2014
uncertainty is a benefit rather than a disadvantage in the process. Sarasvathy aims at identifying the typical logic used by entrepreneurs and the dominant entrepreneurial style.
A decision involving effectuation consists of: 1) a given set of means (that usually consists of relatively unalterable characteristics/ circumstances of the decision maker); 2) a set of effects or possible operationalizations of generalized aspirations (mostly generated through the decision process); 3) constraints on (and opportunities for) possible effects (usually imposed by the limited means as well as by the environment and its contingencies), and; 4) criteria for selecting between the effects (usually a predetermined level of affordable loss or acceptable risk related to the given means) (Sarasvathy, 2001, pp. 249-250).
More specifically, if neither supply nor demand exist in an obvious manner, one or both have to be "created" and constructed, and several economic inventions in marketing, financing etc. have to be made, for the opportunity to come into existence. Examples include Wedgewood Pottery, Edison's General Electric, U-Haul, AES Corporation, Netscape, Beanie Babies, and the MIR space resort. Opportunities are ‘created’ through abductive processes when both supply and demand are unknown. This is an opportunity practice based upon the principle that the entrepreneur himself or herself comes up with hypotheses, interpretations or models of problem solving as possible solutions to a certain problem, challenge or opportunity. Effectuation is concerned with the generation of alternatives, which involves generating novel alternatives that are underdetermined by learning from past experience. The abductive process may enable the entrepreneur to organize, reorganize and transform problem solving actions, especially with regard to the development of conjectures and the process of reasoning in which explanatory hypotheses are formed and evaluated.
The key distinguishing feature of opportunity creation is that the entrepreneur has a causal role in bringing the opportunity into being (see Alvarez and Barney, 2007). Hence, the opportunity does not exist prior to the entrepreneur’s perception and action. As Sarasvathy et al. (2003, p. 156) observe; “opportunities do not pre-exist-either to be recognized or to be discovered. Instead they get created as the residual of a process” (p.27). Dew and Sarasvathy (2002) suggest that effectuation is an alternative narrative to the ‘‘discovery’’ process, suggesting that Knightian uncertainty is irrational:
“The reconstitution of rationality into causal as well as effectual allows us to get off the old hobby-horses of luck (Demsetz, 1982); intuition (Christensen, 2000); alertness (Kirzner, 1973); insight (Rumelt, 1988); prescience (Melville, 1987); or any other explanation for entrepreneurial action that suggests entrepreneurs have knowledge of things before they exist or happen. These myths, usually fuelled by post-hoc rationalization by entrepreneurs themselves, are well overdue for debunking” (p. 27). These perspectives introduce alternative ways to look at the opportunity idea, alternatives
which are theoretically debunked by the creation or effectual process view (Dew and Sarasvathy, 2002), even though they choose to build their argument upon the framework of opportunity discovery (Görling & Rehn, 2008, p. 4). That is to say that it should not be under communicated that the three views share some fundamental assumptions; namely that entrepreneurship is investigated through the lenses of concepts such as decision making, opportunity and market. Hence, they may be considered as having more in common than perhaps certain researchers
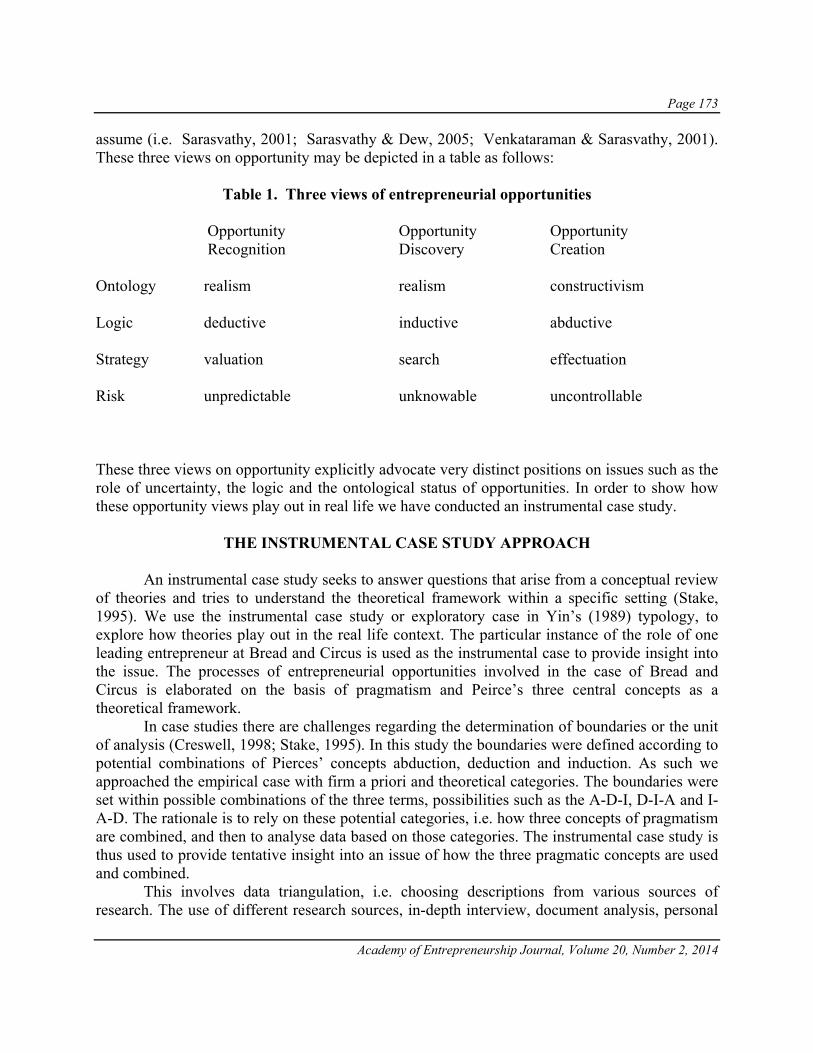
Page 173
Academy of Entrepreneurship Journal, Volume 20, Number 2, 2014
assume (i.e. Sarasvathy, 2001; Sarasvathy & Dew, 2005; Venkataraman & Sarasvathy, 2001). These three views on opportunity may be depicted in a table as follows:
Table 1. Three views of entrepreneurial opportunities Opportunity Recognition
Opportunity Discovery
Opportunity Creation
Ontology Logic Strategy Risk
realism deductive valuation unpredictable
realism inductive search unknowable
constructivism abductive effectuation uncontrollable
These three views on opportunity explicitly advocate very distinct positions on issues such as the role of uncertainty, the logic and the ontological status of opportunities. In order to show how these opportunity views play out in real life we have conducted an instrumental case study.
THE INSTRUMENTAL CASE STUDY APPROACH
An instrumental case study seeks to answer questions that arise from a conceptual review of theories and tries to understand the theoretical framework within a specific setting (Stake, 1995). We use the instrumental case study or exploratory case in Yin’s (1989) typology, to explore how theories play out in the real life context. The particular instance of the role of one leading entrepreneur at Bread and Circus is used as the instrumental case to provide insight into the issue. The processes of entrepreneurial opportunities involved in the case of Bread and Circus is elaborated on the basis of pragmatism and Peirce’s three central concepts as a theoretical framework.
In case studies there are challenges regarding the determination of boundaries or the unit of analysis (Creswell, 1998; Stake, 1995). In this study the boundaries were defined according to potential combinations of Pierces’ concepts abduction, deduction and induction. As such we approached the empirical case with firm a priori and theoretical categories. The boundaries were set within possible combinations of the three terms, possibilities such as the A-D-I, D-I-A and I-A-D. The rationale is to rely on these potential categories, i.e. how three concepts of pragmatism are combined, and then to analyse data based on those categories. The instrumental case study is thus used to provide tentative insight into an issue of how the three pragmatic concepts are used and combined.
This involves data triangulation, i.e. choosing descriptions from various sources of research. The use of different research sources, in-depth interview, document analysis, personal

Page 174
Academy of Entrepreneurship Journal, Volume 20, Number 2, 2014
communication has been shown to be a good approach to finding information, descriptions and interpretations of the entrepreneur’s narrative and decisions.
We have also used theory triangulation to obtain a more comprehensive view of entrepreneurial opportunities at Bread and Circus. It has been proposed that the triangulation of multiple theories can, ‘produce a richer, more sophisticated understanding of the phenomenon’ (Baxter & Babbie, 2004, p. 319). Here, theoretical triangulation means that various theories are examined and compared to facilitate the research question, theoretical insights and practical implications. Using opposing viewpoints can enhance the validity (Denzin, 1970), especially when a broader, deeper analysis of findings is provided (Banik, 1993). In the last section we present some theoretical insights and implications which are articulated in light of different and opposing theories and views. The benefits of this type of triangulation hopefully include a better understanding of the opportunity phenomenon. The case study presented is included to show how the opportunities come into play. It is possible to show retrospectively how an entrepreneur uses different opportunity processes by conducting an instrumental case study. Case study: The case of Bread and Circus and the leading entrepreneur
The business case Brød & Cirkus (Bread and Circus) is a company in the catering trade, serving high-quality, self-made food, partly in their own restaurants and partly for catering and events. The company is located in the mid-Norway in several small towns north of the regional capital Trondheim. On their homepage, http://www.brodogcirkus.no/, their customer orientation is presented, but very little is found about its history, strategy and organization. Our information about the company is therefore basically collected in an in-depth interview with the owner and managing director, Trond Asgeir Lyngstad, in January 2013.
The company has existed since 2003, when a small restaurant was established in a town called Steinkjer with 2 employees and 2 apprentices. The place functioned after some time as a lunch-bar, restaurant in the evenings, bakery/confectioner and caterer. The seating capacity was 36 inside and 20 outside. The concept was an immediate success without many competitors and a similar restaurant was opened other towns, Verdal 3 years later and in Steinkjer shortly after that, all three restaurants were in rented facilities. Meantime, a couple of other restaurant concepts were established in Steinkjer without any success and therefore were wound up.
The company is today owned by the managing director in cooperation with another family member. From the beginning, there were three owners, an investor and a partner working full time in the business. The investor helped with paper work during the initial company phase. During this start up, two other consultants who previously worked for CAP Gemini and Ernst & Young helped with developing strategy and business plans. The managing director presented this as help from friends within his professional network. He presented his networking competence as extremely important for the development of the firm. The investor was bought out after three years and the other partner some years later, meaning that the company today is totally controlled by the managing director.
About 2010, the company took responsibility for the cuisine at a conference hotel (Sandvika) this was handled by the staff in Verdal. At the same time cooperation was established with a deer farm (Gjørv) which wanted to serve locally produced food at large parties (weddings,
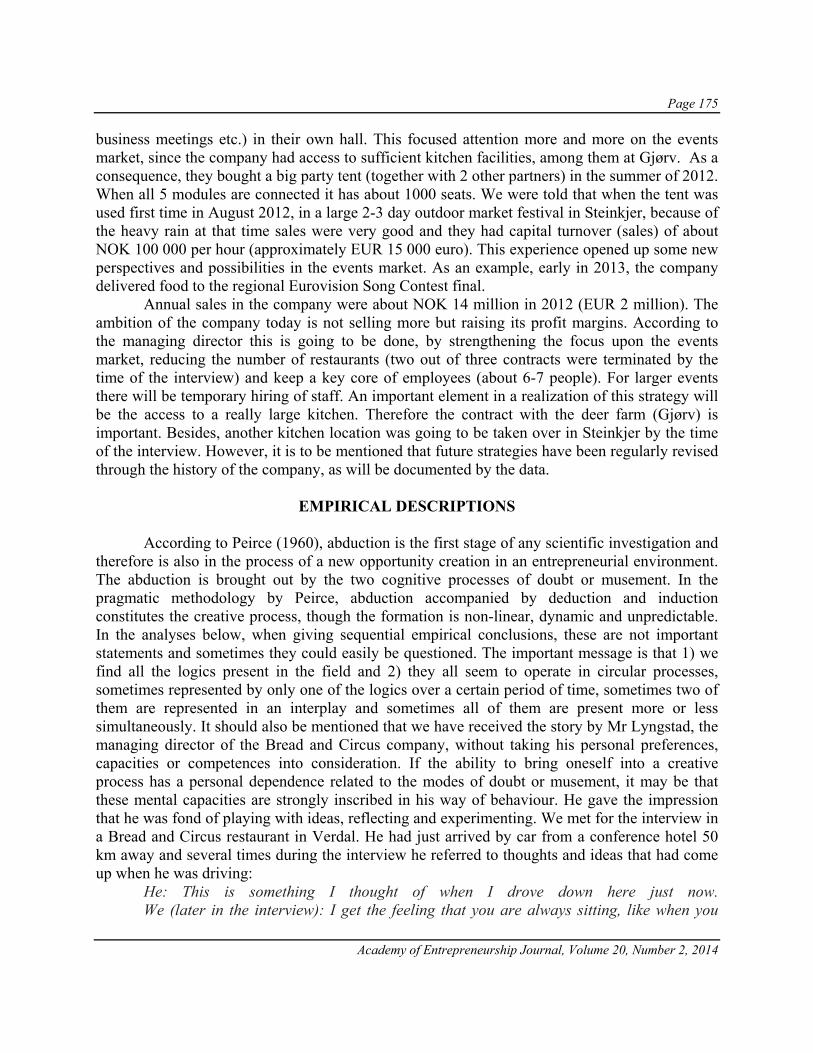
Page 175
Academy of Entrepreneurship Journal, Volume 20, Number 2, 2014
business meetings etc.) in their own hall. This focused attention more and more on the events market, since the company had access to sufficient kitchen facilities, among them at Gjørv. As a consequence, they bought a big party tent (together with 2 other partners) in the summer of 2012. When all 5 modules are connected it has about 1000 seats. We were told that when the tent was used first time in August 2012, in a large 2-3 day outdoor market festival in Steinkjer, because of the heavy rain at that time sales were very good and they had capital turnover (sales) of about NOK 100 000 per hour (approximately EUR 15 000 euro). This experience opened up some new perspectives and possibilities in the events market. As an example, early in 2013, the company delivered food to the regional Eurovision Song Contest final.
Annual sales in the company were about NOK 14 million in 2012 (EUR 2 million). The ambition of the company today is not selling more but raising its profit margins. According to the managing director this is going to be done, by strengthening the focus upon the events market, reducing the number of restaurants (two out of three contracts were terminated by the time of the interview) and keep a key core of employees (about 6-7 people). For larger events there will be temporary hiring of staff. An important element in a realization of this strategy will be the access to a really large kitchen. Therefore the contract with the deer farm (Gjørv) is important. Besides, another kitchen location was going to be taken over in Steinkjer by the time of the interview. However, it is to be mentioned that future strategies have been regularly revised through the history of the company, as will be documented by the data.
EMPIRICAL DESCRIPTIONS
According to Peirce (1960), abduction is the first stage of any scientific investigation and
therefore is also in the process of a new opportunity creation in an entrepreneurial environment. The abduction is brought out by the two cognitive processes of doubt or musement. In the pragmatic methodology by Peirce, abduction accompanied by deduction and induction constitutes the creative process, though the formation is non-linear, dynamic and unpredictable. In the analyses below, when giving sequential empirical conclusions, these are not important statements and sometimes they could easily be questioned. The important message is that 1) we find all the logics present in the field and 2) they all seem to operate in circular processes, sometimes represented by only one of the logics over a certain period of time, sometimes two of them are represented in an interplay and sometimes all of them are present more or less simultaneously. It should also be mentioned that we have received the story by Mr Lyngstad, the managing director of the Bread and Circus company, without taking his personal preferences, capacities or competences into consideration. If the ability to bring oneself into a creative process has a personal dependence related to the modes of doubt or musement, it may be that these mental capacities are strongly inscribed in his way of behaviour. He gave the impression that he was fond of playing with ideas, reflecting and experimenting. We met for the interview in a Bread and Circus restaurant in Verdal. He had just arrived by car from a conference hotel 50 km away and several times during the interview he referred to thoughts and ideas that had come up when he was driving:
He: This is something I thought of when I drove down here just now. We (later in the interview): I get the feeling that you are always sitting, like when you
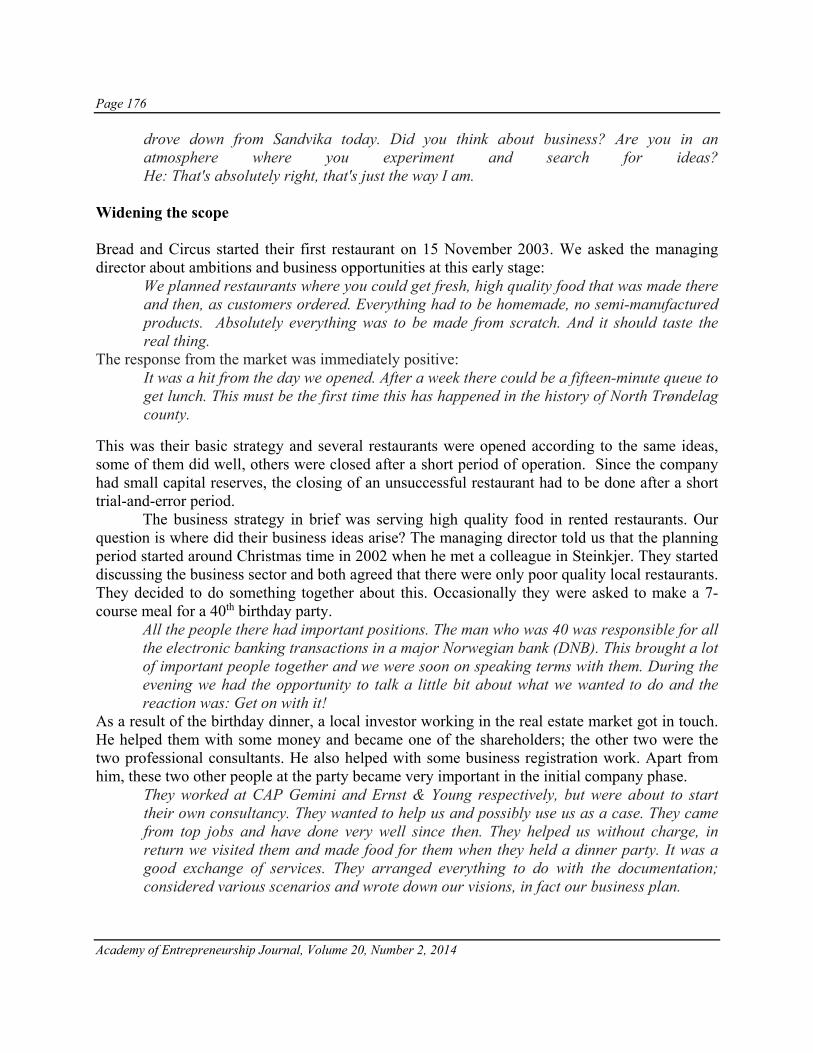
Page 176
Academy of Entrepreneurship Journal, Volume 20, Number 2, 2014
drove down from Sandvika today. Did you think about business? Are you in an atmosphere where you experiment and search for ideas? He: That's absolutely right, that's just the way I am.
Widening the scope Bread and Circus started their first restaurant on 15 November 2003. We asked the managing director about ambitions and business opportunities at this early stage:
We planned restaurants where you could get fresh, high quality food that was made there and then, as customers ordered. Everything had to be homemade, no semi-manufactured products. Absolutely everything was to be made from scratch. And it should taste the real thing.
The response from the market was immediately positive: It was a hit from the day we opened. After a week there could be a fifteen-minute queue to get lunch. This must be the first time this has happened in the history of North Trøndelag county.
This was their basic strategy and several restaurants were opened according to the same ideas, some of them did well, others were closed after a short period of operation. Since the company had small capital reserves, the closing of an unsuccessful restaurant had to be done after a short trial-and-error period.
The business strategy in brief was serving high quality food in rented restaurants. Our question is where did their business ideas arise? The managing director told us that the planning period started around Christmas time in 2002 when he met a colleague in Steinkjer. They started discussing the business sector and both agreed that there were only poor quality local restaurants. They decided to do something together about this. Occasionally they were asked to make a 7-course meal for a 40th birthday party.
All the people there had important positions. The man who was 40 was responsible for all the electronic banking transactions in a major Norwegian bank (DNB). This brought a lot of important people together and we were soon on speaking terms with them. During the evening we had the opportunity to talk a little bit about what we wanted to do and the reaction was: Get on with it!
As a result of the birthday dinner, a local investor working in the real estate market got in touch. He helped them with some money and became one of the shareholders; the other two were the two professional consultants. He also helped with some business registration work. Apart from him, these two other people at the party became very important in the initial company phase.
They worked at CAP Gemini and Ernst & Young respectively, but were about to start their own consultancy. They wanted to help us and possibly use us as a case. They came from top jobs and have done very well since then. They helped us without charge, in return we visited them and made food for them when they held a dinner party. It was a good exchange of services. They arranged everything to do with the documentation; considered various scenarios and wrote down our visions, in fact our business plan.

Page 177
Academy of Entrepreneurship Journal, Volume 20, Number 2, 2014
The company opened bank accounts and asked for a small loan, NOK 500 000, approximately EUR 75 000 (this was rejected, but they were given NOK 150 000) and a bank overdraft. We asked the managing director if the bank asked for their business plan?
I'm not sure, because they just got what we had. Here it is; it’s all that we have. I’m not sure if they required anything more. But we had prepared everything. It took us a year to prepare it.
In parallel with work on the business plan, there was registration work and the reconstruction of premises that were found with the help of their real estate partner. Most of this work was done by themselves, the two professional partners: We just started up and used a pneumatic drill and other equipment. Finally, we had 36 seats inside and 20 outside. Apart from some more or less random, but important meetings between the managing director and his companion and with the key people they met at the birthday party that could be described as abductive, this initial phase and the writing of the business plan, is definitely also a deductive process. The two business companions built their first assumptions on what was needed in general and local untested market knowledge. Besides they received a considerable amount of help from the professional consultants who used theoretical concepts when constructing the business plan. The deductive start-up period was followed by an inductive trial-and-error situation, which decided how to develop the concept, which of the restaurants would survive and which had to be closed down. Summarized the development of the “restaurant strategy” could be named as an A-D-I process. There was some important abductive- and musement-driven logic present, to start things rolling. These were exemplified by the occasional meetings between the original owners and also with others in connection with the 40th birthday party. Then a period of theoretical- and deductive-driven construction took over when the business plans were written. Finally inductive logic was followed when the business strategy was modified; this was represented by a trial-and-error period.
After 7-8 years of operational work that was in accordance with their main strategy, another strategy started emerging. The eye-opener for this was related to the company’s activities located on the deer farm at Gjørv. Here they had possibilities to prepare and serve food for business arrangements and large parties, and they found this to be much more profitable than their regular restaurants. According to the managing director they started to reflect about why they should pay NOK 100 000 a month for one of their restaurants when they had a profitable agreement with Gjørv paying them about 10% of net sales and only for the days they had activities there.
When X (company name) was there after the facilities were renovated, they paid us NOK 140 000 and Gjørv received NOK 12 000. This meant that they also made money.
In Verdal, the company started up a Bread and Circus restaurant in 2006. In January 2013, the restaurant was still going, but the managing director told us that the contract with the facility owner was terminated. Since 2010, the staff at this restaurant also had responsibility for the cuisine at the conference hotel at Sandvika. They earned money here, not at the restaurant:
Yes, all the money we earn from the Verdal operation come from Sandvika. We have an event there at present and will make NOK 50 000 from it. It's much easier to make money this way than when we sell salads to students who are the most frequent visitors to the restaurant here.

Page 178
Academy of Entrepreneurship Journal, Volume 20, Number 2, 2014
A third example that accelerated the emergence of another strategy is related to a large annual weekend market festival in Steinkjer in August 2012. Bread and Circus had some outdoor restaurant activities here. One of the festival managers contacted Lyngstad in Bread and Circus in June 2012 asking if he was interested in a partnership about owning a festival tent, in case of bad weather. If they were going to rent a tent in Trondheim, it would cost them about NOK 190 000. So they decided to buy a tent and found one in Germany that cost NOK 750 000 (about EUR 100 000). A company was established with 3 partners, among them Bread and Circus.
There are 1000 seats in the tent and if we hadn’t had the tent for the Steinkjer market festival, we would have lost a lot of money. It was miserable weather. We bought this state-of-the-art tent together with Steinkjer Festival and Steinkjer Business Forum. It’s on a lease. In the contract we paid NOK 50 000 in the share capital and then had 750 seats in the market square in Steinkjer. We sold 2200 tickets on Saturday night even though it was 8 degrees and a lot of rain outside. In one period we earned NOK 100 000 an hour. We were very pleased with the tent and it was paid off during this one event. Now we can use it for large companies who want a simpler arrangement, for example 300 guests at a spring or summer event.
These examples illustrate why the managing director was able to formulate a new business strategy when we met him for the interview in January 2013. This was far from their first one,
I will use this year to make changes. We will change on the tenth anniversary of the company. I have said that I will be out with a big knife to cut the fixed expenses. We will become a guerrilla business. Quick in and quick out. There is the arrangements market, large events with catering. Catering or bringing a large truck with a kitchen means that we can serve 3000 guests. So my plan now is that I will be 40 years in a few months and I have made a strategy. When I'm 40, I will start making real money. I will go through everything, what I earn money from and what we don’t. I will pull out of the loss ventures. ... We see that we don’t have a chance to get the profits we want if we grow and get too on the payroll. ... We need 6-7 permanent staff to achieve all this, so I can hire more people to cover the logistics of the large arrangements.
This new strategy was based upon a lot of business experience from the last 10 years. It is a process that is strongly influenced by the use of inductive (I) logic. There have also been some unplanned and incidental episodes that have functioned creatively as eye-openers and made the new ideas outside the regular restaurants, more probable. The history of the festival tent is an example of this where abductive (A) logic is represented, again driven more by musement than doubt. From these inductive and abductive processes, the managing director formulated a new business theory that he applied for his firm and enabled him start up a re-engineering process that was strongly influenced by deductive (D) thinking. The whole process could be named I-A-D.
In a longitudinal perspective over a period of 10 years we are able to pin-point 2 major strategies for Bread and Circus, both strongly connected to entrepreneurial opportunities. The first one is strongly based upon deductive logic while the second one is strongly anchored in inductive logic. Both are mixed with important experiences or situations where abductive logic is present. When we narrow the scope though and go more deeply into local and daily life situations, another picture emerges that is more complex. Here the concepts of abduction,

Page 179
Academy of Entrepreneurship Journal, Volume 20, Number 2, 2014
deduction and abduction used to describe opportunity practice are much more non-linear, recursive and have multiple dependency. Narrowing the scope Example 1: In 2003 when the company went to their bank and asked for a loan, accompanied with their carefully written business plan in their suitcase, they were rejected. More precisely, they were given 30% of what they asked for. Later in the interview the managing director told us that it has been very favourable to be financially independent. We asked him if this was a deliberated strategy:
He: No, it was the bank that didn’t give us what we asked for. We: So if you had got a larger loan, would you have taken it? He: Certainly. But I see with hindsight that it is very good to be without it. This put us into a fortunate situation.
This process has a deductive (D) starting point (we had to borrow money as justified by the business plan). The bank rejected their request, probably from some deductive reasons, but for the entrepreneurs the situation turned abductive (A). Then, from real experience with the restaurant, they looked in the driving mirror with their inductive glasses on and found the lack of dependency from financial institutions to be profitable (I). The sequence could be described as D-A-I.
Example 2: In 2006 the company started a Bread and Circus restaurant in Verdal in accordance with their deductive driven strategy mixed with some inductive experience from similar restaurant concepts, mostly in Steinkjer.
On paper, everything was absolutely wonderful when we started. But in retrospect, we see that things are not like the architects said or the municipality that we rent from. We believed this ourselves at the time. But we have learned that there are too many uncertain factors, there is a lot going, just like now (our interview with Lyngstad was in the restaurant and the burglar alarm was suddenly triggered by some students dropping in, even though the restaurant was closed).
As mentioned before the insight they got from the 6-year operational period in Verdal made it clear that the promises were not being fulfilled. Money was being earned at the conference centre at Sandvika, not at the restaurant in Verdal. Therefore activities were stopped in Verdal from 1 May 2013.
I spoke to the chairman yesterday, he is concerned about finances and understands that if we don’t make money, we cannot be here. Therefore, I will move the two most important people from this place. One will be responsible for Sandvika, but will live in Steinkjer. The other, who is the manager, can step in and take over some of my duties, including the invoicing.
The process described in this example is probably best characterized as a D-I-A-I process. After the opening where first deductive (D) and later inductive (I) logic is put into play, the declining belief in the restaurant has probably an abductive (A) starting point characterized by an evoked doubt followed by further experiences where inductive (I) logic confirms the abductive doubt.

Page 180
Academy of Entrepreneurship Journal, Volume 20, Number 2, 2014
Example 3: We have briefly described the story of the festival tent as an experience where abductive (A) logic grounded in musement turns into actions that quite immediately result in commercial success.
We: When I heard about this tent last summer, I understood that you didn’t know anything about the tent a week before you bought it? He: No, I didn’t. And yes, I agreed to buy the tent thinking that we didn’t have much use for it.
When we looked more closely at this case, we find the logic in action is quite complicated and interwoven. When the tent was brought to Norway and they were going to rig it up the first time, they found this much harder than expected.
He: We found that it took 150 hours to assemble it. 15 people spent 10 hours each to assemble it. We: Did you know that in advance? He: No, I was not aware that it took so long.
At this moment Lyngstad who was participating and observing the construction, started to apply former knowledge and experience to this new situation. A process characterized by inductive (I) logic started:
It was the first time and rig manager was not very experienced. I thought it lacked a bit of equipment. I thought there should have been a forklift truck there then it would have been much faster. After an evaluation of the tent, we have bought a trailer that it is stored in. Now we can just hook it behind my largest van.
We see that the abductive starting point quite quickly went into an active trial and error phase, where a lot of knowledge and experience are utilized, making the further process more constructive and profitable. We see an A-I process and might easily imagine a deductive continuation where the tent will be used in new business situations.
Example 4: The article has given three processes of entrepreneurial opportunities, opportunity recognition with a deductive logic, an inductive-driven opportunity discovery process and a creative process supported by abductive logic. We asked the managing director if he could recognize these situations of opportunity and consider the significance of each of them in his daily business. He recognized all of them and was able to give examples where he had followed all three types of logic in the situations they belonged to. He emphasized though that most of their daily business was customer-driven characterized by a discovery process. This is hardly surprising, once a business concept is established you normally live from a repetitive response to the same offer from the market. But when talking to the managing director and analysing his way of thinking, we find a mind-set that was very open to new possibilities and was willing to adjust to new situations or framework conditions
He: We are always moving, never settled. We have to be where things happen or find them. Unexpected things happen all the time. The market can suddenly change.
It is possible to describe this general attitude or business philosophy as being prepared for abduction. Still, later in the interview when talking about how new possibilities came up, it seemed like most of them arouse out of already established activities.
We: Are new opportunities often created by what you already have done? He:Yes.

Page 181
Academy of Entrepreneurship Journal, Volume 20, Number 2, 2014
We: Like with the tent, once you have it, other possibilities pop up? He: Yes, that's it. You can create something in the future through being somewhere and then suddenly, yes, let’s go for it. And then maybe it's not something I've thought about before, it comes like a sudden thought and I say yes, this is something to consider seriously. It could be running an event out on the coast with some diving activities and some fishing. It may be something that has happened before. Yes, I was outside a village called Rørvik on the coast, making some food and then someone dropped in and it's not exactly my home base. It’s 260 km away and I had been booked by Telenor to have an event. I had just given a presentation of who I was about 5 years ago when I got a call from an arrangements company in Oslo and had heard about this from one of Telenor people. We were then hired for a weekend programme for the 50th birthday of Erik Braathen, who owned the Braathens airline in Norway. He now owns Star Tour and 3-4 airlines in Sweden. So he let his 50th party with 12 friends with sports like kayaking, fishing and hiking and we were there to dive and make 12 to 14 course dinner. So it was just something that just turned up. There was no one I knew, it came via a contact. The same gang that has that TV programme 71 degrees North, who came and did some stunts there. Yes, it was a cool weekend.
In this example we see the abductive business orientation, but at the same time we see the importance of the new business possibilities that arose out of day-to-day business activities. From an analytical position we might say it is a mixture of being in an abductive mood when doing daily business. We might say it is a circular A-I process.
Example 5: According to Peirce the abductive logic is necessary when something new is created, therefore the characterization of firstness in relation to deductive (secondness) and inductive (thirdness) logic. In our examples we have mostly seen that this abductive logic arose from musement except in example 2 where there is strong doubt present. We close these empirical descriptions with another example where the abductive doubt seems to have had a vital influence. One of the authors met the managing director two years before the interview in January 2013. On this occasion the managing director told about his anxiousness about establishing a restaurant in Åre (Sweden), the biggest winter sports centre in Scandinavia. As we have seen this was according to the original business strategy (named A-D-I). The interview was a good occasion to ask about the status of these plans.
We: You had an idea of establishing a restaurant where there are a lot of people. You mentioned Åre. Have you given that one up? He: No, they have not got the development plan sorted out in the place where I want to locate, it’s called Rödkullen. This is my idea. A new development, NOK 2.5 billion, with 20 restaurants. But I need to investigate things a bit more first.
It seems that a deeply anchored abductive (A) doubt was present in the mind of the managing director and this doubt could not be removed or followed by musement before some new information about the development plans in Åre was finalized. The managing director is spinning around in an A-circle.

Page 182
Academy of Entrepreneurship Journal, Volume 20, Number 2, 2014
Summing up in a model: The empirical examples lead to the conclusion that is possible to summarize matters in the model (Figure 1) illustrated below.
In-duction
De-duction
Ab-duction
New Action
New Action
New Action
Figure 1 Entrepreneurial opportunity model
The process is best described as circular, non-recursive and unpredictable. We find periods of business activities dominated by a single logic; abductive, deductive or inductive, represented by the blue circles. Then we find sequences where the activities are dominated by two of the logics, the green circles. Finally, there is reason to believe that all three logics might be operating more or less simultaneously in certain periods of business activity, the red circle. Entrepreneurial opportunities such as the empirical material illustrated by the Bread and Circus case are created in various ways as the model illustrates. As a consequence, new actions meant to realize a detected opportunity will be spinning out of the circles (blue, green or red) with a final location in one of the corners (logics) of the model (abduction, deduction, induction), represented by the three blue arrows. These arrows (or new actions) will bring the entrepreneur into similar and endless processes, as long as new opportunities are searched for, in time 2,3…x.
DISCUSSION
The discussion section involves both theoretical insights and practical implications. One major theoretical insight may indicate, as we have tentatively shown empirically by the Bread

Page 183
Academy of Entrepreneurship Journal, Volume 20, Number 2, 2014
and Circus case, that neither the Recognition-, Discovery- nor the Creation-based views supported by their respective logic: abduction, deduction and induction (see Table 1), are flawless or capable on their own. Perhaps a more relevant question is how pivotal concepts and insights from such views can be combined in an effort to present a more integrated perspective about how the entrepreneur creates, recognizes and discovers opportunities. Assuming such an effort is appropriate, the question is how can it be achieved.
Scholars from both sides of the discovery-creation dichotomy tend to assume that both views are needed or that the two models should be combined in order to arrive at a better explanation (Groen, Wakkee & De Weerd-Nederhof, 2008; Sarasvathy, 2006). Currently, entrepreneurship researchers are puzzled by the questions of what are the similarities and differences between the two views and whether and how combinations can be made (Zahra, 2008). A number of researchers have sought to reconcile these seemingly opposing perspectives, often by subsuming them under larger theoretical frameworks (Vaghely & Julian, 2010; Moroz & Hindle, 2012). Some draw on the psychological literature of creativity to argue that both discovery and creation are special cases of a more general process. Psychological models of creativity typically comprise five stages: preparation, incubation, insight, evaluation and elaboration (Csikszentmihalyi, 1996). This stage model is then used as a master framework that subsumes both discovery and creation (Lumpkin, Hills and Schrader, 2003). In a similar vein, Chiasson and Saunders (2005) use Giddens' structuration theory as a higher-order framework to discriminate between conceptualizations of opportunities, i.e. whether they emphasize recognition or formation of relevant 'structure-guided scripts'.
As Sarasvathy et al.. (2003) point out when classifying the threefold typology based on the a priori conditions for their existence, the views representing (actual) processes are confounded in entrepreneurial practice. This follows one of Sarasvathy et al.’s (2003) suggestions that the three views/processes could be integrated by employing different processes at different stages. In other words, opportunities once created are available for subsequent discovery and recognition and there is a possibility of evoking each process in a context-specific manner. For example, whereas opportunity recognition presumably could occur by itself, opportunity discovery entails recognition at some point in the process, and opportunity creation includes both the discovery and recognition processes. Also Baron and Ward (2004) state with foresight that “… it may be the case that successful entrepreneurs are more adept at switching between these two modes of thought as the need arises” (p. 557).
Here it is possible to see how we can avoid the question of which view is the correct one a priori. The important angle of avoiding the question of a priori “correctness” can be found in opportunity research. Both in Buchanan and Vanberg's (1991) theoretical exposition of the market as a creative process and Sarasvathy's (2001) empirically grounded research on effectuation, the question of a priori “correctness” is avoided, in favour of questions like which view is more useful under what conditions of uncertainty. Following Sarasvathy and Venkataram (2002): “if we are to deepen our understanding of entrepreneurial opportunity, we need to integrate these three approaches, emphasize contingencies rather than inevitabilities in each” (p. 27). The purpose is to contribute to a better (theoretical and empirical) understanding of the complexities concerning entrepreneurial opportunity and the difficulties of modelling an accurate
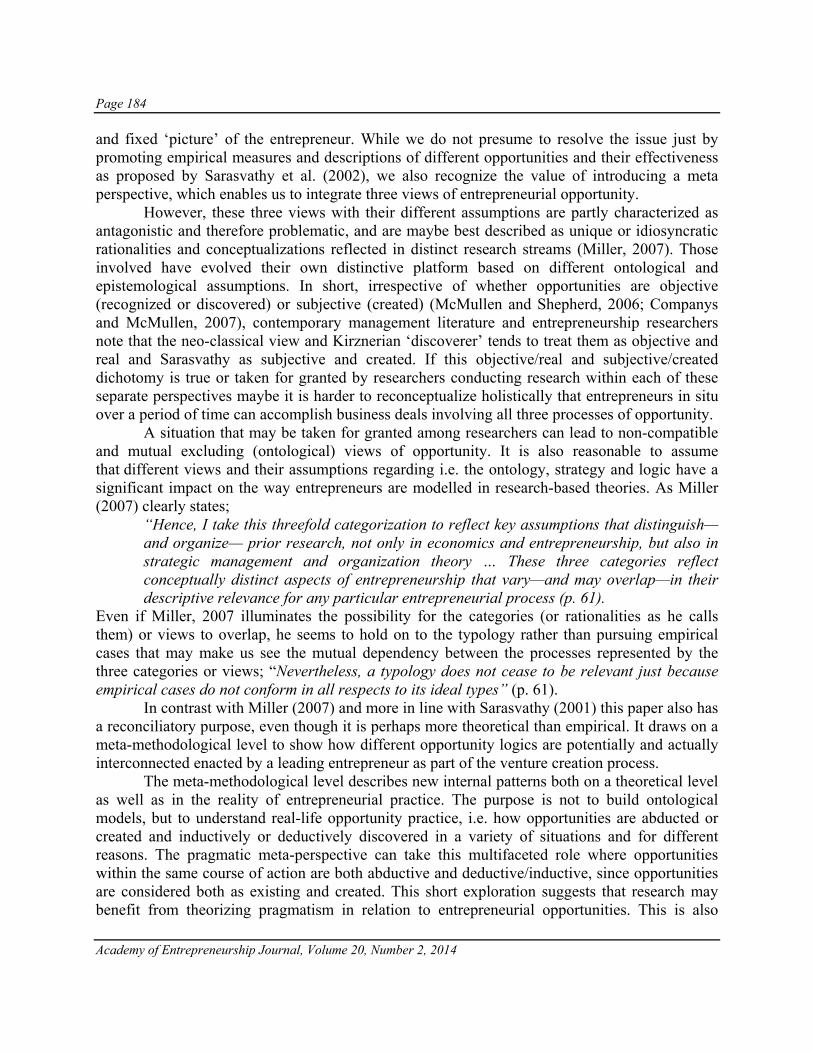
Page 184
Academy of Entrepreneurship Journal, Volume 20, Number 2, 2014
and fixed ‘picture’ of the entrepreneur. While we do not presume to resolve the issue just by promoting empirical measures and descriptions of different opportunities and their effectiveness as proposed by Sarasvathy et al. (2002), we also recognize the value of introducing a meta perspective, which enables us to integrate three views of entrepreneurial opportunity.
However, these three views with their different assumptions are partly characterized as antagonistic and therefore problematic, and are maybe best described as unique or idiosyncratic rationalities and conceptualizations reflected in distinct research streams (Miller, 2007). Those involved have evolved their own distinctive platform based on different ontological and epistemological assumptions. In short, irrespective of whether opportunities are objective (recognized or discovered) or subjective (created) (McMullen and Shepherd, 2006; Companys and McMullen, 2007), contemporary management literature and entrepreneurship researchers note that the neo-classical view and Kirznerian ‘discoverer’ tends to treat them as objective and real and Sarasvathy as subjective and created. If this objective/real and subjective/created dichotomy is true or taken for granted by researchers conducting research within each of these separate perspectives maybe it is harder to reconceptualize holistically that entrepreneurs in situ over a period of time can accomplish business deals involving all three processes of opportunity.
A situation that may be taken for granted among researchers can lead to non-compatible and mutual excluding (ontological) views of opportunity. It is also reasonable to assume that different views and their assumptions regarding i.e. the ontology, strategy and logic have a significant impact on the way entrepreneurs are modelled in research-based theories. As Miller (2007) clearly states;
“Hence, I take this threefold categorization to reflect key assumptions that distinguish—and organize— prior research, not only in economics and entrepreneurship, but also in strategic management and organization theory … These three categories reflect conceptually distinct aspects of entrepreneurship that vary—and may overlap—in their descriptive relevance for any particular entrepreneurial process (p. 61).
Even if Miller, 2007 illuminates the possibility for the categories (or rationalities as he calls them) or views to overlap, he seems to hold on to the typology rather than pursuing empirical cases that may make us see the mutual dependency between the processes represented by the three categories or views; “Nevertheless, a typology does not cease to be relevant just because empirical cases do not conform in all respects to its ideal types” (p. 61).
In contrast with Miller (2007) and more in line with Sarasvathy (2001) this paper also has a reconciliatory purpose, even though it is perhaps more theoretical than empirical. It draws on a meta-methodological level to show how different opportunity logics are potentially and actually interconnected enacted by a leading entrepreneur as part of the venture creation process.
The meta-methodological level describes new internal patterns both on a theoretical level as well as in the reality of entrepreneurial practice. The purpose is not to build ontological models, but to understand real-life opportunity practice, i.e. how opportunities are abducted or created and inductively or deductively discovered in a variety of situations and for different reasons. The pragmatic meta-perspective can take this multifaceted role where opportunities within the same course of action are both abductive and deductive/inductive, since opportunities are considered both as existing and created. This short exploration suggests that research may benefit from theorizing pragmatism in relation to entrepreneurial opportunities. This is also

Page 185
Academy of Entrepreneurship Journal, Volume 20, Number 2, 2014
important because it can contribute to a more flexible and reflexive mode/way of doing opportunity research.
More specifically with regard to practical contributions we believe that the paper will help entrepreneurs to reflect upon their own practice and evaluate the existence of the different logics as a personal knowledge base. This is based on the following contributions: 1) presenting this meta-perspective upon entrepreneurial practice, 2) conceptualizing opportunity practice with help of Peirce`s three logics and 3) documenting the interwoven and connected existence of these logics as living practice in the field as we have shown by the Bread and Circus case. For the entrepreneur the implication of the paper might be greater awareness of the need for simultaneously and constantly searching for abductive, deductive and inductive inferences and answers to their entrepreneurial challenges. This will be helpful to entrepreneurs as a tool to understand and run their projects more efficiently. By elaborating with the “entrepreneurial opportunity model” (Table 1), the entrepreneur can reflect upon personal strengths and weaknesses regarding opportunity logics as a competence skill. If he/she finds some of the corners in the model, or way of developing knowledge are difficult or underdeveloped, steps for improving this lack may be taken. In our case it is easy to see both the abductive and inductive capabilities or preferences from the managing director, while it is possible to question his deductive abilities. As we heard from the case, his company received valuable deductive help from two external consultants in the initial phase of their history.
In light of the three views of the market process, the allocative, discovery and creation opportunity views, the case study has documented their complementary (and non-competitive) existence. This is a valuable implication for entrepreneurial teaching, arguing for a multi- perspective approach.
LIMITATIONS AND FURTHER RESEARCH
This is an instrumental case study which seeks to answer questions that arise from a conceptual review of theories and tries to understand the theoretical framework within a specific setting (Stake, 1995). We use the instrumental case study, to explore how theories play out in the real life context. The particular instance of the Bread and Circus firm is used as the instrumental case to provide insight into the issue. The case of Bread and Circus is elaborated on the basis of different opportunity views and the (methodological) logics in pragmatism provide a theoretical framework. However, while this paper examines some challenges of entrepreneurial practice based on a single case, it is important to note that none of these findings may apply to other entrepreneurial contexts. That is to say, the aim is not to achieve and defend statistical generalizability, rather provide a context of application to enable naturalistic generalization. The concept of naturalistic generalization is described as a partially intuitive process arrived at by recognizing the similarities of objects and issues in and out of context (Stake 1980, p. 69). Hence, it is essential that the case study is properly descriptive so that readers can recognize essential similarities to cases of interest to them. These are similarities which can be associated with the fact that no entrepreneurial practice is without challenges. For example challenges dealing with creating opportunities, recognizing opportunities and analyzing opportunities discovered as shown in this case. Moreover perhaps entrepreneurs and researchers could be more

Page 186
Academy of Entrepreneurship Journal, Volume 20, Number 2, 2014
aware of how different opportunity logics actually are combined and constitute each other instead of treating different opportunities (logics) as separated and mutually exclusive logics.
Moreover, Berglund (2007) proposes a phenomenological account to explore how entrepreneurial experiences, among other things, also challenge the ontological status of theories, i.e. whether opportunities exist a priori or are created. In line with Berglund’s (2007) approach a pragmatic perspective may help to focus on the practical use of opportunity theories and not just their ontological assumptions. The next step could be to pursue a phenomenological and pragmatic approach by focusing on tacit knowledge/knowing and time/timing. A special form of tacit knowledge, gut feeling, for making decisions is especially of great value in entrepreneurship. This because entrepreneurs often hold limited information about their business idea (Gartner,Bird, & Starr, 1992) and their decisions can seldom be based on historical trends (Miller & Frierson, 1984). In line with gut feeling as a strategic weapon, time is as important as money, productivity, quality, and even innovation (Stalk Jr, 1988). For example Eriksen (1999) refer to the importance of subjective time as linear in an elastic manner, or something cyclic. A subjective perception of time can be theorized by that the quality of trust in strategic alliances will result in a certain amount of time to obtain, but the amount of time will not affect the quality of trust.
More empirical studies involving field experiments and longitudinal research designs are needed because such designs can help establish the causal relationship between the individual, the team, and organizational factors and opportunities. Studies are needed to evaluate opportunities which alter organizational work practices to facilitate innovation. For example, when a firm plans to pilot an opportunity creation before pursuing and implementing an opportunity full-scale. Ideally, two comparable units of a firm may be carefully chosen with one unit first serving as the control condition and then implementing the same opportunity intervention. This design allows researchers to compare the overall differences in opportunity practice between the two units as well as differences that occur over time.
Finally, phenomena and logics within opportunity practice do not reside within one level of analysis but are hierarchical, which necessitates an examination across levels to capture their complexity (Sheperd 2011). It is possible to use both individual and dyadic levels to examine dyadic opportunity practice. More work using multi-level analysis is needed to appropriately examine opportunity dynamics. It is possible that some team- or community-level factors such as team size and autonomy and individual-level factors may jointly influence the opportunity (logics) practice in an entrepreneurial team.
REFERENCES
Alvarez, S. A. and Barney, J. (2007). ‘Discovery and creation: alternative theories of entrepreneurial
action. Strategic Entrepreneurship Journal, 1, 11–26. Babbie, E., & Baxter, L. (2004). The basics of communication research. Belmont, CA: Thomson Learning. Banik, B. (1993). Applying triangulation in nursing research. Applied Nursing Research 6(1) , 47-52. Buchanan JM, Vanberg VJ.(1991). The market as a creative process. Economics and Philosophy 7: 167–186. Baron RA, and Ward TB.(2004). Expanding the entrepreneurial cognition’s toolbox: potential contributions from
the field of cognitive science. Journal of Business Venturing 28: 553–573.

Page 187
Academy of Entrepreneurship Journal, Volume 20, Number 2, 2014
Choi, Y. R. and Shepherd, D. A. (2004). ‘Entrepreneurs’ decisions to exploit opportunities’. Journal of Management, 30, 377–95.
Christensen, C. M. (1997). The Innovator’s Dilemma: When New Technologies Cause Great Firms to Fail. Boston: Harvard Business School Press.
Companys, and Mcmullen (2007). Strategic Entrepreneurs at Work: The Nature, Discovery, and Exploitation of Entrepreneurial Opportunities. Small Business Economics,(28), 4, pp 301-322.
Creswell, J. (1998). Qualitative inquiry and research design: Choosing among five traditions. Beverly Hills, CA:Sage Publications, INC
Csikszentmihalyi, M. (1996) Creativity: Flow and the Psychology of Discovery and Invention. NewYork: HarperCollins.
Demsetz, H. (1982). Barriers to entry. The American Economic Review (72), 1,, pp. 47-57 DeTienne and Chandler (2004). Opportunity Identification and Its Role in the Entrepreneurial Classroom: A
Pedagogical Approach and Empirical Test. In Academy of Management Learning and Education. vol. 3no. 3 242-257.
Denzin, N. (1970). The research act. Aldine Publications Co. Eckhardt, J.T. & Shane, S.A. (2003). Opportinities and Entrepreneurship. Journal of Management, 29(3), 333-349. Eriksen, T. B. (1999). Tidens historie (The history of time). Oslo, Norway: J. M. Stenersen Forlag AS. Fiet, J. O. (1996). The informational basis of entrepreneurial discovery. Small Business Economics , 419-430. Gartner, W. B., Bird, B. J., & Starr, J. A.(1992). Acting as if: Differentiating entrepreneurial from organizational
behavior.Entrepreneurship Theory and Practice, 16(3), 13-31. Groen, A.J., I.A.M. Wakkee, P.C. de Weerd-Nederhof, 2008, Managing Tensions in a High Tech Startup: An
innovation journey in Social System Perspective, International Small Business Journal, 26(1), 57-81. Görling, S., & Rehn, A. (2008). Accidental ventures - A materialist reading of opportunity and entrepreneurial
potential. Scandinavian Journal of Management , 94-102. Hacking, I. (1975). The Identity of Indiscernibles. The Journal of Philosophy
,(72), 9, pp. 249-256 Hayek, F. (1945). The Use of Knowledge in Society. The American Economic Review, Vol. 35, No. 4 , 519-530. Joas H.(1997.)The Creativity of Action. University of Chicago Press: Chicago, IL. Kirzner, I. (1973). Competition and Entrepreneurship. Chicago, Il: University of Chicago Press. James, W. 1907, Pragmatism: A New Name for Some Old Ways of Thinking. New York: Longmans.Gartner, W.B. (2001): “Is there an elephant in entrepreneurship? blind assumptions in theory
development”, Entrepreneurship Theory and Practice, 25(4): 27–39. Kirzner IM.(1985).Discovery and the Capitalist Process. University of Chicago Press: Chicago, IL. Kirzner, I. (1992). The Meaning of the Market Process: Essays in the Development of Modern Austrian Economics,
London and New York: Routledge. Kirzner, I. M. (1997). Entrepreneurial discovery and the competitive market process: An Austrian approach. Journal
of Economic Literature, 35(1), 60-85. Littlechild S.C.(1986).Three types of market process. In Economics as a Process: Essays in the New Institutional
EconomicsLangloisRN (ed). Cambridge University Press: Cambridge, UK; 27–39. McMullen, J. S. and Shepherd, D. A. (2006). ‘Entrepreneurial action and the role of uncertainty in the theory of the
entrepreneur’. Academy of Management Review, 31, 132–52. Melville, D. (1987). "MARKETING PRESCIENCE: PICKING THE RIGHT HORSE". In Journal of Business and
Industrial Marketing, Vol. 2 Iss: 3, pp.35 - 39 Miller, K. D. (2007). Risk and rationality in entrepreneurial processes. Strategic Entrepreneurship Journal, 1(1-2),
57-74. Miller, D., & Frierson, P. H. (1984). Organizations: A quantum view. New Jersey: Prentice Hall. Mises, L. (1996). Human Action: A Treatise on Economics (4th rev. edn), Fox and Wilkes, San Francisco. Moroz, P.W & Hindle, K. (2012). Entrepreneurship as a process. Towards harmonizing multiple perspectives.
Entrepreneurship: Theory and Practice, 36, 4, 781-818. Lumpkin, G. T. , G. E. Hills, and R. C. Shrader (2003), "Opportunity Recognition," in Entrepreneurship: The Way
Ahead, Harold P. Welsch, Ed. New York: Routledge.

Page 188
Academy of Entrepreneurship Journal, Volume 20, Number 2, 2014
Peirce, C. S.(1986). Writings of Charles S. Peirce: A chronological edition (Volume 3: 1872-1878). Bloomington: Indiana University Press.
Rumelt, R. P. (1987). ‘Theory, strategy, and entrepreneurship’. In Teece, D. (Ed.), The Competitive Challenge:Strategies for Industrial Innovation and Renewal. Cambridge, MA: Ballinger, 137–58
Sarasvathy, S. (2001). ‘Causation and effectuation: toward a theoretical shift from economic inevitability to entrepreneurial contingency. Academy of Management Review, 26, 243–63.
Sarasvathy SD, Dew N, Velamuri SR, Venkataraman S.(2003).Three views of entrepreneurial opportunity. In Handbook of Entrepreneurship Research: An Interdisciplinary Survey and Introduction, AcsZJ, AudretschDB (eds). Kluwer: Dordrecht, The Netherlands; 141–160.
Sarasvathy, S. D. & Dew, N. (2005). New market creation through transformation. Journal of Evolutionary Economics, 15(Issue 5): 533-565.
Shane, S. A. (2003). A general theory of entrepreneurship: the individual-opportunity nexus. Cheltenham, Glos: Edward Elgar Publishing.
Shane, S. and Venkataraman, S. (2000). The promise of entrepreneurship as a field of research. Academy of Management Review,25, 217–26.
Shepherd, D.A. (2011). Multilevel Entrepreneurship Research: Opportunities for studying Entrepreneurial Decision Making. Journal of Management, 37(2),412-420.
Sheriff, J. K. (1989). The fate of meaning: Charles Peirce, structuralism, and literature.Guildford: Princeton University Press.
Short, J.C., Ketchen, D.J., Shook, C.L. & Duan Ireland, R. (2010). The Concept of “opportunity” in Entrepreneurship Research: Past Accomplishments and Future Challenges. Journal of Management, 36(1),40-65.
Short, T. L. (1996). Interpreting Peirce’s interpretant: A response to Lalor, Liszka, and Meyers. Transactions of the Charles S. Peirce Society, 4, 488–541.
Sorrell, K. S. (2004). Representative practices. New York, NY: Fordham University Press. Simon HA.(1981).The Sciences of the Artificial, 2nd edn. MIT Press: Cambridge, MA. Stake, R. E. (1995). An Intensive Study of Case Study Research Methods. Houston: Sage Publications. Stalk Jr, G. (1988). Time - The next source of competitive advantage. Harvard Business Review, 66, 41-51. Vaghely, I. P & Julian, P. A. (2010). Are opportunities recognized or constructed?: An information perspective on
entrepreneurial opportunity identification. Journal of Business Venturing, 25, 1, 73-86. Venkataraman, S. (1997). The distinctive domain of entrepreneurship research. Advances in Entrepreneurship, Firm
Emergence and Growth, 3, 119-138. Yin, R. (1989). Case Study Research: Design and Methods (1st ed.). Beverly Hills, CA: Sage Publishing. Zahra, S. A. (2008). The virtuous cycle of discovery and creation of entrepreneurial opportunities. Strategic
Entrepreneurship Journal, 2, 3, 243-257.