
A Minimum of Rivalry: Evidence from Transition Economies on the Importance of Competition for...
33
CENTRE FOR ECONOMIC REFORM AND TRANSFORMATION School of Management and Languages, Heriot-Watt University, Edinburgh, EH14 4AS Tel: 0131 451 8143/3485 Fax: 0131 451 3498 email: [email protected] World-Wide Web: http://www.sml.hw.ac.uk/cert A Minimum of Rivalry: Evidence from Transition Economies on the Importance of Competition for Innovation and Growth * Wendy Carlin † Mark E. Schaffer ‡ Paul Seabright § March 2004 Discussion Paper 2004/02 Abstract This paper examines the importance of competition in the growth and development of firms. We make use of the large-scale natural experiment of the shift from an economic system without competition to a market economy to shed light on the factors that influence innovation by firms and their subsequent growth. Using a dataset from a survey of nearly 4,000 firms in 24 transition countries, we find evidence of the importance of a minimum of rivalry in both innovation and growth: the presence of at least a few competitors is effective both directly and through improving the efficiency with which the rents from market power in product markets are utilised to undertake innovation. Keywords: competition, productivity growth, innovation, rivalry, transition JEL Classification: P0, L1, L33, O12 * We have received advice and help from Philippe Aghion, Richard Blundell, Ronald Braeutigam, Saul Estrin, Rachel Griffith and Mark Schankerman. We are grateful to the EBRD and World Bank, who financed the survey, and especially to Steven Fries, with whom we have co-authored related papers using these data. The usual caveat applies. † University College London, CEPR and WDI. Contact address: Department of Economics, University College London, Gower St, London WC1E 6BT. email: [email protected]. ‡ CERT, Heriot-Watt University; CEPR, London; IZA, Bonn; WDI, University of Michigan. Contact address: Centre for Economic Reform and Transformation, School of Management and Languages, Heriot-Watt University, Edinburgh EH14 4AS, UK. Email: [email protected]. § IDEI (Université de Toulouse-1) and CEPR. Contact address: Institut d'Economie Industrielle, Université de Toulouse-1, Manufacture des Tabacs, 21, Allée de Brienne, 31000 Toulouse, France. Email: <[email protected]>
Transcript of A Minimum of Rivalry: Evidence from Transition Economies on the Importance of Competition for...

CENTRE FOR ECONOMIC REFORM AND TRANSFORMATIONSchool of Management and Languages, Heriot-Watt University, Edinburgh, EH14 4AS
Tel: 0131 451 8143/3485 Fax: 0131 451 3498 email: [email protected] Web: http://www.sml.hw.ac.uk/cert
A Minimum of Rivalry: Evidence from TransitionEconomies on the Importance of Competition for
Innovation and Growth*
Wendy Carlin†
Mark E. Schaffer‡
Paul Seabright §
March 2004Discussion Paper 2004/02
AbstractThis paper examines the importance of competition in the growth and development of firms. Wemake use of the large-scale natural experiment of the shift from an economic system withoutcompetition to a market economy to shed light on the factors that influence innovation by firmsand their subsequent growth. Using a dataset from a survey of nearly 4,000 firms in 24transition countries, we find evidence of the importance of a minimum of rivalry in bothinnovation and growth: the presence of at least a few competitors is effective both directly andthrough improving the efficiency with which the rents from market power in product marketsare utilised to undertake innovation.
Keywords: competition, productivity growth, innovation, rivalry, transition
JEL Classification: P0, L1, L33, O12
* We have received advice and help from Philippe Aghion, Richard Blundell, Ronald Braeutigam, Saul Estrin, Rachel Griffithand Mark Schankerman. We are grateful to the EBRD and World Bank, who financed the survey, and especially to Steven Fries,with whom we have co-authored related papers using these data. The usual caveat applies.† University College London, CEPR and WDI. Contact address: Department of Economics, University College London, GowerSt, London WC1E 6BT. email: [email protected].‡ CERT, Heriot-Watt University; CEPR, London; IZA, Bonn; WDI, University of Michigan. Contact address: Centre forEconomic Reform and Transformation, School of Management and Languages, Heriot-Watt University, Edinburgh EH14 4AS,UK. Email: [email protected].§ IDEI (Université de Toulouse-1) and CEPR. Contact address: Institut d'Economie Industrielle, Université de Toulouse-1,Manufacture des Tabacs, 21, Allée de Brienne, 31000 Toulouse, France. Email: <[email protected]>

2
1. Introduction
How much does competition matter for the growth and development of firms,and if it is significant, through what channels does it work? These are important andlong-standing questions in economics, but ones to which convincing answers havebeen frustratingly difficult to find. Theories of the influence of competition on firmbehaviour and performance suggest that this influence can work through manydifferent channels, some of them mutually offsetting, so the question of their relativeimportance can only be settled empirically. However, there are many obstacles in theway of finding convincing empirical answers. These consist partly in the lack ofappropriate data, notably concerning measures of the competitive pressure faced byfirms. Proxies such as shares of administratively defined product markets identifiedby SIC codes may be a long way from identifying the true nature of economiccompetition. The obstacles consist partly also in the difficulty of identifying theappropriate counterfactual against which actual outcomes can be measured. When thedegree of competition varies many other things typically vary as well, includingtechnology and regulation, and it is not easy to see which of these variations shouldproperly be considered exogenous to the economic processes under investigation.
In this paper we present evidence that competition matters for firm innovationand growth. Specifically, we find evidence that firms facing just a few rivals performbetter than those that face none; there is also some less clear-cut evidence that thepresence of a few rivals is more conducive to performance than the presence of manycompetitors. This is consistent with a broadly Schumpeterian view of the relationshipbetween competition and performance (such as has begun attracting renewedtheoretical interest in recent years).
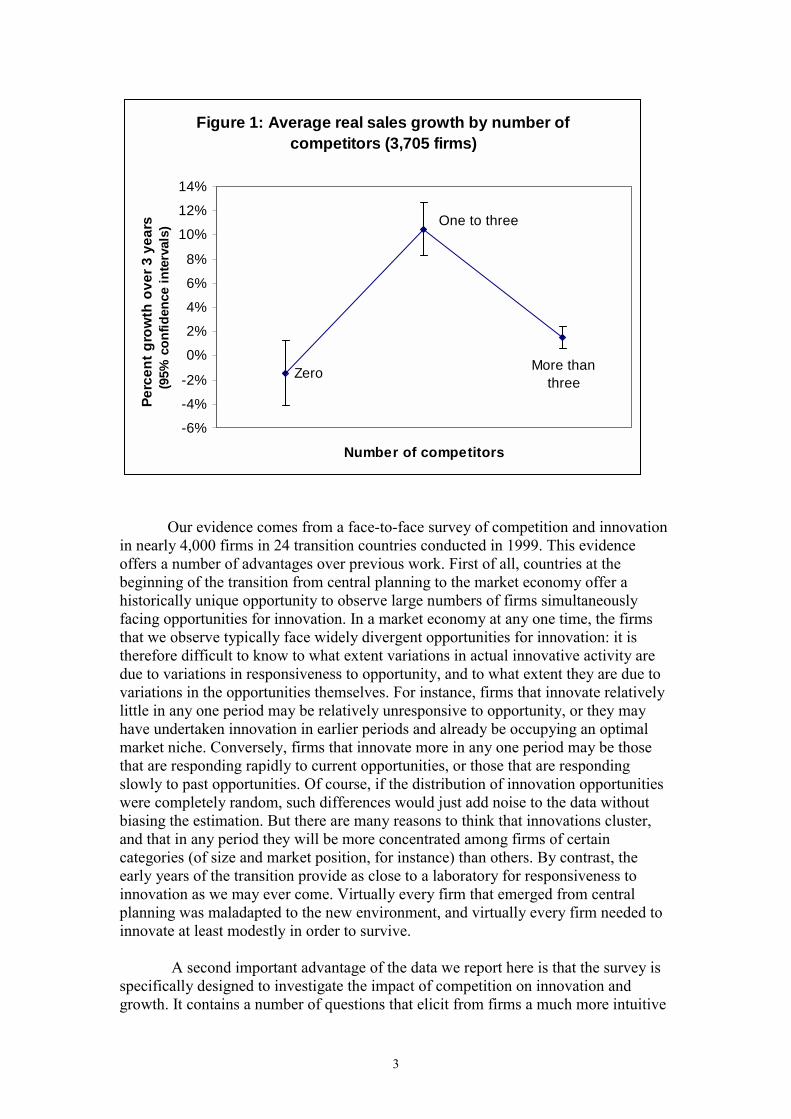
In the raw data presented in Fig. 1, there is a clear inverted-U relationshipbetween firm growth and the number of competitors faced by the firm. Firms facingbetween one and three competitors had average sales growth of nearly 11% over thethree years to 1999, while monopolists saw real sales decline by over 1% and firmsfacing more than three competitors had sales growth of under 2%.2 To investigatewhether this bivariate correlation stands up to more rigorous econometric estimationis the task of this paper. We also explore in some detail the channels through whichcompetition works, distinguishing between the effects of competition on managerialand work-force motivation, and its effects on the resources available to firms to putinto practice their strategies of investment and innovation. We do so in two ways.First of all, we use two measures of competitive pressure, one being the number ofrival firms perceived by the firm in its main market, and the other being the elasticityof demand the firm perceives for its products; these turn out to have distinct andlargely independent influences on firm behaviour. In turn we look at this behaviour intwo ways – through measures of the innovation activity undertaken by the firm, andthrough a measure of its growth in sales. These respond in distinct ways to the twokinds of competitive pressure just described.
[Figure 1 here]
2 The vertical lines are 95% confidence intervals from a simple least squares regression of log salesgrowth on three category dummies (monopolist, 1-3 competitors, >3 competitors) and no constant.
3
Figure 1: Average real sales growth by number of competitors (3,705 firms)
More than three
One to three
Zero
-6%
-4%
-2%
0%
2%
4%
6%
8%
10%
12%
14%
Number of competitors
Perc
ent g
row
th o
ver 3
yea
rs(9
5% c
onfid
ence
inte
rval
s)
Our evidence comes from a face-to-face survey of competition and innovationin nearly 4,000 firms in 24 transition countries conducted in 1999. This evidenceoffers a number of advantages over previous work. First of all, countries at thebeginning of the transition from central planning to the market economy offer ahistorically unique opportunity to observe large numbers of firms simultaneouslyfacing opportunities for innovation. In a market economy at any one time, the firmsthat we observe typically face widely divergent opportunities for innovation: it istherefore difficult to know to what extent variations in actual innovative activity aredue to variations in responsiveness to opportunity, and to what extent they are due tovariations in the opportunities themselves. For instance, firms that innovate relativelylittle in any one period may be relatively unresponsive to opportunity, or they mayhave undertaken innovation in earlier periods and already be occupying an optimalmarket niche. Conversely, firms that innovate more in any one period may be thosethat are responding rapidly to current opportunities, or those that are respondingslowly to past opportunities. Of course, if the distribution of innovation opportunitieswere completely random, such differences would just add noise to the data withoutbiasing the estimation. But there are many reasons to think that innovations cluster,and that in any period they will be more concentrated among firms of certaincategories (of size and market position, for instance) than others. By contrast, theearly years of the transition provide as close to a laboratory for responsiveness toinnovation as we may ever come. Virtually every firm that emerged from centralplanning was maladapted to the new environment, and virtually every firm needed toinnovate at least modestly in order to survive.
A second important advantage of the data we report here is that the survey isspecifically designed to investigate the impact of competition on innovation andgrowth. It contains a number of questions that elicit from firms a much more intuitive

4
and economically-grounded view of their competitive circumstances than haspreviously been possibly in surveys on this scale. It also contains detailed questionsabout the innovative activities undertaken by managers. These provide us with theopportunity of investigating the impact of competition on innovation as the first stepand then in the second step, looking at how competitive conditions influence outputgrowth as distinct from their effect on innovation.
The concern raised in many studies of the effects of competition on firmperformance in mature market economies is that in the long run, successfulperformance brings with it an increase in market share and more market power.Reverse causality of this kind will put an upward bias on measures of market power ina performance regression. However, although our data and measures of growth andinnovation cannot entirely eliminate such worries, they go a considerable way tomitigating them.
Transition economies were subjected to a comprehensive economy-wideshock to competition. This shock had the effect of introducing competition betweenexisting firms in an environment where there was previously none, of removingautomatic state financial support thus creating the incentive for managers of existingfirms to attend to competitive conditions (in domestic and export markets), of openingthe way for the entry of new firms, and of introducing competition from imports.There are therefore two kinds of firms in the sample: ‘old’ firms that existed under theplanned economy and either remain state-owned or are privatized and ‘new’ firms thathad no predecessor in the pre-reform economy.
Broadly speaking, the large, established firms in the sample are likely tooperate in markets, the structure of which at the time of the survey is still stronglyinfluenced by the pre-transition arrangements in which competitive success was not adeterminant of market structure. The new firms making up the bulk of the sample aremainly small and more plausibly characterized as responding to market conditionsthan establishing them. Furthermore, since all new firms are relatively young(founded between 1990 and 1996), to the extent that there is some endogeneity ofmarket structure it will affect them to a similar degree. As we shall see when weinspect the data, market power is much more characteristic of state-owned firms thanof others: such firms had privileged access to resources in the old regime. At the timeof the survey, transition economies were distant from an equilibrium in which marketstructure was the outcome of the playing out of competitive forces.
For these reasons, transition economies observed at the time of this surveymay constitute a closer approximation to a large-scale ‘natural experiment’ in whichwe can examine the effects of competition on behaviour and performance than we areever likely to find again, at least on such a scale. Furthermore, by analyzing separatelythe way competition affects performance for the two sub-samples of new firms andestablished firms we may obtain a qualitative and quantitative indication of thechanging character of market structure, which will assist us in interpreting the resultsfor the sample as a whole.
To summarize, two features of the transition context lessen concern aboutreverse causality between firm success and measures of competition: on the one hand,aspects of market structure and the competitive pressure faced by firms were inherited

5
from the command economy and on the other, for many firms, their competitivecontext is the outcome of random events during the liberalisation process early in thetransition.
Of course, one disadvantage of the natural experiment offered by transition isthat a change in the degree of competition was only one of many changes to theeconomic environment. In particular, many countries implemented privatisationprogrammes, as well as changes in regulations affecting a large number of aspects ofthe business environment. All these countries have also been going through aprofound social transformation that affects everything from the aspirations ofentrepreneurs to perceptions of the socially acceptable level of corruption. In order toisolate the influence of competition, we control for a number of general features offirms and their external environment (e.g., their size, whether they existed undercentral planning or not, economic sector and location). Other elements of theinstitutional and policy environment will vary across countries and will be captured inthe country dummies.
The structure of the paper is as follows. In section 2 we review briefly thetheoretical and empirical literature on the link between competition and growth – dowe have any reason to expect there to be a link at all? In section 3 we describe ourdata, and in section 4 we discuss empirical specifications. Sections 5 and 6 present ourresults and section 7 concludes.
2. Why should competition matter for innovation and for the growth of firms?
Whilst there is a clear consensus in theoretical and empirical work thatstronger competition improves allocative efficiency in most types of industries, theconnection between competition and both innovation and growth is much morecontentious. Schumpeter identified the countervailing pressures at work in 1943 and itis more than a half century later that theoretical work has been able to formalize themechanisms he described and that best-practice empirical analysis has begun to findways of separating out the effects in the data.
Schumpeter’s vision of the capitalist economy was of a system in whichincumbents with market power are constantly being threatened both by existingcompetitors and by new entrants (Schumpeter 1943, Carlin, Haskel and Seabright,2001). Innovation is spurred by the potential rents that would come from success in anecessarily risky activity and by the need to innovate to maintain existing rents in theface of competitive threat. He also emphasized that innovation is costly, that financialmarkets are imperfect and that internal funds are often necessary in order for a firm toinnovate. This analysis suggests that on the one hand market power can boostinnovation: higher rents enable more innovation to be undertaken (resources) andincrease the rewards to such innovation as occurs (incentives), whilst on the otherhand, more competition can also boost innovation: incumbents who fail to innovatewill be pushed out by innovating incumbents or entrants. In his vision of how thecompetitive process works, these counteracting forces are simultaneously present. Thesubtlety of Schumpeter’s analysis does not therefore lend itself to a simple hypothesissuch as ‘more competition raises/lowers innovation’ that can be taken to the data. Hisanalysis distinguishes between actual rents (resources), perceived rents (post-innovation), actual competition and potential competition.

6
Considerable progress has been made in recent years in building formalmodels in both industrial organization and in growth theory that capture severalaspects of the Schumpeterian competitive process. A survey of models from bothtraditions is provided in Aghion and Griffith (2004). Taking incentive effects first, inaddition to the classic Schumpeterian effect of greater ex post competition depressingthe incentive to innovate (as in Aghion and Howitt 1998), other models have shownhow the adverse effects of knowledge spillovers to competitors on the incentive toinvest may offset the direct productivity-enhancing impact of the spilloversthemselves (e.g. Dutta & Seabright, 2002). The opposite relationship with greatercompetition inducing productivity growth is captured in some models. For example,the emergence of new competitors threatens the temporary monopoly profits frominnovation and the survival of incumbents, which prompts satisficing managers toexert effort and shorten the innovation cycle (Aghion, Dewatripont & Rey 1997).More recently, the basic Schumpeterian model has been extended by allowingincumbent firms to innovate (Aghion, Harris, Howitt & Vickers 2001). This producesan inverse-U shaped relationship between competition and innovation. At low levelsof competition, the incentive to innovate is sharpened as more competition raises theincremental profits from innovation. When competition becomes intense, furthercompetition may inhibit innovation as the standard Schumpeterian effect offsets thepressure to innovate so as to escape competition.
Empirical support for the role of competition as a spur to performance comesfrom recent econometric research using a variety of performance measures. Forinstance, Blundell, Griffith and Van Reenen (1999) use numbers of innovations as ameasure and are able to reconcile the fact that large firms are more likely to innovatewith the positive role of competition in innovation. They show both that firms withlarger market shares have more to gain by innovating in a pre-emptive fashion(potential competitive threat) and that in industries where competition is less intense,rates of innovation are lower. The results are consistent with those of a quite differentmethodology (bench-marking using case studies) in which Baily and Gersbach (1995)find that “head-to-head” competition in the same market results in faster innovation inseveral manufacturing industries. Nickell (1996) controls for industry levelconcentration and import concentration and finds that a firm-level measure ofcompetition is correlated with TFP growth. A robust inverse U-relationship betweenproduct market competition and the patenting activity of UK firms consistent with thecounteracting Schumpeterian mechanisms set out in Aghion, Harris, Howitt &Vickers (2001) is reported in Aghion, Bloom, Blundell, Griffith & Howitt (2003).
Evidence that only a few competitors is sufficient to sharpen incentives isprovided in an empirical study of entry thresholds. Bresnahan and Reiss (1991) findthat most of the competitive impact from entry comes from the first two entrants tochallenge a monopolist, with the effect levelling out once market participants numberaround five.
Nickell motivates his 1996 paper by observing that the most convincingevidence for the role of competition in innovation and growth comes from a ‘broadbrush’ comparison between the lack of dynamism of centrally planned as comparedwith market economies (Nickell, 1996). Studies are beginning to emerge that examinethe role of competition in the transition from central planning to the market economy.

7
Grosfeld and Tressel (2002) apply Nickell’s methodology to a panel of Polish firmslisted on the stock market. They find that a reduction of 10 percentage points in thefirm’s market share is associated with faster total factor productivity growth of 1.4percentage points. Using a measure of competition at industry level, Konings (1998)found in a study of Bulgaria and Estonia that more competitive pressure in theindustry enhanced firm TFP growth in Bulgaria but not in Estonia. A recent attempthas been made to use the statistical technique of meta-analysis to synthesize theempirical results of over one hundred studies of transition economies (Djankov andMurrell, 2002). Although there are important questions about the reliability of meta-analysis techniques, especially where there is reason to suspect that empirical biasesmay be correlated across studies,3 their findings are nevertheless illuminating.Djankov and Murrell (2002) pool 23 studies (using mainly level but with some growthrate measures) and report a positive impact of competition on performance (see Table7 in Djankov and Murrell for the estimated size of the effects). Finally, a study ofGeorgian firms (Djankov and Kreacic 1998) that collected information on actionstaken by managers found that competition from foreign producers tended to beassociated with employment cuts and changes in suppliers (but tended to reduce thelikelihood of the disposal of assets, renovations and computerization). By contrast,firms with a larger market share were more likely to engage in computerization,introduce renovations, establish a new marketing department and dispose of assets.
Naturally, all studies of the impact of competition need to control for otherfactors, and studies vary in the extent and manner in which they do so. One suchfactor is ownership. Since privately-owned firms also tend to operate in a differentcompetitive environment, failure to control for ownership might lead to significantbias. Pooling 37 studies and placing more weight on studies that controlled forselection bias in the privatization process, Djankov and Murrell (2002) found thatprivatization improved performance significantly (the majority of studies used levelsrather than growth rate measures, see Djankov and Murrell Table 2). For theCommonwealth of Independent States (CIS) countries (former Soviet Union),however, there was no robust significant difference between the performance of state-owned and privatized firms.
Bearing these findings in mind, as well as the fact that in our data it isimpossible to take into account the endogeneity of the privatisation decision bycorrecting for selection bias, we do not distinguish separately between privatisedfirms and ones that were state-owned at the time of the survey. We can report,however, that this distinction proved insignificant in our preliminary work: anypositive bias on the effect of privatization due to selection effects was not strongenough to produce a significant difference in performance between state-owned andprivatized firms once competition, size and sector were controlled for. The relevantdistinction in the data appears to be between old and new firms rather than betweenstate-owned and private (i.e. privatized plus new) ones. This distinction also raisesfewer econometric problems since the difference between old and new firms is givenby history.
To summarise, theory provides good reasons to expect that monopolists willbe less dynamic and innovative than rivalrous oligopolists, with a small number of 3 For a survey of the methodological problems associated with ‘narrative’ and meta-analysis reviews,see Chalmers and Altman (1995).

8
exceptions in naturally monopolistic industries. Empirical evidence tends to confirmthis view. Both theory and evidence are less clear, however, as to whether competitionhas a monotonically beneficial effect on performance or whether many competitorsare actually less good for performance than just a few. Theory and evidence alsosuggest that any attempt to test for such a relationship needs to control for firm andindustry characteristics, as well as for relevant features of the external environment.
It is evident that the theories we have outlined above do not providesufficiently precise empirical predictions for us to be able to distinguish one theoryfrom another; instead they provide a guide as to certain empirical tendencies forwhich one can test (such as whether the effect of competition is monotonic).Nevertheless, we can tentatively draw a distinction between theories that appeal to theeffect of competition on managerial incentives (on how keenly managers will wish toensure the efficient use of the firm’s resources), and those that appeal to the effect ofcompetition on the resources over which managers enjoy discretionary control. Theformer type of effect could well be non-monotonic: for firms in which monetaryrewards for managers are weak, lack of rivalry may make managers lazy, while toomuch rivalry may make them resigned to their fate. Equally in profit-maximizingfirms, the incentive to escape competition by innovating may be strong at low levelsof competition but be offset by the standard Schumpeterian effect when competition ishigh, again producing an inverted U pattern. However, the effect of managerialresources is more likely to be monotonic, but to depend qualitatively on how wellaligned are the incentives of the managers and the shareholders. Managers actingefficiently will tend to do more for the firm the more resources they have to play with,while those acting inefficiently will tend to do worse, the more resources they have toplay with. We explore this suggestion further in the regressions we report in section 6below. Our data is ideal for this purpose since in the new post-reform competitiveenvironment of transition countries, we have both old firms, which can be assumed tobe characterized by relatively weak monetary incentives for managers, and new firms,where monetary incentives are strong.
3. Data and Variables
Our objective is to make use of a large multi-country cross-sectional firm-leveldata-set to examine the determinants of innovation and growth at the level of thefirm. Although there are serious shortcomings with the data that limit the analysis thatcan be undertaken, these are balanced by the opportunities afforded by bespoke data-collection on this scale. The key disadvantages stem from the fact that there is nopanel structure and that the data is self-reported rather than of an accounting oradministrative nature. On the other hand, information collected from firms of all sizesacross all sectors in a large number of economies following a major shock to thecompetitive environment is a potentially rich source of evidence to complement theinsights from more conventional data-sets.
We discuss the nature of the survey and the data collected and then in turn theissues raised by the measurement of growth, innovation and competition.

9
The BEEPS enterprise survey
A major effort at the collection of firm-level data on enterprise performanceand the external environment of firms in transition economies was undertaken in 1999by the EBRD and World Bank. Face-to-face interviews at enterprises in twentytransition countries were conducted in the early summer of 1999. Surveys of fivemore transition countries were completed later in 1999. The aim was to investigatehow enterprise restructuring behaviour and performance were related to competitivepressure, the quality of the business environment, and the relationship betweenenterprises and the state.
The survey sample was designed to be broadly representative of the populationof the firms according to their economic significance, sector, size and geographicallocation within each country. The sectoral composition of the total sample in eachcountry in terms of agriculture, industry and services was determined by their relativecontribution to GDP after allowing certain excluded sectors. Firms that operated insectors subject to government price regulation and prudential supervision wereexcluded from the sample. Within each sector, the sample was designed to be asrepresentative as possible of the population of firms subject to various minimumquotas for the total sample in each country. This approach sought to achieve arepresentative cross-section of firms while ensuring sufficient weight in the tails ofthe distribution of firms for key control parameters (size, geographical location,exports, and ownership).
The survey was implemented on behalf of the EBRD and World Bank by ACNielsen through face-to-face interviews with each of the respondents in their locallanguage (see Appendix). They were informed that the EBRD and World Bank hadcommissioned the survey and that the identity of the survey respondents was to bekept strictly confidential by the survey firm. The interviewers assured respondentsthat their identity would not be disclosed either to the two sponsoring institutions or tothe government. In order to collect evidence on the role of competition in growth andrestructuring, we designed a block of questions to be included in the BEEPS survey.
The full sample size was 3,954 firms. The survey included approximately 125firms from each of the 24 countries, with larger samples in Poland and Ukraine (over200 firms) and in Russia (over 500 firms). We omit from the analysis firms missingany of the most basic indicators (industry, size classification, ownership classification,sales growth and employment growth) leaving us with a sample of 3,837 firms. Theeconometric analysis in the next section removes all firms with missing values in anyvariable in use, reducing the sample to between 3,288 and 3,448 firms.
Just over half the firms in the sample were newly-established private firms,32% were privatized and 16% remained in state ownership at the time of the survey.Table 1 provides some basic information on the distribution by size, sector and regionof the sample of firms. The sample is dominated by small and medium-sizedenterprises; one-half the sampled firms employed fewer than 50 persons, and just overone-fifth employed more than 200. Nearly one half of firms are from the servicesector and 12% are from agriculture. 30% of firms are from the manufacturing sector.Just under one-third of the sample is from the Central and Eastern European region(including the Baltics) and nearly 10% of firms are Russian. Most firms were located
10
in either large cities or national capitals (36%) or in medium-sized cities (32%), withthe remaining 32% in towns and rural areas.
[Table 1 here]
The measurement of performance: growth and innovation
Table 2 presents data on the average performance by firms using theperformance measures that we concentrate on in this paper: the growth of real sales,of real sales per worker and the engagement of firms in innovation activities. Thegrowth measures were calculated from self-reported figures for the real growth ofsales and of employment over the previous three years. It is important to note thatthere is no true time-series dimension. We have only self-reported information on thechange in real sales as well as on the kinds of restructuring activities carried out bythe firms over the preceding three years. We need to keep these limitations in mindwhen analyzing the results.
In the sample as a whole, 32% of firms reported a contraction in sales (in realterms) over the previous three years; just under one-quarter reported flat sales and justover 44% reported growing sales. The Central and Eastern European region includingthe Baltic States (CEB) and the South East European region (SEE) were the onlyregions in which more than one half of firms reported growing sales. In line with themacroeconomic performance across different regions, the proportion of firms withshrinking sales in a region ranged from just over one-fifth in CEB to one-third inRussia and 40% in the Western and Southern CIS.
For old firms (state-owned and privatized), average growth of sales wasnegative; it was positive for new firms. The opposite was true of productivity growth:average growth of sales per worker was negative in new firms and positive in oldones. For both privatized and new private firms, average growth increased with thesize of the firm. This was not the case for state firms. In old firms, where between 55and 60% of firms had declining sales, the more rapid shedding of labour thanreduction of output lies behind the positive productivity growth recorded. In newfirms, average productivity growth was negative but there is a clear size effect: as wemove to higher size classes, productivity growth becomes less negative. In the largestsize class, positive productivity growth was recorded for new firms. A possibleexplanation for this size effect is the endogeneity of size. Larger firms may be largerat the time of survey because they grew faster (or shrank less rapidly); we return tothis issue in the next section when we discuss our econometric estimations.
In addition to measures of performance based on sales growth, we sought touncover the steps undertaken by firms to improve their performance throughinnovation.4 To capture the extent of their innovative activities, firms were askedquestions about whether they had developed a new product line or upgraded anexisting one, whether they had opened a new plant, and whether they had obtainedISO9000 quality accreditation in the previous three years. Table 2 shows that 40% ofall firms upgraded at least one product, 30% introduced a new product, 20% opened a
4 Patterns of cost-oriented or defensive restructuring are explored in Carlin, Fries, Seabright andSchaffer (2001).

11
new plant and 15% obtained ISO9000 quality accreditation. Engagement in theseactivities was common across all firm types, including state-owned firms.
The innovation variable used in our estimations is constructed using themethod of principal components analysis from responses to the questions describedabove.5 For our innovation measure r we used responses to the four restructuringquestions. The first of the four components explains 44% of the total variation, morethan double that of the second component. The introduction of a new product orupgrading an existing one are given the largest weights in the construction of theindex. The index is normalized so that the minimum value is zero and the maximumvalue is the number of possible restructuring measures. This is done to facilitateinterpretation of the regression results – a unit increase in the index corresponds,roughly speaking, to the introduction of another restructuring measure.
[Table 2 here]
The measurement of competition
One common and intuitive starting point for measuring competition is theextent to which production is concentrated in the hands of a few firms. The crudestmeasure of this concentration is simply the number of firms that are operating in thesame or a recognisably similar market. To be useful this measure depends on therebeing some practical method of defining the relevant market (see Neven et.al., 1993,chapter 2), which essentially means finding goods and services that are reasonablyclose substitutes for each other while being distant substitutes for all other goods orservices. But while this may be a useful first indicator, it may be seriously misleadingwhen there are important differences in size, strength and productivity between firms.For example, the exit of one large firm and entry of many small ones may reduceconventionally measured concentration but lower the vigour of the rivalry faced bythe remaining large firms. This problem has been observed in transition countrieswhere the exit of one or two large enterprises from an industry along with thesimultaneous entry of many new small firms has resulted in a reduction in effectivecompetition (see Kattuman and Domanski, 1998 on Poland). One way of dealing withthis is by calculating measures of market power at the firm rather than the marketlevel, in particular by looking directly at the market share of each individual firm orby asking managers to provide a judgement as to the number of competitors theybelieve the firm faces in its main market.
A second way of measuring competition is to look at some of theconsequences of market structure rather than market structure itself, and specificallyat the freedom firms have to choose prices (and other business strategies)independently of any concern about losing business to other firms. A natural way todo this is to estimate the so-called residual elasticity of demand for the firm’s ownproducts, namely the extent to which a price rise by the firm would lead customers to 5 The use of these summary measures is more conservative than the alternative of including all theindividual components as explanatory variables in the various regressions. With so many regressors, alikely outcome of this alternative procedure is a finding that some regressors are significant and withthe expected sign, some are insignificant, and some are significant but with the opposite of the expectedsign, making it difficult to reach an overall interpretation of the results.

12
substitute away, either to rival firms or away from the product altogether. Whensophisticated data are available, this elasticity can sometimes be estimatedeconometrically (see Hausman et.al., 1992, for an application to the case of beer), andit is particularly useful to do so when products are differentiated so that the notion of asingle product market may make little sense.
A third and altogether different approach to measuring competition is to lookdirectly at the behaviour of firms and to infer from this the extent of the rivalry theybelieve themselves to face. In particular, the price-cost margin charged by a profit-maximising firm facing constant marginal costs (given by the technology and notcapable of being influenced by the firm itself) will be inversely proportional to theown-price elasticity of demand for its products. If price-cost margins can be reliablymeasured, therefore, they may themselves be an inverse indicator of the vigour ofcompetition in the market.
The survey instrument was expressly designed to discover the extent to whichfirms believed themselves to be facing significant competitive challenge using each ofthese kinds of measures.
• As a measure of market structure we use the number of competitors reportedby the respondent in the market for its main product, dividing firms into thosereporting respectively no competitors, between one and three competitors andmore than three competitors. Note that although this looks like a simplemarket concentration measure, it measures concentration in what the firmbelieves to be its main market, rather than the administrative category ofproducts the firm is placed in by the national statistical agency. In particular,in a survey with coverage of the entire economy, this is likely to provide aneconomically meaningful measure of competition whether the firm is a pizzaparlour or a components supplier for a multinational company.
• As a measure of firms’ freedom to raise prices we use their response to aquestion asking them what would be the consequence of a 10% rise in the realprice of their product relative to that of their competitors, scoring from one(for firms reporting that most customers would switch to rival suppliers) tofour (for firms reporting that most customers would continue to buy in similarquantities as previously).
• As a measure of firms’ behaviour we use their (self-reported) price-costmargin.
We can ask two questions about these different ways of measuringcompetition. First, are they empirically consistent one another, in the sense that theyidentify the same firms as possessing market power? And secondly, are they justalternative empirical proxies for the same phenomenon, or do they measure distinctaspects of market power? To answer the first question, we report in Table 3 meanvalues of the second and third measure for firms categorised by the first measure, andsub-categorised by ownership status (state firm, privatised firm and other) in order tocontrol for different degrees of commitment to profit-maximising behaviour. Theanswers clearly indicate that in markets with no competitors firms report lower own-price elasticities of demand and higher price-cost margins than in markets with 1-3competitors. The exception is for state firms, where the price-cost margin is lower forfirms facing 1-3 competitors than for either of the other categories (as one mightexpect given their weaker incentives for profit-maximisation). It appears that the

13
responses to these three questions complement one another, which is reassuring interms of the economic content of the data. The questions asked about the number ofcompetitors appear to have focused the attention of managers on an economicallyrelevant concept of the ‘market’ in which they are competing. Nevertheless, thesomewhat counter-intuitive behaviour of the price-cost margin for state firms leads usto prefer not to use this as an indicator of market power in the regressions below.
[Table 3 here]
To answer the second question (about whether these measure distinct aspectsof market power) we shall investigate in detail the ways in which they interact withour measures of performance; we do so in section 6 below. However, we can makesome general empirical predictions at this stage. First, if these measures were justimperfect proxies for the same basic phenomenon (‘market power’) we would expectthat each of them would have a stronger impact when entered singly in a performanceregression than when entered in the presence of the other (that is, entering a secondmeasure would reduce the explanatory power of the first). In fact, as we shall see, theexplanatory power of the measures appears to be more or less unchanged whetherentered singly or together, which suggests that they may be identifying distinctaspects of market power.
So what might these distinct aspects of market power be? We distinguishedabove between theories that appeal to the effect of competition on managerialincentives, and those that appeal to the effect of competition on the resources overwhich managers enjoy discretionary control. It seems reasonable to suggest that theperceived number of competitors is likely to capture the motivation of managers,while the freedom to raise prices will capture their control over resources (the rentsavailable to them). This prompts a second empirical prediction: if motivation isstrongest when there are 1-3 competitors and weakest when there are none, then moreresources should be associated with better performance when there are 1-3competitors and not associated (or negatively associated) when there are none.
Finally, the survey also sought to investigate the impact of perceivedcompetitive pressure on decisions by managers to undertake restructuring measures(rated in each case on a scale of 1=not important to 4=very important). The questionsabout pressure to innovate are important since they enable us to explore more closelyhow performance improvements come about. A smaller proportion of state firms ascompared with other firms reported pressure from domestic competitors as playing asignificant role in their decision to enter new markets or introduce new products.Amongst private firms, one in five reported pressures from foreign competitors assignificant in stimulating the introduction of new products. New entrants reported lesspressure from foreign competition, which may reflect their small average size.
4. Econometric estimation and modelling strategy
Our model consists of two structural equations, one for innovation and thesecond for sales growth, in which we include innovation and the growth ofemployment, along with other regressors. The second equation may be interpreted asone version of an augmented total factor productivity growth equation. We do not

14
have a measure of the growth of the capital stock but our innovation/restructuringmeasure includes information on the opening of new plants.
The determinants of innovation are the following:- Product market competition.- Market growth.- Access to resources.- Managerial incentives.- Size of firm.- Controls for industry (innovation opportunities vary by sector), location (to
account for agglomeration effects) and country.
The determinants of sales growth are the following:- Growth of employment- Innovation- Product market competition.- Access to resources.- Managerial incentives.- Controls for industry, location and country.
Before specifying the estimating equations, issues of identification must beaddressed in conjunction with data availability. There is a set of variables thattheoretical considerations suggest should be in the innovation/restructuring equationbut not in the growth equation and vice versa. Variables that on a priori groundsshould be excluded from the growth equation are the so-called pressure variables thatreflect the view of managers as to the importance of different sources of pressure fortheir decision to undertake restructuring. Sources of competitive pressure were‘domestic’ or ‘foreign’ competitors. In addition, managers were asked about the roleof pressure from customers, which we use as a proxy for the growth of the market.This allows us to exclude sales growth from the innovation equation. The ‘pressure’variables are instruments for innovation in the growth equation, the validity of whichcan be tested. The size of firm is a standard determinant of innovation (reflecting, forexample, economies of scale in R&D and marketing) but it is less clear that it has aplace in a TFP growth equation. We test whether size is a valid instrument in thegrowth equation.
Conversely, on a priori grounds, employment growth should be in the growthequation but not in the innovation equation. Since inputs and output may be chosensimultaneously, the possible endogeneity of employment growth in the growthequation must be addressed. Suitable instruments are difficult to find in the surveydata so we take two alternative strategies to deal with this. The first is to experimentwith an instrument for employment constructed by interacting the country dummieswith an exogenous determinant of performance at the level of firm (we use one of thecompetition measures). The logic of the choice of the country-competition interactionvariable is that there is country variation in policies to downsize firms (by adjustingemployment).6 We refer to these as country-competition interaction effects.
6 The approach is analogous to the approach adopted in Angrist and Krueger’s (1991) study of thereturns to education. They estimated earnings equations for a sample of American males in whichyears of education was an endogenous regressor and dummies for year and state of birth were

15
Unfortunately diagnostic tests reveal these instruments to be rather weak, so analternative strategy we use is to impose a range of coefficients on employment growth(from 0.25 to 1) and examine the sensitivity of the other coefficients to this variation.Using a coefficient of one is equivalent to estimating a labour productivity growthequation.
As discussed above we interpret the 10% price test variable as capturing theextent to which managers have discretionary control over resources, and the numberof competitors variable, as well as the distinction between old and new firms, ascapturing managerial incentives. We report separate estimations for new and old firmsas well as pooled estimations
We therefore estimate equation (1) for innovation
176
543210
aaaaaaaa
usizenewpressureCpressureFpressureDmpowercompr
+++++++++=
8Xa(1)
and equation (2) for growth
2543210 bbbbbb unewrlmpowercompy +++++++= 6Xb (2)
where comp measures the number of competitors, mpower, market power (the 10%price test), pressureD and pressureF measure the pressure on firms to innovate fromrespectively domestic and foreign competitors, pressureC measures pressure fromcustomers, new is a dummy denoting the difference between new and old firms andsize measure the employment in the firm. The controls for sector and location aredenoted by the vector X. In the growth equation, y is the growth of output and l isemployment growth. Country fixed effects are included in all regressions.
For the a priori reasons discussed earlier, we take the measures of competitionas exogenous to the performance outcomes; the distinction between new and old firmsis also exogenous and we assume that sector and location are exogenous. However, bysplitting the sample between old and new firms, we explore further the possibility thatfor new firms there may be reverse causality from a recent decision to innovate to itsperception of the number of its near competitors.
We are able to deal with the endogeneity of size in a straightforward way. Asnoted earlier, there may be a spurious correlation between performance as measuredover the preceding three years and size as measured at the time of survey, becauseceteris paribus firms that grew during the period will tend to be larger at the end ofthe period. We therefore use average employment during the period as our sizemeasure calculated from observed end-period employment7 and employment growthduring the period (both in logs).8 exogenous regressors. Angrist and Krueger created instruments for years of education by interactingquarter-of-birth with state-of-birth and quarter-of-birth with year-of-birth.7 Firms report employment by choosing 1 of 6 size categories; our end-period “log employment” is thelog of the midpoint of the reported category.8 We note that when the sales growth equation is re-estimated using end-period size, it is positive andhighly significant. In the results reported below using average-period size, it is statisticallyinsignificant.

16
Estimation methods and diagnostic tests
For the instrumental variables estimations we employ several diagnostic tests.Our benchmark regression is a two-step efficient GMM chosen because it is efficientin the presence of arbitrary heteroskedasticity, which tests suggest is present.9 Whenthere is only one endogenous regressor, we report an F-test of the excludedinstruments in the first-stage regression.
We also present a test of overidentifying restrictions, namely the Hansen Jstatistic. This is a test of the joint hypothesis that the instruments are valid (i.e.,uncorrelated with the error term) and that none of the instruments should have beenincluded in the set of regressors and were not. All estimations were done using theStata statistical package.10
5. Results
Before estimating the structural equations, we complete the data description byestimating a reduced form equation for sales growth with only the exogenousvariables present (as shown in equation (3)). The results constitute our initial check ofthe bivariate correlation of growth with intense rivalry in the product marketillustrated in Fig. 1.
376
543210
usizenewpressureCpressureFpressureDmpowercompy
+++++++++=
8Xβββββββββ
(3)
We also estimate two “semi-reduced” forms which include employment growth, oneinstrumented and one with an imposed coefficient of unity; however, both estimationsinclude the exogenous determinants of innovation but exclude innovation itself. Theequation with an imposed employment growth coefficient of unity is in effectestimating the determinants of labour productivity – and so, given the high estimatedlabour elasticity of over 0.9, is the instrumented estimation; our interpretation belowuses this terminology.
Reduced and semi-reduced form estimation
The results of reduced and semi-reduced form estimations of the sales growthindicator on the exogenous variables are shown in Table 4. When interpreting theresults, it is important to recall that the average growth of sales and of productivity of
9 We also estimated the modification of limited-information maximum likelihood (LIML) proposed byFuller (1977); we set the Fuller parameter α=1, giving us the mean-unbiased version of his estimator.The main motivation for the use of LIML is that recent research suggests it performs relatively wellwhen instruments are weak, which is the case when we treat employment as endogenous. We do notreport these results since they were qualitatively identical to the GMM results.10 For further details of the estimation routines used, see Baum, Stillman and Schaffer (2003).

17
firms was close to zero and only just over 40% of firms reported positive sales growthover the preceding three years. The findings are striking.
[Table 4 here]
The nature of competition in the product market has important effects on theperformance of firms in all of these specifications. There are indications of a non-monotonic (‘inverse-U’) relationship with performance. Sales and productivity growthwere higher in firms facing between one and three competitors in the market for theirmain product than in firms that either faced no competition at all or that faced morethan three competitors. The positive effect of an intermediate degree of productmarket competition is economically as well as statistically significant. Firms facingbetween one and three competitors reported growth in sales and productivity about10% higher than other firms. Firms reporting more than three competitors have a littleover 4% higher growth than monopolists, although this difference is not statisticallysignificant. However, the difference between the growth of firms facing one to threecompetitors and those facing more than three is significant at 5% in all specifications,indicating that the inverse-U relation is statistically significant in all the reduced-formestimations. As we shall see, it is not always statistically significant in the structuralequations capturing the separate component effects, but such an inverse-U is certainlya robust descriptive property of the total impact of product market competition.
The second indication that competition effects are important comes from thepositive sign on the variable for firms reporting that sales would fall only slightly ornot at all in response to a 10% price rise. These firms saw productivity growthbetween 5% and 13.5% higher than others depending on the specification.
Thirdly, although the competitive pressure variables are insignificant in thereduced forms for productivity growth, foreign competitors and more weakly,customers boost sales growth. We shall see that they are both important in theinnovation equation, to which we now turn.
Controlling for other factors, new firms have significantly higher sales growththan old firms, but lower productivity growth. The weaker productivity growth of newentrants is likely to indicate that such firms were attracting labour faster than theirsales were growing. We investigate this further below. Size is positive in bothequations, the control variables are not significant and country fixed effects are highlysignificant. We now explore in more detail the channels by which competition effectsappear to be working by turning to the structural equations.
Innovation
The results for the innovation equation are shown in Table 5. Column (2) isidentical to column (1) except that a single indicator has been used for each of thepressure variables. This does not affect the results. We note that although pressurefrom domestic competitors was included in the initial estimation of this equation, itproved insignificant; we also tested whether it was a valid instrument for innovationin the growth equation but it failed the instrument validity test. It is therefore droppedfrom the equation.

18
Columns (3) and (4) report estimates separately for the sub-samples of oldfirms and new firms. Although many of the coefficients are remarkably similar for thetwo samples, the effect of the number of competitors is strikingly different. Old firmsdisplay the inverted-U form (the coefficient on 1-3 competitors being significant at6%), but new firms show a monotonically decreasing impact of the number ofcompetitors on innovation.
We draw the following conclusions from the results for the innovation equationshown in Table 4:
• The number of competitors is a (weakly) significant positive determinant of thedecision to innovate only for old firms (and although there is a hint of an inverse-U, it is not significant at conventional levels). This is consistent with the impact ofcompetitive pressure in raising the incentives of managers of old firms to exertmore effort and innovate. For new firms, the number of competitors is negativelyrelated to innovation. This may be due, as we suggested above, to the more likelyendogeneity of market structure for new firms – those that have successfullyinnovated view themselves as having fewer competitors as a result.
• The ability to raise prices as measured by the 10% test is an important positivedeterminant of innovation, but so is pressure from foreign competitors. As notedabove, pressure from domestic competitors was insignificant. One interpretationof this is that domestic and foreign competition are only imperfect substitutes.
• The positive role of market power in innovation – controlling for both the numberof competitors and for the pressure from competitors in the decision to innovate –is suggestive that firms face resource constraints. Rents are needed to financeinnovation.
• Pressure from customers is a significant determinant of innovation, which weinterpret as capturing the importance of market growth for innovation.
• New firms are more likely to engage in innovation, which supports the hypothesisthat managerial incentives play a role.
• Larger firms and those in big cities are much more likely to have engaged ininnovation, which is in line with other empirical evidence and suggests thateconomies of scale in innovation and agglomeration effects are at work in thetransition economies.
• Predictable industry effects are confirmed: firms in the service and agriculturalsectors are much less likely to have engaged in new product restructuring.
[Table 5 here]
Growth
We look now at the determinants of growth using the estimates of thestructural equation (2). Employment growth and innovation are highly significantdeterminants in the growth equation, which suggests that the equation be interpretedas a form of augmented TFP growth equation. Table 6 shows the results ofestimations in which we instrument for innovation. Diagnostic tests on regressions inwhich both employment and innovation were treated as endogenous revealed aproblem of weak instruments, which is not present when only innovation is

19
instrumented. Since we are not directly interested in the size of the coefficient onemployment growth, we therefore treat employment growth as exogenous andexamine in Table 7 below the sensitivity of the resulting parameter estimates tovariations in imposed employment growth coefficients as discussed above.
Column (1) of Table 6 presents the OLS estimates of the growth equation.Columns (2) and (3) present the instrumental variables estimates. The excludedinstruments are the ‘pressure to innovate’ variables and size. The really importantfeature to emerge from this table is that, for new firms, having between one and threecompetitors contributes positively and significantly to productivity growth in a directway, even when the role of innovation is taken into account. Conditional oninnovation (which as we have indicated may have an influence on its own on marketstructure), the presence of rivalry seems to matter for these firms. For old firms bycontrast, rivalry matters through its impact on innovation. Market power as measuredby the own-price elasticity of demand appears to work partly indirectly, via promotinginnovation and partly directly as indicated by its continued significance in the growthregressions.11
The only other variable that is consistently significant is the dummy foragriculture. Agriculture attracts a significant negative coefficient in the innovationequation. In the growth regression, it is positive, which indicates that residualproductivity growth in firms in agriculture is high relative to firms in other sectors.The other control variables are important for innovation – and therefore indirectly forgrowth – but play no role in explaining residual productivity growth.
New firms undertake more innovation but there is no consistent sign on newfirms in the growth equations. As we shall see below, this reflects the way thatemployment growth is modelled.
[Table 6 here]
The diagnostic tests of the instruments for innovation are quite satisfactory,with the F-tests of the excluded instruments in the first stage regression ranging from11 (for new firms only) to over 30 (for the total sample). The overidentification testsare also comfortably passed in each specification, which indicates that it is correct toexclude the ‘pressure’ and size variables from the growth equation.
Since we cannot be fully confident that our estimation of the productivitygrowth equation has dealt satisfactorily with the endogeneity of employment growth,we experiment with a range of values of the employment growth elasticity andexplore the implications for how the growth equation behaves. The results forcoefficients ranging from 1 (which makes the growth equation a labour productivitygrowth equation) to a coefficient of 0.25 are shown in Table 7. The key competitionresults discussed in connection with Table 6 remain in place, which is reassuring.
This experiment provides some additional insight into forces behind thegrowth of new as compared with old firms. We have seen that new firms do 11 Concern about the bias on TFP level estimates in the context of imperfect competition in the productmarket (Hall 1988) is mitigated by the fact that we are looking at the impact of a given level ofcompetition on productivity growth.

20
significantly more innovation than do old ones. We note that, in the structuralequation for growth in Table 7, as the coefficient on employment growth is reducedfrom one, the coefficient on new firms begins as negative and significant (as in thereduced form labour productivity growth equation), is insignificant when thecoefficient on employment growth is 0.5 and becomes positive and significant whenthe coefficient is reduced to 0.25.
How can we interpret this? Our prior is that new private firms get more oftheir growth from labour growth and less from capital deepening than is the case forold firms. In our augmented TFP-like growth equation we do not have capital growth,but instead we have our measure of innovation. Although some capital deepening willbe captured in the innovation variable (specifically, the opening of a new plant) somewill be in the productivity growth residual. When the employment growth elasticity isassumed to be large, then the rapid labour growth of new private firms explains a lotof sales growth and innovation explains some of what is attributable to capital growth.In this scenario, the dummy for new private firms takes on the character of a dummyfor slow capital deepening and therefore attracts a negative coefficient. Conversely,when the coefficient on employment growth is constrained to be small (0.25 or indeedzero as in the column (1) of Table 4), the rapid labour growth of the new private firmsis allowed to explain little of their growth, with the consequence that the dummy forthe new firms captures this instead and turns positive.
[Table 7 here]
6. The interaction between managerial motivation and resources
In this section we explore the interaction between the number of competitorsfaced by a firm and its market power as measured by the freedom to raise prices. Wesuggested above that the former might work primarily through influencing themotivation of managers, and the latter through influencing the resources over whichthey have discretionary control. Table 8 provides evidence which clearly corroboratesthis suggestion. It reports the results of variants of the regression for innovation.Column (1) repeats for comparative purposes the basic equation reported in Table 5,with the minor modification that the market power variable is entered in cardinalrather than categorical form. This is motivated by the clarity it lends to the experimentwe focus on here. Columns (2) and (3) exclude respectively the market power (10%test) and number of competitors variable. This also has almost no effect on the results,which strengthens our belief that these measures may be capturing distinct aspects ofmarket power rather than being alternative imperfect measures of the samephenomenon. The same finding holds true in the growth equation, although we do notreport this result explicitly.
Column (4) reports the result of interacting the number of competitors with themarket power (10% test) variable. The results are striking. Firms facing nocompetitors do no more innovation when they have market power than when they donot. Firms with 1-3 competitors, on the other hand, do more innovation when theyhave market power than when they do not. So do firms with more than threecompetitors. Both the latter two coefficients are significantly different from the firstcoefficient at 10% levels, though they are not significantly different from each other.

21
In the growth equations, by contrast, there is no significant interaction betweenthe number of competitors and the freedom to raise prices, though once again we donot report these results explicitly.
These results provide suggestive, though not conclusive, evidence that ourmeasures of numbers of competitors and of the freedom to raise prices are indeedmeasuring distinct facets of a firm’s market power, rather than being imperfectproxies for one single phenomenon. It seems plausible to suggest that the formerrepresents the motivation of managers while the latter captures the resources overwhich they have discretionary control. Pursuing this hypothesis further seems to us afruitful subject for further research.
7. Concluding remarks
The chief finding of this study is the power of competition in influencinginnovation and growth. In the innovation equation, the presence of some marketpower together with competitive pressure from foreign suppliers, strongly androbustly enhances performance, though in ways that differ interestingly and intuitivelybetween old and new firms. Furthermore, it appears that the presence of at least somerivalry in the market is important not just in its own right but because it ensures thatthe resources available to a firm from any market power it enjoys are efficiently used.In the productivity growth equation (where we control for innovation as well as foremployment growth), innovation matters strongly for growth but there is an additionaleffect of competition, indicating that intense rivalry in the product market raisesresidual productivity growth. The effect is stronger for new firms than for old ones,for whom the competition impact works more strongly through innovation. There isalso some evidence that the effect is stronger for limited rivalry (one to threecompetitors) than for more than three competitors – the inverse-U relation. Thedifference is not consistently significant at conventional levels in the structuralequations, though it is significant in all the reduced-form specifications. This meansthat we can be more confident that an inverse-U relation of some sort characterizesthe link between competition and growth than about the channels through which sucha relation might operate.
Although we have made a start in examining the channels through which thesecompetitive pressures work, notably by distinguishing between factors influencingmanagerial incentives and those influencing the resources under managers’discretionary control, it is not possible on the evidence we have to distinguish moreprecisely between alternative hypotheses about the mechanisms at work. However,these findings are certainly consistent with the presence of a Schumpeterian-typecompetitive process, albeit one accompanied by considerable disruption andturbulence (see Carlin, Haskel and Seabright, 2001). Consistently also with thefindings of Bresnahan and Reiss (1991), this evidence suggests that it is the presenceof a minimum number of seriously competing firms that generates competitiveconduct. And retained profits – in the presence of competitive pressure – appear alsoto be important for financing the restructuring that helps firms to succeed.
We have also been able to show that new private firms are more heavilyengaged in innovation than are firms that pre-existed the reforms. Light was thrown

22
on the paradox of the significantly better performance of new firms on innovation buttheir apparently weaker labour productivity growth performance by experimentingwith different elasticities on employment growth. New firms appear to relysystematically more on labour than on capital-deepening growth in expanding theiractivities. We have also suggested how endogeneity in new firms’ perceptions ofcompetitors in their niche may account for the negative sign on the number ofcompetitors in the innovation equation.
Turning to policy implications, our findings strongly reinforce the messagethat unchallenged monopoly is a drain on dynamism. It is certainly more important toensure that monopolists face at least some challenge than to try refereeing thenecessarily confused process of rivalry among the few. It is true that at the same timeas the importance of competition is becoming more apparent, so are the difficulties inthe way of bringing about such a process effectively, especially in countries trying toestablish market systems from scratch (see Fingleton, Fox, Neven & Seabright, 1996).But our results help to illuminate the ingredients needed for the competitive process towork. Not only must there be a market structure in which firms face rivalry but also:removal of the obstacles facing new entrants and financial systems that can supportmajor investments in restructuring.
Finally, our results strongly support the value of using measures of marketpower that correspond to the perceptions of individual firms as to the competitivepressures they face. These are an important supplement to more conventionalmeasures, such as shares of markets based on conventional industrial classifications.These can help not just in illuminating the overall pressures faced by firms but alsothe way in which different constraints on managerial decision-making interact.

23
References
P. Aghion and P. Howitt (1998), Endogenous Growth Theory, MIT Press, Cambridge,MA.
P. Aghion, N. Bloom, R. Blundell, R. Griffith, and P. Howitt (2002): ‘Competitionand Innovation: An Inverted-U Relationship’, IFS Working Paper 0204http://www.ifs.org.uk/workingpapers/wp0204.pdf.
P. Aghion, M. Dewatripont, and P. Rey (1999), ‘Competition, Financial Discipline,and Growth,’ Review of Economic Studies, Vol. 66, pp. 825-852.
P. Aghion, C. Harris, P. Howitt, and J.Vickers (2001), ‘Competition, Imitation andGrowth with Step-by-Step Innovation’, Review of Economic Studies.,Vol. 68, No. 3, 467-492.
P. Aghion and R. Griffith (2004 forthcoming). Competition and Growth, MIT Press,Cambridge, MA
J. Angrist and A. Krueger (1991), ‘Does Compulsory School Attendance AffectSchooling and Earnings?’, Quarterly Journal of Economics, Vol. 106, pp. 979-1014.
M. N. Baily, and H.Gersbach (1995), ‘Efficiency in Manufacturing and the Need forGlobal Competition,’ Brookings Papers on Economic Activity: Microeconomics,pp. 307-347.
C.J. Baum, S. Stillman and M. Schaffer (2003), ‘Instrumental Variables and GMM:Estimation and Testing’, The Stata Journal, Vol. 3, No. 1, pp. 1-31.
R. Blundell, R. Griffith and J. Van Reenen (1999), ‘Market Share, Market Value andInnovation in a Panel of British Manufacturing Firms’, Review of Economic Studies,Vol. 66, pp. 529-554.
T. Bresnahan and P. Reiss. (1991). ‘Entry and competition in concentrated markets’,Journal of Political Economy, Vol. 99, No. 5, pp. 977-1009.
W. Carlin, J. Haskel and P. Seabright. (2001). ‘Understanding “the essential factabout capitalism”: markets, competition and creative destruction’, National InstituteEconomic Review. January.
W. Carlin. S. Fries, M. Schaffer & P. Seabright (2001): ‘Competition and EnterprisePerformance in Transition Economies: Evidence from a Cross-country Survey’,CEPR discussion paper no. 2840.
I. Chalmers and D.G. Altman (eds.) (1995). Systematic Reviews London: BMJPublishing Group.
S. Djankov and V.-G. Kreacic (1998), ‘Restructuring of manufacturing firms inGeorgia: four case studies and a survey’, Working Paper.
24
S. Djankov and P. Murrell (2002). ‘Enterprise restructuring in transition: aquantitative survey’, Journal of Economic Literature, Vol. 40, No. 3, pp.739-792.J. Dutta & P. Seabright (2002): ‘Competition and Economic Growth’, University ofBirmingham, mimeo.
J. Fingleton, E. Fox, D. Neven and P. Seabright (1996): Competition Policy and theTransformation of Central Europe, London, Centre for Economic Policy Research.
I. Grosfeld, and T. Tressel (2002),‘Competition, Corporate Governance: Substitutesor Complements? Evidence from the Warsaw Stock Exchange’, Economics ofTransition, Vol. 10, No. 3.
R. E. Hall, (1988), ‘The Relation between Price and Marginal cost in U.S. Industry’,Journal of Political Economy, Vol. 96, No. 5, pp. 921-947.
J. Hausman, G. Leonard and J.D. Zona (1994): ‘Competitive Analysis withDifferentiated Products’, Annales d'Economie et de Statistique, Vol. 34, pp. 159-180.
W.A. Fuller, (1977), “Some Properties of a Modification of the Limited InformationEstimator”, Econometrica, Vol. 45, pp. 939-954.
P. Kattuman, and R. Domanski, (1997) ‘Industrial concentration under shocktherapy: Poland in early transition years’, ESRC Centre for Business Research,Cambridge University, Working Paper No. 76.
J. Konings (1998), ‘Firm performance in Bulgaria and Estonia: the effects ofcompetitive pressure, financial pressure and disorganization’, The Davidson InstituteWorking Paper Series, No. 185.
D. Neven, R. Nuttall & P. Seabright (1993): Merger in Daylight: the Economics andPolitics of European Merger Control, London, Centre for Economic Policy Research.
S. Nickell (1996). ‘Competition and corporate performance’, Journal of PoliticalEconomy, Vol. 104, August, pp. 724-46.
J. A. Schumpeter (1943) Capitalism, Socialism and Democracy. London, Allen andUnwin, reprinted 1976.

25
Data Appendix: Survey method
The survey instrument was developed by the staff of the EBRD and World Bank andthe authors of this paper. The 1996 survey by Brunetti et al.on behalf of the WorldBank provided a basis for this instrument. The sampling frame was designed to bebroadly representative of the population of the firms according to their economicsignificance, sector, size and geographical location within each country. The sectoralcomposition of the total sample in each country in terms of industry versus serviceswas determined by their relative contribution to GDP after allowing for certainexcluded sectors. Firms that operated in sectors subject to government priceregulation and prudential supervisions, such as banking, electric power, rail transport,water and wastewater were excluded from the sample.
Enterprises eligible for the 1999 BEEPS were therefore in the followingsectors:
Industry1. Agriculture, hunting and forestry (ISIC Sections A: 1 – 2, B: 5)2. Mining and quarrying (ISIC Section C: 10 – 14)3. Construction (ISIC Section F: 45)4. Manufacturing (ISIC Section D: 15 – 37)
Services5. Transportation (ISIC Section I: 60 – 62)6. Wholesale and retail trade and repairs (ISIC Section G: 50 – 52)7. Real estate and business services (ISIC Section K: 70 – 74)8. Financial services (ISIC Section J: 67)9. Hotels, restaurants and other personal services (ISIC Sections H: 55, I:63 )10. Other community, social and personal services (ISIC Section M:80, N: 85, O:
91 – 93 and 93)
The International Standard Industrial Classification (ISIC) codes for each sector arereported parenthetically.
Within sectors, the sample was designed to be as representative as possible of thepopulation of firms subject to various minimum quotas for the total sample in eachcountry. This approach sought to achieve a representative cross-section of firms whileensuring sufficient weight in the tails of the distribution of firms for key controlparameters (size, geographical location, exports, and ownership). The minimumquotas of the samples for each country were:
1. At least 15 per cent of the total sample should be small in size (2 to 49employees) and 15 per cent large (200 to 9,999 employees) Firms with onlyone employee and 10,000 or more employees were excluded from thesample.
2. At least 15 per cent of the firms should have foreign control and 15 per centstate control, where control is defined as an ownership share of more than 50per cent.
3. At least 15 per cent of the firms should be exporters, meaning that at least 20per cent of their total sales are from exports.

26
4. At least 15 per cent of the firms should be located in a small city (populationunder 50,000) or countryside.
The BEEPS was implemented in 24 of the 27 countries of Central and EasternEurope and the former Soviet Union. For analytical purposes, the Federation ofBosnia and Herzegovina and Republika Srpska are treated separately. The survey wasnot implemented in FR Yugoslavia, Tajikistan and Turkmenistan because AC Nielsendid not have the capacity to implement the survey in these countries, in some casesdue to the security situation.
AC Nielsen implemented the survey on behalf of the EBRD and World Bank andwas selected through a competitive tendering process. AC Nielsen follows theICC/ESOMAR International Code of Marketing and Social Research Practice(www.esomar.org, click on codes and guidelines), including those pertaining to therights of respondents. These rights provide for the confidentiality and anonymity ofthe respondents. The interviewers working on behalf of AC Nielsen assured thesurvey respondents that their identities would not be disclosed to either the sponsoringinstitutions or government authorities and that their anonymity would be protected.

27
Table 1. Number of firms by size, sector and region.(In proportion of firm type, %)
Agricul-ture
Manufact-uring
Otherindustry
Retail &wholesaletrade
Otherservices
Total
All firms 441 (11.5) 1157 (30.2) 380 (9.9) 1090 (28.4) 769 (20.0) 3837 (100)Micro 40 179 73 520 234 1046 (27.3)Small 49 215 96 310 137 843 (22.0)Medium 155 383 142 191 214 1085 (28.3)
Fullsample
Large 197 380 69 69 148 863 (22.5)CEB 58 (4.9) 319 (27.2) 93 (7.9) 364 (31.0) 341 (29.0) 1175 (100)SEE 26 (3.1) 346 (41.7) 72 (8.7) 226 (27.2) 160 (19.3) 830 (100)Russia 125 (22.8) 139 (25.3) 66 (12.0) 165 (30.1) 54 (9.8) 549 (100)Western CIS 57 (15.3) 120 (32.2) 47 (12.6) 105 (28.2) 44 (11.8) 373 (100)Southern CIS 72 (14.0) 125 (24.4) 52 (10.1) 173 (33.7) 91 (17.7) 513 (100)Central Asia 103 (25.9) 108 (27.2) 50 (12.6) 57 (14.4) 79 (19.9) 397 (100)
Note. Micro firms (employment < 10); small firms (employment 10-49); medium firms (50-199), large(>200). “Other industry” comprises mining, construction and electricity; “other services” comprisestransport, financial, personal, business and miscellaneous services. CEB=Central Europe & Baltics,SEE= South-Eastern Europe.
Table 2. Real sales and productivity growth and restructuring/innovation byownership of firmMean of log 3-year real sales and productivity growth
Old firmsSOE Privatized
New firms All firms
Number of firms(in proportion of firm type, %)
603(15.7)
1240(32.3)
1994(52.0)
3837(100)
Sales growth (%) -0.9 -2.5 6.5 2.4Increase in sales 38.1 42.4 47.3 44.4Zero growth 28.9 20.7 23.1 23.2Decline in sales 32.3 36.9 32.4 32.4
Number offirms, inproportion offirm type (%) 100 100 100 100Productivity growth (%) 8.6 8.8 -2.4 3.0Firms undertaking various types of restructuring activity:Opening of new plant 15.8 23.0 19.0 19.8New product line 26.9 32.0 20.0 29.7Upgrade 41.0 37.7 36.9 37.8ISO 16.9 21.3 10.2 14.8
Note: The question asked was, “By what percentage have your sales changed in real terms over the lastthree years?” “Productivity” growth is calculated from the change in sales and in employment reportedover the last three years. All restructuring indicators refer to changes in the previous three years. “Newproduct line” refers to the successful development of a major new product line. “Upgrade” refers to theupgrading of an existing product line. “ISO” refers to the receipt of an ISO9000 accreditation.

28
Table 3. Competition and concentrationMarket power (10% test, answer from 1 - all customers switch - to 4 - customers continue to buy asbefore) and price-cost margin, by ownership and number of competitors
Number of competitors
None 1 to 3 >3 TotalState-owned EnterprisesNumber of firms(in proportion of firm type, %)
154(25.5)
108(17.9)
341(56.6) 603
% price-cost margin 15.3 12.1 16.0 15.110% test (answer from 1 to 4) 3.08 2.48 2.25 2.50Privatized firmsNumber of firms(in proportion of firm type, %)
96(7.7)
160(12.9)
984(79.4) 1240
% price-cost margin 18.3 15.4 15.4 15.610% test (answer from 1 to 4) 2.65 2.38 2.13 2.20New firmsNumber of firms(in proportion of firm type, %)
97(4.9)
236(11.8)
1661(83.3) 1994
% price-cost margin 22.7 20.5 17.4 18.010% test (answer from 1 to 4) 2.42 2.39 2.25 2.50All firmsNumber of firms(in proportion of all firms, %)
347(9.0)
504(13.1)
2986(77.8) 3837
% price-cost margin 18.3 17.0 16.6 16.710% test (answer from 1 to 4) 2.78 2.40 2.07 2.18
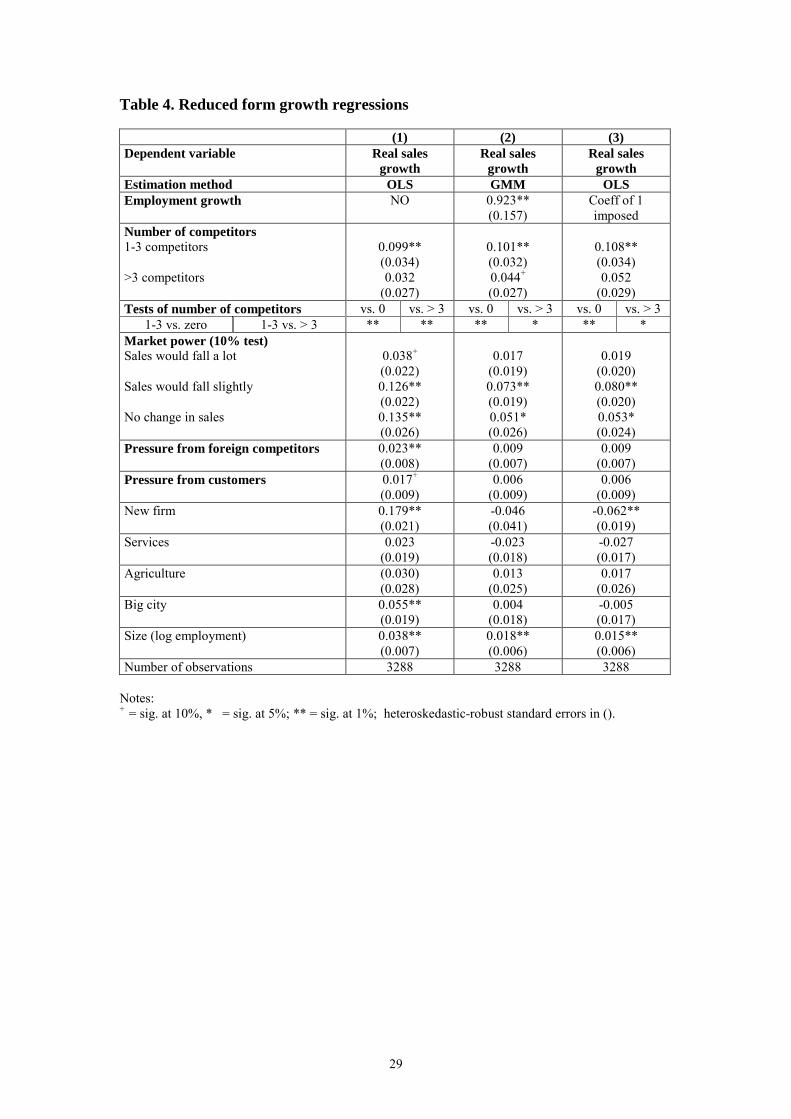
29
Table 4. Reduced form growth regressions
(1) (2) (3)Dependent variable Real sales
growthReal sales
growthReal sales
growthEstimation method OLS GMM OLSEmployment growth NO 0.923**
(0.157)Coeff of 1imposed
Number of competitors1-3 competitors
>3 competitors
0.099**(0.034)0.032
(0.027)
0.101**(0.032)0.044+
(0.027)
0.108**(0.034)0.052
(0.029)Tests of number of competitors vs. 0 vs. > 3 vs. 0 vs. > 3 vs. 0 vs. > 3
1-3 vs. zero 1-3 vs. > 3 ** ** ** * ** *Market power (10% test)Sales would fall a lot
Sales would fall slightly
No change in sales
0.038+
(0.022)0.126**(0.022)0.135**(0.026)
0.017(0.019)0.073**(0.019)0.051*(0.026)
0.019(0.020)0.080**(0.020)0.053*(0.024)
Pressure from foreign competitors 0.023**(0.008)
0.009(0.007)
0.009(0.007)
Pressure from customers 0.017+
(0.009)0.006
(0.009)0.006
(0.009)New firm 0.179**
(0.021)-0.046(0.041)
-0.062**(0.019)
Services 0.023(0.019)
-0.023(0.018)
-0.027(0.017)
Agriculture (0.030)(0.028)
0.013(0.025)
0.017(0.026)
Big city 0.055**(0.019)
0.004(0.018)
-0.005(0.017)
Size (log employment) 0.038**(0.007)
0.018**(0.006)
0.015**(0.006)
Number of observations 3288 3288 3288
Notes:+ = sig. at 10%, * = sig. at 5%; ** = sig. at 1%; heteroskedastic-robust standard errors in ().

30
Table 5. Determinants of innovation
(1) (2) (3) (4)Dependent variable Innovation Innovation Innovation
(old firms)Innovation(new firms)
No. of competitors1-3 competitors
>3 competitors
0.144+
(0.087)-0.033(0.073)
0.145+
(0.087)-0.030(0.073)
0.202+
(0.108)0.104
(0.089)
-0.062(0.141)
-0.343**(0.124)
Tests of number ofcompetitors
vs. 0 vs. > 3 vs. 0 vs. > 3 vs. 0 vs. > 3 vs. 0 vs. > 3
1-3 vs. zero 1-3 vs. > 3 + ** + ** + 0 0 **Market power (10% test)Sales would fall a lot
Sales would fall slightly
No change in sales
0.143**(0.051)0.272**(0.053)0.236**(0.067)
0.142**(0.051)0.279**(0.053)0.232**(0.067)
0.163*(0.074)0.211**(0.077)0.251**(0.090)
0.118+
(0.069)0.382**(0.073)0.259**(0.102)
Foreign competitorsCategoricalSlightly important
Fairly important
Very important
0.233**(0.058)0.166**(0.056)0.335**(0.063)
Coded 1 to 4 (cardinal) 0.101**(0.019)
0.137**(0.027)
0.081**(0.027)
CustomersCategoricalSlightly important
Fairly important
Very important
0.131*(0.062)0.189**(0.061)0.296**(0.068)
Coded 1 to 4 (cardinal) 0.095**(0.021)
0.094**(0.031)
0.089**(0.029)
Size (log employment) 0.106**(0.016)
0.106**(0.016)
0.111**(0.022)
0.115**(0.023)
New firm 0.219**(0.050)
0.225**(0.050)
Services -0.456**(0.045)
-0.462**(0.045)
-0.374**(0.067)
-0.497**(0.061)
Agriculture -0.497**(0.070)
-0.496**(0.071)
-0.571**(0.086)
-0.163(0.130)
Big city 0.134**(0.045)
0.134**(0.045)
0.219**(0.066)
0.064(0.059)
Number of observations 3448 3448 1678 1770
Notes:= + sig. at 10%, * = sig. at 5%; ** = sig. at 1%; heteroskedastic-robust standard errors in ().Test of (1) vs. (2): χ2(4)=8.35, p-value=0.08.

31
Table 6. Determinants of sales growth, employment growth treated as exogenous
(1) (2) (3) (4)Dependent variable Real sales growth Real sales growth Real sales growth
(old firms)Real sales growth
(new firms)Estimation method OLS GMM GMM GMMEmployment growth 0.602**
(0.028)0.530**(0.036)
0.439**(0.046)
0.619**(0.055)
Innovation 0.052**(0.007)
0.181**(0.038)
0.192**(0.042)
0.121+
(0.064)Number of competitors1-3 competitors
>3 competitors
0.100**(0.030)0.041
(0.025)
0.081**(0.032)0.045
(0.027)
0.047(0.037)0.001
(0.032)
0.149**(0.057)0.104+
(0.054)Tests of number ofcompetitors
vs. 0 vs. > 3 vs. 0 vs. > 3 vs. 0 vs. > 3 vs. 0 vs. > 3
1-3 vs. zero 1-3 vs. > 3 ** ** ** 0 ** 0 ** 0Market power (10% test)Sales would fall a lot
Sales would fall slightly
No change in sales
0.019(0.019)0.087**(0.018)0.072**(0.022)
0.003(0.021)0.056**(0.021)0.051*(0.024)
-0.008(0.028)0.061*(0.026)0.068*(0.031)
0.018(0.029)0.057
(0.036)0.025
(0.036)New firm -0.008
(0.016)0.002
(0.017)Services 0.001
(0.016)0.076*(0.027)
0.109**(0.032)
0.021(0.041)
Agriculture 0.049*(0.024)
0.113**(0.032)
0.123**(0.041)
0.076(0.040)
Big city 0.015(0.016)
-0.002(0.018)
-0.026(0.026)
0.021(0.022)
Excluded instruments n.a. Pressure toinnovate, size
Pressure toinnovate, size
Pressure toinnovate, size
First-stage F-test ofexcluded instruments
F(3,3250)=33.2 F(3,1573)=26.0 F(3,1636)=11.2
Test of overidentifyingrestrictions (Hansen J)
n.a. χ2(2)=1.80p-value=0.41
χ2(2)=1.10p-value=0.58
χ2(2)=0.41p-value=0.82
Number of observations 3288 3288 1615 1673
Notes:= + sig. at 10%, * = sig. at 5%; ** = sig. at 1%.Standard errors and test statistics are heteroskedastic-robust.

32
Table 7. Determinants of sales growth, imposed labour elasticity
(1) (2) (3) (4)Dependent variableSales growth withimposed labour elasticityof:
1 0.75 0.5 0.25
Estimation method GMM GMM GMM GMMInnovation 0.104**
(0.035)0.145**(0.034)
0.187**(0.035)
0.228**(0.037)
Number of competitors1-3 competitors
>3 competitors
0.096**(0.034)0.054
(0.029)
0.088**(0.032)0.050
(0.027)
0.080**(0.032)0.045
(0.027)
0.072*(0.033)0.040
(0.028)Tests of number ofcompetitors
vs. 0 vs. > 3 vs. 0 vs. > 3 vs. 0 vs. > 3 vs. 0 vs. > 3
1-3 vs. zero 1-3 vs. > 3 ** + ** + ** 0 ** 0Market power (10% test)Sales would fall a lot
Sales would fall slightly
No change in sales
0.005(0.021)0.054**(0.021)0.029
(0.025)
0.003(0.020)0.055**(0.021)0.041
(0.024)
0.002(0.021)0.056**(0.021)0.052*(0.024)
0.002(0.022)0.056**(0.023)0.063**(0.026)
New firm -0.091**(0.016)
-0.042**(0.015)
0.007(0.016)
0.056**(0.017)
Services 0.019(0.024)
0.050*(0.024)
0.080**(0.025)
0.111**(0.028)
Agriculture 0.069*(0.032)
0.093**(0.031)
0.116**(0.031)
0.139**(0.032)
Big city -0.020(0.018)
-0.010(0.018)
-0.001(0.018)
0.008(0.019)
Country dummies Yes Yes Yes YesExcluded instruments Pressure to
innovate, sizePressure to
innovate, sizePressure to
innovate, sizePressure to
innovate, sizeTest of overidentifyingrestrictions (Hansen J)
χ2(2)=0.57p-value=0.75
χ2(2)=1.19p-value=0.55
χ2(2)=1.87p-value=0.39
χ2(2)=2.41p-value=0.30
Notes:* = significant at 5%; ** = significant at 1%; heteroskedastic-robust standard errors in (); number ofobservations=3288.First-stage regression statistic (all equations): heteroskedastic-robust F(3,3251)=38.7.Heteroskedasticity-robust endogeneity tests: (1) vs. (2), χ2(2)=19.8, p-value=0.00, OLS rejected; (1)vs. (4), χ2(1)=14.2, p-value=0.00, OLS rejected.
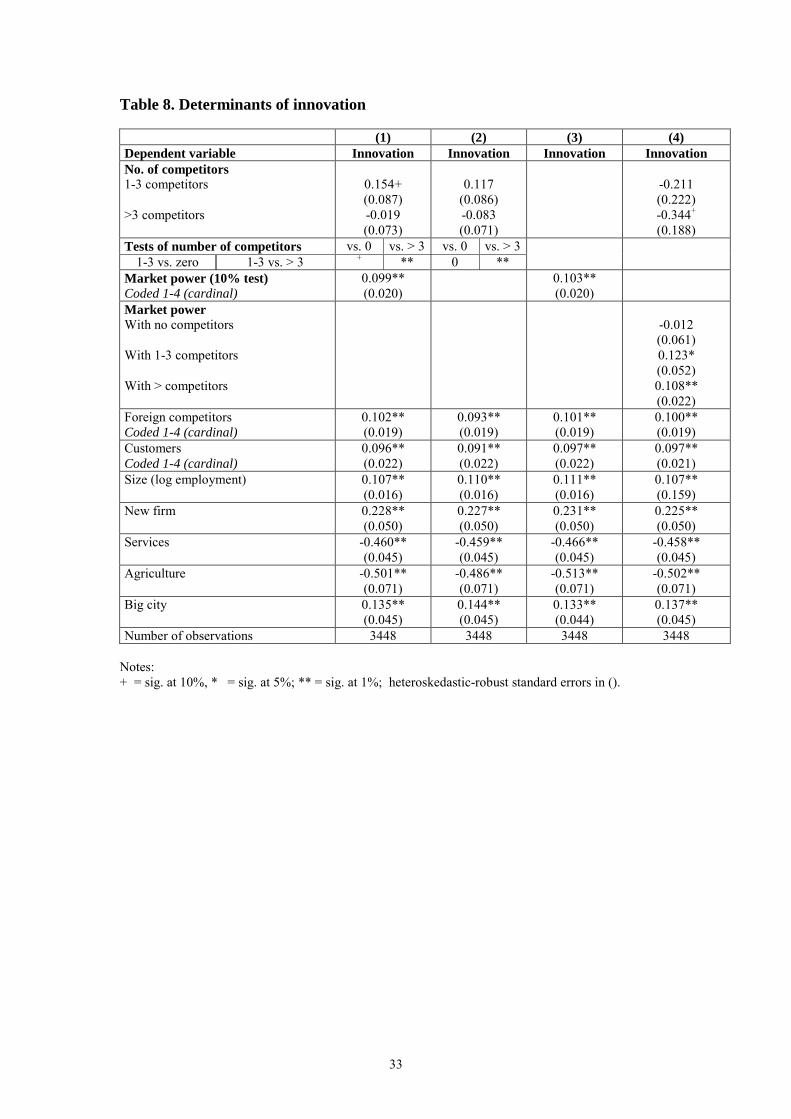
33
Table 8. Determinants of innovation
(1) (2) (3) (4)Dependent variable Innovation Innovation Innovation InnovationNo. of competitors1-3 competitors
>3 competitors
0.154+(0.087)-0.019(0.073)
0.117(0.086)-0.083(0.071)
-0.211(0.222)-0.344+
(0.188)Tests of number of competitors vs. 0 vs. > 3 vs. 0 vs. > 3
1-3 vs. zero 1-3 vs. > 3 + ** 0 **Market power (10% test)Coded 1-4 (cardinal)
0.099**(0.020)
0.103**(0.020)
Market powerWith no competitors
With 1-3 competitors
With > competitors
-0.012(0.061)0.123*(0.052)0.108**(0.022)
Foreign competitorsCoded 1-4 (cardinal)
0.102**(0.019)
0.093**(0.019)
0.101**(0.019)
0.100**(0.019)
CustomersCoded 1-4 (cardinal)
0.096**(0.022)
0.091**(0.022)
0.097**(0.022)
0.097**(0.021)
Size (log employment) 0.107**(0.016)
0.110**(0.016)
0.111**(0.016)
0.107**(0.159)
New firm 0.228**(0.050)
0.227**(0.050)
0.231**(0.050)
0.225**(0.050)
Services -0.460**(0.045)
-0.459**(0.045)
-0.466**(0.045)
-0.458**(0.045)
Agriculture -0.501**(0.071)
-0.486**(0.071)
-0.513**(0.071)
-0.502**(0.071)
Big city 0.135**(0.045)
0.144**(0.045)
0.133**(0.044)
0.137**(0.045)
Number of observations 3448 3448 3448 3448
Notes:+ = sig. at 10%, * = sig. at 5%; ** = sig. at 1%; heteroskedastic-robust standard errors in ().


![Diva Rivalry for Fun and Profit: An Examination of Diva [Mis-] Conceptions via the Rivalry of Maria Callas and Renata Tebaldi](https://static.fdokumen.com/doc/165x107/631a5fdbd43f4e1763046af6/diva-rivalry-for-fun-and-profit-an-examination-of-diva-mis-conceptions-via-the.jpg)