Green and chemical synthesis of bimetallic nanoparticles (Fe/Ni ...
25
Page | 1062 Received: 12 April 2022 Revised: 22 May 2022 Accepted: 30 May 2022 DOI: 10.22034/ecc.2022.342067.1466 Eurasian Chem. Commun. 4 (2022) 1062-1086 http:/echemcom.com FULL PAPER Green and chemical synthesis of bimetallic nanoparticles (Fe/Ni) supported by zeolite 5A as aheterogeneous fenton-like catalyst and study of kinetic and thermodynamic reaction for decolorization of reactive red 120 dye from aqueous pollution Maysoon M. Abdul Hassan a, * |Sahar S. Hassan b |Ahmed K. Hassan a a Environment and Water Directorate, Ministry of Science and Technology, Baghdad, Iraq b Department of Chemistry, College of Science for Women, University of Baghdad, Baghdad, Iraq *Corresponding Author: Maysoon M. Abdul Hassan Tel.: +947730015951 In this work, the green and chemical synthesis of bimetallic nanoparticles (Fe/Ni) NPs supported by zeolite 5A using green tea extract and sodium borohydride as reducing agents, respectively, at the best ratio of Fe: Ni was obtained and used as heterogeneous Fenton-like oxidation for the decolorization of reactive red 120 dye (RR120) from water polluted. The nanoparticles were characterized by using SEM, (EDX), (AFM), (XRD), (FT-IR), (BET), and Zeta potential. The hydrothermal preparation of zeolite 5A from local kaolin, then characterization, and use of it as a supporting material. The optimum conditions of decolorization of RR120 were studied under experimental parameters such as: [H2O2] = (0.1–20) mmol/L, catalyst dosages = (0.1–1.5) g/L, pH (2.5–9), [RR120 dye] = (15– 100) mg/L, reaction time = (0–120) min, and temperature (30–50) °C. The decolorization efficiency of RR120 dye under the optimum reaction conditions by Fenton-like reaction for (GT-Z-Fe/Ni) NPs synthesis by green methods was 99.9%, whereas 96.6% with (Z- Fe/Ni) NPs synthesized by chemical methods. Furthermore, we studied the kinetic and thermodynamic effects of RR120 dye removal by heterogeneous Fenton-like oxidation for GT-Z-Fe/Ni and Z-Fe/Ni NPs by three kinetic models (first-order, second-order, and Behnajady–Modirshahla–Ghanbary (BMG)) and the thermodynamic parameters (∆G 0 , ∆H 0 , and ∆S 0 ) at (30, 40, and 50) C°. The results indicate the second-order and the (BMG) are the best models representing the experimental kinetic data of RR120 dye removal, and the reaction is spontaneous and endothermic using GT-Z-Fe/Ni and Z-Fe/Ni nanoparticles. Finally, the comparison of the decolorization efficiency of RR120 dye in optimum conditions using different reaction mechanisms. KEYWORDS Green synthesis; chemical synthesis; Fenton-like oxidation; bimetallic Fe/Ni nanoparticles; zeolite-supported nanoparticles; azo dyes. Introduction The most severe form of water pollution in developing countries is the uncontrolled release of hazardous and persistent organic compounds into aquatic systems [1]. Various industries generate waste that is discharged into water effluents, affecting the appearance and quality of water and causing a severe
-
Upload
khangminh22 -
Category
Documents
-
view
0 -
download
0
Transcript of Green and chemical synthesis of bimetallic nanoparticles (Fe/Ni ...

P a g e | 1062
Received: 12 April 2022 Revised: 22 May 2022 Accepted: 30 May 2022
DOI: 10.22034/ecc.2022.342067.1466
Eurasian Chem. Commun. 4 (2022) 1062-1086 http:/echemcom.com
FULL PAPER
Green and chemical synthesis of bimetallic nanoparticles (Fe/Ni) supported by zeolite 5A as aheterogeneous fenton-like catalyst and study of kinetic and thermodynamic reaction for decolorization of reactive red 120 dye from aqueous pollution
Maysoon M. Abdul Hassana,* |Sahar S. Hassanb |Ahmed K. Hassana
aEnvironment and Water Directorate, Ministry of Science and Technology, Baghdad, Iraq
bDepartment of Chemistry, College of Science for Women, University of Baghdad, Baghdad, Iraq
*Corresponding Author:
Maysoon M. Abdul Hassan
Tel.: +947730015951
In this work, the green and chemical synthesis of bimetallic nanoparticles (Fe/Ni) NPs supported by zeolite 5A using green tea extract and sodium borohydride as reducing agents, respectively, at the best ratio of Fe: Ni was obtained and used as heterogeneous Fenton-like oxidation for the decolorization of reactive red 120 dye (RR120) from water polluted. The nanoparticles were characterized by using SEM, (EDX), (AFM), (XRD), (FT-IR), (BET), and Zeta potential. The hydrothermal preparation of zeolite 5A from local kaolin, then characterization, and use of it as a supporting material. The optimum conditions of decolorization of RR120 were studied under experimental parameters such as: [H2O2] = (0.1–20) mmol/L, catalyst dosages = (0.1–1.5) g/L, pH (2.5–9), [RR120 dye] = (15–100) mg/L, reaction time = (0–120) min, and temperature (30–50) °C. The decolorization efficiency of RR120 dye under the optimum reaction conditions by Fenton-like reaction for (GT-Z-Fe/Ni) NPs synthesis by green methods was 99.9%, whereas 96.6% with (Z-Fe/Ni) NPs synthesized by chemical methods. Furthermore, we studied the kinetic and thermodynamic effects of RR120 dye removal by heterogeneous Fenton-like oxidation for GT-Z-Fe/Ni and Z-Fe/Ni NPs by three kinetic models (first-order, second-order, and Behnajady–Modirshahla–Ghanbary (BMG)) and the thermodynamic parameters (∆G0, ∆H0, and ∆S0) at (30, 40, and 50) C°. The results indicate the second-order and the (BMG) are the best models representing the experimental kinetic data of RR120 dye removal, and the reaction is spontaneous and endothermic using GT-Z-Fe/Ni and Z-Fe/Ni nanoparticles. Finally, the comparison of the decolorization efficiency of RR120 dye in optimum conditions using different reaction mechanisms.
KEYWORDS
Green synthesis; chemical synthesis; Fenton-like oxidation; bimetallic Fe/Ni nanoparticles; zeolite-supported nanoparticles; azo dyes.
Introduction
The most severe form of water pollution in
developing countries is the uncontrolled
release of hazardous and persistent organic
compounds into aquatic systems [1]. Various
industries generate waste that is discharged
into water effluents, affecting the appearance
and quality of water and causing a severe
P a g e | 1063 M.M. Abdul Hassan et al.
problem by reducing the amount of pure and
clean water available in our world. The
organic pollutants, particularly dyes, are
among these wastes, and they have a harmful
effect on the environment and humans [2].
The azo dye-containing wastewater
discharged has a high level of environmental
toxicity, is non-biodegradable, poses a risk to
human health and the aquatic ecosystem as
well as it has the potential to cause cancer in
humans [3]. Various materials and
techniques, such as adsorption,
electrocoagulation, phytoremediation,
membrane separation, and advanced
oxidation processes (AOPs) have been
utilized to remediate industrial water
contaminated with dyes [4]. AOPs are widely
used to eliminate complex organic
contaminants [5,6]. The environmentally
benign approach of AOPs is heterogeneous
Fenton oxidation, which is based on the
reaction of solid iron (as a catalyst) with
hydrogen peroxide (H2O2) to form highly
reactive intermediate species known as
hydroxyl free radicals [7]. The advantages of
using this method are that it has the highest
efficiency of dye removal, is more feasible,
and is not expensive as compared with a
homogenous one [5]. In the green Fenton-like
oxidation process, hydroxyl radicals are
produced by a green synthesis of metal-
catalyzed oxidation using hydrogen peroxide
and then consumed to remove azo dyes [6,8].
Chemical methods used in the production of
iron nanoparticles by using materials such as
sodium borohydride or hydrazine hydrate,
cause increased toxicity in the environment
and have detrimental effects on living
organisms [9] and several drawbacks,
including reliance on expensive equipment,
significant energy consumption and a reliance
on chemical substances that are hazardous to
the environment and individuals. Green
synthesis is another eco-friendly approach
which avoids the use of harmful chemicals.
Because it uses biological microorganisms or
plant extracts, green synthesis has become a
simple alternative to toxic chemical
techniques. It is also environmentally benign,
cost-effective, and easy to scale up to large-
scale synthesis for metal ion bioreduction
[10]. Plant extracts have been widely used to
reduce the negative impacts of chemical
synthesis, and they have a significant
advantage due to their natural abundance,
low cost, eco-friendliness [9], and large
surface area [11]. Although iron
nanoparticles have achieved the broad usage
as a promising metal in treatment methods
for the removal of a variety of environmental
contaminants, their reactivity may be affected
by the formation of an oxide layer around
particle surfaces. Due to its aggregation
feature and ease of oxidation on the surface, a
second catalyst such as Cu, Pt, Pd, or Ni can be
added to improve catalytic reactivity and
reduce iron oxidation [12]. Because the
mutual action of two metals improves the
properties of nanoparticles as compared with
using only one metal (monometallic). In an
NZVI-based bimetallic system, the iron acts as
an electron donor, while the second metal
acts as both a carrier and a catalyst,
accelerating the transition of H into activated
atomic H, and thereby enhancing NZVI’s
reduction reactivity [13]. Although Ni had a
weak catalytic effect when compared with
noble metals like Pd and Pt, it was more
useful for practical applications due to its
inexpensive cost and strong corrosion
resistance [14]. The stabilization of bimetallic
nanoparticles into suitable support materials
is needed to overcome the limitations of
bimetallic nanoparticles [14]. Biochar,
montmorillonite, rectorite, bentonite,
kaolinite, zeolite, and sepiolite, are examples
of supporting materials that improve not only
the dispersion of NZVI particles, but also their
reactivity by acting as pre-concentrate
reactants and mediating electron transfer
reactions [15]. Supporting materials like
zeolite, as a microporous material, have
unique physicochemical properties, such as
the presence of strong acidic centers, an

P a g e | 1064 Green and chemical synthesis of bimetallic …
extremely large surface area, high ion-
exchange ability, and a precise system of
micropores and channels, all of which could
improve NZVI dispersibility and stability [15].
In this work, bimetallic GT-Z-Fe/Ni and Z-
Fe/Ni nanoparticles were synthesized in
different ratios of Fe/Ni using green tea leaf
extract and sodium borohydride as a
reducing agent. Then, these ratios were
evaluated to select the most effective ratio for
removing reactive red 120 dye (RR120),
which is an example of an azo dye. The goals
of this study are: (1) using zeolite5A as
supporting material for bimetallic Fe/Ni
nanoparticles to improve the reaction of
nanoparticles, reduce the cost, and enhance
the adsorption capacity for nanoparticles; (2)
to investigate the functions of bimetallic GT-
Z-Fe/Ni and Z-Fe/Ni NPs in heterogeneous
Fenton-like oxidation; (3) to investigate the
influence of various parameters on the
degradation rate of the RR120 dye from
aqueous solution; (4) to assess the effect of
three kinetic models and thermodynamic
reaction parameters on the degradation of
RR120 dye by using bimetallic NPs and (5) to
compare the decolorization efficiencies of
RR120 dye with Fenton-like oxidation and
adsorption processes by using catalysts
bimetallic GT-Z-Fe/Ni and Z-Fe/Ni NPs and
zeolite 5A under optimum conditions.
Experimental procedure
Instrumentation
The field emission scanning electron
microscope FE-SEM (TESCAN MIRA3, FEG-
SEM) (1-30 kV) (Franch) is a type of high-
resolution electron microscopy that produces
three-dimensional digital images, this model
was used to investigate the morphology,
topography, and average particle size. The
SEM images were taken to identify bimetallic
(GT-Z-Fe/Ni) and (Z-Fe/Ni) nanoparticles
and to identify changes in the surface
morphology. The electron dispersive x-ray
spectroscopy (EDX) XFlah6-10 Detector-
Bruker is used to identify the elemental
composition of nanoparticles. The size and
surface morphology of the nanoparticles, as
well as the contact force between the tip and
the surface, were measured using an atomic
force microscopy (AFM) model (AFM
Workshop, TT-2AFM) (USA). The surface
composition and element combination state
of bimetallic [GT-Fe/Ni and Z-Fe/Ni]
nanoparticles were studied using an x-ray
diffraction (XRD) model (Panalytical X’Pert
Philips, Holland), Brunauer-Emmett-Teller
(BET) (Micromeritics TriStar ll Plus 2.03)
(USA) at analysis adsorptive, the surface area
was determined using a Brunauer-Emmett-
Teller (BET) (Micromeritics TriStar ll Plus
2.03) (USA) at N2 temperature in the bath (-
196.675 °C) to calculate the specific surface
area (BET), pore-volume, and average pore
size of GT-Z-Fe/Ni and Z-Fe/Ni by using a
sample mass of 0.1515 g of GT-Z-Fe/Ni and Z-
Fe/Ni transferred to the BET tube. Each of
these items was analyzed in the laboratory of
Kashan University (Iran). A zeta potential
analyzer model (NanoBrook ZetaPlus) was
utilized to determine nanoparticle stability by
studying the electrophoretic behavior of the
fluid. The zeta potential of any nanoparticle
might be positive at low pH levels and
negative at high pH levels. The zeta potential
that was measured had a pH of about 6. An
FT-IR spectroscopic instrument was used to
determine the functional groups present on
the GT-Z-Fe/Ni and Z-Fe/Ni (Shimadzu, Japan
in the 400 to 4000 cm-1 range). This was
carried out in the laboratories of Iraq’s
Ministry of Science and Technology’s
Environment and Water Directorate. The
concentration of RR120 dye in an aqueous
solution before and after treatment was
analyzed by a UV-Vis Spectrophotometer
(Optima, SP-3000 Plus, Tokyo, Japan) at a
maximum absorption wavelength of 535 nm
and pH (pH meter, WTW, Germany). Shaking
Water Bath B5-21, JEIO TECH (Korea).
Ultrasonic Cole-Parmer, Four Digital Balances
and Magnetic Stirrers, ABINCO.LD-814
P a g e | 1065 M.M. Abdul Hassan et al.
(Netherlands), SCIEN TECH, BOULDER.COM
(USA),and Heidolph (RZR1) mechanical
stirring (Germany).
Materials and methods
Materials and solutions
All of the utilized reagents were of the highest
purity and provided without further
purification. Deionized water of the highest
purity was used to make all of the solutions.
The kaolin clay used in the present work was
supplied from the Doakhla site in the west of
Iraq. The green tea leaves were purchased
from the local market. Hydrogen peroxide
(H2O2) at 30% weight per weight, ferrous
sulfate heptahydrate (FeSO47H2O), nickel
nitrate hexahydrate (NiNO3.6H2O), and
ethanol from BDH. Sodium borohydride
(NaBH4) from Merck & Co. (Germany).
Sodium hydroxide (NaOH) and sulfuric acid
(H2SO4) were used to adjust pH and were
purchased from Appli Chem (GbH). The
Reactive Red 120 dye was a gift from the
Textile Factory from the Ministry of Industry
and Minerals. The commercial reactive red
120 dye’s main characteristics and chemical
structure have been described in Table 1.
TABLE 1 The Commercial Reactive Red 120 dye’s main characteristics and chemical structure
IUPAC Name Hexasodium 4,4'-[1,4-phenylenebis[imino(6-chloro-1,3,5-triazine-4,2-diyl)imino]]bis[5-hydroxy-6-[(2-sulphonatophenyl)azo]naphthalene-
2,7-disulphonate] Common Name Reactive Red 120
Dye Glass Diazo Molecular formula C44H24Cl2N14Na6O20S6
Molar Mass 1470 g/mol Application: Reactive red 120 is a polyaromatic azo organosulfur dye
Purity 98.8 Color Bright Red
λ max (nm) 535
Chemical Structure
Synthesis of zeolite-Fe/Ni nanoparticles bygreen and chemical methods
Preparation of zeolite 5A
To prepare the zeolite 5A, kaolin clay was
taken from the Dwikla site. The local kaolin
clay was crushed and sifted to 75-micron
grain size. To produce zeolite 4A from kaolin
clay by thermal activation of kaolin clay and
ion exchange methods. Metakaolin is
produced through the thermal activation of
kaolin clay. The dried kaolin clay was calcined
at 550 ° C for 3 hours. As illustrated by the
following reaction:
2Al2Si2O5(OH)4 550-600 °C 2Al2Si2O7 +
4H2O (1)
Through ion exchange, the sodium ion was
inserted into the kaolin structure by treating
it with sodium hydroxide. In a 1:2 ratio, meta
kaolinite was treated with a sodium
hydroxide solution. The meta kaolinite (0.1
M, 2.22 g) was treated with a sodium
hydroxide solution (0.2 M, 8 g) in 100 mL of

P a g e | 1066 Green and chemical synthesis of bimetallic …
distilled water and then refluxed for 8 hours
in a shaker water bath at 95 °C. Zeolite was
left to settle for several hours and washed
three times with deionized water to remove
the excess on the reacted sodium hydroxide.
Then, it was filtered by any suitable means
and dried in an oven at 110 °C for four hours.
The following reaction led to the preparation
of zeolite 4A.
6Al2Si2O7+12NaOH
Na12(AlO2)12(SiO2)12.27H2O + 6H2O (2)
Ion exchange was used to produce zeolite
type 5A from zeolite type 4A. Calcium (Ca+2)
ions were replaced by sodium ions in zeolite
type 4A. They were produced by reacting 25 g
of zeolite type 4A with a 1M CaCl2 solution
(22.19 g of CaCl2 (1M) in 200 mL of distilled
water). The solution was then filtered and
dried for 4 hours at 110 °C in an oven. As for
zeolite type 5A, the obtained zeolite powder
was ground, molded, and calcined. The
chemical analysis of the synthesized zeolite
5A was conducted at 95 °C and 8 hours of
shaking. Because of its high surface area and
pore size[16], we chose zeolite 5A to
synthesize zeolite-supported nanoparticles.
Synthesis of zeolite-Fe/Ni nanoparticles (GT-Z-Fe/Ni) bygreen methods
Preparation of green tea extraction
The green tea extract was produced by
mixing 10.0 g of green tea in 100 mL of
deionized water on the hot plate. The solution
was heated for 30 min at 85 °C. The extract
was filtered through a 0.45 m membrane
filter to remove the remaining tea particles
and kept at 4 °C for later usage as reducing
agent.
Synthesis of green Tea-Z-Fe/Ni (GT-Z-Fe/Ni) nanoparticles
A solutions of (0.10 M) FeSO4.7H2O and
(0.01M) NiNO4.6H2O was prepared in the best
ratio (1:0.2) of Fe:Ni by adding 4.9782 g and
0.77928 g, respectively, of solid FeSO4.7H2O
and NiNO3.6H2O to 178 mL of deionized
water. After complete dissolving, this solution
was filtered using a 0.45 μm membrane filter
to remove any impurities. The solutions of
FeSO4.7H2O and NiNO3.6H2O were mixed, and
then they were stirred immediately for 30
min at room temperature at 300 pm. Then 2.0
g of the zeolite (5A) was added to this
solution and stirred for 60 min in an
ultrasonic vibration bath where the best ratio
of zeolite: Fe:Ni was 2:1:0.2 (w/w). Then,
dropwise, the green tea extract was added to
the mixture of FeSO4.7H2O, NiNO3.6H2O, and
zeolite 5A solutions by adding it slowly for 15
min at room temperature and immediately
stirring it at 300 pm. After the addition, the
color of the solution changed from yellowish-
green to black, which indicated the reduction
of iron (II) ions to iron (0) nanoparticles.
Constantly stirred for 15 min, the black
precipitate of GT-Z-Fe/Ni nanoparticles was
collected by vacuum filtration using filter
paper of 0.45 μm pore size and quickly rinsed
several times with water and ethanol. The
GT-Z-Fe/Ni nanoparticles were dried at 50 °C
in an oven and then ground to a fine powder.
Synthesis of zeolite-Fe/Ni (Z-Fe/Ni)
nanoparticles by chemical method
The Z-Fe/Ni nanoparticles were prepared by
the liquid-phase reduction method using
sodium borohydride as a reducing agent. The
solutions of (0.10 M) FeSO4.7H2O and (0.01M)
NiNO4.6H2O were prepared in the best ratio
(1:0.2) of Fe:Ni by adding 4.9782 g and
0.77928 g, respectively, of solid FeSO4.7H2O
and NiNO3.6H2O to 178 mL of deionized
water. After complete dissolving, this solution
was filtered using a 0.45 μm membrane filter
to remove any impurities. The solutions of
FeSO4.7H2O and NiNO3.6H2O were mixed in a
three-neck flask and stirred by a
mechanicstirring put inside the flask for 30
min at 300 rpm at room temperature. Then
2.0 g of the zeolite (5A) was added to this
solution at the best ratio of zeolite: Fe: Ni

P a g e | 1067 M.M. Abdul Hassan et al.
ratio of 2:1:0.2 (w/w) was chosen and stirred
for 60 minutes in an ultrasonic vibration
bath.N2 gas flowed into the three-neck flask
from the beginning of the reaction and
continued throughout the reaction. The
sodium borohydride NaBH4-(0.3 M) aqueous
solution was prepared by dissolving (1.13403
g) in 100 mL of deionized water in a
separation flask inside a three-neck flask,
then adding dropwise (5 mL per minute) to
the solution of FeSO47H2O, NiNO3.6H2O, and
zeolite, and immediately stirring for 30
minutes at room temperature at 300 rpm.
The color of the solution changed from
yellowish-green to black, indicating the
reduction of iron (II) ions to iron (0)
nanoparticles, with the continued flow of N2
gas into the three-neck flask for the reaction
to end, removing the air and avoiding
oxidation of the nanoparticles formed. The
black precipitate of Z-Fe/Ni nanoparticles
was collected by vacuum filtration using filter
paper of 0.45 μm pore size and quickly rinsed
several times with water and ethanol,
keeping it immediately in ethanol or
methanol solution.
Selection of theoptimum ratio of Fe/Ni
The experiments for the Fe/Ni (1: 1, 1: 0.5,
and 1: 0.2) ratioswere carried out at different
pH (2.5-9) and the results revealed that the
1:0.2 ratio has a higher level of removal
efficiency than the 1:1 and 1:0.5 ratios. The
rapid increase in RR120 removal was noticed
in the first 30 min and that was due to the
availability of active sites on the adsorbent
surface that adsorbed a large amount of dye.
Then the removal rate slowed because we are
approaching the saturation of vacant sites.
After selection of the highest percentage,the
removal of RR120 dye among Fe/Ni (1:1,
1:0.5, and 1:0.2) and then the
characterization of the best ratio of GT-Fe/Ni
and Z-Fe/Ni NPs were conducted.
Batch experiments procedure
In this search, batch experiments were
carried out to determine the removal
efficiency of RR120 dye using the following
approach. Dye removal experiments were
carried out in 1000 mL beakers with 1000 mL
of dye solution of the desired concentration.
The effect of the concentration of H2O2 on
heterogeneous Fenton-like oxidation ranges
from (0.1-7.5) mmol/L in the state of
bimetallic GT-Z-Fe/Ni NPs and (0.1-20)
mmol/L in the state of bimetallic Z-Fe/Ni NPs
on the elimination of RR120 dye solution (25
g/L) was tested at a pH =3 using the GT-Z-
Fe/Ni and Z-Fe/Ni dose (0.2 and 0.5) g/L
respectively. The concentration of RR120 dye
during Fenton-like oxidation was measured
by taking 10 mL samples at predetermined
intervals, filtering the samples with 0.45 mm
pore size membrane filters to remove the
catalyst, and transferring the samples to a
glass vial. The effect of GT-Z-Fe/Ni and Z-
Fe/Ni nanoparticles dosages in the range of
(0.05-1.5) g/L on the degradation of 1 L of a
synthetic solution with 25 mg/L RR120 dye
at a fixed H2O2 concentration of (1 and 7.5)
mmol/L, respectively and pH=3 was
investigated in Fenton-like experiments.
Subsequently, the experiments were carried
out at pH values ranging from (2.5 to 9.0) to
find the optimal pH for RR120 dye
degradation. Meanwhile, under optimal
conditions condition of pH, GT-Z-Fe/Ni and Z-
Fe/Ni dose and concentration of H2O2 in
heterogeneous Fenton-like oxidation on the
elimination of RR120 dye solution the initial
concentration of RR120 dye was tested in the
range of (15-100) mg/L and the reaction
temperature was estimated to be between
(30-50)°C. At specific time intervals (5, 10,
15, 20, 30, 45, 60, 90, and 120) min, the
RR120 dyeconcentration was analyzed in the
solution.

P a g e | 1068 Green and chemical synthesis of bimetallic …
Analytical methods of RR120dye aqueous media
Organic compounds such as RR120 dye
solution of desired concentration were
prepared by dilution of stock solution
instantly before use. Stock solutions of RR120
dye were prepared in demineralization water.
Figure 1 displays the calibration curve for
RR120 dye concentrations at λmax=535 nm
wavelength. The absorbance of the RR120
dye solution was measured before and after
degradation by using a UV-Vis
spectrophotometer (model SP-3000 OPTIMA,
Japan) equipped with a quartz cell of 1.0 cm
Path length. The decolorization efficiency (Ed)
(%) for RR120 dye was expressed in terms of
the decrease rate in the dye concentration, it
was calculated as in Equation(3), where C0 is
the initial concentration of RR120 dye, and Ct
is the concentration of RR120 dye at time t.
Ed% = [C0 - Ct /C0] x 100% (3)
FIGURE 1 Calibration curve for RR120 dye concentrations at λmax= 535 nm
Results and discussion
Characterization of bimetallic nanoparticles
Scanningelectron microscope (SEM)
The scanning electron microscope (SEM) is a
direct method for determining nanoparticle
size and surface morphology. It is used to
investigate the morphology, topography,and
average particle size. The external
appearance, texture, chemical composition,
crystalline structure, and orientation of
components which make up the sample are
all revealed by the signals derived from
electron sample interactions [17]. The
morphology and size of the synthesized [GT-
Z-Fe/Ni and Z-Fe/Ni] NPs samples were
verified using SEM, which was utilized to
assess the diameter of the nanoparticles as
illustrated in Figure 2. The morphology and
distributions of GT-Z-Fe/Ni NPs Figure 2A in
SEM images revealed that synthesized GT-Z-
Fe/Ni NPs were uniformLy dispersed on the
surface of zeolite with no aggregation, and
these nanoparticles were porous and shaped
as spherical, with diameters ranging from
(24-36) nm, indicating that Fe/Ni NPs were
present on the surface of zeolite, they were
well-supported. Therefore, as depicted in
SEM images in Figure 2B, chemically
synthesized Z-Fe/Ni NPs morphology and
distributions were uniformLy dispersed on
the surface of zeolite with no aggregation and
a uniform size of (29–52) nm. Because zeolite
disperses and stabilizes (Fe/Ni) NPs, it helps
to minimize costs, maximize the adsorption
capacity of Fe/Ni andincrease the surface
area and active sites for reactivity
enhancement, it was chosen as a support
material. The zeolite is thought to minimize
the aggregation propensity of nanoparticles
caused by the magnetic characteristics of iron
nanoparticles while also protecting them
from oxidation [18]. The presence of

P a g e | 1069 M.M. Abdul Hassan et al.
polyphenols on the surface of the GT-Z-Fe/Ni
NPs resulted in irregular nanoparticle
morphologies, which was confirmed by NZVI
preparation results by using tree leaf extract
and green tea extract. This is dependent on
the number of polyphenols in the extract,
which can produce a variety of reactions,
such as inhibiting or stimulating the
formation of GT-Z-Fe/Ni nanoparticles,
resulting in a variety of forms and sizes of
iron nanoparticles [6].
FIGURE 2 Scanning electron microscope images of bimetallic NPs (A)- GT-Z-Fe/Ni and (B)- Z-Fe/Ni
Atomic-force microscopy
Atomic force microscopy (AFM) is used to
analyze the topography of nanomaterials. The
attracted or repulsive forces between a
nanometer-sized fine tip (20–50 nm) or less
and the substance are measured using AFM
[19]. The AFM studies were used to analyze
the diameter of the nanoparticles and were
used to verify the morphology and size of the
synthesized [GT-Fe/Ni and Z-Fe/Ni] samples.
The high rough surface was formed by hills
and valleys shaped with a nano-rough texture
and homogenous distribution of NPs as
indicated in Figure 3. This roughness
enhances the capability of the NPs surface to
absorb the ions. The average size distribution
of particles of GT-Z-Fe/Ni synthesized iron
nanoparticles tested by AFM is an average
diameter of less than 8.243 nm, as shown in
Figure 3A, and Z-Fe/Ni had an average
diameter of less than 61.46 nm and no
agglomeration, as displayed in Figure 3B.
A B
A
P a g e | 1070 Green and chemical synthesis of bimetallic …
FIGURE 3 Atomic Force Microscopy (AFM) images of (A): GT-Z-Fe/Ni and (B): Z-Fe/Ni
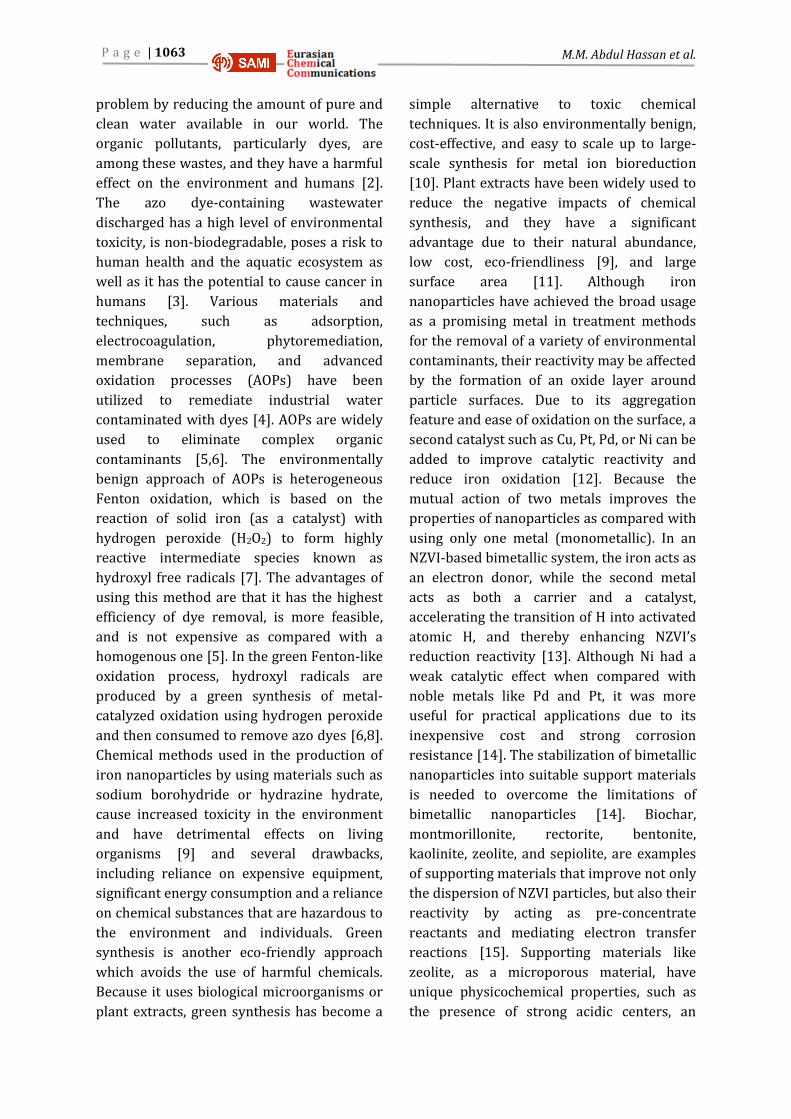
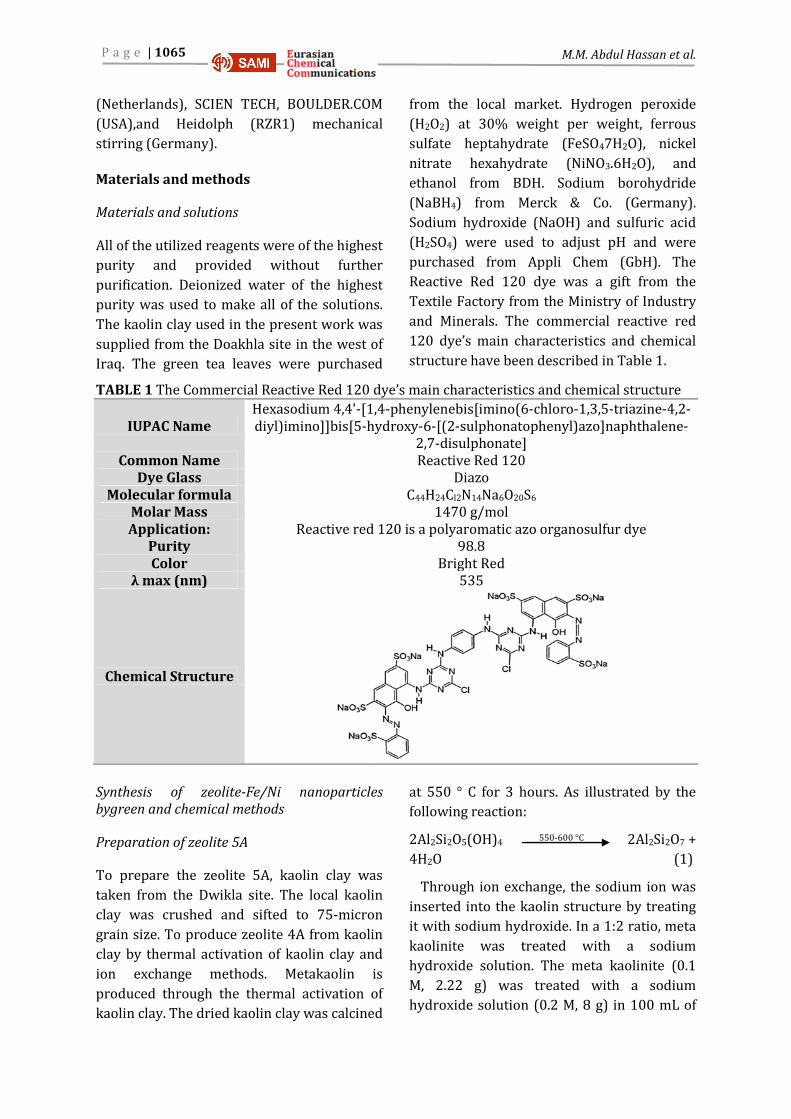
Energy-dispersive spectroscopy
The energy-dispersive spectroscopy (EDXS)
technique is a confirmatory technique for
verifying particle identification, chemical
classification, and the elemental composition
of nanoparticles can be determined. Figure
4depicts the energy dispersive X-Ray
spectroscopy (EDXS) spectrum of
nanoparticles, which offers information about
the synthesis of GT-Fe/Ni and Z-Fe/Ni NPs,
such as the location of atomic distribution on
the surface and chemical composition of (GT-
Z-Fe/Ni and Z-Fe/Ni) NPs. The intense peaks
of (Fe, Ni, C, O, Al, and Si), 3.05 wt%, 1.08
wt%, 50.00 wt%, 40.00 wt%, 2.98 wt%, and
2.88 wt%, respectively in the GT-Z-Fe/Ni NPs
and the intense peaks of (Fe, Ni, C, O, Ca, Al,
and Si), 2.04 wt%, 1.04 wt%, 12.92 wt%,
60.40 wt%, 3.67 wt%, 6.66 wt%, and 13.27
wt%, respectively in the analysis of Z-Fe/Ni
NPs. The discovery of adjoining elements like
C and O signals was primarily due to the
green tea extracts, C and O are organic
substances which play an important role in
the reduction and stabilization of GT-Fe/Ni
NPs [20,21].
FIGURE 4 EDAX of prepared (A)- GT-Z-Fe/Ni and (B)- Z-Fe/Ni NPs samples
X-Ray diffraction
The morphology of nanoparticles is widely
studied using X-ray diffraction. The
diffraction pattern produced by XRD is then
compared to data in a standard
crystallographic database. According to
Bragg’s law, the findings of an X-ray
diffraction test were used to calculate the d-
spacing of NPs. The relationship between
intensity and diffraction angle 2θ in Bragg’s
law (n = 2d sin θ) is depicted in the x-ray
diffraction figure. The Debye–Scherrer
equation (t = K λ/βc cos θ) is used to calculate
the crystallite size of a sample from the
FWHM of a diffraction peak broadening.
A B wt % Elem.
3.05 Fe
1.08 Ni 50.00 C 40.00 O 2.98 Al 2.88 Si
100 Sum
wt % Elem. 2.04 Fe
1.04 Ni 12.92 C 60.40 O 3.67 Ca 6.66 Al
13.27 Si 100 Sum
B
P a g e | 1071 M.M. Abdul Hassan et al.
Where the crystallite size is t, βc is the
FWHM, and (K) is the Scherrer’s constant,
which varies between 0.9 and 1.15 for
diffractions with varying crystallographic
Miller indices (hkl) of a cubic crystal lattice
and it is usually assumed to be 0.9 for cubic
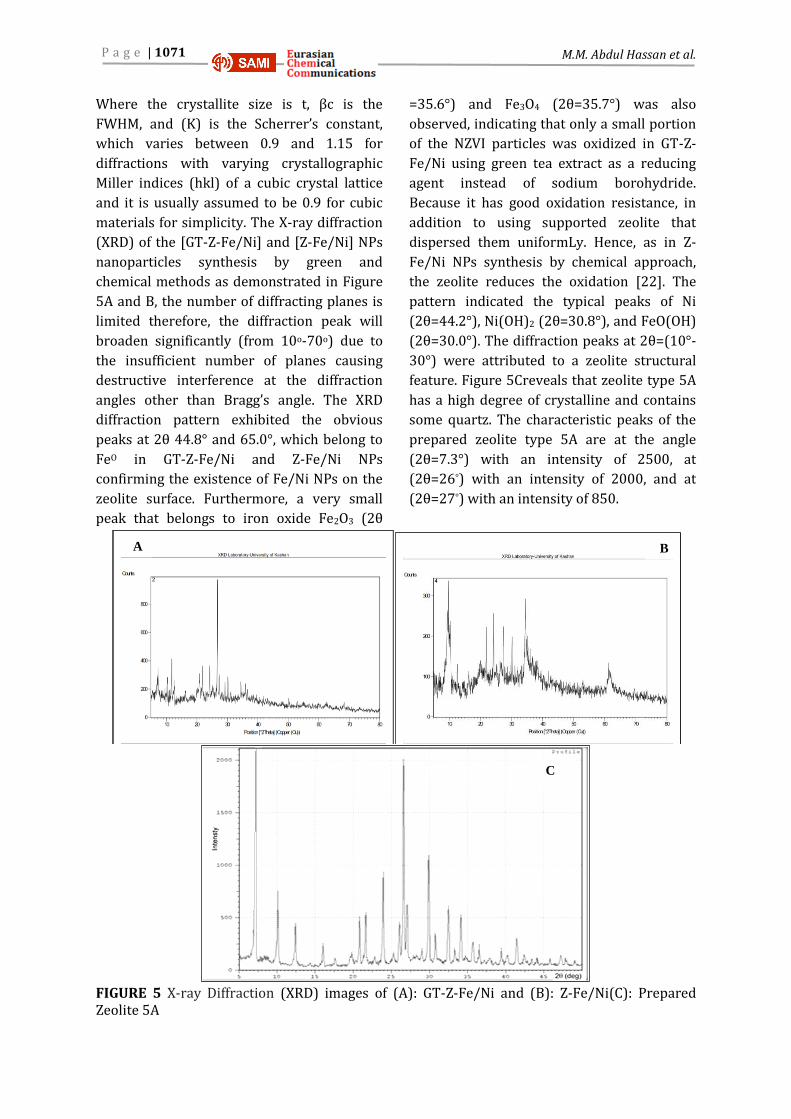
materials for simplicity. The X-ray diffraction
(XRD) of the [GT-Z-Fe/Ni] and [Z-Fe/Ni] NPs
nanoparticles synthesis by green and
chemical methods as demonstrated in Figure
5A and B, the number of diffracting planes is
limited therefore, the diffraction peak will
broaden significantly (from 10o-70o) due to
the insufficient number of planes causing
destructive interference at the diffraction
angles other than Bragg’s angle. The XRD
diffraction pattern exhibited the obvious
peaks at 2θ 44.8° and 65.0°, which belong to
FeO in GT-Z-Fe/Ni and Z-Fe/Ni NPs
confirming the existence of Fe/Ni NPs on the
zeolite surface. Furthermore, a very small
peak that belongs to iron oxide Fe2O3 (2θ
=35.6°) and Fe3O4 (2θ=35.7°) was also
observed, indicating that only a small portion
of the NZVI particles was oxidized in GT-Z-
Fe/Ni using green tea extract as a reducing
agent instead of sodium borohydride.
Because it has good oxidation resistance, in
addition to using supported zeolite that
dispersed them uniformLy. Hence, as in Z-
Fe/Ni NPs synthesis by chemical approach,
the zeolite reduces the oxidation [22]. The
pattern indicated the typical peaks of Ni
(2θ=44.2°), Ni(OH)2 (2θ=30.8°), and FeO(OH)
(2θ=30.0°). The diffraction peaks at 2θ=(10°-
30°) were attributed to a zeolite structural
feature. Figure 5Creveals that zeolite type 5A
has a high degree of crystalline and contains
some quartz. The characteristic peaks of the
prepared zeolite type 5A are at the angle
(2θ=7.3°) with an intensity of 2500, at
(2θ=26°) with an intensity of 2000, and at
(2θ=27°) with an intensity of 850.
FIGURE 5 X-ray Diffraction (XRD) images of (A): GT-Z-Fe/Ni and (B): Z-Fe/Ni(C): Prepared Zeolite 5A
A B
C

P a g e | 1072 Green and chemical synthesis of bimetallic …
Brunauer-Emmett-Teller (BET)
The specific surface area (BET), pore volume,
average pore size, and Languir surface area of
synthetic zeolite 5A and (GT-Z-Fe/Ni and Z-
Fe/Ni) nanoparticles are listed in Table 2.
When zeolite 5A was compared to zeolite
supported on Fe/Ni (GT-Z-Fe/Ni) and (Z-
Fe/Ni), the specific surface area decreased
from 221.10 m2/gto (18.47 and 32.72) m2/g,
pore volume decreased from 0.15 cm3/g to
(0.05 and 0.10) cm3/g and average pore size
increased from 2.73 nm to (11.54 and 12.76)
nm, respectively. The decrease in specific
surface area and pore volume was most
commonly caused by nanoscale Fe/Ni
particles loading zeolite pores, whereas the
increase in average pore size could be due to
micropore clogging [15]. When Fe/Ni
particles were loaded onto zeolite, they had a
significantly greater surface area, pore-
volume and decreased pore size, indicating
that zeolite played an important role in
dispersing Fe/Ni and therefore increasing the
surface area and active sites for reactivity
improvement. These bimetallic [GT-Z-Fe/Ni
and Z-Fe/Ni] nanoparticle results revealed an
improvement in nanoparticle structure
because the presence of zeolite leads to an
increase in surface area, which is one of the
most important factors in achieving high
catalyst performance, where the surface area
of the porous material is one of the most
significant parameters in determining its
properties and the activity of the
nanoparticles would be enhanced due to a
high surface-to-volume ratio. The pore
volume of nanomaterials produced with
zeolite was enhanced, too. As a result, these
sizes of pores provide more stability by acting
as a covering agent to prevent the extreme
reaction conditions of the nanoparticles’
active sites, which are largely dependent on
exposed pore channels due to their benefits
for material diffusion. In this analysis, the
pore size for GT-Z-Fe/Ni NPs was 11.54 nm
and 12.76 nm for Z-Fe/Ni NPs which can be
classified as mesopores according to the
classification of the international union of
pure and applied chemistry (IUPAC) that
categorized the process of classification of the
pore size as macropore (greater than 50 nm),
mesopore (2 to 50 nm), super-micropore (0.7
to 2 nm), and ultra-micropore (smaller than
0.7 nm) [23].Likewise, the results revealed
that the pore size of zeolite 5A ranged from˂
2- 50 nm which indicates that they have a
high percentage of mesopore in the zeolite
5A.
TABLE 2 The specific surface area (BET), pore-volume, average pore size, and Languir surface area of zeolite 5A and synthesis nanoparticles
Parameter Zeolite -5A GT-Z-Fe/Ni Z-Fe/Ni
BET (m2/g) 221.10 18.47 32.72 pore volume (cm3/g) 0.15 0.05 0.10
Pore size (nm) 2.73 11.54 12.76 Languir surface area (m2/g) 316.80 910.71 1,484.69
Pore volume Single point.cm3/g 0.151 0.05 0.10 Pore volume B JH accumulation cm3/g 0.06 0.12 0.24
Adsorption average pore size diameter nm 2.73 11.54 12.54 Average pore size B JH nm 6.31 10.83 12.54
Zeta potential analysis
The Zeta potential measurement provides an
important indicator for providing
information about the stability of particles.
The high zeta potential provides
nanoparticles with the stability they need to
prevent aggregation, whereas the lower
potential causes them to cluster together.
This method is further used to determine the
nanofluids’ stability. Figure 6 displays the
zeta potential value for the synthesis of

P a g e | 1073 M.M. Abdul Hassan et al.
bimetallic (GT-Z-Fe/Ni and Z-Fe/Ni)
nanoparticles by green and chemicals
methods (-259.04 and –49.81) mV,
respectively. The high negative zeta potential
values of GT-Z-Fe/Ni NPS were attributed to
the negative charge of green tea polyphenols.
This result demonstrates the presence of
polyphenols on the surface of nanoparticles.
The electrostatic repulsive interactions
between negatively charged nanoparticles
can prevent aggregation and hence improve
stability. In terms of nanoparticle stability in
environmental fluids, a zeta potential value of
greater than 60 mV or less than -60 mV
indicates excellent stability, a value of 40 to
60 mV or -60 to-40 mV signifies good
stability, a value of 30 to 40 mV or - 40 to -30
mV is stable, and a value ranging from -30 mV
to 30 mV is highly agglomerative [24].
FIGURE 6 Graphs of the zeta potential for synthesis nanoparticles A- [GT-Z-Fe/Ni] and B- [Z-Fe/Ni]
FT-IR spectroscopy
The Fourier-transform infrared spectroscopy
(FT-IR) spectrum was recorded in the range
of 400 to 4000 cm-1 for bimetallic [GT-Z-
Fe/Ni and Z-Fe/Ni] and zeolite, as depicted in
Figure 7. It is used to investigate the
functional groups attached to the surface of
the nanoparticles. The FT-IR spectra of
bimetallic [GT-Z-Fe/Ni] synthesized showed
broadband stretching vibrations of strong
group O-H observed in the band (3392.79)
cm-1, this belongs to polyphenol compounds
as shown in Figure 7A. Polyphenols can be
assumed as reducing and capping agents.
This indicates the presence of polyphenol
compounds in the synthesis of bimetallic GT-
Z-Fe/Ni NPs [21]. In bimetallic Z-Fe/Ni NPs, a
broadband stretching vibration of strong
group OH was observed at 3402.43 cm-1, as
well as a band of an O-H bending vibration of
Z-Fe/Ni at 1637.56 cm-1, which may belong to
the ethanol that keeps the NPs in Figure 7
(B).The absorption bands at 2900.94 cm-1 of
the C-H group and the bands at 1631.78 cm-1
reveal the presence of a C=O stretching
vibration of polyphenols; the bands at
1581.63 cm-1 of C=C aromatic ring stretching
and the band at 1429.25 cm-1 of C-H aromatic
stretching; the bands of 1346.31-1215.15 cm-
1 belong to O-H stretching and 1070.49 cm-1
denote the existence of a C-O-C symmetric
stretching vibration of polyphenols presence
in GT-Z-Fe/Ni [25]. The bands described
above belonged to the characteristic peaks of
green tea extracts. This indicates that the
effective components in green tea extracts
can be coated onto the surface of [GT-Z-
Fe/Ni] particles. Figure 7A demonstrates that
the presence and intensity of phenolic
compound peaks can reduce Fe, and are a
strong indicator of synthesized GT-Z-Fe/Ni
[6]. A small absorption band at 1006.86 cm-1
for C-O-C and a small absorption band at
470.36 cm-1 for Fe-O in Z-Fe/Ni NPs. This
indicates that a small portion of the NZVI
particles was oxidized in Z-Fe/Ni synthesis
chemically compared with G-Z-Fe/Ni
synthesis by the green methods. It was most
likely caused by a coordination reaction
between the oxygen atom’s lone pair of
electrons and the iron atom’s 3d space
A B

P a g e | 1074 Green and chemical synthesis of bimetallic …
orbital, which resulted in a decrease in the O-
H group’s electron cloud density and the
bond force constant, weakening the O-H
stretching vibration bond [22]. The new
bands appeared in GT-Z-Fe/Ni and Z-Fe/Ni at
(1029.99 and 1008.77 cm-1) and (1006.84 cm-
1), respectively, this may be attributed to the
bending vibration of Si-O vibrations, as
illustrated in Figure 7A and B. The absorption
peak near 759.95 cm-1 was caused by the
antisymmetric stretching vibration of Si-O-Si
in the zeolite of [GT-Z-Fe/Ni]. The bands at
578.64 cm-1, 534.28 cm-1, and 542.00 cm-1
indicate the presence of bending vibrations of
Si-O-Al and Si-O-Si in GT-Z-Fe/Ni, Z-Fe/Ni,
and zeolite, respectively. No new bands
at<900 cm-1were observed with (GT- Z-Fe/Ni
and Z-Fe/Ni) NPs indicating the slight
oxidation of NZVI on the surface of zeolite
[15]. In Figure 7C, the characteristic peaks at
(3437.15 and 1647.21) cm-1 were attributed
to the stretching and bending vibration of OH,
respectively and the band at 1029.99 cm-1
corresponded to the Si-O-Si anti-symmetric
stretching vibration. The band around
1006.84 cm-1 can be attributed to the
stretching vibration of Si_ O. The bands
observed at 688.59, 542.00 cm-1 were due to
quarts or amorphous SiO2 stretching
vibration and Si_O_Al bending mode [15].
FIGURE 7 FT-IR Spectroscopy of (A): GT-Z-Fe/Ni and (B): Z-Fe/Ni(C): Zeolite 5A
The optimum conditions for the removal of RR120 dye
The removal of RR120 dye from aqueous
solutions by GT-Z-Fe/Ni and Z-Fe/Ni in a
heterogeneous Fenton-like oxidation
experiments was carried out in an open
system, and the removal efficiency was
evaluated and determined under various
experimental conditions, such as H2O2
concentrations, doses of NPs, initial pH, initial
RR120 dye concentrations, and the effect of
temperature, which were used to determine
the RR120 dye removal efficiency
performance by using Equation 3 and
C
B A
P a g e | 1075 M.M. Abdul Hassan et al.
determine the optimum conditions for
removal.
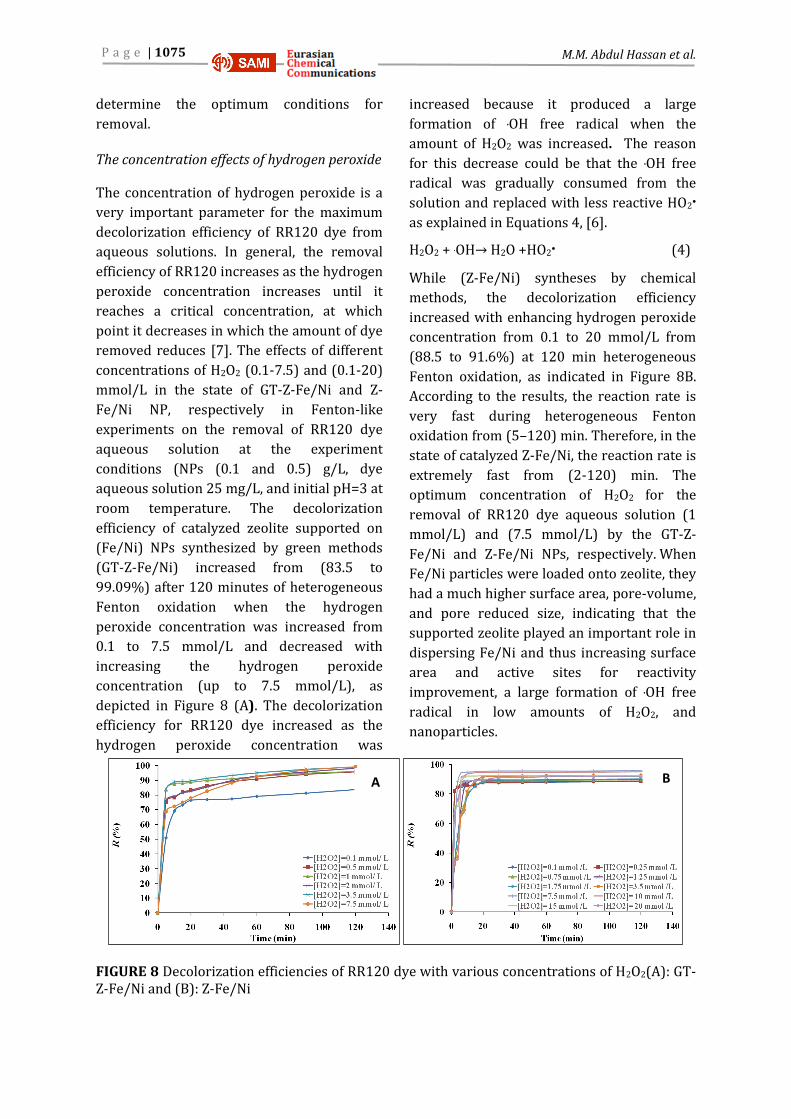
The concentration effects of hydrogen peroxide
The concentration of hydrogen peroxide is a
very important parameter for the maximum
decolorization efficiency of RR120 dye from
aqueous solutions. In general, the removal
efficiency of RR120 increases as the hydrogen
peroxide concentration increases until it
reaches a critical concentration, at which
point it decreases in which the amount of dye
removed reduces [7]. The effects of different
concentrations of H2O2 (0.1-7.5) and (0.1-20)
mmol/L in the state of GT-Z-Fe/Ni and Z-
Fe/Ni NP, respectively in Fenton-like
experiments on the removal of RR120 dye
aqueous solution at the experiment
conditions (NPs (0.1 and 0.5) g/L, dye
aqueous solution 25 mg/L, and initial pH=3 at
room temperature. The decolorization
efficiency of catalyzed zeolite supported on
(Fe/Ni) NPs synthesized by green methods
(GT-Z-Fe/Ni) increased from (83.5 to
99.09%) after 120 minutes of heterogeneous
Fenton oxidation when the hydrogen
peroxide concentration was increased from
0.1 to 7.5 mmol/L and decreased with
increasing the hydrogen peroxide
concentration (up to 7.5 mmol/L), as
depicted in Figure 8 (A). The decolorization
efficiency for RR120 dye increased as the
hydrogen peroxide concentration was
increased because it produced a large
formation of .OH free radical when the
amount of H2O2 was increased. The reason
for this decrease could be that the .OH free
radical was gradually consumed from the
solution and replaced with less reactive HO2•
as explained in Equations 4, [6].
H2O2 + .OH→ H2O +HO2• (4)
While (Z-Fe/Ni) syntheses by chemical
methods, the decolorization efficiency
increased with enhancing hydrogen peroxide
concentration from 0.1 to 20 mmol/L from
(88.5 to 91.6%) at 120 min heterogeneous
Fenton oxidation, as indicated in Figure 8B.
According to the results, the reaction rate is
very fast during heterogeneous Fenton
oxidation from (5–120) min. Therefore, in the
state of catalyzed Z-Fe/Ni, the reaction rate is
extremely fast from (2-120) min. The
optimum concentration of H2O2 for the
removal of RR120 dye aqueous solution (1
mmol/L) and (7.5 mmol/L) by the GT-Z-
Fe/Ni and Z-Fe/Ni NPs, respectively. When
Fe/Ni particles were loaded onto zeolite, they
had a much higher surface area, pore-volume,
and pore reduced size, indicating that the
supported zeolite played an important role in
dispersing Fe/Ni and thus increasing surface
area and active sites for reactivity
improvement, a large formation of .OH free
radical in low amounts of H2O2, and
nanoparticles.
FIGURE 8 Decolorization efficiencies of RR120 dye with various concentrations of H2O2(A): GT-Z-Fe/Ni and (B): Z-Fe/Ni
B A
P a g e | 1076 Green and chemical synthesis of bimetallic …
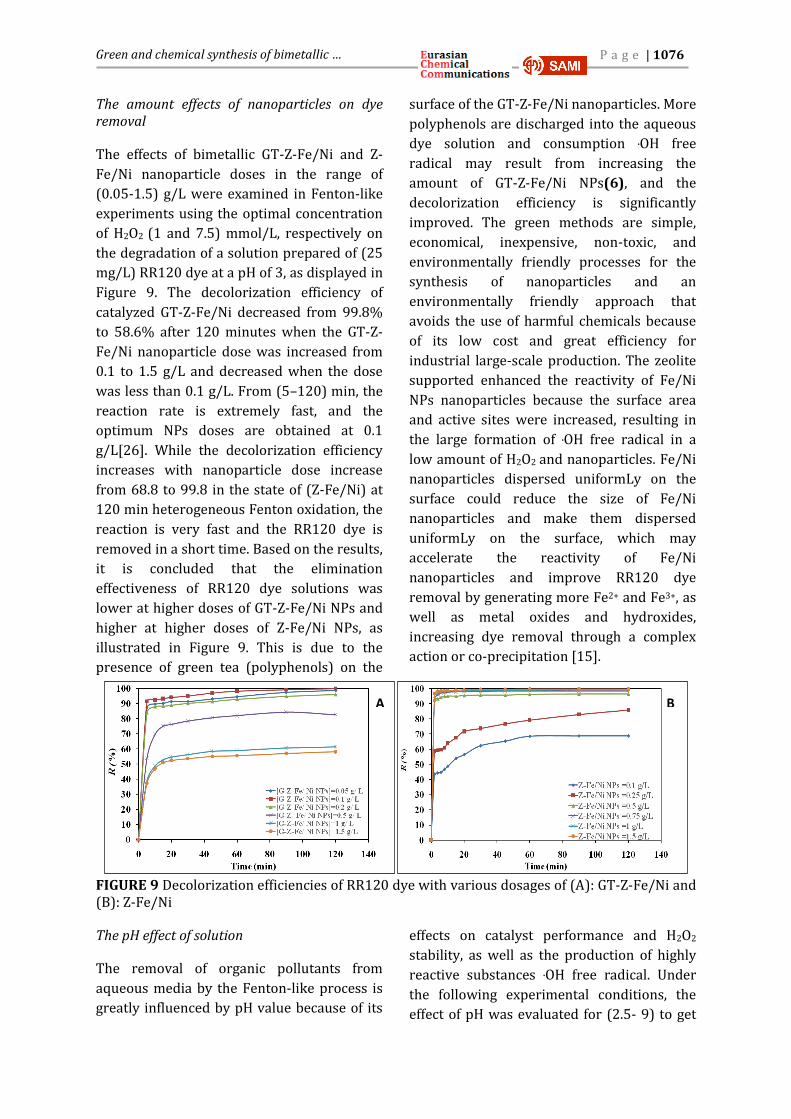
The amount effects of nanoparticles on dye removal
The effects of bimetallic GT-Z-Fe/Ni and Z-
Fe/Ni nanoparticle doses in the range of
(0.05-1.5) g/L were examined in Fenton-like
experiments using the optimal concentration
of H2O2 (1 and 7.5) mmol/L, respectively on
the degradation of a solution prepared of (25
mg/L) RR120 dye at a pH of 3, as displayed in
Figure 9. The decolorization efficiency of
catalyzed GT-Z-Fe/Ni decreased from 99.8%
to 58.6% after 120 minutes when the GT-Z-
Fe/Ni nanoparticle dose was increased from
0.1 to 1.5 g/L and decreased when the dose
was less than 0.1 g/L. From (5–120) min, the
reaction rate is extremely fast, and the
optimum NPs doses are obtained at 0.1
g/L[26]. While the decolorization efficiency
increases with nanoparticle dose increase
from 68.8 to 99.8 in the state of (Z-Fe/Ni) at
120 min heterogeneous Fenton oxidation, the
reaction is very fast and the RR120 dye is
removed in a short time. Based on the results,
it is concluded that the elimination
effectiveness of RR120 dye solutions was
lower at higher doses of GT-Z-Fe/Ni NPs and
higher at higher doses of Z-Fe/Ni NPs, as
illustrated in Figure 9. This is due to the
presence of green tea (polyphenols) on the
surface of the GT-Z-Fe/Ni nanoparticles. More
polyphenols are discharged into the aqueous
dye solution and consumption .OH free
radical may result from increasing the
amount of GT-Z-Fe/Ni NPs(6), and the
decolorization efficiency is significantly
improved. The green methods are simple,
economical, inexpensive, non-toxic, and
environmentally friendly processes for the
synthesis of nanoparticles and an
environmentally friendly approach that
avoids the use of harmful chemicals because
of its low cost and great efficiency for
industrial large-scale production. The zeolite
supported enhanced the reactivity of Fe/Ni
NPs nanoparticles because the surface area
and active sites were increased, resulting in
the large formation of .OH free radical in a
low amount of H2O2 and nanoparticles. Fe/Ni
nanoparticles dispersed uniformLy on the
surface could reduce the size of Fe/Ni
nanoparticles and make them dispersed
uniformLy on the surface, which may
accelerate the reactivity of Fe/Ni
nanoparticles and improve RR120 dye
removal by generating more Fe2+ and Fe3+, as
well as metal oxides and hydroxides,
increasing dye removal through a complex
action or co-precipitation [15].
FIGURE 9 Decolorization efficiencies of RR120 dye with various dosages of (A): GT-Z-Fe/Ni and (B): Z-Fe/Ni
The pH effect of solution
The removal of organic pollutants from
aqueous media by the Fenton-like process is
greatly influenced by pH value because of its
effects on catalyst performance and H2O2
stability, as well as the production of highly
reactive substances .OH free radical. Under
the following experimental conditions, the
effect of pH was evaluated for (2.5- 9) to get
B A
A

P a g e | 1077 M.M. Abdul Hassan et al.
the optimum pH for dye degradation, [RR120
dye] = 25 at the optimum concentrations of
[H2O2] = (1 and 7.5) and dosages for
bimetallic [GT-Z-Fe/Ni] and [Z-Fe/Ni] NPS
(0.1 and 0.5) g/L, respectively, at room
temperature. After 120 min of Fenton-like
oxidation reactions catalyzed by bimetallic
[GT-Z-Fe/Ni and Z-Fe/Ni] nanoparticles, the
RR120 dye removal efficiency at various pH
was (100, 99.8, 17.6, 10, 9.8, and 5) and (96.6,
96.6, 94, 92.7, 92, and 83.9%), respectively.
From the results for bimetallic [GT-Z-Fe/Ni
and Z-Fe/Ni], then the noparticles indicated
that there was an increase in the
decolorization efficiency of RR120 dye with a
decrease in aqueous pH and a decrease in the
decolorization efficiency of RR120 dye with
an increase in pH aqueous solution, with the
best removal performance of the RR120 dye
occurring at pH 2.5 and 3, with decolorization
efficiencies of 100 and 99.8% and 96.6 and
96.6% in RR120 dye, respectively. When
bimetallic [GT-Z-Fe/Ni] and [Z-Fe/Ni] are
oxidized in solutions with low pH values,
ferrous hydroxide clogs the nano iron surface,
resulting in this behavior [26]. The reason for
this behavior is related to a Fenton-like
mechanism and the production of •OH free
radical. At low pH values, the reaction
between Fe0 in Fe/Ni NPs and H2O2 is
accelerated at low pH values to produce Fe+2.
These ions surround the surface and react
with H2O2 to generate •OH free radical, as
illustrated in the following Equations (5-9),
[27].
Fe0→Fe2++ 2e- (5)
Fe0 + 2H+→ Fe2++ H2 (6)
Fe2++ H2O2 → Fe3+ + HO•+ HO- (7)
HO• + dye → oxidized dye + H2O (8)
2Fe3++ Fe0→ 3Fe2+ (9)
Furthermore, the high acidic medium at pH
levels below 2.5 resulted in an excess of H+
ions, which contributed to a decrease in the
number of highly reactive .OH free radical
and, as a result, a decrease in removal
efficiency. The decrease in •OH free radical
results in the inability to convert Fe+3into Fe+2
efficiently. Additionally, because ferrous ions
and hydrogen peroxide are unstable at higher
pH values (values above 4), the catalyst
would precipitate and form complex by-
products (ferric hydroxo complexes), causing
the H2O2 to decompose and lowering the
removal effectiveness (6). At these higher pH
values, the elimination of RR120 dye was
completed by coagulation or sorption instead
of oxidation. The influence of a solution’s
initial pH on RR120 dye adsorption by
bimetallic [GT-Z-Fe/Ni and Z-Fe/Ni]
nanoparticles was illustrated in Figures 10A
and B. According to the research results,
higher RR120 dye adsorption could be due to
two causes: (1) At pH=3, the H+ concentration
in the solution was extremely high, increasing
the electrostatic attraction between the H+
solution and the adsorbent, [23].The degree
of ionization, the surface load of the sorbent,
and the adsorbate classes can be influenced
by pH. This could be attributed to the reason
that at low pH, the Fe/Ni NPs surface has a
positive charge, whereas dye molecules with
a sulfuric group (SO3) have a negative charge,
attracting the NZVI particles. They discovered
that decolorization significantly improved the
pH of acidic solutions. The reaction rate of the
RR120 dye removal in the state of GT-Z-Fe/Ni
nanoparticles is extremely rapid (5 to 120)
min and this catalyst only operates in an
acidic medium and not with a pH greater than
3, as displayed in Figure 10A. While in the
state of Z-Fe/Ni nanoparticles, the reaction is
very fast, removing the RR120 dye in 2 to 120
min. It works well in acidic media, neutral
and basic solutions, but not in solutions with
a pH greater than 9, and the best pH values
are 2.5 and 3, as demonstrated in Figure 10B.
Both catalysts do not work in (pH less than
2.5), and when the original solution pH was
lower, more H+ was consumed during RR120
removal. H+ could prevent the formation of
the oxide layer on the surface of NPs,
revealing more active sites and increasing the
removal rate [15].
P a g e | 1078 Green and chemical synthesis of bimetallic …
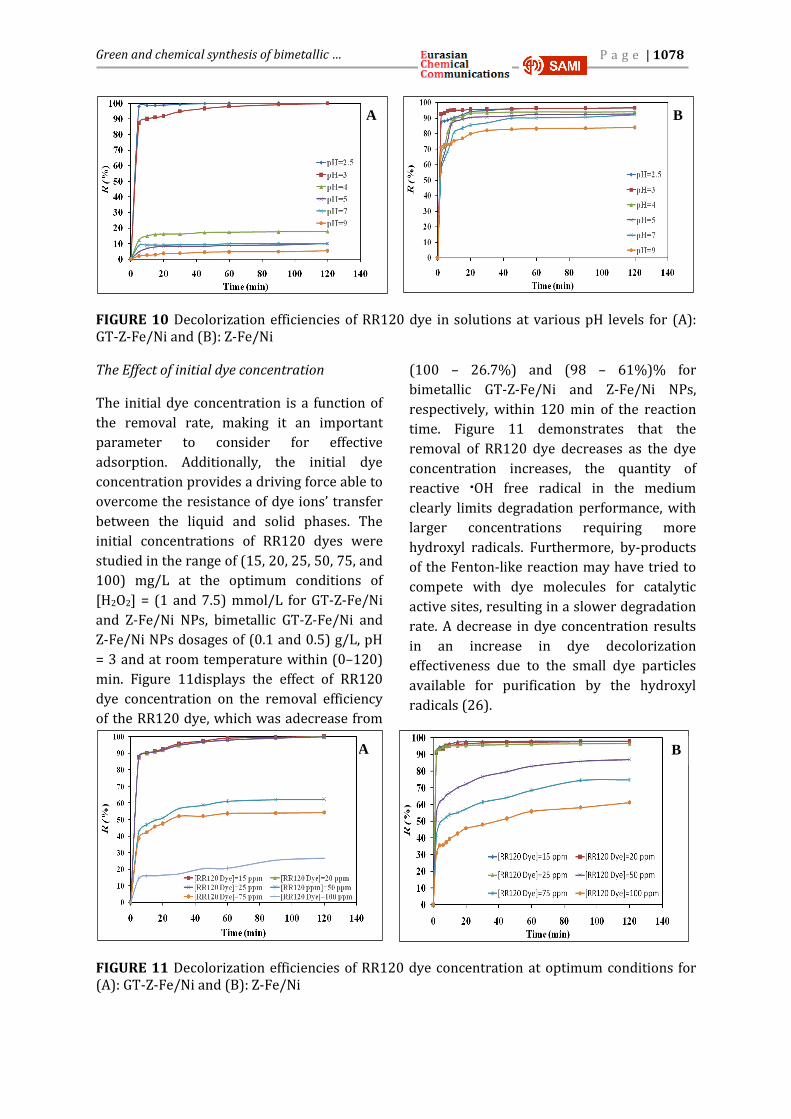
FIGURE 10 Decolorization efficiencies of RR120 dye in solutions at various pH levels for (A): GT-Z-Fe/Ni and (B): Z-Fe/Ni
The Effect of initial dye concentration
The initial dye concentration is a function of
the removal rate, making it an important
parameter to consider for effective
adsorption. Additionally, the initial dye
concentration provides a driving force able to
overcome the resistance of dye ions’ transfer
between the liquid and solid phases. The
initial concentrations of RR120 dyes were
studied in the range of (15, 20, 25, 50, 75, and
100) mg/L at the optimum conditions of
[H2O2] = (1 and 7.5) mmol/L for GT-Z-Fe/Ni
and Z-Fe/Ni NPs, bimetallic GT-Z-Fe/Ni and
Z-Fe/Ni NPs dosages of (0.1 and 0.5) g/L, pH
= 3 and at room temperature within (0–120)
min. Figure 11displays the effect of RR120
dye concentration on the removal efficiency
of the RR120 dye, which was adecrease from
(100 – 26.7%) and (98 – 61%)% for
bimetallic GT-Z-Fe/Ni and Z-Fe/Ni NPs,
respectively, within 120 min of the reaction
time. Figure 11 demonstrates that the
removal of RR120 dye decreases as the dye
concentration increases, the quantity of
reactive •OH free radical in the medium
clearly limits degradation performance, with
larger concentrations requiring more
hydroxyl radicals. Furthermore, by-products
of the Fenton-like reaction may have tried to
compete with dye molecules for catalytic
active sites, resulting in a slower degradation
rate. A decrease in dye concentration results
in an increase in dye decolorization
effectiveness due to the small dye particles
available for purification by the hydroxyl
radicals (26).
FIGURE 11 Decolorization efficiencies of RR120 dye concentration at optimum conditions for (A): GT-Z-Fe/Ni and (B): Z-Fe/Ni
A B
A B

P a g e | 1079 M.M. Abdul Hassan et al.
Effect of temperature
The effect of Fenton-like oxidation reactions
on the removal efficiency of RR120 dye (100
mg/L) was studied at temperatures ranging
from (30 to 50) °C. The tests were carried out
to examine the removal of dye at the
optimum conditions of [H2O2] = (1 and 7.5)
mmol/L, bimetallic nanoparticle dosages of
(0.1 and 0.5) g/L for [GT-Z-Fe/Ni] and [Z-
Fe/Ni] NPs, respectively and pH=3. The
decolorization efficiency of the processes
catalyzed by GT-Z-Fe/Ni and Z-Fe/Ni NPS
increased from (26.7 to 97.4 and 99.8) and
(61 to 70 and 90%), respectively, when the
temperature was raised from 30-50 °C. The
best temperature for the degradation of
RR120 dye is between (40-50) °C for
bimetallic GT-Z-Fe/Ni nanoparticles and (50)
°C for Z-Fe/Ni nanoparticles. The removal
percentage increased as the temperature
increased from (30 to 50) °C[26]. This could
be because greater temperatures tend to
increase the oxidation reaction rate between
the catalyst and H2O2, leading to an increase
in the production rate of .OH free radical or
high valence iron species. High temperatures
can provide more energy to reactant
molecules, allowing them to overcome the
energy required for reaction activation
[6,26,28].
FIGURE 12 Decolorization efficiencies of RR120 dye in solutions at various temperatures. (A): GT-Z-Fe/Ni and (B): Z-Fe/Ni
Kinetics of RR120 dye removal by fenton-like process
Three kinetic models for RR120 dye
decolorization kinetic rates by the Fenton-
like oxidation reaction were used to calculate
the decolorization rate constants using the
linear forms of the first-order, the second-
order [5,29], and Behnajady-Modirshahla-
Ghanbary (BMG) models [20,23], as shown in
Equations 10-12, respectively. The value of
the rate constant k1 for first-order (min-1) was
calculated from the slope of the graph
between Ln C◦/Ctand time (t) according to
Equation 10. Besides, the values of k2 for
second-order (L/(mol. min) were obtained
from the slope of the plot between 1/Ctand t
according to Equation 11. The concentration
of the RR120 dye (C0 and Ct) at times 0 and t,
respectively.
Ln C◦/Ct =K1t First - order (10)
1/Ct–1/C◦=K2t Second-order (11)
t/[1-(Ct/C◦]=m+bt BMG models (12)
The rate constant K1 increases with the
increase of H2O2 concentration, the dosage of
NPs, and temperature and decreases with the
increase of initial RR120 dye concentration
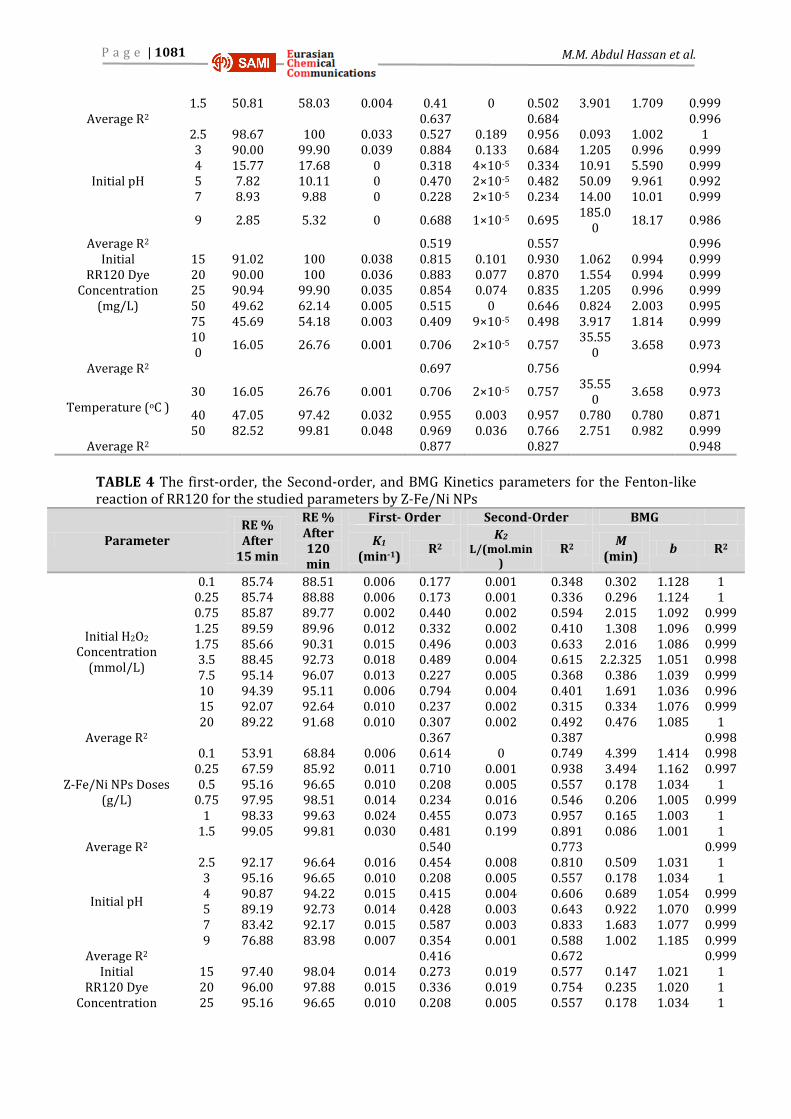
and pH. Tables 3 and 4 show the parameters
of the model for bimetallic GT-Z-Fe/Ni and Z-
Fe/Ni NPs with the corresponding correlation
coefficient for each factor. From the result,
the first order was not fitted for degradation
of RR120 dye by the Fenton-like oxidation
A B

P a g e | 1080 Green and chemical synthesis of bimetallic …
reaction due to having low values for the
regression coefficient R2compared with other
kinetic models for each NPs. In bimetallic GT-
Z-Fe/Ni, the decolorization kinetic rate
constant K2 of RR120 dye catalyzed by the
Fenton-like oxidation reaction increased with
increasing H2O2 and temperature because of
the thermal decomposition of H2O2, the rate
of degradation was increased at a
temperature higher than 313 K and
decreased with increasing (the dosage of GT-
Z-Fe/Ni NPs, pH, and the concentration of
RR120 dye) increases. Based on the results, it
is evident that the linear fitting value of the
regression coefficient R2 for the second-order
is higher than R2 for first-order, which
indicates that the second-order kinetic model
is well fitted for RR120 dye kinetic
degradation by a Fenton-like process
catalyzed by GT-Z-Fe/Ni-NPs [7]. The second-
order model fits the degradation of the
RR120 dye by the Fenton-like reaction by
using bimetallic nanoparticles (Z-Fe/Ni)
synthesis by chemical methods, as well.
The Behnajady-Modirshahla-Ghanbary (BMG)
kinetic model for RR120 dye decolorization
kinetic rates by the Fenton-like oxidation
reaction at different conditions was
calculated from a line of t/[1-(C t/C o)] vs. t
values in a straight line with a slope m (min)
and an intercept b in the BMG model
Equation 12. In the Fenton-like oxidation
process by GT-Z-Fe/Ni NPs, show decrease or
increase in the values of m, but the values of b
decrease with increasing the concentration of
H2O2 and with increasing the dosage of
nanoparticles, as well as the m and b values
increased at various pH. As the initial
concentration of RR120 dye increased, the
values of m and b increased. A Fenton-like
process was used at a different temperature
that reduced the parameters m and b. The
BMG kinetic model has a higher correlation
coefficient R2 value than the other models
indicating that it fits the experimental data
better, as observed in Table 3. In the Fenton-
like oxidation process by Z-Fe/Ni NPs, the
values of m increased with the concentration
of H2O2 increasing from 0.1 to10 mmol/L and
began to gradually decrease after the
concentration of H2O2 increased from 15 to
20 mmol/L. The values of the b parameter
decrease with an increase in the
concentration of H2O2 from 0.1 to 20 mmol/L,
the m and b values increased at different pH,
as well as, with the concentration of RR120
dye increased, the values of m and b
increased. While the m and b values
decreased as the temperature rose from 30 to
50 °C. Furthermore, depending on the RR120
removal regression coefficient values, the
BMG kinetic model has a higher correlation
coefficient R2 value than other models and fits
the experimental data, as indicated in Table 4.
TABLE 3 The first-order, the Second-order, and BMG Kinetics parameters for the Fenton-like reaction of RR120 for the studied parameters by GT-Z-Fe/Ni NPs
Parameters RE %
After 15 min
RE % After
120 min
First- Order Second-Order BMG
K1 (min-1)
R2 K2
L/(mol.min)
R2 m
(min) B R2
Initial H2O2 Concentration
(mmol / L)
0.1 73.23 83.75 0.011 0.526 0.001 0.737 2.923 1.193 0.998 0.5 81.91 95.57 0.018 0.743 0.006 0.982 2.476 1.039 0.999 1 87.88 95.89 0.016 0.573 0.006 0.947 1.455 1.043 0.999 2 81.35 98.15 0.025 0.868 0.014 0.862 2.901 1.011 0.998
3.5 89.27 98.72 0.025 0.777 0.020 0.870 1.647 1.010 0.999 7.5 74.96 99.09 0.032 0.954 0.027 0.747 4.301 0.991 0.996
Average R2 0.740 0.857 0.998
GT-Z-Fe/Ni NPs Doses (g/L)
0.05 89.94 98.51 0.023 0.710 0.018 0.896 1.674 1.007 0.999 0.1 93.14 99.90 0.037 0.842 0.132 0.680 0.995 0.998 0.999
0.25 88.18 96.00 0.030 0.921 0.008 0.793 1.455 1.043 0.999 0.5 74.99f 82.60 0.009 0.492 0.001 0.672 4.475 1.059 0.980
1 52.66 61.41 0.004 0.444 0 0.559 3.977 1.608 0.999
P a g e | 1081 M.M. Abdul Hassan et al.
1.5 50.81 58.03 0.004 0.41 0 0.502 3.901 1.709 0.999 Average R2 0.637 0.684 0.996
Initial pH
2.5 98.67 100 0.033 0.527 0.189 0.956 0.093 1.002 1 3 90.00 99.90 0.039 0.884 0.133 0.684 1.205 0.996 0.999 4 15.77 17.68 0 0.318 4×10⁻⁵ 0.334 10.91 5.590 0.999 5 7.82 10.11 0 0.470 2×10⁻⁵ 0.482 50.09 9.961 0.992 7 8.93 9.88 0 0.228 2×10⁻⁵ 0.234 14.00 10.01 0.999
9 2.85 5.32 0 0.688 1×10⁻⁵ 0.695 185.0
0 18.17 0.986
Average R2 0.519 0.557 0.996 Initial
RR120 Dye Concentration
(mg/L)
15 91.02 100 0.038 0.815 0.101 0.930 1.062 0.994 0.999 20 90.00 100 0.036 0.883 0.077 0.870 1.554 0.994 0.999 25 90.94 99.90 0.035 0.854 0.074 0.835 1.205 0.996 0.999 50 49.62 62.14 0.005 0.515 0 0.646 0.824 2.003 0.995
75 45.69 54.18 0.003 0.409 9×10⁻⁵ 0.498 3.917 1.814 0.999 100
16.05 26.76 0.001 0.706 2×10⁻⁵ 0.757 35.55
0 3.658 0.973
Average R2 0.697 0.756 0.994
Temperature (oC ) 30 16.05 26.76 0.001 0.706 2×10⁻⁵ 0.757
35.550
3.658 0.973
40 47.05 97.42 0.032 0.955 0.003 0.957 0.780 0.780 0.871 50 82.52 99.81 0.048 0.969 0.036 0.766 2.751 0.982 0.999
Average R2 0.877 0.827 0.948
TABLE 4 The first-order, the Second-order, and BMG Kinetics parameters for the Fenton-like reaction of RR120 for the studied parameters by Z-Fe/Ni NPs
Parameter RE % After
15 min
RE % After 120 min
First- Order Second-Order BMG
K1 (min-1)
R2 K2
L/(mol.min)
R2 M
(min) b R2
Initial H2O2 Concentration
(mmol/L)
0.1 85.74 88.51 0.006 0.177 0.001 0.348 0.302 1.128 1 0.25 85.74 88.88 0.006 0.173 0.001 0.336 0.296 1.124 1 0.75 85.87 89.77 0.002 0.440 0.002 0.594 2.015 1.092 0.999 1.25 89.59 89.96 0.012 0.332 0.002 0.410 1.308 1.096 0.999 1.75 85.66 90.31 0.015 0.496 0.003 0.633 2.016 1.086 0.999 3.5 88.45 92.73 0.018 0.489 0.004 0.615 2.2.325 1.051 0.998 7.5 95.14 96.07 0.013 0.227 0.005 0.368 0.386 1.039 0.999 10 94.39 95.11 0.006 0.794 0.004 0.401 1.691 1.036 0.996 15 92.07 92.64 0.010 0.237 0.002 0.315 0.334 1.076 0.999 20 89.22 91.68 0.010 0.307 0.002 0.492 0.476 1.085 1
Average R2 0.367 0.387 0.998
Z-Fe/Ni NPs Doses (g/L)
0.1 53.91 68.84 0.006 0.614 0 0.749 4.399 1.414 0.998 0.25 67.59 85.92 0.011 0.710 0.001 0.938 3.494 1.162 0.997 0.5 95.16 96.65 0.010 0.208 0.005 0.557 0.178 1.034 1
0.75 97.95 98.51 0.014 0.234 0.016 0.546 0.206 1.005 0.999 1 98.33 99.63 0.024 0.455 0.073 0.957 0.165 1.003 1
1.5 99.05 99.81 0.030 0.481 0.199 0.891 0.086 1.001 1 Average R2 0.540 0.773 0.999
Initial pH
2.5 92.17 96.64 0.016 0.454 0.008 0.810 0.509 1.031 1 3 95.16 96.65 0.010 0.208 0.005 0.557 0.178 1.034 1 4 90.87 94.22 0.015 0.415 0.004 0.606 0.689 1.054 0.999 5 89.19 92.73 0.014 0.428 0.003 0.643 0.922 1.070 0.999 7 83.42 92.17 0.015 0.587 0.003 0.833 1.683 1.077 0.999 9 76.88 83.98 0.007 0.354 0.001 0.588 1.002 1.185 0.999
Average R2 0.416 0.672 0.999 Initial
RR120 Dye Concentration
15 97.40 98.04 0.014 0.273 0.019 0.577 0.147 1.021 1 20 96.00 97.88 0.015 0.336 0.019 0.754 0.235 1.020 1 25 95.16 96.65 0.010 0.208 0.005 0.557 0.178 1.034 1
P a g e | 1082 Green and chemical synthesis of bimetallic …
(mg/L) 50 70.27 86.96 0.012 0.704 0.001 0.930 3057 1.37 0.998
75 55.28 74.90 0.008 0.708 0 0.887 5.218 1.317 0.995
100 42.65 61.31 0.005 0.712 0 0.841 7.993 1.617 0.994 Average R2 0.490 0.757 0.997
Temperature (oC )
30 42.65 61.31 0.005 0.712 0 0.841 7.993 1.161 0.994 40 42.80 70.38 0.007 0.599 0 0.756 4.108 1.393 0.998 50 79.40 90.03 0.011 0.558 0 0.872 1.624 1.104 0.999
Average R2 0.623 0.823 0.997
Thermodynamic of dye removal by Fenton-like process
The thermodynamic parameters of enthalpy
(∆H°), entropy (∆S°), and Gibbs free energy
(∆G°) were calculated [2,5,20] using
Equations 13 to 15 depending on the removal
of RR120 dye by Fenton-like oxidation
reaction using (GT-Z-Fe/Ni and Z-Fe/Ni) NPs
at 303, 313, and 323 K, as listed in Table 5.
Kd = (C0 -Ce)/Ce× (v/m) (13)
∆G°=-RT ln Kd = ∆H° -T ∆S° (14)
Ln Kd=(∆S°)/R – (∆H°/RT) (15)
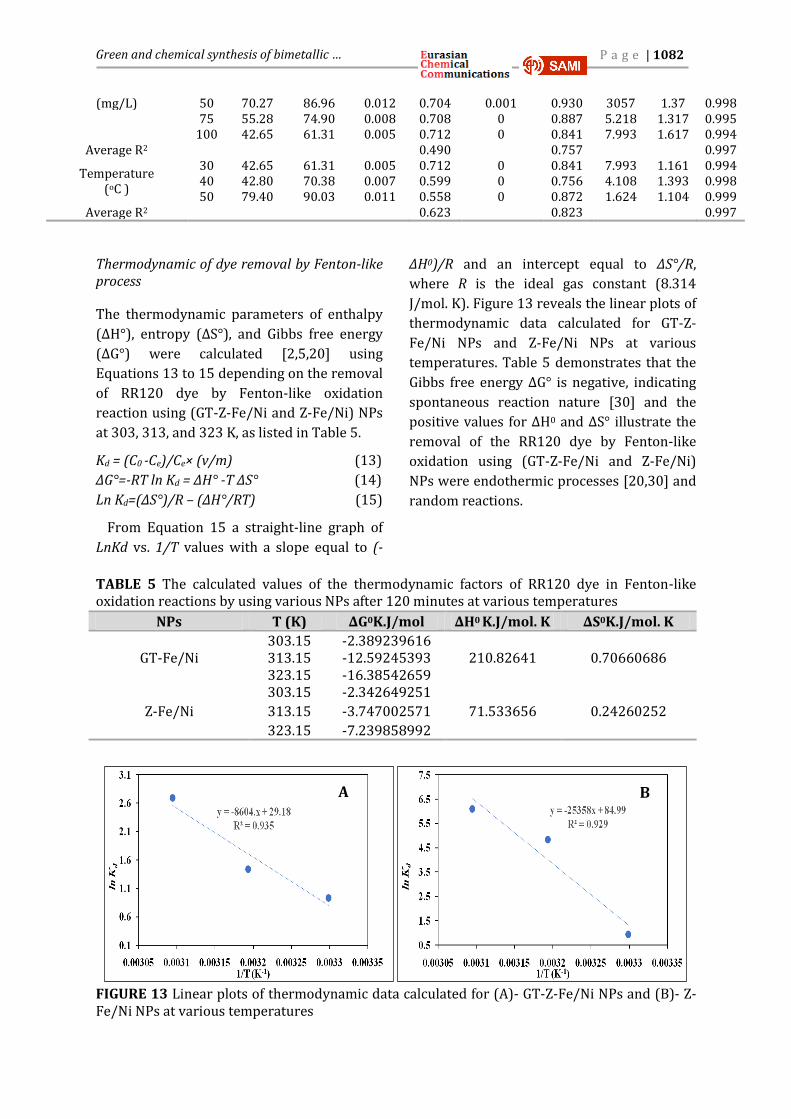
From Equation 15 a straight-line graph of
LnKd vs. 1/T values with a slope equal to (-
∆H0)/R and an intercept equal to ∆S°/R,
where R is the ideal gas constant (8.314
J/mol. K). Figure 13 reveals the linear plots of
thermodynamic data calculated for GT-Z-
Fe/Ni NPs and Z-Fe/Ni NPs at various
temperatures. Table 5 demonstrates that the
Gibbs free energy ∆G° is negative, indicating
spontaneous reaction nature [30] and the
positive values for ∆H0 and ∆S° illustrate the
removal of the RR120 dye by Fenton-like
oxidation using (GT-Z-Fe/Ni and Z-Fe/Ni)
NPs were endothermic processes [20,30] and
random reactions.
TABLE 5 The calculated values of the thermodynamic factors of RR120 dye in Fenton-like oxidation reactions by using various NPs after 120 minutes at various temperatures
FIGURE 13 Linear plots of thermodynamic data calculated for (A)- GT-Z-Fe/Ni NPs and (B)- Z-Fe/Ni NPs at various temperatures
NPs T (K) ∆G0K.J/mol ∆H0 K.J/mol. K ∆S0K.J/mol. K
GT-Fe/Ni 303.15 -2.389239616
210.82641 0.70660686 313.15 -12.59245393 323.15 -16.38542659
Z-Fe/Ni
303.15 -2.342649251
71.533656 0.24260252 313.15 -3.747002571
323.15 -7.239858992
A B

P a g e | 1083 M.M. Abdul Hassan et al.
Comparison of decolorization efficiency by using different reaction mechanisms
The efficiency of decolorization employing
various reaction processes is compared as
indicated in Figure 14. At the optimum
conditions, the efficiency of RR120 dye
removal in an aqueous solution was
examined as heterogeneous Fenton-like
oxidation reaction and absorbance catalyst by
various catalysts, such as (GT-Z-Fe/Ni), (Z-
Fe/Ni), and zeolite 5A. The decolorization
efficiency of RR120 dye by Fenton-like
oxidation processes and adsorbent processes
without using H2O2by GT-Z-Fe/Ni NPs was
99.90% and 6.30%, respectively, at room
temperature. In contrast, the decolorization
efficiency of RR120 dye by Fenton-like
oxidation processes and adsorbent processes
using GT-Z-Fe/Ni NPs was 96.65 and 91.26%,
respectively, at room temperature, as
reported in Table 6. At optimum conditions,
the decolorization efficiency of RR120 dye by
zeolite 5A was studied as an adsorbent
catalyst and was (28%). The difference in
removal efficiency indicates that the
reactivity of bimetallic GT-Z-Fe/Ni and Z-
Fe/Ni with and without H2O2 varied
significantly. This is usually due to their
morphology and reaction mechanisms. The
removal efficiency of RR120 dye utilizing GT-
Z-Fe/Ni and Z-Fe/Ni with the Fenton-like
oxidation reaction was higher than the
removal efficiency by adsorption processes
without using H2O2. Furthermore, the
removal efficiency of Z-Fe/Ni NPs by
adsorption processes was greater than GT-Z-
Fe/Ni NPs and zeolite. This confirms that the
presence of zeolite as a support material
caused the dispersion and stabilization of
nanoparticles and further enhanced the
reactivity of Fe/Ni NPs. Due to an increase in
the surface area, active sites, and large
formation of .OH free radical in the low
amount of H2O2concentration [6,31]. When
using the Fenton-like oxidation processes, the
decolorization rates were much higher.
Additionally, .OH free radicals are formed
when Fe0 on the surface of GT-Z-Fe/Ni or Z-
Fe/Ni reacts with H2O2 to produce Fe+2. When
Fe+2 is oxidized by H2O2 and converted into
Fe+3, it accelerates the breakdown of H2O2 and
produces highly reactive hydroxyl free
radicals. Furthermore, when Fe+3 reacts with
H2O2, it produces fewer reactive
hydroperoxyl radicals (HOO.).OH[32].In order
to maintain a cycle for the generation of .OH
free radical in severe reactions continuing,
Fe+3 is reduced to Fe+2. Finally, the RR120 dye
molecules on the surface of GT-Z-Fe/Ni or Z-
Fe/Ni are attacked by .OH free radical,
resulting in RR120 dye degradation into CO2
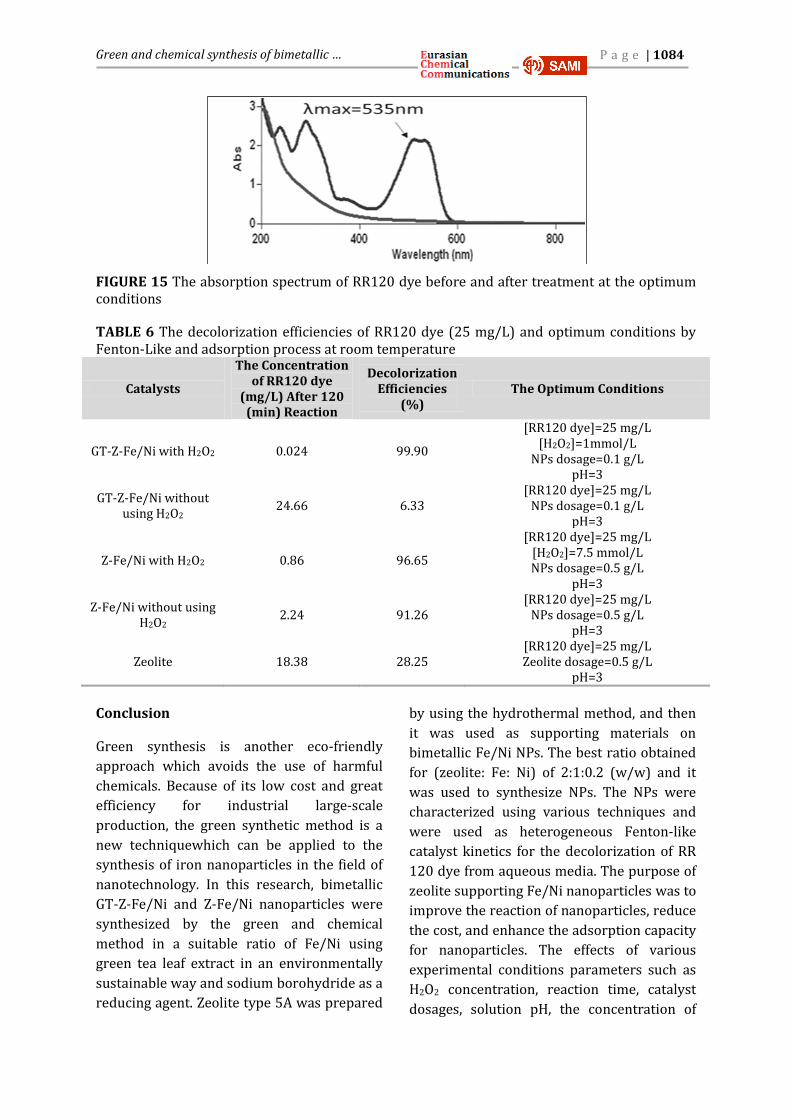
and H2O. Figure 15reveals the absorption
spectrum of RR120 dye before and after
treatment at the optimum conditions.
FIGURE 14 Comparison between decolorization efficiencies of RR120 dye solution by Fenton-like and adsorption process without using H2O2 using various catalysts under optimum condition after 120 minute at room temperature
P a g e | 1084 Green and chemical synthesis of bimetallic …
FIGURE 15 The absorption spectrum of RR120 dye before and after treatment at the optimum conditions
TABLE 6 The decolorization efficiencies of RR120 dye (25 mg/L) and optimum conditions by Fenton-Like and adsorption process at room temperature
Catalysts
The Concentration of RR120 dye
(mg/L) After 120 (min) Reaction
Decolorization Efficiencies
(%) The Optimum Conditions
GT-Z-Fe/Ni with H2O2 0.024 99.90
[RR120 dye]=25 mg/L [H2O2]=1mmol/L
NPs dosage=0.1 g/L pH=3
GT-Z-Fe/Ni without using H2O2
24.66 6.33 [RR120 dye]=25 mg/L
NPs dosage=0.1 g/L pH=3
Z-Fe/Ni with H2O2 0.86 96.65
[RR120 dye]=25 mg/L [H2O2]=7.5 mmol/L NPs dosage=0.5 g/L
pH=3
Z-Fe/Ni without using H2O2
2.24 91.26 [RR120 dye]=25 mg/L
NPs dosage=0.5 g/L pH=3
Zeolite 18.38 28.25 [RR120 dye]=25 mg/L Zeolite dosage=0.5 g/L
pH=3
Conclusion
Green synthesis is another eco-friendly
approach which avoids the use of harmful
chemicals. Because of its low cost and great
efficiency for industrial large-scale
production, the green synthetic method is a
new techniquewhich can be applied to the
synthesis of iron nanoparticles in the field of
nanotechnology. In this research, bimetallic
GT-Z-Fe/Ni and Z-Fe/Ni nanoparticles were
synthesized by the green and chemical
method in a suitable ratio of Fe/Ni using
green tea leaf extract in an environmentally
sustainable way and sodium borohydride as a
reducing agent. Zeolite type 5A was prepared
by using the hydrothermal method, and then
it was used as supporting materials on
bimetallic Fe/Ni NPs. The best ratio obtained
for (zeolite: Fe: Ni) of 2:1:0.2 (w/w) and it
was used to synthesize NPs. The NPs were
characterized using various techniques and
were used as heterogeneous Fenton-like
catalyst kinetics for the decolorization of RR
120 dye from aqueous media. The purpose of
zeolite supporting Fe/Ni nanoparticles was to
improve the reaction of nanoparticles, reduce
the cost, and enhance the adsorption capacity
for nanoparticles. The effects of various
experimental conditions parameters such as
H2O2 concentration, reaction time, catalyst
dosages, solution pH, the concentration of

P a g e | 1085 M.M. Abdul Hassan et al.
(RR120) dye, and temperature effect were
studied to determine an optimization method
for removal. This study reveals that
improvement was achieved when using GT-Z-
Fe/Ni NPs and Z-Fe/Ni NPs to remove the dye
solution. Under the optimum conditions, high
decolorization efficiencies of RR120 dye
(99.9% and 96.6%, respectively) were
obtained by using GT-Z-Fe/Ni NPs and Z-
Fe/Ni NPs to catalyze the Fenton-like
oxidation. The experimental kinetic and
thermodynamic parameter data showed that
the degradation of RR120 dye by a Fenton-
like oxidation process using GT-Z-Fe/Ni and
Z-Fe/Ni nanoparticles fitted the (second-
order and BMG) models well and that the
process is appropriate for spontaneous
reaction and endothermic reaction for all
prepared nanoparticles. Subsequently, using
green and chemical Fenton-like systems, a
possible mechanism was determined for the
oxidative degradation of RR120 dye. It
demonstrates that GT-Z-Fe/Ni or Z Fe/Ni
catalyzes H2O2 activation, resulting in the
formation of.OH radicals and the degradation
of the RR120 dye into CO2 and H2O. The result
illustrated that GT-Z-Fe/Ni and Z Fe/Ni NPS
improvement and had excellent azo dye
removal capabilities; however, it is preferred
the catalyst synthesis by green methods to
reduce and avoid the use of harmful
chemicals.
Acknowledgements
Great thanks to Almighty Allah, who awarded me the strength, I praise him and thank him for his grace and from him on me… I would like express high thanks to the Department of chemistry at the College of Science for women/ University of Baghdad, Iraq, and the Environment and Water Directorate /Ministry of Science and Technology, Iraq, for providing all the facilities to carry out this work.
Maysoon M. Abdul Hassan: https://orcid.org/0000-0002-4083-5470
References
[1] N. Akhtar, M.I.S. Ishak, S.A. Bhawani, K.
Umar, Water, 2021, 13, 2660. [Crossref],
[Google Scholar], [Publisher]
[2] A.A. Mohammed, K.H. Ahmed, M.L. Imad,
Nat. Environ. Pollut. Technol., 2022, 21, 355-
365. [Crossref], [Google Scholar], [PDF]
[3] S. Homaeigohar, Nanomaterials, 2020, 10,
295. [Crossref], [Google Scholar], [Publisher]
[4] K.G. Ahila, B. Ravindran, V.
Muthunarayanan, D.D. Nguyen, X.C. Nguyen,
S.W. Chang, V.K. Nguyen, C. Thamaraiselvi,
Sustainability, 2021, 13, 329 . [Crossref],
[Google Scholar], [Publisher]
[5] H. Xiang, G. Ren, Y. Zhong, D. Xu, Z. Zhang,
X. Wang, X. Yang, Nanomaterials Article,
2021, 8, 330. [Crossref], [Google Scholar],
[Publisher]
[6] A.K. Hassan, G.Y. Al-Kindi, G. Dalal, Water
Sci. Eng., 2020, 13, 286-298.. [Crossref],
[Google Scholar], [Publisher]
[7] A.K. Hassan, M.R. Mohammad, C. Gautam,
N. Ravi, Environ. Technol. Innov., 2019, 15,
100380. [Crossref], [Google Scholar],
[Publisher]
[8] N. Beheshtkhoo, M.A.J. Kouhbanani, A.
Savardashtaki, A.M. Amani, S. Taghizadeh,
Appl. Phys. A., 2018, 124, 363. [Crossref],
[Google Scholar], [Publisher]
[9] H.Q. Alijani, S. Pourseyedi, M. Torkzadeh-
Mahani, A. Seifalian, M. Khatami, Artificial
Cells, Nanomed. Biotechnol., 2020, 48, 242-
251. [Crossref], [Google Scholar], [Publisher]
[10] K. Sravanthi, D. Ayodhya, P.S. Yadgiri, J.
Anal. Sci. Technol., 2018, 9, 3. [Crossref],
[Google Scholar], [Publisher]
[11] T. Bao, J. Jin, M.M. Damtie, K. Wu, Z.M. Yu,
L. Wang, J. Chen, Y. Zhang, R.L. Frost, J. Saudi
Chem. Soc., 2019, 23, 864-878. [Crossref],
[Google Scholar], [Publisher]
[12] G. Gopal, H. Sankar, C. Natarajan, A.
Mukherjee, J. Environ. Manage., 2020,
254, 109812. [Crossref], [Google Scholar],
[Publisher]
P a g e | 1086 Green and chemical synthesis of bimetallic …
[13] G.G. Valiyeva, I Bavasso, L. Di Palma, S.R.
Hajiyeva, M.A. Ramazanov, F.V. Hajiyeva.
Nanomaterials, 2019, 9, 1130. [Crossref],
[Google Scholar], [Publisher]
[14] N. Ezzatahmadi, J. Clean. Prod., 2019,
151, 21-33. [Crossref], [Google Scholar],
[Publisher]
[15] H. Yinhai, L. Hai, D. Yingbo, L. Bing, W.
Liang, C. Shangye, L. Mingke, L. Junfei, Chem.
Eng. J., 2018, 347, 664-681. [Crossref],
[Google Scholar], [Publisher]
[16] A.N. Hammadi, I.K. Shakir, Iraqi J. Chem.
Pet. Eng., 2019, 20, 27-33. [Crossref], [Google
Scholar], [Publisher]
[17] N. Butterfield, P.M. Rowe, E. Stewart, D.
Roesel, S. Neshba, J. Geophys. Res. Atmos.,
2017, 122, 3023-3041. [Crossref], [Google
Scholar], [Publisher]
[18] K.Y. Abdolmmotaleb, A. Seidmohammadi,
M. Khazaei, A. Bhatnagar, M. Leili, J. Environ.
Health Sci. Engineer., 2019, 17, 337-351.
[Crossref], [Google Scholar], [Publisher]
[19] S. Mourdikoudis, R.M. Pallares, N.T.K.
Thanh, Nanoscale, 2018, 10, 12871-12934.
[Crossref], [Google Scholar], [Publisher]
[20] A.R. Suvarna, A. Shetty, S. Anchan, N.
Kabeer, S. Nayak, Bionanoscience, 2020, 10,
606–617. [Crossref], [Google Scholar],
[Publisher]
[21] H.M. Abd El-Aziz, R.S. Farag, S.A. Abdel-
Gawad, Nanotechnol. Environ. Eng., 2020, 5,
1–9. [Crossref], [Google Scholar], [Publisher]
[22] X. Li, Y. Zhao, B. Xi, X. Mao, B. Gong, R. Li, X. Peng, H. Liu, Appl. Surf. Sci., 2016, 370, 260-
269. [Crossref], [Google Scholar], [Publisher] [23] Y.-C. Chiang, W.-T. Chin, Nanomaterials, 2022, 12, 1492. [Crossref], [Google Scholar], [Publisher] [24] A.R. Puthukkara, S. Jose, D. Lal, J. Environ. Chem. Eng., 2020, 9, 104569. [Crossref], [Google Scholar], [Publisher]
[25] H.M. Abdel-Aziz, R.S. Farag, S.A. Abdel-
Gawad, Int. J. Environ. Res., 2019, 13, 843-852.
[Crossref], [Google Scholar], [Publisher]
[26] G.Y.B. Al Kindi, A.K. Hassan, G.Y. Dalal,
A.A. Husam, IOP Conf. Ser.: Earth Environ. Sci.,
2021, 779, 012092. [Crossref], [Google
Scholar], [Publisher]
[27] X. Wang, C. Jiang, B. Hou, Y. Wang, C. Hao,
J. Wu, Chemosphere, 2018, 206, 587–596.
[Crossref], [Google Scholar], [Publisher]
[28] G.Y. AL-Kindi, F.H. AL Ani, J. Eng.
Technol., 2019, 37, 175-85. [Crossref],
[Google Scholar], [Publisher]
[29] P. Ma, Q. Liu, P. Liu, H. Li, X. Han, L. Liu,
W. Zou, J. Dispers. Sci. Technol., 2020, 42,
1350-1367. [Crossref], [Google Scholar],
[Publisher]
[30] D.F. Romdhane, Y. Satlaoui, R. Nasraoui,
A. Charef, R. Azouzi, J. Chem., 2020, 2020, 1-
17. [Crossref], [Google Scholar], [Publisher]
[31] D.V. Kerkez, S.C. Toma, G. Kozma, M.R. Be
Celic Tomin, M.D. Prica, S.D. Roncevic, A.C.
Kukovecz, B.D. Dalmacija, Z. Konya,J. Taiwan
Inst. Chem. Eng., 2014, 45, 2451-2461.
[Crossref], [Google Scholar], [Publisher]
[32] Z. Chi, Z. Wang, H.Q. Chu, P. Bin, L. Lucian,
RSC Adv., 2017, 7, 44605-44613. [Crossref],
[Google Scholar], [Publisher]
How to cite this article: Maysoon M. Abdul
Hassan*, Sahar S. Hassan, Ahmed K. Hassan.
Green and chemical synthesis of bimetallic
nanoparticles (Fe/Ni) supported by zeolite
5A as a heterogeneous Fenton-like catalyst
and study of kinetic and thermodynamic
reaction for decolorization of reactive red
120 dye from aqueous pollution. Eurasian
Chemical Communications, 2022, 4(11), 1062-
1086. Link:
http://www.echemcom.com/article_152379.
html
Copyright © 2022 by SPC (Sami Publishing Company) + is an open access article distributed
under the Creative Commons Attribution License(CC BY) license
(https://creativecommons.org/licenses/by/4.0/), which permits unrestricted use,
distribution, and reproduction in any medium, provided the original work is properly cited.