Combustion synthesis of NiAl/Al2O3 composites by induction heating
Upload
independentCategory
view
3download
0
Cc
AHa
b
c
a
ARR2AA
KPNCHS
1
i17hirdstapai
iobt
0h
Applied Catalysis A: General 449 (2012) 121– 130
Contents lists available at SciVerse ScienceDirect
Applied Catalysis A: General
j ourna l ho me page: www.elsev ier .com/ locate /apcata
atalytic hydrotreatment of fast pyrolysis oil using bimetallic Ni–Cuatalysts on various supports
.R. Ardiyanti a, S.A. Khromovab, R.H. Venderboschc, V.A. Yakovlevb, I.V. Melián-Cabreraa,.J. Heeresa,∗
Chemical Engineering, University of Groningen, Nijenborgh 4, 9747 AG Groningen, The NetherlandsBoreskov Institute of Catalysis, 5, pr. Akad. Lavrentieva, 630090 Novosibirsk, Russian FederationBTG Biomass Technology Group BV, Josink Esweg 34, 7545 PN Enschede, The Netherlands
r t i c l e i n f o
rticle history:eceived 27 February 2012eceived in revised form2 September 2012ccepted 25 September 2012vailable online 5 October 2012
a b s t r a c t
Bimetallic Ni–Cu catalysts on various supports (CeO2–ZrO2, ZrO2, SiO2, TiO2, rice husk carbon, andSibunite) with metal contents ranging from 7.5 to 9.0 (Ni) and 3.1–3.6 wt.% (Cu) for the inorganic sup-ports and 17.1–17.8 (Ni) and 7.1–7.8 (Cu) for the carbon supports were synthesised and screened for thecatalytic hydrotreatment of fast pyrolysis oil in a batch set-up (350 ◦C, 200 bar initial pressure). NiCu/TiO2
showed the highest activity (average activity of 576 NLhydrogen kgPO−1 gactive metal
−1 for a 4 h batch time)and gave a product oil with the most favourable properties, viz. a H/C ratio of 1.43, a low TG residue
eywords:yrolysis oilickel–Copperatalytic hydrotreatmentDO
(2.7 wt.%) and the highest solubility in a hydrocarbon solvent. The TiO2 based catalyst was characterisedas having moderate leaching levels of Ni and Cu metals (Ti remained unchanged), low carbon depositionon the catalyst surface and limited metal sintering.
© 2012 Elsevier B.V. All rights reserved.
upport effects
. Introduction
Fast pyrolysis of lignocellulosic biomass at temperatures of typ-cally between 450 and 500 ◦C, and residence times of less than
s, produces an oil known as fast pyrolysis oil in yields of up to5 wt.% [1]. The product contains negligible amounts of ash, andas a volumetric energy density 5 to 20 times higher than the orig-
nal biomass. The oil is a complex multi-component mixture ofelatively polar organic compounds (ca. 75–80 wt.%) with a broadegree of polymerisation and water (ca. 20–25 wt.%) [2,3]. It is con-idered an attractive second generation biofuel and has been usedo generate heat and electricity, e.g. in combustors or turbines ors a co-feed in power stations. However, the oil is acidic in nature,olar and therefore not miscible with conventional crude oils. Inddition, it is thermally labile, and an increase in viscosity in times observed due to (re-) polymerisation of organic groups in the oil.
A number of catalytic technologies have been proposed andnvestigated to improve the product properties of fast pyrolysis
ils. A well-known approach is the catalytic cracking of pureiomass and/or pyrolysis oil to oxygen-free products. However,his approach is accompanied by a significant amount of coke∗ Corresponding author. Tel.: +31 503634484; fax: +31 503634479.E-mail address: [email protected] (H.J. Heeres).
926-860X/$ – see front matter © 2012 Elsevier B.V. All rights reserved.ttp://dx.doi.org/10.1016/j.apcata.2012.09.016
production (up to 40 wt.% of the biomass) [4–6] and furtherresearch and development activities are required to reduce cokeformation. A number of studies have been performed to remove thebound oxygen in the form of CO and/or CO2 by decarbonylation anddecarboxylation reactions, either thermally or catalytically. Thethermal process is known as the HPTT process, a high pressure tem-perature treatment [7]. However, oxygen removal beyond a levelof 10 wt.% appears very difficult, even when using catalysts. Theproduct is also highly viscous, limiting its applications potential.
Catalytic hydroprocessing or hydrotreatment of fast pyrolysis oilis a more promising option [8–10]. In this process, the fast-pyrolysisoil is treated with hydrogen in the presence of a heterogeneouscatalyst with the aim to hydro(deoxy)genate the pyrolysis oilto a product with improved product properties. Typically, ele-vated temperatures (350–450 ◦C), and high pressures (200 bar) arerequired. Elliott et al. [11] and Venderbosch et al. [12] discussedthe need to perform an stabilisation step (i.e. hydrotreatmentat low temperature, 150–225 ◦C) prior to the high-temperaturehydrotreatment to prevent excessive polymerisation by thermalreactions [7].
Possible product applications of the upgraded pyrolysis oil from
catalytic hydrotreatments are as transportation fuels and as a co-feed in existing oil refineries [13,14]. For the former, the propertiesof the upgraded oils should preferably mimic those of conventionalfossil-fuel based gasoline or diesel to use the product as a drop in
1 alysis A: General 449 (2012) 121– 130
fvweshhwrsywi
hAcHtccawchhefowR
oW�poAtcrw
o(tgco
2
2
wpopTSCbRe
Table 1Relevant properties of the pyrolysis oil used in this study.a
Amount (wt.%)
C (wb) 40.1H (wb) 7.6N (wb) 0.1S (wb) 0.01O (by difference, wb) 52.1O (db) 40.1Water content 23.9Atomic O/C (db) 0.56
22 A.R. Ardiyanti et al. / Applied Cat
uel. This implies that the oxygen content should be reduced toery low levels and, though technically feasible and proven already,ill lead to high hydrogen consumptions and as such limit the
conomic feasibility. For co-feeding purposes, deep deoxygenationeems not necessary, and the H/C ratio seems more important, withigh H/C ratios being preferred. For instance, the co-processing ofydrotreated pyrolysis oils in a lab scale simulated FCC unit (MAT)ith an H/C ratio of 1.6–1.7 and oxygen contents >5 wt.% have been
eported [15]. The hydrotreated products were successfully dis-olved and processed in long residue (20 wt.% upgraded oil). Theields of FCC gasoline (44–46 wt.%) and light cycle oil (23–25 wt.%)ere close to the conventional feed without an excessive increase
n undesired coke and dry gas.A wide variety of catalysts have been tested for catalytic
ydrotreatment. Traditionally, sulphided NiCu and CoMo on �-l2O3 have been applied. The use of these catalysts is rationalised byonsidering the close analogy of the process with HDS [8–10,16,17].owever, the need for additional sulphur in steady-state condi-
ions to maintain activity when HDS catalysts are applied, mayontaminate the originally sulphur-free pyrolysis oil. Noble metalatalysts, like Ru/C and Pd/C, were also shown to be good catalystsnd upgraded oils with a low oxygen content and high H/C ratioere obtained [18,19]. Particularly, Ru/C was shown to be an active
atalyst and a range of studies have been reported. However, theigh cost of noble metals like Ru may limit their potential use. Weave recently shown that non-noble metal catalysts based on less-xpensive Ni and Cu metals on a �-alumina support are also activeor the catalytic hydrotreatment of fast pyrolysis oil [20]. Productils with oxygen contents of ca. 10 wt.% and H/C ratios of ca. 1.35ere obtained. Methane formation, a serious concern when usingu based/C catalysts, was shown to be reduced dramatically.
A limited number of studies have been performed on the effectsf catalyst supports for the hydrotreatment of fast pyrolysis oil.ildschut et al. [19] used Ru catalysts on various supports (C,
-Al2O3, TiO2) for the hydrotreatment at 350 ◦C for 4 h. Productroperties were determined and the H/C values decreased in therder Ru/TiO2 > Ru/C > Ru/�-Al2O3. The lower performance of Ru/�-l2O3 compared to other catalysts was assumed to be related
o the relatively low stability of �-Al2O3 at the harsh reactiononditions (elevated temperatures and pressures, acidic aqueouseaction medium). Water reacts with �-Al2O3 to form boehmite,ith loss of surface area and physical integrity as the result.
We here report a screening study on catalytic hydrotreatmentf fast pyrolysis oil using Ni–Cu catalysts on different supportsinorganic-based like CeO2–ZrO2, TiO2, ZrO2, Al2O3) and carbonype supports (Sibunite [21] and carbon derived from rice husk) toain insight on the impact of the supports on the catalytic activity,atalyst stability and relevant product properties of the upgradedils.
. Materials and methods
.1. Materials
Pyrolysis oil was obtained from fast pyrolysis of pine wood andas provided by VTT (Espoo, Finland). Relevant properties of theyrolysis oil are compiled in Table 1. The Ru/C (5 wt.%) catalyst wasbtained from Sigma–Aldrich (St Louis, USA). Hydrogen of 99.999%urity was purchased from Hoekloos (Schiedam, The Netherlands).iO2 Hombifine N (320 m2/g, 100% anatase) was obtained fromachtleben Chemie GmbH (Duisburg, Germany). SiO2, ZrO2 and
eO2–ZrO2 (weight ratio of CeO2:ZrO2 is 1:1) were synthesisedy sol–gel techniques using Si(OEt)4 (Penta-91, Ltd., Moscow,ussia), ZrO(NO3)2·2H2O (Reahim–Samara, Samara, Russian Fed-ration) and Ce(NO3)3·6H2O (SaintehLab, Russia). MesoporousAtomic H/C (db) 1.47
a Wb = wet basis, db = dry basis.
carbonaceous rice husk (CRH) was synthesised using a pro-cedure given in previous work [22,23]. Sibunite was obtainedfrom the Institute of Hydrocarbons Processing SB RAS (Omsk,Russia). Ni(NO3)2·6H2O and Cu(NO3)2·3H2O were obtained fromReahim–Samara (Samara, Russian Federation).
2.2. Catalyst preparation
The ZrO2 and CeO2–ZrO2 supports were prepared bya (co)-precipitation procedure using aqueous solutions ofZrO(NO3)2·2H2O (or ZrO(NO3)2·2H2O and Ce(NO3)3·6H2O) andammonia followed by a heat treatment. The zirconyl nitrate (orzirconyl nitrate and cerium nitrate) was dissolved in distilled waterwhile stirring, after which the solution was filtered to removesolid impurities. Co-precipitation was carried out in a reactor withthe turbine stirrer in a continuous mode at a constant pH of 7 bythe addition of ammonia. The resulting suspension was filteredand washed with cold distilled water. The precipitate was dried at110◦ C for 24 h and then calcined at 350 ◦C in air.
All catalysts were prepared by an incipient wetness impreg-nation procedure with aqueous solutions of the metals salts(Ni(NO3)2·6H2O and Cu(NO3)2·3H2O). The precursor solutionswere added dropwise to the supports. After impregnation, the cata-lysts were dried at 100 ◦C for 12 h, then calcined at 450 ◦C for 3 h andsubsequently crushed and sieved. The fraction 0.25–0.5 mm wasused for the reactions. Before reaction, the catalysts were activatedby reduction using hydrogen gas (vide infra).
2.3. Catalyst characterization
Temperature programmed reduction (TPR). Catalyst samples(0.05 g) were placed in a U-tube quartz reactor and were treatedin a reducing atmosphere (10 vol.% of H2 balanced in Ar at a flowrate of 20 ml/min) with a constant heating rate of about 8 ◦C/minuntil 800 ◦C. The hydrogen concentration in the outlet stream dur-ing reduction was measured by a thermal conductivity detector(TCD).
X-ray diffraction. XRD analyses were performed on a D500Siemens (Germany) and X’tra (Thermo, Switzerland) X-ray diffrac-tometer using CuK� radiation. The diffraction patterns wererecorded by scanning with 0.05◦ step increments at an angle rangefrom 30◦ to 80◦ using an accumulation period of 5 s per step.High temperature in situ XRD experiments were performed in ahome-made reactor chamber developed at the Boreskov Instituteof Catalysis [21]. The gas flow (hydrogen) was fixed at 60 ml/minand a heating rate of 25 ◦C/min was applied. The hydrogen pres-sure was set at 1 bar and the samples were heated in the hydrogenatmosphere to 300 ◦C. Then XRD patterns were recorded by scan-
ning 2� angles from 30◦ to 55◦ at 300 ◦C until the sample achievedquasi equilibrium state as evidenced from the absence of noticeablechanges in the diffraction patterns. Then the samples were cooledunder a hydrogen atmosphere and the XRD patterns were recorded.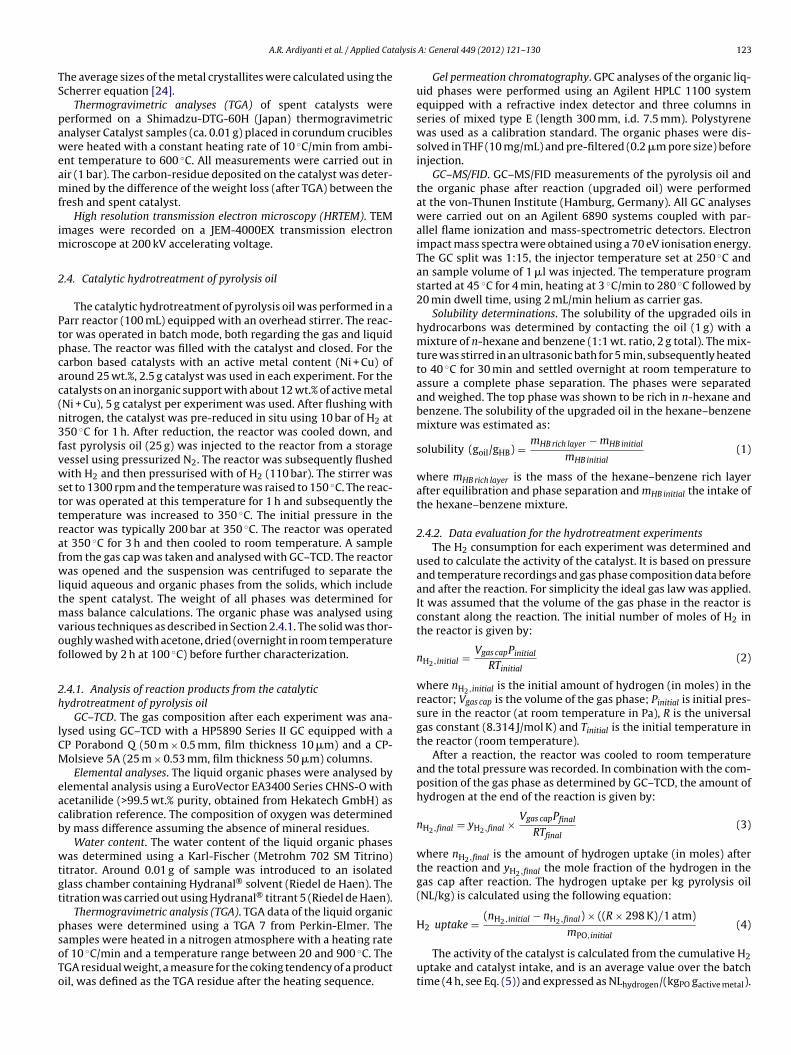
alysis
TS
paweamf
im
2
Ptpcac(n3fvwsttrafwltmvof
2h
lCM
eacb
wtgt
psoTo
A.R. Ardiyanti et al. / Applied Cat
he average sizes of the metal crystallites were calculated using thecherrer equation [24].
Thermogravimetric analyses (TGA) of spent catalysts wereerformed on a Shimadzu-DTG-60H (Japan) thermogravimetricnalyser Catalyst samples (ca. 0.01 g) placed in corundum cruciblesere heated with a constant heating rate of 10 ◦C/min from ambi-
nt temperature to 600 ◦C. All measurements were carried out inir (1 bar). The carbon-residue deposited on the catalyst was deter-ined by the difference of the weight loss (after TGA) between the
resh and spent catalyst.High resolution transmission electron microscopy (HRTEM). TEM
mages were recorded on a JEM-4000EX transmission electronicroscope at 200 kV accelerating voltage.
.4. Catalytic hydrotreatment of pyrolysis oil
The catalytic hydrotreatment of pyrolysis oil was performed in aarr reactor (100 mL) equipped with an overhead stirrer. The reac-or was operated in batch mode, both regarding the gas and liquidhase. The reactor was filled with the catalyst and closed. For thearbon based catalysts with an active metal content (Ni + Cu) ofround 25 wt.%, 2.5 g catalyst was used in each experiment. For theatalysts on an inorganic support with about 12 wt.% of active metalNi + Cu), 5 g catalyst per experiment was used. After flushing withitrogen, the catalyst was pre-reduced in situ using 10 bar of H2 at50 ◦C for 1 h. After reduction, the reactor was cooled down, andast pyrolysis oil (25 g) was injected to the reactor from a storageessel using pressurized N2. The reactor was subsequently flushedith H2 and then pressurised with of H2 (110 bar). The stirrer was
et to 1300 rpm and the temperature was raised to 150 ◦C. The reac-or was operated at this temperature for 1 h and subsequently theemperature was increased to 350 ◦C. The initial pressure in theeactor was typically 200 bar at 350 ◦C. The reactor was operatedt 350 ◦C for 3 h and then cooled to room temperature. A samplerom the gas cap was taken and analysed with GC–TCD. The reactoras opened and the suspension was centrifuged to separate the
iquid aqueous and organic phases from the solids, which includehe spent catalyst. The weight of all phases was determined for
ass balance calculations. The organic phase was analysed usingarious techniques as described in Section 2.4.1. The solid was thor-ughly washed with acetone, dried (overnight in room temperatureollowed by 2 h at 100 ◦C) before further characterization.
.4.1. Analysis of reaction products from the catalyticydrotreatment of pyrolysis oil
GC–TCD. The gas composition after each experiment was ana-ysed using GC–TCD with a HP5890 Series II GC equipped with aP Porabond Q (50 m × 0.5 mm, film thickness 10 �m) and a CP-olsieve 5A (25 m × 0.53 mm, film thickness 50 �m) columns.Elemental analyses. The liquid organic phases were analysed by
lemental analysis using a EuroVector EA3400 Series CHNS-O withcetanilide (>99.5 wt.% purity, obtained from Hekatech GmbH) asalibration reference. The composition of oxygen was determinedy mass difference assuming the absence of mineral residues.
Water content. The water content of the liquid organic phasesas determined using a Karl-Fischer (Metrohm 702 SM Titrino)
itrator. Around 0.01 g of sample was introduced to an isolatedlass chamber containing Hydranal® solvent (Riedel de Haen). Theitration was carried out using Hydranal® titrant 5 (Riedel de Haen).
Thermogravimetric analysis (TGA). TGA data of the liquid organichases were determined using a TGA 7 from Perkin-Elmer. The
amples were heated in a nitrogen atmosphere with a heating ratef 10 ◦C/min and a temperature range between 20 and 900 ◦C. TheGA residual weight, a measure for the coking tendency of a productil, was defined as the TGA residue after the heating sequence.A: General 449 (2012) 121– 130 123
Gel permeation chromatography. GPC analyses of the organic liq-uid phases were performed using an Agilent HPLC 1100 systemequipped with a refractive index detector and three columns inseries of mixed type E (length 300 mm, i.d. 7.5 mm). Polystyrenewas used as a calibration standard. The organic phases were dis-solved in THF (10 mg/mL) and pre-filtered (0.2 �m pore size) beforeinjection.
GC–MS/FID. GC–MS/FID measurements of the pyrolysis oil andthe organic phase after reaction (upgraded oil) were performedat the von-Thunen Institute (Hamburg, Germany). All GC analyseswere carried out on an Agilent 6890 systems coupled with par-allel flame ionization and mass-spectrometric detectors. Electronimpact mass spectra were obtained using a 70 eV ionisation energy.The GC split was 1:15, the injector temperature set at 250 ◦C andan sample volume of 1 �l was injected. The temperature programstarted at 45 ◦C for 4 min, heating at 3 ◦C/min to 280 ◦C followed by20 min dwell time, using 2 mL/min helium as carrier gas.
Solubility determinations. The solubility of the upgraded oils inhydrocarbons was determined by contacting the oil (1 g) with amixture of n-hexane and benzene (1:1 wt. ratio, 2 g total). The mix-ture was stirred in an ultrasonic bath for 5 min, subsequently heatedto 40 ◦C for 30 min and settled overnight at room temperature toassure a complete phase separation. The phases were separatedand weighed. The top phase was shown to be rich in n-hexane andbenzene. The solubility of the upgraded oil in the hexane–benzenemixture was estimated as:
solubility (goil/gHB) = mHB rich layer − mHB initial
mHB initial(1)
where mHB rich layer is the mass of the hexane–benzene rich layerafter equilibration and phase separation and mHB initial the intake ofthe hexane–benzene mixture.
2.4.2. Data evaluation for the hydrotreatment experimentsThe H2 consumption for each experiment was determined and
used to calculate the activity of the catalyst. It is based on pressureand temperature recordings and gas phase composition data beforeand after the reaction. For simplicity the ideal gas law was applied.It was assumed that the volume of the gas phase in the reactor isconstant along the reaction. The initial number of moles of H2 inthe reactor is given by:
nH2,initial = Vgas capPinitial
RTinitial(2)
where nH2,initial is the initial amount of hydrogen (in moles) in thereactor; Vgas cap is the volume of the gas phase; Pinitial is initial pres-sure in the reactor (at room temperature in Pa), R is the universalgas constant (8.314 J/mol K) and Tinitial is the initial temperature inthe reactor (room temperature).
After a reaction, the reactor was cooled to room temperatureand the total pressure was recorded. In combination with the com-position of the gas phase as determined by GC–TCD, the amount ofhydrogen at the end of the reaction is given by:
nH2,final = yH2,final × Vgas capPfinal
RTfinal(3)
where nH2,final is the amount of hydrogen uptake (in moles) afterthe reaction and yH2,final the mole fraction of the hydrogen in thegas cap after reaction. The hydrogen uptake per kg pyrolysis oil(NL/kg) is calculated using the following equation:
H2 uptake = (nH2,initial − nH2,final) × ((R × 298 K)/1 atm)(4)
mPO,initial
The activity of the catalyst is calculated from the cumulative H2uptake and catalyst intake, and is an average value over the batchtime (4 h, see Eq. (5)) and expressed as NLhydrogen/(kgPO gactive metal).
124 A.R. Ardiyanti et al. / Applied Catalysis
Table 2Catalysts composition and specific surface areas as determined by the BET method.
Catalysts Ni/Cu loadings (wt.%) Specific surfacearea (SBET, m2/g)
NiCu/TiO2 9.1/3.1 31NiCu/CeO2–ZrO2 7.5/3.6 70NiCu/ZrO2 8.0/3.5 73NiCu/CRH 17.1/7.1 583NiCu/Sibunite 17.8/8.1 262
T(
C
3
3
CSahbscfl5
spcmcaTCtosrNit
tcNT(
sd(ofwNpsd
NiCu/�-Al2O3 16/2 90
he activity is based on the sum of the amount of the active metalsNi and Cu) in the catalyst formulation.
atalyst activity (NLhydrogen/(kgPO g active metals)) = H2uptake
gactive metal(5)
. Results and discussion
.1. Catalyst syntheses and characterization
The catalysts were produced by dry impregnation of the Ni andu precursors in the form of metal-nitrates on the various supports.imilar loadings of Ni and Cu (ca. 8 and 3.5 wt.%, respectively) werepplied for the inorganic supports (TiO2, ZrO2, and CeO2–ZrO2),igher Ni and Cu loadings of ca. 17 and 7 wt. % were applied on car-on supports (Sibunite and rice husk), making use of the superiorurface areas capacities. The BET areas of the fresh catalysts afteralcination was determined and ranged between 31 and 73 m2/gor the metal oxide supports (Table 2). The carbon based cata-ysts showed much higher quantities, ranging between 262 and83 m2/g.
The reduction behaviour of Ni(II) and Cu(II) in the catalysts wastudied by TPR and the reduction profiles for the inorganic sup-ort based catalysts are given in Fig. 1. TPR analyses for the twoatalysts supported on carbon were not successful due to partialethanation of the support during the TPR experiments. For all
atalysts, except NiCu/TiO2, the catalyst is fully reduced at temper-tures below 350 ◦C. Several peaks are present in the TPR curves.hose below 220 ◦C are likely associated with reduction of Cu(II) tou(0), whereas peaks above this temperature are associated withhe reduction of bimetallic NixCu1−x species [25] and the reductionf Ni(II) to Ni(0). The TPR curve of NiCu/TiO2 shows the latter tran-itions at a much higher temperature (>400 ◦C). Lazaro et al. [26]eported that NiO and TiO2 may interact strongly and form surfaceiO–TiO2 (NiTiO3) species. The reduction temperature of the latter
s higher than found for pure NiO. Our observation is in line withhis proposal.
The phase identification results by XRD measurements on bothhe freshly prepared and reduced catalysts are given in Table 3. Thealcined, non-reduced catalysts show the expected reflections ofiO and CuO clusters and the support. The only exception is NiCu oniO2 where the formation of a distinct NiTiO3 phase was identifiedTable 3), in agreement with the reduction behaviour.
After in situ reduction at 300 ◦C, the carbon based catalystshowed the presence of two distinct bimetallic Ni–Cu clustersiffering in both size and composition. The Ni rich clusters150–200 A) are larger than the Cu rich ones (100 A). Distinct all-Nir Cu clusters were not observed. For the inorganic supports, onlyor NiCu on zirconia, a Ni–Cu cluster was observed (Ni0.97Cu0.03)hereas clear peaks for the bimetallic clusters were absent for
i–Cu on the TiO2 and CeO2–ZrO2. For TiO2, the reduction tem-erature is likely too low, as pointed out in Fig. 1. The crystallinetate of the TiO2 support (anatase) and ZrO2 support (amorphous)o not change during the reduction step.A: General 449 (2012) 121– 130
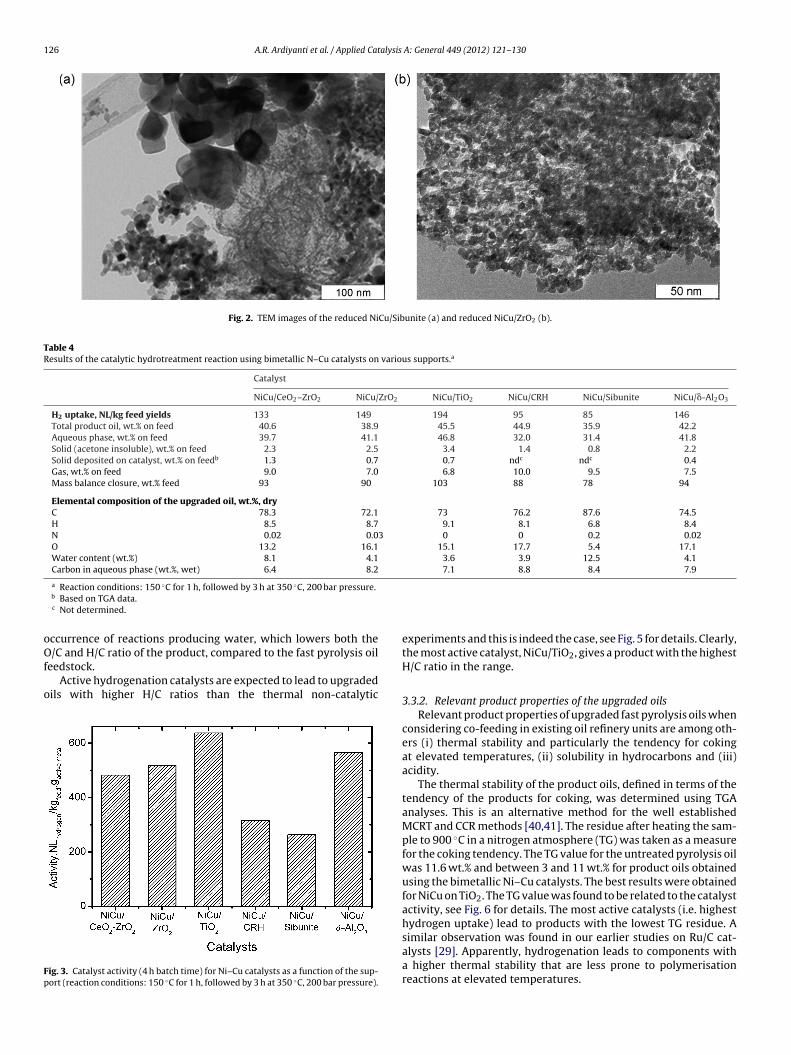
TEM/EDX analyses were performed for all catalysts in theoxidised form after calcination. It shows the presence of twodistinct Ni–Cu–O containing clusters; one rich in nickel, onerich in copper. These are likely the precursors of the Ni1−xCux
clusters upon reduction as observed separately by XRD for thecarbon supports and ZrO2. The sizes of NiO-rich particles aresmaller (e.g. 5–10 nm for NiCu/SiO2, >25 nm for NiCu/Sibunite and10–20 for NiCu/CeO2–ZrO2) than the CuO-rich particles (20–50 nmfor NiCu/SiO2, >100 nm for NiCu/Sibunite and up to 100 nm forNiCu/CeO2–ZrO2). This trend is opposite to that observed for thereduced catalysts and indicates a large effect of the reduction pro-cess on the cluster sizes. TEM–EDX also reveals the presence ofNiTiO3 species on the NiCu/TiO2, in line with the XRD measure-ments.
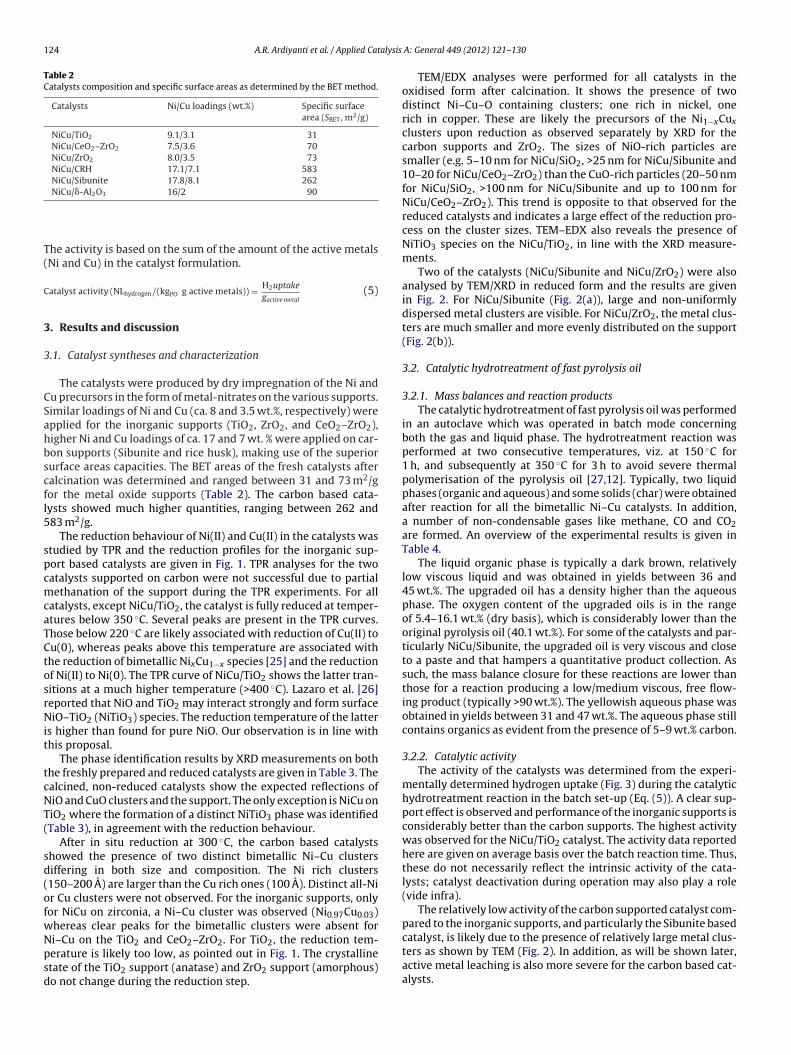
Two of the catalysts (NiCu/Sibunite and NiCu/ZrO2) were alsoanalysed by TEM/XRD in reduced form and the results are givenin Fig. 2. For NiCu/Sibunite (Fig. 2(a)), large and non-uniformlydispersed metal clusters are visible. For NiCu/ZrO2, the metal clus-ters are much smaller and more evenly distributed on the support(Fig. 2(b)).
3.2. Catalytic hydrotreatment of fast pyrolysis oil
3.2.1. Mass balances and reaction productsThe catalytic hydrotreatment of fast pyrolysis oil was performed
in an autoclave which was operated in batch mode concerningboth the gas and liquid phase. The hydrotreatment reaction wasperformed at two consecutive temperatures, viz. at 150 ◦C for1 h, and subsequently at 350 ◦C for 3 h to avoid severe thermalpolymerisation of the pyrolysis oil [27,12]. Typically, two liquidphases (organic and aqueous) and some solids (char) were obtainedafter reaction for all the bimetallic Ni–Cu catalysts. In addition,a number of non-condensable gases like methane, CO and CO2are formed. An overview of the experimental results is given inTable 4.
The liquid organic phase is typically a dark brown, relativelylow viscous liquid and was obtained in yields between 36 and45 wt.%. The upgraded oil has a density higher than the aqueousphase. The oxygen content of the upgraded oils is in the rangeof 5.4–16.1 wt.% (dry basis), which is considerably lower than theoriginal pyrolysis oil (40.1 wt.%). For some of the catalysts and par-ticularly NiCu/Sibunite, the upgraded oil is very viscous and closeto a paste and that hampers a quantitative product collection. Assuch, the mass balance closure for these reactions are lower thanthose for a reaction producing a low/medium viscous, free flow-ing product (typically >90 wt.%). The yellowish aqueous phase wasobtained in yields between 31 and 47 wt.%. The aqueous phase stillcontains organics as evident from the presence of 5–9 wt.% carbon.
3.2.2. Catalytic activityThe activity of the catalysts was determined from the experi-
mentally determined hydrogen uptake (Fig. 3) during the catalytichydrotreatment reaction in the batch set-up (Eq. (5)). A clear sup-port effect is observed and performance of the inorganic supports isconsiderably better than the carbon supports. The highest activitywas observed for the NiCu/TiO2 catalyst. The activity data reportedhere are given on average basis over the batch reaction time. Thus,these do not necessarily reflect the intrinsic activity of the cata-lysts; catalyst deactivation during operation may also play a role(vide infra).
The relatively low activity of the carbon supported catalyst com-pared to the inorganic supports, and particularly the Sibunite based
catalyst, is likely due to the presence of relatively large metal clus-ters as shown by TEM (Fig. 2). In addition, as will be shown later,active metal leaching is also more severe for the carbon based cat-alysts.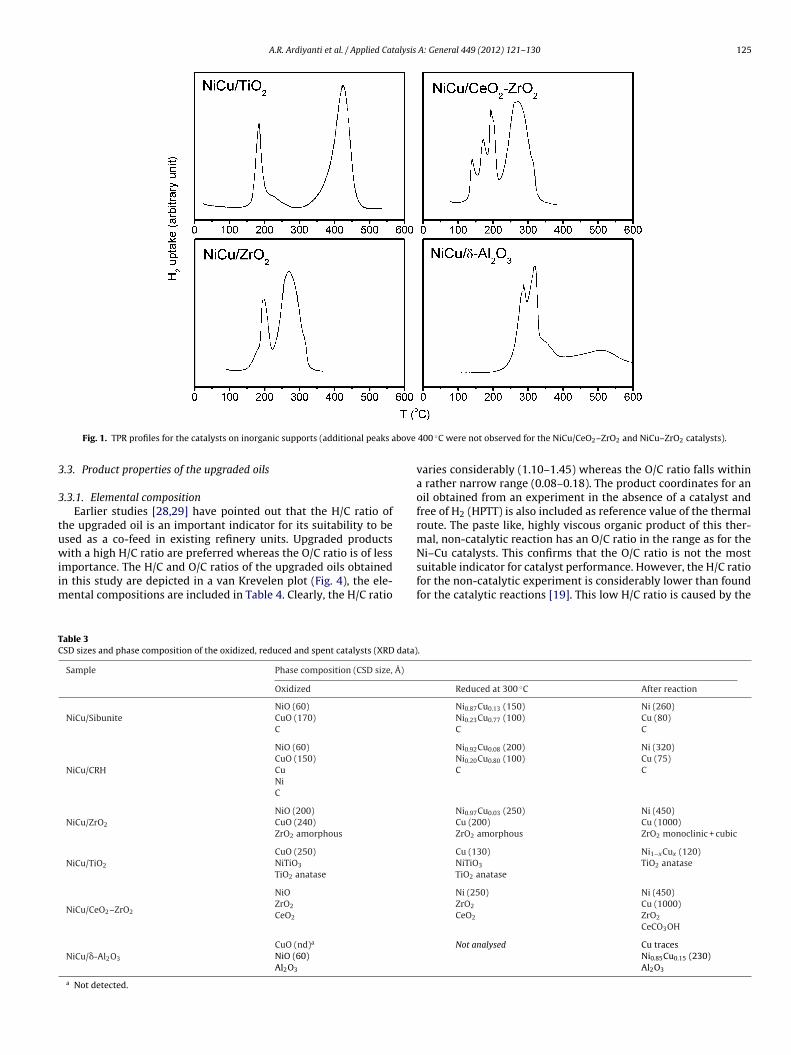
A.R. Ardiyanti et al. / Applied Catalysis A: General 449 (2012) 121– 130 125
bove
3
3
tuwiim
TC
Fig. 1. TPR profiles for the catalysts on inorganic supports (additional peaks a
.3. Product properties of the upgraded oils
.3.1. Elemental compositionEarlier studies [28,29] have pointed out that the H/C ratio of
he upgraded oil is an important indicator for its suitability to besed as a co-feed in existing refinery units. Upgraded productsith a high H/C ratio are preferred whereas the O/C ratio is of less
mportance. The H/C and O/C ratios of the upgraded oils obtainedn this study are depicted in a van Krevelen plot (Fig. 4), the ele-
ental compositions are included in Table 4. Clearly, the H/C ratio
able 3SD sizes and phase composition of the oxidized, reduced and spent catalysts (XRD data)
Sample Phase composition (CSD size, Å)
Oxidized
NiCu/SibuniteNiO (60)
CuO (170)
C
NiCu/CRH
NiO (60)
CuO (150)
CuNiC
NiCu/ZrO2
NiO (200)
CuO (240)
ZrO2 amorphous
NiCu/TiO2
CuO (250)
NiTiO3
TiO2 anatase
NiCu/CeO2–ZrO2
NiO
ZrO2
CeO2
NiCu/�-Al2O3
CuO (nd)a
NiO (60)
Al2O3
a Not detected.
400 ◦C were not observed for the NiCu/CeO2–ZrO2 and NiCu–ZrO2 catalysts).
varies considerably (1.10–1.45) whereas the O/C ratio falls withina rather narrow range (0.08–0.18). The product coordinates for anoil obtained from an experiment in the absence of a catalyst andfree of H2 (HPTT) is also included as reference value of the thermalroute. The paste like, highly viscous organic product of this ther-mal, non-catalytic reaction has an O/C ratio in the range as for theNi–Cu catalysts. This confirms that the O/C ratio is not the most
suitable indicator for catalyst performance. However, the H/C ratiofor the non-catalytic experiment is considerably lower than foundfor the catalytic reactions [19]. This low H/C ratio is caused by the.
Reduced at 300 ◦C After reaction
Ni0.87Cu0.13 (150) Ni (260)Ni0.23Cu0.77 (100) Cu (80)C C
Ni0.92Cu0.08 (200) Ni (320)Ni0.20Cu0.80 (100) Cu (75)C C
Ni0.97Cu0.03 (250) Ni (450)Cu (200) Cu (1000)ZrO2 amorphous ZrO2 monoclinic + cubic
Cu (130) Ni1−xCux (120)NiTiO3 TiO2 anataseTiO2 anatase
Ni (250) Ni (450)ZrO2 Cu (1000)CeO2 ZrO2
CeCO3OH
Not analysed Cu tracesNi0.85Cu0.15 (230)Al2O3
126 A.R. Ardiyanti et al. / Applied Catalysis A: General 449 (2012) 121– 130
Fig. 2. TEM images of the reduced NiCu/Sibunite (a) and reduced NiCu/ZrO2 (b).
Table 4Results of the catalytic hydrotreatment reaction using bimetallic N–Cu catalysts on various supports.a
Catalyst
NiCu/CeO2–ZrO2 NiCu/ZrO2 NiCu/TiO2 NiCu/CRH NiCu/Sibunite NiCu/�-Al2O3
H2 uptake, NL/kg feed yields 133 149 194 95 85 146Total product oil, wt.% on feed 40.6 38.9 45.5 44.9 35.9 42.2Aqueous phase, wt.% on feed 39.7 41.1 46.8 32.0 31.4 41.8Solid (acetone insoluble), wt.% on feed 2.3 2.5 3.4 1.4 0.8 2.2Solid deposited on catalyst, wt.% on feedb 1.3 0.7 0.7 ndc ndc 0.4Gas, wt.% on feed 9.0 7.0 6.8 10.0 9.5 7.5Mass balance closure, wt.% feed 93 90 103 88 78 94
Elemental composition of the upgraded oil, wt.%, dryC 78.3 72.1 73 76.2 87.6 74.5H 8.5 8.7 9.1 8.1 6.8 8.4N 0.02 0.03 0 0 0.2 0.02O 13.2 16.1 15.1 17.7 5.4 17.1Water content (wt.%) 8.1 4.1 3.6 3.9 12.5 4.1Carbon in aqueous phase (wt.%, wet) 6.4 8.2 7.1 8.8 8.4 7.9
oOf
o
Fp
a Reaction conditions: 150 ◦C for 1 h, followed by 3 h at 350 ◦C, 200 bar pressure.b Based on TGA data.c Not determined.
ccurrence of reactions producing water, which lowers both the
/C and H/C ratio of the product, compared to the fast pyrolysis oileedstock.Active hydrogenation catalysts are expected to lead to upgraded
ils with higher H/C ratios than the thermal non-catalytic
ig. 3. Catalyst activity (4 h batch time) for Ni–Cu catalysts as a function of the sup-ort (reaction conditions: 150 ◦C for 1 h, followed by 3 h at 350 ◦C, 200 bar pressure).
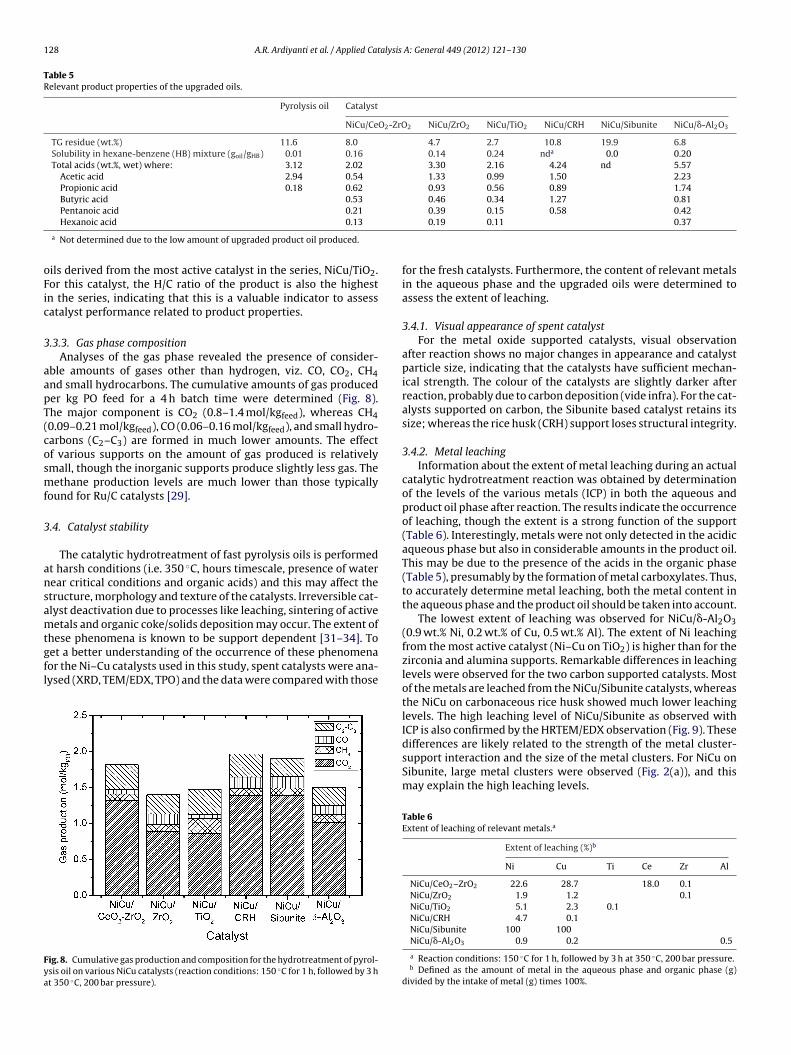
experiments and this is indeed the case, see Fig. 5 for details. Clearly,the most active catalyst, NiCu/TiO2, gives a product with the highestH/C ratio in the range.
3.3.2. Relevant product properties of the upgraded oilsRelevant product properties of upgraded fast pyrolysis oils when
considering co-feeding in existing oil refinery units are among oth-ers (i) thermal stability and particularly the tendency for cokingat elevated temperatures, (ii) solubility in hydrocarbons and (iii)acidity.
The thermal stability of the product oils, defined in terms of thetendency of the products for coking, was determined using TGAanalyses. This is an alternative method for the well establishedMCRT and CCR methods [40,41]. The residue after heating the sam-ple to 900 ◦C in a nitrogen atmosphere (TG) was taken as a measurefor the coking tendency. The TG value for the untreated pyrolysis oilwas 11.6 wt.% and between 3 and 11 wt.% for product oils obtainedusing the bimetallic Ni–Cu catalysts. The best results were obtainedfor NiCu on TiO2. The TG value was found to be related to the catalystactivity, see Fig. 6 for details. The most active catalysts (i.e. highesthydrogen uptake) lead to products with the lowest TG residue. A
similar observation was found in our earlier studies on Ru/C cat-alysts [29]. Apparently, hydrogenation leads to components witha higher thermal stability that are less prone to polymerisationreactions at elevated temperatures.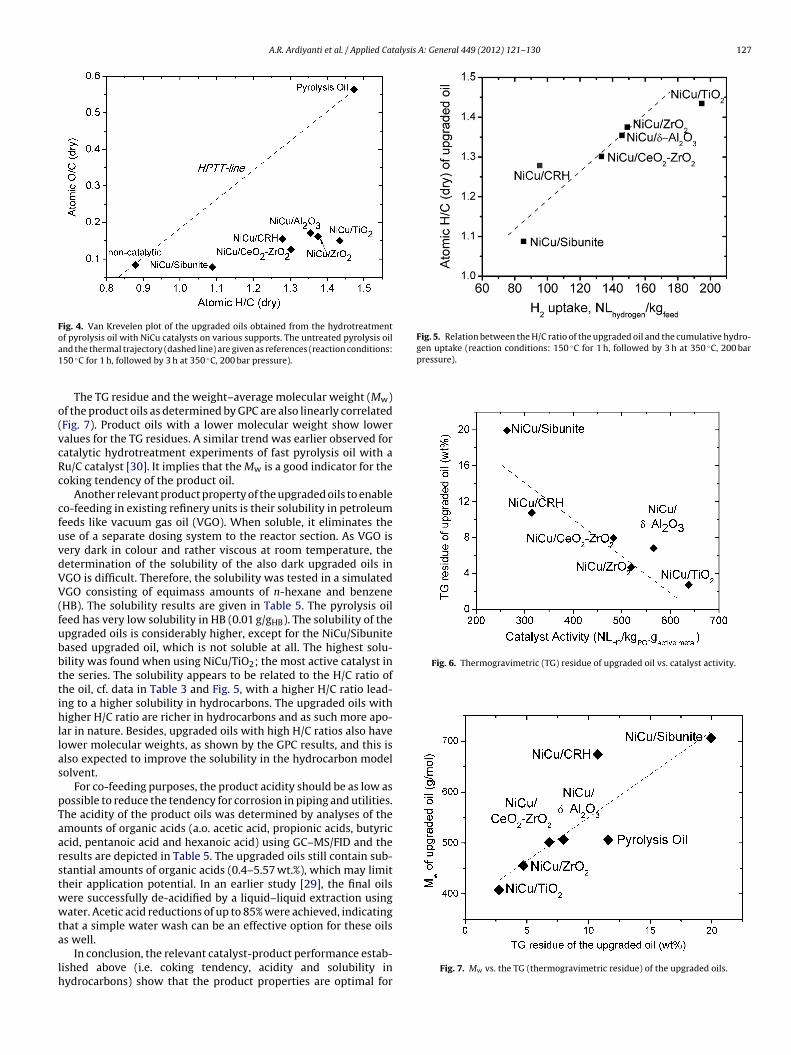
A.R. Ardiyanti et al. / Applied Catalysis A: General 449 (2012) 121– 130 127
Fig. 4. Van Krevelen plot of the upgraded oils obtained from the hydrotreatmentof pyrolysis oil with NiCu catalysts on various supports. The untreated pyrolysis oila1
o(vcRc
cfuvdVV(fubbttihllas
pTaarstwwta
lh
Fig. 5. Relation between the H/C ratio of the upgraded oil and the cumulative hydro-gen uptake (reaction conditions: 150 ◦C for 1 h, followed by 3 h at 350 ◦C, 200 barpressure).
Fig. 6. Thermogravimetric (TG) residue of upgraded oil vs. catalyst activity.
nd the thermal trajectory (dashed line) are given as references (reaction conditions:50 ◦C for 1 h, followed by 3 h at 350 ◦C, 200 bar pressure).
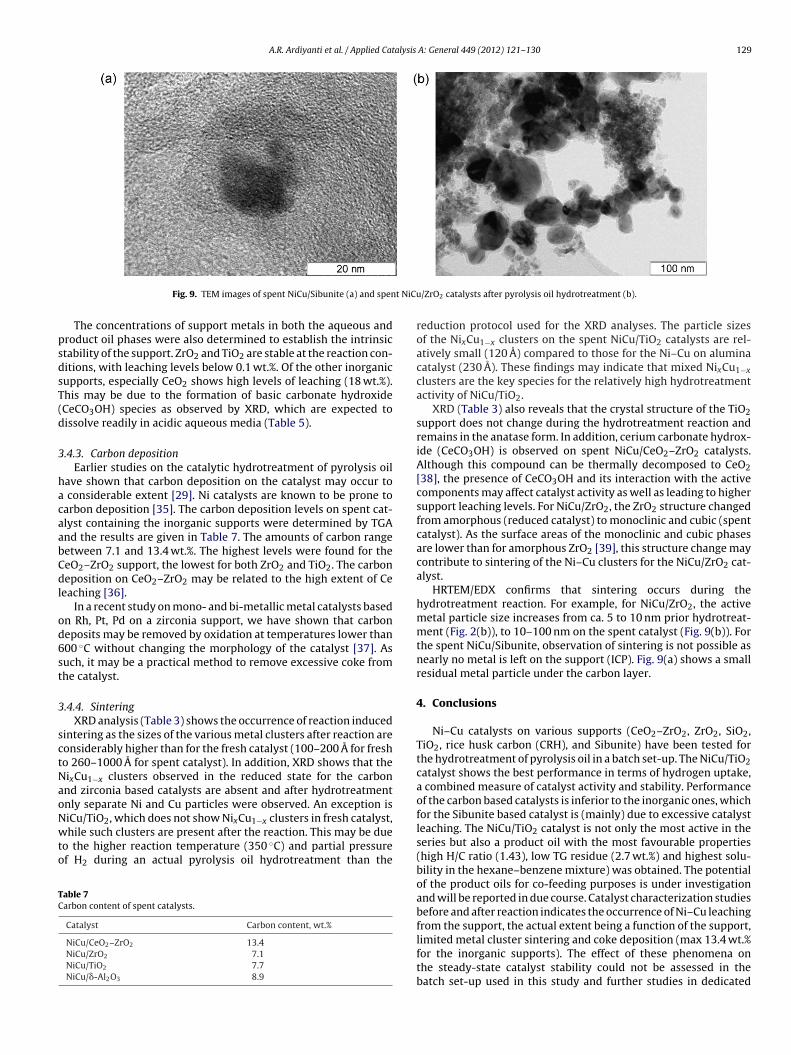
The TG residue and the weight–average molecular weight (Mw)f the product oils as determined by GPC are also linearly correlatedFig. 7). Product oils with a lower molecular weight show loweralues for the TG residues. A similar trend was earlier observed foratalytic hydrotreatment experiments of fast pyrolysis oil with au/C catalyst [30]. It implies that the Mw is a good indicator for theoking tendency of the product oil.
Another relevant product property of the upgraded oils to enableo-feeding in existing refinery units is their solubility in petroleumeeds like vacuum gas oil (VGO). When soluble, it eliminates these of a separate dosing system to the reactor section. As VGO isery dark in colour and rather viscous at room temperature, theetermination of the solubility of the also dark upgraded oils inGO is difficult. Therefore, the solubility was tested in a simulatedGO consisting of equimass amounts of n-hexane and benzene
HB). The solubility results are given in Table 5. The pyrolysis oileed has very low solubility in HB (0.01 g/gHB). The solubility of thepgraded oils is considerably higher, except for the NiCu/Sibuniteased upgraded oil, which is not soluble at all. The highest solu-ility was found when using NiCu/TiO2; the most active catalyst inhe series. The solubility appears to be related to the H/C ratio ofhe oil, cf. data in Table 3 and Fig. 5, with a higher H/C ratio lead-ng to a higher solubility in hydrocarbons. The upgraded oils withigher H/C ratio are richer in hydrocarbons and as such more apo-
ar in nature. Besides, upgraded oils with high H/C ratios also haveower molecular weights, as shown by the GPC results, and this islso expected to improve the solubility in the hydrocarbon modelolvent.
For co-feeding purposes, the product acidity should be as low asossible to reduce the tendency for corrosion in piping and utilities.he acidity of the product oils was determined by analyses of themounts of organic acids (a.o. acetic acid, propionic acids, butyriccid, pentanoic acid and hexanoic acid) using GC–MS/FID and theesults are depicted in Table 5. The upgraded oils still contain sub-tantial amounts of organic acids (0.4–5.57 wt.%), which may limitheir application potential. In an earlier study [29], the final oilsere successfully de-acidified by a liquid–liquid extraction usingater. Acetic acid reductions of up to 85% were achieved, indicating
hat a simple water wash can be an effective option for these oils
s well.In conclusion, the relevant catalyst-product performance estab-ished above (i.e. coking tendency, acidity and solubility inydrocarbons) show that the product properties are optimal for
Fig. 7. Mw vs. the TG (thermogravimetric residue) of the upgraded oils.
128 A.R. Ardiyanti et al. / Applied Catalysis A: General 449 (2012) 121– 130
Table 5Relevant product properties of the upgraded oils.
Pyrolysis oil Catalyst
NiCu/CeO2-ZrO2 NiCu/ZrO2 NiCu/TiO2 NiCu/CRH NiCu/Sibunite NiCu/�-Al2O3
TG residue (wt.%) 11.6 8.0 4.7 2.7 10.8 19.9 6.8Solubility in hexane-benzene (HB) mixture (goil/gHB) 0.01 0.16 0.14 0.24 nda 0.0 0.20Total acids (wt.%, wet) where: 3.12 2.02 3.30 2.16 4.24 nd 5.57
Acetic acid 2.94 0.54 1.33 0.99 1.50 2.23Propionic acid 0.18 0.62 0.93 0.56 0.89 1.74Butyric acid 0.53 0.46 0.34 1.27 0.81Pentanoic acid 0.21 0.39 0.15 0.58 0.42
oFic
3
aapT(cosmf
3
ansamtgfl
Fya
Hexanoic acid 0.13
a Not determined due to the low amount of upgraded product oil produced.
ils derived from the most active catalyst in the series, NiCu/TiO2.or this catalyst, the H/C ratio of the product is also the highestn the series, indicating that this is a valuable indicator to assessatalyst performance related to product properties.
.3.3. Gas phase compositionAnalyses of the gas phase revealed the presence of consider-
ble amounts of gases other than hydrogen, viz. CO, CO2, CH4nd small hydrocarbons. The cumulative amounts of gas produceder kg PO feed for a 4 h batch time were determined (Fig. 8).he major component is CO2 (0.8–1.4 mol/kgfeed), whereas CH40.09–0.21 mol/kgfeed), CO (0.06–0.16 mol/kgfeed), and small hydro-arbons (C2–C3) are formed in much lower amounts. The effectf various supports on the amount of gas produced is relativelymall, though the inorganic supports produce slightly less gas. Theethane production levels are much lower than those typically
ound for Ru/C catalysts [29].
.4. Catalyst stability
The catalytic hydrotreatment of fast pyrolysis oils is performedt harsh conditions (i.e. 350 ◦C, hours timescale, presence of waterear critical conditions and organic acids) and this may affect thetructure, morphology and texture of the catalysts. Irreversible cat-lyst deactivation due to processes like leaching, sintering of activeetals and organic coke/solids deposition may occur. The extent of
hese phenomena is known to be support dependent [31–34]. Toet a better understanding of the occurrence of these phenomenaor the Ni–Cu catalysts used in this study, spent catalysts were ana-ysed (XRD, TEM/EDX, TPO) and the data were compared with those
ig. 8. Cumulative gas production and composition for the hydrotreatment of pyrol-sis oil on various NiCu catalysts (reaction conditions: 150 ◦C for 1 h, followed by 3 ht 350 ◦C, 200 bar pressure).
0.19 0.11 0.37
for the fresh catalysts. Furthermore, the content of relevant metalsin the aqueous phase and the upgraded oils were determined toassess the extent of leaching.
3.4.1. Visual appearance of spent catalystFor the metal oxide supported catalysts, visual observation
after reaction shows no major changes in appearance and catalystparticle size, indicating that the catalysts have sufficient mechan-ical strength. The colour of the catalysts are slightly darker afterreaction, probably due to carbon deposition (vide infra). For the cat-alysts supported on carbon, the Sibunite based catalyst retains itssize; whereas the rice husk (CRH) support loses structural integrity.
3.4.2. Metal leachingInformation about the extent of metal leaching during an actual
catalytic hydrotreatment reaction was obtained by determinationof the levels of the various metals (ICP) in both the aqueous andproduct oil phase after reaction. The results indicate the occurrenceof leaching, though the extent is a strong function of the support(Table 6). Interestingly, metals were not only detected in the acidicaqueous phase but also in considerable amounts in the product oil.This may be due to the presence of the acids in the organic phase(Table 5), presumably by the formation of metal carboxylates. Thus,to accurately determine metal leaching, both the metal content inthe aqueous phase and the product oil should be taken into account.
The lowest extent of leaching was observed for NiCu/�-Al2O3(0.9 wt.% Ni, 0.2 wt.% of Cu, 0.5 wt.% Al). The extent of Ni leachingfrom the most active catalyst (Ni–Cu on TiO2) is higher than for thezirconia and alumina supports. Remarkable differences in leachinglevels were observed for the two carbon supported catalysts. Mostof the metals are leached from the NiCu/Sibunite catalysts, whereasthe NiCu on carbonaceous rice husk showed much lower leachinglevels. The high leaching level of NiCu/Sibunite as observed withICP is also confirmed by the HRTEM/EDX observation (Fig. 9). These
differences are likely related to the strength of the metal cluster-support interaction and the size of the metal clusters. For NiCu onSibunite, large metal clusters were observed (Fig. 2(a)), and thismay explain the high leaching levels.Table 6Extent of leaching of relevant metals.a
Extent of leaching (%)b
Ni Cu Ti Ce Zr Al
NiCu/CeO2–ZrO2 22.6 28.7 18.0 0.1NiCu/ZrO2 1.9 1.2 0.1NiCu/TiO2 5.1 2.3 0.1NiCu/CRH 4.7 0.1NiCu/Sibunite 100 100NiCu/�-Al2O3 0.9 0.2 0.5
a Reaction conditions: 150 ◦C for 1 h, followed by 3 h at 350 ◦C, 200 bar pressure.b Defined as the amount of metal in the aqueous phase and organic phase (g)
divided by the intake of metal (g) times 100%.
A.R. Ardiyanti et al. / Applied Catalysis A: General 449 (2012) 121– 130 129
t NiCu
psdsT(d
3
hacaabCdl
od6st
3
sctNaoNwto
TC
Fig. 9. TEM images of spent NiCu/Sibunite (a) and spen
The concentrations of support metals in both the aqueous androduct oil phases were also determined to establish the intrinsictability of the support. ZrO2 and TiO2 are stable at the reaction con-itions, with leaching levels below 0.1 wt.%. Of the other inorganicupports, especially CeO2 shows high levels of leaching (18 wt.%).his may be due to the formation of basic carbonate hydroxideCeCO3OH) species as observed by XRD, which are expected toissolve readily in acidic aqueous media (Table 5).
.4.3. Carbon depositionEarlier studies on the catalytic hydrotreatment of pyrolysis oil
ave shown that carbon deposition on the catalyst may occur to considerable extent [29]. Ni catalysts are known to be prone toarbon deposition [35]. The carbon deposition levels on spent cat-lyst containing the inorganic supports were determined by TGAnd the results are given in Table 7. The amounts of carbon rangeetween 7.1 and 13.4 wt.%. The highest levels were found for theeO2–ZrO2 support, the lowest for both ZrO2 and TiO2. The carboneposition on CeO2–ZrO2 may be related to the high extent of Ce
eaching [36].In a recent study on mono- and bi-metallic metal catalysts based
n Rh, Pt, Pd on a zirconia support, we have shown that carboneposits may be removed by oxidation at temperatures lower than00 ◦C without changing the morphology of the catalyst [37]. Asuch, it may be a practical method to remove excessive coke fromhe catalyst.
.4.4. SinteringXRD analysis (Table 3) shows the occurrence of reaction induced
intering as the sizes of the various metal clusters after reaction areonsiderably higher than for the fresh catalyst (100–200 A for fresho 260–1000 A for spent catalyst). In addition, XRD shows that theixCu1−x clusters observed in the reduced state for the carbonnd zirconia based catalysts are absent and after hydrotreatmentnly separate Ni and Cu particles were observed. An exception is
iCu/TiO2, which does not show NixCu1−x clusters in fresh catalyst,hile such clusters are present after the reaction. This may be dueo the higher reaction temperature (350 ◦C) and partial pressuref H2 during an actual pyrolysis oil hydrotreatment than the
able 7arbon content of spent catalysts.
Catalyst Carbon content, wt.%
NiCu/CeO2–ZrO2 13.4NiCu/ZrO2 7.1NiCu/TiO2 7.7NiCu/�-Al2O3 8.9
/ZrO2 catalysts after pyrolysis oil hydrotreatment (b).
reduction protocol used for the XRD analyses. The particle sizesof the NixCu1−x clusters on the spent NiCu/TiO2 catalysts are rel-atively small (120 A) compared to those for the Ni–Cu on aluminacatalyst (230 A). These findings may indicate that mixed NixCu1−xclusters are the key species for the relatively high hydrotreatmentactivity of NiCu/TiO2.
XRD (Table 3) also reveals that the crystal structure of the TiO2support does not change during the hydrotreatment reaction andremains in the anatase form. In addition, cerium carbonate hydrox-ide (CeCO3OH) is observed on spent NiCu/CeO2–ZrO2 catalysts.Although this compound can be thermally decomposed to CeO2[38], the presence of CeCO3OH and its interaction with the activecomponents may affect catalyst activity as well as leading to highersupport leaching levels. For NiCu/ZrO2, the ZrO2 structure changedfrom amorphous (reduced catalyst) to monoclinic and cubic (spentcatalyst). As the surface areas of the monoclinic and cubic phasesare lower than for amorphous ZrO2 [39], this structure change maycontribute to sintering of the Ni–Cu clusters for the NiCu/ZrO2 cat-alyst.
HRTEM/EDX confirms that sintering occurs during thehydrotreatment reaction. For example, for NiCu/ZrO2, the activemetal particle size increases from ca. 5 to 10 nm prior hydrotreat-ment (Fig. 2(b)), to 10–100 nm on the spent catalyst (Fig. 9(b)). Forthe spent NiCu/Sibunite, observation of sintering is not possible asnearly no metal is left on the support (ICP). Fig. 9(a) shows a smallresidual metal particle under the carbon layer.
4. Conclusions
Ni–Cu catalysts on various supports (CeO2–ZrO2, ZrO2, SiO2,TiO2, rice husk carbon (CRH), and Sibunite) have been tested forthe hydrotreatment of pyrolysis oil in a batch set-up. The NiCu/TiO2catalyst shows the best performance in terms of hydrogen uptake,a combined measure of catalyst activity and stability. Performanceof the carbon based catalysts is inferior to the inorganic ones, whichfor the Sibunite based catalyst is (mainly) due to excessive catalystleaching. The NiCu/TiO2 catalyst is not only the most active in theseries but also a product oil with the most favourable properties(high H/C ratio (1.43), low TG residue (2.7 wt.%) and highest solu-bility in the hexane–benzene mixture) was obtained. The potentialof the product oils for co-feeding purposes is under investigationand will be reported in due course. Catalyst characterization studiesbefore and after reaction indicates the occurrence of Ni–Cu leachingfrom the support, the actual extent being a function of the support,
limited metal cluster sintering and coke deposition (max 13.4 wt.%for the inorganic supports). The effect of these phenomena onthe steady-state catalyst stability could not be assessed in thebatch set-up used in this study and further studies in dedicated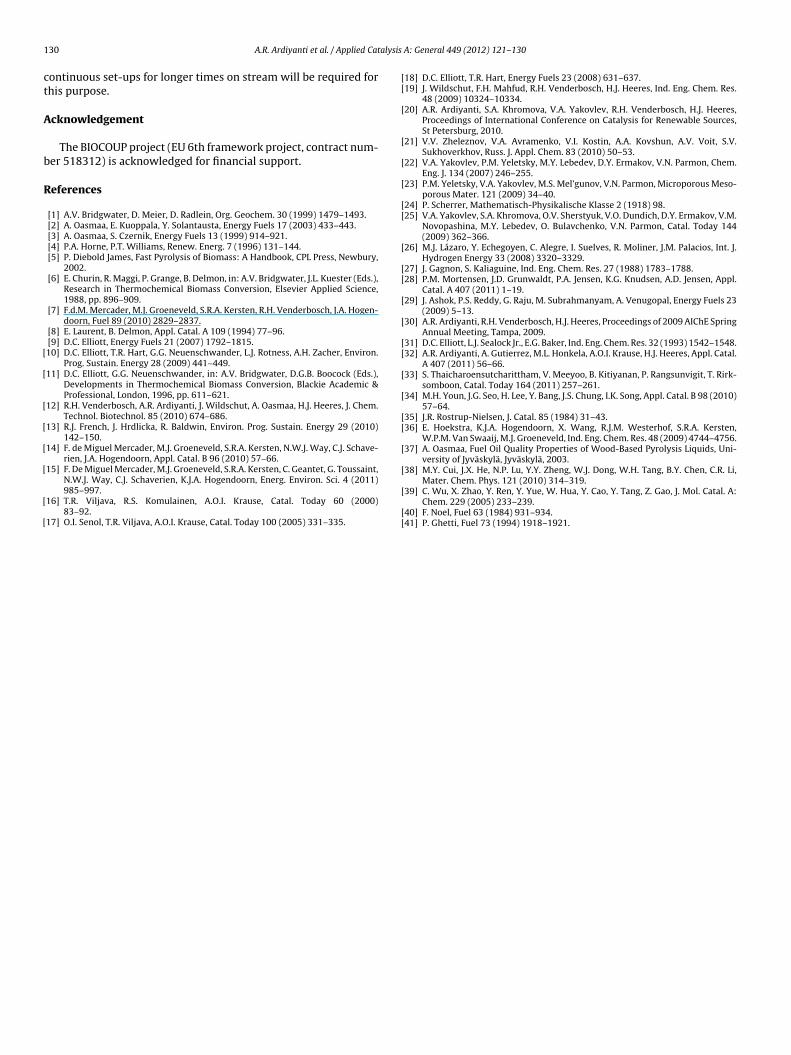
1 alysis
ct
A
b
R
[
[
[
[
[
[
[
[
[[
[
[
[
[
[[
[
[[
[
[
[[
[
[
[[
[
[
30 A.R. Ardiyanti et al. / Applied Cat
ontinuous set-ups for longer times on stream will be required forhis purpose.
cknowledgement
The BIOCOUP project (EU 6th framework project, contract num-er 518312) is acknowledged for financial support.
eferences
[1] A.V. Bridgwater, D. Meier, D. Radlein, Org. Geochem. 30 (1999) 1479–1493.[2] A. Oasmaa, E. Kuoppala, Y. Solantausta, Energy Fuels 17 (2003) 433–443.[3] A. Oasmaa, S. Czernik, Energy Fuels 13 (1999) 914–921.[4] P.A. Horne, P.T. Williams, Renew. Energ. 7 (1996) 131–144.[5] P. Diebold James, Fast Pyrolysis of Biomass: A Handbook, CPL Press, Newbury,
2002.[6] E. Churin, R. Maggi, P. Grange, B. Delmon, in: A.V. Bridgwater, J.L. Kuester (Eds.),
Research in Thermochemical Biomass Conversion, Elsevier Applied Science,1988, pp. 896–909.
[7] F.d.M. Mercader, M.J. Groeneveld, S.R.A. Kersten, R.H. Venderbosch, J.A. Hogen-doorn, Fuel 89 (2010) 2829–2837.
[8] E. Laurent, B. Delmon, Appl. Catal. A 109 (1994) 77–96.[9] D.C. Elliott, Energy Fuels 21 (2007) 1792–1815.10] D.C. Elliott, T.R. Hart, G.G. Neuenschwander, L.J. Rotness, A.H. Zacher, Environ.
Prog. Sustain. Energy 28 (2009) 441–449.11] D.C. Elliott, G.G. Neuenschwander, in: A.V. Bridgwater, D.G.B. Boocock (Eds.),
Developments in Thermochemical Biomass Conversion, Blackie Academic &Professional, London, 1996, pp. 611–621.
12] R.H. Venderbosch, A.R. Ardiyanti, J. Wildschut, A. Oasmaa, H.J. Heeres, J. Chem.Technol. Biotechnol. 85 (2010) 674–686.
13] R.J. French, J. Hrdlicka, R. Baldwin, Environ. Prog. Sustain. Energy 29 (2010)142–150.
14] F. de Miguel Mercader, M.J. Groeneveld, S.R.A. Kersten, N.W.J. Way, C.J. Schave-rien, J.A. Hogendoorn, Appl. Catal. B 96 (2010) 57–66.
15] F. De Miguel Mercader, M.J. Groeneveld, S.R.A. Kersten, C. Geantet, G. Toussaint,
N.W.J. Way, C.J. Schaverien, K.J.A. Hogendoorn, Energ. Environ. Sci. 4 (2011)985–997.16] T.R. Viljava, R.S. Komulainen, A.O.I. Krause, Catal. Today 60 (2000)83–92.
17] O.I. Senol, T.R. Viljava, A.O.I. Krause, Catal. Today 100 (2005) 331–335.
[
[[
A: General 449 (2012) 121– 130
18] D.C. Elliott, T.R. Hart, Energy Fuels 23 (2008) 631–637.19] J. Wildschut, F.H. Mahfud, R.H. Venderbosch, H.J. Heeres, Ind. Eng. Chem. Res.
48 (2009) 10324–10334.20] A.R. Ardiyanti, S.A. Khromova, V.A. Yakovlev, R.H. Venderbosch, H.J. Heeres,
Proceedings of International Conference on Catalysis for Renewable Sources,St Petersburg, 2010.
21] V.V. Zheleznov, V.A. Avramenko, V.I. Kostin, A.A. Kovshun, A.V. Voit, S.V.Sukhoverkhov, Russ. J. Appl. Chem. 83 (2010) 50–53.
22] V.A. Yakovlev, P.M. Yeletsky, M.Y. Lebedev, D.Y. Ermakov, V.N. Parmon, Chem.Eng. J. 134 (2007) 246–255.
23] P.M. Yeletsky, V.A. Yakovlev, M.S. Mel’gunov, V.N. Parmon, Microporous Meso-porous Mater. 121 (2009) 34–40.
24] P. Scherrer, Mathematisch-Physikalische Klasse 2 (1918) 98.25] V.A. Yakovlev, S.A. Khromova, O.V. Sherstyuk, V.O. Dundich, D.Y. Ermakov, V.M.
Novopashina, M.Y. Lebedev, O. Bulavchenko, V.N. Parmon, Catal. Today 144(2009) 362–366.
26] M.J. Lázaro, Y. Echegoyen, C. Alegre, I. Suelves, R. Moliner, J.M. Palacios, Int. J.Hydrogen Energy 33 (2008) 3320–3329.
27] J. Gagnon, S. Kaliaguine, Ind. Eng. Chem. Res. 27 (1988) 1783–1788.28] P.M. Mortensen, J.D. Grunwaldt, P.A. Jensen, K.G. Knudsen, A.D. Jensen, Appl.
Catal. A 407 (2011) 1–19.29] J. Ashok, P.S. Reddy, G. Raju, M. Subrahmanyam, A. Venugopal, Energy Fuels 23
(2009) 5–13.30] A.R. Ardiyanti, R.H. Venderbosch, H.J. Heeres, Proceedings of 2009 AIChE Spring
Annual Meeting, Tampa, 2009.31] D.C. Elliott, L.J. Sealock Jr., E.G. Baker, Ind. Eng. Chem. Res. 32 (1993) 1542–1548.32] A.R. Ardiyanti, A. Gutierrez, M.L. Honkela, A.O.I. Krause, H.J. Heeres, Appl. Catal.
A 407 (2011) 56–66.33] S. Thaicharoensutcharittham, V. Meeyoo, B. Kitiyanan, P. Rangsunvigit, T. Rirk-
somboon, Catal. Today 164 (2011) 257–261.34] M.H. Youn, J.G. Seo, H. Lee, Y. Bang, J.S. Chung, I.K. Song, Appl. Catal. B 98 (2010)
57–64.35] J.R. Rostrup-Nielsen, J. Catal. 85 (1984) 31–43.36] E. Hoekstra, K.J.A. Hogendoorn, X. Wang, R.J.M. Westerhof, S.R.A. Kersten,
W.P.M. Van Swaaij, M.J. Groeneveld, Ind. Eng. Chem. Res. 48 (2009) 4744–4756.37] A. Oasmaa, Fuel Oil Quality Properties of Wood-Based Pyrolysis Liquids, Uni-
versity of Jyväskylä, Jyväskylä, 2003.38] M.Y. Cui, J.X. He, N.P. Lu, Y.Y. Zheng, W.J. Dong, W.H. Tang, B.Y. Chen, C.R. Li,
Mater. Chem. Phys. 121 (2010) 314–319.39] C. Wu, X. Zhao, Y. Ren, Y. Yue, W. Hua, Y. Cao, Y. Tang, Z. Gao, J. Mol. Catal. A:
Chem. 229 (2005) 233–239.40] F. Noel, Fuel 63 (1984) 931–934.41] P. Ghetti, Fuel 73 (1994) 1918–1921.
Copyright © 2022 FDOKUMEN