Bimetallic PtAg and PdAg nanoparticles
8
Bimetallic Pt–Ag and Pd–Ag nanoparticles Debdutta Lahiri, Bruce Bunker, a and Bhoopesh Mishra Department of Physics, University of Notre Dame, Notre Dame, Indiana 46556 Zhenyuan Zhang and Dan Meisel Radiation Laboratory and Department of Chemistry and Biochemistry, University of Notre Dame, Notre Dame, Indiana 46556 C. M. Doudna, M. F. Bertino, Frank D. Blum, and A. T. Tokuhiro Departments of Physics, Chemistry and Nuclear Engineering, University of Missouri–Rolla, Missouri 65409 Soma Chattopadhyay, Tomohiro Shibata, and Jeff Terry Department of Biological, Chemical, and Physical Sciences (BCPS), Illinois Institute of Technology, Chicago, Illinois 60616 Received 23 June 2004; accepted 17 February 2005; published online 19 April 2005 We report studies of bimetallic nanoparticles with 15%–16% atomic crystal parameters size mismatch. The degree of alloying was probed in a 2-nm Pt core smallest attainable core size of Pt–Ag nanoparticles completely immiscible in bulk and 20-nm-diameter Pd–Ag nanowires completely miscible in bulk. Particles were synthesized radiolytically, and depending on the initial parameters, they assume spherical or cylindrical nanowire morphologies. In all cases, the metals are seen to follow their bulk alloying characteristics. Pt and Ag segregate in both spherical and wire forms, which indicates that strain due to crystallographic mismatch overcomes the excess surface free energy in the small particles. The Pd–Ag nanowires alloy similar to previously reported spherical Pd–Ag particles of similar diameter and composition. © 2005 American Institute of Physics. DOI: 10.1063/1.1888043 INTRODUCTION There has been a great deal of interest in the size depen- dence of electronic and thermodynamic properties of metal- lic nanoparticles because of their potential use in many ap- plications from catalysis to electronic devices. The electronic structure of a metallic nanoparticle undergoes major devia- tion from that of bulk. 1,2 Crystallographic parameters in these large clusters might be significantly different from those of the bulk, partially because of increased surface en- ergy and partially because of capping agents that are always present when the particles are generated from suspensions in solution. 3 A significant impetus to study metallic nanopar- ticles comes from their ability to store excess electrons. 4 These stored electrons can reduce substrates in solution via multielectron-transfer processes, e.g., produce hydrogen from water. Bimetallic nanoparticles, composed of two dif- ferent metal elements, are of greater interest since they offer a method to control the energy of the plasmon absorption band of the metallic mixture, which becomes a versatile tool in biosensing. 5 They may also improve the catalytic activity of the particles, sometimes creating new catalysts unknown in the bulk size. 6 Furthermore, structural changes can be cre- ated in small bimetallic nanoparticles as a result of alloying of the component metals, even though they remain segre- gated in bulk dimensions at ambient temperature. This may affect the electronic properties of the composite and may enhance or inhibit Fermi-level equilibration in such systems. 7 Binary phase diagrams for bulk metals are a well- established, commonly utilized tool. 8 However, it is doubtful that they can be extended to the nanometer size regime be- cause of the presence of the large bimetallic interface, the large surface area, and the possible presence of defects at the interface. A significant fraction of the total atoms present in the nanoparticles resides at the surface and contributes to the excess Gibbs free energy, thereby modifying the bulk binary phase diagram. 9,10 Similarly, a large fraction of the atoms occupies the bimetallic interface thereby affecting the misci- bility of the metals in one another. Other factors that contrib- ute to the modified alloying characteristics of the two metals are the depression of the melting point in clusters 11,12 and the presence of defects at the bimetallic interface of the particles that enhances the interdiffusion of the metals. 13 Both of these factors lead to an enhanced diffusion rate within the small particles, as much as nine orders of magnitude faster than in the bulk. 14 Size-dependent alloying in Au–Ag core-shell nanoparticles, at room temperature, had been reported by our group earlier. 13 At 2-nm Au core and variable thickness Ag shell, rapid random alloying has been observed at ambient temperature. However, for Au nanoparticles of 8-nm core size a distinct interface between the core and the Ag shell was maintained. In this context it should be noted that Au and Ag are bulk miscible at every ratio at elevated tempera- tures and they have essentially identical lattice parameters. In the present report we explore the mixing behavior of Pt–Ag and Pd–Ag nanoparticles. In these systems the atomic sizes of the components differ by 15% and 16%, respec- tively, and the melting points of Pt and Pd are higher than that of the previously studied Au. In the bulk such a mis- a Electronic mail: [email protected] JOURNAL OF APPLIED PHYSICS 97, 094304 2005 0021-8979/2005/979/094304/8/$22.50 © 2005 American Institute of Physics 97, 094304-1 Downloaded 06 Oct 2006 to 129.74.11.24. Redistribution subject to AIP license or copyright, see http://jap.aip.org/jap/copyright.jsp
-
Upload
independent -
Category
Documents
-
view
0 -
download
0
Transcript of Bimetallic PtAg and PdAg nanoparticles
Bimetallic Pt–Ag and Pd–Ag nanoparticlesDebdutta Lahiri, Bruce Bunker,a! and Bhoopesh MishraDepartment of Physics, University of Notre Dame, Notre Dame, Indiana 46556
Zhenyuan Zhang and Dan MeiselRadiation Laboratory and Department of Chemistry and Biochemistry, University of Notre Dame,Notre Dame, Indiana 46556
C. M. Doudna, M. F. Bertino, Frank D. Blum, and A. T. TokuhiroDepartments of Physics, Chemistry and Nuclear Engineering, University of Missouri–Rolla, Missouri 65409
Soma Chattopadhyay, Tomohiro Shibata, and Jeff TerryDepartment of Biological, Chemical, and Physical Sciences (BCPS), Illinois Institute of Technology,Chicago, Illinois 60616
!Received 23 June 2004; accepted 17 February 2005; published online 19 April 2005"
We report studies of bimetallic nanoparticles with 15%–16% atomic crystal parameters sizemismatch. The degree of alloying was probed in a 2-nm Pt core !smallest attainable core size" ofPt–Ag nanoparticles !completely immiscible in bulk" and 20-nm-diameter Pd–Ag nanowires!completely miscible in bulk". Particles were synthesized radiolytically, and depending on the initialparameters, they assume spherical or cylindrical !nanowire" morphologies. In all cases, the metalsare seen to follow their bulk alloying characteristics. Pt and Ag segregate in both spherical and wireforms, which indicates that strain due to crystallographic mismatch overcomes the excess surfacefree energy in the small particles. The Pd–Ag nanowires alloy similar to previously reportedspherical Pd–Ag particles of similar diameter and composition. © 2005 American Institute ofPhysics. #DOI: 10.1063/1.1888043$
INTRODUCTION
There has been a great deal of interest in the size depen-dence of electronic and thermodynamic properties of metal-lic nanoparticles because of their potential use in many ap-plications from catalysis to electronic devices. The electronicstructure of a metallic nanoparticle undergoes major devia-tion from that of bulk.1,2 Crystallographic parameters inthese large clusters might be significantly different fromthose of the bulk, partially because of increased surface en-ergy and partially because of capping agents that are alwayspresent when the particles are generated from suspensions insolution.3 A significant impetus to study metallic nanopar-ticles comes from their ability to store excess electrons.4
These stored electrons can reduce substrates in solution viamultielectron-transfer processes, e.g., produce hydrogenfrom water. Bimetallic nanoparticles, composed of two dif-ferent metal elements, are of greater interest since they offera method to control the energy of the plasmon absorptionband of the metallic mixture, which becomes a versatile toolin biosensing.5 They may also improve the catalytic activityof the particles, sometimes creating new catalysts unknownin the bulk size.6 Furthermore, structural changes can be cre-ated in small bimetallic nanoparticles as a result of alloyingof the component metals, even though they remain segre-gated in bulk dimensions at ambient temperature. This mayaffect the electronic properties of the composite and mayenhance or inhibit Fermi-level equilibration in suchsystems.7
Binary phase diagrams for bulk metals are a well-established, commonly utilized tool.8 However, it is doubtfulthat they can be extended to the nanometer size regime be-cause of the presence of the large bimetallic interface, thelarge surface area, and the possible presence of defects at theinterface. A significant fraction of the total atoms present inthe nanoparticles resides at the surface and contributes to theexcess Gibbs free energy, thereby modifying the bulk binaryphase diagram.9,10 Similarly, a large fraction of the atomsoccupies the bimetallic interface thereby affecting the misci-bility of the metals in one another. Other factors that contrib-ute to the modified alloying characteristics of the two metalsare the depression of the melting point in clusters11,12 and thepresence of defects at the bimetallic interface of the particlesthat enhances the interdiffusion of the metals.13 Both of thesefactors lead to an enhanced diffusion rate within the smallparticles, as much as nine orders of magnitude faster than inthe bulk.14 Size-dependent alloying in Au–Ag core-shellnanoparticles, at room temperature, had been reported by ourgroup earlier.13 At 2-nm Au core and variable thickness Agshell, rapid random alloying has been observed at ambienttemperature. However, for Au nanoparticles of !8-nm coresize a distinct interface between the core and the Ag shellwas maintained. In this context it should be noted that Auand Ag are bulk miscible at every ratio at elevated tempera-tures and they have essentially identical lattice parameters.
In the present report we explore the mixing behavior ofPt–Ag and Pd–Ag nanoparticles. In these systems the atomicsizes of the components differ by 15% and 16%, respec-tively, and the melting points of Pt and Pd are higher thanthat of the previously studied Au. In the bulk such a mis-a"Electronic mail: [email protected]
JOURNAL OF APPLIED PHYSICS 97, 094304 !2005"
0021-8979/2005/97"9!/094304/8/$22.50 © 2005 American Institute of Physics97, 094304-1
Downloaded 06 Oct 2006 to 129.74.11.24. Redistribution subject to AIP license or copyright, see http://jap.aip.org/jap/copyright.jsp

match results in a pronounced distortion of the alloy latticeand it might be expected that the solubility of one in theother will be difficult even in the nanoscale. It has beenpostulated that in order to obtain a primary solid solution theatomic radii should not differ by more than about 14%.15
However, the large surface area, the increased surface freeenergy, and the reduced cohesive energy in the nanoparticlesmay partially relieve the mismatch-induced strain and in-crease the miscibility of the two metals. This competitionbetween excess surface free energy and elastic relaxation hasbeen analyzed in detail by Vanderbilt and co-workers.16,17
Such theoretical studies have motivated us to explore suchlattice-mismatched bimetallic systems.
To study the alloying of the two metals the x-ray-absorption fine structure !XAFS" technique was utilized.18
The analysis is based on fitting the complex Fourier trans-form of the XAFS oscillations, revealing quantitative infor-mation about coordination numbers !N", bond lengths !r",and bond-length distribution !Debye–Waller factor" !"2" ofthe neighboring atoms. Unlike diffraction, XAFS does notrequire a high degree of crystallinity or long-range orderingin the sample to obtain high-quality data. Hence, the tech-nique is particularly useful to extract structural informationfrom disordered systems, such as powders or suspensions ofnanoparticles. The part of the XAFS spectrum around theedge energy, called x-ray appearance near-edge structure!XANES", can be used to determine the oxidation state of theabsorbing atom. A change in the oxidation state is reflectedin a shift in the edge energy !from the pure metallic value"and “whiteline” features.18 As mentioned above, we considertwo systems, Pt–Ag and Pd–Ag; the bimetallic Pt–Ag is bulkimmiscible, but it has been reported that deposition of Ag onPt !111" leads to a monolayer-confined mixing.19–21 The bi-metallic Pd–Ag is bulk miscible22 and it has already beenshown that Pd–Ag spherical nanoparticles are miscible aswell.23 In the present report we examine cylindrical-shapedPd–Ag nanoparticles !nanowires" to examine the effect ofmorphology on alloying. Both systems were synthesized us-ing the radiolytic technique developed by Henglein andco-workers.24 Using this technique and varying the experi-mental parameters allow morphology control of the particles.The size, shape, and composition of the samples were char-acterized by transmission electron microscopy !TEM" and adetailed analysis of the local structure was done using theXAFS technique. The XANES was observed to ensure thatthe samples did not oxidize during the measurements. Theanalysis leads to the conclusion that Pt and Ag do not alloyin the nanosize regime down to a diameter of 2 nm whilePd–Ag alloy even in the cylindrical rods.
EXPERIMENTAL SECTIONMaterials and methods
Alloying of Au–Ag was observed at a core size of2 nm;13 hence we started at this small size for Pt core aswell. The 2-nm Pt core particles were synthesized followingHenglein et al.24 A 70-ml solution containing 0.5-M metha-nol, 2#10−3 M sodium polyphosphate, 1#10−3 M sodiumcitrate, and 8#10−4 M K2PtCl4 !99.99%, Aldrich" was de-
aerated by bubbling Ar for 10 min and then irradiated in a60Co-$ source for 21 min at a dose rate of 9.6#102 krad/h.Irradiation was done in a 100-ml glass vessel that carried asidearm cuvette made of high-purity quartz, so absorptionspectra could be measured in complete isolation from air.After irradiation, 7-ml 0.2-M polyvinyl alcohol !PVA, Mw50 000–85 000, Aldrich" was added to stabilize the Pt sol.Approximately 1 g of ion-exchange mixed-bed resin !Am-berlite MB-150, Sigma" was added to decrease the concen-tration of free ions that remains from the various parent com-ponents and the solution was shaken overnight. The solutionwas separated from the resin, and 1.4-ml 0.1-M sodium cit-rate added to stabilize the Pt particles and the solution wasfiltered. This treatment with the ion-exchange resin was re-peated and the absorption spectrum of the sol was measuredafter each treatment. The final concentration of Pt was about5#10−4 M. All manipulations of the sol were carried out ina glove box under Ar atmosphere. The size of the roughlyspherical Pt particles thus obtained was determined by TEMto be 2±0.2 nm. The TEM image of these particles is shownin Fig. 1.
FIG. 1. TEM image of the 2-nm Pt nanoparticles. The particles were syn-thesized radiolytically and were used as core for the Pt–Ag particles.
FIG. 2. UV spectra of 2-nm Pt !A" and 2-nm Pt particles coated with 1.2 !B"and 2.7 !C" layers of Ag. For A, #Pt$=5#10−4 M and its plasmon band is at212 nm. For B, #Pt$=3.3#10−4 M, #Ag$=3.3#10−4 M, and #Pt$ / #Ag$=1:1. For C, #Pt$=2.5#10−4 M, #Pt$ / #Ag$=1:3, and its plasmon band is at361 nm. Optical path is 2 mm.
094304-2 Lahiri et al. J. Appl. Phys. 97, 094304 "2005!
Downloaded 06 Oct 2006 to 129.74.11.24. Redistribution subject to AIP license or copyright, see http://jap.aip.org/jap/copyright.jsp
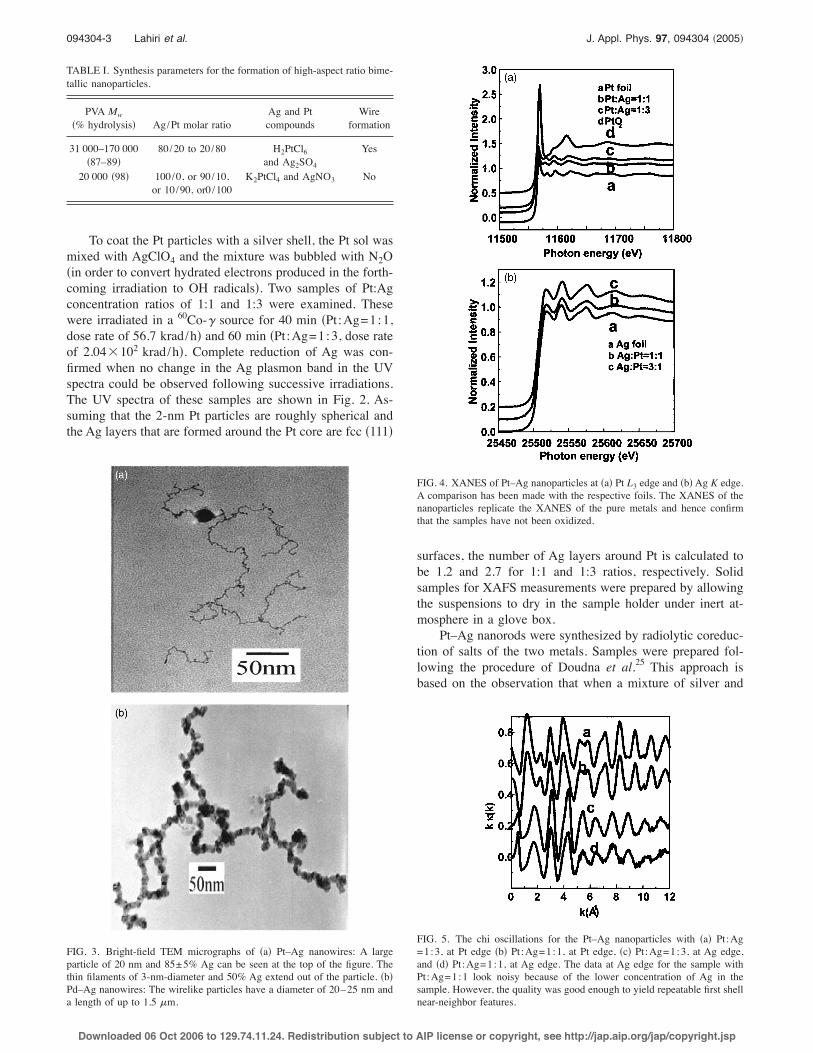
To coat the Pt particles with a silver shell, the Pt sol wasmixed with AgClO4 and the mixture was bubbled with N2O!in order to convert hydrated electrons produced in the forth-coming irradiation to OH radicals". Two samples of Pt:Agconcentration ratios of 1:1 and 1:3 were examined. Thesewere irradiated in a 60Co-$ source for 40 min !Pt:Ag=1:1,dose rate of 56.7 krad/h" and 60 min !Pt:Ag=1:3, dose rateof 2.04#102 krad/h". Complete reduction of Ag was con-firmed when no change in the Ag plasmon band in the UVspectra could be observed following successive irradiations.The UV spectra of these samples are shown in Fig. 2. As-suming that the 2-nm Pt particles are roughly spherical andthe Ag layers that are formed around the Pt core are fcc !111"
surfaces, the number of Ag layers around Pt is calculated tobe 1.2 and 2.7 for 1:1 and 1:3 ratios, respectively. Solidsamples for XAFS measurements were prepared by allowingthe suspensions to dry in the sample holder under inert at-mosphere in a glove box.
Pt–Ag nanorods were synthesized by radiolytic coreduc-tion of salts of the two metals. Samples were prepared fol-lowing the procedure of Doudna et al.25 This approach isbased on the observation that when a mixture of silver and
TABLE I. Synthesis parameters for the formation of high-aspect ratio bime-tallic nanoparticles.
PVA Mw!% hydrolysis" Ag/Pt molar ratio
Ag and Ptcompounds
Wireformation
31 000–170 000!87–89"
80/20 to 20/80 H2PtCl6and Ag2SO4
Yes
20 000 !98" 100/0, or 90/10,or 10/90, or0 /100
K2PtCl4 and AgNO3 No
FIG. 3. Bright-field TEM micrographs of !a" Pt–Ag nanowires: A largeparticle of 20 nm and 85±5% Ag can be seen at the top of the figure. Thethin filaments of 3-nm-diameter and 50% Ag extend out of the particle. !b"Pd–Ag nanowires: The wirelike particles have a diameter of 20–25 nm anda length of up to 1.5 %m.
FIG. 4. XANES of Pt–Ag nanoparticles at !a" Pt L3 edge and !b"Ag K edge.A comparison has been made with the respective foils. The XANES of thenanoparticles replicate the XANES of the pure metals and hence confirmthat the samples have not been oxidized.
FIG. 5. The chi oscillations for the Pt–Ag nanoparticles with !a" Pt:Ag=1:3, at Pt edge !b" Pt:Ag=1:1, at Pt edge, !c" Pt:Ag=1:3, at Ag edge,and !d" Pt:Ag=1:1, at Ag edge. The data at Ag edge for the sample withPt:Ag=1:1 look noisy because of the lower concentration of Ag in thesample. However, the quality was good enough to yield repeatable first shellnear-neighbor features.
094304-3 Lahiri et al. J. Appl. Phys. 97, 094304 "2005!
Downloaded 06 Oct 2006 to 129.74.11.24. Redistribution subject to AIP license or copyright, see http://jap.aip.org/jap/copyright.jsp
platinum salts is irradiated under reducing conditions, theformer is reduced before the latter. The faster reduction ofAg+ is due to the more positive reduction potential of Ag+relative to the multivalent platinum.25 Under these circum-stances, Ag seeds are initially formed and Pt shell is thendeposited on them. Experimental conditions for rod-shapeformation of these particles have been summarized previ-ously and are outlined in Table I.25 The rods are composed oftwo types of particles; large particles of typical diameters of20–30 nm are joined by thin filaments of diameters of2–5 nm. A TEM picture of the Ag–Pt nanowires is shown inFig. 3!a". The elemental composition of the regions centeredon the large particles and the filaments was determined usingenergy dispersive spectroscopy !EDS", with a spatial resolu-tion of 150 nm. The large particles composed of 80%–90%Ag, while the filaments are close to 50% each, Ag and Pt.The EDS results suggest that the large Ag particles wereformed in the early stages of the reduction, nucleation, andripening while the Ag–Pt filaments result from the reductionof the Pt ions deposition on the Ag seeds. The Pd–Ag nano-rods were synthesized similarly. Filamentlike particles, withtypical diameters of 20–25 nm, and up to 1.5 %m long, wereroutinely observed after irradiation. The ratio between thetwo metals varied within the same particle and betweennanoparticles, but the variation was, on average, within±15% of the mole ratio of the original sample. The TEMpicture of the Pd–Ag nanowires is shown in Fig. 3!b".
The XAFS studies were performed at the MRCAT undu-lator beamline 10-ID at the Advanced Photon Source, Ar-gonne National Laboratory. The measurements involved thePt L3 edge !11.564 keV", the Ag K edge !25.514 keV", andthe Pd K edge !26.500 keV". The undulator parameters wereoptimized in the tapered mode to obtain a nearly constantintensity within the XAFS energy range. A cryogenic double-crystal Si !111" monochromator was utilized for x-ray energyselection. To eliminate unwanted higher harmonics from themonochromator, a Rh-coated harmonic rejection mirror atthe Pt L3 edge was used, while a Pt-coated mirror was usedfor the Pd and Ag K edges. The incident photon intensity wasmeasured by an ion chamber filled with a mixture of 80% Heand 20% N2 gas at the Pt edge and 100% N2 at Ag and Pdedges. At the Pt edge, x-ray fluorescence intensity was mea-sured by a conventional three-grid “Lytle” ionization cham-ber detector filled with Kr gas. Since the concentration of Ptatoms in the sample was low, a thick Ga2O3 x-ray filter ofnine absorption lengths was used to reduce background scat-tering and Soller slits were used to suppress multiple refluo-rescence from the filter. At the Ag and Pd edges, fluorescenceflux was measured with the same Lytle detector with a sixabsorption-length Ru x-ray filter and Soller slits or, for somemeasurements, a 13-element Ge detector. For energy calibra-tion, transmission-mode XAFS was measured on Pt, Ag, andPd foils in parallel.
The extended x-ray-absorption fine structure !EXAFS"oscillations were isolated using standard methods. The edge
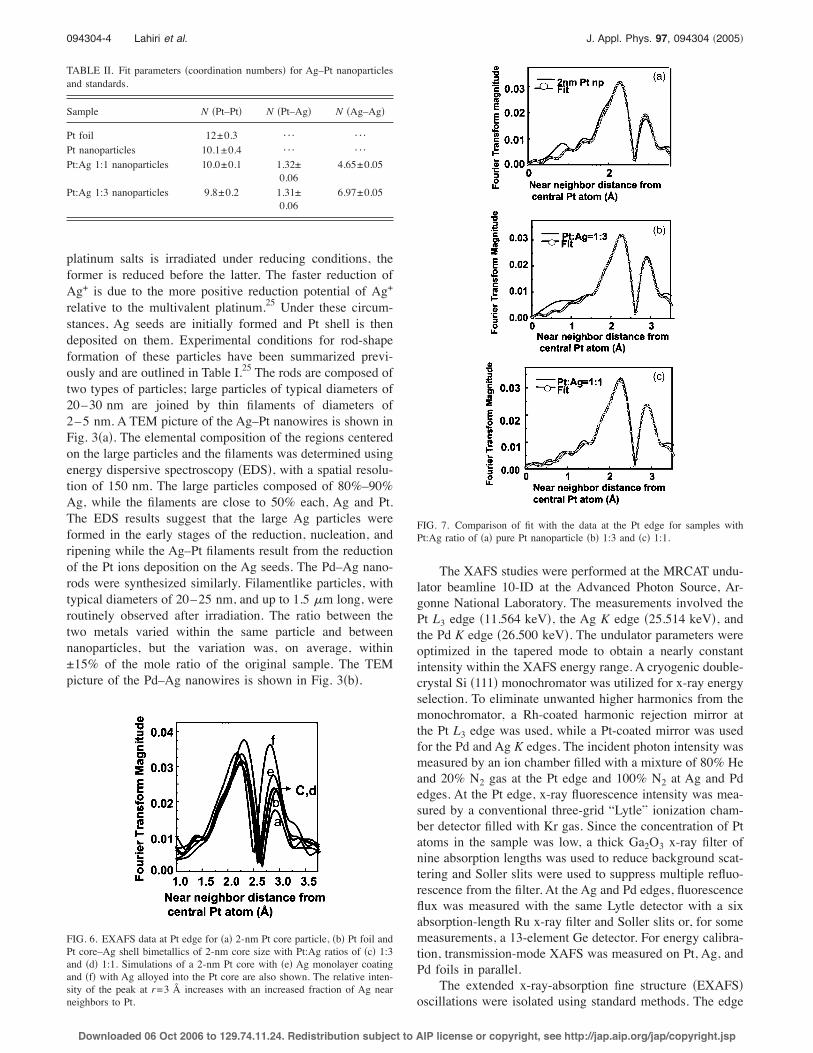
TABLE II. Fit parameters !coordination numbers" for Ag–Pt nanoparticlesand standards.
Sample N !Pt–Pt" N !Pt–Ag" N !Ag–Ag"
Pt foil 12±0.3 ¯ ¯Pt nanoparticles 10.1±0.4 ¯ ¯Pt:Ag 1:1 nanoparticles 10.0±0.1 1.32±
0.064.65±0.05
Pt:Ag 1:3 nanoparticles 9.8±0.2 1.31±0.06
6.97±0.05
FIG. 6. EXAFS data at Pt edge for !a" 2-nm Pt core particle, !b" Pt foil andPt core–Ag shell bimetallics of 2-nm core size with Pt:Ag ratios of !c" 1:3and !d" 1:1. Simulations of a 2-nm Pt core with !e" Ag monolayer coatingand !f" with Ag alloyed into the Pt core are also shown. The relative inten-sity of the peak at r=3 Å increases with an increased fraction of Ag nearneighbors to Pt.
FIG. 7. Comparison of fit with the data at the Pt edge for samples withPt:Ag ratio of !a" pure Pt nanoparticle !b" 1:3 and !c" 1:1.
094304-4 Lahiri et al. J. Appl. Phys. 97, 094304 "2005!
Downloaded 06 Oct 2006 to 129.74.11.24. Redistribution subject to AIP license or copyright, see http://jap.aip.org/jap/copyright.jsp
energy, E!, was determined by the point of inflection of theabsorption spectrum. The preedge background was first sub-tracted from the raw data and normalized by the edge step.The postedge smooth background #&0!E"$ was fitted to apolynomial to minimize the least-square deviation either us-ing the AUTOBK program26 or manually, and then subtractedfrom the normalized data #&!E"$. The oscillations were plot-ted as a function of the electron wave vector !k" using therelation k=%2m!E−E!" /'2, where m is the electron massand E! is the edge energy of the photoelectron. The &!k" wasthen Fourier transformed into r space #&!r"$. A model wasreasonably constructed and the theoretical scattering ampli-tudes and phase shift for this model are generated by FEFF!6.01a version". Structural parameters for the scattering werethen determined using FEFFIT !Ref. 27" to give the best-fitvalues for bond lengths !r", coordination numbers !N",Debye–Waller factors "2 !and further degrees of disorder asnecessary", and energy origin correction !E0" arising fromchanges in the electronic energy levels by the presence of
other atoms. The degree of alloying in bimetallic systems canbe determined from the coordination number and/or thebond-length information. The fraction of near-neighbor coor-dination numbers for guest-guest and guest-host out of thetotal near-neighbor atoms can indicate the degree of alloying.Similarly, a systematic change of the interatomic distances inthe host matrix, with the increased proportion of addedguest-metal atoms, is considered to be a signature of alloy-ing. Although the nearest-neighbor distances to each atomicspecies vary only slightly with alloy composition thesechanges can still be observed in the EXAFS parameters. Onthe other hand, if the two metals remain segregated, no sig-nificant change in the interatomic distances is observed.
RESULTS AND DISCUSSIONSPt–Ag system
The analysis is first done at the Pt L3 edge and then atthe Ag K edge. Prior to fitting, the XANES from the sampleswas observed to confirm that the metals were not oxidized.The XANES spectra at the Pt and Ag edges are shown inFigs. 4!a" and 4!b", respectively. The analysis at the Pt edgeprogresses in the following order:
!a" Pt foil fit;!b" Pt nanoparticle fit. Approximating the seed Pt particles
as spherical !from TEM" and comparing the fit resultswith those for the foil, determination of coordinationloss due to surface effects;
!c" Pt–Ag determination of coordination number for thePt:Ag=1:3 sample; and
!d" Pt–Ag determination of coordination number for thePt:Ag=1:1 sample.
The XAFS oscillations from these samples are shown in Fig.5. They were transformed in the k range of 3–11 Å−1. Fit inr space was attempted between 1.4 and 3.2 Å for all thesamples. The fit parameters are listed in Table II.
The decrease in the coordination number of Pt–Pt nearneighbors in 2-nm Pt particles !10.06±0.39" from that in Ptfoil !12±0.30" is due to coordination loss at the surface.Because of the large fraction of surface atoms, their contri-bution to the EXAFS results is as significant as that from thecore atoms. Surface atoms constitute &53% of the total num-ber of atoms for a 2-nm Pt particle with 10% size distribu-tion, as indicated from TEM. From the measured coordina-
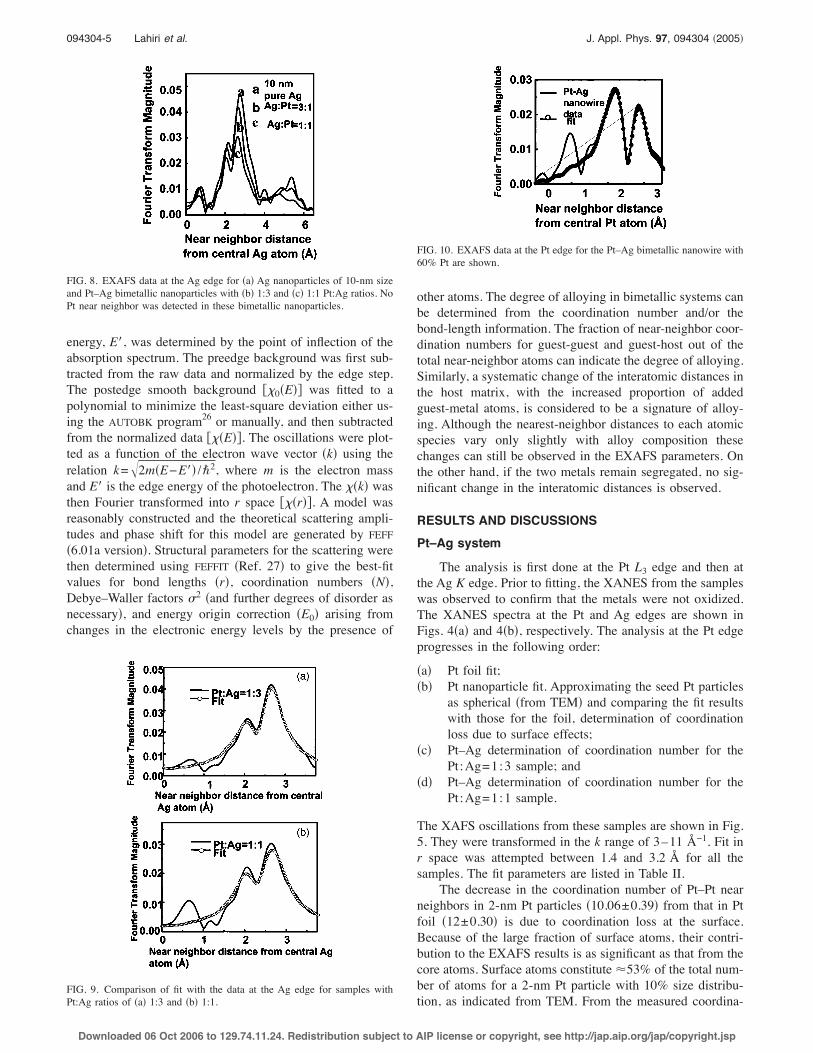
FIG. 8. EXAFS data at the Ag edge for !a" Ag nanoparticles of 10-nm sizeand Pt–Ag bimetallic nanoparticles with !b" 1:3 and !c" 1:1 Pt:Ag ratios. NoPt near neighbor was detected in these bimetallic nanoparticles.
FIG. 9. Comparison of fit with the data at the Ag edge for samples withPt:Ag ratios of !a" 1:3 and !b" 1:1.
FIG. 10. EXAFS data at the Pt edge for the Pt–Ag bimetallic nanowire with60% Pt are shown.
094304-5 Lahiri et al. J. Appl. Phys. 97, 094304 "2005!
Downloaded 06 Oct 2006 to 129.74.11.24. Redistribution subject to AIP license or copyright, see http://jap.aip.org/jap/copyright.jsp
tion number one estimates that for the Pt atoms at the surfaceapproximately a third of the bonds are uncoordinated !3.7dangling bonds".
To determine the degree of alloying in the 2-nm Ptcore–Ag shell, the EXAFS spectra for complete coating ofthe Pt core with a layer of Ag were first simulated. Experi-mental results at the Pt edge for the two Pt:Ag ratios arecompared with the simulations in Fourier-transformed rspace in Fig. 6. The backscattering amplitude from Ag nearneighbors, as well as the phase shift, differ from those of Pt.Correspondingly their Fourier transforms are different andthe ratio of the peak heights at r=2 and r=3 Å depends onthe ratio of Pt to Ag neighboring atoms. From the simula-tions in Fig. 4 one expects the intensity of the peak at r=3 Å to increase relative to that at r=2 Å with increasingthe fraction of Ag near neighbors. From the experimentalresults of Fig. 5, it is clear that the number of Pt–Ag bonds inboth samples is much lower than that suggested by the simu-lation of an alloyed mixture #Fig. 6!f" versus Figs. 6!c" and6!d"$ and is independent of the amount of Ag added. Thisimplies that Ag does not alloy into the Pt core at ambienttemperatures on this time scale but rather remain segregated.
For both the bimetallic samples, the fit results for thenumber of Pt–Pt bonds are seen to be equal to that for purePt nanoparticle within error limits !Table II". If alloyed, thisnumber would have reduced from that of the pure particlesince some of the Pt–Pt bonds would have been replaced byPt–Ag bonds. Furthermore, fitting yields Pt–Ag coordinationnumbers of 1.32±0.06 for both the bimetallic samples. Com-paring this Pt–Ag coordination number to Pt–Pt coordinationnumber !10.06", one concludes that 1.32 out of the 3.7 avail-able bonds, i.e., on the average, only 36% of the surface iscovered with Ag in both the Pt–Ag core-shell samples, irre-spective of the amount of Ag added. This indicates an eccen-tric growth of Pt and Ag nanoparticles. The Pt–Pt bondlength in the bimetallic nanoparticles is found to be slightlysmaller than that in bulk, viz., 2.73±0.01 Å !bulk value=2.75±0.004 Å", with a Debye–Waller factor "2
=0.004±0.001 Å2. The Pt–Ag bond length in the samplewith Pt:Ag=1:3 is found to be 2.79±0.01 Å, with Debye–Waller factor "2=0.006±0.001 Å2. The Pt–Ag bond lengthin the sample with Pt:Ag=1:1 is found to be 2.84±0.01 Å,with Debye–Waller factor "2=0.006±0.001 Å2. A compari-son of the fits with the respective data at the Pt edge for !a"a Pt nanoparticle of 2-nm size, !b" bimetallic particle withPt:Ag=1:3, and !c" bimetallic particle with Pt:Ag=1:1 isshown in Fig. 7.
The XAFS oscillations at the Ag K edge are shown inFig. 5. The data were transformed over the k range of3–11 Å−1 and the fit was done in r space for the range of1.0–3.75 Å and 1.0–3.68 Å for Pt:Ag ratios of 1:3 and 1:1,respectively. The parameters for the Pt–Ag bonds were fixedat the values obtained from the Pt L3 edge for consistency.Results from the Ag K edge measurements on these bimetal-lic particles are shown and compared with pure Ag nanopar-ticles of 10-nm size in Fig. 8. The EXAFS of pure Ag nano-particles of 10 nm resembles that of Ag foil, except for theslight coordination loss and a larger Debye–Waller factor. Inthe figure, we see that the bimetallic EXAFS merely repli-cates the pure Ag EXAFS. For alloying, one of the peaksshould have increased more than the other.
TABLE III. Fit parameters for Ag–Pd nanowires.
Sample name Edge Near-neighbor species N E0 !eV" r !Å1" " !Å2"
Pd0.2Ag0.8 Pd Pd 9±1 −6.29±0.8 2.79±0.04 0.008±0.001Pd0.4Ag0.6 Pd Pd 9±5 −6.29 !fixed" 2.76±0.04 0.007±0.002Pd0.6Ag0.4 Pd Pd 9±6 −6.29 !fixed" 2.77±0.04 0.006±0.002Ag0.8Pd0.2 Ag Ag 10±1 3.55 !fixed" 2.83±0.02 0.008a
Ag0.6Pd0.4 Ag Ag 9±1 3.55±0.2 2.80±0.04 0.007Ag0.4Pd0.6 Ag Ag 12±2 3.55 !fixed" 2.80±0.01 0.006
aNote that because the Ag and Pd distances are not resolved, both are approximated by a single distance andDebye–Waller factor.
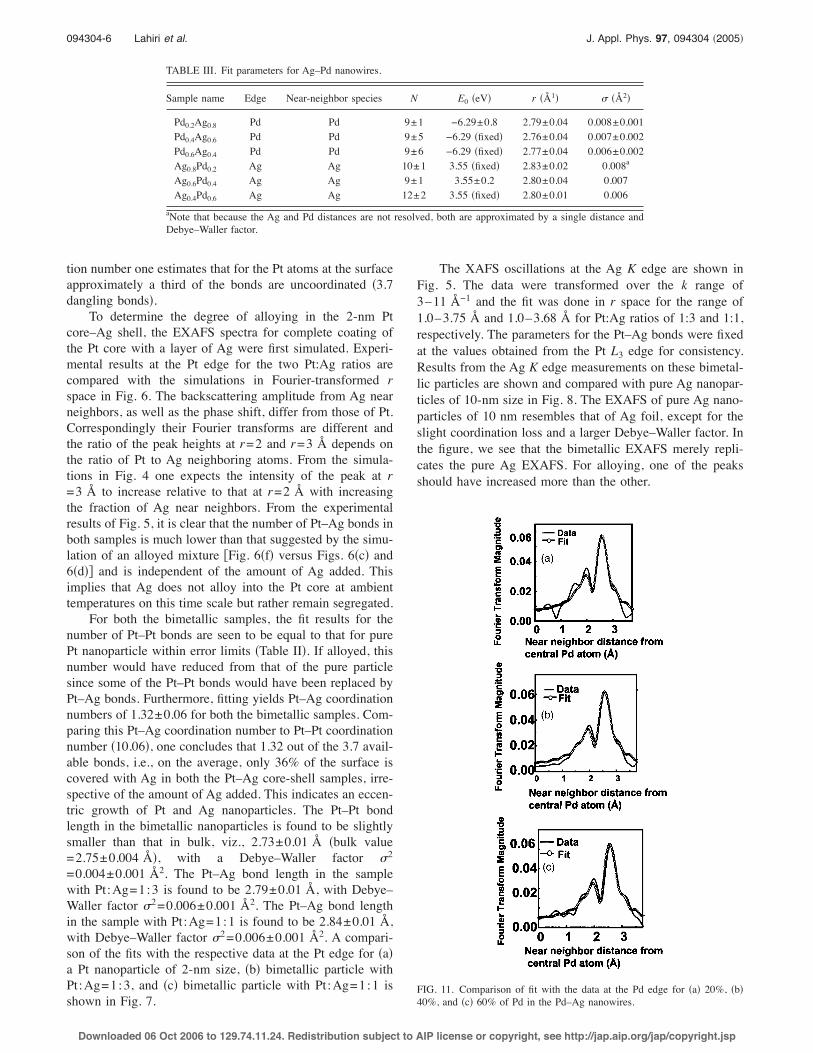
FIG. 11. Comparison of fit with the data at the Pd edge for !a" 20%, !b"40%, and !c" 60% of Pd in the Pd–Ag nanowires.
094304-6 Lahiri et al. J. Appl. Phys. 97, 094304 "2005!
Downloaded 06 Oct 2006 to 129.74.11.24. Redistribution subject to AIP license or copyright, see http://jap.aip.org/jap/copyright.jsp
The Ag–Ag coordination numbers in the Pt:Ag 1:3 and1:1 samples are 6.97±0.05 and 4.65±0.05, respectively. Thissimply reflects the greater number of Ag atoms in the formercase. This further confirms the observation from the Pt edge.Even with the addition of thrice the amount of Ag, the Agatoms still tend to form an eccentric nanocluster rather thandiffusing into the Pt core. To summarize, from both the Pt L3and Ag K edge data, it is concluded that Ag and Pt do notalloy at ambient temperature even in particles of 2-nm Ptcore. Nearly complete alloying was reported for the Au–Agsystem at a similar size and ambient temperatures. This dif-ference is attributed to the different atomic size and latticeparameters for Pt–Ag system, which apparently requirelarger defect concentrations at the bimetallic interface foralloying to happen. Decreasing the core size may furtherinduce alloying due to larger defects concentrations andhigher diffusion coefficients induced by lower melting tem-perature. However, at present, we have been limited by syn-thesis difficulties and the smallest core size that could bereproducibly obtained was 2 nm. A comparison between thefits and the respective experimental data at the Ag K edge for!a" bimetallic with Pt:Ag=1:3 and !b" bimetallic withPt:Ag=1:1 is shown in Fig. 9.
The structure of the Ag core–Pt shell nanowire was mea-sured at the Pt L3 edge. Experimental data and simulation forthis nanowire at the Pt L3 edge is shown in Fig. 10. The
average Pt–Pt bond length in this bimetallic is found to be2.74±0.01, which is essentially the same as the interatomicdistance in the bulk. Alloy formation would have led insteadto an expansion of the average near-neighbor distance aboutPt because of the larger atomic size of Ag. From this, it canbe concluded that Pt and Ag do not alloy in the wire. ThePt–Ag coordination number is found to be !1±0.2" and thePt–Ag interatomic distance has been found to be2.75±0.05 Å, with a Debye–Waller factor of0.006±0.002 Å2. Thus in all of the Ag–Pt samples, irrespec-tive of their morphology, no significant signature of alloyingis observed.
Pd–Ag system
Pd and Ag are adjacent to one another in the PeriodicTable. Therefore, their backscattering amplitude and phaseeffects on the photoelectron wave are nearly identical and itis very difficult to distinguish between these two near-neighbor species around the central atom. Fortunately, thenear-neighbor distances of Pd and Ag are quite different,with the “natural” Pd–Pd bond length of 2.75 Å and thenatural Ag–Ag bond length of 2.88 Å, as seen in the puremetals. With an increased fraction of the larger Ag atoms inthe nanowires, both the average nearest-neighbor bondlength around Pd and the Debye–Waller factor are expectedto systematically increase.
Like the Pt–Ag nanoparticles, the Pd–Ag nanowires donot show any sign of oxidation. The data quality is of thesame order as that for the Pt–Ag nanoparticles. We consid-
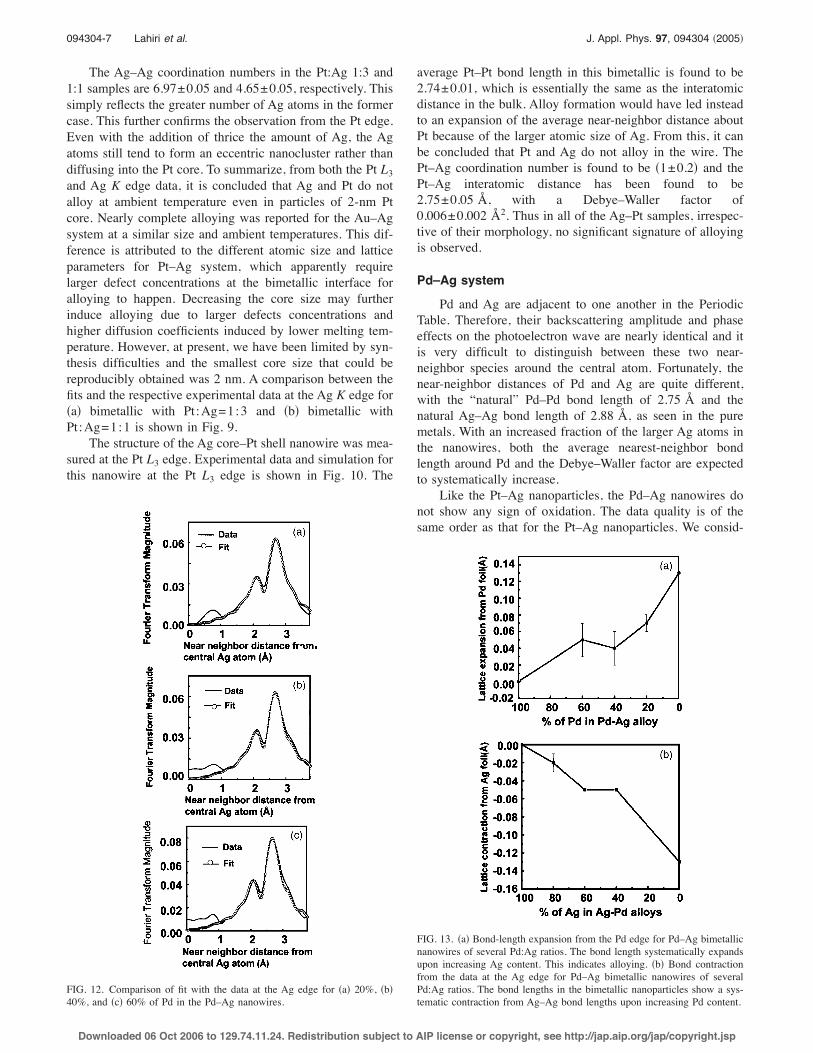
FIG. 12. Comparison of fit with the data at the Ag edge for !a" 20%, !b"40%, and !c" 60% of Pd in the Pd–Ag nanowires.
FIG. 13. !a" Bond-length expansion from the Pd edge for Pd–Ag bimetallicnanowires of several Pd:Ag ratios. The bond length systematically expandsupon increasing Ag content. This indicates alloying. !b" Bond contractionfrom the data at the Ag edge for Pd–Ag bimetallic nanowires of severalPd:Ag ratios. The bond lengths in the bimetallic nanoparticles show a sys-tematic contraction from Ag–Ag bond lengths upon increasing Pd content.
094304-7 Lahiri et al. J. Appl. Phys. 97, 094304 "2005!
Downloaded 06 Oct 2006 to 129.74.11.24. Redistribution subject to AIP license or copyright, see http://jap.aip.org/jap/copyright.jsp
ered three different models for the neighbors around a centralPd atom: !a" Pd atoms only, !b" Ag atoms only, and !c" amixture of Ag and Pd atoms. This is because, in spite of thesimilarity between scattering characteristics of Ag and Pd,the fit parameters were seen to vary slightly upon changingthe near-neighbor species. This variation has been includedin our estimate of errors. The fitting parameters for the aver-age near-neighbor distances around Pd atoms and theDebye–Waller factors as determined at the Pd K edge aregiven in Table III as function of the mol % of Pd in thePd–Ag sample. The errors in the parameters also includecorrelation between the various parameters. Despite the un-certainties, the change in the average near-neighbor distance,as a function of the mole fraction of the guest metal, isclearly systematic and significant. A comparison of the simu-lation with the experimental data at the Pd K edge is shownin Fig. 11, for various proportions of Pd in the alloys.
The conclusions from the results at the Pd K edge arecorroborated by the results at the Ag edge. The fit parametersare listed in Table III. A comparison of the simulations withthe experimental data at the Ag K edge is shown in Fig. 12,for the various proportions of Ag in the nanowires. The ex-pansion in near-neighbor distance around Pd, as a function ofincreased proportion of Ag in the nanowires, is plotted inFig. 13!a", and the contraction around Ag, as a function ofincreased proportion of Pd, is shown in Fig. 13!b". Thesesystematic changes in the bond length indicate random alloy-ing of Pd and Ag in these nanowires.
CONCLUSIONS
Pt and Ag !which are bulk immiscible" do not alloy evenat a core size of 2 nm, although Ag and Au were seen toalloy at the same size. The separation between the two met-als is maintained because of the strain induced in the Ag–Ptlattice as a result of lattice mismatch. The concentration ofdefects in such small particle size is not enough to initiatealloying. The segregation of Ag and Pt has also been ob-served in the cylindrical nanorods. On the other hand, Agand Pd in nanowires !bulk miscible" are seen to alloy at roomtemperature, similar to their spherical counterparts. Thus themorphology of the nanostructure has little effect on its abilityto alloy in these systems and at these dimensions.
ACKNOWLEDGMENTS
Work performed at MRCAT is supported in part by fund-ing from the US Department of Energy under Grant No.DE-FG02-04ER46106. The work done at the Notre DameRadiation Laboratory has been funded by the US Departmentof Energy under Contract No. 4568.
1R. Kubo, J. Phys. Colloq. 2, C2-69 !1977".2I. J. Friedel, Ann. Phys. !N.Y." 1, 257 !1976".3R. L. Whetten, M. N. Shafigullin, J. T. Khoury, T. G. Schaaff, I. Vezmar,M. M. Alvarez, and A. Wilkinson, Acc. Chem. Res. 32, 397 !1999".4A. Henglein, Top. Curr. Chem. 143, 113 !1988".5J. M. Nam, C. S. Thaxton, and C. A. Mirkin, Science 301, 1884 !2003".6G. C. Bond and D. T. Thompson, Catal. Rev. - Sci. Eng. 41, 319 !1999".7A. Henglein, A. Holzwarth, and P. Mulvaney, J. Phys. Chem. 96, 8700!1992".8W. G. Moffett, The Handbook of Binary Phase Diagrams !Genium Pub.Corp., Schenectady, NY, 1984".9M. Wautelet, J. P. Dauchot, and M. Hecq, Nanotechnology 11, 6 !2000".10R. Vallee, M. Wautlet, J. P. Dauchot, and M. Hecq, Nanotechnology 12,68 !2001".
11H. Sakai, Surf. Sci. 351, 285 !1996"; Ph. Buffat and J-P. Borel, Phys. Rev.A 13, 2287 !1976"; C. L. Cleveland, W. D. Luedtke, and U. Landman,Phys. Rev. B 60, 5065 !1999"; K. K. Nanda, S. N. Sahu, and S. N. Behera,Phys. Rev. A 66, 013208 !2002".
12K. Dick, T. Dhanasekaran, Z. Zhang, and D. Meisel, J. Am. Chem. Soc.124, 2312 !2002".
13T. Shibata, B. A. Bunker, Z. Zhang, D. Meisel, C. F. Vardeman, and J. D.Gezelter, J. Am. Chem. Soc. 124, 11989 !2002"; T. Shibata, H. Tostmann,B. A. Bunker, A. Henglein, D. Meisel, S. Cheong, and M. Boyanov, J.Synchrotron Radiat. 8, 545 !2001".
14H. Yasuda, H. Mori, M. Komatsu, K. Takeda, and H. Fujita, J. ElectronMicrosc. 41, 267 !1992"; H. Mori, H. Yasuda, and T. Kamino, Philos.Mag. Lett. 69, 279 !1994".
15W. Hume-Rothery, G. W. Mabbott, and K. M. Channel-Evans, Philos.Trans. R. Soc. London, Ser. A 233, 1 !1934".
16D. Vanderbilt and L. K. Wickham, Mater. Res. Soc. Symp. Proc. 202, 555!1991".
17O. L. Alerhand, D. Vanderbilt, R. D. Meade, and J. D. Joannopoulos,Phys. Rev. Lett. 61, 1973 !1988".
18X-ray Absorption: Principles, Applications and Techniques of EXAFS,SEXAFS and XANES, edited by D. C. Koningsberger and R. Prins !Wiley,New York, 1988".
19J. S. Tsay, Y. D. Yao, and C. S. Shern, Phys. Rev. B 58, 3609 !1998".20H. Röder, R. Schuster, H. Brune, and K. Kern, Phys. Rev. Lett. 71, 2086
!1993"; H. Röder, K. Bromann, H. Brune, and K. Kern, Surf. Sci. 376, 13!1997".
21A. F. Becker, G. Rosenfeld, B. Poelsema, and G. Comsa, Phys. Rev. Lett.70, 477 !1993".
22S. Müller and A. Zunger, Phys. Rev. Lett. 87, 165502 !2001"; A. Gonis,W. H. Butler, and G. M. Stocks, ibid. 50, 1482 !1983"; N. Takano, A.Yoshiwaka, and F. Terasaki, Solid State Commun. 107, 213 !1998"; I.Coulthard and T. K. Sham, Phys. Rev. Lett. 77, 4824 !1996"; K. H. Chaeet al., Phys. Rev. B 53, 10328 !1996"; G. Battaglin et al., Nucl. Instrum.Methods Phys. Res. B 191, 392 !2002"; Y.-H. Chen, Y.-H. Tseng, andC.-S. Yeh, J. Mater. Chem. 12, 1419 !2002"; C. M. Doudna, M. F. Bertino,and A. Tokuhiro, Langmuir 18, 2434 !2002".
23K. H. Chae et al., Phys. Rev. B 53, 10328 !1996".24A. Henglein, B. G. Ershov, and M. Malow, J. Phys. Chem. 99, 14129
!1995"; A. Henglein and D. Meisel, Langmuir 14, 7392 !1998".25C. M. Doudna, M. F. Bertino, F. Blum, A. Tokuhiro, D. Lahiri-Dey, S.Chattopadhyay, B. A. Bunker, and J. Terry, J. Phys. Chem. B 107, 2966!2003".
26M. Newville, P. Livins, Y. Yacobi, E. A. Stern, and J. J. Rehr, Phys. Rev.B 47, 14126 !1993".
27M. Newville, J. Synchrotron Radiat. 8, 96 !2001"; M. Newville, B. Ravel,D. Haskel, J. J. Rehr, E. A. Stern, and Y. Yacoby, Physica B 208–209, 15!1995".
094304-8 Lahiri et al. J. Appl. Phys. 97, 094304 "2005!
Downloaded 06 Oct 2006 to 129.74.11.24. Redistribution subject to AIP license or copyright, see http://jap.aip.org/jap/copyright.jsp