
Optical nanoparticles: synthesis and biomedical application
15
This content has been downloaded from IOPscience. Please scroll down to see the full text. Download details: IP Address: 14.160.26.85 This content was downloaded on 04/03/2015 at 03:39 Please note that terms and conditions apply. Optical nanoparticles: synthesis and biomedical application View the table of contents for this issue, or go to the journal homepage for more 2015 Adv. Nat. Sci: Nanosci. Nanotechnol. 6 023002 (http://iopscience.iop.org/2043-6262/6/2/023002) Home Search Collections Journals About Contact us My IOPscience
-
Upload
independent -
Category
Documents
-
view
0 -
download
0
Transcript of Optical nanoparticles: synthesis and biomedical application

This content has been downloaded from IOPscience. Please scroll down to see the full text.
Download details:
IP Address: 14.160.26.85
This content was downloaded on 04/03/2015 at 03:39
Please note that terms and conditions apply.
Optical nanoparticles: synthesis and biomedical application
View the table of contents for this issue, or go to the journal homepage for more
2015 Adv. Nat. Sci: Nanosci. Nanotechnol. 6 023002
(http://iopscience.iop.org/2043-6262/6/2/023002)
Home Search Collections Journals About Contact us My IOPscience

Review
Optical nanoparticles: synthesis andbiomedical application
Hong Nhung Tran1, Thi Ha Lien Nghiem1, Thi Thuy Duong Vu1,Viet Ha Chu1, Quang Huan Le2, Thi My Nhung Hoang3, Lai Thanh Nguyen3,Duc Minh Pham4, Kim Thuan Tong2, Quang Hoa Do1, Duong Vu1,Trong Nghia Nguyen1, Minh Tan Pham1, Cao Nguyen Duong3,Thanh Thuy Tran2, Van Son Vu1, Thi Thuy Nguyen1,Thi Bich Ngoc Nguyen1, Anh Duc Tran1, Thi Thuong Trinh1 andThi Thai An Nguyen1
1 Institute of Physics, Vietnam Academy of Science and Technology, 18 Hoang Quoc Viet, Hanoi, Vietnam2 Institute of Biotechnology, Vietnam Academy of Science and Technology, 18 Hoang Quoc Viet, Hanoi,Vietnam3University of Science, Vietnam National University in Hanoi (VNUH), 334 Nguyen Trai Road, ThanhXuan District, Hanoi, Vietnam4 103 Hospital, Vietnam Military Medical University, 261 Phung Hung, Ha Dong, Hanoi, Vietnam
E-mail: [email protected]
Received 7 January 2015Accepted for publication 3 February 2015Published 2 March 2015
AbstractThis paper presents a summary of our results on studies of synthesis and biomedical applicationof optical nanoparticles. Gold, dye-doped silica based and core–shell multifunctional multilayer(SiO2/Au, Fe3O4/SiO2, Fe3O4/SiO2/Au) water-monodispersed nanoparticles were synthesized bychemical route and surface modified with proteins and biocompatible chemical reagents. Theparticles were conjugated with antibody or aptamer for specific detecting and imaging bacteriaand cancer cells. The photothermal effects of gold nanoshells (SiO2/Au and Fe3O4/SiO2/Au) oncells and tissues were investigated. The nano silver substrates were developed for surfaceenhanced Raman scattering (SERS) spectroscopy to detect melamine.
Keywords: nanoparticles, nanoshells, cell labeling, E. coli O157:H7, breast cancerClassification numbers: 2.04, 4.02
1. Introduction
Nanoparticles (quantum dots [1–3], upconverting nanopho-sphors [4–6], polymeric [7–9], metallic [10–26] and mag-netic [27, 28]) have attracted significant attention in the fieldof biomedical applications over recent decades, triggeringnumerous research interests in evaluating their biologicalsensing [10, 13], drug delivery [12, 13], cancer therapy[12, 16–20], and molecular imaging abilities [10, 14–17, 29]. Among the various kinds of available nanoparticles(NPs), metallic nanoparticles (mainly gold) have attractedgreat scientific and technological interest due to their ease ofsynthesis, chemical stability, and unique optical properties
related with the localized surface plasmon resonance(LSPR). The technology of gold [30–32] and silver [33] NPssynthesis has developed rapidly in the last 10–15 years,beginning from the well-known colloidal gold nanospheres,nanorods, or silica/gold nanoshells, and ending with differ-ent morphologies such as nanorice, nanostars, or nanocages[34, 35], having many advantages for biosensing, imaging,and controlled release. Newly, multifunctional compacthybrid gold nanoshells, ranging from ‘hard’ semiconductorquantum dots, to superparamagnetic NPs, to ‘soft’ lipo-somes, are in the process of development. This new gen-eration of nanoplasmonic probes provides promisingstrategic agents to efficiently diagnose and treat cancers due
| Vietnam Academy of Science and Technology Advances in Natural Sciences: Nanoscience and Nanotechnology
Adv. Nat. Sci.: Nanosci. Nanotechnol. 6 (2015) 023002 (14pp) doi:10.1088/2043-6262/6/2/023002
2043-6262/15/023002+14$33.00 © 2015 Vietnam Academy of Science & Technology1

to their low photobleaching, tunable surface plasmon reso-nance properties, strong absorption in near-infrared (NIR)region, and high photothermal energy conversion efficiency.The strong NIR light absorption characteristics provide forgold nanoparticles (AuNPs) a great potential application inphotothermal therapy (PTT) with high selectivity, excellentefficacy. The possibility to combine the diagnosis andtherapy creates the new health care modality named astheranostics that may offer great advantages in diseasemanagement and prognosis.
One of the criteria for nano biological probes is beingnon-toxic. However, many nano probes have long-termtoxicity issues that obstruct the progress of their efficiencyfor long-term use in vivo. Recently, interest has been gen-erated in the use of new silica-based nanoparticles for dif-ferent bioapplications. Silica and silica-based nanoparticleshave several attributes that facilitate their use as a platformfor an ideal nanoprobe [36–41]. The silica-based nano-particles can be easily synthesized in a cost-effective man-ner, using microemulsion medium and ambient conditions.These materials are inert, optically transparent, non-anti-genic, resistant to bioenvironment and can be conjugatedwith any fluorophore type, leading to the generation ofrobust, fluorescent nanoparticles [4, 5, 38]. The surface ofsilica particles facilitates different methods of surface mod-ifications and allows conjugation of various biomoleculessuch as proteins and nucleic acids. In recent years, silica-based nanoparticles doped with organic dyes have beenwidely used in many applications such as gene delivery,photodynamic therapy, and other photonics areas [31, 42–47]. Actually, the silica-based nanoparticles conjugated witha NIR fluorophore DY776 and radiolabelled with iodine-124(124I), also with multiple NIR fluorofores for both flowcytometry and in vivo imaging were fabricated. The bio-distribution demonstrates the use of these NIR dyes and 124Iconjugated silica-based nanoparticles as promising probesfor safe in vivo bioimaging. These nanoparticles facilitateoptical bioimaging in the NIR window, with maximum tis-sue penetration of light and minimum background signal[44, 47]. The in vivo studies indicate that these novel silicabased nanoparticles are biocompatible and not toxic towhole organisms, and have potential for the development ofin vivo and long-term applications [47].
Herein we present our resent research results on stu-dies of synthesis and biomedical application of opticalnanoparticles. Water-monodispersed gold, multilayer anddye-doped silica-based fluorescent nanoparticles were syn-thesized by wet-chemical route and surface modified withproteins and biocompatible chemical reagents. The parti-cles were conjugated with antibody or aptamer for speci-fically detecting and imaging bacteria and cancer cells.The photothermal effects of gold nanoshells (SiO2/Au andFe3O4/SiO2/Au) on cells and tissues were investigated.The nano silver substrates were developed for surfaceenhanced Raman scattering (SERS) spectroscopy to detectmelamine.
2. Gold nanoparticles
2.1. Synthesis
The colloidal nano golds were synthesized from metal pre-cursor chloroauric acid (HAuCl4) using trisodium citratedehydrate (C6H5O7Na3) as reducing and stabilizing agents.The obtained gold nanoparticles (AuNPs) are spherical uni-form and well water-monodispersible with the diameter var-ied from 15–35 nm and optical density (OD) changing from0.2 to 3.0 (figure 1) [21–25]. The synthesized AuNPs arecharacterized by UV–vis spectroscopy and transmissionelectron microscopy (TEM) (figure 2).
2.2. Biofunctionalization
2.2.1. Protein conjugation. Depending on the followingapplication, AuNPs will be conjugated with differentproteins such as: bovine serum albumin (BSA), streptavidinor antibodies, and also heterobiofunctionalized thiolpolyethylene glycol acid (HS-PEG-COOH). The minimumamount of protein and PEG required to stabilize AuNPs wasdetermined by applying the surface plasmon resonanceabsorption assay [21].
2.2.2. Aptamer conjugation. To prepare the aptameroligonucleotide-coated gold nanoparticles, 7 μM of aptameroligonucleotide was reduced with DTT (dithiothreitol, PierceChemical) for 30 min and added to 0.5 mL of 20 nm colloidalgold nanoparticles (3.5 × 10¹² AuNPs per mL). The conjugatewas aged at 4 °C for 24 h, then blocked by PEG. Theunreacted residues were removed from the aptameroligonucleotide-coated gold nanoparticles by centrifugationat 10 000 r m−1 for 5 min. The obtained conjugate wasdispersed in tris HCl pH8 buffer. The detailedoligonucleotide coating process is described in anotherwork. The Au aptamer-conjugated NPs are used assignaling probes.
2.3. Toxicological studies
The fabricated BSA and HS-PEG-COOH capped AuNPswere introduced in mice to study their toxicity and availabilityin the liver. The nano golds did not produce any mortality orany gross behavioral changes in mice at the doses studied,which are 1.16, 2.32, 3.52, 4.68 and 5.84 mg kg−1 in theperiod of eight days (figure 3). The accumulation of BSAcapped AuNPs in liver organs after intravenous multi-injec-tion did not also produce any changes in cell morphol-ogy [25].
2.4. Application for diagnostic
2.4.1. Imaging. The aptamers used for cell imaging hadfollowing sequence: 5′-AGCCGCGAGGGGAGGGAUAGGGUAGGGCGCGGCU{3′/Thiol Mod C3 S-S}-3′. These aptamers was conjugatedwith AuNPs to form AptHER2@AuNPs as described above.
2
Adv. Nat. Sci.: Nanosci. Nanotechnol. 6 (2015) 023002 Review

The breast cancer cells labeled by specific-HER2oligonucleotide-colloidal gold conjugate (AptHER2@-AuNPs) were efficiently optically imaged (figure 4). Humanbreast cancer cell line BT-474 and HCT116 cervical cancercell line (control cells) were provided by Centre for CancerApplied Research, College of Science (VNUH). Living cells(3.105 CFU) were treated with PEG-coated AuNPs andAptHER2@AuNPs blocked with PEG for 24 h. These cellswere then fixed with 4% paraformaldehyde fixative andmounting medium (Invitrogen). Cells were imaged by NikonTi-E inverted microscope in dark field mode, objective ×10.Figure 4(a) exhibits the light scattering images of BT-474 and
Figure 1. Images of fabricated gold nanoparticles (AuNPs): (a) of different concentrations, (b) scanning electron microscopy (SEM) image,(c) size distribution of as-prepared AuNPs, (d) UV–vis absorption spectra of AuNPs newly fabricated (red line, t= 0 m) and after six monthsof storage (dotted blue line, t = 6 m).
Figure 2. (a) UV–vis spectra of colloidal AuNPs (black line) and Au@PEG NPs (red line). (b) Absorbance of Au@PEG-NPs versus PEGconcentration at pH= 4. Inset: transmission electron microscope (TEM) image of Au@PEG-NPs, scale bar is 20 nm [21].
Figure 3. Weight development of certain mice groups (circlesindicate the injection days). Data are presented as mean ±SD [25].
3
Adv. Nat. Sci.: Nanosci. Nanotechnol. 6 (2015) 023002 Review

HCT116 cancer cells. Two types of cells have round shapes,some areas within the cells display dim spots due to scatteringfrom the organelles that are distributed in the cells’cytoplasms and membranes. For BT-474 cells, no significantdifferences between the scattering images of cells in theabsence and presence of PEG-coated AuNPs (figures 4(a) and(c), upper panel). Only small and faint dots occurred withinthe cells, indicating that no or light aggregation occurred inthose cells. After incubation with the AptHER2@AuNPs, theincorporated NPs led to the appearance of spotted patternswithin the cytoplasms of the cells. Aggregation of theAptHER2@AuNPs resulted in bright scattered spots thatallow the ready identification of individual cells (figure 4(b)).BT-474 cells are human breast cancer cell line stronglyoverexpress c-ErbB-2 protein, so this aggregation of theAptHER2@AuNPs occurred mainly as a result of specificbinding through cross-linking with the HER2 antigenreceptors present in the cytoplasm of the cells. For thecontrol experiment, no significant differences between thescattering images of HCT116 cells in the absence andpresence of PEG-coated AuNPs, also incubated withAptHER2@AuNPs (figure 4 lower panel). This findingsuggests that specific interactions occurred between theAptHER2@AuNPs and the HER2 receptors.
2.4.2. Strip sensor. A strip sandwich type DNA sensor forbreast cancer cells detecting was realized using Au-aptamerconjugate as signaling probes. Combining the unique opticalproperties of gold nanoparticles and the high efficiency ofchromatographic separation, sandwich type DNAhybridization reactions were realized on the lateral flowstrips. A pair of aptamers capable of specifically binding
breast cancer cells is used to prepare the strip sensor. Athiolated short aptamer (Thiol-S2) was immobilized on theAuNPs (Thiol-S2@AuNPs) and sequenced with the specificHER2 complementary aptamer S1(HER2-S1) to form thecomplex HER2-S1 +Thiol-S2@AuNPs. The biotinylatedaptamers (Biotin-TT and Biotin-CR) were immobilized onthe test and control zone of the strip. Breast cancer cellsinteract with aptamer probes of the HER2-S1 +Thiol-S2@AuNPs conjugates to pull out the Thiol-S2@AuNPsfrom the HER2-S1. The pulled off Thiol-S2@AuNPscontinue to migrate along the strip. The captured Thiol-S2@AuNPs conjugation probes on the test zone and controlzone of the biosensor produce the characteristic red bands,enabling visual detection of breast cancer antigen sampleswithout instrumentation (figure 5). The aptamers selected toprepare the strip sensor had the following sequence:
HER2-S1: 5′-GAGTCAGCCGCGAGGGGAGG-GAUAGGGUAGGGCGCGGCU-3′,
Thiol-S2: 5′-SH-CGCGGCTGACTC-3′,Biotin-TT: 5′-Biotin-AAAAAGAGTCAGCCGCG-3′,Biotin-CR: 5′-Biotin-AAAAAAGCCGCGCCCT-3′.The Au-Aptamer conjugate specific to HER2 antigen can
be a potential biomarker in a lateral flow biosensor fordetecting breast cancer cell.
3. Multilayer multifunctional nanoparticles
3.1. Gold based nanoshells
3.1.1. Synthesis. Multilayer multifunctional gold nanoshellsSiO2/Au and magnetic gold nanoshells Fe3O4/SiO2/Au were
Figure 4. Dark field microscope images of BT-474 (upper panel) and HCT116 (lower panel) cancer cells cultured a) in the absence ofAptHER2@AuNPs, and in the presence of b) AptHER2@AuNPs and c) Au@PEG-NPs (control) for 24 h. Nikon Ti-E inverted microscope,objective ×20.
4
Adv. Nat. Sci.: Nanosci. Nanotechnol. 6 (2015) 023002 Review

synthesized by gold ion plating on hydrophilic-functionalizedsilica or magnetic iron oxide embedded in silica core, usingformaldehyde as a reducing reagent.
Gold nanoshells SiO2/Au have silica core size from 40 to180 nm and gold shell thickness of 10–20 nm, giving asurface plasmon resonance absorption ranging from 550 to1000 nm. Magnetic gold nanoshells Fe3O4/SiO2/Au size80–140 nm with silica coated single- or multi-domain super-paramagnetic Fe3O4 core and gold shell of 10–20 nmthickness, have surface plasmon resonance absorption vari-able from 600 to 900 nm (figure 6).
3.1.2. Theranostic application3.1.2.1. Imaging. The SiO2/Au gold nanoshells and Fe3O4/SiO2/Au magnetic gold nanoshells were conjugated withmonoclonal anti-HER2 antibody to obtain the conjugatenanoparticle@antibody SiO2/Au@HER2 and Fe3 O4/SiO2/Au@HER2. The conjugates SiO2/Au@HER2 and Fe3O4/SiO2/Au@HER2 were used for for specific recognition ofbreast cancer cells type BT-474 by imaging. The experimentwas prepared as described above in paragraph 2.4.1, but theAptHER2@Au conjugates were replaced by SiO2/
Au@HER2 and Fe3O4/SiO2/Au@HER2. Figure 7 presentsthe light scattering images of BT-474. As shown infigure 7(a), the individual BT-474 cells are well imaged bybright scattered spots resulting from the aggregation of theFe3O4/SiO2/Au@HER2 conjugates, in contrast with thecontrol cells displaying dim spots due to scattering from theorganelles (figure 7(b)).
3.1.2.2. Photothermal effects. The study of the photothermaleffect of Fe3O4/SiO2/Au and SiO2/Au nanoshells (NSs) inchicken tissue under near-infrared radiation demonstrates thatboth nanoshells have a high photothermal transductionefficiency. The temperature of chicken tissue samples reach48 °C, 46 °C in the presence and 30 °C in the absence of thenanoshells when illuminated by 808 nm laser at power densityI= 7.3W cm−2. The BT-474 cells are destroyed after 20 minirradiation at 808 nm and I = 7.3W cm−2 (figure 8). The heattransduction efficiency of nanoshells deduced fromexperimental data was 16% and 22% for Fe3O4/SiO2/Auand SiO2/Au nanoshells, respectively.
The results show the ability of multilayer multifunctionalSiO2/Au and Fe3O4/SiO2/Au nanoparticles to work for
Figure 5. Images of test strips using DNA-AuNP signaling probes specific for HER2 receptors. Test strips using DNA-AuNPs signalingprobes specific for HER2 receptors. Positive test is BT474 cells at concentration 10 000 cells mL−1 (a). Negative control is HEK293 cells atconcentration 10 000 cells mL−1 (b).
Figure 6. TEM image of core/shells nanoparticles: (a) Fe3O4/SiO2, (b) Fe3O4/SiO2/Au and (c) SiO2/Au. (d) UV–vis absorption spectrum and(e) magnetization curves of Fe3O4/SiO2/Au NPs.
5
Adv. Nat. Sci.: Nanosci. Nanotechnol. 6 (2015) 023002 Review

theranostic applications: they can be used simultaneously asbiomarkers and also as therapeutic agents.
3.2. Silver-coated nanospheres
3.2.1. Synthesis. Water-monodispered silica SiO2
nanospheres size varied from 100 to 1000 nm weresynthesized by Stober method using triethoxysilane (TEOS)and aminopropyl triethoxysilane (APTEOS) as precursors,ethanol or isopropanol as solvent. Silver nanoparticles of size
variable 15–100 nm were reduced onto functionalized silica-spheres surface from silver nitrate with sodium nitrate asreduction agent and stabilizer. The obtained silver-coatednanospheres SiO2@Ag are the silica spheres with the silvernanoparticles attached on their surface, having a broadbandplasmon absorption spectra in region 400–700 nm with peakpositioned around 500 nm (figure 9). The silver nanoparticlesurface can absorb various small organic molecules and canachieve as surface enhancement Raman scattering (SERS)encoded spheres for multi-analysis.
Figure 7. Dark field microscope images of BT- 474 cancer cells cultured (a) in the presence and (b) absence of Fe3O4/SiO2/Au@HER2conjugates. Nikon Ti-E inverted microscope, objective ×20.
Figure 8. (a) Experimental setup for measurements of temperature in the chicken tissue, (b) UV–vis absorption spectrum obtained fromaqueous suspensions of SiO2/Au and Fe3O4/SiO2/Au NSs. (c) Temperature variations of chicken tissue samples with and without AuNSssolutions under the illumination of the laser light at a power density I = 7.3 W cm−2 as function of time. Note that the injected NSs solutionhas the same optical density. (d) Light microscope image of BT474 cells stained with trypan blue (d): after 20 min irradiation at 808 nm andI= 7.3 W cm−2 (right part of image) and non-irradiated (left part of image). The dead cells have dark color.
6
Adv. Nat. Sci.: Nanosci. Nanotechnol. 6 (2015) 023002 Review

3.2.2. Surface enhanced Raman scattering (SERS)application. The as-prepared nanospheres SiO2@Ag wereused as SERS substrates for the detection of melamine insolution at low concentration. Raman spectra were measuredfor melamine powder and solution at different concentrations.The melamine at different concentration in water was mixedwith SiO2@Ag spheres. The obtained solutions then weredispersed onto the glass substrates. These substrates were usedto measure the Raman spectra of melamine using laser He-Ne633 nm as excitation source. As shown in figure 10, melamine
solution of 10−7M L−1 has almost no background SERSinterference from 600 to 1000 cm−1. The 687 cm−1 peak, whichbelongs to the in-plane deformation vibration of triazine ring,increases with increasing amounts of melamine. This peak isconsistent with the characteristic band of melamine reported inthe literature on silver substrates. It can be seen from figure 10that melamine at concentration 10−6M L−1 can be detected bythis technique. This work may provide a potential technique inapplications to detect low concentration analyte.
3.3. Gold/silver nanostars
The gold/silver bimetallic star shape NPs of size 50–70 nmwere synthesized by mixing aqueous HAuCl4 with AgNO3,and then adding a suitable amount of reducing agent, ascorbicacid. The shape of the NPs is controlled by altering the ratioof gold to silver precursors (figure 11). Changing the molarratio of HAuCl4:AgNO3 led to the star-shaped nanoparticleswith reduced thorns and irregularly quasi-spherical goldnanoparticles. The detail results on synthesis and theranosticapplication of theses NPs will be presented in another work.
4. Silica dye-doped fluorescent nanoparticles
4.1. Synthesis
Rhodamine B (RB), rhodamine 6 G (R6G), coumarinand fluorescein isothiocyanate (FITC) dye-doped silica
Figure 9. SEM images of (a) silica spheres sized 1000 nm and (b) silver-coated silica 1000 nm spheres; (c) UV–vis absorption spectra ofSiO2@Ag nanospheres of different sizes.
Figure 10. SERS spectra of melamine solution at differentconcentrations: (1) 10−4 M, (2) 10−6 M, (3) 10−7 M recorded usingSiO2@Ag as substrate, (4) the response of melamine solution10−2 M without SiO2@Ag nanospheres.
7
Adv. Nat. Sci.: Nanosci. Nanotechnol. 6 (2015) 023002 Review
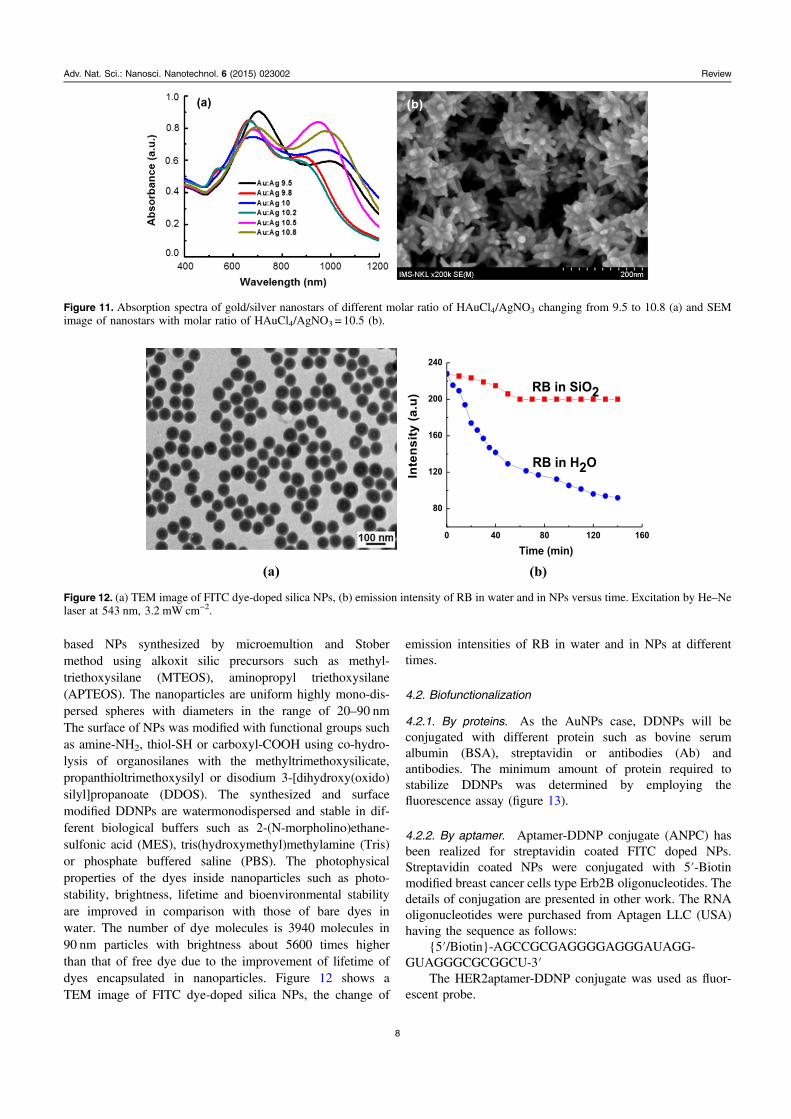
based NPs synthesized by microemultion and Stobermethod using alkoxit silic precursors such as methyl-triethoxysilane (MTEOS), aminopropyl triethoxysilane(APTEOS). The nanoparticles are uniform highly mono-dis-persed spheres with diameters in the range of 20–90 nmThe surface of NPs was modified with functional groups suchas amine-NH2, thiol-SH or carboxyl-COOH using co-hydro-lysis of organosilanes with the methyltrimethoxysilicate,propanthioltrimethoxysilyl or disodium 3-[dihydroxy(oxido)silyl]propanoate (DDOS). The synthesized and surfacemodified DDNPs are watermonodispersed and stable in dif-ferent biological buffers such as 2-(N-morpholino)ethane-sulfonic acid (MES), tris(hydroxymethyl)methylamine (Tris)or phosphate buffered saline (PBS). The photophysicalproperties of the dyes inside nanoparticles such as photo-stability, brightness, lifetime and bioenvironmental stabilityare improved in comparison with those of bare dyes inwater. The number of dye molecules is 3940 molecules in90 nm particles with brightness about 5600 times higherthan that of free dye due to the improvement of lifetime ofdyes encapsulated in nanoparticles. Figure 12 shows aTEM image of FITC dye-doped silica NPs, the change of
emission intensities of RB in water and in NPs at differenttimes.
4.2. Biofunctionalization
4.2.1. By proteins. As the AuNPs case, DDNPs will beconjugated with different protein such as bovine serumalbumin (BSA), streptavidin or antibodies (Ab) andantibodies. The minimum amount of protein required tostabilize DDNPs was determined by employing thefluorescence assay (figure 13).
4.2.2. By aptamer. Aptamer-DDNP conjugate (ANPC) hasbeen realized for streptavidin coated FITC doped NPs.Streptavidin coated NPs were conjugated with 5′-Biotinmodified breast cancer cells type Erb2B oligonucleotides. Thedetails of conjugation are presented in other work. The RNAoligonucleotides were purchased from Aptagen LLC (USA)having the sequence as follows:
{5′/Biotin}-AGCCGCGAGGGGAGGGAUAGG-GUAGGGCGCGGCU-3′
The HER2aptamer-DDNP conjugate was used as fluor-escent probe.
Figure 11. Absorption spectra of gold/silver nanostars of different molar ratio of HAuCl4/AgNO3 changing from 9.5 to 10.8 (a) and SEMimage of nanostars with molar ratio of HAuCl4/AgNO3 = 10.5 (b).
Figure 12. (a) TEM image of FITC dye-doped silica NPs, (b) emission intensity of RB in water and in NPs versus time. Excitation by He–Nelaser at 543 nm, 3.2 mW cm−2.
8
Adv. Nat. Sci.: Nanosci. Nanotechnol. 6 (2015) 023002 Review

4.3. Application
4.3.1. Imaging and quantitative detecting Ecoli 0157:H7bacteria. The dye-doped silica-based nanoparticles wereused for immunolabeling the bacteria E. coli O157:H7(figure 14). The results show that due to the brightness ofnanoparticles, the fluorescence microscope signal of bacteriais amplified. A spectrofluorometer method for rapidquantitative detection of bacteria was proposed.
As is shown in figure 15, the fluorescence intensity ofsamples is proportional to the number of bacteria in the
sample. The curve of fluorescence intensity versus bacterialnumber can be used as a calibration curve to determine thebacterial number in the sample under analysis. The total timeneeded for this quantitative analysis is about 3–4 h.
4.3.2. Breast cancer cells imaging and detecting4.3.2.1. Imaging. The breast cancer cells labeled by anti-HER2 monoclonal antibody–NP conjugates were efficientlyoptically imaged (figure 16). Humain breast cancer cell lineKPL-4, BT-474 and HeLa cervical cancer cell line wereprovided by Centre for Cancer Applied Research, College of
Figure 13. (a) Fluorescence spectra of 80 nm RB-DDNPs and RB-DD@BSA NPs at pH= 6.4. (b) Fluorescence spectra of RB-DD@BSANPs versus BSA concentration at pH= 3.8. The minimum amount of protein BSA necessary to overcoat the DDNPs is about 0.8 mg mL−1,which is deduced graphically from the concentration at which the fluorescence intensity at pH∼ 4 becomes nearly constant. Inset: TEMimage of RB-DD@BSA NPs, scale bar is 500 nm [37].
Figure 14. Images of E. coli O157:H7 bacterial cells Transmission (a) and fluorescence (b) microscope images of cells after being incubatedwith antibody-conjugated nanoparticles and fluorescence microscope image of cells before being incubated with antibody-conjugatednanoparticles (c). The size of images is 46 μm×46 μm. Scanning electron microscope image of cell incubated with DDONP-Ab complex (d).Fluorescence confocal microscope image of bacterial cell after incubation with DDONP-Ab complex (e). The nanoparticle-basedfluorescence signal amplification can be easily seen in a fluorescent image ((e) inset). The bacterial size after (d) is much larger than thatbefore (f) incubation, due to the bound nanoparticles [37].
9
Adv. Nat. Sci.: Nanosci. Nanotechnol. 6 (2015) 023002 Review

Science (VNUH). Living cells (3.105 CFU) were treated withBSA coated-DDNPs and HER2@DDNPs of 60 nm size(300 μL, 1 μg mL−1) for different period times: 1.5, 3, 6 and16.5 h at 37 °C. These cells were then fixed with 4%paraformaldehyde fixative and mounting medium(invitrogen). The nucleus was counterstained with Hoechst33 342 (invitrogen). The multicellular BT-474 spheroidscreated by hanging drop method (4000 cells/dropletscultured for 8 days) were used to study the ability topenetrate and distribution of nanoparticles targeted systemthrough the cell layer of the spheroid. The BT-474 cells and
spheroids were incubated with HER2@DDNPs (2.1010
particles/well) for the time of 6 h, 12 h.It could be clearly seen from the fluorescence imaging
that the KPL4 cells labeled with DDNPs emit brightred fluorescence, while all the cellular nuclei stained byDAPI emit blue fluorescence, and DDNPs appeared as brightdots in the membrane and nuclear area of the cells(figure 16(B) lower panel). In contrast, the KPL4 cells treatedby DDNPs only and HER2@DDNPs treated Hela cells havequite weak fluorescence images (figures 16(A) and (C) lowerpanel).
Figure 15. (a) The fluorescence spectra of different bacterial concentration samples; (b) the fluorescence intensity versus the bacterial number(red curve) and fit line (blue line) [24].
Figure 16. Confocal image of KPL4 living cell treated with (A) BSA@ DDNPs, (B) HER2@DDNPs. (C): Hela cell treated withHER2@DDNPs. The upper panel shows the transmission image and the lower panel shows both the transmission and fluorescence images.Image size: 4.6 μm. Fluorescence images were taken using a Zeiss LSM 510 confocal microscope with an oil immersion ×40 objectivelens [36].
10
Adv. Nat. Sci.: Nanosci. Nanotechnol. 6 (2015) 023002 Review

Figure 17 represents the image of cross-section at thedifferent depths of multicellular BT-474 cancer cellsspheroids. It can be seen clearly that silica nanoparticlespenetrated deep and distributed in different structural classesof multicellular spheroids: at a depth of 82.6 μm, which isequivalent to the thickness of more than 5 cell layers,fluorescence signal was clearly observed with intensityhomogeneously distributed from the outer to the core of thespheroid. However, in the deeper layers cut (141.6 μm,200.6 μm), the fluorescence signal of silica nanoparticles wasstill observed in a clear and uniform distribution. Even inslices of 141.6 μm, the signal of HER2@DDNPs is still veryclear at the border and inside the core of the spheroid BT-474.This proves the ability of HER2@DDNPs to penetrate wellinto the different cell layers of the multicellular BT-474spheroids. So the HER2@DDNPs are well suited for thestudy of the endocytosis of nanoparticles. The DDNPs can beused as the biomarkers for the study of the drug delivery intothe spheroids as well as in the cancer tumor.
4.3.2.2. Flow cytometry experiments. The ability of specificrecognition of KPL4 cells in the mixing of KPL4 (target) andHeLa cell (negative cells) lines was performed by flowcytometry. The results are shown in figure 18. As shown infigures 18(A) and (B), the signal curves from the NPsincubated with either negative or target cells, but in theabsence of antibodies, are almost the same and can beconsidered as background lines with intensities are about2.5 × 103. The signal curves of the mixture of Hela/ KPL4cells in the ratio 1:1 and 5:1, incubated with HER2@AF546
(antibodies HER2 conjugated with alexa fluor 546 (AF546)goat anti-mouse conjugated second antibody (Sigma-Aldrich), are similar to the background, having the intensityabout 3.5 and 3.0 × 10³, respectively (figures 18(C) and (D)).Antibodies HER2 conjugated with AF546 goat anti-mouseconjugated second antibody (HER2@AF546).
This intensity is only slightly higher than that ofbackground, implying that by using the label AF546, it isdifficult to specifically discriminate the KPL4 cells fromHeLa cells at those concentration ratios. The fluorescencecurves of the mixture incubated with HER2@DDNPs have alarge enhancement in intensity, about 2 × 10⁴ and 6 × 10³ forthe ratios 1:1 and 5:1, respectively. These results show thatthe KPL4 cells can be specifically detected by using theDDNPs markers, even when the percentage of KPL4 cells isfive times less than for Hela cells.
4.3.2.3. Labeling with aptamer-conjugated FITC- DDNPs.The BT-474 cells were incubated with HER2aptamer-DDNPconjugates (2.1010 particles/well) for the time of 6 h, 12 h.The Hela cells were also incubated with the above probes andused as control. BT474 cells were imaged using FITC-dopedsilica nanoparticles as the vector and HER2-aptamer as therecognition element (figure 19). The cell nuclear was stainedwith Hoescht 33 342 (Invitrogen).
As shown in figure 19, BT-474 cells incubated withprobes exhibit significant green fluorescence of nanoparticlesnot only on the cell membrane but in cytoplasm surroundingthe cell nucleus region. This proves that the HER2aptamer-DDNP conjugates penetrated deep into the cytoplasm of the
Figure 17. Transmission (a) and fluorescent images (b)–(e) of a sphere cut layer line BT-474 3D incubated with HER2@DDNPs in 16 h(figure left corner indicates the depth slices). Fluorescence images were taken using a Zeiss LSM 510 confocal microscope with a ×20objective lens.
11
Adv. Nat. Sci.: Nanosci. Nanotechnol. 6 (2015) 023002 Review

Figure 18. Flow cytometry analyses using BSA@DDNPs, HER2@DDNPs and HER2@AF546. The curves represent: (A) mixture of Helaand KPL4 cells in the ratio 1:1 only, and incubated with (B) BSA@DDNPs, (C) HER2@AF546 and E) HER2@DDNPs. Mixture of ratio 5:1incubated with D) HER2@AF546 and F) HER2@DDNPs [36].
Figure 19. Fluorescence microscope image of cells incubated with HER2aptamer-DDNP conjugates: (a) BT-474 cells and (b) Hela cells.Image size: 4.6 μm.
12
Adv. Nat. Sci.: Nanosci. Nanotechnol. 6 (2015) 023002 Review

cell lines that express HER2 receptor. The control shows nolabeling of cells, which indicates no nonspecific bindingbetween the cells and NPs. These results show the ability ofHER2aptamer-DDNP conjugates to work as probes forfluorescence bioimaging.
5. Conclusion
Three types of water-monodispersed nanoparticles: gold,multilayer and dye-doped silica-based fluorescent, were syn-thesized by wet-chemical route. The colloidal gold nano-particles with high concentration size 15–40 nm weresynthesized from metal precursor HAuCl4. The dye-dopedsilica-based size 20–90 nm nanoparticles were synthesized byStober method using alkoxit silic precursors. The NPs werebiofunctionalized by proteins (BSA, SA) and polymer PEGand biocompatible chemical reagents that allow them tofunction as biomarkers. A simple procedure to determine theminimum amount of BSA and HS-PEG-COOH necessary tocoat gold colloidal or dye-doped silica-based NPs was car-ried-out.
Fabricated BSA and HS-PEG-COOH capped AuNPswere studied for toxicity in vitro and in vivo. The nano goldsdid not produce any mortality or any gross behavioral chan-ges in cells and mice at the doses studied. The AuNPs werebioconjugated with specific breast cancer antibodies andaptamers-oligonucleotides. The breast cancer cells labeled byanti-HER2 oligonucleotide-coated gold nanoparticles wereefficiently optically imaged. An aptamer-based strip sensorwas realized for rapidly detecting the breast cancer cells.
Multilayer multifunctional gold nanoshells SiO2/Au andmagnetic gold nanoshells Fe3O4/SiO2/Au size 40–180 nmwere synthesized by gold ion plating on hydrophilic-func-tionalized silica or magnetic iron oxide embedded in silicacore to form the shell of 10–20 nm thickness. The nanoshellshave the surface plasmon resonance absorption ranging from550 to 1000 nm. The BT-474 breast cancer cells were effec-tively imaged by complex-probes nanoshell-HER2antibody.These cells also were destroyed after 20 min irradiation at808 nm with power density I= 7.3W cm−2. The heat trans-duction efficiency of nanoshells deduced from experimentaldata was 16% and 22% for Fe3O4/SiO2/Au and SiO2/Aunanoshells, respectively. The nanoshells show their capabilityto be used in theranostic bioapplications.
The silver-coated nanospheres SiO2@Ag with size variedfrom 100 to 1000 nm are the silica spheres with the silvernanoparticles size 15–100 nm attached on their surface, giv-ing a broadband plasmon absorption spectra in region400–700 nm with peak positioned around 500 nm. The mel-amine in solution at concentration 10−6 M L−1 was detectedusing the nanospheres SiO2@Ag as SERS substrates. Theresults may provide a potential technique in application todetect low concentration analyte.
High-intensity fluorescent dye-doped NPs were com-bined with specific bacterial, breast cancer antibodies andaptamers-oligonucleotides to form the conjugates-probes. Theprobes-antibody-conjugated nanoparticles can identify the
bacteria E.coli O157:H7. A spectrofluorometer method forrapid quantitative detection of bacteria was proposed. Thebreast cancer cells labeled by anti-HER2 monoclonal anti-body and aptamer-nanoparticles conjugates were efficientlyoptically imaged and detected with much higher sensibilitythan by antibody-free dyes. The ability of the dye-doped silicaNPs to penetrate well into the different cell layers of themulticellular BT-474 spheroids demonstrates the potential touse them as biomarkers for the study of drug delivery into thespheroids as well as in the cancer tumor. The dye dopedsilica-based nanoparticles show their capability to work asmarkers for different bioapplications.
In conclusion, we can say that all three types of opticalnanoparticles in this research: dye-doped silica nanoparticles,gold nanoparticles and gold-based nanoshells have thepotential to be used as biomarkers for nano-diagnostics andanalysis. In particular, the nanoshells are the candidate fortheranostic applications. On other hand, the silver-coatednanospheres are the promising substrate for SERS techniquein low concentration analysis and single molecule detection.
Acknowledgments
This work was supported by National Project No 01/2/2011/HDD-NCCBUD
References
[1] Chae W S, Ung T D T and Nguyen Q L 2013 Adv. Nat. Sci.:Nanosci. Nanotechnol. 4 045009
[2] Ha C V, Fort E, Lien N T H and Nhung T H 2011 Adv. Nat.Sci.: Nanosci. Nanotechnol. 2 045010
[3] Nguyen N H et al 2015 Adv. Nat. Sci.: Nanosci. Nanotechnol.6 015015
[4] Singh S K 2014 RSC Adv. 4 58674[5] Arca M et al 2014 Chem. Commun. 50 15259[6] Thuan T K, Nhung T H, Thuy T T, Hoat P C, Tan P M,
Brochon J-C, Tauc P and Ngan N T T 2009 J. Biotechnol.7 513
[7] Trofymchuk K et al 2014 Nanoscale 6 12934[8] Dao T P T, Nguyen T H, Vinh T V, Nguyen T A and
Dang M C 2014 Adv. Nat. Sci.: Nanosci. Nanotechnol. 5035013
[9] Lacroix J C, Trippe-Allard G, Ghilane J and Martin P 2014Adv. Nat. Sci.: Nanosci. Nanotechnol. 5 015001
[10] Jin Y 2014 Acc. Chem. Res. 47 138[11] Dao K A, Nguyen T H, Nguyen T M H and Nguyen D T 2015
Adv. Nat. Sci.: Nanosci. Nanotechnol. 6 015018[12] Cao-Milán R and Liz-Marzán L M 2014 Expert Opin. Drug
Deliv. 11 741[13] Kumar D, Saini N, Jain N, Sareen R and Pandit V 2013 Expert
Opin. Drug Deliv. 10 397[14] Jain P K, Lee K S, El-Sayed I H and El-Sayed M A 2006
J. Phys. Chem. B 110 7238[15] Zhu H, Du M, Zhang M, Wang P, Bao S, Zou M, Fu Y and
Yao J 2014 Biosens. Bioelectron. 54 91[16] Jing L, Liang X, Deng Z, Feng S, Li X, Huang M, Li C and
Dai Z 2014 Biomaterials 35 5814[17] Curry T, Kopelman R, Shilo M and Popovtzer R 2014
Contrast Media Mol. Imaging 9 53
13
Adv. Nat. Sci.: Nanosci. Nanotechnol. 6 (2015) 023002 Review

[18] Wang S, Dai Z, Ke H, Qu E, Qi X, Zhang K and Wang J 2014Eur. J. Radiol. 83 117
[19] Ke H, Yue X, Wang J, Xing S, Zhang Q, Dai Z, Tian J,Wang S and Jin Y 2014 Small 10 1220
[20] Parida U K and Nayak P L 2012 World J. Nano Sci. Technol.1 10
[21] Lien N T H, Huyen L T, Hoa V X, Ha C V, Nguyen T H,Huan L Q, Fort E, Hoa D Q and Nhung T H 2010 Adv. Nat.Sci.: Nanosci. Nanotechnol. 1 025009
[22] Lien N T H, Nguyen T H, Hoa V X, Hoa D Q and Nhung T H2010 J. Chem. 48 718
[23] Ha C V, Lien N T H, Huyen L T, Thuy U T D, Huan L Q,Kim Thuan T, Nguyen Q L and Nhung T H 2010 Adv. Nat.Sci.: Nanosci. Nanotechnol. 1 025005
[24] Ha C V, Fort E, Lien N T H and Nhung T H 2011 Adv. Nat.Sci.: Nanosci. Nanotechnol. 2 045010
[25] Lien N T H, Phuong N T, Tuyen N T, Nhung H T M, Quy N T,Fort E and Nhung T H 2012 Adv. Nat. Sci.: Nanosci.Nanotechnol. 3 015002
[26] Vu X H, Levy M, Barroca T, Tran H N and Fort E 2013Nanotechnology 24 325501
[27] Trang M T T, Phong L T H, Nam P H, Manh D H andNguyen X P 2014 Adv. Nat. Sci.: Nanosci. Nanotechnol. 5045007
[28] Duy N H, Dung N T, Hai N D and Tung N P 2014 Adv. Nat.Sci.: Nanosci. Nanotechnol. 5 035017
[29] Li J, Gupta S and Li C 2013 Quant Imaging Med. Surg. 3 284[30] Daniel M C and Astruc D 2004 Chem. Rev. 104 293
[31] Dykmana L and Khlebtsov N 2012 Chem. Soc. Rev. 41 2256[32] Tiwari P M, Vig K, Dennis V A and Singh S R 2011
Nanomaterials 1 31[33] Pastoriza-Santos I and Liz–Marzan L M 2008 J. Mater. Chem.
18 1724[34] Hirsch L R et al 2003 PNAS 100 13549[35] Lal S, Clare S E and Halas N J 2008 Acc. Chem. Res. 41 1842[36] Nhung T H et al 2013 Adv. Nat. Sci.: Nanosci. Nanotechnol. 4
043001[37] Tan P M, Nguyen T V, Duong V T T, Lien N T H, Kim Thuan T,
Thanh Thuy T, Ha C V, Brochon J C and Nhung T H 2012Adv. Nat. Sci.: Nanosci. Nanotechnol. 3 045013
[38] Lien N T H, Ngan L T, Hue D T, Duong V T T, Hoa D Q andNhung T H 2013 J. Nanopart. Res. 15 1
[39] Biffi S et al 2014 RSC Adv. 4 18278[40] Ricciardi L et al 2014 J. Photochem. Photobiol. B 140 396[41] Rampazzo E et al 2014 J. Phys. Chem. C 118 9261[42] Kumar R et al 2008 ACS Nano 2 449[43] Slowing I I, Wu C W, Vivero-Escoto J L and Lin V S 2009
Small 5 57[44] Kumar R, Roy I, Ohulchanskky T Y, Vathy L A, Bergey E J,
Sajjad M and Prasad P N 2010 ACS Nano 4 699[45] Ow H et al 2005 Nano Lett. 5 113[46] Zhao X, Hilliard L R, Mechery S J, Wang Y, Bagwe R P,
Jin S and Tan W 2004 Proc. Natl Acad. Sci. USA 101 15027[47] Barandeh F, Nguyen P L, Kumar R, Iacobucci G J,
Kuznicki M L, Kosterman A, Bergey E J, Prasad P N andGunawardena S 2012 PlosOne 7 29424
14
Adv. Nat. Sci.: Nanosci. Nanotechnol. 6 (2015) 023002 Review