
The Direct Synthesis of Hydrogen Peroxide Using Bimetallic ...
203
PhD Thesis School of Chemistry Cardiff University The Direct Synthesis of Hydrogen Peroxide Using Bimetallic, Gold and Palladium, Supported Catalysts Thesis submitted in accordance with the requirements of the University of Cardiff for the degree of doctor in philosophy by: Greg Shaw 2013 Cardiff CatalysisInstitute
-
Upload
khangminh22 -
Category
Documents
-
view
1 -
download
0
Transcript of The Direct Synthesis of Hydrogen Peroxide Using Bimetallic ...

PhD Thesis
School of Chemistry
Cardiff University
The Direct Synthesis of Hydrogen Peroxide Using Bimetallic, Gold and Palladium, Supported Catalysts
Thesis submitted in accordance with the requirements of the University of Cardiff for the degree of doctor in philosophy by:
Greg Shaw
2013
CardiffCatalysisInstitute

DECLARATION
This work has not been submitted in substance for any other degree or award
at this or any other university or place of learning, nor is being submitted
concurrently in candidature for any degree or other award.
Signed ………………………………………… (candidate) Date …………………………
STATEMENT 1
This thesis is being submitted in partial fulfilment of the requirements for the degree of PhD
Signed ………………………………………… (candidate) Date …………………………
STATEMENT 2
This thesis is the result of my own independent work/investigation, except where otherwise
stated. Other sources are acknowledged by explicit references. The views expressed are my
own.
Signed ………………………………………… (candidate) Date …………………………
STATEMENT 3
I hereby give consent for my thesis, if accepted, to be available for photocopying and for
inter- library loan, and for the title and summary to be made available to outside organisations.
Signed ………………………………………… (candidate) Date …………………………
STATEMENT 4: PREVIOUSLY APPROVED BAR ON ACCESS
I hereby give consent for my thesis, if accepted, to be available for photocopying and for
inter- library loans after expiry of a bar on access previously approved by the Academic
Standards & Quality Committee.
Signed ………………………………………… (candidate) Date …………………………


------------------------------------------------------- PREFACE --------------------------------------------------------------------
I
Summary
In this thesis the direct synthesis of hydrogen peroxide from hydrogen and oxygen using
gold-palladium supported catalysts is described. The direct route presents a greener and
sustainable alternative to the current industrial manufacture process. This work aims to meet
industrial requirements set by Solvay® which would make the direct process industrially
viable.
The drawback preventing the requirements being met is the reaction of hydrogen and oxygen
over a catalyst can yield water as well as hydrogen peroxide. Once H2O2 is formed, it can be
consumed by either reduction or decomposition. Thus, the rates of the subsequent reactions
must be minimized to increase the selectivity and therefore H2O2 concentration to a desirable
level. Aspects of the catalyst design and reaction variables have been studied over three
results chapters.
Firstly, the thermal treatment conditions have been altered, ultimately producing a catalyst
with no activity to the H2O2 consumption under standard conditions. Switching off H2O2
hydrogenation was concluded to be due to an increase in Pd2+, isolating active Pd0 species.
Secondly, active catalysts to both the synthesis and hydrogenation of H2O2 have been
produced with no halide; the addition of halide has been shown to decrease hydrogenation
activity while maintaining synthesis activity.
Finally, a biphasic solvent system and a constant flow of gases through the reaction medium
have been examined in order to produce higher H2O2 concentrations. In the former case
H2O2 is extracted in-situ from an immiscible organic phase. The production of a 3 wt% H2O2
solution highlights the potential of such a system. In the latter case a semi-continuous flow
reactor is utilised increasing the H2O2 concentration up to ca. 1 wt% (from ca. 0.2 wt%). The
reactor allowed H2 selectivity and H2O concentration to be measured as a function of time,
thus providing greater insight into catalyst activity.

------------------------------------------------------- PREFACE --------------------------------------------------------------------
II
Acknowledgements
I would like to express my gratitude to Professor Graham Hutchings, my research supervisor,
who not only provided me with this opportunity, but gave invaluable guidance,
encouragement and useful critiques throughout this research work.
I would also like to thank Dr. Jennifer Edwards, for her advice and assistance throughout my
three years of laboratory work and during the writing of this thesis. My grateful thanks are
also extended to Dr. Albert Carley and Dr. David Morgan for their help with extensive X-ray
photoelectron analysis; the team at Lehigh University in particular Professor Chris Kiely and
Dr. Qian He who provided the electron microscopy characterisation; and Dr. Pelham Hawker,
Dr. David Harrison and Dr. Jacob Moulijn for their useful and constructive recommendations
on this project. I gratefully acknowledge all the staff in the chemistry department at Cardiff
University who have helped with all enquires and allowed this project to run smoothly.
I wish to acknowledge Solvay® for their support and contribution to this project. My special
thanks are extended to all the staff and students at Solvay NOH who helped me greatly during
a 6 month secondment to Brussels, in particular Jean-Pierre Ganhy for his extensive guidance
and support.
I would like to express my appreciation to all the students, postdocs and staff in the CCI for
their constant help and suggestions throughout this work. Special thanks goes to Dr. Simon
Kondrat and Dr. Peter Medizak for their assistance and guidance during the physical grinding
work; and all of the ‘hydrogen peroxide team’, Dr Marco Piccinini, James Pritchard, Simon
Freakley, Yingyu Wang and Adeeba Akram.
Last but not least I would like to thank all of my family and friends who I will always be
indebted to for the love and support they have provided, without them this wouldn’t have
been possible.
------------------------------------------------------- PREFACE --------------------------------------------------------------------
III
CONTENTS
Summary I
Acknowledgements II
CHAPTER ONE: Introduction 1
1.1 General Introduction 1
1.1.1 Green Chemistry 2
1.2 Catalysis 4
1.2.1 Heterogeneous Catalysts 5
1.2.2 Preparation of Heterogeneous Catalysts 7
1.3 Hydrogen Peroxide 10
1.3.1 Applications 11
1.3.2 Manufacturing 13
1.4 Emerging Alternatives 17
1.4.1 Direct Synthesis of Hydrogen Peroxide Using Pd Supported Catalysts 17
1.4.2 Electrolysis/Fuel Cells 21
1.4.3 Plasma 22
1.4.4 Supercritical CO2 22
1.5 Gold Catalysis 22
1.5.1 Carbon Monoxide Oxidation 23
1.5.2 Hydrochlorination of Acetylene 24
1.5.3 Alkene Epoxidation 25
1.5.4 Alcohol Oxidation 26
1.5.5 Direct Synthesis of Hydrogen Peroxide 26
1.6 Bimetallic Catalysts 27
1.6.1 Direct Synthesis of H2O2 Using Au-Pd Catalysts (Cardiff) 27
1.6.2 Direct Synthesis of H2O2 Using Bimetallic Catalysts 33
(Other Research Groups)
1.7 Aims and Objectives 34
1.8 References 35

------------------------------------------------------- PREFACE --------------------------------------------------------------------
IV
CHAPTER TWO: Experimental 40
2.1 Catalyst Preparation 40
2.1.1 Impregnation 40
2.1.2 Physical Grinding 41
2.1.3 Support Pre-treatment 41
2.2 Direct Synthesis of Hydrogen Peroxide - Batch Reactor 42
2.2.1 Standard Direct H2O2 Synthesis Conditions 43
2.2.2 Standard H2O2 Hydrogenation and Decomposition Conditions 43
2.2.3 Evaluation of Catalyst Stability 43
2.2.4 Direct H2O2 Synthesis Using Organic Solvents 44
2.3 Direct Synthesis of Hydrogen Peroxide - Semi-Continuous Flow Reactor 44
2.3.1 Standard Direct H2O2 Synthesis Conditions 45
2.3.2 Product Analysis 46
2.4 Benzyl Alcohol Oxidation 50
2.4.1 Background 50
2.4.2 Standard Procedure 52
2.4.3 Product Analysis 52
2.5 Characterisation Techniques 54
2.5.1 Thermo-gravimetric Analysis (TGA) 54
2.5.2 X-Ray Diffraction (XRD) 54
2.5.3 Electron Microscopy (EM) 57
2.5.4 X-Ray Photoelectron Spectroscopy (XPS) 61
2.6 References 63
CHAPTER THREE: The Effect of Thermal Treatment Conditions on Catalytic Activity 64
3.1 Introduction 64
3.2 The Effect of Calcination Temperature on Au-Pd/Acid-Washed Carbon 65
3.2.1 Direct H2O2 Synthesis and Hydrogenation 65
3.2.2 X-Ray Photoelectron Spectroscopy (XPS) 67
3.2.3 Electron Microscopy (EM) 69
3.2.4 Discussion 70
3.3 The Effect of Pd Oxidation State on Direct H2O2 Synthesis 73

------------------------------------------------------- PREFACE --------------------------------------------------------------------
V
3.3.1 Background 73
3.3.2 Comparison of Au-Pd/AwC and Au-Pd/C catalysts calcined at 400 oC 74
3.4 Reduction – Oxidation Treatment of Au-Pd/Acid-Washed Carbon 77
3.4.1 Direct H2O2 Synthesis and Hydrogenation 77
3.4.2 X-Ray Photoelectron Spectroscopy (XPS) 79
3.4.3 Electron Microscopy (EM) 84
3.4.4 Discussion 85
3.5 Reduction – Oxidation Treatment of Monometallic Pd/Acid-Washed Carbon 87
3.6 Influence of the Support 88
3.6.1 Sequential Reduction – Re-oxidation of Au-Pd/C 88
3.6.2 Sequential Reduction – Re-oxidation of Au-Pd/TiO2 90
3.7 Conclusion 92
3.8 References 92
CHAPTER FOUR: Catalysts Prepared by Physical Grinding 94
4.1 Introduction 94
4.1.1 Thermal Decomposition of Metal Acetates 96
4.2 Thermo-gravimetric Analysis (TGA) 98
4.2.1 Bulk Metal Acetates 98
4.2.2 Metal Acetates With a Support 99
4.3 Effect of Preparation Method on Catalyst Activity 101
4.3.1 Direct H2O2 Synthesis and Hydrogenation 101
4.3.2 Catalyst Stability 103
4.3.3 Benzyl Alcohol Oxidation 104
4.4 Carbon Supported Au, Pd and Au-Pd Catalysts Prepared by Physical Grinding 106
4.4.1 Direct H2O2 Synthesis and Hydrogenation 106
4.4.2 Benzyl Alcohol Oxidation 107
4.4.3 X-Ray Diffraction (XRD) 109
4.4.4 Electron Microscopy (EM) 110
4.4.5 X-Ray Photoelectron Spectroscopy (XPS) 114
4.4.6 Discussion 117
4.5 Titania Supported Au, Pd and Au-Pd Catalysts Prepared by Physical Grinding 119
4.5.1 Direct H2O2 Synthesis and Hydrogenation 119

------------------------------------------------------- PREFACE --------------------------------------------------------------------
VI
4.5.2 X-Ray Diffraction (XRD) 120
4.5.3 Scanning Transmission Electron Microscopy (STEM) 122
4.5.4 X-Ray Photoelectron Spectroscopy (XPS) 124
4.6 Effect of Grinding Time 126
4.7 Effect of Thermal Treatment Temperature 127
4.8 Effect of Chloride Addition 128
4.8.1 Direct H2O2 Synthesis and Hydrogenation 129
4.8.2 Scanning Transmission Electron Microscopy (STEM) 130
4.8.3 X-Ray Photoelectron Spectroscopy (XPS) 132
4.8.4 Discussion 134
4.9 Conclusion 135
4.10 References 136
CHAPTER FIVE: Increasing Hydrogen Peroxide concentration 138
5.1 Introduction - A biphasic Solvent System for Direct H2O2 Synthesis 138
5.2 Choice of a Suitable Organic Solvent 141
5.2.1 Direct H2O2 Synthesis 141
5.2.2 H2O Solubility 143
5.2.3 Stability of the Solvent 144
5.3 Determining the H2O2 Concentration in a Biphasic Solvent System 145
5.4 Choice of a Suitable Catalyst 147
5.4.1 Direct H2O2 Synthesis 147
5.4.2 H2O2 Hydrogenation 148
5.4.3 Discussion 150
5.5 The Effect of Reaction Variables on H2O2 Concentration 151
5.5.1 The Effect of Decan-1-ol/H2O ratio 152
5.5.2 The Effect of Solvent Mass and Catalyst Loading 153
5.5.3 The Effect of Reaction Time 156
5.5.4 The Effect of Stirring Speed 157
5.5.5 The Effect of Pressure 158
5.5.6 Discussion 160
5.6 Increasing H2O2 Concentration Using Ceria Supported Catalysts 162
5.6.1 Ceria Supported Catalysts 162

------------------------------------------------------- PREFACE --------------------------------------------------------------------
VII
5.6.2 Direct H2O2 Synthesis Using Bimetallic and Tri-metallic Catalysts 163
5.6.3 Effect of Reagent Reloading 165
5.7 Introduction - Direct H2O2 Synthesis Using a Semi-Continuous Flow Reactor 167
5.8 Reactor Design and Working Conditions 169
5.8.1 Standard Procedure 170
5.8.2 Calculations 170
5.9 Initial Results 172
5.9.1 Solvent Composition 172
5.9.2 Influence of Catalyst Mass 173
5.9.3 Flow Rate 174
5.9.4 Influence of the Diluent Gas 175
5.10 Influence of Reaction Time 177
5.10.1 Hydrogen Peroxide and Water Concentration 178
5.10.2 Hydrogen Conversion 179
5.10.3 H2O2 Productivity, Selectivity and Yield 180
5.10.4 Discussion 181
5.11 References 182
CHAPTER SIX: Conclusion and Future Work 185
6.1 Conclusion 185
6.2 Future Work 189
6.3 References 191


1
Introduction
1.1 General Introduction
The existence of a new force, which was called a ‘catalytic force’, was first published in
a report, in 1836, by J. J. Berzelius.1 While creating a report summarising the progress of the
whole of chemistry, for the Stockholm Academy of Sciences, he reviewed a number of earlier
findings on chemical change in both heterogeneous and homogeneous systems. He was able
to show that these could be rationally co-ordinated by the introduction of a new concept
which he called catalysis. He summarised his ideas on catalysis as a new force by writing:
‘‘It is, then, proved that several simple or compound bodies, soluble and insoluble, have the
property of exercising on other bodies an action very different from chemical affinity. By
means of this action they produce, in these bodies, decompositions of their elements and
different recombinations of these same elements to which they remain indifferent.’’
Some of the early work which was summarised by Berzelius was done by a French scientist
called Louis Jacques Thénard.1 He observed that a chemical substance can speed up a
chemical reaction without itself, at the end of the reaction, being chemically changed. This
became clear as he researched the decomposition of hydrogen peroxide in the presence of
various solids. He also found that the action of metals in bringing about decomposition
became more vigorous as the metal was reduced to a finer state of subdivision.
Thénard had previously discovered the existence of hydrogen peroxide in 1818 when he was
working on the reaction of barium peroxide with nitric or hydrochloric acid.2 The following
thesis concentrates on the synthesis of hydrogen peroxide directly from H2 and O2, by
catalysis, with a view to making its production ‘greener’ and as a result increasing its
contribution to ‘Green Chemistry’.

-------------------------------------------- CHAPTER ONE: Introduction -------------------------------------------------------
2
1.1.1 Green Chemistry
Green chemistry, also known as sustainable chemistry, is the design, manufacture and
application of chemical products that reduce or eliminate the use or generation of substances
that are hazardous to human health and the environment. It is a science-based non-regulatory,
economically driven approach toward sustainable development that has grown substantially
since the concept fully emerged in the 1990’s.3 Today, the following 12 Principles of Green
Chemistry developed by Paul Anastas and John, C., Warner,4 are used as a guideline and
criteria by chemical scientists.
1. Prevention – It is better to prevent waste than to treat or clean up waste after it has
been created.
2. Atom Economy – Synthetic methods should be designed to maximise the
incorporation of all materials used in the process into the final product.
3. Less Hazardous Chemical Synthesis – Wherever practicable, synthetic methods
should be designed to use and generate substances that possess little or no toxicity to
human health and the environment.
4. Designing Safer Chemicals – Chemical products should be designed to affect their
desired function while minimising their toxicity.
5. Safer Solvents and Auxiliaries – The use of auxiliary substances (e.g. solvents,
separation agents, etc) should be made unnecessary wherever possible and innocuous
when used.
6. Design for Energy Efficiency – Energy requirements of chemical processes should
be recognised for their environmental and economic impacts and should be minimised.
If possible, synthetic methods should be conducted at ambient temperature and
pressure.
7. Use of Renewable Feedstock’s – A raw material or feedstock should be renewable
rather than depleting whenever technically and economically practicable.
8. Reduce Derivatives – Unnecessary derivatisation (use of blocking groups, protection
/de-protection, temporary modification of physical/chemical processes) should be

-------------------------------------------- CHAPTER ONE: Introduction -------------------------------------------------------
3
minimised or avoided if possible, because such steps require additional reagents and
can generate waste.
9. Catalysis – Catalytic reagents (as selective as possible) are superior to stoichiometric
reagents.
10. Design and Degradation – Chemical products should be designed so that at the end
of their function they break down into innocuous degradation products and do not
persist in the environment.
11. Real – Time anyalysis for Pollution Prevention – Analytical methodologies need to
be further developed to allow for real-time, in process monitoring and control prior to
the formation of hazardous substances.
12. Inherently Safer Chemistry for Accident Prevention – Substances and the form of
a substance used in a chemical process should be chosen to minimise the potential for
chemical accidents, including releases, explosions and fires.
In 2005, Ryoji Noyori5 (Nobel laureate in chemistry, 2001) identified three key developments
in green chemistry: (1) use of supercritical carbon dioxide as green solvent; (2) using aqueous
hydrogen peroxide for clean oxidations and (3) use of hydrogen in asymmetric synthesis.

-------------------------------------------- CHAPTER ONE: Introduction -------------------------------------------------------
4
1.2 Catalysis
Today catalysis is defined as the acceleration (or deceleration) of a chemical reaction due
to the presence of a catalyst. Where a catalyst is a substance that increases the rate of a
chemical reaction (k) by reducing the activation energy (Ea), but which is left unchanged
chemically at the end of the reaction. The catalyst lowers the activation energy of the
reaction by providing an alternative path that avoids the slow, rate determining step of the un-
catalysed reaction. The rate constant of such a reaction can be expressed using the Arrhenius
rate law:
R - molar gas constant
T - absolute temperature
A - pre-exponential factor
Ea - activation energy
k - rate constant
Biological catalysts called enzymes are at the pinnacle of catalytic power and all synthetic
catalysts strive to emulate them. For example, splitting hydrogen and oxygen from water
using conventional electrolysis techniques requires considerable amounts of electrical energy.
But green plants produce oxygen from water efficiently using a catalytic technique powered
by sunlight, a process that is part of photosynthesis and so effective that it is Earth’s major
source of oxygen.
Formation of byproducts in various sectors of the chemical industry makes current processes
non-environmentally benign. The fine chemical and pharmaceutical sectors have a very high
impact on the environment and human life, due to the utilisation of conventional multistep
syntheses based on using stiochiometric reagents producing large amounts of organic or
-------------------------------------------- CHAPTER ONE: Introduction -------------------------------------------------------
5
inorganic wastes. This is highlighted later in this introduction when dealing with the current
manufacture of hydrogen peroxide.
In order to minimise such problems, chemical processes based on reagents need to be
replaced by more catalytic dependent routes. Depending upon the phase in which a catalyst
exists, it is classified in two types,
Homogeneous catalysis - all the substances are in one single phase; typically everything will
be a gas or a single liquid phase.
Heterogeneous catalysis - here the catalyst is in a different phase to the reactants; normally
the catalyst is a solid and the reactants are either a gas or liquid.
Catalysis has played a major role in improving quality of life by offe ring environmentally
benign processes for the manufacture of various chemical products in day to day life.
Catalysis is a multidisciplinary science that serves a broad range of applications covering
speciality, fine, intermediate, and life science chemicals. About 85-90 % of industrial
processes are based on catalysis, 80 % of which utilise heterogeneous catalysts.
Heterogeneous catalysts, which are the focus of this report, have a distinct advantage over
homogeneous catalysts of easy recovery and recycling. Although colloidal catalysis is
sometimes described as heterogeneous catalysis, this thesis does not deal with this topic and
will concentrate on metal supported heterogeneous catalysts.
1.2.1 Heterogeneous Catalysts
The availability of bonding sites on the catalyst makes the catalytic process possible.
This provides a lower energy pathway for molecules to rearrange their bonds in the breaking
and reforming that is required for a chemical reaction, Figure 1.1. In the gas phase the
activation energy, ?Ea, is high largely because energy has to be expended to break bonds,
before bond making begins. On the surface, however, the reacting molecules are anchored
during the process, always keeping this bonding which stabilises the intermediates in the
reaction.

-------------------------------------------- CHAPTER ONE: Introduction -------------------------------------------------------
6
Figure 1.1 - The simplified energetics associated with a catalytic reaction. 6
The result is that the activation barriers are generally lower than for the un-catalysed process
and the reaction is kinetically accelerated. A catalyst, then, enhances reaction rates by
lowering activation barriers, speeding the approach to equilibrium, but does not affect the
equilibrium concentrations.
A high activity catalyst often requires a large active surface area and thus small particles, i.e.
a high dispersion of the active phase. Because small particles, especially small metal
particles, tend to sinter at relatively low temperatures, they are generally affixed to a pre-
formed support which allows higher dispersion. Catalyst supports are thermally stable and
maintain a specific surface area up to high temperatures. Suitable and frequently used
supports are metal oxides and carbon, all being compounds with high melting and
decomposition temperatures. With these supports other important (physical) features like
texture (specific surface area, pore size distribution and pore volume), density and
mechanical strength can be established.
A complication is that catalyst particles must have prescribed size and shape to be applicable
in a specific reactor and/or to be removable from the liquid-phase by filtration or

-------------------------------------------- CHAPTER ONE: Introduction -------------------------------------------------------
7
centrifugation. Due to this, a large specific surface area can only be attained when support
bodies are highly porous, which might conflict with the desired mechanical strength of the
texture. Moreover, narrow and long pores might hinder transport of reactants which
generally is undesirable. Furthermore, a high porosity might bring along a decreased
mechanical strength causing the formation of fines and loss of expensive catalytic material.
With most catalysed reactions the combined chemical properties of the active phase and the
support bring about the catalytic functionality. But even when the support material only
serves as a vehicle for keeping the catalytically active species separated, these species have to
interact in some degree and in some way with the support. And due to this interaction, which
nature is often still unknown, the catalytic performance strongly depends on a complex mix-
up of contributions of the morphology and dispersion of the active particles and, with metal
catalysts, with the electronic properties of the metal.7, 8
The main catalysts used in this thesis are based on supported Au and Pd nano-particles.
1.2.2 Preparation of Heterogeneous Catalysts
The preparation of heterogeneous catalysts, complex ensembles of nano-scale active
particles consisting of several thousand atoms, fixed onto a support, is complex even when
the active site/features required are known. Catalyst preparations can be divided into two
classes;
• The support and the metal precursor are formed at the same time – co-precipitation
• The metal precursor is added to a pre-formed support – impregnation, precipitation,
reduction, physical mixing etc.
This thesis concentrates on the second class of preparation and minor adjustments of the
preparation can significantly influence the delicate balance of conflicting demands: a high
activity, a high selectivity and a long lifetime.
1) The concentration of the metal precursor in solution
2) The ratio of its volume and concentration to the mass of the support
3) The type of support
4) The temperature
5) The pH

-------------------------------------------- CHAPTER ONE: Introduction -------------------------------------------------------
8
6) The nature of the base or acid used to change the pH if necessary
7) The time
8) The method of filtration, washing, and drying
9) The conditions of calcination
10) External conditions e.g. light, humidity, temperature etc
Specific preparations of bimetallic catalysts active for the direct synthesis of H2O2 are
highlighted in section 1.6; however it is important to briefly look at solvated precursors and
suitable adsorption sites on the support surface (oxides and carbon).
Metal cations in water lead to the formation of covalent bonds between the central metal
cation and the water ligands, charge transfer then promotes hydrolysis. The nature of the
species formed with changing pH has been reasonably well studied for gold and palladium
compounds.16
xM+(aq) + yH2O Mx(OH)y(aq)(xn-y)+ + yH+(Kxy)
For example, Gold at high pH has been found to completely hydrolyse;
[AuCl4]- + 4H2O [Au(OH)4]- + 4H+ + 4Cl-
In view of the surface chemistry of the oxidic and carbon supports cationic or anionic metal
precursor ions have to be available in a pH range of ~3 to ~9.
Oxides are widely used as pre-formed supports due to their high thermal stability. The
surfaces of most oxides are hydroxylated or become hydroxylated upon contact with water.
The nature of these sites can be identified by IR spectroscopy.9, 10 Generally, when dispersed
in aqueous solutions the surface of mineral amphoteric oxide particles, such as silica and
alumina, become charged; primarily basic OH groups will be involved in reaction (1) and
acidic hydroxyl in reaction (2);
(1) M-OH + H+ M-OH2+

-------------------------------------------- CHAPTER ONE: Introduction -------------------------------------------------------
9
(2) M-OH M-O- + H+
Where M = Si, Ti, Ce etc.
From the above equations it follows that the pH will influence the nature as well as the
concentration of the charged surface. The pH value at which the net surface charge (surface
and layer around the particle) is zero is referred to as the iso-electric point (IEP). At pH
values above the IEP the surface is negatively charged and will adsorb cations, such as
Pd(NH3)42+. Below the IEP the surface will be positively charged and anionic species, like
PdCl4-, can adsorb.11
In addition to oxide materials, carbon supports are very important in catalysis as they have a
high surface area (500-1200 m2/g), low cost and relatively high chemical inertness. However,
even after activation, carbon contains a large range of elements in various concentrations,
such as hydrogen, oxygen, sulphur and even metal containments which can affect
reproducibility/activity of catalysts. The texture of activated carbon is also extremely
complex since it involves macro-pores, meso-pores as well as micro-pores.12-14
The precise nature of the surface species is not entirely established, it can vary between
carbon type and even batches. In general, oxygen containing surface groups are believed to
be the most important groups influencing the surface characteristics and adsorption behaviour
of activated carbon.15, 16 Several carbon-oxygen groups have been identified, Figure 1.2.17
Figure 1.2 - Different types of oxygen containing surface groups on activated carbon.17

-------------------------------------------- CHAPTER ONE: Introduction -------------------------------------------------------
10
1.3 Hydrogen peroxide
Hydrogen peroxide is a clear, colourless liquid which is completely miscible with water.
It is the simplest peroxide containing a single oxygen-oxygen bond. It has a skewed structure
with a dihedral angle of 111.5o in the gas phase, Figure 1.3, which minimises repulsion
between the lone pairs and O-H bond pairs. In the liquid and solid state the angle is affected
by hydrogen bonding.2
Figure 1.3 - Hydrogen peroxide in the gas phase highlighting the skewed angle and bond
lengths.2
Compared to water, the energy content of hydrogen peroxide is much higher, seen from the
heats of formations for water and H2O2.18
1) H2 + ½ O2 H2O ?H = -286 kJmol-1
2) H2 + O2 H2O2 ?H = -188 kJmol-1
The decomposition of hydrogen peroxide produces water, gaseous oxygen and heat (100.4 kJ
mol-1). The rate of decomposition can be controlled by the temperature and concentration of
-------------------------------------------- CHAPTER ONE: Introduction -------------------------------------------------------
11
the peroxide, as well as on the presence of impurities and stabilisers. Since the activation
energy for the cleavage of the oxygen-oxygen bond is rather low (?H = -71 kJ mol-1), traces
of many substances can start the reaction, including most of the transition metals and their
compounds, as well as certain organic compounds.19 Although H2O2 will oxidise some
reactions unaided, for faster reactions the addition of an activating agent, such as Fentons
reagent,20 is required.
Hydrogen peroxide is a strong, versatile oxidant, which can oxidise a broad variety of
inorganic and organic substrates in liquid phase reactions. It is effective over the whole pH
range, with high oxidation potential,
Acidic – H2O2 + 2H+ + 2e- 2H2O (E0 = 1.763 eV at pH 0)
Alkaline - H2O2 + 2OH- 2H2O + 2O2 + 2e- (E0 = 0.878 eV at pH 14)
H2O2 possesses both nucleophillic and electrophillic properties. In alkaline solution H2O2
dissociates forming a perhydroxyl anion, HO-, which is a powerful nucleophile reacting
readily with a number of compounds including aldehydes and electron deficient olefins. In a
highly acidic medium H2O2 can be protonated, forming H3O2+, which is crucial to its use in
wastewater treatment where it has the ability to reduce chlorine and hypochlorite. This
electorphillic form can also be utilised for phenol hydroxylation.21
1.3.1 Applications
H2O2 decomposes to give only water and oxygen as the only reaction products,
making it an environmentally safe oxidising agent for many large-scale applications, such as
pulp and paper bleaching, textile applications, detergent applications, wastewater treatment,
and chemical oxidation processes, Figure 1.4.

-------------------------------------------- CHAPTER ONE: Introduction -------------------------------------------------------
12
Figure 1.4 - Principal uses of hydrogen peroxide21
One of the most important applications is currently its use in pulp and paper bleaching,22, 23 as
well as for treatment of wastewaters and a variety of industrial wastes.24 It has advantages
over traditional chlorine and chlorine-containing bleaches and oxidants, such as sodium
hypochlorite and sodium hydrochlorite, in that it is suitable for continuous processing, has no
severe toxicity or effluent problems and is noncorrosive. The formation of the perhydroxyl
anion, a nucleophile intermediate, is important for bleaching as it’s responsible for the
oxidation of chromophores in lignin through the cleavage of side chains.
Hydrogen peroxide is also used as a source of hydroxyl radicals which is the second most
powerful oxidant after fluorine. They occur from single electron transfer reactions in the
presence of an initiator, such as metals, enzymes (catalase) or heat. Generally, radicals
produce more negative effects (delignification) than positive effects in the bleaching
process,23 however, are useful for more complex advanced oxidation processes.25
For processes in the fine chemical industry, operated using molecular oxygen, the presence of
di-radical triplet states can potentially initiate homogeneous, non-catalysed background
reactions in addition to the target reaction. Hence significant demand exists for green, atom-
efficient, singlet-state oxygen donors, such as hydrogen peroxide. H2O2 can be employed
H2O2
Pulp & Paper Bleaching
DetergentsElectronicIndustry
Metallurgy
TextileIndustry
WastewaterTreatment
OtherApplications
Chemical Synthesis

-------------------------------------------- CHAPTER ONE: Introduction -------------------------------------------------------
13
either directly or following transformation into a peroxocarboxylic acid, leading to an
economically viable synthesis route for the manufacture of many organic and inorganic
chemicals.
The potential of including hydrogen peroxide in large volume chemical synthesises has been
recognised following the commercialisation of the integrated HPPO (hydrogen peroxide-
propylene oxide) process, in which the hydrogen peroxide required for the epoxidation is
produced on site. BASF and Dow Chemical opened a joint-venture pilot plant in Antwerp in
2008 with a yearly capacity of producing about 2x10⁵ metric tons.26 In Japan, an increase in
the consumption of hydrogen peroxide has stemmed from the commercialisation of
Sumitomo’s route to caprolactam.27
1.3.2 Manufacturing
In a rapidly expanding market the annual world production of hydrogen peroxide,
currently c.a. 2.2 million metric tons23 growing at roughly 10 % per annum, however, it is
forecast to reach 4.67 million metric tons by 2017, mainly due to its demand in large scale
chemical synthesis.28
H2O2 was first obtained on an industrial scale via a wet chemical process by treating barium
peroxide with nitric acid. However, the high production costs limited H2O2 application. This
was followed by large-scale production of hydrogen peroxide by electrolysis which can be
traced back to Meidinger in 1895.29 This proved to be an economically viable process for the
production of highly concentrated solutions of hydrogen peroxide of high purity and stability.
However, on-site electrochemical production of H2O2 for industrial applications requires a
production method with higher reaction rates, higher efficiency and lower costs.
Currently, the anthraquinone oxidation (AO) process accounts for >95% hydrogen peroxide
production worldwide. This industrial process was first developed by Hans – Joachim Riedl
and Georg Pfliederer, in 1939,30 with the first production plant being introduced by IG
Farben- industrie in Germany in the 1940’s. Since then significant improvements have been
made in each of the four major steps: hydrogenation, oxidation, hydrogen peroxide
extraction and treatment of the working solution. This has made the process more efficient
and able to gain very high yields of peroxide per cycle at concentrations as high as 70 wt%.

-------------------------------------------- CHAPTER ONE: Introduction -------------------------------------------------------
14
Figure 1.5 - Synthesis of H2O2 via anthraquinone auto-oxidation reactions.31
Firstly the working solution, 2-alkylanthraquinone (AQ) (usually 2-ethyl, 2-tert-buyl or 2-
amylanthraquinone) in an appropriate solvent/s, is hydrogenated over a nickel or palladium
based catalyst,32, 33 to the corresponding anthraquinol or anthrahydroquinone (AHQ). The
AHQ undergoes further hydrogenation to yield the corresponding
tetrahydroanthrahydroquinone (THAHQ), Figure 1.5. This process is carried out under
relatively mild conditions, normally temperatures of 40-50 oC and a hydrogen partial pressure
of up to 4 bar are utilised. This step has two serious drawbacks: excessive hydrogenation and
rapid deactivation.31
The solution containing the AHQ and THAHQ is separated from the hydrogenation catalyst
and oxidised, usually by air, to regenerate the corresponding AQ and
tetrahydroanthraquinone (THAQ) and equimolecular amounts of hydrogen peroxide. The
oxidation is carried out non-catalytically by bubbling air through the solution at 30-60oC and
near atmospheric pressure. The reaction occurs by means of a well-documented free-radical
mechanism, Figure 1.6.21
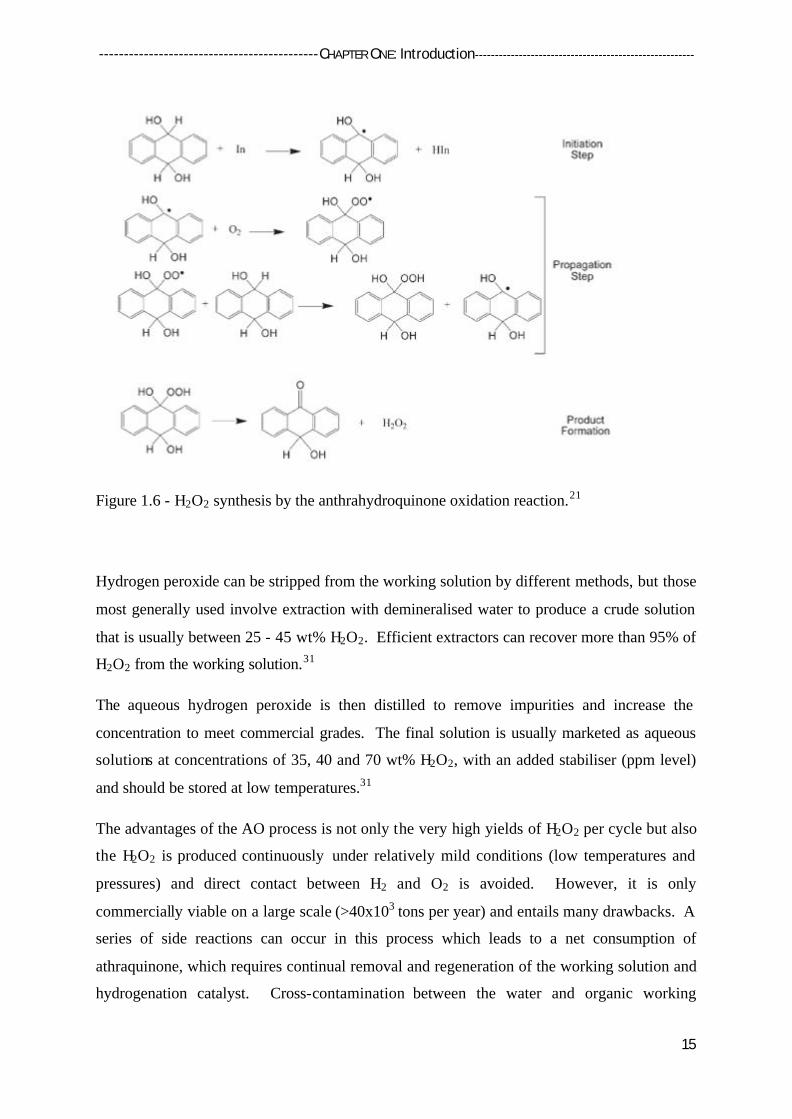
-------------------------------------------- CHAPTER ONE: Introduction -------------------------------------------------------
15
Figure 1.6 - H2O2 synthesis by the anthrahydroquinone oxidation reaction.21
Hydrogen peroxide can be stripped from the working solution by different methods, but those
most generally used involve extraction with demineralised water to produce a crude solution
that is usually between 25 - 45 wt% H2O2. Efficient extractors can recover more than 95% of
H2O2 from the working solution.31
The aqueous hydrogen peroxide is then distilled to remove impurities and increase the
concentration to meet commercial grades. The final solution is usually marketed as aqueous
solutions at concentrations of 35, 40 and 70 wt% H2O2, with an added stabiliser (ppm level)
and should be stored at low temperatures.31
The advantages of the AO process is not only the very high yields of H2O2 per cycle but also
the H2O2 is produced continuously under relatively mild conditions (low temperatures and
pressures) and direct contact between H2 and O2 is avoided. However, it is only
commercially viable on a large scale (>40x103 tons per year) and entails many drawbacks. A
series of side reactions can occur in this process which leads to a net consumption of
athraquinone, which requires continual removal and regeneration of the working solution and
hydrogenation catalyst. Cross-contamination between the water and organic working

-------------------------------------------- CHAPTER ONE: Introduction -------------------------------------------------------
16
solution during the recovery of the H2O2 product, by liquid- liquid extraction, is also a major
problem. 31
Most importantly there are safety concerns associated with the transportation of an unstable
highly concentrated product from a central site to point of use. The fact that an
environmentally friendly oxidant is manufactured in a non-environmentally friendly manner
when general applications require 3-8 wt% H2O2 has prompted research and development
into small-scale and widespread synthesis routes with improved efficiency to manufacture
hydrogen peroxide at a lower market value. As such, there exists considerable interest in the
development of a direct synthesis process to produce H2O2 from H2 and O2 gases using
palladium based catalysts.

-------------------------------------------- CHAPTER ONE: Introduction -------------------------------------------------------
17
1.4 Emerging alternatives
1.4.1 Direct synthesis of hydrogen peroxide using Pd catalysts
Until very recently predominately supported Pd catalysts have been used in the direct
synthesis of H2O2. Since the first patent by Henkel and Weber in 1914,34 which utilised a Pd
catalyst, it has been known that Pd is effective, for the liquid-phase hydrogenation of O2 by
H2 to form H2O2.
However, two major drawbacks have prevented the process from an industrial application
being accomplished. Firstly, due to safety issues H2/O2 mixtures need to be outside the
flammability limits (5-95 v/v% for H2 in O2), H2 concentrations less than 5 vol% H2 are
typically used. Secondly, Pd catalysts that are shown to be active for the direct H2O2
synthesis pathway are also active for the unwanted side reaction shown in Figure 1.7.
Figure 1.7 - Reactions involved in the direct production of H2O2.
All these reactions are thermodynamically favourable and highly exothermic, however, H2O2
is an intermediate and selectivity towards H2O2 is severely limited by the consecutive

-------------------------------------------- CHAPTER ONE: Introduction -------------------------------------------------------
18
decomposition and hydrogenation of H2O2. This is borne out by the heat contents (? H) and
the free energy values (?G) shown in Figure 1.7. Factors that can influence the rate of H2O2
decomposition/hydrogenation are listed below.
• Catalyst design - hydrophobicity of catalyst etc
• Reaction conditions - H2/O2 ratio in feed, reaction time, catalyst amount, etc
• Reaction medium
• Presence of acids (i.e. H+ ions)
• Presence of halide ions in reaction medium and/or catalyst
• Oxidation state of Pd in catalyst
• Presence of a second metal in Pd catalyst
Most of the research on the direct H2O2 synthesis concentrates on the catalyst design, where
different metals or combination of metals and supports were studied to minimise the
unwanted reactions. However, in addition to designing a suitable catalyst, the unwanted
reactions can also be minimised acting on the operating conditions, but kinetics and mass
transfer limitations must be known. Recently, contributions on the kinetics are growing in
the literature.35-42 The main efforts have been spent to rationalise the effect of different
reaction conditions on the catalyst and to develop models to study the actual mechanism, for
further optimisation of selectivity and production rate. However, results are difficult to
compare mainly because of the different catalyst preparations, reactor designs and reaction
conditions involved.
It has generally been accepted the rate determining step in the liquid-phase direct H2O2
synthesis is the dissociation of H2. Taking into account the findings of a reaction variables
investigation comparing the effect of different H2/O2 ratios and total reaction pressures,
Hutchings and Moulijn43 proposed a kinetic scheme for the production of hydrogen peroxide
(steps 1-5) and for the parallel combustion and consecutive hydrogenation/decomposition of
hydrogen peroxide (steps 6-10, which consider the dissociative adsorption of O2), where *
denotes a vacant site on the catalyst surface43.
.
1. H2 + 2* ? 2H* 6. O2 + 2* ? 2O*
2. O2 + * ? O2* 7. O* + H* ? OH* + *

-------------------------------------------- CHAPTER ONE: Introduction -------------------------------------------------------
19
3. H* + O2* ? OOH* + * 8. OH* + H* ? H2O* + *
4. OOH* + H* ? H2O2* + * 9. H2O* ? H2O + *
5. H2O2* ? H2O2 + * 10. H2O2* + *? H2O* + O*
Therefore the rate of H2O2 production will strongly depend on the overall rate of mass
transfer of the gaseous reactants to the catalyst surface. Water is the most desirable solvent
considering its availability, cost and non-toxicity, however, the addition of alcohol improves
the solubility of hydrogen and oxygen,44 and thus the rate of H2O2 production.45
Since H2O2 is highly likely to decompose in the presence of a catalyst, it is often
recommended to add a mineral acid to the reaction medium to stabilise the produced peroxide.
With Pd-only catalysts, the presence of H+ ions in the reaction medium has been found to be
crucial for achieving higher H2O2 selectivity and productivity by inhibit ing H2O2
decomposition.46-50 However, high quantities of acid are undesirable since it may create
problems related to catalyst stability and corrosion of reactor materials; with the dissolution
of active substances (metals) into the reaction medium.
The specific role of H+ ions in the catalytic path towards H2O2 formation is still not
completely clear. In separate studies, Choudary46 and Abate51 postulated the H+ ions plays a
significant role in the elementary ionic and free radical reactions. Whereas Liu and
Lunsford,52 proposed H+ have an indirect role in H2O2 formation, perhaps by influencing the
electronic state of the palladium surface.
The catalysts activity towards the decomposition/hydrogenation of H2O2 can also be inhibited
by adding halide ions to the reaction medium, causing an increase in the H2O2 selectivity.
The halide ions can be added to the reaction medium as an alkali metal salt (Na, K or Cs salt)
or in the form of a halogen acid (HCl, HBr or HI). Gosser et al.53 disclosed that the presence
of Cl- or Br- ions in an acidified reaction medium is important for improving both H2O2
productivity and selectivity. Whereas others have shown that although the addition of halide
improves the selectivity the H2 conversion is decreased.42, 49, 54, 55
The presence of iodide ions was detrimental to the catalysts activity and KF improved
hydrogen conversion the most, however the reverse effect existed for H2O2 selectivity,
indicating fluoride ions promote side and consecutive reaction pathways. The halide effects
in the Pd-catalysed direct H2O2 synthesis can be correlated with the a or p donation ability of
-------------------------------------------- CHAPTER ONE: Introduction -------------------------------------------------------
20
halogens, which increases down the group (F<Cl<Br<I). The Pd-halide interaction was
found to modify the electronic environment of Pd in the catalyst.46
Choudhary et al.46, 56 indicated the presence of halide ions alone is not enough for promoting
the selective oxidation of H2 to H2O2 in the direct synthesis. However when halide ions (Cl-
or Br-) were present together with H+ ions, the selectivity for H2O2 formation was improved
significantly. In general, when oxoacids (H3PO4, H2SO4 or HNO3) in water were utilised
very little H2O2 was formed. Whereas when halogen acids (HCl or HBr) were found to
drastically improve the H2O2 selectivity while maintaining H2O2 synthesis rates. However,
the use of the oxoacid, phosphoric acid (at a concentration <0.3 moldm-3) in conjunction with
halide, was recommended due to phosphate ions stabilising the H2O2 formed during
reaction.56 The combined halide and acid is thought to inhibit the dissociative chemisorption
of dioxygen on the catalyst surface stabilising the formed peroxide which increases
selectivity.
An optimum concentration of halide and H+ is crucial for achieving the maximum H2O2 yield
in the direct synthesis. Excess causes indiscriminate blocking of catalytic active sites,
inhibiting the H2 conversion and thereby decreasing the net formation of H2O2 in the direct
synthesis.54
The presence of halide ions together with H+ ions in a reaction medium may cause the
reaction medium to become strongly corrosive towards the catalyst and even the metallic
reactor materials, particularly stainless steel. Not only may these form active homogeneous
catalysts that could promote the side reactions57, 58 but isolation of H2O2 and catalyst recovery
from the complex reaction mixture is a difficult task. This has limited the use of halogen
promoters in acidic liquid reaction medium for the purpose of improving H2O2
yield/selectivity.
Colloidal palladium may be considered as a homogeneous catalytic system for the direct
synthesis of H2O2. Dissanayake and Lunsford57, 58 found the presence Pd0/Pd2+ in a steady
state (the overall composition of Pd0/Pd2+ does not change dramatically over time), to be
active for the direct synthesis of H2O2. A concentrated HCl (0.1-1.0M) reaction medium,
together with O2, led to dissolution of Pd from a Pd0/SiO2. There was a linear relationship
between colloid concentration and H2O2 formation. Although a colloidal Pd system is highly
interesting at a fundamental level, it is not suitable from a commercial perspective since the
management of a Pd colloid would be a difficult task on a large scale.
-------------------------------------------- CHAPTER ONE: Introduction -------------------------------------------------------
21
To eliminate the need for corrosive halide in the reaction medium, incorporation of halide
ions into the catalyst has been investigated. This was achieved by directly impregnating the
halide ions into the supported Pd catalyst or via the deposition of halide ions onto the support
prior to the deposition of Pd.47, 54 An improvement in catalyst performance for the direct
H2O2 synthesis was observed, however, the stability of the catalysts wasn’t investigated.
Impregnating preformed Au-Pd supported catalysts with bromide was shown to destabilise
the supported metal causing it to leach into the reaction medium.59
The effect of the palladium oxidation state in the direct H2O2 synthesis has been investigated
by many research groups. Choudhary et al.60-62 have claimed that a PdO catalyst is more
suitable than a Pd0 catalyst, owing to its higher selectivity for the H2O2 formation. On the
other hand, other scientists, including Thompson and co-workers44, Chinta and Lunsford,42
and Burch and Ellis49 have claimed that higher H2O2 productivity and selectivity can be
obtained with Pd0 catalysts.
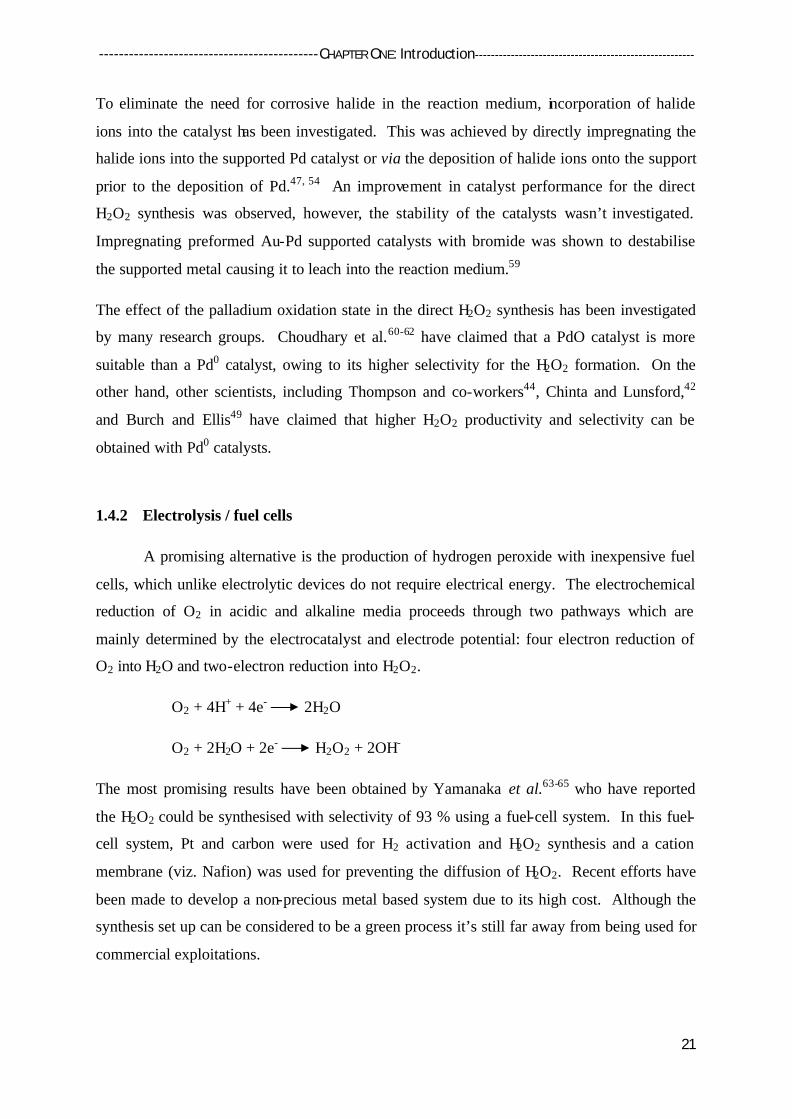
1.4.2 Electrolysis / fuel cells
A promising alternative is the production of hydrogen peroxide with inexpensive fuel
cells, which unlike electrolytic devices do not require electrical energy. The electrochemical
reduction of O2 in acidic and alkaline media proceeds through two pathways which are
mainly determined by the electrocatalyst and electrode potential: four electron reduction of
O2 into H2O and two-electron reduction into H2O2.
O2 + 4H+ + 4e- 2H2O
O2 + 2H2O + 2e- H2O2 + 2OH-
The most promising results have been obtained by Yamanaka et al.63-65 who have reported
the H2O2 could be synthesised with selectivity of 93 % using a fuel-cell system. In this fuel-
cell system, Pt and carbon were used for H2 activation and H2O2 synthesis and a cation
membrane (viz. Nafion) was used for preventing the diffusion of H2O2. Recent efforts have
been made to develop a non-precious metal based system due to its high cost. Although the
synthesis set up can be considered to be a green process it’s still far away from being used for
commercial exploitations.

-------------------------------------------- CHAPTER ONE: Introduction -------------------------------------------------------
22
1.4.3 Plasma
H2O2 can be synthesised from hydrogen and oxygen mixtures by plasma and other
physical methods. The activation of H2 and O2 molecules in non-equilibrium plasma by
dielectric barrier discharge gives quite high yields and selectivities of H2O2. This can be
considered a green process and the optimum H2/O2-plasma mixtures are outside the explosive
regime. However, this depends strongly on the reactor configuration.66
1.4.4 Supercritical CO2
Supercritical CO2 (Sc-CO2) is becoming an important commercial and industrial
solvent due to its low toxicity and environmental impact. It has been investigated using both
homogeneous67, 68 and heterogeneous69, 70 catalysis. The synthesis of H2O2 from H2 and O2 in
supercritical CO2 is advantageous since both O2 and H2 are miscible with Sc-CO2, which
favours in reducing or even eliminating the mass transfer resistance. However, the
disadvantage is the rate of H2O2 decomposition is too rapid at temperatures above the critical
temperature (Tc = 31.1oC) for this reaction medium to be beneficial.71, 72
1.5 Gold Catalysis
Gold is a fascinating metal that has long been used for its beauty. The chemical inertness
of bulk gold has made it an important metal with high monetary value which is readily traded.
two key discoveries came in the early eighties that predicted and subsequently demonstrated
that nano-particulate gold can be an effective catalyst, superior to other metals.73, 74
• Graham Hutchings working in industrial laboratories for ACSI Ltd, in 1982, predicted
that gold would be the best catalyst for acetylene hydrochlorination. Hutchings
observations were published in 1985 and from subsequent experimental research this
was found to be the case.73
• In 1982 Haruta et.al prepared ‘composite’ oxides of gold with a variety of transition
metals by coprecipitation with a view to investigate their hydrogen oxidation activity.
Later that year, he discovered that these gold materials were much more active for CO
oxidation than for hydrogen oxidation and that they were still active even at -76°C.74

-------------------------------------------- CHAPTER ONE: Introduction -------------------------------------------------------
23
Although, prior to these studies there were reports of gold’s activity, most notably Bond et
al.75 reported, in 1973, the hydrogenation of olefins over supported gold catalysts; these were
the first studies that showed gold to be the best catalyst. It wasn’t until a decade later, the
mid 1990’s, after the commercialisation of gold catalysts as an odour eater in 1992 that
interest in gold as a catalyst really flourished. Supported gold nano-particles were
implemented in rest rooms in Japan where they were utilised to oxidise the decomposition of
odour compounds, especially ammonia and trimethylamine, at room temperature. Here the
focus is on supported gold in catalysis but it also fascinates material scientists, surface and
synthetic chemists and theoreticians in great numbers.
Since gold catalysts have been investigated for an extensive range of reactions, which have
been reviewed by Hutchings and Hashmi,76 a selection of important reactions using Au
supported catalysts is discussed in the following sections.
1.5.1 Carbon Monoxide Oxidation
The oxidation of CO is a very important within both industrial and academic sectors.
CO emissions within exhaust gases of petrol and diesel engine vehicles as well as industrial
processes is of great burden to the environment and human health, and control of CO is of
paramount importance (respirators for the removal of CO in toxic environments). For a
simple reaction that has been studied by many, there are still many unresolved issues in the
literature which are subject to continued debate, including the nature of the active site and
although several mechanisms have been proposed its puzzling mechanism still hasn’t been
resolved.
Haruta et al. discovered that Au nanoparticles deposited on oxide supports were extremely
active for the oxidation of CO at temperatures as low as -70 oC. Generally the active
catalysts are thought to comprise of gold nano-particles (2-4 nm in diameter) on a suitable
oxide support (e.g. ferric oxide or titania), prepared by precipitation.77
Bond and Thompson78 have investigated the reaction mechanism and proposed that
peripheral cationic gold is responsible for the activation of di-oxygen in the catalytic process.
Kung et al.79 reported mechanistic proposals in agreement with Bond-Thompson using the
interface between small gold nanoparticles and the support as the key to the reaction.
However, it is still unclear whether Au3+ or Au0 is the active form of gold.

-------------------------------------------- CHAPTER ONE: Introduction -------------------------------------------------------
24
Hutchings et al.80 showed that Au3+ in Au/Fe2O3 was an important component of very active
catalysts for the oxidation of CO. In accordance with this study, in a later paper Flytzani-
Stephanopoulos et al.81, 82 demonstrated that Au3+ was an important factor in obtaining high
activity water gas shift catalyst based on Au added by deposition precipitation onto
nanocrystalline 10 % La-doped CeO2 (~5 nm). The catalysts were subsequently leached
with 2 % NaCN removing 90 % of the gold and surprisingly, the catalytic activity was not
only retained it was significantly enhanced.
A quantum size effect of the very small Au particles has been proposed by Goodman83 and
subsequently Boyen84 concluded that Au particle size containing 55 atoms, which are 1.4 nm
in diameter, are the most stable and active towards CO oxidation. Norskav et al.85 showed by
using DFT calculations the activation of CO was energetically favoured on Au particles with
10 atoms.
1.5.2 Hydrochlorination of Acetylene
The prediction by Hutchings in the 1980’s that Au would be the best catalyst for the
hydro-chlorination of acetylene to vinyl chloride, led to the industrial synthesis of vinyl
acetate86 and vinyl chloride73, 87, 88 being performed based on gold catalysis. Production of
vinyl chloride, which monometallic gold supported catalysts are the most active, is an
important intermediate for the production of PVC (polyvinyl chloride).
Previously, vinyl chloride was produced using HgCl2 supported on carbon; however, it was
extremely toxic and suffered from a high deactivation rate. A study by Shinoda, highlighted
a wide range of metal chloride catalysts supported on carbon were active for the reaction.
However, a correlation based on the electron affinity of the metal cation divided by the metal
valence was not useful for a prediction of the most active. Hutchings73 reasoned that the
reaction was not a one-electron process, as defined by the electron affinity, but was more
likely to involve the 2 electrons of ethyne and hence, as most of the cations in the data set
were divalent; the standard electrode potential was more viable parameter with which to
correlate the data. On this basis it was predicted that Au would be the best catalyst for this
reaction. In fact AuCl3/carbon prepared by wetness impregnation with HAuCl4 solution was
found to be three times more active than traditional HgCl2/carbon. Moreover, AuCl3/carbon
deactivated much less rapidly. Subsequent 197Au M?ssbauer spectroscopy87 clearly
-------------------------------------------- CHAPTER ONE: Introduction -------------------------------------------------------
25
demonstrated how this process was due to reduction of Au3+ to Au0. Remarkably, gold
catalysed acetylene hydro-chlorination is very selective with a selectivity >99.9 % to the
vinyl chloride monomer.
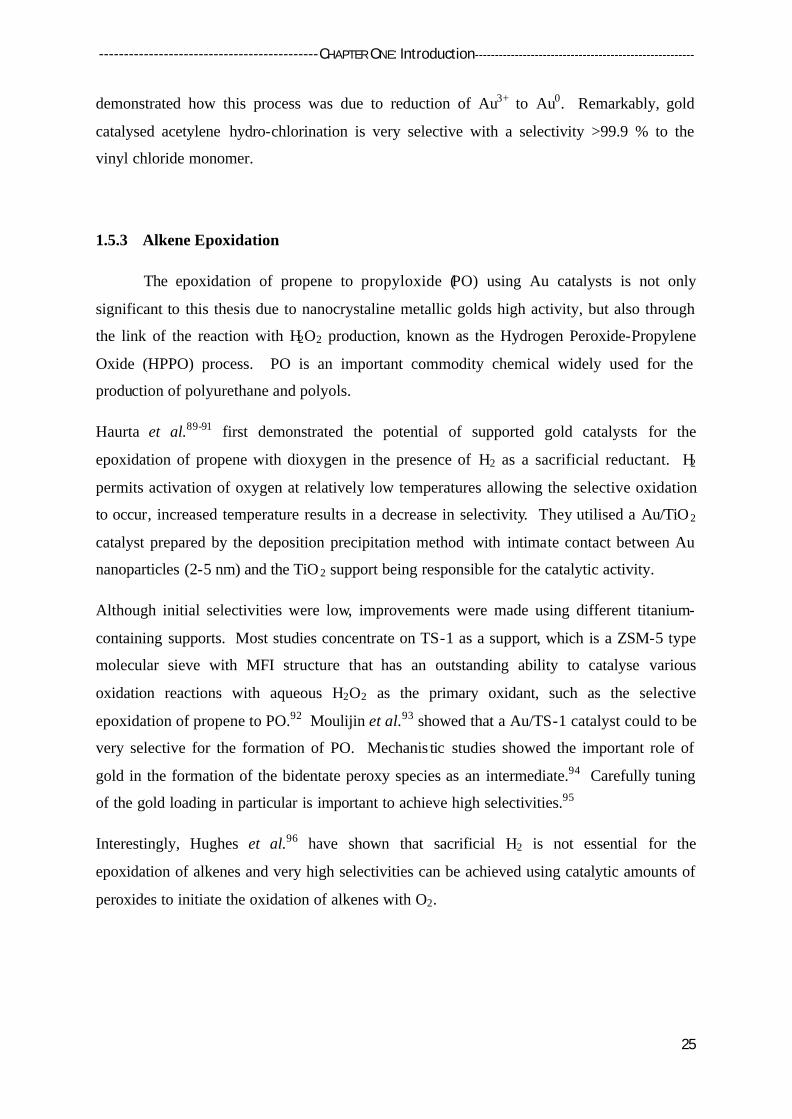
1.5.3 Alkene Epoxidation
The epoxidation of propene to propyloxide (PO) using Au catalysts is not only
significant to this thesis due to nanocrystaline metallic golds high activity, but also through
the link of the reaction with H2O2 production, known as the Hydrogen Peroxide-Propylene
Oxide (HPPO) process. PO is an important commodity chemical widely used for the
production of polyurethane and polyols.
Haurta et al.89-91 first demonstrated the potential of supported gold catalysts for the
epoxidation of propene with dioxygen in the presence of H2 as a sacrificial reductant. H2
permits activation of oxygen at relatively low temperatures allowing the selective oxidation
to occur, increased temperature results in a decrease in selectivity. They utilised a Au/TiO2
catalyst prepared by the deposition precipitation method with intimate contact between Au
nanoparticles (2-5 nm) and the TiO 2 support being responsible for the catalytic activity.
Although initial selectivities were low, improvements were made using different titanium-
containing supports. Most studies concentrate on TS-1 as a support, which is a ZSM-5 type
molecular sieve with MFI structure that has an outstanding ability to catalyse various
oxidation reactions with aqueous H2O2 as the primary oxidant, such as the selective
epoxidation of propene to PO.92 Moulijin et al.93 showed that a Au/TS-1 catalyst could to be
very selective for the formation of PO. Mechanis tic studies showed the important role of
gold in the formation of the bidentate peroxy species as an intermediate.94 Carefully tuning
of the gold loading in particular is important to achieve high selectivities.95
Interestingly, Hughes et al.96 have shown that sacrificial H2 is not essential for the
epoxidation of alkenes and very high selectivities can be achieved using catalytic amounts of
peroxides to initiate the oxidation of alkenes with O2.
-------------------------------------------- CHAPTER ONE: Introduction -------------------------------------------------------
26
1.5.4 Alcohol Oxidation
The selective oxidation of alcohols to chemical intermediates represents an important
reaction in the production of fine chemicals. Platinum and palladium have been found to be
very active for the oxidation of a large number of substrates, however they have low
selectivity to the desired aldehydes or carboxylic acids.
Prati, Rossi and co-workers97-104 have demonstrated that catalysts based on Au/C systems
were effective for alcohol oxidation including diols such as ethane-1,2-diol (ethylene glycol).
These studies have been extended to the oxidation of sugars, and similar high activities for
the oxidation of glucose and glycerol have been observed. This is significant
environmentally due to the increasing production of glycerol in the last decade, as the main
by-product in the synthesis of bio-diesel.
Interestingly, in studies of the mechanism of glucose oxidation to gluconic acid using
colloidal gold it has been postulated that hydrogen peroxide may be formed in-situ, however
it decomposes before forming a critical concetration, due to the basic nature of the reaction
medium, to efficiently compete with O2 as the oxidant.105
Another significant advance in this area came from Corma and co-workers106-109 who showed
that Au/CeO2 is active for the selective oxidation of alcohols to aldehydes and ketones as
well as oxidation aldehydes to acids under relatively mild solvent- less conditions, in the
presence of O2. Stabilisation of a reactive peroxy intermediate by the Au/CeO2 catalyst is
thought to be responsible for the activity observed.
1.5.5 Direct Synthesis of Hydrogen Peroxide
Hutchings and co-workers were the first to show that gold catalysts were effective for
the direct reaction.71 However, the key discovery was the observation that the direct synthesis
was significantly enhanced by using Au/Pd alloys supported on alumina compared to the
monometallic counterparts, Au and Pd.72 Bond and co-workers have highlighted that gold
has a unique ability in forming stable, hydroperoxy, OOH species (an intermediate in the
direct H2O2 synthesis), compared to Pd and Pt which are efficient with respect to dissociating
the oxygen-oxygen bond.

-------------------------------------------- CHAPTER ONE: Introduction -------------------------------------------------------
27
1.6 Bimetallic catalysts
Besides the development of monometallic catalysts, a new set of catalysts prepared by
mixing two metal components within a single catalyst, known as bimetallic or alloy catalysts
have recently been investigated. Pioneering work by Sinfelt110-112 led to their introduction in
the area of petroleum refineries. After this discovery, a number of bimetallic catalysts have
been reported for a range of reactions including oxidation,113-115 hydrogenation,116-118
hydrogenolysis,119, 120 and reforming121, 122 reactions. The properties of bimetallic catalysts
are significantly different from their monometallic analogues because of what is often termed
as ‘synergistic’ effects between the two metals, causing an enhancement in catalytic
stabilities, activities and selectivities.
Bimetallic catalysts can be prepared in similar ways to the monometallic catalysts, however,
due to the presence of the second metal component the complexity of the preparation method
and final structure of the nano-particles increases. This leads them to be of interest for not
only their catalytic activity but also from a materials science perspective.123 Here the focus is
on the preparation and influence of bimetallic Au-Pd nano-particles supported catalysts on
the direct synthesis of hydrogen peroxide.
The enhancement observed by the addition of Au to Pd, has been postulated to be due to two
alloy effects, i.e. ensemble and ligand effects. The ensemble effect is a dilution of surface Pd
by Au. With increasing surface Au coverage, contiguous Pd ensembles disappear and
isolated Pd ensembles form, and even cause the formation of highly active surface sites, e.g.
isolated Pd pairs. The disappearance of contiguous Pd ensembles also switches off side
reactions catalysed by these sites. The ligand effects are electronic perturbation of Pd by Au,
via direct charge transfer or by affecting bond lengths, the ligand effects cause the Pd d band
to be more filled, moving the d-band centre from the Fermi level. Both cause Pd to bind the
reactants and products more weakly increasing selectivity.124
1.6.1 Direct Synthesis of Hydrogen Peroxide Using Au-Pd Catalysts (Cardiff)
Hutchings et al. discovered Au/Al2O3 was active for the liquid-phase direct synthesis
of hydrogen peroxide. Its activity was relatively low compared to the monometallic Pd
analogue. However, the most important discovery was the improved activity and selectivity

-------------------------------------------- CHAPTER ONE: Introduction -------------------------------------------------------
28
of Au-Pd catalysts, prepared by the impregnation of Al2O3 with Au and Pd simultaneously,
compared to Pd/Al2O3.71, 72
Initial investigations used supercritical CO2 (sc-CO2) as the solvent. However, in subsequent
experiments, due to high H2O2 decomposition rates in the sc-CO2 reactions, a methanol-water
solvent was utilised without the addition of promoters. The reactions were performed in a
three-phase system (catalyst-solid, solvent-liquid, and reagents-gas) in a sealed stainless steel
autoclave. The effect of reaction conditions on the direct H2O2 synthesis, have previously
been studied.125, 126 The total reaction pressure and the methanol-water solvent composition
had profound effects on the rate of H2O2 synthesis, as both parameters affected the amount of
H2 available, in the solvent, for the reaction to take place. However, as expected, the reaction
temperature, the H2/O2 molar ratio and the reaction time also had significant effects. By fine
tuning of the parameters very high reaction rates for the synthesis of H2O2 were achieved
with Au-Pd alloy catalysts.
Interestingly, Au-Pd/TiO2 catalysts effective for low-temperature CO oxidation prepared by
deposition precipitation (DP) were inactive for the direct H2O2 synthesis, whereas
impregnation materials showed the opposite trend.127 It was concluded that this activity was
due to the particle size distribution and the nano-particle morphology. DP produced Au
particles of the correct size (< 5 nm) to be active for CO oxidation and relatively large Au
nano-crystals (ca. 25 nm), present on the impregnation Au/TiO 2, are active for selective
hydrogenation of O2 to H2O2.
It was shown that by using a simple impregnation method and by choosing the proper
calcination temperature, highly efficient, stable Au-Pd/TiO2 catalysts could be synthesised for
the direct H2O2 synthesis. Catalysts calcined at lower temperature achieved higher H2O2
synthesis rates however this rate decreased upon re-use, shown to be due to the leaching of
active components from the support surface. Detailed scanning transmission electron
microscopy (STEM)-X-ray energy dispersive spectroscopy (XEDS) studies128 showed that
increasing the calcination temperature is crucial not only to achieve catalyst stability but also
the development of Aucore-Pdshell structures from random alloys. Furthermore, a bimodal
distribution of metal particles was found, the majority of which were in the 2-10 nm regime
with a minority of much larger particles, 35-80 nm in size. In agreement with the STEM-
XEDS findings, x-ray photoelectron spectroscopy (XPS) revealed a significant surface Pd
enrichment, as PdO, in the Au-Pd particles, indicating the development of the core shell
-------------------------------------------- CHAPTER ONE: Introduction -------------------------------------------------------
29
structure after heat treatment. A calcination temperature of 400 oC produced a stable Au-
Pd/TiO2 catalyst with a catalytic activity (64 molH2O2kgcat-1h-1; 0.12 wt% H2O2), that was a
factor of 2 and 9 higher than the corresponding Pd and Au monometallic catalysts
respectively.127
In subsequent studies,129-133 the effect of the support identity was carefully studied and it was
found that carbon-based catalysts showed the lowest H2O2 hydrogenation and decomposition
activity, whereas oxide supports such as TiO 2,127, 133 CeO2,134 Fe2O3,135 Al2O3, 136 SiO2,130 and
MgO132 showed much lower productivity.
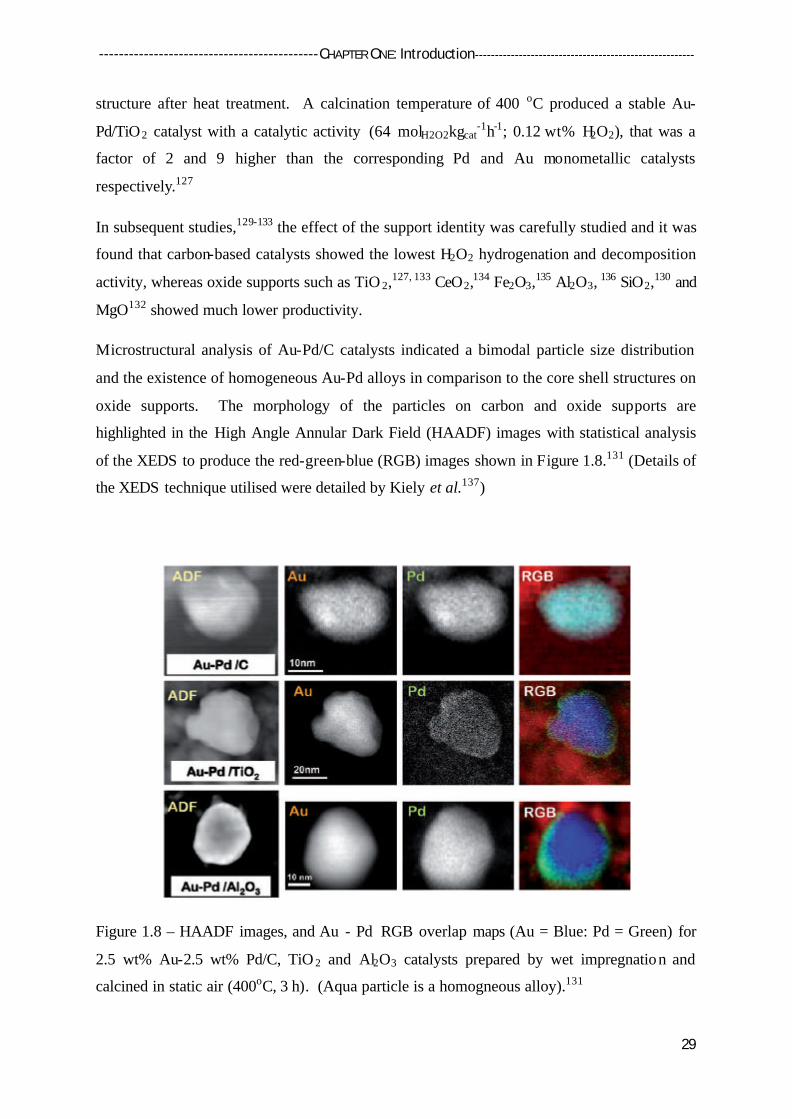
Microstructural analysis of Au-Pd/C catalysts indicated a bimodal particle size distribution
and the existence of homogeneous Au-Pd alloys in comparison to the core shell structures on
oxide supports. The morphology of the particles on carbon and oxide supports are
highlighted in the High Angle Annular Dark Field (HAADF) images with statistical analysis
of the XEDS to produce the red-green-blue (RGB) images shown in Figure 1.8.131 (Details of
the XEDS technique utilised were detailed by Kiely et al.137)
Figure 1.8 – HAADF images, and Au - Pd RGB overlap maps (Au = Blue: Pd = Green) for
2.5 wt% Au-2.5 wt% Pd/C, TiO 2 and Al2O3 catalysts prepared by wet impregnation and
calcined in static air (400oC, 3 h). (Aqua particle is a homogneous alloy).131

-------------------------------------------- CHAPTER ONE: Introduction -------------------------------------------------------
30
However, it was concluded that this activity trend was not only related to the morphology of
the Au-Pd particles but also to the isoelectric point of the support as indicated in Figure 1.9.
A general observation was made that acidic supports such as carbon and silica having low
isoelectric points showed better catalytic performance, than basic supports. 132
Figure 1.9 - H2O2 productivity over Au-Pd catalysts as a function of the isoelectric point of
the support.132
This has recently been highlighted in a study into using Cs-containing heteropolyacid Au-Pd
catalysts, which were considerably more effective in achieving H2O2 yields in the absence of
acid or halide additives than previously reported catalysts. These materials also showed
superior H2O2 synthesis activity under challenging conditions (ambient temperature, water-
only solvent and CO2-free reaction gas).138
Due to the consistently large improvements of H2O2 activity obtained using carbon supports,
Hutchings et al. focused on further optimising Au-Pd bimetallic catalysts using carbon as the
chosen support. They showed that a simple acid pre-treatment of an activated carbon support
prior to the deposition of Au-Pd random alloy particles could yield a very significant
improvement in the yield of H2O2 produced. This treatment resulted in a ‘switching-off’ of
the hydrogen peroxide hydrogenation route, to allow hydrogen selectivities greater than
95%.139 The same acid pre-treatment of titania produced a Au-Pd/TiO2 sample with

-------------------------------------------- CHAPTER ONE: Introduction -------------------------------------------------------
31
improved H2O2 productivity with lowered H2O2 hydrogenation, however, it was not switched
off.140
STEM-XEDS analysis of the acid and non-acid treated Au-Pd/C samples showed that in both
cases all the particles were homogenous Au-Pd alloys, but a significant difference was found
in the size distribution of the alloy particles. The acid pre-treatment favoured the formation
of a greater number fraction of the smallest Pd-rich alloy particles, at the expense of the
larger Au-rich particles, Figure 1.10. Therefore, an improvement of the Au dispersion in the
bimetallic alloy particles was achieved by increasing the number of smaller Au-Pd nano-
particles. This coupled with a selective decoration/blocking of specific active sites on the
support were concluded to be responsible for the hydrogenation/decomposition of H2O2.
Increase in H2O2 productivity was due to the formation of a larger number of smaller active
alloy nanoparticles and the preferential blockage of the active H2O2 hydrogenation sites on
the support.139
Figure 1.10 - The particle size distribution of; (A) alloy particles for untreated and acid pre-
treated Au-Pd/carbon catalysts, (B) Pd particle size for untreated and acid pre-treated pure
Pd/carbon catalysts, and (C) Au particles for the untreated and acid pre-treated pure
Au/carbon catalysts.139
AAA
A B
C

-------------------------------------------- CHAPTER ONE: Introduction -------------------------------------------------------
32
Further experiments by the same group utilised a colloidal method, sol- immobilisation, for
the synthesis of Au-Pd nano-particles supported on carbon. This technique synthesised
bimetallic Au-Pd colloids via sequential addition and reduction of the metals in the presence
of a stabiliser, followed by immobilising the sols on carbon. These Au-Pd catalysts prepared
were more active for the direct H2O2 synthesis than analogous impregnation catalysts. This
was attributed to the significantly smaller mean particle size, particle size distribution, and
predominately metallic oxidation state of the former materials.141 It was also confirmed by
changing the Au/Pd ratios that 1:1 by wt Au-Pd catalysts were the most active.142
The particle morphology was tuned using sol immobilisation to study the effect of random
alloys versus core-shell structures on Au-Pd/C for the direct H2O2 synthesis, while
maintaining a narrow particle size distribution. Instead of adding the Au and Pd salts
simultaneously in the stabilising solution and reducing them together, it is also possible to
reduce the metal salts sequentially.143 Hutchings et al. concluded homogeneous alloy
particles to be the most active for direct H2O2 synthesis and, contrary to previous
conclusions,131 that ultra-small Au-Pd nano-particles may not be the optimal catalyst structure
for this demanding synthesis.143 Although, sol- immobilisation catalysts achieved high initial
yields, they were found to only be useful as ‘model’ catalysts due to high H2O2
hydrogenation rates and lack of stability.
Very recently Sankar et al.144 have reported a stabilizer- ligand free synthesis method for
producing supported gold-palladium nanoalloys with exceptionally high catalytic activity and
stability for the direct synthesis of hydrogen peroxide. This method involves an ‘anion-
excess’ modification of the conventially used impregnation methodology for preparing these
catalysts. They demonstrated that by adding an excess of chloride anions during the
synthesis of Au-Pd nanoalloy catalysts using HAuCl4 and PdCl2 as metal precursors, superior
control over the particles size distribution and composition could be achieved without the
need to add any stabilising ligands such as PVP or PVA. 1 wt%Au-Pd/TiO2 catalysts were
prepared by this modified impregnation method which had higher activity compared to
analogus catalysts prepared by conventional impregnation and sol immobilisation methods.
It was also demonstrated that more of the gold was in nanoscale alloy particles rather micron
scale monometallic Au particles as was found for conventional impregnation. When the
dried sample was calcined (static air atmosphere), a Aucore-Pdshell nanoparticles were achieved,
whereas, when it was reduced in a dilute hydrogen atmosphere homogeneous random Au-Pd
alloys were obtained. The reduced homogeneous alloys were more catalytically active
-------------------------------------------- CHAPTER ONE: Introduction -------------------------------------------------------
33
compared to the core-shell structures. It should be noted reduction of the sample was
required to induce stability and enable the catalyst to be reusable; this was concluded to be
due to the removal of the majority of excess chloride.144
1.6.2 Direct Synthesis of Hydrogen Peroxide Using Bimetallic Catalysts (Other
research groups)
Ishihara et al. reported that a 1wt% Au/SiO 2 catalyst tested in the absence of halide
promoters exhibited promising H2O2 synthesis activity (with 30 % H2 selectivity) compared
to Pt, Pd or Ag/SiO 2 catalysts where no hydrogen peroxide was formed. The addition of 1 wt%
Pd to Au/SiO 2 gave improved rates of H2O2 synthesis, with maximum yield reported using a
Pd:Au weight ratio of 82:18.145
Strukul et al. have examined bimetallic palladium-gold catalysts supported on zirconia and
ceria for the direct synthesis of hydrogen peroxide under very mild (1 bar and 20 oC) and
non-explosive conditions. Monometallic gold catalysts were completely inactive, while the
addition of gold to palladium improved both the productivity and the selectivity of the
process. They also showed pre-treatment with hydrogen and oxygen improved the catalytic
performance further.146
In 1989, Gosser et al. gained a patent for hydrogen peroxide production by direct
combination of hydrogen and oxygen using platinum-palladium/Al2O3 catalysts. They used a
colloidal method to deposit Pt-Pd on to a preformed Pt/Al2O3 catalyst, and found a Pt:Pd ratio
of about 0.02 to about 0.2, to be beneficial for the direct H2O2 synthesis. However, harsh
reaction conditions were utilised (138 oC).147
Lunsford et al. utilised a solvent system of ethanol, that contained H2SO4 and halide ions (Cl-
or Br-) to show the addition of only 5 atom% Pt to a 0.5 wt% Pd resulted in a 2.5-fold
increase in the rate of peroxide formation with only a small decrease in selectivity. The
authors conclude the increase in rate was due to an electronic modification between Pt and
the halide increasing hydrogen activation.148
Choudhary et al.149 studied the effect of metal additives, Au, Pt, Rh and Ru, on a preformed
2.5%Pd/ZrO2 for the direct synthesis of H2O2. They found the H2O2 yield passed through a
maximum at ca. 0.02 wt%Au and then decreased slightly with increase in the Au

-------------------------------------------- CHAPTER ONE: Introduction -------------------------------------------------------
34
concentration. Although a similar effect was observed in the case of Pt, Au was found to be a
superior promoter. Addition of Rh and Ru was found to be detrimental for the H2O2 yields;
these results were explained in terms of increased H2O2 decomposition activity and/or
enhanced H2 to H2O reaction activity in their presence.
1.7 Aims and objectives
The aim of this research is to produce hydrogen peroxide directly from H2 and O2 by
heterogeneous catalysis in which the percentage produced is sufficiently high to make the
process economically, environmentally and industrially viable and as a result replace the AO
process currently used. The parameters required to achieve this have been identified by
Solvay® as [H2O2] = 8 wt% with H2 selectivity > 90 %.
The objectives to reach this aim are as follows.
1. Study and record previous work in this field as the process develops.
2. Vary the heat treatment and preparation of the catalysts with a view of obtaining the
most active sites for hydrogen peroxide production.
3. Identify the sites/components of the catalyst that are active for the unwanted
subsequent H2O2 hydrogenation and decomposition pathways which lead to the
destruction of the formed H2O2.
4. Develop a biphasic solvent system and investigate its potential, for producing high
H2O2 concentrations, by varying reaction conditions.
5. Develop a semi-continuous flow reactor, enabling reagent H2 selectivity to be
calculated to give greater insight into a catalyst’s activity.
6. Draw a conclusion to find if the aim was met and suggest further work.

-------------------------------------------- CHAPTER ONE: Introduction -------------------------------------------------------
35
1.8 References
1. J. J. Berzelius, Edinburgh New Philosophical Journal, 1836, XXI, 223. 2. C. W. Jones, in Applications of Hydrogen Peroxide and Derivatives, ed. J. H. Clark, Royal
Society of Chemistry, Editon edn., 1999, pp. p1-36. 3. T. A. Paul, G. H. Lauren and C. W. Tracy, in Green Chemical Syntheses and Processes,
American Chemical Society, Editon edn., 2000, vol. 767, pp. 1-6. 4. P. T. Anastas and J. C. Warner, Green Chemistry: Theory and Practice, Oxford University Press,
New York, 1998. 5. R. Noyori, Chemical Communications, 2005, 1807-1811. 6. M. Bowker, The Basis and Applications of Heterogeneous Catalysis, Oxford University Press,
Oxford, 1998. 7. A. Y. Stakheev and L. M. Kustov, Applied Catalysis A: General, 1999, 188, 3-35. 8. B. L. Mojet, J. T. Miller, D. E. Ramaker and D. C. Koningsberger, Journal of Catalysis, 1999,
186, 373-386. 9. I. V. Babich, Y. V. Plyuto, A. D. Van Langeveld and J. A. Moulijn, Applied Surface Science, 1997,
115, 267-272. 10. J. A. R. Van Veen, Journal of Colloid and Interface Science, 1988, 121, 214-219. 11. J. P. Brunelle, in Studies in Surface Science and Catalysis, ed. P. G. P. J. a. G. P. B. Delmon,
Elsevier, Editon edn., 1979, vol. Volume 3, pp. 211-232. 12. F. Rodríguez-reinoso, Carbon, 1998, 36, 159-175. 13. Z. Hu and E. F. Vansant, Carbon, 1995, 33, 561-567. 14. H. F. Stoeckli, Carbon, 1990, 28, 1-6. 15. C. Moreno-Castilla, A. n. F. Pérez-Cadenas, F. J. Maldonado-Hódar, F. CarrasÐŽ-D A?T?Y�AYE�:. L.
G. Fierro, Carbon, 2003, 41, 1157-1167. 16. M. L. Toebes, J. M. P. van Heeswijk, J. H. Bitter, A. Jos van Dillen and K. P. de Jong, Carbon,
2004, 42, 307-315. 17. L. A. Langley, D. E. Villanueva and D. H. Fairbrother, Chemistry of Materials, 2005, 18, 169-
178. 18. N. N. Greenwood and A. Earnshaw, Chemistry of the Elements: Second Edition, Elsevier's
Science & Technology, Burlington, 1997. 19. A. Hiroki and J. A. LaVerne, The Journal of Physical Chemistry B, 2005, 109, 3364-3370. 20. N. S. S. Martinez, J. F. Fernández, X. F. Segura and A. S. Ferrer, Journal of Hazardous
Materials, 2003, 101, 315-322. 21. J. M. Campos-Martin, G. Blanco-Brieva and J. L. G. Fierro, Angewandte Chemie International
Edition, 2006, 45, 6962-6984. 22. H. U. Süss and N. F. Nimmerfroh, HYDROGEN PEROXIDE IN CHEMICAL PULP BLEACHING. 23. R. Hage and A. Lienke, Angewandte Chemie International Edition, 2006, 45, 206-222. 24. P. C. Vandevivere, R. Bianchi and W. Verstraete, Journal of Chemical Technology &
Biotechnology, 1998, 72, 289-302. 25. C. B. Chidambara Raj and H. Li Quen, Chemical Engineering Science, 2005, 60, 5305-5311. 26. D. BASF, SOLVAY, BASF, Dow, Solvay partnership breaks new ground with innovative HPPO
technology in Antwerp. 27. US6265574 Pat., 2001. 28. I. Global Industry Analysts, Hydrogen Peroxide Market Report, 2012. 29. H. Meidinger, Ann. Chem. Pharm., 1853, 88. 30. CA 382467 Pat., 1939. 31. C. Samanta, Applied Catalysis a-General, 2008, 350, 133-149. 32. R. Edvinsson Albers, M. Nyström, M. Siverström, A. Sellin, A. C. Dellve, U. Andersson, W.
Herrmann and T. Berglin, Catalysis Today, 2001, 69, 247-252.

-------------------------------------------- CHAPTER ONE: Introduction -------------------------------------------------------
36
33. Y. Hou, Y. Wang, F. He, S. Han, Z. Mi, W. Wu and E. Min, Materials Letters, 2004, 58, 1267-1271.
34. US 1108752 Pat., 1914. 35. Y. Voloshin, R. Halder and A. Lawal, Catalysis Today, 2007, 125, 40-47. 36. T. Deguchi and M. Iwamoto, Journal of Catalysis, 2011, 280, 239-246. 37. T. Inoue, M. A. Schmidt and K. F. Jensen, Industrial & Engineering Chemistry Research , 2007,
46, 1153-1160. 38. Y. Voloshin and A . Lawal, Chemical Engineering Science, 2010, 65, 1028-1036. 39. P. Biasi, N. Gemo, J. R. Hernández Carucci, K. Eränen, P. Canu and T. O. Salmi, Industrial &
Engineering Chemistry Research, 2012, 51, 8903-8912. 40. T. Deguchi and M. Iwamoto, Industrial & Engineering Chemistry Research , 2011, 50, 4351-
4358. 41. P. Biasi, P. Canu, F. Menegazzo, F. Pinna and T. O. Salmi, Industrial & Engineering Chemistry
Research, 2012, 51, 8883-8890. 42. S. Chinta and J. H. Lunsford, Journal of Catalysis, 2004, 225, 249-255. 43. E. Ntainjua N, J. K. Edwards, A. F. Carley, J. A. Lopez-Sanchez, J. A. Moulijn, A. A. Herzing, C. J.
Kiely and G. J. Hutchings, Green Chemistry, 2008, 10, 1162-1169. 44. V. V. Krishnan, A. G. Dokoutchaev and M. E. Thompson, Journal of Catalysis, 2000, 196, 366-
374. 45. US 7105143 B2 Pat., 2006. 46. V. R. Choudhary and C. Samanta, Journal of Catalysis, 2006, 238, 28-38. 47. C. Samanta and V. R. Choudhary, Applied Catalysis A: General, 2007, 326, 28-36. 48. V. R. Choudhary, P. Jana and S. K. Bhargava, Catalysis Letters, 2008, 125, 296-301. 49. R. Burch and P. R. Ellis, Applied Catalysis B-Environmental, 2003, 42, PII S0926-
3373(0902)00232-00231. 50. J. H. Lunsford, Journal of Catalysis, 2003, 216, 455-460. 51. S. Abate, G. Centi, S. Melada, S. Perathoner, F. Pinna and G. Strukul, Catalysis Today, 2005,
104, 323-328. 52. Q. S. Liu and J. H. Lunsford, Applied Catalysis a-General, 2006, 314, 94-100. 53. , US 4832938, 1989. 54. C. Samanta and V. R. Choudhary, Applied Catalysis A: General, 2007, 330, 23-32. 55. V. R. Choudhary and P. Jana, Applied Catalysis A: General, 2007, 329, 79-85. 56. V. R. Choudhary, C. Samanta and P. Jana, Applied Catalysis A: General, 2007, 317, 234-243. 57. D. P. Dissanayake and J. H. Lunsford, Journal of Catalysis, 2002, 206, 173-176. 58. D. P. Dissanayake and J. H. Lunsford, Journal of Catalysis, 2003, 214, 113-120. 59. E. Ntainjua N, M. Piccinini, J. C. Pritchard, Q. He, J. K. Edwards, A. F. Carley, J. A. Moulijn, C. J.
Kiely and G. J. Hutchings, ChemCatChem, 2009, 1, 479-484. 60. A. G. Gaikwad, S. D. Sansare and V. R. Choudhary, Journal of Molecular Catalysis A: Chemical,
2002, 181, 143-149. 61. V. Choudhary, A. Gaikwad and S. Sansare, Catalysis Letters, 2002, 83, 235-239. 62. V. R. Choudhary, S. D. Sansare and A. G. Gaikwad, Catalysis Letters, 2002, 84, 81-87. 63. K. Otsuka and I. Yamanaka, Electrochimica Acta, 1990, 35, 319-322. 64. I. Yamanaka, T. Onizawa, S. Takenaka and K. Otsuka, Angewandte Chemie International
Edition, 2003, 42, 3653-3655. 65. I. Yamanaka, T. Hashimoto, R. Ichihashi and K. Otsuka, Electrochimica Acta, 2008, 53, 4824-
4832. 66. J. Zhou, H. Guo, X. Wang, M. Guo, J. Zhao, L. Chen and W. Gong, Chemical Communications,
2005, 1631-1633. 67. D. Hâncu, J. Green and E. J. Beckman, Industrial & Engineering Chemistry Research, 2002, 41,
4466-4474. 68. D. Hancu and E. J. Beckman, Green Chemistry, 2001, 3, 80-86.

-------------------------------------------- CHAPTER ONE: Introduction -------------------------------------------------------
37
69. Q. Chen and E. J. Beckman, Green Chemistry, 2007, 9, 802-808. 70. E. J. Beckman, Green Chemistry, 2003, 5, 332-336. 71. P. Landon, P. J. Collier, A. J. Papworth, C. J. Kiely and G. J. Hutchings, Chemical
Communications, 2002, 2058-2059. 72. P. Landon, P. J. Collier, A. F. Carley, D. Chadwick, A. J. Papworth, A. Burrows, C. J. Kiely and G.
J. Hutchings, Physical Chemistry Chemical Physics, 2003, 5, 1917-1923. 73. G. J. Hutchings, Journal of Catalysis, 1985, 96, 292-295. 74. M. Haruta, T. Kobayashi, H. Sano and N. Yamada, Chemistry Letters, 1985, 16, 405-408. 75. G. C. Bond, P. A. Sermon, G. Webb, D. A. Buchanan and P. B. Wells, Journal of the Chemical
Society, Chemical Communications, 1973, 444b-445. 76. A. S. K. Hashmi and G. J. Hutchings, Angewandte Chemie International Edition, 2006, 45,
7896-7936. 77. M. Haruta, N. Yamada, T. Kobayashi and S. Iijima, Journal of Catalysis, 1989, 115, 301-309. 78. G. Bond and D. Thompson, Gold Bulletin, 2000, 33, 41-50. 79. H. H. Kung, M. C. Kung and C. K. Costello, Journal of Catalysis, 2003, 216, 425-432. 80. N. A. Hodge, C. J. Kiely, R. Whyman, M. R. H. Siddiqui, G. J. Hutchings, Q. A. Pankhurst, F. E.
Wagner, R. R. Rajaram and S. E. Golunski, Catalysis Today, 2002, 72, 133-144. 81. M. B. Boucher, S. Goergen, N. Yi and M. Flytzani-Stephanopoulos, Physical Chemistry
Chemical Physics, 2011, 13, 2517-2527. 82. Q. Fu, H. Saltsburg and M. Flytzani-Stephanopoulos, Science, 2003, 301, 935-938. 83. M. Valden, X. Lai and D. W. Goodman, Science, 1998, 281, 1647-1650. 84. H. G. Boyen, G. Kästle, F. Weigl, B. Koslowski, C. Dietrich, P. Ziemann, J. P. Spatz, S.
Riethmüller, C. Hartmann, M. Möller, G. Schmid, M. G. Garnier and P. Oelhafen, Science, 2002, 297, 1533-1536.
85. N. Lopez and J. K. Nørskov, Journal of the American Chemical Society, 2002, 124, 11262-11263.
86. M. Chen, D. Kumar, C.-W. Yi and D. W. Goodman, Science, 2005, 310, 291-293. 87. B. Nkosi, M. D. Adams, N. J. Coville and G. J. Hutchings, Journal of Catalysis, 1991, 128, 378-
386. 88. B. Nkosi, N. J. Coville and G. J. Hutchings, Applied Catalysis, 1988, 43, 33-39. 89. M. Haruta, Nature, 2005, 437, 1098-1099. 90. T. Hayashi, K. Tanaka and M. Haruta, Journal of Catalysis, 1998, 178, 566-575. 91. M. Haruta and M. Daté, Applied Catalysis A: General, 2001, 222, 427-437. 92. T. A. Nijhuis, T. Visser and B. M. Weckhuysen, The Journal of Physical Chemistry B, 2005, 109,
19309-19319. 93. T. A. Nijhuis, B. J. Huizinga, M. Makkee and J. A. Moulijn, Industrial & Engineering Chemistry
Research, 1999, 38, 884-891. 94. T. A. Nijhuis, T. Q. Gardner and B. M. Weckhuysen, Journal of Catalysis, 2005, 236, 153-163. 95. C. Qi, T. Akita, M. Okumura, K. Kuraoka and M. Haruta, Applied Catalysis A: General, 2003,
253, 75-89. 96. M. D. Hughes, Y.-J. Xu, P. Jenkins, P. McMorn, P. Landon, D. I. Enache, A. F. Carley, G. A.
Attard, G. J. Hutchings, F. King, E. H. Stitt, P. Johnston, K. Griffin and C. J. Kiely, Nature, 2005, 437, 1132-1135.
97. L. Prati and M. Rossi, Journal of Catalysis, 1998, 176, 552-560. 98. S. Biella, L. Prati and M. Rossi, Journal of Catalysis, 2002, 206, 242-247. 99. L. Prati and F. Porta, Applied Catalysis A: General, 2005, 291, 199-203. 100. L. Prati and G. Martra, Gold Bulletin, 1999, 32, 96-101. 101. M. Comotti, C. D. Pina, R. Matarrese, M. Rossi and A. Siani, Applied Catalysis A: General,
2005, 291, 204-209. 102. F. Porta, L. Prati, M. Rossi, S. Coluccia and G. Martra, Catalysis Today, 2000, 61, 165-172. 103. F. Porta, L. Prati, M. Rossi and G. Scari, Journal of Catalysis, 2002, 211, 464-469.

-------------------------------------------- CHAPTER ONE: Introduction -------------------------------------------------------
38
104. C. Della Pina, E. Falletta, L. Prati and M. Rossi, Chem Soc Rev, 2008, 37, 2077-2095. 105. M. Comotti, C. Della Pina, E. Falletta and M. Rossi, Advanced Synthesis & Catalysis, 2006, 348,
313-316. 106. A. Abad, C. Almela, A. Corma and H. García, Tetrahedron, 2006, 62, 6666-6672. 107. A. Corma and M. E. Domine, Chemical Communications, 2005, 4042-4044. 108. A. Abad, P. Concepción, A. Corma and H. García, Angewandte Chemie International Edition,
2005, 44, 4066-4069. 109. A. Corma and H. Garcia, Chemical Society Reviews, 2008, 37, 2096-2126. 110. J. H. Sinfelt, J. L. Carter and D. J. C. Yates, Journal of Catalysis, 1972, 24, 283-296. 111. J. H. Sinfelt, Journal of Catalysis, 1973, 29, 308-315. 112. J. L. Carter, G. B. McVinker, W. Weissman, M. S. Kmak and J. H. Sinfelt, Applied Catalysis,
1982, 3, 327-346. 113. M. Dhakad, D. Fino, S. S. Rayalu, R. Kumar, A. Watanabe, H. Haneda, S. Devotta, T.
Mitsuhashi and N. Labhsetwar, Topics in Catalysis, 2007, 42-43, 273-276. 114. S. Murahashi, T. Naota and N. Hirai, The Journal of Organic Chemistry, 1993, 58, 7318-7319. 115. X. Peng, Q. Pan and G. L. Rempel, Chemical Society Reviews, 2008, 37, 1619-1628. 116. P. Lu, T. Teranishi, K. Asakura, M. Miyake and N. Toshima, The Journal of Physical Chemistry
B, 1999, 103, 9673-9682. 117. S. Hermans, R. Raja, J. M. Thomas, B. F. G. Johnson, G. Sankar and D. Gleeson, Angewandte
Chemie International Edition, 2001, 40, 1211-1215. 118. R. M. Navarro, B. Pawelec, J. M. Trejo, R. Mariscal and J. L. G. Fierro, Journal of Catalysis,
2000, 189, 184-194. 119. E. P. Maris, W. C. Ketchie, M. Murayama and R. J. Davis, Journal of Catalysis, 2007, 251, 281-
294. 120. A. M. Ruppert, K. Weinberg and R. Palkovits, Angewandte Chemie International Edition, 2012,
51, 2564-2601. 121. T. Conant, A. M. Karim, V. Lebarbier, Y. Wang, F. Girgsdies, R. Schlögl and A. Datye, Journal of
Catalysis, 2008, 257, 64-70. 122. J. Zhang, H. Wang and A. K. Dalai, Journal of Catalysis, 2007, 249, 300-310. 123. M. Sankar, N. Dimitratos, P. J. Miedziak, P. P. Wells, C. J. Kiely and G. J. Hutchings, Chemical
Society Reviews, 2012, 41, 8099-8139. 124. F. Gao and D. W. Goodman, Chem Soc Rev, 2012, 41, 8009-8020. 125. M. Piccinini, E. Ntainjua N, J. K. Edwards, A. F. Carley, J. A. Moulijn and G. J. Hutchings,
Physical Chemistry Chemical Physics, 2010, 12, 2488-2492. 126. M. Piccinini, J. K. Edwards, J. A. Moulijn and G. J. Hutchings, Catalysis Science & Technology,
2012, 2, 1908-1913. 127. J. K. Edwards, B. E. Solsona, P. Landon, A. F. Carley, A. Herzing, C. J. Kiely and G. J. Hutchings,
Journal of Catalysis, 2005, 236, 69-79. 128. A. A. Herzing, A. F. Carley, J. K. Edwards, G. J. Hutchings and C. J. Kiely, Chemistry of
Materials, 2008, 20, 1492-1501. 129. J. K. Edwards, A. Thomas, B. E. Solsona, P. Landon, A. F. Carley and G. J. Hutchings, Catalysis
Today, 2007, 122, 397-402. 130. J. K. Edwards, A. Thomas, A. F. Carley, A. A. Herzing, C. J. Kiely and G. J. Hutchings, Green
Chemistry, 2008, 10, 388-394. 131. J. K. Edwards, A. F. Carley, A. A. Herzing, C. J. Kiely and G. J. Hutchings, Faraday Discussions,
2008, 138, 225-239. 132. N. N. Edwin, J. K. Edwards, A. F. Carley, J. A. Lopez-Sanchez, J. A. Moulijn, A. A. Herzing, C. J.
Kiely and G. J. Hutchings, Green Chemistry, 2008, 10, 1162-1169. 133. J. C. Pritchard, Q. He, E. N. Ntainjua, M. Piccinini, J. K. Edwards, A. A. Herzing, A. F. Carley, J. A.
Moulijn, C. J. Kiely and G. J. Hutchings, Green Chemistry, 2010, 12, 915-921.

-------------------------------------------- CHAPTER ONE: Introduction -------------------------------------------------------
39
134. E. N. Ntainjua, M. Piccinini, J. C. Pritchard, J. K. Edwards, A. F. Carley, C. J. Kiely and G. J. Hutchings, Catalysis Today, 2011, 178, 47-50.
135. J. K. Edwards, B. Solsona, P. Landon, A. F. Carley, A. Herzing, M. Watanabe, C. J. Kiely and G. J. Hutchings, Journal of Materials Chemistry, 2005, 15, 4595-4600.
136. B. E. Solsona, J. K. Edwards, P. Landon, A. F. Carley, A. Herzing, C. J. Kiely and G. J. Hutchings, Chemistry of Materials, 2006, 18, 2689-2695.
137. A. A. Herzing, M. Watanabe, J. K. Edwards, M. Conte, Z. R. Tang, G. J. Hutchings and C. J. Kiely, Faraday Discussions, 2008, 138, 337-351.
138. E. N. Ntainjua, M. Piccinini, S. J. Freakley, J. C. Pritchard, J. K. Edwards, A. F. Carley and G. J. Hutchings, Green Chemistry, 2012, 14, 170-181.
139. J. K. Edwards, B. Solsona, E. N. N, A. F. Carley, A. A. Herzing, C. J. Kiely and G. J. Hutchings, Science, 2009, 323, 1037-1041.
140. J. K. Edwards, E. Ntainjua N, A. F. Carley, A. A. Herzing, C. J. Kiely and G. J. Hutchings, Angewandte Chemie International Edition, 2009, 48, 8512-8515.
141. J. A. Lopez-Sanchez, N. Dimitratos, P. Miedziak, E. Ntainjua, J. K. Edwards, D. Morgan, A. F. Carley, R. Tiruvalam, C. J. Kiely and G. J. Hutchings, Physical Chemistry Chemical Physics, 2008, 10, 1921-1930.
142. J. Pritchard, L. Kesavan, M. Piccinini, Q. He, R. Tiruvalam, N. Dimitratos, J. A. Lopez-Sanchez, A. F. Carley, J. K. Edwards, C. J. Kiely and G. J. Hutchings, Langmuir, 2010, 26, 16568-16577.
143. R. C. Tiruvalam, J. C. Pritchard, N. Dimitratos, J. A. Lopez-Sanchez, J. K. Edwards, A. F. Carley, G. J. Hutchings and C. J. Kiely, Faraday Discuss, 2011, 152, 63-86; discussion 99-120.
144. M. Sankar, Q. He, M. Morad, J. Pritchard, S. J. Freakley, J. K. Edwards, S. H. Taylor, D. J. Morgan, A. F. Carley, D. W. Knight, C. J. Kiely and G. J. Hutchings, ACS Nano, 2012, 6, 6600-6613.
145. T. Ishihara, Y. Ohura, S. Yoshida, Y. Hata, H. Nishiguchi and Y. Takita, Applied Catalysis A: General, 2005, 291, 215-221.
146. F. Menegazzo, P. Burti, M. Signoretto, M. Manzoli, S. Vankova, F. Boccuzzi, F. Pinna and G. Strukul, Journal of Catalysis, 2008, 257, 369-381.
147. , 1989. 148. Q. Liu, J. C. Bauer, R. E. Schaak and J. H. Lunsford, Applied Catalysis A: General, 2008, 339,
130-136. 149. V. R. Choudhary, C. Samanta and T. V. Choudhary, Applied Catalysis A: General, 2006, 308,
128-133.

40
Experimental
In this chapter the standard procedures for the preparation of catalysts and reaction conditions
for the direct H2O2 synthesis and benzyl alcohol oxidation are described. Changes to these
conditions have been highlighted during the thesis when studying certain aspects. The
characterisation techniques used to analyse the prepared catalysts are also described.
2.1 Catalyst Preparation
Important Note: 2.5 wt%-2.5 wt% Pd represents the bimetallic catalyst composition
that has been found to be the most active for direct H2O2 synthesis. If not specified otherwise,
the abbreviation “Au-Pd” indicates a 2.5 wt% Au- 2.5 wt% Pd composition has been used.
2.1.1 Impregnation
Pd-only, Au-only and Au-Pd bimetallic catalysts were synthesised via impregnation
of various preformed supports; titania (TiO 2, P25, Degussa), activated carbon (C, Darco G60,
Aldrich), silica (SiO 2, matrex 60, Fisher) ceria (CeO2, Nano-grade, Aldrich). 2.5 wt% Au-2.5
wt% Pd supported catalyst (1 g) was prepared using the following standard procedure.
HAuCl4.6H2O solution (2.04 ml), extracted from a readymade solution (12.25 g Au dissolved
in water (1000 ml)), and PdCl2 (0.0417 g) were weighed accurately into a vial. The solution
was stirred (400 rpm) and heated (80°C) until the PdCl2 had dissolved forming a
homogeneous solution. The appropriate support (0.95g) was added to the solution and stirred
(400 rpm) until a paste with minimal water was formed, (this has proved to be the crucial step
when producing Au-Pd / TiO2 catalysts1). The resultant material was placed in an oven (110
ºC, 16 hours), before being calcined in static air (400 ºC, 3 hours, 20 ºC/min).
------------------------------------------- CHAPTER TWO: Experimental ------------------------------------------------------
41
Monometallic Au and Pd were synthesised using the same protocol with appropriate amounts
of PdCl2 or HAuCl4.6H2O solution and support. A minimal amount of HCl in deionised water
was required to dissolve PdCl2 for preparation of the Pd-only catalysts.
2.1.2 Physical Grinding
Pd-only, Au-only and Au-Pd bimetallic catalysts were synthesised via grinding of
metal acetates with various preformed supports; titania (TiO 2, P25, Degussa), activated
carbon (C, Darco G60, Aldrich), silica (SiO 2, matrex 60, Fisher) ceria (CeO2, Nano-grade,
Aldrich). 2.5 wt% Au-2.5 wt% Pd supported catalyst (1 g) was prepared using the following
standard procedure. Palladium acetate (0.0474 g) and gold acetate (0.0526 g) were added to
the selected support (0.95 g) and the mixture was ground in a pestle and mortar (10 mins).
The resultant material was heated (350 oC, 2 hours, 20 ºC/min) under flowing Helium.
2.1.3 Support Pre-treatment
Acid washing the support prior to impregnating with Au and Pd has been shown to
decrease the final materials activity towards the hydrogenation pathway of H2O2 2, 3. In the
case of carbon (acid washed activated carbon (AwC, Darco G60, Aldrich)) the path can be
switched off completely using the following standard procedure.
Support (5 g) was washed with HNO3 (150 ml, 2 wt%), filtered and washed with an excess of
water until the pH was neutral. The resulting material was dried (110 °C, 16 hours) before
being used for catalyst preparation.

------------------------------------------- CHAPTER TWO: Experimental ------------------------------------------------------
42
2.2 Direct Synthesis of Hydrogen Peroxide - Batch reactor
Catalytic tests were performed using a Parr Instruments stainless steel autoclave
(Figure 2.1) with a nominal volume of 100 ml and a maximum working pressure of 2000 psi.
However, for convenience a Teflon liner was used reducing the volume to ca.75 ml.
The autoclave was equipped with an overhead mechanical stirrer (0-2000 rpm) and provision
for measurement of temperature and pressure. The desired temperature was maintained with
a cooling jacket. Two pre-mixed gas cylinders (5 %H2 / CO2 and 25 %O2 / CO2 supplied by
BOC) were connected.
Figure 2.1 – Schematic of batch reactor

------------------------------------------- CHAPTER TWO: Experimental ------------------------------------------------------
43
2.2.1 Standard Direct H2O2 Synthesis Conditions
Typically, the autoclave was charged with the catalyst (0.01 g), solvent (5.6 g CH3OH
and 2.9 g H2O), purged three times with 5 %H2/CO2 (100 psi) and then filled with 5%
H2/CO2 (420 psi) and 25 %O2/CO2 (160 psi) to give a hydrogen to oxygen ratio of 1:2 at a
total working pressure of 580 psi. Stirring (1200 rpm) was commenced on reaching the
desired temperature (2 °C). Standard experiments were carried out for 30 minutes. H2O2
yield was determined by titration of aliquots of the final filtered solution with acidified
Ce(SO4)2 solution (ca.8x10-3 M), using ferroin as indicator. Ce(SO4)2 solution was
standardised against (NH4)2Fe(SO4)2.6H2O. The error level, calculated from repeat
experiments, was ± 2 molH2O2kgcat-1h-1 in all cases.
2.2.2 Standard H2O2 Hydrogenation and Decomposition Conditions
To test catalysts for H2O2 hydrogenation, the autoclave was charged with the catalyst
(0.01 g) and a solution containing 4wt% H2O2 (5.6 g CH3OH, 2.22 g H2O and 0.68 g 50 wt%
H2O2), purged three times with 5 %H2/CO2 (100 psi) and then filled with 5 %H2/CO2 (420
psi). Stirring (1200 rpm) was commenced on reaching the desired temperature (2 °C).
Standard experiments were carried out for 30 minutes. The amount of hydrogenated H2O2
was determined before and after by titrating aliquots with acidified Ce(SO4)2 solution
(ca.8x10-3 M), using ferroin as indicator. Standardised as indicated in section 2.2.1.
The hydrogenation reaction described measures the catalysts activity towards H2O2
hydrogenation and decomposition. In order to evaluate the catalysts activity towards H2O2
decomposition only, 5 %H2/CO2 is omitted and 25 %O2/CO2 is utilised.
2.2.3 Evaluation of Catalyst Stability
The autoclave was charged with the catalyst (0.05 g), solvent (5.6 g CH3OH and 2.9 g
H2O), purged three times with 5% H2/CO2 (100 psi) and then filled with 5% H2/CO2 (420 psi)
and 25% O2/CO2 (160 psi) to give a total pressure of 580 psi. Stirring (1200 rpm) was
commenced on reaching the desired temperature (2 ºC), and experiments were carried out for
30 minutes. After filtration, the catalyst was then dried in the oven (110 ºC, 2 h). Used
catalyst (0.01 g) was tested using the standard H2O2 synthesis reaction conditions (section
2.2.1).

------------------------------------------- CHAPTER TWO: Experimental ------------------------------------------------------
44
2.2.4 Direct H2O2 Synthesis Using Organic Solvents
In chapter 5 reactions were carried out using higher chain alcohols creating a two-
phase reaction medium. The reaction conditions were the same as above however reactions
were run at room temperature (ca.25 °C), to prevent the reaction medium freezing, and the
solvent composition has been varied when studying certain aspects.
2.3 Direct Synthesis of Hydrogen Peroxide - Semi-Continuous Flow Reactor
In chapter 6, catalytic tests under a continuous flow of gas were performed inside a
modified batch reactor, as shown in Figure 2.2, with a nominal volume of 100 ml and a
maximum working pressure of 2000 psi.
Three flow meters with the possibility to regulate the rate of gas flow were installed. A
mixing chamber with an internal volume of 150µm was positioned in order to make a
homogenous combination of the three gases. At the exit of the reactor a back pressure
regulator was installed; it controlled the inlet pressure by balancing an adjustable spring force
against the inlet gas flow, making it possible to work with a fixed pressure inside the
autoclave. Finally a gas chromatographer (GC-14 B SHIMADZU) was installed on line to
measure the concentration of gases coming out of the reactor.

------------------------------------------- CHAPTER TWO: Experimental ------------------------------------------------------
45
Figure 2.2 - Modified batch reactor with facility to flow the reactant gases continuously.
2.3.1 Standard Direct H2O2 Synthesis Conditions
The autoclave was charged with catalyst (0.02 g) and solvent (17 ml CH3OH). Pre-
mixed gas was injected inside the autoclave (N2 180 ml min-1, O2 14 ml min-1 and H2 7ml
min-1), in order to have a mixture of 89.5 %N2, 7 %O2, 3.5 %H2. The H2 concentration was
monitored using the online GC, until the pressure (580 psi) and temperature (2 oC) was
obtained. When the H2 concentration stabilised the stirring (1200 rpm) was started (t=0).
Throughout the reaction (30 min), the gas concentrations were recorded every 6 minutes.
The gas was evacuated and the solution filtered to separate the catalyst. The concentration of
H2O2 was determined calorimetrically at ?=410 nm after mixing a aliquot (ca.0.1 g) of the
reaction medium with TiCl4 in 2M H2SO4 (25 ml). Water concentration has been determined
using Karl-Fischer titration in certain studies.

------------------------------------------- CHAPTER TWO: Experimental ------------------------------------------------------
46
2.3.2 Product Analysis
2.3.2.1 UV-Visible Spectroscopy (UV-Vis)
Spectroscopy is a fundamental technique that allows quantification of the amount of
radiation absorbed or emitted by a sample, based on the interaction of light with matter. In
particular, UV-Vis spectroscopy concerns the absorption of emission of electromagnetic
radiation in the ultraviolet or visible spectral region, ranging from 10-400 nm and 400-780
nm respectively. The radiation emitted by a light source is passed through a monochromator
that selects one single wavelength and then focuses it on the sample. When light passes over
the sample some energy will be absorbed causing molecules to undergo electronic transition
from a lower energy state to one of higher energy. The signal is converted by a detector
(usually a photomultiplier) that produces an electric signal when a photon strikes it. There
are two different ways of describing the amount of radiation absorbed by a sample;
• Transmittance (T) is defined as the fraction of the initial radiation that crosses the
sample, however, is more commonly recorded as the percent transmittance.
T = P/P0
P = irradiance, energy per second per unit of the light beam
• Absorbance (A) is defined as;
A = log(P0/P) = -logT
Absorbance is most commonly used as, according to the Beer-Lambert law, the
electromagnetic radiation absorbed by the species is proportional to its concentration;
A = e.[c].l
[c] = concentration of the sample
e = molar extinction co-efficient
l = path length of the sample cell
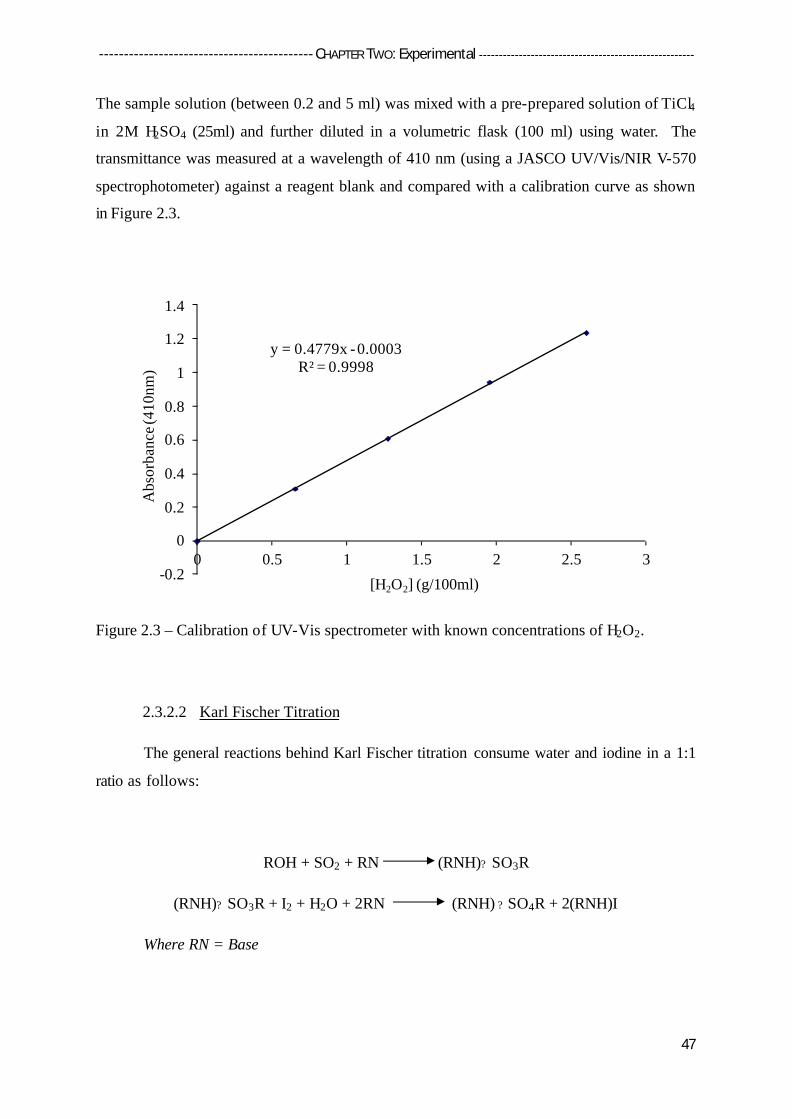
------------------------------------------- CHAPTER TWO: Experimental ------------------------------------------------------
47
The sample solution (between 0.2 and 5 ml) was mixed with a pre-prepared solution of TiCl4
in 2M H2SO4 (25ml) and further diluted in a volumetric flask (100 ml) using water. The
transmittance was measured at a wavelength of 410 nm (using a JASCO UV/Vis/NIR V-570
spectrophotometer) against a reagent blank and compared with a calibration curve as shown
in Figure 2.3.
Figure 2.3 – Calibration of UV-Vis spectrometer with known concentrations of H2O2.
2.3.2.2 Karl Fischer Titration
The general reactions behind Karl Fischer titration consume water and iodine in a 1:1
ratio as follows:
ROH + SO2 + RN (RNH)? SO3R
(RNH)? SO3R + I2 + H2O + 2RN (RNH) ? SO4R + 2(RNH)I
Where RN = Base
y = 0.4779x -0.0003R² = 0.9998
-0.2
0
0.2
0.4
0.6
0.8
1
1.2
1.4
0 0.5 1 1.5 2 2.5 3
Abs
orba
nce (
410n
m)
[H2O2] (g/100ml)

------------------------------------------- CHAPTER TWO: Experimental ------------------------------------------------------
48
In order to assure a stoichiometric course of the Karl Fischer titration, certain fundamental
requirements must be met and several potential interferences must be avoided. The choice of
working medium and pH range are the most critical considerations. Methanol is the preferred
choice of working medium as it allows for a rapid and stoichiometric course of reaction.
Most samples dissolve easily in methanol and it gives a sensitive and reliable indication of
the end point. However, the direct H2O2 synthesis reactions are run with methanol as solvent,
therefore a methanol free working medium was required. Research carried out by E. Scholz4
revealed that other alcohols capable of improving the titre stability of the reagent such as
ethanol, 2-propanol or methoxyethanol can be substituted for methanol.
A one-component titrating agent is used for the volumetric Karl Fischer titration. It contains
all the reactants: iodine, sulphur dioxide and the bases imidazole and 2-methylimidazole,
dissolved in diethyleneglycol monoethyl ether (DEGEE). Using 2-methylimidazole in
addition to imidazole improves the stability and eliminates the formation of crystals, which
can interfere with the performance of the titration. The concentration of the titrating agent
was accurately calibrated using a Hydranal® Water Standard 10.0.
The volumetric Karl Fischer method was performed on a TitroLine KF where the titrating
agent was accurately added through a piston burette. The standard procedure was as follows;
• The burette was filled with the titrating agent (Hydranal®-Composite 5),
• The working medium (Hydranal®-CompoSolver E) was added to the titration vessel,
• The working medium was titrated to dryness with the titrating agent,
• Sample was added (between 0.1 – 1 g depending on expected water concentration)
• The water concentration was determined through titration.
The volumetric method is used for the detection of the endpoint: An alternating current is
applied to a pair of indicator electrodes. The voltage difference thus generated decreases
drastically if traces of iodine are present. This fact is used to detect the endpoint of the
titration.

------------------------------------------- CHAPTER TWO: Experimental ------------------------------------------------------
49
2.3.2.3 Gas Chromatography
The exit gas was analysed by online gas chromatography (GC-14 B SHIMADZU).
Manual injections were made at certain time intervals, so that a detailed profile of the
composition of the exhaust gases could be obtained as a function of time. This allowed
analysis of the catalytic performance of the catalyst during the reaction.
The injection valve of the GC was equipped with a six ways valve and two positions as
shown in Figure 2.4.
Figure 2.4 - Schematic of six way valve in two positions, A bypassing the GC, B after sample
injection
The sample loop (0.375 ml) is constantly filled with the reactor effluent mixture. When an
injection takes place, the carrier gas (Ar) injects the gases contained in the sample loop into
the column molecular sieve, MS-5A. The GC was kept at constant temperature (100 oC) and
the retention times are shown in Table 2.1.
1
2
3
4
5
6
SAMPLE
SAMPLELOOP
COLUMN
VENT / WASTE
CARRIER/MOBILE PHASE
1
2
3
4
5
6
SAMPLE
SAMPLELOOP
COLUMN
VENT / WASTE
CARRIER/MOBILE PHASE
Position A Position B

------------------------------------------- CHAPTER TWO: Experimental ------------------------------------------------------
50
Table 2.1 - Retention times observed for un-reacted gases during the direct H2O2 synthesis.
Eluted product Retention time (min)
Hydrogen 0.524
Oxygen 1.438
Nitrogen 2.859
A thermal conductivity detector (TCD) was used for the detection and quantification of the
un-reacted gases. The TCD produces a signal, the signal is plotted and an elution peak is
obtained for each product. A TCD detects the difference between the heat capacities of a
reference gas flow (carrier gas, Ar) and the sample gas flow (reactor products plus carrier
gas). Differences in the heat capacities of different compounds mean that the results need to
be corrected with a response factor (RF). The RF’s for the TCD were obtained from
calibration with 2 %H2/N2 and compressed air (oxygen content taken to equal 21 %). The
peaks are integrated and the numeric value of each integrated peak is divided by the relative
response factor of the compound. The result is the true response values. The true response
values are proportional to the composition of the mixture, further calculations (as shown in
Chapter Five) lead to the values of conversion and selectivity for a specific catalytic test.
2.4 Benzyl Alcohol Oxidation
2.4.1 Background
The catalytic oxidation of benzyl alcohol under free solvent conditions has been
chosen as an appropriate model reaction for exploring the catalytic performance of the
catalysts in chapter 4, at higher temperatures (140 oC). Not only has it been chosen due to its
high reactivity in the presence of Au-Pd catalysts but also because of the existence of a
complex reaction network as shown in Figure 2.5.
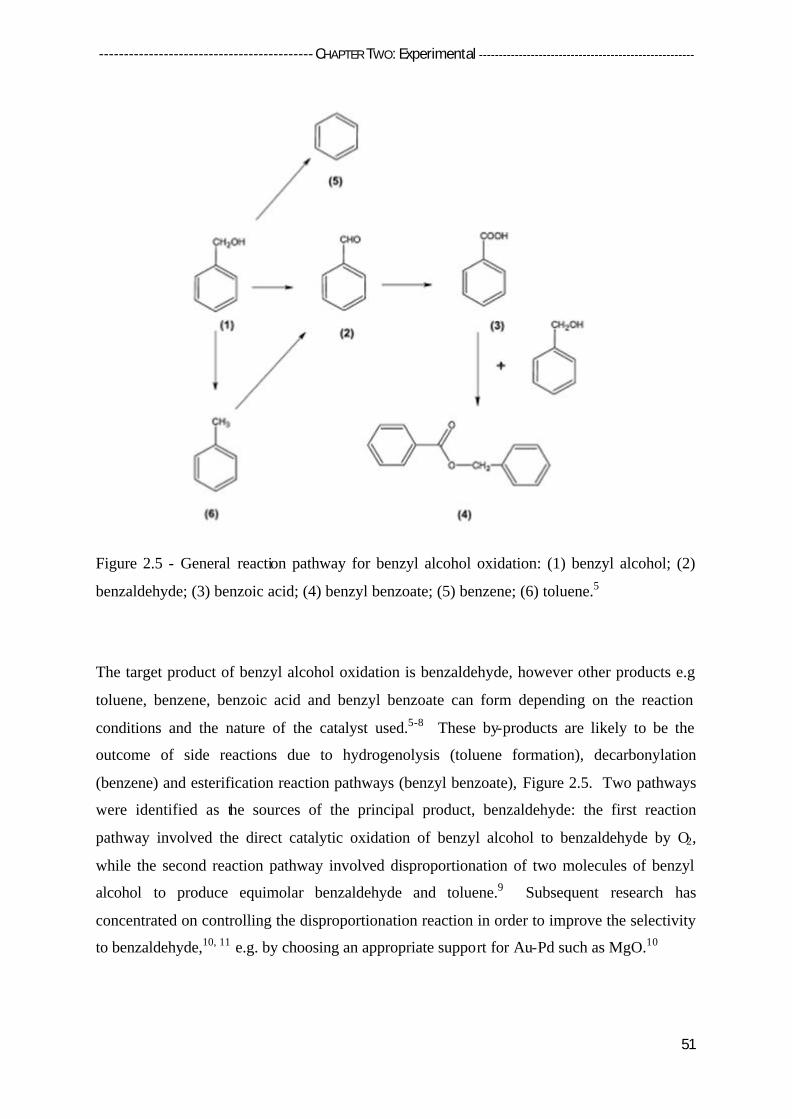
------------------------------------------- CHAPTER TWO: Experimental ------------------------------------------------------
51
Figure 2.5 - General reaction pathway for benzyl alcohol oxidation: (1) benzyl alcohol; (2)
benzaldehyde; (3) benzoic acid; (4) benzyl benzoate; (5) benzene; (6) toluene.5
The target product of benzyl alcohol oxidation is benzaldehyde, however other products e.g
toluene, benzene, benzoic acid and benzyl benzoate can form depending on the reaction
conditions and the nature of the catalyst used.5-8 These by-products are likely to be the
outcome of side reactions due to hydrogenolysis (toluene formation), decarbonylation
(benzene) and esterification reaction pathways (benzyl benzoate), Figure 2.5. Two pathways
were identified as the sources of the principal product, benzaldehyde: the first reaction
pathway involved the direct catalytic oxidation of benzyl alcohol to benzaldehyde by O2,
while the second reaction pathway involved disproportionation of two molecules of benzyl
alcohol to produce equimolar benzaldehyde and toluene.9 Subsequent research has
concentrated on controlling the disproportionation reaction in order to improve the selectivity
to benzaldehyde,10, 11 e.g. by choosing an appropriate support for Au-Pd such as MgO.10
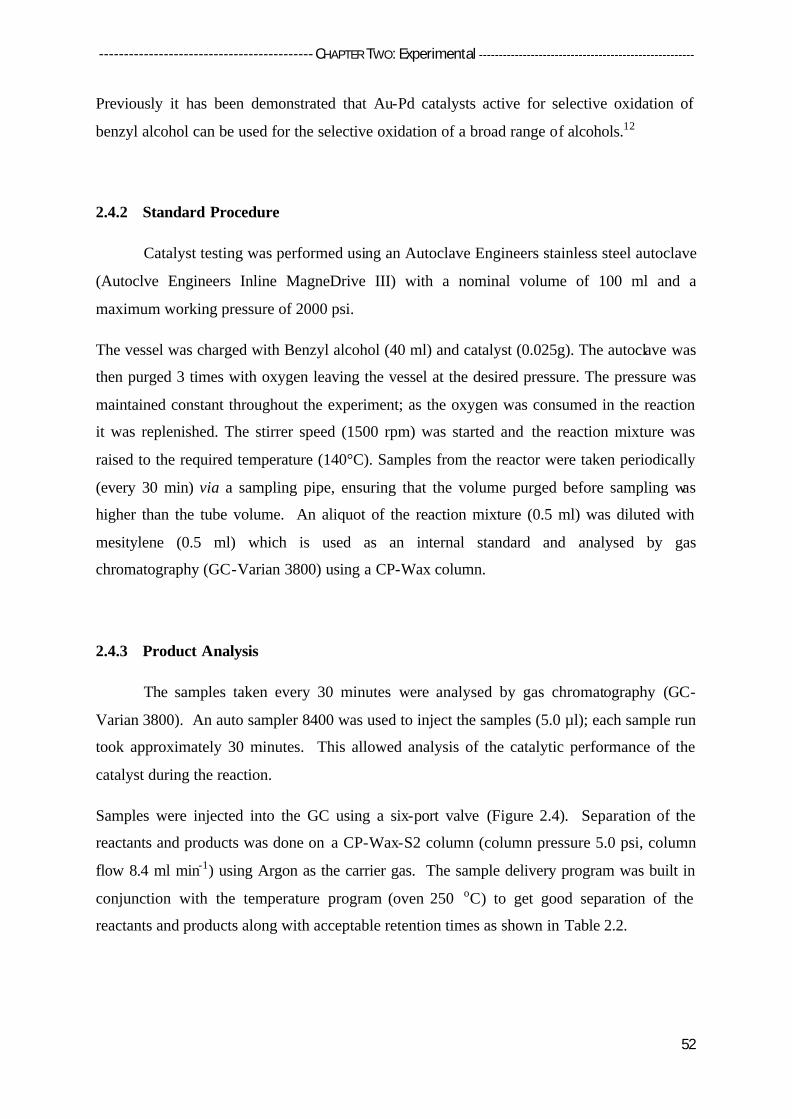
------------------------------------------- CHAPTER TWO: Experimental ------------------------------------------------------
52
Previously it has been demonstrated that Au-Pd catalysts active for selective oxidation of
benzyl alcohol can be used for the selective oxidation of a broad range of alcohols.12
2.4.2 Standard Procedure
Catalyst testing was performed using an Autoclave Engineers stainless steel autoclave
(Autoclve Engineers Inline MagneDrive III) with a nominal volume of 100 ml and a
maximum working pressure of 2000 psi.
The vessel was charged with Benzyl alcohol (40 ml) and catalyst (0.025g). The autoclave was
then purged 3 times with oxygen leaving the vessel at the desired pressure. The pressure was
maintained constant throughout the experiment; as the oxygen was consumed in the reaction
it was replenished. The stirrer speed (1500 rpm) was started and the reaction mixture was
raised to the required temperature (140°C). Samples from the reactor were taken periodically
(every 30 min) via a sampling pipe, ensuring that the volume purged before sampling was
higher than the tube volume. An aliquot of the reaction mixture (0.5 ml) was diluted with
mesitylene (0.5 ml) which is used as an internal standard and analysed by gas
chromatography (GC-Varian 3800) using a CP-Wax column.
2.4.3 Product Analysis
The samples taken every 30 minutes were analysed by gas chromatography (GC-
Varian 3800). An auto sampler 8400 was used to inject the samples (5.0 µl); each sample run
took approximately 30 minutes. This allowed analysis of the catalytic performance of the
catalyst during the reaction.
Samples were injected into the GC using a six-port valve (Figure 2.4). Separation of the
reactants and products was done on a CP-Wax-S2 column (column pressure 5.0 psi, column
flow 8.4 ml min-1) using Argon as the carrier gas. The sample delivery program was built in
conjunction with the temperature program (oven 250 oC) to get good separation of the
reactants and products along with acceptable retention times as shown in Table 2.2.

------------------------------------------- CHAPTER TWO: Experimental ------------------------------------------------------
53
Table 2.2 - Retention times observed for the products of benzyl alcohol oxidation, un-reacted
benzyl alcohol and the internal standard mesitylene.
Eluted product Retention time (min)
Benzene 1.852
Toluene 2.401
Mesitylene 3.934
Benzaldehyde 6.029
Benzyl alcohol 8.233
Benzoic acid 11.711
Benzbenzoate 12.465
A flame ionization detector (FID) was used for the detection and quantification of the
products and un-reacted benzyl alcohol. The FID produces ions from burning the sample gas
which will contain the hydrocarbons in turn as they are eluted. These ions are detected using
a metal collector, which is biased, with a high direct current voltage. The current across the
collector is proportional to the rate of ionisation which in turn depends upon the
concentration of the hydrocarbon in the sample gas. The signal received from the GC was
processed with Varian Star 4.5 software and with the aid of an electronic datasheet a quick
analysis of the products is performed.
The GC was calibrated for analysis by injecting known amounts of reactants and products.
The response factor (RF) is taken from the gradient of the calibration chart. The peak areas
of each product corresponded to a specific concentration, determined by dividing the counts
of each product by the corresponding response factor (RF) multiplied by the mesitylene count
of the sample. Further calculations lead to the values of conversion and selectivity for a
specific catalyst test. Mass balances were in the range of 95-105 % and the reaction data in
the following work were reproducible with an error level of less than 5 %. Turn over
frequency (TOF) was determined by assuming all the metal in the catalyst was active; moles
of benzyl alcohol converted per kg metal per hour.

------------------------------------------- CHAPTER TWO: Experimental ------------------------------------------------------
54
2.5 Characterisation Techniques13-16
The techniques briefly described in this section are vital in investigating the nano-
scale materials used for heterogeneous catalysis, and go some way to explaining the catalytic
activities observed.
2.5.1 Thermo-Gravimetric Analysis (TGA)
Thermal-gravimetric analysis (TGA) allows the measurement of weight changes of a
material resulting from chemical reactions, decomposition, solvent and water evolution, and
oxidation, as a function of increasing temperature or time. During the current work TGA is
utilised to determine decomposition temperatures.
A Setaram TGA/Differential Thermal Analysis (DTA) was used to perform TGA. The
instrument consists of a furnace which is mechanically connected to an analytical balance.
The microbalance used is extremely sensitive; capable of detecting weight changes as small
as 0.1 µg. When a sample is placed in the sample pan, the beam that supports the sample pan
deflects. A detector measures the deflection with an optical sensor and uses current to return
the beam to its original position. The amount of current used is a direct measure of the
weight on the beam. The current is amplified and the signal is displayed as a percentage of
total sample weight.
The sample pan was filled with sample (5-15 mg). The furnace was flushed with nitrogen
and the inert atmosphere was maintained throughout the analysis. The weight change was
recorded over a temperature range of 30 - 400 oC with a ramping rate of 5 oCmin-1.
2.5.2 X-Ray Diffraction (XRD)
X-ray diffraction (XRD) is used to characterise crystalline materials and determine
their bulk structure. XRD allows the identification of crystalline phases, but cannot detect
phases with crystallite size lower that ca.5 nm.
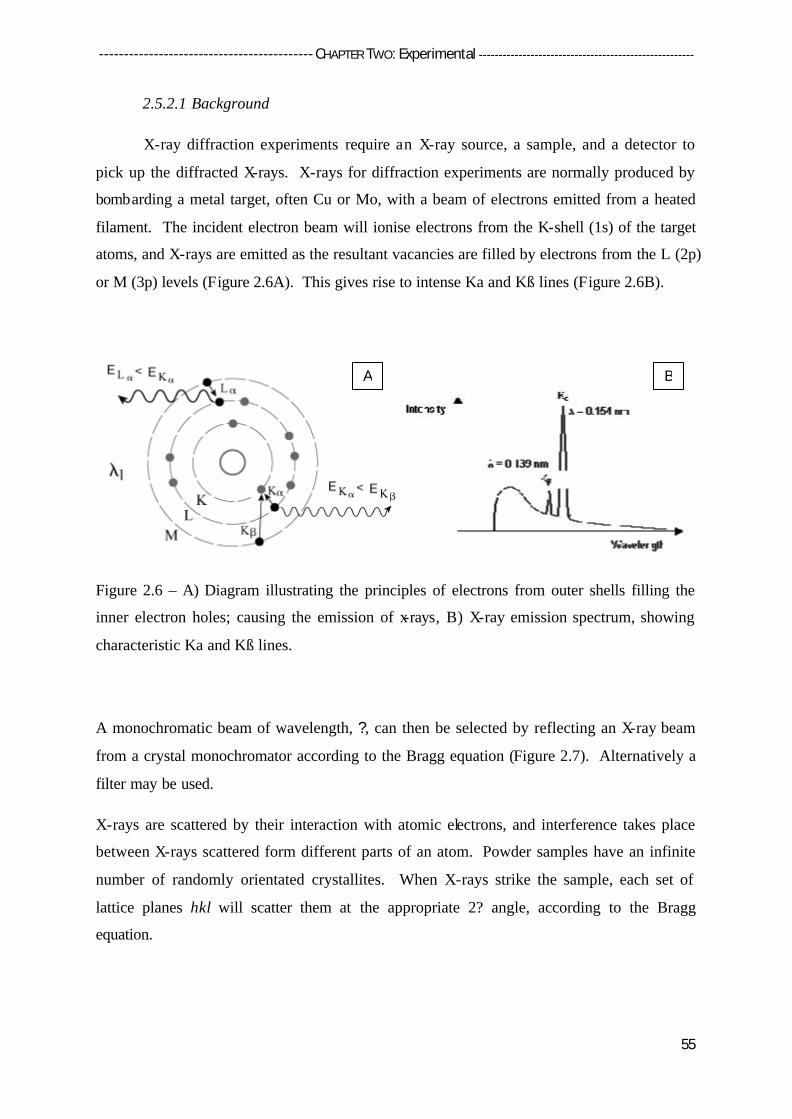
------------------------------------------- CHAPTER TWO: Experimental ------------------------------------------------------
55
2.5.2.1 Background
X-ray diffraction experiments require an X-ray source, a sample, and a detector to
pick up the diffracted X-rays. X-rays for diffraction experiments are normally produced by
bombarding a metal target, often Cu or Mo, with a beam of electrons emitted from a heated
filament. The incident electron beam will ionise electrons from the K-shell (1s) of the target
atoms, and X-rays are emitted as the resultant vacancies are filled by electrons from the L (2p)
or M (3p) levels (Figure 2.6A). This gives rise to intense Ka and Kß lines (Figure 2.6B).
Figure 2.6 – A) Diagram illustrating the principles of electrons from outer shells filling the
inner electron holes; causing the emission of x-rays, B) X-ray emission spectrum, showing
characteristic Ka and Kß lines.
A monochromatic beam of wavelength, ?, can then be selected by reflecting an X-ray beam
from a crystal monochromator according to the Bragg equation (Figure 2.7). Alternatively a
filter may be used.
X-rays are scattered by their interaction with atomic electrons, and interference takes place
between X-rays scattered form different parts of an atom. Powder samples have an infinite
number of randomly orientated crystallites. When X-rays strike the sample, each set of
lattice planes hkl will scatter them at the appropriate 2? angle, according to the Bragg
equation.
B A

------------------------------------------- CHAPTER TWO: Experimental ------------------------------------------------------
56
Figure 2.7 - Bragg’s law, where n is an integer, ? is the X-ray wavelength, d is the particular
lattice plane spacing and ? is the Bragg diffraction angle.
When Bragg’s law is satisfied, the reflected beams interfere constructively and a diffracted
beam is produced, the angle of reflection is equal to the angle of incidence (Figure 2.8). If
the angle of incidence does not satisfy Bragg’s law, the reflected beams are out of phase and
destructive interference occurs; hence the Bragg equation represents the condition for
diffraction to take place.
Figure 2.8 - Reflection of the incident beam at Bragg’s angle, ?.
Since all possible orientations of crystallite should be present, a cone of scattering will be
given at each Bragg angle. Each cone can be intercepted and analysised using the Debye-
Scherrer X-ray powder method17.
Limited information can be gained about the crystallite sizes according to the Debye-Scherrer
equation (Figure 2.9). This is limited as particles under ca.5nm are too small to diffract the
incident X-ray to a large enough angle to be measured.

------------------------------------------- CHAPTER TWO: Experimental ------------------------------------------------------
57
Figure 2.9 – Debye-Scherrer equation, where B is the broadening of the diffraction peak, ? is
the X-ray wavelength, d is the crystallite size and ? is the Bragg angle of diffraction.
2.5.2.2 Procedure
Investigation of the bulk of the materials was performed using powder X-ray
diffraction (XRD) on a (?-?) PANalytical X’pert Pro powder diffractometer using a CuKa
radiation source operating at 40 KeV and 40 mA. Standard analysis was performed using a
40 minute run with a back filled sample. Diffraction patterns of phases were identified using
the International Centre for Diffraction Data (ICDD). Diffraction patterns were analyzed
using full pattern refinement, with background functions, zero shift and pseudo-Voigt profile
functions. Reference crystal structure profiles were provided by the inorganic crystal
structure database18.
2.5.3 Electron Microscopy (EM)
Electron microscopy (EM) provides a range of high resolution image modes used to
characterise nanostructures. The resolution is such that it has the ability to image a single
atom19, 20. From studying such images comments can be made about the topology of the
material and a detailed particle distribution can be determined. When linked with an X-ray
energy dispersive spectroscopy (XEDS) detector it has the ability to provide elemental
composition and electronic structure.
2.5.3.1 Background
An incident high energy beam of electrons (formed by thermionic emission, often
from a tungsten electrode) interacts with the sample surface in a variety of ways, some of
which are shown in Figure 2.10. The electrons are scattered by the atomic potentials of the
atom in the sample and broadly speaking the degree of scattering increases with atomic

------------------------------------------- CHAPTER TWO: Experimental ------------------------------------------------------
58
number. In contrast to X-rays and neutrons, the scattering of electrons by matter is very
strong and diffraction of electrons is feasible with gaseous samples.
Figure 2.10 - The interaction of an electron beam with a sample
The low-energy (<50eV) secondary electrons emitted from the surface of the sample provide
the basis for scanning electron microscopy (SEM). The electron beam can be concentrated to
a small probe (say 20A diameter) that may be deflected across the sample in a raster fashion
using scanning coils. The secondary electrons can be detected above the sample, and an
image showing the intensity of secondary electrons emitted can be displayed. Heavier
elements scatter the electrons more efficiently so show up brighter in the image (Z-contrast
imaging21). The image is also dependent on the samples orientation as parts of the surface
facing the detector appear brighter than surfaces facing away.
Imaging using secondary electrons, SEM, can produce images to a resolution of
approximately 5nm however it is highly desirable to examine individual nanostructures with
atomic level sensitivity. This requires a more sophisticated instrument, based on high
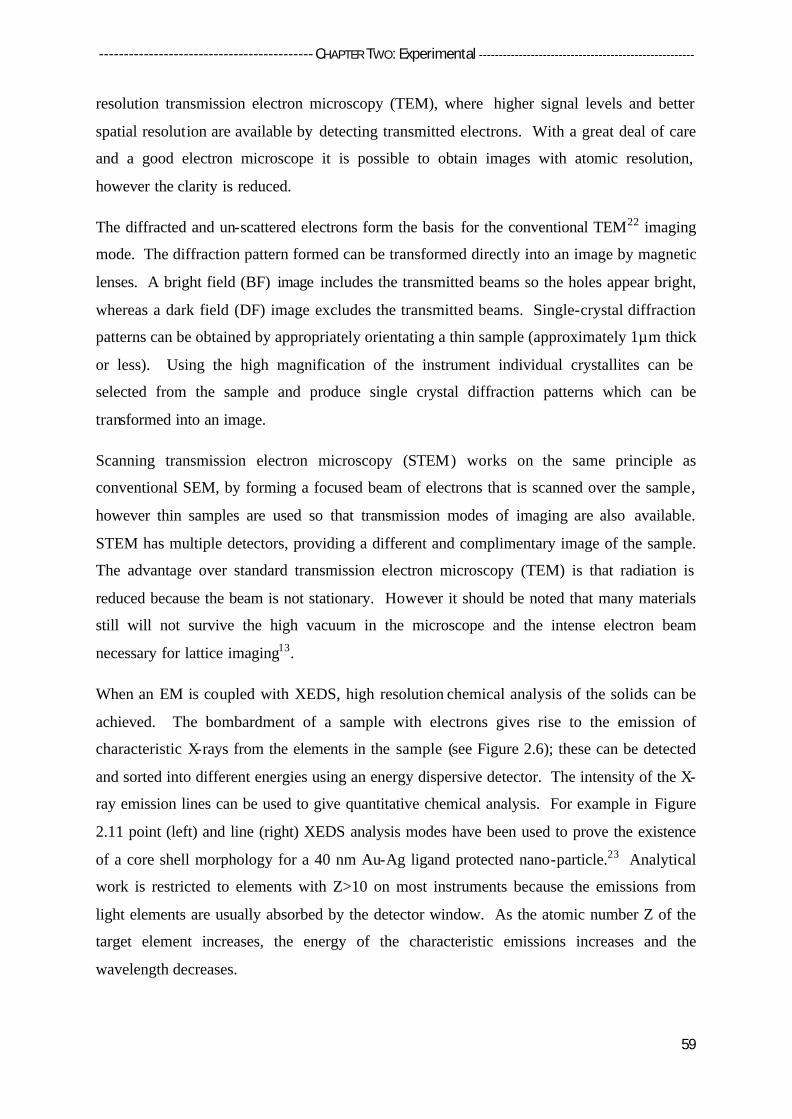
------------------------------------------- CHAPTER TWO: Experimental ------------------------------------------------------
59
resolution transmission electron microscopy (TEM), where higher signal levels and better
spatial resolution are available by detecting transmitted electrons. With a great deal of care
and a good electron microscope it is possible to obtain images with atomic resolution,
however the clarity is reduced.
The diffracted and un-scattered electrons form the basis for the conventional TEM22 imaging
mode. The diffraction pattern formed can be transformed directly into an image by magnetic
lenses. A bright field (BF) image includes the transmitted beams so the holes appear bright,
whereas a dark field (DF) image excludes the transmitted beams. Single-crystal diffraction
patterns can be obtained by appropriately orientating a thin sample (approximately 1µm thick
or less). Using the high magnification of the instrument individual crystallites can be
selected from the sample and produce single crystal diffraction patterns which can be
transformed into an image.
Scanning transmission electron microscopy (STEM) works on the same principle as
conventional SEM, by forming a focused beam of electrons that is scanned over the sample,
however thin samples are used so that transmission modes of imaging are also available.
STEM has multiple detectors, providing a different and complimentary image of the sample.
The advantage over standard transmission electron microscopy (TEM) is that radiation is
reduced because the beam is not stationary. However it should be noted that many materials
still will not survive the high vacuum in the microscope and the intense electron beam
necessary for lattice imaging13.
When an EM is coupled with XEDS, high resolution chemical analysis of the solids can be
achieved. The bombardment of a sample with electrons gives rise to the emission of
characteristic X-rays from the elements in the sample (see Figure 2.6); these can be detected
and sorted into different energies using an energy dispersive detector. The intensity of the X-
ray emission lines can be used to give quantitative chemical analysis. For example in Figure
2.11 point (left) and line (right) XEDS analysis modes have been used to prove the existence
of a core shell morphology for a 40 nm Au-Ag ligand protected nano-particle.23 Analytical
work is restricted to elements with Z>10 on most instruments because the emissions from
light elements are usually absorbed by the detector window. As the atomic number Z of the
target element increases, the energy of the characteristic emissions increases and the
wavelength decreases.
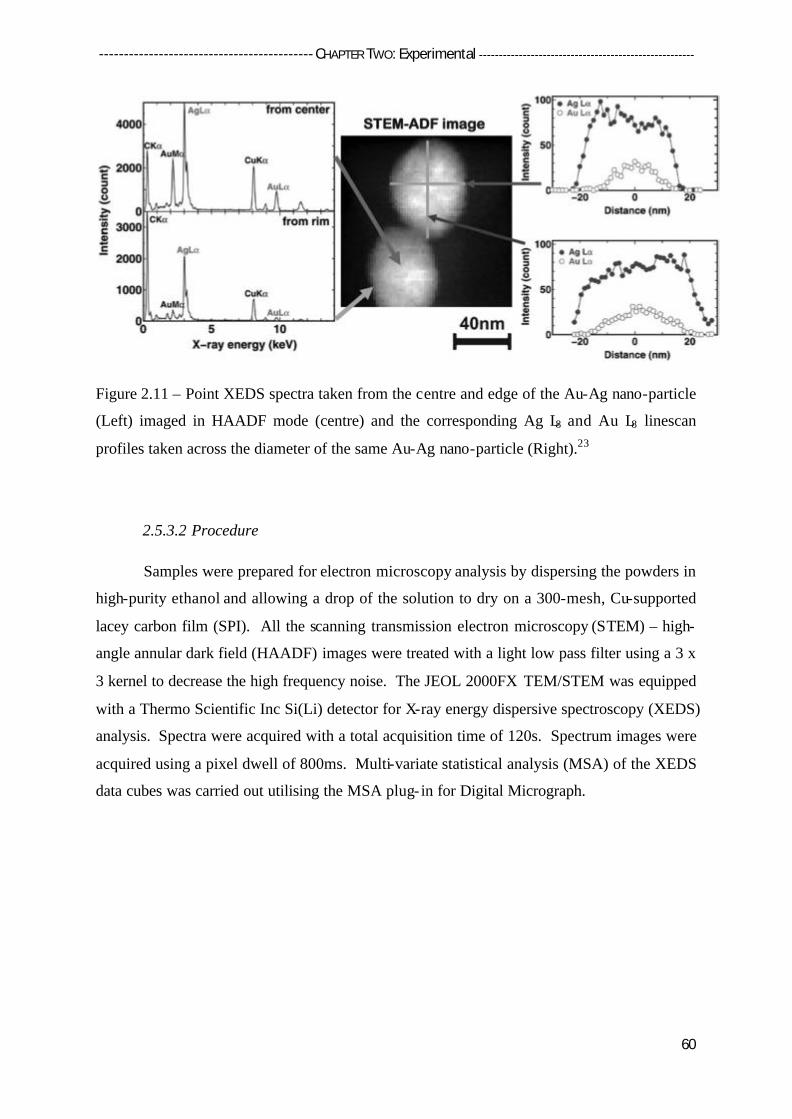
------------------------------------------- CHAPTER TWO: Experimental ------------------------------------------------------
60
Figure 2.11 – Point XEDS spectra taken from the centre and edge of the Au-Ag nano-particle
(Left) imaged in HAADF mode (centre) and the corresponding Ag L8 and Au L8 linescan
profiles taken across the diameter of the same Au-Ag nano-particle (Right).23
2.5.3.2 Procedure
Samples were prepared for electron microscopy analysis by dispersing the powders in
high-purity ethanol and allowing a drop of the solution to dry on a 300-mesh, Cu-supported
lacey carbon film (SPI). All the scanning transmission electron microscopy (STEM) – high-
angle annular dark field (HAADF) images were treated with a light low pass filter using a 3 x
3 kernel to decrease the high frequency noise. The JEOL 2000FX TEM/STEM was equipped
with a Thermo Scientific Inc Si(Li) detector for X-ray energy dispersive spectroscopy (XEDS)
analysis. Spectra were acquired with a total acquisition time of 120s. Spectrum images were
acquired using a pixel dwell of 800ms. Multi-variate statistical analysis (MSA) of the XEDS
data cubes was carried out utilising the MSA plug- in for Digital Micrograph.

------------------------------------------- CHAPTER TWO: Experimental ------------------------------------------------------
61
2.5.4 X-ray Photoelectron Spectroscopy (XPS)
X-ray Photoelectron Spectroscopy (XPS) is a surface analysis technique (1-10 nm
deep into the sample) giving information on the chemical and electronic state of the elements
present at the surface of the material. Interpreting the data collected can indicate the
concentration and composition of the elements. The basic principles, which are based on the
photoelectric effect, are described in this section.
2.5.4.1 Background
When a sample is irradiated with x-rays an atom absorbs a photon of energy causing a
core or valence electron with binding energy Eb to be ejected with a quantised kinetic energy
Emax; this is based on the photoelectric effect as shown by Figures 2.12 and 2.13.
Figure 2.12 - Photoelectric equation, Emax = maximum kinetic energy of the emitted electron,
h? = energy of the incident X-ray, h is Planck’s constant and ? is the frequency of the incident
ray in Hertz. F is the work function; the energy, equal to the Eb, required to eject the
photoelectron.
Figure 2.13 - Diagrammatic representation of the photoelectric effect.

------------------------------------------- CHAPTER TWO: Experimental ------------------------------------------------------
62
Photoemission data shows kinetic energy of the photoelectron correspond ing to the orbital
from which the electron has been emitted. Binding energy of a photoelectron contains
information on both the chemical state of the atom before photo ionisation (the initial state)
and on the core- ionised atom left behind after the emission of an electron (the final state).
However, it is often correct to interpret binding energy shifts as being the initial state.
A spectrometer detects the number of electrons being emitted and their kinetic energy. Each
element has its own unique characteristic binding energies, which creates a ‘fingerprint’
spectrum of peaks. Different oxidation states can be identified as they cause the peaks on the
spectra to shift slightly, due to changes in binding energies.
As XPS is a surface sensitive technique it can also recognise how well particles are dispersed
over a support. When the particles are small almost all atoms are at the surface, covering the
support to a large extent. This gives a high intensity from the particles, but a relatively low
intensity from the support. Concentrations of the elements can be calculated when assuming
a model structure first.
2.5.4.2 Procedure
XPS analysis was carried out using a Kratos Axis Ultra-DLD spectrometer employing
a monochromatic AlKa X-ray source (75-120 W) and analyzer pass energies of 160 eV ( for
survey scans) or 40 eV (for detailed scans). Samples were mounted using double sided
adhesive tape and analysised under ultra high vacuum (UHV) (<5x10⁻¹⁰ Torr). Binding
energies were referenced to the C(1s) binding energy of adventitious carbon contamination
which was taken to be 284.7eV.

------------------------------------------- CHAPTER TWO: Experimental ------------------------------------------------------
63
2.6 References
1. J. C. Pritchard, Q. He, E. N. Ntainjua, M. Piccinini, J. K. Edwards, A. A. Herzing, A. F. Carley, J. A. Moulijn, C. J. Kiely and G. J. Hutchings, Green Chemistry, 2010, 12, 915-921.
2. J. K. Edwards, E. Ntainjua N, A. F. Carley, A. A. Herzing, C. J. Kiely and G. J. Hutchings, Angewandte Chemie International Edition, 2009, 48, 8512-8515.
3. J. K. Edwards, B. Solsona, E. N. N, A. F. Carley, A. A. Herzing, C. J. Kiely and G. J. Hutchings, Science, 2009, 323, 1037-1041.
4. E. Scholz, Fresenius' Zeitschrift für analytische Chemie, 1983, 314, 567-571. 5. J. A. Lopez-Sanchez, N. Dimitratos, P. Miedziak, E. Ntainjua, J. K. Edwards, D. Morgan, A. F.
Carley, R. Tiruvalam, C. J. Kiely and G. J. Hutchings, Physical Chemistry Chemical Physics, 2008, 10, 1921-1930.
6. P. Miedziak, M. Sankar, N. Dimitratos, J. A. Lopez-Sanchez, A. F. Carley, D. W. Knight, S. H. Taylor, C. J. Kiely and G. J. Hutchings, Catalysis Today, 2011, 164, 315-319.
7. J. Pritchard, L. Kesavan, M. Piccinini, Q. He, R. Tiruvalam, N. Dimitratos, J. A. Lopez-Sanchez, A. F. Carley, J. K. Edwards, C. J. Kiely and G. J. Hutchings, Langmuir, 2010, 26, 16568-16577.
8. N. Dimitratos, J. A. Lopez-Sanchez, D. Morgan, A. F. Carley, R. Tiruval am, C. J. Kiely, D. Bethell and G. J. Hutchings, Physical Chemistry Chemical Physics, 2009, 11, 5142-5153.
9. S. Meenakshisundaram, E. Nowicka, P. J. Miedziak, G. L. Brett, R. L. Jenkins, N. Dimitratos, S. H. Taylor, D. W. Knight, D. Bethell and G. J. Hutchings, Faraday Discussions, 2010, 145, 341-356.
10. M. Sankar, E. Nowicka, R. Tiruvalam, Q. He, S. H. Taylor, C. J. Kiely, D. Bethell, D. W. Knight and G. J. Hutchings, Chemistry – A European Journal, 2011, 17, 6524-6532.
11. E. Cao, M. Sankar, E. Nowicka, Q. He, M. Morad, P. J. Miedziak, S. H. Taylor, D. W. Knight, D. Bethell, C. J. Kiely, A. Gavriilidis and G. J. Hutchings, Catalysis Today.
12. D. I. Enache, J. K. Edwards, P. Landon, B. Solsona-Espriu, A. F. Carley, A. A. Herzing, M. Watanabe, C. J. Kiely, D. W. Knight and G. J. Hutchings, Science, 2006, 311, 362-365.
13. A. K. Cheetham and P. Day, Solid State Chemistry Techniques, Oxford Science, Oxford. 14. G. A. Somorjai and Y. Li, Introduction To Surface Chemistry And Catalysis, Second Edition.,
John Wiley & Sons, New Jersey, 2010. 15. P. Atkins and J. d. Paula, Elements of Physical Chemistry, Fourth Edition, Oxford University
Press, 2005. 16. M. Bowker, The Basis and Applications of Hetrogeneous Catalysis, Oxford University Press,
Oxford, 1998. 17. H. P. Klug and L. E. Alexander, X-ray diffraction procedures for polycrystalline and amorphous
materials, John Wiley and Sons, New York, 1974. 18. J. I. C. f. D. Data, 1984. 19. P. M. Voyles, J. L. Grazul and D. A. Muller, in Ultramicroscopy, Netherlands, Editon edn.,
2003, vol. 96, pp. 251-273. 20. Y. Zhu, H. Inada, K. Nakamura and J. Wall, in Nat Mater, England, Editon edn., 2009, vol. 8,
pp. 808-812. 21. S. J. Pennycook, Philosophical Transactions of the Royal Society A., 2009, 367, 3709-3733. 22. G. Thomas and M. J. Goringe, Transmission electron microscopy of materials, Wiley-
Interscience, New York, 1979. 23. A. A. Herzing, M. Watanabe, J. K. Edwards, M. Conte, Z. R. Tang, G. J. Hutchings and C. J. Kiely,
Faraday Discussions, 2008, 138, 337-351.
64
The Effect of Heat Treatment Conditions on Catalytic Activity
3.1 Introduction
Catalysts have been prepared by impregnation and their activity towards the direct
synthesis and hydrogenation of hydrogen peroxide under standard conditions are described
and discussed. Experimental procedures are outlined in chapter 2.
The activity and stability of the catalyst depends not only on the method of preparation, but
also on the conditions used for the subsequent thermal treatment.1-4 After impregnation,
many catalysts require calcination and/or a reduction stage to render the adsorbed metal
species active. Thermal treatments may take the form of low-temperature drying operations
(up to 150 oC) simply to remove water, although decomposition of some species are known to
occur within this temperature range. Treatment temperatures between 150 oC and 500 oC are
principally used to decompose the adsorbed species to the metal or metal oxide. Edwards et
al.5 have shown an un-calcined (dried at 110oC for 16h-only) Au-Pd/TiO2 catalyst prepared
by impregnation has the highest activity for the direct H2O2 synthesis; however, it is not
stable with both metals leaching from the TiO2 surface during use. In order to stabilise the
catalyst for subsequent uses, calcination at 400 oC for 3 h is crucial.
Compared to monometallic counterparts6-8 bimetallic Au-Pd catalysts are highly active for
the direct synthesis of H2O2; however, the origin of the active site is a topic currently under
hot debate. The direct catalytic oxidation of H2 with O2 over an active catalyst will
preferentially form water rather than H2O2. This is mainly because the catalysts which are
active for H2O2 production could also facilitate the depletion of H2O2 formed via further
hydrogenation and/or decomposition. However, a recent key discovery9 has been that an acid
pre-treatment of the support prior to the deposition of the metals, produces catalysts with
higher activity towards H2O2 synthesis and lower activity towards the hydrogenation of H2O2,
compared to catalysts prepared with an un-treated support. In the case of an acid pre-

-------------- CHAPTER THREE: The Effect of Heat Treatment Conditions on Catalytic Activity ------------------
65
treatment of activated carbon, the Au-Pd impregnated material produced has no activity
towards the hydrogenation of H2O2 under standard conditions. 10
Within this chapter the dependence of the calcination temperature on stabilising and
switching off the hydrogenation of Au-Pd supported by acid-treated carbon (AwC) has been
investigated. Detailed X-ray photoelectron spectroscopy (XPS) and Scanning transmission
electron microscopy (STEM) of the materials has highlighted a number of key aspects which
could be responsible for the effect in activity observed.
A series of carefully controlled reduction – oxidation treatments have also been utilised to
elucidate the dependence of the Pd oxidation state on the activity of the catalyst towards
H2O2 formation.
Note – The procedure for acid pre-treatment of the support has been described in section
2.1.3. Au-Pd = 2.5 %Au- 2.5 %Pd. The following reaction conditions have been utilised;
(a) Hydrogen Peroxide Synthesis catalyst (10 mg), 5% H2/CO2 (420 psi), 25% O2/CO2
(160psi), 5.6g MeOH and 2.9 H2O as solvent, 2 oC, 1200 rpm, 30 minutes.
(b) Hydrogen Peroxide Hydrogenation catalyst (10 mg), 5% H2/CO2 (420 psi), 5.6g MeOH,
2.22 H2O and 0.68g 50 wt% H2O2 as solvent, 2 oC, 1200 rpm, 30 minutes.
3.2 The Effect of Calcination Temperature on Au-Pd/Acid-Washed Carbon (AwC)
3.2.1 Direct H2O2 Synthesis and Hydrogenation
A series of Au-Pd/acid pre-treated activated carbon (AwC) catalysts, were calcined
under static air at a variety of temperatures. The resultant materials were used for the direct
synthesis of H2O2 and their stability was determined through re-use tests.

-------------- CHAPTER THREE: The Effect of Heat Treatment Conditions on Catalytic Activity ------------------
66
Table 3.1 - H2O2 synthesis activity of Au-Pd/AwC that were calcined at different
temperatures.
Heat treatmenta Productivity (molH2O2kgcat-1h-1) Hydrogenation (molH2O2kgcat
-1h-1)
Initial activity Re-use activity
Dried 120 °C 212 101 736
Calcined 200 °C 180 106 617
Calcined 300 °C 174 124 546
Calcined 350 °C - - 279
Calcined 400 °C 160 160 0 a. All catalysts were dried in air at 120 °C and then calcined for 3 h in static air at the
temperature indicated
Table 3.1 shows that the material dried at 120 oC and not calcined has the highest activity of
212 molH2O2kgcat-1h-1 on initial use; however upon re-use this activity falls by over a half to
101 molH2O2kgcat-1h-1. This material is also the most active towards the hydrogenation of
H2O2, destroying 736 molH2O2kgcat-1h-1 under standard conditions, corresponding to a 36%
consumption of the initial 4 wt% H2O2 present in the solution.
Increasing the calcination temperature decreases the catalysts activity towards the direct H2O2
synthesis; however, the loss in activity upon re-use is proportionally less. The hydrogenation
rate also decreases with increasing calcination temperature.
A calcination temperature of 400 oC produces a material that retains all its initial activity, 160
molH2O2kgcat-1h-1. Calcination at 400oC is also crucial to switch off the catalysts activity
towards the H2O2 hydrogenation pathway. This would suggest that different sites on the
catalyst are active for the H2O2 synthesis and hydrogenation.
The Au-Pd/AwC catalyst calcined at 350oC still had considerable activity towards H2O2
hydrogenation (279 molH2O2kg-1h-1). A possibility for such a narrow temperature range is that
a temperature >350 is required to decompose the metal chloride precursors completely. This
binds the Au-Pd metal nano-particles to the surface and destroys/covers up active species for
the H2O2 hydrogenation pathway.

-------------- CHAPTER THREE: The Effect of Heat Treatment Conditions on Catalytic Activity ------------------
67
3.2.2 X-Ray Photoelectron Spectroscopy (XPS)
The unused Au-Pd/AwC catalys ts, which have been calcined at different temperatures,
were analysed by XPS.
Figure 3.1 - Pd(3d) spectra observed for the Au-Pd/AwC catalysts calcined at the
temperatures indicated.
Table 3.2 - Quantified XP data for the Au-Pd/AwC catalysts that were calcined at different
temperatures.
Molar ratios Pd/Au (Pd + Au)/C (x100) Cl/C (x100) Pd2+ (%)
Acid pre-treated (°C)
Dried 120°C 2.7 0.44 0.71 >90
Calcined 200°C 3.8 0.45 0.61 >90
Calcined 300°C 4.3 0.46 0.51 >90
Calcined 350°C 4.1 0.41 0.44 >90
Calcined 400°C 4.2 0.50 0.42 >90
The Pd (3d) spectra (Figure 3.1) and quantified X-ray photoelectron data (Table 3.2) indicate
that Pd2+ species are predominant (=90 %) on the acid pre-treated support, for all calcination

-------------- CHAPTER THREE: The Effect of Heat Treatment Conditions on Catalytic Activity ------------------
68
temperatures. The Pd/Au ratio significantly increases when the catalyst is calcined at all
temperatures utilised compared to the baseline material (dried only). This observation could
in principle reflect the formation of core-shell type particles8, as seen previously on a titania
support5; however, detailed electron microscopy analysis, presented later, shows that this is
not the case. Therefore, it is postulated that the variation in Pd/Au ratio is due to changes in
the relative sizes of the Pd and Au nano-particles.
The corresponding Au(4f) and Cl(2p) spectra for the Au-Pd/AwC catalysts, are shown in
Figure 3.2.
Figure 3.2 – XPS spectra observed for Au-Pd/AwC catalysts, calcined at the temperatures
indicated. (A) Au(4f), (B) Cl(2p).
Firstly, looking at the Au(4f) spectra in figure 3.2A, there is no obvious affect on Au
oxidation state or intensity in the Au-Pd/AwC catalysts calcined at different temperatures.
This is as expected and highlights the characteristics of the difference in standard reduction
potentials (E0) of Au3+ and Pd2+ cations, 1.50 and 0.92 respectively.
The Cl(2p) spectra in figure 3.2B, shows the presence of chloride on the AwC surface at all
calcination temperatures. The Cl signal is due to residual chlorine from the two metal
precursors, aurochloric acid and palladium chloride, used to prepare the catalysts. Three
doublets, which are indicated, are present in the spectra. The higher binding energy doublet
(corresponding to a more ionic, negatively charged ClX- species) dominates after calcination
at 400 oC. This indicates that increasing the calcination temperature causes an electronic
A B

-------------- CHAPTER THREE: The Effect of Heat Treatment Conditions on Catalytic Activity ------------------
69
modification. A weaker chloride signal as calcination temperature increases is due to the loss
of chloride from the surface as the metal chloride precursor oxidises.
3.2.3 Electron Microscopy (EM)
To determine the Au and Pd distribution as a function of calcination temperature, the
unused Au-Pd/AwC catalysts, were analysed by scanning transmission electron microscopy
(STEM), Figure 3.3.
Figure 3.3 - Representative STEM-HAADF images of Au-Pd/AwC catalysts calcined at
different temperatures.
As expected, in all samples highly dispersed Pd metal species, namely sub-nm clusters and
single atoms, were found over all the acid pre-treated acid carbon support. In comparison to
the baseline catalyst (dried only), the population of sub-nm clusters appeared to decrease
progressively as the calcination temperature was increased. The calcination process appears
to aid in dispersing the sub-nm clusters into atomically dispersed species. However, the
differences between the morphology of samples with increasing calcination were subtle.
(a) Dried 120 °C (b) Dried 120 °C
(e) Calcined 300 °C (f) Calcined 300 °C
(g) Calcined 400 °C (h) Calcined 400 °C
(c) Calcined 200 °C (d) Calcined 200 °C
-------------- CHAPTER THREE: The Effect of Heat Treatment Conditions on Catalytic Activity ------------------
70
It was not possible to directly determine the chemical identity of the sub-nm species and
isolated atoms, in the Au-Pd/AwC samples. Atomic level Z-contrast measurements were not
effective due to the rough nature of the support which leads to complicating height variations
between neighbouring metallic species. However, a previous study by Edwards et al.11 of
monometallic Au and Pd supported on untreated activated carbon showed that Pd tends to be
more highly dispersed than Au for catalysts prepared using this impregnation route. This
leads to the suggestion that in the bimetallic system the atomically dispersed species are
mainly Pd intermixed with a dilute concentration of atomically dispersed Au.
3.2.4 Discussion
In order to stabilise a Au-Pd/AwC catalyst prepared using impregnation, calcination
in static air at 400oC for 3h is required. Calcination at 400oC is also critical to the catalysts
activity towards the hydrogenation pathway being switched off under the reaction cond itions
utilised. These are two key traits a catalyst material would require for the direct H2O2
synthesis to become viable at an industrial level.
However, explaining why these activity traits are only observed for the material calcined at
400oC proves difficult. Below is a summary of the trends observed in surface composition
and activity towards H2O2 synthesis, with increasing calcination temperature:
• H2O2 synthesis activity decreases
• H2O2 hydrogenation activity decrease, with hydrogenation switching off at 400 oC
• Catalyst stability increases, with stability being achieved at 400 oC
• Chloride concentration decreases and we observe more ionic, negatively charged Clx-
species
• Pd/Au ratio increases for temperatures up to 300 oC then stabilises at a value of
around 4.2
• Improved overall metal dispersion
The detailed XPS and STEM measurements highlighted a number of trends in the surface
composition, with increasing calcination temperature, which could be responsible for the
catalytic activity observed ind ividually or simultaneously. This makes it difficult to identify
the crucial feature/s required to switch off H2O2 hydrogenation.

-------------- CHAPTER THREE: The Effect of Heat Treatment Conditions on Catalytic Activity ------------------
71
The activity trends indicate that the effect of calcination temperature is a trade off between
the activity of the catalyst and its stability. Unstable catalysts indicate that active components
are leaching into the reaction mixture5; these could be forming active homogeneous catalysts
which are producing a ‘fa lse’ activity result. Dissanayake and Lunsford12, 13 found there is a
linear relationship between colloid palladium concentration and H2O2 formation. Although a
homogeneous catalytic system of colloidal Pd is highly interesting at a fundamental level, it
is not suitable from a commercial perspective since the management of the colloid would be a
difficult task.
The modification of chloride species with calcination temperature in Figure 3.2B can be
linked with decomposition/oxidation of the metal chloride precursor and an interaction
between the chloride species with activated carbon. Simonov et al.14 studied H2PdCl4
adsorption onto graphite- like carbon supports, identifying two competitive adsorption
pathways.
The first, involved reduction of Pd (based on the high reducing power of carbon) close to the
exterior of carbon particles, forming electropositive C+ holes on the carbon surface. The Cl-
anions compensate the charge through the formation of an electric double layer on the carbon
surface. If this is occurring, in this case, the reduced Pd is quickly oxidised at the
temperatures used as >10% Pd0 was found by XPS on the acid washed activated carbon of all
catalysts.
The second, involved PdCl2 forming p-complexes with C=C fragments of the carbon network.
During drying weakly bonded PdCl2 migrate along the surface to form more stable small
clusters. The centres of agglomeration were found to be the surface steps due to their high
adsorption potential. It can be assumed that increasing the calcination temperature oxidises
the strongly bound Pd-complexes, releasing Cl- to further interact with the carbon support.
The breaking up of the complexes may be a reason why the dispersion of the Pd2+ nano-
particles increases with increasing calcination temperature, as seen in the STEM images.
The effect that chloride has on the direct synthesis of H2O2 has been linked previously to a
decrease in H2O2 hydrogenation activity, however it is complicated by the presence of H+
ions and leaching of active metal species into the reaction medium.15, 16 Therefore to
investigate further, a chloride free ‘baseline’ catalyst is required a preparation technique to
produce a halide free catalyst is called physical grinding is investigated in Chapter Four.

-------------- CHAPTER THREE: The Effect of Heat Treatment Conditions on Catalytic Activity ------------------
72
Another observation is the Pd/Au ratio is higher for the calcined samples compared to the
dried only material. This represents an important discovery with higher Pd/Au ratio with the
palladium in a Pd2+ oxidation state is linked with switching off H2O2 hydrogenation of the
Au-Pd/AwC calcined at 400oC. However, it is clear that this alone has little to do with the
observed effects on hydrogenation activity and catalyst re-usability, as there are no
significant changes in Pd/Au ratio between samples calcined at 200 and 400 oC. Samples
calcined at 200 oC still have significant activity towards H2O2 hydrogenation. The reason for
this could be the migration of all PdCl2-complexes to the step sites being complete at 200 oC
and increasing the temperature serves to increase oxidation/decomposition of the complexes.
The change of Pd oxidation state with calcination temperature is inconclusive from the results
reported so far as Pd2+ species predominant (>90 %) for all Au-Pd/AwC catalysts calcined at
all temperatures. Detecting changes in the Pd oxidation state are complicated by the presence
of the Au (4d5/2) component under the Pd (3d) envelope making it difficult to accurately
assign the contribution of each state when Pd2+ species are predominant (>90 %).

-------------- CHAPTER THREE: The Effect of Heat Treatment Conditions on Catalytic Activity ------------------
73
3.3 The Effect of Pd Oxidation State on Direct H2O2 Synthesis
3.3.1 Background
The effect of the Pd oxidation state in the direct synthesis of H2O2 has been
investigated by many research groups, when using monometallic Pd supported catalysts, with
little agreement. Choudary et al.17-19 have claimed that a PdO catalyst is more suitable than a
Pd0 catalyst, owing to its higher selectivity, increasing H2O2 yield for the direct synthesis.
Interestingly, separate studies20-22 have demonstrated that supported PdO catalysts are more
selective but less active than the corresponding Pd0 catalysts in the direct H2O2 synthesis.
The higher H2O2 selectivity of a PdO catalyst compared with the corresponding Pd0 catalyst
is attributed to the lower H2O2 decomposition/hydrogenation activity of the PdO catalyst.
This is mostly attributed to the higher propensity of H2O2 to adsorb on the Pd0 surface as
compared to the PdO surface.
On the other hand, other researchers, including Thompson and co-workers23, Chinta and
Lunsford24, and Burch and Ellis25, have claimed that higher H2O2 productivity and selectivity
can be obtained with Pd0 catalysts.
The oxidation of surface/sub-surface Pd0 and/or partial oxidation of bulk Pd0 to PdO in the
supported Pd0 catalysts has been claimed to promote the H2O2 productivity17. Oxidation/
partial oxidation can be achieved by treating a Pd0 catalyst with an oxidising agent, such as
perchloric acid, hydrogen peroxide, nitrous oxide, oxygen or air. However, the increase in
the H2O2 yield/ selectivity has been found to be small17.
Melada et al.26 used a combination of reduction and oxidation treatments to achieve higher
catalytic activity/selectivity for direct H2O2 synthesis. They demonstrated that pre-treatment
of a supported PdO catalyst with 5%H2/Ar, reduced the PdO phase to Pd0 (partially or
completely). Using Temperature Programmed Reduction (TPR) it was shown that different
Pd2+ species reduce at different temperatures. Some of their samples contained room
temperature-reducible Pd2+ species; reduction of PdO species formed during calcination can
be reduced at temperatures as low as -15oC. Others possessed Pd2+ species reducible at about
90-100oC along with another Pd2+ fraction that reduced at about 280-300 oC. The latter
species was believed to be due to residual palladium (II) oxychloride, formed during
calcination and not decomposed during thermal treatment.

-------------- CHAPTER THREE: The Effect of Heat Treatment Conditions on Catalytic Activity ------------------
74
It was postulated that oxygen pre-treatment immediately after the hydrogen pre-treatment of a
PdO catalyst may result in the formation of a mixed PdO-Pd0 phase in the catalyst with
surface enriched PdO. Supported Pd0 catalysts with surface-enriched PdO were found to be
highly selective for the direct H2O2 formation because of their low H2O2 decomposition
activity.
3.3.2 Comparison of Au-Pd/AwC and Au-Pd/C Calcined at 400 oC
To investigate the effect of Pd oxidation state further, a comparison of the Au-
Pd/AwC and Au-Pd/C catalyst (both calcined at 400 oC) is required. The Au-Pd/C catalyst is
stable and has activity for H2O2 hydrogenation corresponding to a lower H2O2 synthesis
activity than Au-Pd/AwC as shown in Table 3.3.
Table 3.3 - Direct H2O2 synthesis and hydrogenation activities of Au-Pd/C and Au-Pd/AwC.
Sample Productivity (molH2O2kgcat-1h-1) Hydrogenation (molH2O2kgcat
-1h-1)
Initial activity Re-use activity
Au-Pd/C 110 110 120
Au-Pd/AwC 160 160 0
Detailed STEM measurements10 have previously shown that the acid pre-treatment of the
support does not appear to affect the morphology or dispersion of the metallic species in the
catalysts, so eliminating the metal dispersion as a factor in this case. They both contain Au-
rich nano-particles and a highly dispersed coverage of atomic and cluster-like Pd species,
intermixed with small amount of atomically dispersed Au.

-------------- CHAPTER THREE: The Effect of Heat Treatment Conditions on Catalytic Activity ------------------
75
Figure 3.4 – XPS spectra comparing Au-Pd/AwC (acid pre-treated carbon) and Au-Pd/C
(untreated carbon), calcined at 400oC.10
.
Table 3.4 - Quantified XPS data and H2O2 synthesis/hydrogenation data for stable Au-
Pd/AwC (acid pre-treated carbon) and Au-Pd/C (untreated carbon) catalysts, calcined at
400oC.10
XPS – Molar ratios
Pd/Au (Pd + Au)/C (x100) Cl/C (x100) Pd2+ (%)
Acid pre-treated
Calcined 400°C 4.2 0.50 0.42 >90
Untreated (°C)
Calcined 400°C 1.4 0.63 0.44 68
The untreated carbon catalyst has a lower H2O2 productivity as a result of its activity towards
H2O2 hydrogenation. Examining the quantified XPS data, it is clear the acid pre-treated
sample has increased palladium at the surface, which is also in a different oxidation state.
The presence of reduced palladium on the untreated carbon indicates that it has a higher
reducing power.14

-------------- CHAPTER THREE: The Effect of Heat Treatment Conditions on Catalytic Activity ------------------
76
Firstly, the pre-treated sample has a higher Pd/Au ratio indicating changes in the relative size
of the Pd and Au nano-particles leading to an apparently enhanced surface palladium
concentration (the molar ratio for a nominal 2.5 wt%Au-2.5 w%Pd loading is 1.8). More
highly dispersed Pd at the surface, of the catalyst, could explain the higher productivity of the
acid pre-treated supported catalyst, as Pd has been shown to be the active component in the
catalyst. Monometallic gold supported catalysts have relatively low activity compared to
their monometallic Pd counterparts. The addition of Au to Pd to produce a bimetallic Au-Pd
supported catalyst causes a synergistic effect on activity. This effect is probably achieved by
Au altering the physical or electronic structure of Pd sufficiently to inhibit its hydrogenation
ability. This is similar to observations by Goodman and co-workers27 that Au promoted the
synthesis of vinyl chloride monomer (VCM) for Au-Pd model catalysts. This effect was
achieved through a slight alteration of the atomic spacing of Pd, which did not affect VCM
synthesis but did inhibit its decomposition. It is also thought that gold has a unique ability in
stabilising the hydroperoxy (OOH) species which is a precursor for H2O2 formation28.
Secondly, the untreated supported catalyst, which is active for the H2O2 hydrogenation
pathway, exhibits both Pd2+ and Pd0 species, with a Pd2+ concentration of 68 %. This
indicates that an acid pre-treatment of the support modifies the electronic state of the highly
dispersed Pd, increasing H2 selectivity by switching off the H2O2 hydrogenation pathway.
The modification of the Pd could have been induced by Au and/or changes in the Clx- or O2-
species on the acid pre-treated support.
In order to investigate the effect of the palladium oxidation state on the performance of Au-
Pd/AwC samples, a set of carefully controlled reduction-oxidation treatments were performed.
Testing each material for the direct H2O2 synthesis and gathering quantified XPS data, the
catalytic activity was investigated as a function of the palladium oxidation state.

-------------- CHAPTER THREE: The Effect of Heat Treatment Conditions on Catalytic Activity ------------------
77
3.4 Reduction – Oxidation Treatment of Au-Pd/Acid-Washed Carbon
Catalysts prepared by incipient wetness impregnation using standard conditions (calcined
at 400 oC preceding deposition of the metals) were subjected to various reduction – oxidation
treatments to elucidate the influence of the Pd oxidation state.
3.4.1 Direct H2O2 Synthesis and Hydrogenation
A Au-Pd catalyst, prepared on an acid pre-treated activated carbon support, that
showed high activity towards the direct synthesis and some residual hydrogenation of
hydrogen peroxide was selected as the baseline material. This was prepared by manipulation
of the impregnation procedure as described previously29. A sample with some hydrogenation
activity was needed to determine that the reduction-oxidation treatment had a negative or
positive effect on hydrogenation activity.
3.4.1.1 Reduction
Firstly the baseline catalyst was subjected to a series of reduction procedures at
various temperatures, using 5 %H2/Ar. Their activities towards the direct synthesis and
hydrogenation of hydrogen peroxide are shown in Table 3.5.
Table 3.5 - Effect of reduction at various temperatures on a 2.5 wt%Au-2.5 wt%Pd/AwC
catalyst (pre-treated with 2 %HNO3).
Sample Heat treatment Productivity
(molH2O2kgcat-1h-1)
Hydrogenation
(molH2O2kgcat-1h-1)
a Initial catalyst 185 60
Sample a + 5 %H2/Ar treatment
Temperature ( oC) Time ( h)
b 100 1 176 72
c 110 2 173 86
d 150 2 141 126
e 200 2 80 286
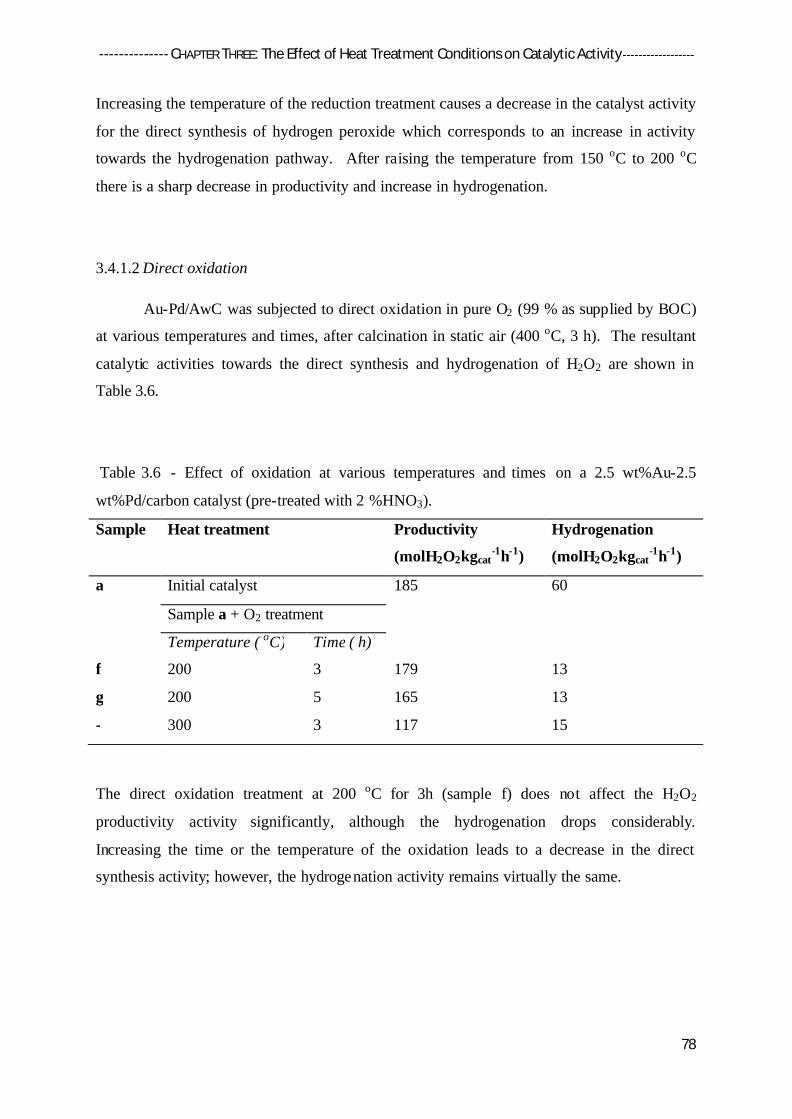
-------------- CHAPTER THREE: The Effect of Heat Treatment Conditions on Catalytic Activity ------------------
78
Increasing the temperature of the reduction treatment causes a decrease in the catalyst activity
for the direct synthesis of hydrogen peroxide which corresponds to an increase in activity
towards the hydrogenation pathway. After raising the temperature from 150 oC to 200 oC
there is a sharp decrease in productivity and increase in hydrogenation.
3.4.1.2 Direct oxidation
Au-Pd/AwC was subjected to direct oxidation in pure O2 (99 % as supplied by BOC)
at various temperatures and times, after calcination in static air (400 oC, 3 h). The resultant
catalytic activities towards the direct synthesis and hydrogenation of H2O2 are shown in
Table 3.6.
Table 3.6 - Effect of oxidation at various temperatures and times on a 2.5 wt%Au-2.5
wt%Pd/carbon catalyst (pre-treated with 2 %HNO3).
Sample Heat treatment Productivity
(molH2O2kgcat-1h-1)
Hydrogenation
(molH2O2kgcat-1h-1)
a Initial catalyst 185 60
Sample a + O2 treatment
Temperature ( oC) Time ( h)
f 200 3 179 13
g 200 5 165 13
- 300 3 117 15
The direct oxidation treatment at 200 oC for 3h (sample f) does not affect the H2O2
productivity activity significantly, although the hydrogenation drops considerably.
Increasing the time or the temperature of the oxidation leads to a decrease in the direct
synthesis activity; however, the hydrogenation activity remains virtually the same.

-------------- CHAPTER THREE: The Effect of Heat Treatment Conditions on Catalytic Activity ------------------
79
3.4.1.3 Re-oxidation of reduced sample
Au-Pd/AwC which was previously subjected to calcination (400 oC, 3 h) and
reduction (5 %H2/Ar, 200 oC, 2 h) at was re-oxidised in pure O2 (99 %) at 100 oC and 200 oC;
the resultant materials activities towards the direct synthesis and hydrogenation of H2O2 are
shown in Table 3.7.
Table 3.7 - Effect of oxidation at various temperatures on a reduced 2.5 wt%Au-2.5
wt%Pd/AwC catalyst (pre-treated with 2 %HNO3).
Sample Heat treatment Productivity
(molH2O2kgcat-1h-1)
Hydrogenation
(molH2O2kgcat-1h-1)
a Initial catalyst 185 60
Sample a + 5%H2/Ar treatment
Temperature ( oC) Time ( h)
e 200 2 80 286
Sample e + O2 treatment
Temperature ( oC) Time ( h)
h 100 3 116 180
i 200 3 126 0
Increasing the temperature of the oxidation treatment causes an increase in the activity of the
catalyst towards H2O2 formation, and decreases the hydrogenation activity. The Au-Pd/AwC
catalyst reduced at 200 oC and then re-oxidised at 200 oC exhibits, very importantly, no
activity towards the hydrogenation of hydrogen peroxide.
3.4.2 X-Ray Photoelectron Spectroscopy (XPS)
The Pd(3d) XP spectra for the Au-Pd catalysts, supported on acid pre-treated carbon,
subjected to reduction and oxidation treatments are presented in Figure 3.5 and re-oxidised
sample in Figure 3.6. The quantified XPS data is shown in Table 3.8.
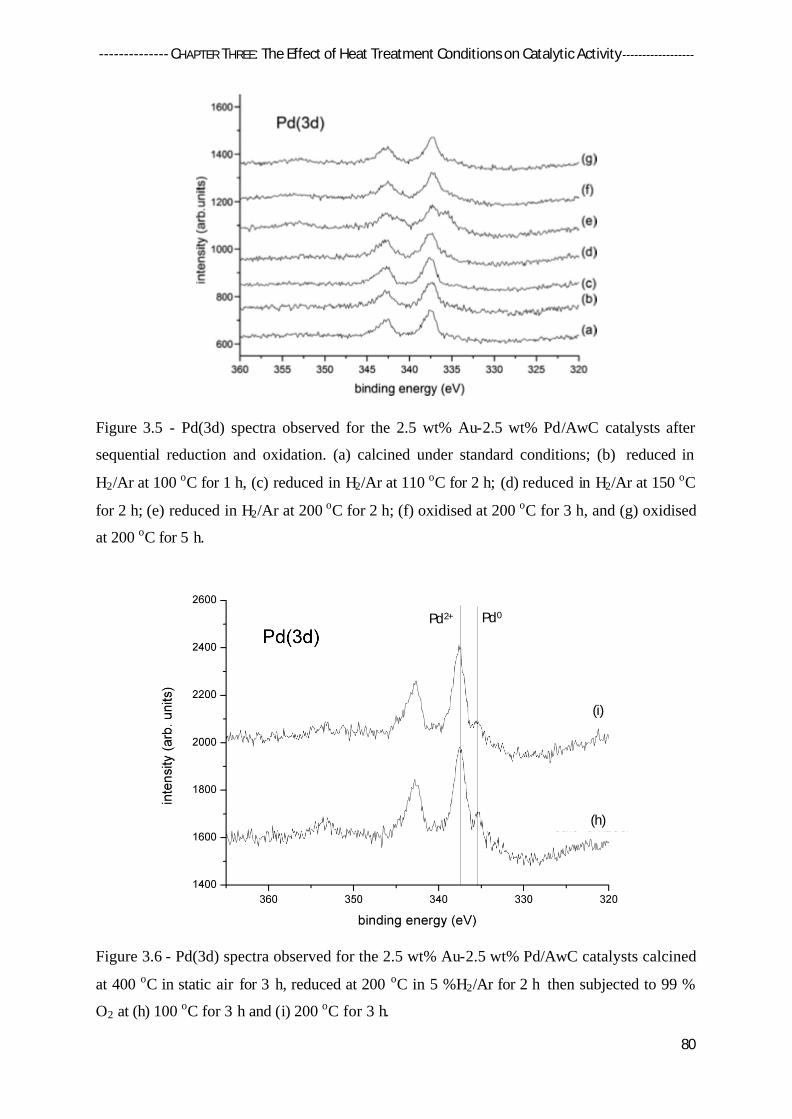
-------------- CHAPTER THREE: The Effect of Heat Treatment Conditions on Catalytic Activity ------------------
80
Figure 3.5 - Pd(3d) spectra observed for the 2.5 wt% Au-2.5 wt% Pd/AwC catalysts after
sequential reduction and oxidation. (a) calcined under standard conditions; (b) reduced in
H2/Ar at 100 oC for 1 h, (c) reduced in H2/Ar at 110 oC for 2 h; (d) reduced in H2/Ar at 150 oC
for 2 h; (e) reduced in H2/Ar at 200 oC for 2 h; (f) oxidised at 200 oC for 3 h, and (g) oxidised
at 200 oC for 5 h.
Figure 3.6 - Pd(3d) spectra observed for the 2.5 wt% Au-2.5 wt% Pd/AwC catalysts calcined
at 400 oC in static air for 3 h, reduced at 200 oC in 5 %H2/Ar for 2 h then subjected to 99 %
O2 at (h) 100 oC for 3 h and (i) 200 oC for 3 h.
(h)
(i)
Pd0Pd2+
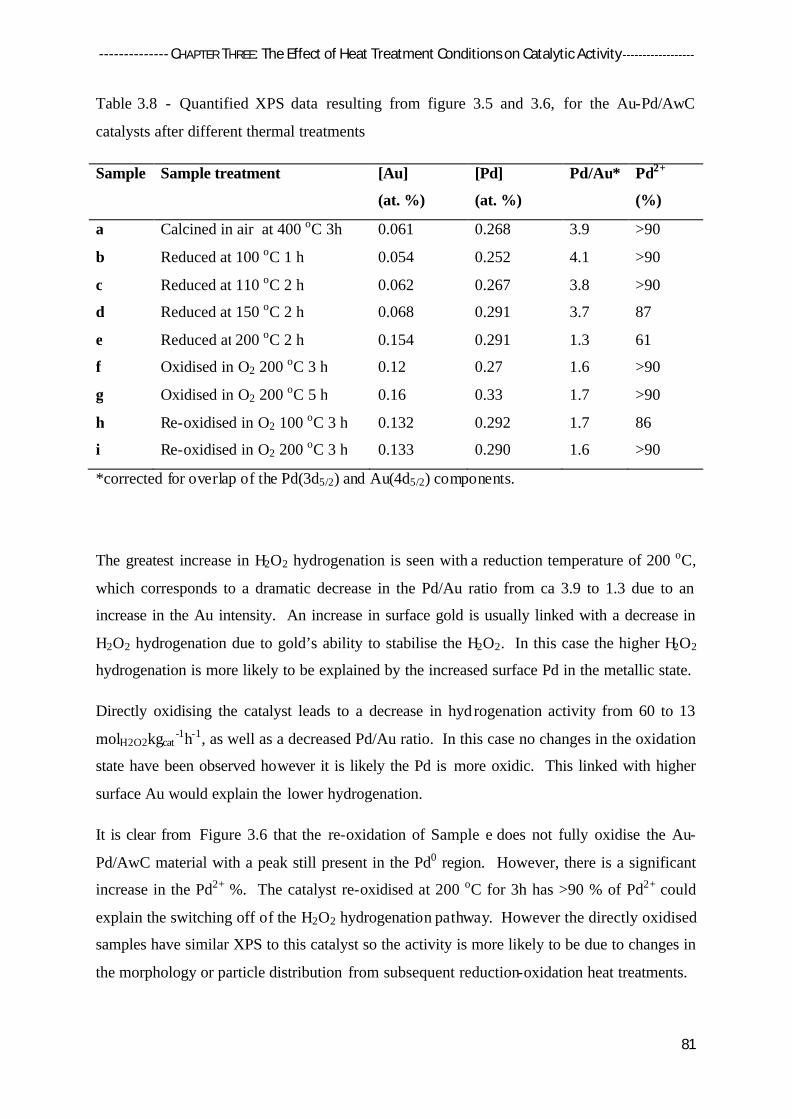
-------------- CHAPTER THREE: The Effect of Heat Treatment Conditions on Catalytic Activity ------------------
81
Table 3.8 - Quantified XPS data resulting from figure 3.5 and 3.6, for the Au-Pd/AwC
catalysts after different thermal treatments
Sample Sample treatment [Au]
(at. %)
[Pd]
(at. %)
Pd/Au* Pd2+
(%)
a Calcined in air at 400 oC 3h 0.061 0.268 3.9 >90
b Reduced at 100 oC 1 h 0.054 0.252 4.1 >90
c Reduced at 110 oC 2 h 0.062 0.267 3.8 >90
d Reduced at 150 oC 2 h 0.068 0.291 3.7 87
e Reduced at 200 oC 2 h 0.154 0.291 1.3 61
f Oxidised in O2 200 oC 3 h 0.12 0.27 1.6 >90
g Oxidised in O2 200 oC 5 h 0.16 0.33 1.7 >90
h Re-oxidised in O2 100 oC 3 h 0.132 0.292 1.7 86
i Re-oxidised in O2 200 oC 3 h 0.133 0.290 1.6 >90
*corrected for overlap of the Pd(3d5/2) and Au(4d5/2) components.
The greatest increase in H2O2 hydrogenation is seen with a reduction temperature of 200 oC,
which corresponds to a dramatic decrease in the Pd/Au ratio from ca 3.9 to 1.3 due to an
increase in the Au intensity. An increase in surface gold is usually linked with a decrease in
H2O2 hydrogenation due to gold’s ability to stabilise the H2O2. In this case the higher H2O2
hydrogenation is more likely to be explained by the increased surface Pd in the metallic state.
Directly oxidising the catalyst leads to a decrease in hydrogenation activity from 60 to 13
molH2O2kgcat-1h-1, as well as a decreased Pd/Au ratio. In this case no changes in the oxidation
state have been observed however it is likely the Pd is more oxidic. This linked with higher
surface Au would explain the lower hydrogenation.
It is clear from Figure 3.6 that the re-oxidation of Sample e does not fully oxidise the Au-
Pd/AwC material with a peak still present in the Pd0 region. However, there is a significant
increase in the Pd2+ %. The catalyst re-oxidised at 200 oC for 3h has >90 % of Pd2+ could
explain the switching off of the H2O2 hydrogenation pathway. However the directly oxidised
samples have similar XPS to this catalyst so the activity is more likely to be due to changes in
the morphology or particle distribution from subsequent reduction-oxidation heat treatments.

-------------- CHAPTER THREE: The Effect of Heat Treatment Conditions on Catalytic Activity ------------------
82
Re-oxidation leads to a small increase in the Pd/Au ratio from 1.3 to 1.6. These effects are
consistent with the activity of the catalyst and as has previously been indicated, the Pd/Au
ratio is important in controlling the formation of H2O2. The level of interaction between Au
and Pd is likely to be crucial to reducing and switching off H2O2 hydrogenation28.
The Pd (3d) spectra were analysed to deduce the Pd2+ and Pd0 content. These were obtained
through curve fitting of the Pd (3d) spectra, although the process was complicated by the
presence of the Au (4d5/2) component under the Pd (3d) envelope. This is a particular
problem here due to the significant surface gold content for the reduced and re-oxidised
samples. Strict parameter constraints had to be used, some dependent on the measured values
for the metal-oxide binding energy shift and the magnitude of the Au (4d) spin orbit splitting.
The Cl (2p), Au (4f) and O (1s) spectra (Figure 3.7) showed no significant changes in profile.
There is no change in either the Au or Cl- electronic state, indicating the difference between
the standard reduction potentials of Au3+ and Pd2+ cations. Also confirming significant
interaction of Cl- species with the support as discussed in section 3.2.4.
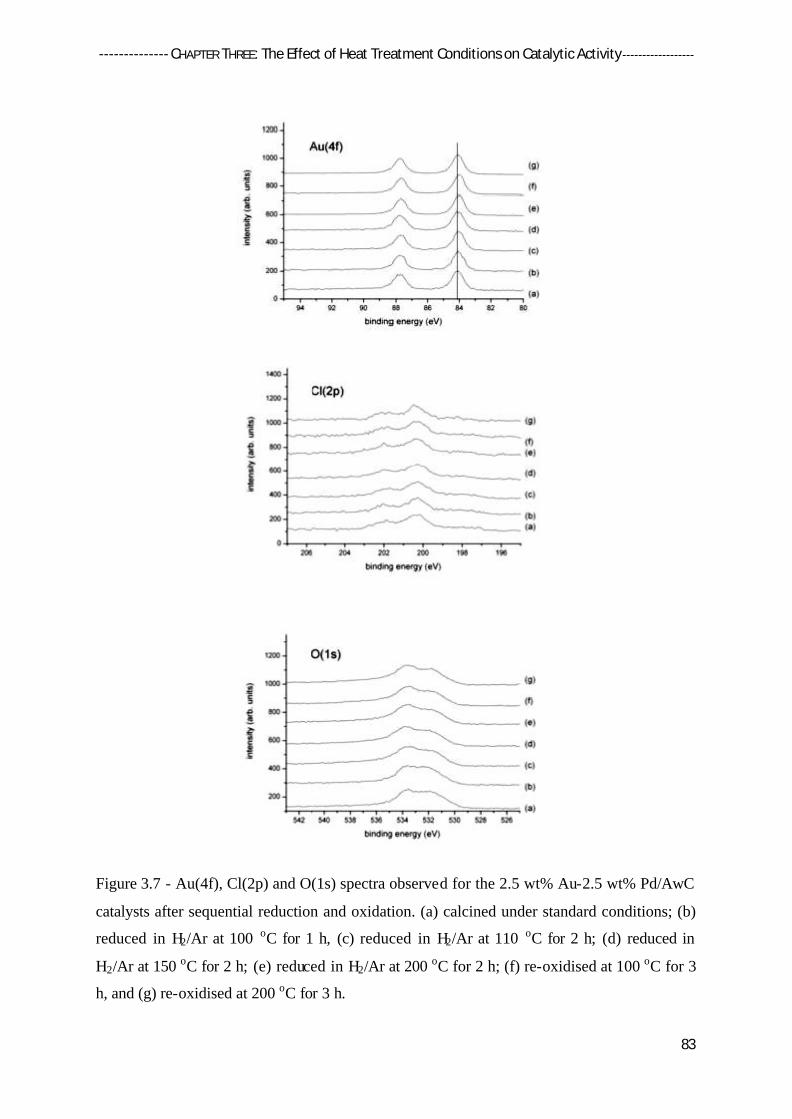
-------------- CHAPTER THREE: The Effect of Heat Treatment Conditions on Catalytic Activity ------------------
83
Figure 3.7 - Au(4f), Cl(2p) and O(1s) spectra observed for the 2.5 wt% Au-2.5 wt% Pd/AwC
catalysts after sequential reduction and oxidation. (a) calcined under standard conditions; (b)
reduced in H2/Ar at 100 oC for 1 h, (c) reduced in H2/Ar at 110 oC for 2 h; (d) reduced in
H2/Ar at 150 oC for 2 h; (e) reduced in H2/Ar at 200 oC for 2 h; (f) re-oxidised at 100 oC for 3
h, and (g) re-oxidised at 200 oC for 3 h.

-------------- CHAPTER THREE: The Effect of Heat Treatment Conditions on Catalytic Activity ------------------
84
3.4.3 Electron Microscopy (EM)
A series of STEM-HAADF images of the Au-Pd catalysts, supported on acid pre-
treated activated carbon support, subjected to the sequential reduction and oxidation
conditions are shown in Figure 3.8.
Figure 3.8 - STEM-HAADF images of the Au- Pd/AwC catalysts after sequential reduction
and oxidation. (a) Sample calcined under standard conditions at 400 oC for 3 h; (b) shows
sample (a) heated in O2 at 200 oC for 3 h; (c) shows sample (a) reduced in 5% H2/Ar at 200 oC for 2 h; and (d) shows sample (c) re-oxidised at 200 oC in O2 for 3 h.
The baseline material, figure 3.8a, was the Au-Pd/AwC catalyst that had been calcined at
400oC for 3 hours, which showed predominately atomically dispersed Pd species intermixed
a b
c d
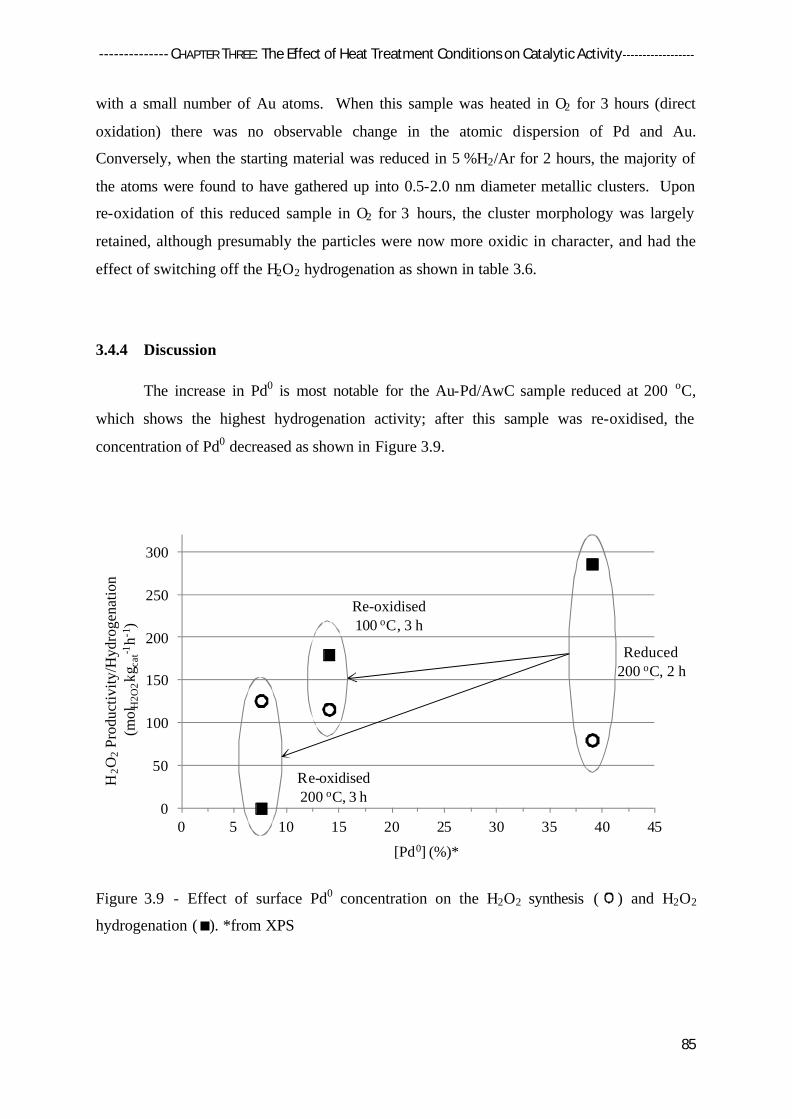
-------------- CHAPTER THREE: The Effect of Heat Treatment Conditions on Catalytic Activity ------------------
85
with a small number of Au atoms. When this sample was heated in O2 for 3 hours (direct
oxidation) there was no observable change in the atomic dispersion of Pd and Au.
Conversely, when the starting material was reduced in 5 %H2/Ar for 2 hours, the majority of
the atoms were found to have gathered up into 0.5-2.0 nm diameter metallic clusters. Upon
re-oxidation of this reduced sample in O2 for 3 hours, the cluster morphology was largely
retained, although presumably the particles were now more oxidic in character, and had the
effect of switching off the H2O2 hydrogenation as shown in table 3.6.
3.4.4 Discussion
The increase in Pd0 is most notable for the Au-Pd/AwC sample reduced at 200 oC,
which shows the highest hydrogenation activity; after this sample was re-oxidised, the
concentration of Pd0 decreased as shown in Figure 3.9.
Figure 3.9 - Effect of surface Pd0 concentration on the H2O2 synthesis ( ) and H2O2
hydrogenation ( ). *from XPS
0
50
100
150
200
250
300
0 5 10 15 20 25 30 35 40 45
[Pd0] (%)*
H2O
2Pr
oduc
tivity
/Hyd
roge
natio
n(m
olH
2O2k
g cat
-1h-1
)
Reduced200 oC, 2 h
Re-oxidised100 oC, 3 h
Re-oxidised200 oC, 3 h

-------------- CHAPTER THREE: The Effect of Heat Treatment Conditions on Catalytic Activity ------------------
86
During Pd reduction, to form Pd0 species, a structural rearrangement may occur (Figure
3.10), leading to the formation of surface defects (more active sites), which could easily
account for the improved hydrogenation performance responsible for the low H2O2 synthesis
activity of the reduced materials. Upon re-oxidising the reduced species an oxidic layer
could be forming stabilising the metal particles and protecting them from taking part in H2O2
hydrogenation.
Figure 3.10 - Change in Pd particle structure from reduction – oxidation treatment; adapted
from Melada et al.26
Another contributing factor could be the formation of ß-PdH from the dissolution of H2 into
Pd clusters during heat treatment under H2. If ß-PdH is present on the catalyst surface it
could account for the hydrogenation activity observed due to its high reduction potential.
However, as ß-PdH decomposition is around 70 oC it is likely that reduction at 200 oC would
cause re-dispersion of active metallic palladium species from its decomposition.30 Reduction
of a metal supported catalyst generally weakens the metal-support bond causing the metallic
particles to become more mobile on the support surface. This accounts for the ‘mopping up’
of atomic species during reduction seen by STEM analysis and why direct oxidation doesn’t
have the desired effect of switching off H2O2 hydrogenation.
When preparing a sample by using the standard impregnation procedure, the addition of Au
to Pd and an acid pre-treatment of activated carbon are required to produce a catalyst that
does not hydrogenate H2O2.
To extend these studies and gain greater fundamental understanding of the scope of the
reduction – oxidation treatment, the dependence on the addition of Au and the nature of the
support for switching off H2O2 hydrogenation have been investigated in the following
sections.
AwC AwC AwC
PdO Pd Pd-PdO
H2 O2
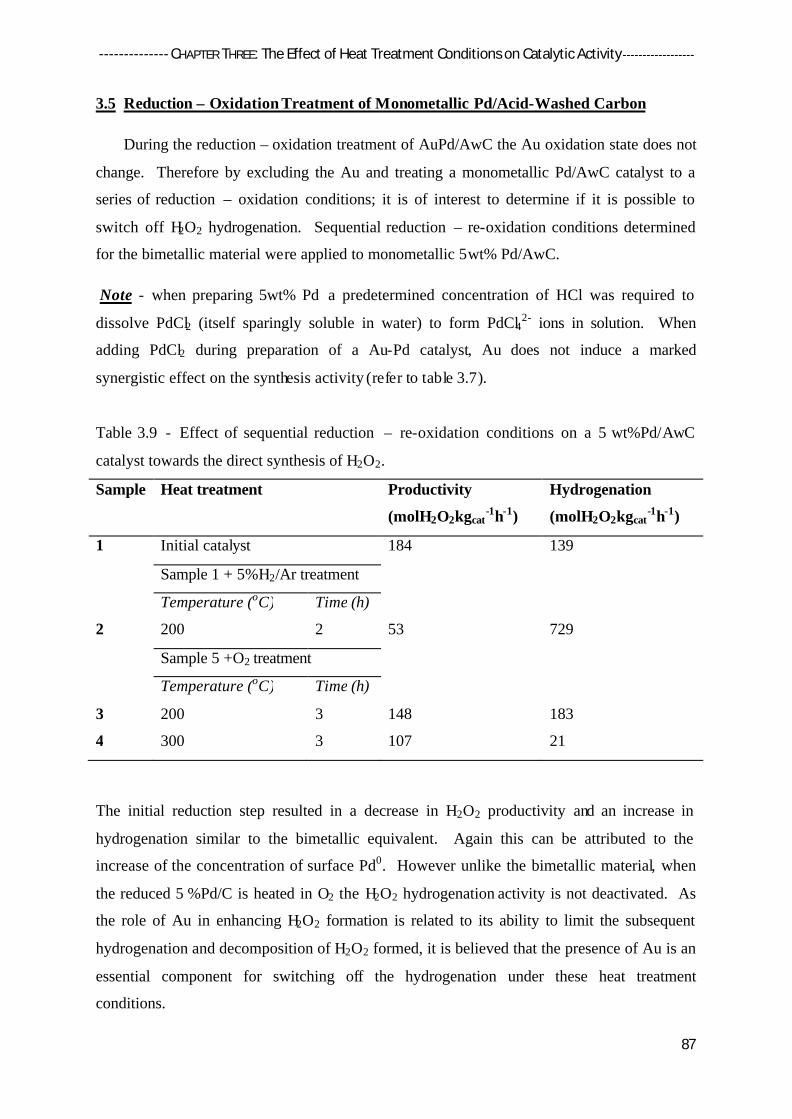
-------------- CHAPTER THREE: The Effect of Heat Treatment Conditions on Catalytic Activity ------------------
87
3.5 Reduction – Oxidation Treatment of Monometallic Pd/Acid-Washed Carbon
During the reduction – oxidation treatment of AuPd/AwC the Au oxidation state does not
change. Therefore by excluding the Au and treating a monometallic Pd/AwC catalyst to a
series of reduction – oxidation conditions; it is of interest to determine if it is possible to
switch off H2O2 hydrogenation. Sequential reduction – re-oxidation conditions determined
for the bimetallic material were applied to monometallic 5wt% Pd/AwC.
Note - when preparing 5wt% Pd a predetermined concentration of HCl was required to
dissolve PdCl2 (itself sparingly soluble in water) to form PdCl42- ions in solution. When
adding PdCl2 during preparation of a Au-Pd catalyst, Au does not induce a marked
synergistic effect on the synthesis activity (refer to table 3.7).
Table 3.9 - Effect of sequential reduction – re-oxidation conditions on a 5 wt%Pd/AwC
catalyst towards the direct synthesis of H2O2.
Sample Heat treatment Productivity
(molH2O2kgcat-1h-1)
Hydrogenation
(molH2O2kgcat-1h-1)
1 Initial catalyst 184 139
Sample 1 + 5%H2/Ar treatment
Temperature (oC) Time (h)
2 200 2 53 729
Sample 5 +O2 treatment
Temperature (oC) Time (h)
3 200 3 148 183
4 300 3 107 21
The initial reduction step resulted in a decrease in H2O2 productivity and an increase in
hydrogenation similar to the bimetallic equivalent. Again this can be attributed to the
increase of the concentration of surface Pd0. However unlike the bimetallic material, when
the reduced 5 %Pd/C is heated in O2 the H2O2 hydrogenation activity is not deactivated. As
the role of Au in enhancing H2O2 formation is related to its ability to limit the subsequent
hydrogenation and decomposition of H2O2 formed, it is believed that the presence of Au is an
essential component for switching off the hydrogenation under these heat treatment
conditions.

-------------- CHAPTER THREE: The Effect of Heat Treatment Conditions on Catalytic Activity ------------------
88
3.6 Influence of the Support
Further investigation was required to determine the effect of the support in switching off
H2O2 hydrogenation with reduction – oxidation treatments. This has been achieved by
studying the effect of the sequential reduction–re-oxidation conditions on the activity of Au-
Pd/C and Au-Pd/TiO2 was investigated.
3.6.1 Sequential Reduction - Re-Oxidation of Au-Pd/C (Untreated Carbon)
A Au-Pd/C catalyst produced by impregnation was subjected to sequential reduction-
re-oxidation treatment and tested for the direct synthesis of H2O2, table 3.10. The sequential
heat treatment utilised has previously been shown to turn off H2O2 hydrogenation for a Au-
Pd/AwC, in section 3.4.
Table 3.10 - Effect of sequential reduction – re-oxidation conditions on a Au-Pd/C (untreated
carbon) catalyst towards the direct synthesis of H2O2.
Sample Heat treatment Productivity
(molH2O2kgcat-1h-1)
Hydrogenation
(molH2O2kgcat-1h-1)
1 Initial catalyst 108 98
Sample 1 + 5%H2/Ar treatment
Temperature (oC) Time (h)
2 200 2 101 302
Sample 2 +O2 treatment
Temperature (oC) Time (h)
3 200 2 99 139
4 200 3 82 31
Interestingly, the hydrogenation could not be switched off on Au-Pd/C, indicating significant
differences based on support choice.
When the Au-Pd/C was subjected to the reduction conditions (sample 2), the productivity
remains similar to the non-reduced sample whereas the hydrogenation increases dramatically.

-------------- CHAPTER THREE: The Effect of Heat Treatment Conditions on Catalytic Activity ------------------
89
This is believed to be due to reductio n of the surface palladium, producing active sites which
are responsible for H2O2 hydrogenation.
Re-oxidation at 200oC for 2 hours (sample 3) doesn’t affect H2O2 productivity activity,
however the hydrogenation approximately halves. This confirming an earlier conclusion that
different active sites are responsible for the H2O2 productivity and hydrogenation.
Upon re-oxidation for 3 hours (sample 4) both the H2O2 productivity and hydrogenation
decrease, indicating that the overall activity of the catalyst has dropped. However, the H2O2
hydrogenation hasn’t been switched off. Decreased activity of the catalyst could be due to
sintering of the Au and Pd nano-particles producing larger oxidised Au-Pd clusters (as seen in
figure 3.8 for Au-Pd/AwC subjected to the same treatment), which have less activity,
suggesting that re-oxidation for 3 hours is too long.
The Au-Pd/C samples were characterised using XPS, the Pd(3d) spectra is shown in Figure
3.11 with corresponding quantified XP data in Table 3.11.
Figure 3.11 - Pd(3d) spectra observed for the 2.5 wt% Au-2.5 wt% Pd/C catalysts after
sequential reduction and oxidation. (a) calcined under standard conditions (400 oC, 3 h) ; (b)
reduced in H2/Ar at 200 oC for 2 h; (c) (b) re-oxidised at 200 oC for 2 h and (d) (b) re-
oxidised at 200 oC for 3 h.
(d)
(c)
(b)
(a)
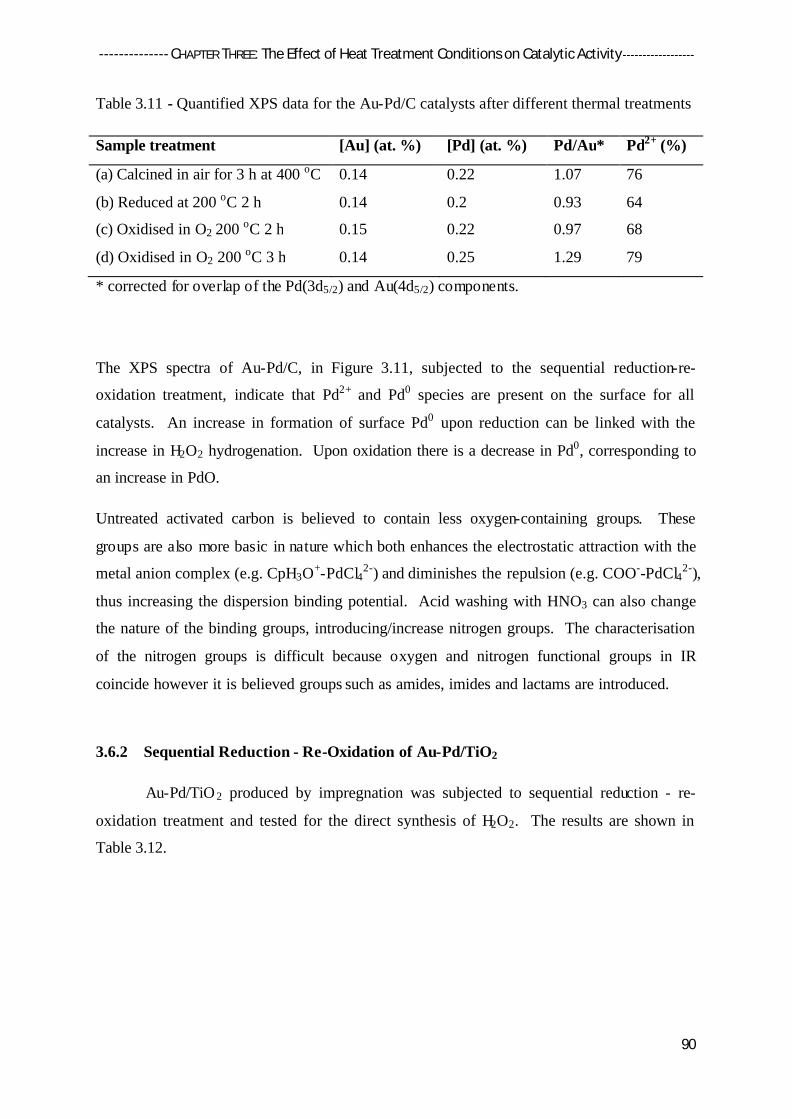
-------------- CHAPTER THREE: The Effect of Heat Treatment Conditions on Catalytic Activity ------------------
90
Table 3.11 - Quantified XPS data for the Au-Pd/C catalysts after different thermal treatments
Sample treatment [Au] (at. %) [Pd] (at. %) Pd/Au* Pd2+ (%)
(a) Calcined in air for 3 h at 400 oC 0.14 0.22 1.07 76
(b) Reduced at 200 oC 2 h 0.14 0.2 0.93 64
(c) Oxidised in O2 200 oC 2 h 0.15 0.22 0.97 68
(d) Oxidised in O2 200 oC 3 h 0.14 0.25 1.29 79
* corrected for overlap of the Pd(3d5/2) and Au(4d5/2) components.
The XPS spectra of Au-Pd/C, in Figure 3.11, subjected to the sequential reduction-re-
oxidation treatment, indicate that Pd2+ and Pd0 species are present on the surface for all
catalysts. An increase in formation of surface Pd0 upon reduction can be linked with the
increase in H2O2 hydrogenation. Upon oxidation there is a decrease in Pd0, corresponding to
an increase in PdO.
Untreated activated carbon is believed to contain less oxygen-containing groups. These
groups are also more basic in nature which both enhances the electrostatic attraction with the
metal anion complex (e.g. CpH3O+-PdCl42-) and diminishes the repulsion (e.g. COO--PdCl42-),
thus increasing the dispersion binding potential. Acid washing with HNO3 can also change
the nature of the binding groups, introducing/increase nitrogen groups. The characterisation
of the nitrogen groups is difficult because oxygen and nitrogen functional groups in IR
coincide however it is believed groups such as amides, imides and lactams are introduced.
3.6.2 Sequential Reduction - Re-Oxidation of Au-Pd/TiO2
Au-Pd/TiO2 produced by impregnation was subjected to sequential reduction - re-
oxidation treatment and tested for the direct synthesis of H2O2. The results are shown in
Table 3.12.

-------------- CHAPTER THREE: The Effect of Heat Treatment Conditions on Catalytic Activity ------------------
91
Table 3.12 - Effect of sequential reduction – re-oxidation conditions on the activity of a Au-
Pd/TiO2 catalyst towards the direct synthesis of H2O2.
Sample Heat treatment Productivity
(molH2O2kgcat-1h-1)
Hydrogenation
(molH2O2kgcat-1h-1)
1 Initial catalyst 67 221
Sample 1 + 5%H2/Ar treatment
Temperature (oC) Time (h)
2 200 2 76 353
Sample 2 +O2 treatment
Temperature (oC) Time (h)
3 200 3 82 47
Reduction of Au-Pd/TiO2 preceding calcination (sample 2) is responsible for an increase in
both the H2O2 productivity and the H2O2 hydrogenation, which is again believed to be due to
an increase in surface Pd0.
Re-oxidation (sample 3) dramatically decreases the hydrogenation corresponding to an
increase in the H2O2 productivity.
The larger changes in activity could be due to less stable interaction between Pd-complexes
and the surface increasing mobility and stability of the complex.
The nature of the support has previously been shown to be crucial to the activity of the
catalysts towards direct H2O2 synthesis1, 2, 9, 28, 31-33. Reasons for this include differing
reduction potentials of Au and Pd according to the chemical nature of the support as well as
the concentration of oxygen-containing groups and their nature responsible for binding the
metals are different.
Determination of the iso-electric point and surface acidity are cons idered important
parameters in modifying the structure and activity of Au-Pd catalysts. While these
techniques were not made available for this study, the specificity of the pre-treatment step
with respect to concentration and acid species has an important effect.
-------------- CHAPTER THREE: The Effect of Heat Treatment Conditions on Catalytic Activity ------------------
92
3.7 Conclusion
In this chapter two ways of maintaining high synthesis rates while also switching off
activity towards H2O2 hydrogenation have been shown. The acid-pre-treatment of the
support prior to deposition of the metals, Au and Pd, drying and calcination at 400 oC for 3 h
in static air presents one way of achieving this goal. And that a sequential reduction – re-
oxidation treatment presents an alternative route to the same outcome. Further studies
indicate that using acid-washed carbon and the presence of gold are essential to preparing a
catalyst with zero H2O2 hydrogenation under standard conditions.
These experiments show that the oxidation state of Pd is crucial for determining not only the
initial formation of H2O2, but also its sequential hydrogenation. It is clear that minimising
the amount of Pd0 is essential and the role of the Au and Pd2+ (as well as Clx-) could
essentially be to isolate the residual Pd0 so that the active sites required for synthesis persist,
but those for hydrogenation are minimised. As H2O2 hydrogenation /decomposition can be
switched off, as demonstrated by acid washing the support followed by an oxidation
procedure, then it is clear that the sites for synthesis and hydrogenation of H2O2 are different.
This is a logical conclusion since the sites for synthesis require the associative adsorption of
O2 followed by hydrogenation, whereas the sites for hydrogenation / decomposition will
break the O-O bond. Isolating Pd0 sites on the surface enables high rates of synthesis.
3.8 References
1. V. R. Choudhary and P. Jana, Catalysis Communications, 2008, 9, 1624-1629. 2. J. K. Edwards, A. Thomas, A. F. Carley, A. A. Herzing, C. J. Kiely and G. J. Hutchings, Green
Chemistry, 2008, 10, 388-394. 3. J. K. Edwards, A. F. Carley, A. A. Herzing, C. J. Kiely and G. J. Hutchings, Faraday Discussions,
2008, 138, 225-239. 4. A. A. Herzing, A. F. Carley, J. K. Edwards, G. J. Hutchings and C. J. Kiely, Chemistry of
Materials, 2008, 20, 1492-1501. 5. J. K. Edwards, B. E. Solsona, P. Landon, A. F. Carley, A. Herzing, C. J. Kiely and G. J. Hutchings,
Journal of Catalysis, 2005, 236, 69-79. 6. F. Menegazzo, P. Burti, M. Signoretto, M. Manzoli, S. Vankova, F. Boccuzzi, F. Pinna and G.
Strukul, Journal of Catalysis, 2008, 257, 369-381. 7. P. Landon, P. J. Collier, A. F. Carley, D. Chadwick, A. J. Papworth, A. Burrows, C. J. Kiely and G.
J. Hutchings, Physical Chemistry Chemical Physics, 2003, 5, 1917-1923. 8. A. F. Lee, C. J. Baddeley, C. Hardacre, R. M. Ormerod, R. M. Lambert, G. Schmid and H. West,
The Journal of Physical Chemistry, 1995, 99, 6096-6102. 9. J. K. Edwards, E. Ntainjua N, A. F. Carley, A. A. Herzing, C. J. Kiely and G. J. Hutchings,
Angewandte Chemie International Edition, 2009, 48, 8512-8515.

-------------- CHAPTER THREE: The Effect of Heat Treatment Conditions on Catalytic Activity ------------------
93
10. J. K. Edwards, B. Solsona, E. N. N, A. F. Carley, A. A. Herzing, C. J. Kiely and G. J. Hutchings, Science, 2009, 323, 1037-1041.
11. J. K. Edwards, J. Pritchard, M. Piccinini, G. Shaw, Q. He, A. F. Carley, C. J. Kiely and G. J. Hutchings, Journal of Catalysis, 2012, 292, 227-238.
12. D. P. Dissanayake and J. H. Lunsford, Journal of Catalysis, 2002, 206, 173-176. 13. D. P. Dissanayake and J. H. Lunsford, Journal of Catalysis, 2003, 214, 113-120. 14. P. A. Simonov, A. V. Romanenko, I. P. Prosvirin, E. M. Moroz, A. I. Boronin, A. L. Chuvilin and
V. A. Likholobov, Carbon, 1997, 35, 73-82. 15. N. E. Ntainjua, M. Piccinini, J. C. Pritchard, J. K. Edwards, A. F. Carley, J. A. Moulijn and G. J.
Hutchings, ChemSusChem, 2009, 2, 575-580. 16. E. Ntainjua N, M. Piccinini, J. C. Pritchard, Q. He, J. K. Edwards, A. F. Carley, J. A. Moulijn, C. J.
Kiely and G. J. Hutchings, ChemCatChem, 2009, 1, 479-484. 17. V. Choudhary, A. Gaikwad and S. Sansare, Catalysis Letters, 2002, 83, 235-239. 18. V. R. Choudhary, S. D. Sansare and A. G. Gaikwad, Catalysis Letters, 2002, 84, 81-87. 19. A. G. Gaikwad, S. D. Sansare and V. R. Choudhary, Journal of Molecular Catalysis A: Chemical,
2002, 181, 143-149. 20. C. Samanta and V. R. Choudhary, Applied Catalysis A: General, 2007, 326, 28-36. 21. C. Samanta and V. R. Choudhary, Chemical Engineering Journal, 2008, 136, 126-132. 22. C. Samanta and V. R. Choudhary, Applied Catalysis A: General, 2007, 330, 23-32. 23. V. V. Krishnan, A. G. Dokoutchaev and M. E. Thompson, Journal of Catalysis, 2000, 196, 366-
374. 24. S. Chinta and J. H. Lunsford, Journal of Catalysis, 2004, 225, 249-255. 25. R. Burch and P. R. Ellis, Applied Catalysis B-Environmental, 2003, 42, PII S0926-
3373(0902)00232-00231. 26. S. Melada, R. Rioda, F. Menegazzo, F. Pinna and G. Strukul, Journal of Catalysis, 2006, 239,
422-430. 27. M. Chen, D. Kumar, C.-W. Yi and D. W. Goodman, Science, 2005, 310, 291-293. 28. V. R. Choudhary, C. Samanta and T. V. Choudhary, Applied Catalysis A: General, 2006, 308,
128-133. 29. J. C. Pritchard, Q. He, E. N. Ntainjua, M. Piccinini, J. K. Edwards, A. A. Herzing, A. F. Carley, J. A.
Moulijn, C. J. Kiely and G. J. Hutchings, Green Chemistry, 2010, 12, 915-921. 30. M. W. Tew, J. T. Miller and J. A. van Bokhoven, The Journal of Physical Chemistry C, 2009,
113, 15140-15147. 31. J. K. Edwards, A. Thomas, B. E. Solsona, P. Landon, A. F. Carley and G. J. Hutchings, Catalysis
Today, 2007, 122, 397-402. 32. N. N. Edwin, J. K. Edwards, A. F. Carley, J. A. Lopez-Sanchez, J. A. Moulijn, A. A. Herzing, C. J.
Kiely and G. J. Hutchings, Green Chemistry, 2008, 10, 1162-1169. 33. E. N. Ntainjua, M. Piccinini, J. C. Pritchard, J. K. Edwards, A. F. Carley, C. J. Kiely and G. J.
Hutchings, Catalysis Today, 2011, 178, 47-50.

94
Catalysts Prepared by Physical Grinding
4.1 Introduction
As already described in Chapter 1, halides are often used in the reaction medium for the
direct synthesis of H2O2 as promoters. Particularly, they are very effective for enhancing the
catalytic activity of monometallic Pd supported catalysts by suppressing the unwanted and
non selective H2O2 hydrogenation pathway.1-8
Hutchings et al.9, 10 have investigated the effect of halide on bimetallic Au-Pd catalysts,
prepared by impregnation, for the direct H2O2 synthesis. Although there was an initial
promotion in activity in the presence of low halide concentrations (<0.0057 mmolBr- dm-1)
they concluded that neither the addition of halide to the solvent9, nor a pre-treatment of the
catalyst with halide10 are beneficial for bimetallic Au-Pd supported catalysts. The addition of
halide to the solvent and halide pre-treatment both caused leaching of the metal from the
catalyst during reaction, which could form active homogeneous species11, 12 that are
unsuitable for an industrial process. In these studies a Au-Pd catalyst was prepared by
impregnation using tetrachloroauric acid and palladium chloride as the precursors. Even after
calcination at 400 oC for 3 hours and washing the catalysts with water, a low chloride
concentration (0.45 at%, determined by XPS) remains on the catalyst surface, which may
affect the catalytic activity.
The presence of chloride during preparation has been found to increase the mobility of metal
nano-particles on the support, leading to larger metal particles forming.13 A method for
limiting chloride levels, remaining in catalysts, involves tuning the pH during deposition
precipitation, to ensure significant hydrolysis of the HAuCl4 to [Au(OH)4]-, and minimise Cl-
deposition onto the support.14 However, it is known that a pH that facilitates total hydrolysis
(~pH 10) also results in a decrease in the target Au loading levels (around 67% of the metal is
deposited).14, 15 Au-Pd catalysts prepared by deposition precipitation have previously been
shown to have low H2O2 productivity compared to impregnation catalysts.16 An alternative

--------------------------- CHAPTER FOUR: Catalysts Prepared by Physical Grinding ----------------------------------
95
method of reducing chloride levels is by reduction (heat treatment in a H2 rich atmosphere to
remove Cl- as HCl) of the catalyst, but unfortunately this causes metal particle agglomeration
through sintering14.
With a view to providing greater insight into the role the halide plays in Au-Pd catalysts for
the direct synthesis of hydrogen peroxide, a rapid, solvent-less, and readily scalable method
to prepare halide free Au-Pd supported nano-particles was developed. The technique, named
here as physical grinding, consists of mixing gold and palladium acetate with a preformed
support, followed by thermal treatment in an inert atmosphere to decompose the acetate salt.
The absence of aqueous chloride ions from the preparation medium significant ly decreases
the volume of material used, ensur ing that the catalyst preparation is completed in a greener
manner and is readily scalable.
The catalysts produced using this methodology have been shown to be highly active for the
direct H2O2 synthesis and the oxidation of benzyl alcohol, compared to previously reported
impregnation catalysts. The origins of these effects are discussed in the following sections.
Note - Full details of experimental procedures and characterisation techniques are described
in chapter two. The following reaction conditions have been utilised;
(a) Hydrogen Peroxide Synthesis catalyst (10 mg), 5% H2/CO2 (420 psi), 25% O2/CO2
(160psi), 5.6g MeOH and 2.9 H2O as solvent, 2 oC, 1200 rpm, 30 minutes.
(b) Hydrogen Peroxide Hydrogenation catalyst (10 mg), 5% H2/CO2 (420 psi), 5.6g MeOH,
2.22 H2O and 0.68g 50 wt% H2O2 as solvent, 2 oC, 1200 rpm, 30 minutes.
Au-Pd = 2.5 %Au-2.5% Pd. In the naming of catalysts PG is used for catalysts prepared by
physical grinding and IMP is used for catalysts prepared by impregnation. For example PG-
Au-Pd/C = 2.5 %Au-2.5%Pd supported on carbon prepared by physical grinding.
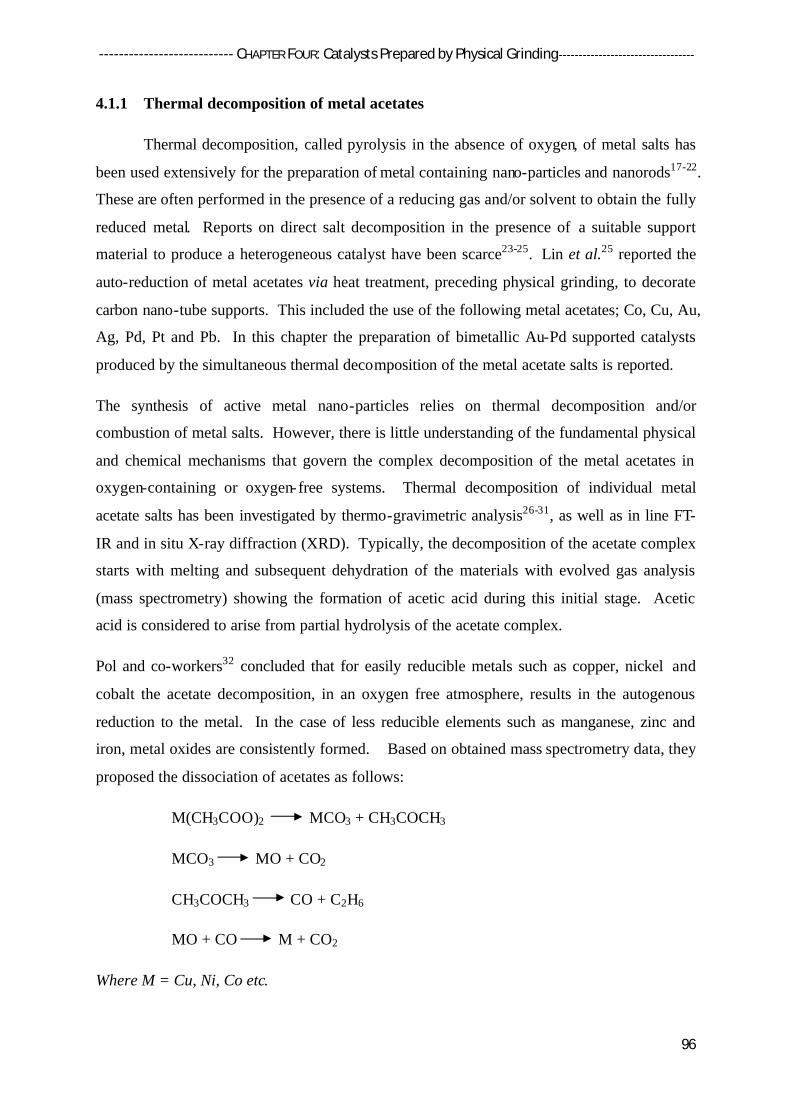
--------------------------- CHAPTER FOUR: Catalysts Prepared by Physical Grinding ----------------------------------
96
4.1.1 Thermal decomposition of metal acetates
Thermal decomposition, called pyrolysis in the absence of oxygen, of metal salts has
been used extensively for the preparation of metal containing nano-particles and nanorods17-22.
These are often performed in the presence of a reducing gas and/or solvent to obtain the fully
reduced metal. Reports on direct salt decomposition in the presence of a suitable support
material to produce a heterogeneous catalyst have been scarce23-25. Lin et al.25 reported the
auto-reduction of metal acetates via heat treatment, preceding physical grinding, to decorate
carbon nano-tube supports. This included the use of the following metal acetates; Co, Cu, Au,
Ag, Pd, Pt and Pb. In this chapter the preparation of bimetallic Au-Pd supported catalysts
produced by the simultaneous thermal decomposition of the metal acetate salts is reported.
The synthesis of active metal nano-particles relies on thermal decomposition and/or
combustion of metal salts. However, there is little understanding of the fundamental physical
and chemical mechanisms that govern the complex decomposition of the metal acetates in
oxygen-containing or oxygen-free systems. Thermal decomposition of individual metal
acetate salts has been investigated by thermo-gravimetric analysis26-31, as well as in line FT-
IR and in situ X-ray diffraction (XRD). Typically, the decomposition of the acetate complex
starts with melting and subsequent dehydration of the materials with evolved gas analysis
(mass spectrometry) showing the formation of acetic acid during this initial stage. Acetic
acid is considered to arise from partial hydrolysis of the acetate complex.
Pol and co-workers32 concluded that for easily reducible metals such as copper, nickel and
cobalt the acetate decomposition, in an oxygen free atmosphere, results in the autogenous
reduction to the metal. In the case of less reducible elements such as manganese, zinc and
iron, metal oxides are consistently formed. Based on obtained mass spectrometry data, they
proposed the dissociation of acetates as follows:
M(CH3COO)2 MCO3 + CH3COCH3
MCO3 MO + CO2
CH3COCH3 CO + C2H6
MO + CO M + CO2
Where M = Cu, Ni, Co etc.

--------------------------- CHAPTER FOUR: Catalysts Prepared by Physical Grinding ----------------------------------
97
The formation of the first oxygenated product, acetone, occurs by equation 1. The metal
carbonate which is a short lived intermediate, de-carboxylates to give a metal oxide at ca. 350 oC. Oxygenates, such as acetic acid, are known to decompose to hydrocarbon and further to
carbon. Then the metal oxide, in the case of certain metals such as nickel (-0.25 eV at 25 oC),
undergoes reduction by the evolved CO, while metals with lower reduction potential, such as
Fe (-0.44 eV at 25 oC), prefer to stay as the oxide.32 Note - The standard reduction potentials
for Pd and Au are +0.92 eV and +1.52 eV respectively, for metal-metal ion equilibrium,
therefore it is predicted their metal acetates will readily undergo reduction to the
corresponding metal.
The decomposition is considered complex with other products including acetic acid and
methane being produced. Judd et al.27 observed that acetic acid was the primary component
when a metal is formed; whereas, acetone is the primary component for decomposition that
results in metal acetate. A kinetic study of the decomposition of nickel acetate, by Leicester
and Redman,33 showed that rates of decomposition are affected by sample mass due to a
blanket of dense acetic acid formed from initial decomposition coating the sample. Arii and
Kishi,34 found that the humidity of the atmosphere had a dramatic effect on the
decomposition of zinc acetate, with ZnO only being formed when water vapour was present
in the atmosphere.
The thermal decomposition of bulk palladium acetate31, 35 and gold acetate30 have previously
been studied. Gallagher and Gross31 found that the ligand part CH3COO+ and CO2 were the
main decomposition products during TGA studies of palladium acetate to palladium metal.
In an inert atmosphere the decomposition took place between 200-300 oC, which had
observed activation energy of ca. 115 kJ mol-1 and enthalpy ca. 440+20 kJ mol-1.31 The
decomposition of thin palladium acetate films using an excimer UV lamp (? = 222 nm)
produced a number of fragments due to the high photon energy (540 kJ mol-1). The
fragments, analysised by mass spectrometry, included CO2+, CH3CO+, CH3C+, H2O+ and
CH3.35
Bakrania et al30 studied the decomposition of gold acetate, using TGA in an inert atmosphere,
and observed significant mass loss between 120-210 oC, with a DTG peak occurring at 170 oC. The same group examined the decomposition of gold acetate to be rapid and violent in
air with the decomposition occurring at ca. 103+20 oC. They concluded that the highly
exothermic nature of gold acetate and other metal acetates decomposition assists the

--------------------------- CHAPTER FOUR: Catalysts Prepared by Physical Grinding ----------------------------------
98
formation of nano-particles through fragmentation. Theses fragments can potentially be at
much higher temperature than the decomposition temperature.30 However, further
investigation into the decomposition at a macro-scale and in the presence of a support is
required to enable greater control over the architecture of the nano-particles.
4.2 Thermo-Gravimetric Analysis (TGA)
TGA records the weight loss of a material as the temperature is raised allowing the
decomposition temperature of the metal acetates to be pinpointed. These were determined
from the differential thermo-gravimetric (DTG) curve obtained at 5 oC min-1 in N2 (refer to
chapter two for full experimental procedures).
Gold and palladium acetate were investigated individually and together, both with and
without supports. It is essential the thermal treatment temperature used is above the
decomposition temperature required to produce the active metal catalyst.
4.2.1 Bulk Metal Acetates
Thermo-gravimetric analysis (TGA) was performed on the bulk acetates, palladium
acetate Figure 4.1A and gold acetate, Figure 4.1B, and a 1:1 weight mixture of both, Figure
4.2.
Figure 4.1 - TGA-DTG of metal acetate salts under flowing nitrogen with 5 oC min-1 ramp
rate A) palladium (II) acetate, B) gold (III) acetate.
A B

--------------------------- CHAPTER FOUR: Catalysts Prepared by Physical Grinding ----------------------------------
99
The decomposition temperatures of the palladium and gold salts corresponded well with
those quoted in the literature25, 30, 31, ca.190 oC and ca.180 oC respectively. Gold acetate had
a low temperature weight loss around 100 oC associated with absorbed water. Both acetate
DTG peaks have a slight shoulder at ca. 180 oC for palladium acetate and ca. 200 oC for gold
acetate; suggesting that decomposition occurs in two separate steps, highlighting the complex
nature of acetate decomposition.
Figure 4.2 - TGA-DTG of a gold (III) acetate and palladium (II) acetate mixture, 1:1 by
weight, under flowing nitrogen with 5 oC min-1 ramp rate.
When the salts were combined (with a 1:1 wt ratio) there was no obvious change in the
decomposition profile or temperature of the gold and palladium acetates, ca.190 oC and
ca.180 oC respectively. The close proximity of the two acetate decomposition temperatures
may well be a beneficial factor for the formation of alloyed Au-Pd materials.
4.2.2 Metal Acetates With a Support
Following an understanding of the bulk acetates decomposition temperatures the
effect of grinding the precursors with a carbon and oxide support was considered. The TGA-
DTG graphs are shown in Figure 4.3.

--------------------------- CHAPTER FOUR: Catalysts Prepared by Physical Grinding ----------------------------------
100
Figure 4.3 - TGA-DTG of a gold (III) acetate and palladium (II) acetate ground mixture, 1:1
by weight with, A) carbon and B) TiO 2 support, under flowing nitrogen with 5 oC min-1 ramp
rate.
The addition of a support, carbon or TiO2, slowed the rate of acetate decomposition as
evident from the DTG peak occurring over a temperature range of ca. 150 – 250 oC on carbon
(figure 4.3A) and 150 – 350oC on titania (figure 4.3B). This compared to the sharp peak,
observed in Figure 4.2, when no support is present implies an interaction exists between the
supports and dispersed metal acetates. Reduced heat transfer rates, because of acetate
dilution by the support material, could also be playing some role.
The salt decomposition starts at a slightly lower temperature in the presence of the carbon
support, which can be attributed to the distribution of smaller salt particles on the support
surface. The low temperature weight loss, at 100 oC, in Figure 4.3A is associated with
adsorbed water.
In the presence of the TiO 2 support there is a distinct splitting of the metal acetate
decomposition profiles into two distinct mass loss regions. The TGA-DTG of the blank
support was performed to confirm these were due to metal precursor decomposition. The
lower temperature (150-230 oC) mass loss correlates with the bulk salt decomposition; while
the higher mass loss (230-350 oC) suggests the presence of an interaction between the salt
and support and could be stable dispersed metal acetate salts.
A B

--------------------------- CHAPTER FOUR: Catalysts Prepared by Physical Grinding ----------------------------------
101
4.3 Effect of Preparation Method on Catalyst Activity
Au-Pd (2.5 %Au-2.5 %Pd) catalysts on various supports (SiO2, ZrO2, CeO2, C and TiO2)
were prepared by impregnation and physical grinding and tested for direct H2O2 synthesis
and benzyl alcohol oxidation. The supports used have previously been shown to be effective
supports for Au and Pd nano-particles, capable of generating excellent catalytic materia ls for
both oxidation and reduction reactions36.
4.3.1 Direct H2O2 Synthesis and Hydrogenation
IMP-Au-Pd and PG-Au-Pd catalysts were evaluated for the direct synthesis of H2O2
(Figure 4.4A) and the H2O2 hydrogenation pathway (Figure 4.4B) under standard reaction
conditions.
0
20
40
60
80
100
120
140
160
SiO2 ZrO2 CeO2 G60 TiO2
Series1
Series2
SiO2
Physical grinding
Impregnation
ZrO2 CeO2 C TiO2
Prod
uctiv
ity /
mol
H 2O
2kg c
at-1
h-1
A
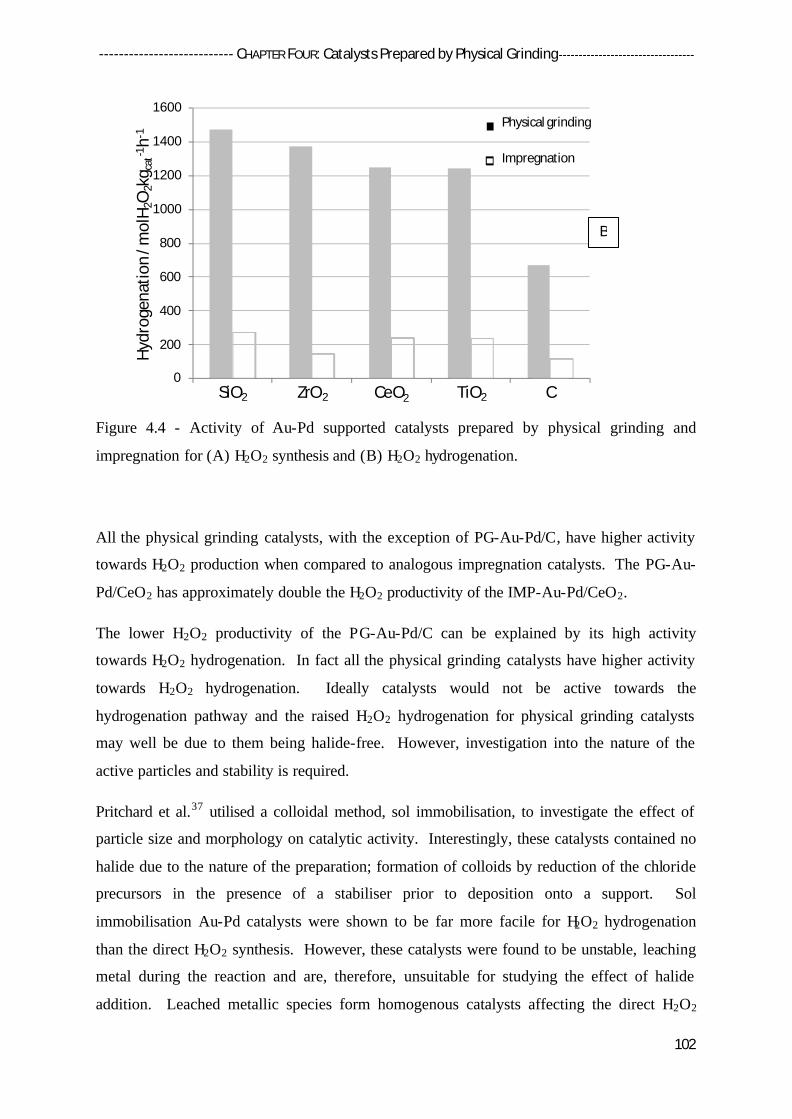
--------------------------- CHAPTER FOUR: Catalysts Prepared by Physical Grinding ----------------------------------
102
Figure 4.4 - Activity of Au-Pd supported catalysts prepared by physical grinding and
impregnation for (A) H2O2 synthesis and (B) H2O2 hydrogenation.
All the physical grinding catalysts, with the exception of PG-Au-Pd/C, have higher activity
towards H2O2 production when compared to analogous impregnation catalysts. The PG-Au-
Pd/CeO2 has approximately double the H2O2 productivity of the IMP-Au-Pd/CeO2.
The lower H2O2 productivity of the PG-Au-Pd/C can be explained by its high activity
towards H2O2 hydrogenation. In fact all the physical grinding catalysts have higher activity
towards H2O2 hydrogenation. Ideally catalysts would not be active towards the
hydrogenation pathway and the raised H2O2 hydrogenation for physical grinding catalysts
may well be due to them being halide-free. However, investigation into the nature of the
active particles and stability is required.
Pritchard et al.37 utilised a colloidal method, sol immobilisation, to investigate the effect of
particle size and morphology on catalytic activity. Interestingly, these catalysts contained no
halide due to the nature of the preparation; formation of colloids by reduction of the chloride
precursors in the presence of a stabiliser prior to deposition onto a support. Sol
immobilisation Au-Pd catalysts were shown to be far more facile for H2O2 hydrogenation
than the direct H2O2 synthesis. However, these catalysts were found to be unstable, leaching
metal during the reaction and are, therefore, unsuitable for studying the effect of halide
addition. Leached metallic species form homogenous catalysts affecting the direct H2O2
0
200
400
600
800
1000
1200
1400
1600
SiO2 CeO2 ZrO2 TiO2 G60
Series1
Series2
SiO2
Physical grinding
Impregnation
ZrO2 CeO2 CTiO2
Hydr
ogen
atio
n / m
olH 2
O2k
g cat
-1h-1
B

--------------------------- CHAPTER FOUR: Catalysts Prepared by Physical Grinding ----------------------------------
103
synthesis results11, 12. For this reason an investigation into the stability of the physical
grinding catalysts is required.
4.3.2 Catalyst Stability
Reuse tests were performed on the physical grinding bimetallic supported catalysts in
order to determine their stability for the direct synthesis of H2O2, Table 4.1.
Table 4.1 - Reuse data of physical grinding catalysts for the direct synthesis of H2O2
Catalyst H2O2 Productivity (molH2O2 kgcat
-1hr-1)
1st Use 2nd Use
2.5%Au 2.5%Pd / C 100 100
2.5%Au 2.5%Pd / TiO 2 90 90
2.5%Au 2.5%Pd / SiO 2 142 99
2.5%Au 2.5%Pd / CeO2 115 60
2.5%Au 2.5%Pd / ZrO2 127 81
The productivity of the PG-Au-Pd/C and TiO 2 catalysts displayed no decrease in activity
upon second use, indicating stability. The comparable silica, zirconia and ceria supported
catalysts, however, did show a decrease in productivity on second use, indicating that the
metal particles are not stable on these particular supports. Previously, IMP-Au-Pd/SiO2
catalysts have been shown to lack stability with a decreased H2O2 productivity on reuse.38 It
was concluded that the H2O2 productivity decrease was because of active metal leaching from
the SiO2 surface during the previous use, determined by atomic absorption spectroscopy
(AAS) of the reaction medium. However, the Au-Pd zirconia and ceria supported catalysts
prepared by impregnation are stable. In future, fur ther investigation by AAS of the reaction
medium and XPS of the catalyst after reaction, will be required to understand why physical
grinding do not produce stable zirconia and ceria catalysts. A higher thermal treatment
temperature or sequential treatments of the catalyst may aid the stability.
In subsequent tests only the stable PG-Au-Pd/C and TiO2 catalysts have been used.

--------------------------- CHAPTER FOUR: Catalysts Prepared by Physical Grinding ----------------------------------
104
4.3.3 Benzyl Alcohol Oxidation
To gain a greater understanding of the differences between the techniques, the
bimetallic materials that were stable for the direct synthesis of H2O2 (Au-Pd/C and TiO 2),
were tested for the oxidation of benzyl alcohol at 140oC. The time-on- line data is shown in
Figure 4.5 with corresponding turnover frequency (TOF – molBenzyl Alcohol converted molmetal-1h-1),
calculated at 0.5 hours, in Table 4.2.
Figure 4.5 - Activity of bimetallic supported catalysts, prepared by impregnation and physical
grinding, for the oxidation of benzyl alcohol. IMP-Au-Pd/C PG-Au-Pd/C, IMP-Au-
Pd/TiO2, PG-Au-Pd/TiO2
Table 4.2 - TOFs for the benzyl alcohol oxidation reaction over bimetallic titania- and
carbon-supported catalysts prepared by impregnation and physical gr inding.
Catalyst (2.5 wt%Au- 2.5 wt%Pd) TOF*
Carbon – Impregnation 8418
Titania – Impregnation 16008
Carbon – Physical grinding 34313
Titania – Physical grinding 27172
*Calculated at 0.5 hours.
0
10
20
30
40
50
60
70
80
90
100
0 0.5 1 1.5 2
Conv
ersi
on (%
)
Time (h)

--------------------------- CHAPTER FOUR: Catalysts Prepared by Physical Grinding ----------------------------------
105
The conversion and TOF (calculated after 0.5 h) of the PG-Au-Pd/C and PG-Au-Pd/TiO2 are
higher than the equivalent catalysts prepared by impregnation. Interestingly, when
considering the methods separately, the IMP-Au-Pd/TiO2 is the most active for impregnation;
this trend is reversed for physical grinding catalysts; with the PG-Au-Pd/C having the highest
conversion. The selectivity of each catalyst to benzaldehyde is shown in Figure 4.6.
Figure 4.6 - Selectivity of bimetallic supported catalysts, prepared by impregnation and
physical grinding, for the oxidation of benzyl alcohol to benzaldehyde. IMP-Au-Pd/C
PG-Au-Pd/C, IMP-Au-Pd/TiO2, PG-Au-Pd/TiO2
The selectivities towards benzaldehyde are similar for all catalysts, indicating that the
preparation method used does not affect selectivity even though physical grinding catalysts
are more active.
These results indicate that the removal of the chloride from the preparation step and therefore,
from the final catalyst, leads to a significant enhancement in the activity as compared to
previously reported impregnation catalysts. The origins of these effects are discussed in the
following sections. The monometallic catalysts on carbon and titania have been prepared to
elucidate if alloying is occurring in the analogous bimetallic Au-Pd, with XRD, STEM and
50
55
60
65
70
75
80
85
90
95
100
0 0.5 1 1.5 2
Sele
ctiv
ity (%
)
Time (h)

--------------------------- CHAPTER FOUR: Catalysts Prepared by Physical Grinding ----------------------------------
106
XPS being utilised to characterise the materials. Impregnation catalysts have previously been
extensively characterised16, 39-44.
4.4 Carbon Supported Au, Pd and Au-Pd Catalysts Prepared by Physical Grinding
4.4.1 Direct H2O2 Synthesis and Hydrogenation
A series of monometallic (Au and Pd) and bimetallic (Au-Pd) carbon supported
catalysts were prepared by physical grinding and tested for H2O2 synthesis under standard
reaction conditions. The data in Table 4.3 shows that both the monometallic and bimetallic
materials have activity for the direct synthesis of hydrogen peroxide.
Table 4.3 - H2O2 synthesis data for monometallic and bimetallic catalysts prepared by
physical grinding.
Catalyst Productivity
(molH2O2kgcat-1h-1)
Hydrogenation
(molH2O2kgcat-1h-1)
2.5%Au / G60 3 44
5%Au / G60 5 60
2.5%Pd / G60 45 779
5%Pd / G60 48 1150
2.5%Au-2.5%Pd / G60 100 672
Although it can be seen the 5 %Au/C catalyst prepared by physical grinding generates H2O2
the rate of formation is considerably lower than the 5 %Pd containing catalysts. The addition
of Au to Pd significantly enhances the catalytic performance for the synthesis of H2O2 (48 to
100 molkgcat-1h-1); it also decreases the catalysts activity to the unwanted hydrogenation
pathway. It has been reported that the incorporation of only a small amount of Au into a Pd-
rich particle leads to a significant increase in the activity of the catalyst, suggesting alloying
is being achieved here.43
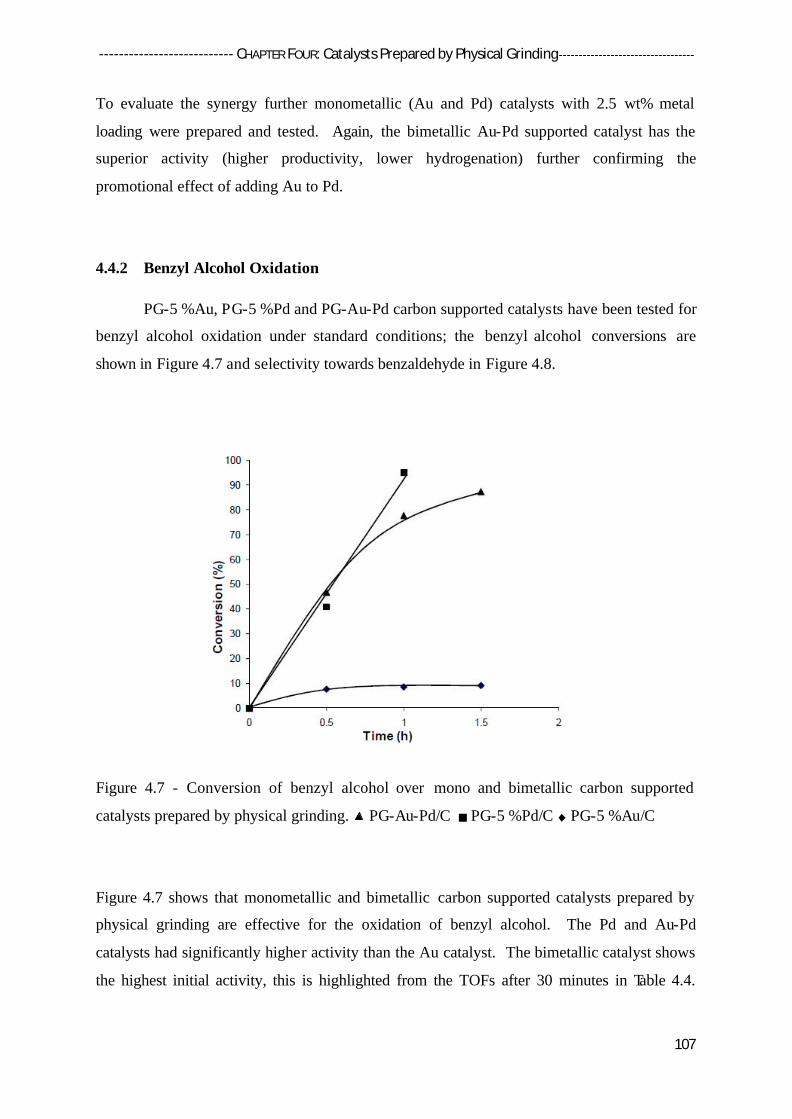
--------------------------- CHAPTER FOUR: Catalysts Prepared by Physical Grinding ----------------------------------
107
To evaluate the synergy further monometallic (Au and Pd) catalysts with 2.5 wt% metal
loading were prepared and tested. Again, the bimetallic Au-Pd supported catalyst has the
superior activity (higher productivity, lower hydrogenation) further confirming the
promotional effect of adding Au to Pd.
4.4.2 Benzyl Alcohol Oxidation
PG-5 %Au, PG-5 %Pd and PG-Au-Pd carbon supported catalysts have been tested for
benzyl alcohol oxidation under standard conditions; the benzyl alcohol conversions are
shown in Figure 4.7 and selectivity towards benzaldehyde in Figure 4.8.
Figure 4.7 - Conversion of benzyl alcohol over mono and bimetallic carbon supported
catalysts prepared by physical grinding. PG-Au-Pd/C PG-5 %Pd/C PG-5 %Au/C
Figure 4.7 shows that monometallic and bimetallic carbon supported catalysts prepared by
physical grinding are effective for the oxidation of benzyl alcohol. The Pd and Au-Pd
catalysts had significantly higher activity than the Au catalyst. The bimetallic catalyst shows
the highest initial activity, this is highlighted from the TOFs after 30 minutes in Table 4.4.

--------------------------- CHAPTER FOUR: Catalysts Prepared by Physical Grinding ----------------------------------
108
Again this indicates, as with the direct synthesis of H2O2 in section 4.4.1, that alloying
between Au and Pd is being achieved.
Table 4.4 - TOFs for the benzyl alcohol oxidation reaction over mono and bimetallic carbon
supported catalysts prepared by physical grinding.
Catalyst (5wt% total) TOF* (/h)
Au 9340
Pd 26900
Au-Pd 39900
*calculated after 0.5 h
Figure 4.8 - Selectivity towards benzaldehyde during benzyl alcohol oxidation with mono
and bimetallic carbon supported catalysts prepared by physical grinding. PG-Au-Pd/C,
PG-5 %Pd/C, PG-5 %Au/C
The Au-Pd catalyst has comparable selectivity to the monometallic Au catalyst; both are
more selective towards benzaldehyde than monometallic Pd. The monometallic Pd catalyst
0
10
20
30
40
50
60
70
80
90
100
0 0.5 1 1.5 2
Sele
ctiv
ity (%
)
Time (h)

--------------------------- CHAPTER FOUR: Catalysts Prepared by Physical Grinding ----------------------------------
109
produces higher concentrations of further oxidation products such as benzoic acid and toluene.
This is further evidence of synergy occurring on the addition of Au to Pd.
In order to investigate the origin of the synergistic effect, a number of characterisation
techniques were employed to try to identify the nature of the nano-particles on activated
carbon.
4.4.3 X-Ray Diffraction (XRD)
X-ray diffraction (XRD) analysis of the 5 %Au, 5 %Pd and Au-Pd carbon supported
catalysts, produced by physical grinding, is shown in Figure 4.9.
Figure 4.9 - XRD analysis of carbon supported 5 %Au, 5 %Pd and Au-Pd catalysts produced
by physical grinding.
The average crystallite size of the monometallic Au on C, determined by Rietveld
refinement of Figure 4.9 (refer to chapter two for further details), is significantly larger, at ca.
30 nm, than the monometallic Pd on C catalyst. However, the monometallic Pd supported on
carbon showed two distinct metal Pd phases with different unit cell sizes and substantially

--------------------------- CHAPTER FOUR: Catalysts Prepared by Physical Grinding ----------------------------------
110
different crystallite sizes. The conventional Pd phase with a unit cell size of 59.40 Å3 had the
larger average crystallite size of 29+2 nm, while the phase with an expanded unit cell of
63.09 Å3 had a smaller average crystallite size of 7 nm. The expanded unit cell is indicative
of incorporation of additional species into the Pd unit cell, such as interstitial carbon45-47. As
expected there was no evidence of interstitial carbon incorporation into the f.c.c Au phase,
since these two components are known to be immiscible48.
Au-Pd/C catalysts produced by acetate decomposition resulted in the distinct Au and Pd
phases. The presence of the expanded Pd phase in the monometallic sample makes the
identification of a Au-Pd alloy difficult to determine by XRD. Therefore, further
characterisation is needed to explain the catalytic activities, in particular the synergistic effect,
observed in the direct H2O2 synthesis results.
4.4.4 Electron Microscopy (EM)
Scanning transmission microscopy (STEM) - high-angle annular dark-field (HAADF)
micrographs of Au (Figure 4.10), Pd (Figure 4.11) and Au-Pd (Figure 4.12) carbon supported
material prepared by physical grinding are presented. X-ray energy-dispersive spectroscopy
(XEDS) was used to analyse the composition of individual nano-particles.
Figure 4.10 - Representative HAADF images of a carbon supported Au material prepared by
physical grinding.
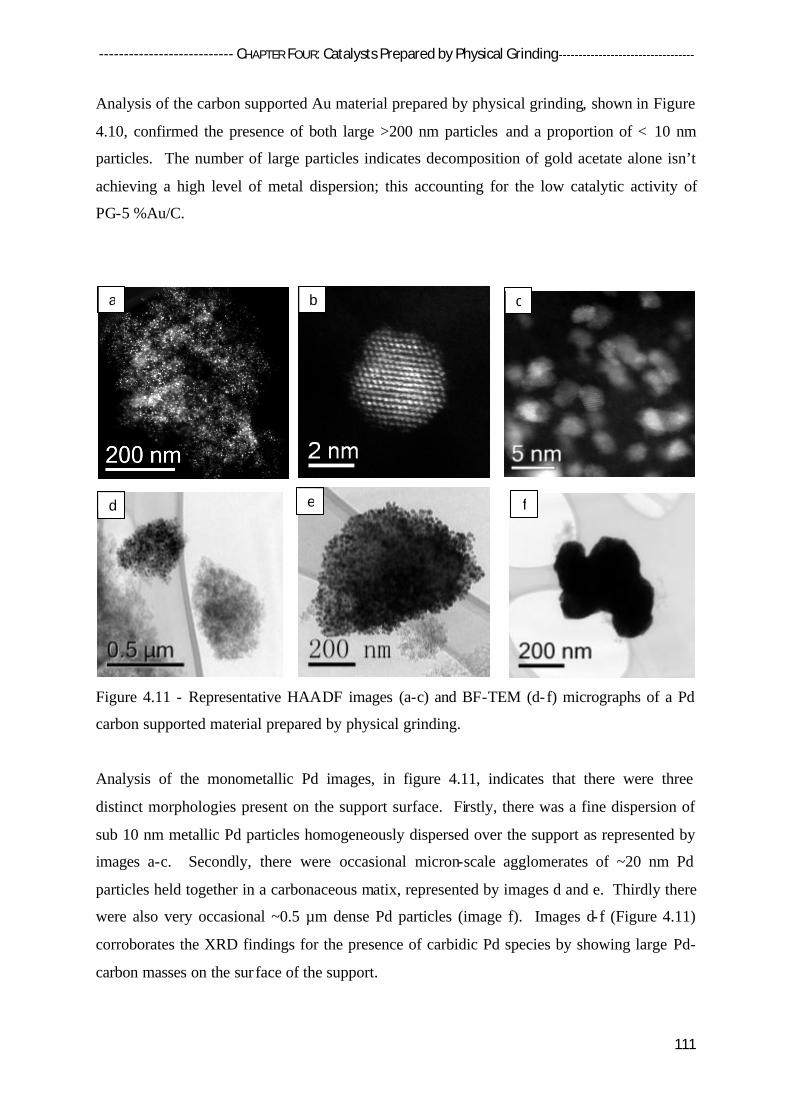
--------------------------- CHAPTER FOUR: Catalysts Prepared by Physical Grinding ----------------------------------
111
Analysis of the carbon supported Au material prepared by physical grinding, shown in Figure
4.10, confirmed the presence of both large >200 nm particles and a proportion of < 10 nm
particles. The number of large particles indicates decomposition of gold acetate alone isn’t
achieving a high level of metal dispersion; this accounting for the low catalytic activity of
PG-5 %Au/C.
Figure 4.11 - Representative HAADF images (a-c) and BF-TEM (d-f) micrographs of a Pd
carbon supported material prepared by physical grinding.
Analysis of the monometallic Pd images, in figure 4.11, indicates that there were three
distinct morphologies present on the support surface. Firstly, there was a fine dispersion of
sub 10 nm metallic Pd particles homogeneously dispersed over the support as represented by
images a-c. Secondly, there were occasional micron-scale agglomerates of ~20 nm Pd
particles held together in a carbonaceous matix, represented by images d and e. Thirdly there
were also very occasional ~0.5 µm dense Pd particles (image f). Images d-f (Figure 4.11)
corroborates the XRD findings for the presence of carbidic Pd species by showing large Pd-
carbon masses on the sur face of the support.
a b c
d e f

--------------------------- CHAPTER FOUR: Catalysts Prepared by Physical Grinding ----------------------------------
112
Also in agreement with XRD, is that there are significantly more small particles (sub 5 nm) in
the monometallic Pd/C catalysts (figure 4.11 a-c) than the monometallic Au/C catalysts,
indicating that Pd disperses far more successfully than Au on heat treatment. The high
dispersion of Pd accounts for the high catalytic activity observed for monometallic Pd.
Figure 4.12 - Representative HAADF images and corresponding XEDS spectra from a Au-Pd
carbon supported material prepared by phys ical grinding. (A) large ca. 200 nm gold, (B)
large ca. 200 nm palladium and (C) Au-Pd alloy ca. 5 nm.
The HAADF images of PG-Au-Pd/C show a variety of metal particles. Firstly, it is apparent
there are a number of large (ca. 0.2 µm) Au rich particles, represented in figure 4.12A, and
large (ca. 0.2 µm) Pd rich particles, figure 4.12B. These particles are believed to be inactive,
with active particles being less than 10 nm, and therefore a waste of expensive metal
materials.
Analysis of higher resolution images shows the presence of sub 5 nm particles, represented
by figure 4.12C, that are not observable by XRD analysis (Figure 4.12). Smaller, sub 5 nm,
particles of monometallic and bimetallic nature were observed, with the alloying explaining
the synergistic effect seen in the catalyst testing data. As seen in catalysts prepared by
A B C

--------------------------- CHAPTER FOUR: Catalysts Prepared by Physical Grinding ----------------------------------
113
impregnation, the bimetallic carbon supported catalysts exhibit Au-Pd bulk alloying.43 The
images are in agreement with an earlier postulation in section 4.2.1 that decomposing the
metal acetates together may assist the formation of Au-Pd alloys. It appears that a higher
level of metal dispersion, particularly gold, is being achieved due to simultaneous metal
acetate decomposition, encouraging small (< 5 nm) Au-Pd alloys to form. However, sub 5
nm monometallic (unalloyed) particles were found on the carbon surface. It is likely that
these Pd particles are responsible for the majority of the PG-Au-Pd/C catalysts H2O2
hydrogenation, due to the high H2O2 hydrogenation activity of PG-5 % Pd/C catalysts.
IMP-Au-Pd/C catalysts also comprise a broad size range of particles; mainly small particles
that are ca. 2-10 nm, but also some larger particles, >10 nm.43
As well as varying composition, wide variations of sizes for the sub 10 nm particles were
observed. A particle size distribution histogram is shown in Figure 4.13.
Figure 4.13 - Size distribution of sub-10 nm particles in carbon supported Au-Pd materials
produced by physical grinding. Note - many much larger Au-rich and Pd-rich particles were
also observed but are not included in this histogram.
Figure 4.13 indicates that PG-Au-Pd/C has mean particle size of 3.1 nm; this value is only for
particles below 10 nm due to the high number of larger particles (>10 nm) making a particle
size distribution graph for the whole particle range difficult.
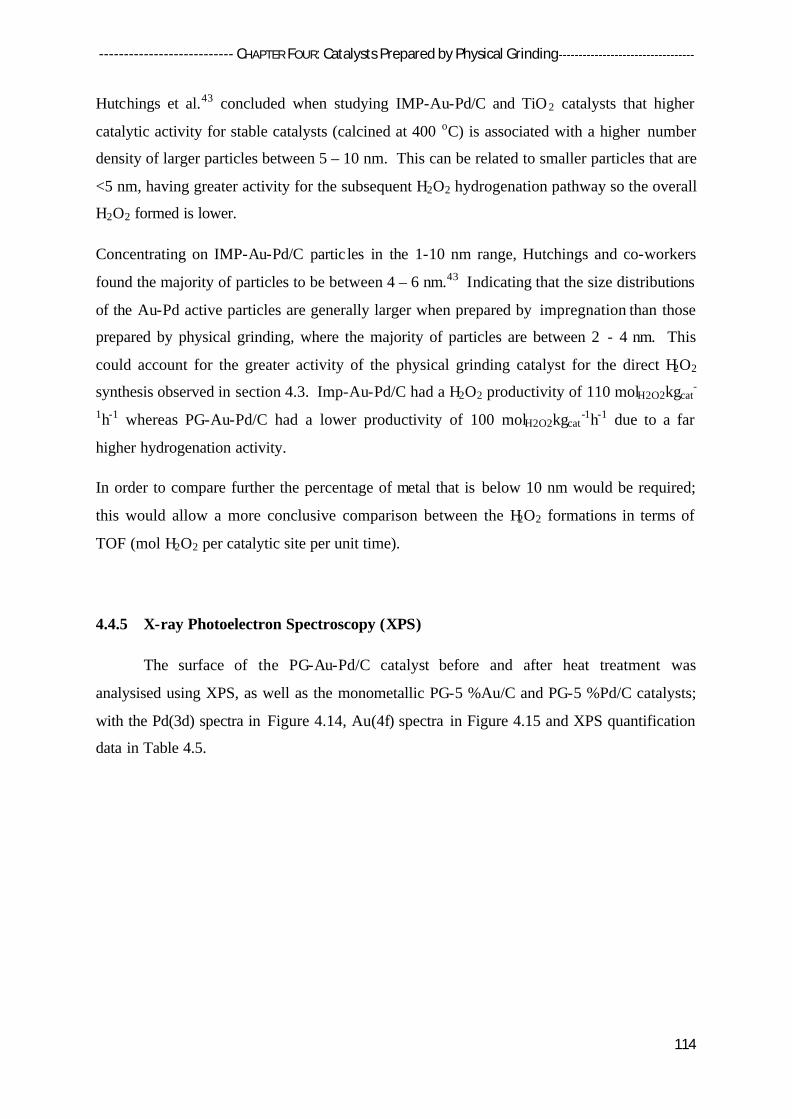
--------------------------- CHAPTER FOUR: Catalysts Prepared by Physical Grinding ----------------------------------
114
Hutchings et al.43 concluded when studying IMP-Au-Pd/C and TiO 2 catalysts that higher
catalytic activity for stable catalysts (calcined at 400 oC) is associated with a higher number
density of larger particles between 5 – 10 nm. This can be related to smaller particles that are
<5 nm, having greater activity for the subsequent H2O2 hydrogenation pathway so the overall
H2O2 formed is lower.
Concentrating on IMP-Au-Pd/C partic les in the 1-10 nm range, Hutchings and co-workers
found the majority of particles to be between 4 – 6 nm.43 Indicating that the size distributions
of the Au-Pd active particles are generally larger when prepared by impregnation than those
prepared by physical grinding, where the majority of particles are between 2 - 4 nm. This
could account for the greater activity of the physical grinding catalyst for the direct H2O2
synthesis observed in section 4.3. Imp-Au-Pd/C had a H2O2 productivity of 110 molH2O2kgcat-
1h-1 whereas PG-Au-Pd/C had a lower productivity of 100 molH2O2kgcat-1h-1 due to a far
higher hydrogenation activity.
In order to compare further the percentage of metal that is below 10 nm would be required;
this would allow a more conclusive comparison between the H2O2 formations in terms of
TOF (mol H2O2 per catalytic site per unit time).
4.4.5 X-ray Photoelectron Spectroscopy (XPS)
The surface of the PG-Au-Pd/C catalyst before and after heat treatment was
analysised using XPS, as well as the monometallic PG-5 %Au/C and PG-5 %Pd/C catalysts;
with the Pd(3d) spectra in Figure 4.14, Au(4f) spectra in Figure 4.15 and XPS quantification
data in Table 4.5.
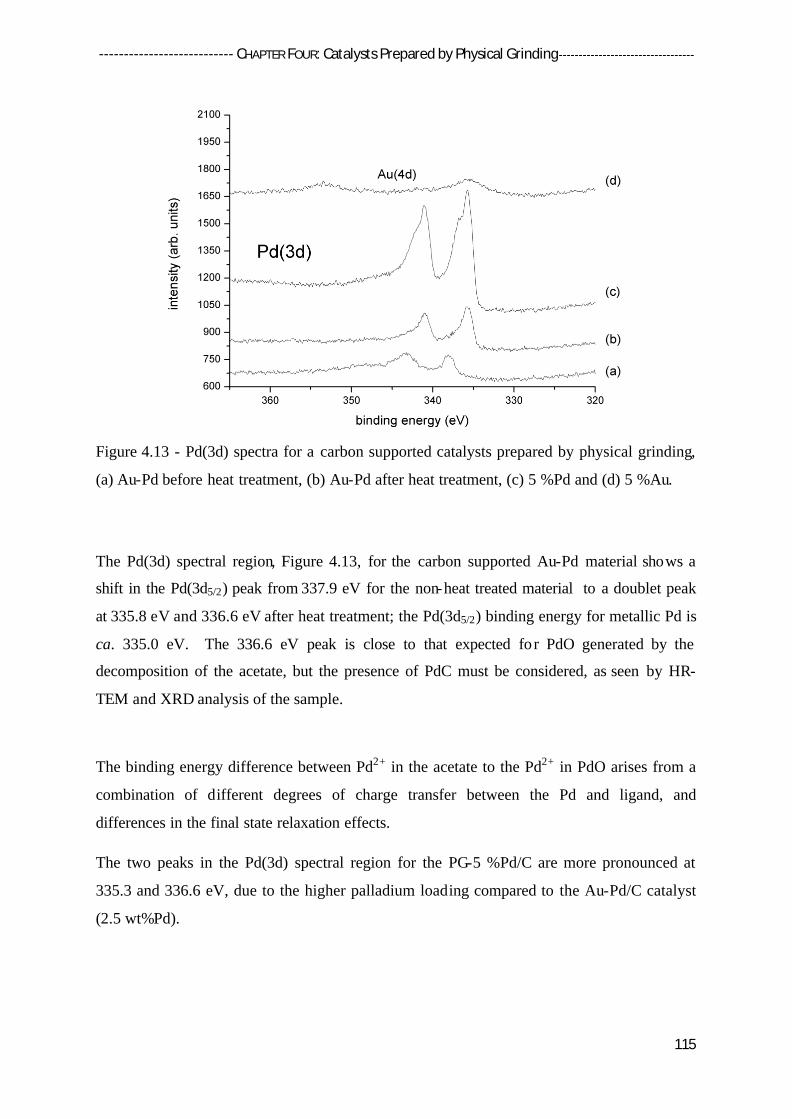
--------------------------- CHAPTER FOUR: Catalysts Prepared by Physical Grinding ----------------------------------
115
Figure 4.13 - Pd(3d) spectra for a carbon supported catalysts prepared by physical grinding,
(a) Au-Pd before heat treatment, (b) Au-Pd after heat treatment, (c) 5 %Pd and (d) 5 %Au.
The Pd(3d) spectral region, Figure 4.13, for the carbon supported Au-Pd material shows a
shift in the Pd(3d5/2) peak from 337.9 eV for the non-heat treated material to a doublet peak
at 335.8 eV and 336.6 eV after heat treatment; the Pd(3d5/2) binding energy for metallic Pd is
ca. 335.0 eV. The 336.6 eV peak is close to that expected for PdO generated by the
decomposition of the acetate, but the presence of PdC must be considered, as seen by HR-
TEM and XRD analysis of the sample.
The binding energy difference between Pd2+ in the acetate to the Pd2+ in PdO arises from a
combination of different degrees of charge transfer between the Pd and ligand, and
differences in the final state relaxation effects.
The two peaks in the Pd(3d) spectral region for the PG-5 %Pd/C are more pronounced at
335.3 and 336.6 eV, due to the higher palladium loading compared to the Au-Pd/C catalyst
(2.5 wt%Pd).
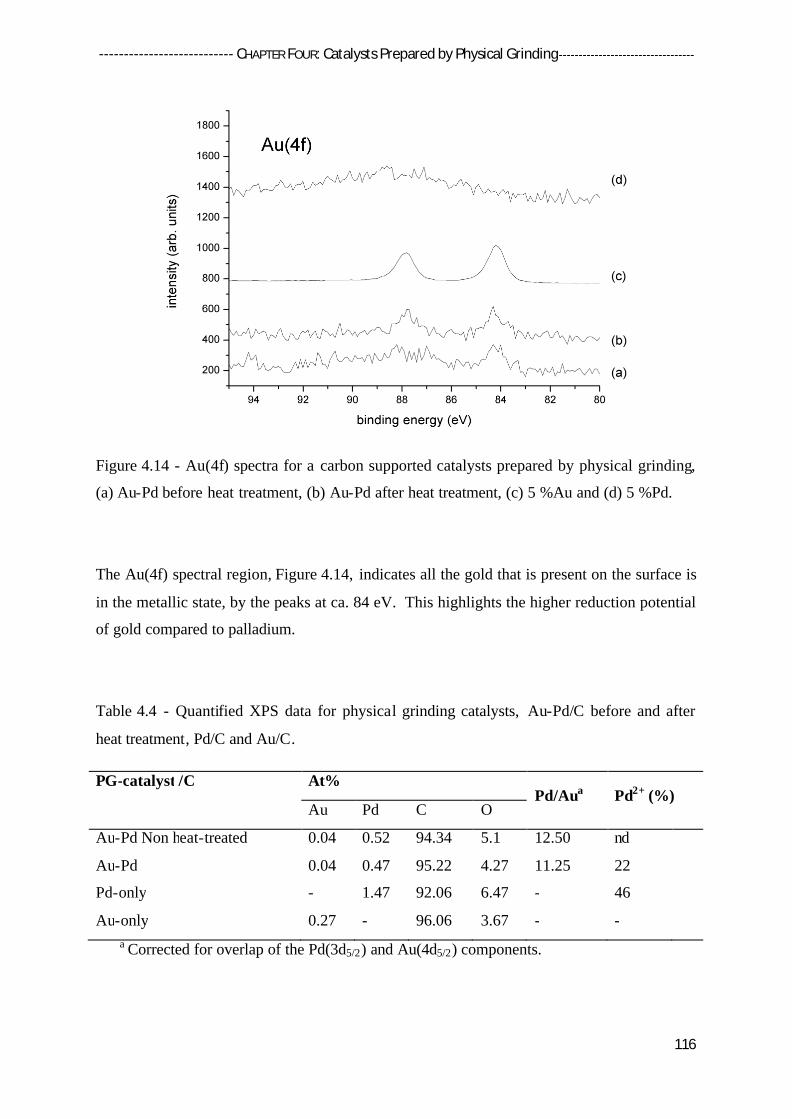
--------------------------- CHAPTER FOUR: Catalysts Prepared by Physical Grinding ----------------------------------
116
Figure 4.14 - Au(4f) spectra for a carbon supported catalysts prepared by physical grinding,
(a) Au-Pd before heat treatment, (b) Au-Pd after heat treatment, (c) 5 %Au and (d) 5 %Pd.
The Au(4f) spectral region, Figure 4.14, indicates all the gold that is present on the surface is
in the metallic state, by the peaks at ca. 84 eV. This highlights the higher reduction potential
of gold compared to palladium.
Table 4.4 - Quantified XPS data for physical grinding catalysts, Au-Pd/C before and after
heat treatment, Pd/C and Au/C.
PG-catalyst /C At% Pd/Aua Pd2+ (%)
Au Pd C O
Au-Pd Non heat-treated 0.04 0.52 94.34 5.1 12.50 nd
Au-Pd 0.04 0.47 95.22 4.27 11.25 22
Pd-only - 1.47 92.06 6.47 - 46
Au-only 0.27 - 96.06 3.67 - - a Corrected for overlap of the Pd(3d5/2) and Au(4d5/2) components.

--------------------------- CHAPTER FOUR: Catalysts Prepared by Physical Grinding ----------------------------------
117
Quantification of the integrated peak intensities, in Table 4.4, shows that there is an excess of
surface Pd over surface Au, prior and preceding heat treatment of the PG-Au-Pd/C catalyst.
There is also a high metallic Pd content for both PG-Au-Pd/C (78 %Pd0) and PG-5 %Pd/C
(54 %Pd0) preceding heat treatment, compared to Imp-Au-Pd/C which has 32 % surface Pd0.
A high surface Pd content in the metallic state would account for the high H2O2
hydrogenation activity of the physical grinding catalysts compared to the impregnation
counterparts. Metallic Pd has previously been shown to be responsible for H2O2
hydrogenation, which has previously been investigated in Chapter Three.
4.4.6 Discussion
The characterisation, by XRD (figure 4.9) and STEM (figure 4.11 d-f), of the carbon
supported material showed that carbidic species are present in the bulk and on the surface of
the catalyst. This hasn’t been observed previously for comparable impregnation catalysts,
and the comparable selectivities to benzaldehyde of the physical grinding and impregnation
derived catalysts suggest the carbidic species do not have an obvious effect on catalyst
performance. However, when producing catalysts on a larger scale or lower metal content
this may become an important issue. The presence of interstitial carbon has not been reported
previously for carbon supported catalysts prepared by impregnation, so it is believed that the
carbon exists as a result of acetate decomposition in an inert atmosphere. This carbon could
be removed by calcination in oxygen; however the oxidation state will change and at high
temperature the particles may sinter causing deactivation. Krishnankutty et al.46 proposed a
model, which is shown in Figure 4.15, in which a Pd/C catalyst could contain a mixture of
particles, type A-D, with various extents of carbon coverage; each type could affect the
catalyst performance differently.46

--------------------------- CHAPTER FOUR: Catalysts Prepared by Physical Grinding ----------------------------------
118
Figure 4.15 - Carbon deposits on Palladium which may affect the catalysts performance
depending on the extent of coverage46.
Type A, a clean Pd surface, would allow adsorption of the reactants to occur allowing the
palladium particle to participate in the reaction to its full capacity. In contrast complete
coverage of the Pd surface by carbon, type B, would deactivate the catalyst activity as there
would be no active surface for the reactants to adsorb too. Partial carbon coverage, as in type
C and D, would cause differing lower levels of reactant adsorption reducing the catalytic
activity.
A number of differences between carbon and titania supported Au-Pd catalysts prepared by
impregnation have previously been identified43. A particularly interesting observation is that
the bimetallic titania supported particles form a core shell structure (Au core, Pd shell) upon
calcination. In order to elucidate the extent and nature of Au-Pd alloying on titania when
using physical grinding, monometallic Au, Pd and bimetallic Au-Pd catalysts were prepared,
tested and characterised.
Type A: Clean Pd surface
Type B: Complete encapsulationof Pd particle by carbon
Type C: Partial carbon overlayer and also bulk carbide
Type D: Partial carbon overlayerand no bulk carbide

--------------------------- CHAPTER FOUR: Catalysts Prepared by Physical Grinding ----------------------------------
119
4.5 Titania Supported Au, Pd and Au-Pd Catalysts Prepared by Physical Grinding
4.5.1 Direct H2O2 Synthesis and Hydrogenation
A series of titania supported monometallic (Au and Pd) and bimetallic (Au-Pd)
catalysts were prepared by physical grinding and tested for H2O2 synthesis under standard
reaction conditions the results are shown in Table 4.5.
Table 4.5 - H2O2 synthesis data for monometallic and bimetallic titania supported catalysts
prepared by physical grinding.
In common with the carbon supported catalysts described earlier, the Pd and Au-Pd catalysts
have significantly higher activity than the Au catalyst, with the bimetallic catalyst showing
the highest productivity. The addition of Au to Pd also decreases the hydrogenation activity
of the materials, indicating synergy. In order to investigate the origin of the synergistic effect,
a number of characterisation techniques were employed to try to identify the nature of the
nano-particles on TiO 2.
Catalyst Productivity
(molH2O2kgcat-1h-1)
Hydrogenation
(molH2O2kgcat-1h-1)
5%Au / TiO2 1 59
5%Pd / TiO2 45 1416
2.5%Au-2.5%Pd / TiO 2 90 1243

--------------------------- CHAPTER FOUR: Catalysts Prepared by Physical Grinding ----------------------------------
120
4.5.2 X-Ray Diffraction (XRD)
X-ray diffraction (XRD) analysis of the 5 %Au, 5 %Pd and Au-Pd titania supported
catalysts, produced by physical grinding, with a comparable catalyst prepared by
impregnation, is shown in Figure 4.16, with calculated parameters shown in Table 4.6 (refer
to the experimental procedures in chapter 2 for furthe r details).
Figure 4.16 - XRD analysis of Au, Pd and Au-Pd titania catalysts produced by physical
grinding and a comparable Au-Pd titania catalyst produced by impregnation (Std).
Table 4.6 – Calculated Au and Pd particle properties, for titania supported monometallic (Au,
Pd) and bimetallic (Au-Pd) materials produced by physical grinding and a comparable Au-Pd
catalyst prepared by impregnation (Std), from XRDa.
Sample Metal
phase
Calculated unit
cell volume (Å3)
Average crystallite
size (nm)
Weight contribution of
phase (%)
Au Au 67.79 57 4.4
Pd Pd 59.03 7 4.7
Au-Pd Pd
Au
59.65
67.26
4
62
1.2
2.0
Std Pd
Au
n/a
67.70
n/a
34
n/a
2.2 a Errors: unit cell volume +0.1 Å3, crystallite size +2 nm, weight fraction +0.5 %

--------------------------- CHAPTER FOUR: Catalysts Prepared by Physical Grinding ----------------------------------
121
Refinement of the monometallic XRD patterns showed metallic Au and Pd and provided
agreement with interpretations of the crystallite size derived from catalytic testing.
Suggesting the high activity of the monometallic Pd for the direct H2O2 synthesis being due
to the presence of smaller particles, whereas, Au with the larger average particle size (57 nm)
exhibited a lower H2O2 activity. The average Au crystallite size of 57 nm is considerably
larger than the < 10 nm size required for an active particle.49 The smaller average crystallite
size (7 nm) of Pd particles produced by physical grinding indicates a far greater intrinsic
ability of this metal to disperse over the support.
The PG-Au-Pd/TiO2 catalyst showed reflections associated with two crystalline cubic phases,
with unit cell volumes closely associated with Au and Pd. Both phases have an observable
shift in unit cell volumes compared to the respective comparable monometallic systems.
However no reflections associated with the unit cell size of a bulk 1:1 Au-Pd alloy (63.04 Å)
were observed.50 This suggests some limited alloying, with a small incorporation of one
element into the bulk of the other. Though no reflections indicative of a homogeneous Au-Pd
alloy were observed, as expected from the synergistic effect in catalyst activity, a proportion
of nano-particles that are below the detectability limit of the XRD technique could be present.
This is confirmed by the calculated weight contribution of the Pd and Au phases accounting
for only 60 % of the metal loading (Table 4.6), implying the presence of sub 5 nm particles.
Therefore, further characterisation is needed to explain the catalytic activities, in particular
the synergistic effect, observed in the direct H2O2 synthesis results.
The lower Pd average particle size of 4 nm in the PG-Au-Pd/TiO2 catalyst compared to 7 nm
in the monometallic 5 % Pd catalyst indicates the decomposition of gold acetate aids the
dispersion of Pd during the decomposition of Pd(OAc)2. However, the higher Pd content in
the monometallic 5 wt% Pd, compared to 2.5 wt% Pd in the bimetallic may be a factor. This
increases the likelihood of metal sintering during heat treatment.
Titania supported Au-Pd catalysts produced by impregnation have previously been shown to
form core shell structures by HR-TEM and XPS.16 XRD of the impregnated sample shows
reflections closely associated with a Au phase but with no observable Pd phase; making it
difficult to compare the two techniques using this data. This is attributed to small
monometallic Pd particles and the shell in the bimetallic particles having insufficient number
of planes to provide observable reflections. However, what is evident is the larger average
Au crystalline size of 62 nm in the PG-Au-Pd/TiO2 catalyst than that seen in the comparable

--------------------------- CHAPTER FOUR: Catalysts Prepared by Physical Grinding ----------------------------------
122
impregnation catalyst, 34 nm. This illustrates the overall poorer dispersion of Au metal
achieved by physical grinding over TiO 2.
4.5.3 Scanning Transmission Electron Microscopy (STEM)
STEM - high-angle annular dark-field (HAADF) micrographs of titania supported
Au-Pd material prepared by physical grinding are presented in Figure 4.17. X-ray energy-
dispersive spectroscopy (XEDS) was used to analyse the composition of individual nano-
particles. Particle distribution was obtained for sub-10 nm particles and their distribution
compared to the corresponding carbon supported catalysts.
Figure 4.17 - Representative HAADF images and corresponding XEDS spectra from titania
supported Au-Pd material prepared by physical grinding.
STEM-HAADF images of a titania supported Au-Pd catalyst prepared by physical grinding
shows large Au and Pd particles on the titania surface. Smaller sub 5 nm particles can also be
readily found and these appear to comprise of Au and Pd which indicates alloying. The
alloying would explain the synergistic effect seen in the catalyst testing data.
A B C
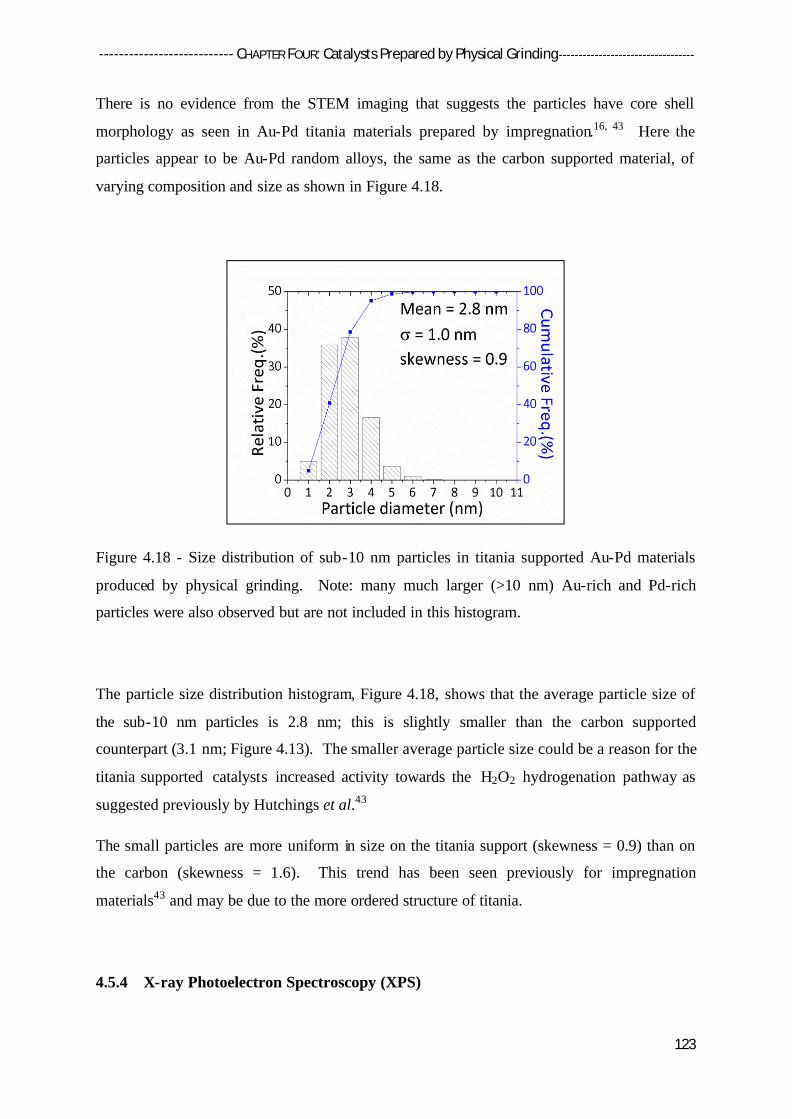
--------------------------- CHAPTER FOUR: Catalysts Prepared by Physical Grinding ----------------------------------
123
There is no evidence from the STEM imaging that suggests the particles have core shell
morphology as seen in Au-Pd titania materials prepared by impregnation.16, 43 Here the
particles appear to be Au-Pd random alloys, the same as the carbon supported material, of
varying composition and size as shown in Figure 4.18.
Figure 4.18 - Size distribution of sub-10 nm particles in titania supported Au-Pd materials
produced by physical grinding. Note: many much larger (>10 nm) Au-rich and Pd-rich
particles were also observed but are not included in this histogram.
The particle size distribution histogram, Figure 4.18, shows that the average particle size of
the sub-10 nm particles is 2.8 nm; this is slightly smaller than the carbon supported
counterpart (3.1 nm; Figure 4.13). The smaller average particle size could be a reason for the
titania supported catalysts increased activity towards the H2O2 hydrogenation pathway as
suggested previously by Hutchings et al.43
The small particles are more uniform in size on the titania support (skewness = 0.9) than on
the carbon (skewness = 1.6). This trend has been seen previously for impregnation
materials43 and may be due to the more ordered structure of titania.
4.5.4 X-ray Photoelectron Spectroscopy (XPS)

--------------------------- CHAPTER FOUR: Catalysts Prepared by Physical Grinding ----------------------------------
124
The surface of Au-Pd titania supported material before and after heat treatment was
analysised using X-ray photoelectron spectroscopy (XPS).
Figure 4.19 - Pd(3d) spectra for a titania supported Au-Pd material produced by physical
grinding, before and after heat treatment.
The Pd(3d) spectral region, in Figure 4.19, for the titania supported Au-Pd material shows a
shift in the Pd(3d5/2) peak from 336.9 eV for the non-heat treated material to 336.4 eV after
heat treatment; the Pd(3d5/2) binding energy for metallic Pd is ca. 335.0 eV. The 336.4 eV
peak is close to that expected for PdO generated by the decomposition of the acetate, but the
presence of PdC must be considered, as seen for the carbon supported material. However,
extensive analysis of the sample by HR-TEM did not show any presence of PdC; it was also
not observed in the XRD analysis of the titania supported material.
As a result of the changes in the C(1s) profile from the different treatments, we have
referenced all binding energies to the Ti(2p3/2) peak from the support, taken to be 458.2 eV51.
The binding energy difference between Pd2+ in the acetate to the Pd2+ in PdO arises from a

--------------------------- CHAPTER FOUR: Catalysts Prepared by Physical Grinding ----------------------------------
125
combination of different degrees of charge transfer between the Pd and ligand, and
differences in the final state relaxation effects.
Table 4.7 - Quantified surface compositions (at%) for the titania supported Au-Pd materials
before and after heat treatment.
Catalyst At% Pd/Aua Pd2+ (%)
Au Pd Ti O
Non-heat
treated
0.052 0.45 28.0 71.5 8.1 nd
Heat-treated 0.057 0.95 30.3 68.7 16.2 >90 a Corrected for overlap of the Pd(3d5/2) and Au(4d5/2) components.
Quantification of the integrated peak intensities in Table 4.7 shows that there is an excess of
surface Pd over surface Au, especially after the heat treatment in He. This shows that the Pd
disperses far more successfully than Au on heat treatment. Alternatively the high Pd surface
contribution may indicate development of some core-shell morphology, although this was not
observed in the corresponding STEM-HAADF imaging analysis.
Interestingly, the majority of the surface palladium on the heat treated sample is Pd2+ (>90 %).
This is not what was expected due to the high hydrogenation activity of these materials (1243
molH2O2kgcat-1h-1) and contradicts the findings for the PG-Au-Pd/C catalyst. However, there
is double the palladium content on the titania surface (0.95 at%) compared to carbon (0.47
at%), which in this case could be responsible for the higher H2O2 hydrogenation activity.
Further, indicating both the Pd/Au ratio and Pd2+ surface concentration play an important role.
Palladium disperses more efficiently on titania and is primarily in the Pd2+ oxidation state,
whereas it is less dispersed with a higher metallic Pd content on carbon. This suggests that
carbon aids the reduction of Pd2+ to Pd0. And in conjunction with carboneous species only
being observed when preparing physical grinding carbon supported catalysts indicates the
support plays a vital role in the acetate decomposition.

--------------------------- CHAPTER FOUR: Catalysts Prepared by Physical Grinding ----------------------------------
126
4.6 Effect of Grinding Time
Physical grinding of the metal acetate precursor with the support provides improved
macro-scale distribution of the precursors on the support, prior to the decomposition stage
which is induced by the heat treatment step of the synthesis. This then leads to the observed
mixture of Au, Pd and Au-Pd nano-particles. In order to ascertain the importance of the
initial mixing of the support and metal acetate precursors, a series of Au-Pd/C catalysts were
prepared with increasing grinding time. These catalysts were subsequently heat treated and
tested for H2O2 formation as shown in Table 4.8.
Table 4.8 - The effect of grinding time on H2O2 productivity for a Au-Pd/C catalyst
H2O2 synthesis tests showed similar productivity for all grinding times attempted. This
indicates the most important redistribution of the metal occurs during the heat treatment stage
rather than the grinding stage, once a certain level of basic mixing has been achieved.
Grinding time (min) Productivity (molH2O2kgcat-1h-1)
1 100
5 102
10 102
20 104

--------------------------- CHAPTER FOUR: Catalysts Prepared by Physical Grinding ----------------------------------
127
4.7 Effect of Thermal Treatment Temperature
From TGA analysis, Figure 4.3A (section 4.2.2), the thermal decomposition of acetate on
a carbon support starts at temperatures as low as 150 oC and is complete by 250 oC,
suggesting that the use of lower thermal treatment temperatures might also be successful.
The thermal treatment temperature has previously been shown to be a play off between
activity and stability 16, 43, with catalysts calcined at lower temperature being more unstable
but having higher activity. Thus, a series of experiments were performed for Au-Pd/C
mixtures produced at 5 min grinding times, with the mixtures heated to 250 oC, 300 oC, 350 oC, and 400 oC, and then tested for H2O2 synthesis (Table 4.9). The heating rate and time
were kept constant at 20 oC min-1 and 2 h.
Table 4.9 - The thermal treatment temperature on H2O2 productivity for a Au-Pd/C catalyst
Thermal treatment temperature (oC) H2O2 Productivity (molH2O2 kgcat
-1hr-1)
1st Use 2nd Use
250 131 92
300 114 94
350 100 100
400 94 94
The catalytic testing data shown in table indicates that a temperature of 350 oC is required to
produce a stable Au-Pd catalyst. It is likely that the higher temperature of 400 oC causes
sintering of the nano-particles leading to deactivation of the catalyst. At lower temperatures
(250 and 300 oC) the initial catalyst activity is higher; however the loss of activity on reuse
indicates the nano-particles are not stable on the support surface. At the lower temperature
TGA, Figure 4.3A, has shown the acetate not to be fully decomposed which would explain
the lower activity and stability.

--------------------------- CHAPTER FOUR: Catalysts Prepared by Physical Grinding ----------------------------------
128
4.8 Effect of Chloride Addition
The objective of this study is to determine the role of halide in the catalyst; previous
attempts to impregnate the catalyst with halide led to destabilising the material and leaching
of active components into the reaction medium. Also the baseline catalyst already contained
a significant concentration of halide, with the addition of extra halide leading to unselective
catalyst poisoning10.
A series of Au-Pd/C catalysts were prepared by physical grinding with varying
concentrations of chloride, in collaboration with a colleague, Daniel Gaskell. The
introduction of chloride was achieved by substituting amounts of Pd(OAc)2 with PdCl2 in the
ratios shown in Table 4.10. Unfortunately the concentration of chloride has not been
accurately measured here. In future the concentration of chloride in the bulk can be
determined using inductively coupled plasma mass spectrometry (ICP). Results have been
expressed as the theoretical weight percent if all chloride remains.
Table 4.10 - Au-Pd/C prepared by physical grinding using different precursor compositions.
Pd(OAc)2: PdCl2 C (g) Au(OAc)3 (g) Pd(OAc)2 (g) PdCl2 (g) Cl- (wt %)
100:0 0.475 0.025 0.026 0.0000 0.00
75:25 0.475 0.025 0.020 0.0053 0.42
50:50 0.475 0.025 0.013 0.0107 0.83
25:75 0.475 0.025 0.007 0.0160 1.25
0:100 0.475 0.025 0.000 0.0214 1.67
After heat treatment at 350 oC for 2 h in flowing He, the catalysts were tested for the direct
H2O2 synthesis with a view of observing the effect on the hydrogenation activity. Here it
should be noted that PdCl2 does not decompose until ca. 680 oC; however, it is believed that
the exothermic nature of Au(OAc)3 decomposition may assist the decomposition of PdCl2 and
at a macro-scale particle size the temperature may be decreased. In order to elucidate the
nature of the active metal particles, the catalyst prepared using exclusively PdCl2 was
characterised by STEM and XPS, the findings being compared to the characterisation,
reported previously in Section 4.4, of the catalyst prepared using exclusively Pd(OAc)2.
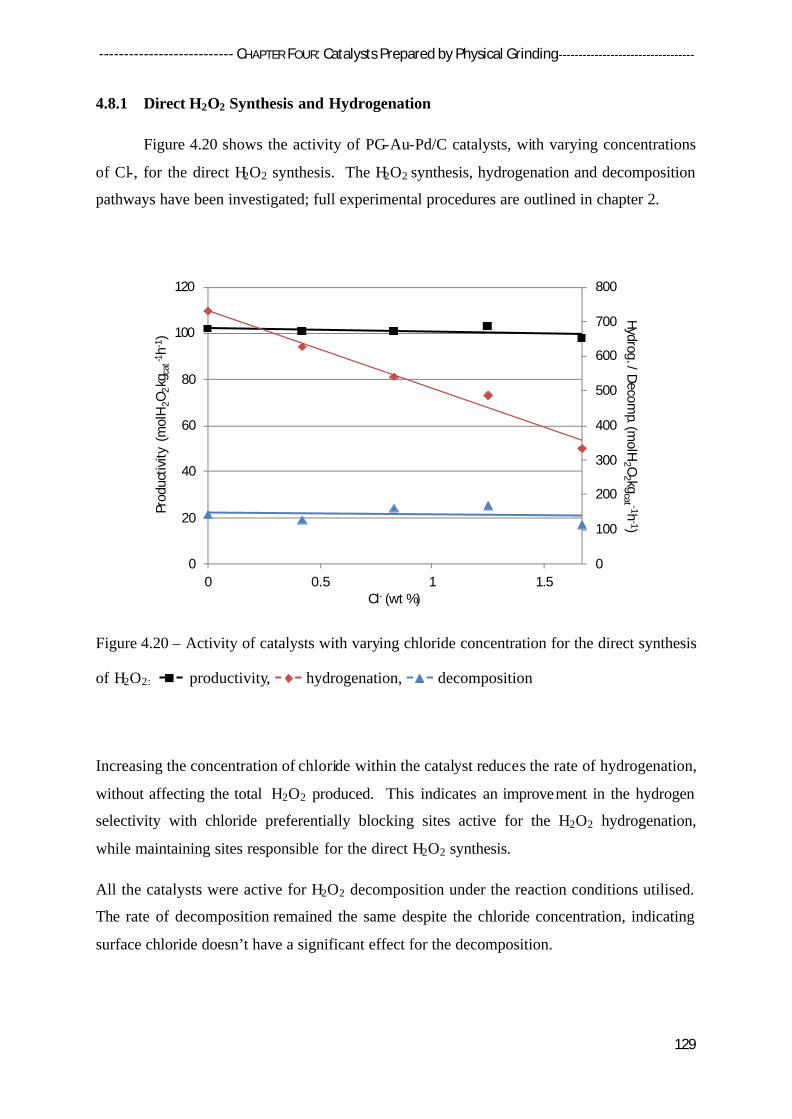
--------------------------- CHAPTER FOUR: Catalysts Prepared by Physical Grinding ----------------------------------
129
4.8.1 Direct H2O2 Synthesis and Hydrogenation
Figure 4.20 shows the activity of PG-Au-Pd/C catalysts, with varying concentrations
of Cl-, for the direct H2O2 synthesis. The H2O2 synthesis, hydrogenation and decomposition
pathways have been investigated; full experimental procedures are outlined in chapter 2.
Figure 4.20 – Activity of catalysts with varying chloride concentration for the direct synthesis
of H2O2: - - productivity, - - hydrogenation, - - decomposition
Increasing the concentration of chloride within the catalyst reduces the rate of hydrogenation,
without affecting the total H2O2 produced. This indicates an improvement in the hydrogen
selectivity with chloride preferentially blocking sites active for the H2O2 hydrogenation,
while maintaining sites responsible for the direct H2O2 synthesis.
All the catalysts were active for H2O2 decomposition under the reaction conditions utilised.
The rate of decomposition remained the same despite the chloride concentration, indicating
surface chloride doesn’t have a significant effect for the decomposition.
Prod
uctiv
ity (
mol
H2O
2kg c
at-1
h-1)
Hydrog. / Decomp. (m
olH2 O
2 kgcat -1h
-1)
Cl- (wt %)
0
100
200
300
400
500
600
700
800
0
20
40
60
80
100
120
0 0.5 1 1.5

--------------------------- CHAPTER FOUR: Catalysts Prepared by Physical Grinding ----------------------------------
130
4.8.2 Scanning Transmission Electron Microscopy (STEM)
Scanning transmission electron microscopy (STEM) - high-angle annular dark-field
(HAADF) micrographs of the Au-Pd/C catalyst prepared using PdCl2 as the sole precursor
(1.67 wt%Cl-) are shown in Figure 4.21. The Au-Pd/C catalyst was prepared by physically
grinding PdCl2, Au(OAc)3 and carbon prior to heat treatment at 350 oC in He for 2 h. X-ray
energy-dispersive spectroscopy (XEDS) was used to analyse the composition of individual
nano-particles. Particle distribution was obtained for sub-10 nm particles and their
distribution compared to the corresponding PG-carbon material.
Figure 4.21 – Bright field imaging of PG-Au-Pd/C using PdCl2 and Au(OAc)3 precursors.
STEM showed that there was a larger proportion of large (ca. 50 nm) Au and Pd particles,
suggesting the Pd is not dispersed as well when using PdCl2 instead of Pd(OAc)2 . PdCl2 has
a decomposition temperature of 500 °C52, and therefore does not undergo auto-reduction at
the 350 °C, heat treatment temperature used here. The presence of a larger portion of Pd
particles >50 nm could be a reason for the lower activity seen. There were also large Au
particles present; however this is similar to PG-Au-Pd/carbon and titania-acetate only. Small
A B C

--------------------------- CHAPTER FOUR: Catalysts Prepared by Physical Grinding ----------------------------------
131
particles (<5 nm) were formed which contained both Au and Pd, and are thought to be the
active species. The size distributuion of sub-10 nm particles is shown in Figure 4.22.
Figure 4.22 - Size distribution of sub-10 nm particles in Au-Pd/C (PdCl2 precursor) produced
by physical grinding. Note: many much larger Au-rich and Pd-rich particles were also
observed but are not included in this histogram.
The average particle size of 5.4 nm, from Figure 4.22, is larger than for the PG-Au-Pd/carbon
catalyst prepared with acetate only, of 3.1 nm in Figure 4.13 (section 4.4.4). In line with
Hutching et al previous observation that a higher number density of larger particles (2-10 nm)
is responsible for a high H2O2 producitvity due to lower H2O2 hydrogenation.43 This may be
the reason for the lower H2O2 hydrogenation activty observed for the catalyst prepared with
PdCl2. It also confirms an earlier postulation that the simultaneous decomposition of gold
and palladium acetate may assist the decompositions in order to form more dispersed metal
particles.

--------------------------- CHAPTER FOUR: Catalysts Prepared by Physical Grinding ----------------------------------
132
4.8.3 X-ray Photoelectron Spectroscopy (XPS)
The surface of Au-Pd carbon supported materials using Pd(OAc)2 (Figure 4.23a) and
PdCl2 (Figure 4.23b) precursors, were analysised by XPS.
Figure 4.23 – Pd (3d) spectra observed for the PG-Au-Pd/C catalysts using different Pd
precursors, (a) PdCl2 and (b) Pd(OAc)2.
The Pd(3d) spectral region, in Figure 4.23, of the physical grinding carbon catalysts are
similar, when using PdCl2 or Pd(OAc)2 as the Pd metal precursor. Both spectra have a
Pd(3d5/2) peak at ca. 335.0 eV which corresponds to metallic Pd.
Figure 4.24 – [A] Au(4f) spectra observed for PG-Au-Pd/C catalysts using different
precursors (a) PdCl2 and (b) Pd(OAc)2. [B] Cl(2p) spectra for PG-Au-Pd/C using PdCl2.
A B

--------------------------- CHAPTER FOUR: Catalysts Prepared by Physical Grinding ----------------------------------
133
The Au(4f) spectral region in Figure 4.24A indicates all the gold that is present on the surface
is in the metallic state, by the peaks at ca. 84 eV. This highlights the higher reduction
potential of gold compared to palladium.
The Cl(2p) spectra in Figure 4.24B, shows the presence of chloride on the surface of the PG-
Au-Pd/C catalyst prepared with PdCl2 precursor. Interestingly, a high binding energy
(corresponding to more ionic, negatively charge Clx- species) is observed similar to stable
IMP-Au-Pd catalysts (calcined at 400oC), represented by Figure 3.2 in Chapter Three. It
can be postulated that a complex stable interaction between the support and Pd is occurring
due to the stability of the catalyst during direct H2O2 synthesis which corresponds to lower
H2O2 hydrogenation activity.
Table 4.11 - Quantified XPS data for PG-Au-Pd/C catalysts using different Pd precursors.
PG-Au-Pd/C
Pd precursor
At% Pd/Aua Pd2+ (%)
Au Pd C O Cl
Pd(OAc)2 0.04 0.47 95.22 4.27 11.25 22
PdCl2 0.31 0.74 94.9 3.61 0.44 1.89 25 a Corrected for overlap of the Pd(3d5/2) and Au(4d5/2) components.
Quantification of the XPS in Table 4.11 indicates there is approximately 8 times the amount
of gold on the surface as well as increased surface palladium, when the PdCl2 precursor is
utilised. This may mean a higher palladium and gold dispersion; however, this contradicts
the STEM analysis so it is more likely to be simply due to a higher content of metal on the
support surface i.e. less metal in the carbon pores. In this case unlike previously when it was
postulated higher surface palladium causes higher H2O2 hydrogenation, on this occasion it
corresponds to a lower Pd/Au ratio (1.89). Therefore, the decrease in H2O2 hydrogenation is
likely to be due to a higher association between gold and palladium providing higher stability
of the formed peroxide. This linked with chloride (0.44 at%) preferentially blocking active
sites will be responsible for the lower H2O2 hydrogenation.
The Pd on the carbon surface, for both catalysts is mainly in the metallic state, indicating
sufficient decomposition of the Pd precursor is being achieved, when PdCl2 or Pd(OAc)2 are
utilised.

--------------------------- CHAPTER FOUR: Catalysts Prepared by Physical Grinding ----------------------------------
134
4.8.4 Discussion
Interestingly, XPS quantification of PG-Au-Pd/C prepared using PdCl2 shows the
presence of 0.44 at% on the carbon surface; this concentration is similar to that seen
previously for stable IMP-Au-Pd/C catalysts, table. Table 4.12 compares quantified XPS
data and direct H2O2 synthesis activities of PG-Au-Pd/C (PdCl2 precursor) and IMP-Au-Pd/C.
Table 4.12 - Quantified XP data and H2O2 testing data for stable PG-Au-Pd/C (PdCl2
precursor - 350oC in He) and IMP-Au-Pd/C (400oC in static air) catalysts.
H2O2 Synthesis XPS – Molar ratios
Prod Hydrog Au Pd C O Cl Pd/Au Pd2+ (%)
PG-PdCl2
350°C in He 98 335 0.31 0.74 94.9 3.61 0.44 1.89 25
IMP10
Calcined 400°C 110 120 0.17 0.38 93.7 5.3 0.45 1.7 68
It is clear from table, that the presence of halide on the catalyst surface is not solely
responsible for the catalysts activity towards H2O2 hydrogenation and thus the synthesis of
H2O2. This is shown by the PG-catalyst having a higher H2O2 hydrogenation activity of 335
molH2O2kgcat-1h-1, than the IMP-Au-Pd/C 120 molH2O2kgcat
-1h-1, despite approximately the
same surface halide concentration, 0.44 and 0.45 at% respectively. This indicates that
although halide may be responsible for blocking some active sites for decreasing for H2O2
hydrogenation, halide is not solely responsible. The particle size distribution, palladium
oxidation state and extent of Au-Pd alloying and all play vital roles.
The mean average particle size of particles <10 nm, believed to be active, is approximately
the same 4-6 nm. They have both higher number densities of smaller particles compared to
equivalent titania catalysts with higher hydrogenation. However, direct comparison between
the mean particle sizes is difficult as values for the percentage of metal below 10 nm are
unknown.

--------------------------- CHAPTER FOUR: Catalysts Prepared by Physical Grinding ----------------------------------
135
Examination of the palladium oxidation state indicates a higher surface Pd2+ concentration on
the impregnation catalyst. This is as expected, as in order to stabilise the impregnation
catalyst a heat treatment in an oxygen rich atmosphere (static air) and high temperature
(400oC) will partially oxidise the palladium. Whereas, to stabilise the physical grinding
catalyst it is heated in an inert atmosphere to 350 oC causing the reduction of the precursor to
the metal. In the previous chapter (Chapter Two) the presence of PdO has been shown to be
crucial, by inhibiting the Pd0 activity on a Au-Pd/AwC resulting in switching off H2O2
hydrogenation.
In Table 4.12, although the Pd/Au ratios are similar for the PG-Au-Pd/C and IMP-Au-Pd/C
catalysts, the physical grinding catalyst has approximately double the metal content, Au and
Pd. This may inhibit gold’s ability to influence Pd and stabilise the O-O bond. Therefore, in
this case, it can be postulated that double the metal in a higher metallic Pd concentration can
be attributed to the higher H2O2 hydrogenation thus lower synthesis activity.
4.9 Conclusion
In conclusion, it has been shown that it is possible to prepare stable halide free Au-Pd
catalysts on carbon and titania by physical grinding, a simple ‘mix and heat’ technique. Even
though the catalysts had approximately six times higher activity towards the H2O2
hydrogenation pathway than previously reported impregnation catalysts the H2O2
productivities were similar in the case of Au-Pd/C or higher for oxide supported equivalents.
Characterisation of the materials showed there to be three types of particles present on the
surface. The catalysts consistent of a significant amount of Au-Pd alloyed particles <5 nm.
However, high H2O2 hydrogenation believed to be due to small (< 10 nm) monometallic Pd
particles. The addition of halide in the form of Cl- introduced by using PdCl2 instead of
Pd(OAc)2 corresponds to a decreased H2O2 hydrogenation while retaining the catalysts H2O2
synthesis activity.
As well as small un-alloyed metal it was evident from STEM and XRD analysis that there
was a significant amount of large metal particles (>10 nm) believed to be inactive for the
H2O2 synthesis. Physical grinding could be improved by using this metal more efficiently,
either by achieving control over the dispersion during heat treatment or using a lower content.

--------------------------- CHAPTER FOUR: Catalysts Prepared by Physical Grinding ----------------------------------
136
4.10 References
1. V. R. Choudhary, C. Samanta and P. Jana, Applied Catalysis a-General, 2007, 332, 70-78. 2. V. R. Choudhary, Y. V. Ingole, C. Samanta and P. Jana, Industrial & Engineering Chemistry
Research, 2007, 46, 8566-8573. 3. V. R. Choudhary, C. Samanta and P. Jana, Applied Catalysis A: General, 2007, 317, 234-243. 4. V. R. Choudhary, C. Samanta and P. Jana, Industrial & Engineering Chemistry Research , 2007,
46, 3237-3242. 5. V. R. Choudhary and P. Jana, Catalysis Communications, 2008, 9, 2371-2375. 6. S. Chinta and J. H. Lunsford, Journal of Catalysis, 2004, 225, 249-255. 7. Y. F. Han and J. H. Lunsford, Journal of Catalysis, 2005, 230, 313-316. 8. Q. S. Liu and J. H. Lunsford, Journal of Catalysis, 2006, 239, 237-243. 9. N. E. Ntainjua, M. Piccinini, J. C. Pritchard, J. K. Edwards, A. F. Carley, J. A. Moulijn and G. J.
Hutchings, ChemSusChem, 2009, 2, 575-580. 10. E. Ntainjua N, M. Piccinini, J. C. Pritchard, Q. He, J. K. Edwards, A. F. Carley, J. A. Moulijn, C. J.
Kiely and G. J. Hutchings, ChemCatChem, 2009, 1, 479-484. 11. D. P. Dissanayake and J. H. Lunsford, Journal of Catalysis, 2002, 206, 173-176. 12. D. P. Dissanayake and J. H. Lunsford, Journal of Catalysis, 2003, 214, 113-120. 13. H. S. Oh, J. H. Yang, C. K. Costello, Y. M. Wang, S. R. Bare, H. H. Kung and M. C. Kung, Journal
of Catalysis, 2002, 210, 375-386. 14. H. H. Kung, M. C. Kung and C. K. Costello, Journal of Catalysis, 2003, 216, 425-432. 15. F. Moreau, G. C. Bond and A. O. Taylor, Journal of Catalysis, 2005, 231, 105-114. 16. J. K. Edwards, B. E. Solsona, P. Landon, A. F. Carley, A. Herzing, C. J. Kiely and G. J. Hutchings,
Journal of Catalysis, 2005, 236, 69-79. 17. C. Burda, X. Chen, R. Narayanan and M. A. El-Sayed, Chemical Reviews, 2005, 105, 1025-1102. 18. Y. Wang and Y. Xia, Nano Letters, 2004, 4, 2047-2050. 19. H. Guan, C. Shao, S. Wen, B. Chen, J. Gong and X. Yang, Inorganic Chemistry Communications,
2003, 6, 1302-1303. 20. F. X. Redl, C. T. Black, G. C. Papaefthymiou, R. L. Sandstrom, M. Yin, H. Zeng, C. B. Murray and
S. P. O'Brien, Journal of the American Chemical Society, 2004, 126, 14583-14599. 21. R. Q. Song, A. W. Xu, B. Deng, Q. Li and G. Y. Chen, Advanced Functional Materials, 2007, 17,
296-306. 22. C. J. Murphy, T. K. Sau, A. M. Gole, C. J. Orendorff, J. Gao, L. Gou, S. E. Hunyadi and T. Li, The
Journal of Physical Chemistry B, 2005, 109, 13857-13870. 23. L. Vovchenko, L. Matzui, M. Zakharenko, M. Babich and A. Brusilovetz, Journal of Physics and
Chemistry of Solids, 2004, 65, 171-175. 24. T. Ishida, N. Kinoshita, H. Okatsu, T. Akita, T. Takei and M. Haruta, Angew Chem Int Ed Engl,
2008, 47, 9265-9268. 25. Y. Lin, K. A. Watson, M. J. Fallbach, S. Ghose, J. G. Smith Jr, D. M. Delozier, W. Cao, R. E.
Crooks and J. W. Connell, Acs Nano, 2009, 3, 871-884. 26. A. Obaid, A. Alyoubi, A. Samarkandy, S. Al-Thabaiti, S. Al-Juaid, A. El-Bellihi and E.-H.
Deifallah, Journal of Thermal Analysis and Calorimetry, 2000, 61, 985-994. 27. M. D. Judd, B. A. Plunkett and M. I. Pope, Journal of thermal analysis, 1974, 6, 555-563. 28. K. C. Patil, G. V. Chandrashekhar, M. V. George and C. N. R. Rao, Canadian Journal of
Chemistry, 1968, 46, 257-265. 29. J. C. De Jesus, I. González, A. Quevedo and T. Puerta, Journal of Molecular Catalysis A:
Chemical, 2005, 228, 283-291. 30. S. D. Bakrania, G. K. Rathore and M. S. Wooldridge, Journal of Thermal Analysis and
Calorimetry, 2009, 95, 117-122. 31. P. K. Gallagher and M. E. Gross, Journal of Thermal Analysis and Calorimetry, 1986, 31, 1231-
1241.

--------------------------- CHAPTER FOUR: Catalysts Prepared by Physical Grinding ----------------------------------
137
32. S. V. Pol, V. G. Pol, I. Felner and A. Gedanken, European Journal of Inorganic Chemistry, 2007, 2007, 2089-2096.
33. J. Leicester and M. J. Redman, Journal of Applied Chemistry, 1962, 12, 357-366. 34. T. Arii and A. Kishi, Thermochimica Acta, 2003, 400, 175-185. 35. J.-Y. Zhang, H. Esrom and I. W. Boyd, Applied Surface Science, 1996, 96–98, 399-404. 36. M. Sankar, N. Dimitratos, P. J. Miedziak, P. P. Wells, C. J. Kiely and G. J. Hutchings, Chemical
Society Reviews, 2012, 41, 8099-8139. 37. J. Pritchard, L. Kesavan, M. Piccinini, Q. He, R. Tiruvalam, N. Dimitratos, J. A. Lopez-Sanchez,
A. F. Carley, J. K. Edwards, C. J. Kiely and G. J. Hutchings, Langmuir, 2010, 26, 16568-16577. 38. J. C. Pritchard, Cardiff University, 2012. 39. A. A. Herzing, M. Watanabe, J. K. Edwards, M. Conte, Z. R. Tang, G. J. Hutchings and C. J. Kiely,
Faraday Discussions, 2008, 138, 337-351. 40. J. K. Edwards, B. Solsona, E. N. N, A. F. Carley, A. A. Herzing, C. J. Kiely and G. J. Hutchings,
Science, 2009, 323, 1037-1041. 41. J. K. Edwards, E. Ntainjua N, A. F. Carley, A. A. Herzing, C. J. Kiely and G. J. Hutchings,
Angewandte Chemie International Edition, 2009, 48, 8512-8515. 42. J. K. Edwards, A. Thomas, A. F. Carley, A. A. Herzing, C. J. Kiely and G. J. Hutchings, Green
Chemistry, 2008, 10, 388-394. 43. J. K. Edwards, A. F. Carley, A. A. Herzing, C. J. Kiely and G. J. Hutchings, Faraday Discussions,
2008, 138, 225-239. 44. N. N. Edwin, J. K. Edwards, A. F. Carley, J. A. Lopez-Sanchez, J. A. Moulijn, A. A. Herzing, C. J.
Kiely and G. J. Hutchings, Green Chemistry, 2008, 10, 1162-1169. 45. S. B. Ziemecki, G. A. Jones, D. G. Swartzfager, R. L. Harlow and J. Faber, Journal of the
American Chemical Society, 1985, 107, 4547-4548. 46. N. Krishnankutty, J. Li and M. Albert Vannice, Applied Catalysis A: General, 1998, 173, 137-
144. 47. M. Beck, M. Ellner and E. J. Mittemeijer, Acta Materialia, 2001, 49, 985-993. 48. H. Okamoto and T. B. Massalski, Bulletin of Alloy Phase Diagrams, 1984, 5, 378-379. 49. M. Haruta, N. Yamada, T. Kobayashi and S. Iijima, Journal of Catalysis, 1989, 115, 301-309. 50. A. Maeland and T. B. Flanagan, Canadian Journal of Physics, 1964, 42, 2364-2366. 51. www.cf.ac.uk/chemy/staffinfo/xpsaccess/database/tio2p25, Editon edn. 52. https://fscimage.fishersci.com/msds/17980.htm, Editon edn.

138
Increasing Hydrogen Peroxide Concentration
5.1 Introduction – A Biphasic Solvent System for Direct H2O2 Synthesis
The direct synthesis of H2O2 is mainly carried out in water based solvents1-9. Water is
not only desirable due to its non-toxicity but it is readily available and low cost compared
with other solvents. Aqueous H2O2 can be directly used for a wide range of applications,
including pulp/paper and textile bleaching, as a substitute for chlorine or chlorine-containing
oxidants10. However a major drawback of using water is that H2 and O2, the reactant gases,
have low solubility leading to low synthesis rates.4, 6
To overcome the gas solubility limitations of water various solvent systems have been
investigated, including supercritical CO211-16 and a biphasic mixture of water and fluorinated
solvents as well as other halogenated hydrocarbon compounds17-20, however low H2O2
synthesis rates were achieved.
The addition of water soluble organic additives proved more successful,21 with low chain
alcohol (methanol and ethanol) based solvents being extensively studied.1-3, 22-25 The
solubility of H2 in alcohols is 4-5 times higher than in water, while that of O2 may increase up
to eightfold, as shown in Table 5.1, leading to higher H2O2 productivities4.
Table 5.1 - H2 and O2 solubility’s in low chain alcohols and water at 25oC4
Solvent Solubility of H2 (mg/l)(mM) Solubility of O2 (mg/L)(mM)
Water 1.62 (0.81) 40 (1.25)
Methanol 7.91 (3.96) 324 (10.12)
Ethanol 7.50 (3.75) 320 (10.0)
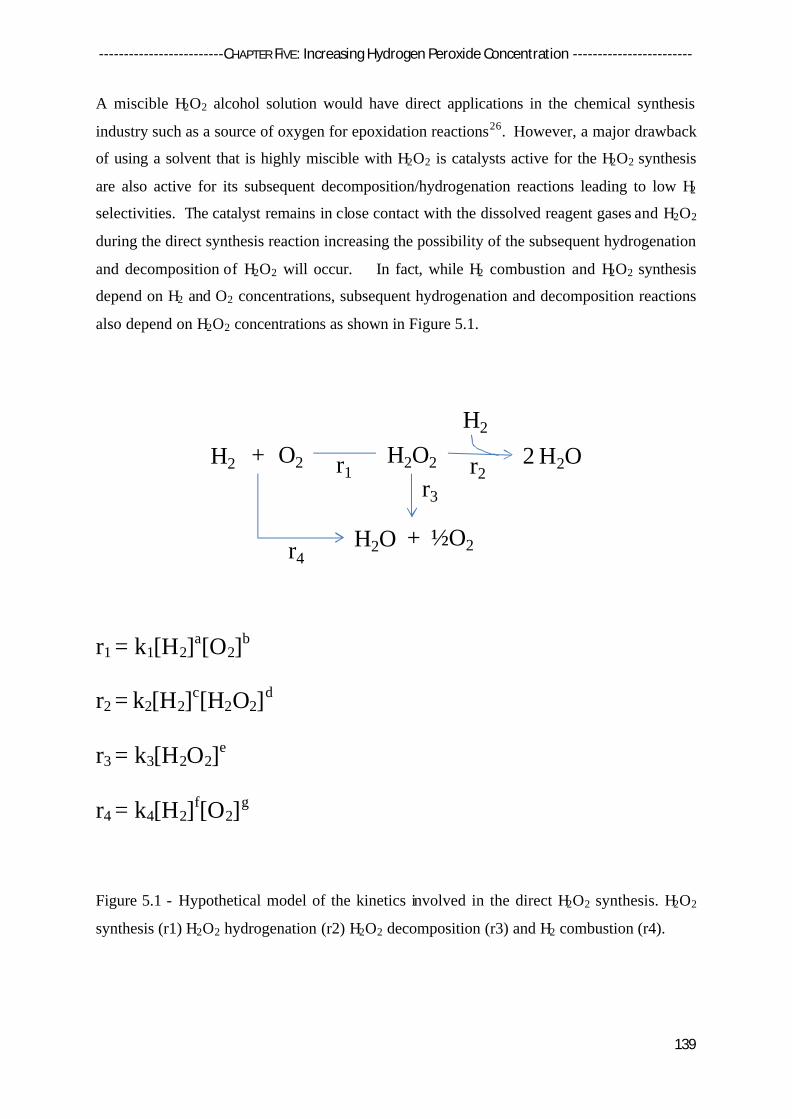
-------------------------CHAPTER FIVE: Increasing Hydrogen Peroxide Concentration ------------------------
139
A miscible H2O2 alcohol solution would have direct applications in the chemical synthesis
industry such as a source of oxygen for epoxidation reactions26. However, a major drawback
of using a solvent that is highly miscible with H2O2 is catalysts active for the H2O2 synthesis
are also active for its subsequent decomposition/hydrogenation reactions leading to low H2
selectivities. The catalyst remains in close contact with the dissolved reagent gases and H2O2
during the direct synthesis reaction increasing the possibility of the subsequent hydrogenation
and decomposition of H2O2 will occur. In fact, while H2 combustion and H2O2 synthesis
depend on H2 and O2 concentrations, subsequent hydrogenation and decomposition reactions
also depend on H2O2 concentrations as shown in Figure 5.1.
r1 = k1[H2]a[O2]b
r2 = k2[H2]c[H2O2]d
r3 = k3[H2O2]e
r4 = k4[H2]f[O2]g
Figure 5.1 - Hypothetical model of the kinetics involved in the direct H2O2 synthesis. H2O2
synthesis (r1) H2O2 hydrogenation (r2) H2O2 decomposition (r3) and H2 combustion (r4).
H2 O2+
H2O + ½O2
H2O2 2 H2OH2
r1 r2r3
r4

-------------------------CHAPTER FIVE: Increasing Hydrogen Peroxide Concentration ------------------------
140
Interestingly, Solvay® has postulated that using a biphasic solvent system consisting of a
hydrophobic organic solvent and water, could present a way to produce high concentrations
of H2O2. A schematic of the proposed system is shown in Figure 5.2.
Figure 5.2 - A schematic highlighting the key features of the biphasic solvent system
proposed.
In theory the catalyst would be held in the organic phase where the H2O2 would be formed.
This is immediately extracted in-situ into the water phase due to the higher solubility of H2O2
in water than in the alcohol, therefore avoiding hydrogenation/decomposition. This allows a
smaller target yield of H2O2. For example, if a solvent composition of 8 g organic solvent
and 0.5 g immiscible co-solvent is used, then only 0.0425 g of H2O2 are required for 8.5 wt%
H2O2 to be extracted from the immiscible phase. Whereas, if the same mass of H2O2 was
produced in a one phase system (8.5 g) a solution of only 0.5 wt% H2O2 will be obtained.
In this chapter, the development of an innovative approach for the direct H2O2 synthesis
based on a biphasic water/alcohol solvent system has been investigated in detail. The
potential of such a system has been examined with a goal of producing a H2O2 concentration
Organic Solvent + CatalystProduce H2O2
Co-solventUsed to extract H2O2 in-situ
Reactant GasesH2 + O2 / diluent gas
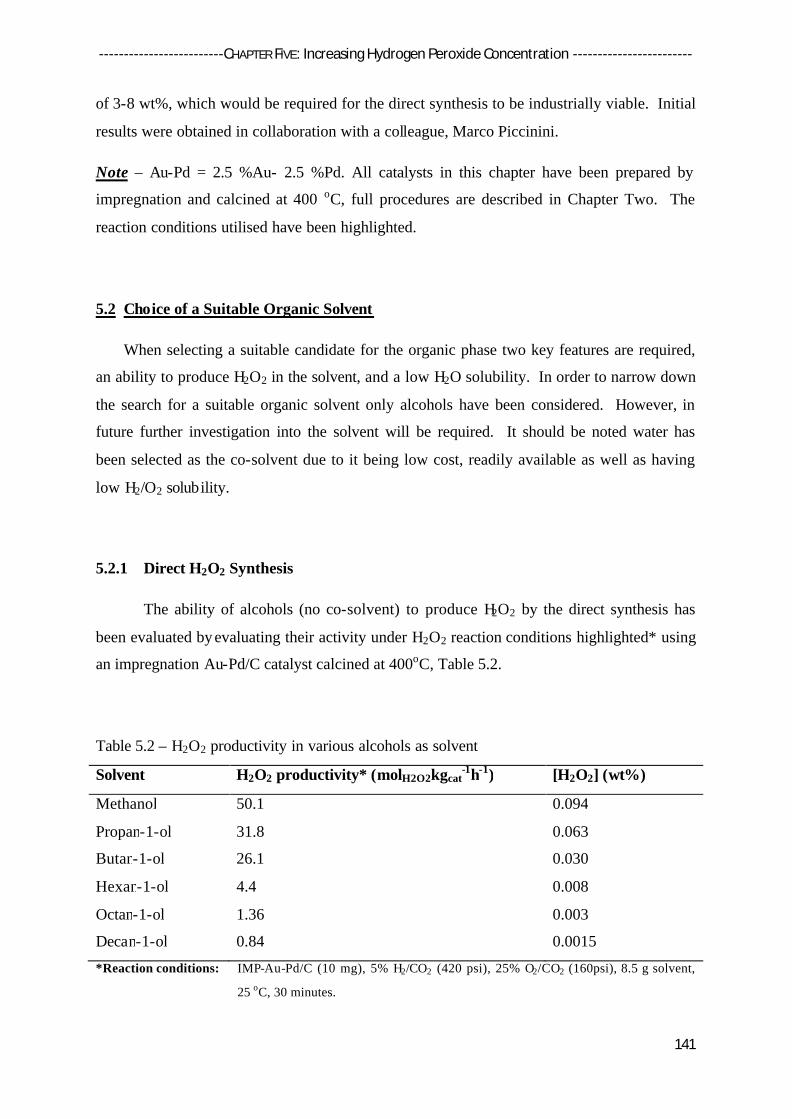
-------------------------CHAPTER FIVE: Increasing Hydrogen Peroxide Concentration ------------------------
141
of 3-8 wt%, which would be required for the direct synthesis to be industrially viable. Initial
results were obtained in collaboration with a colleague, Marco Piccinini.
Note – Au-Pd = 2.5 %Au- 2.5 %Pd. All catalysts in this chapter have been prepared by
impregnation and calcined at 400 oC, full procedures are described in Chapter Two. The
reaction conditions utilised have been highlighted.
5.2 Choice of a Suitable Organic Solvent
When selecting a suitable candidate for the organic phase two key features are required,
an ability to produce H2O2 in the solvent, and a low H2O solubility. In order to narrow down
the search for a suitable organic solvent only alcohols have been considered. However, in
future further investigation into the solvent will be required. It should be noted water has
been selected as the co-solvent due to it being low cost, readily available as well as having
low H2/O2 solubility.
5.2.1 Direct H2O2 Synthesis
The ability of alcohols (no co-solvent) to produce H2O2 by the direct synthesis has
been evaluated by evaluating their activity under H2O2 reaction conditions highlighted* using
an impregnation Au-Pd/C catalyst calcined at 400oC, Table 5.2.
Table 5.2 – H2O2 productivity in various alcohols as solvent
Solvent H2O2 productivity* (molH2O2kgcat-1h-1) [H2O2] (wt%)
Methanol 50.1 0.094
Propan-1-ol 31.8 0.063
Butan-1-ol 26.1 0.030
Hexan-1-ol 4.4 0.008
Octan-1-ol 1.36 0.003
Decan-1-ol 0.84 0.0015
*Reaction conditions: IMP-Au-Pd/C (10 mg), 5% H2/CO2 (420 psi), 25% O2/CO2 (160psi), 8.5 g solvent,
25 oC, 30 minutes.

-------------------------CHAPTER FIVE: Increasing Hydrogen Peroxide Concentration ------------------------
142
Low concentrations of H2O2 have been produced regardless of the alcohol employed as the
solvent. The activity decreases with increasing carbon chain length. This may be due to
higher viscosity and surface tension as the carbon chain length increases. The success of the
solvent being able to produce H2O2 strongly depends on the overall rate of mass transfer of
gaseous reactants to the catalyst surface, highlighted in Figure 5.3.
Figure 5.3 - Outline of the pathway of the reagent gas to the liquid phase then the catalyst
surface to produce H2O227.
Here two mass transfer resistances are highlighted, dissolution of gases into the liquid phase
and reactant transport in the liquid to the catalyst surface. Unfortunately it was not possible
to measure solubility using the current reagent gases, 5 % H2/CO2 and 25 % O2/CO2, as the
dissolution of H2 and O2 has to compete with the dissolution of CO2 into the solvent.
However, Francesconi et al. 28 and Wainwright et al.29 have shown that hydrogen solubility
in the C1-4 n-primary alcohol series increases with carbon chain length and therefore it is
reasonable to expect hydrogen to be more miscible in decan-1-ol rather than methanol.
Factors that will increase the mass transfer include: increasing the solubility of H2 and O2 by
increasing reaction pressure; using solvents that have higher gas solubility; and using solvents
with lower viscosity and surface tension.
H2O
H2O2
O2H2
H2
GASphase
LIQUIDphase
Catalyst

-------------------------CHAPTER FIVE: Increasing Hydrogen Peroxide Concentration ------------------------
143
5.2.2 H2O Solubility
Another important consideration when selecting the organic solvent is the necessity
for it to have low H2O solubility in order to have a two phase system. Table 5.2 shows that
methanol is the best solvent for the direct H2O2 synthesis. However, due to it being
completely miscible with water, it is not a suitable solvent for this investigation. Higher
carbon chain alcohols (>C6) have low water solubility and the addition of excess water
creates a two phase system. The saturation point of the alcohols has been determined
experimentally by Karl Fischer titration with the results shown in Table 5.3.
Table 5.3 - Solubility of water in high chain alcohols
Solvent H2O solubility (gH2O dm-3)
Hexan-1-ol 77
Octan-1-ol 44
Decan-1-ol 39
As chain length increases the H2O solubility decreases, with decan-1-ol having the lowest
saturation point. In this case it is desirable for a suitable industrial solvent to be hydrophobic
so the concentration of alcohol in the final H2O-H2O2 solution is minimal to decrease costs
relating to purification through distillation. Hence, the only suitable candidate is decan-1-ol
which was chosen as the ideal solvent candidate
It should be noted that although dodecan-1-ol has a lower saturation point, its melting point
of 24 oC mean the direct H2O2 synthesis reaction would have to be run at higher temperatures
than room temperature. H2O2 decomposition is much more facile at higher temperatures
therefore this solvent was rendered unsuitable.

-------------------------CHAPTER FIVE: Increasing Hydrogen Peroxide Concentration ------------------------
144
5.2.3 Stability of the Solvent
In order to ascertain the possible reactivity of decan-1-ol with the H2O2 synthesised
during direct synthesis testing conditions, the working solution after reaction, with and
without catalyst in the presence of H2 and O2, was filtered and then analyzed by 1H-NMR
(spectra were recorded at room temperature on a Bruker DPX 500MHz Ultra-Shield NMR
spectrometer (1H 500.13 MHz)), and compared to reference spectra ascertained from unused
decan-1-ol in Figure 5.4. No differences were observed, indicating the decan-1-ol is stable
towards the reaction conditions employed.
Figure 5.4 - 1H-NMR spectra of decan-1-ol after a standard reaction with catalyst (A) and
without catalyst (B), compared to un-used decan-1-ol (C). The H-shift due to decan-1-ol has
been highlighted.

-------------------------CHAPTER FIVE: Increasing Hydrogen Peroxide Concentration ------------------------
145
5.3 Determining the H2O2 Concentration in a Biphasic Solvent System
The separation of water from the organic solvent proved very time consuming and when
less than ~0.3 g water in 8 g decan-1-ol was used separation was complicated as the organic
solvent was saturated with water. Therefore, in all the cases reported in this chapter the
overall H2O2 amount was determined by direct titration of the whole emulsion (decan-1-
ol/H2O) with acidified Ce(SO4)2 solution (ca.8x10-3M), using ferroin as indicator. In order to
determine the error when using this method compared to separation, three different
experiments were performed with increasing masses of water. In each case, H2O2
concentration was ascertained using a direct titration of the whole emulsion and a titration of
the separated water phase, the results are shown in Figure 5.5.
Figure 5.5 - Evaluation of the error of H2O2 determination; H2O2 concentration ( ) calculated
from titration of whole emulsion, ( ) determined from water phase after separation.
Reaction conditions: IMP-Au-Pd/C (10 mg), 5% H2/CO2 (420 psi), 25% O2/CO2 (160psi),
X g solvent, 1200 rpm, 25 oC, 30 minutes.
0
0.1
0.2
0.3
0.4
1 2 3
[H2O
2] (w
t%)
8 g decan-1-ol1 g H2O
8 g decan-1-ol2 g H2O
20 g decan-1-ol5 g H2O

-------------------------CHAPTER FIVE: Increasing Hydrogen Peroxide Concentration ------------------------
146
The error due to the over-estimation on the final concentration with titration of the whole
emulsion is due to it not being a completely distinct two phase system as the decan-1-ol will
contain 39 gH2O dm-3, therefore retain small amounts of H2O2. The error varies between ~20 %
discrepancy for the first two experiments and ~6 % when 5 g water is added.
Although the assessment of H2O2 in the water phase is a more accurate way of determining
H2O2 concentrations, the addition of more leads to less concentrated H2O2 solutions. In the
following experiments the smallest amount of water will be added to the organic solvent to
produce the highest H2O2 concentration possible. The influence of the addition of water has
been studied in more detail in section 5.5.1. It is impossible to separate the 2 distinct phases
if less than 39 gH2O dm-3 is used
The H2O2 concentrations throughout this chapter will be expressed as gH2O2kgH2O-1 (division
by 10 is required to determine the H2O2 wt%). The value obtained represents the theoretical
H2O2 concentration in water if neither H2O nor H2O2 were soluble in the decan-1-ol. The
H2O2 productivity (molH2O2kgcat-1h-1) has also been provided where necessary to highlight
trends.

-------------------------CHAPTER FIVE: Increasing Hydrogen Peroxide Concentration ------------------------
147
5.4 Choice of a Suitable Catalyst
The choice of the catalyst is vital to the production of H2O2 and as previously recorded in
this thesis many preparation methods have been used to produce supported Au-Pd catalysts.
However within this chapter only Au-Pd catalysts prepared by impregnation are investigated.
The supports have been varied due to their varying hydrophobicity. This was done to control
the phase the catalyst was present in, to determine whether the presence in the aqueous or
organic phase affected the H2O2 yield.
.
5.4.1 Direct H2O2 Synthesis
The activity of supported Au-Pd catalysts prepared by impregnation of different
supports were evaluated for the direct synthesis of H2O2 in the new bi-phase solvent system
described, the results are shown in Figure 5.6.
Figure 5.6 - H2O2 concentration produced in the biphasic solvent system described, using Au-
Pd supported catalysts prepared by impregnation
Reaction conditions: IMP-Au-Pd/X (10 mg), 5 %H2/CO2 (420 psi), 25 %O2/CO2 (160 psi),
solvent (8.17 g decan-1-ol, 0.33 g H2O), 1200 rpm, 25 oC, 30 min.
0
1
2
3
4
5
6
AuPd / G60 AuPd / CeO2 AuPd / TiO2 AuPd / SiO2C CeO2 TiO2 SiO2
H2O
2co
ncen
trat
ion
(gH
2O2kg
H2O
-1)
Au-Pd catalyst (support)

-------------------------CHAPTER FIVE: Increasing Hydrogen Peroxide Concentration ------------------------
148
Interestingly, the TiO2 supported Au-Pd catalyst displayed the highest productivity in
comparison to the other supported catalysts, with carbon having the lowest productivity. This
is surprising as Au-Pd/TiO2 has the lowest productivity, 64 molH2O2kgcat-1h-1, and Au-Pd/C
displays much higher activity, 110 molH2O2kgcat-1h-1, in the standard water-methanol solvent
system22. To investigate further the hydrogenation activities of the catalysts were evaluated
in order to investigate whether H2O2 destruction was playing a vital role in the biphasic
solvent system.
5.4.2 H2O2 Hydrogenation.
The activities of impregnation Au-Pd catalysts on various supports have been
evaluated for the hydrogenation of H2O2 in the new biphasic solvent system. The results are
given in Figure 5.7.
Note - The water phase was substituted with a 4 wt% H2O2 solution, the accuracy of this
measurement being important because any small error in the titration would result in an
unacceptable error in the final result. The reactions were run under hydrogenation conditions,
420 psi 5% H2 /CO2, full reaction conditions are highlighted*. The results have been
expressed as the percent of H2O2 destroyed during 30 minutes.

-------------------------CHAPTER FIVE: Increasing Hydrogen Peroxide Concentration ------------------------
149
Figure 5.7 - % H2O2 destroyed by hydrogenation in the biphasic solvent system described,
using impregnation Au-Pd supported catalysts.
*Reaction conditions: IMP-Au-Pd/X (10 mg), 5% H2/CO2 (420 psi), solvent (8.17g decan-1-
ol, 0.33 g 4 wt% H2O2), 1200 rpm, 25 oC, 30 min.
All the Au-Pd supported catalysts examined had extremely high hydrogenation activities, this
is a major problem of this system which wasn’t expected and in the future needs addressing.
However, the Au-Pd/C catalyst has the lowest activity, whereas the Au-Pd oxide supported
catalysts destroyed nearly all of the H2O2 present in the reaction medium.
0
10
20
30
40
50
60
70
80
90
100
1 2 3 4C CeO2 TiO2 SiO2
H2O
2hy
drog
enat
ion
(%)
Au-Pd catalyst (support)

-------------------------CHAPTER FIVE: Increasing Hydrogen Peroxide Concentration ------------------------
150
5.4.3 Discussion
It is likely the direct synthesis of H2O2 results (productivity and hydrogenation) in the
bi-phasic solvent system is due to varying amounts of interaction between the catalyst and the
aqueous solvent. It is possible that if the catalyst is in the same phase as the H2O2 it is much
more likely to hydrogenate the H2O2 In order to determine the phase in which the catalyst
resides, the Au-Pd supported catalysts were added to separate vials which contained a
mixture of decan-1-ol and water,. These results are shown in Figure 5.8.
Figure 5.8 – Simple vial experiment to indicate which phase the catalyst resides.
The images in Figure 5.8 clearly demonstrate that the AuPd/carbon catalyst is the only
material which resides entirely in the decan-1-ol phase; whereas the oxide supported catalysts
have differing levels of interaction in the water phase. The Au-Pd/SiO2 catalyst seems to be
considerably hydrophilic as a large majority of the catalyst being held in the water phase. As
a result of its hydrophilic nature SiO 2 has been used by scientists as it maintains a high water
content, this enables the performance of proton exchange membrane fuel cells to be improved.
This is achieved by SiO 2 addition improving the hydrophillicity, therefore conductivity of the
cathode and preventing dehydration at high temperatures.30, 31
For the TiO2 and CeO2 supported catalysts it is more difficult to define their hydrophilicity;
finely dispersed particles appeared to be retained in both the decan-1-ol and water phase. In
the case of the ceria particles, in the water phase aggregation occurred forming a single large
particle. The varying levels of water interaction may be explained by varying amounts of
oxygen vacancies on the surface, which are favourable for water adsorption. In order to

-------------------------CHAPTER FIVE: Increasing Hydrogen Peroxide Concentration ------------------------
151
improve the hydrophilicity a greater number of oxygen vacancies can be introduced by
irradiation with UV light.32 Comparing these results (figure 5.7) to the catalytic activities
(figure 5.5 and figure 5.6) indicates that interaction between the catalyst support and water is
crucial for producing higher H2O2 synthesis and hydrogenation activities.
However, Au-Pd/C is the only one that resides in the alcohol phase and also shows much
reduced H2O2 hydrogenation activity, so was used in further studies. The H2O2
hydrogenation activity observed could be due to the catalyst being forced into the aqueous
phase under the vigorous stirring conditions employed (1200rpm) when catalysts are
evaluated under standard reaction conditions.
5.5 The Effect of Reaction Variables on H2O2 Concentration
In order for the biphasic solvent system to compete with the current commercially
operated indirect process it is essential that a 3-8 wt% H2O2 solution can be obtained with
high H2 selectivity. Piccinini et al.2, 3 have previously shown the performance of a catalyst,
using a one phase solvent, can be significantly enhanced by understanding the effect of the
key reaction parameters and by operating under optimised conditions.
In order to produce the highest H2O2 concentration possible in the decan-1-ol/water solvent
system described the effect of key reaction variables have been investigated. An
impregnation Au-Pd/C catalyst has been utilised with the decan-1-ol/H2O ratio, solvent
loading, catalyst mass, reaction time, stirring speed and pressure varied.

-------------------------CHAPTER FIVE: Increasing Hydrogen Peroxide Concentration ------------------------
152
5.5.1 The Effect of Decan-1-ol/H2O Ratio
The effect of decan-1-ol/water ratio on H2O2 synthesis was studied in detail by
changing the ratio of decan-1-ol to water keeping the total solvent mass fixed at 8.5g, the
results are shown in Figure 5.9.
Figure 5.9 - H2O2 concentration and productivity as a function of water content.
H2O2 concentration, H2O2 productivity
Reaction conditions: IMP-Au-Pd/C (10 mg), 5% H2/CO2 (420 psi), 25% O2/CO2 (160psi),
8.5g solvent (8.5-X g decan-1-ol, X g H2O), 1200 rpm, 25 oC, 30 min.
The greatest H2O2 concentration was achieved when the decan-1-ol was saturated (3.9 gH2O
dm-3). The saturation point of decan-1-ol is shown by the dotted line. On the left of this line
the solvent is in one phase with the water completely dissolved in the decan-1-ol. On the
right a two phase system exists with a greater excess of water as shown.
Interestingly, water was found to be extremely beneficial to the productivity of H2O2. This is
in agreement with the theory behind the biphasic solvent system, with the water acting as an
0
1
2
3
4
5
6
7
8
9
10
0
0.2
0.4
0.6
0.8
1
1.2
1.4
1.6
1.8
2
0 0.1 0.2 0.3 0.4 0.5 0.6 0.7 0.8 0.9 1
Solvent H 2O content (g)
[H2O
2](g
H2O
2kg
H2O
-1)
H2 O
2 productivity (molH
2O2 kg
cat -1h-1)

-------------------------CHAPTER FIVE: Increasing Hydrogen Peroxide Concentration ------------------------
153
in-situ extractor. As the water mass is increased over the saturation point the H2O2
productivity increases almost linearly. This could be an indication of the catalyst mainly
remaining in the decan-1-ol phase. The slow decrease in rate could be due to the amount of
decan-1-ol decreasing meaning the overall amount of reagent gases, H2 and O2, dissolved in
the solution will be less.
However, interaction between the catalyst Au-Pd/C and water cannot be ruled out. This
would explain both the hydrogenation activity observed earlier in Figure 5.7 and the increase
in H2O2 productivity of ca. 10 times when only 0.33 g of water in Figure 5.9. The addition of
water to a methanol solvent system has previously been shown to improve direct H2O2
synthesis activities.2, 3 Water addition has also been shown to promote other reactions such
as CO oxidation. Date et al.33 developed a reactor system to probe water concentration from
0.1 to 6000 ppm, clearly demonstrating the promotional effect of water on various supported
catalysts. Very low moisture concentrations (~3 ppm) were shown to have rather large
effects on activity. Goodman et al.34 subsequently postulated that the promotional effects of
water on CO oxidation were due to its effect on molecular oxygen adsorption and activation.
Further study found that surface hydroxyl species may play the same promotional role as
adsorbed water.
5.5.2 The Effect of Solvent Mass and Catalyst Loading
The effects of solvent mass and catalyst loading have been investigated in order to
produce the maximum H2O2 concentration with a Au-Pd/C catalyst. Firstly, the mass of
saturated decan-1-ol was varied keeping the catalyst loading at 10 mg, the results obtained
are shown in Figure 5.10.

-------------------------CHAPTER FIVE: Increasing Hydrogen Peroxide Concentration ------------------------
154
Figure 5.10 - H2O2 concentration and productivity as a function of solvent mass.
H2O2 concentration, H2O2 productivity
Reaction conditions: IMP-Au-Pd/C (10 mg), 5% H2/CO2 (420 psi), 25% O2/CO2 (160psi),
X g solvent, 1200 rpm, 25 oC, 30 min.
The results show how it is possible to enhance the concentration of H2O2 by decreasing the
solvent mass. Similar masses of H2O2 are produced by the horizontal trend of H2O2
productivity with solvent mass. This indicates that there are enough reagent gases dissolved
in the decan-1-ol even when 4 g of solvent are used to not put kinetic restrictions on the
system i.e. there is a high enough concentration of reagent in the solvent to allow the catalyst
to work to its full capacity. However, the H2O2 is dissolved in a lower mass of H2O hence
the higher H2O2 concentration as the solvent mass is decreased.
Although it is theoretically possible to further decrease the amount of solvent, 4 g are the
minimum that allows adequate stirring with the type of autoclaves used. Therefore the mass
of catalyst loading was varied keeping the solvent mass constant at 4 g saturated decan-1-ol.
The results are shown in Figure 5.11.
0
0.5
1
1.5
2
2.5
3
3.5
0
0.5
1
1.5
2
2.5
3
3.5
0 2 4 6 8 10 12 14
Total solvent mass (g)
[H2O
2] (g
H2O
2kg
H2O
-1)
H2 O
2 productivity (molH
2O2 kg
cat -1h-1)
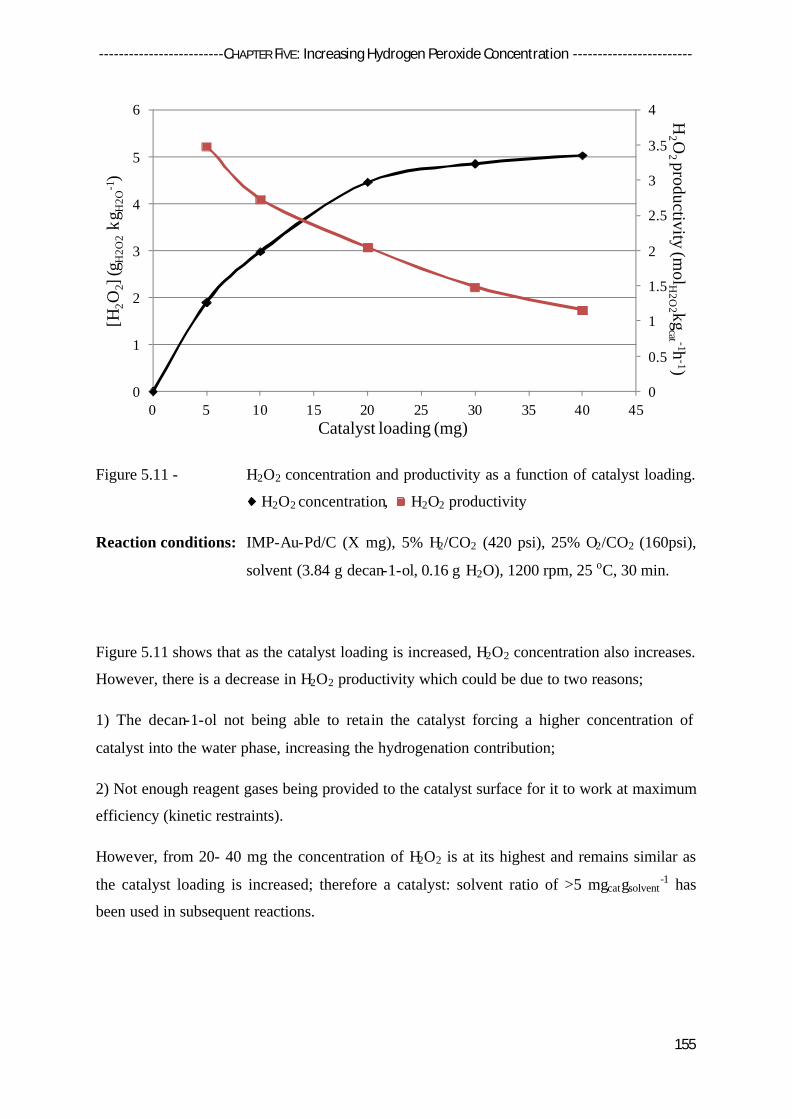
-------------------------CHAPTER FIVE: Increasing Hydrogen Peroxide Concentration ------------------------
155
Figure 5.11 - H2O2 concentration and productivity as a function of catalyst loading.
H2O2 concentration, H2O2 productivity
Reaction conditions: IMP-Au-Pd/C (X mg), 5% H2/CO2 (420 psi), 25% O2/CO2 (160psi),
solvent (3.84 g decan-1-ol, 0.16 g H2O), 1200 rpm, 25 oC, 30 min.
Figure 5.11 shows that as the catalyst loading is increased, H2O2 concentration also increases.
However, there is a decrease in H2O2 productivity which could be due to two reasons;
1) The decan-1-ol not being able to retain the catalyst forcing a higher concentration of
catalyst into the water phase, increasing the hydrogenation contribution;
2) Not enough reagent gases being provided to the catalyst surface for it to work at maximum
efficiency (kinetic restraints).
However, from 20- 40 mg the concentration of H2O2 is at its highest and remains similar as
the catalyst loading is increased; therefore a catalyst: solvent ratio of >5 mgcatgsolvent-1 has
been used in subsequent reactions.
0
0.5
1
1.5
2
2.5
3
3.5
4
0
1
2
3
4
5
6
0 5 10 15 20 25 30 35 40 45
H2 O
2 productivity (molH
2O2 kg
cat -1h-1)
[H2O
2] (g
H2O
2kg
H2O
-1)
Catalyst loading (mg)

-------------------------CHAPTER FIVE: Increasing Hydrogen Peroxide Concentration ------------------------
156
5.5.3 The Effect of Reaction Time
The biphasic system should decrease/remove the contribution from the subsequent
hydrogenation/decomposition reactions leading to higher H2O2 concentrations, so the H2O2
should increase linearly as a function of reaction time; this has been investigated and the
results shown in Figure 5.12.
Figure 5.12 - H2O2 concentration and productivity as a function of reaction time.
H2O2 concentration, H2O2 productivity
Reaction conditions: IMP-Au-Pd/C (10 mg), 5% H2/CO2 (420 psi), 25% O2/CO2 (160psi),
solvent (3.84 g decan-1-ol, 0.16 g H2O), 1200 rpm, 25 oC, X min.
As time increases, up to 60 minutes, the concentration of peroxide in the reaction mixture
also increases. The higher H2O2 concentration leads to faster H2O2 decomposition rates.
Therefore, at higher residence time the hydrogenation rate is faster than synthesis leading to a
net consumption of the H2O2. Also as time increases H2 and O2 concentration in the solvent
decreases leading to slower H2O2 synthesis rates, so the H2O2 decomposition pathway
becomes prevalent.
0
2
4
6
8
10
12
14
0
1
2
3
4
5
6
0 20 40 60 80 100 120 140
H2 O
2 productivity (molH
2O2 kg
cat -1h-1)
[H2O
2] (g
H2O
2kg
H2O
-1)
Reaction time (min)

-------------------------CHAPTER FIVE: Increasing Hydrogen Peroxide Concentration ------------------------
157
5.5.4 The Effect of Stirring Speed
The effect of stirring speed was evaluated whilst keeping all other variables
unchanged, Figure 5.13.
Figure 5.13 - H2O2 concentration as a function of stirring speed.
Reaction conditions: IMP-Au-Pd/C (10 mg), 5% H2/CO2 (420 psi), 25% O2/CO2 (160psi),
solvent (3.84 g decan-1-ol, 0.16 g H2O), X rpm, 25 oC, 30 min.
The maximum point most H2O2 was formed when a stirring speed of 900 – 1200 rpm, was
employed. Below this point it can be considered the system is under kinetic constraints, i.e.
dissolution of the reagent gases is low. Increasing above this stirring speed should be
beneficial to enhancing the H2O2 concentration as a greater quantity of H2 and O2 should be
in solution, instead a decrease in the H2O2 concentration is observed. This lower
concentration could be due to higher H2O2 hydrogenation at higher stirring speeds due to
increased H2 in solution. Alternatively the intensity of the stirring could inhibit the H2O2
being removed from the alcohol phase.
0
0.5
1
1.5
2
2.5
3
3.5
4
4.5
5
0 200 400 600 800 1000 1200 1400 1600
[H2O
2] (g
H2O
2kg
H2O
-1)
Stirring speed (rpm)
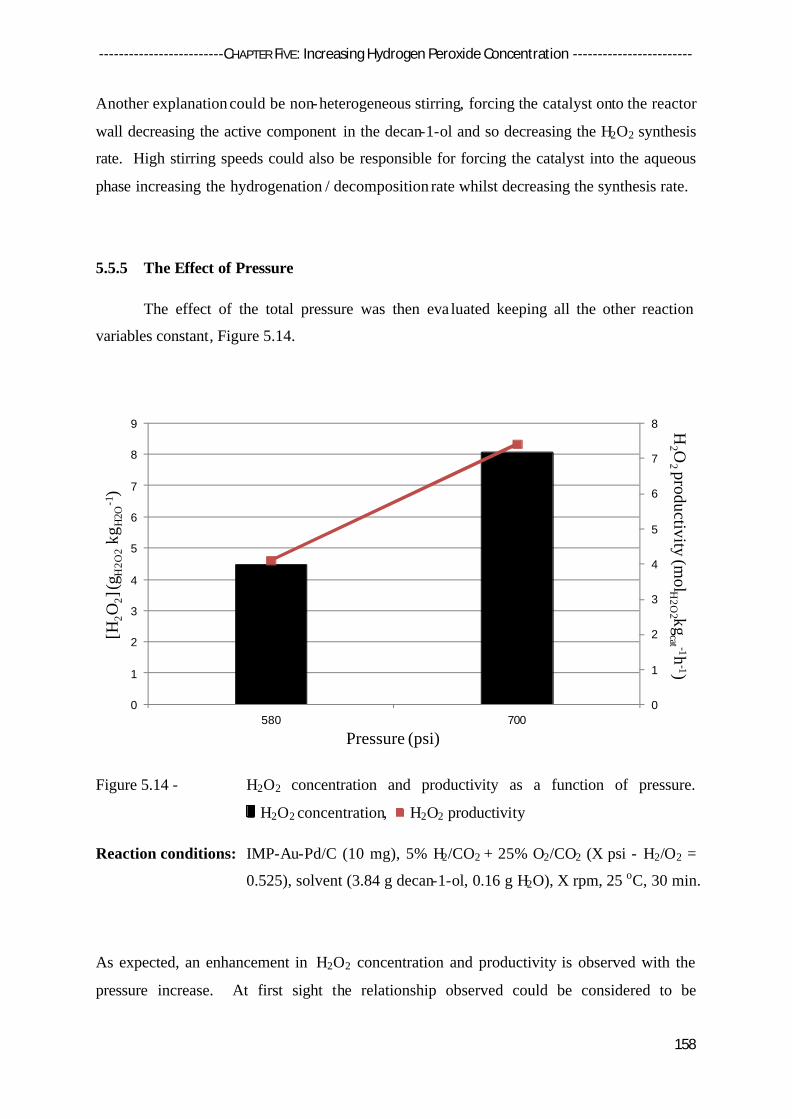
-------------------------CHAPTER FIVE: Increasing Hydrogen Peroxide Concentration ------------------------
158
Another explanation could be non-heterogeneous stirring, forcing the catalyst onto the reactor
wall decreasing the active component in the decan-1-ol and so decreasing the H2O2 synthesis
rate. High stirring speeds could also be responsible for forcing the catalyst into the aqueous
phase increasing the hydrogenation / decomposition rate whilst decreasing the synthesis rate.
5.5.5 The Effect of Pressure
The effect of the total pressure was then eva luated keeping all the other reaction
variables constant, Figure 5.14.
Figure 5.14 - H2O2 concentration and productivity as a function of pressure.
H2O2 concentration, H2O2 productivity
Reaction conditions: IMP-Au-Pd/C (10 mg), 5% H2/CO2 + 25% O2/CO2 (X psi - H2/O2 =
0.525), solvent (3.84 g decan-1-ol, 0.16 g H2O), X rpm, 25 oC, 30 min.
As expected, an enhancement in H2O2 concentration and productivity is observed with the
pressure increase. At first sight the relationship observed could be considered to be
0
1
2
3
4
5
6
7
8
0
1
2
3
4
5
6
7
8
9
580 700
H2 O
2 productivity (molH
2O2 kg
cat -1h-1)
[H2O
2] (g
H2O
2kg
H2O
-1)
Pressure (psi)

-------------------------CHAPTER FIVE: Increasing Hydrogen Peroxide Concentration ------------------------
159
consistent with Henry’s law, the rate of solute gas uptake by the liquid phase is related to the
rate of change in pressure with the mole fraction of gas in solution.
p = kH c
p = partial pressure of the gas above the solution
c = concentration of the gas in solution
kH = Henry’s law constant.
Therefore as the rate of H2O2 synthesis is controlled by the amount of H2 and/or O2 available
for the reaction in solution, the rate equation can be written as;
rH2O2 = k1. pH2nH2. pO2
nO2
rH2O2 = the rate of H2O2 synthesis
And the rate of hydrogenation can be written as follows;
rH2O = k2.pH2aH2. [H2O2]
b
rH2O = the rate of H2O2 hydrogenation
Therefore it can be postulated that, although increasing the pressure increases the rate of
synthesis by increasing the concentration of reagents in solution. It will also increase the rate
of H2O2 hydrogenation and decomposition as the concentration of hydrogen peroxide
increases.
However, in this case the intercept of the line is just below zero. This could be due to higher
solubility of CO2 in the solvent, at 700 psi, having a positive effect on the H2O2 concentration.
Hutchings et al.1 have previously found that using CO2 as the diluent gas increases peroxide
stability attributed to it forming carbonic acid in solution. Unfortunately, the pressure could
not be increased further due to the pressure of the 5 %H2 / CO2 and 25 %O2 / CO2 cylinders
supplied by BOC which are restricted causing CO2 liquefaction at room temperature at ~ 65
bar.

-------------------------CHAPTER FIVE: Increasing Hydrogen Peroxide Concentration ------------------------
160
5.5.6 Discussion
Based on the set of reactions carried out it is possible to define a new set of reaction
parameters, Table 5.4, required to produce the highest possible H2O2 concentration using a
Au-Pd/C catalyst in the new biphasic solvent system described. Two parameters are missing
and have not been examined in this study.
Firstly, the H2 / O2 ratio was not investigated; a ratio of 1 has previously been shown to give
the highest H2O2 productivity2, 3. A ratio of 0.525 was used in this chapter where dissociation
of H2 is found to be the rate limiting step.
Secondly, the temperature, which was kept at room temperature (25 oC) throughout this study,
any attempt to lower the temperature resulted in the decan-1-ol freezing and increasing the
temperature is believed to be detrimental, due to higher H2O2 decomposition rates.
Table 5.4 - Optimum conditions to produce highest H2O2 concentration
Conditions Au-Pd/C
Solvent decan-1-ol (wt% H2O) 0.39
Solvent mass (g) 4
Catalyst loading (mg) >20
Catalyst : solvent ratio (mgcatgsol-1) >5
Time (min) 30-60
Stirring speed (rpm) 1200
Total pressure (psi) 700
Using the optimum conditions in, Table 5.4, a H2O2 concentration of 8 gH2O2kgH2O-1 (0.8 wt%)
was achieved, thus highlighting the potential of using a biphasic system. The highest
concentration achieved previously in the methanol-water solvent system is ca. 0.7 wt% using
a Au-Pd/acid washed carbon supported catalyst that showed no H2O2 hydrogenation activity.
H2O addition (section 5.5.1) indicates that the solvent system could be working as outlined in
the theory; however it also indicates a definite interaction between catalyst and the water,
which accounts for the hydrogenation seen in Figure 5.7. Varying the parameter using
saturated decan-1-ol increased the concentration from 1.7 (0.17 wt%) to 8 gH2O2kgH2O-1 (0.8
wt%).

-------------------------CHAPTER FIVE: Increasing Hydrogen Peroxide Concentration ------------------------
161
The catalyst loading to solvent mass ratio has been highlighted in Table 5.4 and may be a
crucial feature when looking to scale up the reaction. The retention of the catalyst in the
organic solvent not only depends on the hydrophobic nature of the catalyst but also on the
mass of catalyst the organic layer can hold under experimental procedures.
An important observation is a rise in the pressure by 20 % accounts for the H2O2
concentration approximately doubling. One of the simplest ideas to increase the H2O2
concentration further would be to increase the pressure. However, due to cylinder pressure
restrictions this was not possible. High pressure is also unsuitable for an industrial process.
Although it may be of interest at a later date to investigate the potential of the system further.
The key issue appears to be the H2O2 hydrogenation / decomposition due to catalyst coming
into contact with the H2O2 solution which is limiting the biphasic system. To prevent this
more hydrophobic solvents’ and catalysts need to be investigated. Using a different solvent
may be required in order to lower the reaction temperature which will allow H2O2
hydrogenation/decomposition to be decreased. Slow transfer of reagents through the solvent
to the active surface in order to produce H2O2 is also paramount to the success of the system
and will need investigating in future.

-------------------------CHAPTER FIVE: Increasing Hydrogen Peroxide Concentration ------------------------
162
5.6 Increasing H2O2 Concentration Using Ceria Supported Catalysts
Ceria has been identified as an alternative support to carbon for producing active Au-Pd
catalysts for the direct synthesis of H2O2. Section 5.4.1 indicates that Au-Pd/CeO2 produces
a higher concentration than Au-Pd/C and the catalyst mostly resides in the decan-1-ol phase.
Solvay rendered TiO2 unsuitable due to the formation of [Ti-H2O2] complexes when in
contact with high H2O2 concentrations. Silica supported catalysts have been shown to be
unstable35 but require further investigation.
5.6.1 Ceria Supported Catalysts
Ceria supported catalysts have received considerable interest. Gold nano-particles
supported on ceria have been identified to be active across a range of reactions including
alcohol oxidation36, 37 and carbon monoxide oxidation38-42. They have also been proved to be
effective for other fuel-cell/automotive reactions such as water-gas shift (WGS) and
preferential oxidation of CO in the presence of hydrogen (PROX). These results are of
particular interest, since ceria is extensively employed in modern catalyst converters as the
active component which is wash coated (deposited in a thin layer) on the walls of a monolith
(cordierite). This is due to ceria’s surface oxygen storage properties and capacity to undergo
a rapid change in oxidation state upon changes in the redox potential of the exhaust gases.
Monometallic Pd/CeO2 catalysts are also active for the water gas shift43, 44 and CO
oxidation45-48 reactions. However, in the former, it suffers from rapid deactivation and in the
latter low activity/selectivity in the presence of hydrogen (PROX) due to a change in the
oxidation state of Pd (easily reducible).
Metsumura et al. have reported a monometallic Pd ceria catalyst to be effective for methanol
synthesis from carbon monoxide and hydrogen49-51. They furthered this study by
investigating Pd/CeO2 catalysts for methanol decomposition52, followed by the effect of X wt%
Au addition to a 5 wt% Pd/CeO2 catalyst on the decomposition at 180oC with a significant
promotional effect being observed53. Luo et al. have shown a promotional effect in the
activity of Au-Pd/CeO2 for partial oxidation of methanol compared to monometallic ceria
catalyst54.
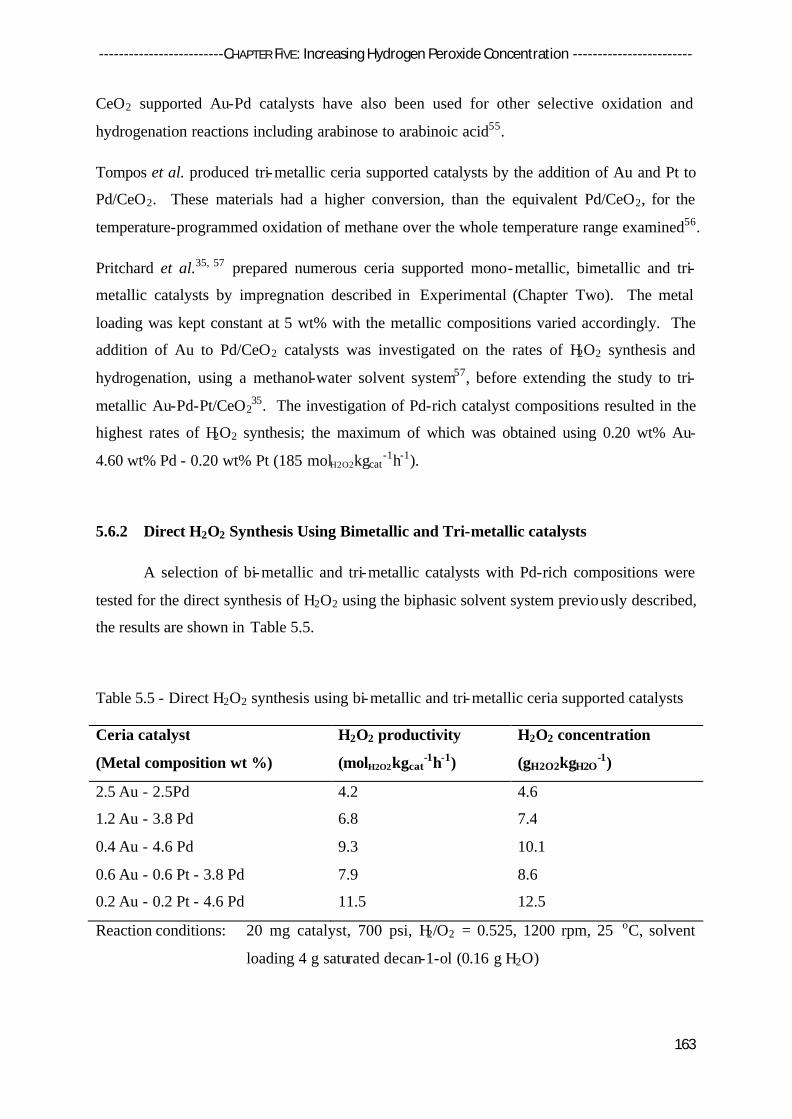
-------------------------CHAPTER FIVE: Increasing Hydrogen Peroxide Concentration ------------------------
163
CeO2 supported Au-Pd catalysts have also been used for other selective oxidation and
hydrogenation reactions including arabinose to arabinoic acid55.
Tompos et al. produced tri-metallic ceria supported catalysts by the addition of Au and Pt to
Pd/CeO2. These materials had a higher conversion, than the equivalent Pd/CeO2, for the
temperature-programmed oxidation of methane over the whole temperature range examined56.
Pritchard et al.35, 57 prepared numerous ceria supported mono-metallic, bimetallic and tri-
metallic catalysts by impregnation described in Experimental (Chapter Two). The metal
loading was kept constant at 5 wt% with the metallic compositions varied accordingly. The
addition of Au to Pd/CeO2 catalysts was investigated on the rates of H2O2 synthesis and
hydrogenation, using a methanol-water solvent system57, before extending the study to tri-
metallic Au-Pd-Pt/CeO235. The investigation of Pd-rich catalyst compositions resulted in the
highest rates of H2O2 synthesis; the maximum of which was obtained using 0.20 wt% Au-
4.60 wt% Pd - 0.20 wt% Pt (185 molH2O2kgcat-1h-1).
5.6.2 Direct H2O2 Synthesis Using Bimetallic and Tri-metallic catalysts
A selection of bi-metallic and tri-metallic catalysts with Pd-rich compositions were
tested for the direct synthesis of H2O2 using the biphasic solvent system previously described,
the results are shown in Table 5.5.
Table 5.5 - Direct H2O2 synthesis using bi-metallic and tri-metallic ceria supported catalysts
Ceria catalyst
(Metal composition wt %)
H2O2 productivity
(molH2O2kgcat-1h-1)
H2O2 concentration
(gH2O2kgH2O-1)
2.5 Au - 2.5Pd 4.2 4.6
1.2 Au - 3.8 Pd 6.8 7.4
0.4 Au - 4.6 Pd 9.3 10.1
0.6 Au - 0.6 Pt - 3.8 Pd 7.9 8.6
0.2 Au - 0.2 Pt - 4.6 Pd 11.5 12.5
Reaction conditions: 20 mg catalyst, 700 psi, H2/O2 = 0.525, 1200 rpm, 25 oC, solvent
loading 4 g saturated decan-1-ol (0.16 g H2O)

-------------------------CHAPTER FIVE: Increasing Hydrogen Peroxide Concentration ------------------------
164
Interestingly, for the bi-metallic catalysts selected, when the Pd content is increased a higher
H2O2 concentration is achieved; palladium is believed to be the active component with the
addition of gold electronically promoting its activity. Previously, it has been shown that the
optimum H2O2 productivity is achieved with a Au-Pd ratio of 1, however here it seems a
lower Au content and higher Pd content causes a larger promotional effect.
When adding the third metal, Pt, a maximum concentration (12 gH2O2kgH2O-1) was achieved
with a metal composition of 0.2 wt% Au - 0.2 wt% Pt - 4.6 wt% Pd. Again the high
palladium content is likely to be the crucial component. This represents a significant step
forward towards producing H2O2 concentration of 3-8 wt%.
Interestingly, although Au-Pd ceria appeared initially to be a more active than Au-Pd/C
Figure 5.6, however, under the ‘optimum conditions’ utilised carbon produces a higher
concentration (0.8 v 0.46 wt%). This could be due to a higher retention of carbon in the
organic phase hence lower H2O2 hydrogenation activity and/or the conditions utilised are not
the optimum conditions for ceria catalysts.
Changing the metal compositions and the addition of a third metal both increased the H2O2
concentration, indicating the preparation of the catalyst will be crucial in future studies.

-------------------------CHAPTER FIVE: Increasing Hydrogen Peroxide Concentration ------------------------
165
5.6.3 Effect of Reagent Reloading
In order to increase H2O2 concentration even further, it was decided to run top-up
experiments, Figure 5.17. These experiments consist of the subsequent refilling of the
autoclave with reagent gases for a determined number of times.
Figure 5.17 - H2O2 concentration as a function of reagent gas charges. Varying
masses of 0.2Au0.2Pt4.6Pd/CeO2 catalyst have been used.
Reaction conditions: Each gas charge = IMP-Au-Pd-Pt/CeO2 (X mg), 5% H2/CO2 (507
psi), 25% O2/CO2 (193 psi), solvent (4.08 g decan-1-ol, 0.17 g H2O),
X rpm, 25 oC, 30 min.
The conditions, catalysts loading and working pressure used for this set of experiments were
extremely drastic. However, the aim was to have an understanding of the reaction limits of
this synthesis approach rather than fine tuning the reaction parameters.
Surprisingly, a H2O2 concentration > 3 wt% was achieved after 5 gas cha rges using 40 and 50
mg of catalyst. Decreasing the catalyst loading to 20 mg resulted in a decrease of H2O2
10
15
20
25
30
35
0 1 2 3 4 5 6
50mg 40mg 20mg
Gas charges (number of times)
H2O
2co
ncen
tratio
n (g
H2O
2kg
H2O
-1)

-------------------------CHAPTER FIVE: Increasing Hydrogen Peroxide Concentration ------------------------
166
concentration to 2.4 wt%. The fact that H2O2 concentration achieved is almost the same for
40 and 50 mg agrees with previous results proving that kinetic limitations occur at catalyst
loading > 30-40 mg.
Reagent reloading proved to be successful producing a H2O2 concentration >3 wt%, showing
a biphasic solvent system has significant potential. Reagent reloading rejuvenates the H2/O2
concentration every 30 minutes in order to maintain a constant supply to the catalyst to
produce further H2O2. As hydrogen is the limiting reagent, keeping the H2 concentration
constant and ensuring the catalyst is working at the highest efficiency possible, throughout
the reaction may increase the H2O2 concentration further. This could be achieved by flowing
reagent gases through the solvent using a semi-continuous flow reactor as described in the
following sections of this chapter.
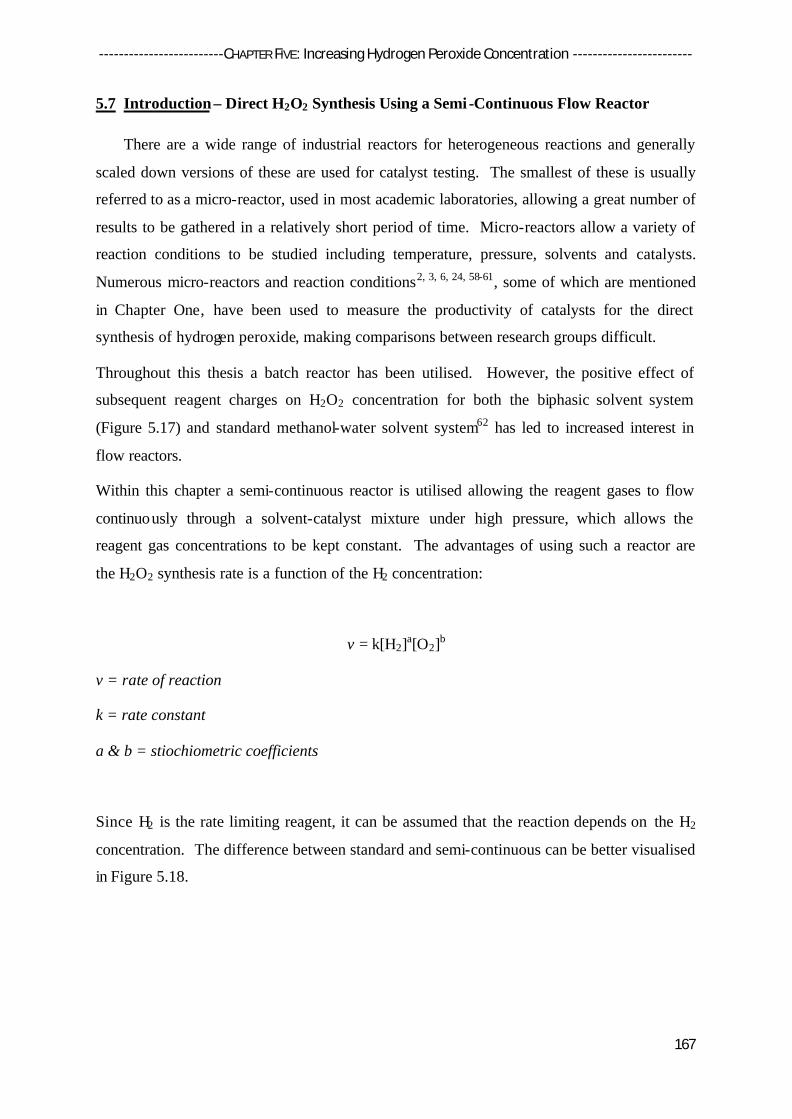
-------------------------CHAPTER FIVE: Increasing Hydrogen Peroxide Concentration ------------------------
167
5.7 Introduction – Direct H2O2 Synthesis Using a Semi-Continuous Flow Reactor
There are a wide range of industrial reactors for heterogeneous reactions and generally
scaled down versions of these are used for catalyst testing. The smallest of these is usually
referred to as a micro-reactor, used in most academic laboratories, allowing a great number of
results to be gathered in a relatively short period of time. Micro-reactors allow a variety of
reaction conditions to be studied including temperature, pressure, solvents and catalysts.
Numerous micro-reactors and reaction conditions2, 3, 6, 24, 58-61, some of which are mentioned
in Chapter One, have been used to measure the productivity of catalysts for the direct
synthesis of hydrogen peroxide, making comparisons between research groups difficult.
Throughout this thesis a batch reactor has been utilised. However, the positive effect of
subsequent reagent charges on H2O2 concentration for both the biphasic solvent system
(Figure 5.17) and standard methanol-water solvent system62 has led to increased interest in
flow reactors.
Within this chapter a semi-continuous reactor is utilised allowing the reagent gases to flow
continuously through a solvent-catalyst mixture under high pressure, which allows the
reagent gas concentrations to be kept constant. The advantages of using such a reactor are
the H2O2 synthesis rate is a function of the H2 concentration:
v = k[H2]a[O2]b
v = rate of reaction
k = rate constant
a & b = stiochiometric coefficients
Since H2 is the rate limiting reagent, it can be assumed that the reaction depends on the H2
concentration. The difference between standard and semi-continuous can be better visualised
in Figure 5.18.

-------------------------CHAPTER FIVE: Increasing Hydrogen Peroxide Concentration ------------------------
168
Figure 5.18 - Difference between reagent reloading in batch and semi-continuous flow
conditions.
The semi-continuous reactor allows the H2 concentration and pressure to be kept constant
hence increasing the overall kinetic driving force. As the H2O2 concentration increases with
the number of gas charges, flowing reagent gases should led to the same or a promotion in
activity by simply increasing the reaction time.
A methanol-only solvent system has been utilised, which allows the water concentration to be
measured using Karl Fischer titration as a function of time giving greater insight into the
catalyst activity. A novel approach to investigating H2O2 decomposition has also been
investigated using the procedure described.
3.5
3.0
2.5
2.0
1.5
40
35
30
25
20
1 2 3 4 5
0.5 1.0 1.5 2.0 2.5
Gas charges (number of times)
Reaction time (h)[H
2] (%
)Pressure (bar)
Semi-cont. Batch

-------------------------CHAPTER FIVE: Increasing Hydrogen Peroxide Concentration ------------------------
169
5.8 Reactor Design and Working Conditions
Catalytic tests under a continuous flow of gas were performed inside a modified batch
reactor detailed in Figure 5.19.
Figure 5.19 - Schematic of semi-continuous flow reactor for the direct synthesis of H2O2
Three flow meters, for, with the possibility to regulate the rate of O2, H2 and N2 flows were
installed. A mixing chamber with an internal volume of 150µm was positioned in order to
make a homogenous combination of the three gases. At the exit of the reactor a back
pressure regulator was installed to control the inlet pressure by balancing an adjustable spring
force against the inlet gas flow, making it possible to work with a fixed pressure inside the
autoclave. Finally a gas chromatographer (GC-14 B SHIMADZU) (GC) was installed on line
to measure the concentration of gases coming out of the reactor.
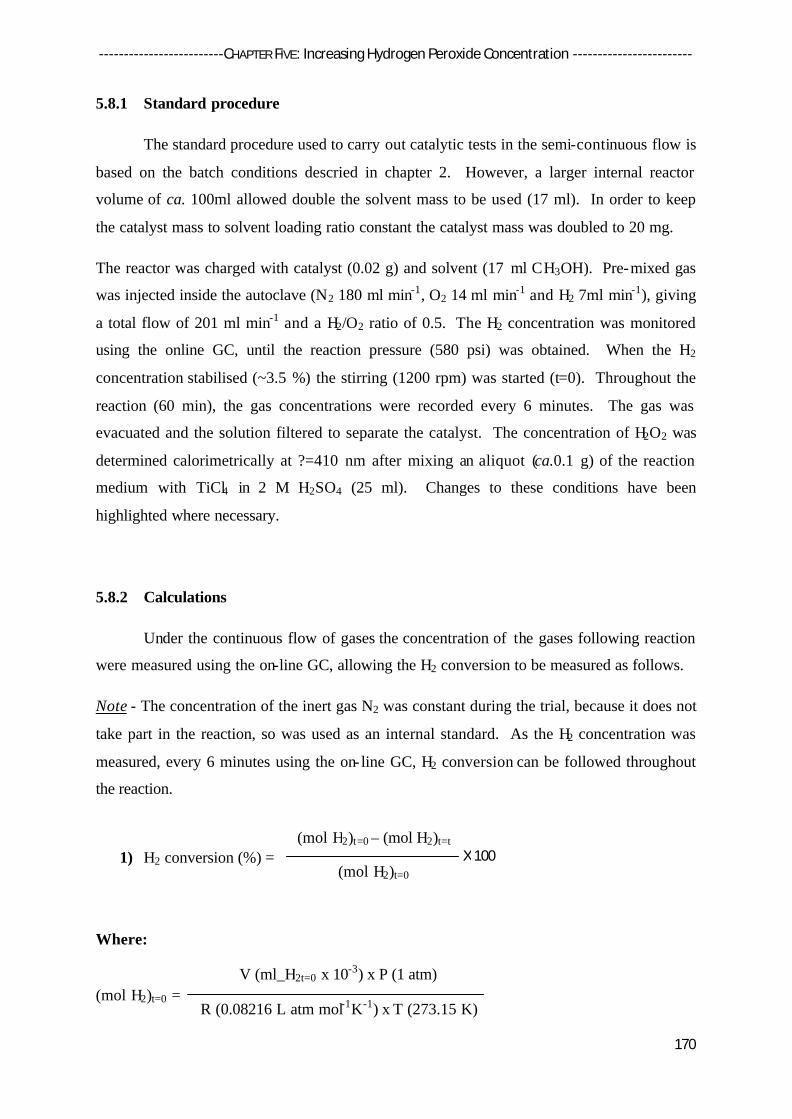
-------------------------CHAPTER FIVE: Increasing Hydrogen Peroxide Concentration ------------------------
170
5.8.1 Standard procedure
The standard procedure used to carry out catalytic tests in the semi-continuous flow is
based on the batch conditions descried in chapter 2. However, a larger internal reactor
volume of ca. 100ml allowed double the solvent mass to be used (17 ml). In order to keep
the catalyst mass to solvent loading ratio constant the catalyst mass was doubled to 20 mg.
The reactor was charged with catalyst (0.02 g) and solvent (17 ml CH3OH). Pre-mixed gas
was injected inside the autoclave (N2 180 ml min-1, O2 14 ml min-1 and H2 7ml min-1), giving
a total flow of 201 ml min-1 and a H2/O2 ratio of 0.5. The H2 concentration was monitored
using the online GC, until the reaction pressure (580 psi) was obtained. When the H2
concentration stabilised (~3.5 %) the stirring (1200 rpm) was started (t=0). Throughout the
reaction (60 min), the gas concentrations were recorded every 6 minutes. The gas was
evacuated and the solution filtered to separate the catalyst. The concentration of H2O2 was
determined calorimetrically at ?=410 nm after mixing an aliquot (ca.0.1 g) of the reaction
medium with TiCl4 in 2 M H2SO4 (25 ml). Changes to these conditions have been
highlighted where necessary.
5.8.2 Calculations
Under the continuous flow of gases the concentration of the gases following reaction
were measured using the on-line GC, allowing the H2 conversion to be measured as follows.
Note - The concentration of the inert gas N2 was constant during the trial, because it does not
take part in the reaction, so was used as an internal standard. As the H2 concentration was
measured, every 6 minutes using the on- line GC, H2 conversion can be followed throughout
the reaction.
1) H2 conversion (%) =
Where:
(mol H2)t=0 = V (ml_H2t=0 x 10-3) x P (1 atm)
R (0.08216 L atm mol-1K-1) x T (273.15 K)
(mol H2)t=0 – (mol H2)t=t
(mol H2)t=0 X 100

-------------------------CHAPTER FIVE: Increasing Hydrogen Peroxide Concentration ------------------------
171
ml_H2t=0 =
and:
(mol H2)t=t =
ml_H2t=t =
Following acquisition of the H2O2 concentration of in solution, the selectivity of H2
consumption towards H2O2 can be measured. A high H2 selectivity is of paramount
importance to the success of the direct H2O2 synthesis becoming industrially viable due to the
expense of using H2 financially and economically. As well as the selectivity the H2O2
productivity and yield have been calculated.
2) H2 selectivity (%) =
3) H2O2 productivity (molH2O2kgcat-1h-1) =
4) H2O2 yield (%) =
[H2]t=0 (%)
100 X total flowt=0 (mlmin-1) (flow N2 + flow O2 + flow H2)
V (ml_H2t=t x 10-3) x P (1 atm)
R (0.08216 L atm mol-1K-1) x T (273.15 K)
[H2]t=0 (%)
100 X total flowt=t (mlmin-1) (total flow t=0 x )
[N2]t=0 (%)
[N2]t=t (%)
(mol H2O2formed)t=t
t=th x kgcat
(mol H2O2formed)t=t
(mol H2)t=0 – (mol H2)t=t X 100
(mol H2O2formed)t=t
(mol H2)t=0
X 100

-------------------------CHAPTER FIVE: Increasing Hydrogen Peroxide Concentration ------------------------
172
5.9 Initial Results
5.9.1 Solvent Composition
The solvent composition was investigated using water-only, methanol-only and a
methanol-water mixture with a ratio of 1.93 (66 wt% CH3OH) keeping the total amount of
solvent constant (Table 5.6). The latter is used by Edwards et al. for standard reactions1. The
addition of water to methanol has previously been shown to be beneficial for direct H2O2
synthesis2, 3.
Table 5.6 - Influence of solvent composition on catalyst activity.
Solvent H2O2 Conc.
wt %
Productivity
molH2O2kgcat-1h-1
Selectivity
%
H2 Conversion
%
Yield
Methanol 0.49 245 45 29 13
CH3OH + H2O* 0.45 107 36 32 12
H2O 0.07 20 11 16 2
* 5.6 g MeOH + 2.9 g H2O
Reaction conditions: IMP-Au-Pd/C (10 mg), 3.5 %H2, 7 %O2, 89.5 %N2, 201 ml min-1, 40
bar, 8.5 g solvent, 2 oC, 60 min.
The highest H2O2 concentration, productivity and yield were obtained in pure-methanol. In
methanol-only the IMP-Au-Pd/C catalyst also showed the highest H2 selectivity towards
H2O2. This has been likened to the development of surface formate when using methanol as
solvent (acetate species when using ethanol) by reaction with oxygen on the Pd [110] surface
thus preventing HO-OH bond breaking (HO-OH = 213 kJ mol-1, H-O2H = 369 kJ mol-1)63.
The highest H2 conversion was achieved with a mixture of CH3OH and H2O, indicating that
the water is having a positive effect on the catalytic activity. Goodman et al.34 have
previously postulated the promotional effects of water on CO oxidation can be rationalised by
its effects on molecular oxygen adsorption and activation. In this case water may be
increasing the adsorption and activation of molecular oxygen and hydrogen, promoting the
production of H2O2 and to a greater extent H2O2 hydrogenation. It is likely the lower
concentration, productivity and selectivity is due to a higher rate of H2O2
hydrogenation/decomposition in this solvent mixture.

-------------------------CHAPTER FIVE: Increasing Hydrogen Peroxide Concentration ------------------------
173
As expected water-only leads to the lowest catalytic activity which can be explained by the
lower solubility of the reagent gases, H2 and O2, in water compared to methanol. The lower
selectivity observed in H2O-only indicates that H2O2 may not be as stable in H2O as CH3OH
and is lost through either the H2O2 hydrogenation or decomposition pathway. Another
explanation could be the combustion of H2 is more prevalent in H2O-only.
5.9.2 Influence of Catalyst Mass
The effect of increasing the amount of catalyst on the H2O2 concentration was
investigated whilst keeping all the other reaction variables outlined in section 6.2 constant;
the results are shown in Table 5.7.
Table 5.7 – Catalyst activity towards direct H2O2 synthesis as the catalyst mass is increased
Catalyst mass
mg
H2O2 Conc.
wt %
Productivity
molH2O2kgcat-1h-1
Selectivity
%
H2 Conversion
%
Yield
10 0.49 245 45 29 13
20 0.83 208 53 42 22
40 1.05 131 50 55 28
60 1.09 91 51 56 29
Reaction conditions: IMP-Au-Pd/C (X mg), 3.5 %H2, 7 %O2, 89.5 %N2, 201 ml min-1, 40
bar, 8.5 g CH3OH, 2 oC, 60 min.
Table 5.7 shows how the H2O2 concentration increases as the amount of catalyst is increased,
with the highest concentration of 1.09 wt% H2O2, achieved using 60 mg of catalyst.
Although there is a significant increase in concentration from 10 – 20 mg, the concentration
increase plateaus as the catalyst mass is increased further. The fact that H2O2 productivity is
the highest at lower catalyst masses suggests that at higher catalyst loadings the contribution
of the subsequent H2O2 hydrogenation/decomposition reaction becomes more marked.
However when 20 mg of catalyst is used the highest H2 selectivity is achieved, indicating that
mass transfer limitations, may also be playing a pivotal role when using higher catalyst
loadings.

-------------------------CHAPTER FIVE: Increasing Hydrogen Peroxide Concentration ------------------------
174
5.9.3 Flow Rate
The influence of flow rate was investigated keeping all other variables the same.
Increasing the flow rate increases the amount of reagent gas available for the direct H2O2
synthesis to occur during the 60 minute reaction. The results are shown in Table 5.8.
Table 5.8 - Influence of the reagent gas flow rate on catalyst activity
Flow
rate
ml/min
H2
input
mmol
H2O2
Conc.
wt %
Productivity
molH2O2kgcat-1h-
1
Selectivity
%
H2
Conversion
%
Yield
201 19.0 0.83 208 53 42 22
313 29.7 0.86 215 48 30 14
402 37.7 0.89 224 43 28 12
Reaction conditions: IMP-Au-Pd/C (20 mg), 3.5 %H2, 7 %O2, 89.5 %N2, X ml min-1, 40 bar,
8.5 g CH3OH, 2 oC, 60 min.
Increasing the flow rate increases the H2O2 concentration and productivity; however the
increase is not proportional to the increase in H2 input. This suggests that saturation of the
solvent with H2 is being achieved efficiently enough, at a flow rate of 201 ml min-1, for the
catalyst to work to full capacity.
H2 conversion and more importantly selectivity decrease with increasing flow rate indicating
that the excess flow of H2 causes the H2O2 hydrogenation pathway to become more
predominate.
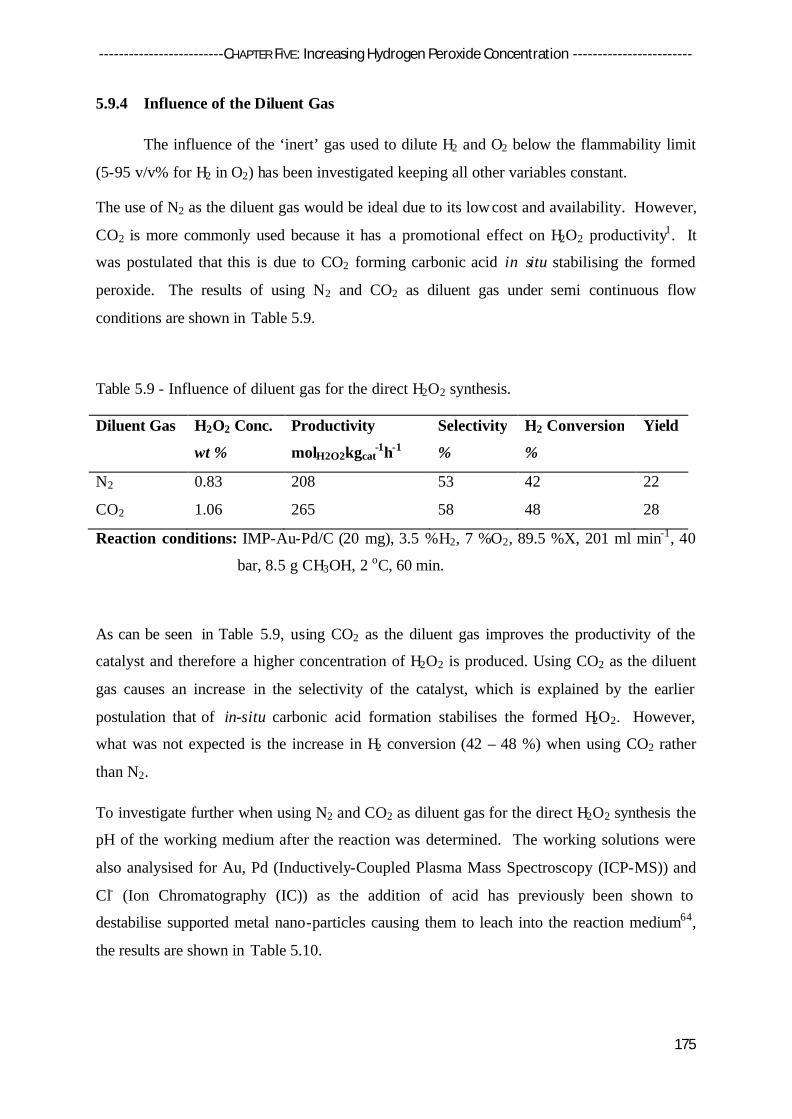
-------------------------CHAPTER FIVE: Increasing Hydrogen Peroxide Concentration ------------------------
175
5.9.4 Influence of the Diluent Gas
The influence of the ‘inert’ gas used to dilute H2 and O2 below the flammability limit
(5-95 v/v% for H2 in O2) has been investigated keeping all other variables constant.
The use of N2 as the diluent gas would be ideal due to its low cost and availability. However,
CO2 is more commonly used because it has a promotional effect on H2O2 productivity1. It
was postulated that this is due to CO2 forming carbonic acid in situ stabilising the formed
peroxide. The results of using N2 and CO2 as diluent gas under semi continuous flow
conditions are shown in Table 5.9.
Table 5.9 - Influence of diluent gas for the direct H2O2 synthesis.
Diluent Gas H2O2 Conc.
wt %
Productivity
molH2O2kgcat-1h-1
Selectivity
%
H2 Conversion
%
Yield
N2 0.83 208 53 42 22
CO2 1.06 265 58 48 28
Reaction conditions: IMP-Au-Pd/C (20 mg), 3.5 %H2, 7 %O2, 89.5 %X, 201 ml min-1, 40
bar, 8.5 g CH3OH, 2 oC, 60 min.
As can be seen in Table 5.9, using CO2 as the diluent gas improves the productivity of the
catalyst and therefore a higher concentration of H2O2 is produced. Using CO2 as the diluent
gas causes an increase in the selectivity of the catalyst, which is explained by the earlier
postulation that of in-situ carbonic acid formation stabilises the formed H2O2. However,
what was not expected is the increase in H2 conversion (42 – 48 %) when using CO2 rather
than N2.
To investigate further when using N2 and CO2 as diluent gas for the direct H2O2 synthesis the
pH of the working medium after the reaction was determined. The working solutions were
also analysised for Au, Pd (Inductively-Coupled Plasma Mass Spectroscopy (ICP-MS)) and
Cl- (Ion Chromatography (IC)) as the addition of acid has previously been shown to
destabilise supported metal nano-particles causing them to leach into the reaction medium64,
the results are shown in Table 5.10.

-------------------------CHAPTER FIVE: Increasing Hydrogen Peroxide Concentration ------------------------
176
Table 5.10 - Analysis of the working solution after reactions using N2 and CO2.
Diluent gas used
during reaction
pH of reaction
medium
Impurities (µg/kgsolvent) **
Au Pd Cl (mg/L)
(MeOH*) 6.1 1 0.9 <0.1
N2 4.14 7 28 24
CO2 3.5 22 34 22
*Before the reaction ** 1 µg/kg solvent = 0.034 % of original metal (2.5 wt%) leached
Under semi-continuous flow conditions the catalyst appears to be unstable, when using either
N2 or CO2 as the diluent gas. This can be linked to the reaction medium becoming more
acidic. The stability of the catalyst is decreased when using CO2, where the reaction medium
is most acidic, suggesting carbonic acid is being formed1. The increased metal content in the
reaction medium when using CO2 as the diluent may explain the previously unexplained
trend of increased H2 conversion (42 – 48 %). Dissanayake et al.65, 66 have shown that
leached Pd can form a homogeneous catalyst active for the direct H2O2 synthesis.
The increased acidity when using N2 can be attributed to the slight acidity of the carbon
support (~ 6) linked with the slight acidic nature of H2O2 in solution (c.a. 4.5 – 6.2 depending
on concentration). Metal leached from the catalyst can form active homogeneous species65, 66
and lead to significant deactivation in activity on catalyst reuse67. The leaching of chloride
into the reaction medium can alter catalyst performance68 and is not ideal for industrial use
due to its corrosive nature.
After running the experiments with CO2 as the diluent gas it was noted the gas flow rate was
not steady. The fluctuation of the gas flow had a major effect on the final H2O2 concentration
and it was not possible to acquire adequate reproducible data. The reason of this fluctuation
was finally assigned to the gaseous CO2 liquefying in the mass flow controllers. Therefore it
was decided reactions were to be run using nitrogen as the diluent gas.

-------------------------CHAPTER FIVE: Increasing Hydrogen Peroxide Concentration ------------------------
177
5.10 Influence of Reaction Time
Provision to extract a sample of the working solution was installed enabling the
reaction to be run continuously with samples taken every 30minutes. The samples were
analysised for water and hydrogen peroxide by volumetric Karl Fischer titration and UV-vis
spectroscopy, respectively (refer to chapter 2 for further details). H2 conversion was
determined by online GC ana lysis as a function of time. This enabled the H2O2 productivity,
selectivity and yield to be calculated using the equations shown in section 5.8.2. The
standard experimental procedure in section 5.8.1 was utilised.
Note – In this section the following reaction conditions have been utilised:
Catalyst - IMP-Au-Pd/C (20 mg)
Gas composition - 3.5 %H2, 7 %O2, 89.5 %N2
Flow rate - 201 ml min-1
Pressure - 40 bar
Solvent mass - 17 g CH3OH
Temperature - 2 oC
Reaction time - 60 min.

-------------------------CHAPTER FIVE: Increasing Hydrogen Peroxide Concentration ------------------------
178
5.10.1 Hydrogen Peroxide and Water Concentration
The liquid phase was sampled every 30 minutes and the concentrations of H2O and
H2O2 were obtained as a function of time as shown in Figure 5.20.
The amount of liquid subtracted for each analysis was 0.8 ml, so that the total uptake never
exceeded 25 % of the initial liquid volume. Errors on H2O2 and H2O measurements were
estimated analyzing a methanol solution with a known water and hydrogen peroxide content
(0.8 % and 1.6 % respectively), sampled from the reactor under experimental conditions.
Estimated error for H2O2 was 0.8 %, whereas for H2O it was 2 %.
Figure 5.20 - Concentration of H2O ( ) and H2O2 ( ) as a function of time.
The H2O2 concentration steadily increases up to 120 minutes then plateaus for the remaining
time investigated, whereas the H2O concentration increases linearly with time. The apparent
limit on the H2O2 concentration could be due to the rate of H2O2 production being equal to
the rate of its destruction. This provides important information about the catalyst activity,
with H2O being the predominant product in the direct H2O2 synthesis after 60 minutes. H2O
can either be formed by H2 combustion or subsequent hydrogenation/decomposition of H2O2.
However, in this case, both may be dominating the H2O2 synthesis pathway.
0
0.5
1
1.5
2
2.5
3
3.5
4
4.5
5
0 50 100 150 200 250 300
H2O
2/ H
2O c
once
ntra
tion
(wt %
)
Time (min)

-------------------------CHAPTER FIVE: Increasing Hydrogen Peroxide Concentration ------------------------
179
5.10.2 Hydrogen Conversion
The H2 concentration and conversions as a function of time are presented in Figure
5.21.
Figure 5.21 – Concentration of H2 ( ) in the exit gas and the corresponding H2 conversion
( ) as a function of time.
Figure 5.21 indicates that H2 conversion decreases slowly over time; this could be due to the
loss of catalyst mass through sampling or the stability of the metal on the support surface. A
lack of metal stability could cause a change in the metal oxidation state or even leaching of
the metal from the support into the solvent; both of which would affect the catalysts
performance. The IMP-Au-Pd/C catalyst utilised has been shown in section 5.9.4 to be
unstable under semi-continuous flow conditions and the stability will need to be investigated
further in future studies.
0
10
20
30
40
50
60
70
80
90
100
0
0.5
1
1.5
2
2.5
3
3.5
0 50 100 150 200 250 300
H2
cons
umpt
ion
(%)
Time (min)
H2 conversion (%
)

-------------------------CHAPTER FIVE: Increasing Hydrogen Peroxide Concentration ------------------------
180
5.10.3 H2O2 Productivity, Selectivity and Yield
As the H2O2 concentration and H2 conversion have been observed as a function of
time the H2O2 productivity, selectivity and yield can be calculated using the equations in
section 5.8.2. The obtained results as a function of time are presented in Figure 5.22.
Figure 5.22 - H2O2 productivity ( ), concentration (x), yield ( ) and selectivity ( ) as a
function of time.
H2 selectivity towards H2O2 decreases rapidly as a function of time this is likely to be due to
increased rate of H2O2 hydrogenation/decomposition to water. This corresponds to a fast
decrease in H2O2 productivity. It is likely H2O2 is being produced at similar rates due to
similar H2 conversions as a function of time. However, higher H2O2 concentration
contributes to a greater rate of H2O2 hydrogenation/decomposition.
The rapid decrease in selectivity may well be linked with a change in surface Pd oxidation
state which would, following reaction, require further analysis of the catalyst by XPS.
However, it is likely that a loss of metal from the catalyst surface as observed in section 6.3.4,
with colloidal Pd promoting the decomposition of H2O2 is the primary reason for the decrease.
0
10
20
30
40
50
60
70
80
90
100
0
50
100
150
200
250
300
350
0 50 100 150 200 250 300
H2O
2pr
oduc
tivity
(mol
H2O
2kg c
at-1
h-1)
H2O
2co
ncen
tratio
n (w
t% x
100
)H
2 O2 selectivity / yield (%
)
Time (min)
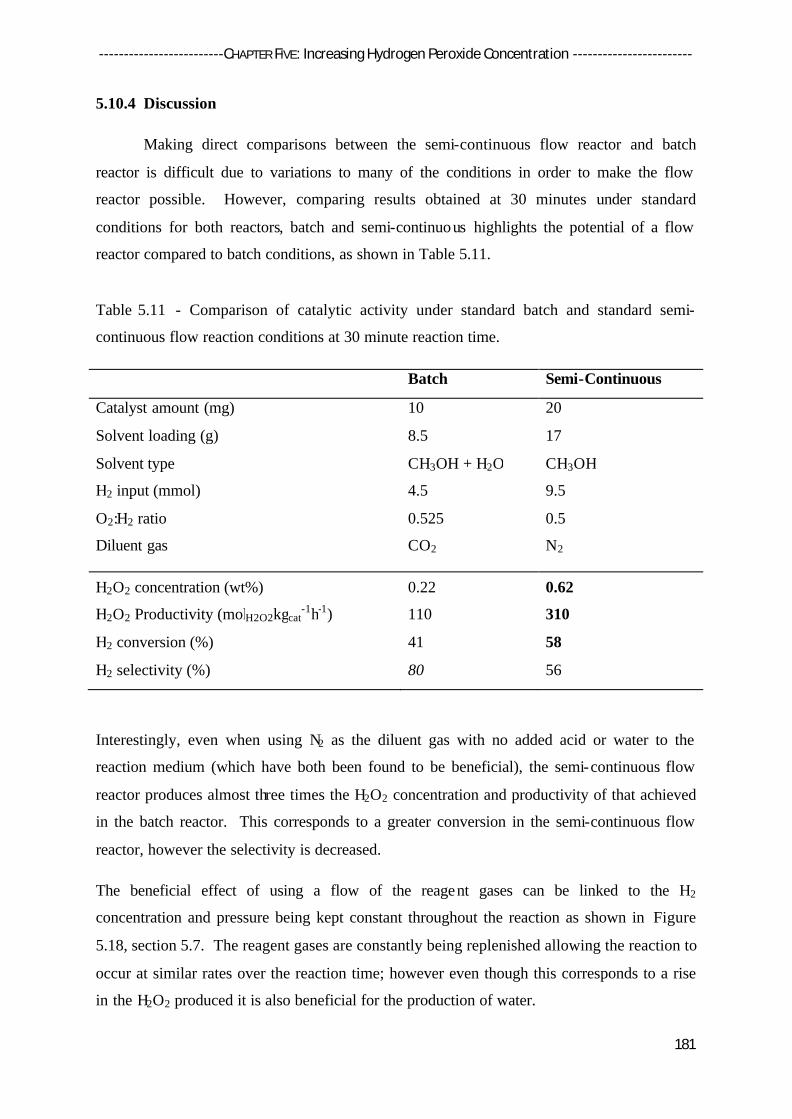
-------------------------CHAPTER FIVE: Increasing Hydrogen Peroxide Concentration ------------------------
181
5.10.4 Discussion
Making direct comparisons between the semi-continuous flow reactor and batch
reactor is difficult due to variations to many of the conditions in order to make the flow
reactor possible. However, comparing results obtained at 30 minutes under standard
conditions for both reactors, batch and semi-continuous highlights the potential of a flow
reactor compared to batch conditions, as shown in Table 5.11.
Table 5.11 - Comparison of catalytic activity under standard batch and standard semi-
continuous flow reaction conditions at 30 minute reaction time.
Batch Semi-Continuous
Catalyst amount (mg) 10 20
Solvent loading (g) 8.5 17
Solvent type CH3OH + H2O CH3OH
H2 input (mmol) 4.5 9.5
O2:H2 ratio 0.525 0.5
Diluent gas CO2 N2
H2O2 concentration (wt%) 0.22 0.62
H2O2 Productivity (molH2O2kgcat-1h-1) 110 310
H2 conversion (%) 41 58
H2 selectivity (%) 80 56
Interestingly, even when using N2 as the diluent gas with no added acid or water to the
reaction medium (which have both been found to be beneficial), the semi-continuous flow
reactor produces almost three times the H2O2 concentration and productivity of that achieved
in the batch reactor. This corresponds to a greater conversion in the semi-continuous flow
reactor, however the selectivity is decreased.
The beneficial effect of using a flow of the reagent gases can be linked to the H2
concentration and pressure being kept constant throughout the reaction as shown in Figure
5.18, section 5.7. The reagent gases are constantly being replenished allowing the reaction to
occur at similar rates over the reaction time; however even though this corresponds to a rise
in the H2O2 produced it is also beneficial for the production of water.

-------------------------CHAPTER FIVE: Increasing Hydrogen Peroxide Concentration ------------------------
182
5.11 References
1. J. K. Edwards, B. E. Solsona, P. Landon, A. F. Carley, A. Herzing, C. J. Kiely and G. J. Hutchings, Journal of Catalysis, 2005, 236, 69-79.
2. M. Piccinini, E. Ntainjua N, J. K. Edwards, A. F. Carley, J. A. Moulijn and G. J. Hutchings, Physical Chemistry Chemical Physics, 2010, 12, 2488-2492.
3. M. Piccinini, J. K. Edwards, J. A. Moulijn and G. J. Hutchings, Catalysis Science & Technology, 2012, 2, 1908-1913.
4. V. V. Krishnan, A. G. Dokoutchaev and M. E. Thompson, Journal of Catalysis, 2000, 196, 366-374.
5. V. R. Choudhary, S. D. Sansare and A. G. Gaikwad, Catalysis Letters, 2002, 84, 81-87. 6. C. Samanta, Applied Catalysis a-General, 2008, 350, 133-149. 7. S. Chinta and J. H. Lunsford, Journal of Catalysis, 2004, 225, 249-255. 8. J. M. Campos-Martin, G. Blanco-Brieva and J. L. G. Fierro, Angewandte Chemie International
Edition, 2006, 45, 6962-6984. 9. Y. F. Han and J. Lunsford, Catalysis Letters, 2005, 99, 13-19. 10. R. Hage and A. Lienke, Angewandte Chemie International Edition, 2006, 45, 206-222. 11. P. Landon, P. J. Collier, A. J. Papworth, C. J. Kiely and G. J. Hutchings, Chemical
Communications, 2002, 2058-2059. 12. P. Landon, P. J. Collier, A. F. Carley, D. Chadwick, A. J. Papworth, A. Burrows, C. J. Kiely and G.
J. Hutchings, Physical Chemistry Chemical Physics, 2003, 5, 1917-1923. 13. D. Hancu and E. J. Beckman, Green Chemistry, 2001, 3, 80-86. 14. E. J. Beckman, Green Chemistry, 2003, 5, 332-336. 15. Q. Chen and E. J. Beckman, Green Chemistry, 2007, 9, 802-808. 16. D. Hâncu, J. Green and E. J. Beckman, Industrial & Engineering Chemistry Research , 2002, 41,
4466-4474. 17. , 1982. 18. P. Li, C. He, S. Campestrini, B. Corain, W. Yuan and Y. F. Han, Phys Chem Chem Phys, 2010, 12,
2170-2176. 19. I. T. Horváth, Accounts of Chemical Research , 1998, 31, 641-650. 20. , 1994. 21. US Pat., 2006. 22. J. K. Edwards, A. Thomas, B. E. Solsona, P. Landon, A. F. Carley and G. J. Hutchings, Catalysis
Today, 2007, 122, 397-402. 23. US Pat., 2002. 24. Q. Liu, J. C. Bauer, R. E. Schaak and J. H. Lunsford, Applied Catalysis A: General, 2008, 339,
130-136. 25. G. Blanco-Brieva, E. Cano-Serrano, J. M. Campos-Martin and J. L. G. Fierro, Chemical
Communications, 2004, 1184-1185. 26. X. Liu, X. Wang, X. Guo and G. Li, Catalysis Today, 2004, 93–95, 505-509. 27. N. Gemo, P. Biasi, P. Canu and T. O. Salmi, Chemical Engineering Journal, 2012, 207–208,
539-551. 28. J. V. H. d‘Angelo and A. Z. Francesconi, Journal of Chemical & Engineering Data, 2001, 46,
671-674. 29. M. S. Wainwright, T. Ahn, D. L. Trimm and N. W. Cant, Journal of Chemical & Engineering
Data, 1987, 32, 22-24. 30. Y. Tominaga, I.-C. Hong, S. Asai and M. Sumita, Journal of Power Sources, 2007, 171, 530-534. 31. Z. Miao, H. Yu, W. Song, D. Zhao, L. Hao, B. Yi and Z. Shao, Electrochemistry Communications,
2009, 11, 787-790. 32. K.-s. Guan and Y.-s. Yin, Materials Chemistry and Physics, 2005, 92, 10-15.

-------------------------CHAPTER FIVE: Increasing Hydrogen Peroxide Concentration ------------------------
183
33. M. Daté, M. Okumura, S. Tsubota and M. Haruta, Angewandte Chemie International Edition, 2004, 43, 2129-2132.
34. F. Gao, T. Wood and D. W. Goodman, Catalysis Letters, 2010, 134, 9-12. 35. J. C. Pritchard, Cardiff University, 2012. 36. A. Abad, C. Almela, A. Corma and H. García, Tetrahedron, 2006, 62, 6666-6672. 37. M. Alhumaimess, Z. Lin, W. Weng, N. Dimitratos, N. F. Dummer, S. H. Taylor, J. K. Bartley, C. J.
Kiely and G. J. Hutchings, ChemSusChem, 2012, 5, 125-131. 38. U. R. Pillai and S. Deevi, Applied Catalysis A: General, 2006, 299, 266-273. 39. S.-Y. Lai, Y. Qiu and S. Wang, Journal of Catalysis, 2006, 237, 303-313. 40. S. A. C. Carabineiro, A. M. T. Silva, G. Dražic, P. B. Tavares and J. L. Figueiredo, Catalysis
Today, 2010, 154, 21-30. 41. Z. Chen and Q. Gao, Applied Catalysis B: Environmental, 2008, 84, 790-796. 42. S. D. Gardner, G. B. Hoflund, D. R. Schryer, J. Schryer, B. T. Upchurch and E. J. Kielin,
Langmuir, 1991, 7, 2135-2139. 43. S. Hilaire, X. Wang, T. Luo, R. J. Gorte and J. Wagner, Applied Catalysis A: General, 2004, 258,
271-276. 44. X. Wang and R. J. Gorte, Applied Catalysis A: General, 2003, 247, 157-162. 45. Marti, amp, x, A. nez-Arias, Hungri, A. B. a, G. Fernández, M. a, A. Iglesias-Juez, J. A.
Anderson and J. C. Conesa, Journal of Catalysis, 2004, 221, 85-92. 46. J. A. Wang, L. F. Chen, M. A. Valenzuela, A. Montoya, J. Salmones and P. D. Angel, Applied
Surface Science, 2004, 230, 34-43. 47. E. Bekyarova, P. Fornasiero, J. Kašpar and M. Graziani, Catalysis Today, 1998, 45, 179-183. 48. O. Pozdnyakova, D. Teschner, A. Wootsch, J. Kröhnert, B. Steinhauer, H. Sauer, L. Toth, F. C.
Jentoft, A. Knop-Gericke, Z. Paál and R. Schlögl, Journal of Catalysis, 2006, 237, 17-28. 49. W. J. Shen, Y. Ichihashi, M. Okumura and Y. Matsumura, Catalysis Letters, 2000, 64, 23-25. 50. Y. Matsumura, W.-J. Shen, Y. Ichihashi and H. Ando, Catalysis Letters, 2000, 68, 181-183. 51. W.-J. Shen, Y. Ichihashi, H. Ando, Y. Matsumura, M. Okumura and M. Haruta, Applied
Catalysis A: General, 2001, 217, 231-239. 52. W.-J. Shen and Y. Matsumura, Journal of Molecular Catalysis A: Chemical, 2000, 153, 165-
168. 53. M. P. Kapoor, Y. Ichihashi, T. Nakamori and Y. Matsumura, Journal of Molecular Catalysis A:
Chemical, 2004, 213, 251-255. 54. Q.-b. Chen, L.-t. Luo and X. Yang, Indian Journal of Chemistry - Section A, 2008, 47A, 1317-
1322. 55. E. Smolentseva, B. T. Kusema, S. Beloshapkin, M. Estrada, E. Vargas, D. Y. Murzin, F. Castillon,
S. Fuentes and A. Simakov, Applied Catalysis A: General, 2011, 392, 69-79. 56. A. Tompos, J. L. Margitfalvi, M. Hegedus, A. Szegedi, J. L. Fierro and S. Rojas, Comb Chem
High Throughput Screen, 2007, 10, 71-82. 57. E. N. Ntainjua, M. Piccinini, J. C. Pritchard, J. K. Edwards, A. F. Carley, C. J. Kiely and G. J.
Hutchings, Catalysis Today, 2011, 178, 47-50. 58. V. R. Choudhary, C. Samanta and P. Jana, Industrial & Engineering Chemistry Research , 2007,
46, 3237-3242. 59. P. Biasi, N. Gemo, J. R. Hernández Carucci, K. Eränen, P. Canu and T. O. Salmi, Industrial &
Engineering Chemistry Research, 2012, 51, 8903-8912. 60. P. Biasi, P. Canu, F. Menegazzo, F. Pinna and T. O. Salmi, Industrial & Engineering Chemistry
Research, 2012, 51, 8883-8890. 61. S. Chinta and J. H. Lunsford, Journal of Catalysis, 2004, 225, 249-255. 62. M. Piccinini, Cardiff University, 2011. 63. S. Melada, F. Pinna, G. Strukul, S. Perathoner and G. Centi, Journal of Catalysis, 2006, 237,
213-219.

-------------------------CHAPTER FIVE: Increasing Hydrogen Peroxide Concentration ------------------------
184
64. N. E. Ntainjua, M. Piccinini, J. C. Pritchard, J. K. Edwards, A. F. Carley, J. A. Moulijn and G. J. Hutchings, ChemSusChem, 2009, 2, 575-580.
65. D. P. Dissanayake and J. H. Lunsford, Journal of Catalysis, 2002, 206, 173-176. 66. D. P. Dissanayake and J. H. Lunsford, Journal of Catalysis, 2003, 214, 113-120. 67. J. K. Edwards, J. Pritchard, M. Piccinini, G. Shaw, Q. He, A. F. Carley, C. J. Kiely and G. J.
Hutchings, Journal of Catalysis, 2012, 292, 227-238. 68. V. R. Choudhary and C. Samanta, Journal of Catalysis, 2006, 238, 28-38.

185
Conclusion and Future Work
6.1 Conclusion
The aim and objectives of this research and the topic of this thesis are set out in chapter
one. The anthraquinone auto-oxidation (AO) process currently used for the production of
hydrogen peroxide suffers from requiring large amounts of energy and a continuous refill of
the organic solvents due to unwanted side reactions, which makes it only economically viable
on a large scale. Solvay have outlined that if certain requirements are met (H2 selectivity >
90 %; [H2O2] > 8 wt %) the direct process would be able to challenge the AO process and
allow H2O2 to be produced on site where required. As discussed in chapter one, many
important developments in the research of the direct H2O2 synthesis, since the first patent in
1914, have already been achieved by research groups worldwide.
In this thesis a number of aspects of the direct synthesis of H2O2 were studied, by looking at
the design of the catalyst (chapter 3-4) and varying reaction conditions together with the
reactor (chapter 5). Conclusions have been recorded at the end of each chapter. It can be
seen that the percentage of hydrogen peroxide produced has varied dependent on the
conditions. However, although the requirements outlined by Solvay have not been achieved,
the advantage of direct H2O2 synthesis to industry, the economy and the environment is so
important that further study of variations in heterogeneous catalysis is necessary.
Specific lines of research were undertaken in an attempt to establish the active site
responsible for the synthesis, hydrogenation and decomposition of H2O2 and to produce
higher H2O2 concentrations. The most important results achieved within this thesis are
highlighted, in Table 6.1, followed by a discussion of the results and an outline of future
work.

-------------------------------------------------------------------- CHAPTER SIX: Conclusion and Future Work --------------------------------------------------------------------
186
Table 6.1 – Important results gained from this thesis
Chapter Catalyste Reaction time
(min)
H2 input
(mmol)
H2O2 productivity
(molH2O2kgcat-1h-1)
H2O2 hydrogenation
(molH2O2kgcat-1h-1)
H2O2 concentration
(wt%)
H2 selectivity
(%)
Literaturea1 Au-Pd/C 30 4.5 110 110 0.22 80
3a Au-Pd/AwC2 30 4.5 160 0 0.32 -
3a Au-Pd/AwC 30 4.5 126 0 0.252 -
4a Au-Pd/Cf 30 4.5 100 672 0.2 -
5b Au-Pd/C 30 5.43 7 highg 0.8 -
5c AuPdPt/CeO2 150 5.43 x 5 8 highg 3.2 -
5d Au-Pd/C 30 9.5 310 - 0.62 56
5d Au-Pd/C 120 38 124 - 1.0 25
a Standard batch conditions – 10 mg catalyst, 2 oC, 580 psi, 5 %H2/CO2 + 25 %O2/CO2, H2/O2 = 0.525, 5.6 g CH3OH + 2.9 g H2O, 1200 rpm b Biphasic solvent – 10 mg catalyst, 25 oC, 700 psi, 5 %H2/CO2 + 25 %O2/CO2, H2/O2 = 0.525, 3.84 g decan-1-ol + 0.16 g H2O, 1200 rpm c Reagent gases re-charged 5 times, biphasic solvent – 50 mg catalyst, 25 oC, 700 psi, 5 %H2/CO2 + 25 %O2/CO2, H2/O2 = 0.525, 3.84 g decan-1-
ol + 0.16 g H2O, 1200 rpm d Semi-continuous flow reactor - 20 mg catalyst, 2 oC, 580 psi, total flow = 201 ml min-1, 3.5 % H2 + 7 %O2 + 89.5 %N2, H2/O2 = 0.5, 17 g
CH3OH, 1200 rpm e Catalysts prepared by impregnation; Au-Pd = 2.5 %Au-2.5 %Pd, AuPdPt = 0.2 wt% Au-0.2 wt% Pt- 4.6 wt% Pd, AwC = acid-washed carbon. f 2.5 %Au- 2.5 %Pd catalyst prepared by physical grinding g Presumed based on initial results in section 5.4.

----------------------------------- CHAPTER SIX: Conclusion and Future Work-----------------------------------
187
In Chapter Three two ways to turn off a Au-Pd/C supported catalyst’s activity towards H2O2
hydrogenation/decomposition under standard reaction conditions have been discussed.
Firstly, preceding acid washing the support and deposition of Au-Pd by impregnation a
calcination of 400 oC for 3 h in static air is required. Higher activity was achieved with lower
calcination temperature, but catalysts were unstable. Extensive characterisation by XPS of
the series of catalysts calcined at different temperatures identified that the oxidation state of
Pd maybe a crucial feature in achieving zero hydrogenation activity. In order to study this
aspect further a number of controlled reduction and oxidation heat treatments were run. It
was found that a sequential reduction (200 oC, 2 h) and oxidation (300 oC, 3 h) of a calcined
Au-Pd/AwC catalyst also led to the switching off the hydrogenation pathway. This was
linked to the formation of increased PdO on the surface isolating a minimum content of
active Pd0. Extended studies showed the presence of gold and acid-washing the carbon
support, prior to deposition of the metals, are crucial features to switching off H2O2
hydrogenation. This goes some way to identifying what components of the catalyst are
required in order to produce H2O2 without subsequent H2O2 hydrogenation and
decomposition. This could be considered critical in future when designing catalysts to
produce high H2O2 concentrations at high H2 selectivities.
The presence of chloride on the surface even after extensive heat treatments, as shown in
chapter 3, led to research into the effect of surface chloride. In current literature it has been
shown a low concentration of halide has a beneficial effect on H2 selectivity leading to
greater H2O2 productivities. However, the presence of halide in the reaction medium is not
ideal for industry and attempts to incorporate halide into a catalyst before or after metal
deposition has proved unsuccessful, destabilising the supported metal. In Chapter Four, a
very active stable catalyst produced for direct H2O2 synthesis, which contained no halide, was
achieved by physical grinding metal acetates with a support and heated to produce the metal.
The simple physical grinding technique produced small < 10 nm Au-Pd alloy particles and
would be easily scalable for industrial use. The drawback of these materials was the ‘wasted’
metal in the form of large > 10 nm inactive particles and small non-alloyed particles as well
as their high hydrogenation activities. At the end of the chapter it has been shown
incorporating chloride into the physical grinding material led to a lowering of the
hydrogenation activity. It is recommended future work concentrates on reducing the
hydrogenation activity and using Au-Pd more efficiently without compromising the catalysts
activity.
----------------------------------- CHAPTER SIX: Conclusion and Future Work-----------------------------------
188
The potential of the batch reactor setup has previously been extensively examined by Picinini
et al. using Au-Pd/TiO23 and Au-Pd/C4 by changing all reaction variables. However,
methanol-water was used and is generally the solvent of choice in the literature. The
potential of using a biphasic system of decan-1-ol and water is the decan-1-ol produces the
H2O2 and the water extracts the H2O2 in-situ as outlined in chapter 5. The organic solvent
retains the catalyst, serving to protect the H2O2 from decomposition /hydrogenation activity.
It has been shown that at the saturation point when the solvent goes from one to two phases
the highest H2O2 concentration is produced. The potential of this system has been examined
by altering reaction variables to achieve the greatest H2O2 concentration possible with a Au-
Pd/C catalyst. H2O2 concentrations approximately 8x higher were achieved than when
reaction variables were not optimised. This has been extended by using the most active
catalysts produced thus far, tri-metallic Au-Pd-Pt/CeO2, where a H2O2 concentration of > 3
wt% was produced after reagent reloading. This value is closer to the 8 wt% industrial target
set by Solvay®; however using the current reactor design H2 selectivities were not measured.
In the early stages of the research it was shown that H2O2 hydrogenation activities are high
which in future will need to be investigated further.
Due to the promising results of reagent reloading in a batch reactor a semi-continuous flow
reactor was set up as described in the latter part of Chapter Five. The flowing of reagent
gases enables the pressure and maybe more importantly the H2 concentration to be
maintained throughout the reaction. Not only does this set-up allow the H2 selectivities to be
measured, it also proved to enhance the H2O2 concentration. Within this research Karl-
Fischer titration was used to determine the water content proceeding reaction. A H2O2
concentration of 1 wt% was achieved with a standard Au-Pd/C catalyst, which is significantly
higher than in the batch reactor (0.22 wt%) under standard conditions highlighted the
potential of the flow reactor. The semi-continuous flow results indicated that a large excess
of water was being produced over extended reaction time, this and the stability of the catalyst
require further investigation. This study should be extended in order to provide a more in-
depth understanding of the direct H2O2 synthesis using a larger set of catalysts.
Hopefully once greater understanding and refinement of the biphasic solvent system,
described in the first part of Chapter Five, is achieved the semi-continuous flow reactor or a
reactor based on it will provide the means to produce higher H2O2 concentrations. In future
flow of both the gases and the solvent may be required. Interesting results using such a set up
have already been achieved by some research groups.5-11

----------------------------------- CHAPTER SIX: Conclusion and Future Work-----------------------------------
189
6.2 Future Work
A great deal of work prior to and throughout this thesis has involved solving the
selectivity problem of H2O2 synthesis, which requires switching off catalyst activity towards
the H2O2 hydrogenation and decomposition pathways. This would in turn allow for a greater
H2O2 concentration to be produced. Although as concluded in chapter three this has been
achieved under standard batch reaction conditions it is recommended further work
concentrates on this particular problem under the various conditions used in the preceding
chapters. To begin this study a greater understanding of the H2 selectivity for a larger set of
catalysts is required. This may be achieved by either online gas analysis, using the semi-
continuous flow reactor outlined in the latter sections of Chapter Five, or by recording the
water concentration before and after reaction using Karl Fischer titration.
Catalyst Design
• Detailed XPS analysis of a larger set of catalysts – Comparing characterisation results
from chapter three with a larger number of catalysts prepared by different techniques
and/or on various supports would give greater understanding/confirmation of the
active components required for H2O2 synthesis and hydrogenation.
• Use metal more efficiently - Increase level of dispersion of larger >10 nm particles
and achieve greater alloying of small particles. For physical grinding catalysts this
may be achieved by altering the heat treatment conditions for example heating rate,
heat treatment time or flow of inert gas or through the use of a ball mill. The latter
would also allow the technique to be readily scalable for industrial use.
• Oxidation state of the Pd – A detailed investigation starting from a halide-free catalyst
as outlined in chapter Four will allow greater understanding without halide being a
factor. XPS data showed the majority of Pd, in physical grinding catalysts, was in the
metallic state whereas Chapter Three showed a PdO state would be more selective to
H2O2 production.
• Further investigation of halide addition – Addition of further halide to physical
grinding catalysts may be required to lower the H2O2 hydrogenation. This
investigation will give greater insight into the role of halide in direct H2O2 synthesis.

----------------------------------- CHAPTER SIX: Conclusion and Future Work-----------------------------------
190
• Stability of the catalyst – The stability of using physical grinding to produce a Au-
Pd/CeO2 catalyst has been highlighted as an issue and investigation may lead to
greater understanding of the preparation technique. The stability of ALL catalysts
over extended reaction time and under more abrasive conditions requires investigation.
• The use of cheaper metals – Cheaper alternative metals, to replace gold and/or
palladium, may prove to be more suitable for industrial use.
Biphasic Solvent System
• Hydrophilicity of the catalyst – a greater hydrophilicity will allow more of the catalyst
to be retained in the organic phase throughout the reaction.
• Organic Solvent – A detailed investigation into the organic solvent in order to achieve
greater H2 dissolution and catalyst retention whilst still possessing low water
solubility.
• Au-Pd(-Pt) particle compositions - It was noted that catalysts with higher Pd contents
produced higher H2O2 concentration. Further investigation into ratios between the
metals and their preparation will give greater understanding of the catalyst activity in
order to achieve higher H2O2 concentrations.
• Reactor design – Investigation into the reactor design may allow for H2O2 to be
produced at a higher concentration with greater selectivity. This maybe along the
lines of the semi-continuous flow reactor outlined in the latter part of Chapter Five, as
reagent reloading has already been shown to be beneficial.
If the hydrogenation/decomposition pathways cannot be switched off, a thorough
investigation of in-situ H2O2 utilisation in a target reaction such as benzyl alcohol oxidation is
recommended. To start such an investigation, knowledge of a materials activity towards
H2O2 decomposition is desired. Although the H2O2 decomposition pathway is generally
undesired for direct H2O2 synthesis, recent research has focussed on producing H2O2 in-situ
for utilisation in oxidation reactions12-14. In this case H2O2 decomposition would be
beneficial by activating the produced hydrogen peroxide in order to react further.
Decomposition of hydrogen peroxide is a widely studied reaction, and a number of stud ies
have been performed on the decomposition catalysed by palladium on a variety of supports15-
21. However further investigation is required under the reaction conditions used in this thesis.

----------------------------------- CHAPTER SIX: Conclusion and Future Work-----------------------------------
191
It has been a privilege to make a small contribution to hopefully an eventual successful
outcome of further research. It is hoped that the work described in this thesis will provide a
basis and prove to be helpful for anyone continuing studies in catalysis and the direct H2O2
synthesis.
References
1. J. K. Edwards, A. F. Carley, A. A. Herzing, C. J. Kiely and G. J. Hutchings, Faraday Discussions, 2008, 138, 225-239.
2. J. K. Edwards, B. Solsona, E. N. N, A. F. Carley, A. A. Herzing, C. J. Kiely and G. J. Hutchings, Science, 2009, 323, 1037-1041.
3. M. Piccinini, E. Ntainjua N, J. K. Edwards, A. F. Carley, J. A. Moulijn and G. J. Hutchings, Physical Chemistry Chemical Physics, 2010, 12, 2488-2492.
4. M. Piccinini, J. K. Edwards, J. A. Moulijn and G. J. Hutchings, Catalysis Science & Technology, 2012, 2, 1908-1913.
5. Y. Voloshin, R. Halder and A. Lawal, Catalysis Today, 2007, 125, 40-47. 6. Y. Voloshin and A. Lawal, Chemical Engineering Science, 2010, 65, 1028-1036. 7. Y. Voloshin and A. Lawal, Applied Catalysis A: General, 2009, 353, 9-16. 8. T. Inoue, M. A. Schmidt and K. F. Jensen, Industrial & Engineering Chemistry Research , 2007,
46, 1153-1160. 9. T. Inoue, K. Ohtaki, Y. Kikutani, K. Sato, M. Nishioka, S. Hamakawa, K. Mawatari, F. Mizukami
and T. Kitamori, Chemistry Letters, 2009, 38, 820-821. 10. X. Wang, Y. Nie, J. L. C. Lee and S. Jaenicke, Applied Catalysis A: General, 2007, 317, 258-265. 11. J. F. Ng, Y. Nie, G. K. Chuah and S. Jaenicke, Journal of Catalysis, 2010, 269, 302-308. 12. T. V. Choudhary and D. W. Goodman, Topics in Catalysis, 2002, 21, 25-34. 13. G. Blanco-Brieva, M. C. Capel-Sanchez, M. P. de Frutos, A. Padilla-Polo, J. M. Campos-Martin
and J. L. G. Fierro, Industrial & Engineering Chemistry Research, 2008, 47, 8011-8015. 14. G. Li, J. Edwards, A. F. Carley and G. J. Hutchings, Catalysis Communications, 2007, 8, 247-
250. 15. V. R. Choudhary, S. D. Sansare and A. G. Gaikwad, Catalysis Letters, 2002, 84, 81-87. 16. V. R. Choudhary, C. Samanta and P. Jana, Applied Catalysis a-General, 2007, 332, 70-78. 17. V. R. Choudhary and C. Samanta, Journal of Catalysis, 2006, 238, 28-38. 18. T. Moreno, J. García-Serna and M. J. Cocero, The Journal of Supercritical Fluids, 2011, 57,
227-235. 19. I. Huerta, J. García-Serna and M. J. Cocero, The Journal of Supercritical Fluids, 2012. 20. Y. Voloshin, J. Manganaro and A. Lawal, Industrial & Engineering Chemistry Research, 2008,
47, 8119-8125. 21. V. R. Choudhary, C. Samanta and P. Jana, Applied Catalysis A: General, 2007, 317, 234-243.