![Lower Rim Substituted p-tert -Butyl-Calix[4]arene. Part 15. Pb(II)-Ion-Selective Electrodes Based on p-tert -Butyl-calix[4]arene Thioamides](https://static.fdokumen.com/doc/165x107/6342a72ff9c0d1681b0ad302/lower-rim-substituted-p-tert-butyl-calix4arene-part-15-pbii-ion-selective.jpg)
Gene Expression after Treatment with Hydrogen Peroxide, Menadione, or t-Butyl Hydroperoxide in...
10
2002;62:6246-6254. Cancer Res Yao-Yu Eric Chuang, Yidong Chen, Gadisetti, et al. -Butyl Hydroperoxide in Breast Cancer Cells t Menadione, or Gene Expression after Treatment with Hydrogen Peroxide, Updated version http://cancerres.aacrjournals.org/content/62/21/6246 Access the most recent version of this article at: Cited Articles http://cancerres.aacrjournals.org/content/62/21/6246.full.html#ref-list-1 This article cites by 37 articles, 16 of which you can access for free at: Citing articles http://cancerres.aacrjournals.org/content/62/21/6246.full.html#related-urls This article has been cited by 22 HighWire-hosted articles. Access the articles at: E-mail alerts related to this article or journal. Sign up to receive free email-alerts Subscriptions Reprints and . [email protected] Department at To order reprints of this article or to subscribe to the journal, contact the AACR Publications Permissions . [email protected] Department at To request permission to re-use all or part of this article, contact the AACR Publications Research. on November 5, 2014. © 2002 American Association for Cancer cancerres.aacrjournals.org Downloaded from Research. on November 5, 2014. © 2002 American Association for Cancer cancerres.aacrjournals.org Downloaded from
Transcript of Gene Expression after Treatment with Hydrogen Peroxide, Menadione, or t-Butyl Hydroperoxide in...
2002;62:6246-6254. Cancer Res Yao-Yu Eric Chuang, Yidong Chen, Gadisetti, et al.
-Butyl Hydroperoxide in Breast Cancer CellstMenadione, or Gene Expression after Treatment with Hydrogen Peroxide,
Updated version
http://cancerres.aacrjournals.org/content/62/21/6246
Access the most recent version of this article at:
Cited Articles
http://cancerres.aacrjournals.org/content/62/21/6246.full.html#ref-list-1
This article cites by 37 articles, 16 of which you can access for free at:
Citing articles
http://cancerres.aacrjournals.org/content/62/21/6246.full.html#related-urls
This article has been cited by 22 HighWire-hosted articles. Access the articles at:
E-mail alerts related to this article or journal.Sign up to receive free email-alerts
SubscriptionsReprints and
To order reprints of this article or to subscribe to the journal, contact the AACR Publications
Permissions
To request permission to re-use all or part of this article, contact the AACR Publications
Research. on November 5, 2014. © 2002 American Association for Cancercancerres.aacrjournals.org Downloaded from
Research. on November 5, 2014. © 2002 American Association for Cancercancerres.aacrjournals.org Downloaded from
[CANCER RESEARCH 62, 6246–6254, November 1, 2002]
Gene Expression after Treatment with Hydrogen Peroxide, Menadione, or t-ButylHydroperoxide in Breast Cancer Cells
Yao-Yu Eric Chuang, Yidong Chen, Gadisetti, V. R. Chandramouli, John A. Cook, Deborah Coffin, Mong-Hsun Tsai,William DeGraff, Hailing Yan, Shuping Zhao, Angelo Russo, Edison T. Liu, and James B. Mitchell1
Radiation Biology Branch, Center for Cancer Research, National Cancer Institute [Y-Y. E. C., G. V. R. C., J. A. C., D. C., M-H. T., W. D., H. Y., S. Z., A. R., J. B. M.], and CancerGenetics Branch, National Human Genome Research Institute [Y. C.], NIH, Bethesda, Maryland 20892, and Genome Institute of Singapore, Singapore 117528 [E. T. L.]
ABSTRACT
Global gene expression patterns in breast cancer cells after treatmentwith oxidants (hydrogen peroxide, menadione, and t-butyl hydroperoxide)were investigated in three replicate experiments. RNA collected aftertreatment (at 1, 3, 7, and 24 h) rather than after a single time point,enabled an analysis of gene expression patterns. Using a 17,000 microar-ray, template-based clustering and multidimensional scaling analysis ofthe gene expression over the entire time course identified 421 genes asbeing either up- or down-regulated by the three oxidants. In contrast, only127 genes were identified for any single time point and a 2-fold changecriteria. Surprisingly, the patterns of gene induction were highly similaramong the three oxidants; however, differences were observed, particu-larly with respect to p53, IL-6, and heat-shock related genes. Replicateexperiments increased the statistical confidence of the study, whereaschanges in gene expression patterns over a time course demonstratedsignificant additional information versus a single time point. Analyzing thethree oxidants simultaneously by template cluster analysis identified genesthat heretofore have not been associated with oxidative stress.
INTRODUCTION
Cells normally maintain intracellular redox homeostasis by enlist-ing functional antioxidant buffers through redox-coupled enzymaticnetworks that regenerate oxidized substrates. A variety of oxidants,including superoxide, HP,2 lipid hydroperoxides, and hydroxyl radi-cal, are produced by diverse initiating agents or modalities such asionizing radiation, redox cycling drugs, leakage from the mitochon-dria during electron transport (1, 2), activation of signal transductionpathways (3), and a variety of cell types of the immune system whenstressed or activated (3). Left unchecked, oxidizing species can dam-age cells and tissues (4). Indeed, an extensive list of human diseasesand/or conditions are etiologically associated with oxidative stress.Among these are inflammatory diseases, heart disease and stroke,hypertension, gastric ulcers, Alzheimer’s disease, Parkinson’s disease,smoking-related diseases, cancer, and aging (4). Yet, free radicals areimportant and essential as intermediates in primary metabolism andthe regulation of specific signal transduction pathways and geneexpression (3, 5). The characteristic short lifetimes of free radicalsmay serve as ideal cellular switches that initiate molecular events inresponse to stresses and normal cellular metabolism. Understandingthe regulation of complex molecular circuits and biochemical path-ways resulting from oxidative stress will provide the necessary infra-structure to develop novel ways to protect against oxidative damage.
Whereas considerable information has accumulated from studying
individual genes and associated gene products or specific signaltransduction pathways after treatment with various oxidants, microar-ray technology affords the opportunity to interrogate the expression ofthousands of genes in a single experiment (6). Not surprisingly, thesimultaneous study of expression profiles of a huge population ofgenes present on microarrays is challenging. Historically, gene ex-pressions, monitored at different time points or under different con-ditions, were analyzed by clustering genes having similar expressionprofiles (7, 8) and by a comparison of distributions, line graphs of aclustered gene expressions (9). However, none of these reports criti-cally address the statistical significance of the observed differenceswith respect to measurement accuracy. A single time course studyinvolves multiple arrays measured under the same conditions at dif-ferent time points. Systematic study of expressions of successive timepoints can provide an estimate of reliability in principle. However, atrue replicate would additionally cover the variations that can occurwithin biological samples.
Here, we report time course experiments with multiple replicates toobtain the statistical significance for every measured expression ratioand to verify reproducibility. The global gene expression of a singlecell type exposed to three different oxidants: MEN, HP, and TBH wasfollowed by microarray analysis. HP can be reduced by metals togenerate OH radicals leading to cellular damage and cytotoxicity (10).In addition, HP has been implicated in the induction of various signaltransduction pathways (11). MEN through redox cycling may gener-ate superoxide, HP, and semiquinone radicals (12). TBH is a knowntumor promoter in which OH and lipid radicals have been implicated(13). Collectively, the selected oxidants may generate a broad spec-trum of free radicals in different intracellular compartments andwould be expected to evoke common and perhaps disparate geneexpression responses.
MATERIALS AND METHODS
Cell Culture. MCF7 cells (human breast cancer) were grown in RPMI1640 supplemented with 10% FCS, penicillin, and streptomycin. Cells(2 � 106) from exponentially growing stock cultures were plated into 150-mmdishes and were incubated for 3 days before treatment. Cells were treated withHP (0, 500 �M), MEN (0, 25 �M), or TBH (0, 2000 �M) for 1 h, and totalRNAs were extracted from untreated cells or treated cells at 1, 3, 7, and 24 hafter treatments for cDNA microarrays. Cytotoxicity was assessed by clono-genic assay for each treatment group immediately after treatment, as describedpreviously (14). Survival of MCF7 cells, plated in parallel with each arraystudy, treated with HP, MEN, and TBH was 17 � 7%; 67� 46%; and 27�27%, respectively (n � 3).
Microarray Fabrication. The microarrays used for the experiments con-tained 17,600 human cDNA clones and were prepared from two different clonesets including Incyte UniGEM2 set (Fremont, CA) and Research GeneticsNamed Genes set (Huntsville, AL). These cDNA clones are enriched forknown genes. All 17,000 cDNAs were spotted onto poly-L-lysine-coated slides(NCI ROSP 17,000 Human Array) according to Eisen & Brown (15) using anOmniGrid arrayer (GeneMachines, San Carlos, CA).
RNA Extraction. For each collection point, the cell monolayer waswashed once with PBS (4°C) and cells (�15 � 106) were scraped in 10 ml ofPBS (4°C) followed by centrifugation (1000 rpm at 4°C, 5 min). Total RNA
Received 6/11/02; accepted 9/4/02.The costs of publication of this article were defrayed in part by the payment of page
charges. This article must therefore be hereby marked advertisement in accordance with18 U.S.C. Section 1734 solely to indicate this fact.
1 To whom requests for reprints should be addressed, at Radiation Biology Branch,National Cancer Institute, Building 10, Room B3-B69, Bethesda, Maryland 20827. Phone:(301) 496-7511; Fax: (301) 480-2238; E-mail: [email protected].
2 The abbreviations used are: MEN, menadione; HP, hydrogen peroxide; TBH, t-butylhydroperoxide; RT, reverse transcription; MDS, multidimensional scaling; ARE, antiox-idant response element; IL, interleukin; GSH, reduced glutathione; MAPK, mitogen-activated protein kinase; MT, metallothionein; HSP, heat shock protein; PTP, proteintyrosine phosphatase; SHP, SH2-containing protein-tyrosine phosphatase.
6246
Research. on November 5, 2014. © 2002 American Association for Cancercancerres.aacrjournals.org Downloaded from
was extracted with the use of Trizol reagent (Invitrogen, Carlsbad, CA) and theQiagen RNAeasy Mini kit according to the manufacturers’ instructions (Va-lencia, CA).
Probe Labeling and Microarray Hybridization. The methods for probelabeling reaction and microarray hybridization were used as described previ-ously (16) with a few modifications. For all experiments, the cDNA probesfrom untreated and treated MCF7 cells were compared with a reference probethat was generated from a universal human reference RNA (Stratagene, LaJolla, CA), which consisted of RNAs isolated from 10 cell lines. Forty �g ofMCF-7 RNA or 20 �g of universal reference RNA were labeled with Cy5 andCy3, respectively, by using Superscript II Reverse Transcriptase (Invitrogen,Carlsbad, CA).
The arrays were prehybridized with buffer (5� SSC, 0.1% SDS, 1% BSA)at 42°C for 1 h. Slides were washed in deionized water followed by 2-propa-nol. Cy5- and Cy3-labeled cDNA samples were mixed with 1 �l of COT1-DNA (10 �g/�l; Invitrogen, Carlsbad, CA), polyadenylate (8–10 �g/�l;Amersham Pharmacia Biotech, Piscataway, NJ), and yeast tRNA (4 �g/�l;Ambion, Austin, TX) for hybridization. The mixed samples were denaturedand after the addition of 20 �l of 2� hybridization buffer (50% formamide,10� SSC, 0.2% SDS) the entire sample was loaded onto the slides forovernight hybridization at 42°C. After hybridization, the hybridized slideswere then washed in 2� SSC, 0.1%, 1� SSC, 0.1% SDS, and 0.2� SSC, for4 min each, followed by a 1-min wash in 0.05� SSC. Slides were then placedin 2-propanol followed by spin drying.
Microarray Image Analysis. Hybridized arrays were scanned at 10-�mresolution on a GenePix 4000A scanner (Axon Instruments, Inc., Foster City,CA). The Cy5- and the Cy3-labeled cDNA samples were scanned at 635 nmand 532 nm, respectively. The resulting TIFF images were analyzed byGenePix Pro 3.0 software (Axon Instruments, Inc., Foster City, CA). The ratiosof the sample intensity to the reference red (Cy5)/green (Cy3) intensity for alltargets were determined, and ratio normalization was performed to normalizethe center of ratio distribution to 1.0.
TaqMan Assay. After initial expression analysis, 11 clones were selectedbased on the following criteria: (a) �2-fold induction; (b) high correlationamong the three replicates; and (c) signal intensities �4000 for both channels.In addition, one clone (GADPH) was selected as a control gene. QuantitativeRT-PCR was performed using 1 �g of total RNA. After RT, all of the sampleswere diluted 1:9 with sterile water and 4 �l were used for each SYBR GreenPCR assay. Real-time PCR was performed using the ABI Prism 7900HTsequence detection system according to the manufacturer’s instructions.
Statistical Analyses of Microarray Data. The raw fluorescent intensitieswere initially subjected to a spot quality filter to ensure the accuracy of theexpression ratios. The spot quality filter was defined as follows: (a) signal:background ratios higher than 3; (b) a minimum background corrected signalof 250 counts; and (c) 70% of pixels in the spot have greater than a SD plusbackground. The local median pixel intensity level of the unspotted areaaround the spot was considered as background. MDS was performed tovisualize the similarity of gene expression profile between any pair of samplesby Pearson correlation coefficients of the log-transformed expression ratios of446 genes. Samples with similar gene expression profiles (shorter distances)were thereby placed near each other in the MDS plot and separated from otherdissimilar groups (longer distances).
Template-based Clustering and Gene Selection. A template-based clus-tering algorithm was used to study the temporal changes of gene expressionafter oxidant treatment (17). First, a set of templates (12) that corresponded topossible gene expression response for a given treatment was designed (seewebsite)3 to ensure that the temporal changes of selected genes were notattributable to random phenomena, at the expense of excluding some unex-plainable expression profiles. In addition, we selected genes with highermaximum ratio fold-change during the time course or, equivalently, eliminatedgenes with no significant ratio changes or no response to the treatment. Toassess the significance of the selection criteria, a bootstrap method wasdesigned as follows. First the SD for each gene was estimated. Then thetemporal profiles were simulated by randomly drawing five data points,1,000,000 times, to provide the P of a gene being selected by random chance.
The P for each gene was estimated based on the three replicated ratio profiles,which assumed independence between the experiments.
Selected genes satisfied the following criteria in at least one of the treat-ments: (a) at least 60% of data points (at least three time points) in each profilehad a maximum intensity �500 and a minimum intensity �200 (gray-levels);(b) correlation coefficient of fitting �k � 0.85; (c) maximum fold-change �2;and (d) total P of three replicates �0.001. Among 17,000 genes, 421 geneswere selected after removing 4 duplicated clones. Also selected were 25 genesthat had importance in oxidative stress-related gene expression or that wererelated to the other 421 genes but failed one of the aforementioned selectioncriterion. Therefore, 446 genes were chosen for further statistical analysis.
RESULTS
Gene Expression Clustering Analysis. Gene expression profilesfrom the three different oxidants experiments were analyzed using atemplate-based clustering algorithm. Fig. 1A shows the hierarchicalclustering map of the 446 genes that met the selection criteria. Anumber of observations can be made from Fig. 1A. First, of the 446genes selected, the majority of genes were down-regulated for allthree of the oxidants (average overall time points: 71%, HP; 68%,MEN; 63%, TBH). Second, within a few subclusters, there weredistinct differences in gene expression resulting from exposure to thethree different oxidants (Fig. 1A, panels C, E, and F; e.g., panel C)shows that the TBH-treated cells strongly overexpressed a number ofMT clones, whereas there was minimal expression of the MT geneafter treatment with HP and MEN. Third, regardless of the oxidant,more gene expression was altered (either up or down) at the later timepoints. Approximately 1% of the genes among the selected gene setwere overexpressed (�2-fold) immediately after oxidant exposure (1h), whereas 12–19% of the genes were overexpressed at one of thelater time points after treatment (3, 7, or 24 h). Lastly, most of theoverexpressed genes returned to pretreatment levels by 24 h (only4–9% of the genes remained overexpressed). Of those genes theexpression of which was suppressed, a significant number remainedsuppressed at 24 h (see Fig. 1A).
MDS Analysis. To further examine the global similarity of geneexpression patterns, MDS analysis was performed using the 446 genesselected for the hierarchical clustering analysis as shown in Fig. 1B.The figure illustrates the relationships between all of the samples. Theinitial time point (0 h) for all three of the treatments is the samebecause the “0 h” is the untreated sample. MEN treatment had theleast impact on the MCF7 cells, showing the smallest variation in theMDS plot, whereas HP and TBH treatments exhibited larger pertur-bations. Overall, the MDS analysis indicated that the MEN treatmentgave a different expression profile than either the HP or the TBHtreatment.
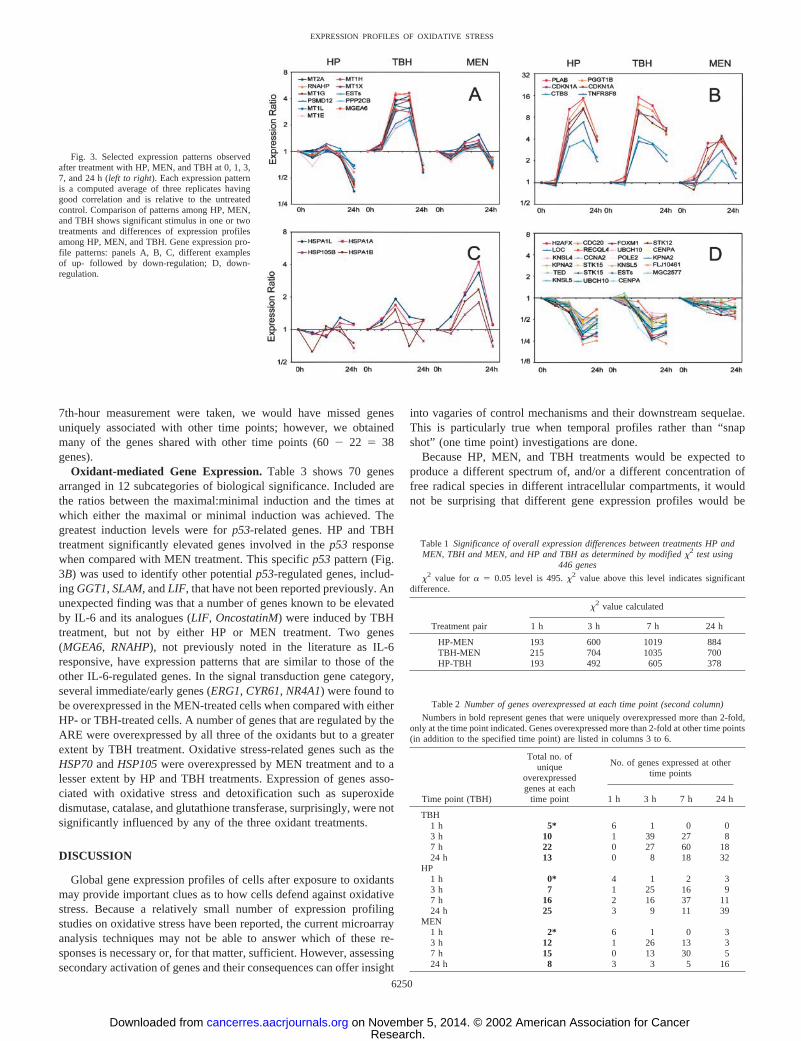
Validation of Microarray Data. To further confirm the results ofmicroarray analysis, quantitative RT-PCR (TaqMan) analysis wasconducted for 12 selected genes at the 7-h time point for each oxidant.Both over- and underexpressed genes were selected. Fig. 2 shows thatthere was excellent agreement between the microarray and TaqMananalyses. GADPH had expression ratios �1.5-fold for all three of theoxidants, and MT2A had expression ratios �1.5-fold for HP-treatedcells; however, even with these small differences, the TaqMan resultswere in excellent agreement with the microarray ratios for thesegenes.
Patterns of Gene Expression of Different Functional Catego-ries. From the hierarchical map shown in Fig. 1A, all three of theoxidants gave similar global gene expression profiles. However, therewere a number of different expression profiles observed among thethree oxidant treatments. Fig. 3 shows different patterns of responseamong the three oxidants for selected genes over the time course aftertreatment. Fig. 3A shows a distinct pattern that emerged showing an
3 Additional information regarding methods, statistical analysis, and tables can be found athttps://arrayanalysis.nih.gov/resources/pub_download/CancerRes1_supplement.htm.
6247
EXPRESSION PROFILES OF OXIDATIVE STRESS
Research. on November 5, 2014. © 2002 American Association for Cancercancerres.aacrjournals.org Downloaded from
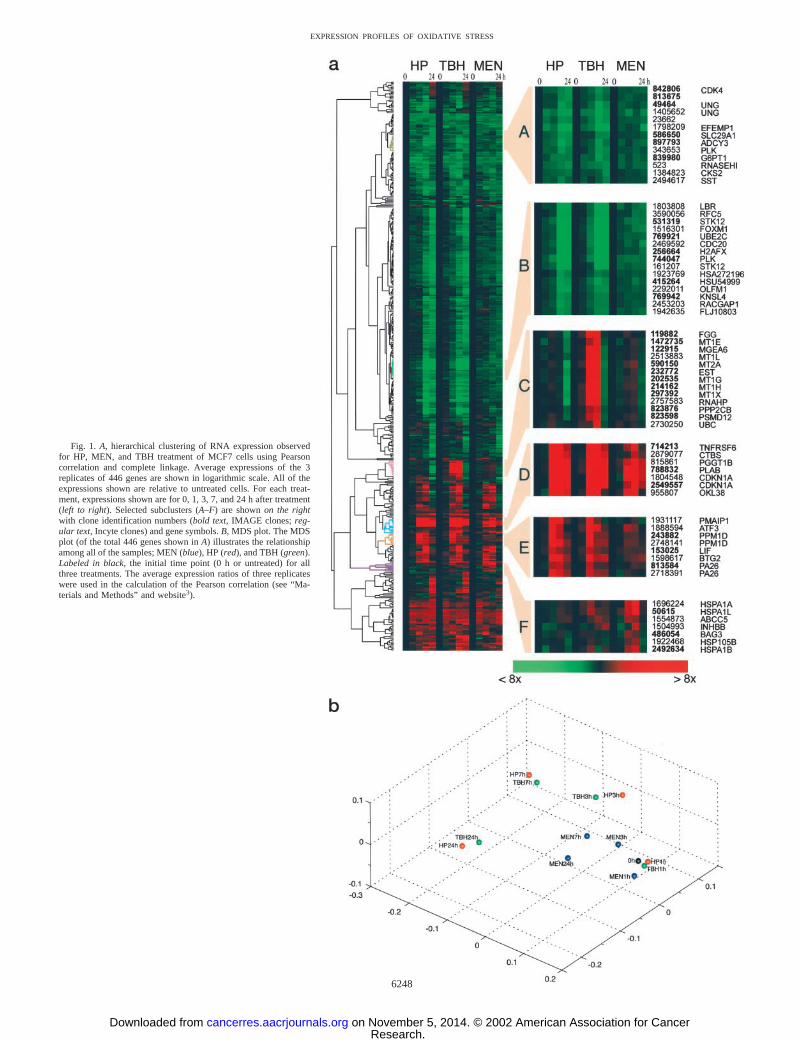
Fig. 1. A, hierarchical clustering of RNA expression observedfor HP, MEN, and TBH treatment of MCF7 cells using Pearsoncorrelation and complete linkage. Average expressions of the 3replicates of 446 genes are shown in logarithmic scale. All of theexpressions shown are relative to untreated cells. For each treat-ment, expressions shown are for 0, 1, 3, 7, and 24 h after treatment(left to right). Selected subclusters (A–F) are shown on the rightwith clone identification numbers (bold text, IMAGE clones; reg-ular text, Incyte clones) and gene symbols. B, MDS plot. The MDSplot (of the total 446 genes shown in A) illustrates the relationshipamong all of the samples; MEN (blue), HP (red), and TBH (green).Labeled in black, the initial time point (0 h or untreated) for allthree treatments. The average expression ratios of three replicateswere used in the calculation of the Pearson correlation (see “Ma-terials and Methods” and website3).
6248
EXPRESSION PROFILES OF OXIDATIVE STRESS
Research. on November 5, 2014. © 2002 American Association for Cancercancerres.aacrjournals.org Downloaded from
up-regulation in TBH-treated cells but not in either HP- or MEN-treated cells. The reproducibility of the minor changes in the profilesmay indicate real variations, because these were confirmed by thecorrelation coefficients �0.9 among the replicates. A second pattern(Fig. 3B) was an up-regulation over 3–7 h followed by a decrease ingene expression at 24 h. There was a difference with respect to themaximal increases with MEN exhibiting less induction than HP orTBH. HSPs were expressed at higher levels in MEN-treated cellscompared with HP- and TBH-treated cells, as shown in Fig. 3C.
Finally, in Fig. 3D, a number of genes were down-regulated after HPand TBH treatment to a greater extent than after MEN treatment.
Statistical Validation of Distinctiveness of Gene ExpressionPatterns. Statistical validation of expression differences requires anunderstanding of the reproducibility of expression data. To testwhether two gene expression patterns were significantly different,paired Student t-tests were used to determine the difference of eachgene’s expressions from different treatments. However, under manyexperimental conditions, the mean of the difference is not coherentlyshifted; instead, the spread of the difference is different when com-paring within or between treatments. When t-tests were performed onmany of the genes, it was found that, because of the variabilitybetween experiments, very few differences noted were significant atthe 95% level. For example, p21 expression, well known to beoverexpressed by oxidative stress (18), was found not to be significantat the 95% level at any time point after TBH, even though it wasclearly up-regulated in all three experiments (control, 1.6 � 0.4; 1 h,1.7 � 0.9; 3 h, 16.9 � 12.6; 7 h, 16.8 � 14.9; and 24 h, 10.5 � 7.7).For this reason, we chose the �2 statistic (Table 1) to test for thesignificance of the difference between two treatments (see website fordetails).3 Table 1 gives �2 values calculated for each pair at each timepoint. The critical �2 value for � � 0.05 is 495. It should be notedthat, although MDS analysis using correlation reveals the similarity ofexpression patterns, the �2 value addresses overall magnitude changesbetween a treatment pair. The �2 values fell below 95% significancelevel at the first hour of treatment (Table 1), which indicated that thethree oxidants did not show significant differences in their overallexpression pattern. However, the expression differences between HPand MEN treatments appear to be significant at 3, 7, and 24 h resultingin �2 values that are much higher than the 95% significance level. Thesame is true between TBH and MEN treatments. Expression differ-ences between HP and TBH treatments were below significance levelat all time points except at 7 h. The results of the difference analysisagree on the conclusion from the MDS analysis, suggesting an overallsimilarity of expression pattern between HP and TBH, whereas bothtreatments differ significantly with MEN.
Single Time Point versus Multiple Time Course Analysis. Rou-tinely, gene expression experiments are carried out using a single timepoint, optimized with some prior knowledge or supporting experi-ments. We assumed that oxidative treatment with different agentswould perturb the cell at different times with different downstreameffects. In an attempt to identify genes the expressions of which canbe unambiguously detected from single-time-point measurements, weselected genes expressed or repressed 2-fold compared with untreatedsamples. Expression of all of the replicates at all of the time points andtreatments measured for 446 selected genes was used for this purpose.A 100% agreement of three replicates showing 2-fold over- or under-expression was used instead of the average value. Using the 2-foldcriterion at any time point, 44 genes were up-regulated and 80 geneswere down-regulated, whereas 3 genes showed both up- and down-regulation at different time points. These analyses are in sharp contrastto those for the 421 genes that were determined to be significantlyaltered by the time analysis (see Fig. 1A) because single measure-ments do not permit an estimation of some of the systematic errorsthat are detectable by multiple time point measurements.
Table 2 lists the genes (of the 446 genes given in Fig. 1A) that wereoverexpressed more than 2-fold at each time point (boldface) afterTBH, HP, and MEN treatment and also shows the distribution of theseoverexpressed genes at the other time points studied. For example,there were 60 genes overexpressed more than 2-fold in the 7th hourafter TBH treatment. Among them, none (0) were overexpressed at1 h, 27 were overexpressed at 3 h, only 22 were overexpressed at 7 h,and 18 continued to be overexpressed at 24 h. Clearly, if only the
Fig. 2. Validation of cDNA microarray data using the TaqMan assay. The expressionratios between 7 h after treatment and 0 h (untreated control) for MEN (A), HP (B), orTBH (C) are compared for 11 selected genes and GAPDH (used as a control). Ratios �1means up-regulation, whereas ratios �1 means down-regulation. The RNAs used for theTaqMan assay were taken from one set of the three replicate experiments, and the TaqMandata shown represent the average of three independent real-time RT-PCR reactions.
6249
EXPRESSION PROFILES OF OXIDATIVE STRESS
Research. on November 5, 2014. © 2002 American Association for Cancercancerres.aacrjournals.org Downloaded from
7th-hour measurement were taken, we would have missed genesuniquely associated with other time points; however, we obtainedmany of the genes shared with other time points (60 � 22 � 38genes).
Oxidant-mediated Gene Expression. Table 3 shows 70 genesarranged in 12 subcategories of biological significance. Included arethe ratios between the maximal:minimal induction and the times atwhich either the maximal or minimal induction was achieved. Thegreatest induction levels were for p53-related genes. HP and TBHtreatment significantly elevated genes involved in the p53 responsewhen compared with MEN treatment. This specific p53 pattern (Fig.3B) was used to identify other potential p53-regulated genes, includ-ing GGT1, SLAM, and LIF, that have not been reported previously. Anunexpected finding was that a number of genes known to be elevatedby IL-6 and its analogues (LIF, OncostatinM) were induced by TBHtreatment, but not by either HP or MEN treatment. Two genes(MGEA6, RNAHP), not previously noted in the literature as IL-6responsive, have expression patterns that are similar to those of theother IL-6-regulated genes. In the signal transduction gene category,several immediate/early genes (ERG1, CYR61, NR4A1) were found tobe overexpressed in the MEN-treated cells when compared with eitherHP- or TBH-treated cells. A number of genes that are regulated by theARE were overexpressed by all three of the oxidants but to a greaterextent by TBH treatment. Oxidative stress-related genes such as theHSP70 and HSP105 were overexpressed by MEN treatment and to alesser extent by HP and TBH treatments. Expression of genes asso-ciated with oxidative stress and detoxification such as superoxidedismutase, catalase, and glutathione transferase, surprisingly, were notsignificantly influenced by any of the three oxidant treatments.
DISCUSSION
Global gene expression profiles of cells after exposure to oxidantsmay provide important clues as to how cells defend against oxidativestress. Because a relatively small number of expression profilingstudies on oxidative stress have been reported, the current microarrayanalysis techniques may not be able to answer which of these re-sponses is necessary or, for that matter, sufficient. However, assessingsecondary activation of genes and their consequences can offer insight
into vagaries of control mechanisms and their downstream sequelae.This is particularly true when temporal profiles rather than “snapshot” (one time point) investigations are done.
Because HP, MEN, and TBH treatments would be expected toproduce a different spectrum of, and/or a different concentration offree radical species in different intracellular compartments, it wouldnot be surprising that different gene expression profiles would be
Table 1 Significance of overall expression differences between treatments HP andMEN, TBH and MEN, and HP and TBH as determined by modified �2 test using
446 genes
�2 value for � � 0.05 level is 495. �2 value above this level indicates significantdifference.
Treatment pair
�2 value calculated
1 h 3 h 7 h 24 h
HP-MEN 193 600 1019 884TBH-MEN 215 704 1035 700HP-TBH 193 492 605 378
Table 2 Number of genes overexpressed at each time point (second column)
Numbers in bold represent genes that were uniquely overexpressed more than 2-fold,only at the time point indicated. Genes overexpressed more than 2-fold at other time points(in addition to the specified time point) are listed in columns 3 to 6.
Time point (TBH)
Total no. ofunique
overexpressedgenes at each
time point
No. of genes expressed at othertime points
1 h 3 h 7 h 24 h
TBH1 h 5* 6 1 0 03 h 10 1 39 27 87 h 22 0 27 60 1824 h 13 0 8 18 32
HP1 h 0* 4 1 2 33 h 7 1 25 16 97 h 16 2 16 37 1124 h 25 3 9 11 39
MEN1 h 2* 6 1 0 33 h 12 1 26 13 37 h 15 0 13 30 524 h 8 3 3 5 16
Fig. 3. Selected expression patterns observedafter treatment with HP, MEN, and TBH at 0, 1, 3,7, and 24 h (left to right). Each expression patternis a computed average of three replicates havinggood correlation and is relative to the untreatedcontrol. Comparison of patterns among HP, MEN,and TBH shows significant stimulus in one or twotreatments and differences of expression profilesamong HP, MEN, and TBH. Gene expression pro-file patterns: panels A, B, C, different examplesof up- followed by down-regulation; D, down-regulation.
6250
EXPRESSION PROFILES OF OXIDATIVE STRESS
Research. on November 5, 2014. © 2002 American Association for Cancercancerres.aacrjournals.org Downloaded from
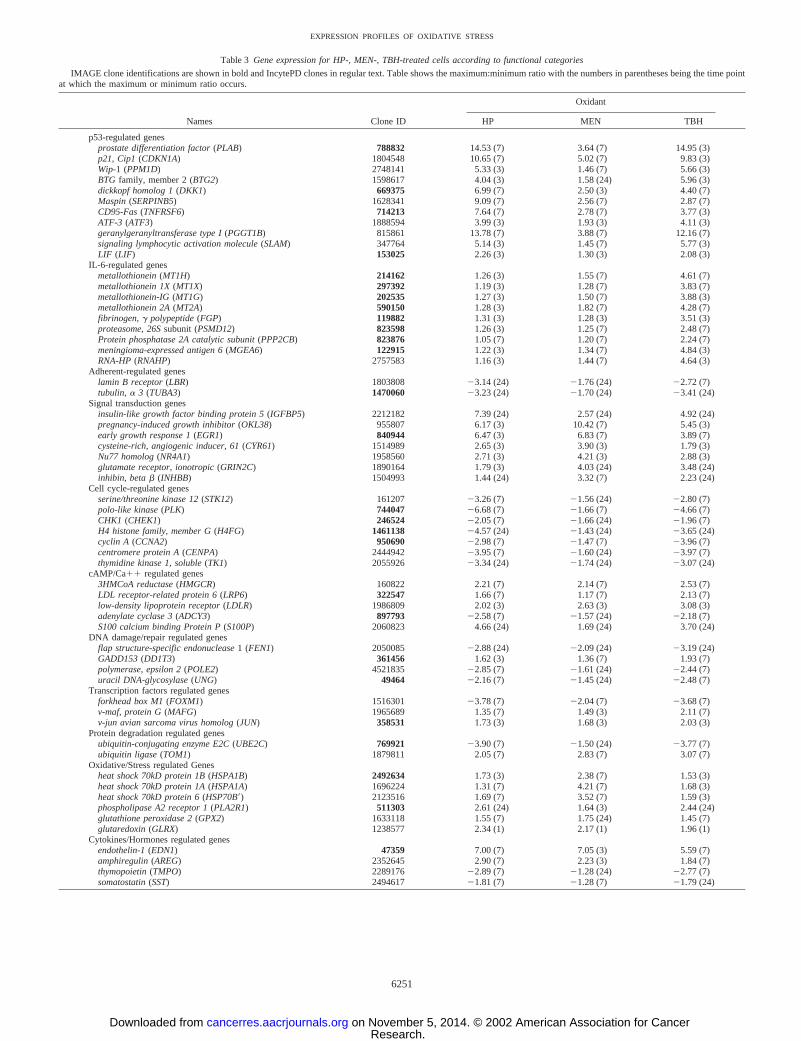
Table 3 Gene expression for HP-, MEN-, TBH-treated cells according to functional categories
IMAGE clone identifications are shown in bold and IncytePD clones in regular text. Table shows the maximum:minimum ratio with the numbers in parentheses being the time pointat which the maximum or minimum ratio occurs.
Names Clone ID
Oxidant
HP MEN TBH
p53-regulated genesprostate differentiation factor (PLAB) 788832 14.53 (7) 3.64 (7) 14.95 (3)p21, Cip1 (CDKN1A) 1804548 10.65 (7) 5.02 (7) 9.83 (3)Wip-1 (PPM1D) 2748141 5.33 (3) 1.46 (7) 5.66 (3)BTG family, member 2 (BTG2) 1598617 4.04 (3) 1.58 (24) 5.96 (3)dickkopf homolog 1 (DKK1) 669375 6.99 (7) 2.50 (3) 4.40 (7)Maspin (SERPINB5) 1628341 9.09 (7) 2.56 (7) 2.87 (7)CD95-Fas (TNFRSF6) 714213 7.64 (7) 2.78 (7) 3.77 (3)ATF-3 (ATF3) 1888594 3.99 (3) 1.93 (3) 4.11 (3)geranylgeranyltransferase type I (PGGT1B) 815861 13.78 (7) 3.88 (7) 12.16 (7)signaling lymphocytic activation molecule (SLAM) 347764 5.14 (3) 1.45 (7) 5.77 (3)LIF (LIF) 153025 2.26 (3) 1.30 (3) 2.08 (3)
IL-6-regulated genesmetallothionein (MT1H) 214162 1.26 (3) 1.55 (7) 4.61 (7)metallothionein 1X (MT1X) 297392 1.19 (3) 1.28 (7) 3.83 (7)metallothionein-IG (MT1G) 202535 1.27 (3) 1.50 (7) 3.88 (3)metallothionein 2A (MT2A) 590150 1.28 (3) 1.82 (7) 4.28 (7)fibrinogen, � polypeptide (FGP) 119882 1.31 (3) 1.28 (3) 3.51 (3)proteasome, 26S subunit (PSMD12) 823598 1.26 (3) 1.25 (7) 2.48 (7)Protein phosphatase 2A catalytic subunit (PPP2CB) 823876 1.05 (7) 1.20 (7) 2.24 (7)meningioma-expressed antigen 6 (MGEA6) 122915 1.22 (3) 1.34 (7) 4.84 (3)RNA-HP (RNAHP) 2757583 1.16 (3) 1.44 (7) 4.64 (3)
Adherent-regulated geneslamin B receptor (LBR) 1803808 �3.14 (24) �1.76 (24) �2.72 (7)tubulin, � 3 (TUBA3) 1470060 �3.23 (24) �1.70 (24) �3.41 (24)
Signal transduction genesinsulin-like growth factor binding protein 5 (IGFBP5) 2212182 7.39 (24) 2.57 (24) 4.92 (24)pregnancy-induced growth inhibitor (OKL38) 955807 6.17 (3) 10.42 (7) 5.45 (3)early growth response 1 (EGR1) 840944 6.47 (3) 6.83 (7) 3.89 (7)cysteine-rich, angiogenic inducer, 61 (CYR61) 1514989 2.65 (3) 3.90 (3) 1.79 (3)Nu77 homolog (NR4A1) 1958560 2.71 (3) 4.21 (3) 2.88 (3)glutamate receptor, ionotropic (GRIN2C) 1890164 1.79 (3) 4.03 (24) 3.48 (24)inhibin, beta � (INHBB) 1504993 1.44 (24) 3.32 (7) 2.23 (24)
Cell cycle-regulated genesserine/threonine kinase 12 (STK12) 161207 �3.26 (7) �1.56 (24) �2.80 (7)polo-like kinase (PLK) 744047 �6.68 (7) �1.66 (7) �4.66 (7)CHK1 (CHEK1) 246524 �2.05 (7) �1.66 (24) �1.96 (7)H4 histone family, member G (H4FG) 1461138 �4.57 (24) �1.43 (24) �3.65 (24)cyclin A (CCNA2) 950690 �2.98 (7) �1.47 (7) �3.96 (7)centromere protein A (CENPA) 2444942 �3.95 (7) �1.60 (24) �3.97 (7)thymidine kinase 1, soluble (TK1) 2055926 �3.34 (24) �1.74 (24) �3.07 (24)
cAMP/Ca�� regulated genes3HMCoA reductase (HMGCR) 160822 2.21 (7) 2.14 (7) 2.53 (7)LDL receptor-related protein 6 (LRP6) 322547 1.66 (7) 1.17 (7) 2.13 (7)low-density lipoprotein receptor (LDLR) 1986809 2.02 (3) 2.63 (3) 3.08 (3)adenylate cyclase 3 (ADCY3) 897793 �2.58 (7) �1.57 (24) �2.18 (7)S100 calcium binding Protein P (S100P) 2060823 4.66 (24) 1.69 (24) 3.70 (24)
DNA damage/repair regulated genesflap structure-specific endonuclease 1 (FEN1) 2050085 �2.88 (24) �2.09 (24) �3.19 (24)GADD153 (DD1T3) 361456 1.62 (3) 1.36 (7) 1.93 (7)polymerase, epsilon 2 (POLE2) 4521835 �2.85 (7) �1.61 (24) �2.44 (7)uracil DNA-glycosylase (UNG) 49464 �2.16 (7) �1.45 (24) �2.48 (7)
Transcription factors regulated genesforkhead box M1 (FOXM1) 1516301 �3.78 (7) �2.04 (7) �3.68 (7)v-maf, protein G (MAFG) 1965689 1.35 (7) 1.49 (3) 2.11 (7)v-jun avian sarcoma virus homolog (JUN) 358531 1.73 (3) 1.68 (3) 2.03 (3)
Protein degradation regulated genesubiquitin-conjugating enzyme E2C (UBE2C) 769921 �3.90 (7) �1.50 (24) �3.77 (7)ubiquitin ligase (TOM1) 1879811 2.05 (7) 2.83 (7) 3.07 (7)
Oxidative/Stress regulated Genesheat shock 70kD protein 1B (HSPA1B) 2492634 1.73 (3) 2.38 (7) 1.53 (3)heat shock 70kD protein 1A (HSPA1A) 1696224 1.31 (7) 4.21 (7) 1.68 (3)heat shock 70kD protein 6 (HSP70B) 2123516 1.69 (7) 3.52 (7) 1.59 (3)phospholipase A2 receptor 1 (PLA2R1) 511303 2.61 (24) 1.64 (3) 2.44 (24)glutathione peroxidase 2 (GPX2) 1633118 1.55 (7) 1.75 (24) 1.45 (7)glutaredoxin (GLRX) 1238577 2.34 (1) 2.17 (1) 1.96 (1)
Cytokines/Hormones regulated genesendothelin-1 (EDN1) 47359 7.00 (7) 7.05 (3) 5.59 (7)amphiregulin (AREG) 2352645 2.90 (7) 2.23 (3) 1.84 (7)thymopoietin (TMPO) 2289176 �2.89 (7) �1.28 (24) �2.77 (7)somatostatin (SST) 2494617 �1.81 (7) �1.28 (7) �1.79 (24)
6251
EXPRESSION PROFILES OF OXIDATIVE STRESS
Research. on November 5, 2014. © 2002 American Association for Cancercancerres.aacrjournals.org Downloaded from
elicited from the three oxidants. Surprisingly, the data of the presentstudy show a greater commonality with regards to gene expressionrather than highly unique mRNA expression profiles. The differentmagnitude of expression levels for HP, TBH and MEN treatmentsmay result in statistical significance between three treatments asshown in Fig. 1B and �2 values (Table 1).
Reproducibility of Replicate Experiments. Systematic develop-ment of statistical significance of expressions measured by cDNAmicroarrays can be found in some recent reports (18–20). However,rigorous methods of analyzing time-dependent data set with relativelyfew time points and without obvious oscillation model are apparentlylacking.
To alleviate the difficulty of assessing the significance of responseto the oxidative agents used in the present study, we chose to usereplicate measurements at each time point to estimate the reproduc-ibility levels explicitly for every spot. The reproducibility of expres-sion was interrogated by the calculation of average and variance ofexpression ratios using replicate experiments for all of the time pointsseparately. The median level of variance corresponds to a ratio of�1.5-fold, which suggests that an expression ratio of �2-fold is avalid means of selecting significant response to the treatment. Aver-aging the replicated experiments effectively reduced noise by n
–,where n is the number of replicates. The strategy appears to bereasonable as seen by the reproducible patterns of a variety of geneswith similar function as shown in Fig. 3A. Reproducibility is alsoevident in some cases with lower than a 2-fold change (in Fig. 3A,MEN).
Gene Expression Patterns after Oxidative Treatment. To assessthe significance of gene expression levels in response to the treatment,one may attempt to choose an optimal time point when most genesrespond to the treatment. However, single-time-point measurementscan reveal limited information compared with a time course pattern. Atime course pattern shows gradual change in expressions givingimportance to low expressions as well as high expression changes. Forinstance, a significant change in expression of many genes at 3 and 7 hafter treatment support the expressions observed at 1 h that areconsistent with the path of expression within the same gene and withina cluster of genes. Additionally, the confidence in a time coursepattern increases, even at lower statistical significance level of ex-pressions, when significant patterns of similar clones are available. Touse this important observation, we chose the template-based timecourse analysis method because a set of preselected response-templates may possess certain characteristics of a smooth responseand thereby ensure reinforcement between gene expression measure-ments from adjacent time points. At the same time, a smooth responsepattern also eliminates noise patterns that render no biological mean-ing at all. To further reduce the rate of false selection of genes thatrespond to the treatment besides requiring matching similarity of 0.85and minimum 2-fold change during the time course, we assessed the
probability that the preselected templates may meet the same criterionwhen random noise (simulated, based on the parameters estimatedfrom each gene) were presented. By requiring the probability ofselecting genes with random expression values in all three replicateexperiments to be small enough, we used the advantages offered byreplicate experiments (template pattern for time-dependent data set,average of replicated time point for noise reduction, P assessmentfrom three replicate experiments) to ensure consistency among threereplicates.
Antioxidant Response. Given the importance of cell redox inmaintaining protein structure and function, MCF7 cells responded toall three oxidants by overexpressing a number of genes responsible forreturning cells to a more reducing state. For example, both GPX(glutathione peroxidase) and GLRX (glutaradoxin) were induced dur-ing the oxidant exposure time and remained elevated for 24 h. Genesfor cystine transport (SLC7A11), glutamate transport (GRIN2C), andGSH synthesis (GCLM) were up-regulated. Finally, TXNRD1 wasalso significantly overexpressed, presumably to aid in the reduction ofoxidized protein sulfhydryls. TBH induced the highest expression ofthe antioxidant genes. As noted above, we unexpectedly found neithersuperoxide dismutase nor catalase expression to be induced. However,a number of other ARE-containing genes were induced by the threeoxidants (Table 3). TBH was particularly effective in inducing thesegenes. This robust activation of ARE by TBH could make the cellsmore resistant to subsequent exposure to oxidants than HP treatment.Likewise, MEN-treated cells may be more resistant by virtue of theheat shock response because it is known that overexpression of theconstitutive form of HSP 70 confers oxidative protection (21).
p53 Response. Eleven p53-regulated genes were induced by allthree of the oxidants, presumably because of DNA damage. Amongthe genes induced by the three oxidants were genes that heretoforehave not been associated with the inducible p53 response (SLAM, LIF,PGGT1B). Nonetheless, they exhibit patterns of response consistentwith genes that are known to be modulated by p53 such as PLAB (22),PPM1D (23), and BTG2 (24). IL-6 mRNA regulation has been linkedto wild-type p53 when overexpression of wild-type p53 inhibits IL-6expression (25). On the other hand, it has been reported that UVirradiation up-regulates LIF expression and secretion in human kera-tinocytes (26). This conflicting data may be explained by the differ-ences in phosphorylation status of p53 induced by different cytotoxicconditions (27). PPM1D has been shown to dephosphorylate andinactivate p38 MAPK (23). Because p38 MAPK is known to regulatethe p53 response, the induction of PPM1D may be an importantmechanism that suppresses the p53 response and possibly preventsapoptosis (23). We cannot rule out the possibility of other mechanismsfor the induction of SLAM, LIF, or PGGT1B genes based on theseresults alone.
IL-6 Response. A key finding of the study was that both HP andTBH increased the LIF transcript, but only the TBH-treated cells
Table 3 Continued
Names Clone ID
Oxidant
HP MEN TBH
ARE-regulated genesdihydrodiol dehydrogenase 2 (AKR1C2) 2449395 2.48 (24) 2.09 (24) 4.31 (7)cationic amino acid transporter, y� system (SLC7A11) 1397926 5.62 (7) 4.03 (7) 8.33 (7)glutamate-cysteine ligase, modifier subunit (GCLM) 132212 1.63 (7) 2.00 (7) 2.82 (7)heme oxygenase 1 (HMOX1) 85259 1.05 (7) 1.37 (7) 1.51 (7)NAD(P)H dehydrogenase (NQO1) 813387 1.25 (7) 1.25 (7) 1.71 (7)malic enzyme 1, NADP(�)-dependent (ME1) 2622181 1.51 (7) 1.85 (7) 2.02 (7)thioredoxin reductase 1 (TXNRD1) 630625 3.84 (7) 3.92 (7) 5.23 (7)cytochrome P450 IB1 (CYP1B1) 782760 3.16 (7) 3.26 (3) 3.61 (7)ferredoxin reductase (FDXR) 2409863 1.89 (7) 1.56 (24) 2.57 (7)ferritin, light polypeptide (FTL) 2868138 1.21 (24) 1.25 (24) 1.62 (7)
6252
EXPRESSION PROFILES OF OXIDATIVE STRESS
Research. on November 5, 2014. © 2002 American Association for Cancercancerres.aacrjournals.org Downloaded from
exhibited an IL-6 like-response. IL-6 is associated with a proinflam-matory response, which may result from free radical generation as apart of the inflammatory response (28). LIF is an IL-6 type cytokine,which can share the same receptor as IL-6 and elicits most of theresponses that IL-6 generates (29). Genes responding to the IL-6response included FGP, MT1, MT2, and PP2A (30–32). Importantly,it has been shown that LIF functions as a growth factor in MCF7 cells,presumably through the erb-b2-gp130 interaction (33). MT is ofparticular interest because others have shown that oxidants induceboth MT-1 and MT-2 (34). It is clear from our studies, however, thatHP did not induce MT1 or MT2 expression. Dalton et al. (35) showedthat HP could induce MT1 overexpression in Hepa cells; however, itwas also noted that other cell lines did not respond to HP by increas-ing MT1 (35). The authors noted that the MT1 HP response wasdependent on the volume of media used, the amount of serum used inthe medium, and the reductive capacity of the cells (35). These factorscan influence the amount of HP in the medium and cytosol. Althoughthe concentration of HP used in the present study resulted in cytotox-icity, it may not have reached the concentration required to induceMT1 overexpression.
Heat Shock Response. Cells treated with either MEN or TBHinduced HSP-associated genes to a similar extent by 3 h; whereas,HP-treated cells did not. Xie et al. (36) showed that the nuclear factorof IL-6 and the heat shock transcription factor 1 can interact with eachother to reduce the effect of either transcription activator dependingon their relative quantities. Perhaps the mutually antagonistic natureof the HSP and the IL-6 responses account for these findings. It is alsowell documented that a proinflammatory response can inhibit a heatshock response and vice versa (37).
Up- and down-regulation of cytokine/hormones (LIF, EDN1,CTGF, AREG, TMPO, and SST) by each of the oxidants was mostimpressive. Several mechanisms of oxidative stress-mediated signaltransduction pathway inhibition may be involved, but one that iscurrently of interest is the finding that HP inhibits tyrosine andserine/threonine phosphatases (38, 39). Meng et al. (40) showed thatHP oxidatively modifies the SHP-2 PTPs resulting in SHP-2 inhibi-tion. This inhibition increased phosphorylation on a number of recep-tor and nonreceptor tyrosine kinases (11). Importantly, TBH could notoxidize SHP-2 PTP because of steric hindrance (38). Moreover, thePTP cysteine oxidation was reversed by GSH or thioredoxin-mediatedreduction, such that the SHP-2 protein regained full activity (40). TheSHP-2 PTP is an intricate component of both epidermal growth factorreceptor signaling as well as the gp130-IL6 receptor group (29, 40).Unlike HP, TBH primarily partitions into membranes and perhaps thiscompartmentalization also prevents significant PTP oxidation.
Survival differences between the MEN and TBH or HP couldexplain some of the different patterns of gene expression (see MDSplot, Fig. 1B). Although beyond the scope of the present study,experiments are planned to determine whether gene expression pro-files differ for treatment with various concentrations (and survivallevels) of MEN. The variability observed in the present study, withrespect to both survival and gene expression profiles among experi-ments, serve to underscore the importance of conducting independentreplicate experiments for gene expression studies. Although it isimportant to include intra-experimental controls (same sample run onreplicate chips, and/or performing dye reversal Cy3/Cy5 studies),because of biological variability it is indeed important to replicateexperiments. The present study demonstrates the statistical strengththat both replicate and time course studies provide for gene expressionstudies. There is currently a trend in microarray-based gene expres-sion studies to increase the stringency associated with “true” geneinduction by accepting only genes that are �3–4-fold expressed.Whereas this convenient criterion will assure more certainty, such
certainty will be gained at the expense of potentially forfeiting infor-mation that can be harvested as a result of more subtle changes thatoccur over time in the cellular milieu. We have introduced severalmethods to analyze bioinformatic data resulting from stress by threeoxidants. By using replicate studies and multiple time points, we havebeen able to examine changes in gene expression of �2-fold and attimes as low as �1.5-fold and, consequently, to evaluate more infor-mation. The ability to interrogate more subtle perturbations in geneexpression and ascertain how they relate to more robust, better-defined pathways should enable a more complete understanding of thecomplex responses associated with oxidative stress.
ACKNOWLEDGMENTS
We thank Dr. David Gius for helpful discussions and critical review of themanuscript.
REFERENCES
1. Chance, B., Sies, H., and Boveris, A. Hydroperoxide metabolism in mammalianorgans. Physiol. Rev., 59: 527–605, 1979.
2. Cadenas, E., and Davies, K. J. A. Mitchondrial free radical generation: oxidativestress and aging. Free Radic. Biol. Med., 29: 222–230, 2000.
3. Thannickal, V. J., and Fansburg, B. L. Reactive oxygen species in cell signaling.Am. J. Physiol. Lung Cell Mol. Physiol., 279: L1005–L1028, 2000.
4. Halliwell, B., and Gutteridge, J. M. C. Free Radicals in Biology and Medicine, Ed. 3.Oxford, United Kingdom: Oxford University Press, pp. 246–350, 1999.
5. Dalton, T. P., Shertzer, H. G., and Puga, A. Regulation of gene expression by reactiveoxygen. Annu. Rev. Pharmacol. Toxicol., 39: 67–101, 1999.
6. Schena, M., Shalon, D., Davis, R. W., and Brown, P. O. Quantitative monitoring ofgene expression patterns with a complementary DNA microarray. Science (Wash.DC), 270: 467–470, 1995.
7. DeRisi, J. L., Iyer, V. R., and Brown, P. O. Exploring the metabolic and geneticcontrol of gene expression on a genomic scale. Science (Wash. DC), 278: 680–686,1997.
8. Eisen, M. B., Spellman, P. T., Brown, P. O., and Botstein, D. Cluster analysis anddisplay of genome-wide expression patterns. Proc. Natl. Acad. Sci. USA, 95: 14863–14868, 1998.
9. Mariadason, J. M., Corner, G. A., and Augenlicht, L. H. Genetic reprogramming inpathways of colonic cell maturation induced by short chain fatty acids: comparisonwith trichostatin A, sulindac, and curcumin and implications for chemoprevention ofcolon cancer. Cancer Res., 60: 4561–4572, 2000.
10. Imlay, J. A., Chin, S. M., and Linn, S. Toxic DNA damage by hydrogen peroxidethrough the Fenton reaction in vivo and in vitro. Science (Wash. DC), 240: 640–642,1988.
11. Rhee, S. G., Bae, Y. S., Lee, S. R., and Kwon, J. Hydrogen peroxide: a key messengerthat modulates protein phosphorylation through cysteine oxidation. Sci. STKE, 2000:1–6, 2000.
12. Thor, H., Smith, M. T., Hartzill, P., Bellomo, G., Jewell, S. A., and Orrenius, S. Themetabolism of menadione (2-methyl-1,4-naphthaquinone) by isolated hepatocytes.J. Biol. Chem., 257: 12419–12425, 1982.
13. Taffe, B. G., Takahashi, N., Kensler, T. W., and Mason, R. P. Generation of freeradicals from organic hydroperoxide tumor promoters in isolated mouse keratino-cytes. Formation of alkyl and alkoxyl radicals from tert-butyl hydroperoxide andcumene hydroperoxide. J. Biol. Chem., 262: 12143–12149, 1987.
14. Mitchell, J. B., Samuni, A., Krishna, M. C., DeGraff, W. G., Ahn, M. S., Samuni, U.,and Russo, A. Biologically active metal-independent superoxide dismutase mimics.Biochemistry, 29: 2802–2807, 1990.
15. Eisen, M. B., and Brown, P. O. DNA arrays for analysis of gene expression. MethodsEnzymol., 303: 179–205, 1999.
16. Khan, J., Simon, R., Bittner, M., Chen, Y., Leighton, S. B., Pohida, T., Smith, P. D.,Jiang, Y., Gooden, G. C., Trent, J. M., and Meltzer, P. S. Gene expression profilingof alveolar rhabdomyosarcoma with cDNA microarrays. Cancer Res., 58: 5009–5013, 1998.
17. Mousses, S., Wagner, U., Chen, Y., Kim, J. W., Bubendorf, L., Bittner, M., Pretlow,T., Elkahloun, A. G., Trepel, J. B., and Kallioniemi, O. P. Failure of hormone therapyin prostate cancer involves systematic restoration of androgen responsive genes andactivation of rapamycin sensitive signaling. Oncogene, 20: 6718–6723, 2001.
18. Tusher, V. G., Tibshirani, R., and Chu, G. Significance analysis of microarraysapplied to the ionizing radiation response. Proc. Natl. Acad. Sci. USA, 98: 5116–5121, 2001.
19. Kerr, M. K., Martin, M., and Churchill, G. A. Analysis of variance for geneexpression microarray data. J. Comput. Biol., 7: 819–837, 2000.
20. Chen, Y., Kamat, V., Dougherty, E. R., Bittner, M. L., Meltzer, P. S., and Trent, J. M.Ratio statistics of gene expression levels and applications to microarray data analysis.Bioinformatics, 18: 1207–1215, 2002.
21. Chong, K. Y., Lai, C. C., Lille, S., Chang, C., and Su, C. Y. Stable overexpression ofthe constitutive form of heat shock protein 70 confers oxidative protection. J. Mol.Cell. Cardiol., 30: 599–608, 1998.
6253
EXPRESSION PROFILES OF OXIDATIVE STRESS
Research. on November 5, 2014. © 2002 American Association for Cancercancerres.aacrjournals.org Downloaded from
22. Kannan, K., Amariglio, N., Rechavi, G., and Givol, D. Profile of gene expressionregulated by induced p53: connection to the TGF-� family. FEBS Lett., 470: 77–82,2000.
23. Takekawa, M., Adachi, M., Nakahata, A., Nakayama, I., Itoh, F., Tsukuda, H., Taya,Y., and Imai, K. p53-inducible wip1 phosphatase mediates a negative feedbackregulation of p38 MAPK-p53 signaling in response to UV radiation. EMBO J., 19:6517–6526, 2000.
24. Tirone, F. The gene PC3 TI S21/BTG2, protype member of the PC3/BTG/TOBfamily: regulator in control of cell growth, differentiation, and DNA repair? J. CellPhysiol., 187: 155–165, 2001.
25. Angelo, L. S., Talpaz, M., and Kurzrock, R. Autocrine interleukin-6 production in renalcell carcinoma: evidence for the involvement of p53. Cancer Res., 62: 932–940, 2002.
26. McKenzie, R. C. Ultraviolet radiation B (UVB)-induction of Leukaemia InhibitoryFactor (LIF) in human keratinocytes. Photodermatol. Photoimmunol. Photomed., 17:284–285, 2001.
27. Keller, D., Zeng, X., Li, X., Kapoor, M., Iordanov, M. S., Taya, Y., Lozano, G.,Magun, B., and Lu, H. The p38MAPK inhibitor SB203580 alleviates ultraviolet-induced phosphorylation at serine 389 but not serine 15 and activation of p53.Biochem. Biophys. Res. Commun., 261: 464–471, 1999.
28. Gadient, R. A., and Patterson, P. H. Leukemia inhibitory factor, interleukin 6, andother cytokines using the GP130 transducing receptor: roles in inflammation andinjury. Stem Cells (Dayton), 17: 127–137, 1999.
29. Heinrich, P. C., Behrmann, I., Muller-Newen, G., Schaper, F., and Graeve, L.Interleukin-6-type cytokine signalling through the gp130/Jak/STAT pathway. Bio-chem. J., 334: 297–314, 1998.
30. Fuller, G. M., and Zhang, Z. Transcriptional control mechanism of fibrinogen geneexpression. Ann. N. Y. Acad. Sci., 936: 469–479, 2001.
31. Hernandez, J., and Hidalgo, J. Endotoxin and intracerebroventricular injection of IL-1 andIL-6 induce rat brain metallothionein-I and -II. Neurochem. Int., 32: 369–373, 1998.
32. Choi, I., Lee, M. J., Kim, E. J., Kang, H. S., and Pyun, K. H. Roles of proteinphosphatase 2A in IL-6 signal transduction in Hep3B cells. Immunol. Lett., 61:103–107, 1998.
33. Qiu, Y., Ravi, L., and Kung, H. J. Requirement of ErbB2 for signalling by interleu-kin-6 in prostate carcinoma cells. Nature (Lond.), 393: 83–85, 1998.
34. Ghoshal, K., and Jacob, S. T. Regulation of metallothionein gene expression. Prog.Nucleic Acid Res. Mol. Biol., 66: 357–384, 2001.
35. Dalton, T., Palmiter, R. D., and Andrews, G. K. Transcriptional induction of themouse metallothionein-I gene in hydrogen peroxide-treated Hepa cells involves acomposite major late transcription factor/antioxidant response element and metalresponse promoter elements. Nucleic Acids Res., 22: 5016–5023, 1994.
36. Xie, Y., Chen, C., Stevenson, M. A., Hume, D. A., Auron, P. E., and Calderwood,S. K. NF-IL6 and HSF1 have mutually antagonistic effects on Transcription inmonocytic cells. Biochem. Biophys. Res. Commun., 291: 1071–1080, 2002.
37. Xie, Y., Chen, C., Stevenson, M. A., Auron, P. E., and Calderwood, S. K. Heat shockfactor 1 represses transcription of the IL-1� gene through physical interaction with thenuclear factor of interleukin 6. J. Biol. Chem., 277: 11802–11810, 2002.
38. Denu, J. M., and Tanner, K. G. Specific and reversible inactivation of protein tyrosinephosphatases by hydrogen peroxide: evidence for a sulfenic acid intermediate andimplications for redox regulation. Biochemistry, 37: 5633–5642, 1998.
39. Bogumil, R., Namgaladze, D., Schaarschmidt, D., Schmachtel, T., Hellstern, S.,Mutzel, R., and Ullrich, V. Inactivation of calcineurin by hydrogen peroxide andphenylarsine oxide. Evidence for a dithiol-disulfide equilibrium and implications forredox regulation. Eur. J. Biochem., 267: 1407–1415, 2000.
40. Meng, T. C., Fukada, T., and Tonks, N. K. Reversible oxidation and inactivation ofprotein tyrosine phosphatases in vivo. Mol. Cell, 9: 387–399, 2002.
6254
EXPRESSION PROFILES OF OXIDATIVE STRESS
Research. on November 5, 2014. © 2002 American Association for Cancercancerres.aacrjournals.org Downloaded from


![Structural characterization and reactivity of Cu(II) complex of p- tert-butyl-calix[4]arene bearing two imine pendants at lower rim](https://static.fdokumen.com/doc/165x107/631fe67f962ed4ca8e03e9b8/structural-characterization-and-reactivity-of-cuii-complex-of-p-tert-butyl-calix4arene.jpg)