Geospatial Data Sharing in Pakistan: Possibilities and Problems
Sci-Afric Journal of Scientific Issues, Research and Essays Vol. 2 (9), Pp. 430-441, September, 2014. (ISSN 2311-6188)
http://www.sci-afric.org
Research Paper
Geospatial information and indicators for mapping land sensitivity to degradation in Siwa Oasis, Egypt.
*Ahmed A. Afifi1, Kh. M. Darwish2 and Refat A. Youssef1
1. National Research Centre, Soils and Water Use Dept., El-Bohouse st., Dokki, Giza, Egypt. 2. Arid Land Research Institute, City for Scientific Research and Technology Applications, Borg El-Arab, Alexandria, Egypt.
*Corresponding Author’s E-mail: [email protected]
Accepted September 29th, 2014
------------------------------------------------------------------------------------------------------------------------------------------------------------------------------ ABSTRACT
The main goal of this work is to identify places with different environmental sensitivity to land degradation in Siwa Oasis (Egypt) by means of a modelling approach developed in the European Commission funded MEDALUS project (Mediterranean Desertification and Land Use) which identifies such areas on the basis of an index (Environmental Sensitive Area index, ESA index) in which environmental quality (climate, vegetation, soil) as well as, FAO/UNEP provisional methodology for the common degradation process, are integrated and mapped. Siwa Oasis is vulnerable to desertification due to its fragile ecosystem and intensive human activity. Studies reveal that desertification is both a natural and anthropogenic process. Three desertification indicators (vegetation, soil and climate indices) were used to assess the severity of decertification in the region with Geoinformation technology (Remote Sensing, Geographical Information System 'GIS' and Global Positioning System 'GPS'). The first two factors were derived from multitemporal remote sensing. The last factor was calculated from census data. The results indicated that the sensitivity of the studied area is ranged from moderately sensitive to very severe sensitive area to degradation. Where, 48.9 % (149.52 km
2) of the studied area are moderately sensitive
area to degradation, while the very severe area to degradation is representing 37.56 % (102.61 km2). The rest of
the study area 55.63 km2 (17.56%) are characterized by sever area to degradation. According to the FAO/UNEP
methodology the most common process of land degradation are the salinity and wind erosion hazard. The slainty status of the study area shows amoderate to very severe condition except in small patches located in the eastern part of the study area, while the wind erosion status has a range form moderate to severe hazard except small patches has a slight wind erosion hazard which is located in the eastern and southern part of the oasis.
Key words: Geoinformatics, Land degradation sensitivity, MEDALUS, FAO/UNEP, Oasis. INTRODUCTION
The word oases is commonly used to describe a place characterized by a sustainable life features, inserted among severe environmental conditioned areas. The Oasis can be defined as an isolated fertile area, usually limited in extent and surrounded by desert. They are depressions in the desert comprising springs, wells and trees, reflects the beauty, charm and diversity of nature.
Dealing with desertification in threatened areas requires some assessment capacity to provide guidelines for implementing successful mitigation and monitoring programmes. Such capacity includes identifying symptoms and driving forces and evaluating risk.The approaches to desertification assessment evolved with the desertification concept itself. This was established after the big drought that the Sahel experienced in the 1970s. Desertification was, at that time, associated with the soil’s loss of capacity to sustain yield and population. Cumbersome debates took place to ascertain whether humans or climatewere causing that process until itwas understood that the effect was synergetic.
The need to assess sustainable use of the lands requires the degradation issue and risks associated to be addressed by proper methods according to the locally dominant degradation related processes. It is important to identify and describe the driving forces leading to land degradation in order to properly understand the phenomenon at a local scale. An environmental sensitive area to degradation (ESA) could be considered as a spatially delimited area in which some key aspects related to its sustainability are unbalanced and not sustainable for a particular environment.
Desertification is defind as land degradation in arid, semi-arid and dry subhumid areas resulting from various factors, including climatic variations and human activities. Land degradation implies the reduction of the resource potential of the landscape through different processes (UNCED, 1992).
The issues mentioned imply that the interpretation of the UNCED desertification definition can differ a lot. The varying interpretations have given rise to varying land degradation and desertification conceptual schools. The different schools may provide different syndrome descriptions depending on scientific experience and geographic “desertification” background of the members of the schools (Reynolds et al., 2007). Land degradation is a ‘holistic’ concept and has often been inadequately assessed by adding up several soil features, such as erosion, compaction, salinization, nutrient depletion, etc. Recently new

Afifi et al 430
approaches are being developed. They are based on ecosystem functions such as productivity (Prince, 2002) or efficiency in the use of water (Boer and Puigdefabregas, 2005). The advantage of these methods is that they are based on attributes that can be directly associated with the ecosystem’s maturity level. However, they fail to include thresholds and integrate human activities. While they do work well for monitoring designs, they are not entirely suitable for risk assessment applications.
Lately it has been suggested that the concept of desertification syndrome is the characteristic sets of symptoms that are associated with specific series of disturbances in desertification threatened areas (Geist, 2005). Desertification syndromes provide a useful frame for integrating the human and biophysical components of household populations or similar management units. They also constitute a qualitative shift from desertification status assessment to risk evaluation. Desertification is the consequence of a set of important processes, which are active in arid and semi-arid environment, where water is the main limiting factor of land use performance in ecosystems (Batterbury and Warren, 2001). Land degradation (LD) is a global process which ultimately leads to a reduction of soil fertility (Fantechi, et.al., 1995). In dry areas LD coupled with extreme bio-physical and socio-economic phenomena may turn into an irreversible process of environmental degradation that is desertification (Montanarella, 2007). In the Mediterranean basin, sensitivity to LD has generally been associated to ecological conditions (e.g. climate aridity, soil characteristics and erosion, slope, vegetation cover) together with specific aspects of drought, human pressure (e.g. population density), and unsustainable land use management (e.g. Incerti et al., 2007; Moonen et al., 2002; Salvati and Zitti, 2008). Methodologies allowing an identification of sensitive areas have already been applied in a number of studies (e.g. Rubio and Bochet, 1998; Simeonakis et al., 2007; Thornes, 2004) especially at the local level (e.g. Motroni et al., 2004). Among them, the ESA (Environmental Sensitive Area) procedure, developed in the context of the EU funded MEDALUS research project, appears to be the most largely applied in southern Europe due to its simplicity in model building and to its explicitly in the use of available/relevant indicators (Basso et al., 2000). Several variables and thematic indicators are considered in the ESA index (ESAI) which involves the assessment of climate, soil quality, vegetation cover, and land management, taken as significant factors leading to LD (Salvati and Zitti, 2005). The ESAI was validated at both the local and regional scales in several testing areas of southern Europe (e.g. Portugal, Spain, Italy, and Greece) under different environmental conditions (Basso et al., 2000 and Brandt, et al., 2003). For instance, (Lavado Contador, et al. 2009) demonstrated that ESAI is well correlated to several, independent indicators of soil degradation in a large region in Spain and thus it was able to correctly identify areas potentially affected by LD. In the last years, the ESA approach was applied also over non-Mediterranean conditions. Ferrara et al., (2012) proposed approach confirms the potentiality of the ESA system when evaluating the level of land vulnerability to desertification. Since the ESA does not provide an absolute estimation of the relationships existing between dependent and independent variables, it should be used as a robust base. ESAI can hence be regarded as a well-established ‘early warning’ indicator of the level of land sensitivity to degradation and its changes over time. In fact, it does not focus on a specific process of LD (e.g. soil erosion, salinization, compacting, sealing, etc. e see Montanarella, 2007 for an extensive review), but quantities the synergic impact of different factors potentially leading to LD. Independently from the assessment methodology, a relatively high number of studies quantified the evolution of the main factors affecting LD at the local scale (e.g. Otto et al., 2007; Simeonakis et al., 2007). A key assumption in such approaches is that land sensitivity is not static and needs permanent monitoring (Salvati and Zitti, 2009). Unfortunately, time series and scenarios analyses quantifying the increase in number and extent of sensitive areas at the national scale are lacking in the Mediterranean basin (Salvati and Zitti, 2008). A permanent assessment of the bio-physical and socio-economic conditions leading to LD over large areas should therefore be a major concern (Lambin, 1993) (i) to guide studies describing (at the local scale) the specific processes involved in LD and (ii) to identify and coordinate various measures with the final goal of obtaining a comprehensive policy framework against desertification (Briassoulis, 2004).
Environmental systems are generally in a state of dynamic equilibrium with external driving forces. Small changes in the driving forces, such as climate or imposed land use tend to be accommodated partially by a small change in the equilibrium and partially by being absorbed or buffered by the system. Desertification of an area will proceed if certain land components are brought beyond specific threshold, beyond which further change produces irreversible change (Tucker et al. 1991; Nicholson et al. 1998). Environmentally Sensitive Areas (ESA’s) to desertification in desert oases exhibit different sensitivity status to desertification for various reasons. Low rainfall is generally the main constraint supporting severe desertification sensitivity. However, availability of ground water and preferable soil and landscape conditions may sustain a satisfactory vegetation cover causing drought resistance (Ferrara et al, 1999). G. Ladisa et al., (2012), developed a new indicators to account for the regional-specific environmental features as well as for the socio-economic parameters relevant to land use planning and control measures. The results showed good performance of the proposed approach that permits not only to identify and refine different degrees of vulnerability to land degradation, but also to analyse specific factors affecting desertification as well as their evaluation in terms of spatial and temporal distribution.
The most common methods used to assess land degradation are: expert opinions, land users’ opinions, field monitoring, observations and measurement, modelling, estmates of productivity changes and remote sensing. The methods have been applied to different approaches which use either qualitative or quantitative measures or both. Modeling can be an important technique in analyzing and describing processes of desertification change in addition to furthering our understanding of the relationship between the socio-conomic and ecological factors involved and their affects on desertification. Rasmy et al., (2010). presents the development of a system dynamic model to simulate and analyze potential future state of desertification in Egypt. the results showed that the urban expansion, salinization, and not applying the policy enforcement are considered the most variables provoking the desertification. The main goal of this work is to identify places with different environmental sensitivity to land degradation in Siwa Oasis (Egypt) by MEDALUS approch (Mediterranean Desertification and Land Use) as well as, FAO/UNEP provisional methodology for the common degradation process, are integrated and mapped.

Afifi et al 431
Location of the study area
Siwa Oasis is located in the northern Western Desert of Egypt, some 65 km east of the Libyan–Egyptian border and 300 km south of the Mediterranean Sea. It is limited by longitudes 24°–26° 15' E and latitudes 29°– 30° N, figure (1).
Figure 1: Location of the study area
Siwa Oasis is a natural depression about 23m below sea level. It covers an area of about 1050 km
2 (250,000 Feddans); of
which about 87.95 km2 (20940 Feddans) are currently cultivated. The total numbers of inhabitants in Siwa were 21482 residents in
2006. The main activity in Siwa oasis is agriculture which depends on the groundwater that outflows from about 1199 wells and springs, giving a total annual discharge of about 255 million cubic meters. From this, about 222 million cubic meters are lost as evaporation and evapotranspiration, while the remainder goes to the natural lakes of Siwa Oasis. Thus, the annual surplus groundwater – based on monitoring in 1997 and under present conditions – reaches 33 million cubic meters. This has led to a continuous rise in the water table level (4.5 cm/ year) causing water logging, soil salinization as a result of improper management and uncontrolled water flow from wells and springs and inefficiencies in the system of drainage water, and consequently, deterioration in land productivity, which in turn results in lowering Agriculture income. Agriculture represents the basis of the Siwan economy (International Union for Conservation of Nature, (IUCN, 2000).
Siwa Oasis is characterized by an average temperature of 21.7 °C (71 °F), the average temperature range is 17 °C. The highest monthly average high temperature is 38 °C (100 °F) in July and August, while the lowest monthly average low temperature is 5 °C (41 °F) in January. Siwa Oasis's climate receives an average of 13 mm (0.5 in) of rainfall per year, or 1 mm (0.0 in) per month. On average there are 7.5 days per year with more than 0.1 mm (0.004 in) of rainfall (precipitation) or 1 day with a quantity of rain, sleet, snow etc. per month. The driest weather is in August when an average of 0 mm (0.0 in) of rainfall (precipitation) occurs across 0 days. The wettest weather is in February when an average of 3 mm (0.1 in) of rainfall (precipitation) occurs across 1 day. The average annual relative humidity is 31.5% and average monthly relative humidity ranges from 22% in May to 45% in December.
MATERIALS AND METHOD
Two soil and vegetation quality indexes (SQI and VQI) were computed, the climatic quality index was neglected as the arid desert climate is similar in the studied oases. The main input data for calculating these indices include a mosaic of LANDSAT ETM image and the geologic map of Egypt, produced by CONOCO, 1990. The satellite images were processed using the ENVI 5 system. Different enhancement and classification techniques were tried to specify the optimal ones for the study purposes. Computational and map editing functions were performed using Arc GIS 10.1 GIS system to find out the environmental sensitivity areas (ESA’s).
Image Processing
The satellite images were classified using supervised classification to obtain the land use / land cover map. Maximum likelihood classification technique is carried out to produce the final land use land cove map. The accuracy assessment shows higher level of accuracy that reach up to 94%. The images were geometrically corrected and enhanced as the following:
Pre-processing Techniques : Initially the satellite images were geometrically corrected to the UTM grid system (Zone: 36N, datum: WGS84). Then, the images were radiometrically corrected to remove any noise and additives from the atmosphere (Campbell, 1993). Once geometric and radiometric corrections have done the image is ready for any further analysis.

Afifi et al 432 Enhancement Techniques: Histogram stretching was applied onto the Landsat satellite image to show off the water bodies and clearly discriminate the shoreline boundary of the water bodies. The typical example of the histogram stretching applied in this research to discriminate the lake’s water body and the shoreline.
Geographic Information System (GIS): Geo-spatial database is generated in this project based on the satellite imageries and thematic maps. Topographic maps at scale 1:50,000 were used to initiate the GIS base map.
Digital Elevation Model: The digital elevation model of the studied area was extracted from the Shuttle Radar Topographic Mission (SRTM) images provided by NASA. These data are the main source for extracting the surface features i.e. elevation, slope, and slope aspect and direction. ENVI 5 software was used for geometrically correction and enhancement of the SRTM images and the Arc-GIS 9.2 software was used for extracting the surface features. Figure 2, demonstrates the digital elevation model of the studied areas.
Figure 2: Digital elevation model of Siwa Oasis DESERTIFICATION SENSITIVITY ASSESSMENT
This study used spatial analyses in a Geographic Information System (GIS) to assess and map the environmental sensitivity to
desertification in western desert oases of Egypt depending upon the soils, climate, vegetation and management quality indexes. Concerning the data required for estimating the Environmental Sensitivity to desertification, the indices of soils, vegetation, climate and management were computed. In the standard MEDALUS approach (Kosmas et al., 1999 and Ahmed et al., 2010), the score was allocated to each parameter in each quality index. The scores ranged from “1= best” (for the least sensitive areas to desertification) to “2= worst” (for the most sensitive areas to desertification). The main input data for calculating these indices include land surveying data, Landsat ETM+ images, Digital Elevation Model (DEM), climatic data and geological map of the studied areas (CONOCO, 1989). An image processing system (i.e. ENVI 4.2) and a GIS system (i.e. Arc GIS 9.3) were the main tools in indices computations and ESA’s mapping.
The provisional methodology of the FAO/UNEP (1984) for assessing and mapping of desertification was adopted for investigating the active desertification processes in the study area. Assessing of desertification processes is performed by assessing numerical ratings to land affected by each one of the processes within the specific classes of desertification. Four classes of desertification are used to show the intensity (slight, moderate, severe combination and very severe). The very severe class indicates the extreme conditions. To evaluate the desertification hazards reference has to be made to the natural susceptibility of land to desertification on assessment of status, rate inherent risk and man made factors (Ahmed and Gad, 2011).
Preparation of thematic layers
The three quality indices of soil Quality Index (SQI), vegetation Quality Index (VQI) and limatic Quality Index (CQI) were
computed. The main information to this model was the mosaic landsat satellite image, geologic map of Egypt, and climatic data. ENVI and Arc GIS package were used to carry out the computation of these indices and generate the Environmental Sensitivity maps (ESA).
Afifi et al 433 RESULTS AND DISCUSSIONS
Soil quality index
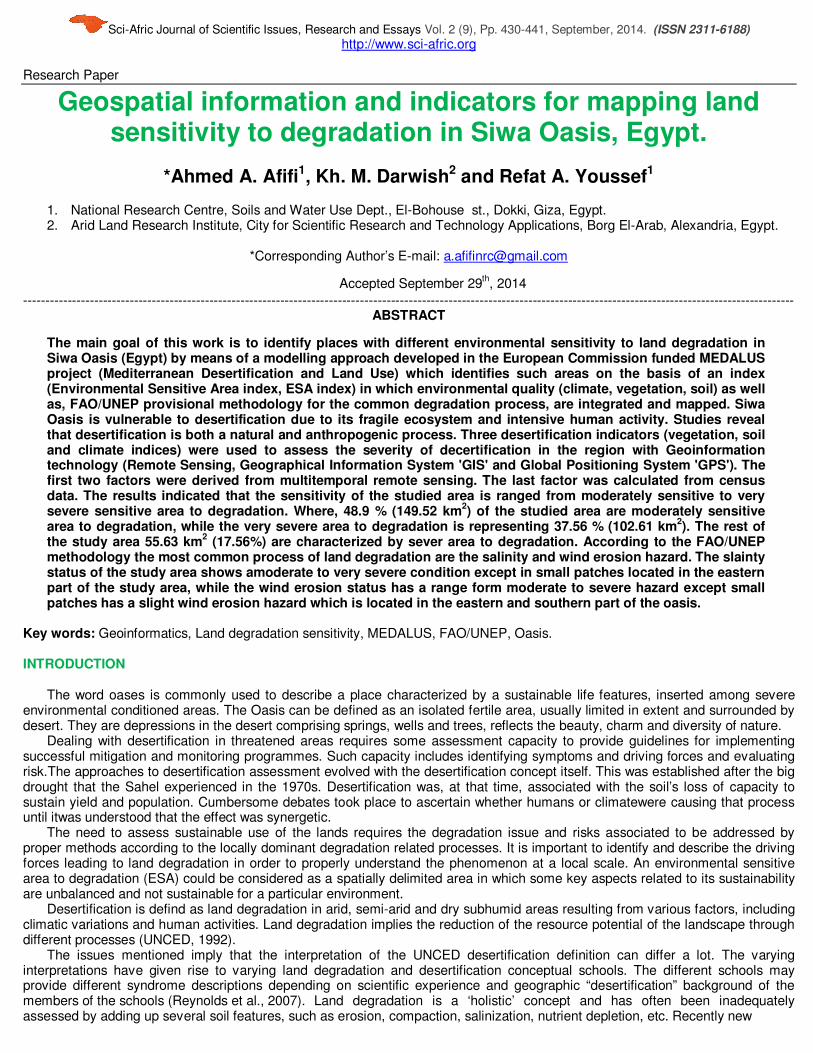
Soil is an essential factor in evaluating the environmental sensitivity of an ecosystem, especially in the arid and semi-arid zones. Soil properties related to desertification phenomena affect the water storage and retention capacity and erosion resistance. The soil quality index (SQI) was evaluated depending upon the drainage condition, rock fragments (%) slope gradient (%), soil texture class, soil depth (cm) and the parent material as sown in Table (1) and figure (3). The layer of soil quality index of Siwa Oases Table (2) and figure (4), indicate that the areas of high soil quality index (value <1.13) is not found in the Siwa Oases, the areas of moderate quality index (value = 1.13 – 1.45) represents 89.43% of the total area (i.e 270.52 Km
2) and the areas of low soil
quality index (value >1.45) represents 10.57 % of the total area (i.e 31.96 Km2). The low soil quality dominates the areas which
characterized by sandy texture, shallow depth and poor drainage soils. Table 1: Soil class parameters of Siwa Oases
Parameter Classes Description Area (sq km) Area % Score
Soil
depth
Shallow Soil thickness 0.15 m 19.58 6.47 2.00
Moderately deep Soil thickness ranges from <1m to 0.5 m 240.73 79.59 1.33
Deep Soil thickness ranges from <0.5m to 0.25 m 6.20 2.05 1.66
Very deep Soil thickness is more than 1 meter 35.97 11.89 1.00
Pare
nt
mate
rial
Good Limestone, dolomite, non-friable sandstone, hard limestone layer
31.88 10.54 1.00
Moderate Marine limestone, friable sandstone 234.55 77.54 1.50
Poor Calcareous clay, clay, sandy formation, alluvium and colluvium
36.05 11.92 2.00
Slo
pe
Abrupt 18- 35 % 19.58 6.47 1.66
Not very gentle 6 - 18 % 12.38 4.09 1.33
Gentle < 6% 270.52 89.43 1.00
Te
xtu
re Coarse Sandy to very Sandy 67.93 22.46 2.00
Medium Loamy sand, Sandy loam, Balanced 234.55 77.54 1.33 Table 2: Soil quality index of Siwa Oases
Classes Area (sq km) Area % Score
Low quality 31.96 10.57 1.63
Moderate quality 270.52 89.43 1.28
Total 302.48 100.00
Figure 3: Soil classe indicaters of Siwa oasis a) soil slope class, b) parent materials class, c) slope class, and d) textural class
a
b
c
d

Afifi et al 434
Figure 4: Soil quality classes of Siwa oasis Vegetation Quality index
Vegetation plays an important role in mitigating the effects of desertification and degradation phenomena. The plant cover (%), erosion protection, drought resistance and vegetation cover parameters (Table, 3) were used for assessing the vegetation quality index (Table,4 and Figure, 5), the layer of vegetation quality index of the area, indicate that the areas of high vegetation quality (Value <1.20) dominate the northern east parts of the area, it represents 48.90 % of the total area (i.e. 149.54 Km
2), the moderate
vegetation quality index (Value 1.2 – 1.4) represents 17.54 % of the total area (i.e. 53.63 Km2). The very low (Value 1.4 – 1.6)
vegetation index (Value >1.60) dominates the rest of the oasis representing 33.56 % of the total area. Table 3: vegetation class parameters of Siwa Oases
Parameter Classes Area (sq km) Area % Score
Ero
sio
n
Pro
tecti
on
Deciduous forests 53.63 17.54 1.66
Mediterranean macchia, permanent grasslands, evergreen perennial crops 149.54 48.90 1.33
Annual agricultural crops, annual grasslands, vines, bare land 102.63 33.56 2.00
Dro
ught
resis
tan
ce
Crop lands mixed with orchards 53.63 17.54 1.33
Halophytes 149.54 48.90 1.00
Saharan vegetation < 40% 102.63 33.56 1.66
Vegeta
tion c
over > 40% 53.63 17.54 1.66
40-10% 149.54 48.90 1.33
Saharan vegetation < 10% 102.63 33.56 1.80 Table 4: Vegetation quality index of Siwa Oases
Classes Description Area (sq km) Area % Score
Average Halophytes 149.54 48.90 1.209
Very weak Saharan vegetation < 40% 102.63 33.56 1.815
Weak Crop lands mixed with orchards 53.63 17.54 1.542
Total 305.80 100.00

Afifi et al 435
Figure 5: Vegetation quality index of Siwa Oasis
Climatic Quality Index
Climate quality index (CQI) is assessed depending upon the amount of rainfall, aridity and slope aspect parameters. The
amount of rainfall and aridity are the same in the studied area, but the microclimate differ from place to another depending on the surface slope and slope aspect. The digital elevation model (DEM) of the depression was established and used for extracting the slope and aspect. The climatic quality index layer of Siwa Oasis refer that the area is characterized by a low (>1.80) climatic quality index.
Desertification quality index of Siwa Oasis
The previous layers were driven together to assess the environmentally sensitive areas (ESA’s) to desertification, on basis of
the calculated desertification sensitivity index (DSI). Table (5) and Figure (6) shows the distribution of environmentally sensitive areas (ESA’s) in the Siwa Oasis, it is clear that the high sensitive areas for desertification in Siwa Oasis are found in the edges of Oasis representing 48.9 % of the total area of the Oasis, where the soil quality, climatic quality and management quality are low. The areas of moderate to low sensitivity for desertification exhibit the middle parts of Siwa as it represents 51.10 % of the total area. The low sensitivity for desertification is due to the good vegetation cover and soil quality.
Table 5: Desertification quality index of Siwa Oases
Classes Area (sq km) Area % Score
Moderately sensitive areas for desertification 149.52 48.90 1.3-1.4
Sensitive areas for desertification 53.63 17.54 1.4-1.6
very sensitive areas for desertification 102.61 33.56 > 1.6
Total 305.76 100.00
Figure 6: Desertification Sensitivity of Siwa Oasis

Afifi et al 436
ASSESSING THE COMMON DEGRADATION PROCESS ACCORDING TO FAO/UNEP (1984) Assessing of desertification is performed by assessing numerical ratings to land affected by each one of the processes within
the specific classes of desertification. Four classes of desertification are used to show the intensity (slight, moderate, severe and very severe). As illustrated in table (6).
Table 6: FAO’s matrix. Example of the criteria for the evaluation of desertification status proposed by FAO/UNEP (1984)
Type Variables Class limits
Slight Moderate Severe Very severe
Wind erosion
Area covered by hummocks (%) <5 5-15 15-30 >30 Surface gravel percent cover <15 15-30 30-50 >50
Salinity
Soil electrical conductivity (dS/cm) <4 4–8 8–16 >16 Exchangeable sodium (%) <5 5–20 20–45 >45 Crop yield (% potential) 85–100 65–85 20–65 >45
Affected areas (%) <5 5–20 20–50 >50
Salinity hazard Soil salinity is one of land degradation problems in Siwa Oasis; the assessment of soil salinity was worked using the spatial
analyst of Arc-GIS 9.2 software. The layers of salinity rate, inherent salinity and salinity status were created as presented in figures (7, 8 and 9). The areas of
the different salinity rate, inherent risk and status are illustrated in tables 7, 8 and 9. The obtained data revealed that the rate of soil salinity in general is moderate where about 75 % of the Oasis is affected by a
moderate rate, 23 % of the total area of the Oasis is affected by severe rate, and the rest of the area (2%) is characterized by a slight rate. From the spatial distribution of salinity rates in the Oasis it is noticed that the severe class exhibit the western parts of the Oasis, while the eastern parts are in general characterized by moderate rate of salinity except small strip dominated by slight rate. The severe inherent risk for salinity dominates 75.82 % of the Oasis while the rest of the Oasis area is characterized by moderate (1.21 %) or slight (22.96 %) risk. The spatial distribution of the salinity inherent risk indicates that the moderate or slight risks are associated with the sandy soils around the edges of the Oasis.
Regarding to the salinity status it is noticed that the severe to very severe class affect 77.71 % of the total area of the Oasis. The severe class affects 8.77 % of the Oasis, the moderate to severe class affect 12.97 % and the slight class represents 0.55 % of the Oasis area. The spatial distribution of salinity status of the Oasis indicate that the high hazard characterize the middle of the depression where the salt lakes are found.
Figure 7: Spatial distribution of salinity status in Siwa Oasis

Afifi et al 437
Table 7: salinity status class
salinity status class Km2 %
slight 5.29 0.55
moderate to severe 123.97 12.97
severe to very severe 742.76 77.71
very severe 83.80 8.77
Total 955.84 100.00
Figure 8: Spatial distribution of salinity inherent risk in Siwa Oasis
Table 8: salinity inherent risk
Class Km2 %
slight 218.79 22.96
moderate 11.55 1.21
severe 722.45 75.82
Total 952.79 100.00
Figure 9: Spatial distribution of salinity rates in Siwa Oasis
Afifi et al 438
Table 9: Sailinity rate class
salinity_rate Km2 %
slight 19.02 2.00
moderate 714.77 75.02
severe 219.00 22.99
Total 952.79 100.00
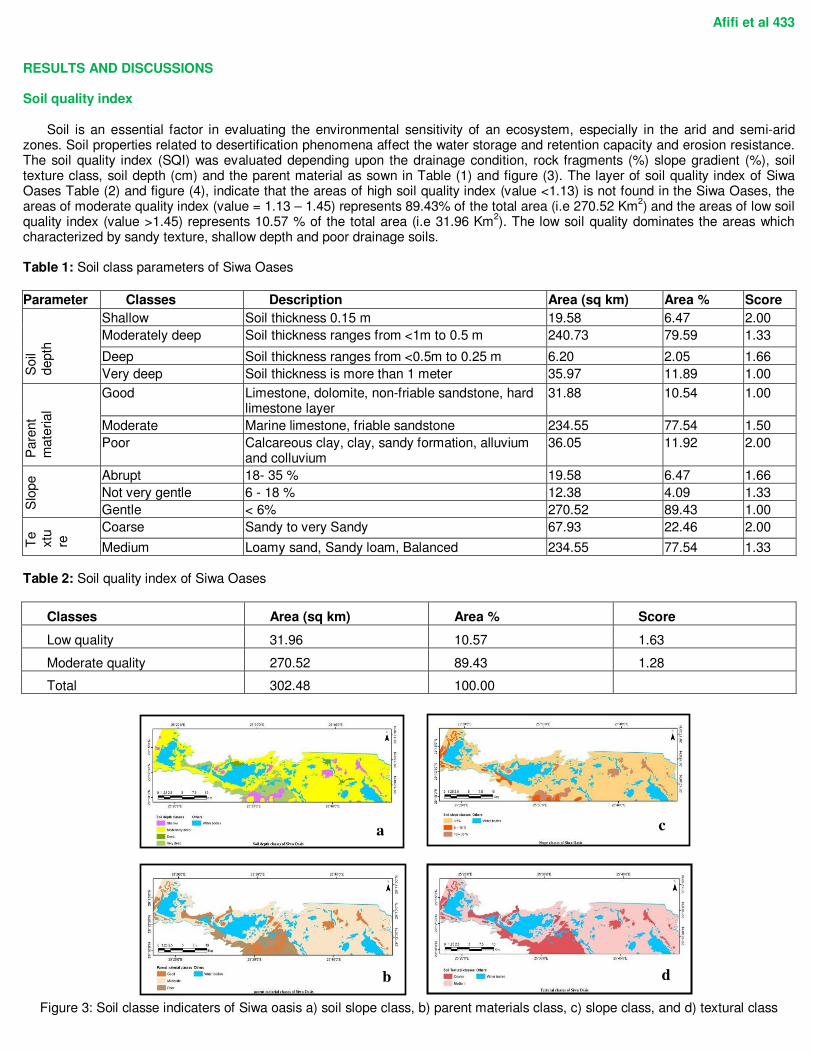
Wind erosion hazard
The layers of wind erosion rate, inherent risk and status were created as presented in figures (10, 11 and 12). The areas of the
different wind erosion rate, inherent risk and status are illustrated in tables (10, 11 and 12). Wind erosion rate was categorized to four classes‟ i.e. slight, moderate, severe and very severe. The very severe class dominates 51.32 % of the Oasis total area, the severe class exhibits 41.39 % of the Oasis, while the slight and moderate classes represent 0.32 and 6.98 % respectively. The spatial distribution of wind erosion rate indicated that very severe class dominate the western parts of the Oasis, while the eastern parts in general is characterized by severe rate except small patches of moderate or slight rate of wind erosion.
Figure 10: Spatial distribution of wind erosion status in Siwa Oasis
Table 10: Wind erosion status class
Class Km2 %
moderate 236.55 24.83
severe 670.99 70.42
slight 45.24 4.75
Total 952.79 100.00
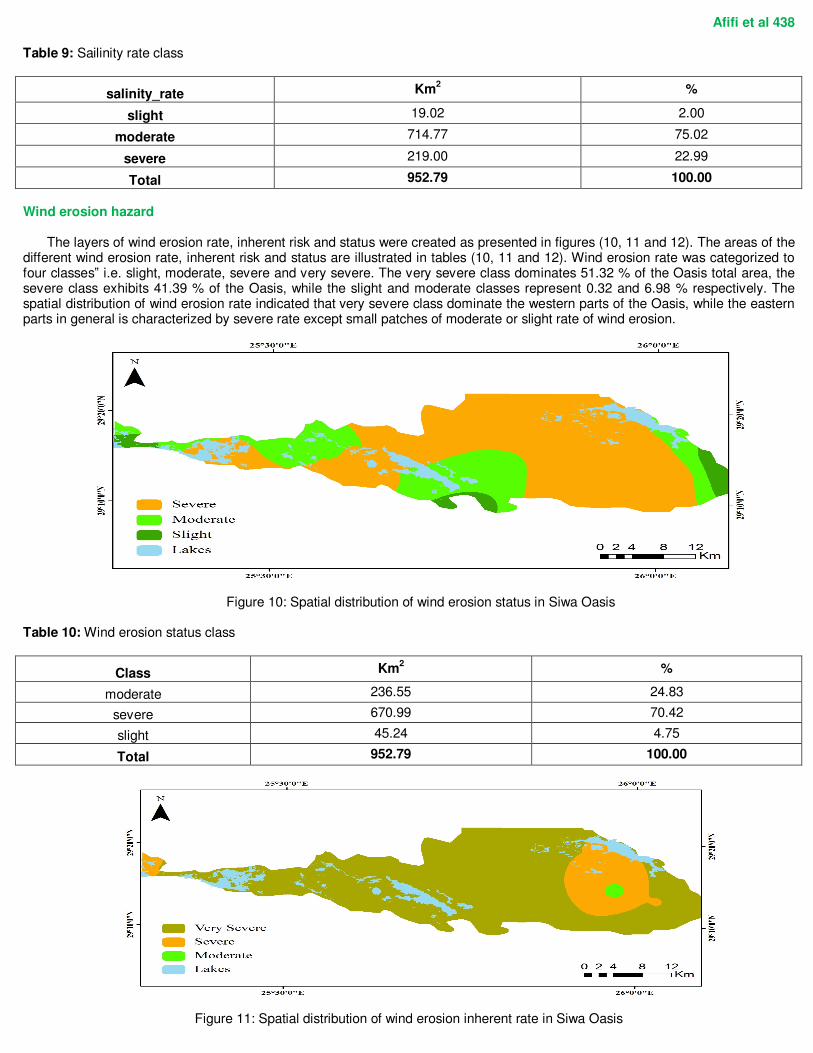
Figure 11: Spatial distribution of wind erosion inherent rate in Siwa Oasis

Afifi et al 439 Table 11: Wind erosion inherent risk class
Class Km2 %
moderate 6.30 0.66
severe 147.31 15.46
very severe 799.18 83.88
Total 952.80 100.00
Figure 12: Spatial distribution of wind erosion rate in Siwa Oasis
Table 12: Wind erosion rate class
Class Km2 %
moderate 66.51 6.98
severe 394.31 41.39
slight 3.03 0.32
very severe 488.93 51.32
Total 952.79 100.00
References Ahmed A. Afifi and Abd Allah Gad (2011). Assessment and Mapping Areas Affected by Soil Erosion and Desertification in the
North Coastal Part of Egypt. International Journal of Water Resources and Arid Environments 1(2): 83-91.
Ahmed A. Afifi; Gad, A. and Refat, A. 2010. Use of GIS and Remote Sensing for Environmental Sensitivity Assessment of North
Coastal Part, Egypt. Journal of American Science; 6(11):632-646.
Agostino Ferrara, Luca Salvati, Adele Sateriano and Angelo Nolè (2012). Performance evaluation and cost assessment of a key
indicator system to monitor desertification vulnerability. Ecological Indicators 23, 123–129.
Basso, F., Bove, E., Dumontet, S., Ferrara, A., Pisante, M., Quaranta, G., et al. (2000). Evaluating environmental sensitivity at the
basin scale through the use of geographic information systems and remotely sensed data: an example covering the Agri basin
e Southern Italy. Catena, 40, 19e35.
Batterbury, SPJ. and A.Warren. (2001). Desertification. in N. Smelser and P. Baltes (eds.) International Encyclopedia of the Social
and Behavioral Sciences. Elsevier Press. Pp. 3526-3529
Boer, M., Puigdefabregas, J., 2005. Assessment of dryland condition using spatial anomalies of vegetation index values.
International Journal of Remote Sensing 26 (18), 4045–4065.
Brandt, J., Geeson, N., and Imeson, A. (2003). A desertification indicator system for Mediterranean Europe.
http://www.kcl.ac.uk/desertlinks (accessed on 21 January 2010).

Afifi et al 440
Briassoulis, H. (2004). The institutional complexity of environmental policy and planning problems: the example of Mediterranean
desertification. Journal of Environmental Planning and Management, 47, 115e135.
Campbell, E. (1993). Influence for empirical transforms. Communications in
Statistics: Theory and Method 22, no. 9: 2491-502
CONOCO, 1989. "Startigraphic Lexicon and explanatory notes to the geological amp of Egypt 1- 500,000,eds." Maurice Hermina,
Eberhard klitzsch and Franz K. List, pp. 263, Cairo: CONOCO Inc., ISBN 3- 927541-09-5.
Fantechi, R., Peter, D., Balabanis, P., and Rubio, JL. (1995). In R. Fantechi, D. Peter, P. Balabanis, and J. L. Rubio (Eds.),
Deserti.cation in a European context: Physical and socio-economic aspects. Brussels, Belgium: Of.ce for Of.cial Publications of
the European Communities. EUR 15415.
Ferrara A., Bellotti A., Faretta S., Mancino G., Taberner M. (1999). Identification and assessment of Environmentally Sensitive
Areas by Remote Sensing. MEDALUS III 2.6.2. - OU Final Report. King's College, London. Volume 2: 397- 429.
G. Ladisa, M. Todorovic, G. Trisorio Liuzzi (2012). A GIS-based approach for desertification risk assessment in Apulia region, SE
Italy. Physics and Chemistry of the Earth. 49, 103–113.
Geist, H., 2005. The causes and progression of desertification. In: Ashgate Studies in Environmental Policy and Practice. Ashgate
Publishing Ltd.
Incerti, G., Feoli, E., Giovacchini, A., Salvati, L., and Brunetti, A. (2007). Analysis of bioclimatic time series and their neural
network-based classi.cation to characterize drought risk patterns in south Italy. International Journal of Biometeorology, 51,
253e263.
IUCN (International Union for Conservation of Nature). 2000. IUCN Guidelines for the Prevention of Biodiversity Loss Caused by
Alien Invasive Species. IUCN, Gland, Switzerland.
Kosmas, C., Kirkby, M. and Geeson, N. 1999. Manual on: Key indicators of desertification and mapping environmentally sensitive
areas to desertification. European Commission, Energy, Environment and Sustainable Development, EUR 18882, 87 p.
Lambin, E. (1993). Spatial scales and deserti.cation. Deserti.cation Control Bulletin, 23, 20e23.
Lavado Contador, J. F., Schnabel, S., Gómez Gutiérrez, A., and Pulido Fernández, M. (2009). Mapping sensitivity to land
degradation in Extremadura, SW Spain. Land Degradation and Development, 20, 129e144.
M. Rasmy, A. Gad , H. Abdelsalam, M. Siwailam. (2010). A dynamic simulation model of desertification in Egypt. The Egyptian
Journal of Remote Sensing and Space Sciences. 13, 101–111
Montanarella, L. (2007). Trends in land degradation in Europe. In M. V. Sivakumar, and N. N’diangui (Eds.), Climate and land
degradation. Berlin: Springer.
Moonen, AC., Ercoli, L., Mariotti, M., and Masoni, A. (2002). Climate change in Italy indicated by agrometeorological indices over
122 years. Agricultural and Forest Meteorology, 111, 13e27.
Motroni, A., Canu, S., Bianco, G., and Loy, G. (2004). Carta delle aree sensibili alla deserti.cazione in Sardegna e Desertnet
project. Cagliari: Regional Agrometeorological Service.
Nicholson, SE, CJ Tucker, and MB Ba. (1998). “Desertification, Drought and Surface Vegetation: an example from the West African
Sahel.” Bulletin of the American Meteorological Society 79 (5): 815-829.
Otto, R., Krusi, BO., and Kienast, F. (2007). Degradation of an arid coastal landscape in relation to land use changes in southern
Tenerife (Canary Islands). Journal of Arid Environment, 70, 527e539.
Prince, SD. 2002. Spatial and temporal scales for detection of desertification. In: Reynolds, J.F., Stafford Smith, D.M. (Eds.), Global
Desertification, Do Humans cause Deserts? Dahlem Workshop Report 88. Dahlem University Press.
Reynolds, JF., Stafford Smith, DM., Lambin, EF., Turner II, BL., Mortimore, M., Battwerbury, S.P.J., Downing, T.E., Dowlatabadi,
H., Fernandez, RJ., Herrick, JE., Huber-Sannwald, E., Jiang, H., Leemans, R., Lynman, T., Maestre, FT., Ayarza, M., Walker,
B., 2007. Global desertification: building a science for dryland development. Science 316, 847–851.
Rubio, JL., and Bochet, E. (1998). Desertification indicators as diagnosis criteria for desertification risk assessment in Europe.
Journal of Arid Environment, 39,113e120.
Salvati, L., and Zitti, M. (2005). Land degradation in the Mediterranean basin: linking bio-physical and economic factors into an
ecological perspective. Biota, 5, 67e77.
Salvati, L., and Zitti, M. (2008). Regional convergence of environmental variables: empirical evidences from land degradation.
Ecological Economics, 68, 162e168.
Salvati, L., and Zitti, M. (2009). Assessing the impact of ecological and economic factors on land degradation vulnerability through
multiway analysis. Ecological Indicators, 9, 357e363.
Simeonakis, E., Calvo-Cases, A., and Arnau-Rosalen, E. (2007). Land use change and land degradation in southeastern
Mediterranean Spain. Environmental Management, 40, 80e94.
Thornes, JB. (2004). Stability and instability in the management of Mediterranean desertification. In J. Wainwright, and M. Mulligan
(Eds.), Environmental modelling: Finding simplicity in complexity (pp. 303e315). Chichester, UK: Wiley.

Afifi et al 441
Tucker, CJ, Dregne, HE, Newcomb WW (1991). Expansion and Contraction of the Sahara Desert from 1980 to 1990. Science 253:
299-301.
UNCED 1992: Report of the United Nations Conference on Environment and Development, Chapter 12: Managing fragile
ecosystems: combating desertification and drought- (Rio de Janeiro, 3–14 June 1992), General A/CONF.151/26 (Vol. II),
Chapter 12.
Copyright © 2022 FDOKUMEN